UNITED STATES
SECURITIES AND EXCHANGE COMMISSION
WASHINGTON, D.C. 20549
FORM N-CSR/A
CERTIFIED SHAREHOLDER REPORT OF REGISTERED MANAGEMENT
INVESTMENT COMPANIES
Investment Company Act file number 811-4626
The Cascades Trust
(Exact name of Registrant as specified in charter)
380 Madison Avenue
New York, New York 10017
(Address of principal executive offices) (Zip code)
Joseph P. DiMaggio
380 Madison Avenue
New York, New York 10017
(Name and address of agent for service)
Registrant's telephone number, including area code: (212) 697-6666
Date of fiscal year end: 3/31/13
Date of reporting period: 3/31/13
FORM N-CSR/A
ITEM 1. REPORTS TO STOCKHOLDERS
| |
|
| March 31, 2013 |
| |
TAX-FREE TRUST OF OREGON A tax-free income investment |
|
| |
| Serving Oregon Investors For Over 25 Years Tax-Free Trust of Oregon “Research Matters” | |
May, 2013
Dear Fellow Shareholder:
While we didn’t necessarily coin the phrases, “Invest in what you know” or “If you don’t understand it, don’t buy it,” these concepts are certainly not new to Tax-Free Trust of Oregon and the Aquila Group of Funds. In fact, they have been at the very core of our investment philosophy since day one.
Our country’s currently volatile economic environment makes these adages ring true louder than ever.
The value provided by a professional investment management team, such as that of Tax-Free Trust of Oregon, which conducts initial research and provides on-going surveillance of issuers and individual bonds as markets develop and credit conditions change, has become increasingly important.
Over the past year or so, you may have read or heard about problems being experienced by certain municipalities – including growing concerns over budget shortfalls, infrastructure demands, pension funding, and high unemployment.
Even when concerns such as these don’t make the mainstream newspapers, it is in your best interest that your Trust’s investment team makes every effort to know about each and every little hiccup. And, since each municipality has its own distinct nuances, we feel it is vital to have a local presence.
Local investment management and research enables us to monitor the local economy, issuers in the state, and policy decisions that will impact issuers, while we conduct research on issues held by the Trust. The research conducted prior to investing in a bond, and ongoing credit monitoring, make it possible to evaluate both the risk associated with an individual bond, and the adequacy of the compensation provided for that risk.
Tax-Free Trust of Oregon specifically benefits from its collective team of local Trustees, portfolio management staff and Trust Officers who seek to be intimately aware of any potential challenges facing the citizens of Oregon throughout the state.
They know the ups and downs that affect you, our shareholders, because they too are affected. Your local representatives are also your friends, neighbors and co-workers.
They hear the same discussions at little league games and pot luck dinners. They read the same small and big town newspapers that you do, shop in the same supermarkets and gas up at the same pumps.
They, like you, are Oregonians.
As you know, by prospectus, Tax-Free Trust of Oregon may only invest in investment grade securities. These higher rated securities are intended to indicate those municipal issues which have not only sufficient, but significant, cash flow strength in order to pay interest when due and to redeem the bonds at maturity. Nonetheless, we firmly believe in the importance of looking beyond credit ratings.
NOT A PART OF THE ANNUAL REPORT
We invest in an issue based on our initial research, and we conduct frequent credit monitoring in order to evaluate the financial condition of the issuer. We devote significant resources to understanding the financial condition of issuers in Oregon, the financing details of individual issues, and how payments of principal and interest on those issues are secured. We monitor the difficult, but necessary, steps being taken to balance budgets within the state. Based on the research we conduct, we select the bonds held in the Trust’s portfolio and decide whether or not to continue holding issues already in the portfolio.
The Aquila Group of Funds has been managing the assets of Oregon investors for over 25 years. Our long history in the Oregon market, the knowledge and experience of the Trust’s portfolio management team, and the research conducted on bonds held in Tax-Free Trust of Oregon continue to provide shareholders with the benefits of local, professional investment management.
Sincerely,
Diana P. Herrmann, Vice Chair and President
Note: Your Board of Trustees determined to change Tax-Free Trust of Oregon’s fiscal year end from September 30th to March 31st to align it with the fiscal and tax year ends of the other tax-free municipal bond funds in the Aquila Group of Funds. We believe your Trust will recognize certain cost savings, such as legal and audit, because the overall amount of review time and expense may now be spread across seven funds.
Consideration should be given to the risks of investing, including potential loss of value, market risk, interest rate risk, credit risk, and geographic concentration. Past performance does not guarantee future results. Investment return and principal value will fluctuate so that an investor’s shares, when redeemed, may be worth more or less than their original cost. For certain investors, some dividends may be subject to Federal and state taxes.
NOT A PART OF THE ANNUAL REPORT
| Serving Oregon Investors For Over 25 Years Tax-Free Trust of Oregon ANNUAL REPORT Management Discussion | |
U.S. Economy
At the end of 2012, the much reported and dramatically named fiscal cliff resulted from a culmination of the expiration of the Bush tax cuts, temporary payroll tax cut and extended unemployment benefits all expiring while higher Medicare taxes and cuts to discretionary spending, agreed to in the Budget Control Act of 2011 (the “BCA”), became effective. The fiscal cliff was averted after the House of Representatives and Senate reached a last-minute compromise and the Federal Reserve (the “Fed”) indicated they may reevaluate quantitative easing if they see substantial improvements in the labor market. The compromise in Congress to avoid the fiscal cliff consisted mostly of raising revenue through new taxes and postponement of most other fiscal decisions until February 2013. From the bond market’s perspective, the last minute maneuvers resulted in a steepening of the U.S. Treasury curve with longer rates rising most significantly.
While the fiscal cliff was largely averted, sequestration was not. On March 1 automatic spending cuts to the U.S. federal budget began. Early estimates of impacts on municipal issuers indicate the effects of sequestration will be limited, primarily due to the fiscal flexibility of states and the federal nature of the cuts. However, we do expect to see some spending reluctance on the part of issuers due to the uncertainty of the financial impact of sequestration. Therefore, we continue to remain cautious of bonds with a high degree of dependence on appropriations from the federal government. In our last management discussion we expressed similar sentiment regarding federal spending following the Treasury Department’s report that the debt limit of $14.29 trillion had been reached in May 2011.
Over the past year, economic data continued to indicate that the recovery is well under way, although proceeding at a slow pace. Consumer spending for autos and housing have shown recent strength. In January, the Case Shiller housing index was up 8.1% year-over-year, the greatest increase since the summer of 2006. However, while personal income and personal spending have exceeded expectations, change in non-farm payrolls has been lower than expected. Nevertheless, the ability of the U.S. equity and real estate markets to sustain their recovery will likely have the greatest impact on the bond market.
State Economy
The improving housing market has also benefitted Oregon. In addition to the economic benefit of housing price appreciation, local governments, dependent upon property tax receipts, benefit from price increases widening the ratio between real market value and assessed value, which provides local governments with more breathing room as they budget for the next fiscal year. Assessed values within Oregon’s most populated county, Multnomah County, were able to sustain growth of 1.97% despite four consecutive years of declining real market values.
While the national municipal market continues to process certain isolated negative headlines, Oregon has been remarkably quiet. Headlines in Oregon have primarily been related to pension reform proposals at the state level and underfunding of pensions at the issuer level. Recently, the Oregon Senate narrowly approved Senate Bill 822 which was designed to cut public workers retirement benefits by nearly half a billion dollars over the next two years. The bill proposes to reduce cost of living increases for retirees receiving more than $20,000 a year in benefits and to stop reimbursing out-of-state retirees for income taxes. Through our credit research we have noted distinct differences in pension funding levels and pension contribution levels at the issuer level. These differences and their potential impact have resulted in our credit research including a review of each holding’s pension exposure.
1 | Tax-Free Trust of Oregon
MANAGEMENT DISCUSSION (continued)
First quarter tax-exempt bond issuance in Oregon doubled for 2013 versus 2012. The increase in issuance is more impressive when viewed without the State’s participation, which results in an increase of issuance of over 5 times 2012 levels. While much of the issuance by local governments continues to be driven by school districts, in 2013 we have seen a more diverse array of local governments issuing bonds.
Fund Performance
The portfolio characteristics for Tax-Free Trust of Oregon (the “Trust”) have become increasingly defensive over the past year. The weighted average maturity shortened to 11.6 years at March 31, 2013 from 12.8 years as of March 31, 2012 and the portfolio duration declined to 4.84 years from 5.01 years. Credit quality remained extremely high - as of March 31, 2013, 77% of the portfolio holdings were rated AAA or AA. For the 12 months ended March 31, 2013, the Y share class of Tax-Free Trust of Oregon provided a 4.58% total rate of return which compared favorably to the 3.85% return for the Barclays Capital Quality Intermediate Municipal Bond Index during the same period. Your Trust’s favorable performance can be attributed to its slightly longer duration versus the index which generated higher prices in a declining interest rate environment. Securities issued in the state of Oregon also performed better than the national average as the limited, although improving, supply and high demand for Oregon bonds contributed to higher price appreciation during the year. Furthermore, the Trust’s overweighted position in education and pre-refunded sectors boosted performance versus the index.
Outlook and Strategy
We have sought to maintain a consistent investment strategy with Tax-Free Trust of Oregon that emphasizes intermediate maturities, thorough credit analysis, and investment grade credit quality securities with the goal of providing an above average double tax-exempt dividend and a relatively stable share price. We plan to accomplish this goal in 2013 by maintaining a neutral to defensive interest rate posture. Despite the Fed’s announced intention to maintain low interest rates, we believe the risk to our shareholders is a meaningful rise in interest rates from the current historically low levels. Developments leading to a tapering of the Fed’s quantitative easing policy or significant progress toward reducing the Federal deficit could be a catalyst for the market to believe the economy will improve and exert upward pressure on interest rates. If it appears that no improvement is on the immediate horizon, we believe it is likely that we will remain in a low interest rate environment for the foreseeable future. In that case, legacy portfolio holdings purchased when rates were higher than today’s levels should continue to add stability to your Trust’s share price and monthly dividend. We have also made great efforts to reduce our reinvestment risk by limiting the bonds subject to call in the next 2 years to approximately 8% of your Trust’s portfolio of investments. We intend to closely monitor the yield differentials between long and short maturities as well as the differences between the various credit rating categories.
As has always been the case, we will seek to reduce our exposure to longer maturities and lower credit quality bonds when their yields narrow relative to shorter, higher quality securities. In a market environment that tempts investors to purchase longer dated maturities or lower credit quality to gain additional yield, we contend it is more prudent to reduce interest rate and credit risks when interest rates are extremely low. Finally, we strongly believe that it is imperative that we stay as fully informed as possible on the financial condition of our holdings in this challenging economic environment. We intend to continue our diligent credit research and surveillance for existing holdings and any securities we consider adding to the portfolio. We believe this investment strategy will continue to generate a reliable double tax-exempt income stream with a relatively stable share price experience.
Thank you for your investment in Tax-Free Trust of Oregon.
Performance data represents past performance, but does not guarantee future results. Investment return and principal value will fluctuate; shares, when redeemed, may be worth more or less than their original cost; current performance may be lower or higher than the data presented.
NOT FDIC INSURED – NO BANK GUARANTEE – MAY LOSE VALUE
2 | Tax-Free Trust of Oregon
PERFORMANCE REPORT
The following graph illustrates the value of $10,000 invested in the Class Y shares of Tax-Free Trust of Oregon for the 10-year period ended March 31, 2013 as compared with the Barclays Capital Quality Intermediate Municipal Bond Index (the “Barclays Capital Index”) and the Consumer Price Index (a cost of living index). The performance of each of the other classes is not shown in the graph but is included in the table below. It should be noted that the Barclays Capital Index does not include any operating expenses nor sales charges, and being nationally oriented, does not reflect state-specific bond market performance.
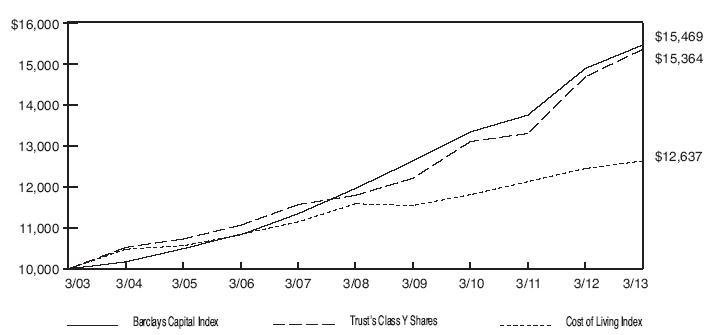
| | | Average Annual Total Return | |
| | | for periods ended March 31, 2013 | |
| | | | | | | | | | | | Since | |
| Class and Inception Date | | 1 Year | | | 5 Years | | | 10 Years | | | Inception | |
| Class A since 6/16/86 | | | | | | | | | | | | |
| With Maximum Sales Charge | | | 0.33 | % | | | 4.41 | % | | | 3.81 | % | | | 5.57 | % |
| Without Sales Charge | | | 4.51 | | | | 5.27 | | | | 4.24 | | | | 5.73 | |
| | | | | | | | | | | | | | | | | |
| Class C since 4/5/96 | | | | | | | | | | | | | | | | |
| With CDSC** | | | 2.61 | | | | 4.38 | | | | 3.36 | | | | 4.04 | |
| Without CDSC | | | 3.63 | | | | 4.38 | | | | 3.36 | | | | 4.04 | |
| | | | | | | | | | | | | | | | | |
| Class Y since 4/5/96 | | | | | | | | | | | | | | | | |
| No Sales Charge | | | 4.58 | | | | 5.43 | | | | 4.39 | | | | 5.08 | |
| | | | | | | | | | | | | | | | | |
| Barclays Capital Index | | | 3.85 | | | | 5.27 | | | | 4.46 | | | 5.78 | * (Class A) |
| | | | | | | | | | | | | | | 5.12 | (Class C & Y) |
Total return figures shown for the Trust reflect any change in price and assume all distributions within the period were invested in additional shares. The rates of return will vary and the principal value of an investment will fluctuate with market conditions. Shares, if redeemed, may be worth more or less than their original cost. A portion of each class’s income may be subject to Federal and state income taxes. Past performance is not predictive of future investment results.
| * | From commencement of the index on 1/1/87. |
| ** | CDSC = 1% contingent deferred sales charge imposed on redemptions made within the first 12 months after purchase. |
3 | Tax-Free Trust of Oregon
REPORT OF INDEPENDENT REGISTERED PUBLIC ACCOUNTING FIRM
To the Board of Trustees and Shareholders of
Tax-Free Trust of Oregon:
We have audited the accompanying statement of assets and liabilities, including the schedule of investments, of Tax-Free Trust of Oregon as of March 31, 2013 and the related statements of operations for the period ended March 31, 2013 and the year ended September 30, 2012, the statements of changes in net assets for the period ended March 31, 2013 and for each of the two years in the period ended September 30, 2012, and the financial highlights for the period ended March 31, 2013 and for each of the five years in the period ended September 30, 2012. These financial statements and financial highlights are the responsibility of the Trust’s management. Our responsibility is to express an opinion on these financial statements and financial highlights based on our audits.
We conducted our audits in accordance with the standards of the Public Company Accounting Oversight Board (United States). Those standards require that we plan and perform the audit to obtain reasonable assurance about whether the financial statements and financial highlights are free of material misstatement. The Trust is not required to have, nor were we engaged to perform, an audit of the Trust’s internal control over financial reporting. Our audits included consideration of internal control over financial reporting as a basis for designing audit procedures that are appropriate in the circumstances, but not for the purpose of expressing an opinion on the effectiveness of the Trust’s internal control over financial reporting. Accordingly, we express no such opinion. An audit also includes examining, on a test basis, evidence supporting the amounts and disclosures in the financial statements. Our procedures included confirmation of securities owned as of March 31, 2013, by correspondence with the custodian and brokers. An audit also includes assessing the accounting principles used and significant estimates made by management, as well as evaluating the overall financial statement presentation. We believe that our audits provide a reasonable basis for our opinion.
In our opinion, the financial statements and financial highlights referred to above present fairly, in all material respects, the financial position of Tax-Free Trust of Oregon as of March 31, 2013, the results of its operations for the period ended March 31, 2013 and the year ended September 30, 2012, the changes in its net assets for the period ended March 31, 2013 and for each of the two years in the period ended September 30, 2012, and the financial highlights for the period ended March 31, 2013 and for each of the five years in the period ended September 30, 2012, in conformity with accounting principles generally accepted in the United States of America.
TAIT, WELLER & BAKER LLP
Philadelphia, Pennsylvania
May 29, 2013
4 | Tax-Free Trust of Oregon
TAX-FREE TRUST OF OREGON
SCHEDULE OF INVESTMENTS
MARCH 31, 2013
| | | | | Rating | | | |
| | | | | Moody’s/S&P | | | |
| Principal | | | | and Fitch | | | |
| Amount | | General Obligation Bonds (50.0%) | | (unaudited) | | Value | |
| | |
| | | City & County (4.9%) | | | | | |
| | | Bend, Oregon | | | | | |
| $ | 2,435,000 | | 4.000%, 06/01/24 | | Aa2/NR/NR | | $ | 2,768,644 | |
| | | | Canby, Oregon | | | | | | |
| | 1,405,000 | | 4.000%, 12/01/24 AGMC Insured | | A2/NR/NR | | | 1,560,758 | |
| | 1,060,000 | | 5.000%, 06/01/27 | | A2/NR/NR | | | 1,197,673 | |
| | | | Clackamas County, Oregon Refunding | | | | | | |
| | 1,135,000 | | 4.000%, 06/01/24 | | Aa2/NR/NR | | | 1,280,530 | |
| | | | Clackamas County, Oregon Tax | | | | | | |
| | | | Allocation | | | | | | |
| | 705,000 | | 6.500%, 05/01/20 | | NR/NR/NR* | | | 706,537 | |
| | | | Hillsboro, Oregon | | | | | | |
| | 380,000 | | 3.500%, 06/01/15 Series B | | Aa3/NR/NR | | | 401,094 | |
| | 390,000 | | 3.500%, 06/01/16 Series B | | Aa3/NR/NR | | | 420,135 | |
| | 345,000 | | 3.500%, 06/01/17 Series B | | Aa3/NR/NR | | | 374,912 | |
| | | | Hillsboro, Oregon Refunding | | | | | | |
| | 1,305,000 | | 4.500%, 06/01/22 | | Aa3/NR/NR | | | 1,556,356 | |
| | | | Portland, Oregon | | | | | | |
| | 5,800,000 | | 4.350%, 06/01/23 | | Aa1/NR/NR | | | 5,823,026 | |
| | | | Portland, Oregon Public Safety | | | | | | |
| | 2,130,000 | | 4.125%, 06/01/26 Series A | | Aaa/NR/NR | | | 2,336,653 | |
| | | | Portland, Oregon Revenue Limited Tax, | | | | | | |
| | | | Improvement | | | | | | |
| | 1,045,000 | | 4.000%, 06/01/22 Series A | | Aa1/NR/NR | | | 1,117,168 | |
| | | | Redmond, Oregon Refunding | | | | | | |
| | 735,000 | | 5.000%, 06/01/23 Series A | | A1/NR/NR | | | 877,950 | |
| | | | City of Salem, Oregon | | | | | | |
| | 1,585,000 | | 4.000%, 06/01/17 | | Aa2/AA-/NR | | | 1,774,867 | |
| | 1,750,000 | | 5.000%, 06/01/29 | | Aa2/AA-/NR | | | 2,011,258 | |
| | | | Washington County, Oregon | | | | | | |
| | 2,465,000 | | 5.000%, 06/01/23 | | Aa1/NR/NR | | | 2,797,997 | |
| | | | Total City & County | | | | | 27,005,558 | |
| | | | | | | | | | |
| | | | Community College (5.6%) | | | | | | |
| | | | Central Oregon Community College | | | | | | |
| | | | District | | | | | | |
| | 1,850,000 | | 4.750%, 06/15/22 | | NR/AA+/NR | | | 2,207,309 | |
| | 2,195,000 | | 4.750%, 06/15/23 | | NR/AA+/NR | | | 2,597,826 | |
| | 2,175,000 | | 4.750%, 06/15/26 | | NR/AA+/NR | | | 2,515,714 | |
5 | Tax-Free Trust of Oregon
TAX-FREE TRUST OF OREGON
SCHEDULE OF INVESTMENTS (continued)
MARCH 31, 2013
| | | | | Rating | | | |
| | | | | Moody’s/S&P | | | |
| Principal | | | | and Fitch | | | |
| Amount | | General Obligation Bonds (continued) | | (unaudited) | | Value | |
| | |
| | | Community College (continued) | | | | | |
| | | Chemeketa, Oregon Community | | | | | |
| | | College District | | | | | |
| $ | 1,385,000 | | 5.500%, 06/01/14 ETM FGIC Insured | | NR/NR/NR* | | $ | 1,467,906 | |
| | | | Chemeketa, Oregon Community | | | | | | |
| | | | College District | | | | | | |
| | 1,010,000 | | 5.500%, 06/15/24 | | NR/AA+/NR | | | 1,187,548 | |
| | 1,235,000 | | 5.000%, 06/15/25 | | NR/AA+/NR | | | 1,407,258 | |
| | 1,540,000 | | 5.000%, 06/15/26 | | NR/AA+/NR | | | 1,745,066 | |
| | | | Clackamas, Oregon Community | | | | | | |
| | | | College District | | | | | | |
| | 1,535,000 | | 5.000%, 05/01/25 NPFG Insured | | Aa3/AA/NR | | | 1,662,205 | |
| | | | Columbia Gorge, Oregon Community | | | | | | |
| | | | College District, Refunding | | | | | | |
| | 1,000,000 | | 4.000%, 06/15/24 | | Aa1/NR/NR | | | 1,128,710 | |
| | | | Lane, Oregon Community College | | | | | | |
| | 1,840,000 | | 5.000%, 06/15/24 | | NR/AA+/NR | | | 2,236,152 | |
| | | | Oregon Coast Community College | | | | | | |
| | | | District State | | | | | | |
| | 1,590,000 | | 5.250%, 06/15/17 NPFG Insured | | | | | | |
| | | | (pre-refunded) | | Aa1/NR/NR | | | 1,684,589 | |
| | 1,770,000 | | 5.000%, 06/15/25 | | Aa1/NR/NR | | | 2,139,682 | |
| | | | Portland, Oregon Community College | | | | | | |
| | | | District | | | | | | |
| | 7,915,000 | | 5.000%, 06/15/28 | | Aa1/AA/NR | | | 9,257,621 | |
| | | | Total Community College | | | | | 31,237,586 | |
| | | | | | | | | | |
| | | | Higher Education (2.6%) | | | | | | |
| | | | Oregon State, Oregon University System | | | | | | |
| | 2,000,000 | | 4.000%, 08/01/24 Series A | | Aa1/AA+/AA+ | | | 2,324,900 | |
| | 1,170,000 | | 4.000%, 08/01/25 Series B | | Aa1/AA+/AA+ | | | 1,327,681 | |
| | 1,745,000 | | 4.000%, 08/01/26 Series C | | Aa1/AA+/AA+ | | | 1,966,667 | |
| | | | Oregon State, Oregon University | | | | | | |
| | | | System Projects | | | | | | |
| | 2,365,000 | | 4.000%, 08/01/26 Series H | | Aa1/AA+/AA+ | | | 2,615,146 | |
| | | | State of Oregon Board of Higher | | | | | | |
| | | | Education | | | | | | |
| | 820,000 | | zero coupon, 08/01/16 | | Aa1/AA+/AA+ | | | 784,355 | |
6 | Tax-Free Trust of Oregon
TAX-FREE TRUST OF OREGON
SCHEDULE OF INVESTMENTS (continued)
MARCH 31, 2013
| | | | | Rating | | | |
| | | | | Moody’s/S&P | | | |
| Principal | | | | and Fitch | | | |
| Amount | | General Obligation Bonds (continued) | | (unaudited) | | Value | |
| | |
| | | Higher Education (continued) | | | | | |
| | | State of Oregon Board of Higher | | | | | |
| | | Education (continued) | | | | | |
| $ | 1,125,000 | | 5.000%, 08/01/21 Series A | | | | | |
| | | | (pre-refunded) | | NR/NR/NR* | | $ | 1,243,665 | |
| | 875,000 | | 5.000%, 08/01/21 Series A | | | | | | |
| | | | (pre-refunded) | | Aa1/AA+/NR | | | 968,380 | |
| | 500,000 | | 5.750%, 08/01/29 Series A | | | | | | |
| | | | (pre-refunded) | | Aa1/AA+/AA+ | | | 625,570 | |
| | 1,000,000 | | 5.000%, 08/01/34 | | Aa1/AA+/AA+ | | | 1,142,710 | |
| | 1,000,000 | | 5.000%, 08/01/38 | | Aa1/AA+/AA+ | | | 1,134,090 | |
| | | | Total Higher Education | | | | | 14,133,164 | |
| | | | | | | | | | |
| | | | Housing (0.2%) | | | | | | |
| | | | State of Oregon Veterans’ Welfare | | | | | | |
| | 550,000 | | 4.800%, 12/01/22 | | Aa1/AA+/AA+ | | | 598,318 | |
| | 400,000 | | 4.900%, 12/01/26 | | Aa1/AA+/AA+ | | | 430,804 | |
| | | | Total Housing | | | | | 1,029,122 | |
| | | | | | | | | | |
| | | | School District (25.2%) | | | | | | |
| | | | Benton & Linn Counties, Oregon School | | | | | | |
| | | | District #509J Corvallis | | | | | | |
| | 4,670,000 | | 5.000%, 06/01/21 AGMC Insured | | | | | | |
| | | | (pre-refunded) | | Aa1/NR/NR | | | 4,706,006 | |
| | | | Clackamas County, Oregon School | | | | | | |
| | | | District #12 (North Clackamas) | | | | | | |
| | 8,000,000 | | 5.000%, 06/15/27 AGMC Insured | | | | | | |
| | | | Series B | | Aa1/AA+/NR | | | 9,055,120 | |
| | 9,250,000 | | 5.000%, 06/15/29 AGMC Insured | | Aa1/AA+/NR | | | 10,450,002 | |
| | | | Clackamas County, Oregon School | | | | | | |
| | | | District #46 (Oregon Trail) | | | | | | |
| | 1,000,000 | | 5.000%, 06/15/22 | | NR/AA+/NR | | | 1,166,470 | |
| | 1,865,000 | | 5.000%, 06/15/28 Series A | | NR/AA+/NR | | | 2,111,721 | |
| | 1,800,000 | | 5.000%, 06/15/29 Series A | | NR/AA+/NR | | | 2,031,534 | |
| | 2,000,000 | | 4.500%, 06/15/30 AGMC Insured | | Aa1/AA+/NR | | | 2,175,980 | |
| | 2,000,000 | | 5.000%, 06/15/32 Series A | | NR/AA+/NR | | | 2,231,880 | |
| | 3,780,000 | | 4.750%, 06/15/32 Series A | | NR/AA+/NR | | | 4,165,031 | |
| | | | Clackamas County, Oregon School | | | | | | |
| | | | District #86 (Canby) | | | | | | |
| | 2,240,000 | | 5.000%, 06/15/19 AGMC Insured | | | | | | |
| | | | (pre-refunded) | | Aa1/AA+/NR | | | 2,465,971 | |
7 | Tax-Free Trust of Oregon
TAX-FREE TRUST OF OREGON
SCHEDULE OF INVESTMENTS (continued)
MARCH 31, 2013
| | | | | Rating | | | |
| | | | | Moody’s/S&P | | | |
| Principal | | | | and Fitch | | | |
| Amount | | General Obligation Bonds (continued) | | (unaudited) | | Value | |
| | |
| | | School District (continued) | | | | | |
| | | Clackamas County, Oregon School | | | | | |
| | | District #86 (Canby) (continued) | | | | | |
| $ | 1,800,000 | | 5.000%, 06/15/24 | | Aa1/AA+/NR | | $ | 2,212,596 | |
| | 1,110,000 | | 5.000%, 06/15/25 Series A | | Aa1/AA+/NR | | | 1,352,058 | |
| | | | Clackamas & Washington Counties, | | | | | | |
| | | | Oregon School District No. 3JT | | | | | | |
| | | | (West Linn-Wilsonville) | | | | | | |
| | 1,110,000 | | 5.000%, 06/15/26 | | Aa1/AA+/NR | | | 1,294,782 | |
| | 2,850,000 | | 5.000%, 06/15/27 | | Aa1/AA+/NR | | | 3,304,689 | |
| | 2,000,000 | | 4.500%, 06/15/29 | | Aa1/AA+/NR | | | 2,194,600 | |
| | 1,965,000 | | 5.000%, 06/15/30 | | Aa1/AA+/NR | | | 2,258,846 | |
| | 3,000,000 | | 5.000%, 06/15/33 | | Aa1/AA+/NR | | | 3,422,610 | |
| | 500,000 | | 5.000%, 06/15/34 | | Aa1/AA+/NR | | | 568,900 | |
| | | | Columbia County, Oregon School | | | | | | |
| | | | District #502 | | | | | | |
| | 2,070,000 | | zero coupon, 06/01/15 NPFG/ FGIC | | | | | | |
| | | | Insured | | Aa3/NR/NR | | | 1,997,343 | |
| | | | Columbia & Washington Counties, | | | | | | |
| | | | Oregon School District #47J | | | | | | |
| | | | (Vernonia) | | | | | | |
| | 3,430,000 | | 5.00%, 06/15/27 | | NR/AA+/NR | | | 3,984,322 | |
| | | | Deschutes County, Oregon | | | | | | |
| | | | Administrative School District #1 | | | | | | |
| | | | Refunding | | | | | | |
| | 400,000 | | 5.000%, 06/15/13 AGMC Insured | | Aa1/NR/NR | | | 403,860 | |
| | | | Deschutes County, Oregon School | | | | | | |
| | | | District #6 (Sisters) | | | | | | |
| | 1,735,000 | | 5.250%, 06/15/19 AGMC Insured | | A2/AA+/NR | | | 2,100,478 | |
| | 1,030,000 | | 5.250%, 06/15/21 AGMC Insured | | A2/AA+/NR | | | 1,272,328 | |
| | | | Deschutes and Jefferson Counties, | | | | | | |
| | | | Oregon School District #02J | | | | | | |
| | | | (Redmond) | | | | | | |
| | 1,000,000 | | 5.000%, 06/15/21 NPFG/ FGIC | | | | | | |
| | | | Insured | | Aa1/NR/NR | | | 1,049,310 | |
| | 1,025,000 | | zero coupon, 06/15/23 | | Aa1/NR/NR | | | 770,328 | |
| | 5,000,000 | | 6.000%, 06/15/31 (pre-refunded) | | Aa1/NR/NR | | | 6,289,650 | |
8 | Tax-Free Trust of Oregon
TAX-FREE TRUST OF OREGON
SCHEDULE OF INVESTMENTS (continued)
MARCH 31, 2013
| | | | | Rating | | | |
| | | | | Moody’s/S&P | | | |
| Principal | | | | and Fitch | | | |
| Amount | | General Obligation Bonds (continued) | | (unaudited) | | Value | |
| | |
| | | School District (continued) | | | | | |
| | | Hood River County, Oregon School | | | | | |
| | | District Refunding | | | | | |
| $ | 365,000 | | 3.000%, 06/15/14 | | NR/AA+/NR | | $ | 376,034 | |
| | 385,000 | | 3.000%, 06/15/15 | | NR/AA+/NR | | | 403,430 | |
| | 250,000 | | 4.000%, 06/15/16 | | NR/AA+/NR | | | 273,890 | |
| | | | Jackson County, Oregon School | | | | | | |
| | | | District #9 (Eagle Point) | | | | | | |
| | 2,080,000 | | 5.500%, 06/15/15 NPFG Insured | | Aa1/NR/NR | | | 2,290,330 | |
| | 1,445,000 | | 5.500%, 06/15/16 NPFG Insured | | Aa1/NR/NR | | | 1,646,317 | |
| | | | Jackson County, Oregon School | | | | | | |
| | | | District #549C (Medford) | | | | | | |
| | 1,000,000 | | 4.625%, 06/15/27 | | Aa1/AA+/NR | | | 1,119,550 | |
| | 2,000,000 | | 4.750%, 12/15/29 AGMC Insured | | Aa1/AA+/NR | | | 2,214,220 | |
| | 1,000,000 | | 5.000%, 06/15/33 | | Aa1/AA+/NR | | | 1,124,800 | |
| | | | Jefferson County, Oregon School | | | | | | |
| | | | District #509J | | | | | | |
| | 1,215,000 | | 5.250%, 06/15/14 NPFG/ FGIC | | | | | | |
| | | | Insured | | NR/AA+/NR | | | 1,219,167 | |
| | 1,025,000 | | 5.250%, 06/15/17 NPFG/ FGIC | | | | | | |
| | | | Insured | | NR/AA+/NR | | | 1,028,516 | |
| | | | Lane County, Oregon School District | | | | | | |
| | | | #4J (Eugene) Refunding | | | | | | |
| | 1,000,000 | | 5.000%, 07/01/15 | | Aa1/NR/NR | | | 1,100,300 | |
| | 1,130,000 | | 4.000%, 06/15/23 | | Aa1/NR/NR | | | 1,281,815 | |
| | 2,455,000 | | 4.000%, 06/15/25 | | Aa1/NR/NR | | | 2,745,206 | |
| | | | Lane County, Oregon School District | | | | | | |
| | | | #19 (Springfield) | | | | | | |
| | 3,425,000 | | zero coupon, 06/15/29 AGMC | | | | | | |
| | | | Insured | | Aa1/NR/NR | | | 1,703,698 | |
| | | | Lincoln County, Oregon School District | | | | | | |
| | 2,370,000 | | 4.000%, 06/15/24 Series A | | Aa1/NR/NR | | | 2,645,062 | |
| | | | Linn County, Oregon School District | | | | | | |
| | | | #9 (Lebanon) | | | | | | |
| | 3,000,000 | | 5.600%, 06/15/30 FGIC Insured | | | | | | |
| | | | (pre-refunded) | | NR/AA+/NR | | | 3,032,010 | |
| | | | Morrow County, Oregon School | | | | | | |
| | | | District #1 | | | | | | |
| | 1,710,000 | | 5.250%, 06/15/19 AGMC Insured | | A2/AA+/NR | | | 2,070,211 | |
9 | Tax-Free Trust of Oregon
TAX-FREE TRUST OF OREGON
SCHEDULE OF INVESTMENTS (continued)
MARCH 31, 2013
| | | | | Rating | | | |
| | | | | Moody’s/S&P | | | |
| Principal | | | | and Fitch | | | |
| Amount | | General Obligation Bonds (continued) | | (unaudited) | | Value | |
| | |
| | | School District (continued) | | | | | |
| | | Multnomah County, Oregon School | | | | | |
| | | District #7 (Reynolds) Refunding | | | | | |
| $ | 1,165,000 | | 5.000%, 06/01/29 | | Aa3/NR/NR | | $ | 1,348,220 | |
| | | | Multnomah County, Oregon School | | | | | | |
| | | | District #40 (David Douglas) | | | | | | |
| | 1,420,000 | | 4.000%, 06/15/23 Series A | | NR/AA+/NR | | | 1,619,098 | |
| | | | Multnomah and Clackamas Counties, | | | | | | |
| | | | Oregon School District #10 | | | | | | |
| | | | (Gresham-Barlow) | | | | | | |
| | 4,275,000 | | 5.250%, 06/15/19 AGMC Insured | | Aa1/AA+/NR | | | 5,260,473 | |
| | | | Multnomah and Clackamas Counties, | | | | | | |
| | | | Oregon School District #28JT | | | | | | |
| | | | (Centennial) | | | | | | |
| | 2,680,000 | | 5.250%, 12/15/18 AGMC Insured | | Aa1/NR/NR | | | 3,271,262 | |
| | | | Polk, Marion & Benton Counties, Oregon | | | | | | |
| | | | School District #13J (Central) | | | | | | |
| | 1,520,000 | | 5.000%, 06/15/21 AGMC Insured | | | | | | |
| | | | (pre-refunded) | | A2/AA+/NR | | | 1,791,411 | |
| | | | Salem-Keizer, Oregon School District #24J | | | | | | |
| | 1,000,000 | | 5.000%, 06/15/19 AGMC Insured | | | | | | |
| | | | (pre-refunded) | | Aa1/AA+/NR | | | 1,056,500 | |
| | | | Wasco County, Oregon School District | | | | | | |
| | | | #12 (The Dalles) | | | | | | |
| | 1,400,000 | | 5.500%, 06/15/17 AGMC Insured | | A2/AA-/NR | | | 1,645,826 | |
| | 1,790,000 | | 5.500%, 06/15/20 AGMC Insured | | A2/AA-/NR | | | 2,224,397 | |
| | | | Washington County, Oregon School | | | | | | |
| | | | District #48J (Beaverton) | | | | | | |
| | 2,275,000 | | 4.000%, 06/15/23 Series B | | Aa1/AA+/NR | | | 2,614,316 | |
| | 4,000,000 | | 4.000%, 06/15/25 | | Aa1/AA+/NR | | | 4,472,840 | |
| | 1,280,000 | | 5.000%, 06/01/31 AGC Insured | | Aa3/AA-/NR | | | 1,466,355 | |
| | 1,000,000 | | 5.125%, 06/01/36 AGC Insured | | Aa3/AA-/NR | | | 1,150,230 | |
| | | | Washington Multnomah & Yamhill | | | | | | |
| | | | Counties, Oregon School District #1J | | | | | | |
| | | | (Hillsboro) | | | | | | |
| | 2,575,000 | | 4.000%, 06/15/22 | | Aa1/NR/NR | | | 3,001,034 | |
| | 2,310,000 | | 4.000%, 06/15/24 | | Aa1/NR/NR | | | 2,627,717 | |
| | 1,535,000 | | 4.000%, 06/15/25 | | Aa1/NR/NR | | | 1,729,868 | |
10 | Tax-Free Trust of Oregon
TAX-FREE TRUST OF OREGON
SCHEDULE OF INVESTMENTS (continued)
MARCH 31, 2013
| | | | | Rating | | | |
| | | | | Moody’s/S&P | | | |
| Principal | | | | and Fitch | | | |
| Amount | | General Obligation Bonds (continued) | | (unaudited) | | Value | |
| | |
| | | School District (continued) | | | | | |
| | | Yamhill County, Oregon School District | | | | | |
| | | #40 (McMinnville) | | | | | |
| $ | 1,205,000 | | 5.000%, 06/15/19 AGMC Insured | | | | | |
| | | | (pre-refunded) | | Aa1/NR/NR | | $ | 1,420,165 | |
| | 1,375,000 | | 5.000%, 06/15/22 AGMC Insured | | | | | | |
| | | | (pre-refunded) | | Aa1/NR/NR | | | 1,620,520 | |
| | | | Total School Districts | | | | | 139,631,203 | |
| | | | | | | | | | |
| | | | Special District (2.0%) | | | | | | |
| | | | Metro, Oregon | | | | | | |
| | 1,100,000 | | 5.000%, 06/01/18 | | Aaa/AAA/NR | | | 1,279,861 | |
| | 5,140,000 | | 4.000%, 06/01/26 Series A | | Aaa/AAA/NR | | | 5,758,702 | |
| | | | Tualatin Hills, Oregon Park & | | | | | | |
| | | | Recreational District | | | | | | |
| | 1,000,000 | | 4.250%, 06/01/24 | | Aa1/AA/NR | | | 1,103,530 | |
| | | | Tualatin Valley, Oregon Fire & Rescue | | | | | | |
| | | | Rural Fire Protection District | | | | | | |
| | 1,235,000 | | 4.000%, 06/01/26 | | Aaa/NR/NR | | | 1,373,851 | |
| | 1,170,000 | | 4.000%, 06/01/27 | | Aaa/NR/NR | | | 1,291,528 | |
| | | | Total Special District | | | | | 10,807,472 | |
| | | | | | | | | | |
| | | | State (8.7%) | | | | | | |
| | | | Oregon State Alternative Energy Project | | | | | | |
| | 1,255,000 | | 4.750%, 04/01/29 Series B | | Aa1/AA+/AA+ | | | 1,393,577 | |
| | 500,000 | | 6.000%, 10/01/29 Series B | | Aa1/AA+/AA+ | | | 604,445 | |
| | | | Oregon State Department of | | | | | | |
| | | | Administrative Services | | | | | | |
| | 3,270,000 | | 5.000%, 11/01/27 Series C | | Aa2/AA/AA | | | 3,682,641 | |
| | 2,155,000 | | 5.000%, 11/01/28 Series C | | Aa2/AA/AA | | | 2,414,591 | |
| | 5,000,000 | | 5.125%, 05/01/33 | | Aa2/AA/AA | | | 5,548,050 | |
| | | | Oregon State Department of | | | | | | |
| | | | Administrative Services | | | | | | |
| | 2,000,000 | | 5.000%, 11/01/20 NPFG/ FGIC Insured | | | | | | |
| | | | (pre-refunded) | | Aa2/AA/AA | | | 2,236,240 | |
| | 2,660,000 | | 5.000%, 11/01/23 NPFG FGIC/ Insured | | | | | | |
| | | | (pre-refunded) | | Aa2/AA/AA | | | 3,078,790 | |
| | 2,945,000 | | 5.000%, 11/01/24 NPFG/ FGIC Insured | | | | | | |
| | | | (pre-refunded) | | Aa2/AA/AA | | | 3,408,661 | |
11 | Tax-Free Trust of Oregon
TAX-FREE TRUST OF OREGON
SCHEDULE OF INVESTMENTS (continued)
MARCH 31, 2013
| | | | | Rating | | | |
| | | | | Moody’s/S&P | | | |
| Principal | | | | and Fitch | | | |
| Amount | | General Obligation Bonds (continued) | | (unaudited) | | Value | |
| | |
| | | State (continued) | | | | | |
| | | Oregon State Department of | | | | | |
| | | Administrative Services (continued) | | | | | |
| $ | 1,475,000 | | 5.000%, 11/01/26 NPFG/ FGIC Insured | | | | | |
| | | | (pre-refunded) | | Aa2/AA/AA | | $ | 1,707,224 | |
| | 3,880,000 | | 5.000%, 11/01/27 NPFG/ FGIC Insured | | | | | | |
| | | | (pre-refunded) | | Aa2/AA/AA | | | 4,490,867 | |
| | | | Oregon State Department of | | | | | | |
| | | | Administrative Services, Oregon | | | | | | |
| | | | Opportunity Refunding | | | | | | |
| | 6,210,000 | | 5.000%, 12/01/19 | | Aa1/AA+/AA+ | | | 7,675,933 | |
| | | | Oregon State Refunding | | | | | | |
| | 3,000,000 | | 5.000%, 05/01/23 Series L | | Aa1/AA+/AA+ | | | 3,663,180 | |
| | 1,125,000 | | 5.000%, 05/01/24 Series L | | Aa1/AA+/AA+ | | | 1,363,421 | |
| | 2,630,000 | | 5.000%, 05/01/26 Series L | | Aa1/AA+/AA+ | | | 3,142,140 | |
| | | | Oregon State Refunding Various Projects | | | | | | |
| | 2,125,000 | | 4.000%, 05/01/25 Series O | | Aa1/AA+/AA+ | | | 2,361,725 | |
| | | | Oregon State Various Projects | | | | | | |
| | 1,470,000 | | 4.000%, 11/01/26 Series M | | Aa1/AA+/AA+ | | | 1,629,686 | |
| | | | Total State | | | | | 48,401,171 | |
| | | | | | | | | | |
| | | | Water & Sewer (0.8%) | | | | | | |
| | | | Gearheart, Oregon | | | | | | |
| | 1,060,000 | | 4.500%, 03/01/26 AGMC Insured | | A2/NR/NR | | | 1,197,493 | |
| | | | Pacific City, Oregon Joint Water - | | | | | | |
| | | | Sanitary Authority | | | | | | |
| | 1,830,000 | | 4.800%, 07/01/27 | | NR/NR/NR* | | | 1,924,465 | |
| | | | Rockwood, Oregon Water Peoples | | | | | | |
| | | | Utility District Water Revenue | | | | | | |
| | | | Refunding | | | | | | |
| | 1,270,000 | | 4.250%, 08/15/26 | | A1/NR/NR | | | 1,370,063 | |
| | | | Total Water & Sewer | | | | | 4,492,021 | |
| | | | Total General Obligation Bonds | | | | | 276,737,297 | |
| | | | | | | | | | |
| | | | Revenue Bonds (48.2%) | | | | | | |
| | | | | | | | | | |
| | | | City & County (4.8%) | | | | | | |
| | | | Newport, Oregon Urban Renewal | | | | | | |
| | | | Obligations, Refunding | | | | | | |
| | 565,000 | | 4.500%, 06/15/22 Series B | | NR/A+/NR | | | 642,207 | |
12 | Tax-Free Trust of Oregon
TAX-FREE TRUST OF OREGON
SCHEDULE OF INVESTMENTS (continued)
MARCH 31, 2013
| | | | | Rating | | | |
| | | | | Moody’s/S&P | | | |
| Principal | | | | and Fitch | | | |
| Amount | | Revenue Bonds (continued) | | (unaudited) | | Value | |
| | |
| | | City & County (continued) | | | | | |
| | | Portland, Oregon | | | | | |
| $ | 2,975,000 | | zero coupon, 06/01/15 | | Aa1/NR/NR | | $ | 2,904,671 | |
| | | | Portland, Oregon Revenue Refunding | | | | | | |
| | | | Limited Tax, Oregon Convention | | | | | | |
| | | | Center | | | | | | |
| | 2,825,000 | | 5.000%, 06/01/24 | | Aa1/NR/NR | | | 3,405,848 | |
| | 4,765,000 | | 5.000%, 06/01/27 | | Aa1/NR/NR | | | 5,608,548 | |
| | | | Portland, Oregon Revenue Refunding | | | | | | |
| | | | Limited Tax | | | | | | |
| | 1,000,000 | | 4.000%, 04/01/22 Series A | | Aa1/NR/NR | | | 1,117,250 | |
| | | | Portland, Oregon River District Urban | | | | | | |
| | | | Renewal and Redevelopment | | | | | | |
| | 1,915,000 | | 5.000%, 06/15/20 AMBAC Insured | | | | | | |
| | | | (pre-refunded) | | A1/NR/NR | | | 1,933,327 | |
| | 1,600,000 | | 5.000%, 06/15/22 Series B | | A1/NR/NR | | | 1,895,088 | |
| | 1,830,000 | | 5.000%, 06/15/23 Series B | | A1/NR/NR | | | 2,154,459 | |
| | | | Portland, Oregon Urban Renewal and | | | | | | |
| | | | Redevelopment, Refunding, North | | | | | | |
| | | | Macadam | | | | | | |
| | 1,000,000 | | 4.000%, 06/15/25 Series B | | A1/NR/NR | | | 1,037,990 | |
| | | | Portland, Oregon Urban Renewal Tax | | | | | | |
| | | | Allocation (Interstate Corridor) | | | | | | |
| | 1,890,000 | | 5.250%, 06/15/20 NPFG/ FGIC | | | | | | |
| | | | Insured | | A1/NR/NR | | | 2,001,340 | |
| | 1,810,000 | | 5.250%, 06/15/21 NPFG/ FGIC | | | | | | |
| | | | Insured | | A1/NR/NR | | | 1,907,468 | |
| | 2,030,000 | | 5.000%, 06/15/23 NPFG/ FGIC | | | | | | |
| | | | Insured | | A1/NR/NR | | | 2,122,345 | |
| | | | Total City & County | | | | | 26,730,541 | |
| | | | | | | | | | |
| | | | Electric (2.2%) | | | | | | |
| | | | Emerald Peoples Utility District, Oregon | | | | | | |
| | 1,455,000 | | 5.250%, 11/01/22 AGMC Insured | | A1/NR/NR | | | 1,487,781 | |
| | | | Eugene, Oregon Electric Utility | | | | | | |
| | 5,635,000 | | 5.000%, 08/01/30 | | Aa3/AA-/AA- | | | 6,306,579 | |
| | | | Eugene, Oregon Electric Utility | | | | | | |
| | | | Refunding System | | | | | | |
| | 2,000,000 | | 5.000%, 08/01/27 Series A | | Aa3/AA-/AA- | | | 2,344,200 | |
13 | Tax-Free Trust of Oregon
TAX-FREE TRUST OF OREGON
SCHEDULE OF INVESTMENTS (continued)
MARCH 31, 2013
| | | | | Rating | | | |
| | | | | Moody’s/S&P | | | |
| Principal | | | | and Fitch | | | |
| Amount | | Revenue Bonds (continued) | | (unaudited) | | Value | |
| | |
| | | Electric (continued) | | | | | |
| | | Northern Wasco County, Oregon | | | | | |
| | | Peoples Utility District, McNary | | | | | |
| | | Dam Fishway Hydroelectric Project, | | | | | |
| | | Refunding | | | | | |
| $ | 1,585,000 | | 5.000%, 12/01/21 Series A | | NR/AA-/NR | | $ | 1,931,798 | |
| | | | Total Electric | | | | | 12,070,358 | |
| | | | | | | | | | |
| | | | Higher Education (6.7%) | | | | | | |
| | | | Forest Grove, Oregon Campus | | | | | | |
| | | | Improvement (Pacific University | | | | | | |
| | | | Project) | | | | | | |
| | 1,500,000 | | 6.000%, 05/01/30 | | NR/BBB/NR | | | 1,537,995 | |
| | | | Forest Grove, Oregon (Pacific University) | | | | | | |
| | 4,000,000 | | 5.000%, 05/01/22 Radian Insured | | NR/BBB/NR | | | 4,191,200 | |
| | | | Forest Grove, Oregon Student Housing | | | | | | |
| | | | (Oak Tree Foundation) | | | | | | |
| | 5,750,000 | | 5.500%, 03/01/37 | | NR/NR/NR* | | | 5,887,597 | |
| | | | Oregon State Facilities Authority | | | | | | |
| | | | (Lewis & Clark College Project) | | | | | | |
| | 1,000,000 | | 5.250%, 10/01/24 Series A | | A3/A-/NR | | | 1,173,340 | |
| | 3,000,000 | | 5.000%, 10/01/27 Series A | | A3/A-/NR | | | 3,356,250 | |
| | | | Oregon State Facilities Authority | | | | | | |
| | | | (Linfield College Project) | | | | | | |
| | 2,830,000 | | 5.000%, 10/01/20 Series A 2005 | | Baa1/NR/NR | | | 3,014,205 | |
| | 2,115,000 | | 5.000%, 10/01/25 Series A 2005 | | Baa1/NR/NR | | | 2,214,891 | |
| | 1,220,000 | | 5.000%, 10/01/31 Series A 2010 | | Baa1/NR/NR | | | 1,346,490 | |
| | | | Oregon State Facilities Authority | | | | | | |
| | | | Revenue Refunding (Reed College | | | | | | |
| | | | Project) | | | | | | |
| | 1,500,000 | | 5.000%, 07/01/29 Series A | | Aa2/AA-/NR | | | 1,722,375 | |
| | | | Oregon State Facilities Authority | | | | | | |
| | | | (University of Portland) | | | | | | |
| | 3,000,000 | | 5.000%, 04/01/32 | | NR/BBB+/NR | | | 3,215,940 | |
| | | | Oregon State Facilities Authority | | | | | | |
| | | | (Willamette University) | | | | | | |
| | 1,000,000 | | 4.000%, 10/01/24 | | NR/A/NR | | | 1,086,340 | |
| | 2,500,000 | | 5.000%, 10/01/32 | | NR/A/NR | | | 2,698,950 | |
14 | Tax-Free Trust of Oregon
TAX-FREE TRUST OF OREGON
SCHEDULE OF INVESTMENTS (continued)
MARCH 31, 2013
| | | | | Rating | | | |
| | | | | Moody’s/S&P | | | |
| Principal | | | | and Fitch | | | |
| Amount | | Revenue Bonds (continued) | | (unaudited) | | Value | |
| | |
| | | Higher Education (continued) | | | | | |
| | | Portland, Oregon Economic | | | | | |
| | | Development (Broadway Project) | | | | | |
| $ | 5,000,000 | | 6.500%, 04/01/35 | | A1/A+/NR | | $ | 5,713,850 | |
| | | | Total Higher Education | | | | | 37,159,423 | |
| | | | | | | | | | |
| | | | Hospital (11.0%) | | | | | | |
| | | | Deschutes County, Oregon Hospital | | | | | | |
| | | | Facilities Authority (Cascade Health) | | | | | | |
| | 3,500,000 | | 8.000%, 01/01/28 | | A2/NR/NR | | | 4,368,665 | |
| | 3,250,000 | | 5.375%, 01/01/35 AMBAC Insured | | A2/NR/NR | | | 3,461,412 | |
| | | | Medford, Oregon Hospital Facilities | | | | | | |
| | | | Authority Revenue Refunding, | | | | | | |
| | | | Asante Health Systems | | | | | | |
| | 9,000,000 | | 5.500%, 08/15/28 AGMC Insured | | NR/AA-/NR | | | 10,240,920 | |
| | | | Multnomah County, Oregon Hospital | | | | | | |
| | | | Facilities Authority (Adventist | | | | | | |
| | | | Health/West) | | | | | | |
| | 500,000 | | 5.000%, 09/01/21 | | NR/A/A | | | 578,100 | |
| | | | Multnomah County, Oregon Hospital | | | | | | |
| | | | Facilities Authority (Providence | | | | | | |
| | | | Health System) | | | | | | |
| | 1,390,000 | | 5.250%, 10/01/22 | | Aa2/AA/AA | | | 1,463,781 | |
| | | | Oregon Health Sciences University | | | | | | |
| | 11,550,000 | | zero coupon, 07/01/21 NPFG | | | | | | |
| | | | Insured | | A1/A+/A+ | | | 9,037,297 | |
| | 2,000,000 | | 5.000%, 07/01/23 Series A | | A1/A+/A+ | | | 2,392,100 | |
| | 4,500,000 | | 5.750%, 07/01/39 Series A | | A1/A+/A+ | | | 5,294,925 | |
| | | | Oregon State Facilities Authority Revenue | | | | | | |
| | | | Refunding, Legacy Health Systems | | | | | | |
| | 2,000,000 | | 4.250%, 03/15/17 | | A2/A+/NR | | | 2,214,220 | |
| | 3,000,000 | | 4.500%, 03/15/18 | | A2/A+/NR | | | 3,400,200 | |
| | 1,000,000 | | 4.750%, 03/15/24 | | A2/A+/NR | | | 1,100,470 | |
| | 1,000,000 | | 5.000%, 03/15/30 | | A2/A+/NR | | | 1,081,550 | |
| | | | Oregon State Facilities Authority | | | | | | |
| | | | Revenue Refunding, Samaritan | | | | | | |
| | | | Health Services | | | | | | |
| | 1,500,000 | | 4.375%, 10/01/20 | | NR/A-/NR | | | 1,643,835 | |
| | 2,000,000 | | 4.500%, 10/01/21 | | NR/A-/NR | | | 2,192,980 | |
| | 1,520,000 | | 5.000%, 10/01/23 | | NR/A-/NR | | | 1,705,334 | |
15 | Tax-Free Trust of Oregon
TAX-FREE TRUST OF OREGON
SCHEDULE OF INVESTMENTS (continued)
MARCH 31, 2013
| | | | | Rating | | | |
| | | | | Moody’s/S&P | | | |
| Principal | | | | and Fitch | | | |
| Amount | | Revenue Bonds (continued) | | (unaudited) | | Value | |
| | |
| | | Hospital (continued) | | | | | |
| | | Oregon State Facilities Authority | | | | | |
| | | Revenue Refunding, Samaritan | | | | | |
| | | Health Services (continued) | | | | | |
| $ | 1,795,000 | | 4.875%, 10/01/25 | | NR/A-/NR | | $ | 1,942,926 | |
| | 2,000,000 | | 5.000%, 10/01/30 | | NR/A-/NR | | | 2,149,840 | |
| | | | Salem, Oregon Hospital Facility | | | | | | |
| | | | Authority (Salem Hospital) | | | | | | |
| | 2,000,000 | | 5.750%, 08/15/23 | | NR/A/A | | | 2,261,160 | |
| | 1,075,000 | | 5.000%, 08/15/27 Series A | | NR/A/A | | | 1,139,070 | |
| | | | State of Oregon Health Housing | | | | | | |
| | | | Educational and Cultural Facilities | | | | | | |
| | | | Authority (Peacehealth) | | | | | | |
| | 1,835,000 | | 5.250%, 11/15/17 AMBAC Insured | | NR/A+/AA- | | | 1,840,358 | |
| | 1,430,000 | | 5.000%, 11/15/32 AMBAC Insured | | NR/A+/AA- | | | 1,431,616 | |
| | | | Total Hospital | | | | | 60,940,759 | |
| | | | | | | | | | |
| | | | Housing (1.1%) | | | | | | |
| | | | Clackamas County, Oregon Housing | | | | | | |
| | | | Authority Multifamily Housing | | | | | | |
| | | | Revenue (Easton Ridge Apartments | | | | | | |
| | | | Project) | | | | | | |
| | 1,310,000 | | 4.000%, 09/01/27 Series A | | Aa3/NR/NR | | | 1,398,373 | |
| | | | Portland, Oregon Urban Renewal and | | | | | | |
| | | | Redevelopment, Interstate Corridor | | | | | | |
| | 1,390,000 | | 5.000%, 06/15/27 Series B | | A1/NR/NR | | | 1,508,539 | |
| | | | State of Oregon Housing and | | | | | | |
| | | | Community Services | | | | | | |
| | 1,780,000 | | 4.650%, 07/01/25 | | Aa2/NR/NR | | | 1,841,641 | |
| | 1,370,000 | | 5.350%, 07/01/30 | | Aa2/NR/NR | | | 1,455,803 | |
| | | | Total Housing | | | | | 6,204,356 | |
| | | | | | | | | | |
| | | | Lottery (3.9%) | | | | | | |
| | | | Oregon State Department of | | | | | | |
| | | | Administration Services (Lottery | | | | | | |
| | | | Revenue) | | | | | | |
| | 2,700,000 | | 5.000%, 04/01/19 AGMC Insured | | | | | | |
| | | | (pre-refunded) | | Aa2/AAA/AA- | | | 2,828,952 | |
| | 1,195,000 | | 5.000%, 04/01/24 Series A | | Aa2/AAA/NR | | | 1,463,421 | |
| | 1,500,000 | | 5.000%, 04/01/25 Series B | | Aa2/AAA/NR | | | 1,820,580 | |
16 | Tax-Free Trust of Oregon
TAX-FREE TRUST OF OREGON
SCHEDULE OF INVESTMENTS (continued)
MARCH 31, 2013
| | | | | | | | |
| | | | | Rating | | | |
| | | | | Moody’s/S&P | | | |
| Principal | | | | and Fitch | | | |
| Amount | | Revenue Bonds (continued) | | (unaudited) | | Value | |
| | |
| | | Lottery (continued) | | | | | |
| | | Oregon State Department of | | | | | |
| | | Administration Services (Lottery | | | | | |
| | | Revenue) (continued) | | | | | |
| $ | 7,300,000 | | 5.250%, 04/01/26 | | Aa2/AAA/NR | | $ | 8,882,275 | |
| | 3,000,000 | | 5.000%, 04/01/27 AGMC Insured | | Aa2/AAA/AA- | | | 3,383,220 | |
| | 2,500,000 | | 5.000%, 04/01/29 | | Aa2/AAA/NR | | | 2,841,450 | |
| | | | Total Lottery | | | | | 21,219,898 | |
| | | | | | | | | | |
| | | | Transportation (5.5%) | | | | | | |
| | | | Jackson County, Oregon Airport Revenue | | | | | | |
| | 750,000 | | 5.250%, 12/01/32 Syncora Guarantee, | | | | | | |
| | | | Inc. Insured | | Baa1/NR/NR | | | 802,965 | |
| | | | Oregon State Department Transportation | | | | | | |
| | | | Highway Usertax | | | | | | |
| | 1,200,000 | | 5.000%, 11/15/22 Series A | | | | | | |
| | | | (pre-refunded) | | Aa1/AAA/AA+ | | | 1,292,316 | |
| | 1,260,000 | | 5.000%, 11/15/23 Series A | | | | | | |
| | | | (pre-refunded) | | Aa1/AAA/AA+ | | | 1,356,932 | |
| | 1,000,000 | | 5.000%, 11/15/29 Series A | | | | | | |
| | | | (pre-refunded) | | Aa1/AAA/AA+ | | | 1,076,930 | |
| | | | Oregon State Department Transportation | | | | | | |
| | | | Highway Usertax, Senior Lien | | | | | | |
| | 1,865,000 | | 5.000%, 11/15/23 Series A | | Aa1/AAA/AA+ | | | 2,185,575 | |
| | 2,000,000 | | 4.625%, 11/15/25 Series A | | Aa1/AAA/AA+ | | | 2,269,980 | |
| | 3,540,000 | | 4.625%, 11/15/26 Series A | | Aa1/AAA/AA+ | | | 3,899,027 | |
| | 2,155,000 | | 5.000%, 11/15/28 Series A | | Aa1/AAA/AA+ | | | 2,426,013 | |
| | 3,410,000 | | 5.000%, 11/15/24 Series N | | Aa1/AAA/AA+ | | | 4,206,815 | |
| | | | Tri-County Metropolitan Transportation | | | | | | |
| | | | District, Oregon | | | | | | |
| | 1,010,000 | | 5.000%, 09/01/24 | | Aa1/AAA/NR | | | 1,255,996 | |
| | | | Tri-County Metropolitan Transportation | | | | | | |
| | | | District, Oregon Capital Grant Receipt | | | | | | |
| | 1,685,000 | | 5.000%, 10/01/24 Series A | | A2/A/NR | | | 1,987,222 | |
| | 3,480,000 | | 5.000%, 10/01/26 Series A | | A2/A/NR | | | 4,049,502 | |
| | 3,000,000 | | 5.000%, 10/01/27 Series A | | A2/A/NR | | | 3,476,220 | |
| | | | Total Transportation | | | | | 30,285,493 | |
17 | Tax-Free Trust of Oregon
TAX-FREE TRUST OF OREGON
SCHEDULE OF INVESTMENTS (continued)
MARCH 31, 2013
| | | | | Rating | | | |
| | | | | Moody’s/S&P | | | |
| Principal | | | | and Fitch | | | |
| Amount | | Revenue Bonds (continued) | | (unaudited) | | Value | |
| | |
| | | Water and Sewer (13.0%) | | | | | |
| | | Ashland, Oregon Refunding | | | | | |
| $ | 1,025,000 | | 4.000%, 05/01/17 AGMC Insured | | NR/AA-/NR | | $ | 1,156,333 | |
| | | | Grants Pass, Oregon | | | | | | |
| | 1,000,000 | | 4.000%, 12/01/23 | | NR/AA-/NR | | | 1,146,500 | |
| | | | Klamath Falls, Oregon Water | | | | | | |
| | 1,575,000 | | 5.500%, 07/01/16 AGMC Insured | | A2/AA-/NR | | | 1,700,827 | |
| | | | Lane County, Oregon Metropolitan | | | | | | |
| | | | Wastewater | | | | | | |
| | 2,500,000 | | 5.250%, 11/01/28 | | Aa2/AA/NR | | | 2,832,150 | |
| | | | Madras, Oregon | | | | | | |
| | 725,000 | | 4.500%, 02/15/27 | | Baa1/NR/NR | | | 779,382 | |
| | | | Portland, Oregon Sewer System, | | | | | | |
| | | | Second Lien | | | | | | |
| | 3,005,000 | | 5.000%, 03/01/28 Series A | | Aa3/AA/NR | | | 3,526,938 | |
| | | | Portland Oregon Sewer System Revenue | | | | | | |
| | | | Refunding Second Lien | | | | | | |
| | 5,000,000 | | 5.000%, 06/15/33 Series B | | Aa3/AA/NR | | | 5,585,100 | |
| | | | Portland, Oregon Sewer System | | | | | | |
| | 2,760,000 | | 5.250%, 06/01/17 AGMC Insured | | Aa3/AA/NR | | | 2,781,059 | |
| | 4,595,000 | | 5.000%, 06/01/17 AGMC Insured | | Aa2/AA/NR | | | 5,028,446 | |
| | 3,470,000 | | 5.000%, 06/01/21 AGMC Insured | | Aa3/AA/NR | | | 3,492,729 | |
| | 4,410,000 | | 5.000%, 06/15/25 NPFG Insured | | Aa2/AA/NR | | | 4,905,023 | |
| | 4,630,000 | | 5.000%, 06/15/26 NPFG Insured | | Aa2/AA/NR | | | 5,131,290 | |
| | 1,610,000 | | 5.000%, 06/15/27 NPFG Insured | | Aa2/AA/NR | | | 1,781,127 | |
| | | | Portland, Oregon Water System | | | | | | |
| | | | Revenue Refunding | | | | | | |
| | 1,920,000 | | 4.000%, 05/01/14 Series A | | Aaa/NR/NR | | | 1,998,086 | |
| | 1,275,000 | | 4.000%, 05/01/25 Series A | | Aaa/NR/NR | | | 1,407,039 | |
| | | | Prineville, Oregon Refunding | | | | | | |
| | 1,255,000 | | 4.400%, 06/01/29 AGMC Insured | | NR/AA-/NR | | | 1,388,005 | |
| | | | Salem, Oregon Water & Sewer | | | | | | |
| | 1,000,000 | | 5.375%, 06/01/15 AGMC Insured | | | | | | |
| | | | ETM | | Aa3/AA-/NR | | | 1,107,170 | |
| | | | Seaside, Oregon Wastewater System | �� | | | | | |
| | 1,000,000 | | 4.250%, 07/01/26 | | A3/NR/NR | | | 1,077,780 | |
| | | | Sunrise Water Authority, Oregon | | | | | | |
| | 2,630,000 | | 5.000%, 03/01/19 AGMC Insured | | A2/AA-/NR | | | 2,715,133 | |
| | 1,350,000 | | 5.250%, 03/01/24 AGMC Insured | | A2/AA-/NR | | | 1,387,773 | |
| | 1,000,000 | | 5.000%, 09/01/25 Syncora Guarantee, | | | | | | |
| | | | Inc. | | NR/NR/NR* | | | 1,037,880 | |
18 | Tax-Free Trust of Oregon
TAX-FREE TRUST OF OREGON
SCHEDULE OF INVESTMENTS (continued)
MARCH 31, 2013
| | | | | Rating | | | |
| | | | | Moody’s/S&P | | | |
| Principal | | | | and Fitch | | | |
| Amount | | Revenue Bonds (continued) | | (unaudited) | | Value | |
| | |
| | | Water and Sewer (continued) | | | | | |
| | | Tigard, Oregon Water System Revenue | | | | | |
| | | Refunding | | | | | |
| $ | 2,025,000 | | 4.000%, 08/01/21 | | A1/AA-/NR | | $ | 2,315,851 | |
| | 1,105,000 | | 5.000%, 08/01/24 | | A1/AA-/NR | | | 1,356,233 | |
| | | | Washington County, Oregon Clean | | | | | | |
| | | | Water Services | | | | | | |
| | 2,235,000 | | 5.250%, 10/01/15 NPFG Insured | | Aa2/AA/NR | | | 2,497,836 | |
| | 4,000,000 | | 5.000%, 10/01/28 | | Aa2/AA/NR | | | 4,501,560 | |
| | | | Washington County, Oregon Clean | | | | | | |
| | | | Water Services Sewer Revenue | | | | | | |
| | | | Senior Lien | | | | | | |
| | 1,500,000 | | 4.000%, 10/01/23 Series B | | Aa2/AA/NR | | | 1,701,930 | |
| | 2,850,000 | | 4.000%, 10/01/26 Series B | | Aa2/AA/NR | | | 3,136,368 | |
| | 2,745,000 | | 4.000%, 10/01/28 Series B | | Aa2/AA/NR | | | 2,955,898 | |
| | | | Woodburn, Oregon Wastewater | | | | | | |
| | | | Revenue Refunding | | | | | | |
| | 1,090,000 | | 5.000%, 03/01/21 Series A | | A2/NR/NR | | | 1,283,617 | |
| | | | Total Water and Sewer | | | | | 71,715,063 | |
| | |
| | | | Total Revenue Bonds | | | | | 266,325,891 | |
| | |
| | | | Total Investments (cost $502,762,195- | | | | | | |
| | | | note 4) | | 98.2% | | | 543,063,188 | |
| | | | Other assets less liabilities | | 1.8 | | | 9,891,318 | |
| | | | Net Assets | | 100.0% | | $ | 552,954,506 | |
| | | | | | | | | | |
| | * | | Any security not rated (“NR”) by any of the Nationally Recognized Statistical Rating Organizations (“NRSRO” or “Credit Rating Agency”) has been determined by the Investment Sub-Adviser to have sufficient quality to be ranked in the top four credit ratings if a credit rating were to be assigned by a NRSRO. | | | | |
19 | Tax-Free Trust of Oregon
TAX-FREE TRUST OF OREGON
SCHEDULE OF INVESTMENTS (continued)
MARCH 31, 2013
| | | Percent of | |
| Portfolio Distribution by Quality Rating (unaudited) | | Portfolio† | |
| Aaa of Moody’s or AAA of S&P | | | 9.2 | % |
Pre-refunded bonds †† / Escrowed to Maturity bonds | | | 9.7 | |
| Aa of Moody’s, AA of S&P or Fitch | | | 59.0 | |
| A of Moody’s, S&P or Fitch | | | 17.1 | |
| Baa of Moody’s or BBB of S&P | | | 3.2 | |
| Not rated* | | | 1.8 | |
| | | | 100.0 | % |
| † | Where applicable, calculated using the highest rating of the three NRSROs. |
| | |
| †† | Pre-refunded bonds are bonds for which U.S. Government Obligations usually have been placed in escrow to retire the bonds at their earliest call date. |
| | PORTFOLIO ABBREVIATIONS: |
| AGC | Assured Guaranty Insurance |
| AGMC | Assured Guaranty Municipal Corp. |
| AMBAC | American Municipal Bond Assurance Corporation |
| ETM | Escrowed to Maturity |
| FGIC | Financial Guaranty Insurance Co. |
| NPFG | National Public Finance Guarantee |
| NR | Not Rated |
See accompanying notes to financial statements.
20 | Tax-Free Trust of Oregon
TAX-FREE TRUST OF OREGON
STATEMENT OF ASSETS AND LIABILITIES
YEAR ENDED MARCH 31, 201330, 2012
| ASSETS | | | |
| Investments at value (cost $502,762,195) | | $ | 543,063,188 | |
| Cash | | | 6,512,213 | |
| Interest receivable | | | 7,413,834 | |
| Receivable for Trust shares sold | | | 368,094 | |
| Other assets | | | 18,299 | |
| Total assets | | | 557,375,628 | |
| LIABILITIES | | | | |
| Payable for investment securities purchased | | | 2,604,215 | |
| Payable for Trust shares redeemed | | | 1,217,167 | |
| Dividends payable | | | 248,863 | |
| Management fees payable | | | 184,981 | |
| Distribution and service fees payable | | | 14,085 | |
| Accrued expenses | | | 151,811 | |
| Total liabilities | | | 4,421,122 | |
| NET ASSETS | | $ | 552,954,506 | |
| | | | | |
| Net Assets consist of: | | | | |
| Capital Stock - Authorized an unlimited number of shares, par | | | | |
| value $0.01 per share | | $ | 486,354 | |
| Additional paid-in capital | | | 511,842,657 | |
| Net unrealized appreciation on investments (note 4) | | | 40,300,993 | |
| Undistributed net investment income | | | 242,877 | |
| Accumulated net realized gain on investments | | | 81,625 | |
| | | $ | 552,954,506 | |
| | | | | |
| CLASS A | | | | |
| Net Assets | | $ | 424,800,312 | |
| Capital shares outstanding | | | 37,356,696 | |
| Net asset value and redemption price per share | | $ | 11.37 | |
| Maximum offering price per share (100/96 of $11.37) | | $ | 11.84 | |
| | | | | |
| CLASS C | | | | |
| Net Assets | | $ | 39,137,951 | |
| Capital shares outstanding | | | 3,444,936 | |
| Net asset value and offering price per share | | $ | 11.36 | |
| Redemption price per share (* a charge of 1% is imposed on the | | | | |
| redemption proceeds, or on the original price, whichever is | | | | |
| lower, if redeemed during the first 12 months after purchase) | | $ | 11.36 | * |
| | | | | |
| CLASS Y | | | | |
| Net Assets | | $ | 89,016,243 | |
| Capital shares outstanding | | | 7,833,748 | |
| Net asset value, offering and redemption price per share | | $ | 11.36 | |
See accompanying notes to financial statements.
21 | Tax-Free Trust of Oregon
TAX-FREE TRUST OF OREGON
STATEMENTS OF OPERATIONS
| | | Six Months Ended | | | Year Ended | |
| | | March 31, 2013† | | | September 30, 2012 | |
| Investment Income: | | | | | | |
| | |
| Interest income | | $ | 10,378,644 | | | $ | 20,441,131 | |
| | |
| | |
| Expenses: | | | | | | | | |
| | |
| Management fees (note 3) | | | 1,093,507 | | | | 2,030,450 | |
| Distribution and service fees (note 3) | | | 511,023 | | | | 918,321 | |
| Legal fees | | | 134,825 | | | | 218,330 | |
| Trustees’ fees and expenses (note 7) | | | 123,723 | | | | 255,863 | |
| Transfer and shareholder servicing agent fees | | | 100,085 | | | | 294,286 | |
| Shareholders’ reports and proxy statements | | | 25,333 | | | | 69,563 | |
| Auditing and tax fees | | | 22,500 | | | | 25,903 | |
| Custodian fees (note 6) | | | 19,209 | | | | 36,576 | |
| Insurance | | | 12,442 | | | | 20,088 | |
| Registration fees and dues | | | 9,406 | | | | 28,882 | |
| Chief compliance officer services (note 3) | | | 2,755 | | | | 5,194 | |
| Miscellaneous | | | 17,674 | | | | 37,469 | |
| Total expenses | | | 2,072,482 | | | | 3,940,925 | |
| | |
| Management fees waived (note 3) | | | (14,839 | ) | | | (21,466 | ) |
| Expenses paid indirectly (note 6) | | | (789 | ) | | | (1,008 | ) |
| Net expenses | | | 2,056,854 | | | | 3,918,451 | |
| Net investment income | | | 8,321,790 | | | | 16,522,680 | |
| | |
| Realized and Unrealized Gain (Loss) on Investments: | | | | | | | | |
| | |
| Net realized gain (loss) from securities | | | | | | | | |
| transactions | | | 82,033 | | | | 2,522,836 | |
| Change in unrealized appreciation on | | | | | | | | |
| investments | | | (5,674,924 | ) | | | 16,001,761 | |
| | |
| Net realized and unrealized gain (loss) on | | | | | | | | |
| investments | | | (5,592,891 | ) | | | 18,524,597 | |
| Net change in net assets resulting from | | | | | | | | |
| operations | | $ | 2,728,899 | | | $ | 35,047,277 | |
| † | Effective December 1, 2012, the Trust changed its fiscal year end from September 30 to March 31. The information presented is for the period October 1, 2012 to March 31, 2013. |
See accompanying notes to financial statements.
22 | Tax-Free Trust of Oregon
TAX-FREE TRUST OF OREGON
STATEMENTS OF CHANGES IN NET ASSETS
| | | Six Months Ended | | | Year Ended | | | Year Ended | |
| | | March 31, 2013† | | | September 30, 2012 | | | September 30, 2011 | |
| OPERATIONS: | | | | | | | | | |
| Net investment income | | $ | 8,321,790 | | | $ | 16,522,680 | | | $ | 16,847,144 | |
| Net realized gain (loss) from | | | | | | | | | | | | |
| securities transactions | | | 82,033 | | | | 2,522,836 | | | | (213,603 | ) |
| Change in unrealized appreciation | | | | | | | | | | | | |
| on investments | | | (5,674,924 | ) | | | 16,001,761 | | | | (5,092,691 | ) |
| Change in net assets resulting | | | | | | | | | | | | |
| from operations | | | 2,728,899 | | | | 35,047,277 | | | | 11,540,850 | |
| | |
| DISTRIBUTIONS TO SHAREHOLDERS (note 10): | | | | | | | | | |
| Class A Shares: | | | | | | | | | | | | |
| Net investment income | | | (6,503,519 | ) | | | (13,021,908 | ) | | | (13,260,251 | ) |
| Net realized gain on | | | | | | | | | | | | |
| investments | | | (1,699,647 | ) | | | – | | | | – | |
| | |
| Class C Shares: | | | | | | | | | | | | |
| Net investment income | | | (431,433 | ) | | | (778,958 | ) | | | (713,975 | ) |
| Net realized gain on | | | | | | | | | | | | |
| investments | | | (156,809 | ) | | | – | | | | – | |
| | |
| Class Y Shares: | | | | | | | | | | | | |
| Net investment income | | | (1,374,077 | ) | | | (2,679,809 | ) | | | (2,852,438 | ) |
| Net realized gain on | | | | | | | | | | | | |
| investments | | | (336,740 | ) | | | – | | | | – | |
| Change in net assets from | | | | | | | | | | | | |
| distributions | | | (10,502,225 | ) | | | (16,480,675 | ) | | | (16,826,664 | ) |
| | |
| CAPITAL SHARE TRANSACTIONS (note 8): | | | | | | | | | |
| Proceeds from shares sold | | | 44,481,773 | | | | 84,694,490 | | | | 51,950,817 | |
| Reinvested dividends and | | | | | | | | | | | | |
| distributions | | | 7,473,829 | | | | 10,296,809 | | | | 10,362,686 | |
| Cost of shares redeemed | | | (31,722,298 | ) | | | (52,022,893 | ) | | | (103,034,039 | ) |
| Change in net assets from | | | | | | | | | | | | |
| capital share transactions | | | 20,233,304 | | | | 42,968,406 | | | | (40,720,536 | ) |
| | |
| Change in net assets | | | 12,459,978 | | | | 61,535,008 | | | | (46,006,350 | ) |
| | |
| NET ASSETS: | | | | | | | | | | | | |
| Beginning of period | | | 540,494,528 | | | | 478,959,520 | | | | 524,965,870 | |
| End of period* | | $ | 552,954,506 | | | $ | 540,494,528 | | | $ | 478,959,520 | |
| * Includes undistributed net | | | | | | | | | | | | |
| investment income of: | | $ | 242,877 | | | $ | 230,091 | | | $ | 245,539 | |
| † | Effective December 1, 2012, the Trust changed its fiscal year end from September 30 to March 31. The information presented is for the period October 1, 2012 to March 31, 2013. |
See accompanying notes to financial statements.
23 | Tax-Free Trust of Oregon
TAX-FREE TRUST OF OREGON
NOTES TO FINANCIAL STATEMENTS
MARCH 31, 2013
��
1. Organization
Tax-Free Trust of Oregon (the “Trust”) is the sole portfolio of The Cascades Trust. The Cascades Trust (the “Business Trust”) is an open-end investment company, which was organized on October 17, 1985, as a Massachusetts business trust and is authorized to issue an unlimited number of shares. The Trust is a non-diversified portfolio which commenced operations on June 16, 1986 and until April 5, 1996, offered only one class of shares. On that date, the Trust began offering two additional classes of shares, Class C and Class Y Shares. All shares outstanding prior to that date were designated as Class A Shares and are sold at net asset value plus a sales charge of varying size (depending upon a variety of factors) paid at the time of purchase and bear a distribution fee. Class C Shares are sold at net asset value with no sales charge payable at the time of purchase but with a level charge for service and distribution fees for six years thereafter. Class C Shares automatically convert to Class A Shares after six years. Class Y Shares are sold only through authorized financial institutions acting for investors in a fiduciary, advisory, agency, custodial or similar capacity, and are not offered directly to retail customers. Class Y Shares are sold at net asset value with no sales charge, no redemption fee, no contingent deferred sales charge (“CDSC”) and no distribution fee. On January 31, 1998, the Trust established Class I Shares which are offered and sold only through financial intermediaries and are not offered directly to retail customers. Class I Shares are sold at net asset value with no sales charge and no redemption fee or CDSC, although a financial intermediary may charge a fee for effecting a purchase or other transaction on behalf of its customers. Class I Shares carry a distribution and a service fee. As of the report date, there were no Class I Shares outstanding. All classes of shares represent interests in the same portfolio of investments and are identical as to rights and privileges but differ with respect to the effect of sales charges, the distribution and/or service fees borne by each class, expenses specific to each class, voting rights on matters affecting a single class and the exchange privileges of each class. On December 1, 2012, the Board of Trustees approved a change in the Trust’s fiscal and tax year end from September to March.
2. Significant Accounting Policies
The following is a summary of significant accounting policies followed by the Trust in the preparation of its financial statements. The policies are in conformity with accounting principles generally accepted in the United States of America for investment companies.
| a) | Portfolio valuation: Municipal securities which have remaining maturities of more than 60 days are valued each business day based upon information provided by a nationally prominent independent pricing service and periodically verified through other pricing services. In the case of securities for which market quotations are readily available, securities are valued by the pricing service at the mean of bid and asked quotations. If a market quotation or a valuation from the pricing service is not readily available, the security is valued at fair value determined in good faith under procedures established by and under the general supervision of the Board of Trustees. Securities which mature in 60 days or less are generally valued at amortized cost if their term to maturity at purchase is 60 days or less, or by amortizing their unrealized appreciation or depreciation on the 61st day prior to maturity, if their term to maturity at purchase exceeds 60 days. |
24 | Tax-Free Trust of Oregon
TAX-FREE TRUST OF OREGON
NOTES TO FINANCIAL STATEMENTS (continued)
MARCH 31, 2013
| b) | Fair value measurements: The Trust follows a fair value hierarchy that distinguishes between market data obtained from independent sources (observable inputs) and the Trust’s own market assumptions (unobservable inputs). These inputs are used in determining the value of the Trust’s investments and are summarized in the following fair value hierarchy: Level 1 – Unadjusted quoted prices in active markets for identical assets or liabilities that the Trust has the ability to access. Level 2 – Observable inputs other than quoted prices included in Level 1 that are observable for the asset or liability, either directly or indirectly. These inputs may include quoted prices for the identical instrument on an inactive market, prices for similar instruments, interest rates, prepayment speeds, credit risk, yield curves, default rates and similar data. Level 3 – Unobservable inputs for the asset or liability, to the extent relevant observable inputs are not available, representing the Trust’s own assumptions about the assumptions a market participant would use in valuing the asset or liability, based on the best information available. The inputs or methodology used for valuing securities are not an indication of the risk associated with investing in those securities. The following is a summary of the valuation inputs, representing 100% of the Trust’s investments, used to value the Trust’s net assets as of March 31, 2013: |
| Valuation Inputs | | | Investments in Securities | |
| Level 1 – Quoted Prices | | $ | – | |
Level 2 – Other Significant Observable Inputs –Municipal Bonds* | | | 543,063,188 | |
| Level 3 – Significant Unobservable Inputs | | | – | |
| Total | | $ | 543,063,188 | |
*See schedule of investments for a detailed listing of securities.
| c) | Subsequent events: In preparing these financial statements, the Trust has evaluated events and transactions for potential recognition or disclosure through the date these financial statements were issued. |
| d) | Securities transactions and related investment income: Securities transactions are recorded on the trade date. Realized gains and losses from securities transactions are reported on the identified cost basis. Interest income is recorded daily on the accrual basis and is adjusted for amortization of premium and accretion of original issue and market discount. |
| e) | Federal income taxes: It is the policy of the Trust to continue to qualify as a regulated investment company by complying with the provisions of the Internal Revenue Code applicable to certain investment companies. The Trust intends to make distributions of income and securities profits sufficient to relieve it from all, or substantially all, Federal income and excise taxes. |
25 | Tax-Free Trust of Oregon
TAX-FREE TRUST OF OREGON
NOTES TO FINANCIAL STATEMENTS (continued)
MARCH 31, 2013
| | Management has reviewed the tax positions for each of the open tax years (2010-2012) or expected to be taken in the Trust’s 2013 tax returns and has concluded that there are no significant uncertain tax positions that would require recognition in the financial statements. |
| f) | Multiple class allocations: All income, expenses (other than class-specific expenses), and realized and unrealized gains or losses are allocated daily to each class of shares based on the relative net assets of each class. Class-specific expenses, which include distribution and service fees and any other items that are specifically attributed to a particular class, are also charged directly to such class on a daily basis. |
| g) | Use of estimates: The preparation of financial statements in conformity with accounting principles generally accepted in the United States of America requires management to make estimates and assumptions that affect the reported amounts of assets and liabilities and disclosure of contingent assets and liabilities at the date of the financial statements and the reported amounts of increases and decreases in net assets from operations during the reporting period. Actual results could differ from those estimates. |
| h) | Reclassification of capital accounts: Accounting principles generally accepted in the United States of America require that certain components of net assets relating to permanent differences be reclassified between financial and tax reporting. On March 31, 2013, the Trust increased undistributed net investment income by $25 and decreased paid-in capital by $25 due primarily to differing book/tax treatment of distributions and bond amortization. These reclassifications had no effect on net assets or net asset value per share. |
| i) | Accounting pronouncement: In January 2013, the Financial Accounting Standards Board (“FASB”) issued Accounting Standards Update (“ASU”) No. 2013-01 Clarifying the Scope of Disclosures about Offsetting Assets and Liabilities. This update gives additional clarification to the FASB ASU No. 2011-11 Disclosures about Offsetting Assets and Liabilities. The amendments in this ASU require an entity to disclose information about offsetting and related arrangements to enable users of its financial statements to understand the effect of those arrangements on its financial position. The ASU is effective for annual reporting periods beginning on or after January 1, 2013, and interim periods within those annual periods. The guidance requires retrospective application for all comparative periods presented. Management expects ASU 2013-01 to have no impact on the financial statement disclosures. |
3. Fees and Related Party Transactions
a) Management Arrangements:
Aquila Investment Management LLC (the “Manager”), a wholly-owned subsidiary of Aquila Management Corporation, the Trust’s founder and sponsor, serves as the Manager for the Trust under an Advisory and Administration Agreement with the Trust. The portfolio management of the Trust has been delegated to a Sub-Adviser as described below. Under the Advisory and Administrative Agreement, the Manager provides all administrative services to the Trust, other than those relating to the day-today portfolio management. The Manager’s services include providing the office of the Trust and all related services as well as overseeing the activities of the Sub-Adviser and managing relationships with all the various support organizations to the Trust such as the shareholder servicing agent, custodian, legal counsel, auditors and distributor and additionally maintaining the Trust’s accounting books and records. For its services, the Manager is entitled to receive a fee which is payable monthly and computed as of the close of business each day at the annual rate of 0.40 of 1% of net assets of the Trust. The Manager determined to contractually waive its fees to the extent necessary in order to pass savings through to the shareholders recognized under the Sub-Advisory Agreement (as described below) such that its fees are as follows: the annual rate shall be equivalent to 0.40 of 1% of net assets of the Trust up to $400 million; 0.38 of 1% of the Trust’s net assets above that amount to $1 billion and 0.36 of 1% of the Trust’s net assets above $1 billion. For the six months ended March 31, 2013, the Trust incurred management fees of $1,093,507, of which $14,839 was waived. For the year ended September 30, 2012, the Trust incurred management fees of $2,030,450, of which $21,466 was waived.
26 | Tax-Free Trust of Oregon
TAX-FREE TRUST OF OREGON NOTES TO
FINANCIAL STATEMENTS (continued)
MARCH 31, 2013
Kirkpatrick Pettis Capital Management (the “Sub-Adviser”) serves as the Investment Sub-Adviser for the Trust under a Sub-Advisory Agreement between the Manager and the Sub-Adviser. Under this agreement, the Sub-Adviser continuously provides, subject to oversight of the Manager and the Board of Trustees of the Trust, the investment program of the Trust and the composition of its portfolio, arranges for the purchases and sales of portfolio securities, and provides for daily pricing of the Trust’s portfolio. For its services, the Sub-Adviser is entitled to receive a fee from the Manager which is payable monthly and computed as of the close of business each day at the annual rate of 0.18 of 1% of net assets of the Trust up to $400 million; 0.16 of 1% of net assets above $400 million up to $1 billion; and 0.14 of 1% of net assets above $1 billlion.
Under a Compliance Agreement with the Manager, the Manager is compensated by the Trust for Chief Compliance Officer related services provided to enable the Trust to comply with Rule 38a-1 of the Investment Company Act of 1940.
Specific details as to the nature and extent of the services provided by the Manager and the Sub-Adviser are more fully defined in the Trust’s Prospectus and Statement of Additional Information.
b) Distribution and Service Fees:
The Trust has adopted a Distribution Plan (the “Plan”) pursuant to Rule 12b-1 (the “Rule”) under the Investment Company Act of 1940. Under one part of the Plan, with respect to Class A Shares, the Trust is authorized to make distribution fee payments to broker-dealers or others (“Qualified Recipients”) selected by Aquila Distributors, Inc. (the “Distributor”), including, but not limited to, any principal underwriter of the Trust, with which the Distributor has entered into written agreements contemplated by the Rule and which have rendered assistance in the distribution and/or retention of the Trust’s shares or servicing of shareholder accounts. The Trust makes payment of this distribution fee at the annual rate of 0.15% of the Trust’s average net assets represented by Class A Shares. For the six months ended March 31, 2013, distribution fees on Class A Shares amounted to $317,120 of which the Distributor retained $14,080. For the year ended September 30, 2012, distribution fees on Class A Shares amounted to $595,726 of which the Distributor retained $30,292.
27 | Tax-Free Trust of Oregon
TAX-FREE TRUST OF OREGON
NOTES TO FINANCIAL STATEMENTS (continued)
MARCH 31, 2013
Under another part of the Plan, the Trust is authorized to make payments with respect to Class C Shares to Qualified Recipients which have rendered assistance in the distribution and/or retention of the Trust’s Class C shares or servicing of shareholder accounts. These payments are made at the annual rate of 0.75% of the Trust’s average net assets represented by Class C Shares. For the six months ended March 31, 2013, these payments amounted to $145,427 and for the year ended September 30, 2012, amounted to $241,946. In addition, under a Shareholder Services Plan, the Trust is authorized to make service fee payments with respect to Class C Shares to Qualified Recipients for providing personal services and/or maintenance of shareholder accounts. These payments are made at the annual rate of 0.25% of the Trust’s average net assets represented by Class C Shares. For the six months ended March 31, 2013, these payments amounted to $48,476 and for the year ended September 30, 2012, amounted to $80,649. For the six months ended March 31, 2013, the total of these payments made with respect to Class C Shares amounted to $193,903 of which the Distributor retained $35,208. For the year ended September 30, 2012, the total of these payments with respect to Class C Shares amounted to $322,595 of which the Distributor retained $57,461.
Specific details about the Plans are more fully defined in the Trust’s Prospectus and Statement of Additional Information.
Under a Distribution Agreement, the Distributor serves as the exclusive distributor of the Trust’s shares. Through agreements between the Distributor and various brokerage and advisory firms (“intermediaries”), the Trust’s shares are sold primarily through the facilities of these intermediaries having offices within Oregon, with the bulk of any sales commissions inuring to such intermediaries. For the six months ended March 31, 2013, total commissions on sales of Class A Shares amounted to $625,929 of which the Distributor received $110,463. For the year ended September 30, 2012, total commissions on sales of Class A Shares amounted to $1,250,842 of which the Distributor received $226,793.
4. Purchases and Sales of Securities
During the six months ended March 31, 2013, purchases of securities and proceeds from the sales of securities aggregated $34,000,506 and $17,373,766, respectively.
At March 31, 2013, the aggregate tax cost for all securities was $502,519,318. At March 31, 2013, the aggregate gross unrealized appreciation for all securities in which there is an excess of value over tax cost amounted to $41,294,702 and aggregate gross unrealized depreciation for all securities in which there is an excess of tax cost over value amounted to $750,832 for a net unrealized appreciation of $40,543,870.
28 | Tax-Free Trust of Oregon
TAX-FREE TRUST OF OREGON
NOTES TO FINANCIAL STATEMENTS (continued)
MARCH 31, 2013
5. Portfolio Orientation
Since the Trust invests principally and may invest entirely in double tax-free municipal obligations of issuers within Oregon, it is subject to possible risks associated with economic, political, or legal developments or industrial or regional matters specifically affecting Oregon and whatever effects these may have upon Oregon issuers’ ability to meet their obligations. Two such developments, Measure 5, a 1990 amendment to the Oregon Constitution, as well as Measures 47 and 50, limit the taxing and spending authority of certain Oregon governmental entities. These amendments could have an adverse effect on the general financial condition of certain municipal entities that would impair the ability of certain Oregon issuers to pay interest and principal on their obligations.
6. Expenses
The Trust has negotiated an expense offset arrangement with its custodian, wherein it receives credit toward the reduction of custodian fees and other Trust expenses whenever there are uninvested cash balances. The Statement of Operations reflects the total expenses before any offset, the amount of offset and the net expenses.
7. Trustees’ Fees and Expenses
At March 31, 2013 there were 7 Trustees, one of whom is affiliated with the Manager and is not paid any fees. The total amount of Trustees’ service fees (for carrying out their responsibilities) and attendance fees paid during the six months ended March 31, 2013 was $104,006 and for the year ended September 30, 2012, the amount was $202,873. Attendance fees are paid to those in attendance at regularly scheduled quarterly Board Meetings and meetings of the Independent Trustees held prior to each quarterly Board Meeting, as well as additional meetings (such as Audit, Nominating, Shareholder and special meetings). Trustees are reimbursed for their expenses such as travel, accommodations, and meals incurred in connection with attendance at Board Meetings and at the Annual Meeting of Shareholders. For the six months ended March 31, 2013, such meeting-related expenses amounted to $19,717. For the year ended September 30, 2012, such meeting-related expenses amounted to $52,990.
29 | Tax-Free Trust of Oregon
TAX-FREE TRUST OF OREGON
NOTES TO FINANCIAL STATEMENTS (continued)
MARCH 31, 2013
8. Capital Share Transactions
Transactions in Capital Shares of the Trust were as follows:
| | | Six Months | | | | | | | |
| | | Ended | | | Year Ended | | | Year Ended | |
| | | March 31, 2013 | | | September 30, 2012 | | | September 30, 2011 | |
| SHARES | | | | | | | | | |
| Class A Shares: | | | | | | | | | |
| Shares sold | | | 2,403,021 | | | | 4,298,384 | | | | 2,898,388 | |
| Reinvested dividends and | | | | | | | | | | | | |
| distributions | | | 517,684 | | | | 733,155 | | | | 787,415 | |
| Shares redeemed | | | (1,916,583 | ) | | | (2,893,087 | ) | | | (5,278,453 | ) |
| Net change | | | 1,004,122 | | | | 2,138,452 | | | | (1,592,650 | ) |
| Class C Shares: | | | | | | | | | | | | |
| Shares sold | | | 418,499 | | | | 1,283,173 | | | | 549,608 | |
| Reinvested dividends and | | | | | | | | | | | | |
| distributions | | | 40,490 | | | | 49,403 | | | | 47,902 | |
| Shares redeemed | | | (286,525 | ) | | | (517,711 | ) | | | (758,285 | ) |
| Net change | | | 172,464 | | | | 814,865 | | | | (160,775 | ) |
| Class Y Shares: | | | | | | | | | | | | |
| Shares sold | | | 1,048,609 | | | | 1,888,049 | | | | 1,352,255 | |
| Reinvested dividends and | | | | | | | | | | | | |
| distributions | | | 92,977 | | | | 125,029 | | | | 123,185 | |
| Shares redeemed | | | (557,959 | ) | | | (1,186,848 | ) | | | (3,577,404 | ) |
| Net change | | | 583,627 | | | | 826,230 | | | | (2,101,964 | ) |
| Total transactions in | | | | | | | | | | | | |
| Trust shares | | | 1,760,213 | | | | 3,779,547 | | | | (3,855,389 | ) |
| DOLLARS | | | | | | | | | | | | |
| Class A Shares: | | | | | | | | | | | | |
| Proceeds from shares sold | | $ | 27,641,772 | | | $ | 48,821,795 | | | $ | 31,437,611 | |
| Reinvested dividends and | | | | | | | | | | | | |
| distributions | | | 5,942,752 | | | | 8,316,442 | | | | 8,515,528 | |
| Cost of shares redeemed | | | (22,009,651 | ) | | | (32,761,551 | ) | | | (56,779,136 | ) |
| Net change | | | 11,574,873 | | | | 24,376,686 | | | | (16,825,997 | ) |
| Class C Shares: | | | | | | | | | | | | |
| Proceeds from shares sold | | | 4,818,034 | | | | 14,532,028 | | | | 5,952,506 | |
| Reinvested dividends and | | | | | | | | | | | | |
| distributions | | | 464,411 | | | | 560,212 | | | | 517,523 | |
| Cost of shares redeemed | | | (3,287,373 | ) | | | (5,849,065 | ) | | | (8,101,298 | ) |
| Net change | | | 1,995,072 | | | | 9,243,175 | | | | (1,631,269 | ) |
| Class Y Shares: | | | | | | | | | | | | |
| Proceeds from shares sold | | | 12,021,967 | | | | 21,340,667 | | | | 14,560,700 | |
| Reinvested dividends and | | | | | | | | | | | | |
| distributions | | | 1,066,666 | | | | 1,420,155 | | | | 1,329,635 | |
| Cost of shares redeemed | | | (6,425,274 | ) | | | (13,412,277 | ) | | | (38,153,605 | ) |
| Net change | | | 6,663,359 | | | | 9,348,545 | | | | (22,263,270 | ) |
| Total transactions in | | | | | | | | | | | | |
| Trust shares | | $ | 20,233,304 | | | $ | 42,968,406 | | | $ | (40,720,536 | ) |
30 | Tax-Free Trust of Oregon
TAX-FREE TRUST OF OREGON
NOTES TO FINANCIAL STATEMENTS (continued)
MARCH 31, 2013
9. Securities Traded on a When-Issued Basis
The Trust may purchase or sell securities on a when-issued basis. When-issued transactions arise when securities are purchased or sold by the Trust with payment and delivery taking place in the future in order to secure what is considered to be an advantageous price and yield to the Trust at the time of entering into the transaction. Beginning on the date the Trust enters into a when-issued transaction, cash or other liquid securities are segregated in an amount equal to or greater than the value of the when-issued transaction. These transactions are subject to market fluctuations and their current value is determined in the same manner as for other securities.
10. Income Tax Information and Distributions
The Trust declares dividends daily from net investment income and makes payments monthly. Net realized capital gains, if any, are distributed annually and are taxable. These distributions are paid in additional shares at the net asset value per share, in cash, or in a combination of both, at the shareholder’s option.
The Trust intends to maintain, to the maximum extent possible, the tax-exempt status of interest payments received from portfolio municipal securities in order to allow dividends paid to shareholders from net investment income to be exempt from regular Federal and State of Oregon income taxes. Due to differences between financial statement reporting and Federal income tax reporting requirements, distributions made by the Trust may not be the same as the Trust’s net investment income, and/ or net realized securities gains. Further, a portion of the dividends may, under some circumstances, be subject to taxes at ordinary income and/or capital gain rates. As a result of the passage of the Regulated Investment Company Act of 2010 (“the Act”), losses incurred in this fiscal year and beyond retain their character as short-term or long-term, have no expiration date and are utilized before capital losses incurred prior to the enactment of the Act.
As of March 31, 2013, there were no post October capital loss deferrals.
The tax character of distributions:
| | | | | | Year Ended September 30, | |
| | | March 31, 2013 | | | 2012 | | | 2011 | |
| Net tax-exempt income | | $ | 8,309,029 | | | $ | 16,425,024 | | | $ | 16,826,664 | |
| Ordinary income | | | – | | | | 55,651 | | | | – | |
| Capital gain | | | 2,193,196 | | | | – | | | | – | |
| | | $ | 10,502,225 | | | $ | 16,480,675 | | | $ | 16,826,444 | |
As of March 31, 2013, the components of distributable earnings on a tax basis were as follows:
| Unrealized appreciation | | $ | 40,543,870 | |
| Undistributed tax-exempt income | | | 248,863 | |
| Accumulated net gain on investments | | | 81,625 | |
| Other temporary differences | | | (248,863 | ) |
| | | $ | 40,625,495 | |
31 | Tax-Free Trust of Oregon
TAX-FREE TRUST OF OREGON
NOTES TO FINANCIAL STATEMENTS (continued)
MARCH 31, 2013
The difference between book basis and tax basis undistributed income is due to the timing difference in recognizing dividends paid and the tax treatment of discount amortization.
11. Ongoing Development
Beginning in December 2007, the three major rating agencies (Standard & Poor’s, Moody’s and Fitch) downgraded or eliminated ratings of the municipal bond insurance companies due to loss of capital from investments in subprime mortgages. Only a few insurers are now deemed to be investment grade. Thus, while certain bonds have insurance, some are no longer rated based upon the ratings of their insurers. Furthermore, because the ability of many of the Trust’s insurers to pay claims has been downgraded, the protection of such insurance has been diminished, and there is no assurance that some of them may be relied upon for payment.
32 | Tax-Free Trust of Oregon
TAX-FREE TRUST OF OREGON
FINANCIAL HIGHLIGHTS
For a share outstanding throughout each period
| | | | | | Class A | |
| | | Six Months | | Year Ended September 30, | |
| | | 3/31/13 Ended† | | 2012 | | | 2011 | | | 2010 | | | 2009 | | | 2008 | |
| Net asset value, beginning of period | | $ | 11.53 | | | $ | 11.12 | | | $ | 11.18 | | | $ | 11.05 | | | $ | 10.11 | | | $ | 10.68 | |
| Income (loss) from investment operations: | | | | | | | | | | | | | | | | | | | | | | | | |
Net investment income(1) | | | 0.18 | | | | 0.37 | | | | 0.38 | | | | 0.40 | | | | 0.42 | | | | 0.42 | |
| Net gain (loss) on securities (both | | | | | | | | | | | | | | | | | | | | | | | | |
| realized and unrealized) | | | (0.11 | ) | | | 0.41 | | | | (0.06 | ) | | | 0.13 | | | | 0.94 | | | | (0.58 | ) |
| Total from investment operations | | | 0.07 | | | | 0.78 | | | | 0.32 | | | | 0.53 | | | | 1.36 | | | | (0.16 | ) |
| Less distributions (note 10): | | | | | | | | | | | | | | | | | | | | | | | | |
| Dividends from net investment income | | | (0.18 | ) | | | (0.37 | ) | | | (0.38 | ) | | | (0.40 | ) | | | (0.42 | ) | | | (0.41 | ) |
| Distributions from capital gains | | | (0.05 | ) | | | – | | | | – | | | | – | | | | – | | | | – | |
| Total distributions | | | (0.23 | ) | | | (0.37 | ) | | | (0.38 | ) | | | (0.40 | ) | | | (0.42 | ) | | | (0.41 | ) |
| Net asset value, end of period | | $ | 11.37 | | | $ | 11.53 | | | $ | 11.12 | | | $ | 11.18 | | | $ | 11.05 | | | $ | 10.11 | |
| Total return(not reflecting sales charge) | | | 0.54 | %(2) | | | 7.14 | % | | | 3.05 | % | | | 4.95 | % | | | 13.74 | % | | | (1.58 | )% |
| Ratios/supplemental data | | | | | | | | | | | | | | | | | | | | | | | | |
| Net assets, end of period (in millions) | | $ | 425 | | | $ | 419 | | | $ | 380 | | | $ | 400 | | | $ | 370 | | | $ | 324 | |
| Ratio of expenses to average net assets | | | 0.71 | %(3) | | | 0.74 | % | | | 0.76 | % | | | 0.72 | % | | | 0.73 | % | | | 0.76 | % |
| Ratio of net investment income to | | | | | | | | | | | | | | | | | | | | | | | | |
| average net assets | | | 3.08 | %(3) | | | 3.29 | % | | | 3.55 | % | | | 3.65 | % | | | 4.02 | % | | | 3.89 | % |
| Portfolio turnover rate | | | 3 | %(2) | | | 8 | % | | | 15 | % | | | 9 | % | | | 15 | % | | | 15 | % |
| | |
The expense and net investment income ratios without the effect of the contractual waiver of management fees were (note 3): | |
| | | | | | | | | | | | | | | | | | | | | | | | | |
| Ratio of expenses to average net assets | | | 0.72 | %(3) | | | 0.75 | % | | | 0.76 | % | | | – | | | | – | | | | – | |
| Ratio of net investment income to | | | | | | | | | | | | | | | | | | | | | | | | |
| average net assets | | | 3.07 | %(3) | | | 3.28 | % | | | 3.55 | % | | | – | | | | – | | | | – | |
| | |
The expense ratios after giving effect to the contractual waiver of management fees and expense offset for uninvested cash balances were: | |
| | | | | | | | | | | | | | | | | | | | | | | | | |
| Ratio of expenses to average net assets | | | 0.71 | %(3) | | | 0.74 | % | | | 0.76 | % | | | 0.72 | % | | | 0.73 | % | | | 0.74 | % |
_________________
| (1) | Per share amounts have been calculated using the daily average shares method. |
| Note: | On January 1, 2011, Kirkpatrick Pettis Capital Management became the Trust’s InvestmentSub-Adviser, replacing FAF Advisors, Inc. |
| † | Effective December 1, 2012, the Trust changed its fiscal year end from September 30 to March 31. The information presented is for the period October 1, 2012 to March 31, 2013. |
See accompanying notes to financial statements.
33 | Tax-Free Trust of Oregon
TAX-FREE TRUST OF OREGON
FINANCIAL HIGHLIGHTS (continued)
For a share outstanding throughout each period
| | | | | | Class C | |
| | | Six Months | | Year Ended September 30, | |
| | | 3/31/13 Ended† | | 2012 | | | 2011 | | | 2010 | | | 2009 | | | 2008 | |
| Net asset value, beginning of period | | $ | 11.52 | | | $ | 11.11 | | | $ | 11.17 | | | $ | 11.04 | | | $ | 10.10 | | | $ | 10.68 | |
| Income (loss) from investment operations: | | | | | | | | | | | | | | | | | | | | | | | | |
Net investment income(1) | | | 0.13 | | | | 0.27 | | | | 0.29 | | | | 0.30 | | | | 0.33 | | | | 0.33 | |
| Net gain (loss) on securities (both | | | | | | | | | | | | | | | | | | | | | | | | |
| realized and unrealized) | | | (0.11 | ) | | | 0.42 | | | | (0.06 | ) | | | 0.14 | | | | 0.94 | | | | (0.59 | ) |
| Total from investment operations | | | 0.02 | | | | 0.69 | | | | 0.23 | | | | 0.44 | | | | 1.27 | | | | (0.26 | ) |
| Less distributions (note 10): | | | | | | | | | | | | | | | | | | | | | | | | |
| Dividends from net investment income | | | (0.13 | ) | | | (0.28 | ) | | | (0.29 | ) | | | (0.31 | ) | | | (0.33 | ) | | | (0.32 | ) |
| Distributions from capital gains | | | (0.05 | ) | | | – | | | | – | | | | – | | | | – | | | | – | |
| Total distributions | | | (0.18 | ) | | | (0.28 | ) | | | (0.29 | ) | | | (0.31 | ) | | | (0.33 | ) | | | (0.32 | ) |
| Net asset value, end of period | | $ | 11.36 | | | $ | 11.52 | | | $ | 11.11 | | | $ | 11.17 | | | $ | 11.04 | | | $ | 10.10 | |
| Total return(not reflecting CDSC) | | | 0.11 | %(2) | | | 6.24 | % | | | 2.18 | % | | | 4.07 | % | | | 12.79 | % | | | (2.51 | )% |
| Ratios/supplemental data | | | | | | | | | | | | | | | | | | | | | | | | |
| Net assets, end of period (in millions) | | $ | 39 | | | $ | 38 | | | $ | 27 | | | $ | 29 | | | $ | 22 | | | $ | 18 | |
| Ratio of expenses to average net assets | | | 1.56 | %(3) | | | 1.59 | % | | | 1.61 | % | | | 1.57 | % | | | 1.58 | % | | | 1.61 | % |
| Ratio of net investment income to | | | | | | | | | | | | | | | | | | | | | | | | |
| average net assets | | | 2.23 | %(3) | | | 2.42 | % | | | 2.70 | % | | | 2.78 | % | | | 3.15 | % | | | 3.04 | % |
| Portfolio turnover rate | | | 3 | %(2) | | | 8 | % | | | 15 | % | | | 9 | % | | | 15 | % | | | 15 | % |
| | |
The expense and net investment income ratios without the effect of the contractual waiver of management fees were (note 3): | |
| | | | | | | | | | | | | | | | | | | | | | | | | |
| Ratio of expenses to average net assets | | | 1.57 | %(3) | | | 1.59 | % | | | 1.61 | % | | | – | | | | – | | | | – | |
| Ratio of net investment income to | | | | | | | | | | | | | | | | | | | | | | | | |
| average net assets | | | 2.22 | %(3) | | | 2.42 | % | | | 2.70 | % | | | – | | | | – | | | | – | |
| | |
The expense ratios after giving effect to the contractual waiver of management fees and expense offset for uninvested cash balances were: | |
| | | | | | | | | | | | | | | | | | | | | | | | | |
| Ratio of expenses to average net assets | | | 1.56 | %(3) | | | 1.59 | % | | | 1.61 | % | | | 1.57 | % | | | 1.58 | % | | | 1.59 | % |
_________________
| (1) | Per share amounts have been calculated using the daily average shares method. |
| Note: | On January 1, 2011, Kirkpatrick Pettis Capital Management became the Trust’s InvestmentSub-Adviser, replacing FAF Advisors, Inc. |
| † | Effective December 1, 2012, the Trust changed its fiscal year end from September 30 to March 31. The information presented is for the period October 1, 2012 to March 31, 2013. |
See accompanying notes to financial statements.
34 | Tax-Free Trust of Oregon
TAX-FREE TRUST OF OREGON
FINANCIAL HIGHLIGHTS (continued)
For a share outstanding throughout each period
| | | | | | ClassY | |
| | | Six Months | | Year Ended September 30, | |
| | | 3/31/13 Ended† | | 2012 | | | 2011 | | | 2010 | | | 2009 | | | 2008 | |
| Net asset value, beginning of period | | $ | 11.52 | | | $ | 11.11 | | | $ | 11.18 | | | $ | 11.04 | | | $ | 10.10 | | | $ | 10.68 | |
| Income (loss) from investment operations: | | | | | | | | | | | | | | | | | | | | | | | | |
Net investment income(1) | | | 0.18 | | | | 0.39 | | | | 0.40 | | | | 0.42 | | | | 0.44 | | | | 0.43 | |
| Net gain (loss) on securities (both | | | | | | | | | | | | | | | | | | | | | | | | |
| realized and unrealized) | | | (0.11 | ) | | | 0.41 | | | | (0.07 | ) | | | 0.14 | | | | 0.93 | | | | (0.58 | ) |
| Total from investment operations | | | 0.07 | | | | 0.80 | | | | 0.33 | | | | 0.56 | | | | 1.37 | | | | (0.15 | ) |
| Less distributions (note 10): | | | | | | | | | | | | | | | | | | | | | | | | |
| Dividends from net investment income | | | (0.18 | ) | | | (0.39 | ) | | | (0.40 | ) | | | (0.42 | ) | | | (0.43 | ) | | | (0.43 | ) |
| Distributions from capital gains | | | (0.05 | ) | | | – | | | | – | | | | – | | | | – | | | | – | |
| Total distributions | | | (0.23 | ) | | | (0.39 | ) | | | (0.40 | ) | | | (0.42 | ) | | | (0.43 | ) | | | (0.43 | ) |
| Net asset value, end of period | | $ | 11.36 | | | $ | 11.52 | | | $ | 11.11 | | | $ | 11.18 | | | $ | 11.04 | | | $ | 10.10 | |
| Total return | | | 0.61 | %(2) | | | 7.30 | % | | | 3.11 | % | | | 5.21 | % | | | 13.92 | % | | | (1.52 | )% |
| Ratios/supplemental data | | | | | | | | | | | | | | | | | | | | | | | | |
| Net assets, end of period (in millions) | | $ | 89 | | | $ | 84 | | | $ | 71 | | | $ | 95 | | | $ | 85 | | | $ | 58 | |
| Ratio of expenses to average net assets | | | 0.56 | %(3) | | | 0.59 | % | | | 0.61 | % | | | 0.57 | % | | | 0.58 | % | | | 0.61 | % |
| Ratio of net investment income to | | | | | | | | | | | | | | | | | | | | | | | | |
| average net assets | | | 3.23 | %(3) | | | 3.44 | % | | | 3.70 | % | | | 3.80 | % | | | 4.16 | % | | | 4.04 | % |
| Portfolio turnover rate | | | 3 | %(2) | | | 8 | % | | | 15 | % | | | 9 | % | | | 15 | % | | | 15 | % |
| | |
The expense and net investment income ratios without the effect of the contractual waiver of management fees were (note 3): | |
| | | | | | | | | | | | | | | | | | | | | | | | | |
| Ratio of expenses to average net assets | | | 0.57 | %(3) | | | 0.60 | % | | | 0.61 | % | | | – | | | | – | | | | – | |
| Ratio of net investment income to | | | | | | | | | | | | | | | | | | | | | | | | |
| average net assets | | | 3.22 | %(3) | | | 3.43 | % | | | 3.70 | % | | | – | | | | – | | | | – | |
| | |
The expense ratios after giving effect to the contractual waiver of management fees and expense offset for uninvested cash balances were: | |
| | | | | | | | | | | | | | | | | | | | | | | | | |
| Ratio of expenses to average net assets | | | 0.56 | %(3) | | | 0.59 | % | | | 0.61 | % | | | 0.57 | % | | | 0.58 | % | | | 0.59 | % |
_________________
| (1) | Per share amounts have been calculated using the daily average shares method. |
| Note: | On January 1, 2011, Kirkpatrick Pettis Capital Management became the Trust’s InvestmentSub-Adviser, replacing FAF Advisors, Inc. |
| † | Effective December 1, 2012, the Trust changed its fiscal year end from September 30 to March 31. The information presented is for the period October 1, 2012 to March 31, 2013. |
See accompanying notes to financial statements.
35 | Tax-Free Trust of Oregon
| Additional Information (unaudited) | | | | | | |
| | | | | | | |
Trustees(1) | | | | | | | | |
| and Officers | | | | | | | | |
| | | | | | | Number of | | |
| | | Positions | | | | Portfolios | | |
| | | Held with | | | | in Fund | | |
| Name, | | Trust and | | Principal | | Complex(4) | | Other Directorships |
Address(2) | | Length of | | Occupation(s) | | Overseen | | Held by Trustee |
| and Year of Birth | | Service(3) | | During Past 5 Years | | by Trustee | | During Past 5 Years |
| | | | | | | | | |
Interested Trustee(5) | | | | | | | | |
| | | | | | | | | |
Diana P. Herrmann New York, NY (1958) | | Vice Chair of the Board of Trustees since 2003, President since 1998 and Trustee since 1994 | | Vice Chair and Chief Executive Officer of Aquila Management Corporation, Founder and Sponsor of the Aquila Group of Funds(6) and parent of Aquila Investment Management LLC, Manager, since 2004, President since 1997, Chief Operating Officer, 1997-2008, a Director since 1984, Secretary since 1986 and previously its Executive Vice President, Senior Vice President or Vice President, 1986-1997; Chief Executive Officer and Vice Chair since 2004, President and Manager since 2003, and Chief Operating Officer (2003-2008), of the Manager; Chair, Vice Chair, President, Executive Vice President and/or Senior Vice President of funds in the Aquila Group of Funds since 1986; Director of the Distributor since 1997; Governor, Investment Company Institute (the U.S. mutual fund industry trade organization dedicated to protecting shareholder interests and educating the public about investing) for various periods since 2004, and head of its Small Funds Committee, 2004-2009; active in charitable and volunteer organizations. | | 11 | | ICI Mutual Insurance Company, a Risk Retention Group (2006-2009 and since 2010); Vice Chair and Trustee of Pacific Capital Funds of Cash Assets Trust (three Aquila money-market funds) 2004-2012 |
| | | | | | | | | |
Non-interested Trustees | | | | | | | | |
| | | | | | | | | |
James A. Gardner Terrebonne, OR (1943) | | Chair of the Board of Trustees since 2005 and Trustee since 1986 | | President, Gardner Associates, an investment and real estate firm, since 1989; Owner and Developer of Vandevert Ranch, Sunriver, Oregon since 1989; Founding Partner, Chairman Emeritus and previously Chairman (1991-2010), Ranch at the Canyons, Terrebonne, Oregon; President Emeritus and previously President (1981-1989), Lewis and Clark College and Law School; director, Oregon High Desert Museum, 1989-2003; active in civic, business and educational organizations in Oregon; writer on Native American and settlement history of Oregon. | | 1 | | None |
36 | Tax-Free Trust of Oregon
| | | | | | | Number of | | |
| | | Positions | | | | Portfolios | | |
| | | Held with | | | | in Fund | | |
| Name, | | Trust and | | Principal | | Complex(4) | | Other Directorships |
Address(2) | | Length of | | Occupation(s) | | Overseen | | Held by Trustee |
| and Year of Birth | | Service(3) | | During Past 5 Years | | by Trustee | | During Past 5 Years |
| | | | | | | | | |
Gary C. Cornia Orem, UT (1948) | | Trustee since 2002 | | Dean, Marriott School of Management, Brigham Young University, since 2008; Director, Romney Institute of Public Management, Marriott School of Management, 2004-2008; Professor, Marriott School of Management, 1980-present; Past President, National Tax Association; Fellow, Lincoln Institute of Land Policy, 2002-present; Associate Dean, Marriott School of Management, Brigham Young University, 1991-2000; member, Utah Governor’s Tax Review Committee, 1993-2009. | | 6 | | Utah Foundation, Salt Lake City, UT; formerly director, Lincoln Institute of Land Policy, Cambridge, MA |
| | | | | | | | | |
Edmund P. Jensen Portland, OR (1937) | | Trustee since 2003 | | President and CEO, VISA International, 1994-1999; Vice Chairman and Chief Operating Officer, US Bancorp, 1974-1994. | | 1 | | Five Cubits, Inc. (formerly BMG Seltec), a software company; Lewis and Clark College, Portland, OR |
| | | | | | | | | |
John W. Mitchell Lake Oswego, OR (1944) | | Trustee since 1999 | | Principal of M & H Economic Consultants; Economist, Western Region, for U.S. Bancorp 1998-2007; Chief Economist, U.S. Bancorp, Portland, Oregon, 1983-1998; member, Oregon Governor’s Council of Economic Advisors, 1984-1998; Chairman, Oregon Governor’s Technical Advisory Committee for Tax Review in 1998. | | 1 | | Oregon Mutual Insurance; Western Capital Corporation; Northwest Bank. |
| | | | | | | | | |
Ralph R. Shaw Portland, OR (1938) | | Trustee since 2000 | | President, Shaw Management Company, an investment counseling firm, 1980-present; General Partner, Shaw Venture Partners, 1983-2005; Shaw Venture Partners II, 1987-2005; and Shaw Venture Partners III, 1994-2005. | | 1 | | Schnitzer Steel Industries, Inc., Telestream, Inc., Five Cubits, Inc. (formerly BMG Seltec), a software company, Rentrak Corporation, One-to-One Interactive, Optimum Energy Co. |
37 | Tax-Free Trust of Oregon
| | | | | | | Number of | | |
| | | Positions | | | | Portfolios | | |
| | | Held with | | | | in Fund | | |
| Name, | | Trust and | | Principal | | Complex(4) | | Other Directorships |
Address(2) | | Length of | | Occupation(s) | | Overseen | | Held by Trustee |
| and Year of Birth | | Service(3) | | During Past 5 Years | | by Trustee | | During Past 5 Years |
| | | | | | | | | |
Nancy Wilgenbusch Marylhurst, OR (1947) | | Trustee since 2002 | | President Emerita since 2008 and President 1984-2008, Marylhurst University; member, former Chair, Portland Branch of the Federal Reserve Bank of San Francisco; active board member of a number of civic organizations. | | 1 | | West Coast Bank; Cascade Corporation, a leading international manufacturer of lift truck attachments |
| | | | | |
| | | Positions | | |
| | | Held with | | |
| Name, | | Trust and | | |
Address(2) | | Length of | | |
| and Year of Birth | | Service(3) | | Principal Occupation(s) During Past 5 Years |
| | | | | |
Trustees Emeritus(7) | | | | |
| | | | | |
Vernon R. Alden Boston, MA (1923) | | Trustee Emeritus since 2006 | | Retired; former director or trustee of various Fortune 500 companies, including Colgate-Palmolive and McGraw Hill; formerly President of Ohio University and Associate Dean of the Harvard University Graduate School of Business Administration; Trustee, Aquila Narragansett Tax-Free Income Fund, 1992-2006, Tax-Free Trust of Oregon, 1988-2001, Hawaiian Tax-Free Trust, 1989-2001, and Pacific Capital Funds of Cash Assets Trust (three Aquila money-market funds, consisting of Pacific Capital Cash Assets Trust, Pacific Capital Tax-Free Cash Assets Trust and Pacific Capital U.S. Government Securities Cash Assets Trust), 1989-2001; Trustee Emeritus, Aquila Narragansett Tax-Free Income Fund and Tax-Free Trust of Oregon since 2006; member of several Japan-related advisory councils, including Chairman of the Japan Society of Boston; trustee of various cultural, educational and civic organizations. |
| | | | | |
David B. Frohnmayer Eugene, OR (1940) | | Trustee Emeritus since 2003 | | President Emeritus and formerly President (1994-2009), University of Oregon; former Dean of the University of Oregon Law School and former Attorney General of the State of Oregon; Trustee, Tax-Free Trust of Oregon, 1997-2003. |
| | | | | |
Patricia L. Moss Bend, OR (1953) | | Trustee Emerita since 2005 | | President and Chief Executive Officer, Cascade Bancorp and Bank of the Cascades since 1998; Director, Cascade Bancorp; Director, MDU Resources; Trustee, Tax-Free Trust of Oregon, 2002-2005; active in community and educational organizations. |
38 | Tax-Free Trust of Oregon
| | | | | |
| | | Positions | | |
| | | Held with | | |
| Name, | | Trust and | | |
Address(2) | | Length of | | |
| and Year of Birth | | Service(3) | | Principal Occupation(s) During Past 5 Years |
| | | | | |
| Officers | | | | |
| | | | | |
Charles E. Childs, III New York, NY (1957) | | Executive Vice President since 2003 and Secretary since 2011 | | Executive Vice President of all funds in the Aquila Group of Funds and the Manager and the Manager’s parent since 2003; Chief Operating Officer of the Manager and the Manager’s parent since 2008; Secretary of all funds in the Aquila Group of Funds since 2011; formerly Senior Vice President, corporate development, Vice President, Assistant Vice President and Associate of the Manager’s parent since 1987; Executive Vice President, Senior Vice President, Vice President or Assistant Vice President of the Aquila money-market funds, 1988-2012; Director of the Distributor since 2012. |
| | | | | |
Marie E. Aro Denver, CO (1955) | | Senior Vice President since 2010 | | Co-President of the Distributor since 2010, Vice President, 1993-1997; Senior Vice President, Aquila Three Peaks Opportunity Growth Fund since 2004; Senior Vice President, Tax-Free Trust of Arizona since 2010 and Vice President, 2004-2010; Senior Vice President, Aquila Three Peaks High Income Fund since 2006; Senior Vice President, Churchill Tax-Free Fund of Kentucky, Hawaiian Tax-Free Trust, Aquila Narragansett Tax-Free Income Fund, Tax-Free Fund For Utah, Tax-Free Fund of Colorado and Tax-Free Trust of Oregon since 2010; Vice President, INVESCO Funds Group, 1998-2003. |
| | | | | |
Paul G. O’Brien Charlotte, NC (1959) | | Senior Vice President since 2010 | | Co-President, Aquila Distributors, Inc. since 2010, Managing Director, 2009-2010; Senior Vice President of Aquila Three Peaks High Income Fund, Aquila Three Peaks Opportunity Growth Fund, and each of the Aquila Municipal Bond Funds since 2010; held various positions to Senior Vice President and Chief Administrative Officer of Evergreen Investments Services, Inc., 1997-2008; Mergers and Acquisitions Coordinator for Wachovia Corporation, 1994-1997. |
| | | | | |
Christine L. Neimeth Portland, OR (1964) | | Vice President since 1998 | | Vice President of Aquila Three Peaks Opportunity Growth Fund and Tax-Free Trust of Oregon. |
| | | | | |
Randall S. Fillmore New York, NY (1960) | | Chief Compliance Officer since 2012 | | Chief Compliance Officer of each fund in the Aquila Group of Funds, the Manager and the Distributor since 2012; Managing Director, Fillmore & Associates, 2009-2012; Fund and Adviser Chief Compliance Officer (2002-2009), Senior Vice President - Broker Dealer Compliance (2004-2009), Schwab Funds Anti Money Laundering Officer and Identity Theft Prevention Officer (2004-2009), Vice President - Internal Audit (2000-2002), Charles Schwab Corporation; National Director, Information Systems Risk Management - Consulting Services (1999-2000), National Director, Investment Management Audit and Business Advisory Services (1992-1999), Senior Manager, Manager, Senior and Staff Roles (1983-1992), PricewaterhouseCoopers LLP. |
39 | Tax-Free Trust of Oregon
| | | | | |
| | | Positions | | |
| | | Held with | | |
| Name, | | Trust and | | |
Address(2) | | Length of | | |
| and Year of Birth | | Service(3) | | Principal Occupation(s) During Past 5 Years |
| | | | | |
Joseph P. DiMaggio New York, NY (1956) | | Chief Financial Officer since 2003 and Treasurer since 2000 | | Chief Financial Officer of each fund in the Aquila Group of Funds since 2003 and Treasurer since 2000. |
| | | | | |
Yolonda S. Reynolds New York, NY (1960) | | Assistant Treasurer since 2010 | | Assistant Treasurer of each fund in the Aquila Group of Funds since 2010; Director of Fund Accounting for the Aquila Group of Funds since 2007; Investment Accountant, TIAA-CREF, 2007; Senior Fund Accountant, JP Morgan Chase, 2003-2006. |
| | | | | |
Lori A. Vindigni New York, NY (1966) | | Assistant Treasurer since 2000 | | Assistant Treasurer of each fund in the Aquila Group of Funds since 2000; Assistant Vice President of the Manager or its predecessor and current parent since 1998; Fund Accountant for the Aquila Group of Funds, 1995-1998. |
_______________
(1) The Trust’s Statement of Additional Information includes additional information about the Trustees and officers and is available, without charge, upon request by calling 800-437-1020 (toll-free) or by visiting www.aquilafunds.com or the EDGAR Database at the SEC’s internet site at www.sec.gov.
(2) The mailing address of each Trustee and officer is c/o Tax-Free Trust of Oregon, 380 Madison Avenue, Suite 2300, New York, NY 10017.
(3) Each Trustee holds office until the next annual meeting of shareholders or until his or her successor is elected and qualifies. The term of office of each officer is one year.
(4) Includes certain Aquila-sponsored funds that are dormant and have no public shareholders.
(5) Ms. Herrmann is an interested person of the Trust as an officer of the Trust, as a director, officer and shareholder of the Manager’s corporate parent, as an officer and Manager of the Manager, and as a shareholder and director of the Distributor. Ms. Herrmann is the daughter of Lacy B. Herrmann, the Founder and former Trustee, Chairman and Chairman Emeritus of the Trust.
(6) The “Aquila Group of Funds” includes: Tax-Free Trust of Arizona, Tax-Free Fund of Colorado, Hawaiian Tax-Free Trust, Churchill Tax-Free Fund of Kentucky, Tax-Free Trust of Oregon, Aquila Narragansett Tax-Free Income Fund (Rhode Island) and Tax-Free Fund For Utah, each of which is a tax-free municipal bond fund and are called the “Aquila Municipal Bond Funds”; Aquila Three Peaks Opportunity Growth Fund, which is an equity fund; and Aquila Three Peaks High Income Fund, which is a high-income corporate bond fund.
(7) A Trustee Emeritus or Emerita may attend Board meetings but has no voting power.
40 | Tax-Free Trust of Oregon
Analysis of Expenses (unaudited)
As a shareholder of the Trust, you may incur two types of costs: (1) transaction costs, including front-end sales charges with respect to Class A shares or contingent deferred sales charges (“CDSC”) with respect to Class C shares; and (2) ongoing costs, including management fees; distribution and/or service (12b-1) fees; and other Trust expenses. The table below is intended to help you understand your ongoing costs (in dollars) of investing in the Trust and to compare these costs with the ongoing costs of investing in other mutual funds.
The table below is based on an investment of $1,000 invested on October 1, 2012 and held for the six months ended March 31, 2013.
Actual Expenses
This table provides information about actual account values and actual expenses. You may use the information provided in this table, together with the amount you invested, to estimate the expenses that you paid over the period. To estimate the expenses you paid on your account, divide your ending account value by $1,000 (for example, an $8,600 ending account value divided by $1,000 = 8.6), then multiply the result by the number under the heading “Expenses Paid During the Period”.
Six months ended March 31, 2013
| | Actual | | | |
| | Total Return | Beginning | Ending | Expenses |
| | Without | Account | Account | Paid During |
| | Sales Charges(1) | Value | Value | the Period(2) |
| Class A | 0.54% | $1,000.00 | $1,005.40 | $3.55 |
| Class C | 0.11% | $1,000.00 | $1,001.10 | $7.78 |
| Class Y | 0.61% | $1,000.00 | $1,006.10 | $2.80 |
| (1) | Assumes reinvestment of all dividends and capital gain distributions, if any, at net asset value and does not reflect the deduction of the applicable sales charges with respect to Class A shares or the applicable CDSC with respect to Class C shares. Total return is not annualized, as it may not be representative of the total return for the year. |
| (2) | Expenses are equal to the annualized expense ratio of 0.71%, 1.56% and 0.56% for the Trust’s Class A, C and Y shares, respectively, multiplied by the average account value over the period, multiplied by 182/365 (to reflect the one-half year period). |
41 | Tax-Free Trust of Oregon
Analysis of Expenses (unaudited) (continued)
Hypothetical Example for Comparison Purposes
The table below provides information about hypothetical account values and hypothetical expenses based on the actual expense ratio and an assumed rate of return of 5.00% per year before expenses, which is not the Trust’s actual return. The hypothetical account values and expenses may not be used to estimate the actual ending account balance or expenses you paid for the period. You may use the information provided in this table to compare the ongoing costs of investing in the Trust and other mutual funds. To do so, compare this 5.00% hypothetical example relating to the Trust with the 5.00% hypothetical examples that appear in the shareholder reports of other mutual funds.
Please note that the expenses shown in the table below are meant to highlight your ongoing costs only and do not reflect any transactional costs, with respect to Class A shares. The example does not reflect the deduction of CDSC with respect to Class C shares. Therefore, the table is useful in comparing ongoing costs only, and will not help you determine the relative total costs of owning different mutual funds. In addition, if these transaction costs were included, your costs would have been higher.
Six months ended March 31, 2013
| | Hypothetical | | | |
| | Annualized | Beginning | Ending | Expenses |
| | Total | Account | Account | Paid During |
| | Return | Value | Value | the Period(1) |
| Class A | 5.00% | $1,000.00 | $1,021.39 | $3.58 |
| Class C | 5.00% | $1,000.00 | $1,017.15 | $7.85 |
| Class Y | 5.00% | $1,000.00 | $1,022.14 | $2.82 |
| (1) | Expenses are equal to the annualized expense ratio of 0.71%, 1.56% and 0.56% for the Trust’s Class A, C and Y shares, respectively, multiplied by the average account value over the period, multiplied by 182/365 (to reflect the one-half year period). |
42 | Tax-Free Trust of Oregon
Shareholder Meeting Results (unaudited)
The Annual Meeting of Shareholders of Tax-Free Trust of Oregon (the “Trust”) was held on April 18, 2013. The holders of shares representing 98% of the total net asset value of the shares entitled to vote were present in person or by proxy. At the meeting, the following matters were voted upon and approved by the shareholders (the resulting votes are presented below).
| Dollar Amount of Votes: |
| Trustee | For | Withheld | |
| Gary C. Cornia | $535,081,882 | $4,081,150 | |
| James A. Gardner | $535,485,696 | $3,677,336 | |
| Diana P. Herrmann | $535,754,203 | $3,408,829 | |
| Edmund P. Jensen | $535,037,053 | $4,125,979 | |
| John W. Mitchell | $533,779,723 | $5,383,309 | |
| Ralph R. Shaw | $533,463,449 | $5,699,583 | |
| Nancy Wilgenbusch | $535,526,204 | $3,636,828 | |
2. To ratify the selection of Tait, Weller & Baker LLP as the Trust’s independent registered public accounting firm.
| Dollar Amount of Votes: |
| | For | Against | Abstain |
| | $515,044,701 | $995,773 | $23,122,558 |
43 | Tax-Free Trust of Oregon
Additional Information (unaudited)
Renewal of the Advisory and Administration Agreement and the Sub-Advisory Agreement
Aquila Investment Management LLC (the “Manager”) serves as the investment adviser to the Trust pursuant to an Advisory and Administration Agreement (the “Advisory Agreement”). The Manager has retained Davidson Fixed Income Management, Inc., doing business as Kirkpatrick Pettis Capital Management, Inc. (the “Sub-Adviser”), to serve as the sub-adviser to the Trust pursuant to a Sub-Advisory Agreement between the Manager and the Sub-Adviser (the “Sub-Advisory Agreement”). In order for the Manager and the Sub-Adviser to continue to serve in their respective roles, the Trustees of the Trust must determine annually whether to renew the Advisory Agreement and the Sub-Advisory Agreement for the Trust.
Contract review materials were provided to the Trustees in February 2013. The independent Trustees met telephonically in February, 2013 and in person in March, 2013 to review and discuss the contract review materials. In addition, the Trustees took into account the information related to the Trust provided to the Trustees at each regularly scheduled meeting. The Trustees considered the Advisory Agreement and the Sub-Advisory Agreement separately as well as in conjunction with each other to determine their combined effects on the Trust.
At a meeting held in March, 2013, based on their evaluation of the information provided by the Manager and the Sub-Adviser, the Trustees of the Trust, including the independent Trustees voting separately, unanimously approved the renewal of each of the Advisory Agreement and the Sub-Advisory Agreement until March 31, 2014. In considering the renewal of the Advisory Agreement and the Sub-Advisory Agreement, the Trustees considered various factors that they determined were relevant, including the factors described below. The Trustees did not identify any single factor as the controlling factor in determining to approve the renewal of the Advisory Agreement or the Sub-Advisory Agreement.
The nature, extent, and quality of the services provided by the Manager and the Sub-Adviser.
The Trustees considered the nature, extent and quality of the services that had been provided by the Manager and the Sub-Adviser to the Trust, taking into account the investment objectives and strategies of the Trust. The Trustees reviewed the terms of the Advisory Agreement and the Sub-Advisory Agreement.
The Manager has retained the Sub-Adviser to provide investment management of the Trust’s portfolio. The Trustees reviewed the Sub-Adviser’s investment approach for the Trust. The Trustees considered the personnel of the Sub-Adviser who provide investment management services to the Trust. The Trustees noted the extensive experience of the Sub-Adviser’s portfolio manager, Mr. Christopher Johns. The Sub-Adviser has provided local information regarding specific holdings in the Trust’s portfolio, a particular advantage as to holdings with less than the highest ratings from the rating agencies. The Trustees noted that compared to other Oregon state-specific municipal bond-funds, the portfolio of the Trust was of higher quality and contained no securities subject to the alternative minimum tax.
The Trustees considered that the Manager and the Sub-Adviser had provided all administrative and advisory services to the Trust that the Trustees deemed necessary or appropriate, including the specific services that the Trustees have determined are required for the Trust, given that it seeks to provide shareholders with as high a level of current income exempt from Oregon state and regular Federal income taxes as is consistent with preservation of capital.
44 | Tax-Free Trust of Oregon
The Manager has additionally provided all administrative services to the Trust and provided the Trust with personnel (including Trust officers) and other resources that are necessary for the Trust’s business management and operations. The Trustees considered the nature and extent of the Manager’s supervision of third-party service providers, including the Trust’s shareholder servicing agent and custodian.
Based on these considerations, the Trustees concluded that the nature, extent and quality of services that had been provided by the Manager and the Sub-Adviser to the Trust were satisfactory and consistent with the terms of the Advisory Agreement and Sub-Advisory Agreement, as applicable.
The investment performance of the Trust and the Manager and the Sub-Adviser.
The Trustees reviewed each aspect of the Trust’s performance and compared its performance with that of its local competitors (as identified by the Manager), its peer and its benchmark index, the Barclays Capital Quality Intermediate Municipal Bond Index.
It was noted that the materials provided by the Manager indicated that the Trust had investment performance measured by average annual total returns that outperformed its benchmark index for the 1 and 3 year periods ended December 31, 2012 but that generally lagged the investment performance of its local competitors and peer group. The Trustees discussed the Trust’s performance record with the Manager and the Sub-Adviser and considered the Manager’s and Sub-Adviser’s view that the Trust’s performance, as compared to its local competitors and peer group, was explained in part by the Trust’s generally higher-quality portfolio and its current intermediate maturity structure, which limits price appreciation and depreciation as compared to funds with longer maturity structures. The Trustees noted that the Trust had average annual total returns for the 1, 3, 5 and 10 year periods ended December 31, 2012 that exceeded the investment performance of the Morningstar single-state intermediate tax-free municipal bond peer group. They also considered that, unlike the Trust’s returns, the performance of the benchmark index did not reflect any fees or expenses. The Trustees considered these results to be consistent with the investment objectives of the Trust.
The Trustees concluded that the performance of the Trust was acceptable in light of market conditions, the length of its average maturities, its portfolio quality, its investment objectives and the long-standing efforts of the Sub-Adviser to minimizing risk, observing that the Trust’s Sharpe and Treynor ratios, which measure risk-adjusted return, were generally more favorable than those of the Trust’s local competitors. Evaluation of this factor indicated to the Trustees that renewal of the Advisory Agreement would be appropriate.
The costs of the services to be provided and profits to be realized by the Manager and the Sub-Adviser and their affiliates from their relationship with the Trust.
The information provided by the Manager in connection with renewal contained advisory fee and expense data for the Trust and its peer group. The Trustees considered that the Manager, not the Trust, paid the Sub-Adviser pursuant to the Sub-Advisory Agreement. The Trustees evaluated both the fee under the Sub-Advisory Agreement and the portion of the fee under the Advisory Agreement retained by the Manager. The materials also showed the profitability to the Manager and the Sub-Adviser of their services to the Trust, as well as the profitability to Aquila Distributors, Inc. (the “Distributor”) of distribution services provided to the Trust.
45 | Tax-Free Trust of Oregon
The Trustees compared the advisory fee and expense data with respect to the Trust to similar data about other funds that they found to be relevant. The Trustees concluded that the advisory fee and expenses of the Trust were similar to and were reasonable as compared to those advisory fees and expenses being paid by the Trust’s peer group and that the advisory and sub-advisory fees were reasonable in relation to the nature and quality of the services provided to the Trust by the Manager and the Sub-Adviser.
The Trustees considered information provided by the Manager regarding the profitability of the Manager with respect to the services provided by the Manager to the Trust, including the methodology used by the Manager in allocating certain of its costs to the services provided to the Trust. The Trustees noted that the Distributor did not derive profits from its relationship with the Trust. The Trustees had retained an independent consultant to provide data on profitability. The Trustees considered that, based on the data provided by the independent consultant, the returns to the Manager were below the range and average identified by the consultant but were suitable for ongoing financial viability. The Trustees concluded that profitability to the Manager with respect to advisory services provided to the Trust was not unreasonable in light of the nature, extent and quality of the services provided to the Fund by the Manager.
The Trustees also considered information provided by the Sub-Adviser regarding the profitability of the Sub-Adviser with respect to the sub-advisory services provided by the Sub-Adviser to the Trust. They considered that, based on the data provided by the independent consultant, the returns to the Sub-Adviser were within the range and below the average identified by the consultant, but were suitable for ongoing financial viability. The Trustees concluded that the profitability of the Sub-Adviser with respect to sub-advisory services provided to the Trust was not unreasonable in light of the nature, extent and quality of the services provided to the Fund by the Sub-Adviser.
The extent to which economies of scale would be realized as the Trust grows.
The Trust has in place breakpoints in the sub-advisory fee which would be realized as the Trust grows. Under the Sub-Advisory Agreement the Manager will compensate the Sub-Adviser at the annual rate of 0.18% on the Trust’s net assets up to $400 million; 0.16% on assets above that amount to $1 billion in net assets and 0.14% on net assets thereafter. In addition, the Manager has contractually agreed to waive fees to the extent necessary so that the annual rate payable under the Advisory Agreement shall be equivalent to 0.40% on the Trust’s net assets up to $400 million; 0.38% on assets above that amount to $1 billion in net assets and 0.36% on net assets thereafter. Evaluation of this factor indicated to the Trustees that the Advisory Agreement and Sub-Advisory Agreement should be renewed without any changes at this time.
Benefits derived or to be derived by the Manager and the Sub-Adviser and their affiliates from their relationships with the Trust.
The Trustees observed that, as is generally true of most fund complexes, the Manager and Sub-Adviser and their affiliates, by providing services to a number of funds or other investment clients including the Trust, were able to spread costs as they would otherwise be unable to do. The Trustees noted that while that could produce efficiencies and increased profitability for the Manager and Sub-Adviser and their affiliates, it also makes their services available to the Trust at favorable levels of quality and cost which are more advantageous to the Trust than would otherwise have been possible.
46 | Tax-Free Trust of Oregon
Information Available (unaudited)
Much of the information that the funds in the Aquila Group of Funds produce is automatically sent to you and all other shareholders. Specifically, you are routinely sent your Trust’s entire list of portfolio securities twice a year in the semi-annual and annual reports you receive. Additionally, under Trust policies, the Manager publicly discloses the complete schedule of the Trust’s portfolio holdings, as of each calendar quarter, generally by the 15th day after the end of each calendar quarter. Such information remains accessible until the next schedule is made publicly available. You may obtain a copy of the Trust’s portfolio holdings schedule for the most recently completed period by visiting the Trust’s website at www.aquilafunds.com. The Trust may also disclose other portfolio holdings as of a specified date (currently the Trust discloses its five largest holdings and/or sector holdings by value as of the close of the last business day of each calendar month in a posting to its website on approximately the 5th business day following the month end). This information remains on the website until the next such posting. Whenever you wish to see a listing of your Trust’s portfolio other than in your shareholder reports, please check our website at www. aquilafunds.com or call us at 1-800-437-1020.
The Trust additionally files a complete list of its portfolio holdings with the SEC for the first and third quarter ends of each fiscal year on Form N-Q. Forms N-Q are available free of charge on the SEC website at www.sec.gov. You may also review or, for a fee, copy the forms at the SEC’s Public Reference Room in Washington, D.C. or by calling 1-800-SEC-0330.
Proxy Voting Record (unaudited)
During the 12 month period ended June 30, 2012, the Trust did not hold any portfolio securities for which the Trust was entitled to participate in proxy voting. Applicable regulations require us to inform you that the Trust’s proxy voting information is available on the SEC website at www.sec.gov.
Federal Tax Status of Distributions (unaudited)
This information is presented in order to comply with a requirement of the Internal Revenue Code. No action on the part of shareholders is required.
For the fiscal year ended March 31, 2013, $8,309,029 of dividends paid by Tax-Free Trust of Oregon, constituting 79.12% of total dividends paid during fiscal 2013, were exempt-interest dividends; $2,193,196 of dividends paid by the Trust, constituting 20.88% of total dividends paid during the fiscal year, were capital gain distributions.
Prior to February 15, 2013, shareholders were mailed the appropriate tax form(s) which contained information on the status of distributions paid for the 2012 calendar year.
47 | Tax-Free Trust of Oregon
PRIVACY NOTICE (unaudited)
Tax-Free Trust of Oregon
Our Privacy Policy. In providing services to you as an individual who owns or is considering investing in shares of the Trust, we collect certain non-public personal information about you. Our policy is to keep this information strictly safeguarded and confidential, and to use or disclose it only as necessary to provide services to you or as otherwise permitted by law. Our privacy policy applies equally to former shareholders and persons who inquire about the Trust.
Information We Collect. ”Non-public personal information” is personally identifiable financial information about you as an individual or your family. The kinds of non-public personal information we have about you may include the information you provide us on your share purchase application or in telephone calls or correspondence with us, and information about your fund transactions and holdings, how you voted your shares and the account where your shares are held.
Information We Disclose. We disclose non-public personal information about you to companies that provide necessary services to us, such as the Trust’s transfer agent, distributor, investment adviser or sub-adviser, if any, as permitted or required by law, or as authorized by you. Any other use is strictly prohibited. We do not sell information about you or any of our fund shareholders to anyone.
Non-California Residents: We also may disclose some of this information to another fund in the Aquila Group of Funds (or its service providers) under joint marketing agreements that permit the funds to use the information only to provide you with information about other funds in the Aquila Group of Funds or new services we are offering that may be of interest to you.
California Residents Only: In addition, unless you “opt-out” of the following disclosures using the form that was mailed to you under separate cover, we may disclose some of this information to another fund in the Aquila Group of Funds (or its service providers) under joint marketing agreements that permit the funds to use the information only to provide you with information about other funds in the Aquila Group of Funds or new services we are offering that may be of interest to you.
How We Safeguard Your Information. We restrict access to non-public personal information about you to only those persons who need it to provide services to you or who are permitted by law to receive it. We maintain physical, electronic and procedural safeguards to protect the confidentiality of all non-public personal information we have about you.
If you have any questions regarding our Privacy Policy, please contact us at 1-800-437-1020.
Aquila Investment Management LLC
Aquila Distributors, Inc.
This Privacy Policy also has been adopted by Aquila Investment Management LLC and Aquila Distributors, Inc. and applies to all non-public information about you that each of these companies may obtain in connection with services provided to the Trust or to you as a shareholder of the Trust.
48 | Tax-Free Trust of Oregon