downgrade demonstrates the resiliency of the municipal bond asset class. Furthermore, the effect on Oregon municipal bonds has been minor; the primary result being increased scrutiny of credits relying upon Federal appropriations. Nevertheless, the downgrade of our Nation’s credit rating reinforces the value of deep credit research and a disciplined approach to portfolio management.
its ability to cover pension obligations. The State Treasurer’s office has estimated savings from the upgrade at $4.3 million per $100 million over the life of a bond issue. Additionally, Moody’s and Fitch have reaffirmed the State’s stable Aa1 and AA+ ratings.
on the ballot do not pass - of the 17 bond measures presented on May ballots in Oregon, only 8 passed. Furthermore, on the May ballot, there were 13 school districts with general obligation bond measures, a sharp contrast to the upcoming November ballot with only 2 school districts submitting ballot measures for general obligation bond measures. Given the shortage of money issues on the November ballot, it is likely that low supply of new issues from 2011 will carry into 2012.
Thank you for your investment and continued confidence in Tax-Free Trust of Oregon.
Performance data represents past performance, but does not guarantee future results. Investment return and principal value will fluctuate; shares, when redeemed, may be worth more or less than their original cost; current performance may be lower or higher than the data presented.
PERFORMANCE REPORT
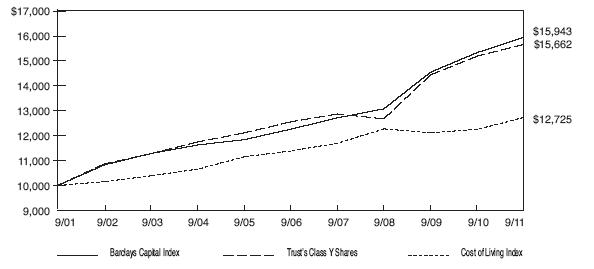
The following graph illustrates the value of $10,000 invested in the Class Y shares of Tax-Free Trust of Oregon for the 10-year period ended September 30, 2011 as compared with the Barclays Capital Quality Intermediate Municipal Bond Index (the “Barclays Capital Index”) and the Consumer Price Index (a cost of living index). The performance of each of the other classes is not shown in the graph but is included in the table below. In prior “Performance Reports”, Class A shares performance was graphed. The chart below now shows Class Y shares which is consistent with the bar chart disclosure in the Trust’s prospectus. It should be noted that the Barclays Capital Index does not include any operating expenses nor sales charges, and being nationally oriented, does not reflect state specific bond market performance.
| | | Average Annual Total Return | |
| | | for periods ended September 30, 2011 | |
| | | | | | | | | | | | Since | |
| Class and Inception Date | | 1 Year | | | 5 Years | | | 10 Years | | | Inception | |
| Class A (commenced operations on 6/16/86) | | | | | | | | | | | | |
| With Maximum Sales Charge | | | (1.11 | )% | | | 3.54 | % | | | 4.01 | % | | | 5.60 | % |
| Without Sales Charge | | | 3.05 | | | | 4.39 | | | | 4.44 | | | | 5.77 | |
| | | | | | | | | | | | | | | | | |
| Class C (commenced operations on 4/5/96) | | | | | | | | | | | | | | | | |
| With CDSC | | | 1.16 | | | | 3.49 | | | | 3.56 | | | | 4.02 | |
| Without CDSC | | | 2.18 | | | | 3.49 | | | | 3.56 | | | | 4.02 | |
| | | | | | | | | | | | | | | | | |
| Class Y (commenced operations on 4/5/96) | | | | | | | | | | | | | | | | |
| No Sales Charge | | | 3.11 | | | | 4.53 | | | | 4.59 | | | | 5.07 | |
| | | | | | | | | | | | | | | | | |
| Barclays Capital Index | | | 3.98 | | | | 5.40 | | | | 4.77 | | | 5.88 | *(Class A) |
| | | | | | | | | | | | | | | 5.20 | (Class C & Y) |
Total return figures shown for the Trust reflect any change in price and assume all distributions within the period were invested in additional shares. Returns for Class A shares are calculated with and without the effect of the initial 4% maximum sales charge. Returns for Class C shares are calculated with and without the effect of the 1% contingent deferred sales charge (CDSC) imposed on redemptions made within the first 12 months after purchase. Class Y shares are sold without any sales charge. The rates of return will vary and the principal value of an investment will fluctuate with market conditions. Shares, if redeemed, may be worth more or less than their original cost. A portion of each class’s income may be subject to Federal and state income taxes. Past performance is not predictive of future investment results.
* From commencement of the index on 1/1/87.
REPORT OF INDEPENDENT REGISTERED PUBLIC ACCOUNTING FIRM
To the Board of Trustees and Shareholders of
Tax-Free Trust of Oregon:
We have audited the accompanying statement of assets and liabilities, including the schedule of investments, of Tax-Free Trust of Oregon as of September 30, 2011 and the related statement of operations for the year then ended, the statements of changes in net assets for each of the two years in the period then ended, and the financial highlights for each of the five years in the period then ended. These financial statements and financial highlights are the responsibility of the Trust’s management. Our responsibility is to express an opinion on these financial statements and financial highlights based on our audits.
We conducted our audits in accordance with the standards of the Public Company Accounting Oversight Board (United States). Those standards require that we plan and perform the audit to obtain reasonable assurance about whether the financial statements and financial highlights are free of material misstatement. The Trust is not required to have, nor were we engaged to perform, an audit of the Trust’s internal control over financial reporting. Our audits included consideration of internal control over financial reporting as a basis for designing audit procedures that are appropriate in the circumstances, but not for the purpose of expressing an opinion on the effectiveness of the Trust’s internal control over financial reporting. Accordingly, we express no such opinion. An audit also includes examining, on a test basis, evidence supporting the amounts and disclosures in the financial statements. Our procedures included confirmation of securities owned as of September 30, 2011, by correspondence with the custodian and brokers or by other appropriate auditing procedures where replies from brokers were not received. An audit also includes assessing the accounting principles used and significant estimates made by management, as well as evaluating the overall financial statement presentation. We believe that our audits provide a reasonable basis for our opinion.
In our opinion, the financial statements and financial highlights referred to above present fairly, in all material respects, the financial position of Tax-Free Trust of Oregon as of September 30, 2011, the results of its operations for the year then ended, the changes in its net assets for each of the two years in the period then ended, and the financial highlights for each of the five years in the period then ended, in conformity with accounting principles generally accepted in the United States of America.
TAIT, WELLER & BAKER LLP
Philadelphia, Pennsylvania
November 28, 2011
| TAX-FREE TRUST OF OREGON |
| SCHEDULE OF INVESTMENTS |
| SEPTEMBER 30, 2011 |
| | | | | Rating | | | |
| | | | | Moody’s, S&P | | | |
| Principal | | | | and Fitch | | | |
| Amount | | State of Oregon General Obligation Bonds (49.3%) | | (unaudited) | | Value | |
| | | City & County (5.3%) | | | | | |
| | | Canby, Oregon | | | | | |
| $ | 1,060,000 | | 5.000%, 06/01/27 | | A2/NR/NR | | $ | 1,158,368 | |
| | | | Clackamas County, Oregon Tax Allocation | | | | | | |
| | 705,000 | | 6.500%, 05/01/20 | | NR/NR/NR* | | | 705,352 | |
| | | | Deschutes County, Oregon (Assured Guaranty | | | | | | |
| | | | Municipal Corp. Insured) | | | | | | |
| | 2,260,000 | | 5.000%, 12/01/16 | | Aa2/NR/NR | | | 2,365,452 | |
| | | | Gresham, Oregon (Assured Guaranty Municipal | | | | | | |
| | | | Corp. Insured) | | | | | | |
| | 1,155,000 | | 5.375%, 06/01/18 | | Aa3/NR/NR | | | 1,185,758 | |
| | | | Hillsboro, Oregon Series B | | | | | | |
| | 380,000 | | 3.500%, 06/01/15 | | Aa3/NR/NR | | | 412,585 | |
| | 390,000 | | 3.500%, 06/01/16 | | Aa3/NR/NR | | | 426,231 | |
| | 345,000 | | 3.500%, 06/01/17 | | Aa3/NR/NR | | | 375,429 | |
| | | | Independence, Oregon City Hall Project (Assured | | | | | | |
| | | | Guaranty Municipal Corp. Insured) | | | | | | |
| | 2,435,000 | | 5.00%, 06/15/30 | | NR/AA+/NR | | | 2,697,006 | |
| | | | Portland, Oregon | | | | | | |
| | 7,170,000 | | 4.350%, 06/01/23 | | Aa1/NR/NR | | | 7,381,228 | |
| | | | Portland, Oregon Public Safety, Series A | | | | | | |
| | 2,130,000 | | 4.125%, 06/01/26 | | Aaa/NR/NR | | | 2,292,753 | |
| | | | City of Salem, Oregon | | | | | | |
| | 1,585,000 | | 4.000%, 06/01/17 | | Aa2/AA-/NR | | | 1,803,682 | |
| | 1,750,000 | | 5.000%, 06/01/29 | | Aa2/AA-/NR | | | 1,932,298 | |
| | | | Washington County, Oregon | | | | | | |
| | 2,465,000 | | 5.000%, 06/01/23 | | Aa1/NR/NR | | | 2,779,238 | |
| | | | Total City & County | | | | | 25,515,380 | |
| | |
| | | | Community College (5.6%) | | | | | | |
| | | | Central Oregon Community College District (School | | | | | | |
| | | | Bond Guaranty Program) | | | | | | |
| | 1,850,000 | | 4.750%, 06/15/22 | | NR/AA+/NR | | | 2,174,990 | |
| | 2,195,000 | | 4.750%, 06/15/23 | | NR/AA+/NR | | | 2,548,922 | |
| | 2,175,000 | | 4.750%, 06/15/26 | | NR/AA+/NR | | | 2,451,877 | |
| | | | Chemeketa, Oregon Community College District | | | | | | |
| | | | (Financial Guaranty Insurance Corp. Insured) | | | | | | |
| | 1,385,000 | | 5.500%, 06/01/14 Escrowed to Maturity | | NR/NR/NR* | | | 1,550,231 | |
| TAX-FREE TRUST OF OREGON |
SCHEDULE OF INVESTMENTS (continued) |
| SEPTEMBER 30, 2011 |
| | | | | Rating | | | |
| | | | | Moody’s, S&P | | | |
| Principal | | | | and Fitch | | | |
| Amount | | State of Oregon General Obligation Bonds (continued) | | (unaudited) | | Value | |
| | | Community College (continued) | | | | | |
| | | Chemeketa, Oregon Community College District | | | | | |
| | | (School Bond Guaranty Program) | | | | | |
| $ | 1,010,000 | | 5.500%, 06/15/24 | | NR/AA+/NR | | $ | 1,181,417 | |
| | 1,235,000 | | 5.000%, 06/15/25 | | NR/AA+/NR | | | 1,389,326 | |
| | 1,540,000 | | 5.000%, 06/15/26 | | NR/AA+/NR | | | 1,720,534 | |
| | | | Clackamas, Oregon Community College District | | | | | | |
| | | | (National Public Finance Guarantee Insured) | | | | | | |
| | 1,535,000 | | 5.000%, 05/01/25 | | Aa3/AA/NR | | | 1,661,806 | |
| | | | Oregon Coast Community College District (National | | | | | | |
| | | | Public Finance Guarantee Insured) (State School | | | | | | |
| | | | Bond Guaranty Program) | | | | | | |
| | 1,590,000 | | 5.250%, 06/15/17 | | Aa1/NR/NR | | | 1,764,232 | |
| | | | Portland, Oregon Community College District | | | | | | |
| | 1,195,000 | | 3.000%, 06/15/12 | | Aa1/AA/NR | | | 1,215,088 | |
| | 7,915,000 | | 5.000%, 06/15/28 | | Aa1/AA/NR | | | 9,124,333 | |
| | | | Total Community College | | | | | 26,782,756 | |
| | |
| | | | Higher Education (1.7%) | | | | | | |
| | | | State of Oregon Board of Higher Education | | | | | | |
| | 820,000 | | zero coupon, 08/01/16 | | Aa1/AA+/AA+ | | | 747,815 | |
| | 2,000,000 | | 5.000%, 08/01/21 | | Aa1/AA+/AA+ | | | 2,201,060 | |
| | 500,000 | | 5.750%, 08/01/29 Series A | | Aa1/AA+/AA+ | | | 576,900 | |
| | 1,000,000 | | 5.000%, 08/01/34 | | Aa1/AA+/AA+ | | | 1,080,200 | |
| | 1,000,000 | | 5.000%, 08/01/38 | | Aa1/AA+/AA+ | | | 1,080,200 | |
| | | | Oregon State, Oregon University System Project, | | | | | | |
| | | | Series H | | | | | | |
| | 2,365,000 | | 4.000%, 08/01/26 | | Aa1/AA+/AA+ | | | 2,510,991 | |
| | | | Total Higher Education | | | | | 8,197,166 | |
| | |
| | | | Housing (0.2%) | | | | | | |
| | | | State of Oregon Veterans’ Welfare | | | | | | |
| | 550,000 | | 4.800%, 12/01/22 | | Aa1/AA+/AA+ | | | 583,765 | |
| | 400,000 | | 4.900%, 12/01/26 | | Aa1/AA+/AA+ | | | 418,248 | |
| | | | Total Housing | | | | | 1,002,013 | |
| | |
| | | | School District (26.3%) | | | | | | |
| | | | Benton and Linn Counties, Oregon School District | | | | | | |
| | | | #509J (Assured Guaranty Municipal Corp. Insured) | | | | | | |
| | 4,670,000 | | 5.000%, 06/01/21 pre-refunded | | Aa1/NR/NR | | | 5,025,714 | |
| TAX-FREE TRUST OF OREGON |
SCHEDULE OF INVESTMENTS (continued) |
| SEPTEMBER 30, 2011 |
| | | | | Rating | | | |
| | | | | Moody’s, S&P | | | |
| Principal | | | | and Fitch | | | |
| Amount | | State of Oregon General Obligation Bonds (continued) | | (unaudited) | | Value | |
| | | School District (continued) | | | | | |
| | | Clackamas County, Oregon School District #12 (North | | | | | |
| | | Clackamas) Convertible Capital Appreciation Bonds | | | | | |
| | | (Assured Guaranty Municipal Corp. Insured) (School | | | | | |
| | | Bond Guaranty Program) | | | | | |
| $ | 8,000,000 | | 5.000%, 06/15/27 Series B | | Aa1/AA+/NR | | $ | 8,696,080 | |
| | 9,250,000 | | 5.000%, 06/15/29 | | Aa1/AA+/NR | | | 9,955,312 | |
| | | | Clackamas County, Oregon School District #46 | | | | | | |
| | | | (Oregon Trail) (School Bond Guaranty Program) | | | | | | |
| | 1,000,000 | | 5.000%, 06/15/22 | | NR/AA+/NR | | | 1,177,030 | |
| | 1,865,000 | | 5.000%, 06/15/28 Series A | | NR/AA+/NR | | | 2,080,146 | |
| | 1,800,000 | | 5.000%, 06/15/29 Series A | | NR/AA+/NR | | | 1,990,890 | |
| | 2,000,000 | | 4.500%, 06/15/30 | | Aa1/AA+/NR | | | 2,076,180 | |
| | 2,000,000 | | 5.000%, 06/15/32 Series A | | NR/AA+/NR | | | 2,165,640 | |
| | 3,780,000 | | 4.750%, 06/15/32 Series A | | NR/AA+/NR | | | 4,012,243 | |
| | | | Clackamas County, Oregon School District #86 | | | | | | |
| | | | (Canby) (Assured Guaranty Municipal Corp. | | | | | | |
| | | | Insured) | | | | | | |
| | 2,240,000 | | 5.000%, 06/15/19 | | Aa1/AA+/NR | | | 2,484,026 | |
| | | | Clackamas County, Oregon School District #115 | | | | | | |
| | | | (Gladstone) (National Public Finance Guarantee | | | | | | |
| | | | Insured) (State School Bond Guaranty Program) | | | | | | |
| | 5,000,000 | | zero coupon, 06/15/27 | | Baa1/AA+/NR | | | 2,476,500 | |
| | | | Clackamas & Washington Counties, Oregon School | | | | | | |
| | | | District No. 003 (West Linn-Wilsonville) (School | | | | | | |
| | | | Bond Guaranty Program) | | | | | | |
| | 1,110,000 | | 5.000%, 06/15/26 | | Aa1/AA+/NR | | | 1,247,684 | |
| | 500,000 | | 5.000%, 06/15/34 | | Aa1/AA+/NR | | | 538,985 | |
| | | | Clackamas & Washington Counties, Oregon School | | | | | | |
| | | | District #3J (West Linn - Wilsonville) (State School | | | | | | |
| | | | Bond Guaranty Program) | | | | | | |
| | 2,850,000 | | 5.000%, 06/15/27 | | Aa1/AA+/NR | | | 3,180,828 | |
| | 2,000,000 | | 4.500%, 06/15/29 | | Aa1/AA+/NR | | | 2,135,180 | |
| | 1,965,000 | | 5.000%, 06/15/30 | | Aa1/AA+/NR | | | 2,149,730 | |
| | 3,000,000 | | 5.000%, 06/15/33 | | Aa1/AA+/NR | | | 3,240,150 | |
| TAX-FREE TRUST OF OREGON |
SCHEDULE OF INVESTMENTS (continued) |
| SEPTEMBER 30, 2011 |
| | | | | Rating | | | |
| | | | | Moody’s, S&P | | | |
| Principal | | | | and Fitch | | | |
| Amount | | State of Oregon General Obligation Bonds (continued) | | (unaudited) | | Value | |
| | | School District (continued) | | | | | |
| | | Columbia County, Oregon School District #502 | | | | | |
| | | (National Public Finance Guarantee Financial | | | | | |
| | | Guaranty Insurance Corp. Insured) | | | | | |
| $ | 2,070,000 | | zero coupon, 06/01/15 | | Aa3/BBB/NR | | $ | 1,921,974 | |
| | | | Columbia & Washington Counties, Oregon School | | | | | | |
| | | | District #47J (Vernonia) (State School Bond | | | | | | |
| | | | Guaranty Program) | | | | | | |
| | 3,430,000 | | 5.00%, 06/15/27 | | NR/AA+/NR | | | 3,906,393 | |
| | | | Deschutes County, Oregon Administrative School | | | | | | |
| | | | District #1 Refunding (Assured Guaranty | | | | | | |
| | | | Municipal Corp. Insured) | | | | | | |
| | 400,000 | | 5.000%, 06/15/13 | | Aa1/NR/NR | | | 430,756 | |
| | | | Deschutes County, Oregon School District #6 (Sisters) | | | | | | |
| | | | (Assured Guaranty Municipal Corp. Insured) | | | | | | |
| | 1,735,000 | | 5.250%, 06/15/19 | | Aa3/AA+/NR | | | 2,103,531 | |
| | 1,030,000 | | 5.250%, 06/15/21 | | Aa3/AA+/NR | | | 1,260,545 | |
| | | | Deschutes and Jefferson Counties, Oregon School | | | | | | |
| | | | District #02J (Redmond) (National Public Finance | | | | | | |
| | | | Guarantee- Financial Guaranty Insurance Corp. | | | | | | |
| | | | Insured) | | | | | | |
| | 1,000,000 | | 5.000%, 06/15/21 | | Aa1/NR/NR | | | 1,094,010 | |
| | | | Deschutes and Jefferson Counties, Oregon School | | | | | | |
| | | | District #02J (Redmond) (School Bond Guaranty | | | | | | |
| | | | Program) | | | | | | |
| | 1,025,000 | | zero coupon, 06/15/23 | | Aa1/NR/NR | | | 659,987 | |
| | | | Deschutes and Jefferson Counties, Oregon School | | | | | | |
| | | | District #02J (Redmond) (School Bond Guaranty | | | | | | |
| | | | Program) (continued) | | | | | | |
| | 2,275,000 | | zero coupon, 06/15/29 | | Aa1/NR/NR | | | 1,040,540 | |
| | 5,000,000 | | 6.000%, 06/15/31 | | Aa1/NR/NR | | | 5,811,200 | |
| | | | Hood River County, Oregon School District Refunding | | | | | | |
| | | | (School Bond Guaranty Program) | | | | | | |
| | 365,000 | | 3.000%, 06/15/14 | | NR/AA+/NR | | | 386,057 | |
| | 385,000 | | 3.000%, 06/15/15 | | NR/AA+/NR | | | 413,001 | |
| | 250,000 | | 4.000%, 06/15/16 | | NR/AA+/NR | | | 280,032 | |
| TAX-FREE TRUST OF OREGON |
SCHEDULE OF INVESTMENTS (continued) |
| SEPTEMBER 30, 2011 |
| | | | | Rating | | | |
| | | | | Moody’s, S&P | | | |
| Principal | | | | and Fitch | | | |
| Amount | | State of Oregon General Obligation Bonds (continued) | | (unaudited) | | Value | |
| | | School District (continued) | | | | | |
| | | Jackson County, Oregon School District #9 (Eagle | | | | | |
| | | Point) (National Public Finance Guarantee Insured) | | | | | |
| $ | 2,080,000 | | 5.500%, 06/15/15 | | Aa1/NR/NR | | $ | 2,383,534 | |
| | 1,445,000 | | 5.500%, 06/15/16 | | Aa1/NR/NR | | | 1,701,719 | |
| | | | Jackson County, Oregon School District #549 | | | | | | |
| | | | (Medford) (State School Bond Guaranty Program) | | | | | | |
| | 1,750,000 | | 5.000%, 06/15/12 | | Aa1/NR/NR | | | 1,805,877 | |
| | | | Jackson County, Oregon School District #549C | | | | | | |
| | | | (Medford) (Assured Guaranty Municipal Corp. | | | | | | |
| | | | Insured) | | | | | | |
| | 2,000,000 | | 4.750%, 12/15/29 | | Aa1/AA+/NR | | | 2,120,880 | |
| | 3,000,000 | | 5.000%, 12/15/32 | | Aa1/AA+/NR | | | 3,201,990 | |
| | | | Jackson County, Oregon School District #549C | | | | | | |
| | | | (Medford) (School Board Guaranty Program) | | | | | | |
| | 1,000,000 | | 4.625%, 06/15/27 | | Aa1/AA+/NR | | | 1,070,270 | |
| | 1,000,000 | | 5.000%, 06/15/33 | | Aa1/AA+/NR | | | 1,073,960 | |
| | | | Jefferson County, Oregon School District #509J | | | | | | |
| | | | (National Public Finance Guarantee Insured) | | | | | | |
| | | | (State School Bond Guaranty Program) | | | | | | |
| | 1,215,000 | | 5.250%, 06/15/14 | | NR/AA+/NR | | | 1,255,302 | |
| | 1,025,000 | | 5.250%, 06/15/17 | | NR/AA+/NR | | | 1,059,214 | |
| | | | Lane County, Oregon School District #4J (Eugene) | | | | | | |
| | | | Refunding (School Bond Guaranty Program) | | | | | | |
| | 1,000,000 | | 5.000%, 07/01/15 | | Aa1/NR/NR | | | 1,150,800 | |
| | | | Lane County, Oregon School District #19 (Springfield) | | | | | | |
| | | | (Assured Guaranty Municipal Corp. Insured) | | | | | | |
| | 3,425,000 | | zero coupon, 06/15/29 | | Aa1/NR/NR | | | 1,505,424 | |
| | | | Lincoln County, Oregon School District, Series A | | | | | | |
| | | | (School Bond Guaranty Program) | | | | | | |
| | 2,370,000 | | 4.000%, 06/15/24 | | Aa1/NR/NR | | | 2,537,085 | |
| | | | Linn County, Oregon School District #9 (Lebanon) | | | | | | |
| | | | (Financial Guaranty Insurance Corp. Insured) (State | | | | | | |
| | | | School Bond Guaranty Program) | | | | | | |
| | 3,000,000 | | 5.600%, 06/15/30 pre-refunded | | NR/AA+/NR | | | 3,264,240 | |
| TAX-FREE TRUST OF OREGON |
SCHEDULE OF INVESTMENTS (continued) |
| SEPTEMBER 30, 2011 |
| | | | | Rating | | | |
| | | | | Moody’s, S&P | | | |
| Principal | | | | and Fitch | | | |
| Amount | | State of Oregon General Obligation Bonds (continued) | | (unaudited) | | Value | |
| | | School District (continued) | | | | | |
| | | Morrow County, Oregon School District #1 (Assured | | | | | |
| | | Guaranty Municipal Corp. Insured) | | | | | |
| $ | 1,710,000 | | 5.250%, 06/15/19 | | Aa3/AA+/NR | | $ | 2,073,221 | |
| | | | Multnomah County, Oregon School District #7 | | | | | | |
| | | | (Reynolds) Refunding | | | | | | |
| | 1,165,000 | | 5.000%, 06/01/29 | | Aa3/NR/NR | | | 1,317,697 | |
| | | | Multnomah and Clackamas Counties, Oregon School | | | | | | |
| | | | District #10 (Gresham-Barlow) (Assured Guaranty | | | | | | |
| | | | Municipal Corp. Insured) | | | | | | |
| | 4,275,000 | | 5.250%, 06/15/19 | | Aa1/AA+/NR | | | 5,281,762 | |
| | | | Multnomah and Clackamas Counties, Oregon School | | | | | | |
| | | | District #28JT (Centennial) (Assured Guaranty | | | | | | |
| | | | Municipal Corp. Insured) | | | | | | |
| | 2,680,000 | | 5.250%, 12/15/18 | | Aa1/NR/NR | | | 3,242,880 | |
| | | | Polk, Marion & Benton Counties, Oregon School | | | | | | |
| | | | District #13J (Central) (Assured Guaranty | | | | | | |
| | | | Municipal Corp. Insured) | | | | | | |
| | 1,520,000 | | 5.000%, 06/15/21 | | Aa3/AA+/NR | | | 1,710,167 | |
| | | | Polk Marion & Benton Counties, Oregon School | | | | | | |
| | | | District No. 13J (Central) Series B (State School | | | | | | |
| | | | Bond Guaranty Program) | | | | | | |
| | 5,650,000 | | zero coupon, 06/15/32 | | NR/AA+/NR | | | 2,263,221 | |
| | | | Salem-Keizer, Oregon School District #24J (Assured | | | | | | |
| | | | Guaranty Municipal Corp. Insured) | | | | | | |
| | 1,000,000 | | 5.000%, 06/15/19 | | Aa1/AA+/NR | | | 1,094,010 | |
| | | | Salem-Keizer, Oregon School District #24J (State | | | | | | |
| | | | School Bond Guaranty Program) | | | | | | |
| | 3,500,000 | | zero coupon, 06/15/30 | | Aa1/AA+/NR | | | 1,600,375 | |
| | | | Wasco County, Oregon School District #12 (The | | | | | | |
| | | | Dalles) (Assured Guaranty Municipal Corp. | | | | | | |
| | | | Insured) | | | | | | |
| | 1,400,000 | | 5.500%, 06/15/17 | | Aa3/AA+/NR | | | 1,686,692 | |
| | 1,790,000 | | 5.500%, 06/15/20 | | Aa3/AA+/NR | | | 2,202,523 | |
| | | | Washington County, Oregon School District #48J | | | | | | |
| | | | (Beaverton) (Assured Guaranty Corp. Insured) | | | | | | |
| | 1,280,000 | | 5.000%, 06/01/31 | | Aa2/AA+/NR | | | 1,394,445 | |
| | 1,000,000 | | 5.125%, 06/01/36 | | Aa2/AA+/NR | | | 1,086,560 | |
| TAX-FREE TRUST OF OREGON |
SCHEDULE OF INVESTMENTS (continued) |
| SEPTEMBER 30, 2011 |
| | | | | Rating | | | |
| | | | | Moody’s, S&P | | | |
| Principal | | | | and Fitch | | | |
| Amount | | State of Oregon General Obligation Bonds (continued) | | (unaudited) | | Value | |
| | | School District (continued) | | | | | |
| | | Yamhill County, Oregon School District #40 | | | | | |
| | | (McMinnville) (Assured Guaranty Municipal Corp. | | | | | |
| | | Insured) (School Bond Guaranty Program) | | | | | |
| $ | 1,205,000 | | 5.000%, 06/15/19 | | Aa1/NR/NR | | $ | 1,402,138 | |
| | 1,375,000 | | 5.000%, 06/15/22 | | Aa1/NR/NR | | | 1,562,605 | |
| | | | Total School District | | | | | 125,988,935 | |
| | |
| | | | Special District (0.8%) | | | | | | |
| | | | Metro, Oregon | | | | | | |
| | 1,100,000 | | 5.000%, 06/01/18 | | Aaa/AAA/NR | | | 1,305,370 | |
| | | | Tualatin Hills, Oregon Park & Recreational District | | | | | | |
| | 1,000,000 | | 4.250%, 06/01/24 | | Aa1/AA/NR | | | 1,091,340 | |
| | | | Tualatin Valley, Oregon Fire & Rescue Rural Fire | | | | | | |
| | | | Protection District | | | | | | |
| | 1,235,000 | | 4.000%, 06/01/26 | | Aaa/NR/NR | | | 1,310,137 | |
| | | | Total Special District | | | | | 3,706,847 | |
| | |
| | | | State (8.5%) | | | | | | |
| | | | Oregon State Department of Administrative Services | | | | | | |
| | 3,270,000 | | 5.000%, 11/01/27 Series C | | Aa2/AA/AA | | | 3,561,847 | |
| | 2,155,000 | | 5.000%, 11/01/28 Series C | | Aa2/AA/AA | | | 2,331,710 | |
| | 5,000,000 | | 5.125%, 05/01/33 | | Aa2/AA/AA | | | 5,327,200 | |
| | | | Oregon State Department of Administrative Services | | | | | | |
| | | | (National Public Finance Guarantee- Financial | | | | | | |
| | | | Guaranty Insurance Corp. Insured) | | | | | | |
| | 2,000,000 | | 5.000%, 11/01/20 | | Aa2/AA/AA | | | 2,185,920 | |
| | 2,660,000 | | 5.000%, 11/01/23 | | Aa2/AA/AA | | | 2,873,412 | |
| | 2,945,000 | | 5.000%, 11/01/24 | | Aa2/AA/AA | | | 3,158,513 | |
| | 1,475,000 | | 5.000%, 11/01/26 | | Aa2/AA/AA | | | 1,574,150 | |
| | 3,880,000 | | 5.000%, 11/01/27 | | Aa2/AA/AA | | | 4,109,386 | |
| | | | Oregon State Department of Administrative Services, | | | | | | |
| | | | Oregon Opportunity Refunding | | | | | | |
| | 6,210,000 | | 5.000%, 12/01/19 | | Aa1/AA+/AA+ | | | 7,636,872 | |
| | | | Oregon State Refunding, Series L | | | | | | |
| | 3,000,000 | | 5.000%, 05/01/23 | | Aa1/AA+/AA+ | | | 3,598,170 | |
| | 1,125,000 | | 5.000%, 05/01/24 | | Aa1/AA+/AA+ | | | 1,332,574 | |
| | 1,000,000 | | 5.000%, 05/01/26 | | Aa1/AA+/AA+ | | | 1,161,700 | |
| TAX-FREE TRUST OF OREGON |
SCHEDULE OF INVESTMENTS (continued) |
| SEPTEMBER 30, 2011 |
| | | | | Rating | | | |
| | | | | Moody’s, S&P | | | |
| Principal | | | | and Fitch | | | |
| Amount | | State of Oregon General Obligation Bonds (continued) | | (unaudited) | | Value | |
| | | State (continued) | | | | | |
| | | Oregon State Alternative Energy Project, Series B | | | | | |
| $ | 1,255,000 | | 4.750%, 04/01/29 | | Aa1/AA+/AA+ | | $ | 1,358,412 | |
| | 500,000 | | 6.000%, 10/01/29 | | Aa1/AA+/AA+ | | | 586,370 | |
| | | | Total State | | | | | 40,796,236 | |
| | |
| | | | Water & Sewer (0.9%) | | | | | | |
| | | | Gearheart, Oregon | | | | | | |
| | 1,060,000 | | 4.500%, 03/01/26 | | Aa3/NR/NR | | | 1,162,110 | |
| | | | Pacific City, Oregon Joint Water - Sanitary Authority | | | | | | |
| | 1,830,000 | | 4.800%, 07/01/27 | | NR/NR/NR* | | | 1,880,673 | |
| | | | Rockwood, Oregon Water Peoples Utility District | | | | | | |
| | | | Water Revenue Refunding | | | | | | |
| | 1,270,000 | | 4.250%, 08/15/26 | | A1/NR/NR | | | 1,320,825 | |
| | | | Total Water & Sewer | | | | | 4,363,608 | |
| | | | Total General Obligation Bonds | | | | | 236,352,941 | |
| | |
| | | | State of Oregon Revenue Bonds (49.4%) | | | | | | |
| | |
| | | | City & County (2.8%) | | | | | | |
| | | | Newport, Oregon Urban Renewal Obligations, | | | | | | |
| | | | Refunding, Series B | | | | | | |
| | 565,000 | | 4.500%, 06/15/22 | | NR/A+/NR | | | 634,472 | |
| | | | Portland, Oregon | | | | | | |
| | 2,975,000 | | zero coupon, 06/01/15 | | Aa1/NR/NR | | | 2,793,436 | |
| | | | Portland, Oregon Revenue Refunding Limited Tax, | | | | | | |
| | | | Series A | | | | | | |
| | 1,000,000 | | 4.000%, 04/01/22 | | Aa1/NR/NR | | | 1,091,150 | |
| | | | Portland, Oregon River District Urban Renewal and | | | | | | |
| | | | Redevelopment (American Municipal Bond | | | | | | |
| | | | Assurance Corp. Insured) | | | | | | |
| | 1,915,000 | | 5.000%, 06/15/20 | | A2/NR/NR | | | 1,973,561 | |
| | | | Portland, Oregon Urban Renewal and Redevelopment, | | | | | | |
| | | | Refunding, North Macadam, Series B | | | | | | |
| | 1,000,000 | | 4.000%, 06/15/25 | | A1/NR/NR | | | 999,950 | |
| | | | Portland, Oregon Urban Renewal Tax Allocation | | | | | | |
| | | | (Interstate Corridor) (National Public Finance | | | | | | |
| | | | Guarantee- Financial Guaranty Insurance Corp. | | | | | | |
| | | | Insured) | | | | | | |
| | 1,890,000 | | 5.250%, 06/15/20 | | A2/NR/NR | | | 2,011,678 | |
| TAX-FREE TRUST OF OREGON |
SCHEDULE OF INVESTMENTS (continued) |
| SEPTEMBER 30, 2011 |
| | | | | | Rating | | |
| | | | | | Moody’s, S&P | | |
| | Principal | | | | and Fitch | | |
| | Amount | | State of Oregon Revenue Bonds (continued) | | (unaudited) | | Value |
| | | City & County (continued) | | | | | |
| | | Portland, Oregon Urban Renewal Tax Allocation | | | | | |
| | | (Interstate Corridor) (National Public Finance | | | | | |
| | | Guarantee - Financial Guaranty Insurance Corp. | | | | | |
| | | Insured) (continued) | | | | | |
| $ | 1,810,000 | | 5.250%, 06/15/21 | | A2/NR/NR | | $ | 1,917,496 | |
| | 2,030,000 | | 5.000%, 06/15/23 | | A2/NR/NR | | | 2,104,603 | |
| | | | Total City & County | | | | | 13,526,346 | |
| | |
| | | | Electric (2.1%) | | | | | | |
| | | | Emerald Peoples Utility District, Oregon (Assured | | | | | | |
| | | | Guaranty Municipal Corp. Insured) | | | | | | |
| | 1,455,000 | | 5.250%, 11/01/22 | | Aa3/NR/NR | | | 1,552,310 | |
| | | | Eugene, Oregon Electric Utility | | | | | | |
| | 5,635,000 | | 5.000%, 08/01/30 | | Aa2/AA-/AA- | | | 6,072,840 | |
| | | | Eugene, Oregon Electric Utility Refunding System | | | | | | |
| | | | Series A | | | | | | |
| | 2,000,000 | | 5.000%, 08/01/27 | | Aa2/AA-/AA- | | | 2,263,440 | |
| | | | Total Electric | | | | | 9,888,590 | |
| | |
| | | | Higher Education (7.8%) | | | | | | |
| | | | Forest Grove, Oregon Campus Improvement (Pacific | | | | | | |
| | | | University Project) | | | | | | |
| | 1,500,000 | | 6.000%, 05/01/30 | | NR/BBB/NR | | | 1,520,190 | |
| | | | Forest Grove, Oregon (Pacific University) (Radian | | | | | | |
| | | | Insured) | | | | | | |
| | 4,000,000 | | 5.000%, 05/01/22 | | NR/BBB/NR | | | 4,037,600 | |
| | | | Forest Grove, Oregon Student Housing (Oak Tree | | | | | | |
| | | | Foundation) | | | | | | |
| | 5,750,000 | | 5.500%, 03/01/37 | | NR/NR/NR* | | | 5,207,487 | |
| | | | Oregon Health Sciences University (National Public | | | | | | |
| | | | Finance Guarantee Insured) | | | | | | |
| | 2,890,000 | | 5.250%, 07/01/22 | | A1/A/A | | | 2,952,048 | |
| | | | Oregon Health Sciences University Series B (National | | | | | | |
| | | | Public Finance Guarantee Insured) | | | | | | |
| | 1,150,000 | | 5.250%, 07/01/15 | | A1/A/A | | | 1,153,116 | |
| TAX-FREE TRUST OF OREGON |
SCHEDULE OF INVESTMENTS (continued) |
| SEPTEMBER 30, 2011 |
| | | | | | Rating | | |
| | | | | | Moody’s, S&P | | |
| | Principal | | | | and Fitch | | |
| | Amount | | State of Oregon Revenue Bonds (continued) | | (unaudited) | | Value |
| | | Higher Education (continued) | | | | | |
| | | Oregon State Facilities Authority (Linfield College | | | | | |
| | | Project), Series A 2005 | | | | | |
| $ | 2,830,000 | | 5.000%, 10/01/20 | | Baa1/NR/NR | | $ | 2,981,377 | |
| | 2,115,000 | | 5.000%, 10/01/25 | | Baa1/NR/NR | | | 2,168,721 | |
| | | | Oregon State Facilities Authority (Linfield College | | | | | | |
| | | | Project), Series A 2010 | | | | | | |
| | 1,220,000 | | 5.000%, 10/01/31 | | Baa1/NR/NR | | | 1,246,572 | |
| | | | Oregon State Facilities Authority Revenue Refunding | | | | | | |
| | | | (Reed College Project), Series A | | | | | | |
| | 1,500,000 | | 5.000%, 07/01/29 | | Aa2/AA-/NR | | | 1,662,105 | |
| | | | Oregon State Facilities Authority (University of | | | | | | |
| | | | Portland) | | | | | | |
| | 3,000,000 | | 5.000%, 04/01/32 | | NR/BBB+/NR | | | 3,038,100 | |
| | | | Oregon State Facilities Authority (Willamette | | | | | | |
| | | | University) | | | | | | |
| | 1,000,000 | | 4.000%, 10/01/24 | | NR/A/NR | | | 1,023,150 | |
| | 5,000,000 | | 5.000%, 10/01/32 | | NR/A/NR | | | 5,098,400 | |
| | | | Portland, Oregon Economic Development (Broadway | | | | | | |
| | | | Project) | | | | | | |
| | 5,000,000 | | 6.500%, 04/01/35 | | A1/A+/NR | | | 5,362,600 | |
| | | | Total Higher Education | | | | | 37,451,466 | |
| | |
| | | | Hospital (12.4%) | | | | | | |
| | | | Deschutes County, Oregon Hospital Facilities | | | | | | |
| | | | Authority (Cascade Health) | | | | | | |
| | 2,000,000 | | 5.600%, 01/01/27 pre-refunded | | A3/NR/NR | | | 2,025,820 | |
| | 3,500,000 | | 8.000%, 01/01/28 | | A3/NR/NR | | | 4,302,795 | |
| | 3,000,000 | | 5.600%, 01/01/32 pre-refunded | | A3/NR/NR | | | 3,038,730 | |
| | | | Deschutes County, Oregon Hospital Facilities | | | | | | |
| | | | Authority (Cascade Health) (American Municipal | | | | | | |
| | | | Bond Assurance Corp. Insured) | | | | | | |
| | 3,250,000 | | 5.375%, 01/01/35 | | A3/NR/NR | | | 3,345,940 | |
| | | | Medford, Oregon Hospital Facilities Authority | | | | | | |
| | | | Revenue Refunding, Asante Health Systems | | | | | | |
| | | | (Assured Guaranty Municipal Corp. Insured) | | | | | | |
| | 9,000,000 | | 5.500%, 08/15/28 | | NR/AA+/NR | | | 9,885,690 | |
| TAX-FREE TRUST OF OREGON |
SCHEDULE OF INVESTMENTS (continued) |
| SEPTEMBER 30, 2011 |
| | | | | | Rating | | |
| | | | | | Moody’s, S&P | | |
| | Principal | | | | and Fitch | | |
| | Amount | | State of Oregon Revenue Bonds (continued) | | (unaudited) | | Value |
| | | Hospital (continued) | | | | | |
| | | Multnomah County, Oregon Hospital Facilities | | | | | |
| | | Authority (Adventist Health/West) | | | | | |
| $ | 500,000 | | 5.000%, 09/01/21 | | NR/A/A | | $ | 551,755 | |
| | | | Multnomah County, Oregon Hospital Facilities | | | | | | |
| | | | Authority (Providence Health System) | | | | | | |
| | 1,390,000 | | 5.250%, 10/01/22 | | Aa2/AA/AA | | | 1,482,046 | |
| | | | Oregon Health Sciences University (National Public | | | | | | |
| | | | Finance Guarantee Insured) | | | | | | |
| | 11,550,000 | | zero coupon, 07/01/21 | | A1/A/A | | | 7,628,544 | |
| | | | Oregon Health Science University Series A | | | | | | |
| | 4,500,000 | | 5.750%, 07/01/39 | | A1/A/A | | | 4,894,470 | |
| | | | Oregon State Facilities Authority Revenue Refunding, | | | | | | |
| | | | Legacy Health Systems | | | | | | |
| | 2,000,000 | | 4.250%, 03/15/17 | | A2/A+/NR | | | 2,158,060 | |
| | 3,000,000 | | 4.500%, 03/15/18 | | A2/A+/NR | | | 3,282,090 | |
| | 1,000,000 | | 4.750%, 03/15/24 | | A2/A+/NR | | | 1,043,800 | |
| | 1,000,000 | | 5.000%, 03/15/30 | | A2/A+/NR | | | 1,020,680 | |
| | | | Oregon State Facilities Authority Revenue Refunding, | | | | | | |
| | | | Samaritan Health Services | | | | | | |
| | 1,500,000 | | 4.375%, 10/01/20 | | NR/A-/NR | | | 1,548,990 | |
| | 2,000,000 | | 4.500%, 10/01/21 | | NR/A-/NR | | | 2,076,400 | |
| | 1,520,000 | | 5.000%, 10/01/23 | | NR/A-/NR | | | 1,600,940 | |
| | 1,795,000 | | 4.875%, 10/01/25 | | NR/A-/NR | | | 1,848,329 | |
| | 2,000,000 | | 5.000%, 10/01/30 | | NR/A-/NR | | | 2,026,000 | |
| | | | Salem, Oregon Hospital Facility Authority (Salem | | | | | | |
| | | | Hospital) | | | | | | |
| | 2,000,000 | | 5.750%, 08/15/23 | | NR/A+/A+ | | | 2,224,560 | |
| | | | State of Oregon Health Housing Educational and | | | | | | |
| | | | Cultural Facilities Authority (Peacehealth) | | | | | | |
| | | | (American Municipal Bond Assurance Corp. | | | | | | |
| | | | Insured) | | | | | | |
| | 1,835,000 | | 5.250%, 11/15/17 | | NR/A+/AA- | | | 1,859,571 | |
| | 1,430,000 | | 5.000%, 11/15/32 | | NR/A+/AA- | | | 1,436,364 | |
| | | | Total Hospital | | | | | 59,281,574 | |
| TAX-FREE TRUST OF OREGON |
SCHEDULE OF INVESTMENTS (continued) |
| SEPTEMBER 30, 2011 |
| | | | | | Rating | | |
| | | | | | Moody’s, S&P | | |
| | Principal | | | | and Fitch | | |
| | Amount | | State of Oregon Revenue Bonds (continued) | | (unaudited) | | Value |
| | | Housing (1.0%) | | | | | |
| | | Portland, Oregon Urban Renewal and Redevelopment, | | | | | |
| | | Interstate Corridor, Series B | | | | | |
| $ | 750,000 | | 5.000%, 06/15/27 | | A2/NR/NR | | $ | 778,553 | |
| | | | State of Oregon Housing and Community Services | | | | | | |
| | 2,130,000 | | 4.650%, 07/01/25 | | Aa2/NR/NR | | | 2,154,623 | |
| | 1,745,000 | | 5.350%, 07/01/30 | | Aa2/NR/NR | | | 1,810,368 | |
| | | | Total Housing | | | | | 4,743,544 | |
| | |
| | | | Lottery (3.7%) | | | | | | |
| | | | Oregon State Department of Administration Services | | | | | | |
| | | | (Lottery Revenue) | | | | | | |
| | 7,300,000 | | 5.250%, 04/01/26 | | Aa2/AAA/NR | | | 8,607,941 | |
| | 2,500,000 | | 5.000%, 04/01/29 | | a2/AAA/NR | | | 2,760,750 | |
| | | | Oregon State Department of Administration Services | | | | | | |
| | | | (Lottery Revenue) (Assured Guaranty Municipal | | | | | | |
| | | | Corp. Insured) | | | | | | |
| | 2,700,000 | | 5.000%, 04/01/19 | | Aa2/AAA/AA- | | | 2,897,073 | |
| | 3,000,000 | | 5.000%, 04/01/27 | | Aa2/AAA/AA- | | | 3,268,260 | |
| | | | Total Lottery | | | | | 17,534,024 | |
| | |
| | | | Transportation (5.1%) | | | | | | |
| | | | Jackson County, Oregon Airport Revenue (Syncora | | | | | | |
| | | | Guarantee, Inc.) | | | | | | |
| | 750,000 | | 5.250%, 12/01/32 | | Baa1/NR/NR | | | 741,450 | |
| | | | Oregon State Department Transportation Highway | | | | | | |
| | | | Usertax | | | | | | |
| | 3,025,000 | | 5.500%, 11/15/18 Series A pre-refunded | | Aa1/AAA/AA+ | | | 3,201,448 | |
| | 1,200,000 | | 5.000%, 11/15/22 Series A | | Aa1/AAA/AA+ | | | 1,306,140 | |
| | 1,260,000 | | 5.000%, 11/15/23 Series A | | Aa1/AAA/AA+ | | | 1,366,646 | |
| | 4,545,000 | | 5.125%, 11/15/26 Series A pre-refunded | | Aa1/AAA/AA+ | | | 4,791,203 | |
| | 1,000,000 | | 5.000%, 11/15/29 Series A | | Aa1/AAA/AA+ | | | 1,046,820 | |
| | | | Oregon State Department Transportation Highway | | | | | | |
| | | | Usertax, Senior Lien | | | | | | |
| | 1,865,000 | | 5.000%, 11/15/23 Series A | | Aa1/AAA/AA+ | | | 2,148,592 | |
| | 2,000,000 | | 4.625%, 11/15/25 Series A | | Aa1/AAA/AA+ | | | 2,212,460 | |
| | 2,155,000 | | 5.000%, 11/15/28 Series A | | Aa1/AAA/AA+ | | | 2,324,879 | |
| TAX-FREE TRUST OF OREGON |
SCHEDULE OF INVESTMENTS (continued) |
| SEPTEMBER 30, 2011 |
| | | | | | Rating | | |
| | | | | | Moody’s, S&P | | |
| | Principal | | | | and Fitch | | |
| | Amount | | State of Oregon Revenue Bonds (continued) | | (unaudited) | | Value |
| | | Transportation (continued) | | | | | |
| | | Tri-County Metropolitan Transportation District, Oregon | | | | | |
| $ | 1,775,000 | | 5.000%, 09/01/16 | | Aa2/AAA/NR | | $ | 1,866,927 | |
| | | | Tri-County Metropolitan Transportation District, | | | | | | |
| | | | Oregon Capital Grant Receipt - Series A | | | | | | |
| | 3,000,000 | | 5.000%, 10/01/27 | | A1/A/NR | | | 3,281,250 | |
| | | | Total Transportation | | | | | 24,287,815 | |
| | |
| | | | Water and Sewer (14.5%) | | | | | | |
| | | | Ashland, Oregon Refunding (Assured Guaranty | | | | | | |
| | | | Municipal Corp. Insured) | | | | | | |
| | 1,025,000 | | 4.000%, 05/01/17 | | NR/AA+/NR | | | 1,163,836 | |
| | | | Klamath Falls, Oregon Water (Assured Guaranty | | | | | | |
| | | | Municipal Corp. Insured) | | | | | | |
| | 1,575,000 | | 5.500%, 07/01/16 | | Aa3/AA+/NR | | | 1,764,520 | |
| | | | Lane County, Oregon Metropolitan Wastewater | | | | | | |
| | 2,500,000 | | 5.250%, 11/01/28 | | Aa2/AA-/NR | | | 2,753,825 | |
| | | | Lebanon, Oregon Wastewater Revenue Refunding | | | | | | |
| | | | (Assured Guaranty Municipal Corp. Insured) | | | | | | |
| | 230,000 | | 4.000%, 03/01/20 | | NR/AA+/NR | | | 252,147 | |
| | | | Molalla, Oregon Sewer Revenue Refunding | | | | | | |
| | 210,000 | | 4.000%, 03/01/18 | | NR/A/NR | | | 230,622 | |
| | 240,000 | | 4.000%, 03/01/19 | | NR/A/NR | | | 261,989 | |
| | 250,000 | | 4.000%, 03/01/20 | | NR/A/NR | | | 270,765 | |
| | 260,000 | | 4.000%, 03/01/21 | | NR/A/NR | | | 279,786 | |
| | 270,000 | | 4.000%, 03/01/22 | | NR/A/NR | | | 287,855 | |
| | 280,000 | | 4.000%, 03/01/23 | | NR/A/NR | | | 294,910 | |
| | 290,000 | | 4.000%, 03/01/24 | | NR/A/NR | | | 301,974 | |
| | 150,000 | | 4.000%, 03/01/25 | | NR/A/NR | | | 154,864 | |
| | | | Portland, Oregon Sewer System, Second Lien, Series A | | | | | | |
| | 3,005,000 | | 5.000%, 03/01/28 | | Aa3/AA/NR | | | 3,339,937 | |
| | | | Portland Oregon Sewer System Revenue Refunding | | | | | | |
| | | | Second Lien Series B | | | | | | |
| | 5,000,000 | | 5.000%, 06/15/33 | | Aa3/AA/NR | | | 5,348,400 | |
| | | | Portland, Oregon Sewer System (Assured Guaranty | | | | | | |
| | | | Municipal Corp. Insured) | | | | | | |
| | 2,760,000 | | 5.250%, 06/01/17 | | Aa3/AA+/NR | | | 2,956,346 | |
| | 4,595,000 | | 5.000%, 06/01/17 | | Aa2/AA+/NR | | | 5,198,186 | |
| | 3,470,000 | | 5.000%, 06/01/21 | | Aa3/AA+/NR | | | 3,643,257 | |
| TAX-FREE TRUST OF OREGON |
SCHEDULE OF INVESTMENTS (continued) |
| SEPTEMBER 30, 2011 |
| | | | | | Rating | | |
| | | | | | Moody’s, S&P | | |
| | Principal | | | | and Fitch | | |
| | Amount | | State of Oregon Revenue Bonds (continued) | | (unaudited) | | Value |
| | | Water and Sewer (continued) | | | | | |
| | | Portland, Oregon Sewer System (National Public | | | | | |
| | | Finance Guarantee Insured) | | | | | |
| $ | 4,410,000 | | 5.000%, 06/15/25 | | Aa2/AA/NR | | $ | 4,783,307 | |
| | 4,630,000 | | 5.000%, 06/15/26 | | Aa2/AA/NR | | | 4,998,780 | |
| | 1,610,000 | | 5.000%, 06/15/27 | | Aa2/AA/NR | | | 1,730,959 | |
| | | | Portland, Oregon Water System Revenue Refunding, | | | | | | |
| | | | Series A | | | | | | |
| | 1,920,000 | | 4.000%, 05/01/14 | | Aaa/NR/NR | | | 2,090,496 | |
| | 1,275,000 | | 4.000%, 05/01/25 | | Aaa/NR/NR | | | 1,365,742 | |
| | | | Prineville, Oregon Refunding (Assured Guaranty | | | | | | |
| | | | Municipal Corp. Insured) | | | | | | |
| | 1,255,000 | | 4.400%, 06/01/29 | | NR/AA+/NR | | | 1,339,386 | |
| | | | Salem, Oregon Water & Sewer (Assured Guaranty | | | | | | |
| | | | Municipal Corp. Insured) | | | | | | |
| | 1,000,000 | | 5.375%, 06/01/15 | | Aa3/AA+/NR | | | 1,149,250 | |
| | | | Seaside, Oregon Wastewater System Revenue | | | | | | |
| | 1,000,000 | | 4.250%, 07/01/26 | | A3/NR/NR | | | 1,039,600 | |
| | | | Sunrise Water Authority, Oregon (Assured Guaranty | | | | | | |
| | | | Municipal Corp. Insured) | | | | | | |
| | 2,630,000 | | 5.000%, 03/01/19 | | Aa3/AA+/NR | | | 2,799,661 | |
| | 1,350,000 | | 5.250%, 03/01/24 | | Aa3/AA+/NR | | | 1,420,591 | |
| | | | Sunrise Water Authority, Oregon (Syncora Guarantee, | | | | | | |
| | | | Inc.) | | | | | | |
| | 1,000,000 | | 5.000%, 09/01/25 | | NR/NR/NR* | | | 1,024,880 | |
| | | | Washington County, Oregon Clean Water Services | | | | | | |
| | 4,000,000 | | 5.000%, 10/01/28 | | Aa2/AA/NR | | | 4,412,080 | |
| | | | Washington County, Oregon Clean Water Services | | | | | | |
| | | | (National Public Finance Guarantee - Financial | | | | | | |
| | | | Guaranty Insurance Corp. Insured) | | | | | | |
| | 995,000 | | 5.000%, 10/01/13 | | Aa2/AA/NR | | | 995,000 | |
| | 3,525,000 | | 5.125%, 10/01/17 | | Aa2/AA/NR | | | 3,525,000 | |
| | | | Washington County, Oregon Clean Water Services | | | | | | |
| | | | (National Public Finance Guarantee Insured) | | | | | | |
| | 2,235,000 | | 5.250%, 10/01/15 | | Aa2/AA/NR | | | 2,625,656 | |
| TAX-FREE TRUST OF OREGON |
SCHEDULE OF INVESTMENTS (continued) |
| SEPTEMBER 30, 2011 |
| | | | | | Rating | | |
| | | | | | Moody’s, S&P | | |
| | Principal | | | | and Fitch | | |
| | Amount | | State of Oregon Revenue Bonds (continued) | | (unaudited) | | Value |
| | | Water and Sewer (continued) | | | | | | |
| | | Washington County, Oregon Clean Water Services | | | | | | |
| | | Sewer Revenue Senior Lien, Series B | | | | | | |
| $ | 2,850,000 | | 4.000%, 10/01/26 | | Aa2/AA/NR | | | $ | 3,016,098 | |
| | 2,745,000 | | 4.000%, 10/01/28 | | Aa2/AA/NR | | | | 2,838,769 | |
| | | | Total Water and Sewer | | | | | | 69,658,474 | |
| | | | Total Revenue Bonds | | | | | | 236,371,833 | |
| | |
| | | | U.S. Territory Bonds (0.4%) | | | | | | | |
| | | | Puerto Rico Commonwealth (National Public Finance | | | | | | | |
| | | | Guarantee Insured) | | | | | | | |
| | 1,270,000 | | 6.000%, 07/01/28 | | Baa1/BBB/NR | | | | 1,344,016 | |
| | | | Puerto Rico Municipal Finance Agency (Assured | | | | | | | |
| | | | Guaranty Municipal Corp. Insured) | | | | | | | |
| | 500,000 | | 5.250%, 08/01/16 | | Aa3/AA+/NR | | | | 512,175 | |
| | | | Total U.S. Territory Bonds | | | | | | 1,856,191 | |
| | |
| | | | Total Investments (cost $444,606,809-note 4) | | 99.1 | % | | | 474,580,965 | |
| | | | Other assets less liabilities | | 0.9 | | | | 4,378,555 | |
| | | | Net Assets | | 100.0 | % | | $ | 478,959,520 | |
| | | | * | Any security not rated (NR) by any of the Nationally Recognized Statistical Rating Organizations (“NRSRO” or “credit rating agency”) has been determined by the Investment Sub-Adviser to have sufficient quality to be ranked in the top four credit ratings if a credit rating were to be assigned by a NRSRO. | | | |
| | | | | | | | | | | | |
| | | | | | | Percent of | | | | | |
| | | | Portfolio Distribution by Quality Rating | | Portfolio† | | | | | |
| | | | Aaa of Moody’s or AAA of S&P | | 8.0 | % | | | | |
| | | | Pre-refunded bonds †† / Escrowed to Maturity bonds | | 4.8 | | | | | |
| | | | Aa of Moody’s, AA of S&P or Fitch | | 66.0 | | | | | |
| | | | A of Moody’s, S&P or Fitch | | 15.7 | | | | | |
| | | | Baa of Moody’s or BBB of S&P | | 3.6 | | | | | |
| | | | Not rated* | | 1.9 | | | | | |
| | | | | | | 100.0 | % | | | | |
| | |
| | † | | Where applicable, calculated using the highest rating of the three NRSROs. | | | | | |
| | †† | | Pre-refunded bonds are bonds for which U.S. Government Obligations have been placed in escrow to retire the bonds at their earliest call date. | | | | | |
| | | | | | | | | | |
| | | | PORTFOLIO ABBREVIATIONS: | | | | | | | |
| | | | NR – Not Rated | | | | | | | |
See accompanying notes to financial statements.
| TAX-FREE TRUST OF OREGON |
| STATEMENT OF ASSETS AND LIABILITIES |
| SEPTEMBER 30, 2011 |
| ASSETS | | | |
| Investments at value (cost $444,606,809) | | $ | 474,580,965 | |
| Cash | | | 696,443 | |
| Interest receivable | | | 6,586,788 | |
| Receivable for Trust shares sold | | | 907,676 | |
| Other assets | | | 19,631 | |
| Total assets | | | 482,791,503 | |
| LIABILITIES | | | | |
| Payable for investment securities purchased | | | 2,829,464 | |
| Payable for Trust shares redeemed | | | 544,188 | |
| Dividends payable | | | 256,170 | |
| Management fees payable | | | 155,859 | |
| Distribution and service fees payable | | | 4,619 | |
| Accrued expenses | | | 41,683 | |
| Total liabilities | | | 3,831,983 | |
| NET ASSETS | | $ | 478,959,520 | |
| Net Assets consist of: | | | | |
| Capital Stock - Authorized an unlimited number of shares, par value $0.01 per share | | $ | 430,956 | |
| Additional paid-in capital | | | 448,638,917 | |
| Net unrealized appreciation on investments (note 4) | | | 29,974,156 | |
| Undistributed net investment income | | | 245,539 | |
| Accumulated net realized loss on investments | | | (330,048 | ) |
| | | $ | 478,959,520 | |
| | | | | |
| CLASS A | | | | |
| Net Assets | | $ | 380,312,264 | |
| Capital shares outstanding | | | 34,214,122 | |
| Net asset value and redemption price per share | | $ | 11.12 | |
| Maximum offering price per share (100/96 of $11.12 adjusted to nearest cent) | | $ | 11.58 | |
| | | | | |
| CLASS C | | | | |
| Net Assets | | $ | 27,293,297 | |
| Capital shares outstanding | | | 2,457,607 | |
| Net asset value and offering price per share | | $ | 11.11 | |
| Redemption price per share (* a charge of 1% is imposed on the redemption | | | | |
| proceeds of the shares, or on the original price, whichever is lower, if redeemed | | | | |
| during the first 12 months after purchase) | | $ | 11.11 | * |
| | | | | |
| CLASS Y | | | | |
| Net Assets | | $ | 71,353,959 | |
| Capital shares outstanding | | | 6,423,891 | |
| Net asset value, offering and redemption price per share | | $ | 11.11 | |
See accompanying notes to financial statements.
| TAX-FREE TRUST OF OREGON |
| STATEMENT OF OPERATIONS |
| YEAR ENDED SEPTEMBER 30, 2011 |
| Investment Income: | | | | | | |
| | |
| Interest income | | | | | $ | 20,591,282 | |
| | |
| | |
| Expenses: | | | | | | | |
| | |
| Management fees (note 3) | | $ | 1,909,607 | | | | | |
| Distribution and service fees (note 3) | | | 825,581 | | | | | |
| Trustees’ fees and expenses (note 7) | | | 262,076 | | | | | |
| Transfer and shareholder servicing agent fees | | | 248,223 | | | | | |
| Legal fees (note 3) | | | 230,184 | | | | | |
| Shareholders’ reports and proxy statements | | | 100,368 | | | | | |
| Custodian fees (note 6) | | | 35,609 | | | | | |
| Registration fees and dues | | | 33,958 | | | | | |
| Insurance | | | 24,656 | | | | | |
| Auditing and tax fees | | | 24,396 | | | | | |
| Chief compliance officer services (note 3) | | | 4,504 | | | | | |
| Miscellaneous | | | 55,576 | | | | | |
| Total expenses | | | 3,754,738 | | | | | |
| | |
| Management fees waived (note 3) | | | (9,956 | ) | | | | |
| Expenses paid indirectly (note 6) | | | (644 | ) | | | | |
| Net expenses | | | | | | | 3,744,138 | |
| Net investment income | | | | | | | 16,847,144 | |
| | |
| Realized and Unrealized Gain (Loss) on Investments: | | | | | | | | |
| | |
| Net realized gain (loss) from securities transactions | | | (213,603 | ) | | | | |
| Change in unrealized appreciation on investments | | | (5,092,691 | ) | | | | |
| | |
| Net realized and unrealized gain (loss) on investments | | | | | | | (5,306,294 | ) |
| Net change in net assets resulting from operations | | | | | | $ | 11,540,850 | |
See accompanying notes to financial statements.
TAX-FREE TRUST OF OREGON
STATEMENTS OF CHANGES IN NET ASSETS
| | | Year Ended | | | Year Ended | |
| | | September 30, 2011 | | | September 30, 2010 | |
| | |
| OPERATIONS: | | | | | | |
| Net investment income | | $ | 16,847,144 | | | $ | 17,934,326 | |
| Net realized gain (loss) from securities transactions | | | (213,603 | ) | | | 469,057 | |
| Change in unrealized appreciation on investments | | | (5,092,691 | ) | | | 6,367,757 | |
| Change in net assets resulting from operations | | | 11,540,850 | | | | 24,771,140 | |
| | |
| DISTRIBUTIONS TO SHAREHOLDERS (note 10): | | | | | | | | |
| Class A Shares: | | | | | | | | |
| Net investment income | | | (13,260,251 | ) | | | (13,893,914 | ) |
| | |
| Class C Shares: | | | | | | | | |
| Net investment income | | | (713,975 | ) | | | (724,866 | ) |
| | |
| Class Y Shares: | | | | | | | | |
| Net investment income | | | (2,852,438 | ) | | | (3,389,719 | ) |
| Change in net assets from distributions | | | (16,826,664 | ) | | | (18,008,499 | ) |
| | |
| CAPITAL SHARE TRANSACTIONS (note 8): | | | | | | | | |
| Proceeds from shares sold | | | 51,950,817 | | | | 87,301,291 | |
| Reinvested dividends and distributions | | | 10,362,686 | | | | 10,787,566 | |
| Cost of shares redeemed | | | (103,034,039 | ) | | | (56,381,161 | ) |
| Change in net assets from capital share transactions | | | (40,720,536 | ) | | | 41,707,696 | |
| | |
| Change in net assets | | | (46,006,350 | ) | | | 48,470,337 | |
| | |
| NET ASSETS: | | | | | | | | |
| Beginning of period | | | 524,965,870 | | | | 476,495,533 | |
| End of period* | | $ | 478,959,520 | | | $ | 524,965,870 | |
| | |
| * Includes undistributed net investment income of: | | $ | 245,539 | | | $ | 236,284 | |
See accompanying notes to financial statements.
TAX-FREE TRUST OF OREGON
NOTES TO FINANCIAL STATEMENTS
SEPTEMBER 30, 2011
1. Organization
Tax-Free Trust of Oregon (the “Trust”) is a separate portfolio of The Cascades Trust. The Cascades Trust (the “Business Trust”) is an open-end investment company, which was organized on October 17, 1985, as a Massachusetts business trust and is authorized to issue an unlimited number of shares. The Trust is a non-diversified portfolio which commenced operations on June 16, 1986 and until April 5, 1996, offered only one class of shares. On that date, the Trust began offering two additional classes of shares, Class C and Class Y Shares. All shares outstanding prior to that date were designated as Class A Shares and are sold at net asset value plus a sales charge of varying size (depending upon a variety of factors) paid at the time of purchase and bear a distribution fee. Class C Shares are sold at net asset value with no sales charge payable at the time of purchase but with a level charge for service and distribution fees for six years thereafter. Class C Shares automatically convert to Class A Shares after six years. Class Y Shares are sold only through institutions acting for investors in a fiduciary, advisory, agency, custodial or similar capacity, and are not offered directly to retail customers. Class Y Shares are sold at net asset value with no sales charge, no redemption fee, no contingent deferred sales charge (“CDSC”) and no distribution fee. On January 31, 1998, the Trust established Class I Shares which are offered and sold only through financial intermediaries and are not offered directly to retail customers. Class I Shares are sold at net asset value with no sales charge and no redemption fee or CDSC, although a financial intermediary may charge a fee for effecting a purchase or other transaction on behalf of its customers. Class I Shares carry a distribution and a service fee. As of the report date, there were no Class I Shares outstanding. All classes of shares represent interests in the same portfolio of investments and are identical as to rights and privileges but differ with respect to the effect of sales charges, the distribution and/or service fees borne by each class, expenses specific to each class, voting rights on matters affecting a single class and the exchange privileges of each class.
2. Significant Accounting Policies
The following is a summary of significant accounting policies followed by the Trust in the preparation of its financial statements. The policies are in conformity with accounting principles generally accepted in the United States of America for investment companies.
| a) | Portfolio valuation: Municipal securities which have remaining maturities of more than 60 days are valued each business day based upon information provided by a nationally prominent independent pricing service and periodically verified through other pricing services. In the case of securities for which market quotations are readily available, securities are valued by the pricing service at the mean of bid and asked quotations. If a market quotation or a valuation from the pricing service is not readily available, the security is valued at fair value determined in good faith under procedures established by and under the general supervision of the Board of Trustees. Securities which mature in 60 days or less are valued at amortized cost if their term to maturity at purchase is 60 days or less, or by amortizing their unrealized appreciation or depreciation on the 61st day prior to maturity, if their term to maturity at purchase exceeds 60 days. |
TAX-FREE TRUST OF OREGON
NOTES TO FINANCIAL STATEMENTS (continued)
SEPTEMBER 30, 2011
| b) | Fair value measurements: The Trust follows a fair value hierarchy that distinguishes between market data obtained from independent sources (observable inputs) and the Trust’s own market assumptions (unobservable inputs). These inputs are used in determining the value of the Trust’s investments and are summarized in the following fair value hierarchy: Level 1 – Unadjusted quoted prices in active markets for identical assets or liabilities that the Trust has the ability to access. Level 2 – Observable inputs other than quoted prices included in Level 1 that are observable for the asset or liability, either directly or indirectly. These inputs may include quoted prices for the identical instrument on an inactive market, prices for similar instruments, interest rates, prepayment speeds, credit risk, yield curves, default rates and similar data. Level 3 – Unobservable inputs for the asset or liability, to the extent relevant observable inputs are not available, representing the Trust’s own assumptions about the assumptions a market participant would use in valuing the asset or liability, based on the best information available. The inputs or methodology used for valuing securities are not an indication of the risk associated with investing in those securities. The following is a summary of the valuation inputs, representing 100% of the Trust’s investments, used to value the Trust’s net assets as of September 30, 2011: |
| Valuation Inputs | | | Investments in Securities | |
| Level 1 – Quoted Prices | | $ | – | |
| Level 2 – Other Significant Observable Inputs – | | | | |
| Municipal Bonds* | | | 474,580,965 | |
| Level 3 – Significant Unobservable Inputs | | | – | |
| Total | | $ | 474,580,965 | |
*See schedule of investments for a detailed listing of securities.
| c) | Subsequent events: In preparing these financial statements, the Trust has evaluated events and transactions for potential recognition or disclosure through the date these financial statements were issued. |
| | |
| d) | Securities transactions and related investment income: Securities transactions are recorded on the trade date. Realized gains and losses from securities transactions are reported on the identified cost basis. Interest income is recorded daily on the accrual basis and is adjusted for amortization of premium and accretion of original issue and market discount. |
| | |
| e) | Federal income taxes: It is the policy of the Trust to continue to qualify as a regulated investment company by complying with the provisions of the Internal Revenue Code applicable to certain |
TAX-FREE TRUST OF OREGON
NOTES TO FINANCIAL STATEMENTS (continued)
SEPTEMBER 30, 2011
| | investment companies. The Trust intends to make distributions of income and securities profits sufficient to relieve it from all, or substantially all, Federal income and excise taxes. Management has reviewed the tax positions for each of the open tax years (2008-2010) or expected to be taken in the Trust’s 2011 tax returns and has concluded that there are no significant uncertain tax positions that would require recognition in the financial statements. |
| | |
| f) | Multiple class allocations: All income, expenses (other than class-specific expenses), and realized and unrealized gains or losses are allocated daily to each class of shares based on the relative net assets of each class. Class-specific expenses, which include distribution and service fees and any other items that are specifically attributed to a particular class, are also charged directly to such class on a daily basis. |
| | |
| g) | Use of estimates: The preparation of financial statements in conformity with accounting principles generally accepted in the United States of America requires management to make estimates and assumptions that affect the reported amounts of assets and liabilities and disclosure of contingent assets and liabilities at the date of the financial statements and the reported amounts of increases and decreases in net assets from operations during the reporting period. Actual results could differ from those estimates. |
| | |
| h) | Reclassification of capital accounts: Accounting principles generally accepted in the United States of America require that certain components of net assets relating to permanent differences be reclassified between financial and tax reporting. On September 30, 2011, the Trust decreased undistributed net investment income by $11,225 and increased paid-in capital by $11,225 due primarily to differing book/tax treatment of distributions and bond amortization. These reclassifications had no effect on net assets or net asset value per share. |
| | |
| i) | Accounting pronouncements: In January 2010, the Financial Accounting Standards Board (“FASB”) issued Accounting Standards Update (“ASU”) “Improving Disclosures about Fair Value Measurements” that requires additional disclosures regarding fair value measurements. Certain required disclosures are effective for interim and annual reporting periods beginning after December 15, 2010. |
| | |
| | In May 2011, FASB issued ASU No. 2011-04 “Amendments to Achieve Common Fair Value Measurement and Disclosure Requirements” in U.S. generally accepted accounting principles (“GAAP”) and the International Financial Reporting Standards (“IFRSs”). ASU No. 2011-04 amends FASB ASC Topic 820, Fair Value Measurements and Disclosures, to establish common requirements for measuring fair value and for disclosing information about fair value measurements in accordance with GAAP and IFRSs. ASU No. 2011-04 is effective for fiscal years beginning after December 15, 2011 and for interim periods within those fiscal years. Management is currently evaluating the impact these updates and amendments may have on the Trust’s financial statements. |
TAX-FREE TRUST OF OREGON
NOTES TO FINANCIAL STATEMENTS (continued)
SEPTEMBER 30, 2011
3. Fees and Related Party Transactions
a) Management Arrangements:
Aquila Investment Management LLC (the “Manager”), a wholly-owned subsidiary of Aquila Management Corporation, the Trust’s founder and sponsor, serves as the Manager for the Trust under an Advisory and Administration Agreement with the Trust. The portfolio management of the Trust has been delegated to a Sub-Adviser as described below. Under the Advisory and Administrative Agreement, the Manager provides all administrative services to the Trust, other than those relating to the day-to-day portfolio management. The Manager’s services include providing the office of the Trust and all related services as well as overseeing the activities of the Sub-Adviser and managing relationships with all the various support organizations to the Trust such as the shareholder servicing agent, custodian, legal counsel, auditors and distributor and additionally maintaining the Trust’s accounting books and records. For its services, the Manager is entitled to receive a fee which is payable monthly and computed as of the close of business each day at the annual rate of 0.40 of 1% of net assets of the Trust. Beginning January 1, 2011, the Manager determined to waive its fees to the extent necessary so that fees through the period ending January 31, 2012 shall be as follows: the annual rate shall be equivalent to 0.40 of 1% of such net asset value on net assets of the Trust above $400 million; 0.38 of 1% of the Trust’s net assets above that amount to $1 billion and 0.36 of 1% of the Trust’s net assets above $1 billion. For the year ended September 30, 2011, the Trust incurred management fees of $1,909,607 of which $9,956 was waived.
Kirkpatrick Pettis Capital Management (the “Sub-Adviser”) serves as the Investment Sub-Adviser for the Trust under a Sub-Advisory Agreement between the Manager and the Sub-Adviser. Under this agreement, the Sub-Adviser continuously provides, subject to oversight of the Manager and the Board of Trustees of the Trust, the investment program of the Trust and the composition of its portfolio, arranges for the purchases and sales of portfolio securities, and provides for daily pricing of the Trust’s portfolio. For its services, the Sub-Adviser is entitled to receive a fee from the Manager which is payable monthly and computed as of the close of business each day at the annual rate of 0.18 of 1% of net assets of the Trust up to $400 million; 0.16 of 1% of net assets above $400 million up to $1 billion; and 0.14 of 1% of net assets above $1 billlion. Prior to January 1, 2011, the former Sub-Adviser was paid a fee at the annual rate of 0.18 of 1% on the Trust’s entire net assets.
Under a Compliance Agreement with the Manager, the Manager is compensated for Chief Compliance Officer related services provided to enable the Trust to comply with Rule 38a-1 of the Investment Company Act of 1940.
Specific details as to the nature and extent of the services provided by the Manager and the Sub-Adviser are more fully defined in the Trust’s Prospectus and Statement of Additional Information.
TAX-FREE TRUST OF OREGON
NOTES TO FINANCIAL STATEMENTS (continued)
SEPTEMBER 30, 2011
b) Distribution and Service Fees:
The Trust has adopted a Distribution Plan (the “Plan”) pursuant to Rule 12b-1 (the “Rule”) under the Investment Company Act of 1940. Under one part of the Plan, with respect to Class A Shares, the Trust is authorized to make distribution fee payments to broker-dealers or others (“Qualified Recipients”) selected by Aquila Distributors, Inc. (the “Distributor”), including, but not limited to, any principal underwriter of the Trust, with which the Distributor has entered into written agreements contemplated by the Rule and which have rendered assistance in the distribution and/or retention of the Trust’s shares or servicing of shareholder accounts. The Trust makes payment of this distribution fee at the annual rate of 0.15% of the Trust’s average net assets represented by Class A Shares. For the year ended September 30, 2011, distribution fees on Class A Shares amounted to $560,647 of which the Distributor retained $30,229.
Under another part of the Plan, the Trust is authorized to make payments with respect to Class C Shares to Qualified Recipients which have rendered assistance in the distribution and/or retention of the Trust’s Class C shares or servicing of shareholder accounts. These payments are made at the annual rate of 0.75% of the Trust’s average net assets represented by Class C Shares and for the year ended September 30, 2011, amounted to $198,700. In addition, under a Shareholder Services Plan, the Trust is authorized to make service fee payments with respect to Class C Shares to Qualified Recipients for providing personal services and/or maintenance of shareholder accounts. These payments are made at the annual rate of 0.25% of the Trust’s average net assets represented by Class C Shares and for the year ended September 30, 2011, amounted to $66,234. The total of these payments made with respect to Class C Shares amounted to $264,934 of which the Distributor retained $48,890.
Specific details about the Plans are more fully defined in the Trust’s Prospectus and Statement of Additional Information.
Under a Distribution Agreement, the Distributor serves as the exclusive distributor of the Trust’s shares. Through agreements between the Distributor and various brokerage and advisory firms (“intermediaries”), the Trust’s shares are sold primarily through the facilities of these intermediaries having offices within Oregon, with the bulk of any sales commissions inuring to such intermediaries. For the year ended September 30, 2011, total commissions on sales of Class A Shares amounted to $778,370 of which the Distributor received $136,903.
c) Other Related Party Transactions
On June 1, 2011, Bingham McCutchen LLP replaced Butzel Long PC (“Butzel”) as counsel to the Trust. During the period October 1, 2010 to May 31, 2011, the Trust incurred $202,577 of legal fees allocable to Butzel for legal services in conjunction with the Trust’s ongoing operations. During this period, the Trust’s former Secretary was Of Counsel to Butzel.
TAX-FREE TRUST OF OREGON
NOTES TO FINANCIAL STATEMENTS (continued)
SEPTEMBER 30, 2011
4. Purchases and Sales of Securities
During the year ended September 30, 2011, purchases of securities and proceeds from the sales of securities aggregated $70,032,316 and $91,102,635, respectively.
At September 30, 2011, the aggregate tax cost for all securities was $444,361,270. At September 30, 2011, the aggregate gross unrealized appreciation for all securities in which there is an excess of value over tax cost amounted to $30,808,197 and aggregate gross unrealized depreciation for all securities in which there is an excess of tax cost over value amounted to $588,502 for a net unrealized appreciation of $30,219,695.
5. Portfolio Orientation
Since the Trust invests principally and may invest entirely in double tax-free municipal obligations of issuers within Oregon, it is subject to possible risks associated with economic, political, or legal developments or industrial or regional matters specifically affecting Oregon and whatever effects these may have upon Oregon issuers’ ability to meet their obligations. Two such developments, Measure 5, a 1990 amendment to the Oregon Constitution, as well as Measures 47 and 50, limit the taxing and spending authority of certain Oregon governmental entities. These amendments could have an adverse effect on the general financial condition of certain municipal entities that would impair the ability of certain Oregon issuers to pay interest and principal on their obligations.
6. Expenses
The Trust has negotiated an expense offset arrangement with its custodian, wherein it receives credit toward the reduction of custodian fees and other Trust expenses whenever there are uninvested cash balances. The Statement of Operations reflects the total expenses before any offset, the amount of offset and the net expenses.
7. Trustees’ Fees and Expenses
At September 30, 2011 there were 7 Trustees, one of whom is affiliated with the Manager and is not paid any fees. The total amount of Trustees’ service fees (for carrying out their responsibilities) and attendance fees paid during the year ended September 30, 2011 was $197,816. Attendance fees are paid to those in attendance at regularly scheduled quarterly Board Meetings and meetings of the Independent Trustees held prior to each quarterly Board Meeting, as well as additional meetings (such as Audit, Nominating, Shareholder and special meetings). Trustees are reimbursed for their expenses such as travel, accommodations, and meals incurred in connection with attendance at Board Meetings and at the Annual Meeting of Shareholders. For the year ended September 30, 2011, such meeting-related expenses amounted to $64,260.
TAX-FREE TRUST OF OREGON
NOTES TO FINANCIAL STATEMENTS (continued)
SEPTEMBER 30, 2011
8. Capital Share Transactions
Transactions in Capital Shares of the Trust were as follows:
| | | Year Ended | | | Year Ended | |
| | | September 30, 2011 | | | September 30, 2010 | |
| | | Shares | | | Amount | | | Shares | | | Amount | |
| Class A Shares: | | | | | | | | | | | | |
| Proceeds from shares sold | | | 2,898,388 | | | $ | 31,437,611 | | | | 4,473,622 | | | $ | 48,902,418 | |
| Reinvested dividends and | | | | | | | | | | | | | | | | |
| distributions | | | 787,415 | | | | 8,515,528 | | | | 813,690 | | | | 8,901,500 | |
| Cost of shares redeemed | | | (5,278,453 | ) | | | (56,779,136 | ) | | | (2,939,280 | ) | | | (32,145,652 | ) |
| Net change | | | (1,592,650 | ) | | | (16,825,997 | ) | | | 2,348,032 | | | | 25,658,266 | |
| Class C Shares: | | | | | | | | | | | | | | | | |
| Proceeds from shares sold | | | 549,608 | | | | 5,952,506 | | | | 1,121,113 | | | | 12,232,462 | |
| Reinvested dividends and | | | | | | | | | | | | | | | | |
| distributions | | | 47,902 | | | | 517,523 | | | | 45,661 | | | | 499,481 | |
| Cost of shares redeemed | | | (758,285 | ) | | | (8,101,298 | ) | | | (536,556 | ) | | | (5,876,357 | ) |
| Net change | | | (160,775 | ) | | | (1,631,269 | ) | | | 630,218 | | | | 6,855,586 | |
| Class Y Shares: | | | | | | | | | | | | | | | | |
| Proceeds from shares sold . | | | 1,352,255 | | | | 14,560,700 | | | | 2,395,679 | | | | 26,166,411 | |
| Reinvested dividends and | | | | | | | | | | | | | | | | |
| distributions | | | 123,185 | | | | 1,329,635 | | | | 126,770 | | | | 1,386,585 | |
| Cost of shares redeemed | | | (3,577,404 | ) | | | (38,153,605 | ) | | | (1,682,972 | ) | | | (18,359,152 | ) |
| Net change | | | (2,101,964 | ) | | | (22,263,270 | ) | | | 839,477 | | | | 9,193,844 | |
| Total transactions in Trust | | | | | | | | | | | | | | | | |
| shares | | | (3,855,389 | ) | | $ | (40,720,536 | ) | | | 3,817,727 | | | $ | 41,707,696 | |
9. Securities Traded on a When-Issued Basis
The Trust may purchase or sell securities on a when-issued basis. When-issued transactions arise when securities are purchased or sold by the Trust with payment and delivery taking place in the future in order to secure what is considered to be an advantageous price and yield to the Trust at the time of entering into the transaction. Beginning on the date the Trust enters into a when-issued transaction, cash or other liquid securities are segregated in an amount equal to or greater than the value of the when-issued transaction. These transactions are subject to market fluctuations and their current value is determined in the same manner as for other securities.
TAX-FREE TRUST OF OREGON
NOTES TO FINANCIAL STATEMENTS (continued)
SEPTEMBER 30, 2011
10. Income Tax Information and Distributions
The Trust declares dividends daily from net investment income and makes payments monthly. Net realized capital gains, if any, are distributed annually and are taxable. These distributions are paid in additional shares at the net asset value per share, in cash, or in a combination of both, at the shareholder’s option.
The Trust intends to maintain, to the maximum extent possible, the tax-exempt status of interest payments received from portfolio municipal securities in order to allow dividends paid to shareholders from net investment income to be exempt from regular Federal and State of Oregon income taxes. Due to differences between financial statement reporting and Federal income tax reporting requirements, distributions made by the Trust may not be the same as the Trust’s net investment income, and/or net realized securities gains. Further, a portion of the dividends may, under some circumstances, be subject to taxes at ordinary income and/or capital gain rates. At September 30, 2011, the Trust had a capital loss carry forward of $116,445 which expires in 2017.
As of September 30, 2011, there were post-October capital loss deferrals of $213,603 which will be recognized in the following year.
The tax character of distributions:
| | | Year Ended September 30, | |
| | | 2011 | | | 2010 | |
| Net tax-exempt income | | $ | 16,826,664 | | | $ | 17,862,526 | |
| Ordinary income | | | – | | | | 145,973 | |
| Capital gain | | | – | | | | – | |
| | | $ | 16,826,664 | | | $ | 18,008,499 | |
As of September 30, 2011, the components of distributable earnings on a tax basis were as follows:
| Unrealized appreciation | | $ | 30,219,695 | |
| Undistributed tax-exempt income | | | 256,170 | |
| Accumulated net loss on investments | | | (116,445 | ) |
| Other temporary differences | | | (469,773 | ) |
| | | $ | 29,889,647 | |
The difference between book basis and tax basis undistributed income is due to the timing difference in recognizing dividends paid.
TAX-FREE TRUST OF OREGON
NOTES TO FINANCIAL STATEMENTS (continued)
SEPTEMBER 30, 2011
11. Tax Information
The Regulated Investment Company Modernization Act of 2010 (the “Modernization Act”) was enacted on December 22, 2010. The Modernization Act amends several tax provisions impacting mutual funds. In general, the amendments are effective for fiscal years beginning after enactment. The Modernization Act provides several benefits, including the unlimited carryover of future capital losses versus the prior eight year limitation. Relevant information regarding the impact of the Modernization Act, if any, will be contained within the Federal Tax Status of Distributions section of the financial statements for the fiscal year ending September 30, 2012.
12. Ongoing Development
Since December 2007, the three major rating agencies (Standard & Poor’s, Moody’s and Fitch) downgraded or eliminated ratings of the majority of the municipal bond insurance companies due to loss of capital from investments in subprime mortgages. Only a few insurers are now deemed to be investment grade. Thus, while certain bonds have insurance, some are no longer rated based upon the ratings of their insurers. Furthermore, because the ability of many of the Trust’s insurers to pay claims has been downgraded, the protection of such insurance has been diminished, and there is no assurance that some of them may be relied upon for payment.
TAX-FREE TRUST OF OREGON
FINANCIAL HIGHLIGHTS
For a share outstanding throughout each period
| | | Class A | |
| | |
| | | Year Ended September 30, | |
| | | 2011 | | | 2010 | | | 2009 | | | 2008 | | | 2007 | |
| Net asset value, beginning of period | | $ | 11.18 | | | $ | 11.05 | | | $ | 10.11 | | | $ | 10.68 | | | $ | 10.84 | |
| Income (loss) from investment operations: | | | | | | | | | | | | | | | | | | | | |
| Net investment income | | | 0.38 | (1) | | | 0.40 | (1) | | | 0.42 | (1) | | | 0.42 | (1) | | | 0.41 | (2) |
| Net gain (loss) on securities (both | | | | | | | | | | | | | | | | | | | | |
| realized and unrealized) | | | (0.06 | ) | | | 0.13 | | | | 0.94 | | | | (0.58 | ) | | | (0.16 | ) |
| Total from investment operations | | | 0.32 | | | | 0.53 | | | | 1.36 | | | | (0.16 | ) | | | 0.25 | |
| Less distributions (note 10): | | | | | | | | | | | | | | | | | | | | |
| Dividends from net investment income | | | (0.38 | ) | | | (0.40 | ) | | | (0.42 | ) | | | (0.41 | ) | | | (0.41 | ) |
| Distributions from capital gains | | | – | | | | – | | | | – | | | | – | | | | (3) | |
| Total distributions | | | (0.38 | ) | | | (0.40 | ) | | | (0.42 | ) | | | (0.41 | ) | | | (0.41 | ) |
| Net asset value, end of period | | $ | 11.12 | | | $ | 11.18 | | | $ | 11.05 | | | $ | 10.11 | | | $ | 10.68 | |
| Total return (not reflecting sales charge) | | | 3.05 | % | | | 4.95 | % | | | 13.74 | % | | | (1.58 | )% | | | 2.37 | % |
| Ratios/supplemental data | | | | | | | | | | | | | | | | | | | | |
| Net assets, end of period (in millions) | | $ | 380 | | | $ | 400 | | | $ | 370 | | | $ | 324 | | | $ | 336 | |
| Ratio of expenses to average net assets | | | 0.76 | % | | | 0.72 | % | | | 0.73 | % | | | 0.76 | % | | | 0.75 | % |
| Ratio of net investment income to average | | | | | | | | | | | | | | | | | | | | |
| net assets | | | 3.55 | % | | | 3.65 | % | | | 4.02 | % | | | 3.89 | % | | | 3.77 | % |
| Portfolio turnover rate | | | 15 | % | | | 9 | % | | | 15 | % | | | 15 | % | | | 22 | % |
| | |
| The expense and net investment income ratios without the effect of the contractual waiver of management fees were (note 3): | |
| | |
| Ratio of expenses to average net assets | | | 0.76 | % | | | – | | | | – | | | | – | | | | – | |
| Ratio of net investment income to average | | | | | | | | | | | | | | | | | | | | |
| net assets | | | 3.55 | % | | | – | | | | – | | | | – | | | | – | |
| | |
| The expense ratios after giving effect to the contractual waiver of management fees and expense offset for uninvested cash balances were: | |
| | |
| Ratio of expenses to average net assets | | | 0.76 | % | | | 0.72 | % | | | 0.73 | % | | | 0.74 | % | | | 0.74 | % |
___________________
(1) Per share amounts have been calculated using the daily average shares method.
(2) Per share amounts have been calculated using the monthly average shares method.
(3) Less than $0.01 per share.
Note: On January 1, 2011, Kirkpatrick Pettis Capital Management became the Trust’s Investment Sub-Adviser, replacing FAF Advisors, Inc.
See accompanying notes to financial statements.
TAX-FREE TRUST OF OREGON
FINANCIAL HIGHLIGHTS (continued)
For a share outstanding throughout each period
| | | Class C | | | Class Y | |
| | | Year Ended September 30, | | | Year Ended September 30, | |
| | | 2011 | | | 2010 | | | 2009 | | | 2008 | | | 2007 | | | 2011 | | | 2010 | | | 2009 | | | 2008 | | | 2007 | |
| Net asset value, beginning of period | | $ | 11.17 | | | $ | 11.04 | | | $ | 10.10 | | | $ | 10.68 | | | $ | 10.84 | | | $ | 11.18 | | | $ | 11.04 | | | $ | 10.10 | | | $ | 10.68 | | | $ | 10.84 | |
| Income (loss) from investment operations: | | | | | | | | | | | | | | | | | | | | | | | | | | | | | | | | | | | | | | | | |
| Net investment income | | | 0.29 | (1) | | | 0.30 | (1) | | | 0.33 | (1) | | | 0.33 | (1) | | | 0.32 | (2) | | | 0.40 | (1) | | | 0.42 | (1) | | | 0.44 | (1) | | | 0.43 | (1) | | | 0.43 | (2) |
| Net gain (loss) on securities (both | | | | | | | | | | | | | | | | | | | | | | | | | | | | | | | | | | | | | | | | |
| realized and unrealized) | | | (0.06 | ) | | | 0.14 | | | | 0.94 | | | | (0.59 | ) | | | (0.16 | ) | | | (0.07 | ) | | | 0.14 | | | | 0.93 | | | | (0.58 | ) | | | (0.16 | ) |
| Total from investment operations | | | 0.23 | | | | 0.44 | | | | 1.27 | | | | (0.26 | ) | | | 0.16 | | | | 0.33 | | | | 0.56 | | | | 1.37 | | | | (0.15 | ) | | | 0.27 | |
| Less distributions (note 10): | | | | | | | | | | | | | | | | | | | | | | | | | | | | | | | | | | | | | | | | |
| Dividends from net investment income | | | (0.29 | ) | | | (0.31 | ) | | | (0.33 | ) | | | (0.32 | ) | | | (0.32 | ) | | | (0.40 | ) | | | (0.42 | ) | | | (0.43 | ) | | | (0.43 | ) | | | (0.43 | ) |
| Distributions from capital gains | | | – | | | | – | | | | – | | | | – | | | | (3) | | | | – | | | | – | | | | – | | | | – | | | | (3) | |
| Total distributions | | | (0.29 | ) | | | (0.31 | ) | | | (0.33 | ) | | | (0.32 | ) | | | (0.32 | ) | | | (0.40 | ) | | | (0.42 | ) | | | (0.43 | ) | | | (0.43 | ) | | | (0.43 | ) |
| Net asset value, end of period | | $ | 11.11 | | | $ | 11.17 | | | $ | 11.04 | | | $ | 10.10 | | | $ | 10.68 | | | $ | 11.11 | | | $ | 11.18 | | | $ | 11.04 | | | $ | 10.10 | | | $ | 10.68 | |
| Total return | | | 2.18 | %(4) | | | 4.07 | %(4) | | | 12.79 | %(4) | | | (2.51 | )%(4) | | | 1.51 | %(4) | | | 3.11 | % | | | 5.21 | % | | | 13.92 | % | | | (1.52 | )% | | | 2.52 | % |
| Ratios/supplemental data | | | | | | | | | | | | | | | | | | | | | | | | | | | | | | | | | | | | | | | | |
| Net assets, end of period (in millions) | | $ | 27 | | | $ | 29 | | | $ | 22 | | | $ | 18 | | | $ | 25 | | | $ | 71 | | | $ | 95 | | | $ | 85 | | | $ | 58 | | | $ | 49 | |
| Ratio of expenses to average net assets | | | 1.61 | % | | | 1.57 | % | | | 1.58 | % | | | 1.61 | % | | | 1.60 | % | | | 0.61 | % | | | 0.57 | % | | | 0.58 | % | | | 0.61 | % | | | 0.60 | % |
| Ratio of net investment income to | | | | | | | | | | | | | | | | | | | | | | | | | | | | | | | | | | | | | | | | |
| average net assets | | | 2.70 | % | | | 2.78 | % | | | 3.15 | % | | | 3.04 | % | | | 2.92 | % | | | 3.70 | % | | | 3.80 | % | | | 4.16 | % | | | 4.04 | % | | | 3.92 | % |
| Portfolio turnover rate | | | 15 | % | | | 9 | % | | | 15 | % | | | 15 | % | | | 22 | % | | | 15 | % | | | 9 | % | | | 15 | % | | | 15 | % | | | 22 | % |
| | | | | | | | | | | | | | | | | | |
| The expense and net investment income ratios without the effect of the contractual waiver of management fees were (note 3): | | | | | | | | | | | | | | | | | |
| | | | | | | | | | | | | | | | | | |
| Ratio of expenses to average net assets | | | 1.61 | % | | | – | | | | – | | | | – | | | | – | | | | 0.61 | % | | | – | | | | – | | | | – | | | | – | |
| Ratio of net investment income to | | | | | | | | | | | | | | | | | | | | | | | | | | | | | | | | | | | | | | | | |
| average net assets | | | 2.70 | % | | | – | | | | – | | | | – | | | | – | | | | 3.70 | % | | | – | | | | – | | | | – | | | | – | |
| | | | | | | | | | |
| The expense ratios after giving effect to the contractual waiver of management fees and expense offset for uninvested cash balances were: | | | | | | | | | |
| | | | | | | | | | |
| Ratio of expenses to average net assets | | | 1.61 | % | | | 1.57 | % | | | 1.58 | % | | | 1.59 | % | | | 1.59 | % | | | 0.61 | % | | | 0.57 | % | | | 0.58 | % | | | 0.59 | % | | | 0.59 | % |
___________________
(1) Per share amounts have been calculated using the daily average shares method.
(2) Per share amounts have been calculated using the monthly average shares method.
(3) Less than $0.01 per share.
(4) Not reflecting CDSC.
Note: On January 1, 2011, Kirkpatrick Pettis Capital Management became the Trust’s Investment Sub-Adviser, replacing FAF Advisors, Inc.
See accompanying notes to financial statements.
| Additional Information (unaudited) | | | | |
| | | | | |
Trustees(1) | | | | |
| and Officers | | | | |
| | | | | | | Number of | | |
| | | Positions | | | | Portfolios | | |
| | | Held with | | | | in Fund | | |
| Name, | | Trust and | | Principal | | Complex | | Other Directorships |
Address(2) | | Length of | | Occupation(s) | | Overseen | | Held by Trustee |
| and Date of Birth | | Service(3) | | During Past 5 Years | | by Trustee | | During Past 5 Years |
Interested Trustee(4) | | | | | | |
| | | | | | | | | |
Diana P. Herrmann New York, NY (02/25/58) | | Vice Chair of the Board of Trustees since 2003, President since 1998 and Trustee since 1994 | | Vice Chair and Chief Executive Officer of Aquila Management Corporation, Founder of the Aquila Group of Funds(5) and parent of Aquila Investment Management LLC, Manager since 2004, President since 1997, Chief Operating Officer, 1997-2008, a Director since 1984, Secretary since 1986 and previously its Executive Vice President, Senior Vice President or Vice President, 1986-1997; Chief Executive Officer and Vice Chair since 2004, President and Manager since 2003, and Chief Operating Officer (2003-2008), of the Manager; Chair, Vice Chair, President, Executive Vice President and/or Senior Vice President of funds in the Aquila Group of Funds since 1986; Director of the Distributor since 1997; Governor, Investment Company Institute (the trade organization for the U.S. mutual fund industry dedicated to protecting shareholder interests and educating the public about investing) for various periods since 2004, and head of its Small Funds Committee, 2004-2009; active in charitable and volunteer organizations. | | 12 | | ICI Mutual Insurance Company, a Risk Retention Group (2006-2009 and since 2010) |
Trustees(1) | | | | | | | | |
| and Officers | | | | | | |
| | | | | | | Number of | | |
| | | Positions | | | | Portfolios | | |
| | | Held with | | | | in Fund | | |
| Name, | | Trust and | | Principal | | Complex | | Other Directorships |
Address(2) | | Length of | | Occupation(s) | | Overseen | | Held by Trustee |
| and Date of Birth | | Service(3) | | During Past 5 Years | | by Trustee | | During Past 5 Years |
| | | | | | | | | |
| Non-interested Trustees | | | | | | |
| | | | | | | | | |
James A. Gardner Terrebonne, OR (07/22/43) | | Chair of the Board of Trustees since 2005 and Trustee since 1986 | | President, Gardner Associates, an investment and real estate firm, since 1989; Owner and Developer of Vandevert Ranch, Sunriver, Oregon since 1989; Founding Partner, Chairman Emeritus and previously Chairman (1991-2010), Ranch at the Canyons, Terrebonne, Oregon; President Emeritus and previously President (1981-1989), Lewis and Clark College and Law School; director, Oregon High Desert Museum, 1989-2003; active in civic, business and educational organizations in Oregon; writer on Native American and settlement history of Oregon. | | 1 | | None |
| | | | | | | | | |
Gary C. Cornia Orem, UT (06/24/48) | | Trustee since 2002 | | Dean, Marriott School of Management, Brigham Young University, since 2008; Director, Romney Institute of Public Management, Marriott School of Management, 2004-2008; Professor, Marriott School of Management, 1980-present; Past President, National Tax Association; Fellow, Lincoln Institute of Land Policy, 2002-present; Associate Dean, Marriott School of Management, Brigham Young University, 1991-2000; member, Utah Governor’s Tax Review Committee, 1993-2009. | | 5 | | Utah Foundation, Salt Lake City, UT; formerly director, Lincoln Institute of Land Policy, Cambridge, MA |
| | | | | | | | | |
| Edmund P. Jensen Portland, OR (04/13/37) | | Trustee since 2003 | | President and CEO, VISA International, 1994-1999; Vice Chairman and Chief Operating Officer, US Bancorp, 1974-1994. | | 1 | | Five Cubits, Inc. (formerly BMG Seltec), a software company; Lewis and Clark College, Portland, OR |
Trustees(1) | | | | | | | | |
| and Officers | | | | | | |
| | | | | | | Number of | | |
| | | Positions | | | | Portfolios | | |
| | | Held with | | | | in Fund | | |
| Name, | | Trust and | | Principal | | Complex | | Other Directorships |
Address(2) | | Length of | | Occupation(s) | | Overseen | | Held by Trustee |
| and Date of Birth | | Service(3) | | During Past 5 Years | | by Trustee | | During Past 5 Years |
| | | | | | | | | |
John W. Mitchell Lake Oswego, OR (07/13/44) | | Trustee since 1999 | | Principal of M & H Economic Consultants; Economist, Western Region, for U.S. Bancorp 1998-2007; Chief Economist, U.S. Bancorp, Portland, Oregon, 1983-1998; member, Oregon Governor’s Council of Economic Advisors, 1984-1998; Chairman, Oregon Governor’s Technical Advisory Committee for Tax Review in 1998. | | 1 | | Oregon Mutual Insurance; Western Capital Corporation |
| | | | | | | | | |
Ralph R. Shaw Portland, OR (08/23/38) | | Trustee since 2000 | | President, Shaw Management Company, an investment counseling firm, 1980-present; General Partner, Shaw Venture Partners, 1983-2005; Shaw Venture Partners II, 1987-2005; and Shaw Venture Partners III, 1994-2005. | | 1 | | Schnitzer Steel Industries, Inc., Telestream, Inc., Five Cubits, Inc. (formerly BMG Seltec), a software company, Rentrak Corporation, One-to-One Interactive, Optimum Energy Co. |
| | | | | | | | | |
Nancy Wilgenbusch Marylhurst, OR (09/17/47) | | Trustee since 2002 | | President Emerita since 2008 and President 1984-2008, Marylhurst University; member, former Chair, Portland Branch of the Federal Reserve Bank of San Francisco; active board member of a number of civic organizations. | | 1 | | West Coast Bank; Cascade Corporation, a leading international manufacturer of lift truck attachments |
The specific experience, qualifications, attributes or skills that led to the conclusion that these persons should serve as Trustees of the Trust, in addition to those listed above, were as follows.
Diana P. Herrmann: James A. Gardner: Gary C. Cornia: Edmund P. Jensen: John W. Mitchell: Ralph R. Shaw: | More than 25 years of experience in mutual fund management. Experienced mutual fund Trustee; wide background in public affairs. Experienced educator in business and finance. Experienced in banking and finance matters. Experienced economist, extensive knowledge of Oregon economy. Prominent local businessman with extensive knowledge of local and national capital markets. |
| Nancy Wilgenbusch: | Experienced educator; member and former Chair of Portland branch of the Federal Reserve Bank of San Francisco. |
References to the qualifications, attributes and skills of Trustees are pursuant to requirements of the SEC, do not constitute holding out of the Board or any Trustee as having any special expertise or experience, and shall not impose any greater responsibility or liability on any such person or on the Board by reason thereof.
| Name, | | Trust and | | |
Address(1) | | Length of | | |
| and Date of Birth | | Service(2) | | Principal Occupation(s) During Past 5 Years |
| | | | | |
Trustees Emeritus(6) | | | | |
| | | | | |
Lacy B. Herrmann New York, NY (05/12/29) | | Founder and Chairman Emeritus since 2005; Chairman of the Board of Trustees 1985-2004 and Trustee, 1985-2005 | | Founder and Chairman of the Board, Aquila Management Corporation, the sponsoring organization and parent of the Manager or Administrator and/or Adviser to each fund of the Aquila Group of Funds; Chairman of the Manager or Administrator and/or Adviser to each since 2004; Founder and Chairman Emeritus of each fund in the Aquila Group of Funds; previously Chairman and a Trustee of each fund in the Aquila Group of Funds since its establishment until 2004 or 2005; Director of the Distributor since 1981 and formerly Vice President or Secretary, 1981-1998; Director or trustee, Premier VIT, 1994-2009; Director or trustee of Oppenheimer Quest Value Funds Group, Oppenheimer Small Cap Value Fund, Oppenheimer Midcap Fund, 1987-2009, and Oppenheimer Rochester Group of Funds, 1995-2009; Trustee Emeritus, Brown University and the Hopkins School; active in university, school and charitable organizations. |
| | | | | |
Vernon R. Alden Boston, MA (04/07/23) | | Trustee Emeritus since 2006 | | Retired; former director or trustee of various Fortune 500 companies, including Colgate-Palmolive and McGraw Hill; formerly Chairman of the Boston Company, President of Ohio University and Associate Dean of the Harvard University Graduate School of Business Administration; Trustee, Narragansett Insured Tax-Free Income Fund, 1992-2006, Tax-Free Trust of Oregon, 1988-2001 and Hawaiian Tax-Free Trust, Pacific Capital Cash Assets Trust, Pacific Capital Tax-Free Cash Assets Trust and Pacific Capital U.S. Government Securities Cash Assets Trust, 1989-2001; Trustee Emeritus, Narragansett Insured Tax-Free Income Fund since 2006; member of several Japan-related advisory councils, including Chairman of the Japan Society of Boston; trustee of various cultural, educational and civic organizations. |
| | | | | |
David B. Frohnmayer Eugene, OR (07/09/40) | | Trustee Emeritus since 2003 | | President Emeritus and formerly President (1994-2009), University of Oregon; former Dean of the University of Oregon Law School and former Attorney General of the State of Oregon; Trustee, Tax-Free Trust of Oregon, 1997-2003. |
| | | | | |
Patricia L. Moss Bend, OR (07/23/53) | | Trustee Emerita since 2005 | | President and Chief Executive Officer, Cascade Bancorp and Bank of the Cascades since 1998; Director, Cascade Bancorp; Director, MDU Resources; Trustee, Tax-Free Trust of Oregon, 2002-2005; active in community and educational organizations. |
| Name, | | Trust and | | |
Address(1) | | Length of | | |
| and Date of Birth | | Service(2) | | Principal Occupation(s) During Past 5 Years |
| | | | | |
| Officers | | | | |
| | | | | |
Charles E. Childs, III New York, NY (04/01/57) | | Executive Vice President since 2003 and Secretary since 2011 | | Executive Vice President of all funds in the Aquila Group of Funds and the Manager and the Manager’s parent since 2003; Chief Operating Officer of the Manager and the Manager’s parent since 2008; Secretary of all funds in the Aquila Group of Funds since 2011; formerly Senior Vice President, corporate development, Vice President, Assistant Vice President and Associate of the Manager’s parent since 1987; Senior Vice President, Vice President or Assistant Vice President of the Aquila Money-Market Funds, 1988-2003. |
| | | | | |
Marie E. Aro Denver, CO (02/10/55) | | Senior Vice President since 2010 | | Co-President of the Distributor since 2010, Vice President, 1993-1997; Senior Vice President, Aquila Three Peaks Opportunity Growth Fund since 2004; Senior Vice President, Tax-Free Trust of Arizona since 2010 and Vice President, 2004-2010; Senior Vice President, Aquila Three Peaks High Income Fund since 2006; Senior Vice President, Hawaiian Tax-Free Trust, Tax-Free Fund For Utah, Tax-Free Fund of Colorado, Tax-Free Trust of Oregon, Churchill Tax-Free Fund of Kentucky and Narragansett Insured Tax-Free Income Fund since 2010; Vice President, INVESCO Funds Group, 1998-2003. |
| | | | | |
Paul G. O’Brien Charlotte, NC (11/28/59) | | Senior Vice President since 2010 | | Co-President, Aquila Distributors, Inc. since 2010, Managing Director, 2009-2010; Senior Vice President of Aquila Three Peaks Opportunity Growth Fund, Aquila Three Peaks High Income Fund, and each of the Aquila Municipal Bond Funds since 2010; held various positions to Senior Vice President and Chief Administrative Officer of Evergreen Investments Services, Inc., 1997-2008; Mergers and Acquisitions Coordinator for Wachovia Corporation, 1994-1997. |
| | | | | |
Christine L. Neimeth Portland, OR (02/10/64) | | Vice President since 1998 | | Vice President of Aquila Three Peaks Opportunity Growth Fund and Tax-Free Trust of Oregon. |
| | | | | |
Robert S. Driessen New York, NY (10/12/47) | | Chief Compliance Officer since 2009 | | Chief Compliance Officer of each fund in the Aquila Group of Funds, the Manager and the Distributor since 2009; Vice President, Chief Compliance Officer, Curian Capital, LLC, 2004-2008; Vice President, Chief Compliance Officer, Phoenix Investment Partners, Ltd., 1999-2004; Vice President, Risk Liaison, Corporate Compliance, Bank of America, 1996-1999; Vice President, Securities Compliance, Prudential Insurance Company of America, 1993-1996; various positions to Branch Chief, U.S. Securities and Exchange Commission, 1972-1993. |
| Name, | | Trust and | | |
Address(1) | | Length of | | |
| and Date of Birth | | Service(2) | | Principal Occupation(s) During Past 5 Years |
| | | | | |
Joseph P. DiMaggio New York, NY (11/06/56) | | Chief Financial Officer since 2003 and Treasurer since 2000 | | Chief Financial Officer of each fund in the Aquila Group of Funds since 2003 and Treasurer since 2000. |
| | | | | |
Yolonda S. Reynolds New York, NY (04/23/60) | | Assistant Treasurer since 2010 | | Director of Fund Accounting for the Aquila Group of Funds since 2007; Investment Accountant, TIAA-CREF, 2007; Senior Fund Accountant, JP Morgan Chase, 2003-2006. |
| | | | | |
Lori A. Vindigni New York, NY (11/02/66) | | Assistant Treasurer since 2000 | | Assistant Treasurer of each fund in the Aquila Group of Funds since 2000; Assistant Vice President of the Manager or its predecessor and current parent since 1998; Fund Accountant for the Aquila Group of Funds, 1995-1998. |
_____________________
(1) The Trust’s Statement of Additional Information includes additional information about the Trustees and officers and is available, without charge, upon request by calling 800-437-1020 (toll-free) or by visiting www.aquilafunds.com or the EDGAR Database at the SEC’s internet site at www.sec.gov.
(2) The mailing address of each Trustee and officer is c/o Tax-Free Trust of Oregon, 380 Madison Avenue, Suite 2300, New York, NY 10017.
(3) Each Trustee holds office until the next annual meeting of shareholders or until his or her successor is elected and qualifies. The term of office of each officer is one year.
(4) Ms. Herrmann is an interested person of the Trust as an officer of the Trust, as a director, officer and shareholder of the Manager’s corporate parent, as an officer and Manager of the Manager, and as a shareholder and director of the Distributor. Ms. Herrmann is the daughter of Lacy B. Herrmann, the Founder and Chairman Emeritus of the Trust.
(5) In this material Pacific Capital Cash Assets Trust, Pacific Capital Tax-Free Cash Assets Trust and Pacific Capital U.S. Government Securities Cash Assets Trust, each of which is a money-market fund, are called the “Aquila Money-Market Funds”; Tax-Free Trust of Arizona, Tax-Free Fund of Colorado, Hawaiian Tax-Free Trust, Churchill Tax-Free Fund of Kentucky, Tax-Free Trust of Oregon, Narragansett Insured Tax-Free Income Fund (Rhode Island) and Tax-Free Fund For Utah, each of which is a tax-free municipal bond fund, are called the “Aquila Municipal Bond Funds”; Aquila Three Peaks Opportunity Growth Fund is an equity fund; and Aquila Three Peaks High Income Fund is a high income corporate bond fund; considered together, these 12 funds are called the “Aquila Group of Funds.”
(6) A Trustee Emeritus may attend Board meetings but has no voting power.
Analysis of Expenses (unaudited)
As a shareholder of the Trust, you may incur two types of costs: (1) transaction costs, including front-end sales charges with respect to Class A shares or contingent deferred sales charges (“CDSC”) with respect to Class C shares; and (2) ongoing costs, including management fees; distribution and/or service (12b-1) fees; and other Trust expenses. The table below is intended to help you understand your ongoing costs (in dollars) of investing in the Trust and to compare these costs with the ongoing costs of investing in other mutual funds.
The table below is based on an investment of $1,000 invested on April 1, 2011 and held for the six months ended September 30, 2011.
Actual Expenses
This table provides information about actual account values and actual expenses. You may use the information provided in this table, together with the amount you invested, to estimate the expenses that you paid over the period. To estimate the expenses you paid on your account, divide your ending account value by $1,000 (for example, an $8,600 ending account value divided by $1,000 = 8.6), then multiply the result by the number under the heading entitled “Expenses Paid During the Period”.
Six months ended September 30, 2011
| | Actual | | | |
| | Total Return | Beginning | Ending | Expenses |
| | Without | Account | Account | Paid During |
| | Sales Charges(1) | Value | Value | the Period(2) |
| Class A | 6.85% | $1,000.00 | $1,068.50 | $4.10 |
| Class C | 6.41% | $1,000.00 | $1,064.10 | $8.49 |
| Class Y | 6.94% | $1,000.00 | $1,069.40 | $3.32 |
| (1) | Assumes reinvestment of all dividends and capital gain distributions, if any, at net asset value and does not reflect the deduction of the applicable sales charges with respect to Class A shares or the applicable contingent deferred sales charges (“CDSC”) with respect to Class C shares. Total return is not annualized, as it may not be representative of the total return for the year. |
| | |
| (2) | Expenses are equal to the annualized expense ratio of 0.79%, 1.64% and 0.64% for the Trust’s Class A, C and Y shares, respectively, multiplied by the average account value over the period, multiplied by 183/365 (to reflect the one-half year period). |
Analysis of Expenses (unaudited) (continued)
Hypothetical Example for Comparison Purposes
The table below provides information about hypothetical account values and hypothetical expenses based on the actual expense ratio and an assumed rate of return of 5.00% per year before expenses, which is not the Trust’s actual return. The hypothetical account values and expenses may not be used to estimate the actual ending account balance or expenses you paid for the period. You may use the information provided in this table to compare the ongoing costs of investing in the Trust and other mutual funds. To do so, compare this 5.00% hypothetical example relating to the Trust with the 5.00% hypothetical examples that appear in the shareholder reports of other mutual funds.
Please note that the expenses shown in the table below are meant to highlight your ongoing costs only and do not reflect any transactional costs, with respect to Class A shares. The example does not reflect the deduction of contingent deferred sales charges (“CDSC”) with respect to Class C shares. Therefore, the table is useful in comparing ongoing costs only, and will not help you determine the relative total costs of owning different mutual funds. In addition, if these transaction costs were included, your costs would have been higher.
Six months ended September 30, 2011
| | Hypothetical | | | |
| | Annualized | Beginning | Ending | Expenses |
| | Total | Account | Account | Paid During |
| | Return | Value | Value | the Period(1) |
| Class A | 5.00% | $1,000.00 | $1,021.11 | $4.00 |
| Class C | 5.00% | $1,000.00 | $1,016.85 | $8.29 |
| Class Y | 5.00% | $1,000.00 | $1,021.86 | $3.24 |
| (1) | Expenses are equal to the annualized expense ratio of 0.79%, 1.64% and 0.64% for the Trust’s Class A, C and Y shares, respectively, multiplied by the average account value over the period, multiplied by 183/365 (to reflect the one-half year period). |
Shareholder Meeting Results (unaudited)
The Annual Meeting of Shareholders of Tax-Free Trust of Oregon (the “Trust”) was held on April 13, 2011. The holders of shares representing 88% of the total net asset value of the shares entitled to vote were present in person or by proxy. At the meeting, the following matters were voted upon and approved by the shareholders (the resulting votes are presented below).
| | Dollar Amount of Votes: | | |
| | | | |
| Trustee | For | Withheld | |
| | | | |
| Gary C. Cornia | $400,936,157 | $5,820,252 | |
| James A. Gardner | $400,005,640 | $6,750,769 | |
| Diana P. Herrmann | $401,335,281 | $5,421,128 | |
| Edmund P. Jensen | $401,606,396 | $5,150,013 | |
| John W. Mitchell | $401,665,344 | $5,091,075 | |
| Ralph R. Shaw | $400,120,724 | $6,635,695 | |
| Nancy Wilgenbusch | $401,415,085 | $5,341,334 | |
| 2. | To ratify the selection of Tait, Weller & Baker LLP as the Trust’s independent registered public accounting firm. |
| | | | |
| | Dollar Amount of Votes: | | |
| | | | |
| | For | Against | Abstain |
| | | | |
| | $392,005,737 | $5,655,732 | $9,094,940 |
Additional Information (unaudited)
Renewal of the Advisory and Administration Agreement and the Sub-Advisory Agreement
Renewal until June 30, 2012 of the Advisory and Administration Agreement (the “Advisory Agreement”) between the Trust and the Manager and the Sub-Advisory Agreement (the “Sub-Advisory Agreement”) between the Manager and Davidson Fixed Income Management, Inc., doing business as Kirkpatrick Pettis Capital Management, (the “Sub-Adviser”) was approved by the Board of Trustees and the independent Trustees in June, 2011. At a meeting called and held for the foregoing purpose at which a majority of the independent Trustees were present in person, the following materials were considered:
| | · | Copies of the agreements to be renewed; |
| | · | A term sheet describing the material terms of the agreements; |
| | · | The Annual Report of the Trust for the year ended September 30, 2010; |
| | · | A report, prepared by the Manager containing data about the performance of the Trust, data about its fees, expenses and purchases and redemptions of capital shares together with comparisons of such data with similar data about other comparable funds, as well as data as to the profitability of the Manager and the Sub-Adviser; and |
| | · | Quarterly materials reviewed at prior meetings on the Trust’s performance, operations, portfolio and compliance. |
The Trustees acted on the Advisory Agreement and the Sub-Advisory Agreement separately but they considered each in conjunction with the other to determine the agreements’ combined effects on the Trust. The Trustees reviewed materials relevant to, and considered, the factors set forth below, and as to each agreement reached the conclusions described.
The nature, extent, and quality of the services provided by the Manager and the sub-Adviser.
The Manager has provided all administrative services to the Trust. The Board considered the nature and extent of the Manager’s supervision of third-party service providers, including the Trust’s shareholder servicing agent and custodian.
The Manager has arranged for the Sub-Adviser to manage the Trust’s portfolio. The Trustees noted that the Sub-Adviser employed Mr. Christopher B. Johns as portfolio manager for the Trust, and had provided facilities for credit analysis of the Trust’s portfolio securities. The Trustees noted that Mr. Johns possessed more than 30 years of fixed income portfolio management experience including 24 years managing the portfolio of Tax-Free Fund of Colorado, a related fund advised by the Manager. The portfolio manager has also been available to and has met with the brokerage and financial planner community and with investors and prospective investors to provide them with information generally about the Trust’s portfolio, with which to assess the Trust as an investment vehicle for residents of Oregon in light of prevailing interest rates and local economic conditions.
The Board considered that the Manager and the Sub-Adviser had provided all services the Board deemed necessary or appropriate, including the specific services that the Board has
determined are required for the Trust, given that its purpose is to provide shareholders with as high a level of current income exempt from Oregon state and regular Federal income taxes as is consistent with preservation of capital. It noted that compared to other Oregon state-specific municipal bond-funds, the portfolio of the Trust was of higher quality and contained no securities subject to the alternative minimum tax.
The Board concluded that a commendable quality of services was provided and that the Trust would be well served if they continued. Evaluation of this factor weighed in favor of renewal of the Advisory Agreement and the Sub-Advisory Agreement.
The investment performance of the Trust.
The Board reviewed each aspect of the Trust’s performance and compared its performance with that of its local competitors, with national averages and with a benchmark index. It was noted that the materials provided by the Manager indicated that the Trust had investment performance measured by total return that was generally comparable to the local Oregon competition and peer group for the year-to-date, one-, three-, five- and ten-year periods.
The Board concluded that the performance of the Trust was acceptable in light of market conditions, the length of its average maturities, its investment objectives including portfolio quality and its long-standing emphasis on risk minimization, while observing that the Trust’s Sharpe and Treynor ratios, which measure risk-adjusted return, were slightly less favorable than two in-state competitors. Evaluation of the investment performance of the Trust indicated to the Trustees that renewal of the Advisory Agreement and the Sub-Advisory Agreement would be appropriate.
The costs of the services to be provided and profits to be realized by the Manager and the sub-Adviser and their affiliates from their relationships with the Trust.
The information provided in connection with renewal contained expense data for the Trust and its local competitors and peer group as well as data for single-state tax-free municipal bond funds nationwide, including data for such front-end sales charge funds of a comparable asset size. The materials also showed the profitability to the Manager and estimated profitability to the Sub-Adviser of their services to the Trust.
The Board compared the expense and fee data with respect to the Trust to similar data about other funds that it found to be relevant. The Board concluded that the expenses of the Trust and the fees paid were similar to and were reasonable as compared to those being paid by single-state tax-free municipal bond funds nationwide and by the Trust’s local competitors.
The Board retained an independent consultant to provide data on profitability. The returns to the Adviser and Sub-Adviser were at or below industry averages but were sufficient for ongoing financial viability.
The Board considered that the foregoing indicated the appropriateness of the costs of the services to the Trust, which was being well managed as indicated by the factors considered previously.
The Board further concluded that the profitability to the Manager and the Sub-Adviser did not argue against approval of the fees to be paid under the Advisory Agreement or the Sub-Advisory Agreement.
The extent to which economies of scale would be realized as the Trust grows.
The Trust has in place breakpoints in the sub-advisory fee which would be realized as the Trust grows. Under the Sub-Advisory Agreement the Manager will compensate the Sub-Adviser at the annual rate of 0.18 of 1% on the Trust’s net assets up to $400 million; 0.16% on net assets above that amount to $1 billion in net assets and 0.14% on net assets thereafter. The Trustees also noted that the materials indicated that the Trust’s fees were already lower than what those of its peers would be at comparable asset levels, including those with breakpoints. Evaluation of this factor indicated to the Board that the Advisory Agreement and the Sub-Advisory Agreement should be renewed.
Benefits derived or to be derived by the Manager and the Sub-Adviser and their affiliates from their relationships with the Trust.
The Board observed that, as is generally true of most fund complexes, the Manager and the Sub-Adviser and their affiliates, by providing services to a number of funds or other investment clients including the Trust, were able to spread costs as they would otherwise be unable to do. The Board noted that while that produces efficiencies and increased profitability for the Manager and the Sub-Adviser and their affiliates, it also makes their services available to the Trust at favorable levels of quality and cost which are more advantageous to the Trust than would otherwise have been possible.
Information Available (unaudited)
Much of the information that the funds in the Aquila Group of Funds produce is automatically sent to you and all other shareholders. Specifically, you are routinely sent your Trust’s entire list of portfolio securities twice a year in the semi-annual and annual reports you receive. Additionally, under Trust policies, the Manager publicly discloses the complete schedule of the Trust’s portfolio holdings, as of each calendar quarter, generally by the 15th day after the end of each calendar quarter. Such information remains accessible until the next schedule is made publicly available. You may obtain a copy of the Trust’s portfolio holdings schedule for the most recently completed period by visiting the Trust’s website at www.aquilafunds.com. The Trust may also disclose other portfolio holdings as of a specified date (currently the Trust discloses its five largest holdings by value as of the close of the last business day of each calendar month in a posting to its website on approximately the 5th business day following the month end). This information remains on the website until the next such posting. Whenever you wish to see a listing of your Trust’s portfolio other than in your shareholder reports, please check our website at www.aquilafunds.com or call us at 1-800-437-1020.
The Trust additionally files a complete list of its portfolio holdings with the SEC for the first and third quarter ends of each fiscal year on Form N-Q. Forms N-Q are available free of charge on the SEC website at www.sec.gov. You may also review or, for a fee, copy the forms at the SEC’s Public Reference Room in Washington, D.C. or by calling 1-800-SEC-0330.
Proxy Voting Record (unaudited)
The Trust does not invest in equity securities. Accordingly, there were no matters relating to a portfolio security considered at any shareholder meeting held during the 12 months ended June 30, 2011 with respect to which the Trust was entitled to vote. Applicable regulations require us to inform you that the foregoing proxy voting information is available on the SEC website at www.sec.gov.
Federal Tax Status of Distributions (unaudited)
This information is presented in order to comply with a requirement of the Internal Revenue Code and no action on the part of shareholders is required.
For the fiscal year ended September 30, 2011, $16,826,664 of dividends paid by Tax-Free Trust of Oregon, constituting 100% of total dividends paid during the fiscal year ended September 30, 2011, were exempt-interest dividends.
Prior to February 15, 2011, shareholders were mailed the appropriate tax form(s) which contained information on the status of distributions paid for the 2010 calendar year.
Prior to February 15, 2012, shareholders will be mailed the appropriate tax form(s) which will contain information on the status of distributions paid for the 2011 calendar year.
PRIVACY NOTICE (unaudited)
Tax-Free Trust of Oregon
Our Privacy Policy. In providing services to you as an individual who owns or is considering investing in shares of the Trust, we collect certain non-public personal information about you. Our policy is to keep this information strictly safeguarded and confidential, and to use or disclose it only as necessary to provide services to you or as otherwise permitted by law. Our privacy policy applies equally to former shareholders and persons who inquire about the Trust. I
Information We Collect. ”Non-public personal information” is personally identifiable financial information about you as an individual or your family. The kinds of non-public personal information we have about you may include the information you provide us on your share purchase application or in telephone calls or correspondence with us, and information about your fund transactions and holdings, how you voted your shares and the account where your shares are held.
Information We Disclose. We disclose non-public personal information about you to companies that provide necessary services to us, such as the Trust’s transfer agent, distributor, investment adviser or sub-adviser, if any, as permitted or required by law, or as authorized by you. Any other use is strictly prohibited. We do not sell information about you or any of our fund shareholders to anyone.
Non-california Residents: We also may disclose some of this information to another fund in the Aquila Group of Funds (or its service providers) under joint marketing agreements that permit the funds to use the information only to provide you with information about other funds in the Aquila Group of Funds or new services we are offering that may be of interest to you.
California Residents Only: In addition, unless you “opt-out” of the following disclosures using the form that was mailed to you under separate cover, we may disclose some of this information to another fund in the Aquila Group of Funds (or its service providers) under joint marketing agreements that permit the funds to use the information only to provide you with information about other funds in the Aquila Group of Funds or new services we are offering that may be of interest to you.
How We Safeguard Your Information. We restrict access to non-public personal information about you to only those persons who need it to provide services to you or who are permitted by law to receive it. We maintain physical, electronic and procedural safeguards to protect the confidentiality of all non-public personal information we have about you.
If you have any questions regarding our Privacy Policy, please contact us at 1-800-437-1020.
Aquila Distributors, Inc.
Aquila Investment Management LLC
This Privacy Policy also has been adopted by Aquila Distributors, Inc. and Aquila Investment Management LLC and applies to all non-public information about you that each of these companies may obtain in connection with services provided to the Trust or to you as a shareholder of the Trust.