UNITED STATES
SECURITIES AND EXCHANGE COMMISSION
Washington, D.C. 20549
FORM 10-K
| x | ANNUAL REPORT PURSUANT TO SECTION 13 OR 15(d) OF THE SECURITIES EXCHANGE ACT OF 1934 |
For the fiscal year ended December 31, 2010
OR
| ¨ | TRANSITION REPORT PURSUANT TO SECTION 13 OR 15(d) OF THE SECURITIES EXCHANGE ACT OF 1934 |
For the transition period from to
Commission File Number 0-14697
HARLEYSVILLE GROUP INC.
(Exact name of registrant as specified in its charter)
| | |
| Delaware | | 51-0241172 |
(State or other jurisdiction of incorporation or organization) | | (I.R.S. Employer Identification No.) |
355 Maple Avenue, Harleysville, PA 19438-2297
(Address of principal executive offices) (Zip Code)
Registrant’s telephone number, including area code: (215) 256-5000
Securities registered pursuant to Section 12(b) of the Act:
| | |
Title of each class | | Name of each exchange on which registered |
| None | | None |
Securities registered pursuant to Section 12(g) of the Act:
Common Stock, $1 par value
(Title of class)
Indicate by check mark if the registrant is a well-known seasoned issuer, as defined in Rule 405 of the Securities Act. Yes ¨ No x.
Indicate by check mark if the registrant is not required to file reports pursuant to Section 13 or Section 15(d) of the Act. Yes ¨ No x.
Indicate by check mark whether the registrant (1) has filed all reports required to be filed by Section 13 or 15(d) of the Securities Exchange Act of 1934 during the preceding 12 months (or for such shorter period that the registrant was required to file such reports), and (2) has been subject to such filing requirements for the past 90 days. Yes x No ¨.
Indicate by check mark whether the registrant has submitted electronically and posted on its corporate web site, if any, every Interactive Data File required to be submitted and posted pursuant to Rule 405 of Regulation S-T during the preceding 12 months (or for such shorter period that the registrant was required to submit and post such files). Yes ¨ No ¨.
Indicate by check mark if disclosure of delinquent filers pursuant to Item 405 of Regulation S-K is not contained herein, and will not be contained, to the best of registrant’s knowledge, in definitive proxy or information statements incorporated by reference in Part III of this Form 10-K or any amendment to this Form 10-K ¨.
Indicate by check mark whether the registrant is a large accelerated filer, an accelerated filer, a non-accelerated filer, or a smaller reporting company. See the definitions of “large accelerated filer,” “accelerated filer” and “smaller reporting company” in Rule 12b-2 of the Exchange Act.
| | | | | | |
| Large accelerated filer | | ¨ | | Accelerated filer | | x |
| | | |
| Non-accelerated filer | | ¨ (Do not check if a smaller reporting company) | | Smaller reporting company | | ¨ |
Indicate by check mark whether the registrant is a shell company (as defined in Rule 12b-2 of the Exchange Act) Yes ¨ No x.
On June 30, 2010, the last business day of the registrant’s most recently completed second fiscal quarter, the aggregate market value (based on the closing sales price on that date) of the voting stock held by non-affiliates of the registrant was $399,218,118.
The number of shares outstanding of the registrant’s common stock, as of March 1, 2011 was 27,082,867.
DOCUMENTS INCORPORATED BY REFERENCE:
| 1. | Portions of the registrant’s definitive proxy statement relating to the annual meeting of stockholders to be held April 27, 2011 are incorporated by reference in Part III of this report. |
HARLEYSVILLE GROUP INC.
ANNUAL REPORT ON FORM 10-K
DECEMBER 31, 2010
PART I
General
Harleysville Group Inc. (the Company) is an insurance holding company headquartered in Pennsylvania which, through its subsidiaries, engages in the property and casualty insurance business on a regional basis in the United States. As used herein, “Harleysville Group” refers to Harleysville Group Inc. and its subsidiaries.
The Company is a Delaware corporation formed by Harleysville Mutual Insurance Company (the Mutual Company) in 1979 as a wholly owned subsidiary. In May 1986, the Company completed an initial public offering of its common stock, reducing the percentage of outstanding shares owned by the Mutual Company to approximately 70%. In April 1992, the Mutual Company completed a secondary public offering of a portion of the Company’s common stock then owned by it, further reducing the percentage of outstanding shares owned by the Mutual Company. At December 31, 2010, the Mutual Company owned approximately 54% of the Company’s outstanding shares.
Harleysville Group and the Mutual Company operate together to pursue a strategy of underwriting a broad array of personal and commercial coverages. These insurance coverages are marketed primarily in the eastern and midwestern United States through approximately 1,300 insurance agencies. Regional offices are maintained in Georgia, Illinois, Indiana, Maryland, Massachusetts, Michigan, Minnesota, New Jersey, New York, North Carolina, Pennsylvania, Tennessee, and Virginia. The Company’s property and casualty insurance subsidiaries are: Harleysville-Atlantic Insurance Company (Atlantic), Harleysville Insurance Company (HIC), Harleysville Insurance Company of New Jersey (HNJ), Harleysville Insurance Company of New York (HIC New York), Harleysville Insurance Company of Ohio (HIC Ohio), Harleysville Lake States Insurance Company (Lake States), Harleysville Preferred Insurance Company (Preferred), and Harleysville Worcester Insurance Company (Worcester). Harleysville Group Inc. acquired Mainland Insurance Company (Mainland) from the Mutual Company in December 2010. HIC New York was then merged into Mainland and the surviving company was re-named Harleysville Insurance Company of New York (HIC New York). Mainland was a shell property and casualty insurance company with no premiums or outstanding insurance obligations. The acquisition and merger were completed to facilitate the redomestication of HIC New York from New York to Pennsylvania in order to improve the efficiency of the corporate structure.
The Company operates regionally. Management believes that the Company’s regional organization permits each regional operation to benefit from economies of scale provided by centralized support while encouraging local marketing autonomy and managerial entrepreneurship. Services which directly involve the insured or the agent (i.e., underwriting, claims and marketing) generally are performed regionally in accordance with Company-wide standards to promote high quality service, while actuarial, investment, legal, data processing and similar services are performed centrally. Since its formation, the Company’s network of insurance companies has expanded significantly. In 1983, the Company acquired Worcester, a property and casualty insurer which has conducted business in New England since 1823. In 1984, HNJ was formed by the Company and began underwriting property and casualty insurance in New Jersey. In 1987, the Company acquired Atlantic, a property and casualty insurer which has conducted business in the southeastern United States since 1905. In 1991, the Company acquired HIC New York, which conducts business in New York. In 1993, the Company acquired Lake States, which primarily conducts business in Michigan. In 1994, the Company formed HIC Ohio which began underwriting property and casualty insurance in Ohio. In 1997, the Company acquired HIC, which primarily conducted business in Minnesota and neighboring states.
The Company’s property and casualty subsidiaries participate in an intercompany pooling arrangement whereby these subsidiaries cede to the Mutual Company all of their net premiums written and assume from the Mutual Company a portion of the pooled business. See “Business - Pooling Arrangement.”
Business Segments
Harleysville Group has three segments which consist of the personal lines of insurance, the commercial lines of insurance and the investment function. Financial information about these segments is set forth in Note 12 of the Notes to Consolidated Financial Statements.
Narrative Description of Business
Property and Casualty Underwriting
Harleysville Group and the Mutual Company together underwrite a broad line of personal and commercial property and casualty coverages, including automobile, homeowners, commercial multi-peril and workers compensation. The Mutual Company and the Company’s insurance subsidiaries participate in an intercompany pooling arrangement under which such subsidiaries and the Mutual Company and its property and casualty insurance subsidiary, Harleysville Pennland Insurance Company (Pennland), combine their property and casualty business.
Harleysville Group and the Mutual Company have an A.M. Best Company, Inc. (Best’s) group rating of “A” (excellent), which was upgraded from A- in April 2010. Best’s ratings are based upon factors relevant to policyholders and are not directed toward the protection of investors. Management believes that the Best’s rating is an important factor in marketing Harleysville Group’s products to its agents and customers, and that the current rating is satisfactory in that regard.
The following table sets forth ratios for the Company’s property and casualty subsidiaries, prepared in accordance with U.S. generally accepted accounting principles (GAAP) and with statutory accounting practices (SAP) prescribed or permitted by state insurance authorities. The statutory combined ratio is a standard measure of underwriting profitability. This ratio is the sum of (i) the ratio of incurred losses and loss settlement expenses to net earned premium (loss ratio); (ii) the ratio of expenses incurred for commissions, premium taxes, administrative and other underwriting expenses to net written premium (expense ratio); and (iii) the ratio of dividends to policyholders to net earned premium (dividend ratio). The GAAP combined ratio is calculated in the same manner, except that it is based on GAAP amounts and the denominator for each component is net earned premium. When the combined ratio is under 100%, underwriting results are generally considered profitable. Conversely, when the combined ratio is over 100%, underwriting results are generally considered unprofitable. The combined ratio does not reflect investment income, federal income taxes or other non-operating income or expense. Harleysville Group’s operating income is a function of both underwriting results and investment income.
HARLEYSVILLE GROUP BUSINESS ONLY
| | | | | | | | | | | | |
| | | Year Ended December 31, | |
| | | 2010 | | | 2009 | | | 2008 | |
GAAP combined ratio | | | 103.1 | % | | | 99.5 | % | | | 100.5 | % |
| | | | | | | | | | | | |
Statutory operating ratios: | | | | | | | | | | | | |
Loss ratio | | | 67.9 | % | | | 64.3 | % | | | 66.5 | % |
Expense and dividend ratios | | | 34.6 | % | | | 35.5 | % | | | 33.8 | % |
| | | | | | | | | | | | |
Statutory combined ratio | | | 102.5 | % | | | 99.8 | % | | | 100.3 | %(1) |
| | | | | | | | | | | | |
| (1) | The statutory combined ratio for 2008 includes a benefit of 0.4% due to the impact of the transfer of liabilities in connection with the pool change. This benefit results from the statutory treatment of the ceding commission paid on the unearned premiums transferred on January 1, 2008. Excluding this benefit, the statutory combined ratio was 100.7%. See Note 2(a) of the Notes to Consolidated Financial Statements. |
2
The following table sets forth the net written premiums and combined ratios by line of insurance, prepared in accordance with statutory accounting practices prescribed or permitted by state insurance authorities, for Harleysville Group for the periods indicated:
HARLEYSVILLE GROUP BUSINESS ONLY
| | | | | | | | | | | | | | | | |
| | | Year Ended December 31, | |
| | | 2010 | | | 2009 | | | 2008 | | | 2008 | |
| | | | | | | | | Without
Intercompany
Pooling Transfer (1) | | | | |
| | | (dollars in thousands) | |
Net Premiums Written | | | | | | | | | | | | | | | | |
Commercial: | | | | | | | | | | | | | | | | |
Automobile | | $ | 178,353 | | | $ | 182,169 | | | $ | 198,680 | | | $ | 208,983 | |
Workers compensation | | | 77,734 | | | | 80,484 | | | | 100,701 | | | | 105,809 | |
Commercial multi-peril | | | 338,992 | | | | 326,242 | | | | 350,209 | | | | 367,839 | |
Other commercial | | | 84,078 | | | | 85,380 | | | | 92,043 | | | | 96,228 | |
| | | | | | | | | | | | | | | | |
Total commercial | | | 679,157 | | | | 674,275 | | | | 741,633 | | | | 778,859 | |
| | | | | | | | | | | | | | | | |
Personal: | | | | | | | | | | | | | | | | |
Automobile | | | 102,045 | | | | 85,195 | | | | 75,805 | | | | 79,664 | |
Homeowners | | | 87,736 | | | | 80,044 | | | | 75,912 | | | | 80,044 | |
Other personal | | | 13,123 | | | | 12,103 | | | | 11,062 | | | | 11,563 | |
| | | | | | | | | | | | | | | | |
Total personal | | | 202,904 | | | | 177,342 | | | | 162,779 | | | | 171,271 | |
| | | | | | | | | | | | | | | | |
Total Harleysville Group Business | | $ | 882,061 | | | $ | 851,617 | | | $ | 904,412 | | | $ | 950,130 | |
| | | | | | | | | | | | | | | | |
Combined Ratios | | | | | | | | | | | | | | | | |
Commercial: | | | | | | | | | | | | | | | | |
Automobile | | | 100.0 | % | | | 91.4 | % | | | 93.1 | % | | | 92.6 | % |
Workers compensation | | | 106.1 | % | | | 106.2 | % | | | 112.9 | % | | | 112.4 | % |
Commercial multi-peril | | | 106.1 | % | | | 105.1 | % | | | 104.5 | % | | | 104.1 | % |
Other commercial | | | 88.8 | % | | | 97.6 | % | | | 89.6 | % | | | 89.3 | % |
Total commercial | | | 102.3 | % | | | 100.7 | % | | | 100.9 | % | | | 100.4 | % |
Personal: | | | | | | | | | | | | | | | | |
Automobile | | | 104.9 | % | | | 103.0 | % | | | 96.1 | % | | | 95.7 | % |
Homeowners | | | 108.2 | % | | | 92.7 | % | | | 105.8 | % | | | 105.3 | % |
Other personal | | | 62.6 | % | | | 81.1 | % | | | 88.7 | % | | | 88.8 | % |
Total personal | | | 103.5 | % | | | 96.8 | % | | | 100.1 | % | | | 99.7 | % |
Total Harleysville Group Business | | | 102.5 | % | | | 99.8 | % | | | 100.7 | % | | | 100.3 | % |
| (1) | The effect of the January 1, 2008 pooling transfer of $45,718,282 of net premiums written (representing the transfer of the January 1, 2008 unearned premium balance) and the effect of the pool transfer on the statutory combined ratios are excluded. |
Pooling Arrangement
The Company’s property and casualty subsidiaries participate in an intercompany pooling arrangement with the Mutual Company and Pennland. The underwriting pool is intended to produce a more uniform and stable underwriting result from year to year for all companies in the pool than they would experience individually and to reduce the risk of loss of any of the pool participants by spreading the risk among all the participants. Each company participating in the pool has at its disposal the capacity of the entire pool, rather than being limited to policy exposures of a size commensurate with its own capital and surplus. The additional capacity exists because such policy exposures are spread among all the pool participants which each have their own capital and surplus. Regulation is applied to the individual companies rather than to the pool.
3
Pursuant to the terms of the pooling agreement with the Mutual Company, each of the Company’s subsidiary participants and Pennland cede premiums, losses and underwriting expenses on all of its business to the Mutual Company which, in turn, retrocedes to such subsidiaries a specified portion of premiums, losses and underwriting expenses of the Mutual Company, Pennland and such subsidiaries. Under the terms of the intercompany pooling agreement which became effective January 1, 1986, Preferred and HNJ ceded to the Mutual Company all of their insurance business written on or after January 1, 1986. All of the Mutual Company’s property and casualty insurance business written or in force on or after January 1, 1986, was also included in the pooled business. The pooling agreement provides, however, that Harleysville Group is not liable for any losses incurred by the Mutual Company, Preferred and HNJ prior to January 1, 1986. The pooling agreement does not legally discharge Harleysville Group from its primary liability for the full amount of the policies ceded. However, it makes the Mutual Company liable to Harleysville Group to the extent of the business ceded.
The following table sets forth a chronology of the changes that have occurred in the pooling agreement since it became effective on January 1, 1986.
Chronology of Changes in Pooling Agreement
| | | | | | |
Date | | Harleysville
Group
Percentage | | Mutual
Company/Pennland
Percentage | | Event |
January 1, 1986 | | 30% | | 70% | | Current pooling agreement began with Preferred and HNJ as participants with the Mutual Company. |
July 1, 1987 | | 35% | | 65% | | Atlantic acquired and included in the pool. |
January 1, 1989 | | 50% | | 50% | | Worcester included in the pool. |
January 1, 1991 | | 60% | | 40% | | HIC New York acquired and included in the pool and the Mutual Company formed Pennland (not a pool participant) to write Pennsylvania personal automobile business. |
January 1, 1996 | | 65% | | 35% | | Pennland included in the pool. |
January 1, 1997 | | 70% | | 30% | | Lake States included in the pool. |
January 1, 1998 | | 72% | | 28% | | HIC included in the pool. |
January 1, 2008 | | 80% | | 20% | | Amendment to the pooling participation percentages. |
January 1, 2010 | | 80% | | 20% | | Amendment to exclude any premiums, losses and expenses assumed by the Mutual Company, other than business assumed from any mandatory regulatory pool or association. |
January 1, 2011 | | 80% | | 20% | | Amendment to establish that the financial results of the workers compensation line of business for accident years 2011 and following will be retained 100% by the Mutual Company. |
When pool participation percentages increased as described above, cash and investments equal to the net increase in liabilities assumed less a ceding commission related to the net increase in the liability for unearned premiums, was transferred from the Mutual Company to Harleysville Group. See Note 2(a) of the Notes to Consolidated Financial Statements.
All premiums, losses, loss settlement expenses and other underwriting expenses are prorated among the parties to the pooling arrangement on the basis of their participation in the pool. The method of establishing reserves is set forth under “Business - Reserves.” The pooling agreement may be amended or terminated by agreement of the parties. Termination may occur only at the end of a calendar year. The Boards of Directors of the Company and the Mutual Company maintain a coordinating committee which reviews and evaluates, and when changes are warranted, approves, the pooling arrangements between the Company and the Mutual Company. See “Business-Relationship with the Mutual Company.” In evaluating pool participation changes, the coordinating committee considers current and
4
proposed acquisitions, the relative capital positions and revenue contributions of the pool participants, and growth prospects and ability to access capital markets to support that growth. Harleysville Group does not intend to terminate its participation in the pooling agreement.
The following table sets forth the net premiums written and combined ratios by line of insurance for the total business of the pooled companies after elimination of management fees and the voluntary assumed reinsurance business of the Mutual Company, prepared in accordance with statutory accounting practices prescribed or permitted by state insurance authorities, for the periods indicated.
TOTAL BUSINESS OF POOLED COMPANIES
| | | | | | | | | | | | |
| | | Year Ended December 31, | |
| | | 2010 | | | 2009 | | | 2008 | |
| | | (dollars in thousands) | |
Net Premiums Written | | | | | | | | | | | | |
Commercial: | | | | | | | | | | | | |
Automobile | | $ | 222,941 | | | $ | 227,711 | | | $ | 248,349 | |
Workers compensation | | | 97,167 | | | | 100,606 | | | | 125,876 | |
Commercial multi-peril | | | 423,742 | | | | 407,803 | | | | 437,761 | |
Other commercial | | | 105,097 | | | | 106,724 | | | | 115,054 | |
| | | | | | | | | | | | |
Total commercial | | | 848,947 | | | | 842,844 | | | | 927,040 | |
| | | | | | | | | | | | |
Personal: | | | | | | | | | | | | |
Automobile | | | 127,556 | | | | 106,493 | | | | 94,757 | |
Homeowners | | | 109,670 | | | | 100,056 | | | | 94,889 | |
Other personal | | | 16,403 | | | | 15,128 | | | | 13,828 | |
| | | | | | | | | | | | |
Total personal | | | 253,629 | | | | 221,677 | | | | 203,474 | |
| | | | | | | | | | | | |
Total pooled business | | $ | 1,102,576 | | | $ | 1,064,521 | | | $ | 1,130,514 | |
| | | | | | | | | | | | |
Combined Ratios(1) | | | | | | | | | | | | |
Commercial: | | | | | | | | | | | | |
Automobile | | | 100.0 | % | | | 91.6 | % | | | 93.3 | % |
Workers compensation | | | 109.6 | % | | | 106.4 | % | | | 114.2 | % |
Commercial multi-peril | | | 106.1 | % | | | 105.1 | % | | | 104.6 | % |
Other commercial | | | 89.1 | % | | | 97.6 | % | | | 89.7 | % |
Total commercial | | | 102.7 | % | | | 100.7 | % | | | 101.2 | % |
Personal: | | | | | | | | | | | | |
Automobile | | | 106.8 | % | | | 104.4 | % | | | 99.0 | % |
Homeowners | | | 108.1 | % | | | 92.8 | % | | | 105.8 | % |
Other personal | | | 62.6 | % | | | 81.1 | % | | | 88.7 | % |
Total personal | | | 104.4 | % | | | 97.5 | % | | | 101.5 | % |
Total pooled business | | | 103.0 | % | | | 100.0 | % | | | 101.2 | % |
| (1) | See the definition of combined ratio in “Business-Property and Casualty Underwriting.” |
The combined ratio for the total business of the pooled companies differs from Harleysville Group’s combined ratio primarily because of the effect of the inclusion of incurred losses occurring prior to 1986 retained by the Mutual Company and for 2008, due to the impact of the pool change on the statutory combined ratio described in note (1) on page 2. See Note 2(a) of the Notes to Consolidated Financial Statements and “Business–Reinsurance”.
Reserves.Loss reserves are estimates at a given point in time of what the insurer expects to pay to claimants for claims occurring on or before such point in time, including claims which have been incurred but not yet reported to the insurer. These are estimates, and it can be expected that the ultimate liability will exceed or be less than such estimates. During the loss settlement period, additional facts regarding individual claims may become known, and consequently it often becomes necessary to refine and adjust the estimates of liability.
Harleysville Group maintains reserves for estimates of the ultimate unpaid cost of all losses incurred, including losses for claims which have been incurred but have not yet been reported to Harleysville Group. Loss settlement expense reserves are intended to cover the ultimate costs of settling all claims, including investigation and
5
litigation costs relating to such claims. The amount of loss reserves for reported claims is based primarily upon a case-by-case evaluation of the type of risk involved and knowledge of the circumstances surrounding each claim and the insurance policy provisions relating to the type of loss. The amounts of loss reserves for incurred but unreported claims and loss settlement expense reserves are determined utilizing historical information by line of insurance as adjusted to current conditions. Inflation is implicitly provided for in the reserving function through analysis of costs, trends and reviews of historical reserving results. Estimates of the liabilities are reviewed and updated on a regular basis using the most recent information on reported claims and a variety of actuarial techniques. With the exception of reserves relating to some workers compensation long-term disability cases, loss reserves are not discounted.
The following table sets forth a reconciliation of beginning and ending net reserves for unpaid losses and loss settlement expenses for the years indicated for the total business of the pooled companies, excluding the voluntary assumed reinsurance business of the Mutual Company, on a statutory basis.
TOTAL BUSINESS OF POOLED COMPANIES
| | | | | | | | | | | | |
| | | Year Ended December 31, | |
| | | 2010 | | | 2009 | | | 2008 | |
| | | (in thousands) | |
Reserves for losses and loss settlement expenses, beginning of the year | | $ | 1,997,647 | | | $ | 1,998,006 | | | $ | 1,967,094 | |
| | | | | | | | | | | | |
Incurred losses and loss settlement expenses: | | | | | | | | | | | | |
Provision for insured events of the current year | | | 798,294 | | | | 734,820 | | | | 802,925 | |
Decrease in provision for insured events of prior years | | | (56,437 | ) | | | (42,781 | ) | | | (34,307 | ) |
| | | | | | | | | | | | |
Total incurred losses and loss settlement expenses | | | 741,857 | | | | 692,039 | | | | 768,618 | |
| | | | | | | | | | | | |
Payments: | | | | | | | | | | | | |
Losses and loss settlement expenses attributable to insured events of the current year | | | 311,542 | | | | 254,342 | | | | 283,524 | |
Losses and loss settlement expenses attributable to insured events of prior years | | | 433,127 | | | | 438,056 | | | | 454,182 | |
| | | | | | | | | | | | |
Total payments | | | 744,669 | | | | 692,398 | | | | 737,706 | |
| | | | | | | | | | | | |
Reserves for losses and loss settlement expenses, end of the year | | $ | 1,994,835 | | | $ | 1,997,647 | | | $ | 1,998,006 | |
| | | | | | | | | | | | |
The following table sets forth the development of net reserves for unpaid losses and loss settlement expenses from 2000 through 2010 for the total pooled business of the Mutual Company, Pennland and Harleysville Group on a statutory basis. “Net reserve for losses and loss settlement expenses” sets forth the estimated liability for unpaid losses and loss settlement expenses recorded at the balance sheet date for each of the indicated years. This liability represents the estimated amount of losses and loss settlement expenses for claims arising in the current and all prior years that are unpaid at the balance sheet date, including losses incurred but not reported.
The “Net reserves re-estimated” portion of the table shows the re-estimated amount of the previously recorded liability based on experience of each succeeding year. The estimate is increased or decreased as payments are made and more information becomes known about the severity of remaining unpaid claims. For example, the 2000 liability has developed a deficiency after ten years, in that re-estimated losses and loss settlement expenses are expected to be higher than the initial estimated liability established in 2000 of $1,136.8 million by $311.9 million, or 27.4%.
6
The “Cumulative amount of reserves paid” portion of the table shows the cumulative losses and loss settlement expense payments made in succeeding years for losses incurred prior to the balance sheet date. For example, the 2000 column indicates that as of December 31, 2010, payments of $1,172.8 million of the currently re-estimated ultimate liability for losses and loss settlement expenses had been made.
The “Redundancy (deficiency)” portion of the table shows the cumulative redundancy or deficiency at December 31, 2010 of the reserve estimate shown on the top line of the corresponding column. A redundancy in reserves means that reserves established in prior years exceeded actual losses and loss settlement expenses or were reevaluated at less than the original reserved amount. A deficiency in reserves means that the reserves established in prior years were less than actual losses and loss settlement expenses or were reevaluated at more than the originally reserved amounts.
The following table includes all 2010 pool participants as if they had participated in the pooling arrangement in all years indicated except for acquired pool participant companies, which are included from their date of acquisition. Under the terms of the pooling arrangement, Harleysville Group is not responsible for losses on the pooled business of the Mutual Company, Preferred and HNJ occurring prior to January 1, 1986.
TOTAL BUSINESS OF POOLED COMPANIES
| | | | | | | | | | | | | | | | | | | | | | | | | | | | | | | | | | | | | | | | | | | | |
| | | Year ended December 31, | |
| | | 2000 | | | 2001 | | | 2002 | | | 2003 | | | 2004 | | | 2005 | | | 2006 | | | 2007 | | | 2008 | | | 2009 | | | 2010 | |
| | | (dollars in thousands) | |
Net reserve for losses and loss settlement expenses | | $ | 1,136,848 | | | $ | 1,147,517 | | | $ | 1,224,380 | | | $ | 1,514,548 | | | $ | 1,613,374 | | | $ | 1,761,198 | | | $ | 1,893,753 | | | $ | 1,967,094 | | | $ | 1,998,006 | | | $ | 1,997,647 | | | $ | 1,994,835 | |
Net reserves re-estimated: | | | | | | | | | | | | | | | | | | | | | | | | | | | | | | | | | | | | | | | | | | | | |
One year later | | | 1,114,404 | | | | 1,143,701 | | | | 1,397,821 | | | | 1,538,929 | | | | 1,593,829 | | | | 1,743,774 | | | | 1,867,438 | | | | 1,932,787 | | | | 1,955,225 | | | | 1,941,210 | | | | | |
Two years later | | | 1,124,881 | | | | 1,308,498 | | | | 1,459,056 | | | | 1,566,305 | | | | 1,602,547 | | | | 1,746,441 | | | | 1,827,703 | | | | 1,889,611 | | | | 1,902,147 | | | | | | | | | |
Three years later | | | 1,245,333 | | | | 1,369,239 | | | | 1,501,724 | | | | 1,605,840 | | | | 1,622,733 | | | | 1,719,799 | | | | 1,786,263 | | | | 1,844,392 | | | | | | | | | | | | | |
Four years later | | | 1,290,895 | | | | 1,413,644 | | | | 1,557,058 | | | | 1,630,971 | | | | 1,612,897 | | | | 1,696,843 | | | | 1,753,011 | | | | | | | | | | | | | | | | | |
Five years later | | | 1,325,808 | | | | 1,478,729 | | | | 1,585,986 | | | | 1,636,248 | | | | 1,608,069 | | | | 1,681,098 | | | | | | | | | | | | | | | | | | | | | |
Six years later | | | 1,387,325 | | | | 1,505,789 | | | | 1,601,882 | | | | 1,642,881 | | | | 1,603,408 | | | | | | | | | | | | | | | | | | | | | | | | | |
Seven years later | | | 1,411,603 | | | | 1,522,153 | | | | 1,616,442 | | | | 1,645,017 | | | | | | | | | | | | | | | | | | | | | | | | | | | | | |
Eight years later | | | 1,429,381 | | | | 1,538,558 | | | | 1,620,582 | | | | | | | | | | | | | | | | | | | | | | | | | | | | | | | | | |
Nine years later | | | 1,443,393 | | | | 1,543,298 | | | | | | | | | | | | | | | | | | | | | | | | | | | | | | | | | | | | | |
Ten years later | | | 1,448,769 | | | | | | | | | | | | | | | | | | | | | | | | | | | | | | | | | | | | | | | | | |
Cumulative amount of reserves paid: | | | | | | | | | | | | | | | | | | | | | | | | | | | | | | | | | | | | | | | | | | | | |
One year later | | | 395,561 | | | | 372,642 | | | | 437,855 | | | | 490,353 | | | | 389,968 | | | | 395,159 | | | | 405,441 | | | | 454,182 | | | | 438,056 | | | | 433,127 | | | | | |
Two years later | | | 609,777 | | | | 654,045 | | | | 759,313 | | | | 742,476 | | | | 642,066 | | | | 673,385 | | | | 716,150 | | | | 773,324 | | | | 721,607 | | | | | | | | | |
Three years later | | | 801,234 | | | | 884,746 | | | | 935,691 | | | | 921,520 | | | | 835,193 | | | | 892,400 | | | | 913,883 | | | | 931,820 | | | | | | | | | | | | | |
Four years later | | | 945,886 | | | | 1,005,199 | | | | 1,051,788 | | | | 1,042,755 | | | | 979,233 | | | | 1,025,007 | | | | 1,035,537 | | | | | | | | | | | | | | | | | |
Five years later | | | 1,019,943 | | | | 1,076,672 | | | | 1,127,999 | | | | 1,130,739 | | | | 1,067,068 | | | | 1,095,662 | | | | | | | | | | | | | | | | | | | | | |
Six years later | | | 1,066,271 | | | | 1,130,754 | | | | 1,187,789 | | | | 1,189,524 | | | | 1,113,655 | | | | | | | | | | | | | | | | | | | | | | | | | |
Seven years later | | | 1,102,146 | | | | 1,172,272 | | | | 1,230,143 | | | | 1,224,529 | | | | | | | | | | | | | | | | | | | | | | | | | | | | | |
Eight years later | | | 1,133,497 | | | | 1,204,801 | | | | 1,253,632 | | | | | | | | | | | | | | | | | | | | | | | | | | | | | | | | | |
Nine years later | | | 1,158,271 | | | | 1,222,778 | �� | | | | | | | | | | | | | | | | | | | | | | | | | | | | | | | | | | | | |
Ten years later | | | 1,172,830 | | | | | | | | | | | | | | | | | | | | | | | | | | | | | | | | | | | | | | | | | |
Cumulative redundancy/ (deficiency) | | | (311,921 | ) | | | (395,781 | ) | | | (396,202 | ) | | | (130,469 | ) | | | 9,966 | | | | 80,100 | | | | 140,742 | | | | 122,702 | | | | 95,859 | | | | 56,437 | | | | | |
Cumulative redundancy/ (deficiency) expressed as a percent of year-end reserves | | | (27.4 | %) | | | (34.5 | %) | | | (32.4 | %) | | | (8.6 | %) | | | 0.6 | % | | | 4.5 | % | | | 7.4 | % | | | 6.2 | % | | | 4.8 | % | | | 2.8 | % | | | | |
Cumulative redundancy/ (deficiency) excluding pre-1986 reserve development(1) | | | (263,324 | ) | | | (348,011 | ) | | | (350,613 | ) | | | (92,550 | ) | | | 40,764 | | | | 105,846 | | | | 159,049 | | | | 136,703 | | | | 104,406 | | | | 62,661 | | | | | |
| (1) | Excludes business not included in pooling arrangement with Harleysville Group. |
Harleysville Group’s reserves primarily are derived from those established for the total pooled business. The terms of the pooling agreement provide that Harleysville Group is not liable for any losses incurred by the Mutual Company, Preferred and HNJ prior to January 1, 1986, or for certain business assumed by the Mutual Company effective January 1, 2010. The GAAP loss reserve experience of Harleysville Group, as reflected in its financial statements, is shown in the following table which sets forth a reconciliation of beginning and ending net reserves for unpaid losses and loss settlement expenses for the years indicated for the business of Harleysville Group only.
7
HARLEYSVILLE GROUP BUSINESS ONLY
| | | | | | | | | | | | |
| | | Year Ended December 31, | |
| | | 2010 | | | 2009 | | | 2008 | |
| | | (in thousands) | |
Reserves for losses and loss settlement expenses, beginning of the year | | $ | 1,559,164 | | | $ | 1,558,249 | | | $ | 1,381,812 | |
| | | | | | | | | | | | |
Incurred losses and loss settlement expenses: | | | | | | | | | | | | |
Provision for insured events of the current year | | | 639,234 | | | | 588,575 | | | | 642,576 | |
Decrease in provision for insured events of prior years | | | (50,129 | ) | | | (36,084 | ) | | | (31,808 | ) |
| | | | | | | | | | | | |
Total incurred losses and loss settlement expenses | | | 589,105 | | | | 552,491 | | | | 610,768 | |
| | | | | | | | | | | | |
Payments: | | | | | | | | | | | | |
Losses and loss settlement expenses attributable to insured events of the current year | | | 249,831 | | | | 204,192 | | | | 227,056 | |
Losses and loss settlement expenses attributable to insured events of prior years | | | 344,373 | | | | 347,384 | | | | 360,810 | |
| | | | | | | | | | | | |
Total payments | | | 594,204 | | | | 551,576 | | | | 587,866 | |
| | | | | | | | | | | | |
Adjustment to beginning reserves resulting from change in pool participation percentage | | | | | | | | | | | (153,535 | ) |
| | | | | | | | | | | | |
Total payments adjusted for pool change | | | | | | | | | | | 434,331 | |
| | | | | | | | | | | | |
Reserves for losses and loss settlement expenses, end of the year | | $ | 1,554,065 | | | $ | 1,559,164 | | | $ | 1,558,249 | |
| | | | | | | | | | | | |
See page 10 for reconciliation of net reserves to gross reserves.
Harleysville Group recognized net favorable development in the provision for insured events of prior years of $50.1 million in 2010, primarily due to lower-than-expected claims severity broadly experienced across all casualty lines in accident years 2004 through 2008, partially offset by a slight amount of adverse development in accident years prior to 2000. The 2010 net favorable development consisted of $44.8 million in commercial lines and $5.3 million in personal lines.
Harleysville Group recognized net favorable development in the provision for insured events of prior years of $36.1 million in 2009, primarily due to lower-than-expected claims severity broadly experienced across all casualty lines in accident years 2002 through 2006, partially offset by adverse development in accident year 2008 and accident years prior to 2002. A lower-than-expected level of claims severity was observed in personal lines in accident year 2008, which led to the recognition of $2.3 million of favorable development in this accident year in 2009. This amount was offset by the recognition in 2009 of $2.6 million of adverse development in commercial lines in accident year 2008, primarily related to a higher-than-expected level of commercial property severity in this accident year. The 2009 net favorable development consisted of $31.5 million in commercial lines and $4.6 million in personal lines.
Harleysville Group recognized net favorable development in the provision for insured events of prior years of $31.8 million in 2008, primarily due to lower-than-expected claims severity broadly experienced across all casualty lines in accident years 2003 through 2006, partially offset by adverse development in accident year 2007 and accident years prior to 2003. A higher-than-expected level of claims severity was observed in accident year 2007 and led to the recognition of $4.3 million of adverse development in this accident year in 2008. The net favorable development consisted of $25.3 million in commercial lines and $6.5 million in personal lines.
8
The following table sets forth the development of net reserves for unpaid losses and loss settlement expenses for Harleysville Group. The effect of changes to the pooling agreement participation is reflected in this table. For example, the January 1, 2008 increase in Harleysville Group’s pooling participation from 72% to 80% is reflected in the first line of the 2008 column. Amounts of assets equal to increases in net liabilities were transferred to Harleysville Group from the Mutual Company and Pennland in conjunction with each respective pooling change. The amount of the assets transferred has been netted against and has reduced the cumulative amounts paid for years prior to the pooling changes. For example, the 2007 column of the “Cumulative amount of reserves paid” portion of the table reflects the assets transferred in conjunction with the 2008 increase in the pooling percentage from 72% to 80% as a decrease netted in the “one year later” line. The cumulative amounts paid are reflected in this manner to maintain comparability. This is because when Harleysville Group pays claims subsequent to the date of a pool participation increase, the amounts paid are greater, however, the prior year’s reserve amounts are reflective of a lower pool participation percentage. By reflecting pooling participation increases in this manner, loss development is not obscured. Loss development reflects Harleysville Group’s share of the total pooled business loss development since January 1, 1986 when Harleysville Group began participation.
9
Loss development information for the total business of the pooled companies is presented on pages 6 to 8 to provide greater analysis of underlying claims development.
HARLEYSVILLE GROUP BUSINESS
| | | | | | | | | | | | | | | | | | | | | | | | | | | | | | | | | | | | | | | | | | | | |
| | | Year Ended December 31, | |
| | | 2000 | | | 2001 | | | 2002 | | | 2003 | | | 2004 | | | 2005 | | | 2006 | | | 2007 | | | 2008 | | | 2009 | | | 2010 | |
| | | (dollars in thousands) | |
Net reserve for losses and loss settlement expenses | | $ | 792,584 | | | $ | 800,861 | | | $ | 857,182 | | | $ | 1,062,660 | | | $ | 1,131,609 | | | $ | 1,237,090 | | | $ | 1,329,849 | | | $ | 1,381,812 | | | $ | 1,558,249 | | | $ | 1,559,164 | | | $ | 1,554,065 | |
Net reserves re-estimated: | | | | | | | | | | | | | | | | | | | | | | | | | | | | | | | | | | | | | | | | | | | | |
One year later | | | 775,234 | | | | 796,213 | | | | 976,241 | | | | 1,075,122 | | | | 1,114,076 | | | | 1,219,005 | | | | 1,307,802 | | | | 1,350,004 | | | | 1,522,165 | | | | 1,509,035 | | | | | |
Two years later | | | 781,117 | | | | 909,048 | | | | 1,015,209 | | | | 1,091,322 | | | | 1,114,813 | | | | 1,217,825 | | | | 1,271,651 | | | | 1,313,605 | | | | 1,474,723 | | | | | | | | | |
Three years later | | | 862,320 | | | | 947,660 | | | | 1,042,276 | | | | 1,114,275 | | | | 1,126,248 | | | | 1,192,149 | | | | 1,236,640 | | | | 1,272,450 | | | | | | | | | | | | | |
Four years later | | | 889,996 | | | | 975,978 | | | | 1,076,597 | | | | 1,129,270 | | | | 1,114,016 | | | | 1,171,926 | | | | 1,205,060 | | | | | | | | | | | | | | | | | |
Five years later | | | 911,482 | | | | 1,017,319 | | | | 1,094,325 | | | | 1,129,129 | | | | 1,108,295 | | | | 1,154,351 | | | | | | | | | | | | | | | | | | | | | |
Six years later | | | 950,295 | | | | 1,033,702 | | | | 1,102,679 | | | | 1,132,577 | | | | 1,099,587 | | | | | | | | | | | | | | | | | | | | | | | | | |
Seven years later | | | 964,675 | | | | 1,042,431 | | | | 1,112,468 | | | | 1,129,307 | | | | | | | | | | | | | | | | | | | | | | | | | | | | | |
Eight years later | | | 974,535 | | | | 1,053,696 | | | | 1,110,801 | | | | | | | | | | | | | | | | | | | | | | | | | | | | | | | | | |
Nine years later | | | 983,886 | | | | 1,052,509 | | | | | | | | | | | | | | | | | | | | | | | | | | | | | | | | | | | | | |
Ten years later | | | 983,208 | | | | | | | | | | | | | | | | | | | | | | | | | | | | | | | | | | | | | | | | | |
Cumulative amount of reserves paid: | | | | | | | | | | | | | | | | | | | | | | | | | | | | | | | | | | | | | | | | | | | | |
One year later | | | 282,110 | | | | 265,422 | | | | 312,224 | | | | 350,082 | | | | 278,270 | | | | 281,655 | | | | 289,661 | | | | 207,275 | | | | 347,384 | | | | 344,373 | | | | | |
Two years later | | | 434,579 | | | | 465,001 | | | | 541,063 | | | | 529,126 | | | | 456,921 | | | | 479,720 | | | | 422,565 | | | | 427,529 | | | | 572,095 | | | | | | | | | |
Three years later | | | 569,696 | | | | 628,494 | | | | 665,513 | | | | 655,219 | | | | 593,715 | | | | 570,384 | | | | 577,691 | | | | 584,196 | | | | | | | | | | | | | |
Four years later | | | 671,230 | | | | 712,677 | | | | 746,455 | | | | 740,251 | | | | 706,410 | | | | 673,410 | | | | 672,885 | | | | | | | | | | | | | | | | | |
Five years later | | | 722,038 | | | | 761,490 | | | | 799,069 | | | | 764,877 | | | | 773,618 | | | | 727,804 | | | | | | | | | | | | | | | | | | | | | |
Six years later | | | 752,787 | | | | 798,172 | | | | 811,558 | | | | 808,844 | | | | 808,758 | | | | | | | | | | | | | | | | | | | | | | | | | |
Seven years later | | | 776,360 | | | | 802,680 | | | | 842,381 | | | | 834,719 | | | | | | | | | | | | | | | | | | | | | | | | | | | | | |
Eight years later | | | 777,981 | | | | 825,643 | | | | 859,043 | | | | | | | | | | | | | | | | | | | | | | | | | | | | | | | | | |
Nine years later | | | 794,740 | | | | 837,895 | | | | | | | | | | | | | | | | | | | | | | | | | | | | | | | | | | | | | |
Ten years later | | | 804,258 | | | | | | | | | | | | | | | | | | | | | | | | | | | | | | | | | | | | | | | | | |
Net cumulative redundancy/ (deficiency) | | | (190,624 | ) | | | (251,648 | ) | | | (253,619 | ) | | | (66,647 | ) | | | 32,022 | | | | 82,739 | | | | 124,789 | | | | 109,362 | | | | 83,526 | | | | 50,129 | | | | | |
Net cumulative redundancy/ (deficiency) expressed as a percent of year end reserves | | | (24.1 | %) | | | (31.4 | %) | | | (29.6 | %) | | | (6.3 | %) | | | 2.8 | % | | | 6.7 | % | | | 9.4 | % | | | 7.9 | % | | | 5.4 | % | | | 3.2 | % | | | | |
Gross reserve | | $ | 864,843 | | | $ | 879,056 | | | $ | 928,335 | | | $ | 1,219,977 | | | $ | 1,317,735 | | | $ | 1,480,802 | | | $ | 1,493,645 | | | $ | 1,546,690 | | | $ | 1,767,601 | | | $ | 1,782,292 | | | $ | 1,771,661 | |
Ceded reserve | | | 72,259 | | | | 78,195 | | | | 71,153 | | | | 157,317 | | | | 186,126 | | | | 243,712 | | | | 163,796 | | | | 164,878 | | | | 209,352 | | | | 223,128 | | | | 217,596 | |
| | | | | | | | | | | | | | | | | | | | | | | | | | | | | | | | | | | | | | | | | | | | |
Net reserve | | $ | 792,584 | | | $ | 800,861 | | | $ | 857,182 | | | $ | 1,062,660 | | | $ | 1,131,609 | | | $ | 1,237,090 | | | $ | 1,329,849 | | | $ | 1,381,812 | | | $ | 1,558,249 | | | $ | 1,559,164 | | | $ | 1,554,065 | |
| | | | | | | | | | | | | | | | | | | | | | | | | | | | | | | | | | | | | | | | | | | | |
Gross cumulative redundancy/ (deficiency) | | $ | (341,284 | ) | | $ | (398,737 | ) | | $ | (404,469 | ) | | $ | (141,646 | ) | | $ | (8,037 | ) | | $ | 40,621 | | | $ | 86,920 | | | $ | 78,281 | | | $ | 72,115 | | | $ | 47,384 | | | | | |
| | | | | | | | | | | | | | | | | | | | | | | | | | | | | | | | | | | | | | | | | | | | |
Gross re-estimated | | $ | 1,206,127 | | | $ | 1,277,793 | | | $ | 1,332,804 | | | $ | 1,361,623 | | | $ | 1,325,772 | | | $ | 1,440,181 | | | $ | 1,406,725 | | | $ | 1,468,409 | | | $ | 1,695,486 | | | $ | 1,734,908 | | | | | |
Ceded re-estimated | | | 222,919 | | | | 225,284 | | | | 222,003 | | | | 232,316 | | | | 226,185 | | | | 285,830 | | | | 201,665 | | | | 195,959 | | | | 220,763 | | | | 225,873 | | | | | |
| | | | | | | | | | | | | | | | | | | | | | | | | | | | | | | | | | | | | | | | | | | | |
Net re-estimated | | $ | 983,208 | | | $ | 1,052,509 | | | $ | 1,110,801 | | | $ | 1,129,307 | | | $ | 1,099,587 | | | $ | 1,154,351 | | | $ | 1,205,060 | | | $ | 1,272,450 | | | $ | 1,474,723 | | | $ | 1,509,035 | | | | | |
| | | | | | | | | | | | | | | | | | | | | | | | | | | | | | | | | | | | | | | | | | | | |
| Note: | The amount of cash and investments received equal to the increase in liabilities for unpaid losses and loss settlement expenses was $153,535,000 for the change in pool participation in 2008. |
Reinsurance.Harleysville Group follows the customary industry practice of reinsuring a portion of its exposures and paying to the reinsurers a portion of the premiums received. Insurance is ceded principally to reduce the net liability on individual risks and to protect against catastrophic losses. Ceded reinsurance contracts do not relieve Harleysville Group’s primary obligation to its policyholders. Consequently, an exposure exists with respect to reinsurance recoverables to the extent that any reinsurer is unable to meet its obligation or disputes the liabilities assumed under the reinsurance contract. From time to time, Harleysville Group may encounter such disputes with its reinsurers. In addition, the creditworthiness of our reinsurers could deteriorate in the future due to adverse events affecting the reinsurance industry, such as a large number of major catastrophes. Harleysville Group has not entered into any finite reinsurance agreements.
10
The reinsurance described below is maintained for the Company’s subsidiaries and the Mutual Company and its wholly owned subsidiary. Reinsurance premiums and recoveries are allocated to participants in the pooling agreement according to pooling percentages.
Reinsurance for property and auto physical damage losses is currently maintained under a per risk excess of loss treaty affording recovery to $23.5 million above a retention of $1.5 million for homeowners losses and $23.0 million above a retention of $2.0 million for other property losses. Harleysville Group’s 2010 pooling share of such recovery would be $18.8 million above a retention of $1.2 million for homeowners losses and $18.4 million above a retention of $1.6 million for other property losses. In addition, the Company’s subsidiaries and the Mutual Company and its wholly owned subsidiary are reinsured under a property catastrophe reinsurance treaty effective for one year from July 1, 2010 which provides the following coverage:
| | | | |
| | | Property Catastrophe Reinsurance Treaty |
| | | Full Treaty | | Harleysville Group’s Pooling Share |
Retention | | $50 million | | $40 million |
| | |
Coverage for Losses | | 82% of losses between $50 and $90 million | | 82% of losses between $40 and $72 million |
| | 78% of losses between $90 and $200 million | | 78% of losses between $72 and $160 million |
| | 75.4% of losses between $200 and $425 million | | 75.4% of losses between $160 and $340 million |
| | 75% of losses between $425 and $475 million | | 75% of losses between $340 and $380 million |
| | |
Maximum Recovery | | $325.7 million for losses of $475 million or more | | $260.5 million for losses of $380 million or more |
The treaty includes reinstatement provisions providing for coverage for a second catastrophe and requiring payment of an additional premium in the event of a first catastrophe occurring. Most terrorism losses would not be covered by the treaty. Harleysville Group has not purchased funded catastrophe covers.
Effective January 1, 2011, the Company’s subsidiaries and the Mutual Company and its wholly owned subsidiary purchased additional property catastrophe reinsurance for one year providing coverage of 75% of up to $50.0 million in excess of $475.0 million. Harleysville Group’s pooling share of this coverage is 75% of up to $40.0 million in excess of $380.0 million. Accordingly, effective January 1, 2011, pursuant to the terms of the property catastrophe treaties, the maximum recovery would be $363.2 million for any catastrophe involving an insured loss equal to or greater than $525.0 million. Harleysville Group’s pooling share of this maximum recovery would be $290.5 million for any catastrophe involving an insured loss of $420.0 million or greater.
There is reinsurance to protect Harleysville Group from large workers compensation losses on a per-life and occurrence basis above a retention of $2.0 million. Harleysville Group’s pooling share of this retention would be $1.6 million. In addition, casualty reinsurance (including liability, umbrella and workers compensation subject to per-life maximums) is maintained under an excess of loss treaty affording recovery to $47.5 million above a retention of $2.5 million for each loss occurrence for commercial lines coverages and recovery of up to $48.5 million above a retention of $1.5 million for personal lines coverages. Additionally, a 30% participation on losses of $2.5 million in excess of $2.5 million is retained on commercial lines coverages. Harleysville Group’s 2010 pooling share of a recovery would be up to $37.4 million above a retention of $2.0 million for commercial lines and $38.8 million above a retention of $1.2 million for personal lines. The casualty reinsurance programs provide coverage for a terrorist event with no reinstatement provision.
The terms and charges for reinsurance coverage are typically negotiated annually. The reinsurance market is subject to conditions which are similar to those in the direct property and casualty insurance market, and there can be no assurance that reinsurance will remain available to Harleysville Group to the same extent and at the same cost currently maintained.
Harleysville Group considers numerous factors in choosing reinsurers, the most important of which are the financial stability and credit worthiness of the reinsurer. Harleysville Group has not experienced any material uncollectible reinsurance recoverables.
The Company’s subsidiaries and the Mutual Company are servicing carriers in the “Write-Your-Own” (WYO) program of the United States government’s National Flood Insurance Program (NFIP). The WYO program is a cooperative undertaking of the insurance industry and the Federal Emergency Management Agency. As servicing
11
carriers, Harleysville Group and the Mutual Company bear no risk of loss on flood insurance policies. All of the premiums collected on flood insurance policies are ceded to the federal government and, in exchange, a servicing fee is received from which agency commission, claim handling fees and other related expenses are paid.
As a writer of personal and commercial automobile policies in the state of Michigan, in compliance with applicable state regulations, Harleysville Group cedes premiums and claims for medical benefits and work loss, above a specified retention amount, to the Michigan Catastrophic Claims Association. For policies effective July 1, 2010 to June 30, 2011, the required retention is $480,000.
Competition.The property and casualty insurance industry is highly competitive on the basis of both price and service. There are numerous companies competing for the categories of business underwritten by Harleysville Group in the geographic areas where Harleysville Group operates, many of which are substantially larger and have considerably greater financial resources than Harleysville Group. In addition, because the insurance products of Harleysville Group and the Mutual Company are marketed exclusively through independent insurance agencies, most of which represent more than one company, Harleysville Group faces competition within each agency.
Marketing.Harleysville Group markets its insurance products through independent agencies and monitors the performance of these agencies relative to many factors including profitability, growth and retention. At December 31, 2010, there were approximately 1,300 agencies.
Investments
An important element of the financial results of Harleysville Group is the return on invested assets. An investment objective of Harleysville Group is to maintain a widely diversified fixed maturities portfolio structured to maximize after-tax investment income while minimizing credit risk through investments in high quality instruments. An objective also is to provide adequate funds to pay claims without forced sales of investments. At December 31, 2010, substantially all of Harleysville Group’s fixed maturity investment portfolio was rated investment grade and the investment portfolio did not contain any real estate or mortgage loans. Harleysville Group also invests in equity securities with the objective of capital appreciation and dividend income.
Harleysville Group has adopted and follows an investment philosophy which precludes the purchase of non-investment grade fixed income securities. However, due to uncertainties in the economic environment, it is possible that the quality of investments held in Harleysville Group’s portfolio may change, as a result of which Harleysville Group may hold some non-investment grade securities.
The following table shows the composition of Harleysville Group’s fixed maturity investment portfolio at amortized cost, excluding short-term investments, by rating as of December 31, 2010:
| | | | | | | | |
| | | December 31, 2010 | |
| | | Amount | | | Percent | |
| | | (dollars in thousands) | |
Rating(1) | | | | | | | | |
U.S. Treasury obligations | | $ | 119,009 | | | | 5.4 | % |
U.S agency obligations(2) | | | 361,801 | | | | 16.3 | |
Aaa | | | 575,443 | | | | 26.0 | |
Aa | | | 862,603 | | | | 38.9 | |
A | | | 266,716 | | | | 12.0 | |
Baa | | | 31,887 | | | | 1.4 | |
| | | | | | | | |
Total | | $ | 2,217,459 | | | | 100.0 | % |
| | | | | | | | |
| (1) | Ratings assigned by Moody’s Investors Services, Inc., or Standard & Poor’s if Moody’s rating not available. |
| (2) | Includes GNMA pass-through obligations and collateralized mortgage obligations. |
Harleysville Group invests in both taxable and tax-exempt fixed income securities as part of its strategy to maximize after-tax income. Such strategy considers, among other factors, the impact of the alternative minimum tax. Tax-exempt bonds made up approximately 44%, 42% and 34% of the total investment portfolio at December 31, 2010, 2009 and 2008, respectively.
12
The following table shows the composition of Harleysville Group’s investment portfolio at carrying value, excluding short-term investments, by type of security as of December 31, 2010:
| | | | | | | | |
| | | December 31, 2010 | |
| | | Amount | | | Percent | |
| | | (dollars in thousands) | |
Fixed maturities: | | | | | | | | |
U.S. Treasury obligations | | $ | 122,857 | | | | 4.8 | % |
U.S. agency obligations | | | 17,541 | | | | 0.7 | |
Mortgage-backed securities | | | 369,821 | | | | 14.3 | |
Obligations of states and political subdivisions | | | 1,248,258 | | | | 48.3 | |
Corporate securities | | | 554,986 | | | | 21.5 | |
| | | | | | | | |
Total fixed maturities | | | 2,313,463 | | | | 89.6 | |
| | | | | | | | |
Equity securities | | | 268,104 | | | | 10.4 | |
| | | | | | | | |
Total | | $ | 2,581,567 | | | | 100.0 | % |
| | | | | | | | |
Investment results of Harleysville Group’s fixed maturity investment portfolio are as shown in the following table:
| | | | | | | | | | | | |
| | | Year Ended December 31, | |
| | | 2010 | | | 2009 | | | 2008 | |
| | | (dollars in thousands) | |
Invested assets(1) | | $ | 2,229,368 | | | $ | 2,188,955 | | | $ | 2,196,690 | |
Investment income(2) | | $ | 100,504 | | | $ | 103,971 | | | $ | 108,592 | |
Average yield | | | 4.5 | % | | | 4.7 | % | | | 4.9 | % |
| (1) | Average of the aggregate invested amounts at amortized cost at the beginning and end of the period. The 2008 amount was adjusted for the 2008 pooling agreement amendment. |
| (2) | Investment income does not include investment expenses, realized investment gains or losses or provision for income taxes. |
The following table indicates the composition of Harleysville Group’s fixed maturity investment portfolio at carrying value, excluding short-term investments, by time to maturity as of December 31, 2010:
| | | | | | | | |
| | | December 31, 2010 | |
| | | Amount | | | Percent | |
| | | (dollars in thousands) | |
| Due in(1) | | | | | | | | |
1 year or less | | $ | 138,933 | | | | 6.0 | % |
Over 1 year through 5 years | | | 629,741 | | | | 27.2 | |
Over 5 years through 10 years | | | 732,668 | | | | 31.7 | |
Over 10 years | | | 442,300 | | | | 19.1 | |
| | | | | | | | |
| | | 1,943,642 | | | | 84.0 | |
Mortgage-backed securities | | | 369,821 | | | | 16.0 | |
| | | | | | | | |
Total | | $ | 2,313,463 | | | | 100.0 | % |
| | | | | | | | |
| (1) | Based on stated maturity dates with no prepayment assumptions. Actual maturities may differ because borrowers may have the right to call or prepay obligations with or without call or prepayment penalties. |
The average expected life of Harleysville Group’s investment portfolio as of December 31, 2010 was approximately 4.8 years.
Regulation
Insurance companies are subject to supervision and regulation in the states in which they transact business. Such supervision and regulation relate to numerous aspects of an insurance company’s business and financial condition. The purpose of such supervision and regulation is the protection of policyholders. The extent of such supervision and regulation varies, but generally derives from state statutes which delegate regulatory, supervisory and administrative authority to state insurance departments. Accordingly, the authority of the state insurance departments typically includes the establishment of standards of solvency which must be met and maintained by insurers, the licensing to do business of insurers and agents, the nature of and limitations on investments, the approval process for premium rates
13
for property and casualty insurance, the provisions which insurers must make for current losses and future liabilities, the deposit of securities for the benefit of policyholders and the approval of policy forms. Such insurance departments also conduct periodic examinations of the affairs of insurance companies and require the filing of annual and other reports relating to the financial condition of insurance companies.
All of the states in which Harleysville Group and the Mutual Company do business have guaranty fund laws under which insurers doing business in such states can be assessed up to 2% of annual premiums written by the insurer in that state in order to fund policyholder liabilities of insolvent insurance companies. Under these laws in general, an insurer is subject to assessment, depending upon its market share of a given line of business, to assist in the payment of policyholder and third party claims against insolvent insurers.
State laws also require Harleysville Group to participate in involuntary insurance programs for automobile insurance and workers compensation, as well as other property and casualty lines, in states in which Harleysville Group writes such lines. These programs include joint underwriting associations, assigned risk plans, fair access to insurance requirements (FAIR) plans, reinsurance facilities and wind storm plans. These state laws generally require all companies that write lines covered by these programs to provide coverage (either directly or through reinsurance) for insureds who cannot obtain insurance in the voluntary market. The legislation creating these programs usually allocates a pro rata portion of risks attributable to such insureds to each company on the basis of direct written premiums or the number of automobiles insured. Generally, state law requires participation in such programs as a condition to doing business. The loss ratio on insurance written under involuntary programs generally has been greater than the loss ratio on insurance in the voluntary market.
State insurance holding company acts regulate insurance holding company systems. Each insurance company in the holding company system is required to register with the insurance supervisory agency of its state of domicile and furnish certain information concerning transactions between companies within the holding company system that may materially affect the operations, management or financial condition of the insurer within the system, including the payment of dividends from the insurance subsidiaries to the Company.
Insurance holding company acts require that all transactions involving any insurer within the holding company system, including those involving the Mutual Company and the Company’s insurance subsidiaries, must be fair and equitable to that insurer. Further, approval of the applicable insurance commissioner is required prior to the consummation of a transaction affecting the control of an insurer.
The Terrorism Risk Insurance Act of 2002 (the Act) established a program that provides a backstop for insurance-related losses resulting from any act of terrorism as defined. The Act, originally set to expire in 2005, was extended through December 31, 2007 in December 2005. The Act was extended again through December 31, 2014 in December 2007 and retitled as the Terrorism Risk Insurance Program Reauthorization Act (TRIPRA) of 2007. Under the program, the federal government will pay 85% of covered losses after an insurer’s losses exceed a deductible determined by a statutorily prescribed formula, up to a combined annual aggregate limit for the federal government and all insurers of $100 billion. If an act of terrorism or acts of terrorism result in covered losses exceeding the $100 billion annual limit, insurers with losses exceeding their deductibles will not be responsible for additional losses. The triggering threshold for certifying an act of terrorism is $100 million in 2010 through 2014. TRIPRA adds coverage for domestic acts of terror, in addition to foreign acts of terror covered under the previous Act.
The statutory formula for determining a company’s deductible for each year is based on the company’s direct commercial earned premiums for the prior calendar year multiplied by a specified percentage. This percentage is 20% for 2010 through 2014. The following lines of business are excluded from coverage and are not to be included in the deductible calculation: commercial auto, burglary and theft, surety, professional liability and farmowners’ multi-peril insurance. Based on the Company’s insurance subsidiaries 2010 earned premiums for lines subject to the Act, our 2011 deductible would be $104.9 million.
The Act and TRIPRA require all property and casualty insurers to make terrorism insurance coverage available in all of their covered commercial property and casualty insurance policies (as defined in the Act).
In the event the Act is not renewed beyond 2014, or is renewed in a materially different form, the Company may have to attempt to obtain appropriate reinsurance for the related terrorism risk, seek exclusion from coverage related to terrorism exposure from the appropriate regulatory authorities, limit certain of its writings, or pursue a solution encompassing aspects of one or more of the foregoing.
14
The insurance industry has received adverse publicity about alleged anti-competitive activities by certain insurance brokers and insurers. Harleysville Group primarily distributes its products through its agents and writes less than 2% of its premiums through brokers.
The property and casualty insurance industry has been subject to significant public scrutiny and comment primarily due to concerns regarding solvency issues, rising insurance costs, and the industry’s methods of operations. Accordingly, regulations and legislation may be adopted or enacted to provide a greater role for the federal government in regulation of insurance companies, to strengthen state oversight, particularly in the field of solvency and investments, to further restrict an insurer’s flexibility in underwriting and pricing risks and to impose new taxes and assessments. It is not possible to predict whether, in what form or in what jurisdictions, any of these measures might be adopted or the effect, if any, on Harleysville Group.
The Company’s insurance subsidiaries generally are restricted by the insurance laws of their respective states of domicile as to the amount of dividends they may pay to the Company without the prior approval of the respective state regulatory authorities. Generally, the maximum dividend that may be paid by an insurance subsidiary during any year without prior regulatory approval is limited to a stated percentage of that subsidiary’s statutory surplus as of a certain date, or adjusted net income of the subsidiary, for the preceding year. Applying the current regulatory restrictions as of December 31, 2010, $59.0 million would be available for distribution to Harleysville Group Inc. in 2011 without prior approval. The Company’s insurance subsidiaries declared dividends of $89.0 million, $57.0 million and $109.9 million in 2010, 2009 and 2008, respectively. The Company’s insurance subsidiaries paid dividends of $94.3 million in 2010 ($29.5 million of which had been declared in 2009), $27.5 million in 2009 and $163.1 million in 2008 ($53.2 million of which were declared in 2007).
Various states have adopted the National Association of Insurance Commissioners (NAIC) risk-based capital (RBC) standards that require insurance companies to calculate and report statutory capital and surplus needs based on a formula measuring underwriting, investment and other business risks inherent in an individual company’s operations. These RBC standards have not affected the operations of Harleysville Group since each of the Company’s insurance subsidiaries has statutory capital and surplus in excess of RBC requirements.
Harleysville Group is required to file financial statements for its subsidiaries, prepared by using statutory accounting practices, with state regulatory authorities. The adjustments necessary to reconcile net income and shareholders’ equity determined by using SAP to net income and shareholders’ equity determined in accordance with GAAP are as follows:
| | | | | | | | | | | | | | | | | | | | |
| | | Net Income
Year Ended December 31, | | | Shareholders’ Equity
December 31, | |
| | | 2010 | | | 2009 | | | 2008 | | | 2010 | | | 2009 | |
| | | (in thousands) | |
SAP amounts | | $ | 68,429 | | | $ | 90,892 | | | $ | 26,951 | | | $ | 695,475 | | | $ | 681,160 | |
Adjustments: | | | | | | | | | | | | | | | | | | | | |
Deferred policy acquisition costs | | | 2,348 | | | | 1,310 | | | | 8,385 | | | | 113,997 | | | | 111,649 | |
Deferred income taxes | | | (760 | ) | | | (3,385 | ) | | | 10,318 | | | | (43,220 | ) | | | (32,005 | ) |
Unrealized investment gains | | | | | | | | | | | | | | | 96,004 | | | | 93,208 | |
Pension | | | (768 | ) | | | 877 | | | | 2,611 | | | | (49,302 | ) | | | (45,976 | ) |
Non-admitted assets | | | | | | | | | | | | | | | 4,382 | | | | 5,727 | |
Other, net | | | (793 | ) | | | (1,308 | ) | | | (4,080 | ) | | | 10,114 | | | | 9,083 | |
Holding company(1) | | | (1,558 | ) | | | (2,090 | ) | | | (1,866 | ) | | | (58,817 | ) | | | (50,218 | ) |
| | | | | | | | | | | | | | | | | | | | |
GAAP amounts | | $ | 66,898 | | | $ | 86,296 | | | $ | 42,319 | | | $ | 768,633 | | | $ | 772,628 | |
| | | | | | | | | | | | | | | | | | | | |
| (1) | Represents the GAAP loss and equity amounts for Harleysville Group Inc., excluding the earnings of and investment in subsidiaries. |
15
Business - Relationship with the Mutual Company
Harleysville Group’s operations are interrelated with the operations of the Mutual Company due to the pooling arrangement and other factors. The Mutual Company owned approximately 54% of the issued and outstanding common stock of Harleysville Group Inc. at December 31, 2010. Harleysville Group employees provide a variety of services to the Mutual Company and its wholly owned subsidiaries. The cost of facilities and employees required to conduct the business of both companies is charged on a cost-allocated basis. Harleysville Group also manages the operations of the Mutual Company and its wholly owned subsidiaries pursuant to a management agreement which commenced January 1, 1993, and was amended and restated effective January 1, 1994, under which Harleysville Group receives a management fee. The agreement was subsequently amended effective January 1, 2010 to include voluntary assumed reinsurance business written by the Mutual Company. Harleysville Group received $5.8 million, $5.1 million, and $6.0 million for the years ended December 31, 2010, 2009 and 2008, respectively, for all such management services.
All of the Company’s officers are officers of the Mutual Company, and six of the Company’s eight directors are directors of the Mutual Company. A coordinating committee exists to review and evaluate the pooling agreement and other material transactions between Harleysville Group and the Mutual Company and is responsible for matters involving actual or potential conflicts of interest between the two companies. The coordinating committee currently consists of six non-employee directors, two from Harleysville Group Inc. and three from the Mutual Company all of whom are not members of both Boards and one, a non-voting Chairman, who is a member of both Boards. The decisions of the coordinating committee are binding on the two companies. No intercompany transaction can be authorized by the coordinating committee unless the Company’s committee members conclude that such transaction is fair and equitable to Harleysville Group.
The Mutual Company leases the home office from a Company subsidiary and it shares most of the facility with Harleysville Group. Rental income under the lease was $4.4 million for 2010 and $4.2 million for 2009 and 2008. Harleysville Group believes that the lease terms are no less favorable to it than if the property were leased to a non-affiliate.
In connection with the acquisition of HIC New York in 1991, the Company borrowed $18.5 million from the Mutual Company. See Note 7 of the Notes to Consolidated Financial Statements. For additional information with respect to transactions with the Mutual Company, see Note 2 of the Notes to Consolidated Financial Statements.
Employees
All employees are paid by Harleysville Group Inc. and, accordingly, are considered to be employees of Harleysville Group Inc. As of December 31, 2010, there were 1,706 employees. The Company considers its relationships with its employees to be good. They also provide a variety of services to the Mutual Company and its wholly owned subsidiaries. See “Business-Relationship with the Mutual Company” and Note 2 of the Notes to Consolidated Financial Statements.
Available Information
The Company maintains a website atwww.harleysvillegroup.com. Our annual report on Form 10-K, quarterly reports on Form 10-Q and current reports on Form 8-K, and amendments to those reports, filed or furnished pursuant to Section 13(a) or 15(d) of the Securities Exchange Act of 1934 (the Exchange Act), are available free of charge on our website as soon as practicable after electronic filing of such material with, or furnishing it to, the U.S. Securities and Exchange Commission.
For the Company’s risk factors, see “Management’s Discussion and Analysis - Risk Factors.”
| Item 1B. | Unresolved Staff Comments. |
None.
16
The buildings which house the headquarters of Harleysville Group and the Mutual Company are leased to the Mutual Company by a subsidiary of Harleysville Group. See “Business-Relationship with the Mutual Company.” The Mutual Company charges Harleysville Group for an appropriate portion of the rent under an intercompany allocation agreement. See “Certain Relationships and Related Transactions, and Director Independence,” Item 13 in Part III of this Form 10-K, which incorporates by reference to our definitive Proxy Statement for our annual meeting of stockholders to be held on April 27, 2011, which shall be filed with the SEC within 120 days after the end of our fiscal year. The buildings containing the headquarters of Harleysville Group and the Mutual Company have approximately 220,000 square feet of office space. Harleysville Group also rents office facilities in certain of the states in which it does business.
| Item 3. | Legal Proceedings. |
Harleysville Group is a party to numerous lawsuits arising in the ordinary course of its insurance business. Harleysville Group believes that the resolution of these lawsuits will not have a material adverse effect on its financial condition and results of operations.
17
PART II
| Item 5. | Market for Registrant’s Common Equity, Related Stockholder Matters and Issuer Purchases of Equity Securities. |
The stock of Harleysville Group Inc. is quoted on the NASDAQ National Market System, and assigned the symbol HGIC. At the close of business on March 1, 2011, the approximate number of holders of record of Harleysville Group Inc.’s common stock was 2,496 (counting all shares held in single nominee registration as one stockholder).
The payment of dividends is subject to the discretion of Harleysville Group Inc.’s Board of Directors which considers, among other factors, Harleysville Group’s operating results, overall financial condition, capital requirements and general business conditions each quarter. The present regular quarterly dividend of $0.36 per share paid in each of the third and fourth quarters of 2010 is expected to continue during 2011. However, the current quarterly dividend level could be impacted by future economic events. As a holding company, one of Harleysville Group Inc.’s sources of cash with which to pay dividends is dividends from its subsidiaries. Harleysville Group Inc.’s insurance company subsidiaries are subject to state laws that restrict their ability to pay dividends. See Note 8 of the Notes to Consolidated Financial Statements and “Business-Regulation.”
The following table sets forth the amount of cash dividends declared per share, and the high and low trading price as reported by Nasdaq for Harleysville Group Inc.’s common stock for each quarter during the past two years.
| | | | | | | | | | | | |
| | | High | | | Low | | | Cash
Dividends
Declared | |
2010 | | | | | | | | | | | | |
First Quarter | | $ | 35.33 | | | $ | 30.98 | | | $ | .325 | |
Second Quarter | | | 34.21 | | | | 30.55 | | | | .325 | |
Third Quarter | | | 33.41 | | | | 30.31 | | | | .360 | |
Fourth Quarter | | | 37.81 | | | | 32.22 | | | | 1.800 | (1) |
| (1) | Includes a special dividend of $1.44 per share. |
| | | | | | | | | | | | |
| | | High | | | Low | | | Cash
Dividends
Declared | |
2009 | | | | | | | | | | | | |
First Quarter | | $ | 35.18 | | | $ | 26.86 | | | $ | .300 | |
Second Quarter | | | 33.54 | | | | 26.77 | | | | .300 | |
Third Quarter | | | 33.42 | | | | 26.09 | | | | .325 | |
Fourth Quarter | | | 34.38 | | | | 30.05 | | | | .325 | |
Securities Authorized for Issuance Under Equity Compensation Plans.See “Security Ownership of Certain Beneficial Owners and Management and Related Stockholder Matters,” Item 12 in Part III of this Form 10-K, which incorporates by reference to our definitive Proxy Statement for our annual meeting of stockholders to be held on April 27, 2011, which shall be filed with the SEC within 120 days after the end of our fiscal year.
18
Unregistered Sales of Equity Securities and Use of Proceeds.
None.
Issuer Purchases of Equity Securities(1)
| | | | | | | | | | | | | | | | |
Period | | Total Number
of Shares
Purchased(2) | | | Average Price
Paid Per Share | | | Total Number of
Shares Purchased
as Part of Publicly
Announced Plans
or Programs | | | Maximum Number
of Shares that
May Yet Be Purchased
Under the Plans
or Programs | |
November 1 - November 30, 2010 | | | 118,912 | | | $ | 37.09 | | | | -0- | | | | 554,916 | |
December 1 - December 31, 2010 | | | 842 | | | $ | 36.71 | | | | -0- | | | | 554,916 | |
| (1) | On February 19, 2009, the Board of Directors authorized the Company to repurchase up to 800,000 shares of its outstanding common stock over a two year period in the open market or in privately negotiated transactions. Additionally, the Board authorized the Company to make purchases under the terms of a Rule 10b5-1 trading plan, which allows the Company to purchase its shares at times when it ordinarily would not be in the market because of self-imposed trading blackout periods, such as the time preceding its quarterly earnings releases, or because its officers are in possession of material, non-public information. The Company repurchased shares in open market transactions from the public float, and did not repurchase shares from the Mutual Company. This program was completed on June 15, 2009. On July 30, 2009, the Board of Directors authorized the Company to repurchase up to an additional 800,000 shares of its outstanding common stock over a two year period under terms similar to the repurchase authorization of February 19, 2009. The Company repurchased shares in open market transactions from the public float, and did not repurchase shares from the Mutual Company. This program was completed on August 3, 2010. On August 6, 2010, the Board of Directors authorized the Company to repurchase up to an additional 800,000 shares of its outstanding common stock over a two year period under terms similar to the repurchase authorization of July 30, 2009. The Company currently intends to repurchase shares in open market transactions from the public float, and not repurchase shares from the Mutual Company. |
| (2) | In accordance with the terms of its Equity Incentive Plan, the Company acquired all of the above shares from employees in connection with stock option exercises and the vesting of restricted stock. The stock was received in payment of the exercise price of the stock options and in satisfaction of withholding taxes due upon exercise or vesting. |
19
Stock Performance Chart.
The following graph shows changes over the past five-year period (all full calendar-year periods) in the value of $100 invested in: 1) Harleysville Group common stock; 2) the NASDAQ National Market System index; and 3) the Peer Group index. All values are as of the last trading day of each year.
Comparison of 5-Year Cumulative Total Stockholder Return
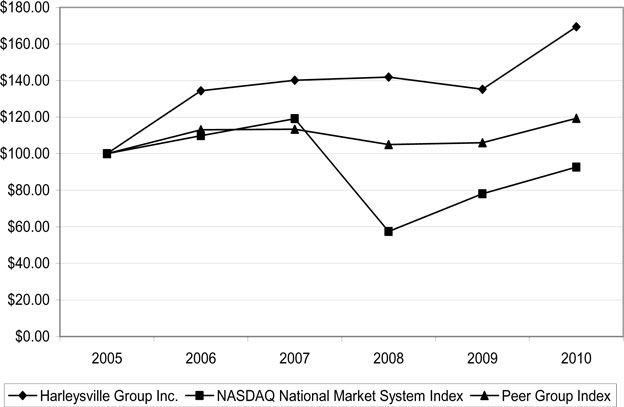
| | | | | | | | | | | | | | | | | | | | | | | | |
| | | 2005 | | | 2006 | | | 2007 | | | 2008 | | | 2009 | | | 2010 | |
Harleysville Group Inc. | | | 100.00 | | | | 134.37 | | | | 140.16 | | | | 141.90 | | | | 135.25 | | �� | | 169.37 | |
NASDAQ National Market System Index | | | 100.00 | | | | 109.84 | | | | 119.12 | | | | 57.41 | | | | 78.03 | | | | 92.61 | |
Peer Group Index | | | 100.00 | | | | 113.06 | | | | 113.31 | | | | 104.96 | | | | 106.01 | | | | 119.34 | |
The year-end values of each investment shown in the preceding graph are based on share price appreciation plus dividends, with the dividends reinvested as of the day such dividends were ex-dividend. The calculations exclude trading commissions and taxes. Total stockholder returns from each investment, whether measured in dollars or percentages, can be calculated from the year-end investment values shown in the legend.
The graph was prepared by Zacks Investment Research, Inc. (Zacks). The NASDAQ National Market System index includes all U.S. Companies in the NASDAQ National Market System and the Peer Group index includes 32 NASDAQ Company stocks in SIC Major Group 633 (SIC 6330-6339: U.S. and foreign, fire, marine and casualty insurance). A complete list of these companies may be obtained from Zacks, 111 North Canal Street, Suite 1101, Chicago, Illinois 60606; (800)767-3771. Zacks reweights the indices daily, using the market capitalization on the previous trading day.
20
| Item 6. | Selected Financial Data. |
At December 31, 2010, the Mutual Company owned approximately 54% of the Common Stock of the Company. Harleysville Group Inc. and its wholly owned subsidiaries are engaged in property and casualty insurance. These subsidiaries are: Harleysville-Atlantic Insurance Company, Harleysville Insurance Company, Harleysville Insurance Company of New Jersey, Harleysville Insurance Company of New York, Harleysville Insurance Company of Ohio, Harleysville Lake States Insurance Company, Harleysville Preferred Insurance Company, Harleysville Worcester Insurance Company, and Harleysville Ltd., a real estate partnership that owns the home office.
| | | | | | | | | | | | | | | | | | | | |
| | | Year Ended December 31, | |
| | | 2010 | | | 2009 | | | 2008 | | | 2007 | | | 2006 | |
| | | (in thousands, except per share data) | |
Income Statement Data(1): | | | | | | | | | | | | | | | | | | | | |
Premiums earned | | $ | 866,350 | | | $ | 858,500 | | | $ | 918,515 | | | $ | 833,024 | | | $ | 838,821 | |
Investment income, net | | | 103,313 | | | | 106,649 | | | | 113,555 | | | | 110,827 | | | | 102,609 | |
Realized investment gains (losses) | | | 597 | | | | 2,293 | | | | (59,841 | ) | | | 875 | | | | 40,605 | |
Total revenues | | | 986,272 | | | | 980,620 | | | | 985,316 | | | | 962,012 | | | | 999,171 | |
Income before income taxes | | | 82,712 | | | | 115,998 | | | | 50,962 | | | | 142,995 | | | | 156,368 | |
Income taxes | | | 15,814 | | | | 29,702 | | | | 8,643 | | | | 42,941 | | | | 46,241 | |
Net income | | | 66,898 | | | | 86,296 | | | | 42,319 | | | | 100,054 | | | | 111,069 | |
Basic earnings per share | | $ | 2.43 | | | $ | 3.09 | | | $ | 1.45 | | | $ | 3.21 | | | $ | 3.57 | |
Diluted earnings per share | | $ | 2.42 | | | $ | 3.07 | | | $ | 1.43 | | | $ | 3.17 | | | $ | 3.51 | |
Cash dividends per share | | $ | 2.81 | | | $ | 1.25 | | | $ | 1.10 | | | $ | .88 | | | $ | .73 | |
| | | | | |
Balance Sheet Data at Year End: | | | | | | | | | | | | | | | | | | | | |
Total investments | | $ | 2,661,476 | | | $ | 2,639,814 | | | $ | 2,473,592 | | | $ | 2,358,473 | | | $ | 2,249,014 | |
Total assets | | | 3,278,232 | | | | 3,301,986 | | | | 3,155,318 | | | | 3,072,445 | | | | 2,990,984 | |
Debt | | | 118,500 | | | | 118,500 | | | | 118,500 | | | | 118,500 | | | | 118,500 | |
Shareholders’ equity | | | 768,633 | | | | 772,628 | | | | 652,634 | | | | 758,841 | | | | 712,162 | |
Shareholders’ equity per share | | $ | 28.42 | | | $ | 27.98 | | | $ | 23.18 | | | $ | 25.03 | | | $ | 22.49 | |
| (1) | The Company’s insurance subsidiaries participate in an underwriting pooling arrangement with the Mutual Company and Pennland. Harleysville Group’s participation was 80% for 2008 through 2010 and 72% for 2006 and 2007. See “Management’s Discussion and Analysis of Financial Condition and Results of Operations” and Note 2(a) of the Notes to Consolidated Financial Statements. |
| Item 7. | Management’s Discussion and Analysis of Financial Condition and Results of Operations. |
Certain of the statements contained herein (other than statements of historical facts) are forward-looking statements. Such forward-looking statements are made pursuant to the safe harbor provisions of the Private Securities Litigation Reform Act of 1995 and include estimates and assumptions related to economic, competitive, legislative and regulatory developments. These forward-looking statements are subject to change and uncertainty which are, in many instances, beyond the control of Harleysville Group Inc. (the Company) and have been made based upon management’s expectations and beliefs concerning future developments and their potential effect on the Company and its wholly owned property and casualty insurance subsidiaries (collectively, Harleysville Group). There can be no assurance that future developments will be in accordance with management’s expectations or that the effect of future developments on Harleysville Group will be those anticipated by management. Actual financial results, including premium levels and underwriting results, could differ materially from those anticipated by Harleysville Group depending on the outcome of certain factors, which may include changes in property and casualty loss trends and reserves; the insurance product pricing environment; changes in applicable law; government regulation and changes therein that may impede the ability to charge adequate rates; performance of and instability in the financial markets; investment losses; fluctuations in interest rates; significant catastrophe events in the geographic regions where we do business; decreased demand for property and casualty insurance; availability and price of reinsurance; the A. M. Best group rating of Harleysville Group; and the status of labor markets in which the Company operates. In addition, see “Management’s Discussion and Analysis - Risk Factors.”
21
Overview
The Company’s net income is primarily determined by four elements:
| | • | | investment income and realized investment gains (losses); |
| | • | | amounts paid or reserved to settle insured claims; and |
| | • | | other income and expense. |
Variations in premium income are subject to a number of factors, including:
| | • | | limitations on premium rates arising from the competitive marketplace or regulation; |
| | • | | limitations on available business arising from a need to maintain the quality of underwritten risks; |
| | • | | the Company’s ability to maintain it’s A (“excellent”) group rating by A.M. Best; and |
| | • | | the ability of the Company to maintain a reputation for efficiency and fairness in claims administration. |
Variations in investment income and realized investment gains (losses) are subject to a number of factors, including:
| | • | | general interest rate levels and financial market conditions; |
| | • | | specific adverse events affecting the issuers of debt obligations held by the Company; and |
| | • | | changes in the prices of debt and equity securities generally and those held by the Company specifically. |
Loss and loss settlement expenses are affected by a number of factors, including:
| | • | | the quality of the risks underwritten by the Company; |
| | • | | the nature and severity of catastrophic losses; |
| | • | | the availability, cost and terms of reinsurance; and |
| | • | | underlying settlement costs, including medical and legal costs. |
Variations in other income and expense are affected by a number of factors, including:
| | • | | the level of premiums written by the Mutual Company and its subsidiaries which are subject to the management fee; |
| | • | | the amount of flood insurance written and ceded to the National Flood Insurance Program; and |
| | • | | the interest rate on debt issued by the Company. |
The Company seeks to manage each of the foregoing to the extent within its control. Many of the foregoing factors are partially, or entirely, outside of the control of the Company.
Critical Accounting Policies and Estimates
The consolidated financial statements are prepared in conformity with U.S. generally accepted accounting principles, which require Harleysville Group to make estimates and assumptions (see Note 1 of the Notes to Consolidated Financial Statements). Harleysville Group believes that of its significant accounting policies, the following may involve a higher degree of judgment and estimation. The judgments, or the methodology on which the judgments are made, are reviewed quarterly with the Audit Committee.
Liabilities for Losses and Loss Settlement Expenses. The liability for losses and loss settlement expenses represents estimates of the ultimate unpaid cost of all losses incurred, including losses for claims which have not yet been reported to Harleysville Group. The amount of loss reserves for reported claims is based primarily upon a case-
22
by-case evaluation of the type of risk involved, knowledge of the circumstances surrounding each claim and the insurance policy provisions relating to the type of loss. The amounts of loss reserves for unreported claims and loss settlement expense reserves are determined utilizing historical information by line of insurance as adjusted to current conditions. Inflation is implicitly provided for in the reserving function through analysis of costs, trends and reviews of historical reserving results. Estimates of the liabilities are reviewed and updated on a regular basis using the most recent information on reported claims and a variety of actuarial techniques. It is expected that such estimates will be more or less than the amounts ultimately paid when the claims are settled. Changes in these estimates are reflected in current operations.
Investments. Generally, unrealized investment gains or losses on investments carried at fair value, net of applicable income taxes, are reflected directly in shareholders’ equity as a component of comprehensive income and, accordingly, have no effect on net income. However, if the fair value of an investment in equity securities declines below its cost and that decline is deemed other than temporary, the amount of the decline below cost is charged to earnings. Per the Company’s current policy, a fixed maturity security is other than temporarily impaired if the present value of the cash flows expected to be collected is less than the amortized cost of the security or where the security’s fair value is below cost and the Company intends to sell, or more likely than not will be required to sell, the security before recovery of its value. If the Company does not intend to sell, or more likely than not will not be required to sell, a fixed maturity security whose fair value has declined below its cost, the amount of the decline below cost due to credit-related reasons is charged to earnings and the remaining difference is included in comprehensive income. Harleysville Group monitors its investment portfolio and at least quarterly reviews investments that have experienced a decline in fair value below cost to evaluate whether the decline is other than temporary. Such evaluations consider, among other things, the magnitude and reasons for a decline, the prospects for the fair value to recover in the near term and Harleysville Group’s intent to retain the investment for a period of time sufficient to allow for a recovery in value. Future adverse investment market conditions, or poor operating results of underlying investments, could result in an impairment charge in the future.
The severe downturn in the public debt and equity markets in recent years, reflecting uncertainties associated with the mortgage crisis, worsening economic conditions, widening of credit spreads, bankruptcies and government intervention in large financial institutions, has resulted in significant realized and unrealized losses in our investment portfolio in the past. Depending on market conditions going forward, we could incur additional realized and unrealized losses in future periods.
The fair value of equity securities is based on the closing market value. The fair value of mutual fund holdings is based on the closing net asset value reported by the fund. The fair value of fixed maturities is based upon data supplied by an independent pricing service. It can be difficult to determine the fair value of non-traded securities, but Harleysville Group does not own a material amount of non-traded securities.
Policy Acquisition Costs. Policy acquisition costs, such as commissions, premium taxes and certain other underwriting and agency expenses that vary with and are primarily related to the production of business, are deferred and amortized over the effective period of the related insurance policies and in proportion to the premiums earned. The method followed in computing deferred policy acquisition costs limits the amount of such deferred costs to their estimated realizable value. The estimation of net realizable value takes into account the premium to be earned, related investment income over the claim paying period, expected losses and loss settlement expenses, and certain other costs expected to be incurred as the premium is earned. Future changes in estimates, the most significant of which is expected losses and loss settlement expenses, may require adjustments to deferred policy acquisition costs. If the estimation of net realizable value indicates that the deferred acquisition costs are not recoverable, they would be written off and further analyses would be performed to determine if an additional liability would need to be accrued.
Contingencies. Besides claims related to its insurance products, Harleysville Group is subject to proceedings, lawsuits and claims in the normal course of business. Harleysville Group assesses the likelihood of any adverse outcomes to these matters as well as potential ranges of probable losses. There can be no assurance that actual outcomes will be consistent with those assessments.
The application of certain of these critical accounting policies to the years ended December 31, 2010 and 2009 is discussed in greater detail below.
23
Results of Operations
Harleysville Group underwrites property and casualty insurance in both the personal and commercial lines of insurance. The personal lines of insurance include both auto and homeowners, and the commercial lines include auto, commercial multi-peril and workers compensation. The business is marketed primarily in the eastern and midwestern United States through independent agents.
Historically, Harleysville Group’s results of operations have been influenced by factors affecting the property and casualty insurance industry in general. The operating results of the United States property and casualty insurance industry have been subject to significant variations due to competition, weather, catastrophic events, regulation, the availability and cost of satisfactory reinsurance, general economic conditions, judicial trends, fluctuations in interest rates and other changes in the investment environment.
Harleysville Group’s premium growth and underwriting results have been, and continue to be, influenced by market conditions. Insurance industry price competition has often made it difficult both to obtain and to retain properly priced personal and commercial lines business. It is management’s policy to continue to maintain its underwriting standards.
Property and casualty insurance premiums are established before the amount of losses and loss settlement expenses, or the extent to which inflation may affect such expenses, are known. Consequently, Harleysville Group attempts, in establishing rates, to anticipate the potential impact of inflation. In the past, inflation has contributed to increased losses and loss settlement expenses.
The key elements of Harleysville Group’s business model are the sales of properly priced and underwritten personal and commercial property and casualty insurance through independent agents and the investment of the premiums in a manner designed to assure that claims and expenses can be paid while providing a return on the capital employed. Loss trends and investment performance are critical factors in influencing the success of the business model. These factors are affected by the factors impacting the insurance industry in general as described above and factors unique to Harleysville Group as described in the following discussion.
Transactions with Affiliates
The Company’s property and casualty subsidiaries participate in a pooling agreement with Harleysville Mutual Insurance Company (the Mutual Company) and its property and casualty insurance subsidiary, Harleysville Pennland Insurance Company (Pennland). The pooling agreement provides for the allocation of premiums, losses, loss settlement expenses and underwriting expenses between Harleysville Group and the Mutual Company. Harleysville Group is not liable for any losses incurred by the Mutual Company or Company subsidiaries Harleysville Preferred Insurance Company (Preferred) and Harleysville Insurance Company of New Jersey (HNJ) prior to January 1, 1986, the date the pooling agreement became effective, or for certain business assumed by the Mutual Company effective January 1, 2010. Harleysville Group’s participation in the pool has been 80% since January 1, 2008.
Effective January 1, 2011, the Company’s property and casualty subsidiaries and the Mutual Company and Pennland amended their intercompany pooling agreement as it relates to their workers compensation business. The amendment establishes that the financial results associated with the workers compensation business for accident years 2011 and following will be retained 100 percent by the Mutual Company. The financial results of this business for prior accident years will continue to be shared between the Company’s property and casualty subsidiaries, the Mutual Company and Pennland under the existing pool participations. Harleysville Group paid cash of $33 million on January 3, 2011 associated with the transfer of the unearned premium liability on the workers compensation business as of January 1, 2011. Harleysville Group’s unearned premium liability decreased by $40 million and Harleysville Group received a ceding commission of $7 million for expenses that were incurred to generate the business ceded to the Mutual Company, which ceding commission reduced deferred policy acquisition costs.
Effective January 1, 2010, the pooling agreement was amended to exclude premiums, losses, loss settlement expenses and underwriting expenses voluntarily assumed by the Mutual Company.
Effective January 1, 2008, the Company’s property and casualty subsidiaries and the Mutual Company and Pennland amended their intercompany pooling agreement to increase Harleysville Group’s share of the pool from 72% to 80%. Harleysville Group received cash and investments of $192.1 million on January 3, 2008 associated with the transfer of liabilities from the Mutual Company to Harleysville Group in connection with the pool change. Harleysville Group’s liabilities increased $203.4 million and Harleysville Group reimbursed the Mutual Company $11.3 million, through a ceding commission, for expenses that were incurred to generate the additional business assumed by the Company’s property and casualty subsidiaries, which ceding commission was deferred as policy acquisition costs.
24
These liabilities consisted of the following at January 1, 2008 (in thousands):
| | | | |
Unpaid losses and loss settlement expenses (net of reinsurance) | | $ | 153,535 | |
Unearned premiums (net of reinsurance) | | | 45,718 | |
Other liabilities | | | 4,163 | |
Less: ceding commission paid | | | (11,338 | ) |
| | | | |
| | $ | 192,078 | |
| | | | |
When the Company’s property and casualty insurance subsidiaries’ pooling participation increases, there is a larger retrocession of this pooled business from the Mutual Company. Through this retrocession, Harleysville Group is assuming a larger share of premiums, losses and underwriting expenses for current and future periods originating both from its subsidiaries and the Mutual Company. An increase in Harleysville Group’s pooling participation results in a larger share of the pooled liabilities being assumed by Harleysville Group. Cash and investments are received by Harleysville Group equal to this greater share of loss reserves, unearned premiums and other insurance liabilities (primarily commissions and premium taxes) less a ceding commission based on acquisition costs related to unearned premiums. An increase in pool participation also increases Harleysville Group’s leverage and exposure to prior period development.
Because the pooling agreement does not relieve Harleysville Group of primary liability as the originating insurer, there is a concentration of credit risk arising from business ceded to the Mutual Company. However, the pooling agreement provides for the right of offset and the amount of credit risk with the Mutual Company was not material at December 31, 2010 and 2009. The Mutual Company has an A. M. Best rating of “A” (Excellent).
On December 30, 2010, Harleysville Group Inc. acquired Mainland Insurance Company (Mainland) from the Mutual Company for $4,825,000 in cash. On December 31, 2010, HIC New York was merged into Mainland and Mainland’s name was changed to Harleysville Insurance Company of New York (HIC New York). As a result of this transaction, HIC New York was redomesticated from New York to Pennsylvania.
Harleysville Ltd. is a subsidiary of the Company and leases the home office to the Mutual Company, which shares the facility with Harleysville Group. Rental income under the lease was $4.4 million, $4.2 million and $4.2 million for 2010, 2009 and 2008, respectively, and is included in other income after elimination of intercompany amounts of $3.0 million, $2.9 million and $2.8 million in 2010, 2009 and 2008, respectively. The lease had a five-year term expiring December 31, 2009 and included a formula for additional rent for any additions, improvements or renovations. The lease was renewed for one-year periods expiring December 31, 2011 and December 31, 2010 under its prior terms. The Mutual Company is responsible for the building operating expenses including maintenance and repairs. The pricing of the lease was based upon an appraisal obtained from an independent real estate appraiser.
Harleysville Group provides certain management services to the Mutual Company and other affiliates. Harleysville Group received a fee of $5.8 million, $5.1 million and $6.0 million in 2010, 2009 and 2008, respectively, for its services under these management agreements. Effective January 1, 2010, the management agreement was amended to include voluntary assumed reinsurance business written by the Mutual Company. Under related agreements, Harleysville Group serves as the paymaster for Harleysville companies, with each company being charged for its proportionate share of salary and employee benefits expense based upon time allocation. The level of fees has been approved by each state insurance department having jurisdiction.
The Company’s insurance subsidiaries and the Mutual Company are parties to an Equipment and Supplies Allocation Agreement whereby equipment and supplies are shared between parties. Ultimate expense for such items is allocated to Harleysville Group based on its pooling participation. The Mutual Company has purchased and developed certain equipment and software which is expensed by Harleysville Group based on its pooling participation as the items are depreciated or amortized.
Intercompany balances are created primarily from the pooling arrangement (settled quarterly), allocation of common expenses, collection of premium balances and payment of claims (settled monthly). No interest is charged or received on intercompany balances due to the timely settlement terms and nature of the items.
25
Harleysville Group borrowed $18.5 million from the Mutual Company in connection with the acquisition of Harleysville Insurance Company of New York (HIC New York) in 1991. It was a demand loan with a stated maturity in March 1998 which had been extended to March 2005. In February 2005, the maturity was extended again to March 2012 and the interest rate became LIBOR plus 0.45%, which was a commercially reasonable market rate in 2005. Interest expense on this loan was $0.1 million, $0.3 million, and $0.6 million in 2010, 2009 and 2008, respectively.
Harleysville Group has no material relationships with current or former members of management other than compensatory plans and arrangements disclosed or described in the Company’s public filings.
Off Balance Sheet Arrangements
Harleysville Group has off-balance-sheet credit risk related to approximately $99.6 million and $82.0 million of premium balances due to the Mutual Company from agents and insureds at December 31, 2010 and 2009, respectively. The Mutual Company bills and collects such receivables on behalf of Harleysville Group for efficiency reasons. Harleysville Group recognizes any associated bad debts, which have not been material.
2010 Compared to 2009
Premiums earned increased $7.8 million, or 0.9%, for the year ended December 31, 2010 compared to the prior year primarily due to an increase of $21.2 million in premiums earned for personal lines, partially offset by a decrease of $13.4 million in premiums earned for commercial lines. The increase in premiums earned for personal lines was 12.6%, primarily due to new business writings and higher average premiums. The decrease in premiums earned for commercial lines was 1.9%, primarily due to lower average premiums, lower exposures and a decline in assumed premiums earned from involuntary pools.
Investment income decreased $3.3 million for the year ended December 31, 2010, primarily due to a lower investment yield on fixed income securities and short-term investments and a greater percentage of fixed income securities invested in tax-exempt securities. During the second half of 2010, Harleysville Group purchased an additional $50 million of equity securities in order to generate additional investment income. Investments were made in high-quality, large-cap companies with strong balance sheets and a history of paying and increasing their dividends. In 2011, Harleysville Group plans to add an additional $120 million to dividend paying equities, with $50 million of this amount resulting from a re-allocation of its broad-based equity index fund.
Net realized investment gains decreased $1.7 million for the year ended December 31, 2010, compared to the prior year. There were no credit-related impairment charges in 2010 and credit-related impairment charges of $1.5 million on non-equity securities in 2009. The 2009 impairment charges consisted of $0.5 million on bonds which were sold in 2010 and $1.0 million on structured investment vehicles.
Harleysville Group holds securities with unrealized losses at December 31, 2010 as follows:
| | | | | | | | | | | | |
| | | | | | | | | Length of
Unrealized
Loss | |
| | | Fair Value | | | Unrealized
Loss | | | Less Than
12 Months | |
| | | (in thousands) | |
Fixed maturities: | | | | | | | | | | | | |
U.S. Treasury securities | | $ | 3,073 | | | $ | 38 | | | $ | 38 | |
Obligations of states and political subdivisions | | | 232,551 | | | | 3,978 | | | | 3,978 | |
Corporate securities | | | 33,594 | | | | 330 | | | | 330 | |
| | | | | | | | | | | | |
Total fixed maturities | | | 269,218 | | | | 4,346 | | | | 4,346 | |
| | | | | | | | | | | | |
Equity securities | | | 17,231 | | | | 313 | | | | 313 | |
| | | | | | | | | | | | |
Total temporarily impaired securities | | $ | 286,449 | | | $ | 4,659 | | | $ | 4,659 | |
| | | | | | | | | | | | |
All of the fixed maturity securities with an unrealized loss at December 31, 2010, are classified as available for sale and are carried at fair value on the balance sheet.
26
The unrealized losses on fixed maturity investments were primarily due to an increase in interest rates rather than a decline in credit quality. Per the Company’s policy, a fixed maturity security is other than temporarily impaired if the present value of the cash flows expected to be collected is less than the amortized cost of the security or where the security’s fair value is below cost and the Company intends to sell or more likely than not will be required to sell the security before recovery of its value. The Company believes, based on its analysis, that these securities are not other than temporarily impaired. However, depending on developments involving both the issuers and worsening economic conditions, these investments may be written down in the income statement in the future.
Twelve positions comprise the unrealized loss in equity investments at December 31, 2010. These securities have not been below cost for significant continuous amounts of time. Harleysville Group is monitoring these securities and some could possibly be written down in the income statement in the future.
Income before income taxes decreased $33.3 million for the year ended December 31, 2010 compared to the prior year. The decrease was primarily due to an underwriting loss in 2010 compared to an underwriting gain in 2009 and a decrease in investment income.
An insurance company’s statutory combined ratio is a standard measure of underwriting profitability. This ratio is the sum of (1) the ratio of incurred losses and loss settlement expenses to net earned premium, (2) the ratio of expenses incurred for commissions, premium taxes, administrative and other underwriting expenses to net written premium, and (3) the ratio of dividends to policyholders to net earned premium. The combined ratio does not reflect investment income, federal income taxes or other non-operating income or expense. A ratio of less than 100 percent generally indicates underwriting profitability. Harleysville Group’s statutory combined ratio increased to 102.5% for the year ended December 31, 2010 from 99.8% for the year ended December 31, 2009. The increase in the combined ratio was primarily due to greater catastrophe losses and greater non-catastrophe property losses in 2010, partially offset by greater favorable development in 2010. Net catastrophe losses increased to $35.7 million (4.1 points) for 2010 from $6.2 million (0.7 points) for 2009. The 2010 catastrophe losses were primarily due to a series of severe winter storms in the first quarter and several wind and hail events during the second and third quarters.
The statutory combined ratios by line of business for the year ended December 31, 2010 as compared to the year ended December 31, 2009 are shown below.
| | | | | | | | |
| | | For the Year Ended
December 31, | |
| | | 2010 | | | 2009 | |
Commercial: | | | | | | | | |
Automobile | | | 100.0 | % | | | 91.4 | % |
Workers compensation | | | 106.1 | % | | | 106.2 | % |
Commercial multi-peril | | | 106.1 | % | | | 105.1 | % |
Other commercial | | | 88.8 | % | | | 97.6 | % |
Total commercial | | | 102.3 | % | | | 100.7 | % |
Personal: | | | | | | | | |
Automobile | | | 104.9 | % | | | 103.0 | % |
Homeowners | | | 108.2 | % | | | 92.7 | % |
Other personal | | | 62.6 | % | | | 81.1 | % |
Total personal | | | 103.5 | % | | | 96.8 | % |
Total personal and commercial | | | 102.5 | % | | | 99.8 | % |
The commercial lines statutory combined ratio increased to 102.3% for the year ended December 31, 2010 from 100.7% for the year ended December 31, 2009. This increase was primarily due to the commercial automobile line of business for which the statutory combined ratio increased to 100.0% for the year ended December 31, 2010 from 91.4% for the year ended December 31, 2009. The increase in the commercial automobile combined ratio is primarily due to the recognition of 4.5 points of favorable development from prior accident years in 2010, compared to the recognition of 10.9 points of favorable development from prior accident years in 2009. The commercial multi-peril line of business also contributed to the increase in the commercial lines statutory combined ratio in the year. The commercial multi-peril statutory combined ratio increased to 106.1% for the year ended December 31, 2010 from 105.1% for the year ended December 31, 2009, primarily due to a higher level of property losses compared to the prior year.
27
The personal lines statutory combined ratio increased to 103.5% for the year ended December 31, 2010 from 96.8% for the year ended December 31, 2009. The increase in the personal lines combined ratio for the year ended December 31, 2010 primarily relates to a higher incidence of personal lines catastrophe losses during 2010 (9.7 points) compared to the catastrophe losses in 2009 (1.0 points). Catastrophe losses in the homeowners line of business were significantly higher during 2010 (20.1 points) compared to 2009 (1.6 points).
Reserves for unpaid losses and loss settlement expenses are estimated for case reserves and losses incurred but not reported (IBNR) separately. The sum of case reserves and IBNR represents the Company’s estimate of total unpaid loss and loss settlement expense. Case reserves are determined for each reported claim by the Company’s claims organization reflecting the known circumstances of the individual claim. The Company’s actuaries calculate IBNR by reducing their estimate of ultimate loss and loss settlement expense by cumulative paid loss and loss settlement expense and case reserves. Ultimate losses are re-estimated for each line of business on a quarterly basis using the most current loss and claim data as of the quarter end.
In addition to analyzing reserves on a line of business basis, reserving categories are identified and reviewed. For example, the following categories for the Commercial Auto Liability line of business are analyzed quarterly: Commercial Auto Liability Bodily Injury; Commercial Auto Liability Property Damage; and Commercial Auto Liability Excess. In the discussion that follows, these categories are referred to by the label “line of business.” In the course of our quarterly reserve estimation process, several standard loss reserving methods and procedures are utilized to derive estimates of ultimate loss for each line of business, including:
| | • | | Paid Loss Development Method |
| | • | | Incurred Loss Development Method |
| | • | | Incurred Counts and Averages Method (Based on Exponential Fit of Severity) |
| | • | | Bornhuetter-Ferguson Method |
Any individual method used to estimate loss reserves has its advantages and disadvantages based on trends, changes within the external business environment, changes in internal company processes and procedures and any bias that may be inherent in the methodology. The actuaries give consideration to the relative strengths and weaknesses of each of the methods to derive a selected point estimate within the range. Following is a general description of each of the methods used:
| | • | | Paid Loss Development Method:The Paid Loss Development Method uses historical payment patterns to project future payments as of a given evaluation date to ultimate loss. Estimates using this method are not affected by changes in case reserving practices that might have occurred during the review period, but may be understated as this method does not take into account large unpaid claims. This method is also susceptible to any changes in the rate of claim settlements or shifts in the size of claims settled. |
A number of indications of ultimate loss may be produced from the Paid Loss Development Method since a number of loss development factors (LDFs) may be selected. The actuaries produce and review several indications of ultimate loss using this method based on various LDF selections as judged appropriate, such as:
| | • | | 3-Year Average (straight average and loss-weighted average) |
| | • | | 5-Year Average (straight average and loss-weighted average) |
| | • | | 5-Year Excluding Highest and Lowest LDFs |
| | • | | All-Year loss-weighted average |
| | • | | Selected LDF Pattern (LDFs are selected for each evaluation based on the actuaries’ review of the historical development) |
| | • | | Incurred Loss Development Method:The Incurred Loss Development Method is similar to the paid method, but instead uses historical incurred (case reserves plus payments) patterns to project future incurred losses as of a given evaluation date to ultimate loss. In many cases, the incurred development method is preferred over the paid method as it includes the additional information provided by the |
28
| | aggregation of individual case reserves. The resulting LDFs tend to be lower and more stable than those of the paid development method. However, the incurred development method may be affected by changes in case reserving practices and any unusually large individual claims. |
As with the Paid Loss Development Method, various indications of ultimate loss may be produced from the Incurred Loss Development Method. The actuaries produce and review several indications of ultimate loss using this method based on various LDF selections.
| | • | | Incurred Counts and Averages Method:This method is used to estimate ultimate loss by separately estimating ultimate counts and severity (average loss per claim) components of ultimate loss. Both the ultimate claim counts and ultimate severity are estimated using a loss development factor approach similar to the Incurred Loss Development Method. For this reason, the same considerations discussed in the Incurred Loss Development Method apply to this method as well. |
An ultimate severity is selected by fitting a curve to the historical ultimate severities indicated using the ratio of the ultimate loss and ultimate claim counts. This method yields ultimate severities that are based on the underlying historical trends in the data. Ultimate claim counts and ultimate severities are multiplied together to produce an estimate of ultimate losses.
This method is useful in more recent accident years where the data is not mature and is especially useful when loss development patterns are volatile or not well established.
| | • | | Bornhuetter-Ferguson Method: The Bornhuetter-Ferguson Method is a blended method that explicitly takes into account both actual loss development to date and expected future loss emergence. Two versions of this method may be used: one based on paid loss and one based on incurred loss. This method uses the selected loss development patterns from the Development Methods to calculate the expected percentage of loss unpaid (or unreported). The expected component of the method is calculated by multiplying earned premium for the given exposure period by a selected a priori loss ratio. The resulting dollars are then multiplied by the expected percentage of unpaid (or unreported) loss described above. This provides an estimate of future loss payments (or reporting) that is then added to actual paid (or incurred) loss data to produce estimated ultimate loss. |
Each of the methodologies described above (and their derivatives) are reviewed for each line of business. This approach allows the actuaries to identify and respond to the unique characteristics of each line of business. Further, since long-term historical data is reviewed, changes in development patterns within a line of business may likewise be identified and considered in the actuaries’ process of selecting ultimate loss.
An actuarial central estimate, which is management’s best estimate, of ultimate loss is selected for each line of business based on a review of the indications produced by the above methodologies. More consideration is given to those methods that the actuaries deem to be more appropriate in a particular situation. In addition, other metrics such as claim closing ratios, average case reserve levels, paid loss to incurred loss ratios, individual large loss information, and recent insurance pricing changes are reviewed to help the actuaries select the most appropriate estimates of ultimate loss.
The selection of the ultimate loss is based on information unique to each line of business and accident year and the judgment and expertise of the actuaries.
| | • | | Short-Tail versus Long-Tail Lines of Business:The reserving methods described above are generally applied to each line of business, regardless of their classification as short-tail or long-tail. “Tail” refers to the time period between the occurrence of a loss and the final settlement of the claim. The merits of an individual reserving method relative to the line of business and age of accident period are considered in the actuaries’ process of selecting ultimate loss. |
Short-tail lines of business, by definition, develop to their ultimate value faster than long-tail lines of business. Property coverages including inland marine along with automobile physical damage coverages are considered short-tail lines of business. Automobile Liability, General Liability, Commercial Multi-Peril Liability and Workers’ Compensation are considered long-tail lines of business. For many liability claims, significant periods of time may elapse between the occurrence of the loss, the reporting of the loss, and the final settlement of the claim. Workers’ Compensation claims can result in providing medical benefits and wage replacement over the course of an injured worker’s lifetime.
29
In general, more consideration may be given to the results of the development methodologies for short-tail lines than to long-tail lines for accident periods of the same maturity. For example, the indicated ultimate loss using the Incurred Loss Development Method for the most recent accident year is generally considered more reliable for a short-tail line, such as Homeowners Property, than a long-tail line, such as Workers’ Compensation.
As mentioned previously, the selection of ultimate loss is based on information unique to each line of business and accident year subject to exceptions, such as the emergence of one or more unusually large claims in a particular accident period for a short-tail line. In this case, the indications produced by the development methods may be overstated (due to development of ultimate losses to amounts in excess of policy limits) and such information would be considered in the actuaries’ process of selecting ultimate loss.
| | • | | Immature Accident Periods: The Paid Loss Development Method is generally given less consideration than the Incurred Loss Development Method for less mature accident periods since the relatively low magnitude of losses paid at early evaluations tends to result in less reliable indications from the Paid Loss Development Method. For long-tail lines of business, neither the Incurred nor the Paid Loss Development methods may receive significant consideration for the most recent accident period. This is due to the fact that the relatively low magnitude of losses either incurred or paid at early evaluations tends to result in less reliable indications from these methods. |
In faster developing, short-tailed lines such as Auto Physical Damage, Special Property, Homeowners, Commercial Multi-Peril Property and Property Damage, the Paid Loss Development Method, the Incurred Loss Development Method and the Bornhuetter-Ferguson methods are primarily used as they typically produce tightly clustered projections for all accident years.
The estimation of loss reserves for long-tail lines such as Commercial Auto Liability, Commercial Multi-Peril Liability, and Workers Compensation is more complex and is subject to a higher degree of variability than for short-tail lines of business.
The following table presents the liability for unpaid losses and loss settlement expenses by major line of business:
| | | | | | | | |
| | | December 31, | |
| | | 2010 | | | 2009 | |
| | | (in thousands) | |
Commercial: | | | | | | | | |
Automobile | | $ | 288,289 | | | $ | 302,378 | |
Workers compensation | | | 370,838 | | | | 376,522 | |
Commercial multi-peril | | | 634,145 | | | | 623,946 | |
Other commercial | | | 143,070 | | | | 139,612 | |
| | | | | | | | |
Total commercial | | | 1,436,342 | | | | 1,442,458 | |
| | | | | | | | |
Personal: | | | | | | | | |
Automobile | | | 78,505 | | | | 77,234 | |
Homeowners | | | 36,427 | | | | 35,406 | |
Other personal | | | 2,791 | | | | 4,066 | |
| | | | | | | | |
Total personal | | | 117,723 | | | | 116,706 | |
| | | | | | | | |
Total personal and commercial | | | 1,554,065 | | | | 1,559,164 | |
Plus reinsurance recoverables | | | 217,596 | | | | 223,128 | |
| | | | | | | | |
Total liability | | $ | 1,771,661 | | | $ | 1,782,292 | |
| | | | | | | | |
30
The following table presents the increase (decrease) in the estimated ultimate loss and loss settlement expenses attributable to insured events of prior years for the year ended December 31, 2010 by line of business:
Increase (Decrease) in the Estimated Ultimate Loss and Loss Settlement Expenses
Attributable to Insured Events of Prior Years
For the Year Ended December 31, 2010
| | | | | | | | | | | | | | | | |
| | | | | | Accident Years | |
| | | Total | | | 2009 | | | 2008 | | | 2007 and
Prior Years | |
| | | (in thousands) | |
Line of Business | | | | | | | | | | | | | | | | |
Commercial: | | | | | | | | | | | | | | | | |
Automobile | | $ | (8,071 | ) | | $ | 490 | | | $ | (402 | ) | | $ | (8,159 | ) |
Workers compensation | | | (8,184 | ) | | | 1,228 | | | | (391 | ) | | | (9,021 | ) |
Commercial multi-peril | | | (18,945 | ) | | | (4,084 | ) | | | (1,722 | ) | | | (13,139 | ) |
Other commercial | | | (9,626 | ) | | | (1,000 | ) | | | (3,346 | ) | | | (5,280 | ) |
| | | | | | | | | | | | | | | | |
Total commercial | | | (44,826 | ) | | | (3,366 | ) | | | (5,861 | ) | | | (35,599 | ) |
| | | | | | | | | | | | | | | | |
Personal: | | | | | | | | | | | | | | | | |
Automobile | | | (4,356 | ) | | | 506 | | | | (948 | ) | | | (3,914 | ) |
Homeowners | | | (270 | ) | | | 81 | | | | 413 | | | | (764 | ) |
Other personal | | | (677 | ) | | | 92 | | | | 109 | | | | (878 | ) |
| | | | | | | | | | | | | | | | |
Total personal | | | (5,303 | ) | | | 679 | | | | (426 | ) | | | (5,556 | ) |
| | | | | | | | | | | | | | | | |
Total net development | | $ | (50,129 | ) | | $ | (2,687 | ) | | $ | (6,287 | ) | | $ | (41,155 | ) |
| | | | | | | | | | | | | | | | |
In 2010, Harleysville Group recognized net favorable development of $50.1 million in the provision for insured events of prior years, primarily due to lower-than-expected claims severity broadly experienced across all casualty lines in accident years 2004 through 2008, partially offset by a slight amount of adverse development in accident years prior to 2000.
A decrease in commercial automobile severity was observed during 2010, which led to the recognition of $8.1 million of favorable development in this line during the year. Approximately $2.4 million of the favorable development experienced in this line during 2010 is related to the Company’s involuntary pools.
A decrease in workers compensation severity, primarily in accident years 2002 through 2007, was observed during 2010 and led to the recognition of favorable development for those accident years during the year. An increase in workers compensation medical severity in accident years 2001 and prior was observed during 2010, which led to the recognition of adverse development for those accident years during the year. An increase in severity in accident year 2009 was observed in this line during 2010, which led to the recognition of $1.2 million of adverse development during the year. In total, $8.2 million of favorable development was recognized in the workers compensation line during 2010. Approximately $2.6 million of the favorable development experienced in this line during 2010 is related to the Company’s involuntary pools.
In the commercial multi-peril line of business, a reduction in severity, primarily in accident years 2004 through 2009, led to the recognition of $18.9 million of favorable development during 2010.
A reduction in other commercial lines severity was widely observed during 2010, which led to the recognition of $9.6 million of favorable prior year development.
A reduction in personal automobile severity in accident years 2008 and prior was widely observed during 2010. Claim frequency in accident year 2009 increased, which led to $0.5 million of adverse development during the year. In total, $4.4 million of favorable prior year development was recognized in this line during 2010.
A reduction in homeowners severity was observed during 2010, especially in accident year 2006. Claim frequency and severity in accident years 2008 and 2009 were observed to increase slightly, which led to the recognition of $0.4 million and $0.1 million of adverse development in these years, respectively. In total, $0.3 million of favorable development was recognized in this line during 2010.
31
A reduction in other personal lines severity was observed during 2010, especially in accident year 2005. Severity in accident years 2008 and 2009 was observed to marginally increase, which led to the recognition of $0.1 million of adverse development in each accident year. In total, $0.7 million of favorable development was recognized in other personal lines during 2010.
Harleysville Group recognized net favorable development in the provision for insured events of prior years of $36.1 million in 2009, primarily due to lower-than-expected claims severity broadly experienced across all casualty lines in accident years 2002 through 2006, partially offset by adverse development in accident year 2008 and accident years prior to 2002. A lower-than-expected level of claims severity was observed in personal lines in accident year 2008, which led to the recognition of $2.3 million of favorable development in this accident year in 2009. This amount was offset by the recognition in 2009 of $2.6 million of adverse development in commercial lines in accident year 2008, primarily related to a higher-than-expected level of commercial property severity in this accident year. The 2009 net favorable development consisted of $31.5 million in commercial lines and $4.6 million in personal lines.
A decrease in commercial automobile severity was observed during 2009 which led to the recognition of $20.5 million of favorable development in this line during 2009. Approximately $1.1 million of the favorable development experienced in this line during 2009 is related to the Company’s involuntary pools.
A decrease in workers compensation severity in accident years 2003 through 2006 was observed during 2009 which led to the recognition of favorable development for those accident years during 2009. An increase in workers compensation medical severity in accident years 2002 and prior was observed during 2009 which led to the recognition of adverse development for those accident years during 2009. An increase in severity in accident year 2008 was observed in this line during 2009 and led to the recognition of $1.1 million of adverse development during the year. In total, $9.1 million of favorable development was recognized in the workers compensation line during 2009. Approximately $3.4 million of the favorable development experienced in this line during 2009 is related to the Company’s involuntary pools.
In the commercial multi-peril line of business, a reduction in severity in accident years 2003 through 2006 led to the recognition of favorable development for those accident years during 2009. An increase in claim frequency in accident year 2007 and an increase in severity in accident year 2008 led to the recognition of a small amount of adverse development for those accident years during 2009. In total, $1.9 million of favorable development was recognized in the commercial multi-peril line of business during 2009 for all accident years.
A reduction in other commercial lines severity in accident years 2005 and prior was widely observed during 2009. This amount was largely offset by an increase in severity in accident years 2007 and 2008 which led to approximately $0.5 million and $0.4 million of adverse development in these years, respectively. In total, there was no significant prior year development in other commercial lines during 2009.
A reduction in personal automobile severity was widely observed during 2009 which led to the recognition of $2.6 million of favorable development during 2009 for all accident years.
A reduction in homeowners severity was widely observed during 2009, especially in accident year 2008, which led to the recognition of $3.0 million of favorable development during 2009 for all accident years.
An increase in other personal lines severity was observed during 2009 which led to the recognition of $1.0 million of adverse development during the year for all accident years.
The tables below break out the change in the estimate of ultimate losses between December 31, 2009 and December 31, 2010 for the 2009, 2008, 2007 and 2006 accident years into severity and frequency components for the major commercial and personal lines of business. Table 1 summarizes the Company’s percentage change in the estimate of ultimate loss and loss settlement expense by line of business between December 31, 2009 and December 31, 2010. Tables 2 and 3 summarize the Company’s percentage change in the estimate of ultimate severity and ultimate claim counts, respectively. The relationship between the three tables is as follows: (1+ the % change in estimated ultimate loss) = (1+ the % change in estimated ultimate severity) x (1+ the % change in estimated ultimate claim counts). The estimated ultimate severity is calculated as the ratio of estimated ultimate loss to estimated ultimate claim counts. The amounts underlying these tables are based on direct loss and claim experience minus ceded loss experience and exclude a small portion of losses associated with business assumed from involuntary pools.
32
Table 1
Percentage Increase (Decrease) in Ultimate Loss and Loss Settlement Expense
Between the Years Ended December 31, 2009 and December 31, 2010
| | | | | | | | | | | | | | | | |
| | | Accident Years | |
| | | 2009 | | | 2008 | | | 2007 | | | 2006 | |
Line of Business | | | | | | | | | | | | | | | | |
Commercial: | | | | | | | | | | | | | | | | |
Automobile | | | 0.4 | % | | | -0.3 | % | | | -1.4 | % | | | -2.1 | % |
Workers compensation | | | 1.6 | % | | | -0.4 | % | | | -1.6 | % | | | -3.4 | % |
Commercial multi-peril | | | -1.8 | % | | | -0.7 | % | | | -0.9 | % | | | -3.7 | % |
Other commercial | | | -2.0 | % | | | -6.8 | % | | | -10.6 | % | | | -2.9 | % |
Total commercial | | | -0.7 | % | | | -1.1 | % | | | -1.9 | % | | | -3.1 | % |
Personal: | | | | | | | | | | | | | | | | |
Automobile | | | 0.8 | % | | | -1.7 | % | | | -1.4 | % | | | -0.7 | % |
Homeowners | | | 0.2 | % | | | 0.8 | % | | | -0.3 | % | | | -2.2 | % |
Other personal | | | 1.8 | % | | | 2.0 | % | | | -0.7 | % | | | -1.2 | % |
Total personal | | | 0.6 | % | | | -0.4 | % | | | -0.9 | % | | | -1.2 | % |
Total All Lines | | | -0.5 | % | | | -1.0 | % | | | -1.7 | % | | | -2.7 | % |
Table 2
Percentage Increase (Decrease) in Ultimate Severity
Between the Years Ended December 31, 2009 and December 31, 2010
| | | | | | | | | | | | | | | | |
| | | Accident Years | |
| | | 2009 | | | 2008 | | | 2007 | | | 2006 | |
Line of Business | | | | | | | | | | | | | | | | |
Commercial: | | | | | | | | | | | | | | | | |
Automobile | | | 3.8 | % | | | -0.2 | % | | | -1.3 | % | | | -2.0 | % |
Workers compensation | | | 2.3 | % | | | -0.4 | % | | | -1.6 | % | | | -3.4 | % |
Commercial multi-peril | | | 1.3 | % | | | 1.1 | % | | | -0.3 | % | | | -3.0 | % |
Other commercial | | | 0.1 | % | | | -7.6 | % | | | -9.6 | % | | | -2.3 | % |
Total commercial | | | 2.1 | % | | | -0.6 | % | | | -1.7 | % | | | -2.8 | % |
Personal: | | | | | | | | | | | | | | | | |
Automobile | | | -1.5 | % | | | -1.6 | % | | | -1.4 | % | | | -0.7 | % |
Homeowners | | | 0.0 | % | | | 0.6 | % | | | -0.4 | % | | | -2.2 | % |
Other personal | | | 2.8 | % | | | 2.0 | % | | | -0.5 | % | | | -1.2 | % |
Total personal | | | -1.1 | % | | | -0.4 | % | | | -0.9 | % | | | -1.3 | % |
Total All Lines | | | 0.3 | % | | | -0.7 | % | | | -1.6 | % | | | -2.6 | % |
33
Table 3
Percentage Increase (Decrease) in Ultimate Claim Counts
Between the Years Ended December 31, 2009 and December 31, 2010
| | | | | | | | | | | | | | | | |
| | | Accident Years | |
| | | 2009 | | | 2008 | | | 2007 | | | 2006 | |
Line of Business | | | | | | | | | | | | | | | | |
Commercial: | | | | | | | | | | | | | | | | |
Automobile | | | -3.3 | % | | | -0.1 | % | | | -0.1 | % | | | -0.2 | % |
Workers compensation | | | -0.6 | % | | | -0.1 | % | | | 0.0 | % | | | 0.0 | % |
Commercial multi-peril | | | -3.1 | % | | | -1.8 | % | | | -0.6 | % | | | -0.7 | % |
Other commercial | | | -2.1 | % | | | 0.9 | % | | | -1.1 | % | | | -0.6 | % |
Total commercial | | | -2.8 | % | | | -0.5 | % | | | -0.3 | % | | | -0.3 | % |
Personal: | | | | | | | | | | | | | | | | |
Automobile | | | 2.3 | % | | | 0.0 | % | | | 0.0 | % | | | 0.0 | % |
Homeowners | | | 0.2 | % | | | 0.2 | % | | | 0.1 | % | | | 0.1 | % |
Other personal | | | -1.0 | % | | | 0.0 | % | | | -0.2 | % | | | 0.0 | % |
Total personal | | | 1.7 | % | | | 0.0 | % | | | 0.0 | % | | | 0.0 | % |
Total All Lines | | | -0.8 | % | | | -0.3 | % | | | -0.1 | % | | | -0.2 | % |
These tables illustrate that the changes to the Company’s estimates of ultimate loss for prior accident years between December 31, 2009 and December 31, 2010 are primarily driven by the severity component of loss. In this context, the term “severity” does not refer to an actuarial assumption, rather, it refers to “severity” as a descriptive statistic derived from the ratio of estimated ultimate loss to estimated ultimate claim counts. In general, as estimates of the ultimate number of claims were relatively stable for the prior accident periods, the changes in estimates of ultimate loss are characterized as resulting from a reduction in severity.
In general, those lines of business with a relatively low underlying volume of data, such as other commercial lines and other personal lines, are subject to greater variability in both claim severity and claim count development.
The following table presents workers compensation claim count information for the total pooled business in which Harleysville Group participates and payment amounts which are Harleysville Group’s pooling share of the total pooled amounts:
| | | | | | | | |
| | | For the Year Ended
December 31, | |
| | | 2010 | | | 2009 | |
| | | (dollars in thousands) | |
| | |
Number of claims pending, beginning of period | | | 4,743 | | | | 5,367 | |
Number of claims reported | | | 6,473 | | | | 6,674 | |
Number of claims settled or dismissed | | | (6,698 | ) | | | (7,298 | ) |
| | | | | | | | |
Number of claims pending, end of period | | | 4,518 | | | | 4,743 | |
| | | | | | | | |
Losses paid | | $ | 52,684 | | | $ | 62,956 | |
Loss settlement expenses paid | | $ | 14,069 | | | $ | 14,141 | |
Workers compensation losses primarily consist of indemnity and medical costs for injured workers.
34
Harleysville Group records the actuarial central estimate, which is management’s best estimate, of the ultimate unpaid losses and loss settlement expenses incurred. The estimate represents the actuarially determined expected amount of future payments on all loss and loss settlement expenses incurred on or before December 31, 2010. Actuarial loss reserving techniques and assumptions, which rely on historical information as adjusted to reflect current conditions, have been consistently applied, after including consideration of recent case reserve activity, during the periods presented. Changes in the estimate of the liability for unpaid losses and loss settlement expenses reflect actual payments and evaluations of new information and data since the last reporting date. These changes correlate with actuarial trends.
The following table presents the liability for unpaid losses and loss settlement expenses by case and incurred but not reported (IBNR) reserves by line of business and a statistically determined range of estimates of the ultimate unpaid losses and loss settlement expenses incurred for each line of business as of December 31, 2010. The range of estimates around the actuarial central estimates is statistically determined in order to provide information regarding the variability of the actuarial central estimates. The statistical analysis is completed only on a basis that is net of reinsurance recoverables, as this appropriately reflects Harleysville Group’s risk profile based on the type and quality of its reinsurance. The range is determined using the Monte Carlo Simulation method. This method uses the Company’s actual historical loss data to estimate the mean and standard deviation of a statistical distribution for future loss development. There have been no adjustments made to the historical data. The Company’s application of the Monte Carlo Simulation assumes that loss development factors are normally distributed with a mean and standard deviation derived from the historical data.
Reserve ranges are determined using both paid and incurred loss development data with a 10,000 trial simulation run against each set of data for each line of business presented in the table below. Each simulation generates a unique set of loss development factors randomly generated from the normal distribution with mean and standard deviation as defined above. Each unique set of loss development factors, when applied to the data, produces a unique reserve estimate. At the completion of the simulation, there are 20,000 unique reserve estimates which can be ordered from lowest to highest creating a range of reserve estimates. The resulting range produced by the simulation is used to create a reasonable representation of a 90% confidence interval using the 5% point as the low end of the range and the 95% point as the high end of the range. The 90% confidence interval represents the range of reserve estimates for which there is approximately a 90% probability that the actual reserve amount (which will not be known for many years) is contained within the defined range. The total commercial lines range and total personal lines range were developed as separate simulations using the means and standard deviations of the individual lines as inputs. Therefore, the 90% confidence interval for all lines of business is smaller than the straight sum of the individual lines of business 90% intervals.
The use of this technique to analyze reserve ranges assumes historical data has validity in predicting future outcomes. This assumption is consistent with a key assumption underlying much of insurance pricing and reserving theory.
35
Liability for Unpaid Losses and Loss Settlement Expenses (LAE)
at December 31, 2010
| | | | | | | | | | | | | | | | | | | | | | | | | | | | |
| | | | | | | | | | | | | | | | | | Statistically Determined
Range of Estimates | |
| | | Case | | | IBNR | | | LAE
Liability | | | IBNR
(Inc. LAE) | | | Total
Liability | | | High | | | Low | |
| | | (in thousands) | |
Line of Business | | | | | | | | | | | | | | | | | | | | | | | | | | | | |
Commercial: | | | | | | | | | | | | | | | | | | | | | | | | | | | | |
Automobile | | $ | 98,710 | | | $ | 138,412 | | | $ | 51,167 | | | $ | 189,579 | | | $ | 288,289 | | | $ | 328,124 | | | $ | 204,430 | |
Workers compensation | | | 156,663 | | | | 160,886 | | | | 53,289 | | | | 214,175 | | | | 370,838 | | | | 406,243 | | | | 286,205 | |
Commercial multi-peril | | | 172,693 | | | | 292,007 | | | | 169,445 | | | | 461,452 | | | | 634,145 | | | | 750,082 | | | | 516,244 | |
Other commercial | | | 31,998 | | | | 78,246 | | | | 32,826 | | | | 111,072 | | | | 143,070 | | | | 185,516 | | | | 80,903 | |
| | | | | | | | | | | | | | | | | | | | | | | | | | | | |
Total commercial | | | 460,064 | | | | 669,551 | | | | 306,727 | | | | 976,278 | | | | 1,436,342 | | | | 1,602,222 | | | | 1,132,193 | |
| | | | | | | | | | | | | | | | | | | | | | | | | | | | |
Personal: | | | | | | | | | | | | | | | | | | | | | | | | | | | | |
Automobile | | | 37,095 | | | | 27,132 | | | | 14,278 | | | | 41,410 | | | | 78,505 | | | | 89,897 | | | | 61,867 | |
Homeowners | | | 10,636 | | | | 18,334 | | | | 7,457 | | | | 25,791 | | | | 36,427 | | | | 44,952 | | | | 21,543 | |
Other personal | | | 819 | | | | 1,644 | | | | 328 | | | | 1,972 | | | | 2,791 | | | | 2,897 | | | | 1,149 | |
| | | | | | | | | | | | | | | | | | | | | | | | | | | | |
Total personal | | | 48,550 | | | | 47,110 | | | | 22,063 | | | | 69,173 | | | | 117,723 | | | | 135,344 | | | | 88,182 | |
| | | | | | | | | | | | | | | | | | | | | | | | | | | | |
Total net liability | | | 508,614 | | | | 716,661 | | | | 328,790 | | | | 1,045,451 | | | | 1,554,065 | | | | | | | | | |
| | | | | | | | | | | | | | | | | | | | | | | | | | | | |
Reinsurance recoverables | | | 134,390 | | | | 82,780 | | | | 426 | | | | 83,206 | | | | 217,596 | | | | | | | | | |
| | | | | | | | | | | | | | | | | | | | | | | | | | | | |
Gross liability | | $ | 643,004 | | | $ | 799,441 | | | $ | 329,216 | | | $ | 1,128,657 | | | $ | 1,771,661 | | | | | | | | | |
| | | | | | | | | | | | | | | | | | | | | | | | | | | | |
Reinsurance receivables were $219.1 million and $226.8 million at December 31, 2010 and 2009, respectively. Of these amounts, $102.3 million and $107.4 million, respectively, or 47% and 47%, respectively, of the receivables were due from governmental bodies, regulatory agencies or quasi governmental pools and reinsurance facilities where, Harleysville Group believes, there is limited credit risk. The remainder of the reinsurance recoverables are principally due from reinsurers rated A- or higher by the A.M. Best Company. Ceded reinsurance contracts do not relieve Harleysville Group’s primary obligation to its policyholders. Consequently, an exposure exists with respect to reinsurance recoverables to the extent that any reinsurer is unable to meet its obligation or disputes the liabilities assumed under the reinsurance contract. From time to time, Harleysville Group may encounter such disputes with its reinsurers. In addition, the creditworthiness of our reinsurers could deteriorate in the future due to adverse events affecting the reinsurance industry, such as a large number of major catastrophes.
Because of the nature of insurance claims, there are uncertainties inherent in the estimates of ultimate losses. Harleysville Group’s reorganization of its claims operation in recent years has resulted in new people and processes involved in settling claims. As a result, more recent statistical data reflects different patterns than in the past and gives rise to uncertainty as to the pattern of future loss settlements. There are uncertainties regarding future loss cost trends particularly related to medical treatments and automobile repair. Court decisions, regulatory changes and economic conditions can affect the ultimate cost of claims that occurred in the past. Accordingly, the ultimate liability for unpaid losses and loss settlement expenses will likely differ from the amount recorded at December 31, 2010.
The property and casualty industry has had substantial aggregate loss experience from claims related to asbestos-related illnesses, environmental remediation, product liability, mold, and other uncertain exposures. Harleysville Group has not experienced significant losses from such claims.
36
Other income increased $2.8 million for the year ended December 31, 2010 compared to the prior year primarily due to an increase in fee income received in connection with the National Flood Insurance Program and an increase in management fees received from the Mutual Company. The management fees received from the Mutual Company are expected to increase in 2011, as the Mutual Company has entered into additional assumed reinsurance agreements in 2011 which are subject to the management fee.
The income tax expense for the year ended December 31, 2010 includes the tax benefit of $13.2 million associated with tax-exempt income compared to $11.1 million in the prior year.
2009 Compared to 2008
Premiums earned decreased $60.0 million, or 6.5%, for the year ended December 31, 2009 compared to the prior year primarily due to a decrease of $67.1 million in premiums earned for commercial lines, partially offset by an increase of $7.1 million in premiums earned for personal lines. The decrease in premiums earned for commercial lines was 8.9%, primarily due to lower average premiums and lower exposures. The increase in premiums earned for personal lines was 4.4%, with increases in premiums earned in homeowners, personal automobile and other personal lines primarily due to an increase in new business writings and higher average premiums.
Investment income decreased $6.9 million for the year ended December 31, 2009, primarily due to a lower average level of fixed income securities, a lower investment yield on fixed income securities and short-term investments and a greater percentage of fixed income securities invested in tax-exempt securities. The lower average level of fixed income securities was primarily due to the use of the proceeds from sales of these investments to repurchase shares under the Company’s stock repurchase programs in 2008 and 2009.
Net realized investment gains (losses) increased $62.1 million for the year ended December 31, 2009, primarily due to a decrease in impairment charges in 2009.
There were credit-related impairment charges of $1.5 million on non-equity securities in 2009 and $16.4 million in 2008. The 2009 impairment charges consisted of $0.5 million on bonds the Company intends to sell (the bonds were sold at a slight gain in 2010) and $1.0 million on structured investment vehicles. The 2008 impairment charges consisted of $5.4 million on Lehman Brothers bonds and $11.0 million on structured investment vehicles.
In the third quarter of 2008, the Company recorded an impairment charge of $17.7 million on equity securities that it was planning to sell. There was an additional impairment charge of $30.9 million in the fourth quarter of 2008 on the equity securities, prior to their sale. The equity securities were sold in November 2008 to recover a portion of federal income taxes which were previously paid. In 2006, the Company sold all of its holdings of individual equity securities and invested in equity index funds. As a result of this transaction, the Company recognized a capital gain of approximately $40 million. Under existing federal income tax regulations, such taxes can be recovered in future periods to the extent capital losses are recognized. As a result of the decline in value of the equity index funds held by the Company during 2008, the duration of the impairment, the likelihood of near term recovery and the availability to carryback realized capital losses for federal income tax purposes upon their disposal, the Company determined that it was appropriate to sell the equity investments and recover a portion of the federal income taxes which were previously paid.
Income before income taxes increased $65.0 million for the year ended December 31, 2009 compared to the prior year. The increase was primarily due to the change in realized investment gains (losses) and underwriting gains in 2009 compared to underwriting losses in 2008, partially offset by the decrease in investment income.
Harleysville Group’s statutory combined ratio decreased to 99.8% for the year ended December 31, 2009 from 100.3% for the year ended December 31, 2008. The statutory combined ratio for 2008 includes a benefit of 0.4% due to the impact of the transfer of liabilities in connection with the pool change. This benefit results from the statutory treatment of the ceding commission paid on the unearned premiums transferred on January 1, 2008.
37
Excluding the impact of the pool transfer, the statutory combined ratio decreased to 99.8% for the year ended December 31, 2009 from 100.7% for the year ended December 31, 2008. The decrease in the combined ratio was primarily due to lower catastrophe losses in 2009, partially offset by greater non-catastrophe property losses. Net catastrophe losses decreased to $6.2 million (0.7 points) for 2009 from $34.7 million (3.8 points) for 2008. The 2008 catastrophe losses were primarily due to tornadoes and hail storms impacting Arkansas and Minnesota during the second quarter.
The statutory combined ratios by line of business for the year ended December 31, 2009 as compared to the year ended December 31, 2008 are shown below. The statutory combined ratios for 2008 are shown both including and excluding the impact of the pool transfer. The combined ratios excluding the pool transfer are shown, as they are prepared on a basis that is comparable to the combined ratios for 2009.
| | | | | | | | | | | | |
| | | For the Year Ended
December 31, | |
| | | 2009 | | | 2008 | | | 2008 | |
| | | | | | Excluding the
Impact of the
Pool Transfer | | | Including the
Impact of the
Pool Transfer | |
Commercial: | | | | | | | | | | | | |
Automobile | | | 91.4 | % | | | 93.1 | % | | | 92.6 | % |
Workers compensation | | | 106.2 | % | | | 112.9 | % | | | 112.4 | % |
Commercial multi-peril | | | 105.1 | % | | | 104.5 | % | | | 104.1 | % |
Other commercial | | | 97.6 | % | | | 89.6 | % | | | 89.3 | % |
Total commercial | | | 100.7 | % | | | 100.9 | % | | | 100.4 | % |
Personal: | | | | | | | | | | | | |
Automobile | | | 103.0 | % | | | 96.1 | % | | | 95.7 | % |
Homeowners | | | 92.7 | % | | | 105.8 | % | | | 105.3 | % |
Other personal | | | 81.1 | % | | | 88.7 | % | | | 88.8 | % |
Total personal | | | 96.8 | % | | | 100.1 | % | | | 99.7 | % |
Total personal and commercial | | | 99.8 | % | | | 100.7 | % | | | 100.3 | % |
The commercial lines statutory combined ratio decreased to 100.7% for the year ended December 31, 2009 from 100.9% for the year ended December 31, 2008 (excluding the impact of the pool transfer). Although the commercial lines statutory combined ratio for the year ended December 31, 2009 was similar to that of the prior year, more significant changes were noted by line of business, particularly for the workers compensation and other commercial lines. The workers compensation statutory combined ratio decreased for the year ended December 31, 2009, primarily due to the recognition of 10.6 points of favorable development from prior accident years in 2009, compared to the recognition of 1.3 points of favorable development from prior accident years in 2008. The other commercial statutory combined ratios increased for the year ended December 31, 2009, primarily due to a higher level of non-cat property losses compared to one year prior.
The personal lines statutory combined ratio decreased to 96.8% for the year ended December 31, 2009 from 100.1% for the year ended December 31, 2008 (excluding the impact of the pool transfer). The decrease in the personal lines combined ratio for the year ended December 31, 2009 primarily relates to the lower incidence of personal lines catastrophe losses during 2009 (1.0 points) compared to the catastrophe losses in 2008 (7.7 points). The favorable impact of lower catastrophe experience in 2009 was partially offset by a lower amount of favorable prior year development in the personal auto line in 2009 (3.2 points) compared to 2008 (9.8 points).
38
The following table presents the increase (decrease) in the estimated ultimate loss and loss settlement expenses attributable to insured events of prior years for the year ended December 31, 2009 by line of business:
Increase (Decrease) in the Estimated Ultimate Loss and Loss Settlement Expenses
Attributable to Insured Events of Prior Years
For the Year Ended December 31, 2009
| | | | | | | | | | | | | | | | |
| | | | | | Accident Years | |
| | Total | | | 2008 | | | 2007 | | | 2006 and
Prior Years | |
| | | (in thousands) | |
Line of Business | | | | | | | | | | | | | | | | |
Commercial: | | | | | | | | | | | | | | | | |
Automobile | | $ | (20,525 | ) | | $ | 458 | | | $ | (1,746 | ) | | $ | (19,237 | ) |
Workers compensation | | | (9,118 | ) | | | 1,134 | | | | 5 | | | | (10,257 | ) |
Commercial multi-peril | | | (1,863 | ) | | | 594 | | | | 498 | | | | (2,955 | ) |
Other commercial | | | (7 | ) | | | 423 | | | | 469 | | | | (899 | ) |
| | | | | | | | | | | | | | | | |
Total commercial | | | (31,513 | ) | | | 2,609 | | | | (774 | ) | | | (33,348 | ) |
| | | | | | | | | | | | | | | | |
Personal: | | | | | | | | | | | | | | | | |
Automobile | | | (2,553 | ) | | | (227 | ) | | | (666 | ) | | | (1,660 | ) |
Homeowners | | | (2,995 | ) | | | (2,522 | ) | | | 35 | | | | (508 | ) |
Other personal | | | 977 | | | | 454 | | | | 16 | | | | 507 | |
| | | | | | | | | | | | | | | | |
Total personal | | | (4,571 | ) | | | (2,295 | ) | | | (615 | ) | | | (1,661 | ) |
| | | | | | | | | | | | | | | | |
Total net development | | $ | (36,084 | ) | | $ | 314 | | | $ | (1,389 | ) | | $ | (35,009 | ) |
| | | | | | | | | | | | | | | | |
Harleysville Group recognized net favorable development in the provision for insured events of prior years of $36.1 million in 2009, primarily due to lower-than-expected claims severity broadly experienced across all casualty lines in accident years 2002 through 2006, partially offset by adverse development in accident year 2008 and accident years prior to 2002. A lower-than-expected level of claims severity was observed in personal lines in accident year 2008, which led to the recognition of $2.3 million of favorable development in this accident year in 2009. This amount was offset by the recognition in 2009 of $2.6 million of adverse development in commercial lines in accident year 2008, primarily related to a higher-than-expected level of commercial property severity in this accident year. The 2009 net favorable development consisted of $31.5 million in commercial lines and $4.6 million in personal lines.
A decrease in commercial automobile severity was observed during 2009 which led to the recognition of $20.5 million of favorable development in this line during 2009. Approximately $1.1 million of the favorable development experienced in this line during 2009 is related to the Company’s involuntary pools.
A decrease in workers compensation severity in accident years 2003 through 2006 was observed during 2009 which led to the recognition of favorable development for those accident years during 2009. An increase in workers compensation medical severity in accident years 2002 and prior was observed during 2009 which led to the recognition of adverse development for those accident years during 2009. An increase in severity in accident year 2008 was observed in this line during 2009 and led to the recognition of $1.1 million of adverse development during the year. In total, $9.1 million of favorable development was recognized in the workers compensation line during 2009. Approximately $3.4 million of the favorable development experienced in this line during 2009 is related to the Company’s involuntary pools.
In the commercial multi-peril line of business, a reduction in severity in accident years 2003 through 2006 led to the recognition of favorable development for those accident years during 2009. An increase in claim frequency in accident year 2007 and an increase in severity in accident year 2008 led to the recognition of a small amount of adverse development for those accident years during 2009. In total, $1.9 million of favorable development was recognized in the commercial multi-peril line of business during 2009 for all accident years.
39
A reduction in other commercial lines severity in accident years 2005 and prior was widely observed during 2009. This amount was largely offset by an increase in severity in accident years 2007 and 2008 which led to approximately $0.5 million and $0.4 million of adverse development in these years, respectively. In total, there was no significant prior year development in other commercial lines during 2009.
A reduction in personal automobile severity was widely observed during 2009 which led to the recognition of $2.6 million of favorable development during 2009 for all accident years.
A reduction in homeowners severity was widely observed during 2009, especially in accident year 2008, which led to the recognition of $3.0 million of favorable development during 2009 for all accident years.
An increase in other personal lines severity was observed during 2009 which led to the recognition of $1.0 million of adverse development during the year for all accident years.
The income tax expense for the year ended December 31, 2009 includes the tax benefit of $11.1 million associated with tax-exempt income compared to $9.4 million in the prior year.
Underwriting expenses, including amortization of deferred policy acquisition costs, decreased $10.7 million for the year ended December 31, 2009 compared to the prior year, primarily due to a decrease in amortization of deferred acquisition costs due to the decrease in premiums earned.
New Accounting Standards
In June 2009, the Financial Accounting Standards Board (FASB) issued guidance which replaces the quantitative-based risks and rewards calculation for determining whether an enterprise is the primary beneficiary in a variable interest entity with an approach that is primarily qualitative, and requires ongoing assessments of whether an enterprise is the primary beneficiary of a variable interest entity. The guidance, which is effective for financial statements issued for fiscal years beginning after November 15, 2009, also requires additional disclosures about an enterprise’s involvement in variable interest entities. The adoption of this guidance did not have a material impact on the Company’s results of operations or financial position.
In January 2010, the FASB issued Accounting Standards Update (ASU) 2010-06, “Fair Value Measurements and Disclosures.” ASU 2010-06 applies to all entities that are required to make disclosures about recurring or non-recurring fair value measurements. ASU 2010-06 provides guidance on additional disclosures on any significant transfers in and out of Level 1 and Level 2 and a description of the transfer. ASU 2010-06 also requires separate disclosures of the activity in the Level 3 category related to any purchases, sales, issuances and settlements on a gross basis. The effective date of the new disclosures relating to the existing disclosures regarding Level 1 and Level 2 categories is for interim and annual periods beginning after December 15, 2009. The effective date of the disclosures regarding purchases, sales, issuances and settlements to the Level 3 category is for interim and annual periods beginning after December 15, 2010. The portion of ASU 2010-06 that has been adopted did not have a material impact on the Company’s results of operations or financial position as it focuses on additional disclosures. The portion of ASU 2010-06 that has not yet been adopted is not expected to have a material impact on the Company’s results of operations or financial position.
In March 2010, the FASB issued ASU 2010-11, “Derivatives and Hedging.” This ASU clarifies that the transfer of credit risk that is only in the form of subordination of one financial instrument to another (thereby redistributing credit risk) is an embedded derivative feature that should not be subject to potential bifurcation and separate accounting. This ASU is effective the first day of the first fiscal quarter beginning after June 15, 2010. The adoption of this ASU did not have a material impact on the Company’s results of operations or financial position.
In October 2010, the FASB issued ASU 2010-26, “Accounting for Costs Associated with Acquiring or Renewing Insurance Contracts (a consensus of the FASB Emerging Issues Task Force).” This ASU amends FASB Accounting Standards Codification (ASC) Topic 944, Financial Services-Insurance, to address which costs related to the acquisition of new or renewal insurance contracts qualify for deferral. The ASU allows insurance entities to defer costs related to the acquisition of new or renewal insurance contracts that are (1) incremental direct costs of the contract transaction (i.e., would not have occurred without the contract transaction), (2) a portion of the employee’s compensation and fringe benefits related to certain activities for successful contract acquisitions, or (3) direct-response advertising costs as defined in ASC Subtopic 340-20, Other Assets and Deferred Costs – Capitalized Advertising Costs. An insurance entity would expense as incurred all other costs related to the acquisition of new or renewal insurance contracts. The amendments in the ASU are effective for fiscal years, and interim periods within those years, beginning on or after December 15, 2011, and can be applied either prospectively or retrospectively. Early application is permitted at the beginning of an entity’s annual reporting period. The impact of adopting this ASU is currently being evaluated.
40
In December 2010, the FASB issued ASU 2010-28, “Intangibles-Goodwill and Other.” The amendments in this ASU modify Step 1 of the goodwill impairment test for reporting units with zero or negative carrying amounts. For these units, an entity is required to perform Step 2 of the goodwill impairment test if it is more likely than not that a goodwill impairment exists. In determining whether it is more likely than not that a goodwill impairment exists, an entity should consider whether there are any adverse qualitative factors indicating that an impairment may exist. For public entities, this ASU is effective for fiscal years, and interim periods within those years, beginning after December 15, 2010. The adoption of this ASU is not expected to have a material impact on the Company’s results of operations or financial position.
Liquidity and Capital Resources
Liquidity is a measure of the ability to generate sufficient cash to meet cash obligations as they come due. Harleysville Group’s primary sources of cash are premium income, investment income and maturing investments. Cash outflows can be variable because of uncertainties regarding settlement dates for liabilities for unpaid losses and because of the potential for large losses, either individually or in the aggregate. Accordingly, Harleysville Group maintains investment and reinsurance programs generally intended to provide adequate funds to pay claims without forced sales of investments. Harleysville Group models its exposure to catastrophes and has the ability to pay claims without selling held to maturity securities even for events having a low (less than 1%) probability. Even in years of greater catastrophe frequency, Harleysville Group generally has been able to pay claims without liquidating any investments. Harleysville Group has also considered scenarios of declines in revenue and increases in loss payments, and believes it has the ability to meet cash requirements under such scenarios without selling held to maturity securities. Harleysville Group’s policy with respect to fixed maturity investments is to purchase only those that are of investment grade quality.
Net cash provided by operating activities was $98.2 million and $105.4 million for 2010 and 2009, respectively. The decrease of $7.2 million is primarily due to a decrease in underwriting cash flow, a decrease in investment income, and an increase in federal income tax payments.
Net cash used by investing activities was $2.8 million and $53.3 million for 2010 and 2009, respectively. The decrease is primarily due to lower net purchases of investments due to the decrease in net cash provided by operating activities and the increase in cash used by financing activities.
Financing activities used net cash of $95.6 million and $52.2 million for 2010 and 2009, respectively. The increase is primarily due to an increase in dividends paid in 2010.
Harleysville Group’s investment strategy is designed to complement and support the insurance operations. Harleysville Group considers projected cash flow (premiums, investment income, reinsurance programs, liability payout patterns, general expenses, large seasonal obligations, intercompany transfers, etc.) to assure that sufficient liquidity exists within Harleysville Group and the Mutual Company. Maintaining a regular maturity schedule in readily marketable securities is an essential part of addressing liquidity. This regular maturity schedule is maintained in all interest rate environments. After-tax yield will be maximized consistent with safety and liquidity considerations by investment in taxable or tax-exempt securities, depending on Harleysville Group’s tax position.
The Company had $22.1 million of cash and marketable securities at December 31, 2010, which are available for general corporate purposes including dividends, debt service, capital contributions to subsidiaries, acquisitions and the repurchase of stock. On February 19, 2009, the Board of Directors authorized the Company to repurchase up to 800,000 shares of its outstanding common stock over a two year period in the open market or in privately negotiated transactions. Additionally, the Board authorized the Company to make purchases under the terms of a Rule 10b5-1 trading plan, which allows the Company to purchase its shares at times when it ordinarily would not be in the market because of self-imposed trading blackout periods, such as the time preceding its quarterly earnings releases or because its officers are in possession of material, non-public information. The Company repurchased shares in open market transactions from the public float, and did not repurchase shares from the Mutual Company. This program was completed on June 15, 2009. On July 30, 2009, the Board of Directors authorized the Company to repurchase up to an additional 800,000 shares of its outstanding common stock over a two year period under terms similar to the repurchase authorization of February 19, 2009. The Company repurchased shares in open market transactions from the public float, and did not repurchase shares from the Mutual Company. This program was completed on August 3, 2010. On August 6, 2010, the Board of Directors authorized the Company to repurchase up to an additional 800,000 shares of its common stock over a two year period under terms similar to the repurchase authorization of July 30, 2009. The Company currently intends to repurchase shares in open market transactions from the public float, and not repurchase shares from the Mutual Company. As of December 31, 2010, the Company had repurchased 245,084 shares under this authorization, leaving 554,916 shares authorized to be repurchased. Harleysville Group has no other material commitments for capital expenditures as of December 31, 2010.
41
As a holding company, the Company’s principal source of cash for the payment of dividends is dividends from its insurance subsidiaries. The Company’s insurance subsidiaries are subject to state laws that restrict their ability to pay dividends. The Company’s insurance subsidiaries declared dividends of $89.0 million and paid dividends of $94.3 million in 2010 ($29.5 million of which had been declared in 2009). The Company’s insurance subsidiaries declared dividends of $57.0 million and paid dividends of $27.5 million to the Company in 2009.
Applying the current regulatory restrictions as of December 31, 2010, $59.0 million would be available for distribution to the Company by its subsidiaries in 2011 without prior regulatory approval. See the Business-Regulation section of this Annual Report on Form 10-K, which includes a reconciliation of net income and shareholders’ equity as determined under statutory accounting practices to net income and shareholders’ equity as determined in accordance with accounting principles generally accepted in the United States of America. Also, see Note 8 of the Notes to Consolidated Financial Statements.
The National Association of Insurance Commissioners (NAIC) adopted risk-based capital (RBC) standards that require insurance companies to calculate and report statutory capital and surplus needs based on a formula measuring underwriting, investment and other business risks inherent in an individual company’s operations. These RBC standards have not affected the operations of Harleysville Group since each of the Company’s insurance subsidiaries has statutory capital and surplus in excess of RBC requirements.
These RBC standards require the calculation of a ratio of total adjusted capital to Authorized Control Level. Insurers with a ratio below 200% are subject to different levels of regulatory intervention and action. Based upon their 2010 statutory financial statements, the ratio of total adjusted capital to the Authorized Control Level for the Company’s eight insurance subsidiaries at December 31, 2010 ranged from 461% to 783%.
The following summarizes Harleysville Group’s contractual obligations at December 31, 2010.
| | | | | | | | | | | | | | | | | | | | |
| | | Total | | | Less Than
1 Year | | | 1-3 Years | | | 4-5 Years | | | More than
5 Years | |
| | | (in thousands) | |
Contractual obligations: | | | | | | | | | | | | | | | | | | | | |
Debt | | $ | 118,500 | | | | | | | $ | 118,500 | | | | | | | | | |
Interest on debt | | $ | 14,773 | | | $ | 5,881 | | | $ | 8,892 | | | | | | | | | |
Gross liability for unpaid losses and loss settlement expenses | | $ | 1,771,661 | | | $ | 413,516 | | | $ | 476,505 | | | $ | 238,043 | | | $ | 643,597 | |
| | | | | | | | | | | | | | | | | | | | |
Total | | $ | 1,904,934 | | | $ | 419,397 | | | $ | 603,897 | | | $ | 238,043 | | | $ | 643,597 | |
| | | | | | | | | | | | | | | | | | | | |
The table above does not include capital lease obligations, operating lease obligations or purchase obligations as they are either not applicable or not material. The timing of the amounts for the gross liability for unpaid losses and loss settlement expenses is an estimate based on historical experience and expectations of future payment patterns. However, the timing of these payments may vary significantly from the amounts stated above.
Risk Factors
You should consider carefully the following risks, as well as the other information contained in this 2010 Annual Report on Form 10-K. If any of the following events described in the risk factors below actually occur, our business, financial condition and results of operations could be materially adversely affected. You should refer to the other information set forth in this 2010 Annual Report on Form 10-K including our consolidated financial statements and the related notes.
Risks Related to the Property and Casualty Insurance Industry Generally
If our estimated liability for losses and loss settlement expenses is incorrect, our reserves may not be adequate to cover our ultimate liability for losses and loss settlement expenses and may have to be increased.
We are required to maintain loss reserves for our estimated liability for losses and loss settlement expenses associated with reported and unreported claims for each accounting period. We regularly review our reserving techniques and our overall amount of reserves and, based on our estimated liability, raise or lower the levels of our
42
reserves accordingly. If our estimates are incorrect and our reserves are inadequate, we are obligated to increase our reserves. An increase in reserves results in an increase in losses and a reduction in our net income for the period in which the deficiency in reserves is identified. Accordingly, an increase in reserves could have a material adverse effect on our results of operations, liquidity and financial condition. Our reserve amounts are estimated based on what we expect our ultimate liability for losses and loss settlement expenses to be. These estimates are based on facts and circumstances of which we are aware, predictions of future events, trends in claims severity and frequency and other subjective factors. Although we use a number of actuarial methods to project our ultimate liability, there is no method that can always exactly predict our ultimate liability for losses and loss settlement expenses.
In addition to reviewing our reserving techniques, as part of our reserving process we also consider:
| | • | | information regarding each claim for losses; |
| | • | | our loss history and the industry’s loss history; |
| | • | | legislative enactments, judicial decisions and legal developments regarding damages; |
| | • | | changes in political attitudes; and |
| | • | | trends in general economic conditions, including inflation. |
If certain catastrophic events occur, including increased claims related to changing climate conditions, they could have a significant impact on our operating results and financial condition.
Results of property insurers are subject to weather and other events prevailing in any given year. While one year may be relatively free of major weather or other disasters, another year may have numerous such events causing results for that year to be materially worse than for other years.
Our insurance subsidiaries have experienced, and are expected in the future to experience, catastrophe losses. It is possible that a catastrophic event or a series of multiple catastrophic events could have a material adverse effect on the operating results and financial condition of our insurance subsidiaries, thereby limiting the ability of our insurance subsidiaries to pay dividends to us. In the last 12 years, the largest non-flood catastrophe to affect our results of operations was Hurricane Floyd in the third quarter of 1999, which resulted in $15.1 million of losses. In 2008, we experienced losses totaling $34.7 million from thirty-two different catastrophes. In 2010, we experienced losses totaling $37.7 million from twenty-seven different catastrophes.
Various events can cause catastrophes, including severe winter weather, hurricanes, windstorms, earthquakes, hail, war, terrorism, explosions and fires. The frequency and severity of these catastrophes are inherently unpredictable. The extent of losses from a catastrophe is a function of both the total amount of insured exposures in the area affected by the event and the severity of the event.
Our insurance subsidiaries seek to reduce the impact on our business of a catastrophe through geographic diversification and through the purchase of reinsurance covering various categories of catastrophes, which generally excludes terrorism. Nevertheless, reinsurance may prove inadequate if:
| | • | | a major catastrophic loss exceeds the reinsurance limit; or |
| | • | | an insurance subsidiary pays a number of smaller catastrophic loss claims that, individually, fall below the subsidiary’s retention level. |
In addition, we use models developed by third party vendors in assessing our property exposure to catastrophe losses that assume various conditions and probability scenarios. These models do not necessarily accurately predict future losses.
We are heavily regulated in the states in which we operate and if we violate those regulations or if the regulations unreasonably restrict our ability to do business, or if they change significantly, it could have a material adverse effect on our business.
We are subject to extensive supervision and regulation in the states in which we transact business. The purpose of supervision and regulation is to protect individual policyholders and not stockholders or other investors. Our business can be adversely affected by private passenger automobile insurance regulations and any other regulations affecting property and casualty insurance companies. For example, laws and regulations can reduce or set
43
rates at levels that we do not believe are adequate for the risks we insure. Other laws and regulations can limit our ability to cancel or refuse to renew policies and require us to offer coverage to all consumers. Changes in laws and regulations, or their interpretations, pertaining to insurance, including workers compensation, may also have a material adverse effect on our business. Although the federal government does not directly regulate the insurance industry, federal initiatives, such as federal terrorism backstop legislation, from time to time, also can impact the insurance industry.
Although we do not write health insurance, rules affecting health care services can affect other insurance that we write, including workers compensation and commercial and personal automobile and liability insurance. We cannot determine whether or in what form additional health care reform legislation may be adopted by the U.S. Congress or any state legislature. We also cannot determine the nature and effect, if any, that the adoption of health care legislation or regulations, or changing interpretations, at the federal or state level would have on us.
In July 2010, the Dodd-Frank Wall Street Reform and Consumer Protection Act (the Dodd-Frank Act) was signed into law. Among other things, the Dodd-Frank Act established a Federal Insurance Office within the U.S. Department of the Treasury and empowered it to gather data and information regarding the insurance industry and insurers. We cannot predict what impact, if any, the Dodd-Frank Act or any other such legislation will have on us.
We currently write flood insurance which is reinsured by the National Flood Insurance Program (the NFIP). There have been various legislative proposals to reform or terminate the NFIP. We cannot currently determine whether or in what form legislation may be adopted concerning the NFIP and the effect this may have on us.
On January 7, 2011, the South Carolina Supreme Court held inCrossmann v Harleysville Mutual Insurance Company (Opinion No. 26909, January 7, 2011) that a contractor’s or subcontractor’s negligent/faulty work does not constitute an “occurrence” under the applicable Commercial general liability policy. Recently, the South Carolina legislature has introduced legislation (S431, H3449, H3498) to overturn theCrossmann decision. We can not currently determine whether or in what form such legislation may be adopted and the effect that this may have on Harleysville Group.
If demand for property and casualty insurance decreases, it could have a material adverse impact on our business.
Historically, the results of the property and casualty insurance industry have been subject to significant fluctuations over time due to competition and due to unpredictable developments, including:
| | • | | natural and man-made disasters; |
| | • | | fluctuations in interest rates and other changes in the investment environment that affect returns on our investments; |
| | • | | inflationary pressures that affect the size of losses; and |
| | • | | legislative and regulatory changes and judicial decisions that affect insurers’ liabilities. |
The demand for property and casualty insurance, particularly commercial lines, also can vary with the overall level of economic activity. Any of the foregoing could reduce the demand for property and casualty insurance, which would have a material adverse effect on our business, including on the amount of premiums earned in any fiscal quarter or fiscal year.
If we are unable to reduce our exposure to risks through reliable reinsurance or if the cost of reinsurance increases, our risk of loss, or the cost of controlling our risk of loss, will increase.
We transfer a portion of our exposure to selected risks to other insurance and reinsurance companies through reinsurance arrangements. Under our reinsurance arrangements, another insurer assumes a specified portion of our losses and loss adjustment expenses in exchange for a specified portion of policy premiums. The availability, amount and cost of reinsurance depend on market conditions and may vary significantly. Any decrease in the amount of our reinsurance will increase our risk of loss. Furthermore, we face a credit risk when we obtain reinsurance because we are still liable for the transferred risks if the reinsurer cannot meet the transferred obligations. Therefore, the inability of any of our reinsurers to meet its financial obligations could materially and adversely affect our financial condition and results of operations.
44
The threat of terrorism and military and other actions may result in decreases in our net income, revenue and assets under management and may materially adversely affect our investment portfolio.
The threat of terrorism, both within the United States and abroad, and military and other actions and heightened security measures in response to these types of threats, may cause significant volatility and declines in the equity markets in the United States, Europe and elsewhere, as well as loss of life, property damage, additional disruptions to commerce and reduced economic activity. Actual terrorist attacks could cause losses from insurance claims related to the property and casualty insurance operations of Harleysville Group, as well as a decrease in our shareholders’ equity, net income and/or revenue. The effects of changes related to Harleysville Group may result in a decrease in our stock price. The Terrorism Risk Insurance Act of 2002, which was originally extended in 2005 and extended again in 2007, requires that some coverage for terrorist loss be offered by primary property insurers and provides Federal assistance for recovery of claims through 2014. In addition, some of the assets in our investment portfolio may be materially adversely affected by declines in the equity markets and economic activity caused by the continued threat of terrorism, ongoing military and other actions and heightened security measures.
We cannot predict at this time whether and the extent to which industry sectors in which we maintain investments may suffer losses as a result of potential decreased commercial and economic activity, or how any such decrease might impact the ability of companies within the affected industry sectors to pay interest or principal on their securities, or how the value of any underlying collateral might be affected.
We can offer no assurances that the threats of future terrorist-like events in the United States and abroad or military actions by the United States will not have a material adverse effect on our business, financial condition or results of operations.
Certain changes in the accounting standards issued by the Financial Accounting Standards Board or other standard-setting bodies could have a material adverse impact on our reported net income.
We are subject to the application of U.S. GAAP and other accounting standards, which are periodically revised and/or expanded. As such, we are required to adopt new or revised accounting standards issued by recognized authoritative bodies, including the Financial Accounting Standards Board. It is possible that future changes required to be adopted could change the current accounting treatment that we apply and such changes could result in material adverse impacts on our results of operations and financial condition.
If our investments lose value, our revenues, earnings and financial position will be materially adversely affected.
Like many other property and casualty insurance companies, we depend on income from our investment portfolio for a significant portion of our revenues and earnings. Any significant decline in our investment income as a result of falling interest rates, decreased dividend payment rates or general market conditions would have a material adverse effect on our results. Any significant decline in the market value of our investments would reduce our shareholders’ equity and our policyholders’ surplus, which could impact our ability to write additional business.
The volatility and disruption of the capital and credit markets and adverse changes in the global economy may negatively impact our business.
Adverse capital and credit market conditions could affect our ability to meet liquidity needs, as well as our access to capital and cost of capital. Further, if adverse regional, national or international economic conditions persist or worsen, we could experience decreased revenues and shareholders’ equity.
The capital and credit markets experienced extreme volatility and disruption in the recent past. The volatility and disruption in the markets exerted downward pressure on the availability of liquidity and credit capacity for certain issuers. Our results of operations, financial condition, cash flows and statutory capital position could be materially adversely affected by continued disruptions in the capital and credit markets.
Continued deterioration in the public debt and equity markets could lead to investment losses.
The severe downturn in the public debt and equity markets in 2008, reflecting uncertainties associated with the mortgage crisis, worsening economic conditions, widening of credit spreads, bankruptcies and government intervention in large financial institutions, has resulted in significant realized and unrealized losses in our investment portfolio in the past. Depending on market conditions going forward, we could incur substantial additional realized and unrealized losses in future periods, which could have a material adverse impact on our results of operations, financial condition, debt and financial strength ratings and ability to access capital markets.
45
If our financial strength ratings are reduced, we may be materially adversely impacted.
Insurance companies are subject to financial strength ratings produced by external rating agencies. Higher ratings generally indicate greater financial stability and a stronger ability to pay claims. Ratings are assigned by rating agencies to insurers based upon factors that they believe are relevant to policyholders. Ratings are not recommendations to buy, hold or sell our securities.
Although other agencies cover the property and casualty industry, we believe our ability to write business is most influenced by our financial strength rating from A. M. Best. According to A. M. Best, its ratings are designed to assess an insurer’s financial strength and ability to meet ongoing policyholder obligations. Currently, our rating from A. M. Best is “A”, or “excellent.” A rating below “A-” from A. M. Best could materially adversely affect the business we write. Both Moody’s and Standard & Poor’s also assign financial strength ratings to the Company. Our Moody’s rating is A3 and our Standard & Poor’s rating is A-. While we consider our financial strength ratings from these rating agencies important, we believe that they have less impact on our business compared to our financial strength rating from A. M. Best.
In addition to being assigned financial strength ratings, the Company is also assigned credit ratings. We consider our credit ratings from Moody’s and Standard & Poor’s to be most important with regard to our ability to access capital markets. Our current credit rating from Moody’s is Baa2 with a stable outlook while our Standard & Poor’s credit rating is BBB- with a stable outlook. We cannot be sure we will maintain our current investment grade credit ratings. An unfavorable change in our Moody’s or Standard & Poor’s credit rating to below investment grade could make it more expensive for us to access capital markets.
Risks Related to Our Company in Particular
We face significant competition from other regional and national insurance companies, agents and from self-insurance, which may result in lower revenues.
We compete with local, regional and national insurance companies, including direct writers of insurance coverage. Many of these competitors are larger than we are and many have greater financial, technical and operating resources. In addition, we face competition within each insurance agency that sells our insurance because we sell through independent agencies that represent several insurance companies.
The property and casualty insurance industry is highly competitive on the basis of product, price and service. If our competitors offer products with more coverage, or price their products more aggressively, our ability to grow or renew our business may be materially adversely impacted. There are more than 200 groups writing property and casualty insurance in the United States, and we rank among the top 70 in size. Our most significant competitors vary significantly in our different lines of business and in the geographic markets in which we compete. The Internet also could emerge as a significant source of new competition, both from existing competitors using their brand name and resources to write business through this distribution channel and from new competitors.
We also face competition because of entities that self-insure, primarily in the commercial insurance market. From time to time, certain of our customers and potential customers may examine the benefits and risks of self-insurance and other alternatives to traditional insurance.
A number of new, proposed or potential legislative or industry developments could further increase competition in the property and casualty insurance industry. These developments include:
| | • | | programs in which state-sponsored entities provide property insurance in catastrophe-prone areas or other alternative market types of coverage; and |
| | • | | changing practices caused by the Internet, which have led to greater competition in the insurance business and, in some cases, greater expectations for customer service. |
New competition from these developments could cause the supply or demand for insurance to change, which could materially adversely affect our results of operations and financial condition.
46
If adverse conditions in the eastern and midwestern United States exist, our business would be disproportionately impacted.
We primarily write property and casualty insurance business in the eastern and midwestern United States. Consequently, unusually severe storms or other natural or man-made disasters that destroy property in these states could materially adversely affect our operations. Our revenues and profitability also are subject to prevailing economic and regulatory conditions in the states in which we write insurance. We may be exposed to risks of adverse developments that are greater than if we conducted business nationwide.
We depend on independent insurance agents, which exposes us to risks not applicable to companies with dedicated agents.
We market and sell our insurance products through independent, non-exclusive insurance agencies. These agencies are not obligated to sell our insurance products, and generally they also sell our competitors’ insurance products. As a result, our business depends in part on the marketing and sales efforts of these agencies. If we diversify and expand our business geographically, then we may need to expand our network of agencies to successfully market our products. If these agencies fail to market our products successfully, our business may be materially adversely impacted. Also, independent agents may decide to sell their businesses to banks, other insurance agencies or other businesses. Changes in ownership of agencies, or expansion of agencies through acquisition, could adversely affect an agency’s ability to control growth and profitability, thereby adversely affecting our business.
If our insurance subsidiaries are not able to pay adequate dividends to us, our ability to meet our obligations and pay dividends would be adversely affected.
Our principal assets are the shares of capital stock of our insurance company subsidiaries. We principally rely on dividends from our insurance company subsidiaries to meet our obligations for paying principal and interest on outstanding debt obligations and for paying corporate expenses and dividends to stockholders. The payment of dividends by our insurance company subsidiaries is subject to regulatory restrictions and will depend on the surplus and future earnings of these subsidiaries, as well as other regulatory restrictions. As a result, we may not be able to receive dividends from these subsidiaries at times and in amounts necessary to meet our obligations or to allow us to pay dividends.
If insurance regulators determine that payment of a dividend to our holding company would be detrimental to an insurance subsidiary’s policyholders or creditors, because of the financial condition of the insurance subsidiary or otherwise, the regulators may block dividends that would otherwise be permitted without prior approval.
Our subsidiaries are permitted under the terms of our debt agreement for our $100 million notes due 2013 to incur additional indebtedness that may restrict or prohibit the making of distributions, the payment of dividends or the making of loans by our subsidiaries to us. We cannot assure you that the agreements governing the current and future indebtedness of our subsidiaries will permit our subsidiaries to provide us with sufficient dividends, distributions or loans to fund payments on these notes when due.
Although we have paid cash dividends in the past, we may not be able to pay cash dividends in the future.
We have a history of paying dividends to our stockholders when sufficient cash is available. However, future cash dividends will depend upon our results of operations, financial condition, cash requirements and other factors, including the ability of our subsidiaries to make distributions to us, which ability is restricted in the manner previously discussed in this section. Also, there can be no assurance that we will continue to pay dividends even if the necessary financial conditions are met and if sufficient cash is available for distribution.
If our use of predictive modeling or other underwriting tools is not effective, our business could be materially adversely impacted.
We use predictive modeling and other underwriting tools in underwriting a significant portion of our commercial lines business. We believe these tools allow us to more accurately match underwriting risk with pricing to operate more profitably. If the tools do not accurately reflect the level of losses that we ultimately will incur, our ability to write business and our financial results could be materially adversely affected.
47
If our technology initiatives are not successful, or the benefits are not realized, our business could be materially adversely affected.
Our businesses are increasingly dependent on technology. Our inability to anticipate or manage problems with technology, or fully realize the expected benefits from investments in technology, could materially adversely affect our ability to write business and could materially adversely impact our financial results.
If we lose our key personnel our business could be materially adversely affected.
The success of our business is dependent, to a large extent, on our ability to attract and retain key employees, in particular our senior officers and key management, sales, information systems, underwriting, claims and corporate personnel. Competition to attract and retain key personnel is intense. Although we have change in control agreements with a number of key managers, in general, we do not have employment contracts or non-compete arrangements with, or key person insurance covering, our employees, including our key employees.
Applicable insurance laws and certain provisions in our certificate of incorporation make it difficult to effect a change of control of our Company, and the Mutual Company has significant influence over potential change of control transactions, which could affect our share value.
Under applicable insurance laws and regulations of the states in which our subsidiaries are domiciled, no person may acquire control of us unless that person has filed a statement containing specified information with the insurance commissioner of each state and obtains advance approval for such acquisition. Under applicable laws and regulations, any person acquiring, directly or indirectly (by revocable proxy or otherwise), 10% or more of the voting stock of any other person is presumed to have acquired control of such person, and a person who beneficially acquires 10% or more of our common stock without obtaining advance approval of the insurance commissioner of each state would be in violation of applicable insurance laws and would be subject to injunctive action requiring disposition or seizure of the shares and prohibiting the voting of such shares, as well as other action determined by the insurance commissioner of each such state.
In addition, many state insurance laws require prior notification to the state insurance department of a change of control of a non-domiciliary insurance company licensed to transact an insurance business in that state. Although these pre-notification statutes do not authorize the state insurance departments to disapprove the change of control, they authorize regulatory action – including a possible revocation of our authority to do business – in the affected state if particular conditions exist such as undue market concentration. Any future transactions that would constitute a change of control of us may require prior notification in the states that have pre-acquisition notification laws.
As of December 31, 2010, the Mutual Company owned approximately 54% of our outstanding common stock. The Mutual Company’s stock ownership and ability, by reason of such ownership, to elect our board of directors, provides it with significant influence over potential change of control transactions. Further, Section 203 of the Delaware General Corporation Law provides that if a person acquires 15% or more of our voting stock, the person is an “interested stockholder” and may not engage in “business combinations” with us for a period of three years from the time the person acquired 15% or more of our voting stock, subject to certain exceptions. Section 203 may discourage a potential change of control transaction. Our Board of Directors is divided into three classes (A, B and C). The current three-year terms of Class A, B and C directors expire in 2013, 2012 and 2011, respectively. This classification of our Board of Directors could have the effect of discouraging a potential change in control transaction.
Finally, our certificate of incorporation permits our board of directors to issue up to one million shares of preferred stock having such terms, including voting rights, as the board of directors shall fix and determine.
48
| Item 7A. | Quantitative and Qualitative Disclosures about Market Risk. |
Interest Rate Risk
Harleysville Group’s exposure to market risk for changes in interest rates is concentrated in its investment portfolio and, to a lesser extent, its debt obligations. Harleysville Group monitors this exposure through periodic reviews of asset and liability positions. Estimates of cash flows and the impact of interest rate fluctuations relating to the investment portfolio are modeled regularly.
Principal cash flows and related weighted-average interest rates by expected maturity dates for financial instruments sensitive to interest rates are as follows:
| | | | | | | | |
| | | December 31, 2010 | |
| | | Principal
Cash Flows | | | Weighted-Average
Interest Rate | |
| | | (dollars in thousands) | |
Fixed maturities and short-term investments: | | | | | | | | |
2011 | | $ | 281,515 | | | | 3.85 | % |
2012 | | | 279,768 | | | | 5.17 | % |
2013 | | | 231,383 | | | | 4.66 | % |
2014 | | | 218,101 | | | | 4.56 | % |
2015 | | | 225,642 | | | | 4.50 | % |
Thereafter | | | 998,319 | | | | 4.99 | % |
| | | | | | | | |
Total | | $ | 2,234,728 | | | | | |
| | | | | | | | |
Fair value | | $ | 2,401,977 | | | | | |
| | | | | | | | |
Debt: | | | | | | | | |
2012 | | $ | 18,500 | | | | 0.71 | % |
2013 | | | 100,000 | | | | 5.75 | % |
| | | | | | | | |
Total | | $ | 118,500 | | | | | |
| | | | | | | | |
Fair value | | $ | 117,913 | | | | | |
| | | | | | | | |
Actual cash flows may differ from those stated as a result of calls and prepayments.
Equity Price Risk
Harleysville Group’s portfolio of equity securities, which is carried on the balance sheet at fair value, has exposure to price risk. Price risk is defined as the potential loss in fair value resulting from an adverse change in prices. Portfolio characteristics are analyzed regularly and price risk is actively managed through a variety of techniques.
The combined total of realized and unrealized equity investment gains (losses) was $27.7 million, $46.4 million and $(53.7) million in 2010, 2009 and 2008, respectively. During these three years, the largest total equity investment gain and (loss) in a quarter was $25.4 million (3rd quarter 2009) and $(26.4) million (4th quarter 2008), respectively.
49
| Item 8. | Financial Statements and Supplementary Data. |
50
HARLEYSVILLE GROUP
CONSOLIDATED BALANCE SHEETS
(in thousands, except share data)
| | | | | | | | |
| | | December 31, | |
| | | 2010 | | | 2009 | |
| Assets | | | | | | | | |
Investments: | | | | | | | | |
Fixed maturities: | | | | | | | | |
Held to maturity, at amortized cost (fair value $156,967 and $213,838) | | $ | 148,362 | | | $ | 204,284 | |
Available for sale, at fair value (amortized cost $2,069,097 and $2,036,993) | | | 2,165,101 | | | | 2,130,179 | |
Equity securities, at fair value (cost $191,095 and $137,150) | | | 268,104 | | | | 186,395 | |
Short-term investments, at cost, which approximates fair value | | | 79,909 | | | | 116,476 | |
Other invested assets, at cost, which approximates fair value | | | | | | | 2,480 | |
| | | | | | | | |
Total investments | | | 2,661,476 | | | | 2,639,814 | |
Cash | | | 39 | | | | 126 | |
Receivables: | | | | | | | | |
Premiums | | | 133,758 | | | | 141,486 | |
Reinsurance | | | 219,149 | | | | 226,781 | |
Accrued investment income | | | 26,910 | | | | 26,058 | |
| | | | | | | | |
Total receivables | | | 379,817 | | | | 394,325 | |
Deferred policy acquisition costs | | | 113,997 | | | | 111,649 | |
Prepaid reinsurance premiums | | | 51,625 | | | | 48,314 | |
Property and equipment, net | | | 13,312 | | | | 13,579 | |
Deferred income taxes | | | 9,413 | | | | 21,429 | |
Other assets | | | 48,553 | | | | 72,750 | |
| | | | | | | | |
Total assets | | $ | 3,278,232 | | | $ | 3,301,986 | |
| | | | | | | | |
| Liabilities and Shareholders’ Equity | | | | | | | | |
Liabilities: | | | | | | | | |
Unpaid losses and loss settlement expenses (affiliate $214,518 and $257,562) | | $ | 1,771,661 | | | $ | 1,782,292 | |
Unearned premiums (affiliate $32,935 and $44,275) | | | 503,532 | | | | 484,510 | |
Accounts payable and accrued expenses | | | 96,461 | | | | 130,780 | |
Due to affiliate | | | 19,445 | | | | 13,276 | |
Debt (affiliate $18,500 and $18,500) | | | 118,500 | | | | 118,500 | |
| | | | | | | | |
Total liabilities | | | 2,509,599 | | | | 2,529,358 | |
| | | | | | | | |
Shareholders’ equity: | | | | | | | | |
Preferred stock, $1 par value, authorized 1,000,000 shares; none issued Common stock, $1 par value, authorized 80,000,000 shares; issued 2010, 34,987,829 and 2009, 34,583,182 shares; outstanding 2010, 27,044,836 and 2009, 27,615,120 shares | | | 34,988 | | | | 34,583 | |
Additional paid-in capital | | | 263,857 | | | | 245,636 | |
Accumulated other comprehensive income | | | 80,506 | | | | 62,276 | |
Retained earnings | | | 630,603 | | | | 640,593 | |
Treasury stock, at cost, 7,942,993 and 6,968,062 shares | | | (241,321 | ) | | | (210,460 | ) |
| | | | | | | | |
Total shareholders’ equity | | | 768,633 | | | | 772,628 | |
| | | | | | | | |
Total liabilities and shareholders’ equity | | $ | 3,278,232 | | | $ | 3,301,986 | |
| | | | | | | | |
See accompanying notes to consolidated financial statements.
51
HARLEYSVILLE GROUP
CONSOLIDATED STATEMENTS OF INCOME
(in thousands, except per share data)
| | | | | | | | | | | | |
| | | Year Ended December 31, | |
| | | 2010 | | | 2009 | | | 2008 | |
Revenues: | | | | | | | | | | | | |
Premiums earned from affiliate (ceded to affiliate, $783,340, $730,699 and $761,751) | | $ | 866,350 | | | $ | 858,500 | | | $ | 918,515 | |
Investment income, net of investment expense | | | 103,313 | | | | 106,649 | | | | 113,555 | |
Realized investment gains (losses), net: | | | | | | | | | | | | |
Total other-than-temporary impairment losses | | | — | | | | (1,548 | ) | | | (65,032 | ) |
Portion of loss recognized in other comprehensive income | | | — | | | | — | | | | — | |
Other realized investment gains, net | | | 597 | | | | 3,841 | | | | 5,191 | |
| | | | | | | | | | | | |
Total realized investment gains (losses), net | | | 597 | | | | 2,293 | | | | (59,841 | ) |
| | | | | | | | | | | | |
Other income (affiliate $7,251, $6,451 and $7,324) | | | 16,012 | | | | 13,178 | | | | 13,087 | |
| | | | | | | | | | | | |
Total revenues | | | 986,272 | | | | 980,620 | | | | 985,316 | |
| | | | | | | | | | | | |
Expenses: | | | | | | | | | | | | |
Losses and loss settlement expenses (ceded to affiliate, $540,619, $476,641 and $524,735) | | | 589,105 | | | | 552,491 | | | | 610,768 | |
Amortization of deferred policy acquisition costs | | | 220,150 | | | | 216,470 | | | | 227,287 | |
Other underwriting expenses | | | 84,227 | | | | 85,349 | | | | 85,182 | |
Interest expense (affiliate $137, $290 and $640) | | | 6,064 | | | | 6,217 | | | | 6,572 | |
Other expenses | | | 4,014 | | | | 4,095 | | | | 4,545 | |
| | | | | | | | | | | | |
Total expenses | | | 903,560 | | | | 864,622 | | | | 934,354 | |
| | | | | | | | | | | | |
Income before income taxes | | | 82,712 | | | | 115,998 | | | | 50,962 | |
Income taxes | | | 15,814 | | | | 29,702 | | | | 8,643 | |
| | | | | | | | | | | | |
Net income | | $ | 66,898 | | | $ | 86,296 | | | $ | 42,319 | |
| | | | | | | | | | | | |
Per common share: | | | | | | | | | | | | |
Basic net income | | $ | 2.43 | | | $ | 3.09 | | | $ | 1.45 | |
| | | | | | | | | | | | |
Diluted net income | | $ | 2.42 | | | $ | 3.07 | | | $ | 1.43 | |
| | | | | | | | | | | | |
Cash dividend | | $ | 2.81 | | | $ | 1.25 | | | $ | 1.10 | |
| | | | | | | | | | | | |
See accompanying notes to consolidated financial statements.
52
HARLEYSVILLE GROUP
CONSOLIDATED STATEMENTS OF SHAREHOLDERS’ EQUITY
For the years ended December 31, 2010, 2009 and 2008
(dollars in thousands)
| | | | | | | | | | | | | | | | | | | | | | | | | | | | |
| | | Common Stock | | | Additional
Paid-in
Capital | | | Accumulated
Other
Comprehensive
Income (Loss) | | | Retained
Earnings | | | Treasury
Stock | | | Total | |
| | Shares | | | Amount | | | | | | |
Balance at December 31, 2007 | | | 33,656,253 | | | $ | 33,656 | | | $ | 213,654 | | | $ | 20,599 | | | $ | 578,705 | | | $ | (87,773 | ) | | $ | 758,841 | |
Net income | | | | | | | | | | | | | | | | | | | 42,319 | | | | | | | | 42,319 | |
Other comprehensive (loss), net of tax: | | | | | | | | | | | | | | | | | | | | | | | | | | | | |
Unrealized investment losses, net of reclassification adjustment | | | | | | | | | | | | | | | (5,880 | ) | | | | | | | | | | | (5,880 | ) |
Defined benefit pension plan: | | | | | | | | | | | | | | | | | | | | | | | | | | | | |
Net actuarial loss adjustment | | | | | | | | | | | | | | | (32,109 | ) | | | | | | | | | | | (32,109 | ) |
| | | | | | | | | | | | | | | | | | | | | | | | | | | | |
Other comprehensive loss | | | | | | | | | | | | | | | | | | | | | | | | | | | (37,989 | ) |
| | | | | | | | | | | | | | | | | | | | | | | | | | | | |
Comprehensive income | | | | | | | | | | | | | | | | | | | | | | | | | | | 4,330 | |
| | | | | | | | | | | | | | | | | | | | | | | | | | | | |
Issuance of common stock: | | | | | | | | | | | | | | | | | | | | | | | | | | | | |
Incentive plans | | | 570,643 | | | | 571 | | | | 8,083 | | | | | | | | | | | | | | | | 8,654 | |
Dividend Reinvestment Plan | | | 27,685 | | | | 27 | | | | 965 | | | | | | | | | | | | | | | | 992 | |
Tax benefit from stock compensation | | | | | | | | | | | 3,114 | | | | | | | | | | | | | | | | 3,114 | |
Stock compensation | | | | | | | | | | | 5,899 | | | | | | | | | | | | | | | | 5,899 | |
Purchase of treasury stock, 2,764,561 shares | | | | | | | | | | | | | | | | | | | | | | | (97,318 | ) | | | (97,318 | ) |
Cash dividends paid | | | | | | | | | | | | | | | | | | | (31,878 | ) | | | | | | | (31,878 | ) |
| | | | | | | | | | | | | | | | | | | | | | | | | | | | |
Balance at December 31, 2008 | | | 34,254,581 | | | | 34,254 | | | | 231,715 | | | | (17,390 | ) | | | 589,146 | | | | (185,091 | ) | | | 652,634 | |
Net income | | | | | | | | | | | | | | | | | | | 86,296 | | | | | | | | 86,296 | |
Other comprehensive income, net of tax: | | | | | | | | | | | | | | | | | | | | | | | | | | | | |
Unrealized investment gains, net of reclassification adjustment | | | | | | | | | | | | | | | 74,976 | | | | | | | | | | | | 74,976 | |
Defined benefit pension plan: | | | | | | | | | | | | | | | | | | | | | | | | | | | | |
Net actuarial loss adjustment | | | | | | | | | | | | | | | 4,690 | | | | | | | | | | | | 4,690 | |
| | | | | | | | | | | | | | | | | | | | | | | | | | | | |
Other comprehensive income | | | | | | | | | | | | | | | | | | | | | | | | | | | 79,666 | |
| | | | | | | | | | | | | | | | | | | | | | | | | | | | |
Comprehensive income | | | | | | | | | | | | | | | | | | | | | | | | | | | 165,962 | |
| | | | | | | | | | | | | | | | | | | | | | | | | | | | |
Issuance of common stock: | | | | | | | | | | | | | | | | | | | | | | | | | | | | |
Incentive plans | | | 296,483 | | | | 297 | | | | 6,087 | | | | | | | | | | | | | | | | 6,384 | |
Dividend Reinvestment Plan | | | 32,118 | | | | 32 | | | | 963 | | | | | | | | | | | | | | | | 995 | |
Tax benefit from stock compensation | | | | | | | | | | | 571 | | | | | | | | | | | | | | | | 571 | |
Stock compensation | | | | | | | | | | | 6,300 | | | | | | | | | | | | | | | | 6,300 | |
Purchase of treasury stock, 870,153 shares | | | | | | | | | | | | | | | | | | | | | | | (25,369 | ) | | | (25,369 | ) |
Cash dividends paid | | | | | | | | | | | | | | | | | | | (34,849 | ) | | | | | | | (34,849 | ) |
| | | | | | | | | | | | | | | | | | | | | | | | | | | | |
Balance at December 31, 2009 | | | 34,583,182 | | | $ | 34,583 | | | $ | 245,636 | | | $ | 62,276 | | | $ | 640,593 | | | $ | (210,460 | ) | | $ | 772,628 | |
(Continued)
53
HARLEYSVILLE GROUP
CONSOLIDATED STATEMENTS OF SHAREHOLDERS’ EQUITY
For the years ended December 31, 2010, 2009 and 2008
(dollars in thousands)
(Continued)
| | | | | | | | | | | | | | | | | | | | | | | | | | | | |
| | | Common Stock | | | Additional
Paid-in
Capital | | | Accumulated
Other
Comprehensive
Income (Loss) | | | Retained
Earnings | | | Treasury
Stock | | | Total | |
| | Shares | | | Amount | | | | | | |
Net income | | | | | | $ | | | | $ | | | | $ | | | | $ | 66,898 | | | $ | | | | $ | 66,898 | |
Other comprehensive income, net of tax: | | | | | | | | | | | | | | | | | | | | | | | | | | | | |
Unrealized investment gains, net of reclassification adjustment | | | | | | | | | | | | | | | 19,878 | | | | | | | | | | | | 19,878 | |
Defined benefit pension plan: Net actuarial loss adjustment | | | | | | | | | | | | | | | (1,648 | ) | | | | | | | | | | | (1,648 | ) |
| | | | | | | | | | | | | | | | | | | | | | | | | | | | |
Other comprehensive income | | | | | | | | | | | | | | | | | | | | | | | | | | | 18,230 | |
| | | | | | | | | | | | | | | | | | | | | | | | | | | | |
Comprehensive income | | | | | | | | | | | | | | | | | | | | | | | | | | | 85,128 | |
| | | | | | | | | | | | | | | | | | | | | | | | | | | | |
Issuance of common stock: | | | | | | | | | | | | | | | | | | | | | | | | | | | | |
Incentive plans | | | 338,678 | | | | 339 | | | | 8,634 | | | | | | | | | | | | | | | | 8,973 | |
Dividend Reinvestment Plan | | | 65,969 | | | | 66 | | | | 2,211 | | | | | | | | | | | | | | | | 2,277 | |
Tax benefit from stock compensation | | | | | | | | | | | 1,013 | | | | | | | | | | | | | | | | 1,013 | |
Stock compensation | | | | | | | | | | | 6,363 | | | | | | | | | | | | | | | | 6,363 | |
Purchase of treasury stock, 974,931 shares | | | | | | | | | | | | | | | | | | | | | | | (30,861 | ) | | | (30,861 | ) |
Dividends declared | | | | | | | | | | | | | | | | | | | (76,888 | ) | | | | | | | (76,888 | ) |
| | | | | | | | | | | | | | | | | | | | | | | | | | | | |
Balance at December 31, 2010 | | | 34,987,829 | | | $ | 34,988 | | | $ | 263,857 | | | $ | 80,506 | | | $ | 630,603 | | | $ | (241,321 | ) | | $ | 768,633 | |
| | | | | | | | | | | | | | | | | | | | | | | | | | | | |
See accompanying notes to consolidated financial statements.
54
HARLEYSVILLE GROUP
CONSOLIDATED STATEMENTS OF CASH FLOWS
(in thousands)
| | | | | | | | | | | | |
| | | Year Ended December 31, | |
| | | 2010 | | | 2009 | | | 2008 | |
Cash flows from operating activities: | | | | | | | | | | | | |
Net income | | $ | 66,898 | | | $ | 86,296 | | | $ | 42,319 | |
Adjustments to reconcile net income to net cash provided by operating activities: | | | | | | | | | | | | |
Change in receivables, unearned premiums and prepaid reinsurance | | | 30,221 | | | | (20,322 | ) | | | (54,861 | ) |
Change in affiliate balance | | | 6,162 | | | | 316 | | | | 20,157 | |
Increase (decrease) in unpaid losses and loss settlement expenses | | | (10,631 | ) | | | 14,691 | | | | 67,376 | |
Deferred income taxes | | | 2,200 | | | | 4,566 | | | | (9,892 | ) |
(Increase) decrease in deferred policy acquisition costs | | | (2,348 | ) | | | (1,310 | ) | | | 2,953 | |
Amortization and depreciation | | | 10,058 | | | | 6,177 | | | | 5,926 | |
Realized investment (gains) losses, net | | | (597 | ) | | | (2,293 | ) | | | 59,841 | |
Change in other assets and other liabilities | | | (10,162 | ) | | | 10,876 | | | | (25,332 | ) |
Other, net | | | 6,439 | | | | 6,432 | | | | 5,901 | |
| | | | | | | | | | | | |
| | | 98,240 | | | | 105,429 | | | | 114,388 | |
Cash provided by the change in the intercompany pooling agreement | | | | | | | | | | | 82,640 | |
| | | | | | | | | | | | |
Net cash provided by operating activities | | | 98,240 | | | | 105,429 | | | | 197,028 | |
| | | | | | | | | | | | |
Cash flows from investing activities: | | | | | | | | | | | | |
Held to maturity investments: | | | | | | | | | | | | |
Maturities | | | 54,916 | | | | 41,406 | | | | 68,124 | |
Available for sale investments: | | | | | | | | | | | | |
Purchases | | | (388,940 | ) | | | (507,669 | ) | | | (474,363 | ) |
Maturities | | | 241,602 | | | | 226,449 | | | | 192,530 | |
Sales | | | 52,333 | | | | 93,960 | | | | 241,379 | |
Other invested assets: | | | | | | | | | | | | |
Purchases | | | | | | | | | | | (5,789 | ) |
Maturities | | | 436 | | | | 410 | | | | 99 | |
Sales | | | 1,408 | | | | | | | | | |
Net (purchases) sales or maturities of short-term investments | | | 40,896 | | | | 94,206 | | | | (102,741 | ) |
Purchase of property and equipment, net | | | (602 | ) | | | (2,025 | ) | | | (100 | ) |
Acquisition of affiliate, net of cash acquired | | | (4,825 | ) | | | | | | | | |
| | | | | | | | | | | | |
Net cash used by investing activities | | | (2,776 | ) | | | (53,263 | ) | | | (80,861 | ) |
| | | | | | | | | | | | |
Cash flows from financing activities: | | | | | | | | | | | | |
Issuance of common stock | | | 8,973 | | | | 7,382 | | | | 9,649 | |
Purchase of treasury stock | | | (30,940 | ) | | | (25,290 | ) | | | (97,318 | ) |
Dividends paid (to affiliate, $40,819, $18,158 and $16,486) | | | (74,597 | ) | | | (34,849 | ) | | | (31,878 | ) |
Excess tax benefits from share-based payment arrangements | | | 1,013 | | | | 571 | | | | 3,114 | |
| | | | | | | | | | | | |
Net cash used by financing activities | | | (95,551 | ) | | | (52,186 | ) | | | (116,433 | ) |
| | | | | | | | | | | | |
Decrease in cash | | | (87 | ) | | | (20 | ) | | | (266 | ) |
Cash at beginning of year | | | 126 | | | | 146 | | | | 412 | |
| | | | | | | | | | | | |
Cash at end of year | | $ | 39 | | | $ | 126 | | | $ | 146 | |
| | | | | | | | | | | | |
Supplemental schedule of noncash investing and financing activities:
In connection with the amendment to the intercompany pooling agreement between the Company’s insurance subsidiaries and Harleysville Mutual Insurance Company (the Mutual Company) and its property and casualty insurance subsidiary, Harleysville Pennland Insurance Company (Pennland), effective January 1, 2008, fixed maturity investments and liabilities of $109,438,000 were transferred from the Mutual Company and Pennland to the Company’s insurance subsidiaries. See Note 2 of the Notes to Consolidated Financial Statements.
See accompanying notes to consolidated financial statements.
55
NOTES TO CONSOLIDATED FINANCIAL STATEMENTS
1 - Description of Business and Summary of Significant Accounting Policies
Description of Business
Harleysville Group consists of Harleysville Group Inc. and its subsidiaries (all wholly owned). Those subsidiaries are:
| | • | | Harleysville-Atlantic Insurance Company (Atlantic) |
| | • | | Harleysville Insurance Company (HIC) |
| | • | | Harleysville Insurance Company of New Jersey (HNJ) |
| | • | | Harleysville Insurance Company of New York (HIC New York) |
| | • | | Harleysville Insurance Company of Ohio (HIC Ohio) |
| | • | | Harleysville Lake States Insurance Company (Lake States) |
| | • | | Harleysville Preferred Insurance Company (Preferred) |
| | • | | Harleysville Worcester Insurance Company (Worcester) |
| | • | | Harleysville Ltd., a real estate partnership that owns the home office |
Harleysville Group is approximately 54% owned by Harleysville Mutual Insurance Company (the Mutual Company).
Harleysville Group underwrites property and casualty insurance in both the personal and commercial lines of insurance. The personal lines of insurance include both auto and homeowners, and the commercial lines include auto, commercial multi-peril and workers compensation. The business is marketed primarily in the eastern and midwestern United States through independent agents.
Principles of Consolidation and Basis of Presentation
The accompanying financial statements include the accounts of Harleysville Group prepared in conformity with U.S. generally accepted accounting principles, which differ in some respects from those followed in reports to insurance regulatory authorities. All significant intercompany balances and transactions have been eliminated in consolidation.
The preparation of financial statements in conformity with U.S. generally accepted accounting principles requires management to make estimates and assumptions that affect the reported amounts of assets and liabilities, including loss and loss settlement expenses, the disclosure of contingent assets and liabilities at the date of the financial statements, and the reported amounts of revenues and expenses, including the determination of other-than-temporary declines in investments, during the reporting period. Actual results could differ from these estimates.
Investments
Accounting for fixed maturities depends on their classification as held to maturity, available for sale or trading. Fixed maturities classified as held to maturity are carried at amortized cost. Fixed maturities classified as available for sale are carried at fair value. There were no investments classified as trading. Equity securities are carried at fair value. Short-term investments are recorded at cost, which approximates fair value. The fair value of level 1 and 2 fixed maturities is based upon data supplied by an independent pricing service. The fair value of level 3 fixed maturity securities is based on cash flow analysis and other valuation techniques. The fair value of equity securities is based on the closing market value. The fair value of mutual fund holdings is based on the closing net asset value reported by the fund.
Premiums and discounts on fixed income securities are amortized or accreted using the interest method. Mortgage-backed securities are amortized over a period based on estimated future principal payments, including prepayments. Prepayment assumptions are reviewed periodically and adjusted as necessary to reflect actual prepayments and changes in expectations. Adjustments related to changes in prepayment assumptions are recognized on a retrospective basis.
56
Realized gains and losses on sales of investments are recognized in net income on the specific identification basis. Unrealized gains or losses on investments carried at fair value, net of applicable income taxes, are reflected directly in shareholders’ equity as a component of comprehensive income and, accordingly, have no effect on net income. However, if the fair value of an investment in equity securities declines below its cost and that decline is deemed other than temporary, the amount of the decline below cost is charged to earnings. Per the Company’s current policy, a fixed maturity security is other than temporarily impaired if the present value of the cash flows expected to be collected is less than the amortized cost of the security or where the security’s fair value is below cost and the Company intends to sell or more likely than not will be required to sell the security before recovery of its value. If the Company does not intend to sell, or more likely than not will not be required to sell, a fixed maturity security whose fair value has declined below its cost, the amount of the decline below cost due to credit-related reasons is charged to earnings and the remaining difference is included in comprehensive income. Harleysville Group monitors its investment portfolio and at least quarterly reviews investments that have experienced a decline in fair value below cost to evaluate whether the decline is other than temporary. Such evaluations consider, among other things, the magnitude and reasons for a decline, the prospects for the fair value to recover in the near term and Harleysville Group’s intent to retain the investment for a period of time sufficient to allow for a recovery in value.
The severe downturn in the public debt and equity markets in 2008, reflecting uncertainties associated with the mortgage crisis, worsening economic conditions, widening of credit spreads, bankruptcies and government intervention in large financial institutions, has resulted in significant realized and unrealized losses in our investment portfolio in the past. Depending on market conditions going forward, we could incur additional realized and unrealized losses in future periods.
Premiums
Premiums are recognized as revenue ratably over the terms of the respective policies. Unearned premiums are calculated on the daily pro rata basis.
Policy Acquisition Costs
Policy acquisition costs, such as commissions, premium taxes and certain other underwriting and agency expenses that vary with, and are primarily related to, the production of business, are deferred and amortized over the effective period of the related insurance policies in proportion to the premiums earned. The method followed in computing deferred policy acquisition costs limits the amount of such deferred costs to their estimated realizable value. The estimation of net realizable value takes into account the premium to be earned, related investment income over the claims paying period, expected losses and loss settlement expenses, and certain other costs expected to be incurred as the premium is earned. Future changes in estimates, the most significant of which is expected losses and loss settlement expenses, may require adjustments to deferred policy acquisition costs. If the estimation of net realizable value indicates that the deferred acquisition costs are not recoverable, they would be written off and further analyses would be performed to determine if an additional liability would need to be accrued.
Losses and Loss Settlement Expenses
The liability for losses and loss settlement expenses represents estimates of the ultimate unpaid cost of all losses incurred, which includes the gross liabilities to Harleysville Group’s policyholders plus the net liability to the Mutual Company under the pooling agreement. See Note 2(a). Such estimates may be more or less than the amounts ultimately paid when the claims are settled. These estimates are periodically reviewed and adjusted as necessary; such adjustments are reflected in current operations.
Share-Based Payments
Harleysville Group has several share-based compensation plans. Harleysville Group measures compensation expense associated with the plans based on the grant-date fair value of the awards.
Property and Equipment
Property and equipment are carried at cost less accumulated depreciation. Depreciation is calculated primarily on the straight-line basis over the estimated useful lives of the assets (up to 40 years for buildings and three to 15 years for equipment).
57
Income Taxes
Deferred income tax assets and liabilities are recognized for the expected future tax consequences attributable to differences between the financial statement carrying amounts of existing assets and liabilities and their respective tax bases. Deferred tax assets are reduced by a valuation allowance if it is more likely than not that all or some portion of the deferred tax assets will not be realized.
Earnings Per Share
Basic earnings per share (EPS) is calculated using the weighted average shares outstanding, including participating securities with non-forfeitable rights to dividends, such as unvested restricted stock and restricted stock units. In calculating diluted EPS, the weighted average shares outstanding includes all potentially dilutive securities. Basic and diluted EPS are calculated by dividing net income available to common shareholders by the applicable weighted average number of shares outstanding during the year.
The Company adopted the accounting guidance on “Participating Securities and the Two-Class Method,” in 2009. This guidance redefines participating securities to include unvested share-based payment awards that contain non-forfeitable dividends or dividend equivalents as participating securities to be included in the computation of EPS pursuant to the “two-class method.” Outstanding unvested restricted stock and restricted stock units issued by the Company under employee compensation programs containing such dividend participation features are considered participating securities subject to the “two-class method” in computing EPS rather than the “treasury stock method.” Prior period EPS has been adjusted retroactively to conform to this guidance. Adoption of this guidance reduced basic EPS by $.04 and $.01 for 2009 and 2008, respectively, and diluted EPS by $.02 and $.01 for 2009 and 2008, respectively.
New Accounting Standards
In June 2009, the Financial Accounting Standards Board (FASB) issued guidance which replaces the quantitative-based risks and rewards calculation for determining whether an enterprise is the primary beneficiary in a variable interest entity with an approach that is primarily qualitative, and requires ongoing assessments of whether an enterprise is the primary beneficiary of a variable interest entity. The guidance, which is effective for financial statements issued for fiscal years beginning after November 15, 2009, also requires additional disclosures about an enterprise’s involvement in variable interest entities. The adoption of this guidance did not have a material impact on the Company’s results of operations or financial position.
In January 2010, the FASB issued Accounting Standards Update (ASU) 2010-06, “Fair Value Measurements and Disclosures.” ASU 2010-06 applies to all entities that are required to make disclosures about recurring or non-recurring fair value measurements. ASU 2010-06 provides guidance on additional disclosures on any significant transfers in and out of Level 1 and Level 2 and a description of the transfer. ASU 2010-06 also requires separate disclosures of the activity in the Level 3 category related to any purchases, sales, issuances and settlements on a gross basis. The effective date of the new disclosures relating to the existing disclosures regarding Level 1 and Level 2 categories is for interim and annual periods beginning after December 15, 2009. The effective date of the disclosures regarding purchases, sales, issuances and settlements to the Level 3 category is for interim and annual periods beginning after December 15, 2010. The portion of ASU 2010-06 that has been adopted did not have a material impact on the Company’s results of operations or financial position as it focuses on additional disclosures. The portion of ASU 2010-06 that has not yet been adopted is not expected to have a material impact on the Company’s results of operations or financial position.
In March 2010, the FASB issued ASU 2010-11, “Derivatives and Hedging.” This ASU clarifies that the transfer of credit risk that is only in the form of subordination of one financial instrument to another (thereby redistributing credit risk) is an embedded derivative feature that should not be subject to potential bifurcation and separate accounting. This ASU is effective the first day of the first fiscal quarter beginning after June 15, 2010. The adoption of this ASU did not have a material impact on the Company’s results of operations or financial position.
In October 2010, the FASB issued ASU 2010-26, “Accounting for Costs Associated with Acquiring or Renewing Insurance Contracts (a consensus of the FASB Emerging Issues Task Force).” This ASU amends FASB Accounting Standards Codification (ASC) Topic 944, Financial Services-Insurance, to address which costs related to the acquisition of new or renewal insurance contracts qualify for deferral. The ASU allows insurance entities to defer costs related to the acquisition of new or renewal insurance contracts that are (1) incremental direct costs of the contract transaction (i.e., would not have occurred without the contract transaction), (2) a portion of the employee’s compensation and fringe benefits related to certain activities for successful contract acquisitions, or (3) direct-response advertising costs as defined in ASC Subtopic 340-20, Other Assets and Deferred Costs – Capitalized Advertising Costs. An insurance entity would expense as incurred
58
all other costs related to the acquisition of new or renewal insurance contracts. The amendments in the ASU are effective for fiscal years, and interim periods within those years, beginning on or after December 15, 2011, and can be applied either prospectively or retrospectively. Early application is permitted at the beginning of an entity’s annual reporting period. The impact of adopting this ASU is currently being evaluated.
In December 2010, the FASB issued ASU 2010-28, “Intangibles-Goodwill and Other.” The amendments in this ASU modify Step 1 of the goodwill impairment test for reporting units with zero or negative carrying amounts. For these units, an entity is required to perform Step 2 of the goodwill impairment test if it is more likely than not that a goodwill impairment exists. In determining whether it is more likely than not that a goodwill impairment exists, an entity should consider whether there are any adverse qualitative factors indicating that an impairment may exist. For public entities, this ASU is effective for fiscal years, and interim periods within those years, beginning after December 15, 2010. The adoption of this ASU is not expected to have a material impact on the Company’s results of operations or financial position.
2 - Transactions with Affiliates
(a) Underwriting
The insurance subsidiaries participate in a reinsurance pooling agreement with the Mutual Company and its property and casualty insurance subsidiary, Harleysville Pennland Insurance Company (Pennland), whereby such subsidiaries and Pennland cede to the Mutual Company all of their insurance business and assume from the Mutual Company an amount equal to their participation in the pooling agreement. All losses and loss settlement expenses and other underwriting expenses are prorated among the parties on the basis of participation in the pooling agreement. The agreement pertains to all insurance business written or earned on or after January 1, 1986. Harleysville Group’s participation was 80% for 2010, 2009 and 2008.
Effective January 1, 2011, the Company’s property and casualty subsidiaries and the Mutual Company and Pennland amended their intercompany pooling agreement as it relates to their workers compensation business. The amendment establishes that the financial results associated with the workers compensation business for accident years 2011 and following will be retained 100 percent by the Mutual Company. The financial results of this business for prior accident years will continue to be shared between the Company’s property and casualty subsidiaries, the Mutual Company and Pennland under the existing pool participations. Harleysville Group paid cash of $33 million on January 3, 2011 associated with the transfer of the unearned premium liability on the workers compensation business as of January 1, 2011. Harleysville Group’s unearned premium liability decreased by $40 million and Harleysville Group received a ceding commission of $7 million for expenses that were incurred to generate the business ceded to the Mutual Company, which ceding commission reduced deferred policy acquisition costs.
Effective January 1, 2010, the pooling agreement was amended to exclude premiums, losses, loss settlement expenses and underwriting expenses voluntarily assumed by the Mutual Company.
Effective January 1, 2008, the Company’s property and casualty subsidiaries and the Mutual Company and Pennland amended their intercompany pooling agreement to increase Harleysville Group’s share of the pool from 72% to 80%. Harleysville Group received cash and investments of $192.1 million on January 3, 2008 associated with the transfer of liabilities from the Mutual Company to Harleysville Group in connection with the pool change. The Company’s liabilities increased $203.4 million and the Company reimbursed the Mutual Company $11.3 million, through a ceding commission, for expenses that were incurred to generate the additional business assumed by the Company’s property and casualty insurance subsidiaries, which ceding commission was deferred as policy acquisition costs.
These liabilities consisted of the following at January 1, 2008 (in thousands):
| | | | |
Unpaid losses and loss settlement expenses (net of reinsurance) | | $ | 153,535 | |
Unearned premiums (net of reinsurance) | | | 45,718 | |
Other liabilities | | | 4,163 | |
Less: ceding commission paid | | | (11,338 | ) |
| | | | |
| | $ | 192,078 | |
| | | | |
59
When the Company’s property and casualty insurance subsidiaries’ pooling participation increases, there is a larger retrocession of this pooled business from the Mutual Company. Through this retrocession, Harleysville Group is assuming a larger share of premiums, losses and loss settlement expenses and underwriting expenses for current and future periods originating both from its subsidiaries and the Mutual Company. An increase in Harleysville Group’s pooling participation results in a larger share of the pooled liabilities being assumed by Harleysville Group. Cash and investments are received by Harleysville Group equal to this greater share of loss reserves, unearned premiums and other insurance liabilities (primarily commissions and premium taxes) less a ceding commission based on acquisition costs related to unearned premiums. An increase in pool participation also increases Harleysville Group’s leverage and exposure to prior period development.
Because this pooling agreement does not relieve Harleysville Group of primary liability as the originating insurer, there is a concentration of credit risk arising from business ceded to the Mutual Company. However, the reinsurance pooling agreement provides for the right of offset, and the amount of credit risk with the Mutual Company was not material at December 31, 2010 and 2009. The Mutual Company has an A. M. Best rating of “A” (Excellent).
The following amounts represent reinsurance transactions between Harleysville Group and the Mutual Company under the pooling arrangement:
| | | | | | | | | | | | |
| | | 2010 | | | 2009 | | | 2008 | |
| | | (in thousands) | |
Ceded: | | | | | | | | | | | | |
Premiums written | | $ | 810,391 | | | $ | 748,289 | | | $ | 753,173 | |
| | | | | | | | | | | | |
Premiums earned | | $ | 783,340 | | | $ | 730,699 | | | $ | 761,751 | |
| | | | | | | | | | | | |
Losses incurred | | $ | 540,619 | | | $ | 476,641 | | | $ | 524,735 | |
| | | | | | | | | | | | |
Assumed: | | | | | | | | | | | | |
Premiums written | | $ | 882,061 | | | $ | 851,617 | | | $ | 950,130 | |
| | | | | | | | | | | | |
Premiums earned | | $ | 866,350 | | | $ | 858,500 | | | $ | 918,515 | |
| | | | | | | | | | | | |
Losses incurred | | $ | 588,506 | | | $ | 551,773 | | | $ | 610,531 | |
| | | | | | | | | | | | |
Net assumed from the Mutual Company: | | | | | | | | | | | | |
Unearned premiums | | $ | 32,935 | | | $ | 44,275 | | | $ | 68,748 | |
| | | | | | | | | | | | |
Unpaid losses and loss settlement expenses | | $ | 214,518 | | | $ | 257,562 | | | $ | 278,841 | |
| | | | | | | | | | | | |
(b) Property
Harleysville Ltd. leases the home office to the Mutual Company, which shares the facility with Harleysville Group. Rental income under the lease was $4,402,000, $4,194,000 and $4,170,000 for 2010, 2009, and 2008, respectively, and is included in other income after elimination of intercompany amounts of $2,994,000, $2,852,000 and $2,836,000 in 2010, 2009 and 2008, respectively.
(c) Management Agreements
Harleysville Group Inc. received $5,843,000, $5,109,000 and $5,990,000 of management fee income in 2010, 2009 and 2008, respectively, under agreements whereby Harleysville Group Inc. provides management services to the Mutual Company and other affiliates. Such amounts are included in other income. Effective January 1, 2010, the management agreement was amended to include voluntary assumed reinsurance business written by the Mutual Company.
(d) Intercompany Balances
Intercompany balances are created primarily from the pooling arrangement (settled quarterly), allocation of common expenses, collection of premium balances and payment of claims (settled monthly). No interest is charged or received on intercompany balances due to the timely settlement terms and nature of the items. Interest expense on the loan from the Mutual Company described in Note 7 was $137,000, $290,000 and $640,000 in 2010, 2009 and 2008, respectively.
Harleysville Group has off-balance-sheet credit risk related to approximately $99,600,000 and $82,000,000 of premium balances due to the Mutual Company from agents and insureds at December 31, 2010 and 2009, respectively.
60
(e) Acquisition
On December 30, 2010, Harleysville Group Inc. acquired Mainland Insurance Company (Mainland) from the Mutual Company for $4,825,000 in cash. On December 31, 2010, HIC New York was merged into Mainland and Mainland’s name was changed to Harleysville Insurance Company of New York (HIC New York). Mainland was a shell property and casualty insurance company with no premiums or outstanding insurance obligations. The acquisition and merger were completed to facilitate the redomestication of HIC New York to Pennsylvania in order to improve the efficiency of the corporate structure. Supplemental cash flow information for the acquisition is as follows:
| | | | |
| | | (in thousands) | |
Fair value of assets (including short-term investments of $4.3 million) | | $ | 4,832 | |
Liabilities assumed | | | 7 | |
| | | | |
Cash paid | | $ | 4,825 | |
| | | | |
3 - Investments
Fair value accounting guidance defines fair value, establishes a framework for measuring fair value in generally accepted accounting principles, and expands disclosures about fair value measurements.
Fair value measurements are determined under a three-level hierarchy which gives the highest priority to quoted prices in active markets and the lowest priority to unobservable inputs which are based on the Company’s own assumptions. The three levels of the hierarchy are as follows:
Level 1 - Unadjusted quoted market prices for identical assets or liabilities in active markets that the Company has the ability to access.
Level 2 - Inputs other than Level 1 that are based on observable market data. These include quoted prices for similar assets in active markets, quoted prices for identical assets in inactive markets, inputs other than quoted prices that are observable for the asset or liability and inputs that are derived from or corroborated by observable market data.
Level 3 - Inputs that are unobservable, reflecting the Company’s own assumptions.
For investments that have quoted market prices in active markets, the Company uses the quoted market price as fair value and includes these investments in Level 1 of the fair value hierarchy. The Company classifies U.S. Treasury securities and publicly traded equity securities and equity mutual funds as Level 1. When quoted market prices in active markets are not available, the Company relies on a pricing service to estimate fair value. The Company classifies its fixed maturity securities other than U.S. Treasury securities and private placements as Level 2. Private placement fixed maturity securities, non-publicly traded equity securities and investments in receivership are classified as Level 3. Fair value of the investments in receivership is based on cash flow analysis and other valuation techniques.
The Company utilizes a nationally recognized independent pricing service to obtain fair value estimates for its fixed maturity holdings because of the detailed process it uses in arriving at a fair value estimate. For fixed maturity securities that have quoted prices in active markets, market quotations are provided. For fixed maturity securities that do not trade on a daily basis, the independent pricing service prepares estimates of fair value using a wide array of observable inputs including relevant market information, benchmark curves, benchmarking of like securities, sector groupings and matrix pricing. The observable market inputs that our independent pricing service utilizes include, listed in approximate order of priority: benchmark yields, reported trades, broker/dealer quotes, issuer spreads, two-sided markets, benchmark securities, bids, offers and reference data including market research publications. Additionally, the independent pricing service uses an Option Adjusted Spread model to develop prepayment and interest rate scenarios.
When the independent pricing service provides a fair value estimate, the Company uses that estimate. At December 31, 2010, the independent pricing service provided a fair value estimate for all of the investments classified as Level 1 investments within the fair value hierarchy and approximately 99% of the investments classified as Level 2 estimates within the fair value hierarchy. The fair value of all Level 2 securities is based on observable market inputs.
In instances when the independent pricing service is unable to provide a fair value estimate, the Company attempts to obtain a non-binding fair value estimate from a number of broker/dealers and reviews any fair value estimate reported by an independent business news service. In instances where only one broker/dealer provides a fair value estimate for a fixed maturity security, the Company uses that estimate. In instances where the Company is able to obtain fair value estimates from more than one broker/dealer, the Company generally uses the lowest or next to lowest
61
fair value estimate. In instances where neither the independent pricing service nor a broker/dealer is able to provide a fair value estimate, the fair value is based on cash flow analysis and other valuation techniques which utilize significant unobservable inputs and the Company classifies the fixed maturity investment as a Level 3 investment. Level 3 investments represent less than 1% of the Company’s total investment portfolio.
Quotes obtained from third parties are non-binding. The third parties from whom quotes are obtained are knowledgeable market participants that have a detailed understanding of the sector, the security type and the issuer. The non-binding quotes are fair value estimates based on observable market data utilized by these market participants. The Company does not adjust quotes or prices obtained from third parties.
Management reviews, on an ongoing basis, the reasonableness of the methodologies employed by the independent pricing service. As part of the monthly review process, management examines the prices obtained from the independent pricing service. This process routinely involves reviewing any available recent transaction activity reported via various investment research tools. Additionally, the Company tracks changes in credit ratings of all fixed maturity securities on a monthly basis and performs a more in-depth, quarterly evaluation of fixed income securities that are rated below single A by Moody’s and/or S&P. If as a result of its review, management does not believe that a price received with respect to any particular security is a reasonable estimate of the fair value of the security, it will discuss this with the independent pricing service to resolve the discrepancy. Management then determines the appropriate level of classification of each investment within the fair value hierarchy based on its evaluation of the inputs used in determining the fair value.
62
The following is a summary of the fair value measurements of applicable Company assets by level within the fair value hierarchy as of December 31, 2010 and 2009. These assets are measured at fair value on a recurring basis. There were no transfers to or from Levels 1 and 2 of the fair value hierarchy in 2010. Harleysville Group’s policy is to recognize transfers between levels as of the end of the reporting period.
| | | | | | | | | | | | | | | | |
| | | | | | Fair Value Measurements at Reporting Date Using | |
| | December 31,
2010 | | | Quoted Prices
in Active
Markets for
Identical
Assets
(Level 1) | | | Significant
Other
Observable
Inputs
(Level 2) | | | Significant
Unobservable
Inputs
(Level 3) | |
| | | (in thousands) | |
Fixed maturities available for sale: | | | | | | | | | | | | | | | | |
U.S. Treasury securities | | $ | 122,857 | | | $ | 122,857 | | | | | | | | | |
Obligations of U.S. government corporations and agencies | | | 17,171 | | | | | | | $ | 17,171 | | | | | |
Obligations of states and political subdivisions | | | 1,173,447 | | | | | | | | 1,173,447 | | | | | |
Corporate securities | | | 481,805 | | | | | | | | 481,805 | | | | | |
Mortgage-backed securities | | | 369,821 | | | | | | | | 369,821 | | | | | |
| | | | | | | | | | | | | | | | |
Total available for sale | | | 2,165,101 | | | | 122,857 | | | | 2,042,244 | | | | | |
| | | | | | | | | | | | | | | | |
Equity securities: | | | | | | | | | | | | | | | | |
Dividend income portfolio of common stocks | | | 51,684 | | | | 51,684 | | | | | | | | | |
International fund | | | 44,877 | | | | 44,877 | | | | | | | | | |
Total stock market index fund | | | 171,536 | | | | 171,536 | | | | | | | | | |
Other | | | 7 | | | | | | | | | | | $ | 7 | |
| | | | | | | | | | | | | | | | |
Total equity securities | | | 268,104 | | | | 268,097 | | | | | | | | 7 | |
| | | | | | | | | | | | | | | | |
Total | | $ | 2,433,205 | | | $ | 390,954 | | | $ | 2,042,244 | | | $ | 7 | |
| | | | | | | | | | | | | | | | |
| | |
| | | | | | Fair Value Measurements at Reporting Date Using | |
| | December 31,
2009 | | | Quoted Prices
in Active
Markets for
Identical
Assets
(Level 1) | | | Significant
Other
Observable
Inputs
(Level 2) | | | Significant
Unobservable
Inputs
(Level 3) | |
| | | (in thousands) | |
Fixed maturities available for sale: | | | | | | | | | | | | | | | | |
U.S. Treasury securities | | $ | 110,228 | | | $ | 110,228 | | | | | | | | | |
Obligations of U.S. government corporations and agencies | | | 25,449 | | | | | | | $ | 25,449 | | | | | |
Obligations of states and political subdivisions | | | 1,074,458 | | | | | | | | 1,074,458 | | | | | |
Corporate securities | | | 516,611 | | | | | | | | 516,511 | | | $ | 100 | |
Mortgage-backed securities | | | 403,433 | | | | | | | | 403,433 | | | | | |
| | | | | | | | | | | | | | | | |
Total available for sale | | | 2,130,179 | | | | 110,228 | | | | 2,019,851 | | | | 100 | |
| | | | | | | | | | | | | | | | |
Equity securities: | | | | | | | | | | | | | | | | |
International fund | | | 40,093 | | | | 40,093 | | | | | | | | | |
Total stock market index fund | | | 146,296 | | | | 146,296 | | | | | | | | | |
Other | | | 6 | | | | | | | | | | | | 6 | |
| | | | | | | | | | | | | | | | |
Total equity securities | | | 186,395 | | | | 186,389 | | | | | | | | 6 | |
| | | | | | | | | | | | | | | | |
Total | | $ | 2,316,574 | | | $ | 296,617 | | | $ | 2,019,851 | | | $ | 106 | |
| | | | | | | | | | | | | | | | |
63
The following tables presents additional information about assets measured at fair value on a recurring basis for which significant unobservable inputs (Level 3) were used to determine fair value.
| | | | | | | | | | | | |
| | | Fair Value Measurements Using Significant
Unobservable Inputs (Level 3)
Year Ended December 31, 2010 | |
| | | Fixed Maturities
Available for Sale | | | Equity
Securities | | | Total | |
| | | (in thousands) | |
Balance at January 1, 2010 | | $ | 100 | | | $ | 6 | | | $ | 106 | |
Purchases | | | | | | | 1 | | | | 1 | |
Settlements | | | (100 | ) | | | | | | | (100 | ) |
| | | | | | | | | | | | |
Balance at December 31, 2010 | | $ | — | | | $ | 7 | | | $ | 7 | |
| | | | | | | | | | | | |
The amount of total losses for the year included in earnings (realized investment gains (losses), net) attributable to the change in unrealized losses relating to assets still held at December 31, 2010 | | | | | | | | | | $ | — | |
| | | | | | | | | | | | |
| |
| | | Fair Value Measurements Using Significant
Unobservable Inputs (Level 3)
Year Ended December 31, 2009 | |
| | | Fixed Maturities
Available for Sale | | | Equity
Securities | | | Total | |
| | | (in thousands) | |
Balance at January 1, 2009 | | $ | 3,116 | | | $ | 6 | | | $ | 3,122 | |
Total gains (losses) (realized/unrealized) | | | | | | | | | | | | |
Included in earnings | | | (955 | ) | | | | | | | (955 | ) |
Sales and settlements | | | (2,061 | ) | | | | | | | (2,061 | ) |
| | | | | | | | | | | | |
Balance at December 31, 2009 | | $ | 100 | | | $ | 6 | | | $ | 106 | |
| | | | | | | | | | | | |
The amount of total losses for the year included in earnings (realized investment gains (losses), net) attributable to the change in unrealized losses relating to assets still held at December 31, 2009 | | | | | | | | | | $ | — | |
| | | | | | | | | | | | |
The other invested assets on the balance sheet at December 31, 2009 were carried at cost and were tested for impairment on a quarterly basis. During 2009, the securities were written down to fair value and an impairment charge of $299,000 was included in earnings for the year. Fair value was determined based on cash flow analysis and other valuation techniques, based on unobservable inputs (Level 3). The security was sold in 2010 at a loss of $635,000.
64
The amortized cost and estimated fair value of investments in fixed maturity and equity securities are as follows:
| | | | | | | | | | | | | | | | |
| | | December 31, 2010 | |
| | Amortized
Cost | | | Gross
Unrealized
Gains | | | Gross
Unrealized
Losses | | | Estimated
Fair
Value | |
| | | (in thousands) | |
Held to maturity: | | | | | | | | | | | | | | | | |
Obligations of U.S. government corporations and agencies | | $ | 370 | | | $ | 8 | | | | | | | $ | 378 | |
Obligations of states and political subdivisions | | | 74,811 | | | | 3,722 | | | $ | | | | | 78,533 | |
Corporate securities | | | 73,181 | | | | 4,875 | | | | | | | | 78,056 | |
| | | | | | | | | | | | | | | | |
Total held to maturity | | | 148,362 | | | | 8,605 | | | | | | | | 156,967 | |
| | | | | | | | | | | | | | | | |
Available for sale: | | | | | | | | | | | | | | | | |
U.S. Treasury securities | | | 119,009 | | | | 3,886 | | | | (38 | ) | | | 122,857 | |
Obligations of U.S. government corporations and agencies | | | 16,274 | | | | 897 | | | | | | | | 17,171 | |
Obligations of states and political subdivisions | | | 1,140,695 | | | | 36,730 | | | | (3,978 | ) | | | 1,173,447 | |
Corporate securities | | | 447,962 | | | | 34,173 | | | | (330 | ) | | | 481,805 | |
Mortgage-backed securities | | | 345,157 | | | | 24,664 | | | | | | | | 369,821 | |
| | | | | | | | | | | | | | | | |
Total available for sale | | | 2,069,097 | | | | 100,350 | | | | (4,346 | ) | | | 2,165,101 | |
| | | | | | | | | | | | | | | | |
Total fixed maturities | | $ | 2,217,459 | | | $ | 108,955 | | | $ | (4,346 | ) | | $ | 2,322,068 | |
| | | | | | | | | | | | | | | | |
Total equity securities | | $ | 191,095 | | | $ | 77,322 | | | $ | (313 | ) | | $ | 268,104 | |
| | | | | | | | | | | | | | | | |
| |
| | | December 31, 2009 | |
| | Amortized
Cost | | | Gross
Unrealized
Gains | | | Gross
Unrealized
Losses | | | Estimated
Fair
Value | |
| | | (in thousands) | |
Held to maturity: | | | | | | | | | | | | | | | | |
Obligations of U.S. government corporations and agencies | | $ | 459 | | | $ | 8 | | | | | | | $ | 467 | |
Obligations of states and political subdivisions | | | 119,430 | | | | 5,012 | | | $ | (12 | ) | | | 124,430 | |
Corporate securities | | | 84,395 | | | | 4,594 | | | | (48 | ) | | | 88,941 | |
| | | | | | | | | | | | | | | | |
Total held to maturity | | | 204,284 | | | | 9,614 | | | | (60 | ) | | | 213,838 | |
| | | | | | | | | | | | | | | | |
Available for sale: | | | | | | | | | | | | | | | | |
U.S. Treasury securities | | | 109,195 | | | | 1,495 | | | | (462 | ) | | | 110,228 | |
Obligations of U.S. government corporations and agencies | | | 24,295 | | | | 1,214 | | | | (60 | ) | | | 25,449 | |
Obligations of states and political subdivisions | | | 1,030,968 | | | | 45,425 | | | | (1,935 | ) | | | 1,074,458 | |
Corporate securities | | | 491,782 | | | | 25,591 | | | | (762 | ) | | | 516,611 | |
Mortgage-backed securities | | | 380,753 | | | | 22,691 | | | | (11 | ) | | | 403,433 | |
| | | | | | | | | | | | | | | | |
Total available for sale | | | 2,036,993 | | | | 96,416 | | | | (3,230 | ) | | | 2,130,179 | |
| | | | | | | | | | | | | | | | |
Total fixed maturities | | $ | 2,241,277 | | | $ | 106,030 | | | $ | (3,290 | ) | | $ | 2,344,017 | |
| | | | | | | | | | | | | | | | |
Total equity securities | | $ | 137,150 | | | $ | 49,256 | | | $ | (11 | ) | | $ | 186,395 | |
| | | | | | | | | | | | | | | | |
65
The amortized cost and estimated fair value of fixed maturity securities at December 31, 2010 by contractual maturity are shown below. Expected maturities may differ from contractual maturities because borrowers may have the right to call or prepay obligations with or without call or prepayment penalties.
| | | | | | | | |
| | | Amortized
Cost | | | Estimated
Fair
Value | |
| | | (in thousands) | |
Held to maturity: | | | | | | | | |
Due in one year or less | | $ | 20,380 | | | $ | 20,602 | |
Due after one year through five years | | | 109,861 | | | | 117,260 | |
Due after five years through ten years | | | 7,932 | | | | 8,200 | |
Due after ten years | | | 10,189 | | | | 10,905 | |
| | | | | | | | |
| | | 148,362 | | | | 156,967 | |
| | | | | | | | |
Available for sale: | | | | | | | | |
Due in one year or less | | | 116,371 | | | | 118,553 | |
Due after one year through five years | | | 493,760 | | | | 519,880 | |
Due after five years through ten years | | | 688,496 | | | | 724,736 | |
Due after ten years | | | 425,313 | | | | 432,111 | |
| | | | | | | | |
| | | 1,723,940 | | | | 1,795,280 | |
| | | | | | | | |
Mortgage-backed securities | | | 345,157 | | | | 369,821 | |
| | | | | | | | |
| | | 2,069,097 | | | | 2,165,101 | |
| | | | | | | | |
Total fixed maturities | | $ | 2,217,459 | | | $ | 2,322,068 | |
| | | | | | | | |
The amortized cost of fixed maturities on deposit with various regulatory authorities at December 31, 2010 and 2009 amounted to $32,581,000 and $31,411,000 respectively.
The estimated fair value and unrealized loss for temporarily impaired securities is as follows:
| | | | | | | | | | | | | | | | |
| | | December 31, 2010 | |
| | | Less than 12 Months | | | Total | |
| | | Estimated
Fair Value | | | Unrealized
Losses | | | Estimated
Fair Value | | | Unrealized
Losses | |
| | | (in thousands) | |
U.S. Treasury securities | | $ | 3,073 | | | $ | 38 | | | $ | 3,073 | | | $ | 38 | |
Obligations of states and political subdivisions | | | 232,551 | | | | 3,978 | | | | 232,551 | | | | 3,978 | |
Corporate securities | | | 33,594 | | | | 330 | | | | 33,594 | | | | 330 | |
| | | | | | | | | | | | | | | | |
Total fixed maturities | | | 269,218 | | | | 4,346 | | | | 269,218 | | | | 4,346 | |
| | | | | | | | | | | | | | | | |
Equity securities | | | 17,231 | | | | 313 | | | | 17,231 | | | | 313 | |
| | | | | | | | | | | | | | | | |
Total temporarily impaired securities | | $ | 286,449 | | | $ | 4,659 | | | $ | 286,449 | | | $ | 4,659 | |
| | | | | | | | | | | | | | | | |
66
| | | | | | | | | | | | | | | | | | | | | | | | |
| | | December 31, 2009 | |
| | | Less than 12 Months | | | 12 Months or Longer | | | Total | |
| | | Estimated
Fair Value | | | Unrealized
Losses | | | Estimated
Fair Value | | | Unrealized
Losses | | | Estimated
Fair Value | | | Unrealized
Losses | |
| | | (in thousands) | |
U.S. Treasury securities | | $ | 76,791 | | | $ | 462 | | | | | | | | | | | $ | 76,791 | | | $ | 462 | |
Obligations of U.S. government corporations and agencies | | | 1,429 | | | | 60 | | | | | | | | | | | | 1,429 | | | | 60 | |
Obligations of states and political subdivisions | | | 115,997 | | | | 1,947 | | | | | | | | | | | | 115,997 | | | | 1,947 | |
Corporate securities | | | 2,470 | | | | 22 | | | $ | 24,980 | | | $ | 788 | | | | 27,450 | | | | 810 | |
Mortgage-backed securities | | | 2,973 | | | | 11 | | | | | | | | | | | | 2,973 | | | | 11 | |
| | | | | | | | | | | | | | | | | | | | | | | | |
Total fixed maturities | | | 199,660 | | | | 2,502 | | | | 24,980 | | | | 788 | | | | 224,640 | | | | 3,290 | |
| | | | | | | | | | | | | | | | | | | | | | | | |
Equity mutual funds | | | 944 | | | | 11 | | | | | | | | | | | | 944 | | | | 11 | |
| | | | | | | | | | | | | | | | | | | | | | | | |
Total temporarily impaired securities | | $ | 200,604 | | | $ | 2,513 | | | $ | 24,980 | | | $ | 788 | | | $ | 225,584 | | | $ | 3,301 | |
| | | | | | | | | | | | | | | | | | | | | | | | |
All of the fixed maturity securities with an unrealized loss at December 31, 2010 are classified as available for sale and are carried at fair value on the balance sheet.
The unrealized losses on fixed maturity investments were primarily due to an increase in interest rates rather than a decline in credit quality. Per the Company’s policy, a fixed maturity security is other than temporarily impaired if the present value of the cash flows expected to be collected is less than the amortized cost of the security or where the security’s fair value is below cost and the Company intends to sell or more likely than not will be required to sell the security before recovery of its value. The Company believes, based on its analysis, that these securities are not other than temporarily impaired. However, depending on developments involving both the issuers and worsening economic conditions, these investments may be written down in the income statement in the future.
Twelve positions comprise the unrealized loss in equity investments at December 31, 2010. These securities have not been below cost for significant continuous amounts of time. Harleysville Group is monitoring these securities and some could possibly be written down in the income statement in the future.
A summary of net investment income is as follows:
| | | | | | | | | | | | |
| | | 2010 | | | 2009 | | | 2008 | |
| | | (in thousands) | |
Interest on fixed maturities | | $ | 100,504 | | | $ | 103,971 | | | $ | 108,592 | |
Dividends on equity securities | | | 4,239 | | | | 3,639 | | | | 3,235 | |
Interest on short-term investments | | | 548 | | | | 1,150 | | | | 3,896 | |
Income on other invested assets | | | 12 | | | | 67 | | | | 52 | |
| | | | | | | | | | | | |
Total investment income | | | 105,303 | | | | 108,827 | | | | 115,775 | |
Less: Investment expense | | | 1,990 | | | | 2,178 | | | | 2,220 | |
| | | | | | | | | | | | |
Net investment income | | $ | 103,313 | | | $ | 106,649 | | | $ | 113,555 | |
| | | | | | | | | | | | |
67
Realized gross gains (losses) from investments and the change in difference between fair value and cost of investments, before applicable income taxes, are as follows:
| | | | | | | | | | | | |
| | | 2010 | | | 2009 | | | 2008 | |
| | | (in thousands) | |
Fixed maturity securities: | | | | | | | | | | | | |
Available for sale: | | | | | | | | | | | | |
Gross gains | | $ | 1,438 | | | $ | 6,655 | | | $ | 3,213 | |
Gross losses | | | (127 | ) | | | (2,814 | ) | | | (79 | ) |
Other than temporary impairment losses | | | | | | | (1,249 | ) | | | (13,678 | ) |
Equity securities: | | | | | | | | | | | | |
Gross gains | | | | | | | | | | | 2,057 | |
Gross losses | | | (79 | ) | | | | | | | | |
Other than temporary impairment losses | | | | | | | | | | | (48,669 | ) |
Other invested assets: | | | | | | | | | | | | |
Gross losses | | | (635 | ) | | | | | | | | |
Other than temporary impairment losses | | | | | | | (299 | ) | | | (557 | ) |
Securities lending collateral: | | | | | | | | | | | | |
Available for sale: | | | | | | | | | | | | |
Other than temporary impairment losses | | | | | | | | | | | (2,128 | ) |
| | | | | | | | | | | | |
Net realized investment gains (losses) | | $ | 597 | | | $ | 2,293 | | | $ | (59,841 | ) |
| | | | | | | | | | | | |
Change in difference between fair value and cost of investments(1): | | | | | | | | | | | | |
Fixed maturity securities | | $ | 1,869 | | | $ | 74,524 | | | $ | (2,177 | ) |
Equity securities | | | 27,764 | | | | 46,434 | | | | (7,053 | ) |
Securities lending collateral | | | | | | | | | | | 660 | |
| | | | | | | | | | | | |
Total | | $ | 29,633 | | | $ | 120,958 | | | $ | (8,570 | ) |
| | | | | | | | | | | | |
| (1) | Parentheses indicate a net unrealized decline in fair value. |
Income taxes (benefit) on realized investment gains (losses) were $209,000, $803,000 and $(20,944,000) for 2010, 2009 and 2008, respectively.
Deferred income tax liabilities applicable to net unrealized investment gains included in shareholders’ equity were $60,555,000 and $49,851,000 at December 31, 2010 and 2009, respectively.
Harleysville Group had no credit-related impairment charges on non-equity securities in 2010. Harleysville Group recognized credit-related impairment charges on non-equity securities of $1,548,000 and $16,363,000 in 2009 and 2008, respectively. The 2009 impairment charges consisted of $568,000 on bonds the Company sold in 2010 and $980,000 on structured investment vehicles. The 2008 impairment charges consisted of $5,420,000 on Lehman Brothers bonds and $10,943,000 on structured investment vehicles.
Harleysville Group had no impairment charges on equity securities in 2010 or 2009. In the third quarter of 2008, the Company recorded an impairment charge of $17,786,000 on equity securities that it was planning to sell. There was an additional impairment charge of $30,872,000 in the fourth quarter of 2008 on the equity securities, prior to their sale. The equity securities were sold in November 2008 to recover a portion of federal income taxes which were previously paid. Under existing federal income tax regulations, such taxes can be recovered in future periods to the extent capital losses are recognized. As a result of the decline in value of the equity index funds held by the Company during 2008, the duration of the impairment and the likelihood of near term recovery and the availability to carryback realized capital losses for federal income tax purposes upon their disposal, the Company determined that it was appropriate to sell the equity investments and recover a portion of the federal income taxes which were paid in prior years.
Harleysville Group has not directly held or issued derivative financial instruments during the periods presented.
68
4 - Reinsurance
In the ordinary course of business, Harleysville Group cedes insurance to, and assumes insurance from, insurers to limit its maximum loss exposure through diversification of its risks. See Note 2(a) for discussion of reinsurance with the Mutual Company. Reinsurance contracts do not relieve Harleysville Group of primary liability as the originating insurer. After excluding reinsurance transactions with the Mutual Company under the pooling arrangement in the assumed and ceded amounts below, the effect of Harleysville Group’s share of other reinsurance on premiums written and earned is as follows:
| | | | | | | | | | | | |
| | | 2010 | | | 2009 | | | 2008 | |
| | | (in thousands) | |
Premiums written: | | | | | | | | | | | | |
Direct | | $ | 1,004,632 | | | $ | 954,375 | | | $ | 1,045,690 | |
Assumed | | | 4,598 | | | | 13,818 | | | | 11,365 | |
Ceded | | | (127,169 | ) | | | (116,576 | ) | | | (106,925 | ) |
| | | | | | | | | | | | |
Net premiums written | | $ | 882,061 | | | $ | 851,617 | | | $ | 950,130 | |
| | | | | | | | | | | | |
Premiums earned: | | | | | | | | | | | | |
Direct | | $ | 979,444 | | | $ | 958,151 | | | $ | 1,010,203 | |
Assumed | | | 10,765 | | | | 10,092 | | | | 12,477 | |
Ceded | | | (123,859 | ) | | | (109,743 | ) | | | (104,165 | ) |
| | | | | | | | | | | | |
Net premiums earned | | $ | 866,350 | | | $ | 858,500 | | | $ | 918,515 | |
| | | | | | | | | | | | |
Losses and loss settlement expenses are net of reinsurance recoveries of $44,414,000, $53,563,000 and $62,821,000 for 2010, 2009 and 2008, respectively.
Assumed and ceded written premiums for 2009 include $6,200,000 and assumed and ceded earned premiums for 2010 and 2009 include $5,280,000 and $920,000, respectively, for Harleysville Group’s share of flood insurance business the Mutual Company assumed from another carrier, which is ceded 100% to the National Flood Insurance Program.
5 - Property and Equipment
Property and equipment consisted of our home office land and buildings with a cost of $28,737,000 and $28,241,000, and equipment, including software, with a cost of $5,749,000 and $5,865,000 at December 31, 2010 and 2009, respectively. Accumulated depreciation related to such assets was $21,174,000 and $20,527,000 at December 31, 2010 and 2009, respectively.
Rental expense under leases with non-affiliates amounted to $2,514,000, $2,793,000 and $2,494,000 for 2010, 2009 and 2008, respectively. Operating lease commitments were not material at December 31, 2010.
69
6 - Liability for Unpaid Losses and Loss Settlement Expenses
Activity in the liability for unpaid losses and loss settlement expenses is summarized as follows:
| | | | | | | | | | | | |
| | | 2010 | | | 2009 | | | 2008 | |
| | | (in thousands) | |
Liability at January 1 | | $ | 1,782,292 | | | $ | 1,767,601 | | | $ | 1,546,690 | |
Less reinsurance recoverables | | | 223,128 | | | | 209,352 | | | | 164,878 | |
| | | | | | | | | | | | |
Net liability at January 1 | | | 1,559,164 | | | | 1,558,249 | | | | 1,381,812 | |
| | | | | | | | | | | | |
Incurred related to: | | | | | | | | | | | | |
Current year | | | 639,234 | | | | 588,575 | | | | 642,576 | |
Prior years | | | (50,129 | ) | | | (36,084 | ) | | | (31,808 | ) |
| | | | | | | | | | | | |
Total incurred | | | 589,105 | | | | 552,491 | | | | 610,768 | |
| | | | | | | | | | | | |
Paid related to: | | | | | | | | | | | | |
Current year | | | 249,831 | | | | 204,192 | | | | 227,056 | |
Prior years | | | 344,373 | | | | 347,384 | | | | 360,810 | |
| | | | | | | | | | | | |
Total paid | | | 594,204 | | | | 551,576 | | | | 587,866 | |
| | | | | | | | | | | | |
Adjustment to beginning reserves resulting from change in pool participation percentage | | | | | | | | | | | (153,535 | ) |
| | | | | | | | | | | | |
Total paid adjusted for pool change | | | | | | | | | | | 434,331 | |
| | | | | | | | | | | | |
Net liability at December 31 | | | 1,554,065 | | | | 1,559,164 | | | | 1,558,249 | |
Plus reinsurance recoverables | | | 217,596 | | | | 223,128 | | | | 209,352 | |
| | | | | | | | | | | | |
Liability at December 31 | | $ | 1,771,661 | | | $ | 1,782,292 | | | $ | 1,767,601 | |
| | | | | | | | | | | | |
In 2010, Harleysville Group recognized net favorable development of $50,129,000 in the provision for insured events of prior years, primarily due to lower-than-expected claims severity broadly experienced across all casualty lines in accident years 2004 through 2008, partially offset by a slight amount of adverse development in accident years prior to 2000.
A decrease in commercial automobile severity was observed during 2010, which led to the recognition of $8,071,000 of favorable development in this line during the year. Approximately $2,400,000 of the favorable development experienced in this line during 2010 is related to the Company’s involuntary pools.
A decrease in workers compensation severity, primarily in accident years 2002 through 2007, was observed during 2010, and led to the recognition of favorable development for those accident years during the year. An increase in workers compensation medical severity in accident years 2001 and prior was observed during 2010 which led to the recognition of adverse development for those accident years during the year. An increase in severity in accident year 2009 was observed in this line during 2010, which led to the recognition of $1,228,000 of adverse development during the year. In total, $8,184,000 of favorable development was recognized in the workers compensation line during 2010. Approximately $2,600,000 of the favorable development experienced in this line during 2010 is related to the Company’s involuntary pools.
In the commercial multi-peril line of business, a reduction in severity, primarily in accident years 2004 through 2009, led to the recognition of $18,945,000 of favorable development during 2010.
A reduction in other commercial lines severity was widely observed during 2010, which led to the recognition of $9,626,000 of favorable prior year development.
A reduction in personal automobile severity in accident years 2008 and prior was widely observed during 2010. Claim frequency in accident year 2009 increased, which led to $506,000 of adverse development during the year. In total, $4,356,000 of favorable prior year development was recognized in this line during 2010.
70
A reduction in homeowners severity was observed during 2010, especially in accident year 2006. Claim frequency and severity in accident years 2008 and 2009 was observed to increase slightly, which led to the recognition of $413,000 and $81,000 of adverse development in these years, respectively. In total, $270,000 of favorable development was recognized in this line during 2010.
A reduction in other personal lines severity was observed during 2010, especially in accident year 2005. Severity in accident years 2008 and 2009 was observed to marginally increase, which led to the recognition of approximately $100,000 of adverse development in each accident year. In total, $677,000 of favorable development was recognized in other personal lines during 2010.
In 2009, Harleysville Group recognized net favorable development of $36,084,000 in the provision for insured events of prior years, primarily due to lower-than-expected claims severity broadly experienced across all casualty lines in accident years 2002 through 2006, partially offset by adverse development in accident year 2008 and accident years prior to 2002. A lower-than-expected level of claims severity was observed in personal lines in accident year 2008, which led to the recognition of $2,295,000 of favorable development in this accident year. This amount was offset by the recognition of $2,609,000 of adverse development in commercial lines in accident year 2008, primarily related to a higher-than-expected level of commercial property severity in this accident year.
A decrease in commercial automobile severity was observed during 2009 which led to the recognition of $20,525,000 of favorable development in this line during 2009. Approximately $1,100,000 of the favorable development experienced in this line during 2009 is related to the Company’s involuntary pools.
A decrease in workers compensation severity in accident years 2003 through 2006 was observed during 2009 which led to the recognition of favorable development for those accident years during 2009. An increase in workers compensation medical severity in accident years 2002 and prior was observed during 2009 which led to the recognition of adverse development for those accident years during 2009. An increase in severity in accident year 2008 was observed in this line during 2009 and led to the recognition of $1,134,000 of adverse development during the year. In total, $9,118,000 of favorable development was recognized in the workers compensation line during 2009. Approximately $3,400,000 of the favorable development experienced in this line during 2009 is related to the Company’s involuntary pools.
In the commercial multi-peril line of business, a reduction in severity in accident years 2003 through 2006 led to the recognition of favorable development for those accident years during 2009. An increase in claim frequency in accident year 2007 and an increase in severity in accident year 2008 led to the recognition of a small amount of adverse development for those accident years during 2009. In total, $1,863,000 of favorable development was recognized in the commercial multi-peril line of business during 2009 for all accident years.
A reduction in other commercial lines severity in accident years 2005 and prior was widely observed during 2009. This amount was largely offset by an increase in severity in accident years 2007 and 2008 which led to $469,000 and $423,000 of adverse development in these years, respectively. In total, there was no significant prior year development in other commercial lines during 2009.
A reduction in personal automobile severity was widely observed during 2009 which led to the recognition of $2,553,000 of favorable development during 2009 for all accident years.
A reduction in homeowners severity was widely observed during 2009, especially in accident year 2008, which led to the recognition of $2,995,000 of favorable development during 2009 for all accident years.
An increase in other personal lines severity was observed during 2009 which led to the recognition of $977,000 of adverse development during the year for all accident years.
In 2008, Harleysville Group recognized net favorable development of $31,800,000 in the provision for insured events of prior years, primarily due to lower-than-expected claims severity broadly experienced across all casualty lines in accident years 2003 through 2006, partially offset by adverse development in accident year 2007 and accident years prior to 2003. A higher-than-expected level of claims severity was observed in accident year 2007 and led to the recognition of approximately $4,300,000 of adverse development in this accident year during 2008.
71
A reduction in commercial automobile severity was observed during 2008 and led to the recognition of $19,500,000 of favorable development in this line in 2008. Approximately $1,600,000 of the favorable development experienced in this line during 2008 is related to the Company’s involuntary pools.
A reduction in workers compensation severity in accident years 2003 through 2006 was observed during 2008 and led to the recognition of favorable development for those accident years in 2008. An increase in workers compensation medical severity in accident years 2002 and prior was observed during 2008 and led to the recognition of adverse development for those accident years in 2008. An increase in severity in accident year 2007 was observed in this line during 2008 and led to the recognition of $900,000 of adverse development during the year. In total, $1,400,000 in favorable development was recognized in the workers compensation line during 2008.
In the commercial multi-peril line of business, a reduction in severity in accident year 2006 and a reduction in claim frequency in accident year 2007 were observed during 2008 and contributed to the recognition of favorable development for those accident years in 2008. A slight increase in commercial multi-peril severity in the liability portion of the line in accident years prior to 2005 was observed during 2008 and contributed to the recognition of adverse development for those accident years in 2008. In total, $1,200,000 in favorable development was recognized in the commercial multi-peril line during 2008.
A reduction in other commercial lines severity in accident years 2006 and prior was widely observed during 2008 and led to the recognition of $3,200,000 of favorable development in this line during 2008.
A reduction in personal automobile severity in accident years 2006 and prior was observed during 2008. A slight increase in severity in accident year 2007 was observed in this line during 2008 and led to the recognition of $900,000 of adverse development during the year. In total, $7,500,000 of favorable development was recognized in the personal auto line during 2008.
A reduction in homeowners severity in accident years 2006 and prior was observed during 2008. A slight increase in claim severity and an increase in claim frequency in accident year 2007 was observed in this line during 2008 and led to the recognition of $1,200,000 of adverse development during the year. In total, $700,000 of favorable development was recognized in the homeowners line during 2008.
An increase in other personal lines severity was observed during 2008, primarily related to the emergence of a single $1,000,000 claim in the third quarter. In total, $1,600,000 of adverse development was recognized in other personal lines during 2008.
Harleysville Group records the actuarial central estimate, which is management’s best estimate, of the ultimate unpaid losses and loss settlement expenses incurred. Actuarial loss reserving techniques and assumptions, which rely on historical information as adjusted to reflect current conditions, have been consistently applied, after including consideration of recent case reserve activity, during the periods presented. Changes in the estimate of the liability for unpaid losses and loss settlement expenses reflect actual payments and evaluations of new information and data since the last reporting date. These changes correlate with actuarial trends.
Because of the nature of insurance claims, there are uncertainties inherent in the estimates of ultimate losses. Harleysville Group’s reorganization of its claims operation in recent years has resulted in new people and processes involved in settling claims. As a result, more recent statistical data reflects different patterns than in the past and gives rise to uncertainty as to the pattern of future loss settlements. There are uncertainties regarding future loss cost trends particularly related to medical treatments and automobile repair. Court decisions, regulatory changes and economic conditions can affect the ultimate cost of claims that occurred in the past.
In establishing the liability for unpaid losses and loss settlement expenses, management considers facts currently known and the current state of the law and coverage litigation. Liabilities are recognized for known losses (including the cost of related litigation) when sufficient information has been developed to indicate the involvement of a specific insurance policy, and management can reasonably estimate its liability. In addition, liabilities have been established to cover additional exposures on both known and unasserted losses. Estimates of the liabilities are reviewed and updated on a regular basis.
The property and casualty insurance industry has received significant publicity about environmental-related losses from exposures insured many years ago. Since the intercompany pooling agreement pertains to insurance business written or earned on or after January 1, 1986, Harleysville Group has not incurred significant environmental-related losses.
72
7 - Borrowings
Debt is as follows:
| | | | | | | | |
| | | December 31, | |
| | | 2010 | | | 2009 | |
| | | (in thousands) | |
Notes, 5.75%, due 2013 | | $ | 100,000 | | | $ | 100,000 | |
Demand term-loan payable to the Mutual Company, LIBOR plus 0.45%, due 2012 | | | 18,500 | | | | 18,500 | |
| | | | | | | | |
Total debt | | $ | 118,500 | | | $ | 118,500 | |
| | | | | | | | |
The fair value of the notes was $99,413,000 and $99,975,000 at December 31, 2010 and 2009, respectively, based on quoted market prices for the same or similar debt. The carrying value of the remaining debt approximates fair value.
Interest paid was $5,887,000, $6,054,000 and $6,406,000 in 2010, 2009 and 2008 respectively.
8 - Shareholders’ Equity
Comprehensive income consisted of the following:
| | | | | | | | | | | | |
| | | 2010 | | | 2009 | | | 2008 | |
| | | (in thousands) | |
Net income | | $ | 66,898 | | | $ | 86,296 | | | $ | 42,319 | |
Other comprehensive income (loss): | | | | | | | | | | | | |
Unrealized investment gains (losses): | | | | | | | | | | | | |
Unrealized investment holding gains (losses) arising during period, net of taxes (benefits) of $10,912, $41,174 and $(24,111) | | | 20,266 | | | | 76,466 | | | | (44,777 | ) |
Less: | | | | | | | | | | | | |
Reclassification adjustment for (gains) losses included in net income, net of (taxes) benefits of $(209), $(803) and $20,944 | | | (388 | ) | | | (1,490 | ) | | | 38,897 | |
| | | | | | | | | | | | |
Net unrealized investment gains (losses) | | | 19,878 | | | | 74,976 | | | | (5,880 | ) |
| | | | | | | | | | | | |
Defined benefit pension plan: | | | | | | | | | | | | |
Net actuarial gain (loss) arising during the period, net of taxes (benefit) of $(2,020), $1,886 and $(17,372) | | | (3,749 | ) | | | 3,503 | | | | (32,260 | ) |
Recognition of net actuarial loss in net periodic pension cost, net of taxes of $1,132, $640 and $82 | | | 2,101 | | | | 1,187 | | | | 151 | |
| | | | | | | | | | | | |
Defined benefit pension plan | | | (1,648 | ) | | | 4,690 | | | | (32,109 | ) |
| | | | | | | | | | | | |
Other comprehensive income (loss) | | | 18,230 | | | | 79,666 | | | | (37,989 | ) |
| | | | | | | | | | | | |
Comprehensive income | | $ | 85,128 | | | $ | 165,962 | | | $ | 4,330 | |
| | | | | | | | | | | | |
73
Accumulated other comprehensive income consisted of the following amounts (which are net of tax):
| | | | | | | | |
| | | December 31, | |
| | | 2010 | | | 2009 | |
| | | (in thousands) | |
Unrealized investment gains | | $ | 112,459 | | | $ | 92,581 | |
Defined benefit pension plan-net actuarial loss | | | (31,953 | ) | | | (30,305 | ) |
| | | | | | | | |
Accumulated other comprehensive income | | $ | 80,506 | | | $ | 62,276 | |
| | | | | | | | |
A source of cash for the payment of dividends is dividends from subsidiaries. Harleysville Group Inc.’s insurance subsidiaries are required by law to maintain certain minimum surplus on a statutory basis, and are subject to risk-based capital requirements and to regulations under which payment of a dividend from statutory surplus is restricted and may require prior approval of regulatory authorities. Applying the current regulatory restrictions as of December 31, 2010, $59,022,000 would be available for distribution to Harleysville Group Inc. in 2011 without prior approval.
Various states have adopted the National Association of Insurance Commissioners (NAIC) risk-based capital (RBC) standards that require insurance companies to calculate and report statutory capital and surplus needs based on a formula measuring underwriting, investment and other business risks inherent in an individual company’s operations. These RBC standards have not affected the operations of Harleysville Group since each of the Company’s insurance subsidiaries has statutory capital and surplus in excess of RBC requirements.
These RBC standards require the calculation of a ratio of total adjusted capital to Authorized Control Level. Insurers with a ratio below 200% are subject to different levels of regulatory intervention and action. Based upon their 2010 statutory financial statements, the ratio of total adjusted capital to the Authorized Control Level for the Company’s eight insurance subsidiaries at December 31, 2010 ranged from 461% to 783%.
The following table contains selected information for Harleysville Group Inc.’s property and casualty insurance subsidiaries, as determined in accordance with prescribed statutory accounting practices:
| | | | | | | | | | | | |
| | | 2010 | | | 2009 | | | 2008 | |
| | | (Unaudited) | | | (in thousands) | | | | |
Statutory capital and surplus | | $ | 695,475 | | | $ | 681,160 | | | $ | 588,892 | |
| | | | | | | | | | | | |
Statutory unassigned surplus | | $ | 553,904 | | | $ | 541,786 | | | $ | 458,623 | |
| | | | | | | | | | | | |
Statutory net income | | $ | 68,429 | | | $ | 90,892 | | | $ | 26,951 | |
| | | | | | | | | | | | |
9 - Income Taxes
The components of income tax expense (benefit) are as follows:
| | | | | | | | | | | | |
| | | 2010 | | | 2009 | | | 2008 | |
| | | (in thousands) | |
Current | | $ | 13,614 | | | $ | 25,136 | | | $ | 18,535 | |
Deferred | | | 2,200 | | | | 4,566 | | | | (9,892 | ) |
| | | | | | | | | | | | |
| | $ | 15,814 | | | $ | 29,702 | | | $ | 8,643 | |
| | | | | | | | | | | | |
Net cash paid for federal income taxes in 2010, 2009 and 2008 was $11,100,000, $9,100,000 and $31,500,000 respectively.
The actual income tax rate differed from the statutory federal income tax rate applicable to income before income taxes as follows:
| | | | | | | | | | | | |
| | | 2010 | | | 2009 | | | 2008 | |
Statutory federal income tax rate | | | 35.0 | % | | | 35.0 | % | | | 35.0 | % |
Tax-exempt income | | | (16.0 | ) | | | (9.5 | ) | | | (18.4 | ) |
Other, net | | | 0.1 | | | | 0.1 | | | | 0.4 | |
| | | | | | | | | | | | |
| | | 19.1 | % | | | 25.6 | % | | | 17.0 | % |
| | | | | | | | | | | | |
74
The tax effects of the significant temporary differences that give rise to deferred tax liabilities and assets are as follows:
| | | | | | | | |
| | | December 31, | |
| | | 2010 | | | 2009 | |
| | | (in thousands) | |
Deferred tax liabilities: | | | | | | | | |
Deferred policy acquisition costs | | $ | 39,899 | | | $ | 39,077 | |
Unrealized investment gains | | | 60,555 | | | | 49,851 | |
Other | | | 9,528 | | | | 10,822 | |
| | | | | | | | |
Total deferred tax liabilities | | | 109,982 | | | | 99,750 | |
| | | | | | | | |
Deferred tax assets: | | | | | | | | |
Unearned premiums | | | 31,633 | | | | 30,534 | |
Losses incurred | | | 54,037 | | | | 56,888 | |
Pension plan | | | 13,525 | | | | 13,887 | |
Alternative minimum tax credit carryforward | | | 476 | | | | | |
Capital loss carryforward | | | 4,881 | | | | 2,015 | |
Other | | | 14,843 | | | | 17,855 | |
| | | | | | | | |
Total deferred tax assets | | | 119,395 | | | | 121,179 | |
| | | | | | | | |
Net deferred tax asset | | $ | 9,413 | | | $ | 21,429 | |
| | | | | | | | |
A valuation allowance is required to be established for any portion of the deferred tax asset that management believes will not be realized. In the opinion of management, it is more likely than not that the benefit of the deferred tax asset will be realized through the generation of future income. Therefore, no such valuation allowance has been established.
As of December 31, 2010, 2009 and 2008, Harleysville Group had no material unrecognized tax benefits or accrued interest and penalties. The Company’s policy is to account for interest as a component of interest expense and penalties as a component of other expense. Federal tax years 2007 through 2009 were open for examination as of December 31, 2010.
10 - Incentive Plans
The compensation expense for the various share-based compensation plans that has been charged against income before income taxes was $6,363,000, $6,300,000 and $5,899,000 for 2010, 2009 and 2008, respectively with a corresponding income tax benefit of $2,130,000, $2,083,000 and $1,964,000 for 2010, 2009 and 2008, respectively.
Fixed Stock Option Plans
Harleysville Group has an Equity Incentive Plan (EIP) for key employees. Awards may be made in the form of stock options, stock appreciation rights (SARs), restricted stock, restricted stock units or any combination of the above. The EIP was amended in 1997, 2006, 2007 and 2010 and limited future awards to an aggregate of 3,500,000 shares, plus the remaining shares under the plan in existence in 1997, of Harleysville Group Inc.’s common stock. Such shares may be authorized and unissued shares or treasury shares. The plan provides that stock options may become exercisable from six months to 10 years from the date of grant with an exercise price not less than fair market value on the date of grant. Options granted normally vest 33 1/3% at the end of one year, 33 1/3% at the end of two years and 33 1/3% at the end of three years from the date of grant. SARs have not been material. Time-based restricted stock awards have vesting periods of three to five years and vest 100% at the end of the period. Time-based restricted stock units have vesting periods of three to five years and vest 100% at the end of the period. Some restricted stock and restricted stock unit awards have performance-based vesting requirements and can vest anywhere from 0% to 200% of the number of target shares, depending upon the achievement of such performance goals. Performance-based restricted stock and restricted stock units have vesting periods of three to five years.
In determining the expense to be recorded for stock options, the fair value of each option award is estimated on the date of grant using the Black-Scholes option pricing model. The significant assumptions utilized in applying the Black-Scholes option pricing model are the risk-free interest rate, expected term, dividend yield, and expected volatility. The risk-free interest rate is the implied yield currently available on U.S. Treasury zero-coupon issues with a remaining term equal to the expected term used as the assumption in the model. The expected term of an option award is based on historical experience of similar awards. The dividend yield is determined by dividing the per share-
75
dividend by the grant date stock price. The expected volatility is based on the volatility of the Company’s stock price over a historical period comparable to the expected term. The weighted average assumptions used in applying the Black-Scholes valuation model are shown below:
| | | | | | | | | | | | |
| | | For the year ended
December 31, | |
| | | 2010 | | | 2009 | | | 2008 | |
Risk-free interest rate | | | 2.79 | % | | | 2.56 | % | | | 2.76 | % |
Expected term | | | 5.5 years | | | | 5.5 years | | | | 5.5 years | |
Dividend yield | | | 3.83 | % | | | 4.11 | % | | | 2.90 | % |
Expected volatility | | | 29.32 | % | | | 29.84 | % | | | 28.13 | % |
A summary of share option activity under the plan is as follows:
| | | | | | | | | | | | | | | | |
| | | Number
of Shares | | | Weighted
Average
Exercise
Price
Per Share | | | Weighted
Average
Remaining
Contractual Life | | | Aggregate
Intrinsic Value | |
| | | | | | | | | (in years) | | | (in thousands) | |
Outstanding at January 1, 2008 | | | 1,685,470 | | | $ | 25.62 | | | | | | | | | |
Granted—2008 | | | 346,340 | | | | 34.50 | | | | | | | | | |
Exercised—2008 | | | (404,842 | ) | | | 22.47 | | | | | | | | | |
Forfeited—2008 | | | (32,531 | ) | | | 33.72 | | | | | | | | | |
| | | | | | | | | | | | | | | | |
Outstanding at December 31, 2008 | | | 1,594,437 | | | | 28.18 | | | | | | | | | |
Granted—2009 | | | 544,250 | | | | 29.18 | | | | | | | | | |
Exercised—2009 | | | (154,116 | ) | | | 23.36 | | | | | | | | | |
Forfeited—2009 | | | (72,842 | ) | | | 31.49 | | | | | | | | | |
| | | | | | | | | | | | | | | | |
Outstanding at December 31, 2009 | | | 1,911,729 | | | | 28.73 | | | | | | | | | |
Granted—2010 | | | 511,790 | | | | 33.94 | | | | | | | | | |
Exercised—2010 | | | (434,795 | ) | | | 25.49 | | | | | | | | | |
Forfeited—2010 | | | (153,363 | ) | | | 32.26 | | | | | | | | | |
| | | | | | | | | | | | | | | | |
Outstanding at December 31, 2010 | | | 1,835,361 | | | $ | 30.66 | | | | 6.8 | | | $ | 11,167 | |
| | | | | | | | | | | | | | | | |
Exercisable at: | | | | | | | | | | | | | | | | |
December 31, 2010 | | | 967,205 | | | $ | 29.20 | | | | 5.3 | | | $ | 7,296 | |
| | | | | | | | | | | | | | | | |
The per share weighted-average fair value of options granted during 2010, 2009 and 2008 was $6.84, $5.67 and $7.52, respectively. The total intrinsic value of options exercised was $4,066,000, $1,199,000, and $5,557,000 for 2010, 2009 and 2008, respectively.
The expense to be recorded over the vesting period for restricted stock and restricted stock unit awards is determined utilizing the number of awards granted and the grant date fair market value.
A summary of restricted stock activity under the plan is as follows:
| | | | | | | | |
| | | Number of
Shares | | | Weighted
Average
Grant Date
Fair Value | |
Restricted stock awards at January 1, 2008 | | | 219,972 | | | $ | 30.30 | |
Granted 2008 | | | 93,774 | | | | 35.68 | |
Vested 2008 | | | (40,271 | ) | | | 22.54 | |
Forfeited 2008 | | | (18,558 | ) | | | 32.47 | |
| | | | | | | | |
Restricted stock awards at December 31, 2008 | | | 254,917 | | | | 33.34 | |
Granted 2009 | | | 86,342 | | | | 31.03 | |
Vested 2009 | | | (3,931 | ) | | | 32.51 | |
Forfeited 2009 | | | (17,500 | ) | | | 32.17 | |
| | | | | | | | |
Restricted stock awards at December 31, 2009 | | | 319,828 | | | | 32.79 | |
Vested 2010 | | | (58,872 | ) | | | 32.67 | |
Forfeited 2010 | | | (30,336 | ) | | | 33.24 | |
| | | | | | | | |
Restricted stock awards at December 31, 2010 | | | 230,620 | | | $ | 32.77 | |
| | | | | | | | |
76
The total fair market value of restricted shares which vested during 2010, 2009 and 2008 was $2,034,000, $122,000 and $993,000, respectively. In 2009, 15,735 restricted shares granted included a performance condition, while 10,480 restricted shares granted in 2008 included a performance condition. No restricted shares were granted in 2010.
A summary of restricted stock unit activity under the plan is as follows:
| | | | | | | | |
| | | Number of
Units | | | Weighted
Average
Grant Date
Fair Value | |
Restricted stock unit awards at January 1, 2008 | | | 17,440 | | | $ | 34.76 | |
Granted 2008 | | | 22,040 | | | | 38.92 | |
| | | | | | | | |
Restricted stock unit awards at December 31, 2008 | | | 39,480 | | | | 37.08 | |
Granted 2009 | | | 27,270 | | | | 34.21 | |
| | | | | | | | |
Restricted stock unit awards at December 31, 2009 | | | 66,750 | | | | 35.91 | |
Granted 2010 | | | 113,285 | | | | 36.49 | |
Forfeited 2010 | | | (10,250 | ) | | | 35.76 | |
| | | | | | | | |
Restricted stock unit awards at December 31, 2010 | | | 169,785 | | | $ | 36.31 | |
| | | | | | | | |
In 2010, 39,485 of the restricted stock units granted include a performance condition (at target). All of the restricted stock units granted in 2009 and 2008 include a performance condition.
For share options, restricted stock and restricted stock unit awards granted under the plan, the Company recognized compensation expense of $5,589,000, $5,498,000 and $5,105,000 in 2010, 2009 and 2008, respectively. As of December 31, 2010, the Company’s total unrecognized compensation cost related to nonvested share-based compensation arrangements (including share options, restricted stock and restricted stock unit awards) granted under the plan was $5,183,000. The cost is expected to be recognized over a weighted average period of 1.7 years.
Other Stock Purchase and Incentive Plans
Harleysville Group Inc. is authorized to issue up to 3,150,000 shares of common stock under the terms of the Amended and Restated Employee Stock Purchase Plan (ESPP). Such shares may be authorized and unissued shares or treasury shares. Virtually all employees are eligible to participate in the plan, under which a participant may elect to have up to 15% of base pay withheld to purchase shares. The purchase price of the stock is 85% of the lower of the beginning-of-the-subscription-period or end-of-the-subscription-period fair market value. Subscription periods run from January 15 through July 14, or July 15 through January 14 in each year. In April 2010, the ESPP was amended to establish a 1,000 share purchase limitation per participant per subscription period.
In determining the expense to be recorded for the ESPP, the fair value of each option award is estimated on the date of grant using the Black-Scholes option pricing model with the following weighted average assumptions:
| | | | | | | | | | | | |
| | | For the Year Ended
December 31, | |
| | | 2010 | | | 2009 | | | 2008 | |
Risk-free interest rate | | | 0.14 | % | | | 0.24 | % | | | 2.48 | % |
Expected term | | | 6 Months | | | | 6 months | | | | 6 months | |
Dividend yield | | | 4.06 | % | | | 4.30 | % | | | 2.96 | % |
Expected volatility | | | 21.43 | % | | | 43.22 | % | | | 26.91 | % |
The weighted-average fair value of options granted under the ESPP was $6.08, $7.07 and $7.14 for 2010, 2009 and 2008, respectively. The total intrinsic value of options exercised under the plan was $340,000, $212,000 and $241,000 for 2010, 2009 and 2008, respectively. Compensation expense of $277,000, $348,000 and $288,000 related to grants under the plan was recognized in 2010, 2009 and 2008, respectively. As of December 31, 2010, there was $12,000 of total unrecognized compensation cost related to nonvested share-based compensation arrangements granted under the plan. The cost is expected to be recognized over a period of one month.
77
The 2005 Non-Employee Directors’ Deferred Stock Unit Plan provided for the grant of up to 110,000 fully vested deferred stock units to outside directors of Harleysville Group Inc. and the Mutual Company. Each stock unit represents the right to receive, without payment to the Company, one share of common stock of Harleysville Group Inc. The plan was amended and restated in 2007 to provide for the grant of awards in the form of stock options, deferred stock units and restricted stock and was renamed the Amended and Restated Directors’ Equity Compensation Plan. The aggregate number of shares which may be issued under the plan is 500,000, which may be either authorized and unissued shares or treasury shares. At each April Board of Directors meeting, each non-employee director continuing in office receives a number of deferred stock units equal to the result of dividing $50,000 by the fair market value of a share of HGI common stock.
The expense to be recorded for the deferred stock units is determined utilizing the number of awards granted and the grant date fair market value. The expense is recognized at the date of grant as the awards are fully vested. In 2010, 2009 and 2008, respectively, there were 16,830, 17,985 and 15,092 units issued under the plan for which $493,000, $450,000 and $502,000 of expense was recognized. The weighted average grant date fair value of units granted during 2010, 2009 and 2008 was $32.58, $27.83 and $36.96 per unit, respectively.
Cash received from option exercises under all share-based payment arrangements for 2010, 2009 and 2008 was $8,476,000, $4,721,000 and $9,410,000, respectively. The actual tax benefit realized for the tax deductions from option exercises of the share-based payment arrangements was $1,423,000, $419,000 and $1,945,000, respectively, for 2010, 2009 and 2008.
Harleysville Group has incentive bonus plans which include virtually all employees. Cash bonuses are earned on a formula basis depending upon the performance of Harleysville Group and the Mutual Company in relation to certain targets. Harleysville Group’s expense for such plans was $5,829,000, $7,732,000 and $6,111,000 for 2010, 2009 and 2008, respectively.
11 - Pension and Other Benefit Plans
Harleysville Group Inc. has a frozen pension plan that covers employees hired before January 1, 2006. Retirement benefits are a function of both the years of service and level of compensation. Harleysville Group Inc.’s funding policy is to contribute annually an amount equal to at least the minimum required contribution in accordance with minimum funding standards established by ERISA. Contributions are intended to provide for benefits attributed to service through March 31, 2006. Harleysville Group Inc. uses a December 31 measurement date for the pension plan. The plan was frozen at the then current benefit levels as of March 31, 2006, at which time the accrual of future benefits for eligible employees ceased.
The following table sets forth the year-end status of the plan including the Mutual Company:
| | | | | | | | |
| | | 2010 | | | 2009 | |
| | | (in thousands) | |
Change in benefit obligation | | | | | | | | |
Benefit obligation at January 1 | | $ | 201,960 | | | $ | 188,995 | |
Interest cost | | | 11,893 | | | | 11,478 | |
Net actuarial loss | | | 14,730 | | | | 9,483 | |
Benefits paid | | | (8,348 | ) | | | (7,996 | ) |
| | | | | | | | |
Benefit obligation at December 31 | | $ | 220,235 | | | $ | 201,960 | |
| | | | | | | | |
Accumulated benefit obligation at December 31 | | $ | 220,235 | | | $ | 201,960 | |
| | | | | | | | |
Change in plan assets | | | | | | | | |
Fair value of plan assets at January 1 | | $ | 141,994 | | | $ | 114,472 | |
Actual return on plan assets | | | 18,498 | | | | 28,537 | |
Contributions | | | 7,400 | | | | 6,695 | |
Benefits paid | | | (8,065 | ) | | | (7,710 | ) |
| | | | | | | | |
Fair value of plan assets at December 31 | | $ | 159,827 | | | $ | 141,994 | |
| | | | | | | | |
Funded status at December 31 | | $ | (60,408 | ) | | $ | (59,966 | ) |
| | | | | | | | |
Harleysville Group portion: | | | | | | | | |
Amount recognized in the statement of financial position | | $ | (41,418 | ) | | $ | (42,510 | ) |
| | | | | | | | |
Amount recognized in accumulated other comprehensive income: | | | | | | | | |
Net actuarial loss | | $ | 49,158 | | | $ | 46,622 | |
| | | | | | | | |
78
The net periodic pension cost for the plan, including the Mutual Company, consists of the following components:
| | | | | | | | | | | | |
| | | 2010 | | | 2009 | | | 2008 | |
| | | (dollars in thousands) | |
Components of net periodic pension cost: | | | | | | | | | | | | |
Interest cost | | $ | 11,893 | | | $ | 11,478 | | | $ | 11,312 | |
Expected return on plan assets | | | (12,080 | ) | | | (11,980 | ) | | | (12,372 | ) |
Recognized net actuarial loss | | | 4,581 | | | | 2,567 | | | | 362 | |
| | | | | | | | | | | | |
Net periodic pension cost (benefit): | | | | | | | | | | | | |
Entire plan | | $ | 4,394 | | | $ | 2,065 | | | $ | (698 | ) |
| | | | | | | | | | | | |
Harleysville Group portion | | $ | 3,101 | | | $ | 1,470 | | | $ | (164 | ) |
| | | | | | | | | | | | |
Other changes recognized in other comprehensive income - Harleysville Group portion | | | | | | | | | | | | |
Net actuarial (gain) loss arising during the period | | $ | 5,769 | | | $ | (5,389 | ) | | | 49,632 | |
Recognition of actuarial loss in net periodic benefit cost | | | (3,233 | ) | | | (1,827 | ) | | | (233 | ) |
| | | | | | | | | | | | |
Total recognized in other comprehensive income - Harleysville Group portion | | $ | 2,536 | | | $ | (7,216 | ) | | | 49,399 | |
| | | | | | | | | | | | |
Total recognized in net periodic benefit cost and other comprehensive income | | $ | 5,637 | | | $ | (5,746 | ) | | | 49,235 | |
| | | | | | | | | | | | |
Additional information: | | | | | | | | | | | | |
Weighted-average assumptions used to determine benefit obligations at December 31: | | | | | | | | | | | | |
Discount rate | | | 5.50 | % | | | 6.00 | % | | | 6.20 | % |
Weighted-average assumptions used to determine net cost for years ended December 31: | | | | | | | | | | | | |
Discount rate | | | 6.00 | % | | | 6.20 | % | | | 6.55 | % |
Expected return on plan assets | | | 8.25 | % | | | 8.25 | % | | | 8.25 | % |
Amounts in accumulated other comprehensive income expected to be recognized as components of net periodic pension cost in 2011 are as follows: net actuarial loss $4,661,000.
The discount rate assumption used to determine the benefit obligation was based on high quality bond yields that relate to the estimated timing of benefit payouts of the plan.
Pension Plan Assets
The investment assets of the plan are managed for the benefit and support of plan participants. The Company’s primary objective is to maximize total return over the long term. The target allocations for plan assets are 65% to 75% in equity securities and 25% to 35% in fixed maturity securities, including cash and short-term investments. Investment in equities utilizes a low-cost, index-based approach. Fixed maturity holdings are conservatively invested with emphasis on safety of principal, liquidity and yield. Consideration is also given to the slope of the yield curve and to the relative value of sector relationships. Fixed maturities securities include U.S. Treasury and Agency obligations, corporate bonds and mortgage-backed and asset-backed securities.
Fair value measurements are determined under the three-level hierarchy consistent with the methodologies discussed in Note 3.
At December 31, 2010, the independent pricing service provided a fair value estimate for all of the pension plan investments classified as Level 1 investments within the fair value hierarchy and approximately 96% of the pension plan investments classified as Level 2 estimates within the fair value hierarchy. The fair value of all Level 2 securities is based on observable market inputs.
79
The following is a summary of the fair value of major categories of plan assets as of December 31, 2010 and December 31, 2009.
| | | | | | | | | | | | | | | | |
| | | | | | Fair Value Measurements at December 31, 2010 | |
| | Total | | | Quoted Prices
in Active
Markets for
Identical
Assets
(Level 1) | | | Significant
Other
Observable
Inputs
(Level 2) | | | Significant
Unobservable
Inputs
(Level 3) | |
| | | (in thousands) | |
Asset Category | | | | | | | | | | | | | | | | |
Cash and cash equivalents | | $ | 8,300 | | | $ | 8,300 | | | | | | | | | |
Equity securities: | | | | | | | | | | | | | | | | |
Institutional Total Stock Market Fund (a) | | | 96,418 | | | | 96,418 | | | | | | | | | |
FTSE All World Ex U.S. Fund (b) | | | 23,505 | | | | 23,505 | | | | | | | | | |
Fixed income securities: | | | | | | | | | | | | | | | | |
U.S. Treasury securities | | | 9,324 | | | | 9,324 | | | | | | | | | |
Obligations of U.S. government corporations and agencies | | | 2,980 | | | | | | | $ | 2,980 | | | | | |
Corporate bonds (c) | | | 13,827 | | | | | | | | 13,827 | | | | | |
Mortgage-backed securities | | | 5,216 | | | | | | | | 5,216 | | | | | |
Other investment: | | | | | | | | | | | | | | | | |
Venture capital fund (d) | | | 43 | | | | | | | | | | | $ | 43 | |
| | | | | | | | | | | | | | | | |
Total Asset Category | | $ | 159,613 | | | $ | 137,547 | | | $ | 22,023 | | | $ | 43 | |
| | | | | | | | | | | | | | | | |
| | |
| | | | | | Fair Value Measurements at December 31, 2009 | |
| | Total | | | Quoted Prices
in Active
Markets for
Identical
Assets
(Level 1) | | | Significant
Other
Observable
Inputs
(Level 2) | | | Significant
Unobservable
Inputs
(Level 3) | |
| | | (in thousands) | |
Asset Category | | | | | | | | | | | | | | | | |
Cash and cash equivalents | | $ | 7,299 | | | $ | 7,299 | | | | | | | | | |
Equity securities: | | | | | | | | | | | | | | | | |
Institutional Total Stock Market Fund (a) | | | 83,526 | | | | 83,526 | | | | | | | | | |
FTSE All World Ex U.S. Fund (b) | | | 21,000 | | | | 21,000 | | | | | | | | | |
Fixed income securities: | | | | | | | | | | | | | | | | |
U.S. Treasury securities | | | 9,030 | | | | 9,030 | | | | | | | | | |
Obligations of U.S. government corporations and agencies | | | 3,464 | | | | | | | $ | 3,464 | | | | | |
Corporate bonds (c) | | | 13,103 | | | | | | | | 13,103 | | | | | |
Mortgage-backed securities | | | 5,242 | | | | | | | | 5,242 | | | | | |
Other investment: | | | | | | | | | | | | | | | | |
Venture capital fund (d) | | | 103 | | | | | | | | | | | $ | 103 | |
| | | | | | | | | | | | | | | | |
Total Asset Category | | $ | 142,767 | | | $ | 120,855 | | | $ | 21,809 | | | $ | 103 | |
| | | | | | | | | | | | | | | | |
| (a) | This category comprised entirely of a low-cost, index-based mutual fund that is designed to track the performance of the MSCI Broad Market Index |
80
| (b) | This category is comprised entirely of a low-cost, index-based mutual fund that is designed to track the performance of the FTSE All-World ex-US Index |
| (c) | This category is comprised of investment grade bonds of US issuers from diverse industries |
| (d) | This category is comprised of an equity investment in a company that engages in venture capital investment activities with selected businesses that have significant potential for growth and long-term appreciation |
As of December 31, 2010, the pension plan also includes net assets of $214,000, primarily related to accrued investment income receivable at that date. As of December 31, 2009, the pension plan also includes net liabilities of $773,000, primarily related to securities in transit at that date.
The following table presents additional information about assets measured at fair value on a recurring basis for which significant unobservable inputs were used to determine fair value.
| | | | | | | | |
| | | Fair Value Measurements Using
Significant Unobservable Inputs
(Level 3)
Year Ended December 31, | |
| | | 2010 | | | 2009 | |
| | | Venture Capital Fund | |
| | | (in thousands) | |
Balance at the beginning of the year | | $ | 103 | | | $ | 149 | |
Actual return on plan assets: | | | | | | | | |
Relating to assets still held at the reporting date | | | (60 | ) | | | (46 | ) |
| | | | | | | | |
Balance at the end of the year | | $ | 43 | | | $ | 103 | |
| | | | | | | | |
To develop the expected long-term rate of return on assets assumption, the Company considered the historical returns and the future expectations for returns for each asset class, as well as the target asset allocation of the pension plan portfolio. This resulted in the selection of the 8.25% long-term rate of return on assets assumption.
Cash Flows
The expected 2011 contribution to the pension plan is $8,294,000, of which $7,339,000 is Harleysville Group’s expected portion.
The following benefit payments are expected to be paid:
| | | | | | | | |
| | | December 31, | |
| | | Total Plan | | | Harleysville
Group’s
Portion | |
2011 | | $ | 8,949,000 | | | $ | 6,354,000 | |
2012 | | | 9,343,000 | | | | 6,634,000 | |
2013 | | | 9,859,000 | | | | 7,000,000 | |
2014 | | | 10,503,000 | | | | 7,457,000 | |
2015 | | | 11,046,000 | | | | 7,843,000 | |
2016-2020 | | | 63,854,000 | | | | 45,336,000 | |
Harleysville Group has a profit-sharing plan covering qualified employees. Harleysville Group’s expense under the plan was $2,140,000, $2,834,000 and $3,868,000 for 2010, 2009 and 2008, respectively. The plan also requires a Company core contribution, equal to 4% of salary in 2010 and 5% of salary in 2009 and 2008, to be automatically contributed to all eligible employees’ accounts on a biweekly basis regardless of the employees’ salary deferral amounts into the plan. Harleysville Group’s expense for the Company core contribution was $3,051,000, $3,957,000 and $3,822,000 in 2010, 2009 and 2008, respectively.
81
12 - Segment Information
As an underwriter of property and casualty insurance, Harleysville Group has three reportable segments, which consist of the investment function, the personal lines of insurance and the commercial lines of insurance. Using independent agents, Harleysville Group markets personal lines of insurance to individuals, and commercial lines of insurance to small and medium-sized businesses.
Harleysville Group evaluates the performance of the personal lines and commercial lines primarily based upon underwriting results as determined under statutory accounting practices (SAP). Assets are not allocated to the personal and commercial lines, and are reviewed in total by management for purposes of decision making. Harleysville Group operates only in the United States, and no single customer or agent provides 10 percent or more of revenues.
Financial data by segment is as follows:
| | | | | | | | | | | | |
| | | 2010 | | | 2009 | | | 2008 | |
| | | (in thousands) | |
Revenues: | | | | | | | | | | | | |
Premiums earned: | | | | | | | | | | | | |
Commercial lines | | $ | 676,740 | | | $ | 690,116 | | | $ | 757,196 | |
Personal lines | | | 189,610 | | | | 168,384 | | | | 161,319 | |
| | | | | | | | | | | | |
Total premiums earned | | | 866,350 | | | | 858,500 | | | | 918,515 | |
Net investment income | | | 103,313 | | | | 106,649 | | | | 113,555 | |
Realized investment gains (losses), net | | | 597 | | | | 2,293 | | | | (59,841 | ) |
Other | | | 16,012 | | | | 13,178 | | | | 13,087 | |
| | | | | | | | | | | | |
Total revenues | | $ | 986,272 | | | $ | 980,620 | | | $ | 985,316 | |
| | | | | | | | | | | | |
Income before income taxes: | | | | | | | | | | | | |
Underwriting gain (loss): | | | | | | | | | | | | |
Commercial lines | | $ | (16,203 | ) | | $ | 1,196 | | | $ | (10,723 | ) |
Personal lines | | | (10,700 | ) | | | 2,610 | | | | (2,621 | ) |
| | | | | | | | | | | | |
SAP underwriting gain (loss) | | | (26,903 | ) | | | 3,806 | | | | (13,344 | ) |
GAAP adjustments | | | (229 | ) | | | 384 | | | | 8,622 | |
| | | | | | | | | | | | |
GAAP underwriting gain (loss) | | | (27,132 | ) | | | 4,190 | | | | (4,722 | ) |
Net investment income | | | 103,313 | | | | 106,649 | | | | 113,555 | |
Realized investment gains (losses), net | | | 597 | | | | 2,293 | | | | (59,841 | ) |
Other | | | 5,934 | | | | 2,866 | | | | 1,970 | |
| | | | | | | | | | | | |
Income before income taxes | | $ | 82,712 | | | $ | 115,998 | | | $ | 50,962 | |
| | | | | | | | | | | | |
The GAAP adjustment of $8,622,000 for 2008 includes the impact of deferring the ceding commission paid in January 2008 of $11,338,000 related to the change in the intercompany pooling agreement as described in Note 2 of the Notes to Consolidated Financial Statements. The impact on commercial lines was $9,376,000 and the impact on personal lines was $1,962,000.
13 - Earnings Per Share
The computation of basic and diluted earnings per share is as follows:
| | | | | | | | | | | | |
| | | 2010 | | | 2009 | | | 2008 | |
| | | (dollars in thousands, except per share data) | |
Numerator for basic and diluted earnings per share: | | | | | | | | | | | | |
Net income | | $ | 66,898 | | | $ | 86,296 | | | $ | 42,319 | |
| | | | | | | | | | | | |
Denominator for basic earnings per share – weighted-average shares outstanding | | | 27,521,016 | | | | 27,956,227 | | | | 29,220,001 | |
Effect of stock incentive plans | | | 206,887 | | | | 171,075 | | | | 275,560 | |
| | | | | | | | | | | | |
Denominator for diluted earnings per share | | | 27,727,903 | | | | 28,127,302 | | | | 29,495,561 | |
| | | | | | | | | | | | |
Basic earnings per share | | $ | 2.43 | | | $ | 3.09 | | | $ | 1.45 | |
| | | | | | | | | | | | |
Diluted earnings per share | | $ | 2.42 | | | $ | 3.07 | | | $ | 1.43 | |
| | | | | | | | | | | | |
82
The following options to purchase shares of common stock were not included in the computation of diluted earnings per share because the exercise price of the options was greater than the average market price:
| | | | | | | | | | | | |
| | | 2010 | | | 2009 | | | 2008 | |
| | | (in thousands) | |
Number of options | | | 921 | | | | 565 | | | | — | |
| | | | | | | | | | | | |
14 - Quarterly Results of Operations (Unaudited)
| | | | | | | | | | | | | | | | | | | | |
| | | 2010 | |
| | | (in thousands, except per share data) | |
| | | First | | | Second | | | Third | | | Fourth | | | Total | |
| | | | | |
Revenues | | $ | 238,957 | | | $ | 243,506 | | | $ | 249,799 | | | $ | 254,010 | | | $ | 986,272 | |
Losses and expenses | | | 229,022 | | | | 222,501 | | | | 224,069 | | | | 227,968 | | | | 903,560 | |
Net income | | | 8,050 | | | | 17,054 | | | | 20,829 | | | | 20,965 | | | | 66,898 | |
Earnings per common share: | | | | | | | | | | | | | | | | | | | | |
Basic net income | | $ | .29 | | | $ | .61 | | | $ | .76 | | | $ | .77 | | | $ | 2.43 | |
Diluted net income | | $ | .29 | | | $ | .61 | | | $ | .76 | | | $ | .76 | | | $ | 2.42 | |
| |
| | | 2009 | |
| | | (in thousands, except per share data) | |
| | | First | | | Second | | | Third | | | Fourth | | | Total | |
| | | | | |
Revenues | | $ | 246,894 | | | $ | 244,461 | | | $ | 244,292 | | | $ | 244,973 | | | $ | 980,620 | |
Losses and expenses | | | 223,986 | | | | 217,518 | | | | 210,583 | | | | 212,535 | | | | 864,622 | |
Net income | | | 17,289 | | | | 20,132 | | | | 24,724 | | | | 24,151 | | | | 86,296 | |
Earnings per common share: | | | | | | | | | | | | | | | | | | | | |
Basic net income | | $ | .61 | | | $ | .72 | | | $ | .89 | | | $ | .87 | | | $ | 3.09 | |
Diluted net income | | $ | .61 | | | $ | .72 | | | $ | .88 | | | $ | .86 | | | $ | 3.07 | |
15 - Contingencies
Besides claims related to its insurance products, Harleysville Group is subject to proceedings, lawsuits and claims in the normal course of business. Harleysville Group assesses the likelihood of any adverse outcomes to these matters as well as potential ranges of probable losses. There can be no assurance that actual outcomes will be consistent with those assessments.
83
Report of Independent Registered Public Accounting Firm
The Board of Directors and Shareholders
Harleysville Group Inc.:
We have audited the accompanying consolidated balance sheets of Harleysville Group Inc. and Subsidiaries as of December 31, 2010 and 2009, and the related consolidated statements of income, shareholders’ equity, and cash flows for each of the years in the three-year period ended December 31, 2010. These consolidated financial statements are the responsibility of the Company’s management. Our responsibility is to express an opinion on these consolidated financial statements based on our audits.
We conducted our audits in accordance with the standards of the Public Company Accounting Oversight Board (United States). Those standards require that we plan and perform the audit to obtain reasonable assurance about whether the financial statements are free of material misstatement. An audit includes examining, on a test basis, evidence supporting the amounts and disclosures in the financial statements. An audit also includes assessing the accounting principles used and significant estimates made by management, as well as evaluating the overall financial statement presentation. We believe that our audits provide a reasonable basis for our opinion.
In our opinion, the consolidated financial statements referred to above present fairly, in all material respects, the financial position of Harleysville Group Inc. and Subsidiaries as of December 31, 2010 and 2009, and the results of their operations and their cash flows for each of the years in the three-year period ended December 31, 2010, in conformity with U.S. generally accepted accounting principles.
We also have audited, in accordance with the standards of the Public Company Accounting Oversight Board (United States), Harleysville Group Inc.’s internal control over financial reporting as of December 31, 2010, based on criteria established inInternal Control – Integrated Framework issued by the Committee of Sponsoring Organizations of the Treadway Commission, and our report dated March 4, 2011 expressed an unqualified opinion on the effectiveness of the Company’s internal control over financial reporting.
/s/ KPMG LLP
Philadelphia, Pennsylvania
March 4, 2011
84
| Item 9. | Changes in and Disagreements with Accountants on Accounting and Financial Disclosure. |
None.
| Item 9A. | Controls and Procedures. |
Evaluation of Disclosure Controls and Procedures
Harleysville Group Inc.’s Chief Executive Officer and Chief Financial Officer have evaluated the Company’s disclosure controls and procedures as of the end of the period covered by this report and they have concluded that these controls and procedures are effective.
Management’s Annual Report on Internal Control over Financial Reporting
The management of Harleysville Group Inc. and its subsidiaries, is responsible for establishing and maintaining adequate internal control over financial reporting. With the participation of the Chief Executive Officer and the Chief Financial Officer, management has evaluated the effectiveness of its internal control over financial reporting as of December 31, 2010 based on the control criteria established inInternal Control-Integrated Framework, issued by the Committee of Sponsoring Organizations of the Treadway Commission. Based on such evaluation, management has concluded that Harleysville Group’s internal control over financial reporting is effective as of December 31, 2010.
The independent registered public accounting firm of KPMG LLP, as auditors of Harleysville Group’s consolidated financial statements, has issued an attestation report on the effectiveness of Harleysville Group’s internal control over financial reporting.
Changes in Internal Control Over Financial Reporting
There have been no changes in Harleysville Group’s internal control over financial reporting (as defined in Exchange Act Rules 13a-15(f) and 15d-15(f)) that occurred during the fiscal quarter ended December 31, 2010, that have materially affected, or are reasonably likely to materially affect, Harleysville Group’s internal control over financial reporting.
| | | | |
| | |
| /s/ MICHAEL L. BROWNE | | | | /s/ ARTHUR E. CHANDLER |
| Michael L. Browne | | | | Arthur E. Chandler |
| President and | | | | Senior Vice President and |
| Chief Executive Officer | | | | Chief Financial Officer |
March 4, 2011
Attestation Report of the Registered Public Accounting Firm (see next page)
| Item 9B. | Other Information. |
None.
85
Report of Independent Registered Public Accounting Firm
The Board of Directors and Shareholders
Harleysville Group Inc.:
We have audited Harleysville Group Inc.’s internal control over financial reporting as of December 31, 2010, based on criteria established in Internal Control – Integrated Framework issued by the Committee of Sponsoring Organizations of the Treadway Commission (COSO). Harleysville Group Inc.’s management is responsible for maintaining effective internal control over financial reporting and for its assessment of the effectiveness of internal control over financial reporting, included in the accompanying Management’s Annual Report on Internal Control over Financial Reporting. Our responsibility is to express an opinion on the Company’s internal control over financial reporting based on our audit.
We conducted our audit in accordance with the standards of the Public Company Accounting Oversight Board (United States). Those standards require that we plan and perform the audit to obtain reasonable assurance about whether effective internal control over financial reporting was maintained in all material respects. Our audit included obtaining an understanding of internal control over financial reporting, assessing the risk that a material weakness exists, and testing and evaluating the design and operating effectiveness of internal control based on the assessed risk. Our audit also included performing such other procedures as we considered necessary in the circumstances. We believe that our audit provides a reasonable basis for our opinion.
A company’s internal control over financial reporting is a process designed to provide reasonable assurance regarding the reliability of financial reporting and the preparation of financial statements for external purposes in accordance with generally accepted accounting principles. A company’s internal control over financial reporting includes those policies and procedures that (1) pertain to the maintenance of records that, in reasonable detail, accurately and fairly reflect the transactions and dispositions of the assets of the company; (2) provide reasonable assurance that transactions are recorded as necessary to permit preparation of financial statements in accordance with generally accepted accounting principles, and that receipts and expenditures of the company are being made only in accordance with authorizations of management and directors of the company; and (3) provide reasonable assurance regarding prevention or timely detection of unauthorized acquisition, use, or disposition of the company’s assets that could have a material effect on the financial statements.
Because of its inherent limitations, internal control over financial reporting may not prevent or detect misstatements. Also, projections of any evaluation of effectiveness to future periods are subject to the risk that controls may become inadequate because of changes in conditions, or that the degree of compliance with the policies or procedures may deteriorate.
In our opinion, Harleysville Group Inc. maintained, in all material respects, effective internal control over financial reporting as of December 31, 2010, based on criteria established inInternal Control – Integrated Framework issued by the Committee of Sponsoring Organizations of the Treadway Commission.
We also have audited, in accordance with the standards of the Public Company Accounting Oversight Board (United States), the consolidated balance sheets of Harleysville Group Inc. and Subsidiaries as of December 31, 2010 and 2009, and the related consolidated statements of income, shareholders’ equity, and cash flows for each of the years in the three-year period ended December 31, 2010, and our report dated March 4, 2011 expressed an unqualified opinion on those consolidated financial statements.
/s/ KPMG LLP
Philadelphia, Pennsylvania
March 4, 2011
86
PART III
| Item 10. | Directors, Executive Officers and Corporate Governance. |
The information required under this Item is incorporated herein by reference to our definitive Proxy Statement for our annual meeting of stockholders to be held on April 27, 2011, which shall be filed with the SEC within 120 days after the end of our fiscal year.
| Item 11. | Executive Compensation. |
The information required under this Item is incorporated herein by reference to our definitive Proxy Statement for our annual meeting of stockholders to be held on April 27, 2011, which shall be filed with the SEC within 120 days after the end of our fiscal year.
| Item 12. | Security Ownership of Certain Beneficial Owners and Management and Related Stockholders Matters. |
The information required under this Item is incorporated herein by reference to our definitive Proxy Statement for our annual meeting of stockholders to be held on April 27, 2011, which shall be filed with the SEC within 120 days after the end of our fiscal year.
| Item 13. | Certain Relationships and Related Transactions, and Director Independence. |
The information required under this Item is incorporated herein by reference to our definitive Proxy Statement for our annual meeting of stockholders to be held on April 27, 2011, which shall be filed with the SEC within 120 days after the end of our fiscal year.
| Item 14. | Principal Accountant Fees and Services. |
The information required under this Item is incorporated herein by reference to our definitive Proxy Statement for our annual meeting of stockholders to be held on April 27, 2011, which shall be filed with the SEC within 120 days after the end of our fiscal year.
87
PART IV
| Item 15. | Exhibits and Financial Statement Schedules. |
(a)(1) The following consolidated financial statements are filed as a part of this report:
(2) The following consolidated financial statement schedules for the years 2010, 2009 and 2008 are submitted herewith:
Financial Statement Schedules
Report and Consent of Independent Registered Public Accounting Firm
(filed as Exhibit 23)
All other schedules are omitted because they are not applicable or the required information is included in the financial statements or notes thereto.
88
| | |
Exhibit
No. | | Description of Exhibits |
| |
| (3)(A) | | Amended and Restated Certificate of Incorporation of Registrant – incorporated herein by reference to Exhibit (4)(A) to the Registrant’s Form S-8 Registration Statement No. 333-03127 filed May 3, 1996. |
| |
| (3)(B) | | Amended and Restated By-laws of Registrant – incorporated herein by reference to Exhibit 3.1 to the Registrant’s Current Report on Form 8-K filed February 24, 2009. |
| |
| (4) | | Indenture between the Registrant and J. P. Morgan Trust Company, N.A., dated as of July 7, 2003 – incorporated herein by reference to Exhibit 4.1 to the Registrant’s Form 8-K Report dated July 7, 2003. |
| |
| (10)(A)+ | | Standard Deferred Compensation Plan for Directors of Harleysville Mutual Insurance Company and Harleysville Group Inc. Amended and Restated effective January 1, 2008 – incorporated herein by reference to Exhibit 10(A) to the Registrant’s Annual Report on Form 10-K for the year ended December 31, 2007. |
| |
| (10)(B)+ | | Harleysville Insurance Companies Director Deferred Compensation Plan Approved by the Board of Directors November 25, 1987 – incorporated herein by reference to Exhibit (10)(B) to the Registrant’s Form S-3 Registration Statement No. 33-28948 filed May 25, 1989. |
| |
| (10)(C)+ | | Harleysville Group Inc. Non-Qualified Deferred Compensation Plan Amended and Restated as of January 1, 2008 – incorporated herein by reference to Exhibit (10)(C) to the Registrant’s Annual Report on Form 10-K for the year ended December 31, 2007. |
| |
| (10)(D)+ | | Pension Plan of Harleysville Group Inc. and Associated Employers Amended and Restated as of January 1, 2008 – incorporated herein by reference to Exhibit (10)(D) to the Registrant’s Annual Report on Form 10-K for the year ended December 31, 2007. |
| |
| (10)(E)+ | | Harleysville Group Inc. Senior Executive Incentive Compensation Plan Effective January 1, 2009 – incorporated herein by reference to Exhibit 10.1 to the Registrant’s Quarterly Report on Form 10-Q filed May 1, 2009. |
| |
| (10)(F)+ | | Amended and Restated Equity Incentive Plan of Registrant effective as of April 28, 2010 – incorporated herein by reference to Exhibit 10.1 to the Registrant’s Current Report on Form 8-K filed May 4, 2010. |
| |
| (10)(G) | | Tax Allocation Agreement dated December 24, 1986 among Harleysville Insurance Company of New Jersey, Huron Insurance Company, Worcester Insurance Company, McAlear Associates, Inc. and the Registrant – incorporated herein by reference to Exhibit (10)(Q) to the Registrant’s Annual Report on Form 10-K for the year ended December 31, 1986. |
| |
| (10)(H) | | Amended and Restated Financial Tax Sharing Agreement dated March 20, 1995 among Huron Insurance Company, Harleysville Insurance Company of New Jersey, Worcester Insurance Company, Harleysville-Atlantic Insurance Company, New York Casualty Insurance Company, Connecticut Union Insurance Company, Great Oaks Insurance Company, Lakes States Insurance Company and the Registrant – incorporated herein by reference to Exhibit (10)(L) to the Registrant’s Annual Report on Form 10-K for the year ended December 31, 1994. |
| |
| (10)(I) | | Proportional Reinsurance Agreement effective as of January 1, 1986 among Harleysville Mutual Insurance Company, Huron Insurance Company and Harleysville Insurance Company of New Jersey – incorporated herein by reference to Exhibit 10(N) to the Registrant’s Form S-1 Registration Statement No. 33-4885 declared effective May 23, 1986. |
89
| | |
Exhibit
No. | | Description of Exhibits |
| |
| (10)(I)(1) | | Amendment, effective July 1, 1987, to the Proportional Reinsurance Agreement effective January 1, 1986 among Harleysville Mutual Insurance Company, Huron Insurance Company, Harleysville Insurance Company of New Jersey and Atlantic Insurance Company of Savannah – incorporated herein by reference to the Registrant’s Form 8-K Report dated July 1, 1987. |
| |
| (10)(I)(2) | | Amendment, effective January 1, 1989, to the Proportional Reinsurance Agreement effective January 1, 1986 among Harleysville Mutual Insurance Company, Huron Insurance Company, Harleysville Insurance Company of New Jersey, Atlantic Insurance Company of Savannah and Worcester Insurance Company – incorporated herein by reference to Exhibit (10)(U) to the Registrant’s Annual Report on Form 10-K for the year ended December 31, 1988. |
| |
| (10)(I)(3) | | Amendment, effective January 1, 1991, to the Proportional Reinsurance Agreement effective January 1, 1986 among Harleysville Mutual Insurance Company, Huron Insurance Company, Harleysville Insurance Company of New Jersey, Atlantic Insurance Company of Savannah, Worcester Insurance Company, Phoenix General Insurance Company and New York Casualty Insurance Company – incorporated herein by reference to Exhibit (10)(O) to the Registrant’s Annual Report on Form 10-K for the year ended December 31, 1990. |
| |
| (10)(I)(4) | | Amendments, effective January 1, 1995 and 1993, respectively, to the Proportional Reinsurance Agreement effective January 1, 1986 among Harleysville Mutual Insurance Company, Huron Insurance Company, Harleysville Insurance Company of New Jersey, Harleysville-Atlantic Insurance Company, Worcester Insurance Company, Connecticut Union Insurance Company, New York Casualty Insurance Company and Great Oaks Insurance Company – incorporated herein by reference to Exhibit (10)(P) to the Registrant’s Annual Report on Form 10-K for the year ended December 31, 1994. |
| |
| (10)(I)(5) | | Amendment, effective January 1, 1996 to the Proportional Reinsurance Agreement effective January 1, 1986 among Harleysville Mutual Insurance Company, Huron Insurance Company, Harleysville Insurance Company of New Jersey, Harleysville-Atlantic Insurance Company, Worcester Insurance Company, Connecticut Union Insurance Company, New York Casualty Insurance Company, Great Oaks Insurance Company and Pennland Insurance Company – incorporated herein by reference to Exhibit (10)(O) to the Registrant’s Annual Report on Form 10-K for the year ended December 31, 1995. |
| |
| (10)(I)(6) | | Amendment, effective January 1, 1997 to the Proportional Reinsurance Agreement effective January 1, 1986 among Harleysville Mutual Insurance Company, Huron Insurance Company, Harleysville Insurance Company of New Jersey, Harleysville-Atlantic Insurance Company, Worcester Insurance Company, Mid-America Insurance Company, New York Casualty Insurance Company, Great Oaks Insurance Company, Pennland Insurance Company and Lake States Insurance Company – incorporated herein by reference to Exhibit (10)(P) to the Registrant’s Annual Report on Form 10-K for the year ended December 31, 1996. |
| |
| (10)(I)(7) | | Amendment, effective January 1, 1998 to the Proportional Reinsurance Agreement effective January 1, 1986 among Harleysville Mutual Insurance Company, Huron Insurance Company, Harleysville Insurance Company of New Jersey, Harleysville-Atlantic Insurance Company, Worcester Insurance Company, Mid-America Insurance Company, New York Casualty Insurance Company, Great Oaks Insurance Company, Pennland Insurance Company, Lake States Insurance Company and Minnesota Fire and Casualty Company – incorporated herein by reference to Exhibit (10)(Q) to the Registrant’s Annual Report on Form 10-K for the year ended December 31, 1997. |
| |
| (10)(I)(8) | | Tenth Amendment, effective January 1, 2008, to the Proportional Reinsurance Agreement effective January 1, 1986 among Harleysville Mutual Insurance Company, Harleysville Preferred Insurance Company, Harleysville Insurance Company of New Jersey, Harleysville-Atlantic Insurance Company, Harleysville Worcester Insurance Company, Harleysville Insurance Company of New York, Harleysville Insurance Company of Ohio, Harleysville Pennland Insurance Company, Harleysville Lake States Insurance Company and Harleysville Insurance Company – incorporated herein by reference to Exhibit (10)(I)(8) to the Registrant’s Annual Report on Form 10-K for the year ended December 31, 2007. |
90
| | |
Exhibit
No. | | Description of Exhibits |
| |
| (10)(I)(9) | | Eleventh Amendment, effective January 1, 2010, to the Proportional Reinsurance Agreement effective January 1, 1986 among Harleysville Mutual Insurance Company, Harleysville Preferred Insurance Company, Harleysville Insurance Company of New Jersey, Harleysville-Atlantic Insurance Company, Harleysville Worcester Insurance Company, Harleysville Insurance Company of New York, Harleysville Insurance Company of Ohio, Harleysville Pennland Insurance Company, Harleysville Lake States Insurance Company and Harleysville Insurance Company – incorporated herein by reference to Exhibit (10)(I)(9) to the Registrant’s Annual Report on Form 10-K for the year ended December 31, 2009. |
| |
| (10)(I)(10)* | | Twelfth Amendment, effective January 1, 2011, to the Proportional Reinsurance Agreement effective January 1, 1986 among Harleysville Mutual Insurance Company, Harleysville Preferred Insurance Company, Harleysville Insurance Company of New Jersey, Harleysville-Atlantic Insurance Company, Harleysville Worcester Insurance Company, Harleysville Insurance Company of New York, Harleysville Insurance Company of Ohio, Harleysville Pennland Insurance Company, Harleysville Lake States Insurance Company and Harleysville Insurance Company. |
| |
| (10)(J) | | Lease and Amendment effective January 1, 2000 between Harleysville, Ltd. and Harleysville Mutual Insurance Company – incorporated herein by reference to Exhibit (10)(R) to the Registrant’s Annual Report on Form 10-K for the year ended December 31, 1999. |
| |
| (10)(J)(1) | | Second Amendment to Lease Agreement, effective January 1, 2005 between Harleysville Ltd. and Harleysville Mutual Insurance Company – incorporated herein by reference to Exhibit (10)(R) to the Registrant’s Annual Report on Form 10-K for the year ended December 31, 2004. |
| |
| (10)(J)(2) | | Third Amendment to Lease Agreement, effective January 1, 2010, between Harleysville Ltd. and Harleysville Mutual Insurance Company – incorporated herein by reference to Exhibit (10)(J)(2) to the Registrant’s Annual Report on Form 10-K for the year ended December 31, 2009. |
| |
| (10)(J)(3)* | | Fourth Amendment to Lease Agreement, effective January 1, 2011 between Harleysville Ltd. and Harleysville Mutual Insurance Company. |
| |
| (10)(K)+ | | Harleysville Group Inc. Year 2000 Directors’ Stock Option Program of Registrant – incorporated herein by reference to Exhibit (4)(C) to the Registrant’s Form S-8 Registration Statement No. 333-85941, filed August 26, 1999. |
| |
| (10)(L) | | Loan Agreement dated as of March 19, 1998 by and between Harleysville Group Inc. and Harleysville Mutual Insurance Company – incorporated herein by reference to Exhibit (10)(V) to the Registrant’s Annual Report on Form 10-K for the year ended December 31, 1997. |
| |
| (10)(L)(1) | | Amendment to Loan Agreement, effective March 1, 2005 by and between Harleysville Group Inc. and Harleysville Mutual Insurance Company – incorporated herein by reference to Exhibit (10)(V) to the Registrant’s Annual Report on Form 10-K for the year ended December 31, 2004. |
| |
| (10)(M) | | Form of Management Agreements dated January 1, 1994 between Harleysville Group Inc. and Harleysville Mutual Insurance Company, Harleysville-Garden State Insurance Company, Mainland Insurance Company, Pennland Insurance Company, Berkshire Mutual Insurance Company and Harleysville Life Insurance Company – incorporated herein by reference to Exhibit (10)(U) to the Registrant’s Annual Statement on Form 10-K for the year ended December 31, 1993. |
| |
| (10)(M)(1)! | | Amendment, effective January 1, 2010, to the Management Agreement between Harleysville Group Inc. and Harleysville Mutual Insurance Company – incorporated herein by reference to Exhibit (10)(M)(1) to the Registrant’s Annual Report on Form 10-K for the year ended December 31, 2009. |
91
| | |
Exhibit
No. | | Description of Exhibits |
| |
| (10)(N) | | Form of Amended Consolidated and Restated Compensation Allocation Agreement between Harleysville Group Inc. and Harleysville Mutual Insurance Company, Harleysville Life Insurance Company, Harleysville Worcester Insurance Company, Harleysville Insurance Company of New York, Harleysville Preferred Insurance Company, Harleysville Pennland Insurance Company, Harleysville Insurance Company of New Jersey, Harleysville-Atlantic Insurance Company, Harleysville Insurance Company of Ohio, Harleysville Insurance Company, Harleysville Lake States Insurance Company, Mainland Insurance Company, Harleysville Services, Inc., Harleysville Ltd., and Insurance Management Resources L.P., effective February 19, 2009 – incorporated herein by reference to Exhibit (10)(N) to the Registrant’s Annual Statement on Form 10-K for the year ended December 31, 2008. |
| |
| (10)(O) | | Equipment and Supplies Allocation Agreement dated January 1, 1993 between Harleysville Mutual Insurance Company and Harleysville Group Inc. – incorporated herein by reference to Exhibit (10)(V) to the Registrant’s Annual Report on Form 10-K for the year ended December 31, 1992. |
| |
| (10)(P)+ | | Form of Change in Control Employment Agreements effective January 1, 2008 – incorporated herein by reference to Exhibit (10)(P) to the Registrant’s Annual Report on Form 10-K for the year ended December 31, 2007. |
| |
| (10)(P)(1)+* | | List of Executive Officers who have executed a Change in Control Agreement with the Company substantially similar to the form described in Exhibit (10)(P). |
| |
| (10)(Q)+ | | Harleysville Group Inc. Supplemental Retirement Plan Amended and Restated as of January 1, 2008 – incorporated herein by reference to Exhibit (10)(Q) to the Registrant’s Annual Report on Form 10-K for the year ended December 31, 2007. |
| |
| (10)(R)+ | | Directors Equity Award Program of Registrant – incorporated herein by reference to Exhibit (4)(C) to the Registrant’s Form S-8 Registration Statement No. 333-09701 filed August 7, 1996. |
| |
| (10)(S)+ | | Non-Qualified Excess Contribution and Match Program - Amended and Restated as of January 1, 2008 – incorporated herein by reference to Exhibit (10)(T) to the Registrant’s Annual Report on Form 10-K for the year ended December 31, 2007. |
| |
| (10)(T) | | Agency Stock Purchase Plan – incorporated herein by reference to Exhibit 4(A) to the Registrant’s Form S-3 Registration Statement No. 33-90810 filed December 6, 2005. |
| |
| (10)(U)+ | | Harleysville Group Inc. Amended and Restated Directors’ Equity Compensation Plan – incorporated herein by reference to Exhibit 10.2 to the Registrant’s Quarterly Report on Form 10-Q filed May 4, 2007. |
| |
| (10)(U)(1)+ | | Amendment 2007-1, effective December 20, 2007, to the Harleysville Group Inc. Amended and Restated Directors’ Equity Compensation Plan – incorporated herein by reference to Exhibit (10)(V)(1) to the Registrant’s Annual Report on Form 10-K for the year ended December 31, 2007. |
| |
| (10)(V)+ | | Non-Employee Director Compensation – incorporated herein by reference to Exhibit (10)(W) to the Registrant’s Annual Report on Form 10-K for the year ended December 31, 2009. |
| |
| (10)(W)+ | | Form of Non-Qualified Stock Option Award Agreement – incorporated herein by reference to Exhibit (10)(X) to the Registrant’s Annual Report on Form 10-K for the year ended December 31, 2009. |
| |
| (10)(X)+ | | Form of Restricted Stock Award Agreement – incorporated by reference to Exhibit 10.3 to the Registrant’s Current Report on Form 8-K filed January 5, 2006. |
| |
| (10)(Y)+ | | Form of Restricted Stock Award Agreement for Reporting Persons – incorporated by reference to Exhibit 10.4 to the Registrant’s Current Report on Form 8-K filed January 5, 2006. |
| |
| (10)(Z)+ | | Form of Restricted Stock Units Award Agreement for CEO - time-based – incorporated herein by reference to Exhibit (10)(AA) to the Registrant’s Annual Report on Form 10-K for the year ended December 31, 2009. |
92
| | |
Exhibit
No. | | Description of Exhibits |
| |
| (10)(AA)+ | | Form of Restricted Stock Units Award Agreement for CEO - TSR-based – incorporated herein by reference to Exhibit (10)(AB) to the Registrant’s Annual Report on Form 10-K for the year ended December 31, 2009. |
| |
| (10)(AB)+ | | Form of Restricted Stock Units Award Agreement - time based – incorporated herein by reference to Exhibit (10)(AC) to the Registrant’s Annual Report on Form 10-K for the year ended December 31, 2009. |
| |
| (10)(AC)+ | | Form of Restricted Stock Units Award Agreement - performance based – incorporated herein by reference to Exhibit (10)(AD) to the Registrant’s Annual Report on Form 10-K for the year ended December 31, 2009. |
| |
| (10)(AD)+ | | Amended and Restated Employee Stock Purchase Plan – incorporated by reference to Exhibit 10.2 to the Registrant’s Periodic Report on Form 10-Q for the period ended March 31, 2010. |
| |
| (21)* | | Subsidiaries of Registrant. |
| |
| (23)* | | Report and Consent of Independent Registered Public Accounting Firm |
| |
| (31.1)* | | Certification of Chief Executive Officer Pursuant to Section 302 of the Sarbanes-Oxley Act of 2002. |
| |
| (31.2)* | | Certification of Chief Financial Officer Pursuant to Section 302 of the Sarbanes-Oxley Act of 2002. |
| |
| (32.1)* | | Certification of Chief Executive Officer Pursuant to Section 906 of the Sarbanes-Oxley Act of 2002. |
| |
| (32.2)* | | Certification of Chief Financial Officer Pursuant to Section 906 of the Sarbanes-Oxley Act of 2002. |
| |
| (99)* | | Form 11-K Annual Report for the Harleysville Group Inc. Amended and Restated Employee Stock Purchase Plan for the year ended December 31, 2010. |
| + | A management contract, compensatory plan or arrangement required to be separately identified. |
| ! | Confidential treatment has been requested for certain provisions of this agreement pursuant to an application for confidential treatment filed with the Securities and Exchange Commission on March 5, 2010. Such provisions have been filed separately with the Commission. |
93
HARLEYSVILLE GROUP
SCHEDULE I - SUMMARY OF INVESTMENTS -
OTHER THAN INVESTMENTS IN RELATED PARTIES
December 31, 2010
(in thousands)
| | | | | | | | | | | | |
Type of Investment | | Cost | | | Value | | | Amount at
Which
Shown in the
Balance
Sheet | |
Fixed maturities: | | | | | | | | | | | | |
U.S. Treasury securities | | $ | 119,009 | | | $ | 122,857 | | | $ | 122,857 | |
Obligations of U.S. government corporations and agencies | | | 16,644 | | | | 17,549 | | | | 17,541 | |
Obligations of states and political subdivisions | | | 1,215,506 | | | | 1,251,980 | | | | 1,248,258 | |
Mortgage-backed securities | | | 345,157 | | | | 369,821 | | | | 369,821 | |
All other corporate bonds | | | 521,143 | | | | 559,861 | | | | 554,986 | |
| | | | | | | | | | | | |
Total fixed maturities | | | 2,217,459 | | | | 2,322,068 | | | | 2,313,463 | |
| | | | | | | | | | | | |
Equity securities: | | | | | | | | | | | | |
Common stocks: | | | | | | | | | | | | |
Banks, trust and insurance companies | | | 7 | | | | 7 | | | | 7 | |
Industrial, miscellaneous and all other | | | 191,088 | | | | 268,097 | | | | 268,097 | |
| | | | | | | | | | | | |
Total equities | | | 191,095 | | | | 268,104 | | | | 268,104 | |
| | | | | | | | | | | | |
Short-term investments | | | 79,909 | | | | | | | | 79,909 | |
| | | | | | | | | | | | |
Total investments | | $ | 2,488,463 | | | | | | | $ | 2,661,476 | |
| | | | | | | | | | | | |
See accompanying report of independent registered public accounting firm.
94
HARLEYSVILLE GROUP INC.
SCHEDULE II - CONDENSED FINANCIAL INFORMATION OF PARENT COMPANY
CONDENSED BALANCE SHEETS
(in thousands, except share data)
| | | | | | | | |
| | | December 31, | |
| | | 2010 | | | 2009 | |
| ASSETS | | | | | | | | |
Short-term investments | | $ | 22,047 | | | $ | 29,095 | |
Fixed maturities: | | | | | | | | |
Available for sale, at fair value (cost $15 and $15) | | | 15 | | | | 15 | |
Investments in common stock of subsidiaries (equity method) | | | 827,450 | | | | 822,846 | |
Accrued investment income | | | | | | | 1 | |
Dividends receivable from subsidiaries | | | 24,167 | | | | 29,522 | |
Due from affiliate | | | 16,567 | | | | 6,064 | |
Other assets | | | 12,951 | | | | 16,515 | |
| | | | | | | | |
Total assets | | $ | 903,197 | | | $ | 904,058 | |
| | | | | | | | |
| LIABILITIES AND SHAREHOLDERS’ EQUITY | | | | | | | | |
Debt | | $ | 118,500 | | | $ | 118,500 | |
Accounts payable and accrued expenses | | | 10,593 | | | | 10,409 | |
Federal income tax payable | | | 5,471 | | | | 2,521 | |
| | | | | | | | |
Total liabilities | | | 134,564 | | | | 131,430 | |
| | | | | | | | |
Shareholders’ equity: | | | | | | | | |
Preferred stock, $1 par value; authorized 1,000,000 shares, none issued | | | | | | | | |
Common stock, $1 par value; authorized 80,000,000 shares; issued 2010, 34,987,829 and 2009, 34,583,182 shares; outstanding 2010, 27,044,836 and 2009, 27,615,120 shares | | | 34,988 | | | | 34,583 | |
Additional paid-in capital | | | 263,857 | | | | 245,636 | |
Accumulated other comprehensive income | | | 80,506 | | | | 62,276 | |
Retained earnings | | | 630,603 | | | | 640,593 | |
Treasury stock, at cost, 7,942,993 and 6,968,062 shares | | | (241,321 | ) | | | (210,460 | ) |
| | | | | | | | |
Total shareholders’ equity | | | 768,633 | | | | 772,628 | |
| | | | | | | | |
Total liabilities and shareholders’ equity | | $ | 903,197 | | | $ | 904,058 | |
| | | | | | | | |
See accompanying notes to consolidated financial statements and report of independent registered public accounting firm.
95
HARLEYSVILLE GROUP INC.
SCHEDULE II - CONDENSED FINANCIAL INFORMATION OF PARENT COMPANY
CONDENSED STATEMENTS OF INCOME
(in thousands)
| | | | | | | | | | | | |
| | | Year Ended December 31, | |
| | | 2010 | | | 2009 | | | 2008 | |
Revenues | | $ | 5,858 | | | $ | 5,372 | | | $ | 6,282 | |
Expenses: | | | | | | | | | | | | |
Interest | | | 6,064 | | | | 6,217 | | | | 6,572 | |
Expenses other than interest | | | 2,200 | | | | 2,318 | | | | 2,557 | |
| | | | | | | | | | | | |
| | | (2,406 | ) | | | (3,163 | ) | | | (2,847 | ) |
Income tax benefit | | | (848 | ) | | | (1,073 | ) | | | (981 | ) |
| | | | | | | | | | | | |
Loss before equity in income of subsidiaries | | | (1,558 | ) | | | (2,090 | ) | | | (1,866 | ) |
Equity in income of subsidiaries | | | 68,456 | | | | 88,386 | | | | 44,185 | |
| | | | | | | | | | | | |
Net income | | $ | 66,898 | | | $ | 86,296 | | | $ | 42,319 | |
| | | | | | | | | | | | |
See accompanying notes to consolidated financial statements and report of independent registered public accounting firm.
96
HARLEYSVILLE GROUP INC.
SCHEDULE II - CONDENSED FINANCIAL INFORMATION OF PARENT COMPANY
CONDENSED STATEMENTS OF CASH FLOWS
(in thousands)
| | | | | | | | | | | | |
| | | Year Ended December 31, | |
| | | 2010 | | | 2009 | | | 2008 | |
Cash flows from operating activities: | | | | | | | | | | | | |
Net income | | $ | 66,898 | | | $ | 86,296 | | | $ | 42,319 | |
Adjustments to reconcile net income to net cash provided (used) by operating activities: | | | | | | | | | | | | |
Equity in income of subsidiaries | | | (68,456 | ) | | | (88,386 | ) | | | (44,185 | ) |
Decrease in accrued investment income | | | 1 | | | | 20 | | | | 6 | |
Increase (decrease) in accrued income taxes | | | 2,943 | | | | 17,583 | | | | (16,579 | ) |
Other, net | | | (2,419 | ) | | | (16,274 | ) | | | 22,313 | |
| | | | | | | | | | | | |
Net cash provided (used) by operating activities | | | (1,033 | ) | | | (761 | ) | | | 3,874 | |
| | | | | | | | | | | | |
Cash flows from investing activities: | | | | | | | | | | | | |
Purchases of fixed maturity investments | | | (15 | ) | | | | | | | (15 | ) |
Maturities of fixed maturity investments | | | 15 | | | | | | | | 15 | |
Net sales (purchases) of short-term investments | | | 7,048 | | | | 25,468 | | | | (50,582 | ) |
Acquisition of affiliate, net of cash acquired | | | (4,825 | ) | | | | | | | | |
| | | | | | | | | | | | |
Net cash provided (used) by investing activities | | | 2,223 | | | | 25,468 | | | | (50,582 | ) |
| | | | | | | | | | | | |
Cash flows from financing activities: | | | | | | | | | | | | |
Issuance of common stock | | | 8,973 | | | | 7,382 | | | | 9,649 | |
Purchase of treasury stock | | | (30,940 | ) | | | (25,290 | ) | | | (97,318 | ) |
Dividends from subsidiaries | | | 94,361 | | | | 27,479 | | | | 163,141 | |
Dividends paid | | | (74,597 | ) | | | (34,849 | ) | | | (31,878 | ) |
Excess tax benefits from share-based payment arrangements | | | 1,013 | | | | 571 | | | | 3,114 | |
| | | | | | | | | | | | |
Net cash provided (used) by financing activities | | | (1,190 | ) | | | (24,707 | ) | | | 46,708 | |
| | | | | | | | | | | | |
Change in cash | | | | | | | | | | | | |
Cash at beginning of year | | | — | | | | — | | | | — | |
| | | | | | | | | | | | |
Cash at end of year | | $ | — | | | $ | — | | | $ | — | |
| | | | | | | | | | | | |
See accompanying notes to consolidated financial statements and report of independent registered public accounting firm.
97
HARLEYSVILLE GROUP
SCHEDULE III - SUPPLEMENTARY INSURANCE INFORMATION
Years Ended December 31, 2010, 2009 and 2008
(in thousands)
| | | | | | | | | | | | | | | | | | | | | | | | | | | | | | | | | | | | |
| | | Deferred
Policy
Acquisition
Costs | | | Liability
For
Unpaid
Losses
and
Loss
Settlement
Expenses | | | Unearned
Premiums | | | Earned
Premiums | | | Net
Investment
Income | | | Losses
And Loss
Settlement
Expenses | | | Amortization
Of Deferred
Policy
Acquisition
Costs | | | Other
Underwriting
Expense | | | Premiums
Written | |
Year ended | | | | | | | | | | | | | | | | | | | | | | | | | | | | | | | | | | | | |
December 31, 2010 | | | | | | | | | | | | | | | | | | | | | | | | | | | | | | | | | | | | |
Commercial lines | | | | | | $ | 1,436,342 | | | $ | 343,280 | | | $ | 676,740 | | | | | | | $ | 450,417 | | | | | | | | | | | $ | 679,157 | |
Personal lines | | | | | | | 117,723 | | | | 108,627 | | | | 189,610 | | | | | | | | 138,089 | | | | | | | | | | | | 202,904 | |
GAAP adjustments(1) | | | | | | | 217,596 | | | | 51,625 | | | | | | | | | | | | 599 | | | | | | | | | | | | | |
| | | | | | | | | | | | | | | | | | | | | | | | | | | | | | | | | | | | |
Total | | $ | 113,997 | | | $ | 1,771,661 | | | $ | 503,532 | | | $ | 866,350 | | | | | | | $ | 589,105 | | | $ | 220,150 | | | $ | 84,227 | | | $ | 882,061 | |
| | | | | | | | | | | | | | | | | | | | | | | | | | | | | | | | | | | | |
Net investment income | | | | | | | | | | | | | | | | | | $ | 103,313 | | | | | | | | | | | | | | | | | |
| | | | | | | | | | | | | | | | | | | | | | | | | | | | | | | | | | | | |
Year ended | | | | | | | | | | | | | | | | | | | | | | | | | | | | | | | | | | | | |
December 31, 2009 | | | | | | | | | | | | | | | | | | | | | | | | | | | | | | | | | | | | |
Commercial lines | | | | | | $ | 1,442,458 | | | $ | 340,863 | | | $ | 690,116 | | | | | | | $ | 441,852 | | | | | | | | | | | $ | 674,275 | |
Personal lines | | | | | | | 116,706 | | | | 95,333 | | | | 168,384 | | | | | | | | 109,921 | | | | | | | | | | | | 177,342 | |
GAAP adjustments(1) | | | | | | | 223,128 | | | | 48,314 | | | | | | | | | | | | 718 | | | | | | | | | | | | | |
| | | | | | | | | | | | | | | | | | | | | | | | | | | | | | | | | | | | |
Total | | $ | 111,649 | | | $ | 1,782,292 | | | $ | 484,510 | | | $ | 858,500 | | | | | | | $ | 552,491 | | | $ | 216,470 | | | $ | 85,349 | | | $ | 851,617 | |
| | | | | | | | | | | | | | | | | | | | | | | | | | | | | | | | | | | | |
Net investment income | | | | | | | | | | | | | | | | | | $ | 106,649 | | | | | | | | | | | | | | | | | |
| | | | | | | | | | | | | | | | | | | | | | | | | | | | | | | | | | | | |
Year ended | | | | | | | | | | | | | | | | | | | | | | | | | | | | | | | | | | | | |
December 31, 2008 | | | | | | | | | | | | | | | | | | | | | | | | | | | | | | | | | | | | |
Commercial lines | | | | | | $ | 1,437,215 | | | $ | 356,704 | | | $ | 757,196 | | | | | | | $ | 500,440 | | | | | | | | | | | $ | 778,859 | |
Personal lines | | | | | | | 121,034 | | | | 86,375 | | | | 161,319 | | | | | | | | 110,091 | | | | | | | | | | | | 171,271 | |
GAAP adjustments(1) | | | | | | | 209,352 | | | | 41,481 | | | | | | | | | | | | 237 | | | | | | | | | | | | | |
| | | | | | | | | | | | | | | | | | | | | | | | | | | | | | | | | | | | |
Total | | $ | 110,339 | | | $ | 1,767,601 | | | $ | 484,560 | | | $ | 918,515 | | | | | | | $ | 610,768 | | | $ | 227,287 | | | $ | 85,182 | | | $ | 950,130 | |
| | | | | | | | | | | | | | | | | | | | | | | | | | | | | | | | | | | | |
Net investment income | | | | | | | | | | | | | | | | | | $ | 113,555 | | | | | | | | | | | | | | | | | |
| | | | | | | | | | | | | | | | | | | | | | | | | | | | | | | | | | | | |
| (1) | GAAP adjustments are not determined separately for commercial and personal lines. |
See Note 12 of the Notes to Consolidated Financial Statements.
See accompanying report of independent registered public accounting firm.
98
HARLEYSVILLE GROUP
SCHEDULE IV - REINSURANCE
Years Ended December 31, 2010, 2009 and 2008
(in thousands)
| | | | | | | | | | | | | | | | | | | | | | | | | | | | |
| | | Gross
Amount | | | Ceded to | | | Assumed From | | | Net
Amount | | | Percentage
of
Amount
Assumed
to Net | |
| | | Outside
Companies | | | Affiliated
Companies(1) | | | Outside
Companies | | | Affiliated
Companies(1) | | | |
Property and casualty premiums for year ended December 31, | | | | | | | | | | | | | | | | | | | | | | | | | | | | |
2010 | | $ | 896,434 | | | $ | 123,859 | | | $ | 783,340 | | | $ | 10,765 | | | $ | 866,350 | | | $ | 866,350 | | | | 101.2 | % |
2009 | | $ | 830,350 | | | $ | 109,743 | | | $ | 730,699 | | | $ | 10,092 | | | $ | 858,500 | | | $ | 858,500 | | | | 101.2 | % |
2008 | | $ | 853,439 | | | $ | 104,165 | | | $ | 761,751 | | | $ | 12,477 | | | $ | 918,515 | | | $ | 918,515 | | | | 101.4 | % |
| (1) | These columns include the effect of the intercompany pooling. |
See accompanying report of independent registered public accounting firm.
99
HARLEYSVILLE GROUP
SCHEDULE VI - SUPPLEMENTAL INSURANCE INFORMATION CONCERNING
PROPERTY AND CASUALTY SUBSIDIARIES
Years Ended December 31, 2010, 2009 and 2008
(in thousands)
| | | | | | | | | | | | | | | | | | | | |
| | | Liability
For Unpaid
Losses and
Loss Settlement
Expenses | | | Discount,
If Any,
Deducted
From
Reserves(1) | | | Losses and Loss
Settlement Expenses
(Benefits) Incurred
Related To | | | Paid Losses
And Loss
Settlement
Expenses | |
| | | | Current Year | | | Prior Years | | |
Year ended: | | | | | | | | | | | | | | | | | | | | |
December 31, 2010 | | $ | 1,771,661 | | | $ | 6,874 | | | $ | 639,234 | | | $ | (50,129 | ) | | $ | 594,204 | |
| | | | | | | | | | | | | | | | | | | | |
December 31, 2009 | | $ | 1,782,292 | | | $ | 6,993 | | | $ | 588,575 | | | $ | (36,084 | ) | | $ | 551,576 | |
| | | | | | | | | | | | | | | | | | | | |
December 31, 2008 | | $ | 1,767,601 | | | $ | 6,823 | | | $ | 642,576 | | | $ | (31,808 | ) | | $ | 587,866 | |
| | | | | | | | | | | | | | | | | | | | |
| Notes: (1) | The amount of discount relates to certain long-term disability workers’ compensation cases. A discount rate of 3.5% was used. |
| (2) | Information required by remaining columns is contained in Schedule III. |
See accompanying report of independent registered public accounting firm.
100
SIGNATURES
Pursuant to the requirements of Section 13 or 15(d) of the Securities Exchange Act of 1934, the Registrant has duly caused this report to be signed on its behalf by the undersigned thereunto duly authorized.
| | | | | | | | |
| | | | Harleysville Group Inc. |
| | | |
| Date: March 4, 2011 | | | | By: | | /S/ MICHAEL L. BROWNE |
| | | | | | | | Michael L. Browne President, Chief Executive Officer and a Director (principal executive officer) |
Pursuant to the requirements of the Securities Exchange Act of 1934, this report has been signed by the following persons on behalf of the Registrant in the capacities and on the dates indicated.
| | | | |
Signature | | Title | | Date |
| | |
/S/ MICHAEL L. BROWNE Michael L. Browne | | President, Chief Executive Officer and a Director (principal executive officer) | | March 4, 2011 |
| | |
/S/ ARTHUR E. CHANDLER Arthur E. Chandler | | Senior Vice President and Chief Financial Officer (principal financial officer and principal accounting officer) | | March 4, 2011 |
| | |
/S/ WILLIAM W. SCRANTON William W. Scranton | | Chairman of the Board and a Director | | March 4, 2011 |
| | |
/S/ BARBARA A. AUSTELL Barbara A. Austell | | Director | | March 4, 2011 |
| | |
/S/ W. THACHER BROWN W. Thacher Brown | | Director | | March 4, 2011 |
| | |
/S/ G. LAWRENCE BUHL G. Lawrence Buhl | | Director | | March 4, 2011 |
| | |
/S/ MIRIAN M. GRADDICK-WEIR Mirian M. Graddick-Weir | | Director | | March 4, 2011 |
| | |
/S/ JERRY S. ROSENBLOOM Jerry S. Rosenbloom | | Director | | March 4, 2011 |
| | |
/S/ WILLIAM E. STORTS William E. Storts | | Director | | March 4, 2011 |
101