UNITED STATES
SECURITIES AND EXCHANGE COMMISSION
Washington, D.C. 20549
FORM 10-K
| x | ANNUAL REPORT PURSUANT TO SECTION 13 OR 15(d) OF THE SECURITIES EXCHANGE ACT OF 1934 |
For the fiscal year ended December 31, 2011
OR
| ¨ | TRANSITION REPORT PURSUANT TO SECTION 13 OR 15(d) OF THE SECURITIES EXCHANGE ACT OF 1934 |
For the transition period from to
Commission File Number 0-14697
HARLEYSVILLE GROUP INC.
(Exact name of registrant as specified in its charter)
| | |
| Delaware | | 51-0241172 |
(State or other jurisdiction of incorporation or organization) | | (I.R.S. Employer Identification No.) |
355 Maple Avenue, Harleysville, PA 19438-2297
(Address of principal executive offices) (Zip Code)
Registrant’s telephone number, including area code: (215) 256-5000
Securities registered pursuant to Section 12(b) of the Act:
| | |
Title of each class | | Name of each exchange on which registered |
| None | | None |
Securities registered pursuant to Section 12(g) of the Act:
Common Stock, $1 par value
(Title of class)
Indicate by check mark if the registrant is a well-known seasoned issuer, as defined in Rule 405 of the Securities Act. Yes ¨ No x.
Indicate by check mark if the registrant is not required to file reports pursuant to Section 13 or Section 15(d) of the Act. Yes ¨ No x.
Indicate by check mark whether the registrant (1) has filed all reports required to be filed by Section 13 or 15(d) of the Securities Exchange Act of 1934 during the preceding 12 months (or for such shorter period that the registrant was required to file such reports), and (2) has been subject to such filing requirements for the past 90 days. Yes x No ¨.
Indicate by check mark whether the registrant has submitted electronically and posted on its corporate Web site, if any, every Interactive Data File required to be submitted and posted pursuant to Rule 405 of Regulation S-T (§ 232.405 of this chapter) during the preceding 12 months (or for such shorter period that the registrant was required to submit and post such files). Yes x No ¨.
Indicate by check mark if disclosure of delinquent filers pursuant to Item 405 of Regulation S-K is not contained herein, and will not be contained, to the best of registrant’s knowledge, in definitive proxy or information statements incorporated by reference in Part III of this Form 10-K or any amendment to this Form 10-K ¨.
Indicate by check mark whether the registrant is a large accelerated filer, an accelerated filer, a non-accelerated filer, or a smaller reporting company. See the definitions of “large accelerated filer,” “accelerated filer” and “smaller reporting company” in Rule 12b-2 of the Exchange Act.
| | | | | | |
| Large accelerated filer | | ¨ | | Accelerated filer | | x |
| | | |
| Non-accelerated filer | | ¨ (Do not check if a smaller reporting company) | | Smaller reporting company | | ¨ |
Indicate by check mark whether the registrant is a shell company (as defined in Rule 12b-2 of the Exchange Act) Yes ¨ No x.
On June 30, 2011, the last business day of the registrant’s most recently completed second fiscal quarter, the aggregate market value (based on the closing sales price on that date) of the voting stock held by non-affiliates of the registrant was $392,800,274.
The number of shares outstanding of the registrant’s common stock, as of March 8, 2012 was 27,277,285.
HARLEYSVILLE GROUP INC.
ANNUAL REPORT ON FORM 10-K
DECEMBER 31, 2011
PART I
General
Harleysville Group Inc. (the Company) is an insurance holding company headquartered in Pennsylvania which, through its subsidiaries, engages in the property and casualty insurance business on a regional basis in the United States. As used herein, “Harleysville Group” refers to Harleysville Group Inc. and its subsidiaries.
The Company is a Delaware corporation formed by Harleysville Mutual Insurance Company (the Mutual Company) in 1979 as a wholly owned subsidiary. In May 1986, the Company completed an initial public offering of its common stock, reducing the percentage of outstanding shares owned by the Mutual Company to approximately 70%. In April 1992, the Mutual Company completed a secondary public offering of a portion of the Company’s common stock then owned by it, further reducing the percentage of outstanding shares owned by the Mutual Company. At December 31, 2011, the Mutual Company owned approximately 53% of the Company’s outstanding shares.
Harleysville Group and the Mutual Company operate together to pursue a strategy of underwriting a broad array of personal and commercial coverages. These insurance coverages are marketed primarily in the eastern and midwestern United States through approximately 1,300 insurance agencies. Regional offices are maintained in Georgia, Illinois, Indiana, Maryland, Massachusetts, Michigan, Minnesota, New Jersey, New York, North Carolina, Pennsylvania, Tennessee, and Virginia. The Company’s property and casualty insurance subsidiaries are: Harleysville-Atlantic Insurance Company (Atlantic), Harleysville Insurance Company (HIC), Harleysville Insurance Company of New Jersey (HNJ), Harleysville Insurance Company of New York (HIC New York), Harleysville Insurance Company of Ohio (HIC Ohio), Harleysville Lake States Insurance Company (Lake States), Harleysville Preferred Insurance Company (Preferred), and Harleysville Worcester Insurance Company (Worcester). Atlantic and HIC Ohio were merged into Worcester in December 2011. Harleysville Group Inc. acquired Mainland Insurance Company (Mainland) from the Mutual Company in December 2010. HIC New York was then merged into Mainland and the surviving company was re-named Harleysville Insurance Company of New York (HIC New York). Mainland was a shell property and casualty insurance company with no premiums or outstanding insurance obligations. The acquisition and merger were completed to facilitate the redomestication of HIC New York from New York to Pennsylvania in order to improve the efficiency of the corporate structure.
The Company operates regionally. Management believes that the Company’s regional organization permits each regional operation to benefit from economies of scale provided by centralized support while encouraging local marketing autonomy and managerial entrepreneurship. Services which directly involve the insured or the agent (i.e., underwriting, claims and marketing) generally are performed regionally in accordance with Company-wide standards to promote high quality service, while actuarial, investment, legal, data processing and similar services are performed centrally. Since its formation, the Company’s network of insurance companies has expanded significantly. In 1983, the Company acquired Worcester, a property and casualty insurer which has conducted business in New England since 1823. In 1984, HNJ was formed by the Company and began underwriting property and casualty insurance in New Jersey. In 1987, the Company acquired Atlantic, a property and casualty insurer which has conducted business in the southeastern United States since 1905. In 1991, the Company acquired HIC New York, which conducts business in New York. In 1993, the Company acquired Lake States, which primarily conducts business in Michigan. In 1994, the Company formed HIC Ohio which began underwriting property and casualty insurance in Ohio. In 1997, the Company acquired HIC, which primarily conducted business in Minnesota and neighboring states.
The Company’s property and casualty subsidiaries participate in an intercompany pooling arrangement whereby these subsidiaries cede to the Mutual Company all of their net premiums written and assume from the Mutual Company a portion of the pooled business. See “Business - Pooling Arrangement.”
On September 28, 2011, the Company and the Mutual Company entered into an agreement and plan of merger (the Merger Agreement) with Nationwide Mutual Insurance Company (Nationwide) under which a subsidiary of Nationwide would merge into the Company, (the Merger). Nationwide would acquire all of the publicly held shares of common stock of the Company for $60.00 per share in cash and the Mutual Company would merge into Nationwide and the policyholders and members of the Mutual Company would become policyholders and members of Nationwide. The Mutual Company has also entered into a voting agreement with Nationwide (the Voting Agreement) under which the Mutual Company agreed to vote its 53% voting interest in the Company in favor of the Merger. The
Merger Agreement restricts the Company from engaging in certain activities and taking certain actions without Nationwide’s prior approval, including among others, the payment of stockholder dividends.
The transactions contemplated by the Merger Agreement are subject to customary closing conditions, including among others, approvals from stockholders of the Company, members of the Mutual Company and members of Nationwide, the Pennsylvania Insurance Department, the Ohio Insurance Department and various other regulatory bodies. The transactions are expected to close in the first half of 2012. The Merger Agreement provides certain termination rights. In the event that the agreement is terminated under certain conditions by the Company’s Board of Directors, the Company will be required to pay Nationwide a termination fee of $29.6 million and reimburse Nationwide for its transaction expenses.
Business Segments
Harleysville Group has three segments which consist of the personal lines of insurance, the commercial lines of insurance and the investment function. Financial information about these segments is set forth in Note 13 of the Notes to Consolidated Financial Statements.
Narrative Description of Business
Property and Casualty Underwriting
Harleysville Group and the Mutual Company together underwrite a broad line of personal and commercial property and casualty coverages, including automobile, homeowners, commercial multi-peril and workers compensation. The Mutual Company and the Company’s insurance subsidiaries participate in an intercompany pooling arrangement under which such subsidiaries and the Mutual Company and its property and casualty insurance subsidiary, Harleysville Pennland Insurance Company (Pennland), combine their property and casualty business.
Harleysville Group and the Mutual Company have an A.M. Best Company, Inc. (Best’s) group rating of “A” (Excellent). Best’s ratings are based upon factors relevant to policyholders and are not directed toward the protection of investors. Management believes that the Best’s rating is an important factor in marketing Harleysville Group’s products to its agents and customers, and that the current rating is satisfactory in that regard.
The following table sets forth ratios for the Company’s property and casualty subsidiaries, prepared in accordance with U.S. generally accepted accounting principles (GAAP) and with statutory accounting practices (SAP) prescribed or permitted by state insurance authorities. The statutory combined ratio is a standard measure of underwriting profitability. This ratio is the sum of (i) the ratio of incurred losses and loss settlement expenses to net earned premium (loss ratio); (ii) the ratio of expenses incurred for commissions, premium taxes, administrative and other underwriting expenses to net written premium (expense ratio); and (iii) the ratio of dividends to policyholders to net earned premium (dividend ratio). The GAAP combined ratio is calculated in the same manner, except that it is based on GAAP amounts and the denominator for each component is net earned premium. When the combined ratio is under 100%, underwriting results are generally considered profitable. Conversely, when the combined ratio is over 100%, underwriting results are generally considered unprofitable. The combined ratio does not reflect investment income, federal income taxes or other non-operating income or expense. Harleysville Group’s operating income is a function of both underwriting results and investment income.
HARLEYSVILLE GROUP BUSINESS ONLY
| | | | | | | | | | | | |
| | | Year Ended December 31, | |
| | | 2011 | | | 2010 | | | 2009 | |
| | | |
GAAP combined ratio | | | 119.9 | % | | | 103.1 | % | | | 99.5 | % |
| | | | | | | | | | | | |
Statutory operating ratios: | | | | | | | | | | | | |
Loss ratio | | | 84.7 | % | | | 67.9 | % | | | 64.3 | % |
Expense and dividend ratios | | | 35.2 | % | | | 34.6 | % | | | 35.5 | % |
| | | | | | | | | | | | |
Statutory combined ratio | | | 119.9 | %(1) | | | 102.5 | % | | | 99.8 | % |
| | | | | | | | | | | | |
| (1) | The statutory combined ratio for 2011 includes 0.9% due to the impact of the transfer of liabilities in connection with the pool change. This impact results from the statutory treatment of the ceding commission received on the unearned premiums transferred on January 1, 2011. Excluding this impact, the statutory combined ratio was 119.0%. See Note 3(a) of the Notes to Consolidated Financial Statements. |
2
The following table sets forth the net written premiums and combined ratios by line of insurance, prepared in accordance with statutory accounting practices prescribed or permitted by state insurance authorities, for Harleysville Group for the periods indicated:
HARLEYSVILLE GROUP BUSINESS ONLY
| | | | | | | | | | | | |
| | | Year Ended December 31, | |
| | | 2011 | | | 2010 | | | 2009 | |
| | | (dollars in thousands) | |
Net Premiums Written | | | | | | | | | | | | |
Commercial: | | | | | | | | | | | | |
Automobile | | $ | 169,490 | | | $ | 178,353 | | | $ | 182,169 | |
Workers compensation | | | (40,012 | ) | | | 77,734 | | | | 80,484 | |
Commercial multi-peril | | | 337,691 | | | | 338,992 | | | | 326,242 | |
Other commercial | | | 73,521 | | | | 84,078 | | | | 85,380 | |
| | | | | | | | | | | | |
Total commercial | | | 540,690 | | | | 679,157 | | | | 674,275 | |
| | | | | | | | | | | | |
Total commercial without workers compensation net premiums written(1) | | | 580,702 | | | | | | | | | |
| | | | | | | | | | | | |
| | | |
Personal: | | | | | | | | | | | | |
Automobile | | | 109,820 | | | | 102,045 | | | | 85,195 | |
Homeowners | | | 94,063 | | | | 87,736 | | | | 80,044 | |
Other personal | | | 14,044 | | | | 13,123 | | | | 12,103 | |
| | | | | | | | | | | | |
Total personal | | | 217,927 | | | | 202,904 | | | | 177,342 | |
| | | | | | | | | | | | |
| | | |
Total Harleysville Group Business | | $ | 758,617 | | | $ | 882,061 | | | $ | 851,617 | |
| | | | | | | | | | | | |
| | | |
Total Harleysville Group Business without workers compensation net premiums written(1) | | $ | 798,629 | | | | | | | | | |
| | | | | | | | | | | | |
| | | |
Combined Ratios | | | | | | | | | | | | |
Commercial: | | | | | | | | | | | | |
Automobile | | | 105.4 | % | | | 100.0 | % | | | 91.4 | % |
Workers compensation | | | | | | | 106.1 | % | | | 106.2 | % |
Commercial multi-peril | | | 127.6 | % | | | 106.1 | % | | | 105.1 | % |
Other commercial | | | 98.7 | % | | | 88.8 | % | | | 97.6 | % |
Total commercial | | | 116.7 | % | | | 102.3 | % | | | 100.7 | % |
Total commercial without intercompany pooling transfer(1) | | | 115.4 | % | | | | | | | | |
| | | |
Personal: | | | | | | | | | | | | |
Automobile | | | 119.4 | % | | | 104.9 | % | | | 103.0 | % |
Homeowners | | | 148.9 | % | | | 108.2 | % | | | 92.7 | % |
Other personal | | | 75.9 | % | | | 62.6 | % | | | 81.1 | % |
Total personal | | | 129.3 | % | | | 103.5 | % | | | 96.8 | % |
| | | |
Total Harleysville Group Business | | | 119.9 | % | | | 102.5 | % | | | 99.8 | % |
| | | |
Total Harleysville Group Business without intercompany pooling transfer(1) | | | 119.0 | % | | | | | | | | |
| (1) | The effect of the January 1, 2011 pooling transfer of $40 million of net premiums written (representing the transfer of the January 1, 2011 unearned premium balance of workers compensation) and the effect of the pool transfer on the statutory combined ratios are excluded for comparative purposes. |
3
Pooling Arrangement
The Company’s property and casualty subsidiaries participate in an intercompany pooling arrangement with the Mutual Company and Pennland. The underwriting pool is intended to produce a more uniform and stable underwriting result from year to year for all companies in the pool than they would experience individually and to reduce the risk of loss of any of the pool participants by spreading the risk among all the participants. Each company participating in the pool has at its disposal the capacity of the entire pool, rather than being limited to policy exposures of a size commensurate with its own capital and surplus. The additional capacity exists because such policy exposures are spread among all the pool participants which each have their own capital and surplus. Regulation is applied to the individual companies rather than to the pool.
Pursuant to the terms of the pooling agreement with the Mutual Company, each of the Company’s subsidiary participants and Pennland cede premiums, losses and underwriting expenses on all of its business to the Mutual Company which, in turn, retrocedes to such subsidiaries a specified portion of premiums, losses and underwriting expenses of the Mutual Company, Pennland and such subsidiaries. Under the terms of the intercompany pooling agreement which became effective January 1, 1986, Preferred and HNJ ceded to the Mutual Company all of their insurance business written on or after January 1, 1986. All of the Mutual Company’s property and casualty insurance business written or in force on or after January 1, 1986, was also included in the pooled business. The pooling agreement provides, however, that Harleysville Group is not liable for any losses incurred by the Mutual Company, Preferred and HNJ prior to January 1, 1986. The pooling agreement does not legally discharge Harleysville Group from its primary liability for the full amount of the policies ceded. However, it makes the Mutual Company liable to Harleysville Group to the extent of the business ceded.
The following table sets forth a chronology of the changes that have occurred in the pooling agreement since it became effective on January 1, 1986.
Chronology of Changes in Pooling Agreement
| | | | | | | | | | |
Date | | Harleysville
Group
Percentage | | | Mutual
Company/Pennland
Percentage | | | Event |
| | | |
January 1, 1986 | | | 30 | % | | | 70 | % | | Current pooling agreement began with Preferred and HNJ as participants with the Mutual Company. |
| | | |
July 1, 1987 | | | 35 | % | | | 65 | % | | Atlantic acquired and included in the pool. |
| | | |
January 1, 1989 | | | 50 | % | | | 50 | % | | Worcester included in the pool. |
| | | |
January 1, 1991 | | | 60 | % | | | 40 | % | | HIC New York acquired and included in the pool and the Mutual Company formed Pennland (not a pool participant) to write Pennsylvania personal automobile business. |
| | | |
January 1, 1996 | | | 65 | % | | | 35 | % | | Pennland included in the pool. |
| | | |
January 1, 1997 | | | 70 | % | | | 30 | % | | Lake States included in the pool. |
| | | |
January 1, 1998 | | | 72 | % | | | 28 | % | | HIC included in the pool. |
| | | |
January 1, 2008 | | | 80 | % | | | 20 | % | | Amendment to the pooling participation percentages. |
| | | |
January 1, 2010 | | | 80 | % | | | 20 | % | | Amendment to exclude any premiums, losses and expenses assumed by the Mutual Company, other than business assumed from any mandatory regulatory pool or association. |
| | | |
January 1, 2011 | | | 80 | % | | | 20 | % | | Amendment to establish that the financial results of the workers compensation line of business for accident years 2011 and following is retained 100% by the Mutual Company. |
When pool participation percentages increased as described above, cash and investments equal to the net increase in liabilities assumed less a ceding commission related to the net increase in the liability for unearned premiums, was transferred from the Mutual Company to Harleysville Group. In connection with the January 1, 2011
4
pool change, cash equal to the net decrease in the liability for unearned premiums, less a ceding commission, was transferred from Harleysville Group to the Mutual Company. See Note 3(a) of the Notes to Consolidated Financial Statements.
All premiums, losses, loss settlement expenses and other underwriting expenses are prorated among the parties to the pooling arrangement on the basis of their participation in the pool. The method of establishing reserves is set forth under “Business - Reserves.” The pooling agreement may be amended or terminated by agreement of the parties. Termination may occur only at the end of a calendar year. The Boards of Directors of the Company and the Mutual Company maintain a coordinating committee which reviews and evaluates, and when changes are warranted, approves, the pooling arrangements between the Company and the Mutual Company. See “Business - Relationship with the Mutual Company.” In evaluating pool participation changes, the coordinating committee considers current and proposed acquisitions, the relative capital positions and revenue contributions of the pool participants, and growth prospects and ability to access capital markets to support that growth.
The following table sets forth the net premiums written and combined ratios by line of insurance for the total business of the pooled companies after elimination of management fees and the voluntary assumed reinsurance business of the Mutual Company, prepared in accordance with statutory accounting practices prescribed or permitted by state insurance authorities, for the periods indicated.
TOTAL BUSINESS OF POOLED COMPANIES
| | | | | | | | | | | | |
| | | Year Ended December 31, | |
| | | 2011 | | | 2010 | | | 2009 | |
| | | (dollars in thousands) | |
| | | |
Net Premiums Written | | | | | | | | | | | | |
Commercial: | | | | | | | | | | | | |
Automobile | | $ | 211,862 | | | $ | 222,941 | | | $ | 227,711 | |
Workers compensation | | | 94,613 | | | | 97,167 | | | | 100,606 | |
Commercial multi-peril | | | 422,114 | | | | 423,742 | | | | 407,803 | |
Other commercial | | | 91,901 | | | | 105,097 | | | | 106,724 | |
| | | | | | | | | | | | |
Total commercial | | | 820,490 | | | | 848,947 | | | | 842,844 | |
| | | | | | | | | | | | |
| | | |
Personal: | | | | | | | | | | | | |
Automobile | | | 137,275 | | | | 127,556 | | | | 106,493 | |
Homeowners | | | 117,578 | | | | 109,670 | | | | 100,056 | |
Other personal | | | 17,555 | | | | 16,403 | | | | 15,128 | |
| | | | | | | | | | | | |
Total personal | | | 272,408 | | | | 253,629 | | | | 221,677 | |
| | | | | | | | | | | | |
| | | |
Total pooled business | | $ | 1,092,898 | | | $ | 1,102,576 | | | $ | 1,064,521 | |
| | | | | | | | | | | | |
| | | |
Combined Ratios(1) | | | | | | | | | | | | |
Commercial: | | | | | | | | | | | | |
Automobile | | | 105.7 | % | | | 100.0 | % | | | 91.6 | % |
Workers compensation | | | 106.1 | % | | | 109.6 | % | | | 106.4 | % |
Commercial multi-peril | | | 127.8 | % | | | 106.1 | % | | | 105.1 | % |
Other commercial | | | 98.8 | % | | | 89.1 | % | | | 97.6 | % |
Total commercial | | | 116.1 | % | | | 102.7 | % | | | 100.7 | % |
| | | |
Personal: | | | | | | | | | | | | |
Automobile | | | 119.8 | % | | | 106.8 | % | | | 104.4 | % |
Homeowners | | | 149.0 | % | | | 108.1 | % | | | 92.8 | % |
Other personal | | | 75.9 | % | | | 62.6 | % | | | 81.1 | % |
Total personal | | | 129.5 | % | | | 104.4 | % | | | 97.5 | % |
| | | |
Total pooled business | | | 119.3 | % | | | 103.0 | % | | | 100.0 | % |
| (1) | See the definition of combined ratio in “Business - Property and Casualty Underwriting.” |
The combined ratio for the total business of the pooled companies differs from Harleysville Group’s combined ratio primarily because of the effect of the inclusion of incurred losses occurring prior to 1986 retained by the Mutual Company and for 2011, due to the impact of the pool change on the statutory combined ratio described in note (1) on page 2. See Note 3(a) of the Notes to Consolidated Financial Statements and “Business - Reinsurance.”
5
Reserves.Loss reserves are estimates at a given point in time of what the insurer expects to pay to claimants for claims occurring on or before such point in time, including claims which have been incurred but not yet reported to the insurer. These are estimates, and it can be expected that the ultimate liability will exceed or be less than such estimates. During the loss settlement period, additional facts regarding individual claims may become known, and consequently it often becomes necessary to refine and adjust the estimates of liability.
Harleysville Group maintains reserves for estimates of the ultimate unpaid cost of all losses incurred, including losses for claims which have been incurred but have not yet been reported to Harleysville Group. Loss settlement expense reserves are intended to cover the ultimate costs of settling all claims, including investigation and litigation costs relating to such claims. The amount of loss reserves for reported claims is based primarily upon a case-by-case evaluation of the type of risk involved and knowledge of the circumstances surrounding each claim and the insurance policy provisions relating to the type of loss. The amounts of loss reserves for incurred but unreported claims and loss settlement expense reserves are determined utilizing historical information by line of insurance as adjusted to current conditions. Inflation is implicitly provided for in the reserving function through analysis of costs, trends and reviews of historical reserving results. Estimates of the liabilities are reviewed and updated on a regular basis using the most recent information on reported claims and a variety of actuarial techniques. With the exception of reserves relating to some workers compensation long-term disability cases, loss reserves are not discounted.
The following table sets forth a reconciliation of beginning and ending net reserves for unpaid losses and loss settlement expenses for the years indicated for the total business of the pooled companies, excluding the voluntary assumed reinsurance business of the Mutual Company, on a statutory basis.
TOTAL BUSINESS OF POOLED COMPANIES
| | | | | | | | | | | | |
| | | Year Ended December 31, | |
| | | 2011 | | | 2010 | | | 2009 | |
| | | (in thousands) | |
| | | |
Reserves for losses and loss settlement expenses, beginning of the year | | $ | 1,994,835 | | | $ | 1,997,647 | | | $ | 1,998,006 | |
| | | | | | | | | | | | |
| | | |
Incurred losses and loss settlement expenses: | | | | | | | | | | | | |
Provision for insured events of the current year | | | 980,258 | | | | 798,294 | | | | 734,820 | |
Decrease in provision for insured events of prior years | | | (36,699 | ) | | | (56,437 | ) | | | (42,781 | ) |
| | | | | | | | | | | | |
| | | |
Total incurred losses and loss settlement expenses | | | 943,559 | | | | 741,857 | | | | 692,039 | |
| | | | | | | | | | | | |
| | | |
Payments: | | | | | | | | | | | | |
Losses and loss settlement expenses attributable to insured events of the current year | | | 409,457 | | | | 311,542 | | | | 254,342 | |
Losses and loss settlement expenses attributable to insured events of prior years | | | 476,460 | | | | 433,127 | | | | 438,056 | |
| | | | | | | | | | | | |
| | | |
Total payments | | | 885,917 | | | | 744,669 | | | | 692,398 | |
| | | | | | | | | | | | |
| | | |
Reserves for losses and loss settlement expenses, end of the year | | $ | 2,052,477 | | | $ | 1,994,835 | | | $ | 1,997,647 | |
| | | | | | | | | | | | |
The following table sets forth the development of net reserves for unpaid losses and loss settlement expenses from 2001 through 2011 for the total pooled business of the Mutual Company, Pennland and Harleysville Group on a statutory basis. “Net reserve for losses and loss settlement expenses” sets forth the estimated liability for unpaid losses and loss settlement expenses recorded at the balance sheet date for each of the indicated years. This liability represents the estimated amount of losses and loss settlement expenses for claims arising in the current and all prior years that are unpaid at the balance sheet date, including losses incurred but not reported.
6
The “Net reserves re-estimated” portion of the table shows the re-estimated amount of the previously recorded liability based on experience of each succeeding year. The estimate is increased or decreased as payments are made and more information becomes known about the severity of remaining unpaid claims. For example, the 2001 liability has developed a deficiency after ten years, in that re-estimated losses and loss settlement expenses are expected to be higher than the initial estimated liability established in 2001 of $1,147.5 million by $387.4 million, or 33.8%.
The “Cumulative amount of reserves paid” portion of the table shows the cumulative losses and loss settlement expense payments made in succeeding years for losses incurred prior to the balance sheet date. For example, the 2001 column indicates that as of December 31, 2011, payments of $1,238.8 million of the currently re-estimated ultimate liability for losses and loss settlement expenses had been made.
The “Redundancy (deficiency)” portion of the table shows the cumulative redundancy or deficiency at December 31, 2011 of the reserve estimate shown on the top line of the corresponding column. A redundancy in reserves means that reserves established in prior years exceeded actual losses and loss settlement expenses or were reevaluated at less than the original reserved amount. A deficiency in reserves means that the reserves established in prior years were less than actual losses and loss settlement expenses or were reevaluated at more than the originally reserved amounts.
The following table includes all 2011 pool participants as if they had participated in the pooling arrangement in all years indicated except for acquired pool participant companies, which are included from their date of acquisition. Under the terms of the pooling arrangement, Harleysville Group is not responsible for losses on the pooled business of the Mutual Company, Preferred and HNJ occurring prior to January 1, 1986.
TOTAL BUSINESS OF POOLED COMPANIES
| | | | | | | | | | | | | | | | | | | | | | | | | | | | | | | | | | | | | | | | | | | | | | |
| | | Year ended December 31, | |
| | | 2001 | | | 2002 | | | 2003 | | | 2004 | | | 2005 | | | 2006 | | | 2007 | | | 2008 | | | 2009 | | | 2010 | | | 2011 | |
| | | (dollars in thousands) | |
| | | | | | | | | | | | |
Net reserve for losses and loss settlement expenses | | $ | 1,147,517 | | | $ | 1,224,380 | | | $ | 1,514,548 | | | $ | 1,613,374 | | | $ | 1,761,198 | | | $ | 1,893,753 | | | $ | 1,967,094 | | | $ | 1,998,006 | | | $ | 1,997,647 | | | $ | 1,994,835 | | | | | $ | 2,052,477 | |
Net reserves re-estimated: | | | | | | | | | | | | | | | | | | | | | | | | | | | | | | | | | | | | | | | | | | | | | | |
One year later | | | 1,143,701 | | | | 1,397,821 | | | | 1,538,929 | | | | 1,593,829 | | | | 1,743,774 | | | | 1,867,438 | | | | 1,932,787 | | | | 1,955,225 | | | | 1,941,210 | | | | 1,958,136 | | | | | | | |
Two years later | | | 1,308,498 | | | | 1,459,056 | | | | 1,566,305 | | | | 1,602,547 | | | | 1,746,441 | | | | 1,827,703 | | | | 1,889,611 | | | | 1,902,147 | | | | 1,884,269 | | | | | | | | | | | |
Three years later | | | 1,369,239 | | | | 1,501,724 | | | | 1,605,840 | | | | 1,622,733 | | | | 1,719,799 | | | | 1,786,263 | | | | 1,844,392 | | | | 1,843,354 | | | | | | | | | | | | | | | |
Four years later | | | 1,413,644 | | | | 1,557,058 | | | | 1,630,971 | | | | 1,612,897 | | | | 1,696,843 | | | | 1,753,011 | | | | 1,796,744 | | | | | | | | | | | | | | | | | | | |
Five years later | | | 1,478,729 | | | | 1,585,986 | | | | 1,636,248 | | | | 1,608,069 | | | | 1,681,098 | | | | 1,717,327 | | | | | | | | | | | | | | | | | | | | | | | |
Six years later | | | 1,505,789 | | | | 1,601,882 | | | | 1,642,881 | | | | 1,603,408 | | | | 1,652,283 | | | | | | | | | | | | | | | | | | | | | | | | | | | |
Seven years later | | | 1,522,153 | | | | 1,616,442 | | | | 1,645,017 | | | | 1,583,407 | | | | | | | | | | | | | | | | | | | | | | | | | | | | | | | |
Eight years later | | | 1,538,558 | | | | 1,620,582 | | | | 1,628,848 | | | | | | | | | | | | | | | | | | | | | | | | | | | | | | | | | | | |
Nine years later | | | 1,543,298 | | | | 1,609,908 | | | | | | | | | | | | | | | | | | | | | | | | | | | | | | | | | | | | | | | |
Ten years later | | | 1,534,875 | | | | | | | | | | | | | | | | | | | | | | | | | | | | | | | | | | | | | | | | | | | |
| | | | | | | | | | | | |
Cumulative amount of reserves paid: | | | | | | | | | | | | | | | | | | | | | | | | | | | | | | | | | | | | | | | | | | | | | | |
One year later | | | 372,642 | | | | 437,855 | | | | 490,353 | | | | 389,968 | | | | 395,159 | | | | 405,441 | | | | 454,182 | | | | 438,056 | | | | 433,127 | | | | 476,460 | | | | | | | |
Two years later | | | 654,045 | | | | 759,313 | | | | 742,476 | | | | 642,066 | | | | 673,385 | | | | 716,150 | | | | 773,324 | | | | 721,607 | | | | 725,439 | | | | | | | | | | | |
Three years later | | | 884,746 | | | | 935,691 | | | | 921,520 | | | | 835,193 | | | | 892,400 | | | | 913,883 | | | | 931,820 | | | | 923,051 | | | | | | | | | | | | | | | |
Four years later | | | 1,005,199 | | | | 1,051,788 | | | | 1,042,755 | | | | 979,233 | | | | 1,025,007 | | | | 1,035,537 | | | | 1,061,440 | | | | | | | | | | | | | | | | | | | |
Five years later | | | 1,076,672 | | | | 1,127,999 | | | | 1,130,739 | | | | 1,067,068 | | | | 1,095,662 | | | | 1,114,593 | | | | | | | | | | | | | | | | | | | | | | | |
Six years later | | | 1,130,754 | | | | 1,187,789 | | | | 1,189,524 | | | | 1,113,655 | | | | 1,144,355 | | | | | | | | | | | | | | | | | | | | | | | | | | | |
Seven years later | | | 1,172,272 | | | | 1,230,143 | | | | 1,224,529 | | | | 1,148,924 | | | | | | | | | | | | | | | | | | | | | | | | | | | | | | | |
Eight years later | | | 1,204,801 | | | | 1,253,632 | | | | 1,250,660 | | | | | | | | | | | | | | | | | | | | | | | | | | | | | | | | | | | |
Nine years later | | | 1,222,778 | | | | 1,275,425 | | | | | | | | | | | | | | | | | | | | | | | | | | | | | | | | | | | | | | | |
Ten years later | | | 1,238,786 | | | | | | | | | | | | | | | | | | | | | | | | | | | | | | | | | | | | | | | | | | | |
| | | | | | | | | | | | |
Cumulative redundancy/ (deficiency) | | | (387,358 | ) | | | (385,528 | ) | | | (114,300 | ) | | | 29,967 | | | | 108,915 | | | | 176,426 | | | | 170,350 | | | | 154,652 | | | | 113,378 | | | | 36,699 | | | | | | | |
Cumulative redundancy/ (deficiency) expressed as a percent of year-end reserves | | | (33.8 | %) | | | (31.5 | %) | | | (7.5 | %) | | | 1.9 | % | | | 6.2 | % | | | 9.3 | % | | | 8.7 | % | | | 7.7 | % | | | 5.7 | % | | | 1.8 | % | | | | | | |
Cumulative redundancy/ (deficiency) excluding pre-1986 reserve development(1) | | | (336,211 | ) | | | (336,562 | ) | | | (73,004 | ) | | | 64,143 | | | | 138,038 | | | | 198,110 | | | | 187,728 | | | | 166,576 | | | | 122,979 | | | | 40,076 | | | | | | | |
| (1) | Excludes business not included in pooling arrangement with Harleysville Group. |
7
Harleysville Group’s reserves primarily are derived from those established for the total pooled business. The terms of the pooling agreement provide that Harleysville Group is not liable for any losses incurred by the Mutual Company, Preferred and HNJ prior to January 1, 1986, or for certain business assumed by the Mutual Company effective January 1, 2010 and for workers compensation business for accident years 2011 and following. The GAAP loss reserve experience of Harleysville Group, as reflected in its financial statements, is shown in the following table which sets forth a reconciliation of beginning and ending net reserves for unpaid losses and loss settlement expenses for the years indicated for the business of Harleysville Group only.
HARLEYSVILLE GROUP BUSINESS ONLY
| | | | | | | | | | | | |
| | | Year Ended December 31, | |
| | | 2011 | | | 2010 | | | 2009 | |
| | | (in thousands) | |
| | | |
Reserves for losses and loss settlement expenses, beginning of the year | | $ | 1,554,065 | | | $ | 1,559,164 | | | $ | 1,558,249 | |
| | | | | | | | | | | | |
| | | |
Incurred losses and loss settlement expenses: | | | | | | | | | | | | |
Provision for insured events of the current year | | | 713,697 | | | | 639,234 | | | | 588,575 | |
Decrease in provision for insured events of prior years | | | (32,061 | ) | | | (50,129 | ) | | | (36,084 | ) |
| | | | | | | | | | | | |
| | | |
Total incurred losses and loss settlement expenses | | | 681,636 | | | | 589,105 | | | | 552,491 | |
| | | | | | | | | | | | |
| | | |
Payments: | | | | | | | | | | | | |
Losses and loss settlement expenses attributable to insured events of the current year | | | 311,828 | | | | 249,831 | | | | 204,192 | |
| | | |
Losses and loss settlement expenses attributable to insured events of prior years | | | 378,469 | | | | 344,373 | | | | 347,384 | |
| | | | | | | | | | | | |
| | | |
Total payments | | | 690,297 | | | | 594,204 | | | | 551,576 | |
| | | | | | | | | | | | |
| | | |
Reserves for losses and loss settlement expenses, end of the year | | $ | 1,545,404 | | | $ | 1,554,065 | | | $ | 1,559,164 | |
| | | | | | | | | | | | |
See page 10 for reconciliation of net reserves to gross reserves.
Harleysville Group recognized net favorable development in the provision for insured events of prior years of $32.1 million in 2011, primarily due to lower-than-expected claims severity broadly experienced across casualty lines in accident years 2003 through 2008, partially offset by adverse development in accident years 2009 and 2010. The 2011 net favorable development consisted of $30.9 million in commercial lines and $1.2 million in personal lines.
Harleysville Group recognized net favorable development in the provision for insured events of prior years of $50.1 million in 2010, primarily due to lower-than-expected claims severity broadly experienced across all casualty lines in accident years 2004 through 2008, partially offset by a slight amount of adverse development in accident years prior to 2000. The 2010 net favorable development consisted of $44.8 million in commercial lines and $5.3 million in personal lines.
Harleysville Group recognized net favorable development in the provision for insured events of prior years of $36.1 million in 2009, primarily due to lower-than-expected claims severity broadly experienced across all casualty lines in accident years 2002 through 2006, partially offset by adverse development in accident year 2008 and accident years prior to 2002. A lower-than-expected level of claims severity was observed in personal lines in accident year 2008, which led to the recognition of $2.3 million of favorable development in this accident year in 2009. This amount was offset by the recognition in 2009 of $2.6 million of adverse development in commercial lines in accident year 2008, primarily related to a higher-than-expected level of commercial property severity in this accident year. The 2009 net favorable development consisted of $31.5 million in commercial lines and $4.6 million in personal lines.
8
The following table sets forth the development of net reserves for unpaid losses and loss settlement expenses for Harleysville Group. The effect of changes to the pooling agreement participation is reflected in this table. For example, the January 1, 2008 increase in Harleysville Group’s pooling participation from 72% to 80% is reflected in the first line of the 2008 column. Amounts of assets equal to increases in net liabilities were transferred to Harleysville Group from the Mutual Company and Pennland in conjunction with each respective pooling change. The amount of the assets transferred has been netted against and has reduced the cumulative amounts paid for years prior to the pooling changes. For example, the 2007 column of the “Cumulative amount of reserves paid” portion of the table reflects the assets transferred in conjunction with the 2008 increase in the pooling percentage from 72% to 80% as a decrease netted in the “one year later” line. The cumulative amounts paid are reflected in this manner to maintain comparability. This is because when Harleysville Group pays claims subsequent to the date of a pool participation increase, the amounts paid are greater, however, the prior year’s reserve amounts are reflective of a lower pool participation percentage. By reflecting pooling participation increases in this manner, loss development is not obscured. Loss development reflects Harleysville Group’s share of the total pooled business loss development since January 1, 1986 when Harleysville Group began participation.
9
Loss development information for the total business of the pooled companies is presented on pages 6 to 8 to provide greater analysis of underlying claims development.
HARLEYSVILLE GROUP BUSINESS
| | | | | | | | | | | | | | | | | | | | | | | | | | | | | | | | | | | | | | | | | | | | |
| | | Year Ended December 31, | |
| | | 2001 | | | 2002 | | | 2003 | | | 2004 | | | 2005 | | | 2006 | | | 2007 | | | 2008 | | | 2009 | | | 2010 | | | 2011 | |
| | | (dollars in thousands) | |
| | | | | | | | | | | |
Net reserve for losses and loss settlement expenses | | $ | 800,861 | | | $ | 857,182 | | | $ | 1,062,660 | | | $ | 1,131,609 | | | $ | 1,237,090 | | | $ | 1,329,849 | | | $ | 1,381,812 | | | $ | 1,558,249 | | | $ | 1,559,164 | | | $ | 1,554,065 | | | $ | 1,545,404 | |
Net reserves re- estimated: | | | | | | | | | | | | | | | | | | | | | | | | | | | | | | | | | | | | | | | | | | | | |
One year later | | | 796,213 | | | | 976,241 | | | | 1,075,122 | | | | 1,114,076 | | | | 1,219,005 | | | | 1,307,802 | | | | 1,350,004 | | | | 1,522,165 | | | | 1,509,035 | | | | 1,522,004 | | | | | |
Two years later | | | 909,048 | | | | 1,015,209 | | | | 1,091,322 | | | | 1,114,813 | | | | 1,217,825 | | | | 1,271,651 | | | | 1,313,605 | | | | 1,474,723 | | | | 1,460,781 | | | | | | | | | |
Three years later | | | 947,660 | | | | 1,042,276 | | | | 1,114,275 | | | | 1,126,248 | | | | 1,192,149 | | | | 1,236,640 | | | | 1,272,450 | | | | 1,424,987 | | | | | | | | | | | | | |
Four years later | | | 975,978 | | | | 1,076,597 | | | | 1,129,270 | | | | 1,114,016 | | | | 1,171,926 | | | | 1,205,060 | | | | 1,231,630 | | | | | | | | | | | | | | | | | |
Five years later | | | 1,017,319 | | | | 1,094,325 | | | | 1,129,129 | | | | 1,108,295 | | | | 1,154,351 | | | | 1,173,811 | | | | | | | | | | | | | | | | | | | | | |
Six years later | | | 1,033,702 | | | | 1,102,679 | | | | 1,132,577 | | | | 1,099,587 | | | | 1,128,598 | | | | | | | | | | | | | | | | | | | | | | | | | |
Seven years later | | | 1,042,431 | | | | 1,112,468 | | | | 1,129,307 | | | | 1,080,885 | | | | | | | | | | | | | | | | | | | | | | | | | | | | | |
Eight years later | | | 1,053,696 | | | | 1,110,801 | | | | 1,113,670 | | | | | | | | | | | | | | | | | | | | | | | | | | | | | | | | | |
Nine years later | | | 1,052,509 | | | | 1,099,560 | | | | | | | | | | | | | | | | | | | | | | | | | | | | | | | | | | | | | |
Ten years later | | | 1,043,069 | | | | | | | | | | | | | | | | | | | | | | | | | | | | | | | | | | | | | | | | | |
Cumulative amount of reserves paid: | | | | | | | | | | | | | | | | | | | | | | | | | | | | | | | | | | | | | | | | | | | | |
One year later | | | 265,422 | | | | 312,224 | | | | 350,082 | | | | 278,270 | | | | 281,655 | | | | 289,661 | | | | 207,275 | | | | 347,384 | | | | 344,373 | | | | 378,469 | | | | | |
Two years later | | | 465,001 | | | | 541,063 | | | | 529,126 | | | | 456,921 | | | | 479,720 | | | | 422,565 | | | | 427,529 | | | | 572,095 | | | | 575,524 | | | | | | | | | |
Three years later | | | 628,494 | | | | 665,513 | | | | 655,219 | | | | 593,715 | | | | 570,384 | | | | 577,691 | | | | 584,196 | | | | 730,551 | | | | | | | | | | | | | |
Four years later | | | 712,677 | | | | 746,455 | | | | 740,251 | | | | 706,410 | | | | 673,410 | | | | 672,885 | | | | 685,193 | | | | | | | | | | | | | | | | | |
Five years later | | | 761,490 | | | | 799,069 | | | | 764,877 | | | | 773,618 | | | | 727,804 | | | | 733,431 | | | | | | | | | | | | | | | | | | | | | |
Six years later | | | 798,172 | | | | 811,558 | | | | 808,844 | | | | 808,758 | | | | 764,059 | | | | | | | | | | | | | | | | | | | | | | | | | |
Seven years later | | | 802,680 | | | | 842,381 | | | | 834,719 | | | | 834,275 | | | | | | | | | | | | | | | | | | | | | | | | | | | | | |
Eight years later | | | 825,643 | | | | 859,043 | | | | 852,925 | | | | | | | | | | | | | | | | | | | | | | | | | | | | | | | | | |
Nine years later | | | 837,895 | | | | 873,779 | | | | | | | | | | | | | | | | | | | | | | | | | | | | | | | | | | | | | |
Ten years later | | | 848,003 | | | | | | | | | | | | | | | | | | | | | | | | | | | | | | | | | | | | | | | | | |
| | | | | | | | | | | |
Net cumulative redundancy/ (deficiency) | | | (242,208 | ) | | | (242,378 | ) | | | (51,010 | ) | | | 50,724 | | | | 108,492 | | | | 156,038 | | | | 150,182 | | | | 133,262 | | | | 98,383 | | | | 32,061 | | | | | |
| | | | | | | | | | | |
Net cumulative redundancy/ (deficiency) expressed as a percent of year end reserves | | | (30.2 | %) | | | (28.3 | %) | | | (4.8 | %) | | | 4.5 | % | | | 8.8 | % | | | 11.7 | % | | | 10.9 | % | | | 8.6 | % | | | 6.3 | % | | | 2.1 | % | | | | |
| | | | | | | | | | | |
Gross reserve | | $ | 879,056 | | | $ | 928,335 | | | $ | 1,219,977 | | | $ | 1,317,735 | | | $ | 1,480,802 | | | $ | 1,493,645 | | | $ | 1,546,690 | | | $ | 1,767,601 | | | $ | 1,782,292 | | | $ | 1,771,661 | | | $ | 1,789,591 | |
Ceded reserve | | | 78,195 | | | | 71,153 | | | | 157,317 | | | | 186,126 | | | | 243,712 | | | | 163,796 | | | | 164,878 | | | | 209,352 | | | | 223,128 | | | | 217,596 | | | | 244,187 | |
| | | | | | | | | | | | | | | | | | | | | | | | | | | | | | | | | | | | | | | | | | | | |
Net reserve | | $ | 800,861 | | | $ | 857,182 | | | $ | 1,062,660 | | | $ | 1,131,609 | | | $ | 1,237,090 | | | $ | 1,329,849 | | | $ | 1,381,812 | | | $ | 1,558,249 | | | $ | 1,559,164 | | | $ | 1,554,065 | | | $ | 1,545,404 | |
| | | | | | | | | | | | | | | | | | | | | | | | | | | | | | | | | | | | | | | | | | | | |
| | | | | | | | | | | |
Gross cumulative redundancy/ (deficiency) | | $ | (387,261 | ) | | $ | (391,128 | ) | | $ | (124,098 | ) | | $ | 12,637 | | | $ | 68,346 | | | $ | 120,194 | | | $ | 121,696 | | | $ | 124,583 | | | $ | 100,773 | | | $ | 33,969 | | | | | |
| | | | | | | | | | | | | | | | | | | | | | | | | | | | | | | | | | | | | | | | | | | | |
| | | | | | | | | | | |
Gross re-estimated | | $ | 1,266,317 | | | $ | 1,319,463 | | | $ | 1,344,075 | | | $ | 1,305,098 | | | $ | 1,412,456 | | | $ | 1,373,451 | | | $ | 1,424,994 | | | $ | 1,643,018 | | | $ | 1,681,519 | | | $ | 1,737,692 | | | | | |
Ceded re-estimated | | | 223,248 | | | | 219,903 | | | | 230,405 | | | | 224,213 | | | | 283,858 | | | | 199,640 | | | | 193,364 | | | | 218,031 | | | | 220,738 | | | | 215,688 | | | | | |
| | | | | | | | | | | | | | | | | | | | | | | | | | | | | | | | | | | | | | | | | | | | |
Net re-estimated | | $ | 1,043,069 | | | $ | 1,099,560 | | | $ | 1,113,670 | | | $ | 1,080,885 | | | $ | 1,128,598 | | | $ | 1,173,811 | | | $ | 1,231,630 | | | $ | 1,424,987 | | | $ | 1,460,781 | | | $ | 1,522,004 | | | | | |
| | | | | | | | | | | | | | | | | | | | | | | | | | | | | | | | | | | | | | | | | | | | |
Note: The amount of cash and investments received equal to the increase in liabilities for unpaid losses and loss settlement expenses was $153,535,000 for the change in pool participation in 2008.
Reinsurance.Harleysville Group follows the customary industry practice of reinsuring a portion of its exposures and paying to the reinsurers a portion of the premiums received. Insurance is ceded principally to reduce the net liability on individual risks and to protect against catastrophic losses. Ceded reinsurance contracts do not relieve Harleysville Group’s primary obligation to its policyholders. Consequently, an exposure exists with respect to reinsurance recoverables to the extent that any reinsurer is unable to meet its obligation or disputes the liabilities assumed under the reinsurance contract. From time to time, Harleysville Group may encounter such disputes with its reinsurers. In addition, the creditworthiness of our reinsurers could deteriorate in the future due to adverse events affecting the reinsurance industry, such as a large number of major catastrophes. Harleysville Group has not entered into any finite reinsurance agreements.
10
The reinsurance described below is maintained for the Company’s subsidiaries and the Mutual Company and its wholly owned subsidiary. Reinsurance premiums and recoveries are allocated to participants in the pooling agreement according to pooling percentages.
Reinsurance for property and auto physical damage losses is currently maintained under a per risk excess of loss treaty affording recovery to $23.5 million above a retention of $1.5 million for homeowners losses and $23.0 million above a retention of $2.0 million for other property losses. Harleysville Group’s 2011 pooling share of such recovery would be $18.8 million above a retention of $1.2 million for homeowners losses and $18.4 million above a retention of $1.6 million for other property losses. In addition, the Company’s subsidiaries and the Mutual Company and its wholly owned subsidiary are reinsured under property catastrophe reinsurance treaties which provide the following coverage:
| | | | |
| | | Property Catastrophe Reinsurance Treaties |
| | | Full Treaties | | Harleysville Group’s Pooling Share |
| | |
Retention | | $60 million | | $48 million |
| | |
Coverage for Losses | | 71.45% of losses between $60 and $90 million | | 71.45% of losses between $48 and $72 million |
| | 75.7% of losses between $90 and $200 million | | 75.7% of losses between $72 and $160 million |
| | 80.34% of losses between $200 and $475 million | | 80.34% of losses between $160 and $380 million |
| | 75% of losses between $475 and $525 million | | 75% of losses between $380 and $420 million |
| | |
Maximum Recovery | | $363.1 million for losses of $525 million or more | | $290.5 million for losses of $420 million or more |
The treaties includes reinstatement provisions providing for coverage for a second catastrophe and requiring payment of an additional premium in the event of a first catastrophe occurring. Most terrorism losses would not be covered by the treaties. Harleysville Group has not purchased funded catastrophe covers.
Effective January 1, 2012, the Company’s subsidiaries and the Mutual Company and its wholly owned subsidiary renewed the top layer of its property catastrophe reinsurance program and decreased reinsurance coverage in the layer from 75% to 64.35%. Accordingly, effective January 1, 2012, pursuant to the terms of the property catastrophe treaties, the maximum recovery would be $357.8 million for any catastrophe involving an insured loss equal to or greater than $525.0 million. Harleysville Group’s pooling share of this maximum recovery would be $286.3 million for any catastrophe involving an insured loss of $420.0 million or greater.
There is reinsurance to protect Harleysville Group from large workers compensation losses on a per-life and occurrence basis above a retention of $2.0 million. As a result of the January 1, 2011 change to the pooling agreement, Harleysville Group’s pooling share of this retention for workers compensation losses occurring in 2011 would be zero. In addition, casualty reinsurance (including liability, umbrella and workers compensation subject to per-life maximums) is maintained under an excess of loss treaty affording recovery to $47.5 million above a retention of $2.5 million for each loss occurrence for commercial lines coverages and recovery of up to $48.5 million above a retention of $1.5 million for personal lines coverages. Additionally, a 30% participation on losses of $2.5 million in excess of $2.5 million is retained on commercial lines coverages. Harleysville Group’s 2011 pooling share of a recovery would be up to $37.4 million above a retention of $2.0 million for commercial lines and $38.8 million above a retention of $1.2 million for personal lines. The casualty reinsurance programs provide coverage for a terrorist event with no reinstatement provision.
The terms and charges for reinsurance coverage are typically negotiated annually. The reinsurance market is subject to conditions which are similar to those in the direct property and casualty insurance market, and there can be no assurance that reinsurance will remain available to Harleysville Group to the same extent and at the same cost currently maintained.
Harleysville Group considers numerous factors in choosing reinsurers, the most important of which are the financial stability and credit worthiness of the reinsurer. Harleysville Group has not experienced any material uncollectible reinsurance recoverables.
The Company’s subsidiaries and the Mutual Company are servicing carriers in the “Write-Your-Own” (WYO) program of the United States government’s National Flood Insurance Program (NFIP). The WYO program is a cooperative undertaking of the insurance industry and the Federal Emergency Management Agency. As servicing
11
carriers, Harleysville Group and the Mutual Company bear no risk of loss on flood insurance policies. All of the premiums collected on flood insurance policies are ceded to the federal government and, in exchange, a servicing fee is received from which agency commission, claim handling fees and other related expenses are paid.
As a writer of personal and commercial automobile policies in the state of Michigan, in compliance with applicable state regulations, Harleysville Group cedes premiums and claims for medical benefits and work loss, above a specified retention amount, to the Michigan Catastrophic Claims Association. For policies effective July 1, 2011 to June 30, 2012, the required retention is $500,000.
Competition.The property and casualty insurance industry is highly competitive on the basis of both price and service. There are numerous companies competing for the categories of business underwritten by Harleysville Group in the geographic areas where Harleysville Group operates, many of which are substantially larger and have considerably greater financial resources than Harleysville Group. In addition, because the insurance products of Harleysville Group and the Mutual Company are marketed exclusively through independent insurance agencies, most of which represent more than one company, Harleysville Group faces competition within each agency.
Marketing.Harleysville Group markets its insurance products through independent agencies and monitors the performance of these agencies relative to many factors including profitability, growth and retention. At December 31, 2011, there were approximately 1,300 agencies.
Investments
An important element of the financial results of Harleysville Group is the return on invested assets. An investment objective of Harleysville Group is to maintain a widely diversified fixed maturities portfolio structured to maximize after-tax investment income while minimizing credit risk through investments in high quality instruments. An objective also is to provide adequate funds to pay claims without forced sales of investments. At December 31, 2011, substantially all of Harleysville Group’s fixed maturity investment portfolio was rated investment grade and the investment portfolio did not contain any real estate or mortgage loans.
Harleysville Group has adopted and follows an investment philosophy which precludes the purchase of non-investment grade fixed income securities. However, due to uncertainties in the economic environment, it is possible that the quality of investments held in Harleysville Group’s portfolio may change, as a result of which Harleysville Group may hold some non-investment grade securities.
Following the execution of the Merger Agreement, the Company determined that it was prudent to sell its equity securities portfolio holdings to reduce risks that could negatively impact the Company’s ability to meet various financial covenant closing conditions set forth in the Merger Agreement. Such sales occurred in the fourth quarter of 2011.
The following table shows the composition of Harleysville Group’s fixed maturity investment portfolio at amortized cost, excluding short-term investments, by rating as of December 31, 2011:
| | | | | | | | |
| | | December 31, 2011 | |
| | | Amount | | | Percent | |
| | | (dollars in thousands) | |
| | |
Rating(1) | | | | | | | | |
U.S. Treasury obligations | | $ | 434,308 | | | | 18.7 | % |
U.S. agency obligations(2) | | | 286,304 | | | | 12.4 | |
Aaa | | | 529,280 | | | | 22.8 | |
Aa | | | 791,701 | | | | 34.1 | |
A | | | 244,012 | | | | 10.5 | |
Baa | | | 28,880 | | | | 1.2 | |
Not rated | | | 5,671 | | | | 0.3 | |
| | | | | | | | |
| | |
Total | | $ | 2,320,156 | | | | 100.0 | % |
| | | | | | | | |
| (1) | Ratings assigned by Moody’s Investors Services, Inc., or Standard & Poor’s if Moody’s rating not available. |
| (2) | Includes GNMA pass-through obligations and collateralized mortgage obligations. |
12
Harleysville Group invests in both taxable and tax-exempt fixed income securities as part of its strategy to maximize after-tax income. Such strategy considers, among other factors, the impact of the alternative minimum tax. Tax-exempt bonds made up approximately 46%, 44% and 42% of the total investment portfolio at December 31, 2011, 2010 and 2009, respectively.
The following table shows the composition of Harleysville Group’s investment portfolio at carrying value, excluding short-term investments, by type of security as of December 31, 2011:
| | | | | | | | |
| | | December 31, 2011 | |
| | | Amount | | | Percent | |
| | | (dollars in thousands) | |
| | |
Fixed maturities: | | | | | | | | |
U.S. Treasury obligations | | $ | 442,324 | | | | 17.8 | % |
U.S. agency obligations | | | 8,354 | | | | 0.3 | |
Mortgage-backed securities | | | 294,617 | | | | 11.9 | |
Obligations of states and political subdivisions | | | 1,225,735 | | | | 49.3 | |
Corporate securities | | | 515,876 | | | | 20.7 | |
| | | | | | | | |
| | |
Total fixed maturities | | | 2,486,906 | | | | 100.0 | |
| | | | | | | | |
| | |
Equity securities | | | 7 | | | | — | |
| | | | | | | | |
| | |
Total | | $ | 2,486,913 | | | | 100.0 | % |
| | | | | | | | |
Investment results of Harleysville Group’s fixed maturity investment portfolio are as shown in the following table:
| | | | | | | | | | | | |
| | | Year Ended December 31, | |
| | | 2011 | | | 2010 | | | 2009 | |
| | | (dollars in thousands) | |
| | | |
Invested assets(1) | | $ | 2,268,808 | | | $ | 2,229,368 | | | $ | 2,188,955 | |
Investment income(2) | | $ | 89,910 | | | $ | 100,504 | | | $ | 103,971 | |
Average yield | | | 4.0 | % | | | 4.5 | % | | | 4.7 | % |
| (1) | Average of the aggregate invested amounts at amortized cost at the beginning and end of the period. |
| (2) | Investment income does not include investment expenses, realized investment gains or losses or provision for income taxes. |
The following table indicates the composition of Harleysville Group’s fixed maturity investment portfolio at carrying value, excluding short-term investments, by time to maturity as of December 31, 2011:
| | | | | | | | |
| | | December 31, 2011 | |
| | | Amount | | | Percent | |
| | | (dollars in thousands) | |
Due in(1) | | | | | | | | |
| | |
1 year or less | | $ | 66,608 | | | | 2.7 | % |
Over 1 year through 5 years | | | 1,060,027 | | | | 42.6 | |
Over 5 years through 10 years | | | 637,752 | | | | 25.6 | |
Over 10 years | | | 427,902 | | | | 17.2 | |
| | | | | | | | |
| | | 2,192,289 | | | | 88.1 | |
| | |
Mortgage-backed securities | | | 294,617 | | | | 11.9 | |
| | | | | | | | |
| | |
Total | | $ | 2,486,906 | | | | 100.0 | % |
| | | | | | | | |
| (1) | Based on stated maturity dates with no prepayment assumptions. Actual maturities may differ because borrowers may have the right to call or prepay obligations with or without call or prepayment penalties. |
The average expected life of Harleysville Group’s investment portfolio as of December 31, 2011 was approximately 4.3 years.
13
Regulation
Insurance companies are subject to supervision and regulation in the states in which they transact business. Such supervision and regulation relate to numerous aspects of an insurance company’s business and financial condition. The purpose of such supervision and regulation is the protection of policyholders. The extent of such supervision and regulation varies, but generally derives from state statutes which delegate regulatory, supervisory and administrative authority to state insurance departments. Accordingly, the authority of the state insurance departments typically includes the establishment of standards of solvency which must be met and maintained by insurers, the licensing to do business of insurers and agents, the nature of and limitations on investments, the approval process for premium rates for property and casualty insurance, the provisions which insurers must make for current losses and future liabilities, the deposit of securities for the benefit of policyholders and the approval of policy forms. Such insurance departments also conduct periodic examinations of the affairs of insurance companies and require the filing of annual and other reports relating to the financial condition of insurance companies.
All of the states in which Harleysville Group and the Mutual Company do business have guaranty fund laws under which insurers doing business in such states can be assessed up to 2% of annual premiums written by the insurer in that state in order to fund policyholder liabilities of insolvent insurance companies. Under these laws in general, an insurer is subject to assessment, depending upon its market share of a given line of business, to assist in the payment of policyholder and third party claims against insolvent insurers.
State laws also require Harleysville Group to participate in involuntary insurance programs for automobile insurance and workers compensation, as well as other property and casualty lines, in states in which Harleysville Group writes such lines. These programs include joint underwriting associations, assigned risk plans, fair access to insurance requirements (FAIR) plans, reinsurance facilities and wind storm plans. These state laws generally require all companies that write lines covered by these programs to provide coverage (either directly or through reinsurance) for insureds who cannot obtain insurance in the voluntary market. The legislation creating these programs usually allocates a pro rata portion of risks attributable to such insureds to each company on the basis of direct written premiums or the number of automobiles insured. Generally, state law requires participation in such programs as a condition to doing business. The loss ratio on insurance written under involuntary programs generally has been greater than the loss ratio on insurance in the voluntary market.
State insurance holding company acts regulate insurance holding company systems. Each insurance company in the holding company system is required to register with the insurance supervisory agency of its state of domicile and furnish certain information concerning transactions between companies within the holding company system that may materially affect the operations, management or financial condition of the insurer within the system, including the payment of dividends from the insurance subsidiaries to the Company.
Insurance holding company acts require that all transactions involving any insurer within the holding company system, including those involving the Mutual Company and the Company’s insurance subsidiaries, must be fair and equitable to that insurer. Further, approval of the applicable insurance commissioner is required prior to the consummation of a transaction affecting the control of an insurer. In this regard, the Merger must be approved by the Commissioner of Insurance of the Commonwealth of Pennsylvania under the Pennsylvania laws governing the regulation of insurance companies and insurance holding companies. Nationwide submitted a Form A application to the Pennsylvania Insurance Commissioner on November 10, 2011.
The Terrorism Risk Insurance Act of 2002 (the Act) established a program that provides a backstop for insurance-related losses resulting from any act of terrorism as defined. The Act, originally set to expire in 2005, was extended through December 31, 2007 in December 2005. The Act was extended again through December 31, 2014 in December 2007 and retitled as the Terrorism Risk Insurance Program Reauthorization Act (TRIPRA) of 2007. Under the program, the federal government will pay 85% of covered losses after an insurer’s losses exceed a deductible determined by a statutorily prescribed formula, up to a combined annual aggregate limit for the federal government and all insurers of $100 billion. If an act of terrorism or acts of terrorism result in covered losses exceeding the $100 billion annual limit, insurers with losses exceeding their deductibles will not be responsible for additional losses. The triggering threshold for certifying an act of terrorism is $100 million in 2011 through 2014. TRIPRA adds coverage for domestic acts of terror, in addition to foreign acts of terror covered under the previous Act.
The statutory formula for determining a company’s deductible for each year is based on the company’s direct commercial earned premiums for the prior calendar year multiplied by a specified percentage. This percentage is 20% for 2011 through 2014. The following lines of business are excluded from coverage and are not to be included in the
14
deductible calculation: commercial auto, burglary and theft, surety, professional liability and farmowners’ multi-peril insurance. Based on the Company’s insurance subsidiaries 2011 earned premiums for lines subject to the Act, our 2012 deductible would be $89.3 million.
The Act and TRIPRA require all property and casualty insurers to make terrorism insurance coverage available in all of their covered commercial property and casualty insurance policies (as defined in the Act).
In the event the Act is not renewed beyond 2014, or is renewed in a materially different form, the Company may have to attempt to obtain appropriate reinsurance for the related terrorism risk, seek exclusion from coverage related to terrorism exposure from the appropriate regulatory authorities, limit certain of its writings, or pursue a solution encompassing aspects of one or more of the foregoing.
The property and casualty insurance industry has been subject to significant public scrutiny and comment primarily due to concerns regarding solvency issues, rising insurance costs, and the industry’s methods of operations. Accordingly, regulations and legislation may be adopted or enacted to provide a greater role for the federal government in regulation of insurance companies, to strengthen state oversight, particularly in the field of solvency and investments, to further restrict an insurer’s flexibility in underwriting and pricing risks and to impose new taxes and assessments. It is not possible to predict whether, in what form or in what jurisdictions, any of these measures might be adopted or the effect, if any, on Harleysville Group.
The Company’s insurance subsidiaries generally are restricted by the insurance laws of their respective states of domicile as to the amount of dividends they may pay to the Company without the prior approval of the respective state regulatory authorities. Generally, the maximum dividend that may be paid by an insurance subsidiary during any year without prior regulatory approval is limited to a stated percentage of that subsidiary’s statutory surplus as of a certain date, or adjusted net income of the subsidiary, for the preceding year. Applying the current regulatory restrictions as of December 31, 2011, $65.1 million would be available for distribution to Harleysville Group Inc. in 2012 without prior approval. The Company’s insurance subsidiaries declared dividends of $19.3 million, $89.0 million and $57.0 million in 2011, 2010 and 2009, respectively. The Company’s insurance subsidiaries paid dividends of $43.4 million in 2011 ($24.1 million of which had been declared in 2010), $94.3 million in 2010 ($29.5 million of which had been declared in 2009), and $27.5 million in 2009.
Various states have adopted the National Association of Insurance Commissioners (NAIC) risk-based capital (RBC) standards that require insurance companies to calculate and report statutory capital and surplus needs based on a formula measuring underwriting, investment and other business risks inherent in an individual company’s operations. These RBC standards have not affected the operations of Harleysville Group since each of the Company’s insurance subsidiaries has statutory capital and surplus in excess of RBC requirements.
Harleysville Group is required to file financial statements for its subsidiaries, prepared by using statutory accounting practices, with state regulatory authorities. The adjustments necessary to reconcile net income and shareholders’ equity determined by using SAP to net income and shareholders’ equity determined in accordance with GAAP are as follows:
| | | | | | | | | | | | | | | | | | | | |
| | | Net Income
Year Ended December 31, | | | Shareholders’ Equity
December 31, | |
| | | 2011 | | | 2010 | | | 2009 | | | 2011 | | | 2010 | |
| | | | | | | | | (in thousands) | | | | | | | |
| | | | | |
SAP amounts | | $ | 43,736 | | | $ | 68,429 | | | $ | 90,892 | | | $ | 628,670 | | | $ | 695,475 | |
Adjustments: | | | | | | | | | | | | | | | | | | | | |
Deferred policy acquisition costs | | | (12,741 | ) | | | 2,348 | | | | 1,310 | | | | 101,256 | | | | 113,997 | |
Deferred income taxes | | | (994 | ) | | | (760 | ) | | | (3,385 | ) | | | (23,961 | ) | | | (43,220 | ) |
Unrealized investment gains | | | | | | | | | | | | | | | 166,750 | | | | 96,004 | |
Pension | | | (1,584 | ) | | | (768 | ) | | | 877 | | | | (70,599 | ) | | | (49,302 | ) |
Non-admitted assets | | | | | | | | | | | | | | | 3,436 | | | | 4,382 | |
Other, net | | | (2,100 | ) | | | (793 | ) | | | (1,308 | ) | | | 14,503 | | | | 10,114 | |
Holding company(1) | | | (3,705 | ) | | | (1,558 | ) | | | (2,090 | ) | | | (66,499 | ) | | | (58,817 | ) |
| | | | | | | | | | | | | | | | | | | | |
| | | | | |
GAAP amounts | | $ | 22,612 | | | $ | 66,898 | | | $ | 86,296 | | | $ | 753,556 | | | $ | 768,633 | |
| | | | | | | | | | | | | | | | | | | | |
| (1) | Represents the GAAP loss and equity amounts for Harleysville Group Inc., excluding the earnings of and investment in subsidiaries. |
15
Business - Relationship with the Mutual Company
Harleysville Group’s operations are interrelated with the operations of the Mutual Company due to the pooling arrangement and other factors. The Mutual Company owned approximately 53% of the issued and outstanding common stock of Harleysville Group Inc. at December 31, 2011. Harleysville Group employees provide a variety of services to the Mutual Company and its wholly owned subsidiaries. The cost of facilities and employees required to conduct the business of both companies is charged on a cost-allocated basis. Harleysville Group also manages the operations of the Mutual Company and its wholly owned subsidiaries pursuant to a management agreement which commenced January 1, 1993, and was amended and restated effective January 1, 1994, under which Harleysville Group receives a management fee. The agreement was subsequently amended effective January 1, 2010 to include voluntary assumed reinsurance business written by the Mutual Company. Harleysville Group received $8.5 million, $5.8 million, and $5.1 million for the years ended December 31, 2011, 2010 and 2009, respectively, for all such management services.
All of the Company’s officers are officers of the Mutual Company, and six of the Company’s eight directors are directors of the Mutual Company. A coordinating committee exists to review and evaluate the pooling agreement and other material transactions between Harleysville Group and the Mutual Company and is responsible for matters involving actual or potential conflicts of interest between the two companies. The coordinating committee currently consists of six non-employee directors, two from Harleysville Group Inc. and three from the Mutual Company all of whom are not members of both Boards and one, a non-voting Chairman, who is a member of both Boards. The decisions of the coordinating committee are binding on the two companies. No intercompany transaction can be authorized by the coordinating committee unless the Company’s committee members conclude that such transaction is fair and equitable to Harleysville Group.
The Mutual Company leases the home office from a Company subsidiary and it shares most of the facility with Harleysville Group. Rental income under the lease was $4.5 million for 2011, $4.4 million for 2010 and $4.2 million for 2009. Harleysville Group believes that the lease terms are no less favorable to it than if the property were leased to a non-affiliate.
In connection with the acquisition of HIC New York in 1991, the Company borrowed $18.5 million from the Mutual Company. See Note 8 of the Notes to Consolidated Financial Statements. For additional information with respect to transactions with the Mutual Company, see Note 3 of the Notes to Consolidated Financial Statements.
Employees
All employees are paid by Harleysville Group Inc. and, accordingly, are considered to be employees of Harleysville Group Inc. As of December 31, 2011, there were 1,717 employees. The Company considers its relationships with its employees to be good. They also provide a variety of services to the Mutual Company and its wholly owned subsidiaries. See “Business-Relationship with the Mutual Company” and Note 3 of the Notes to Consolidated Financial Statements.
Available Information
The Company maintains a website atwww.harleysvillegroup.com. Our annual report on Form 10-K, quarterly reports on Form 10-Q and current reports on Form 8-K, and amendments to those reports, filed or furnished pursuant to Section 13(a) or 15(d) of the Securities Exchange Act of 1934 (the Exchange Act), are available free of charge on our website as soon as practicable after electronic filing of such material with, or furnishing it to, the U.S. Securities and Exchange Commission. This information may be read and copied at the Public Reference Room of the SEC at 100 F Street, N.E., Washington, D.C., 20549. The SEC also maintains an internet web site that contains reports, proxy statements, and other information about issuers, like Harleysville Group Inc., who file electronically with the SEC. The address of the site is http://www.sec.gov.
For the Company’s risk factors, see “Management’s Discussion and Analysis - Risk Factors.”
| Item 1B. | Unresolved Staff Comments. |
None.
16
The buildings which house the headquarters of Harleysville Group and the Mutual Company in Harleysville, Pennsylvania are leased to the Mutual Company by a subsidiary of Harleysville Group. See “Business-Relationship with the Mutual Company.” The Mutual Company charges Harleysville Group for an appropriate portion of the rent under an intercompany allocation agreement. See “Certain Relationships and Related Transactions, and Director Independence,” Item 13 in Part III of this Form 10-K. The buildings containing the headquarters of Harleysville Group and the Mutual Company have approximately 220,000 square feet of office space. Harleysville Group also rents office facilities in certain of the states in which it does business.
| Item 3. | Legal Proceedings. |
Stockholder Lawsuits
Louisiana Municipal Police Employees Retirement System v. Harleysville Group Inc., et al.
On October 4, 2011, the Company, the Mutual Company, the Company’s directors, Nationwide and a subsidiary of Nationwide (Merger Sub) were named as defendants in a putative class action complaint in the Court of Chancery of the State of Delaware, captionedLouisiana Municipal Police Employees Retirement System v. Harleysville Group Inc., et al.That action, purportedly brought on behalf of a class of stockholders, alleges that the Company’s directors breached their fiduciary duties of care, loyalty, good faith, candor and independence. The complaint further alleges that the Company’s directors, through their acts, transactions and courses of conduct, are attempting to unfairly deprive stockholders of the true value of their investment in the Company. The complaint further alleges that there exists an imbalance and disparity of knowledge between our directors and our public stockholders which makes it inherently unfair for the Company’s directors to benefit from their own interests to the exclusion of maximizing stockholder value. The complaint further alleges that the Company’s directors failed to disclose to the plaintiffs all material information necessary to cast an informed stockholder vote on the proposed transaction. The complaint further alleges that Nationwide and Merger Sub aided and abetted the claimed breaches of fiduciary duties by our directors. The plaintiff seeks injunctive and other equitable relief, including a request that the court enjoin us from consummating the Merger, as well as damages, fees and costs. To date, by agreement of the parties, the Company has not filed an answer to this complaint.
Eric H. Berger v. Harleysville Group Inc., et al.
On October 6, 2011, the Company, the Mutual Company, the Company’s directors, Nationwide and Merger Sub were named as defendants in a putative class action complaint in the Court of Chancery of the State of Delaware, captionedEric H. Berger v. Harleysville Group Inc., et al.That action, purportedly brought on behalf of a class of stockholders, alleges that the Company’s directors breached their fiduciary duties of care, loyalty, good faith, candor and independence. The complaint further alleges that the directors, through their acts, transactions and courses of conduct, are attempting to unfairly deprive our stockholders of the true value of their investment in the Company. The complaint further alleges that there exists an imbalance and disparity of knowledge between the Company’s directors and its public stockholders which makes it inherently unfair for the Company’s directors to benefit from their own interests to the exclusion of maximizing stockholder value. The complaint further alleges that the directors failed to disclose to the plaintiffs all material information necessary to cast an informed stockholder vote on the proposed transaction. The complaint further alleges that Nationwide and Merger Sub aided and abetted the claimed breaches of fiduciary duties by the Company’s directors. The plaintiff seeks injunctive and other equitable relief, including a request that the court enjoin the Company from consummating the Merger, as well as damages, fees and costs. To date, by agreement of the parties, the Company has not filed an answer to this complaint.
Consolidated Stockholder Lawsuits
The plaintiffs in both the Louisiana Municipal Police Employees Retirement System and the Berger cases are represented by the same law firm. On October 21, 2011, the Court of Chancery of Delaware entered an order agreed to by counsel for the plaintiffs and counsel for the Company, the Mutual Company, the Company’s directors, Nationwide and Merger Sub consolidating both cases. On January 3, 2012, the plaintiffs filed their Consolidated Amended Class Action Complaint, which adds allegations about the sale process, asserting that there was not a vigorous enough effort to find other buyers at a higher price together with alleged disclosure shortfalls, all by reference to the preliminary proxy statement filed by the Company with the SEC on December 23, 2011. To date, by agreement of the parties, the Company has not filed an answer to the Consolidated Amended Class Action Complaint.
17
Policyholder Lawsuits
After the announcement of the Merger Agreement, the Mutual Company received five letters on behalf of purported policyholders objecting to the merger of the Mutual Company into Nationwide (the Parent Merger). Six lawsuits were filed against the Mutual Company brought by purported policyholders challenging the proposed transaction. Initially, Nationwide was named as a defendant in three of these suits. Since their initial filing, three of the lawsuits against the Mutual Company have been dismissed and the remaining three consolidated into one action. For additional procedural history regarding the original policyholder actions, please see the Harleysville Group Definitive Proxy Statement, to be filed in March 2012.
On January 20, 2012, pursuant to a Court Order, plaintiffs filed a Consolidated Class Action and Derivative Complaint (the CCADC) on behalf of the three plaintiffs with continuing lawsuits against the Mutual Company. The CCADC contains nine claims variously stated as being derivative and/or class in nature: (1) declaratory and injunctive relief contending that the Merger and the Parent Merger (the Mergers) are fundamentally unfair; (2) declaratory and injunctive relief contending that the draft proxy statement for the policyholders-members of the Mutual Company, which was filed by the Mutual Company with the Pennsylvania Insurance Department on December 23, 2011, is materially misleading; (3) declaratory relief contending that the Merger Agreement prevents the Special Litigation Committee formed by the Mutual Company’s board of directors from performing its authorized function; (4) equitable relief contending that the Mutual Company has been effectively demutualized; (5) breach of duty by the Mutual Company’s directors; (6) aiding and abetting a breach of duty by the Mutual Company’s directors, Nationwide and Merger Sub; (7) unjust enrichment against the Mutual Company’s directors, the two directors of the Company who are only directors of the Company, the Mutual Company, Nationwide and Merger Sub; (8) constructive trust against the Mutual Company, Nationwide and Merger Sub; and (9) declaratory and injunctive relief to enjoin enforcement of allegedly unlawful provisions of the Merger Agreement against Nationwide and the Company. On January 31, 2012, all defendants filed preliminary objections to the CCADC. The preliminary objections are pending.
The Harleysville Mutual Special Litigation Committee
In response to the demands and complaints, the Mutual Company’s Board of Directors established a Special Litigation Committee to investigate the claims set forth in the demands and complaints and to determine the most appropriate actions for the Mutual Company to take in response to them. The Special Litigation Committee consists of three newly appointed independent directors of the Mutual Company. None of the members of the Special Litigation Committee own any stock of the Company. On February 8, 2012, the Court issued an Order which granted the Special Litigation Committee’s motion to have until March 1, 2012 to issue its report on its investigation.
On March 1, 2012, the Special Litigation Committee issued a report of its investigation, which concluded that: (1) the Mutual Company directors had fulfilled their fiduciary obligations and had not breached their duties of care and loyalty in negotiating and entering into the Merger Agreement with Nationwide; (2) the Merger Agreement transaction is intrinsically fair and satisfies the standards of both fair process and fair result; (3) the derivative claims filed by the plaintiffs lack merit; (4) it is in the best interests of the Mutual Company that the plaintiffs’ derivative claims be dismissed; (5) the Parent Merger is in the best interests of the Mutual Company, including its policyholders; and (6) substantial delay in the consummation of the Parent Merger would be damaging to the Mutual Company and, therefore, the Parent Merger should proceed without further disruption. On the same day, the Special Litigation Committee filed a motion to dismiss the derivative claims contained in the CCADC.
Other
On January 7, 2011, the South Carolina Supreme Court held inCrossmann v Harleysville Mutual Insurance Company (Opinion No. 26909, January 7, 2011) that a contractor’s or subcontractor’s negligent/faulty work does not constitute an “occurrence” under the applicable Commercial general liability policy. In May 2011, the South Carolina legislature passed legislation to overturn theCrossmann decision. The law purported to impact all pending and future claims. The constitutionality of the retroactive application of the legislation is now being challenged.
| Item 4. | Mine Safety Disclosures |
Not applicable.
18
PART II
| Item 5. | Market for Registrant’s Common Equity, Related Stockholder Matters and Issuer Purchases of Equity Securities. |
The stock of Harleysville Group Inc. is quoted on the NASDAQ National Market System, and assigned the symbol HGIC. At the close of business on March 8, 2012, the approximate number of holders of record of Harleysville Group Inc.’s common stock was 2,378 (counting all shares held in single nominee registration as one stockholder).
The payment of dividends is subject to the discretion of Harleysville Group Inc.’s Board of Directors which considers, among other factors, Harleysville Group’s operating results, overall financial condition, capital requirements and general business conditions each quarter. As a holding company, one of Harleysville Group Inc.’s sources of cash with which to pay dividends is dividends from its subsidiaries. Harleysville Group Inc.’s insurance company subsidiaries are subject to state laws that restrict their ability to pay dividends. See Note 9 of the Notes to Consolidated Financial Statements and “Business - Regulation.”
The following table sets forth the amount of cash dividends declared per share, and the high and low trading price as reported by NASDAQ for Harleysville Group Inc.’s common stock for each quarter during the past two years.
| | | | | | | | | | | | |
| | | High | | | Low | | | Cash
Dividends
Declared | |
2011 | | | | | | | | | | | | |
First Quarter | | $ | 37.66 | | | $ | 30.55 | | | $ | .360 | |
Second Quarter | | | 33.91 | | | | 29.50 | | | | .360 | |
Third Quarter | | | 59.00 | | | | 24.75 | | | | .380 | |
Fourth Quarter | | | 59.76 | | | | 53.51 | | | | .000 | |
| | | |
| | | High | | | Low | | | Cash
Dividends
Declared | |
2010 | | | | | | | | | | | | |
First Quarter | | $ | 35.33 | | | $ | 30.98 | | | $ | .325 | |
Second Quarter | | | 34.21 | | | | 30.55 | | | | .325 | |
Third Quarter | | | 33.41 | | | | 30.31 | | | | .360 | |
Fourth Quarter | | | 37.81 | | | | 32.22 | | | | 1.800 | (1) |
| (1) | Includes a special dividend of $1.44 per share. |
Securities Authorized for Issuance Under Equity Compensation Plans.See “Security Ownership of Certain Beneficial Owners and Management and Related Stockholder Matters,” Item 12 in Part III of this Form 10-K.
19
Unregistered Sales of Equity Securities and Use of Proceeds.
None.
Issuer Purchases of Equity Securities(1)
| | | | | | | | | | | | | | | | |
Period | | Total Number
of Shares
Purchased (2) | | | Average Price
Paid Per Share | | | Total Number of
Shares Purchased
as Part of Publicly
Announced Plans
or Programs | | | Maximum Number
of Shares that
May Yet Be Purchased
Under the Plans
or Programs | |
| | | | |
October 1 - October 31, 2011 | | | 1,492 | | | $ | 59.00 | | | | -0- | | | | 554,916 | |
November 1 - November 30, 2011 | | | 5,714 | | | $ | 59.06 | | | | -0- | | | | 554,916 | |
December 1 - December 31, 2011 | | | 144,421 | | | $ | 58.50 | | | | -0- | | | | 554,916 | |
| | | | | | | | | | | | | | | | |
Total | | | 151,627 | | | | | | | | | | | | | |
| (1) | On July 30, 2009, the Board of Directors authorized the Company to repurchase up to 800,000 shares of its outstanding common stock over a two year period in the open market or in privately negotiated transactions. Additionally, the Board authorized the Company to make purchases under the terms of a Rule 10b5-1 trading plan, which allows the Company to purchase its shares at times when it ordinarily would not be in the market because of self-imposed trading blackout periods, such as the time preceding its quarterly earnings releases, or because its officers are in possession of material, non-public information. The Company repurchased shares in open market transactions from the public float, and did not repurchase shares from the Mutual Company. This program was completed on August 3, 2010. On August 6, 2010, the Board of Directors authorized the Company to repurchase up to an additional 800,000 shares of its outstanding common stock over a two year period under terms similar to the repurchase authorization of July 30, 2009. As of December 31, 2011, the Company had repurchased 245,084 shares under this authorization, leaving 554,916 shares authorized to be repurchased. Provisions in the Merger Agreement with Nationwide restrict the Company from repurchasing further shares. |
| (2) | In accordance with the terms of its Equity Incentive Plan, the Company acquired all of the above shares from employees in connection with stock option exercises and the vesting of restricted stock and restricted stock unit awards. The stock was received in payment of the exercise price of the stock options and in satisfaction of withholding taxes due upon exercise or vesting of stock awards. |
20
Stock Performance Chart.
The following graph shows changes over the past five-year period (all full calendar-year periods) in the value of $100 invested in: 1) Harleysville Group common stock; 2) the NASDAQ National Market System index; and 3) the Peer Group index. All values are as of the last trading day of each year.
Comparison of 5-Year Cumulative Total Stockholder Return
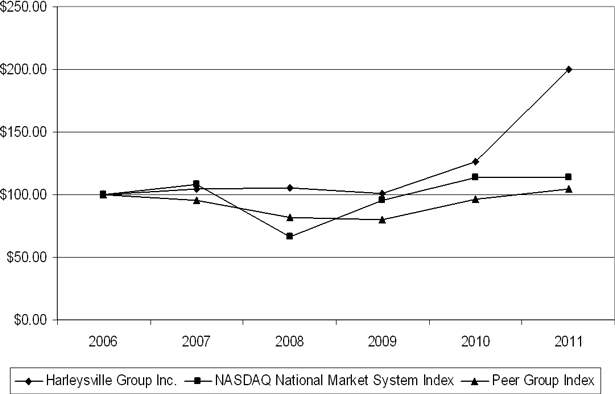
| | | | | | | | | | | | | | | | | | | | | | | | |
| | | 2006 | | | 2007 | | | 2008 | | | 2009 | | | 2010 | | | 2011 | |
Harleysville Group Inc. | | | 100.00 | | | | 104.31 | | | | 105.61 | | | | 100.66 | | | | 126.05 | | | | 199.73 | |
NASDAQ National Market System Index | | | 100.00 | | | | 108.47 | | | | 66.35 | | | | 95.38 | | | | 113.19 | | | | 113.81 | |
Peer Group Index | | | 100.00 | | | | 95.57 | | | | 81.69 | | | | 80.22 | | | | 96.46 | | | | 104.98 | |
The year-end values of each investment shown in the preceding graph are based on share price appreciation plus dividends, with the dividends reinvested as of the day such dividends were ex-dividend. The calculations exclude trading commissions and taxes. Total stockholder returns from each investment, whether measured in dollars or percentages, can be calculated from the year-end investment values shown in the legend.
The graph was prepared by Zacks Investment Research, Inc. (Zacks). The NASDAQ National Market System index includes all U.S. Companies in the NASDAQ National Market System and the Peer Group index includes 28 NASDAQ Company stocks in SIC Major Group 633 (SIC 6330-6339: U.S. and foreign, fire, marine and casualty insurance). A complete list of these companies may be obtained from Zacks, 111 North Canal Street, Suite 1101, Chicago, Illinois 60606; (800)767-3771. Zacks reweights the indices daily, using the market capitalization on the previous trading day.
21
| Item 6. | Selected Financial Data. |
At December 31, 2011, the Mutual Company owned approximately 53% of the Common Stock of the Company. Harleysville Group Inc. and its wholly owned subsidiaries are engaged in property and casualty insurance. These subsidiaries are: Harleysville-Atlantic Insurance Company, Harleysville Insurance Company, Harleysville Insurance Company of New Jersey, Harleysville Insurance Company of New York, Harleysville Insurance Company of Ohio, Harleysville Lake States Insurance Company, Harleysville Preferred Insurance Company, Harleysville Worcester Insurance Company, and Harleysville Ltd., a real estate partnership that owns the home office. Harleysville-Atlantic Insurance Company and Harleysville Insurance Company of Ohio were merged into Harleysville Worcester Insurance Company in December 2011.
| | | | | | | | | | | | | | | | | | | | |
| | | Year Ended December 31, | |
| | | 2011 | | | 2010 | | | 2009 | | | 2008 | | | 2007 | |
| | | (in thousands, except per share data) | |
Income Statement Data(1): | | | | | | | | | | | | | | | | | | | | |
Premiums earned | | $ | 804,508 | | | $ | 866,350 | | | $ | 858,500 | | | $ | 918,515 | | | $ | 833,024 | |
Investment income, net | | | 95,401 | | | | 103,313 | | | | 106,649 | | | | 113,555 | | | | 110,827 | |
Realized investment gains (losses) | | | 75,478 | | | | 597 | | | | 2,293 | | | | (59,841 | ) | | | 875 | |
Total revenues | | | 995,159 | | | | 986,272 | | | | 980,620 | | | | 985,316 | | | | 962,012 | |
Income before income taxes | | | 16,261 | | | | 82,712 | | | | 115,998 | | | | 50,962 | | | | 142,995 | |
Income tax expense (benefit) | | | (6,351 | ) | | | 15,814 | | | | 29,702 | | | | 8,643 | | | | 42,941 | |
Net income | | | 22,612 | | | | 66,898 | | | | 86,296 | | | | 42,319 | | | | 100,054 | |
Basic earnings per share | | $ | 0.82 | | | $ | 2.43 | | | $ | 3.09 | | | $ | 1.45 | | | $ | 3.21 | |
Diluted earnings per share | | $ | 0.81 | | | $ | 2.42 | | | $ | 3.07 | | | $ | 1.43 | | | $ | 3.17 | |
Cash dividends per share | | $ | 1.10 | | | $ | 2.81 | | | $ | 1.25 | | | $ | 1.10 | | | $ | 0.88 | |
| | | | | |
Balance Sheet Data at Year End: | | | | | | | | | | | | | | | | | | | | |
Total investments | | $ | 2,616,301 | | | $ | 2,661,476 | | | $ | 2,639,814 | | | $ | 2,473,592 | | | $ | 2,358,473 | |
Total assets | | | 3,267,069 | | | | 3,278,232 | | | | 3,301,986 | | | | 3,155,318 | | | | 3,072,445 | |
Debt | | | 118,500 | | | | 118,500 | | | | 118,500 | | | | 118,500 | | | | 118,500 | |
Shareholders’ equity | | | 753,556 | | | | 768,633 | | | | 772,628 | | | | 652,634 | | | | 758,841 | |
Shareholders’ equity per share | | $ | 27.66 | | | $ | 28.42 | | | $ | 27.98 | | | $ | 23.18 | | | $ | 25.03 | |
| (1) | The Company’s insurance subsidiaries participate in an underwriting pooling arrangement with the Mutual Company and Pennland. Harleysville Group’s participation was 80% for 2008 through 2011 and 72% for 2007. See “Management’s Discussion and Analysis of Financial Condition and Results of Operations” and Note 3(a) of the Notes to Consolidated Financial Statements. |
| Item 7. | Management’s Discussion and Analysis of Financial Condition and Results of Operations. |
Certain of the statements contained herein (other than statements of historical facts) are forward-looking statements. Such forward-looking statements are made pursuant to the safe harbor provisions of the Private Securities Litigation Reform Act of 1995 and include estimates and assumptions related to economic, competitive, legislative and regulatory developments. These forward-looking statements are subject to change and uncertainty which are, in many instances, beyond the control of Harleysville Group Inc. (the Company) and have been made based upon management’s expectations and beliefs concerning future developments and their potential effect on the Company and its wholly owned property and casualty insurance subsidiaries (collectively, Harleysville Group). There can be no assurance that future developments will be in accordance with management’s expectations or that the effect of future developments on Harleysville Group will be those anticipated by management. Actual financial results, including premium levels and underwriting results, could differ materially from those anticipated by Harleysville Group depending on the outcome of certain factors, which may include changes in property and casualty loss trends and reserves; the insurance product pricing environment; changes in applicable law; government regulation and changes therein that may impede the ability to charge adequate rates; performance of and instability in the financial markets; investment losses; fluctuations in interest rates; significant catastrophe events in the geographic regions where we do business; decreased demand for property and casualty insurance; availability and price of reinsurance; the A. M. Best group rating of Harleysville Group; and the status of labor markets in which the Company operates. In addition, see “Management’s Discussion and Analysis - Risk Factors.”
22
Overview
The Company’s net income is primarily determined by four elements:
| | • | | investment income and realized investment gains (losses); |
| | • | | amounts paid or reserved to settle insured claims; and |
| | • | | other income and expense. |
Variations in premium income are subject to a number of factors, including:
| | • | | limitations on premium rates arising from the competitive marketplace or regulation; |
| | • | | limitations on available business arising from a need to maintain the quality of underwritten risks; |
| | • | | the Company’s ability to maintain its A (Excellent) group rating by A.M. Best; and |
| | • | | the ability of the Company to maintain a reputation for efficiency and fairness in claims administration. |
Variations in investment income and realized investment gains (losses) are subject to a number of factors, including:
| | • | | general interest rate levels and financial market conditions; |
| | • | | specific adverse events affecting the issuers of debt obligations held by the Company; and |
| | • | | changes in the prices of debt and equity securities generally and those held by the Company specifically. |
Loss and loss settlement expenses are affected by a number of factors, including:
| | • | | the quality of the risks underwritten by the Company; |
| | • | | the nature and severity of catastrophic losses; |
| | • | | the availability, cost and terms of reinsurance; and |
| | • | | underlying settlement costs, including medical and legal costs. |
Variations in other income and expense are affected by a number of factors, including:
| | • | | the level of premiums written by the Mutual Company and its subsidiaries which are subject to the management fee; |
| | • | | the amount of flood insurance written and ceded to the National Flood Insurance Program; and |
| | • | | the interest rate on debt issued by the Company. |
The Company seeks to manage each of the foregoing to the extent within its control. Many of the foregoing factors are partially, or entirely, outside of the control of the Company.
Critical Accounting Policies and Estimates
The consolidated financial statements are prepared in conformity with U.S. generally accepted accounting principles, which require Harleysville Group to make estimates and assumptions (see Note 1 of the Notes to Consolidated Financial Statements). Harleysville Group believes that of its significant accounting policies, the following may involve a higher degree of judgment and estimation. The judgments, or the methodology on which the judgments are made, are reviewed quarterly with the Audit Committee.
Liabilities for Losses and Loss Settlement Expenses. The liability for losses and loss settlement expenses represents estimates of the ultimate unpaid cost of all losses incurred, including losses for claims which have not yet been reported to Harleysville Group. The amount of loss reserves for reported claims is based primarily upon a case-
23
by-case evaluation of the type of risk involved, knowledge of the circumstances surrounding each claim and the insurance policy provisions relating to the type of loss. The amounts of loss reserves for unreported claims and loss settlement expense reserves are determined utilizing historical information by line of insurance as adjusted to current conditions. Inflation is implicitly provided for in the reserving function through analysis of costs, trends and reviews of historical reserving results. Estimates of the liabilities are reviewed and updated on a regular basis using the most recent information on reported claims and a variety of actuarial techniques. It is expected that such estimates will be more or less than the amounts ultimately paid when the claims are settled. Changes in these estimates are reflected in current operations.
Investments. Generally, unrealized investment gains or losses on investments carried at fair value, net of applicable income taxes, are reflected directly in shareholders’ equity as a component of comprehensive income and, accordingly, have no effect on net income. However, if the fair value of an investment in equity securities declines below its cost and that decline is deemed other than temporary, the amount of the decline below cost is charged to earnings. A fixed maturity security is other than temporarily impaired if the present value of the cash flows expected to be collected is less than the amortized cost of the security or where the security’s fair value is below cost and the Company intends to sell, or more likely than not will be required to sell, the security before recovery of its value. If the Company does not intend to sell, or more likely than not will not be required to sell, a fixed maturity security whose fair value has declined below its cost, the amount of the decline below cost due to credit-related reasons is charged to earnings and the remaining difference is included in comprehensive income. Harleysville Group monitors its investment portfolio and at least quarterly reviews investments that have experienced a decline in fair value below cost to evaluate whether the decline is other than temporary. Such evaluations consider, among other things, the magnitude and reasons for a decline, the prospects for the fair value to recover in the near term and Harleysville Group’s intent to retain the investment for a period of time sufficient to allow for a recovery in value. Future adverse investment market conditions, or poor operating results of underlying investments, could result in an impairment charge in the future.
The severe downturn in the public debt and equity markets in 2008, reflecting uncertainties associated with the mortgage crisis, worsening economic conditions, widening of credit spreads, bankruptcies and government intervention in large financial institutions, has resulted in significant realized and unrealized losses in our investment portfolio in the past. Depending on market conditions going forward, we could incur additional realized and unrealized losses in future periods.
The fair value of equity securities is based on the closing market value. The fair value of mutual fund holdings is based on the closing net asset value reported by the fund. The fair value of fixed maturities is based upon data supplied by an independent pricing service. It can be difficult to determine the fair value of non-traded securities, but Harleysville Group does not own a material amount of non-traded securities.
Policy Acquisition Costs. Policy acquisition costs, such as commissions, premium taxes and certain other underwriting and agency expenses that vary with and are primarily related to the production of business, are deferred and amortized over the effective period of the related insurance policies and in proportion to the premiums earned. The method followed in computing deferred policy acquisition costs limits the amount of such deferred costs to their estimated realizable value. The estimation of net realizable value takes into account the premium to be earned, related investment income over the claim paying period, expected losses and loss settlement expenses, and certain other costs expected to be incurred as the premium is earned. Future changes in estimates, the most significant of which is expected losses and loss settlement expenses, may require adjustments to deferred policy acquisition costs. If the estimation of net realizable value indicates that the deferred acquisition costs are not recoverable, they are written off and further analyses are performed to determine if an additional liability would need to be accrued.
Contingencies. Besides claims related to its insurance products, Harleysville Group is subject to proceedings, lawsuits and claims in the normal course of business. Harleysville Group assesses the likelihood of any adverse outcomes to these matters as well as potential ranges of probable losses. There can be no assurance that actual outcomes will be consistent with those assessments.
The application of certain of these critical accounting policies to the years ended December 31, 2011 and 2010 is discussed in greater detail below.
24
Results of Operations
Harleysville Group underwrites property and casualty insurance in both the personal and commercial lines of insurance. The personal lines of insurance include both auto and homeowners, and the commercial lines include auto, commercial multi-peril and workers compensation. The business is marketed primarily in the eastern and midwestern United States through independent agents.
Historically, Harleysville Group’s results of operations have been influenced by factors affecting the property and casualty insurance industry in general. The operating results of the United States property and casualty insurance industry have been subject to significant variations due to competition, weather, catastrophic events, regulation, the availability and cost of satisfactory reinsurance, general economic conditions, judicial trends, fluctuations in interest rates and other changes in the investment environment.
Harleysville Group’s premium growth and underwriting results have been, and continue to be, influenced by market conditions. Insurance industry price competition has often made it difficult both to obtain and to retain properly priced personal and commercial lines business. It is management’s policy to continue to maintain its underwriting standards.
Property and casualty insurance premiums are established before the amount of losses and loss settlement expenses, or the extent to which inflation may affect such expenses, are known. Consequently, Harleysville Group attempts, in establishing rates, to anticipate the potential impact of inflation. In the past, inflation has contributed to increased losses and loss settlement expenses.
The key elements of Harleysville Group’s business model are the sales of properly priced and underwritten personal and commercial property and casualty insurance through independent agents and the investment of the premiums in a manner designed to assure that claims and expenses can be paid while providing a return on the capital employed. Loss trends and investment performance are critical factors in influencing the success of the business model. These factors are affected by the factors impacting the insurance industry in general as described above and factors unique to Harleysville Group as described in the following discussion.
Transactions with Affiliates
On September 28, 2011, the Company and Harleysville Mutual Insurance Company (the Mutual Company) entered into an agreement and plan of merger (the Merger Agreement) with Nationwide Mutual Insurance Company (Nationwide) under which a subsidiary of Nationwide would merge into the Company. Nationwide would acquire all of the publicly held shares of common stock of the Company for $60.00 per share in cash, and the Mutual Company would merge into Nationwide and the policyholders and members of the Mutual Company would become policyholders and members of Nationwide. The Mutual Company has also entered into a voting agreement with Nationwide (the Voting Agreement) under which the Mutual Company agreed to vote its 53% voting interest in the Company in favor of the Merger. The Merger Agreement restricts the Company from engaging in certain activities and taking certain actions without Nationwide’s prior approval, including among others, the payment of stockholder dividends.
The transactions are subject to customary closing conditions, including, among others, approvals from stockholders of the Company, policyholders of the Mutual Company and Nationwide, the Pennsylvania Insurance Department, the Ohio Insurance Department and various other regulatory bodies. The transactions are expected to close in the first half of 2012. The Merger Agreement provides certain termination rights. In the event that the agreement is terminated under certain conditions by the Company’s Board of Directors, the Company will be required to pay Nationwide a termination fee of $29.6 million and reimburse Nationwide for its transaction expenses.
The Company’s property and casualty subsidiaries participate in a pooling agreement with the Mutual Company and its property and casualty insurance subsidiary, Harleysville Pennland Insurance Company (Pennland). The pooling agreement provides for the allocation of premiums, losses, loss settlement expenses and underwriting expenses between Harleysville Group and the Mutual Company. Harleysville Group is not liable for any losses incurred by the Mutual Company or Company subsidiaries Harleysville Preferred Insurance Company (Preferred) and Harleysville Insurance Company of New Jersey (HNJ) prior to January 1, 1986, the date the pooling agreement became effective, or for certain business assumed by the Mutual Company effective January 1, 2010. Harleysville Group’s participation in the pool has been 80% since January 1, 2008.
Effective January 1, 2011, the Company’s property and casualty subsidiaries and the Mutual Company and Pennland amended their intercompany pooling agreement as it relates to their workers compensation business. The amendment established that the financial results associated with the workers compensation business for accident years
25
2011 and following will be retained 100 percent by the Mutual Company. The financial results of this business for prior accident years will continue to be shared between the Company’s property and casualty subsidiaries, the Mutual Company and Pennland under the existing pool participations. Harleysville Group paid cash of $33 million on January 3, 2011 associated with the transfer of the unearned premium liability on the workers compensation business as of January 1, 2011. Harleysville Group’s unearned premium liability decreased by $40 million and Harleysville Group received a ceding commission of $7 million for expenses that were incurred to generate the business transferred to the Mutual Company, which ceding commission reduced deferred policy acquisition costs.
Because the pooling agreement does not relieve Harleysville Group of primary liability as the originating insurer, there is a concentration of credit risk arising from business ceded to the Mutual Company. However, the pooling agreement provides for the right of offset and the amount of credit risk with the Mutual Company was not material at December 31, 2011 and 2010. The Mutual Company has an A. M. Best rating of “A” (Excellent).
On December 30, 2010, Harleysville Group Inc. acquired Mainland Insurance Company (Mainland) from the Mutual Company for $4,825,000 in cash. On December 31, 2010, HIC New York was merged into Mainland and Mainland’s name was changed to Harleysville Insurance Company of New York (HIC New York). As a result of this transaction, HIC New York was redomesticated from New York to Pennsylvania.
Harleysville Ltd. is a subsidiary of the Company and leases the home office to the Mutual Company, which shares the facility with Harleysville Group. Rental income under the lease was $4.5 million, $4.4 million and $4.2 million for 2011, 2010 and 2009, respectively, and is included in other income after elimination of intercompany amounts of $3.2 million, $3.0 million and $2.9 million in 2011, 2010 and 2009, respectively. The lease had a five-year term expiring December 31, 2009 and included a formula for additional rent for any additions, improvements or renovations. The lease was renewed for one-year periods expiring December 31, 2012, December 31, 2011 and December 31, 2010 under its prior terms. The Mutual Company is responsible for the building operating expenses including maintenance and repairs. The pricing of the lease was based upon an appraisal obtained from an independent real estate appraiser.
Harleysville Group provides certain management services to the Mutual Company and other affiliates. Harleysville Group received a fee of $8.5 million, $5.8 million and $5.1 million in 2011, 2010 and 2009, respectively, for its services under these management agreements. Effective January 1, 2010, the management agreement was amended to include voluntary assumed reinsurance business written by the Mutual Company. The level of fees has been approved by each state insurance department having jurisdiction. Under related agreements, Harleysville Group serves as the paymaster for the Harleysville companies, with each company being charged for its proportionate share of salary and employee benefits expense.
The Company’s insurance subsidiaries and the Mutual Company are parties to an Equipment and Supplies Allocation Agreement whereby equipment and supplies are shared between parties. Ultimate expense for such items is allocated to Harleysville Group based on its pooling participation. The Mutual Company has purchased and developed certain equipment and software which is expensed by Harleysville Group based on its pooling participation as the items are depreciated or amortized.
Intercompany balances are created primarily from the pooling arrangement (settled quarterly), allocation of common expenses, collection of premium balances and payment of claims (settled monthly). No interest is charged or received on intercompany balances due to the timely settlement terms and nature of the items.
Harleysville Group borrowed $18.5 million from the Mutual Company in connection with the acquisition of Harleysville Insurance Company of New York (HIC New York) in 1991. It was a demand loan with a stated maturity in March 1998 which had been extended to March 2005. In February 2005, the maturity was extended again to March 2012 and the interest rate became LIBOR plus 0.45%, which was a commercially reasonable market rate in 2005. Interest expense on this loan was $0.1 million, $0.1 million, and $0.3 million in 2011, 2010 and 2009, respectively.
Harleysville Group has no material relationships with current or former members of management other than compensatory plans and arrangements disclosed or described in the Company’s public filings.
Off Balance Sheet Arrangements
Harleysville Group has off-balance-sheet credit risk related to approximately $97.3 million and $99.6 million of premium balances due to the Mutual Company from agents and insureds at December 31, 2011 and 2010,
26
respectively. The Mutual Company bills and collects such receivables on behalf of Harleysville Group for efficiency reasons. Harleysville Group recognizes any associated bad debts, which have not been material.
2011 Compared to 2010
Premiums earned decreased $61.8 million, or 7.1%, for the year ended December 31, 2011 compared to the prior year primarily due to the change to the pooling agreement effective January 1, 2011, whereby premiums earned on workers compensation business is retained 100% by the Mutual Company. Excluding 2010 premiums earned on workers compensation business, premiums earned increased 2.1% for the year ended December 31, 2011 compared to the prior year.
Premiums earned for commercial lines decreased $83.8 million, or 12.4%, compared to the prior year primarily due to the change to the pooling agreement described in the preceding paragraph. Excluding 2010 premiums earned on workers compensation business, premiums earned decreased 0.9% for the year ended December 31, 2011 compared to the prior year. Premiums earned for personal lines increased $22.0 million, or 11.6%, compared to the prior year primarily due to higher average premiums and greater policy counts.
Investment income decreased $7.9 million for the year ended December 31, 2011, primarily due to a lower investment yield on fixed income securities and lower average invested assets, partially offset by greater dividends on equity securities. Average invested assets were lower due to negative operating cash flow in 2011 and use of the proceeds from the sale of these investments to pay dividends in 2011 and 2010, and repurchase shares in 2010.
Net realized investment gains increased $74.9 million for the year ended December 31, 2011, compared to the prior year primarily due to gains on the sale of equity securities in 2011. In October 2011, the Company sold virtually all of its equity securities, at a gain of $62 million, in order to reduce potential volatility in statutory surplus. Prior to this sale, the Company recognized impairment charges of $3.6 million on equity securities. Impairment charges of $0.4 million were also recognized on fixed maturity securities the Company sold in 2011. There were no credit-related impairment charges in 2010.
Harleysville Group holds securities with unrealized losses at December 31, 2011 as follows:
| | | | | | | | | | | | |
| | | | | | | | | Length of Unrealized Loss | |
| | | Fair Value | | | Unrealized
Loss | | | Less Than
12 Months | |
| | | (in thousands) | |
| | | |
Fixed maturities: | | | | | | | | | | | | |
Obligations of states and political subdivisions | | $ | 8,976 | | | $ | 19 | | | $ | 19 | |
Corporate securities | | | 7,956 | | | | 29 | | | | 29 | |
| | | | | | | | | | | | |
Total temporarily impaired securities | | $ | 16,932 | | | $ | 48 | | | $ | 48 | |
| | | | | | | | | | | | |
Of total fixed maturity securities with an unrealized loss at December 31, 2011, securities with a fair value of $11.0 million and an unrealized loss of $22,000 are classified as available for sale and are carried at fair value on the balance sheet while securities with a fair value of $6.0 million and an unrealized loss of $26,000 are classified as held to maturity on the balance sheet and are carried at amortized cost.
The unrealized losses on fixed maturity investments were primarily due to the expected call of a municipal bond and the widening of credit spreads on securities in the financial sector. Per the Company’s policy, a fixed maturity security is other than temporarily impaired if the present value of the cash flows expected to be collected is less than the amortized cost of the security or where the security’s fair value is below cost and the Company intends to sell or more likely than not will be required to sell the security before recovery of its value. The Company believes, based on its analysis, that these securities are not other than temporarily impaired. However, depending on developments involving both the issuers and worsening economic conditions, these investments may be written down in the income statement in the future.
27
The fair value and amortized cost of general obligation and special revenue bonds held by the Company as of December 31, 2011 is as follows:
| | | | | | | | |
| | | Fair Value | | �� | Amortized Cost | |
| | | (in thousands) | |
| | |
General obligation bonds | | $ | 864,584 | | | $ | 789,370 | |
Special revenue bonds | | | 363,576 | | | | 336,982 | |
| | | | | | | | |
| | |
Total | | $ | 1,228,160 | | | $ | 1,126,352 | |
| | | | | | | | |
For each category above, no state, municipality or political subdivision comprised more than 10% of the total.
The break-down of the special revenue bonds category, by nature of activity for activities comprising more than 10% of the category, is as follows:
| | | | | | | | | | | | |
| | | Fair Value | | | Amortized
Cost | | | Moody’s Average
Credit Rating | |
| | | (dollars in thousands) | |
| | | |
Education | | $ | 116,167 | | | $ | 106,130 | | | | Aa | |
Water & sewer | | | 97,839 | | | | 91,071 | | | | Aaa | |
Transportation | | | 48,759 | | | | 45,294 | | | | Aa | |
Escrowed To Maturity/Pre-refunded | | | 41,252 | | | | 39,640 | | | | Aa | |
| | | | | | | | | | | | |
| | | |
Total | | $ | 304,017 | | | $ | 282,135 | | | | | |
| | | | | | | | | | | | |
Income before income taxes decreased $66.5 million for the year ended December 31, 2011 compared to the prior year. The decrease was primarily due to a greater underwriting loss in 2011 compared to 2010 and a decrease in investment income, partially off set by greater realized gains in 2011.
An insurance company’s statutory combined ratio is a standard measure of underwriting profitability. This ratio is the sum of (1) the ratio of incurred losses and loss settlement expenses to net earned premium, (2) the ratio of expenses incurred for commissions, premium taxes, administrative and other underwriting expenses to net written premium, and (3) the ratio of dividends to policyholders to net earned premium. The combined ratio does not reflect investment income, federal income taxes or other non-operating income or expense. A ratio of less than 100 percent generally indicates underwriting profitability. Harleysville Group’s statutory combined ratio increased to 119.9% for the year ended December 31, 2011 from 102.5% for the year ended December 31, 2010. The combined ratio for 2011 includes 0.9% due to the impact of the statutory treatment of the ceding commission received on the unearned premiums transferred to the Mutual Company on January 1, 2011. Excluding the impact of the pool transfer, the statutory combined ratio was 119.0% for 2011. The increase in the combined ratio was primarily due to greater catastrophe losses, greater non-catastrophe weather losses and less favorable development in 2011. Net catastrophe losses increased to $93.2 million (11.6 points) for 2011 from $35.7 million (4.1 points) for 2010.
28
The statutory combined ratios by line of business for the year ended December 31, 2011 as compared to the year ended December 31, 2010 are shown below.
| | | | | | | | | | |
| | | For the Year Ended
December 31, | |
| | | 2011 | | | 2010 | |
Commercial: | | | | | | | | | | |
Automobile | | | | | 105.4 | % | | | 100.0 | % |
Workers compensation | | | | | | | | | 106.1 | % |
Commercial multi-peril | | | | | 127.6 | % | | | 106.1 | % |
Other commercial | | | | | 98.7 | % | | | 88.8 | % |
Total commercial | | | | | 116.7 | % | | | 102.3 | % |
Total commercial without intercompany pooling transfer | | | | | 115.4 | % | | | | |
| | | |
Personal: | | | | | | | | | | |
Automobile | | | | | 119.4 | % | | | 104.9 | % |
Homeowners | | | | | 148.9 | % | | | 108.2 | % |
Other personal | | | | | 75.9 | % | | | 62.6 | % |
Total personal | | | | | 129.3 | % | | | 103.5 | % |
Total personal and commercial | | | | | 119.9 | % | | | 102.5 | % |
Total personal and commercial without intercompany pooling transfer | | | | | 119.0 | % | | | | |
The commercial lines statutory combined ratio increased to 115.4% (excluding the impact of the pooling transfer) for the year ended December 31, 2011 from 102.3% for the year ended December 31, 2010. This increase was primarily due to unusually high catastrophe and non-catastrophe weather losses experienced in all four quarters of 2011. In the first quarter of 2011, unusually severe winter weather resulted in catastrophe and non-catastrophe losses that contributed to elevated loss activity, particularly in the Northeast and Mid-Atlantic regions. In the second quarter of 2011, all regions were significantly impacted by catastrophes, with the Southeast and Midwest regions being most adversely affected due to tornado and hail losses. In the third quarter of 2011, Hurricane Irene, Tropical Storm Lee, and other hail and windstorm events contributed to significant losses, particularly in the Northeast and Mid-Atlantic regions. In the fourth quarter of 2011, an unusual October snow event contributed to losses in the Mid-Atlantic and the Northeast regions. Catastrophe losses in the commercial lines represented 9.2 points of the combined ratio in calendar year 2011 compared to 2.6 points in calendar year 2010. The commercial automobile line of business also contributed to the overall increase in the commercial lines combined ratio in 2011. The increase in the commercial automobile combined ratio from 100.0% for the year ended December 31, 2010 to 105.4% for the year ended December 31, 2011 is primarily due to higher than expected frequency and severity in accident year 2011.
The personal lines statutory combined ratio increased to 129.3% for the year ended December 31, 2011 from 103.5% for the year ended December 31, 2010. The increase in the personal lines combined ratio for the year ended December 31, 2011 is primarily due to higher catastrophe and non-catastrophe weather losses affecting property coverages during 2011. The unusually severe weather described for commercial lines also impacted personal lines during 2011. Catastrophe losses in the personal lines represented 18.3 points of the combined ratio in calendar year 2011 compared to 9.7 points in calendar year 2010. The personal automobile line of business also contributed to the overall increase in the personal lines combined ratio in 2011. The increase in the personal automobile combined ratio from 104.9% for the year ended December 31, 2010 to 119.4% for the year ended December 31, 2011 is primarily due to higher than expected frequency and severity in accident years 2010 and 2011.
Reserves for unpaid losses and loss settlement expenses are estimated for case reserves and losses incurred but not reported (IBNR) separately. The sum of case reserves and IBNR represents the Company’s estimate of total unpaid loss and loss settlement expense. Case reserves are determined for each reported claim by the Company’s claims organization reflecting the known circumstances of the individual claim. The Company’s actuaries calculate IBNR by reducing their estimate of ultimate loss and loss settlement expense by cumulative paid loss and loss settlement expense and case reserves. Ultimate losses are re-estimated for each line of business on a quarterly basis using the most current loss and claim data as of the quarter end.
29
In addition to analyzing reserves on a line of business basis, reserving categories are identified and reviewed. For example, the following categories for the Commercial Auto Liability line of business are analyzed quarterly: Commercial Auto Liability Bodily Injury; Commercial Auto Liability Property Damage; and Commercial Auto Liability Excess. In the discussion that follows, these categories are referred to by the label “line of business.” In the course of our quarterly reserve estimation process, several standard loss reserving methods and procedures are utilized to derive estimates of ultimate loss for each line of business, including:
| | • | | Paid Loss Development Method |
| | • | | Incurred Loss Development Method |
| | • | | Incurred Counts and Averages Method (Based on Exponential Fit of Severity) |
| | • | | Bornhuetter-Ferguson Method |
Any individual method used to estimate loss reserves has its advantages and disadvantages based on trends, changes within the external business environment, changes in internal company processes and procedures and any bias that may be inherent in the methodology. The actuaries give consideration to the relative strengths and weaknesses of each of the methods to derive a selected point estimate within the range. Following is a general description of each of the methods used:
| | • | | Paid Loss Development Method:The Paid Loss Development Method uses historical payment patterns to project future payments as of a given evaluation date to ultimate loss. Estimates using this method are not affected by changes in case reserving practices that might have occurred during the review period, but may be understated as this method does not take into account large unpaid claims. This method is also susceptible to any changes in the rate of claim settlements or shifts in the size of claims settled. |
A number of indications of ultimate loss may be produced from the Paid Loss Development Method since a number of loss development factors (LDFs) may be selected. The actuaries produce and review several indications of ultimate loss using this method based on various LDF selections as judged appropriate, such as:
| | • | | 3-Year Average (straight average and loss-weighted average) |
| | • | | 5-Year Average (straight average and loss-weighted average) |
| | • | | 5-Year Excluding Highest and Lowest LDFs |
| | • | | All-Year loss-weighted average |
| | • | | Selected LDF Pattern (LDFs are selected for each evaluation based on the actuaries’ review of the historical development) |
| | • | | Incurred Loss Development Method:The Incurred Loss Development Method is similar to the paid method, but instead uses historical incurred (case reserves plus payments) patterns to project future incurred losses as of a given evaluation date to ultimate loss. In many cases, the incurred development method is preferred over the paid method as it includes the additional information provided by the aggregation of individual case reserves. The resulting LDFs tend to be lower and more stable than those of the paid development method. However, the incurred development method may be affected by changes in case reserving practices and any unusually large individual claims. |
As with the Paid Loss Development Method, various indications of ultimate loss may be produced from the Incurred Loss Development Method. The actuaries produce and review several indications of ultimate loss using this method based on various LDF selections.
| | • | | Incurred Counts and Averages Method:This method is used to estimate ultimate loss by separately estimating ultimate counts and severity (average loss per claim) components of ultimate loss. Both the ultimate claim counts and ultimate severity are estimated using a loss development factor approach similar to the Incurred Loss Development Method. For this reason, the same considerations discussed in the Incurred Loss Development Method apply to this method as well. |
30
An ultimate severity is selected by fitting a curve to the historical ultimate severities indicated using the ratio of the ultimate loss and ultimate claim counts. This method yields ultimate severities that are based on the underlying historical trends in the data. Ultimate claim counts and ultimate severities are multiplied together to produce an estimate of ultimate losses.
This method is useful in more recent accident years where the data is not mature and is especially useful when loss development patterns are volatile or not well established.
| | • | | Bornhuetter-Ferguson Method: The Bornhuetter-Ferguson Method is a blended method that explicitly takes into account both actual loss development to date and expected future loss emergence. Two versions of this method may be used: one based on paid loss and one based on incurred loss. This method uses the selected loss development patterns from the Development Methods to calculate the expected percentage of loss unpaid (or unreported). The expected component of the method is calculated by multiplying earned premium for the given exposure period by a selected a priori loss ratio. The resulting dollars are then multiplied by the expected percentage of unpaid (or unreported) loss described above. This provides an estimate of future loss payments (or reporting) that is then added to actual paid (or incurred) loss data to produce estimated ultimate loss. |
Each of the methodologies described above (and their derivatives) are reviewed for each line of business. This approach allows the actuaries to identify and respond to the unique characteristics of each line of business. Further, since long-term historical data is reviewed, changes in development patterns within a line of business may likewise be identified and considered in the actuaries’ process of selecting ultimate loss.
An actuarial central estimate, which is management’s best estimate, of ultimate loss is selected for each line of business based on a review of the indications produced by the above methodologies. More consideration is given to those methods that the actuaries deem to be more appropriate in a particular situation. In addition, other metrics such as claim closing ratios, average case reserve levels, paid loss to incurred loss ratios, individual large loss information, and recent insurance pricing changes are reviewed to help the actuaries select the most appropriate estimates of ultimate loss.
The selection of the ultimate loss is based on information unique to each line of business and accident year and the judgment and expertise of the actuaries.
| | • | | Short-Tail versus Long-Tail Lines of Business:The reserving methods described above are generally applied to each line of business, regardless of their classification as short-tail or long-tail. “Tail” refers to the time period between the occurrence of a loss and the final settlement of the claim. The merits of an individual reserving method relative to the line of business and age of accident period are considered in the actuaries’ process of selecting ultimate loss. |
Short-tail lines of business, by definition, develop to their ultimate value faster than long-tail lines of business. Property coverages including inland marine along with automobile physical damage coverages are considered short-tail lines of business. Automobile Liability, General Liability, Commercial Multi-Peril Liability and Workers’ Compensation are considered long-tail lines of business. For many liability claims, significant periods of time may elapse between the occurrence of the loss, the reporting of the loss, and the final settlement of the claim. Workers’ Compensation claims can result in providing medical benefits and wage replacement over the course of an injured worker’s lifetime.
In general, more consideration may be given to the results of the development methodologies for short-tail lines than to long-tail lines for accident periods of the same maturity. For example, the indicated ultimate loss using the Incurred Loss Development Method for the most recent accident year is generally considered more reliable for a short-tail line, such as Homeowners Property, than a long-tail line, such as Workers’ Compensation.
As mentioned previously, the selection of ultimate loss is based on information unique to each line of business and accident year subject to exceptions, such as the emergence of one or more unusually large claims in a particular accident period for a short-tail line. In this case, the indications produced by the development methods may be overstated (due to development of ultimate losses to amounts in excess of policy limits) and such information would be considered in the actuaries’ process of selecting ultimate loss.
31
| | • | | Immature Accident Periods:The Paid Loss Development Method is generally given less consideration than the Incurred Loss Development Method for less mature accident periods since the relatively low magnitude of losses paid at early evaluations tends to result in less reliable indications from the Paid Loss Development Method. For long-tail lines of business, neither the Incurred nor the Paid Loss Development methods may receive significant consideration for the most recent accident period. This is due to the fact that the relatively low magnitude of losses either incurred or paid at early evaluations tends to result in less reliable indications from these methods. |
In faster developing, short-tailed lines such as Auto Physical Damage, Special Property, Homeowners, Commercial Multi-Peril Property and Property Damage, the Paid Loss Development Method, the Incurred Loss Development Method and the Bornhuetter-Ferguson methods are primarily used as they typically produce tightly clustered projections for all accident years.
The estimation of loss reserves for long-tail lines such as Commercial Auto Liability, Commercial Multi-Peril Liability, and Workers Compensation is more complex and is subject to a higher degree of variability than for short-tail lines of business.
The following table presents the liability for unpaid losses and loss settlement expenses by major line of business:
| | | | | | | | |
| | | December 31, | |
| | | 2011 | | | 2010 | |
| | | (in thousands) | |
| | |
Commercial: | | | | | | | | |
Automobile | | $ | 272,590 | | | $ | 288,289 | |
Workers compensation | | | 307,453 | | | | 370,838 | |
Commercial multi-peril | | | 679,849 | | | | 634,145 | |
Other commercial | | | 144,983 | | | | 143,070 | |
| | | | | | | | |
Total commercial | | | 1,404,875 | | | | 1,436,342 | |
| | | | | | | | |
| | |
Personal: | | | | | | | | |
Automobile | | | 87,714 | | | | 78,505 | |
Homeowners | | | 49,955 | | | | 36,427 | |
Other personal | | | 2,860 | | | | 2,791 | |
| | | | | | | | |
Total personal | | | 140,529 | | | | 117,723 | |
| | | | | | | | |
| | |
Total personal and commercial | | | 1,545,404 | | | | 1,554,065 | |
| | |
Plus reinsurance recoverables | | | 244,187 | | | | 217,596 | |
| | | | | | | | |
| | |
Total liability | | $ | 1,789,591 | | | $ | 1,771,661 | |
| | | | | | | | |
The following table presents the increase (decrease) in the estimated ultimate loss and loss settlement expenses attributable to insured events of prior years for the year ended December 31, 2011 by line of business:
32
Increase (Decrease) in the Estimated Ultimate Loss and Loss Settlement Expenses
Attributable to Insured Events of Prior Years
For the Year Ended December 31, 2011
| | | | | | | | | | | | | | | | |
| | | | | | Accident Years | |
| | Total | | | 2010 | | | 2009 | | | 2008 and
Prior Years | |
| | | (in thousands) | |
| | | | |
Line of Business | | | | | | | | | | | | | | | | |
Commercial: | | | | | | | | | | | | | | | | |
Automobile | | $ | (5,646 | ) | | $ | 1,145 | | | $ | (544 | ) | | $ | (6,247 | ) |
Workers compensation | | | (11,787 | ) | | | 3,149 | | | | 1,656 | | | | (16,592 | ) |
Commercial multi-peril | | | (10,596 | ) | | | 3,089 | | | | 1,148 | | | | (14,833 | ) |
Other commercial | | | (2,809 | ) | | | 1,573 | | | | (1,950 | ) | | | (2,432 | ) |
| | | | | | | | | | | | | | | | |
Total commercial | | | (30,838 | ) | | | 8,956 | | | | 310 | | | | (40,104 | ) |
| | | | | | | | | | | | | | | | |
Personal: | | | | | | | | | | | | | | | | |
Automobile | | | (70 | ) | | | 6,283 | | | | 670 | | | | (7,023 | ) |
Homeowners | | | (867 | ) | | | 1,026 | | | | 828 | | | | (2,721 | ) |
Other personal | | | (286 | ) | | | (72 | ) | | | (326 | ) | | | 112 | |
| | | | | | | | | | | | | | | | |
Total personal | | | (1,223 | ) | | | 7,237 | | | | 1,172 | | | | (9,632 | ) |
| | | | | | | | | | | | | | | | |
| | | | |
Total net development | | $ | (32,061 | ) | | $ | 16,193 | | | $ | 1,482 | | | $ | (49,736 | ) |
| | | | | | | | | | | | | | | | |
In 2011, Harleysville Group recognized net favorable development of $32.1 million in the provision for insured events of prior years, primarily due to lower-than-expected claims severity broadly experienced across casualty lines in accident years 2003 through 2008, partially offset by adverse development in accident years 2009 and 2010.
A decrease in commercial automobile severity, primarily in accident years 2005 through 2009, was observed during 2011, which led to the recognition of favorable development in these accident years. Slightly higher than expected severity was observed in accident year 2010, which led to the recognition of adverse development in this accident year. In aggregate, $5.6 million of favorable prior year development was recognized in this line during 2011.
A decrease in workers compensation severity, primarily in accident years 2003 through 2008, was observed during 2011, which led to the recognition of favorable development in these accident years. An increase in severity was observed in accident years 2009 and 2010, which led to the recognition of adverse development in these accident years. In aggregate, $11.8 million of favorable prior year development was recognized in this line during 2011.
A decrease in commercial multi-peril severity was widely observed during 2011, which led to the recognition of favorable development in most accident years prior to 2009. An increase in severity was observed in accident years 2009 and 2010, which led to the recognition of adverse development in these years. In aggregate, $10.6 million of favorable prior year development was recognized in this line during 2011.
A decrease in other commercial lines severity, primarily in accident years 2007 through 2009, was observed during 2011, which led to the recognition of favorable development in these accident years. An increase in severity was observed in accident year 2010, which led to the recognition of adverse development in this accident year. In aggregate, $2.8 million of favorable prior year development was recognized in this line during 2011.
A decrease in personal automobile severity in accident years 2008 and prior was widely observed during 2011, which led to the recognition of favorable development in these accident years. An increase in severity was observed in accident years 2009 and 2010, which led to the recognition of adverse development in these accident years. In aggregate, $0.1 million of favorable prior year development was recognized in this line during 2011.
33
A decrease in homeowners severity in accident years 2008 and prior was widely observed during 2011, which led to the recognition of favorable development in these accident years. An increase in severity was observed in accident years 2009 and 2010, which led to the recognition of adverse development in these accident years. In aggregate, $0.9 million of favorable prior year development was recognized in this line during 2011.
A slight decrease in other personal lines severity was observed during 2011, primarily in accident year 2009. In aggregate, $0.3 of favorable prior year development was recognized in other personal lines during 2011.
In 2010, Harleysville Group recognized net favorable development of $50.1 million in the provision for insured events of prior years, primarily due to lower-than-expected claims severity broadly experienced across all casualty lines in accident years 2004 through 2008, partially offset by a slight amount of adverse development in accident years prior to 2000.
A decrease in commercial automobile severity was observed during 2010, which led to the recognition of $8.1 million of favorable development in this line during the year. Approximately $2.4 million of the favorable development experienced in this line during 2010 is related to the Company’s involuntary pools.
A decrease in workers compensation severity, primarily in accident years 2002 through 2007, was observed during 2010 and led to the recognition of favorable development for those accident years during the year. An increase in workers compensation medical severity in accident years 2001 and prior was observed during 2010, which led to the recognition of adverse development for those accident years during the year. An increase in severity in accident year 2009 was observed in this line during 2010, which led to the recognition of $1.2 million of adverse development during the year. In total, $8.2 million of favorable development was recognized in the workers compensation line during 2010. Approximately $2.6 million of the favorable development experienced in this line during 2010 is related to the Company’s involuntary pools.
In the commercial multi-peril line of business, a reduction in severity, primarily in accident years 2004 through 2009, led to the recognition of $18.9 million of favorable development during 2010.
A reduction in other commercial lines severity was widely observed during 2010, which led to the recognition of $9.6 million of favorable prior year development.
A reduction in personal automobile severity in accident years 2008 and prior was widely observed during 2010. Claim frequency in accident year 2009 increased, which led to $0.5 million of adverse development during the year. In total, $4.4 million of favorable prior year development was recognized in this line during 2010.
A reduction in homeowners severity was observed during 2010, especially in accident year 2006. Claim frequency and severity in accident years 2008 and 2009 were observed to increase slightly, which led to the recognition of $0.4 million and $0.1 million of adverse development in these years, respectively. In total, $0.3 million of favorable development was recognized in this line during 2010.
A reduction in other personal lines severity was observed during 2010, especially in accident year 2005. Severity in accident years 2008 and 2009 was observed to marginally increase, which led to the recognition of $0.1 million of adverse development in each accident year. In total, $0.7 million of favorable development was recognized in other personal lines during 2010.
The tables below break out the change in the estimate of ultimate losses between December 31, 2010 and December 31, 2011 for the 2010, 2009, 2008 and 2007 accident years into severity and frequency components for the major commercial and personal lines of business. Table 1 summarizes the Company’s percentage change in the estimate of ultimate loss and loss settlement expense by line of business between December 31, 2010 and December 31, 2011. Tables 2 and 3 summarize the Company’s percentage change in the estimate of ultimate severity and ultimate claim counts, respectively. The relationship between the three tables is as follows: (1+ the % change in estimated ultimate loss) = (1+ the % change in estimated ultimate severity) x (1+ the % change in estimated ultimate claim counts). The estimated ultimate severity is calculated as the ratio of estimated ultimate loss to estimated ultimate claim counts. The amounts underlying these tables are based on direct loss and claim experience minus ceded loss experience and exclude a small portion of losses associated with business assumed from involuntary pools.
34
Table 1
Percentage Increase (Decrease) in Ultimate Loss and Loss Settlement Expense
Between the Years Ended December 31, 2010 and December 31, 2011
| | | | | | | | | | | | | | | | |
| | | Accident Years | |
| | | 2010 | | | 2009 | | | 2008 | | | 2007 | |
| | | | |
Line of Business | | | | | | | | | | | | | | | | |
Commercial: | | | | | | | | | | | | | | | | |
Automobile | | | 0.9 | % | | | -0.4 | % | | | -1.4 | % | | | -1.0 | % |
Workers compensation | | | 4.5 | % | | | 2.2 | % | | | -2.8 | % | | | -3.2 | % |
Commercial multi-peril | | | 1.2 | % | | | 0.5 | % | | | -0.9 | % | | | -1.3 | % |
Other commercial | | | 3.2 | % | | | -4.1 | % | | | -2.7 | % | | | -4.8 | % |
Total commercial | | | 1.8 | % | | | 0.1 | % | | | -1.5 | % | | | -1.8 | % |
Personal: | | | | | | | | | | | | | | | | |
Automobile | | | 8.4 | % | | | 1.1 | % | | | -1.0 | % | | | -0.9 | % |
Homeowners | | | 1.6 | % | | | 1.7 | % | | | -1.2 | % | | | -2.6 | % |
Other personal | | | -1.4 | % | | | -6.2 | % | | | 2.9 | % | | | -1.0 | % |
Total personal | | | 5.0 | % | | | 1.0 | % | | | -0.9 | % | | | -1.6 | % |
| | | | |
Total All Lines | | | 2.5 | % | | | 0.3 | % | | | -1.4 | % | | | -1.8 | % |
Table 2
Percentage Increase (Decrease) in Ultimate Severity
Between the Years Ended December 31, 2010 and December 31, 2011
| | | | | | | | | | | | | | | | |
| | | Accident Years | |
| | | 2010 | | | 2009 | | | 2008 | | | 2007 | |
| | | | |
Line of Business | | | | | | | | | | | | | | | | |
Commercial: | | | | | | | | | | | | | | | | |
Automobile | | | 1.1 | % | | | -0.6 | % | | | -1.3 | % | | | -1.0 | % |
Workers compensation | | | 4.0 | % | | | 1.6 | % | | | -3.1 | % | | | -3.3 | % |
Commercial multi-peril | | | 4.4 | % | | | 1.2 | % | | | -0.4 | % | | | -1.0 | % |
Other commercial | | | 8.9 | % | | | -4.1 | % | | | -3.0 | % | | | -3.6 | % |
Total commercial | | | 3.2 | % | | | 0.1 | % | | | -1.4 | % | | | -1.7 | % |
Personal: | | | | | | | | | | | | | | | | |
Automobile | | | 7.1 | % | | | 1.0 | % | | | -1.0 | % | | | -0.9 | % |
Homeowners | | | 0.5 | % | | | 1.5 | % | | | -1.2 | % | | | -2.6 | % |
Other personal | | | -1.3 | % | | | -6.0 | % | | | 2.7 | % | | | -1.0 | % |
Total personal | | | 3.9 | % | | | 0.9 | % | | | -0.9 | % | | | -1.6 | % |
| | | | |
Total All Lines | | | 2.6 | % | | | 0.2 | % | | | -1.4 | % | | | -1.7 | % |
35
Table 3
Percentage Increase (Decrease) in Ultimate Claim Counts
Between the Years Ended December 31, 2010 and December 31, 2011
| | | | | | | | | | | | | | | | |
| | | Accident Years | |
| | | 2010 | | | 2009 | | | 2008 | | | 2007 | |
| | | | |
Line of Business | | | | | | | | | | | | | | | | |
Commercial: | | | | | | | | | | | | | | | | |
Automobile | | | -0.2 | % | | | 0.2 | % | | | -0.1 | % | | | 0.0 | % |
Workers compensation | | | 0.5 | % | | | 0.6 | % | | | 0.4 | % | | | 0.2 | % |
Commercial multi-peril | | | -3.0 | % | | | -0.7 | % | | | -0.5 | % | | | -0.3 | % |
Other commercial | | | -5.2 | % | | | 0.0 | % | | | 0.2 | % | | | -1.2 | % |
Total commercial | | | -1.3 | % | | | 0.0 | % | | | -0.1 | % | | | -0.1 | % |
Personal: | | | | | | | | | | | | | | | | |
Automobile | | | 1.2 | % | | | 0.1 | % | | | 0.1 | % | | | 0.0 | % |
Homeowners | | | 1.1 | % | | | 0.2 | % | | | 0.0 | % | | | -0.1 | % |
Other personal | | | -0.1 | % | | | -0.2 | % | | | 0.2 | % | | | 0.0 | % |
Total personal | | | 1.1 | % | | | 0.1 | % | | | 0.0 | % | | | 0.0 | % |
| | | | |
Total All Lines | | | -0.1 | % | | | 0.0 | % | | | 0.0 | % | | | -0.1 | % |
These tables illustrate that the changes to the Company’s estimates of ultimate loss for prior accident years between December 31, 2010 and December 31, 2011 are primarily driven by the severity component of loss. In this context, the term “severity” does not refer to an actuarial assumption, rather, it refers to “severity” as a descriptive statistic derived from the ratio of estimated ultimate loss to estimated ultimate claim counts. In general, as estimates of the ultimate number of claims were relatively stable for the prior accident periods, the changes in estimates of ultimate loss are characterized as resulting from a reduction in severity.
In general, those lines of business with a relatively low underlying volume of data, such as other commercial lines and other personal lines, are subject to greater variability in both claim severity and claim count development.
Harleysville Group records the actuarial central estimate, which is management’s best estimate, of the ultimate unpaid losses and loss settlement expenses incurred. The estimate represents the actuarially determined expected amount of future payments on all loss and loss settlement expenses incurred on or before December 31, 2011. Actuarial loss reserving techniques and assumptions, which rely on historical information as adjusted to reflect current conditions, have been consistently applied, after including consideration of recent case reserve activity, during the periods presented. Changes in the estimate of the liability for unpaid losses and loss settlement expenses reflect actual payments and evaluations of new information and data since the last reporting date. These changes correlate with actuarial trends.
The following table presents the liability for unpaid losses and loss settlement expenses by case and incurred but not reported (IBNR) reserves by line of business and a statistically determined range of estimates of the ultimate unpaid losses and loss settlement expenses incurred for each line of business as of December 31, 2011. The range of estimates around the actuarial central estimates is statistically determined in order to provide information regarding the variability of the actuarial central estimates. The statistical analysis is completed only on a basis that is net of reinsurance recoverables, as this appropriately reflects Harleysville Group’s risk profile based on the type and quality of its reinsurance. The range is determined using the Monte Carlo Simulation method. This method uses the Company’s actual historical loss data to estimate the mean and standard deviation of a statistical distribution for future loss development. There have been no adjustments made to the historical data. The Company’s application of the Monte Carlo Simulation assumes that loss development factors are normally distributed with a mean and standard deviation derived from the historical data.
Reserve ranges are determined using both paid and incurred loss development data with a 10,000 trial simulation run against each set of data for each line of business presented in the table below. Each simulation generates a unique set of loss development factors randomly generated from the normal distribution with mean and standard deviation as defined above. Each unique set of loss development factors, when applied to the data, produces
36
a unique reserve estimate. At the completion of the simulation, there are 20,000 unique reserve estimates which can be ordered from lowest to highest creating a range of reserve estimates. The resulting range produced by the simulation is used to create a reasonable representation of a 90% confidence interval using the 5% point as the low end of the range and the 95% point as the high end of the range. The 90% confidence interval represents the range of reserve estimates for which there is approximately a 90% probability that the actual reserve amount (which will not be known for many years) is contained within the defined range. The total commercial lines range and total personal lines range were developed as separate simulations using the means and standard deviations of the individual lines as inputs. Therefore, the 90% confidence interval for all lines of business is smaller than the straight sum of the individual lines of business 90% intervals.
The use of this technique to analyze reserve ranges assumes historical data has validity in predicting future outcomes. This assumption is consistent with a key assumption underlying much of insurance pricing and reserving theory.
Liability for Unpaid Losses and Loss Settlement Expenses (LAE)
at December 31, 2011
| | | | | | | | | | | | | | | | | | | | | | | | | | | | |
| | | Case | | | IBNR | | | LAE
Liability | | | IBNR
(Inc. LAE) | | | Total
Liability | | | Statistically Determined
Range of Estimates | |
| | | | | | | High | | | Low | |
| | | (in thousands) | |
| | | | | | | |
Line of Business | | | | | | | | | | | | | | | | | | | | | | | | | | | | |
Commercial: | | | | | | | | | | | | | | | | | | | | | | | | | | | | |
Automobile | | $ | 95,774 | | | $ | 127,245 | | | $ | 49,571 | | | $ | 176,816 | | | $ | 272,590 | | | $ | 327,518 | | | $ | 207,987 | |
Workers compensation | | | 131,269 | | | | 130,920 | | | | 45,264 | | | | 176,184 | | | | 307,453 | | | | 334,938 | | | | 238,766 | |
Commercial multi-peril | | | 185,179 | | | | 311,776 | | | | 182,894 | | | | 494,670 | | | | 679,849 | | | | 791,081 | | | | 557,586 | |
Other commercial | | | 28,828 | | | | 80,866 | | | | 35,289 | | | | 116,155 | | | | 144,983 | | | | 186,249 | | | | 82,846 | |
| | | | | | | | | | | | | | | | | | | | | | | | | | | | |
Total commercial | | | 441,050 | | | | 650,807 | | | | 313,018 | | | | 963,825 | | | | 1,404,875 | | | | 1,568,315 | | | | 1,112,365 | |
| | | | | | | | | | | | | | | | | | | | | | | | | | | | |
| | | | | | | |
Personal: | | | | | | | | | | | | | | | | | | | | | | | | | | | | |
Automobile | | | 42,010 | | | | 29,944 | | | | 15,760 | | | | 45,704 | | | | 87,714 | | | | 100,360 | | | | 66,875 | |
Homeowners | | | 17,199 | | | | 24,086 | | | | 8,670 | | | | 32,756 | | | | 49,955 | | | | 66,068 | | | | 35,558 | |
Other personal | | | 975 | | | | 1,489 | | | | 396 | | | | 1,885 | | | | 2,860 | | | | 2,891 | | | | 1,686 | |
| | | | | | | | | | | | | | | | | | | | | | | | | | | | |
Total personal | | | 60,184 | | | | 55,519 | | | | 24,826 | | | | 80,345 | | | | 140,529 | | | | 163,431 | | | | 108,590 | |
| | | | | | | | | | | | | | | | | | | | | | | | | | | | |
| | | | | | | |
Total net liability | | | 501,234 | | | | 706,326 | | | | 337,844 | | | | 1,044,170 | | | | 1,545,404 | | | | | | | | | |
| | | | | | | | | | | | | | | | | | | | | | | | | | | | |
| | | | | | | |
Reinsurance recoverables | | | 166,033 | | | | 76,239 | | | | 1,915 | | | | 78,154 | | | | 244,187 | | | | | | | | | |
| | | | | | | | | | | | | | | | | | | | | | | | | | | | |
| | | | | | | |
Gross liability | | $ | 667,267 | | | $ | 782,565 | | | $ | 339,759 | | | $ | 1,122,324 | | | $ | 1,789,591 | | | | | | | | | |
| | | | | | | | | | | | | | | | | | | | | | | | | | | | |
Reinsurance recoverables were $245.9 million and $219.1 million at December 31, 2011 and 2010, respectively. Of these amounts, $137.7 million and $102.3 million, respectively, or 56% and 47%, respectively, of the recoverables were due from governmental bodies, regulatory agencies or quasi governmental pools and reinsurance facilities where, Harleysville Group believes, there is limited credit risk. The remainder of the reinsurance recoverables are principally due from reinsurers rated A- or higher by the A.M. Best Company. Ceded reinsurance contracts do not relieve Harleysville Group’s primary obligation to its policyholders. Consequently, an exposure exists with respect to reinsurance recoverables to the extent that any reinsurer is unable to meet its obligation or disputes the liabilities assumed under the reinsurance contract. From time to time, Harleysville Group may encounter such disputes with its reinsurers. In addition, the creditworthiness of our reinsurers could deteriorate in the future due to adverse events affecting the reinsurance industry, such as a large number of major catastrophes.
Because of the nature of insurance claims, there are uncertainties inherent in the estimates of ultimate losses. Harleysville Group’s reorganization of its claims operation in recent years has resulted in new people and processes involved in settling claims. As a result, more recent statistical data reflects different patterns than in the past and gives rise to uncertainty as to the pattern of future loss settlements. There are uncertainties regarding future loss cost trends
37
particularly related to medical treatments and automobile repair. Court decisions, regulatory changes and economic conditions can affect the ultimate cost of claims that occurred in the past. Accordingly, the ultimate liability for unpaid losses and loss settlement expenses will likely differ from the amount recorded at December 31, 2011.
The property and casualty industry has had substantial aggregate loss experience from claims related to asbestos-related illnesses, environmental remediation, product liability, mold, and other uncertain exposures. Harleysville Group has not experienced significant losses from such claims.
The income tax expense for the year ended December 31, 2011 includes the tax benefit of $13.3 million associated with tax-exempt income compared to $13.2 million in the prior year.
2010 Compared to 2009
Premiums earned increased $7.8 million, or 0.9%, for the year ended December 31, 2010 compared to the prior year primarily due to an increase of $21.2 million in premiums earned for personal lines, partially offset by a decrease of $13.4 million in premiums earned for commercial lines. The increase in premiums earned for personal lines was 12.6%, primarily due to new business writings and higher average premiums. The decrease in premiums earned for commercial lines was 1.9%, primarily due to lower average premiums, lower exposures and a decline in assumed premiums earned from involuntary pools.
Investment income decreased $3.3 million for the year ended December 31, 2010, primarily due to a lower investment yield on fixed income securities and short-term investments and a greater percentage of fixed income securities invested in tax-exempt securities. During the second half of 2010, Harleysville Group purchased an additional $50 million of equity securities in order to generate additional investment income. Investments were made in high-quality, large-cap companies with strong balance sheets and a history of paying and increasing their dividends. In 2011, Harleysville Group plans to add an additional $120 million to dividend paying equities, with $50 million of this amount resulting from a re-allocation of its broad-based equity index fund.
Net realized investment gains decreased $1.7 million for the year ended December 31, 2010, compared to the prior year. There were no credit-related impairment charges in 2010 and credit-related impairment charges of $1.5 million on non-equity securities in 2009. The 2009 impairment charges consisted of $0.5 million on bonds which were sold in 2010 and $1.0 million on structured investment vehicles.
Income before income taxes decreased $33.3 million for the year ended December 31, 2010 compared to the prior year. The decrease was primarily due to an underwriting loss in 2010 compared to an underwriting gain in 2009 and a decrease in investment income.
Harleysville Group’s statutory combined ratio increased to 102.5% for the year ended December 31, 2010 from 99.8% for the year ended December 31, 2009. The increase in the combined ratio was primarily due to greater catastrophe losses and greater non-catastrophe property losses in 2010, partially offset by greater favorable development in 2010. Net catastrophe losses increased to $35.7 million (4.1 points) for 2010 from $6.2 million (0.7 points) for 2009. The 2010 catastrophe losses were primarily due to a series of severe winter storms in the first quarter and several wind and hail events during the second and third quarters.
38
The statutory combined ratios by line of business for the year ended December 31, 2010 as compared to the year ended December 31, 2009 are shown below:
| | | | | | | | |
| | | For the Year Ended
December 31, | |
| | | 2010 | | | 2009 | |
| | |
Commercial: | | | | | | | | |
Automobile | | | 100.0 | % | | | 91.4 | % |
Workers compensation | | | 106.1 | % | | | 106.2 | % |
Commercial multi-peril | | | 106.1 | % | | | 105.1 | % |
Other commercial | | | 88.8 | % | | | 97.6 | % |
Total commercial | | | 102.3 | % | | | 100.7 | % |
Personal: | | | | | | | | |
Automobile | | | 104.9 | % | | | 103.0 | % |
Homeowners | | | 108.2 | % | | | 92.7 | % |
Other personal | | | 62.6 | % | | | 81.1 | % |
Total personal | | | 103.5 | % | | | 96.8 | % |
| | |
Total personal and commercial | | | 102.5 | % | | | 99.8 | % |
The commercial lines statutory combined ratio increased to 102.3% for the year ended December 31, 2010 from 100.7% for the year ended December 31, 2009. This increase was primarily due to the commercial automobile line of business for which the statutory combined ratio increased to 100.0% for the year ended December 31, 2010 from 91.4% for the year ended December 31, 2009. The increase in the commercial automobile combined ratio is primarily due to the recognition of 4.5 points of favorable development from prior accident years in 2010, compared to the recognition of 10.9 points of favorable development from prior accident years in 2009. The commercial multi-peril line of business also contributed to the increase in the commercial lines statutory combined ratio in the year. The commercial multi-peril statutory combined ratio increased to 106.1% for the year ended December 31, 2010 from 105.1% for the year ended December 31, 2009, primarily due to a higher level of property losses compared to the prior year.
The personal lines statutory combined ratio increased to 103.5% for the year ended December 31, 2010 from 96.8% for the year ended December 31, 2009. The increase in the personal lines combined ratio for the year ended December 31, 2010 primarily relates to a higher incidence of personal lines catastrophe losses during 2010 (9.7 points) compared to the catastrophe losses in 2009 (1.0 points). Catastrophe losses in the homeowners line of business were significantly higher during 2010 (20.1 points) compared to 2009 (1.6 points).
39
The following table presents the increase (decrease) in the estimated ultimate loss and loss settlement expenses attributable to insured events of prior years for the year ended December 31, 2010 by line of business:
Increase (Decrease) in the Estimated Ultimate Loss and Loss Settlement Expenses
Attributable to Insured Events of Prior Years
For the Year Ended December 31, 2010
| | | | | | | | | | | | | | | | |
| | | | | | Accident Years | |
| | Total | | | 2009 | | | 2008 | | | 2007 and
Prior Years | |
| | | (in thousands) | |
| | | | |
Line of Business | | | | | | | | | | | | | | | | |
Commercial: | | | | | | | | | | | | | | | | |
Automobile | | $ | (8,071 | ) | | $ | 490 | | | $ | (402 | ) | | $ | (8,159 | ) |
Workers compensation | | | (8,184 | ) | | | 1,228 | | | | (391 | ) | | | (9,021 | ) |
Commercial multi-peril | | | (18,945 | ) | | | (4,084 | ) | | | (1,722 | ) | | | (13,139 | ) |
Other commercial | | | (9,626 | ) | | | (1,000 | ) | | | (3,346 | ) | | | (5,280 | ) |
| | | | | | | | | | | | | | | | |
Total commercial | | | (44,826 | ) | | | (3,366 | ) | | | (5,861 | ) | | | (35,599 | ) |
| | | | | | | | | | | | | | | | |
Personal: | | | | | | | | | | | | | | | | |
Automobile | | | (4,356 | ) | | | 506 | | | | (948 | ) | | | (3,914 | ) |
Homeowners | | | (270 | ) | | | 81 | | | | 413 | | | | (764 | ) |
Other personal | | | (677 | ) | | | 92 | | | | 109 | | | | (878 | ) |
| | | | | | | | | | | | | | | | |
Total personal | | | (5,303 | ) | | | 679 | | | | (426 | ) | | | (5,556 | ) |
| | | | | | | | | | | | | | | | |
| | | | |
Total net development | | $ | (50,129 | ) | | $ | (2,687 | ) | | $ | (6,287 | ) | | $ | (41,155 | ) |
| | | | | | | | | | | | | | | | |
In 2010, Harleysville Group recognized net favorable development of $50.1 million in the provision for insured events of prior years, primarily due to lower-than-expected claims severity broadly experienced across all casualty lines in accident years 2004 through 2008, partially offset by a slight amount of adverse development in accident years prior to 2000.
A decrease in commercial automobile severity was observed during 2010, which led to the recognition of $8.1 million of favorable development in this line during the year. Approximately $2.4 million of the favorable development experienced in this line during 2010 is related to the Company’s involuntary pools.
A decrease in workers compensation severity, primarily in accident years 2002 through 2007, was observed during 2010 and led to the recognition of favorable development for those accident years during the year. An increase in workers compensation medical severity in accident years 2001 and prior was observed during 2010, which led to the recognition of adverse development for those accident years during the year. An increase in severity in accident year 2009 was observed in this line during 2010, which led to the recognition of $1.2 million of adverse development during the year. In total, $8.2 million of favorable development was recognized in the workers compensation line during 2010. Approximately $2.6 million of the favorable development experienced in this line during 2010 is related to the Company’s involuntary pools.
In the commercial multi-peril line of business, a reduction in severity, primarily in accident years 2004 through 2009, led to the recognition of $18.9 million of favorable development during 2010.
A reduction in other commercial lines severity was widely observed during 2010, which led to the recognition of $9.6 million of favorable prior year development.
A reduction in personal automobile severity in accident years 2008 and prior was widely observed during 2010. Claim frequency in accident year 2009 increased, which led to $0.5 million of adverse development during the year. In total, $4.4 million of favorable prior year development was recognized in this line during 2010.
A reduction in homeowners severity was observed during 2010, especially in accident year 2006. Claim frequency and severity in accident years 2008 and 2009 were observed to increase slightly, which led to the recognition of $0.4 million and $0.1 million of adverse development in these years, respectively. In total, $0.3 million of favorable development was recognized in this line during 2010.
40
A reduction in other personal lines severity was observed during 2010, especially in accident year 2005. Severity in accident years 2008 and 2009 was observed to marginally increase, which led to the recognition of $0.1 million of adverse development in each accident year. In total, $0.7 million of favorable development was recognized in other personal lines during 2010.
Other income increased $2.8 million for the year ended December 31, 2010 compared to the prior year primarily due to an increase in fee income received in connection with the National Flood Insurance Program and an increase in management fees received from the Mutual Company.
The income tax expense for the year ended December 31, 2010 included the tax benefit of $13.2 million associated with tax-exempt income compared to $11.1 million in the prior year.
New Accounting Standards
In January 2010, the Financial Accounting Standards Board (FASB) issued Accounting Standards Update (ASU) 2010-06, “Fair Value Measurements and Disclosures.” ASU 2010-06 applies to all entities that are required to make disclosures about recurring or non-recurring fair value measurements. ASU 2010-06 provides guidance on additional disclosures on any significant transfers in and out of Level 1 and Level 2 and a description of the transfer. ASU 2010-06 also requires separate disclosures of the activity in the Level 3 category related to any purchases, sales, issuances and settlements on a gross basis. The effective date of the new disclosures relating to the existing disclosures regarding Level 1 and Level 2 categories is for interim and annual periods beginning after December 15, 2009. The effective date of the disclosures regarding purchases, sales, issuances and settlements to the Level 3 category is for interim and annual periods beginning after December 15, 2010. The adoption of this ASU did not have a material impact on the Company’s results of operations or financial position.
In October 2010, the FASB issued ASU 2010-26, “Accounting for Costs Associated with Acquiring or Renewing Insurance Contracts (a consensus of the FASB Emerging Issues Task Force).” This ASU amends FASB Accounting Standards Codification (ASC) Topic 944, Financial Services-Insurance, to address which costs related to the acquisition of new or renewal insurance contracts qualify for deferral. The ASU allows insurance entities to defer costs related to the acquisition of new or renewal insurance contracts that are (1) incremental direct costs of the contract transaction (i.e., would not have occurred without the contract transaction), (2) a portion of the employee’s compensation and fringe benefits related to certain activities for successful contract acquisitions, or (3) direct-response advertising costs as defined in ASC Subtopic 340-20, Other Assets and Deferred Costs - Capitalized Advertising Costs. An insurance entity would expense as incurred all other costs related to the acquisition of new or renewal insurance contracts. The amendments in the ASU are effective for fiscal years, and interim periods within those years, beginning on or after December 15, 2011, and can be applied either prospectively or retrospectively. Early application is permitted at the beginning of an entity’s annual reporting period. The Company will adopt this guidance prospectively. During 2012, the Company estimates that pre-tax expenses will increase by approximately $20 million, as a lower amount of acquisition costs will be capitalized and amortization of the greater December 31, 2011 balance will continue.
In December 2010, the FASB issued ASU 2010-28, “Intangibles-Goodwill and Other.” The amendments in this ASU modify Step 1 of the goodwill impairment test for reporting units with zero or negative carrying amounts. For these units, an entity is required to perform Step 2 of the goodwill impairment test if it is more likely than not that a goodwill impairment exists. In determining whether it is more likely than not that a goodwill impairment exists, an entity should consider whether there are any adverse qualitative factors indicating that an impairment may exist. For public entities, this ASU is effective for fiscal years, and interim periods within those years, beginning after December 15, 2010. The adoption of this ASU did not have a material impact on the Company’s results of operations or financial position.
In May 2011, the FASB issued ASU 2011-04, “Fair Value Measurement: Amendments to Achieve Common Fair Value Measurement and Disclosure Requirements in U.S. GAAP and IFRSs.” The amendments in this ASU result in common fair value measurement and disclosure in U.S. GAAP and IFRSs. The amendments change the wording used to describe many of the requirements in U.S. GAAP for measuring fair value and for disclosing information about fair value measurements. The amendments include: (1) those that clarify the FASB’s intent about the application of existing fair value measurement and disclosure requirements; and (2) those that change a particular principle or requirement for measuring fair value or for disclosing information about fair value measurement. For public entities, the amendments in this ASU are effective during interim and annual periods beginning after December 15, 2011, and are to be applied prospectively. Early application by public entities is not permitted. The adoption of this ASU will not have a material impact on the Company’s results of operations or financial position.
In June 2011, the FASB issued ASU 2011-05, “Presentation of Comprehensive Income.” Under the amendments
41
in this ASU, an entity has the option to present the total of comprehensive income, the components of net income, and the components of other comprehensive income either in a single continuous statement of comprehensive income or in two separate but consecutive statements. In December 2011, the FASB amended this guidance to postpone the requirement to present on the face of the financial statements reclassification adjustments for items that are reclassified from other comprehensive income to net income where the components of net income and the components of other comprehensive income are presented and reinstate previous guidance related to such reclassifications. For public entities, the amendments in this ASU are effective for fiscal years, and interim periods within those years, beginning after December 15, 2011, and are to be applied retrospectively. Early adoption is permitted. The adoption of this ASU will not have a material impact on the Company’s results of operations or financial position.
In September 2011, the FASB issued ASU 2011-08, “Testing Goodwill for Impairment.” The amendments in this ASU permit an entity to first assess qualitative factors to determine whether it is more likely than not that the fair value of a reporting unit is less than its carrying amount as a basis for determining whether it is necessary to perform the two-step goodwill impairment test described in ASC Topic 350, Intangibles-Goodwill and Other. Previous guidance under this topic required an entity to test goodwill for impairment, on at least an annual basis, by comparing the fair value of a reporting unit with its carrying amount. If the fair value of the reporting unit is less than its carrying amount, then the second step of the test must be performed to measure the amount of the impairment loss, if any. Under the amendments in this ASU, an entity is not required to calculate the fair value of a reporting unit unless the entity determines that it is more likely than not that its fair value is less than its carrying amount. This ASU is effective for annual and interim goodwill impairment tests performed for fiscal years beginning after December 15, 2011. The adoption of this ASU will not have a material impact on the Company’s results of operations or financial position.
Liquidity and Capital Resources
Liquidity is a measure of the ability to generate sufficient cash to meet cash obligations as they come due. Harleysville Group’s primary sources of cash are premium income, investment income and maturing investments. Cash outflows can be variable because of uncertainties regarding settlement dates for liabilities for unpaid losses and because of the potential for large losses, either individually or in the aggregate. Accordingly, Harleysville Group maintains investment and reinsurance programs generally intended to provide adequate funds to pay claims without forced sales of investments. Harleysville Group models its exposure to catastrophes and has the ability to pay claims without selling held to maturity securities even for events having a low (less than 1%) probability. Even in years of greater catastrophe frequency, Harleysville Group generally has been able to pay claims without liquidating any investments. Harleysville Group has also considered scenarios of declines in revenue and increases in loss payments, and believes it has the ability to meet cash requirements under such scenarios without selling held to maturity securities. Harleysville Group’s policy with respect to fixed maturity investments is to purchase only those that are of investment grade quality.
Operating activities used net cash of $77.4 million and provided net cash of $98.2 million for 2011 and 2010, respectively. The 2011 amount includes $33.0 million paid in connection with the change to the intercompany pooling agreement effective January 1, 2011. The remaining decrease of $142.6 million is due to a decrease in underwriting cash flow, primarily from an increase in paid losses from greater catastrophe losses and a decrease in premiums due to the change in the pooling agreement.
Investing activities provided net cash of $104.5 million and used net cash of $2.8 million for 2011 and 2010, respectively. The change is primarily due to net sales of investments in 2011 due to the use of cash by operating activities and financing activities.
Following the execution of the Merger Agreement, the Company determined that it was prudent to sell its equity securities portfolio holdings to reduce risks that could negatively impact the Company’s ability to meet various financial covenant closing conditions set forth in the Merger Agreement. Such sales occurred in the fourth quarter of 2011.
Financing activities used net cash of $27.1 million and $95.6 million for 2011 and 2010, respectively. The decrease is primarily due to a decrease in dividends paid and a decrease in the purchase of treasury stock in 2011.
Harleysville Group’s investment strategy is designed to complement and support the insurance operations. Harleysville Group considers projected cash flow (premiums, investment income, reinsurance programs, liability payout patterns, general expenses, large seasonal obligations, intercompany transfers, etc.) to assure that sufficient
42
liquidity exists within Harleysville Group and the Mutual Company. Maintaining a regular maturity schedule in readily marketable securities is an essential part of addressing liquidity. This regular maturity schedule is maintained in all interest rate environments. After-tax yield will be maximized consistent with safety and liquidity considerations by investment in taxable or tax-exempt securities, depending on Harleysville Group’s tax position.
The Company had $43.4 million of cash and marketable securities at December 31, 2011, which are available for general corporate purposes including dividends, debt service, capital contributions to subsidiaries, acquisitions and the repurchase of stock. On July 30, 2009, the Board of Directors authorized the Company to repurchase up to 800,000 shares of its outstanding common stock over a two year period in the open market or in privately negotiated transactions. Additionally, the Board authorized the Company to make purchases under the terms of a Rule 10b5-1 trading plan, which allows the Company to purchase its shares at times when it ordinarily would not be in the market because of self-imposed trading blackout periods, such as the time preceding its quarterly earnings releases or because its officers are in possession of material, non-public information. The Company repurchased shares in open market transactions from the public float, and did not repurchase shares from the Mutual Company. This program was completed on August 3, 2010. On August 6, 2010, the Board of Directors authorized the Company to repurchase up to an additional 800,000 shares of its common stock over a two year period under terms similar to the repurchase authorization of July 30, 2009. As of December 31, 2011, the Company had repurchased 245,084 shares under this authorization, leaving 554,916 shares authorized to be repurchased. Provisions in the Merger Agreement with Nationwide restrict the Company from repurchasing further shares. Harleysville Group has no other material commitments for capital expenditures as of December 31, 2011.
As a holding company, the Company’s principal source of cash for the payment of stockholder dividends is dividends from its insurance subsidiaries. The Company’s insurance subsidiaries are subject to state laws that restrict their ability to pay dividends. The Company’s insurance subsidiaries declared dividends of $19.3 million and paid dividends of $43.4 million in 2011 ($24.1 million of which had been declared in 2010). The Company’s insurance subsidiaries declared dividends of $89.0 million and paid dividends of $94.3 million in 2010 ($29.5 million of which had been declared in 2009).
Applying the current regulatory restrictions as of December 31, 2011, $65.1 million would be available for distribution to the Company by its subsidiaries in 2012 without prior regulatory approval. See the Business-Regulation section of this Annual Report on Form 10-K, which includes a reconciliation of net income and shareholders’ equity as determined under statutory accounting practices to net income and shareholders’ equity as determined in accordance with accounting principles generally accepted in the United States of America. Also, see Note 9 of the Notes to Consolidated Financial Statements.
The National Association of Insurance Commissioners (NAIC) adopted risk-based capital (RBC) standards that require insurance companies to calculate and report statutory capital and surplus needs based on a formula measuring underwriting, investment and other business risks inherent in an individual company’s operations. These RBC standards have not affected the operations of Harleysville Group since each of the Company’s insurance subsidiaries has statutory capital and surplus in excess of RBC requirements.
These RBC standards require the calculation of a ratio of total adjusted capital to Authorized Control Level. Insurers with a ratio below 200% are subject to different levels of regulatory intervention and action. Based upon their 2011 statutory financial statements, the ratio of total adjusted capital to the Authorized Control Level for the Company’s six insurance subsidiaries at December 31, 2011 ranged from 406% to 721%.
The following summarizes Harleysville Group’s contractual obligations at December 31, 2011:
| | | | | | | | | | | | | | | | | | | | |
| | | Total | | | Less Than
1 Year | | | 1-3 Years | | | 4-5 Years | | | More than
5 Years | |
| | | (in thousands) | |
Contractual obligations: | | | | | | | | | | | | | | | | | | | | |
Debt | | $ | 118,500 | | | $ | 18,500 | | | $ | 100,000 | | | | | | | | | |
Interest on debt | | $ | 8,894 | | | $ | 5,779 | | | $ | 3,115 | | | | | | | | | |
Gross liability for unpaid losses and loss settlement expenses | | $ | 1,789,591 | | | $ | 427,613 | | | $ | 471,421 | | | $ | 235,736 | | | $ | 654,821 | |
| | | | | | | | | | | | | | | | | | | | |
Total | | $ | 1,916,985 | | | $ | 451,892 | | | $ | 574,536 | | | $ | 235,736 | | | $ | 654,821 | |
| | | | | | | | | | | | | | | | | | | | |
43
The table above does not include capital lease obligations, operating lease obligations or purchase obligations as they are either not applicable or not material. The timing of the amounts for the gross liability for unpaid losses and loss settlement expenses is an estimate based on historical experience and expectations of future payment patterns. However, the timing of these payments may vary significantly from the amounts stated above.
Risk Factors
You should consider carefully the following risks, as well as the other information contained in this 2011 Annual Report on Form 10-K. If any of the following events described in the risk factors below actually occur, our business, financial condition and results of operations could be materially adversely affected. You should refer to the other information set forth in this 2011 Annual Report on Form 10-K including our consolidated financial statements and the related notes.
Risks Related to the Property and Casualty Insurance Industry Generally
If our estimated liability for losses and loss settlement expenses is incorrect, our reserves may not be adequate to cover our ultimate liability for losses and loss settlement expenses and may have to be increased.
We are required to maintain loss reserves for our estimated liability for losses and loss settlement expenses associated with reported and unreported claims for each accounting period. We regularly review our reserving techniques and our overall amount of reserves and, based on our estimated liability, raise or lower the levels of our reserves accordingly. If our estimates are incorrect and our reserves are inadequate, we are obligated to increase our reserves. An increase in reserves results in an increase in losses and a reduction in our net income for the period in which the deficiency in reserves is identified. Accordingly, an increase in reserves could have a material adverse effect on our results of operations, liquidity and financial condition. Our reserve amounts are estimated based on what we expect our ultimate liability for losses and loss settlement expenses to be. These estimates are based on facts and circumstances of which we are aware, predictions of future events, trends in claims severity and frequency and other subjective factors. Although we use a number of actuarial methods to project our ultimate liability, there is no method that can always exactly predict our ultimate liability for losses and loss settlement expenses.
In addition to reviewing our reserving techniques, as part of our reserving process we also consider:
| | • | | information regarding each claim for losses; |
| | • | | our loss history and the industry’s loss history; |
| | • | | legislative enactments, judicial decisions and legal developments regarding damages; |
| | • | | changes in political attitudes; and |
| | • | | trends in general economic conditions, including inflation. |
If certain catastrophic events occur, including increased claims related to changing climate conditions, they could have a significant impact on our operating results and financial condition.
Results of property insurers are subject to weather and other events prevailing in any given year. While one year may be relatively free of major weather or other disasters, another year may have numerous such events causing results for that year to be materially worse than for other years.
Our insurance subsidiaries have experienced, and are expected in the future to experience, catastrophe losses. It is possible that a catastrophic event or a series of multiple catastrophic events could have a material adverse effect on the operating results and financial condition of our insurance subsidiaries, thereby limiting the ability of our insurance subsidiaries to pay dividends to us. The largest non-flood catastrophe to affect our results of operations was Hurricane Irene in the third quarter of 2011, which resulted in $28.0 million of losses. In 2010, we experienced losses totaling $37.7 million from twenty-seven different catastrophes. In 2011, we experienced losses totaling $91.5 million from twenty-five different catastrophes.
Various events can cause catastrophes, including severe winter weather, hurricanes, windstorms, earthquakes, hail, war, terrorism, explosions and fires. The frequency and severity of these catastrophes are inherently unpredictable. The extent of losses from a catastrophe is a function of both the total amount of insured exposures in the area affected by the event and the severity of the event.
44
Our insurance subsidiaries seek to reduce the impact on our business of a catastrophe through geographic diversification and through the purchase of reinsurance covering various categories of catastrophes, which generally excludes terrorism. Nevertheless, reinsurance may prove inadequate if:
| | • | | a major catastrophic loss exceeds the reinsurance limit; or |
| | • | | an insurance subsidiary pays a number of smaller catastrophic loss claims that, individually, fall below the subsidiary’s retention level. |
In addition, we use models developed by third party vendors in assessing our property exposure to catastrophe losses that assume various conditions and probability scenarios. These models do not necessarily accurately predict future losses.
We are heavily regulated in the states in which we operate and if we violate those regulations or if the regulations unreasonably restrict our ability to do business, or if they change significantly, it could have a material adverse effect on our business.
We are subject to extensive supervision and regulation in the states in which we transact business. The purpose of supervision and regulation is to protect individual policyholders and not stockholders or other investors. Our business can be adversely affected by private passenger automobile insurance regulations and any other regulations affecting property and casualty insurance companies. For example, laws and regulations can reduce or set rates at levels that we do not believe are adequate for the risks we insure. Other laws and regulations can limit our ability to cancel or refuse to renew policies and require us to offer coverage to all consumers. Changes in laws and regulations, or their interpretations, pertaining to insurance, including workers compensation, may also have a material adverse effect on our business. Although the federal government does not directly regulate the insurance industry, federal initiatives, such as federal terrorism backstop legislation, from time to time, also can impact the insurance industry.
Although we do not write health insurance, rules affecting health care services can affect other insurance that we write, including workers compensation and commercial and personal automobile and liability insurance. We cannot determine whether or in what form additional health care reform legislation may be adopted by the U.S. Congress or any state legislature. We also cannot determine the nature and effect, if any, that the adoption of health care legislation or regulations, or changing interpretations, at the federal or state level would have on us.
In July 2010, the Dodd-Frank Wall Street Reform and Consumer Protection Act (the Dodd-Frank Act) was signed into law. Among other things, the Dodd-Frank Act established a Federal Insurance Office within the U.S. Department of the Treasury and empowered it to gather data and information regarding the insurance industry and insurers. We cannot predict what impact, if any, the Dodd-Frank Act or any other such legislation will have on us.
We currently write flood insurance which is reinsured by the National Flood Insurance Program (the NFIP). There have been various legislative proposals to reform or terminate the NFIP. We cannot currently determine whether or in what form legislation may be adopted concerning the NFIP and the effect this may have on us.
On January 7, 2011, the South Carolina Supreme Court held inCrossmann v Harleysville Mutual Insurance Company (Opinion No. 26909, January 7, 2011) that a contractor’s or subcontractor’s negligent/faulty work does not constitute an “occurrence” under the applicable Commercial general liability policy. In May 2011, the South Carolina legislature passed legislation to overturn theCrossmann decision. The law purported to impact all pending and future claims. The constitutionality of the retroactive application of the legislation is now being challenged. We can not currently determine the effect that this constitutional challenge may have on the legislation or the effect of this legislation on Harleysville Group.
If demand for property and casualty insurance decreases, it could have a material adverse impact on our business.
45
Historically, the results of the property and casualty insurance industry have been subject to significant fluctuations over time due to competition and due to unpredictable developments, including:
| | • | | natural and man-made disasters; |
| | • | | fluctuations in interest rates and other changes in the investment environment that affect returns on our investments; |
| | • | | inflationary pressures that affect the size of losses; and |
| | • | | legislative and regulatory changes and judicial decisions that affect insurers’ liabilities. |
The demand for property and casualty insurance, particularly commercial lines, also can vary with the overall level of economic activity. Any of the foregoing could reduce the demand for property and casualty insurance, which would have a material adverse effect on our business, including on the amount of premiums earned in any fiscal quarter or fiscal year.
If we are unable to reduce our exposure to risks through reliable reinsurance or if the cost of reinsurance increases, our risk of loss, or the cost of controlling our risk of loss, will increase.
We transfer a portion of our exposure to selected risks to other insurance and reinsurance companies through reinsurance arrangements. Under our reinsurance arrangements, another insurer assumes a specified portion of our losses and loss adjustment expenses in exchange for a specified portion of policy premiums. The availability, amount and cost of reinsurance depend on market conditions and may vary significantly. Any decrease in the amount of our reinsurance will increase our risk of loss. Furthermore, we face a credit risk when we obtain reinsurance because we are still liable for the transferred risks if the reinsurer cannot meet the transferred obligations. Therefore, the inability of any of our reinsurers to meet its financial obligations could materially and adversely affect our financial condition and results of operations.
The threat of terrorism and military and other actions may result in decreases in our net income, revenue and assets under management and may materially adversely affect our investment portfolio.
The threat of terrorism, both within the United States and abroad, and military and other actions and heightened security measures in response to these types of threats, may cause significant volatility and declines in the financial markets in the United States, Europe and elsewhere, as well as loss of life, property damage, additional disruptions to commerce and reduced economic activity. Actual terrorist attacks could cause losses from insurance claims related to the property and casualty insurance operations of Harleysville Group, as well as a decrease in our shareholders’ equity, net income and/or revenue. The effects of changes related to Harleysville Group may result in a decrease in our stock price. The Terrorism Risk Insurance Act of 2002, which was originally extended in 2005 and extended again in 2007, requires that some coverage for terrorist loss be offered by primary property insurers and provides Federal assistance for recovery of claims through 2014. In addition, some of the assets in our investment portfolio may be materially adversely affected by declines in the financial markets and economic activity caused by the continued threat of terrorism, ongoing military and other actions and heightened security measures.
We cannot predict at this time whether and the extent to which industry sectors in which we maintain investments may suffer losses as a result of potential decreased commercial and economic activity, or how any such decrease might impact the ability of companies within the affected industry sectors to pay interest or principal on their securities, or how the value of any underlying collateral might be affected.
We can offer no assurances that the threats of future terrorist-like events in the United States and abroad or military actions by the United States will not have a material adverse effect on our business, financial condition or results of operations.
Certain changes in the accounting standards issued by the Financial Accounting Standards Board or other standard-setting bodies could have a material adverse impact on our reported net income.
We are subject to the application of U.S. GAAP and other accounting standards, which are periodically revised and/or expanded. As such, we are required to adopt new or revised accounting standards issued by recognized authoritative bodies, including the Financial Accounting Standards Board. It is possible that future changes required to be adopted could change the current accounting treatment that we apply and such changes could result in material adverse impacts on our results of operations and financial condition.
46
If our investments lose value, our revenues, earnings and financial position will be materially adversely affected.
Like many other property and casualty insurance companies, we depend on income from our investment portfolio for a significant portion of our revenues and earnings. Any significant decline in our investment income as a result of falling interest rates or general market conditions would have a material adverse effect on our results. Any significant decline in the market value of our investments would reduce our shareholders’ equity and our policyholders’ surplus, which could impact our ability to write additional business.
The volatility and disruption of the capital and credit markets and adverse changes in the global economy may negatively impact our business.
Adverse capital and credit market conditions could affect our ability to meet liquidity needs, as well as our access to capital and cost of capital. Further, if adverse regional, national or international economic conditions persist or worsen, we could experience decreased revenues and shareholders’ equity.
The capital and credit markets experienced extreme volatility and disruption in the recent past. The volatility and disruption in the markets exerted downward pressure on the availability of liquidity and credit capacity for certain issuers. Our results of operations, financial condition, cash flows and statutory capital position could be materially adversely affected by continued disruptions in the capital and credit markets.
Continued deterioration in the public debt and equity markets could lead to investment losses.
The severe downturn in the public debt and equity markets in 2008, reflecting uncertainties associated with the mortgage crisis, worsening economic conditions, widening of credit spreads, bankruptcies and government intervention in large financial institutions, has resulted in significant realized and unrealized losses in our investment portfolio in the past. Depending on market conditions going forward, we could incur substantial additional realized and unrealized losses in future periods, which could have a material adverse impact on our results of operations, financial condition, debt and financial strength ratings and ability to access capital markets.
If our financial strength ratings are reduced, we may be materially adversely impacted.
Insurance companies are subject to financial strength ratings produced by external rating agencies. Higher ratings generally indicate greater financial stability and a stronger ability to pay claims. Ratings are assigned by rating agencies to insurers based upon factors that they believe are relevant to policyholders. Ratings are not recommendations to buy, hold or sell our securities.
Although other agencies cover the property and casualty industry, we believe our ability to write business is most influenced by our financial strength rating from A. M. Best. According to A. M. Best, its ratings are designed to assess an insurer’s financial strength and ability to meet ongoing policyholder obligations. Currently, our rating from A. M. Best is “A”, or “excellent.” A rating below “A-” from A. M. Best could materially adversely affect the business we write. Both Moody’s and Standard & Poor’s also assign financial strength ratings to the Company. Our Moody’s rating is A3 and our Standard & Poor’s rating is A-. While we consider our financial strength ratings from these rating agencies important, we believe that they have less impact on our business compared to our financial strength rating from A. M. Best.
In addition to being assigned financial strength ratings, the Company is also assigned credit ratings. We consider our credit ratings from Moody’s and Standard & Poor’s to be most important with regard to our ability to access capital markets. Our current credit rating from Moody’s is Baa2 with a positive outlook while our Standard & Poor’s credit rating is BBB- with a positive outlook. We cannot be sure we will maintain our current investment grade credit ratings. An unfavorable change in our Moody’s or Standard & Poor’s credit rating to below investment grade could make it more expensive for us to access capital markets.
Risks Related to Our Company in Particular
Delay in the consummation of the Mergers could have an adverse effect on our stock price, financial condition, results of operations or business prospects.
The announcement of the Merger Agreement with Nationwide was made in September 2011, however, due to the need for a number of regulatory approvals, and approvals of the stockholders of the Company and the members of the Mutual Company and Nationwide, the Mergers are not expected to close until of the first half of 2012. While expected, the delay between
47
announcement and closing, and the risk that the transactions will not be consummated, could disrupt our business in the following ways, among others:
| | • | | employees may experience uncertainty regarding their future roles with the merged company, which might adversely affect the Company’s ability to retain, recruit and motivate key personnel; |
| | • | | the attention of the Company’s management may be directed toward the completion of the Merger and transaction-related considerations and may be diverted from the day-to-day business operations of the Company, and the matters related to the Merger may require commitments of time and resources that could otherwise have been devoted to other opportunities that might have been beneficial to the Company; |
| | • | | the Company may be unable to grow its business or implement new business initiatives given the pendency of the Merger transactions; and |
| | • | | third parties with business relationships with the Company may seek to terminate or renegotiate their relationships with the Company as a result of the Merger. |
The Merger Agreement also restricts the Company from engaging in certain activities and taking certain actions without Nationwide’s approval, which could prevent us from pursuing opportunities that may arise prior to the closing of the Merger or termination of the agreement.
Any of these matters could adversely affect our financial condition, results of operations or business prospects.
Failure to complete the Merger could negatively affect our stock price and our future business and financial results.
If the Merger is not completed, for any reason, including reasons beyond our control, our ongoing business is likely to be adversely affected and we will be subject to the following risks, among others:
| | • | | we may have to pay significant costs relating to the Merger without receiving the benefits of the Merger; |
| | • | | any resulting negative customer perception could adversely affect our ability to compete for, or to win, new and renewal business in the marketplace; and |
| | • | | the Company would need to re-evaluate its strategic alternatives and operational functions, including the need to establish retention programs to retain employees, evaluate its investment portfolio and re-establish its strategic path as a stand-alone company, and may not be successful in retaining employees and re-establishing its stand-alone operational functions. |
We have incurred and will continue to incur substantial transaction and Merger-related costs in connection with the Merger.
We have incurred and expect to continue to incur a number of substantial non-recurring transaction fees and other costs associated with the Merger. Additional unanticipated costs may be incurred in the integration of the merged businesses. In the event the Merger Agreement is terminated, under certain circumstances we may be required to pay Nationwide a termination fee of $29.6 million and reimburse them for their expenses.
We face significant competition from other regional and national insurance companies, agents and from self-insurance, which may result in lower revenues.
We compete with local, regional and national insurance companies, including direct writers of insurance coverage. Many of these competitors are larger than we are and many have greater financial, technical and operating resources. In addition, we face competition within each insurance agency that sells our insurance because we sell through independent agencies that represent several insurance companies.
The property and casualty insurance industry is highly competitive on the basis of product, price and service. If our competitors offer products with more coverage, or price their products more aggressively, our ability to grow or renew our business may be materially adversely impacted. There are more than 200 groups writing property and
48
casualty insurance in the United States, and we rank among the top 60 in size. Our most significant competitors vary significantly in our different lines of business and in the geographic markets in which we compete. The Internet also could emerge as a significant source of new competition, both from existing competitors using their brand name and resources to write business through this distribution channel and from new competitors.
We also face competition because of entities that self-insure, primarily in the commercial insurance market. From time to time, certain of our customers and potential customers may examine the benefits and risks of self-insurance and other alternatives to traditional insurance.
A number of new, proposed or potential legislative or industry developments could further increase competition in the property and casualty insurance industry. These developments include:
| | • | | programs in which state-sponsored entities provide property insurance in catastrophe-prone areas or other alternative market types of coverage; and |
| | • | | changing practices caused by the Internet, which have led to greater competition in the insurance business and, in some cases, greater expectations for customer service. |
New competition from these developments could cause the supply or demand for insurance to change, which could materially adversely affect our results of operations and financial condition.
If adverse conditions in the eastern and midwestern United States exist, our business would be disproportionately impacted.
We primarily write property and casualty insurance business in the eastern and midwestern United States. Consequently, unusually severe storms or other natural or man-made disasters that destroy property in these states could materially adversely affect our operations. Our revenues and profitability also are subject to prevailing economic and regulatory conditions in the states in which we write insurance. We may be exposed to risks of adverse developments that are greater than if we conducted business nationwide.
We depend on independent insurance agents, which exposes us to risks not applicable to companies with dedicated agents.
We market and sell our insurance products through independent, non-exclusive insurance agencies. These agencies are not obligated to sell our insurance products, and generally they also sell our competitors’ insurance products. As a result, our business depends in part on the marketing and sales efforts of these agencies. If we diversify and expand our business geographically, then we may need to expand our network of agencies to successfully market our products. If these agencies fail to market our products successfully, our business may be materially adversely impacted. Also, independent agents may decide to sell their businesses to banks, other insurance agencies or other businesses. Changes in ownership of agencies, or expansion of agencies through acquisition, could adversely affect an agency’s ability to control growth and profitability, thereby adversely affecting our business.
If our insurance subsidiaries are not able to pay adequate dividends to us, our ability to meet our obligations and pay dividends would be adversely affected.
Our principal assets are the shares of capital stock of our insurance company subsidiaries. We principally rely on dividends from our insurance company subsidiaries to meet our obligations for paying principal and interest on outstanding debt obligations and for paying corporate expenses and dividends to stockholders. The payment of dividends by our insurance company subsidiaries is subject to regulatory restrictions and will depend on the surplus and future earnings of these subsidiaries, as well as other regulatory restrictions. As a result, we may not be able to receive dividends from these subsidiaries at times and in amounts necessary to meet our obligations or to allow us to pay dividends.
If insurance regulators determine that payment of a dividend to our holding company would be detrimental to an insurance subsidiary’s policyholders or creditors, because of the financial condition of the insurance subsidiary or otherwise, the regulators may block dividends that would otherwise be permitted without prior approval.
Our subsidiaries are permitted under the terms of our debt agreement for our $100 million notes due 2013 to incur additional indebtedness that may restrict or prohibit the making of distributions, the payment of dividends or the making of loans by our subsidiaries to us. We cannot assure you that the agreements governing the current and future indebtedness of our subsidiaries will permit our subsidiaries to provide us with sufficient dividends, distributions or loans to fund payments on these notes when due.
49
Although we have paid cash dividends in the past, we are currently restricted, under the Merger Agreement, from paying cash dividends, and we may not be able to pay cash dividends in the future.
We have a history of paying dividends to our stockholders when sufficient cash is available. However, under the Merger Agreement we are restricted from paying cash dividends to our stockholders without the consent of Nationwide, and did not pay a fourth quarter 2011 dividend. Further, any payment of future cash dividends will depend upon our results of operations, financial condition, cash requirements and other factors, including the ability of our subsidiaries to make distributions to us, which ability is restricted in the manner previously discussed in this section.
If our use of predictive modeling or other underwriting tools is not effective, our business could be materially adversely impacted.
We use predictive modeling and other underwriting tools in underwriting a significant portion of our commercial lines business. We believe these tools allow us to more accurately match underwriting risk with pricing to operate more profitably. If the tools do not accurately reflect the level of losses that we ultimately will incur, our ability to write business and our financial results could be materially adversely affected.
If our technology initiatives are not successful, or the benefits are not realized, our business could be materially adversely affected.
Our businesses are increasingly dependent on technology. Our inability to anticipate or manage problems with technology, or fully realize the expected benefits from investments in technology, could materially adversely affect our ability to write business and could materially adversely impact our financial results.
If we lose our key personnel our business could be materially adversely affected.
The success of our business is dependent, to a large extent, on our ability to attract and retain key employees, in particular our senior officers and key management, sales, information systems, underwriting, claims and corporate personnel. Competition to attract and retain key personnel is intense. Although we have change in control agreements with a number of key managers, in general, we do not have employment contracts or non-compete arrangements with, or key person insurance covering, our employees, including our key employees.
Applicable insurance laws and certain provisions in our certificate of incorporation make it difficult to effect a change of control of our Company, and the Mutual Company has significant influence over potential change of control transactions, which could affect our share value.
Under applicable insurance laws and regulations of the states in which our subsidiaries are domiciled, no person may acquire control of us unless that person has filed a statement containing specified information with the insurance commissioner of each state and obtains advance approval for such acquisition. Under applicable laws and regulations, any person acquiring, directly or indirectly (by revocable proxy or otherwise), 10% or more of the voting stock of any other person is presumed to have acquired control of such person, and a person who beneficially acquires 10% or more of our common stock without obtaining advance approval of the insurance commissioner of each state would be in violation of applicable insurance laws and would be subject to injunctive action requiring disposition or seizure of the shares and prohibiting the voting of such shares, as well as other action determined by the insurance commissioner of each such state.
In addition, many state insurance laws require prior notification to the state insurance department of a change of control of a non-domiciliary insurance company licensed to transact an insurance business in that state. Although these pre-notification statutes do not authorize the state insurance departments to disapprove the change of control, they authorize regulatory action - including a possible revocation of our authority to do business - in the affected state if particular conditions exist such as undue market concentration. Any future transactions that would constitute a change of control of us may require prior notification in the states that have pre-acquisition notification laws.
As of December 31, 2011, the Mutual Company owned approximately 53% of our outstanding common stock. The Mutual Company’s stock ownership and ability, by reason of such ownership, to elect our board of directors, provides it with significant influence over potential change of control transactions. Further, Section 203 of the Delaware General Corporation Law provides that if a person acquires 15% or more of our voting stock, the person is an “interested stockholder” and may not engage in “business combinations” with us for a period of three years from the time the person acquired 15% or more of our voting stock, subject to certain exceptions. Section 203 may discourage a potential change of control transaction. Our Board of Directors is divided into three classes (A, B
50
and C). The current three-year terms of Class A, B and C directors expire in 2013, 2012 and 2014, respectively. This classification of our Board of Directors could have the effect of discouraging a potential change in control transaction.
Finally, our certificate of incorporation permits our board of directors to issue up to one million shares of preferred stock having such terms, including voting rights, as the board of directors shall fix and determine.
| Item 7A. | Quantitative and Qualitative Disclosures about Market Risk. |
Interest Rate Risk
Harleysville Group’s exposure to market risk for changes in interest rates is concentrated in its investment portfolio and, to a lesser extent, its debt obligations. Harleysville Group monitors this exposure through periodic reviews of asset and liability positions. Estimates of cash flows and the impact of interest rate fluctuations relating to the investment portfolio are modeled regularly.
Principal cash flows and related weighted-average interest rates by expected maturity dates for financial instruments sensitive to interest rates are as follows:
| | | | | | | | |
| | | December 31, 2011 | |
| | | Principal
Cash Flows | | | Weighted-Average
Interest Rate | |
| | | (dollars in thousands) | |
| | |
Fixed maturities and short-term investments: | | | | | | | | |
2012 | | $ | 386,591 | | | | 3.45 | % |
2013 | | | 212,204 | | | | 4.58 | % |
2014 | | | 301,292 | | | | 3.63 | % |
2015 | | | 346,558 | | | | 3.39 | % |
2016 | | | 331,411 | | | | 3.42 | % |
Thereafter | | | 807,255 | | | | 5.01 | % |
| | | | | | | | |
| | |
Total | | $ | 2,385,311 | | | | | |
| | | | | | | | |
| | |
Fair value | | $ | 2,622,792 | | | | | |
| | | | | | | | |
| | |
Debt: | | | | | | | | |
2012 | | $ | 18,500 | | | | 0.74 | % |
2013 | | | 100,000 | | | | 5.75 | % |
| | | | | | | | |
| | |
Total | | $ | 118,500 | | | | | |
| | | | | | | | |
| | |
Fair value | | $ | 121,822 | | | | | |
| | | | | | | | |
Actual cash flows may differ from those stated as a result of calls and prepayments.
Equity Price Risk
Harleysville Group’s portfolio of equity securities, which is carried on the balance sheet at fair value, has exposure to price risk. Price risk is defined as the potential loss in fair value resulting from an adverse change in prices. Portfolio characteristics are analyzed regularly and price risk is actively managed through a variety of techniques.
The combined total of realized and unrealized equity investment gains (losses) was $(1.4) million, $27.7 million and $46.4 million in 2011, 2010 and 2009, respectively. During these three years, the largest total equity investment gain and (loss) in a quarter was $25.4 million (3rd quarter 2009) and $(34.7) million (3rd quarter 2011), respectively.
Following the execution of the Merger Agreement, the Company determined that it was prudent to sell its equity securities portfolio holdings to reduce risks that could negatively impact the Company’s ability to meet various financial covenant closing conditions set forth in the Merger Agreement. Such sales occurred in the fourth quarter of 2011.
51
| Item 8. | Financial Statements and Supplementary Data. |
52
HARLEYSVILLE GROUP
CONSOLIDATED BALANCE SHEETS
(in thousands, except share data)
| | | | | | | | |
| | | December 31, | |
| | | 2011 | | | 2010 | |
| Assets | | | | | | | | |
Investments: | | | | | | | | |
Fixed maturities: | | | | | | | | |
Held to maturity, at amortized cost (fair value $131,433 and $156,967) | | $ | 124,935 | | | $ | 148,362 | |
Available for sale, at fair value (amortized cost $2,195,221 and $2,069,097) | | | 2,361,971 | | | | 2,165,101 | |
Equity securities, at fair value (cost $7 and $191,095) | | | 7 | | | | 268,104 | |
Short-term investments, at cost, which approximates fair value | | | 129,388 | | | | 79,909 | |
| | | | | | | | |
Total investments | | | 2,616,301 | | | | 2,661,476 | |
Cash | | | 36 | | | | 39 | |
Premiums receivable | | | 133,277 | | | | 133,758 | |
Reinsurance recoverables | | | 245,948 | | | | 219,149 | |
Accrued investment income | | | 25,629 | | | | 26,910 | |
Deferred policy acquisition costs | | | 101,256 | | | | 113,997 | |
Prepaid reinsurance premiums | | | 54,753 | | | | 51,625 | |
Property and equipment, net | | | 12,763 | | | | 13,312 | |
Deferred income taxes | | | 15,712 | | | | 9,413 | |
Other assets | | | 61,394 | | | | 48,553 | |
| | | | | | | | |
Total assets | | $ | 3,267,069 | | | $ | 3,278,232 | |
| | | | | | | | |
| Liabilities and Shareholders’ Equity | | | | | | | | |
Liabilities: | | | | | | | | |
Unpaid losses and loss settlement expenses (affiliate $132,536 and $214,518) | | $ | 1,789,591 | | | $ | 1,771,661 | |
Unearned premiums (affiliate $(14,201) and $32,935) | | | 460,768 | | | | 503,532 | |
Accounts payable and accrued expenses | | | 104,258 | | | | 96,461 | |
Due to affiliate | | | 40,396 | | | | 19,445 | |
Debt (affiliate $18,500 and $18,500) | | | 118,500 | | | | 118,500 | |
| | | | | | | | |
Total liabilities | | | 2,513,513 | | | | 2,509,599 | |
| | | | | | | | |
Shareholders’ equity: | | | | | | | | |
Preferred stock, $1 par value, authorized 1,000,000 shares; none issued | | | | | | | | |
Common stock, $1 par value, authorized 80,000,000 shares; issued 2011, 35,448,861 and 2010, 34,987,829 shares; outstanding 2011, 27,246,172 and 2010, 27,044,836 shares | | | 35,449 | | | | 34,988 | |
Additional paid-in capital | | | 285,585 | | | | 263,857 | |
Accumulated other comprehensive income | | | 63,571 | | | | 80,506 | |
Retained earnings | | | 622,973 | | | | 630,603 | |
Treasury stock, at cost, 8,202,689 and 7,942,993 shares | | | (254,022 | ) | | | (241,321 | ) |
| | | | | | | | |
Total shareholders’ equity | | | 753,556 | | | | 768,633 | |
| | | | | | | | |
Total liabilities and shareholders’ equity | | $ | 3,267,069 | | | $ | 3,278,232 | |
| | | | | | | | |
| | | | |
| See accompanying notes to consolidated financial statements. | | | | |
| | 53 | | |
HARLEYSVILLE GROUP
CONSOLIDATED STATEMENTS OF INCOME
(in thousands, except per share data)
| | | | | | | | | | | | |
| | | Year Ended December 31, | |
| | | 2011 | | | 2010 | | | 2009 | |
Revenues: | | | | | | | | | | | | |
Premiums earned from affiliate (ceded to affiliate, $819,071, $783,340 and $730,699) | | $ | 804,508 | | | $ | 866,350 | | | $ | 858,500 | |
Investment income, net of investment expense | | | 95,401 | | | | 103,313 | | | | 106,649 | |
Realized investment gains, net: | | | | | | | | | | | | |
Total other-than-temporary impairment losses | | | (3,967 | ) | | | — | | | | (1,548 | ) |
Portion of loss recognized in other comprehensive income | | | — | | | | — | | | | — | |
Other realized investment gains, net | | | 79,445 | | | | 597 | | | | 3,841 | |
| | | | | | | | | | | | |
Total realized investment gains, net | | | 75,478 | | | | 597 | | | | 2,293 | |
| | | | | | | | | | | | |
Other income (affiliate $9,814, $7,251 and $6,451) | | | 19,772 | | | | 16,012 | | | | 13,178 | |
| | | | | | | | | | | | |
Total revenues | | | 995,159 | | | | 986,272 | | | | 980,620 | |
| | | | | | | | | | | | |
Expenses: | | | | | | | | | | | | |
Losses and loss settlement expenses (ceded to affiliate, $702,141, $540,619 and $476,641) | | | 681,636 | | | | 589,105 | | | | 552,491 | |
Amortization of deferred policy acquisition costs | | | 205,783 | | | | 220,150 | | | | 216,470 | |
Other underwriting expenses | | | 77,228 | | | | 84,227 | | | | 85,349 | |
Interest expense (affiliate $126, $137 and $290) | | | 6,053 | | | | 6,064 | | | | 6,217 | |
Other expenses | | | 8,198 | | | | 4,014 | | | | 4,095 | |
| | | | | | | | | | | | |
Total expenses | | | 978,898 | | | | 903,560 | | | | 864,622 | |
| | | | | | | | | | | | |
Income before income taxes | | | 16,261 | | | | 82,712 | | | | 115,998 | |
Income tax expense (benefit) | | | (6,351 | ) | | | 15,814 | | | | 29,702 | |
| | | | | | | | | | | | |
Net income | | $ | 22,612 | | | $ | 66,898 | | | $ | 86,296 | |
| | | | | | | | | | | | |
Per common share: | | | | | | | | | | | | |
Basic net income | | $ | .82 | | | $ | 2.43 | | | $ | 3.09 | |
| | | | | | | | | | | | |
Diluted net income | | $ | .81 | | | $ | 2.42 | | | $ | 3.07 | |
| | | | | | | | | | | | |
Cash dividend | | $ | 1.10 | | | $ | 2.81 | | | $ | 1.25 | |
| | | | | | | | | | | | |
| | | | |
| See accompanying notes to consolidated financial statements. | | | | |
| | 54 | | |
HARLEYSVILLE GROUP
CONSOLIDATED STATEMENTS OF SHAREHOLDERS’ EQUITY
For the years ended December 31, 2011, 2010 and 2009
(dollars in thousands)
| | | | | | | | | | | | | | | | | | | | | | | | | | | | |
| | | Common Stock | | | Additional Paid-in | | | Accumulated Other Comprehensive | | | Retained | | | Treasury | | | | |
| | | Shares | | | Amount | | | Capital | | | Income (Loss) | | | Earnings | | | Stock | | | Total | |
Balance at December 31, 2008 | | | 34,254,581 | | | $ | 34,254 | | | $ | 231,715 | | | $ | (17,390 | ) | | $ | 589,146 | | | $ | (185,091 | ) | | $ | 652,634 | |
| | | | | | | |
Net income | | | | | | | | | | | | | | | | | | | 86,296 | | | | | | | | 86,296 | |
Other comprehensive income, net of tax: | | | | | | | | | | | | | | | | | | | | | | | | | | | | |
Unrealized investment gains, net of reclassification adjustment | | | | | | | | | | | | | | | 74,976 | | | | | | | | | | | | 74,976 | |
Defined benefit pension plan: | | | | | | | | | | | | | | | | | | | | | | | | | | | | |
Net actuarial loss adjustment | | | | | | | | | | | | | | | 4,690 | | | | | | | | | | | | 4,690 | |
| | | | | | | | | | | | | | | | | | | | | | | | | | | | |
Other comprehensive income | | | | | | | | | | | | | | | | | | | | | | | | | | | 79,666 | |
| | | | | | | | | | | | | | | | | | | | | | | | | | | | |
Comprehensive income | | | | | | | | | | | | | | | | | | | | | | | | | | | 165,962 | |
| | | | | | | | | | | | | | | | | | | | | | | | | | | | |
Issuance of common stock: | | | | | | | | | | | | | | | | | | | | | | | | | | | | |
Incentive plans | | | 296,483 | | | | 297 | | | | 6,087 | | | | | | | | | | | | | | | | 6,384 | |
Dividend Reinvestment Plan | | | 32,118 | | | | 32 | | | | 963 | | | | | | | | | | | | | | | | 995 | |
Tax benefit from stock compensation | | | | | | | | | | | 571 | | | | | | | | | | | | | | | | 571 | |
Stock compensation | | | | | | | | | | | 6,300 | | | | | | | | | | | | | | | | 6,300 | |
Purchase of treasury stock, 870,153 shares | | | | | | | | | | | | | | | | | | | | | | | (25,369 | ) | | | (25,369 | ) |
Dividends declared | | | | | | | | | | | | | | | | | | | (34,849 | ) | | | | | | | (34,849 | ) |
| | | | | | | | | | | | | | | | | | | | | | | | | | | | |
Balance at December 31, 2009 | | | 34,583,182 | | | | 34,583 | | | | 245,636 | | | | 62,276 | | | | 640,593 | | | | (210,460 | ) | | | 772,628 | |
Net income | | | | | | | | | | | | | | | | | | | 66,898 | | | | | | | | 66,898 | |
Other comprehensive income, net of tax: | | | | | | | | | | | | | | | | | | | | | | | | | | | | |
Unrealized investment gains, net of reclassification adjustment | | | | | | | | | | | | | | | 19,878 | | | | | | | | | | | | 19,878 | |
Defined benefit pension plan: | | | | | | | | | | | | | | | | | | | | | | | | | | | | |
Net actuarial loss adjustment | | | | | | | | | | | | | | | (1,648 | ) | | | | | | | | | | | (1,648 | ) |
| | | | | | | | | | | | | | | | | | | | | | | | | | | | |
Other comprehensive income | | | | | | | | | | | | | | | | | | | | | | | | | | | 18,230 | |
| | | | | | | | | | | | | | | | | | | | | | | | | | | | |
Comprehensive income | | | | | | | | | | | | | | | | | | | | | | | | | | | 85,128 | |
| | | | | | | | | | | | | | | | | | | | | | | | | | | | |
Issuance of common stock: | | | | | | | | | | | | | | | | | | | | | | | | | | | | |
Incentive plans | | | 338,678 | | | | 339 | | | | 8,634 | | | | | | | | | | | | | | | | 8,973 | |
Dividend Reinvestment Plan | | | 65,969 | | | | 66 | | | | 2,211 | | | | | | | | | | | | | | | | 2,277 | |
Tax benefit from stock compensation | | | | | | | | | | | 1,013 | | | | | | | | | | | | | | | | 1,013 | |
Stock compensation | | | | | | | | | | | 6,363 | | | | | | | | | | | | | | | | 6,363 | |
Purchase of treasury stock, 974,931 shares | | | | | | | | | | | | | | | | | | | | | | | (30,861 | ) | | | (30,861 | ) |
Dividends declared | | | | | | | | | | | | | | | | | | | (76,888 | ) | | | | | | | (76,888 | ) |
| | | | | | | | | | | | | | | | | | | | | | | | | | | | |
Balance at December 31, 2010 | | | 34,987,829 | | | $ | 34,988 | | | $ | 263,857 | | | $ | 80,506 | | | $ | 630,603 | | | $ | (241,321 | ) | | $ | 768,633 | |
(Continued)
55
HARLEYSVILLE GROUP
CONSOLIDATED STATEMENTS OF SHAREHOLDERS’ EQUITY
For the years ended December 31, 2011, 2010 and 2009
(dollars in thousands)
(Continued)
| | | | | | | | | | | | | | | | | | | | | | | | | | | | |
| | | Common Stock | | | Additional Paid-in | | | Accumulated Other Comprehensive | | | Retained | | | Treasury | | | | |
| | | Shares | | | Amount | | | Capital | | | Income (Loss) | | | Earnings | | | Stock | | | Total | |
Net income | | | | | | $ | | | | $ | | | | $ | | | | $ | 22,612 | | | $ | | | | $ | 22,612 | |
Other comprehensive income, net of tax: | | | | | | | | | | | | | | | | | | | | | | | | | | | | |
Unrealized investment losses, net of reclassification adjustment | | | | | | | | | | | | | | | (4,072 | ) | | | | | | | | | | | (4,072 | ) |
Defined benefit pension plan: | | | | | | | | | | | | | | | | | | | | | | | | | | | | |
Net actuarial loss adjustment | | | | | | | | | | | | | | | (12,863 | ) | | | | | | | | | | | (12,863 | ) |
| | | | | | | | | | | | | | | | | | | | | | | | | | | | |
Other comprehensive loss | | | | | | | | | | | | | | | | | | | | | | | | | | | (16,935 | ) |
| | | | | | | | | | | | | | | | | | | | | | | | | | | | |
Comprehensive income | | | | | | | | | | | | | | | | | | | | | | | | | | | 5,677 | |
| | | | | | | | | | | | | | | | | | | | | | | | | | | | |
Issuance of common stock: | | | | | | | | | | | | | | | | | | | | | | | | | | | | |
Incentive plans | | | 431,168 | | | | 431 | | | | 12,272 | | | | | | | | | | | | | | | | 12,703 | |
Dividend Reinvestment Plan | | | 29,864 | | | | 30 | | | | 959 | | | | | | | | | | | | | | | | 989 | |
Tax benefit from stock compensation | | | | | | | | | | | 2,108 | | | | | | | | | | | | | | | | 2,108 | |
Stock compensation | | | | | | | | | | | 6,389 | | | | | | | | | | | | | | | | 6,389 | |
Purchase of treasury stock, 259,696 shares | | | | | | | | | | | | | | | | | | | | | | | (12,701 | ) | | | (12,701 | ) |
Dividends declared | | | | | | | | | | | | | | | | | | | (30,242 | ) | | | | | | | (30,242 | ) |
| | | | | | | | | | | | | | | | | | | | | | | | | | | | |
Balance at December 31, 2011 | | | 35,448,861 | | | $ | 35,449 | | | $ | 285,585 | | | $ | 63,571 | | | $ | 622,973 | | | $ | (254,022 | ) | | $ | 753,556 | |
| | | | | | | | | | | | | | | | | | | | | | | | | | | | |
| | | | |
| See accompanying notes to consolidated financial statements. | | | | |
| | 56 | | |
HARLEYSVILLE GROUP
CONSOLIDATED STATEMENTS OF CASH FLOWS
(in thousands)
| | | | | | | | | | | | |
| | | Year Ended December 31, | |
| | | 2011 | | | 2010 | | | 2009 | |
Cash flows from operating activities: | | | | | | | | | | | | |
Net income | | $ | 22,612 | | | $ | 66,898 | | | $ | 86,296 | |
Adjustments to reconcile net income to net cash provided by operating activities: | | | | | | | | | | | | |
Change in receivables, recoverables, unearned premiums and prepaid reinsurance | | | (32,198 | ) | | | 30,221 | | | | (20,322 | ) |
Change in affiliate balance | | | 20,951 | | | | 6,162 | | | | 316 | |
Increase (decrease) in unpaid losses and loss settlement expenses | | | 17,930 | | | | (10,631 | ) | | | 14,691 | |
Deferred income taxes | | | 2,820 | | | | 2,200 | | | | 4,566 | |
(Increase) decrease in deferred policy acquisition costs | | | 5,743 | | | | (2,348 | ) | | | (1,310 | ) |
Amortization and depreciation | | | 10,727 | | | | 10,058 | | | | 6,177 | |
Realized investment gains, including other than temporary impairment losses net | | | (75,478 | ) | | | (597 | ) | | | (2,293 | ) |
Change in other assets and other liabilities | | | (25,110 | ) | | | (10,162 | ) | | | 10,876 | |
Other, net | | | 7,642 | | | | 6,439 | | | | 6,432 | |
| | | | | | | | | | | | |
| | | (44,361 | ) | | | 98,240 | | | | 105,429 | |
Cash used by the change in the intercompany pooling agreement | | | (33,014 | ) | | | | | | | | |
| | | | | | | | | | | | |
Net cash provided (used) by operating activities | | | (77,375 | ) | | | 98,240 | | | | 105,429 | |
| | | | | | | | | | | | |
Cash flows from investing activities: | | | | | | | | | | | | |
Held to maturity investments: | | | | | | | | | | | | |
Maturities | | | 21,854 | | | | 54,916 | | | | 41,406 | |
Available for sale investments: | | | | | | | | | | | | |
Purchases | | | (533,289 | ) | | | (388,940 | ) | | | (507,669 | ) |
Maturities | | | 253,335 | | | | 241,602 | | | | 226,449 | |
Sales | | | 412,301 | | | | 52,333 | | | | 93,960 | |
Other invested assets: | | | | | | | | | | | | |
Maturities | | | | | | | 436 | | | | 410 | |
Sales | | | | | | | 1,408 | | | | | |
Net (purchases) sales or maturities of short-term investments | | | (49,479 | ) | | | 40,896 | | | | 94,206 | |
Purchase of property and equipment, net | | | (234 | ) | | | (602 | ) | | | (2,025 | ) |
Acquisition of affiliate, net of cash acquired | | | | | | | (4,825 | ) | | | | |
| | | | | | | | | | | | |
Net cash provided (used) by investing activities | | | 104,488 | | | | (2,776 | ) | | | (53,263 | ) |
| | | | | | | | | | | | |
Cash flows from financing activities: | | | | | | | | | | | | |
Issuance of common stock | | | 5,336 | | | | 8,973 | | | | 7,382 | |
Purchase of treasury stock | | | (5,307 | ) | | | (30,940 | ) | | | (25,290 | ) |
Dividends paid (to affiliate, $15,979, $40,819 and $18,158) | | | (29,253 | ) | | | (74,597 | ) | | | (34,849 | ) |
Excess tax benefits from share-based payment arrangements | | | 2,108 | | | | 1,013 | | | | 571 | |
| | | | | | | | | | | | |
Net cash used by financing activities | | | (27,116 | ) | | | (95,551 | ) | | | (52,186 | ) |
| | | | | | | | | | | | |
Decrease in cash | | | (3 | ) | | | (87 | ) | | | (20 | ) |
Cash at beginning of year | | | 39 | | | | 126 | | | | 146 | |
| | | | | | | | | | | | |
Cash at end of year | | $ | 36 | | | $ | 39 | | | $ | 126 | |
| | | | | | | | | | | | |
| | | | |
| See accompanying notes to consolidated financial statements. | | | | |
| | 57 | | |
NOTES TO CONSOLIDATED FINANCIAL STATEMENTS
1 – Description of Business and Summary of Significant Accounting Policies
Description of Business
Harleysville Group consists of Harleysville Group Inc. and its subsidiaries (all wholly owned). Those subsidiaries are:
| | • | | Harleysville-Atlantic Insurance Company (Atlantic) – merged into Worcester in December 2011 |
| | • | | Harleysville Insurance Company (HIC) |
| | • | | Harleysville Insurance Company of New Jersey (HNJ) |
| | • | | Harleysville Insurance Company of New York (HIC New York) |
| | • | | Harleysville Insurance Company of Ohio (HIC Ohio) – merged into Worcester in December 2011 |
| | • | | Harleysville Lake States Insurance Company (Lake States) |
| | • | | Harleysville Preferred Insurance Company (Preferred) |
| | • | | Harleysville Worcester Insurance Company (Worcester) |
| | • | | Harleysville Ltd., a real estate partnership that owns the home office |
Harleysville Group is approximately 53% owned by Harleysville Mutual Insurance Company (the Mutual Company).
Harleysville Group underwrites property and casualty insurance in both the personal and commercial lines of insurance. The personal lines of insurance include both auto and homeowners, and the commercial lines include auto, commercial multi-peril and workers compensation. The business is marketed primarily in the eastern and midwestern United States through independent agents.
Principles of Consolidation and Basis of Presentation
The accompanying financial statements include the accounts of Harleysville Group prepared in conformity with U.S. generally accepted accounting principles, which differ in some respects from those followed in reports to insurance regulatory authorities. All significant intercompany balances and transactions have been eliminated in consolidation.
The preparation of financial statements in conformity with U.S. generally accepted accounting principles requires management to make estimates and assumptions that affect the reported amounts of assets and liabilities, including loss and loss settlement expenses, the disclosure of contingent assets and liabilities at the date of the financial statements, and the reported amounts of revenues and expenses, including the determination of other-than-temporary declines in investments, during the reporting period. Actual results could differ from these estimates.
Investments
Accounting for fixed maturities depends on their classification as held to maturity, available for sale or trading. Fixed maturities classified as held to maturity are carried at amortized cost. Fixed maturities classified as available for sale are carried at fair value. There were no investments classified as trading. Equity securities are carried at fair value. Short-term investments are recorded at cost, which approximates fair value. The fair value of level 1 and 2 fixed maturities is based upon data supplied by an independent pricing service. The fair value of level 3 fixed maturity securities is based on cash flow analysis and other valuation techniques. The fair value of equity securities is based on the closing market value. The fair value of mutual fund holdings is based on the closing net asset value reported by the fund.
Premiums and discounts on fixed income securities are amortized or accreted using the interest method. Mortgage-backed securities are amortized over a period based on estimated future principal payments, including prepayments. Prepayment assumptions are reviewed periodically and adjusted as necessary to reflect actual prepayments and changes in expectations. Adjustments related to changes in prepayment assumptions are recognized on a retrospective basis.
58
Realized gains and losses on sales of investments are recognized in net income on the specific identification basis. Unrealized gains or losses on investments carried at fair value, net of applicable income taxes, are reflected directly in shareholders’ equity as a component of comprehensive income and, accordingly, have no effect on net income. However, if the fair value of an investment in equity securities declines below its cost and that decline is deemed other than temporary, the amount of the decline below cost is charged to earnings. A fixed maturity security is other than temporarily impaired if the present value of the cash flows expected to be collected is less than the amortized cost of the security or where the security’s fair value is below cost and the Company intends to sell or more likely than not will be required to sell the security before recovery of its value. If the Company does not intend to sell, or more likely than not will not be required to sell, a fixed maturity security whose fair value has declined below its cost, the amount of the decline below cost due to credit-related reasons is charged to earnings and the remaining difference is included in comprehensive income. Harleysville Group monitors its investment portfolio and at least quarterly reviews investments that have experienced a decline in fair value below cost to evaluate whether the decline is other than temporary. Such evaluations consider, among other things, the magnitude and reasons for a decline, the prospects for the fair value to recover in the near term and Harleysville Group’s intent to retain the investment for a period of time sufficient to allow for a recovery in value.
The severe downturn in the public debt and equity markets in 2008, reflecting uncertainties associated with the mortgage crisis, worsening economic conditions, widening of credit spreads, bankruptcies and government intervention in large financial institutions, has resulted in significant realized and unrealized losses in our investment portfolio in the past. Depending on market conditions going forward, we could incur additional realized and unrealized losses in future periods.
Premiums
Premiums are recognized as revenue ratably over the terms of the respective policies. Unearned premiums are calculated on the daily pro rata basis.
Policy Acquisition Costs
Policy acquisition costs, such as commissions, premium taxes and certain other underwriting and agency expenses that vary with, and are primarily related to, the production of business, are deferred and amortized over the effective period of the related insurance policies in proportion to the premiums earned. The method followed in computing deferred policy acquisition costs limits the amount of such deferred costs to their estimated realizable value. The estimation of net realizable value takes into account the premium to be earned, related investment income over the claims paying period, expected losses and loss settlement expenses, and certain other costs expected to be incurred as the premium is earned. Future changes in estimates, the most significant of which is expected losses and loss settlement expenses, may require adjustments to deferred policy acquisition costs. If the estimation of net realizable value indicates that the deferred acquisition costs are not recoverable, they are written off and further analyses are performed to determine if an additional liability would need to be accrued.
Losses and Loss Settlement Expenses
The liability for losses and loss settlement expenses represents estimates of the ultimate unpaid cost of all losses incurred, which includes the gross liabilities to Harleysville Group’s policyholders plus the net liability to the Mutual Company under the pooling agreement. See Note 3(a). Such estimates may be more or less than the amounts ultimately paid when the claims are settled. These estimates are periodically reviewed and adjusted as necessary; such adjustments are reflected in current operations.
Share-Based Payments
Harleysville Group has several share-based compensation plans. Harleysville Group measures compensation expense associated with the plans based on the grant-date fair value of the awards.
Property and Equipment
Property and equipment are carried at cost less accumulated depreciation. Depreciation is calculated primarily on the straight-line basis over the estimated useful lives of the assets (up to 40 years for buildings and three to 15 years for equipment).
59
Income Taxes
Deferred income tax assets and liabilities are recognized for the expected future tax consequences attributable to differences between the financial statement carrying amounts of existing assets and liabilities and their respective tax bases. Deferred tax assets are reduced by a valuation allowance if it is more likely than not that all or some portion of the deferred tax assets will not be realized.
Earnings Per Share
Basic earnings per share (EPS) is calculated using the weighted average shares outstanding, including participating securities with non-forfeitable rights to dividends, such as unvested restricted stock and restricted stock units. In calculating diluted EPS, the weighted average shares outstanding includes all potentially dilutive securities. Basic and diluted EPS are calculated by dividing net income available to common shareholders by the applicable weighted average number of shares outstanding during the year.
The Company adopted the accounting guidance on “Participating Securities and the Two-Class Method,” in 2009. This guidance redefines participating securities to include unvested share-based payment awards that contain non-forfeitable dividends or dividend equivalents as participating securities to be included in the computation of EPS pursuant to the “two-class method.” Outstanding unvested restricted stock and restricted stock units issued by the Company under employee compensation programs containing such dividend participation features are considered participating securities subject to the “two-class method” in computing EPS rather than the “treasury stock method.” Adoption of this guidance reduced 2009 basic and diluted EPS by $.04 and $.02, respectively.
New Accounting Standards
In January 2010, the Financial Accounting Standards Board (FASB) issued Accounting Standards Update (ASU) 2010-06, “Fair Value Measurements and Disclosures.” ASU 2010-06 applies to all entities that are required to make disclosures about recurring or non-recurring fair value measurements. ASU 2010-06 provides guidance on additional disclosures on any significant transfers in and out of Level 1 and Level 2 and a description of the transfer. ASU 2010-06 also requires separate disclosures of the activity in the Level 3 category related to any purchases, sales, issuances and settlements on a gross basis. The effective date of the new disclosures relating to the existing disclosures regarding Level 1 and Level 2 categories was for interim and annual periods beginning after December 15, 2009. The effective date of the disclosures regarding purchases, sales, issuances and settlements to the Level 3 category was for interim and annual periods beginning after December 15, 2010. The adoption of this ASU did not have a material impact on the Company’s results of operations or financial position.
In October 2010, the FASB issued ASU 2010-26, “Accounting for Costs Associated with Acquiring or Renewing Insurance Contracts (a consensus of the FASB Emerging Issues Task Force).” This ASU amends FASB Accounting Standards Codification (ASC) Topic 944, Financial Services-Insurance, to address which costs related to the acquisition of new or renewal insurance contracts qualify for deferral. The ASU allows insurance entities to defer costs related to the acquisition of new or renewal insurance contracts that are (1) incremental direct costs of the contract transaction (i.e., would not have occurred without the contract transaction), (2) a portion of the employee’s compensation and fringe benefits related to certain activities for successful contract acquisitions, or (3) direct-response advertising costs as defined in ASC Subtopic 340-20, Other Assets and Deferred Costs – Capitalized Advertising Costs. An insurance entity would expense as incurred all other costs related to the acquisition of new or renewal insurance contracts. The amendments in the ASU are effective for fiscal years, and interim periods within those years, beginning on or after December 15, 2011, and can be applied either prospectively or retrospectively. Early application is permitted at the beginning of an entity’s annual reporting period. The Company will adopt this guidance prospectively. During 2012, the Company estimates that pre-tax expenses will increase by approximately $20 million (unaudited), as a lower amount of acquisition costs will be capitalized and amortization of the greater December 31, 2011 balance will continue.
In December 2010, the FASB issued ASU 2010-28, “Intangibles-Goodwill and Other.” The amendments in this ASU modify Step 1 of the goodwill impairment test for reporting units with zero or negative carrying amounts. For these units, an entity is required to perform Step 2 of the goodwill impairment test if it is more likely than not that a goodwill impairment exists. In determining whether it is more likely than not that a goodwill impairment exists, an entity should consider whether there are any adverse qualitative factors indicating that an impairment may exist. For public entities, this ASU is effective for fiscal years, and interim periods within those years, beginning after December 15, 2010. The adoption of this ASU did not have a material impact on the Company’s results of operations or financial position.
60
In May 2011, the FASB issued ASU 2011-04, “Fair Value Measurement: Amendments to Achieve Common Fair Value Measurement and Disclosure Requirements in U.S. GAAP and IFRSs.” The amendments in this ASU result in common fair value measurement and disclosure in U.S. GAAP and IFRSs. The amendments change the wording used to describe many of the requirements in U.S. GAAP for measuring fair value and for disclosing information about fair value measurements. The amendments include: (1) those that clarify the FASB’s intent about the application of existing fair value measurement and disclosure requirements; and (2) those that change a particular principle or requirement for measuring fair value or for disclosing information about fair value measurement. For public entities, the amendments in this ASU are effective during interim and annual periods beginning after December 15, 2011, and are to be applied prospectively. Early application by public entities is not permitted. The adoption of this ASU will not have a material impact on the Company’s results of operations or financial position.
In June 2011, the FASB issued ASU 2011-05, “Presentation of Comprehensive Income.” Under the amendments in this ASU, an entity has the option to present the total of comprehensive income, the components of net income, and the components of other comprehensive income either in a single continuous statement of comprehensive income or in two separate but consecutive statements. In December 2011, the FASB amended this guidance to postpone the requirement to present on the face of the financial statements reclassification adjustments for items that are reclassified from other comprehensive income to net income where the components of net income and the components of other comprehensive income are presented, and reinstate previous guidance related to such reclassifications. For public entities, the amendments in this ASU are effective for fiscal years, and interim periods within those years, beginning after December 15, 2011, and are to be applied retrospectively. Early adoption is permitted. The adoption of this ASU will not have a material impact on the Company’s results of operations or financial position.
In September 2011, the FASB issued ASU 2011-08, “Testing Goodwill for Impairment.” The amendments in this ASU permit an entity to first assess qualitative factors to determine whether it is more likely than not that the fair value of a reporting unit is less than its carrying amount as a basis for determining whether it is necessary to perform the two-step goodwill impairment test described in ASC Topic 350, Intangibles-Goodwill and Other. Previous guidance under this topic required an entity to test goodwill for impairment, on at least an annual basis, by comparing the fair value of a reporting unit with its carrying amount. If the fair value of the reporting unit is less than its carrying amount, then the second step of the test must be performed to measure the amount of the impairment loss, if any. Under the amendments in this ASU, an entity is not required to calculate the fair value of a reporting unit unless the entity determines that it is more likely than not that its fair value is less than its carrying amount. This ASU is effective for annual and interim goodwill impairment tests performed for fiscal years beginning after December 15, 2011. The adoption of this ASU will not have a material impact on the Company’s results of operations or financial position.
2 – Merger Agreement
On September 28, 2011, the Company and the Mutual Company entered into an agreement and plan of merger (the Merger Agreement) with Nationwide Mutual Insurance Company (Nationwide) under which a subsidiary of Nationwide would merge into the Company. Nationwide would acquire all of the publicly held shares of common stock of the Company for $60.00 per share in cash, and the Mutual Company would merge into Nationwide and the policyholders and members of the Mutual Company would become policyholders and members of Nationwide. The Mutual Company has also entered into a voting agreement with Nationwide (the Voting Agreement) under which the Mutual Company agreed to vote its 53% voting interest in the Company in favor of the Merger. The Merger Agreement restricts the Company from engaging in certain activities and taking certain actions without Nationwide’s prior approval, including among others, the payment of stockholder dividends.
The transactions are subject to customary closing conditions, including, among others, approvals from stockholders of the Company, policyholders of the Mutual Company and Nationwide, the Pennsylvania Insurance Department, the Ohio Insurance Department and various other regulatory bodies. The transactions are expected to close in the first half of 2012. The Merger Agreement provides certain termination rights. In the event that the agreement is terminated under certain conditions by the Company’s Board of Directors, the Company will be required to pay Nationwide a termination fee of $29.6 million and reimburse Nationwide for its transaction expenses.
61
3 – Transactions with Affiliates
(a) Underwriting
The insurance subsidiaries participate in a reinsurance pooling agreement with the Mutual Company and its property and casualty insurance subsidiary, Harleysville Pennland Insurance Company (Pennland), whereby such subsidiaries and Pennland cede to the Mutual Company all of their insurance business and assume from the Mutual Company an amount equal to their participation in the pooling agreement. All losses and loss settlement expenses and other underwriting expenses are prorated among the parties on the basis of participation in the pooling agreement. The pooling agreement provides for allocation of premiums, losses and loss settlement expenses and underwriting expenses between Harleysville Group and the Mutual Company. Harleysville Group is not liable for any losses incurred by its subsidiaries, Harleysville Preferred Insurance Company and Harleysville Insurance Company of New Jersey, and the Mutual Company prior to January 1, 1986, the date the pooling agreement became effective. Harleysville Group’s participation in the pool has been 80% since January 1, 2008. Effective January 1, 2010, the pooling agreement was amended to exclude reinsurance premiums, losses, loss settlement expenses and underwriting expenses voluntarily assumed by the Mutual Company.
Effective January 1, 2011, the Company’s property and casualty subsidiaries and the Mutual Company and Pennland amended their intercompany pooling agreement as it relates to their workers compensation business. The amendment established that the financial results associated with the workers compensation business for accident years 2011 and following will be retained 100 percent by the Mutual Company. The financial results of this business for prior accident years will continue to be shared between the Company’s property and casualty subsidiaries, the Mutual Company and Pennland under the existing pool participations. Harleysville Group paid cash of $33 million on January 3, 2011 associated with the transfer of the unearned premium liability on the workers compensation business as of January 1, 2011. Harleysville Group’s unearned premium liability decreased by $40 million and Harleysville Group received a ceding commission of $7 million for expenses that were incurred to generate the business transferred to the Mutual Company, which ceding commission reduced deferred policy acquisition costs.
Because this pooling agreement does not relieve Harleysville Group of primary liability as the originating insurer, there is a concentration of credit risk arising from business ceded to the Mutual Company. However, the reinsurance pooling agreement provides for the right of offset, and the amount of credit risk with the Mutual Company was not material at December 31, 2011 and 2010. The Mutual Company has an A. M. Best rating of “A” (Excellent).
The following amounts represent reinsurance transactions between Harleysville Group and the Mutual Company under the pooling arrangement:
| | | | | | | | | | | | |
| | | 2011 | | | 2010 | | | 2009 | |
| | | (in thousands) | |
Ceded: | | | | | | | | | | | | |
Premiums written | | $ | 820,316 | | | $ | 810,391 | | | $ | 748,289 | |
| | | | | | | | | | | | |
Premiums earned | | $ | 819,071 | | | $ | 783,340 | | | $ | 730,699 | |
| | | | | | | | | | | | |
Losses incurred | | $ | 702,141 | | | $ | 540,619 | | | $ | 476,641 | |
| | | | | | | | | | | | |
Assumed: | | | | | | | | | | | | |
Premiums written | | $ | 758,617 | | | $ | 882,061 | | | $ | 851,617 | |
| | | | | | | | | | | | |
Premiums earned | | $ | 804,508 | | | $ | 866,350 | | | $ | 858,500 | |
| | | | | | | | | | | | |
Losses incurred | | $ | 680,854 | | | $ | 588,506 | | | $ | 551,773 | |
| | | | | | | | | | | | |
Net (ceded to) assumed from the Mutual Company: | | | | | | | | | | | | |
Unearned premiums | | $ | (14,201 | ) | | $ | 32,935 | | | $ | 44,275 | |
| | | | | | | | | | | | |
Unpaid losses and loss settlement expenses | | $ | 132,536 | | | $ | 214,518 | | | $ | 257,562 | |
| | | | | | | | | | | | |
62
(b) Property
Harleysville Ltd. leases the home office to the Mutual Company, which shares the facility with Harleysville Group. Rental income under the lease was $4,469,000, $4,402,000 and $4,194,000 for 2011, 2010, and 2009, respectively, and is included in other income after elimination of intercompany amounts of $3,175,000, $2,994,000 and $2,852,000 in 2011, 2010 and 2009, respectively.
(c) Management Agreements
Harleysville Group Inc. received $8,520,000, $5,843,000 and $5,109,000 of management fee income in 2011, 2010 and 2009, respectively, under agreements whereby Harleysville Group Inc. provides management services to the Mutual Company and other affiliates. Such amounts are included in other income. Effective January 1, 2010, the management agreement was amended to include voluntary assumed reinsurance business written by the Mutual Company.
(d) Affiliate Balances
Affiliate balances are created primarily from the pooling arrangement (settled quarterly), allocation of common expenses, collection of premium balances and payment of claims (settled monthly). No interest is charged or received on affiliate balances due to the timely settlement terms and nature of the items. Interest expense on the loan from the Mutual Company described in Note 8 was $126,000, $137,000 and $290,000 in 2011, 2010 and 2009, respectively.
Harleysville Group has off-balance-sheet credit risk related to approximately $97,300,000 and $99,600,000 of premium balances due to the Mutual Company from agents and insureds at December 31, 2011 and 2010, respectively.
(e) Acquisition
On December 30, 2010, Harleysville Group Inc. acquired Mainland Insurance Company (Mainland) from the Mutual Company for $4,825,000 in cash. On December 31, 2010, HIC New York was merged into Mainland and Mainland’s name was changed to Harleysville Insurance Company of New York (HIC New York). Mainland was a shell property and casualty insurance company with no premiums or outstanding insurance obligations. The acquisition and Merger were completed to facilitate the redomestication of HIC New York to Pennsylvania in order to improve the efficiency of the corporate structure. Supplemental cash flow information for the acquisition is as follows:
| | | | |
| | | (in thousands) | |
Fair value of assets (including short-term investments of $4.3 million) | | $ | 4,832 | |
Liabilities assumed | | | 7 | |
| | | | |
Cash paid | | $ | 4,825 | |
| | | | |
4 – Investments
Fair value accounting guidance defines fair value, establishes a framework for measuring fair value in generally accepted accounting principles, and expands disclosures about fair value measurements.
Fair value measurements are determined under a three-level hierarchy which gives the highest priority to quoted prices in active markets and the lowest priority to unobservable inputs which are based on the Company’s own assumptions. The three levels of the hierarchy are as follows:
Level 1 – Unadjusted quoted market prices for identical assets or liabilities in active markets that the Company has the ability to access.
Level 2 – Inputs other than Level 1 that are based on observable market data. These include quoted prices for similar assets in active markets, quoted prices for identical assets in inactive markets, inputs other than quoted prices that are observable for the asset or liability and inputs that are derived from or corroborated by observable market data.
Level 3 – Inputs that are unobservable, reflecting the Company’s own assumptions.
63
For investments that have quoted market prices in active markets, the Company uses the quoted market price as fair value and includes these investments in Level 1 of the fair value hierarchy. The Company classifies U.S. Treasury securities and publicly traded equity securities and equity mutual funds as Level 1. When quoted market prices in active markets are not available, the Company relies on a pricing service to estimate fair value. The Company classifies its fixed maturity securities other than U.S. Treasury securities and private placements as Level 2. Private placement fixed maturity securities and non-publicly traded equity securities are classified as Level 3.
The Company utilizes a nationally recognized independent pricing service to obtain fair value estimates for its fixed maturity holdings because of the detailed process it uses in arriving at a fair value estimate. For fixed maturity securities that have quoted prices in active markets, market quotations are provided. For fixed maturity securities that do not trade on a daily basis, the independent pricing service prepares estimates of fair value using a wide array of observable inputs including relevant market information, benchmark curves, benchmarking of like securities, sector groupings and matrix pricing. The observable market inputs that our independent pricing service utilizes include, listed in approximate order of priority: benchmark yields, reported trades, broker/dealer quotes, issuer spreads, two-sided markets, benchmark securities, bids, offers and reference data including market research publications. Additionally, the independent pricing service uses an Option Adjusted Spread model to develop prepayment and interest rate scenarios.
When the independent pricing service provides a fair value estimate, the Company uses that estimate. At December 31, 2011 and 2010, the independent pricing service provided a fair value estimate for all of the investments classified as Level 1 investments within the fair value hierarchy and approximately 99% of the investments classified as Level 2 estimates within the fair value hierarchy. The fair value of all Level 2 securities is based on observable market inputs.
In instances when the independent pricing service is unable to provide a fair value estimate, the Company attempts to obtain a non-binding fair value estimate from a number of broker/dealers and reviews any fair value estimate reported by an independent business news service. In instances where only one broker/dealer provides a fair value estimate for a fixed maturity security, the Company uses that estimate. In instances where the Company is able to obtain fair value estimates from more than one broker/dealer, the Company generally uses the lowest or next to lowest fair value estimate. In instances where neither the independent pricing service nor a broker/dealer is able to provide a fair value estimate, the fair value is based on cash flow analysis and other valuation techniques which utilize significant unobservable inputs and the Company classifies the fixed maturity investment as a Level 3 investment. Level 3 investments represent less than 1% of the Company’s total investment portfolio.
Quotes obtained from third parties are non-binding. The third parties from whom quotes are obtained are knowledgeable market participants that have a detailed understanding of the sector, the security type and the issuer. The non-binding quotes are fair value estimates based on observable market data utilized by these market participants. The Company does not adjust quotes or prices obtained from third parties.
Management reviews, on an ongoing basis, the reasonableness of the methodologies employed by the independent pricing service. As part of the monthly review process, management examines the prices obtained from the independent pricing service. This process routinely involves reviewing any available recent transaction activity reported via various investment research tools. Additionally, the Company tracks changes in credit ratings of all fixed maturity securities on a monthly basis and performs a more in-depth, quarterly evaluation of fixed income securities that are rated below single A by Moody’s and/or S&P. If, as a result of its review, management does not believe that a price received with respect to any particular security is a reasonable estimate of the fair value of the security, it will discuss this with the independent pricing service to resolve the discrepancy. Management then determines the appropriate level of classification of each investment within the fair value hierarchy based on its evaluation of the inputs used in determining the fair value.
64
The following is a summary of the fair value measurements of applicable Company assets by level within the fair value hierarchy as of December 31, 2011 and 2010. These assets are measured at fair value on a recurring basis. There were no transfers to or from Levels 1 and 2 of the fair value hierarchy in 2011. Harleysville Group’s policy is to recognize transfers between levels as of the end of the reporting period.
| | | | | | | | | | | | | | | | |
| | | | | | Fair Value Measurements at Reporting Date Using | |
| | December 31,
2011 | | | Quoted Prices
in Active
Markets for
Identical
Assets
(Level 1) | | | Significant
Other
Observable
Inputs
(Level 2) | | | Significant
Unobservable
Inputs
(Level 3) | |
| | | (in thousands) | |
Fixed maturities available for sale: | | | | | | | | | | | | | | | | |
U.S. Treasury securities | | $ | 442,324 | | | $ | 442,324 | | | | | | | | | |
Obligations of U.S. government corporations and agencies | | | 8,088 | | | | | | | $ | 8,088 | | | | | |
Obligations of states and political subdivisions | | | 1,159,065 | | | | | | | | 1,159,065 | | | | | |
Corporate securities | | | 457,877 | | | | | | | | 457,877 | | | | | |
Mortgage-backed securities | | | 294,617 | | | | | | | | 294,617 | | | | | |
| | | | | | | | | | | | | | | | |
Total available for sale | | | 2,361,971 | | | | 442,324 | | | | 1,919,647 | | | | | |
| | | | | | | | | | | | | | | | |
Equity securities: | | | | | | | | | | | | | | | | |
Other | | | 7 | | | | | | | | | | | $ | 7 | |
| | | | | | | | | | | | | | | | |
Total equity securities | | | 7 | | | | | | | | | | | | 7 | |
| | | | | | | | | | | | | | | | |
Total | | $ | 2,361,978 | | | $ | 442,324 | | | $ | 1,919,647 | | | $ | 7 | |
| | | | | | | | | | | | | | | | |
| | | | | | | | | | | | | | | | |
| | | | | | Fair Value Measurements at Reporting Date Using | |
| | December 31,
2010 | | | Quoted Prices
in Active
Markets for
Identical
Assets
(Level 1) | | | Significant
Other
Observable
Inputs
(Level 2) | | | Significant
Unobservable
Inputs
(Level 3) | |
| | | (in thousands) | |
Fixed maturities available for sale: | | | | | | | | | | | | | | | | |
U.S. Treasury securities | | $ | 122,857 | | | $ | 122,857 | | | | | | | | | |
Obligations of U.S. government corporations and agencies | | | 17,171 | | | | | | | $ | 17,171 | | | | | |
Obligations of states and political subdivisions | | | 1,173,447 | | | | | | | | 1,173,447 | | | | | |
Corporate securities | | | 481,805 | | | | | | | | 481,805 | | | | | |
Mortgage-backed securities | | | 369,821 | | | | | | | | 369,821 | | | | | |
| | | | | | | | | | | | | | | | |
Total available for sale | | | 2,165,101 | | | | 122,857 | | | | 2,042,244 | | | | | |
| | | | | | | | | | | | | | | | |
Equity securities: | | | | | | | | | | | | | | | | |
Dividend income portfolio of common stocks | | | 51,684 | | | | 51,684 | | | | | | | | | |
International fund | | | 44,877 | | | | 44,877 | | | | | | | | | |
Total stock market index fund | | | 171,536 | | | | 171,536 | | | | | | | | | |
Other | | | 7 | | | | | | | | | | | $ | 7 | |
| | | | | | | | | | | | | | | | |
Total equity securities | | | 268,104 | | | | 268,097 | | | | | | | | 7 | |
| | | | | | | | | | | | | | | | |
Total | | $ | 2,433,205 | | | $ | 390,954 | | | $ | 2,042,244 | | | $ | 7 | |
| | | | | | | | | | | | | | | | |
65
The following tables presents additional information about assets measured at fair value on a recurring basis for which significant unobservable inputs (Level 3) were used to determine fair value.
| | | | | | | | | | | | |
| | | Fair Value Measurements Using Significant
Unobservable Inputs (Level 3)
Year Ended December 31, 2011 | |
| | | Fixed Maturities
Available for Sale | | | Equity
Securities | | | Total | |
| | | | | | (in thousands) | | | | |
Balance at January 1, 2011 | | $ | — | | | $ | 7 | | | $ | 7 | |
Purchases | | | | | | | | | | | | |
Settlements | | | | | | | | | | | | |
| | | | | | | | | | | | |
Balance at December 31, 2011 | | $ | — | | | $ | 7 | | | $ | 7 | |
| | | | | | | | | | | | |
The amount of total losses for the year included in earnings (realized investment gains (losses), net) attributable to the change in unrealized losses relating to assets still held at December 31, 2011 | | | | | | | | | | $ | — | |
| | | | | | | | | | | | |
| | | | | | | | | | | | |
| | | Fair Value Measurements Using Significant
Unobservable Inputs (Level 3)
Year Ended December 31, 2010 | |
| | | Fixed Maturities
Available for Sale | | | Equity
Securities | | | Total | |
| | | | | | (in thousands) | | | | |
Balance at January 1, 2010 | | $ | 100 | | | $ | 6 | | | $ | 106 | |
Purchases | | | | | | | 1 | | | | 1 | |
Settlements | | | (100 | ) | | | | | | | (100 | ) |
| | | | | | | | | | | | |
Balance at December 31, 2010 | | $ | — | | | $ | 7 | | | $ | 7 | |
| | | | | | | | | | | | |
The amount of total losses for the year included in earnings (realized investment gains (losses), net) attributable to the change in unrealized losses relating to assets still held at December 31, 2010 | | | | | | | | | | $ | — | |
| | | | | | | | | | | | |
66
The amortized cost and estimated fair value of investments in fixed maturity and equity securities are as follows:
| | | | | | | | | | | | | | | | |
| | | December 31, 2011 | |
| | Amortized
Cost | | | Gross
Unrealized
Gains | | | Gross
Unrealized
Losses | | | Estimated
Fair
Value | |
| | | (in thousands) | |
Held to maturity: | | | | | | | | | | | | | | | | |
Obligations of U.S. government corporations and agencies | | $ | 266 | | | $ | 17 | | | | | | | $ | 283 | |
Obligations of states and political subdivisions | | | 66,670 | | | | 2,425 | | | | | | | | 69,095 | |
Corporate securities | | | 57,999 | | | | 4,082 | | | $ | (26 | ) | | | 62,055 | |
| | | | | | | | | | | | | | | | |
Total held to maturity | | | 124,935 | | | | 6,524 | | | | (26 | ) | | | 131,433 | |
| | | | | | | | | | | | | | | | |
Available for sale: | | | | | | | | | | | | | | | | |
U.S. Treasury securities | | | 434,308 | | | | 8,016 | | | | | | | | 442,324 | |
Obligations of U.S. government corporations and agencies | | | 7,523 | | | | 565 | | | | | | | | 8,088 | |
Obligations of states and political subdivisions | | | 1,059,682 | | | | 99,402 | | | | (19 | ) | | | 1,159,065 | |
Corporate securities | | | 415,193 | | | | 42,687 | | | | (3 | ) | | | 457,877 | |
Mortgage-backed securities | | | 278,515 | | | | 16,102 | | | | | | | | 294,617 | |
| | | | | | | | | | | | | | | | |
Total available for sale | | | 2,195,221 | | | | 166,772 | | | | (22 | ) | | | 2,361,971 | |
| | | | | | | | | | | | | | | | |
Total fixed maturities | | $ | 2,320,156 | | | $ | 173,296 | | | $ | (48 | ) | | $ | 2,493,404 | |
| | | | | | | | | | | | | | | | |
Total equity securities | | $ | 7 | | | $ | — | | | $ | — | | | $ | 7 | |
| | | | | | | | | | | | | | | | |
| | | | | | | | | | | | | | | | |
| | | December 31, 2010 | |
| | Amortized
Cost | | | Gross
Unrealized
Gains | | | Gross
Unrealized
Losses | | | Estimated
Fair
Value | |
| | | (in thousands) | |
Held to maturity: | | | | | | | | | | | | | | | | |
Obligations of U.S. government corporations and agencies | | $ | 370 | | | $ | 8 | | | | | | | $ | 378 | |
Obligations of states and political subdivisions | | | 74,811 | | | | 3,722 | | | | | | | | 78,533 | |
Corporate securities | | | 73,181 | | | | 4,875 | | | | | | | | 78,056 | |
| | | | | | | | | | | | | | | | |
Total held to maturity | | | 148,362 | | | | 8,605 | | | | | | | | 156,967 | |
| | | | | | | | | | | | | | | | |
Available for sale: | | | | | | | | | | | | | | | | |
U.S. Treasury securities | | | 119,009 | | | | 3,886 | | | $ | (38 | ) | | | 122,857 | |
Obligations of U.S. government corporations and agencies | | | 16,274 | | | | 897 | | | | | | | | 17,171 | |
Obligations of states and political subdivisions | | | 1,140,695 | | | | 36,730 | | | | (3,978 | ) | | | 1,173,447 | |
Corporate securities | | | 447,962 | | | | 34,173 | | | | (330 | ) | | | 481,805 | |
Mortgage-backed securities | | | 345,157 | | | | 24,664 | | | | | | | | 369,821 | |
| | | | | | | | | | | | | | | | |
Total available for sale | | | 2,069,097 | | | | 100,350 | | | | (4,346 | ) | | | 2,165,101 | |
| | | | | | | | | | | | | | | | |
Total fixed maturities | | $ | 2,217,459 | | | $ | 108,955 | | | $ | (4,346 | ) | | $ | 2,322,068 | |
| | | | | | | | | | | | | | | | |
Total equity securities | | $ | 191,095 | | | $ | 77,322 | | | $ | (313 | ) | | $ | 268,104 | |
| | | | | | | | | | | | | | | | |
67
The amortized cost and estimated fair value of fixed maturity securities at December 31, 2011 by contractual maturity are shown below. Expected maturities may differ from contractual maturities because borrowers may have the right to call or prepay obligations with or without call or prepayment penalties.
| | | | | | | | |
| | | Amortized
Cost | | | Estimated
Fair
Value | |
| | | (in thousands) | |
Held to maturity: | | | | | | | | |
Due in one year or less | | $ | 20,747 | | | $ | 20,864 | |
Due after one year through five years | | | 92,414 | | | | 98,236 | |
Due after five years through ten years | | | 1,771 | | | | 1,862 | |
Due after ten years | | | 10,003 | | | | 10,471 | |
| | | | | | | | |
| | | 124,935 | | | | 131,433 | |
| | | | | | | | |
Available for sale: | | | | | | | | |
Due in one year or less | | | 45,243 | | | | 45,861 | |
Due after one year through five years | | | 923,868 | | | | 967,613 | |
Due after five years through ten years | | | 572,442 | | | | 635,981 | |
Due after ten years | | | 375,153 | | | | 417,899 | |
| | | | | | | | |
| | | 1,916,706 | | | | 2,067,354 | |
| | | | | | | | |
Mortgage-backed securities | | | 278,515 | | | | 294,617 | |
| | | | | | | | |
| | | 2,195,221 | | | | 2,361,971 | |
| | | | | | | | |
Total fixed maturities | | $ | 2,320,156 | | | $ | 2,493,404 | |
| | | | | | | | |
The amortized cost of fixed maturities on deposit with various regulatory authorities at December 31, 2011 and 2010 amounted to $32,658,000 and $32,581,000 respectively.
The estimated fair value and unrealized loss for temporarily impaired securities is as follows:
| | | 00000000 | | | | 00000000 | | | | 00000000 | | | | 00000000 | |
| | | December 31, 2011 | |
| | | Less than 12 Months | | | Total | |
| | | Estimated
Fair Value | | | Unrealized
Losses | | | Estimated
Fair Value | | | Unrealized
Losses | |
| | | (in thousands) | |
Fixed maturities: | | | | | | | | | | | | | | | | |
Obligations of states and political subdivisions | | $ | 8,976 | | | $ | 19 | | | $ | 8,976 | | | $ | 19 | |
Corporate securities | | | 7,956 | | | | 29 | | | | 7,956 | | | | 29 | |
| | | | | | | | | | | | | | | | |
Total temporarily impaired securities | | $ | 16,932 | | | $ | 48 | | | $ | 16,932 | | | $ | 48 | |
| | | | | | | | | | | | | | | | |
68
| | | 000000111 | | | | 000000111 | | | | 000000111 | | | | 000000111 | |
| | | December 31, 2010 | |
| | | Less than 12 Months | | | Total | |
| | | Estimated
Fair Value | | | Unrealized
Losses | | | Estimated
Fair Value | | | Unrealized
Losses | |
| | | (in thousands) | |
U.S. Treasury securities | | $ | 3,073 | | | $ | 38 | | | $ | 3,073 | | | $ | 38 | |
Obligations of states and political subdivisions | | | 232,551 | | | | 3,978 | | | | 232,551 | | | | 3,978 | |
Corporate securities | | | 33,594 | | | | 330 | | | | 33,594 | | | | 330 | |
| | | | | | | | | | | | | | | | |
Total fixed maturities | | | 269,218 | | | | 4,346 | | | | 269,218 | | | | 4,346 | |
| | | | | | | | | | | | | | | | |
Equity securities | | | 17,231 | | | | 313 | | | | 17,231 | | | | 313 | |
| | | | | | | | | | | | | | | | |
Total temporarily impaired securities | | $ | 286,449 | | | $ | 4,659 | | | $ | 286,449 | | | $ | 4,659 | |
| | | | | | | | | | | | | | | | |
Of the total fixed maturity securities with an unrealized loss at December 31, 2011, securities with a fair value of $10,963,000 and an unrealized loss of $22,000 are classified as available for sale and are carried at fair value on the balance sheet while securities with a fair value of $5,969,000 and an unrealized loss of $26,000 are classified as held to maturity on the balance sheet and are carried at amortized cost.
The unrealized losses on fixed maturity investments were primarily due to the expected call of a municipal bond and the widening of credit spreads on securities in the financial sector. Per the Company’s policy, a fixed maturity security is other than temporarily impaired if the present value of the cash flows expected to be collected is less than the amortized cost of the security or where the security’s fair value is below cost and the Company intends to sell or more likely than not will be required to sell the security before recovery of its value. The Company believes, based on its analysis, that these securities are not other than temporarily impaired. However, depending on developments involving both the issuers and worsening economic conditions, these investments may be written down in the income statement in the future.
A summary of net investment income is as follows:
| | | | | | | | | | | | |
| | | 2011 | | | 2010 | | | 2009 | |
| | | (in thousands) | |
Interest on fixed maturities | | $ | 89,910 | | | $ | 100,504 | | | $ | 103,971 | |
Dividends on equity securities | | | 7,020 | | | | 4,239 | | | | 3,639 | |
Interest on short-term investments | | | 333 | | | | 548 | | | | 1,150 | |
Income on other invested assets | | | | | | | 12 | | | | 67 | |
| | | | | | | | | | | | |
Total investment income | | | 97,263 | | | | 105,303 | | | | 108,827 | |
| | | |
Less: Investment expense | | | 1,862 | | | | 1,990 | | | | 2,178 | |
| | | | | | | | | | | | |
Net investment income | | $ | 95,401 | | | $ | 103,313 | | | $ | 106,649 | |
| | | | | | | | | | | | |
69
Realized gross gains (losses) from investments and the change in difference between fair value and cost of investments, before applicable income taxes, are as follows:
| | | | | | | | | | | | |
| | | 2011 | | | 2010 | | | 2009 | |
| | | (in thousands) | |
Fixed maturity securities: | | | | | | | | | | | | |
Available for sale: | | | | | | | | | | | | |
Gross gains | | $ | 314 | | | $ | 1,438 | | | $ | 6,655 | |
Gross losses | | | (106 | ) | | | (127 | ) | | | (2,814 | ) |
Other than temporary impairment losses | | | (381 | ) | | | | | | | (1,249 | ) |
| | | |
Equity securities: | | | | | | | | | | | | |
Gross gains | | | 82,313 | | | | | | | | | |
Gross losses | | | (3,076 | ) | | | (79 | ) | | | | |
Other than temporary impairment losses | | | (3,586 | ) | | | | | | | | |
| | | |
Other invested assets: | | | | | | | | | | | | |
Gross losses | | | | | | | (635 | ) | | | | |
Other than temporary impairment losses | | | | | | | | | | | (299 | ) |
| | | | | | | | | | | | |
Net realized investment gains | | $ | 75,478 | | | $ | 597 | | | $ | 2,293 | |
| | | | | | | | | | | | |
Change in difference between fair value and cost of investments(1): | | | | | | | | | | | | |
Fixed maturity securities | | $ | 68,639 | | | $ | 1,869 | | | $ | 74,524 | |
Equity securities | | | (77,009 | ) | | | 27,764 | | | | 46,434 | |
| | | | | | | | | | | | |
Total | | $ | (8,370 | ) | | $ | 29,633 | | | $ | 120,958 | |
| | | | | | | | | | | | |
| (1) | Parentheses indicate a net unrealized decline in fair value. |
Income taxes on realized investment gains were $26,417,000, $209,000 and $803,000 for 2011, 2010 and 2009, respectively.
Deferred income tax liabilities applicable to net unrealized investment gains included in shareholders’ equity were $58,362,000 and $60,555,000 at December 31, 2011 and 2010, respectively.
There were impairment charges of $381,000 on fixed maturity securities in 2011that Harleysville Group intended to sell. All of these securities were subsequently sold in 2011. At September 30, 2011, a bond with an amortized cost of $999,000 was transferred from the held to maturity category to the available for sale category due to a significant deterioration in the credit worthiness of the issuer. An impairment charge of $21,000 recognized on this security is included in the fixed maturity impairment total of $381,000. Harleysville Group had no credit-related impairment charges on non-equity securities in 2010. Harleysville Group recognized credit-related impairment charges on non-equity securities of $1,548,000 in 2009. The 2009 impairment charges consisted of $568,000 on bonds the Company sold in 2010 and $980,000 on structured investment vehicles.
There were impairment charges of $3,586,000 on equity securities in 2011 that Harleysville Group intended to sell. In October 2011, the Company sold virtually all of its equity securities, at a gain of $62 million, in order to reduce potential volatility in statutory surplus. Harleysville Group had no impairment charges on equity securities in 2010 or 2009.
Harleysville Group has not directly held or issued derivative financial instruments during the periods presented.
70
5 – Reinsurance
In the ordinary course of business, Harleysville Group cedes insurance to, and assumes insurance from, insurers to limit its maximum loss exposure through diversification of its risks. See Note 3(a) for discussion of reinsurance with the Mutual Company. Reinsurance contracts do not relieve Harleysville Group of primary liability as the originating insurer. After excluding reinsurance transactions with the Mutual Company under the pooling arrangement in the assumed and ceded amounts below, the effect of Harleysville Group’s share of other reinsurance on premiums written and earned is as follows:
| | | | | | | | | | | | |
| | | 2011 | | | 2010 | | | 2009 | |
| | | (in thousands) | |
Premiums written: | | | | | | | | | | | | |
Direct | | $ | 886,352 | | | $ | 1,004,632 | | | $ | 954,375 | |
Assumed | | | 4,030 | | | | 4,598 | | | | 13,818 | |
Ceded | | | (131,765 | ) | | | (127,169 | ) | | | (116,576 | ) |
| | | | | | | | | | | | |
Pooled share of premiums written | | $ | 758,617 | | | $ | 882,061 | | | $ | 851,617 | |
| | | | | | | | | | | | |
Premiums earned: | | | | | | | | | | | | |
Direct | | $ | 928,348 | | | $ | 979,444 | | | $ | 958,151 | |
Assumed | | | 4,797 | | | | 10,765 | | | | 10,092 | |
Ceded | | | (128,637 | ) | | | (123,859 | ) | | | (109,743 | ) |
| | | | | | | | | | | | |
Pooled share of premiums earned | | $ | 804,508 | | | $ | 866,350 | | | $ | 858,500 | |
| | | | | | | | | | | | |
Losses and loss settlement expenses are net of reinsurance recoveries of $88,418,000, $44,414,000 and $53,563,000 for 2011, 2010 and 2009, respectively.
Assumed and ceded written premiums for 2009 include $6,200,000 and assumed and ceded earned premiums for 2010 and 2009 include $5,280,000 and $920,000, respectively, for Harleysville Group’s share of flood insurance business the Mutual Company assumed from another carrier, which is ceded 100% to the National Flood Insurance Program.
6 – Property and Equipment
Property and equipment consisted of the Company’s home office land and buildings with a cost of $28,971,000 and $28,737,000, and equipment, including software, with a cost of $4,906,000 and $5,749,000 at December 31, 2011 and 2010, respectively. Accumulated depreciation related to such assets was $21,114,000 and $21,174,000 at December 31, 2011 and 2010, respectively.
Rental expense under leases with non-affiliates amounted to $2,619,000, $2,514,000 and $2,793,000 for 2011, 2010 and 2009, respectively. Operating lease commitments were not material at December 31, 2011.
71
7 – Liability for Unpaid Losses and Loss Settlement Expenses
Activity in the liability for unpaid losses and loss settlement expenses is summarized as follows:
| | | | | | | | | | | | |
| | | 2011 | | | 2010 | | | 2009 | |
| | | (in thousands) | |
Liability at January 1 | | $ | 1,771,661 | | | $ | 1,782,292 | | | $ | 1,767,601 | |
Less reinsurance recoverables | | | 217,596 | | | | 223,128 | | | | 209,352 | |
| | | | | | | | | | | | |
Net liability at January 1 | | | 1,554,065 | | | | 1,559,164 | | | | 1,558,249 | |
| | | | | | | | | | | | |
Incurred related to: | | | | | | | | | | | | |
Current year | | | 713,697 | | | | 639,234 | | | | 588,575 | |
Prior years | | | (32,061 | ) | | | (50,129 | ) | | | (36,084 | ) |
| | | | | | | | | | | | |
Total incurred | | | 681,636 | | | | 589,105 | | | | 552,491 | |
| | | | | | | | | | | | |
Paid related to: | | | | | | | | | | | | |
Current year | | | 311,828 | | | | 249,831 | | | | 204,192 | |
Prior years | | | 378,469 | | | | 344,373 | | | | 347,384 | |
| | | | | | | | | | | | |
Total paid | | | 690,297 | | | | 594,204 | | | | 551,576 | |
| | | | | | | | | | | | |
Net liability at December 31 | | | 1,545,404 | | | | 1,554,065 | | | | 1,559,164 | |
Plus reinsurance recoverables | | | 244,187 | | | | 217,596 | | | | 223,128 | |
| | | | | | | | | | | | |
Liability at December 31 | | $ | 1,789,591 | | | $ | 1,771,661 | | | $ | 1,782,292 | |
| | | | | | | | | | | | |
In 2011, Harleysville Group recognized net favorable development of $32,061,000 in the provision for insured events of prior years, primarily due to lower-than-expected claims severity broadly experienced across casualty lines in accident years 2003 through 2008, partially offset by adverse development in accident years 2009 and 2010.
A decrease in commercial automobile severity, primarily in accident years 2005 through 2009, was observed during 2011, which led to the recognition of favorable development in these accident years. Slightly higher than expected severity was observed in accident year 2010, which led to the recognition of adverse development in this accident year. In aggregate, $5,600,000 of favorable prior year development was recognized in this line during 2011.
A decrease in workers compensation severity, primarily in accident years 2003 through 2008, was observed during 2011, which led to the recognition of favorable development in these accident years. An increase in severity was observed in accident years 2009 and 2010, which led to the recognition of adverse development in these accident years. In aggregate, $11,800,000 of favorable prior year development was recognized in this line during 2011.
A decrease in commercial multi-peril severity was widely observed during 2011, which led to the recognition of favorable development in most accident years prior to 2009. An increase in severity was observed in accident years 2009 and 2010, which led to the recognition of adverse development in these years. In aggregate, $10,600,000 of favorable prior year development was recognized in this line during 2011.
A decrease in other commercial lines severity, primarily in accident years 2007 through 2009, was observed during 2011, which led to the recognition of favorable development in these accident years. An increase in severity was observed in accident year 2010, which led to the recognition of adverse development in this accident year. In aggregate, $2,800,000 of favorable prior year development was recognized in this line during 2011.
A decrease in personal automobile severity in accident years 2008 and prior was widely observed during 2011, which led to the recognition of favorable development in these accident years. An increase in severity was observed in accident years 2009 and 2010, which led to the recognition of adverse development in these accident years. In aggregate, $70,000 of favorable prior year development was recognized in this line during 2011.
A decrease in homeowners severity in accident years 2008 and prior was widely observed during 2011, which led to the recognition of favorable development in these accident years. An increase in severity was observed in accident years 2009 and 2010, which led to the recognition of adverse development in these accident years. In aggregate, $900,000 of favorable prior year development was recognized in this line during 2011.
72
A slight decrease in other personal lines severity was observed during 2011, primarily in accident year 2009. In aggregate, $300,000 of favorable prior year development was recognized in other personal lines during 2011.
In 2010, Harleysville Group recognized net favorable development of $50,129,000 in the provision for insured events of prior years, primarily due to lower-than-expected claims severity broadly experienced across all casualty lines in accident years 2004 through 2008, partially offset by a slight amount of adverse development in accident years prior to 2000.
A decrease in commercial automobile severity was observed during 2010, which led to the recognition of $8,071,000 of favorable development in this line during the year. Approximately $2,400,000 of the favorable development experienced in this line during 2010 is related to the Company’s involuntary pools.
A decrease in workers compensation severity, primarily in accident years 2002 through 2007, was observed during 2010, and led to the recognition of favorable development for those accident years during the year. An increase in workers compensation medical severity in accident years 2001 and prior was observed during 2010 which led to the recognition of adverse development for those accident years during the year. An increase in severity in accident year 2009 was observed in this line during 2010, which led to the recognition of $1,228,000 of adverse development during the year. In total, $8,184,000 of favorable development was recognized in the workers compensation line during 2010. Approximately $2,600,000 of the favorable development experienced in this line during 2010 is related to the Company’s involuntary pools.
In the commercial multi-peril line of business, a reduction in severity, primarily in accident years 2004 through 2009, led to the recognition of $18,945,000 of favorable development during 2010.
A reduction in other commercial lines severity was widely observed during 2010, which led to the recognition of $9,626,000 of favorable prior year development.
A reduction in personal automobile severity in accident years 2008 and prior was widely observed during 2010. Claim frequency in accident year 2009 increased, which led to $506,000 of adverse development during the year. In total, $4,356,000 of favorable prior year development was recognized in this line during 2010.
A reduction in homeowners severity was observed during 2010, especially in accident year 2006. Claim frequency and severity in accident years 2008 and 2009 was observed to increase slightly, which led to the recognition of $413,000 and $81,000 of adverse development in these years, respectively. In total, $270,000 of favorable development was recognized in this line during 2010.
A reduction in other personal lines severity was observed during 2010, especially in accident year 2005. Severity in accident years 2008 and 2009 was observed to marginally increase, which led to the recognition of approximately $100,000 of adverse development in each accident year. In total, $677,000 of favorable development was recognized in other personal lines during 2010.
In 2009, Harleysville Group recognized net favorable development of $36,084,000 in the provision for insured events of prior years, primarily due to lower-than-expected claims severity broadly experienced across all casualty lines in accident years 2002 through 2006, partially offset by adverse development in accident year 2008 and accident years prior to 2002. A lower-than-expected level of claims severity was observed in personal lines in accident year 2008, which led to the recognition of $2,295,000 of favorable development in this accident year. This amount was offset by the recognition of $2,609,000 of adverse development in commercial lines in accident year 2008, primarily related to a higher-than-expected level of commercial property severity in this accident year.
A decrease in commercial automobile severity was observed during 2009 which led to the recognition of $20,525,000 of favorable development in this line during 2009. Approximately $1,100,000 of the favorable development experienced in this line during 2009 is related to the Company’s involuntary pools.
A decrease in workers compensation severity in accident years 2003 through 2006 was observed during 2009 which led to the recognition of favorable development for those accident years during 2009. An increase in workers compensation medical severity in accident years 2002 and prior was observed during 2009 which led to the recognition of adverse development for those accident years during 2009. An increase in severity in accident year 2008 was observed in this line during 2009 and led to the recognition of $1,134,000 of adverse development during the year. In total, $9,118,000 of favorable development was recognized in the workers compensation line during 2009. Approximately $3,400,000 of the favorable development experienced in this line during 2009 is related to the Company’s involuntary pools.
73
In the commercial multi-peril line of business, a reduction in severity in accident years 2003 through 2006 led to the recognition of favorable development for those accident years during 2009. An increase in claim frequency in accident year 2007 and an increase in severity in accident year 2008 led to the recognition of a small amount of adverse development for those accident years during 2009. In total, $1,863,000 of favorable development was recognized in the commercial multi-peril line of business during 2009 for all accident years.
A reduction in other commercial lines severity in accident years 2005 and prior was widely observed during 2009. This amount was largely offset by an increase in severity in accident years 2007 and 2008 which led to $469,000 and $423,000 of adverse development in these years, respectively. In total, there was no significant prior year development in other commercial lines during 2009.
A reduction in personal automobile severity was widely observed during 2009 which led to the recognition of $2,553,000 of favorable development during 2009 for all accident years.
A reduction in homeowners severity was widely observed during 2009, especially in accident year 2008, which led to the recognition of $2,995,000 of favorable development during 2009 for all accident years.
An increase in other personal lines severity was observed during 2009 which led to the recognition of $977,000 of adverse development during the year for all accident years.
Harleysville Group records the actuarial central estimate, which is management’s best estimate, of the ultimate unpaid losses and loss settlement expenses incurred. Actuarial loss reserving techniques and assumptions, which rely on historical information as adjusted to reflect current conditions, have been consistently applied, after including consideration of recent case reserve activity, during the periods presented. Changes in the estimate of the liability for unpaid losses and loss settlement expenses reflect actual payments and evaluations of new information and data since the last reporting date. These changes correlate with actuarial trends.
Because of the nature of insurance claims, there are uncertainties inherent in the estimates of ultimate losses. Harleysville Group’s reorganization of its claims operation in recent years has resulted in new people and processes involved in settling claims. As a result, more recent statistical data reflects different patterns than in the past and gives rise to uncertainty as to the pattern of future loss settlements. There are uncertainties regarding future loss cost trends particularly related to medical treatments and automobile repair. Court decisions, regulatory changes and economic conditions can affect the ultimate cost of claims that occurred in the past.
In establishing the liability for unpaid losses and loss settlement expenses, management considers facts currently known and the current state of the law and coverage litigation. Liabilities are recognized for known losses (including the cost of related litigation) when sufficient information has been developed to indicate the involvement of a specific insurance policy, and management can reasonably estimate its liability. In addition, liabilities have been established to cover additional exposures on both known and unasserted losses. Estimates of the liabilities are reviewed and updated on a regular basis.
The property and casualty insurance industry has received significant publicity about environmental-related losses from exposures insured many years ago. Since the intercompany pooling agreement pertains to insurance business written or earned on or after January 1, 1986, Harleysville Group has not incurred significant environmental-related losses.
8 – Borrowings
Debt is as follows:
| | | | | | | | |
| | | December 31, | |
| | | 2011 | | | 2010 | |
| | | (in thousands) | |
Notes, 5.75%, due 2013 | | $ | 100,000 | | | $ | 100,000 | |
Demand term-loan payable to the Mutual Company, LIBOR plus 0.45%, due 2012 | | | 18,500 | | | | 18,500 | |
| | | | | | | | |
Total debt | | $ | 118,500 | | | $ | 118,500 | |
| | | | | | | | |
74
The fair value of the notes was $103,322,000 and $99,413,000 at December 31, 2011 and 2010, respectively, based on quoted market prices for the same or similar debt. The carrying value of the remaining debt approximates fair value.
Interest paid was $5,876,000, $5,887,000 and $6,054,000 in 2011, 2010 and 2009 respectively.
9 – Shareholders’ Equity
Comprehensive income consisted of the following:
| | | | | | | | | | | | |
| | | 2011 | | | 2010 | | | 2009 | |
| | | (in thousands) | |
Net income | | $ | 22,612 | | | $ | 66,898 | | | $ | 86,296 | |
Other comprehensive income (loss): | | | | | | | | | | | | |
Unrealized investment gains (losses): | | | | | | | | | | | | |
Unrealized investment holding gains arising during period, net of taxes of $24,226, $10,912 and $41,174 | | | 44,989 | | | | 20,266 | | | | 76,466 | |
Less: | | | | | | | | | | | | |
Reclassification adjustment for gains included in net income, net of taxes of $26,417, $209 and $803 | | | (49,061 | ) | | | (388 | ) | | | (1,490 | ) |
| | | | | | | | | | | | |
Net unrealized investment gains (losses) | | | (4,072 | ) | | | 19,878 | | | | 74,976 | |
| | | | | | | | | | | | |
Defined benefit pension plan: | | | | | | | | | | | | |
Net actuarial gain (loss) arising during the period, net of taxes (benefit) of $(8,378), $(2,020) and $1,886 | | | (15,561 | ) | | | (3,749 | ) | | | 3,503 | |
Recognition of net actuarial loss in net periodic pension cost, net of taxes of $1,452, $1,132 and $640 | | | 2,698 | | | | 2,101 | | | | 1,187 | |
| | | | | | | | | | | | |
Defined benefit pension plan | | | (12,863 | ) | | | (1,648 | ) | | | 4,690 | |
| | | | | | | | | | | | |
Other comprehensive income (loss) | | | (16,935 | ) | | | 18,230 | | | | 79,666 | |
| | | | | | | | | | | | |
Comprehensive income | | $ | 5,677 | | | $ | 85,128 | | | $ | 165,962 | |
| | | | | | | | | | | | |
Accumulated other comprehensive income consisted of the following amounts (which are net of tax):
| | | | | | | | |
| | | December 31, | |
| | | 2011 | | | 2010 | |
| | | (in thousands) | |
Unrealized investment gains | | $ | 108,387 | | | $ | 112,459 | |
Defined benefit pension plan-net actuarial loss | | | (44,816 | ) | | | (31,953 | ) |
| | | | | | | | |
Accumulated other comprehensive income | | $ | 63,571 | | | $ | 80,506 | |
| | | | | | | | |
A source of cash for the payment of dividends is dividends from subsidiaries. Harleysville Group Inc.’s insurance subsidiaries are required by law to maintain certain minimum surplus on a statutory basis, and are subject to risk-based capital requirements and to regulations under which payment of a dividend from statutory surplus is restricted and may require prior approval of regulatory authorities. Applying the current regulatory restrictions as of December 31, 2011, $65,135,000 would be available for distribution to Harleysville Group Inc. in 2012 without prior approval.
Various states have adopted the National Association of Insurance Commissioners (NAIC) risk-based capital (RBC) standards that require insurance companies to calculate and report statutory capital and surplus needs based on a formula measuring underwriting, investment and other business risks inherent in an individual company’s operations. These RBC standards have not affected the operations of Harleysville Group since each of the Company’s insurance subsidiaries has statutory capital and surplus in excess of RBC requirements.
These RBC standards require the calculation of a ratio of total adjusted capital to Authorized Control Level. Insurers with a ratio below 200% are subject to different levels of regulatory intervention and action. Based upon their 2011 statutory financial statements, the ratio of total adjusted capital to the Authorized Control Level for the Company’s six insurance subsidiaries at December 31, 2011 ranged from 406% to 721%.
75
The following table contains selected information for Harleysville Group Inc.’s property and casualty insurance subsidiaries, as determined in accordance with prescribed statutory accounting practices:
| | | | | | | | | | | | |
| | | 2011 | | | 2010 | | | 2009 | |
| | | (unaudited) | | | | | | | |
| | | | | | (in thousands) | | | | |
Statutory capital and surplus | | $ | 628,670 | | | $ | 695,475 | | | $ | 681,160 | |
| | | | | | | | | | | | |
Statutory unassigned surplus | | $ | 506,085 | | | $ | 553,904 | | | $ | 541,786 | |
| | | | | | | | | | | | |
Statutory net income | | $ | 43,736 | | | $ | 68,429 | | | $ | 90,892 | |
| | | | | | | | | | | | |
10 – Income Taxes
The components of income tax expense (benefit) are as follows:
| | | | | | | | | | | | |
| | | 2011 | | | 2010 | | | 2009 | |
| | | (in thousands) | |
Current | | $ | (9,171 | ) | | $ | 13,614 | | | $ | 25,136 | |
Deferred | | | 2,820 | | | | 2,200 | | | | 4,566 | |
| | | | | | | | | | | | |
| | $ | (6,351 | ) | | $ | 15,814 | | | $ | 29,702 | |
| | | | | | | | | | | | |
Net cash paid for federal income taxes in 2011, 2010 and 2009 was $1,046,000, $11,100,000 and $9,100,000 respectively.
The actual income tax rate differed from the statutory federal income tax rate applicable to income before income taxes as follows:
| | | | | | | | | | | | |
| | | 2011 | | | 2010 | | | 2009 | |
Statutory federal income tax rate | | | 35.0 | % | | | 35.0 | % | | | 35.0 | % |
Tax-exempt income | | | (81.9 | ) | | | (16.0 | ) | | | (9.5 | ) |
Non-deductible merger-related expenses | | | 7.1 | | | | | | | | | |
Other, net | | | 0.7 | | | | 0.1 | | | | 0.1 | |
| | | | | | | | | | | | |
| | | (39.1 | )% | | | 19.1 | % | | | 25.6 | % |
| | | | | | | | | | | | |
The tax effects of the significant temporary differences that give rise to deferred tax liabilities and assets are as follows:
| | | | | | | | |
| | | December 31, | |
| | | 2011 | | | 2010 | |
| | | (in thousands) | |
Deferred tax liabilities: | | | | | | | | |
Deferred policy acquisition costs | | $ | 35,439 | | | $ | 39,899 | |
Unrealized investment gains | | | 58,362 | | | | 60,555 | |
Other | | | 8,540 | | | | 9,528 | |
| | | | | | | | |
Total deferred tax liabilities | | | 102,341 | | | | 109,982 | |
| | | | | | | | |
Deferred tax assets: | | | | | | | | |
Unearned premiums | | | 28,421 | | | | 31,633 | |
Losses incurred | | | 48,867 | | | | 54,037 | |
Pension plan | | | 19,279 | | | | 13,525 | |
Alternative minimum tax credit carryforward | | | 8,607 | | | | 476 | |
Capital loss carryforward | | | | | | | 4,881 | |
Other | | | 12,879 | | | | 14,843 | |
| | | | | | | | |
Total deferred tax assets | | | 118,053 | | | | 119,395 | |
| | | | | | | | |
Net deferred tax asset | | $ | 15,712 | | | $ | 9,413 | |
| | | | | | | | |
76
A valuation allowance is required to be established for any portion of the deferred tax asset that management believes will not be realized. In the opinion of management, it is more likely than not that the benefit of the deferred tax asset will be realized through the generation of future income. Therefore, no such valuation allowance has been established.
As of December 31, 2011 and 2010, Harleysville Group had no material unrecognized tax benefits or accrued interest and penalties. The Company’s policy is to account for interest as a component of interest expense and penalties as a component of other expense. Federal tax years 2007 through 2010 were open for examination as of December 31, 2011.
11 – Incentive Plans
The compensation expense for the various share-based compensation plans that has been charged against income before income taxes was $6,389,000, $6,363,000 and $6,300,000 for 2011, 2010 and 2009, respectively with a corresponding income tax benefit of $2,138,000, $2,130,000 and $2,083,000 for 2011, 2010 and 2009, respectively.
Fixed Stock Option Plans
Harleysville Group has an Equity Incentive Plan (EIP) for key employees. Awards may be made in the form of stock options, stock appreciation rights (SARs), restricted stock, restricted stock units or any combination of the above. The EIP was amended in 1997, 2006, 2007 and 2010 and limits future awards to an aggregate of 3,500,000 shares of the Company’s common stock, plus the remaining shares under the plan in existence in 1997. Such shares may be authorized and unissued shares or treasury shares. The plan provides that stock options may become exercisable from six months to 10 years from the date of grant with an exercise price not less than fair market value on the date of grant. Options granted normally vest 33 1/3% at the end of one year, 33 1/3% at the end of two years and 33 1/3% at the end of three years from the date of grant, subject to earlier or accelerated vesting in designated situations, including a change-in-control or qualifying retirement of the award holder. SARs have not been material. Time-based restricted stock awards have vesting periods of three to five years and vest 100% at the end of the period. Time-based restricted stock units have vesting periods of three to five years and vest 100% at the end of the period. Some restricted stock and restricted stock unit awards have performance-based vesting requirements and can vest anywhere from 0% to 200% of the number of target shares, depending upon the achievement of such performance goals. Performance-based restricted stock and restricted stock units have vesting periods of three to five years. All of the restricted stock awards and restricted stock unit awards are subject to earlier or accelerated vesting in designated situations, including a change-in-control or qualifying retirement of the award holder.
In determining the expense to be recorded for stock options, the fair value of each option award is estimated on the date of grant using the Black-Scholes option pricing model. The significant assumptions utilized in applying the Black-Scholes option pricing model are the risk-free interest rate, expected term, dividend yield, and expected volatility. The risk-free interest rate is the implied yield currently available on U.S. Treasury zero-coupon issues with a remaining term equal to the expected term used as the assumption in the model. The expected term of an option award is based on historical experience of similar awards. The dividend yield is determined by dividing the per share- dividend by the grant date stock price. The expected volatility is based on the volatility of the Company’s stock price over a historical period comparable to the expected term. The weighted average assumptions used in applying the Black-Scholes valuation model are shown below:
| | | | | | | | | | | | |
| | | For the Year Ended
December 31, | |
| | | 2011 | | | 2010 | | | 2009 | |
Risk-free interest rate | | | 2.58 | % | | | 2.79 | % | | | 2.56 | % |
Expected term | | | 5.5 years | | | | 5.5 years | | | | 5.5 years | |
Dividend yield | | | 3.96 | % | | | 3.83 | % | | | 4.11 | % |
Expected volatility | | | 27.42 | % | | | 29.32 | % | | | 29.84 | % |
77
A summary of share option activity under the plan is as follows:
| | | | | | | | | | | | | | | | |
| | | Number
of Shares | | | Weighted
Average
Exercise
Price
Per Share | | | Weighted
Average
Remaining
Contractual Life | | | Aggregate
Intrinsic Value | |
| | | | | | | | | (in years) | | | (in thousands) | |
Outstanding at January 1, 2009 | | | 1,594,437 | | | $ | 28.18 | | | | | | | | | |
Granted—2009 | | | 544,250 | | | | 29.18 | | | | | | | | | |
Exercised—2009 | | | (154,116 | ) | | | 23.36 | | | | | | | | | |
Forfeited—2009 | | | (72,842 | ) | | | 31.49 | | | | | | | | | |
| | | | | | | | | | | | | | | | |
Outstanding at December 31, 2009 | | | 1,911,729 | | | | 28.73 | | | | | | | | | |
Granted—2010 | | | 511,790 | | | | 33.94 | | | | | | | | | |
Exercised—2010 | | | (434,795 | ) | | | 25.49 | | | | | | | | | |
Forfeited—2010 | | | (153,363 | ) | | | 32.26 | | | | | | | | | |
| | | | | | | | | | | | | | | | |
Outstanding at December 31, 2010 | | | 1,835,361 | | | | 30.66 | | | | | | | | | |
Granted—2011 | | | 232,325 | | | | 36.38 | | | | | | | | | |
Exercised—2011 | | | (284,874 | ) | | | 30.73 | | | | | | | | | |
Forfeited—2011 | | | (21,617 | ) | | | 32.29 | | | | | | | | | |
| | | | | | | | | | | | | | | | |
Outstanding at December 31, 2011 | | | 1,761,195 | | | $ | 31.38 | | | | 6.5 | | | $ | 44,368 | |
| | | | | | | | | | | | | | | | |
Exercisable at: | | | | | | | | | | | | | | | | |
December 31, 2011 | | | 1,078,006 | | | $ | 29.89 | | | | 5.4 | | | $ | 28,759 | |
| | | | | | | | | | | | | | | | |
The per share weighted-average fair value of options granted during 2011, 2010 and 2009 was $6.58, $6.84 and $5.67, respectively. The total intrinsic value of options exercised was $5,577,000, $4,066,000, and $1,199,000 for 2011, 2010 and 2009, respectively.
The expense to be recorded over the vesting period for restricted stock and restricted stock unit awards is determined utilizing the number of awards granted and the grant date fair market value.
A summary of restricted stock activity under the plan is as follows:
| | | | | | | | |
| | | Number of
Shares | | | Weighted
Average
Grant Date
Fair Value | |
Restricted stock awards at January 1, 2009 | | | 254,917 | | | $ | 33.34 | |
Granted 2009 | | | 86,342 | | | | 31.03 | |
Vested 2009 | | | (3,931 | ) | | | 32.51 | |
Forfeited 2009 | | | (17,500 | ) | | | 32.17 | |
| | | | | | | | |
Restricted stock awards at December 31, 2009 | | | 319,828 | | | | 32.79 | |
Vested 2010 | | | (58,872 | ) | | | 32.67 | |
Forfeited 2010 | | | (30,336 | ) | | | 33.24 | |
| | | | | | | | |
Restricted stock awards at December 31, 2010 | | | 230,620 | | | | 32.77 | |
Vested 2011 | | | (144,666 | ) | | | 33.24 | |
Forfeited 2011 | | | (6,465 | ) | | | 32.78 | |
| | | | | | | | |
Restricted stock awards at December 31, 2011 | | | 79,489 | | | $ | 31.91 | |
| | | | | | | | |
The total fair market value of restricted shares which vested during 2011, 2010 and 2009 was $5,723,000, $2,034,000 and $122,000, respectively. In 2009, 15,735 restricted shares granted included a performance condition. No restricted shares were granted in 2011 or 2010.
78
A summary of restricted stock unit activity under the plan is as follows:
| | | | | | | | |
| | | Number of
Units | | | Weighted
Average
Grant Date
Fair Value | |
Restricted stock unit awards at January 1, 2009 | | | 39,480 | | | $ | 37.08 | |
Granted 2009 | | | 27,270 | | | | 34.21 | |
| | | | | | | | |
Restricted stock unit awards at December 31, 2009 | | | 66,750 | | | | 35.91 | |
Granted 2010 | | | 113,285 | | | | 36.49 | |
Forfeited 2010 | | | (10,250 | ) | | | 35.76 | |
| | | | | | | | |
Restricted stock unit awards at December 31, 2010 | | | 169,785 | | | | 36.31 | |
Granted 2011 | | | 133,010 | | | | 37.40 | |
Vested 2011 | | | (54,918 | ) | | | 37.38 | |
Forfeited 2011 | | | (3,597 | ) | | | 36.27 | |
| | | | | | | | |
Restricted stock unit awards at December 31, 2011 | | | 244,280 | | | $ | 36.66 | |
| | | | | | | | |
The total fair market value of restricted stock units which vested during 2011 was $3,066,000. In 2011 and 2010, respectively, 30,855 and 39,485 of the restricted stock units granted included a performance condition (at target). All of the restricted stock units granted in 2009 included a performance condition (at target).
For share options, restricted stock and restricted stock unit awards granted under the plan, the Company recognized compensation expense of $5,638,000, $5,589,000, and $5,498,000 in 2011, 2010 and 2009, respectively. As of December 31, 2011, the Company’s total unrecognized compensation cost related to nonvested share-based compensation arrangements (including share options, restricted stock and restricted stock unit awards) granted under the plan was $3,807,000. The cost is expected to be recognized over a weighted average period of 1.7 years.
Other Stock Purchase and Incentive Plans
Harleysville Group Inc. is authorized to issue up to 3,150,000 shares of common stock under the terms of the Amended and Restated Employee Stock Purchase Plan (ESPP). Such shares may be authorized and unissued shares or treasury shares. Virtually all employees are eligible to participate in the plan, under which a participant may elect to have up to 15% of base pay withheld to purchase shares. The purchase price of the stock is 85% of the lower of the beginning-of-the-subscription-period or end-of-the-subscription-period fair market value. Subscription periods run from January 15 through July 14, or July 15 through January 14 in each year. In accordance with the terms of the Merger Agreement with Nationwide described in Note 2 of the Notes to Consolidated Financial Statements, no new subscription period will be commenced after the date of the Merger Agreement (September 28, 2011). In April 2010, the ESPP was amended to establish a 1,000 share purchase limitation per participant per subscription period.
In determining the expense to be recorded for the ESPP, the fair value of each option award is estimated on the date of grant using the Black-Scholes option pricing model with the following weighted average assumptions:
| | | | | | | | | | | | |
| | | For the Year Ended
December 31, | |
| | | 2011 | | | 2010 | | | 2009 | |
Risk-free interest rate | | | 0.11 | % | | | 0.14 | % | | | 0.24 | % |
Expected term | | | 6 months | | | | 6 months | | | | 6 months | |
Dividend yield | | | 4.21 | % | | | 4.06 | % | | | 4.30 | % |
Expected volatility | | | 19.04 | % | | | 21.43 | % | | | 43.22 | % |
The weighted-average fair value of options granted under the ESPP was $6.29, $6.08 and $7.07 for 2011, 2010 and 2009, respectively. The total intrinsic value of options exercised under the plan was $340,000, $340,000 and $212,000 for 2011, 2010 and 2009, respectively. Compensation expense of $280,000, $277,000 and $348,000 related to grants under the plan was recognized in 2011, 2010 and 2009, respectively. As of December 31, 2011, there was $12,000 of total unrecognized compensation cost related to nonvested share-based compensation arrangements granted under the plan. The cost is expected to be recognized over a period of one month.
79
The 2005 Non-Employee Directors’ Deferred Stock Unit Plan provided for the grant of up to 110,000 fully vested deferred stock units to outside directors of Harleysville Group Inc. and the Mutual Company. Each stock unit represents the right to receive, without payment to the Company, one share of common stock of Harleysville Group Inc. The plan was amended and restated in 2007 to provide for the grant of awards in the form of stock options, deferred stock units and restricted stock and was renamed the Amended and Restated Directors’ Equity Compensation Plan. The aggregate number of shares which may be issued under the plan is 500,000, which may be either authorized and unissued shares or treasury shares. At each April Board of Directors meeting, each non-employee director continuing in office receives a number of deferred stock units equal to the result of dividing $50,000 by the fair market value of a share of HGI common stock.
The expense to be recorded for the deferred stock units is determined utilizing the number of awards granted and the grant date fair market value. The expense is recognized at the date of grant as the awards are fully vested. In 2011, 2010 and 2009, respectively, there were 15,600, 16,830 and 17,985 units issued under the plan for which $443,000, $493,000 and $450,000 of expense was recognized. The weighted average grant date fair value of units granted during 2011, 2010 and 2009 was $31.89, $32.58 and $27.83 per unit, respectively.
Cash received from option exercises under all share-based payment arrangements for 2011, 2010 and 2009 was $2,622,000, $8,476,000 and $4,721,000, respectively. The actual tax benefit realized for the tax deductions from option exercises of the share-based payment arrangements was $1,952,000, $1,423,000 and $419,000, respectively, for 2011, 2010 and 2009.
Harleysville Group has incentive bonus plans which include virtually all employees. Cash bonuses are earned on a formula basis depending upon the performance of Harleysville Group and the Mutual Company in relation to certain targets. Harleysville Group’s expense for such plans was $65,000, $5,829,000 and $7,732,000 for 2011, 2010 and 2009, respectively.
12 – Pension and Other Benefit Plans
Harleysville Group Inc. has a frozen pension plan that covers employees hired before January 1, 2006. Retirement benefits are a function of both the years of service and level of compensation. Harleysville Group Inc.’s funding policy is to contribute annually an amount equal to at least the minimum required contribution in accordance with minimum funding standards established by ERISA. Contributions are intended to provide for benefits attributed to service through March 31, 2006. Harleysville Group Inc. uses a December 31 measurement date for the pension plan. The plan was frozen at the then current benefit levels as of March 31, 2006, at which time the accrual of future benefits for eligible employees ceased.
The following table sets forth the year-end status of the plan including the Mutual Company:
| | | | | | | | |
| | | 2011 | | | 2010 | |
| | | (in thousands) | |
Change in benefit obligation | | | | | | | | |
Benefit obligation at January 1 | | $ | 220,235 | | | $ | 201,960 | |
Interest cost | | | 11,873 | | | | 11,893 | |
Net actuarial loss | | | 29,144 | | | | 14,730 | |
Benefits paid | | | (8,776 | ) | | | (8,348 | ) |
| | | | | | | | |
Benefit obligation at December 31 | | $ | 252,476 | | | $ | 220,235 | |
| | | | | | | | |
Accumulated benefit obligation at December 31 | | $ | 252,476 | | | $ | 220,235 | |
| | | | | | | | |
Change in plan assets | | | | | | | | |
Fair value of plan assets at January 1 | | $ | 159,827 | | | $ | 141,994 | |
Actual return on plan assets | | | 68 | | | | 18,498 | |
Contributions | | | 8,000 | | | | 7,400 | |
Benefits paid | | | (8,494 | ) | | | (8,065 | ) |
| | | | | | | | |
Fair value of plan assets at December 31 | | $ | 159,401 | | | $ | 159,827 | |
| | | | | | | | |
Funded status at December 31 | | $ | (93,075 | ) | | $ | (60,408 | ) |
| | | | | | | | |
Harleysville Group portion: | | | | | | | | |
Amount recognized in the statement of financial position | | $ | (57,796 | ) | | $ | (41,418 | ) |
| | | | | | | | |
Amount recognized in accumulated other comprehensive income: | | | | | | | | |
Net actuarial loss | | $ | 68,947 | | | $ | 49,158 | |
| | | | | | | | |
80
The net periodic pension cost for the plan, including the Mutual Company, consists of the following components:
| | | | | | | | | | | | |
| | | 2011 | | | 2010 | | | 2009 | |
| | | (dollars in thousands) | |
Components of net periodic pension cost: | | | | | | | | | | | | |
Interest cost | | $ | 11,873 | | | $ | 11,893 | | | $ | 11,478 | |
Expected return on plan assets | | | (12,469 | ) | | | (12,080 | ) | | | (11,980 | ) |
Recognized net actuarial loss | | | 6,316 | | | | 4,581 | | | | 2,567 | |
| | | | | | | | | | | | |
Net periodic pension cost (benefit): | | | | | | | | | | | | |
Entire plan | | $ | 5,720 | | | $ | 4,394 | | | $ | 2,065 | |
| | | | | | | | | | | | |
Harleysville Group portion | | $ | 3,759 | | | $ | 3,101 | | | $ | 1,470 | |
| | | | | | | | | | | | |
Other changes recognized in other comprehensive income - Harleysville Group portion | | | | | | | | | | | | |
Net actuarial (gain) loss arising during the period | | $ | 23,939 | | | $ | 5,769 | | | $ | (5,389 | ) |
Recognition of actuarial loss in net periodic benefit cost | | | (4,150 | ) | | | (3,233 | ) | | | (1,827 | ) |
| | | | | | | | | | | | |
Total recognized in other comprehensive income - Harleysville Group portion | | $ | 19,789 | | | $ | 2,536 | | | $ | (7,216 | ) |
| | | | | | | | | | | | |
Total recognized in net periodic benefit cost and other comprehensive income | | $ | 23,368 | | | $ | 5,637 | | | $ | (5,746 | ) |
| | | | | | | | | | | | |
Additional information: | | | | | | | | | | | | |
Weighted-average assumptions used to determine benefit obligations at December 31: | | | | | | | | | | | | |
Discount rate | | | 4.60 | % | | | 5.50 | % | | | 6.00 | % |
| | | |
Weighted-average assumptions used to determine net cost for years ended December 31: | | | | | | | | | | | | |
Discount rate | | | 5.50 | % | | | 6.00 | % | | | 6.20 | % |
Expected return on plan assets | | | 8.25 | % | | | 8.25 | % | | | 8.25 | % |
Amounts in accumulated other comprehensive income expected to be recognized as components of net periodic pension cost in 2012 are as follows: net actuarial loss $6,785,000.
The discount rate assumption used to determine the benefit obligation was based on high quality bond yields that relate to the estimated timing of benefit payouts of the plan.
Pension Plan Assets
The investment assets of the plan are managed for the benefit and support of plan participants. The Company’s primary objective is to maximize total return over the long term. The target allocations for plan assets are 65% to 75% in equity securities and 25% to 35% in fixed maturity securities, including cash and short-term investments. Investment in equities utilizes a low-cost, index-based approach. Fixed maturity holdings are conservatively invested with emphasis on safety of principal, liquidity and yield. Consideration is also given to the slope of the yield curve and to the relative value of sector relationships. Fixed maturities securities include U.S. Treasury and Agency obligations, corporate bonds and mortgage-backed and asset-backed securities.
Fair value measurements are determined under the three-level hierarchy consistent with the methodologies discussed in Note 4.
At December 31, 2011, the independent pricing service provided a fair value estimate for all of the pension plan investments classified as Level 1 investments within the fair value hierarchy and approximately 97% of the pension plan investments classified as Level 2 estimates within the fair value hierarchy. The fair value of all Level 2 securities is based on observable market inputs.
81
The following is a summary of the fair value of major categories of plan assets as of December 31, 2011 and December 31, 2010:
| | | | | | | | | | | | | | | | |
| | | | | | Fair Value Measurements at December 31, 2011 | |
| | Total | | | Quoted Prices
in Active
Markets for
Identical
Assets
(Level 1) | | | Significant
Other
Observable
Inputs
(Level 2) | | | Significant
Unobservable
Inputs
(Level 3) | |
| | | (in thousands) | |
Asset Category | | | | | | | | | | | | | | | | |
Cash and cash equivalents | | $ | 5,314 | | | $ | 5,314 | | | | | | | | | |
Equity securities: | | | | | | | | | | | | | | | | |
Institutional Total Stock Market Fund (a) | | | 91,829 | | | | 91,829 | | | | | | | | | |
FTSE All World Ex U.S. Fund (b) | | | 22,310 | | | | 22,310 | | | | | | | | | |
Fixed income securities: | | | | | | | | | | | | | | | | |
U.S. Treasury securities | | | 14,562 | | | | 14,562 | | | | | | | | | |
Obligations of U.S. government corporations and agencies | | | 1,965 | | | | | | | $ | 1,965 | | | | | |
Corporate bonds (c) | | | 17,155 | | | | | | | | 17,155 | | | | | |
Mortgage-backed securities | | | 6,099 | | | | | | | | 6,099 | | | | | |
Other investment: | | | | | | | | | | | | | | | | |
Venture capital fund (d) | | | 24 | | | | | | | | | | | $ | 24 | |
| | | | | | | | | | | | | | | | |
Total Asset Category | | $ | 159,258 | | | $ | 134,015 | | | $ | 25,219 | | | $ | 24 | |
| | | | | | | | | | | | | | | | |
| | | | | | | | | | | | | | | | |
| | | | | | Fair Value Measurements at December 31, 2010 | |
| | Total | | | Quoted Prices
in Active
Markets for
Identical
Assets
(Level 1) | | | Significant
Other
Observable
Inputs
(Level 2) | | | Significant
Unobservable
Inputs
(Level 3) | |
| | | (in thousands) | |
Asset Category | | | | | | | | | | | | | | | | |
Cash and cash equivalents | | $ | 8,300 | | | $ | 8,300 | | | | | | | | | |
Equity securities: | | | | | | | | | | | | | | | | |
Institutional Total Stock Market Fund (a) | | | 96,418 | | | | 96,418 | | | | | | | | | |
FTSE All World Ex U.S. Fund (b) | | | 23,505 | | | | 23,505 | | | | | | | | | |
Fixed income securities: | | | | | | | | | | | | | | | | |
U.S. Treasury securities | | | 9,324 | | | | 9,324 | | | | | | | | | |
Obligations of U.S. government corporations and agencies | | | 2,980 | | | | | | | $ | 2,980 | | | | | |
Corporate bonds (c) | | | 13,827 | | | | | | | | 13,827 | | | | | |
Mortgage-backed securities | | | 5,216 | | | | | | | | 5,216 | | | | | |
Other investment: | | | | | | | | | | | | | | | | |
Venture capital fund (d) | | | 43 | | | | | | | | | | | $ | 43 | |
| | | | | | | | | | | | | | | | |
Total Asset Category | | $ | 159,613 | | | $ | 137,547 | | | $ | 22,023 | | | $ | 43 | |
| | | | | | | | | | | | | | | | |
| (a) | This category comprised entirely of a low-cost, index-based mutual fund that is designed to track the performance of the MSCI Broad Market Index |
82
| (b) | This category is comprised entirely of a low-cost, index-based mutual fund that is designed to track the performance of the FTSE All-World ex-US Index |
| (c) | This category is comprised of investment grade bonds of US issuers from diverse industries |
| (d) | This category is comprised of an equity investment in a company that engages in venture capital investment activities with selected businesses that have significant potential for growth and long-term appreciation |
As of December 31, 2011 and 2010, the pension plan also includes net assets of $143,000 and $214,000, respectively, primarily related to accrued investment income receivable at that date.
The following table presents additional information about assets measured at fair value on a recurring basis for which significant unobservable inputs were used to determine fair value:
| | | | | | | | |
| | | Fair Value Measurements Using
Significant Unobservable Inputs
(Level 3)
Year Ended December 31, | |
| | | 2011 | | | 2010 | |
| | | Venture Capital Fund | |
| | | (in thousands) | |
Balance at the beginning of the year | | $ | 43 | | | $ | 103 | |
Actual return on plan assets: | | | | | | | | |
Relating to assets still held at the reporting date | | | (19 | ) | | | (60 | ) |
| | | | | | | | |
Balance at the end of the year | | $ | 24 | | | $ | 43 | |
| | | | | | | | |
To develop the expected long-term rate of return on assets assumption, the Company considered the historical returns and the future expectations for returns for each asset class, as well as the target asset allocation of the pension plan portfolio. This resulted in the selection of the 8.25% long-term rate of return on assets assumption.
Cash Flows
The expected 2012 contribution to the pension plan is $12,703,000, of which $11,580,000 is Harleysville Group’s expected portion.
The following benefit payments are expected to be paid:
| | | | | | | | |
| | | December 31, | |
| | | Total Plan | | | Harleysville
Group’s
Portion | |
2012 | | $ | 9,373,000 | | | $ | 6,186,000 | |
2013 | | | 9,887,000 | | | | 6,525,000 | |
2014 | | | 10,534,000 | | | | 6,952,000 | |
2015 | | | 11,078,000 | | | | 7,311,000 | |
2016 | | | 11,593,000 | | | | 7,651,000 | |
2017-2021 | | | 67,338,000 | | | | 44,443,000 | |
Harleysville Group has a profit-sharing plan covering qualified employees. Harleysville Group’s expense under the plan was $1,959,000, $2,140,000 and $2,834,000 for 2011, 2010 and 2009, respectively. The plan also requires a Company core contribution, equal to 4% of salary in 2011 and 2010 and 5% of salary in 2009, to be automatically contributed to all eligible employees’ accounts on a biweekly basis regardless of the employees’ salary deferral amounts into the plan. Harleysville Group’s expense for the Company core contribution was $2,988,000, $3,051,000 and $3,957,000 in 2011, 2010 and 2009, respectively.
83
13 – Segment Information
As an underwriter of property and casualty insurance, Harleysville Group has three reportable segments, which consist of the investment function, the personal lines of insurance and the commercial lines of insurance. Using independent agents, Harleysville Group markets personal lines of insurance to individuals, and commercial lines of insurance to small and medium-sized businesses.
Harleysville Group evaluates the performance of the personal lines and commercial lines primarily based upon underwriting results as determined under statutory accounting practices (SAP). Assets are not allocated to the personal and commercial lines, and are reviewed in total by management for purposes of decision making. Harleysville Group operates only in the United States, and no single customer or agent provides 10 percent or more of revenues.
Financial data by segment is as follows:
| | | | | | | | | | | | |
| | | 2011 | | | 2010 | | | 2009 | |
| | | (in thousands) | |
Revenues: | | | | | | | | | | | | |
Premiums earned: | | | | | | | | | | | | |
Commercial lines | | $ | 592,910 | | | $ | 676,740 | | | $ | 690,116 | |
Personal lines | | | 211,598 | | | | 189,610 | | | | 168,384 | |
| | | | | | | | | | | | |
Total premiums earned | | | 804,508 | | | | 866,350 | | | | 858,500 | |
Net investment income | | | 95,401 | | | | 103,313 | | | | 106,649 | |
Realized investment gains, net | | | 75,478 | | | | 597 | | | | 2,293 | |
Other | | | 19,772 | | | | 16,012 | | | | 13,178 | |
| | | | | | | | | | | | |
Total revenues | | $ | 995,159 | | | $ | 986,272 | | | $ | 980,620 | |
| | | | | | | | | | | | |
Income before income taxes: | | | | | | | | | | | | |
Underwriting gain (loss): | | | | | | | | | | | | |
Commercial lines | | $ | (79,820 | ) | | $ | (16,203 | ) | | $ | 1,196 | |
Personal lines | | | (63,901 | ) | | | (10,700 | ) | | | 2,610 | |
| | | | | | | | | | | | |
SAP underwriting gain (loss) | | | (143,721 | ) | | | (26,903 | ) | | | 3,806 | |
GAAP adjustments | | | (16,418 | ) | | | (229 | ) | | | 384 | |
| | | | | | | | | | | | |
GAAP underwriting gain (loss) | | | (160,139 | ) | | | (27,132 | ) | | | 4,190 | |
Net investment income | | | 95,401 | | | | 103,313 | | | | 106,649 | |
Realized investment gains, net | | | 75,478 | | | | 597 | | | | 2,293 | |
Other | | | 5,521 | | | | 5,934 | | | | 2,866 | |
| | | | | | | | | | | | |
Income before income taxes | | $ | 16,261 | | | $ | 82,712 | | | $ | 115,998 | |
| | | | | | | | | | | | |
The GAAP adjustment of $16,418,000 for 2011 includes the impact on deferred acquisition costs related to the ceding commission paid in January 2011 of $6,998,000 related to the change in the intercompany pooling agreement as described in Note 3 of the Notes to Consolidated Financial Statements. The impact was all in commercial lines.
14 – Earnings Per Share
The computation of basic and diluted earnings per share is as follows:
| | | | | | | | | | | | |
| | | 2011 | | | 2010 | | | 2009 | |
| | | (dollars in thousands, except per share data) | |
Numerator for basic and diluted earnings per share: | | | | | | | | | | | | |
Net income | | $ | 22,612 | | | $ | 66,898 | | | $ | 86,296 | |
| | | | | | | | | | | | |
Denominator for basic earnings per share – weighted-average shares outstanding | | | 27,491,906 | | | | 27,521,016 | | | | 27,956,227 | |
Effect of stock incentive plans | | | 387,165 | | | | 206,887 | | | | 171,075 | |
| | | | | | | | | | | | |
Denominator for diluted earnings per share | | | 27,879,071 | | | | 27,727,903 | | | | 28,127,302 | |
| | | | | | | | | | | | |
Basic earnings per share | | $ | .82 | | | $ | 2.43 | | | $ | 3.09 | |
| | | | | | | | | | | | |
Diluted earnings per share | | $ | .81 | | | $ | 2.42 | | | $ | 3.07 | |
| | | | | | | | | | | | |
84
The following options to purchase shares of common stock were not included in the computation of diluted earnings per share because the exercise price of the options was greater than the average market price:
| | | | |
| | | 2010 | | 2009 |
| | | (in thousands) |
Number of options | | 921 | | 565 |
| | | | |
Net income per basic and diluted share for 2011 excluded the allocation of $107,000 of undistributed losses to participating share-based awards, since such allocation would result in anti-dilution of basic and diluted earnings per share.
15 – Quarterly Results of Operations (Unaudited)
| | | | | | | | | | | | | | | | | | | | |
| | | 2011 | |
| | | (in thousands, except per share data) | |
| | | First | | | Second | | | Third | | | Fourth | | | Total | |
Revenues | | $ | 245,522 | | | $ | 230,667 | | | $ | 228,179 | | | $ | 290,791 | | | $ | 995,159 | |
Losses and expenses | | | 220,028 | | | | 256,065 | | | | 269,999 | | | | 232,806 | | | | 978,898 | |
Net income (loss) | | | 18,227 | | | | (11,328 | ) | | | (24,797 | ) | | | 40,510 | | | | 22,612 | |
Earnings per common share: | | | | | | | | | | | | | | | | | | | | |
Basic net income (loss) | | $ | .67 | | | $ | (.43 | ) | | $ | (.92 | ) | | $ | 1.47 | | | $ | .82 | |
Diluted net income (loss) | | $ | .66 | | | $ | (.43 | ) | | $ | (.92 | ) | | $ | 1.44 | | | $ | .81 | |
| | | | | | | | | | | | | | | | | | | | |
| | | 2010 | |
| | | (in thousands, except per share data) | |
| | | First | | | Second | | | Third | | | Fourth | | | Total | |
Revenues | | $ | 238,957 | | | $ | 243,506 | | | $ | 249,799 | | | $ | 254,010 | | | $ | 986,272 | |
Losses and expenses | | | 229,022 | | | | 222,501 | | | | 224,069 | | | | 227,968 | | | | 903,560 | |
Net income | | | 8,050 | | | | 17,054 | | | | 20,829 | | | | 20,965 | | | | 66,898 | |
Earnings per common share: | | | | | | | | | | | | | | | | | | | | |
Basic net income | | $ | .29 | | | $ | .61 | | | $ | .76 | | | $ | .77 | | | $ | 2.43 | |
Diluted net income | | $ | .29 | | | $ | .61 | | | $ | .76 | | | $ | .76 | | | $ | 2.42 | |
16 – Contingencies
The Harleysville Group insurance subsidiaries are subject to disputes, including litigation and arbitration, arising in the ordinary course of their insurance business. The Company’s estimates of the costs of settling such matters are reflected in its liability for unpaid losses and loss settlement expenses, and the Company does not believe that the ultimate outcome of such matters will have a material adverse effect on its financial condition or results of operations. However, adverse outcomes of insurance claims are possible and could negatively impact the Company’s financial condition and results of operations in the future.
Harleysville Group is also subject to other non-insurance claims proceedings, lawsuits and claims arising in the normal course of business. The Company does not believe that the ultimate liability associated with these claims will have a material adverse effect on its financial condition or results of operations. However, adverse outcomes are possible and could negatively impact the Company’s financial condition and results of operations in the future.
Harleysville Group is also subject to two class action lawsuits in connection with the Merger Agreement with Nationwide described in Note 2 of the Notes to Consolidated Financial Statements. The Company does not believe that the ultimate liability associated with these lawsuits will have a material adverse effect on its financial condition or results of operations. However, adverse outcomes are possible and could negatively impact the Company’s financial condition and results of operations in the future.
85
Report of Independent Registered Public Accounting Firm
The Board of Directors and Shareholders
Harleysville Group Inc.:
We have audited the accompanying consolidated balance sheets of Harleysville Group Inc. and Subsidiaries as of December 31, 2011 and 2010, and the related consolidated statements of income, shareholders’ equity, and cash flows for each of the years in the three-year period ended December 31, 2011. These consolidated financial statements are the responsibility of the Company’s management. Our responsibility is to express an opinion on these consolidated financial statements based on our audits.
We conducted our audits in accordance with the standards of the Public Company Accounting Oversight Board (United States). Those standards require that we plan and perform the audit to obtain reasonable assurance about whether the financial statements are free of material misstatement. An audit includes examining, on a test basis, evidence supporting the amounts and disclosures in the financial statements. An audit also includes assessing the accounting principles used and significant estimates made by management, as well as evaluating the overall financial statement presentation. We believe that our audits provide a reasonable basis for our opinion.
In our opinion, the consolidated financial statements referred to above present fairly, in all material respects, the financial position of Harleysville Group Inc. and Subsidiaries as of December 31, 2011 and 2010, and the results of their operations and their cash flows for each of the years in the three-year period ended December 31, 2011, in conformity with U.S. generally accepted accounting principles.
We also have audited, in accordance with the standards of the Public Company Accounting Oversight Board (United States), Harleysville Group Inc.’s internal control over financial reporting as of December 31, 2011, based on criteria established inInternal Control - Integrated Framework issued by the Committee of Sponsoring Organizations of the Treadway Commission, and our report dated March 14, 2012 expressed an unqualified opinion on the effectiveness of the Company’s internal control over financial reporting.
/s/ KPMG LLP
Philadelphia, PA
March 14, 2012
86
| Item 9. | Changes in and Disagreements with Accountants on Accounting and Financial Disclosure. |
None.
| Item 9A. | Controls and Procedures. |
Evaluation of Disclosure Controls and Procedures
Harleysville Group Inc.’s Chief Executive Officer and Chief Financial Officer have evaluated the Company’s disclosure controls and procedures as of the end of the period covered by this report and they have concluded that these controls and procedures are effective.
Management’s Annual Report on Internal Control over Financial Reporting
The management of Harleysville Group Inc. and its subsidiaries, is responsible for establishing and maintaining adequate internal control over financial reporting. With the participation of the Chief Executive Officer and the Chief Financial Officer, management has evaluated the effectiveness of its internal control over financial reporting as of December 31, 2011 based on the control criteria established inInternal Control - Integrated Framework, issued by the Committee of Sponsoring Organizations of the Treadway Commission. Based on such evaluation, management has concluded that Harleysville Group’s internal control over financial reporting is effective as of December 31, 2011.
The independent registered public accounting firm of KPMG LLP, as auditors of Harleysville Group’s consolidated financial statements, has issued an attestation report on the effectiveness of Harleysville Group’s internal control over financial reporting.
Changes in Internal Control Over Financial Reporting
There have been no changes in Harleysville Group’s internal control over financial reporting (as defined in Exchange Act Rules 13a-15(f) and 15d-15(f)) that occurred during the fiscal quarter ended December 31, 2011, that have materially affected, or are reasonably likely to materially affect, Harleysville Group’s internal control over financial reporting.
| | | | |
/S/ MICHAEL L. BROWNE | | | | /S/ ARTHUR E. CHANDLER |
| Michael L. Browne | | | | Arthur E. Chandler |
| President and Chief Executive Officer | | | | Senior Vice President and Chief Financial Officer |
March 14, 2012
Attestation Report of the Registered Public Accounting Firm (see next page)
| Item 9B. | Other Information. |
None.
87
Report of Independent Registered Public Accounting Firm
The Board of Directors and Shareholders
Harleysville Group Inc.:
We have audited Harleysville Group Inc.’s internal control over financial reporting as of December 31, 2011, based on criteria established in Internal Control - Integrated Framework issued by the Committee of Sponsoring Organizations of the Treadway Commission (COSO). Harleysville Group Inc.’s management is responsible for maintaining effective internal control over financial reporting and for its assessment of the effectiveness of internal control over financial reporting, included in the accompanying Management’s Annual Report on Internal Control over Financial Reporting. Our responsibility is to express an opinion on the Company’s internal control over financial reporting based on our audit.
We conducted our audit in accordance with the standards of the Public Company Accounting Oversight Board (United States). Those standards require that we plan and perform the audit to obtain reasonable assurance about whether effective internal control over financial reporting was maintained in all material respects. Our audit included obtaining an understanding of internal control over financial reporting, assessing the risk that a material weakness exists, and testing and evaluating the design and operating effectiveness of internal control based on the assessed risk. Our audit also included performing such other procedures as we considered necessary in the circumstances. We believe that our audit provides a reasonable basis for our opinion.
A company’s internal control over financial reporting is a process designed to provide reasonable assurance regarding the reliability of financial reporting and the preparation of financial statements for external purposes in accordance with generally accepted accounting principles. A company’s internal control over financial reporting includes those policies and procedures that (1) pertain to the maintenance of records that, in reasonable detail, accurately and fairly reflect the transactions and dispositions of the assets of the company; (2) provide reasonable assurance that transactions are recorded as necessary to permit preparation of financial statements in accordance with generally accepted accounting principles, and that receipts and expenditures of the company are being made only in accordance with authorizations of management and directors of the company; and (3) provide reasonable assurance regarding prevention or timely detection of unauthorized acquisition, use, or disposition of the company’s assets that could have a material effect on the financial statements.
Because of its inherent limitations, internal control over financial reporting may not prevent or detect misstatements. Also, projections of any evaluation of effectiveness to future periods are subject to the risk that controls may become inadequate because of changes in conditions, or that the degree of compliance with the policies or procedures may deteriorate.
In our opinion, Harleysville Group Inc. maintained, in all material respects, effective internal control over financial reporting as of December 31, 2011, based on “criteria established inInternal Control - Integrated Framework issued by the Committee of Sponsoring Organizations of the Treadway Commission.
We also have audited, in accordance with the standards of the Public Company Accounting Oversight Board (United States), the consolidated balance sheets of Harleysville Group Inc. and Subsidiaries as of December 31, 2011 and 2010, and the related consolidated statements of income, shareholders’ equity, and cash flows for each of the years in the three-year period ended December 31, 2011, and our report dated March 14, 2012 expressed an unqualified opinion on those consolidated financial statements.
/s/ KPMG LLP
Philadelphia, Pennsylvania
March 14, 2012
88
PART III
| Item 10. | Directors, Executive Officers and Corporate Governance. |
The Company’s Board of Directors currently consists of eight directors: Barbara A. Austell, W. Thacher Brown, Michael L. Browne, G. Lawrence Buhl, Mirian M. Graddick-Weir, Jerry S. Rosenbloom, William W. Scranton III (Chairman), and William E. Storts.
Corporate Governance Practices
In order to promote the highest standards of management for the benefit of stockholders, the Board of Directors of Harleysville Group follows certain governance practices regarding how the Board conducts its business and fulfills its duties. The Company’s Board of Directors’ Governance Principles may be accessed through the Governance section of the Company’s website (http://www.harleysvillegroup.com). Among these practices are:
Board Size, Composition, and Independence
The Board is currently comprised of seven independent non-employee directors and one employee director, Michael L. Browne, who is the President and Chief Executive Officer (CEO) of the Company. Historically, the Board has concluded that the Board should consist of at least seven directors and that, because some members of the Board are also members of the Board of the Mutual Company, the total number of individuals comprising the boards of the Mutual Company and Harleysville Group should be no more than 12. The Board further believes that of the maximum total board membership, no more than three should be employee directors, with the remainder being independent directors as defined by the NASDAQ corporate governance rules.
The Board has determined that no non-employee director has a relationship with the Company that impairs his or her independence, and therefore, has determined that all of its non-employee directors are independent. In assessing the independence of Board members, the Board considers the independence requirements under the NASDAQ corporate governance rules and the absence of any related person transactions between the individual and the Company. In addition, the Company’s Board of Directors’ Governance Principles provide that no member of the Board may serve as an independent director on more than three other boards of for-profit companies.
Qualifications and Skills of Directors and Director Nominees
The Nominating and Corporate Governance Committee, with input from the Chairman of the Board and the CEO, screens director candidates and evaluates the qualification and skills applicable to the Company of the existing members of the Board. In overseeing the nomination of candidates for election, and the qualifications and skills of incumbent directors, the Nominating and Corporate Governance Committee, and subsequently the Board, seeks qualified individuals with outstanding records of success in their chosen careers, the skills to perform the role of director, and the time and motivation to perform as a director. Directors are expected to bring specialized talents to the Board that add value to the Board’s deliberative process and advance the business goals and social consciousness of the Company. Directors are expected to be knowledgeable about profit-making enterprises and the elements necessary for such enterprises to be successful. The Board has determined that insurance industry expertise, financial and investment experience, and governmental experience are generally useful qualifications for directors, and the composition of the Board reflects such assessment. All of the incumbent directors exhibit outstanding records of success in their chosen careers and have demonstrated their ability to devote the time and energy necessary to serve on the Board and to advance the business goals and strategies of the Company. The directors have the following additional qualifications and skills that make them productive members of the Board:
| | • | | Barbara A. Austell - significant operational finance and investment banking expertise |
| | • | | W. Thacher Brown - investment advisory expertise |
| | • | | Michael L. Browne - current CEO of the Company, and distinguished legal career and former government service |
89
| | • | | G. Lawrence Buhl - financial and accounting expertise, with specific experience in the insurance industry |
| | • | | Mirian M. Graddick-Weir - substantial experience leading the human resources function of a global company |
| | • | | Jerry S. Rosenbloom - distinguished academic career focused on insurance and risk management, and extensive board membership and consultancy experience in the insurance industry |
| | • | | William W. Scranton III - former lieutenant governor of Pennsylvania, and significant financial and business acumen and expertise |
| | • | | William E. Storts - significant information technology, financial and business acumen and expertise |
Attendance at Directors’ and Stockholders’ Meetings
Directors are expected to attend all meetings of the stockholders, the Board, and the Committees on which they serve.
Director Retirement or Resignation
It is Board policy that if a director resigns or retires from his or her primary employment, that such director cannot continue to serve on the Board unless the Nominating and Corporate Governance Committee and the Chairman of the Board request the individual to remain as a director. Pursuant to the Company’s By-Laws, each director must retire from the Board at the first annual meeting following his or her 72nd birthday.
Stock Ownership
The Company established stock ownership guidelines in 2002 that are now effective for all current directors, and will be effective for newly elected directors five years after being first elected to the Board. Under these guidelines, each non-employee director is expected to beneficially own an amount of the Company’s common stock having a value equal to at least five times the then current annual retainer. To assist the non-employee directors in attaining this goal, the Company grants Deferred Stock Units to non-employee directors.
Leadership
Currently the roles of non-executive Chairman of the Board and CEO of the Company are split. The Board retains the right to exercise its judgment to combine the roles of Chairman of the Board and CEO. The Company believes that the Chairman of the Board, William W. Scranton III, has significant leadership experience, including executive experience in both business and government, that positions him well to lead the Board. Further, Mr. Scranton’s leadership provides an independent viewpoint in leadership of the Board.
Risk Oversight
In April 2009, the Board formed a separate Risk Committee of the Board. Its members are Jerry S. Rosenbloom (Chair), Michael L. Browne (CEO), G. Lawrence Buhl (Audit Committee Chair), William W. Scranton III (Chairman), William E. Storts, and Michael L. Lapeyrouse (a member of the Mutual Company Board). The Risk Committee oversees the Company’s establishment and implementation of standards, operational processes, controls, limits, guidelines, and policies relating to the assessment and management of risks that could have a material impact on the Company, and advises the Board of Directors as to the Company’s enterprise risk management. The Risk Committee reviews the enterprise risk management policies of the Company, including, but not limited to: (i) the Company’s risk tolerance; (ii) the risk governance structure; and (iii) the effectiveness of the risk management procedures and how they support the business strategy of the Company. In addition, the Risk Committee - in combination with the other Committees of the Board - has the authority to review the Company’s risk exposure as it relates to capital adequacy, earnings, competition, and compliance with the Company’s risk policies covering financial risk; regulatory risk; strategic risk; operational risk; competition risk; management risk; compensation risk; investment and counterparty risk; and underwriting risk.
90
The Board believes that the Risk Committee membership must always include a member of the Board’s Audit Committee to assure communication and coordination of the risk oversight responsibilities of the Audit Committee and the Risk Committee.
CEO Performance Evaluation
The independent directors of the Company annually review the CEO’s performance. Each such director provides an evaluation of the CEO’s performance to the Chair of the Compensation and Personnel Development Committee, who compiles a report of the reviews of the independent directors. The independent directors then meet in an executive session to discuss the CEO’s performance and to agree on the content of the appraisal, which the Chair of the Compensation and Personnel Development Committee later reviews with the CEO.
Code of Conduct
The Board of Directors, through the Nominating and Corporate Governance Committee, has established and oversees compliance with a Code of Conduct for Directors, Officers and Employees and a Code of Ethics for Senior Financial Officers meeting the requirements of the Securities and Exchange Commission (SEC) and the NASDAQ corporate governance rules. These are posted in the Governance section of the Company’s website (http://www.harleysvillegroup.com). The Company will provide a copy of either code to any person upon request and without charge. Requests should be addressed to the Nominating and Corporate Governance Committee, Harleysville Group Inc., 355 Maple Avenue, Harleysville, PA 19438-2297, with the words “Request for Codes” placed on the lower left-hand corner of the envelope. The Company intends to disclose waivers from, and amendments to, the Code of Conduct and the Code of Ethics on its website. In addition, in accordance with the SEC rules and NASDAQ listing requirements, the Company also intends to disclose on a Form 8-K any material amendments to the Code of Conduct and any waivers from the Code of Conduct that are granted to directors or executive officers.
Board Effectiveness Assessment
Annually, the Nominating and Corporate Governance Committee conducts an assessment of the Board’s effectiveness and makes a report on that subject to the Board. That Committee also reviews and makes recommendations to modify the Company’s corporate governance practices. All standing Committees also conduct annual self-assessments and report such self-assessments to the Board.
Director Compensation
In order to attract and retain qualified board members, the Company believes its director compensation should be competitive with the compensation of directors at peer companies. Directors’ fees are determined by the Compensation and Personnel Development Committee, after consultation, as appropriate, with a compensation consultant. Please see page 121 for a description of the directors’ fees paid during 2011.
Board Agendas and Meetings
A Board calendar for each year is prepared in advance, which establishes the dates of regularly scheduled meetings and certain items to be addressed by the Board. Additional items are added by the Chairman or CEO. Each director is free to suggest items for an agenda, and each director is free to raise a subject at any Board meeting that is not on the agenda for that meeting. The Board reviews and approves Harleysville Group’s yearly operating plan and specific financial goals for each year, and the Board monitors performance throughout the year. The Board also reviews long-range strategic issues at regular Board meetings, as well as at periodic meetings devoted solely to strategic issues.
Executive Sessions of Independent Directors
The independent directors meet in executive session without the CEO in attendance. Executive sessions of the independent directors are scheduled at each regular Board meeting, Audit Committee meeting, Compensation and Personnel Development Committee meeting, and Nominating and Corporate Governance Committee meeting, as well as at most other Committee meetings. The non-executive Chairman of the Board presides at the executive sessions of the Board.
91
Access to Management and Independent Advisers
The independent directors have access to management and, as necessary and appropriate, independent advisers.
The Board and its Committees
Board and Committee Meetings
The following table shows each standing Board Committee.
BOARD COMMITTEE MEMBERS AS OF DECEMBER 31, 2011
| | | | | | | | | | | | | | |
Name | | Audit | | Compensation
and Personnel
Development | | Nominating
and
Corporate
Governance | | Risk | | Coordinating | | Executive/
Strategy | | Finance
and
Investment |
Barbara A. Austell | | X | | | | | | | | X | | | | X |
W. Thacher Brown | | X | | X | | | | | | | | X | | X* |
Michael L. Browne | | | | | | | | X | | | | X | | X |
G. Lawrence Buhl | | X* | | | | | | X | | | | X | | |
Mirian M. Graddick-Weir | | | | X* | | X | | | | X | | X | | |
Jerry S. Rosenbloom | | | | X | | X | | X* | | | | X | | |
William W. Scranton III | | | | X | | X | | X | | | | X* | | X |
William E. Storts | | X | | | | | | X | | X* | | | | X |
| * | Denotes Chairperson of the Committee. |
Biographies of Directors
Barbara A. Austell (age 58) became a director of Harleysville Group in 2007. She served as senior vice president of finance and treasurer of ARAMARK Corporation from 1996 to 2004. Prior to that, she was with J.P. Morgan & Co., Inc. for 21 years, most recently as managing director - investment banking. Ms. Austell currently serves on the boards of Williams College, the Mann Center for the Performing Arts, and The Pennsylvania Ballet.
W. Thacher Brown (age 64) was elected a director of the Mutual Company in 1994 and a director of Harleysville Group in 2002. He had been president of 1838 Investment Advisers, LLC from 1988 until 2004. Mr. Brown had been president of MBIA Asset Management LLC and a director of MBIA Insurance Company Inc. from 1998 until 2004. He is a director of Rivus Bond Fund and was a director of Airgas, Inc. from 1989 until 2010.
Michael L. Browne (age 65) was elected a director of Harleysville Group in 1986 and served as its non-executive chairman of the board in 2003. In 2003, he was also elected as a director and appointed as the non-executive chairman of the board of the Mutual Company. He held such non-executive chairman of the board positions until he was appointed as chief executive officer of Harleysville Group and president and chief executive officer of the Mutual Company in February 2004. In January 2005, Mr. Browne was appointed president of Harleysville Group. Mr. Browne served on active duty in the United States Marine Corps from 1968-1971, was a Marine infantry platoon leader in Vietnam, and attained the rank of captain. From 1975 to 1977, he was special assistant to U.S. Secretary of Transportation, William T. Coleman, Jr., and from 1976 to 1977, he also served as U.S. Deputy Under Secretary of Transportation. From 1980 to 1983, Mr. Browne was the Insurance Commissioner of the Commonwealth of Pennsylvania. In 1983, he joined the law firm of Reed Smith LLP as a partner. Mr. Browne was the managing partner of its Delaware Valley regional office from 1993 until 2001, when he became head of Reed Smith’s international insurance practice, a position he held until 2004. Mr. Browne currently is a member of the Board of Trustees of The Institutes, the Board of Directors of the Property Loss Research Bureau, the Board of Governors of the Property Casualty Insurers Association of America, the Board of Directors of the Insurance Federation of Pennsylvania, and the
92
Board of Directors of Insurance Information Institute. He was a member of the Board of Directors of Harleysville National Corporation from 2008 to 2009.
G. Lawrence Buhl (age 65) was elected a director of Harleysville Group in 2004 and elected a director of the Mutual Company in 2005. In 2003, Mr. Buhl retired from Ernst & Young after serving 35 years with the firm. He served as regional director for insurance services in Ernst & Young’s Philadelphia office as well as for both the Baltimore and New York offices. For 24 of his years with Ernst & Young, Mr. Buhl was an audit partner performing extensive work for the Pennsylvania Insurance Department and many insurance companies. He is on the Board of Sponsors of Loyola University Maryland Sellinger School of Business and Management. He is also a director of Assured Guaranty, Ltd., for which he served as chairman of its audit committee from 2004 to 2011 and has served as a member of its finance, compensation, and governance and nominating committees, chairing the last since 2011.
Mirian M. Graddick-Weir (age 57) was elected a director of Harleysville Group in 2000. Currently, Ms. Graddick-Weir serves as executive vice president of human resources for Merck. Prior to that, she was executive vice president for human resources at AT&T Corp., a position she assumed in 1999. Ms. Graddick-Weir was also the vice president at AT&T for various human resource responsibilities since 1994. Prior to that, she held various executive positions with AT&T, where she commenced working in 1981.
Jerry S. Rosenbloom (age 72) has been a director of the Mutual Company since 1995 and a director of Harleysville Group since 1999. Dr. Rosenbloom is the Frederick H. Ecker Emeritus Professor of Insurance and Risk Management and Academic Director of the Certified Employee Benefit Specialist Program at the Wharton School of the University of Pennsylvania, a position he has held since 1976. He also served as Chairman of the Department of Insurance and Risk Management at Wharton from 1989 until 1994. Dr. Rosenbloom was a trustee of MBIA Claymore Closed End Municipal Bond Fund (a mutual fund) from 2004 to 2006, and is a trustee of Century Funds (a mutual fund). He serves on the Board of Directors of the American Institute for Property and Liability Underwriters. He also is on the Board of Directors of the S. S. Huebner Foundation for Insurance Education.
William W. Scranton III (age 64) was elected a director of Harleysville Group in 2004 and has served as the non-executive Chairman of the Board since that time. He was first elected as a director of the Mutual Company in 1999 and was appointed as the non-executive Chairman of the Board of the Mutual Company in 2004. Mr. Scranton was lieutenant governor of the Commonwealth of Pennsylvania from 1980 to 1988 and is currently manager of the Scranton Family Office.
William E. Storts (age 68) was elected a director of the Mutual Company in 2001 and elected a director of Harleysville Group in 2007. In 2000, Mr. Storts retired as a senior executive of Accenture. Prior to his retirement, he was a managing partner in the Global Financial Services Market Unit. Mr. Storts is currently the Chairman of Darby Oaks Family Farms LLC. He also serves as an independent director of R.C. Olmstead, Inc. and as a member of the Board of Directors for Ocean Pointe II Condominium Association, Inc.
Audit Committee
The Audit Committee consists of at least three members, all of whom satisfy the definition of independent director established by both NASDAQ and state insurance regulatory requirements. Each member is financially knowledgeable as required by NASDAQ and also satisfies the SEC additional independence requirements for members of audit committees. The Audit Committee currently is comprised of four individuals: G. Lawrence Buhl (Chair), Barbara A. Austell, W. Thacher Brown, and William E. Storts, each of whom has been determined by the Board of Directors to be an “audit committee financial expert” as defined by SEC rules and NASDAQ corporate governance requirements. The Audit Committee:
| | • | | oversees corporate accounting policies, reporting practices, audits, and the quality and integrity of the financial reports; |
| | • | | reviews the internal audit function; |
| | • | | facilitates free and open communication among the directors, the independent auditor, the internal auditors, and the Company’s financial management; |
93
| | • | | establishes procedures for the receipt and investigation of complaints regarding accounting and auditing matters pursuant to Section 301 of the Sarbanes-Oxley Act; and |
| | • | | performs other specific duties to accomplish the above as set forth in its charter. |
The Audit Committee annually pre-approves the annual audit engagement and pre-approves any additional audit-related or non-audit services, as necessary, provided by the Company’s independent registered public accounting firm. The delegation by the Audit Committee of pre-approval of additional services provided by the Company’s independent registered public accounting firm is as follows: The Chair of the Audit Committee or, if he is not available, any member of the Audit Committee may pre-approve any additional services to be provided by the Company’s independent registered public accounting firm, as long as the type of services meets the applicable standards set forth in the Company’s Pre-Approval Policy. In the event of such approval, the full Audit Committee is informed of such action at its next meeting. With regard to non-audit services, the pre-approval requirement does not apply if: (1) the aggregate amount of all such services provided constitutes no more than 5% of the total amount of revenues paid by the Company to its registered public accounting firm during the fiscal year in which the services are provided; (2) such services were not recognized by the Company at the time of the engagement to be non-audit services; and (3) such services are promptly brought to the attention of the Audit Committee and approved by the Audit Committee or by its Chair prior to the completion of the audit.
Compensation and Personnel Development Committee
The Compensation and Personnel Development Committee consists of five members: Mirian M. Graddick-Weir (Chair), W. Thacher Brown, Jerry S. Rosenbloom, William W. Scranton III, and Ellen M. Dunn (a member of the Mutual Company Board). The Compensation and Personnel Development Committee:
| | • | | is comprised exclusively of independent directors as defined in the NASDAQ listing requirements and SEC requirements; |
| | • | | approves compensation for the executive officers, other than the CEO, and makes recommendations to the Board on compensation for the CEO, after consultation with all independent directors; |
| | • | | recommends director compensation, with input and review from the Nominating and Corporate Governance Committee, for approval by the Board; |
| | • | | determines participants in, establishes awards under, and approves payouts under the Company’s incentive plans, including the Senior Executive Incentive Compensation Plan; |
| | • | | grants awards of Stock Options, Restricted Stock, Stock Appreciation Rights, and Restricted Stock Units under the Amended and Restated Equity Incentive Plan; |
| | • | | monitors compliance by officers with the Company’s stock ownership guidelines; |
| | • | | oversees the annual review of the CEO’s performance; |
| | • | | oversees Harleysville Group’s management development and succession program; |
| | • | | reviews and determines compensation policies; and |
| | • | | has the authority to retain and dismiss compensation consultants. |
Nominating and Corporate Governance Committee
The Nominating and Corporate Governance Committee is comprised of five members: Ellen M. Dunn (a member of the Mutual Company Board who also serves as Chair of the Committee), Mirian M. Graddick-Weir, Jerry S. Rosenbloom, William W. Scranton III, and Michael L. Lapeyrouse (a member of the Mutual Company Board). The Nominating and Corporate Governance Committee:
94
| | • | | is comprised exclusively of independent directors as defined in the NASDAQ listing requirements and SEC requirements; |
| | • | | has formal written procedures addressing the director nomination process; |
| | • | | considers and recommends nominees for election as a director to the Board; |
| | • | | considers recommendations for nominees for election as a director from stockholders who submit such recommendations in writing as described below; |
| | • | | considers and recommends members for appointment to the Committees except the Nominating and Corporate Governance Committee; |
| | • | | assesses the effectiveness of the Board and corporate governance practices; |
| | • | | recommends new corporate governance practices to the Board; and |
| | • | | oversees establishment and compliance with the Code of Conduct for Directors, Officers and Employees and the Code of Ethics for Senior Financial Officers. |
Security Holder Communication Process
Stockholders may communicate with Board members by sending letters to them, either by regular U.S. Mail or express delivery service. Letters may be addressed to an individual Board member or to a specific Committee Chair at 355 Maple Avenue, Harleysville, PA 19438-2297. The actual letter should be enclosed in an inner envelope. Attached to that envelope should be a cover page setting forth the amount of stock owned by the sender and whether the sender owns the shares directly or in a nominee (or street) name. If the latter, a recent statement from the broker or custodian setting forth the amount of securities owned should accompany the letter. The envelope containing the letter and the cover page on stock ownership should be placed in an outer envelope, which should be mailed to the Company with the legend “Security Holder Communication” in the lower left-hand corner. Company personnel will open the outer envelope and determine if the sender is a security holder. If so, the inner envelope will be forwarded to the Director so designated. If a letter is addressed to the “Audit Committee Chair c/o Chief Compliance Officer,” it is presumed to be a complaint to the Audit Committee and will be handled as set forth in the Company’s “Audit Committee Complaints Procedures and Whistleblower Protection Policy.”
EXECUTIVE OFFICERS
The executive officers of the Company as of March 9, 2012 were:
| | | | |
Name | | Age | | Title |
| Michael L. Browne | | 65 | | President & Chief Executive Officer |
| Arthur E. Chandler | | 55 | | Senior Vice President & Chief Financial Officer |
| Allan R. Becker | | 53 | | Senior Vice President & Chief Actuary |
| Thomas E. Clark | | 51 | | Senior Vice President, Field Operations |
| Mark R. Cummins | | 55 | | Executive Vice President, Chief Investment Officer & Treasurer |
| Arnold F. Herenstein | | 63 | | Senior Vice President & Chief Information Officer |
| Beth A. Friel | | 38 | | Senior Vice President, Human Resources & Senior Vice President, Claims |
| Robert A. Kauffman | | 48 | | Senior Vice President, Secretary, General Counsel & Chief Compliance Officer |
| Theodore A. Majewski | | 60 | | Senior Vice President, Personal Lines; President and Chief Operating Officer of Harleysville Life Insurance Company |
| Kevin M. Toth | | 38 | | Senior Vice President & Chief Underwriting Officer |
Michael L. Browne is president and CEO of Harleysville Group and the Mutual Company. Please see pages 92-93 for additional biographical information.
95
Arthur E. Chandler was named senior vice president and chief financial officer in April 2005. Prior to that, he was senior vice president of financial controls for XL America, and he had been chief financial officer for Kemper Insurance’s casualty division. Mr. Chandler also spent nearly 20 years with CIGNA in various financial positions.
Allan R. Becker became senior vice president and chief actuary of Harleysville Group and the Mutual Company in October 2005. Before joining Harleysville, he was vice president and senior actuary for ACE USA. During his 18 years with ACE USA and its predecessor CIGNA Property and Casualty, Mr. Becker held a variety of actuarial management roles. He holds the FCAS and MAAA designations.
Thomas E. Clark was named senior vice president for Harleysville Group and the Mutual Company in charge of branch and subsidiary operations in March 2004. Before that, he was in charge of branch operations and had been resident vice president for the New Jersey operations of Harleysville Group and the Mutual Company since July 2000. From 1995 through 2000, he worked for Fireman’s Fund Insurance Company as a business segment leader.
Mark R. Cummins is executive vice president, chief investment officer, and treasurer of Harleysville Group and the Mutual Company and has been in charge of the investment and treasury function since 1992.
Beth A. Friel was appointed senior vice president of claims for Harleysville Group and the Mutual Company in January 2012. Additionally, she has been senior vice president of human resources since February 2009. She joined Harleysville in August 2006 as assistant vice president and assistant general counsel and served as vice president, human resources from April 2008 until February 2009. Before that, Ms. Friel was an attorney in the labor and employment department of the law firm of Montgomery, McCracken, Walker & Rhoads, LLP.
Arnold F. Herenstein became senior vice president and chief information officer of Harleysville Group and the Mutual Company in July 2011. Prior to joining Harleysville, he was vice president of information technology at OneBeacon Insurance in Massachusetts.
Robert A. Kauffman has been senior vice president, secretary and general counsel of Harleysville Group and the Mutual Company since November 2004. In February 2009, he was named chief compliance officer. Before joining Harleysville, he had been an equity partner in the law firm of Reed Smith LLP in Philadelphia. He also served as an Assistant United States Attorney in the criminal and asset forfeiture divisions of the United States Attorney’s Philadelphia office.
Theodore A. Majewski was named senior vice president, personal lines for Harleysville Group and the Mutual Company in June 2003. Mr. Majewski also was appointed president and chief operating officer of Harleysville Life Insurance Company, a wholly owned subsidiary of the Mutual Company, in April 2008. Prior to joining Harleysville, Mr. Majewski was, among other senior management positions, the chief underwriting director of Encompass Insurance Company (formerly CNA).
Kevin M. Toth was appointed senior vice president and chief underwriting officer of Harleysville Group and the Mutual Company in February 2009. He joined Harleysville in January 2005 as vice president, associate general counsel, and chief litigation counsel and served as senior vice president, claims for Harleysville Group and the Mutual Company from July 2005 until February 2009. Before that, Mr. Toth was an attorney in the litigation department of the law firm of Reed Smith LLP.
SECTION 16(a) BENEFICIAL OWNERSHIP REPORTING COMPLIANCE
Section 16(a) of the Securities Exchange Act of 1934, as amended (the Exchange Act), requires the Company’s directors, executive officers, and persons who own more than 10% of a registered class of the Company’s equity securities (10% Holders) to file with the SEC initial reports of ownership and reports of changes in ownership of the Company’s common stock and other equity securities of the Company. Directors, officers, and 10% Holders are required by the regulations under the Exchange Act to file all Section 16(a) reports electronically and to provide the Company with notice of all of the Section 16(a) reports, which they file. Based solely upon a review of the Section 16(a) reports filed electronically and the representations made by the reporting persons to the Company, the Company believes that its directors, officers, and 10% Holders complied with the filing requirements under Section 16(a) of the Exchange Act during 2011.
96
AUDIT COMMITTEE REPORT
Prior to release of the Company’s consolidated financial statements for 2011, which are included on pages 53-85 of this annual report on Form 10-K, the Audit Committee met and held discussions with management and KPMG LLP (KPMG), the independent registered public accounting firm, regarding the fair and complete presentation of the Company’s results. Management represented to the Committee that the Company’s consolidated financial statements were prepared in accordance with U.S. generally accepted accounting principles, and the Committee reviewed and discussed the consolidated financial statements with management and the independent registered public accounting firm. The Committee discussed with KPMG matters required to be discussed by Statement on Auditing Standards No. 61, as amended,Communication With Audit Committees.
In addition, the Audit Committee has discussed with KPMG the firm’s independence from the Company and its management, including the matters in the written disclosures required by the Public Company Accounting Oversight Board Ethics and Independence Rule 3526,Communications with Audit Committees Concerning Independence. The Audit Committee also considered whether KPMG’s provision of other non-audit services to the Company is compatible with the firm’s independence. The Audit Committee has concluded that KPMG is independent from the Company and its management.
The Audit Committee discussed with the Company’s internal auditor and the independent registered public accounting firm the overall scope and plans for their respective audits. The Audit Committee met with the internal auditors and the independent registered public accounting firm, with and without management present, to discuss the results of their examinations, the evaluations of the Company’s internal controls and procedures, and the overall quality of the Company’s financial reporting.
In reliance on the reviews and discussions referred to above, the Audit Committee recommended to the Board of Directors that the audited consolidated financial statements be included in this annual report on Form 10-K.
Management is responsible for the Company’s financial reporting process and for the preparation of its consolidated financial statements in accordance with U.S. generally accepted accounting principles. KPMG is responsible for auditing those consolidated financial statements. The Audit Committee’s responsibility is to monitor and review these processes. It is not the Audit Committee’s responsibility to conduct auditing or accounting reviews or procedures. Therefore, in approving the inclusion of the audited consolidated financial statements in this Annual Report on Form 10-K, the Audit Committee has relied on management’s representation that the consolidated financial statements have been prepared in conformity with U.S. generally accepted accounting principles and on the reports of KPMG included in this annual report on Form 10-K.
Submitted by the Audit Committee:
G. Lawrence Buhl, Chair
Barbara A. Austell
W. Thacher Brown
William E. Storts
| Item 11. | Executive Compensation. |
EXECUTIVE COMPENSATION
COMPENSATION DISCUSSION AND ANALYSIS
Introduction
The Company embraces a “pay for performance” philosophy that is designed to reward executives for driving organizational performance and creating shareholder value. Specifically, the compensation program supports the achievement of specific performance targets through articulated goals that reflect the Company’s strategic priorities and
97
business focus and enables the Company to compete for talented and experienced staff with companies of similar size or in similar lines of business.
Named Executive Officer (NEO) compensation consists of a mix of base salary, annual incentive cash compensation, and time and performance-based equity compensation. The Compensation and Personnel Development Committee of the Board of Directors (Compensation Committee) targets the median of the benchmark companies’ compensation for the Named Executive Officers. The Compensation Committee believes the median represents a total compensation package that is competitive within the property/casualty insurance industry without responding to more extreme compensation decisions by individual benchmark companies.
The Compensation Committee reviews, on a retrospective basis, the relationship between Company performance and actual compensation of the Named Executive Officers as compared to the benchmark companies (when information regarding the benchmark companies becomes available). To evaluate Company performance, the Compensation Committee evaluates a number of performance metrics, including net written premium growth; operating income growth; return on equity (ROE); combined ratio; and relative total shareholder return (TSR). Over the past few years, this analysis has confirmed that the Company’s relative performance on key metrics is aligned with relative earned compensation as compared to the executive officers of the peer group companies.
Each year the Compensation Committee also reviews target pay levels of the peer group as part of its benchmarking review in order to help its determination of Named Executive Officers’ target compensation for the following year. Because of the pendency of the proposed Merger with Nationwide, and the limitations imposed by the Merger Agreement on making compensation changes, however, the Compensation Committee did not obtain or review any peer group benchmarking data in October 2011. References in this Compensation Discussion and Analysis to peer group comparisons are based on the review performed in October 2010, which informed the Committee’s compensation decisions for 2011, and in some cases on prior reviews.
In addition to working to align Named Executive Officer compensation with Company performance and peer benchmarking, the Company has continued several compensation practices that the Committee believes represent strong corporate governance:
| | • | | The Company believes the focus of its compensation programs should be on providing competitive compensation to officers during their employment with the Company. Therefore, the Company does not have standard severance arrangements with its Named Executive Officers, and provides post-termination payments only in the event of a change in control. |
| | • | | The Company’s compensation practices are aligned with those of its peer group companies, although its base salary component is lower than the peer group companies for all Named Executive Officers other than the CEO and higher than the peer group companies in use of equity compensation. |
| | • | | The Company provides protection to its senior executives by providing Change-in-Control Agreements; benefits are paid on a double-trigger basis (generally, consummation of a change in control transaction followed by termination of employment by the Company for reasons other than “Cause” or “Disability” or termination by the executive for “Good Reason”). The Company believes that Change in Control Agreements provide a necessary incentive to executives to join and then remain with the Company in times of substantial change or uncertainty and are necessary to maintain the Company’s competitive position in its industry. The proposed merger transaction with Nationwide’s subsidiary will constitute a change in control of the Company under such Change in Control Agreements. See pages 1-2 for more information. |
The Company’s proxy statement for its 2011 Annual Meeting included a separate shareholder advisory proposal to approve the 2010 compensation of the Named Executive Officers as disclosed in such proxy statement pursuant to Item 402 of Regulation S-K (say-on-pay), and a separate “say-on-frequency” shareholder proposal with a recommendation to hold the advisory say-on-pay vote every year. Approximately 95% of the shares authorized to vote were represented at the 2011 Annual Meeting and approximately 94% of the votes cast on the say-on-pay proposal were votes for approval. The Mutual Company, the parent of the Company, owns approximately 53% of the outstanding shares, but the approval reflected support by a majority of the remaining stockholders as well. The Compensation Committee did not take the results of the 2011 Annual Meeting say-on-pay vote into account in
98
establishing 2011 compensation. Given the pendency of the Merger with Nationwide, the results of the say-on-pay vote are not expected to have any impact on 2012 compensation decisions.
The Board of Directors has determined that the Company will provide an advisory say-on-pay vote on an annual basis at any future meeting at which directors are to be elected. This follows the stockholder advisory say-on-frequency vote results.
Compensation Philosophy
The Company provides a mix of fixed and variable compensation that is intended to motivate and retain talented executives and support the achievement of a high-performance culture. In order to achieve these strategic goals, the Company has identified principles that guide its management compensation program. The program is designed to:
| | • | | attract, retain, and motivate talented executives; |
| | • | | reward competencies and behaviors identified as critical to the Company’s success; |
| | • | | offer total compensation that is consistent with the performance of an individual executive measured against other executives, both within the Company and within the peer group of companies utilized by the Company; and |
| | • | | focus on developing incentive compensation that is keyed to internal Company performance objectives and creation of stockholder value, maintaining a proper balance between the incentive to achieve the compensation levels and the incurrence of unnecessary risk in the pursuit of such objectives that could negatively impact the Company. |
Compensation Methodology
Compensation Process
The Compensation Committee, which consists entirely of independent directors as defined in Section 162(m) of the Internal Revenue Code of 1986, as amended (the Internal Revenue Code) and as defined by NASDAQ, oversees the Company’s management compensation program. The Compensation Committee is the principal decision-maker with respect to the Company’s compensation philosophy and executive compensation components, but it seeks input and recommendations from the CEO and other members of senior leadership. Human Resources and General Counsel management representatives have assisted the Compensation Committee in evaluating executive compensation programs. Management also participates in identifying the corporate goals that will be used in a fiscal year, which are finalized and approved by the Compensation Committee. For individual performance goals, the individual Named Executive Officer, except in the case of the CEO, works with the CEO to develop individual performance goals based on position responsibilities, which are then presented to the Compensation Committee. The CEO works directly with the Compensation Committee with respect to his own individual performance goals, and those goals are approved by the Compensation Committee. The CEO participates in the annual compensation evaluation process for the other members of senior management by reviewing the individual goals with, and obtaining a self-appraisal from, each Named Executive Officer, performing his own assessment of the individual goals, and the achievement thereof, and then making a recommendation to the Compensation Committee with respect to the incentive compensation based on the degree of achievement of individual goals by each Named Executive Officer. For the CEO, the independent members of the Board provide an annual performance evaluation to the Chair of the Compensation Committee who aggregates the performance feedback and assessments. The Compensation Committee then meets and provides a recommendation to the independent members of the Board, who make their determination as to CEO compensation. The Chair of the Compensation Committee then reviews the CEO’s performance assessment with the CEO.
To evaluate individual performance of role responsibilities, the Compensation Committee assesses, with management input, actual performance as compared to position responsibilities. To evaluate Company performance, the Compensation Committee evaluates a number of performance metrics, including net written premium growth; operating income growth; return on equity (ROE); combined ratio; and relative TSR. The term “combined ratio” is a
99
standard term of measurement in the property/casualty insurance industry and is defined on page 2 of this annual report on Form 10-K.
During 2011, the Compensation Committee retained Compensation Advisory Partners LLC (CAP), an independent compensation consultant, to provide the Committee with information, analyses, and advice regarding the form and amount of executive and non-employee director compensation. CAP reports directly to the Compensation Committee Chair, and neither the Company nor the Compensation Committee engages CAP for any additional services other than executive compensation and non-employee director compensation. In prior years, CAP provided the Compensation Committee with benchmarking analyses; the Committee deferred receipt of such report in October 2011 because of the pendency of the Merger with Nationwide.
Peer Group Comparisons
With the help of CAP, and under the direction of the Compensation Committee, the Company collects and analyzes data from a peer group of property/casualty insurance companies to assist in the determination of total compensation for the Named Executive Officers. Such peer companies may range in size or business focus, but are similar at the median to the Company. The Company evaluates this benchmark peer group on a periodic basis to ensure that the proper companies are considered in the compensation determinations. The peer group for purposes of determining 2011 compensation, which was substantially the same group the Company has used since 2008, was:
| | |
Company | | Company |
| Alleghany Corporation | | One Beacon Insurance Group |
| W.R. Berkley Corporation | | RLI Corporation |
| Cincinnati Financial Corporation | | Safety Insurance Group |
| Donegal Group Inc. | | Selective Insurance Group Inc. |
| EMC Insurance Group Inc. | | State Auto Financial Corporation |
| Erie Indemnity Company | | Tower Group Inc. |
| Hanover Insurance Group Inc. | | United Fire and Casualty Company |
| HCC Insurance Holding Company | | |
Elements of Compensation
Total annual compensation for executive officers of the Company is comprised of fixed compensation (annual base salary), variable compensation (annual cash-based incentive awards), and long-term compensation (annual equity awards). Based on recommendations from the CEO, the Company’s senior leadership team is placed into two groups for compensation determinations. For executive officers who would be considered named executive officers by the Company because of their positions and job responsibilities (Messrs. Browne, Chandler and Toth), the total compensation targets are based on benchmark data for named executive officers at the peer companies. Specifically, the Compensation Committee reviews comparative data for the CEO and for the CFO and a blend of the compensation paid to named executive officers (other than the CEO or CFO) at the benchmark companies for the other executive officers in the named executive officer grouping. For the other executive officers who are part of the senior leadership team, including Mr. Becker and Ms. Friel, the CEO and the Compensation Committee generally use survey data for the specific position. Two of the Named Executive Officers (Mr. Becker and Ms. Friel) have not historically been in the named executive officer grouping and are NEOs for 2011 because of the acceleration of payment of some of their compensation, as described below on page 103 and in the Summary Compensation Table.
The Compensation Committee has targeted the median of the benchmark companies’ compensation, or, as applicable, the survey data at the individual position, for determining the total compensation targets for the Named Executive Officers because it believes the median represents a total compensation package that is competitive within the property/casualty insurance industry without responding to more extreme compensation decisions by individual benchmark companies. Based on this benchmarking data, the Compensation Committee determined that Messrs. Chandler and Toth are not receiving total compensation equivalent to the median, and therefore has been working toward moving those Named Executive Officers closer to the median of their peers over time.
The Company does not have policies or practices that establish firm allocations between short- and long-term incentive compensation or equity- versus cash-based compensation. The Compensation Committee regularly reviews
100
the programs utilized to provide short- and long-term incentive compensation, and makes changes as it determines appropriate. The Compensation Committee believes that its ability to use discretion in considering all pertinent factors and issues provides flexibility that allows the Compensation Committee to determine compensation based on both the value of the Named Executive Officer to the Company and the corporate results achieved. Because equity awards are a component of a total compensation target for a given year, these annual equity awards do not take into account equity awards already held by the Named Executive Officer.
Compensation Program for 2011
During 2011, the principal components of compensation were base salary, annual cash incentive bonus compensation, and long-term incentive compensation comprised of a mixture of equity-based awards. The specific components of the Company’s compensation program for the Named Executive Officers for 2011 are described below.
Base Salary
Consistent with the Company’s compensation philosophy, annual base salary is designed to be competitive within the property/casualty insurance industry. Executive salaries are based on a combination of benchmark data from the peer companies, paygrade range, individual performance of role responsibilities, and Company performance, the weightings of which may change from year to year. The Company has a paygrade structure, ranging from 1 to 32, with all positions assigned to a paygrade. Executive officers tend to be assigned paygrades of 25 to 32, with the highest reserved for the CEO.
The Compensation Committee considered overall Company performance, benchmark data from the peer companies and the assessment of individual performance as the principal factors in establishing base salaries for the Named Executive Officers. As noted above, the Compensation Committee has determined that Messrs. Chandler and Toth have target compensation that is not aligned with the peer group median, and therefore has begun to work toward moving those Named Executive Officers closer to the median of their peers over time. For 2011, that movement included 7% base salary increases for Messrs. Chandler and Toth. Mr. Becker’s salary increased by 8%, also to bring him closer to the peer group median. Ms. Friel’s salary increased by 13%, mainly due to her assumption of additional responsibilities for the business process improvement and learning and development functions. Mr. Browne’s salary did not increase, as his compensation was viewed as being in line with the median of CEOs at the peer group companies and the Company’s overall compensation philosophy. The salary earned by each of the Named Executive Officers for 2011 is included in the Summary Compensation Table on page 107.
Annual Incentive Compensation
The Senior Executive Incentive Compensation Plan (SEIP), approved by stockholders at the 2009 annual meeting, represents the incentive compensation program used by the Company during 2011 for awarding annual non-equity variable incentive compensation to members of the senior leadership team, including the Named Executive Officers. In February 2011, the Compensation Committee established the 2011 incentive award opportunities under the SEIP. The minimum funding target established under the SEIP for 2011 was achievement of a ROE of at least 5.0%. In addition, the Compensation Committee established corporate performance goals and reviewed individual goals identified by the Named Executive Officers, to be used, in the exercise of its discretion under the SEIP, to determine the actual annual incentive awards for 2011. The same corporate performance goals were used for all of the Named Executive Officers, and were weighted at 70% of the overall incentive opportunity. Individual performance goals for each Named Executive Officer were weighted at 30%. The weightings of the various corporate and individual goals were established based on factors such as elements of the Company’s business strategy, benchmark data from peer companies, and the individual roles and responsibilities.
The target award was 80% of base salary for the CEO, 65% for the CFO, 60% for Mr. Toth, and 45% for Mr. Becker and Ms. Friel. This represented an increase in the percentage of base salary from prior years for the CEO, the CFO, and Mr. Toth. The term “base salary” for purposes of the SEIP refers to the base salary at the beginning of the plan year. The target incentive award levels reflect the assessment of the impact of such positions on the achievement of the corporate goals, the importance of the achievement of the individual performance goals of the Named Executive Officers, the appropriate use of incentive compensation, and the total compensation as compared to other Company executive officers and appropriate positions at the peer companies.
101
For 2011, the Company did not achieve ROE of at least 5%, therefore no incentive bonuses were earned under the SEIP for 2011.
Under Section 7.11 of the Merger Agreement, Nationwide has committed to pay (unless previously paid), not later than sixty days after the closing date of the Merger, to each eligible employee who is employed by the surviving company after the Merger and remains so employed on such payment date, an amount equal to such employee’s 2011 target bonus incentive compensation under the SEIP or other incentive compensation plan of the Company (2011 Target Bonuses). Each of the Named Executive Officers, therefore, if he or she remains employed as of the payment date, will receive such 2011 Target Bonus from Nationwide. See page 109 for the amounts of such 2011 SEIP bonuses at target. As described below, under “Acceleration of Payment of Compensation,” payment of such 2011 Target Bonuses was accelerated for the 2011 Target Bonuses of Messrs. Browne, Chandler and Becker and Ms. Friel into December 2011. See page 103.
Long-Term Incentive Compensation
The Company uses equity-based incentive awards as an important component of overall incentive compensation to more closely align the interests of the Named Executive Officers with the shareholders. In February 2011, the Compensation Committee made equity-based awards to the Named Executive Officers under the Equity Incentive Plan (EIP). The awards consisted of a mixture of awards, by value, of 50% Stock Option grants (using Black-Scholes value), 25% Restricted Stock Unit (RSU) awards with performance-based vesting requirements, and 25% RSU awards with time-vesting requirements, in each case, based on the five-day average stock price for the week ending two weeks before the date of grant. The time-based RSU awards for the CEO also have a performance-based vesting requirement. All of the awards were made under the Company’s Amended and Restated Equity Incentive Plan (the Equity Incentive Plan). The Company selected these types of equity awards, and the mixture of such awards, because it believes this combination of equity-based awards with market-based, performance-based, and time-based vesting allows it to align executive rewards with the creation of value for the stockholders, while being easy for participants and stockholders to understand. Furthermore, the Company believes that this structure closely aligns the long-term incentive compensation program with the Company’s current business strategy and the long-term compensation programs of its competitors.
The Stock Option awards have a three-year vesting schedule, with one-third of each award vesting on each of the three anniversaries of the date of grant. The exercise price for all Stock Options granted was equal to the closing price of the stock on the date of grant. All Stock Options granted to the Named Executive Officers were non-qualified options, receiving no special tax treatment, and have a term of 10 years. The annual time-based RSU awards made to the Named Executive Officers have a three-year vesting period.
The remaining annual RSU awards made to the Named Executive Officers are all performance-based, with an established three-year performance period. The performance-based RSU awards are based on the achievement of total shareholder return (TSR) relative to the TSR of peer group companies at the end of the three-year period. The peer group selected for these awards for 2011 were the companies included in the executive compensation benchmarking group, as identified on page 100, plus the other companies in the S&P Property/Casualty Index as of January 1, 2011. This peer group was selected to reflect the belief that performance should be measured based on companies followed by investors, and to broaden the number of companies to prevent fluctuations based on individual company results. The performance-based target awards range from a maximum award of 200% of target paid if the TSR achieved at the end of the performance period is at the 90th percentile or higher; and a minimum award of 50% of target is paid if the TSR achieved at the end of the performance period is at the 30th percentile. No award is paid if the TSR is below the 30th percentile. TSR falling between the 30th and 90th percentiles is interpolated to determine the actual earned award.
The 2011 target equity awards were 80% of base salary for Mr. Chandler, 70% for Mr. Toth, and 45% for Mr. Becker and Ms. Friel, plus potential participation for each in a pool equal to 10% of aggregate base salaries of executives that is allocated based on the recommendations of the CEO. Ms. Friel also received a special award of restricted stock units valued at approximately $40,000, in recognition of her contributions in recent years, the fact that she served as head of human resources for the majority of the three-year period (2008-2010) for which other SLT members received performance-based restricted stock, and her new responsibilities in 2011. For the CEO, the target award was 225% of base salary. These target awards were selected based upon the impact and importance of the executive positions to the Company performance objectives generally, and to provide equity-based awards competitive with those made by the peer companies.
102
For the CEO, while his total compensation approximates the median for the benchmark peer group, the mixture of his compensation is more heavily weighted towards long-term incentive compensation (approximates the 75th percentile) than base salary (approximates the 25th percentile) to tie a significant part of his total compensation to delivery of results to investors.
The equity awards granted to the Named Executive Officers in 2011 are disclosed in the 2011 Grant of Plan-Based Awards Table on page 109, and the grant date fair value of such awards is set forth in the Summary Compensation Table on page 107.
Acceleration of Payment of Compensation
In order to preserve economic benefits to the Company and to the Mutual Company, and their respective stockholders and policyholders, of approximately $14.0 million that would otherwise have been expended or lost in connection with excise taxes, lost tax deductions and tax “gross-up” payments associated with change in control payments made pursuant to the pending Merger under the Merger Agreement, and to meet commitments made to Nationwide under the Merger Agreement, on December 20, 2011, the Compensation Committee approved, subject to certain conditions, for four of the Named Executive Officers: (1) payment, on an accelerated basis, of the 2011 Target Bonuses (described on page 102); and (2) the vesting of time-based restricted stock/restricted stock unit awards held by such Named Executive Officers (subject to transfer restrictions described below); and committed to accelerate, at the end of the performance period, certain performance-based restricted stock/restricted stock unit awards held by certain executive officers of the Company. The acceleration of the vesting of the performance-based equity awards was approved by the Compensation Committee on December 30, 2011. The acceleration of compensation determination was ratified by the full Board of Directors of the Company.
The 2011 Target Bonuses and the outstanding equity awards represent compensation that, but for the acceleration, would have been paid to the Named Executive Officers either on vesting dates arising at various times in 2012 or, if not paid earlier, at the time of or following the closing of the Merger. The Company believes that the acceleration in payment of such compensation is in the best interests of the Company, the Mutual Company and their respective stockholders and policyholders because it: (1) eliminates or reduces tax gross-up payments to certain executive officers that would otherwise be required under the terms of the existing change-in-control agreements, and (2) preserves tax deductions that would otherwise be lost, in each case on account of the impact of Sections 280G and 4999 of the Internal Revenue Code. The tax gross-up payments that the Company avoids, and the tax deductions (after-tax) that are preserved total approximately $14.0 million, assuming a price of $59.00 per share of the Company’s common stock.
In connection with the acceleration of the 2011 Target Bonuses and the accelerated vesting of selected equity awards, the Company and each impacted Named Executive Officer entered into a Change in Control Payment Acknowledgement and Agreement (the Agreement) that imposes significant transfer restrictions on the accelerated compensation. Under the Agreement, each Named Executive Officer agrees to return the 2011 Target Bonus, less the Federal, state and local income and employment taxes paid by the Named Executive Officer with respect to the 2011 Target Bonus, if: (1) the Merger is not consummated and a change in control of the Company does not otherwise occur before the effective date of the termination of the Merger Agreement, or (2) the Named Executive Officer’s employment by the Company is terminated prior to the 60th day following the closing of the Merger for any reason other than termination by the Company without cause. In addition, in the event of a return of the 2011 Target Bonus compensation, the Named Executive Officer agrees to assign to the Company any and all rights to a refund for taxes paid, and to assist the Company in its pursuit of such refunds.
With respect to accelerated equity-based compensation, under the Agreement each executive cannot transfer, assign, gift, pledge, hypothecate or otherwise transfer, for value or otherwise, any of the shares of common stock received until the earlier of the original vesting date of such shares or the closing date of the Merger.
The Company believes, after consultation with its internal and external legal and other advisors, that the acceleration preserves for the Company and the Mutual Company the economic benefit of approximately $14.0 million that would otherwise be lost. The actions represent an acceleration of compensation, not payment of additional compensation to any of the Named Executive Officers of the Company. The actions taken were limited to only those executive officers for whom a potential excise tax gross-up and lost tax deduction would have been triggered by the closing of the Merger, and the affected executive officers are expected to remain with the Company after the closing of the Merger and have adequate incentive to do so.
103
Equity Granting Practices
Generally, the Compensation Committee determines annual grants of equity-based awards at a regularly scheduled meeting held in the first quarter of any given year. The Compensation Committee makes all annual equity awards to the Named Executive Officers during meetings, not by unanimous consent. The Compensation Committee holds such regularly scheduled meetings at a consistent time during each calendar year and generally does not consider the potential for the existence of extraordinary corporate events when establishing its meeting schedule. In addition to such annual grants, the Compensation Committee will make equity-based awards to newly hired executives or to key employees on an ad hoc basis. If a regularly scheduled Compensation Committee meeting will occur prior to the commencement date of the new hire or promotion, the Compensation Committee may approve such award at its meeting, conditioned upon the actual employment or promotion occurring. Otherwise, the Compensation Committee may act by unanimous written consent or by holding a telephonic meeting.
Prior to the annual equity award grants, the CEO provides input and recommendations to the Compensation Committee with respect to the equity awards to executive officers. The Compensation Committee establishes the equity awards for the CEO and recommends approval of such awards by the independent members of the Board.
Stock Ownership Guidelines
The Company has established stock ownership guidelines for its executive officers to encourage continued stock ownership by executives and further to align the interests of the executives with the interests of stockholders. Under these guidelines, the executive officers must beneficially own Harleysville Group stock equal to a specific multiple of base salary in order to receive additional equity awards at a level necessary to keep total compensation at the target level. The multiple is 6.0 times base salary for the CEO and 2.5 times base salary for the other Named Executive Officers. The current Named Executive Officers must meet the increased stock ownership guidelines by May 1, 2014. The following table shows compliance with such stock ownership guidelines as of December 31, 2011.
| | | | | | | | |
Named Executive Officer | | Ownership Target (Shares) (1) | | | Total Qualifying Shares (2) | |
Michael L. Browne | | | 70,002 | | | | 243,278 | |
Arthur E. Chandler | | | 15,909 | | | | 27,134 | |
Allan R. Becker | | | 11,711 | | | | 21,587 | |
Beth A. Friel | | | 11,711 | | | | 11,390 | |
Kevin M. Toth | | | 13,037 | | | | 26,060 | |
| (1) | Based on the closing price of the Harleysville Group common stock on December 31, 2011 of $56.57. |
| (2) | Qualifying shares include owned shares and outstanding Restricted Stock/RSU awards. |
Other Benefits
The Company maintains various retirement and savings plans for its senior executives, and believes such programs are a necessary component of its overall compensation program. The current retirement-focused plans are the Harleysville Retirement Savings Plus Plan, which is a defined contribution plan that is available to all employees and has both non-matching and matching Company contributions; a Non-Qualified Excess Contribution and Match Program (the Excess Plan), which is available to all officers of the Company at paygrade level 20 or higher, including the senior executives; and a Non-Qualified Deferred Compensation Plan, which is also available to all officers at paygrade level 20 or higher, including the senior executives. The Company believes that its defined contribution plan positions it competitively in its markets.
The Company provides health and welfare benefits to its executive officers, including medical, dental, and life insurance coverage, and long-term disability benefits, holidays and vacation. The executives receive these benefits at the same rates as other employees. In general, the Company does not provide perquisites to its executive officers that are not offered to employees generally.
The Company also provides all employees, including the Named Executive Officers, with the ability to purchase shares of the Company’s common stock at a discount under the Employee Stock Purchase Plan (ESPP). The ESPP allows employees to purchase shares of the Company’s common stock at a price of 85% of the lower of the fair
104
market value of the stock at the start or end of the six-month subscription period, whichever is less, and allows for a maximum purchase of $25,000 of common stock per year. No new offering period has been commenced under the ESPP since September 28, 2011 (the date the Merger Agreement was executed), and, so long as the Merger Agreement remains in effect, no such new offering period will commence. Under the Merger Agreement, the current offering period under such plan ended on January 14, 2012 (ESPP Termination Time). Any amounts credited to a participant’s account at the ESPP Termination Time were used in accordance with the plan to purchase shares of Harleysville Group common stock for participants at the discounts provided for under the plan. Such shares are issued and outstanding and entitled to receive the Group Merger consideration of $60.00 per share (less any amounts necessary to meet applicable tax withholding obligations).
Post-Employment Arrangements
The Company provides certain post-employment benefits as part of its overall compensation program and, as described above, believes these benefits are a necessary component of a competitive compensation package. In 2006, the Company evaluated its retirement benefits and determined it was appropriate to cease benefit accruals under its defined benefit plans, as discussed below, in favor of enhanced Company benefits under the defined contribution plans. The Company believes this provides employees with more flexibility and encourages retirement savings.
Deferred Compensation Plan
Executive officers are eligible to participate in the Company’s Non-Qualified Deferred Compensation Plan. The Company believes that deferred compensation plans provide executives with greater flexibility to establish savings and to engage in retirement planning. Each executive who elects to defer compensation under the plan has a participant account established with the service provider. The mutual fund investment options are similar to those offered in the Company’s defined contribution plan. Such deferred compensation remains an asset of the Company, subject to a Rabbi Trust Agreement, until the participant dies, becomes permanently disabled, or otherwise terminates employment with the Company. The Non-Qualified Deferred Compensation Table on page 115 provides information regarding the accounts of the participating Named Executive Officers under this plan. All benefits under the Non-Qualified Deferred Compensation Plan will be paid immediately following the closing date of the Merger transactions.
Pension Plans
The Company maintains a qualified defined benefit plan and related Supplemental Retirement Plan (SERP) for its executive officers, including the Named Executive Officers. The Company established the SERP to permit payouts to executives of a pension benefit calculated on the full amount of their compensation, which otherwise would have been limited because of the federal limits imposed on the qualified pension plan. Prior to March 31, 2006, a pension awarded under the pension plan was based on the highest five-year average of base salary, while an award under the SERP was based on the highest five-year average of credited salary plus average annual incentive compensation, which then included the Senior Management Incentive Plan annual bonus and compensation under the Long-Term Incentive Plan. As of March 31, 2006, no additional benefits accrue under the pension plan and SERP, although participants will continue to earn vesting credit. The Pension Benefits Table on page 114 shows the final benefit that was accrued as of March 31, 2006 for the Named Executive Officers, which is payable at age 65 in the form of a single life annuity. For participants who are married at retirement, the normal form of payment would be an actuarially reduced joint and 50% survivor annuity. The SERP will be terminated and all benefits will be paid to SERP participants by December 31, 2012, if the Merger transactions close on or before June 1, 2012, or by the one-year anniversary of the closing of the Merger transactions if the closing occurs after June 1, 2012.
Harleysville Retirement Savings Plus Plan (Defined Contribution Plan) and Non-Qualified Excess Contribution and Match Program (Excess Plan)
All regular full- and part-time employees who are scheduled to work 20 or more hours in a given week, excluding any student or intern workers who are scheduled to work for less than four months, are eligible to participate in the Company’s tax-qualified defined contribution plan, which is a long-term investment plan designed primarily to assist employees in saving for retirement. Participating employees can defer up to 100% of their base salary each year, up to the limits established by federal law, and the Company matches such contributions up to 6% of salary. For 2011, the matching contribution by the Company consisted of a guaranteed match of 50% up to 6% of base salary deferred. There was no additional performance match for 2011 as the threshold combined ratio was not achieved. The Company
105
also makes a Company core contribution equal to 4% of base salary for all eligible employees, and these Company core contributions vest upon the employee attaining three years of service.
The Company also has established the Excess Plan to provide for company contributions on salary paid that is in excess of the annual limitation imposed by the Internal Revenue Service. Under this Plan, executives receive a 4% contribution on salary paid in excess of the annual limits for contribution under the Company’s tax-qualified defined contribution plan and an amount equal to the matching contribution made under the deferred compensation on 6% of salary paid in excess of those annual limits. All benefits under the Excess Plan will be paid immediately following the closing date of the Merger transactions.
Change in Control Agreements
The Company has entered into Change in Control Agreements with the Named Executive Officers. The Company believes these agreements are necessary to attract and retain senior executives who may face potential job loss as a result of consolidation or merger activities. Such agreements provide the Named Executive Officers with a level of financial security that can be beneficial to their retention if the Company becomes involved in a change in control transaction and the executive loses his position. Under these agreements, change-in-control benefits are paid in a change in control on a “double trigger” basis only, i.e., if the executive loses his or her position as a result of the change in control. The only compensation subject to single trigger vesting on a change in control are equity-based awards, which are governed by the EIP.
The change in control events have been selected to trigger the benefits if the current control of the Company or the Mutual Company changes, either in respect of stockholders or incumbent directors, or in the event that some other significant change occurs in the relationship between the Company and the Mutual Company. Because the transactions contemplated by the Merger Agreement will constitute a change in control event for both the Company and the Mutual Company, the closing of the transactions will satisfy the first trigger under the Change In Control Agreements. The Company has agreed with Nationwide to terminate the Change in Control Agreements and to cause all amounts under such agreements to be liquidated and paid to the Named Executive Officers, conditioned upon closing of the Merger.
Please see pages 116-118 for a description of the Company’s Change in Control Agreements with the Named Executive Officers and the impact of the Merger on such Change in Control Agreements.
Impact of Termination of Employment or Change in Control on Outstanding Equity Awards
The Company’s equity award agreements include provisions that provide for accelerated vesting on death, disability, retirement and a change in control. These benefits are described under the heading “Post-Employment Arrangements” on page 116 of this annual report on Form 10-K.
TAX CONSIDERATIONS
The Compensation Committee has considered the implications of executive compensation deductibility under the limits set forth in Section 162(m) of the Internal Revenue Code in making decisions concerning compensation design and administration. The Compensation Committee views tax deductibility as an important consideration and intends to maintain deductibility where possible, but also believes that the Company’s business needs should be the most important factor in compensation design. In addition, the Compensation Committee also considers tax implications for executives and structures its compensation programs to comply with Section 409A of the Internal Revenue Code. With the exception of approximately $630,000 of the CEO’s compensation, all compensation paid to the Named Executive Officers for 2011 was fully deductible under Section 162(m) of the Internal Revenue Code.
106
SUMMARY COMPENSATION TABLE
This table provides compensation disclosure, for 2011, for the Named Executive Officers, who are (1) the Chief Executive Officer (CEO) and the Chief Financial Officer (CFO); and (2) the Company’s three most highly compensated executive officers, other than the CEO and the CFO, who were serving in such capacity on December 31, 2011.
| | | | | | | | | | | | | | | | | | | | | | | | | | | | | | | | | | | | |
Name & Principal Position | | Year | | | Salary ($) | | | Bonus ($)
(1) | | | Stock
Awards
($)(2)(3) | | | Option
Awards
($) (2) | | | Non-Equity
Incentive
Plan
Compensation
($) (4) | | | Change in
Pension Value
and
Nonqualified
Deferred
Compensation
Earnings ($)
(5) | | | All Other
Compensation
($) (6) | | | Total ($) | |
Michael L. Browne,
President & Chief Executive Officer | | | 2011 | | | | 660,000 | | | | 528,000 | | | | 833,669 | | | | 757,345 | | | | 0 | | | | 30,300 | | | | 70,007 | | | | 2,879,321 | |
| | | 2010 | | | | 649,615 | | | | | | | | 925,757 | | | | 825,827 | | | | 487,108 | | | | 25,800 | | | | 71,777 | | | | 2,985,884 | |
| | | 2009 | | | | 630,000 | | | | | | | | 932,907 | | | | 803,099 | | | | 587,721 | | | | 23,200 | | | | 79,061 | | | | 3,055,988 | |
| | | | | | | | | |
Arthur E. Chandler,
SVP & Chief Financial Officer | | | 2011 | | | | 346,539 | | | | 234,000 | | | | 190,588 | | | | 146,888 | | | | 0 | | | | 9,700 | | | | 24,258 | | | | 951,973 | |
| | | 2010 | | | | 335,000 | | | | 30,000 | | | | 196,975 | | | | 148,599 | | | | 183,752 | | | | 5,500 | | | | 23,450 | | | | 923,276 | |
| | | 2009 | | | | 330,962 | | | | | | | | 145,393 | | | | 125,024 | | | | 210,607 | | | | 4,000 | | | | 29,588 | | | | 845,574 | |
| | | | | | | | | |
Allan R. Becker,
SVP & Chief Actuary (7) | | | 2011 | | | | 254,231 | | | | 119,250 | | | | 110,274 | | | | 60,830 | | | | 0 | | | | 3,100 | | | | 17,796 | | | | 565,481 | |
| | | | | | | | | |
Beth A. Friel,
SVP, Human Resources and SVP, Claims (7) | | | 2011 | | | | 262,000 | | | | 119,250 | | | | 151,165 | | | | 60,830 | | | | 0 | | | | | | | | 18,340 | | | | 611,585 | |
| | | | | | | | | |
Kevin M. Toth,
SVP, Chief Underwriting Officer | | | 2011 | | | | 284,231 | | | | | | | | 159,361 | | | | 105,318 | | | | 0 | | | | 4,800 | | | | 19,896 | | | | 573,606 | |
| | | 2010 | | | | 271,538 | | | | 30,000 | | | | 172,352 | | | | 126,677 | | | | 126,541 | | | | 2,400 | | | | 40,415 | | | | 769,923 | |
| | | 2009 | | | | 260,962 | | | | | | | | 112,551 | | | | 96,844 | | | | 169,977 | | | | 1,200 | | | | 23,163 | | | | 664,697 | |
| (1) | For 2011, represents the accelerated payment, on December 30, 2011, of the 2011 Target Bonuses to the affected Named Executive Officers. See page 102 for a discussion of the 2011 Target Bonuses, and page 103 for a description of the acceleration of payment of compensation for four of the Named Executive Officers. For 2010, represents the cash portion of the June 2010 special bonus related to the successful results of the A.M. Best-evaluation of the Company’s ratings. |
| (2) | The “Stock Awards” and “Option Awards” columns reflect the grant date fair value for all stock or option awards granted under the Equity Incentive Plan during 2009, 2010 and 2011. These amounts are determined in accordance with FASB Accounting Standards Codification 718 (previously known as Statement of Financial Accounting Standards No. 123(R)) (ASC 718), without regard to any estimate of forfeiture for service vesting. Assumptions used in the calculation of the amounts in this table are included in footnote 12 to the Company’s audited financial statements for the fiscal year ended December 31, 2011, included in this annual report on Form 10-K. |
107
| (3) | For the 2011 performance-based RSU awards, the grant date fair value associated with maximum performance of such awards is set forth below: |
| | | | | | | | |
Named Executive Officer | | No. of Shares at
Maximum Award
(#) | | | ASC 718 Grant Date
Fair Value at
Maximum ($) | |
Michael L. Browne | | | 20,720 | | | | 910,851 | |
Arthur E. Chandler | | | 4,020 | | | | 176,719 | |
Allan R. Becker | | | 1,670 | | | | 73,413 | |
Beth A. Friel | | | 1,670 | | | | 73,413 | |
Kevin M. Toth | | | 2,890 | | | | 127,044 | |
| (4) | The “Non-Equity Incentive Plan Compensation” column reflects the annual cash bonuses earned under the SEIP. The bonuses listed were earned for the fiscal year reported, but were paid in the subsequent year. |
| (5) | This column represents the change in values under the pension plan and SERP. The change in benefit values from January 1, 2011 to December 31, 2011, from an actuarial perspective, for each Named Executive Officer under the pension plan and SERP, respectively, are: $10,100 and $20,200 for Mr. Browne; $6,800 and $2,900 for Mr. Chandler; $3,100 and $0 for Mr. Becker; $0 and $0 for Ms. Friel; and $4,800 and $0 for Mr. Toth. Assumptions used in the calculation of these amounts are included in footnote 12 to the Company’s audited financial statements for the fiscal year ended December 31, 2011, included in this annual report on Form 10-K. |
| (6) | For the fiscal year ended December 31, 2011, the aggregate amount in “All Other Compensation” consists of the following compensation: |
| | | | | | | | | | | | |
Named Executive Officer | | Retirement Savings Plus
Plan Contributions
(Defined Contribution
Plan) ($) | | | Non-Qualified Excess
Contribution and Match
Program Contributions
($) | | | Other ($) | |
Michael L. Browne | | | 16,908 | | | | 29,292 | | | | 23,807 | |
Arthur E. Chandler | | | 16,873 | | | | 7,385 | | | | | |
Allan R. Becker | | | 16,881 | | | | 915 | | | | | |
Beth A. Friel | | | 17,150 | | | | 1,190 | | | | | |
Kevin M. Toth | | | 17,150 | | | | 2,746 | | | | | |
The “Retirement Savings Plus Plan Contributions (Defined Contribution Plan)” amounts include a Company contribution of 4% of base salary, as well as a Company guaranteed match of 50% and a Company performance match of 0%. The matching contributions are made on percentages of base salary deferred by the executives, up to 6% of base salary, and all contributions are subject to the annual limitations on compensation imposed by the IRS for qualified plans (IRS compensation limits). The Company guaranteed match was paid and earned in 2011.
The “Non-Qualified Excess Contribution and Match Program Contributions” column consists of a matching contribution equal to the sum of the company contribution and guaranteed match of up to 6% of base salary in excess of IRS compensation limitations.
For Mr. Browne, the “Other” compensation in the above table represents a reimbursement of $23,807 in expenses associated with business trips and work-related events that did not meet the tax-deduction qualifications under the Internal Revenue Code regulations, including spousal expenses and a tax gross-up.
| (7) | Mr. Becker and Ms. Friel were not Named Executive Officers in the Company’s proxy statements in 2009 and 2010. Therefore, the Summary Compensation Table sets forth the required disclosures with respect to their compensation in 2011 only. Please see page 96 for their biographical information. |
108
2011 GRANT OF PLAN-BASED AWARDS TABLE
| | | | | | | | | | | | | | | | | | | | | | | | | | | | | | | | | | | | | | | | | | | | |
Named Executive Officer | | Grant
Date | | | Estimated Future Payouts
Under Non-Equity Incentive
Plan Awards (1) | | | Estimated Future Payouts
Under Equity Incentive Plan
Awards (2) | | | All Other
Stock
Awards:
Number
of Shares
of Stock
or Units | | | All Other
Option
Awards:
Number of
Securities
Underlying
Options | | | Exercise
or Base
Price of
Option
Awards | | | Grant Date
Fair Value
of Stock
and Option
Awards | |
| | | | | | Threshold
($) | | | Target
($) | | | Maximum
($) | | | Threshold
(#) | | | Target
(#) | | | Maximum
(#) | | | (#) (3) | | | (#) (4) | | | ($/Sh) | | | ($) (5) | |
Michael L. Browne | | | 2/17/11 | | | | 264,000 | | | | 528,000 | | | | 1,056,000 | | | | 5,180 | | | | 10,360 | | | | 20,720 | | | | | | | | | | | | | | | | 455,426 | |
| | | 2/17/11 | | | | | | | | | | | | | | | | | | | | | | | | | | | | 10,360 | | | | | | | | | | | | 378,244 | |
| | | 2/17/11 | | | | | | | | | | | | | | | | | | | | | | | | | | | | | | | | 114,230 | | | | 36.51 | | | | 757,345 | |
Arthur E. Chandler | | | 2/17/11 | | | | 117,000 | | | | 234,000 | | | | 468,000 | | | | 1,005 | | | | 2,010 | | | | 4,020 | | | | | | | | | | | | | | | | 88,360 | |
| | | 2/17/11 | | | | | | | | | | | | | | | | | | | | | | | | | | | | 2,800 | | | | | | | | | | | | 102,228 | |
| | | 2/17/11 | | | | | | | | | | | | | | | | | | | | | | | | | | | | | | | | 22,155 | | | | 36.51 | | | | 146,888 | |
Allan R. Becker | | | 2/17/11 | | | | 59,625 | | | | 119,250 | | | | 238,500 | | | | 417 | | | | 835 | | | | 1,670 | | | | | | | | | | | | | | | | 36,707 | |
| | | 2/17/11 | | | | | | | | | | | | | | | | | | | | | | | | | | | | 2,015 | | | | | | | | | | | | 73,568 | |
| | | 2/17/11 | | | | | | | | | | | | | | | | | | | | | | | | | | | | | | | | 9,175 | | | | 36.51 | | | | 60,830 | |
Beth A. Friel | | | 2/17/11 | | | | 59,625 | | | | 119,250 | | | | 238,500 | | | | 417 | | | | 835 | | | | 1,670 | | | | | | | | | | | | | | | | 36,707 | |
| | | 2/17/11 | | | | | | | | | | | | | | | | | | | | | | | | | | | | 2,015 | | | | | | | | | | | | 73,568 | |
| | | 2/17/11 | | | | | | | | | | | | | | | | | | | | | | | | | | | | 1,120 | | | | | | | | | | | | 40,891 | |
| | | 2/17/11 | | | | | | | | | | | | | | | | | | | | | | | | | | | | | | | | 9,175 | | | | 36.51 | | | | 60,830 | |
Kevin M. Toth | | | 2/17/11 | | | | 88,500 | | | | 177,000 | | | | 354,000 | | | | 722 | | | | 1,445 | | | | 2,890 | | | | | | | | | | | | | | | | 63,522 | |
| | | 2/17/11 | | | | | | | | | | | | | | | | | | | | | | | | | | | | 2,625 | | | | | | | | | | | | 95,839 | |
| | | 2/17/11 | | | | | | | | | | | | | | | | | | | | | | | | | | | | | | | | 15,885 | | | | 36.51 | | | | 105,318 | |
| (1) | The amounts in these columns represent the potential payouts under the 2011 SEIP awards. Please see the “Non-Equity Incentive Plan Compensation” column in the Summary Compensation Table for the actual 2011 SEIP payouts to the Named Executive Officers. |
| (2) | The amounts in these columns represent the potential payouts to the Named Executive Officers under the performance-based Restricted Stock Unit component of their annual equity compensation granted under the Equity Incentive Plan. Forfeiture restrictions will lapse and awards will vest after the end of a three-year performance period if the Named Executive Officer remains continuously employed on the vesting date and the required performance goals for the performance period have been met. In the event of a change in control, the forfeiture restrictions on these performance-based awards will lapse at target. |
| (3) | The “All Other Stock Awards” column includes Restricted Stock Unit awards for all of the Named Executive Officers as part of their annual equity compensation granted under the Equity Incentive Plan. In Ms. Friel’s case, a special award of 1,120 RSUs from February 2011, which was granted in recognition of her service to the Company in the years 2008-2010 (and her ineligibility for the performance-based awards that vested for other executive officers for that timeframe), is also included in this column. In Mr. Browne’s case, his “time-based” RSU award contains a performance goal as well. Forfeiture restrictions on all of these awards will lapse and awards will vest on the third anniversary of the date of grant if the Named Executive Officer remains continuously employed on the vesting date. In the event of a change in control, the forfeiture restrictions on these time-based awards will lapse fully. |
| (4) | The “All Other Option Awards” column represents Non-Qualified Stock Options granted under the Equity Incentive Plan. The options will vest and become exercisable in three installments of one-third each on the first, second, and third anniversary of the date of grant. In the event of a change in control, any unvested Stock Options will vest. |
| (5) | The “Grant Date Fair Value” for the performance-based Restricted Stock Unit awards is based on an ASC 718 value of $43.96 per share. The “Grant Date Fair Value” for the annual time-based Restricted Stock Unit awards is $36.51 per share. |
109
The “Grant Date Fair Value” for the Stock Option awards was determined by using the Black-Scholes option pricing model. The dividend yield assumption was 3.94%; the expected volatility assumption was 27.42%; the risk-free interest rate assumption was 2.60%; and the expected life assumption was 5.5 years. These numbers are calculated based on the disclosure requirements and do not reflect Harleysville Group’s estimate of future stock price growth. Use of this model should not be viewed in any way as a forecast of the future performance of Harleysville Group’s common stock, which will be determined by future events and unknown factors.
2011 OPTION EXERCISES AND STOCK VESTED TABLE
| | | | | | | | | | | | | | | | |
| | | Option Awards | | | Stock Awards | |
Named Executive Officer | | Number of Shares
Acquired on
Exercise (#) | | | Value Realized
on Exercise
($) | | | Number of Shares
Acquired on
Vesting
(#) (1) | | | Value Realized
on Vesting ($) (1) | |
Michael L. Browne | | | 108,820 | | | | 2,615,435 | | | | 72,971 | | | | 2,961,785 | |
Arthur E. Chandler | | | — | | | | — | | | | 16,935 | | | | 825,790 | |
Allan R. Becker | | | 18,338 | | | | 467,655 | | | | 12,135 | | | | 598,007 | |
Beth A. Friel | | | 12,596 | | | | 345,953 | | | | 7,605 | | | | 426,168 | |
Kevin M. Toth | | | — | | | | — | | | | 5,385 | | | | 189,161 | |
110
| (1) | The numbers in these columns represent the vesting of the following awards: |
| | | | | | | | | | |
Named Executive Officer | | Grant
Date | | Award Type | | Date of
Vesting | | Number
of Shares
Acquired
on
Vesting | |
Michael L. Browne | | 3/4/08 | | Time-Based RSU | | 3/4/11 | | | 11,020 | |
| | 3/4/08 | | Perf.-Based RSU | | 3/4/11 | | | 22,040 | |
| | 4/26/06 | | Time-Based RS | | 4/26/11 | | | 20,630 | |
| | 8/28/96 | | Time-Based RS | | 12/30/11 | | | 5,646 | |
| | 2/19/09 | | Perf.Based RSU | | 12/30/11 | | | 13,635 | |
Arthur E. Chandler | | 3/4/08 | | Time-Based RS | | 3/4/11 | | | 1,330 | |
| | 3/4/08 | | Perf.-Based RS | | 3/4/11 | | | 2,660 | |
| | 4/26/06 | | Time-Based RS | | 4/26/11 | | | 2,170 | |
| | 2/21/07 | | Time-Based RS | | 12/30/11 | | | 2,200 | |
| | 2/19/09 | | Time-Based RS | | 12/30/11 | | | 600 | |
| | 2/19/09 | | Perf.-Based RS | | 12/30/11 | | | 2,125 | |
| | 2/18/10 | | Time-Based RSU | | 12/30/11 | | | 2,100 | |
| | 6/8/10 | | Time-Based RSU | | 12/30/11 | | | 950 | |
| | 2/17/11 | | Time-Based RSU | | 12/30/11 | | | 2,800 | |
Allan R. Becker | | 3/4/08 | | Time-Based RS | | 3/4/11 | | | 850 | |
| | 3/4/08 | | Perf.-Based RS | | 3/4/11 | | | 1,700 | |
| | 4/26/06 | | Time-Based RS | | 4/26/11 | | | 1,550 | |
| | 2/21/07 | | Time-Based RS | | 12/30/11 | | | 1,400 | |
| | 2/19/09 | | Time-Based RS | | 12/30/11 | | | 1,210 | |
| | 2/19/09 | | Perf.-Based RS | | 12/30/11 | | | 1,210 | |
| | 2/18/10 | | Time-Based RSU | | 12/30/11 | | | 1,250 | |
| | 6/8/10 | | Time-Based RSU | | 12/30/11 | | | 950 | |
| | 2/17/11 | | Time-Based RSU | | 12/30/11 | | | 2,015 | |
Beth A. Friel | | 3/4/08 | | Time-Based RS | | 3/4/11 | | | 230 | |
| | 2/21/07 | | Time-Based RS | | 12/30/11 | | | 190 | |
| | 2/19/09 | | Time-Based RS | | 12/30/11 | | | 1,005 | |
| | 2/19/09 | | Perf.-Based RS | | 12/30/11 | | | 1,005 | |
| | 2/18/10 | | Time-Based RSU | | 12/30/11 | | | 1,090 | |
| | 6/8/10 | | Time-Based RSU | | 12/30/11 | | | 950 | |
| | 2/17/11 | | Time-Based RSU | | 12/30/11 | | | 2,015 | |
| | 2/17/11 | | Time-Based RSU | | 12/30/11 | | | 1,120 | |
Kevin M. Toth | | 3/4/08 | | Time-Based RS | | 3/4/11 | | | 1,215 | |
| | 3/4/08 | | Perf.-Based RS | | 3/4/11 | | | 2,430 | |
| | 4/26/06 | | Time-Based RS | | 4/26/11 | | | 1,740 | |
For a discussion of the acceleration of payment of compensation for Messrs. Browne, Chandler and Becker, and Ms. Friel, including accelerated vesting of certain Restricted Stock/RSU awards on December 30, 2011, please see page 103.
111
OUTSTANDING EQUITY AWARDS AT FISCAL YEAR END TABLE
| | | | | | | | | | | | | | | | | | | | | | | | | | | | | | | | | | | | |
| | | Option Awards | | | Stock Awards and RSUs | |
Named Executive Officer | | Number of
Securities
Underlying
Unexercised
Options
Exercisable
(#) | | | Number of
Securities
Underlying
Unexercised
Options
Unexer-
cisable
(#) (1) | | | Equity
Incentive
Plan
Awards:
Number of
Securities
Underlying
Unexercised
Unearned
Options
(#) | | | Option
Exercise
Price
($) | | | Option
Expiration
Date | | | Number
of Shares
or Units
of Stock
That
Have Not
Vested
(#) (2) | | | Market
Value of
Shares or
Units of
Stock
That
Have Not
Vested
($) (3) | | | Equity
Incentive
Plan
Awards:
Number
of
Unearned
Shares,
Units or
Other
Rights
That
Have Not
Vested
(#) (4) | | | Equity
Incentive
Plan
Awards:
Market
or Payout
Value of
Unearned
Shares,
Units, or
Other
Rights
That
Have Not
Vested
($) (3) (4) | |
Michael L. Browne | | | 71,810 | | | | — | | | | — | | | | 34.50 | | | | 3/04/2018 | | | | — | | | | — | | | | — | | | | — | |
| | | 94,426 | | | | 47,214 | | | | — | | | | 29.18 | | | | 2/19/2019 | | | | — | | | | — | | | | — | | | | — | |
| | | 40,245 | | | | 80,490 | | | | — | | | | 33.94 | | | | 2/18/2020 | | | | — | | | | — | | | | — | | | | — | |
| | | — | | | | 114,230 | | | | — | | | | 36.51 | | | | 2/17/2021 | | | | 53,090 | | | | 3,003,301 | | | | — | | | | — | |
| | | | | | | | | | | | | | | | | | | | | | | | | | | | | | | 11,655 | | | | 659,323 | |
| | | | | | | | | | | | | | | | | | | | | | | | | | | | | | | 10,360 | | | | 586,065 | |
Arthur E. Chandler | | | 10,290 | | | | — | | | | — | | | | 34.76 | | | | 2/21/2017 | | | | — | | | | — | | | | — | | | | — | |
| | | 11,890 | | | | — | | | | — | | | | 34.50 | | | | 3/04/2018 | | | | — | | | | — | | | | — | | | | — | |
| | | 7,350 | | | | 7,350 | | | | — | | | | 29.18 | | | | 2/19/2019 | | | | — | | | | — | | | | — | | | | — | |
| | | 7,241 | | | | 14,484 | | | | — | | | | 33.94 | | | | 2/18/2020 | | | | — | | | | — | | | | — | | | | — | |
| | | — | | | | 22,155 | | | | — | | | | 36.51 | | | | 2/17/2021 | | | | 1,525 | | | | 86,269 | | | | — | | | | — | |
| | | | | | | | | | | | | | | | | | | | | | | | | | | | | | | 2,100 | | | | 118,797 | |
| | | | | | | | | | | | | | | | | | | | | | | | | | | | | | | 2,010 | | | | 113,706 | |
Allan R. Becker | | | — | | | | 4,189 | | | | — | | | | 29.18 | | | | 2/19/2019 | | | | — | | | | — | | | | — | | | | — | |
| | | 4,318 | | | | 8,637 | | | | — | | | | 33.94 | | | | 2/18/2020 | | | | — | | | | — | | | | — | | | | — | |
| | | — | | | | 9,175 | | | | — | | | | 36.51 | | | | 2/17/2021 | | | | — | | | | — | | | | — | | | | — | |
| | | | | | | | | | | | | | | | | | | | | | | | | | | | | | | 1,250 | | | | 70,713 | |
| | | | | | | | | | | | | | | | | | | | | | | | | | | | | | | 835 | | | | 47,236 | |
Beth A. Friel | | | — | | | | 3,477 | | | | — | | | | 29.18 | | | | 2/19/2019 | | | | — | | | | — | | | | — | | | | — | |
| | | — | | | | 7,507 | | | | — | | | | 33.94 | | | | 2/18/2020 | | | | — | | | | — | | | | — | | | | — | |
| | | — | | | | 9,175 | | | | | | | | 36.51 | | | | 2/17/2021 | | | | — | | | | — | | | | — | | | | — | |
| | | | | | | | | | | | | | | | | | | | | | | | | | | | | | | 1,090 | | | | 61,661 | |
| | | | | | | | | | | | | | | | | | | | | | | | | | | | | | | 835 | | | | 47,236 | |
Kevin M. Toth | | | 8,520 | | | | — | | | | — | | | | 34.76 | | | | 2/21/2017 | | | | — | | | | — | | | | — | | | | — | |
| | | 10,870 | | | | — | | | | — | | | | 34.50 | | | | 3/04/2018 | | | | — | | | | — | | | | — | | | | — | |
| | | 5,693 | | | | 5,694 | | | | — | | | | 29.18 | | | | 2/19/2019 | | | | — | | | | — | | | | — | | | | — | |
| | | 6,173 | | | | 12,347 | | | | — | | | | 33.94 | | | | 2/18/2020 | | | | — | | | | — | | | | — | | | | — | |
| | | — | | | | 15,885 | | | | — | | | | 36.51 | | | | 2/17/2021 | | | | 8,830 | | | | 499,513 | | | | 1,645 | | | | 93,058 | |
| | | | | | | | | | | | | | | | | | | | | | | | | | | | | | | 1,790 | | | | 101,260 | |
| | | | | | | | | | | | | | | | | | | | | | | | | | | | | | | 1,445 | | | | 81,744 | |
| (1) | The unvested Non-Qualified Stock Options held by the Named Executive Officers as of December 31, 2011 vest as follows: |
| | | | | | | | | | | | | | | | | | | | | | | | |
Named Executive Officer | | Vest
02/17/12 | | | Vest
02/18/12 | | | Vest
02/19/12 | | | Vest
02/17/13 | | | Vest
02/18/13 | | | Vest
02/17/14 | |
Michael L. Browne | | | 38,076 | | | | 40,245 | | | | 47,214 | | | | 38,077 | | | | 40,245 | | | | 38,077 | |
Arthur E. Chandler | | | 7,385 | | | | 7,242 | | | | 7,350 | | | | 7,385 | | | | 7,242 | | | | 7,385 | |
Allan R. Becker | | | 3,058 | | | | 4,318 | | | | 4,189 | | | | 3,058 | | | | 4,319 | | | | 3,059 | |
Beth A. Friel | | | 3,058 | | | | 3,753 | | | | 3,477 | | | | 3,058 | | | | 3,754 | | | | 3,059 | |
Kevin M. Toth | | | 5,295 | | | | 6,173 | | | | 5,694 | | | | 5,295 | | | | 6,174 | | | | 5,295 | |
112
| (2) | The vesting schedule for the time-based Restricted Stock/RSU awards held by the Named Executive Officers is as follows: |
| | | | | | | | |
Named Executive Officer | | Number of Shares | | | Award Type | | Date of Vesting |
Michael L. Browne | | | 13,635 | | | RSU | | February 19, 2012 |
| | | 17,440 | | | RSU | | February 21, 2012 |
| | | 11,655 | | | RSU | | February 18, 2013 |
| | | 10,360 | | | RSU | | February 17, 2014 |
Arthur E. Chandler | | | 1,525 | | | RS | | February 19, 2012 |
Kevin M. Toth | | | 1,645 | | | RS | | February 19, 2012 |
| | | 1,820 | | | RS | | February 21, 2012 |
| | | 1,790 | | | RSU | | February 18, 2013 |
| | | 950 | | | RSU | | June 8, 2013 |
| | | 2,625 | | | RSU | | February 17, 2014 |
| (3) | The “Market Value” is based on a closing market price of $56.57 on December 31, 2011. |
| (4) | Represents the performance-based awards granted (a) in 2009 at the actual payout amount of 100% of target for Mr. Toth (the other Named Executive Officers’ awards having already vested on December 30, 2011 - see page 103), and (b) in 2010 and 2011 at 100% of target. Pursuant to the Equity Incentive Plan, in the event of a change in control, the forfeiture restrictions on these performance-based awards will lapse at 100% of target. Thus, in view of the pending Merger, all awards are presented at 100% of target. The performance periods for these performance-based awards are: |
| | | | | | | | |
Named Executive Officer | | Number of
Shares at
Target | | | Award
Type | | Performance
Period
Ends |
Michael L. Browne | | | 11,655 | | | RSU | | December 31, 2012 |
| | | 10,360 | | | RSU | | December 31, 2013 |
Arthur E. Chandler | | | 2,100 | | | RSU | | December 31, 2012 |
| | | 2,010 | | | RSU | | December 31, 2013 |
Allan R. Becker | | | 1,250 | | | RSU | | December 31, 2012 |
| | | 835 | | | RSU | | December 31, 2013 |
Beth A. Friel | | | 1,090 | | | RSU | | December 31, 2012 |
| | | 835 | | | RSU | | December 31, 2013 |
Kevin M. Toth | | | 1,645 | | | RS | | December 31, 2011 |
| | | 1,790 | | | RSU | | December 31, 2012 |
| | | 1,445 | | | RSU | | December 31, 2013 |
113
PENSION BENEFITS TABLE
| | | | | | | | | | | | | | | | |
Named Executive Officer | | Plan Name | | | Number of Years
Credited Service
(#) | | | Present Value of
Accumulated
Benefit ($) | | | Payments During
Last Fiscal Year
($) | |
Michael L. Browne | | | Pension Plan | | | | 2.25 | | | | 99,600 | | | | — | |
| | | SERP | | | | 2.25 | | | | 199,700 | | | | — | |
Arthur E. Chandler | | | Pension Plan | | | | 1.25 | | | | 35,200 | | | | — | |
| | | SERP | | | | 1.25 | | | | 14,900 | | | | — | |
Allan R. Becker | | | Pension Plan | | | | 0.58 | | | | 15,100 | | | | — | |
| | | SERP | | | | — | | | | — | | | | — | |
Beth A. Friel | | | Pension Plan | | | | — | | | | — | | | | — | |
| | | SERP | | | | — | | | | — | | | | — | |
Kevin M. Toth | | | Pension Plan | | | | 1.25 | | | | 16,200 | | | | — | |
| | | SERP | | | | — | | | | — | | | | — | |
The Company maintains a qualified pension plan and related SERP for its executives, including the Named Executive Officers. No additional benefits accrue under the pension plan or SERP after March 31, 2006, but participants will continue to earn vesting credit. Benefits accrued under the plans as of March 31, 2006 will be paid in accordance with the terms of the pension plan and SERP. Prior to March 31, 2006, a pension awarded under the pension plan was based on the highest five-year average of base salary as defined in the pension plan, while an award under the SERP was based on the highest five-year average of credited salary plus average annual incentive compensation, which included the annual bonus and long-term-incentive plan compensation.
The foregoing table shows the present value of the final benefit that was accrued as of March 31, 2006 for the Named Executive Officers, which is payable at age 65 in the form of a single life annuity. The present values have been determined assuming benefits commence as of each individual’s earliest retirement age at which they are entitled to unreduced benefits. For the pension plans, this is the individual’s normal retirement date, the later of age 65 and the fifth anniversary of participation in the pension plan. Additionally, the present values have been determined using the same actuarial assumptions that have been used for financial disclosure requirements for the pension plan. Specifically, this includes a post-retirement mortality assumption of the RP2000 Mortality Tables projected to 2013 for healthy males and females and a discount rate of 4.60% as of December 31, 2011. No pre-retirement decrements have been reflected in the present values.
All of the Named Executive Officers, except Ms. Friel, are now fully vested in the qualified pension plan. Currently, Messrs. Browne and Chandler are fully vested in their SERP benefits. Mr. Becker is not currently entitled to a SERP benefit, but will be entitled to receive benefits under the SERP if he continues to be employed until attaining age 55 and five years of service, and then will receive the benefits accrued as of March 31, 2006, which have a present value of less than $50. Mr. Toth does not have any accrued benefits under the SERP because his earnings were not in excess of the limit set forth in Section 401(a)(17) of the Internal Revenue Code as of March 31, 2006, and therefore, he does not meet the SERP’s eligibility requirements. Ms. Friel did not commence employment with the Company until August 2006 and therefore is not a participant in the pension plan or the SERP.
114
NON-QUALIFIED DEFERRED COMPENSATION TABLE
| | | | | | | | | | | | | | | | | | | | |
Named Executive Officer | | Executive
Contributions
in 2011 ($) | | | Company
Contributions
in 2011 ($) (1) | | | Aggregate
Earnings
in 2011 ($)
(2) | | | Aggregate
Withdrawals/
Distributions
($) | | | Aggregate
Balance at
December 31,
2011 ($) (3) | |
Michael L. Browne | | | — | | | | 29,292 | | | | 8,065 | | | | — | | | | 456,372 | |
Arthur E. Chandler | | | — | | | | 7,385 | | | | 1,235 | | | | — | | | | 54,442 | |
Allan R. Becker | | | — | | | | 915 | | | | 0 | | | | — | | | | 4,881 | |
Beth A. Friel | | | — | | | | 1,190 | | | | — | | | | — | | | | 1,190 | |
Kevin M. Toth | | | — | | | | 2,746 | | | | (34 | ) | | | — | | | | 15,716 | |
| (1) | The “Company Contributions in 2011” column consists of Company contributions under the Non-Qualified Excess Contribution and Match Program (the Excess Plan). The contributions include a guaranteed match that was paid and earned in 2011. The contributions pay at the same rate as paid under the Company’s Retirement Savings Plus Plan (Defined Contribution Plan). Please see pages 105-106 for a description of the Excess Plan. |
| (2) | The “Aggregate Earnings in 2011” column reflects the investment income earned in the participant’s deferred compensation account, including the change in market value in the account in 2011. For Mr. Browne, this amount includes the aggregate earnings in 2011 in the Company’s Corporate Owned Life Insurance (COLI) account on his behalf during his tenure as CEO ($11,221) and the aggregate losses in 2011 in his employee deferred compensation account ($3,156). The COLI plans were offered to directors as a way to defer compensation and Mr. Browne continued in active COLIs after becoming CEO in February 2004. The last COLI ended in 2007. |
| (3) | For Mr. Browne, the “Aggregate Balance at December 31, 2011” column includes the balance in his employee’s COLI account ($151,484) and the balance in his account under the Non-Qualified Deferred Compensation Plan ($304,888). |
115
POST-EMPLOYMENT ARRANGEMENTS
General
As discussed in the Compensation Discussion and Analysis, the Company has entered into Change in Control Agreements with its Named Executive Officers. There are no established severance plans or arrangements in the event of voluntary termination of employment by the executive or termination without cause by the Company.
Death and Disability
The Company provides disability and life insurance benefits in the event of termination of employment because of death or disability. These plans are broad-based plans applicable to all full-time employees. The Equity Incentive Plan provides for vesting of some equity awards upon death or disability, and certain extended periods to exercise vested equity awards upon death or disability. Stock Options that have been held for at least six months become immediately exercisable upon an executive officer’s death or disability, and can be exercised for one year following the termination of employment. The restrictions lapse for Restricted Stock and RSU awards upon death or disability of the executive officer.
Retirement
As described on page 105 of this annual report on Form 10-K, the Company provides pension and SERP benefits to eligible employees and provides all employees with the ability to participate in the Retirement Savings Plus Plan. In addition, Stock Options that have been held for at least six months become immediately exercisable upon an executive officer’s retirement, and can be exercised for one, two, or five years after retirement, depending upon the age of the participant at retirement, and the years of continuous service prior to such retirement. Under the Equity Incentive Plan, unless the Compensation Committee provides otherwise, all restrictions on Restricted Stock/RSU awards to the senior executives lapse: (1) upon retirement, after attaining age 65 with at least five years of continuous service; or (2) on a pro-rata basis, upon retirement, after attaining age 55 with at least 10 years of continuous service or attaining age 62 with at least five years of continuous service (except for the performance-based Restricted Stock and RSUs, which vest at the end of the performance period, if performance goals are met).
The Company believes these retirement benefits are a valuable retention tool for its employees, including the Named Executive Officers, because they incent employees to remain with the Company through normal or early retirement, leading to the provision of at least five years of service to the Company.
Change in Control
Equity Incentive Plan
In the event of a merger, consolidation, or other change in control of Harleysville Group or the Mutual Company, all outstanding Stock Options become vested and immediately exercisable, and the forfeiture restrictions on Restricted Stock/RSU awards lapse. For the performance-based awards, the forfeiture restrictions lapse on the number of shares at target. This acceleration is “single trigger” in that it occurs when the change of control occurs, and does not require termination of employment to be effected. For executive officers, this accelerated vesting upon a change in control will only occur if the change in control is compliant with Section 409A of the Internal Revenue Code. This acceleration is set forth in the Equity Incentive Plan and applies to all awards made under such plan. The definition of a change in control is set forth below. The Company believes this acceleration benefit is important to provide assurance that long-term equity awards will not be forfeited upon an event outside the control of the participant.
Change in Control Agreements
The Company has entered into an agreement with each Named Executive Officer that provides for compensation to be paid if both a “change in control” of Harleysville Group or the Mutual Company occurs and the Named Executive Officer’s employment is subsequently terminated (either by the Company without “cause” or by the Named Executive Officer for “good reason”). The agreements define “cause” as a failure by the Named Executive
116
Officer to perform his duties or willful conduct that injures the Company, and define “good reason” as a substantial change in the status of the Named Executive Officer’s role with Harleysville Group, including a diminution of responsibilities, reduction in pay, failure to continue comparable incentive plans, or a change of place of employment. In order for the termination to trigger the payment obligations, such termination must occur within three years after a change in control for Mr. Browne or within two years after a change in control for the other Named Executive Officers.
A “change in control” will occur under these agreements: (a) subject to several exceptions, upon the acquisition of beneficial ownership of more than 20% of the voting securities of the Company by any person other than the Mutual Company at any time when the Mutual Company does not own at least a majority of the Company’s voting securities; (b) if, during any rolling 24 month period, persons who were directors of the Company or the Mutual Company, as the case may be, cease to constitute a majority of the directors of such company (including, for such purpose as members of such board at the beginning of such period persons whose nomination or appointment to such board was approved by a vote of at least two-thirds of the incumbent directors); (c) a merger to which the Company is a party unless (i) the Company’s stockholders prior to the merger own more than 50% of the survivor of the merger in substantially the same proportion as they held voting securities of the Company prior to the merger, (ii) no person acquires more than 50% of the voting securities of the survivor in the merger, except to the extent such person owned such a percentage of the Company prior to the merger, and (iii) at least a majority of the members of the board of the survivor were members of the board of the Company that approved the transaction (for purposes of the foregoing, a new parent company of the Company is included in the term “survivor”); (d) the Mutual Company affiliates with a third party and persons who were members of the board of the Company prior to such affiliation cease to constitute at least two-thirds of the members of the board of the Company following such affiliation; (e) the stockholders of the Company and all necessary regulatory authorities approve the liquidation of the Company; (f) a person acquires control reportable under the SEC’s tender offer rules; or (g) the Company or the Mutual Company enters into a management agreement with a third party who obtains through such agreement the power to direct the management and policies of the Company or the Mutual Company (but only if, at such time, the Mutual Company owns at least 20% of the voting power of the Company).
If a change in control occurs, and the Named Executive Officer has a qualifying termination event as described above (referred to as a “double trigger” event), the severance compensation to be paid to Mr. Browne, as CEO, is 2.999 times, and the compensation to be paid to the other Named Executive Officers is two times, the sum of annual base salary and the average annual incentive target awards over the past three years. The Change in Control Agreements also provide, under certain circumstances, a full “gross up” benefit, entitling the Named Executive Officers to receive funds to pay any resulting excise tax payable as a result of the compensation if such excise tax is incurred under the applicable Internal Revenue Code sections (Section 4999 and 280G), and payment of any legal fees incurred as a result of the termination. In addition, the Named Executive Officers will continue to be eligible to participate in health and welfare benefit plans comparable to those received prior to the change in control, for up to three years for Mr. Browne and for two years for the other Named Executive Officers. Such payments would be made in a lump sum within 30 days after the date of termination, with the exception of “Benefits Continuation.”
The current Change in Control Agreements expire on December 31, 2012, and will be automatically renewed for an additional year unless the Company gives notice of non-renewal not later than twelve months prior to the expiration date of any scheduled renewal.
In connection with the closing of the Merger, the Company has taken irrevocable action, contingent on the closing of the Merger, to terminate all Change in Control Agreements and to cause all amounts under such agreements to be liquidated and paid (the CIC Payments). Such liquidated CIC Payments will be made to the executive officers by December 31, 2012, if the Merger closes on or before June 1, 2012, or by the one-year anniversary of the Merger closing if the closing occurs after June 1, 2012 (as applicable, the CIC Payment Date), unless the executive officer resigns or otherwise voluntarily terminates employment with Harleysville Group prior to the CIC Payment Date (other than by reason of death or disability).
The Company has entered into retention bonus agreements with each of its Named Executive Officers. The obligations of Nationwide to complete the Merger are subject to the execution of a retention bonus agreement by Mr. Browne. Under the retention bonus agreements, if the Named Executive Officer is terminated other than for cause after the closing date but before payment of the CIC Payment described above, or if the Named Executive Officer’s employment with the Company or any Nationwide entity terminates prior to the CIC Payment Date due to death or disability, the CIC Payment will be paid to the Named Executive Officer in full by the applicable CIC Payment Date. However, if the Named Executive Officer resigns or otherwise voluntarily leaves employment with the
117
Company or any Nationwide Mutual entity prior to the CIC Payment Date for any reason, the Named Executive Officer will not be eligible for, and will not receive, any part of the CIC Payment.
The retention bonus agreements provide for the payment, under certain circumstances, of (1) a full “gross up” benefit, entitling the executive officer to receive funds to pay any resulting excise tax payable as a result of the payment of amounts due under the retention bonus agreement if such excise tax is incurred under Section 4999 of the Internal Revenue Code, and (2) any legal fees incurred by the executive officer in connection with the retention bonus agreement.
Post-Employment Benefits
The table below sets forth the compensation that would be paid to the Named Executive Officers at various post-employment events, assuming that such event had occurred on January 1, 2012. In addition to the payments listed in the table, each of the Named Executive Officers who participates in the Company’s Non-Qualified Deferred Compensation Plan, or has other deferred compensation accounts, would be entitled to receive a payout of his outstanding account balances, in accordance with the plan and the elections made by the participant, and any vested pension benefits would be paid. Please see pages 115 and 122 of this annual report on Form 10-K for the account balances at December 31, 2011.
118
POST-EMPLOYMENT BENEFITS
| | | | | | | | | | | | | | | | | | | | | | |
Named Executive Officer | | Benefit | | Death or
Disability
(1) (2) ($) | | | Early
Retirement
(2) (3) ($) | | | Normal
Retirement
(2) (3) ($) | | | Change In
Control
(Single
Trigger)
(4) ($) | | | Change In
Control
Agreement
(Double
Trigger)
(5) ($) | |
Michael L. Browne | | Severance | | | — | | | | — | | | | — | | | | — | | | | 3,475,841 | |
| | Stock Awards | | | 3,003,301 | | | | 2,247,891 | | | | 3,003,301 | | | | 4,248,690 | | | | — | |
| | Options | | | 5,406,134 | | | | 5,406,134 | | | | 5,406,134 | | | | 5,406,134 | | | | — | |
| | Benefit Continuation | | | — | | | | — | | | | — | | | | — | | | | 144,794 | |
| | Excise Taxes | | | — | | | | — | | | | — | | | | — | | | | — | |
| | Pension | | | — | | | | 99,600 | | | | 99,600 | | | | — | | | | (6 | ) |
| | SERP | | | — | | | | 199,700 | | | | 199,700 | | | | — | | | | (6 | ) |
| | | | | | | | | | | | | | | | | | | | | | |
| | Total | | | 8,409,435 | | | | 7,953,325 | | | | 8,708,735 | | | | 9,654,824 | | | | 3,620,635 | |
| | | | | | | | | | | | | | | | | | | | | | |
Arthur E. Chandler | | Severance | | | — | | | | — | | | | — | | | | — | | | | 1,110,500 | |
| | Stock Awards | | | 86,829 | | | | 81,477 | | | | 86,829 | | | | 318,772 | | | | — | |
| | Options | | | 973,519 | | | | 973,519 | | | | 973,519 | | | | 973,519 | | | | — | |
| | Benefit Continuation | | | — | | | | — | | | | — | | | | — | | | | 66,433 | |
| | Excise Taxes | | | — | | | | — | | | | — | | | | — | | | | — | |
| | Pension | | | — | | | | 33,500 | | | | 35,200 | | | | — | | | | (6 | ) |
| | SERP | | | — | | | | 14,200 | | | | 14,900 | | | | — | | | | (6 | ) |
| | | | | | | | | | | | | | | | | | | | | | |
| | Total | | | 1,059,788 | | | | 1,102,695 | | | | 1,109,888 | | | | 1,292,291 | | | | 1,176,933 | |
| | | | | | | | | | | | | | | | | | | | | | |
Allan R. Becker | | Severance | | | — | | | | — | | | | — | | | | — | | | | 756,500 | |
| | Stock Awards | | | — | | | | — | | | | — | | | | 117,948 | | | | — | |
| | Options | | | 494,243 | | | | 494,243 | | | | 494,243 | | | | 494,243 | | | | — | |
| | Benefit Continuation | | | — | | | | — | | | | — | | | | — | | | | 45,998 | |
| | Excise Taxes | | | — | | | | — | | | | — | | | | — | | | | — | |
| | Pension | | | — | | | | 14,400 | | | | 15,100 | | | | — | | | | (6 | ) |
| | SERP | | | — | | | | — | | | | — | | | | — | | | | — | |
| | | | | | | | | | | | | | | | | | | | | | |
| | Total | | | 494,243 | | | | 508,643 | | | | 509,343 | | | | 612,191 | | | | 802,498 | |
| | | | | | | | | | | | | | | | | | | | | | |
Beth A. Friel | | Severance | | | — | | | | — | | | | — | | | | — | | | | 747,500 | |
| | Stock Awards | | | — | | | | — | | | | — | | | | 108,897 | | | | — | |
| | Options | | | 449,169 | | | | 449,169 | | | | 449,169 | | | | 449,169 | | | | — | |
| | Benefit Continuation | | | — | | | | — | | | | — | | | | — | | | | 59,008 | |
| | Excise Taxes | | | — | | | | — | | | | — | | | | — | | | | — | |
| | Pension | | | — | | | | — | | | | — | | | | — | | | | — | |
| | SERP | | | — | | | | — | | | | — | | | | — | | | | — | |
| | | | | | | | | | | | | | | | | | | | | | |
| | Total | | | 449,169 | | | | 449,169 | | | | 449,169 | | | | 558,066 | | | | 806,508 | |
| | | | | | | | | | | | | | | | | | | | | | |
Kevin M. Toth | | Severance | | | — | | | | — | | | | — | | | | — | | | | 897,167 | |
| | Stock Awards | | | 499,513 | | | | 317,414 | | | | 499,513 | | | | 775,575 | | | | — | |
| | Options | | | 754,024 | | | | 754,024 | | | | 754,024 | | | | 754,024 | | | | — | |
| | Benefit Continuation | | | — | | | | — | | | | — | | | | — | | | | 61,014 | |
| | Excise Taxes | | | — | | | | — | | | | — | | | | — | | | | — | |
| | Pension | | | — | | | | 15,400 | | | | 16,200 | | | | — | | | | (6 | ) |
| | SERP | | | — | | | | — | | | | — | | | | — | | | | — | |
| | | | | | | | | | | | | | | | | | | | | | |
| | Total | | | 1,253,357 | | | | 1,086,839 | | | | 1,269,737 | | | | 1,529,599 | | | | 958,180 | |
| | | | | | | | | | | | | | | | | | | | | | |
119
| (1) | Represents the value of Stock Options and time-based Restricted Stock/RSU awards that become exercisable or vest upon death or disability. |
| (2) | In the event of termination of employment because of death, disability, or Normal Retirement, all performance-based Restricted Stock/RSU awards will continue to exist and will be paid in full at the end of the performance period if the applicable performance goal is achieved. Upon an Early Retirement, all performance-based Restricted Stock/RSU awards will continue to exist and will be paid, on a pro rata basis, based upon the date of Early Retirement, at the end of the performance period if the applicable performance goal is achieved. The values of performance-based awards are not included in this table. |
| (3) | Mr. Browne was the only Named Executive Officer who was eligible at December 31, 2011 for Early Retirement under the pension plan; none of the Named Executive Officers were eligible for Normal Retirement under the pension plan at December 31, 2011. Under the pension plan, a participant is eligible for Early Retirement at 55 years of age with five years of vesting service, and is assumed to accrue an additional year of vesting service (1,000 hours) after 26 weeks of service from his or her anniversary date. Mr. Browne was eligible for Early Retirement under the pension plan in September 2008, and Mr. Chandler in January 2012. The other Named Executive Officers will be eligible for Early Retirement as follows: Allan R. Becker - October 2013; and Kevin M. Toth - September 2028. Ms. Friel was not a participant in the pension plan, as she did not commence employment with the Company until August 2006. |
The numbers reflected in the “Early Retirement” and “Normal Retirement” columns include pension benefits that would be payable to the Named Executive Officers, as Mr. Browne is vested in the pension plan and SERP and Mr. Chandler, Mr. Clark, Mr. Becker, and Mr. Toth are vested in the pension plan. Such payments would not be made until the officer has retired after reaching the applicable retirement age trigger. Please see the Pension Benefits Table and accompanying notes on page 114 of this annual report on Form 10-K for a discussion of the present value of the accumulated benefits under the pension plan and SERP for the Named Executive Officers.
Under the Equity Incentive Plan, the Named Executive Officers are eligible for Early Retirement at 55 years of age with 10 years of continuous service or at 62 years of age with five years of continuous service. Mr. Browne was eligible for Early Retirement in February 2009. The other Named Executive Officers’ eligibility for Early Retirement under the Equity Incentive Plan is as follows: Arthur E. Chandler - April 2015; Allan R. Becker - August 2015; Beth A. Friel - August 2028; and Kevin M. Toth - August 2028. Please see page 116 of this annual report on Form 10-K for a discussion of the vesting and extension of the exercise period for Stock Options upon retirement, and the lapse of forfeiture restrictions for Restricted Stock/RSU awards.
| (4) | The “Change in Control (Single Trigger)” column quantifies the value to the Named Executive Officers of the acceleration of outstanding unvested equity awards under the Equity Incentive Plan. Under the Equity Incentive Plan, all then outstanding but unvested Stock Option, Restricted Stock, and RSU awards will vest, and all forfeiture restrictions will lapse; provided that the forfeiture restriction lapse is at target for all performance-based Restricted Stock/RSU awards. If a change in control of the Company or the Mutual Company occurs, the outstanding equity awards then held by the Named Executive Officers are impacted, regardless of whether their employment is terminated in connection with that change in control. |
| (5) | The “Change in Control Agreement (Double Trigger)” column represents the payments or benefits each Named Executive Officer would receive upon a qualifying termination event, under his Change in Control Agreement, in addition to those payments listed under the “Change in Control (Single Trigger)” column. The payments include salary and bonus severance payments and health and welfare plan benefit continuation for designated periods. The amount indicated for “Benefits Continuation” represents the value of such payments. Such amount does not include any conversion cost that may be incurred as a result of the termination of the Named Executive Officer’s employment with respect to life insurance and disability policies. The Change in Control Agreements provide, under certain circumstances, for the payment of excise tax “gross-ups” if the compensation paid to the Named Executive Officer exceeds the “golden parachute” amount set forth in Section 280G of the Internal Revenue |
120
| | Code. Such excise tax gross up benefit is not triggered by the amounts payable to the Named Executive Officers in the table above. |
| (6) | The Named Executive Officer would also receive his pension benefits upon reaching the applicable retirement age. |
DIRECTOR COMPENSATION
The Company pays each non-employee director cash-based fees, including an annual retainer, per meeting- and committee-based fees, and issues Deferred Stock Units with a value of $50,000 to each non-employee director continuing in office at each annual meeting. The following provides details regarding this non-employee director compensation for 2011.
| | | | | | | | | | | | | | | | | | | | |
Name (1) | | Fees Earned or
Paid in Cash ($)
(2) | | | Stock
Awards
($)(3) | | | Option
Awards ($) | | | All Other
Compensation ($) | | | Total ($) | |
Barbara A. Austell | | | 83,000 | | | | 49,748 | | | | — | | | | — | | | | 132,748 | |
W. Thacher Brown | | | 96,500 | | | | 49,748 | | | | — | | | | — | | | | 146,248 | |
G. Lawrence Buhl | | | 94,500 | | | | 49,748 | | | | — | | | | — | | | | 144,248 | |
Mirian M. Graddick-Weir | | | 94,000 | | | | 49,748 | | | | — | | | | — | | | | 143,748 | |
Jerry S. Rosenbloom | | | 90,000 | | | | 49,748 | | | | — | | | | — | | | | 139,748 | |
William W. Scranton III | | | 174,000 | | | | 49,748 | | | | — | | | | — | | | | 223,748 | |
William E. Storts | | | 92,500 | | | | 49,748 | | | | — | | | | — | | | | 142,248 | |
| (1) | Please see the Summary Compensation Table and the tables that follow it beginning on page 107 of this annual report on Form 10-K for disclosure regarding the compensation paid to Michael Browne as CEO of the Company. Mr. Browne does not receive any additional compensation for service on the Board of Directors. |
| (2) | The following chart shows the schedule of non-employee directors’ cash fees for 2011. |
| | | | |
Type of Compensation | | Amount ($) | |
Annual Retainer | | | 35,000 | |
Additional Monthly Retainer for Non-Executive Chairman | | | 6,250 | |
Board Attendance Fee per Meeting | | | 2,000 | |
Committee Attendance Fee per Meeting | | | 1,500/2,000 | |
Annual Retainer for Committee Chair | | | 8,000/12,000/16,000 | |
In 2011, the Chair of the Audit Committee and the Chair of the Compensation and Personnel Development Committee received an annual retainer of $16,000 and $12,000, respectively; the Chairs of the other Committees received an annual retainer of $8,000. The 2011 Committee meeting fees per meeting for Committee members was $2,000 for Audit Committee members and $1,500 for all other Committee members. Directors are reimbursed for out-of-pocket expenses. A non-employee director who serves on both the Harleysville Group and the Mutual Company boards receives only one retainer and, if the boards or the same Committees of Harleysville Group and the Mutual Company meet on the same day, the non-employee director receives only one attendance fee. In either situation, the retainer or attendance fee is allocated equally to Harleysville Group and the Mutual Company.
Board members may defer receipt of some or all of their Board and Committee fees under the Directors’ Standard Deferred Compensation Plan or, in prior years, the directors’ COLI Plan. The directors’ COLI Plan was offered every four years to each director a few months before the beginning of the first year of the plan. In order to defer compensation pursuant to the COLI Plan, the director was required to commit to a four-year deferral of an identified portion of his or her fees and was required to consent to having his or her life insured by the Company, with the Company being the owner and beneficiary of the policy. Upon retirement from the
121
Board, the participants were entitled to receive the deferred fees plus the interest earned. The Company established the COLI plans in 1988, and the last plan period began in 2004. Michael L. Browne had been a participant in these plans since 1988, when he was a director, and continued in the 2004-2007 COLI Plan when he became CEO in February 2004; W. Thacher Brown had participated in the COLI Plan since 1996; and William E. Storts participated in the 2004-2007 COLI Plan. The Company elected not to initiate a new four-year plan in December 2007, and therefore, directors are currently not able to defer their compensation under a COLI Plan.
In 2011, Ms. Graddick-Weir deferred $94,000 from her fees; and no other non-employee directors deferred fees. As of December 31, 2011, the balances in the deferred compensation accounts of the directors who have elected to defer fees under either the Standard Deferred Compensation Plan or the COLI Plans were: Mr. Brown - $720,178; Mr. Browne - $2,428,979; Ms. Graddick-Weir - $418,654; Dr. Rosenbloom - $69,788; and Mr. Storts - $162,463.
| (3) | In April 2011, each non-employee director received a grant of Deferred Stock Units equal to a value of $50,000 on the date of grant under the Amended and Restated Directors’ Equity Compensation Plan. A Deferred Stock Unit is the right to receive, without payment to the Company, one share of common stock of the Company. Upon termination of service, a non-employee director will receive shares of common stock equal to the Deferred Stock Units in his or her account. The Deferred Stock Units have a dividend equivalent feature, which provides for payment of cash dividends when and if cash dividends are paid on the outstanding common stock. |
The amount in the “Stock Awards” column represents the grant date fair value, calculated in accordance with ASC 718, of the Deferred Stock Unit awards granted under the Amended and Restated Directors’ Equity Compensation Plan.
COMPENSATION AND PERSONNEL DEVELOPMENT COMMITTEE REPORT
The Compensation and Personnel Development Committee has reviewed and discussed the Compensation Discussion and Analysis, as set forth on pages 97-106 of this annual report on Form 10-K, with management of the Company. Based on such review and discussions, the Compensation and Personnel Development Committee recommended to the Board of Directors that the Compensation Discussion and Analysis be included in this annual report on Form 10-K.
Submitted by the Compensation and Personnel Development Committee:
Mirian M. Graddick-Weir, Chair
W. Thacher Brown
Jerry S. Rosenbloom
William W. Scranton III
122
| Item 12. | Security Ownership of Certain Beneficial Owners and Management and Related Stockholders Matters. |
Table I - Five Percent Stockholders
Those persons owning 5% or more of Harleysville Group stock, as of December 31, 2011, are set forth below. On that date, there were 27,246,172 shares of Harleysville Group stock outstanding.
| | | | | | | | | | | | | | | | | | | | | | | | |
| | | | | | | | | | | | | | | Total Amount | | | | |
| | | Voting Authority | | | Dispositive Authority | | | of Beneficial
Ownership | | | Percent
of Class | |
Name and Address | | Sole | | | Shared | | | Sole | | | Shared | | | |
Harleysville Mutual Insurance Company 355 Maple Avenue Harleysville, PA 19438 | | | — | | | | 14,526,445 | | | | 14,526,445 | | | | — | | | | 14,526,445 | | | | 53.32 | % |
Nationwide Mutual Insurance Company One Nationwide Plaza Columbus, Ohio 43215 (1) | | | — | | | | 14,526,445 | | | | — | | | | — | | | | 14,526,445 | | | | 53.32 | % |
Neuberger Berman LLC 605 Third Avenue 36th Floor New York, NY 10158 (2) | | | — | | | | 1,896,807 | | | | — | | | | 2,117,777 | | | | 2,117,777 | | | | 7.79 | % |
Dimensional Fund Advisors LP Palisades West Building One 6300 Bee Cave Road Austin, TX 78746 (3) | | | 1,496,200 | | | | — | | | | 1,525,677 | | | | — | | | | 1,525,677 | | | | 5.61 | % |
| (1) | Represents Nationwide’s indirect beneficial interest in the shares of the Company’s common stock owned by the Mutual Company. Under the Voting Agreement, the Mutual Company has agreed to vote such shares in favor of the Merger. Nationwide filed a Schedule 13D on October 6, 2011 to report such indirect beneficial ownership. |
| (2) | Numbers of shares and percentage ownership are derived from the Schedule 13G/A filed on February 15, 2012, based upon holdings as of December 31, 2011. |
| (3) | Numbers of shares and percentage ownership are derived from the Schedule 13G/A filed on February 14, 2012, based upon holdings as of December 31, 2011. |
123
Table II - Beneficial Ownership of Directors and Executive Officers
This table shows the Harleysville Group stock holdings, as of February 29, 2012, of the directors, the Named Executive Officers (who are the CEO, the CFO, and the next three most highly compensated executive officers employed as of December 31, 2011), and all directors and executive officers as a group. Please see the table on page 95 of this annual report on Form 10-K for titles of the Named Executive Officers.
| | | | | | | | | | | | | | | | | | | | | | | | |
Name | | Aggregate
Number of
Shares
Beneficially
Owned
(1) | | | Right to
Acquire
(number of
shares)
(2) | | | Number of
Shares of
Restricted
Stock
Owned
(3) | | | Number of
Restricted
Stock Units
Owned
(3) | | | Number of
Deferred
Stock Units
(4) | | | Percent of
Shares (less
than 1%
unless
indicated)
(5) | |
Barbara A. Austell | | | 7,436 | | | | — | | | | — | | | | — | | | | 7,436 | | | | — | |
W. Thacher Brown | | | 63,181 | | | | 7,500 | | | | 5,646 | | | | — | | | | 10,146 | | | | — | |
G. Lawrence Buhl | | | 13,146 | | | | — | | | | — | | | | — | | | | 10,146 | | | | — | |
Mirian M. Graddick-Weir | | | 34,277 | | | | 7,500 | | | | — | | | | — | | | | 10,146 | | | | — | |
Jerry S. Rosenbloom | | | 51,089 | | | | 7,500 | | | | 5,646 | | | | — | | | | 10,146 | | | | — | |
William W. Scranton III | | | 24,729 | | | | 7,500 | | | | — | | | | — | | | | 10,146 | | | | — | |
William E. Storts | | | 30,129 | | | | — | | | | — | | | | — | | | | 10,146 | | | | — | |
Michael L. Browne (6) | | | 679,313 | | | | 448,415 | | | | — | | | | 44,030 | | | | 0 | | | | 2.45 | % |
Arthur E. Chandler | | | 85,221 | | | | 58,748 | | | | — | | | | 4,110 | | | | 0 | | | | — | |
Allan R. Becker | | | 37,519 | | | | 15,883 | | | | — | | | | 2,085 | | | | 0 | | | | — | |
Beth A. Friel | | | 21,776 | | | | 10,288 | | | | — | | | | 1,925 | | | | 0 | | | | — | |
Kevin M. Toth | | | 72,864 | | | | 48,418 | | | | — | | | | 8,600 | | | | 0 | | | | — | |
All Directors & Executive Officers as a Group (17 individuals) (6) | | | 1,488,827 | | | | 854,581 | | | | 11,292 | | | | 86,690 | | | | 68,312 | | | | 5.26 | % |
| (1) | The “Aggregate Number of Shares Beneficially Owned” column includes the numbers listed in the third, fourth, fifth, and sixth columns. Although restricted stock units and deferred stock units cannot be voted, they are included to provide complete information about shares owned or to be acquired. |
| (2) | The “Right to Acquire” column includes shares of common stock subject to vested but unexercised stock options, and shares of common stock subject to stock options that will vest within 60 days after February 29, 2012. |
| (3) | Some of the Restricted Stock and Restricted Stock Unit awards are subject to performance-based vesting requirements, and others to time-based vesting requirements. The performance-based Restricted Stock and Restricted Stock Units that remained unvested as of February 29, 2012 are presented in this table at target. |
| (4) | Deferred Stock Units generally vest upon termination of service as a director. |
| (5) | On February 29, 2012, there were 27,277,285 shares of Harleysville Group stock outstanding. |
| (6) | The number of shares included in the “Right to Acquire” column includes all shares underlying stock option grants that will vest upon Mr. Browne’s and one other executive officer’s retirement from the Company, as they are now eligible for early retirement under the Amended & Restated Equity Incentive Plan. |
124
SECURITIES AUTHORIZED UNDER EQUITY COMPENSATION PLANS AS OF DECEMBER 31, 2011
| | | | | | | | | | | | |
Plan Category | | Number of Securities to
be Issued Upon
Exercise of
Outstanding Options,
Warrants, and Rights
(a) | | | Weighted-Average
Exercise Price of
Outstanding Options,
Warrants, and Rights
(b) | | | Number of Securities
Remaining Available For
Future Issuance Under
Equity Compensation Plans
(Excluding Securities
Reflected in Column (a))
(c) | |
Equity Compensation Plans Approved by Security Holders | | | 1,761,195 | | | $ | 31.38 | | | | 5,151,119 | |
Equity Compensation Plans Not Approved by Security Holders | | | — | | | | — | | | | — | |
The shares in the foregoing table represent the aggregate shares underlying existing awards, or available for future awards under the Amended and Restated Equity Incentive Plan (employee plan), the Employee Stock Purchase Plan, the Amended and Restated Directors’ Equity Compensation Plan, and the Agency Stock Purchase Plan.
The Amended and Restated Equity Incentive Plan (the EIP) is the principal equity-based plan utilized by the Company to make long-term incentive equity awards to officers and other employees of the Company. Awards can be in the form of stock options, including both incentive stock options and non-qualified stock options, stock appreciation rights, and restricted stock and restricted stock unit awards, with both time or performance-based forfeiture restrictions. At the 2010 Annual Meeting, the stockholders approved the addition of 2,500,000 shares to the number of shares available for awards under the EIP, and approved the EIP for purposes of compliance with the provisions of Section 162(m) of the Internal Revenue Code. The EIP was last amended and restated in 2010. As of December 31, 2011, 2,658,266 shares remain available for future awards under the EIP. The EIP’s term will expire on February 29, 2020.
The Amended and Restated Employee Stock Purchase Plan (the ESPP) is a plan intended to meet the requirements of Section 423 under the Internal Revenue Code. As such, the ESPP provides all eligible employees with the opportunity to purchase shares of Company common stock at an amount equal to 85% of the fair market value of the common stock. The participants eligible to participate in the ESPP are all regular full-time employees and regular part-time employees who work at least 20 hours or more per week for the Company, the Mutual Company, or any of their respective subsidiaries. A person who would otherwise be eligible cannot participate in the ESPP if he or she owns, or would own as a result of purchases under the ESPP, 5% or more of the total voting power of the Company stock. The ESPP was originally established in 1995, and was last amended and restated in April 2010 to establish a share purchase limitation of 1,000 shares per participant per subscription period. The aggregate number of shares that may be purchased under the ESPP is 3,150,000 shares. As of December 31, 2011, 1,768,336 shares remain available for future purchases under the ESPP. The ESPP’s term will expire in July 2018 at the completion of the last subscription period, unless it is terminated in accordance with the Merger Agreement.
The Amended and Restated Directors’ Equity Compensation Plan (the Directors’ Plan) provides the Company with the ability to grant stock options, deferred stock units, and restricted stock awards to non-employee directors of the Company, the Mutual Company, and subsidiaries of the Company and the Mutual Company. The Directors’ Plan was initially established in 2005, and was amended and restated, and approved by the shareholders, in 2007. The aggregate number of shares subject to awards under the Directors’ Plan is 500,000. As of December 31, 2011, 394,369 shares remain available for future awards under the Directors’ Plan. The Directors’ Plan will expire on February 21, 2017.
In 2005, the Company adopted the Amended and Restated Agency Stock Purchase Plan, which was approved by written consent of the holders of a majority of the Company’s voting stock. Under the plan, the top-tier independent insurance agencies that sell insurance products for the Company’s parent, subsidiaries, and affiliates may purchase twice a year, on January 15 and July 15, Company stock at a discount of 10% off the closing price on the previous trading day. The amount that can be purchased by any one agency is limited to no more than $12,500 in value every six months. A total of 1,000,000 shares were reserved for issuance under this program at the time of its initial adoption in February 1995. As of December 31, 2011, 669,852 shares have been issued under this program.
125
| Item 13. | Certain Relationships and Related Transactions, and Director Independence. |
RELATED PERSON TRANSACTIONS
Review of Related Person Transactions
The Company reviews, in advance of entering into any transaction or business relationship with a director, director nominee, executive officer, or the Mutual Company, the parameters of such transaction, and whether such transaction or business relationship could cause a potential conflict of interest between the Company and such other participant, or could lead to an arrangement that would not be commercially reasonable for the Company. This review is performed first by management and then, to the extent a potential issue is identified, by the Board of Directors of the Company. In making this assessment, management and the Board are guided by the requirements of Item 404(a) of Regulation S-K under the SEC rules, relating to related person transactions, and other SEC guidance on related person transactions, the guidance of the NASDAQ corporate governance rules, including director independence requirements, and the Company’s Conflict of Interest, Code of Ethics and Corporate Governance policies. Because of the frequent transactions and business relationships between the Company and the Mutual Company, the Board has established a separate Committee, the Coordinating Committee, to review all material transactions between the Company and the Mutual Company. The Coordinating Committee is comprised of individuals who are solely on the Board of the Company or solely on the Board of the Mutual Company, plus a non-voting Chair who is a director of both companies. Transactions are not approved unless at least two directors from each company have approved the transaction.
The Company’s related person transaction procedures are not separately recorded in a policy, but are incorporated into the corporate governance policies described above.
Transactions with the Mutual Company
Harleysville Group was formed by the Mutual Company in 1979. It was a wholly owned subsidiary of the Mutual Company until May 1986, when the Mutual Company sold shares of Harleysville Group’s common stock in a public offering. The Mutual Company’s ownership of Harleysville Group’s outstanding common stock was reduced from 100% to approximately 70% at that time. As of December 31, 2011, the Mutual Company’s ownership was approximately 53%. Harleysville Group’s operations are interrelated with the operations of the Mutual Company. Harleysville Group believes that its various transactions with the Mutual Company, of which the material ones are summarized below, have been fair to Harleysville Group (as well as to the Mutual Company) and at least as favorable to Harleysville Group as those terms that could have been negotiated with an independent third party.
Under a Lease Agreement, amended effective January 1, 2005, the Mutual Company rented the home office property from a partnership, comprised of Harleysville Group and two of its wholly owned subsidiaries, for a five-year term, which was subsequently extended through 2011, at a base rent of $3,959,789 per year. Effective January 1, 2012, the term of the Lease Agreement was again extended through December 31, 2012 under the same terms and conditions as under the expiring term. The Mutual Company also may pay additional rent, based on a formula, for any additions, improvements, or renovations. There was an additional rental payment of $508,460 made in 2011. The Mutual Company also is responsible for all operating expenses including maintenance and repairs. The base rent and formula for additional charges are based upon an appraisal obtained from an independent real estate appraiser. The Mutual Company and Harleysville Group and their respective affiliates share these facilities; and the expenses of the facilities, including equipment and office supplies, are allocated according to an intercompany allocation agreement.
Pursuant to a Management Agreement, Harleysville Group provides certain management services to the Mutual Company and to the Mutual Company’s wholly owned subsidiary insurers for a fee based upon an applicable percentage of direct written premium for each insurer. Effective January 1, 2010, the Management Agreement between the Mutual Company and Harleysville Group was amended (the Amendment) to reflect that Harleysville Group will also provide certain management services to the Mutual Company in connection with the Mutual Company’s assumed reinsurance program in which the Mutual Company may assume quota share retrocessions from non-affiliated reinsurers (the Mutual Company Assumed Reinsurance Program). This program does not include business assumed by the Mutual Company from any mandatory regulatory pool or association, and no business was assumed by the Mutual Company under this program prior to January 1, 2010. Pursuant to this amendment to the Management Agreement, the
126
Mutual Company pays Harleysville Group a fee based upon a percentage of the total earned premium assumed by the Mutual Company under the Mutual Company Assumed Reinsurance Program. In recognition of the differences in the value of the services provided, the percentage used to calculate the fee for the assumed business differs from the percentage used with respect to the direct business. For 2011, Harleysville Group received total fees under the Management Agreements and the Amendment in 2010 in the aggregate amount of $8,519,952.
Pursuant to a Consolidated and Restated Compensation Allocation Agreement, Harleysville Group serves as the paymaster for the Harleysville companies, with each company being charged for its proportionate share of salary and employee benefits expense. This allocation is initially made as between the property/casualty insurer affiliates and the non-property/casualty insurer affiliates on the basis of time allocation. The collective amount allocated to all of the property/casualty insurer affiliates on the basis of time allocation is then reallocated among each property/casualty insurer affiliate on the basis of the following: premium volume, loss volume, investments, and such special studies acceptable to statutory accounting principals as may be mutually agreed upon by such insurers from time to time. These allocations are made prior to the application of the inter-company pooling agreement referenced below. On February 19, 2009, the Harleysville Group and the Mutual Company Boards of Directors approved the amendment of this Agreement to limit to pre-2009 levels the amount of Harleysville Group’s contributions to its now frozen employee defined benefit pension plan that are allocated back to its affiliates pursuant to the Agreement. Under this amendment, Harleysville Group will be allocated any excess that is contributed over the amount allocated to the affiliates. The amendment was approved by various state insurance departments. Additionally, pursuant to the Management Agreements, Harleysville Group (through a partnership comprised of wholly owned subsidiaries of Harleysville Group) provides administrative services to the Mutual Company in connection with the Mutual Company’s participation as a Write Your Own carrier in the National Flood Insurance Plan.
Harleysville Group borrowed $18.5 million from the Mutual Company in 1991 in connection with the acquisition of Mid-America Insurance Company (merged into another subsidiary, Harleysville Worcester, in November 2007) and Harleysville Insurance Company of New York pursuant to a demand loan with a stated maturity of March 1998. In February 1998, the maturity was extended to March 2005 and the interest rate became LIBOR plus 0.65%, which was a commercially reasonable market rate in 1998. In February 2005, the maturity was extended to March 2012 and the interest rate was decreased to LIBOR plus 0.45%, which was a commercially reasonable rate in 2005. For 2011, the interest paid by Harleysville Group on the demand note was $125,903, and the principal balance of the demand note remained at $18.5 million at December 31, 2011.
Harleysville Group’s property/casualty insurance subsidiaries participate in an underwriting pool with the Mutual Company, whereby such subsidiaries cede to the Mutual Company all of their insurance business and assume from the Mutual Company an amount equal to their participation in the pooling agreement. All losses and loss settlement and other underwriting expenses are prorated among the parties on the basis of participation in the pooling agreement. The agreement pertains to all insurance business written or earned on or after January 1, 1986. Harleysville Group and its property/casualty insurance subsidiaries are not liable for any losses incurred by the Mutual Company, Harleysville Preferred Insurance Company, or Harleysville Insurance Company of New Jersey, occurring prior to January 1, 1986. In November 2007, Harleysville Group and the Mutual Company approved an amendment to the pooling agreement to increase Harleysville Group’s participation from 72% to 80%. The amendment was approved by the Coordinating Committee and by the respective Boards of Harleysville Group and the Mutual Company. The Mutual Company then submitted applications for and received the approvals of various insurance regulatory authorities. The pooling agreement amendment became effective on January 1, 2008. In addition, in November 2009, Harleysville Group and the Mutual Company approved a further amendment to the pooling agreement to exclude from the intercompany pool all business assumed by the Mutual Company under the Mutual Company Assumed Reinsurance Program. This amendment was approved by the Coordinating Committee of the Boards of Directors of Harleysville Group and the Mutual Company. The Mutual Company then submitted applications for and received the approvals of various insurance regulatory authorities. This amendment to the pooling agreement became effective on January 1, 2010. Finally, in September 2010, Harleysville Group and the Mutual Company approved an amendment to the pooling agreement which provided for the Mutual Company to retain the financial results of workers’ compensation business written by the Mutual Company and assumed by it under the pooling agreement for policies either first effective or renewed on or after January 1, 2011 as well as with respect to the unearned portion of polices in force as of that date. This amendment also was approved by the Coordinating Committee of the Boards of Directors of Harleysville Group and the Mutual Company and by the various insurance regulatory authorities, and it became effective on January 1, 2011. The pooling agreement may be amended or terminated by agreement of the parties. Further information describing the pooling arrangement is contained on pages 4-5 of this annual report on Form 10-K.
127
From June 2007 to July 2010, the Harleysville Group Board of Directors authorized five stock repurchase programs under which an aggregate of 6.3 million shares of common stock was repurchased. The current stock repurchase program, approved by the Board in August 2010, authorizes the repurchase of up to an additional 800,000 shares. Under such current repurchase program, the Company was authorized to repurchase shares from the public float but not from the Mutual Company.
For information about the Merger Agreement between and among Harleysville Group, the Mutual Company, Nationwide, and Nationals Subs Inc., and the Voting Agreement between the Mutual Company and Nationwide, please see pages 1-2 of this annual report on Form 10-K.
| Item 14. | Principal Accountant Fees and Services. |
Audit Fees
KPMG, the Company’s independent registered public accounting firm for 2010 and 2011, rendered the following services and billed, or expects to bill, the following fees for fiscal year 2010 and 2011.
| | | | | | | | |
Services | | 2010 Fees | | | 2011 Fees | |
Audit | | $ | 765,000 | | | $ | 825,000 | |
Audit-Related | | $ | 35,000 | | | $ | 35,000 | |
Tax | | $ | — | | | $ | — | |
All Other | | $ | 60,000 | | | $ | 76,000 | |
“Audit” services also include audits of insurance operations in accordance with statutory accounting principles required by insurance regulatory authorities and review of documents filed with the SEC.
“Audit-Related” services include audits of employee benefit plans.
“All Other” services include assistance to management in connection with an information technology risk assessment in 2010 and 2011 and merger-related assistance in 2011.
The Audit Committee has determined that the rendering of “audit-related” and “all other” services is compatible with KPMG maintaining its independence.
The Audit Committee engaged KPMG to provide audit services and approved all of the audit-related and all other fees.
128
PART IV
| Item 15. | Exhibits and Financial Statement Schedules. |
| | (a) | (1) The following consolidated financial statements are filed as a part of this report: |
(2) The following consolidated financial statement schedules for the years 2011, 2010 and 2009 are submitted herewith:
Financial Statement Schedules
All other schedules are omitted because they are not applicable or the required information is included in the financial statements or notes thereto.
129
| | |
Exhibit
No. | | Description of Exhibits |
| |
(2) | | Agreement and Plan of Merger by and among Nationwide Mutual Insurance Company, Harleysville Mutual Insurance Company, Nationals Sub, Inc. and Harleysville Group Inc. dated as of September 28, 2011 - incorporated herein by reference to Exhibit 2.1 to the Registrant’s Current Report on Form 8-K filed September 30, 2011. |
| |
(3)(A) | | Amended and Restated Certificate of Incorporation of Registrant - incorporated herein by reference to Exhibit (4)(A) to the Registrant’s Form S-8 Registration Statement No. 333-03127 filed May 3, 1996. |
| |
(3)(B) | | Amended and Restated By-laws of Registrant - incorporated herein by reference to Exhibit 3.1 to the Registrant’s Current Report on Form 8-K filed February 24, 2009. |
| |
(4) | | Indenture between the Registrant and J. P. Morgan Trust Company, N.A., dated as of July 7, 2003 - incorporated herein by reference to Exhibit 4.1 to the Registrant’s Form 8-K Report dated July 7, 2003. |
| |
(10)(A)+ | | Standard Deferred Compensation Plan for Directors of Harleysville Mutual Insurance Company and Harleysville Group Inc. Amended and Restated effective January 1, 2008 - incorporated herein by reference to Exhibit 10(A) to the Registrant’s Annual Report on Form 10-K for the year ended December 31, 2007. |
| |
(10)(B)+ | | Harleysville Insurance Companies Director Deferred Compensation Plan Approved by the Board of Directors November 25, 1987 - incorporated herein by reference to Exhibit (10)(B) to the Registrant’s Form S-3 Registration Statement No. 33-28948 filed May 25, 1989. |
| |
(10)(C)+ | | Harleysville Group Inc. Non-Qualified Deferred Compensation Plan Amended and Restated as of January 1, 2008 - incorporated herein by reference to Exhibit (10)(C) to the Registrant’s Annual Report on Form 10-K for the year ended December 31, 2007. |
| |
(10)(D)+ | | Pension Plan of Harleysville Group Inc. and Associated Employers Amended and Restated as of January 1, 2008 - incorporated herein by reference to Exhibit (10)(D) to the Registrant’s Annual Report on Form 10-K for the year ended December 31, 2007. |
| |
(10)(E)+ | | Harleysville Group Inc. Senior Executive Incentive Compensation Plan Effective January 1, 2009 - incorporated herein by reference to Exhibit 10.1 to the Registrant’s Quarterly Report on Form 10-Q filed May 1, 2009. |
| |
(10)(F)+ | | Amended and Restated Equity Incentive Plan of Registrant effective as of April 28, 2010 - incorporated herein by reference to Exhibit 10.1 to the Registrant’s Current Report on Form 8-K filed May 4, 2010. |
| |
(10)(G) | | Tax Allocation Agreement dated December 24, 1986 among Harleysville Insurance Company of New Jersey, Huron Insurance Company, Worcester Insurance Company, McAlear Associates, Inc. and the Registrant - incorporated herein by reference to Exhibit (10)(Q) to the Registrant’s Annual Report on Form 10-K for the year ended December 31, 1986. |
| |
(10)(H) | | Amended and Restated Financial Tax Sharing Agreement dated March 20, 1995 among Huron Insurance Company, Harleysville Insurance Company of New Jersey, Worcester Insurance Company, Harleysville-Atlantic Insurance Company, New York Casualty Insurance Company, Connecticut Union Insurance Company, Great Oaks Insurance Company, Lakes States Insurance Company and the Registrant - incorporated herein by reference to Exhibit (10)(L) to the Registrant’s Annual Report on Form 10-K for the year ended December 31, 1994. |
| |
(10)(I) | | Proportional Reinsurance Agreement effective as of January 1, 1986 among Harleysville Mutual Insurance Company, Huron Insurance Company and Harleysville Insurance Company of New Jersey - incorporated herein by reference to Exhibit 10(N) to the Registrant’s Form S-1 Registration Statement No. 33-4885 declared effective May 23, 1986. |
130
| | |
Exhibit
No. | | Description of Exhibits |
| |
(10)(I)(1) | | Amendment, effective July 1, 1987, to the Proportional Reinsurance Agreement effective January 1, 1986 among Harleysville Mutual Insurance Company, Huron Insurance Company, Harleysville Insurance Company of New Jersey and Atlantic Insurance Company of Savannah - incorporated herein by reference to the Registrant’s Form 8-K Report dated July 1, 1987. |
| |
(10)(I)(2) | | Amendment, effective January 1, 1989, to the Proportional Reinsurance Agreement effective January 1, 1986 among Harleysville Mutual Insurance Company, Huron Insurance Company, Harleysville Insurance Company of New Jersey, Atlantic Insurance Company of Savannah and Worcester Insurance Company - incorporated herein by reference to Exhibit (10)(U) to the Registrant’s Annual Report on Form 10-K for the year ended December 31, 1988. |
| |
(10)(I)(3) | | Amendment, effective January 1, 1991, to the Proportional Reinsurance Agreement effective January 1, 1986 among Harleysville Mutual Insurance Company, Huron Insurance Company, Harleysville Insurance Company of New Jersey, Atlantic Insurance Company of Savannah, Worcester Insurance Company, Phoenix General Insurance Company and New York Casualty Insurance Company - incorporated herein by reference to Exhibit (10)(O) to the Registrant’s Annual Report on Form 10-K for the year ended December 31, 1990. |
| |
(10)(I)(4) | | Amendments, effective January 1, 1995 and 1993, respectively, to the Proportional Reinsurance Agreement effective January 1, 1986 among Harleysville Mutual Insurance Company, Huron Insurance Company, Harleysville Insurance Company of New Jersey, Harleysville-Atlantic Insurance Company, Worcester Insurance Company, Connecticut Union Insurance Company, New York Casualty Insurance Company and Great Oaks Insurance Company - incorporated herein by reference to Exhibit (10)(P) to the Registrant’s Annual Report on Form 10-K for the year ended December 31, 1994. |
| |
(10)(I)(5) | | Amendment, effective January 1, 1996 to the Proportional Reinsurance Agreement effective January 1, 1986 among Harleysville Mutual Insurance Company, Huron Insurance Company, Harleysville Insurance Company of New Jersey, Harleysville-Atlantic Insurance Company, Worcester Insurance Company, Connecticut Union Insurance Company, New York Casualty Insurance Company, Great Oaks Insurance Company and Pennland Insurance Company - incorporated herein by reference to Exhibit (10)(O) to the Registrant’s Annual Report on Form 10-K for the year ended December 31, 1995. |
| |
(10)(I)(6) | | Amendment, effective January 1, 1997 to the Proportional Reinsurance Agreement effective January 1, 1986 among Harleysville Mutual Insurance Company, Huron Insurance Company, Harleysville Insurance Company of New Jersey, Harleysville-Atlantic Insurance Company, Worcester Insurance Company, Mid-America Insurance Company, New York Casualty Insurance Company, Great Oaks Insurance Company, Pennland Insurance Company and Lake States Insurance Company - incorporated herein by reference to Exhibit (10)(P) to the Registrant’s Annual Report on Form 10-K for the year ended December 31, 1996. |
| |
(10)(I)(7) | | Amendment, effective January 1, 1998 to the Proportional Reinsurance Agreement effective January 1, 1986 among Harleysville Mutual Insurance Company, Huron Insurance Company, Harleysville Insurance Company of New Jersey, Harleysville-Atlantic Insurance Company, Worcester Insurance Company, Mid-America Insurance Company, New York Casualty Insurance Company, Great Oaks Insurance Company, Pennland Insurance Company, Lake States Insurance Company and Minnesota Fire and Casualty Company - incorporated herein by reference to Exhibit (10)(Q) to the Registrant’s Annual Report on Form 10-K for the year ended December 31, 1997. |
| |
(10)(I)(8) | | Tenth Amendment, effective January 1, 2008, to the Proportional Reinsurance Agreement effective January 1, 1986 among Harleysville Mutual Insurance Company, Harleysville Preferred Insurance Company, Harleysville Insurance Company of New Jersey, Harleysville-Atlantic Insurance Company, Harleysville Worcester Insurance Company, Harleysville Insurance Company of New York, Harleysville Insurance Company of Ohio, Harleysville Pennland Insurance Company, Harleysville Lake States Insurance Company and Harleysville Insurance Company - incorporated herein by reference to Exhibit (10)(I)(8) to the Registrant’s Annual Report on Form 10-K for the year ended December 31, 2007. |
131
| | |
Exhibit
No. | | Description of Exhibits |
| |
(10)(I)(9) | | Eleventh Amendment, effective January 1, 2010, to the Proportional Reinsurance Agreement effective January 1, 1986 among Harleysville Mutual Insurance Company, Harleysville Preferred Insurance Company, Harleysville Insurance Company of New Jersey, Harleysville-Atlantic Insurance Company, Harleysville Worcester Insurance Company, Harleysville Insurance Company of New York, Harleysville Insurance Company of Ohio, Harleysville Pennland Insurance Company, Harleysville Lake States Insurance Company and Harleysville Insurance Company - incorporated herein by reference to Exhibit (10)(I)(9) to the Registrant’s Annual Report on Form 10-K for the year ended December 31, 2009. |
| |
(10)(I)(10) | | Twelfth Amendment, effective January 1, 2011, to the Proportional Reinsurance Agreement effective January 1, 1986 among Harleysville Mutual Insurance Company, Harleysville Preferred Insurance Company, Harleysville Insurance Company of New Jersey, Harleysville-Atlantic Insurance Company, Harleysville Worcester Insurance Company, Harleysville Insurance Company of New York, Harleysville Insurance Company of Ohio, Harleysville Pennland Insurance Company, Harleysville Lake States Insurance Company and Harleysville Insurance Company - incorporated herein by reference to Exhibit (10)(I)(10) to the Registrant’s Annual Report on Form 10-K for the year ended December 31, 2010. |
| |
(10)(J) | | Lease and Amendment effective January 1, 2000 between Harleysville, Ltd. and Harleysville Mutual Insurance Company - incorporated herein by reference to Exhibit (10)(R) to the Registrant’s Annual Report on Form 10-K for the year ended December 31, 1999. |
| |
(10)(J)(1) | | Second Amendment to Lease Agreement, effective January 1, 2005 between Harleysville Ltd. and Harleysville Mutual Insurance Company - incorporated herein by reference to Exhibit (10)(R) to the Registrant’s Annual Report on Form 10-K for the year ended December 31, 2004. |
| |
(10)(J)(2) | | Third Amendment to Lease Agreement, effective January 1, 2010, between Harleysville Ltd. and Harleysville Mutual Insurance Company - incorporated herein by reference to Exhibit (10)(J)(2) to the Registrant’s Annual Report on Form 10-K for the year ended December 31, 2009. |
| |
(10)(J)(3) | | Fourth Amendment to Lease Agreement, effective January 1, 2011 between Harleysville Ltd. and Harleysville Mutual Insurance Company - incorporated herein by reference to Exhibit (10)(J)(3) to the Registrant’s Annual Report on Form 10-K for the year ended December 31, 2010. |
| |
(10)(J)(4)* | | Fifth Amendment to Lease Agreement, effective January 1, 2012, between Harleysville Ltd. and Harleysville Mutual Insurance Company. |
| |
(10)(K)+ | | Harleysville Group Inc. Year 2000 Directors’ Stock Option Program of Registrant - incorporated herein by reference to Exhibit (4)(C) to the Registrant’s Form S-8 Registration Statement No. 333-85941, filed August 26, 1999. |
| |
(10)(L) | | Loan Agreement dated as of March 19, 1998 by and between Harleysville Group Inc. and Harleysville Mutual Insurance Company - incorporated herein by reference to Exhibit (10)(V) to the Registrant’s Annual Report on Form 10-K for the year ended December 31, 1997. |
| |
(10)(L)(1) | | Amendment to Loan Agreement, effective March 1, 2005 by and between Harleysville Group Inc. and Harleysville Mutual Insurance Company - incorporated herein by reference to Exhibit (10)(V) to the Registrant’s Annual Report on Form 10-K for the year ended December 31, 2004. |
| |
(10)(M) | | Form of Management Agreements dated January 1, 1994 between Harleysville Group Inc. and Harleysville Mutual Insurance Company, Harleysville-Garden State Insurance Company, Mainland Insurance Company, Pennland Insurance Company, Berkshire Mutual Insurance Company and Harleysville Life Insurance Company - incorporated herein by reference to Exhibit (10)(U) to the Registrant’s Annual Statement on Form 10-K for the year ended December 31, 1993. |
| |
(10)(M)(1)! | | Amendment, effective January 1, 2010, to the Management Agreement between Harleysville Group Inc. and Harleysville Mutual Insurance Company - incorporated herein by reference to Exhibit (10)(M)(1) to the Registrant’s Annual Report on Form 10-K for the year ended December 31, 2009. |
132
| | |
Exhibit
No. | | Description of Exhibits |
| |
(10)(N) | | Form of Amended Consolidated and Restated Compensation Allocation Agreement between Harleysville Group Inc. and Harleysville Mutual Insurance Company, Harleysville Life Insurance Company, Harleysville Worcester Insurance Company, Harleysville Insurance Company of New York, Harleysville Preferred Insurance Company, Harleysville Pennland Insurance Company, Harleysville Insurance Company of New Jersey, Harleysville-Atlantic Insurance Company, Harleysville Insurance Company of Ohio, Harleysville Insurance Company, Harleysville Lake States Insurance Company, Mainland Insurance Company, Harleysville Services, Inc., Harleysville Ltd., and Insurance Management Resources L.P., effective February 19, 2009 - incorporated herein by reference to Exhibit (10)(N) to the Registrant’s Annual Statement on Form 10-K for the year ended December 31, 2008. |
| |
(10)(O) | | Equipment and Supplies Allocation Agreement dated January 1, 1993 between Harleysville Mutual Insurance Company and Harleysville Group Inc. - incorporated herein by reference to Exhibit (10)(V) to the Registrant’s Annual Report on Form 10-K for the year ended December 31, 1992. |
| |
(10)(P)+ | | Form of Change in Control Employment Agreements effective January 1, 2008 - incorporated herein by reference to Exhibit (10)(P) to the Registrant’s Annual Report on Form 10-K for the year ended December 31, 2007. |
| |
(10)(P)(1)+* | | List of Executive Officers who have executed a Change in Control Agreement with the Company substantially similar to the form described in Exhibit (10)(P). |
| |
(10)(Q)+ | | Harleysville Group Inc. Supplemental Retirement Plan Amended and Restated as of January 1, 2008 - incorporated herein by reference to Exhibit (10)(Q) to the Registrant’s Annual Report on Form 10-K for the year ended December 31, 2007. |
| |
(10)(R)+ | | Directors Equity Award Program of Registrant - incorporated herein by reference to Exhibit (4)(C) to the Registrant’s Form S-8 Registration Statement No. 333-09701 filed August 7, 1996. |
| |
(10)(S)+ | | Non-Qualified Excess Contribution and Match Program - Amended and Restated as of January 1, 2008 - incorporated herein by reference to Exhibit (10)(T) to the Registrant’s Annual Report on Form 10-K for the year ended December 31, 2007. |
| |
(10)(T) | | Agency Stock Purchase Plan - incorporated herein by reference to Exhibit 4(A) to the Registrant’s Form S-3 Registration Statement No. 33-90810 filed December 6, 2005. |
| |
(10)(U)+ | | Harleysville Group Inc. Amended and Restated Directors’ Equity Compensation Plan - incorporated herein by reference to Exhibit 10.2 to the Registrant’s Quarterly Report on Form 10-Q filed May 4, 2007. |
| |
(10)(U)(1)+ | | Amendment 2007-1, effective December 20, 2007, to the Harleysville Group Inc. Amended and Restated Directors’ Equity Compensation Plan - incorporated herein by reference to Exhibit (10)(V)(1) to the Registrant’s Annual Report on Form 10-K for the year ended December 31, 2007. |
| |
(10)(V)+ | | Non-Employee Director Compensation - incorporated herein by reference to Exhibit (10)(W) to the Registrant’s Annual Report on Form 10-K for the year ended December 31, 2009. |
| |
(10)(W)+ | | Form of Non-Qualified Stock Option Award Agreement - incorporated herein by reference to Exhibit (10)(X) to the Registrant’s Annual Report on Form 10-K for the year ended December 31, 2009. |
| |
(10)(X)+ | | Form of Restricted Stock Award Agreement - incorporated by reference to Exhibit 10.3 to the Registrant’s Current Report on Form 8-K filed January 5, 2006. |
| |
(10)(Y)+ | | Form of Restricted Stock Award Agreement for Reporting Persons - incorporated by reference to Exhibit 10.4 to the Registrant’s Current Report on Form 8-K filed January 5, 2006. |
| |
(10)(Z)+ | | Form of Restricted Stock Units Award Agreement for CEO - time-based - incorporated herein by reference to Exhibit (10)(AA) to the Registrant’s Annual Report on Form 10-K for the year ended December 31, 2009. |
133
| | |
Exhibit
No. | | Description of Exhibits |
| |
(10)(AA)+ | | Form of Restricted Stock Units Award Agreement for CEO - TSR-based - incorporated herein by reference to Exhibit (10)(AB) to the Registrant’s Annual Report on Form 10-K for the year ended December 31, 2009. |
| |
(10)(AB)+ | | Form of Restricted Stock Units Award Agreement - time based - incorporated herein by reference to Exhibit (10)(AC) to the Registrant’s Annual Report on Form 10-K for the year ended December 31, 2009. |
| |
(10)(AC)+ | | Form of Restricted Stock Units Award Agreement - performance based - incorporated herein by reference to Exhibit (10)(AD) to the Registrant’s Annual Report on Form 10-K for the year ended December 31, 2009. |
| |
(10)(AD)+ | | Amended and Restated Employee Stock Purchase Plan - incorporated by reference to Exhibit 10.2 to the Registrant’s Periodic Report on Form 10-Q for the period ended March 31, 2010. |
| |
(10)(AE)+* | | Form of Change in Control Payment Acknowledgement and Agreement. |
| |
(21)* | | Subsidiaries of Registrant. |
| |
(23)* | | Report and Consent of Independent Registered Public Accounting Firm |
| |
(31.1)* | | Certification of Chief Executive Officer Pursuant to Section 302 of the Sarbanes-Oxley Act of 2002. |
| |
(31.2)* | | Certification of Chief Financial Officer Pursuant to Section 302 of the Sarbanes-Oxley Act of 2002. |
| |
(32.1)* | | Certification of Chief Executive Officer Pursuant to Section 906 of the Sarbanes-Oxley Act of 2002. |
| |
(32.2)* | | Certification of Chief Financial Officer Pursuant to Section 906 of the Sarbanes-Oxley Act of 2002. |
| |
(99)(A)* | | Form 11-K Annual Report for the Harleysville Group Inc. Amended and Restated Employee Stock Purchase Plan for the year ended December 31, 2011. |
| |
(99)(B) | | Stockholder Voting Agreement dated as of September 28, 2011 by and between Nationwide Mutual Insurance Company and Harleysville Mutual Insurance Company - incorporated herein by reference to Exhibit 99.1 to the Registrant’s Current Report on Form 8-K filed September 30, 2011. |
| |
101.INS** | | XBRL Instance Document. |
| |
101.SCH** | | XBRL Taxonomy Extension Schema Document. |
| |
101.CAL** | | XBRL Taxonomy Extension Calculation Linkbase Document. |
| |
101.LAB** | | XBRL Taxonomy Extension Label Linkbase Document. |
| |
101.PRE** | | XBRL Taxonomy Extension Presentation Linkbase Document. |
| |
101.DEF** | | XBRL Taxonomy Extension Definition Linkbase Document. |
| + | A management contract, compensatory plan or arrangement required to be separately identified. |
| ** | Furnished and not filed herewith. |
| ! | Confidential treatment has been requested for certain provisions of this agreement pursuant to an application for confidential treatment filed with the Securities and Exchange Commission on March 5, 2010. Such provisions have been filed separately with the Commission. |
134
HARLEYSVILLE GROUP
SCHEDULE I - SUMMARY OF INVESTMENTS -
OTHER THAN INVESTMENTS IN RELATED PARTIES
December 31, 2011
(in thousands)
| | | | | | | | | | | | |
Type of Investment | | Cost | | | Value | | | Amount at
Which
Shown in the
Balance Sheet | |
Fixed maturities: | | | | | | | | | | | | |
| | | |
U.S. Treasury securities | | $ | 434,308 | | | $ | 442,324 | | | $ | 442,324 | |
| | | |
Obligations of U.S. government corporations and agencies | | | 7,789 | | | | 8,371 | | | | 8,354 | |
| | | |
Obligations of states and political subdivisions | | | 1,126,352 | | | | 1,228,160 | | | | 1,225,735 | |
| | | |
Mortgage-backed securities | | | 278,515 | | | | 294,617 | | | | 294,617 | |
| | | |
All other corporate bonds | | | 473,192 | | | | 519,932 | | | | 515,876 | |
| | | | | | | | | | | | |
| | | |
Total fixed maturities | | | 2,320,156 | | | | 2,493,404 | | | | 2,486,906 | |
| | | | | | | | | | | | |
| | | |
Equity securities: | | | | | | | | | | | | |
| | | |
Common stocks: | | | | | | | | | | | | |
Banks, trust and insurance companies | | | 7 | | | | 7 | | | | 7 | |
| | | | | | | | | | | | |
| | | |
Total equities | | | 7 | | | | 7 | | | | 7 | |
| | | | | | | | | | | | |
| | | |
Short-term investments | | | 129,388 | | | | | | | | 129,388 | |
| | | | | | | | | | | | |
| | | |
Total investments | | $ | 2,449,551 | | | | | | | $ | 2,616,301 | |
| | | | | | | | | | | | |
See accompanying report of independent registered public accounting firm.
135
HARLEYSVILLE GROUP INC.
SCHEDULE II - CONDENSED FINANCIAL INFORMATION OF PARENT COMPANY
CONDENSED BALANCE SHEETS
(in thousands, except share data)
| | | | | | | | |
| | | December 31, | |
| | | 2011 | | | 2010 | |
| | |
| ASSETS | | | | | | | | |
Short-term investments | | $ | 43,398 | | | $ | 22,047 | |
Fixed maturities: | | | | | | | | |
Available for sale, at fair value (cost $15 and $15) | | | 15 | | | | 15 | |
Investments in common stock of subsidiaries (equity method) | | | 820,055 | | | | 827,450 | |
Dividends receivable from subsidiaries | | | | | | | 24,167 | |
Due from affiliate | | | 5,321 | | | | 16,567 | |
Federal income tax recoverable | | | 5,056 | | | | | |
Other assets | | | 13,022 | | | | 12,951 | |
| | | | | | | | |
| | |
Total assets | | $ | 886,867 | | | $ | 903,197 | |
| | | | | | | | |
| | |
| LIABILITIES AND SHAREHOLDERS’ EQUITY | | | | | | | | |
| | |
Debt | | $ | 118,500 | | | $ | 118,500 | |
Accounts payable and accrued expenses | | | 14,811 | | | | 10,593 | |
Federal income tax payable | | | | | | | 5,471 | |
| | | | | | | | |
| | |
Total liabilities | | | 133,311 | | | | 134,564 | |
| | | | | | | | |
Shareholders’ equity: | | | | | | | | |
Preferred stock, $1 par value; authorized 1,000,000 shares, none issued | | | | | | | | |
Common stock, $1 par value; authorized 80,000,000 shares; issued 2011, 35,448,861 and 2010, 34,987,829 shares; outstanding 2011, 27,246,172 and 2010, 27,044,836 shares | | | 35,449 | | | | 34,988 | |
Additional paid-in capital | | | 285,585 | | | | 263,857 | |
Accumulated other comprehensive income | | | 63,571 | | | | 80,506 | |
Retained earnings | | | 622,973 | | | | 630,603 | |
Treasury stock, at cost, 8,202,689 and 7,942,993 shares | | | (254,022 | ) | | | (241,321 | ) |
| | | | | | | | |
| | |
Total shareholders’ equity | | | 753,556 | | | | 768,633 | |
| | | | | | | | |
| | |
Total liabilities and shareholders’ equity | | $ | 886,867 | | | $ | 903,197 | |
| | | | | | | | |
See accompanying notes to consolidated financial statements and report of independent registered public accounting firm.
136
HARLEYSVILLE GROUP INC.
SCHEDULE II - CONDENSED FINANCIAL INFORMATION OF PARENT COMPANY
CONDENSED STATEMENTS OF INCOME
(in thousands)
| | | | | | | | | | | | |
| | | Year Ended December 31, | |
| | | 2011 | | | 2010 | | | 2009 | |
| | | |
Revenues | | $ | 8,525 | | | $ | 5,858 | | | $ | 5,372 | |
Expenses: | | | | | | | | | | | | |
Interest | | | 6,053 | | | | 6,064 | | | | 6,217 | |
Expenses other than interest | | | 6,409 | | | | 2,200 | | | | 2,318 | |
| | | | | | | | | | | | |
| | | |
| | | (3,937 | ) | | | (2,406 | ) | | | (3,163 | ) |
Income tax benefit | | | (232 | ) | | | (848 | ) | | | (1,073 | ) |
| | | | | | | | | | | | |
| | | |
Loss before equity in income of subsidiaries | | | (3,705 | ) | | | (1,558 | ) | | | (2,090 | ) |
| | | |
Equity in income of subsidiaries | | | 26,317 | | | | 68,456 | | | | 88,386 | |
| | | | | | | | | | | | |
| | | |
Net income | | $ | 22,612 | | | $ | 66,898 | | | $ | 86,296 | |
| | | | | | | | | | | | |
See accompanying notes to consolidated financial statements and report of independent registered public accounting firm.
137
HARLEYSVILLE GROUP INC.
SCHEDULE II - CONDENSED FINANCIAL INFORMATION OF PARENT COMPANY
CONDENSED STATEMENTS OF CASH FLOWS
(in thousands)
| | | | | | | | | | | | |
| | | Year Ended December 31, | |
| | | 2011 | | | 2010 | | | 2009 | |
| | | |
Cash flows from operating activities: | | | | | | | | | | | | |
Net income | | $ | 22,612 | | | $ | 66,898 | | | $ | 86,296 | |
Adjustments to reconcile net income to net cash provided (used) by operating activities: | | | | | | | | | | | | |
Equity in income of subsidiaries | | | (26,317 | ) | | | (68,456 | ) | | | (88,386 | ) |
Decrease in accrued investment income | | | | | | | 1 | | | | 20 | |
Increase (decrease) in accrued income taxes | | | (10,501 | ) | | | 2,943 | | | | 17,583 | |
Other, net | | | 19,197 | | | | (2,419 | ) | | | (16,274 | ) |
| | | | | | | | | | | | |
Net cash provided (used) by operating activities | | | 4,991 | | | | (1,033 | ) | | | (761 | ) |
| | | | | | | | | | | | |
| | | |
Cash flows from investing activities: | | | | | | | | | | | | |
Purchases of fixed maturity investments | | | | | | | (15 | ) | | | | |
Maturities of fixed maturity investments | | | | | | | 15 | | | | | |
Net sales (purchases) of short-term investments | | | (21,351 | ) | | | 7,048 | | | | 25,468 | |
Acquisition of affiliate, net of cash acquired | | | | | | | (4,825 | ) | | | | |
| | | | | | | | | | | | |
Net cash provided (used) by investing activities | | | (21,351 | ) | | | 2,223 | | | | 25,468 | |
| | | | | | | | | | | | |
| | | |
Cash flows from financing activities: | | | | | | | | | | | | |
Issuance of common stock | | | 5,336 | | | | 8,973 | | | | 7,382 | |
Purchase of treasury stock | | | (5,307 | ) | | | (30,940 | ) | | | (25,290 | ) |
Dividends from subsidiaries | | | 43,476 | | | | 94,361 | | | | 27,479 | |
Dividends paid | | | (29,253 | ) | | | (74,597 | ) | | | (34,849 | ) |
Excess tax benefits from share-based payment arrangements | | | 2,108 | | | | 1,013 | | | | 571 | |
| | | | | | | | | | | | |
Net cash provided (used) by financing activities | | | 16,360 | | | | (1,190 | ) | | | (24,707 | ) |
| | | | | | | | | | | | |
| | | |
Change in cash | | | | | | | | | | | | |
Cash at beginning of year | | | — | | | | — | | | | — | |
| | | | | | | | | | | | |
Cash at end of year | | $ | — | | | $ | — | | | $ | — | |
| | | | | | | | | | | | |
See accompanying notes to consolidated financial statements and report of independent registered public accounting firm.
138
HARLEYSVILLE GROUP
SCHEDULE III - SUPPLEMENTARY INSURANCE INFORMATION
Years Ended December 31, 2011, 2010 and 2009
(in thousands)
| | | | | | | | | | | | | | | | | | | | | | | | | | | | | | | | | | | | |
| | | Deferred
Policy
Acquisition
Costs | | | Liability
For
Unpaid
Losses
and
Loss
Settlement
Expenses | | | Unearned
Premiums | | | Earned
Premiums | | | Net
Investment
Income | | | Losses
And Loss
Settlement
Expenses | | | Amortization
Of Deferred
Policy
Acquisition
Costs | | | Other
Underwriting
Expense | | | Premiums
Written | |
| | | | | | | | | |
Year ended | | | | | | | | | | | | | | | | | | | | | | | | | | | | | | | | | | | | |
December 31, 2011 | | | | | | | | | | | | | | | | | | | | | | | | | | | | | | | | | | | | |
Commercial lines | | | | | | $ | 1,404,875 | | | $ | 291,060 | | | $ | 592,910 | | | | | | | $ | 470,361 | | | | | | | | | | | $ | 540,690 | |
Personal lines | | | | | | | 140,529 | | | | 114,955 | | | | 211,598 | | | | | | | | 210,493 | | | | | | | | | | | | 217,927 | |
GAAP adjustments(1) | | | | | | | 244,187 | | | | 54,753 | | | | | | | | | | | | 782 | | | | | | | | | | | | | |
| | | | | | | | | | | | | | | | | | | | | | | | | | | | | | | | | | | | |
Total | | $ | 101,256 | | | $ | 1,789,591 | | | $ | 460,768 | | | $ | 804,508 | | | | | | | $ | 681,636 | | | $ | 205,783 | | | $ | 77,228 | | | $ | 758,617 | |
| | | | | | | | | | | | | | | | | | | | | | | | | | | | | | | | | | | | |
Net investment income | | | | | | | | | | | | | | | | | | $ | 95,401 | | | | | | | | | | | | | | | | | |
| | | | | | | | | | | | | | | | | | | | | | | | | | | | | | | | | | | | |
Year ended | | | | | | | | | | | | | | | | | | | | | | | | | | | | | | | | | | | | |
December 31, 2010 | | | | | | | | | | | | | | | | | | | | | | | | | | | | | | | | | | | | |
Commercial lines | | | | | | $ | 1,436,342 | | | $ | 343,280 | | | $ | 676,740 | | | | | | | $ | 450,417 | | | | | | | | | | | $ | 679,157 | |
Personal lines | | | | | | | 117,723 | | | | 108,627 | | | | 189,610 | | | | | | | | 138,089 | | | | | | | | | | | | 202,904 | |
GAAP adjustments(1) | | | | | | | 217,596 | | | | 51,625 | | | | | | | | | | | | 599 | | | | | | | | | | | | | |
| | | | | | | | | | | | | | | | | | | | | | | | | | | | | | | | | | | | |
Total | | $ | 113,997 | | | $ | 1,771,661 | | | $ | 503,532 | | | $ | 866,350 | | | | | | | $ | 589,105 | | | $ | 220,150 | | | $ | 84,227 | | | $ | 882,061 | |
| | | | | | | | | | | | | | | | | | | | | | | | | | | | | | | | | | | | |
Net investment income | | | | | | | | | | | | | | | | | | $ | 103,313 | | | | | | | | | | | | | | | | | |
| | | | | | | | | | | | | | | | | | | | | | | | | | | | | | | | | | | | |
| | | | | | | | | |
Year ended | | | | | | | | | | | | | | | | | | | | | | | | | | | | | | | | | | | | |
December 31, 2009 | | | | | | | | | | | | | | | | | | | | | | | | | | | | | | | | | | | | |
Commercial lines | | | | | | $ | 1,442,458 | | | $ | 340,863 | | | $ | 690,116 | | | | | | | $ | 441,852 | | | | | | | | | | | $ | 674,275 | |
Personal lines | | | | | | | 116,706 | | | | 95,333 | | | | 168,384 | | | | | | | | 109,921 | | | | | | | | | | | | 177,342 | |
GAAP adjustments(1) | | | | | | | 223,128 | | | | 48,314 | | | | | | | | | | | | 718 | | | | | | | | | | | | | |
| | | | | | | | | | | | | | | | | | | | | | | | | | | | | | | | | | | | |
Total | | $ | 111,649 | | | $ | 1,782,292 | | | $ | 484,510 | | | $ | 858,500 | | | | | | | $ | 552,491 | | | $ | 216,470 | | | $ | 85,349 | | | $ | 851,617 | |
| | | | | | | | | | | | | | | | | | | | | | | | | | | | | | | | | | | | |
Net investment income | | | | | | | | | | | | | | | | | | $ | 106,649 | | | | | | | | | | | | | | | | | |
| | | | | | | | | | | | | | | | | | | | | | | | | | | | | | | | | | | | |
| (1) | GAAP adjustments are not determined separately for commercial and personal lines. |
See Note 13 of the Notes to Consolidated Financial Statements.
See accompanying report of independent registered public accounting firm.
139
HARLEYSVILLE GROUP
SCHEDULE IV - REINSURANCE
Years Ended December 31, 2011, 2010 and 2009
(in thousands)
| | | | | | | | | | | | | | | | | | | | | | | | | | | | |
| | | | | | | | | | | | | | | | | | | | | Percentage | |
| | | | | | | | | | | | | | | | | | | | | of | |
| | | | | | Ceded to | | | Assumed From | | | | | | Amount
Assumed
to Net | |
| | Gross
Amount | | | Outside
Companies | | | Affiliated
Companies(1) | | | Outside
Companies | | | Affiliated
Companies(1) | | | Net
Amount | | |
Property and casualty premiums for year ended December 31, | | | | | | | | | | | | | | | | | | | | | | | | | | | | |
| | | | | | | |
2011 | | $ | 942,911 | | | $ | 128,637 | | | $ | 819,071 | | | $ | 4,797 | | | $ | 804,508 | | | $ | 804,508 | | | | 100.6 | % |
| | | | | | | |
2010 | | $ | 896,434 | | | $ | 123,859 | | | $ | 783,340 | | | $ | 10,765 | | | $ | 866,350 | | | $ | 866,350 | | | | 101.2 | % |
| | | | | | | |
2009 | | $ | 830,350 | | | $ | 109,743 | | | $ | 730,699 | | | $ | 10,092 | | | $ | 858,500 | | | $ | 858,500 | | | | 101.2 | % |
| (1) | These columns include the effect of the intercompany pooling. |
See accompanying report of independent registered public accounting firm.
140
HARLEYSVILLE GROUP
SCHEDULE VI - SUPPLEMENTAL INSURANCE INFORMATION CONCERNING
PROPERTY AND CASUALTY SUBSIDIARIES
Years Ended December 31, 2011, 2010 and 2009
(in thousands)
| | | | | | | | | | | | | | | | | | | | |
| | | Liability
For Unpaid
Losses and
Loss Settlement
Expenses | | | Discount,
If Any,
Deducted
From
Reserves(1) | | | Losses and Loss
Settlement Expenses
(Benefits) Incurred
Related To | | | Paid Losses
And Loss
Settlement
Expenses | |
| | | | Current Year | | | Prior Years | | |
| | | | | |
Year ended: | | | | | | | | | | | | | | | | | | | | |
| | | | | |
December 31, 2011 | | $ | 1,789,591 | | | $ | 5,701 | | | $ | 713,697 | | | $ | (32,061 | ) | | $ | 690,297 | |
| | | | | | | | | | | | | | | | | | | | |
| | | | | |
December 31, 2010 | | $ | 1,771,661 | | | $ | 6,874 | | | $ | 639,234 | | | $ | (50,129 | ) | | $ | 594,204 | |
| | | | | | | | | | | | | | | | | | | | |
| | | | | |
December 31, 2009 | | $ | 1,782,292 | | | $ | 6,993 | | | $ | 588,575 | | | $ | (36,084 | ) | | $ | 551,576 | |
| | | | | | | | | | | | | | | | | | | | |
| Notes: (1) | The amount of discount relates to certain long-term disability workers’ compensation cases. A discount rate of 3.5% was used. |
| (2) | Information required by remaining columns is contained in Schedule III. |
See accompanying report of independent registered public accounting firm.
141
SIGNATURES
Pursuant to the requirements of Section 13 or 15(d) of the Securities Exchange Act of 1934, the Registrant has duly caused this report to be signed on its behalf by the undersigned thereunto duly authorized.
| | | | | | |
| | | | Harleysville Group Inc. |
| | | |
| Date: March 14, 2012 | | | | By: | | /s/ MICHAEL L. BROWNE |
| | | | | | Michael L. Browne President, Chief Executive Officer and a Director (principal executive officer) |
Pursuant to the requirements of the Securities Exchange Act of 1934, this report has been signed by the following persons on behalf of the Registrant in the capacities and on the dates indicated.
| | | | |
Signature | | Title | | Date |
| | |
/s/ MICHAEL L. BROWNE Michael L. Browne | | President, Chief Executive Officer and a Director (principal executive officer) | | March 14, 2012 |
| | |
/s/ ARTHUR E. CHANDLER Arthur E. Chandler | | Senior Vice President and Chief Financial Officer (principal financial officer and principal accounting officer) | | March 14, 2012 |
| | |
/s/ WILLIAM W. SCRANTON William W. Scranton | | Chairman of the Board and a Director | | March 14, 2012 |
| | |
/s/ BARBARA A. AUSTELL Barbara A. Austell | | Director | | March 14, 2012 |
| | |
/s/ W. THACHER BROWN W. Thacher Brown | | Director | | March 14, 2012 |
| | |
/s/ G. LAWRENCE BUHL G. Lawrence Buhl | | Director | | March 14, 2012 |
| | |
/s/ MIRIAN M. GRADDICK-WEIR Mirian M. Graddick-Weir | | Director | | March 14, 2012 |
| | |
/s/ JERRY S. ROSENBLOOM Jerry S. Rosenbloom | | Director | | March 14, 2012 |
| | |
/s/ WILLIAM E. STORTS William E. Storts | | Director | | March 14, 2012 |
142
Exhibit Index
| | |
Exhibit No. | | Description of Exhibits |
| |
| (10)(J)(4)* | | Fifth Amendment to Lease Agreement, effective January 1, 2012, between Harleysville Ltd. and Harleysville Mutual Insurance Company. |
| |
| (10)(P)(1)* | | List of Executive Officers who have executed a Change in Control Agreement with the Company substantially similar to the form described in Exhibit (10)(P). |
| |
| (10)(AE)* | | Form of Change in Control Payment Acknowledgement and Agreement. |
| |
| (21)* | | Subsidiaries of Registrant. |
| |
| (23)* | | Report and Consent of Independent Registered Public Accounting Firm. |
| |
| (31.1)* | | Certification of Chief Executive Officer Pursuant to Section 302 of the Sarbanes-Oxley Act of 2002. |
| |
| (31.2)* | | Certification of Chief Financial Officer Pursuant to Section 302 of the Sarbanes-Oxley Act of 2002. |
| |
| (32.1)* | | Certification of Chief Executive Officer Pursuant to Section 906 of the Sarbanes-Oxley Act of 2002. |
| |
| (32.2)* | | Certification of Chief Financial Officer Pursuant to Section 906 of the Sarbanes-Oxley Act of 2002. |
| |
| (99)(A)* | | Form 11-K Annual Report for the Harleysville Group Inc. Amended and Restated Employee Stock Purchase Plan for the year ended December 31, 2011. |
| |
| 101.INS** | | XBRL Instance Document. |
| |
| 101.SCH** | | XBRL Taxonomy Extension Schema Document. |
| |
| 101.CAL** | | XBRL Taxonomy Extension Calculation Linkbase Document. |
| |
| 101.LAB** | | XBRL Taxonomy Extension Label Linkbase Document. |
| |
| 101.PRE** | | XBRL Taxonomy Extension Presentation Linkbase Document. |
| |
| 101.DEF** | | XBRL Taxonomy Extension Definition Linkbase Document. |
| ** | Furnished and not filed herewith. |