UNITED STATES
SECURITIES AND EXCHANGE COMMISSION
Washington, D.C. 20549
FORM N-CSR
CERTIFIED SHAREHOLDER REPORT OF REGISTERED
MANAGEMENT INVESTMENT COMPANIES
Investment Company Act file number: 811-4661
Dryden Global Total Return Fund, Inc
(Exact name of registrant as specified in charter)
| | |
Gateway Center 3 100 Mulberry Street, Newark, New Jersey | | 07102 |
| |
| (Address of principal executive offices) | | (Zip code) |
Marguerite E. H. Morrison
Gateway Center 3
100 Mulberry Street,
Newark, New Jersey 07102
(Name and address of agent for service)
Registrant’s telephone number, including area code: 973-367-7525
Date of fiscal year end: 12/31/03
Date of reporting period: 12/31/03
Item 1—Reports to Stockholders—[INSERT REPORT]
Dryden Global Total Return Fund, Inc.
Formerly known as Prudential Global Total Return Fund, Inc.
| | |
|
| DECEMBER 31, 2003 | | ANNUAL REPORT |

FUND TYPE
Global/international bond
OBJECTIVE
Total return, made up of current income and capital appreciation
This report is not authorized for distribution to prospective investors unless preceded or accompanied by a current prospectus.
The views expressed in this report and information about the Fund’s portfolio holdings are for the period covered by this report and are subject to change thereafter.
JennisonDryden is a service mark of The Prudential Insurance Company of America.

Dear Shareholder,
February 23, 2004
As you may know, the mutual fund industry recently has been the subject of much media attention. As president of your Fund, I’d like to provide you with an update on the issues as they pertain to JennisonDryden mutual funds.
Regulators and government authorities have requested information regarding trading practices from many mutual fund companies across the nation. Our fund family has been cooperating with inquiries it has received, and at the same time, Prudential Financial, Inc. has been conducting its own internal review. This review encompasses the policies, systems, and procedures of our fund family, Prudential Financial’s investment units and its proprietary distribution channels. The review also includes mutual fund trading activity by investment professionals who manage our funds.
Market timing
The frequent trading of shares in response to short-term fluctuations in the market is known as “market timing”. When market timing occurs in violation of a fund’s prospectus, in certain circumstances, a fund may have to sell portfolio securities to have the cash necessary to redeem the market timer’s shares. The redemption may happen when it is not advantageous to sell securities and result in harming the fund’s performance and/or subject the fund to additional transaction costs.
Prudential Investments LLC, the Fund’s investment manager, has actively discouraged market timing and for years our mutual fund prospectuses have identified and addressed this issue. Prudential Investments has established operating policies and procedures that are designed to detect and deter frequent trading activities that would be disruptive to the management of our mutual fund portfolios, and has rejected numerous orders placed by market timers in the past.
Late trading
The Securities and Exchange Commission requires that orders to purchase or redeem mutual fund shares be received either by the fund or by an intermediary (such as a broker, financial adviser, or 401(k) record keeper) before the time at which the fund calculates its net asset value (normally 4:00 p.m., Eastern time) if they are to receive that day’s price. The policies of our mutual funds do not make and have not made allowances for the practice known as “late trading”.
For more than 40 years we have offered investors quality investment products, financial guidance, and responsive customer service. Today we remain committed to this heritage and to the highest ethical principles in our investment practices.
Sincerely,

Judy A. Rice, President
Dryden Global Total Return Fund, Inc.
| | |
| Dryden Global Total Return Fund, Inc. | | 1 |
Your Fund’s Performance
Fund Objective
The investment objective of the Dryden Global Total Return Fund, Inc. (the Fund) is total return, made up of current income and capital appreciation. There can be no assurance that the Fund will achieve its investment objective.
| | | | | | | | | | | | |
| | | |
| Cumulative Total Returns1 as of 12/31/03 | | | | | | | | | | |
| | | One Year | | | Five Years | | | Ten Years | | | Since Inception2 | |
Class A | | 13.44 | % | | 23.99 | % | | 86.84 | % | | 327.07 | % |
| |
Class B | | 12.72 | | | 20.55 | | | N/A | | | 51.78 | |
| |
Class C | | 12.88 | | | 20.82 | | | N/A | | | 52.14 | |
| |
Class Z | | 13.71 | | | 25.49 | | | N/A | | | 44.48 | |
| |
Citigroup WGBI–Unhedged3 | | 14.91 | | | 32.22 | | | 92.91 | | | *** | |
| |
Lipper Global Income Funds Avg.4 | | 13.46 | | | 33.05 | | | 85.34 | | | **** | |
| |
| | | | | | | | | | | | | |
| | |
| Average Annual Total Returns1 as of 12/31/03 | | | | | | | |
| | | One Year | | | Five Years | | | Ten Years | | | Since Inception2 | |
Class A | | 8.90 | % | | 3.55 | % | | 6.02 | % | | 8.40 | % |
| |
Class B | | 7.72 | | | 3.65 | | | N/A | | | 5.38 | |
| |
Class C | | 10.76 | | | 3.65 | | | N/A | | | 5.28 | |
| |
Class Z | | 13.71 | | | 4.65 | | | N/A | | | 5.57 | |
| |
Citigroup WGBI–Unhedged3 | | 14.91 | | | 5.75 | | | 6.79 | | | *** | |
| |
Lipper Global Income Funds Avg.4 | | 13.46 | | | 5.80 | | | 6.29 | | | **** | |
| |
| | | | | | | | | | | | | |
| | | |
| Distributions and Yields1 as of 12/31/03 | | | | | | | | | | |
| | | | | | | | | |
| | | | | | | Total Distributions
Paid for 12 Months | | 30-Day
SEC
Yield | |
Class A | | | | | | $0.59 | | 1.60 | % |
| |
Class B | | | | | | $0.54 | | 0.94 | |
| |
Class C | | | | | | $0.56 | | 1.15 | |
| |
Class Z | | | | | | $0.61 | | 1.91 | |
| |
Past performance is not indicative of future results. Principal value and investment return will fluctuate so that an investor’s shares, when redeemed, may be worth more or less than their original cost. Past performance numbers, with the exception of six-month, one-, and five-year returns, do not fully reflect the higher operating expenses incurred since the Fund commenced operations as an open-end mutual fund on January 15, 1996. If these expenses had been applied since the Fund’s inception, past performance returns would have been lower. Prior to January 15, 1996, the Fund operated as a closed-end fund with shares being traded on the New York Stock Exchange. 1Source: Prudential Investments LLC and Lipper Inc. The cumulative total returns do not take into account applicable sales charges. If reflected, the applicable sales charges would reduce the cumulative total return performance quoted. The average annual total returns do take into account applicable sales charges. Without the distribution and service (12b-1) fee waiver of 0.05% and 0.25% for Class A and Class C shares
| | |
| 2 | | Visit our website at www.jennisondryden.com |
respectively, the returns for these classes would have been lower. The Fund charges a maximum front-end sales charge of 4% for Class A shares and a 12b-1 fee of up to 0.30% annually. In some circumstances, Class A shares may not be subject to a front-end sales charge, but may be subject to a 1% contingent deferred sales charge (CDSC) for the first year. Class B shares are subject to a declining CDSC of 5%, 4%, 3%, 2%, 1%, and 1% for the first six years respectively after purchase and a 12b-1 fee of 1% annually. Approximately seven years after purchase, Class B shares will automatically convert to Class A shares on a quarterly basis. Class C shares are subject to a CDSC of 1% for shares redeemed within 12 months of purchase, and a 12b-1 fee of up to 1% annually. Class Z shares are not subject to a sales charge or 12b-1 fee. The returns in the tables do not reflect the deduction of taxes that a shareholder would pay on fund distributions or following the redemption of fund shares. 2Inception dates: Class A, 7/7/86; Class B and Class C, 1/15/96; and Class Z, 3/17/97. 3The Citigroup World Government Bond Index (WGBI)–Unhedged (formerly known as the Salomon Smith Barney World Government Bond Index–Unhedged) is a market capitalization-weighted index consisting of the government bond markets of 18 countries, which are selected based on market capitalization and investability criteria. All issues have a remaining maturity of at least one year. 4The Lipper Global Income Funds Average (Lipper Average) represents returns based on an average return of all funds in the Lipper Global Income Funds category for the periods noted. Funds in the Lipper Average invest primarily in U.S. dollar and non-U.S. dollar debt securities of issuers located in at least three countries, one of which may be the United States. Investors cannot invest directly in an index. The returns for the Citigroup WGBI–Unhedged and the Lipper Average would be lower if they included the effects of sales charges, operating expenses of a mutual fund, or taxes. Returns for the Lipper Average reflect the deduction of operating expenses, but not sales charges or taxes. ***Citigroup WGBI–Unhedged Closest Month-End to Inception cumulative total returns are 297.57% for Class A, 60.33% for Class B and Class C, and 59.41% for Class Z. Citigroup WGBI–Unhedged Closest Month-End to Inception average annual total returns are 8.25% for Class A, 6.14% for Class B and Class C, and 7.15% for Class Z. ****Lipper Average Closest Month-End to inception cumulative total returns are 279.50% for Class A, 61.73% for Class B and Class C, and 50.53% for Class Z. Lipper Average Closest Month-End to Inception average annual total returns are 7.94% for Class A, 6.16% for Class B and Class C, and 6.18% for Class Z.
| | | |
| |
| Five Largest Issuers expressed as a percentage of total investments as of 12/31/03 | | | |
United States Treasury Bonds | | 24.3 | % |
| |
Japanese Government Bonds | | 20.5 | |
| |
German Government Bonds | | 19.9 | |
| |
Prudential Core Investment Fund | | 11.3 | |
| |
French Government Bonds | | 4.3 | |
| |
Issuers are subject to change.
| | |
| Dryden Global Total Return Fund, Inc. | | 3 |
Investment Adviser’s Report
Prudential Investment Management, Inc.
U.S. dollar decline a dominant theme in global bond markets
Despite improving economic conditions in the United States during 2003, the U.S. dollar weakened considerably during the year, marking its second consecutive annual decline versus major world currencies. The U.S. currency decreased 20.04% versus the euro in 2003, 9.7% versus the Japanese yen, and 14.65% versus a group of currencies comprised of the United States’ major trading partners. The U.S. dollar’s decline was a major factor in global fixed income market performance, as gains on non-U.S. bonds increased substantially when translated into U.S. dollars on an unhedged basis. This impact is reflected in the double-digit returns of the Fund; its benchmark, the Citigroup World Government Bond Index–Unhedged (the Index); and the Lipper Global Income Funds Average (the Lipper Average) in 2003. For the year, the Fund’s Class A shares posted a cumulative total return that lagged the Index, keeping in mind the Index does not include the effect of mutual fund operating expenses. The Class A shares’ cumulative total return was in line with the Lipper Average in 2003. Both the Fund and its Lipper peer group take into account operating expenses.
Numerous factors weighed on the U.S. dollar
Pressure on the U.S. dollar came in large part from a combination of the growing federal budget gap and the widening U.S. current account deficit. An increase in the current account deficit implies that more funds from abroad are necessary to finance the deficit. Concern that foreign inflows would fall short placed additional weight on the dollar. Another factor in the currency’s decline was the increasing acceptance of the euro as a world reserve currency, encouraging many central banks to hold euros as well as dollars in reserve. Furthermore, the resurgence of Asia as an economic powerhouse has attracted capital flows to Japan, China, and other Asian nations that might otherwise have been invested in U.S. dollar-based assets. Other factors that weighed on the dollar included rising prices for gold, oil, and copper, which helped currencies of commodity-driven economies strengthen versus the U.S. dollar, as well as the apparent abandonment of the “strong dollar” policy by the Bush administration in September 2003.
The U.S. dollar story was not just one of direction, but also of movement, as foreign exchange markets experienced volatility in 2003. Fluctuations in exchange rates presented the markets with attractive investment opportunities. During the year, we frequently adjusted the Fund’s currency exposures in an effort to take advantage of these moves. By year-end, the Fund was positioned with a larger exposure to the euro than to the U.S. dollar, reflecting the greater relative strength of the single European currency.
| | |
| 4 | | Visit our website at www.jennisondryden.com |
Global government bonds experienced mixed results in 2003
Global government bond markets were also volatile in 2003. In the first half of the year, with global growth prospects and economic recovery expectations still uncertain, many major central banks, including the Federal Reserve (the Fed), the European Central Bank, and the Bank of England, were expected to cut short-term interest rates in order to stimulate growth in their respective economies. Anticipation of lower rates exerted downward pressure on bond yields, which, in turn, pushed bond prices higher, since yields and prices move in opposite directions. In the case of the Fed, its only change in monetary policy occurred in late June in the form of a quarter of a percentage point move to lower the interbank overnight lending rate to 1%. Market disappointment over this modest change in monetary policy, combined with increasing signs that a U.S.-led global economic recovery might be taking hold, fueled a sharp sell-off in U.S. Treasury securities. The sell-off lasted into August, and spilled over (albeit to a slightly lesser extent) into other government bond markets. During this time, the Fund benefited from having a larger exposure to euro-area, Canadian, and Australian government bonds than to U.S. Treasurys. However, Fund performance was diminished by exposure to Japanese government bonds, which, like U.S. Treasurys, sold off during the summer.
Corporate and emerging-market bond positions aided the Fund
During September, U.S. Treasurys and some other government bond markets regained some of the ground they had lost earlier in the summer, but during the balance of 2003, remained vulnerable to periodic sell-offs. In contrast, U.S. corporate bonds experienced solid performance during the year, as improving domestic economic conditions, aided by a low interest rate environment, tax cuts, and a weaker U.S. dollar, created a positive setting for credit product. In fact, high yield corporate bonds and emerging-market bonds surged in value. Both sectors returned nearly 30% for the year, as measured by various broker indexes. The Fund benefited from its exposure to high yield corporate bonds and emerging-market positions in countries such as Russia, Brazil, and Poland.
| | |
| Dryden Global Total Return Fund, Inc. | | 5 |
This Page Intentionally Left Blank
Portfolio of Investments
as of December 31, 2003
| | | | | | |
Principal
Amount (000) | | Description | | US$ Value (Note 1) |
| | | | | | | |
| | LONG-TERM INVESTMENTS 88.2% |
| |
| | Eurobonds 37.7% | | | |
|
| | | | Austrian Government Bonds, | | | |
| EUR | 1,870 | | 5.50%, 1/15/10 | | $ | 2,568,940 |
| | | | Bank of America Corp., | | | |
| | 910 | | 3.625%, 3/3/08 | | | 1,146,069 |
| | | | Belgian Government Bonds, | | | |
| | 4,225 | | 6.50%, 3/31/05 | | | 5,598,363 |
| | | | Citigroup, Inc., | | | |
| | 985 | | 4.625%, 11/14/07 | | | 1,286,581 |
| | | | French Government Bonds, | | | |
| | 3,320 | | 8.50%, 4/25/23 | | | 6,134,957 |
| | 2,390 | | 5.75%, 10/25/32 | | | 3,376,383 |
| | | | German Government Bonds, | | | |
| | 4,665 | | 2.50%, 3/18/05 | | | 5,899,564 |
| | 5,700 | | 4.00%, 2/16/07 | | | 7,397,632 |
| | 7,515 | | 3.00%, 4/11/08 | | | 9,332,124 |
| | 3,850 | | 3.50%, 10/10/08 | | | 4,855,685 |
| | 1,550 | | 4.50%, 1/4/13 | | | 1,995,173 |
| | 2,470 | | 4.25%, 1/4/14 | | | 3,101,516 |
| | 7,580 | | 5.50%, 1/4/31 | | | 10,368,945 |
| | 610 | | 4.75%, 7/4/34 | | | 746,049 |
| | | | HSBC Capital Funding LP, | | | |
| | 500 | | 8.03%, 4/17/49 | | | 765,324 |
| | | | ING Verzekeringen NV, | | | |
| | 390 | | 6.375%, 5/7/27 | | | 531,281 |
| | | | Italian Government Bonds, | | | |
| | 4,385 | | 5.00%, 10/15/07 | | | 5,865,522 |
| | | | Spanish Government Bonds, | | | |
| | 2,190 | | 4.95%, 7/30/05 | | | 2,869,013 |
| | 4,785 | | 5.35%, 10/31/11 | | | 6,528,004 |
| | | | | |
|
|
| | | | | | | 80,367,125 |
| | | | | |
|
|
|
| | Japan 21.1% |
|
| | | | Japanese Government Bonds, | | | |
| JPY | 375,800 | | 0.50%, 12/20/06 | | | 3,532,892 |
| | 823,000 | | 0.30%, 9/20/07 | | | 7,659,729 |
| | 1,189,950 | | 0.30%, 3/20/08 | | | 11,032,436 |
| | 198,650 | | 0.80%, 9/20/08 | | | 1,875,208 |
| | 152,700 | | 1.80%, 3/22/10 | | | 1,509,474 |
| | 1,070,500 | | 1.60%, 3/21/11 | | | 10,387,756 |
See Notes to Financial Statements.
| | |
| Dryden Global Total Return Fund, Inc. | | 7 |
Portfolio of Investments
as of December 31, 2003
| | | | | | |
Principal
Amount (000) | | Description | | US$ Value (Note 1) |
| | | | | | | |
| JPY | 388,450 | | 1.10%, 9/20/12 | | $ | 3,583,331 |
| | 426,300 | | 1.90%, 6/20/22 | | | 4,049,711 |
| | 145,000 | | 1.90%, 9/20/22 | | | 1,374,801 |
| | | | | |
|
|
| | | | | | | 45,005,338 |
| | | | | |
|
|
|
| | Poland 0.8% |
|
| | | | Poland Government Bonds, | | | |
| PLZ | 6,290 | | 8.50%, 11/12/06 | | | 1,767,831 |
| | | | | |
|
|
|
| | United Kingdom 4.8% |
|
| | | | Deutsche Telecom International Finance BV, | | | |
| GBP | 780 | | 7.125%, 6/15/05 | | | 1,446,446 |
| | | | International Nederland Bank NV, | | | |
| | 410 | | 7.00%, 10/5/10 | | | 801,487 |
| | | | United Kingdom Treasury Bonds, | | | |
| | 2,415 | | 4.00%, 3/7/09 | | | 4,200,181 |
| | 2,020 | | 5.00%, 9/7/14 | | | 3,675,771 |
| | | | | |
|
|
| | | | | | | 10,123,885 |
| | | | | |
|
|
|
| | United States 23.8% |
|
| |
| | Corporate Bonds 1.3% | | | |
|
| USD | 170 | | Alcan, Inc.,
5.20%, 1/15/14 | | | 171,833 |
| | 230 | | Cadbury Schweppes US Finance,
5.125%, 10/1/13 | | | 228,502 |
| | 450 | | Chohung Bank, FRN,
6.07%, 1/7/05 | | | 465,750 |
| | 834 | | Fideicomiso Petacalco,
10.16%, 12/23/09 | | | 975,780 |
| | 220 | | Korea Exchange Bank,
13.75%, 6/30/10 | | | 252,736 |
| | 500 | | Petrobras International Finance Co. (PIFCO),
8.375%, 12/10/18 | | | 513,750 |
| | 30 | | Telefonica Europe BV,
7.75%, 9/15/10 | | | 35,617 |
| | | | | |
|
|
| | | | | | | 2,643,968 |
| | | | | |
|
|
| |
| | Sovereign Bonds 0.3% | | | |
|
| | | | Federal Republic of Brazil, | | | |
| | 545 | | 9.25%, 10/22/10 | | | 585,875 |
| | | | | |
|
|
See Notes to Financial Statements.
| | |
| 8 | | Visit our website at www.jennisondryden.com |
| | | | | | | |
Principal
Amount (000) | | Description | | US$ Value (Note 1) | |
| | | | | | | | |
|
| | United States Government Obligations 22.2% | |
|
| USD | 4,820 | | United States Treasury Bonds,
5.375%, 2/15/31 | | $ | 5,026,547 | |
| | | | United States Treasury Notes, | | | | |
| | 915 | | 7.50%, 2/15/05 | | | 978,156 | �� |
| | 975 | | 6.75%, 5/15/05 | | | 1,045,230 | |
| | 4,765 | | 1.50%, 7/31/05 | | | 4,761,279 | |
| | 4,250 | | 1.875%, 12/31/05 | | | 4,254,648 | |
| | 2,148 | | 3.25%, 8/15/07 | | | 2,191,044 | |
| | 6,635 | | 3.125%, 10/15/08 | | | 6,622,301 | |
| | 6,600 | | 3.375%, 12/15/08 | | | 6,644,860 | |
| | 4,950 | | 6.00%, 8/15/09 | | | 5,606,840 | |
| | 405 | | 4.00%, 11/15/12 | | | 401,108 | |
| | 125 | | 4.25%, 11/15/13 | | | 124,863 | |
| | 6,085 | | 11.25%, 2/15/15 | | | 9,739,329 | |
| | | | | |
|
|
|
| | | | | | | 47,396,205 | |
| | | | | |
|
|
|
| | | | Total United States investments | | | 50,626,048 | |
| | | | | |
|
|
|
| | | | Total long-term investments
(cost US$173,803,001) | | | 187,890,227 | |
| | | | | |
|
|
|
|
| | SHORT-TERM INVESTMENTS 14.4% | |
|
|
| | United States Government Obligations 2.7% | |
|
| | | | United States Treasury Notes, | | | | |
| | 2,145 | | 1.875%, 9/30/04 (a) (b) | | | 2,157,149 | |
| | 3,715 | | 2.125%, 10/31/04 (b) | | | 3,743,877 | |
| | | | | |
|
|
|
| | | | | | | 5,901,026 | |
| | | | | |
|
|
|
| | |
Shares
| | | | | |
| |
| | Mutual Fund 11.7% | | | | |
| |
| | 24,896,416 | | Dryden Core Investment Fund-Taxable Money Market Series
(Note 3) | | | 24,896,416 | |
| | | | | |
|
|
|
| | | | Total short-term investments
(cost US$30,775,099) | | | 30,797,442 | |
| | | | | |
|
|
|
| | | | Total Investments 102.6%
(cost $204,578,100; Note 5) | | | 218,687,669 | |
| | | | Liabilities in excess of other assets (2.6%) | | | (5,557,242 | ) |
| | | | | |
|
|
|
| | | | Net Assets 100% | | $ | 213,130,427 | |
| | | | | |
|
|
|
See Notes to Financial Statements.
| | |
| Dryden Global Total Return Fund, Inc. | | 9 |
Portfolio of Investments
as of December 31, 2003
Portfolio securities are classified according to the security’s currency denomination.
| (a) | Pledged as initial margin on financial futures contracts. |
| (b) | Percentages quoted represent yield-to-maturity as of purchase date. |
EUR—Euro.
FRN—Floating Rate Note.
GBP—Pound Sterling.
JPY—Japanese Yen.
PLZ—Polish Zloty.
The industry classification of portfolio holdings and other assets shown as a percentage of net assets as of December 31, 2003 was as follows:
| | | |
Foreign Government Obligations | | 62.0 | % |
U.S Government Obligations | | 24.9 | |
Bank | | 3.4 | |
Life Insurance | | 0.2 | |
Oil | | 0.2 | |
Food | | 0.1 | |
Metal | | 0.1 | |
Liabilities in excess of other assets (including Taxable Money Market Series) | | 9.1 | |
| | |
|
|
| | | 100.0 | % |
| | |
|
|
See Notes to Financial Statements.
| | |
| 10 | | Visit our website at www.jennisondryden.com |
This Page Intentionally Left Blank
Statement of Assets and Liabilities
as of December 31, 2003
| | | | |
Assets | |
|
Investments, at value (cost $204,578,100) | | $ | 218,687,669 | |
Foreign currency, at value (cost $44,225) | | | 44,371 | |
Cash | | | 2,672 | |
Dividends and interest receivable | | | 3,102,710 | |
Unrealized appreciation on forward currency contracts | | | 2,383,748 | |
Receivable for Fund shares sold | | | 44,648 | |
Prepaid assets | | | 12,801 | |
| | |
|
|
|
Total assets | | | 224,278,619 | |
| | |
|
|
|
| |
Liabilities | | | | |
| |
Payable for investments purchased | | | 8,541,027 | |
Unrealized depreciation on forward currency contracts | | | 1,940,764 | |
Payable for Fund shares reacquired | | | 271,546 | |
Accrued expenses and other liabilities | | | 201,830 | |
Management fee payable | | | 134,593 | |
Distribution fee payable | | | 49,549 | |
Due to broker—variation margin | | | 8,883 | |
| | |
|
|
|
Total liabilities | | | 11,148,192 | |
| | |
|
|
|
| |
NET ASSETS | | $ | 213,130,427 | |
| | |
|
|
|
| | | | | |
| |
Net assets were comprised of: | | | | |
Common stock, at par | | $ | 283,665 | |
Paid-in capital in excess of par | | | 213,002,066 | |
| | |
|
|
|
| | | | 213,285,731 | |
Undistributed net investment income | | | 4,710,880 | |
Accumulated net realized loss on investment and foreign currency transactions | | | (19,639,531 | ) |
Net unrealized appreciation on investments and foreign currencies | | | 14,773,347 | |
| | |
|
|
|
Net assets December 31, 2003 | | $ | 213,130,427 | |
| | |
|
|
|
See Notes to Financial Statements.
| | |
| 12 | | Visit our website at www.jennisondryden.com |
| | | |
Class A | | | |
|
Net asset value and redemption price per share | | | |
($198,687,564 ÷ 26,446,940 shares of common stock issued and outstanding) | | $ | 7.51 |
Maximum sales charge (4% of offering price) | | | 0.31 |
| | |
|
|
Maximum offering price to public | | $ | 7.82 |
| | |
|
|
| |
Class B | | | |
|
Net asset value, offering price and redemption price per share ($8,601,621 ÷ 1,142,721 shares of common stock issued and outstanding) | | $ | 7.53 |
| | |
|
|
| |
Class C | | | |
|
Net asset value and redemption price per share
($903,500 ÷ 120,276 shares of common stock issued and outstanding) | | $ | 7.51 |
Sales charge (1% of offering price) | | | 0.08 |
| | |
|
|
Offering price to public | | $ | 7.59 |
| | |
|
|
| |
Class Z | | | |
|
Net asset value, offering price and redemption price per share
($4,937,742 ÷ 656,528 shares of common stock issued and outstanding) | | $ | 7.52 |
| | |
|
|
See Notes to Financial Statements.
| | |
| Dryden Global Total Return Fund, Inc. | | 13 |
Statement of Operations
Year Ended December 31, 2003
| | | | |
Net Investment Income | | | | |
| |
Income | | | | |
Interest (net of foreign withholding taxes of $138,678) | | $ | 6,362,711 | |
Dividends | | | 130,607 | |
| | |
|
|
|
| | | | 6,493,318 | |
| | |
|
|
|
| |
Expenses | | | | |
Management fee | | | 1,650,367 | |
Distribution fee—Class A | | | 515,316 | |
Distribution fee—Class B | | | 81,724 | |
Distribution fee—Class C | | | 6,113 | |
Transfer agent’s fees and expenses | | | 380,000 | |
Custodian’s fees and expenses | | | 277,000 | |
Reports to shareholders | | | 156,000 | |
Audit fee | | | 42,000 | |
Legal fees and expenses | | | 37,000 | |
Registration fees | | | 33,000 | |
Directors’ fees | | | 13,000 | |
Miscellaneous | | | 12,316 | |
| | |
|
|
|
Total expenses | | | 3,203,836 | |
| | |
|
|
|
Net investment income | | | 3,289,482 | |
| | |
|
|
|
| |
Realized And Unrealized Gain (Loss) On Investments And Foreign Currency Transactions | | | | |
| |
Net realized gain (loss) on: | | | | |
Investment transactions | | | 19,852,276 | |
Foreign currency transactions | | | 3,820,842 | |
Financial futures contracts | | | (956,054 | ) |
| | |
|
|
|
| | | | 22,717,064 | |
| | |
|
|
|
Net change in unrealized appreciation (depreciation) on: | | | | |
Investments | | | 3,153,915 | |
Foreign currencies | | | (1,924,366 | ) |
Financial futures contracts | | | 433,917 | |
| | |
|
|
|
| | | | 1,663,466 | |
| | |
|
|
|
Net gain on investments and foreign currencies | | | 24,380,530 | |
| | |
|
|
|
Net Increase In Net Assets Resulting From Operations | | $ | 27,670,012 | |
| | |
|
|
|
See Notes to Financial Statements.
| | |
| 14 | | Visit our website at www.jennisondryden.com |
Statement of Changes in Net Assets
| | | | | | | | |
| |
| | | Year Ended December 31,
| |
| | | 2003 | | | 2002 | |
Increase (Decrease) In Net Assets | | | | | | | | |
| |
Operations | | | | | | | | |
Net investment income | | $ | 3,289,482 | | | $ | 8,518,344 | |
Net realized gain (loss) on investment and foreign currency transactions | | | 22,717,064 | | | | (2,236,405 | ) |
Net change in unrealized appreciation (depreciation) on investments and foreign currencies | | | 1,663,466 | | | | 15,196,646 | |
| | |
|
|
| |
|
|
|
Net increase in net assets resulting from operations | | | 27,670,012 | | | | 21,478,585 | |
| | |
|
|
| |
|
|
|
Dividends from net investment income (Note 1) | | | | | | | | |
Class A | | | (15,873,792 | ) | | | (9,125,204 | ) |
Class B | | | (588,720 | ) | | | (264,924 | ) |
Class C | | | (63,425 | ) | | | (27,759 | ) |
Class Z | | | (402,702 | ) | | | (234,572 | ) |
| | |
|
|
| |
|
|
|
| | | | (16,928,639 | ) | | | (9,652,459 | ) |
| | |
|
|
| |
|
|
|
Fund share transactions (Net of share conversions) (Note 6) | | | | | | | | |
Net proceeds from shares sold | | | 19,510,499 | | | | 11,254,043 | |
Net asset value of shares issued in reinvestment of dividends | | | 8,311,617 | | | | 4,545,936 | |
Cost of shares reacquired | | | (48,829,240 | ) | | | (42,051,649 | ) |
| | |
|
|
| |
|
|
|
Decrease in net assets from Fund share transactions | | | (21,007,124 | ) | | | (26,251,670 | ) |
| | |
|
|
| |
|
|
|
Total decrease | | | (10,265,751 | ) | | | (14,425,544 | ) |
| | |
Net Assets | | | | | | | | |
| |
Beginning of year | | | 223,396,178 | | | | 237,821,722 | |
| | |
|
|
| |
|
|
|
End of year(a) | | $ | 213,130,427 | | | $ | 223,396,178 | |
| | |
|
|
| |
|
|
|
| | | | | | | | |
(a) Includes undistributed net investment income of: | | $ | 4,710,880 | | | | — | |
| | |
|
|
| |
|
|
|
See Notes to Financial Statements.
| | |
| Dryden Global Total Return Fund, Inc. | | 15 |
Notes to Financial Statements
Dryden Global Total Return Fund, Inc. (the “Fund”), formerly Prudential Global Total Return Fund, Inc., is an open-end, non-diversified management investment company. The Fund’s investment objective is to seek total return made up of current income and capital appreciation.
The Fund seeks to achieve this objective by investing at least 65% of its total assets in income-producing debt securities issued by the U.S. and foreign corporations and governments, supranational organizations, semi-government entities or governmental agencies, authorities or instrumentalities and short-term bank debt securities or bank deposits. The Fund invests primarily in investment-grade securities denominated in U.S. dollars and in foreign currencies.
Note 1. Accounting Policies
The following is a summary of significant accounting policies followed by the Fund in the preparation of its financial statements.
Security Valuation: In valuing a Fund’s assets, quotations of foreign securities in a foreign currency are converted to U.S. dollar equivalents at the then current currency value. Securities listed on a securities exchange (other than options on securities and indices) are valued at the last sale price on such exchange or market on the day of valuation or, if there was no sale on such day, at the mean between the last reported bid and asked prices, or at the last bid price on such day in the absence of an asked price. Securities that are actively traded in the over-the-counter market, including listed securities for which the primary market is believed by Prudential Investments LLC (“PI” or “Manager”), in consultation with the subadvisor, to be over-the-counter, are valued at market value using prices provided by an independent pricing agent or principal market maker. Corporate bonds, U.S. Government securities and convertible debt securities traded in the over-the-counter market, including securities listed on exchanges whose primary market is believed to be over-the-counter, are valued at market value using prices provided by an independent pricing agent or principal market maker. Futures contracts and options thereon traded on a commodities exchange or board of trade are valued at the last sale price at the close of trading on such exchange or board of trade or, if there was no sale on the applicable commodities exchange or board of trade on such day, at the mean between the most recently quoted prices on such exchange or board of trade or at the last bid price in the absence of an asked price. Prices may be obtained from independent pricing services which use information provided by market makers or estimates of market values obtained from yield data relating to investments or securities with similar characteristics. Securities for which reliable market quotations
| | |
| 16 | | Visit our website at www.jennisondryden.com |
are not readily available, or whose values have been affected by events occurring after the close of the security’s foreign market and before the Fund’s normal pricing time, are valued at fair value in accordance with Board of Directors’ approved fair valuation procedures.
Investments in mutual funds are valued at their net asset value as of the close of the New York Stock Exchange on the date of the valuation.
Short-term securities which mature in sixty days or less are valued at amortized cost, which approximates market value. The amortized cost method involves valuing a security at its cost on the date of purchase and thereafter assuming a constant amortization to maturity of the difference between the principal amount due at maturity and cost. Short-term securities which mature in more than 60 days are valued at current market quotations.
Foreign Currency Translation: The books and records of the Fund are maintained in U.S. dollars. Foreign currency amounts are translated into U.S. dollars on the following basis:
(i) market value of investment securities, other assets and liabilities—at the current rates of exchange.
(ii) purchases and sales of investment securities, income and expenses—at the rates of exchange prevailing on the respective dates of such transactions.
Although the net assets of the Fund are presented at the foreign exchange rates and market values at the close of the period, the Fund does not isolate that portion of the results of operations arising as a result of changes in the foreign exchange rates from the fluctuations arising from changes in the market prices of the securities held at the end of the period. Similarly, the Fund does not isolate the effect of changes in foreign exchange rates from the fluctuations arising from changes in the market prices of long-term debt securities sold during the period. Accordingly, such realized foreign currency gains or losses are included in the reported net realized gains or losses on investment transactions.
Net realized gains or losses on foreign currency transactions represent net foreign exchange gains or losses from sales and maturities of short-term securities and forward currency contracts, disposition of foreign currencies, currency gains or losses realized between the trade and settlement dates on securities transactions, and the difference between the amounts of interest, discount and foreign withholding taxes recorded on the Fund’s books and the U.S. dollar equivalent amounts actually received or paid. Net currency gains or losses resulting from the valuing of foreign
| | |
| Dryden Global Total Return Fund, Inc. | | 17 |
Notes to Financial Statements
Cont’d
currency denominated assets (excluding investments) and liabilities at year-end exchange rates are reflected as a component of net unrealized appreciation or depreciation on foreign currencies.
Foreign security and currency transactions may involve certain considerations and risks not typically associated with those of U.S. companies as a result of, among other factors, the possibility of political or economic instability and the level of governmental supervision and regulation of foreign securities markets.
Financial Futures Contracts: A financial futures contract is an agreement to purchase (long) or sell (short) an agreed amount of securities at a set price for delivery on a future date. Upon entering into a financial futures contract, the Fund is required to pledge to the broker an amount of cash and/or other assets equal to a certain percentage of the contract amount. This amount is known as the “initial margin.” Subsequent payments, known as “variation margin,” are made or received by the Fund each day, depending on the daily fluctuations in the value of the underlying security. Such variation margin is recorded for financial statement purposes on a daily basis as unrealized gain or loss. When the contract expires or is closed, the gain or loss is realized and is presented in the Statement of Operations as net realized gain or loss on financial futures contracts.
The Fund invests in financial futures contracts in order to hedge existing portfolio securities, or securities the Fund intends to purchase, against fluctuations in value caused by changes in prevailing interest rates. Should interest rates move unexpectedly, the Fund may not achieve the anticipated benefits of the financial futures contracts and may realize a loss. The use of futures transactions involves the risk of imperfect correlation in movements in the price of futures contracts, interest rates and the underlying hedged assets.
Forward Currency Contracts: A forward currency contract is a commitment to purchase or sell a foreign currency at a future date at a negotiated forward rate. The Fund enters into forward currency contracts in order to hedge its exposure to changes in foreign currency exchange rates on its foreign portfolio holdings or on specific receivables and payables denominated in a foreign currency. The contracts are valued daily at current forward exchange rates and any unrealized gain or loss is included in net unrealized appreciation or depreciation on foreign currencies. Gain or loss is realized on the settlement date of the contract equal to the difference between the trade date and settlement value. This gain or loss, if any, is included in
| | |
| 18 | | Visit our website at www.jennisondryden.com |
net realized gain or loss on foreign currency transactions. Risks may arise upon entering into these contracts from the potential inability of the counterparties to meet the terms of their contracts.
Financial futures contracts and forward currency contracts involve elements of both market and credit risk in excess of the amounts reflected on the Statement of Assets and Liabilities.
Security Transactions and Net Investment Income: Security transactions are recorded on the trade date. Realized and unrealized gains or losses on sales of securities are calculated on the identified cost basis. Dividend income is recorded on the ex-dividend date and interest income, including amortization of premium and accretion of discount on debt securities, as required, is recorded on the accrual basis. Expenses are recorded on the accrual basis.
Net investment income (other than distribution fees, which are charged directly to the respective class) and unrealized and realized gains or losses are allocated daily to each class of shares based upon the relative proportion of net assets of each class at the beginning of the day.
Dividends and Distributions: Dividends are declared and paid quarterly. Distributions of capital gains, if any, will be declared at least annually. Dividends and distributions to shareholders, which are determined in accordance with federal income tax regulations and which may differ from generally accepted accounting principles, are recorded on the ex-dividend date. Permanent book/tax differences relating to income and gains are reclassified to paid-in capital when they arise.
Taxes: For federal income tax purposes it is the Fund’s policy to continue to meet the requirements of the Internal Revenue Code applicable to regulated investment companies and to distribute all of its taxable net income and capital gains, if any, to shareholders. Therefore, no federal income tax provision is required.
Withholding taxes on foreign interest are recorded, net of reclaimable amounts, at the time the related income is earned.
Estimates: The preparation of the financial statements requires management to make estimates and assumptions that affect the reported amounts and disclosures in the financial statements. Actual results could differ from those amounts.
Note 2. Agreements
The Fund has a management agreement with PI. Pursuant to this agreement, PI has responsibility for all investment advisory services
| | |
| Dryden Global Total Return Fund, Inc. | | 19 |
Notes to Financial Statements
Cont’d
and supervises the subadvisor’s performance of such services. PI has entered into a subadvisory agreement with Prudential Investment Management, Inc. (“PIM”). The subadvisory agreement provides that the subadvisor will furnish investment advisory services in connection with the management of the Fund. In connection therewith, the subadvisor is obligated to keep certain books and records of the Fund. PI pays for the services of PIM, the cost of compensation of officers of the Fund, occupancy and certain clerical and bookkeeping costs of the Fund. The Fund bears all other costs and expenses.
The management fee paid to PI is accrued daily and payable monthly at an annual rate of .75 of 1% of the Fund’s average daily net assets up to $500 million, .70 of 1% of such assets between $500 million and $1 billion, and .65 of 1% of such assets in excess of $1 billion.
The Fund has a distribution agreement with Prudential Investment Management Services LLC (“PIMS”), which acts as the distributor of the Class A, B, C and Z shares of the Fund. The Fund compensates PIMS for distributing and servicing the Fund’s Class A, Class B and Class C shares, pursuant to plans of distribution (the “Class A, B and C Plans”), regardless of expenses actually incurred by it. The distribution fees are accrued daily and payable monthly. No distribution or service fees are paid to PIMS as distributor of the Class Z shares of the Fund.
Pursuant to the Class A, B and C Plans, the Fund compensates PIMS for distribution-related activities at an annual rate of up to .30 of 1%, 1% and 1% of the average daily net assets of the Class A, B, and C shares, respectively. For the year ended December 31, 2003, PIMS contractually agreed to limit such fee to .25 of 1% and .75 of 1% of the average daily net assets of the Class A and C shares, respectively.
PIMS has advised the Fund that it has received approximately $26,900 and $1,400 in front-end sales charges resulting from sales of Class A and Class C shares, respectively, during the year ended December 31, 2003. From these fees, PIMS paid a substantial part of such sales charges to dealers, which in turn paid commissions to salespersons and incurred other distribution costs.
PIMS has advised the Fund that for the year ended December 31, 2003, it received approximately $20,800 and $0 in contingent deferred sales charges imposed upon certain redemptions by Class B and Class C shareholders, respectively.
| | |
| 20 | | Visit our website at www.jennisondryden.com |
PI, PIM and PIMS are indirect, wholly-owned subsidiaries of Prudential Financial, Inc. (“Prudential”).
The Fund, along with other affiliated registered investment companies (the “Funds”), is a party to a syndicated credit agreement (“SCA”) with a group of banks. For the year ended December 31, 2003, the SCA provides for a commitment of $800 million and allows the Funds to increase the commitment to $1 billion, if necessary. Interest on any borrowings will be at market rates. The Funds pay a commitment fee of .08 of 1% of the unused portion of the SCA. The commitment fee is accrued and allocated to the Funds pro rata based on net assets. The purpose of the SCA is to serve as an alternative source of funding for capital share redemptions. The expiration date of the SCA was May 2, 2003. On May 2, 2003, the SCA was renewed under the same terms and conditions (“May 2003 renewal”). The expiration date of the May 2003 renewal is April 30, 2004. The Fund did not borrow any amounts pursuant to the SCA during the year ended December 31, 2003.
Note 3. Other Transactions with Affiliates
Prudential Mutual Fund Services LLC (“PMFS”), an affiliate of PI and an indirect, wholly-owned subsidiary of Prudential, serves as the Fund’s transfer agent. During the year ended December 31, 2003, the Fund incurred fees of approximately $342,700 for the services of PMFS. As of December 31, 2003, approximately $28,100 of such fees were due to PMFS. Transfer agent fees and expenses in the Statement of Operations include certain out-of-pocket expenses paid to non-affiliates, where applicable.
The Fund pays networking fees to affiliated and unaffiliated broker/dealers. These networking fees are payments made to broker/dealers that clear mutual fund transactions through a national mutual fund clearing system. The Fund incurred approximately $34,300 in total networking fees, of which the amount relating to the services of Wachovia Securities, LLC (“Wachovia”) and Prudential Securities, Inc. (“PSI”), affiliates of PI, was approximately $25,700 for the year ended December 31, 2003. Effective July 1, 2003 Prudential and Wachovia Corp. formed a joint venture (“Wachovia Securities, LLC”) whereby Prudential and Wachovia Corp. combined their brokerage businesses with Prudential holding a minority interest. Prior to July 1, 2003, PSI was an indirect, wholly-owned subsidiary of Prudential. These amounts are included in transfer agent’s fees and expenses in the Statement of Operations.
The Fund invests in the Taxable Money Market Series (the “Series”), a portfolio of Dryden Core Investment Fund, formerly Prudential Core Investment Fund, pursuant to an exemptive order received from the Securities and Exchange Commission. The Series is a money market mutual fund registered under the Investment Company Act
| | |
| Dryden Global Total Return Fund, Inc. | | 21 |
Notes to Financial Statements
Cont’d
of 1940, as amended, and managed by PI. During the year ended December 31, 2003, the Fund earned income of $130,607 from the Series by investing its excess cash.
Note 4. Portfolio Securities
Purchases and sales of investment securities, other than short-term investments for the year ended December 31, 2003, aggregated $516,669,478 and $550,549,966 respectively.
During the year ended December 31, 2003, the Fund entered into financial futures contracts. Details of open contracts at December 31, 2003, are as follows:
| | | | | | | | | | | | | | |
Number of
Contracts
| | Type
| | Expiration
Date
| | Value at
Trade
Date
| | Value at
December 31,
2003
| | Unrealized
Appreciation
(Depreciation)
| |
| | | Short Positions: | | | | | | | | | | | | |
| 104 | | 10-yr T-Notes | | Mar. 2004 | | $ | 11,577,111 | | $ | 11,675,625 | | $ | (98,514 | ) |
| 20 | | 10-yr Euro-Bond | | Mar. 2004 | | | 2,846,313 | | | 2,853,680 | | | (7,367 | ) |
| | | Long Positions: | | | | | | | | | | | | |
| 87 | | 2-yr Euro-Schatz | | Mar. 2004 | | | 11,556,456 | | | 11,604,741 | | | 48,285 | |
| 54 | | 30-yr T-Bonds | | Mar. 2004 | | | 5,868,320 | | | 5,902,875 | | | 34,555 | |
| 48 | | 5-yr Eurodollars | | Mar. 2004 | | | 6,636,319 | | | 6,692,020 | | | 55,701 | |
| | | | | | | | | | | | |
|
|
|
| | | | | | | | | | | | | $ | 32,660 | |
| | | | | | | | | | | | |
|
|
|
At December 31, 2003, the Fund had outstanding forward currency contracts to purchase and sell foreign currencies as follows:
| | | | | | | | | | | | |
Foreign Currency Purchase Contracts
| | Current
Value
| | Value at
Settlement Date
Payable
| | Unrealized
Appreciation
| | Unrealized
Depreciation
|
| Australian Dollars, | | | | | �� | | | | | | | |
| expiring 1/14/04 | | $ | 4,024,394 | | $ | 3,932,135 | | $ | 92,259 | | $ | — |
| Canadian Dollars, | | | | | | | | | | | | |
| expiring 1/6/04 | | | 6,861,700 | | | 6,771,804 | | | 89,896 | | | — |
| expiring 2/6/04 | | | 2,418,811 | | | 2,338,230 | | | 80,581 | | | — |
| Danish Krones, | | | | | | | | | | | | |
| expiring 1/9/04 | | | 2,931,964 | | | 2,790,543 | | | 141,421 | | | — |
| Euros, | | | | | | | | | | | | |
| expiring 1/5/04 | | | 24,109,439 | | | 23,286,316 | | | 823,123 | | | — |
| expiring 2/3/04 | | | 8,312,480 | | | 8,191,224 | | | 121,256 | | | — |
| | |
| 22 | | Visit our website at www.jennisondryden.com |
| | | | | | | | | | | | | |
Foreign Currency Purchase Contracts
| | Current
Value
| | Value at
Settlement Date
Payable
| | Unrealized
Appreciation
| | Unrealized
Depreciation
| |
| Hungarian Forint, | | | | | | | | | | | | | |
| expiring 1/8/04 | | $ | 2,356,789 | | $ | 2,261,597 | | $ | 95,192 | | $ | — | |
| Japanese Yen, | | | | | | | | | | | | | |
| expiring 1/6/04 | | | 27,654,415 | | | 27,188,285 | | | 466,977 | | | (847 | ) |
| expiring 2/3/04 | | | 17,286,713 | | | 17,212,081 | | | 74,632 | | | — | |
| Norwegian Krone, | | | | | | | | | | | | | |
| expiring 1/22/04 | | | 587,921 | | | 581,388 | | | 6,533 | | | — | |
| Polish Zloty, | | | | | | | | | | | | | |
| expiring 1/9/04 | | | 2,406,455 | | | 2,366,166 | | | 40,289 | | | — | |
| Pound Sterling, | | | | | | | | | | | | | |
| expiring 1/9/04 | | | 6,495,362 | | | 6,250,487 | | | 244,875 | | | — | |
Pound Sterling in
exchange for Euros, | | | | | | | | | | | | | |
| expiring 1/9/04 | | | 1,585,523 | | | 1,600,395 | | | — | | | (14,872 | ) |
| Swedish Kronas, | | | | | | | | | | | | | |
| expiring 1/16/04 | | | 1,939,653 | | | 1,903,130 | | | 36,523 | | | — | |
| Swiss Francs, | | | | | | | | | | | | | |
| expiring 1/9/04 | | | 1,665,548 | | | 1,596,436 | | | 69,112 | | | — | |
| | |
|
| |
|
| |
|
| |
|
|
|
| | | $ | 110,637,167 | | $ | 108,270,217 | | $ | 2,382,669 | | $ | (15,719 | ) |
| | |
|
| |
|
| |
|
| |
|
|
|
| | | | | | | | | | | | | |
Foreign Currency
Sale Contracts
| | Current
Value
| | Value at
Settlement Date
Receivable
| | Unrealized
Appreciation
| | Unrealized
Depreciation
| |
| Australian Dollars, | | | | | | | | | | | | | |
| expiring 1/14/04 | | $ | 3,268,907 | | $ | 3,180,000 | | $ | — | | $ | (88,907 | ) |
| Canadian Dollars, | | | | | | | | | | | | | |
| expiring 1/6/04 | | | 6,861,700 | | | 6,684,395 | | | — | | | (177,305 | ) |
| expiring 2/6/04 | | | 2,162,760 | | | 2,130,000 | | | — | | | (32,760 | ) |
| Danish Krones, | | | | | | | | | | | | | |
| expiring 1/9/04 | | | 603,281 | | | 598,000 | | | — | | | (5,281 | ) |
| Euros, | | | | | | | | | | | | | |
| expiring 1/5/04 | | | 24,109,438 | | | 23,251,190 | | | — | | | (858,248 | ) |
| expiring 2/3/04 | | | 3,065,861 | | | 3,050,000 | | | — | | | (15,861 | ) |
| Hungarian Forint, | | | | | | | | | | | | | |
| expiring 1/8/04 | | | 2,356,789 | | | 2,208,101 | | | — | | | (148,688 | ) |
| Japanese Yen, | | | | | | | | | | | | | |
| expiring 1/6/04 | | | 27,654,415 | | | 27,506,148 | | | — | | | (148,267 | ) |
| expiring 2/3/04 | | | 448,921 | | | 450,000 | | | 1,079 | | | — | |
| Polish Zloty, | | | | | | | | | | | | | |
| expiring 1/9/04 | | | 3,358,100 | | | 3,236,716 | | | — | | | (121,384 | ) |
| Pound Sterling, | | | | | | | | | | | | | |
| expiring 1/9/04 | | | 8,404,491 | | | 8,076,147 | | | — | | | (328,344 | ) |
| | |
|
| |
|
| |
|
| |
|
|
|
| | | $ | 82,294,663 | | $ | 80,370,697 | | $ | 1,079 | | $ | (1,925,045 | ) |
| | |
|
| |
|
| |
|
| |
|
|
|
| | |
| Dryden Global Total Return Fund, Inc. | | 23 |
Notes to Financial Statements
Cont’d
Note 5. Distributions and Tax Information
In order to present undistributed net investment income or loss and accumulated net realized gains or losses on the Statement of Assets and Liabilities that more closely represent their tax character, certain adjustments have been made to paid-in-capital in excess of par, undistributed net investment income loss and accumulated net realized gain or loss on investments. For the year ended December 31, 2003, the adjustments were to increase undistributed net investment income and increase accumulated net realized loss by $21,226,860, due to foreign currency reclassification and differences in the treatment of premium amortization. Net investment income, net realized gains and net assets were not affected by this change.
For the years ended December 31, 2003 and 2002, the tax character of dividends paid as reflected in the Statements of Changes in Net Assets were $16,928,639 and $9,652,459 of ordinary income, respectively.
As of December 31, 2003, the accumulated undistributed earnings on a tax basis consisted of $8,362,750 of ordinary income.
For federal income tax purposes, the Fund had a capital loss carryforward as of December 31, 2003, of approximately $18,405,800, of which $2,259,700 expires in 2007, $5,073,400 expires in 2008, $3,490,900 expires in 2009 and $7,581,800 expires in 2010. Approximately $2,391,300 of the capital loss carryforward was used to offset net taxable gains realized in the Fiscal Year ended December 31, 2003. Accordingly, no capital gains distribution is expected to be paid to shareholders until net gains have been realized in excess of such carryforward. The capital loss carryforward differs from the amount on the Statement of Assets and Liabilities primarily due to the Fund electing to treat post-October capital losses of approximately $179,600 as having occurred in the following fiscal year.
The United States federal income tax basis of the Fund’s investments and the net unrealized appreciation as of December 31, 2003 were as follows:
| | | | | | |
Tax Basis
| | Appreciation
| | Depreciation
| | Total Net Unrealized
Appreciation
|
| $206,056,387 | | $13,811,201 | | $1,179,919 | | $12,631,282 |
| | |
| 24 | | Visit our website at www.jennisondryden.com |
The differences between book and tax basis are primarily attributable to deferred losses on wash sales and amortization of premiums. The adjusted net unrealized appreciation on a tax basis was $12,937,275, which included other tax basis adjustments of $305,993 that were primarily attributable to appreciation of foreign currency and to the mark-to-market of receivables and payables.
Note 6. Capital
The Fund offers Class A, Class B, Class C and Class Z shares. Class A shares are sold with a front-end sales charge of up to 4%. In some limited circumstances, Class A shares may not be subject to a front-end sales charge, but may be subject to a 1% contingent deferred sales charge for the first fiscal year. Class B shares are sold with a contingent deferred sales charge which declines from 5% to zero depending on the period of time the shares are held. Class C shares are sold with a front-end sales charge of 1% and a contingent deferred sales charge of 1% during the first 18 months. Class B shares will automatically convert to Class A shares on a quarterly basis approximately seven years after purchase. A special exchange privilege is also available for shareholders who qualify to purchase Class A shares at net asset value. Class Z shares are not subject to any sales or redemption charge and are offered exclusively for sale to a limited group of investors.
There are 2 billion authorized shares of common stock at $.01 par value per share, divided equally into Class A, B, C and Z shares.
Transactions in shares of common stock were as follows:
| | | | | | | |
Class A
| | Shares
| | | Amount
| |
Year ended December 31, 2003: | | | | | | | |
Shares sold | | 1,806,486 | | | $ | 13,428,426 | |
Shares issued in reinvestment of dividends and distributions | | 1,002,831 | | | | 7,356,164 | |
Shares reacquired | | (5,784,773 | ) | | | (43,220,642 | ) |
| | |
|
| |
|
|
|
Net increase (decrease) in shares outstanding before conversions | | (2,975,456 | ) | | | (22,436,052 | ) |
Shares issued upon conversion and/or exchange from Class B | | 86,520 | | | | 659,185 | |
| | |
|
| |
|
|
|
Net increase (decrease) in shares outstanding | | (2,888,936 | ) | | $ | (21,776,867 | ) |
| | |
|
| |
|
|
|
Year ended December 31, 2002: | | | | | | | |
Shares sold | | 1,084,773 | | | $ | 7,522,821 | |
Shares issued in reinvestment of dividends and distributions | | 591,982 | | | | 4,069,148 | |
Shares reacquired | | (5,305,213 | ) | | | (36,528,145 | ) |
| | |
|
| |
|
|
|
Net increase (decrease) in shares outstanding before conversions | | (3,628,458 | ) | | | (24,936,176 | ) |
Shares issued upon conversion and/or exchange from Class B | | 70,097 | | | | 487,465 | |
| | |
|
| |
|
|
|
Net increase (decrease) in shares outstanding | | (3,558,361 | ) | | $ | (24,448,711 | ) |
| | |
|
| |
|
|
|
| | |
| Dryden Global Total Return Fund, Inc. | | 25 |
| | | | | | | |
Class B
| | Shares
| | | Amount
| |
Year ended December 31, 2003: | | | | | | | |
Shares sold | | 412,603 | | | $ | 3,076,114 | |
Shares issued in reinvestment of dividends and distributions | | 71,935 | | | | 528,301 | |
Shares reacquired | | (296,695 | ) | | | (2,197,517 | ) |
| | |
|
| |
|
|
|
Net increase (decrease) in shares outstanding before conversions | | 187,843 | | | | 1,406,898 | |
Shares issued upon conversion and/or exchange into Class A | | (86,499 | ) | | | (659,185 | ) |
| | |
|
| |
|
|
|
Net increase (decrease) in shares outstanding | | 101,344 | | | $ | 747,713 | |
| | |
|
| |
|
|
|
Year ended December 31, 2002: | | | | | | | |
Shares sold | | 322,255 | | | $ | 2,221,044 | |
Shares issued in reinvestment of dividends and distributions | | 34,185 | | | | 235,368 | |
Shares reacquired | | (308,773 | ) | | | (2,129,635 | ) |
| | |
|
| |
|
|
|
Net increase (decrease) in shares outstanding before conversions | | 47,667 | | | | 326,777 | |
Shares issued upon conversion and/or exchange into Class A | | (70,118 | ) | | | (487,465 | ) |
| | |
|
| |
|
|
|
Net increase (decrease) in shares outstanding | | (22,451 | ) | | $ | (160,688 | ) |
| | |
|
| |
|
|
|
Class C
| | | | | | |
Year ended December 31, 2003: | | | | | | | |
Shares sold | | 56,175 | | | $ | 418,335 | |
Shares issued in reinvestment of dividends and distributions | | 7,609 | | | | 55,800 | |
Shares reacquired | | (36,396 | ) | | | (270,629 | ) |
| | |
|
| |
|
|
|
Net increase (decrease) in shares outstanding | | 27,388 | | | $ | 203,506 | |
| | |
|
| |
|
|
|
Year ended December 31, 2002: | | | | | | | |
Shares sold | | 35,125 | | | $ | 241,946 | |
Shares issued in reinvestment of dividends and distributions | | 3,604 | | | | 24,792 | |
Shares reacquired | | (51,402 | ) | | | (358,799 | ) |
| | |
|
| |
|
|
|
Net increase (decrease) in shares outstanding | | (12,673 | ) | | $ | (92,061 | ) |
| | |
|
| |
|
|
|
Class Z
| | | | | | |
Year ended December 31, 2003: | | | | | | | |
Shares sold | | 347,039 | | | $ | 2,587,624 | |
Shares issued in reinvestment of dividends and distributions | | 50,594 | | | | 371,352 | |
Shares reacquired | | (423,263 | ) | | | (3,140,452 | ) |
| | |
|
| |
|
|
|
Net increase (decrease) in shares outstanding | | (25,630 | ) | | $ | (181,476 | ) |
| | |
|
| |
|
|
|
Year ended December 31, 2002: | | | | | | | |
Shares sold | | 182,499 | | | $ | 1,268,232 | |
Shares issued in reinvestment of dividends and distributions | | 31,511 | | | | 216,628 | |
Shares reacquired | | (439,639 | ) | | | (3,035,070 | ) |
| | |
|
| |
|
|
|
Net increase (decrease) in shares outstanding | | (225,629 | ) | | $ | (1,550,210 | ) |
| | |
|
| |
|
|
|
| | |
| 26 | | Visit our website at www.jennisondryden.com |
Financial Highlights
| | |
|
| DECEMBER 31, 2003 | | ANNUAL REPORT |
Dryden Global Total Return Fund, Inc.
Financial Highlights
| | | | |
| |
| | | Class A
| |
| | | Year Ended
December 31, 2003(b) | |
| |
Per Share Operating Performance: | | | | |
Net Asset Value, Beginning Of Year | | $ | 7.17 | |
| | |
|
|
|
Income from investment operations | | | | |
Net investment income | | | .11 | |
Net realized and unrealized gain (loss) on investment and foreign currencies | | | .82 | |
| | |
|
|
|
Total from investment operations | | | .93 | |
| | |
|
|
|
Less distributions | | | | |
Dividends from net investment income | | | (.59 | ) |
Tax return of capital distributions | | | — | |
| | |
|
|
|
Total distributions | | | (.59 | ) |
| | |
|
|
|
Net asset value, end of year | | $ | 7.51 | |
| | |
|
|
|
Total Return(a): | | | 13.44 | % |
Ratios/Supplemental Data: | | | | |
Net assets, end of year (000) | | $ | 198,688 | |
Average net assets (000) | | $ | 206,127 | |
Ratios to average net assets: | | | | |
Expenses, including distribution and service (12b-1) fees(c) | | | 1.43 | % |
Expenses, excluding distribution and service (12b-1) fees | | | 1.18 | % |
Net investment income | | | 1.52 | % |
For Class A, B, C and Z shares: | | | | |
Portfolio turnover rate | | | 251 | % |
| (a) | Total return does not consider the effects of sales loads. Total return is calculated assuming a purchase of shares on the first day and a sale on the last day of each year reported and includes reinvestment of dividends and distributions. |
| (b) | Calculated based upon weighted average shares outstanding during the year. |
| (c) | The distributor of the Fund contractually agreed to limit its distribution and service (12b-1) fees to .25% of 1% of the average daily net assets of the Class A shares. |
See Notes to Financial Statements.
| | |
| 28 | | Visit our website at www.jennisondryden.com |
| | | | | | | | | | | | | | |
| Class A | |
|
| Year Ended December 31, | |
|
| 2002 | | | 2001(b) | | | 2000 | | | 1999(b) | |
| |
| | | | | | | | | | | | | | | |
| $ | 6.80 | | | $ | 7.10 | | | $ | 7.26 | | | $ | 8.03 | |
|
|
| |
|
|
| |
|
|
| |
|
|
|
| | | | | | | | | | | | | | | |
| | .26 | | | | .32 | | | | .42 | | | | .44 | |
| | .41 | | | | (.33 | ) | | | (.18 | ) | | | (.75 | ) |
|
|
| |
|
|
| |
|
|
| |
|
|
|
| | .67 | | | | (.01 | ) | | | .24 | | | | (.31 | ) |
|
|
| |
|
|
| |
|
|
| |
|
|
|
| | | | | | | | | | | | | | | |
| | (.30 | ) | | | (.24 | ) | | | — | | | | (.33 | ) |
| | — | | | | (.05 | ) | | | (.40 | ) | | | (.13 | ) |
|
|
| |
|
|
| |
|
|
| |
|
|
|
| | (.30 | ) | | | (.29 | ) | | | (.40 | ) | | | (.46 | ) |
|
|
| |
|
|
| |
|
|
| |
|
|
|
| $ | 7.17 | | | $ | 6.80 | | | $ | 7.10 | | | $ | 7.26 | |
|
|
| |
|
|
| |
|
|
| |
|
|
|
| | 10.13 | % | | | (.15 | )% | | | 3.49 | % | | | (3.95 | )% |
| | | | | | | | | | | | | | | |
| $ | 210,353 | | | $ | 223,683 | | | $ | 208,101 | | | $ | 257,548 | |
| $ | 212,828 | | | $ | 226,129 | | | $ | 225,914 | | | $ | 166,940 | |
| | | | | | | | | | | | | | | |
| | 1.46 | % | | | 1.52 | % | | | 1.62 | % | | | 1.75 | % |
| | 1.21 | % | | | 1.27 | % | | | 1.37 | % | | | 1.50 | % |
| | 3.78 | % | | | 4.50 | % | | | 5.74 | % | | | 6.00 | % |
| | | | | | | | | | | | | | | |
| | 252 | % | | | 237 | % | | | 436 | % | | | 132 | % |
See Notes to Financial Statements.
| | |
| Dryden Global Total Return Fund, Inc. | | 29 |
Financial Highlights
Cont’d
| | | | |
| |
| | | Class B
| |
| | | Year Ended
December 31, 2003(b) | |
| |
Per Share Operating Performance: | | | | |
Net Asset Value, Beginning Of Year | | $ | 7.18 | |
| | |
|
|
|
Income from investment operations | | | | |
Net investment income | | | .05 | |
Net realized and unrealized gain (loss) on investment and foreign currencies | | | .84 | |
| | |
|
|
|
Total from investment operations | | | .89 | |
| | |
|
|
|
Less distributions | | | | |
Dividends from net investment income | | | (.54 | ) |
Tax return of capital distributions | | | — | |
| | |
|
|
|
Total distributions | | | (.54 | ) |
| | |
|
|
|
Net asset value, end of year | | $ | 7.53 | |
| | |
|
|
|
Total Return(a): | | | 12.72 | % |
Ratios/Supplemental Data: | | | | |
Net assets, end of year (000) | | $ | 8,602 | |
Average net assets (000) | | $ | 8,172 | |
Ratios to average net assets: | | | | |
Expenses, including distribution and service (12b-1) fees | | | 2.18 | % |
Expenses, excluding distribution and service (12b-1) fees | | | 1.18 | % |
Net investment income | | | .77 | % |
| (a) | Total return does not consider the effects of sales loads. Total return is calculated assuming a purchase of shares on the first day and a sale on the last day of each year reported and includes reinvestment of dividends and distributions. |
| (b) | Calculated based upon weighted average shares outstanding during the year. |
See Notes to Financial Statements.
| | |
| 30 | | Visit our website at www.jennisondryden.com |
| | | | | | | | | | | | | | |
|
| Class B | |
|
| Year Ended December 31, | |
|
| 2002 | | | 2001(b) | | | 2000 | | | 1999(b) | |
| |
| | | | | | | | | | | | | | | |
| $ | 6.81 | | | $ | 7.10 | | | $ | 7.26 | | | $ | 8.03 | |
|
|
| |
|
|
| |
|
|
| |
|
|
|
| | | | | | | | | | | | | | | |
| | .21 | | | | .28 | | | | .37 | | | | .40 | |
| | .41 | | | | (.31 | ) | | | (.17 | ) | | | (.76 | ) |
|
|
| |
|
|
| |
|
|
| |
|
|
|
| | .62 | | | | (.03 | ) | | | .20 | | | | (.36 | ) |
|
|
| |
|
|
| |
|
|
| |
|
|
|
| | | | | | | | | | | | | | | |
| | (.25 | ) | | | (.21 | ) | | | — | | | | (.28 | ) |
| | — | | | | (.05 | ) | | | (.36 | ) | | | (.13 | ) |
|
|
| |
|
|
| |
|
|
| |
|
|
|
| | (.25 | ) | | | (.26 | ) | | | (.36 | ) | | | (.41 | ) |
|
|
| |
|
|
| |
|
|
| |
|
|
|
| $ | 7.18 | | | $ | 6.81 | | | $ | 7.10 | | | $ | 7.26 | |
|
|
| |
|
|
| |
|
|
| |
|
|
|
| | 9.28 | % | | | (.49 | )% | | | 2.82 | % | | | (4.35 | )% |
| | | | | | | | | | | | | | | |
| $ | 7,480 | | | $ | 7,241 | | | $ | 6,145 | | | $ | 7,810 | |
| $ | 7,461 | | | $ | 7,120 | | | $ | 6,821 | | | $ | 4,642 | |
| | | | | | | | | | | | | | | |
| | 2.21 | % | | | 2.02 | % | | | 2.12 | % | | | 2.25 | % |
| | 1.21 | % | | | 1.27 | % | | | 1.37 | % | | | 1.50 | % |
| | 3.02 | % | | | 4.01 | % | | | 5.24 | % | | | 5.49 | % |
See Notes to Financial Statements.
| | |
| Dryden Global Total Return Fund, Inc. | | 31 |
Financial Highlights
Cont’d
| | | | |
| |
| | | Class C
| |
| | | Year Ended
December 31, 2003(b) | |
| |
Per Share Operating Performance: | | | | |
Net Asset Value, Beginning Of Year | | $ | 7.17 | |
| | |
|
|
|
Income from investment operations | | | | |
Net investment income | | | .07 | |
Net realized and unrealized gain (loss) on investment and foreign currencies | | | .83 | |
| | |
|
|
|
Total from investment operations | | | .90 | |
| | |
|
|
|
Less distributions | | | | |
Dividends from net investment income | | | (.56 | ) |
Tax return of capital distributions | | | — | |
| | |
|
|
|
Total distributions | | | (.56 | ) |
| | |
|
|
|
Net asset value, end of year | | $ | 7.51 | |
| | |
|
|
|
| | | | 12.88 | % |
Total Return(a): | | | | |
Ratios/Supplemental Data: | | | | |
Net assets, end of year (000) | | $ | 904 | |
Average net assets (000) | | $ | 815 | |
Ratios to average net assets: | | | | |
Expenses, including distribution and service (12b-1) fees(c) | | | 1.93 | % |
Expenses, excluding distribution and service (12b-1) fees | | | 1.18 | % |
Net investment income | | | 1.01 | % |
| (a) | Total return does not consider the effects of sales loads. Total return is calculated assuming a purchase of shares on the first day and a sale on the last day of each year reported and includes reinvestment of dividends and distributions. |
| (b) | Calculated based upon weighted average shares outstanding during the year. |
| (c) | The distributor of the Fund has contractually agreed to limit its distribution and service (12b-1) fees to .75% of 1% of the average daily net assets of the Class C shares. |
See Notes to Financial Statements.
| | |
| 32 | | Visit our website at www.jennisondryden.com |
| | | | | | | | | | | | | | |
| Class C | |
|
| Year Ended December 31, | |
|
| 2002 | | | 2001(b) | | | 2000 | | | 1999(b) | |
| |
| | | | | | | | | | | | | | | |
| $ | 6.81 | | | $ | 7.10 | | | $ | 7.26 | | | $ | 8.03 | |
|
|
| |
|
|
| |
|
|
| |
|
|
|
| | | | | | | | | | | | | | | |
| | .22 | | | | .28 | | | | .36 | | | | .40 | |
| | .40 | | | | (.31 | ) | | | (.16 | ) | | | (.76 | ) |
|
|
| |
|
|
| |
|
|
| |
|
|
|
| | .62 | | | | (.03 | ) | | | .20 | | | | (.36 | ) |
|
|
| |
|
|
| |
|
|
| |
|
|
|
| | | | | | | | | | | | | | | |
| | (.26 | ) | | | (.21 | ) | | | — | | | | (.28 | ) |
| | — | | | | (.05 | ) | | | (.36 | ) | | | (.13 | ) |
|
|
| |
|
|
| |
|
|
| |
|
|
|
| | (.26 | ) | | | (.26 | ) | | | (.36 | ) | | | (.41 | ) |
|
|
| |
|
|
| |
|
|
| |
|
|
|
| $ | 7.17 | | | $ | 6.81 | | | $ | 7.10 | | | $ | 7.26 | |
|
|
| |
|
|
| |
|
|
| |
|
|
|
| | 9.37 | % | | | (.49 | )% | | | 2.82 | % | | | (4.35 | )% |
| | | | | | | | | | | | | | | |
| | | | | | | | | | | | | | | |
| $ | 666 | | | $ | 719 | | | $ | 424 | | | $ | 561 | |
| $ | 741 | | | $ | 564 | | | $ | 482 | | | $ | 354 | |
| | | | | | | | | | | | | | | |
| | 1.96 | % | | | 2.02 | % | | | 2.12 | % | | | 2.25 | % |
| | 1.21 | % | | | 1.27 | % | | | 1.37 | % | | | 1.50 | % |
| | 3.28 | % | | | 3.97 | % | | | 5.29 | % | | | 5.51 | % |
See Notes to Financial Statements.
| | |
| Dryden Global Total Return Fund, Inc. | | 33 |
Financial Highlights
Cont’d
| | | | |
| |
| | | Class Z
| |
| | | Year Ended
December 31, 2003(b) | |
| |
Per Share Operating Performance: | | | | |
Net Asset Value, Beginning Of Year | | $ | 7.18 | |
| | |
|
|
|
Income from investment operations | | | | |
Net investment income | | | .13 | |
Net realized and unrealized gain (loss) on investment and foreign currencies | | | .82 | |
| | |
|
|
|
Total from investment operations | | | .95 | |
| | |
|
|
|
Less distributions | | | | |
Dividends from net investment income | | | (.61 | ) |
Tax return of capital distributions | | | — | |
| | |
|
|
|
Total distributions | | | (.61 | ) |
| | |
|
|
|
Net asset value, end of year | | $ | 7.52 | |
| | |
|
|
|
Total Return(a): | | | 13.71 | % |
Ratios/Supplemental Data: | | | | |
Net assets, end of year (000) | | $ | 4,938 | |
Average net assets (000) | | $ | 4,935 | |
Ratios to average net assets: | | | | |
Expenses, including distribution and service (12b-1) fees | | | 1.18 | % |
Expenses, excluding distribution and service (12b-1) fees | | | 1.18 | % |
Net investment income | | | 1.77 | % |
| (a) | Total return is calculated assuming a purchase of shares on the first day and a sale on the last day of each year reported and includes reinvestment of dividends and distributions. |
| (b) | Calculated based upon weighted average shares outstanding during the year. |
See Notes to Financial Statements.
| | |
| 34 | | Visit our website at www.jennisondryden.com |
| | | | | | | | | | | | | | |
| Class Z | |
|
| Year Ended December 31, | |
|
| 2002 | | | 2001(b) | | | 2000 | | | 1999(b) | |
| |
| | | | | | | | | | | | | | | |
| $ | 6.81 | | | $ | 7.10 | | | $ | 7.27 | | | $ | 8.03 | |
|
|
| |
|
|
| |
|
|
| |
|
|
|
| | | | | | | | | | | | | | | |
| | .27 | | | | .35 | | | | .43 | | | | .42 | |
| | .42 | | | | (.33 | ) | | | (.18 | ) | | | (.71 | ) |
|
|
| |
|
|
| |
|
|
| |
|
|
|
| | .69 | | | | .02 | | | | .25 | | | | (.29 | ) |
|
|
| |
|
|
| |
|
|
| |
|
|
|
| | | | | | | | | | | | | | | |
| | (.32 | ) | | | (.25 | ) | | | — | | | | (.34 | ) |
| | — | | | | (.06 | ) | | | (.42 | ) | | | (.13 | ) |
|
|
| |
|
|
| |
|
|
| |
|
|
|
| | (.32 | ) | | | (.31 | ) | | | (.42 | ) | | | (.47 | ) |
|
|
| |
|
|
| |
|
|
| |
|
|
|
| $ | 7.18 | | | $ | 6.81 | | | $ | 7.10 | | | $ | 7.27 | |
|
|
| |
|
|
| |
|
|
| |
|
|
|
| | 10.37 | % | | | .10 | % | | | 3.78 | % | | | (3.74 | )% |
| | | | | | | | | | | | | | | |
| $ | 4,897 | | | $ | 6,179 | | | $ | 10,551 | | | $ | 12,847 | |
| $ | 5,334 | | | $ | 9,591 | | | $ | 11,136 | | | $ | 4,604 | |
| | | | | | | | | | | | | | | |
| | 1.21 | % | | | 1.27 | % | | | 1.37 | % | | | 1.50 | % |
| | 1.21 | % | | | 1.27 | % | | | 1.37 | % | | | 1.50 | % |
| | 4.07 | % | | | 4.84 | % | | | 5.98 | % | | | 6.11 | % |
See Notes to Financial Statements.
| | |
| Dryden Global Total Return Fund, Inc. | | 35 |
Report of Independent Auditors
To the Board of Directors and Shareholders of
Dryden Global Total Return Fund, Inc.
In our opinion, the accompanying statement of assets and liabilities, including the portfolio of investments, and the related statements of operations and of changes in net assets and the financial highlights present fairly, in all material respects, the financial position of Dryden Global Total Return Fund, Inc., formerly Prudential Global Total Return Fund, Inc. (the “Fund”), at December 31, 2003, the results of its operations for the year then ended, the changes in its net assets for each of the two years in the period then ended and the financial highlights for each of the five years in the period then ended, in conformity with accounting principles generally accepted in the United States of America. These financial statements and financial highlights (hereafter referred to as “financial statements”) are the responsibility of the Fund’s management; our responsibility is to express an opinion on these financial statements based on our audits. We conducted our audits of these financial statements in accordance with auditing standards generally accepted in the United States of America, which require that we plan and perform the audit to obtain reasonable assurance about whether the financial statements are free of material misstatement. An audit includes examining, on a test basis, evidence supporting the amounts and disclosures in the financial statements, assessing the accounting principles used and significant estimates made by management, and evaluating the overall financial statement presentation. We believe that our audits, which included confirmation of securities at December 31, 2003 by correspondence with the custodian and brokers, provide a reasonable basis for our opinion.
PricewaterhouseCoopers LLP
New York, New York
February 20, 2004
| | |
| 36 | | Visit our website at www.jennisondryden.com |
Federal Income Tax Information
(Unaudited)
We are required by the Internal Revenue Code to advise you within 60 days of the Fund’s fiscal year end (December 31, 2003) as to the federal tax status of distributions paid by the Fund during such fiscal year. Accordingly, during its fiscal year ended December 31, 2003, the Fund paid distributions of $.59 per Class A share, $.54 per Class B share, $.56 per Class C share and $.61 per Class Z share representing dividends from ordinary income.
We wish to advise you that the dividends received deduction for the Fund is zero. Only funds that invest in U.S. equity securities are entitled to pass-through a corporate dividends received deduction.
| | |
| Dryden Global Total Return Fund, Inc. | | 37 |
Supplemental Proxy Information
(Unaudited)
A Special Meeting of Shareholders was held on July 2, 2003 and adjourned to July 24, 2003. At such meetings the shareholders approved the following proposals:
| 1)* | To approve the election of ten (10) directors to the Board of Directors, as follows: |
| | | | | | |
Matter
| | Votes For
| | Votes
Withheld
| | Abstentions
|
David E. A. Carson | | 18,805,710 | | 1,096,659 | | — |
Robert E. La Blanc | | 18,799,600 | | 1,102,769 | | — |
Douglas H. McCorkindale | | 18,822,781 | | 1,079,588 | | — |
Stephen P. Munn*** | | 18,829,047 | | 1,073,322 | | — |
Richard A. Redeker | | 18,819,631 | | 1,082,738 | | — |
Robin B. Smith | | 18,801,504 | | 1,100,865 | | — |
Stephen Stoneburn | | 18,814,693 | | 1,087,676 | | — |
Clay T. Whitehead | | 18,815,361 | | 1,087,008 | | — |
Judy A. Rice | | 18,815,959 | | 1,086,410 | | — |
Robert F. Gunia | | 18,814,620 | | 1,087,749 | | — |
| 2)* | To approve a proposal to permit the Manager to enter into, or make material changes to, subadvisory agreements without shareholder approval. |
| | |
| | | Shares
Voted
|
For | | 14,420,706 |
Against | | 2,729,875 |
Abstain | | 854,500 |
| 3)* | To permit an amendment to the Management Contract Between PI and the Fund. |
| | |
| | | Shares
Voted
|
For | | 16,737,533 |
Against | | 2,246,624 |
Abstain | | 918,212 |
| | |
| 38 | | Visit our website at www.jennisondryden.com |
| 4b)* | To approve changes to fundamental investment restrictions and policies, relating to: issuing senior securities, borrowing money or pledging assets. |
| | |
| | | Shares
Voted
|
For | | 14,829,436 |
Against | | 2,265,221 |
Abstain | | 910,425 |
| 4c)* | To approve changes to fundamental investment restrictions and policies, relating to: buying and selling real estate. |
| | |
| | | Shares
Voted
|
For | | 15,028,661 |
Against | | 2,114,129 |
Abstain | | 862,292 |
| 4d)* | To approve changes to fundamental investment restrictions and policies, relating to: buying and selling commodities and commodity contracts. |
| | |
| | | Shares
Voted
|
For | | 14,789,576 |
Against | | 2,254,258 |
Abstain | | 961,248 |
| 4e)* | To approve changes to fundamental investment restrictions and policies, relating to: fund concentration. |
| | |
| | | Shares
Voted
|
For | | 15,017,177 |
Against | | 2,018,667 |
Abstain | | 969,237 |
| 4f)* | To approve changes to fundamental investment restrictions and policies, relating to: making loans. |
| | |
| | | Shares
Voted
|
For | | 14,721,102 |
Against | | 2,400,672 |
Abstain | | 883,307 |
| | |
| Dryden Global Total Return Fund, Inc. | | 39 |
| 4g)* | To approve changes to fundamental investment restrictions and policies, relating to: other investment restrictions, including investing in securities of other investment companies. |
| | |
| | | Shares
Voted
|
For | | 14,987,332 |
Against | | 2,087,424 |
Abstain | | 930,326 |
| 5)** | To approve amendments to the Fund’s Articles of Incorporation. |
| | |
| | | Shares
Voted
|
For | | 15,425,565 |
Against | | 1,846,510 |
Abstain | | 989,650 |
| * | Approved at the July 2, 2003 meeting. |
| ** | Approved at the July 24, 2003 meeting. |
| *** | Mr. Munn ceased being a Director effective November 30, 2003. |
| | |
| 40 | | Visit our website at www.jennisondryden.com |
Management of the Fund
(Unaudited)
Information pertaining to the Directors of the Fund is set forth below. Directors who are not deemed to be “interested persons” of the Fund, as defined in the 1940 Act are referred to as “Independent Directors.” Directors who are deemed to be “interested persons” of the Fund are referred to as “Interested Directors.” “Fund Complex”† consists of the Fund and any other investment companies managed by PI.
Independent Directors2
David E.A. Carson (69), Director since 20033 Oversees 89 portfolios in Fund complex
Principal occupations (last 5 years): Director (January 2000 to May 2000), Chairman (January 1999 to December 1999), Chairman and Chief Executive Officer (January 1998 to December 1998) and President, Chairman and Chief Executive Officer (1983-1997) of People’s Bank.
Other Directorships held:4 Director of United Illuminating and UIL Holdings (utility company), since 1993.
Robert E. La Blanc (69), Director since 20033 Oversees 98 portfolios in Fund complex
Principal occupations (last 5 years): President (since 1981) of Robert E. La Blanc Associates, Inc. (telecommunications); formerly General Partner at Salomon Brothers and Vice-Chairman of Continental Telecom; Trustee of Manhattan College.
Other Directorships held:4 Director of Storage Technology Corporation (since 1979) (technology), Chartered Semiconductor Manufacturing, Ltd. (since 1998); Titan Corporation (electronics) (since 1995), Computer Associates International, Inc. (since 2002) (software company); FiberNet Telecom Group, Inc. (since 2003) (telecom company); Director (since April 1999) of the High Yield Plus Fund, Inc.
Douglas H. McCorkindale (64), Director since 19963 Oversees 91 portfolios in Fund complex
Principal occupations (last 5 years): Chairman (since February 2001), Chief Executive Officer (since June 2000) and President (since September 1997) of Gannett Co. Inc. (publishing and media); formerly Vice Chairman (March 1984-May 2000) of Gannett Co., Inc.
Other Directorships held:4 Director of Gannett Co. Inc., Director of Continental Airlines, Inc. (since May 1993); Director of Lockheed Martin Corp. (aerospace and defense) (since May 2001); Director of The High Yield Plus Fund, Inc. (since 1996).
Richard A. Redeker (60), Director since 19933 Oversees 92 portfolios in Fund complex
Principal occupations (last 5 years): Management Consultant; formerly employee of Prudential Investments (October 1996-December 1998); Director of Invesmart, Inc. (since 2001) and Director of Penn Tank Lines, Inc. (since 1999).
Other Directorships held:4 None.
| | |
| Dryden Global Total Return Fund, Inc. | | 41 |
Robin B. Smith (64), Director since 19963 Oversees 99 portfolios in Fund complex
Principal occupations (last 5 years): Chairman of the Board (since January 2003) of Publishers Clearing House (direct marketing), formerly Chairman and Chief Executive Officer (August 1996-January 2003) of Publishers Clearing House.
Other Directorships held:4 Director of BellSouth Corporation (since 1992).
Stephen Stoneburn (60), Director since 20033 Oversees 97 portfolios in Fund complex
Principal occupations (last 5 years): President and Chief Executive Officer (since June 1996) of Quadrant Media Corp. (a publishing company); formerly President (June 1995-June 1996) of Argus Integrated Media, Inc.; Senior Vice President and Managing Director (January 1993-1995) of Cowles Business Media and Senior Vice President of Fairchild Publications, Inc. (1975-1989).
Other Directorships held:4 None
Clay T. Whitehead (65), Director since 19963 Oversees 96 portfolios in Fund complex
Principal occupations (last 5 years): President (since 1983) of National Exchange Inc. (new business development firm).
Other Directorships held:4 Director (since 2000) of the High Yield Plus Fund, Inc.
Interested Directors1
Judy A. Rice (56), President since 2003 and Director since 20003 Oversees 95 portfolios in Fund complex
Principal occupations (last 5 years): President, Chief Executive Officer, Chief Operating Officer and Officer-in-Charge (since 2003) of PI; Director, Officer-in-Charge, President, Chief Executive Officer and Chief Operating Officer (since May 2003) of American Skandia Advisory Services, Inc. and American Skandia Investment Services, Inc.; Director, Officer-in-Charge, President, Chief Executive Officer (since May 2003) of American Skandia Fund Services, Inc.; Vice President (since February 1999) of Prudential Investment Management Services LLC; President, Chief Executive Officer and Officer-in-Charge (since April 2003) of Prudential Mutual Fund Services LLC; formerly various positions to Senior Vice President (1992-1999) of Prudential Securities; and various positions to Managing Director (1975-1992) of Salomon Smith Barney; Member of Board of Governors of the Money Management Institute.
Other Directorships held:4 None
Robert F. Gunia (57), Vice President and Director since 19963 Oversees 179 portfolios in Fund complex
Principal occupations (last 5 years): Chief Administrative Officer (since June 1999) of PI; Executive Vice President and Treasurer (since January 1996) of PI; President (since April 1999) of Prudential Investment Management Services LLC (PIMS); Corporate Vice President (since September 1997) of The Prudential Insurance Company of America (Prudential); Director, Executive Vice President and Chief Administrative Officer (since May 2003) of American Skandia Investment Services, Inc., American Skandia Advisory Services, Inc. and American Skandia Fund Services, Inc.; President (since April 1999) of Prudential Investment Management Services LLC; Executive Vice President (since March 1999) and Treasurer (since May 2000) of Prudential Mutual Fund Services LLC; formerly Senior Vice President (March 1987-May 1999) of Prudential Securities.
Other Directorships held:4 Vice President and Director (since May 1989) and Treasurer (since 1999) of The Asia Pacific Fund, Inc.
| | |
| 42 | | Visit our website at www.jennisondryden.com |
Information pertaining to the Officers of the Fund is set forth below.
Officers2
Marguerite E.H. Morrison (47), Chief Legal Officer since 2003 and Assistant Secretary since 20023
Principal occupations (last 5 years): Vice President and Chief Legal Officer—Mutual Funds and Unit Investment Trust (since August 2000) of Prudential; Senior Vice President and Secretary (since April 2003) of PI; Senior Vice President and Secretary (since May 2003) of American Skandia Investment Services, Inc., American Skandia Advisory Services, Inc. and American Skandia Fund Services, Inc.; Vice President and Assistant Secretary of PIMS (since October 2001), previously Senior Vice President and Assistant Secretary (February 2001-April 2003) of PI, Vice President and Associate General Counsel (December 1996-February 2001) of PI.
Maryanne Ryan (39), Anti-Money Laundering Compliance Officer since 20023
Principal occupations (last 5 years): Vice President, Prudential (since November 1998), First Vice President, Prudential Securities (March 1997-May 1998); Anti-Money Laundering Compliance Officer (since 2003) of American Skandia Investment Services, Inc., American Skandia Advisory Services, Inc. and American Skandia Marketing, Inc.
Grace C. Torres (44), Treasurer and Principal Financial and Accounting Officer since 19983
Principal occupations (last 5 years): Senior Vice President (since January 2000) of PI, Senior Vice President and Assistant Treasurer (since May 2003) of American Skandia Investment Services, Inc. and American Skandia Advisory Services, Inc.; formerly First Vice President (December 1996-January 2000) of PI and First Vice President (March 1993-1999) of Prudential Securities.
| 1 | “Interested” Director, as defined in the 1940 Act, by reason of employment with the Manager, (Prudential Investments LLC or PI), the Subadviser (Prudential Investment Management, Inc. or PIM) or the Distributor (Prudential Investment Management Services LLC or PIMS). |
| 2 | Unless otherwise noted, the address of the Directors and Officers is c/o: Prudential Investments LLC, Gateway Center Three, 100 Mulberry Street, Newark, NJ 07102. |
| 3 | There is no set term of office for Directors and Officers. The Independent Directors have adopted a retirement policy, which calls for the retirement of Directors on December 31 of the year in which they reach the age of 75. The table shows the individuals length of service as Director and/or Officer. |
| 4 | This includes only directorships of companies requested to register, or file reports with the SEC under the Securities and Exchange Act of 1934 (that is, “public companies”) or other investment companies registered under the 1940 Act. |
| † | The Fund Complex consists of all investment companies managed by PI. The Funds for which PI serves as manager include JennisonDryden Mutual Funds, Strategic Partners Funds, American Skandia Advisor Funds, Inc., The Prudential Variable Contract Accounts 2, 10, 11, The Target Portfolio Trust, The Prudential Series Fund, Inc., American Skandia Trust, and Prudential’s Gibraltar Fund. |
Additional information about the Fund’s Directors is included in the Fund’s Statement of Additional Information which is available without charge, upon request, by calling (800) 521-7466 or (732) 482-7555 (Calling from outside the U.S.)
| | |
| Dryden Global Total Return Fund, Inc. | | 43 |
Growth of a $10,000 Investment
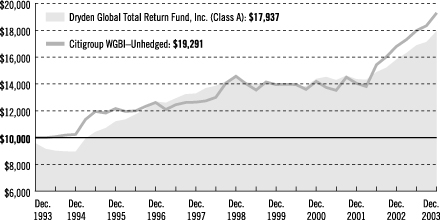
| | | | | | | | | | | | |
| |
| Average Annual Total Returns (With Sales Charges) as of 12/31/03 | | | | |
| | | One Year | | | Five Years | | | Ten Years | | | Since Inception | |
Class A | | 8.90 | % | | 3.55 | % | | 6.02 | % | | 8.40 | % |
| |
Class B | | 7.72 | | | 3.65 | | | N/A | | | 5.38 | |
| |
Class C | | 10.76 | | | 3.65 | | | N/A | | | 5.28 | |
| |
Class Z | | 13.71 | | | 4.65 | | | N/A | | | 5.57 | |
| |
| | | | | | | | | | | | | |
|
| Average Annual Total Returns (Without Sales Charges) as of 12/31/03 | |
| | | One Year | | | Five Years | | | Ten Years | | | Since Inception | |
Class A | | 13.44 | % | | 4.39 | % | | 6.45 | % | | 8.66 | % |
| |
Class B | | 12.72 | | | 3.81 | | | N/A | | | 5.38 | |
| |
Class C | | 12.88 | | | 3.86 | | | N/A | | | 5.41 | |
| |
Class Z | | 13.71 | | | 4.65 | | | N/A | | | 5.57 | |
| |
Past performance is not indicative of future results. Principal value and investment return will fluctuate so that an investor’s shares, when redeemed, may be worth more or less than their original cost. Source: Prudential Investments LLC and Lipper Inc. Inception dates: Class A, 7/7/86; Class B and C, 1/15/96; and Class Z, 3/17/97.
The graph compares a $10,000 investment in the Dryden Global Total Return Fund, Inc. (Class A shares) with a similar investment in the Citigroup WGBI–Unhedged by portraying the initial account values at the beginning of the 10-year period for Class A shares (December 31, 1993) and the account values at the end of the current fiscal year (December 31, 2003) as measured on a quarterly basis. For purposes of the graph, and unless otherwise indicated, it has been assumed that (a) the maximum applicable front-end sales charge was deducted from the initial $10,000 investment in Class A shares; (b) all recurring fees (including management fees) were deducted; and (c) all dividends and distributions were reinvested. The line graph provides information for Class A shares only. As indicated in the tables provided earlier, performance for Class B, C, and Z shares will vary due to the differing charges and expenses applicable to each share class (as indicated in the following paragraphs).
| | |
| | | Visit our website at www.jennisondryden.com |
Without a distribution and service (12b-1) fee waiver of 0.05% for Class A shares annually through December 31, 2003, the returns shown in the graph and for Class A shares in the tables would have been lower.
The Citigroup WGBI–Unhedged is a market capitalization-weighted index consisting of the government bond markets of 18 countries, which are selected based on market capitalization and investability criteria. All issues have a remaining maturity of at least one year. The Index’s total returns include the reinvestment of all dividends, but do not include the effects of sales charges, operating expenses of a mutual fund, or taxes. The returns for the Index would be lower if they included the effects of sales charges, operating expenses, or taxes. The securities that comprise the Index may differ substantially from the securities in the Fund. This is not the only Index that may be used to characterize performance of global/international bond funds. Other indexes may portray different comparative performance. Investors cannot invest directly in an index.
The Fund charges a maximum front-end sales charge of 4% for Class A shares and a 12b-1 fee of up to 0.30% annually. Class A shares may not be subject to a front-end sales charge, but may be subject to a 1% contingent deferred sales charge (CDSC) for the first year. Class B shares are subject to a declining CDSC of 5%, 4%, 3%, 2%, 1%, and 1% for the first six years respectively after purchase and a 12b-1 fee of 1% annually. Approximately seven years after purchase, Class B shares will automatically convert to Class A shares on a quarterly basis. Effective February 1, 2004, Class C shares do not have a front-end sales charge of 1%, but are subject to a CDSC of 1% for shares redeemed within 12 months of purchase, and a 12b-1 fee of up to 1% annually. Class Z shares are not subject to a sales charge or 12b-1 fee. The returns in the tables do not reflect the deduction of taxes that a shareholder would pay on fund distributions or following the redemption of fund shares.
| | |
| Dryden Global Total Return Fund, Inc. | | |
| | | | |
| | |
| n MAIL | | n TELEPHONE | | n WEBSITE |
Gateway Center Three 100 Mulberry Street Newark, NJ 07102 | | (800) 225-1852 | | www.jennisondryden.com |
|
| DIRECTORS |
David E.A. Carson•Robert F. Gunia•Robert E. La Blanc•Douglas H. McCorkindale•Richard A. Redeker• Judy A. Rice•Robin B. Smith•Stephen D. Stoneburn•Clay T. Whitehead |
|
| OFFICERS |
| Judy A. Rice, President•Robert F. Gunia, Vice President•Grace C. Torres, Treasurer and Principal Financial and Accounting Officer•Marguerite E.H. Morrison, Chief Legal Officer and Assistant Secretary•Maryanne Ryan, Anti-Money Laundering Compliance Officer |
| | | | |
| MANAGER | | Prudential Investments LLC | | Gateway Center Three
100 Mulberry Street
Newark, NJ 07102 |
|
| INVESTMENT ADVISER | | Prudential Investment
Management, Inc. | | Gateway Center Two
100 Mulberry Street
Newark, NJ 07102 |
|
| DISTRIBUTOR | | Prudential Investment
Management Services LLC | | Gateway Center Three
14th Floor
100 Mulberry Street
Newark, NJ 07102 |
|
| CUSTODIAN | | State Street Bank
and Trust Company | | One Heritage Drive
North Quincy, MA 02171 |
|
| TRANSFER AGENT | | Prudential Mutual Fund
Services LLC | | PO Box 8098
Philadelphia, PA 19101 |
|
| INDEPENDENT AUDITORS | | PricewaterhouseCoopers LLP | | 1177 Avenue of the
Americas
New York, NY 10036 |
|
| FUND COUNSEL | | Sullivan & Cromwell LLP | | 125 Broad Street
New York, NY 10004 |
| | | | | | | | | | | | |
| | | |
| | | Dryden Global Total Return Fund, Inc. | | | | |
| | | Share Class | | A | | B | | C | | Z | | |
| | | | | | |
| | | Nasdaq | | GTRAX | | PBTRX | | PCTRX | | PZTRX | | |
| | | CUSIP | | 26243L105 | | 26243L204 | | 26243L303 | | 26243L402 | | |
| | | | | | | | | | | | | |
Mutual Funds:
| | | | |
| ARE NOT INSURED BY THE FDIC OR ANY FEDERAL GOVERNMENT AGENCY | | MAY LOSE VALUE | | ARE NOT A DEPOSIT OF OR GUARANTEED BY ANY BANK OR ANY BANK AFFILIATE |
| | | | | | | | | | | | |
| | | |
| Dryden Global Total Return Fund, Inc. | | | | | | |
| | | Share Class | | A | | B | | C | | Z | | |
| | | | | | |
| | | Nasdaq | | GTRAX | | PBTRX | | PCTRX | | PZTRX | | |
| | | CUSIP | | 26243L105 | | 26243L204 | | 26243L303 | | 26243L402 | | |
| | | | | | | | | | | | | |
MF169E IFS-A087972
Item 2—Code of Ethics—See Exhibit (a)
As of the end of the period covered by this report, the registrant has adopted a code of ethics (the “Section 406 Standards for Investment Companies—Ethical Standards for Principal Executive and Financial Officers”) that applies to the registrant’s Principal Executive Officer and Principal Financial Officer; the registrant’s Principal Financial Officer also serves as the Principal Accounting Officer.
The registrant hereby undertakes to provide any person, without charge, upon request, a copy of the code of ethics. To request a copy of the code of ethics, contact the registrant 973-367-7525, and ask for a copy of the Section 406 Standards for Investment Companies—Ethical Standards for Principal Executive and Financial Officers.
Item 3—Audit Committee Financial Expert—
The registrant’s Board has determined that Mr. David Carson, member of the Board’s Audit Committee is an “audit committee financial expert,” and that he is “independent,” for purposes of this Item.
Item 4—Principal Accountant Fees and Services—
For each of the fiscal years ended December 31, 2003 and December 31, 2002 PricewaterhouseCoopers LLP (“PwC”), the Registrant’s principal accountant, billed the Registrant $42,000 for professional services rendered for the audit of the Registrant’s annual financial statements or services that are normally provided in connection with statutory and regulatory filings.
None.
None.
None.
(e)(1) Audit Committee Pre-Approval Policies and Procedures
THE PRUDENTIAL MUTUAL FUNDS
AUDIT COMMITTEE POLICY
on
Pre-Approval of Services Provided by the Independent Accountants
The Audit Committee of each Prudential Mutual Fund is charged with the responsibility to monitor the independence of the Fund’s independent accountants. As part of this responsibility, the Audit Committee must pre-approve any independent accounting firm’s engagement to render audit and/or permissible non-audit services, as required by law. In evaluating a proposed engagement of the independent accountants, the Audit Committee will assess the effect that the engagement might reasonably be expected to have on the accountant’s independence. The Committee’s evaluation will be based on:
| | • | a review of the nature of the professional services expected to be provided, |
| | • | a review of the safeguards put into place by the accounting firm to safeguard independence, and |
| | • | periodic meetings with the accounting firm. |
Policy for Audit and Non-Audit Services Provided to the Funds
On an annual basis, the scope of audits for each Fund, audit fees and expenses, and audit-related and non-audit services (and fees proposed in respect thereof) proposed to be performed by the Fund’s independent accountants will be presented by the Treasurer and the independent accountants to the Audit Committee for review and, as appropriate, approval prior to the initiation of such services. Such presentation shall be accompanied by confirmation by both the Treasurer and the independent accountants that the proposed services will not adversely affect the independence of the independent accountants. Proposed services shall be described in sufficient detail to enable the Audit Committee to assess the appropriateness of such services and fees, and the compatibility of the provision of such services with the auditor’s independence. The Committee shall receive periodic reports on the progress of the audit and other services which are approved by the Committee or by the Committee Chair pursuant to authority delegated in this Policy.
The categories of services enumerated under “Audit Services”, “Audit-related Services”, and “Tax Services” are intended to provide guidance to the Treasurer and the independent accountants as to those categories of services which the Committee believes are generally consistent with the independence of the independent accountants and which the Committee (or the Committee Chair) would expect upon the presentation of specific proposals to pre-approve. The enumerated categories are not intended as an exclusive list of audit, audit-related or tax services which the Committee (or the Committee Chair) would consider for pre-approval.
Audit Services
The following categories of audit services are considered to be consistent with the role of the Fund’s independent accountants
| | Ø | Annual Fund financial statement audits |
| | Ø | Seed audits (related to new product filings, as required) |
| | Ø | SEC and regulatory filings and consents |
Audit-related Services
The following categories of audit-related services are considered to be consistent with the role of the Fund’s independent accountants:
| | Ø | Accounting consultations |
| | Ø | Fund merger support services |
| | Ø | Agreed Upon Procedure Reports |
| | Ø | Other Internal Control Reports |
Individual audit-related services that fall within one of these categories and are not presented to the Audit Committee as part of the annual pre-approval process will be subject to pre-approval by the Committee Chair (or any other Committee member on whom this responsibility has been delegated) so long as the estimated fee for those services does not exceed $50,000.
Tax Services
The following categories of tax services are considered to be consistent with the role of the Fund’s independent accountants:
| | Ø | Tax compliance services related to the filing or amendment of the following: |
| | n | Federal, state and local income tax compliance; and, |
| | n | Sales and use tax compliance |
| | Ø | Timely RIC qualification reviews |
| | Ø | Tax distribution analysis and planning |
| | Ø | Tax authority examination services |
| | Ø | Tax appeals support services |
| | Ø | Accounting methods studies |
| | Ø | Fund merger support services |
| | Ø | Tax consulting services and related projects |
Individual tax services that fall within one of these categories and are not presented to the Audit Committee as part of the annual pre-approval process will be subject to pre-approval by the Committee Chair (or any other Committee member on whom this responsibility has been delegated) so long as the estimated fee for those services does not exceed $50,000.
Other Non-audit Services
Certain non-audit services that the independent accountants are legally permitted to render will be subject to pre-approval by the Committee or by one or more Committee members to whom the Committee has delegated this authority and who will report to the full Committee any pre-approval decisions made pursuant to this Policy. Non-audit services presented for pre-approval pursuant to this paragraph will be accompanied by a confirmation from both the Treasurer and the independent accountants that the proposed services will not adversely affect the independence of the independent accountants.
Proscribed Services
The Fund’s independent accountants will not render services in the following categories of non-audit services:
| | Ø | Bookkeeping or other services related to the accounting records or financial statements of the Fund |
| | Ø | Financial information systems design and implementation |
| | Ø | Appraisal or valuation services, fairness opinions, or contribution-in-kind reports |
| | Ø | Internal audit outsourcing services |
| | Ø | Management functions or human resources |
| | Ø | Broker or dealer, investment adviser, or investment banking services |
| | Ø | Legal services and expert services unrelated to the audit |
| | Ø | Any other service that the Public Company Accounting Oversight Board determines, by regulation, is impermissible. |
Pre-approval of Non-Audit Services Provided to Other Entities Within the Prudential Fund Complex
Certain non-audit services provided to Prudential Investments LLC or any of its affiliates that also provide ongoing services to the Prudential Mutual Funds will be subject to pre-approval by the Audit Committee. The only non-audit services provided to these entities that will require pre-approval are those related directly to the operations and financial reporting of the Funds. Individual projects that are not presented to the Audit Committee as part of the annual pre-approval process, will be subject to pre-approval by the Committee Chair (or any other Committee member on whom this responsibility has been delegated) so long as the estimated fee for those services does not exceed $50,000. Services presented for pre-approval pursuant to this paragraph will be accompanied by a confirmation from both the Treasurer and the independent accountants that the proposed services will not adversely affect the independence of the independent accountants.
Although the Audit Committee will not pre-approve all services provided to Prudential Investments LLC and its affiliates, the Committee will receive an annual report from the Fund’s independent accounting firm showing the aggregate fees for all services provided to Prudential Investments and its affiliates.
(e)-(2) Percentage of services referred to in 4(b)- (4)(d) that were approved by the audit committee—Not applicable.
| (f) | Percentage of hours expended attributable to work performed by other than full time employees of principal accountant if greater than 50%. |
Not applicable.
N/A to Registrant. The aggregate non-audit fees billed by PwC for services rendered to the registrant’s investment adviser and any entity controlling, controlled by, or under common control with the investment adviser that provides ongoing services to the registrant for each of the last two fiscal years 2003 and 2002 were $1,715,979 and $1,601,295 respectively.
(h) Principal Accountants Independence
The Registrant’s Audit Committee has considered whether the provision of non-audit services that were rendered to the registrant’s investment adviser and any entity controlling, controlled by, or under common control with the investment adviser that provides ongoing services to the registrant that were not pre-approved pursuant to Rule 2-01(c)(7)(ii) of Regulation S-X is compatible with maintaining PwC’s independence.
Item 5—Reserved
Item 6—Reserved
Item 7—Disclosure of Proxy Voting Policies and Procedures for Closed-End Management Investment Companies—Not required in
this filing
Item 8—Reserved
Item 9—Controls and Procedures
| | (a) | It is the conclusion of the registrant’s principal executive officer and principal financial officer that the effectiveness of the registrant’s current disclosure controls and procedures (such disclosure controls and procedures having been evaluated within 90 days of the date of this filing) provide reasonable assurance that the information required to be disclosed by the registrant has been recorded, processed, summarized and reported within the time period specified in the Commission’s rules and forms and that the information required to be disclosed by the registrant has been accumulated and communicated to the registrant’s principal executive officer and principal financial officer in order to allow timely decisions regarding required disclosure. |
| | (b) | There have been no significant changes in the registrant’s internal controls or in other factors that could significantly affect these controls subsequent to the date of their evaluation, including any corrective actions with regard to significant deficiencies and material weaknesses. |
Item 10—Exhibits
| | (a) | Code of Ethics—attached hereto |
| | (b) | Certifications pursuant to Section 302 and 906 of the Sarbanes-Oxley Act—Attached hereto |
SIGNATURES
Pursuant to the requirements of the Securities Exchange Act of 1934 and the Investment Company Act of 1940, the registrant has duly caused this report to be signed on its behalf by the undersigned, thereunto duly authorized.
| | |
| |
| (Registrant) | | Dryden Total Return Bond Fund, Inc. |
| | |
|
| | |
| By (Signature and Title)* | | /s/ Marguerite E. H. Morrison |
| | |
|
| | | Marguerite E. H. Morrison |
| | | Assistant Secretary |
Date February 23, 2004
Pursuant to the requirements of the Securities Exchange Act of 1934 and the Investment Company Act of 1940, this report has been signed below by the following persons on behalf of the registrant and in the capacities and on the dates indicated.
| | |
| By (Signature and Title)* | | /s/ Judy A. Rice |
| | |
|
| | | Judy A. Rice |
| | | President and Principal Executive Officer |
Date February 23, 2004
| | |
| By (Signature and Title)* | | /s/ Grace C. Torres |
| | |
|
| | | Grace C. Torres |
| | | Treasurer and Principal Financial Officer |
Date February 23, 2004
| * | Print the name and title of each signing officer under his or her signature. |