UNITED STATES
SECURITIES AND EXCHANGE COMMISSION
Washington, D.C. 20549
FORM N-CSR
CERTIFIED SHAREHOLDER REPORT OF REGISTERED
MANAGEMENT INVESTMENT COMPANIES
| | |
| Investment Company Act file number: | | 811-04661 |
| |
| Exact name of registrant as specified in charter: | | Dryden Global Total Return Fund, Inc. |
| |
| Address of principal executive offices: | | Gateway Center 3, |
| | 100 Mulberry Street, |
| | Newark, New Jersey 07102 |
| |
| Name and address of agent for service: | | Deborah A. Docs |
| | Gateway Center 3, |
| | 100 Mulberry Street, |
| | Newark, New Jersey 07102 |
| |
| Registrant’s telephone number, including area code: | | 973-367-7521 |
| |
| Date of fiscal year end: | | 12/31/2005 |
| |
| Date of reporting period: | | 12/31/2005 |
Item 1 – Reports to Stockholders – [ INSERT REPORT ]

Dryden Global Total Return Fund, Inc.
| | |
| DECEMBER 31, 2005 | | ANNUAL REPORT |

FUND TYPE
Global/international bond
OBJECTIVE
Total return made up of current income and capital appreciation
This report is not authorized for distribution to prospective investors unless preceded or accompanied by a current prospectus.
The views expressed in this report and information about the Fund’s portfolio holdings are for the period covered by this report and are subject to change thereafter.
JennisonDryden is a registered trademark of The Prudential Insurance Company of America.

February 15, 2006
Dear Shareholder:
We hope you find the annual report for the Dryden Global Total Return Fund, Inc. informative and useful. As a JennisonDryden mutual fund shareholder, you may be thinking about where you can find additional growth opportunities. You could invest in last year’s top-performing asset class and hope history repeats itself or you could stay in cash while waiting for the “right moment” to invest.
Instead, we believe it is better to take advantage of developing domestic and global investment opportunities through a diversified portfolio of stock and bond mutual funds. A diversified asset allocation offers two potential advantages. It helps you manage downside risk by not being overly exposed to any particular asset class, plus it gives you a better opportunity to have at least some of your assets in the right place at the right time. Your financial professional can help you create a diversified investment plan that may include mutual funds covering all the basic asset classes and that reflects your personal investor profile and tolerance for risk.
JennisonDryden Mutual Funds gives you a wide range of choices that can help you make progress toward your financial goals. Our funds offer the experience, resources, and professional discipline of three leading asset managers. They are recognized and respected in the institutional market and by discerning investors for excellence in their respective strategies. JennisonDryden equity funds are advised by Jennison Associates LLC and/or Quantitative Management Associates LLC (QMA). Prudential Investment Management, Inc. (PIM) advises the JennisonDryden fixed income and money market funds. Jennison Associates, QMA, and PIM are registered investment advisors and Prudential Financial companies.
Thank you for choosing JennisonDryden Mutual Funds.
Sincerely,

Judy A. Rice, President
Dryden Global Total Return Fund, Inc.
| | |
| Dryden Global Total Return Fund, Inc. | | 1 |
Your Fund’s Performance
Fund objective
The investment objective of the Dryden Global Total Return Fund, Inc. (the Fund) is total return made up of current income and capital appreciation. There can be no assurance that the Fund will achieve its investment objective.
Performance data quoted represent past performance. Past performance does not guarantee future results. The investment return and principal value of an investment will fluctuate, so that an investor’s shares, when redeemed, may be worth more or less than their original cost. Current performance may be lower or higher than the past performance data quoted. An investor may obtain performance data as of the most recent month-end by visiting our website at www.jennisondryden.com or by calling (800) 225-1852. The maximum initial sales charge is 4.50% (Class A shares).
| | | | | | | | |
| Cumulative Total Returns1 as of 12/31/05 | | | | |
| | | One Year | | Five Years | | Ten Years | | Since Inception2 |
Class A | | –7.94% (–8.08) | | 25.66% (25.46) | | 60.94% (60.69) | | 330.21% (329.55) |
Class B | | –8.60 (–8.74) | | 21.49 (21.31) | | N/A | | 50.45 (50.21) |
Class C | | –8.43 (–8.57) | | 22.48 (22.29) | | N/A | | 51.66 (51.43) |
Class Z | | –7.62 (–7.76) | | 27.29 (27.10) | | N/A | | 46.39 (46.17) |
Citigroup WGBI–Unhedged3 | | –6.88 | | 39.71 | | 62.72 | | *** |
Lipper Global Income Funds Avg.4 | | –2.20 | | 38.68 | | 78.52 | | **** |
| | | | | | | | | |
| Average Annual Total Returns1 as of 12/31/05 | | | | |
| | | One Year | | Five Years | | Ten Years | | Since Inception2 |
Class A | | –12.08% (–12.22) | | 3.71% (3.68) | | 4.39% (4.38) | | 7.52% (7.51) |
Class B | | –12.90 (–13.04) | | 3.81 (3.78) | | N/A | | 4.18 (4.17) |
Class C | | –9.29 (–9.44) | | 4.14 (4.11) | | N/A | | 4.27 (4.25) |
Class Z | | –7.62 (–7.76) | | 4.94 (4.91) | | N/A | | 4.43 (4.41) |
Citigroup WGBI–Unhedged3 | | –6.88 | | 6.92 | | 4.99 | | *** |
Lipper Global Income Funds Avg.4 | | –2.20 | | 6.70 | | 5.83 | | **** |
| | | | | | | | | |
| Distributions and Yields1 as of 12/31/05 | | | | | | | | | |
| | | | | | | Total Distributions
Paid for 12 Months | | 30-Day
SEC Yield | |
Class A | | | | | | $0.46 | | 2.30 | % |
Class B | | | | | | $0.42 | | 1.67 | |
Class C | | | | | | $0.43 | | 1.92 | |
Class Z | | | | | | $0.47 | | 2.65 | |
| | |
| 2 | | Visit our website at www.jennisondryden.com |
The cumulative total returns do not reflect the deduction of applicable sales charges. If reflected, the applicable sales charges would reduce the cumulative total returns performance quoted. Class A shares are subject to a maximum front-end sales charge of 4.50%. Under certain circumstances, Class A shares may be subject to a contingent deferred sales charge (CDSC) of 1%. Class B and Class C shares are subject to a maximum CDSC of 5% and 1% respectively. Class Z shares are not subject to a sales charge.
1The Fund operated as a closed-end fund with shares being traded on the New York Stock Exchange from inception to January 15, 1996. The performance numbers that cover this period under the columns “Ten Years” and “Since Inception” do not fully reflect the higher operating expenses incurred since the Fund commenced operations as an open-end mutual fund on January 15, 1996. If these expenses had been applied since the Fund’s inception, past performance returns would have been lower, as indicated in parentheses. The performance numbers for the one-year and five-year periods do reflect these higher operating expenses.
Source: Prudential Investments LLC and Lipper Inc.
The average annual total returns take into account applicable sales charges. During certain periods shown, fee waivers and/or expense reimbursements were in effect. Without such fee waivers and expense reimbursements, the returns for the share classes would have been lower, as indicated in parentheses. Class A, Class B, and Class C shares are subject to an annual distribution and service (12b-1) fee of up to 0.30%, 1.00%, and 1.00% respectively. Approximately seven years after purchase, Class B shares will automatically convert to Class A shares on a quarterly basis. Class Z shares are not subject to a 12b-1 fee. Except where noted, the returns, distributions, and yields in the tables do not reflect the deduction of taxes that a shareholder would pay on Fund distributions or following the redemption of Fund shares.
2Inception dates: Class A, 7/7/86; Class B and Class C, 1/15/96; and Class Z, 3/17/97.
3The Citigroup World Government Bond Index (WGBI)–Unhedged (formerly known as the Salomon Smith Barney World Government Bond Index–Unhedged) is a market capitalization-weighted index consisting of the government bond markets of 21 countries, which are selected based on market capitalization and investability criteria. All issues have a remaining maturity of at least one year.
4The Lipper Global Income Funds Average (Lipper Average) represents returns based on an average return of all funds in the Lipper Global Income Funds category for the periods noted. Funds in the Lipper Average invest primarily in U.S. dollar and non-U.S. dollar debt securities of issuers located in at least three countries, one of which may be the United States.
Investors cannot invest directly in an index. The returns for Citigroup WGBI–Unhedged would be lower if they included the effects of sales charges, operating expenses of a mutual fund, or taxes. Returns for the Lipper Average reflect the deduction of operating expenses, but not sales charges or taxes.
***Citigroup WGBI–Unhedged Closest Month-End to Inception cumulative total returns are 308.56% for Class A, 64.75% for Class B and Class C, and 63.81% for Class Z. Citigroup WGBI–Unhedged Closest Month-End to Inception average annual total returns are 7.52% for Class A, 5.16% for Class B and Class C, and 5.80% for Class Z.
****Lipper Average Closest Month-End to Inception cumulative total returns are 296.05% for Class A, 74.70% for Class B and Class C, and 61.57% for Class Z. Lipper Average Closest Month-End to Inception average annual total returns are 7.34% for Class A, 5.67% for Class B and Class C, and 5.55% for Class Z.
| | | |
Five Largest Issues expressed as a percentage of net assets as of 12/31/05 | | | |
United Kingdom Treasury Bonds, 5.00%, 09/07/14 | | 6.4 | % |
Japanese Government Bonds, 1.30%, 03/20/14 | | 6.3 | |
Japanese Government Bonds, 0.60%, 09/20/10 | | 5.4 | |
Spanish Government Bonds, 5.35%, 10/31/11 | | 3.9 | |
French Government Bonds, 5.75%, 10/25/32 | | 3.6 | |
Issues are subject to change.
| | |
| Dryden Global Total Return Fund, Inc. | | 3 |
Investment Subadvisor’s Report
Prudential Investment Management, Inc.
U.S. dollar rally a major development in global bond markets
The U.S. dollar managed to post a solid gain against the euro and the Japanese yen in 2005, ending three consecutive years of decline. It rose 12.6% versus the euro, 14.7% versus the Japanese yen, and 10.2% versus a basket of currencies comprised of major trading partners of the United States. The U.S. dollar strengthened as large flows of foreign capital were attracted to the United States because investments generally earned much higher interest rates than in Europe or Japan. The Federal Reserve (the Fed) repeatedly increased short-term interest rates in the United States during 2005, while the European Central Bank (ECB) raised its key rate once and the Bank of Japan (BOJ) left rates at 0%. The U.S. currency also gained as the Homeland Investment Act allowed U.S. multinational corporations to repatriate overseas profits at a lower tax rate under certain circumstances. Some profits were in foreign currencies that had to be converted to U.S. dollars.
The rally in the U.S. currency had a significant impact on the performance of global fixed income markets. Gains on non-U.S. bonds often turned into losses when translated into U.S. dollars on an unhedged basis. This was reflected in the negative returns of the Fund; its benchmark, the Citigroup World Government Bond Index–Unhedged (the Index); and the Lipper Global Income Funds Average (the Lipper Average) in 2005.
The U.S. dollar’s appreciation also had an impact on the Fund’s dividend distribution. On a quarterly basis, the Fund typically distributes dividends of any net investment income to shareholders. The last dividend distribution cycle of each year includes any currency gains or losses and any capital gains. Currency transactions are treated as ordinary income for tax purposes. For the fourth quarter of 2005 distribution, the Fund’s currency losses were enough to offset the net investment income that would normally be distributed. Thus, the Fund did not make a quarterly dividend distribution for the fourth quarter of 2005. However, we anticipate the Fund will resume making quarterly dividend distributions beginning in March 2006.
For the year, the Fund posted cumulative total returns that lagged the Index, which does not include the effect of mutual fund operating expenses. The Fund also lagged its Lipper Average, which includes portfolios that are either partially or fully hedged against foreign currency exposure. The Fund uses an unhedged foreign-exchange strategy in keeping with its benchmark.
Fine-tuning the Fund’s foreign exchange exposure
To take advantage of fluctuations in exchange rates, we often adjusted the Fund’s currency positions. Some of our strategies were successful, but others were not. In early 2005, the Fund had exposure to the Australian and New Zealand dollars, which
| | |
| 4 | | Visit our website at www.jennisondryden.com |
hurt its performance as both weakened versus the U.S. dollar. In the fourth quarter, the Fund benefited from its underweight positions in the euro and Japanese yen, since we anticipated that these currencies would continue to weaken versus the U.S. dollar. On the whole, foreign exchange trading contributed positively to the Fund’s performance relative to the Index, even though the Fund’s absolute returns were negative for the year.
Benefiting from flatter yield curves in the United States and Europe
The Fed repeatedly raised short-term interest rates to prevent a robust U.S. economy from overheating and fueling higher inflationary pressures. From June 2004 through December 2005, the target for the federal funds rate on overnight loans between banks was increased 13 times in quarter-point increments, from 1.00% to 4.25%. Eight of the increases occurred in 2005.
Because shorter-term bonds are very sensitive to changes in the federal funds rate, their yields rose sharply and their prices often fell as bond prices move inversely to interest rates. Long-term bond yields primarily reflect inflation expectations in the economy, and because inflation was largely contained, their yields fluctuated in a range rather than moving sharply higher. Consequently, there was considerable flattening in the U.S. yield curve, which depicts yields on bonds of the same quality from the shortest to the longest maturities. Our strategy in the fourth quarter emphasized the longer-term portion of the U.S. yield curve, which benefited the Fund’s performance.
A similar dynamic played out in the European bond market in the fourth quarter. The ECB expected economic growth and inflationary pressures to pick up in the euro zone, causing it to raise its benchmark interest rate by a quarter-point from 2.00% to 2.25%, its first increase in five years. In the European government bond market, shorter-term bond yields rose while long-term bond yields moved lower, causing the European yield curve to flatten. Here again our strategy positioned the Fund to benefit from this development.
U.S. corporate bonds provided diversification
To diversify away from the risks associated with investing in government bonds, the Fund maintained a modest exposure to the U.S. corporate bond market. Despite being pressured by the trend toward higher short-term interest rates in the United States and a crisis in the U.S. auto industry, favorable security selection in the corporate bond market had a moderately positive impact on the Fund’s performance. For example, the Fund held bonds of Sprint Corporation and Nextel Communications Inc., which merged in 2005 to become Sprint Nextel Corporation. The bonds performed well as the merger is expected to strengthen the competitive position of the newly created mobile phone services firm. On the other hand, the Fund held bonds of
| | |
| Dryden Global Total Return Fund, Inc. | | 5 |
Investment Subadvisor’s Report (continued)
Georgia-Pacific Corporation that performed poorly amid concern that purchase of the papermaker by Koch Forest Products, Inc. could result in increased credit risk for Georgia-Pacific bondholders.
Emerging-market bonds another positive for the Fund
Emerging-market bonds turned in an impressive performance in 2005. A strong global economy boosted investor confidence in the bonds of developing nations. Balance-of-payment positions remained strong in many emerging-market countries, helped by rising commodity and oil prices. In addition, a search for attractive yields in the low global interest-rate environment encouraged investment in emerging-market debt securities. Among the Fund’s holdings were unhedged bonds of the Mexican government and Petroleos Mexicanos (PEMEX ), the Mexican state-owned petroleum company. Both gained in value on the back of rising oil prices and the Mexican government’s sound fiscal and monetary policies. Similarly, a solid fiscal policy and rising oil prices helped strengthen Russian government bonds held by the Fund. Ample revenues from oil exports have enabled the Russian government to buy back some of its debt, thereby improving the nation’s balance sheet. Some of the Fund’s other positions included unhedged government bonds of South Africa, Poland, Hungary, and Brazil, all of which contributed positively to its performance.
| | |
| 6 | | Visit our website at www.jennisondryden.com |
Fees and Expenses (Unaudited)
As a shareholder of the Fund, you incur two types of costs: (1) transaction costs, including sales charges (loads) on purchase payments and redemptions, as applicable, and (2) ongoing costs, including management fees, distribution and/or service (12b-1) fees, and other Fund expenses, as applicable. This example is intended to help you understand your ongoing costs (in dollars) of investing in the Fund and to compare these costs with the ongoing costs of investing in other mutual funds.
The example is based on an investment of $1,000 invested on July 1, 2005, at the beginning of the period, and held through the six-month period ended December 31, 2005.
The Fund’s transfer agent may charge additional fees to holders of certain accounts that are not included in the expenses shown in the table on the following page. These fees apply to Individual Retirement Accounts (IRAs) and Section 403(b) accounts. As of the close of the six-month period covered by the table, IRA fees included an annual maintenance fee of $15 per account (subject to a maximum annual maintenance fee of $25 for all accounts held by the same shareholder). Section 403(b) accounts are charged an annual $25 fiduciary maintenance fee. Some of the fees may vary in amount, or may be waived, based on your total account balance or the number of JennisonDryden or Strategic Partners Funds, including the Fund, that you own. You should consider the additional fees that were charged to your Fund account over the six-month period when you estimate the total ongoing expenses paid over the period and the impact of these fees on your ending account value, as these additional expenses are not reflected in the information provided in the expense table. Additional fees have the effect of reducing investment returns.
Actual Expenses
The first line for each share class in the table on the following page provides information about actual account values and actual expenses. You may use the information on this line, together with the amount you invested, to estimate the expenses that you paid over the period. Simply divide your account value by $1,000 (for example, an $8,600 account value ÷ $1,000 = 8.6), then multiply the result by the number on the first line under the heading “Expenses Paid During the Six-Month Period” to estimate the expenses you paid on your account during this period.
Hypothetical Example for Comparison Purposes
The second line for each share class in the table on the following page provides information about hypothetical account values and hypothetical expenses based on the Fund’s actual expense ratio and an assumed rate of return of 5% per year before
| | |
| Dryden Global Total Return Fund, Inc. | | 7 |
Fees and Expenses (continued)
expenses, which is not the Fund’s actual return. The hypothetical account values and expenses may not be used to estimate the actual ending account balance or expenses you paid for the period. You may use this information to compare the ongoing costs of investing in the Fund and other funds. To do so, compare this 5% hypothetical example with the 5% hypothetical examples that appear in the shareholder reports of the other funds.
Please note that the expenses shown in the table are meant to highlight your ongoing costs only, and do not reflect any transactional costs such as sales charges (loads). Therefore the second line for each share class in the table is useful in comparing ongoing costs only, and will not help you determine the relative total costs of owning different funds. In addition, if these transactional costs were included, your costs would have been higher.
| | | | | | | | | | | | | | |
Dryden Global Total
Return Fund, Inc. | | Beginning Account
Value
July 1, 2005 | | Ending Account
Value December 31, 2005 | | Annualized
Expense Ratio
Based on the
Six-Month Period | | | Expenses Paid
During the Six-
Month Period* |
| | | | | | | | | | | | | | | |
| Class A | | Actual | | $ | 1,000.00 | | $ | 971.50 | | 1.35 | % | | $ | 6.71 |
| | | Hypothetical | | $ | 1,000.00 | | $ | 1,018.40 | | 1.35 | % | | $ | 6.87 |
| | | | | | | | | | | | | | | |
| Class B | | Actual | | $ | 1,000.00 | | $ | 968.10 | | 2.10 | % | | $ | 10.42 |
| | | Hypothetical | | $ | 1,000.00 | | $ | 1,014.62 | | 2.10 | % | | $ | 10.66 |
| | | | | | | | | | | | | | | |
| Class C | | Actual | | $ | 1,000.00 | | $ | 968.70 | | 1.85 | % | | $ | 9.18 |
| | | Hypothetical | | $ | 1,000.00 | | $ | 1,015.88 | | 1.85 | % | | $ | 9.40 |
| | | | | | | | | | | | | | | |
| Class Z | | Actual | | $ | 1,000.00 | | $ | 973.60 | | 1.10 | % | | $ | 5.47 |
| | | Hypothetical | | $ | 1,000.00 | | $ | 1,019.66 | | 1.10 | % | | $ | 5.60 |
* Fund expenses (net of fee waivers or subsidies, if any) for each share class are equal to the annualized expense ratio for each share class (provided in the table), multiplied by the average account value over the period, multiplied by the 184 days in the six-month period ended December 31, 2005, and divided by the 365 days in the Fund’s fiscal year ended December 31, 2005 (to reflect the six-month period).
| | |
| 8 | | Visit our website at www.jennisondryden.com |
Portfolio of Investments
as of December 31, 2005
| | | | | | |
Principal
Amount (000) | | Description | | Value (Note 1) |
| | | | | | | |
| | LONG-TERM INVESTMENTS 96.1% |
|
| | Australia 0.7% |
| AUD | 1,380 | | Australia Government Bond,
6.25%, 4/15/15 | | $ | 1,088,559 |
| | | | | |
|
|
|
| | Canada 2.2% |
| CAD | 930 | | Canadian Government Bonds,
4.00%, 9/1/10 | | | 802,515 |
| | 2,220 | | 5.00%, 6/1/14 | | | 2,050,661 |
| | 735 | | 5.75%, 6/1/33 | | | 809,325 |
| | | | | |
|
|
| | | | | | | 3,662,501 |
| | | | | |
|
|
|
| | Eurobonds 34.3% |
| EUR | 2,700 | | Austria Government Bond,
4.30%, 7/15/14 | | | 3,439,603 |
| | 910 | | Bank of America Corp.,
3.625%, 3/3/08 | | | 1,089,924 |
| | 985 | | Citigroup, Inc.,
4.625%, 11/14/07 | | | 1,199,197 |
| | 4,485 | | French Government Bonds,
4.00%, 4/25/14 | | | 5,597,725 |
| | 2,810 | | 8.50%, 4/25/23 | | | 5,465,829 |
| | 310 | | 5.50%, 4/25/29 | | | 477,514 |
| | 3,585 | | 5.75%, 10/25/32 | | | 5,805,131 |
| | 1,885 | | German Government Bonds,
4.00%, 2/16/07 | | | 2,262,100 |
| | 1,080 | | 4.50%, 7/4/09 | | | 1,342,209 |
| | 4,505 | | 3.50%, 10/9/09 | | | 5,425,675 |
| | 705 | | 5.375%, 1/4/10 | | | 907,642 |
| | 1,655 | | 5.00%, 7/4/12 | | | 2,166,465 |
| | 430 | | 4.25%, 7/4/14 | | | 545,656 |
| | 590 | | 3.75%, 1/4/15 | | | 723,692 |
| | 220 | | 4.75%, 7/4/34 | | | 313,757 |
| | 390 | | ING Verzekeringen NV,
6.375%, 5/7/27 | | | 559,626 |
| | 2,740 | | Italian Government Bonds,
5.50%, 11/1/10 | | | 3,586,368 |
| | 865 | | 6.00%, 5/1/31 | | | 1,378,155 |
| | 300 | | Mexican Government International Bond,
5.50%, 2/17/20 | | | 386,849 |
See Notes to Financial Statements.
| | |
| Dryden Global Total Return Fund, Inc. | | 9 |
Portfolio of Investments
as of December 31, 2005 Cont’d.
| | | | | | |
Principal
Amount (000) | | Description | | Value (Note 1) |
| | | | | | | |
| | 2,950 | | Netherlands Government Bonds,
5.00%, 7/15/11 | | $ | 3,825,553 |
| | 1,710 | | 3.75%, 7/15/14 | | | 2,098,253 |
| | 4,785 | | Spanish Government Bonds,
5.35%, 10/31/11 | | | 6,317,829 |
| | 560 | | 5.75%, 7/30/32 | | | 907,417 |
| | | | | |
|
|
| | | | | | | 55,822,169 |
| | | | | |
|
|
|
| | Hungary 0.6% |
| HUF | 197,360 | | Hungary Government Bond,
8.00%, 2/12/15 | | | 988,243 |
| | | | | |
|
|
|
| | Japan 20.6% |
| JPY | 62,700 | | Japanese Government Bonds,
0.60%, 3/20/09 | | | 532,663 |
| | 1,034,450 | | 0.60%, 9/20/10 | | | 8,689,968 |
| | 80,850 | | 1.80%, 3/22/10 | | | 716,319 |
| | 126,950 | | 0.80%, 9/20/10 | | | 1,076,683 |
| | 579,450 | | 1.60%, 3/21/11 | | | 5,089,319 |
| | 1,207,800 | | 1.30%, 3/20/14 | | | 10,225,821 |
| | 87,450 | | 1.50%, 9/20/15 | | | 744,303 |
| | 166,400 | | 1.50%, 3/20/19 | | | 1,383,698 |
| | 247,150 | | 1.90%, 12/20/23 | | | 2,100,585 |
| | 284,700 | | 2.10%, 9/20/24 | | | 2,467,546 |
| | 51,500 | | 1.70%, 6/20/33 | | | 385,146 |
| | | | | |
|
|
| | | | | | | 33,412,051 |
| | | | | |
|
|
|
| | Mexico 2.2% |
| MXN | 34,400 | | Mexican Government Bonds,
10.00%, 12/5/24 | | | 3,657,255 |
| | | | | |
|
|
|
| | New Zealand 1.4% |
| NZD | 500 | | General Electric Capital Corp.,
6.625%, 2/4/10 | | | 339,177 |
| | 1,495 | | New Zealand Government Bonds,
7.00%, 7/15/09 | | | 1,054,615 |
| | 750 | | 6.00%, 4/15/15 | | | 523,421 |
| | 625 | | Quebec Province,
6.75%, 11/9/15 | | | 431,433 |
| | | | | |
|
|
| | | | | | | 2,348,646 |
| | | | | |
|
|
See Notes to Financial Statements.
| | |
| 10 | | Visit our website at www.jennisondryden.com |
| | | | | | |
Principal
Amount (000) | | Description | | Value (Note 1) |
| | | | | | | |
|
| | Norway 0.5% |
| NOK | 4,920 | | Norwegian Government & Sovereign Bond,
5.00%, 5/15/15 | | $ | 805,593 |
| | | | | |
|
|
|
| | Poland 4.8% |
| PLN | 13,295 | | Poland Government Bonds,
8.50%, 5/12/07 | | | 4,300,747 |
| | 10,360 | | 6.25%, 10/24/15 | | | 3,468,676 |
| | | | | |
|
|
| | | | | | | 7,769,423 |
| | | | | |
|
|
|
| | Sweden 0.6% |
| SEK | 6,185 | | Sweden Government Bonds,
6.75%, 5/5/14 | | | 973,235 |
| | | | | |
|
|
|
| | United Kingdom 8.1% |
| GBP | 410 | | International Nederland Bank NV,
7.00%, 10/5/10 | | | 772,534 |
| | 130 | | Royal & Sun Alliance
8.50%, 12/31/49 | | | 266,652 |
| | 275 | | United Kingdom Treasury Bonds,
5.00%, 3/7/12 | | | 495,135 |
| | 5,705 | | 5.00%, 9/7/14 | | | 10,445,540 |
| | 620 | | 4.25%, 3/7/36 | | | 1,116,986 |
| | | | | |
|
|
| | | | | | | 13,096,847 |
| | | | | |
|
|
| | United States 20.1% |
|
| | Corporate Bonds 6.5% |
| USD | 650 | | Computer Associates, Inc., Sr. Notes,
6.50%, 4/15/08 | | | 666,405 |
| | 500 | | Computer Associates, Inc., Sr. Notes,144A,
4.75%, 12/1/09 | | | 487,559 |
| | 300 | | CVS Corp.,
4.00%, 9/15/09 | | | 288,534 |
| | 450 | | Dex Media East, LLC,
9.875%, 11/15/09 | | | 486,563 |
| | 556 | | Fideicomiso Petacalco, 144A,
10.16%, 12/23/09 | | | 633,840 |
| | 240 | | First Data Corp., Notes,
4.85%, 10/1/14 | | | 227,349 |
| | 190 | | Georgia-Pacific Corp., Notes,
8.875%, 5/15/31 | | | 190,475 |
See Notes to Financial Statements.
| | |
| Dryden Global Total Return Fund, Inc. | | 11 |
Portfolio of Investments
as of December 31, 2005 Cont’d.
| | | | | | |
Principal
Amount (000) | | Description | | Value (Note 1) |
| | | | | | | |
| USD | 500 | | Hertz Corp.,144A,
8.875%, 1/1/14 | | $ | 509,375 |
| | 150 | | HJ Heinz Co.,144A,
6.428%, 12/1/08 | | | 154,091 |
| | 550 | | Huntsman International LLC, Gtd. Notes,
9.875%, 3/1/09 | | | 580,250 |
| | 370 | | IMC Global, Inc., Sr. Notes,
10.875%, 8/1/13 | | | 425,038 |
| | 4 | | Jefferson Smurfit Corp.,
8.25%, 10/1/12 | | | 3,840 |
| | 292 | | Lyondell Chemical Co., Gtd. Notes,
9.50%, 12/15/08 | | | 305,870 |
| | 155 | | Motorola, Inc., Debs.,
6.50%, 9/1/25 | | | 169,029 |
| | 500 | | Nextel Communications, Inc., Sr. Notes,
5.95%, 3/15/14 | | | 502,619 |
| | 300 | | Omnicare Inc.,
6.875%, 12/15/15 | | | 304,500 |
| | 750 | | Oneok Inc .,
5.51%, 2/16/08 | | | 752,964 |
| | 475 | | Oregon Steel Mills, Inc., Gtd. Notes,
10.00%, 7/15/09 | | | 508,250 |
| | 855 | | Royal Caribbean Cruises Ltd., Sr. Notes,
6.875%, 12/1/13 | | | 905,565 |
| | 140 | | Sprint Capital Corp., Gtd. Notes,
8.75%, 3/15/32 | | | 185,791 |
| | 540 | | Sungard Data Systems, 144A,
9.125%, 8/15/13 | | | 558,900 |
| | 1,229 | | TRAINS HY-2005-1, 144A,
7.651%, 6/15/15 | | | 1,263,074 |
| | 340 | | Transocean Inc.,
7.375%, 4/15/18 | | | 399,709 |
| | | | | |
|
|
| | | | | | | 10,509,590 |
| | | | | |
|
|
|
| | Collateralized Mortgage Obligation 1.2% |
| | 1,000 | | Banc of America Commercial Mortgage Inc., Series 2005-06, Class A4,
5.182%, 9/10/47 | | | 1,008,516 |
| | | | JP Morgan Chase Commercial Mortgage Securities Corp,
Series 2005-LDP5, Class A4, | | | |
| | 1,000 | | 5.179%, 12/15/44 | | | 1,006,670 |
| | | | | |
|
|
| | | | | | | 2,015,186 |
| | | | | |
|
|
See Notes to Financial Statements.
| | |
| 12 | | Visit our website at www.jennisondryden.com |
| | | | | |
Principal
Amount (000) | | Description | | Value (Note 1) |
| | | | | | |
|
| Emerging Market Bonds 0.9% |
| 260 | | Empresa Nacional de Electricidad SA (Chile),
8.35%, 8/1/13 | | $ | 296,118 |
| 430 | | Kazkommerts Intl. BV, 144A,
7.875%, 4/7/14 | | | 451,500 |
| 190 | | Pemex Project Funding Master Trust, 144A,
9.25%, 3/30/18 | | | 241,490 |
| 400 | | United Overseas Bank Ltd., Bonds,144A,
5.375%, 9/3/19 | | | 398,301 |
| | | | |
|
|
| | | | | | 1,387,409 |
| | | | |
|
|
|
| Structured Notes 0.3% |
| 500 | | Dow Jones CDX HY, Series 5-T3, 144A,
8.25%, 12/29/10 | | | 501,250 |
| | | | |
|
|
|
| Sovereign Bonds 1.1% |
| 1,045 | | Federal Republic of Brazil,
9.25%, 10/22/10 | | | 1,169,355 |
| 210 | | Federal Republic of Russia, 144A,
10.00%, 6/26/07 | | | 224,700 |
| 440 | | Republic of Argentina,
3.00%, 4/30/13 | | | 354,376 |
| | | | |
|
|
| | | | | | 1,748,431 |
| | | | |
|
|
|
| United States Government Obligations 10.1% |
| 597 | | United States Treasury Bonds,(b)
8.125%, 8/15/21 | | | 828,361 |
| 3,094 | | 5.375%, 2/15/31 | | | 3,475,431 |
| 1,220 | | United States Treasury Notes,(b)
3.00%, 2/15/09 | | | 1,170,915 |
| 290 | | 4.125%, 8/15/10 | | | 287,144 |
| 1,055 | | 4.375%, 12/15/10 | | | 1,055,824 |
| 430 | | 1.875%, 7/15/15, TIPS | | | 433,019 |
| 2,985 | | 9.25%, 2/15/16 | | | 4,136,673 |
| 1,380 | | 8.125%, 5/15/21 | | | 1,910,491 |
| 2,515 | | 6.125%, 8/15/29 | | | 3,063,486 |
| | | | |
|
|
| | | | | | 16,361,344 |
| | | | |
|
|
| | | Total United States investments | | | 32,523,210 |
| | | | |
|
|
| | | Total long-term investments
(cost USD $155,533,427) | | | 156,147,732 |
| | | | |
|
|
See Notes to Financial Statements.
| | |
| Dryden Global Total Return Fund, Inc. | | 13 |
Portfolio of Investments
as of December 31, 2005 Cont’d.
| | | | | | | |
| Shares | | | Description | | Value (Note 1) | |
| | | | | | | | |
|
| SHORT-TERM INVESTMENTS 3.9% | |
|
| Mutual Fund | |
| 6,395,286 | | | Dryden Core Investment Fund - Taxable Money Market Fund Series(a)
(cost $6,395,286; Note 3) | | $ | 6,395,286 | |
| | | | | |
|
|
|
| | |
Contracts
| | | | | | |
|
| OUTSTANDING OPTIONS PURCHASED | |
|
| Call Options | |
| 29 | | | 90 Day Euro, expiring 9/18/06 @ $95.25
(cost $33,984) | | | 12,144 | |
| | | | | |
|
|
|
| | | | Total Investments Before Outstanding Options Written 100.0%
(cost $161,962,697) | | | 162,555,162 | |
| | | | | |
|
|
|
|
| OUTSTANDING OPTIONS WRITTEN | |
|
| Call Options | |
| (29 | ) | | 90 Day Euro, expiring 9/18/06 @ $95.75
(premium received $15,353) | | | (3,444 | ) |
| | | | | |
|
|
|
| | | | Total Investments, Net of Outstanding Call Options Written 100.0%
(cost $161,947,344; Note 5) | | | 162,551,718 | |
| | | | Liabilities in excess of other assets(c) 0.0% | | | (63,073 | ) |
| | | | | |
|
|
|
| | | | Net Assets 100% | | $ | 162,488,645 | |
| | | | | |
|
|
|
Portfolio securities are classified according to the security’s currency denomination. The following abbreviations are used in the portfolio descriptions:
AUD—Australian Dollar
CAD—Canadian Dollar
EUR—Euro
GBP—Pound Sterling
HUF—Hungarian Forint
JPY—Japanese Yen
MXN—Mexican Peso
NOK—Norwegian Krones
NZD—New Zealand Dollar
PLN—Polish Zloty
SEK—Swedish Krona
TIPS—Treasury Inflation Protected Security
USD—United States Dollar
144A—Securities were pursuant to Rule 144A under the Securities Act of 1993 and may not be resold subject to that rule except to qualified institutional buyers. Unless otherwise noted, 144A securities are deemed to be liquid.
| (a) | Prudential Investments LLC, the manager of the Fund, also serves as manager of the Dryden Core Investment Fund—Taxable Money Market Series. |
| (b) | Pledged as initial margin on financial futures contracts. |
See Notes to Financial Statements.
| | |
| 14 | | Visit our website at www.jennisondryden.com |
| (c) | Liabilities in excess of other assets include net unrealized appreciation (depreciation) on futures contracts, forwards and swaps of: |
Open futures contracts outstanding as of December 31, 2005:
| | | | | | | | | | | | | | |
Number of
Contracts
| | Type
| | Expiration
Date
| | Value at
December 31,
2005
| | Value at Trade Date
| | Unrealized
Appreciation
(Depreciation)
| |
| | | Long Positions: | | | | | | | | | | | | |
| 12 | | 90 Day Euro Euribor | | Mar. 07 | | $ | 3,441,581 | | $ | 3,455,555 | | $ | (13,974 | ) |
| 12 | | 90 Day Euro Euribor | | Dec. 06 | | | 3,442,469 | | | 3,457,684 | | | (15,215 | ) |
| 80 | | 90 Day Euro SFR Liffe | | Jun. 06 | | | 14,990,297 | | | 15,005,197 | | | (14,900 | ) |
| 4 | | 30 Day Fed Fund | | Apr. 06 | | | 1,589,294 | | | 1,589,218 | | | 76 | |
| 357 | | 5-Yr. U.S. T-Notes | | Mar. 06 | | | 37,964,719 | | | 37,827,049 | | | 137,670 | |
| 2 | | Japan Gov’t. Bonds 10yr | | Mar. 06 | | | 2,329,249 | | | 2,322,209 | | | 7,040 | |
| 20 | | Euro-Bund | | Mar. 06 | | | 2,884,914 | | | 2,861,356 | | | 23,558 | |
| 33 | | Euroyen tfx | | Sep. 06 | | | 6,972,644 | | | 6,972,591 | | | 53 | |
| 16 | | Euroyen tfx | | Dec. 06 | | | 3,376,945 | | | 3,374,126 | | | 2,819 | |
| 6 | | 90 Day Sterling | | Mar. 06 | | | 1,232,300 | | | 1,232,701 | | | (401 | ) |
| 12 | | 90 Day Sterling | | Mar .07 | | | 2,464,085 | | | 2,464,371 | | | (286 | ) |
| | | Short Positions: | | | | | | | | | | | | |
| 85 | | Euro-Schatz | | Mar. 06 | | | 10,594,936 | | | 10,574,063 | | | 20,873 | |
| 6 | | 90 Day Euro Euribor | | Mar. 06 | | | 1,727,805 | | | 1,721,854 | | | 5,951 | |
| 6 | | 90 Day Euro Euribor | | Mar. 08 | | | 1,719,370 | | | 1,714,094 | | | 5,276 | |
| 50 | | Euro-BOBL | | Mar. 06 | | | 6,683,675 | | | 6,679,967 | | | 3,708 | |
| 134 | | 2-Yr. U.S. T-Notes | | Mar. 06 | | | 27,495,125 | | | 27,484,464 | | | 10,661 | |
| 298 | | 10-Yr. U.S. T-Notes | | Mar. 06 | | | 32,603,063 | | | 32,869,253 | | | (266,190 | ) |
| 8 | | U.S. Long Bond | | Mar. 06 | | | 913,500 | | | 913,072 | | | 428 | |
| 49 | | 90 Day Euroyen | | Mar. 06 | | | 10,373,055 | | | 10,373,330 | | | (275 | ) |
| 18 | | 90 Day Sterling | | Sep. 06 | | | 3,699,611 | | | 3,698,488 | | | 1,123 | |
| | | | | | | | | | | | |
|
|
|
| | | | | | | | | | | | | $ | (92,005 | ) |
| | | | | | | | | | | | |
|
|
|
Forward foreign currency exchange contracts outstanding at December 31, 2005:
| | | | | | | | | | | | | | | | |
Purchase Contracts
| | Notional Amount
| | Value at Settlement
Date payable
| | Value at
December 31,
2005
| | Unrealized
Appreciation
| | Unrealized
(Depreciation)
| |
Australian Dollars,
Expiring 01/19/06 | | $ | 1,127,694 | | $ | 826,261 | | $ | 826,170 | | $ | — | | $ | (91 | ) |
Brazilian Real,
Expiring 09/21/07 | | | 2,635,000 | | | 1,000,000 | | | 1,067,969 | | | 67,969 | | | — | |
Canadian Dollars,
Expiring 01/04/06 | | | 978,086 | | | 839,559 | | | 841,502 | | | 1,943 | | | — | |
| Expiring 01/12/06 | | | 1,786,882 | | | 1,546,040 | | | 1,537,725 | | | — | | | (8,315 | ) |
| Expiring 01/12/06 | | | 965,425 | | | 827,286 | | | 830,809 | | | 3,523 | | | — | |
See Notes to Financial Statements.
| | |
| Dryden Global Total Return Fund, Inc. | | 15 |
Portfolio of Investments
as of December 31, 2005 Cont’d.
| | | | | | | | | | | | | | | | |
Purchase Contracts
| | Notional Amount
| | Value at Settlement
Date payable
| | Value at
December 31,
2005
| | Unrealized
Appreciation
| | Unrealized
(Depreciation)
| |
Danish Krones,
Expiring 01/20/06 | | $ | 7,701,851 | | $ | 1,247,196 | | $ | 1,223,498 | | $ | — | | $ | (23,698 | ) |
Euros,
Expiring 01/20/06 | | | 699,600 | | | 831,404 | | | 829,197 | | | — | | | (2,207 | ) |
| Expiring 01/20/06 | | | 695,700 | | | 825,187 | | | 824,575 | | | — | | | (612 | ) |
| Expiring 01/20/06 | | | 693,400 | | | 824,655 | | | 821,849 | | | — | | | (2,806 | ) |
| Expiring 01/23/06 | | | 694,200 | | | 825,130 | | | 822,938 | | | — | | | (2,192 | ) |
| Expiring 01/24/06 | | | 698,021 | | | 829,200 | | | 827,521 | | | — | | | (1,679 | ) |
| Expiring 01/24/06 | | | 1,497,481 | | | 1,772,299 | | | 1,775,286 | | | 2,987 | | | — | |
| Expiring 01/24/06 | | | 781,816 | | | 930,189 | | | 926,855 | | | — | | | (3,334 | ) |
| Expiring 01/24/06 | | | 650,938 | | | 777,500 | | | 771,697 | | | — | | | (5,803 | ) |
Hungarian Forint,
Expiring 01/20/06 | | | 307,948,643 | | | 1,466,771 | | | 1,442,679 | | | — | | | (24,092 | ) |
Japanese Yen,
Expiring 01/24/06 | | | 96,705,450 | | | 829,200 | | | 822,519 | | | — | | | (6,681 | ) |
| Expiring 01/24/06 | | | 1,294,786,820 | | | 11,144,086 | | | 11,012,684 | | | — | | | (131,402 | ) |
| Expiring 01/24/06 | | | 2,785,676 | | | 23,818 | | | 23,693 | | | — | | | (125 | ) |
| Expiring 01/24/06 | | | 96,709,536 | | | 823,200 | | | 822,554 | | | — | | | (646 | ) |
Mexican Nuevo Pesos,
Expiring 01/12/06 | | | 8,717,266 | | | 819,600 | | | 818,578 | | | — | | | (1,022 | ) |
| Expiring 01/12/06 | | | 8,729,314 | | | 819,600 | | | 819,709 | | | 109 | | | — | |
New Zealand Dollars,
Expiring 01/19/06 | | | 9,015 | | | 6,069 | | | 6,145 | | | 76 | | | — | |
| Expiring 01/19/06 | | | 1,205,400 | | | 817,743 | | | 821,634 | | | 3,891 | | | — | |
| Expiring 01/19/06 | | | 1,207,693 | | | 823,200 | | | 823,197 | | | — | | | (3 | ) |
Norwegian Krones,
Expiring 01/23/06 | | | 2,431,940 | | | 366,452 | | | 360,796 | | | — | | | (5,656 | ) |
| Expiring 01/23/06 | | | 5,552,166 | | | 837,203 | | | 823,705 | | | — | | | (13,498 | ) |
Pound Sterling,
Expiring 01/20/06 | | | 470,800 | | | 820,651 | | | 809,935 | | | — | | | (10,716 | ) |
South African Rand,
Expiring 01/12/06 | | | 5,553,677 | | | 872,959 | | | 876,858 | | | 3,899 | | | — | |
Swedish Krona,
Expiring 01/20/06 | | | 8,661,757 | | | 1,109,216 | | | 1,091,979 | | | — | | | (17,237 | ) |
Singapore Dollar,
Expiring 01/19/06 | | | 789,488 | | | 470,236 | | | 475,136 | | | 4,900 | | | — | |
Swiss Francs,
Expiring 01/20/06 | | | 2,867,370 | | | 2,250,595 | | | 2,186,695 | | | — | | | (63,900 | ) |
| | | | | |
|
| |
|
| |
|
| |
|
|
|
| | | | | | $ | 38,202,505 | | $ | 37,966,087 | | $ | 89,297 | | $ | (325,715 | ) |
| | | | | |
|
| |
|
| |
|
| |
|
|
|
See Notes to Financial Statements.
| | |
| 16 | | Visit our website at www.jennisondryden.com |
| | | | | | | | | | | | | | | | |
Sales Contracts
| | Notional Amount
| | Value at Settlement
Date Receivable
| | Value at
December 31,
2005
| | Unrealized
Appreciation
| | Unrealized
(Depreciation)
| |
Australian Dollars,
Expiring 01/04/06 | | $ | 1,127,694 | | $ | 826,600 | | $ | 826,598 | | $ | 2 | | $ | — | |
| Expiring 01/19/06 | | | 646,221 | | | 487,322 | | | 473,434 | | | 13,888 | | | — | |
| Expiring 01/19/06 | | | 1,120,813 | | | 830,500 | | | 821,129 | | | 9,371 | | | — | |
| Expiring 01/19/06 | | | 157,441 | | | 115,300 | | | 115,344 | | | — | | | (44 | ) |
Canadian Dollars,
Expiring 01/12/06 | | | 972,030 | | | 829,200 | | | 836,493 | | | — | | | (7,293 | ) |
| Expiring 01/12/06 | | | 154,389 | | | 131,700 | | | 132,862 | | | — | | | (1,162 | ) |
| Expiring 01/12/06 | | | 978,086 | | | 839,739 | | | 841,705 | | | — | | | (1,966 | ) |
Euros,
Expiring 01/24/06 | | | 1,392,455 | | | 1,658,400 | | | 1,650,776 | | | 7,624 | | | — | |
| Expiring 01/24/06 | | | 957,307 | | | 1,136,869 | | | 1,134,902 | | | 1,967 | | | — | |
| Expiring 01/24/06 | | | 445,474 | | | 527,000 | | | 528,116 | | | — | | | (1,116 | ) |
Hungarian Forint,
Expiring 01/20/06 | | | 176,144,283 | | | 825,187 | | | 825,201 | | | — | | | (14 | ) |
Japanese Yen,
Expiring 01/12/06 | | | 96,477,800 | | | 827,286 | | | 819,321 | | | 7,965 | | | — | |
| Expiring 01/19/06 | | | 96,094,488 | | | 817,743 | | | 816,799 | | | 944 | | | — | |
| Expiring 01/24/06 | | | 50,127,233 | | | 428,200 | | | 426,352 | | | 1,848 | | | — | |
| Expiring 01/24/06 | | | 96,747,403 | | | 823,200 | | | 822,876 | | | 324 | | | — | |
Mexican Nuevo Pesos,
Expiring 01/12/06 | | | 8,769,066 | | | 833,300 | | | 823,442 | | | 9,858 | | | — | |
| Expiring 01/12/06 | | | 12,487,204 | | | 1,185,588 | | | 1,172,587 | | | 13,001 | | | — | |
| Expiring 01/12/06 | | | 8,770,376 | | | 819,600 | | | 823,565 | | | — | | | (3,965 | ) |
New Zealand Dollars,
Expiring 01/19/06 | | | 1,064,026 | | | 753,245 | | | 725,269 | | | 27,976 | | | — | |
| Expiring 01/19/06 | | | 2,420,577 | | | 1,661,000 | | | 1,649,933 | | | 11,067 | | | — | |
Norwegian Krones,
Expiring 01/23/06 | | | 5,577,966 | | | 825,130 | | | 827,533 | | | — | | | (2,403 | ) |
Polish Zloty,
Expiring 01/20/06 | | | 6,083,735 | | | 1,895,067 | | | 1,872,715 | | | 22,352 | | | — | |
| Expiring 01/20/06 | | | 2,687,583 | | | 831,404 | | | 827,301 | | | 4,103 | | | — | |
| Expiring 01/20/06 | | | 5,849,134 | | | 1,810,597 | | | 1,800,500 | | | 10,097 | | | — | |
Pound Sterling,
Expiring 01/24/06 | | | 937,758 | | | 1,631,699 | | | 1,613,232 | | | 18,467 | | | — | |
| Expiring 01/26/06 | | | 210,312 | | | 370,245 | | | 361,800 | | | 8,445 | | | — | |
South African Rand,
Expiring 01/12/06 | | | 5,197,394 | | | 813,300 | | | 820,605 | | | — | | | (7,305 | ) |
Swedish Kronas,
Expiring 01/20/06 | | | 6,559,564 | | | 824,655 | | | 826,958 | | | — | | | (2,303 | ) |
See Notes to Financial Statements.
| | |
| Dryden Global Total Return Fund, Inc. | | 17 |
Portfolio of Investments
as of December 31, 2005 Cont’d.
| | | | | | | | | | | | | | | | |
Sales Contracts
| | Notional Amount
| | Value at Settlement
Date Receivable
| | Value at
December 31,
2005
| | Unrealized
Appreciation
| | Unrealized
(Depreciation)
| |
Swiss Francs,
Expiring 01/20/06 | | $ | 1,076,230 | | $ | 820,651 | | $ | 820,747 | | $ | — | | $ | (96 | ) |
| Expiring 01/20/06 | | | 2,155,414 | | | 1,646,800 | | | 1,643,748 | | | 3,052 | | | — | |
| Expiring 01/20/06 | | | 194,566 | | | 148,200 | | | 148,379 | | | — | | | (179 | ) |
| Expiring 01/20/06 | | | 1,081,479 | | | 823,200 | | | 824,750 | | | — | | | (1,550 | ) |
| | | | | |
|
| |
|
| |
|
| |
|
|
|
| | | | | | $ | 28,797,927 | | $ | 28,654,972 | | $ | 172,351 | | $ | (29,396 | ) |
| | | | | |
|
| |
|
| |
|
| |
|
|
|
Interest rate swap agreements outstanding at December 31, 2005:
| | | | | | | | | | | | | |
Counterparty(a)
| | Termination
Date
| | Notional
Amount
(000)
| | Fixed
Rate
| | | Floating
Rate
| | Unrealized
Appreciation
|
Merrill Lynch Capital Services | | 12/15/2015 | | $ | 900 | | 5.098 | % | | 3 Month LIBOR | | $ | 13,597 |
Merrill Lynch Capital Services | | 12/15/2025 | | $ | 900 | | 5.25 | % | | 3 Month LIBOR | | | 25,900 |
Morgan Stanley Capital Services | | 07/14/2010 | | $ | 2,700 | | 5.047 | % | | 3 Month LIBOR | | | 19,831 |
| | | | | | | | | | | | |
|
|
| | | | | | | | | | | | | $ | 59,328 |
| | | | | | | | | | | | |
|
|
| (a) | The Fund pays the floating rate and receives the fixed rate. |
See Notes to Financial Statements.
| | |
| 18 | | Visit our website at www.jennisondryden.com |
The industry classification of portfolio holdings and liabilities in excess of other assets shown as a percentage of net assets as of December 31,2005 was as follows:
| | | |
Foreign Government Obligations | | 77.2 | % |
U.S. Government Obligations | | 10.1 | |
Mutual Fund | | 3.9 | |
Banking | | 1.8 | |
Non Captive Finance | | 1.5 | |
Technology | | 1.3 | |
Chemicals | | 0.8 | |
Lodging | | 0.6 | |
Pipelines & Others | | 0.5 | |
Telecommunications | | 0.4 | |
Capital Goods | | 0.4 | |
Metals | | 0.3 | |
Media & Entertainment | | 0.3 | |
Electric | | 0.2 | |
Energy—Other | | 0.2 | |
Retail | | 0.2 | |
Healthcare & Pharmaceutical | | 0.2 | |
Paper | | 0.1 | |
| | |
|
|
| | | 100.0 | |
Liabilities in excess of other assets. | | 0.0 | |
| | |
|
|
| | | 100.0 | % |
| | |
|
|
See Notes to Financial Statements.
| | |
| Dryden Global Total Return Fund, Inc. | | 19 |
Statement of Assets and Liabilities
as of December 31, 2005
| | | | |
Assets | | | | |
Investments, at value: | | | | |
Unaffiliated investments (cost $155,567,411) | | $ | 156,159,876 | |
Affiliated investments (cost $6,395,286) | | | 6,395,286 | |
Foreign currency, at value (cost $160,043) | | | 160,058 | |
Dividends and interest receivable | | | 2,296,828 | |
Receivable for investments sold | | | 826,713 | |
Unrealized appreciation on forward currency contracts | | | 261,648 | |
Unrealized appreciation on interest rate swaps | | | 59,328 | |
Prepaid expenses | | | 17,206 | |
Interest receivable on swap agreements | | | 3,453 | |
| | |
|
|
|
Total assets | | | 166,180,396 | |
| | |
|
|
|
| |
Liabilities | | | | |
Payable for investments purchased | | | 2,587,920 | |
Unrealized depreciation on forward foreign currency contracts | | | 355,111 | |
Payable for Fund shares reacquired | | | 320,014 | |
Accrued expenses | | | 164,461 | |
Payable to custodian | | | 92,237 | |
Management fee payable | | | 81,065 | |
Distribution fee payable | | | 37,760 | |
Transfer agent fee payable | | | 34,685 | |
Due to broker—variation margin | | | 13,427 | |
Outstanding options written (premiums received $15,353) | | | 3,444 | |
Deferred directors’ fees | | | 1,627 | |
| | |
|
|
|
Total liabilities | | | 3,691,751 | |
| | |
|
|
|
| |
Net Assets | | $ | 162,488,645 | |
| | |
|
|
|
| | | | | |
Net assets were comprised of: | | | | |
Common stock, at par | | $ | 249,616 | |
Paid-in capital in excess of par | | | 186,214,776 | |
| | |
|
|
|
| | | | 186,464,392 | |
Overdistribution of net investment income | | | (5,332,735 | ) |
Accumulated net realized loss on investment and foreign currency transactions | | | (19,102,337 | ) |
Net unrealized appreciation on investments and foreign currencies | | | 459,325 | |
| | |
|
|
|
Net assets, December 31, 2005 | | $ | 162,488,645 | |
| | |
|
|
|
See Notes to Financial Statements.
| | |
| 20 | | Visit our website at www.jennisondryden.com |
| | | |
Class A | | | |
Net asset value and redemption price per share
($151,398,433 ÷ 23,259,699 shares of common stock issued and outstanding) | | $ | 6.51 |
Maximum sales charge (4.50% of offering price) | | | .31 |
| | |
|
|
Maximum offering price to public | | $ | 6.82 |
| | |
|
|
| |
Class B | | | |
Net asset value, offering price and redemption price per share
($5,513,490 ÷ 846,613 shares of common stock issued and outstanding) | | $ | 6.51 |
| | |
|
|
| |
Class C | | | |
Net asset value, offering price and redemption price per share
($1,161,363 ÷ 178,648 shares of common stock issued and outstanding) | | $ | 6.50 |
| | |
|
|
| |
Class Z | | | |
Net asset value, offering price and redemption price per share
($4,415,359 ÷ 676,627 shares of common stock issued and outstanding) | | $ | 6.53 |
| | |
|
|
See Notes to Financial Statements.
| | |
| Dryden Global Total Return Fund, Inc. | | 21 |
Statement of Operations
Year Ended December 31, 2005
| | | | |
Net Investment Income | | | | |
Income | | | | |
Interest (net of foreign withholding taxes of $25,337) | | $ | 6,467,645 | |
Affiliated dividend income | | | 207,986 | |
| | |
|
|
|
Total income | | | 6,675,631 | |
| | |
|
|
|
| |
Expenses | | | | |
Management fee | | | 1,299,759 | |
Distribution fee—Class A | | | 424,667 | |
Distribution fee—Class B | | | 67,924 | |
Distribution fee—Class C | | | 9,832 | |
Transfer agent’s fee and expenses (including affiliated expense of $318,600) | | | 411,000 | |
Custodian’s fees and expenses | | | 207,000 | |
Reports to shareholders | | | 84,000 | |
Registration fees | | | 49,000 | |
Legal fees and expenses | | | 40,000 | |
Audit fee | | | 26,000 | |
Directors’ fees | | | 12,000 | |
Insurance | | | 6,000 | |
Miscellaneous | | | 13,695 | |
| | |
|
|
|
Total expenses | | | 2,650,877 | |
Less: expense subsidy (Note 2) | | | (135,198 | ) |
| | |
|
|
|
Net expenses | | | 2,515,679 | |
| | |
|
|
|
Net investment income | | | 4,159,952 | |
| | |
|
|
|
| |
Realized And Unrealized Gain (Loss) On Investment And Foreign Currency Transactions | | | | |
Net realized gain (loss) on: | | | | |
Investment transactions | | | (1,080,021 | ) |
Foreign currency transactions | | | (2,677,488 | ) |
Financial futures contracts transactions | | | 583,401 | |
Written options transactions | | | 1,333 | |
Swap transactions | | | (112,724 | ) |
| | |
|
|
|
| | | | (3,285,499 | ) |
| | |
|
|
|
Net change in unrealized appreciation (depreciation) on: | | | | |
Investments | | | (15,342,432 | ) |
Foreign currencies | | | (1,042,650 | ) |
Financial futures contracts | | | (74,415 | ) |
Written options | | | 11,910 | |
Swaps | | | 62,781 | |
| | |
|
|
|
| | | | (16,384,806 | ) |
| | |
|
|
|
Net loss on investments | | | (19,670,305 | ) |
| | |
|
|
|
Net Decrease In Net Assets Resulting From Operations | | $ | (15,510,353 | ) |
| | |
|
|
|
See Notes to Financial Statements.
| | |
| 22 | | Visit our website at www.jennisondryden.com |
Statement of Changes in Net Assets
| | | | | | | | |
| | | Year Ended December 31,
| |
| | | 2005 | | | 2004 | |
Decrease In Net Assets | | | | | | | | |
Operations: | | | | | | | | |
Net investment income | | $ | 4,159,952 | | | $ | 3,386,536 | |
Net realized gain (loss) on investment and foreign currencies | | | (3,285,499 | ) | | | 11,987,101 | |
Net change in unrealized appreciation (depreciation) on investments and foreign currencies | | | (16,384,806 | ) | | | 2,070,784 | |
| | |
|
|
| |
|
|
|
Net increase (decrease) in net assets resulting from operations | | | (15,510,353 | ) | | | 17,444,421 | |
| | |
|
|
| |
|
|
|
Dividends and Distributions (Note 1) | | | | | | | | |
Dividends from net investment income | | | | | | | | |
Class A | | | (9,707,101 | ) | | | (15,715,012 | ) |
Class B | | | (353,619 | ) | | | (604,123 | ) |
Class C | | | (69,681 | ) | | | (84,753 | ) |
Class Z | | | (287,376 | ) | | | (420,109 | ) |
| | |
|
|
| |
|
|
|
| | | | (10,417,777 | ) | | | (16,823,997 | ) |
| | |
|
|
| |
|
|
|
Tax Return of Capital Distributions: | | | | | | | | |
Class A | | | (1,562,180 | ) | | | — | |
Class B | | | (57,949 | ) | | | — | |
Class C | | | (11,419 | ) | | | — | |
Class Z | | | (47,093 | ) | | | — | |
| | |
|
|
| |
|
|
|
| | | | (1,678,641 | ) | | | — | |
| | |
|
|
| |
|
|
|
| | |
Fund share transactions (Net of share conversions) (Note 6) | | | | | | | | |
Net proceeds from shares sold | | | 7,345,855 | | | | 8,230,116 | |
Net asset value of shares issued in reinvestment of dividends | | | 7,709,881 | | | | 9,342,437 | |
Cost of shares reacquired | | | (29,257,250 | ) | | | (27,026,474 | ) |
| | |
|
|
| |
|
|
|
Net decrease in net assets from Fund share transactions | | | (14,201,514 | ) | | | (9,453,921 | ) |
| | |
|
|
| |
|
|
|
Total decrease | | | (41,808,285 | ) | | | (8,833,497 | ) |
| | |
Net Assets: | | | | | | | | |
Beginning of year | | | 204,296,930 | | | | 213,130,427 | |
| | |
|
|
| |
|
|
|
End of year(a) | | $ | 162,488,645 | | | $ | 204,296,930 | |
| | |
|
|
| |
|
|
|
(a) Includes undistributed net investment income of: | | $ | — | | | $ | 2,488,171 | |
| | |
|
|
| |
|
|
|
See Notes to Financial Statements.
| | |
| Dryden Global Total Return Fund, Inc. | | 23 |
Notes to Financial Statements
Dryden Global Total Return Fund, Inc. (the “Fund”), is an open-end, non-diversified management investment company. The Fund’s investment objective is to seek total return made up of current income and capital appreciation.
The Fund seeks to achieve this objective by investing at least 65% of its total assets in income-producing debt securities issued by the U.S. and foreign corporations and governments, supranational organizations, semi-government entities or governmental agencies, authorities or instrumentalities and short-term bank debt securities or bank deposits. The Fund invests primarily in investment-grade securities denominated in U.S. dollars and in foreign currencies.
Note 1. Accounting Policies
The following is a summary of significant accounting policies followed by the Fund in the preparation of its financial statements.
Security Valuation: In valuing the Fund’s assets, quotations of foreign securities in a foreign currency are converted to U.S. dollar equivalents at the then current currency value. Securities listed on a securities exchange (other than options on securities and indices) are valued at the last sale price on such exchange or market on the day of valuation or, if there was no sale on such a day, at the mean between the last reported bid and asked prices, or at the last bid price on such day in the absence of an asked price. Securities that are actively traded in the over-the-counter market, including listed securities for which the primary market is believed by Prudential Investments LLC (“PI” or “Manager”), in consultation with the subadvisor, to be over-the-counter, are valued at market value using prices provided by an independent pricing agent or principal market maker. Corporate bonds, U.S. Government securities and convertible debt securities traded in the over-the-counter market, including securities listed on exchanges whose primary market is believed to be over-the counter, are valued at market value using prices provided by an independent pricing agent or principal market maker. Options on securities and indices traded on an exchange are valued at the last sale price as of the close of trading on the applicable exchange or, if there was no sale, at the mean between the most recently quoted bid and asked prices on such exchange. Future contracts and options thereon traded on a commodities exchange or board of trade are valued at the last sale price at the close of trading on such exchange or board of trade or, if there was no sale on the applicable commodities exchange or board of trade on such day, at the mean between the most recently quoted prices on such exchange or board of trade or at the last bid price in the absence of an asked price. Prices may be obtained from independent pricing services which use
| | |
| 24 | | Visit our website at www.jennisondryden.com |
information provided by market makers or estimates of market values obtained from yield data relating to investments or securities with similar characteristics. Securities for which reliable market quotations are not readily available, or whose values have been affected by events occurring after the close of the security���s foreign market and before the Fund’s normal pricing time, are valued at fair value in accordance with Board of Directors’ approved fair valuation procedures valued at fair value in accordance with the Board of Directors’ approved fair valuation procedures. When determining the fair valuation of securities, some of the factors influencing the valuation include, the nature of any restrictions on disposition of the securities; assessment of the general liquidity of the securities; the issuer’s financial condition and the markets in which it does business; the cost of the investment; the size of the holding and the capitalization of issuer; the prices of any recent transactions or bids/offers for such securities or any comparable securities; any available analyst media or other reports or information deemed reliable by the investment adviser regarding the issuer or the markets or industry in which it operates. Using fair value to price securities may result in a value that is different from a security’s most recent closing price and from the price used by other mutual funds to calculate their net asset values. As of December 31, 2005, there were no securities whose values were adjusted in accordance with procedures approved by the Board of Directors.
Investments in mutual funds are valued at their net asset value as of the close of the New York Stock Exchange on the date of the valuation.
Short-term securities which mature in sixty days or less are valued at amortized cost, which approximates market value. The amortized cost method involves valuing a security at its cost on the date of purchase and thereafter assuming a constant amortization to maturity of the difference between the principal amount due at maturity and cost. Short-term securities which mature in more than sixty days are valued at current market quotations.
Foreign Currency Translation: The books and records of the Fund are maintained in U.S. dollars. Foreign currency amounts are translated into U.S. dollars on the following basis:
(i) market value of investment securities, other assets and liabilities-at the current rates of exchange.
(ii) purchases and sales of investment securities, income and expenses-at the rates of exchange prevailing on the respective dates of such transactions.
Although the net assets of the Fund are presented at the foreign exchange rates and market values at the close of the period, the Fund does not isolate that portion of the
| | |
| Dryden Global Total Return Fund, Inc. | | 25 |
Notes to Financial Statements
Cont’d
results of operations arising as a result of changes in the foreign exchange rates from the fluctuations arising from changes in the market prices of long-term portfolio securities held at the end of the period. Similarly, the Fund does not isolate the effect of changes in foreign exchange rates from the fluctuations arising from changes in the market prices of long-term portfolio securities sold during the period. Accordingly, these realized foreign currency gains or losses are included in the reported net realized gains or losses on investment transactions.
Net realized gains or losses on foreign currency transactions represent net foreign exchange gains or losses from sales and maturities of short-term securities and forward currency contracts, disposition of foreign currencies, currency gains or losses realized between the trade and settlement dates on securities transactions, and the difference between the amounts of interest, discount and foreign withholding taxes recorded on the Fund’s books and the U.S. dollar equivalent amounts actually received or paid. Net unrealized currency gains or losses resulting from valuing foreign currency denominated assets (excluding investments) and liabilities at period-end exchange rates are reflected as a component of net unrealized appreciation or depreciation on foreign currencies.
Foreign security and currency transactions may involve certain considerations and risks not typically associated with those of U.S. companies as a result of, among other factors, the possibility of political or economic instability or the level of governmental supervision and regulation of foreign securities markets.
Financial Futures Contracts: A financial futures contract is an agreement to purchase (long) or sell (short) an agreed amount of securities at a set price for delivery on a future date. Upon entering into a financial futures contract, the Fund is required to pledge to the broker an amount of cash and/or other assets equal to a certain percentage of the contract amount. This amount is known as the “initial margin.” Subsequent payments, known as “variation margin,” are made or received by the Fund each day, depending on the daily fluctuations in the value of the underlying security. Such variation margin is recorded for financial statement purposes on a daily basis as unrealized gain or loss. When the contract expires or is closed, the gain or loss is realized and is presented in the Statement of Operations as net realized gain or loss on financial futures contracts.
The Fund invests in financial futures contracts in order to hedge existing portfolio securities, or securities the Fund intends to purchase, against fluctuations in value
| | |
| 26 | | Visit our website at www.jennisondryden.com |
caused by changes in prevailing interest rates or market conditions. Should interest rates move unexpectedly, the Fund may not achieve the anticipated benefits of the financial futures contracts and may realize a loss. The use of futures transactions involves the risk of imperfect correlation in movements in the price of futures contracts, interest rates and the underlying hedged assets.
Forward Currency Contracts: A forward currency contract is a commitment to purchase or sell a foreign currency at a future date at a negotiated forward rate. The Fund enters into forward currency contracts in order to hedge its exposure to changes in foreign currency exchange rates on its foreign portfolio holdings or on specific receivables and payables denominated in a foreign currency. The contracts are valued daily at current forward exchange rates and any unrealized gain or loss is included in net unrealized appreciation or depreciation on foreign currencies. Gain or loss is realized on the settlement date of the contract equal to the difference between the trade date and settlement value. This gain or loss, if any, is included in net realized gain or loss on foreign currency transactions. Risks may arise upon entering into these contracts from the potential inability of the counterparties to meet the terms of their contracts.
Options: The Fund may either purchase or write options in order to hedge against adverse market movements or fluctuations in value caused by changes in prevailing interest rates with respect to securities, which the Fund currently owns or intends to purchase. The Fund’s principal reason for writing options is to realize, through receipt of premiums, a greater current return than would be realized on the underlying security alone. When a Fund purchases an option, it pays a premium and an amount equal to that premium is recorded as an asset. When a Fund writes an option, it receives a premium and an amount equal to that premium is recorded as a liability. The asset or liability is adjusted daily to reflect the current market value of the option. If an option expires unexercised, a Fund realizes a gain or loss to the extent of the premium received or paid. If an option is exercised, the premium received or paid is recorded as an adjustment to the proceeds from the sale or the cost basis of the purchase in determining whether the Fund has realized a gain or loss. The difference between the premium and the amount received or paid on effecting a closing purchase or sale transaction is also treated as a realized gain or loss. Gain or loss on purchased options is included in net realized gain or loss on investment transactions. Gain or loss on written options is presented separately as net realized gain or loss on options written.
The Fund, as writer of an option, may have no control over whether the underlying securities may be sold (called) or purchased (put). As a result, the Fund bears the market risk of an unfavorable change in the price of the security underlying the written option. The Fund, as purchaser of an option, bears the risk of the potential inability of the counterparties to meet the terms of their contracts.
| | |
| Dryden Global Total Return Fund, Inc. | | 27 |
Notes to Financial Statements
Cont’d
Swaps: The Fund may enter into swap agreements. A swap is an agreement to exchange the return generated by one instrument for the return generated by another instrument. The Fund enters into interest rate swap agreements to manage its exposure to interest rates. Interest rate swap agreements involve the exchange by the Fund with another party of their respective commitments to pay or receive interest and may involve payment/receipt of a premium at the time of initiation of the swap agreement. The Fund’s swap agreements involve commitments to pay interest in exchange for a market-linked return, both based on notional amounts. To the extent the total return of the security or index underlying the transaction exceeds or falls short of the offsetting interest rate obligation, the Fund will receive a payment from or make a payment to the counterparty. The swaps are valued daily at current market value and any unrealized gain or loss is included in the Statement of Assets and Liabilities. Gain or loss is realized on the termination date of the swap and is equal to the difference between the Fund’s cost basis in the swap and the proceeds of the closing transaction, including any fees.
During the period that the swap agreement is open, the Fund may be subject to risk from the potential inability of the counterparty to meet the terms of the agreement.
Risk: Forward currency contracts, written options, financial futures contracts, and swap agreements involve elements of both market and credit risk in excess of the amounts reflected on the Statements of Assets and Liabilities. Lower rated or unrated securities are more likely to react to developments affecting market risk (general market liquidity) and credit risk (an issuer’s inability to meet principal and interest payments on its obligations) than are more highly rated securities, which react primarily to movements in the general level of interest rates. The ability of issuers of debt securities held by the Fund to meet their obligations may be affected by economic developments in a specific industry or region.
Security Transactions and Net Investment Income: Security transactions are recorded on the trade date. Realized and unrealized gains or losses on sales of securities are calculated on the identified cost basis. Dividend income is recorded on the ex-dividend date. Interest income, including amortization of premium and accretion of discount on debt securities, as required, is recorded on the accrual basis. Expenses are recorded on the accrual basis.
Net investment income or loss (other than distribution fees, which are charged directly to the respective class) and unrealized and realized gains or losses are allocated daily to each class of shares based upon the relative proportion of net assets of each class at the beginning of the day.
| | |
| 28 | | Visit our website at www.jennisondryden.com |
Dividends and Distributions: The Fund expects to pay dividends of net investment income quarterly and distributions of net realized capital and currency gains, if any, annually. Foreign currency losses may reduce the amount of dividends of net investment income. Dividends and distributions to shareholders, which are determined in accordance with federal income tax regulations and which may differ from generally accepted accounting, are recorded on the ex-dividend date. Permanent book/tax differences relating to income and gains are reclassified to paid-in-capital when they arise.
Taxes: It is the Fund’s policy to continue to meet the requirements of the Internal Revenue Code applicable to regulated investment companies and to distribute all of its taxable net income and capital gains, if any, to its shareholders. Therefore, no federal income tax provision is required.
Withholding taxes on foreign interest are recorded, net of reclaimable amounts, at the time the related income is earned.
Estimates: The preparation of the financial statements requires management to make estimates and assumptions that affect the reported amounts and disclosures in the financial statements. Actual results could differ from those amounts.
Note 2. Agreements
The Fund has a management agreement with PI. Pursuant to this agreement, PI has responsibility for all investment advisory services and supervises the subadviser’s performance of such services. PI has entered into a subadvisory agreement with Prudential Investment Management, Inc. (“PIM”). The subadvisory agreement provides that PIM will furnish investment advisory services in connection with the management of the Fund. In connection therewith, PIM is obligated to keep certain books and records of the Fund. PI pays for the services of PIM, the cost of compensation of officers of the Fund, occupancy and certain clerical and bookkeeping costs of the Fund. The Fund bears all other costs and expenses.
During the period from January 1, 2005 through July 31, 2005, the management fee paid to PI was accrued daily and payable monthly at an annual rate of .75 of 1% of the Fund’s average daily net assets up to $500 million, .70 of 1% of such assets between $500 million and $1 billion, and .65 of 1% of such assets in excess of $1 billion. Effective August 1, 2005, the management fee paid to PI is accrued daily and payable monthly at an annual rate of .65 of 1% of the Fund’s average daily net assets up to $1 billion and .60 of 1% of such assets in excess of $1 billion. The effective management fee rate was .71 of 1% for the year ended December 31, 2005.
| | |
| Dryden Global Total Return Fund, Inc. | | 29 |
Notes to Financial Statements
Cont’d
PI has agreed to reimburse the Fund in order to limit operating expenses (excluding interest, taxes, and brokerage commissions) to 1.35%, 2.10%, 1.85%, and 1.10% of the average daily net assets, which amounted to $135,198, of the Class A, B, C, and Z shares, respectively.
The Fund has a distribution agreement with Prudential Investment Management Services LLC (“PIMS”), which acts as the distributor of the Class A, Class B, Class C and Class Z shares of the Fund. The Fund compensates PIMS for distributing and servicing the Fund’s Class A, Class B and Class C shares, pursuant to plans of distribution (the “Class A, B and C Plans”), regardless of expenses actually incurred by PIMS. The distribution fees are accrued daily and payable monthly. No distribution or service fees are paid to PIMS as distributor of the Class Z shares of the Fund.
Pursuant to the Class A, B and C Plans, the Fund compensates PIMS for distribution related activities at an annual rate of up to .30 of 1%, 1% and 1% of the average daily net assets of the Class A, B, and C shares, respectively. For the year ended December 31, 2005, PIMS contractually agreed to limit such fees to .25 of 1% of the average daily net assets of the Class A and .75 of 1% of the average daily net assets of the C shares, respectively.
PIMS has advised the Fund that it has received approximately $53,800 in front-end sales charges resulting from sales of Class A shares, during the year ended December 31, 2005. From these fees, PIMS paid such sales charges to affiliated broker-dealers, which in turn paid commissions to salespersons and incurred other distribution costs.
PIMS has advised the Fund that for the year ended December 31, 2005, it received approximately $12,900 and $300 in contingent deferred sales charges imposed upon redemptions by certain Class B and Class C shareholders, respectively.
PI, PIM and PIMS are indirect, wholly-owned subsidiaries of Prudential Financial, Inc. (“Prudential”).
The Fund, along with other affiliated registered investment companies (the “Funds”), is a party to a syndicated credit agreement (“SCA”) with two banks. The SCA provides for a commitment of $500 million. Interest on any borrowings under the SCA would be incurred at market rates. For the period from October 29, 2004 through October 28, 2005, the Fund paid a commitment fee of .075 of 1% of the unused portion of the agreement. Effective October 29, 2005, the Funds renewed the SCA
| | |
| 30 | | Visit our website at www.jennisondryden.com |
with the banks. The commitment under the renewed SCA continues to be $500 million. The Fund pays a commitment fee of .0725 of 1% of the unused portion of the renewed SCA. The commitment fee is accrued daily and paid quarterly and is allocated to the Funds pro-rata based on net assets. The purpose of the SCA is to serve as an alternative source of funding for capital share redemptions. The expiration date of the renewed SCA is October 27, 2006. The Fund did not borrow any amounts pursuant to the SCA during the year ended December 31, 2005.
Note 3. Other Transactions with Affiliates
Prudential Mutual Fund Services LLC (“PMFS”), an affiliate of PI and an indirect, wholly-owned subsidiary of Prudential, serves as the Fund’s transfer agent. Transfer agent’s fees and expenses in the Statement of Operations include certain out-of-pocket expenses paid to non-affiliates, where applicable.
The Fund pays networking fees to affiliated and unaffiliated broker/dealers. These networking fees are payments made to broker/dealers that clear mutual fund transactions through a national clearing system. First Clearing Corporation, an affiliate of PI, serves as a broker/dealer. For the year ended December 31, 2005 the Fund incurred approximately $70,600 in total networking fees. These amounts are included in transfer agent’s fees and expenses in the Statement of Operations.
The Fund invests in the Taxable Money Market Series (the “Portfolio”), a portfolio of Dryden Core Investment Fund, pursuant to an exemptive order received from the Securities and Exchange Commission. The Portfolio is a money market mutual fund registered under the Investment Company Act of 1940, as amended, and managed by PI.
Note 4. Portfolio Securities
Purchases and sales of portfolio securities, other than short-term investments, for the year ended December 31, 2005, aggregated $538,389,876 and $550,143,882, respectively.
Transactions in options written during the year ended December 31, 2005, were as follows:
| | | | | | | |
| | | Contracts
| | | Premiums Received
| |
Options outstanding at December 31, 2004 | | — | | | $ | — | |
Options written | | 129 | | | | 29,827 | |
Options closed | | (76 | ) | | | (11,536 | ) |
Options expired | | (24 | ) | | | (2,938 | ) |
| | |
|
| |
|
|
|
Options outstanding at December 31, 2005 | | 29 | | | $ | 15,353 | |
| | |
|
| |
|
|
|
| | |
| Dryden Global Total Return Fund, Inc. | | 31 |
Notes to Financial Statements
Cont’d
Note 5. Distributions and Tax Information
In order to present overdistribution of net investment income and accumulated net realized loss on investments and foreign currency transactions on the Statement of Assets and Liabilities that more closely represent their tax character, certain adjustments have been made to paid-in-capital in excess of par, overdistribution of net investment income and accumulated net realized loss on investments and foreign currencies. For the year ended December 31, 2005, the adjustments were to decrease overdistribution of net investment income by $115,560, decrease accumulated net realized loss on investments and foreign currencies by $3,050,344 and decrease paid-in-capital in excess of par by $3,165,904, due to foreign currency reclassification and differences in the treatment of premium amortization and other book to tax adjustments. Net investment income, net realized gains and net assets were not affected by this change.
The tax character of dividends paid as reflected in the Statements of Changes in Net Assets were $10,417,777 and $1,678,641 of ordinary income and tax return of capital, respectively, for the year ended December 31, 2005. The tax character of dividends paid was $16,823,997 of ordinary income for the year ended December 31, 2004.
For federal income tax purposes, the Fund had a capital loss carryforwards as of December 31, 2005, of approximately $16,692,000, of which $5,619,000 expires in 2008, $3,491,000 expires in 2009 and $7,582,000 expires in 2010. Approximately $1,488,000 of the capital loss carryforward was used to offset net taxable gains realized in the fiscal year ended December 31, 2005. Accordingly, no capital gains distribution is expected to be paid to shareholders until net gains have been realized in excess of such carryforward. In addition, the Fund elected to treat post-October foreign currency and capital losses of approximately $1,059,000 and $740,000, respectively, incurred in the two month period ended December 31, 2005 as having been incurred in the following fiscal year.
The United States federal income tax basis of the Fund’s investments and the net unrealized appreciation as of December 31, 2005 were as follows:
| | | | | | |
Tax Basis
| | Appreciation
| | Depreciation
| | Net Unrealized
Depreciation
|
| $168,097,308 | | $4,048,464 | | $(9,590,610) | | $(5,542,146) |
The differences between book and tax basis are primarily attributable to deferred losses on wash sales, amortization of premiums and other book to tax differences. The adjusted net unrealized depreciation on a tax basis was $5,454,532 which included
| | |
| 32 | | Visit our website at www.jennisondryden.com |
other tax basis adjustments of $87,614 that were primarily attributable to appreciation of foreign currency, to the mark-to-market of receivables and payables, swaps and written options.
Note 6. Capital
The Fund offers Class A, Class B, Class C and Class Z shares. Class A shares are sold with a front-end sales charge of up to 4.5%. All investors who purchase Class A shares in an amount of $1 million or more and sell these shares within 12 months of purchase are subject to a contingent deferred sales charge (CDSC) of 1%, including investors who purchase their shares through broker-dealers affiliated with Prudential. Class B shares are sold with a CDSC which declines from 5% to zero depending on the period of time the shares are held. Class C shares are sold with a CDSC of 1% during the first 12 months. Class B shares automatically convert to Class A shares on a quarterly basis approximately seven years after purchase. A special exchange privilege is also available for shareholders who qualified to purchase Class A shares at net asset value. Class Z shares are not subject to any sales or redemption charge and are offered exclusively for sale to a limited group of investors.
There are 2 billion authorized shares of common stock at $.01 par value per share, divided equally into Class A, B, C and Z shares.
Transactions in shares of common stock were as follows:
| | | | | | | |
Class A
| | Shares
| | | Amount
| |
Year ended December 31, 2005: | | | | | | | |
Shares sold | | 629,108 | | | $ | 4,398,289 | |
Shares issued in reinvestment of distributions | | 1,007,680 | | | | 6,944,130 | |
Shares reacquired | | (3,626,002 | ) | | | (24,806,467 | ) |
| | |
|
| |
|
|
|
Net increase (decrease) in shares outstanding before conversion | | (1,989,214 | ) | | | (13,464,048 | ) |
Shares issued upon conversion from Class B | | 112,733 | | | | 780,811 | |
| | |
|
| |
|
|
|
Net increase (decrease) in shares outstanding | | (1,876,481 | ) | | $ | (12,683,237 | ) |
| | |
|
| |
|
|
|
Year ended December 31, 2004: | | | | | | | |
Shares sold | | 583,534 | | | $ | 4,224,398 | |
Shares issued in reinvestment of dividends and distributions | | 1,166,689 | | | | 8,319,581 | |
Shares reacquired | | (3,149,728 | ) | | | (22,705,055 | ) |
| | |
|
| |
|
|
|
Net increase (decrease) in shares outstanding before conversion | | (1,399,505 | ) | | | (10,161,076 | ) |
Shares issued upon conversion from Class B | | 88,745 | | | | 642,654 | |
| | |
|
| |
|
|
|
Net increase (decrease) in shares outstanding | | (1,310,760 | ) | | $ | (9,518,422 | ) |
| | |
|
| |
|
|
|
| | |
| Dryden Global Total Return Fund, Inc. | | 33 |
Notes to Financial Statements
Cont’d
| | | | | | | |
Class B
| | Shares
| | | Amount
| |
Year ended December 31, 2005: | | | | | | | |
Shares sold | | 137,758 | | | $ | 969,515 | |
Shares issued in reinvestment of dividends | | 53,278 | | | | 367,940 | |
Shares reacquired | | (257,572 | ) | | | (1,764,839 | ) |
| | |
|
| |
|
|
|
Net increase (decrease) in shares outstanding before conversion | | (66,536 | ) | | | (427,384 | ) |
Shares reacquired upon conversion into Class A | | (112,683 | ) | | | (780,811 | ) |
| | |
|
| |
|
|
|
Net increase (decrease) in shares outstanding | | (179,219 | ) | | $ | (1,208,195 | ) |
| | |
|
| |
|
|
|
Year ended December 31, 2004: | | | | | | | |
Shares sold | | 187,756 | | | $ | 1,367,146 | |
Shares issued in reinvestment of dividends and distributions | | 76,661 | | | | 547,445 | |
Shares reacquired | | (292,626 | ) | | | (2,095,160 | ) |
| | |
|
| |
|
|
|
Net increase (decrease) in shares outstanding before conversion | | (28,209 | ) | | | (180,569 | ) |
Shares reacquired upon conversion into Class A | | (88,680 | ) | | | (642,654 | ) |
| | |
|
| |
|
|
|
Net increase (decrease) in shares outstanding | | (116,889 | ) | | $ | (823,223 | ) |
| | |
|
| |
|
|
|
Class C
| | | | | | |
Year ended December 31, 2005: | | | | | | | |
Shares sold | | 94,344 | | | $ | 644,946 | |
Shares issued in reinvestment of dividends | | 9,504 | | | | 65,385 | |
Shares reacquired | | (115,052 | ) | | | (784,027 | ) |
| | |
|
| |
|
|
|
Net increase (decrease) in shares outstanding | | (11,204 | ) | | $ | (73,696 | ) |
| | |
|
| |
|
|
|
Year ended December 31, 2004: | | | | | | | |
Shares sold | | 99,448 | | | $ | 725,281 | |
Shares issued in reinvestment of dividends and distributions | | 10,638 | | | | 75,840 | |
Shares reacquired | | (40,510 | ) | | | (293,000 | ) |
| | |
|
| |
|
|
|
Net increase (decrease) in shares outstanding | | 69,576 | | | $ | 508,121 | |
| | |
|
| |
|
|
|
Class Z
| | | | | | |
Year ended December 31, 2005: | | | | | | | |
Shares sold | | 190,022 | | | $ | 1,333,105 | |
Shares issued in reinvestment of dividends | | 48,222 | | | | 332,426 | |
Shares reacquired | | (273,998 | ) | | | (1,901,917 | ) |
| | |
|
| |
|
|
|
Net increase (decrease) in shares outstanding | | (35,754 | ) | | $ | (236,386 | ) |
| | |
|
| |
|
|
|
Year ended December 31, 2004: | | | | | | | |
Shares sold | | 266,686 | | | $ | 1,913,291 | |
Shares issued in reinvestment of dividends and distributions | | 56,023 | | | | 399,571 | |
Shares reacquired | | (266,856 | ) | | | (1,933,259 | ) |
| | |
|
| |
|
|
|
Net increase (decrease) in shares outstanding | | 55,853 | | | $ | 379,603 | |
| | |
|
| |
|
|
|
| | |
| 34 | | Visit our website at www.jennisondryden.com |
Financial Highlights
| | |
| DECEMBER 31, 2005 | | ANNUAL REPORT |
Dryden Global Total Return Fund, Inc.
Financial Highlights
| | | | |
| | | Class A
| |
| | | Year Ended
December 31, 2005(a) | |
Per Share Operating Performance: | | | | |
Net Asset Value, Beginning of Year | | $ | 7.55 | |
| | |
|
|
|
Income from investment operations: | | | | |
Net investment income | | | .16 | |
Net realized and unrealized gain (loss) on investment and foreign currency transactions | | | (.74 | ) |
| | |
|
|
|
Total from investment operations | | | (.58 | ) |
| | |
|
|
|
Less Distributions | | | | |
Dividends from net investment income | | | (.40 | ) |
Tax return of capital distributions | | | (.06 | ) |
| | |
|
|
|
Total distributions | | | (.46 | ) |
| | |
|
|
|
Net asset value, end of year | | $ | 6.51 | |
| | |
|
|
|
Total Return(b): | | | (7.94 | )% |
Ratios/Supplemental Data: | | | | |
Net assets, end of year (000) | | $ | 151,399 | |
Average net assets (000) | | $ | 169,867 | |
Ratios to average net assets: | | | | |
Expenses, including distribution and service (12b-1) fees(c) | | | 1.35 | %(d) |
Expenses, excluding distribution and service (12b-1) fees | | | 1.10 | %(d) |
Net investment income | | | 2.30 | %(d) |
For Class A, B, C and Z shares: | | | | |
Portfolio turnover rate | | | 307 | % |
| (a) | Calculated based upon weighted average shares outstanding during the year. |
| (b) | Total return does not consider the effects of sales loads. Total return is calculated assuming a purchase of shares on the first day and a sale on the last day of each year reported, and includes reinvestment of dividends and distributions. |
| (c) | The distributor of the Fund contractually agreed to limit its distribution and service (12b-1) fees to .25 of 1% of the average net assets of the Class A shares. |
| (d) | As of June 1, 2004, the Manager of the Fund has agreed to reimburse the Fund in order to limit operating expense (excluding interest, taxes and brokerage commissions) to 1.35% of the average daily net assets of Class A. If the manager had not reimbursed the Fund, the annual expenses (both including and excluding distribution and service (12b-1) fees and net investment income ratios would be 1.44%, 1.19% and 1.63%, respectively, for the year ended December 31, 2004, and 1.42%, 1.17% and 2.23%, respectively, for the year ended December 31, 2005. |
See Notes to Financial Statements.
| | |
| 36 | | Visit our website at www.jennisondryden.com |
| | | | | | | | | | | | | | |
| Class A | |
| Year Ended December 31, | |
| 2004(a) | | | 2003(a) | | | 2002 | | | 2001(a) | |
| | | | | | | | | | | | | | | |
| $ | 7.51 | | | $ | 7.17 | | | $ | 6.80 | | | $ | 7.10 | |
|
|
| |
|
|
| |
|
|
| |
|
|
|
| | | | | | | | | | | | | | | |
| | .12 | | | | .11 | | | | .26 | | | | .32 | |
| | .53 | | | | .82 | | | | .41 | | | | (.33 | ) |
|
|
| |
|
|
| |
|
|
| |
|
|
|
| | .65 | | | | .93 | | | | .67 | | | | (.01 | ) |
|
|
| |
|
|
| |
|
|
| |
|
|
|
| | | | | | | | | | | | | | | |
| | (.61 | ) | | | (.59 | ) | | | (.30 | ) | | | (.24 | ) |
| | — | | | | — | | | | — | | | | (.05 | ) |
|
|
| |
|
|
| |
|
|
| |
|
|
|
| | (.61 | ) | | | (.59 | ) | | | (.30 | ) | | | (.29 | ) |
|
|
| |
|
|
| |
|
|
| |
|
|
|
| $ | 7.55 | | | $ | 7.51 | | | $ | 7.17 | | | $ | 6.80 | |
|
|
| |
|
|
| |
|
|
| |
|
|
|
| | 9.42 | % | | | 13.44 | % | | | 10.13 | % | | | (.15 | )% |
| | | | | | | | | | | | | | | |
| $ | 189,719 | | | $ | 198,688 | | | $ | 210,353 | | | $ | 223,683 | |
| $ | 185,333 | | | $ | 206,127 | | | $ | 212,828 | | | $ | 226,129 | |
| | | | | | | | | | | | | | | |
| | 1.35 | %(d) | | | 1.43 | % | | | 1.46 | % | | | 1.52 | % |
| | 1.1 | %(d) | | | 1.18 | % | | | 1.21 | % | | | 1.27 | % |
| | 1.74 | %(d) | | | 1.52 | % | | | 3.78 | % | | | 4.50 | % |
| | | | | | | | | | | | | | | |
| | 312 | % | | | 251 | % | | | 252 | % | | | 237 | % |
See Notes to Financial Statements.
| | |
| Dryden Global Total Return Fund, Inc. | | 37 |
Financial Highlights
Cont’d
| | | | |
| | | Class B
| |
| | | Year Ended
December 31, 2005(a) | |
Per Share Operating Performance: | | | | |
Net Asset Value, Beginning of Year | | $ | 7.56 | |
| | |
|
|
|
Income from investment operations: | | | | |
Net investment income | | | .11 | |
Net realized and unrealized gain (loss) on investment and foreign currency transactions | | | (.74 | ) |
| | |
|
|
|
Total from investment operations | | | (.63 | ) |
| | |
|
|
|
Less Distributions | | | | |
Dividends from net investment income | | | (.36 | ) |
Tax return of capital distributions | | | (.06 | ) |
| | |
|
|
|
Total distributions | | | (.42 | ) |
| | |
|
|
|
Net asset value, end of year | | $ | 6.51 | |
| | |
|
|
|
Total Return(b): | | | (8.60 | )% |
Ratios/Supplemental Data: | | | | |
Net assets, end of year (000) | | $ | 5,513 | |
Average net assets (000) | | $ | 6,792 | |
Ratios to average net assets: | | | | |
Expenses, including distribution and service (12b-1) fees | | | 2.10 | %(c) |
Expenses, excluding distribution and service (12b-1) fees | | | 1.10 | %(c) |
Net investment income | | | 1.54 | %(c) |
| (a) | Calculated based upon weighted average shares outstanding during the year. |
| (b) | Total return does not consider the effects of sales loads. Total return is calculated assuming a purchase of shares on the first day and a sale on the last day of each year reported+A113 and includes reinvestment of dividends and distributions. |
| (c) | As of June 1, 2004, the Manager of the Fund has agreed to reimburse the Fund in order to limit operating expense (excluding interest, taxes and brokerage commissions) to 2.10% of the average daily net assets of Class B. If the manager had not reimbursed the Fund, the annual expenses (both including and excluding distribution and service (12b-1) fees and net investment income ratios would be 2.19%, 1.19% and .90%, respectively, for the year ended December 31, 2004, and 2.17%, 1.17% and 1.47%, respectively, for the year ended December 31, 2005. |
See Notes to Financial Statements.
| | |
| 38 | | Visit our website at www.jennisondryden.com |
| | | | | | | | | | | | | | |
Class B | |
| Year Ended December 31, | |
| 2004(a) | | | 2003(a) | | | 2002 | | | 2001(a) | |
| | | | | | | | | | | | | | | |
| $ | 7.53 | | | $ | 7.18 | | | $ | 6.81 | | | $ | 7.10 | |
|
|
| |
|
|
| |
|
|
| |
|
|
|
| | | | | | | | | | | | | | | |
| | .07 | | | | .05 | | | | .21 | | | | .28 | |
| | .52 | | | | .84 | | | | .41 | | | | (.31 | ) |
|
|
| |
|
|
| |
|
|
| |
|
|
|
| | .59 | | | | .89 | | | | .62 | | | | (.03 | ) |
|
|
| |
|
|
| |
|
|
| |
|
|
|
| | | | | | | | | | | | | | | |
| | (.56 | ) | | | (.54 | ) | | | (.25 | ) | | | (.21 | ) |
| | — | | | | — | | | | — | | | | (.05 | ) |
|
|
| |
|
|
| |
|
|
| |
|
|
|
| | (.56 | ) | | | (.54 | ) | | | (.25 | ) | | | (.26 | ) |
|
|
| |
|
|
| |
|
|
| |
|
|
|
| $ | 7.56 | | | $ | 7.53 | | | $ | 7.18 | | | $ | 6.81 | |
|
|
| |
|
|
| |
|
|
| |
|
|
|
| | 8.44 | % | | | 12.72 | % | | | 9.28 | % | | | (.49 | )% |
| | | | | | | | | | | | | | | |
| $ | 7,759 | | | $ | 8,602 | | | $ | 7,480 | | | $ | 7,241 | |
| $ | 7,854 | | | $ | 8,172 | | | $ | 7,461 | | | $ | 7,120 | |
| | | | | | | | | | | | | | | |
| | 2.10 | %(c) | | | 2.18 | % | | | 2.21 | % | | | 2.02 | % |
| | 1.10 | %(c) | | | 1.18 | % | | | 1.21 | % | | | 1.27 | % |
| | 0.99 | %(c) | | | .77 | % | | | 3.02 | % | | | 4.01 | % |
See Notes to Financial Statements.
| | |
| Dryden Global Total Return Fund, Inc. | | 39 |
Financial Highlights
Cont’d
| | | | |
| | | Class C
| |
| | | Year Ended
December 31, 2005 (a) | |
Per Share Operating Performance: | | | | |
Net Asset Value, Beginning of Year | | $ | 7.55 | |
| | |
|
|
|
Income from investment operations: | | | | |
Net investment income | | | .13 | |
Net realized and unrealized gain (loss) on investment and foreign currency transactions | | | (.75 | ) |
| | |
|
|
|
Total from investment operations | | | (.62 | ) |
| | |
|
|
|
Less Distributions | | | | |
Dividends from net investment income | | | (.37 | ) |
Tax return of capital distributions | | | (.06 | ) |
| | |
|
|
|
Total distributions | | | (.43 | ) |
| | |
|
|
|
Net asset value, end of year | | $ | 6.50 | |
| | |
|
|
|
Total Return(b): | | | (8.43 | )% |
Ratios/Supplemental Data: | | | | |
Net assets, end of year (000) | | $ | 1,161 | |
Average net assets (000) | | $ | 1,311 | |
Ratios to average net assets: | | | | |
Expenses, including distribution and service (12b-1) fees(c) | | | 1.85 | %(d) |
Expenses, excluding distribution and service (12b-1) fees | | | 1.10 | %(d) |
Net investment income | | | 1.80 | %(d) |
| (a) | Calculated based upon weighted average shares outstanding during the year. |
| (b) | Total return does not consider the effects of sales loads. Total return is calculated assuming a purchase of shares on the first day and a sale on the last day of each year reported, and includes reinvestment of dividends and distributions. |
| (c) | The distributor of the Fund contractually agreed to limit its distribution and service (12b-1) fees to .75 of 1% of the average net assets of the Class C shares. |
| (d) | As of June 1, 2004, the Manager of the Fund has agreed to reimburse the Fund in order to limit operating expense (excluding interest, taxes and brokerage commissions) to 1.85% of the average daily net assets of Class C. If the manager had not reimbursed the Fund, the annual expenses (both including and excluding distribution and service (12b-1) fees and net investment income ratios would be 1.94%, 1.19% and 1.00%, respectively, for the year ended December 31, 2004, and 1.92%, 1.17% and 1.73%, respectively, for the year ended December 31, 2005. |
See Notes to Financial Statements.
| | |
| 40 | | Visit our website at www.jennisondryden.com |
| | | | | | | | | | | | | | |
| Class C | |
| Year Ended December 31, | |
| 2004(a) | | | 2003(a) | | | 2002 | | | 2001(a) | |
| | | | | | | | | | | | | | | |
| $ | 7.51 | | | $ | 7.17 | | | $ | 6.81 | | | $ | 7.10 | |
|
|
| |
|
|
| |
|
|
| |
|
|
|
| | | | | | | | | | | | | | | |
| | .08 | | | | .07 | | | | .22 | | | | .28 | |
| | .54 | | | | .83 | | | | .40 | | | | (.31 | ) |
|
|
| |
|
|
| |
|
|
| |
|
|
|
| | .62 | | | | .90 | | | | .62 | | | | (.03 | ) |
|
|
| |
|
|
| |
|
|
| |
|
|
|
| | | | | | | | | | | | | | | |
| | (.58 | ) | | | (.56 | ) | | | (.26 | ) | | | (.21 | ) |
| | — | | | | — | | | | — | | | | (.05 | ) |
|
|
| |
|
|
| |
|
|
| |
|
|
|
| | (.58 | ) | | | (.56 | ) | | | (.26 | ) | | | (.26 | ) |
|
|
| |
|
|
| |
|
|
| |
|
|
|
| $ | 7.55 | | | $ | 7.51 | | | $ | 7.17 | | | $ | 6.81 | |
|
|
| |
|
|
| |
|
|
| |
|
|
|
| | 8.87 | % | | | 12.88 | % | | | 9.37 | % | | | (.49 | )% |
| | | | | | | | | | | | | | | |
| $ | 1,433 | | | $ | 904 | | | $ | 666 | | | $ | 719 | |
| $ | 1,049 | | | $ | 815 | | | $ | 741 | | | $ | 564 | |
| | | | | | | | | | | | | | | |
| | 1.85 | %(d) | | | 1.93 | % | | | 1.96 | % | | | 2.02 | % |
| | 1.10 | %(d) | | | 1.18 | % | | | 1.21 | % | | | 1.27 | % |
| | 1.09 | %(d) | | | 1.01 | % | | | 3.28 | % | | | 3.97 | % |
See Notes to Financial Statements.
| | |
| Dryden Global Total Return Fund, Inc. | | 41 |
Financial Highlights
Cont’d
| | | | |
| | | Class Z
| |
| | | Year Ended
December 31, 2005(b) | |
Per Share Operating Performance: | | | | |
Net Asset Value, Beginning of Year | | $ | 7.56 | |
| | |
|
|
|
Income from investment operations: | | | | |
Net investment income | | | .18 | |
Net realized and unrealized gain (loss) on investment and foreign currency transactions | | | (.74 | ) |
| | |
|
|
|
Total from investment operations | | | (.56 | ) |
| | |
|
|
|
Less Distributions | | | | |
Dividends from net investment income | | | (.41 | ) |
Tax return of capital distributions | | | (.06 | ) |
| | |
|
|
|
Total distributions | | | (.47 | ) |
| | |
|
|
|
Net asset value, end of year | | $ | 6.53 | |
| | |
|
|
|
Total Return(a): | | | (7.62 | )% |
Ratios/Supplemental Data: | | | | |
Net assets, end of year (000) | | $ | 4,415 | |
Average net assets (000) | | $ | 4,901 | |
Ratios to average net assets: | | | | |
Expenses, including distribution and service (12b-1) fees | | | 1.10 | %(d) |
Expenses, excluding distribution and service (12b-1) fees | | | 1.10 | %(d) |
Net investment income | | | 2.55 | %(d) |
| (a) | Total return does not consider the effects of sales loads. Total return is calculated assuming a purchase of shares on the first day and a sale on the last day of each year reported, and includes reinvestment of dividends and distributions. |
| (b) | Calculated based upon weighted average shares outstanding during the year. |
| (c) | As of June 1, 2004, the Manager of the Fund has agreed to reimburse the Fund in order to limit operating expense (excluding interest, taxes and brokerage commissions) to 1.10% of the average daily net assets of Class Z. If the manager had not reimbursed the Fund, the annual expenses (both including and excluding distribution and service (12b-1) fees and net investment income ratios would be 1.19%, 1.19% and 1.86%, respectively, for the year ended December 31, 2004, and 1.17%, 1.17% and 2.48%, respectively, for the year ended December 31, 2005. |
See Notes to Financial Statements.
| | |
| 42 | | Visit our website at www.jennisondryden.com |
| | | | | | | | | | | | | | |
| Class Z | |
| Year Ended December 31, | |
| 2004(b) | | | 2003(b) | | | 2002 | | | 2001(b) | |
| | | | | | | | | | | | | | | |
| $ | 7.52 | | | $ | 7.18 | | | $ | 6.81 | | | $ | 7.10 | |
|
|
| |
|
|
| |
|
|
| |
|
|
|
| | | | | | | | | | | | | | | |
| | .14 | | | | .13 | | | | .27 | | | | .35 | |
| | .53 | | | | .82 | | | | .42 | | | | (.33 | ) |
|
|
| |
|
|
| |
|
|
| |
|
|
|
| | .67 | | | | .95 | | | | .69 | | | | .02 | |
|
|
| |
|
|
| |
|
|
| |
|
|
|
| | | | | | | | | | | | | | | |
| | (.63 | ) | | | (.61 | ) | | | (.32 | ) | | | (.25 | ) |
| | — | | | | — | | | | — | | | | (.06 | ) |
|
|
| |
|
|
| |
|
|
| |
|
|
|
| | (.63 | ) | | | (.61 | ) | | | (.32 | ) | | | (.31 | ) |
|
|
| |
|
|
| |
|
|
| |
|
|
|
| $ | 7.56 | | | $ | 7.52 | | | $ | 7.18 | | | $ | 6.81 | |
|
|
| |
|
|
| |
|
|
| |
|
|
|
| | 9.68 | % | �� | | 13.71 | % | | | 10.37 | % | | | .10 | % |
| | | | | | | | | | | | | | | |
| $ | 5,386 | | | $ | 4,938 | | | $ | 4,897 | | | $ | 6,179 | |
| $ | 4,953 | | | $ | 4,935 | | | $ | 5,334 | | | $ | 9,591 | |
| | | | | | | | | | | | | | | |
| | 1.10 | %(c) | | | 1.18 | % | | | 1.21 | % | | | 1.27 | % |
| | 1.10 | %(c) | | | 1.18 | % | | | 1.21 | % | | | 1.27 | % |
| | 1.95 | %(c) | | | 1.77 | % | | | 4.07 | % | | | 4.84 | % |
See Notes to Financial Statements.
| | |
| Dryden Global Total Return Fund, Inc. | | 43 |
Report of Independent Registered Public Accounting Firm
The Board of Directors and Shareholders of
Dryden Global Total Return Fund, Inc.:
We have audited the accompanying statement of assets and liabilities of Dryden Global Total Return Fund, Inc. (hereafter referred to as the “Fund”), including the portfolio of investments, as of December 31, 2005, and the related statement of operations for the year then ended, and the statements of changes in net assets and the financial highlights for each of the years in the two-year period then ended. These financial statements and financial highlights are the responsibility of the Fund’s management. Our responsibility is to express an opinion on these financial statements and financial highlights based on our audits. The financial highlights for the years presented prior to the year ended December 31, 2004, were audited by another independent registered public accounting firm, whose report dated February 20, 2004, expressed an unqualified opinion thereon.
We conducted our audits in accordance with the standards of the Public Company Accounting Oversight Board (United States). Those standards require that we plan and perform the audit to obtain reasonable assurance about whether the financial statements and financial highlights are free of material misstatement. An audit includes examining, on a test basis, evidence supporting the amounts and disclosures in the financial statements. Our procedures included confirmation of securities owned as of December 31, 2005, by correspondence with the custodian and brokers or by other appropriate auditing procedures where replies from brokers were not received. An audit also includes assessing the accounting principles used and significant estimates made by management, as well as evaluating the overall financial statement presentation. We believe that our audits provides a reasonable basis for our opinion.
In our opinion, the financial statements and financial highlights referred to above present fairly, in all material respects, the financial position of the Fund as of December 31, 2005, and the results of its operations for the year then ended, and the changes in its net assets, and the financial highlights for the each of the years in the two-year period then ended, in conformity with U.S. generally accepted accounting principles.
New York, New York
February 28, 2006
| | |
| 44 | | Visit our website at www.jennisondryden.com |
Federal Income Tax Information
(Unaudited)
We are required by the Internal Revenue Code to advise you within 60 days of the Fund’s fiscal year end (December 31, 2005) as to the federal tax status of distributions paid by the Fund during such fiscal year. Accordingly, during its fiscal year ended December 31, 2005, the Fund paid distributions as follows:
| | | | | | | | | | | | |
| | | Class
|
| | | A
| | B
| | C
| | Z
|
Distributions from ordinary income | | $ | .40 | | $ | .36 | | $ | .37 | | $ | .41 |
Tax return of capital | | | .06 | | | .06 | | | .06 | | | .06 |
| | |
|
| |
|
| |
|
| |
|
|
| | | $ | .46 | | $ | .42 | | $ | .43 | | $ | .47 |
| | |
|
| |
|
| |
|
| |
|
|
We wish to advise you that the dividends received deduction for the Fund is zero. Only funds that invest in U.S. equity securities are entitled to pass-through a corporate dividends received deduction.
For the fiscal year ended December 31, 2005, the Fund intends on passing through $25,337 as a foreign tax credit based on foreign source income of $7,338,628.
We are required by New York, California, Massachusetts, Missouri and Oregon to inform you that dividends which have been derived from federal obligations are not taxable to shareholders provided the mutual fund meets certain requirements mandated by the respective states’ taxing authorities. We are pleased to report that 7.46% of the dividends paid by the Fund qualify for such deductions. Due to certain minimum portfolio holding requirements in California, Connecticut and New York, residents of those states will not be able to exclude interest on federal obligations from state and local tax.
The Fund intends to designate 18.33% of the ordinary income dividends as qualified interest income under The American Jobs Creation Act of 2004.
For more detailed information regarding your federal, state and local taxes, you should contact your tax adviser.
| | |
| Dryden Global Total Return Fund, Inc. | | 45 |
Management of the Fund
(Unaudited)
Information pertaining to the Directors of the Fund is set forth below. Directors who are not deemed to be “interested persons” of the Fund, as defined in the Investment Company Act of 1940 (the 1940 Act), are referred to as “Independent Directors.” Directors who are deemed to be “interested persons” of the Fund are referred to as “Interested Directors.” “Fund Complex”† consists of the Fund and any other investment companies managed by PI.
Independent Directors(2)
Linda W. Bynoe (53), Director since 2005 Oversees 82 portfolios in Fund complex
Principal occupations (last 5 years): President and Chief Executive Officer (since March 1995) of Telemat, Ltd. (management consulting); formerly Vice President at Morgan Stanley & Co.
Other Directorships held: Director of Dynegy Inc. (energy services) (since September 2002) and Simon Property Group, Inc. (real estate investment trust) (since May 2003); Anixter International (communication products distributor) (since January 2006); Director (since August 2005) of The High Yield Plus Fund, Inc.
David E.A. Carson (71), Director since 2003(3) Oversees 86 portfolios in Fund complex
Principal occupations (last 5 years): Formerly Director (January 2000 to May 2000), Chairman (January 1999 to December 1999), Chairman and Chief Executive Officer (January 1998 to December 1998) and President, Chairman and Chief Executive Officer (1983-1997) of People’s Bank.
Other Directorships held.(4) Director (since 2004) of The High Yield Plus Fund, Inc.
Robert E. La Blanc (71), Director since 2003(3) Oversees 85 portfolios in Fund complex
Principal occupations (last 5 years): President (since 1981) of Robert E. La Blanc Associates, Inc. (telecommunications).
Other Directorships held:(4) Director of Chartered Semiconductor Manufacturing, Ltd. (since 1998); Computer Associates International, Inc. (software company) (since 2002); FiberNet Telecom Group, Inc. (telecom company) (since 2003); Director (since April 1999) of the High Yield Plus Fund, Inc.
Douglas H. McCorkindale (66), Director since 1996(3) Oversees 85 portfolios in Fund complex
Principal occupations (last 5 years): Chairman (since February 2001), formerly Chief Executive Officer (June 2000-July 2005) and President (September 1997-July 2005) of Gannett Co. Inc. (publishing and media); formerly Vice Chairman (March 1984-May 2000) of Gannett Co., Inc.
Other Directorships held:(4) Director of Gannett Co. Inc., Director of Continental Airlines, Inc. (since May 1993); Director of Lockheed Martin Corp. (aerospace and defense) (since May 2001); Director of The High Yield Plus Fund, Inc. (since 1996).
Richard A. Redeker (62), Director since 1993(3) Oversees 85 portfolios in Fund complex
Principal occupations (last 5 years): Management Consultant; Director (since 2001) and Chairman of the Board (since 2006) of Investmart, Inc. and Director of Penn Tank Lines, Inc. (since 1999).
Other Directorships held:(4) Director (since January 2005) of The High Yield Plus Fund, Inc.
| | |
| 46 | | Visit our website at www.jennisondryden.com |
Robin B. Smith (66), Director since 1996(3) Oversees 85 portfolios in Fund complex
Principal occupations (last 5 years): Chairman of the Board (since January 2003) of Publishers Clearing House (direct marketing); formerly Chairman and Chief Executive Officer (August 1996-January 2003) of Publishers Clearing House.
Other Directorships held:(4) Director of BellSouth Corporation (since 1992). Director (since January 2005) of the High Yield Plus Fund, Inc.
Stephen D. Stoneburn (62), Director since 2003(3) Oversees 85 portfolios in Fund complex
Principal occupations (last 5 years): President and Chief Executive Officer (since June 1996) of Quadrant Media Corp. (a publishing company); formerly President (June 1995-June 1996) of Argus Integrated Media, Inc.; Senior Vice President and Managing Director (January 1993-1995) of Cowles Business Media and Senior Vice President of Fairchild Publications, Inc. (1975-1989).
Other Directorships held:(4) Director (since January 2005) of The High Yield Plus Fund, Inc.
Clay T. Whitehead (67), Director since 1996(3) Oversees 85 portfolios in Fund complex
Principal occupations (last 5 years): President (since 1983) of National Exchange Inc. (new business development firm).
Other Directorships held:(4) Director (since 2000) of the High Yield Plus Fund, Inc.
Interested Directors(1)
Judy A. Rice (58), President since 2003 and Director since 2000(3) Oversees 81 portfolios in Fund complex
Principal occupations (last 5 years): President, Chief Executive Officer, Chief Operating Officer and Officer-In-Charge (since February 2003) of Prudential Investments LLC; Vice President (since February 1999) of Prudential Investment Management Services LLC; President, Chief Executive Officer and Officer-In-Charge (since April 2003) of Prudential Mutual Fund Services LLC; Director (since May 2003) and Executive Vice President (since June 2005) of American Skandia Investment Services, Inc.; formerly Executive Vice President (September 1999-February 2003) of Prudential Investments LLC; Member of Board of Governors of the Money Management Institute.
Other Directorships held:(4) Director (since August 2005) of The High Yield Plus Fund, Inc.
Robert F. Gunia (59), Vice President and Director since 1996(3) Oversees 158 portfolios in Fund complex
Principal occupations (last 5 years): Chief Administrative Officer (since September 1999) and Executive Vice President (since December 1996) of Prudential Investments LLC; President (since April 1999) of Prudential Investment Management Services LLC; Executive Vice President (since March 1999) and Treasurer (since May 2000) of Prudential Mutual Fund Services LLC.
Other Directorships held:(4) Vice President and Director (since May 1989) and Treasurer (since 1999) of The Asia Pacific Fund, Inc.; Vice President (since 2004) and Director (since August 2005) of The High Yield Plus Fund, Inc.
Information pertaining to the Officers of the Fund who are not also Directors is set forth below.
Officers(2)
Kathryn L. Quirk (53), Chief Legal Officer since 2005
Principal occupations (last 5 years): Vice President and Corporate Counsel (since September 2004) of Prudential; Executive Vice President, Chief Legal Officer and Secretary (since July 2005) of Prudential Investments LLC and
| | |
| Dryden Global Total Return Fund, Inc. | | 47 |
Prudential Mutual Fund Services LLC; formerly Managing Director, General Counsel, Chief Compliance Officer, Chief Risk Officer and Corporate Secretary (1997-2002) of Zurich Scudder Investments, Inc.
Deborah A. Docs (48), Secretary since 2005(3)
Principal occupations (last 5 years): Vice President and Corporate Counsel (since January 2001) of Prudential; Chief Legal Officer of the High Yield Income Fund, Inc. and The High Yield Plus Fund, Inc.; Vice President (since December 1996) and Assistant Secretary (since March 1999) of PI; formerly Vice President and Assistant Secretary (May 2003-June 2005) of American Skandia Investment Services, Inc.
Jonathan D. Shain (47), Assistant Secretary since 2005
Principal occupations (last 5 years): Vice President and Corporate Counsel (since August 1998) of Prudential; Vice President and Assistant Secretary (since May 2001) of PI; Vice President and Assistant Secretary (since February 2001) of PMFS; formerly Vice President and Assistant Secretary (May 2003-June 2005) of American Skandia Investment Services, Inc.
Claudia DiGiacomo (31), Assistant Secretary since 2005
Principal occupations (last 5 years): Vice President and Corporate Counsel (since January 2005) of Prudential; Vice President and Assistant Secretary of PI (since December 2005); Associate at Sidley Austin Brown Wood LLP (1999-2004).
Helene Gurian (52), Acting Anti-Money Laundering Compliance Officer since 2004
Principal occupations (last 5 years): Vice President, Prudential (since July 1997); Vice President, Compliance (July 1997-January 2001); Vice President, Compliance and Risk Officer, Retail Distribution (January 2001-May 2002); Vice President, Corporate Investigations (May 2002-present) responsible for supervision of Prudential’s fraud investigations, anti-money laundering program and high technology investigation unit.
Lee D. Augsburger (46), Chief Compliance Officer since 2004(3)
Principal occupations (last 5 years): Senior Vice President and Chief Compliance Officer (since April 2003) of PI; Vice President (since November 2000) and Chief Compliance Officer (since October 2000) of Prudential Investment Management, Inc.; Chief Compliance Officer and Senior Vice President (since May 2003) of American Skandia Investment Services, Inc.
Grace C. Torres (46), Treasurer and Principal Financial and Accounting Officer since 1998(3)
Principal occupations (last 5 years): Assistant Treasurer (since March 1999) and Senior Vice President (since September 1999) of PI; Assistant Treasurer (since May 2003) and Vice President (since June 2005) of American Skandia Investment Services, Inc.; Senior Vice President and Assistant Treasurer (since May 2003) of American Skandia Advisory Services, Inc.; formerly Senior Vice President (May 2003-June 2005) of American Skandia Investment Services, Inc.
| † | The Fund Complex consists of all investment companies managed by PI. The Funds for which PI serves as manager include Jennison Dryden Mutual Funds, Strategic Partners Funds, The Prudential Variable Contract Accounts 2, 10, 11. The Target Portfolio Trust, The Prudential Series Fund, American Skandia Trust, The High Yield Income Fund, Inc., The High Yield Plus Fund, Inc. and Prudential’s Gibraltar Fund. |
| (1) | “Interested” Director, as defined in the 1940 Act, by reason of employment with the Manager (Prudential Investments LLC or PI), the Subadviser or the Distributor (Prudential Investment Management Services LLC or PIMS). |
| (2) | Unless otherwise noted, the address of the Directors and Officers is c/o: Prudential Investments LLC, Gateway Center Three, 100 Mulberry Street, Newark, NJ 07102. |
| (3) | There is no set term of office for Directors and Officers. The independent Directors have adopted a retirement policy, which calls for the retirement of Directors on December 31 of the year in which they reach the age of 75. The table shows the individuals length of service as Director and/or Officer. |
| | |
| 48 | | Visit our website at www.jennisondryden.com |
| (4) | This includes only directorships of companies required to register, or file reports with the SEC under the Securities and Exchange Act of 1934 (that is, “public companies”) or other investment companies registered under the 1940 Act. |
Additional Information about the Fund’s Directors is included in the Fund’s Statement of Additional Information which is available without charge, upon request, by calling (800) 521-7466 or (732) 482-7555 (Calling from outside the U.S.)
| | |
| Dryden Global Total Return Fund, Inc. | | 49 |
Growth of a $10,000 Investment
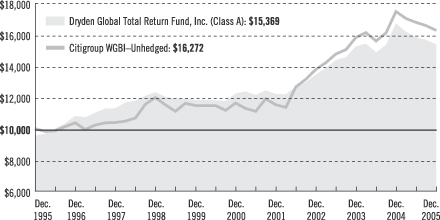
| | | | | | | | |
| Average Annual Total Returns (With Sales Charges) as of 12/31/05 | | |
| | | One Year | | Five Years | | Ten Years | | Since Inception |
Class A | | –12.08% (–12.22) | | 3.71% (3.68) | | 4.39% (4.38) | | 7.52% (7.51) |
Class B | | –12.90 (–13.04) | | 3.81 (3.78) | | N/A | | 4.18 (4.17) |
Class C | | –9.29 (–9.44) | | 4.14 (4.11) | | N/A | | 4.27 (4.25) |
Class Z | | –7.62 (–7.76) | | 4.94 (4.91) | | N/A | | 4.43 (4.41) |
| | | | | | | | | |
| Average Annual Total Returns (Without Sales Charges) as of 12/31/05 |
| | | One Year | | Five Years | | Ten Years | | Since Inception |
Class A | | –7.94% (–8.08) | | 4.67% (4.64) | | 4.87% (4.86) | | 7.77% |
Class B | | –8.60 (–8.74) | | 3.97 (3.94) | | N/A | | 4.18 (4.17) |
Class C | | –8.43 (–8.57) | | 4.14 (4.11) | | N/A | | 4.27 (4.25) |
Class Z | | –7.62 (–7.76) | | 4.94 (4.91) | | N/A | | 4.43 (4.41) |
Performance data quoted represent past performance. Past performance does not guarantee future results. The investment return and principal value of an investment will fluctuate, so that an investor’s shares, when redeemed, may be worth more or less than their original cost. Current performance may be lower or higher than the past performance data quoted. An investor may obtain performance data as of the most recent month-end by visiting our website at www.jennisondryden.com or by calling (800) 225-1852. The maximum initial sales charge is 4.50%.
The returns in the graph and the tables do not reflect the deduction of taxes that a shareholder would pay on Fund distributions or following the redemption of Fund shares.
| | |
| | | Visit our website at www.jennisondryden.com |
Source: Prudential Investments LLC and Lipper Inc.
Inception dates: Class A, 7/7/86; Class B and C, 1/15/96; and Class Z, 3/17/97.
The graph compares a $10,000 investment in the Dryden Global Total Return Fund, Inc. (Class A shares) with a similar investment in the Citigroup WGBI–Unhedged by portraying the initial account values at the beginning of the 10-year period for Class A shares (December 31, 1995) and the account values at the end of the current fiscal year (December 31, 2005) as measured on a quarterly basis. For purposes of the graph, and unless otherwise indicated, it has been assumed that (a) the maximum applicable front-end sales charge was deducted from the initial $10,000 investment in Class A shares; (b) all recurring fees (including management fees) were deducted; and (c) all dividends and distributions were reinvested. The line graph provides information for Class A shares only. As indicated in the tables provided earlier, performance for Class B, C, and Z shares will vary due to the differing charges and expenses applicable to each share class (as indicated in the following paragraphs). Without a distribution and service (12b-1) fee waiver of 0.05% for Class A shares annually through December 31, 2005, the returns shown in the graph and for Class A shares in the tables would have been lower.
The Citigroup WGBI–Unhedged is a market capitalization-weighted index consisting of the government bond markets of 18 countries, which are selected based on market capitalization and investability criteria. All issues have a remaining maturity of at least one year. The Index’s total returns include the reinvestment of all dividends, but do not include the effects of sales charges, operating expenses of a mutual fund, or taxes. The returns for the Index would be lower if they included the effects of sales charges, operating expenses, or taxes. The securities that comprise the Index may differ substantially from the securities in the Fund. This is not the only index that may be used to characterize performance of global/international bond funds. Other indexes may portray different comparative performance. Investors cannot invest directly in an index.
Class A shares are subject to a maximum front-end sales charge of 4.50% and a 12b-1 fee of up to 0.30% annually, and all investors who purchase Class A shares in an amount of $1 million or more and sell these shares within 12 months of purchase are subject to a contingent deferred sales charge (CDSC) of 1%. Class B shares are subject to a declining CDSC of 5%, 4%, 3%, 2%, 1%, and 1% respectively for the first six years after purchase and a 12b-1 fee of 1% annually. Approximately seven years after purchase, Class B shares will automatically convert to Class A shares on a quarterly basis. Class C shares purchased are not subject to a front-end sales charge, but charge a CDSC of 1% for Class C shares sold within 12 months from the date of purchase and an annual 12b-1 fee of 1%. Class Z shares are not subject to a sales charge or 12b-1 fees. The returns in the graph and tables reflect the share class expense structure in effect at the close of the fiscal period.
| | |
| Dryden Global Total Return Fund, Inc. | | |
| | | | |
| n MAIL | | n TELEPHONE | | n WEBSITE |
Gateway Center Three 100 Mulberry Street Newark, NJ 07102 | | (800) 225-1852 | | www.jennisondryden.com |
|
| PROXY VOTING |
| The Board of Directors of the Fund has delegated to the Fund’s investment subadvisor the responsibility for voting any proxies and maintaining proxy recordkeeping with respect to the Fund. A description of these proxy voting policies and procedures is available without charge, upon request, by calling (800) 225-1852 or by visiting the Securities and Exchange Commission’s website at www.sec.gov. Information regarding how the Fund voted proxies relating to portfolio securities during the most recent 12-month period ended June 30 is available on the Fund’s website at www.jennisondryden.com and on the Commission’s website at www.sec.gov. |
|
| DIRECTORS |
| Linda W. Bynoe • David E.A. Carson • Robert F. Gunia • Robert E. La Blanc • Douglas H. McCorkindale • Richard A. Redeker • Judy A. Rice • Robin B. Smith • Stephen G. Stoneburn • Clay T. Whitehead |
|
| OFFICERS |
| Judy A. Rice, President • Robert F. Gunia, Vice President • Grace C. Torres, Treasurer and Principal Financial and Accounting Officer • Kathryn L. Quirk, Chief Legal Officer • Deborah A. Docs, Secretary • Jonathan D. Shain, Assistant Secretary • Claudia DiGiacomo, Assistant Secretary • Helen Gurian, Acting Anti-Money Laundering Compliance Officer • Lee D. Augsburger, Chief Compliance Officer |
| | | | |
| MANAGER | | Prudential Investments LLC | | Gateway Center Three
100 Mulberry Street
Newark, NJ 07102 |
|
| INVESTMENT SUBADVISOR | | Prudential Investment
Management, Inc. | | Gateway Center Two
100 Mulberry Street
Newark, NJ 07102 |
|
| DISTRIBUTOR | | Prudential Investment
Management Services LLC | | Gateway Center Three
100 Mulberry Street
Newark, NJ 07102 |
|
| CUSTODIAN | | The Bank of New York | | One Wall Street
New York, NY 10286 |
|
| TRANSFER AGENT | | Prudential Mutual Fund
Services LLC | | PO Box 8098
Philadelphia, PA 19176 |
|
| INDEPENDENT REGISTERED PUBLIC ACCOUNTING FIRM | | KPMG LLP | | 345 Park Avenue
New York, NY 10154 |
|
| FUND COUNSEL | | Sullivan & Cromwell LLP | | 125 Broad Street
New York, NY 10004 |
|
| An investor should consider the investment objectives, risks, charges, and expenses of the Fund carefully before investing. The prospectus for the Fund contains this and other information about the Fund. An investor may obtain a prospectus by visiting our website at www.jennisondryden.com or by calling (800) 225-1852. The prospectus should be read carefully before investing. |
|
| E-DELIVERY |
| To receive your mutual fund documents on-line, go to www.icsdelivery.com/prudential/funds and enroll. Instead of receiving printed documents by mail, you will receive notification via e-mail when new materials are available. You can cancel your enrollment or change your e-mail address at any time by clicking on the change/cancel enrollment option at the icsdelivery website address. |
|
| SHAREHOLDER COMMUNICATIONS WITH DIRECTORS |
| Shareholders can communicate directly with the Board of Directors by writing to the Chair of the Board, Dryden Global Total Return Fund, Inc., PO Box 13964, Philadelphia, PA 19176. Shareholders can communicate directly with an individual Director by writing to the same address. Communications are not screened before being delivered to the addressee. |
|
| AVAILABILITY OF PORTFOLIO SCHEDULE |
| The Fund files its complete schedule of portfolio holdings with the Securities and Exchange Commission for the first and third quarters of each fiscal year on Form N-Q. The Fund’s Forms N-Q are available on the Commission’s website at www.sec.gov. The Fund’s Forms N-Q may also be reviewed and copied at the Commission’s Public Reference Room in Washington, D.C. Information on the operation and location of the Public Reference Room may be obtained by calling (800) SEC-0330 (732-0330). The Fund will provide a full list of its portfolio holdings on its website as of the end of the month within approximately 30 days after the end of the month. |
|
| The Fund’s Statement of Additional Information contains additional information about the Fund’s Directors and is available without charge, upon request, by calling (800) 225-1852. |
Mutual Funds:
| | | | |
| ARE NOT INSURED BY THE FDIC OR ANY FEDERAL GOVERNMENT AGENCY | | MAY LOSE VALUE | | ARE NOT A DEPOSIT OF OR GUARANTEED BY ANY BANK OR ANY BANK AFFILIATE |

| | | | | | | | | | | | |
| Dryden Global Total Return Fund, Inc. | | | | |
| | | Share Class | | A | | B | | C | | Z | | |
| | | NASDAQ | | GTRAX | | PBTRX | | PCTRX | | PZTRX | | |
| | | CUSIP | | 26243L105 | | 26243L204 | | 26243L303 | | 26243L402 | | |
| | | | | | | | | | | | | |
MF169E IFS-A114374 Ed. 02/2006
Item 2 – Code of Ethics – – See Exhibit (a)
As of the end of the period covered by this report, the registrant has adopted a code of ethics (the “Section 406 Standards for Investment Companies – Ethical Standards for Principal Executive and Financial Officers”) that applies to the registrant’s Principal Executive Officer and Principal Financial Officer; the registrant’s Principal Financial Officer also serves as the Principal Accounting Officer.
The registrant hereby undertakes to provide any person, without charge, upon request, a copy of the code of ethics. To request a copy of the code of ethics, contact the registrant 973-367-7521, and ask for a copy of the Section 406 Standards for Investment Companies—Ethical Standards for Principal Executive and Financial Officers.
Item 3 – Audit Committee Financial Expert –
The registrant’s Board has determined that Mr. David Carson, member of the Board’s Audit Committee is an “audit committee financial expert,” and that he is “independent,” for purposes of this Item.
Item 4 – Principal Accountant Fees and Services –
(a) Audit Fees
For the fiscal years ended December 31, 2005 and December 31, 2004, KPMG LLP (“KPMG”), the Registrant’s principal accountant, billed the Registrant $25,900 and $25,900, respectively, for professional services rendered for the audit of the Registrant’s annual financial statements or services that are normally provided in connection with statutory and regulatory filings.
(b) Audit-Related Fees
For the fiscal year ended December 31, 2005, KPMG, the Registrant’s principal accountant, billed the Registrant $913 for assurance and related services that are reasonably related to the performance of the audit of the registrant’s financial statements. Professional services rendered included those in connection with additional audit procedures related to the conversion of shareholder accounts. For the fiscal year ended December 31, 2004, KPMG, the Registrant’s principal accountant, did not bill the Registrant for assurance and related services that are reasonably related to the performance of the audit of the registrant’s financial statements.
(c) Tax Fees
None.
(d) All Other Fees
None.
(e) (1) Audit Committee Pre-Approval Policies and Procedures
THE PRUDENTIAL MUTUAL FUNDS
AUDIT COMMITTEE POLICY
on
Pre-Approval of Services Provided by the Independent Accountants
The Audit Committee of each Prudential Mutual Fund is charged with the responsibility to monitor the independence of the Fund’s independent accountants. As part of this responsibility, the Audit Committee must pre-approve any independent accounting firm’s engagement to render audit and/or permissible non-audit services, as required by law. In evaluating a proposed engagement of the independent accountants, the Audit Committee will assess the effect that the engagement might reasonably be expected to have on the accountant’s independence. The Committee’s evaluation will be based on:
| | • | | a review of the nature of the professional services expected to be provided, |
| | • | | a review of the safeguards put into place by the accounting firm to safeguard independence, and |
| | • | | periodic meetings with the accounting firm. |
Policy for Audit and Non-Audit Services Provided to the Funds
On an annual basis, the scope of audits for each Fund, audit fees and expenses, and audit-related and non-audit services (and fees proposed in respect thereof) proposed to be performed by the Fund’s independent accountants will be presented by the Treasurer and the independent accountants to the Audit Committee for review and, as appropriate, approval prior to the initiation of such services. Such presentation shall be accompanied by confirmation by both the Treasurer and the independent accountants that the proposed services will not adversely affect the independence of the independent accountants. Proposed services shall be described in sufficient detail to enable the Audit Committee to assess the appropriateness of such services and fees, and the compatibility of the provision of such services with the auditor’s independence. The Committee shall receive periodic reports on the progress of the audit and other services which are approved by the Committee or by the Committee Chair pursuant to authority delegated in this Policy.
The categories of services enumerated under “Audit Services”, “Audit-related Services”, and “Tax Services” are intended to provide guidance to the Treasurer and the independent accountants as to those categories of services which the Committee believes are generally consistent with the independence of the independent accountants and which the Committee (or the Committee Chair) would expect upon the presentation of specific proposals to pre-approve. The enumerated categories are not intended as an exclusive list of audit, audit-related or tax services which the Committee (or the Committee Chair) would consider for pre-approval.
Audit Services
The following categories of audit services are considered to be consistent with the role of the Fund’s independent accountants:
| | • | | Annual Fund financial statement audits |
| | • | | Seed audits (related to new product filings, as required) |
| | • | | SEC and regulatory filings and consents |
Audit-related Services
The following categories of audit-related services are considered to be consistent with the role of the Fund’s independent accountants:
| | • | | Accounting consultations |
| | • | | Fund merger support services |
| | • | | Agreed Upon Procedure Reports |
| | • | | Other Internal Control Reports |
Individual audit-related services that fall within one of these categories and are not presented to the Audit Committee as part of the annual pre-approval process will be subject to pre-approval by the Committee Chair (or any other Committee member on whom this responsibility has been delegated) so long as the estimated fee for those services does not exceed $50,000.
Tax Services
The following categories of tax services are considered to be consistent with the role of the Fund’s independent accountants:
| | • | | Tax compliance services related to the filing or amendment of the following: |
| | • | | Federal, state and local income tax compliance; and, |
| | • | | Sales and use tax compliance |
| | • | | Timely RIC qualification reviews |
| | • | | Tax distribution analysis and planning |
| | • | | Tax authority examination services |
| | • | | Tax appeals support services |
| | • | | Accounting methods studies |
| | • | | Fund merger support services |
| | • | | Tax consulting services and related projects |
Individual tax services that fall within one of these categories and are not presented to the Audit Committee as part of the annual pre-approval process will be subject to pre-approval by the Committee Chair (or any other Committee member on whom this responsibility has been delegated) so long as the estimated fee for those services does not exceed $50,000.
Other Non-audit Services
Certain non-audit services that the independent accountants are legally permitted to render will be subject to pre-approval by the Committee or by one or more Committee members to whom the Committee has delegated this authority and who will report to the full Committee any pre-approval decisions made pursuant to this Policy. Non-audit services presented for pre-approval pursuant to this paragraph will be accompanied by a confirmation from both the Treasurer and the independent accountants that the proposed services will not adversely affect the independence of the independent accountants.
Proscribed Services
The Fund’s independent accountants will not render services in the following categories of non-audit services:
| | • | | Bookkeeping or other services related to the accounting records or financial statements of the Fund |
| | • | | Financial information systems design and implementation |
| | • | | Appraisal or valuation services, fairness opinions, or contribution-in-kind reports |
| | • | | Internal audit outsourcing services |
| | • | | Management functions or human resources |
| | • | | Broker or dealer, investment adviser, or investment banking services |
| | • | | Legal services and expert services unrelated to the audit |
| | • | | Any other service that the Public Company Accounting Oversight Board determines, by regulation, is impermissible. |
Pre-approval of Non-Audit Services Provided to Other Entities Within the Prudential Fund Complex
Certain non-audit services provided to Prudential Investments LLC or any of its affiliates that also provide ongoing services to the Prudential Mutual Funds will be subject to pre-approval by the Audit Committee. The only non-audit services provided to these entities that will require pre-approval are those related directly to the operations and financial reporting of the Funds. Individual projects that are not presented to the Audit Committee as part of the annual pre-approval process, will be subject to pre-approval by the Committee Chair (or any other Committee member on whom this responsibility has been delegated) so long as the estimated fee for those services does not exceed $50,000. Services presented for pre-approval pursuant to this paragraph will be accompanied by a confirmation from both the Treasurer and the independent accountants that the proposed services will not adversely affect the independence of the independent accountants.
Although the Audit Committee will not pre-approve all services provided to Prudential Investments LLC and its affiliates, the Committee will receive an annual report from the Fund’s independent accounting firm showing the aggregate fees for all services provided to Prudential Investments and its affiliates.
(e) (2) Percentage of services referred to in 4(b)- (4)(d) that were approved by the audit committee –
One hundred percent of the services described in Item 4(b) were approved by the audit committee.
(f) Percentage of hours expended attributable to work performed by other than full time employees of principal accountant if greater than 50%.
Not applicable.
(g) Non-Audit Fees
Not applicable to Registrant for the fiscal years 2005 and 2004. The aggregate non-audit fees billed by KPMG for services rendered to the registrant’s investment adviser and any entity controlling, controlled by, or under common control with the investment adviser that provides ongoing services to the registrant for the fiscal years 2005 and 2004 was $50,087 and $33,500, respectively.
(h) Principal Accountants Independence
Not applicable as KPMG has not provided non-audit services to the registrant’s investment adviser and any entity controlling, controlled by, or under common control with the investment adviser that provides ongoing services to the registrant that were not pre-approved pursuant to Rule 2-01(c)(7)(ii) of Regulation S-X.
Item 5 – Audit Committee of Listed Registrants – Not applicable.
Item 6 – Schedule of Investments – The schedule is included as part of the report to shareholders filed under Item 1 of this Form.
Item 7 – Disclosure of Proxy Voting Policies and Procedures for Closed-End Management Investment Companies – Not applicable.
Item 8 – Portfolio Managers of Closed-End Management Investment Companies – Not applicable.
Item 9 – Purchases of Equity Securities by Closed-End Management Investment Company and Affiliated Purchasers – Not applicable.
Item 10 – Submission of Matters to a Vote of Security Holders – Not applicable.
Item 11 – Controls and Procedures
| | (a) | It is the conclusion of the registrant’s principal executive officer and principal financial officer that the effectiveness of the registrant’s current disclosure controls and procedures (such disclosure controls and procedures having been evaluated within 90 days of the date of this filing) provide reasonable assurance that the information required to be disclosed by the registrant has been recorded, processed, summarized and reported within the time period specified in the Commission’s rules and forms and that the information required to be disclosed by the registrant has been accumulated and communicated to the registrant’s principal executive officer and principal financial officer in order to allow timely decisions regarding required disclosure. |
| | (b) | There has been no significant change in the registrant’s internal control over financial reporting that occurred during the registrant’s most recent fiscal quarter of the period covered by this report that has materially affected, or is likely to materially affect, the registrant’s internal control over financial reporting. |
Item 12 – Exhibits
| | (a) | (1) Code of Ethics – Attached hereto as Exhibit EX-99.CODE-ETH |
(2) Certifications pursuant to Section 302 of the Sarbanes-Oxley Act – Attached hereto as Exhibit EX-99.CERT.
(3) Any written solicitation to purchase securities under Rule 23c-1. – Not applicable.
| | (b) | Certifications pursuant to Section 906 of the Sarbanes-Oxley Act – Attached hereto as Exhibit EX-99.906CERT. |
SIGNATURES
Pursuant to the requirements of the Securities Exchange Act of 1934 and the Investment Company Act of 1940, the registrant has duly caused this report to be signed on its behalf by the undersigned, thereunto duly authorized.
| | | | |
| (Registrant) Dryden Global Total Return Fund, Inc. | | |
| | |
| By (Signature and Title)* | | /s/ Deborah A. Docs | | |
| | Deborah A. Docs | | |
| | Secretary | | |
| |
| Date February 24, 2006 | | |
Pursuant to the requirements of the Securities Exchange Act of 1934 and the Investment Company Act of 1940, this report has been signed below by the following persons on behalf of the registrant and in the capacities and on the dates indicated.
| | | | |
| By (Signature and Title)* | | /s/ Judy A. Rice | | |
| | Judy A. Rice | | |
| | President and Principal Executive Officer | | |
| |
| Date February 24, 2006 | | |
| | |
| By (Signature and Title)* | | /s/ Grace C. Torres | | |
| | Grace C. Torres | | |
| | Treasurer and Principal Financial Officer | | |
| |
| Date February 24, 2006 | | |
| * | Print the name and title of each signing officer under his or her signature. |