UNITED STATES
SECURITIES AND EXCHANGE COMMISSION
Washington, D.C. 20549
FORM N-CSR
CERTIFIED SHAREHOLDER REPORT OF REGISTERED MANAGEMENT
INVESTMENT COMPANIES
| | |
Investment Company Act file number: | | 811-04661 |
| |
Exact name of registrant as specified in charter: | | Dryden Global Total |
| | Return Fund, Inc. |
| |
Address of principal executive offices: | | Gateway Center 3, |
| | 100 Mulberry Street, |
| | Newark, New Jersey 07102 |
| |
Name and address of agent for service: | | Deborah A. Docs |
| | Gateway Center 3, |
| | 100 Mulberry Street, |
| | Newark, New Jersey 07102 |
| |
Registrant’s telephone number, including area code: | | 800-225-1852 |
| |
Date of fiscal year end: | | 10/31/2007 |
| | (Registrant changed its fiscal year end from December 31) |
| |
Date of reporting period: | | 10/31/2007 |
Item 1 – Reports to Stockholders


| | |
| OCTOBER 31, 2007 | | ANNUAL REPORT |
Dryden Global Total Return Fund, Inc.
FUND TYPE
Global/international bond
OBJECTIVE
Total return made up of current income and capital appreciation
This report is not authorized for distribution to prospective investors unless preceded or accompanied by a current prospectus.
The views expressed in this report and information about the Fund’s portfolio holdings are for the period covered by this report and are subject to change thereafter.
JennisonDryden, Dryden, Prudential Financial and the Rock Prudential logo are registered service marks of The Prudential Insurance Company of America, Newark, NJ, and its affiliates.

December 14, 2007
Dear Shareholder:
On the following pages, you’ll find your annual report for the Dryden Global Total Return Fund, which includes performance data, an analysis of Fund performance, and a listing of its holdings at period-end. The Fund’s fiscal year has changed from a reporting period that ends December 31 to one that ends October 31. This change should have no impact on the way the Fund is managed. Shareholders will receive future annual and semiannual reports on the new fiscal year-end schedule.
Mutual funds prices and returns will rise or fall over time, and asset managers tend to have periods when they perform better or worse than their long-term average. The best measures of a mutual fund’s quality are its return compared to that of similar investments and the variability of its return over the long term. We recommend that you review your portfolio regularly with your financial adviser.
Thank you for choosing JennisonDryden Mutual Funds.
Sincerely,

Judy A. Rice, President
Dryden Global Total Return Fund, Inc.
| | |
| Dryden Global Total Return Fund, Inc. | | 1 |
Your Fund’s Performance
Fund objective
The investment objective of the Dryden Global Total Return Fund, Inc. is total return made up of current income and capital appreciation. There can be no assurance that the Fund will achieve its investment objective.
Performance data quoted represent past performance. Past performance does not guarantee future results. The investment return and principal value of an investment will fluctuate, so that an investor’s shares, when redeemed, may be worth more or less than their original cost. Current performance may be lower or higher than the past performance data quoted. An investor may obtain performance data as of the most recent month-end by visiting our website at www.jennisondryden.com or by calling (800) 225-1852. The maximum initial sales charge is 4.50% (Class A shares). Gross operating expenses: Class A, 1.42%; Class B, 2.12%; Class C, 2.12%; Class Z, 1.12%. Net operating expenses apply to: Class A, 1.37%; Class B, 2.12%; Class C, 1.87%; Class Z, 1.12%, after contractual reduction through 2/28/2009.
| | | | | | | | | |
| Cumulative Total Returns as of 10/31/07 | |
| | | One Year | | | Five Years | | | Ten Years | |
Class A | | 9.78 | % | | 36.65 | % | | 55.95 | % |
Class B | | 8.85 | | | 31.47 | | | 45.98 | |
Class C | | 9.09 | | | 33.11 | | | 47.79 | |
Class Z | | 9.95 | | | 38.32 | | | 59.79 | |
Citigroup WGBI–Unhedged1 | | 9.42 | | | 42.98 | | | 77.09 | |
Lipper Global Income Funds Avg.2 | | 7.36 | | | 43.54 | | | 72.58 | |
| | | | | | | | | |
| Average Annual Total Returns3 as of 9/30/07 | | | | | | | | | |
| | | One Year | | | Five Years | | | Ten Years | |
Class A | | 4.34 | % | | 4.80 | % | | 3.80 | % |
Class B | | 3.31 | | | 4.82 | | | 3.59 | |
Class C | | 7.55 | | | 5.25 | | | 3.72 | |
Class Z | | 9.43 | | | 6.03 | | | 4.52 | |
Citigroup WGBI–Unhedged1 | | 8.69 | | | 6.98 | | | 5.93 | |
Lipper Global Income Funds Avg.2 | | 7.07 | | | 7.05 | | | 5.35 | |
| | | | | | |
| Distributions and Yields as of 10/31/07 | | | | | |
| | | Total Distributions
Paid for 10 Months | | 30-Day
SEC Yield | |
Class A | | $ | 0.21 | | 4.08 | % |
Class B | | $ | 0.17 | | 3.54 | |
Class C | | $ | 0.19 | | 3.71 | |
Class Z | | $ | 0.22 | | 4.48 | |
| | |
| 2 | | Visit our website at www.jennisondryden.com |
The cumulative total returns do not reflect the deduction of applicable sales charges. If reflected, the applicable sales charges would reduce the cumulative total returns performance quoted. Class A shares are subject to a maximum front-end sales charge of 4.50%. Under certain circumstances, Class A shares may be subject to a contingent deferred sales charge (CDSC) of 1%. Class B and Class C shares are subject to a maximum CDSC of 5% and 1%, respectively. Class Z shares are not subject to a sales charge.
Source: Prudential Investments LLC and Lipper Inc. Performance figures may reflect fee waivers and/or expense reimbursements. In the absence of such fee waivers and/or expense reimbursements, total returns would be lower.
1The Citigroup World Government Bond Index (WGBI)–Unhedged (formerly known as the Salomon Smith Barney World Government Bond Index–Unhedged) is a market capitalization-weighted index consisting of the government bond markets of 21 countries that are selected based on market capitalization and investability criteria. All issues have a remaining maturity of at least one year.
2The Lipper Global Income Funds Average (Lipper Average) represents returns based on an average return of all funds in the Lipper Global Income Funds category for the periods noted. Funds in the Lipper Average invest primarily in U.S. dollar and non-U.S. dollar debt securities of issuers located in at least three countries, one of which may be the United States.
3The average annual total returns take into account applicable sales charges. Class A, Class B, and Class C shares are subject to an annual distribution and service (12b-1) fee of up to 0.30%, 1.00%, and 1.00%, respectively. Approximately seven years after purchase, Class B shares will automatically convert to Class A shares on a quarterly basis. Class Z shares are not subject to a 12b-1 fee. The returns, distributions, and yields in the tables do not reflect the deduction of taxes that a shareholder would pay on Fund distributions or following the redemption of Fund shares.
Investors cannot invest directly in an index. The returns for Citigroup WGBI–Unhedged would be lower if they included the effects of sales charges, operating expenses of a mutual fund, or taxes. Returns for the Lipper Average reflect the deduction of operating expenses, but not sales charges or taxes.
| | | |
| Five Largest Issues expressed as a percentage of net assets as of 10/31/07 | | | |
Federal Home Loan Mortgage Corp., 5.50%, 05/01/37 | | 4.9 | % |
Federal National Mortgage Association, 6.50%, 03/01/37 | | 4.8 | |
French Government Bonds, 8.50%, 04/25/23 | | 4.7 | |
Japanese Government Bonds, 1.10%, 09/20/12 | | 3.5 | |
Japanese Government Bonds, 1.50%, 03/20/19 | | 3.2 | |
Issues are subject to change.
| | |
| Dryden Global Total Return Fund, Inc. | | 3 |
Strategy and Performance Overview
How did the Fund perform?
The Dryden Global Total Return Fund’s Class A shares posted a total returned 7.81% for the 10-month reporting period ended October 31, 2007*, underperforming the 8.51% total return of the Citigroup World Government Bond Index (WGBI)—Unhedged, which does not include the effect of mutual fund operating expenses. The Fund’s Class A shares outperformed the 6.13% total return of the Lipper Global Income Funds Average.
What were conditions like in the global bond market during the reporting period?
A powerful global economic expansion continued, despite concern a severely weakened housing industry in the United States could drag its economy into a recession that might slow growth worldwide if U.S. consumers cut back on spending. Brisk economic growth coupled with rising inflation in the 13-nation euro zone and the United Kingdom had prompted their respective central banks to tighten monetary policy during the first seven months of 2007 to cool off their economies. The Bank of England (BOE) increased its benchmark interest rate from 5.00% to 5.75% and the European Central Bank (ECB) raised its key interest rate from 3.50% to 4.00%. The Bank of Japan (BOJ) also nudged its target rate for overnight loans from 0.25% to 0.50%. The short-term rate increases, and expectation in financial markets for additional rate hikes later in the year, pressured the U.K., European, and Japanese bond markets, as bond prices fall when interest rates rise (and vice versa.)
Meanwhile, the Federal Reserve (the Fed) initially left short-term rates unchanged in the United States, though it repeatedly expressed concern about inflationary pressures in the world’s largest economy. From January through May, sentiment in the U.S. bond market largely shifted between two views—the Fed would soon ease monetary policy to reinvigorate the economy, or the Fed would leave short-term rates unchanged as the economic expansion remained healthy, despite the worsening state of affairs in the housing and mortgage industries. Conditions in the U.S. bond market began to deteriorate in June as two prominent hedge funds that invested in debt securities linked to subprime mortgages (home loans made to borrowers with poor credit histories) nearly collapsed. By month-end, widespread concern about loose lending standards forced some companies involved in leveraged buyouts to postpone issuing low-quality bonds whose proceeds were intended to help pay for deals.
The credit crunch deepened in July as two major credit rating agencies downgraded ratings on hundreds of subprime mortgage-backed bonds worth billions of dollars. Risk-averse investors flocked to U.S. Treasury securities, which caused the AAA-rated
*The Fund has changed its fiscal year-end to October 31. Refer to the Fund’s previous annual report for performance information prior to January 1, 2007.
| | |
| 4 | | Visit our website at www.jennisondryden.com |
debt securities to rally while other sectors came under pressure. There was also a flight to quality to the government bonds of some other economically developed nations such as Germany and the United Kingdom.
Central banks responded to the subprime mortgage crisis in early August, prompted by signs of distress in global credit markets. The Fed, the ECB, the BOJ, and the Reserve Bank of Australia injected massive amounts of cash into their banking systems to boost liquidity. In mid-August, the Fed reduced the discount rate it charges banks to borrow from its discount window by a half point. In mid-September, it cut its target for the federal funds rate on overnight loans between banks and the discount rate by a half point. Finally, in late October, it cut both short-term rates by another quarter point, which lowered its target for the federal funds rate to 4.50% and the discount rate to 5.00%.
The U.S. fixed income market responded positively to the short-term rate cuts as bond prices generally rallied in August, September, and October, though a resurgence of concern about the credit crisis pressured lower-quality bond prices in October. Considering the massive losses reported by some financial institutions with exposure to risky mortgages, it is not surprising that, for the reporting period, ultra-safe U.S. Treasurys posted a 5.68% return that outperformed most other sectors, including investment-grade corporate bonds, high yield corporate “junk” bonds, federal agency securities, residential mortgage-backed securities, commercial mortgage-backed securities, and asset-backed securities, which are backed by payments on credit cards, auto loans, and other types of consumer loans.
How did the Fund’s allocation to the global bond market affect its performance?
The Fund maintained a diversified portfolio of bonds, the bulk of which consisted of government and corporate bonds of issuers from economically developed nations such as the United States, Japan, and Germany. Developments in the foreign exchange market had a large impact on global bond returns. For example, government bond markets of economically developed nations other than the United States posted returns below that of U.S. Treasurys when expressed in local currency terms. However, when translated into U.S. dollars without hedging for foreign exchange risk, their total returns jumped sharply, reflecting large gains in their currencies versus the U.S. dollar. That said, allocation in the U.S. fixed income market had the biggest impact on the Fund’s performance. Its holdings in investment-grade corporate bonds, high yield bonds, federal agency securities, and residential mortgage-backed securities detracted from its performance because these sectors underperformed U.S. Treasurys, which are included in the WGBI—Unhedged.
| | |
| Dryden Global Total Return Fund, Inc. | | 5 |
Strategy and Performance Overview (continued)
How did the Fund’s foreign exchange strategy affect its performance?
Lower interest rates in the United States and prospects for a recession in its economy dramatically weakened the U.S. dollar versus all major currencies, particularly those of nations whose economies benefited from rising commodity prices. Thus, the Canadian dollar gained roughly 24% versus the U.S. dollar, the Australian dollar about 19%, the Norwegian krone about 16%, and the New Zealand dollar roughly 10%. The euro also gained about 10%, helped in part by central banks diversifying their currency reserves away from the U.S. dollar in favor of the single European currency. The Japanese yen rose roughly 3.0%, helped by the risk-averse environment that tended to discourage investors from selling Japanese yen to purchase assets in higher yielding currencies. This strategy, known as the yen carry trade, had been popular in recent years.
The Fund’s foreign exchange strategy made a significant positive contribution to its return. Specifically, it benefited from having a smaller exposure to the U.S. dollar than the WGBI—Unhedged and from its exposure to the Australian dollar, the new Turkish lira, the Brazilian real, the Colombian peso, the South African rand, the Polish zloty and certain currencies of other nations with relatively high interest rates.
How did the Fund’s yield curve strategy affect its performance?
The U.S. yield curve is a single line graph that depicts yields on bonds of the same type and credit quality from the shortest to the longest maturities. It is usually positively sloped as shorter-term bonds have lower yields than longer-term bonds. The Fund had a “yield curve flattener” strategy in place that emphasized long-term bonds over shorter-term bonds. This approach had benefited the Fund in prior years when yields on long-term bonds had declined more than yields on shorter-term bonds, causing the slope of the yield curve to flatten and enabling long-term bonds to outperform shorter-term bonds.
However, the yield curve behaved differently during the reporting period. Yields on shorter-term bonds—the most sensitive to changes in the federal funds rate—declined more than yields on long-term bonds, causing the slope of the yield curve to become steeper and enabling shorter-term bonds to outperform long-term bonds. Thus, the Fund’s strategy that emphasized the latter detracted from its performance.
| | |
| 6 | | Visit our website at www.jennisondryden.com |
Fees and Expenses (Unaudited)
As a shareholder of the Fund, you incur two types of costs: (1) transaction costs, including sales charges (loads) on purchase payments and redemptions, as applicable, and (2) ongoing costs, including management fees, distribution and/or service (12b-1) fees, and other Fund expenses, as applicable. This example is intended to help you understand your ongoing costs (in dollars) of investing in the Fund and to compare these costs with the ongoing costs of investing in other mutual funds.
The example is based on an investment of $1,000 invested on May 1, 2007, at the beginning of the period, and held through the six-month period ended October 31, 2007. The example is for illustrative purposes only; you should consult the Prospectus for information on initial and subsequent minimum investment requirements.
The Fund’s transfer agent may charge additional fees to holders of certain accounts that are not included in the expenses shown in the table on the following page. These fees apply to Individual Retirement Accounts (IRAs) and Section 403(b) accounts. As of the close of the six-month period covered by the table, IRA fees included an annual maintenance fee of $15 per account (subject to a maximum annual maintenance fee of $25 for all accounts held by the same shareholder). Section 403(b) accounts are charged an annual $25 fiduciary maintenance fee. Some of the fees may vary in amount, or may be waived, based on your total account balance or the number of JennisonDryden Funds, including the Fund, that you own. You should consider the additional fees that were charged to your Fund account over the six-month period when you estimate the total ongoing expenses paid over the period and the impact of these fees on your ending account value, as these additional expenses are not reflected in the information provided in the expense table. Additional fees have the effect of reducing investment returns.
Actual Expenses
The first line for each share class in the table on the following page provides information about actual account values and actual expenses. You may use the information on this line, together with the amount you invested, to estimate the expenses that you paid over the period. Simply divide your account value by $1,000 (for example, an $8,600 account value ÷ $1,000 = 8.6), then multiply the result by the number on the first line under the heading “Expenses Paid During the Six-Month Period” to estimate the expenses you paid on your account during this period.
| | |
| Dryden Global Total Return Fund, Inc. | | 7 |
Fees and Expenses (continued)
Hypothetical Example for Comparison Purposes
The second line for each share class in the table on the following page provides information about hypothetical account values and hypothetical expenses based on the Fund’s actual expense ratio and an assumed rate of return of 5% per year before expenses, which is not the Fund’s actual return. The hypothetical account values and expenses may not be used to estimate the actual ending account balance or expenses you paid for the period. You may use this information to compare the ongoing costs of investing in the Fund and other funds. To do so, compare this 5% hypothetical example with the 5% hypothetical examples that appear in the shareholder reports of the other funds.
Please note that the expenses shown in the table are meant to highlight your ongoing costs only, and do not reflect any transactional costs such as sales charges (loads). Therefore the second line for each share class in the table is useful in comparing ongoing costs only, and will not help you determine the relative total costs of owning different funds. In addition, if these transactional costs were included, your costs would have been higher.
| | | | | | | | | | | | | | |
Dryden Global Total
Return Fund, Inc. | | Beginning Account
Value
May 1, 2007 | | Ending Account
Value
October 31, 2007 | | Annualized
Expense Ratio
Based on the
Six-Month Period | | | Expenses Paid
During the Six-
Month Period* |
| | | | | | | | | | | | | | |
| Class A | | Actual | | $ | 1,000.00 | | $ | 1,053.10 | | 1.37 | % | | $ | 7.09 |
| | | Hypothetical | | $ | 1,000.00 | | $ | 1,018.30 | | 1.37 | % | | $ | 6.97 |
| | | | | | | | | | | | | | |
| Class B | | Actual | | $ | 1,000.00 | | $ | 1,049.20 | | 2.12 | % | | $ | 10.95 |
| | | Hypothetical | | $ | 1,000.00 | | $ | 1,014.52 | | 2.12 | % | | $ | 10.76 |
| | | | | | | | | | | | | | |
| Class C | | Actual | | $ | 1,000.00 | | $ | 1,049.20 | | 1.87 | % | | $ | 9.66 |
| | | Hypothetical | | $ | 1,000.00 | | $ | 1,015.78 | | 1.87 | % | | $ | 9.50 |
| | | | | | | | | | | | | | |
| Class Z | | Actual | | $ | 1,000.00 | | $ | 1,054.30 | | 1.12 | % | | $ | 5.80 |
| | | Hypothetical | | $ | 1,000.00 | | $ | 1,019.56 | | 1.12 | % | | $ | 5.70 |
| | | | | | | | | | | | | | |
* Fund expenses (net of fee waivers or subsidies, if any) for each share class are equal to the annualized expense ratio for each share class (provided in the table), multiplied by the average account value over the period, multiplied by the 184 days in the six-month period ended October 31, 2007, and divided by 365 days to reflect the six-month period. Expenses presented in the table include the expenses of any underlying portfolios in which the Fund may invest.
| | |
| 8 | | Visit our website at www.jennisondryden.com |
Portfolio of Investments
as of October 31, 2007
| | | | | | |
Principal
Amount (000) | | Description | | Value (Note 1) |
| | | | | | |
| | LONG-TERM INVESTMENTS 93.8% |
|
| | Argentina 1.0% |
| ARS | 1,000 | | Argentina Nobac,
13.709%, 10/15/08 | | $ | 316,644 |
| | 2,223 | | Republic of Argentina,
5.83%, 12/31/33 | | | 780,366 |
| | 1,525 | | 0.63%, 12/31/38 | | | 214,411 |
| | | | | | |
| | | | | | 1,311,421 |
| | | | | | |
| |
| | Australia 0.8% | | | |
| AUD | 1,240 | | GE Capital Australia Funding, M.T.N.,
6.00%, 4/15/15 | | | 1,047,799 |
| | | | | | |
| |
| | Brazil 1.8% | | | |
| BRL | 1,100 | | Banco Votorantim Nassau,
17.10%, 2/28/08 | | | 643,862 |
| | 2,850 | | Cia Energetica de Sao Paulo, 144A,
9.75%, 1/15/15 | | | 1,730,815 |
| | | | | | |
| | | | | | 2,374,677 |
| | | | | | |
| |
| | Colombia 0.4% | | | |
| COP | 1,035,000 | | Republic of Columbia,
9.85%, 6/28/27 | | | 536,342 |
| | | | | | |
| |
| | Egypt 1.0% | | | |
| EGP | 3,600 | | Arab Republic of Egypt, 144A,
8.75%, 7/18/12 | | | 670,412 |
| | 4,000 | | Egypt Treasury Bill,
Zero Coupon, 6/24/08 | | | 693,757 |
| | | | | | |
| | | | | | 1,364,169 |
| | | | | | |
| |
| | Eurobonds 16.0% | | | |
| EUR | 300 | | American International Group, Inc.,
4.875%, 3/15/67 | | | 396,115 |
| | 910 | | Bank of America Corp.,
3.625%, 3/3/08 | | | 1,313,566 |
| | 2,715 | | Deutsche Bundesrepublik,
4.00%, 1/4/37 | | | 3,619,187 |
| | 300 | | Fortis Bank,
6.50%, 9/26/49 | | | 448,642 |
See Notes to Financial Statements.
| | |
| Dryden Global Total Return Fund, Inc. | | 9 |
Portfolio of Investments
as of October 31, 2007 continued
| | | | | | |
Principal
Amount (000) | | Description | | Value (Note 1) |
| | | | | | |
| EUR | 395 | | French Government Bonds,
5.00%, 10/25/16 | | $ | 600,960 |
| | 2,965 | | 8.50%, 4/25/23 | | | 6,184,689 |
| | 535 | | 5.50%, 4/25/29 | | | 872,282 |
| | 2,020 | | 5.75%, 10/25/32 | | | 3,431,206 |
| | 275 | | Goldman Sachs Group, Inc., (The)
5.125%, 10/16/14 | | | 391,721 |
| | 5 | | Italian Government Bonds,
5.50%, 11/1/10 | | | 7,499 |
| | 865 | | 6.00%, 5/1/31 | | | 1,462,249 |
| | 980 | | 4.00%, 2/1/37 | | | 1,238,262 |
| | 560 | | Spanish Government Bond,
5.75%, 7/30/32 | | | 948,662 |
| | | | | | |
| | | | | | 20,915,040 |
| | | | | | |
| |
| | Hungary 3.1% | | | |
| HUF | 340,000 | | Hungary Government Bonds,
6.00%, 10/12/11 | | | 1,903,868 |
| | 343,060 | | 8.00%, 2/12/15 | | | 2,124,184 |
| | | | | | |
| | | | | | 4,028,052 |
| | | | | | |
| |
| | Japan 13.3% | | | |
| JPY | 531,500 | | Japanese Government Bonds,
1.10%, 9/20/12 | | | 4,608,194 |
| | 422,150 | | 1.80%, 9/20/16 | | | 3,757,126 |
| | 491,550 | | 1.50%, 3/20/19 | | | 4,153,882 |
| | 220,200 | | 1.90%, 12/20/23 | | | 1,881,292 |
| | 206,700 | | 2.10%, 9/20/24 | | | 1,801,450 |
| | 164,550 | | 1.70%, 6/20/33 | | | 1,237,746 |
| | | | | | |
| | | | | | 17,439,690 |
| | | | | | |
| |
| | Mexico 1.3% | | | |
| MXN | 9,150 | | Mexican Government Bonds,
8.00%, 12/17/15 | | | 864,154 |
| | 8,300 | | 8.00%, 12/7/23 | | | 784,657 |
| | | | | | |
| | | | | | 1,648,811 |
| | | | | | |
| |
| | Norway 0.2% | | | |
| NOK | 1,470 | | Norwegian Government & Sovereign Bond,
5.00%, 5/15/15 | | | 276,194 |
| | | | | | |
See Notes to Financial Statements.
| | |
| 10 | | Visit our website at www.jennisondryden.com |
| | | | | | |
Principal
Amount (000) | | Description | | Value (Note 1) |
| | | | | | |
| | Poland 2.6% | | | |
| PLN | 8,235 | | Poland Government Bond,
6.25%, 10/24/15 | | $ | 3,427,724 |
| | | | | | |
| |
| | South Africa 0.3% | | | |
| ZAR | 2,250 | | International Bank for Reconstruction & Development,
9.75%, 8/2/10 | | | 343,786 |
| | | | | | |
| |
| | Sweden 0.4% | | | |
| SEK | 2,860 | | Sweden Government Bond,
6.75%, 5/5/14 | | | 512,473 |
| | | | | | |
| |
| | Turkey 0.9% | | | |
| TRY | 1,225 | | Turkey Government Bond,
16.00%, 3/7/12 | | | 1,074,586 |
| | 500 | | JP Morgan Chase & Co., 144A, Zero Coupon, 10/4/17 | | | 132,144 |
| | | | | | |
| | | | | | 1,206,730 |
| | | | | | |
| |
| | United Kingdom 3.5% | | | |
| GBP | 410 | | International Nederland Bank NV,
7.00%, 10/5/10 | | | 868,254 |
| | 200 | | QBE Capital Funding LP,
6.857%, 7/18/49 | | | 398,881 |
| | 300 | | Residential Capital Corp.,
8.875%, 7/1/14 | | | 436,654 |
| | 600 | | United Kingdom Treasury Bonds,
4.25%, 6/7/32 | | | 1,182,459 |
| | 855 | | 4.25%, 3/7/36 | | | 1,695,849 |
| | | | | | |
| | | | | | 4,582,097 |
| | | | | | |
| |
| | United States 47.2% | | | |
| |
| | Commercial Mortgage Backed Securities 3.1% | | | |
| USD | 1,000 | | Banc of America Commercial Mortgage Inc.,
Series 2005-06, Class A4,
5.181%, 9/10/47 | | | 980,795 |
| | 1,000 | | JP Morgan Chase Commercial Mortgage Securities Corp., Series 2005-LDP5, Class A4,
5.179%, 12/15/44 | | | 981,174 |
| | 680 | | Series 2006-CB17, Class A4,
5.429%, 12/12/43 | | | 669,719 |
See Notes to Financial Statements.
| | |
| Dryden Global Total Return Fund, Inc. | | 11 |
Portfolio of Investments
as of October 31, 2007 continued
| | | | | | |
Principal
Amount (000) | | Description | | Value (Note 1) |
| | | | | | |
| USD | 680 | | Merrill Lynch/CountryWide Commercial Mortgage Trust, Series 2007-5, Class A4,
5.378%, 8/12/48 | | $ | 665,628 |
| | 740 | | Morgan Stanley Capital 1,
Series 2005-IQ9, Class A4,
4.66%, 7/15/56 | | | 707,974 |
| | | | | | |
| | | | | | 4,005,290 |
| | | | | | |
| |
| | Corporate Bonds 26.9% | | | |
| | 100 | | Accellent, Inc.,
10.50%, 12/1/13 | | | 94,250 |
| | 250 | | AES Corp., (The), 144A,
8.00%, 10/15/17 | | | 252,188 |
| | 150 | | Allergan, Inc.,
5.75%, 4/1/16 | | | 151,283 |
| | 220 | | Alliance Imaging, Inc.,
7.25%, 12/15/12 | | | 210,100 |
| | 250 | | Allied World Insurance Holdings Ltd.,
7.50%, 8/1/16 | | | 266,172 |
| | 170 | | American International Group, Inc.,
5.45%, 5/18/17 | | | 167,658 |
| | 250 | | AstraZeneca PLC,
5.40%, 9/15/12 | | | 252,405 |
| | 400 | | Axis Capital Holdings Ltd,
5.75%, 12/1/14 | | | 396,119 |
| | 480 | | BHP Billiton Finance Ltd.,
5.40%, 3/29/17 | | | 471,638 |
| | 300 | | Blount, Inc.,
8.875%, 8/1/12 | | | 304,500 |
| | 250 | | Burlington North Santa Fe Corp.,
5.65%, 5/1/17 | | | 247,291 |
| | 115 | | Capital One Financial Corp.,
6.15%, 9/1/16 | | | 112,335 |
| | 82 | | Capital Safety Group Ltd, Bank Loan (c)
7.63%, 7/20/15 | | | 80,111 |
| | 218 | | 8.13%, 7/20/16 | | | 212,424 |
| | 250 | | Catalyst Paper Corp.,
8.625%, 6/15/11 | | | 197,500 |
| | 100 | | Caterpillar, Inc.,
6.05%, 8/15/36 | | | 101,775 |
| | 599 | | Cebridge Connections, Inc., Bank Loan (c)
7.253%, 11/5/13 | | | 579,124 |
See Notes to Financial Statements.
| | |
| 12 | | Visit our website at www.jennisondryden.com |
| | | | | | |
Principal
Amount (000) | | Description | | Value (Note 1) |
| | | | | | |
| USD | 350 | | Centennial Communications Corp.,
10.125%, 6/15/13 | | $ | 371,875 |
| | 200 | | CenterPoint Energy Resources Corp.,
6.625%, 11/1/37 | | | 200,699 |
| | 300 | | Citigroup, Inc.,
6.125%, 8/25/36 | | | 292,640 |
| | 300 | | Citizens Communications Co.,
9.00%, 8/15/31 | | | 308,625 |
| | 400 | | CMS Energy Corp.,
8.50%, 4/15/11 | | | 428,898 |
| | 250 | | Coca-Cola Co., (The)
5.35%, 11/15/17 | | | 248,269 |
| | 19 | | Community Health Systems, Bank Loan (c)
7.493%, 7/25/14 | | | 18,109 |
| | 281 | | 7.493%, 7/25/14 | | | 274,578 |
| | 200 | | Community Health Systems, Inc., 144A,
8.875%, 7/15/15 | | | 202,500 |
| | 650 | | Computer Associates, Inc., Sr. Notes,
6.50%, 4/15/08 | | | 654,174 |
| | 90 | | Conoco Philips Canada,
5.95%, 10/15/36 | | | 92,263 |
| | 720 | | Continental Airlines, Inc.
7.487%, 10/2/10 | | | 736,199 |
| | 390 | | Couche-Tard Finance Corp.,
7.50%, 12/15/13 | | | 394,875 |
| | 360 | | Coventry Health Care, Inc.,
6.125%, 1/15/15 | | | 358,874 |
| | 100 | | Covidien International Finance SA, 144A,
6.55%, 10/15/37 | | | 101,876 |
| | 500 | | CRH America, Inc.,
5.625%, 9/30/11 | | | 498,970 |
| | 215 | | CVS Caremark Corp.,
5.75%, 6/1/17 | | | 213,896 |
| | 300 | | CVS Corp.,
4.00%, 9/15/09 | | | 294,573 |
| | 300 | | Delta Air Lines, Inc.,
144A, 6.821%, 8/10/22 | | | 302,274 |
| | 450 | | Dex Media East LLC,
9.875%, 11/15/09 | | | 461,813 |
| | 170 | | Dominion Resources, Inc.,
5.687%, 5/15/08 | | | 170,185 |
See Notes to Financial Statements.
| | |
| Dryden Global Total Return Fund, Inc. | | 13 |
Portfolio of Investments
as of October 31, 2007 continued
| | | | | | |
Principal
Amount (000) | | Description | | Value (Note 1) |
| | | | | | |
| USD | 218 | | Domtar Corp., Bank Loan (c)
7.078%, 3/5/14 | | $ | 213,878 |
| | 200 | | Duke Energy Carolinas LLC,
6.10%, 6/1/37 | | | 199,771 |
| | 440 | | Duke Energy Field Services LLC,
7.875%, 8/16/10 | | | 470,536 |
| | 600 | | Duke Realty LP,
5.625%, 8/15/11 | | | 599,885 |
| | 500 | | Embarq Corp.,(b)
7.082%, 6/1/16 | | | 522,567 |
| | 300 | | Enterprise Group Holdings LP, Bank Loan (c)
7.161%, 10/30/14 | | | 298,875 |
| | 75 | | Erac USA Finance Company, 144A,
6.20%, 11/1/16 | | | 74,032 |
| | 210 | | Federated Retail Holdings, Inc.,
5.35%, 3/15/12 | | | 204,735 |
| | 450 | | FEDEX Corp.,
3.50%, 4/1/09 | | | 439,409 |
| | 250 | | Felcore Lodging LP,
7.26%, 12/1/11 | | | 250,000 |
| | 348 | | Fideicomiso Petacalco,
144A, 10.16%, 12/23/09 | | | 364,875 |
| | 325 | | First Data Corp., 144A,
9.875%, 9/24/15 | | | 311,188 |
| | 300 | | First Data Corp., Bank Loan (c)
7.981%, 9/24/14 | | | 289,125 |
| | 67 | | Flextronics International Ltd, Bank Loan (c)
7.234%, 10/1/14 | | | 66,362 |
| | 233 | | 7.474%, 10/1/14 | | | 230,938 |
| | 400 | | Freescale Semiconductor, Inc.,
9.125%, 12/15/14 | | | 362,000 |
| | 105 | | Goldman Sachs Group, Inc., (The)
6.75%, 10/1/37 | | | 105,396 |
| | 360 | | Graphic Packaging International, Inc.,
8.50%, 8/15/11 | | | 365,400 |
| | 22 | | Hawker Beechcraft, Inc., Bank Loan (c)
7.244%, 3/26/14 | | | 21,400 |
| | 258 | | 7.244%, 3/26/14 | | | 251,644 |
| | 270 | | HCA, Inc., 144A,
9.625%, 11/15/16 | | | 285,525 |
| | 299 | | HCA, Inc., Bank Loan (c)
8.256%, 11/14/13 | | | 292,029 |
See Notes to Financial Statements.
| | |
| 14 | | Visit our website at www.jennisondryden.com |
| | | | | | |
Principal
Amount (000) | | Description | | Value (Note 1) |
| | | | | | |
| USD | 23 | | Hertz Corp., Bank Loan (c)
7.452%, 12/21/12 | | $ | 22,484 |
| | 127 | | 7.479%, 12/21/12 | | | 124,971 |
| | 150 | | HJ Heinz Co.,144A,
6.428%, 12/1/08 | | | 152,615 |
| | 365 | | Honeywell International, Inc.,
5.70%, 3/15/37 | | | 354,841 |
| | 300 | | Huish Detergents, Inc., Bank Loan (c)
7.355%, 4/26/14 | | | 285,161 |
| | 165 | | Husky Energy, Inc.,
6.15%, 6/15/19 | | | 166,637 |
| | 300 | | ICI Wilmington, Inc., Gtd. Notes
4.375%, 12/1/08 | | | 298,775 |
| | 349 | | Inverness Medical Innovations, Bank Loan (c)
7.243%, 6/26/14 | | | 341,270 |
| | 350 | | Jabil Circuit, Inc., Sr. Notes,
5.875%, 7/15/10 | | | 353,689 |
| | 100 | | Kinder Morgan Energy Partners LP,
5.85%, 9/15/12 | | | 101,590 |
| | 290 | | Kinder Morgan, Inc., Bank Loan (c)
7.121%, 5/30/14 | | | 282,694 |
| | 319 | | Las Vegas Sands LLC, Bank Loan (c)
7.256%, 5/23/14 | | | 309,501 |
| | 80 | | 7.256%, 5/23/14 | | | 77,569 |
| | 70 | | Liberty Mutual Group, 144A,
7.50%, 8/15/36 | | | 72,611 |
| | 80 | | Lincoln National Corp.,
6.15%, 4/7/36 | | | 78,938 |
| | 65 | | McDonald’s Corp.,
6.30%, 10/15/37 | | | 66,325 |
| | 400 | | Mediacom LLC,
7.875%, 2/15/11 | | | 387,000 |
| | 65 | | Merrill Lynch & Co. Inc.,
6.05%, 8/15/12 | | | 65,962 |
| | 300 | | Metavante Corp., Bank Loan (c)
6.644%, 11/1/14 | | | 292,500 |
| | 250 | | MGM Mirage, Inc.,
6.875%, 4/1/16 | | | 238,750 |
| | 195 | | Morgan Stanley,
5.25%, 11/2/12 | | | 193,399 |
| | 120 | | MUFG Capital Finance 1 Ltd.,
6.346%, 7/25/49 | | | 114,413 |
| | 250 | | Nalco Co.,
7.75%, 11/15/11 | | | 254,375 |
| | 250 | | National Beef Packing Co. LLC/ NB Finance Corp.,
10.50%, 8/1/11 | | | 251,250 |
| | |
| Dryden Global Total Return Fund, Inc. | | 15 |
Portfolio of Investments
as of October 31, 2007 continued
| | | | | | |
Principal
Amount (000) | | Description | | Value (Note 1) |
| | | | | | |
| USD | 250 | | Neiman-Marcus Group, Inc.,
9.00%, 10/15/15 | | $ | 263,750 |
| | 140 | | New Cingular Wireless Services Inc.,
Notes,
8.125%, 5/1/12 | | | 156,135 |
| | 270 | | Sr. Notes,
8.75%, 3/1/31 | | | 349,130 |
| | 110 | | Newfield Exploration Co.,
6.625%, 4/15/16 | | | 107,800 |
| | 375 | | Nexen, Inc.,
6.40%, 5/15/37 | | | 373,118 |
| | 130 | | Norampac, Inc.,
6.75%, 6/1/13 | | | 123,825 |
| | 400 | | Northern Rock PLC, 144A,
6.594%, 12/31/49 | | | 320,000 |
| | 352 | | NRG Energy, Inc., Bank Loan (c)
7.348%, 2/1/13 | | | 343,851 |
| | 146 | | 7.348%, 2/1/13 | | | 143,108 |
| | 113 | | 8.098%, 6/8/14 | | | 109,977 |
| | 750 | | ONEOK, Inc.,(b)
5.51%, 2/16/08 | | | 749,650 |
| | 315 | | Orion Power Holdings, Inc.
12.00%, 5/1/10 | | | 348,075 |
| | 450 | | Owens Brockway Glass Container, Inc.,
8.875%, 2/15/09 | | | 453,375 |
| | 260 | | Park Place Entertainment Corp., Sr. Sub.
Notes 8.125%, 5/15/11 | | | 263,900 |
| | 150 | | Peabody Energy Corp.,
7.375%, 11/1/16 | | | 156,000 |
| | 200 | | Pioneer Natural Resources Co.,
6.875%, 5/1/18 | | | 188,694 |
| | 100 | | Procter & Gamble Co.,
5.55%, 3/5/37 | | | 98,145 |
| | 399 | | PTS Acquisitions Corp., Bank Loan (c)
7.459%, 4/10/14 | | | 382,666 |
| | 250 | | Qwest Corp.,
7.875%, 9/1/11 | | | 263,750 |
| | 200 | | 8.875%, 3/15/12 | | | 219,000 |
| | 190 | | Rainbow National Services LLC, 144A,
10.375%, 9/1/14 | | | 209,000 |
| | 220 | | Realogy Corp., 144A,
11.00%, 4/15/14 | | | 179,300 |
See Notes to Financial Statements.
| | |
| 16 | | Visit our website at www.jennisondryden.com |
| | | | | | |
Principal
Amount (000) | | Description | | Value (Note 1) |
| | | | | | |
| USD | 500 | | Resona Bank Ltd., 144A,
5.85%, 9/29/49 | | $ | 463,213 |
| | 300 | | Reynolds American, Inc.,
6.75%, 6/15/17 | | | 309,182 |
| | 262 | | RH Donnelley Corp, Bank Loan (c)
7.453%, 6/30/11 | | | 257,136 |
| | 677 | | Royalty Pharma Finance Trust, Bank Loan (c)
6.994%, 5/14/13 | | | 671,526 |
| | 300 | | RSHB Capital SA for OJSC Russian Agricultural Bank, 144A,
6.299%, 5/15/17 | | | 284,220 |
| | 80 | | Russel Metals, Inc.,
6.375%, 3/1/14 | | | 76,000 |
| | 325 | | Schering-Plough Corp.,
6.55%, 9/15/37 | | | 336,825 |
| | 449 | | Sensata Technologies, Bank Loan (c)
6.93%, 4/27/13 | | | 436,119 |
| | 300 | | Smithfield Foods, Inc.,
7.00%, 8/1/11 | | | 303,000 |
| | 130 | | Sprint Nextel Corp.,
6.00%, 12/1/16 | | | 124,996 |
| | 220 | | Station Casinos, Inc.,
6.00%, 4/1/12 | | | 204,050 |
| | 800 | | Sumitomo Mitsui Banking Corp., 144A,
5.625%, 7/29/49 | | | 746,770 |
| | 48 | | Sun Healthcare Group, Bank Loan (c)
7.084%, 4/12/14 | | | 46,888 |
| | 213 | | 7.084%, 4/12/14 | | | 206,580 |
| | 31 | | 7.084%, 4/12/14 | | | 30,142 |
| | 180 | | Sungard Data System, Inc., Bank Loan (c)
7.356%, 2/28/14 | | | 177,361 |
| | 275 | | Tesco PLC, 144A,
6.15%, 11/15/37 | | | 269,535 |
| | 300 | | Texas Competitive Electric Holdings Co., LLC, 144A
10.25%, 11/1/15 | | | 301,500 |
| | 300 | | Thomson Corp., (The)
5.70%, 10/1/14 | | | 299,660 |
| | 700 | | Time Warner Cable, Inc., 144A,
5.40%, 7/2/12 | | | 697,897 |
| | 300 | | TNK-BP Finance SA, 144A,
7.50%, 7/18/16 | | | 292,500 |
| | 90 | | Tyson Foods, Inc.,
6.85%, 4/1/16 | | | 93,607 |
See Notes to Financial Statements.
| | |
| Dryden Global Total Return Fund, Inc. | | 17 |
Portfolio of Investments
as of October 31, 2007 continued
| | | | | | |
Principal
Amount (000) | | Description | | Value (Note 1) |
| | | | | | |
| USD | 150 | | United Airlines, Inc.,
6.636%, 7/2/22 | | $ | 148,500 |
| | 200 | | United States Steel Corp.,
5.65%, 6/1/13 | | | 193,616 |
| | 242 | | Univision Communications, Inc., Bank Loan (c)
7.45%, 9/29/14 | | | 228,650 |
| | 8 | | 7.45%, 9/29/14 | | | 7,939 |
| | 165 | | Viacom, Inc.,
6.875%, 4/30/36 | | | 167,424 |
| | 150 | | Wyeth,
5.95%, 4/1/37 | | | 148,347 |
| | | | | | |
| | | | | | 35,155,360 |
| | | | | | |
| |
| | Emerging Market Bonds 0.8% | | | |
| | 260 | | Empresa Nacional de Electricidad SA (Chile),
8.35%, 8/1/13 | | | 291,910 |
| | 430 | | Kazkommerts International BV, 144A, (Netherlands)
7.875%, 4/7/14 | | | 392,375 |
| | 400 | | United Overseas Bank Ltd., Bonds, 144A,
5.375%, 9/3/19 | | | 386,582 |
| | | | | | |
| | | | | | 1,070,867 |
| | | | | | |
| |
| | Mortgage Backed Securities 13.0% | | | |
| | 6,573 | | Federal Home Loan Mortgage Corp.,
5.50%, 5/1/37 | | | 6,471,371 |
| | 2,972 | | Federal National Mortgage Association,
5.50%, 4/1/36 | | | 2,929,365 |
| | 6,132 | | 6.50%, 3/1/37 | | | 6,276,288 |
| | 1,000 | | Federal National Mortgage Association, TBA
6.50%, 11/1/34 | | | 1,023,437 |
| | 250 | | 6.00%, 11/15/34 | | | 251,797 |
| | | | | | |
| | | | | | 16,952,258 |
| | | | | | |
| |
| | Sovereign Bonds 1.2% | | | |
| | 330 | | Republic of Argentina,
3.00%, 4/30/13 | | | 211,200 |
| | 348 | | 8.28%, 12/31/33 | | | 352,641 |
| | 800 | | 1.33%, 12/31/38 | | | 374,000 |
| | 300 | | Republic of Panama,
7.25%, 3/15/15 | | | 328,500 |
See Notes to Financial Statements.
| | |
| 18 | | Visit our website at www.jennisondryden.com |
| | | | | | |
Principal
Amount (000) | | Description | | Value (Note 1) |
| | | | | | |
| USD | 300 | | Republic of Venezuela,
9.25%, 9/15/27 | | $ | 328,800 |
| | | | | | |
| | | | | | 1,595,141 |
| | | | | | |
| |
| | Structured Notes 2.1% | | | |
| | 250 | | Dow Jones CDX HY,
Series 5-T3, 144A,
8.25%, 12/29/10 | | | 259,063 |
| | 2,500 | | Dow Jones CDX HY,
Series 9-T1, 144A,
8.75%, 12/29/12 | | | 2,481,249 |
| | | | | | |
| | | | | | 2,740,312 |
| | | | | | |
| |
| | United States Government Obligations 0.1% | | | |
| | | United States Treasury Bonds, | | | |
| | 15 | | 4.75%, 8/15/17 | | | 15,330 |
| | 105 | | 4.75%, 2/15/37 | | | 104,943 |
| | | | | | |
| | | | | | 120,273 |
| | | | | | |
| | | Total United States Investments | | | 61,639,501 |
| | | | | | |
| | | Total long-term investments
(cost $117,051,422) | | | 122,654,506 |
| | | | | | |
| |
| | SHORT-TERM INVESTMENTS 7.9% | | | |
| | |
| Shares | | | | |
| |
| | Affiliated Money Market Mutual Fund 5.6% | | | |
| | 7,327,063 | | Dryden Core Investment Fund - Taxable Money Market Series(a)
(cost $7,327,063) | | | 7,327,063 |
| | | | | | |
| | |
Notional
Amount | | | | |
| |
| | OUTSTANDING OPTIONS PURCHASED 2.3% | | | |
| |
| | Call Options 0.3% | | | |
| BRL | 5,200,000 | | Brazilian Real/Japanese Yen, expiring 3/25/2008 @ 52.00 | | | 126,677 |
| CNY | 10,382,500 | | Chinese Yuan/New Taiwan Dollar, expiring 1/22/2008 @ 4.43 | | | 14 |
| ZAR | 5,660,500 | | South African Rand/Japanese Yen, expiring 5/05/2008 @ 15.63 | | | 79,563 |
| USD | 679,200 | | United States Dollar/Canadian Dollar, expiring 2/19/2008 @ 1.15 | | | 7 |
| | 4,499,000 | | United States Dollar/Japanese Yen, expiring 10/09/2008 @ 112.70 | | | 97,538 |
| | 1,269,800 | | United States Dollar/Japanese Yen, expiring 8/05/2010 @ 123.75 | | | 5,562 |
| | 2,551,600 | | United States Dollar/Japanese Yen, expiring 9/30/2008 @ 112.60 | | | 58,916 |
See Notes to Financial Statements.
| | |
| Dryden Global Total Return Fund, Inc. | | 19 |
Portfolio of Investments
as of October 31, 2007 continued
| | | | | | |
Notional
Amount | | Description | | Value (Note 1) |
| | | | | | |
| USD | 673,900 | | United States Dollar/Taiwan Dollar, expiring 4/29/2008 @ 32.55 | | $ | 1,927 |
| | 2,524,800 | | United States Dollar/Taiwan Dollar, expiring 8/14/2008 @ 32.25 | | | 13,583 |
| | | | | | |
| | | Total call options | | | 383,787 |
| | | | | | |
| |
| | Put Options 2.0% | | | |
| EUR | 450,400 | | Euro/Polish Zloty, expiring 10/16/2008 @ 3.73 | | | 20,669 |
| | 273,100 | | Euro/Iceland Krona, expiring 10/30/2008 @ 94.70 | | | 21,358 |
| JPY | 81,590,600 | | Japanese Yen/Mexican Nuevo Peso, expiring 2/04/2008 @ 10.27 | | | 29,7460 |
| CHF | 765,300 | | Swiss Franc/Hungarian Forint, expiring 7/21/2008 @ 153.73 | | | 18,042 |
| | 3,197,600 | | Swiss Franc/Iceland Krona, expiring 3/25/2008 @ 60.72 | | | 91,644 |
| | 841,000 | | Swiss Franc/Mexican Nuevo Peso, expiring 2/04/2008 @ 9.29 | | | 11,340 |
| | 841,000 | | Swiss Franc/Polish Zloty, expiring 2/01/2008 @ 2.45 | | | 87,541 |
| | 1,551,700 | | Swiss Franc/South African Rand, expiring 7/03/2008 @ 6.16 | | | 92,668 |
| USD | 661,700 | | United States Dollar/Chinese Yuan, expiring 5/13/2008 @ 7.25 | | | 8,476 |
| | 2,550,700 | | United States Dollar/Euro, expiring 7/28/2008 @ 1.38 | | | 130,009 |
| | 259,800 | | United States Dollar/Iceland Krona, expiring 6/03/2008 @ 66.25 | | | 19,758 |
| | 317,400 | | United States Dollar/Japanese Yen, expiring 11/05/2007 @ 108.35 | | | 3 |
| | 1,286,200 | | United States Dollar/Mexican Nuevo Peso, expiring 6/10/2008 @ 11.24 | | | 52,027 |
| | 2,800,000 | | United States Dollar/New Turkish Lira, expiring 3/21/2008 @ 1.57 | | | 811,497 |
| | 4,418,300 | | Unites States Dollar/New Turkish Lira, expiring 8/14/2008 @ 1.46 | | | 737,459 |
| | 126,400 | | United States Dollar/Polish Zloty, expiring 7/03/2008 @ 2.76 | | | 11,516 |
| | 4,053,000 | | United States Dollar/Singapore Dollar, expiring 2/12/2008 @ 1.51 | | | 206,662 |
| | 1,087,100 | | United States Dollar/Singapore Dollar, expiring 3/03/2008 @ 1.50 | | | 47,463 |
| | 1,262,500 | | United States Dollar/Taiwan Dollar, expiring 6/19/2008 @ 32.20 | | | 27,409 |
| | 1,313,900 | | United States Dollar/Argentina Nuevo Peso, expiring 10/30/2008 @ 3.39 | | | 55,841 |
| | 1,308,900 | | United States Dollar/Chilean Peso, expiring 10/28/2008 @ 497.90 | | | 40,092 |
| | 1,274,900 | | United States Dollar/Chinese Yuan, expiring 7/21/2008 @ 7.21 | | | 27,907 |
| | 253,400 | | United States Dollar/Iceland Krona, expiring 08/05/2008 @ 67.75 | | | 22,020 |
| | 394,200 | | United States Dollar/Iceland Krona, expiring 10/30/2008 @ 65.50 | | | 21,247 |
| | | | | | |
| | | Total put options | | | 2,592,394 |
| | | | | | |
| | | Total options purchased
(cost $1,597,397) | | | 2,976,181 |
| | | | | | |
| | | Total short-term Investments
(cost $8,924,460) | | | 10,303,244 |
| | | | | | |
| | | Total Investments, Before Options Written
(cost $ 125,975,882; Note 5) | | | 132,957,750 |
| | | | | | |
See Notes to Financial Statements.
| | |
| 20 | | Visit our website at www.jennisondryden.com |
| | | | | | | |
Notional
Amount | | Description | | Value (Note 1) | |
| | | | | | | |
| |
| | OUTSTANDING OPTIONS WRITTEN (0.6%) | | | | |
| |
| | Put Options | | | | |
| USD | 1,269,800 | | United States Dollar/Japanese Yen, expiring 8/05/2010 @ 83.00 | | $ | (14,920 | ) |
| | 2,800,000 | | Unites States Dollar/New Turkish Lira, expiring 3/24/2008 @ 1.57 | | | (768,516 | ) |
| | | | | | | |
| | | Total options written
(premiums received $408,819) | | | (783,436 | ) |
| | | | | | | |
| | | Total Investments, Net of Outstanding Options Written 101.1%
(cost $125,567,063) | | | 132,174,314 | |
| | | Other liabilities in excess of other assets(d) (1.1%) | | | (1,412,625 | ) |
| | | | | | | |
| | | Net Assets 100.0% | | $ | 130,761,689 | |
| | | | | | | |
Portfolio securities are classified according to the security’s currency denomination. The following abbreviations are used in the portfolio descriptions:
ARS—Argentine Peso
AUD—Australian Dollar
BRL—Brazilian Real
CAD—Canadian Dollar
CHF—Swiss Francs
CLP—Chilean Peso
CNY—Chinese Yuan Renminbi
COP—Colombian Peso
CZK—Czech Koruna
DKK—Danish Krone
EGP—Egyptian Pound
EUR—Euros
GBP—Pound Sterling
HUF—Hungarian Forint
IDR—Indonesian Rupee
INR—Indian Rupee
ISK—Iceland Krona
JPY—Japanese Yen
KRW—Republic of Korean Won
MXN—Mexican Nuevo Peso
MYR—Malaysian Ringgit
NOK—Norwegian Krone
NZD—New Zealand Dollar
PEN—Peruvian Nuevo Sol
PHP—Philippines Peso
PLN—Polish New Zloty
RUB—Russian Federation Rouble
SEK—Swedish Krona
See Notes to Financial Statements.
| | |
| Dryden Global Total Return Fund, Inc. | | 21 |
Portfolio of Investments
as of October 31, 2007 continued
SGD—Singapore Dollar
TWD—New Taiwan Dollars
TRY—New Turkish Lira
USD—United States Dollar
ZAR—South African Rand
MTN—Medium Term Note
TBA—To Be Announced
144A—Security was purchased pursuant to Rule 144A under the Securities Act of 1933 and may not be resold subject to that rule except to qualified institutional buyers. Unless otherwise noted, 144A securities are deemed to be liquid.
| (a) | Prudential Investments LLC, the manager of the Fund, also serves as manager of the Dryden Core Investment Fund – Taxable Money Market Series. |
| (b) | All or partial principal amount segregated as initial margin on financial futures contracts. |
| (c) | Indicates a security that has been deemed illiquid. |
| (d) | Other liabilities in excess of other assets include net unrealized appreciation (depreciation) on futures contracts, forward foreign currency exchange contracts, currency swaps and interest rate swaps agreements of: |
Open futures contracts outstanding as of October 31, 2007:
| | | | | | | | | | | | | | |
Number of
Contracts | | Types | | Expiration
Date | | Value at
October 31,
2007 | | Value at
Trade Date | | Unrealized
Appreciation
(Depreciation) | |
| | Long Positions: | | | | | | | | | | | | |
| 7 | | JPN 10 Yr. Bond | | Dec. 07 | | $ | 8,251,463 | | $ | 8,211,931 | | $ | 39,532 | |
| 8 | | Long Gilt | | Dec. 07 | | | 1,784,875 | | | 1,776,405 | | | 8,470 | |
| 23 | | CAN 10 Yr. Bond | | Dec. 07 | | | 2,746,171 | | | 2,740,644 | | | 5,527 | |
| 44 | | Euro-Bund | | Dec. 07 | | | 7,223,177 | | | 7,195,890 | | | 27,287 | |
| 57 | | Euro-Schatz | | Dec. 07 | | | 8,521,721 | | | 8,538,691 | | | (16,970 | ) |
| 61 | | Euro-BOBL | | Dec. 07 | | | 9,517,361 | | | 9,522,706 | | | (5,345 | ) |
| | | | | |
| | Short Positions: | | | | | | | | | | | | |
| 2 | | 10-Yr. Mini | | Dec. 07 | | | 235,929 | | | 235,742 | | | (187 | ) |
| 3 | | CBT Long Bond | | Dec. 07 | | | 337,781 | | | 340,871 | | | 3,090 | |
| 8 | | Australian 10 Yr. Bond | | Dec. 07 | | | 699,036 | | | 700,840 | | | 1,804 | |
| 28 | | 10-Yr. U.S. T-Notes | | Dec. 07 | | | 3,080,438 | | | 3,057,956 | | | (22,482 | ) |
| 87 | | 2-Yr. U.S. T-Notes | | Dec. 07 | | | 18,018,516 | | | 17,944,915 | | | (73,601 | ) |
| 248 | | 5-Yr. U.S. T-Notes | | Dec. 07 | | | 26,621,250 | | | 26,531,879 | | | (89,371 | ) |
| | | | | | | | | | | | | | |
| | | | | | | | | | | | $ | (122,246 | ) |
| | | | | | | | | | | | | | |
See Notes to Financial Statements.
| | |
| 22 | | Visit our website at www.jennisondryden.com |
Forward foreign currency exchange contracts outstanding as of October 31, 2007:
| | | | | | | | | | | | | | | | |
Purchase Contracts | | Notional
Amount | | Value at
Settlement
Date Payable | | Value at
October 31,
2007 | | Unrealized
Appreciation | | Unrealized
(Depreciation) | |
Argentine Peso, | | | | | | | | | | | | | |
Expiring 11/01/07 | | ARS | 450,850 | | $ | 142,000 | | $ | 143,526 | | $ | 1,526 | | $ | — | |
Expiring 11/01/07 | | ARS | 984,250 | | | 310,000 | | | 313,331 | | | 3,331 | | | — | |
Expiring 02/07/08 | | ARS | 272,235 | | | 86,205 | | | 85,235 | | | — | | | (970 | ) |
Expiring 02/25/08 | | ARS | 1,306,652 | | | 399,588 | | | 407,660 | | | 8,072 | | | — | |
Expiring 03/17/08 | | ARS | 3,583,305 | | | 1,128,600 | | | 1,140,726 | | | 12,126 | | | — | |
Expiring 07/17/08 | | ARS | 2,125,300 | | | 621,433 | | | 654,845 | | | 33,412 | | | — | |
Expiring 07/31/08 | | ARS | 1,872,531 | | | 559,800 | | | 596,110 | | | 36,310 | | | — | |
Expiring 07/31/08 | | ARS | 1,279,932 | | | 381,500 | | | 407,460 | | | 25,960 | | | — | |
| | | | | |
Australian Dollar, | | | | | | | | | | | | | | | | |
Expiring 11/21/07 | | AUD | 173,949 | | | 155,253 | | | 161,826 | | | 6,573 | | | — | |
Expiring 11/21/07 | | AUD | 37,200 | | | 33,202 | | | 34,608 | | | 1,406 | | | — | |
| | | | | |
Brazilian Real, | | | | | | | | | | | | | | | | |
Expiring 07/31/08 | | BRL | 250,584 | | | 127,200 | | | 144,792 | | | 17,592 | | | — | |
| | | | | |
Canadian Dollar, | | | | | | | | | | | | | | | | |
Expiring 11/19/07 | | CAD | 1,490,708 | | | 1,525,358 | | | 1,578,170 | | | 52,812 | | | — | |
Expiring 11/19/07 | | CAD | 1,710,709 | | | 1,769,563 | | | 1,811,078 | | | 41,515 | | | — | |
| | | | | |
Chilian Peso, | | | | | | | | | | | | | | | | |
Expiring 10/23/08 | | CLP | 228,693,500 | | | 452,500 | | | 463,458 | | | 10,958 | | | — | |
| | | | | |
Chinese Yuan Renminbi, | | | | | | | | | | | | | | | | |
Expiring 02/14/08 | | CNY | 2,632,600 | | | 358,543 | | | 352,754 | | | — | | | (5,789 | ) |
Expiring 05/15/08 | | CNY | 1,845,888 | | | 253,000 | | | 247,339 | | | — | | | (5,661 | ) |
| | | | | |
Colombian Peso, | | | | | | | | | | | | | | | — | |
Expiring 01/10/08 | | COP | 416,423,000 | | | 191,900 | | | 208,267 | | | 16,367 | | | — | |
Expiring 01/10/08 | | COP | 3,030,833,169 | | | 1,479,899 | | | 1,515,820 | | | 35,921 | | | — | |
| | | | | |
Czech Koruna, | | | | | | | | | | | | | | | — | |
Expiring 11/23/07 | | CZK | 8,603,472 | | | 452,500 | | | 463,249 | | | 10,749 | | | — | |
| | | | | |
Danish Krone, | | | | | | | | | | | | | | | | |
Expiring 11/23/07 | | DKK | 4,526,842 | | | 861,811 | | | 880,080 | | | 18,269 | | | — | |
| | | | | |
Euro, | | | | | | | | | | | | | | | | |
Expiring 11/19/07 | | EUR | 180,500 | | | 256,297 | | | 261,546 | | | 5,249 | | | — | |
Expiring 11/23/07 | | EUR | 155,900 | | | 220,984 | | | 225,915 | | | 4,931 | | | — | |
Expiring 11/26/07 | | EUR | 21,070,938 | | | 30,044,208 | | | 30,535,528 | | | 491,320 | | | — | |
Expiring 11/26/07 | | EUR | 116,150 | | | 167,219 | | | 168,322 | | | 1,103 | | | — | |
See Notes to Financial Statements.
| | |
| Dryden Global Total Return Fund, Inc. | | 23 |
Portfolio of Investments
as of October 31, 2007 continued
| | | | | | | | | | | | | | | | |
Purchase Contracts | | Notional
Amount | | Value at
Settlement
Date Payable | | Value at
October 31,
2007 | | Unrealized
Appreciation | | Unrealized
(Depreciation) | |
Icelandic Krona, | | | | | | | | | | | | | | | | |
Expiring 11/19/07 | | ISK | 16,014,189 | | $ | 259,627 | | $ | 266,937 | | $ | 7,310 | | $ | — | |
| | | | | |
Indian Rupee | | | | | | | | | | | | | | | | |
Expiring 01/08/08 | | INR | 10,953,150 | | | 269,915 | | | 278,540 | | | 8,625 | | | — | |
Expiring 12/12/07 | | INR | 13,005,738 | | | 318,300 | | | 330,041 | | | 11,741 | | | — | |
Expiring 12/27/07 | | INR | 7,609,274 | | | 190,900 | | | 192,956 | | | 2,056 | | | — | |
| | | | | |
Indonesian Rupiah, | | | | | | | | | | | | — | | | | |
Expiring 06/19/08 | | IDR | 1,434,425,000 | | | 158,500 | | | 157,681 | | | — | | | (819 | ) |
Expiring 07/14/08 | | IDR | 2,331,060,500 | | | 254,900 | | | 256,245 | | | 1,345 | | | — | |
Expiring 09/22/08 | | IDR | 3,054,739,500 | | | 318,700 | | | 331,065 | | | 12,365 | | | — | |
| | | | | |
Japanese Yen, | | | | | | | | | | | | | | | | |
Expiring 11/26/07 | | JPY | 2,036,608,067 | | | 17,836,257 | | | 17,708,120 | | | — | | | (128,137 | ) |
Expiring 11/26/07 | | JPY | 59,238,910 | | | 521,800 | | | 515,077 | | | — | | | (6,723 | ) |
| | | | | |
Malaysian Ringgit, | | | | | | | | | | | | | | | | |
Expiring 11/05/07 | | MYR | 704,933 | | | 208,406 | | | 211,374 | | | 2,968 | | | — | |
Expiring 12/14/07 | | MYR | 1,086,695 | | | 319,100 | | | 325,846 | | | 6,746 | | | — | |
Expiring 04/02/08 | | MYR | 684,045 | | | 202,500 | | | 205,111 | | | 2,611 | | | — | |
Expiring 08/01/08 | | MYR | 1,693,316 | | | 500,315 | | | 507,741 | | | 7,426 | | | — | |
Expiring 08/04/08 | | MYR | 644,773 | | | 193,800 | | | 194,384 | | | 584 | | | — | |
Expiring 08/04/08 | | MYR | 644,228 | | | 190,600 | | | 193,172 | | | 2,572 | | | — | |
| | | | | |
Mexican Nuevo Peso | | | | | | | | | | | | | | | | |
Expiring 11/20/07 | | MXN | 9,214,915 | | | 855,927 | | | 862,945 | | | 7,018 | | | — | |
| | | | | |
New Zealand Dollar, | | | | | | | | | | | | | | | | |
Expiring 11/21/07 | | NZD | 1,405,544 | | | 1,052,464 | | | 1,081,622 | | | 29,158 | | | — | |
| | | | | |
Norwegian Krone, | | | | | | | | | | | | | | | | |
Expiring 11/23/07 | | NOK | 5,342,874 | | | 978,940 | | | 995,162 | | | 16,222 | | | — | |
| | | | | |
Peruvian Nuevo Sol, | | | | | | | | | | | | | | | | |
Expiring 08/29/08 | | PEN | 1,197,387 | | | 378,800 | | | 399,829 | | | 21,029 | | | — | |
Expiring 03/13/08 | | PEN | 605,800 | | | 191,800 | | | 202,312 | | | 10,512 | | | — | |
| | | | | |
Philippine Peso, | | | | | | | | | | | | | | | | |
Expiring 05/08/08 | | PHP | 15,183,543 | | | 321,549 | | | 347,609 | | | 26,060 | | | — | |
Expiring 05/08/08 | | PHP | 8,070,447 | | | 177,100 | | | 184,763 | | | 7,663 | | | — | |
Expiring 11/28/07 | | PHP | 17,725,946 | | | 378,800 | | | 405,277 | | | 26,477 | | | — | |
| | | | | |
Polish Zloty, | | | | | | | | | | | | | | | | |
Expiring 11/23/07 | | PLN | 1,591,500 | | | 619,900 | | | 635,993 | | | 16,093 | | | — | |
Expiring 11/23/07 | | PLN | 609,688 | | | 239,973 | | | 243,642 | | | 3,669 | | | — | |
See Notes to Financial Statements.
| | |
| 24 | | Visit our website at www.jennisondryden.com |
| | | | | | | | | | | | | | | | |
Purchase Contracts | | Notional
Amount | | Value at
Settlement
Date Payable | | Value at
October 31,
2007 | | Unrealized
Appreciation | | Unrealized
(Depreciation) | |
Pound Sterling, | | | | | | | | | | | | | | | | |
Expiring 11/23/07 | | GBP | 159,600 | | $ | 323,806 | | $ | 331,614 | | $ | 7,808 | | $ | — | |
Expiring 11/26/07 | | GBP | 123,196 | | | 252,128 | | | 255,950 | | | 3,822 | | | — | |
Expiring 11/26/07 | | GBP | 2,008,840 | | | 4,111,210 | | | 4,173,532 | | | 62,322 | | | — | |
| | | | | |
Russian Rouble, | | | | | | | | | | | | | | | | |
Expiring 01/15/08 | | RUB | 12,549,128 | | | 496,749 | | | 509,144 | | | 12,395 | | | — | |
Expiring 08/08/08 | | RUB | 6,790,303 | | | 268,100 | | | 275,496 | | | 7,396 | | | — | |
| | | | | |
South Korean Won, | | | | | | | | | | | | | | | | |
Expiring 05/23/08 | | KRW | 183,477,100 | | | 197,700 | | | 202,595 | | | 4,895 | | | — | |
Expiring 08/04/08 | | KRW | 173,474,590 | | | 190,600 | | | 192,600 | | | 2,000 | | | — | |
| | | | | |
Swedish Krona, | | | | | | | | | | | | | | | | |
Expiring 11/23/07 | | SEK | 8,541,274 | | | 1,316,822 | | | 1,345,178 | | | 28,356 | | | — | |
| | | | | |
Swiss Francs, | | | | | | | | | | | | | | | | |
Expiring 11/23/07 | | CHF | 3,632,707 | | | 3,100,437 | | | 3,141,107 | | | 40,670 | | | — | |
| | | | | |
New Taiwan Dollar, | | | | | | | | | | | | | | | | |
Expiring 06/26/08 | | TWD | 62,715,632 | | | 1,930,900 | | | 1,966,007 | | | 35,107 | | | — | |
Expiring 10/20/08 | | TWD | 9,745,349 | | | 307,400 | | | 305,497 | | | — | | | (1,903 | ) |
| | | | | |
New Turkish Lira, | | | | | | | | | | | | | | | | |
Expiring 11/02/07 | | TRY | 148,250 | | | 119,707 | | | 127,128 | | | 7,421 | | | — | |
| | | | | | | | | | | | | | | | |
| | | | | $ | 81,532,995 | | $ | 82,660,937 | | $ | 1,277,944 | | $ | (150,002 | ) |
| | | | | | | | | | | | | | | | |
| | | | | | | | | | | | | | | |
Sales Contracts | | Notional
Amount | | Value at
Settlement
Date
Receivable | | Value at
October 31,
2007 | | Unrealized
Appreciation | | Unrealized
(Depreciation) | |
Argentine Peso, | | | | | | | | | | | | | | | |
Expiring 11/01/07 | | ARS 1,438,593 | | $ | 453,100 | | $ | 457,968 | | $ | — | | $ | (4,868 | ) |
Expiring 12/11/07 | | ARS 1,538,432 | | | 483,100 | | | 487,355 | | | — | | | (4,255 | ) |
Expiring 12/11/07 | | ARS 4,539,647 | | | 1,419,394 | | | 1,438,100 | | | — | | | (18,706 | ) |
Expiring 12/11/07 | | ARS 1,571,616 | | | 490,900 | | | 497,867 | | | — | | | (6,967 | ) |
Expiring 02/25/08 | | ARS 1,306,652 | | | 390,628 | | | 407,660 | | | — | | | (17,032 | ) |
Expiring 07/17/08 | | ARS 2,125,300 | | | 662,500 | | | 676,578 | | | — | | | (14,078 | ) |
Expiring 07/31/08 | | ARS 3,474,103 | | | 1,035,500 | | | 1,070,437 | | | — | | | (34,937 | ) |
See Notes to Financial Statements.
| | |
| Dryden Global Total Return Fund, Inc. | | 25 |
Portfolio of Investments
as of October 31, 2007 continued
| | | | | | | | | | | | | | | | |
Sales Contracts | | Notional
Amount | | Value at
Settlement
Date
Receivable | | Value at
October 31,
2007 | | Unrealized
Appreciation | | Unrealized
(Depreciation) | |
Brazilian Real, | | | | | | | | | | | | | | | | |
Expiring 11/13/07 | | BRL | 2,174,270 | | $ | 1,123,654 | | $ | 1,254,263 | | $ | — | | $ | (130,609 | ) |
Expiring 02/29/08 | | BRL | 727,030 | | | 359,827 | | | 413,268 | | | — | | | (53,441 | ) |
| | | | | |
Canadian Dollars, | | | | | | | | | | | | | | | | |
Expiring 11/19/07 | | CAD | 250,033 | | | 256,100 | | | 264,703 | | | — | | | (8,603 | ) |
| | | | | |
Chinese Yuan Renminbi, | | | | | | | | | | | | | | | | |
Expiring 12/27/07 | | CNY | 2,639,142 | | | 356,400 | | | 358,016 | | | — | | | (1,616 | ) |
Expiring 02/14/08 | | CNY | 2,632,600 | | | 357,715 | | | 352,754 | | | 4,961 | | | — | |
Expiring 05/15/08 | | CNY | 3,352,810 | | | 463,800 | | | 466,803 | | | — | | | (3,003 | ) |
Expiring 05/15/08 | | CNY | 1,845,888 | | | 255,345 | | | 256,998 | | | — | | | (1,653 | ) |
Expiring 07/28/08 | | CNY | 3,863,913 | | | 538,900 | | | 517,743 | | | 21,157 | | | — | |
| | | | | |
Colombian Peso, | | | | | | | | | | | | | | | | |
Expiring 01/10/08 | | COP | 3,447,256,169 | | | 1,727,082 | | | 1,737,966 | | | — | | | (10,884 | ) |
Expiring 01/22/08 | | COP | 523,212,300 | | | 256,100 | | | 261,245 | | | — | | | (5,145 | ) |
| | | | | |
Euros, | | | | | | | | | | | | | | | | |
Expiring 11/23/07 | | EUR | 316,700 | | | 452,500 | | | 458,931 | | | — | | | (6,431 | ) |
Expiring 11/26/07 | | EUR | 182,330 | | | 262,800 | | | 264,229 | | | — | | | (1,429 | ) |
| | | | | |
Hungarian Forint, | | | | | | | | | | | | | | | | |
Expiring 11/23/07 | | HUF | 438,050,410 | | | 2,489,276 | | | 2,524,635 | | | — | | | (35,359 | ) |
Expiring 11/23/07 | | HUF | 87,474,951 | | | 494,348 | | | 504,148 | | | — | | | (9,800 | ) |
| | | | | |
Icelandic Krona, | | | | | | | | | | | | | | | | |
Expiring 11/19/07 | | ISK | 16,285,405 | | | 265,832 | | | 271,458 | | | — | | | (5,626 | ) |
Expiring 11/19/07 | | ISK | 15,571,735 | | | 256,297 | | | 259,562 | | | — | | | (3,265 | ) |
| | | | | |
Indian Rupee, | | | | | | | | | | | | | | | | |
Expiring 01/08/08 | | INR | 10,953,150 | | | 258,207 | | | 277,604 | | | — | | | (19,397 | ) |
| | | | | |
Japanese Yen, | | | | | | | | | | | | | | | | |
Expiring 11/19/07 | | JPY | 29,661,000 | | | 259,627 | | | 257,686 | | | 1,941 | | | — | |
Expiring 11/26/07 | | JPY | 29,907,699 | | | 261,375 | | | 260,045 | | | 1,330 | | | — | |
| | | | | |
Malaysian Ringgit, | | | | | | | | | | | | | | | | |
Expiring 12/14/07 | | MYR | 871,750 | | | 254,600 | | | 261,756 | | | — | | | (7,156 | ) |
Expiring 11/05/07 | | MYR | 704,933 | | | 207,639 | | | 211,374 | | | — | | | (3,735 | ) |
Expiring 04/02/08 | | MYR | 684,045 | | | 202,830 | | | 205,111 | | | — | | | (2,281 | ) |
| | | | | |
Mexican Nuevo Peso, | | | | | | | | | | | | | | | | |
Expiring 11/20/07 | | MXN | 35,870,690 | | | 3,301,733 | | | 3,359,165 | | | — | | | (57,432 | ) |
See Notes to Financial Statements.
| | |
| 26 | | Visit our website at www.jennisondryden.com |
| | | | | | | | | | | | | | | | |
Sales Contracts | | Notional
Amount | | Value at
Settlement
Date
Receivable | | Value at
October 31,
2007 | | Unrealized
Appreciation | | Unrealized
(Depreciation) | |
New Zealand Dollar, | | | | | | | | | | | | | | | | |
Expiring 11/21/07 | | NZD | 119,110 | | $ | 88,795 | | $ | 91,660 | | $ | — | | $ | (2,865 | ) |
Expiring 11/21/07 | | NZD | 430,008 | | | 328,500 | | | 330,908 | | | — | | | (2,408 | ) |
| | | | | |
Philippine Peso, | | | | | | | | | | | | | | | | |
Expiring 05/08/08 | | PHP | 11,595,754 | | | 256,600 | | | 265,471 | | | — | | | (8,871 | ) |
| | | | | |
Polish Zloty, | | | | | | | | | | | | | | | | |
Expiring 11/23/07 | | PLN | 8,105,082 | | | 3,141,079 | | | 3,238,940 | | | — | | | (97,861 | ) |
Expiring 11/23/07 | | PLN | 569,768 | | | 220,984 | | | 227,690 | | | — | | | (6,706 | ) |
| | | | | |
Russian Rouble, | | | | | | | | | | | | | | | | |
Expiring 01/15/08 | | RUB | 19,339,431 | | | 750,754 | | | 782,010 | | | — | | | (31,256 | ) |
| | | | | |
Singapore Dollar, | | | | | | | | | | | | | | | | |
Expiring 11/21/07 | | SGD | 1,972,347 | | | 1,353,590 | | | 1,365,165 | | | — | | | (11,575 | ) |
Expiring 11/21/07 | | SGD | 380,955 | | | 262,800 | | | 263,679 | | | — | | | (879 | ) |
| | | | | |
South Africian Rand, | | | | | | | | | | | | | | | | |
Expiring 11/29/07 | | ZAR | 2,012,024 | | | 303,716 | | | 308,042 | | | — | | | (4,326 | ) |
Expiring 11/29/07 | | ZAR | 1,297,943 | | | 197,100 | | | 198,716 | | | — | | | (1,616 | ) |
| | | | | |
Swedish Krona, | | | | | | | | | | | | | | | | |
Expiring 11/23/07 | | SEK | 3,357,396 | | | 521,312 | | | 528,761 | | | — | | | (7,449 | ) |
| | | | | |
Swiss Francs, | | | | | | | | | | | | | | | | |
Expiring 11/23/07 | | CHF | 380,048 | | | 323,806 | | | 328,617 | | | — | | | (4,811 | ) |
| | | | | |
New Taiwan Dollar, | | | | | | | | | | | | | | | | |
Expiring 02/21/08 | | TWD | 8,290,172 | | | 258,100 | | | 258,645 | | | — | | | (545 | ) |
Expiring 02/21/08 | | TWD | 6,321,391 | | | 197,100 | | | 197,221 | | | — | | | (121 | ) |
Expiring 06/26/08 | | TWD | 33,359,848 | | | 1,043,800 | | | 1,045,763 | | | — | | | (1,963 | ) |
| | | | | |
New Turkish Lira, | | | | | | | | | | | | | | | | |
Expiring 11/28/07 | | TRY | 4,262,037 | | | 3,465,634 | | | 3,621,396 | | | — | | | (155,762 | ) |
Expiring 11/28/07 | | TRY | 473,397 | | | 394,300 | | | 402,239 | | | — | | | (7,939 | ) |
| | | | | |
Chilian Peso, | | | | | | | | | | | | | | | | |
Expiring 10/23/08 | | CLP | 162,908,966 | | | 327,225 | | | 330,143 | | | — | | | (2,918 | ) |
| | | | | | | | | | | | | | | | |
| | | | | $ | 33,032,304 | | $ | 33,820,494 | | $ | 29,389 | | $ | (817,579 | ) |
| | | | | | | | | | | | | | | | |
| | |
| Dryden Global Total Return Fund, Inc. | | 27 |
Portfolio of Investments
as of October 31, 2007 continued
Currency swap agreements outstanding as of October 31, 2007:
| | | | | | | | | | | |
Counterparty (a) | | Termination
Date | | Notional
Amount
(000) | | Fixed
Rate | | Floating
Rate | | Unrealized
Appreciation |
Citibank, NA | | 9/5/2008 | | TRY 300 | | 18.05% | | 3 Month LIBOR | | $ | 110,371 |
Citibank, NA | | 6/30/2009 | | 708 | | 19.30% | | 3 Month LIBOR | | | 396,031 |
Citibank, NA | | 6/12/2011 | | 350 | | 16.70% | | 3 Month LIBOR | | | 172,897 |
Barclays Bank PLC | | 10/2/2011 | | 320 | | 17.75% | | 3 Month LIBOR | | | 150,047 |
| | | | | | | | | | | |
| | | | | | | | | | $ | 829,346 |
| | | | | | | | | | | |
| (a) | The Fund receives a fixed rate in New Turkish Lira and pays a floating rate in U.S. Dollar. |
Interest rate swap agreement outstanding as of October 31, 2007:
| | | | | | | | | | | | | | |
Counterparty | | Termination
Date | | Notional
Amount
(000) | | Fixed
Rate | | | Floating
Rate | | Unrealized
Appreciation
(Depreciation) | |
Merrill Lynch Capital Services (a) | | 7/3/2012 | | $ | 3,200 | | 5.508 | % | | 3 Month LIBOR | | $ | 139,052 | |
Merrill Lynch Capital Services (a) | | 8/2/2017 | | | 900 | | 5.530 | % | | 3 Month LIBOR | | | 30,513 | |
Merrill Lynch Capital Services (a) | | 8/14/2012 | | | 6,480 | | 5.209 | % | | 3 Month LIBOR | | | (119,230 | ) |
Morgan Stanley Capital Services (a) | | 9/12/2012 | | | 1,550 | | 4.736 | % | | 3 Month LIBOR | | | (8,086 | ) |
Merrill Lynch Capital Services (b) | | 8/8/2017 | | | 4,415 | | 5.434 | % | | 3 Month LIBOR | | | 116,823 | |
| | | | | | | | | | | | | | |
| | | | | | | | | | | | $ | 159,072 | |
| | | | | | | | | | | | | | |
| (a) | The Fund receives a fixed rate and pays a floating rate. |
| (b) | The Fund pays a fixed rate and receives a floating rate. |
See Notes to Financial Statements.
| | |
| 28 | | Visit our website at www.jennisondryden.com |
The industry classification of portfolio holdings, written options and other liabilities in excess of other assets shown as a percentage of net assets as of October 31, 2007 were as follows:
| | | |
Foreign Government Obligations | | 39.9 | % |
Collateralized Mortgage-Backed Securities | | 16.0 | |
Affiliated Money Market Mutual Fund | | 5.6 | |
Banking | | 4.7 | |
Non Corporate | | 3.6 | |
Healthcare & Pharmaceutical | | 3.1 | |
Options | | 2.3 | |
Structured Notes | | 2.1 | |
Technology | | 2.1 | |
Electric | | 2.0 | |
Telecommunications | | 1.8 | |
Capital Goods | | 1.6 | |
Pipelines & Others | | 1.6 | |
Non Captive Finance | | 1.5 | |
Insurance | | 1.4 | |
Cable | | 1.3 | |
Media & Entertainment | | 1.2 | |
Foods | | 1.1 | |
Retailers | | 1.0 | |
Airlines | | 0.9 | |
Gaming | | 0.8 | |
Metals | | 0.7 | |
Paper | | 0.7 | |
Brokerage | | 0.6 | |
Energy—Other | | 0.5 | |
Real Estate Investment Trusts | | 0.5 | |
Building Materials & Construction | | 0.4 | |
Chemicals | | 0.4 | |
Consumer | | 0.4 | |
Energy—Integrated | | 0.4 | |
Healthcare Insurance | | 0.3 | |
Packaging | | 0.3 | |
Aerospace/Defense | | 0.2 | |
Lodging | | 0.2 | |
Railroads | | 0.2 | |
Tobacco | | 0.2 | |
United States Government Obligations | | 0.1 | |
| | | |
| | 101.7 | |
Written Options | | (0.6 | ) |
Other liabilities in excess of other assets | | (1.1 | ) |
| | | |
| | 100.0 | % |
| | | |
See Notes to Financial Statements.
| | |
| Dryden Global Total Return Fund, Inc. | | 29 |
Statement of Assets and Liabilities
as of October 31, 2007
| | | | |
Assets | | | | |
Investments, at value: | | | | |
Unaffiliated investments (cost $118,648,819) | | $ | 125,630,687 | |
Affiliated investments (cost $7,327,063) | | | 7,327,063 | |
Cash | | | 253,689 | |
Foreign currency, at value (cost $936,398) | | | 937,505 | |
Receivable for investments sold | | | 2,088,407 | |
Dividends and interest receivable | | | 1,711,103 | |
Unrealized appreciation on forward foreign currency contracts | | | 1,307,333 | |
Unrealized appreciation on currency and interest rate swaps | | | 1,115,734 | |
Due from broker—variation margin | | | 81,211 | |
Receivable for Fund shares sold | | | 62,166 | |
Prepaid expenses | | | 19,949 | |
Dividend reclaim receivable | | | 1,452 | |
| | | | |
Total assets | | | 140,536,299 | |
| | | | |
| |
Liabilities | | | | |
Payable for investments purchased | | | 6,954,134 | |
Unrealized depreciation on forward foreign currency contracts | | | 967,581 | |
Written options outstanding, at value (premium received $408,819) | | | 783,436 | |
Payable for Fund shares reacquired | | | 578,878 | |
Unrealized depreciation on currency and interest rate swaps | | | 127,316 | |
Accrued expenses | | | 250,534 | |
Management fee payable | | | 71,161 | |
Distribution fee payable | | | 29,814 | |
Transfer agent fee payable | | | 10,031 | |
Deferred directors’ fees | | | 1,725 | |
| | | | |
Total liabilities | | | 9,774,610 | |
| | | | |
| |
Net Assets | | $ | 130,761,689 | |
| | | | |
| | | | | |
Net assets were comprised of: | | | | |
Common stock, at par | | $ | 186,931 | |
Paid-in capital in excess of par | | | 144,485,299 | |
| | | | |
| | | 144,672,230 | |
Accumulated net investment loss | | | (1,671,391 | ) |
Accumulated net realized loss on investment and foreign currency transactions | | | (20,059,840 | ) |
Net unrealized appreciation on investments and foreign currencies | | | 7,820,690 | |
| | | | |
Net assets, October 31, 2007 | | $ | 130,761,689 | |
| | | | |
See Notes to Financial Statements.
| | |
| 30 | | Visit our website at www.jennisondryden.com |
| | | |
Class A | | | |
Net asset value and redemption price per share | | | |
($122,814,066 ÷ 17,556,136 shares of common stock issued and outstanding) | | $ | 7.00 |
Maximum sales charge (4.50% of offering price) | | | .33 |
| | | |
Maximum offering price to public | | $ | 7.33 |
| | | |
| |
Class B | | | |
Net asset value, offering price and redemption price per share | | | |
($3,507,596 ÷ 502,351 shares of common stock issued and outstanding) | | $ | 6.98 |
| | | |
| |
Class C | | | |
Net asset value, offering price and redemption price per share | | | |
($2,276,871 ÷ 326,467 shares of common stock issued and outstanding) | | $ | 6.97 |
| | | |
| |
Class Z | | | |
Net asset value, offering price and redemption price per share | | | |
($2,163,156 ÷ 308,112 shares of common stock issued and outstanding) | | $ | 7.02 |
| | | |
See Notes to Financial Statements.
| | |
| Dryden Global Total Return Fund, Inc. | | 31 |
Statement of Operations
| | | | | | | | |
| | | Ten Months
Ended
October 31, 2007 | | | Year
Ended
December 31, 2006 | |
Net Investment Income | | | | | | | | |
Interest (net of foreign withholding taxes of $52,891 and $31,518, respectively) | | $ | 5,152,687 | | | $ | 5,926,735 | |
Affiliated dividend income | | | 268,322 | | | | 376,582 | |
| | | | | | | | |
Total income | | | 5,421,009 | | | | 6,303,317 | |
| | | | | | | | |
| | |
Expenses | | | | | | | | |
Management fee | | | 706,805 | | | | 970,279 | |
Distribution fee—Class A | | | 257,359 | | | | 349,664 | |
Distribution fee—Class B | | | 30,208 | | | | 47,259 | |
Distribution fee—Class C | | | 7,988 | | | | 11,028 | |
Transfer agent’s fee and expenses (including affiliated expense of $74,600 and $256,200, respectively) | | | 246,000 | | | | 407,000 | |
Custodian’s fees and expenses | | | 101,000 | | | | 127,000 | |
Audit fee | | | 50,000 | | | | 26,000 | |
Reports to shareholders | | | 40,000 | | | | 81,000 | |
Registration fees | | | 30,000 | | | | 41,000 | |
Legal fees and expenses | | | 18,000 | | | | 50,000 | |
Directors’ fees | | | 11,000 | | | | 15,000 | |
Insurance | | | 3,000 | | | | 5,000 | |
Miscellaneous | | | 9,194 | | | | 22,797 | |
| | | | | | | | |
Total expenses | | | 1,510,554 | | | | 2,153,027 | |
Less: expense subsidy (Note 2) | | | (9,218 | ) | | | (91,202 | ) |
| | | | | | | | |
Net expenses | | | 1,501,336 | | | | 2,061,825 | |
| | | | | | | | |
Net investment income | | | 3,919,673 | | | | 4,241,492 | |
| | | | | | | | |
| | |
Realized And Unrealized Gain (Loss) On Investment And Foreign Currency Transactions | | | | | | | | |
Net realized gain (loss) on: | | | | | | | | |
Investment transactions | | | 1,649,725 | | | | (87,080 | ) |
Foreign currency transactions | | | 1,541,972 | | | | (611,229 | ) |
Financial futures contracts transactions | | | (448,023 | ) | | | (170,092 | ) |
Swap transactions | | | 57,689 | | | | (6,312 | ) |
Written options | | | 24,150 | | | | (34,570 | ) |
| | | | | | | | |
| | | 2,825,513 | | | | (909,283 | ) |
| | | | | | | | |
Net change in unrealized appreciation (depreciation) on: | | | | | | | | |
Investments | | | 3,040,872 | | | | 3,311,487 | |
Foreign currencies | | | (319,673 | ) | | | 816,356 | |
Financial futures contracts | | | (167,121 | ) | | | 136,880 | |
Swaps | | | 710,393 | | | | 218,697 | |
Written options | | | (374,617 | ) | | | (11,909 | ) |
| | | | | | | | |
| | | 2,889,854 | | | | 4,471,511 | |
| | | | | | | | |
Net income on investments | | | 5,715,367 | | | | 3,562,228 | |
| | | | | | | | |
Net Increase In Net Assets Resulting From Operations | | $ | 9,635,040 | | | $ | 7,803,720 | |
| | | | | | | | |
See Notes to Financial Statements.
| | |
| 32 | | Visit our website at www.jennisondryden.com |
Statement of Changes in Net Assets
| | | | | | | | | | | | |
| | | Ten Months
Ended | | | Year Ended December 31, | |
| | | October 31, 2007 | | | 2006 | | | 2005 | |
Decrease In Net Assets | | | | | | | | | | | | |
Operations: | | | | | | | | | | | | |
Net investment income | | $ | 3,919,673 | | | $ | 4,241,492 | | | $ | 4,159,952 | |
Net realized gain (loss) on investment and foreign currency transactions | | | 2,825,513 | | | | (909,283 | ) | | | (3,285,499 | ) |
Net change in unrealized appreciation (depreciation) on investments and foreign currencies | | | 2,889,854 | | | | 4,471,511 | | | | (16,384,806 | ) |
| | | | | | | | | | | | |
Net increase (decrease) in net assets resulting from operations | | | 9,635,040 | | | | 7,803,720 | | | | (15,510,353 | ) |
| | | | | | | | | | | | |
Dividends and distributions (Note 1) | | | | | | | | | | | | |
Dividends from net investment income* | | | | | | | | | | | | |
Class A | | | (3,858,296 | ) | | | (3,614,157 | ) | | | (9,707,101 | ) |
Class B | | | (91,144 | ) | | | (93,686 | ) | | | (353,619 | ) |
Class C | | | (36,918 | ) | | | (33,943 | ) | | | (69,681 | ) |
Class Z | | | (69,341 | ) | | | (86,550 | ) | | | (287,376 | ) |
| | | | | | | | | | | | |
| | | (4,055,699 | ) | | | (3,828,336 | ) | | | (10,417,777 | ) |
| | | | | | | | | | | | |
Tax return of capital distributions | | | | | | | | | | | | |
Class A | | | — | | | | — | | | | (1,562,180 | ) |
Class B | | | — | | | | — | | | | (57,949 | ) |
Class C | | | — | | | | — | | | | (11,419 | ) |
Class Z | | | — | | | | — | | | | (47,093 | ) |
| | | | | | | | | | | | |
| | | — | | | | — | | | | (1,678,641 | ) |
| | | | | | | | | | | | |
| | | |
Fund share transactions (Net of share conversions) (Note 6) | | | | | | | | | | | | |
Net proceeds from shares sold | | | 4,745,485 | | | | 4,884,244 | | | | 7,345,855 | |
Net asset value of shares issued in reinvestment of dividends | | | 2,483,065 | | | | 2,256,270 | | | | 7,709,881 | |
Cost of shares reacquired | | | (20,612,262 | ) | | | (35,038,483 | ) | | | (29,257,250 | ) |
| | | | | | | | | | | | |
Net decrease in net assets from Fund share transactions | | | (13,383,712 | ) | | | (27,897,969 | ) | | | (14,201,514 | ) |
| | | | | | | | | | | | |
Total decrease | | | (7,804,371 | ) | | | (23,922,585 | ) | | | (41,808,285 | ) |
| | | |
Net Assets | | | | | | | | | | | | |
Beginning of period | | | 138,566,060 | | | | 162,488,645 | | | | 204,296,930 | |
| | | | | | | | | | | | |
End of period | | $ | 130,761,689 | | | $ | 138,566,060 | | | $ | 162,488,645 | |
| | | | | | | | | | | | |
| * | Dividends from net investment income include other items that are ordinary income for tax purposes. |
See Notes to Financial Statements.
| | |
| Dryden Global Total Return Fund, Inc. | | 33 |
Notes to Financial Statements
Dryden Global Total Return Fund, Inc. (the “Fund”), is an open-end, non-diversified management investment company. The Fund’s investment objective is to seek total return made up of current income and capital appreciation.
The Fund seeks to achieve this objective by investing at least 65% of its total assets in income-producing debt securities issued by the U.S. and foreign corporations and governments, supranational organizations, semi-government entities or governmental agencies, authorities or instrumentalities and short-term bank debt securities or bank deposits. The Fund invests primarily in investment-grade securities denominated in U.S. dollars and in foreign currencies.
The Fund’s fiscal year has changed from an annual reporting period that ends December 31 to one that ends October 31. This change should have no impact on the way the Fund is managed. Shareholders will receive future annual and semiannual reports on the new fiscal year-end schedule.
Note 1. Accounting Policies
The following is a summary of significant accounting policies followed by the Fund in the preparation of its financial statements.
Security Valuation: In valuing the Fund’s assets, quotations of foreign securities in a foreign currency are converted to U.S. dollar equivalents at the then current currency value. Securities listed on a securities exchange (other than options on securities and indices) are valued at the last sale price on such exchange or market on the day of valuation or, if there was no sale on such a day, at the mean between the last reported bid and asked prices, or at the last bid price on such day in the absence of an asked price. Securities that are actively traded in the over-the-counter market, including listed securities for which the primary market is believed by Prudential Investments LLC (“PI” or “Manager”), in consultation with the subadvisor, to be over-the-counter, are valued at market value using prices provided by an independent pricing agent or principal market maker. Corporate bonds, U.S. Government securities and convertible debt securities traded in the over-the-counter market, including securities listed on exchanges whose primary market is believed to be over-the counter, are valued at market value using prices provided by an independent pricing agent or principal market maker. Options on securities and indices traded on an exchange are valued at the last sale price as of the close of trading on the applicable exchange or, if there was no sale, at the mean between the most recently quoted bid and asked prices on such exchange. Future contracts and options thereon traded on a commodities exchange or board of trade are valued at the last sale price at the close of trading on such exchange
| | |
| 34 | | Visit our website at www.jennisondryden.com |
or board of trade or, if there was no sale on the applicable commodities exchange or board of trade on such day, at the mean between the most recently quoted prices on such exchange or board of trade or at the last bid price in the absence of an asked price. Prices may be obtained from independent pricing services which use information provided by market makers or estimates of market values obtained from yield data relating to investments or securities with similar characteristics. Securities for which reliable market quotations are not readily available, or whose values have been affected by events occurring after the close of the security’s foreign market and before the Fund’s normal pricing time, are valued at fair value in accordance with Board of Directors’ approved fair valuation procedures valued at fair value in accordance with the Board of Directors’ approved fair valuation procedures. When determining the fair valuation of securities, some of the factors influencing the valuation include, the nature of any restrictions on disposition of the securities; assessment of the general liquidity of the securities; the issuer’s financial condition and the markets in which it does business; the cost of the investment; the size of the holding and the capitalization of issuer; the prices of any recent transactions or bids/offers for such securities or any comparable securities; any available analyst media or other reports or information deemed reliable by the investment adviser regarding the issuer or the markets or industry in which it operates. Using fair value to price securities may result in a value that is different from a security’s most recent closing price and from the price used by other mutual funds to calculate their net asset values. As of October 31, 2007, there were no securities whose values were adjusted in accordance with procedures approved by the Board of Directors.
Investments in mutual funds are valued at their net asset value as of the close of the New York Stock Exchange on the date of the valuation.
Short-term debt securities which mature in sixty days or less are valued at amortized cost, which approximates market value. The amortized cost method involves valuing a security at its cost on the date of purchase and thereafter assuming a constant amortization to maturity of the difference between the principal amount due at maturity and cost. Short-term debt securities which mature in more than sixty days are valued at current market quotations.
Foreign Currency Translation: The books and records of the Fund are maintained in U.S. dollars. Foreign currency amounts are translated into U.S. dollars on the following basis:
(i) market value of investment securities, other assets and liabilities-at the current rates of exchange.
(ii) purchases and sales of investment securities, income and expenses-at the rates of exchange prevailing on the respective dates of such transactions.
| | |
| Dryden Global Total Return Fund, Inc. | | 35 |
Notes to Financial Statements
continued
Although the net assets of the Fund are presented at the foreign exchange rates and market values at the close of the period, the Fund does not isolate that portion of the results of operations arising as a result of changes in the foreign exchange rates from the fluctuations arising from changes in the market prices of long-term portfolio securities held at the end of the period. Similarly, the Fund does not isolate the effect of changes in foreign exchange rates from the fluctuations arising from changes in the market prices of long-term portfolio securities sold during the period. Accordingly, these realized foreign currency gains or losses are included in the reported net realized gains or losses on investment transactions.
Net realized gains or losses on foreign currency transactions represent net foreign exchange gains or losses from sales and maturities of short-term securities and forward currency contracts, disposition of foreign currencies, currency gains or losses realized between the trade and settlement dates on securities transactions, and the difference between the amounts of interest, discount and foreign withholding taxes recorded on the Fund’s books and the U.S. dollar equivalent amounts actually received or paid. Net unrealized currency gains or losses resulting from valuing foreign currency denominated assets (excluding investments) and liabilities at period-end exchange rates are reflected as a component of net unrealized appreciation or depreciation on foreign currencies.
Foreign security and currency transactions may involve certain considerations and risks not typically associated with those of U.S. companies as a result of, among other factors, the possibility of political or economic instability or the level of governmental supervision and regulation of foreign securities markets.
Financial Futures Contracts: A financial futures contract is an agreement to purchase (long) or sell (short) an agreed amount of securities at a set price for delivery on a future date. Upon entering into a financial futures contract, the Fund is required to pledge to the broker an amount of cash and/or other assets equal to a certain percentage of the contract amount. This amount is known as the “initial margin.” Subsequent payments, known as “variation margin,” are made or received by the Fund each day, depending on the daily fluctuations in the value of the underlying security. Such variation margin is recorded for financial statement purposes on a daily basis as unrealized gain or loss. When the contract expires or is closed, the gain or loss is realized and is presented in the Statement of Operations as net realized gain or loss on financial futures contracts.
| | |
| 36 | | Visit our website at www.jennisondryden.com |
The Fund invests in financial futures contracts in order to hedge existing portfolio securities, or securities the Fund intends to purchase, against fluctuations in value caused by changes in prevailing interest rates or market conditions. Should interest rates move unexpectedly, the Fund may not achieve the anticipated benefits of the financial futures contracts and may realize a loss.
The use of futures transactions involves the risk of imperfect correlation in movements in the price of futures contracts, interest rates and the underlying hedged assets.
Forward Currency Contracts: A forward currency contract is a commitment to purchase or sell a foreign currency at a future date at a negotiated forward rate. The Fund enters into forward currency contracts in order to hedge its exposure to changes in foreign currency exchange rates on its foreign portfolio holdings or on specific receivables and payables denominated in a foreign currency. The contracts are valued daily at current forward exchange rates and any unrealized gain or loss is included in net unrealized appreciation or depreciation on foreign currencies. Gain or loss is realized on the settlement date of the contract equal to the difference between the trade date and settlement value. This gain or loss, if any, is included in net realized gain or loss on foreign currency transactions. Risks may arise upon entering into these contracts from the potential inability of the counterparties to meet the terms of their contracts.
Options: The Fund may either purchase or write options in order to hedge against adverse market movements or fluctuations in value caused by changes in prevailing interest rates with respect to securities, which the Fund currently owns or intends to purchase. The Fund’s principal reason for writing options is to realize, through receipt of premiums, a greater current return than would be realized on the underlying security alone. When a Fund purchases an option, it pays a premium and an amount equal to that premium is recorded as an asset. When a Fund writes an option, it receives a premium and an amount equal to that premium is recorded as a liability. The asset or liability is adjusted daily to reflect the current market value of the option. If an option expires unexercised, a Fund realizes a gain or loss to the extent of the premium received or paid. If an option is exercised, the premium received or paid is recorded as an adjustment to the proceeds from the sale or the cost basis of the purchase in determining whether the Fund has realized a gain or loss. The difference between the premium and the amount received or paid on effecting a closing purchase or sale transaction is also treated as a realized gain or loss. Gain or loss on purchased options is included in net realized gain or loss on investment transactions. Gain or loss on written options is presented separately as net realized gain or loss on options written.
| | |
| Dryden Global Total Return Fund, Inc. | | 37 |
Notes to Financial Statements
continued
The Fund, as writer of an option, may have no control over whether the underlying securities may be sold (called) or purchased (put). As a result, the Fund bears the market risk of an unfavorable change in the price of the security underlying the written option. The Fund, as purchaser of an option, bears the risk of the potential inability of the counterparties to meet the terms of their contracts.
Swaps: The Fund may enter into swap agreements. A swap is an agreement to exchange the return generated by one instrument for the return generated by another instrument. The Fund enters into interest rate swap agreements to manage its exposure to interest rates. Interest rate swap agreements involve the exchange by the Fund with another party of their respective commitments to pay or receive interest and may involve payment/receipt of a premium at the time of initiation of the swap agreement. The Fund’s swap agreements involve commitments to pay interest in exchange for a market-linked return, both based on notional amounts. To the extent the total return of the security or index underlying the transaction exceeds or falls short of the offsetting interest rate obligation, the Fund will receive a payment from or make a payment to the counterparty. The swaps are valued daily at current market value and any unrealized gain or loss is included in the Statement of Assets and Liabilities. Gain or loss is realized on the termination date of the swap and is equal to the difference between the Fund’s cost basis in the swap and the proceeds of the closing transaction, including any fees.
During the period that the swap agreement is open, the Fund may be subject to risk from the potential inability of the counterparty to meet the terms of the agreement.
Risk: Forward currency contracts, written options, financial futures contracts, and swap agreements involve elements of both market and credit risk in excess of the amounts reflected on the Statements of Assets and Liabilities. Lower rated or unrated securities are more likely to react to developments affecting market risk (general market liquidity) and credit risk (an issuer’s inability to meet principal and interest payments on its obligations) than are more highly rated securities, which react primarily to movements in the general level of interest rates. The ability of issuers of debt securities held by the Fund to meet their obligations may be affected by economic developments in a specific industry or region.
| | |
| 38 | | Visit our website at www.jennisondryden.com |
Security Transactions and Net Investment Income: Security transactions are recorded on the trade date. Realized and unrealized gains or losses on sales of securities are calculated on the identified cost basis. Dividend income is recorded on the ex-dividend date. Interest income, including amortization of premium and accretion of discount on debt securities, as required, is recorded on the accrual basis. Expenses are recorded on the accrual basis.
Net investment income or loss (other than distribution fees, which are charged directly to the respective class) and unrealized and realized gains or losses are allocated daily to each class of shares based upon the relative proportion of net assets of each class at the beginning of the day.
Dividends and Distributions: The Fund expects to pay dividends of net investment income quarterly and distributions of net realized capital and currency gains, if any, annually. Foreign currency losses may reduce the amount of dividends of net investment income. Dividends and distributions to shareholders, which are determined in accordance with federal income tax regulations and which may differ from generally accepted accounting principles, are recorded on the ex-dividend date. Permanent book/tax differences relating to income and gains are reclassified to paid-in capital when they arise.
Taxes: It is the Fund’s policy to continue to meet the requirements of the Internal Revenue Code applicable to regulated investment companies and to distribute all of its taxable net income and capital gains, if any, to its shareholders. Therefore, no federal income tax provision is required.
Withholding taxes on foreign interest are recorded, net of reclaimable amounts, at the time the related income is earned.
Estimates: The preparation of the financial statements requires management to make estimates and assumptions that affect the reported amounts and disclosures in the financial statements. Actual results could differ from those amounts.
Note 2. Agreements
The Fund has a management agreement with PI. Pursuant to this agreement, PI has responsibility for all investment advisory services and supervises the subadviser’s performance of such services. PI has entered into a subadvisory agreement with Prudential Investment Management, Inc. (“PIM”). The subadvisory agreement provides that PIM will furnish investment advisory services in connection with the management of the Fund. In connection therewith, PIM is obligated to keep certain
| | |
| Dryden Global Total Return Fund, Inc. | | 39 |
Notes to Financial Statements
continued
books and records of the Fund. PI pays for the services of PIM, the cost of compensation of officers of the Fund, occupancy and certain clerical and bookkeeping costs of the Fund. The Fund bears all other costs and expenses.
The management fee paid to PI is accrued daily and payable monthly at an annual rate of .65 of 1% of the Fund’s average daily net assets up to $1 billion and .60 of 1% of such assets in excess of $1 billion. The effective management fee rate was .65 of 1% for the ten months ended October 31, 2007.
PI has contractually agreed to reimburse the Fund in order to limit operating expenses (excluding interest, taxes, brokerage commissions and certain extraordinary expenses) to 1.35%, 2.10%, 1.85%, and 1.10% of the average daily net assets of the Class A, B, C, and Z shares, respectively, which for the ten months ended October 31, 2007 amounted to $9,218.
The Fund has a distribution agreement with Prudential Investment Management Services LLC (“PIMS”), which acts as the distributor of the Class A, Class B, Class C and Class Z shares of the Fund. The Fund compensates PIMS for distributing and servicing the Fund’s Class A, Class B and Class C shares, pursuant to plans of distribution (the “Class A, B and C Plans”), regardless of expenses actually incurred by PIMS. The distribution fees are accrued daily and payable monthly. No distribution or service fees are paid to PIMS as distributor of the Class Z shares of the Fund.
Pursuant to the Class A, B and C Plans, the Fund compensates PIMS for distribution related activities at an annual rate of up to .30 of 1%, 1% and 1% of the average daily net assets of the Class A, B, and C shares, respectively. For the ten months ended October 31, 2007, PIMS contractually agreed to limit such fees to .25 of 1% and .75 of 1% of the average daily net assets of the Class A and Class C shares, respectively.
PIMS has advised the Fund that it has received approximately $11,100 in front-end sales charges resulting from sales of Class A shares during the ten months ended October 31, 2007. From these fees, PIMS paid such sales charges to affiliated broker-dealers, which in turn paid commissions to salespersons and incurred other distribution costs.
PIMS has advised the Fund that for the ten months ended October 31, 2007, it received approximately $8,200 and $1,100 in contingent deferred sales charges imposed upon redemptions by certain Class B and Class C shareholders, respectively.
| | |
| 40 | | Visit our website at www.jennisondryden.com |
PI, PIM and PIMS are indirect, wholly-owned subsidiaries of Prudential Financial, Inc. (“Prudential”).
The Fund along with other affiliated registered investment companies (the “Funds”), is a party to a syndicated credit agreement (“SCA”) with two banks. The SCA provides for a commitment of $500 million. Interest on any borrowings under the SCA is incurred at contracted market rates and a commitment fee for the unused amount is accrued daily and paid quarterly. Effective October 26, 2007, the Funds renewed SCA with the banks. The commitment under the renewed SCA continues to be $500 million. The Funds pay a commitment fee of .06 of 1% of the unused portion of the renewed SCA. The expiration date of the renewed SCA will be October 24, 2008. For the period from October 27, 2006 through October 26, 2007, the Funds paid a commitment fee of .07 of 1% of the unused portion of the agreement. The purpose of the SCA is to provide an alternative source of temporary funding for capital share redemptions.
The Fund did not borrow any amounts pursuant to the SCA during the ten months ended October 31, 2007.
Note 3. Other Transactions with Affiliates
Prudential Mutual Fund Services LLC (“PMFS”), an affiliate of PI and an indirect, wholly-owned subsidiary of Prudential, serves as the Fund’s transfer agent. Transfer agent’s fees and expenses in the Statement of Operations include certain out-of-pocket expenses paid to non-affiliates, where applicable.
The Fund pays networking fees to affiliated and unaffiliated broker/dealers including fees relating to the services of Wachovia Securities LLC (“Wachovia”) and First Clearing, LLC (“First Clearing”), affiliates of PI. These networking fees are payments made to broker/dealers that clear mutual fund transactions through a national clearing system. For the ten months ended October 31, 2007 the Fund incurred approximately $67,500 in total networking fees of which approximately $27,200 was paid to First Clearing. These amounts are included in transfer agent’s fees and expenses in the Statement of Operations.
The Fund invests in the Taxable Money Market Series (the “Portfolio”), a portfolio of Dryden Core Investment Fund, pursuant to an exemptive order received from the Securities and Exchange Commission. The Portfolio is a money market mutual fund registered under the Investment Company Act of 1940, as amended, and managed by PI.
| | |
| Dryden Global Total Return Fund, Inc. | | 41 |
Notes to Financial Statements
continued
Note 4. Portfolio Securities
Purchases and sales of portfolio securities, other than short-term investments, for the ten months ended October 31, 2007, aggregated $290,949,723 and $304,508,817, respectively.
Transactions in options written during the ten months ended October 31, 2007, were as follows:
| | | | | | | |
| | | Contracts | | | Premiums
Received | |
Options outstanding at December 31, 2006 | | — | | | $ | — | |
Options written | | 4,069,880 | | | | 469,924 | |
Options closed | | (49 | ) | | | (34,732 | ) |
Options expired | | (31 | ) | | | (26,373 | ) |
| | | | | | | |
Options outstanding at October 31, 2007 | | 4,069,800 | | | $ | 408,819 | |
| | | | | | | |
Note 5. Distributions and Tax Information
Distributions to shareholders, which are determined in accordance with federal income tax regulations and which may differ from generally accepted accounting principles, are recorded on the ex-dividends date.
In order to present accumulated net investment loss, accumulated net realized loss on investments and foreign currency transactions and paid-in capital in excess of par on the Statement of Assets and Liabilities that more closely represent their tax character, certain adjustments have been made to accumulated net investment loss, accumulated net realized loss on investments and foreign currency transactions and paid-in capital in excess of par.
For the ten-month period ended October 31, 2007, the adjustments were to decrease accumulated net investment loss by $2,927,613, increase accumulated net realized loss on investments and foreign currency transactions by $2,381,534 and decrease paid-in-capital in excess of par by $546,079, due to reclassification of foreign currency losses, differences in the treatment of premium amortization and other book to tax adjustments. Net investment income, net realized gains and net assets were not affected by this change.
The tax character of dividends paid as reflected in the Statements of Changes in Net Assets was $4,055,699 of ordinary income for the ten-month period ended October 31, 2007. The tax character of dividends paid was $3,828,336 of ordinary income for the year ended December 31, 2006. The tax character of dividends paid was $10,417,777 and $1,678,641 of ordinary income and tax return of capital, respectively, for the year ended December 31, 2005.
| | |
| 42 | | Visit our website at www.jennisondryden.com |
For federal income tax purposes, the Fund had a capital loss carryforward as of October 31, 2007, of approximately $18,677,700, of which $5,073,400 expires in 2008, $3,491,000 expires in 2009, $7,581,800 expires in 2010, $2,252,000 expires in 2014 and $279,500 expires in 2015. During the fiscal period ended October 31, 2007, approximately $546,100 of the capital loss carryforward expired unused. Accordingly, no capital gains distribution is expected to be paid to shareholders until net gains have been realized in excess of such carryforward. It is unlikely the Fund will be able to realize the full benefit of the remaining carryforwards prior to the expiration dates.
As of October 31, 2007, the Fund had accumulated undistributed ordinary income of $2,443,909. As of December 31, 2006, the Fund had accumulated undistributed ordinary income of $412,706.
The United States federal income tax basis of the Fund’s investments and the net unrealized depreciation as of October 31, 2007 were as follows:
| | | | | | | | | | |
Tax Basis | | Appreciation | | Depreciation | | Net
Unrealized
Appreciation | | Other Cost
Basis
Adjustments | | Total Net
Unrealized
Appreciation |
| $130,311,550 | | $4,173,962 | | $(1,527,762) | | $2,646,200 | | $(321,148) | | $2,325,052 |
The differences between book and tax basis are primarily attributable to the deferred losses on wash sales, difference in the treatment of accreting market discount and amortization of premiums and deferred losses on straddles. Other cost basis adjustments are attributable to net depreciation of foreign currency, mark-to-market of receivables and payables, swaps and written options.
Note 6. Capital
The Fund offers Class A, Class B, Class C and Class Z shares. Class A shares are sold with a front-end sales charge of up to 4.50%. All investors who purchase Class A shares in an amount of $1 million or more and sell these shares within 12 months of purchase are subject to a contingent deferred sales charge (CDSC) of 1%, including investors who purchase their shares through broker-dealers affiliated with Prudential. Class B shares are sold with a CDSC which declines from 5% to zero depending on the period of time the shares are held. Class C shares are sold with a CDSC of 1% during the first 12 months. Class B shares automatically convert to Class A shares on a quarterly basis approximately seven years after purchase. A special exchange privilege is also available for shareholders who qualified to purchase Class A shares at net asset value. Class Z shares are not subject to any sales or redemption charge and are offered exclusively for sale to a limited group of investors.
| | |
| Dryden Global Total Return Fund, Inc. | | 43 |
Notes to Financial Statements
continued
There are 2 billion authorized shares of common stock at $.01 par value per share, divided equally into Class A, B, C and Z shares.
| | | | | | | |
Class A | | Shares | | | Amount | |
Ten months ended October 31, 2007: | | | | | | | |
Shares sold | | 312,593 | | | $ | 2,106,453 | |
Shares issued in reinvestment of distributions | | 346,202 | | | | 2,300,707 | |
Shares reacquired | | (2,806,027 | ) | | | (18,770,109 | ) |
| | | | | | | |
Net increase (decrease) in shares outstanding before conversion | | (2,147,232 | ) | | | (14,362,949 | ) |
Shares issued upon conversion from Class B | | 62,120 | | | | 415,994 | |
| | | | | | | |
Net increase (decrease) in shares outstanding | | (2,085,112 | ) | | $ | (13,946,955 | ) |
| | | | | | | |
Year ended December 31, 2006: | | | | | | | |
Shares sold | | 379,386 | | | $ | 2,493,278 | |
Shares issued in reinvestment of dividends and distributions | | 320,548 | | | | 2,059,666 | |
Shares reacquired | | (4,435,567 | ) | | | (28,984,259 | ) |
| | | | | | | |
Net increase (decrease) in shares outstanding before conversion | | (3,735,633 | ) | | | (24,431,315 | ) |
Shares issued upon conversion from Class B | | 117,182 | | | | 764,742 | |
| | | | | | | |
Net increase (decrease) in shares outstanding | | (3,618,451 | ) | | $ | (23,666,573 | ) |
| | | | | | | |
Year ended December 31, 2005: | | | | | | | |
Shares sold | | 629,108 | | | $ | 4,398,289 | |
Shares issued in reinvestment of dividends and distributions | | 1,007,680 | | | | 6,944,130 | |
Shares reacquired | | (3,626,002 | ) | | | (24,806,467 | ) |
| | | | | | | |
Net increase (decrease) in shares outstanding before conversion | | (1,989,214 | ) | | | (13,464,048 | ) |
Shares issued upon conversion from Class B | | 112,733 | | | | 780,811 | |
| | | | | | | |
Net increase (decrease) in shares outstanding | | (1,876,481 | ) | | $ | (12,683,237 | ) |
| | | | | | | |
Class B | | | | | | |
Ten months ended October 31, 2007: | | | | | | | |
Shares sold | | 75,724 | | | $ | 508,504 | |
Shares issued in reinvestment of dividends | | 12,531 | | | | 83,193 | |
Shares reacquired | | (103,025 | ) | | | (686,774 | ) |
| | | | | | | |
Net increase (decrease) in shares outstanding before conversion | | (14,770 | ) | | | (95,077 | ) |
Shares reacquired upon conversion into Class A | | (62,306 | ) | | | (415,994 | ) |
| | | | | | | |
Net increase (decrease) in shares outstanding | | (77,076 | ) | | $ | (511,071 | ) |
| | | | | | | |
Year ended December 31, 2006: | | | | | | | |
Shares sold | | 62,707 | | | $ | 411,970 | |
Shares issued in reinvestment of dividends and distributions | | 13,036 | | | | 83,785 | |
Shares reacquired | | (225,722 | ) | | | (1,476,111 | ) |
| | | | | | | |
Net increase (decrease) in shares outstanding before conversion | | (149,979 | ) | | | (980,356 | ) |
Shares reacquired upon conversion into Class A | | (117,207 | ) | | | (764,742 | ) |
| | | | | | | |
Net increase (decrease) in shares outstanding | | (267,186 | ) | | $ | (1,745,098 | ) |
| | | | | | | |
| | |
| 44 | | Visit our website at www.jennisondryden.com |
| | | | | | | |
| | | Shares | | | Amount | |
Year ended December 31, 2005: | | | | | | | |
Shares sold | | 137,758 | | | $ | 969,515 | |
Shares issued in reinvestment of dividends and distributions | | 53,278 | | | | 367,940 | |
Shares reacquired | | (257,572 | ) | | | (1,764,839 | ) |
| | | | | | | |
Net increase (decrease) in shares outstanding before conversion | | (66,536 | ) | | | (427,384 | ) |
Shares reacquired upon conversion into Class A | | (112,683 | ) | | | (780,811 | ) |
| | | | | | | |
Net increase (decrease) in shares outstanding | | (179,219 | ) | | $ | (1,208,195 | ) |
| | | | | | | |
Class C | | | | | | |
Ten months ended October 31, 2007: | | | | | | | |
Shares sold | | 233,246 | | | $ | 1,581,857 | |
Shares issued in reinvestment of dividends | | 4,542 | | | | 30,138 | |
Shares reacquired | | (69,434 | ) | | | (459,667 | ) |
| | | | | | | |
Net increase (decrease) in shares outstanding | | 168,354 | | | $ | 1,152,328 | |
| | | | | | | |
Year ended December 31, 2006: | | | | | | | |
Shares sold | | 172,214 | | | $ | 1,127,421 | |
Shares issued in reinvestment of dividends and distributions | | 4,257 | | | | 27,286 | |
Shares reacquired | | (197,006 | ) | | | (1,285,283 | ) |
| | | | | | | |
Net increase (decrease) in shares outstanding | | (20,535 | ) | | $ | (130,576 | ) |
| | | | | | | |
Year ended December 31, 2005: | | | | | | | |
Shares sold | | 94,344 | | | $ | 644,946 | |
Shares issued in reinvestment of dividends and distributions | | 9,504 | | | | 65,385 | |
Shares reacquired | | (115,052 | ) | | | (784,027 | ) |
| | | | | | | |
Net increase (decrease) in shares outstanding | | (11,204 | ) | | $ | (73,696 | ) |
| | | | | | | |
Class Z | | | | | | |
Ten months ended October 31, 2007: | | | | | | | |
Shares sold | | 80,647 | | | $ | 548,671 | |
Shares issued in reinvestment of dividends | | 10,360 | | | | 69,027 | |
Shares reacquired | | (104,472 | ) | | | (695,712 | ) |
| | | | | | | |
Net increase (decrease) in shares outstanding | | (13,465 | ) | | $ | (78,014 | ) |
| | | | | | | |
Year ended December 31, 2006: | | | | | | | |
Shares sold | | 130,165 | | | $ | 851,575 | |
Shares issued in reinvestment of dividends and distributions | | 13,275 | | | | 85,533 | |
Shares reacquired | | (498,490 | ) | | | (3,292,830 | ) |
| | | | | | | |
Net increase (decrease) in shares outstanding | | (355,050 | ) | | $ | (2,355,722 | ) |
| | | | | | | |
Year ended December 31, 2005: | | | | | | | |
Shares sold | | 190,022 | | | $ | 1,333,105 | |
Shares issued in reinvestment of dividends and distributions | | 48,222 | | | | 332,426 | |
Shares reacquired | | (273,998 | ) | | | (1,901,917 | ) |
| | | | | | | |
Net increase (decrease) in shares outstanding | | (35,754 | ) | | $ | (236,386 | ) |
| | | | | | | |
| | |
| Dryden Global Total Return Fund, Inc. | | 45 |
Notes to Financial Statements
continued
Note 7. New Accounting Pronouncements
On July 13, 2006, the Financial Accounting Standards Board (FASB) released FASB Interpretation No. 48 “Accounting for Uncertainty in Income Taxes” (FIN 48). FIN 48 provides guidance for how uncertain tax positions should be recognized, measured, presented and disclosed in the financial statements. FIN 48 requires the evaluation of tax positions taken or expected to be taken in the course of preparing the Fund’s tax returns to determine whether the tax positions are “more-likely-than-not” of being sustained by the applicable tax authority. The impact of the tax positions not deemed to meet the more-likely-than-not threshold would be recorded in the year in which they arise. On December 22, 2006 the Securities and Exchange Commission delayed the effective date until the last net asset value calculation in the first required financial reporting period for its fiscal year beginning after December 15, 2006. The Fund’s financial statements have not been impacted by the adoption of FIN 48. However, the conclusions regarding FIN 48 may be subject to review and adjustment at a later date based on factors including but not limited to, further implementation guidance expected from FASB, and ongoing analysis of tax laws, regulations and interpretations thereof.
On September 20, 2006, the FASB released Statement of Financial Accounting Standards No. 157 “Fair Value Measurements” (FAS 157). FAS 157 establishes an authoritative definition of fair value, sets out a framework for measuring fair value, and requires additional disclosures about fair-value measurements. The application of FAS 157 is required for fiscal years beginning after November 15, 2007 and interim periods within those fiscal years. At this time, management is evaluating the implications of FAS 157 and its impact, if any, in the financial statements has not yet been determined.
| | |
| 46 | | Visit our website at www.jennisondryden.com |
Financial Highlights
| | |
| OCTOBER 31, 2007 | | ANNUAL REPORT |
Dryden Global Total Return Fund, Inc.
Financial Highlights
| | | | |
| | | Class A | |
| | | Ten Months Ended
October 31, 2007(a)(b) | |
Per Share Operating Performance: | | | | |
Net Asset Value, Beginning of Period | | $ | 6.69 | |
| | | | |
Income (loss) from investment operations: | | | | |
Net investment income | | | .20 | |
Net realized and unrealized gain (loss) on investment and foreign currency transactions | | | .32 | |
| | | | |
Total from investment operations | | | .52 | |
| | | | |
Less Dividends and Distributions | | | | |
Dividends from net investment income* | | | (.21 | ) |
Tax return of capital distributions | | | — | |
| | | | |
Total dividends and distributions | | | (.21 | ) |
| | | | |
Net asset value, end of period | | $ | 7.00 | |
| | | | |
Total Return(c): | | | 7.81 | % |
Ratios/Supplemental Data: | | | | |
Net assets, end of period (000) | | $ | 122,811 | |
Average net assets (000) | | $ | 123,600 | |
Ratios to average net assets: | | | | |
Expenses, including distribution and service (12b-1) fees(d) | | | 1.36 | %(e)(f) |
Expenses, excluding distribution and service (12b-1) fees | | | 1.11 | %(e)(f) |
Net investment income | | | 3.63 | %(e)(f) |
For Class A, B, C and Z shares: | | | | |
Portfolio turnover rate | | | 234 | %(g) |
| (a) | Calculated based upon average shares outstanding during the period. |
| (b) | For the ten month period ended October 31, 2007. The Fund changed its fiscal year end from December 31 to October 31. |
| (c) | Total return does not consider the effects of sales loads. Total return is calculated assuming a purchase of shares on the first day and a sale on the last day of each period reported, and includes reinvestment of dividends and distributions. Total investment returns may reflect adjustments to conform to generally accepted accounting principles. Total return for periods less than one full year are not annualized. |
| (d) | The distributor of the Fund has contractually agreed to limit its distribution and service (12b-1) fees to .25 of 1% of the average daily net assets of the Class A shares. |
| (e) | As of June 1, 2004, the Manager of the Fund has agreed to reimburse the Fund in order to limit operating expenses (excluding interest, taxes, brokerage commissions and certain extraordinary expenses) to 1.35% of the average daily net assets of Class A. If the manager had not reimbursed the Fund, the annual expenses (both including and excluding distribution and service (12b-1) fees) and net investment income ratios would be 1.44%, 1.19% and 1.63%, respectively, for the year ended December 31, 2004, 1.42%, 1.17%, and 2.23%, respectively, for the year ended December 31, 2005, 1.42%, 1.17% and 2.81%, respectively, for the year ended December 31, 2006 and 1.37%, 1.12% and 3.62%, respectively, for the ten-month period ended October 31, 2007. |
| * | Dividends from net investment income include other items that are ordinary income for tax purposes. |
See Notes to Financial Statements.
| | |
| 48 | | Visit our website at www.jennisondryden.com |
| | | | | | | | | | | | | | | | |
| Class A | |
| Year Ended December 31, | |
| 2006(a) | | 2005(a) | | | 2004(a) | | | 2003(a) | | | 2002 | |
| | | | | | | | | | | | | | | | |
| $6.51 | | $ | 7.55 | | | $ | 7.51 | | | $ | 7.17 | | | $ | 6.80 | |
| | | | | | | | | | | | | | | | | |
| .19 | | | .16 | | | | .12 | | | | .11 | | | | .26 | |
| | | | | | | | | | | | | | | | |
.16 | | | (.74 | ) | | | .53 | | | | .82 | | | | .41 | |
| | | | | | | | | | | | | | | | | |
| .35 | | | (.58 | ) | | | .65 | | | | .93 | | | | .67 | |
| | | | | | | | | | | | | | | | | |
| | | | | | | | | | | | | | | | |
| (.17) | | | (.40 | ) | | | (.61 | ) | | | (.59 | ) | | | (.30 | ) |
| — | | | (.06 | ) | | | — | | | | — | | | | — | |
| | | | | | | | | | | | | | | | | |
| (.17) | | | (.46 | ) | | | (.61 | ) | | | (.59 | ) | | | (.30 | ) |
| | | | | | | | | | | | | | | | | |
| $6.69 | | $ | 6.51 | | | $ | 7.55 | | | $ | 7.51 | | | $ | 7.17 | |
| | | | | | | | | | | | | | | | | |
| 5.66% | | | (7.94 | )% | | | 9.42 | % | | | 13.44 | % | | | 10.13 | % |
| | | | | | | | | | | | | | | | |
| $131,477 | | $ | 151,399 | | | $ | 189,719 | | | $ | 198,688 | | | $ | 210,353 | |
| $139,865 | | $ | 169,867 | | | $ | 185,333 | | | $ | 206,127 | | | $ | 212,828 | |
| | | | | | | | | | | | | | | | |
| 1.36%(e) | | | 1.35 | % (e) | | | 1.35 | % (e) | | | 1.43 | % | | | 1.46 | % |
| 1.11%(e) | | | 1.10 | % (e) | | | 1.10 | % (e) | | | 1.18 | % | | | 1.21 | % |
| 2.87%(e) | | | 2.30 | % (e) | | | 1.74 | % (e) | | | 1.52 | % | | | 3.78 | % |
| | | | | | | | | | | | | | | | |
| 233% | | | 307 | % | | | 312 | % | | | 251 | % | | | 252 | % |
See Notes to Financial Statements.
| | |
| Dryden Global Total Return Fund, Inc. | | 49 |
Financial Highlights
continued
| | | | |
| | | Class B | |
| | | Ten Months Ended
October 31, 2007(a)(b) | |
Per Share Operating Performance: | | | | |
Net Asset Value, Beginning of Period | | $ | 6.69 | |
| | | | |
Income (loss) from investment operations: | | | | |
Net investment income | | | .16 | |
Net realized and unrealized gain (loss) on investment and foreign currency transactions | | | .30 | |
| | | | |
Total from investment operations | | | .46 | |
| | | | |
Less Dividends and Distributions | | | | |
Dividends from net investment income* | | | (.17 | ) |
Tax return of capital distributions | | | — | |
| | | | |
Total dividends and distributions | | | (.17 | ) |
| | | | |
Net asset value, end of period | | $ | 6.98 | |
| | | | |
Total Return(c): | | | 7.06 | % |
Ratios/Supplemental Data: | | | | |
Net assets, end of period (000) | | $ | 3,508 | |
Average net assets (000) | | $ | 3,627 | |
Ratios to average net assets: | | | | |
Expenses, including distribution and service (12b-1) fees | | | 2.11 | %(d)(e) |
Expenses, excluding distribution and service (12b-1) fees | | | 1.11 | %(d)(e) |
Net investment income | | | 2.86 | %(d)(e) |
| (a) | Calculated based upon average shares outstanding during the period. |
| (b) | For the ten month period ended October 31, 2007. The Fund changed its fiscal year end from December 31 to October 31. |
| (c) | Total return does not consider the effects of sales loads. Total return is calculated assuming a purchase of shares on the first day and a sale on the last day of each period reported, and includes reinvestment of dividends and distributions. Total investment returns may reflect adjustments to conform to generally accepted accounting principles. Total return for periods less than one full year are not annualized. |
| (d) | As of June 1, 2004, the Manager of the Fund has agreed to reimburse the Fund in order to limit operating expenses (excluding interest, taxes, brokerage commissions and certain extraordinary expenses) to 2.10% of the average daily net assets of Class B. If the manager had not reimbursed the Fund, the annual expenses (both including and excluding distribution and service (12b-1) fees) and net investment income ratios would be 2.19%, 1.19% and .90%, respectively, for the year ended December 31, 2004, 2.17%, 1.17%, and 1.47%, respectively, for the year ended December 31, 2005, 2.17%, 1.17% and 2.03%, respectively, for the year ended December 31, 2006 and 2.12%, 1.12% and 2.86%, respectively, for the ten-month period ended October 31, 2007. |
| * | Dividends from net investment income include other items that are ordinary income for tax purposes. |
See Notes to Financial Statements.
| | |
| 50 | | Visit our website at www.jennisondryden.com |
| | | | | | | | | | | | | | | | | | |
| Class B | |
| Year Ended December 31, | |
| 2006(a) | | | 2005(a) | | | 2004(a) | | | 2003(a) | | | 2002 | |
| | | | | | | | | | | | | | | | | | |
| $ | 6.51 | | | $ | 7.56 | | | $ | 7.53 | | | $ | 7.18 | | | $ | 6.81 | |
| | | | | | | | | | | | | | | | | | | |
| | | | | | | | | | | | | | | | | | |
| | .14 | | | | .11 | | | | .07 | | | | .05 | | | | .21 | |
|
.17 |
| | | (.74 | ) | | | .52 | | | | .84 | | | | .41 | |
| | | | | | | | | | | | | | | | | | | |
| | .31 | | | | (.63 | ) | | | .59 | | | | .89 | | | | .62 | |
| | | | | | | | | | | | | | | | | | | |
| | | | | | | | | | | | | | | | | | |
| | (.13 | ) | | | (.36 | ) | | | (.56 | ) | | | (.54 | ) | | | (.25 | ) |
| | — | | | | (.06 | ) | | | — | | | | — | | | | — | |
| | | | | | | | | | | | | | | | | | | |
| | (.13 | ) | | | (.42 | ) | | | (.56 | ) | | | (.54 | ) | | | (.25 | ) |
| | | | | | | | | | | | | | | | | | | |
| $ | 6.69 | | | $ | 6.51 | | | $ | 7.56 | | | $ | 7.53 | | | $ | 7.18 | |
| | | | | | | | | | | | | | | | | | | |
| | 4.90 | % | | | (8.60 | )% | | | 8.44 | % | | | 12.72 | % | | | 9.28 | % |
| | | | | | | | | | | | | | | | | | |
| $ | 3,874 | | | $ | 5,513 | | | $ | 7,759 | | | $ | 8,602 | | | $ | 7,480 | |
| $ | 4,726 | | | $ | 6,792 | | | $ | 7,854 | | | $ | 8,172 | | | $ | 7,461 | |
| | | | | | | | | | | | | | | | | | |
| | 2.11 | %(d) | | | 2.10 | %(d) | | | 2.10 | %(d) | | | 2.18 | % | | | 2.21 | % |
| | 1.11 | %(d) | | | 1.10 | %(d) | | | 1.10 | %(d) | | | 1.18 | % | | | 1.21 | % |
| | 2.09 | %(d) | | | 1.54 | %(d) | | | .99 | %(d) | | | .77 | % | | | 3.02 | % |
See Notes to Financial Statements.
| | |
| Dryden Global Total Return Fund, Inc. | | 51 |
Financial Highlights
continued
| | | | |
| | | Class C | |
| | | Ten Months Ended
October 31, 2007(a)(b) | |
Per Share Operating Performance: | | | | |
Net Asset Value, Beginning of Period | | $ | 6.68 | |
| | | | |
Income (loss) from investment operations: | | | | |
Net investment income | | | .17 | |
Net realized and unrealized gain (loss) on investment and foreign currency transactions | | | .31 | |
| | | | |
Total from investment operations | | | .48 | |
| | | | |
Less Dividends and Distributions | | | | |
Dividends from net investment income* | | | (.19 | ) |
Tax return of capital distributions | | | — | |
| | | | |
Total dividends and distributions | | | (.19 | ) |
| | | | |
Net asset value, end of period | | $ | 6.97 | |
| | | | |
Total Return(c): | | | 7.29 | % |
Ratios/Supplemental Data: | | | | |
Net assets, end of period (000) | | $ | 2,277 | |
Average net assets (000) | | $ | 1,279 | |
Ratios to average net assets: | | | | |
Expenses, including distribution and service (12b-1) fees(d) | | | 1.86 | %(e)(f) |
Expenses, excluding distribution and service (12b-1) fees | | | 1.11 | %(e)(f) |
Net investment income | | | 3.17 | %(e)(f) |
| (a) | Calculated based upon average shares outstanding during the period. |
| (b) | For the ten month period ended October 31, 2007. The Fund changed its fiscal year end from December 31 to October 31. |
| (c) | Total return does not consider the effects of sales loads. Total return is calculated assuming a purchase of shares on the first day and a sale on the last day of each period reported, and includes reinvestment of dividends and distributions. Total investment returns may reflect adjustments to conform to generally accepted accounting principles. Total return for periods less than one full year are not annualized. |
| (d) | The distributor of the Fund has contractually agreed to limit its distribution and service (12b-1) fees to .75 of 1% of the average daily net assets of the Class C shares. |
| (e) | As of June 1, 2004, the Manager of the Fund has agreed to reimburse the Fund in order to limit operating expenses (excluding interest, taxes, brokerage commissions and certain extraordinary expenses) to 1.85% of the average daily net assets of Class C. If the manager had not reimbursed the Fund, the annual expenses (both including and excluding distribution and service (12b-1) fees) and net investment income ratios would be 1.94%, 1.19% and 1.00%, respectively, for the year ended December 31, 2004, 1.92%, 1.17%, and 1.73%, respectively, for the year ended December 31, 2005, 1.93%, 1.18% and 2.27%, respectively, for the year ended December 31, 2006 and 1.87%, 1.12% and 3.32%, respectively, for the ten-month period ended October 31, 2007. |
| * | Dividends from net investment income include other items that are ordinary income for tax purposes. |
See Notes to Financial Statements.
| | |
| 52 | | Visit our website at www.jennisondryden.com |
| | | | | | | | | | | | | | | | | | |
| Class C | |
| Year Ended December 31, | |
| 2006(a) | | | 2005(a) | | | 2004(a) | | | 2003(a) | | | 2002 | |
| | | | | | | | | | | | | | | | | | |
| $ | 6.50 | | | $ | 7.55 | | | $ | 7.51 | | | $ | 7.17 | | | $ | 6.81 | |
| | | | | | | | | | | | | | | | | | | |
| | | | | | | | | | | | | | | | | | |
| | .16 | | | | .13 | | | | .08 | | | | .07 | | | | .22 | |
|
.17 |
| | | (.75 | ) | | | .54 | | | | .83 | | | | .40 | |
| | | | | | | | | | | | | | | | | | | |
| | .33 | | | | (.62 | ) | | | .62 | | | | .90 | | | | .62 | |
| | | | | | | | | | | | | | | | | | | |
| | | | | | | | | | | | | | | | | | |
| | (.15 | ) | | | (.37 | ) | | | (.58 | ) | | | (.56 | ) | | | (.26 | ) |
| | — | | | | (.06 | ) | | | — | | | | — | | | | — | |
| | | | | | | | | | | | | | | | | | | |
| | (.15 | ) | | | (.43 | ) | | | (.58 | ) | | | (.56 | ) | | | (.26 | ) |
| | | | | | | | | | | | | | | | | | | |
| $ | 6.68 | | | $ | 6.50 | | | $ | 7.55 | | | $ | 7.51 | | | $ | 7.17 | |
| | | | | | | | | | | | | | | | | | | |
| | 5.11 | % | | | (8.43 | )% | | | 8.87 | % | | | 12.88 | % | | | 9.37 | % |
| | | | | | | | | | | | | | | | | | |
| $ | 1,056 | | | $ | 1,161 | | | $ | 1,433 | | | $ | 904 | | | $ | 666 | |
| $ | 1,470 | | | $ | 1,311 | | | $ | 1,049 | | | $ | 815 | | | $ | 741 | |
| | | | | | | | | | | | | | | | | | |
| | 1.86 | %(e) | | | 1.85 | %(e) | | | 1.85 | %(e) | | | 1.93 | % | | | 1.96 | % |
| | 1.11 | %(e) | | | 1.10 | %(e) | | | 1.10 | %(e) | | | 1.18 | % | | | 1.21 | % |
| | 2.34 | %(e) | | | 1.80 | %(e) | | | 1.09 | %(e) | | | 1.01 | % | | | 3.28 | % |
See Notes to Financial Statements.
| | |
| Dryden Global Total Return Fund, Inc. | | 53 |
Financial Highlights
continued
| | | | |
| | | Class Z | |
| | | Ten Months Ended
October 31, 2007(a)(b) | |
Per Share Operating Performance: | | | | |
Net Asset Value, Beginning of Period | | $ | 6.72 | |
| | | | |
Income (loss) from investment operations: | | | | |
Net investment income | | | .21 | |
Net realized and unrealized gain (loss) on investment and foreign currency transactions | | | .31 | |
| | | | |
Total from investment operations | | | .52 | |
| | | | |
Less Dividends and Distributions | | | | |
Dividends from net investment income* | | | (.22 | ) |
Tax return of capital distributions | | | — | |
| | | | |
Total dividends and distributions | | | (.22 | ) |
| | | | |
Net asset value, end of period | | $ | 7.02 | |
| | | | |
Total Return(c): | | | 7.99 | % |
Ratios/Supplemental Data: | | | | |
Net assets, end of period (000) | | $ | 2,163 | |
Average net assets (000) | | $ | 2,053 | |
Ratios to average net assets: | | | | |
Expenses, including distribution and service (12b-1) fees | | | 1.11 | %(d)(e) |
Expenses, excluding distribution and service (12b-1) fees | | | 1.11 | %(d)(e) |
Net investment income | | | 3.86 | %(d)(e) |
| (a) | Calculated based upon average shares outstanding during the period. |
| (b) | For the ten month period ended October 31, 2007. The Fund changed its fiscal year end from December 31 to October 31. |
| (c) | Total return is calculated assuming a purchase of shares on the first day and a sale on the last day of each period reported, and includes reinvestment of dividends and distributions. Total investment returns may reflect adjustments to conform to generally accepted accounting principles. Total return for periods less than one full year are not annualized. |
| (d) | As of June 1, 2004, the Manager of the Fund has agreed to reimburse the Fund in order to limit operating expenses (excluding interest, taxes, brokerage commissions and certain extraordinary expenses) to 1.10% of the average daily net assets of Class Z. If the manager had not reimbursed the Fund, the annual expenses (both including and excluding distribution and service (12b-1) fees and net investment income ratios would be 1.19%, 1.19% and 1.86%, respectively, for the year ended December 31, 2004, 1.17%, 1.17%, and 2.48%, respectively, for the year ended December 31, 2005, 1.17%, 1.17% and 3.00%, respectively, for the year ended December 31, 2006 and 1.12%, 1.12% and 3.85%, respectively, for the ten-month period ended October 31, 2007. |
| * | Dividends from net investment income include other items that are ordinary income for tax purposes. |
See Notes to Financial Statements.
| | |
| 54 | | Visit our website at www.jennisondryden.com |
| | | | | | | | | | | | | | | | | | |
| Class Z | |
| Year Ended December 31, | |
| 2006(a) | | | 2005(a) | | | 2004(a) | | | 2003(a) | | | 2002 | |
| | | | | | | | | | | | | | | | | | |
| $ | 6.53 | | | $ | 7.56 | | | $ | 7.52 | | | $ | 7.18 | | | $ | 6.81 | |
| | | | | | | | | | | | | | | | | | | |
| | | | | | | | | | | | | | | | | | |
| | .20 | | | | .18 | | | | .14 | | | | .13 | | | | .27 | |
|
.17 |
| | | (.74 | ) | | | .53 | | | | .82 | | | | .42 | |
| | | | | | | | | | | | | | | | | | | |
| | .37 | | | | (.56 | ) | | | .67 | | | | .95 | | | | .69 | |
| | | | | | | | | | | | | | | | | | | |
| | | | | | | | | | | | | | | | | | |
| | (.18 | ) | | | (.41 | ) | | | (.63 | ) | | | (.61 | ) | | | (.32 | ) |
| | — | | | | (.06 | ) | | | — | | | | — | | | | — | |
| | | | | | | | | | | | | | | | | | | |
| | (.18 | ) | | | (.47 | ) | | | (.63 | ) | | | (.61 | ) | | | (.32 | ) |
| | | | | | | | | | | | | | | | | | | |
| $ | 6.72 | | | $ | 6.53 | | | $ | 7.56 | | | $ | 7.52 | | | $ | 7.18 | |
| | | | | | | | | | | | | | | | | | | |
| | 5.84 | % | | | (7.62 | )% | | | 9.68 | % | | | 13.71 | % | | | 10.37 | % |
| | | | | | | | | | | | | | | | | | |
| $ | 2,160 | | | $ | 4,415 | | | $ | 5,386 | | | $ | 4,938 | | | $ | 4,897 | |
| $ | 3,212 | | | $ | 4,901 | | | $ | 4,953 | | | $ | 4,935 | | | $ | 5,334 | |
| | | | | | | | | | | | | | | | | | |
| | 1.11 | %(d) | | | 1.10 | %(d) | | | 1.10 | %(d) | | | 1.18 | % | | | 1.21 | % |
| | 1.11 | %(d) | | | 1.10 | %(d) | | | 1.10 | %(d) | | | 1.18 | % | | | 1.21 | % |
| | 3.06 | %(d) | | | 2.55 | %(d) | | | 1.95 | %(d) | | | 1.77 | % | | | 4.07 | % |
See Notes to Financial Statements.
| | |
| Dryden Global Total Return Fund, Inc. | | 55 |
Report of Independent Registered Public Accounting Firm
The Board of Directors and Shareholders of
Dryden Global Total Return Fund, Inc.:
We have audited the accompanying statement of assets and liabilities of Dryden Global Total Return Fund, Inc. (hereafter referred to as the “Fund”), including the portfolio of investments, as of October 31, 2007, and the related statement of operations for the period ended October 31, 2007 and the year ended December 31, 2006, the statement of changes in net assets for the period ended October 31, 2007 and each of the years in the two-year period ended December 31, 2006 and the financial highlights for the period ended October 31, 2007 and each of the years in the three-year period ended December 31, 2006. These financial statements and financial highlights are the responsibility of the Fund’s management. Our responsibility is to express an opinion on these financial statements and financial highlights based on our audits. The financial highlights for the years presented prior to the year ended December 31, 2004, were audited by another independent registered public accounting firm, whose report dated February 20, 2004, expressed an unqualified opinion thereon.
We conducted our audits in accordance with the standards of the Public Company Accounting Oversight Board (United States). Those standards require that we plan and perform the audit to obtain reasonable assurance about whether the financial statements and financial highlights are free of material misstatement. An audit includes examining, on a test basis, evidence supporting the amounts and disclosures in the financial statements. Our procedures included confirmation of securities owned as of October 31, 2007, by correspondence with the custodian and brokers or by other appropriate auditing procedures where replies from brokers were not received. An audit also includes assessing the accounting principles used and significant estimates made by management, as well as evaluating the overall financial statement presentation. We believe that our audits provide a reasonable basis for our opinion.
In our opinion, the financial statements and financial highlights referred to above present fairly, in all material respects, the financial position of the Fund as of October 31, 2007, and the results of its operations for the period ended October 31, 2007 and the year ended December 31, 2006, the changes in its net assets for the period ended October 31, 2007 and each of the years in the two-year period ended December 31, 2006 and the financial highlights for the period ended October 31, 2007 and each of the years in the three-year period ended December 31, 2006, in conformity with U.S. generally accepted accounting principles.
New York, New York
December 28, 2007
| | |
| 56 | | Visit our website at www.jennisondryden.com |
Federal Income Tax Information
(Unaudited)
We are required by the Internal Revenue Code to advise you within 60 days of the Fund’s ten-month period end October 31, 2007 as to the federal tax status of distributions paid by the Fund during such fiscal period. Accordingly, we are advising you that during its fiscal period ended October 31, 2007, the Fund paid an ordinary income dividends for Class A, Class B, Class C and Class Z shares of $0.2099 per share, $0.1721 per share, $0.1861 per share and $0.2225 per share, respectively, which represents net investment income.
We are required by New York, California, Massachusetts, Missouri and Oregon to inform you that dividends which have been derived from federal obligations are not taxable to shareholders provided the mutual fund meets certain requirements mandated by the respective states’ taxing authorities. We are pleased to report that 1.82% of the dividends paid by the Fund qualify for such deductions. Due to certain minimum portfolio holding requirements in California, Connecticut and New York, residents of those states will not be able to exclude interest on federal obligations from state and local tax.
The Fund designates 42.45% of the ordinary income dividends as interest related dividends under The American Jobs Creation Act of 2004.
In January 2008, you will be advised on IRS Form 1099-DIV or substitute 1099-DIV as to the federal tax status of dividends and distributions received by you in calendar year 2007.
For more detailed information regarding your federal, state and local taxes, you should contact your tax adviser.
| | |
| Dryden Global Total Return Fund, Inc. | | 57 |
Management of the Fund
(Unaudited)
Information pertaining to the Directors of the Dryden Global Total Return Fund, Inc. (the “Fund”) is set forth below. Directors who are not deemed to be “interested persons” of the Fund, as defined in the Investment Company Act of 1940 (the 1940 Act), are referred to as “Independent Directors.” Directors who are deemed to be “interested persons” of the Fund are referred to as “Interested Directors.” “Fund Complex”† consists of the Fund and any other investment companies managed by PI.
Independent Directors(2)
Linda W. Bynoe (55), Director since 2005(3) Oversees 59 portfolios in Fund complex
Principal occupations (last 5 years): President and Chief Executive Officer (since March 1995) of Telemat, Ltd. (management consulting); formerly Vice President at Morgan Stanley & Co.
Other Directorships held: Director of Simon Property Group, Inc. (real estate investment trust) (since May 2003); Anixter International (communication products distributor) (since January 2006); Director of Northern Trust Corporation (since April 2006).
David E.A. Carson (73), Director since 2003(3) Oversees 63 portfolios in Fund complex
Principal occupations (last 5 years): Director (since October 2007) of ICI Mutual Insurance Company; formerly Chairman and Chief Executive Officer of People’s Bank (1988-2000).
Robert E. La Blanc (73), Director since 2003(3) Oversees 61 portfolios in Fund complex
Principal occupations (last 5 years): President (since 1981) of Robert E. La Blanc Associates, Inc. (telecommunications).
Other Directorships held:(4) Director of CA, Inc. (since 2002) (software company); FiberNet Telecom Group, Inc. (since 2003) (telecom company).
Douglas H. McCorkindale (68), Director since 1996(3) Oversees 59 portfolios in Fund complex
Principal occupations (last 5 years): Formerly Chairman (February 2001-June 2006), Chief Executive Officer (June 2000-July 2005), President (September 1997-July 2005) and Vice Chairman (March 1984-May 2000) of Gannett Co. Inc. (publishing and media).
Other Directorships held:(4) Director of Continental Airlines, Inc. (since May 1993); Director of Lockheed Martin Corp. (aerospace and defense) (since May 2001).
Richard A. Redeker (64), Director since 1993(3) Oversees 60 portfolios in Fund complex
Principal occupations (last 5 years): Management Consultant; Director (since 2001); Director of Penn Tank Lines, Inc. (since 1999).
Robin B. Smith (68), Director since 1996(3) Oversees 61 portfolios in Fund complex
Principal occupations (last 5 years): Chairman of the Board (since January 2003) of Publishers Clearing House (direct marketing); formerly Chairman and Chief Executive Officer (August 1996-January 2003) of Publishers Clearing House.
Other Directorships held:(4) Formerly Director of BellSouth Corporation (1992-2006).
| | |
| 58 | | Visit our website at www.jennisondryden.com |
Stephen G. Stoneburn (64), Director since 2003(3) Oversees 61 portfolios in Fund complex
Principal occupations (last 5 years): President and Chief Executive Officer (since June 1996) of Quadrant Media Corp. (publishing company); formerly President (June 1995-June 1996) of Argus Integrated Media, Inc.; Senior Vice President and Managing Director (January 1993-1995) of Cowles Business Media; Senior Vice President of Fairchild Publications, Inc. (1975-1989).
Clay T. Whitehead (69), Director since 1996(3) Oversees 61 portfolios in Fund complex
Principal occupations (last 5 years): President (since 1983) of YCO (new business development firm).
Interested Directors(1)
Judy A. Rice (59), President since 2003 and Director since 2000(3) Oversees 59 portfolios in Fund complex
Principal occupations (last 5 years): President, Chief Executive Officer, Chief Operating Officer and Officer-In-Charge (since February 2003) of Prudential Investments LLC; Vice President (since February 1999) of Prudential Investment Management Services LLC; President, Chief Executive Officer and Officer-In-Charge (since April 2003) of Prudential Mutual Fund Services LLC; formerly Director (May 2003-March 2006) and Executive Vice President (June 2005-March 2006) of AST Investment Services, Inc.; formerly Executive Vice President (September 1999-February 2003) of Prudential Investments LLC; Member of Board of Governors of the Investment Company Institute.
Robert F. Gunia (61), Vice President since 1999 and Director since 1996(3) Oversees 145 portfolios in Fund complex
Principal occupations (last 5 years): Chief Administrative Officer (since September 1999) and Executive Vice President (since December 1996) of Prudential Investments LLC; President (since April 1999) of Prudential Investment Management Services LLC; Executive Vice President (since March 1999) and Treasurer (since May 2000) of Prudential Mutual Fund Services LLC; Chief Administrative Officer, Executive Vice President and Director (since May 2003) of AST Investment Services, Inc.
Other Directorships held:(4) Vice President and Director (since May 1989) and Treasurer (since 1999) of The Asia Pacific Fund, Inc.
Information pertaining to the Officers of the Fund who are not also Directors is set forth below.
Officers(2)
Kathryn L. Quirk (55), Chief Legal Officer since 2005(3)
Principal occupations (last 5 years): Vice President and Corporate Counsel (since September 2004) of Prudential; Executive Vice President, Chief Legal Officer and Secretary (since July 2005) of Prudential Investments LLC and Prudential Mutual Fund Services LLC; formerly Managing Director, General Counsel, Chief Compliance Officer, Chief Risk Officer and Corporate Secretary (1997-2002) of Zurich Scudder Investments, Inc.
Deborah A. Docs (49), Secretary since 2003(3)
Principal occupations (last 5 years): Vice President and Corporate Counsel (since January 2001) of Prudential; Vice President (since December 1996) and Assistant Secretary (since March 1999) of PI; formerly Vice President and Assistant Secretary (May 2003-June 2005) of AST Investment Services, Inc.
Jonathan D. Shain (49), Assistant Secretary since 2005(3)
Principal occupations (last 5 years): Vice President and Corporate Counsel (since August 1998) of Prudential; Vice President and Assistant Secretary (since May 2001) of PI; Vice President and Assistant Secretary (since February 2001) of PMFS; formerly Vice President and Assistant Secretary (May 2003-June 2005) of AST Investment Services, Inc.
| | |
| Dryden Global Total Return Fund, Inc. | | 59 |
Claudia DiGiacomo (33), Assistant Secretary since 2005(3)
Principal occupations (last 5 years): Vice President and Corporate Counsel (since January 2005) of Prudential; Vice President and Assistant Secretary of PI (since December 2005); Associate at Sidley Austin Brown & Wood LLP (1999-2004).
Timothy J. Knierim (48), Chief Compliance Officer since 2007(3)
Principal occupations (last 5 years): Chief Compliance Officer of Prudential Investment Management, Inc. (since July 2007); formerly Chief Risk Officer of PIM and PI (2002-2007) and formerly Chief Ethics Officer of PIM and PI (2006-2007).
Valerie M. Simpson (49), Deputy Chief Compliance Officer since 2007(3)
Principal occupations (last 5 years): Vice President and Senior Compliance Officer (since March 2006) of PI; Vice President-Financial Reporting (since March 2006) for Prudential Life and Annuities Finance.
Grace C. Torres (48), Treasurer and Principal Financial and Accounting Officer since 1998(3)
Principal occupations (last 5 years): Assistant Treasurer (since March 1999) and Senior Vice President (since September 1999) of PI; Assistant Treasurer (since May 2003) and Vice President (since June 2005) of AST Investment Services, Inc.; Senior Vice President and Assistant Treasurer (since May 2003) of Prudential Annuities Advisory Services, Inc.; formerly Senior Vice President (May 2003-June 2005) of AST Investment Services, Inc.
John P. Schwartz (36), Assistant Secretary since 2006(3)
Principal occupations (last 5 years): Vice President and Corporate Counsel (since April 2005) of Prudential; Vice President and Assistant Secretary of PI (since December 2005); Associate at Sidley, Austin Brown & Wood LLP (1997-2005).
M. Sadiq Peshimam (43), Assistant Treasurer since 2006(3)
Principal occupations (last 5 years): Vice President (since 2005) and Director (2000-2005) within Prudential Mutual Fund Administration.
Peter Parrella (49), Assistant Treasurer since 2007(3)
Principal occupations (last 5 years): Vice President (since 2007) and Director (2004-2007) within Prudential Mutual Fund Administration; formerly Tax Manager at SSB Citi Fund Management LLC (1997-2004).
Andrew R. French (45), Assistant Secretary since 2006(3)
Principal occupations (last 5 years): Director and Corporate Counsel (since May 2006) of Prudential; Vice President and Assistant Secretary (since January 2007) of PI; Vice President and Assistant Secretary (since January 2007) of PMFS; formerly Senior Legal Analyst of Prudential Mutual Fund Law Department (1997-2006).
Noreen M. Fierro (43), Anti-Money Laundering Compliance Officer since 2006(3)
Principal occupations (last 5 years): Vice President, Corporate Compliance (since May 2006) of Prudential; formerly Corporate Vice President, Associate General Counsel (April 2002-May 2005) of UBS Financial Services, Inc., in their Money Laundering Prevention Group; Senior Manager (May 2005-May 2006) of Deloitte Financial Advisory Services, LLP, in their Forensic and Dispute Services, Anti-Money Laundering Group.
| | |
| 60 | | Visit our website at www.jennisondryden.com |
† | The Fund Complex consists of all investment companies managed by PI. The Funds for which PI serves as manager include JennisonDryden Mutual Funds, Strategic Partners Funds, The Prudential Variable Contract Accounts 2, 10, 11. The Target Portfolio Trust, The Prudential Series Fund, The High Yield Income Fund, Inc., The High Yield Plus Fund, Inc., Nicholas-Applegate Fund, Inc., Advanced Series Trust (formerly American Skandia Trust), and Prudential’s Gibraltar Fund, Inc. |
(1) | “Interested” Director, as defined in the 1940 Act, by reason of employment with the Manager, a Subadvisor or the Distributor. |
(2) | Unless otherwise noted, the address of the Directors and Officers is c/o: Prudential Investments LLC, Gateway Center Three, 100 Mulberry Street, Newark, NJ 07102. |
(3) | There is no set term of office for Directors and Officers. The Independent Directors have adopted a retirement policy, which calls for the retirement of Directors on December 31 of the year in which they reach the age of 75. The table shows the individual’s length of service as Director and/or Officer. |
(4) | This includes only directorships of companies required to register, or file reports with the SEC under the Securities and Exchange Act of 1934 (that is, “public companies”) or other investment companies registered under the 1940 Act. |
Additional Information about the Directors is included in the Statement of Additional Information which is available without charge, upon request, by calling (800) 521-7466 or (732) 482-7555 (Calling from outside the U.S.)
| | |
| Dryden Global Total Return Fund, Inc. | | 61 |
Growth of a $10,000 Investment
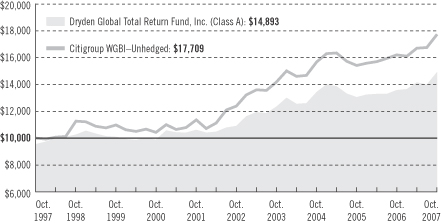
| | | | | | | | | |
| Average Annual Total Returns (With Sales Charges) as of 10/31/07 | |
| | | One Year | | | Five Years | | | Ten Years | |
Class A | | 4.84 | % | | 5.47 | % | | 4.06 | % |
Class B | | 3.85 | | | 5.46 | | | 3.86 | |
Class C | | 8.09 | | | 5.89 | | | 3.98 | |
Class Z | | 9.95 | | | 6.70 | | | 4.80 | |
| | | | | | | | | |
| Average Annual Total Returns (Without Sales Charges) as of 10/31/07 | |
| | | One Year | | | Five Years | | | Ten Years | |
Class A | | 9.78 | % | | 6.44 | % | | 4.54 | % |
Class B | | 8.85 | | | 5.62 | | | 3.86 | |
Class C | | 9.09 | | | 5.89 | | | 3.98 | |
Class Z | | 9.95 | | | 6.70 | | | 4.80 | |
Performance data quoted represent past performance. Past performance does not guarantee future results. The investment return and principal value of an investment will fluctuate, so that an investor’s shares, when redeemed, may be worth more or less than their original cost. Current performance may be lower or higher than the past performance data quoted. An investor may obtain performance data as of the most recent month-end by visiting our website at www.jennisondryden.com or by calling (800) 225-1852. The maximum initial sales charge is 4.50% (Class A shares). Gross operating expenses: Class A, 1.42%; Class B, 2.12%; Class C, 2.12%; Class Z, 1.12%. Net operating expenses apply to: Class A, 1.37%; Class B, 2.12%; Class C, 1.87%; Class Z, 1.12%, after contractual reduction through 2/28/2009.
The returns in the graph and the tables do not reflect the deduction of taxes that a shareholder would pay on Fund distributions or following the redemption of Fund shares.
| | |
| | Visit our website at www.jennisondryden.com |
Source: Prudential Investments LLC and Lipper Inc.
The graph compares a $10,000 investment in the Dryden Global Total Return Fund, Inc. (Class A shares) with a similar investment in the Citigroup WGBI–Unhedged by portraying the initial account values at the beginning of the 10-year period for Class A shares (October 31, 1997) and the account values at the end of the current fiscal year (October 31, 2007) as measured on a quarterly basis. For purposes of the graph, and unless otherwise indicated, it has been assumed that (a) the maximum applicable front-end sales charge was deducted from the initial $10,000 investment in Class A shares; (b) all recurring fees (including management fees) were deducted; and (c) all dividends and distributions were reinvested. The line graph provides information for Class A shares only. As indicated in the tables provided earlier, performance for Class B, C, and Z shares will vary due to the differing charges and expenses applicable to each share class (as indicated in the following paragraphs). Without a distribution and service (12b-1) fee waiver of 0.05% annually and expense subsidization for Class A shares through October 31, 2007, the returns shown in the graph and for Class A shares in the tables would have been lower.
The Citigroup WGBI–Unhedged is a market capitalization-weighted index consisting of the government bond markets of 18 countries, which are selected based on market-capitalization and investability criteria. All issues have a remaining maturity of at least one year. The Citigroup WGBI–Unhedged’s total returns include the reinvestment of all dividends, but do not include the effects of sales charges, operating expenses of a mutual fund, or taxes. The returns for the Citigroup WGBI–Unhedged would be lower if they included the effects of sales charges, operating expenses, or taxes. The securities that comprise the Citigroup WGBI–Unhedged may differ substantially from the securities in the Fund. This is not the only index that may be used to characterize performance of global/international bond funds. Other indexes may portray different comparative performance. Investors cannot invest directly in an index.
Class A shares are subject to a maximum front-end sales charge of 4.50% and a 12b-1 fee of up to 0.30% annually, and all investors who purchase Class A shares in an amount of $1 million or more and sell these shares within 12 months of purchase are subject to a contingent deferred sales charge (CDSC) of 1%. Class B shares are subject to a declining CDSC of 5%, 4%, 3%, 2%, 1%, and 1%, respectively, for the first six years after purchase and a 12b-1 fee of 1% annually. Approximately seven years after purchase, Class B shares will automatically convert to Class A shares on a quarterly basis. Class C shares purchased are not subject to a front-end sales charge, but are subject to a CDSC of 1% for Class C shares sold within 12 months from the date of purchase and an annual 12b-1 fee of 1%. Class Z shares are not subject to a sales charge or 12b-1 fees. Without waiver of fees and/or expense subsidization, the Fund’s total returns would have been lower. The returns in the graph and tables reflect the share class expense structure in effect at the close of the fiscal period.
| | |
| Dryden Global Total Return Fund, Inc. | | |
| | | | |
| n MAIL | | n TELEPHONE | | n WEBSITE |
Gateway Center Three 100 Mulberry Street Newark, NJ 07102 | | (800) 225-1852
| | www.jennisondryden.com |
|
| PROXY VOTING |
| The Board of Directors of the Fund has delegated to the Fund’s investment subadviser the responsibility for voting any proxies and maintaining proxy recordkeeping with respect to the Fund. A description of these proxy voting policies and procedures is available without charge, upon request, by calling (800) 225-1852 or by visiting the Securities and Exchange Commission’s website at www.sec.gov. Information regarding how the Fund voted proxies relating to portfolio securities during the most recent 12-month period ended June 30 is available on the Fund’s website and on the Commission’s website. |
|
| DIRECTORS |
| Linda W. Bynoe • David E.A. Carson • Robert F. Gunia • Robert E. La Blanc • Douglas H. McCorkindale • Richard A. Redeker • Judy A. Rice • Robin B. Smith • Stephen G. Stoneburn • Clay T. Whitehead |
|
| OFFICERS |
| Judy A. Rice, President • Robert F. Gunia, Vice President • Grace C. Torres, Treasurer and Principal Financial and Accounting Officer • Kathryn L. Quirk, Chief Legal Officer • Deborah A. Docs, Secretary • Timothy J. Knierim, Chief Compliance Officer • Valerie M. Simpson, Deputy Chief Compliance Officer • Noreen M. Fierro, Anti-Money Laundering Compliance Officer • Jonathan D. Shain, Assistant Secretary • Claudia DiGiacomo, Assistant Secretary • John P. Schwartz, Assistant Secretary • Andrew R. French, Assistant Secretary • M. Sadiq Peshimam, Assistant Treasurer • Peter Parrella, Assistant Treasurer |
| | | | |
| MANAGER | | Prudential Investments LLC | | Gateway Center Three
100 Mulberry Street
Newark, NJ 07102 |
|
| INVESTMENT SUBADVISER | | Prudential Investment
Management, Inc. | | Gateway Center Two
100 Mulberry Street
Newark, NJ 07102 |
|
| DISTRIBUTOR | | Prudential Investment
Management Services LLC | | Gateway Center Three
100 Mulberry Street
Newark, NJ 07102 |
|
| CUSTODIAN | | The Bank of New York | | One Wall Street
New York, NY 10286 |
|
| TRANSFER AGENT | | Prudential Mutual Fund
Services LLC | | PO Box 9658
Providence, RI 02940 |
|
INDEPENDENT REGISTERED
PUBLIC ACCOUNTING FIRM | | KPMG LLP | | 345 Park Avenue
New York, NY 10154 |
|
| FUND COUNSEL | | Willkie Farr & Gallagher LLP | | 787 Seventh Avenue
New York, NY 10019 |
|
| An investor should consider the investment objectives, risks, charges, and expenses of the Fund carefully before investing. The prospectus for the Fund contains this and other information about the Fund. An investor may obtain a prospectus by visiting our website at www.jennisondryden.com or by calling (800) 225-1852. The prospectus should be read carefully before investing. |
|
| E-DELIVERY |
| To receive your mutual fund documents on-line, go to www.icsdelivery.com/prudential/funds and enroll. Instead of receiving printed documents by mail, you will receive notification via e-mail when new materials are available. You can cancel your enrollment or change your e-mail address at any time by clicking on the change/cancel enrollment option at the icsdelivery website address. |
|
| SHAREHOLDER COMMUNICATIONS WITH DIRECTORS |
| Shareholders can communicate directly with the Board of Directors by writing to the Chair of the Board, Dryden Global Total Return Fund, Inc., Prudential Investments, Attn: Board of Directors, 100 Mulberry Street, Gateway Center Three, Newark, NJ 07102. Shareholders can communicate directly with an individual Director by writing to the same address. Communications are not screened before being delivered to the addressee. |
|
| AVAILABILITY OF PORTFOLIO SCHEDULE |
| The Fund files its complete schedule of portfolio holdings with the Securities and Exchange Commission for the first and third quarters of each fiscal year on Form N-Q. The Fund’s Forms N-Q are available on the Commission’s website at www.sec.gov. The Fund’s Forms N-Q may also be reviewed and copied at the Commission’s Public Reference Room in Washington, D.C. Information on the operation and location of the Public Reference Room may be obtained by calling (800) SEC-0330 (732-0330). The Fund’s schedule of portfolio holdings is also available on the Fund’s website as of the end of each fiscal quarter. |
|
| The Fund’s Statement of Additional Information contains additional information about the Fund’s Directors and is available without charge, upon request, by calling (800) 225-1852. |
Mutual Funds:
| | | | |
| ARE NOT INSURED BY THE FDIC OR ANY FEDERAL GOVERNMENT AGENCY | | MAY LOSE VALUE | | ARE NOT A DEPOSIT OF OR GUARANTEED BY ANY BANK OR ANY BANK AFFILIATE |

| | | | | | | | | | | | |
| | | Dryden Global Total Return Fund, Inc. | | |
| | | Share Class | | A | | B | | C | | Z | | |
| | NASDAQ | | GTRAX | | PBTRX | | PCTRX | | PZTRX | | |
| | CUSIP | | 26243L105 | | 26243L204 | | 26243L303 | | 26243L402 | | |
| | | | | | | | | | | | |
MF169E IFS-A141799 Ed. 12/2007

Item 2 – Code of Ethics – – See Exhibit (a)
As of the end of the period covered by this report, the Registrant has adopted a code of ethics (the “Section 406 Standards for Investment Companies – Ethical Standards for Principal Executive and Financial Officers”) that applies to the Registrant’s Principal Executive Officer and Principal Financial Officer; the Registrant’s Principal Financial Officer also serves as the Principal Accounting Officer.
The Registrant hereby undertakes to provide any person, without charge, upon request, a copy of the code of ethics. To request a copy of the code of ethics, contact the registrant 800-225-1852, and ask for a copy of the Section 406 Standards for Investment Companies—Ethical Standards for Principal Executive and Financial Officers.
Item 3 – Audit Committee Financial Expert –
The Registrant’s Board has determined that Mr. David E. A. Carson, member of the Board’s Audit Committee is an “audit committee financial expert,” and that he is “independent,” for purposes of this Item.
Item 4 – Principal Accountant Fees and Services –
(a) Audit Fees
For the fiscal period January 1, 2007 through October 31, 2007 and fiscal year ended December 31, 2006, KPMG LLP (“KPMG”), the Registrant’s principal accountant, billed the Registrant $48,800 and $25,900, respectively, for professional services rendered for the audit of the Registrant’s annual financial statements or services that are normally provided in connection with statutory and regulatory filings.
(b) Audit-Related Fees
None.
(c) Tax Fees
None.
(d) All Other Fees
None.
(e) (1) Audit Committee Pre-Approval Policies and Procedures
THE PRUDENTIAL MUTUAL FUNDS
AUDIT COMMITTEE POLICY
on
Pre-Approval of Services Provided by the Independent Accountants
The Audit Committee of each Prudential Mutual Fund is charged with the responsibility to monitor the independence of the Fund’s independent accountants. As part of this responsibility, the Audit Committee must pre-approve any independent accounting firm’s engagement to render audit and/or permissible non-audit services, as required by law. In evaluating a proposed engagement of the independent accountants, the Audit Committee will assess the effect that the engagement might reasonably be expected to have on the accountant’s independence. The Committee’s evaluation will be based on:
| | • | | a review of the nature of the professional services expected to be provided, |
| | • | | a review of the safeguards put into place by the accounting firm to safeguard independence, and |
| | • | | periodic meetings with the accounting firm. |
Policy for Audit and Non-Audit Services Provided to the Funds
On an annual basis, the scope of audits for each Fund, audit fees and expenses, and audit-related and non-audit services (and fees proposed in respect thereof) proposed to be performed by the Fund’s independent accountants will be presented by the Treasurer and the independent accountants to the Audit Committee for review and, as appropriate, approval prior to the initiation of such services. Such presentation shall be accompanied by confirmation by both the Treasurer and the independent accountants that the proposed services will not adversely affect the independence of the independent accountants. Proposed services shall be described in sufficient detail to enable the Audit Committee to assess the appropriateness of such services and fees, and the compatibility of the provision of such services with the auditor’s independence. The Committee shall receive periodic reports on the progress of the audit and other services which are approved by the Committee or by the Committee Chair pursuant to authority delegated in this Policy.
The categories of services enumerated under “Audit Services”, “Audit-related Services”, and “Tax Services” are intended to provide guidance to the Treasurer and the independent accountants as to those categories of services which the Committee believes are generally consistent with the independence of the independent accountants and which the Committee (or the Committee Chair) would expect upon the presentation of specific proposals to pre-approve. The enumerated categories are not intended as an exclusive list of audit, audit-related or tax services, which the Committee (or the Committee Chair) would consider for pre-approval.
Audit Services
The following categories of audit services are considered to be consistent with the role of the Fund’s independent accountants:
| | • | | Annual Fund financial statement audits |
| | • | | Seed audits (related to new product filings, as required) |
| | • | | SEC and regulatory filings and consents |
Audit-related Services
The following categories of audit-related services are considered to be consistent with the role of the Fund’s independent accountants:
| | • | | Accounting consultations |
| | • | | Fund merger support services |
| | • | | Agreed Upon Procedure Reports |
| | • | | Other Internal Control Reports |
Individual audit-related services that fall within one of these categories and are not presented to the Audit Committee as part of the annual pre-approval process will be subject to pre-approval by the Committee Chair (or any other Committee member on whom this responsibility has been delegated) so long as the estimated fee for those services does not exceed $50,000.
Tax Services
The following categories of tax services are considered to be consistent with the role of the Fund’s independent accountants:
| | • | | Tax compliance services related to the filing or amendment of the following: |
| | • | | Federal, state and local income tax compliance; and, |
| | • | | Sales and use tax compliance |
| | • | | Timely RIC qualification reviews |
| | • | | Tax distribution analysis and planning |
| | • | | Tax authority examination services |
| | • | | Tax appeals support services |
| | • | | Accounting methods studies |
| | • | | Fund merger support services |
| | • | | Tax consulting services and related projects |
Individual tax services that fall within one of these categories and are not presented to the Audit Committee as part of the annual pre-approval process will be subject to pre-approval by the Committee Chair (or any other Committee member on whom this responsibility has been delegated) so long as the estimated fee for those services does not exceed $50,000.
Other Non-audit Services
Certain non-audit services that the independent accountants are legally permitted to render will be subject to pre-approval by the Committee or by one or more Committee members to whom the Committee has delegated this authority and who will report to the full Committee any pre-approval decisions made pursuant to this Policy. Non-audit services presented for pre-approval pursuant to this paragraph will be accompanied by a confirmation from both the Treasurer and the independent accountants that the proposed services will not adversely affect the independence of the independent accountants.
Proscribed Services
The Fund’s independent accountants will not render services in the following categories of non-audit services:
| | • | | Bookkeeping or other services related to the accounting records or financial statements of the Fund |
| | • | | Financial information systems design and implementation |
| | • | | Appraisal or valuation services, fairness opinions, or contribution-in-kind reports |
| | • | | Internal audit outsourcing services |
| | • | | Management functions or human resources |
| | • | | Broker or dealer, investment adviser, or investment banking services |
| | • | | Legal services and expert services unrelated to the audit |
| | • | | Any other service that the Public Company Accounting Oversight Board determines, by regulation, is impermissible. |
Pre-approval of Non-Audit Services Provided to Other Entities Within the Prudential Fund Complex
Certain non-audit services provided to Prudential Investments LLC or any of its affiliates that also provide ongoing services to the Prudential Mutual Funds will be subject to pre-approval by the Audit Committee. The only non-audit services provided to these entities that will require pre-approval are those related directly to the operations and financial reporting of the Funds. Individual projects that are not presented to the Audit Committee as part of the annual pre-approval process will be subject to pre-approval by the Committee Chair (or any other Committee member on whom this responsibility has been delegated) so long as the estimated fee for those services does not exceed $50,000. Services presented for pre-approval pursuant to this paragraph will be accompanied by a confirmation from both the Treasurer and the independent accountants that the proposed services will not adversely affect the independence of the independent accountants.
Although the Audit Committee will not pre-approve all services provided to Prudential Investments LLC and its affiliates, the Committee will receive an annual report from the Fund’s independent accounting firm showing the aggregate fees for all services provided to Prudential Investments and its affiliates.
(e) (2) Percentage of services referred to in 4(b)- (4)(d) that were approved by the audit committee –
Not applicable.
(f) Percentage of hours expended attributable to work performed by other than full time employees of principal accountant if greater than 50%.
Not applicable.
(g) Non-Audit Fees
Not applicable to Registrant for the fiscal period January 1, 2007 through October 31, 2007 and fiscal year ended December 31, 2006. The aggregate non-audit fees billed by KPMG for services rendered to the registrant’s investment adviser and any entity controlling, controlled by, or under common control with the investment adviser that provides ongoing services to the registrant for the fiscal period January 1, 2007 through October 31, 2007 and fiscal year ended December 31, 2006 was $44,700 and $317,300, respectively.
(h) Principal Accountant’s Independence
Not applicable as KPMG has not provided non-audit services to the Registrant’s investment adviser and any entity controlling, controlled by, or under common control with the investment adviser that provides ongoing services to the registrant that were not pre-approved pursuant to Rule 2-01(c)(7)(ii) of Regulation S-X.
Item 5 – Audit Committee of Listed Registrants – Not applicable.
Item 6 – Schedule of Investments – The schedule is included as part of the report to shareholders filed under Item 1 of this Form.
Item 7 – Disclosure of Proxy Voting Policies and Procedures for Closed-End Management Investment Companies – Not applicable.
Item 8 – Portfolio Managers of Closed-End Management Investment Companies – Not applicable.
Item 9 – Purchases of Equity Securities by Closed-End Management Investment Company and Affiliated Purchasers – Not applicable.
Item 10 – Submission of Matters to a Vote of Security Holders – Not applicable.
Item 11 – Controls and Procedures
| | (a) | It is the conclusion of the Registrant’s principal executive officer and principal financial officer that the effectiveness of the Registrant’s current disclosure controls and procedures (such disclosure controls and procedures having been evaluated within 90 days of the date of this filing) provide reasonable assurance that the information required to be disclosed by the Registrant has been recorded, processed, summarized and reported within the time period specified in the Commission’s rules and forms and that the information required to be disclosed by the Registrant has been accumulated and communicated to the Registrant’s principal executive officer and principal financial officer in order to allow timely decisions regarding required disclosure. |
| | (b) | There has been no significant change in the Registrant’s internal control over financial reporting that occurred during the registrant’s most recent fiscal quarter of the period covered by this report that has materially affected, or is likely to materially affect, the Registrant’s internal control over financial reporting. |
Item 12 – Exhibits
| | | | |
(a) | | (1) | | Code of Ethics – Attached hereto as Exhibit EX-99.CODE-ETH |
| | |
| | (2) | | Certifications pursuant to Section 302 of the Sarbanes-Oxley Act – Attached hereto as Exhibit EX-99.CERT. |
| | |
| | (3) | | Any written solicitation to purchase securities under Rule 23c-1. – Not applicable. |
| |
(b) | | Certifications pursuant to Section 906 of the Sarbanes-Oxley Act – Attached hereto as Exhibit EX-99.906CERT. |
SIGNATURES
Pursuant to the requirements of the Securities Exchange Act of 1934 and the Investment Company Act of 1940, the registrant has duly caused this report to be signed on its behalf by the undersigned, thereunto duly authorized.
| | |
| (Registrant) | | Dryden Global Total Return Fund, Inc. |
| | |
| By (Signature and Title)* | | /s/ Deborah A. Docs |
| | Deborah A. Docs |
| | Secretary |
Pursuant to the requirements of the Securities Exchange Act of 1934 and the Investment Company Act of 1940, this report has been signed below by the following persons on behalf of the registrant and in the capacities and on the dates indicated.
| | |
| By (Signature and Title)* | | /s/ Judy A. Rice |
| | Judy A. Rice |
| | President and Principal Executive Officer |
| | |
| By (Signature and Title)* | | /s/ Grace C. Torres |
| | Grace C. Torres |
| | Treasurer and Principal Financial Officer |
* | Print the name and title of each signing officer under his or her signature. |