UNITED STATES
SECURITIES AND EXCHANGE COMMISSION
Washington, D.C. 20549
FORM N-CSR
CERTIFIED SHAREHOLDER REPORT OF REGISTERED
MANAGEMENT INVESTMENT COMPANIES
Investment Company Act file number: 811-04661
Dryden Global Total Return Fund, Inc.
Exact name of registrant as specified in charter:
Gateway Center 3,
100 Mulberry Street,
Newark, New Jersey 07102
Address of principal executive offices:
Deborah A. Docs
Gateway Center 3,
100 Mulberry Street,
Newark, New Jersey 07102
Name and address of agent for service:
Registrant’s telephone number, including area code: 800-225-1852
Date of fiscal year end: 10/31/2009
Date of reporting period: 10/31/2009
Item 1 – Reports to Stockholders


| | |
| OCTOBER 31, 2009 | | ANNUAL REPORT |
Dryden Global Total Return Fund, Inc.
FUND TYPE
Global bond
OBJECTIVE
Total return made up of current income and capital appreciation
This report is not authorized for distribution to prospective investors unless preceded or accompanied by a current prospectus.
The views expressed in this report and information about the Fund’s portfolio holdings are for the period covered by this report and are subject to change thereafter.
JennisonDryden, Dryden, Prudential Financial and the Rock Prudential logo are registered service marks of The Prudential Insurance Company of America, Newark, NJ, and its affiliates.

December 15, 2009
Dear Shareholder:
On December 11, 2009, the Board of Directors approved the renaming of JennisonDryden, Prudential Financial’s mutual fund family, to Prudential Investments, effective on or about February 16, 2010. As a result of this change, each of our Funds will be renamed to feature “Prudential” as part of its new name. The name of your Fund will change from Dryden Global Total Return Fund to Prudential Global Total Return Fund.
While the name of your Fund will change, its investment objectives and portfolio management team will remain the same. No action is required on your part. If you participate in an automatic investment plan, your account will continue to be invested in the Fund under its new name.
Featuring the Prudential name in our Funds will create an immediate connection to the experience and heritage of Prudential, a name recognized by millions for helping people grow and protect their wealth.
On the following pages, you will find your Fund’s annual report, including an analysis of its performance over the fiscal year in addition to other data. If you have questions about this information or the renaming of our mutual fund family, please contact your financial professional or visit our website at www.jennisondryden.com.
Sincerely,

Judy A. Rice, President
Dryden Global Total Return Fund, Inc.
| | |
| Dryden Global Total Return Fund, Inc. | | 1 |
Your Fund’s Performance
Fund objective
The investment objective of the Dryden Global Total Return Fund, Inc. is total return made up of current income and capital appreciation. There can be no assurance that the Fund will achieve its investment objective.
Performance data quoted represent past performance. Past performance does not guarantee future results. The investment return and principal value of an investment will fluctuate, so that an investor’s shares, when redeemed, may be worth more or less than their original cost. Current performance may be lower or higher than the past performance data quoted. An investor may obtain performance data as of the most recent month-end by visiting our website at www.jennisondryden.com or by calling (800) 225-1852. The maximum initial sales charge is 4.50% (Class A shares). Gross operating expenses: Class A, 1.56%; Class B, 2.26%; Class C, 2.26%; Class Z, 1.26%. Net operating expenses apply to: Class A, 1.51%; Class B, 2.26%; Class C, 2.01%; Class Z, 1.26%, after contractual reduction of distribution fees for Class A and Class C shares.
| | | | | | | | | |
| Cumulative Total Returns as of 10/31/09 | |
| | | One Year | | | Five Years | | | Ten Years | |
Class A | | 31.42 | % | | 28.13 | % | | 70.25 | % |
Class B | | 30.25 | | | 23.37 | | | 58.94 | |
Class C | | 30.73 | | | 24.89 | | | 61.80 | |
Class Z | | 31.62 | | | 29.70 | | | 74.49 | |
Citigroup WGBI—Unhedged1 | | 16.26 | | | 34.12 | | | 91.45 | |
Lipper Average2 | | 21.19 | | | 27.31 | | | 84.45 | |
| | | | | | | | | |
| Average Annual Total Returns3 as of 9/30/09 | |
| | | One Year | | | Five Years | | | Ten Years | |
Class A | | 14.66 | % | | 4.59 | % | | 4.87 | % |
Class B | | 14.16 | | | 4.59 | | | 4.64 | |
Class C | | 18.56 | | | 5.05 | | | 4.83 | |
Class Z | | 20.44 | | | 5.84 | | | 5.62 | |
Citigroup WGBI—Unhedged1 | | 13.78 | | | 6.65 | | | 6.69 | |
Lipper Average2 | | 12.98 | | | 5.15 | | | 6.19 | |
| | |
| 2 | | Visit our website at www.jennisondryden.com |
| | | | | | |
| Distributions and Yields as of 10/31/09 | | | | | |
| | | Total Distributions
Paid for 12 Months | | 30-Day
SEC Yield | |
Class A | | $ | 0.32 | | 3.20 | % |
Class B | | | 0.27 | | 2.61 | |
Class C | | | 0.29 | | 2.88 | |
Class Z | | | 0.33 | | 3.57 | |
The cumulative total returns do not reflect the deduction of applicable sales charges. If reflected, the applicable sales charges would reduce the cumulative total returns performance quoted. Class A shares are subject to a maximum front-end sales charge of 4.50%. Under certain circumstances, Class A shares may be subject to a contingent deferred sales charge (CDSC) of 1%. Class B and Class C shares are subject to a maximum CDSC of 5% and 1%, respectively. Class Z shares are not subject to a sales charge.
Source: Prudential Investments LLC and Lipper Inc. Performance figures may reflect fee waivers and/or expense reimbursements. In the absence of such fee waivers and/or expense reimbursements, total returns would be lower.
1The Citigroup World Government Bond Index (WGBI)—Unhedged is a market capitalization-weighted index consisting of the government bond markets of 23 countries that are selected based on market capitalization and investability criteria. All issues have a remaining maturity of at least one year.
2The Lipper Global Income Funds Average (Lipper Average) represents returns based on an average return of all funds in the Lipper Global Income Funds category for the periods noted. Funds in the Lipper Average invest primarily in U.S. dollar and non-U.S. dollar debt securities of issuers located in at least three countries, one of which may be the United States.
3The average annual total returns take into account applicable sales charges. Class A, Class B, and Class C shares are subject to an annual distribution and service (12b-1) fee of up to 0.30%, 1.00%, and 1.00%, respectively. Approximately seven years after purchase, Class B shares will automatically convert to Class A shares on a quarterly basis. Class Z shares are not subject to a 12b-1 fee. The returns, distributions, and yields in the tables do not reflect the deduction of taxes that a shareholder would pay on Fund distributions or following the redemption of Fund shares.
Investors cannot invest directly in an index. The returns for Citigroup WGBI—Unhedged would be lower if they included the effects of sales charges, operating expenses of a mutual fund, or taxes. Returns for the Lipper Average reflect the deduction of operating expenses, but not sales charges or taxes.
| | | |
| Five Largest Holdings expressed as a percentage of net assets as of 10/31/09 | | | |
Japanese Government Bonds, 0.800%, 03/20/13 | | 2.4 | % |
Italian Government Bonds, 6.000%, 05/1/31 | | 2.2 | |
Republic of Poland, 5.625%, 6/20/18 | | 2.0 | |
Japanese Government Bonds, 1.100%, 09/20/12 | | 1.8 | |
United Kingdom Treasury Bonds, 4.750%, 12/7/30 | | 1.7 | |
Holdings are subject to change.
| | |
| Dryden Global Total Return Fund, Inc. | | 3 |
Strategy and Performance Overview
How did the Fund perform?
The Dryden Global Total Return Fund’s Class A shares posted a 31.42% total return for the 12-month reporting period ended October 31, 2009, outperforming the 16.26 % total return of the Citigroup World Government Bond Index (WGBI)—Unhedged and the 21.19% total return of the Lipper Global Income Funds Average.
How is the Fund managed?
Prudential Fixed Income Management runs the Fund, which seeks income and capital appreciation by investing in a diversified portfolio of government bonds, mortgage-backed securities, corporate bonds, and other types of debt securities drawn from markets around the world. Bonds may be denominated in U.S. dollars or foreign currencies. The Fund may use a variety of hedging strategies to protect the value of its investments.
Research plays a key role in the Fund’s investment process. Senior investment professionals develop a quarterly market outlook that provides an overall view on the global economy, interest rates, risk levels in major bond markets, and the yield curve. The latter is a single-line graph that depicts the relationship between yields on short-term and long-term bonds. This outlook helps set broad investment strategies for the Fund. Portfolio managers also work closely with a team of 57 research analysts in selecting bonds to buy and sell.
Shortly after the reporting period ended, Michael J. Collins joined Robert Tipp as a co-portfolio manager of the Fund. Both hold the Chartered Financial Analyst designation.
What were conditions like in the global bond markets?
Conditions in the global bond markets improved markedly during the reporting period that began November 1, 2008. A flight to quality that favored high-quality debt securities, such as government securities of economically developed nations, began to fade early in the reporting period and was later replaced by investors’ preference for riskier bonds that provided more attractive yields. This shift occurred as the world financial system began to recover from a crisis of historic proportions, and the global economy emerged from its worst recession since World War II.
The global financial crisis had its roots in a bursting housing bubble in the United States that continued to push up foreclosures and delinquencies on residential mortgages. This put at risk financial institutions in the United States and abroad that held vast amounts of debt securities linked to the troubled home loans. Most notably, the bankruptcy of Lehman Brothers, a U.S. investment bank that was heavily involved in the mortgage industry, caused a sharp escalation in the financial crisis several weeks before the reporting period began.
As the world financial system weakened, commercial banks in some countries became increasingly reluctant to lend to businesses and consumers, trade between nations suffered, and the global economy contracted, with advanced economies such
| | |
| 4 | | Visit our website at www.jennisondryden.com |
as the United States and Japan the hardest hit. Governments and central banks around the world stepped up their efforts to stimulate growth in their respective economies and support their financial systems. Governments spent more than $2 trillion, while central banks repeatedly cut short-term interest rates to lower borrowing costs and purchased corporate bonds, mortgage-backed securities, and certain other debt securities to exert additional downward pressure on interest rates. Also leaders of the Group of 20 Nations greatly increased the International Monetary Fund’s financial capacity to address crises in economically developing countries.
Among the programs launched by the Federal Reserve (the Fed) and the U.S. Department of the Treasury was the Term Asset-Backed Securities Loan Facility (TALF), which provides loans on favorable terms to investors who purchase high-quality debt securities backed by credit card debt, auto loans, student loans, commercial mortgages, and certain other types of loans and leases. Sales of these debt securities play an important role in keeping credit flowing to businesses and consumers in the United States.
Programs such as TALF and the return of the global economy to positive growth in 2009 boosted investors’ confidence in assets that carry greater credit risk than government securities of economically developed nations. Investors were also seeking bonds that provided more attractive yields in the low interest-rate environment. This fueled a strong rally in prices of asset-backed securities, commercial mortgage-backed securities, investment-grade corporate bonds, high yield corporate bonds, commonly called “junk” bonds because they are rated below investment grade, and emerging market bonds, debt securities of issuers in economically developing nations. For the reporting period, these markets outperformed the Citigroup WGBI—Unhedged, which includes government bond markets of the United States and 22 other nations with advanced economies.
What were conditions like in the global currency markets?
Initially, a flight to quality in the foreign exchange markets largely favored the U.S. dollar, the world’s reserve currency. However, the safe-haven appeal faded and the greenback lost ground to a variety of currencies as investors seeking higher yields favored riskier assets. The U.S. dollar also weakened on the view that some nations would begin to tighten monetary policy before the Fed, which left its target for the overnight bank lending rate at a record low range of zero to 0.25% since December 2008. Indeed, the Reserve Bank of Australia raised its cash rate by a quarter of a percentage point to 3.25% in October 2009. It cited stronger-than-expected economic conditions and a recovery in measures of confidence in the commodity-rich nation that is a major trading partner with China. The Australian dollar was among the currencies that gained sharply against the U.S. dollar during the reporting period. From its peak on March 5, 2009 to October 31, 2009, the U.S. dollar depreciated 16.4% versus a basket of currencies.
| | |
| Dryden Global Total Return Fund, Inc. | | 5 |
Strategy and Performance Overview (continued)
How did the Fund’s allocation to global bond markets affect its performance?
The Fund maintained positions in many of the government bond markets included in the Citigroup WGBI—Unhedged. However, its solid 12-month total return and its strong relative performance largely reflected its holdings in bond markets not included in the Citigroup WGBI—Unhedged that outperformed it for the reporting period. The Fund had exposure to investment-grade corporate bond markets in the United States and abroad. It also had positions in the markets for high yield corporate bonds and commercial mortgage-backed securities in the United States as well as emerging market bonds of select nations. Of these positions, the largest positive contribution was made by the Fund’s exposure to the investment-grade corporate bond market where it emphasized debt securities in the Baa rating category, the lowest in that market under the rating methodology of Moody’s Investors Service. In keeping with the strong preference for riskier assets, investment-grade corporate bonds rated Baa easily outperformed more highly rated corporate bonds for the reporting period.
How did the Fund’s foreign exchange strategy affect its performance?
The Fund’s currency strategy contributed positively to its performance. It benefited from having a smaller exposure than the Citigroup WGBI—Unhedged to the U.S. dollar and a larger exposure to a variety of other currencies. For example, the Fund had overweight positions in commodity-linked currencies such as the Australian dollar, the New Zealand dollar, the Canadian dollar, and the Norwegian krone that strengthened as prices of commodities rose reflecting improving global economic conditions and speculative pressures. Among currencies of other economically developed nations, the Fund had positions in the British pound and the Swedish krona that also made positive contributions to its performance.
The Fund also benefited from select exposure to currencies of emerging market nations, some of which strengthened versus the U.S. dollar. The Fund’s emerging market currency exposure included the Brazilian real, the South African rand, the Turkish lira, the Hungarian forint, and the Polish zloty.
What effect did issue selection have on the Fund’s performance?
Prudent issue selection, such as the Fund’s previously mentioned emphasis on corporate bonds in the Baa rating category, made a positive contribution to its performance. In addition, the Fund benefited from favoring government bond markets that provided higher yields than higher quality government bond markets that provided lower yields. Specifically, it had larger exposures to the government bonds of Hungary and Latin American nations than to the government bonds of Poland, Malaysia, and Singapore.
| | |
| 6 | | Visit our website at www.jennisondryden.com |
Fees and Expenses (Unaudited)
As a shareholder of the Fund, you incur two types of costs: (1) transaction costs, including sales charges (loads) on purchase payments and redemptions, as applicable, and (2) ongoing costs, including management fees, distribution and/or service (12b-1) fees, and other Fund expenses, as applicable. This example is intended to help you understand your ongoing costs (in dollars) of investing in the Fund and to compare these costs with the ongoing costs of investing in other mutual funds.
The example is based on an investment of $1,000 invested on May 1, 2009, at the beginning of the period, and held through the six-month period ended October 31, 2009. The example is for illustrative purposes only; you should consult the Prospectus for information on initial and subsequent minimum investment requirements.
The Fund’s transfer agent may charge additional fees to holders of certain accounts that are not included in the expenses shown in the table on the following page. These fees apply to individual retirement accounts (IRAs) and Section 403(b) accounts. As of the close of the six-month period covered by the table, IRA fees included an annual maintenance fee of $15 per account (subject to a maximum annual maintenance fee of $25 for all accounts held by the same shareholder). Section 403(b) accounts are charged an annual $25 fiduciary maintenance fee. Some of the fees may vary in amount, or may be waived, based on your total account balance or the number of JennisonDryden funds, including the Fund, that you own. You should consider the additional fees that were charged to your Fund account over the six-month period when you estimate the total ongoing expenses paid over the period and the impact of these fees on your ending account value, as these additional expenses are not reflected in the information provided in the expense table. Additional fees have the effect of reducing investment returns.
Actual Expenses
The first line for each share class in the table on the following page provides information about actual account values and actual expenses. You may use the information on this line, together with the amount you invested, to estimate the expenses that you paid over the period. Simply divide your account value by $1,000 (for example, an $8,600 account value ÷ $1,000 = 8.6), then multiply the result by the number on the first line under the heading “Expenses Paid During the Six-Month Period” to estimate the expenses you paid on your account during this period.
| | |
| Dryden Global Total Return Fund, Inc. | | 7 |
Fees and Expenses (continued)
Hypothetical Example for Comparison Purposes
The second line for each share class in the table below provides information about hypothetical account values and hypothetical expenses based on the Fund’s actual expense ratio and an assumed rate of return of 5% per year before expenses, which is not the Fund’s actual return. The hypothetical account values and expenses may not be used to estimate the actual ending account balance or expenses you paid for the period. You may use this information to compare the ongoing costs of investing in the Fund and other funds. To do so, compare this 5% hypothetical example with the 5% hypothetical examples that appear in the shareholder reports of the other funds.
Please note that the expenses shown in the table are meant to highlight your ongoing costs only and do not reflect any transactional costs such as sales charges (loads). Therefore, the second line for each share class in the table is useful in comparing ongoing costs only and will not help you determine the relative total costs of owning different funds. In addition, if these transactional costs were included, your costs would have been higher.
| | | | | | | | | | | | | | |
Dryden Global Total
Return Fund, Inc. | | Beginning Account
Value
May 1, 2009 | | Ending Account
Value
October 31, 2009 | | Annualized
Expense Ratio
Based on the
Six-Month Period | | | Expenses Paid
During the
Six-Month Period* |
| | | | | | | | | | | | | | |
| Class A | | Actual | | $ | 1,000.00 | | $ | 1,216.10 | | 1.35 | % | | $ | 7.54 |
| | | Hypothetical | | $ | 1,000.00 | | $ | 1,018.40 | | 1.35 | % | | $ | 6.87 |
| | | | | | | | | | | | | | |
| Class B | | Actual | | $ | 1,000.00 | | $ | 1,211.80 | | 2.10 | % | | $ | 11.71 |
| | | Hypothetical | | $ | 1,000.00 | | $ | 1,014.62 | | 2.10 | % | | $ | 10.66 |
| | | | | | | | | | | | | | |
| Class C | | Actual | | $ | 1,000.00 | | $ | 1,214.20 | | 1.85 | % | | $ | 10.32 |
| | | Hypothetical | | $ | 1,000.00 | | $ | 1,015.88 | | 1.85 | % | | $ | 9.40 |
| | | | | | | | | | | | | | |
| Class Z | | Actual | | $ | 1,000.00 | | $ | 1,216.80 | | 1.10 | % | | $ | 6.15 |
| | | Hypothetical | | $ | 1,000.00 | | $ | 1,019.66 | | 1.10 | % | | $ | 5.60 |
| | | | | | | | | | | | | | |
* Fund expenses (net of fee waivers or subsidies, if any) for each share class are equal to the annualized expense ratio for each share class (provided in the table), multiplied by the average account value over the period, multiplied by the 184 days in the six-month period ended October 31, 2009, and divided by 365 days to reflect the six-month period. Expenses presented in the table include the expenses of any underlying portfolios in which the Fund may invest.
| | |
| 8 | | Visit our website at www.jennisondryden.com |
Portfolio of Investments
as of October 31, 2009
| | | | | | |
Principal
Amount (000) | | Description | | Value (Note 1) |
| | | | | | |
| LONG-TERM INVESTMENTS 97.9% |
|
| Australia 0.8% |
| AUD | 1,240 | | GE Capital Australia Funding, Gtd. Notes, M.T.N.,
6.000%, 4/15/15 | | $ | 1,020,657 |
| | | | | | |
|
| Brazil 2.2% |
| BRL | 1,000 | | Banco Bradesco SA, Sr. Unsub. Notes,
14.800%, 1/4/10 | | | 571,679 |
| | 1,000 | | Brazil Notas do Tesouro Nacional Serie F, Notes,
10.000%, 1/1/14 | | | 521,208 |
| | 2,850 | | Cia Energetica de Sao Paulo, Sr. Notes, M.T.N., 144A
9.750%, 1/15/15 | | | 1,612,996 |
| | | | | | |
| | | | | | 2,705,883 |
| | | | | | |
|
| Colombia 0.1% |
| CO | P 345,000 | | Republic of Colombia,
9.850%, 6/28/27 | | | 192,357 |
| | | | | | |
|
| Denmark 0.8% |
| DKK | 5,000 | | Denmark Government Bond,
4.000%, 11/15/17 | | | 1,025,904 |
| | | | | | |
|
| Eurobonds 13.0% |
| EUR | 150 | | Belgium Government Bond,
4.000%, 3/28/17 | | | 231,125 |
| | 150 | | Citigroup, Inc., Sub. Notes, M.T.N.,
4.750%, 5/31/17(d) | | | 190,252 |
| | 100 | | Deutsche Bundesrepublik,
3.750%, 1/4/19 | | | 153,472 |
| | 300 | | Fortis Bank, Jr. Sub. Notes,
6.500%, 9/29/49(d) | | | 410,590 |
| | 410 | | French Government Bonds,
4.000%, 10/25/38 | | | 585,932 |
| | 600 | | 5.750%, 10/25/32 | | | 1,085,414 |
| | 1,000 | | Hellenic Republic Government Bonds,
4.000%, 8/20/13 | | | 1,520,905 |
| | 570 | | 4.300%, 7/20/17 | | | 848,705 |
See Notes to Financial Statements.
| | |
| Dryden Global Total Return Fund, Inc. | | 9 |
Portfolio of Investments
as of October 31, 2009 continued
| | | | | | |
Principal
Amount (000) | | Description | | Value (Note 1) |
| | | | | | |
| Eurobonds (cont’d.) |
| EUR | 530 | | Italian Government Bonds,
4.000%, 2/1/17 | | $ | 814,277 |
| | 1,000 | | 4.250%, 4/15/13 | | | 1,562,391 |
| | 1,130 | | 4.500%, 2/1/18 | | | 1,775,180 |
| | 1,625 | | 6.000%, 5/1/31 | | | 2,760,115 |
| | 500 | | Portugal Obrigacoes do Tesouro OT,
4.450%, 6/15/18 | | | 783,072 |
| | 1,600 | | Republic of Poland,
5.625%, 6/20/18 | | | 2,507,689 |
| | 560 | | Spanish Government Bond,
5.750%, 7/30/32 | | | 966,622 |
| | | | | | |
| | | | | | 16,195,741 |
| | | | | | |
|
| Hungary 1.6% |
| | | Hungary Government Bonds, | | | |
| HUF | 80,000 | | 6.500%, 6/24/19 | | | 399,975 |
| | 200,000 | | 6.750%, 2/24/17 | | | 1,027,028 |
| | 110,000 | | 8.000%, 2/12/15 | | | 604,782 |
| | | | | | |
| | | | | | 2,031,785 |
| | | | | | |
|
| Japan 9.5% |
| | | Japanese Government Bonds, | | | |
| JPY | 265,000 | | 0.800%, 3/20/13 | | | 2,978,687 |
| | 200,000 | | 1.100%, 9/20/12 | | | 2,267,831 |
| | 104,050 | | 1.700%, 6/20/33 | | | 1,039,929 |
| | 79,000 | | 2.100%, 9/20/24 | | | 904,290 |
| | 140,000 | | 2.300%, 3/20/26 | | | 1,629,187 |
| | 94,000 | | 2.500%, 9/20/37 | | | 1,097,803 |
| | | Japanese Government CPI Linked Bond, | | | |
| | 183,705 | | 1.400%, 6/10/18 | | | 1,896,948 |
| | | | | | |
| | | | | | 11,814,675 |
| | | | | | |
|
| Norway 0.2% |
| | | Norwegian Government & Sovereign Bond, | | | |
| NOK | 1,470 | | 5.000%, 5/15/15 | | | 272,512 |
| | | | | | |
|
| Sweden 0.4% |
| | | Sweden Government Bond, | | | |
| SEK | 2,860 | | 6.750%, 5/5/14 | | | 473,988 |
| | | | | | |
See Notes to Financial Statements.
| | |
| 10 | | Visit our website at www.jennisondryden.com |
| | | | | | |
Principal
Amount (000) | | Description | | Value (Note 1) |
| | | | | | |
| Turkey 0.6% |
| | | Turkey Government Bonds, | | | |
| TRY | 1,000 | | 16.000%, 3/7/12 | | $ | 756,029 |
| | | | | | |
|
| United Kingdom 5.0% |
| | | International Nederland Bank NV, Sub. Notes, M.T.N., | | | |
| GBP | 410 | | 7.000%, 10/5/10 | | | 693,523 |
| | | QBE Insurance Group Ltd., Sr. Unsub. Notes, | | | |
| | 140 | | 10.000%, 3/14/14 | | | 267,425 |
| | | United Kingdom Treasury Bonds, | | | |
| | 425 | | 4.250%, 6/7/32 | | | 710,821 |
| | 1,070 | | 4.500%, 3/7/13 | | | 1,884,288 |
| | 1,220 | | 4.750%, 12/7/30(b) | | | 2,171,428 |
| | 190 | | 4.750%, 12/7/38 | | | 343,817 |
| | 95 | | 6.000%, 12/7/28 | | | 195,889 |
| | | | | | |
| | | | | | 6,267,191 |
| | | | | | |
| United States 63.7% |
|
| Asset-Backed Securities 3.6% |
| | | BA Credit Card Trust,
Ser. 2006-A7, Class A7, | | | |
| USD | 459 | | 0.285%, 12/15/16(d) | | | 438,435 |
| | | Citibank Credit Card Issuance Trust, Ser. 2005-A3, Class A3, | | | |
| | 500 | | 0.314%, 4/24/14(d) | | | 493,656 |
| | | Ser. 2005-C2, Class C2 | | | |
| | 500 | | 0.714%, 3/24/17(d) | | | 425,294 |
| | | Ser. 2005-C3, Class C3, | | | |
| | 300 | | 0.655%, 7/15/14(d) | | | 276,778 |
| | | Ser. 2006-C1, Class C1 | | | |
| | 1,000 | | 0.645%, 2/20/15(d) | | | 906,468 |
| | | MBNA Credit Card Master Note Trust, Ser. 2002-C3, Class C3, | | | |
| | 200 | | 1.595%, 10/15/14(d) | | | 188,933 |
| | | Ser. 2004-C2, Class C2, | | | |
| | 1,000 | | 1.145%, 11/15/16(d) | | | 861,607 |
| | | Ser. 2005-A10, Class A10, | | | |
| | 600 | | 0.305%, 11/16/15(d) | | | 580,488 |
| | | Ser. 2006-C1, Class C1, | | | |
| | 200 | | 0.665%, 7/15/15(d) | | | 179,477 |
| | | Railcar Leasing LLC, Ser. 1, Class A2, 144A | | | |
| | 208 | | 7.125%, 1/15/13 | | | 213,731 |
| | | | | | |
| | | | | | 4,564,867 |
| | | | | | |
See Notes to Financial Statements.
| | |
| Dryden Global Total Return Fund, Inc. | | 11 |
Portfolio of Investments
as of October 31, 2009 continued
| | | | | | |
Principal
Amount (000) | | Description | | Value (Note 1) |
| | | | | | |
| Bank Loans(c)(d) 4.3% |
| | | Capital Safety Group Ltd., | | | |
| USD | 82 | | 2.493%, 7/20/15 | | $ | 67,117 |
| | 218 | | 2.993%, 7/20/16 | | | 178,883 |
| | | Davita, Inc., | | | |
| | 300 | | 1.759%, 10/5/12 | | | 287,167 |
| | | Discovery Communications, Inc., | | | |
| | 119 | | 5.250%, 5/14/14 | | | 120,967 |
| | | Domtar Corp., | | | |
| | 393 | | 1.620%, 3/5/14 | | | 373,366 |
| | | Enterprise Group Holdings LP, | | | |
| | 297 | | 2.518%, 11/8/14 | | | 285,120 |
| | | Fidelity National Information Services, | | | |
| | 54 | | 4.473%, 1/18/12 | | | 53,286 |
| | | First Data Corp., | | | |
| | 294 | | 2.997%, 9/24/14 | | | 252,432 |
| | | Flextronics International Ltd., | | | |
| | 228 | | 2.519%, 10/1/14 | | | 210,676 |
| | 66 | | 2.534%, 10/1/14 | | | 60,539 |
| | | Georgia Pacific, | | | |
| | 152 | | 2.316%, 12/20/12 | | | 145,893 |
| | | HCA, Inc., | | | |
| | 223 | | 2.533%, 11/18/13 | | | 207,627 |
| | | Inverness Medical Innovations, | | | |
| | 342 | | 2.260%, 6/26/14 | | | 322,453 |
| | | Metavante Corp., | | | |
| | 131 | | 3.733%, 11/1/14 | | | 130,054 |
| | | Motorcity Casino, | | | |
| | 164 | | 8.500%, 7/13/12 | | | 155,298 |
| | | Mylan, Inc., | | | |
| | 194 | | 3.550%, 10/2/14 | | | 188,400 |
| | | NRG Energy, Inc., | | | |
| | 146 | | 0.183%, 2/1/13 | | | 137,529 |
| | 272 | | 2.021%, 2/1/13 | | | 255,743 |
| | | PTS Acquisitions Corp., | | | |
| | 391 | | 2.493%, 4/10/14 | | | 338,215 |
| | | Royalty Pharma Finance Trust, | | | |
| | 659 | | 2.533%, 4/16/13 | | | 640,132 |
| | | Sensata Technologies, | | | |
| | 108 | | 2.031%, 4/27/13 | | | 92,575 |
| | | Sungard Data Systems, Inc., | | | |
| | 7 | | 1.994%, 2/28/14 | | | 6,209 |
| | 169 | | 4.074%, 2/28/16 | | | 163,792 |
See Notes to Financial Statements.
| | |
| 12 | | Visit our website at www.jennisondryden.com |
| | | | | | |
Principal
Amount (000) | | Description | | Value (Note 1) |
| | | | | | |
| Bank Loans(c)(d) (cont’d.) |
| | | Sun Healthcare Group, | | | |
| USD | 48 | | 0.183%, 4/11/14 | | $ | 45,349 |
| | 230 | | 2.522%, 4/11/14 | | | 215,945 |
| | | Warner Chilcott Corp., | | | |
| | 153 | | 5.500%, 10/30/14 | | | 152,685 |
| | 76 | | 5.750%, 4/30/15 | | | 76,343 |
| | 168 | | 5.750%, 4/30/15 | | | 167,954 |
| | 53 | | 5.750%, 4/30/15 | | | 53,440 |
| | | | | | |
| | | | | | 5,385,189 |
| | | | | | |
|
| Commercial Mortgage-Backed Securities 7.7% |
| | | Commercial Mortgage Loan Trust,
Ser. 2008-LS1, Class A2, | | | |
| | 430 | | 6.019%, 12/10/49(d) | | | 441,393 |
| | | Credit Suisse Mortgage Capital Certificates,
Ser. 2007-C5, Class A2, | | | |
| | 650 | | 5.589%, 9/15/40 | | | 649,101 |
| | | CS First Boston Mortgage Securities Corp.,
Ser. 2005-C5, Class A4, | | | |
| | 600 | | 5.100%, 8/15/38(d) | | | 585,594 |
| | | CW Capital Cobalt Ltd.,
Ser. 2007-C3, Class A3, | | | |
| | 400 | | 5.820%, 5/15/46(d) | | | 375,668 |
| | | Greenwich Capital Commercial Funding Corp.,
Ser. 2005-GG5, Class A5, | | | |
| | 600 | | 5.224%, 4/10/37(d) | | | 579,849 |
| | | Ser. 2007-GG9, Class A2, | | | |
| | 650 | | 5.381%, 3/10/39 | | | 659,893 |
| | | JPMorgan Chase Commercial Mortgage Securities Corp.,
Ser. 2005-LDP4, Class A3A1, | | | |
| | 545 | | 4.871%, 10/15/42 | | | 546,621 |
| | | Ser. 2005-LDP5, Class A4, | | | |
| | 1,000 | | 5.179%, 12/15/44(d) | | | 1,004,117 |
| | | Ser. 2007-LD12, Class A2, | | | |
| | 650 | | 5.827%, 2/15/51 | | | 662,298 |
| | | LB-UBS Commercial Mortgage Trust,
Ser. 2007-C6, Class A2, | | | |
| | 2,000 | | 5.845%, 7/15/40 | | | 2,025,056 |
| | | Merrill Lynch Mortgage Trust,
Ser. 2008-C1, Class A2, | | | |
| | 650 | | 5.425%, 2/12/51 | | | 629,230 |
See Notes to Financial Statements.
| | |
| Dryden Global Total Return Fund, Inc. | | 13 |
Portfolio of Investments
as of October 31, 2009 continued
| | | | | | |
Principal
Amount (000) | | Description | | Value (Note 1) |
| | | | | | |
| Commercial Mortgage-Backed Securities (cont’d.) |
| | | Morgan Stanley Capital 1,
Ser. 2005-IQ9, Class A4, | | | |
| USD | 740 | | 4.660%, 7/15/56 | | $ | 729,144 |
| | | Wachovia Bank Commercial Mortgage Trust,
Ser. 2007-C34, Class A2, | | | |
| | 650 | | 5.569%, 5/15/46 | | | 663,496 |
| | | | | | |
| | | | | | 9,551,460 |
| | | | | | |
|
| Corporate Bonds 35.6% |
| | | Abbott Laboratories, Sr. Unsec’d. Notes, | | | |
| | 150 | | 6.000%, 4/1/39 | | | 165,309 |
| | | AES Corp. (The), Sr. Unsec’d. Notes, | | | |
| | 250 | | 8.000%, 10/15/17 | | | 251,250 |
| | | Affiliated Computer Services, Inc., Sr. Unsec’d. Notes, | | | |
| | 350 | | 4.700%, 6/1/10 | | | 351,750 |
| | | Allergan, Inc., Sr. Unsec’d. Notes, | | | |
| | 150 | | 5.750%, 4/1/16 | | | 160,121 |
| | | Alliance Imaging, Inc., Sr. Sub. Notes, | | | |
| | 70 | | 7.250%, 12/15/12 | | | 68,250 |
| | | Allied World Insurance Holdings Ltd. (Bermuda)
Sr. Unsec’d. Notes, | | | |
| | 250 | | 7.500%, 8/1/16 | | | 260,716 |
| | | Altria Group, Inc., Gtd. Notes, | | | |
| | 250 | | 9.950%, 11/10/38 | | | 326,051 |
| | | American Express Co., Sr. Unsec’d. Notes, | | | |
| | 140 | | 8.125%, 5/20/19 | | | 167,542 |
| | | American International Group, Inc., Sr. Unsec’d. Notes, M.T.N., | | | |
| | 300 | | 5.850%, 1/16/18 | | | 226,006 |
| | | American Tower Corp., Sr. Unsec’d. Notes, | | | |
| | 140 | | 7.125%, 10/15/12 | | | 142,275 |
| | | Amphenol Corp., Gtd. Notes, | | | |
| | 250 | | 4.750%, 11/15/14 | | | 251,440 |
| | | Anheuser-Busch InBev Worldwide, Inc., Gtd. Notes, 144A, | | | |
| | 250 | | 4.125%, 1/15/15 | | | 252,072 |
| | 225 | | 8.000%, 11/15/39 | | | 278,428 |
| | | ArcelorMittal (Luxembourg) Sr. Unsec’d. Notes, | | | |
| | 250 | | 6.125%, 6/1/18 | | | 246,925 |
| | | Arrow Electronics, Inc., Sr. Unsec’d. Notes, | | | |
| | 350 | | 6.000%, 4/1/20 | | | 347,574 |
See Notes to Financial Statements.
| | |
| 14 | | Visit our website at www.jennisondryden.com |
| | | | | | |
Principal
Amount (000) | | Description | | Value (Note 1) |
| | | | | | |
| Corporate Bonds (cont’d.) |
| | | Ashtead Holdings PLC (United Kingdom) 144A, Sec’d. Notes, | | | |
| USD | 400 | | 8.625%, 8/1/15 | | $ | 394,000 |
| | | Axis Capital Holdings Ltd. (Bermuda), Sr. Unsec’d. Notes, | | | |
| | 400 | | 5.750%, 12/1/14 | | | 408,630 |
| | | BAE Systems Holdings, Inc., Gtd. Notes, 144A, | | | |
| | 125 | | 6.375%, 6/1/19 | | | 137,049 |
| | | Ball Corp., Gtd. Notes, | | | |
| | 130 | | 7.125%, 9/1/16 | | | 132,925 |
| | | Bank of America Corp., Sub. Notes, | | | |
| | 400 | | 4.750%, 8/15/13 | | | 408,032 |
| | | Bear Stearns Cos., Inc., (The), Sr. Unsec’d. Notes, | | | |
| | 200 | | 7.250%, 2/1/18 | | | 228,763 |
| | | Blackstone Holdings Finance Co. LLC, Gtd. Notes, 144A | | | |
| | 135 | | 6.625%, 8/15/19 | | | 136,095 |
| | | Block Financial LLC, Gtd. Notes, | | | |
| | 750 | | 7.875%, 1/15/13 | | | 833,041 |
| | | Blount, Inc., Gtd. Notes, | | | |
| | 300 | | 8.875%, 8/1/12 | | | 305,250 |
| | | Boeing Co. (The), Sr. Unsec’d. Notes, | | | |
| | 130 | | 6.875%, 3/15/39 | | | 154,805 |
| | | Bottling Group LLC, Gtd. Notes, | | | |
| | 75 | | 5.125%, 1/15/19 | | | 79,362 |
| | | British Telecommunications PLC (United Kingdom),
Sr. Unsec’d. Notes, | | | |
| | 500 | | 9.125%, 12/15/10 | | | 538,445 |
| | | Cablevision Systems Corp., Sr. Notes, 144A | | | |
| | 325 | | 8.625%, 9/15/17 | | | 336,375 |
| | | Canadian Pacific Railway Co. (Canada), Sr. Unsec’d. Notes, | | | |
| | 77 | | 6.500%, 5/15/18 | | | 84,369 |
| | | Capital One Financial Corp., Sub. Notes, | | | |
| | 115 | | 6.150%, 9/1/16 | | | 114,394 |
| | | CareFusion Corp., Sr. Notes, 144A, | | | |
| | 125 | | 6.375%, 8/1/19 | | | 134,811 |
| | | Caterpillar Financial Services Corp., Sr. Unsec’d. Notes, M.T.N., | | | |
| | 145 | | 5.850%, 9/1/17 | | | 156,450 |
| | | CBS Corp., Gtd. Notes, | | | |
| | 500 | | 8.200%, 5/15/14 | | | 556,862 |
| | | CC Holdings GS V LLC/Crown Castle GS III Corp.,
Sr. Sec’d. Notes, 144A, | | | |
| | 300 | | 7.750%, 5/1/17 | | | 315,000 |
See Notes to Financial Statements.
| | |
| Dryden Global Total Return Fund, Inc. | | 15 |
Portfolio of Investments
as of October 31, 2009 continued
| | | | | | |
Principal
Amount (000) | | Description | | Value (Note 1) |
| | | | | | |
| Corporate Bonds (cont’d.) |
| | | Cenovus Energy, Inc. (Canada), Sr. Notes, 144A | | | |
| USD | 225 | | 6.750%, 11/15/39 | | $ | 245,816 |
| | | CenterPoint Energy Resources Corp., Sr. Unsec’d. Notes, | | | |
| | 200 | | 6.625%, 11/1/37 | | | 202,272 |
| | | Chubb Corp., Sr. Unsec’d. Notes, | | | |
| | 100 | | 6.500%, 5/15/38 | | | 115,269 |
| | | Citigroup, Inc., Sr. Unsec’d. Notes, | | | |
| | 600 | | 6.500%, 8/19/13 | | | 643,169 |
| | 110 | | 8.125%, 7/15/39 | | | 128,003 |
| | | CMS Energy Corp., Sr. Unsec’d. Notes, | | | |
| | 400 | | 8.500%, 4/15/11 | | | 418,491 |
| | | ConAgra Foods, Inc., Sr. Unsec’d. Notes, | | | |
| | 250 | | 7.000%, 4/15/19 | | | 291,581 |
| | | Continental Airlines, Inc., Pass-thru Certs., | | | |
| | 720 | | 7.487%, 10/2/10 | | | 709,200 |
| | | Coventry Health Care, Inc., Sr. Unsec’d. Notes, | | | |
| | 360 | | 6.125%, 1/15/15 | | | 348,040 |
| | | Covidien International Finance SA (Luxembourg), Gtd. Notes, | | | |
| | 50 | | 6.550%, 10/15/37 | | | 58,277 |
| | | CRH America, Inc., Gtd. Notes, | | | |
| | 500 | | 5.625%, 9/30/11 | | | 528,009 |
| | 110 | | 8.125%, 7/15/18 | | | 127,017 |
| | | CVS Caremark Corp., Sr. Unsec’d. Notes, | | | |
| | 200 | | 6.125%, 9/15/39 | | | 202,040 |
| | | Delta Air Lines, Inc., Pass-Thru Certs., | | | |
| | 263 | | 6.821%, 8/10/22 | | | 248,162 |
| | | Diageo Capital PLC (United Kingdom), Gtd. Notes, | | | |
| | 255 | | 5.200%, 1/30/13 | | | 273,432 |
| | | DirecTV Holdings LLC/DirecTV Financing Co., Inc.,
Gtd. Notes, 144A, | | | |
| | 300 | | 4.750%, 10/1/14 | | | 306,052 |
| | | Dow Chemical Co. (The), Sr. Unsec’d. Notes, | | | |
| | 75 | | 5.900%, 2/15/15 | | | 77,587 |
| | 250 | | 7.600%, 5/15/14 | | | 277,765 |
| | 300 | | 8.550%, 5/15/19 | | | 342,487 |
| | 175 | | 9.400%, 5/15/39 | | | 215,267 |
| | 350 | | Duke Energy Corp., Sr. Unsec’d. Notes,
6.300%, 2/1/14 | | | 387,002 |
| | | Duke Energy Field Services LLC, Sr. Unsec’d. Notes, | | | |
| | 440 | | 7.875%, 8/16/10 | | | 461,530 |
See Notes to Financial Statements.
| | |
| 16 | | Visit our website at www.jennisondryden.com |
| | | | | | |
Principal
Amount (000) | | Description | | Value (Note 1) |
| | | | | | |
| Corporate Bonds (cont’d.) |
| | | Duke Realty LP, Sr. Unsec’d. Notes, | | | |
| USD | 600 | | 5.625%, 8/15/11 | | $ | 610,607 |
| | | Embarq Corp., Sr. Unsec’d. Notes, | | | |
| | 850 | | 7.082%, 6/1/16 | | | 928,591 |
| | | Enel Finance International SA (Luxembourg), Gtd. Notes, 144A | | | |
| | 300 | | 6.000%, 10/7/39 | | | 306,907 |
| | | Energy Transfer Partners LP, Sr. Unsec’d. Notes, | | | |
| | 125 | | 7.500%, 7/1/38 | | | 145,886 |
| | 100 | | 9.000%, 4/15/19 | | | 120,827 |
| | 300 | | Erac USA Finance Co., Gtd. Notes, 144A,
5.900%, 11/15/15(c)(f)
(original cost $244,500; date purchased 05/08/09) | | | 304,730 |
| | | Express Scripts, Inc., Gtd. Notes, | | | |
| | 300 | | 6.250%, 6/15/14 | | | 329,623 |
| | | Felcor Lodging LP, Sr. Sec’d. Notes, 144A, | | | |
| | 250 | | 10.000%, 10/1/14 | | | 246,875 |
| | | FirstEnergy Solutions Corp., Gtd. Notes, 144A | | | |
| | 245 | | 6.050%, 8/15/21 | | | 252,429 |
| | | Frontier Communications Corp., Sr. Unsec’d. Notes, | | | |
| | 200 | | 8.250%, 5/1/14 | | | 205,000 |
| | | GameStop Corp./GameStop, Inc., Gtd. Notes, | | | |
| | 250 | | 8.000%, 10/1/12 | | | 257,813 |
| | | Gannett Co., Inc., Sr. Unsec’d. Notes | | | |
| | 225 | | 5.750%, 6/1/11 | | | 220,500 |
| | | Goldman Sachs Group, Inc. (The), Sr. Unsec’d. Notes, | | | |
| | 190 | | 6.250%, 9/1/17 | | | 203,281 |
| | 300 | | 6.750%, 10/1/37 | | | 315,978 |
| | | Graphic Packaging International, Inc., Gtd. Notes, 144A, | | | |
| | 170 | | 9.500%, 6/15/17 | | | 178,500 |
| | | Halliburton Co., Sr. Unsec’d. Notes, | | | |
| | 100 | | 7.450%, 9/15/39 | | | 124,621 |
| | | HCA, Inc., Sec’d. Notes, PIK | | | |
| | 210 | | 9.625%, 11/15/16 | | | 222,863 |
| | | Hess Corp., Sr. Unsec’d. Notes, | | | |
| | 295 | | 7.000%, 2/15/14 | | | 332,071 |
| | | Hewlett-Packard Co., Sr. Unsec’d. Notes, | | | |
| | 150 | | 6.500%, 7/1/12 | | | 167,367 |
| | | Historic TW, Inc., Gtd. Notes, | | | |
| | 130 | | 6.625%, 5/15/29 | | | 131,693 |
| | | Hospira, Inc., Sr. Unsec’d. Notes, | | | |
| | 150 | | 5.550%, 3/30/12 | | | 160,975 |
See Notes to Financial Statements.
| | |
| Dryden Global Total Return Fund, Inc. | | 17 |
Portfolio of Investments
as of October 31, 2009 continued
| | | | | | |
Principal
Amount (000) | | Description | | Value (Note 1) |
| | | | | | |
| Corporate Bonds (cont’d.) |
| | | Hospitality Properties Trust, Sr. Unsec’d. Notes, | | | |
| | USD250 | | 7.875%, 8/15/14 | | $ | 257,110 |
| | | HSBC Holdings PLC (United Kingdom), Sub. Notes | | | |
| | 225 | | 6.500%, 9/15/37 | | | 246,614 |
| | 150 | | 6.800%, 6/1/38 | | | 172,193 |
| | | International Paper Co., Sr. Unsec’d. Notes | | | |
| | 150 | | 7.500%, 8/15/21 | | | 164,264 |
| | | John Deere Capital Corp., Sr. Unsec’d. Notes, M.T.N., | | | |
| | 200 | | 5.250%, 10/1/12 | | | 217,347 |
| | | JPMorgan Chase & Co., Sr. Unsec’d. Notes, | | | |
| | 150 | | 6.000%, 1/15/18 | | | 160,599 |
| | 200 | | 6.300%, 4/23/19 | | | 219,502 |
| | | Kinder Morgan Energy Partners LP, Sr. Unsec’d. Notes, | | | |
| | 100 | | 5.850%, 9/15/12 | | | 107,773 |
| | 170 | | 6.500%, 9/1/39 | | | 173,154 |
| | 170 | | 7.300%, 8/15/33 | | | 184,371 |
| | | Kraft Foods, Inc., Sr. Unsec’d. Notes, | | | |
| | 125 | | 6.875%, 2/1/38 | | | 135,110 |
| | | L-3 Communications Corp., Gtd. Notes, | | | |
| | 400 | | 7.625%, 6/15/12 | | | 405,080 |
| | | Lehman Brothers Holdings, Inc., Sr. Unsec’d. Notes, M.T.N., | | | |
| | 100 | | 6.875%, 5/2/18(e) | | | 16,125 |
| | | Lennar Corp., Gtd. Notes, | | | |
| | 300 | | 5.950%, 10/17/11 | | | 301,500 |
| | | Liberty Mutual Group, 144A, Sr. Unsec’d. Notes, | | | |
| | 70 | | 7.500%, 8/15/36 | | | 61,060 |
| | | Lincoln National Corp., Sr. Unsec’d. Notes, | | | |
| | 80 | | 6.150%, 4/7/36 | | | 73,108 |
| | 200 | | 8.750%, 7/1/19 | | | 232,861 |
| | | Lorillard Tobacco Co., Sr. Unsec’d. Notes, | | | |
| | 200 | | 8.125%, 6/23/19 | | | 222,373 |
| | | Masco Corp., Sr. Unsec’d. Notes | | | |
| | 260 | | 7.125%, 8/15/13 | | | 271,390 |
| | | Mead Johnson Nutrition Co., Sr. Unsec’d. Notes, 144A | | | |
| | 125 | | 3.500%, 11/1/14 | | | 125,511 |
| | | MeadWestvaco Corp., Sr. Unsec’d. Notes | | | |
| | 450 | | 7.375%, 9/1/19 | | | 485,423 |
| | | Merrill Lynch & Co., Inc., Sr. Unsec’d. Notes, | | | |
| | 600 | | 5.450%, 2/5/13 | | | 627,427 |
| | 65 | | 6.050%, 8/15/12, M.T.N. | | | 69,652 |
See Notes to Financial Statements.
| | |
| 18 | | Visit our website at www.jennisondryden.com |
| | | | | | |
Principal
Amount (000) | | Description | | Value (Note 1) |
| | | | | | |
| Corporate Bonds (cont’d.) |
| | | MetLife, Inc., Sr. Unsec’d. Notes, | | | |
| USD | 100 | | 7.717%, 2/15/19 | | $ | 118,414 |
| | | Morgan Stanley, Sr. Unsec’d. Notes, M.T.N., | | | |
| | 170 | | 5.625%, 9/23/19 | | | 171,067 |
| | | MUFG Capital Finance 1 Ltd. (Cayman Islands), Bank
Gtd. Notes, | | | |
| | 120 | | 6.346%, 7/29/49(d) | | | 110,862 |
| | | Nalco Co., Gtd. Notes, | | | |
| | 18 | | 7.750%, 11/15/11 | | | 18,023 |
| | | New Cingular Wireless Services, Inc., Gtd. Notes, | | | |
| | 140 | | 8.125%, 5/1/12 | | | 159,968 |
| | | Newmont Mining Corp., Gtd. Notes | | | |
| | 200 | | 6.250%, 10/1/39 | | | 195,043 |
| | | News America, Inc., Gtd. Notes, 144A | | | |
| | 545 | | 6.900%, 8/15/39 | | | 577,821 |
| | | North American Energy Alliance LLC/North American Energy Alliance Finance Corp., Sr. Sec’d. Notes,144A | | | |
| | 150 | | 10.875%, 6/1/16 | | | 156,000 |
| | | Northwest Pipeline GP, Notes, | | | |
| | 75 | | 6.050%, 6/15/18 | | | 79,955 |
| | | Oncor Electric Delivery Co., First Mtge. Bonds, | | | |
| | 105 | | 6.800%, 9/1/18 | | | 118,407 |
| | | Oracle Corp., Sr. Unsec’d. Notes, | | | |
| | 100 | | 6.125%, 7/8/39 | | | 110,022 |
| | | Orion Power Holdings, Inc., Sr. Unsec’d. Notes, | | | |
| | 315 | | 12.000%, 5/1/10 | | | 325,238 |
| | | Peco Energy Co., First. Ref. Mtge., | | | |
| | 100 | | 5.350%, 3/1/18 | | | 106,973 |
| | | PepsiAmericas, Inc., Sr. Unsec’d. Notes, | | | |
| | 100 | | 4.375%, 2/15/14 | | | 104,911 |
| | | Pfizer, Inc., Sr. Unsec’d. Notes, | | | |
| | 250 | | 6.200%, 3/15/19(b) | | | 284,628 |
| | | Philip Morris International, Inc., Sr. Unsec’d. Notes, | | | |
| | 300 | | 4.875%, 5/16/13 | | | 319,155 |
| | | Pioneer Natural Resources Co., Sr. Unsec’d. Notes, | | | |
| | 200 | | 6.875%, 5/1/18 | | | 191,262 |
| | | ProLogis, Sr. Unsec’d. Notes, | | | |
| | 175 | | 7.375%, 10/30/19 | | | 175,549 |
| | | Public Service Co. of New Mexico, Sr. Unsec’d. Notes, | | | |
| | 50 | | 7.950%, 5/15/18 | | | 51,107 |
See Notes to Financial Statements.
| | |
| Dryden Global Total Return Fund, Inc. | | 19 |
Portfolio of Investments
as of October 31, 2009 continued
| | | | | | |
Principal
Amount (000) | | Description | | Value (Note 1) |
| | | | | | |
| Corporate Bonds (cont’d.) |
| | | Qwest Capital Funding, Inc., Gtd. Notes | | | |
| USD | 100 | | 7.250%, 2/15/11 | | $ | 100,000 |
| | | Qwest Corp., Sr. Unsec’d. Notes, | | | |
| | 250 | | 7.875%, 9/1/11 | | | 258,125 |
| | 200 | | 8.375%, 5/1/16, 144A | | | 206,500 |
| | 200 | | 8.875%, 3/15/12 | | | 210,500 |
| | | Rainbow National Services LLC, Gtd. Notes, 144A | | | |
| | 190 | | 10.375%, 9/1/14 | | | 199,500 |
| | | Ralcorp Holdings, Inc., Sr. Notes, 144A | | | |
| | 250 | | 6.625%, 8/15/39 | | | 256,737 |
| | | Realogy Corp., Gtd. Notes, PIK, | | | |
| | 261 | | 11.000%, 4/15/14 | | | 172,324 |
| | | Republic Services, Inc., Gtd. Notes, 144A | | | |
| | 300 | | 5.500%, 9/15/19 | | | 309,379 |
| | | Reynolds American, Inc., Gtd. Notes, | | | |
| | 300 | | 6.750%, 6/15/17 | | | 308,815 |
| | | Roche Holdings, Inc., Gtd. Notes, 144A, | | | |
| | 125 | | 7.000%, 3/1/39 | | | 153,618 |
| | | Rogers Communications, Inc. (Canada), Gtd. Notes, | | | |
| | 45 | | 6.800%, 8/15/18 | | | 50,723 |
| | | Royal Bank of Scotland Group PLC (United Kingdom), Sr. Unsec’d. Notes | | | |
| | 150 | | 6.400%, 10/21/19 | | | 152,960 |
| | | R.R. Donnelley & Sons Co. Sr. Unsec’d. Notes, | | | |
| | 600 | | 4.950%, 4/1/14 | | | 587,435 |
| | 450 | | 8.600%, 8/15/16 | | | 488,448 |
| | | Schering-Plough Corp., Sr. Unsec’d. Notes, | | | |
| | 175 | | 6.550%, 9/15/37 | | | 203,360 |
| | | Sealed Air Corp., Sr. Unsec’d. Notes, 144A | | | |
| | 600 | | 5.625%, 7/15/13 | | | 601,201 |
| | | Senior Housing Properties Trust, Sr. Unsec’d. Notes | | | |
| | 250 | | 7.875%, 4/15/15 | | | 235,000 |
| | 50 | | 8.625%, 1/15/12 | | | 51,000 |
| | | Service Corp. International, Sr. Unsec’d. Notes, | | | |
| | 250 | | 7.000%, 6/15/17 | | | 243,750 |
| | | Simon Property Group LP, Sr. Unsec’d. Notes, | | | |
| | 350 | | 5.300%, 5/30/13 | | | 362,751 |
| | | SLM Corp., Sr. Unsec’d. Notes, M.T.N., | | | |
| | 510 | | 5.050%, 11/14/14 | | | 407,108 |
| | 225 | | 8.450%, 6/15/18 | | | 198,159 |
See Notes to Financial Statements.
| | |
| 20 | | Visit our website at www.jennisondryden.com |
| | | | | | |
Principal
Amount (000) | | Description | | Value (Note 1) |
| | | | | | |
| Corporate Bonds (cont’d.) |
| | | Sprint Capital Corp., Gtd. Notes | | | |
| USD | 240 | | 7.625%, 1/30/11 | | $ | 242,700 |
| | 150 | | 8.375%, 3/15/12 | | | 151,875 |
| | | Starwood Hotels & Resorts Worldwide, Inc., Gtd. Notes, | | | |
| | 300 | | 7.875%, 5/1/12 | | | 312,000 |
| | | StatoilHydro ASA (Norway), Unsec’d. Notes, | | | |
| | 100 | | 3.875%, 4/15/14 | | | 104,939 |
| | | Sumitomo Mitsui Banking Corp. (Japan), Sub. Notes, 144A, | | | |
| | 800 | | 5.625%, 7/29/49(d) | | | 776,274 |
| | | Sungard Data Systems, Inc., Gtd. Notes, | | | |
| | 250 | | 10.250%, 8/15/15 | | | 257,813 |
| | | SunTrust Banks, Inc., Sr. Unsec’d. Notes | | | |
| | 300 | | 5.250%, 11/5/12 | | | 313,883 |
| | | Target Corp., Sr. Unsec’d. Notes, | | | |
| | 250 | | 7.000%, 1/15/38 | | | 291,766 |
| | | Teck Resources Ltd. (Canada), Sr. Sec’d. Notes, | | | |
| | 50 | | 10.250%, 5/15/16 | | | 57,625 |
| | 150 | | 10.750%, 5/15/19 | | | 174,750 |
| | | Textron, Inc., Sr. Unsec’d. Notes, | | | |
| | 100 | | 5.600%, 12/1/17 | | | 94,174 |
| | 200 | | 7.250%, 10/1/19 | | | 203,685 |
| | | Thomson Corp. (Canada), (The), Gtd. Notes, | | | |
| | 300 | | 5.700%, 10/1/14 | | | 331,097 |
| | | Time Warner Cable, Inc., Gtd. Notes, | | | |
| | 195 | | 6.750%, 7/1/18 | | | 214,668 |
| | 300 | | 8.750%, 2/14/19 | | | 370,022 |
| | | Time Warner Cos., Inc., Gtd. Notes, | | | |
| | 99 | | 6.950%, 1/15/28 | | | 103,312 |
| | | Toll Brothers Finance Corp., Gtd. Notes, | | | |
| | 420 | | 5.150%, 5/15/15 | | | 405,528 |
| | | TransAlta Corp. (Canada), Sr. Unsec’d. Notes, | | | |
| | 200 | | 6.650%, 5/15/18 | | | 204,005 |
| | | TransCanada Pipelines Ltd. (Canada), Sr. Unsec’d. Notes, | | | |
| | 300 | | 7.250%, 8/15/38 | | | 364,572 |
| | | Tyco International Finance SA (Luxembourg), Gtd. Notes, | | | |
| | 200 | | 4.125%, 10/15/14 | | | 204,361 |
| | | Tyson Foods, Inc., Gtd. Notes, | | | |
| | 90 | | 7.850%, 4/1/16 | | | 92,250 |
| | | United Airlines, Inc., Pass-Through Trust | | | |
| | 137 | | 6.636%, 7/2/22 | | | 120,153 |
See Notes to Financial Statements.
| | |
| Dryden Global Total Return Fund, Inc. | | 21 |
Portfolio of Investments
as of October 31, 2009 continued
| | | | | | |
Principal
Amount (000) | | Description | | Value (Note 1) |
| | | | | | |
| Corporate Bonds (cont’d.) |
| | | United States Steel Corp., Sr. Unsec’d. Notes, | | | |
| USD | 200 | | 5.650%, 6/1/13 | | $ | 196,963 |
| | | UnitedHealth Group, Inc., Sr. Unsec’d. Notes, | | | |
| | 235 | | 6.625%, 11/15/37 | | | 237,544 |
| | | Unum Group, Sr. Notes, | | | |
| | 245 | | 7.125%, 9/30/16 | | | 251,857 |
| | | Verizon Communications, Inc., Sr. Unsec’d. Notes, | | | |
| | 85 | | 6.400%, 2/15/38 | | | 90,607 |
| | 175 | | 8.950%, 3/1/39 | | | 237,657 |
| | | Viacom, Inc., Sr. Unsec’d. Notes, | | | |
| | 200 | | 4.250%, 9/15/15 | | | 200,620 |
| | 75 | | 6.750%, 10/5/37 | | | 78,330 |
| | 90 | | 6.875%, 4/30/36 | | | 94,991 |
| | | Vivendi (France), Sr. Unsec’d. Notes, 144A, | | | |
| | 150 | | 5.750%, 4/4/13 | | | 159,883 |
| | | Wachovia Bank NA, Sub. Notes, | | | |
| | 250 | | 6.600%, 1/15/38 | | | 272,264 |
| | | Watson Pharmaceuticals, Inc., Sr. Unsec’d. Notes, | | | |
| | 200 | | 5.000%, 8/15/14 | | | 205,199 |
| | | WEA Finance LLC/WT Finance Aust Pty Ltd., Gtd. Notes, 144A | | | |
| | 200 | | 5.750%, 9/2/15 | | | 201,072 |
| | | Williams Cos., Inc., Sr. Unsec’d. Notes, | | | |
| | 300 | | 7.875%, 9/1/21 | | | 327,355 |
| | | Windstream Corp., Gtd. Notes, 144A | | | |
| | 175 | | 7.875%, 11/1/17 | | | 176,750 |
| | | Wyeth, Sr. Unsec’d. Notes, | | | |
| | 70 | | 6.450%, 2/1/24 | | | 78,344 |
| | 90 | | 6.500%, 2/1/34 | | | 104,092 |
| | | XL Capital Finance Europe PLC (United Kingdom), Gtd. Notes, | | | |
| | 600 | | 6.500%, 1/15/12 | | | 614,662 |
| | | XTO Energy, Inc., Sr. Unsec’d. Notes, | | | |
| | 100 | | 6.375%, 6/15/38 | | | 105,658 |
| | | | | | |
| | | | | | 44,410,617 |
| | | | | | |
|
| Emerging Market Bonds 2.0% |
| | | Empresa Nacional de Electricidad SA (Chile), Unsub. Notes, | | | |
| | 260 | | 8.350%, 8/1/13 | | | 297,856 |
| | | Export-Import Bank of Korea (South Korea), Sr. Notes, | | | |
| | 100 | | 8.125%, 1/21/14 | | | 114,635 |
See Notes to Financial Statements.
| | |
| 22 | | Visit our website at www.jennisondryden.com |
| | | | | | |
Principal
Amount (000) | | Description | | Value (Note 1) |
| | | | | | |
| Emerging Market Bonds (cont’d.) |
| | | Sr. Unsec’d. Notes, | | | |
| USD | 240 | | 5.875%, 1/14/15 | | $ | 252,969 |
| | | Fideicomiso Petacalco (Mexico), Sec’d. Notes, 144A, | | | |
| | 70 | | 10.160%, 12/23/09(c) | | | 68,892 |
| | | Gaz Capital SA (Luxembourg), Sec’d. Notes | | | |
| | 500 | | 9.250%, 4/23/19 | | | 562,800 |
| | | Gazprom International SA (Luxembourg), Gtd. Notes, | | | |
| | 453 | | 7.201%, 2/1/20 | | | 465,832 |
| | | RSHB Capital SA for OJSC Russian Agricultural Bank,
Sec’d. Notes, 144A, | | | |
| | 380 | | 7.125%, 1/14/14 | | | 395,428 |
| | | TNK-BP Finance SA (Luxembourg), Gtd. Notes, 144A, | | | |
| | 300 | | 7.500%, 7/18/16 | | | 302,250 |
| | | | | | |
| | | | | | 2,460,662 |
| | | | | | |
| Municipal Bonds 1.7% |
| | | California St. Build America Bonds. G.O. | | | |
| | 300 | | 7.300%, 10/1/39 | | | 302,793 |
| | | California St. Build America Bonds. Txb. Var. Purp. G.O., | | | |
| | 200 | | 7.500%, 4/1/34 | | | 207,304 |
| | | Chicago Ill. Brd. Ed. Build America Bonds. Taxable. Ser. E | | | |
| | 100 | | 6.138%, 12/1/39 | | | 106,562 |
| | | Dallas, Tex. Area Rapid Tran. Sales. Tax. Rev., | | | |
| | 500 | | 5.999%, 12/1/44 | | | 542,365 |
| | | New Jersey St. Tpk. Auth. Tpk. Rev. Build America. Bds. Taxable. Ser. F. Issuer Subsidy. Rev., | | | |
| | 100 | | 7.414%, 1/1/40 | | | 119,435 |
| | | Salt River Proj. Ariz. Agric. Impt. & Pwr. Elec. Sys. Rev., Ser. A, | | | |
| | 250 | | 5.000%, 1/1/39 | | | 257,585 |
| | | University Calif. Rev. Build America Bonds | | | |
| | 150 | | 5.770%, 5/15/43 | | | 155,708 |
| | | University Tex. Perm. Univ. Build America Bonds | | | |
| | 250 | | 5.262%, 7/1/39 | | | 251,168 |
| | | Utah St. Build America Bonds, Ser. D, G.O. | | | |
| | 150 | | 4.554%, 7/1/24 | | | 153,957 |
| | | | | | |
| | | | | | 2,096,877 |
| | | | | | |
|
| Residential Mortgage-Backed Securities 3.4% |
| | | ACE Securities Corp., Ser. 2004-FM1, Class M1, | | | |
| | 426 | | 1.1437%, 9/25/33(d) | | | 333,067 |
See Notes to Financial Statements.
| | |
| Dryden Global Total Return Fund, Inc. | | 23 |
Portfolio of Investments
as of October 31, 2009 continued
| | | | | | |
Principal
Amount (000) | | Description | | Value (Note 1) |
| | | | | | |
| Residential Mortgage-Backed Securities (cont’d.) |
| | | Ameriquest Mortgage Securities, Inc., Ser. 2004-R8, Class M1 | | | |
| USD | 400 | | 0.884%, 9/25/34(d) | | $ | 296,651 |
| | | Bear Stearns Asset Backed Securities Trust, Ser. 2005-HE11, Class M1, | | | |
| | 240 | | 0.674%, 11/25/35(d) | | | 127,755 |
| | | GSAMP Trust, Ser. 2004-FM1, Class M1 | | | |
| | 371 | | 1.219%, 11/25/33(d) | | | 303,823 |
| | | HFC Home Equity Loan Asset Backed Certificates, Ser. 2007-2, Class A4, | | | |
| | 400 | | 0.545%, 7/20/36(d) | | | 247,186 |
| | | Home Equity Asset Trust, Ser. 2005-5, Class 2A2, | | | |
| | 282 | | 0.494%, 11/25/35(d) | | | 268,222 |
| | | Mastr Asset Backed Securities Trust, Ser. 2004-OPT2, Class A1, | | | |
| | 375 | | 0.594%, 9/25/34(d) | | | 293,668 |
| | | Morgan Stanley ABS Capital I, Ser. 2004-NC1, Class M1, | | | |
| | 505 | | 0.944%, 12/27/33(d) | | | 371,587 |
| | | Ser. 2004-OP1, Class M1, | | | |
| | 437 | | 0.824%, 11/25/34(d) | | | 332,991 |
| | | Ser. 2004-WMC1, Class M1, | | | |
| | 814 | | 1.174%, 6/25/34(d) | | | 575,305 |
| | | Ser. 2004-WMC2, Class M1, | | | |
| | 401 | | 1.159%, 7/25/34(d) | | | 304,290 |
| | | New Century Home Equity Loan Trust,
Ser. 2003-4, Class M1 | | | |
| | 586 | | 1.369%, 10/25/33(d) | | | 432,323 |
| | | Popular ABS Mortgage Pass-Through Trust,
Ser. 2004-4, Class M1, | | | |
| | 235 | | 5.181%, 9/25/34 | | | 178,775 |
| | | Saxon Asset Securities Trust, Ser. 2004-2, Class MF1, | | | |
| | 249 | | 5.500%, 8/25/35 | | | 148,264 |
| | | | | | |
| | | | | | 4,213,907 |
| | | | | | |
| Sovereign Bonds 4.5% |
| | | Republic of Colombia, | | | |
| | 1,000 | | 10.000%, 1/23/12 | | | 1,154,999 |
| | | Republic of Panama, | | | |
| | 1,000 | | 7.125%, 1/29/26 | | | 1,099,999 |
| | 300 | | 7.250%, 3/15/15 | | | 333,750 |
| | | Republic of Poland, | | | |
| | 650 | | 6.375%, 7/15/19 | | | 715,754 |
See Notes to Financial Statements.
| | |
| 24 | | Visit our website at www.jennisondryden.com |
| | | | | | |
Principal
Amount (000) | | Description | | Value (Note 1) |
| | | | | | |
| Sovereign Bonds (cont’d.) |
| | | Republic of Russia, | | | |
| USD | 851 | | 7.500%, 3/31/30 | | $ | 946,488 |
| | | Republic of South Africa, | | | |
| | 1,000 | | 7.375%, 4/25/12 | | | 1,097,499 |
| | | Republic of Venezuela, | | | |
| | 300 | | 9.250%, 9/15/27 | | | 238,500 |
| | | | | | |
| | | | | | 5,586,989 |
| | | | | | |
|
| Structured Note 0.2% |
| | | Dow Jones CDX HY, Series 5-T3, 144A, | | | |
| | 220 | | 8.250%, 12/29/10 | | | 228,221 |
| | | | | | |
|
| United States Government Agency Security |
| | | Federal National Mortgage Association | | | |
| | 50 | | 2.625%, 11/20/14 | | | 49,968 |
| | | | | | |
|
| United States Government Obligation 0.7% |
| | | United States Treasury Bonds | | | |
| | 933 | | 4.250%, 5/15/39 | | | 935,186 |
| | | | | | |
| | | Total United States Investments | | | 79,483,943 |
| | | | | | |
| | | Total long-term investments
(cost $113,669,247) | | | 122,240,665 |
| | | | | | |
| | |
Shares | | | | |
| | SHORT-TERM INVESTMENTS 2.7% |
|
| Affiliated Money Market Mutual Fund 1.6% |
| | 1,930,329 | | Dryden Core Investment Fund - Taxable Money Market Series(a)
(cost $1,930,329) | | | 1,930,329 |
| | | | | | |
| | |
Notional Amount (000) | | | | |
| | OUTSTANDING OPTIONS PURCHASED* 1.1% | | | |
| |
| Put Options | | | |
| USD | 1,133 | | United States Dollar/South African Rand,
expiring 12/3/09 @ 8.3535 | | | 76,223 |
| | 1,110 | | United States Dollar/Brazilian Real, expiring 12/30/09 @ 2.101 | | | 204,039 |
| | 1,110 | | United States Dollar/Indian Rupee, expiring 12/31/09 @ 48.47 | | | 44,178 |
See Notes to Financial Statements.
| | |
| Dryden Global Total Return Fund, Inc. | | 25 |
Portfolio of Investments
as of October 31, 2009 continued
| | | | | | | |
Notional Amount (000) | | Description | | Value (Note 1) | |
| | | | | | | |
| Put Options (cont’d.) | |
| USD | 1,110 | | United States Dollar/Mexican Nuevo Peso,
expiring 12/31/09 @ 13.6465 | | $ | 47,144 | |
| | 1,110 | | United States Dollar/New Turkish Lira,
expiring 12/31/09 @ 1.649 | | | 99,829 | |
| | 1,110 | | United States Dollar/Philippine Peso, 1/4/10 @ 48.489 | | | 28,051 | |
| | 1,104 | | United States Dollar/Brazilian Real, expiring 1/29/10 @ 2.0915 | | | 194,195 | |
| | 1,104 | | United States Dollar/Mexican Nuevo Peso,
expiring 1/29/10 @ 13.5625 | | | 45,616 | |
| | 1,104 | | United States Dollar/South African Rand,
expiring 1/29/10 @ 8.287 | | | 73,762 | |
| | 1,104 | | United States Dollar/New Turkish Lira,
expiring 1/29/10 @ 1.6305 | | | 86,548 | |
| | 3,152 | | United States Dollar/Russian Rouble,
expiring 10/21/10 @ 31.06 | | | 211,069 | |
| | 3,783 | | United States Dollar/New Turkish Lira,
expiring 10/22/10 @ 1.5655 | | | 193,581 | |
| | 1,261 | | United States Dollar/Brazilian Real, expiring 10/27/10 @1.870 | | | 92,923 | |
| | | | | | | |
| | | Total options purchased
(cost $1,172,370) | | | 1,397,158 | |
| | | | | | | |
| | | Total short-term investments
(cost $3,102,699) | | | 3,327,487 | |
| | | | | | | |
| | | Total Investments 100.6%
(cost $116,771,946; Note 5) | | | | |
| | | Liabilities in excess of other assets(g) (0.6%) | | | 125,568,152 | |
| | | NET ASSETS 100.0% | | | (717,696 | ) |
| | | | | | | |
| | | | | $ | 124,850,456 | |
| | | | | | | |
Portfolio securities are classified according to the security’s currency denomination. The following abbreviations are used in the portfolio descriptions:
AUD—Australian Dollar
BRL—Brazilian Real
CAD—Canadian Dollar
CHF—Swiss Franc
CLP—Chilean Peso
CNY—Chinese Yuan Renminbi
COP—Colombian Peso
CZK—Czech Koruna
DKK—Danish Krone
EUR—Euro
See Notes to Financial Statements.
| | |
| 26 | | Visit our website at www.jennisondryden.com |
GBP—British Pound
HUF—Hungarian Forint
INR—Indian Rupee
IDR—Indonesian Rupiah
JPY—Japanese Yen
KRW—South Korean Won
MXN—Mexican Nuevo Peso
MYR—Malaysian Ringgit
NOK—Norwegian Krone
NZD—New Zealand Dollar
PEN—Peruvian Nuevo Sol
PHP—Philippine Peso
PLN—Polish New Zloty
RON—Romanian New Lei
RUB—Russian Rouble
SEK—Swedish Krona
SGD—Singapore Dollar
TRY—New Turkish Lira
TWD—New Taiwan Dollar
USD—United States Dollar
ZAR—South African Rand
CPI—Consumer Price Index
G.O.—General Obligation
M.T.N—Medium Term Note
PIK—Payment-In-Kind
144A—Security was purchased pursuant to Rule 144A under the Securities Act of 1933 and may not be resold subject to that rule except to qualified institutional buyers. Unless otherwise noted, 144A securities are deemed to be liquid.
| * | Non-income producing security. |
| (a) | Prudential Investments LLC, the manager of the Fund, also serves as manager of the Dryden Core Investment Fund—Taxable Money Market Series. |
| (b) | All or partial principal amount segregated as initial margin on financial futures contracts. |
| (c) | Indicates a security that has been deemed illiquid. |
| (d) | Variable rate instrument. The interest rate shown reflects the rate in effect at October 31, 2009. |
| (e) | Represents issuer in default on interest payments; non-income producing security. |
| (f) | Indicates a restricted security; the aggregate original cost of such securities is $244,500. The aggregate market value of $304,730 is approximately 0.2% of net assets. |
| (g) | Liabilities in excess of other assets include net unrealized appreciation (depreciation) on futures contracts, forward foreign currency exchange contracts, credit default swaps and interest rate swap agreements of: |
| | |
| Dryden Global Total Return Fund, Inc. | | 27 |
Portfolio of Investments
as of October 31, 2009 continued
Open futures contracts outstanding as of October 31, 2009:
| | | | | | | | | | | | | | |
Number of
Contracts | | Types | | Expiration
Date | | Value at
October 31,
2009 | | Value at
Trade
Date | | Unrealized
Appreciation
(Depreciation) | |
| | Long Positions: | | | | | | | | | | | | |
| 13 | | JPN 10 Yr. Bond | | Dec. 09 | | $ | 19,928,567 | | $ | 20,091,391 | | $ | (162,824 | ) |
| 7 | | Long Gilt | | Dec. 09 | | | 1,361,880 | | | 1,357,747 | | | 4,133 | |
| 28 | | Euro-Buxl 30 Yr. | | Dec. 09 | | | 4,048,093 | | | 4,055,474 | | | (7,381 | ) |
| 17 | | CAN 10 Yr. Bond | | Dec. 09 | | | 1,893,951 | | | 1,878,688 | | | 15,263 | |
| 27 | | Euro-Bund | | Dec. 09 | | | 4,843,637 | | | 4,824,475 | | | 19,162 | |
| 68 | | Euro-BOBL | | Dec. 09 | | | 11,570,337 | | | 11,552,283 | | | 18,054 | |
| 18 | | Euro-Schatz | | Dec. 09 | | | 2,866,183 | | | 2,858,995 | | | 7,188 | |
| 35 | | 2-Yr. U.S. T-Notes | | Dec. 09 | | | 7,616,328 | | | 7,594,324 | | | 22,004 | |
| | Short Positions: | | | | | | | | | | | | |
| 23 | | CBT Long Bond | | Dec. 09 | | | 2,763,594 | | | 2,797,941 | | | 34,347 | |
| 27 | | 10-Yr. U.S. T-Notes | | Dec. 09 | | | 3,202,453 | | | 3,228,144 | | | 25,691 | |
| 67 | | 5-Yr. U.S. T-Notes | | Dec. 09 | | | 7,802,359 | | | 7,745,289 | | | (57,070 | ) |
| | | | | | | | | | | | | | |
| | | | | | | | | | | | $ | (81,433 | ) |
| | | | | | | | | | | | | | |
Forward foreign currency exchange contracts outstanding as of October 31, 2009:
| | | | | | | | | | | | | | | |
Purchase Contracts | | Counterparty | | Notional
Amount | | Value at
Settlement Date
Payable | | Value at
October 31,
2009 | | Unrealized
Appreciation
(Depreciation) | |
Australian Dollar, | | | | | | | | | | | | | |
Expiring 11/23/09 | | Deutsche Bank Securities Corp. | | AUD | 1,344,603 | | $ | 1,232,121 | | $ | 1,207,750 | | $ | (24,371 | ) |
Expiring 11/23/09 | | Deutsche Bank Securities Corp. | | AUD | 37,200 | | | 34,012 | | | 33,414 | | | (598 | ) |
British Pound, | | | | | | | | | | | | | |
Expiring 11/25/09 | | Citibank NA | | GBP | 997,274 | | | 1,654,954 | | | 1,636,513 | | | (18,441 | ) |
Expiring 11/25/09 | | Morgan Stanley | | GBP | 153,911 | | | 252,200 | | | 252,566 | | | 366 | |
Expiring 11/25/09 | | Morgan Stanley | | GBP | 45,628 | | | 75,200 | | | 74,875 | | | (325 | ) |
Canadian Dollar, | | | | | | | | | | | | | |
Expiring 11/19/09 | | UBS AG | | CAD | 3,727,622 | | | 3,617,399 | | | 3,445,003 | | | (172,396 | ) |
Chilean Peso, | | | | | | | | | | | | | |
Expiring 11/04/09 | | UBS AG | | CLP | 113,047,800 | | | 211,700 | | | 212,996 | | | 1,296 | |
Expiring 11/04/09 | | UBS AG | | CLP | 103,601,015 | | | 187,700 | | | 195,198 | | | 7,498 | |
Expiring 11/24/09 | | UBS AG | | CLP | 129,641,580 | | | 237,700 | | | 244,722 | | | 7,022 | |
Expiring 11/24/09 | | UBS AG | | CLP | 134,220,840 | | | 252,200 | | | 253,367 | | | 1,167 | |
Expiring 02/04/10 | | UBS AG | | CLP | 103,601,015 | | | 196,788 | | | 196,429 | | | (359 | ) |
See Notes to Financial Statements.
| | |
| 28 | | Visit our website at www.jennisondryden.com |
| | | | | | | | | | | | | | | |
Purchase Contracts | | Counterparty | | Notional
Amount | | Value at
Settlement Date
Payable | | Value at
October 31,
2009 | | Unrealized
Appreciation
(Depreciation) | |
Chinese Yuan Renminbi, | | | | | | | | | | | | | |
Expiring 05/04/10 | | UBS AG | | CNY | 3,960,514 | | $ | 582,900 | | $ | 580,338 | | $ | (2,562 | ) |
Expiring 10/27/10 | | UBS AG | | CNY | 1,672,717 | | | 252,200 | | | 245,105 | | | (7,095 | ) |
Colombian Peso, | | | | | | | | | | | | | |
Expiring 11/13/09 | | Morgan Stanley | | COP | 262,141,800 | | | 107,700 | | | 130,897 | | | 23,197 | |
Expiring 12/07/09 | | UBS AG | | COP | 365,285,000 | | | 188,272 | | | 182,042 | | | (6,230 | ) |
Expiring 12/07/09 | | Citibank NA | | COP | 508,435,200 | | | 252,200 | | | 253,382 | | | 1,182 | |
Czech Koruna, | | | | | | | | | | | | | |
Expiring 11/24/09 | | Goldman Sachs | | CZK | 8,353,726 | | | 479,942 | | | 463,088 | | | (16,854 | ) |
Expiring 11/24/09 | | JPMorgan Chase & Co. | | CZK | 4,352,571 | | | 251,733 | | | 241,284 | | | (10,449 | ) |
Danish Krone, | | | | | | | | | | | | | |
Expiring 11/24/09 | | Morgan Stanley | | DKK | 316,390 | | | 62,700 | | | 62,532 | | | (168 | ) |
Euro, | | | | | | | | | | | | | |
Expiring 11/24/09 | | UBS AG | | EUR | 119,100 | | | 176,161 | | | 175,263 | | | (898 | ) |
Expiring 11/24/09 | | UBS AG | | EUR | 120,200 | | | 176,870 | | | 176,882 | | | 12 | |
Expiring 11/24/09 | | UBS AG | | EUR | 204,200 | | | 300,473 | | | 300,493 | | | 20 | |
Expiring 11/25/09 | | UBS AG | | EUR | 176,747 | | | 264,800 | | | 260,094 | | | (4,706 | ) |
Expiring 11/25/09 | | Morgan Stanley | | EUR | 15,139,062 | | | 22,702,613 | | | 22,278,015 | | | (424,598 | ) |
Expiring 11/25/09 | | UBS AG | | EUR | 18,594 | | | 27,895 | | | 27,362 | | | (533 | ) |
Expiring 11/25/09 | | Morgan Stanley | | EUR | 50,900 | | | 74,921 | | | 74,902 | | | (19 | ) |
Expiring 11/25/09 | | Goldman Sachs | | EUR | 171,100 | | | 251,783 | | | 251,784 | | | 1 | |
Indian Rupee, | | | | | | | | | | | | | |
Expiring 01/04/10 | | UBS AG | | INR | 43,326,141 | | | 900,283 | | | 918,171 | | | 17,888 | |
Indonesian Rupiah, | | | | | | | | | | | | | |
Expiring 12/16/09 | | Deutsche Bank Securities Corp. | | IDR | 3,714,448,560 | | | 350,585 | | | 385,441 | | | 34,856 | |
Japanese Yen, | | | | | | | | | | | | | |
Expiring 11/25/09 | | Citibank NA | | JPY | 2,100,889,220 | | | 22,986,615 | | | 23,342,316 | | | 355,701 | |
Expiring 11/25/09 | | Goldman Sachs | | JPY | 143,661,144 | | | 1,576,300 | | | 1,596,174 | | | 19,874 | |
Expiring 11/25/09 | | Morgan Stanley | | JPY | 24,973,088 | | | 275,900 | | | 277,468 | | | 1,568 | |
Malaysian Ringgit, | | | | | | | | | | | | | |
Expiring 12/28/09 | | Citibank NA | | MYR | 1,413,894 | | | 407,815 | | | 413,330 | | | 5,515 | |
Expiring 12/28/09 | | UBS AG | | MYR | 1,493,565 | | | 441,100 | | | 436,620 | | | (4,480 | ) |
Mexican Nuevo Peso, | | | | | | | | | | | | | |
Expiring 11/19/09 | | Citibank NA | | MXN | 20,394,479 | | | 1,551,029 | | | 1,540,778 | | | (10,251 | ) |
Expiring 11/19/09 | | Citibank NA | | MXN | 4,166,629 | | | 315,300 | | | 314,784 | | | (516 | ) |
Norwegian Krone, | | | | | | | | | | | | | |
Expiring 11/24/09 | | JPMorgan Chase & Co. | | NOK | 12,203,860 | | | 2,162,909 | | | 2,129,437 | | | (33,472 | ) |
Expiring 11/24/09 | | JPMorgan Chase & Co. | | NOK | 1,820,571 | | | 327,900 | | | 317,669 | | | (10,231 | ) |
See Notes to Financial Statements.
| | |
| Dryden Global Total Return Fund, Inc. | | 29 |
Portfolio of Investments
as of October 31, 2009 continued
| | | | | | | | | | | | | | | |
Purchase Contracts | | Counterparty | | Notional
Amount | | Value at
Settlement Date
Payable | | Value at
October 31,
2009 | | Unrealized
Appreciation
(Depreciation) | |
New Taiwan Dollar, | | | | | | | | | | | | | |
Expiring 12/11/09 | | UBS AG | | TWD | 34,334,034 | | $ | 1,003,626 | | $ | 1,060,538 | | $ | 56,912 | |
Expiring 12/16/09 | | Deutsche Bank AG | | TWD | 8,713,411 | | | 268,518 | | | 269,303 | | | 785 | |
New Turkish Lira, | | | | | | | | | | | | | |
Expiring 11/25/09 | | Citibank NA | | TRY | 1,871,343 | | | 1,246,398 | | | 1,239,339 | | | (7,059 | ) |
New Zealand Dollar, | | | | | | | | | | | | | |
Expiring 11/23/09 | | JPMorgan Chase & Co. | | NZD | 1,388,648 | | | 1,032,578 | | | 994,817 | | | (37,761 | ) |
Expiring 11/23/09 | | UBS AG | | NZD | 250,205 | | | 188,100 | | | 179,245 | | | (8,855 | ) |
Expiring 11/23/09 | | UBS AG | | NZD | 434,118 | | | 315,300 | | | 310,999 | | | (4,301 | ) |
Peruvian Nuevo Sol, | | | | | | | | | | | | | |
Expiring 11/12/09 | | UBS AG | | PEN | 523,945 | | | 176,146 | | | 180,102 | | | 3,956 | |
Philippine Peso, | | | | | | | | | | | | | |
Expiring 01/05/10 | | UBS AG | | PHP | 15,019,995 | | | 312,396 | | | 313,197 | | | 801 | |
Expiring 01/05/10 | | UBS AG | | PHP | 8,631,210 | | | 178,700 | | | 179,978 | | | 1,278 | |
Polish New Zloty, | | | | | | | | | | | | | |
Expiring 11/24/09 | | Morgan Stanley | | PLN | 5,090,280 | | | 1,795,513 | | | 1,756,477 | | | (39,036 | ) |
Expiring 11/24/09 | | Deutsche Bank Securities Corp. | | PLN | 874,807 | | | 313,500 | | | 301,865 | | | (11,635 | ) |
Romanian New Lei, | | | | | | | | | | | | | |
Expiring 11/24/09 | | Deutsche Bank Securities Corp. | | RON | 877,628 | | | 301,544 | | | 297,517 | | | (4,027 | ) |
Russian Rouble, | | | | | | | | | | | | | |
Expiring 11/10/09 | | UBS AG | | RUB | 2,603,700 | | | 66,000 | | | 89,004 | | | 23,004 | |
Expiring 11/10/09 | | UBS AG | | RUB | 3,720,819 | | | 104,800 | | | 127,191 | | | 22,391 | |
Expiring 11/10/09 | | UBS AG | | RUB | 5,404,002 | | | 163,500 | | | 184,729 | | | 21,229 | |
Expiring 11/10/09 | | UBS AG | | RUB | 5,283,396 | | | 164,290 | | | 180,606 | | | 16,316 | |
Expiring 11/10/09 | | UBS AG | | RUB | 3,303,023 | | | 106,432 | | | 112,910 | | | 6,478 | |
Expiring 02/17/10 | | UBS AG | | RUB | 2,759,798 | | | 71,112 | | | 92,400 | | | 21,288 | |
Expiring 02/17/10 | | UBS AG | | RUB | 9,721,566 | | | 305,700 | | | 325,485 | | | 19,785 | |
Expiring 02/17/10 | | UBS AG | | RUB | 17,145,197 | | | 565,059 | | | 574,033 | | | 8,974 | |
Singapore Dollar, | | | | | | | | | | | | | |
Expiring 11/23/09 | | Morgan Stanley | | SGD | 1,701,782 | | | 1,224,593 | | | 1,213,935 | | | (10,658 | ) |
South African Rand, | | | | | | | | | | | | | |
Expiring 11/30/09 | | UBS AG | | ZAR | 2,459,049 | | | 315,300 | | | 313,107 | | | (2,193 | ) |
Expiring 02/02/10 | | UBS AG | | ZAR | 4,972,020 | | | 589,927 | | | 625,387 | | | 35,460 | |
South Korean Won, | | | | | | | | | | | | | |
Expiring 11/04/09 | | UBS AG | | KRW | 424,469,705 | | | 347,456 | | | 359,018 | | | 11,562 | |
Expiring 11/04/09 | | UBS AG | | KRW | 224,482,700 | | | 185,000 | | | 189,868 | | | 4,868 | |
Expiring 11/25/09 | | UBS AG | | KRW | 304,180,200 | | | 208,200 | | | 257,208 | | | 49,008 | |
See Notes to Financial Statements.
| | |
| 30 | | Visit our website at www.jennisondryden.com |
| | | | | | | | | | | | | | | |
Purchase Contracts | | Counterparty | | Notional
Amount | | Value at
Settlement Date
Payable | | Value at
October 31,
2009 | | Unrealized
Appreciation
(Depreciation) | |
Expiring 11/25/09 | | UBS AG | | KRW | 146,087,655 | | $ | 114,700 | | $ | 123,528 | | $ | 8,828 | |
Expiring 11/25/09 | | UBS AG | | KRW | 221,582,325 | | | 165,700 | | | 187,365 | | | 21,665 | |
Expiring 11/25/09 | | UBS AG | | KRW | 222,172,000 | | | 165,800 | | | 187,863 | | | 22,063 | |
Expiring 02/04/10 | | UBS AG | | KRW | 648,952,405 | | | 543,038 | | | 548,542 | | | 5,504 | |
Expiring 02/04/10 | | UBS AG | | KRW | 299,416,884 | | | 252,200 | | | 253,089 | | | 889 | |
Swedish Krona, | | | | | | | | | | | | | |
Expiring 11/24/09 | | Morgan Stanley | | SEK | 6,146,265 | | | 882,103 | | | 866,709 | | | (15,394 | ) |
Expiring 11/24/09 | | UBS AG | | SEK | 1,718,343 | | | 252,955 | | | 242,310 | | | (10,645 | ) |
Swiss Franc, | | | | | | | | | | | | | |
Expiring 11/24/09 | | Deutsche Bank Securities Corp. | | CHF | 1,013,689 | | | 993,540 | | | 988,266 | | | (5,274 | ) |
Expiring 11/24/09 | | Morgan Stanley | | CHF | 322,024 | | | 315,300 | | | 313,948 | | | (1,352 | ) |
| | | | | | | | | | | | | | | |
| | | | | | | $ | 80,635,897 | | $ | 80,568,362 | | $ | (67,535 | ) |
| | | | | | | | | | | | | | | |
| | | | | |
Sales Contracts | | Counterparty | | Notional
Amount | | Value at
Settlement Date
Receivable | | Value at
October 31,
2009 | | Unrealized
Appreciation
(Depreciation) | |
Brazilian Real, | | | | | | | | | | | | | |
Expiring 11/12/09 | | UBS AG | | BRL | 2,569,410 | | $ | 1,374,531 | | $ | 1,454,962 | | $ | (80,431 | ) |
Expiring 11/12/09 | | UBS AG | | BRL | 303,647 | | | 156,600 | | | 171,944 | | | (15,344 | ) |
Expiring 01/04/10 | | UBS AG | | BRL | 1,218,290 | | | 580,000 | | | 682,982 | | | (102,982 | ) |
Expiring 02/02/10 | | Citibank NA | | BRL | 1,249,440 | | | 600,000 | | | 696,042 | | | (96,042 | ) |
Expiring 10/29/10 | | UBS AG | | BRL | 1,179,035 | | | 630,500 | | | 646,472 | | | (15,972 | ) |
British Pound, | | | | | | | | | | | | | |
Expiring 11/25/09 | | Goldman Sachs | | GBP | 153,397 | | | 251,783 | | | 251,723 | | | 60 | |
Canadian Dollar, | | | | | | | | | | | | | |
Expiring 11/19/09 | | Goldman Sachs | | CAD | 343,471 | | | 327,900 | | | 317,430 | | | 10,470 | |
Chilean Peso, | | | | | | | | | | | | | |
Expiring 11/04/09 | | UBS AG | | CLP | 113,047,800 | | | 203,477 | | | 212,997 | | | (9,520 | ) |
Expiring 11/04/09 | | UBS AG | | CLP | 103,601,015 | | | 195,289 | | | 195,198 | | | 91 | |
Colombian Peso, | | | | | | | | | | | | | |
Expiring 11/13/09 | | UBS AG | | COP | 262,141,800 | | | 104,773 | | | 130,897 | | | (26,124 | ) |
Expiring 12/07/09 | | UBS AG | | COP | 499,860,400 | | | 252,200 | | | 249,109 | | | 3,091 | |
Czech Koruna, | | | | | | | | | | | | | |
Expiring 11/24/09 | | UBS AG | | CZK | 3,110,624 | | | 176,161 | | | 172,437 | | | 3,724 | |
Expiring 11/24/09 | | UBS AG | | CZK | 3,176,405 | | | 176,870 | | | 176,084 | | | 786 | |
Danish Krone, | | | | | | | | | | | | | |
Expiring 11/24/09 | | UBS AG | | DKK | 1,181,561 | | | 236,135 | | | 233,526 | | | 2,609 | |
See Notes to Financial Statements.
| | |
| Dryden Global Total Return Fund, Inc. | | 31 |
Portfolio of Investments
as of October 31, 2009 continued
| | | | | | | | | | | | | | | |
Sales Contracts | | Counterparty | | Notional
Amount | | Value at
Settlement Date
Receivable | | Value at
October 31,
2009 | | Unrealized
Appreciation
(Depreciation) | |
Euro, | | | | | | | | | | | | | |
Expiring 11/24/09 | | UBS AG | | EUR | 167,900 | | $ | 252,955 | | $ | 247,075 | | $ | 5,880 | |
Expiring 11/24/09 | | JPMorgan Chase & Co. | | EUR | 167,900 | | | 251,733 | | | 247,075 | | | 4,658 | |
Expiring 11/25/09 | | Morgan Stanley | | EUR | 110,479 | | | 163,000 | | | 162,576 | | | 424 | |
Expiring 02/17/10 | | UBS AG | | EUR | 50,900 | | | 71,112 | | | 74,873 | | | (3,761 | ) |
Expiring 02/17/10 | | UBS AG | | EUR | 382,791 | | | 565,059 | | | 563,078 | | | 1,981 | |
Hungarian Forint, | | | | | | | | | | | | | |
Expiring 11/24/09 | | UBS AG | | HUF | 187,706,226 | | | 1,042,025 | | | 1,001,318 | | | 40,707 | |
Indian Rupee, | | | | | | | | | | | | | |
Expiring 01/04/10 | | Citibank NA | | INR | 27,405,325 | | | 565,000 | | | 580,776 | | | (15,776 | ) |
Mexican Nuevo Peso, | | | | | | | | | | | | | |
Expiring 11/19/09 | | JPMorgan Chase & Co. | | MXN | 4,123,783 | | | 315,300 | | | 311,547 | | | 3,753 | |
Expiring 01/05/10 | | Citibank NA | | MXN | 7,914,680 | | | 580,000 | | | 594,105 | | | (14,105 | ) |
Expiring 02/03/10 | | UBS AG | | MXN | 8,140,260 | | | 600,000 | | | 608,543 | | | (8,543 | ) |
New Taiwan Dollar, | | | | | | | | | | | | | |
Expiring 12/11/09 | | UBS AG | | TWD | 14,180,924 | | | 425,758 | | | 438,032 | | | (12,274 | ) |
Expiring 12/11/09 | | UBS AG | | TWD | 10,791,221 | | | 317,903 | | | 333,328 | | | (15,425 | ) |
Expiring 12/11/09 | | UBS AG | | TWD | 9,361,886 | | | 274,100 | | | 289,178 | | | (15,078 | ) |
Expiring 12/16/09 | | UBS AG | | TWD | 8,713,411 | | | 269,262 | | | 269,303 | | | (41 | ) |
New Turkish Lira, | | | | | | | | | | | | | |
Expiring 11/25/09 | | Goldman Sachs | | TRY | 338,314 | | | 229,389 | | | 224,056 | | | 5,333 | |
Expiring 11/25/09 | | JPMorgan Chase & Co. | | TRY | 898,835 | | | 596,203 | | | 595,274 | | | 929 | |
Expiring 01/04/10 | | Citibank NA | | TRY | 955,840 | | | 580,000 | | | 628,314 | | | (48,314 | ) |
Expiring 01/04/10 | | Deutsche Bank AG | | TRY | 909,205 | | | 610,000 | | | 597,658 | | | 12,342 | |
Expiring 02/01/10 | | UBS AG | | TRY | 979,200 | | | 600,000 | | | 640,615 | | | (40,615 | ) |
Expiring 02/01/10 | | Deutsche Bank AG | | TRY | 913,475 | | | 610,000 | | | 597,617 | | | 12,383 | |
New Zealand Dollar, | | | | | | | | | | | | | |
Expiring 11/23/09 | | Citibank NA | | NZD | 833,739 | | | 611,600 | | | 597,284 | | | 14,316 | |
Expiring 11/23/09 | | UBS AG | | NZD | 845,382 | | | 611,600 | | | 605,625 | | | 5,975 | |
Expiring 11/23/09 | | UBS AG | | NZD | 263,693 | | | 189,200 | | | 188,908 | | | 292 | |
Philippine Peso, | | | | | | | | | | | | | |
Expiring 01/05/10 | | Citibank NA | | PHP | 27,399,675 | | | 565,000 | | | 571,338 | | | (6,338 | ) |
Romanian New Lei, | | | | | | | | | | | | | |
Expiring 11/24/09 | | UBS AG | | RON | 889,495 | | | 300,473 | | | 301,540 | | | (1,067 | ) |
Russian Rouble, | | | | | | | | | | | | | |
Expiring 11/10/09 | | UBS AG | | RUB | 2,995,734 | | | 94,225 | | | 102,405 | | | (8,180 | ) |
Expiring 11/10/09 | | UBS AG | | RUB | 7,358,625 | | | 225,000 | | | 251,545 | | | (26,545 | ) |
Expiring 11/10/09 | | UBS AG | | RUB | 9,960,581 | | | 292,700 | | | 340,490 | | | (47,790 | ) |
See Notes to Financial Statements.
| | |
| 32 | | Visit our website at www.jennisondryden.com |
| | | | | | | | | | | | | | | |
Sales Contracts | | Counterparty | | Notional
Amount | | Value at
Settlement Date
Receivable | | Value at
October 31,
2009 | | Unrealized
Appreciation
(Depreciation) | |
Expiring 02/07/10 | | Citibank NA | | RUB | 29,626,561 | | $ | 996,963 | | $ | 991,918 | | $ | 5,045 | |
South African Rand, | | | | | | | | | | | | | |
Expiring 11/30/09 | | Goldman Sachs | | ZAR | 1,253,655 | | | 166,161 | | | 159,626 | | | 6,535 | |
Expiring 11/30/09 | | UBS AG | | ZAR | 2,452,403 | | | 315,300 | | | 312,261 | | | 3,039 | |
Expiring 11/30/09 | | UBS AG | | ZAR | 2,462,903 | | | 311,900 | | | 313,598 | | | (1,698 | ) |
Expiring 02/02/10 | | UBS AG | | ZAR | 4,972,020 | | | 600,000 | | | 625,387 | | | (25,387 | ) |
South Korean Won, | | | | | | | | | | | | | |
Expiring 11/04/09 | | UBS AG | | KRW | 648,952,405 | | | 543,193 | | | 548,885 | | | (5,692 | ) |
Expiring 11/25/09 | | UBS AG | | KRW | 303,847,880 | | | 219,100 | | | 256,927 | | | (37,827 | ) |
Expiring 11/25/09 | | UBS AG | | KRW | 235,568,640 | | | 165,800 | | | 199,191 | | | (33,391 | ) |
Expiring 11/25/09 | | UBS AG | | KRW | 354,605,660 | | | 243,736 | | | 299,846 | | | (56,110 | ) |
| | | | | | | | | | | | | | | |
| | | | | | | $ | 20,636,969 | | $ | 21,262,918 | | $ | (625,949 | ) |
| | | | | | | | | | | | | | | |
Credit default swap agreements outstanding as of October 31, 2009:
| | | | | | | | | | | | | | | | | | | | | | |
Counterparty | | Termination
Date | | Notional
Amount
(000)(2) | | Fixed
Rate | | | Underlying
Bond | | Fair
Value | | | Upfront
Premiums
Paid/
(Received) | | | Unrealized
Appreciation
(Depreciation) | |
Credit Default Swaps on Corporate Issues—Buy Protection(1): | | | | | |
Barclays Bank PLC | | 6/20/2011 | | $ | 225 | | 5.000 | % | | Gannett Co., Inc., 6.375%, due 04/01/12 | | $ | (9,019 | ) | | $ | (5,720 | ) | | $ | (3,299 | ) |
Citibank NA | | 3/20/2012 | | | 600 | | 5.000 | | | XL Capital Ltd.,
5.250, due 09/15/14 | | | (58,463 | ) | | | (28,994 | ) | | | (29,469 | ) |
Citibank, NA | | 6/20/2014 | | | 500 | | 1.000 | | | CBS Corp.,
4.625%, due 5/15/18 | | | 15,244 | | | | 36,428 | | | | (21,184 | ) |
Credit Suisse International | | 3/20/2015 | | | 420 | | 1.000 | | | Toll Brothers Finance Corp.,
5.150%, due 05/15/15 | | | 15,825 | | | | 2,646 | | | | 13,179 | |
Deutsche Bank AG | | 6/20/2012 | | | 300 | | 5.000 | | | Starwood Hotels & Resorts Holdings, Inc.,
7.875%, due 05/01/12 | | | (24,385 | ) | | | (8,429 | ) | | | (15,956 | ) |
Deutsche Bank AG | | 12/20/2012 | | | 450 | | 1.000 | | | Block Financial LLC,
5.125%, due 10/30/14 | | | (7,773 | ) | | | (5,431 | ) | | | (2,342 | ) |
Deutsche Bank AG | | 6/20/2013 | | | 600 | | 1.000 | | | Sealed Air Corp.,
5.625%, due 07/15/13 | | | (8,569 | ) | | | 9,304 | | | | (17,873 | ) |
Deutsche Bank AG | | 9/20/2013 | | | 260 | | 1.000 | | | Masco Corp.,
6.125%, due 10/03/16 | | | 10,631 | | | | 9,556 | | | | 1,075 | |
Deutsche Bank AG | | 6/20/2014 | | | 600 | | 1.000 | | | R.R. Donnelley & Sons Co.,
4.950%, due 4/01/14 | | | 29,709 | | | | 44,822 | | | | (15,113 | ) |
See Notes to Financial Statements.
| | |
| Dryden Global Total Return Fund, Inc. | | 33 |
Portfolio of Investments
as of October 31, 2009 continued
| | | | | | | | | | | | | | | | | | | | | | |
Counterparty | | Termination
Date | | Notional
Amount
(000)(2) | | Fixed
Rate | | | Underlying
Bond | | Fair
Value | | | Upfront
Premiums
Paid/
(Received) | | | Unrealized
Appreciation
(Depreciation) | |
Credit Default Swaps on Corporate Issues—Buy Protection(1): | | | | | |
Deutsche Bank AG | | 3/20/2014 | | $ | 250 | | 7.050 | % | | Starwood Hotels & Resorts Holdings, Inc.,
7.875%, due 05/01/12 | | $ | (48,552 | ) | | $ | — | | | $ | (48,552 | ) |
Deutsche Bank AG | | 3/20/2018 | | | 250 | | 3.700 | | | American International Group, Inc.,
6.250%, due 5/01/36 | | | 41,110 | | | | — | | | | 41,110 | |
Goldman Sachs International | | 12/20/2011 | | | 300 | | 1.000 | | | Lennar Corp.,
6.500%, 4/15/16 | | | 10,241 | | | | 11,769 | | | | (1,528 | ) |
Goldman Sachs International | | 3/20/2014 | | | 350 | | 0.700 | | | Duke Energy Corp.,
5.650%, due 06/15/13 | | | (3,840 | ) | | | — | | | | (3,840 | ) |
Goldman Sachs International | | 3/20/2014 | | | 350 | | 6.600 | | | Simon Property Group LP,
5.250%, due 12/1/16 | | | (74,507 | ) | | | — | | | | (74,507 | ) |
JPMorgan Chase Bank | | 6/20/2014 | | | 510 | | 5.000 | | | SLM Corp.,
5.125%, due 8/27/12 | | | 47,199 | | | | 92,263 | | | | (45,064 | ) |
JPMorgan Chase Bank | | 6/20/2016 | | | 350 | | 1.500 | | | Embarq Corp.,
7.082%, due 06/01/16 | | | (16,237 | ) | | | — | | | | (16,237 | ) |
JPMorgan Chase Bank | | 9/20/2016 | | | 450 | | 1.000 | | | R.R. Donnelley & Sons Co.,
4.950%, due 04/01/14 | | | 37,968 | | | | 55,105 | | | | (17,137 | ) |
JPMorgan Chase Bank | | 9/20/2019 | | | 450 | | 1.000 | | | Westvaco Corp.,
7.950%, due 02/15/31 | | | 10,609 | | | | 8,756 | | | | 1,853 | |
Merrill Lynch Capital Services | | 9/20/2016 | | | 90 | | 1.730 | | | Tyson Foods, Inc.,
7.850%, due 04/01/16 | | | 4,054 | | | | — | | | | 4,054 | |
Morgan Stanley Capital Services | | 12/20/2019 | | | 350 | | 1.000 | | | Arrow Electronics, Inc.,
6.875%, due 06/01/18 | | | 3,846 | | | | (2,826 | ) | | | 6,672 | |
| | | | | | | | | | | | | | | | | | | | | | |
| | | | | | | | | | | | $ | (24,909 | ) | | $ | 219,249 | | | $ | (244,158 | ) |
| | | | | | | | | | | | | | | | | | | | | | |
| (1) | If the Fund is a buyer of protection, it pays the fixed rate. When a credit event occurs, as defined under the terms of that particular swap agreement, the Fund will either (i) receive from the seller of protection an amount equal to the notional amount of the swap and make delivery of the referenced obligation or underlying securities comprising the referenced index or (ii) receive a net settlement amount in the form of cash or securities equal to the notional amount of the swap less the recovery value of the referenced obligation or underlying securities comprising the referenced index. |
| (2) | Notional amount represents the maximum potential amount the Fund could be required to pay as a seller of credit protection or receive as a buyer or credit protection if a credit event occurs as defined under the terms of that particular swap agreement. |
See Notes to Financial Statements.
| | |
| 34 | | Visit our website at www.jennisondryden.com |
Interest rate swap agreements outstanding as of October 31, 2009:
| | | | | | | | | | | | | | | | | | | | | |
Counterparty(a) | | Termination
Date | | Notional
Amount
(000) | | Fixed
Rate | | | Floating
Rate | | Fair
Value | | | Upfront
Premiums
Paid/
(Received) | | Unrealized
Appreciation
(Depreciation) | |
Citibank NA | | 8/10/2019 | | $ | 1,200 | | 4.034 | % | | 3 Month LIBOR | | $ | (57,993 | ) | | $ | — | | $ | (57,993 | ) |
Citibank NA | | 2/15/2025 | | | 2,070 | | 4.098 | | | 3 Month LIBOR | | | (22,017 | ) | | | — | | | (22,017 | ) |
Merrill Lynch Capital Services | | 1/20/2014 | | | 4,000 | | 1.972 | | | 3 Month LIBOR | | | 46,386 | | | | — | | | 46,386 | |
| | | | | | | | | | | | | | | | | | | | | |
| | | | | | | | | | | | $ | (33,624 | ) | | $ | — | | $ | (33,624 | ) |
| | | | | | | | | | | | | | | | | | | | | |
| (a) | The Fund pays the fixed rate and receives the floating rate. |
Various inputs are used in determining the value of the Fund’s investments. These inputs are summarized in the three broad levels listed below.
Level 1—quoted prices in active markets for identical securities
Level 2—other significant observable inputs (including quoted prices for similar securities, interest rates, prepayment speeds, credit risk, etc.)
Level 3—significant unobservable inputs (including the Fund’s own assumptions in determining the fair value of investments)
See Notes to Financial Statements.
| | |
| Dryden Global Total Return Fund, Inc. | | 35 |
Portfolio of Investments
as of October 31, 2009 continued
The following is a summary of the inputs used as of October 31, 2009 in valuing the Fund’s assets carried at fair value:
| | | | | | | | | | | |
Investments in Securities | | Level 1 | | | Level 2 | | | Level 3 |
Asset Backed Securities | | $ | — | | | $ | 4,564,867 | | | $ | — |
Bank Loans | | | — | | | | 5,385,189 | | | | — |
Commercial Mortgage-Backed Securities | | | — | | | | 9,551,460 | | | | — |
Corporate Bonds | | | — | | | | 44,410,617 | | | | — |
Emerging Market Bonds | | | — | | | | 2,460,662 | | | | — |
Foreign Corporate Bonds | | | — | | | | 4,767,122 | | | | — |
Foreign Government Bonds | | | — | | | | 37,989,600 | | | | — |
Municipal Bonds | | | — | | | | 2,096,877 | | | | — |
Outstanding Options Purchased | | | — | | | | 1,397,158 | | | | — |
Residential Mortgage-Backed Securities | | | — | | | | 4,213,907 | | | | — |
Sovereign Bonds | | | — | | | | 5,586,989 | | | | — |
Structured Note | | | — | | | | 228,221 | | | | — |
United States Government Agency Security | | | — | | | | 49,968 | | | | — |
United States Government Obligation | | | — | | | | 935,186 | | | | — |
Affiliated Money Market Mutual Fund | | | 1,930,329 | | | | — | | | | — |
| | | | | | | | | | | |
| | | 1,930,329 | | | | 123,637,823 | | | | — |
Other Financial Instruments* | | | (81,433 | ) | | | (971,266 | ) | | | — |
| | | | | | | | | | | |
Total | | $ | 1,848,896 | | | $ | 122,666,557 | | | $ | — |
| | | | | | | | | | | |
The following is a reconciliation of assets in which significant unobservable inputs (Level 3) were used in determining fair value:
| | | | |
| | | Other Financial
Instruments (OFI) | |
Balance as of 10/31/08 | | $ | (3,706 | ) |
Realized gain (loss) | | | — | ** |
Earned amortization/accretion | | | — | |
Change in unrealized appreciation (depreciation) | | | 3,706 | |
Net purchases (sales) | | | — | |
Transfers in and/or out of Level 3 | | | — | |
| | | | |
Balance as of 10/31/09 | | $ | — | |
| | | | |
| * | Other financial instruments are derivative instruments not reflected in the Portfolio of Investments, such as futures, forwards and swap contracts, which are valued at the unrealized appreciation/depreciation on the instrument. |
| ** | The realized gain earned during the period for other financial instruments was $4,307. |
See Notes to Financial Statements.
| | |
| 36 | | Visit our website at www.jennisondryden.com |
The industry classification of portfolio holdings and liabilities in excess of other assets shown as a percentage of net assets as of October 31, 2009 was as follows:
| | | |
Foreign Government Obligations | | 28.4 | % |
Commercial Mortgage-Backed Securities | | 7.7 | |
Non Corporate | | 6.5 | |
Banking | | 5.9 | |
Healthcare & Pharmaceutical | | 4.2 | |
Asset-Backed Securities | | 3.6 | |
Residential Mortgage-Backed Securities | | 3.4 | |
Telecommunications | | 3.2 | |
Media & Entertainment | | 3.0 | |
Foreign Agency | | 2.7 | |
Electric | | 2.6 | |
Insurance | | 2.1 | |
Capital Goods | | 2.0 | |
Non Captive Finance | | 2.0 | |
Pipelines & Others | | 2.0 | |
Technology | | 2.0 | |
Municipal Bonds | | 1.7 | |
Affiliated Money Market Mutual Fund | | 1.6 | |
Foods | | 1.5 | |
Building Materials & Construction | | 1.3 | |
Real Estate Investment Trusts | | 1.3 | |
Cable | | 1.1 | |
Options | | 1.1 | |
Paper | | 1.1 | |
Tobacco | | 1.0 | |
Airlines | | 0.9 | |
Energy—Integrated | | 0.8 | |
Chemicals | | 0.7 | |
Metals | | 0.7 | |
United States Government Obligation | | 0.7 | |
Aerospace & Defense | | 0.6 | |
Packaging | | 0.6 | |
Retailers | | 0.6 | |
Healthcare Insurance | | 0.5 | |
Lodging | | 0.4 | |
Consumer | | 0.3 | |
Energy—Other | | 0.3 | |
Structured Notes | | 0.2 | |
Brokerage | | 0.1 | |
Gaming | | 0.1 | |
Railroad | | 0.1 | |
| | | |
| | 100.6 | |
Liabilities in excess of other assets | | (0.6 | ) |
| | | |
Net Assets | | 100.0 | % |
| | | |
| | |
| Dryden Global Total Return Fund, Inc. | | 37 |
Portfolio of Investments
as of October 31, 2009 continued
The Fund invested in derivative instruments during the reporting period. The primary types of risk associated with these derivative instruments are commodity risk, credit risk, equity risk, foreign exchange risk and interest rate risk. The effect of such derivative instruments on the Fund's financial position and financial performance as reflected in the Statement of Assets and Liabilities and Statement of Operations is presented in the summary below.
Fair values of derivative Instruments as of October 31, 2009 as presented in the Statement of Assets and Liabilities:
| | | | | | | | | | | |
Derivatives not designated
as hedging instruments,
carried at fair value | | Asset Derivatives | | Liability Derivatives | |
| | Balance Sheet Location | | Fair Value | | Balance Sheet Location | | Fair Value | |
Credit contracts | | Unrealized appreciation
on swaps | | $ | 67,943 | | Unrealized depreciation
on swaps | | $ | 312,101 | |
Credit contracts | | Premiums for swaps purchased | | | 270,649 | | Premiums for swaps written | | | 51,400 | |
Foreign exchange contracts | | Unrealized appreciation on forward foreign currency contracts | | | 984,630 | | Unrealized depreciation on forward foreign currency contracts | | | 1,678,114 | |
Foreign exchange contracts | | Unaffiliated investments | | | 1,397,158 | | N/A | | | N/A | |
Interest rate contracts | | N/A | | | N/A | | Due to broker-variation margin | | | 81,433 | * |
Interest rate contracts | | Unrealized appreciation
on swaps | | | 46,386 | | Unrealized depreciation
on swaps | | | 80,010 | |
| | | | | | | | | | | |
Total | | | | $ | 2,766,766 | | | | $ | 2,203,058 | |
| | | | | | | | | | | |
| * | Includes cumulative appreciation/depreciation on futures contracts as reported in Portfolio of Investments. Only unsettled variation margin receivable (payable) is reported within the Statement of Assets and Liabilities. |
See Notes to Financial Statements.
| | |
| 38 | | Visit our website at www.jennisondryden.com |
The effects of derivative instruments on the Statement of Operations for the year ended October 31, 2009 are as follows:
| | | | | | | | | | | | | | | | | | | | | | | |
Amount of Realized Gain or (Loss) on Derivatives Recognized in Income | | | |
Derivatives not designated
as hedging instruments,
carried at fair value | | Forward
Contracts | | | Futures | | | Swaps | | | Purchased
Options | | | Written
Options | | Total | |
Credit contracts | | $ | — | | | $ | — | | | $ | (59,358 | ) | | $ | — | | | $ | — | | $ | (59,358 | ) |
Equity contracts | | | — | | | | — | | | | — | | | | — | | | | — | | | — | |
Foreign exchange contracts | | | 6,040,144 | | | | — | | | | 100,185 | | | | (2,505,614 | ) | | | — | | | 3,634,715 | |
Interest rate contracts | | | — | | | | 1,044,296 | | | | 30,013 | | | | (12,686 | ) | | | 332,782 | | | 1,394,405 | |
| | | | | | | | | | | | | | | | | | | | | | | |
Total | | $ | 6,040,144 | | | $ | 1,044,296 | | | $ | 70,840 | | | $ | (2,518,300 | ) | | $ | 332,782 | | $ | 4,969,762 | |
| | | | | | | | | | | | | | | | | | | | | | | |
| |
Change in Unrealized Appreciation or (Depreciation) on
Derivatives Recognized in Income | | | |
Derivatives not designated
as hedging instruments,
carried at fair value | | Forward
Contracts | | | Futures | | | Swaps | | | Purchased
Options | | | Written
Options | | Total | |
Credit contracts | | $ | — | | | $ | — | | | $ | (249,617 | ) | | $ | — | | | $ | — | | $ | (249,617 | ) |
Equity contracts | | | — | | | | — | | | | — | | | | — | | | | — | | | — | |
Foreign exchange contracts | | | (31,966 | ) | | | — | | | | (61,732 | ) | | | 1,003,559 | | | | 183,630 | | | 1,093,491 | |
Interest rate contracts | | | — | | | | (591,702 | ) | | | (42,884 | ) | | | — | | | | — | | | (634,586 | ) |
| | | | | | | | | | | | | | | | | | | | | | | |
Total | | $ | (31,966 | ) | | $ | (591,702 | ) | | $ | (354,233 | ) | | $ | 1,003,559 | | | $ | 183,630 | | $ | 209,288 | |
| | | | | | | | | | | | | | | | | | | | | | | |
For the year ended October 31, 2009, the Portfolio’s average volume of derivative activities are as follows:
| | | | | | | | | | | | | | | | |
Purchased
Options | | Written
Options | | Futures
Long Position | | Futures
Short Position | | Forward
Currency
Contracts-Purchased | | Forward
Currency
Contracts-Sold |
| (Cost) | | (Premium
Received) | | (Value at
Trade Date) | | (Value at
Trade Date) | | (Value at Settlement
Date Payable) | | (Value at Settlement
Date Receivable) |
| $ | 2,084,089 | | $ | 213,370 | | $ | 46,105,968 | | $ | 21,453,590 | | $ | 83,723,306 | | $ | 35,957,257 |
| | | | | | | | | | |
Interest Rate
Swaps | | Credit Default
Swaps as Buyer | | Credit Default
Swaps as Writer | | Currency Swaps
Swaps |
(Notional Amount
in USD(000)) | | (Notional Amount
in USD(000)) | | (Notional Amount
in USD(000)) | | (Notional Amount
in USD(000)) |
| $ | 6,878 | | $ | 2,955 | | $ | 180 | | $ | 267 |
See Notes to Financial Statements.
| | |
| Dryden Global Total Return Fund, Inc. | | 39 |
Statement of Assets and Liabilities
as of October 31, 2009
| | | | |
Assets | | | | |
Investments, at value: | | | | |
Unaffiliated Investments (cost $114,841,617) | | $ | 123,637,823 | |
Affiliated Investments (cost $1,930,329) | | | 1,930,329 | |
Cash | | | 2,334 | |
Dividends and interest receivable | | | 1,584,674 | |
Receivable for investments sold | | | 1,119,229 | |
Unrealized appreciation on forward foreign currency contracts | | | 984,630 | |
Premium for swaps purchased | | | 270,649 | |
Receivable for Fund shares sold | | | 132,881 | |
Unrealized appreciation on swaps | | | 114,329 | |
Due from broker—variation margin | | | 45,740 | |
Prepaid expenses and other assets | | | 21,859 | |
| | | | |
Total assets | | | 129,844,477 | |
| | | | |
| |
Liabilities | | | | |
Payable for investments purchased | | | 2,333,706 | |
Unrealized depreciation on forward foreign currency contracts | | | 1,678,114 | |
Unrealized depreciation on swaps | | | 392,111 | |
Accrued expenses | | | 245,588 | |
Payable for Fund shares reacquired | | | 167,954 | |
Management fee payable | | | 68,983 | |
Premium for swaps written | | | 51,400 | |
Distribution fee payable | | | 29,437 | |
Affiliated transfer agent fee payable | | | 25,003 | |
Deferred directors’ fees | | | 1,725 | |
| | | | |
Total liabilities | | | 4,994,021 | |
| | | | |
| |
Net Assets | | $ | 124,850,456 | |
| | | | |
| | | | | |
Net assets were comprised of: | | | | |
Common stock, at par | | $ | 173,457 | |
Paid-in capital in excess of par | | | 128,422,365 | |
| | | | |
| | | 128,595,822 | |
Undistributed net investment income | | | 6,742,784 | |
Accumulated net realized loss on investment and foreign currency transactions | | | (18,223,451 | ) |
Net unrealized appreciation on investments and foreign currencies | | | 7,735,301 | |
| | | | |
Net assets, October 31, 2009 | | $ | 124,850,456 | |
| | | | |
See Notes to Financial Statements.
| | |
| 40 | | Visit our website at www.jennisondryden.com |
| | | |
Class A | | | |
Net asset value and redemption price per share
($114,554,072 ÷ 15,914,161 shares of common stock issued and outstanding) | | $ | 7.20 |
Maximum sales charge (4.50% of offering price) | | | .34 |
| | | |
Maximum offering price to public | | $ | 7.54 |
| | | |
| |
Class B | | | |
Net asset value, offering price and redemption price per share
($2,920,131 ÷ 406,001 shares of common stock issued and outstanding) | | $ | 7.19 |
| | | |
| |
Class C | | | |
Net asset value, offering price and redemption price per share
($4,235,736 ÷ 590,703 shares of common stock issued and outstanding) | | $ | 7.17 |
| | | |
| |
Class Z | | | |
Net asset value, offering price and redemption price per share
($3,140,517 ÷ 434,795 shares of common stock issued and outstanding) | | $ | 7.22 |
| | | |
See Notes to Financial Statements.
| | |
| Dryden Global Total Return Fund, Inc. | | 41 |
Statement of Operations
Year Ended October 31, 2009
| | | | |
Net Investment Income | | | | |
Interest (net of foreign withholding taxes of $47,421) | | $ | 6,834,926 | |
Affiliated dividend income | | | 21,206 | |
| | | | |
Total income | | | 6,856,132 | |
| | | | |
| |
Expenses | | | | |
Management fee | | | 726,699 | |
Distribution fee—Class A | | | 258,659 | |
Distribution fee—Class B | | | 29,274 | |
Distribution fee—Class C | | | 26,004 | |
Transfer agent’s fee and expenses (including affiliated expense of $105,700) | | | 233,000 | |
Custodian’s fees and expenses | | | 232,000 | |
Reports to shareholders | | | 59,000 | |
Registration fees | | | 54,000 | |
Audit fee | | | 51,000 | |
Legal fees and expenses | | | 22,000 | |
Directors’ fees | | | 16,000 | |
Insurance | | | 3,000 | |
Loan interest expense (Note 7) | | | 21 | |
Miscellaneous | | | 11,027 | |
| | | | |
| | | 1,721,684 | |
Less: expense subsidy (Note 2) | | | (176,291 | ) |
| | | | |
Net expenses | | | 1,545,393 | |
| | | | |
Net investment income | | | 5,310,739 | |
| | | | |
| |
Realized And Unrealized Gain (Loss) On Investment And Foreign Currency Transactions | | | | |
Net realized gain (loss) on: | | | | |
Investment transactions | | | (2,849,604 | ) |
Foreign currency transactions | | | 4,917,948 | |
Financial futures contracts transactions | | | 1,044,296 | |
Written options | | | 332,782 | |
Swap transactions | | | 70,840 | |
| | | | |
| | | 3,516,262 | |
| | | | |
Net change in unrealized appreciation (depreciation) on: | | | | |
Investments | | | 22,382,074 | |
Foreign currencies | | | 162,093 | |
Financial futures contracts | | | (591,702 | ) |
Written options | | | 183,630 | |
Swaps | | | (354,233 | ) |
| | | | |
| | | 21,781,862 | |
| | | | |
Net gain on investments | | | 25,298,124 | |
| | | | |
Net Increase In Net Assets Resulting From Operations | | $ | 30,608,863 | |
| | | | |
See Notes to Financial Statements.
| | |
| 42 | | Visit our website at www.jennisondryden.com |
Statement of Changes in Net Assets
| | | | | | | | |
| | | Year Ended October 31, | |
| | | 2009 | | | 2008 | |
Increase (Decrease) In Net Assets | | | | | | | | |
Operations: | | | | | | | | |
Net investment income | | $ | 5,310,739 | | | $ | 5,854,953 | |
Net realized gain on investment and foreign currency transactions | | | 3,516,262 | | | | 832,630 | |
Net change in unrealized appreciation (depreciation)
on investments and foreign currencies | | | 21,781,862 | | | | (21,867,251 | ) |
| | | | | | | | |
Net increase (decrease) in net assets resulting from operations | | | 30,608,863 | | | | (15,179,668 | ) |
| | | | | | | | |
Dividends (Note 1) | | | | | | | | |
Dividends from net investment income* | | | | | | | | |
Class A | | | (5,175,541 | ) | | | (7,694,837 | ) |
Class B | | | (122,443 | ) | | | (212,599 | ) |
Class C | | | (157,315 | ) | | | (223,952 | ) |
Class Z | | | (99,474 | ) | | | (142,331 | ) |
| | | | | | | | |
| | | (5,554,773 | ) | | | (8,273,719 | ) |
| | | | | | | | |
| | |
Fund share transactions (Net of share conversions)
(Note 6) | | | | | | | | |
Net proceeds from shares sold | | | 5,730,481 | | | | 18,635,568 | |
Net asset value of shares issued in reinvestment of dividends | | | 3,592,464 | | | | 5,282,427 | |
Cost of shares reacquired | | | (16,220,482 | ) | | | (24,532,394 | ) |
| | | | | | | | |
Net decrease in net assets from Fund share transactions | | | (6,897,537 | ) | | | (614,399 | ) |
| | | | | | | | |
Total increase (decrease ) | | | 18,156,553 | | | | (24,067,786 | ) |
| | |
Net Assets | | | | | | | | |
Beginning of year | | | 106,693,903 | | | | 130,761,689 | |
| | | | | | | | |
End of year(a) | | $ | 124,850,456 | | | $ | 106,693,903 | |
| | | | | | | | |
(a) Includes undistributed net investment income of: | | $ | 6,742,784 | | | $ | 114,094 | |
| | | | | | | | |
| * | Dividends from net investment income include other items that are ordinary income for tax purposes. |
See Notes to Financial Statements.
| | |
| Dryden Global Total Return Fund, Inc. | | 43 |
Notes to Financial Statements
Dryden Global Total Return Fund, Inc. (the “Fund”), is an open-end, non-diversified management investment company. The Fund’s investment objective is to seek total return made up of current income and capital appreciation.
The Fund seeks to achieve this objective by investing at least 65% of its total assets in income-producing debt securities issued by the U.S. and foreign corporations and governments, supranational organizations, semi-government entities or governmental agencies, authorities or instrumentalities and short-term bank debt securities or bank deposits. The Fund invests primarily in investment-grade securities denominated in U.S. dollars and in foreign currencies.
Note 1. Accounting Policies
The following is a summary of significant accounting policies followed by the Fund in the preparation of its financial statements.
Security Valuation: In valuing the Fund’s assets, quotations of foreign securities in a foreign currency are converted to U.S. dollar equivalents at the then current currency value. Securities listed on a securities exchange (other than options on securities and indices) are valued at the last sale price on such exchange or market on the day of valuation or, if there was no sale on such a day, at the mean between the last reported bid and asked prices, or at the last bid price on such day in the absence of an asked price. Securities that are actively traded in the over-the-counter market, including listed securities for which the primary market is believed by Prudential Investments LLC (“PI” or “Manager”), in consultation with the subadvisor, to be over-the-counter, are valued at market value using prices provided by an independent pricing agent or principal market maker. Corporate bonds, U.S. government securities and convertible debt securities traded in the over-the-counter market, including securities listed on exchanges whose primary market is believed to be over-the-counter, are valued at market value using prices provided by an independent pricing agent or principal market maker. Options on securities and indices traded on an exchange are valued at the last sale price as of the close of trading on the applicable exchange or, if there was no sale, at the mean between the most recently quoted bid and asked prices on such exchange. Futures contracts and options thereon traded on a commodities exchange or board of trade are valued at the last sale price at the close of trading on such exchange or board of trade or, if there was no sale on the applicable commodities exchange or board of trade on such day, at the mean
| | |
| 44 | | Visit our website at www.jennisondryden.com |
between the most recently quoted prices on such exchange or board of trade or at the last bid price in the absence of an asked price. Prices may be obtained from independent pricing services which use information provided by market makers or estimates of market values obtained from yield data relating to investments or securities with similar characteristics. Securities for which reliable market quotations are not readily available, or whose values have been affected by events occurring after the close of the security’s foreign market and before the Fund’s normal pricing time, are valued at fair value in accordance with Board of Directors’ approved fair valuation procedures. When determining the fair valuation of securities, some of the factors influencing the valuation include, the nature of any restrictions on disposition of the securities; assessment of the general liquidity of the securities; the issuer’s financial condition and the markets in which it does business; the cost of the investment; the size of the holding and the capitalization of issuer; the prices of any recent transactions or bids/offers for such securities or any comparable securities; any available analyst media or other reports or information deemed reliable by the investment adviser regarding the issuer or the markets or industry in which it operates. Using fair value to price securities may result in a value that is different from a security’s most recent closing price and from the price used by other mutual funds to calculate their net asset values.
Investments in mutual funds are valued at their net asset value as of the close of the New York Stock Exchange on the date of the valuation.
Short-term debt securities which mature in sixty days or less are valued at amortized cost, which approximates fair value. The amortized cost method involves valuing a security at its cost on the date of purchase and thereafter assuming a constant amortization to maturity of the difference between the principal amount due at maturity and cost. Short-term debt securities which mature in more than sixty days are valued at current market quotations.
Foreign Currency Translation: The books and records of the Fund are maintained in U.S. dollars. Foreign currency amounts are translated into U.S. dollars on the following basis:
(i) market value of investment securities, other assets and liabilities-at the current rates of exchange.
(ii) purchases and sales of investment securities, income and expenses-at the rates of exchange prevailing on the respective dates of such transactions.
Although the net assets of the Fund are presented at the foreign exchange rates and market values at the close of the period, the Fund does not isolate that portion of the
| | |
| Dryden Global Total Return Fund, Inc. | | 45 |
Notes to Financial Statements
continued
results of operations arising as a result of changes in the foreign exchange rates from the fluctuations arising from changes in the market prices of long-term portfolio securities held at the end of the period. Similarly, the Fund does not isolate the effect of changes in foreign exchange rates from the fluctuations arising from changes in the market prices of long-term portfolio securities sold during the period. Accordingly, these realized foreign currency gains or losses are included in the reported net realized gains or losses on investment transactions.
Net realized gains or losses on foreign currency transactions represent net foreign exchange gains or losses from sales and maturities of short-term securities and forward currency contracts, disposition of foreign currencies, currency gains or losses realized between the trade and settlement dates on securities transactions, and the difference between the amounts of interest, discount and foreign withholding taxes recorded on the Fund’s books and the U.S. dollar equivalent amounts actually received or paid. Net unrealized currency gains or losses resulting from valuing foreign currency denominated assets (excluding investments) and liabilities at period-end exchange rates are reflected as a component of net unrealized appreciation or depreciation on foreign currencies.
Foreign security and currency transactions may involve certain considerations and risks not typically associated with those of U.S. companies as a result of, among other factors, the possibility of political or economic instability or the level of governmental supervision and regulation of foreign securities markets.
Financial Futures Contracts: A financial futures contract is an agreement to purchase (long) or sell (short) an agreed amount of securities at a set price for delivery on a future date. Upon entering into a financial futures contract, the Fund is required to pledge to the broker an amount of cash and/or other assets equal to a certain percentage of the contract amount. This amount is known as the “initial margin.” Subsequent payments, known as “variation margin,” are made or received by the Fund each day, depending on the daily fluctuations in the value of the underlying security. Such variation margin is recorded for financial statement purposes on a daily basis as unrealized gain or loss. When the contract expires or is closed, the gain or loss is realized and is presented in the Statement of Operations as net realized gain or loss on financial futures contracts.
The Fund invests in financial futures contracts in order to hedge its existing portfolio securities, or securities the Fund intends to purchase, against fluctuations in value
| | |
| 46 | | Visit our website at www.jennisondryden.com |
caused by changes in prevailing interest rates or foreign currency exchange rates. Should interest rates move unexpectedly, the Fund may not achieve the anticipated benefits of the financial futures contracts and may realize a loss. The use of futures transactions involves the risk of imperfect correlation in movements in the price of futures contracts, interest rates and the underlying hedged assets. Financial futures contracts involve elements of risk in excess of the amounts reflected on the Statement of Assets and Liabilities.
Forward Currency Contracts: A forward currency contract is a commitment to purchase or sell a foreign currency at a future date at a negotiated forward rate. The Fund enters into forward currency contracts in order to hedge its exposure to changes in foreign currency exchange rates on its foreign portfolio holdings or on specific receivables and payables denominated in a foreign currency. The contracts are valued daily at current exchange rates and any unrealized gain or loss is included in net unrealized appreciation or depreciation on foreign currencies. Gain or loss is realized on the settlement date of the contract equal to the difference between the settlement value of the original and renegotiated forward contracts. This gain or loss, if any, is included in net realized gain (loss) on foreign currency transactions. Forward currency contracts involve risks from currency exchange rate and credit risk in excess of the amounts reflected on the Statement of Assets and Liabilities. Risks may also arise upon entering into these contracts from the potential inability of the counterparties to meet the terms of their contracts. The Fund’s maximum risk of loss from counterparty credit risk is the net value of the cash flows to be received from the counterparty at the end of the contract’s life. This risk may be mitigated by having a master netting arrangement between the Fund and the counterparty which may permit the Fund to offset amounts payable by the Fund to the same counterparty against amounts to be received; and by the receipt of collateral from the counterparty by the Fund to cover the Fund’s exposure to the counterparty. However, there is no assurance that such mitigating factors are easily enforceable.
Options: The Fund may either purchase or write options in order to hedge against adverse market movements or fluctuations in value caused by changes in prevailing interest rates, value of equities or foreign currencies, with respect to securities which the Fund currently owns or intends to purchase. The Fund’s principal reason for writing options is to realize, through receipt of premiums, a greater current return than would be realized on the underlying security alone. When the Fund purchases an option, it pays a premium and an amount equal to that premium is recorded as an asset. When the Fund writes an option, it receives a premium and an amount equal to that premium is recorded as a liability. The asset or liability is adjusted daily to reflect the current market value of the option. If an option expires unexercised, the Fund realizes a gain or loss to the extent of the premium received or paid. If an option is
| | |
| Dryden Global Total Return Fund, Inc. | | 47 |
Notes to Financial Statements
continued
exercised, the premium received or paid is recorded as an adjustment to the proceeds from the sale or the cost of the purchase in determining whether the Fund has realized a gain or loss. The difference between the premium and the amount received or paid at the closing of a purchase or sale transaction is also treated as a realized gain or loss. Gain or loss on purchased options is included in net realized gain or loss on investment transactions. Gain or loss on written options is presented separately as net realized gain or loss on options written. The Fund, as writer of an option, may have no control over whether the underlying securities may be sold (called) or purchased (put). As a result, the Fund bears the market risk of an unfavorable change in the price of the security underlying the written option. The Fund, as purchaser of an over-the-counter option, bears the risk of the potential inability of the counterparties to meet the terms of their contracts.
With exchange-traded futures and options contracts, there is minimal counterparty credit risk to the Fund since the exchanges’ clearinghouse acts as counterparty to all exchange traded futures and options and guarantees the futures and options contracts against default.
Swap Agreements: The Fund may enter into credit default, interest rate, total return and other forms of swap agreements. A swap agreement is an agreement to exchange the return generated by one instrument for the return generated by another instrument. The swap agreements are valued daily at current market value and any change in value is included in the net unrealized appreciation or depreciation on investments. Payments received or paid by the Fund are recorded as realized gains or losses upon termination or maturity of the swap. Risk of loss may exceed amounts recognized on the Statements of Assets and Liabilities. Swap agreements outstanding at period end, if any, are listed on the Portfolio of Investments.
Interest Rate Swaps: Interest rate swaps represent an agreement between counterparties to exchange cash flows based on the difference between two interest rates, applied to a notional principal amount for a specified period. The Fund is subject to interest rate risk exposure in the normal course of pursuing its investment objectives. The Fund may use interest rate swaps to either maintain its ability to generate steady cash flow by receiving a stream of fixed rate payments or to increase exposure to prevailing market rates by receiving floating rate payments using interest rate swap contracts. The Fund’s maximum risk of loss from counterparty credit risk is the discounted net value of the cash flows to be received from the counterparty over
| | |
| 48 | | Visit our website at www.jennisondryden.com |
the contract’s remaining life. This risk may be mitigated by having a master netting arrangement between the Fund and the counterparty which may permit the Fund to offset amounts payable by the Fund to the same counterparty against amounts to be received; and by the receipt of collateral from the counterparty by the Fund to cover the Fund’s exposure to the counterparty. However, there is no assurance that such mitigating factors are easily enforceable.
Credit Default Swaps: Credit default swaps involve one party (the protection buyer) making a stream of payments to another party (the protection seller) in exchange for the right to receive a specified payment in the event of a default or as a result of a default (“credit event”) for the referenced party, typically corporate issues or sovereign issues of an emerging country, on its obligation; or in the event of a write-down, principal shortfall, interest shortfall or default of all or part of the referenced entities comprising a credit index.
The Fund may use credit default swaps to provide a measure of protection against defaults of the issuers or to take an active long or short position with respect to the likelihood of a particular issuer’s default. The Fund may use credit default swaps on credit indices to hedge a portfolio of credit default swaps or bonds, which is less expensive than it would be to buy many credit default swaps to achieve a similar effect. The Fund is subject to credit risk in the normal course of pursuing its investment objectives. The Fund’s maximum risk of loss from counterparty credit risk for purchased credit default swaps is the notional value of a credit default swap agreement. This risk may be mitigated by having a master netting arrangement between the Fund and the counterparty which may permit the Fund to offset amounts payable by the Fund to the same counterparty against amounts to be received; and by the receipt of collateral from the counterparty by the Fund to cover the Fund’s exposure to the counterparty. However, there is no assurance that such mitigating factors are easily enforceable.
As a seller of protection on credit default swap agreements, the Fund will generally receive from the buyer of protection an agreed upon payment throughout the term of the swap provided that there is no credit event. As the seller, the Fund would effectively increase investment risk to its portfolio because, in addition to its total net assets, the Fund may be subject to investment exposure on the notional amount of the swap.
The maximum amount of the payment that the Fund as a seller of protection could be required to pay under a credit default swap agreement would be equal to the notional amount of the underlying security or index contract as a result of a credit event. These potential amounts will be partially offset by any recovery values of the respective
| | |
| Dryden Global Total Return Fund, Inc. | | 49 |
Notes to Financial Statements
continued
referenced obligations, or net amounts received from the settlement of credit default swap agreements entered into by the Fund as a buyer for the same referenced entity or index. As a buyer of protection, the Fund generally receives an amount up to the notional value of the swap if a credit event occurs.
Implied credit spreads, represented in absolute terms, utilized in determining the market value of credit default swap agreements on corporate issues or sovereign issues of an emerging country as of reporting date are disclosed in the footnotes to the Portfolio of Investments and serve as an indicator of the current status of the payment/performance risk and represent the likelihood of risk of default for the credit derivative. The implied credit spread of a particular referenced entity reflects the cost of buying /selling protection and may include upfront payments required to enter into the agreement. For credit default swap agreements on asset-backed securities and credit indices, the quoted market prices and resulting values serve as the indicator of the current status of the payment/performance risk. Wider credit spreads and increasing market value in absolute terms, when compared to the notional amount of the swap, represent a deterioration of the referenced entity’s credit soundness and a greater likelihood of risk of default or other credit event occurring as defined under the terms of the agreement.
In addition to each instrument’s primary underlying risk exposure (e.g. interest rate, credit, equity or foreign exchange, etc.), swap agreements involve, to varying degrees, elements of credit, market and documentation risk. Such risks involve the possibility that there will be no liquid market for these agreements, that the counterparty to the agreement may default on its obligation to perform or disagree as to the meaning of the contractual terms in the agreement, and that there will be unfavorable changes in net interest rates. In connection with these agreements, securities in the portfolio may be identified as collateral or received as collateral from the counterparty in accordance with the terms of the respective swap agreements to provide or receive assets of value and serve as recourse in the event of default or bankruptcy/insolvency of either party. Such over-the-counter derivative agreements include conditions which when materialized, give the counterparty the right to cause an early termination of the transactions under those agreements. Any election by the counterparty for early termination of the contract(s) may impact the amounts reported on financial statements.
As of October 31, 2009, the Fund has not met conditions under such agreements that give the counterparty the right to call for an early termination.
| | |
| 50 | | Visit our website at www.jennisondryden.com |
Forward currency contracts, written options, financial futures contracts, and swap agreements involve elements of both market and credit risk in excess of the amounts reflected on the Statement of Assets and Liabilities.
Lower rated or unrated securities are more likely to react to developments affecting market risk (general market liquidity) and credit risk (an issuer’s inability to meet principal and interest payments on its obligations) than are more highly rated securities, which react primarily to movements in the general level of interest rates. The ability of issuers of debt securities held by the Fund to meet their obligations may be affected by economic developments in a specific industry or region.
Security Transactions and Net Investment Income: Security transactions are recorded on the trade date. Realized and unrealized gains or losses on sales of securities are calculated on the identified cost basis. Dividend income is recorded on the ex-dividend date. Interest income, including amortization of premium and accretion of discount on debt securities, as required, is recorded on the accrual basis. Expenses are recorded on the accrual basis.
Net investment income or loss (other than distribution fees, which are charged directly to the respective class) and unrealized and realized gains or losses are allocated daily to each class of shares based upon the relative proportion of net assets of each class at the beginning of the day.
Dividends and Distributions: The Fund expects to pay dividends of net investment income quarterly and distributions of net realized capital and currency gains, if any, annually. Foreign currency losses may reduce the amount of dividends of net investment income. Dividends and distributions to shareholders, which are determined in accordance with federal income tax regulations and which may differ from generally accepted accounting principles, are recorded on the ex-dividend date. Permanent book/tax differences relating to income and gains are reclassified to paid-in capital when they arise.
Taxes: It is the Fund’s policy to continue to meet the requirements of the Internal Revenue Code applicable to regulated investment companies and to distribute all of its taxable net income and capital gains, if any, to its shareholders. Therefore, no federal income tax provision is required.
Withholding taxes on foreign interest are recorded, net of reclaimable amounts, at the time the related income is earned.
| | |
| Dryden Global Total Return Fund, Inc. | | 51 |
Notes to Financial Statements
continued
Estimates: The preparation of the financial statements requires management to make estimates and assumptions that affect the reported amounts and disclosures in the financial statements. Actual results could differ from those amounts.
Note 2. Agreements
The Fund has a management agreement with PI. Pursuant to this agreement, PI has responsibility for all investment advisory services and supervises the subadviser’s performance of such services. PI has entered into a subadvisory agreement with Prudential Investment Management, Inc. (“PIM”). The subadvisory agreement provides that PIM will furnish investment advisory services in connection with the management of the Fund. In connection therewith, PIM is obligated to keep certain books and records of the Fund. PI pays for the services of PIM, the cost of compensation of officers of the Fund, occupancy and certain clerical and bookkeeping costs of the Fund. The Fund bears all other costs and expenses.
The management fee paid to PI is accrued daily and payable monthly at an annual rate of .65 of 1% of the Fund’s average daily net assets up to $1 billion and .60 of 1% of such assets in excess of $1 billion. The effective management fee rate was .65 of 1% for the year ended October 31, 2009.
PI has voluntarily agreed to reimburse the Fund in order to limit operating expenses (excluding distribution and service (12b-1) fees, interest, taxes, brokerage commissions and certain extraordinary expenses) to 1.10% of the average daily net assets of the Class A, B, C, and Z shares, respectively, which for the year ended October 31, 2009 amounted to $176,291.
The Fund has a distribution agreement with Prudential Investment Management Services LLC (“PIMS”), which acts as the distributor of the Class A, Class B, Class C and Class Z shares of the Fund. The Fund compensates PIMS for distributing and servicing the Fund’s Class A, Class B and Class C shares, pursuant to plans of distribution (the “Class A, B and C Plans”), regardless of expenses actually incurred by PIMS. The distribution fees are accrued daily and payable monthly. No distribution or service fees are paid to PIMS as distributor of the Class Z shares of the Fund.
Pursuant to the Class A, B and C Plans, the Fund compensates PIMS for distribution related activities at an annual rate of up to .30 of 1%, 1% and 1% of the average daily
| | |
| 52 | | Visit our website at www.jennisondryden.com |
net assets of the Class A, B, and C shares, respectively. Through February 28, 2011, PIMS contractually agreed to limit such fees to .25 of 1% and .75 of 1% of the average daily net assets of the Class A and Class C shares, respectively.
PIMS has advised the Fund that it has received $32,039 in front-end sales charges resulting from sales of Class A shares during the year ended October 31, 2009. From these fees, PIMS paid such sales charges to affiliated broker-dealers, which in turn paid commissions to salespersons and incurred other distribution costs.
PIMS has advised the Fund that for the year ended October 31, 2009, it received $303, $11,979 and $1,172 in contingent deferred sales charges imposed upon redemptions by certain Class A, Class B and Class C shareholders, respectively.
PI, PIM and PIMS are indirect, wholly-owned subsidiaries of Prudential Financial, Inc. (“Prudential”).
Note 3. Other Transactions with Affiliates
Prudential Mutual Fund Services LLC (“PMFS”), an affiliate of PI and an indirect, wholly-owned subsidiary of Prudential, serves as the Fund’s transfer agent. Transfer agent’s fees and expenses in the Statement of Operations include certain out-of-pocket expenses paid to non-affiliates, where applicable.
The Fund pays networking fees to affiliated and unaffiliated broker/dealers including fees relating to the services of First Clearing, LLC (“First Clearing”) and Wells Fargo Advisors LLC (“Wells Fargo”), affiliates of PI. These networking fees are payments made to broker/dealers that clear mutual fund transactions through a national clearing system. For the year ended October 31, 2009 the Fund incurred approximately $81,400 in total networking fees of which approximately $27,800 was paid to First Clearing. These amounts are included in transfer agent’s fees and expenses in the Statement of Operations.
The Fund invests in the Taxable Money Market Series (the “Portfolio”), a portfolio of the Dryden Core Investment Fund. The Portfolio is a money market mutual fund registered under the Investment Company Act of 1940, as amended, and managed by PI. Earnings from the Portfolio is disclosed on the Statement of Operations as affiliated dividend income.
| | |
| Dryden Global Total Return Fund, Inc. | | 53 |
Notes to Financial Statements
continued
Note 4. Portfolio Securities
Purchases and sales of portfolio securities, excluding U.S. Government securities and short-term investments, for the year ended October 31, 2009 aggregated $176,592,276 and $178,687,737, respectively.
Transactions in options written during the year ended October 31, 2009, were as follows:
| | | | | | | |
| | | Contracts | | | Premiums
Received | |
Options outstanding at October 31, 2008 | | 6,998,400 | | | $ | 326,148 | |
Options written | | 17 | | | | 14,375 | |
Options closed | | (17 | ) | | | (14,375 | ) |
Options expired | | (6,998,400 | ) | | | (326,148 | ) |
| | | | | | | |
Options outstanding at October 31, 2009 | | — | | | $ | — | |
| | | | | | | |
Note 5. Distributions and Tax Information
Distributions to shareholders, which are determined in accordance with federal income tax regulations and which may differ from generally accepted accounting principles, are recorded on the ex-dividends date. In order to present undistributed net investment income, accumulated net realized loss on investment and foreign currency transactions and paid-in capital in excess of par on the Statement of Assets and Liabilities that more closely represent their tax character, certain adjustments have been made to undistributed net investment income, accumulated net realized loss on investment and foreign currency transactions and paid-in capital in excess of par. For the year ended October 31, 2009, the adjustments were to increase undistributed net investment income by $6,872,724, increase accumulated net realized loss on investment and foreign currency transactions by $3,381,786 and decrease paid-in capital in excess of par by $3,490,938, due to reclassification of net foreign currency gain, reclass of paydown and swap gain (loss), differences in the treatment of premium amortization, expiration of capital loss carryforward and other book to tax adjustments. Net investment income, net realized gain on investment and foreign currency transactions and net assets were not affected by this change.
The tax character of dividends paid as reflected in the Statements of Changes in Net Assets was $5,554,773 of ordinary income for the year ended October 31, 2009. The
| | |
| 54 | | Visit our website at www.jennisondryden.com |
tax character of dividends paid was $8,273,719 of ordinary income for the year ended October 31, 2008.
As of October 31, 2009, the Fund had accumulated undistributed ordinary income of $8,615,922.
For federal income tax purposes, the Fund had a capital loss carryforward as of October 31, 2009, of approximately $17,355,500, of which $7,581,800 expires in 2010, $2,252,000 expires in 2014, $279,500 expires in 2015, $4,766,500 expires in 2016 and $2,475,700 expires in 2017. During the year ended October 31, 2009, approximately $3,491,000 of the capital loss carryforward was written off unused due to expiration. Accordingly, no capital gains distribution is expected to be paid to shareholders until net gains have been realized in excess of such carryforward. It is uncertain if the Fund will be able to realize the full benefit of the remaining carryforwards prior to the expiration dates.
The United States federal income tax basis of the Fund’s investments and the net unrealized appreciation as of October 31, 2009 were as follows:
| | | | | | | | | | |
Tax Basis | | Appreciation | | Depreciation | | Net
Unrealized
Appreciation | | Other Cost
Basis
Adjustments | | Total Net
Unrealized
Appreciation |
| $120,213,690 | | $7,224,250 | | $(1,869,788) | | $5,354,462 | | $(358,560) | | $4,995,902 |
The differences between book and tax basis are primarily attributable to the deferred losses on wash sales, deferred losses on foreign currencies and difference in the treatment of amortization of premiums. The other cost basis adjustments are primarily attributable to appreciation (depreciation) of foreign currencies, swaps, options and futures.
Management has analyzed the Fund’s tax positions taken on the federal income tax returns for all open tax years and has concluded that as of October 31, 2009, no provision for income tax would be required in the Fund’s financial statements. The Fund’s federal and state income and federal excise tax returns for tax years for which the applicable statutes of limitations have not expired are subject to examination by the Internal Revenue Service and state departments of revenue.
Note 6. Capital
The Fund offers Class A, Class B, Class C and Class Z shares. Class A shares are sold with a front-end sales charge of up to 4.50%. All investors who purchase Class A shares in an amount of $1 million or more and sell these shares within 12 months of
| | |
| Dryden Global Total Return Fund, Inc. | | 55 |
Notes to Financial Statements
continued
purchase are subject to a contingent deferred sales charge (CDSC) of 1%, including investors who purchase their shares through broker-dealers affiliated with Prudential. Class B shares are sold with a CDSC which declines from 5% to zero depending on the period of time the shares are held. Class C shares are sold with a CDSC of 1% during the first 12 months. Class B shares automatically convert to Class A shares on a quarterly basis approximately seven years after purchase. A special exchange privilege is also available for shareholders who qualified to purchase Class A shares at net asset value. Class Z shares are not subject to any sales or redemption charge and are offered exclusively for sale to a limited group of investors.
There are 2 billion authorized shares of common stock at $.01 par value per share, divided equally into Class A, B, C and Z shares.
| | | | | | | |
Class A | | Shares | | | Amount | |
Year ended October 31, 2009: | | | | | | | |
Shares sold | | 388,567 | | | $ | 2,575,234 | |
Shares issued in reinvestment of dividends | | 518,976 | | | | 3,271,542 | |
Shares reacquired | | (2,083,533 | ) | | | (13,052,686 | ) |
| | | | | | | |
Net increase (decrease) in shares outstanding before conversion | | (1,175,990 | ) | | | (7,205,910 | ) |
Shares issued upon conversion from Class B | | 100,800 | | | | 636,652 | |
| | | | | | | |
Net increase (decrease) in shares outstanding | | (1,075,190 | ) | | $ | (6,569,258 | ) |
| | | | | | | |
Year ended October 31, 2008: | | | | | | | |
Shares sold | | 1,440,888 | | | $ | 9,951,088 | |
Shares issued in reinvestment of dividends | | 711,008 | | | | 4,791,278 | |
Shares reacquired | | (2,830,700 | ) | | | (19,045,702 | ) |
| | | | | | | |
Net increase (decrease) in shares outstanding before conversion | | (678,804 | ) | | | (4,303,336 | ) |
Shares issued upon conversion from Class B | | 112,019 | | | | 768,285 | |
| | | | | | | |
Net increase (decrease) in shares outstanding | | (566,785 | ) | | $ | (3,535,051 | ) |
| | | | | | | |
| | |
| 56 | | Visit our website at www.jennisondryden.com |
| | | | | | | |
Class B | | Shares | | | Amount | |
Year ended October 31, 2009: | | | | | | | |
Shares sold | | 63,818 | | | $ | 412,572 | |
Shares issued in reinvestment of dividends | | 15,593 | | | | 97,710 | |
Shares reacquired | | (141,396 | ) | | | (865,712 | ) |
| | | | | | | |
Net increase (decrease) in shares outstanding before conversion | | (61,985 | ) | | | (355,430 | ) |
Shares reacquired upon conversion into Class A | | (100,961 | ) | | | (636,652 | ) |
| | | | | | | |
Net increase (decrease) in shares outstanding | | (162,946 | ) | | $ | (992,082 | ) |
| | | | | | | |
Year ended October 31, 2008: | | | | | | | |
Shares sold | | 398,400 | | | $ | 2,739,772 | |
Shares issued in reinvestment of dividends | | 26,920 | | | | 181,099 | |
Shares reacquired | | (246,423 | ) | | | (1,617,516 | ) |
| | | | | | | |
Net increase (decrease) in shares outstanding before conversion | | 178,897 | | | | 1,303,355 | |
Shares reacquired upon conversion into Class A | | (112,301 | ) | | | (768,285 | ) |
| | | | | | | |
Net increase (decrease) in shares outstanding | | 66,596 | | | $ | 535,070 | |
| | | | | | | |
Class C | | | | | | |
Year ended October 31, 2009: | | | | | | | |
Shares sold | | 209,007 | | | $ | 1,394,842 | |
Shares issued in reinvestment of dividends | | 20,349 | | | | 127,546 | |
Shares reacquired | | (283,544 | ) | | | (1,751,677 | ) |
| | | | | | | |
Net increase (decrease) in shares outstanding | | (54,188 | ) | | $ | (229,289 | ) |
| | | | | | | |
Year ended October 31, 2008: | | | | | | | |
Shares sold | | 682,597 | | | $ | 4,714,339 | |
Shares issued in reinvestment of dividends | | 25,452 | | | | 170,654 | |
Shares reacquired | | (389,625 | ) | | | (2,593,083 | ) |
| | | | | | | |
Net increase (decrease) in shares outstanding | | 318,424 | | | $ | 2,291,910 | |
| | | | | | | |
Class Z | | | | | | |
Year ended October 31, 2009: | | | | | | | |
Shares sold | | 193,281 | | | $ | 1,347,833 | |
Shares issued in reinvestment of dividends | | 15,083 | | | | 95,666 | |
Shares reacquired | | (88,900 | ) | | | (550,407 | ) |
| | | | | | | |
Net increase (decrease) in shares outstanding | | 119,464 | | | $ | 893,092 | |
| | | | | | | |
Year ended October 31, 2008: | | | | | | | |
Shares sold | | 176,548 | | | $ | 1,230,369 | |
Shares issued in reinvestment of dividends | | 20,657 | | | | 139,396 | |
Shares reacquired | | (189,986 | ) | | | (1,276,093 | ) |
| | | | | | | |
Net increase (decrease) in shares outstanding | | 7,219 | | | $ | 93,672 | |
| | | | | | | |
Note 7. Borrowing
The Fund, along with other affiliated registered investment companies (the “Funds”), is a party to a Syndicated Credit Agreement (“SCA”) with two banks. The SCA
| | |
| Dryden Global Total Return Fund, Inc. | | 57 |
Notes to Financial Statements
continued
provides for a commitment of $500 million. Interest on any borrowings under the SCA is incurred at contracted market rates and a commitment fee for the unused amount is accrued daily and paid quarterly. Effective October 22, 2009, the Fund renewed the SCA with the banks. The commitment under the renewed SCA continues to be $500 million. The Fund pays a commitment fee of .15 of 1% of the unused portion of the renewed SCA. The expiration date of the renewed SCA is October 20, 2010. For the period from October 24, 2008 through October 21, 2009, the Fund paid a commitment fee of .13 of 1% of the unused portion of the agreement. The purpose of the SCA is to provide an alternative source of temporary funding for capital share redemptions.
The Fund utilized the line of credit during the year ended October 31, 2009. The average daily balance for the 3 days the Fund had loans outstanding during the period was approximately $216,000 at a weighted average interest rate of 1.15%.
Note 8. Subsequent Events
Management has evaluated the impact of all subsequent events on the Fund through December 23, 2009, the date the financial statements were issued, and has been determined that except for the following, there were no subsequent events requiring recognition or disclosure in the financial statements.
On December 16, 2009, the Fund declared an ordinary income dividend of $0.52452 per Class A share, $0.51100 per Class B share, $0.51560 per Class C share and $0.52904 per Class Z share. The dividend paid to shareholders of record on December 17, 2009. The ex-dividend date was December 18, 2009.
| | |
| 58 | | Visit our website at www.jennisondryden.com |
Financial Highlights
| | |
| OCTOBER 31, 2009 | | ANNUAL REPORT |
Dryden Global Total Return Fund, Inc.
Financial Highlights
| | | | |
| | | Class A | |
| | | Year Ended
October 31, 2009(a) | |
Per Share Operating Performance: | | | | |
Net Asset Value, Beginning of Period | | $ | 5.76 | |
| | | | |
Income (loss) from investment operations: | | | | |
Net investment income | | | .30 | |
Net realized and unrealized gain (loss) on investment and foreign currency transactions | | | 1.46 | |
| | | | |
Total from investment operations | | | 1.76 | |
| | | | |
Less Dividends and Distributions | | | | |
Dividends from net investment income* | | | (.32 | ) |
Tax return of capital distributions | | | — | |
| | | | |
Total dividends and distributions | | | (.32 | ) |
| | | | |
Net asset value, end of period | | $ | 7.20 | |
| | | | |
Total Return(c): | | | 31.42 | % |
Ratios/Supplemental Data: | | | | |
Net assets, end of period (000) | | $ | 114,554 | |
Average net assets (000) | | $ | 103,462 | |
Ratios to average net assets(h): | | | | |
Expenses, including distribution and service (12b-1) fees(d) | | | 1.35 | %(e) |
Expenses, excluding distribution and service (12b-1) fees | | | 1.10 | %(e) |
Net investment income | | | 4.78 | %(e) |
For Class A, B, C and Z shares: | | | | |
Portfolio turnover rate | | | 164 | % |
| (a) | Calculated based upon average shares outstanding during the period. |
| (b) | For the ten month period ended October 31, 2007. The Fund changed its fiscal year end from December 31 to October 31. |
| (c) | Total return does not consider the effects of sales loads. Total return is calculated assuming a purchase of a share on the first day and a sale on the last day of each period reported, and includes reinvestment of dividends and distributions. Total investment returns may reflect adjustments to conform to generally accepted accounting principles. Total returns for periods less than one full year are not annualized. |
| (d) | The distributor of the Fund has contractually agreed to limit its distribution and service (12b-1) fees to .25 of 1% of the average daily net assets of the Class A shares. |
| (e) | As of June 1, 2004, the Manager of the Fund has agreed to reimburse the Fund in order to limit operating expenses (excluding interest, taxes and brokerage commissions and certain extraordinary expenses) to 1.35% of the average daily net assets of Class A. If the manager had not reimbursed the Fund, the annual expenses (both including and excluding distribution and service (12b-1) fees) and net investment income ratios would be 1.44%, 1.19% and 1.63%, respectively, for the year ended December 31, 2004, 1.42%, 1.17%, and 2.23%, respectively, for the year ended December 31, 2005, 1.42%, 1.17% and 2.81%, respectively, for the year ended December 31, 2006, 1.37%, 1.12% and 3.62%, respectively, for the ten-month period ended October 31, 2007, 1.44%, 1.19% and 4.47%, respectively, for the year ended October 31, 2008 and 1.51%, 1.26%, and 4.62%, respectively, for the year ended October 31, 2009. |
| (h) | Does not include expenses of the underlying portfolios in which the Fund invests. |
| * | Dividends from net investment income include other items that are ordinary income for tax purposes. |
See Notes to Financial Statements.
| | |
| 60 | | Visit our website at www.jennisondryden.com |
| | | | | | | | | | | | | | | | | | |
| Class A | |
Year Ended
October 31, 2008(a) | | | Ten Months Ended
October 31, 2007(a)(b) | | | Year Ended December 31, | |
| | | 2006(a) | | | 2005(a) | | | 2004(a) | |
| | | | | | | | | | | | | | | | | | |
| $ | 7.00 | | | $ | 6.69 | | | $ | 6.51 | | | $ | 7.55 | | | $ | 7.51 | |
| | | | | | | | | | | | | | | | | | | |
| | | | | | | | | | | | | | | | | | |
| | .31 | | | | .20 | | | | .19 | | | | .16 | | | | .12 | |
| | | | |
| | (1.11 | ) | | | .32 | | | | .16 | | | | (.74 | ) | | | .53 | |
| | | | | | | | | | | | | | | | | | | |
| | (.80 | ) | | | .52 | | | | .35 | | | | (.58 | ) | | | .65 | |
| | | | | | | | | | | | | | | | | | | |
| | | | | | | | | | | | | | | | | | |
| | (.44 | ) | | | (.21 | ) | | | (.17 | ) | | | (.40 | ) | | | (.61 | ) |
| | — | | | | — | | | | — | | | | (.06 | ) | | | — | |
| | | | | | | | | | | | | | | | | | | |
| | (.44 | ) | | | (.21 | ) | | | (.17 | ) | | | (.46 | ) | | | (.61 | ) |
| | | | | | | | | | | | | | | | | | | |
| $ | 5.76 | | | $ | 7.00 | | | $ | 6.69 | | | $ | 6.51 | | | $ | 7.55 | |
| | | | | | | | | | | | | | | | | | | |
| | (12.19 | )% | | | 7.81 | % | | | 5.66 | % | | | (7.94 | )% | | | 9.42 | % |
| | | | | | | | | | | | | | | | | | |
| $ | 97,894 | | | $ | 122,811 | | | $ | 131,477 | | | $ | 151,399 | | | $ | 189,719 | |
| $ | 119,545 | | | $ | 123,600 | | | $ | 139,865 | | | $ | 169,867 | | | $ | 185,333 | |
| | | | | | | | | | | | | | | | | | |
| | 1.36 | %(e) | | | 1.36 | %(e)(f) | | | 1.36 | %(e) | | | 1.35 | %(e) | | | 1.35 | %(e) |
| | 1.11 | %(e) | | | 1.11 | %(e)(f) | | | 1.11 | %(e) | | | 1.10 | %(e) | | | 1.10 | %(e) |
| | 4.55 | %(e) | | | 3.63 | %(e)(f) | | | 2.87 | %(e) | | | 2.30 | %(e) | | | 1.74 | %(e) |
| | | | | | | | | | | | | | | | | | |
| | 292 | % | | | 234 | %(g) | | | 233 | % | | | 307 | % | | | 312 | % |
See Notes to Financial Statements.
| | |
| Dryden Global Total Return Fund, Inc. | | 61 |
Financial Highlights
continued
| | | | |
| | | Class B | |
| | | Year Ended October 31, 2009(a) | |
Per Share Operating Performance: | | | | |
Net Asset Value, Beginning of Period | | $ | 5.76 | |
| | | | |
Income (loss) from investment operations: | | | | |
Net investment income | | | .25 | |
Net realized and unrealized gain (loss) on investment and foreign currency transactions | | | 1.45 | |
| | | | |
Total from investment operations | | | 1.70 | |
| | | | |
Less Dividends and Distributions | | | | |
Dividends from net investment income* | | | (.27 | ) |
Tax return of capital distributions | | | — | |
| | | | |
Total dividends and distributions | | | (.27 | ) |
| | | | |
Net asset value, end of period | | $ | 7.19 | |
| | | | |
Total Return(c): | | | 30.25 | % |
Ratios/Supplemental Data: | | | | |
Net assets, end of period (000) | | $ | 2,920 | |
Average net assets (000) | | $ | 2,927 | |
Ratios to average net assets(f): | | | | |
Expenses, including distribution and service (12b-1) fees | | | 2.10 | %(d) |
Expenses, excluding distribution and service (12b-1) fees | | | 1.10 | %(d) |
Net investment income | | | 4.03 | %(d) |
| (a) | Calculated based upon average shares outstanding during the period. |
| (b) | For the ten month period ended October 31, 2007. The Fund changed its fiscal year end from December 31 to October 31. |
| (c) | Total return does not consider the effects of sales loads. Total return is calculated assuming a purchase of a share on the first day and a sale on the last day of each period reported, and includes reinvestment of dividends and distributions. Total investment returns may reflect adjustments to conform to generally accepted accounting principles. Total returns for periods less than one full year are not annualized. |
| (d) | As of June 1, 2004, the Manager of the Fund has agreed to reimburse the Fund in order to limit operating expenses (excluding interest, taxes and brokerage commissions and certain extraordinary expenses) to 2.10% of the average daily net assets of Class B. If the manager had not reimbursed the Fund, the annual expenses (both including and excluding distribution and service (12b-1) fees) and net investment income ratios would be 2.19%, 1.19% and .90%, respectively, for the year ended December 31, 2004, 2.17%, 1.17%, and 1.47%, respectively, for the year ended December 31, 2005, 2.17%, 1.17% and 2.03%, respectively, for the year ended December 31, 2006, 2.12%, 1.12% and 2.86%, respectively, for the ten-month period ended October 31, 2007, 2.19%, 1.19%, 3.72%, respectively, for the year ended October 31, 2008 and 2.26%, 1.26%, 3.87%, respectively, for the year ended October 31, 2009. |
| (f) | Does not include expenses of the underlying portfolios in which the Fund invests. |
| * | Dividends from net investment income include other items that are ordinary income for tax purposes. |
See Notes to Financial Statements.
| | |
| 62 | | Visit our website at www.jennisondryden.com |
| | | | | | | | | | | | | | | | | | |
| Class B | |
Year Ended October 31, 2008(a) | | | Ten Months Ended October 31, 2007(a)(b) | | | Year Ended December 31, | |
| | | 2006(a) | | | 2005(a) | | | 2004(a) | |
| | | | | | | | | | | | | | | | | | |
| | | | | | | | | | | | | | | | | | |
| $ | 6.98 | | | $ | 6.69 | | | $ | 6.51 | | | $ | 7.56 | | | $ | 7.53 | |
| | | | | | | | | | | | | | | | | | | |
| | | | | | | | | | | | | | | | | | | |
| | | | | | | | | | | | | | | | | | |
| | .26 | | | | .16 | | | | .14 | | | | .11 | | | | .07 | |
| | | | |
| | (1.10 | ) | | | .30 | | | | .17 | | | | (.74 | ) | | | .52 | |
| | | | | | | | | | | | | | | | | | | |
| | | | | | | | | | | | | | | | | | | |
| | (.84 | ) | | | .46 | | | | .31 | | | | (.63 | ) | | | .59 | |
| | | | | | | | | | | | | | | | | | | |
| | | | | | | | | | | | | | | | | | | |
| | | | | | | | | | | | | | | | | | |
| | (.38 | ) | | | (.17 | ) | | | (.13 | ) | | | (.36 | ) | | | (.56 | ) |
| | — | | | | — | | | | — | | | | (.06 | ) | | | — | |
| | | | | | | | | | | | | | | | | | | |
| | (.38 | ) | | | (.17 | ) | | | (.13 | ) | | | (.42 | ) | | | (.56 | ) |
| | | | | | | | | | | | | | | | | | | |
| $ | 5.76 | | | $ | 6.98 | | | $ | 6.69 | | | $ | 6.51 | | | $ | 7.56 | |
| | | | | | | | | | | | | | | | | | | |
| | (12.67 | )% | | | 7.06 | % | | | 4.90 | % | | | (8.60 | )% | | | 8.44 | % |
| | | | | | | | | | | | | | | | | | |
| $ | 3,275 | | | $ | 3,508 | | | $ | 3,874 | | | $ | 5,513 | | | $ | 7,759 | |
| $ | 3,957 | | | $ | 3,627 | | | $ | 4,726 | | | $ | 6,792 | | | $ | 7,854 | |
| | | | | | | | | | | | | | | | | | |
| | 2.11 | %(d) | | | 2.11 | %(d)(e) | | | 2.11 | %(d) | | | 2.10 | %(d) | | | 2.10 | %(d) |
| | 1.11 | %(d) | | | 1.11 | %(d)(e) | | | 1.11 | %(d) | | | 1.10 | %(d) | | | 1.10 | %(d) |
| | 3.80 | %(d) | | | 2.86 | %(d)(e) | | | 2.09 | %(d) | | | 1.54 | %(d) | | | .99 | %(d) |
See Notes to Financial Statements.
| | |
| Dryden Global Total Return Fund, Inc. | | 63 |
Financial Highlights
continued
| | | | |
| | | Class C | |
| | | Year Ended October 31, 2009(a) | |
Per Share Operating Performance: | | | | |
Net Asset Value, Beginning of Period | | $ | 5.74 | |
| | | | |
Income (loss) from investment operations: | | | | |
Net investment income | | | .27 | |
Net realized and unrealized gain (loss) on investment and foreign currency transactions | | | 1.45 | |
| | | | |
Total from investment operations | | | 1.72 | |
| | | | |
Less Dividends and Distributions | | | | |
Dividends from net investment income* | | | (.29 | ) |
Tax return of capital distributions | | | — | |
| | | | |
Total dividends and distributions | | | (.29 | ) |
| | | | |
Net asset value, end of period | | $ | 7.17 | |
| | | | |
Total Return(c): | | | 30.73 | % |
Ratios/Supplemental Data: | | | | |
Net assets, end of period (000) | | $ | 4,236 | |
Average net assets (000) | | $ | 3,467 | |
Ratios to average net assets(g): | | | | |
Expenses, including distribution and service (12b-1) fees(d) | | | 1.85 | %(e) |
Expenses, excluding distribution and service (12b-1) fees | | | 1.10 | %(e) |
Net investment income | | | 4.28 | %(e) |
| (a) | Calculated based upon average shares outstanding during the period. |
| (b) | For the ten month period ended October 31, 2007. The Fund changed its fiscal year end from December 31 to October 31. |
| (c) | Total return does not consider the effects of sales loads. Total return is calculated assuming a purchase of a share on the first day and a sale on the last day of each period reported, and includes reinvestment of dividends and distributions. Total investment returns may reflect adjustments to conform to generally accepted accounting principles. Total returns for periods less than one full year are not annualized. |
| (d) | The distributor of the Fund has contractually agreed to limit its distribution and service (12b-1) fees to .75 of 1% of the average daily net assets of the Class C shares. |
| (e) | As of June 1, 2004, the Manager of the Fund has agreed to reimburse the Fund in order to limit operating expenses (excluding interest, taxes and brokerage commissions and certain extraordinary expenses) to 1.85% of the average daily net assets of Class C. If the manager had not reimbursed the Fund, the annual expenses (both including and excluding distribution and service (12b-1) fees) and net investment income ratios would be 1.94%, 1.19% and 1.00%, respectively, for the year ended December 31, 2004, 1.92%, 1.17%, and 1.73%, respectively, for the year ended December 31, 2005, 1.93%, 1.18% and 2.27%, respectively, for the year ended December 31, 2006, 1.87%, 1.12% and 3.32%, respectively, for the ten-month period ended October 31, 2007, 1.94%, 1.19% and 3.99% respectively, for the year ended October 31, 2008 and 2.01%, 1.26%, 4.12%, respectively, for the year ended October 31, 2009. |
| (g) | Does not include expenses of the underlying portfolios in which the Fund invests. |
| * | Dividends from net investment income include other items that are ordinary income for tax purposes. |
See Notes to Financial Statements.
| | |
| 64 | | Visit our website at www.jennisondryden.com |
| | | | | | | | | | | | | | | | | | |
| Class C | |
Year Ended October 31, 2008(a) | | | Ten Months Ended October 31, 2007(a)(b) | | | Year Ended December 31, | |
| | | 2006(a) | | | 2005(a) | | | 2004(a) | |
| | | | | | | | | | | | | | | | | | |
| $ | 6.97 | | | $ | 6.68 | | | $ | 6.50 | | | $ | 7.55 | | | $ | 7.51 | |
| | | | | | | | | | | | | | | | | | | |
| | | | | | | | | | | | | | | | | | |
| | .28 | | | | .17 | | | | .16 | | | | .13 | | | | .08 | |
| | | | |
| | (1.10 | ) | | | .31 | | | | .17 | | | | (.75 | ) | | | .54 | |
| | | | | | | | | | | | | | | | | | | |
| | (.82 | ) | | | .48 | | | | .33 | | | | (.62 | ) | | | .62 | |
| | | | | | | | | | | | | | | | | | | |
| | | | | | | | | | | | | | | | | | |
| | (.41 | ) | | | (.19 | ) | | | (.15 | ) | | | (.37 | ) | | | (.58 | ) |
| | — | | | | — | | | | — | | | | (.06 | ) | | | — | |
| | | | | | | | | | | | | | | | | | | |
| | (.41 | ) | | | (.19 | ) | | | (.15 | ) | | | (.43 | ) | | | (.58 | ) |
| | | | | | | | | | | | | | | | | | | |
| $ | 5.74 | | | $ | 6.97 | | | $ | 6.68 | | | $ | 6.50 | | | $ | 7.55 | |
| | | | | | | | | | | | | | | | | | | |
| | (12.51 | )% | | | 7.29 | % | | | 5.11 | % | | | (8.43 | )% | | | 8.87 | % |
| | | | | | | | | | | | | | | | | | |
| $ | 3,702 | | | $ | 2,277 | | | $ | 1,056 | | | $ | 1,161 | | | $ | 1,433 | |
| $ | 3,974 | | | $ | 1,279 | | | $ | 1,470 | | | $ | 1,311 | | | $ | 1,049 | |
| | | | | | | | | | | | | | | | | | |
| | 1.86 | %(e) | | | 1.86 | %(e)(f) | | | 1.86 | %(e) | | | 1.85 | %(e) | | | 1.85 | %(e) |
| | 1.11 | %(e) | | | 1.11 | %(e)(f) | | | 1.11 | %(e) | | | 1.10 | %(e) | | | 1.10 | %(e) |
| | 4.07 | %(e) | | | 3.17 | %(e)(f) | | | 2.34 | %(e) | | | 1.80 | %(e) | | | 1.09 | %(e) |
See Notes to Financial Statements.
| | |
| Dryden Global Total Return Fund, Inc. | | 65 |
Financial Highlights
continued
| | | | |
| | | Class Z | |
| | | Year Ended
October 31, 2009(a) | |
Per Share Operating Performance: | | | | |
Net Asset Value, Beginning of Period | | $ | 5.78 | |
| | | | |
Income (loss) from investment operations: | | | | |
Net investment income | | | .32 | |
Net realized and unrealized gain (loss) on investment and foreign currency transactions | | | 1.45 | |
| | | | |
Total from investment operations | | | 1.77 | |
| | | | |
Less Dividends and Distributions | | | | |
Dividends from net investment income* | | | (.33 | ) |
Tax return of capital distributions | | | — | |
| | | | |
Total dividends and distributions | | | (.33 | ) |
| | | | |
Net asset value, end of period | | $ | 7.22 | |
| | | | |
Total Return(c): | | | 31.62 | % |
Ratios/Supplemental Data: | | | | |
Net assets, end of period (000) | | $ | 3,141 | |
Average net assets (000) | | $ | 1,942 | |
Ratios to average net assets(f): | | | | |
Expenses, including distribution and service (12b-1) fees | | | 1.10 | %(d) |
Expenses, excluding distribution and service (12b-1) fees | | | 1.10 | %(d) |
Net investment income | | | 5.03 | %(d) |
| (a) | Calculated based upon average shares outstanding during the period. |
| (b) | For the ten month period ended October 31, 2007. The Fund changed its fiscal year end from December 31 to October 31. |
| (c) | Total return is calculated assuming a purchase of a share on the first day and a sale on the last day of each period reported, and includes reinvestment of dividends and distributions. Total investment returns may reflect adjustments to conform to generally accepted accounting principles. Total returns for periods less than one full year are not annualized. |
| (d) | As of June 1, 2004, the Manager of the Fund has agreed to reimburse the Fund in order to limit operating expenses (excluding interest, taxes and brokerage commissions and certain extraordinary expenses) to 1.10% of the average daily net assets of Class Z. If the manager had not reimbursed the Fund, the annual expenses (both including and excluding distribution and service (12b-1) fees) and net investment income ratios would be 1.19%, 1.19% and 1.86%, respectively, for the year ended December 31, 2004, 1.17%, 1.17%, and 2.48%, respectively, for the year ended December 31, 2005, 1.17%, 1.17% and 3.00%, respectively, for the year ended December 31, 2006, 1.12%, 1.12% and 3.85%, respectively, for the ten-month period ended October 31, 2007, 1.19%, 1.19% and 4.70%, respectively, for the year ended October 31, 2008 and 1.26%, 1.26%, 4.88%, respectively, for the for the year ended October 31, 2009. |
| (f) | Does not include expenses of the underlying portfolios in which the Fund invests. |
| * | Dividends from net investment income include other items that are ordinary income for tax purposes. |
See Notes to Financial Statements.
| | |
| 66 | | Visit our website at www.jennisondryden.com |
| | | | | | | | | | | | | | | | | | |
| Class Z | |
Year Ended October 31, 2008(a) | | | Ten Months Ended October 31, 2007(a)(b) | | | Year Ended December 31, | |
| | | 2006(a) | | | 2005(a) | | | 2004(a) | |
| | | | | | | | | | | | | | | | | | |
| $ | 7.02 | | | $ | 6.72 | | | $ | 6.53 | | | $ | 7.56 | | | $ | 7.52 | |
| | | | | | | | | | | | | | | | | | | |
| | | | | | | | | | | | | | | | | | |
| | .32 | | | | .21 | | | | .20 | | | | .18 | | | | .14 | |
| | | | |
| | (1.10 | ) | | | .31 | | | | .17 | | | | (.74 | ) | | | .53 | |
| | | | | | | | | | | | | | | | | | | |
| | (.78 | ) | | | .52 | | | | .37 | | | | (.56 | ) | | | .67 | |
| | | | | | | | | | | | | | | | | | | |
| | | | |
| | (.46 | ) | | | (.22 | ) | | | (.18 | ) | | | (.41 | ) | | | (.63 | ) |
| | — | | | | — | | | | — | | | | (.06 | ) | | | — | |
| | | | | | | | | | | | | | | | | | | |
| | (.46 | ) | | | (.22 | ) | | | (.18 | ) | | | (.47 | ) | | | (.63 | ) |
| | | | | | | | | | | | | | | | | | | |
| $ | 5.78 | | | $ | 7.02 | | | $ | 6.72 | | | $ | 6.53 | | | $ | 7.56 | |
| | | | | | | | | | | | | | | | | | | |
| | (11.90 | )% | | | 7.99 | % | | | 5.84 | % | | | (7.62 | )% | | | 9.68 | % |
| | | | | | | | | | | | | | | | | | |
| $ | 1,823 | | | $ | 2,163 | | | $ | 2,160 | | | $ | 4,415 | | | $ | 5,386 | |
| $ | 2,147 | | | $ | 2,053 | | | $ | 3,212 | | | $ | 4,901 | | | $ | 4,953 | |
| | | | | | | | | | | | | | | | | | |
| | 1.11 | %(d) | | | 1.11 | %(d)(e) | | | 1.11 | %(d) | | | 1.10 | %(d) | | | 1.10 | %(d) |
| | 1.11 | %(d) | | | 1.11 | %(d)(e) | | | 1.11 | %(d) | | | 1.10 | %(d) | | | 1.10 | %(d) |
| | 4.78 | %(d) | | | 3.86 | %(d)(e) | | | 3.06 | %(d) | | | 2.55 | %(d) | | | 1.95 | %(d) |
See Notes to Financial Statements.
| | |
| Dryden Global Total Return Fund, Inc. | | 67 |
Report of Independent Registered Public Accounting Firm
The Board of Directors and Shareholders
Dryden Global Total Return Fund, Inc.:
We have audited the accompanying statement of assets and liabilities of Dryden Global Total Return Fund, Inc. (hereafter referred to as the “Fund”), including the portfolio of investments, as of October 31, 2009, and the related statement of operations for the year then ended, the statement of changes in net assets for each of the years in the two-year period then ended and the financial highlights for each of the years in the two-year period then ended, the ten-month period ended October 31, 2007 and each of the years in the three-year period ended December 31, 2006. These financial statements and financial highlights are the responsibility of the Fund’s management. Our responsibility is to express an opinion on these financial statements and financial highlights based on our audits.
We conducted our audits in accordance with the standards of the Public Company Accounting Oversight Board (United States). Those standards require that we plan and perform the audit to obtain reasonable assurance about whether the financial statements and financial highlights are free of material misstatement. An audit includes examining, on a test basis, evidence supporting the amounts and disclosures in the financial statements. Our procedures included confirmation of securities owned as of October 31, 2009, by correspondence with the custodian, transfer agent and brokers or by other appropriate auditing procedures where replies from brokers were not received. An audit also includes assessing the accounting principles used and significant estimates made by management, as well as evaluating the overall financial statement presentation. We believe that our audits provide a reasonable basis for our opinion.
In our opinion, the financial statements and financial highlights referred to above present fairly, in all material respects, the financial position of the Fund as of October 31, 2009, and the results of its operations, the changes in its net assets and the financial highlights for the periods described in the first paragraph above, in conformity with U.S. generally accepted accounting principles.
New York, New York
December 23, 2009
| | |
| 68 | | Visit our website at www.jennisondryden.com |
Federal Income Tax Information
(Unaudited)
We are required by the Internal Revenue Code of 1986, as amended (“the Code”), to advise you within 60 days of the Fund’s fiscal year end October 31, 2009 as to the federal tax status of distributions paid by the Fund during such fiscal period. We are advising you that during its fiscal period ended October 31, 2009, the Fund paid ordinary income dividends for Class A, Class B, Class C and Class Z shares of $0.3181 per share, $0.2692 per share, $0.2874 per share and $0.3330 per share, respectively.
For the year ended October 31, 2009, the Fund designates the maximum amount allowable but not less than 48.97% as interest related dividends in accordance with Sections 871(k)(1) and 881(e)(1) of the Internal Revenue Code.
In January 2010, you will be advised on IRS Form 1099-DIV or substitute 1099-DIV as to the federal tax status of dividends and distributions received by you in calendar year 2009.
We are required by New York, California, Massachusetts, Missouri and Oregon to inform you that dividends which have been derived from federal obligations are not taxable to shareholders provided the mutual fund meets certain requirements mandated by the respective states’ taxing authorities. We are pleased to report that 4.35% of the dividends paid by the Fund qualify for such deductions. Due to certain minimum portfolio holding requirements in California, Connecticut and New York, residents of those states will not be able to exclude interest on federal obligations from state and local tax.
For more detailed information regarding your federal, state and local taxes, you should contact your tax adviser.
| | |
| Dryden Global Total Return Fund, Inc. | | 69 |
MANAGEMENT OF THE FUND
(Unaudited)
Information about Fund Directors/Trustees (referred to herein as “Board Members”) and Fund Officers is set forth below. Board Members who are not deemed to be “interested persons,” as defined in the 1940 Act, are referred to as “Independent Board Members.” Board Members who are deemed to be “interested persons” are referred to as “Interested Board Members.” The Board Members are responsible for the overall supervision of the operations of the Fund and perform the various duties imposed on the directors or trustees of investment companies by the 1940 Act.
| | | | | | |
Independent Board Members (1) |
Name, Address, Age Position(s) Portfolios Overseen | | Principal Occupation(s) During Past Five Years | | | | Other Directorships Held |
Kevin J. Bannon (57) Board Member Portfolios Overseen: 57 | | Managing Director (since April 2008) of Highmount Capital LLC (registered investment adviser); formerly Executive Vice President and Chief Investment Officer (April 1993-August 2007) of Bank of New York Company; President (May 2003-May 2007) of BNY Hamilton Family of Mutual Funds. | | | | Director of Urstadt Biddle Properties (since September 2008). |
Linda W. Bynoe (57) Board Member Portfolios Overseen: 57 | | President and Chief Executive Officer (since March 1995) of Telemat Ltd. (management consulting); formerly Vice President at Morgan Stanley & Co (broker-dealer). | | | | Director of Simon Property Group, Inc. (real estate investment trust) (since May 2003); Anixter International (communication products distributor) (since January 2006); Director of Northern Trust Corporation (banking) (since April 2006). |
David E.A. Carson (75) Board Member Portfolios Overseen: 57 | | Director (since May 2008) of Liberty Bank; Director (since October 2007) of ICI Mutual Insurance Company; formerly President, Chairman and Chief Executive Officer of People’s Bank (1987-2000). | | | | None. |
Michael S. Hyland, CFA (64) Board Member Portfolios Overseen: 57 | | Independent Consultant (since February 2005); formerly Senior Managing Director (July 2001-February 2005) of Bear Stearns & Co, Inc.; Global Partner, INVESCO (1999-2001); Managing Director and President Salomon Brothers Asset Management (1989-1999). | | | | None. |
Robert E. La Blanc (75) Board Member Portfolios Overseen: 57 | | President (since 1981) of Robert E. La Blanc Associates, Inc. (telecommunications). | | | | Director of CA, Inc. (since 2002) (software company); FiberNet Telecom Group, Inc. (since 2003) (telecom company). |
Visit our website at www.jennisondryden.com
| | | | | | |
Douglas H. McCorkindale (70) Board Member Portfolios Overseen: 57 | | Formerly Chairman (February 2001-June 2006), Chief Executive Officer (June 2000-July 2005), President (September 1997-July 2005) and Vice Chairman (March 1984-May 2000) of Gannett Co. Inc. (publishing and media). | | | | Director of Continental Airlines, Inc. (since May 1993); Director of Lockheed Martin Corp. (aerospace and defense) (since May 2001). |
Stephen P. Munn (67) Board Member Portfolios Overseen: 57 | | Lead Director (since 2007) and formerly Chairman (1993-2007) of Carlisle Companies Incorporated (manufacturer of industrial products). | | | | None. |
Richard A. Redeker (66) Board Member Portfolios Overseen: 57 | | Retired Mutual Fund Executive (36 years); Management Consultant; Director of Penn Tank Lines, Inc. (since 1999). | | | | None. |
Robin B. Smith (70) Board Member & Independent Chair Portfolios Overseen: 57 | | Chairman of the Board (since January 2003) of Publishers Clearing House (direct marketing); formerly Chairman and Chief Executive Officer (August 1996-January 2003) of Publishers Clearing House. | | | | Formerly Director of BellSouth Corporation (telecommunications) (1992-2006). |
Stephen G. Stoneburn (66) Board Member Portfolios Overseen: 57 | | President and Chief Executive Officer (since June 1996) of Quadrant Media Corp. (publishing company); formerly President (June 1995-June 1996) of Argus Integrated Media, Inc.; Senior Vice President and Managing Director (January 1993-1995) of Cowles Business Media; Senior Vice President of Fairchild Publications, Inc (1975-1989). | | | | None. |
| | | | | | |
| Interested Board Member (1) | | | | | | |
Judy A. Rice (61) Board Member & President Portfolios Overseen: 57 | | President, Chief Executive Officer, Chief Operating Officer and Officer-In-Charge (since February 2003) of Prudential Investments LLC; President, Chief Executive Officer and Officer-In-Charge (since April 2003) of Prudential Mutual Fund Services LLC; Executive Vice President (since December 2008) of Prudential Investment Management Services LLC; formerly Vice President (February 1999-April 2006) of Prudential Investment Management Services LLC; formerly President, Chief Executive Officer, Chief Operating Officer and Officer-In-Charge (May 2003-June 2005) and Director (May 2003-March 2006) and Executive Vice President (June 2005- March 2006) of AST Investment Services, Inc.; Member of Board of Governors of the Investment Company Institute. | | | | None. |
Dryden Global Total Return Fund, Inc.
| 1 | The year that each Board Member joined the Funds’ Board is as follows: Kevin J. Bannon, 2008; Linda W. Bynoe, 2005; David E.A. Carson, 2003; Michael S. Hyland, 2008; Robert E. La Blanc, 2003; Douglas H. McCorkindale, 1996; Stephen P. Munn, 2008; Richard A. Redeker, 1993; Robin B. Smith, 1996; Stephen G. Stoneburn, 2003; Judy A. Rice, Board Member since 2000 and President since 2003. |
Visit our website at www.jennisondryden.com
| | |
| Fund Officers (a)(1) |
Name, Address and Age Position with Fund | | Principal Occupation(s) During Past Five Years |
Scott E. Benjamin (36) Vice President | | Executive Vice President (since June 2009) of Prudential Investments LLC and Prudential Investment Management Services LLC; Senior Vice President Product Development and Marketing, Prudential Investments (since February 2006); Vice President Product Development and Product Management, Prudential Investments (2003-2006). |
Kathryn L. Quirk (57) Chief Legal Officer | | Vice President and Corporate Counsel (since September 2004) of Prudential; Executive Vice President, Chief Legal Officer and Secretary (since July 2005) of PI and Prudential Mutual Fund Services LLC; Vice President and Corporate Counsel (since June 2005) and Secretary (since February 2006) of AST Investment Services, Inc.; formerly Senior Vice President and Assistant Secretary (November 2004-August 2005) of PI; formerly Assistant Secretary (June 2005-February 2006) of AST Investment Services, Inc.; formerly Managing Director, General Counsel, Chief Compliance Officer, Chief Risk Officer and Corporate Secretary (1997-2002) of Zurich Scudder Investments, Inc. |
Deborah A. Docs (51) Secretary | | Vice President and Corporate Counsel (since January 2001) of Prudential; Vice President (since December 1996) and Assistant Secretary (since March 1999) of PI; formerly Vice President and Assistant Secretary (May 2003-June 2005) of AST Investment Services, Inc. |
Jonathan D. Shain (51) Assistant Secretary | | Vice President and Corporate Counsel (since August 1998) of Prudential; Vice President and Assistant Secretary (since May 2001) of PI; Vice President and Assistant Secretary (since February 2001) of PMFS; formerly Vice President and Assistant Secretary (May 2003-June 2005) of AST Investment Services, Inc. |
Claudia DiGiacomo (35) Assistant Secretary | | Vice President and Corporate Counsel (since January 2005) of Prudential; Vice President and Assistant Secretary of PI (since December 2005); Associate at Sidley Austin Brown & Wood LLP (1999-2004). |
John P. Schwartz (38) Assistant Secretary | | Vice President and Corporate Counsel (since April 2005) of Prudential; Vice President and Assistant Secretary of PI (since December 2005); Associate at Sidley Austin Brown & Wood LLP (1997-2005). |
Andrew R. French (47) Assistant Secretary | | Director and Corporate Counsel (since May 2006) of Prudential; Vice President and Assistant Secretary (since January 2007) of PI; Vice President and Assistant Secretary (since January 2007) of PMFS; formerly Senior Legal Analyst of Prudential Mutual Fund Law Department (1997-2006). |
Timothy J. Knierim (50) Chief Compliance Officer | | Chief Compliance Officer of Prudential Investment Management, Inc. (since July 2007); formerly Chief Risk Officer of PIM and PI (2002-2007) and formerly Chief Ethics Officer of PIM and PI (2006-2007). |
Valerie M. Simpson (51) Deputy Chief Compliance Officer | | Chief Compliance Officer (since April 2007) of PI and AST Investment Services, Inc.; formerly Vice President-Financial Reporting (June 1999-March 2006) for Prudential Life and Annuities Finance. |
Dryden Global Total Return Fund, Inc.
| | |
Theresa C. Thompson (47) Deputy Chief Compliance Officer | | Vice President, Compliance, PI (since April 2004); and Director, Compliance, PI (2001-2004). |
Noreen M. Fierro (45) Anti-Money Laundering Compliance Officer | | Vice President, Corporate Compliance (since May 2006) of Prudential; formerly Corporate Vice President, Associate General Counsel (April 2002-May 2005) of UBS Financial Services, Inc., in their Money Laundering Prevention Group; Senior Manager (May 2005-May 2006) of Deloitte Financial Advisory Services, LLP, in their Forensic and Dispute Services, Anti-Money Laundering Group. |
Grace C. Torres (50) Treasurer and Principal Financial and Accounting Officer | | Assistant Treasurer (since March 1999) and Senior Vice President (since September 1999) of PI; Assistant Treasurer (since May 2003) and Vice President (since June 2005) of AST Investment Services, Inc.; Senior Vice President and Assistant Treasurer (since May 2003) of Prudential Annuities Advisory Services, Inc.; formerly Senior Vice President (May 2003-June 2005) of AST Investment Services, Inc. |
M. Sadiq Peshimam (45) Assistant Treasurer | | Vice President (since 2005) and Director (2000-2005) within Prudential Mutual Fund Administration. |
Peter Parrella (51) Assistant Treasurer | | Vice President (since 2007) and Director (2004-2007) within Prudential Mutual Fund Administration; formerly Tax Manager at SSB Citi Fund Management LLC (1997-2004). |
| (a) | Excludes the interested Board Member who also serve as President. |
| 1 | The year in which each individual became an Officer of the Fund is as follows: Scott E. Benjamin, 2009; Kathryn L. Quirk, 2005; Deborah A. Docs, 2003; Jonathan D. Shain, 2005; Claudia DiGiacomo, 2005; John P. Schwartz, 2006; Andrew R. French, 2006; Timothy J. Knierim, 2007; Valerie M. Simpson, 2007; Theresa C. Thompson, 2008; Noreen M. Fierro, 2006; Grace C. Torres, 1998; Peter Parrella, 2007; M. Sadiq Peshimam, 2006. |
Explanatory Notes
| • | | Board Members are deemed to be “Interested,” as defined in the 1940 Act, by reason of their affiliation with Prudential Investments LLC and/or an affiliate of Prudential Investments LLC. |
| • | | Unless otherwise noted, the address of all Board Members and Officers is c/o Prudential Investments LLC, Gateway Center Three, 100 Mulberry Street, Newark, New Jersey 07102. |
| • | | There is no set term of office for Board Members or Officers. The Board Members have adopted a retirement policy, which calls for the retirement of Board Members on December 31st of the year in which they reach the age of 75. |
| • | | “Other Directorships Held” includes only directorships of companies required to register or file reports with the SEC under the Securities Exchange Act of 1934 (that is, “public companies”) or other investment companies registered under the 1940 Act. |
| • | | “Portfolios Overseen” includes all investment companies managed by Prudential Investments LLC. The investment companies for which PI serves as manager include the JennisonDryden Funds, Strategic Partners Funds, The Prudential Variable Contract Accounts, The Target Portfolio Trust, The Prudential Series Fund, Prudential’s Gibraltar Fund, Inc. and the Advanced Series Trust. |
Visit our website at www.jennisondryden.com
Approval of Advisory Agreements
The Fund’s Board of Directors
The Board of Directors (the “Board”) of Dryden Global Total Return Fund, Inc. (the “Fund”) consists of 11 individuals, 10 of whom are not “interested persons” of the Fund, as defined in the Investment Company Act of 1940, as amended (the “1940 Act”)(the “Independent Directors”). The Board is responsible for the oversight of the Fund and its operations, and performs the various duties imposed on the directors of investment companies by the 1940 Act. The Independent Directors have retained independent legal counsel to assist them in connection with their duties. The Chair of the Board is an Independent Director. The Board has established three standing committees: the Audit Committee, the Nominating and Governance Committee, and the JennisonDryden Investment Committee. Each committee is chaired by, and composed of, Independent Directors.
Annual Approval of the Fund’s Advisory Agreements
As required under the 1940 Act, the Board determines annually whether to renew the Fund’s management agreement with Prudential Investments LLC (“PI”) and the Fund’s subadvisory agreement with Prudential Investment Management, Inc. (“PIM”). In considering the renewal of the agreements, the Board, including all of the Independent Directors, met on June 2-4, 2009 and approved the renewal of the agreements through July 31, 2010, after concluding that renewal of the agreements was in the best interests of the Fund and its shareholders.
In advance of the meetings, the Board requested and received materials relating to the agreements, and had the opportunity to ask questions and request further information in connection with its consideration. Among other things, the Board considered comparisons with other mutual funds in relevant Peer Universes and Peer Groups. The mutual funds included in each Peer Universe or Peer Group were objectively determined by Lipper Inc., an independent provider of mutual fund data. To the extent that PI deems appropriate, and for reasons addressed in detail with the Board, PI may provide supplemental data compiled by Lipper for the Board’s consideration. The comparisons placed the Fund in various quartiles over the one-, three-, five- and ten-year periods ending December 31, 2008, with the first quartile being the best 25% of the mutual funds (for performance, the best performing mutual funds and, for expenses, the lowest cost mutual funds).
In approving the agreements, the Board, including the Independent Directors advised by independent legal counsel, considered the factors it deemed relevant, including the nature, quality and extent of services provided by PI and the subadviser, the performance of the Fund, the profitability of PI and its affiliates, expenses and fees, and the potential for economies of scale that may be shared with the Fund and its
| | |
| Dryden Global Total Return Fund, Inc. | | |
Approval of Advisory Agreements (continued)
shareholders. In their deliberations, the Directors did not identify any single factor which alone was responsible for the Board’s decision to approve the agreements with respect to the Fund. In connection with its deliberations, the Board considered information provided by PI throughout the year at regular Board meetings, presentations from portfolio managers and other information, as well as information furnished at or in advance of the meetings on June 2-4, 2009.
The Directors determined that the overall arrangements between the Fund and PI, which serves as the Fund’s investment manager pursuant to a management agreement, and between PI and PIM, which serves as the Fund’s subadviser pursuant to the terms of a subadvisory agreement with PI, are fair and reasonable in light of the services performed, fees charged and such other matters as the Directors considered relevant in the exercise of their business judgment.
The material factors and conclusions that formed the basis for the Directors’ reaching their determinations to approve the continuance of the agreements are separately discussed below.
Nature, Quality, and Extent of Services
The Board received and considered information regarding the nature, quality and extent of services provided to the Fund by PI and PIM. The Board considered the services provided by PI, including but not limited to the oversight of the subadviser for the Fund, as well as the provision of fund recordkeeping, compliance, and other services to the Fund. With respect to PI’s oversight of the subadviser, the Board noted that PI’s Strategic Investment Research Group (“SIRG”), which is a business unit of PI, is responsible for monitoring and reporting to PI’s senior management on the performance and operations of the subadviser. The Board also considered that PI pays the salaries of all of the officers and non-independent Directors of the Fund. The Board also considered the investment subadvisory services provided by PIM, as well as adherence to the Fund’s investment restrictions and compliance with applicable Fund policies and procedures. The Board considered PI’s evaluation of the subadviser, as well as PI’s recommendation, based on its review of the subadviser, to renew the subadvisory agreement.
The Board reviewed the qualifications, backgrounds and responsibilities of PI’s senior management responsible for the oversight of the Fund and PIM, and also reviewed the qualifications, backgrounds and responsibilities of PIM’s portfolio managers who are responsible for the day-to-day management of the Fund’s portfolio. The Board was provided with information pertaining to PI’s and PIM’s organizational structure, senior management, investment operations, and other relevant information pertaining to
| | |
| | Visit our website at www.jennisondryden.com |
both PI and PIM. The Board also noted that it received favorable compliance reports from the Fund’s Chief Compliance Officer (“CCO”) as to both PI and PIM. The Board noted that PIM is affiliated with PI.
The Board concluded that it was satisfied with the nature, extent and quality of the investment management services provided by PI and the subadvisory services provided to the Fund by PIM, and that there was a reasonable basis on which to conclude that the Fund benefits from the services provided by PI and PIM under the management and subadvisory agreements.
Performance of the Fund
The Board received and considered information about the Fund’s historical performance, noting that the Fund’s gross performance in relation to its Peer Universe (a custom peer group of un-hedged mutual funds included in the Lipper Global Income Funds Performance Universe)1 was in the third quartile over the one-, three, five- and ten-year periods. The Board also noted that the Fund underperformed its benchmark index for all periods. The Board considered that year-to-date, the Fund was in the 32nd percentile of its Peer Universe and that for the second quarter of 2009 (through May) the Fund was in the 21st percentile. The Board expressed its concern with the Fund’s long-term performance, and requested that PI and PIM report their views on strategic alternatives to improve the Fund’s performance at the third quarter Board meeting scheduled for September 2009. The Board also instructed SIRG to provide quarterly updates on Fund performance. The Board concluded that it was reasonable to renew the agreements, subject to its continued close scrutiny of the Fund’s performance and its consideration of PI’s and PIM’s presentation on strategic alternatives to address the Fund’s performance.
Fees and Expenses
The Board considered the Fund’s actual management fees (which reflects any subsidies, expense caps or waivers) ranked in the Expense Group’s third quartile and that the Fund’s total expenses ranked in the fourth quartile. The Board considered PI’s assertion that relatively high custodian fees were a significant factor in the Fund’s fourth quartile total expense ranking. The Board also considered that the Fund’s fourth quartile ranking for total expenses was reflective, in part, of its relatively small asset
| 1 | The Fund was compared to the group of un-hedged mutual funds included in the Lipper Global Income Funds Performance Universe, although Lipper classifies the Fund in its Global Income Fund Performance Universe. The Fund was compared to the group of un-hedged mutual funds included in the Global Income Funds Performance Universe because PI believes that the funds included in this Universe provide a more appropriate basis for Fund performance comparisons. |
| | |
| Dryden Global Total Return Fund, Inc. | | |
Approval of Advisory Agreements (continued)
size. The Board considered that PI has agreed to reimburse and/or waive fees so that the Fund’s annual operating expenses do not exceed 1.10% (exclusive of 12b-1 fees and certain other fees) of the Fund’s average daily net assets. The Board agreed that PI should not discontinue the existing cap on Fund expenses.
As part of its review of the Fund’s management fee, the Board considered that the management fee arrangements for the Fund represented the result of several years of review and discussion between the Board and PI. In its review, the Board considered such things as the difficulty in managing the Fund, the size of the Fund, fees of competitors, Fund’s performance, expenses of service providers and such other aspects that the Directors deemed important in the exercise of their business judgment. The Board concluded that the management fees and total expenses were reasonable in light of the services provided.
Costs of Services and Profits Realized by PI
The Board was provided with information on the profitability of PI and its affiliates in serving as the Fund’s investment manager. The Board discussed with PI the methodology utilized in assembling the information regarding profitability and considered its reasonableness. The Board recognized that it is difficult to make comparisons of profitability from fund management contracts because comparative information is not generally publicly available and is affected by numerous factors, including the structure of the particular adviser, the types of funds it manages, its business mix, numerous assumptions regarding allocations and the adviser’s capital structure and cost of capital. The Board did not separately consider the profitability of the subadviser, an affiliate of PI, as its profitability was reflected in the profitability report for PI. Taking these factors into account, the Board concluded that the profitability of PI and its affiliates in relation to the services rendered was not unreasonable.
Economies of Scale
The Board noted that the management fee schedule for the Fund includes breakpoints, which have the effect of decreasing the fee rate as assets increase, but at the current level of assets the Fund does not realize the effect of those rate reductions. The Board received and discussed information concerning whether PI realizes economies of scale as the Fund’s assets grow beyond current levels. The Board took note that the Fund’s fee structure would result in benefits to Fund shareholders when (and if) assets reach the levels at which the fee rate is reduced. These benefits will accrue whether or not PI is then realizing any economies of scale.
| | |
| | Visit our website at www.jennisondryden.com |
Other Benefits to PI and PIM
The Board considered potential ancillary benefits that might be received by PI and PIM and their affiliates as a result of their relationship with the Fund. The Board concluded that potential benefits to be derived by PI included transfer agency fees received by the Fund’s transfer agent (which is affiliated with PI), as well as benefits to the reputation or other intangible benefits resulting from PI’s association with the Fund. The Board concluded that the potential benefits to be derived by PIM included those generally resulting from an increase in assets under management, specifically, potential access to additional research resources and benefits to the reputation. The Board concluded that the benefits derived by PI and PIM were consistent with the types of benefits generally derived by investment managers and subadvisers to mutual funds.
After full consideration of these factors, the Board concluded that the approval of the agreements was in the best interest of the Fund and its shareholders.
| | |
| Dryden Global Total Return Fund, Inc. | | |
Growth of a $10,000 Investment
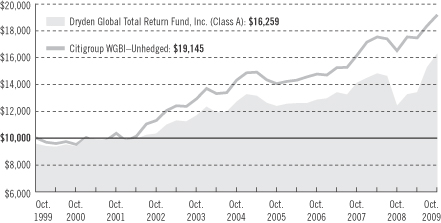
| | | | | | | | | |
| Average Annual Total Returns (With Sales Charges) as of 10/31/09 | |
| | | One Year | | | Five Years | | | Ten Years | |
Class A | | 25.51 | % | | 4.12 | % | | 4.98 | % |
Class B | | 25.25 | | | 4.12 | | | 4.74 | |
Class C | | 29.73 | | | 4.55 | | | 4.93 | |
Class Z | | 31.62 | | | 5.34 | | | 5.72 | |
| | | | | | | | | |
| Average Annual Total Returns (Without Sales Charges) as of 10/31/09 | |
| | | One Year | | | Five Years | | | Ten Years | |
Class A | | 31.42 | % | | 5.08 | % | | 5.47 | % |
Class B | | 30.25 | | | 4.29 | | | 4.74 | |
Class C | | 30.73 | | | 4.55 | | | 4.93 | |
Class Z | | 31.62 | | | 5.34 | | | 5.72 | |
Performance data quoted represent past performance. Past performance does not guarantee future results. The investment return and principal value of an investment will fluctuate, so that an investor’s shares, when redeemed, may be worth more or less than their original cost. Current performance may be lower or higher than the past performance data quoted. An investor may obtain performance data as of the most recent month-end by visiting our website at www.jennisondryden.com or by calling (800) 225-1852. The maximum initial sales charge is 4.50% (Class A shares). Gross operating expenses: Class A, 1.56%; Class B, 2.26%; Class C, 2.26%; Class Z, 1.26%. Net operating expenses apply to: Class A, 1.51%; Class B, 2.26%; Class C, 2.01%; Class Z, 1.26%, after contractual reduction of distribution fees for Class A and Class C shares.
| | |
| | Visit our website at www.jennisondryden.com |
The returns in the graph and the tables do not reflect the deduction of taxes that a shareholder would pay on Fund distributions or following the redemption of Fund shares.
Source: Prudential Investments LLC and Lipper Inc.
The graph compares a $10,000 investment in the Dryden Global Total Return Fund, Inc. (Class A shares) with a similar investment in the Citigroup WGBI—Unhedged by portraying the initial account values at the beginning of the 10-year period for Class A shares (October 31, 1999) and the account values at the end of the current fiscal year (October 31, 2009) as measured on a quarterly basis. For purposes of the graph, and unless otherwise indicated, it has been assumed that (a) the maximum applicable front-end sales charge was deducted from the initial $10,000 investment in Class A shares; (b) all recurring fees (including management fees) were deducted; and (c) all dividends and distributions were reinvested. The line graph provides information for Class A shares only. As indicated in the tables provided earlier, performance for Class B, C, and Z shares will vary due to the differing charges and expenses applicable to each share class (as indicated in the following paragraphs). Without the distribution and service (12b-1) fee waiver of 0.05% annually and expense subsidization for Class A shares in effect through October 31, 2009, the returns shown in the graph and for Class A shares in the tables would have been lower.
The Citigroup WGBI—Unhedged is a market capitalization-weighted index consisting of the government bond markets of 23 countries, which are selected based on market-capitalization and investability criteria. All issues have a remaining maturity of at least one year. The Citigroup WGBI—Unhedged’s total returns include the reinvestment of all dividends, but do not include the effects of sales charges, operating expenses of a mutual fund, or taxes. The returns for the Citigroup WGBI—Unhedged would be lower if they included the effects of sales charges, operating expenses, or taxes. The securities that comprise the Citigroup WGBI—Unhedged may differ substantially from the securities in the Fund. This is not the only index that may be used to characterize performance of global/international bond funds. Other indexes may portray different comparative performance. Investors cannot invest directly in an index.
Class A shares are subject to a maximum front-end sales charge of 4.50% and a 12b-1 fee of up to 0.30% annually, and all investors who purchase Class A shares in an amount of $1 million or more and sell these shares within 12 months of purchase are subject to a contingent deferred sales charge (CDSC) of 1%. Class B shares are subject to a declining CDSC of 5%, 4%, 3%, 2%, 1%, and 1%, respectively, for the first six years after purchase and a 12b-1 fee of 1% annually. Approximately seven years after purchase, Class B shares will automatically convert to Class A shares on a quarterly basis. Class C shares purchased are not subject to a front-end sales charge, but are subject to a CDSC of 1% for Class C shares sold within 12 months from the date of purchase and an annual 12b-1 fee of 1%. Class Z shares are not subject to a sales charge or 12b-1 fees. Without waiver of fees and/or expense subsidization, the Fund’s total returns would have been lower. The returns in the graph and tables reflect the share class expense structure in effect at the close of the fiscal period.
| | |
| Dryden Global Total Return Fund, Inc. | | |
| | | | |
| n MAIL | | n TELEPHONE | | n WEBSITE |
Gateway Center Three 100 Mulberry Street Newark, NJ 07102 | | (800) 225-1852
| | www.jennisondryden.com |
|
| PROXY VOTING |
| The Board of Directors of the Fund has delegated to the Fund’s investment subadviser the responsibility for voting any proxies and maintaining proxy recordkeeping with respect to the Fund. A description of these proxy voting policies and procedures is available without charge, upon request, by calling (800) 225-1852 or by visiting the Securities and Exchange Commission’s website at www.sec.gov. Information regarding how the Fund voted proxies relating to portfolio securities during the most recent 12-month period ended June 30 is available on the Fund’s website and on the Commission’s website. |
|
| DIRECTORS |
| Kevin J. Bannon • Linda W. Bynoe • David E.A. Carson • Michael S. Hyland • Robert E. La Blanc • Douglas H. McCorkindale • Stephen P. Munn • Richard A. Redeker • Judy A. Rice • Robin B. Smith • Stephen G. Stoneburn |
|
| OFFICERS |
| Judy A. Rice, President • Scott E. Benjamin, Vice President • Grace C. Torres, Treasurer and Principal Financial and Accounting Officer • Kathryn L. Quirk, Chief Legal Officer • Deborah A. Docs, Secretary • Timothy J. Knierim, Chief Compliance Officer • Valerie M. Simpson, Deputy Chief Compliance Officer • Theresa C. Thompson, Deputy Chief Compliance Officer • Noreen M. Fierro, Anti-Money Laundering Compliance Officer • Jonathan D. Shain, Assistant Secretary • Claudia DiGiacomo, Assistant Secretary • John P. Schwartz, Assistant Secretary • Andrew R. French, Assistant Secretary • M. Sadiq Peshimam, Assistant Treasurer • Peter Parrella, Assistant Treasurer |
| | | | |
| MANAGER | | Prudential Investments LLC | | Gateway Center Three
100 Mulberry Street
Newark, NJ 07102 |
|
| INVESTMENT SUBADVISER | | Prudential Investment
Management, Inc. | | Gateway Center Two
100 Mulberry Street
Newark, NJ 07102 |
|
| DISTRIBUTOR | | Prudential Investment
Management Services LLC | | Gateway Center Three
100 Mulberry Street
Newark, NJ 07102 |
|
| CUSTODIAN | | The Bank of New York Mellon | | One Wall Street
New York, NY 10286 |
|
| TRANSFER AGENT | | Prudential Mutual Fund
Services LLC | | PO Box 9658
Providence, RI 02940 |
|
INDEPENDENT REGISTERED
PUBLIC ACCOUNTING FIRM | | KPMG LLP | | 345 Park Avenue
New York, NY 10154 |
|
| FUND COUNSEL | | Willkie Farr & Gallagher LLP | | 787 Seventh Avenue
New York, NY 10019 |
|
| An investor should consider the investment objectives, risks, charges, and expenses of the Fund carefully before investing. The prospectus for the Fund contains this and other information about the Fund. An investor may obtain a prospectus by visiting our website at www.jennisondryden.com or by calling (800) 225-1852. The prospectus should be read carefully before investing. |
|
| E-DELIVERY |
| To receive your mutual fund documents online, go to www.prudential.com/edelivery/mutualfunds and enroll. Instead of receiving printed documents by mail, you will receive notification via e-mail when new materials are available. You can cancel your enrollment or change your e-mail address at any time by visiting the website address above. |
|
| SHAREHOLDER COMMUNICATIONS WITH DIRECTORS |
| Shareholders can communicate directly with the Board of Directors by writing to the Chair of the Board, Dryden Global Total Return Fund, Inc., Prudential Investments, Attn: Board of Directors, 100 Mulberry Street, Gateway Center Three, Newark, NJ 07102. Shareholders can communicate directly with an individual Director by writing to the same address. Communications are not screened before being delivered to the addressee. |
|
| AVAILABILITY OF PORTFOLIO SCHEDULE |
| The Fund files its complete schedule of portfolio holdings with the Securities and Exchange Commission for the first and third quarters of each fiscal year on Form N-Q. The Fund’s Forms N-Q are available on the Commission’s website at www.sec.gov. The Fund’s Forms N-Q may also be reviewed and copied at the Commission’s Public Reference Room in Washington, D.C. Information on the operation and location of the Public Reference Room may be obtained by calling (202) 551-8090. The Fund’s schedule of portfolio holdings is also available on the Fund’s website as of the end of each fiscal quarter. |
|
| The Fund’s Statement of Additional Information contains additional information about the Fund’s Directors and is available without charge, upon request, by calling (800) 225-1852. |
Mutual Funds:
| | | | |
| ARE NOT INSURED BY THE FDIC OR ANY FEDERAL GOVERNMENT AGENCY | | MAY LOSE VALUE | | ARE NOT A DEPOSIT OF OR GUARANTEED BY ANY BANK OR ANY BANK AFFILIATE |

| | | | | | | | | | | | |
| | | Dryden Global Total Return Fund, Inc. | | |
| | | Share Class | | A | | B | | C | | Z | | |
| | NASDAQ | | GTRAX | | PBTRX | | PCTRX | | PZTRX | | |
| | CUSIP | | 26243L105 | | 26243L204 | | 26243L303 | | 26243L402 | | |
| | | | | | | | | | | | |
MF169E 0168478-00001-00

Item 2 – Code of Ethics – See Exhibit (a)
As of the end of the period covered by this report, the registrant has adopted a code of ethics (the “Section 406 Standards for Investment Companies – Ethical Standards for Principal Executive and Financial Officers”) that applies to the registrant’s Principal Executive Officer and Principal Financial Officer; the registrant’s Principal Financial Officer also serves as the Principal Accounting Officer.
The registrant hereby undertakes to provide any person, without charge, upon request, a copy of the code of ethics. To request a copy of the code of ethics, contact the registrant 800-225-1852, and ask for a copy of the Section 406 Standards for Investment Companies - Ethical Standards for Principal Executive and Financial Officers.
Item 3 – Audit Committee Financial Expert –
The registrant’s Board has determined that Mr. David E. A. Carson, member of the Board’s Audit Committee is an “audit committee financial expert,” and that he is “independent,” for purposes of this Item.
Item 4 – Principal Accountant Fees and Services –
(a) Audit Fees
For the fiscal years ended October 31, 2009 and October 31, 2008, KPMG LLP (“KPMG”), the Registrant’s principal accountant, billed the Registrant $51,280 and $51,280, respectively, for professional services rendered for the audit of the Registrant’s annual financial statements or services that are normally provided in connection with statutory and regulatory filings.
(b) Audit-Related Fees
During the fiscal year ended October 31, 2009, KPMG, the Registrant’s principal accountant, billed the Registrant $1,558 for professional services rendered in connection with agreed upon procedures performed related to a custody conversion. Not applicable for the fiscal year ended October 31, 2008.
(c) Tax Fees
None.
(d) All Other Fees
None.
(e) (1) Audit Committee Pre-Approval Policies and Procedures
THE PRUDENTIAL MUTUAL FUNDS
AUDIT COMMITTEE POLICY
on
Pre-Approval of Services Provided by the Independent Accountants
The Audit Committee of each Prudential Mutual Fund is charged with the responsibility to monitor the independence of the Fund’s independent accountants. As part of this responsibility, the Audit Committee must pre-approve any independent accounting firm’s engagement to render audit and/or permissible non-audit services, as required by law. In evaluating a proposed engagement of the independent accountants, the Audit Committee will assess the effect that the engagement might reasonably be expected to have on the accountant’s independence. The Committee’s evaluation will be based on:
| | • | | a review of the nature of the professional services expected to be provided, |
| | • | | a review of the safeguards put into place by the accounting firm to safeguard independence, and |
| | • | | periodic meetings with the accounting firm. |
Policy for Audit and Non-Audit Services Provided to the Funds
On an annual basis, the scope of audits for each Fund, audit fees and expenses, and audit-related and non-audit services (and fees proposed in respect thereof) proposed to be performed by the Fund’s independent accountants will be presented by the Treasurer and the independent accountants to the Audit Committee for review and, as appropriate, approval prior to the initiation of such services. Such presentation shall be accompanied by confirmation by both the Treasurer and the independent accountants that the proposed services will not adversely affect the independence of the independent accountants. Proposed services shall be described in sufficient detail to enable the Audit Committee to assess the appropriateness of such services and fees, and the compatibility of the provision of such services with the auditor’s independence. The Committee shall receive periodic reports on the progress of the audit and other services which are approved by the Committee or by the Committee Chair pursuant to authority delegated in this Policy.
The categories of services enumerated under “Audit Services”, “Audit-related Services”, and “Tax Services” are intended to provide guidance to the Treasurer and the independent accountants as to those categories of services which the Committee believes are generally consistent with the independence of the independent accountants and which the Committee (or the Committee Chair) would expect upon the presentation of specific proposals to pre-approve. The enumerated categories are not intended as an exclusive list of audit, audit-related or tax services, which the Committee (or the Committee Chair) would consider for pre-approval.
Audit Services
The following categories of audit services are considered to be consistent with the role of the Fund’s independent accountants:
| | • | | Annual Fund financial statement audits |
| | • | | Seed audits (related to new product filings, as required) |
| | • | | SEC and regulatory filings and consents |
Audit-related Services
The following categories of audit-related services are considered to be consistent with the role of the Fund’s independent accountants:
| | • | | Accounting consultations |
| | • | | Fund merger support services |
| | • | | Agreed Upon Procedure Reports |
| | • | | Other Internal Control Reports |
Individual audit-related services that fall within one of these categories and are not presented to the Audit Committee as part of the annual pre-approval process will be subject to pre-approval by the Committee Chair (or any other Committee member on whom this responsibility has been delegated) so long as the estimated fee for those services does not exceed $50,000.
Tax Services
The following categories of tax services are considered to be consistent with the role of the Fund’s independent accountants:
| | • | | Tax compliance services related to the filing or amendment of the following: |
| | • | | Federal, state and local income tax compliance; and, |
| | • | | Sales and use tax compliance |
| | • | | Timely RIC qualification reviews |
| | • | | Tax distribution analysis and planning |
| | • | | Tax authority examination services |
| | • | | Tax appeals support services |
| | • | | Accounting methods studies |
| | • | | Fund merger support services |
| | • | | Tax consulting services and related projects |
Individual tax services that fall within one of these categories and are not presented to the Audit Committee as part of the annual pre-approval process will be subject to pre-approval by the Committee Chair (or any other Committee member on whom this responsibility has been delegated) so long as the estimated fee for those services does not exceed $50,000.
Other Non-audit Services
Certain non-audit services that the independent accountants are legally permitted to render will be subject to pre-approval by the Committee or by one or more Committee members to whom the Committee has delegated this authority and who will report to the full Committee any pre-approval
decisions made pursuant to this Policy. Non-audit services presented for pre-approval pursuant to this paragraph will be accompanied by a confirmation from both the Treasurer and the independent accountants that the proposed services will not adversely affect the independence of the independent accountants.
Proscribed Services
The Fund’s independent accountants will not render services in the following categories of non-audit services:
| | • | | Bookkeeping or other services related to the accounting records or financial statements of the Fund |
| | • | | Financial information systems design and implementation |
| | • | | Appraisal or valuation services, fairness opinions, or contribution-in-kind reports |
| | • | | Internal audit outsourcing services |
| | • | | Management functions or human resources |
| | • | | Broker or dealer, investment adviser, or investment banking services |
| | • | | Legal services and expert services unrelated to the audit |
| | • | | Any other service that the Public Company Accounting Oversight Board determines, by regulation, is impermissible. |
Pre-approval of Non-Audit Services Provided to Other Entities Within the Prudential Fund Complex
Certain non-audit services provided to Prudential Investments LLC or any of its affiliates that also provide ongoing services to the Prudential Mutual Funds will be subject to pre-approval by the Audit Committee. The only non-audit services provided to these entities that will require pre-approval are those related directly to the operations and financial reporting of the Funds. Individual projects that are not presented to the Audit Committee as part of the annual pre-approval process will be subject to pre-approval by the Committee Chair (or any other Committee member on whom this responsibility has been delegated) so long as the estimated fee for those services does not exceed $50,000. Services presented for pre-approval pursuant to this paragraph will be accompanied by a confirmation from both the Treasurer and the independent accountants that the proposed services will not adversely affect the independence of the independent accountants.
Although the Audit Committee will not pre-approve all services provided to Prudential Investments LLC and its affiliates, the Committee will receive an annual report from the Fund’s independent accounting firm showing the aggregate fees for all services provided to Prudential Investments and its affiliates.
(e) (2) Percentage of services referred to in 4(b) – 4(d) that were approved by the audit committee –
One hundred percent of the services described in Item 4(b) was approved by the audit committee.
(f) Percentage of hours expended attributable to work performed by other than full time employees of principal accountant if greater than 50%.
The percentage of hours expended on the principal accountant’s engagement to audit the registrant’s financial statements for the most recent fiscal year that were attributed to work performed by persons other than the principal accountant’s full-time, permanent employees was 0%.
(g) Non-Audit Fees
Not applicable to Registrant for the fiscal years 2009 and 2008. The aggregate non-audit fees billed by KPMG for services rendered to the registrant’s investment adviser and any entity controlling, controlled by, or under common control with the investment adviser that provides ongoing services to the registrant for the fiscal years 2009 and 2008 was $0 and $0, respectively.
(h) Principal Accountant’s Independence
Not applicable as KPMG has not provided non-audit services to the registrant’s investment adviser and any entity controlling, controlled by, or under common control with the investment adviser that provides ongoing services to the registrant that were not pre-approved pursuant to Rule 2-01(c)(7)(ii) of Regulation S-X.
Item 5 – Audit Committee of Listed Registrants – Not applicable.
Item 6 – Schedule of Investments – The schedule is included as part of the report to shareholders filed under Item 1 of this Form.
Item 7 – Disclosure of Proxy Voting Policies and Procedures for Closed-End Management Investment Companies – Not applicable.
Item 8 – Portfolio Managers of Closed-End Management Investment Companies – Not applicable.
Item 9 – Purchases of Equity Securities by Closed-End Management Investment Company and Affiliated Purchasers – Not applicable.
Item 10 – Submission of Matters to a Vote of Security Holders – Not applicable.
Item 11 – Controls and Procedures
| | (a) | It is the conclusion of the registrant’s principal executive officer and principal financial officer that the effectiveness of the registrant’s current disclosure controls and procedures (such disclosure controls and procedures having been evaluated within 90 days of the date of this filing) provide reasonable assurance that the information required to be disclosed by the registrant has been recorded, processed, summarized and reported within the time period specified in the Commission’s rules and forms and that the information required to be disclosed by the registrant has been accumulated and communicated to the registrant’s principal executive officer and principal financial officer in order to allow timely decisions regarding required disclosure. |
| | (b) | There has been no significant change in the registrant’s internal control over financial reporting that occurred during the registrant’s most recent fiscal quarter of the period covered by this report that has materially affected, or is likely to materially affect, the registrant’s internal control over financial reporting. |
Item 12 – Exhibits
| | | | |
| (a) | | (1) | | Code of Ethics – Attached hereto as Exhibit EX-99.CODE-ETH |
| | |
| | (2) | | Certifications pursuant to Section 302 of the Sarbanes-Oxley Act – Attached hereto as Exhibit EX-99.CERT. |
| | |
| | (3) | | Any written solicitation to purchase securities under Rule 23c-1. – Not applicable. |
| |
| (b) | | Certifications pursuant to Section 906 of the Sarbanes-Oxley Act – Attached hereto as Exhibit EX-99.906CERT. |
SIGNATURES
Pursuant to the requirements of the Securities Exchange Act of 1934 and the Investment Company Act of 1940, the registrant has duly caused this report to be signed on its behalf by the undersigned, thereunto duly authorized.
| | | | | | |
| (Registrant) | | Dryden Global Total Return Fund, Inc. | | | | |
| | | | |
| By (Signature and Title)* | | /S/ DEBORAH A. DOCS | | |
| | Deborah A. Docs | | |
| | Secretary | | |
Pursuant to the requirements of the Securities Exchange Act of 1934 and the Investment Company Act of 1940, this report has been signed below by the following persons on behalf of the registrant and in the capacities and on the dates indicated.
| | | | |
| By (Signature and Title)* | | /S/ JUDY A. RICE | | |
| | Judy A. Rice | | |
| | President and Principal Executive Officer | | |
| | | | |
| By (Signature and Title)* | | /S/ GRACE C. TORRES | | |
| | Grace C. Torres Treasurer and Principal Financial Officer | | |
| * | Print the name and title of each signing officer under his or her signature. |