UNITED STATES
SECURITIES AND EXCHANGE COMMISSION
Washington, D.C. 20549
FORM N-CSR
CERTIFIED SHAREHOLDER REPORT OF REGISTERED
MANAGEMENT INVESTMENT COMPANIES
| | |
| Investment Company Act file number: | | 811-04661 |
| |
| Exact name of registrant as specified in charter: | | Prudential Global Total Return Fund, Inc. |
| |
| Address of principal executive offices: | | Gateway Center 3, |
| | 100 Mulberry Street, |
| | Newark, New Jersey 07102 |
| |
| Name and address of agent for service: | | Deborah A. Docs |
| | Gateway Center 3, |
| | 100 Mulberry Street, |
| | Newark, New Jersey 07102 |
| |
| Registrant’s telephone number, including area code: | | 800-225-1852 |
| |
| Date of fiscal year end: | | 10/31/2011 |
| |
| Date of reporting period: | | 10/31/2011 |
Item 1 – Reports to Stockholders

PRUDENTIAL INVESTMENTS»MUTUAL FUNDS
PRUDENTIAL GLOBAL TOTAL RETURN FUND, INC.
ANNUAL REPORT · OCTOBER 31, 2011
Fund Type
Global bond
Objective
Total return made up of current income and capital appreciation
This report is not authorized for distribution to prospective investors unless preceded or accompanied by a current prospectus.
The views expressed in this report and information about the Fund’s portfolio holdings are for the period covered by this report and are subject to change thereafter.
Prudential Investments, Prudential, the Prudential logo, and the Rock symbol are service marks of Prudential Financial, Inc. and its related entities, registered in many jurisdictions worldwide.

December 15, 2011
Dear Shareholder:
After leading Prudential Investments for the past eight years, I have decided to retire at the end of 2011 from my positions as President of Prudential Investments and President and Director of the Prudential Global Total Return Fund, Inc. (the Fund). Effective January 1, 2012, I will become Chairman of Prudential Investments and act as an advisor to the business during 2012 to help facilitate a smooth transition to my successor, Stuart Parker.
Stuart, who will become President of Prudential Investments and President and Director of the Fund on January 1, 2012, previously served as the Executive Vice President of Retail Mutual Fund Distribution at Prudential Investments. With more than 20 years of investment industry experience, Stuart brings a deep understanding of the needs and challenges facing today’s investors.
We hope you find the annual report for the Fund informative. We recognize that ongoing market volatility may make it a difficult time to be an investor. We continue to believe a prudent response to uncertainty is to maintain a diversified portfolio, including stock and bond mutual funds consistent with your tolerance for risk, time horizon, and financial goals.
Your financial professional can help you create a diversified investment plan that reflects your personal investor profile and risk tolerance. Keep in mind that diversification and asset allocation strategies do not assure a profit or protect against loss in declining markets. We encourage you to call your financial professional before making any investment decision.
Prudential Investments provides a wide range of mutual funds to choose from that can help you make progress toward your financial goals. Our funds offer the experience, resources, and professional discipline of Prudential Financial’s affiliated asset managers.
Finally, I’ve been privileged to have had the opportunity to help you address your investment needs, and I thank you for choosing the Prudential Investments family of mutual funds.
Sincerely,

Judy A. Rice, President
Prudential Global Total Return Fund, Inc.
| | | | |
| Prudential Global Total Return Fund, Inc. | | | 1 | |
Your Fund’s Performance
Performance data quoted represent past performance. Past performance does not guarantee future results. The investment return and principal value of an investment will fluctuate, so that an investor’s shares, when redeemed, may be worth more or less than their original cost. Current performance may be lower or higher than the past performance data quoted. An investor may obtain performance data as of the most recent month-end by visiting our website at www.prudentialfunds.com or by calling (800) 225-1852. The maximum initial sales charge is 4.50% (Class A shares). Gross operating expenses: Class A, 1.44%; Class B, 2.14%; Class C, 2.14%; Class Z, 1.14%. Net operating expenses: Class A, 1.35%; Class B, 2.10%; Class C, 2.05%; Class Z, 1.10%, after contractual and voluntary reduction. The distribution fees for Class A shares are contractually reduced through 2/28/2013. The distribution fees for Class C shares were contractually reduced through 2/28/2011.
| | | | | | | | | | | | |
Cumulative Total Returns (Without Sales Charges) as of 10/31/11 | |
| | | One Year | | | Five Years | | | Ten Years | |
Class A | | | 4.60 | % | | | 51.40 | % | | | 93.58 | % |
Class B | | | 3.86 | | | | 45.83 | | | | 79.62 | |
Class C | | | 4.14 | | | | 47.60 | | | | 83.66 | |
Class Z | | | 4.87 | | | | 53.08 | | | | 98.26 | |
Barclays Capital Global Aggregate Bond Index | | | 4.07 | | | | 39.77 | | | | 95.26 | |
Citigroup WGBI—Unhedged | | | 3.73 | | | | 43.26 | | | | 104.33 | |
Lipper Average | | | 2.41 | | | | 33.20 | | | | 87.97 | |
| | | | | | | | | | | | |
Average Annual Total Returns (With Sales Charges) as of 9/30/11 | |
| | | One Year | | | Five Years | | | Ten Years | |
Class A | | | –1.11 | % | | | 7.36 | % | | | 6.04 | % |
Class B | | | –1.80 | | | | 7.40 | | | | 5.76 | |
Class C | | | 2.23 | | | | 7.81 | | | | 5.99 | |
Class Z | | | 3.80 | | | | 8.59 | | | | 6.79 | |
Barclays Capital Global Aggregate Bond Index | | | 4.00 | | | | 6.85 | | | | 6.88 | |
Citigroup WGBI—Unhedged | | | 4.61 | | | | 7.54 | | | | 7.43 | |
Lipper Average | | | 1.60 | | | | 5.70 | | | | 6.39 | |
| | | | | | | | | | | | |
Average Annual Total Returns (With Sales Charges) as of 10/31/11 | |
| | | One Year | | | Five Years | | | Ten Years | |
Class A | | | –0.10 | % | | | 7.65 | % | | | 6.34 | % |
Class B | | | –0.86 | | | | 7.69 | | | | 6.03 | |
Class C | | | 3.20 | | | | 8.10 | | | | 6.27 | |
Class Z | | | 4.87 | | | | 8.89 | | | | 7.08 | |
| | |
| 2 | | Visit our website at www.prudentialfunds.com |
| | | | | | | | | | | | |
Average Annual Total Returns (Without Sales Charges) as of 10/31/11 | |
| | | One Year | | | Five Years | | | Ten Years | |
Class A | | | 4.60 | % | | | 8.65 | % | | | 6.83 | % |
Class B | | | 3.86 | | | | 7.84 | | | | 6.03 | |
Class C | | | 4.14 | | | | 8.10 | | | | 6.27 | |
Class Z | | | 4.87 | | | | 8.89 | | | | 7.08 | |
Growth of a $10,000 Investment
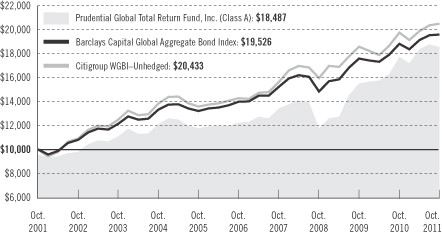
The graph compares a $10,000 investment in the Prudential Global Total Return Fund, Inc. (Class A shares) with a similar investment in the Barclays Capital Global Aggregate Bond Index and Citigroup World Government Bond Index (WGBI)—Unhedged by portraying the initial account values at the beginning of the 10-year period for Class A shares (October 31, 2001) and the account values at the end of the current fiscal year (October 31, 2011) as measured on a quarterly basis. For purposes of the graph, and unless otherwise indicated, it has been assumed that (a) the maximum applicable front-end sales charge was deducted from the initial $10,000 investment in Class A shares; (b) all recurring fees (including management fees) were deducted; and (c) all dividends and distributions were reinvested. The line graph provides information for Class A shares only. As indicated in the tables provided earlier, performance for Class B, Class C, and Class Z shares will vary due to the differing charges and expenses applicable to each share class (as indicated in the following paragraphs). Without the distribution and service (12b-1) fee waiver of 0.05% annually in effect through February 28, 2013, the returns shown in the graph and for Class A shares in the tables would have been lower.
Total returns and the ending account values in the graph include changes in share price and reinvestment of dividends and capital gains distributions in a hypothetical investment for the periods shown. The Fund’s total returns do not reflect the deduction of income taxes on an individual’s investment. Taxes may reduce your actual investment returns on income or gains paid by the Fund or any gains you may realize if you sell your shares.
| | | | |
| Prudential Global Total Return Fund, Inc. | | | 3 | |
Your Fund’s Performance (continued)
Source: Prudential Investments LLC and Lipper Inc. Performance figures may reflect fee waivers and/or expense reimbursements. In the absence of such fee waivers and/or expense reimbursements, total returns would be lower.
The average annual total returns take into account applicable sales charges. Class A shares are subject to a maximum front-end sales charge of 4.50% and a 12b-1 fee of up to 0.30% annually. All investors who purchase Class A shares in an amount of $1 million or more and sell these shares within 12 months of purchase are subject to a contingent deferred sales charge (CDSC) of 1%. Under certain limited circumstances, an exchange may be made from Class A, Class B, or Class C to Class Z shares, or from Class Z to Class A shares of the Fund. Class B shares are subject to a declining CDSC of 5%, 4%, 3%, 2%, 1%, and 1%, respectively, for the first six years after purchase and a 12b-1 fee of 1% annually. Approximately seven years after purchase, Class B will automatically convert to Class A shares on a quarterly basis. Class C shares are not subject to a front-end sales charge, but are subject to a CDSC of 1% for shares sold within 12 months from the date of purchase and an annual 12b-1 fee of 1%. Class Z shares are not subject to a sales charge or 12b-1 fees. Without waiver of fees and/or expense subsidization, the Fund’s total returns would have been lower. The returns in the tables and graph reflect the share class expense structure in effect at the close of the fiscal period.
Benchmark Definitions
Barclays Capital Global Aggregate Bond Index
The Barclays Capital Global Aggregate Bond Index is an unmanaged index of global investment-grade fixed income markets. The three major components of this index are the U.S. Aggregate, the Pan-European Aggregate, and the Asian-Pacific Aggregate Indices. The index also includes Eurodollar and Euro-Yen corporate bonds, Canadian government, agency and corporate securities.
Citigroup World Government Bond Index (WGBI)
Note: The Fund no longer utilizes the Citigroup World Government Bond Index-Unhedged as its performance benchmark for performance comparisons and now utilizes the Barclays Capital Global Aggregate Bond Index. The Citigroup World Government Bond Index-Unhedged is composed of domestic and foreign government debt. The Barclays Capital Global Aggregate Bond Index is composed of diversified domestic and foreign debt sectors, and is a more appropriate index for performance comparisons, because the Fund does not limit its sector allocations to government debt.
Lipper Global Income Funds Average
The Lipper Global Income Funds Average (Lipper Average) represents returns based on an average return of all funds in the Lipper Global Income Funds category for the periods noted. Funds in the Lipper Average invest primarily in U.S. dollar and non-U.S. dollar debt securities of issuers located in at least three countries, one of which may be the United States.
Investors cannot invest directly in an index or average. The returns for the Index would be lower if they included the effects of sales charges, operating expenses of a mutual fund, or taxes. Returns for the Lipper Average reflect the deduction of operating expenses, but not sales charges or taxes.
| | |
| 4 | | Visit our website at www.prudentialfunds.com |
| | | | |
Five Largest Long-Term Holdings expressed as a percentage of net assets as of 10/31/11 | |
Federal Home Loan Mortgage Corp., 4.500%, TBA 30 YR | | | 2.4 | % |
South Africa Government Bond, Ser. R213, 7.000%, 02/28/31 | | | 1.6 | |
Spain Government Bond, 3.250%, 04/30/16 | | | 1.2 | |
Italy Certificati di Credito del Tesoro, 5.110%, 04/30/13 | | | 1.2 | |
Poland Government International Bond, Sr. Unsec’d. Notes, Ser. 8, 1.920% | | | 1.2 | |
Holdings are subject to change.
| | | | | | | | |
Distributions and Yields as of 10/31/11 | | | | | | | | |
| | | Total Distributions
Paid for 12 Months | | | 30-Day
SEC Yield | |
Class A | | $ | 0.71 | | | | 2.84 | % |
Class B | | | 0.65 | | | | 2.22 | |
Class C | | | 0.66 | | | | 2.23 | |
Class Z | | | 0.73 | | | | 3.21 | |
| | | | |
| Prudential Global Total Return Fund, Inc. | | | 5 | |
Strategy and Performance Overview
How did the Fund perform?
Prudential Global Total Return Fund’s Class A shares rose 4.60% for the 12-month reporting period ended October 31, 2011, outperforming the 4.07% gain of the benchmark Barclays Capital Global Aggregate Bond Index (the Global Aggregate Index).
The Class A shares also outperformed the 3.73% gain of the Citigroup World Government Bond Index—Unhedged (Citigroup WGBI—Unhedged) and the 2.41% gain of the Lipper Global Income Funds Average.
On March 8, 2011, Prudential Fixed Income changed the Fund’s benchmark to the Global Aggregate Index from the Citigroup WGBI—Unhedged. The composition of the Global Aggregate Index is more closely aligned with the Fund’s multi-sector strategy, while the Citigroup WGBI—Unhedged is almost entirely composed of the government debt of developed nations.
How is the Fund managed?
Prudential Fixed Income manages the Fund, which seeks total return, made up of current income and capital appreciation. It invests at least 65% of its total assets in debt securities that include (but are not limited to) bonds of U.S. and foreign corporations, governments, and agencies as well as mortgage-related securities and asset-backed securities. The latter are securities created from pools of credit card receivables, auto loans, or certain other types of loans.
The Fund primarily looks for investment-grade bonds denominated in U.S. dollars or foreign currencies. However, it can also invest in high yield corporate bonds, which are commonly called “junk” bonds (and not included in the Global Aggregate Index) because they are rated below investment grade. Portfolio managers work closely with a team of 65 credit research analysts in selecting bonds to buy and sell.
Prudential Fixed Income received approval from the Board of Directors of the Fund to change the Fund’s non-fundamental investment limits to better align them with those of the Prudential Total Return Bond Fund, a similarly managed portfolio. These changes will become effective on or about March 1, 2012.
| | • | | The investment limit in high yield corporate bonds was increased from up to 35% of total assets to up to 50% of total assets. |
| | • | | The investment limit in asset-backed securities was increased from up to 15% of total assets to up to 35% of total assets. |
| | |
| 6 | | Visit our website at www.prudentialfunds.com |
How did global bond markets perform?
Global fixed income markets of economically developed nations faced heightened volatility driven by momentous economic and political developments around the world. Yet these markets delivered a 4.07% gain overall for the period in U.S. dollar terms without hedging for currency risk, according to the Global Aggregate Index.
| | • | | A protracted sovereign-debt crisis in the euro zone was a major source of volatility. Despite efforts of European policymakers to contain the crisis, it spread from smaller nations such as Greece and Portugal to Italy, pushing up yields on Italian government bonds and driving down their prices, as bond prices move inversely to yields. Near the end of the period, European leaders announced their latest deal that called for reducing Greece’s debt load, recapitalizing European banks, and greatly increasing the amount of Europe’s bailout fund. Though investors welcomed this news, sovereign debt markets of Italy, Spain, Portugal, and Greece still ended the reporting period in the red. |
| | • | | Another key source of volatility was the deteriorating prospects for the global economic recovery, which suffered shocks from soaring oil prices caused by regime change in North Africa and the Middle East and supply chain disruptions caused by a natural disaster in Japan. Many central banks reduced borrowing costs to stimulate business activity in their respective nations. Concerns about the euro zone debt debacle and slowing global economic growth encouraged a flight to safety (particularly during the third quarter of 2011) that benefited government bond markets of the United States, Germany, Japan, and the United Kingdom. All four delivered gains for the reporting period. |
| | • | | The rally in U.S. Treasury securities strengthened in September after the Federal Reserve announced it would, in October, begin selling $400 billion of short-term Treasury securities and buying their long-term counterparts. (It had already completed a second bond-buying program earlier in 2011.) The so-called “Operation Twist” is intended to drive down longer-term rates in order to boost growth in the U.S. economy, which some investors feared might slip into a double-dip recession. Longer-term Treasury securities soared in value in September, even though Standard & Poor’s had recently downgraded the U.S. long-term credit rating to AA+ from AAA. However, the Treasury market trimmed its gains in October, after data suggested the economy was not headed back into a recession. |
| | • | | The flight to quality, particularly in the third quarter of 2011, pressured high yield corporate bonds and commercial mortgage-backed securities (CMBS). However, both sectors in October regained some of the ground they had lost and ended the reporting period in positive territory, as did other U.S. fixed |
| | | | |
| Prudential Global Total Return Fund, Inc. | | | 7 | |
Strategy and Performance Overview (continued)
| | income sectors including investment-grade corporate bonds, asset-backed securities, and residential mortgage-backed securities of federal agencies. |
How did foreign exchange markets perform?
Foreign exchange markets were also volatile. Investors fled to safe haven currencies such as the U.S. dollar and the Japanese yen during times of heightened risk aversion, causing them to strengthen versus a variety of other currencies. The opposite tended to occur during times of greater confidence in the global economic recovery. For the entire period, the U.S. dollar finished weaker versus currencies such as the Swiss franc, the Australian dollar, the Singapore dollar, and the Norwegian krone. It finished stronger versus currencies such as the South African rand, the Hungarian forint, and the Mexican peso.
Which investment strategies contributed most to the Fund’s performance?
The Fund benefited from certain aspects of its sector allocation strategies. Compared to the Global Aggregate Index, it had an underweight exposure to government securities of economically developed nations but an overweight exposure to so-called “spread sectors.” The latter include corporate bonds, CMBS, and other debt securities that provide extra yield (spread) over the comparable government securities of their respective markets to compensate investors for the bonds’ greater credit risk.
| | • | | From the perspective of sector allocation, the largest contributor to the Fund’s strong performance versus the Global Aggregate Index was its non-benchmark exposure to U.S. high yield corporate bonds, which outperformed similar-maturity U.S. Treasury securities for the period. |
| | • | | Another key contributor was its exposure to AAA-rated CMBS of the U.S. fixed income market. CMBS also outperformed similar-maturity Treasury securities for the period. |
The Fund benefited from certain aspects of its interest-rate strategy.
| | • | | It had a longer duration in the U.S. fixed income market than the Global Aggregate Index. Duration measures the approximate price volatility of a bond portfolio for a given change in interest rates. A longer duration enabled the Fund to derive greater benefit as yields in the U.S. fixed income market declined, pushing bond prices higher. |
| | • | | Duration exposure in the fixed income market of Mexico also worked well for the Fund, as yields also declined in that market and drove bond prices higher. |
| | |
| 8 | | Visit our website at www.prudentialfunds.com |
The Fund’s tactical currency positioning also aided its results.
| | • | | It underweighted the U.S. dollar and euro versus a diversified basket of currencies such as the Chinese yuan and Swedish krona. The Fund sometimes managed its currency exposures by utilizing currency forward contracts, which had a net positive impact on the Fund’s return for the period. |
Total contribution to the Fund from its derivatives exposures was also a net positive.
| | • | | The Fund used other derivative instruments such as interest rate and credit default swaps, in addition to forward currency contracts. |
Which investment strategy subtracted most from the Fund’s performance?
Poor sector performance by asset-backed securities created from pools of subprime home equity loans was the largest detractor from the Fund’s performance for the period. These lower credit quality securities were hit hard during the time of heightened risk aversion, particularly during August.
The Portfolio of Investments following this report shows the size of the Fund’s positions at period-end.
| | | | |
| Prudential Global Total Return Fund, Inc. | | | 9 | |
Fees and Expenses (Unaudited)
As a shareholder of the Fund, you incur two types of costs: (1) transaction costs, including sales charges (loads) on purchase payments and redemptions, as applicable, and (2) ongoing costs, including management fees, distribution and/or service (12b-1) fees, and other Fund expenses, as applicable. This example is intended to help you understand your ongoing costs (in dollars) of investing in the Fund and to compare these costs with the ongoing costs of investing in other mutual funds.
The example is based on an investment of $1,000 invested on May 1, 2011, at the beginning of the period, and held through the six-month period ended October 31, 2011. The example is for illustrative purposes only; you should consult the Prospectus for information on initial and subsequent minimum investment requirements.
The Fund’s transfer agent may charge additional fees to holders of certain accounts that are not included in the expenses shown in the table on the following page. These fees apply to individual retirement accounts (IRAs) and Section 403(b) accounts. As of the close of the six-month period covered by the table, IRA fees included an annual maintenance fee of $15 per account (subject to a maximum annual maintenance fee of $25 for all accounts held by the same shareholder). Section 403(b) accounts are charged an annual $25 fiduciary maintenance fee. Some of the fees may vary in amount, or may be waived, based on your total account balance or the number of Prudential Investments funds, including the Fund, that you own. You should consider the additional fees that were charged to your Fund account over the six-month period when you estimate the total ongoing expenses paid over the period and the impact of these fees on your ending account value, as these additional expenses are not reflected in the information provided in the expense table. Additional fees have the effect of reducing investment returns.
Actual Expenses
The first line for each share class in the table on the following page provides information about actual account values and actual expenses. You may use the information on this line, together with the amount you invested, to estimate the expenses that you paid over the period. Simply divide your account value by $1,000 (for example, an $8,600 account value ÷ $1,000 = 8.6), then multiply the result by the number on the first line under the heading “Expenses Paid During the Six-Month Period” to estimate the expenses you paid on your account during this period.
| | |
| 10 | | Visit our website at www.prudentialfunds.com |
Hypothetical Example for Comparison Purposes
The second line for each share class in the table below provides information about hypothetical account values and hypothetical expenses based on the Fund’s actual expense ratio and an assumed rate of return of 5% per year before expenses, which is not the Fund’s actual return. The hypothetical account values and expenses may not be used to estimate the actual ending account balance or expenses you paid for the period. You may use this information to compare the ongoing costs of investing in the Fund and other funds. To do so, compare this 5% hypothetical example with the 5% hypothetical examples that appear in the shareholder reports of the other funds.
Please note that the expenses shown in the table are meant to highlight your ongoing costs only and do not reflect any transactional costs such as sales charges (loads). Therefore, the second line for each share class in the table is useful in comparing ongoing costs only and will not help you determine the relative total costs of owning different funds. In addition, if these transactional costs were included, your costs would have been higher.
| | | | | | | | | | | | | | | | | | |
Prudential Global Total
Return Fund, Inc. | | Beginning Account
Value
May 1, 2011 | | | Ending Account
Value
October 31, 2011 | | | Annualized
Expense Ratio
Based on the
Six-Month Period | | | Expenses Paid
During the
Six-Month Period* | |
| | | | | | | | | | | | | | | | | | |
Class A | | Actual | | $ | 1,000.00 | | | $ | 1,009.00 | | | | 1.35 | % | | $ | 6.84 | |
| | | Hypothetical | | $ | 1,000.00 | | | $ | 1,018.40 | | | | 1.35 | % | | $ | 6.87 | |
| | | | | | | | | | | | | | | | | | |
Class B | | Actual | | $ | 1,000.00 | | | $ | 1,005.20 | | | | 2.10 | % | | $ | 10.61 | |
| | | Hypothetical | | $ | 1,000.00 | | | $ | 1,014.62 | | | | 2.10 | % | | $ | 10.66 | |
| | | | | | | | | | | | | | | | | | |
Class C | | Actual | | $ | 1,000.00 | | | $ | 1,005.20 | | | | 2.10 | % | | $ | 10.61 | |
| | | Hypothetical | | $ | 1,000.00 | | | $ | 1,014.62 | | | | 2.10 | % | | $ | 10.66 | |
| | | | | | | | | | | | | | | | | | |
Class Z | | Actual | | $ | 1,000.00 | | | $ | 1,010.20 | | | | 1.10 | % | | $ | 5.57 | |
| | | Hypothetical | | $ | 1,000.00 | | | $ | 1,019.66 | | | | 1.10 | % | | $ | 5.60 | |
* Fund expenses (net of fee waivers or subsidies, if any) for each share class are equal to the annualized expense ratio for each share class (provided in the table), multiplied by the average account value over the period, multiplied by the 184 days in the six-month period ended October 31, 2011, and divided by 365 days to reflect the six-month period. Expenses presented in the table include the expenses of any underlying portfolios in which the Fund may invest.
| | | | |
| Prudential Global Total Return Fund, Inc. | | | 11 | |
Portfolio of Investments
as of October 31, 2011
| | | | | | | | |
Principal
Amount (000)# | | | Description | | Value (Note 1) | |
| | | | | | | | |
| LONG-TERM INVESTMENTS 96.8% | | | | |
| FOREIGN BONDS 48.4% | | | | |
| |
| Belgium 1.4% | | | | |
| EUR | 1,250 | | | Belgium Government Bond, Ser. 59,
2.750%, 03/28/16 | | $ | 1,674,139 | |
| $ | 1,500 | | | Belgium Government International Bond, Ser. E, MTN,
2.750%, 03/05/15 | | | 1,465,501 | |
| | | | | | | | |
| | | | | | | 3,139,640 | |
| | | | | | | | |
| |
| Bermuda 0.6% | | | | |
| | 310 | | | Alliance Oil Co. Ltd., Sr. Unsec’d. Notes, 144A,
9.875%, 03/11/15 | | | 317,750 | |
| | 30 | | | Allied World Assurance Co. Holdings Ltd., Gtd. Notes,
5.500%, 11/15/20 | | | 30,761 | |
| | 250 | | | 7.500%, 08/01/16 | | | 285,594 | |
| | 400 | | | Axis Capital Holdings Ltd., Sr. Unsec’d. Notes,
5.750%, 12/01/14 | | | 427,877 | |
| | 250 | | | Digicel Ltd., Sr. Unsec’d. Notes, 144A,
12.000%, 04/01/14 | | | 282,500 | |
| | 65 | | | Weatherford International Ltd. Bermuda, Gtd. Notes,
5.125%, 09/15/20 | | | 68,792 | |
| | | | | | | | |
| | | | | | | 1,413,274 | |
| | | | | | | | |
| |
| Brazil 1.7% | | | | |
| BRL | 1,000 | | | Brazil Notas do Tesouro Nacional, Ser. NTNF,
10.000%, 01/01/14 | | | 573,278 | |
| | 500 | | | Brazilian Government International Bond,
4.875%, 01/22/21 | | | 552,250 | |
| EUR | 200 | | | 11.000%, 06/26/17 | | | 371,883 | |
| BRL | 2,850 | | | Cia Energetica de Sao Paulo, Sr. Notes, 144A, MTN,
9.750%, 01/15/15 | | | 2,286,189 | |
| | | | | | | | |
| | | | | | | 3,783,600 | |
| | | | | | | | |
| |
| Bulgaria 0.2% | | | | |
| EUR | 350 | | | Bulgaria Government International Bond, 144A,
7.500%, 01/15/13 | | | 509,720 | |
| |
| Canada 1.0% | | | | |
| | 25 | | | Agrium, Inc., Sr. Unsec’d. Notes,
6.125%, 01/15/41 | | | 30,122 | |
See Notes to Financial Statements.
| | | | |
| Prudential Global Total Return Fund, Inc. | | | 13 | |
Portfolio of Investments
as of October 31, 2011 continued
| | | | | | | | |
Principal
Amount (000)# | | | Description | | Value (Note 1) | |
| | | | | | | | |
| FOREIGN BONDS (Continued) | | | | |
| |
| Canada (cont’d.) | | | | |
| $ | 77 | | | Canadian Pacific Railway Co., Sr. Unsec’d. Notes,
6.500%, 05/15/18 | | $ | 91,002 | |
| | 250 | | | Novelis, Inc., Gtd. Notes,
8.375%, 12/15/17 | | | 270,000 | |
| HKD | 5,000 | | | Province of Quebec Canada, Ser. E, MTN,
4.300%, 02/02/12 | | | 649,253 | |
| | 29 | | | Teck Resources Ltd., Sr. Sec’d. Notes,
10.250%, 05/15/16 | | | 33,965 | |
| | 600 | | | Toronto-Dominion Bank (The), Covered Notes, 144A,
1.625%, 09/14/16 | | | 589,342 | |
| | 200 | | | TransAlta Corp., Sr. Unsec’d. Notes,
6.650%, 05/15/18 | | | 228,907 | |
| | 325 | | | Videotron Ltee, Gtd. Notes,
9.125%, 04/15/18 | | | 357,500 | |
| | | | | | | | |
| | | | | | | 2,250,091 | |
| | | | | | | | |
| |
| Cayman Islands 1.1% | | | | |
| | 500 | | | Country Garden Holdings Co., Sr. Unsec’d. Notes, 144A,
11.750%, 09/10/14 | | | 485,000 | |
| | 450 | | | ENN Energy Holdings Ltd., Sr. Unsec’d. Notes, 144A,
6.000%, 05/13/21 | | | 477,437 | |
| | 250 | | | Hutchison Whampoa International (09) Ltd., Gtd. Notes,
RegS,
7.625%, 04/09/19 | | | 308,220 | |
| | 500 | | | IPIC Gmtn Ltd., Gtd. Notes, 144A, MTN,
5.500%, 03/01/22 | | | 496,750 | |
| | 120 | | | MUFG Capital Finance 1 Ltd., Gtd. Notes.,
6.346%, 07/25/49(a) | | | 120,645 | |
| | 300 | | | Seagate HDD Cayman, Gtd. Notes,
6.875%, 05/01/20 | | | 294,000 | |
| | 80 | | | Vale Overseas Ltd., Gtd. Notes,
6.875%, 11/21/36 | | | 91,504 | |
| | 125 | | | 6.875%, 11/10/39 | | | 144,054 | |
| | | | | | | | |
| | | | | | | 2,417,610 | |
| | | | | | | | |
| |
| Chile 0.3% | | | | |
| | 500 | | | Chile Government International Bond,
3.250%, 09/14/21 | | | 493,750 | |
See Notes to Financial Statements.
| | |
| 14 | | Visit our website at www.prudentialfunds.com |
| | | | | | | | |
Principal
Amount (000)# | | | Description | | Value (Note 1) | |
| | | | | | | | |
| FOREIGN BONDS (Continued) | | | | |
| |
| Chile (cont’d.) | | | | |
| $ | 260 | | | Empresa Nacional de Electricidad SA, Sr. Unsec’d. Notes,
8.350%, 08/01/13 | | $ | 285,262 | |
| | | | | | | | |
| | | | | | | 779,012 | |
| | | | | | | | |
| |
| China 0.2% | | | | |
| | 309 | | | China Government International Bond,
4.750%, 10/29/13 | | | 329,473 | |
| |
| Colombia 1.4% | | | | |
| | 1,500 | | | Colombia Government International Bond,
8.250%, 12/22/14 | | | 1,774,500 | |
| COP | 345,000 | | | Republic of Colombia, Sr. Unsec’d. Notes,
9.850%, 06/28/27 | | | 260,457 | |
| | 715 | | | 11.750%, 02/25/20 | | | 1,108,250 | |
| | | | | | | | |
| | | | | | | 3,143,207 | |
| | | | | | | | |
| |
| Croatia 0.7% | | | | |
| EUR | 1,050 | | | Croatia Government International Bond,
6.500%, 01/05/15 | | | 1,493,856 | |
| |
| Czech 1.0% | | | | |
| CZK | 15,000 | | | Czech Republic Government Bond, Ser. 61,
3.850%, 09/29/21 | | | 865,285 | |
| EUR | 1,000 | | | Czech Republic International, Ser. E, MTN,
3.625%, 04/14/21 | | | 1,392,971 | |
| | | | | | | | |
| | | | | | | 2,258,256 | |
| | | | | | | | |
| |
| Denmark 0.3% | | | | |
| EUR | 500 | | | Denmark Government International Bond,
2.750%, 03/16/16 | | | 724,183 | |
| |
| France 0.8% | | | | |
| EUR | 1,000 | | | French Treasury Note BTAN,
2.500%, 07/25/16 | | | 1,409,423 | |
| EUR | 200 | | | Societe des Autoroutes Paris-Rhin-Rhone, Sr. Unsec’d. Notes, Ser. E, MTN,
5.000%, 01/12/17 | | | 284,287 | |
See Notes to Financial Statements.
| | | | |
| Prudential Global Total Return Fund, Inc. | | | 15 | |
Portfolio of Investments
as of October 31, 2011 continued
| | | | | | | | |
Principal
Amount (000)# | | | Description | | Value (Note 1) | |
| | | | | | | | |
| FOREIGN BONDS (Continued) | | | | |
| |
| France (cont’d.) | | | | |
| $ | 150 | | | Vivendi SA, Sr. Unsec’d. Notes, 144A,
5.750%, 04/04/13 | | $ | 158,673 | |
| | | | | | | | |
| | | | | | | 1,852,383 | |
| | | | | | | | |
| |
| Germany 0.6% | | | | |
| EUR | 720 | | | Deutschland Bundesrepublik,
3.750%, 01/04/19 | | | 1,136,847 | |
| EUR | 200 | | | RWE AG, Jr. Sub. Notes,
4.625%, 09/29/49(a) | | | 260,827 | |
| | | | | | | | |
| | | | | | | 1,397,674 | |
| | | | | | | | |
| |
| Ghana 0.1% | | | | |
| | 200 | | | Republic of Ghana, Sr. Unsec’d. Notes, 144A,
8.500%, 10/04/17 | | | 224,000 | |
| |
| Greece | | | | |
| EUR | 200 | | | Hellenic Republic Government Bonds,
4.500%, 09/20/37 | | | 85,928 | |
| |
| Hong Kong 0.1% | | | | |
| | 200 | | | Hong Kong SAR Government Bond,
5.125%, 08/01/14 | | | 219,349 | |
| |
| Hungary 2.9% | | | | |
| EUR | 1,000 | | | Hungary Government International Bond,
4.375%, 07/04/17 | | | 1,235,090 | |
| CHF | 500 | | | Ser. E, MTN,
4.000%, 05/20/16 | | | 532,012 | |
| EUR | 1,500 | | | 6.750%, 07/28/14 | | | 2,116,231 | |
| JPY | 100,000 | | | Sr. Unsec’d. Notes, Ser. 3BR,
0.960%, 07/12/12 | | | 1,250,509 | |
| JPY | 100,000 | | | Sr. Unsec’d. Notes, Ser. 4BR,
1.670%, 03/18/13 | | | 1,227,764 | |
| | | | | | | | |
| | | | | | | 6,361,606 | |
| | | | | | | | |
| |
| India 0.2% | | | | |
| | 350 | | | ICICI Bank Ltd., Sr. Unsec’d. Notes, 144A, MTN,
4.750%, 11/25/16 | | | 346,735 | |
See Notes to Financial Statements.
| | |
| 16 | | Visit our website at www.prudentialfunds.com |
| | | | | | | | |
Principal
Amount (000)# | | | Description | | Value (Note 1) | |
| | | | | | | | |
| FOREIGN BONDS (Continued) | | | | |
| |
| Indonesia 1.0% | | | | |
| $ | 2,000 | | | Indonesia Government International Bond,
6.750%, 03/10/14 | | $ | 2,175,000 | |
| |
| Ireland 1.1% | | | | |
| EUR | 850 | | | Ireland Government Bond,
4.500%, 04/18/20 | | | 929,154 | |
| EUR | 100 | | | 5.000%, 10/18/20 | | | 112,426 | |
| | 295 | | | MTS International Funding Ltd., Sec’d. Notes, 144A,
8.625%, 06/22/20 | | | 322,288 | |
| EUR | 400 | | | Nara Cable Funding Ltd., Sr. Sec’d. Notes,
8.875%, 12/01/18 | | | 514,736 | |
| | 435 | | | Novatek Finance Ltd., Sr. Unsec’d. Notes, 144A,
5.326%, 02/03/16 | | | 446,963 | |
| | 100 | | | Willis Group Holdings PLC, Gtd. Notes,
4.125%, 03/15/16 | | | 102,548 | |
| | | | | | | | |
| | | | | | | 2,428,115 | |
| | | | | | | | |
| |
| Israel 1.8% | | | | |
| EUR | 350 | | | Israel Government International Bond,
MTN,
4.625%, 03/18/20 | | | 496,160 | |
| | 800 | | | Sr. Unsec’d. Notes,
5.125%, 03/26/19 | | | 894,133 | |
| ILS | 9,000 | | | Israel Treasury Bill, Ser. 1111,
2.776%, 11/02/11(f) | | | 2,482,759 | |
| | | | | | | | |
| | | | | | | 3,873,052 | |
| | | | | | | | |
| |
| Italy 1.4% | | | | |
| EUR | 325 | | | Italy Buoni Poliennali del Tesoro,
6.000%, 05/01/31 | | | 412,476 | |
| EUR | 2,000 | | | Italy Certificati di Credito del Tesoro,
5.110%, 04/30/13(f) | | | 2,567,871 | |
| | | | | | | | |
| | | | | | | 2,980,347 | |
| | | | | | | | |
| |
| Japan 2.5% | | | | |
| JPY | 164,000 | | | Japan Government Twenty Year Bond, Sr. Unsec’d. Notes,
Ser. 108
1.900%, 12/20/28 | | | 2,174,693 | |
See Notes to Financial Statements.
| | | | |
| Prudential Global Total Return Fund, Inc. | | | 17 | |
Portfolio of Investments
as of October 31, 2011 continued
| | | | | | | | |
Principal
Amount (000)# | | | Description | | Value (Note 1) | |
| | | | | | | | |
| FOREIGN BONDS (Continued) | | | | |
| |
| Japan (cont’d.) | | | | |
| JPY | 141,000 | | | Ser. 109
1.900%, 03/20/29 | | $ | 1,866,982 | |
| JPY | 99,000 | | | Ser. 116
2.200%, 03/20/30 | | | 1,362,706 | |
| | | | | | | | |
| | | | | | | 5,404,381 | |
| | | | | | | | |
| |
| Kazakhstan | | | | |
| $ | 150 | | | Kazmunaygas National Co., Sr. Unsec’d. Notes, 144A, MTN,
8.375%, 07/02/13 | | | 159,750 | |
| |
| Lithuania 0.2% | | | | |
| EUR | 350 | | | Lithuania Government International Bond,
4.500%, 03/05/13 | | | 492,010 | |
| |
| Luxembourg 1.3% | | | | |
| | 250 | | | Arcelormittal, Sr. Unsec’d. Notes,
6.125%, 06/01/18 | | | 256,780 | |
| | 300 | | | Enel Finance International NV, Gtd. Notes, 144A,
6.000%, 10/07/39 | | | 276,051 | |
| | 250 | | | GAZ Capital SA For Gazprom,
Sr. Unsec’d. Notes, 144A,
9.250%, 04/23/19 | | | 309,700 | |
| | 500 | | | Sr. Unsec’d. Notes, RegS
9.250%, 04/23/19 | | | 619,400 | |
| | 295 | | | Gazprom International SA, Gtd. Notes, RegS
7.201%, 02/01/20 | | | 324,927 | |
| | 250 | | | Intelsat Jackson Holdings SA, Gtd. Notes,
11.250%, 06/15/16 | | | 263,750 | |
| | 325 | | | MHP SA, Gtd. Notes, 144A,
10.250%, 04/29/15 | | | 307,125 | |
| | 380 | | | RSHB Capital SA for OJSC Russian Agricultural Bank,
Sr. Unsec’d. Notes, 144A,
7.125%, 01/14/14 | | | 402,800 | |
| | | | | | | | |
| | | | | | | 2,760,533 | |
| | | | | | | | |
| |
| Mexico 1.8% | | | | |
| MXN | 16,830 | | | Mexican Bonos, Ser. M 30,
10.000%, 11/20/36 | | | 1,618,822 | |
See Notes to Financial Statements.
| | |
| 18 | | Visit our website at www.prudentialfunds.com |
| | | | | | | | |
Principal
Amount (000)# | | | Description | | Value (Note 1) | |
| | | | | | | | |
| FOREIGN BONDS (Continued) | | | | |
| |
| Mexico (cont’d.) | | | | |
| EUR | 1,750 | | | Mexico Government International Bond, Ser. G, MTN,
4.250%, 07/14/17 | | $ | 2,448,717 | |
| | | | | | | | |
| | | | | | | 4,067,539 | |
| | | | | | | | |
| |
| Netherlands 0.7% | | | | |
| SGD | 500 | | | Cooperatieve Centrale Raiffeisen-Boerenleenbank BA,
Sr. Unsec’d. Notes, Ser. G, MTN,
2.100%, 09/10/12 | | | 402,330 | |
| $ | 200 | | | Indo Integrated Energy II BV, Sr. Sec’d. Notes, RegS,
9.750%, 11/05/16 | | | 217,000 | |
| EUR | 272 | | | NXP BV/NXP Funding LLC, Sr. Sec’d. Notes, Ser. EXCH,
4.322%, 10/15/13(a) | | | 368,212 | |
| EUR | 300 | | | Wolters Kluwer NV, Sr. Unsec’d. Notes,
6.375%, 04/10/18 | | | 469,680 | |
| | | | | | | | |
| | | | | | | 1,457,222 | |
| | | | | | | | |
| |
| Panama 0.7% | | | | |
| | 1,000 | | | Republic of Panama, Sr. Unsec’d. Notes,
7.125%, 01/29/26 | | | 1,280,000 | |
| | 300 | | | 7.250%, 03/15/15 | | | 346,500 | |
| | | | | | | | |
| | | | | | | 1,626,500 | |
| | | | | | | | |
| |
| Peru 1.6% | | | | |
| | 1,500 | | | Peruvian Government International Bond,
7.350%, 07/21/25 | | | 1,957,500 | |
| EUR | 1,000 | | | 7.500%, 10/14/14 | | | 1,522,070 | |
| | | | | | | | |
| | | | | | | 3,479,570 | |
| | | | | | | | |
| |
| Philippines 0.3% | | | | |
| | 500 | | | Philippine Government International Bond,
6.500%, 01/20/20 | | | 593,750 | |
| |
| Poland 3.2% | | | | |
| PLN | 4,000 | | | Poland Government Bond, Ser. 1021,
5.750%, 10/25/21 | | | 1,259,491 | |
| CHF | 1,000 | | | Poland Government International Bond,
Ser. E, MTN,
2.625%, 05/12/15 | | | 1,149,692 | |
See Notes to Financial Statements.
| | | | |
| Prudential Global Total Return Fund, Inc. | | | 19 | |
Portfolio of Investments
as of October 31, 2011 continued
| | | | | | | | |
Principal
Amount (000)# | | | Description | | Value (Note 1) | |
| | | | | | | | |
| FOREIGN BONDS (Continued) | | | | |
| |
| Poland (cont’d.) | | | | |
| JPY | 200,000 | | | Sr. Unsec’d. Notes, Ser. 8,
1.920%, 11/13/12 | | $ | 2,555,234 | |
| $ | 650 | | | Republic of Poland,
Sr. Unsec’d. Notes,
6.375%, 07/15/19 | | | 729,300 | |
| JPY | 100,000 | | | Sr. Unsec’d. Notes, Ser. 3BR,
1.000%, 06/20/12 | | | 1,269,426 | |
| | | | | | | | |
| | | | | | | 6,963,143 | |
| | | | | | | | |
| |
| Portugal 0.9% | | | | |
| EUR | 1,000 | | | Portugal Obrigacoes do Tesouro OT,
3.350%, 10/15/15 | | | 957,520 | |
| EUR | 400 | | | 4.800%, 06/15/20 | | | 317,046 | |
| EUR | 1,000 | | | Sr. Unsec’d. Notes,
4.100%, 04/15/37 | | | 690,881 | |
| | | | | | | | |
| | | | | | | 1,965,447 | |
| | | | | | | | |
| |
| Qatar 0.1% | | | | |
| | 115 | | | Qatar Government International Bond,
Sr. Unsec’d. Notes, 144A,
5.250%, 01/20/20 | | | 127,363 | |
| | 115 | | | 6.400%, 01/20/40 | | | 141,162 | |
| | | | | | | | |
| | | | | | | 268,525 | |
| | | | | | | | |
| |
| Romania 0.7% | | | | |
| EUR | 1,050 | | | Romanian Government International Bond,
8.500%, 05/08/12 | | | 1,484,413 | |
| |
| Russia 0.5% | | | | |
| | 835 | | | Russian Foreign Bond, Unsub. Notes, 144A,
7.500%, 03/31/30 | | | 989,475 | |
| |
| Singapore 0.6% | | | | |
| | 140 | | | Bumi Investment Pte Ltd., Sec’d. Notes, MTN, RegS,
10.750%, 10/06/17 | | | 144,900 | |
| SGD | 1,500 | | | Singapore Government Bond,
2.625%, 04/01/12 | | | 1,207,236 | |
| | | | | | | | |
| | | | | | | 1,352,136 | |
| | | | | | | | |
See Notes to Financial Statements.
| | |
| 20 | | Visit our website at www.prudentialfunds.com |
| | | | | | | | |
Principal
Amount (000)# | | | Description | | Value (Note 1) | |
| | | | | | | | |
| FOREIGN BONDS (Continued) | | | | |
| |
| South Africa 2.4% | | | | |
| ZAR | 32,590 | | | South Africa Government Bond, Ser. R213,
7.000%, 02/28/31 | | $ | 3,423,480 | |
| EUR | 550 | | | South Africa Government International Bond,
5.250%, 05/16/13 | | | 780,373 | |
| EUR | 700 | | | Ser. E, MTN,
4.500%, 04/05/16 | | | 992,804 | |
| | | | | | | | |
| | | | | | | 5,196,657 | |
| | | | | | | | |
| |
| South Korea 2.3% | | | | |
| | | | Export-Import Bank of Korea, Sr. Unsec’d. Notes, | | | | |
| $ | 240 | | | 5.875%, 01/14/15 | | | 258,291 | |
| | 100 | | | 8.125%, 01/21/14 | | | 111,105 | |
| | | | Ser. E, MTN, | | | | |
| HKD | 3,000 | | | 0.960%, 02/07/12 | | | 386,089 | |
| SGD | 500 | | | 1.200%, 04/13/12 | | | 398,962 | |
| SGD | 250 | | | 1.570%, 05/24/12 | | | 199,892 | |
| CHF | 200 | | | 2.500%, 10/26/12 | | | 230,964 | |
| HKD | 1,000 | | | 3.070%, 10/15/12 | | | 130,861 | |
| HKD | 5,000 | | | 4.250%, 06/15/12 | | | 655,351 | |
| JPY | 100,000 | | | Industrial Bank of Korea, Sr. Unsec’d. Notes, Ser. 7,
1.700%, 07/23/12 | | | 1,282,079 | |
| | 200 | | | Korea Development Bank,
3.875%, 05/04/17 | | | 199,831 | |
| | 1,000 | | | Korea Housing Finance Corp., Covered Notes, RegS,
4.125%, 12/15/15 | | | 1,033,042 | |
| | 270 | | | Korea Hydro & Nuclear Power Co. Ltd.,
Sr. Unsec’d. Notes, 144A,
4.750%, 07/13/21 | | | 275,772 | |
| | 200 | | | National Agricultural Cooperative Federation,
Sr. Unsec’d. Notes, 144A, MTN,
3.500%, 02/08/17 | | | 195,659 | |
| | | | | | | | |
| | | | | | | 5,357,898 | |
| | | | | | | | |
| |
| Spain 2.1% | | | | |
| | | | Spain Government Bond, | | | | |
| EUR | 2,100 | | | 3.250%, 04/30/16 | | | 2,744,988 | |
| EUR | 160 | | | 5.750%, 07/30/32 | | | 209,193 | |
See Notes to Financial Statements.
| | | | |
| Prudential Global Total Return Fund, Inc. | | | 21 | |
Portfolio of Investments
as of October 31, 2011 continued
| | | | | | | | |
Principal
Amount (000)# | | | Description | | Value (Note 1) | |
| | | | | | | | |
| FOREIGN BONDS (Continued) | | | | |
| |
| Spain (cont’d.) | | | | |
| EUR | 1,300 | | | Sr. Unsub. Notes,
4.000%, 04/30/20 | | $ | 1,645,048 | |
| | | | | | | | |
| | | | | | | 4,599,229 | |
| | | | | | | | |
| |
| Supranational 0.3% | | | | |
| SGD | 500 | | | Asian Development Bank, Sr. Unsec’d. Notes, MTN,
3.270%, 02/08/12 | | | 401,588 | |
| $ | 230 | | | Corp. Andina de Fomento, Sr. Unsec’d. Notes,
3.750%, 01/15/16 | | | 230,790 | |
| | | | | | | | |
| | | | | | | 632,378 | |
| | | | | | | | |
| |
| Turkey 1.7% | | | | |
| | | | Turkey Government Bond, | | | | |
| TRY | 1,000 | | | 10.060%, 11/16/11(f) | | | 562,967 | |
| TRY | 500 | | | 10.120%, 04/25/12(f) | | | 269,339 | |
| | | | Turkey Government International Bond, | | | | |
| EUR | 1,148 | | | 5.500%, 02/16/17 | | | 1,646,467 | |
| EUR | 750 | | | 6.500%, 02/10/14 | | | 1,094,853 | |
| | | | Turkiye Garanti Bankasi AS, Sr. Unsec’d. Notes, 144A, | | | | |
| | 200 | | | 6.250%, 04/20/21 | | | 192,500 | |
| | | | | | | | |
| | | | | | | 3,766,126 | |
| | | | | | | | |
| |
| Ukraine 0.4% | | | | |
| | 320 | | | NAK Naftogaz Ukraine (Ukraine), Gov’t. Gtd.
9.500%, 09/30/14 | | | 316,800 | |
| | 500 | | | Ukraine Government International Bond,
Sr. Unsec’d. Notes, RegS,
6.385%, 06/26/12 | | | 492,500 | |
| | | | | | | | |
| | | | | | | 809,300 | |
| | | | | | | | |
| |
| United Arab Emirates 0.3% | | | | |
| | 424 | | | Dolphin Energy Ltd., Sr. Sec’d. Notes, 144A,
5.888%, 06/15/19 | | | 462,851 | |
| | 100 | | | Dubai Electricity & Water Authority, Sr. Unsec’d. Notes, 144A,
8.500%, 04/22/15 | | | 109,750 | |
| | | | | | | | |
| | | | | | | 572,601 | |
| | | | | | | | |
See Notes to Financial Statements.
| | |
| 22 | | Visit our website at www.prudentialfunds.com |
| | | | | | | | |
Principal
Amount (000)# | | | Description | | Value (Note 1) | |
| | | | | | | | |
| FOREIGN BONDS (Continued) | | | | |
| |
| United Kingdom 3.9% | | | | |
| $ | 450 | | | Barclays Bank PLC, Sr. Unsec’d. Notes,
6.750%, 05/22/19 | | $ | 515,894 | |
| | 125 | | | BP Capital Markets PLC, Gtd. Notes,
4.500%, 10/01/20 | | | 137,255 | |
| | 30 | | | 5.250%, 11/07/13 | | | 32,444 | |
| | 250 | | | HSBC Holdings PLC,
Sr. Unsec’d. Notes,
5.100%, 04/05/21 | | | 269,267 | |
| | 125 | | | Sub. Notes,
6.500%, 09/15/37 | | | 132,110 | |
| | 525 | | | 6.800%, 06/01/38 | | | 576,623 | |
| EUR | 200 | | | Imperial Tobacco Finance PLC, Gtd. Notes, Ser. E, MTN,
8.375%, 02/17/16 | | | 333,154 | |
| | 500 | | | Lloyds TSB Bank PLC,
Gtd. Notes,
6.375%, 01/21/21 | | | 535,542 | |
| | 245 | | | Gtd. Notes., 144A, MTN,
5.800%, 01/13/20 | | | 250,828 | |
| | 150 | | | Royal Bank of Scotland Group PLC, Sr. Unsec’d. Notes, MTN,
6.400%, 10/21/19 | | | 151,157 | |
| | 325 | | | Royal Bank of Scotland PLC (The), Gtd. Notes,
6.125%, 01/11/21 | | | 343,187 | |
| | 140 | | | Ser. 2,
3.400%, 08/23/13 | | | 139,118 | |
| GBP | 425 | | | United Kingdom Treasury Bonds,
4.250%, 06/07/32 | | | 788,505 | |
| GBP | 1,220 | | | 4.750%, 12/07/30(e) | | | 2,406,142 | |
| GBP | 595 | | | 4.750%, 12/07/38(e) | | | 1,194,248 | |
| | 600 | | | XL Capital Finance Europe PLC, Gtd. Notes,
6.500%, 01/15/12 | | | 606,656 | |
| | | | | | | | |
| | | | | | | 8,412,130 | |
| | | | | | | | |
| |
| Venezuela | | | | |
| | 40 | | | Petroleos de Venezuela SA, Sr. Unsec’d. Notes, Ser. 2014,
4.900%, 10/28/14 | | | 30,400 | |
| | 110 | | | Republic of Venezuela, Sr. Unsec’d. Notes,
9.250%, 09/15/27 | | | 79,475 | |
| | | | | | | | |
| | | | | | | 109,875 | |
| | | | | | | | |
See Notes to Financial Statements.
| | | | |
| Prudential Global Total Return Fund, Inc. | | | 23 | |
Portfolio of Investments
as of October 31, 2011 continued
| | | | | | | | |
Principal
Amount (000)# | | | Description | | Value (Note 1) | |
| | | | | | | | |
| FOREIGN BONDS (Continued) | | | | |
| |
| Virgin Islands (BR) | | | | |
| $ | 200 | | | Mega Advance Investments Ltd., Gtd. Notes, 144A,
5.000%, 05/12/21 | | $ | 204,948 | |
| | | | | | | | |
| | | | Total foreign bonds | | | 106,911,647 | |
| | | | | | | | |
| ASSET-BACKED SECURITIES 8.6% | | | | |
| |
| Non-Residential Mortgage-Backed Securities 4.9% | | | | |
| | 500 | | | Apidos CDO (Cayman Islands),
Ser. 2006-4A, Class A1, 144A,
0.672%, 10/27/18(a) | | | 475,508 | |
| | 500 | | | Ser. 2011-8A, Class A1, 144A,
2.094%, 10/17/21(a) | | | 493,515 | |
| | 500 | | | ARES CLO Ltd. (Cayman Islands), Ser. 2011-16A, Class A, 144A,
1.892%, 05/17/21(a) | | | 493,158 | |
| | 479 | | | BlackRock Senior Income Series Corp. (Cayman Islands),
Ser. 2005-2A, Class A1, 144A,
0.562%, 05/25/17(a) | | | 461,058 | |
| | 825 | | | Citibank Credit Card Issuance Trust,
Ser. 2005-C2, Class C2,
0.715%, 03/24/17(a) | | | 803,423 | |
| | 625 | | | Ser. 2005-C3, Class C3,
0.653%, 07/15/14(a) | | | 622,878 | |
| | 1,000 | | | Ser. 2006-C1, Class C1,
0.645%, 02/20/15(a) | | | 990,252 | |
| | 817 | | | Four Corners CLO (Cayman Islands), Ser. 2006-3A,
Class A, 144A,
0.666%, 07/22/20(a) | | | 761,562 | |
| | 200 | | | FUEL Trust, Sec’d. Notes, 144A,
3.984%, 06/15/16 | | | 197,784 | |
| | 250 | | | 4.207%, 04/15/16 | | | 250,972 | |
| | 46 | | | Gulf Stream Compass CLO Ltd. (Cayman Islands), Ser. 2004-1A, Class A, 144A,
0.763%, 07/15/16(a) | | | 44,918 | |
| | 485 | | | Katonah Ltd. (Cayman Islands), Ser. 2005-7A,
Class A2, 144A,
0.546%, 11/15/17(a) | | | 463,708 | |
| | 484 | | | Landmark CDO Ltd. (Cayman Islands), Ser. 2006-8A,
Class A1, 144A,
0.646%, 10/19/20(a) | | | 458,294 | |
See Notes to Financial Statements.
| | |
| 24 | | Visit our website at www.prudentialfunds.com |
| | | | | | | | |
Principal
Amount (000)# | | | Description | | Value (Note 1) | |
| | | | | | | | |
| ASSET-BACKED SECURITIES (Continued) | | | | |
| |
| Non-Residential Mortgage-Backed Securities (cont’d.) | | | | |
| $ | 200 | | | MBNA Credit Card Master Note Trust,
Ser. 2002-C3, Class C3,
1.593%, 10/15/14(a) | | $ | 200,491 | |
| | 1,520 | | | Ser. 2004-C2, Class C2,
1.143%, 11/15/16(a) | | | 1,510,547 | |
| | 400 | | | Ser. 2006-C1, Class C1,
0.663%, 07/15/15(a) | | | 396,933 | |
| | 136 | | | Monument Park CDO Ltd. (Cayman Islands), Ser. 2004-1A,
Class A1, 144A,
0.959%, 01/20/16(a) | | | 131,959 | |
| | 68 | | | Mountain Capital CLO Ltd. (Cayman Islands),
Ser. 2004-3A, Class A1LA, 144A,
0.701%, 02/15/16(a) | | | 66,456 | |
| | 593 | | | Ser. 2005-4A, Class A1L, 144A,
0.597%, 03/15/18(a) | | | 566,963 | |
| EUR | 373 | | | North Westerly CLO BV (Netherlands), Ser. II-A,
Class A, 144A,
2.103%, 09/14/19(a) | | | 474,155 | |
| | 85 | | | Railcar Leasing LLC, Ser. 1997-1, Class A2, 144A,
7.125%, 01/15/13 | | | 88,217 | |
| | 234 | | | Rosedale CLO Ltd. (Cayman Islands), Ser. 2006-A,
Class A1S, 144A,
0.666%, 07/24/21(a) | | | 224,512 | |
| | 600 | | | Trimaran CLO Ltd. (Cayman Islands), Ser. 2006-2A,
Class A1L, 144A,
0.504%, 11/01/18(a) | | | 567,601 | |
| | 193 | | | Venture CDO Ltd. (Cayman Islands), Ser. 2003-1A,
Class A1, 144A,
0.912%, 01/21/16(a)(b) | | | 187,763 | |
| | | | | | | | |
| | | | | | | 10,932,627 | |
| | | | | | | | |
| |
| Residential Mortgage-Backed Securities 3.7% | | | | |
| | 349 | | | ACE Securities Corp., Ser. 2004-FM1, Class M1,
1.145%, 09/25/33(a) | | | 266,015 | |
| | 449 | | | Aegis Asset Backed Securities Trust, Ser. 2004-2, Class A5,
0.695%, 06/25/34(a) | | | 388,207 | |
| | 400 | | | Ameriquest Mortgage Securities, Inc., Ser. 2004-R8, Class M1,
1.205%, 09/25/34(a) | | | 303,688 | |
See Notes to Financial Statements.
| | | | |
| Prudential Global Total Return Fund, Inc. | | | 25 | |
Portfolio of Investments
as of October 31, 2011 continued
| | | | | | | | |
Principal
Amount (000)# | | | Description | | Value (Note 1) | |
| | | | | | | | |
| ASSET-BACKED SECURITIES (Continued) | | | | |
| |
| Residential Mortgage-Backed Securities (cont’d.) | | | | |
| $ | 387 | | | Argent Securities, Inc., Ser. 2004-W6, Class M1,
0.795%, 05/25/34(a) | | $ | 288,866 | |
| | 354 | | | Bear Stearns Asset Backed Securities Trust,
Ser. 2004-HE2, Class M1,
1.145%, 03/25/34(a) | | | 272,838 | |
| | 299 | | | Ser. 2004-HE3, Class M2,
1.970%, 04/25/34(a) | | | 245,503 | |
| | 237 | | | Chase Funding Loan Acquisition Trust, Ser. 2004-AQ1, Class A2,
0.645%, 05/25/34(a) | | | 201,656 | |
| | 283 | | | Citigroup Mortgage Loan Trust, Inc., Ser. 2004-OPT1, Class A2,
0.605%, 10/25/34(a) | | | 244,998 | |
| | 236 | | | Countrywide Asset-Backed Certificates, Ser. 2002-5, Class MV1,
1.745%, 03/25/33(a) | | | 202,282 | |
| | 421 | | | Fremont Home Loan Trust, Ser. 2004-1, Class M1,
0.920%, 02/25/34(a) | | | 311,439 | |
| | 295 | | | GSAMP Trust, Ser. 2004-FM1, Class M1,
1.220%, 11/25/33(a) | | | 228,704 | |
| | 616 | | | Home Equity Asset Trust,
Ser. 2004-3, Class M1,
1.100%, 08/25/34(a) | | | 439,695 | |
| | 37 | | | Ser. 2005-5, Class 2A2,
0.495%, 11/25/35(a) | | | 36,232 | |
| | 400 | | | HSBC Home Equity Loan Trust, Ser. 2007-2, Class A4,
0.545%, 07/20/36(a) | | | 307,229 | |
| | 600 | | | Long Beach Mortgage Loan Trust, Ser. 2004-3, Class M1,
1.100%, 07/25/34(a) | | | 424,476 | |
| | 375 | | | Mastr Asset Backed Securities Trust, Ser. 2004-OPT2, Class A1,
0.595%, 09/25/34(a) | | | 240,706 | |
| | 300 | | | Merrill Lynch Mortgage Investors, Inc., Ser. 2004-HE2, Class M1,
1.045%, 08/25/35(a) | | | 191,885 | |
| | 400 | | | Morgan Stanley ABS Capital I,
Ser. 2003-NC8, Class M1,
1.295%, 09/25/33(a) | | | 293,378 | |
See Notes to Financial Statements.
| | |
| 26 | | Visit our website at www.prudentialfunds.com |
| | | | | | | | |
Principal
Amount (000)# | | | Description | | Value (Note 1) | |
| | | | | | | | |
| ASSET-BACKED SECURITIES (Continued) | | | | |
| |
| Residential Mortgage-Backed Securities (cont’d.) | | | | |
| $ | 505 | | | Ser. 2004-NC1, Class M1,
1.295%, 12/27/33(a) | | $ | 397,808 | |
| | 437 | | | Ser. 2004-OP1, Class M1,
0.825%, 11/25/34(a) | | | 316,707 | |
| | 784 | | | Ser. 2004-WMC1, Class M1,
1.175%, 06/25/34(a) | | | 577,361 | |
| | 313 | | | Ser. 2004-WMC2, Class M1,
1.160%, 07/25/34(a) | | | 231,781 | |
| | 383 | | | Morgan Stanley Dean Witter Capital I, Ser. 2002-AM3,
Class A3,
1.225%, 02/25/33(a) | | | 307,892 | |
| | 524 | | | New Century Home Equity Loan Trust, Ser. 2003-4, Class M1,
1.370%, 10/25/33(a) | | | 412,286 | |
| | 389 | | | Option One Mortgage Loan Trust, Ser. 2003-6, Class A2,
0.575%, 11/25/33(a) | | | 314,804 | |
| | 230 | | | Popular ABS Mortgage Pass-Through Trust, Ser. 2004-4,
Class M1,
5.181%, 09/25/34 | | | 152,953 | |
| | 199 | | | Saxon Asset Securities Trust, Ser. 2004-2, Class MF1,
5.500%, 08/25/35 | | | 126,104 | |
| | 106 | | | Structured Asset Investment Loan Trust,
Ser. 2004-2, Class A4,
0.950%, 03/25/34(a) | | | 76,546 | |
| | 376 | | | Ser. 2004-8, Class A8,
1.245%, 09/25/34(a) | | | 308,081 | |
| | | | | | | | |
| | | | | | | 8,110,120 | |
| | | | | | | | |
| | | | Total asset-backed securities | | | 19,042,747 | |
| | | | | | | | |
| BANK LOANS(a) 2.1% | | | | |
| |
| Automotive 0.2% | | | | |
| | 200 | | | Chrysler LLC,
6.000%, 05/24/17 | | | 188,112 | |
| | 245 | | | Health Management Associates,
2.119%, 02/28/14 | | | 240,078 | |
| | | | | | | | |
| | | | | | | 428,190 | |
| | | | | | | | |
See Notes to Financial Statements.
| | | | |
| Prudential Global Total Return Fund, Inc. | | | 27 | |
Portfolio of Investments
as of October 31, 2011 continued
| | | | | | | | |
Principal
Amount (000)# | | | Description | | Value (Note 1) | |
| | | | | | | | |
| BANK LOANS(a) (Continued) | | | | |
| |
| Capital Goods 0.1% | | | | |
| $ | 82 | | | Capital Safety Group Ltd.,
1.996%, 07/20/15 | | $ | 72,437 | |
| | 218 | | | 2.996%, 07/20/16 | | | 193,063 | |
| | | | | | | | |
| | | | | | | 265,500 | |
| | | | | | | | |
| |
| Chemicals 0.2% | | | | |
| | 250 | | | Ashland, Inc.,
3.750%, 08/23/18 | | | 250,781 | |
| | 250 | | | Rockwood Holdings, Inc.,
3.750%, 02/09/18 | | | 250,625 | |
| | | | | | | | |
| | | | | | | 501,406 | |
| | | | | | | | |
| | |
| | Consumer | | | | | | | |
| | 150 | | | Visant Corp.,
5.250%, 12/22/16 | | | 141,394 | |
| |
| Electric 0.2% | | | | |
| | 399 | | | Calpine Corp.,
4.500%, 04/01/18 | | | 394,197 | |
| |
| Foods 0.1% | | | | |
| | 150 | | | Del Monte Foods Co.,
4.500%, 03/08/18 | | | 145,884 | |
| |
| Gaming 0.1% | | | | |
| | 144 | | | CCM Merger, Inc.,
7.000%, 03/01/17 | | | 143,109 | |
| |
| Healthcare & Pharmaceutical 0.5% | | | | |
| | 479 | | | Community Health Systems, Inc.,
2.569%, 07/25/14 | | | 464,096 | |
| | 56 | | | HCA, Inc.,
2.619%, 11/18/13 | | | 54,869 | |
| | 134 | | | 3.619%, 03/31/17 | | | 129,416 | |
| | 39 | | | Mylan, Inc.,
3.625%, 10/02/14 | | | 39,045 | |
| | 449 | | | RPI Finance Trust,
4.000%, 05/09/18 | | | 445,228 | |
| | | | | | | | |
| | | | | | | 1,132,654 | |
| | | | | | | | |
See Notes to Financial Statements.
| | |
| 28 | | Visit our website at www.prudentialfunds.com |
| | | | | | | | |
Principal
Amount (000)# | | | Description | | Value (Note 1) | |
| | | | | | | | |
| BANK LOANS(a) (Continued) | | | | |
| |
| Retailers 0.2% | | | | |
| $ | 320 | | | Dollar General Corp.,
3.028%, 07/07/14 | | $ | 319,600 | |
| |
| Technology 0.4% | | | | |
| | 25 | | | First Data Corp.,
2.995%, 09/24/14 | | | 23,230 | |
| | 237 | | | 4.358%, 03/24/18 | | | 204,293 | |
| | 399 | | | Sensata Technologies BV,
4.000%, 05/12/18 | | | 396,174 | |
| | 6 | | | SunGard Data System, Inc.,
1.993%, 02/28/14 | | | 6,315 | |
| | 164 | | | 3.903%, 02/28/16 | | | 161,614 | |
| | | | | | | | |
| | | | | | | 791,626 | |
| | | | | | | | |
| |
| Telecommunications 0.1% | | | | |
| | 298 | | | Fibertech Networks LLC,
6.750%, 11/30/16 | | | 291,795 | |
| | | | | | | | |
| | | | Total bank loans | | | 4,555,355 | |
| | | | | | | | |
| COMMERCIAL MORTGAGE-BACKED SECURITIES 6.7% | | | | |
| | 700 | | | Commercial Mortgage Pass Through Certificates,
Ser. 2006-C7, Class A4,
5.751%, 06/10/46(a) | | | 772,706 | |
| | 600 | | | Credit Suisse First Boston Mortgage Securities Corp.,
Ser. 2005-C5, Class A4,
5.100%, 08/15/38(a) | | | 662,295 | |
| | 631 | | | Credit Suisse Mortgage Capital Certificates,
Ser. 2007-C5, Class A2,
5.589%, 09/15/40 | | | 641,303 | |
| | 400 | | | CW Capital Cobalt Ltd., Ser. 2007-C3, Class A3,
5.816%, 05/15/46(a) | | | 421,430 | |
| | 1,000 | | | GE Capital Commercial Mortgage Corp., Ser. 2006-C1, Class A4,
5.331%, 03/10/44(a) | | | 1,095,218 | |
| | 600 | | | Greenwich Capital Commercial Funding Corp.,
Ser. 2005-GG5, Class A5,
5.224%, 04/10/37(a) | | | 640,979 | |
| | 578 | | | Ser. 2007-GG9, Class A2,
5.381%, 03/10/39 | | | 580,803 | |
See Notes to Financial Statements.
| | | | |
| Prudential Global Total Return Fund, Inc. | | | 29 | |
Portfolio of Investments
as of October 31, 2011 continued
| | | | | | | | |
Principal
Amount (000)# | | | Description | | Value (Note 1) | |
| | | | | | | | |
| COMMERCIAL MORTGAGE-BACKED SECURITIES (Continued) | | | | |
| $ | 411 | | | GS Mortgage Securities Corp. II, Ser. 2007-GG10, Class A2,
5.778%, 08/10/45(a) | | $ | 419,074 | |
| | 390 | | | JPMorgan Chase Commercial Mortgage Securities Corp.,
Ser. 2005-LDP4, Class A3A1,
4.871%, 10/15/42 | | | 389,364 | |
| | 1,000 | | | Ser. 2005-LDP5, Class A4,
5.205%, 12/15/44(a) | | | 1,117,052 | |
| | 645 | | | Ser. 2007-LD12, Class A2,
5.827%, 02/15/51 | | | 659,284 | |
| | 700 | | | LB-UBS Commercial Mortgage Trust,
Ser. 2006-C3, Class A4,
5.661%, 03/15/39(a) | | | 781,298 | |
| | 1,920 | | | Ser. 2007-C6, Class A2,
5.845%, 07/15/40 | | | 1,962,520 | |
| | 1,000 | | | Merrill Lynch/Countrywide Commercial Mortgage Trust,
Ser. 2006-2, Class A4,
5.902%, 06/12/46(a) | | | 1,130,757 | |
| | 646 | | | Merrill Lynch Mortgage Trust, Ser. 2008-C1, Class A2,
5.425%, 02/12/51 | | | 660,119 | |
| | 740 | | | Morgan Stanley Capital I,
Ser. 2005-IQ9, Class A4,
4.660%, 07/15/56 | | | 789,049 | |
| | 800 | | | Ser. 2006-HQ8, Class A4,
5.417%, 03/12/44(a) | | | 891,776 | |
| | 500 | | | Wachovia Bank Commercial Mortgage Trust,
Ser. 2006-C23, Class A4,
5.418%, 01/15/45(a) | | | 546,789 | |
| | 646 | | | Ser. 2007-C34, Class A2,
5.569%, 05/15/46 | | | 657,259 | |
| | | | | | | | |
| | | | Total commercial mortgage-backed securities | | | 14,819,075 | |
| | | | | | | | |
| CORPORATE BONDS 25.7% | | | | |
| |
| Aerospace & Defense 0.1% | | | | |
| | 170 | | | Be Aerospace, Inc., Sr. Unsec’d. Notes,
8.500%, 07/01/18 | | | 185,725 | |
| | 75 | | | L-3 Communications Corp., Gtd. Notes,
4.750%, 07/15/20 | | | 74,599 | |
| | | | | | | | |
| | | | | | | 260,324 | |
| | | | | | | | |
See Notes to Financial Statements.
| | |
| 30 | | Visit our website at www.prudentialfunds.com |
| | | | | | | | |
Principal
Amount (000)# | | | Description | | Value (Note 1) | |
| | | | | | | | |
| CORPORATE BONDS (Continued) | | | | |
| |
| Airlines 0.2% | | | | |
| $ | 100 | | | Continental Airlines, Inc., Pass-thru Certs., Ser. A,
4.750%, 01/12/21 | | $ | 99,000 | |
| | 227 | | | Delta Air Lines, Inc., Pass-thru Certs.,
Ser. 071A,
6.821%, 08/10/22 | | | 229,171 | |
| | 25 | | | Ser. 2A,
4.950%, 05/23/19 | | | 23,982 | |
| | 25 | | | Ser. A,
5.300%, 04/15/19 | | | 25,125 | |
| | 120 | | | United Airlines, Inc., Pass-thru Certs., Ser. 071A,
6.636%, 07/02/22 | | | 115,905 | |
| | | | | | | | |
| | | | | | | 493,183 | |
| | | | | | | | |
| |
| Automotive 0.3% | | | | |
| | 50 | | | BorgWarner, Inc., Sr. Unsec’d. Notes,
4.625%, 09/15/20 | | | 52,407 | |
| | 350 | | | Delphi Corp., Gtd. Notes, 144A,
5.875%, 05/15/19 | | | 355,250 | |
| | 225 | | | Ford Motor Credit Co. LLC, Sr. Unsec’d. Notes,
5.625%, 09/15/15 | | | 238,159 | |
| | 75 | | | Harley-Davidson Funding Corp., Gtd. Notes, 144A, MTN,
5.750%, 12/15/14 | | | 81,751 | |
| | | | | | | | |
| | | | | | | 727,567 | |
| | | | | | | | |
| |
| Banking 5.3% | | | | |
| | 440 | | | American Express Co., Sr. Unsec’d. Notes,
8.125%, 05/20/19 | | | 566,342 | |
| | 550 | | | American Express Credit Corp., Sr. Unsec’d. Notes, MTN,
2.800%, 09/19/16 | | | 558,538 | |
| | 235 | | | Bank of America Corp.,
Jr. Sub. Notes, Ser. K,
8.000%, 12/29/49(a) | | | 218,660 | |
| | 130 | | | Sr. Unsec’d. Notes, MTN,
5.000%, 05/13/21 | | | 122,059 | |
| | 120 | | | Sr. Unsec’d. Notes, Ser. 1,
3.750%, 07/12/16 | | | 114,465 | |
| | 400 | | | Sub. Notes,
4.750%, 08/15/13 | | | 400,976 | |
See Notes to Financial Statements.
| | | | |
| Prudential Global Total Return Fund, Inc. | | | 31 | |
Portfolio of Investments
as of October 31, 2011 continued
| | | | | | | | |
Principal
Amount (000)# | | | Description | | Value (Note 1) | |
| | | | | | | | |
| CORPORATE BONDS (Continued) | | | | |
| |
| Banking (cont’d.) | | | | |
| $ | 200 | | | Bear Stearns Cos., Inc. (The), Sr. Unsec’d. Notes,
7.250%, 02/01/18 | | $ | 235,526 | |
| | 350 | | | Capital One Bank USA NA, Sub. Notes,
8.800%, 07/15/19 | | | 415,734 | |
| | 170 | | | Capital One Capital V,
10.250%, 08/15/39 | | | 175,950 | |
| | 115 | | | Capital One Financial Corp., Sub. Notes,
6.150%, 09/01/16 | | | 122,119 | |
| | 305 | | | Citigroup, Inc.,
8.500%, 05/22/19 | | | 377,412 | |
| | 425 | | | Citigroup, Inc.,
Sr. Unsec’d. Notes,
4.500%, 01/14/22 | | | 426,148 | |
| | 305 | | | 5.375%, 08/09/20 | | | 325,844 | |
| | 600 | | | 6.500%, 08/19/13 | | | 635,607 | |
| | 110 | | | 8.125%, 07/15/39 | | | 151,183 | |
| | 300 | | | Sub. Notes,
5.500%, 02/15/17 | | | 307,424 | |
| | 205 | | | Goldman Sachs Group, Inc. (The),
Sr. Notes,
6.250%, 02/01/41 | | | 211,397 | |
| | 700 | | | Sr. Unsec’d. Notes,
5.250%, 07/27/21 | | | 706,583 | |
| | 185 | | | Sub. Notes,
6.750%, 10/01/37 | | | 177,762 | |
| | 450 | | | JPMorgan Chase & Co.,
Ser. 1,
7.900%, 04/29/49(a) | | | 484,520 | |
| | 580 | | | Sr. Unsec’d. Notes,
3.150%, 07/05/16 | | | 580,984 | |
| | 30 | | | 4.250%, 10/15/20 | | | 29,856 | |
| | 750 | | | 4.350%, 08/15/21 | | | 750,248 | |
| | 150 | | | 6.000%, 01/15/18 | | | 167,847 | |
| | 90 | | | KeyCorp, Sr. Unsec’d. Notes, MTN,
5.100%, 03/24/21 | | | 93,570 | |
| | 600 | | | Merrill Lynch & Co., Inc., Sr. Unsec’d. Notes, MTN,
5.450%, 02/05/13 | | | 606,677 | |
| | 65 | | | 6.050%, 08/15/12 | | | 65,914 | |
See Notes to Financial Statements.
| | |
| 32 | | Visit our website at www.prudentialfunds.com |
| | | | | | | | |
Principal
Amount (000)# | | | Description | | Value (Note 1) | |
| | | | | | | | |
| CORPORATE BONDS (Continued) | | | | |
| |
| Banking (cont’d.) | | | | |
| $ | 370 | | | Morgan Stanley,
Sr. Unsec’d. Notes,
5.500%, 07/28/21 | | $ | 361,391 | |
| | 670 | | | Sr. Unsec’d. Notes, MTN,
5.625%, 09/23/19 | | | 661,574 | |
| | 275 | | | PNC Funding Corp., Gtd. Notes.,
2.700%, 09/19/16 | | | 278,340 | |
| | 50 | | | Santander Holdings USA, Inc., Sr. Unsec’d. Notes,
4.625%, 04/19/16 | | | 49,238 | |
| | 245 | | | State Street Corp., Jr. Sub. Debs.,
4.956%, 03/15/18 | | | 242,929 | |
| | 300 | | | SunTrust Banks, Inc., Sr. Unsec’d. Notes,
5.250%, 11/05/12 | | | 309,276 | |
| | 340 | | | US Bancorp, Jr. Sub. Notes,
3.442%, 02/01/16 | | | 348,943 | |
| | 150 | | | USB Capital XIII Trust,
6.625%, 12/15/39 | | | 154,164 | |
| | 210 | | | Wells Fargo & Co., Sr. Unsec’d. Notes,
3.676%, 06/15/16 | | | 220,612 | |
| | 250 | | | Sr. Unsec’d. Notes, MTN,
4.600%, 04/01/21 | | | 267,429 | |
| | | | | | | | |
| | | | | | | 11,923,241 | |
| | | | | | | | |
| |
| Brokerage | | | | |
| | 100 | | | Lehman Brothers Holdings, Inc., Sr. Unsec’d. Notes, MTN,
6.875%, 05/02/18(c) | | | 25,750 | |
| |
| Building Materials & Construction 0.4% | | | | |
| | 110 | | | CRH America, Inc., Gtd. Notes,
8.125%, 07/15/18 | | | 126,818 | |
| | 260 | | | Masco Corp., Sr. Unsec’d. Notes,
7.125%, 08/15/13 | | | 271,719 | |
| | 420 | | | Toll Brothers Finance Corp., Gtd. Notes,
5.150%, 05/15/15 | | | 430,059 | |
| | | | | | | | |
| | | | | | | 828,596 | |
| | | | | | | | |
| |
| Cable 1.9% | | | | |
| | 250 | | | Cequel Communications Holdings I LLC and Cequel Capital Corp., Sr. Unsec’d. Notes, 144A,
8.625%, 11/15/17 | | | 261,250 | |
See Notes to Financial Statements.
| | | | |
| Prudential Global Total Return Fund, Inc. | | | 33 | |
Portfolio of Investments
as of October 31, 2011 continued
| | | | | | | | |
Principal
Amount (000)# | | | Description | | Value (Note 1) | |
| | | | | | | | |
| CORPORATE BONDS (Continued) | | | | |
| |
| Cable (cont’d.) | | | | |
| $ | 850 | | | Charter Communications Operating LLC/Charter Communications Operating Capital, Sec’d. Notes, 144A,
8.000%, 04/30/12 | | $ | 869,125 | |
| | 500 | | | CSC Holdings LLC,
Sr. Unsec’d. Notes,
8.500%, 04/15/14 | | | 548,750 | |
| | 185 | | | 8.625%, 02/15/19 | | | 209,975 | |
| | 325 | | | Sr. Unsec’d. Notes, 144A,
6.750%, 11/15/21 | | | 325,000 | |
| | 125 | | | DIRECTV Holdings LLC/DIRECTV Financing Co., Inc., Gtd. Notes,
3.500%, 03/01/16 | | | 130,094 | |
| | 25 | | | 3.550%, 03/15/15 | | | 26,214 | |
| | 265 | | | 4.750%, 10/01/14 | | | 287,566 | |
| | 900 | | | Dish DBS Corp., Gtd. Notes,
6.625%, 10/01/14 | | | 938,250 | |
| | 195 | | | Time Warner Cable, Inc., Gtd. Notes,
6.750%, 07/01/18 | | | 232,289 | |
| | 300 | | | 8.750%, 02/14/19 | | | 390,202 | |
| | | | | | | | |
| | | | | | | 4,218,715 | |
| | | | | | | | |
| |
| Capital Goods 0.7% | | | | |
| | 145 | | | Caterpillar Financial Services Corp., Sr. Unsec’d. Notes, MTN,
5.850%, 09/01/17 | | | 172,223 | |
| | 300 | | | Clean Harbors, Inc., Sr. Sec’d. Notes,
7.625%, 08/15/16 | | | 317,250 | |
| | 190 | | | ERAC USA Finance Co., Gtd. Notes, 144A,
7.000%, 10/15/37
(original cost $221,242; purchased 10/26/11)(b)(d) | | | 222,067 | |
| | 250 | | | 6.375%, 10/15/17
(original cost $273,750; purchased 02/09/10)(b)(d) | | | 290,338 | |
| | 50 | | | Illinois Tool Works, Inc., Sr. Unsec’d. Notes, 144A,
4.875%, 09/15/41 | | | 57,128 | |
| | 100 | | | Textron, Inc., Sr. Unsec’d. Notes,
5.600%, 12/01/17 | | | 103,319 | |
| | 200 | | | 7.250%, 10/01/19 | | | 221,856 | |
| | 225 | | | Xylem, Inc., Gtd. Notes, 144A,
4.875%, 10/01/21 | | | 233,039 | |
| | | | | | | | |
| | | | | | | 1,617,220 | |
| | | | | | | | |
See Notes to Financial Statements.
| | |
| 34 | | Visit our website at www.prudentialfunds.com |
| | | | | | | | |
Principal
Amount (000)# | | | Description | | Value (Note 1) | |
| | | | | | | | |
| CORPORATE BONDS (Continued) | | | | |
| |
| Chemicals 0.5% | | | | |
| $ | 75 | | | Dow Chemical Co. (The), Sr. Unsec’d. Notes,
5.900%, 02/15/15 | | $ | 83,463 | |
| | 250 | | | 7.600%, 05/15/14 | | | 283,701 | |
| | 152 | | | 9.400%, 05/15/39 | | | 236,153 | |
| | 25 | | | PPG Industries, Inc., Sr. Unsec’d. Notes,
5.500%, 11/15/40 | | | 28,362 | |
| | 550 | | | Rockwood Specialties Group, Inc., Gtd. Notes,
7.500%, 11/15/14 | | | 556,875 | |
| | | | | | | | |
| | | | | | | 1,188,554 | |
| | | | | | | | |
| |
| Consumer 0.5% | | | | |
| | 200 | | | Mac-Gray Corp., Gtd. Notes,
7.625%, 08/15/15 | | | 204,000 | |
| | 1 | | | Realogy Corp., Gtd. Notes,
12.000%, 04/15/17 | | | 995 | |
| | 554 | | | Sealy Mattress Co., Sr. Sec’d. Notes, 144A,
10.875%, 04/15/16 | | | 608,015 | |
| | 250 | | | Service Corp. International, Sr. Unsec’d. Notes,
7.000%, 06/15/17 | | | 268,750 | |
| | 100 | | | VF Corp., Sr. Unsec’d. Notes,
3.500%, 09/01/21 | | | 101,424 | |
| | | | | | | | |
| | | | | | | 1,183,184 | |
| | | | | | | | |
| |
| Electric 0.6% | | | | |
| | 250 | | | AES Corp. (The), Sr. Unsec’d. Notes,
8.000%, 10/15/17 | | | 274,375 | |
| | 250 | | | 9.750%, 04/15/16 | | | 283,750 | |
| | 350 | | | Duke Energy Corp., Sr. Unsec’d. Notes,
6.300%, 02/01/14 | | | 387,204 | |
| | 150 | | | North American Energy Alliance LLC/North American Energy Alliance Finance Corp., Sec’d. Notes, 144A,
10.875%, 06/01/16(c)
(original cost $146,609; purchased 09/22/09)(b)(d) | | | 159,750 | |
| | 105 | | | Oncor Electric Delivery Co. LLC, Sr. Sec’d. Notes,
6.800%, 09/01/18 | | | 127,117 | |
| | 100 | | | Peco Energy Co., First. Ref. Mtge.,
5.350%, 03/01/18 | | | 116,422 | |
See Notes to Financial Statements.
| | | | |
| Prudential Global Total Return Fund, Inc. | | | 35 | |
Portfolio of Investments
as of October 31, 2011 continued
| | | | | | | | |
Principal
Amount (000)# | | | Description | | Value (Note 1) | |
| | | | | | | | |
| CORPORATE BONDS (Continued) | | | | |
| |
| Electric (cont’d.) | | | | |
| $ | 50 | | | Public Service Co. of New Mexico, Sr. Unsec’d. Notes,
7.950%, 05/15/18 | | $ | 59,748 | |
| | | | | | | | |
| | | | | | | 1,408,366 | |
| | | | | | | | |
| |
| Energy—Integrated 0.1% | | | | |
| | 295 | | | Hess Corp., Sr. Unsec’d. Notes,
7.000%, 02/15/14 | | | 329,916 | |
| |
| Energy—Other 0.6% | | | | |
| | 175 | | | Anadarko Petroleum Corp., Sr. Unsec’d. Notes,
6.375%, 09/15/17 | | | 205,930 | |
| | 35 | | | 6.450%, 09/15/36 | | | 40,572 | |
| | 450 | | | Forest Oil Corp., Gtd. Notes,
8.500%, 02/15/14 | | | 486,000 | |
| | 170 | | | Nabors Industries, Inc., Gtd. Notes, 144A,
4.625%, 09/15/21 | | | 169,983 | |
| | 125 | | | Occidental Petroleum Corp., Sr. Unsec’d. Notes,
3.125%, 02/15/22 | | | 126,616 | |
| | 200 | | | Pioneer Natural Resources Co., Sr. Unsec’d. Notes,
6.875%, 05/01/18 | | | 216,263 | |
| | | | | | | | |
| | | | | | | 1,245,364 | |
| | | | | | | | |
| |
| Foods 1.8% | | | | |
| | 250 | | | Anheuser-Busch InBev Worldwide, Inc., Gtd. Notes,
4.125%, 01/15/15 | | | 272,391 | |
| | 225 | | | 8.000%, 11/15/39 | | | 343,807 | |
| | 1,100 | | | ARAMARK Corp., Gtd. Notes,
8.500%, 02/01/15 | | | 1,141,250 | |
| | 155 | | | Aramark Holdings Corp., Sr. Unsec’d. Notes, 144A,
8.625%, 05/01/16 | | | 160,812 | |
| | 250 | | | ConAgra Foods, Inc., Sr. Unsec’d. Notes,
7.000%, 04/15/19 | | | 294,813 | |
| | 150 | | | Ingles Markets, Inc., Sr. Unsec’d. Notes,
8.875%, 05/15/17 | | | 160,875 | |
| | 75 | | | JM Smucker Co. (The), Gtd. Notes,
3.500%, 10/15/21 | | | 76,040 | |
| | 75 | | | Kraft Foods, Inc., Sr. Unsec’d. Notes,
6.875%, 01/26/39 | | | 99,327 | |
See Notes to Financial Statements.
| | |
| 36 | | Visit our website at www.prudentialfunds.com |
| | | | | | | | |
Principal
Amount (000)# | | | Description | | Value (Note 1) | |
| | | | | | | | |
| CORPORATE BONDS (Continued) | | | | |
| |
| Foods (cont’d.) | | | | |
| $ | 550 | | | Smithfield Foods, Inc., Sr. Sec’d. Notes,
10.000%, 07/15/14 | | $ | 639,375 | |
| | 350 | | | Stater Bros Holdings, Inc., Gtd. Notes,
7.750%, 04/15/15 | | | 361,375 | |
| | 205 | | | SUPERVALU, Inc., Sr. Unsec’d. Notes,
7.500%, 11/15/14 | | | 208,075 | |
| | 90 | | | Tyson Foods, Inc., Gtd. Notes,
6.850%, 04/01/16 | | | 97,200 | |
| | | | | | | | |
| | | | | | | 3,855,340 | |
| | | | | | | | |
| |
| Gaming 0.8% | | | | |
| | 205 | | | Ameristar Casinos, Inc., Gtd. Notes, 144A,
7.500%, 04/15/21 | | | 210,125 | |
| | 145 | | | Las Vegas Sands Corp., Sr. Sec’d. Notes,
6.375%, 02/15/15 | | | 146,450 | |
| | 200 | | | Marina District Finance Co., Inc., Sr. Sec’d. Notes,
9.500%, 10/15/15 | | | 198,000 | |
| | 700 | | | MGM Resorts International, Sr. Sec’d. Notes,
13.000%, 11/15/13 | | | 806,750 | |
| | 400 | | | Pinnacle Entertainment, Inc., Gtd. Notes,
8.625%, 08/01/17 | | | 427,000 | |
| | | | | | | | |
| | | | | | | 1,788,325 | |
| | | | | | | | |
| |
| Healthcare & Pharmaceutical 0.6% | | | | |
| | 50 | | | Becton Dickinson and Co., Sr. Unsec’d. Notes,
5.000%, 11/12/40 | | | 56,847 | |
| | 250 | | | HCA, Inc.,
Gtd. Notes,
8.000%, 10/01/18 | | | 262,188 | |
| | 400 | | | Sr. Unsec’d. Notes,
7.190%, 11/15/15 | | | 392,000 | |
| | 35 | | | Sr. Unsec’d. Notes, MTN,
9.000%, 12/15/14 | | | 36,137 | |
| | 170 | | | Mylan, Inc., Gtd. Notes, 144A,
7.625%, 07/15/17 | | | 187,850 | |
| | 125 | | | Thermo Fisher Scientific, Inc., Sr. Unsec’d. Notes,
3.600%, 08/15/21 | | | 129,434 | |
| | 200 | | | Watson Pharmaceuticals, Inc., Sr. Unsec’d. Notes,
5.000%, 08/15/14 | | | 216,063 | |
See Notes to Financial Statements.
| | | | |
| Prudential Global Total Return Fund, Inc. | | | 37 | |
Portfolio of Investments
as of October 31, 2011 continued
| | | | | | | | |
Principal
Amount (000)# | | | Description | | Value (Note 1) | |
| | | | | | | | |
| CORPORATE BONDS (Continued) | | | | |
| |
| Healthcare & Pharmaceutical (cont’d.) | | | | |
| $ | 70 | | | Wyeth, Gtd. Notes,
6.450%, 02/01/24 | | $ | 89,010 | |
| | | | | | | | |
| | | | | | | 1,369,529 | |
| | | | | | | | |
| |
| Healthcare Insurance 0.4% | | | | |
| | 140 | | | Cigna Corp., Sr. Unsec’d. Notes,
5.875%, 03/15/41 | | | 152,773 | |
| | 360 | | | Coventry Health Care, Inc., Sr. Unsec’d. Notes,
6.125%, 01/15/15 | | | 395,681 | |
| | 235 | | | UnitedHealth Group, Inc., Sr. Unsec’d. Notes,
6.625%, 11/15/37 | | | 299,971 | |
| | | | | | | | |
| | | | | | | 848,425 | |
| | | | | | | | |
| |
| Insurance 1.0% | | | | |
| | 300 | | | American International Group, Inc.,
Sr. Unsec’d. Notes,
4.875%, 09/15/16 | | | 293,192 | |
| | 75 | | | 6.400%, 12/15/20 | | | 78,551 | |
| | 100 | | | 8.250%, 08/15/18 | | | 112,521 | |
| | 300 | | | Sr. Unsec’d. Notes, MTN,
5.850%, 01/16/18 | | | 301,905 | |
| | 140 | | | Chubb Corp. (The), Jr. Sub. Notes,
6.375%, 03/29/67(a) | | | 140,700 | |
| | 90 | | | Liberty Mutual Group, Inc., Sr. Unsec’d. Notes, 144A,
6.500%, 03/15/35 | | | 90,737 | |
| | 30 | | | Lincoln National Corp.,
Jr. Sub. Notes,
6.050%, 04/20/67(a) | | | 26,400 | |
| | 80 | | | Sr. Unsec’d. Notes,
6.300%, 10/09/37 | | | 82,267 | |
| | 200 | | | 8.750%, 07/01/19 | | | 244,019 | |
| | 100 | | | MetLife, Inc., Sr. Unsec’d. Notes,
7.717%, 02/15/19 | | | 125,397 | |
| | 50 | | | Northwestern Mutual Life Insurance, Sub. Notes, 144A,
6.063%, 03/30/40 | | | 58,599 | |
| | 100 | | | Progressive Corp. (The), Jr. Sub. Notes,
6.700%, 06/15/37(a) | | | 99,250 | |
See Notes to Financial Statements.
| | |
| 38 | | Visit our website at www.prudentialfunds.com |
| | | | | | | | |
Principal
Amount (000)# | | | Description | | Value (Note 1) | |
| | | | | | | | |
| CORPORATE BONDS (Continued) | | | | |
| |
| Insurance (cont’d.) | | | | |
| $ | 210 | | | Teachers Insurance & Annuity Association of America,
Sub. Notes, 144A,
6.850%, 12/16/39 | | $ | 267,135 | |
| | 245 | | | Unum Group, Sr. Unsec’d. Notes,
7.125%, 09/30/16 | | | 281,035 | |
| | | | | | | | |
| | | | | | | 2,201,708 | |
| | | | | | | | |
| |
| Lodging 0.6% | | | | |
| | 376 | | | Felcor Lodging LP, Sr. Sec’d. Notes,
10.000%, 10/01/14 | | | 407,020 | |
| | 420 | | | Host Hotels & Resorts LP, Gtd. Notes, Ser. O,
6.375%, 03/15/15 | | | 427,350 | |
| | 300 | | | Starwood Hotels & Resorts Worldwide, Inc., Gtd. Notes,
7.875%, 05/01/12 | | | 308,250 | |
| | 150 | | | Wyndham Worldwide Corp., Sr. Unsec’d. Notes,
5.750%, 02/01/18 | | | 157,392 | |
| | | | | | | | |
| | | | | | | 1,300,012 | |
| | | | | | | | |
| |
| Media & Entertainment 1.9% | | | | |
| | 500 | | | CBS Corp., Gtd. Notes,
8.200%, 05/15/14 | | | 574,631 | |
| | 100 | | | Gannett Co., Inc., Sr. Unsec’d. Notes,
6.375%, 04/01/12 | | | 101,000 | |
| | 130 | | | Historic TW, Inc., Gtd. Notes,
6.625%, 05/15/29 | | | 152,278 | |
| | 100 | | | Lin Television Corp.,
Gtd. Notes,
6.500%, 05/15/13 | | | 100,000 | |
| | 260 | | | Gtd. Notes, Ser. B,
6.500%, 05/15/13 | | | 260,000 | |
| | 100 | | | NBCUniversal Media LLC, Sr. Unsec’d. Notes,
4.375%, 04/01/21 | | | 106,343 | |
| | 120 | | | News America, Inc., Gtd. Notes,
6.150%, 03/01/37 | | | 133,897 | |
| | 415 | | | 6.150%, 02/15/41 | | | 455,762 | |
| | 60 | | | 6.900%, 08/15/39 | | | 70,246 | |
| | 450 | | | Nielsen Finance LLC/Nielsen Finance Co., Gtd. Notes,
11.625%, 02/01/14 | | | 517,500 | |
See Notes to Financial Statements.
| | | | |
| Prudential Global Total Return Fund, Inc. | | | 39 | |
Portfolio of Investments
as of October 31, 2011 continued
| | | | | | | | |
Principal
Amount (000)# | | | Description | | Value (Note 1) | |
| | | | | | | | |
| CORPORATE BONDS (Continued) | | | | |
| |
| Media & Entertainment (cont’d.) | | | | |
| $ | 600 | | | R.R. Donnelley & Sons Co., Sr. Unsec’d. Notes,
4.950%, 04/01/14 | | $ | 588,000 | |
| | 450 | | | 8.600%, 08/15/16 | | | 456,750 | |
| | 200 | | | SSI Investments II/SSI Co.-Issuer LLC, Gtd. Notes,
11.125%, 06/01/18 | | | 211,000 | |
| | 99 | | | Time Warner Cos., Inc., Gtd. Notes,
6.950%, 01/15/28 | | | 119,498 | |
| | 55 | | | Viacom, Inc., Sr. Unsec’d. Notes,
4.375%, 09/15/14 | | | 59,231 | |
| | 165 | | | 6.750%, 10/05/37 | | | 207,505 | |
| | | | | | | | |
| | | | | | | 4,113,641 | |
| | | | | | | | |
| |
| Metals 0.8% | | | | |
| | 800 | | | Metals USA, Inc., Sr. Sec’d. Notes,
11.125%, 12/01/15 | | | 830,000 | |
| | 200 | | | Newmont Mining Corp., Gtd. Notes,
6.250%, 10/01/39 | | | 250,427 | |
| | 400 | | | Steel Dynamics, Inc., Gtd. Notes,
6.750%, 04/01/15 | | | 407,000 | |
| | 160 | | | United States Steel Corp., Sr. Unsec’d. Notes,
5.650%, 06/01/13 | | | 162,800 | |
| | | | | | | | |
| | | | | | | 1,650,227 | |
| | | | | | | | |
| |
| Non-Captive Finance 1.8% | | | | |
| | 200 | | | CIT Group, Inc, Sec’d. Notes, 144A,
7.000%, 05/04/15 | | | 200,000 | |
| | 350 | | | 7.000%, 05/02/17 | | | 349,125 | |
| | 1,000 | | | General Electric Capital Corp.,
Sr. Unsec’d. Notes,
4.375%, 12/05/12 | | | 1,184,137 | |
| | 260 | | | Sr. Unsec’d. Notes, MTN,
4.625%, 01/07/21(e) | | | 268,430 | |
| | 365 | | | 4.650%, 10/17/21 | | | 375,996 | |
| SGD | 200 | | | Sr. Unsec’d. Notes, Ser. G, MTN,
2.960%, 05/18/12 | | | 160,638 | |
| | 100 | | | Sub. Notes,
5.300%, 02/11/21 | | | 106,426 | |
See Notes to Financial Statements.
| | |
| 40 | | Visit our website at www.prudentialfunds.com |
| | | | | | | | |
Principal
Amount (000)# | | | Description | | Value (Note 1) | |
| | | | | | | | |
| CORPORATE BONDS (Continued) | | | | |
| |
| Non-Captive Finance (cont’d.) | | | | |
| $ | 200 | | | International Lease Finance Corp.,
Sr. Sec’d. Notes, 144A,
6.500%, 09/01/14 | | $ | 206,000 | |
| | 75 | | | Sr. Unsec’d. Notes,
5.750%, 05/15/16 | | | 70,761 | |
| | 125 | | | 6.250%, 05/15/19 | | | 117,665 | |
| | 55 | | | SLM Corp.,
Sr. Notes, MTN,
6.250%, 01/25/16 | | | 55,000 | |
| | 510 | | | Sr. Unsec’d. Notes, MTN,
5.050%, 11/14/14 | | | 498,525 | |
| | 60 | | | 8.000%, 03/25/20 | | | 62,400 | |
| | 225 | | | 8.450%, 06/15/18 | | | 238,500 | |
| | | | | | | | |
| | | | | | | 3,893,603 | |
| | | | | | | | |
| |
| Packaging 0.4% | | | | |
| | 140 | | | Greif, Inc., Sr. Unsec’d. Notes,
7.750%, 08/01/19 | | | 150,500 | |
| | 600 | | | Sealed Air Corp., Sr. Unsec’d. Notes, 144A,
5.625%, 07/15/13 | | | 625,672 | |
| | | | | | | | |
| | | | | | | 776,172 | |
| | | | | | | | |
| |
| Paper 0.7% | | | | |
| | 250 | | | Georgia-Pacific LLC, Gtd. Notes, 144A,
7.125%, 01/15/17(c)
(original cost $261,563; purchased 09/09/2011)(b)(d) | | | 265,118 | |
| | 75 | | | International Paper Co., Sr. Unsec’d. Notes,
7.300%, 11/15/39 | | | 87,454 | |
| | 200 | | | 7.950%, 06/15/18 | | | 240,043 | |
| | 450 | | | MeadWestvaco Corp., Sr. Unsec’d. Notes,
7.375%, 09/01/19 | | | 493,296 | |
| | 200 | | | Rock-Tenn Co., Gtd. Notes,
9.250%, 03/15/16 | | | 212,500 | |
| | 200 | | | Verso Paper Holdings LLC/Verso Paper, Inc., Sr. Sec’d. Notes,
11.500%, 07/01/14 | | | 210,000 | |
| | | | | | | | |
| | | | | | | 1,508,411 | |
| | | | | | | | |
See Notes to Financial Statements.
| | | | |
| Prudential Global Total Return Fund, Inc. | | | 41 | |
Portfolio of Investments
as of October 31, 2011 continued
| | | | | | | | |
Principal
Amount (000)# | | | Description | | Value (Note 1) | |
| | | | | | | | |
| CORPORATE BONDS (Continued) | | | | |
| |
| Pipelines & Other 0.3% | | | | |
| $ | 200 | | | CenterPoint Energy Resources Corp., Sr. Unsec’d. Notes,
6.625%, 11/01/37 | | $ | 239,373 | |
| | 85 | | | Energy Transfer Partners LP, Sr. Unsec’d. Notes,
4.650%, 06/01/21 | | | 84,381 | |
| | 100 | | | Kinder Morgan Energy Partners LP, Sr. Unsec’d. Notes,
5.850%, 09/15/12 | | | 103,543 | |
| | 170 | | | 7.300%, 08/15/33 | | | 201,739 | |
| | 75 | | | Northwest Pipeline GP, Sr. Unsec’d. Notes,
6.050%, 06/15/18 | | | 86,325 | |
| | | | | | | | |
| | | | | | | 715,361 | |
| | | | | | | | |
| |
| Real Estate Investment Trusts 0.5% | | | | |
| | 250 | | | Hospitality Properties Trust, Sr. Unsec’d. Notes,
7.875%, 08/15/14 | | | 274,100 | |
| | 100 | | | Post Apartment Homes LP, Sr. Unsec’d. Notes,
5.450%, 06/01/12 | | | 101,439 | |
| | 200 | | | Senior Housing Properties Trust, Sr. Unsec’d. Notes,
8.625%, 01/15/12 | | | 202,304 | |
| | 95 | | | Simon Property Group LP, Sr. Unsec’d. Notes,
4.200%, 02/01/15 | | | 100,384 | |
| | 125 | | | 6.750%, 05/15/14 | | | 139,180 | |
| | 200 | | | WEA Finance LLC/WT Finance Aust Pty Ltd., Gtd. Notes, 144A,
5.750%, 09/02/15 | | | 215,692 | |
| | | | | | | | |
| | | | | | | 1,033,099 | |
| | | | | | | | |
| |
| Retailers 0.8% | | | | |
| | 200 | | | CVS Caremark Corp., Sr. Unsec’d. Notes,
6.125%, 09/15/39 | | | 242,904 | |
| | 50 | | | Nordstrom, Inc., Sr. Unsec’d. Notes,
4.000%, 10/15/21 | | | 51,729 | |
| | 400 | | | Sally Holdings LLC/Sally Capital, Inc., Gtd. Notes,
9.250%, 11/15/14 | | | 410,500 | |
| | 450 | | | Susser Holdings LLC/Susser Finance Corp., Gtd. Notes,
8.500%, 05/15/16 | | | 469,125 | |
| | 250 | | | Target Corp., Sr. Unsec’d. Notes,
7.000%, 01/15/38 | | | 344,088 | |
| | 75 | | | Wal-Mart Stores, Inc., Sr. Unsec’d. Notes,
5.000%, 10/25/40 | | | 85,261 | |
See Notes to Financial Statements.
| | |
| 42 | | Visit our website at www.prudentialfunds.com |
| | | | | | | | |
Principal
Amount (000)# | | | Description | | Value (Note 1) | |
| | | | | | | | |
| CORPORATE BONDS (Continued) | | | | |
| |
| Retailers (cont’d.) | | | | |
| $ | 100 | | | 5.625%, 04/15/41 | | $ | 123,344 | |
| | | | | | | | |
| | | | | | | 1,726,951 | |
| | | | | | | | |
| |
| Technology 0.7% | | | | |
| | 250 | | | Amphenol Corp., Sr. Unsec’d. Notes,
4.750%, 11/15/14 | | | 267,716 | |
| | 50 | | | Arrow Electronics, Inc., Sr. Unsec’d. Notes,
3.375%, 11/01/15 | | | 50,121 | |
| | 400 | | | Commscope, Inc., Gtd. Notes, 144A,
8.250%, 01/15/19 | | | 394,000 | |
| | 50 | | | Fiserv, Inc., Gtd. Notes,
3.125%, 10/01/15 | | | 50,951 | |
| | 45 | | | 3.125%, 06/15/16 | | | 45,706 | |
| | 150 | | | SunGard Data Systems, Inc., Gtd. Notes,
7.625%, 11/15/20 | | | 153,750 | |
| | 250 | | | 10.250%, 08/15/15 | | | 259,375 | |
| | 225 | | | Xerox Corp., Sr. Unsec’d. Notes,
4.250%, 02/15/15 | | | 237,258 | |
| | | | | | | | |
| | | | | | | 1,458,877 | |
| | | | | | | | |
| |
| Telecommunications 1.0% | | | | |
| | 225 | | | AT&T, Inc., Sr. Unsec’d. Notes,
5.550%, 08/15/41 | | | 253,867 | |
| | 130 | | | 6.550%, 02/15/39 | | | 162,744 | |
| | 300 | | | CC Holdings GS V LLC/Crown Castle GS III Corp.,
Sr. Sec’d. Notes, 144A,
7.750%, 05/01/17 | | | 324,750 | |
| | 465 | | | Embarq Corp., Sr. Unsec’d. Notes,
7.082%, 06/01/16
(original cost $525,632; purchased 05/04/11 - 05/11/11)(b)(d) | | | 503,955 | |
| | 250 | | | Metropcs Wireless, Inc., Gtd. Notes,
7.875%, 09/01/18 | | | 254,375 | |
| | 290 | | | Nextel Communications, Inc., Gtd. Notes, Ser. E,
6.875%, 10/31/13 | | | 286,375 | |
| | 200 | | | Qwest Corp., Sr. Unsec’d. Notes,
8.375%, 05/01/16 | | | 228,500 | |
See Notes to Financial Statements.
| | | | |
| Prudential Global Total Return Fund, Inc. | | | 43 | |
Portfolio of Investments
as of October 31, 2011 continued
| | | | | | | | |
Principal
Amount (000)# | | | Description | | Value (Note 1) | |
| | | | | | | | |
| CORPORATE BONDS (Continued) | | | | |
| |
| Telecommunications (cont’d.) | | | | |
| $ | 150 | | | Sprint Capital Corp., Gtd. Notes,
8.375%, 03/15/12 | | $ | 151,500 | |
| | 85 | | | Verizon Communications, Inc., Sr. Unsec’d. Notes,
6.400%, 02/15/38 | | | 106,354 | |
| | | | | | | | |
| | | | | | | 2,272,420 | |
| | | | | | | | |
| |
| Tobacco 0.4% | | | | |
| | 250 | | | Altria Group, Inc., Gtd. Notes,
9.950%, 11/10/38 | | | 379,825 | |
| | 60 | | | Lorillard Tobacco Co., Gtd. Notes,
3.500%, 08/04/16 | | | 60,233 | |
| | 80 | | | 8.125%, 06/23/19 | | | 96,410 | |
| | 300 | | | Reynolds American, Inc., Gtd. Notes,
6.750%, 06/15/17 | | | 346,664 | |
| | | | | | | | |
| | | | | | | 883,132 | |
| | | | | | | | |
| | | | Total corporate bonds | | | 56,845,213 | |
| | | | | | | | |
| MORTGAGE-BACKED SECURITY 2.4% | | | | |
| | 5,000 | | | Federal Home Loan Mortgage Corp.,
4.500%, TBA 30 YR | | | 5,271,875 | |
| | | | | | | | |
| MUNICIPAL BONDS 1.9% | | | | |
| | 75 | | | California St. Build America Bonds,
7.625%, 03/01/40 | | | 93,183 | |
| | 115 | | | California St. Build America Bonds, Taxable Var. Purp. GO,
7.500%, 04/01/34 | | | 139,013 | |
| | 100 | | | Chicago Ill. Brd. Ed., Build America Bonds, Taxable Ser. E,
6.138%, 12/01/39 | | | 106,352 | |
| | 60 | | | City of Chicago IL, O’Hare International Arpt., Build America Bonds,
6.395%, 01/01/40 | | | 71,339 | |
| | 275 | | | Connecticut St. Spl. Tax Obligation Rev., Build America Bonds,
5.459%, 11/01/30 | | | 306,196 | |
| | 175 | | | District of Columbia Income Tax Rev., Build America Bonds,
5.582%, 12/01/35 | | | 213,531 | |
| | 175 | | | District of Columbia Wtr. & Sewr. Auth. Pub. Util. Rev.,
Taxable, Build America Bonds,
5.522%, 10/01/44 | | | 204,543 | |
See Notes to Financial Statements.
| | |
| 44 | | Visit our website at www.prudentialfunds.com |
| | | | | | | | |
Principal
Amount (000)# | | | Description | | Value (Note 1) | |
| | | | | | | | |
| MUNICIPAL BONDS (Continued) | | | | |
| $ | 125 | | | Metropolitan Government of Nashville & Davidson Cnty.,
Convention Center Auth., Build America Bonds,
6.731%, 07/01/43 | | $ | 147,359 | |
| | 200 | | | New Jersey St. Tpk. Auth. Tpk. Rev., Build America Bonds,
Taxable, Issuer Subsidy Rev.,
Ser. A,
7.102%, 01/01/41 | | | 266,042 | |
| | 100 | | | Ser. F,
7.414%, 01/01/40 | | | 137,595 | |
| | 250 | | | New York, NY, Build America Bonds,
5.968%, 03/01/36 | | | 297,277 | |
| | 165 | | | Ohio St. Univ. Gen. Rcpts., Build America Bonds,
4.910%, 06/01/40 | | | 185,095 | |
| | 500 | | | Ohio St. Wtr. Dev. Auth. Wtr. Pollutn. Ctl. Rev. Taxable, Build America Bonds,
4.879%, 12/01/34 | | | 551,025 | |
| | 295 | | | Pennsylvania St. Tpk. Commission, Tpk. Rev., Build America Bonds,
5.511%, 12/01/45 | | | 332,164 | |
| | 75 | | | Regional Transn. Dist. Colo. Sales Tax Rev., Build America Bonds, Ser. B,
5.844%, 11/01/50 | | | 94,439 | |
| | 250 | | | Salt River Project Agricultural Improvement & Pwr. Dist., Elec. Sys. Rev., Build America Bonds,
4.839%, 01/01/41 | | | 269,645 | |
| | 150 | | | Texas St. Transn. Commn. Rev. Taxable First Tier. Ser. B, Build America Bonds, Direct pmt.,
5.028%, 04/01/26 | | | 174,290 | |
| | 150 | | | University of Calif. Rev. Build America Bonds,
5.770%, 05/15/43 | | | 169,791 | |
| | 250 | | | University TX, Perm. Univ. Build America Bonds,
5.262%, 07/01/39 | | | 297,323 | |
| | 150 | | | Utah St. Build America Bonds, Ser. D, GO,
4.554%, 07/01/24 | | | 171,683 | |
| | | | | | | | |
| | | | Total municipal bonds | | | 4,227,885 | |
| | | | | | | | |
| U.S. GOVERNMENT AGENCY OBLIGATION 0.2% | | | | |
| | 330 | | | Federal National Mortgage Association,
1.375%, 11/15/16 | | | 330,041 | |
| | | | | | | | |
See Notes to Financial Statements.
| | | | |
| Prudential Global Total Return Fund, Inc. | | | 45 | |
Portfolio of Investments
as of October 31, 2011 continued
| | | | | | | | |
Principal
Amount (000)# | | | Description | | Value (Note 1) | |
| U.S. TREASURY SECURITIES 0.8% | | | | |
| $ | 120 | | | U.S. Treasury Bonds,
4.375%, 05/15/41 | | $ | 147,300 | |
| | 795 | | | 4.750%, 02/15/41(e) | | | 1,033,500 | |
| | 280 | | | U.S. Treasury Notes,
0.625%, 06/30/12(e) | | | 280,941 | |
| | 275 | | | 1.000%, 08/31/16 | | | 275,517 | |
| | | | | | | | |
| | | | Total U.S. treasury securities | | | 1,737,258 | |
| | | | | | | | |
| PREFERRED STOCK | | | | |
| | |
Shares | | | | | | |
|
| Banking | |
| | 4,000 | | | Citigroup Capital XIII
(Capital Security, fixed to floating preferred), 7.875%(a) | | | 107,720 | |
| | | | | | | | |
| | | | Total long-term investments
(cost $206,816,521) | | | 213,848,816 | |
| | | | | | | | |
| SHORT-TERM INVESTMENTS 3.8% | | | | |
|
| Affiliated Money Market Mutual Fund 3.6% | |
| | 7,919,488 | | | Prudential Investment Portfolios 2 - Prudential Core
Taxable Money Market Fund(h)
(cost $7,919,488) | | | 7,919,488 | |
| | | | | | | | |
| | |
Notional
Amount (000)# | | | | | | |
|
| OPTIONS PURCHASED(g) 0.2% | |
| |
| Put Options | | | | |
| | 2,500 | | | United States Dollar/Brazilian Real,
expiring 01/17/12 @ 1.841 | | | 203,044 | |
| | 6,500 | | | United States Dollar/Chinese Yuan Renminbi,
expiring 10/25/12 @ 6.450 | | | 166,588 | |
| | 2,510 | | | United States Dollar/Indian Rupee,
expiring 12/21/11 @ 47.630 | | | 11,757 | |
| | 2,576 | | | United States Dollar/Turkish Lira,
expiring 12/14/11 @ 1.585 | | | 1,078 | |
See Notes to Financial Statements.
| | |
| 46 | | Visit our website at www.prudentialfunds.com |
| | | | | | | | |
Notional
Amount (000) | | | Description | | Value (Note 1) | |
| | | | | | | | |
| OPTIONS PURCHASED(g) (Continued) | | | | |
| |
| Put Options (cont’d.) | | | | |
| $ | 2,582 | | | United States Dollar/South African Rand,
expiring 12/05/11 @ 7.325 | | $ | 6,667 | |
| | | | | | | | |
| | | | Total options purchased
(cost $723,175) | | | 389,134 | |
| | | | | | | | |
| | | | Total short-term investments
(cost $8,642,663) | | | 8,308,622 | |
| | | | | | | | |
| | | | Total Investments 100.6%
(cost $215,459,184; Note 5) | | | 222,157,438 | |
| | | | Liabilities in excess of other assets(i) (0.6%) | | | (1,345,300 | ) |
| | | | | | | | |
| | | | Net Assets 100.0% | | $ | 220,812,138 | |
| | | | | | | | |
The following abbreviations are used in portfolio descriptions:
144A—Security was purchased pursuant to Rule 144A under the Securities Act of 1933 and may not be resold subject to that rule except to qualified institutional buyers. Unless otherwise noted, 144A securities are deemed to be liquid.
RegS—Regulation S. Security was purchased pursuant to Regulation S and may not be offered, sold or delivered within the United States or to, or for the account or benefit of, U.S. persons, except pursuant to an exemption from, or in a transaction not subject to, the registration requirements of the Securities Act of 1933.
GO—General Obligation
CDO—Collateralized Debt Obligation
CLO—Collateralized Loan Obligation
MTN—Medium Term Note
TBA—To Be Announced
ARS—Argentine Peso
AUD—Australian Dollar
BRL—Brazilian Real
CAD—Canadian Dollar
CHF—Swiss Franc
CLP—Chilean Peso
CNY—Chinese Yuan Renminbi
COP—Colombian Peso
CZK—Czech Koruna
DKK—Danish Krone
EUR—Euro
GBP—British Pound
HKD—Hong Kong Dollar
HUF—Hungarian Forint
IDR—Indonesian Rupiah
See Notes to Financial Statements.
| | | | |
| Prudential Global Total Return Fund, Inc. | | | 47 | |
Portfolio of Investments
as of October 31, 2011 continued
ILS—Israeli New Shekel
INR—Indian Rupee
JPY—Japanese Yen
KRW—South Korean Won
MXN—Mexican Nuevo Peso
MYR—Malaysian Ringgit
NOK—Norwegian Krone
NZD—New Zealand Dollar
PEN—Peruvian Nuevo Sol
PHP—Philippine Peso
PLN—Polish Zloty
RON—Romanian New Lei
RUB—Russian Rouble
SEK—Swedish Krona
SGD—Singapore Dollar
THB—Thai Baht
TRY—Turkish Lira
TWD—New Taiwan Dollar
ZAR—South African Rand
AONIA—Overnight Reserve Bank of Australia Rate
BBR—New Zealand Bank Bill Rate
BBSW—Australian Bank Bill Swap Reference Rate
BKIBOR—6M Thailand Fixing Rate
BUBOR—Budapest Interbank Offered Rate
CNDR7D—7 Day Fixing Repo Rates
EONIA OIS—Euro Overnight Index Average
EURIBOR—Euro Interbank Offered Rate
JIBAR—Johannesburg Interbank Agreed Rate
LIBOR—London Interbank Offered Rate
MIBOR—Mumbai Interbank Swap Rate
PRIBOR—Prague Interbank Offered Rate
SONIA OIS—Sterling Overnight Index Average
SOR—Swap Offer Rate
TELBOR—Tel Aviv Interbank Offered Rate
TOIS—TOM Next Index Swap Deposit Rates
WIBOR—Warsaw Interbank Offered Rate
| # | Principal and notional amount is shown in U.S. dollars unless otherwise stated. |
| (a) | Variable rate instrument. The interest rate shown reflects the rate in effect at October 31, 2011. |
| (b) | Indicates a security that has been deemed illiquid. |
| (c) | Represents issuer in default on interest payments and/or principal repayment; non-income producing security. |
| (d) | Indicates a restricted security, the aggregate original cost of such securities is $1,428,796. The aggregate value of $1,441,228 is approximately 0.7% of net assets. |
| (e) | Represents security, or a portion thereof, segregated as collateral for futures contracts. |
| (f) | Represents a zero coupon bond. Rate shown reflects the effective yield at October 31, 2011. |
| (g) | Non-income producing security. |
See Notes to Financial Statements.
| | |
| 48 | | Visit our website at www.prudentialfunds.com |
| (h) | Prudential Investments LLC, the manager of the Fund, also serves as manager of the Prudential Investment Portfolios 2 - Prudential Core Taxable Money Market Fund. |
| (i) | Includes net unrealized appreciation (depreciation) on the following derivative contracts held at reporting period end: |
Open futures contracts outstanding as of October 31, 2011:
| | | | | | | | | | | | | | | | | | | | |
Number of
Contracts | | | Type | | Expiration
Date | | | Value at
Trade
Date | | | Value at
October 31,
2011 | | | Unrealized
Appreciation
(Depreciation) | |
| | | | Long Positions: | | | | | | | | | | | | | | | | |
| | 2 | | | 30 Day Interbank | | | Dec. 2011 | | | $ | 500,817 | | | $ | 497,249 | | | $ | (3,568 | ) |
| | 5 | | | AUST. 10 Year Bond | | | Dec. 2011 | | | | 606,397 | | | | 588,239 | | | | (18,158 | ) |
| | 42 | | | CAN 10 Year Bond | | | Dec. 2011 | | | | 5,488,876 | | | | 5,533,002 | | | | 44,126 | |
| | 47 | | | Euro-BOBL | | | Dec. 2011 | | | | 7,967,430 | | | | 7,956,247 | | | | (11,183 | ) |
| | 69 | | | Euro-BTP Italian Gov’t. Bond | | | Dec. 2011 | | | | 9,472,130 | | | | 9,273,516 | | | | (198,614 | ) |
| | 2 | | | Euro-Bund | | | Dec. 2011 | | | | 370,745 | | | | 374,900 | | | | 4,155 | |
| | 6 | | | Euro-Buxl 30 Year | | | Dec. 2011 | | | | 997,942 | | | | 999,751 | | | | 1,809 | |
| | 19 | | | Fed Fund 30 Day | | | Nov. 2011 | | | | 7,910,613 | | | | 7,910,966 | | | | 353 | |
| | 35 | | | Long Gilt | | | Dec. 2011 | | | | 7,228,106 | | | | 7,222,517 | | | | (5,589 | ) |
| | 15 | | | U.S. Long Bond | | | Dec. 2011 | | | | 2,123,456 | | | | 2,085,469 | | | | (37,987 | ) |
| | | | Short Positions: | | | | | | | | | | | | | | | | |
| | 32 | | | 30 Day Interbank | | | Apr. 2012 | | | | 7,987,359 | | | | 8,000,479 | | | | (13,120 | ) |
| | 6 | | | 2 Year U.S. Treasury Notes | | | Dec. 2011 | | | | 1,323,555 | | | | 1,321,688 | | | | 1,867 | |
| | 55 | | | 5 Year U.S. Treasury Notes | | | Dec. 2011 | | | | 6,745,519 | | | | 6,743,516 | | | | 2,003 | |
| | 132 | | | 10 Year U.S. Treasury Notes | | | Dec. 2011 | | | | 17,150,077 | | | | 17,036,250 | | | | 113,827 | |
| | 31 | | | U.S. Ultra Bond | | | Dec. 2011 | | | | 4,694,144 | | | | 4,723,625 | | | | (29,481 | ) |
| | | | | | | | | | | | | | | | | | | | |
| | | | | | | | | | | | | | | | | | $ | (149,560 | ) |
| | | | | | | | | | | | | | | | | | | | |
Forward foreign currency exchange contracts outstanding as of October 31, 2011:
| | | | | | | | | | | | | | | | | | |
Purchase Contracts | | Counterparty | | Notional
Amount | | | Value at
Settlement
Date
Payable | | | Value at
October 31,
2011 | | | Unrealized
Appreciation
(Depreciation) | |
Argentine Peso, | | | | | | | | | | | | | | | | | | |
Expiring 12/23/11 | | Citibank NA | | ARS | 1,478,575 | | | $ | 335,278 | | | $ | 333,936 | | | $ | (1,342 | ) |
Expiring 01/27/12 | | Citibank NA | | ARS | 4,147,160 | | | | 946,300 | | | | 899,570 | | | | (46,730 | ) |
Expiring 01/27/12 | | Citibank NA | | ARS | 845,025 | | | | 190,000 | | | | 183,296 | | | | (6,704 | ) |
Expiring 05/16/12 | | Citibank NA | | ARS | 3,228,619 | | | | 697,100 | | | | 659,967 | | | | (37,133 | ) |
Expiring 05/16/12 | | Citibank NA | | ARS | 2,869,703 | | | | 610,900 | | | | 586,601 | | | | (24,299 | ) |
See Notes to Financial Statements.
| | | | |
| Prudential Global Total Return Fund, Inc. | | | 49 | |
Portfolio of Investments
as of October 31, 2011 continued
| | | | | | | | | | | | | | | | | | |
Purchase Contracts | | Counterparty | | Notional
Amount | | | Value at
Settlement
Date
Payable | | | Value at
October 31,
2011 | | | Unrealized
Appreciation
(Depreciation) | |
Australian Dollar, | | | | | | | | | | | | | | | | | | |
Expiring 11/18/11 | | Goldman Sachs | | AUD | 7,762,629 | | | $ | 7,958,845 | | | $ | 8,163,120 | | | $ | 204,275 | |
Brazilian Real, | | | | | | | | | | | | | | | | | | |
Expiring 01/19/12 | | Citibank NA | | BRL | 1,986,823 | | | | 1,119,400 | | | | 1,136,183 | | | | 16,783 | |
Expiring 01/19/12 | | Citibank NA | | BRL | 1,485,538 | | | | 806,700 | | | | 849,518 | | | | 42,818 | |
Expiring 01/19/12 | | Citibank NA | | BRL | 1,151,630 | | | | 606,600 | | | | 658,570 | | | | 51,970 | |
Expiring 01/19/12 | | Citibank NA | | BRL | 1,143,723 | | | | 610,800 | | | | 654,048 | | | | 43,248 | |
Expiring 01/19/12 | | Citibank NA | | BRL | 1,133,395 | | | | 604,800 | | | | 648,142 | | | | 43,342 | |
Expiring 01/19/12 | | Citibank NA | | BRL | 1,130,674 | | | | 604,800 | | | | 646,586 | | | | 41,786 | |
Expiring 01/19/12 | | Citibank NA | | BRL | 1,127,060 | | | | 612,200 | | | | 644,520 | | | | 32,320 | |
Expiring 01/19/12 | | Citibank NA | | BRL | 1,121,973 | | | | 605,000 | | | | 641,610 | | | | 36,610 | |
Expiring 01/19/12 | | Citibank NA | | BRL | 1,115,895 | | | | 606,300 | | | | 638,135 | | | | 31,835 | |
Expiring 01/19/12 | | Citibank NA | | BRL | 915,235 | | | | 518,400 | | | | 523,386 | | | | 4,986 | |
Expiring 01/19/12 | | Citibank NA | | BRL | 782,638 | | | | 407,200 | | | | 447,559 | | | | 40,359 | |
Expiring 01/19/12 | | Citibank NA | | BRL | 528,047 | | | | 302,000 | | | | 301,968 | | | | (32 | ) |
Expiring 01/19/12 | | Citibank NA | | BRL | 387,878 | | | | 234,000 | | | | 221,812 | | | | (12,188 | ) |
Expiring 01/19/12 | | Citibank NA | | BRL | 341,757 | | | | 190,500 | | | | 195,437 | | | | 4,937 | |
Expiring 01/19/12 | | Citibank NA | | BRL | 323,720 | | | | 200,000 | | | | 185,122 | | | | (14,878 | ) |
Expiring 01/19/12 | | Morgan Stanley | | BRL | 1,844,187 | | | | 1,074,200 | | | | 1,054,615 | | | | (19,585 | ) |
Expiring 01/19/12 | | UBS AG | | BRL | 969,549 | | | | 505,500 | | | | 554,445 | | | | 48,945 | |
Expiring 01/19/12 | | UBS AG | | BRL | 916,910 | | | | 507,000 | | | | 524,343 | | | | 17,343 | |
Expiring 01/19/12 | | UBS AG | | BRL | 565,798 | | | | 322,300 | | | | 323,557 | | | | 1,257 | |
British Pound, | | | | | | | | | | | | | | | | | | |
Expiring 11/22/11 | | Citibank NA | | GBP | 660,223 | | | | 1,049,500 | | | | 1,061,346 | | | | 11,846 | |
Expiring 11/22/11 | | Morgan Stanley | | GBP | 3,878,469 | | | | 6,176,264 | | | | 6,234,859 | | | | 58,595 | |
Expiring 11/22/11 | | Morgan Stanley | | GBP | 410,036 | | | | 661,200 | | | | 659,157 | | | | (2,043 | ) |
Expiring 11/22/11 | | Morgan Stanley | | GBP | 363,600 | | | | 571,399 | | | | 584,508 | | | | 13,109 | |
Canadian Dollar, | | | | | | | | | | | | | | | | | | |
Expiring 11/17/11 | | Goldman Sachs | | CAD | 650,839 | | | | 644,800 | | | | 652,708 | | | | 7,908 | |
Expiring 11/17/11 | | Morgan Stanley | | CAD | 9,019,272 | | | | 8,855,403 | | | | 9,045,184 | | | | 189,781 | |
Expiring 11/17/11 | | Morgan Stanley | | CAD | 855,454 | | | | 843,200 | | | | 857,912 | | | | 14,712 | |
Chilean Peso, | | | | | | | | | | | | | | | | | | |
Expiring 12/02/11 | | Citibank NA | | CLP | 488,990,650 | | | | 1,051,480 | | | | 994,346 | | | | (57,134 | ) |
Expiring 12/02/11 | | Citibank NA | | CLP | 320,150,820 | | | | 610,800 | | | | 651,016 | | | | 40,216 | |
Expiring 12/02/11 | | Citibank NA | | CLP | 315,706,160 | | | | 676,900 | | | | 641,978 | | | | (34,922 | ) |
Expiring 12/02/11 | | Citibank NA | | CLP | 314,211,650 | | | | 612,200 | | | | 638,939 | | | | 26,739 | |
Expiring 12/02/11 | | Citibank NA | | CLP | 311,762,850 | | | | 612,200 | | | | 633,959 | | | | 21,759 | |
Expiring 01/09/12 | | Citibank NA | | CLP | 426,098,940 | | | | 806,700 | | | | 862,209 | | | | 55,509 | |
Expiring 01/09/12 | | Citibank NA | | CLP | 418,773,040 | | | | 814,100 | | | | 847,385 | | | | 33,285 | |
Expiring 01/09/12 | | Citibank NA | | CLP | 325,838,265 | | | | 629,700 | | | | 659,332 | | | | 29,632 | |
See Notes to Financial Statements.
| | |
| 50 | | Visit our website at www.prudentialfunds.com |
| | | | | | | | | | | | | | | | | | |
Purchase Contracts | | Counterparty | | Notional
Amount | | | Value at
Settlement
Date
Payable | | | Value at
October 31,
2011 | | | Unrealized
Appreciation
(Depreciation) | |
Expiring 01/09/12 | | Citibank NA | | CLP | 325,136,530 | | | $ | 640,600 | | | $ | 657,912 | | | $ | 17,312 | |
Expiring 01/09/12 | | Citibank NA | | CLP | 323,809,920 | | | | 604,800 | | | | 655,227 | | | | 50,427 | |
Expiring 01/09/12 | | Citibank NA | | CLP | 320,544,000 | | | | 604,800 | | | | 648,619 | | | | 43,819 | |
Expiring 01/09/12 | | Citibank NA | | CLP | 319,863,500 | | | | 605,000 | | | | 647,242 | | | | 42,242 | |
Expiring 01/09/12 | | Citibank NA | | CLP | 314,460,685 | | | | 608,300 | | | | 636,310 | | | | 28,010 | |
Expiring 01/09/12 | | Citibank NA | | CLP | 259,848,000 | | | | 518,400 | | | | 525,801 | | | | 7,401 | |
Expiring 01/09/12 | | Citibank NA | | CLP | 217,842,495 | | | | 425,100 | | | | 440,803 | | | | 15,703 | |
Expiring 01/09/12 | | UBS AG | | CLP | 160,118,640 | | | | 322,300 | | | | 323,999 | | | | 1,699 | |
Chinese Yuan Renminbi, | | | | | | | | | | | | | | | | | | |
Expiring 03/26/12 | | UBS AG | | CNY | 16,977,599 | | | | 2,641,400 | | | | 2,675,911 | | | | 34,511 | |
Expiring 03/26/12 | | UBS AG | | CNY | 3,501,034 | | | | 545,800 | | | | 551,813 | | | | 6,013 | |
Expiring 03/26/12 | | UBS AG | | CNY | 1,184,990 | | | | 185,000 | | | | 186,771 | | | | 1,771 | |
Expiring 08/02/12 | | UBS AG | | CNY | 33,327,000 | | | | 5,250,000 | | | | 5,264,688 | | | | 14,688 | |
Expiring 08/02/12 | | UBS AG | | CNY | 21,068,100 | | | | 3,304,800 | | | | 3,328,141 | | | | 23,341 | |
Expiring 08/02/12 | | UBS AG | | CNY | 6,400,188 | | | | 1,011,200 | | | | 1,011,042 | | | | (158 | ) |
Expiring 08/02/12 | | UBS AG | | CNY | 5,693,255 | | | | 905,200 | | | | 899,367 | | | | (5,833 | ) |
Expiring 08/02/12 | | UBS AG | | CNY | 3,145,000 | | | | 500,000 | | | | 496,818 | | | | (3,182 | ) |
Expiring 08/02/12 | | Morgan Stanley | | CNY | 51,328,160 | | | | 8,113,200 | | | | 8,108,343 | | | | (4,857 | ) |
Colombian Peso, | | | | | | | | | | | | | | | | | | |
Expiring 11/01/11 | | Morgan Stanley | | COP | 1,874,876,400 | | | | 1,034,700 | | | | 1,004,757 | | | | (29,943 | ) |
Expiring 11/01/11 | | Morgan Stanley | | COP | 1,394,837,300 | | | | 779,500 | | | | 747,501 | | | | (31,999 | ) |
Expiring 12/06/11 | | Citibank NA | | COP | 2,922,865,875 | | | | 1,526,500 | | | | 1,565,709 | | | | 39,209 | |
Expiring 12/06/11 | | Citibank NA | | COP | 1,579,316,925 | | | | 806,700 | | | | 846,002 | | | | 39,302 | |
Expiring 12/06/11 | | Citibank NA | | COP | 1,208,875,710 | | | | 676,900 | | | | 647,566 | | | | (29,334 | ) |
Expiring 12/06/11 | | Citibank NA | | COP | 1,195,810,560 | | | | 604,800 | | | | 640,567 | | | | 35,767 | |
Expiring 12/06/11 | | Citibank NA | | COP | 1,187,071,200 | | | | 604,800 | | | | 635,886 | | | | 31,086 | |
Expiring 12/06/11 | | Citibank NA | | COP | 1,183,593,600 | | | | 604,800 | | | | 634,023 | | | | 29,223 | |
Expiring 12/06/11 | | Citibank NA | | COP | 1,148,518,800 | | | | 607,200 | | | | 615,234 | | | | 8,034 | |
Expiring 12/06/11 | | Citibank NA | | COP | 1,115,079,750 | | | | 629,100 | | | | 597,321 | | | | (31,779 | ) |
Expiring 12/06/11 | | Citibank NA | | COP | 861,840,000 | | | | 456,000 | | | | 461,667 | | | | 5,667 | |
Expiring 12/06/11 | | Citibank NA | | COP | 798,869,175 | | | | 425,100 | | | | 427,935 | | | | 2,835 | |
Expiring 12/06/11 | | Citibank NA | | COP | 757,900,500 | | | | 393,000 | | | | 405,989 | | | | 12,989 | |
Expiring 12/06/11 | | Citibank NA | | COP | 756,378,426 | | | | 418,300 | | | | 405,174 | | | | (13,126 | ) |
Expiring 12/06/11 | | Citibank NA | | COP | 612,111,600 | | | | 324,900 | | | | 327,893 | | | | 2,993 | |
Expiring 12/06/11 | | Citibank NA | | COP | 605,052,500 | | | | 325,000 | | | | 324,112 | | | | (888 | ) |
Expiring 12/06/11 | | Citibank NA | | COP | 557,996,000 | | | | 318,400 | | | | 298,905 | | | | (19,495 | ) |
Expiring 12/06/11 | | Citibank NA | | COP | 507,846,098 | | | | 286,300 | | | | 272,041 | | | | (14,259 | ) |
Expiring 12/06/11 | | Citibank NA | | COP | 477,096,500 | | | | 251,600 | | | | 255,569 | | | | 3,969 | |
Expiring 12/06/11 | | Citibank NA | | COP | 466,925,000 | | | | 250,000 | | | | 250,120 | | | | 120 | |
Expiring 12/06/11 | | Citibank NA | | COP | 362,175,690 | | | | 194,000 | | | | 194,009 | | | | 9 | |
See Notes to Financial Statements.
| | | | |
| Prudential Global Total Return Fund, Inc. | | | 51 | |
Portfolio of Investments
as of October 31, 2011 continued
| | | | | | | | | | | | | | | | | | |
Purchase Contracts | | Counterparty | | Notional
Amount | | | Value at
Settlement
Date
Payable | | | Value at
October 31,
2011 | | | Unrealized
Appreciation
(Depreciation) | |
Expiring 12/06/11 | | Citibank NA | | COP | 351,364,000 | | | $ | 188,500 | | | $ | 188,217 | | | $ | (283 | ) |
Expiring 12/06/11 | | Citibank NA | | COP | 218,694,000 | | | | 123,000 | | | | 117,149 | | | | (5,851 | ) |
Expiring 12/06/11 | | UBS AG | | COP | 1,990,903,310 | | | | 1,062,098 | | | | 1,066,479 | | | | 4,381 | |
Expiring 12/06/11 | | UBS AG | | COP | 1,016,955,000 | | | | 558,000 | | | | 544,758 | | | | (13,242 | ) |
Expiring 12/06/11 | | UBS AG | | COP | 854,220,000 | | | | 460,000 | | | | 457,585 | | | | (2,415 | ) |
Expiring 12/06/11 | | UBS AG | | COP | 612,358,400 | | | | 326,000 | | | | 328,026 | | | | 2,026 | |
Expiring 12/06/11 | | UBS AG | | COP | 611,195,750 | | | | 324,500 | | | | 327,403 | | | | 2,903 | |
Expiring 12/06/11 | | UBS AG | | COP | 607,136,750 | | | | 331,000 | | | | 325,229 | | | | (5,771 | ) |
Expiring 12/06/11 | | UBS AG | | COP | 476,440,500 | | | | 254,000 | | | | 255,218 | | | | 1,218 | |
Czech Koruna, | | | | | | | | | | | | | | | | | | |
Expiring 11/21/11 | | Citibank NA | | CZK | 14,344,573 | | | | 783,127 | | | | 798,163 | | | | 15,036 | |
Danish Krone, | | | | | | | | | | | | | | | | | | |
Expiring 11/21/11 | | Morgan Stanley | | DKK | 7,326,975 | | | | 1,344,618 | | | | 1,362,058 | | | | 17,440 | |
Euro, | | | | | | | | | | | | | | | | | | |
Expiring 11/22/11 | | JPMorgan | | EUR | 575,655 | | | | 800,000 | | | | 796,364 | | | | (3,636 | ) |
Expiring 11/22/11 | | JPMorgan | | EUR | 361,165 | | | | 500,000 | | | | 499,637 | | | | (363 | ) |
Expiring 11/22/11 | | JPMorgan | | EUR | 317,385 | | | | 450,000 | | | | 439,072 | | | | (10,928 | ) |
Expiring 11/22/11 | | Morgan Stanley | | EUR | 109,300 | | | | 149,429 | | | | 151,206 | | | | 1,777 | |
Expiring 11/22/11 | | UBS AG | | EUR | 17,733,489 | | | | 24,565,901 | | | | 24,532,602 | | | | (33,299 | ) |
Expiring 11/22/11 | | UBS AG | | EUR | 53,000 | | | | 73,623 | | | | 73,320 | | | | (303 | ) |
Hong Kong Dollar, | | | | | | | | | | | | | | | | | | |
Expiring 11/18/11 | | Morgan Stanley | | HKD | 6,340,525 | | | | 815,379 | | | | 816,231 | | | | 852 | |
Expiring 11/18/11 | | Citibank NA | | HKD | 2,019,700 | | | | 259,757 | | | | 260,001 | | | | 244 | |
Hungarian Forint, | | | | | | | | | | | | | | | | | | |
Expiring 11/21/11 | | Citibank NA | | HUF | 136,513,966 | | | | 636,000 | | | | 617,677 | | | | (18,323 | ) |
Expiring 11/21/11 | | Citibank NA | | HUF | 44,215,015 | | | | 200,103 | | | | 200,057 | | | | (46 | ) |
Expiring 11/21/11 | | JPMorgan | | HUF | 112,590,003 | | | | 531,400 | | | | 509,430 | | | | (21,970 | ) |
Indian Rupee, | | | | | | | | | | | | | | | | | | |
Expiring 12/23/11 | | Morgan Stanley | | INR | 91,935,060 | | | | 1,988,000 | | | | 1,870,386 | | | | (117,614 | ) |
Expiring 12/23/11 | | Morgan Stanley | | INR | 48,689,280 | | | | 1,011,200 | | | | 990,566 | | | | (20,634 | ) |
Expiring 12/23/11 | | Morgan Stanley | | INR | 38,065,532 | | | | 777,800 | | | | 774,430 | | | | (3,370 | ) |
Expiring 12/23/11 | | UBS AG | | INR | 38,877,496 | | | | 811,300 | | | | 790,949 | | | | (20,351 | ) |
Expiring 12/23/11 | | UBS AG | | INR | 32,742,900 | | | | 651,600 | | | | 666,143 | | | | 14,543 | |
Expiring 12/23/11 | | UBS AG | | INR | 31,972,346 | | | | 640,600 | | | | 650,466 | | | | 9,866 | |
Expiring 12/23/11 | | UBS AG | | INR | 30,086,518 | | | | 608,300 | | | | 612,100 | | | | 3,800 | |
Expiring 12/23/11 | | UBS AG | | INR | 29,957,283 | | | | 606,300 | | | | 609,470 | | | | 3,170 | |
Expiring 12/23/11 | | UBS AG | | INR | 23,046,000 | | | | 501,000 | | | | 468,863 | | | | (32,137 | ) |
Expiring 12/23/11 | | UBS AG | | INR | 13,572,660 | | | | 282,000 | | | | 276,131 | | | | (5,869 | ) |
Expiring 12/23/11 | | UBS AG | | INR | 10,814,310 | | | | 237,000 | | | | 220,013 | | | | (16,987 | ) |
See Notes to Financial Statements.
| | |
| 52 | | Visit our website at www.prudentialfunds.com |
| | | | | | | | | | | | | | | | | | |
Purchase Contracts | | Counterparty | | Notional
Amount | | | Value at
Settlement
Date
Payable | | | Value at
October 31,
2011 | | | Unrealized
Appreciation
(Depreciation) | |
Indonesian Rupiah, | | | | | | | | | | | | | | | | | | |
Expiring 12/27/11 | | Morgan Stanley | | IDR | 5,529,491,400 | | | $ | 622,200 | | | $ | 620,730 | | | $ | (1,470 | ) |
Expiring 12/27/11 | | UBS AG | | IDR | 5,724,427,500 | | | | 606,000 | | | | 642,613 | | | | 36,613 | |
Expiring 12/27/11 | | UBS AG | | IDR | 5,710,980,000 | | | | 610,800 | | | | 641,103 | | | | 30,303 | |
Expiring 12/27/11 | | UBS AG | | IDR | 5,570,208,000 | | | | 604,800 | | | | 625,300 | | | | 20,500 | |
Expiring 12/27/11 | | UBS AG | | IDR | 3,799,543,800 | | | | 425,100 | | | | 426,529 | | | | 1,429 | |
Israeli New Shekel, | | | | | | | | | | | | | | | | | | |
Expiring 11/16/11 | | Citibank NA | | ILS | 2,252,672 | | | | 604,861 | | | | 620,938 | | | | 16,077 | |
Expiring 11/16/11 | | Goldman Sachs | | ILS | 5,509,942 | | | | 1,547,100 | | | | 1,518,789 | | | | (28,311 | ) |
Expiring 11/16/11 | | JPMorgan | | ILS | 6,109,636 | | | | 1,732,100 | | | | 1,684,092 | | | | (48,008 | ) |
Expiring 11/16/11 | | JPMorgan | | ILS | 3,004,494 | | | | 828,400 | | | | 828,174 | | | | (226 | ) |
Expiring 11/16/11 | | JPMorgan | | ILS | 2,320,330 | | | | 624,500 | | | | 639,588 | | | | 15,088 | |
Expiring 11/16/11 | | JPMorgan | | ILS | 2,222,770 | | | | 606,700 | | | | 612,696 | | | | 5,996 | |
Expiring 11/16/11 | | JPMorgan | | ILS | 1,541,254 | | | | 429,700 | | | | 424,839 | | | | (4,861 | ) |
Expiring 11/16/11 | | UBS AG | | ILS | 2,226,823 | | | | 608,500 | | | | 613,813 | | | | 5,313 | |
Expiring 11/16/11 | | UBS AG | | ILS | 1,903,275 | | | | 505,779 | | | | 524,629 | | | | 18,850 | |
Japanese Yen, | | | | | | | | | | | | | | | | | | |
Expiring 11/22/11 | | UBS AG | | JPY | 489,012,928 | | | | 6,402,000 | | | | 6,257,445 | | | | (144,555 | ) |
Expiring 11/22/11 | | Citibank NA | | JPY | 2,030,564,831 | | | | 26,646,853 | | | | 25,983,256 | | | | (663,597 | ) |
Expiring 11/22/11 | | Morgan Stanley | | JPY | 40,671,951 | | | | 537,100 | | | | 520,441 | | | | (16,659 | ) |
Expiring 11/22/11 | | Morgan Stanley | | JPY | 40,670,877 | | | | 537,100 | | | | 520,427 | | | | (16,673 | ) |
Expiring 11/22/11 | | Morgan Stanley | | JPY | 32,545,091 | | | | 429,700 | | | | 416,449 | | | | (13,251 | ) |
Expiring 11/22/11 | | Morgan Stanley | | JPY | 17,189,194 | | | | 220,400 | | | | 219,954 | | | | (446 | ) |
Expiring 11/22/11 | | Morgan Stanley | | JPY | 16,002,861 | | | | 210,000 | | | | 204,774 | | | | (5,226 | ) |
Expiring 11/28/11 | | Morgan Stanley | | JPY | 64,754,872 | | | | 854,100 | | | | 828,698 | | | | (25,402 | ) |
Malaysian Ringgit, | | | | | | | | | | | | | | | | | | |
Expiring 11/14/11 | | UBS AG | | MYR | 2,107,834 | | | | 699,000 | | | | 686,475 | | | | (12,525 | ) |
Expiring 11/14/11 | | UBS AG | | MYR | 1,696,857 | | | | 555,800 | | | | 552,629 | | | | (3,171 | ) |
Expiring 11/14/11 | | UBS AG | | MYR | 467,390 | | | | 154,000 | | | | 152,219 | | | | (1,781 | ) |
Expiring 12/20/11 | | UBS AG | | MYR | 3,761,747 | | | | 1,217,000 | | | | 1,222,869 | | | | 5,869 | |
Expiring 12/23/11 | | Citibank NA | | MYR | 3,132,877 | | | | 973,487 | | | | 1,018,298 | | | | 44,811 | |
Expiring 12/23/11 | | UBS AG | | MYR | 2,568,533 | | | | 806,700 | | | | 834,866 | | | | 28,166 | |
Expiring 12/23/11 | | UBS AG | | MYR | 1,975,070 | | | | 644,500 | | | | 641,969 | | | | (2,531 | ) |
Expiring 12/23/11 | | UBS AG | | MYR | 1,931,308 | | | | 604,800 | | | | 627,745 | | | | 22,945 | |
Expiring 12/23/11 | | UBS AG | | MYR | 1,923,566 | | | | 604,800 | | | | 625,229 | | | | 20,429 | |
Expiring 12/23/11 | | UBS AG | | MYR | 1,916,449 | | | | 608,300 | | | | 622,915 | | | | 14,615 | |
Expiring 12/23/11 | | UBS AG | | MYR | 1,903,240 | | | | 610,600 | | | | 618,622 | | | | 8,022 | |
Mexican Nuevo Peso, | | | | | | | | | | | | | | | | | | |
Expiring 11/17/11 | | JPMorgan | | MXN | 35,244,311 | | | | 2,614,893 | | | | 2,640,151 | | | | 25,258 | |
Expiring 11/17/11 | | JPMorgan | | MXN | 8,667,095 | | | | 644,800 | | | | 649,252 | | | | 4,452 | |
See Notes to Financial Statements.
| | | | |
| Prudential Global Total Return Fund, Inc. | | | 53 | |
Portfolio of Investments
as of October 31, 2011 continued
| | | | | | | | | | | | | | | | | | |
Purchase Contracts | | Counterparty | | Notional
Amount | | | Value at
Settlement
Date
Payable | | | Value at
October 31,
2011 | | | Unrealized
Appreciation
(Depreciation) | |
Expiring 11/17/11 | | JPMorgan | | MXN | 4,263,703 | | | $ | 322,300 | | | $ | 319,394 | | | $ | (2,906 | ) |
Expiring 11/17/11 | | Morgan Stanley | | MXN | 7,116,243 | | | | 531,400 | | | | 533,078 | | | | 1,678 | |
New Taiwan Dollar, | | | | | | | | | | | | | | | | | | |
Expiring 12/09/11 | | Morgan Stanley | | TWD | 55,590,718 | | | | 1,891,162 | | | | 1,859,573 | | | | (31,589 | ) |
Expiring 12/09/11 | | Morgan Stanley | | TWD | 37,450,881 | | | | 1,288,300 | | | | 1,252,775 | | | | (35,525 | ) |
Expiring 12/09/11 | | Morgan Stanley | | TWD | 18,639,000 | | | | 621,300 | | | | 623,496 | | | | 2,196 | |
Expiring 12/09/11 | | UBS AG | | TWD | 22,359,889 | | | | 788,500 | | | | 747,964 | | | | (40,536 | ) |
Expiring 12/09/11 | | UBS AG | | TWD | 20,775,346 | | | | 707,800 | | | | 694,959 | | | | (12,841 | ) |
Expiring 12/09/11 | | UBS AG | | TWD | 18,430,350 | | | | 610,600 | | | | 616,516 | | | | 5,916 | |
Expiring 12/09/11 | | UBS AG | | TWD | 15,721,962 | | | | 561,900 | | | | 525,918 | | | | (35,982 | ) |
Expiring 12/09/11 | | UBS AG | | TWD | 12,776,381 | | | | 425,100 | | | | 427,385 | | | | 2,285 | |
Expiring 12/09/11 | | UBS AG | | TWD | 12,693,500 | | | | 443,000 | | | | 424,612 | | | | (18,388 | ) |
Expiring 12/09/11 | | UBS AG | | TWD | 11,239,082 | | | | 394,700 | | | | 375,960 | | | | (18,740 | ) |
Expiring 12/09/11 | | UBS AG | | TWD | 4,175,762 | | | | 147,580 | | | | 139,684 | | | | (7,896 | ) |
New Zealand Dollar, | | | | | | | | | | | | | | | | | | |
Expiring 11/18/11 | | JPMorgan | | NZD | 5,306,026 | | | | 4,218,625 | | | | 4,285,666 | | | | 67,041 | |
Expiring 11/18/11 | | UBS AG | | NZD | 796,365 | | | | 632,400 | | | | 643,223 | | | | 10,823 | |
Norwegian Krone, | | | | | | | | | | | | | | | | | | |
Expiring 11/21/11 | | Citibank NA | | NOK | 2,953,334 | | | | 527,000 | | | | 529,747 | | | | 2,747 | |
Expiring 11/21/11 | | UBS AG | | NOK | 24,621,966 | | | | 4,356,599 | | | | 4,416,509 | | | | 59,910 | |
Peruvian Nuevo Sol | | | | | | | | | | | | | | | | | | |
Expiring 01/13/12 | | Citibank NA | | PEN | 2,261,532 | | | | 828,400 | | | | 830,316 | | | | 1,916 | |
Expiring 01/13/12 | | Citibank NA | | PEN | 1,688,299 | | | | 604,800 | | | | 619,855 | | | | 15,055 | |
Philippine Peso, | | | | | | | | | | | | | | | | | | |
Expiring 11/09/11 | | UBS AG | | PHP | 33,267,399 | | | | 780,833 | | | | 779,848 | | | | (985 | ) |
Expiring 11/09/11 | | UBS AG | | PHP | 20,237,805 | | | | 470,100 | | | | 474,411 | | | | 4,311 | |
Expiring 11/09/11 | | UBS AG | | PHP | 6,073,200 | | | | 140,000 | | | | 142,367 | | | | 2,367 | |
Expiring 11/22/11 | | Citibank NA | | PHP | 22,680,360 | | | | 537,640 | | | | 531,240 | | | | (6,400 | ) |
Expiring 11/22/11 | | UBS AG | | PHP | 36,400,740 | | | | 863,600 | | | | 852,611 | | | | (10,989 | ) |
Expiring 11/22/11 | | UBS AG | | PHP | 25,813,978 | | | | 593,971 | | | | 604,638 | | | | 10,667 | |
Expiring 01/06/12 | | UBS AG | | PHP | 35,309,259 | | | | 806,700 | | | | 825,479 | | | | 18,779 | |
Expiring 01/06/12 | | UBS AG | | PHP | 35,299,072 | | | | 811,100 | | | | 825,241 | | | | 14,141 | |
Expiring 01/06/12 | | UBS AG | | PHP | 35,242,389 | | | | 814,100 | | | | 823,916 | | | | 9,816 | |
Expiring 01/06/12 | | UBS AG | | PHP | 26,496,288 | | | | 604,800 | | | | 619,445 | | | | 14,645 | |
Expiring 01/06/12 | | Morgan Stanley | | PHP | 26,784,243 | | | | 621,300 | | | | 626,177 | | | | 4,877 | |
Polish Zloty, | | | | | | | | | | | | | | | | | | |
Expiring 11/21/11 | | Citibank NA | | PLN | 428,961 | | | | 140,016 | | | | 134,531 | | | | (5,485 | ) |
Expiring 11/21/11 | | Citibank NA | | PLN | 324,132 | | | | 102,484 | | | | 101,654 | | | | (830 | ) |
Expiring 11/21/11 | | JPMorgan | | PLN | 3,164,520 | | | | 983,186 | | | | 992,457 | | | | 9,271 | |
Expiring 11/21/11 | | JPMorgan | | PLN | 1,056,312 | | | | 326,163 | | | | 331,280 | | | | 5,117 | |
See Notes to Financial Statements.
| | |
| 54 | | Visit our website at www.prudentialfunds.com |
| | | | | | | | | | | | | | | | | | |
Purchase Contracts | | Counterparty | | Notional
Amount | | | Value at
Settlement
Date
Payable | | | Value at
October 31,
2011 | | | Unrealized
Appreciation
(Depreciation) | |
Expiring 11/21/11 | | Morgan Stanley | | PLN | 981,298 | | | $ | 322,300 | | | $ | 307,755 | | | $ | (14,545 | ) |
Romanian New Lei, | | | | | | | | | | | | | | | | | | |
Expiring 11/21/11 | | JPMorgan | | RON | 1,988,294 | | | | 636,000 | | | | 632,518 | | | | (3,482 | ) |
Russian Rouble, | | | | | | | | | | | | | | | | | | |
Expiring 11/08/11 | | Morgan Stanley | | RUB | 66,586,700 | | | | 2,245,000 | | | | 2,191,989 | | | | (53,011 | ) |
Expiring 11/08/11 | | Morgan Stanley | | RUB | 41,384,752 | | | | 1,488,500 | | | | 1,362,358 | | | | (126,142 | ) |
Expiring 11/08/11 | | Morgan Stanley | | RUB | 35,939,800 | | | | 1,196,000 | | | | 1,183,114 | | | | (12,886 | ) |
Expiring 12/16/11 | | Citibank NA | | RUB | 18,622,656 | | | | 606,700 | | | | 608,926 | | | | 2,226 | |
Expiring 12/21/11 | | Barclays Capital | | RUB | 26,014,038 | | | | 859,400 | | | | 849,733 | | | | (9,667 | ) |
Expiring 12/21/11 | | Citibank NA | | RUB | 65,109,247 | | | | 2,035,300 | | | | 2,126,756 | | | | 91,456 | |
Expiring 12/21/11 | | Citibank NA | | RUB | 32,487,575 | | | | 1,010,500 | | | | 1,061,188 | | | | 50,688 | |
Expiring 12/21/11 | | Citibank NA | | RUB | 19,861,632 | | | | 604,800 | | | | 648,769 | | | | 43,969 | |
Expiring 12/21/11 | | Citibank NA | | RUB | 19,858,608 | | | | 604,800 | | | | 648,670 | | | | 43,870 | |
Expiring 12/21/11 | | Citibank NA | | RUB | 19,733,252 | | | | 608,300 | | | | 644,575 | | | | 36,275 | |
Expiring 12/21/11 | | Citibank NA | | RUB | 19,303,556 | | | | 614,900 | | | | 630,539 | | | | 15,639 | |
Expiring 12/21/11 | | Citibank NA | | RUB | 18,458,343 | | | | 604,300 | | | | 602,931 | | | | (1,369 | ) |
Expiring 12/21/11 | | Citibank NA | | RUB | 13,135,590 | | | | 425,100 | | | | 429,066 | | | | 3,966 | |
Expiring 12/21/11 | | Morgan Stanley | | RUB | 19,269,261 | | | | 644,500 | | | | 629,419 | | | | (15,081 | ) |
Singapore Dollar, | | | | | | | | | | | | | | | | | | |
Expiring 02/08/12 | | Morgan Stanley | | SGD | 508,008 | | | | 387,077 | | | | 404,959 | | | | 17,882 | |
Expiring 04/13/12 | | Morgan Stanley | | SGD | 504,455 | | | | 384,818 | | | | 402,501 | | | | 17,683 | |
Expiring 11/18/11 | | UBS AG | | SGD | 7,047,452 | | | | 5,566,730 | | | | 5,616,368 | | | | 49,638 | |
South African Rand, | | | | | | | | | | | | | | | | | | |
Expiring 11/28/11 | | Citibank NA | | ZAR | 6,756,871 | | | | 850,200 | | | | 847,925 | | | | (2,275 | ) |
Expiring 11/28/11 | | Citibank NA | | ZAR | 4,971,360 | | | | 644,500 | | | | 623,860 | | | | (20,640 | ) |
Expiring 11/28/11 | | Citibank NA | | ZAR | 4,837,635 | | | | 624,842 | | | | 607,078 | | | | (17,764 | ) |
South Korean Won, | | | | | | | | | | | | | | | | | | |
Expiring 11/30/11 | | Morgan Stanley | | KRW | 706,819,200 | | | | 622,200 | | | | 636,373 | | | | 14,173 | |
Expiring 11/30/11 | | Morgan Stanley | | KRW | 593,594,820 | | | | 517,700 | | | | 534,433 | | | | 16,733 | |
Expiring 11/30/11 | | UBS AG | | KRW | 3,201,517,857 | | | | 2,956,921 | | | | 2,882,433 | | | | (74,488 | ) |
Expiring 11/30/11 | | UBS AG | | KRW | 1,447,782,150 | | | | 1,353,700 | | | | 1,303,486 | | | | (50,214 | ) |
Expiring 11/30/11 | | UBS AG | | KRW | 1,073,118,750 | | | | 907,500 | | | | 966,164 | | | | 58,664 | |
Expiring 11/30/11 | | UBS AG | | KRW | 948,996,370 | | | | 814,100 | | | | 854,413 | | | | 40,313 | |
Expiring 11/30/11 | | UBS AG | | KRW | 948,987,000 | | | | 811,100 | | | | 854,404 | | | | 43,304 | |
Expiring 11/30/11 | | UBS AG | | KRW | 794,347,225 | | | | 733,300 | | | | 715,177 | | | | (18,123 | ) |
Expiring 11/30/11 | | UBS AG | | KRW | 719,028,900 | | | | 612,200 | | | | 647,365 | | | | 35,165 | |
Expiring 11/30/11 | | UBS AG | | KRW | 377,475,000 | | | | 350,000 | | | | 339,853 | | | | (10,147 | ) |
Swedish Krona, | | | | | | | | | | | | | | | | | | |
Expiring 11/21/11 | | Goldman Sachs | | SEK | 5,605,447 | | | | 859,700 | | | | 859,099 | | | | (601 | ) |
See Notes to Financial Statements.
| | | | |
| Prudential Global Total Return Fund, Inc. | | | 55 | |
Portfolio of Investments
as of October 31, 2011 continued
| | | | | | | | | | | | | | | | | | |
Purchase Contracts | | Counterparty | | Notional
Amount | | | Value at
Settlement
Date
Payable | | | Value at
October 31,
2011 | | | Unrealized
Appreciation
(Depreciation) | |
Expiring 11/21/11 | | Goldman Sachs | | SEK | 3,485,917 | | | $ | 527,000 | | | $ | 534,257 | | | $ | 7,257 | |
Expiring 11/21/11 | | Morgan Stanley | | SEK | 33,099,840 | | | | 4,955,421 | | | | 5,072,931 | | | | 117,510 | |
Swiss Franc, | | | | | | | | | | | | | | | | | | |
Expiring 11/21/11 | | JPMorgan | | CHF | 376,713 | | | | 421,600 | | | | 429,289 | | | | 7,689 | |
Expiring 11/21/11 | | JPMorgan | | CHF | 188,016 | | | | 210,000 | | | | 214,256 | | | | 4,256 | |
Expiring 11/21/11 | | Morgan Stanley | | CHF | 374,074 | | | | 425,000 | | | | 426,282 | | | | 1,282 | |
Expiring 11/21/11 | | UBS AG | | CHF | 1,677,657 | | | | 1,864,316 | | | | 1,911,801 | | | | 47,485 | |
Expiring 11/21/11 | | UBS AG | | CHF | 749,898 | | | | 854,100 | | | | 854,558 | | | | 458 | |
Thai Baht, | | | | | | | | | | | | | | | | | | |
Expiring 11/30/11 | | Citibank NA | | THB | 33,111,826 | | | | 1,097,872 | | | | 1,074,013 | | | | (23,859 | ) |
Expiring 11/30/11 | | UBS AG | | THB | 25,188,254 | | | | 814,100 | | | | 817,005 | | | | 2,905 | |
Expiring 11/30/11 | | UBS AG | | THB | 25,103,545 | | | | 811,100 | | | | 814,257 | | | | 3,157 | |
Expiring 11/30/11 | | UBS AG | | THB | 18,859,060 | | | | 605,000 | | | | 611,711 | | | | 6,711 | |
Expiring 11/30/11 | | Morgan Stanley | | THB | 19,086,336 | | | | 621,300 | | | | 619,083 | | | | (2,217 | ) |
Turkish Lira, | | | | | | | | | | | | | | | | | | |
Expiring 11/16/11 | | Morgan Stanley | | TRY | 1,000,000 | | | | 535,187 | | | | 563,464 | | | | 28,277 | |
Expiring 11/17/11 | | Goldman Sachs | | TRY | 762,101 | | | | 427,000 | | | | 429,320 | | | | 2,320 | |
Expiring 11/28/11 | | JPMorgan | | TRY | 1,835,783 | | | | 1,021,491 | | | | 1,031,617 | | | | 10,126 | |
Expiring 11/28/11 | | Morgan Stanley | | TRY | 578,137 | | | | 318,800 | | | | 324,884 | | | | 6,084 | |
Expiring 11/28/11 | | UBS AG | | TRY | 1,526,566 | | | | 859,700 | | | | 857,852 | | | | (1,848 | ) |
Expiring 11/28/11 | | UBS AG | | TRY | 778,608 | | | | 425,100 | | | | 437,538 | | | | 12,438 | |
Expiring 11/28/11 | | UBS AG | | TRY | 769,438 | | | | 427,000 | | | | 432,385 | | | | 5,385 | |
Expiring 12/15/11 | | Morgan Stanley | | TRY | 895,237 | | | | 476,900 | | | | 501,032 | | | | 24,132 | |
| | | | | | | | | | | | | | | | | | |
| | | | | | | | $ | 263,577,911 | | | $ | 264,325,243 | | | $ | 747,332 | |
| | | | | | | | | | | | | | | | | | |
| | | | | | | | | | | | | | | | | | |
Sale Contracts | | Counterparty | | Notional
Amount | | | Value at
Settlement
Date
Receivable | | | Value at
October 31,
2011 | | | Unrealized
Appreciation
(Depreciation) | |
Argentine Peso, | | | | | | | | | | | | | | | | | | |
Expiring 12/23/11 | | Citibank NA | | ARS | 1,478,576 | | | $ | 336,997 | | | $ | 333,936 | | | $ | 3,061 | |
Expiring 01/27/12 | | Citibank NA | | ARS | 2,714,500 | | | | 610,000 | | | | 588,809 | | | | 21,191 | |
Expiring 01/27/12 | | Citibank NA | | ARS | 2,277,685 | | | | 507,845 | | | | 494,058 | | | | 13,787 | |
Expiring 05/16/12 | | Citibank NA | | ARS | 6,098,321 | | | | 1,239,496 | | | | 1,246,568 | | | | (7,072 | ) |
Australian Dollar, | | | | | | | | | | | | | | | | | | |
Expiring 11/18/11 | | JPMorgan | | AUD | 1,251,872 | | | | 1,322,300 | | | | 1,316,459 | | | | 5,841 | |
Expiring 11/18/11 | | Morgan Stanley | | AUD | 608,970 | | | | 619,796 | | | | 640,388 | | | | (20,592 | ) |
Brazilian Real, | | | | | | | | | | | | | | | | | | |
Expiring 01/19/12 | | Citibank NA | | BRL | 2,405,912 | | | | 1,327,400 | | | | 1,375,843 | | | | (48,443 | ) |
See Notes to Financial Statements.
| | |
| 56 | | Visit our website at www.prudentialfunds.com |
| | | | | | | | | | | | | | | | | | |
Sale Contracts | | Counterparty | | Notional
Amount | | | Value at
Settlement
Date
Receivable | | | Value at
October 31,
2011 | | | Unrealized
Appreciation
(Depreciation) | |
Expiring 01/19/12 | | Citibank NA | | BRL | 1,910,615 | | | $ | 1,049,500 | | | $ | 1,092,602 | | | $ | (43,102 | ) |
Expiring 01/19/12 | | Citibank NA | | BRL | 1,772,000 | | | | 907,554 | | | | 1,013,334 | | | | (105,780 | ) |
Expiring 01/19/12 | | Citibank NA | | BRL | 1,544,388 | | | | 850,200 | | | | 883,172 | | | | (32,972 | ) |
Expiring 01/19/12 | | Citibank NA | | BRL | 934,078 | | | | 518,500 | | | | 534,161 | | | | (15,661 | ) |
Expiring 01/19/12 | | Morgan Stanley | | BRL | 7,871,886 | | | | 4,310,292 | | | | 4,501,610 | | | | (191,318 | ) |
Expiring 01/19/12 | | UBS AG | | BRL | 2,318,378 | | | | 1,264,800 | | | | 1,325,786 | | | | (60,986 | ) |
Expiring 01/19/12 | | UBS AG | | BRL | 2,302,375 | | | | 1,250,000 | | | | 1,316,634 | | | | (66,634 | ) |
Expiring 01/19/12 | | UBS AG | | BRL | 1,708,950 | | | | 909,500 | | | | 977,279 | | | | (67,779 | ) |
Expiring 01/19/12 | | UBS AG | | BRL | 941,800 | | | | 524,680 | | | | 538,577 | | | | (13,897 | ) |
British Pound, | | | | | | | | | | | | | | | | | | |
Expiring 11/22/11 | | JPMorgan | | GBP | 300,680 | | | | 483,400 | | | | 483,361 | | | | 39 | |
Canadian Dollar, | | | | | | | | | | | | | | | | | | |
Expiring 11/17/11 | | Morgan Stanley | | CAD | 854,174 | | | | 850,200 | | | | 856,628 | | | | (6,428 | ) |
Chilean Peso, | | | | | | | | | | | | | | | | | | |
Expiring 12/02/11 | | Citibank NA | | CLP | 470,229,445 | | | | 878,769 | | | | 956,196 | | | | (77,427 | ) |
Expiring 12/02/11 | | Citibank NA | | CLP | 337,267,515 | | | | 703,300 | | | | 685,822 | | | | 17,478 | |
Expiring 12/02/11 | | Citibank NA | | CLP | 282,523,555 | | | | 582,523 | | | | 574,502 | | | | 8,021 | |
Expiring 12/02/11 | | Citibank NA | | CLP | 184,905,740 | | | | 381,800 | | | | 375,999 | | | | 5,801 | |
Expiring 01/09/12 | | Citibank NA | | CLP | 1,702,530,875 | | | | 3,267,500 | | | | 3,445,063 | | | | (177,563 | ) |
Expiring 12/02/11 | | UBS AG | | CLP | 475,895,875 | | | | 909,500 | | | | 967,718 | | | | (58,218 | ) |
Chinese Yuan Renminbi, | | | | | | | | | | | | | | | | | | |
Expiring 08/02/12 | | Morgan Stanley | | CNY | 24,980,637 | | | | 3,938,300 | | | | 3,946,208 | | | | (7,908 | ) |
Expiring 08/02/12 | | Morgan Stanley | | CNY | 10,626,821 | | | | 1,656,300 | | | | 1,678,726 | | | | (22,426 | ) |
Expiring 08/02/12 | | UBS AG | | CNY | 24,984,575 | | | | 3,938,300 | | | | 3,946,830 | | | | (8,530 | ) |
Expiring 08/02/12 | | UBS AG | | CNY | 18,023,040 | | | | 2,816,100 | | | | 2,847,111 | | | | (31,011 | ) |
Expiring 08/02/12 | | UBS AG | | CNY | 11,194,526 | | | | 1,780,300 | | | | 1,768,407 | | | | 11,893 | |
Expiring 08/02/12 | | UBS AG | | CNY | 10,871,526 | | | | 1,732,100 | | | | 1,717,382 | | | | 14,718 | |
Expiring 10/29/12 | | Goldman Sachs | | CNY | 25,560,000 | | | | 4,000,000 | | | | 4,043,920 | | | | (43,920 | ) |
Colombian Peso, | | | | | | | | | | | | | | | | | | |
Expiring 11/01/11 | | Citibank NA | | COP | 1,278,810,390 | | | | 703,300 | | | | 685,322 | | | | 17,978 | |
Expiring 11/01/11 | | UBS AG | | COP | 1,990,903,310 | | | | 1,062,382 | | | | 1,066,936 | | | | (4,554 | ) |
Expiring 12/06/11 | | Citibank NA | | COP | 4,540,065,289 | | | | 2,555,336 | | | | 2,432,004 | | | | 123,332 | |
Expiring 12/06/11 | | Citibank NA | | COP | 2,479,200,000 | | | | 1,358,280 | | | | 1,328,048 | | | | 30,232 | |
Expiring 12/06/11 | | Citibank NA | | COP | 1,325,293,090 | | | | 733,300 | | | | 709,928 | | | | 23,372 | |
Expiring 12/06/11 | | Citibank NA | | COP | 1,218,208,200 | | | | 632,507 | | | | 652,565 | | | | (20,058 | ) |
Expiring 12/06/11 | | Citibank NA | | COP | 1,150,357,900 | | | | 583,272 | | | | 616,219 | | | | (32,947 | ) |
Expiring 12/06/11 | | Citibank NA | | COP | 1,040,447,500 | | | | 565,000 | | | | 557,343 | | | | 7,657 | |
Expiring 12/06/11 | | Citibank NA | | COP | 809,485,100 | | | | 442,100 | | | | 433,622 | | | | 8,478 | |
Expiring 12/06/11 | | Citibank NA | | COP | 802,911,500 | | | | 423,700 | | | | 430,100 | | | | (6,400 | ) |
Expiring 12/06/11 | | Citibank NA | | COP | 722,529,000 | | | | 387,000 | | | | 387,041 | | | | (41 | ) |
See Notes to Financial Statements.
| | | | |
| Prudential Global Total Return Fund, Inc. | | | 57 | |
Portfolio of Investments
as of October 31, 2011 continued
| | | | | | | | | | | | | | | | | | |
Sale Contracts | | Counterparty | | Notional
Amount | | | Value at
Settlement
Date
Receivable | | | Value at
October 31,
2011 | | | Unrealized
Appreciation
(Depreciation) | |
Expiring 12/06/11 | | Morgan Stanley | | COP | 1,201,992,500 | | | $ | 644,500 | | | $ | 643,879 | | | $ | 621 | |
Expiring 12/06/11 | | UBS AG | | COP | 1,316,794,500 | | | | 737,700 | | | | 705,375 | | | | 32,325 | |
Expiring 12/06/11 | | UBS AG | | COP | 1,244,642,140 | | | | 681,100 | | | | 666,725 | | | | 14,375 | |
Czech Koruna, | | | | | | | | | | | | | | | | | | |
Expiring 11/21/11 | | Citibank NA | | CZK | 11,828,081 | | | | 661,200 | | | | 658,140 | | | | 3,060 | |
Euro, | | | | | | | | | | | | | | | | | | |
Expiring 11/16/11 | | UBA AG | | EUR | 380,000 | | | | 505,779 | | | | 525,725 | | | | (19,946 | ) |
Expiring 11/16/11 | | Citibank NA | | EUR | 455,800 | | | | 604,861 | | | | 630,592 | | | | (25,731 | ) |
Expiring 11/22/11 | | Citibank NA | | EUR | 870,716 | | | | 1,212,200 | | | | 1,204,553 | | | | 7,647 | |
Expiring 11/22/11 | | Morgan Stanley | | EUR | 275,393 | | | | 383,146 | | | | 380,980 | | | | 2,166 | |
Expiring 11/22/11 | | Morgan Stanley | | EUR | 178,342 | | | | 247,199 | | | | 246,719 | | | | 480 | |
Hong Kong Dollar, | | | | | | | | | | | | | | | | | | |
Expiring 01/09/12 | | Morgan Stanley | | HKD | 7,965,219 | | | | 1,024,900 | | | | 1,025,774 | | | | (874 | ) |
Expiring 02/02/12 | | UBS AG | | HKD | 5,096,336 | | | | 655,474 | | | | 656,458 | | | | (984 | ) |
Expiring 02/07/12 | | Citibank NA | | HKD | 3,007,671 | | | | 387,983 | | | | 387,435 | | | | 548 | |
Expiring 06/12/12 | | JPMorgan | | HKD | 5,348,747 | | | | 690,379 | | | | 689,734 | | | | 645 | |
Expiring 10/15/12 | | Goldman Sachs | | HKD | 1,021,989 | | | | 131,730 | | | | 131,918 | | | | (188 | ) |
Hungarian Forint, | | | | | | | | | | | | | | | | | | |
Expiring 11/21/11 | | Citibank NA | | HUF | 256,341,104 | | | | 1,182,100 | | | | 1,159,852 | | | | 22,248 | |
Indian Rupee, | | | | | | | | | | | | | | | | | | |
Expiring 12/23/11 | | UBS AG | | INR | 61,919,000 | | | | 1,300,000 | | | | 1,259,720 | | | | 40,280 | |
Expiring 12/23/11 | | UBS AG | | INR | 50,659,323 | | | | 1,025,700 | | | | 1,030,646 | | | | (4,946 | ) |
Expiring 12/23/11 | | UBS AG | | INR | 47,347,300 | | | | 1,001,000 | | | | 963,264 | | | | 37,736 | |
Expiring 12/23/11 | | UBS AG | | INR | 43,514,944 | | | | 875,200 | | | | 885,296 | | | | (10,096 | ) |
Expiring 12/23/11 | | UBS AG | | INR | 34,621,924 | | | | 723,400 | | | | 704,371 | | | | 19,029 | |
Expiring 12/23/11 | | UBS AG | | INR | 28,651,139 | | | | 580,100 | | | | 582,897 | | | | (2,797 | ) |
Expiring 12/23/11 | | UBS AG | | INR | 23,795,300 | | | | 481,784 | | | | 484,107 | | | | (2,323 | ) |
Expiring 12/23/11 | | UBS AG | | INR | 23,100,700 | | | | 458,075 | | | | 469,976 | | | | (11,901 | ) |
Expiring 12/23/11 | | UBS AG | | INR | 22,285,252 | | | | 480,700 | | | | 453,386 | | | | 27,314 | |
Expiring 12/23/11 | | UBS AG | | INR | 14,632,213 | | | | 318,022 | | | | 297,687 | | | | 20,335 | |
Expiring 12/23/11 | | UBS AG | | INR | 14,565,741 | | | | 311,700 | | | | 296,335 | | | | 15,365 | |
Indonesian Rupiah, | | | | | | | | | | | | | | | | | | |
Expiring 12/27/11 | | UBS AG | | IDR | 10,040,278,500 | | | | 1,099,100 | | | | 1,127,101 | | | | (28,001 | ) |
Israeli New Shekel, | | | | | | | | | | | | | | | | | | |
Expiring 11/02/11 | | Barclays Capital | | ILS | 3,500,000 | | | | 951,164 | | | | 965,517 | | | | (14,353 | ) |
Expiring 11/02/11 | | Barclays Capital | | ILS | 3,444,700 | | | | 998,059 | | | | 950,262 | | | | 47,797 | |
Expiring 11/02/11 | | Citibank NA | | ILS | 3,570,681 | | | | 988,016 | | | | 985,015 | | | | 3,001 | |
Expiring 11/02/11 | | Citibank NA | | ILS | 2,549,914 | | | | 706,000 | | | | 703,425 | | | | 2,575 | |
Expiring 11/02/11 | | Citibank NA | | ILS | 2,000,000 | | | | 584,454 | | | | 551,724 | | | | 32,730 | |
Expiring 11/02/11 | | Morgan Stanley | | ILS | 2,715,093 | | | | 736,900 | | | | 748,991 | | | | (12,091 | ) |
See Notes to Financial Statements.
| | |
| 58 | | Visit our website at www.prudentialfunds.com |
| | | | | | | | | | | | | | | | | | |
Sale Contracts | | Counterparty | | Notional
Amount | | | Value at
Settlement
Date
Receivable | | | Value at
October 31,
2011 | | | Unrealized
Appreciation
(Depreciation) | |
Expiring 11/16/11 | | Citibank NA | | ILS | 2,278,277 | | | $ | 622,000 | | | $ | 627,996 | | | $ | (5,996 | ) |
Expiring 11/16/11 | | Citibank NA | | ILS | 2,164,400 | | | | 580,499 | | | | 596,607 | | | | (16,108 | ) |
Expiring 11/16/11 | | Citibank NA | | ILS | 1,943,305 | | | | 531,400 | | | | 535,663 | | | | (4,263 | ) |
Expiring 11/16/11 | | Goldman Sachs | | ILS | 2,869,117 | | | | 795,200 | | | | 790,859 | | | | 4,341 | |
Expiring 11/16/11 | | JPMorgan | | ILS | 4,445,149 | | | | 1,201,400 | | | | 1,225,284 | | | | (23,884 | ) |
Japanese Yen, | | | | | | | | | | | | | | | | | | |
Expiring 11/22/11 | | Morgan Stanley | | JPY | 40,405,052 | | | | 531,400 | | | | 517,026 | | | | 14,374 | |
Expiring 07/23/12 | | JPMorgan | | JPY | 100,843,013 | | | | 1,282,130 | | | | 1,297,311 | | | | (15,181 | ) |
Expiring 11/13/12 | | Citibank NA | | JPY | 100,960,000 | | | | 1,323,198 | | | | 1,301,668 | | | | 21,530 | |
Mexican Nuevo Peso, | | | | | | | | | | | | | | | | | | |
Expiring 11/17/11 | | Citibank NA | | MXN | 11,520,943 | | | | 854,100 | | | | 863,034 | | | | (8,934 | ) |
Expiring 11/17/11 | | Citibank NA | | MXN | 8,724,367 | | | | 661,200 | | | | 653,542 | | | | 7,658 | |
Expiring 11/17/11 | | JPMorgan | | MXN | 17,460,674 | | | | 1,264,800 | | | | 1,307,979 | | | | (43,179 | ) |
Expiring 11/17/11 | | JPMorgan | | MXN | 11,545,633 | | | | 839,600 | | | | 864,883 | | | | (25,283 | ) |
Malaysian Ringgit, | | | | | | | | | | | | | | | | | | |
Expiring 11/14/11 | | UBS AG | | MYR | 6,199,700 | | | | 2,029,295 | | | | 2,019,106 | | | | 10,189 | |
Expiring 11/14/11 | | UBS AG | | MYR | 971,253 | | | | 311,000 | | | | 316,316 | | | | (5,316 | ) |
Expiring 12/20/11 | | UBS AG | | MYR | 3,761,747 | | | | 1,180,156 | | | | 1,222,869 | | | | (42,713 | ) |
Expiring 12/23/11 | | UBS AG | | MYR | 3,398,201 | | | | 1,074,700 | | | | 1,104,538 | | | | (29,838 | ) |
New Taiwan Dollar, | | | | | | | | | | | | | | | | | | |
Expiring 12/09/11 | | Citibank NA | | TWD | 17,871,840 | | | | 630,400 | | | | 597,833 | | | | 32,567 | |
Expiring 12/09/11 | | Morgan Stanley | | TWD | 17,896,401 | | | | 635,300 | | | | 598,655 | | | | 36,645 | |
Expiring 12/09/11 | | UBS AG | | TWD | 32,197,108 | | | | 1,135,300 | | | | 1,077,030 | | | | 58,270 | |
Expiring 12/09/11 | | UBS AG | | TWD | 18,170,000 | | | | 599,690 | | | | 607,807 | | | | (8,117 | ) |
Expiring 12/09/11 | | UBS AG | | TWD | 17,636,720 | | | | 617,900 | | | | 589,968 | | | | 27,932 | |
Expiring 12/09/11 | | UBS AG | | TWD | 17,438,000 | | | | 576,463 | | | | 583,321 | | | | (6,858 | ) |
Expiring 12/09/11 | | UBS AG | | TWD | 16,591,674 | | | | 575,700 | | | | 555,010 | | | | 20,690 | |
Expiring 12/09/11 | | UBS AG | | TWD | 15,538,444 | | | | 547,900 | | | | 519,779 | | | | 28,121 | |
Expiring 12/09/11 | | UBS AG | | TWD | 14,042,952 | | | | 491,700 | | | | 469,753 | | | | 21,947 | |
Expiring 12/09/11 | | UBS AG | | TWD | 12,987,100 | | | | 435,166 | | | | 434,433 | | | | 733 | |
Expiring 12/09/11 | | UBS AG | | TWD | 12,693,494 | | | | 437,029 | | | | 424,612 | | | | 12,417 | |
Expiring 12/09/11 | | UBS AG | | TWD | 7,439,530 | | | | 263,160 | | | | 248,861 | | | | 14,299 | |
Expiring 12/09/11 | | UBS AG | | TWD | 6,622,119 | | | | 231,300 | | | | 221,517 | | | | 9,783 | |
New Zealand Dollar, | | | | | | | | | | | | | | | | | | |
Expiring 11/18/11 | | UBS AG | | NZD | 1,087,477 | | | | 881,600 | | | | 878,353 | | | | 3,247 | |
Norwegian Krone, | | | | | | | | | | | | | | | | | | |
Expiring 11/21/11 | | Citibank NA | | NOK | 4,763,933 | | | | 876,800 | | | | 854,520 | | | | 22,280 | |
Expiring 11/21/11 | | UBS AG | | NOK | 4,868,789 | | | | 881,600 | | | | 873,328 | | | | 8,272 | |
Peruvian Nuevo Sol | | | | | | | | | | | | | | | | | | |
Expiring 01/13/12 | | Citibank NA | | PEN | 3,949,831 | | | | 1,438,656 | | | | 1,450,170 | | | | (11,514 | ) |
See Notes to Financial Statements.
| | | | |
| Prudential Global Total Return Fund, Inc. | | | 59 | |
Portfolio of Investments
as of October 31, 2011 continued
| | | | | | | | | | | | | | | | | | |
Sale Contracts | | Counterparty | | Notional
Amount | | | Value at
Settlement
Date
Receivable | | | Value at
October 31,
2011 | | | Unrealized
Appreciation
(Depreciation) | |
Philippine Peso, | | | | | | | | | | | | | | | | | | |
Expiring 11/09/11 | | UBS AG | | PHP | 59,578,404 | | | $ | 1,367,732 | | | $ | 1,396,626 | | | $ | (28,894 | ) |
Expiring 11/22/11 | | UBS AG | | PHP | 51,634,102 | | | | 1,205,700 | | | | 1,209,420 | | | | (3,720 | ) |
Expiring 11/22/11 | | UBS AG | | PHP | 33,260,975 | | | | 765,500 | | | | 779,068 | | | | (13,568 | ) |
Expiring 01/06/12 | | UBS AG | | PHP | 50,182,552 | | | | 1,181,600 | | | | 1,173,195 | | | | 8,405 | |
Polish Zloty, | | | | | | | | | | | | | | | | | | |
Expiring 11/21/11 | | Citibank NA | | PLN | 3,439,235 | | | | 1,079,900 | | | | 1,078,613 | | | | 1,287 | |
Expiring 11/21/11 | | Citibank NA | | PLN | 2,736,842 | | | | 843,200 | | | | 858,328 | | | | (15,128 | ) |
Expiring 11/21/11 | | Morgan Stanley | | PLN | 1,972,408 | | | | 644,500 | | | | 618,587 | | | | 25,913 | |
Romanian New Lei, | | | | | | | | | | | | | | | | | | |
Expiring 11/21/11 | | Citibank NA | | RON | 1,988,294 | | | | 635,830 | | | | 632,518 | | | | 3,312 | |
Russian Rouble, | | | | | | | | | | | | | | | | | | |
Expiring 11/08/11 | | Citibank NA | | RUB | 102,526,500 | | | | 3,430,299 | | | | 3,375,102 | | | | 55,197 | |
Expiring 11/08/11 | | Morgan Stanley | | RUB | 41,384,752 | | | | 1,409,082 | | | | 1,362,358 | | | | 46,724 | |
Expiring 12/16/11 | | Citibank NA | | RUB | 18,622,656 | | | | 583,819 | | | | 608,926 | | | | (25,107 | ) |
Expiring 12/21/11 | | Citibank NA | | RUB | 86,832,743 | | | | 2,740,500 | | | | 2,836,341 | | | | (95,841 | ) |
Expiring 12/21/11 | | Citibank NA | | RUB | 32,487,575 | | | | 982,150 | | | | 1,061,188 | | | | (79,038 | ) |
Expiring 12/21/11 | | Citibank NA | | RUB | 18,458,343 | | | | 596,489 | | | | 602,931 | | | | (6,442 | ) |
Singapore Dollar, | | | | | | | | | | | | | | | | | | |
Expiring 11/18/11 | | Goldman Sachs | | SGD | 3,037,115 | | | | 2,424,300 | | | | 2,420,386 | | | | 3,914 | |
Expiring 11/18/11 | | JPMorgan | | SGD | 1,856,977 | | | | 1,454,493 | | | | 1,479,891 | | | | (25,398 | ) |
Expiring 02/08/12 | | UBS AG | | SGD | 508,008 | | | | 420,815 | | | | 404,959 | | | | 15,856 | |
Expiring 04/13/12 | | UBS AG | | SGD | 504,455 | | | | 418,218 | | | | 402,501 | | | | 15,717 | |
Expiring 05/24/12 | | UBS AG | | SGD | 252,803 | | | | 205,280 | | | | 201,819 | | | | 3,461 | |
Expiring 09/10/12 | | UBS AG | | SGD | 512,195 | | | | 423,022 | | | | 409,459 | | | | 13,563 | |
Expiring 10/01/12 | | Morgan Stanley | | SGD | 1,538,793 | | | | 1,270,381 | | | | 1,230,467 | | | | 39,914 | |
South African Rand, | | | | | | | | | | | | | | | | | | |
Expiring 11/28/11 | | UBS AG | | ZAR | 14,418,997 | | | | 1,817,388 | | | | 1,809,450 | | | | 7,938 | |
Expiring 12/07/11 | | Morgan Stanley | | ZAR | 9,449,250 | | | | 1,290,000 | | | | 1,184,147 | | | | 105,853 | |
South Korean Won, | | | | | | | | | | | | | | | | | | |
Expiring 11/30/2011 | | UBS AG | | KRW | 1,532,991,460 | | | | 1,401,400 | | | | 1,380,203 | | | | 21,197 | |
Expiring 11/30/2011 | | UBS AG | | KRW | 1,084,979,600 | | | | 923,387 | | | | 976,843 | | | | (53,456 | ) |
Expiring 11/30/2011 | | UBS AG | | KRW | 997,352,470 | | | | 904,300 | | | | 897,949 | | | | 6,351 | |
Swedish Krona, | | | | | | | | | | | | | | | | | | |
Expiring 11/21/11 | | Citibank NA | | SEK | 4,102,115 | | | | 644,500 | | | | 628,696 | | | | 15,804 | |
Swiss Franc, | | | | | | | | | | | | | | | | | | |
Expiring 11/21/11 | | Citibank NA | | CHF | 286,700 | | | | 324,101 | | | | 326,714 | | | | (2,613 | ) |
Expiring 11/21/11 | | JPMorgan | | CHF | 752,021 | | | | 850,200 | | | | 856,977 | | | | (6,777 | ) |
Expiring 10/25/12 | | Citibank NA | | CHF | 101,598 | | | | 116,551 | | | | 116,895 | | | | (344 | ) |
Expiring 10/26/12 | | Morgan Stanley | | CHF | 104,083 | | | | 117,546 | | | | 119,754 | | | | (2,208 | ) |
See Notes to Financial Statements.
| | |
| 60 | | Visit our website at www.prudentialfunds.com |
| | | | | | | | | | | | | | | | | | |
Sale Contracts | | Counterparty | | Notional
Amount | | | Value at
Settlement
Date
Receivable | | | Value at
October 31,
2011 | | | Unrealized
Appreciation
(Depreciation) | |
Thai Baht, | | | | | | | | | | | | | | | | | | |
Expiring 11/30/11 | | UBS AG | | THB | 50,740,331 | | | $ | 1,639,800 | | | $ | 1,645,810 | | | $ | (6,010 | ) |
Expiring 11/30/11 | | UBS AG | | THB | 35,604,400 | | | | 1,142,265 | | | | 1,154,862 | | | | (12,597 | ) |
Expiring 11/30/11 | | UBS AG | | THB | 17,386,140 | | | | 575,700 | | | | 563,936 | | | | 11,764 | |
Expiring 11/30/11 | | UBS AG | | THB | 3,652,400 | | | | 120,208 | | | | 118,469 | | | | 1,739 | |
Turkish Lira, | | | | | | | | | | | | | | | | | | |
Expiring 11/16/11 | | Citibank NA | | TRY | 1,000,000 | | | | 598,086 | | | | 563,464 | | | | 34,622 | |
Expiring 11/17/11 | | Citibank NA | | TRY | 1,712,758 | | | | 966,800 | | | | 964,859 | | | | 1,941 | |
Expiring 12/15/11 | | Morgan Stanley | | TRY | 2,042,768 | | | | 1,288,000 | | | | 1,143,264 | | | | 144,736 | |
Expiring 04/25/12 | | UBS AG | | TRY | 465,230 | | | | 277,501 | | | | 253,034 | | | | 24,467 | |
| | | | | | | | | | | | | | | | | | |
| | | | | | | | $ | 143,701,339 | | | $ | 144,023,436 | | | | (322,097 | ) |
| | | | | | | | | | | | | | | | | | |
| | | | | | | | | | | | | | | | $ | 425,235 | |
| | | | | | | | | | | | | | | | | | |
Credit default swap agreements outstanding as of October 31, 2011:
| | | | | | | | | | | | | | | | | | | | | | | | | | |
Counterparty | | Termination
Date | | | Notional
Amount
(000)#(4) | | | Fixed
Rate | | | Reference Entity/
Obligation | | Fair
Value | | | Upfront
Premiums
Paid/
(Received) | | | Unrealized
Appreciation
(Depreciation) | |
Credit Default Swaps on Corporate Issues—Buy Protection(1): | |
Citibank NA | | | 06/20/14 | | | $ | 500 | | | | 1.000 | % | | Viacom, Inc. | | $ | (5,495 | ) | | $ | 20,711 | | | $ | (26,206 | ) |
Citibank NA | | | 03/20/12 | | | | 600 | | | | 5.000 | | | XL Capital Ltd. | | | (14,063 | ) | | | (4,666 | ) | | | (9,397 | ) |
Credit Suisse International | | | 03/20/15 | | | | 420 | | | | 1.000 | | | Toll Brothers Finance Corp. | | | 4,824 | | | | 1,663 | | | | 3,161 | |
Deutsche Bank AG | | | 03/20/18 | | | | 250 | | | | 3.700 | | | American International Group, Inc. | | | 2,296 | | | | — | | | | 2,296 | |
Deutsche Bank AG | | | 03/20/12 | | | | 100 | | | | 5.000 | | | Gannett Co., Inc. | | | (2,203 | ) | | | (422 | ) | | | (1,781 | ) |
Deutsche Bank AG | | | 09/20/13 | | | | 260 | | | | 1.000 | | | Masco Corp. | | | 5,531 | | | | 4,640 | | | | 891 | |
Deutsche Bank AG | | | 06/20/14 | | | | 600 | | | | 1.000 | | | R.R. Donnelley & Sons Co. | | | 55,099 | | | | 25,484 | | | | 29,615 | |
Deutsche Bank AG | | | 06/20/13 | | | | 600 | | | | 1.000 | | | Sealed Air Corp. | | | (645 | ) | | | 4,195 | | | | (4,840 | ) |
Deutsche Bank AG | | | 03/20/14 | | | | 250 | | | | 7.050 | | | Starwood Hotels & Resorts Holdings | | | (36,316 | ) | | | — | | | | (36,316 | ) |
Goldman Sachs International | | | 03/20/14 | | | | 350 | | | | 0.700 | | | Duke Energy Corp. | | | (3,481 | ) | | | — | | | | (3,481 | ) |
JPMorgan Chase Bank | | | 09/20/16 | | | | 450 | | | | 1.000 | | | R.R. Donnelley & Sons Co. | | | 88,104 | | | | 39,111 | | | | 48,993 | |
See Notes to Financial Statements.
| | | | |
| Prudential Global Total Return Fund, Inc. | | | 61 | |
Portfolio of Investments
as of October 31, 2011 continued
| | | | | | | | | | | | | | | | | | | | | | | | | | |
Counterparty | | Termination
Date | | | Notional
Amount
(000)#(4) | | | Fixed
Rate | | | Reference Entity/
Obligation | | Fair
Value | | | Upfront
Premiums
Paid/
(Received) | | | Unrealized
Appreciation
(Depreciation) | |
Credit Default Swaps on Corporate Issues—Buy Protection(1) (cont’d.): | |
JPMorgan Chase Bank | | | 06/20/14 | | | $ | 510 | | | | 5.000 | % | | SLM Corp. | | $ | (9,670 | ) | | $ | 52,457 | | | $ | (62,127 | ) |
JPMorgan Chase Bank | | | 09/20/19 | | | | 450 | | | | 1.000 | | | Westvaco Corp. | | | 23,485 | | | | 6,985 | | | | 16,500 | |
| | | | | | | | | | | | | | | | | | | | | | | | | | |
| | | | | | | | | | | | | | | | $ | 107,466 | | | $ | 150,158 | | | $ | (42,692 | ) |
| | | | | | | | | | | | | | | | | | | | | | | | | | |
| | | | | | | | | | | | | | | | | | | | | | | | | | |
Counterparty | | Termination
Date | | | Notional
Amount
(000)#(4) | | | Fixed
Rate | | | Reference Entity/
Obligation | | Fair
Value | | | Upfront
Premiums
Paid/
(Received) | | | Unrealized
Appreciation | |
Credit Default Swaps on Credit Index—Sell Protection(2): | |
Barclays Bank PLC | | | 12/20/16 | | | $ | 3,000 | | | | 5.000 | % | | CDX.NA.HY.17.V1 | | $ | (163,579 | ) | | $ | (282,917 | ) | | $ | 119,338 | |
| | | | | | | | | | | | | | | | | | | | | | | | | | |
| | | | | | | | | | | | | | | | | | | | | | | | | | | | |
Counterparty | | Termination
Date | | | Implied
Credit
Spread at
October 31,
2011(3) | | | Notional
Amount
(000)#(4) | | | Fixed
Rate | | Reference Entity/
Obligation | | Fair
Value | | | Upfront
Premiums
Paid/
(Received) | | | Unrealized
Appreciation
(Depreciation) | |
Credit Default Swaps on Sovereign Issues—Sell Protection(2): | | | | | | | | | |
Barclays Bank PLC | | | 12/20/14 | | | | 12.760 | % | | $ | 1,500 | | | 1.000% | | Republic of Portugal | | $ | (398,308 | ) | | $ | (412,057 | ) | | $ | 13,749 | |
HSBC Bank USA NA | | | 12/20/14 | | | | 8.450 | % | | | 2,000 | | | 1.000 | | Ireland Government
Bond | | | (374,547 | ) | | | (399,762 | ) | | | 25,215 | |
UBS AG | | | 12/20/16 | | | | 1.756 | % | | | 1,000 | | | 1.000 | | Republic of
France | | | (34,972 | ) | | | (31,892 | ) | | | (3,080 | ) |
UBS AG | | | 12/20/16 | | | | 4.409 | % | | | 2,000 | | | 1.000 | | Republic of
Italy | | | (287,818 | ) | | | (293,422 | ) | | | 5,604 | |
| | | | | | | | | | | | | | | | | | | | | | | | | | | | |
| | | | | | | | | | | | | | | | | | $ | (1,095,645 | ) | | $ | (1,137,133 | ) | | $ | 41,488 | |
| | | | | | | | | | | | | | | | | | | | | | | | | | | | |
| (1) | If the Fund is a buyer of protection, it pays the fixed rate. When a credit event occurs, as defined under the terms of that particular swap agreement, the Fund will either (i) receive from the seller of protection an amount equal to the notional amount of the swap and make delivery of the referenced obligation or underlying securities comprising the referenced index or (ii) receive a net settlement amount in the form of cash or securities equal to the notional amount of the swap less the recovery value of the referenced obligation or underlying securities comprising the referenced index. |
| (2) | If the Fund is a seller of protection, it receives the fixed rate. When a credit event occurs, as defined under the terms of that particular swap agreement, the Fund will either (i) pay to the buyer of protection an amount equal to the notional amount of the swap and take delivery of the referenced obligation or underlying securities comprising the referenced index or (ii) pay a net settlement amount in the form of cash or securities equal to the notional |
See Notes to Financial Statements.
| | |
| 62 | | Visit our website at www.prudentialfunds.com |
| | amount of the swap less the recovery value of the referenced obligation or underlying securities comprising the referenced index. |
| (3) | Implied credit spreads, represented in absolute terms, utilized in determining the fair value of credit default swap agreements on corporate issues or sovereign issues of an emerging country as of the reporting date serve as an indicator of the current status of the payment/performance risk and represent the likelihood of risk of default for the credit derivative. The implied credit spread of a particular referenced entity reflects the cost of buying/selling protection and may include up-front payments required to be made to enter into the agreement. Wider credit spreads represent a deterioration of the referenced entity’s credit soundness and a greater likelihood of risk of default or other credit event occurring as defined under the terms of the agreement. |
| (4) | Notional amount represents the maximum potential amount the Fund could be required to pay as a seller of credit protection or receive as a buyer of credit protection if a credit event occurs as defined under the terms of that particular swap agreement. |
| # | Notional amount is shown in U.S. dollars unless otherwise stated. |
Currency swap agreements outstanding as of October 31, 2011:
| | | | | | | | | | | | | | | | | | | | | | | | |
Counterparty | | Termination
Date | | | Notional
Amount
(000) | | | Fixed
Rate | | Floating Rate | | Fair
Value | | | Upfront
Premiums
Paid/
(Received) | | | Unrealized
Appreciation
(Depreciation) | |
Barclays Bank PLC(a) | | | 12/05/12 | | | CHF | 1,000 | | | 4.375% | | 3 Month LIBOR | | $ | 28,668 | | | $ | — | | | $ | 28,668 | |
Credit Suisse International(b) | | | 05/12/15 | | | CHF | 1,000 | | | 2.625 | | 3 Month LIBOR | | | (64,327 | ) | | | (25,901 | ) | | | (38,426 | ) |
Credit Suisse International(c) | | | 05/20/16 | | | CHF | 500 | | | 4.000 | | 3 Month LIBOR | | | 7,557 | | | | 681 | | | | 6,876 | |
Citibank NA(d) | | | 05/16/13 | | | EUR | 550 | | | 5.250 | | 3 Month LIBOR | | | (41,167 | ) | | | — | | | | (41,167 | ) |
Citibank NA(e) | | | 02/10/14 | | | EUR | 750 | | | 6.500 | | 3 Month LIBOR | | | (123,128 | ) | | | (56,251 | ) | | | (66,877 | ) |
Citibank NA(f) | | | 07/28/14 | | | EUR | 1,500 | | | 6.750 | | 3 Month LIBOR | | | (223,206 | ) | | | (56,992 | ) | | | (166,214 | ) |
Citibank NA(g) | | | 10/14/14 | | | EUR | 1,000 | | | 7.500 | | 3 Month LIBOR | | | (207,546 | ) | | | (156,521 | ) | | | (51,025 | ) |
Citibank NA(h) | | | 04/15/16 | | | EUR | 700 | | | 4.500 | | 3 Month LIBOR | | | (73,638 | ) | | | — | | | | (73,638 | ) |
Citibank NA(i) | | | 11/13/12 | | | JPY | 100,000 | | | 1.920 | | 6 Month LIBOR | | | (88,028 | ) | | | — | | | | (88,028 | ) |
| | | | | | | | | | | | | | | | | | | | | | | | |
| | | | | | | | | | | | | | $ | (784,815 | ) | | $ | (294,984 | ) | | $ | (489,831 | ) |
| | | | | | | | | | | | | | | | | | | | | | | | |
| (a) | The Fund pays a fixed rate based on a notional amount of CHF 1,000,000. The Fund receives a floating rate based on a notional amount of $1,221,299. |
| (b) | The Fund pays a fixed rate based on a notional amount of CHF 1,000,000. The Fund receives a floating rate based on a notional amount of $1,111,111. |
| (c) | The Fund pays a fixed rate based on a notional amount of CHF 500,000. The Fund receives a floating rate based on a notional amount of $566,893. |
| (d) | The Fund pays a fixed rate based on a notional amount of EUR 550,000. The Fund receives a floating rate based on a notional amount of $776,875. |
| (e) | The Fund pays a fixed rate based on a notional amount of EUR 750,000. The Fund receives a floating rate based on a notional amount of $1,034,850. |
See Notes to Financial Statements.
| | | | |
| Prudential Global Total Return Fund, Inc. | | | 63 | |
Portfolio of Investments
as of October 31, 2011 continued
| (f) | The Fund pays a fixed rate based on a notional amount of EUR 1,500,000. The Fund receives a floating rate based on a notional amount of $1,986,450. |
| (g) | The Fund pays a fixed rate based on a notional amount of EUR 1,000,000. The Fund receives a floating rate based on a notional amount of $1,364,000. |
| (h) | The Fund pays a fixed rate based on a notional amount of EUR 700,000. The Fund receives a floating rate based on a notional amount of $960,190. |
| (i) | The Fund pays a fixed rate based on a notional amount of JPY 100,000,000. The Fund receives a floating rate based on a notional amount of USD $1,197,891. |
Interest rate swap agreements outstanding as of October 31, 2011:
| | | | | | | | | | | | | | | | | | | | | | | | | | |
Counterparty | | Termination
Date | | | Notional
Amount
(000)# | | | Fixed
Rate | | | Floating Rate | | Fair
Value | | | Upfront
Premiums
Paid/
(Received) | | | Unrealized
Appreciation
(Depreciation) | |
Barclays Bank PLC(a) | | | 09/22/12 | | | AUD | 6,000 | | | | 3.793 | % | | 1 Day AONIA | | $ | 20,325 | | | $ | — | | | $ | 20,325 | |
Barclays Bank PLC(b) | | | 02/14/31 | | | AUD | 700 | | | | 6.110 | | | 6 Month BBSW | | | 76,927 | | | | — | | | | 76,927 | |
Barclays Bank PLC(a) | | | 02/14/41 | | | AUD | 500 | | | | 5.860 | | | 6 Month BBSW | | | (62,869 | ) | | | — | | | | (62,869 | ) |
Citibank NA(b) | | | 09/07/21 | | | AUD | 1,000 | | | | 4.945 | | | 6 Month BBSW | | | (13,962 | ) | | | — | | | | (13,962 | ) |
Credit Suisse International(a) | | | 08/31/21 | | | AUD | 1,300 | | | | 5.160 | | | 6 Month BBSW | | | (4,738 | ) | | | — | | | | (4,738 | ) |
Credit Suisse International(b) | | | 08/31/26 | | | AUD | 900 | | | | 5.358 | | | 6 Month BBSW | | | 3,190 | | | | — | | | | 3,190 | |
Credit Suisse International(b) | | | 08/31/31 | | | AUD | 800 | | | | 5.370 | | | 6 Month BBSW | | | 10,527 | | | | — | | | | 10,527 | |
Credit Suisse International(a) | | | 08/31/36 | | | AUD | 700 | | | | 5.255 | | | 6 Month BBSW | | | (8,183 | ) | | | — | | | | (8,183 | ) |
Royal Bank of Scotland(b) | | | 09/22/21 | | | AUD | 1,400 | | | | 4.900 | | | 6 Month BBSW | | | (25,492 | ) | | | — | | | | (25,492 | ) |
Royal Bank of Scotland(a) | | | 09/22/36 | | | AUD | 700 | | | | 4.970 | | | 6 Month BBSW | | | 21,817 | | | | — | | | | 21,817 | |
Credit Suisse International(b) | | | 09/02/16 | | | CHF | 2,000 | | | | 0.950 | | | 6 Month CHF LIBOR | | | 28,198 | | | | — | | | | 28,198 | |
Credit Suisse International(b) | | | 09/23/16 | | | CHF | 1,200 | | | | 0.800 | | | 6 Month CHF LIBOR | | | 5,019 | | | | — | | | | 5,019 | |
Credit Suisse International(a) | | | 09/23/21 | | | CHF | 600 | | | | 1.453 | | | 6 Month CHF LIBOR | | | 822 | | | | — | | | | 822 | |
UBS AG(a) | | | 11/11/11 | | | CHF | 20,000 | | | | 0.020 | | | 1 Day CHF TOIS | | | (350 | ) | | | — | | | | (350 | ) |
UBS AG(a) | | | 11/18/11 | | | CHF | 20,000 | | | | — | | | 1 Day CHF TOIS | | | 3,156 | | | | — | | | | 3,156 | |
Bank of America NA(b) | | | 09/01/12 | | | CNY | 12,000 | | | | 4.410 | | | CNDR7D | | | (6,958 | ) | | | — | | | | (6,958 | ) |
Bank of America NA(a) | | | 09/01/13 | | | CNY | 12,000 | | | | 4.220 | | | CNDR7D | | | (5,342 | ) | | | — | | | | (5,342 | ) |
Citibank NA(b) | | | 03/15/16 | | | CZK | 33,300 | | | | 2.865 | | | 6 Month PRIBOR | | | 119,869 | | | | — | | | | 119,869 | |
Bank of America NA(a) | | | 08/10/13 | | | EUR | 10,000 | | | | 0.945 | | | 1 Day EUR EONIA OIS | | | (55,375 | ) | | | — | | | | (55,375 | ) |
Bank of America NA(b) | | | 08/10/13 | | | EUR | 10,000 | | | | 1.320 | | | 3 Month EURIBOR | | | 10,289 | | | | — | | | | 10,289 | |
See Notes to Financial Statements.
| | |
| 64 | | Visit our website at www.prudentialfunds.com |
| | | | | | | | | | | | | | | | | | | | | | | | | | |
Counterparty | | Termination
Date | | | Notional
Amount
(000)# | | | Fixed
Rate | | | Floating Rate | | Fair
Value | | | Upfront
Premiums
Paid/
(Received) | | | Unrealized
Appreciation
(Depreciation) | |
Citibank NA(b) | | | 07/22/16 | | | EUR | 500 | | | | 2.600 | % | | 6 Month EURIBOR | | $ | 22,433 | | | $ | — | | | $ | 22,433 | |
Credit Suisse International(b) | | | 09/02/16 | | | EUR | 1,000 | | | | 1.630 | | | 1 Day EUR EONIA OIS | | | 19,533 | | | | — | | | | 19,533 | |
Credit Suisse International(b) | | | 09/23/16 | | | EUR | 1,600 | | | | 1.365 | | | 1 Day EUR EONIA OIS | | | (1,729 | ) | | | — | | | | (1,729 | ) |
Credit Suisse International(b) | | | 09/26/16 | | | EUR | 500 | | | | 1.280 | | | 1 Day EUR EONIA OIS | | | (3,469 | ) | | | — | | | | (3,469 | ) |
HSBC Bank USA NA(b) | | | 08/19/14 | | | EUR | 3,000 | | | | 1.065 | | | 1 Day EUR EONIA OIS | | | 20,428 | | | | — | | | | 20,428 | |
HSBC Bank USA NA(b) | | | 08/04/16 | | | EUR | 1,300 | | | | 1.925 | | | 1 Day EUR EONIA OIS | | | 53,766 | | | | — | | | | 53,766 | |
HSBC Bank USA NA(b) | | | 08/29/16 | | | EUR | 1,000 | | | | 1.600 | | | 1 Day EUR EONIA OIS | | | 17,730 | | | | — | | | | 17,730 | |
HSBC Bank USA NA(b) | | | 08/30/16 | | | EUR | 500 | | | | 1.560 | | | 1 Day EUR EONIA OIS | | | 7,472 | | | | — | | | | 7,472 | |
JP Morgan Chase Bank NA(b) | | | 04/18/13 | | | EUR | 3,200 | | | | 2.413 | | | 6 Month EURIBOR | | | 111,131 | | | | — | | | | 111,131 | |
JP Morgan Chase Bank NA(b) | | | 04/19/16 | | | EUR | 1,600 | | | | 3.124 | | | 6 Month EURIBOR | | | 156,088 | | | | — | | | | 156,088 | |
Citibank NA(a) | | | 08/03/12 | | | GBP | 5,000 | | | | 0.548 | | | 1 Day GBP SONIA OIS | | | (2,065 | ) | | | — | | | | (2,065 | ) |
Citibank NA(b) | | | 08/01/16 | | | GBP | 500 | | | | 2.060 | | | 6 Month GBP LIBOR | | | 12,662 | | | | — | | | | 12,662 | |
HSBC Bank USA NA(b) | | | 08/09/16 | | | GBP | 1,200 | | | | 1.894 | | | 6 Month GBP LIBOR | | | 13,990 | | | | — | | | | 13,990 | |
Barclays Bank PLC(a) | | | 09/21/13 | | | ILS | 10,500 | | | | 2.980 | | | 3 Month TELBOR | | | (8,905 | ) | | | — | | | | (8,905 | ) |
Barclays Bank PLC(b) | | | 09/21/21 | | | ILS | 2,000 | | | | 4.530 | | | 3 Month TELBOR | | | 4,383 | | | | — | | | | 4,383 | |
Citibank NA(b) | | | 10/21/21 | | | ILS | 2,000 | | | | 4.530 | | | 3 Month TELBOR | | | 3,539 | | | | — | | | | 3,539 | |
Bank of America NA(b) | | | 09/07/12 | | | INR | 85,000 | | | | 7.650 | | | 1 Day MIBOR | | | (12,369 | ) | | | — | | | | (12,369 | ) |
Bank of America NA(a) | | | 09/07/13 | | | INR | 85,000 | | | | 7.260 | | | 1 Day MIBOR | | | 17,169 | | | | — | | | | 17,169 | |
Barclays Bank PLC(b) | | | 06/13/18 | | | JPY | 165,000 | | | | 0.778 | | | 6 Month Yen LIBOR | | | 24,799 | | | | — | | | | 24,799 | |
Barclays Bank PLC(b) | | | 02/02/21 | | | JPY | 60,000 | | | | 1.265 | | | 6 Month Yen LIBOR | | | 24,115 | | | | — | | | | 24,115 | |
Barclays Bank PLC(b) | | | 02/16/21 | | | JPY | 96,000 | | | | 1.365 | | | 6 Month Yen LIBOR | | | 49,817 | | | | — | | | | 49,817 | |
Barclays Bank PLC(b) | | | 06/02/21 | | | JPY | 50,000 | | | | 1.200 | | | 6 Month Yen LIBOR | | | 15,155 | | | | — | | | | 15,155 | |
Barclays Bank PLC(b) | | | 06/16/21 | | | JPY | 45,000 | | | | 1.170 | | | 6 Month Yen LIBOR | | | 11,433 | | | | — | | | | 11,433 | |
Barclays Bank PLC(b) | | | 06/28/21 | | | JPY | 40,000 | | | | 1.123 | | | 6 Month Yen LIBOR | | | 7,338 | | | | — | | | | 7,338 | |
Barclays Bank PLC(b) | | | 08/18/31 | | | JPY | 110,000 | | | | 1.750 | | | 6 Month Yen LIBOR | | | 12,094 | | | | — | | | | 12,094 | |
Barclays Bank PLC(b) | | | 08/30/31 | | | JPY | 25,000 | | | | 1.750 | | | 6 Month Yen LIBOR | | | 2,566 | | | | — | | | | 2,566 | |
Citibank NA(b) | | | 05/17/20 | | | JPY | 186,905 | | | | 1.388 | | | 6 Month Yen LIBOR | | | 120,266 | | | | — | | | | 120,266 | |
Citibank NA(b) | | | 12/20/20 | | | JPY | 90,000 | | | | 1.353 | | | 6 Month Yen LIBOR | | | 48,481 | | | | — | | | | 48,481 | |
Citibank NA(b) | | | 07/22/21 | | | JPY | 30,000 | | | | 1.090 | | | 6 Month Yen LIBOR | | | 3,742 | | | | — | | | | 3,742 | |
Citibank NA(b) | | | 07/21/24 | | | JPY | 85,500 | | | | 1.489 | | | 6 Month Yen LIBOR | | | 28,007 | | | | — | | | | 28,007 | |
Citibank NA(b) | | | 07/04/26 | | | JPY | 60,000 | | | | 1.603 | | | 6 Month Yen LIBOR | | | 18,466 | | | | — | | | | 18,466 | |
Citibank NA(b) | | | 08/02/26 | | | JPY | 70,000 | | | | 1.534 | | | 6 Month Yen LIBOR | | | 10,738 | | | | — | | | | 10,738 | |
Citibank NA(b) | | | 07/21/30 | | | JPY | 101,900 | | | | 1.781 | | | 6 Month Yen LIBOR | | | 29,469 | | | | — | | | | 29,469 | |
Citibank NA(b) | | | 08/24/31 | | | JPY | 25,000 | | | | 1.683 | | | 6 Month Yen LIBOR | | | (1,516 | ) | | | — | | | | (1,516 | ) |
Citibank NA(b) | | | 09/02/31 | | | JPY | 30,000 | | | | 1.730 | | | 6 Month Yen LIBOR | | | 1,524 | | | | — | | | | 1,524 | |
See Notes to Financial Statements.
| | | | |
| Prudential Global Total Return Fund, Inc. | | | 65 | |
Portfolio of Investments
as of October 31, 2011 continued
| | | | | | | | | | | | | | | | | | | | | | | | | | |
Counterparty | | Termination
Date | | | Notional
Amount
(000)# | | | Fixed
Rate | | | Floating Rate | | Fair
Value | | | Upfront
Premiums
Paid/
(Received) | | | Unrealized
Appreciation
(Depreciation) | |
Credit Suisse International(c) | | | 10/28/21 | | | JPY | 250,000 | | | | NA | | | 3 Month Yen LIBOR | | $ | (5,381 | ) | | $ | — | | | $ | (5,381 | ) |
Credit Suisse International(b) | | | 09/05/31 | | | JPY | 45,000 | | | | 1.770 | % | | 6 Month Yen LIBOR | | | 9,635 | | | | — | | | | 9,635 | |
Credit Suisse International(b) | | | 09/13/31 | | | JPY | 20,000 | | | | 1.670 | | | 6 Month Yen LIBOR | | | (2,087 | ) | | | — | | | | (2,087 | ) |
Royal Bank of Scotland(b) | | | 10/04/21 | | | JPY | 50,000 | | | | 1.013 | | | 6 Month Yen LIBOR | | | 4,786 | | | | — | | | | 4,786 | |
Royal Bank of Scotland(b) | | | 09/16/31 | | | JPY | 30,000 | | | | 1.636 | | | 6 Month Yen LIBOR | | | (5,668 | ) | | | — | | | | (5,668 | ) |
UBS AG(b) | | | 07/11/21 | | | JPY | 40,000 | | | | 1.193 | | | 6 Month Yen LIBOR | | | 10,644 | | | | — | | | | 10,644 | |
Bank of America NA(b) | | | 05/27/13 | | | KRW | 1,800,000 | | | | 3.780 | | | 3 Month Certificate of Deposit Rate | | | 7,075 | | | | — | | | | 7,075 | |
Bank of America NA(a) | | | 05/27/16 | | | KRW | 700,000 | | | | 3.930 | | | 3 Month Certificate of Deposit Rate | | | (10,939 | ) | | | — | | | | (10,939 | ) |
Citibank NA(a) | | | 05/09/12 | | | KRW | 4,100,000 | | | | 3.790 | | | 3 Month Certificate of Deposit Rate | | | (6,043 | ) | | | — | | | | (6,043 | ) |
UBS AG(b) | | | 05/09/12 | | | KRW | 4,100,000 | | | | 3.640 | | | 3 Month Certificate of Deposit Rate | | | 1,902 | | | | — | | | | 1,902 | |
UBS AG(b) | | | 06/10/13 | | | KRW | 1,800,000 | | | | 3.700 | | | 3 Month Certificate of Deposit Rate | | | 4,970 | | | | — | | | | 4,970 | |
UBS AG(a) | | | 06/10/16 | | | KRW | 700,000 | | | | 3.880 | | | 3 Month Certificate of Deposit Rate | | | (9,550 | ) | | | — | | | | (9,550 | ) |
Barclays Bank PLC(b) | | | 07/05/13 | | | MXN | 40,500 | | | | 5.480 | | | 28 Day Mexican Inter bank Rate | | | 48,329 | | | | — | | | | 48,329 | |
Barclays Bank PLC(b) | | | 08/31/21 | | | MXN | 12,800 | | | | 6.620 | | | 28 Day Mexican Inter bank Rate | | | 15,577 | | | | — | | | | 15,577 | |
Barclays Bank PLC(b) | | | 09/20/21 | | | MXN | 7,900 | | | | 6.790 | | | 28 Day Mexican Interbank Rate | | | 16,843 | | | | — | | | | 16,843 | |
Barclays Bank PLC(b) | | | 06/20/21 | | | NZD | 1,000 | | | | 4.980 | | | 3 Month BBR | | | 29,954 | | | | — | | | | 29,954 | |
Citibank NA(b) | | | 08/18/16 | | | NZD | 3,200 | | | | 4.173 | | | 3 Month BBR | | | 34,990 | | | | — | | | | 34,990 | |
Barclays Bank PLC(a) | | | 10/25/21 | | | PLN | 4,000 | | | | 4.960 | | | 6 Month WIBOR | | | (2,401 | ) | | | — | | | | (2,401 | ) |
UBS AG(b) | | | 06/27/21 | | | PLN | 4,900 | | | | 5.390 | | | 6 Month WIBOR | | | 59,711 | | | | — | | | | 59,711 | |
UBS AG(a) | | | 06/27/26 | | | PLN | 3,600 | | | | 5.280 | | | 6 Month WIBOR | | | (61,922 | ) | | | — | | | | (61,922 | ) |
Barclays Bank PLC(a) | | | 04/11/13 | | | SGD | 4,500 | | | | 0.875 | | | 6 Month SOR | | | (34,679 | ) | | | — | | | | (34,679 | ) |
Citibank NA(b) | | | 04/21/13 | | | SGD | 4,500 | | | | 0.755 | | | 6 Month SOR | | | 25,938 | | | | — | | | | 25,938 | |
HSBC Bank USA NA(a) | | | 10/14/12 | | | THB | 30,000 | | | | 2.730 | | | 6 Month BKIBOR | | | 11 | | | | — | | | | 11 | |
HSBC Bank USA NA(b) | | | 10/14/16 | | | THB | 30,000 | | | | 3.270 | | | 6 Month BKIBOR | | | (30 | ) | | | — | | | | (30 | ) |
Barclays Bank PLC(b) | | | 06/17/16 | | | ZAR | 11,000 | | | | 7.580 | | | 3 Month JIBAR | | | 64,307 | | | | — | | | | 64,307 | |
Bank of America NA(d) | | | 08/10/13 | | | | 15,000 | | | | NA | | | 1 Daily effective federal funds rate | | | (18,626 | ) | | | — | | | | (18,626 | ) |
See Notes to Financial Statements.
| | |
| 66 | | Visit our website at www.prudentialfunds.com |
| | | | | | | | | | | | | | | | | | | | | | | | | | |
Counterparty | | Termination
Date | | | Notional
Amount
(000)# | | | Fixed
Rate | | | Floating Rate | | Fair Value | | | Upfront
Premiums
Paid/
(Received) | | | Unrealized
Appreciation
(Depreciation) | |
Barclays Bank PLC(d) | | | 09/06/13 | | | | 15,000 | | | | NA | | | 1 Daily effective federal funds rate | | $ | (9,953 | ) | | $ | — | | | $ | (9,953 | ) |
Barclays Bank PLC(a) | | | 06/21/16 | | | | 1,400 | | | | 1.870 | % | | 3 Month LIBOR | | | (45,489 | ) | | | — | | | | (45,489 | ) |
Citibank NA(b) | | | 04/20/13 | | | | 3,900 | | | | 0.825 | | | 3 Month LIBOR | | | 17,409 | | | | — | | | | 17,409 | |
Citibank NA(b) | | | 05/15/37 | | | | 485 | | | | 3.116 | | | 3 Month LIBOR | | | 14,191 | | | | — | | | | 14,191 | |
Citibank NA(b) | | | 05/15/37 | | | | 485 | | | | 3.087 | | | 3 Month LIBOR | | | 11,664 | | | | — | | | | 11,664 | |
Deutsche Bank AG(a) | | | 09/14/16 | | | | 660 | | | | 1.206 | | | 3 Month LIBOR | | | 1,167 | | | | — | | | | 1,167 | |
| | | | | | | | | | | | | | | | | | | | | | | | | | |
| | | | | | | | | | | | | | | | $ | 1,121,486 | | | $ | — | | | $ | 1,121,486 | |
| | | | | | | | | | | | | | | | | | | | | | | | | | |
| (a) | Fund pays the fixed rate and receives the floating rate. |
| (b) | Fund pays the floating rate and receives the fixed rate. |
| (c) | Fund pays 6 Month Yen LIBOR + spread and receives the 3 Month Yen LIBOR. |
| (d) | Fund received the Federal Funds Rate and pays the 3 month LIBOR. |
| # | Notional amount is shown in U.S. dollars unless otherwise stated. |
Inflation swap agreements outstanding as of October 31, 2011:
| | | | | | | | | | | | | | | | | | | | | | | | | | |
Counterparty | | Termination
Date | | | Notional
Amount
(000)# | | | Fixed
Rate | | | Description | | Fair
Value | | | Upfront
Premiums
Paid/
(Received) | | | Unrealized
Appreciation
(Depreciation) | |
Barclays Bank
PLC(a) | | | 09/21/21 | | | GBP | 450 | | | | 3.100 | % | | UK Retail Price Index | | $ | 6,684 | | | $ | — | | | $ | 6,684 | |
Barclays Bank
PLC(b) | | | 10/12/21 | | | GBP | 500 | | | | 3.223 | | | UK Retail Price Index | | | 9,334 | | | | — | | | | 9,334 | |
Barclays Bank
PLC(a) | | | 10/12/41 | | | GBP | 180 | | | | 3.450 | | | UK Retail Price Index | | | (3,578 | ) | | | — | | | | (3,578 | ) |
| | | | | | | | | | | | | | | | | | | | | | | | | | |
| | | | | | | | | | | | | | | | $ | 12,440 | | | $ | — | | | $ | 12,440 | |
| | | | | | | | | | | | | | | | | | | | | | | | | | |
| (a) | Fund pays the fixed rate and receives the floating rate. |
| (b) | Fund pays the floating rate and receives the fixed rate. |
| # | Notional amount is shown in U.S. dollars unless otherwise stated. |
Various inputs are used in determining the value of the Fund’s investments. These inputs are summarized in the three broad levels listed below.
Level 1—quoted prices generally for securities actively traded on regulated securities exchange and for open-end mutual funds which trade at daily net asset value.
See Notes to Financial Statements.
| | | | |
| Prudential Global Total Return Fund, Inc. | | | 67 | |
Portfolio of Investments
as of October 31, 2011 continued
Level 2—other significant observable inputs (including, but not limited to, quoted prices for similar securities, interest rates, prepayment speeds, foreign currency exchange rates and amortized cost) generally for debt securities, swaps, forward foreign currency contracts and for foreign stocks priced using vendor modeling tools.
Level 3—significant unobservable inputs for securities valued in accordance with Board approved fair valuation procedures.
The following is a summary of the inputs used as of October 31, 2011 in valuing such portfolio securities:
| | | | | | | | | | | | |
| | | Level 1 | | | Level 2 | | | Level 3 | |
Investments in Securities | | | | | | | | | | | | |
Foreign Bonds | | $ | — | | | $ | 104,625,458 | | | $ | 2,286,189 | |
Asset-Backed Securities | | | | | | | | | | | | |
Non-Residential Mortgage-Backed Securities | | | — | | | | 9,810,284 | | | | 1,122,343 | |
Residential Mortgage-Backed Securities | | | — | | | | 8,110,120 | | | | — | |
Bank Loans | | | — | | | | 4,117,676 | | | | 437,679 | |
Commercial Mortgage-Backed Securities | | | — | | | | 14,819,075 | | | | — | |
Corporate Bonds | | | — | | | | 56,845,213 | | | | — | |
Mortgage-Backed Security | | | — | | | | 5,271,875 | | | | — | |
Municipal Bonds | | | — | | | | 4,227,885 | | | | — | |
U.S. Government Agency Obligation | | | — | | | | 330,041 | | | | — | |
U.S. Treasury Securities | | | — | | | | 1,737,258 | | | | — | |
Preferred Stock | | | 107,720 | | | | — | | | | — | |
Affiliated Money Market Mutual Fund | | | 7,919,488 | | | | — | | | | — | |
Options Purchased | | | — | | | | 389,134 | | | | — | |
Other Financial Instruments* | | | | | | | | | | | | |
Futures | | | (149,560 | ) | | | — | | | | — | |
Forward Foreign Currency Contracts | | | — | | | | 425,235 | | | | — | |
Currency Swap Agreements | | | — | | | | (489,831 | ) | | | — | |
Interest Rate Swap Agreements | | | — | | | | 1,121,486 | | | | — | |
Inflation Swap Agreements | | | — | | | | 12,440 | | | | — | |
Credit Default Swap Agreements | | | — | | | | 121,615 | | | | (3,481 | ) |
| | | | | | | | | | | | |
Total | | $ | 7,877,648 | | | $ | 211,474,964 | | | $ | 3,842,730 | |
| | | | | | | | | | | | |
See Notes to Financial Statements.
| | |
| 68 | | Visit our website at www.prudentialfunds.com |
The following is a reconciliation of assets in which significant unobservable inputs (Level 3) were used in determining fair value:
| | | | | | | | | | | | | | | | |
| | | Foreign Bonds | | | Non-
Residential
Mortgage-
Backed
Securities | | | Bank Loans | | | Credit Default
Swap | |
Balance as of 10/31/10 | | $ | — | | | $ | 307,180 | | | $ | 271,500 | | | $ | — | |
Realized gain (loss) | | | — | | | | — | | | | — | | | | — | ** |
Change in unrealized appreciation (depreciation)*** | | | 130,479 | | | | (31,478 | ) | | | (4,855 | ) | | | 1,105 | |
Purchases | | | — | | | | 1,130,984 | | | | 442,534 | | | | — | |
Sales | | | — | | | | (445,372 | ) | | | — | | | | — | |
Accrued discount/premium | | | — | | | | 3,458 | | | | — | | | | — | |
Transfers into Level 3 | | | 2,155,710 | | | | 157,571 | | | | | | | | (4,586 | ) |
Transfers out of Level 3 | | | — | | | | — | | | | (271,500 | ) | | | — | |
| | | | | | | | | | | | | | | | |
Balance as of 10/31/11 | | $ | 2,286,189 | | | $ | 1,122,343 | | | $ | 437,679 | | | $ | (3,481 | ) |
| | | | | | | | | | | | | | | | |
| * | Other financial instruments are derivative instruments not reflected in the Portfolio of Investments, such as futures, forwards and swap contracts, which are recorded at the unrealized appreciation/depreciation on the instrument. |
| ** | The realized loss incurred during the period for the other financial instruments was $2,484. |
| *** | Of which, $95,251 was included in Net Assets relating to securities held at the reporting period end. |
It is the Fund’s policy to recognize transfers in and transfers out at the fair value as of the beginning of period. At the reporting period end, there was one foreign bond, one non-residential mortgage-backed security and one credit default swap transferred into Level 3 as a result of using a single broker quote.
See Notes to Financial Statements.
| | | | |
| Prudential Global Total Return Fund, Inc. | | | 69 | |
Portfolio of Investments
as of October 31, 2011 continued
The industry classification of portfolio holdings and liabilities in excess of other assets shown as a percentage of net assets as of October 31, 2011 was as follows:
| | | | |
Sovereigns | | | 36.1 | % |
Banking | | | 7.9 | |
Commercial Mortgage-Backed Securities | | | 6.7 | |
Non-Residential Mortgage-Backed Securities | | | 4.9 | |
Non-Corporate Foreign Agency | | | 4.5 | |
Residential Mortgage-Backed Securities | | | 3.7 | |
Affiliated Money Market Mutual Fund | | | 3.6 | |
Mortgage-Backed Security | | | 2.4 | |
Cable | | | 2.3 | |
Media & Entertainment | | | 2.3 | |
Municipal Bonds | | | 1.9 | |
Foods | | | 1.8 | |
Non-Captive Finance | | | 1.8 | |
Insurance | | | 1.7 | |
Telecommunications | | | 1.4 | |
Capital Goods | | | 1.3 | |
Electric | | | 1.3 | |
Metals | | | 1.3 | |
Technology | | | 1.3 | |
Energy—Other | | | 1.2 | |
Healthcare & Pharmaceutical | | | 1.1 | |
Gaming | | | 0.9 | |
Retailers | | | 0.9 | |
Chemicals | | | 0.8 | % |
U.S. Treasury Securities | | | 0.8 | |
Paper | | | 0.7 | |
Building Materials & Construction | | | 0.6 | |
Consumer | | | 0.6 | |
Lodging | | | 0.6 | |
Pipelines & Other | | | 0.6 | |
Tobacco | | | 0.6 | |
Automotive | | | 0.5 | |
Real Estate Investment Trusts | | | 0.5 | |
Healthcare Insurance | | | 0.4 | |
Packaging | | | 0.4 | |
Foreign Local Government | | | 0.3 | |
Airlines | | | 0.2 | |
Energy—Integrated | | | 0.2 | |
Options | | | 0.2 | |
U.S. Government Agency Obligation | | | 0.2 | |
Aerospace & Defense | | | 0.1 | |
| | | | |
| | | 100.6 | |
Liabilities in excess of other assets | | | (0.6 | ) |
| | | | |
Net Assets | | | 100.0 | % |
| | | | |
The Fund invested in derivative instruments during the reporting period. The primary types of risk associated with these derivative instruments are credit risk, foreign exchange risk and interest rate risk. The effect of such derivative instruments on the Fund’s financial position and financial performance as reflected in the Statement of Assets and Liabilities and Statement of Operations is presented in the summary below.
See Notes to Financial Statements.
| | |
| 70 | | Visit our website at www.prudentialfunds.com |
Fair values of derivative instruments as of October 31, 2011 as presented in the Statement of Assets and Liabilities:
| | | | | | | | | | | | |
Derivatives not designated
as hedging instruments,
carried at fair value | | Asset Derivatives | | | Liability Derivatives | |
| | Balance
Sheet Location | | Fair
Value | | | Balance
Sheet Location | | Fair
Value | |
| Credit contracts | | Unrealized appreciation on swap agreements | | $ | 265,362 | | | Unrealized depreciation on swap agreements | | $ | 147,228 | |
| Credit contracts | | Premiums paid for swap agreements | | | 155,246 | | | Premiums received for swap agreements | | | 1,425,138 | |
| Foreign exchange contracts | | Unrealized appreciation on forward foreign currency contracts | | | 4,806,837 | | | Unrealized depreciation on forward foreign currency contracts | | | 4,381,602 | |
| Foreign exchange contracts | | Unaffiliated investments | | | 389,134 | | | — | | | — | |
| Interest rate contracts | | Due to broker—variation margin | | | 168,140 | * | | Due to broker—variation margin | | | 317,700 | * |
| Interest rate contracts | | Premiums paid for swap agreements | | | 681 | | | Premiums received for swap agreements | | | 295,665 | |
| Interest rate contracts | | Unrealized appreciation on swap agreements | | | 1,599,138 | | | Unrealized depreciation on swap agreements | | | 955,043 | |
| | | | | | | | | | | | |
Total | | | | $ | 7,384,538 | | | | | $ | 7,522,376 | |
| | | | | | | | | | | | |
| * | Includes cumulative appreciation/depreciation on futures contracts as reported in Portfolio of Investments. Only unsettled variation margin receivable (payable) is reported within the Statement of Assets and Liabilities. |
The effects of derivative instruments on the Statement of Operations for the year ended October 31, 2011 are as follows:
| | | | | | | | | | | | | | | | | | | | | | | | |
Amount of Realized Gain or (Loss) on Derivatives Recognized in Income | |
Derivatives not designated as
hedging instruments, carried
at fair value | | Options
Purchased | | | Options
Written | | | Futures | | | Forward
Contracts | | | Swaps | | | Total | |
Credit contracts | | $ | — | | | $ | — | | | $ | — | | | $ | — | | | $ | (133,992 | ) | | $ | (133,992 | ) |
Foreign exchange contracts | | | (669,839 | ) | | | — | | | | — | | | | 1,458,119 | | | | — | | | | 788,280 | |
Interest rate contracts | | | (146,124 | ) | | | 106,693 | | | | (100,390 | ) | | | — | | | | 888,210 | | | | 748,389 | |
| | | | | | | | | | | | | | | | | | | | | | | | |
| | $ | (815,963 | ) | | $ | 106,693 | | | $ | (100,390 | ) | | $ | 1,458,119 | | | $ | 754,218 | | | $ | 1,402,677 | |
| | | | | | | | | | | | | | | | | | | | | | | | |
See Notes to Financial Statements.
| | | | |
| Prudential Global Total Return Fund, Inc. | | | 71 | |
Portfolio of Investments
as of October 31, 2011 continued
| | | | | | | | | | | | | | | | | | | | |
Change in Unrealized Appreciation or (Depreciation) on Derivatives Recognized in Income | |
Derivatives not designated as hedging
instruments, carried at fair value | | Options
Purchased | | | Futures | | | Forward
Contracts | | | Swaps | | | Total | |
Credit contracts | | $ | — | | | $ | — | | | $ | — | | | $ | 343,968 | | | $ | 343,968 | |
Foreign exchange contracts | | | (570,633 | ) | | | — | | | | (108,142 | ) | | | — | | | | (678,775 | ) |
Interest rate contracts | | | — | | | | 152,813 | | | | — | | | | 617,557 | | | | 770,370 | |
| | | | | | | | | | | | | | | | | | | | |
| | $ | (570,633 | ) | | $ | 152,813 | | | $ | (108,142 | ) | | $ | 961,525 | | | $ | 435,563 | |
| | | | | | | | | | | | | | | | | | | | |
For the year ended October 31, 2011, the Fund’s average volume of derivative activities are as follows:
| | | | | | | | | | | | | | | | | | |
Options
Purchased
(Cost) | | | Futures
Long
Positions
(Value at
Trade Date) | | | Futures
Short
Positions
(Value at
Trade Date) | | | Forward
Currency
Contracts—
Purchased
(Value at
Settlement
Date Payable) | | | Forward
Currency
Contracts—
Sold
(Value at
Settlement
Date Receivable) | |
| $ | 661,568 | | | $ | 40,036,444 | | | $ | 28,128,757 | | | $ | 164,516,505 | | | $ | 68,121,185 | |
| | | | |
Currency
Swaps
(Notional
Amount in
USD (000)) | | | Inflation
Swaps
(Notional
Amount in
USD (000)) | | | Interest
Rate Swaps
(Notional
Amount in
USD (000)) | | | Credit
Default
Swaps as
Buyer
(Notional
Amount in
USD (000)) | | | Credit
Default
Swaps as
Writer
(Notional
Amount in
USD (000)) | |
| $ | 2,994 | | | $ | 825 | | | $ | 98,048 | | | $ | 6,011 | | | $ | 1,900 | |
See Notes to Financial Statements.
| | |
| 72 | | Visit our website at www.prudentialfunds.com |
Financial Statements
| | |
| OCTOBER 31, 2011 | | ANNUAL REPORT |
Prudential Global Total Return Fund, Inc.
Statement of Assets and Liabilities
as of October 31, 2011
| | | | |
Assets | | | | |
Investments at value: | | | | |
Unaffiliated Investments (cost $207,539,696) | | $ | 214,237,950 | |
Affiliated Investments (cost $7,919,488) | | | 7,919,488 | |
Cash | | | 165,029 | |
Foreign currency, at value (cost $326,703) | | | 329,668 | |
Receivable for investments sold | | | 16,476,874 | |
Receivable for Fund shares sold | | | 6,084,732 | |
Unrealized appreciation on forward foreign currency contracts | | | 4,806,837 | |
Dividends and interest receivable | | | 2,790,619 | |
Unrealized appreciation on swap agreements | | | 1,864,500 | |
Premiums paid for swap agreements | | | 155,927 | |
Foreign tax reclaim receivable | | | 26,238 | |
Prepaid expenses and other assets | | | 20,432 | |
| | | | |
Total assets | | | 254,878,294 | |
| | | | |
| |
Liabilities | | | | |
Payable for investments purchased | | | 24,070,059 | |
Unrealized depreciation on forward foreign currency contracts | | | 4,381,602 | |
Premiums received for swap agreements | | | 1,720,803 | |
Unrealized depreciation on swap agreements | | | 1,102,271 | |
Payable for Fund shares reacquired | | | 1,041,905 | |
Payable to custodian | | | 702,293 | |
Dividends payable | | | 624,493 | |
Accrued expenses | | | 160,885 | |
Management fee payable | | | 104,889 | |
Due to broker—variation margin | | | 87,067 | |
Distribution fee payable | | | 50,743 | |
Affiliated transfer agent fee payable | | | 19,146 | |
| | | | |
Total liabilities | | | 34,066,156 | |
| | | | |
| |
Net Assets | | $ | 220,812,138 | |
| | | | |
| | | | | |
Net assets were comprised of: | | | | |
Common stock, at par | | $ | 315,802 | |
Paid-in capital in excess of par | | | 222,586,748 | |
| | | | |
| | | 222,902,550 | |
Undistributed net investment income | | | 222,200 | |
Accumulated net realized loss on investment and foreign currency transactions | | | (10,002,296 | ) |
Net unrealized appreciation on investments and foreign currencies | | | 7,689,684 | |
| | | | |
Net assets, October 31, 2011 | | $ | 220,812,138 | |
| | | | |
See Notes to Financial Statements.
| | |
| 74 | | Visit our website at www.prudentialfunds.com |
| | | | |
Class A | | | | |
Net asset value and redemption price per share
($154,055,982 ÷ 22,041,179 shares of common stock issued and outstanding) | | $ | 6.99 | |
Maximum sales charge (4.50% of offering price) | | | 0.33 | |
| | | | |
Maximum offering price to public | | $ | 7.32 | |
| | | | |
| |
Class B | | | | |
Net asset value, offering price and redemption price per share
($5,017,587 ÷ 718,062 shares of common stock issued and outstanding) | | $ | 6.99 | |
| | | | |
| |
Class C | | | | |
Net asset value, offering price and redemption price per share
($19,408,131 ÷ 2,784,279 shares of common stock issued and outstanding) | | $ | 6.97 | |
| | | | |
| |
Class Z | | | | |
Net asset value, offering price and redemption price per share
($42,330,438 ÷ 6,036,656 shares of common stock issued and outstanding) | | $ | 7.01 | |
| | | | |
See Notes to Financial Statements.
| | | | |
| Prudential Global Total Return Fund, Inc. | | | 75 | |
Statement of Operations
Year Ended October 31, 2011
| | | | |
Net Investment Income | | | | |
Income | | | | |
Interest (net of foreign withholding taxes of $2,845) | | $ | 6,981,011 | |
Affiliated dividend income | | | 23,073 | |
Unaffiliated dividend income | | | 8,422 | |
| | | | |
Total income | | | 7,012,506 | |
| | | | |
| |
Expenses | | | | |
Management fee | | | 985,280 | |
Distribution fee—Class A | | | 313,232 | |
Distribution fee—Class B | | | 34,651 | |
Distribution fee—Class C | | | 94,961 | |
Transfer agent’s fees and expenses (including affiliated expense of $90,600) | | | 251,000 | |
Custodian’s fees and expenses | | | 240,000 | |
Registration fees | | | 81,000 | |
Reports to shareholders | | | 64,000 | |
Audit fee | | | 55,000 | |
Legal fees and expenses | | | 24,000 | |
Directors’ fees | | | 13,000 | |
Insurance | | | 3,000 | |
Loan Interest expense (Note 7) | | | 100 | |
Miscellaneous | | | 12,843 | |
| | | | |
| | | 2,172,067 | |
Less: Expense subsidy (Note 2) | | | (61,719 | ) |
| | | | |
Net expenses | | | 2,110,348 | |
| | | | |
Net investment income | | | 4,902,158 | |
| | | | |
| |
Realized And Unrealized Gain (Loss) On Investment And Foreign Currency Transactions | | | | |
Net realized gain (loss) on: | | | | |
Investment transactions | | | 934,604 | |
Foreign currency transactions | | | 2,529,631 | |
Financial futures transactions | | | (100,390 | ) |
Swap agreement transactions | | | 754,218 | |
Options written transactions | | | 106,693 | |
| | | | |
| | | 4,224,756 | |
| | | | |
Net change in unrealized appreciation (depreciation) on: | | | | |
Investments | | | (4,535,571 | ) |
Foreign currencies | | | (136,462 | ) |
Financial futures contracts | | | 152,813 | |
Swap agreements | | | 961,525 | |
| | | | |
| | | (3,557,695 | ) |
| | | | |
Net gain on investments | | | 667,061 | |
| | | | |
Net Increase In Net Assets Resulting From Operations | | $ | 5,569,219 | |
| | | | |
See Notes to Financial Statements.
| | |
| 76 | | Visit our website at www.prudentialfunds.com |
Statement of Changes in Net Assets
| | | | | | | | |
| | | Year Ended October 31, | |
| | | 2011 | | | 2010 | |
Increase (Decrease) In Net Assets | | | | | | | | |
Operations: | | | | | | | | |
Net investment income | | $ | 4,902,158 | | | $ | 4,857,125 | |
Net realized gain on investment and foreign currency transactions | | | 4,224,756 | | | | 8,336,463 | |
Net change in unrealized appreciation (depreciation) on investments and foreign currencies | | | (3,557,695 | ) | | | 3,512,078 | |
| | | | | | | | |
Net increase in net assets resulting from operations | | | 5,569,219 | | | | 16,705,666 | |
| | | | | | | | |
| | |
Dividends (Note 1) | | | | | | | | |
Dividends from net investment income* | | | | | | | | |
Class A | | | (11,986,132 | ) | | | (11,348,569 | ) |
Class B | | | (287,550 | ) | | | (286,286 | ) |
Class C | | | (672,964 | ) | | | (427,904 | ) |
Class Z | | | (833,079 | ) | | | (406,877 | ) |
| | | | | | | | |
| | | (13,779,725 | ) | | | (12,469,636 | ) |
| | | | | | | | |
| | |
Fund share transactions (Net of share conversions) (Note 6) | | | | | | | | |
Net proceeds from shares sold | | | 121,323,623 | | | | 20,668,285 | |
Net asset value of shares issued in reinvestment of dividends | | | 10,491,832 | | | | 9,487,962 | |
Cost of shares reacquired | | | (40,769,594 | ) | | | (21,265,950 | ) |
| | | | | | | | |
Net increase in net assets from Fund share transactions | | | 91,045,861 | | | | 8,890,297 | |
| | | | | | | | |
Total increase | | | 82,835,355 | | | | 13,126,327 | |
| | |
Net Assets: | | | | | | | | |
Beginning of year | | | 137,976,783 | | | | 124,850,456 | |
| | | | | | | | |
End of year(a) | | $ | 220,812,138 | | | $ | 137,976,783 | |
| | | | | | | | |
(a) Includes undistributed net investment income of: | | $ | 222,200 | | | $ | 5,380,343 | |
| | | | | | | | |
| * | Dividends from net investment income include other items that are ordinary income for tax purposes. |
See Notes to Financial Statements.
| | | | |
| Prudential Global Total Return Fund, Inc. | | | 77 | |
Notes to Financial Statements
Prudential Global Total Return Fund, Inc. (the “Fund”) is an open-end management investment company, registered under the Investment Company Act of 1940, as amended, (“1940 Act”). The Fund’s investment objective is to seek total return made up of current income and capital appreciation. The Fund is a non-diversified fund.
Note 1. Accounting Policies
The following is a summary of significant accounting policies followed by the Fund in the preparation of its financial statements.
Security Valuation: In valuing the Fund’s assets, quotations of foreign securities in a foreign currency are converted to U.S. dollar equivalents at the then current currency value. Securities listed on a securities exchange (other than options on securities and indices) are valued at the last sale price on such exchange or market on the day of valuation or, if there was no sale on such a day, at the mean between the last reported bid and asked prices, or at the last bid price on such day in the absence of an asked price. Securities that are actively traded via NASDAQ are valued at the NASDAQ official closing price (“NOCP”) on the day of valuation, or if there was no NOCP, at the last sales price. Securities that are actively traded in the over-the-counter market, including listed securities for which the primary market is believed by Prudential Investments LLC (“PI” or “Manager”), in consultation with the subadvisor, to be over-the-counter, are valued at market value using prices provided by an independent pricing agent or principal market maker. Corporate bonds, U.S. government securities and convertible debt securities traded in the over-the-counter market, including securities listed on exchanges whose primary market is believed to be over-the-counter, are valued at market value using prices provided by an independent pricing agent or principal market maker. Options on securities and indices traded on an exchange are valued at the last sale price as of the close of trading on the applicable exchange or, if there was no sale, at the mean between the most recently quoted bid and asked prices on such exchange. Future contracts and options thereon traded on a commodities exchange or board of trade are valued at the last sale price at the close of trading on such exchange or board of trade or, if there was no sale on the applicable commodities exchange or board of trade on such day, at the mean between the most recently quoted prices on such exchange or board of trade or at the last bid price in the absence of an asked price. Prices may be obtained from independent pricing services which use information provided by market makers or estimates of market values obtained from yield data relating to investments or securities with
| | |
| 78 | | Visit our website at www.prudentialfunds.com |
similar characteristics. Securities for which reliable market quotations are not readily available, or whose values have been affected by events occurring after the close of the security’s foreign market and before the Fund’s normal pricing time, are valued at fair value in accordance with Board of Directors’ approved fair valuation procedures. When determining the fair valuation of securities, some of the factors influencing the valuation include, the nature of any restrictions on disposition of the securities; assessment of the general liquidity of the securities; the issuer’s financial condition and the markets in which it does business; the cost of the investment; the size of the holding and the capitalization of issuer; the prices of any recent transactions or bids/offers for such securities or any comparable securities; any available analyst media or other reports or information deemed reliable by the investment adviser regarding the issuer or the markets or industry in which it operates. Using fair value to price securities may result in a value that is different from a security’s most recent closing price and from the price used by other mutual funds to calculate their net asset values.
Investments in open-end, non-exchange-traded mutual funds are valued at their net asset value as of the close of the New York Stock Exchange on the date of the valuation.
Short-term debt securities of sufficient credit quality, which mature in sixty days or less, are valued at amortized cost, which approximates fair value. The amortized cost method involves valuing a security at its cost on the date of purchase and thereafter assuming a constant amortization to maturity of the difference between the principal amount due at maturity and cost. Short-term debt securities, which mature in more than sixty days, are valued at fair value.
Foreign Currency Translation: The books and records of the Fund are maintained in U.S. dollars. Foreign currency amounts are translated into U.S. dollars on the following basis:
(i) market value of investment securities, other assets and liabilities-at the current rates of exchange.
(ii) purchases and sales of investment securities, income and expenses-at the rates of exchange prevailing on the respective dates of such transactions.
Although the net assets of the Fund are presented at the foreign exchange rates and market values at the close of the period, the Fund does not isolate that portion of the results of operations arising as a result of changes in the foreign exchange rates from the fluctuations arising from changes in the market prices of long-term portfolio securities held at the end of the period. Similarly, the Fund does not isolate the effect of changes in foreign exchange rates from the fluctuations arising from changes in the
| | | | |
| Prudential Global Total Return Fund, Inc. | | | 79 | |
Notes to Financial Statements
continued
market prices of long-term portfolio securities sold during the period. Accordingly, these realized foreign currency gains or losses are included in the reported net realized gains or losses on investment transactions.
Net realized gains or losses on foreign currency transactions represent net foreign exchange gains or losses from sales and maturities of short-term securities and forward currency contracts, disposition of foreign currencies, currency gains or losses realized between the trade and settlement dates on securities transactions, and the difference between the amounts of interest, discount and foreign withholding taxes recorded on the Fund’s books and the U.S. dollar equivalent amounts actually received or paid. Net unrealized currency gains or losses from valuing foreign currency denominated assets and liabilities (other than investments) at period end exchange rates are reflected as a component of net unrealized appreciation (depreciation) on foreign currencies.
Concentration of Risk: The ability of issuers of debt securities (other than those issued or guaranteed by the U.S. Government) held by the Fund to meet its obligations may be affected by the economic or political developments in a specific industry, region or country. Foreign security and currency transactions may involve certain considerations and risks not typically associated with those of U.S. companies as a result of, among other factors, the possibility of political or economic instability or the level of governmental supervision and regulation of foreign securities markets.
Financial Futures Contracts: A financial futures contract is an agreement to purchase (long) or sell (short) an agreed amount of securities at a set price for delivery on a future date. Upon entering into a financial futures contract, the Fund is required to pledge to the broker an amount of cash and/or other assets equal to a certain percentage of the contract amount. This amount is known as the “initial margin.” Subsequent payments, known as “variation margin,” are made or received by the Fund each day, depending on the daily fluctuations in the value of the underlying security. Such variation margin is recorded for financial statement purposes on a daily basis as unrealized gain (loss). When the contract expires or is closed, the gain (loss) is realized and is presented in the Statement of Operations as net realized gain (loss) on financial futures transactions.
The Fund invested in financial futures contracts in order to hedge its existing portfolio securities, or securities the Fund intends to purchase, against fluctuations in value
| | |
| 80 | | Visit our website at www.prudentialfunds.com |
caused by changes in prevailing interest rates or foreign currency exchange rates. Should interest rates move unexpectedly, the Fund may not achieve the anticipated benefits of the financial futures contracts and may realize a loss. The use of futures transactions involves the risk of imperfect correlation in movements in the price of futures contracts, interest rates and the underlying hedged assets. Financial futures contracts involve elements of risk in excess of the amounts reflected on the Statement of Assets and Liabilities.
Forward Currency Contracts: A forward currency contract is a commitment to purchase or sell a foreign currency at a future date at a negotiated forward rate between two parties. The Fund enters into forward currency contracts in order to hedge its exposure to changes in foreign currency exchange rates on its foreign portfolio holdings or specific receivables and payables denominated in a foreign currency. The contracts are valued daily at current exchange rates and any unrealized gain or loss is included in net unrealized appreciation or depreciation on foreign currencies. Gain or loss is realized on the settlement date of the contract equal to the difference between the settlement value of the original and negotiated forward contracts. This gain or loss, if any, is included in net realized gain (loss) on foreign currency transactions. Risks may arise upon entering into these contracts from the potential inability of the counterparties to meet the terms of their contracts. Forward currency contracts involve risks from currency exchange rate and credit risk in excess of the amounts reflected on the Statement of Assets and Liabilities. The Fund’s maximum risk of loss from counterparty credit risk is the net value of the cash flows to be received from the counterparty at the end of the contract’s life. A master netting arrangement between the Fund and the counterparty permits the Fund to offset amounts payable by the Fund to the same counterparty against amounts to be received; and by the receipt of collateral from the counterparty by the Fund to cover the Fund’s exposure to the counterparty. However, there is no assurance that such mitigating factors are easily enforceable.
Options: The Fund purchased and wrote options in order to hedge against adverse market movements or fluctuations in value caused by changes in prevailing interest rates or foreign currency exchange rates, with respect to securities which the Fund currently owns or intends to purchase. The Fund’s principal reason for writing options is to realize, through receipt of premiums, a greater current return than would be realized on the underlying security alone. When the Fund purchases an option, it pays a premium and an amount equal to that premium is recorded as an asset. When the Fund writes an option, it receives a premium and an amount equal to that premium is recorded as a liability. The asset or liability is adjusted daily to reflect the current market value of the option. If an option expires unexercised, the Fund realizes a gain or loss to the extent of the premium received or paid. If an option is exercised, the
| | | | |
| Prudential Global Total Return Fund, Inc. | | | 81 | |
Notes to Financial Statements
continued
premium received or paid is recorded as an adjustment to the proceeds from the sale or the cost of the purchase in determining whether the Fund has realized a gain or loss. The difference between the premium and the amount received or paid at the closing of a purchase or sale transaction is also treated as a realized gain or loss. Gain or loss on purchased options is included in net realized gain or loss on investment transactions. Gain or loss on written options is presented separately as net realized gain or loss on options written. The Fund, as writer of an option, may have no control over whether the underlying securities may be sold (called) or purchased (put). As a result, the Fund bears the market risk of an unfavorable change in the price of the security underlying the written option. The Fund, as purchaser of an over-the-counter option, bears the risk of the potential inability of the counterparties to meet the terms of their contracts.
With exchange-traded futures and options contracts, there is minimal counterparty credit risk to the Fund since the exchanges’ clearinghouse acts as counterparty to all exchange traded futures and options and guarantees the futures and options contracts against default.
Swap Agreements: The Fund entered into credit default, interest rate and other forms of swap agreements. A swap agreement is an agreement to exchange the return generated by one instrument for the return generated by another instrument. The swap agreements are valued daily at current market value and any change in value is included in the net unrealized appreciation or depreciation on investments. Payments received or paid by the Fund are recorded as realized gains or losses upon termination or maturity of the swap. Risk of loss may exceed amounts recognized on the Statements of Assets and Liabilities. Swap agreements outstanding at period end, if any, are listed on the Portfolio of Investments.
Credit Default Swaps: Credit default swaps involve one party (the protection buyer) making a stream of payments to another party (the protection seller) in exchange for the right to receive a specified payment in the event of a default or as a result of a default (“credit event”) for the referenced party, typically corporate issues or sovereign issues of an emerging country, on its obligation; or in the event of a write-down, principal shortfall, interest shortfall or default of all or part of the referenced entities comprising a credit index.
The Fund is subject to credit risk in the normal course of pursuing its investment objectives. The Fund purchased credit default swaps to provide a measure of
| | |
| 82 | | Visit our website at www.prudentialfunds.com |
protection against defaults of the issuers. The Fund’s maximum risk of loss from counterparty credit risk for purchased credit default swaps is the notional value of a credit default swap agreement. A master netting arrangement between the Fund and the counterparty permits the Fund to offset amounts payable by the Fund to the same counterparty against amounts to be received; and by the receipt of collateral from the counterparty by the Fund to cover the Fund’s exposure to the counterparty. However, there is no assurance that such mitigating factors are easily enforceable.
As a seller of protection on credit default swap agreements, the Fund will generally receive from the buyer of protection an agreed upon payment throughout the term of the swap provided that there is no credit event. As the seller, the Fund would effectively increase investment risk to its portfolio because, in addition to its total net assets, the Fund may be subject to investment exposure on the notional amount of the swap.
The maximum amount of the payment that the Fund as a seller of protection could be required to make under a credit default swap agreement would be equal to the notional amount of the underlying security or index contract as a result of a credit event. These potential amounts will be partially offset by any recovery values of the respective referenced obligations, or net amounts received from the settlement of buy protection credit default swap agreements entered into by the Fund for the same referenced entity or index. As a buyer of protection, the Fund generally receives an amount up to the notional value of the swap if a credit event occurs.
Implied credit spreads, represented in absolute terms, utilized in determining the market value of credit default swap agreements on corporate issues or sovereign issues of an emerging country as of period end are disclosed in the footnotes to the Portfolio of Investments, if applicable, and serve as an indicator of the current status of the payment/performance risk and represent the likelihood of risk of default for the credit derivative. The implied credit spread of a particular referenced entity reflects the cost of buying/selling protection and may include upfront payments required to enter into the agreement. For credit default swap agreements on asset-backed securities and credit indices, the quoted market prices and resulting values serve as the indicator of the current status of the payment/performance risk. Wider credits spreads and increasing market value in absolute terms, when compared to the notional amount of the swap, represent a deterioration of the referenced entity’s credit soundness and a greater likelihood of risk of default or other credit event occurring as defined under the terms of the agreement.
Interest Rate Swaps: Interest rate swaps represent an agreement between counterparties to exchange cash flows based on the difference between two interest
| | | | |
| Prudential Global Total Return Fund, Inc. | | | 83 | |
Notes to Financial Statements
continued
rates, applied to a notional principal amount for a specified period. The Fund used interest rate swaps to maintain its ability to generate steady cash flow by receiving a stream of fixed rate payments and to increase exposure to prevailing market rates by receiving floating rate payments using interest rate swap contracts. The Fund is subject to interest rate risk exposure in the normal course of pursuing its investment objectives.
Currency Swaps: The Fund entered into currency swap agreements primarily to gain yield exposure on foreign bonds. Currency swap agreements involve two parties exchanging two different currencies with an agreement to reverse the exchange at a later date at specified exchange rates.
Inflation Swaps: The Fund entered into inflation swap agreements to provide a measure of protection against the effect of inflation on yield. Inflation swap agreements involve two parties exchanging cash flows at a later date at rates related to inflation indices.
The Fund’s maximum risk of loss from counterparty credit risk is the discounted net value of the cash flows to be received from the counterparty over the contract’s remaining life. A master netting arrangement between the Fund and the counterparty permits the Fund to offset amounts payable by the Fund to the same counterparty against amounts to be received; and by the receipt of collateral from the counterparty by the Fund to cover the Fund’s exposure to the counterparty. However, there is no assurance that such mitigating factors are easily enforceable.
In addition to each instrument’s primary underlying risk exposure (e.g. interest rate, credit, equity or foreign exchange, etc.), swap agreements involve, to varying degrees, elements of credit, market and documentation risk. Such risks involve the possibility that there will be no liquid market for these agreements, that the counterparty to the agreement may default on its obligation to perform or disagree as to the meaning of the contractual terms in the agreement, and that there will be unfavorable changes in net interest rates. In connection with these agreements, securities in the portfolio may be identified as collateral or received as collateral from the counterparty in accordance with the terms of the respective swap agreements to provide or receive assets of value and serve as recourse in the event of default or bankruptcy/insolvency of either party. Such over-the-counter derivative agreements include conditions which when materialized, give the counterparty the right to cause an early termination of the
| | |
| 84 | | Visit our website at www.prudentialfunds.com |
transactions under those agreements. Any election by the counterparty for early termination of the contract(s) may impact the amounts reported on financial statements. As of October 31, 2011, the Fund has not met conditions under such agreements, which give the counterparty the right to call for an early termination.
Forward currency contracts, swaps and financial futures contracts involve elements of both market and credit risk in excess of the amounts reflected on the Statement of Assets and Liabilities.
Lower rated or unrated securities are more likely to react to developments affecting market risk (general market liquidity) and credit risk (an issuer’s inability to meet principal and interest payments on its obligations) than are more highly rated securities, which react primarily to movements in the general level of interest rates. The ability of issuers of debt securities held by the Fund to meet their obligations may be affected by economic developments in a specific industry or region.
Securities Transactions and Net Investment Income: Securities transactions are recorded on the trade date. Realized gains or losses on sales of securities are calculated on the identified cost basis. Dividend income is recorded on the ex-dividend date and interest income is recorded on the accrual basis. The Fund amortizes premiums and accretes discounts on debt securities as adjustments to interest income. Expenses are recorded on the accrual basis. Net investment income or loss (other than distribution fees, which are charged to the respective class) and unrealized and realized gains or losses are allocated daily to each class of shares based upon the relative proportion of net assets of each class at the beginning of the day.
Dividends and Distributions: The Fund declares dividends from net investment income daily and payment is made monthly. Prior to March 21, 2011, the Fund paid dividends of net investment income quarterly. Distributions of net realized capital and currency gains, if any, are paid annually. Foreign currency losses may reduce the amount of dividends of net investment income. Dividends and distributions are determined in accordance with federal income tax regulations which may differ from generally accepted accounting principles. Permanent book/tax differences relating to income and gains are reclassified to paid-in capital when they arise.
Taxes: For federal income tax purposes, the Fund is treated as a separate taxpaying entity. It is the Fund’s policy to continue to meet the requirements of the Internal Revenue Code applicable to regulated investment companies and to distribute all of its taxable net income and capital gains, if any, to its shareholders. Therefore, no federal income tax provision is required.
| | | | |
| Prudential Global Total Return Fund, Inc. | | | 85 | |
Notes to Financial Statements
continued
Withholding taxes on foreign interest are recorded, net of reclaimable amounts, at the time the related income is earned.
Estimates: The preparation of the financial statements requires management to make estimates and assumptions that affect the reported amounts and disclosures in the financial statements. Actual results could differ from those amounts.
Note 2. Agreements
The Fund has a management agreement with PI. Pursuant to this agreement, PI has responsibility for all investment advisory services and supervises the subadvisor’s performance of such services. PI has entered into a subadvisory agreement with Prudential Investment Management, Inc. (“PIM”). The subadvisory agreement provides that PIM will furnish investment advisory services in connection with the management of the Fund. In connection therewith, PIM is obligated to keep certain books and records of the Fund. PI pays for the services of PIM, the cost of compensation of officers of the Fund, occupancy and certain clerical and bookkeeping costs of the Fund. The Fund bears all other costs and expenses.
The management fee paid to PI is accrued daily and payable monthly at an annual rate of .65% of the Fund’s average daily net assets up to $1 billion and .60% of such assets in excess of $1 billion. The effective management fee rate was .65% for the year ended October 31, 2011.
PI has voluntarily agreed to reimburse the Fund in order to limit operating expenses (excluding distribution and service (12b-1) fees, interest, taxes, brokerage commissions and certain extraordinary expenses) to 1.10% of the average daily net assets of the Class A, B, C, and Z shares, respectively, which for the year ended October 31, 2011 amounted to $61,719.
The Fund has a distribution agreement with Prudential Investment Management Services LLC (“PIMS”), which acts as the distributor of the Class A, Class B, Class C, Class Q and Class Z shares of the Fund. The Fund compensates PIMS for distributing and servicing the Fund’s Class A, Class B and Class C shares, pursuant to plans of distribution (the “Class A, B and C Plans”), regardless of expenses actually incurred by PIMS. The distribution fees are accrued daily and payable monthly. No distribution or service fees are paid to PIMS as distributor of the Class Q and Class Z shares of the Fund. Class Q has not yet commenced operations.
| | |
| 86 | | Visit our website at www.prudentialfunds.com |
Pursuant to the Class A, B and C Plans, the Fund compensates PIMS for distribution related activities at an annual rate of up to .30%, 1% and 1% of the average daily net assets of the Class A, B, and C shares, respectively. Through February 28, 2013, PIMS has contractually agreed to limit such fees to .25% of the average daily net assets of the Class A shares. Through February 28, 2011, PIMS had contractually agreed to limit such fees to .75% of the average daily net assets of the Class C shares.
PIMS has advised the Fund that it has received $280,196 in front-end sales charges resulting from sales of Class A shares during the year ended October 31, 2011. From these fees, PIMS paid such sales charges to affiliated broker-dealers, which in turn paid commissions to salespersons and incurred other distribution costs.
PIMS has advised the Fund that for the year ended October 31, 2011, it received $25,365, $7,912 and $4,548 in contingent deferred sales charges imposed upon redemptions by certain Class A, Class B and Class C shareholders, respectively.
PI, PIM and PIMS are indirect, wholly-owned subsidiaries of Prudential Financial, Inc. (“Prudential”).
Note 3. Other Transactions with Affiliates
Prudential Mutual Fund Services LLC (“PMFS”), an affiliate of PI and an indirect, wholly-owned subsidiary of Prudential, serves as the Fund’s transfer agent. Transfer agent’s fees and expenses in the Statement of Operations include certain out-of-pocket expenses paid to non-affiliates, where applicable.
The Fund invests in the Prudential Core Taxable Money Market Fund (the “Core Fund”), a series of the Prudential Investment Portfolios 2, registered under the 1940 Act, as amended, and managed by PI. Earnings from the Core Fund are disclosed on the Statement of Operations as affiliated dividend income.
Note 4. Portfolio Securities
Purchases and sales of portfolio securities, excluding short-term investments and U.S. Government securities, for the year ended October 31, 2011 aggregated $302,897,451 and $219,509,571, respectively.
| | | | |
| Prudential Global Total Return Fund, Inc. | | | 87 | |
Notes to Financial Statements
continued
Transactions in options written during the year ended October 31, 2011, were as follows:
| | | | | | | | |
| | | Contracts | | | Premiums
Received | |
Options outstanding at October 31, 2010 | | | — | | | $ | — | |
Options written | | | 40 | | | | 120,534 | |
Options terminated in closing purchase transactions | | | (40 | ) | | | (120,534 | ) |
Options expired | | | — | | | | — | |
| | | | | | | | |
Options outstanding at October 31, 2011 | | | — | | | $ | — | |
| | | | | | | | |
Note 5. Distributions and Tax Information
Distributions to shareholders, which are determined in accordance with federal income tax regulations and which may differ from generally accepted accounting principles, are recorded on the ex-dividends date. In order to present undistributed net investment income, accumulated net realized loss on investment and foreign currency transactions and paid-in capital in excess of par on the Statement of Assets and Liabilities that more closely represent their tax character, certain adjustments have been made to undistributed net investment income and accumulated net realized loss on investment and foreign currency transactions. For the year ended October 31, 2011, the adjustments were to increase undistributed net investment income and increase accumulated net realized loss on investment and foreign currency transactions by $3,719,424, due to reclassification of foreign currency gain, reclass of paydown and swap gain (loss), differences in the treatment of premium amortization and other book to tax adjustments. Net investment income, net realized gain on investment and foreign currency transactions and net assets were not affected by this change.
For the years ended October 31, 2011 and 2010, the tax character of dividends paid as reflected in the Statements of Changes in Net Assets were $13,779,725 and $12,469,636 of ordinary income, respectively.
As of October 31, 2011, the Fund had accumulated undistributed ordinary income on a tax basis of $1,621,289.
| | |
| 88 | | Visit our website at www.prudentialfunds.com |
The United States federal income tax basis of the Fund’s investments and the net unrealized appreciation as of October 31, 2011 were as follows:
| | | | | | | | | | |
Tax Basis | | Appreciation | | Depreciation | | Net
Unrealized
Appreciation | | Other Cost
Basis
Adjustments | | Total Net
Unrealized
Appreciation |
| $217,223,591 | | $7,273,984 | | $(2,340,137) | | $4,933,847 | | $725,548 | | $5,659,395 |
The differences between book and tax basis are primarily attributable to the deferred losses on wash sales, deferred losses on foreign currencies and difference in the treatment of amortization of premiums. The other cost basis adjustments are primarily attributable to appreciation (depreciation) of foreign currencies, swaps, options and futures, forward currency transactions and mark-to-market of receivables and payables.
For the federal income tax purposes, the Fund had a capital loss carryforward as of October 31, 2011, of approximately $9,371,000 of which $1,849,000 expires in 2014, $280,000 expires in 2015, $4,767,000 expires in 2016 and $2,475,000 expires in 2017. The Fund utilized approximately $403,000 of its capital loss carryforward to offset net taxable gains realized in the year ended October 31, 2011. Accordingly, no capital gains distributions are expected to be paid to shareholders until net gains have been realized in excess of such carryforward. Under the recently enacted Regulated Investment Company Modernization Act of 2010 (“the Act”), the Fund is permitted to carryforward capital losses incurred in taxable years beginning after December 22, 2010 (“post-enactment losses”) for an unlimited period. However, any post-enactment losses are required to be utilized before the utilization of losses incurred prior to the effective date of the Act. As a result of this ordering rule, capital loss carryforwards related to the taxable years beginning prior to the effective date of the Act may have an increased likelihood to expire unused. Additionally, post-enactment capital losses that are carried forward will retain their character as either short-term or long-term capital losses rather than being considered all short-term as under previous law.
Management has analyzed the Fund’s tax positions taken on federal income tax returns for all open tax years and has concluded that no provision for income tax is required in the Fund’s financial statements for the current reporting period. The Fund’s federal and state income and federal excise tax returns for tax years for which the applicable statutes of limitations have not expired are subject to examination by the Internal Revenue Service and state departments of revenue.
| | | | |
| Prudential Global Total Return Fund, Inc. | | | 89 | |
Notes to Financial Statements
continued
Note 6. Capital
The Fund offers Class A, Class B, Class C and Class Z shares. Class A shares are sold with a front-end sales charge of up to 4.50%. All investors who purchase Class A shares in an amount of $1 million or more and sell these shares within 12 months of purchase are subject to a contingent deferred sales charge (CDSC) of 1%, although the CDSC is waived for purchases by certain retirement and/or benefit plans. Class B shares are sold with a CDSC which declines from 5% to zero depending on the period of time the shares are held. Class C shares are sold with a CDSC of 1% on shares redeemed within the first 12 months after purchase. Class B shares automatically convert to Class A shares on a quarterly basis approximately seven years after purchase. In addition, under certain limited circumstances, an exchange may be made from Class A, Class B or Class C to Class Z shares or from Class Z to Class A shares of the Fund. A special exchange privilege is also available for shareholders who qualified to purchase Class A shares at net asset value. Class Q and Class Z shares are not subject to any sales or redemption charge and are offered exclusively for sale to a limited group of investors.
There are 2 billion authorized shares of common stock at $.01 par value per share, designated Class A, Class B, Class C, Class Q and Class Z, each of which consists of 500 million, 200 million, 400 million, 400 million and 500 million authorized shares, respectively.
| | |
| 90 | | Visit our website at www.prudentialfunds.com |
| | | | | | | | |
Class A | | Shares | | | Amount | |
Year ended October 31, 2011: | | | | | | | | |
Shares sold | | | 7,683,370 | | | $ | 53,906,696 | |
Shares issued in reinvestment of dividends | | | 1,390,175 | | | | 9,175,646 | |
Shares reacquired | | | (3,453,560 | ) | | | (23,759,306 | ) |
| | | | | | | | |
Net increase (decrease) in shares outstanding before conversion | | | 5,619,985 | | | | 39,323,036 | |
Shares issued upon conversion from Class B and Z | | | 81,431 | | | | 565,187 | |
Shares reacquired upon conversion into Class Z | | | (313,082 | ) | | | (2,212,938 | ) |
| | | | | | | | |
Net increase (decrease) in shares outstanding | | | 5,388,334 | | | $ | 37,675,285 | |
| | | | | | | | |
Year ended October 31, 2010: | | | | | | | | |
Shares sold | | | 1,713,037 | | | $ | 11,908,197 | |
Shares issued in reinvestment of dividends | | | 1,281,011 | | | | 8,566,590 | |
Shares reacquired | | | (2,306,028 | ) | | | (15,789,823 | ) |
| | | | | | | | |
Net increase (decrease) in shares outstanding before conversion | | | 688,020 | | | | 4,684,964 | |
Shares issued upon conversion from Class B | | | 50,664 | | | | 348,663 | |
| | | | | | | | |
Net increase (decrease) in shares outstanding | | | 738,684 | | | $ | 5,033,627 | |
| | | | | | | | |
Class B | | | | | | |
Year ended October 31, 2011: | | | | | | | | |
Shares sold | | | 442,894 | | | $ | 3,077,125 | |
Shares issued in reinvestment of dividends | | | 33,384 | | | | 219,464 | |
Shares reacquired | | | (137,775 | ) | | | (945,525 | ) |
| | | | | | | | |
Net increase (decrease) in shares outstanding before conversion | | | 338,503 | | | | 2,351,064 | |
Shares reacquired upon conversion into Class A | | | (67,402 | ) | | | (467,056 | ) |
| | | | | | | | |
Net increase (decrease) in shares outstanding | | | 271,101 | | | $ | 1,884,008 | |
| | | | | | | | |
Year ended October 31, 2010: | | | | | | | | |
Shares sold | | | 222,353 | | | $ | 1,546,827 | |
Shares issued in reinvestment of dividends | | | 33,534 | | | | 224,146 | |
Shares reacquired | | | (164,189 | ) | | | (1,108,733 | ) |
| | | | | | | | |
Net increase (decrease) in shares outstanding before conversion | | | 91,698 | | | | 662,240 | |
Shares reacquired upon conversion into Class A | | | (50,738 | ) | | | (348,663 | ) |
| | | | | | | | |
Net increase (decrease) in shares outstanding | | | 40,960 | | | $ | 313,577 | |
| | | | | | | | |
Class C | | | | | | |
Year ended October 31, 2011: | | | | | | | | |
Shares sold | | | 2,284,453 | | | $ | 15,761,032 | |
Shares issued in reinvestment of dividends | | | 80,049 | | | | 529,276 | |
Shares reacquired | | | (417,012 | ) | | | (2,853,362 | ) |
| | | | | | | | |
Net increase (decrease) in shares outstanding | | | 1,947,490 | | | $ | 13,436,946 | |
| | | | | | | | |
Year ended October 31, 2010: | | | | | | | | |
Shares sold | | | 455,034 | | | $ | 3,190,267 | |
Shares issued in reinvestment of dividends | | | 52,235 | | | | 347,794 | |
Shares reacquired | | | (261,183 | ) | | | (1,774,953 | ) |
| | | | | | | | |
Net increase (decrease) in shares outstanding | | | 246,086 | | | $ | 1,763,108 | |
| | | | | | | | |
| | | | |
| Prudential Global Total Return Fund, Inc. | | | 91 | |
Notes to Financial Statements
continued
| | | | | | | | |
Class Z | | Shares | | | Amount | |
Year ended October 31, 2011: | | | | | | | | |
Shares sold | | | 6,896,780 | | | $ | 48,578,770 | |
Shares issued in reinvestment of dividends | | | 84,288 | | | | 567,446 | |
Shares reacquired | | | (1,911,714 | ) | | | (13,211,401 | ) |
| | | | | | | | |
Net increase (decrease) in shares outstanding before conversion | | | 5,069,354 | | | | 35,934,815 | |
Shares issued upon conversion from Class A | | | 312,475 | | | | 2,212,938 | |
Shares reacquired upon conversion into Class A | | | (14,089 | ) | | | (98,131 | ) |
| | | | | | | | |
Net increase (decrease) in shares outstanding | | | 5,367,740 | | | $ | 38,049,622 | |
| | | | | | | | |
Year ended October 31, 2010: | | | | | | | | |
Shares sold | | | 560,270 | | | $ | 4,022,994 | |
Shares issued in reinvestment of dividends | | | 52,099 | | | | 349,432 | |
Shares reacquired | | | (378,248 | ) | | | (2,592,441 | ) |
| | | | | | | | |
Net increase (decrease) in shares outstanding | | | 234,121 | | | $ | 1,779,985 | |
| | | | | | | | |
Note 7. Borrowings
The Fund, along with other affiliated registered investment companies (the “Funds”), is a party to a Syndicated Credit Agreement (“SCA”) with a group of banks. The purpose of the SCA is to provide an alternative source of temporary funding for capital share redemptions. The SCA provides for a commitment of $750 million for the period December 17, 2010 through December 16, 2011. The Funds pay an annualized commitment fee of 0.10% of the unused portion of the SCA. Prior to December 17, 2010, the Funds had another Syndicated Credit Agreement (the “Expired SCA”) of a $500 million commitment with an annualized commitment fee of 0.15% of the unused portion. Interest on any borrowings under these SCA’s is paid at contracted market rates. The commitment fee for the unused amount is accrued daily and paid quarterly. The SCA has been renewed on substantially similar terms with an increase in the amount of commitment to $900 million.
The Fund utilized the line of credit during the year ended October 31, 2011. The average daily balance for the 7 days that the Fund had loans outstanding during the year was approximately $349,000, borrowed at a weighted average interest rate of 1.47%. At October 31, 2011, the Fund did not have an outstanding loan amount.
| | |
| 92 | | Visit our website at www.prudentialfunds.com |
Note 8. Dividends to Shareholders
Subsequent to the fiscal year end and in addition to the monthly dividends paid by the Fund, the Fund declared ordinary income dividends on December 21, 2011 to shareholders of record on December 22, 2011. The ex-dividend date was December 23, 2011. The per share amounts declared were as follows:
| | | | |
| | | Ordinary Income | |
Class A | | $ | 0.0487 | |
Class B | | $ | 0.0487 | |
Class C | | $ | 0.0487 | |
Class Z | | $ | 0.0487 | |
Note 9. New Accounting Pronouncements
In April 2011, the Financial Accounting Standards Board (“FASB”) issued Accounting Standards Update (“ASU”) No. 2011-03 “Reconsideration of Effective Control for Repurchase Agreements”. The objective of ASU No. 2011-03 is to improve the accounting for repurchase agreements and other agreements that both entitle and obligate a transferor to repurchase or redeem financial assets before their maturity. Under previous guidance, whether or not to account for a transaction as a sale was based on, in part, if the entity maintained effective control over the transferred financial assets. ASU No. 2011-03 removes the transferor’s ability criterion from the effective control assessment. This guidance is effective prospectively for interim and annual reporting periods beginning on or after December 15, 2011. At this time, management is evaluating the implications of ASU No. 2011-03 and its impact on the financial statements has not been determined.
In May 2011, the FASB issued ASU No. 2011-04 “Amendments to Achieve Common Fair Value Measurement and Disclosure Requirements in U.S. GAAP and IFRSs”. ASU No. 2011-04 includes common requirements for measurement of and disclosure about fair value between U.S. GAAP and IFRS. ASU No. 2011-04 will require reporting entities to disclose quantitative information about the unobservable inputs used in the fair value measurements categorized within Level 3 of the fair value hierarchy. In addition, ASU No. 2011-04 will require reporting entities to make disclosures about amounts and reasons for all transfers in and out of Level 1 and Level 2 fair value measurements. The new and revised disclosures are effective for interim and annual reporting periods beginning after December 15, 2011. At this time, management is evaluating the implications of ASU No. 2011-04 and its impact on the financial statements has not been determined.
| | | | |
| Prudential Global Total Return Fund, Inc. | | | 93 | |
Financial Highlights
| | | | | | | | | | | | | | | | | | | | | | | | | | | | |
| Class A Shares | |
| | | Year Ended October 31, | | | | | Ten Months
Ended
October 31, | | | | | Year Ended
December 31, | |
| | | 2011 | | | 2010 | | | 2009 | | | 2008 | | | | | 2007(b) | | | | | 2006 | |
| Per Share Operating Performance(a): | | | | | | | | | | | | | | | | | | | | | | | | | | | | |
| Net Asset Value, Beginning Of Period | | | $7.42 | | | | $7.20 | | | | $5.76 | | | | $7.00 | | | | | | $6.69 | | | | | | $6.51 | |
| Income (loss) from investment operations: | | | | | | | | | | | | | | | | | | | | | | | | | | | | |
| Net investment income | | | .23 | | | | .27 | | | | .30 | | | | .31 | | | | | | .20 | | | | | | .19 | |
| Net realized and unrealized gain (loss) on investment and foreign currency transactions | | | .05 | | | | .66 | | | | 1.46 | | | | (1.11 | ) | | | | | .32 | | | | | | .16 | |
| Total from investment operations | | | .28 | | | | .93 | | | | 1.76 | | | | (.80 | ) | | | | | .52 | | | | | | .35 | |
| Less Dividends | | | | | | | | | | | | | | | | | | | | | | | | | | | | |
| Dividends from net investment income* | | | (.71 | ) | | | (.71 | ) | | | (.32 | ) | | | (.44 | ) | | | | | (.21 | ) | | | | | (.17 | ) |
| Net asset value, end of period | | | $6.99 | | | | $7.42 | | | | $7.20 | | | | $5.76 | | | | | | $7.00 | | | | | | $6.69 | |
| Total Return(c): | | | 4.60% | | | | 14.25% | | | | 31.42% | | | | (12.19)% | | | | | | 7.81% | | | | | | 5.66% | |
| | | | | | | |
| Ratios/Supplemental Data: | |
| Net assets, end of period (000) | | | $154,056 | | | | $123,507 | | | | $114,554 | | | | $97,894 | | | | | | $122,811 | | | | | | $131,477 | |
| Average net assets (000) | | | $125,292 | | | | $112,110 | | | | $103,462 | | | | $119,545 | | | | | | $123,600 | | | | | | $139,865 | |
| Ratios to average net assets(h): | | | | | | | | | | | | | | | | | | | | | | | | | | | | |
| Expenses, including distribution and service (12b-1) fees(d) | | | 1.35% | (e) | | | 1.35% | (e) | | | 1.35% | (e) | | | 1.36% | (e) | | | | | 1.36% | (e)(f) | | | | | 1.36% | (e) |
| Expenses, excluding distribution and service (12b-1) fees | | | 1.10% | (e) | | | 1.10% | (e) | | | 1.10% | (e) | | | 1.11% | (e) | | | | | 1.11% | (e)(f) | | | | | 1.11% | (e) |
| Net investment income | | | 3.28% | (e) | | | 3.97% | (e) | | | 4.78% | (e) | | | 4.55% | (e) | | | | | 3.63% | (e)(f) | | | | | 2.87% | (e) |
| For Class A, B, C and Z shares: | | | | | | | | | | | | | | | | | | | | | | | | | | | | |
| Portfolio turnover rate | | | 203% | | | | 117% | | | | 164% | | | | 292% | | | | | | 234% | (g) | | | | | 233% | |
(a) Calculated based on average shares outstanding during the period.
(b) For the ten month period ended October 31, 2007. The Fund changed its fiscal year end from December 31 to October 31.
(c) Total return does not consider the effects of sales loads. Total return is calculated assuming a purchase of a share on the first day and a sale on the last day of each period reported, and includes reinvestment of dividends and distributions. Total returns may reflect adjustments to conform to generally accepted accounting principles. Total returns for periods less than one full year are not annualized.
(d) The distributor of the Fund has contractually agreed to limit its distribution and service (12b-1) fees to .25% of the average daily net assets of the Class A shares through February 28, 2013.
(e) The Manager of the Fund has agreed to reimburse the Fund in order to limit operating expenses (excluding interest, taxes and brokerage commissions and certain extraordinary expenses) to 1.35% of the average daily net assets of Class A. If the manager had not reimbursed the Fund, the annual expenses (both including and excluding distribution and service (12b-1) fees) and net investment income ratios would be 1.42%, 1.17% and 2.81%, respectively, for the year ended December 31, 2006, 1.37%, 1.12% and 3.62%, respectively, for the ten-month period ended October 31, 2007, 1.44%, 1.19% and 4.47%, respectively, for the year ended October 31, 2008, 1.51%, 1.26% and 4.62%, respectively, for the year ended October 31, 2009, 1.42%, 1.17% and 3.90%, respectively, for the year ended October 31, 2010 and 1.39%, 1.14% and 3.24%, respectively, for the year ended October 31, 2011.
(f) Annualized.
(g) Not annualized.
(h) Does not include expenses of the underlying portfolios in which the Fund invests.
* Dividends from net investment income include other items that are ordinary income for tax purposes.
See Notes to Financial Statements.
| | |
| 94 | | Visit our website at www.prudentialfunds.com |
| | | | | | | | | | | | | | | | | | | | | | | | | | | | |
| Class B Shares | |
| | | Year Ended October 31, | | | | | Ten Months
Ended
October 31, | | | | | Year Ended
December 31, | |
| | | 2011 | | | 2010 | | | 2009 | | | 2008 | | | | | 2007(b) | | | | | 2006 | |
| Per Share Operating Performance(a): | | | | | | | | | | | | | | | | | | | | | | | | | | | | |
| Net Asset Value, Beginning Of Period | | | $7.41 | | | | $7.19 | | | | $5.76 | | | | $6.98 | | | | | | $6.69 | | | | | | $6.51 | |
| Income (loss) from investment operations: | | | | | | | | | | | | | | | | | | | | | | | | | | | | |
| Net investment income | | | .17 | | | | .22 | | | | .25 | | | | .26 | | | | | | .16 | | | | | | .14 | |
| Net realized and unrealized gain (loss) on investment and foreign currency transactions | | | .06 | | | | .66 | | | | 1.45 | | | | (1.10 | ) | | | | | .30 | | | | | | .17 | |
| Total from investment operations | | | .23 | | | | .88 | | | | 1.70 | | | | (.84 | ) | | | | | .46 | | | | | | .31 | |
| Less Dividends | | | | | | | | | | | | | | | | | | | | | | | | | | | | |
| Dividends from net investment income* | | | (.65 | ) | | | (.66 | ) | | | (.27 | ) | | | (.38 | ) | | | | | (.17 | ) | | | | | (.13 | ) |
| Net asset value, end of period | | | $6.99 | | | | $7.41 | | | | $7.19 | | | | $5.76 | | | | | | $6.98 | | | | | | $6.69 | |
| Total Return(c): | | | 3.86% | | | | 13.40% | | | | 30.25% | | | | (12.67)% | | | | | | 7.06% | | | | | | 4.90% | |
| | | | | | | |
| Ratios/Supplemental Data: | |
| Net assets, end of period(000) | | | $5,018 | | | | $3,312 | | | | $2,920 | | | | $3,275 | | | | | | $3,508 | | | | | | $3,874 | |
| Average net assets (000) | | | $3,465 | | | | $3,082 | | | | $2,927 | | | | $3,957 | | | | | | $3,627 | | | | | | $4,726 | |
| Ratios to average net assets(f): | | | | | | | | | | | | | | | | | | | | | | | | | | | | |
| Expenses, including distribution and service (12b-1) fees | | | 2.10% | (d) | | | 2.10% | (d) | | | 2.10% | (d) | | | 2.11% | (d) | | | | | 2.11% | (d)(e) | | | | | 2.11% | (d) |
| Expenses, excluding distribution and service (12b-1) fees | | | 1.10% | (d) | | | 1.10% | (d) | | | 1.10% | (d) | | | 1.11% | (d) | | | | | 1.11% | (d)(e) | | | | | 1.11% | (d) |
| Net investment income | | | 2.52% | (d) | | | 3.23% | (d) | | | 4.03% | (d) | | | 3.80% | (d) | | | | | 2.86% | (d)(e) | | | | | 2.09% | (d) |
(a) Calculated based on average shares outstanding during the period.
(b) For the ten month period ended October 31, 2007. The Fund changed its fiscal year end from December 31 to October 31.
(c) Total return does not consider the effects of sales loads. Total return is calculated assuming a purchase of a share on the first day and a sale on the last day of each period reported, and includes reinvestment of dividends and distributions. Total returns may reflect adjustments to conform to generally accepted accounting principles. Total returns for periods less than one full year are not annualized.
(d) The Manager of the Fund has agreed to reimburse the Fund in order to limit operating expenses (excluding interest, taxes and brokerage commissions and certain extraordinary expenses) to 2.10% of the average daily net assets of Class B. If the manager had not reimbursed the Fund, the annual expenses (both including and excluding distribution and service (12b-1) fees) and net investment income ratios would be 2.17%, 1.17% and 2.03%, respectively, for the year ended December 31, 2006, 2.12%, 1.12% and 2.86%, respectively, for the ten-month period ended October 31, 2007, 2.19%, 1.19%, 3.72%, respectively, for the year ended October 31, 2008, 2.26%, 1.26% and 3.87%, respectively, for the year ended October 31, 2009, 2.17%, 1.17% and 3.16%, respectively, for the year ended October 31, 2010 and 2.14%, 1.14% and 2.48%, respectively, for the year ended October 31, 2011.
(e) Annualized.
(f) Does not include expenses of the underlying portfolios in which the Fund invests.
* Dividends from net investment income include other items that are ordinary income for tax purposes.
See Notes to Financial Statements.
| | | | |
| Prudential Global Total Return Fund, Inc. | | | 95 | |
Financial Highlights
continued
| | | | | | | | | | | | | | | | | | | | | | | | | | | | |
| Class C Shares | |
| | | Year Ended October 31, | | | | | Ten Months
Ended
October 31, | | | | | Year Ended
December 31, | |
| | | 2011 | | | 2010 | | | 2009 | | | 2008 | | | | | 2007(b) | | | | | 2006 | |
| Per Share Operating Performance(a): | | | | | | | | | | | | | | | | | | | | | | | | | | | | |
| Net Asset Value, Beginning Of Period | | | $7.39 | | | | $7.17 | | | | $5.74 | | | | $6.97 | | | | | | $6.68 | | | | | | $6.50 | |
| Income (loss) from investment operations: | | | | | | | | | | | | | | | | | | | | | | | | | | | | |
| Net investment income | | | .17 | | | | .23 | | | | .27 | | | | .28 | | | | | | .17 | | | | | | .16 | |
| Net realized and unrealized gain (loss) on investment and foreign currency transactions | | | .07 | | | | .67 | | | | 1.45 | | | | (1.10 | ) | | | | | .31 | | | | | | .17 | |
| Total from investment operations | | | .24 | | | | .90 | | | | 1.72 | | | | (.82 | ) | | | | | .48 | | | | | | .33 | |
| Less Dividends | | | | | | | | | | | | | | | | | | | | | | | | | | | | |
| Dividends from net investment income* | | | (.66 | ) | | | (.68 | ) | | | (.29 | ) | | | (.41 | ) | | | | | (.19 | ) | | | | | (.15 | ) |
| Net asset value, end of period | | | $6.97 | | | | $7.39 | | | | $7.17 | | | | $5.74 | | | | | | $6.97 | | | | | | $6.68 | |
| Total Return(c): | | | 4.00% | | | | 13.75% | | | | 30.73% | | | | (12.51)% | | | | | | 7.29% | | | | | | 5.11% | |
| |
| Ratios/Supplemental Data: | |
| Net assets, end of period (000) | | | $19,408 | | | | $6,180 | | | | $4,236 | | | | $3,702 | | | | | | $2,277 | | | | | | $1,056 | |
| Average net assets (000) | | | $10,010 | | | | $4,563 | | | | $3,467 | | | | $3,974 | | | | | | $1,279 | | | | | | $1,470 | |
| Ratios to average net assets(g): | | | | | | | | | | | | | | | | | | | | | | | | | | | | |
| Expenses, including distribution and service (12b-1) fees(d) | | | 2.05% | (e) | | | 1.85% | (e) | | | 1.85% | (e) | | | 1.86% | (e) | | | | | 1.86% | (e)(f) | | | | | 1.86% | (e) |
| Expenses, excluding distribution and service (12b-1) fees | | | 1.10% | (e) | | | 1.10% | (e) | | | 1.10% | (e) | | | 1.11% | (e) | | | | | 1.11% | (e)(f) | | | | | 1.11% | (e) |
| Net investment income | | | 2.56% | (e) | | | 3.45% | (e) | | | 4.28% | (e) | | | 4.07% | (e) | | | | | 3.17% | (e)(f) | | | | | 2.34% | (e) |
(a) Calculated based on average shares outstanding during the period.
(b) For the ten month period ended October 31, 2007. The Fund changed its fiscal year end from December 31 to October 31.
(c) Total return does not consider the effects of sales loads. Total return is calculated assuming a purchase of a share on the first day and a sale on the last day of each period reported, and includes reinvestment of dividends and distributions. Total returns may reflect adjustments to conform to generally accepted accounting principles. Total returns for periods less than one full year are not annualized.
(d) The distributor of the Fund had contractually agreed to limit its distribution and service (12b-1) fees to .75% of the average daily net assets of the Class C shares through February 28, 2011.
(e) The Manager of the Fund has agreed to reimburse the Fund in order to limit operating expenses (excluding interest, taxes and brokerage commissions and certain extraordinary expenses) to 2.10% (1.85% through February 28, 2011) of the average daily net assets of Class C. If the manager had not reimbursed the Fund, the annual expenses (both including and excluding distribution and service (12b-1) fees) and net investment income ratios would be 1.93%, 1.18% and 2.27%, respectively, for the year ended December 31, 2006, 1.87%, 1.12% and 3.32%, respectively, for the ten-month period ended October 31, 2007, 1.94%, 1.19% and 3.99%, respectively, for the year ended October 31, 2008, 2.01%, 1.26% and 4.12%, respectively, for the year ended October 31, 2009, 1.92%, 1.17% and 3.38%, respectively, for the year ended October 31, 2010 and 2.09%, 1.14% and 2.52%, respectively, for the year ended October 31, 2011.
(f) Annualized.
(g) Does not include expenses of the underlying portfolios in which the Fund invests.
* Dividends from net investment income include other items that are ordinary income for tax purposes.
See Notes to Financial Statements.
| | |
| 96 | | Visit our website at www.prudentialfunds.com |
| | | | | | | | | | | | | | | | | | | | | | | | | | | | |
| Class Z Shares | |
| | | Year Ended October 31, | | | | | Ten Months
Ended
October 31, | | | | | Year Ended
December 31, | |
| | | 2011 | | | 2010 | | | 2009 | | | 2008 | | | | | 2007(b) | | | | | 2006 | |
| Per Share Operating Performance(a): | | | | | | | | | | | | | | | | | | | | | | | | | | | | |
| Net Asset Value, Beginning Of Period | | | $7.44 | | | | $7.22 | | | | $5.78 | | | | $7.02 | | | | | | $6.72 | | | | | | $6.53 | |
| Income (loss) from investment operations: | | | | | | | | | | | | | | | | | | | | | | | | | | | | |
| Net investment income | | | .22 | | | | .28 | | | | .32 | | | | .32 | | | | | | .21 | | | | | | .20 | |
| Net realized and unrealized gain (loss) on investment and foreign currency transactions | | | .08 | | | | .67 | | | | 1.45 | | | | (1.10 | ) | | | | | .31 | | | | | | .17 | |
| Total from investment operations | | | .30 | | | | .95 | | | | 1.77 | | | | (.78 | ) | | | | | .52 | | | | | | .37 | |
| Less Dividends | | | | | | | | | | | | | | | | | | | | | | | | | | | | |
| Dividends from net investment income* | | | (.73 | ) | | | (.73 | ) | | | (.33 | ) | | | (.46 | ) | | | | | (.22 | ) | | | | | (.18 | ) |
| Net asset value, end of period | | | $7.01 | | | | $7.44 | | | | $7.22 | | | | $5.78 | | | | | | $7.02 | | | | | | $6.72 | |
| Total Return(c): | | | 4.87% | | | | 14.49% | | | | 31.62% | | | | (11.90)% | | | | | | 7.99% | | | | | | 5.84% | |
| | | | | | | |
| Ratios/Supplemental Data: | |
| Net assets, end of period (000) | | | $42,330 | | | | $4,978 | | | | $3,141 | | | | $1,823 | | | | | | $2,163 | | | | | | $2,160 | |
| Average net assets (000) | | | $12,813 | | | | $3,507 | | | | $1,942 | | | | $2,147 | | | | | | $2,053 | | | | | | $3,212 | |
| Ratios to average net assets(f): | | | | | | | | | | | | | | | | | | | | | | | | | | | | |
| Expenses, including distribution and service (12b-1) fees | | | 1.10% | (d) | | | 1.10% | (d) | | | 1.10% | (d) | | | 1.11% | (d) | | | | | 1.11% | (d)(e) | | | | | 1.11% | (d) |
| Expenses, excluding distribution and service (12b-1) fees | | | 1.10% | (d) | | | 1.10% | (d) | | | 1.10% | (d) | | | 1.11% | (d) | | | | | 1.11% | (d)(e) | | | | | 1.11% | (d) |
| Net investment income | | | 3.50% | (d) | | | 4.25% | (d) | | | 5.03% | (d) | | | 4.78% | (d) | | | | | 3.86% | (d)(e) | | | | | 3.06% | (d) |
(a) Calculated based on average shares outstanding during the period.
(b) For the ten month period ended October 31, 2007. The Fund changed its fiscal year end from December 31 to October 31.
(c) Total return is calculated assuming a purchase of a share on the first day and a sale on the last day of each period reported, and includes reinvestment of dividends and distributions. Total returns may reflect adjustments to conform to generally accepted accounting principles. Total returns for periods less than one full year are not annualized.
(d) The Manager of the Fund has agreed to reimburse the Fund in order to limit operating expenses (excluding interest, taxes and brokerage commissions and certain extraordinary expenses) to 1.10% of the average daily net assets of Class Z. If the manager had not reimbursed the Fund, the annual expenses (both including and excluding distribution and service (12b-1) fees) and net investment income ratios would be 1.17%, 1.17% and 3.00%, respectively, for the year ended December 31, 2006, 1.12%, 1.12% and 3.85%, respectively, for the ten-month period ended October 31, 2007, 1.19%, 1.19% and 4.70%, respectively, for the year ended October 31, 2008, 1.26%, 1.26%, 4.88%, respectively, for the year ended October 31, 2009, 1.17%, 1.17% and 4.18%, respectively, for the year ended October 31, 2010 and 1.14%, 1.14% and 3.46%, respectively, for the year ended October 31, 2011.
(e) Annualized.
(f) Does not include expenses of the underlying portfolios in which the Fund invests.
* Dividends from net investment income include other items that are ordinary income for tax purposes.
See Notes to Financial Statements.
| | | | |
| Prudential Global Total Return Fund, Inc. | | | 97 | |
Report of Independent Registered Public
Accounting Firm
The Board of Directors and Shareholders
Prudential Global Total Return Fund, Inc.:
We have audited the accompanying statement of assets and liabilities of Prudential Global Total Return Fund, Inc. (hereafter referred to as the “Fund”), including the portfolio of investments, as of October 31, 2011, and the related statement of operations for the year then ended, the statement of changes in net assets for each of the years in the two-year period then ended and the financial highlights for each of the years in the four-year period then ended, the ten-month period ended October 31, 2007 and the year ended December 31, 2006. These financial statements and financial highlights are the responsibility of the Fund’s management. Our responsibility is to express an opinion on these financial statements and financial highlights based on our audits.
We conducted our audits in accordance with the standards of the Public Company Accounting Oversight Board (United States). Those standards require that we plan and perform the audit to obtain reasonable assurance about whether the financial statements and financial highlights are free of material misstatement. An audit includes examining, on a test basis, evidence supporting the amounts and disclosures in the financial statements. Our procedures included confirmation of securities owned as of October 31, 2011, by correspondence with the custodian, transfer agent and brokers or by other appropriate auditing procedures when replies from brokers were not received. An audit also includes assessing the accounting principles used and significant estimates made by management, as well as evaluating the overall financial statement presentation. We believe that our audits provide a reasonable basis for our opinion.
In our opinion, the financial statements and financial highlights referred to above present fairly, in all material respects, the financial position of the Fund as of October 31, 2011, and the results of its operations for the year then ended, the changes in its net assets for each of the years in the two-year period then ended and the financial highlights for each of the years in the four-year period then ended, the ten-month period ended October 31, 2007 and the year ended December 31, 2006, in conformity with U.S. generally accepted accounting principles.
New York, New York
December 22, 2011
| | |
| 98 | | Visit our website at www.prudentialfunds.com |
Federal Income Tax Information
(Unaudited)
We are required by the Internal Revenue Code of 1986, as amended (“the Code”), to advise you within 60 days of the Fund’s year end October 31, 2011 as to the federal tax status of distributions paid by the Fund during such year. We are advising you that during its fiscal period ended October 31, 2011, the Fund paid ordinary income dividends for Class A, Class B, Class C and Class Z shares of $0.71 per share, $0.65 per share, $0.66 per share and $0.73 per share, respectively, which are taxable as such.
For the year ended October 31, 2011, the Fund designates the maximum amount allowable but not less than 40.29% as interest related dividends in accordance with Sections 871(k)(1) and 881(e)(1) of the Internal Revenue Code.
In January 2012, you will be advised on IRS Form 1099-DIV or substitute 1099-DIV as to the federal tax status of distributions received by you in calendar year 2011.
We are required by New York, California, Massachusetts, Missouri and Oregon to inform you that dividends which have been derived from federal obligations are not taxable to shareholders provided the mutual fund meets certain requirements mandated by the respective states’ taxing authorities. We are pleased to report that 4.01% of the dividends paid by the Fund qualify for such deductions. Due to certain minimum portfolio holding requirements in California, Connecticut and New York, residents of those states will not be able to exclude interest on federal obligations from state and local tax.
For more detailed information regarding your federal, state and local taxes, you should contact your tax adviser.
| | | | |
| Prudential Global Total Return Fund, Inc. | | | 99 | |
INFORMATION ABOUT BOARD MEMBERS AND OFFICERS
(Unaudited)
Information about Board Members and Officers is set forth below. Board Members who are not deemed to be “interested persons” of the Fund, as defined in the 1940 Act, are referred to as “Independent Board Members.” Board Members who are deemed to be “interested persons” of the Fund are referred to as “Interested Board Members.” The Board Members are responsible for the overall supervision of the operations of the Fund and perform the various duties imposed on the directors of investment companies by the 1940 Act.
| | | | |
Independent Board Members(1) | | | | |
Name, Address, Age Position(s) Portfolios Overseen | | Principal Occupation(s) During Past Five Years | | Other Directorships Held |
Kevin J. Bannon (59) Board Member Portfolios Overseen: 58 | | Managing Director (since April 2008) and Chief Investment Officer (since October 2008) of Highmount Capital LLC (registered investment adviser); formerly Executive Vice President and Chief Investment Officer (April 1993-August 2007) of Bank of New York Company; President (May 2003-May 2007) of BNY Hamilton Family of Mutual Funds. | | Director of Urstadt Biddle Properties (since September 2008). |
Linda W. Bynoe (59) Board Member Portfolios Overseen: 58 | | President and Chief Executive Officer (since March 1995) and formerly Chief Operating Officer (December 1989-February 1995) of Telemat Ltd. (management consulting); formerly Vice President (January 1985-June 1989) at Morgan Stanley & Co (broker-dealer). | | Director of Simon Property Group, Inc. (retail real estate) (since May 2003); Director of Anixter International, Inc. (communication products distributor) (since January 2006); Director of Northern Trust Corporation (financial services) (since April 2006); Trustee of Equity Residential (residential real estate) (since December 2009); formerly Director of Dynegy Inc. (power generation) (September 2002-May 2006). |
Michael S. Hyland, CFA (66) Board Member Portfolios Overseen: 58 | | Independent Consultant (since February 2005); formerly Senior Managing Director (July 2001-February 2005) of Bear Stearns & Co, Inc.; Global Partner, INVESCO (1999-2001); Managing Director and President of Salomon Brothers Asset Management (1989-1999). | | None. |
Douglas H. McCorkindale (72) Board Member Portfolios Overseen: 58 | | Formerly Chairman (February 2001-June 2006), Chief Executive Officer (June 2000-July 2005), President (September 1997-July 2005) and Vice Chairman (March 1984-May 2000) of Gannett Co. Inc. (publishing and media). | | Director of Lockheed Martin Corp. (aerospace and defense) (since May 2001). |
Visit our website at www.prudentialfunds.com
| | | | |
Independent Board Members(1) | | | | |
Name, Address, Age Position(s) Portfolios Overseen | | Principal Occupation(s) During Past Five Years | | Other Directorships Held |
Stephen P. Munn (69) Board Member Portfolios Overseen: 58 | | Lead Director (since 2007) and formerly Chairman (1993-2007) of Carlisle Companies Incorporated (manufacturer of industrial products). | | Lead Director (since 2007) of Carlisle Companies Incorporated (manufacturer of industrial products). |
Richard A. Redeker (68) Board Member & Independent Chair Portfolios Overseen: 58 | | Retired Mutual Fund Senior Executive (43 years); Management Consultant; Independent Directors Council (organization of 2,800 Independent Mutual Fund Directors)-Executive Committee, Chair of Policy Steering Committee, Governing Council. | | None. |
Robin B. Smith (72) Board Member Portfolios Overseen: 58 | | Chairman of the Board (since January 2003) of Publishers Clearing House (direct marketing); Member of the Board of Directors of ADLPartner (marketing) (since December 2010); formerly Chairman and Chief Executive Officer (August 1996-January 2003) of Publishers Clearing House. | | Formerly Director of BellSouth Corporation (telecommunications) (1992-2006). |
Stephen G. Stoneburn (68) Board Member Portfolios Overseen: 58 | | President and Chief Executive Officer (since June 1996) of Quadrant Media Corp. (publishing company); formerly President (June 1995-June 1996) of Argus Integrated Media, Inc.; Senior Vice President and Managing Director (January 1993-1995) of Cowles Business Media; Senior Vice President of Fairchild Publications, Inc (1975-1989). | | None. |
Prudential Global Total Return Fund, Inc.
| | | | |
| Interested Board Members(1) | | | | |
Name, Address, Age Position(s) Portfolios Overseen | | Principal Occupation(s) During Past Five Years | | Other Directorships Held |
Judy A. Rice* (63) Board Member & President Portfolios Overseen: 58 | | President, Chief Executive Officer, Chief Operating Officer and Officer-In-Charge (since February 2003) of Prudential Investments LLC; President, Chief Executive Officer and Officer-In-Charge (since April 2003) of Prudential Mutual Fund Services LLC; President, Chief Executive Officer (since May 2011) and Executive Vice President (since December 2008) of Prudential Investment Management Services LLC; Member of the Board of Directors of Jennison Associates LLC (since November 2010); formerly Vice President (February 1999-April 2006) of Prudential Investment Management Services LLC; President, COO, CEO and Manager of PIFM Holdco, LLC (since April 2006); formerly President, Chief Executive Officer, Chief Operating Officer and Officer-In-Charge (May 2003-June 2005) and Director (May 2003-March 2006) and Executive Vice President (June 2005-March 2006) of AST Investment Services, Inc.; Member of Board of Governors of the Investment Company Institute. | | None. |
Stuart S. Parker* (49) Board Member & President Portfolios Overseen: 58 | | President of Prudential Investments LLC (since January 2012); Executive Vice President of Jennison Associates LLC and Head of Retail Distribution of Prudential Investments LLC (June 2005 - December 2011). | | None. |
Scott E. Benjamin (38) Board Member & Vice President Portfolios Overseen: 58 | | Executive Vice President (since June 2009) of Prudential Investments LLC and Prudential Investment Management Services LLC; Executive Vice President (since September 2009) of AST Investment Services, Inc.; Senior Vice President of Product Development and Marketing, Prudential Investments (since February 2006); Vice President of Product Development and Product Management, Prudential Investments (2003-2006). | | None. |
* Ms. Rice has announced her retirement as President and Board Member effective December 31, 2011. Ms. Rice has been appointed as Vice President effective January 1, 2012. The Board has appointed Stuart S. Parker as President and Board Member effective January 1, 2012.
Visit our website at www.prudentialfunds.com
(1) The year that each Board Member joined the Fund’s Board is as follows:
Kevin J. Bannon, 2008; Linda W. Bynoe, 2005; Michael S. Hyland, 2008; 2003; Douglas H. McCorkindale, 1996; Stephen P. Munn, 2008; Richard A. Redeker, 1993; Robin B. Smith, 1996; Stephen G. Stoneburn, 2003; Judy A. Rice, Board Member since 2000 and President since 2003; Scott E. Benjamin, Board Member since 2010 and Vice President since 2009.
| | | | |
| Fund Officers(a)(1) | | | | |
Name, Address and Age Position with Fund | | | | Principal Occupation(s) During Past Five Years |
Kathryn L. Quirk (59) Chief Legal Officer | | | | Vice President and Corporate Counsel (since September 2004) of Prudential; Executive Vice President, Chief Legal Officer and Secretary (since July 2005) of PI and Prudential Mutual Fund Services LLC; Vice President and Corporate Counsel (since June 2005) and Secretary (since February 2006) of AST Investment Services, Inc.; formerly Senior Vice President and Assistant Secretary (November 2004-August 2005) of PI; formerly Assistant Secretary (June 2005-February 2006) of AST Investment Services, Inc.; formerly Managing Director, General Counsel, Chief Compliance Officer, Chief Risk Officer and Corporate Secretary (1997-2002) of Zurich Scudder Investments, Inc. |
Deborah A. Docs (53) Secretary | | | | Vice President and Corporate Counsel (since January 2001) of Prudential; Vice President (since December 1996) and Assistant Secretary (since March 1999) of PI; formerly Vice President and Assistant Secretary (May 2003-June 2005) of AST Investment Services, Inc. |
Jonathan D. Shain (53) Assistant Secretary | | | | Vice President and Corporate Counsel (since August 1998) of Prudential; Vice President and Assistant Secretary (since May 2001) of PI; Vice President and Assistant Secretary (since February 2001) of PMFS; formerly Vice President and Assistant Secretary (May 2003-June 2005) of AST Investment Services, Inc. |
Claudia DiGiacomo (37) Assistant Secretary | | | | Vice President and Corporate Counsel (since January 2005) of Prudential; Vice President and Assistant Secretary of PI (since December 2005); Associate at Sidley Austin Brown & Wood LLP (1999-2004). |
John P. Schwartz (40) Assistant Secretary | | | | Vice President and Corporate Counsel (since April 2005) of Prudential; Vice President and Assistant Secretary of PI (since December 2005); Associate at Sidley Austin Brown & Wood LLP (1997-2005). |
Andrew R. French (49) Assistant Secretary | | | | Vice President and Corporate Counsel (since February 2010) of Prudential; formerly Director and Corporate Counsel (2006-2010) of Prudential; Vice President and Assistant Secretary (since January 2007) of PI; Vice President and Assistant Secretary (since January 2007) of PMFS. |
Timothy J. Knierim (52) Chief Compliance Officer | | | | Chief Compliance Officer of Prudential Investment Management, Inc. (since July 2007); formerly Chief Risk Officer of PIM and PI (2002-2007) and formerly Chief Ethics Officer of PIM and PI (2006-2007). |
Valerie M. Simpson (53) Deputy Chief Compliance Officer | | | | Chief Compliance Officer (since April 2007) of PI and AST Investment Services, Inc.; formerly Vice President-Financial Reporting (June 1999-March 2006) for Prudential Life and Annuities Finance. |
Prudential Global Total Return Fund, Inc.
| | | | |
| Fund Officers(a)(1) | | | | |
Name, Address and Age Position with Fund | | | | Principal Occupation(s) During Past Five Years |
Theresa C. Thompson (49) Deputy Chief Compliance Officer | | | | Vice President, Compliance, PI (since April 2004); and Director, Compliance, PI (2001-2004). |
Richard W. Kinville (43) Anti-Money Laundering Compliance Officer | | | | Vice President, Corporate Compliance, Anti-Money Laundering Unit (since January 2005) of Prudential; committee member of the American Council of Life Insurers Anti-Money Laundering and Critical Infrastructure Committee (since January 2007); formerly Investigator and Supervisor in the Special Investigations Unit for the New York Central Mutual Fire Insurance Company (August 1994-January 1999); Investigator in AXA Financial’s Internal Audit Department and Manager in AXA’s Anti-Money Laundering Office (January 1999-January 2005); first chair of the American Council of Life Insurers Anti-Money Laundering and Critical Infrastructure Committee (June 2007-December 2009). |
Grace C. Torres (52) Treasurer and Principal Financial and Accounting Officer | | | | Assistant Treasurer (since March 1999) and Senior Vice President (since September 1999) of PI; Assistant Treasurer (since May 2003) and Vice President (since June 2005) of AST Investment Services, Inc.; Senior Vice President and Assistant Treasurer (since May 2003) of Prudential Annuities Advisory Services, Inc.; formerly Senior Vice President (May 2003-June 2005) of AST Investment Services, Inc. |
M. Sadiq Peshimam (47) Assistant Treasurer | | | | Vice President (since 2005) of Prudential Investments LLC. |
Peter Parrella (53) Assistant Treasurer | | | | Vice President (since 2007) and Director (2004-2007) within Prudential Mutual Fund Administration; formerly Tax Manager at SSB Citi Fund Management LLC (1997-2004). |
(a) Excludes Ms. Rice and Mr. Benjamin, interested Board Members who also serve as President and Vice President, respectively.
(1) The year in which each individual became an Officer of the Fund is as follows:
Kathryn L. Quirk, 2005; Deborah A. Docs, 2003; Jonathan D. Shain, 2005; Claudia DiGiacomo, 2005; John P. Schwartz, 2006; Andrew R. French, 2006; Timothy J. Knierim, 2007; Valerie M. Simpson, 2007; Theresa C. Thompson, 2008; Richard W. Kinville, 2011; Grace C. Torres, 1998; Peter Parrella, 2007; M. Sadiq Peshimam, 2006.
Explanatory Notes to Tables:
| n | Board Members are deemed to be “Interested,” as defined in the 1940 Act, by reason of their affiliation with Prudential Investments LLC and/or an affiliate of Prudential Investments LLC. |
| n | Unless otherwise noted, the address of all Board Members and Officers is c/o Prudential Investments LLC, Gateway Center Three, 100 Mulberry Street, Newark, New Jersey 07102-4077. |
| n | There is no set term of office for Board Members or Officers. The Board Members have adopted a retirement policy, which calls for the retirement of Board Members on December 31 of the year in which they reach the age of 75. |
| n | “Other Directorships Held” includes only directorships of companies required to register or file reports with the SEC under the 1934 Act) (that is, “public companies”) or other investment companies registered under the 1940 Act. |
| n | “Portfolios Overseen” includes all investment companies managed by Prudential Investments LLC. The investment companies for which PI serves as manager include the Prudential Investments Mutual Funds, The Prudential Variable Contract Accounts, Target Mutual Funds, The Prudential Series Fund, Prudential’s Gibraltar Fund, Inc. and the Advanced Series Trust. |
Visit our website at www.prudentialfunds.com
Approval of Advisory Agreements
The Fund’s Board of Directors
The Board of Directors (the “Board”) of Prudential Global Total Return Fund, Inc. (the “Fund”) consists of 10 individuals, eight of whom are not “interested persons” of the Fund, as defined in the Investment Company Act of 1940, as amended (the “1940 Act”) (the “Independent Directors”). The Board is responsible for the oversight of the Fund and its operations, and performs the various duties imposed on the directors of investment companies by the 1940 Act. The Independent Directors have retained independent legal counsel to assist them in connection with their duties. The Chair of the Board is an Independent Director. The Board has established three standing committees: the Audit Committee, the Nominating and Governance Committee, and the Investment Committee. Each committee is chaired by, and composed of, Independent Directors.
Annual Approval of the Fund’s Advisory Agreements
As required under the 1940 Act, the Board determines annually whether to renew the Fund’s management agreement with Prudential Investments LLC (“PI”) and the Fund’s subadvisory agreement with Prudential Investment Management, Inc. (“PIM”). In considering the renewal of the agreements, the Board, including all of the Independent Directors, met on June 6-8, 2011 and approved the renewal of the agreements through July 31, 2012, after concluding that the renewal of the agreements was in the best interests of the Fund and its shareholders.
In advance of the meetings, the Board requested and received materials relating to the agreements, and had the opportunity to ask questions and request further information in connection with its consideration. Among other things, the Board considered comparative fee information from PI and PIM. Also, the Board considered comparisons with other mutual funds in relevant Peer Universes and Peer Groups. The mutual funds included in each Peer Universe or Peer Group were objectively determined by Lipper Inc. (“Lipper”), an independent provider of mutual fund data. To the extent that PI deems appropriate, and for reasons addressed in detail with the Board, PI may provide supplemental data compiled by Lipper for the Board’s consideration. The comparisons placed the Fund in various quartiles over the one-, three-, five- and 10-year periods ending December 31, 2010, with the first quartile being the best 25% of the mutual funds (for performance, the best performing mutual funds and, for expenses, the lowest cost mutual funds).
In approving the agreements, the Board, including the Independent Directors advised by independent legal counsel, considered the factors it deemed relevant, including the nature, quality and extent of services provided by PI and the subadviser, the performance of the Fund, the profitability of PI and its affiliates, expenses and fees, and the potential for economies of scale that may be shared with the Fund and its shareholders as the Fund’s assets grow. In their deliberations, the Directors did not
Prudential Global Total Return Fund, Inc.
Approval of Advisory Agreements (continued)
identify any single factor which alone was responsible for the Board’s decision to approve the agreements with respect to the Fund. In connection with its deliberations, the Board considered information provided by PI throughout the year at regular Board meetings, presentations from portfolio managers and other information, as well as information furnished at or in advance of the meetings on June 6-8, 2011.
The Directors determined that the overall arrangements between the Fund and PI, which serves as the Fund’s investment manager pursuant to a management agreement, and between PI and PIM, which serves as the Fund’s subadviser pursuant to the terms of a subadvisory agreement with PI, are in the interest of the Fund and its shareholders in light of the services performed, fees charged and such other matters as the Directors considered relevant in the exercise of their business judgment.
The material factors and conclusions that formed the basis for the Directors’ reaching their determinations to approve the continuance of the agreements are separately discussed below.
Nature, Quality and Extent of Services
The Board received and considered information regarding the nature, quality and extent of services provided to the Fund by PI and PIM. The Board considered the services provided by PI, including but not limited to the oversight of the subadviser for the Fund, as well as the provision of fund recordkeeping, compliance, and other services to the Fund. With respect to PI’s oversight of the subadviser, the Board noted that PI’s Strategic Investment Research Group (“SIRG”), which is a business unit of PI, is responsible for monitoring and reporting to PI’s senior management on the performance and operations of the subadviser. The Board also considered that PI pays the salaries of all of the officers and non-independent Directors of the Fund. The Board also considered the investment subadvisory services provided by PIM, as well as adherence to the Fund’s investment restrictions and compliance with applicable Fund policies and procedures. The Board considered PI’s evaluation of the subadviser, as well as PI’s recommendation, based on its review of the subadviser, to renew the subadvisory agreement.
The Board reviewed the qualifications, backgrounds and responsibilities of PI’s senior management responsible for the oversight of the Fund and PIM, and also reviewed the qualifications, backgrounds and responsibilities of PIM’s portfolio managers who are responsible for the day-to-day management of the Fund’s portfolio. The Board was provided with information pertaining to PI’s and PIM’s organizational structure, senior management, investment operations, and other relevant information pertaining to both PI and PIM. The Board also noted that it received favorable compliance reports from the Fund’s Chief Compliance Officer (“CCO”) as to both PI and PIM. The Board noted that PIM is affiliated with PI.
Visit our website at www.prudentialfunds.com
The Board concluded that it was satisfied with the nature, extent and quality of the investment management services provided by PI and the subadvisory services provided to the Fund by PIM, and that there was a reasonable basis on which to conclude that the Fund benefits from the services provided by PI and PIM under the management and subadvisory agreements.
Performance of the Fund
The Board received and considered information about the Fund’s historical performance, noting that the Fund’s gross performance in relation to its Peer Universe (a custom peer group of un-hedged mutual funds included in the Lipper Global Income Funds Performance Universe)1 was in the first quartile over the one-, three- and five-year periods, and in the fourth quartile over the 10-year period. The Board also noted that the Fund outperformed its benchmark index over all periods. The Board concluded that, in light of the Fund’s competitive performance, it would be in the interest of the Fund and its shareholders to renew the agreements.
Fees and Expenses
The Board considered the Fund’s actual management fees (which reflect any subsidies, expense caps or waivers) ranked in the Expense Group’s second quartile and that the Fund’s total expenses ranked in the fourth quartile. The Board considered PI’s assertion that relatively high global custodian fees were a significant factor in the Fund’s fourth quartile total expense ranking due to the Fund’s relatively small asset size. The Board considered that PI has agreed to reimburse and/or waive fees so that the Fund’s annual operating expenses do not exceed 1.100% (exclusive of 12b-1 fees and certain other fees) of the Fund’s average daily net assets. The Board concluded that the management fees (including subadvisory fees) and total expenses were reasonable in light of the services provided.
Costs of Services and Profits Realized by PI
The Board was provided with information on the profitability of PI and its affiliates in serving as the Fund’s investment manager. The Board discussed with PI the methodology utilized in assembling the information regarding profitability and considered its reasonableness. The Board recognized that it is difficult to make comparisons of profitability from fund management contracts because comparative information is not generally publicly available and is affected by numerous factors, including the structure of the particular adviser, the types of funds it manages, its
| 1 | The Fund was compared to the group of un-hedged mutual funds included in the Lipper Global Income Funds Performance Universe, although Lipper classifies the Fund in its Global Income Funds Performance Universe. The Fund was compared to the group of un-hedged mutual funds included in the Global Income Funds Performance Universe because PI believes that these funds provide a more appropriate basis for Fund performance comparisons. |
Prudential Global Total Return Fund, Inc.
Approval of Advisory Agreements (continued)
business mix, numerous assumptions regarding allocations and the adviser’s capital structure and cost of capital. However, the Board considered that the cost of services provided by PI to the Fund during the year ended December 31, 2010 exceeded the management fees paid by the Fund to PI, resulting in an operating loss to PI. The Board did not separately consider the profitability of the subadviser, an affiliate of PI, as its profitability was reflected in the profitability report for PI. Taking these factors into account, the Board concluded that the profitability of PI and its affiliates in relation to the services rendered was not unreasonable.
Economies of Scale
The Board noted that the management fee schedule for the Fund includes breakpoints, which have the effect of decreasing the fee rate as assets increase, but at the current level of assets, the Fund does not realize the effect of those rate reductions. The Board received and discussed information concerning whether PI realizes economies of scale as the Fund’s assets grow beyond current levels. The Board took note that the Fund’s fee structure would result in benefits to Fund shareholders when (and if) assets reach the levels at which the fee rate is reduced. These benefits will accrue whether or not PI is then realizing any economies of scale.
Other Benefits to PI and PIM
The Board considered potential ancillary benefits that might be received by PI and PIM and their affiliates as a result of their relationship with the Fund. The Board concluded that potential benefits to be derived by PI included fees received by affiliates of PI for serving as the Fund’s securities lending agent, transfer agency fees received by the Fund’s transfer agent (which is affiliated with PI), as well as benefits to the reputation or other intangible benefits resulting from PI’s association with the Fund. The Board concluded that the potential benefits to be derived by PIM included those generally resulting from an increase in assets under management, specifically, potential access to additional research resources and benefits to the reputation. The Board concluded that the benefits derived by PI and PIM were consistent with the types of benefits generally derived by investment managers and subadvisers to mutual funds.
After full consideration of these factors, the Board concluded that the approval of the agreements was in the best interest of the Fund and its shareholders.
Visit our website at www.prudentialfunds.com
| | | | |
| n MAIL | | n TELEPHONE | | n WEBSITE |
Gateway Center Three 100 Mulberry Street Newark, NJ 07102 | | (800) 225-1852
| | www.prudentialfunds.com |
|
| PROXY VOTING |
| The Board of Directors of the Fund has delegated to the Fund’s investment subadviser the responsibility for voting any proxies and maintaining proxy recordkeeping with respect to the Fund. A description of these proxy voting policies and procedures is available without charge, upon request, by calling (800) 225-1852 or by visiting the Securities and Exchange Commission’s website at www.sec.gov. Information regarding how the Fund voted proxies relating to portfolio securities during the most recent 12-month period ended June 30 is available on the Fund’s website and on the Commission’s website. |
|
| DIRECTORS |
| Kevin J. Bannon • Scott E. Benjamin • Linda W. Bynoe • Michael S. Hyland • Douglas H. McCorkindale • Stephen P. Munn • Richard A. Redeker • Judy A. Rice • Robin B. Smith • Stephen G. Stoneburn |
|
| OFFICERS |
| Judy A. Rice, President • Scott E. Benjamin, Vice President • Grace C. Torres, Treasurer and Principal Financial and Accounting Officer • Kathryn L. Quirk, Chief Legal Officer • Deborah A. Docs, Secretary • Timothy J. Knierim, Chief Compliance Officer • Valerie M. Simpson, Deputy Chief Compliance Officer • Theresa C. Thompson, Deputy Chief Compliance Officer • Richard W. Kinville, Anti-Money Laundering Compliance Officer • Jonathan D. Shain, Assistant Secretary • Claudia DiGiacomo, Assistant Secretary • John P. Schwartz, Assistant Secretary • Andrew R. French, Assistant Secretary • M. Sadiq Peshimam, Assistant Treasurer • Peter Parrella, Assistant Treasurer |
| | | | |
| MANAGER | | Prudential Investments LLC | | Gateway Center Three
100 Mulberry Street
Newark, NJ 07102 |
|
| INVESTMENT SUBADVISER | | Prudential Investment
Management, Inc. | | Gateway Center Two
100 Mulberry Street
Newark, NJ 07102 |
|
| DISTRIBUTOR | | Prudential Investment
Management Services LLC | | Gateway Center Three
100 Mulberry Street
Newark, NJ 07102 |
|
| CUSTODIAN | | The Bank of New York Mellon | | One Wall Street
New York, NY 10286 |
|
| TRANSFER AGENT | | Prudential Mutual Fund
Services LLC | | PO Box 9658
Providence, RI 02940 |
|
INDEPENDENT REGISTERED
PUBLIC ACCOUNTING FIRM | | KPMG LLP | | 345 Park Avenue
New York, NY 10154 |
|
| FUND COUNSEL | | Willkie Farr & Gallagher LLP | | 787 Seventh Avenue
New York, NY 10019 |
|
| An investor should consider the investment objectives, risks, charges, and expenses of the Fund carefully before investing. The prospectus and summary prospectus contain this and other information about the Fund. An investor may obtain a prospectus and summary prospectus by visiting our website at www.prudentialfunds.com or by calling (800) 225-1852. The prospectus and summary prospectus should be read carefully before investing. |
|
| E-DELIVERY |
| To receive your mutual fund documents online, go to www.prudentialfunds.com/edelivery and enroll. Instead of receiving printed documents by mail, you will receive notification via email when new materials are available. You can cancel your enrollment or change your email address at any time by visiting the website address above. |
|
| SHAREHOLDER COMMUNICATIONS WITH DIRECTORS |
| Shareholders can communicate directly with the Board of Directors by writing to the Chair of the Board, Prudential Global Total Return Fund, Inc., Prudential Investments, Attn: Board of Directors, 100 Mulberry Street, Gateway Center Three, Newark, NJ 07102. Shareholders can communicate directly with an individual Director by writing to the same address. Communications are not screened before being delivered to the addressee. |
|
| AVAILABILITY OF PORTFOLIO SCHEDULE |
| The Fund files its complete schedule of portfolio holdings with the Securities and Exchange Commission for the first and third quarters of each fiscal year on Form N-Q. The Fund’s Forms N-Q are available on the Commission’s website at www.sec.gov. The Fund’s Forms N-Q may also be reviewed and copied at the Commission’s Public Reference Room in Washington, D.C. Information on the operation and location of the Public Reference Room may be obtained by calling (202) 551-8090. The Fund’s schedule of portfolio holdings is also available on the Fund’s website as of the end of each month. |
|
| The Fund’s Statement of Additional Information contains additional information about the Fund’s Directors and is available without charge, upon request, by calling (800) 225-1852. |
Mutual Funds:
| | | | |
| ARE NOT INSURED BY THE FDIC OR ANY FEDERAL GOVERNMENT AGENCY | | MAY LOSE VALUE | | ARE NOT A DEPOSIT OF OR GUARANTEED BY ANY BANK OR ANY BANK AFFILIATE |

PRUDENTIAL GLOBAL TOTAL RETURN FUND, INC.
| | | | | | | | |
| SHARE CLASS | | A | | B | | C | | Z |
| NASDAQ | | GTRAX | | PBTRX | | PCTRX | | PZTRX |
| CUSIP | | 74439A103 | | 74439A202 | | 74439A301 | | 74439A400 |
MF169E 0215376-00001-00
Item 2 – Code of Ethics — See Exhibit (a)
As of the end of the period covered by this report, the registrant has adopted a code of ethics (the “Section 406 Standards for Investment Companies – Ethical Standards for Principal Executive and Financial Officers”) that applies to the registrant’s Principal Executive Officer and Principal Financial Officer; the registrant’s Principal Financial Officer also serves as the Principal Accounting Officer.
The registrant hereby undertakes to provide any person, without charge, upon request, a copy of the code of ethics. To request a copy of the code of ethics, contact the registrant 800-225-1852, and ask for a copy of the Section 406 Standards for Investment Companies - Ethical Standards for Principal Executive and Financial Officers.
Item 3 – Audit Committee Financial Expert –
The registrant’s Board has determined that Mr. Stephen P. Munn, member of the Board’s Audit Committee is an “audit committee financial expert,” and that he is “independent,” for purposes of this Item.
Item 4 – Principal Accountant Fees and Services –
(a) Audit Fees
For the fiscal years ended October 31, 2011 and October 31, 2010, KPMG LLP (“KPMG”), the Registrant’s principal accountant, billed the Registrant $55,000 and $54,500, respectively, for professional services rendered for the audit of the Registrant’s annual financial statements or services that are normally provided in connection with statutory and regulatory filings.
(b) Audit-Related Fees
None.
(c) Tax Fees
None.
(d) All Other Fees
None.
(e) (1) Audit Committee Pre-Approval Policies and Procedures
THE PRUDENTIAL MUTUAL FUNDS
AUDIT COMMITTEE POLICY
on
Pre-Approval of Services Provided by the Independent Accountants
The Audit Committee of each Prudential Mutual Fund is charged with the responsibility to monitor the independence of the Fund’s independent accountants. As part of this responsibility, the Audit Committee must pre-approve any independent accounting firm’s engagement to render audit and/or permissible non-audit services, as required by law. In evaluating a proposed engagement of the independent accountants, the Audit Committee will assess the effect that the engagement might reasonably be expected to have on the accountant’s independence. The Committee’s evaluation will be based on:
| | • | | a review of the nature of the professional services expected to be provided, |
| | • | | a review of the safeguards put into place by the accounting firm to safeguard independence, and |
| | • | | periodic meetings with the accounting firm. |
Policy for Audit and Non-Audit Services Provided to the Funds
On an annual basis, the scope of audits for each Fund, audit fees and expenses, and audit-related and non-audit services (and fees proposed in respect thereof) proposed to be performed by the Fund’s independent accountants will be presented by the Treasurer and the independent accountants to the Audit Committee for review and, as appropriate, approval prior to the initiation of such services. Such presentation shall be accompanied by confirmation by both the Treasurer and the independent accountants that the proposed services will not adversely affect the independence of the independent accountants. Proposed services shall be described in sufficient detail to enable the Audit Committee to assess the appropriateness of such services and fees, and the compatibility of the provision of such services with the auditor’s independence. The Committee shall receive periodic reports on the progress of the audit and other services which are approved by the Committee or by the Committee Chair pursuant to authority delegated in this Policy.
The categories of services enumerated under “Audit Services”, “Audit-related Services”, and “Tax Services” are intended to provide guidance to the Treasurer and the independent accountants as to those categories of services which the Committee believes are generally consistent with the independence of the independent accountants and which the Committee (or the Committee Chair) would expect upon the presentation of specific proposals to pre-approve. The enumerated categories are not intended as an exclusive list of audit, audit-related or tax services, which the Committee (or the Committee Chair) would consider for pre-approval.
Audit Services
The following categories of audit services are considered to be consistent with the role of the Fund’s independent accountants:
| | • | | Annual Fund financial statement audits |
| | • | | Seed audits (related to new product filings, as required) |
| | • | | SEC and regulatory filings and consents |
Audit-related Services
The following categories of audit-related services are considered to be consistent with the role of the Fund’s independent accountants:
| | • | | Accounting consultations |
| | • | | Fund merger support services |
| | • | | Agreed Upon Procedure Reports |
| | • | | Other Internal Control Reports |
Individual audit-related services that fall within one of these categories and are not presented to the Audit Committee as part of the annual pre-approval process will be subject to pre-approval by the Committee Chair (or any other Committee member on whom this responsibility has been delegated) so long as the estimated fee for those services does not exceed $50,000.
Tax Services
The following categories of tax services are considered to be consistent with the role of the Fund’s independent accountants:
| | • | | Tax compliance services related to the filing or amendment of the following: |
| | • | | Federal, state and local income tax compliance; and, |
| | • | | Sales and use tax compliance |
| | • | | Timely RIC qualification reviews |
| | • | | Tax distribution analysis and planning |
| | • | | Tax authority examination services |
| | • | | Tax appeals support services |
| | • | | Accounting methods studies |
| | • | | Fund merger support services |
| | • | | Tax consulting services and related projects |
Individual tax services that fall within one of these categories and are not presented to the Audit Committee as part of the annual pre-approval process will be subject to pre-approval by the Committee Chair (or any other Committee member on whom this responsibility has been delegated) so long as the estimated fee for those services does not exceed $50,000.
Other Non-audit Services
Certain non-audit services that the independent accountants are legally permitted to render will be subject to pre-approval by the Committee or by one or more Committee members to whom the Committee has delegated this authority and who will report to the full Committee any pre-approval decisions made pursuant to this Policy. Non-audit services presented for pre-approval pursuant to this paragraph will be accompanied by a confirmation from both the Treasurer and the independent accountants that the proposed services will not adversely affect the independence of the independent accountants.
Proscribed Services
The Fund’s independent accountants will not render services in the following categories of non-audit services:
| | • | | Bookkeeping or other services related to the accounting records or financial statements of the Fund |
| | • | | Financial information systems design and implementation |
| | • | | Appraisal or valuation services, fairness opinions, or contribution-in-kind reports |
| | • | | Internal audit outsourcing services |
| | • | | Management functions or human resources |
| | • | | Broker or dealer, investment adviser, or investment banking services |
| | • | | Legal services and expert services unrelated to the audit |
| | • | | Any other service that the Public Company Accounting Oversight Board determines, by regulation, is impermissible. |
Pre-approval of Non-Audit Services Provided to Other Entities Within the Prudential Fund Complex
Certain non-audit services provided to Prudential Investments LLC or any of its affiliates that also provide ongoing services to the Prudential Mutual Funds will be subject to pre-approval by the Audit Committee. The only non-audit services provided to these entities that will require pre-approval are those related directly to the operations and financial reporting of the Funds. Individual projects that are not presented to the Audit Committee as part of the annual pre-approval process will be subject to pre-approval by the Committee Chair (or any other Committee member on whom this responsibility has been delegated) so long as the estimated fee for those services does not exceed $50,000. Services presented for pre-approval pursuant to this paragraph will be accompanied by a confirmation from both the Treasurer and the independent accountants that the proposed services will not adversely affect the independence of the independent accountants.
Although the Audit Committee will not pre-approve all services provided to Prudential Investments LLC and its affiliates, the Committee will receive an annual report from the Fund’s independent accounting firm showing the aggregate fees for all services provided to Prudential Investments and its affiliates.
(e) (2) Percentage of services referred to in 4(b) – 4(d) that were approved by the audit committee –
Not applicable.
(f) Percentage of hours expended attributable to work performed by other than full time employees of principal accountant if greater than 50%.
The percentage of hours expended on the principal accountant’s engagement to audit the registrant’s financial statements for the most recent fiscal year that were attributed to work performed by persons other than the principal accountant’s full-time, permanent employees was 0%.
(g) Non-Audit Fees
Not applicable to Registrant for the fiscal years 2011 and 2010. The aggregate non-audit fees billed by KPMG for services rendered to the registrant’s investment adviser and any entity controlling, controlled by, or under common control with the investment adviser that provides ongoing services to the registrant for the fiscal years 2011 and 2010 was $0 and $0, respectively.
(h) Principal Accountant’s Independence
Not applicable as KPMG has not provided non-audit services to the registrant’s investment adviser and any entity controlling, controlled by, or under common control with the investment adviser that provides ongoing services to the registrant that were not pre-approved pursuant to Rule 2-01(c)(7)(ii) of Regulation S-X.
| | |
| Item 5 – | | Audit Committee of Listed Registrants – Not applicable. |
| |
| Item 6 – | | Schedule of Investments – The schedule is included as part of the report to shareholders filed under Item 1 of this Form. |
| |
| Item 7 – | | Disclosure of Proxy Voting Policies and Procedures for Closed-End Management Investment Companies – Not applicable. |
| |
| Item 8 – | | Portfolio Managers of Closed-End Management Investment Companies – Not applicable. |
| |
| Item 9 – | | Purchases of Equity Securities by Closed-End Management Investment Company and Affiliated Purchasers – Not applicable. |
| |
| Item 10 – | | Submission of Matters to a Vote of Security Holders – Not applicable. |
| |
| Item 11 – | | Controls and Procedures |
| | (a) | It is the conclusion of the registrant’s principal executive officer and principal financial officer that the effectiveness of the registrant’s current disclosure controls and procedures (such disclosure controls and procedures having been evaluated within 90 days of the date of this filing) provide reasonable assurance that the information required to be disclosed by the registrant has been recorded, processed, summarized and reported within the time period specified in the Commission’s rules and forms and that the information required to be disclosed by the registrant has been accumulated and communicated to the registrant’s principal executive officer and principal financial officer in order to allow timely decisions regarding required disclosure. |
| | (b) | There has been no significant change in the registrant’s internal control over financial reporting that occurred during the registrant’s most recent fiscal quarter of the period covered by this report that has materially affected, or is likely to materially affect, the registrant’s internal control over financial reporting. |
Item 12 – Exhibits
| | | | | | | | | | |
| | | | | | (a) | | (1) | | Code of Ethics – Attached hereto as Exhibit EX-99.CODE-ETH |
| | | | | |
| | | | | | | | (2) | | Certifications pursuant to Section 302 of the Sarbanes-Oxley Act – Attached hereto as Exhibit EX-99.CERT. |
| | | | | |
| | | | | | | | (3) | | Any written solicitation to purchase securities under Rule 23c-1. – Not applicable. |
| | | | |
| | | | | | (b) | | Certifications pursuant to Section 906 of the Sarbanes-Oxley Act – Attached hereto as Exhibit EX-99.906CERT. |
SIGNATURES
Pursuant to the requirements of the Securities Exchange Act of 1934 and the Investment Company Act of 1940, the registrant has duly caused this report to be signed on its behalf by the undersigned, thereunto duly authorized.
| | |
| Registrant: | | Prudential Global Total Return Fund, Inc. |
| |
| By: | | /s/ Deborah A. Docs |
| | Deborah A. Docs |
| | Secretary |
| |
| Date: | | December 20, 2011 |
Pursuant to the requirements of the Securities Exchange Act of 1934 and the Investment Company Act of 1940, this report has been signed below by the following persons on behalf of the registrant and in the capacities and on the dates indicated.
| | |
| By: | | /s/ Judy A. Rice |
| | Judy A. Rice |
| | President and Principal Executive Officer |
| |
| Date: | | December 20, 2011 |
| |
| By: | | /s/ Grace C. Torres |
| | Grace C. Torres |
| | Treasurer and Principal Financial Officer |
| |
| Date: | | December 20, 2011 |