UNITED STATES
SECURITIES AND EXCHANGE COMMISSION
Washington, D.C. 20549
FORM N-CSR
CERTIFIED SHAREHOLDER REPORT OF REGISTERED
MANAGEMENT INVESTMENT COMPANIES
| | |
| Investment Company Act file number: | | 811-04661 |
| |
| Exact name of registrant as specified in charter: | | Prudential Global Total Return Fund, Inc. |
| |
| Address of principal executive offices: | | Gateway Center 3, |
| | 100 Mulberry Street, |
| | Newark, New Jersey 07102 |
| |
| Name and address of agent for service: | | Deborah A. Docs |
| | Gateway Center 3, |
| | 100 Mulberry Street, |
| | Newark, New Jersey 07102 |
| |
| Registrant’s telephone number, including area code: | | 800-225-1852 |
| |
| Date of fiscal year end: | | 10/31/2013 |
| |
| Date of reporting period: | | 10/31/2013 |
Item 1 – Reports to Stockholders

PRUDENTIAL INVESTMENTS»MUTUAL FUNDS
PRUDENTIAL GLOBAL TOTAL RETURN FUND, INC.
ANNUAL REPORT · OCTOBER 31, 2013
Fund Type
Global Bond
Objective
Total return, made up of current income and capital appreciation
This report is not authorized for distribution to prospective investors unless preceded or accompanied by a current prospectus.
The views expressed in this report and information about the Fund’s portfolio holdings are for the period covered by this report and are subject to change thereafter.
Mutual funds are distributed by Prudential Investment Management Services LLC (PIMS). Prudential Fixed Income is a unit of Prudential Investment Management, Inc. (PIM), a registered investment advisor. PIMS and PIM are Prudential Financial Companies. © 2013 Prudential Financial, Inc., and its related entities. Prudential Investments, Prudential, the Prudential logo, Bring Your Challenges, and the Rock symbol are service marks of Prudential Financial, Inc., and its related entities, registered in many jurisdictions worldwide.

December 16, 2013
Dear Shareholder:
We hope you find the annual report for the Prudential Global Total Return Fund, Inc. informative and useful. The report covers performance for the 12-month period that ended October 31, 2013.
We recognize that ongoing market volatility may make it a difficult time to be an investor. We continue to believe a prudent response to uncertainty is to maintain a diversified portfolio of funds consistent with your tolerance for risk, time horizon, and financial goals.
Your financial advisor can help you create a diversified investment plan that may include funds covering all the basic asset classes and that reflects your personal investor profile and risk tolerance. Keep in mind, however, that diversification and asset allocation strategies do not assure a profit or protect against loss in declining markets.
Prudential Investments® is dedicated to helping you solve your toughest investment challenges—whether it’s capital growth, reliable income, or protection from market volatility and other risks. We offer the expertise of Prudential Financial’s affiliated asset managers* that strive to be leaders in a broad range of funds to help you stay on course to the future you envision. They also manage money for major corporations and pension funds around the world, which means you benefit from the same expertise, innovation, and attention to risk demanded by today’s most sophisticated investors.
Thank you for choosing the Prudential Investments family of funds.
Sincerely,

Stuart S. Parker, President
Prudential Global Total Return Fund, Inc.
*Most of Prudential Investments’ equity funds are advised by Jennison Associates LLC, Quantitative Management Associates LLC (QMA), or Prudential Real Estate Investors. Prudential Investments’ fixed income and money market funds are advised by Prudential Investment Management, Inc. (PIM) through its Prudential Fixed Income unit. Jennison Associates, QMA, and PIM are registered investment advisers and Prudential Financial companies. Prudential Real Estate Investors is a unit of PIM.
| | | | |
| Prudential Global Total Return Fund, Inc. | | | 1 | |
Your Fund’s Performance (Unaudited)
Performance data quoted represent past performance. Past performance does not guarantee future results. The investment return and principal value of an investment will fluctuate, so that an investor’s shares, when redeemed, may be worth more or less than their original cost. Current performance may be lower or higher than the past performance data quoted. An investor may obtain performance data as of the most recent month-end by visiting our website at www.prudentialfunds.com or by calling (800) 225-1852.
| | | | | | | | | | | | | | |
Cumulative Total Returns (Without Sales Charges) as of 10/31/13 |
| | | One Year | | | Five Years | | | Ten Years | | | Since Inception |
Class A | | | 0.21 | % | | | 69.52 | % | | | 79.93 | % | | — |
Class B | | | –0.54 | | | | 63.12 | | | | 66.92 | | | — |
Class C | | | –0.54 | | | | 64.70 | | | | 70.44 | | | — |
Class Q | | | 0.46 | | | | N/A | | | | N/A | | | 7.29% (2/03/12) |
Class Z | | | 0.46 | | | | 71.61 | | | | 84.56 | | | —
|
Barclays Global Aggregate Bond Index | | | –1.54 | | | | 34.29 | | | | 64.14 | | | — |
Lipper Global Income Funds Average | | | –0.37 | | | | 47.24 | | | | 64.02 | | | — |
Lipper Custom Global Income Funds Average | | | –0.91 | | | | 48.79 | | | | 66.17 | | | — |
| | | | | | | | | | | | | | |
Average Annual Total Returns (With Sales Charges) as of 9/30/13 |
| | | One Year | | | Five Years | | | Ten Years | | | Since Inception |
Class A | | | –5.91 | % | | | 7.77 | % | | | 5.27 | % | | — |
Class B | | | –6.95 | | | | 7.80 | | | | 4.95 | | | — |
Class C | | | –3.02 | | | | 8.15 | | | | 5.19 | | | — |
Class Q | | | –1.09 | | | | N/A | | | | N/A | | | 2.90% (2/03/12) |
Class Z | | | –1.09 | | | | 9.04 | | | | 6.02 | | | — |
Barclays Global Aggregate Bond Index | | | –2.64 | | | | 5.07 | | | | 4.92 | | | — |
Lipper Global Income Funds Average | | | –1.30 | | | | 6.33 | | | | 4.85 | | | — |
Lipper Custom Global Income Funds Average | | | –1.77 | | | | 6.42 | | | | 4.99 | | | — |
| | | | | | | | | | | | | | |
Average Annual Total Returns (With Sales Charges) as of 10/31/13 |
| | | One Year | | | Five Years | | | Ten Years | | | Since Inception |
Class A | | | –4.30 | % | | | 10.12 | % | | | 5.56 | % | | — |
Class B | | | –5.35 | | | | 10.15 | | | | 5.26 | | | — |
Class C | | | –1.50 | | | | 10.49 | | | | 5.48 | | | — |
Class Q | | | 0.46 | | | | N/A | | | | N/A | | | 4.12% (2/03/12) |
Class Z | | | 0.46 | | | | 11.41 | | | | 6.32 | | | — |
| | | | | | | | | | | | | | |
| | |
| 2 | | Visit our website at www.prudentialfunds.com |
| | | | | | | | | | | | | | |
Average Annual Total Returns (Without Sales Charges) as of 10/31/13 |
| | | One Year | | | Five Years | | | Ten Years | | | Since Inception |
Class A | | | 0.21 | % | | | 11.13 | % | | | 6.05 | % | | — |
Class B | | | –0.54 | | | | 10.28 | | | | 5.26 | | | — |
Class C | | | –0.54 | | | | 10.49 | | | | 5.48 | | | — |
Class Q | | | 0.46 | | | | N/A | | | | N/A | | | 4.12% (2/03/12) |
Class Z | | | 0.46 | | | | 11.41 | | | | 6.32 | | | — |
Growth of a $10,000 Investment
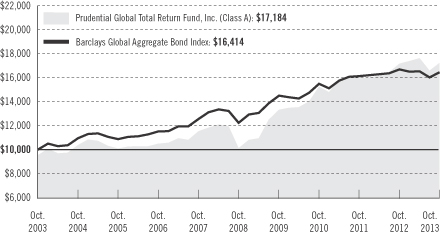
The graph compares a $10,000 investment in the Prudential Global Total Return Fund, Inc. (Class A shares) with a similar investment in the Barclays Global Aggregate Bond Index by portraying the initial account values at the beginning of the 10-year period for Class A shares (October 31, 2003) and the account values at the end of the current fiscal year (October 31, 2013) as measured on a quarterly basis. For purposes of the graph, and unless otherwise indicated, it has been assumed that (a) the maximum applicable front-end sales charge was deducted from the initial $10,000 investment in Class A shares; (b) all recurring fees (including management fees) were deducted; and (c) all dividends and distributions were reinvested. The line graph provides information for Class A shares only. As indicated in the tables provided earlier, performance for Class B, Class C, Class Q and Class Z shares will vary due to the differing charges and expenses applicable to each share class (as indicated in the following paragraphs). Without waiver of fees and/or expense reimbursement, if any, the returns would have been lower.
Past performance does not predict future performance. Total returns and the ending account values in the graph include changes in share price and reinvestment of dividends and capital gains distributions in a hypothetical investment for the periods shown. The Fund’s total returns do not reflect the deduction of income taxes on an
| | | | |
| Prudential Global Total Return Fund, Inc. | | | 3 | |
Your Fund’s Performance (continued)
individual’s investment. Taxes may reduce your actual investment returns on income or gains paid by the Fund or any gains you may realize if you sell your shares.
Source: Prudential Investments LLC and Lipper Inc.
Inception returns are provided for any share class with less than 10 calendar years of returns.
The average annual total returns take into account applicable sales charges, which are described for each share class in the table below.
| | | | | | | | | | |
| | Class A | | Class B | | Class C | | Class Q | | Class Z |
Maximum initial sales charge | | 4.50% of
the public
offering
price | | None | | None | | None | | None |
Contingent deferred sales charge (CDSC) (as a percentage of the lower of original purchase price or sale proceeds) | | 1% on sales
of $1 million
or more
made within
12 months of
purchase | | 5% (Yr. 1)
4% (Yr. 2)
3% (Yr. 3)
2% (Yr. 4)
1% (Yr. 5/6)
0% (Yr. 7) | | 1% on sales
made within
12 months
of purchase | | None | | None |
Annual distribution and service (12b-1) fees (shown as a percentage of average daily net assets) | | .30%
(.25%
currently) | | 1% | | 1% | | None | | None |
Benchmark Definitions
Barclays Global Aggregate Bond Index
The Barclays Global Aggregate Bond Index is an unmanaged index of global investment-grade fixed income markets. The three major components of this index are the U.S. Aggregate, the Pan-European Aggregate, and the Asian-Pacific Aggregate Indices. The index also includes Eurodollar and Euro-Yen corporate bonds, Canadian government, agency and corporate securities. Barclays Global Aggregate Bond Index Closest Month-End to Inception cumulative total return as of 10/31/13 is 1.37% for Class Q. Barclays Global Aggregate Bond Index Closest Month-End to Inception average annual total return as of 9/30/13 is 0.23% for Class Q.
Lipper Global Income Funds Average
The Lipper Global Income Funds Average (Lipper Average) represents returns based on an average return of all funds in the Lipper Global Income Funds category for the periods noted. Funds in the Lipper Average invest primarily in U.S. dollar and non-U.S. dollar debt securities of issuers located in at least three countries, one of which may be the United States. Lipper Average Closest Month-End to Inception cumulative total return as of 10/31/13 is 4.50% for Class Q. Lipper Average Closest Month-End to Inception average annual total return as of 9/30/13 is 1.87% for Class Q.
| | |
| 4 | | Visit our website at www.prudentialfunds.com |
Lipper Custom Global Income Funds Average
The Lipper Custom Global Income Funds Average consists only of un-hedged funds within Lipper’s Global Income Funds Universe and not the entire Global Income Funds Universe, although Lipper classifies the Fund in the Global Income Funds Performance Universe. The Lipper Custom Global Income Funds Average is utilized because the Manager believes that the funds included in this Universe provide a more appropriate basis for Fund performance comparisons.
Note: The Fund is being compared only to the unhedged funds within the Lipper Global Income Funds Performance Universe, because the Fund’s investment manager believes that the unhedged funds provide a more appropriate basis for Fund performance comparisons.
Investors cannot invest directly in an index or average. The returns for the Index would be lower if they included the effects of sales charges, operating expenses of a mutual fund, or taxes. Returns for the Lipper Average reflect the deduction of operating expenses, but not sales charges or taxes.
| | | | |
Five Largest Long-Term Holdings expressed as a percentage of net assets as of 10/31/13 | |
Italy Buoni Poliennali del Tesoro, Bonds, 4.750%, 05/01/17 | | | 3.2 | % |
Spain Government Bond, Sr. Unsub. Notes, 5.850%, 01/31/22 | | | 2.2 | |
Peruvian Government International Bond, Sr. Unsec’d. Notes, RegS, 7.500%, 10/14/14 | | | 2.2 | |
Russian Foreign Bond—Eurobond, Sr. Unsec’d. Notes, RegS, 7.500%, 03/31/30 | | | 1.8 | |
Mexico Government International Bond, Series B, Sr. Unsec’d. Notes, MTN, 4.250%, 07/14/17 | | | 1.7 | |
Holdings reflect only long-term investments and are subject to change.
| | | | | | | | |
Distributions and Yields as of 10/31/13 | | | | | | | | |
| | | Total Distributions
Paid for 12 Months | | | 30-Day
SEC Yield | |
Class A | | $ | 0.29 | | | | 1.76 | % |
Class B | | | 0.24 | | | | 1.10 | |
Class C | |
| 0.24
|
| | | 1.10 | |
Class Q | | | 0.32 | | | | 2.16 | |
Class Z | | | 0.31 | | | | 2.08 | |
| | | | |
| Prudential Global Total Return Fund, Inc. | | | 5 | |
Strategy and Performance Overview
How did the Fund perform?
The Prudential Global Total Return Fund’s Class A shares returned 0.21% for the 12 months ended October 31, 2013, outperforming the 1.54% decline of the Barclays Global Aggregate Bond Index (Global Aggregate Bond Index) and the 0.37% decline of the Lipper Global Income Funds Average.
How did the global fixed income markets perform?
During the reporting period that began November 1, 2012, the global bond markets of economically developed nations declined amid renewed financial tensions in Europe, a global recession and signs that the U.S. Federal Reserve (the Fed) might begin scaling back its quantitative easing asset purchases.
| | • | | At the beginning of the reporting period, the European sovereign debt crisis—and fears of contagion—had eased, allowing the yields on the debt of geographically peripheral nations to decline and creating a tailwind for global spread sectors. (Bond prices rise when yields fall.) Spread sectors are debt securities such as investment-grade corporate bonds that provide extra yield (spread) over similar-duration government bonds to compensate for the greater credit risk associated with investing in them. In addition, the effects of the European Central Bank’s (ECB) liquidity measures, enacted in September 2012, continued to buoy peripheral debt throughout the final months of 2012. |
| | • | | In early 2013, problems reemerged in Europe, as Italy’s elections raised concerns about that country’s commitment to reform, and a banking crisis in Cyprus led to a bailout by the European Union. Meanwhile, Japan inched towards large-scale quantitative easing as more aggressive leadership was installed at the Bank of Japan. Though the turmoil trimmed overall gains, global spread sectors, such as European high yield corporate bonds, continued to perform well. |
| | • | | In May, the ECB cut its main policy interest rate by 0.25% to a record low of 0.50%, citing weak European economic growth and slowing inflation. |
| | • | | Also in May, a surprisingly strong labor report improved the outlook for the U.S. economy and brought a change in stance by the Fed. Fed Chair Ben Bernanke suggested the Fed might scale back asset purchases under its quantitative easing program, driving up yields on U.S. Treasury securities and pushing down their prices. Other segments of the global fixed income market followed suit, which resulted in significant investment outflows. Emerging markets debt suffered the most in the retreat. Securities with floating interest rates, such as senior secured debt, held up well on strong investor demand. |
| | |
| 6 | | Visit our website at www.prudentialfunds.com |
| | • | | By the third calendar quarter, a global economic recovery was finally underway. In September, the Fed surprised the markets by saying it would continue the pace of its asset purchases. The announcement caused yields to drop and sparked a rally in global spread sectors that continued through the end of the reporting period. |
Which strategies made the largest positive contribution to the Fund’s performance?
Prudential Fixed Income manages the Fund, which outperformed the Global Aggregate Bond Index because of its sector allocation strategy and security selection within a number of sectors. The portfolio management team leverages the resources of Prudential Fixed Income’s specialized sector teams to determine the best relative value opportunities for a given market environment. It then implements overweight exposures to what it believes to be its best ideas, while maintaining underweight exposures in sectors that offer less compelling risk/ reward potential.
| | • | | During the reporting period, the Fund’s sector allocation emphasized global spread sectors, rather than government bond sectors. This positioning resulted in consistently positive relative performance for the Fund during the first half of the period. Though returns were mixed between May 2013 and end of the period, the Fund’s sector allocations contributed significantly to relative returns for the period overall. |
| | • | | The Fund benefited from its sector allocations and security selection in developed markets sovereign debt, emerging markets sovereign debt, U.S. high yield corporate bonds, corporate debt, and U.S. asset-backed securities, especially those backed by U.S. home equity loans. (Asset-backed securities are created from credit card receivables, auto loans, and certain other types of loans.) |
What other strategies helped the Fund’s performance?
| | • | | The Fund was positioned for a decline in Japanese interest rates. This added to relative returns as the Bank of Japan announced it would undertake large-scale quantitative easing. |
What strategies detracted most from the Fund’s performance?
| | • | | The Fund’s overweight exposures to foreign currencies subtracted from its return for the period. Speculation about potential tapering of asset purchases under the Fed’s quantitative easing program sparked a rally in the U.S. dollar, which soared relative to many other major currencies. |
| | | | |
| Prudential Global Total Return Fund, Inc. | | | 7 | |
Strategy and Performance Overview (continued)
| | • | | The Fund’s management of duration and yield curve positioning detracted from relative returns. Duration is a measure of the interest rate sensitivity of a bond portfolio or individual debt securities that is expressed as a number of years. The longer the duration, the greater the potential risk or reward when interest rates move. In particular, the Fund was hampered by its long duration position between May and July when interest rates increased. The Fund was also hurt by its exposure to Brazilian interest rates, through interest rate swaps. |
| | • | | Over the past year, the fund utilized derivatives in a variety of ways. The fund used interest rate swaps to implement some of its overweight duration positioning in markets around the world. Taken in total, the net effect of these positions detracted from performance, as global rates sold off broadly on fears over the withdrawal of unprecedented monetary stimulus from major central banks. Derivatives were also used to facilitate curve positioning in a number of countries, particularly those where transactions were more efficiently executable, using interest rate swaps or futures in lieu of cash bonds. In addition to interest rate derivatives, the fund employs currency forwards for the purposes of hedging and tactical (short term) currency exposure. The fund’s positioning in sovereign debt added to relative performance over the year, and was partially implemented through positions in credit default swaps. |
| | |
| 8 | | Visit our website at www.prudentialfunds.com |
Fees and Expenses (Unaudited)
As a shareholder of the Fund, you incur two types of costs: (1) transaction costs, including sales charges (loads) on purchase payments and redemptions, as applicable, and (2) ongoing costs, including management fees, distribution and/or service (12b-1) fees, and other Fund expenses, as applicable. This example is intended to help you understand your ongoing costs (in dollars) of investing in the Fund and to compare these costs with the ongoing costs of investing in other mutual funds.
The example is based on an investment of $1,000 invested on May 1, 2013, at the beginning of the period, and held through the six-month period ended October 31, 2013. The example is for illustrative purposes only; you should consult the Prospectus for information on initial and subsequent minimum investment requirements.
Actual Expenses
The first line for each share class in the table on the following page provides information about actual account values and actual expenses. You may use the information on this line, together with the amount you invested, to estimate the expenses that you paid over the period. Simply divide your account value by $1,000 (for example, an $8,600 account value ÷ $1,000 = 8.6), then multiply the result by the number on the first line under the heading “Expenses Paid During the Six-Month Period” to estimate the expenses you paid on your account during this period.
Hypothetical Example for Comparison Purposes
The second line for each share class in the table below provides information about hypothetical account values and hypothetical expenses based on the Fund’s actual expense ratio and an assumed rate of return of 5% per year before expenses, which is not the Fund’s actual return. The hypothetical account values and expenses may not be used to estimate the actual ending account balance or expenses you paid for the period. You may use this information to compare the ongoing costs of investing in the Fund and other funds. To do so, compare this 5% hypothetical example with the 5% hypothetical examples that appear in the shareholder reports of the other funds.
The Fund’s transfer agent may charge additional fees to holders of certain accounts that are not included in the expenses shown in the table on the following page. These fees apply to individual retirement accounts (IRAs) and Section 403(b) accounts. As of the close of the six-month period covered by the table, IRA fees included an annual maintenance fee of $15 per account (subject to a maximum annual maintenance fee of $25 for all accounts held by the same shareholder). Section 403(b) accounts are charged an annual $25 fiduciary maintenance fee. Some of the fees may vary in amount, or may be waived, based on your total account balance or the number of Prudential Investments funds, including the Fund, that you own. You should consider
| | | | |
| Prudential Global Total Return Fund, Inc. | | | 9 | |
Fees and Expenses (continued)
the additional fees that were charged to your Fund account over the six-month period when you estimate the total ongoing expenses paid over the period and the impact of these fees on your ending account value, as these additional expenses are not reflected in the information provided in the expense table. Additional fees have the effect of reducing investment returns.
Please note that the expenses shown in the table are meant to highlight your ongoing costs only and do not reflect any transactional costs such as sales charges (loads). Therefore, the second line for each share class in the table is useful in comparing ongoing costs only and will not help you determine the relative total costs of owning different funds. In addition, if these transactional costs were included, your costs would have been higher.
| | | | | | | | | | | | | | | | | | |
Prudential Global Total
Return Fund, Inc. | | Beginning Account
Value
May 1, 2013 | | | Ending Account
Value
October 31, 2013 | | | Annualized
Expense Ratio
Based on the
Six-Month Period | | | Expenses Paid
During the
Six-Month Period* | |
| | | | | | | | | | | | | | | | | | |
Class A | | Actual | | $ | 1,000.00 | | | $ | 976.20 | | | | 1.25 | % | | $ | 6.23 | |
| | | Hypothetical | | $ | 1,000.00 | | | $ | 1,018.90 | | | | 1.25 | % | | $ | 6.36 | |
| | | | | | | | | | | | | | | | | | |
Class B | | Actual | | $ | 1,000.00 | | | $ | 971.20 | | | | 2.00 | % | | $ | 9.94 | |
| | | Hypothetical | | $ | 1,000.00 | | | $ | 1,015.12 | | | | 2.00 | % | | $ | 10.16 | |
| | | | | | | | | | | | | | | | | | |
Class C | | Actual | | $ | 1,000.00 | | | $ | 972.50 | | | | 2.00 | % | | $ | 9.94 | |
| | | Hypothetical | | $ | 1,000.00 | | | $ | 1,015.12 | | | | 2.00 | % | | $ | 10.16 | |
| | | | | | | | | | | | | | | | | | |
Class Q | | Actual | | $ | 1,000.00 | | | $ | 976.90 | | | | 0.85 | % | | $ | 4.24 | |
| | | Hypothetical | | $ | 1,000.00 | | | $ | 1,020.92 | | | | 0.85 | % | | $ | 4.33 | |
| | | | | | | | | | | | | | | | | | |
Class Z | | Actual | | $ | 1,000.00 | | | $ | 977.60 | | | | 1.00 | % | | $ | 4.98 | |
| | | Hypothetical | | $ | 1,000.00 | | | $ | 1,020.16 | | | | 1.00 | % | | $ | 5.09 | |
*Fund expenses (net of fee waivers or subsidies, if any) for each share class are equal to the annualized expense ratio for each share class (provided in the table), multiplied by the average account value over the period, multiplied by the 184 days in the six-month period ended October 31, 2013, and divided by the 365 days in the Fund’s fiscal year ended October 31, 2013 (to reflect the six-month period). Expenses presented in the table include the expenses of any underlying portfolios in which the Fund may invest.
| | |
| 10 | | Visit our website at www.prudentialfunds.com |
The Fund’s annual expense ratios for the year ended October 31, 2013, are as follows:
| | | | |
Class | | Gross Operating Expenses | | Net Operating Expenses |
A | | 1.28% | | 1.23% |
B | | 1.98 | | 1.98 |
C | | 1.98 | | 1.98 |
Q | | 0.85 | | 0.85 |
Z | | 0.98 | | 0.98 |
Net operating expenses shown above reflect any fee waivers and/or expense reimbursements. Additional information on Fund expenses and any fee waivers and/or expense reimbursements can be found in the “Financial Highlights” tables in this report and in the Notes to the Financial Statements in this report.
| | | | |
| Prudential Global Total Return Fund, Inc. | | | 11 | |
Portfolio of Investments
as of October 31, 2013
| | | | | | | | | | | | | | | | |
| Description | | | | Interest
Rate | | Maturity
Date | | | Principal
Amount (000)# | | | Value (Note 1) | |
LONG-TERM INVESTMENTS 95.6% | |
FOREIGN BONDS 64.0% | |
| | | | | |
Belgium 1.7% | | | | | | | | | | | | | | | | |
Kingdom of Belgium,
Notes, 144A | | | | 8.875% | | | 12/01/24 | | | | 500 | | | $ | 713,336 | |
Notes, MTN | | | | 5.000 | | | 04/24/18 | | | GBP | 2,000 | | | | 3,585,265 | |
| | | | | | | | | | | | | | | | |
| | | | | | | | | | | | | | | 4,298,601 | |
| | | | | |
Brazil 4.0% | | | | | | | | | | | | | | | | |
Brazil Notas do Tesouro Nacionalie B, Series NTNB, Notes | | | | 6.000 | | | 08/15/50 | | | BRL | 424 | | | | 458,095 | |
Brazilian Government International Bond,
Sr. Unsec’d. Notes | | | | 4.875 | | | 01/22/21 | | | | 500 | | | | 542,500 | |
Sr. Unsec’d. Notes | | | | 7.375 | | | 02/03/15 | | | EUR | 350 | | | | 513,374 | |
Unsec’d. Notes | | | | 11.000 | | | 06/26/17 | | | EUR | 2,120 | | | | 3,776,181 | |
Cia Energetica De Sao Paulo,
Sr. Unsec’d. Notes, MTN, 144A | | | | 9.750 | | | 01/15/15 | | | BRL | 2,850 | | | | 1,880,834 | |
Minerva Luxembourg SA,
Gtd. Notes, 144A | | | | 12.250 | | | 02/10/22 | | | | 200 | | | | 224,000 | |
Petrobras Global Finance BV,
Gtd. Notes | | | | 4.375 | | | 05/20/23 | | | | 2,000 | | | | 1,848,188 | |
Petrobras International Finance Co., Gtd. Notes | | | | 5.375 | | | 01/27/21 | | | | 900 | | | | 915,096 | |
Schahin II Finance Co. SPV Ltd.,
Sr. Sec’d. Notes, 144A | | | | 5.875 | | | 09/25/22 | | | | 240 | | | | 233,513 | |
| | | | | | | | | | | | | | | | |
| | | | | | | | | | | | | | | 10,391,781 | |
| | | | | |
Bulgaria 0.1% | | | | | | | | | | | | | | | | |
Bulgaria Government International Bond,
Sr. Unsec’d. Notes, RegS | | | | 4.250 | | | 07/09/17 | | | EUR | 100 | | | | 146,475 | |
| | | | | |
Canada 0.5% | | | | | | | | | | | | | | | | |
Agrium, Inc.,
Sr. Unsec’d. Notes | | | | 6.125 | | | 01/15/41 | | | | 25 | | | | 27,466 | |
Barrick North America Finance LLC, Gtd. Notes | | | | 5.750 | | | 05/01/43 | | | | 345 | | | | 296,956 | |
Canadian Government Bond, Unsec’d. Notes(a) | | | | 2.750 | | | 06/01/22 | | | CAD | 200 | | | | 198,387 | |
Canadian Pacific Railway Co.,
Sr. Unsec’d. Notes | | | | 6.500 | | | 05/15/18 | | | | 77 | | | | 91,045 | |
TransAlta Corp.,
Sr. Unsec’d. Notes | | | | 6.650 | | | 05/15/18 | | | | 200 | | | | 228,949 | |
See Notes to Financial Statements.
| | | | |
| Prudential Global Total Return Fund, Inc. | | | 13 | |
Portfolio of Investments
as of October 31, 2013 continued
| | | | | | | | | | | | | | | | |
| Description | | | | Interest
Rate | | Maturity
Date | | | Principal
Amount (000)# | | | Value (Note 1) | |
FOREIGN BONDS (Continued) | |
| | | | | |
Canada (cont’d.) | | | | | | | | | | | | | | | | |
Videotron Ltd.,
Gtd. Notes | | | | 9.125% | | | 04/15/18 | | | | 131 | | | $ | 137,714 | |
Xstrata Canadian Finance Ltd.,
Gtd. Notes, 144A | | | | 2.850 | | | 11/10/14 | | | | 250 | | | | 253,755 | |
| | | | | | | | | | | | | | | | |
| | | | | | | | | | | | | | | 1,234,272 | |
| | | | | |
China 2.1% | | | | | | | | | | | | | | | | |
China Government Bond,
Sr. Unsec’d. Notes | | | | 1.800 | | | 12/01/15 | | | CNY | 1,000 | | | | 161,129 | |
Sr. Unsec’d. Notes | | | | 2.380 | | | 07/19/14 | | | CNY | 15,060 | | | | 2,471,365 | |
Sr. Unsec’d. Notes | | | | 3.300 | | | 10/27/14 | | | CNY | 2,970 | | | | 491,550 | |
Sr. Unsec’d. Notes, RegS | | | | 1.850 | | | 06/29/15 | | | CNY | 12,000 | | | | 1,946,190 | |
China Government International Bond,
Sr. Unsec’d. Notes | | | | 4.250 | | | 10/28/14 | | | EUR | 280 | | | | 393,025 | |
| | | | | | | | | | | | | | | | |
| | | | | | | | | | | | | | | 5,463,259 | |
| | | | | |
Colombia 0.8% | | | | | | | | | | | | | | | | |
Colombia Government International Bond,
Sr. Unsec’d. Notes | | | | 4.000 | | | 02/26/24 | | | | 1,000 | | | | 997,500 | |
Sr. Unsec’d. Notes | | | | 11.750 | | | 02/25/20 | | | | 715 | | | | 1,047,475 | |
| | | | | | | | | | | | | | | | |
| | | | | | | | | | | | | | | 2,044,975 | |
| | | | | |
Costa Rica 0.2% | | | | | | | | | | | | | | | | |
Costa Rica Government International Bond,
Sr. Unsec’d. Notes, 144A | | | | 4.375 | | | 04/30/25 | | | | 500 | | | | 460,000 | |
|
Croatia 0.6% | |
Croatia Government International Bond,
Sr. Unsec’d. Notes | | | | 6.500 | | | 01/05/15 | | | EUR | 1,050 | | | | 1,494,073 | |
|
Cyprus 0.5% | |
Cyprus Government International Bond,
Sr. Unsec’d. Notes, MTN, RegS | | | | 3.750 | | | 11/01/15 | | | EUR | 300 | | | | 364,048 | |
Sr. Unsec’d. Notes, MTN, RegS | | | | 4.625 | | | 02/03/20 | | | EUR | 800 | | | | 839,092 | |
| | | | | | | | | | | | | | | | |
| | | | | | | | | | | | | | | 1,203,140 | |
|
Czech Republic 0.4% | |
Czech Republic International,
Sr. Unsec’d. Notes, MTN | | | | 3.625 | | | 04/14/21 | | | EUR | 284 | | | | 424,548 | |
Sr. Unsec’d. Notes, RegS | | | | 2.875 | | | 11/23/16 | | | CHF | 600 | | | | 708,018 | |
| | | | | | | | | | | | | | | | |
| | | | | | | | | | | | | | | 1,132,566 | |
See Notes to Financial Statements.
| | | | | | | | | | | | | | | | |
| Description | | | | Interest
Rate | | Maturity
Date | | | Principal
Amount (000)# | | | Value (Note 1) | |
FOREIGN BONDS (Continued) | |
|
Finland 0.3% | |
Finland Government International Bond, Series E, Sr. Unsec’d. Notes, MTN | | | | 2.250% | | | 01/18/17 | | | SEK | 5,000 | | | $ | 785,565 | |
|
France 1.6% | |
French Treasury Notes BTAN, Bonds(a)(b) | | | | 2.500 | | | 07/25/16 | | | EUR | 2,900 | | | | 4,160,351 | |
|
Germany 1.3% | |
Bundesobligation, Bonds | | | | 1.000 | | | 10/12/18 | | | EUR | 490 | | | | 675,605 | |
Bundesrepublik Deutschland, Bonds | | | | 3.000 | | | 07/04/20 | | | EUR | 440 | | | | 674,538 | |
RWE AG,
Jr. Sub. Notes, RegS | | | | 4.625(c) | | | 12/31/49 | | | EUR | 200 | | | | 275,478 | |
Techem Energy Metering Service GmbH & Co. KG, Gtd. Notes, MTN, 144A | | | | 7.875 | | | 10/01/20 | | | EUR | 275 | | | | 415,673 | |
Techem GmbH,
Sr. Sec’d. Notes, MTN, 144A | | | | 6.125 | | | 10/01/19 | | | EUR | 500 | | | | 733,188 | |
Unitymedia Hessen GmbH & Co. KG/Unitymedia NRW GmbH,
Sr. Sec’d. Notes, 144A | | | | 5.500 | | | 09/15/22 | | | EUR | 450 | | | | 620,155 | |
| | | | | | | | | | | | | | | | |
| | | | | | | | | | | | | | | 3,394,637 | |
|
Greece 2.3% | |
Hellenic Republic Government Bond,
Bonds | | | | 2.000(d) | | | 02/24/23 | | | EUR | 1,350 | | | | 1,251,386 | |
Sr. Unsec’d. Notes, Series 9RG | | | | 5.800 | | | 07/14/15 | | | JPY | 150,000 | | | | 1,388,183 | |
Hellenic Republic Government International Bond,
Sr. Unsec’d. Notes(e) | | | | 5.250 | | | 02/01/16 | | | JPY | 340,000 | | | | 3,146,547 | |
| | | | | | | | | | | | | | | | |
| | | | | | | | | | | | | | | 5,786,116 | |
|
Hong Kong 0.1% | |
Hong Kong SAR Government Bond,
Sr. Unsec’d. Notes, RegS | | | | 5.125 | | | 08/01/14 | | | | 200 | | | | 206,756 | |
|
Hungary 2.8% | |
Hungary Government Bond,
Sr. Unsec’d. Notes, RegS | | | | 5.750 | | | 06/11/18 | | | EUR | 500 | | | | 726,399 | |
Hungary Government International Bond,
Sr. Unsec’d. Notes, MTN | | | | 4.000 | | | 05/20/16 | | | CHF | 500 | | | | 562,076 | |
Sr. Unsec’d. Notes, RegS | | | | 4.375 | | | 07/04/17 | | | EUR | 1,000 | | | | 1,384,761 | |
See Notes to Financial Statements.
| | | | |
| Prudential Global Total Return Fund, Inc. | | | 15 | |
Portfolio of Investments
as of October 31, 2013 continued
| | | | | | | | | | | | | | | | |
| Description | | | | Interest
Rate | | Maturity
Date | | | Principal
Amount (000)# | | | Value (Note 1) | |
FOREIGN BONDS (Continued) | |
|
Hungary (cont’d.) | |
Sr. Unsec’d. Notes, RegS | | | | 5.500% | | | 05/06/14 | | | GBP | 325 | | | $ | 530,338 | |
Sr. Unsec’d. Notes, RegS | | | | 6.000 | | | 01/11/19 | | | EUR | 2,500 | | | | 3,666,277 | |
MFB Magyar Fejlesztesi Bank Zrt,
Gov’t. Gtd. Notes, 144A | | | | 6.250 | | | 10/21/20 | | | | 265 | | | | 271,956 | |
| | | | | | | | | | | | | | | | |
| | | | | | | | | | | | | | | 7,141,807 | |
| | | | | |
Iceland 0.4% | | | | | | | | | | | | | | | | |
Iceland Government International Bond, Unsec’d. Notes, RegS | | | | 4.875 | | | 06/16/16 | | | | 1,000 | | | | 1,043,750 | |
| | | | | |
India 0.6% | | | | | | | | | | | | | | | | |
Bharti Airtel International Netherlands Bank, Gtd. Notes, 144A | | | | 5.125 | | | 03/11/23 | | | | 200 | | | | 187,500 | |
State Bank of India,
Sr. Unsec’d. Notes, MTN, RegS | | | | 4.500 | | | 11/30/15 | | | EUR | 700 | | | | 982,886 | |
Vedanta Resources PLC,
Sr. Notes, 144A | | | | 6.000 | | | 01/31/19 | | | | 350 | | | | 337,750 | |
| | | | | | | | | | | | | | | | |
| | | | | | | | | | | | | | | 1,508,136 | |
| | | | | |
Indonesia 1.2% | | | | | | | | | | | | | | | | |
Pertamina Persero PT,
Sr. Unsec’d. Notes, 144A | | | | 4.300 | | | 05/20/23 | | | | 500 | | | | 456,250 | |
Perusahaan Penerbit SBSN Indonesia,
Sr. Unsec’d. Notes, RegS | | | | 4.000 | | | 11/21/18 | | | | 2,200 | | | | 2,197,250 | |
Unsec’d. Notes, 144A | | | | 6.125 | | | 03/15/19 | | | | 375 | | | | 405,000 | |
PT Adaro Indonesia,
Sr. Unsec’d. Notes, RegS | | | | 7.625 | | | 10/22/19 | | | | 130 | | | | 137,475 | |
| | | | | | | | | | | | | | | | |
| | | | | | | | | | | | | | | 3,195,975 | |
| | | | | |
Ireland 1.5% | | | | | | | | | | | | | | | | |
Ireland Government Bond | | | | 4.400 | | | 06/18/19 | | | EUR | 2,630 | | | | 3,880,206 | |
| | | | | |
Israel 1.1% | | | | | | | | | | | | | | | | |
Israel Government International Bond,
Sr. Unsec’d. Notes | | | | 5.125 | | | 03/26/19 | | | | 800 | | | | 918,800 | |
Sr. Unsec’d. Notes, MTN | | | | 3.750 | | | 10/12/15 | | | EUR | 1,000 | | | | 1,429,037 | |
Sr. Unsec’d. Notes, MTN, RegS | | | | 4.625 | | | 03/18/20 | | | EUR | 350 | | | | 546,306 | |
| | | | | | | | | | | | | | | | |
| | | | | | | | | | | | | | | 2,894,143 | |
See Notes to Financial Statements.
| | | | | | | | | | | | | | | | |
| Description | | | | Interest
Rate | | Maturity
Date | | | Principal
Amount (000)# | | | Value (Note 1) | |
FOREIGN BONDS (Continued) | |
| | | | | |
Italy 7.1% | | | | | | | | | | | | | | | | |
Italy Buoni Poliennali del Tesoro,
Bonds | | | | 4.750 % | | | 05/01/17 | | | EUR | 5,520 | | | $ | 8,085,397 | |
Bonds | | | | 5.500 | | | 11/01/22 | | | EUR | 300 | | | | 456,776 | |
Sr. Unsec’d. Notes | | | | 6.500 | | | 11/01/27 | | | EUR | 2,295 | | | | 3,771,857 | |
Italy Government International Bond,
Series E, Sr. Unsec’d. Notes, MTN, RegS | | | | 2.500 | | | 03/02/15 | | | CHF | 100 | | | | 111,798 | |
Series E, Sr. Unsec’d. Notes, MTN, RegS | | | | 5.750 | | | 07/25/16 | | | EUR | 201 | | | | 298,556 | |
Sr. Unsec’d. Notes, MTN, RegS | | | | 6.000 | | | 08/04/28 | | | GBP | 100 | | | | 166,463 | |
Sr. Unsec’d. Notes, RegS | | | | 3.450 | | | 03/24/17 | | | JPY | 125,000 | | | | 1,309,094 | |
Sr. Unsec’d. Notes, RegS | | | | 3.700 | | | 11/14/16 | | | JPY | 92,000 | | | | 983,301 | |
Sr. Unsec’d. Notes, RegS | | | | 4.500 | | | 06/08/15 | | | JPY | 144,000 | | | | 1,524,074 | |
Sr. Unsec’d. Notes, RegS | | | | 5.500 | | | 12/15/14 | | | JPY | 62,000 | | | | 655,881 | |
Wind Acquisition Finance SA,
Sec’d. Notes, 144A | | | | 11.750 | | | 07/15/17 | | | | 100 | | | | 106,250 | |
Sec’d. Notes, 144A | | | | 11.750 | | | 07/15/17 | | | EUR | 150 | | | | 217,166 | |
Sec’d. Notes, RegS | | | | 11.750 | | | 07/15/17 | | | EUR | 300 | | | | 434,332 | |
| | | | | | | | | | | | | | | | |
| | | | | | | | | | | | | | | 18,120,945 | |
| | | | | |
Japan 0.4% | | | | | | | | | | | | | | | | |
MUFG Capital Finance 1 Ltd.,
Gtd. Notes | | | | 6.346(c) | | | 12/31/49 | | | | 120 | | | | 133,188 | |
Nomura Holdings, Inc.,
Sr. Unsec’d. Notes, MTN | | | | 2.000 | | | 09/13/16 | | | | 800 | | | | 805,847 | |
| | | | | | | | | | | | | | | | |
| | | | | | | | | | | | | | | 939,035 | |
| | | | | |
Latvia 0.4% | | | | | | | | | | | | | | | | |
Republic of Latvia,
Sr. Unsec’d. Notes, RegS | | | | 5.250 | | | 02/22/17 | | | | 1,000 | | | | 1,091,500 | |
|
Lithuania 0.6% | |
Lithuania Government International Bond,
Sr. Unsec’d. Notes | | | | 3.750 | | | 02/10/16 | | | EUR | 1,000 | | | | 1,426,729 | |
| | | | | |
Malaysia 0.3% | | | | | | | | | | | | | | | | |
1Malaysia Sukuk Global Bhd,
Sr. Unsec’d. Notes, RegS | | | | 3.928 | | | 06/04/15 | | | | 825 | | | | 858,180 | |
|
Mexico 4.1% | |
Mexico Government International Bond,
Series B, Sr. Unsec’d. Notes, MTN | | | | 4.250 | | | 07/14/17 | | | EUR | 2,954 | | | | 4,334,680 | |
See Notes to Financial Statements.
| | | | |
| Prudential Global Total Return Fund, Inc. | | | 17 | |
Portfolio of Investments
as of October 31, 2013 continued
| | | | | | | | | | | | | | | | |
| Description | | | | Interest
Rate | | Maturity
Date | | | Principal
Amount (000)# | | | Value (Note 1) | |
FOREIGN BONDS (Continued) | |
|
Mexico (cont’d.) | |
Series G, Sr. Unsec’d. Notes, MTN | | | | 6.750% | | | 02/06/24 | | | GBP | 825 | | | $ | 1,613,834 | |
Series G, Sr. Unsec’d. Notes, MTN | | | | 11.000 | | | 05/08/17 | | | ITL | 250,000 | | | | 224,391 | |
Sr. Unsec’d. Notes | | | | 2.750 | | | 04/22/23 | | | EUR | 2,075 | | | | 2,722,256 | |
Sr. Unsec’d. Notes, MTN | | | | 5.625 | | | 01/15/17 | | | | 526 | | | | 590,172 | |
Petroleos Mexicanos,
Gtd. Notes | | | | 3.500 | | | 01/30/23 | | | | 370 | | | | 343,175 | |
Gtd. Notes | | | | 4.875 | | | 01/24/22 | | | | 300 | | | | 312,000 | |
Gtd. Notes, MTN | | | | 8.250 | | | 06/02/22 | | | GBP | 206 | | | | 411,161 | |
| | | | | | | | | | | | | | | | |
| | | | | | | | | | | | | | | 10,551,669 | |
|
Netherlands 0.2% | |
UPCB Finance III Ltd.,
Sr. Sec’d. Notes, 144A | | | | 6.625 | | | 07/01/20 | | | | 475 | | | | 507,063 | |
|
Panama 0.9% | |
Panama Government International Bond,
Sr. Unsec’d. Notes | | | | 6.700 | | | 01/26/36 | | | | 1,700 | | | | 2,010,250 | |
Sr. Unsec’d. Notes | | | | 10.750 | | | 05/15/20 | | | | 275 | | | | 371,938 | |
| | | | | | | | | | | | | | | | |
| | | | | | | | | | | | | | | 2,382,188 | |
|
Peru 3.4% | |
Peruvian Government International Bond,
Sr. Unsec’d. Notes | | | | 7.350 | | | 07/21/25 | | | | 500 | | | | 644,500 | |
Sr. Unsec’d. Notes, RegS | | | | 7.500 | | | 10/14/14 | | | EUR | 4,003 | | | | 5,761,198 | |
Sr. Unsec’d. Notes, RegS | | | | 9.910 | | | 05/05/15 | | | PEN | 5,800 | | | | 2,272,730 | |
| | | | | | | | | | | | | | | | |
| | | | | | | | | | | | | | | 8,678,428 | |
|
Philippines 2.4% | |
Philippine Government International Bond,
Sr. Unsec’d. Notes | | | | 3.900 | | | 11/26/22 | | | PHP | 60,000 | | | | 1,457,996 | |
Sr. Unsec’d. Notes | | | | 6.250 | | | 03/15/16 | | | EUR | 2,881 | | | | 4,292,299 | |
Power Sector Assets & Liabilities Management Corp.,
Gtd. Notes, RegS | | | | 7.250 | | | 05/27/19 | | | | 250 | | | | 302,500 | |
| | | | | | | | | | | | | | | | |
| | | | | | | | | | | | | | | 6,052,795 | |
|
Poland 2.9% | |
Poland Government International Bond,
Series 9, Sr. Unsec’d. Notes, RegS | | | | 2.340 | | | 11/13/14 | | | JPY | 200,000 | | | | 2,075,725 | |
Series E, Sr. Unsec’d. Notes, MTN | | | | 2.125 | | | 03/31/14 | | | CHF | 500 | | | | 555,409 | |
See Notes to Financial Statements.
| | | | | | | | | | | | | | | | |
| Description | | | | Interest
Rate | | Maturity
Date | | | Principal
Amount (000)# | | | Value (Note 1) | |
FOREIGN BONDS (Continued) | | | | | | | | | | | | | | | | |
| | | | | |
Poland (cont’d.) | | | | | | | | | | | | | | | | |
Series E, Sr. Unsec’d. Notes, MTN | | | | 3.625 % | | | 02/01/16 | | | EUR | 500 | | | $ | 721,749 | |
Series E, Sr. Unsec’d. Notes, MTN | | | | 5.250 | | | 01/20/25 | | | EUR | 500 | | | | 811,259 | |
Series E, Sr. Unsec’d. Notes, MTN, RegS | | | | 2.625 | | | 05/12/15 | | | CHF | 3,000 | | | | 3,412,796 | |
| | | | | | | | | | | | | | | | |
| | | | | | | | | | | | | | | 7,576,938 | |
| | | | | |
Portugal 2.0% | | | | | | | | | | | | | | | | |
Portugal Government International Bond,
Sr. Unsec’d. Notes, MTN, RegS | | | | 3.500 | | | 03/25/15 | | | | 270 | | | | 269,214 | |
Portugal Obrigacoes do Tesouro OT,
Sr. Unsec’d. Notes, 144A | | | | 4.750 | | | 06/14/19 | | | EUR | 2,410 | | | | 3,132,990 | |
Sr. Unsec’d. Notes, 144A | | | | 6.400 | | | 02/15/16 | | | EUR | 750 | | | | 1,063,224 | |
Sr. Unsec’d. Notes, RegS | | | | 3.850 | | | 04/15/21 | | | EUR | 500 | | | | 589,605 | |
| | | | | | | | | | | | | | | | |
| | | | | | | | | | | | | | | 5,055,033 | |
| | | | | |
Romania 1.3% | | | | | | | | | | | | | | | | |
Romanian Government International Bond,
Sr. Unsec’d. Notes, RegS | | | | 5.000 | | | 03/18/15 | | | EUR | 1,307 | | | | 1,853,022 | |
Sr. Unsec’d. Notes, RegS | | | | 6.500 | | | 06/18/18 | | | EUR | 1,000 | | | | 1,535,621 | |
| | | | | | | | | | | | | | | | |
| | | | | | | | | | | | | | | 3,388,643 | |
| | | | | |
Russia 3.3% | | | | | | | | | | | | | | | | |
Gazprom OAO Via GAZ Capital SA,
Sr. Unsec’d. Notes | | | | 8.125 | | | 02/04/15 | | | EUR | 500 | | | | 734,885 | |
Sr. Unsec’d. Notes, 144A | | | | 6.510 | | | 03/07/22 | | | | 500 | | | | 548,750 | |
Sr. Unsec’d. Notes, RegS | | | | 5.092 | | | 11/29/15 | | | | 1,000 | | | | 1,061,400 | |
Lukoil International Finance BV,
Gtd. Notes, 144A | | | | 7.250 | | | 11/05/19 | | | | 130 | | | | 151,671 | |
Raspadskaya OJSC Via Raspadskaya Securities Ltd.,
Sr. Unsec’d. Notes, 144A | | | | 7.750 | | | 04/27/17 | | | | 250 | | | | 258,438 | |
Rosneft Finance SA,
Gtd. Notes, 144A | | | | 6.625 | | | 03/20/17 | | | | 175 | | | | 192,938 | |
Russian Foreign Bond - Eurobond,
Sr. Unsec’d. Notes, RegS | | | | 7.500 | | | 03/31/30 | | | | 3,933 | | | | 4,679,872 | |
Sibur Securities Ltd.,
Gtd. Notes, 144A | | | | 3.914 | | | 01/31/18 | | | | 300 | | | | 293,250 | |
Vimpel Communications Via VIP Finance Ireland Ltd. OJSC,
Sr. Unsec’d. Notes, 144A | | | | 7.748 | | | 02/02/21 | | | | 295 | | | | 323,025 | |
See Notes to Financial Statements.
| | | | |
| Prudential Global Total Return Fund, Inc. | | | 19 | |
Portfolio of Investments
as of October 31, 2013 continued
| | | | | | | | | | | | | | | | |
| Description | | | | Interest
Rate | | Maturity
Date | | | Principal
Amount (000)# | | | Value (Note 1) | |
FOREIGN BONDS (Continued) | | | | | | | | | | | | | | | | |
| | | | | |
Russia (cont’d.) | | | | | | | | | | | | | | | | |
VTB Bank OJSC Via VTB Capital SA,
Sr. Unsec’d. Notes, 144A | | | | 6.875 % | | | 05/29/18 | | | | 315 | | | $ | 347,067 | |
| | | | | | | | | | | | | | | | |
| | | | | | | | | | | | | | | 8,591,296 | |
| | | | | |
Serbia 0.3% | | | | | | | | | | | | | | | | |
Republic of Serbia, Bonds, 144A | | | | 4.875 | | | 02/25/20 | | | | 750 | | | | 706,875 | |
| | | | | |
Singapore 0.2% | | | | | | | | | | | | | | | | |
Berau Capital Resources,
Sr. Sec’d. Notes, RegS | | | | 12.500 | | | 07/08/15 | | | | 400 | | | | 422,000 | |
| | | | | |
Slovak Republic 0.4% | | | | | | | | | | | | | | | | |
Slovakia Government International Bond,
Sr. Unsec’d. Notes, RegS | | | | 4.375 | | | 05/21/22 | | | | 1,000 | | | | 1,050,000 | |
| | | | | |
Slovenia 1.3% | | | | | | | | | | | | | | | | |
Slovenia Government Bond,
Sr. Unsec’d. Notes | | | | 4.375 | | | 02/06/19 | | | EUR | 300 | | | | 389,225 | |
Slovenia Government International Bond,
Bonds, 144A | | | | 5.850 | | | 05/10/23 | | | | 1,500 | | | | 1,462,500 | |
Sr. Unsec’d. Notes, 144A | | | | 4.750 | | | 05/10/18 | | | | 1,500 | | | | 1,481,250 | |
| | | | | | | | | | | | | | | | |
| | | | | | | | | | | | | | | 3,332,975 | |
| | | | | |
South Africa 1.3% | | | | | | | | | | | | | | | | |
Sasol Financing International PLC,
Gtd. Notes | | | | 4.500 | | | 11/14/22 | | | | 400 | | | | 382,000 | |
South Africa Government International Bond,
Unsec’d. Notes, MTN | | | | 4.500 | | | 04/05/16 | | | EUR | 2,047 | | | | 2,956,645 | |
| | | | | | | | | | | | | | | | |
| | | | | | | | | | | | | | | 3,338,645 | |
| | | | | |
South Korea 0.5% | | | | | | | | | | | | | | | | |
Republic of Korea,
Sr. Unsec’d. Notes | | | | 3.625 | | | 11/02/15 | | | EUR | 880 | | | | 1,259,643 | |
| | | | | |
Spain 3.9% | | | | | | | | | | | | | | | | |
Nara Cable Funding Ltd.,
Sr. Sec’d. Notes, RegS | | | | 8.875 | | | 12/01/18 | | | EUR | 400 | | | | 585,192 | |
Spain Government Bond,
Sr. Unsub. Notes | | | | 5.850 | | | 01/31/22 | | | EUR | 3,705 | | | | 5,765,183 | |
See Notes to Financial Statements.
| | | | | | | | | | | | | | | | |
| Description | | | | Interest
Rate | | Maturity
Date | | | Principal
Amount (000)# | | | Value (Note 1) | |
FOREIGN BONDS (Continued) | | | | | | | | | | | | | | | | |
| | | | | |
Spain (cont’d.) | | | | | | | | | | | | | | | | |
Spain Government International Bond,
Sr. Unsec’d. Notes, 144A | | | | 4.000 % | | | 03/06/18 | | | | 3,660 | | | $ | 3,766,872 | |
| | | | | | | | | | | | | | | | |
| | | | | | | | | | | | | | | 10,117,247 | |
| | | | | |
Turkey 0.9% | | | | | | | | | | | | | | | | |
Export Credit Bank of Turkey,
Sr. Unsec’d. Notes, 144A | | | | 5.375 | | | 11/04/16 | | | | 200 | | | | 209,000 | |
Turkey Government International Bond,
Sr. Unsec’d. Notes | | | | 5.500 | | | 02/16/17 | | | EUR | 1,148 | | | | 1,688,075 | |
Sr. Unsec’d. Notes | | | | 5.875 | | | 04/02/19 | | | EUR | 247 | | | | 370,948 | |
| | | | | | | | | | | | | | | | |
| | | | | | | | | | | | | | | 2,268,023 | |
| | | | | |
United Arab Emirates 0.1% | | | | | | | | | | | | | | | | |
IPIC GMTN Ltd.,
Gtd. Notes, MTN, 144A | | | | 5.500 | | | 03/01/22 | | | | 300 | | | | 333,000 | |
| | | | | |
United Kingdom 1.3% | | | | | | | | | | | | | | | | |
Hong Kong & Shanghi Bank Holdings PLC,
Sr. Unsec’d. Notes | | | | 4.875 | | | 01/14/22 | | | | 150 | | | | 164,535 | |
Sr. Unsec’d. Notes | | | | 5.100 | | | 04/05/21 | | | | 85 | | | | 94,675 | |
Sub. Notes | | | | 6.500 | | | 09/15/37 | | | | 125 | | | | 148,090 | |
Lloyds TSB Bank PLC,
Gtd. Notes | | | | 4.200 | | | 03/28/17 | | | | 575 | | | | 622,428 | |
Gtd. Notes | | | | 6.375 | | | 01/21/21 | | | | 500 | | | | 592,867 | |
Gtd. Notes, MTN, 144A | | | | 5.800 | | | 01/13/20 | | | | 245 | | | | 281,633 | |
Lynx I Corp.,
Sr. Sec’d. Notes, 144A | | | | 6.000 | | | 04/15/21 | | | GBP | 500 | | | | 827,761 | |
Royal Bank of Scotland Group PLC (The),
Gtd. Notes | | | | 6.125 | | | 01/11/21 | | | | 325 | | | | 372,019 | |
Sr. Unsec’d. Notes, MTN | | | | 6.400 | | | 10/21/19 | | | | 150 | | | | 174,086 | |
| | | | | | | | | | | | | | | | |
| | | | | | | | | | | | | | | 3,278,094 | |
| | | | | |
Uruguay 0.4% | | | | | | | | | | | | | | | | |
Uruguay Government International Bond,
Sr. Unsec’d. Notes | | | | 4.125 | | | 11/20/45 | | | | 700 | | | | 577,500 | |
Sr. Unsec’d. Notes | | | | 6.875 | | | 01/19/16 | | | EUR | 103 | | | | 153,484 | |
See Notes to Financial Statements.
| | | | |
| Prudential Global Total Return Fund, Inc. | | | 21 | |
Portfolio of Investments
as of October 31, 2013 continued
| | | | | | | | | | | | | | | | |
| Description | | | | Interest
Rate | | Maturity
Date | | | Principal
Amount (000)# | | | Value (Note 1) | |
FOREIGN BONDS (Continued) | | | | | | | | | | | | | | | | |
| | | | | |
Uruguay (cont’d.) | | | | | | | | | | | | | | | | |
Sr. Unsec’d. Notes | | | | 7.000 % | | | 06/28/19 | | | EUR | 119 | | | $ | 193,073 | |
| | | | | | | | | | | | | | | | |
| | | | | | | | | | | | | | | 924,057 | |
| | | | | | | | | | | | | | | | |
TOTAL FOREIGN BONDS
(cost $157,775,931) | | | | | | | | | | | | | | | 164,117,585 | |
| | | | | | | | | | | | | | | | |
| | | | | |
ASSET-BACKED SECURITIES 9.7% | | | | | | | | | | | | | | | | |
| | | | | |
Collateralized Debt Obligations 0.3% | | | | | | | | | | | | | | | | |
Highlander Euro CDO Cayman Ltd.,
Series 2008-4A, Class C, 144A | | | | 4.820(c) | | | 08/01/16 | | | EUR | 500 | | | | 675,224 | |
| | | | | |
Collateralized Loan Obligations 0.9% | | | | | | | | | | | | | | | | |
Ares Enhanced Loan Investment Strategy Ltd.,
Series 2005-2A, Class A2, 144A | | | | 0.498(c) | | | 01/26/20 | | | | 107 | | | | 105,630 | |
Avoca CLO I BV,
Series II-A, Class A1, 144A | | | | 0.670(c) | | | 01/15/20 | | | EUR | 486 | | | | 656,804 | |
Four Corners CLO Ltd.,
Series 2006-3A, Class A, 144A | | | | 0.491(c) | | | 07/22/20 | | | | 395 | | | | 389,337 | |
LightPoint Pan-European CLO PLC,
Series 2006-1A, Class A, 144A | | | | 0.478(c) | | | 01/31/22 | | | EUR | 134 | | | | 177,357 | |
Mountain Capital CLO IV Ltd.,
Series 2005-4A, Class A1L, 144A | | | | 0.504(c) | | | 03/15/18 | | | | 122 | | | | 121,078 | |
North Westerly CLO BV,
Series II-A, Class A, 144A | | | | 0.721(c) | | | 09/14/19 | | | EUR | 191 | | | | 253,628 | |
Shackleton CLO Ltd.,
Series 2013-3A, Class B2, 144A | | | | 3.440 | | | 04/15/25 | | | | 250 | | | | 239,715 | |
Slater Mill Loan Fund LP,
Series 2012-1A, Class B, 144A | | | | 2.913(c) | | | 08/17/22 | | | | 250 | | | | 250,470 | |
Trimaran CLO VI Ltd.,
Series 2006-2A, Class A1L, 144A | | | | 0.515(c) | | | 11/01/18 | | | | 209 | | | | 207,655 | |
| | | | | | | | | | | | | | | | |
| | | | | | | | | | | | | | | 2,401,674 | |
| |
Residential Mortgage-Backed Securities 8.5% | | | | | |
ACE Securities Corp. Home Equity Loan Trust,
Series 2004-FM1, Class M1 | | | | 1.070(c) | | | 09/25/33 | | | | 288 | | | | 266,645 | |
Series 2005-HE2, Class M4 | | | | 1.130(c) | | | 04/25/35 | | | | 1,000 | | | | 892,348 | |
Aegis Asset-Backed Securities Trust,
Series 2004-2, Class A5 | | | | 1.070(c) | | | 06/25/34 | | | | 449 | | | | 443,701 | |
See Notes to Financial Statements.
| | | | | | | | | | | | | | | | |
| Description | | | | Interest
Rate | | Maturity
Date | | | Principal
Amount (000)# | | | Value (Note 1) | |
ASSET-BACKED SECURITIES (Continued) | | | | | | | | | | | | | | | | |
| |
Residential Mortgage-Backed Securities (cont’d.) | | | | | |
Ameriquest Mortgage Securities, Inc.
Asset-Backed Pass-Through Certificates,
Series 2004-R8, Class M1 | | | | 1.130 % (c) | | | 09/25/34 | | | | 400 | | | $ | 386,486 | |
Argent Securities, Inc.,
Series 2004-W6, Class M1 | | | | 0.720(c) | | | 05/25/34 | | | | 238 | | | | 231,957 | |
Series 2005-W2, Class A2C | | | | 0.530(c) | | | 10/25/35 | | | | 1,452 | | | | 1,300,808 | |
Asset-Backed Pass-Through Certificates,
Series 2002-3, Class M3 | | | | 3.020(c) | | | 08/25/32 | | | | 735 | | | | 684,639 | |
Asset-Backed Securities Corp. Home Equity Loan Trust,
Series 2004-HE1, Class M1 | | | | 1.224(c) | | | 01/15/34 | | | | 1,294 | | | | 1,239,299 | |
Bear Stearns Asset-Backed Securities Trust,
Series 2004-HE2, Class M1 | | | | 1.070(c) | | | 03/25/34 | | | | 354 | | | | 329,530 | |
Series 2004-HE3, Class M2 | | | | 1.895(c) | | | 04/25/34 | | | | 247 | | | | 216,842 | |
Chase Funding Loan Acquisition Trust,
Series 2004-AQ1, Class A2 | | | | 0.570(c) | | | 05/25/34 | | | | 214 | | | | 207,041 | |
Citicorp Residential Mortgage Trust,
Series 2006-2, Class A4 | | | | 5.775(c) | | | 09/25/36 | | | | 575 | | | | 584,815 | |
Citigroup Mortgage Loan Trust, Inc.,
Series 2004-OPT1, Class A2 | | | | 0.890(c) | | | 10/25/34 | | | | 100 | | | | 100,105 | |
Countrywide Asset-Backed Certificates,
Series 2002-5, Class MV1 | | | | 1.670(c) | | | 03/25/33 | | | | 196 | | | | 191,516 | |
Finance America Mortgage Loan Trust,
Series 2004-2, Class M1 | | | | 0.995(c) | | | 08/25/34 | | | | 982 | | | | 890,290 | |
Fremont Home Loan Trust,
Series 2004-1, Class M1 | | | | 0.845(c) | | | 02/25/34 | | | | 421 | | | | 380,477 | |
Series 2004-B, Class M1 | | | | 1.040(c) | | | 05/25/34 | | | | 910 | | | | 831,679 | |
Granite Master Issuer PLC,
Series 2007-1, Class 5A1, RegS | | | | 0.708(c) | | | 12/20/54 | | | GBP | 1,698 | | | | 2,687,476 | |
Series 2007-1, Class 6A1, RegS | | | | 0.678(c) | | | 12/20/54 | | | GBP | 326 | | | | 515,995 | |
GSAMP Trust,
Series 2004-FM1, Class M1 | | | | 1.145(c) | | | 11/25/33 | | | | 218 | | | | 211,015 | |
Series 2005-HE5, Class M1 | | | | 0.590(c) | | | 11/25/35 | | | | 1,000 | | | | 939,614 | |
Home Equity Asset Trust,
Series 2004-3, Class M1 | | | | 1.025(c) | | | 08/25/34 | | | | 616 | | | | 573,235 | |
Series 2005-9, Class 2A4 | | | | 0.510(c) | | | 04/25/36 | | | | 1,000 | | | | 931,396 | |
Hong Kong & Shanghi Bank Home Equity
Loan Trust,
Series 2007-2, Class A4 | | | | 0.473(c) | | | 07/20/36 | | | | 400 | | | | 374,982 | |
Long Beach Mortgage Loan Trust,
Series 2004-3, Class M1 | | | | 1.025(c) | | | 07/25/34 | | | | 600 | | | | 573,548 | |
See Notes to Financial Statements.
| | | | |
| Prudential Global Total Return Fund, Inc. | | | 23 | |
Portfolio of Investments
as of October 31, 2013 continued
| | | | | | | | | | | | | | | | |
| Description | | | | Interest
Rate | | Maturity
Date | | | Principal
Amount (000)# | | | Value (Note 1) | |
ASSET-BACKED SECURITIES (Continued) | | | | | | | | | | | | | | | | |
| |
Residential Mortgage-Backed Securities (cont’d.) | | | | | |
MASTR Asset-Backed Securities Trust,
Series 2004-OPT2, Class A1 | | | | 0.870 % (c) | | | 09/25/34 | | | | 375 | | | $ | 345,064 | |
Merrill Lynch Mortgage Investors Trust,
Series 2004-HE2, Class M1 | | | | 1.370(c) | | | 08/25/35 | | | | 236 | | | | 209,177 | |
Morgan Stanley ABS Capital I, Inc. Trust,
Series 2003-NC8, Class M1 | | | | 1.220(c) | | | 09/25/33 | | | | 316 | | | | 297,541 | |
Series 2004-NC1, Class M1 | | | | 1.220(c) | | | 12/27/33 | | | | 380 | | | | 365,506 | |
Series 2004-OP1, Class M1 | | | | 1.040(c) | | | 11/25/34 | | | | 437 | | | | 385,534 | |
Series 2004-WMC1, Class M1 | | | | 1.100(c) | | | 06/25/34 | | | | 631 | | | | 586,955 | |
Series 2004-WMC2, Class M1 | | | | 1.085(c) | | | 07/25/34 | | | | 233 | | | | 220,929 | |
Morgan Stanley Dean Witter Capital I,
Series 2002-AM3, Class A3 | | | | 1.150(c) | | | 02/25/33 | | | | 383 | | | | 361,075 | |
New Century Home Equity Loan Trust,
Series 2003-4, Class M1 | | | | 1.295(c) | | | 10/25/33 | | | | 385 | | | | 371,230 | |
Series 2005-C, Class A2C | | | | 0.420(c) | | | 12/25/35 | | | | 814 | | | | 755,245 | |
Option One Mortgage Loan Trust,
Series 2003-6, Class A2 | | | | 0.830(c) | | | 11/25/33 | | | | 349 | | | | 321,370 | |
Popular ABS Mortgage Pass-Through Trust,
Series 2004-4, Class M1 | | | | 4.968(c) | | | 09/25/34 | | | | 166 | | | | 165,473 | |
Structured Asset Investment Loan Trust,
Series 2004-2, Class A4 | | | | 0.875(c) | | | 03/25/34 | | | | 106 | | | | 99,657 | |
Series 2004-8, Class A8 | | | | 1.170(c) | | | 09/25/34 | | | | 376 | | | | 363,508 | |
Structured Asset Securities Corp. Mortgage Loan Trust,
Series 2005-NC2, Class M3 | | | | 0.600(c) | | | 05/25/35 | | | | 530 | | | | 493,043 | |
Wells Fargo Mortgage-Backed Securities Trust,
Series 2007-5, Class 1A1 | | | | 5.500 | | | 05/25/37 | | | | 545 | | | | 559,280 | |
| | | | | | | | | | | | | | | | |
| | | �� | | | | | | | | | | | | 21,886,026 | |
| | | | | | | | | | | | | | | | |
TOTAL ASSET-BACKED SECURITIES
(cost $22,767,701) | | | | | | | | | | | | | | | 24,962,924 | |
| | | | | | | | | | | | | | | | |
| | | | | |
BANK LOANS(c) 0.8% | | | | | | | | | | | | | | | | |
| | | | | |
Consumer 0.1% | | | | | | | | | | | | | | | | |
OGF SA (France) | | | | 4.658 | | | 10/30/20 | | | EUR | 250 | | | | 342,303 | |
| | | | | |
Gaming 0.1% | | | | | | | | | | | | | | | | |
CCM Merger, Inc. | | | | 5.000 | | | 03/01/17 | | | | 124 | | | | 124,662 | |
See Notes to Financial Statements.
| | | | | | | | | | | | | | | | |
| Description | | | | Interest
Rate | | Maturity
Date | | | Principal
Amount (000)# | | | Value (Note 1) | |
BANK LOANS(c) (Continued) | | | | | | | | | | | | | | | | |
| | | | | |
Healthcare & Pharmaceutical 0.2% | | | | | | | | | | | | | | | | |
Alere, Inc. | | | | 3.168 % | | | 06/30/16 | | | | 100 | | | $ | 100,060 | |
Alere, Inc. | | | | 4.250 | | | 06/30/17 | | | | 100 | | | | 100,441 | |
Alere, Inc. | | | | 4.250 | | | 06/30/17 | | | | 37 | | | | 36,896 | |
DaVita, Inc. | | | | 4.000 | | | 11/01/19 | | | | 221 | | | | 222,197 | |
RPI Finance Trust | | | | 4.000 | | | 11/09/18 | | | | 149 | | | | 149,581 | |
| | | | | | | | | | | | | | | | |
| | | | | | | | | | | | | | | 609,175 | |
| | | | | |
Retailers 0.3% | | | | | | | | | | | | | | | | |
Alliance Boots Holdings Ltd. (United Kingdom) | | | | 3.977 | | | 07/09/17 | | | GBP | 400 | | | | 636,555 | |
| | | | | |
Technology 0.1% | | | | | | | | | | | | | | | | |
First Data Corp. | | | | 4.170 | | | 09/24/18 | | | | 300 | | | | 300,300 | |
| | | | | | | | | | | | | | | | |
TOTAL BANK LOANS
(cost $1,961,233) | | | | | | | | | | | | | | | 2,012,995 | |
| | | | | | | | | | | | | | | | |
| | | | | |
CORPORATE BONDS 19.3% | | | | | | | | | | | | | | | | |
| | | | | |
Aerospace & Defense 0.3% | | | | | | | | | | | | | | | | |
B/E Aerospace, Inc.,
Sr. Unsec’d. Notes | | | | 5.250 | | | 04/01/22 | | | | 350 | | | | 359,625 | |
Textron, Inc.,
Sr. Unsec’d. Notes | | | | 5.600 | | | 12/01/17 | | | | 100 | | | | 111,147 | |
Sr. Unsec’d. Notes | | | | 7.250 | | | 10/01/19 | | | | 200 | | | | 236,057 | |
| | | | | | | | | | | | | | | | |
| | | | | | | | | | | | | | | 706,829 | |
| | | | | |
Airlines 0.3% | | | | | | | | | | | | | | | | |
Continental Airlines 2010-1 Class A Pass-Through Trust, Pass-Through Certificates | | | | 4.750 | | | 01/12/21 | | | | 89 | | | | 93,670 | |
Delta Air Lines, Inc. 2007-1, Class A Pass-Through Trust, Pass-Through Certificates, Series 071A | | | | 6.821 | | | 08/10/22 | | | | 202 | | | | 224,530 | |
Delta Air Lines, Inc. 2010-2, Class A Pass-Through Trust, Pass-Through Certificates | | | | 4.950 | | | 05/23/19 | | | | 21 | | | | 22,022 | |
Delta Air Lines, Inc. 2011-1, Class A Pass-Through Trust, Pass-Through Certificates | | | | 5.300 | | | 04/15/19 | | | | 202 | | | | 217,293 | |
See Notes to Financial Statements.
| | | | |
| Prudential Global Total Return Fund, Inc. | | | 25 | |
Portfolio of Investments
as of October 31, 2013 continued
| | | | | | | | | | | | | | | | |
| Description | | | | Interest
Rate | | Maturity
Date | | | Principal
Amount (000)# | | | Value (Note 1) | |
CORPORATE BONDS (Continued) | | | | | | | | | | | | | | | | |
| | | | | |
Airlines (cont’d.) | | | | | | | | | | | | | | | | |
United Airlines, Inc., Series 071A, Pass-Through Certificates | | | | 6.636 % | | | 07/02/22 | | | | 107 | | | $ | 112,802 | |
| | | | | | | | | | | | | | | | |
| | | | | | | | | | | | | | | 670,317 | |
| | | | | |
Automotive 0.4% | | | | | | | | | | | | | | | | |
Delphi Corp.,
Gtd. Notes | | | | 5.875 | | | 05/15/19 | | | | 350 | | | | 372,750 | |
Ford Motor Credit Co. LLC,
Sr. Unsec’d. Notes | | | | 4.207 | | | 04/15/16 | | | | 460 | | | | 490,963 | |
Sr. Unsec’d. Notes | | | | 5.625 | | | 09/15/15 | | | | 225 | | | | 243,409 | |
| | | | | | | | | | | | | | | | |
| | | | | | | | | | | | | | | 1,107,122 | |
| | | | | |
Banking 4.7% | | | | | | | | | | | | | | | | |
Bank of America Corp.,
Jr. Sub. Notes, Ser. K | | | | 8.000(c) | | | 12/31/49 | | | | 235 | | | | 260,263 | |
Sr. Unsec’d. Notes | | | | 5.700 | | | 01/24/22 | | | | 225 | | | | 258,290 | |
Sr. Unsec’d. Notes, MTN | | | | 5.000 | | | 05/13/21 | | | | 540 | | | | 594,160 | |
Sr. Unsec’d. Notes, MTN | | | | 5.875 | | | 02/07/42 | | | | 700 | | | | 804,197 | |
Bear Stearns Cos. LLC,
Sr. Unsec’d. Notes | | | | 7.250 | | | 02/01/18 | | | | 200 | | | | 241,186 | |
Citigroup, Inc.,
Sr. Unsec’d. Notes | | | | 4.500 | | | 01/14/22 | | | | 425 | | | | 453,671 | |
Sr. Unsec’d. Notes | | | | 8.125 | | | 07/15/39 | | | | 110 | | | | 154,591 | |
Sr. Unsec’d. Notes | | | | 8.500 | | | 05/22/19 | | | | 605 | | | | 782,797 | |
Sub. Notes | | | | 5.500 | | | 02/15/17 | | | | 300 | | | | 332,931 | |
Goldman Sachs Group, Inc. (The),
Sr. Unsec’d. Notes | | | | 5.250 | | | 07/27/21 | | | | 1,200 | | | | 1,324,523 | |
Sr. Unsec’d. Notes | | | | 6.250 | | | 02/01/41 | | | | 205 | | | | 237,266 | |
Sr. Unsec’d. Notes, MTN(a) | | | | 7.500 | | | 02/15/19 | | | | 1,300 | | | | 1,596,261 | |
Sub. Notes | | | | 6.750 | | | 10/01/37 | | | | 185 | | | | 202,079 | |
JPMorgan Chase & Co.,
Jr. Sub. Notes | | | | 7.900(c) | | | 12/31/49 | | | | 450 | | | | 496,125 | |
Sr. Unsec’d. Notes | | | | 4.250 | | | 10/15/20 | | | | 30 | | | | 31,999 | |
Sr. Unsec’d. Notes | | | | 4.350 | | | 08/15/21 | | | | 830 | | | | 880,349 | |
Sr. Unsec’d. Notes | | | | 5.600 | | | 07/15/41 | | | | 500 | | | | 548,968 | |
Sr. Unsec’d. Notes | | | | 6.000 | | | 01/15/18 | | | | 150 | | | | 173,490 | |
Morgan Stanley,
Sr. Unsec’d. Notes | | | | 6.375 | | | 07/24/42 | | | | 325 | | | | 384,533 | |
See Notes to Financial Statements.
| | | | | | | | | | | | | | | | |
| Description | | | | Interest
Rate | | Maturity
Date | | | Principal
Amount (000)# | | | Value (Note 1) | |
CORPORATE BONDS (Continued) | | | | | | | | | | | | | | | | |
| | | | | |
Banking (cont’d.) | | | | | | | | | | | | | | | | |
Sr. Unsec’d. Notes, MTN | | | | 5.625 % | | | 09/23/19 | | | | 1,970 | | | $ | 2,247,967 | |
| | | | | | | | | | | | | | | | |
| | | | | | | | | | | | | | | 12,005,646 | |
| | | | |
Brokerage 0.2% | | | | | | | | | | | | | | |
Jefferies Group, Inc.,
Sr. Unsec’d. Notes | | | | 6.875 | | | 04/15/21 | | | | 500 | | | | 565,000 | |
Lehman Brothers Holdings, Inc.,
Sr. Unsec’d. Notes(f) | | | | 6.875 | | | 05/02/18 | | | | 100 | | | | 21,750 | |
| | | | | | | | | | | | | | | | |
| | | | | | | | | | | | | | | 586,750 | |
| | | | |
Building Materials & Construction 0.3% | | | | | | | | | | | | | | |
CRH America, Inc.,
Gtd. Notes | | | | 8.125 | | | 07/15/18 | | | | 110 | | | | 134,556 | |
Owens Corning, Inc.,
Gtd. Notes | | | | 4.200 | | | 12/15/22 | | | | 270 | | | | 268,106 | |
Toll Brothers Finance Corp.,
Gtd. Notes | | | | 5.150 | | | 05/15/15 | | | | 420 | | | | 441,000 | |
| | | | | | | | | | | | | | | | |
| | | | | | | | | | | | | | | 843,662 | |
| | | | |
Cable 0.8% | | | | | | | | | | | | | | |
CSC Holdings LLC,
Sr. Unsec’d. Notes | | | | 6.750 | | | 11/15/21 | | | | 325 | | | | 354,250 | |
Sr. Unsec’d. Notes | | | | 8.625 | | | 02/15/19 | | | | 185 | | | | 218,763 | |
Dish DBS Corp.,
Gtd. Notes | | | | 6.625 | | | 10/01/14 | | | | 900 | | | | 941,625 | |
Time Warner Cable, Inc.,
Gtd. Notes | | | | 6.750 | | | 07/01/18 | | | | 195 | | | | 219,845 | |
Gtd. Notes | | | | 8.750 | | | 02/14/19 | | | | 300 | | | | 357,522 | |
| | | | | | | | | | | | | | | | |
| | | | | | | | | | | | | | | 2,092,005 | |
| | | | |
Capital Goods 1.6% | | | | | | | | | | | | | | |
Actuant Corp.,
Gtd. Notes | | | | 5.625 | | | 06/15/22 | | | | 400 | | | | 401,000 | |
ERAC USA Finance LLC,
Gtd. Notes, 144A
(original cost $273,750; purchased 02/09/2010)(e)(g) | | | | 6.375 | | | 10/15/17 | | | | 250 | | | | 291,376 | |
See Notes to Financial Statements.
| | | | |
| Prudential Global Total Return Fund, Inc. | | | 27 | |
Portfolio of Investments
as of October 31, 2013 continued
| | | | | | | | | | | | | | | | |
| Description | | | | Interest
Rate | | Maturity
Date | | | Principal
Amount (000)# | | | Value (Note 1) | |
CORPORATE BONDS (Continued) | | | | | | | | | | | | | | | | |
| | | | | |
Capital Goods (cont’d.) | | | | | | | | | | | | | | | | |
Gtd. Notes, 144A
(original cost $221,242; purchased 10/26/2011)(e)(g) | | | | 7.000 % | | | 10/15/37 | | | | 190 | | | $ | 228,647 | |
Hertz Holdings Netherlands BV,
Sr. Sec’d. Notes, RegS | | | | 8.500 | | | 07/31/15 | | | EUR | 155 | | | | 219,396 | |
Penske Truck Leasing Co. LP/PTL Finance Corp.,
Sr. Unsec’d. Notes, 144A
(original cost $998,520; purchased 09/24/2012)(e)(g) | | | | 2.500 | | | 03/15/16 | | | | 1,000 | | | | 1,022,021 | |
Unsec’d. Notes, 144A
(original cost $124,879; purchased 05/08/2012)(e)(g) | | | | 3.125 | | | 05/11/15 | | | | 125 | | | | 128,439 | |
Pentair Finance SA,
Gtd. Notes | | | | 2.650 | | | 12/01/19 | | | | 750 | | | | 722,522 | |
United Rentals North America, Inc.,
Gtd. Notes | | | | 7.625 | | | 04/15/22 | | | | 750 | | | | 840,000 | |
Xylem, Inc.,
Sr. Unsec’d. Notes | | | | 4.875 | | | 10/01/21 | | | | 225 | | | | 240,689 | |
| | | | | | | | | | | | | | | | |
| | | | | | | | | | | | | | | 4,094,090 | |
| | | | |
Chemicals 0.3% | | | | | | | | | | | | | | |
Ashland, Inc.,
Gtd. Notes | | | | 4.750 | | | 08/15/22 | | | | 300 | | | | 288,000 | |
Sr. Unsec’d. Notes | | | | 3.875 | | | 04/15/18 | | | | 175 | | | | 175,875 | |
Dow Chemical Co. (The),
Sr. Unsec’d. Notes | | | | 9.400 | | | 05/15/39 | | | | 152 | | | | 225,339 | |
| | | | | | | | | | | | | | | | |
| | | | | | | | | | | | | | | 689,214 | |
| | | | |
Consumer 0.2% | | | | | | | | | | | | | | |
QVC, Inc.,
Sr. Sec’d. Notes, 144A | | | | 7.500 | | | 10/01/19 | | | | 350 | | | | 377,933 | |
Service Corp. International,
Sr. Unsec’d. Notes | | | | 7.000 | | | 06/15/17 | | | | 250 | | | | 280,313 | |
| | | | | | | | | | | | | | | | |
| | | | | | | | | | | | | | | 658,246 | |
| | | | |
Electric 0.3% | | | | | | | | | | | | | | |
AES Corp. (The),
Sr. Unsec’d. Notes | | | | 8.000 | | | 10/15/17 | | | | 250 | | | | 294,375 | |
See Notes to Financial Statements.
| | | | | | | | | | | | | | | | |
| Description | | | | Interest
Rate | | Maturity
Date | | | Principal
Amount (000)# | | | Value (Note 1) | |
CORPORATE BONDS (Continued) | | | | | | | | | | | | | | | | |
| | | | | |
Electric (cont’d.) | | | | | | | | | | | | | | | | |
Sr. Unsec’d. Notes | | | | 9.750 % | | | 04/15/16 | | | | 250 | | | $ | 295,625 | |
Oncor Electric Delivery Co. LLC,
Sr. Sec’d. Notes | | | | 6.800 | | | 09/01/18 | | | | 105 | | | | 126,122 | |
Public Service Co. of New Mexico,
Sr. Unsec’d. Notes | | | | 7.950 | | | 05/15/18 | | | | 50 | | | | 60,238 | |
| | | | | | | | | | | | | | | | |
| | | | | | | | | | | | | | | 776,360 | |
| | | | |
Energy—Other 0.3% | | | | | | | | | | | | | | |
Anadarko Petroleum Corp.,
Sr. Unsec’d. Notes | | | | 6.375 | | | 09/15/17 | | | | 175 | | | | 204,580 | |
Sr. Unsec’d. Notes | | | | 6.450 | | | 09/15/36 | | | | 35 | | | | 41,194 | |
Nabors Industries, Inc.,
Gtd. Notes | | | | 4.625 | | | 09/15/21 | | | | 170 | | | | 172,022 | |
Pioneer Natural Resources Co.,
Sr. Unsec’d. Notes | | | | 6.875 | | | 05/01/18 | | | | 200 | | | | 238,426 | |
Weatherford International Ltd.,
Gtd. Notes | | | | 5.125 | | | 09/15/20 | | | | 65 | | | | 69,173 | |
| | | | | | | | | | | | | | | | |
| | | | | | | | | | | | | | | 725,395 | |
| | | | |
Foods 1.0% | | | | | | | | | | | | | | |
ARAMARK Corp.,
Gtd. Notes, 144A | | | | 5.750 | | | 03/15/20 | | | | 475 | | | | 497,563 | |
ConAgra Foods, Inc.,
Sr. Unsec’d. Notes | | | | 7.000 | | | 04/15/19 | | | | 250 | | | | 300,982 | |
Cott Beverages, Inc.,
Gtd. Notes | | | | 8.125 | | | 09/01/18 | | | | 800 | | | | 863,000 | |
Darling International, Inc.,
Gtd. Notes | | | | 8.500 | | | 12/15/18 | | | | 200 | | | | 221,000 | |
JBS USA LLC/JBS USA Finance, Inc.,
Sr. Unsec’d. Notes, 144A
(original cost $175,275; purchased 12/08/2011)(e)(g) | | | | 7.250 | | | 06/01/21 | | | | 190 | | | | 195,225 | |
Stater Brothers Holdings, Inc.,
Gtd. Notes | | | | 7.750 | | | 04/15/15 | | | | 350 | | | | 351,316 | |
Tyson Foods, Inc.,
Gtd. Notes | | | | 6.600 | | | 04/01/16 | | | | 90 | | | | 101,038 | |
| | | | | | | | | | | | | | | | |
| | | | | | | | | | | | | | | 2,530,124 | |
See Notes to Financial Statements.
| | | | |
| Prudential Global Total Return Fund, Inc. | | | 29 | |
Portfolio of Investments
as of October 31, 2013 continued
| | | | | | | | | | | | | | | | |
| Description | | | | Interest
Rate | | Maturity
Date | | | Principal
Amount (000)# | | | Value (Note 1) | |
CORPORATE BONDS (Continued) | | | | | | | | | | | | | | | | |
| | | | |
Gaming 0.2% | | | | | | | | | | | | | | |
Marina District Finance Co., Inc.,
Sr. Sec’d. Notes | | | | 9.500 % | | | 10/15/15 | | | | 172 | | | $ | 180,385 | |
Pinnacle Entertainment, Inc.,
Gtd. Notes | | | | 7.500 | | | 04/15/21 | | | | 205 | | | | 224,988 | |
| | | | | | | | | | | | | | | | |
| | | | | | | | | | | | | | | 405,373 | |
| | | | |
Healthcare & Pharmaceutical 0.7% | | | | | | | | | | | | | | |
Amgen, Inc.,
Sr. Unsec’d. Notes | | | | 5.150 | | | 11/15/41 | | | | 280 | | | | 282,210 | |
Sr. Unsec’d. Notes | | | | 5.375 | | | 05/15/43 | | | | 45 | | | | 46,750 | |
HCA, Inc.,
Gtd. Notes | | | | 8.000 | | | 10/01/18 | | | | 250 | | | | 293,750 | |
Sr. Unsec’d. Notes | | | | 7.190 | | | 11/15/15 | | | | 400 | | | | 438,000 | |
Sr. Unsec’d. Notes, MTN | | | | 9.000 | | | 12/15/14 | | | | 35 | | | | 37,800 | |
Valeant Pharmaceuticals International, Inc.,
Gtd. Notes, 144A | | | | 6.500 | | | 07/15/16 | | | | 500 | | | | 517,500 | |
Wyeth LLC,
Gtd. Notes | | | | 6.450 | | | 02/01/24 | | | | 70 | | | | 87,340 | |
| | | | | | | | | | | | | | | | |
| | | | | | | | | | | | | | | 1,703,350 | |
| | | | |
Insurance 1.0% | | | | | | | | | | | | | | |
Allied World Assurance Co. Ltd.,
Gtd. Notes | | | | 5.500 | | | 11/15/20 | | | | 30 | | | | 32,938 | |
Gtd. Notes | | | | 7.500 | | | 08/01/16 | | | | 250 | | | | 290,123 | |
American International Group, Inc.,
Sr. Unsec’d. Notes | | | | 6.400 | | | 12/15/20 | | | | 75 | | | | 89,977 | |
Sr. Unsec’d. Notes | | | | 8.250 | | | 08/15/18 | | | | 100 | | | | 126,506 | |
Sr. Unsec’d. Notes, MTN | | | | 5.850 | | | 01/16/18 | | | | 300 | | | | 346,255 | |
Chubb Corp. (The),
Jr. Sub. Notes | | | | 6.375(c) | | | 03/29/67 | | | | 140 | | | | 152,600 | |
Hartford Financial Services Group, Inc. (The),
Sr. Unsec’d. Notes | | | | 5.125 | | | 04/15/22 | | | | 175 | | | | 195,723 | |
Liberty Mutual Group, Inc.,
Sr. Unsec’d. Notes, 144A | | | | 6.500 | | | 03/15/35 | | | | 90 | | | | 99,816 | |
Lincoln National Corp.,
Jr. Sub. Notes | | | | 6.050(c) | | | 04/20/67 | | | | 30 | | | | 29,775 | |
Sr. Unsec’d. Notes | | | | 6.300 | | | 10/09/37 | | | | 80 | | | | 94,838 | |
Sr. Unsec’d. Notes | | | | 8.750 | | | 07/01/19 | | | | 200 | | | | 260,965 | |
See Notes to Financial Statements.
| | | | | | | | | | | | | | | | |
| Description | | | | Interest
Rate | | Maturity
Date | | | Principal
Amount (000)# | | | Value (Note 1) | |
CORPORATE BONDS (Continued) | |
|
Insurance (cont’d.) | |
Northwestern Mutual Life
Insurance Co. (The),
Sub. Notes, 144A | | | | 6.063 % | | | 03/30/40 | | | | 50 | | | $ | 58,425 | |
Progressive Corp. (The),
Jr. Sub. Notes | | | | 6.700(c) | | | 06/15/37 | | | | 100 | | | | 108,000 | |
Teachers Insurance & Annuity Association of America,
Sub. Notes, 144A | | | | 6.850 | | | 12/16/39 | | | | 210 | | | | 264,620 | |
Unum Group,
Sr. Unsec’d. Notes | | | | 7.125 | | | 09/30/16 | | | | 245 | | | | 280,111 | |
Willis Group Holdings PLC,
Gtd. Notes | | | | 4.125 | | | 03/15/16 | | | | 100 | | | | 105,501 | |
| | | | | | | | | | | | | | | | |
| | | | | | | | | | | | | | | 2,536,173 | |
|
Media & Entertainment 1.2% | |
Cedar Fair LP/Canada’s Wonderland Co./Magnum Management Corp.,
Gtd. Notes | | | | 9.125 | | | 08/01/18 | | | | 250 | | | | 273,750 | |
Historic TW, Inc.,
Gtd. Notes | | | | 6.625 | | | 05/15/29 | | | | 225 | | | | 259,490 | |
Liberty Interactive LLC,
Sr. Unsec’d. Notes | | | | 8.250 | | | 02/01/30 | | | | 500 | | | | 532,500 | |
News America, Inc.,
Gtd. Notes | | | | 6.150 | | | 03/01/37 | | | | 415 | | | | 462,689 | |
Gtd. Notes | | | | 6.900 | | | 08/15/39 | | | | 60 | | | | 72,380 | |
RR Donnelley & Sons Co.,
Sr. Unsec’d. Notes | | | | 4.950 | | | 04/01/14 | | | | 600 | | | | 608,250 | |
Sr. Unsec’d. Notes | | | | 8.600 | | | 08/15/16 | | | | 450 | | | | 523,125 | |
SSI Investments II Ltd./SSI Co.-Issuer LLC,
Gtd. Notes | | | | 11.125 | | | 06/01/18 | | | | 200 | | | | 219,000 | |
Viacom, Inc.,
Sr. Unsec’d. Notes | | | | 4.500 | | | 02/27/42 | | | | 233 | | | | 203,771 | |
| | | | | | | | | | | | | | | | |
| | | | | | | | | | | | | | | 3,154,955 | |
|
Metals 0.2% | |
Peabody Energy Corp.,
Gtd. Notes | | | | 6.000 | | | 11/15/18 | | | | 400 | | | | 422,000 | |
See Notes to Financial Statements.
| | | | |
| Prudential Global Total Return Fund, Inc. | | | 31 | |
Portfolio of Investments
as of October 31, 2013 continued
| | | | | | | | | | | | | | | | |
| Description | | | | Interest
Rate | | Maturity
Date | | | Principal
Amount (000)# | | | Value (Note 1) | |
CORPORATE BONDS (Continued) | |
|
Non-Captive Finance 1.6% | |
International Lease Finance Corp.,
Sr. Sec’d. Notes, 144A | | | | 6.500 % | | | 09/01/14 | | | | 200 | | | $ | 208,250 | |
Sr. Unsec’d. Notes | | | | 5.750 | | | 05/15/16 | | | | 75 | | | | 80,156 | |
Sr. Unsec’d. Notes | | | | 6.250 | | | 05/15/19 | | | | 125 | | | | 136,250 | |
SLM Corp.,
Sr. Unsec’d. Notes, MTN | | | | 5.000 | | | 04/15/15 | | | | 390 | | | | 408,525 | |
Sr. Unsec’d. Notes, MTN | | | | 5.050 | | | 11/14/14 | | | | 510 | | | | 530,400 | |
Sr. Unsec’d. Notes, MTN | | | | 6.000 | | | 01/25/17 | | | | 75 | | | | 81,563 | |
Sr. Unsec’d. Notes, MTN | | | | 6.250 | | | 01/25/16 | | | | 2,155 | | | | 2,346,256 | |
Sr. Unsec’d. Notes, MTN | | | | 8.450 | | | 06/15/18 | | | | 225 | | | | 262,688 | |
| | | | | | | | | | | | | | | | |
| | | | | | | | | | | | | �� | | 4,054,088 | |
|
Oil, Gas & Consumable Fuels 0.2% | |
Reliance Holdings USA, Inc.,
Gtd. Notes, 144A | | | | 5.400 | | | 02/14/22 | | | | 400 | | | | 408,980 | |
|
Packaging 0.2% | |
Greif, Inc.,
Sr. Unsec’d. Notes | | | | 7.750 | | | 08/01/19 | | | | 140 | | | | 158,550 | |
Owens-Brockway Glass Container, Inc., Gtd. Notes | | | | 7.375 | | | 05/15/16 | | | | 400 | | | | 450,500 | |
| | | | | | | | | | | | | | | | |
| | | | | | | | | | | | | | | 609,050 | |
|
Paper 0.4% | |
International Paper Co.,
Sr. Unsec’d. Notes | | | | 6.000 | | | 11/15/41 | | | | 130 | | | | 142,174 | |
Sr. Unsec’d. Notes | | | | 7.300 | | | 11/15/39 | | | | 75 | | | | 93,610 | |
Sr. Unsec’d. Notes | | | | 7.950 | | | 06/15/18 | | | | 150 | | | | 185,826 | |
MeadWestvaco Corp.,
Sr. Unsec’d. Notes | | | | 7.375 | | | 09/01/19 | | | | 450 | | | | 541,337 | |
Rock-Tenn Co.,
Gtd. Notes | | | | 4.450 | | | 03/01/19 | | | | 175 | | | | 187,471 | |
| | | | | | | | | | | | | | | | |
| | | | | | | | | | | | | | | 1,150,418 | |
|
Pipelines & Other 0.5% | |
Energy Transfer Partners LP,
Sr. Unsec’d. Notes | | | | 5.150 | | | 02/01/43 | | | | 420 | | | | 393,714 | |
Kinder Morgan Energy Partners LP,
Sr. Unsec’d. Notes | | | | 7.300 | | | 08/15/33 | | | | 170 | | | | 202,308 | |
See Notes to Financial Statements.
| | | | | | | | | | | | | | | | |
| Description | | | | Interest
Rate | | Maturity
Date | | | Principal
Amount (000)# | | | Value (Note 1) | |
CORPORATE BONDS (Continued) | |
|
Pipelines & Other (cont’d.) | |
Northwest Pipeline LLC,
Sr. Unsec’d. Notes | | | | 6.050 % | | | 06/15/18 | | | | 75 | | | $ | 87,950 | |
Targa Resources Partners LP/Targa Resources Partners Finance Corp.,
Gtd. Notes | | | | 6.875 | | | 02/01/21 | | | | 600 | | | | 646,500 | |
| | | | | | | | | | | | | | | | |
| | | | | | | | | | | | | | | 1,330,472 | |
|
Railroads 0.1% | |
Norfolk Southern Corp.,
Sr. Unsec’d. Notes | | | | 6.000 | | | 03/15/2105 | | | | 300 | | | | 327,869 | |
|
Real Estate Investment Trusts 0.3% | |
Felcor Lodging LP,
Sr. Sec’d. Notes | | | | 10.000 | | | 10/01/14 | | | | 185 | | | | 198,181 | |
Hospitality Properties Trust,
Sr. Unsec’d. Notes | | | | 7.875 | | | 08/15/14 | | | | 250 | | | | 254,895 | |
MPT Operating Partnership LP/MPT
Finance Corp.,
Gtd. Notes, MTN | | | | 5.750 | | | 10/01/20 | | | EUR | 200 | | | | 283,092 | |
| | | | | | | | | | | | | | | | |
| | | | | | | | | | | | | | | 736,168 | |
|
Technology 1.2% | |
Ceridian Corp.,
Gtd. Notes | | | | 11.250 | | | 11/15/15 | | | | 650 | | | | 654,063 | |
CommScope, Inc.,
Gtd. Notes, 144A
(original cost $391,250; purchased 09/29/2011)(e)(g) | | | | 8.250 | | | 01/15/19 | | | | 400 | | | | 439,000 | |
Jabil Circuit, Inc.,
Sr. Unsec’d. Notes | | | | 4.700 | | | 09/15/22 | | | | 655 | | | | 635,350 | |
Seagate HDD Cayman,
Gtd. Notes | | | | 6.875 | | | 05/01/20 | | | | 300 | | | | 329,250 | |
Gtd. Notes, 144A | | | | 3.750 | | | 11/15/18 | | | | 305 | | | | 305,000 | |
SunGard Data Systems, Inc.,
Gtd. Notes | | | | 7.625 | | | 11/15/20 | | | | 150 | | | | 163,313 | |
TransUnion LLC/TransUnion
Financing Corp.,
Gtd. Notes | | | | 11.375 | | | 06/15/18 | | | | 400 | | | | 444,000 | |
| | | | | | | | | | | | | | | | |
| | | | | | | | | | | | | | | 2,969,976 | |
See Notes to Financial Statements.
| | | | |
| Prudential Global Total Return Fund, Inc. | | | 33 | |
Portfolio of Investments
as of October 31, 2013 continued
| | | | | | | | | | | | | | | | |
| Description | | | | Interest
Rate | | Maturity
Date | | | Principal
Amount (000)# | | | Value (Note 1) | |
CORPORATE BONDS (Continued) | |
|
Telecommunications 0.5% | |
CC Holdings GS V LLC/Crown Castle GS III Corp.,
Sr. Sec’d. Notes | | | | 2.381 % | | | 12/15/17 | | | | 200 | | | $ | 197,984 | |
MetroPCS Wireless, Inc.,
Gtd. Notes | | | | 7.875 | | | 09/01/18 | | | | 250 | | | | 270,000 | |
Qwest Corp.,
Sr. Unsec’d. Notes | | | | 6.500 | | | 06/01/17 | | | | 465 | | | | 521,725 | |
Sprint Nextel Corp.,
Sr. Unsec’d. Notes | | | | 7.000 | | | 08/15/20 | | | | 400 | | | | 429,000 | |
| | | | | | | | | | | | | | | | |
| | | | | | | | | | | | | | | 1,418,709 | |
|
Tobacco 0.3% | |
Altria Group, Inc.,
Gtd. Notes | | | | 9.950 | | | 11/10/38 | | | | 250 | | | | 390,409 | |
Lorillard Tobacco Co.,
Gtd. Notes | | | | 3.500 | | | 08/04/16 | | | | 60 | | | | 63,306 | |
Gtd. Notes | | | | 8.125 | | | 06/23/19 | | | | 80 | | | | 98,713 | |
Reynolds American, Inc.,
Gtd. Notes | | | | 6.750 | | | 06/15/17 | | | | 300 | | | | 347,908 | |
| | | | | | | | | | | | | | | | |
| | | | | | | | | | | | | | | 900,336 | |
| | | | | | | | | | | | | | | | |
TOTAL CORPORATE BONDS
(cost $46,282,310) | | | | | | | | | | | | | | | 49,613,677 | |
| | | | | | | | | | | | | | | | |
| | | | | |
MUNICIPAL BONDS 1.2% | | | | | | | | | | | | | | | | |
|
California 0.1% | |
University of California, BABs, Revenue Bonds | | | | 5.770 | | | 05/15/43 | | | | 150 | | | | 171,801 | |
|
Connecticut 0.1% | |
State of Connecticut Special Tax Obligation Revenue., BABs | | | | 5.459 | | | 11/01/30 | | | | 275 | | | | 296,445 | |
|
District of Columbia 0.1% | |
District of Columbia, Income Tax Revenue Bonds, BABs | | | | 5.582 | | | 12/01/35 | | | | 175 | | | | 197,145 | |
|
Illinois | |
Chicago Illinois Board of Education, Taxable Series E, BABs | | | | 6.138 | | | 12/01/39 | | | | 100 | | | | 90,612 | |
See Notes to Financial Statements.
| | | | | | | | | | | | | | | | |
| Description | | | | Interest
Rate | | Maturity
Date | | | Principal
Amount (000)# | | | Value (Note 1) | |
MUNICIPAL BONDS (Continued) | | | | | | | | | | | | |
| | | | | |
New York 0.1% | | | | | | | | | | | | | | | | |
City of New York, NY, Revenue Bonds, BABs | | | | 5.968% | | | 03/01/36 | | | | 250 | | | $ | 283,595 | |
| | | | | |
Ohio 0.4% | | | | | | | | | | | | | | | | |
Ohio State Turnpike Commission, BABs, Revenue Bonds,
Series A-1 | | | | 5.000 | | | 02/15/48 | | | | 1,000 | | | | 1,006,920 | |
| | | | | |
Puerto Rico 0.2% | | | | | | | | | | | | | | | | |
Puerto Rico Electric Power Authority,
Series DDD | | | | 5.000 | | | 07/01/20 | | | | 640 | | | | 516,416 | |
| | | | | |
Tennessee 0.1% | | | | | | | | | | | | | | | | |
Metropolitan Government of Nashville & Davidson County Convention Center Authority, Revenue Bonds, BABs | | | | 6.731 | | | 07/01/43 | | | | 125 | | | | 139,614 | |
| | | | | |
Texas 0.1% | | | | | | | | | | | | | | | | |
University of Texas, Perm. University, BABs | | | | 5.262 | | | 07/01/39 | | | | 250 | | | | 275,568 | |
| | | | | | | | | | | | | | | | |
TOTAL MUNICIPAL BONDS
(cost $2,838,421) | | | | | | | | | | | | | | | 2,978,116 | |
| | | | | | | | | | | | | | | | |
| | | |
U.S. GOVERNMENT AGENCY OBLIGATION 0.6% | | | | | | | | | | | | |
Federal National Mortgage Assoc.
(cost $1,468,184) | | | | 3.000 | | | TBA | | | | 1,500 | | | | 1,480,071 | |
| | | | | | | | | | | | | | | | |
| | | | | |
| | | | | | | | | | Shares | | | | |
PREFERRED STOCK | | | | | | | | | | | | | | | | |
| | | | | |
Banking | | | | | | | | | | | | | | | | |
Citigroup Capital XIII,
(Capital Security, fixed to floating preferred) 7.875%(c)
(cost $100,000) | | | | | | | | | | | 4,000 | | | | 110,000 | |
| | | | | | | | | | | | | | | | |
TOTAL LONG-TERM INVESTMENTS
(cost $233,193,780) | | | | | | | | | | | | | | | 245,275,368 | |
| | | | | | | | | | | | | | | | |
See Notes to Financial Statements.
| | | | |
| Prudential Global Total Return Fund, Inc. | | | 35 | |
Portfolio of Investments
as of October 31, 2013 continued
| | | | | | | | |
| Description | | Shares | | | Value (Note 1) | |
SHORT-TERM INVESTMENTS 4.1% | | | | | | | | |
| |
AFFILIATED MONEY MARKET MUTUAL FUND 2.9% | | | | | |
Prudential Investment Portfolios 2 - Prudential Core Taxable
Money Market Fund(i)
(cost $7,360,644) | | | 7,360,644 | | | $ | 7,360,644 | |
| | | | | | | | |
| | | | | | | | | | | | | | | | |
| | | | | |
| | | | | Interest
Rate | | Maturity
Date | | | Principal
Amount (000)# | | | | |
U.S. TREASURY OBLIGATION 1.2% | | | | | | | | | | | | |
U.S. Treasury Bill(a)
(cost $3,018,231) | | | | 0.101(h) | | | 05/29/14 | | | | 3,020 | | | | 3,018,809 | |
| | | | | | | | | | | | | | | | |
TOTAL SHORT-TERM INVESTMENTS
(cost $10,378,875) | | | | | | | | | | | | | | | 10,379,453 | |
| | | | | | | | | | | | | | | | |
| | | | | | |
TOTAL INVESTMENTS 99.7%
(cost $243,572,655; Note 5) | | | | | 255,654,821 | |
Other assets in excess of liabilities(j) 0.3% | | | 830,823 | |
| | | | | | |
NET ASSETS 100.0% | | | | $ | 256,485,644 | |
| | | | | | |
The following abbreviations are used in the portfolio descriptions:
144A—Security was purchased pursuant to Rule 144A under the Securities Act of 1933 and may not be resold subject to that rule except to qualified institutional buyers. Unless otherwise noted, 144A securities are deemed to be liquid.
RegS—Regulation S. Security was purchased pursuant to Regulation S and may not be offered, sold or delivered within the United States or to, or for the account or benefit of, U.S. persons, except pursuant to an exemption from, or in a transaction not subject to, the registration requirements of the Securities Act of 1933.
ABS—Asset-Backed Security
BABs—Build America Bonds
BBR—New Zealand Bank Bill Rate
BBSW—Australian Bank Bill Swap Reference Rate
bps—Basis Points
BUBOR—Budapest Interbank Offered Rate
BZDIOVER—Overnight Brazil Cetip Interbank Deposit
CDO—Collateralized Debt Obligation
CDX—Credit Derivative Index
CIBOR—Copenhagen Interbank Offered Rate
CLO—Collateralized Loan Obligation
CMM—Constant Maturity Mortgage
CMS—Constant Maturity Swaps
COLIBOR—Colombia Interbank Offered Rate
EIBOR—Emirates Interbank Offered Rate
EONIA—Euro Overnight Index Average
EURIBOR—Euro Interbank Offered Rate
GMTN—Global Medium Term Note
HIBOR—Hong Kong Interbank Offered Rate
JIBAR—Johannesburg Interbank Agreed Rate
LIBOR—London Interbank Offered Rate
MIBOR—Mumbai Interbank Offered Rate
MOSPRIME—Moscow Prime Offered Rate
See Notes to Financial Statements.
MTN—Medium Term Note
NIBOR—Norwegian Interbank Offered Rate
OIS—Overnight Index Swap
PRIBOR—Prague Interbank Offered Rate
SOR—Swap Offer Rate
STIBOR—Stockholm Interbank Offered Rate
TBA—To Be Announced
TELBOR—Tel Aviv Interbank Offered Rate
WIBOR—Warsaw Interbank Offered Rate
AED—United Arab Emirates Dirham
ARS—Argentine Peso
AUD—Australian Dollar
BRL—Brazilian Real
CAD—Canadian Dollar
CHF—Swiss Franc
CLP—Chilean Peso
CNY—Chinese Yuan
COP—Colombian Peso
CZK—Czech Koruna
DKK—Danish Krone
EUR—Euro
GBP—British Pound
HKD—Hong Kong Dollar
HUF—Hungarian Forint
IDR—Indonesian Rupiah
ILS—Israel New Shekel
INR—Indian Rupee
ITL—Italian Lira
JPY—Japanese Yen
KRW—South Korean Won
MXN—Mexican Peso
MYR—Malaysian Ringgit
NOK—Norwegian Krone
NZD—New Zealand Dollar
PEN—Peru Soles
PHP—Philippine Peso
PLN—Polish Zloty
RON—Romanian Leu
RUB—Russian Ruble
SEK—Swedish Krona
SGD—Singapore Dollar
THB—Thai Baht
TRY—Turkish Lira
TWD—New Taiwanese Dollar
USD—United States Dollar
ZAR—South African Rand
| # | Principal or Notional amount is shown in U.S. dollars unless otherwise stated. |
| (a) | Represents security, or a portion thereof, segregated as collateral for swap agreements. |
| (b) | Represents security, or a portion thereof, segregated as collateral for futures contracts. |
| (c) | Variable rate instrument. The interest rate shown reflects the rate in effect at October 31, 2013. |
| (d) | The rate shown reflects the coupon rate after the step date. |
| (e) | Indicates a security or securities that have been deemed illiquid. |
| (f) | Represents issuer in default on interest payments and/or principal repayment; non-income producing security. |
See Notes to Financial Statements.
| | | | |
| Prudential Global Total Return Fund, Inc. | | | 37 | |
Portfolio of Investments
as of October 31, 2013 continued
| (g) | Indicates a restricted security; the aggregate cost of the restricted securities is $2,184,916. The aggregate value, $2,304,708, is approximately 0.9% of net assets. |
| (h) | Rate quoted represents yield-to-maturity as of purchase date. |
| (i) | Prudential Investments LLC, the manager of the Fund, also serves as manager of the Prudential Investment Portfolios 2 - Prudential Core Taxable Money Market Fund. |
| (j) | Includes net unrealized appreciation (depreciation) on the following derivative contracts held at reporting period end: |
Open futures contracts outstanding at October 31, 2013:
| | | | | | | | | | | | | | | | | | | | |
Number of
Contracts | | | Type | | Expiration
Date | | | Value at
Trade
Date | | | Value at
October 31,
2013 | | | Unrealized
Appreciation
(Depreciation) | |
| | | | Long Positions: | | | | | | | | | | | | | | | | |
| | 114 | | | 2 Year U.S. Treasury Notes | | | Dec. 2013 | | | $ | 25,070,406 | | | $ | 25,128,094 | | | $ | 57,688 | |
| | 8 | | | 10 Year U.S. Treasury Notes | | | Dec. 2013 | | | | 1,015,979 | | | | 1,018,875 | | | | 2,896 | |
| | 47 | | | U.S. Long Bond | | | Dec. 2013 | | | | 6,070,402 | | | | 6,336,188 | | | | 265,786 | |
| | 10 | | | U.S. Ultra Bond | | | Dec. 2013 | | | | 1,406,387 | | | | 1,440,937 | | | | 34,550 | |
| | | | | | | | | | | | | | | | | | | | |
| | | | | | | | | | | | | | | | | | | 360,920 | |
| | | | | | | | | | | | | | | | | | | | |
| | | | Short Position: | | | | | | | | | | | | | | | | |
| | 190 | | | 5 Year U.S. Treasury Notes | | | Dec. 2013 | | | | 22,874,102 | | | | 23,120,625 | | | | (246,523 | ) |
| | | | | | | | | | | | | | | | | | | | |
| | | | | | | | | | | | | | | | | | $ | 114,397 | |
| | | | | | | | | | | | | | | | | | | | |
Forward foreign currency exchange contracts outstanding at October 31, 2013:
| | | | | | | | | | | | | | | | | | |
Purchase Contracts | | Counterparty | | Notional
Amount
(000) | | | Value at
Settlement
Date
Payable | | | Current
Value | | | Unrealized
Appreciation
(Depreciation) | |
Argentine Peso, | | | | | | | | | | | | | | | | | | |
Expiring 02/07/2014 | | Citigroup Global Markets | | ARS | 1,704 | | | $ | 240,000 | | | $ | 247,768 | | | $ | 7,768 | |
Expiring 02/07/2014 | | Citigroup Global Markets | | ARS | 10,377 | | | | 1,461,607 | | | | 1,508,913 | | | | 47,306 | |
Australian Dollar, | | | | | | | | | | | | | | | | | | |
Expiring 01/23/2014 | | Citigroup Global Markets | | AUD | 6,881 | | | | 6,583,029 | | | | 6,466,417 | | | | (116,612 | ) |
Expiring 01/23/2014 | | JPMorgan Chase | | AUD | 827 | | | | 780,800 | | | | 777,370 | | | | (3,430 | ) |
Expiring 01/23/2014 | | JPMorgan Chase | | AUD | 1,622 | | | | 1,557,265 | | | | 1,524,190 | | | | (33,075 | ) |
Brazilian Real, | | | | | | | | | | | | | | | | | | |
Expiring 01/17/2014 | | Citigroup Global Markets | | BRL | 1,148 | | | | 514,900 | | | | 503,209 | | | | (11,691 | ) |
Expiring 01/17/2014 | | Citigroup Global Markets | | BRL | 1,762 | | | | 779,600 | | | | 772,012 | | | | (7,588 | ) |
Expiring 01/22/2014 | | Citigroup Global Markets | | BRL | 4,114 | | | | 1,826,515 | | | | 1,800,745 | | | | (25,770 | ) |
Expiring 01/22/2014 | | Credit Suisse First Boston Corp. | | BRL | 1,773 | | | | 780,800 | | | | 776,038 | | | | (4,762 | ) |
See Notes to Financial Statements.
| | | | | | | | | | | | | | | | | | |
Purchase Contracts | | Counterparty | | Notional
Amount
(000) | | | Value at
Settlement
Date
Payable | | | Current
Value | | | Unrealized
Appreciation
(Depreciation) | |
British Pound, | | | | | | | | | | | | | | | | | | |
Expiring 01/27/2014 | | Credit Suisse First Boston Corp. | | GBP | 4,296 | | | $ | 6,943,500 | | | $ | 6,883,777 | | | $ | (59,723 | ) |
Canadian Dollar, | | | | | | | | | | | | | | | | | | |
Expiring 01/22/2014 | | Barclays Capital Group | | CAD | 2,723 | | | | 2,602,500 | | | | 2,606,361 | | | | 3,861 | |
Expiring 01/22/2014 | | Citigroup Global Markets | | CAD | 5,361 | | | | 5,199,293 | | | | 5,130,269 | | | | (69,024 | ) |
Expiring 01/22/2014 | | Deutsche Bank | | CAD | 5,361 | | | | 5,197,663 | | | | 5,130,267 | | | | (67,396 | ) |
Expiring 01/22/2014 | | JPMorgan Chase | | CAD | 815 | | | | 780,800 | | | | 780,243 | | | | (557 | ) |
Chilean Peso, | | | | | | | | | | | | | | | | | | |
Expiring 12/11/2013 | | Citigroup Global Markets | | CLP | 392,860 | | | | 781,500 | | | | 762,346 | | | | (19,154 | ) |
Expiring 12/11/2013 | | Citigroup Global Markets | | CLP | 393,650 | | | | 780,200 | | | | 763,878 | | | | (16,322 | ) |
Expiring 12/11/2013 | | Citigroup Global Markets | | CLP | 397,548 | | | | 785,700 | | | | 771,444 | | | | (14,256 | ) |
Expiring 12/11/2013 | | Citigroup Global Markets | | CLP | 1,658,539 | | | | 3,217,092 | | | | 3,218,399 | | | | 1,307 | |
Chinese Yuan, | | | | | | | | | | | | | | | | | | |
Expiring 01/15/2014 | | Citigroup Global Markets | | CNY | 9,894 | | | | 1,623,800 | | | | 1,618,722 | | | | (5,078 | ) |
Expiring 01/15/2014 | | Citigroup Global Markets | | CNY | 12,151 | | | | 1,991,874 | | | | 1,987,926 | | | | (3,948 | ) |
Expiring 01/15/2014 | | Citigroup Global Markets | | CNY | 17,533 | | | | 2,861,190 | | | | 2,868,368 | | | | 7,178 | |
Expiring 01/15/2014 | | Hong Kong & Shanghai Bank | | CNY | 6,212 | | | | 1,013,831 | | | | 1,016,267 | | | | 2,436 | |
Expiring 01/15/2014 | | JPMorgan Chase | | CNY | 39,925 | | | | 6,515,363 | | | | 6,531,761 | | | | 16,398 | |
Expiring 01/15/2014 | | UBS AG | | CNY | 8,903 | | | | 1,452,453 | | | | 1,456,466 | | | | 4,013 | |
Colombian Peso, | | | | | | | | | | | | | | | | | | |
Expiring 11/06/2013 | | Citigroup Global Markets | | COP | 1,481,552 | | | | 779,600 | | | | 782,483 | | | | 2,883 | |
Expiring 01/22/2014 | | Citigroup Global Markets | | COP | 3,649,796 | | | | 1,926,319 | | | | 1,915,354 | | | | (10,965 | ) |
Expiring 01/22/2014 | | Citigroup Global Markets | | COP | 1,481,552 | | | | 781,987 | | | | 777,495 | | | | (4,492 | ) |
Czech Republic Koruna, | | | | | | | | | | | | | | | | | | |
Expiring 01/24/2014 | | Barclays Capital Group | | CZK | 14,633 | | | | 785,700 | | | | 770,460 | | | | (15,240 | ) |
Expiring 01/24/2014 | | Barclays Capital Group | | CZK | 58,166 | | | | 3,113,800 | | | | 3,062,556 | | | | (51,244 | ) |
Expiring 01/24/2014 | | Deutsche Bank | | CZK | 4,108 | | | | 218,540 | | | | 216,314 | | | | (2,226 | ) |
Euro, | | | | | | | | | | | | | | | | | | |
Expiring 01/27/2014 | | Barclays Capital Group | | EUR | 137 | | | | 186,979 | | | | 185,494 | | | | (1,485 | ) |
Expiring 01/27/2014 | | Citigroup Global Markets | | EUR | 1,749 | | | | 2,409,359 | | | | 2,374,620 | | | | (34,739 | ) |
Expiring 01/27/2014 | | Credit Suisse First Boston Corp. | | EUR | 3,725 | | | | 5,134,258 | | | | 5,057,979 | | | | (76,279 | ) |
Expiring 01/27/2014 | | Goldman Sachs & Co. | | EUR | 433 | | | | 596,800 | | | | 587,615 | | | | (9,185 | ) |
Expiring 01/27/2014 | | Morgan Stanley | | EUR | 3,725 | | | | 5,133,191 | | | | 5,057,979 | | | | (75,212 | ) |
Hungarian Forint, | | | | | | | | | | | | | | | | | | |
Expiring 01/24/2014 | | Citigroup Global Markets | | HUF | 90,045 | | | | 410,135 | | | | 411,319 | | | | 1,184 | |
Expiring 01/24/2014 | | Citigroup Global Markets | | HUF | 90,045 | | | | 410,247 | | | | 411,319 | | | | 1,072 | |
Expiring 01/24/2014 | | Citigroup Global Markets | | HUF | 167,942 | | | | 778,100 | | | | 767,149 | | | | (10,951 | ) |
See Notes to Financial Statements.
| | | | |
| Prudential Global Total Return Fund, Inc. | | | 39 | |
Portfolio of Investments
as of October 31, 2013 continued
| | | | | | | | | | | | | | | | | | |
Purchase Contracts | | Counterparty | | Notional
Amount
(000) | | | Value at
Settlement
Date
Payable | | | Current
Value | | | Unrealized
Appreciation
(Depreciation) | |
Expiring 01/24/2014 | | Deutsche Bank | | HUF | 293,832 | | | $ | 1,358,070 | | | $ | 1,342,207 | | | $ | (15,863 | ) |
Expiring 01/24/2014 | | Hong Kong & Shanghai Bank | | HUF | 293,832 | | | | 1,367,615 | | | | 1,342,207 | | | | (25,408 | ) |
Indian Rupee, | | | | | | | | | | | | | | | | | | |
Expiring 11/04/2013 | | UBS AG | | INR | 3,371 | | | | 55,000 | | | | 54,806 | | | | (194 | ) |
Expiring 11/04/2013 | | UBS AG | | INR | 674 | | | | 11,000 | | | | 10,961 | | | | (39 | ) |
Expiring 11/05/2013 | | Citigroup Global Markets | | INR | 89,993 | | | | 1,462,000 | | | | 1,462,668 | | | | 668 | |
Expiring 11/05/2013 | | Citigroup Global Markets | | INR | 73,229 | | | | 1,210,100 | | | | 1,190,199 | | | | (19,901 | ) |
Expiring 11/05/2013 | | Citigroup Global Markets | | INR | 62,183 | | | | 1,019,900 | | | | 1,010,669 | | | | (9,231 | ) |
Expiring 11/05/2013 | | Citigroup Global Markets | | INR | 55,741 | | | | 945,800 | | | | 905,957 | | | | (39,843 | ) |
Expiring 11/05/2013 | | Citigroup Global Markets | | INR | 48,390 | | | | 781,500 | | | | 786,493 | | | | 4,993 | |
Expiring 11/05/2013 | | Deutsche Bank | | INR | 879,293 | | | | 14,318,396 | | | | 14,291,198 | | | | (27,198 | ) |
Expiring 11/05/2013 | | UBS AG | | INR | 42,589 | | | | 704,700 | | | | 692,194 | | | | (12,506 | ) |
Expiring 11/05/2013 | | UBS AG | | INR | 49,038 | | | | 784,800 | | | | 797,014 | | | | 12,214 | |
Expiring 11/05/2013 | | UBS AG | | INR | 51,538 | | | | 851,100 | | | | 837,656 | | | | (13,444 | ) |
Expiring 11/05/2013 | | UBS AG | | INR | 86,554 | | | | 1,419,458 | | | | 1,406,766 | | | | (12,692 | ) |
Expiring 11/05/2013 | | UBS AG | | INR | 226,609 | | | | 3,829,800 | | | | 3,683,094 | | | | (146,706 | ) |
Expiring 11/05/2013 | | UBS AG | | INR | 93,428 | | | | 1,691,000 | | | | 1,518,487 | | | | (172,513 | ) |
Expiring 02/03/2014 | | Citigroup Global Markets | | INR | 37,129 | | | | 590,400 | | | | 591,084 | | | | 684 | |
Expiring 02/03/2014 | | Deutsche Bank | | INR | 439,646 | | | | 6,978,513 | | | | 6,999,042 | | | | 20,529 | |
Expiring 02/03/2014 | | UBS AG | | INR | 439,646 | | | | 6,981,284 | | | | 6,999,042 | | | | 17,758 | |
Expiring 02/03/2014 | | UBS AG | | INR | 932,989 | | | | 14,658,688 | | | | 14,852,911 | | | | 194,223 | |
Indonesia Rupiah, | | | | | | | | | | | | | | | | | | |
Expiring 11/15/2013 | | UBS AG | | IDR | 11,787,335 | | | | 1,104,200 | | | | 1,043,061 | | | | (61,139 | ) |
Israeli New Shekel, | | | | | | | | | | | | | | | | | | |
Expiring 01/30/2014 | | Citigroup Global Markets | | ILS | 2,756 | | | | 780,800 | | | | 780,392 | | | | (408 | ) |
Expiring 01/30/2014 | | Citigroup Global Markets | | ILS | 2,757 | | | | 778,900 | | | | 780,687 | | | | 1,787 | |
Expiring 01/30/2014 | | Deutsche Bank | | ILS | 17,304 | | | | 4,904,124 | | | | 4,899,756 | | | | (4,368 | ) |
Japanese Yen, | | | | | | | | | | | | | | | | | | |
Expiring 01/27/2014 | | Citigroup Global Markets | | JPY | 156,464 | | | | 1,608,800 | | | | 1,592,167 | | | | (16,633 | ) |
Expiring 01/27/2014 | | Credit Suisse First Boston Corp. | | JPY | 75,717 | | | | 778,400 | | | | 770,494 | | | | (7,906 | ) |
Expiring 01/27/2014 | | Credit Suisse First Boston Corp. | | JPY | 867,538 | | | | 8,925,465 | | | | 8,828,001 | | | | (97,464 | ) |
Expiring 01/27/2014 | | Deutsche Bank | | JPY | 867,538 | | | | 8,926,301 | | | | 8,828,001 | | | | (98,300 | ) |
Expiring 01/27/2014 | | Goldman Sachs & Co. | | JPY | 152,918 | | | | 1,571,500 | | | | 1,556,081 | | | | (15,419 | ) |
Expiring 01/27/2014 | | Morgan Stanley | | JPY | 867,538 | | | | 8,925,070 | | | | 8,828,001 | | | | (97,069 | ) |
Expiring 01/27/2014 | | UBS AG | | JPY | 867,538 | | | | 8,926,549 | | | | 8,828,001 | | | | (98,548 | ) |
Malaysian Ringgit, | | | | | | | | | | | | | | | | | | |
Expiring 01/16/2014 | | Citigroup Global Markets | | MYR | 2,488 | | | | 781,500 | | | | 784,171 | | | | 2,671 | |
See Notes to Financial Statements.
| | | | | | | | | | | | | | | | | | |
Purchase Contracts | | Counterparty | | Notional
Amount
(000) | | | Value at
Settlement
Date
Payable | | | Current
Value | | | Unrealized
Appreciation
(Depreciation) | |
Expiring 01/16/2014 | | Citigroup Global Markets | | MYR | 5,008 | | | $ | 1,560,500 | | | $ | 1,578,425 | | | $ | 17,925 | |
Expiring 01/16/2014 | | Hong Kong & Shanghai Bank | | MYR | 11,672 | | | | 3,643,075 | | | | 3,679,180 | | | | 36,105 | |
Expiring 01/16/2014 | | UBS AG | | MYR | 5,063 | | | | 1,567,200 | | | | 1,595,822 | | | | 28,622 | |
Expiring 01/22/2014 | | Barclays Capital Group | | MYR | 6,545 | | | | 2,043,063 | | | | 2,062,136 | | | | 19,073 | |
Expiring 01/22/2014 | | Citigroup Global Markets | | MYR | 2,474 | | | | 778,400 | | | | 779,438 | | | | 1,038 | |
Expiring 01/22/2014 | | Citigroup Global Markets | | MYR | 6,453 | | | | 2,042,900 | | | | 2,033,007 | | | | (9,893 | ) |
Expiring 01/22/2014 | | UBS AG | | MYR | 2,463 | | | | 784,900 | | | | 776,153 | | | | (8,747 | ) |
Mexican Peso, | | | | | | | | | | | | | | | | | | |
Expiring 01/22/2014 | | Citigroup Global Markets | | MXN | 10,119 | | | | 780,800 | | | | 770,449 | | | | (10,351 | ) |
Expiring 01/22/2014 | | Citigroup Global Markets | | MXN | 16,935 | | | | 1,308,200 | | | | 1,289,422 | | | | (18,778 | ) |
Expiring 01/22/2014 | | Deutsche Bank | | MXN | 16,800 | | | | 1,297,400 | | | | 1,279,154 | | | | (18,246 | ) |
Expiring 01/22/2014 | | JPMorgan Chase | | MXN | 659 | | | | 50,219 | | | | 50,155 | | | | (64 | ) |
Expiring 01/22/2014 | | JPMorgan Chase | | MXN | 48,027 | | | | 3,721,500 | | | | 3,656,703 | | | | (64,797 | ) |
Expiring 01/22/2014 | | Morgan Stanley | | MXN | 7,800 | | | | 601,700 | | | | 593,894 | | | | (7,806 | ) |
New Taiwanese Dollar, | | | | | | | | | | | | | | | | | | |
Expiring 11/13/2013 | | UBS AG | | TWD | 10,570 | | | | 369,200 | | | | 359,882 | | | | (9,318 | ) |
Expiring 11/13/2013 | | UBS AG | | TWD | 43,147 | | | | 1,509,700 | | | | 1,469,029 | | | | (40,671 | ) |
Expiring 11/13/2013 | | UBS AG | | TWD | 43,613 | | | | 1,526,800 | | | | 1,484,888 | | | | (41,912 | ) |
Expiring 12/06/2013 | | Citigroup Global Markets | | TWD | 22,791 | | | | 780,200 | | | | 776,365 | | | | (3,835 | ) |
Expiring 12/06/2013 | | Citigroup Global Markets | | TWD | 22,871 | | | | 776,400 | | | | 779,090 | | | | 2,690 | |
Expiring 12/06/2013 | | Citigroup Global Markets | | TWD | 23,023 | | | | 779,500 | | | | 784,245 | | | | 4,745 | |
Expiring 12/06/2013 | | Citigroup Global Markets | | TWD | 23,134 | | | | 780,000 | | | | 788,053 | | | | 8,053 | |
Expiring 12/26/2013 | | UBS AG | | TWD | 45,511 | | | | 1,522,681 | | | | 1,551,052 | | | | 28,371 | |
New Zealand Dollar, | | | | | | | | | | | | | | | | | | |
Expiring 01/23/2014 | | Citigroup Global Markets | | NZD | 6,180 | | | | 5,142,509 | | | | 5,074,228 | | | | (68,281 | ) |
Expiring 01/23/2014 | | JPMorgan Chase | | NZD | 1,265 | | | | 1,041,000 | | | | 1,038,518 | | | | (2,482 | ) |
Expiring 01/23/2014 | | JPMorgan Chase | | NZD | 1,917 | | | | 1,561,600 | | | | 1,556,822 | | | | (4,778 | ) |
Norwegian Krone, | | | | | | | | | | | | | | | | | | |
Expiring 01/24/2014 | | Barclays Capital Group | | NOK | 4,615 | | | | 778,100 | | | | 772,640 | | | | (5,460 | ) |
Expiring 01/24/2014 | | Credit Suisse First Boston Corp. | | NOK | 10,032 | | | | 1,686,875 | | | | 1,679,660 | | | | (7,215 | ) |
Expiring 01/24/2014 | | JPMorgan Chase | | NOK | 10,032 | | | | 1,686,986 | | | | 1,679,660 | | | | (7,326 | ) |
Expiring 01/24/2014 | | Morgan Stanley | | NOK | 7,667 | | | | 1,301,300 | | | | 1,283,614 | | | | (17,686 | ) |
Expiring 01/24/2014 | | UBS AG | | NOK | 4,648 | | | | 785,700 | | | | 778,149 | | | | (7,551 | ) |
Peruvian Nuevo Sol, | | | | | | | | | | | | | | | | | | |
Expiring 11/04/2013 | | Citigroup Global Markets | | PEN | 2,167 | | | | 779,200 | | | | 781,177 | | | | 1,977 | |
Expiring 11/04/2013 | | Citigroup Global Markets | | PEN | 2,185 | | | | 798,711 | | | | 787,639 | | | | (11,072 | ) |
Expiring 11/04/2013 | | Citigroup Global Markets | | PEN | 2,320 | | | | 821,800 | | | | 836,029 | | | | 14,229 | |
Expiring 11/04/2013 | | Citigroup Global Markets | | PEN | 6,672 | | | | 2,420,164 | | | | 2,404,845 | | | | (15,319 | ) |
See Notes to Financial Statements.
| | | | |
| Prudential Global Total Return Fund, Inc. | | | 41 | |
Portfolio of Investments
as of October 31, 2013 continued
| | | | | | | | | | | | | | | | | | |
Purchase Contracts | | Counterparty | | Notional
Amount
(000) | | | Value at
Settlement
Date
Payable | | | Current
Value | | | Unrealized
Appreciation
(Depreciation) | |
Philippine Peso, | | | | | | | | | | | | | | | | | | |
Expiring 11/29/2013 | | Citigroup Global Markets | | PHP | 33,375 | | | $ | 780,200 | | | $ | 772,919 | | | $ | (7,281 | ) |
Expiring 11/29/2013 | | Citigroup Global Markets | | PHP | 37,004 | | | | 858,000 | | | | 856,947 | | | | (1,053 | ) |
Expiring 11/29/2013 | | Citigroup Global Markets | | PHP | 67,647 | | | | 1,576,300 | | | | 1,566,590 | | | | (9,710 | ) |
Expiring 11/29/2013 | | UBS AG | | PHP | 41,180 | | | | 984,108 | | | | 953,660 | | | | (30,448 | ) |
Expiring 11/29/2013 | | UBS AG | | PHP | 55,288 | | | | 1,282,200 | | | | 1,280,389 | | | | (1,811 | ) |
Expiring 11/29/2013 | | UBS AG | | PHP | 111,980 | | | | 2,570,200 | | | | 2,593,259 | | | | 23,059 | |
Polish Zloty, | | | | | | | | | | | | | | | | | | |
Expiring 01/24/2014 | | JPMorgan Chase | | PLN | 19,407 | | | | 6,344,245 | | | | 6,266,981 | | | | (77,264 | ) |
Romanian Leu, | | | | | | | | | | | | | | | | | | |
Expiring 01/13/2014 | | Citigroup Global Markets | | RON | 1,068 | | | | 301,887 | | | | 325,613 | | | | 23,726 | |
Expiring 01/24/2014 | | Barclays Capital Group | | RON | 4,233 | | | | 1,298,847 | | | | 1,290,017 | | | | (8,830 | ) |
Expiring 01/24/2014 | | Citigroup Global Markets | | RON | 1,688 | | | | 518,800 | | | | 514,482 | | | | (4,318 | ) |
Expiring 01/24/2014 | | Citigroup Global Markets | | RON | 2,520 | | | | 780,800 | | | | 767,946 | | | | (12,854 | ) |
Expiring 01/24/2014 | | Citigroup Global Markets | | RON | 2,536 | | | | 778,900 | | | | 772,892 | | | | (6,008 | ) |
Expiring 01/24/2014 | | Citigroup Global Markets | | RON | 4,233 | | | | 1,299,844 | | | | 1,290,017 | | | | (9,827 | ) |
Russian Ruble, | | | | | | | | | | | | | | | | | | |
Expiring 11/18/2013 | | Citigroup Global Markets | | RUB | 25,238 | | | | 780,200 | | | | 784,461 | | | | 4,261 | |
Expiring 11/18/2013 | | Citigroup Global Markets | | RUB | 25,329 | | | | 779,600 | | | | 787,311 | | | | 7,711 | |
Expiring 01/17/2014 | | Citigroup Global Markets | | RUB | 25,275 | | | | 772,400 | | | | 777,115 | | | | 4,715 | |
Expiring 01/22/2014 | | Citigroup Global Markets | | RUB | 16,755 | | | | 518,800 | | | | 514,799 | | | | (4,001 | ) |
Expiring 01/22/2014 | | Credit Suisse First Boston Corp. | | RUB | 25,254 | | | | 785,700 | | | | 775,959 | | | | (9,741 | ) |
Singapore Dollar, | | | | | | | | | | | | | | | | | | |
Expiring 01/17/2014 | | Credit Suisse First Boston Corp. | | SGD | 3,698 | | | | 2,974,905 | | | | 2,977,518 | | | | 2,613 | |
Expiring 01/17/2014 | | Deutsche Bank | | SGD | 3,698 | | | | 2,976,043 | | | | 2,977,519 | | | | 1,476 | |
South African Rand, | | | | | | | | | | | | | | | | | | |
Expiring 01/30/2014 | | Barclays Capital Group | | ZAR | 24,095 | | | | 2,413,193 | | | | 2,367,183 | | | | (46,010 | ) |
Expiring 01/30/2014 | | Citigroup Global Markets | | ZAR | 8,294 | | | | 838,100 | | | | 814,824 | | | | (23,276 | ) |
South Korean Won, | | | | | | | | | | | | | | | | | | |
Expiring 01/17/2014 | | Citigroup Global Markets | | KRW | 3,907,568 | | | | 3,606,365 | | | | 3,663,611 | | | | 57,246 | |
Expiring 01/17/2014 | | UBS AG | | KRW | 830,381 | | | | 780,800 | | | | 778,538 | | | | (2,262 | ) |
Expiring 01/17/2014 | | UBS AG | | KRW | 3,907,568 | | | | 3,605,267 | | | | 3,663,611 | | | | 58,344 | |
Swedish Krona, | | | | | | | | | | | | | | | | | | |
Expiring 01/24/2014 | | Citigroup Global Markets | | SEK | 6,666 | | | | 1,038,500 | | | | 1,026,485 | | | | (12,015 | ) |
Expiring 01/24/2014 | | Credit Suisse First Boston Corp. | | SEK | 12,858 | | | | 2,010,216 | | | | 1,980,117 | | | | (30,099 | ) |
Expiring 01/24/2014 | | Deutsche Bank | | SEK | 8,294 | | | | 1,308,200 | | | | 1,277,327 | | | | (30,873 | ) |
Expiring 01/24/2014 | | UBS AG | | SEK | 5,007 | | | | 785,700 | | | | 771,122 | | | | (14,578 | ) |
See Notes to Financial Statements.
| | | | | | | | | | | | | | | | | | |
Purchase Contracts | | Counterparty | | Notional
Amount
(000) | | | Value at
Settlement
Date
Payable | | | Current
Value | | | Unrealized
Appreciation
(Depreciation) | |
Swiss Franc, | | | | | | | | | | | | | | | | | | |
Expiring 01/24/2014 | | Credit Suisse First Boston Corp. | | CHF | 1,157 | | | $ | 1,297,400 | | | $ | 1,275,510 | | | $ | (21,890 | ) |
Expiring 01/24/2014 | | Deutsche Bank | | CHF | 693 | | | | 778,400 | | | | 764,796 | | | | (13,604 | ) |
Expiring 01/24/2014 | | JPMorgan Chase | | CHF | 2,160 | | | | 2,408,544 | | | | 2,381,751 | | | | (26,793 | ) |
Thai Baht, | | | | | | | | | | | | | | | | | | |
Expiring 11/18/2013 | | Barclays Capital Group | | THB | 21,252 | | | | 676,300 | | | | 682,018 | | | | 5,718 | |
Expiring 11/18/2013 | | Barclays Capital Group | | THB | 24,175 | | | | 778,000 | | | | 775,822 | | | | (2,178 | ) |
Expiring 11/18/2013 | | Barclays Capital Group | | THB | 24,457 | | | | 787,400 | | | | 784,890 | | | | (2,510 | ) |
Expiring 11/18/2013 | | Deutsche Bank | | THB | 23,871 | | | | 769,600 | | | | 766,058 | | | | (3,542 | ) |
Expiring 11/18/2013 | | Deutsche Bank | | THB | 24,252 | | | | 780,800 | | | | 778,294 | | | | (2,506 | ) |
Expiring 11/18/2013 | | Morgan Stanley | | THB | 24,483 | | | | 783,600 | | | | 785,707 | | | | 2,107 | |
Expiring 11/18/2013 | | UBS AG | | THB | 25,720 | | | | 822,505 | | | | 825,416 | | | | 2,911 | |
Turkish Lira, | | | | | | | | | | | | | | | | | | |
Expiring 01/30/2014 | | UBS AG | | TRY | 1,555 | | | | 778,400 | | | | 766,266 | | | | (12,134 | ) |
| | | | | | | | | | | | | | | | | | |
| | | | | | | | $ | 291,004,575 | | | $ | 289,160,023 | | | $ | (1,844,552 | ) |
| | | | | | | | | | | | | | | | | | |
| | | | | | | | | | | | | | | | | | |
Sale Contracts | | Counterparty | | Notional
Amount
(000) | | | Value at
Settlement
Date
Receivable | | | Current
Value | | | Unrealized
Appreciation
(Depreciation) | |
Argentine Peso, | | | | | | | | | | | | | | | | | | |
Expiring 02/07/2014 | | Citigroup Global Markets | | ARS | 2,011 | | | $ | 286,100 | | | $ | 292,365 | | | $ | (6,265 | ) |
Australian Dollar, | | | | | | | | | | | | | | | | | | |
Expiring 01/23/2014 | | Citigroup Global Markets | | AUD | 1,095 | | | | 1,032,918 | | | | 1,028,783 | | | | 4,135 | |
Expiring 01/23/2014 | | JPMorgan Chase | | AUD | 1,372 | | | | 1,309,500 | | | | 1,289,396 | | | | 20,104 | |
Brazilian Real, | | | | | | | | | | | | | | | | | | |
Expiring 01/22/2014 | | Citigroup Global Markets | | BRL | 574 | | | | 256,700 | | | | 251,225 | | | | 5,475 | |
Expiring 01/22/2014 | | Citigroup Global Markets | | BRL | 1,151 | | | | 514,300 | | | | 503,803 | | | | 10,497 | |
Expiring 01/22/2014 | | Citigroup Global Markets | | BRL | 1,351 | | | | 602,400 | | | | 591,133 | | | | 11,267 | |
Expiring 01/22/2014 | | Citigroup Global Markets | | BRL | 2,530 | | | | 1,141,700 | | | | 1,107,353 | | | | 34,347 | |
Expiring 01/22/2014 | | UBS AG | | BRL | 3,780 | | | | 1,693,887 | | | | 1,654,419 | | | | 39,468 | |
British Pound, | | | | | | | | | | | | | | | | | | |
Expiring 01/27/2014 | | Citigroup Global Markets | | GBP | 220 | | | | 352,748 | | | | 352,414 | | | | 334 | |
Expiring 01/27/2014 | | Citigroup Global Markets | | GBP | 486 | | | | 785,700 | | | | 779,340 | | | | 6,360 | |
Expiring 01/27/2014 | | Credit Suisse First Boston Corp. | | GBP | 832 | | | | 1,347,590 | | | | 1,332,415 | | | | 15,175 | |
Canadian Dollar, | | | | | | | | | | | | | | | | | | |
Expiring 01/22/2014 | | Citigroup Global Markets | | CAD | 396 | | | | 383,587 | | | | 378,742 | | | | 4,845 | |
Expiring 01/22/2014 | | Citigroup Global Markets | | CAD | 675 | | | | 648,700 | | | | 645,808 | | | | 2,892 | |
Expiring 01/22/2014 | | Citigroup Global Markets | | CAD | 685 | | | | 654,100 | | | | 655,476 | | | | (1,376 | ) |
See Notes to Financial Statements.
| | | | |
| Prudential Global Total Return Fund, Inc. | | | 43 | |
Portfolio of Investments
as of October 31, 2013 continued
| | | | | | | | | | | | | | | | | | |
Sale Contracts | | Counterparty | | Notional
Amount
(000) | | | Value at
Settlement
Date
Receivable | | | Current
Value | | | Unrealized
Appreciation
(Depreciation) | |
Expiring 01/22/2014 | | Citigroup Global Markets | | CAD | 1,095 | | | $ | 1,047,600 | | | $ | 1,047,785 | | | $ | (185 | ) |
Expiring 01/22/2014 | | Goldman Sachs & Co. | | CAD | 648 | | | | 622,800 | | | | 620,145 | | | | 2,655 | |
Expiring 01/22/2014 | | JPMorgan Chase | | CAD | 1,550 | | | | 1,505,000 | | | | 1,483,430 | | | | 21,570 | |
Chilean Peso, | | | | | | | | | | | | | | | | | | |
Expiring 12/11/2013 | | Citigroup Global Markets | | CLP | 259,504 | | | | 518,800 | | | | 503,568 | | | | 15,232 | |
Expiring 12/11/2013 | | Citigroup Global Markets | | CLP | 285,113 | | | | 565,700 | | | | 553,262 | | | | 12,438 | |
Expiring 12/11/2013 | | Citigroup Global Markets | | CLP | 304,161 | | | | 597,800 | | | | 590,224 | | | | 7,576 | |
Expiring 12/11/2013 | | Citigroup Global Markets | | CLP | 403,127 | | | | 780,800 | | | | 782,269 | | | | (1,469 | ) |
Expiring 12/11/2013 | | Citigroup Global Markets | | CLP | 511,799 | | | | 1,012,500 | | | | 993,146 | | | | 19,354 | |
Expiring 12/11/2013 | | Citigroup Global Markets | | CLP | 529,845 | | | | 1,046,400 | | | | 1,028,165 | | | | 18,235 | |
Expiring 12/11/2013 | | Citigroup Global Markets | | CLP | 533,452 | | | | 1,042,000 | | | | 1,035,164 | | | | 6,836 | |
Chinese Yuan, | | | | | | | | | | | | | | | | | | |
Expiring 01/15/2014 | | Citigroup Global Markets | | CNY | 46,014 | | | | 7,501,527 | | | | 7,528,017 | | | | (26,490 | ) |
Colombian Peso, | | | | | | | | | | | | | | | | | | |
Expiring 11/06/2013 | | Citigroup Global Markets | | COP | 1,481,552 | | | | 786,804 | | | | 782,483 | | | | 4,321 | |
Expiring 01/22/2014 | | Citigroup Global Markets | | COP | 569,521 | | | | 298,804 | | �� | | 298,875 | | | | (71 | ) |
Expiring 01/22/2014 | | Citigroup Global Markets | | COP | 984,682 | | | | 518,800 | | | | 516,746 | | | | 2,054 | |
Expiring 01/22/2014 | | Citigroup Global Markets | | COP | 1,524,740 | | | | 804,400 | | | | 800,159 | | | | 4,241 | |
Expiring 01/22/2014 | | Citigroup Global Markets | | COP | 2,085,877 | | | | 1,093,800 | | | | 1,094,635 | | | | (835 | ) |
Czech Republic Koruna, | | | | | | | | | | | | | | | | | | |
Expiring 01/24/2014 | | Barclays Capital Group | | CZK | 34,234 | | | | 1,815,700 | | | | 1,802,508 | | | | 13,192 | |
Expiring 01/24/2014 | | Deutsche Bank | | CZK | 14,815 | | | | 780,800 | | | | 780,062 | | | | 738 | |
Expiring 01/24/2014 | | Deutsche Bank | | CZK | 19,575 | | | | 1,037,500 | | | | 1,030,646 | | | | 6,854 | |
Danish Krone, | | | | | | | | | | | | | | | | | | |
Expiring 01/24/2014 | | JPMorgan Chase | | DKK | 28,027 | | | | 5,160,470 | | | | 5,105,639 | | | | 54,831 | |
Expiring 01/24/2014 | | Morgan Stanley | | DKK | 28,027 | | | | 5,161,635 | | | | 5,105,639 | | | | 55,996 | |
Euro, | | | | | | | | | | | | | | | | | | |
Expiring 01/27/2014 | | Citigroup Global Markets | | EUR | 958 | | | | 1,301,300 | | | | 1,300,399 | | | | 901 | |
Expiring 01/27/2014 | | Citigroup Global Markets | | EUR | 1,714 | | | | 2,602,500 | | | | 2,598,845 | | | | 3,655 | |
Expiring 01/27/2014 | | Citigroup Global Markets | | EUR | 1,914 | | | | 2,602,500 | | | | 2,599,159 | | | | 3,341 | |
Expiring 01/27/2014 | | Goldman Sachs & Co. | | EUR | 1,225 | | | | 1,665,600 | | | | 1,663,694 | | | | 1,906 | |
Expiring 01/27/2014 | | Goldman Sachs & Co. | | EUR | 1,317 | | | | 1,802,070 | | | | 1,788,353 | | | | 13,717 | |
Expiring 01/27/2014 | | JPMorgan Chase | | | EUR 954 | | | | 1,299,259 | | | | 1,295,741 | | | | 3,518 | |
Expiring 01/30/2014 | | Deutsche Bank | | EUR | 954 | | | | 1,294,263 | | | | 1,295,748 | | | | (1,485 | ) |
Hong Kong Dollar, | | | | | | | | | | | | | | | | | | |
Expiring 11/01/2013 | | Deutsche Bank | | HKD | 78 | | | | 10,098 | | | | 10,099 | | | | (1 | ) |
Indian Rupee, | | | | | | | | | | | | | | | | | | |
Expiring 11/05/2013 | | Citigroup Global Markets | | INR | 48,390 | | | | 787,990 | | | | 786,493 | | | | 1,497 | |
Expiring 11/05/2013 | | Citigroup Global Markets | | INR | 55,741 | | | | 907,682 | | | | 905,957 | | | | 1,725 | |
Expiring 11/05/2013 | | Citigroup Global Markets | | INR | 62,183 | | | | 1,012,592 | | | | 1,010,669 | | | | 1,923 | |
Expiring 11/05/2013 | | Citigroup Global Markets | | INR | 73,229 | | | | 1,192,464 | | | | 1,190,199 | | | | 2,265 | |
See Notes to Financial Statements.
| | | | | | | | | | | | | | | | | | |
Sale Contracts | | Counterparty | | Notional
Amount
(000) | | | Value at
Settlement
Date
Receivable | | | Current
Value | | | Unrealized
Appreciation
(Depreciation) | |
Expiring 11/05/2013 | | Citigroup Global Markets | | INR | 89,993 | | | $ | 1,465,452 | | | $ | 1,462,668 | | | $ | 2,784 | |
Expiring 11/05/2013 | | Deutsche Bank | | INR | 439,646 | | | | 7,139,434 | | | | 7,145,599 | | | | (6,165 | ) |
Expiring 11/05/2013 | | UBS AG | | INR | 42,589 | | | | 693,512 | | | | 692,194 | | | | 1,318 | |
Expiring 11/05/2013 | | UBS AG | | INR | 49,038 | | | | 798,530 | | | | 797,014 | | | | 1,516 | |
Expiring 11/05/2013 | | UBS AG | | INR | 51,538 | | | | 839,250 | | | | 837,656 | | | | 1,594 | |
Expiring 11/05/2013 | | UBS AG | | INR | 86,554 | | | | 1,409,443 | | | | 1,406,766 | | | | 2,677 | |
Expiring 11/05/2013 | | UBS AG | | INR | 93,428 | | | | 1,521,377 | | | | 1,518,487 | | | | 2,890 | |
Expiring 11/05/2013 | | UBS AG | | INR | 226,609 | | | | 3,690,104 | | | | 3,683,094 | | | | 7,010 | |
Expiring 11/05/2013 | | UBS AG | | INR | 439,646 | | | | 7,140,593 | | | | 7,145,599 | | | | (5,006 | ) |
Expiring 01/17/2014 | | Citigroup Global Markets | | INR | 40,609 | | | | 648,700 | | | | 648,894 | | | | (194 | ) |
Expiring 03/04/2014 | | Citigroup Global Markets | | INR | 38,448 | | | | 646,400 | | | | 608,389 | | | | 38,011 | |
Expiring 03/04/2014 | | Citigroup Global Markets | | INR | 58,224 | | | | 949,200 | | | | 921,321 | | | | 27,879 | |
Expiring 03/04/2014 | | Citigroup Global Markets | | INR | 72,743 | | | | 1,135,900 | | | | 1,151,067 | | | | (15,167 | ) |
Expiring 03/04/2014 | | Citigroup Global Markets | | INR | 99,354 | | | | 1,567,100 | | | | 1,572,155 | | | | (5,055 | ) |
Expiring 03/04/2014 | | Citigroup Global Markets | | INR | 196,282 | | | | 3,132,000 | | | | 3,105,924 | | | | 26,076 | |
Expiring 03/04/2014 | | UBS AG | | INR | 36,278 | | | | 532,400 | | | | 574,050 | | | | (41,650 | ) |
Expiring 03/04/2014 | | UBS AG | | INR | 38,382 | | | | 656,100 | | | | 607,345 | | | | 48,755 | |
Expiring 03/04/2014 | | UBS AG | | INR | 74,665 | | | | 1,282,800 | | | | 1,181,486 | | | | 101,314 | |
Expiring 03/04/2014 | | UBS AG | | INR | 97,169 | | | | 1,668,000 | | | | 1,537,583 | | | | 130,417 | |
Expiring 03/04/2014 | | UBS AG | | INR | 113,548 | | | | 1,964,500 | | | | 1,796,756 | | | | 167,744 | |
Expiring 03/04/2014 | | UBS AG | | INR | 131,736 | | | | 2,247,100 | | | | 2,084,561 | | | | 162,539 | |
Expiring 03/04/2014 | | UBS AG | | INR | 138,271 | | | | 2,157,300 | | | | 2,187,963 | | | | (30,663 | ) |
Expiring 03/04/2014 | | UBS AG | | INR | 188,963 | | | | 3,280,600 | | | | 2,990,096 | | | | 290,504 | |
Expiring 03/04/2014 | | UBS AG | | INR | 192,414 | | | | 3,317,200 | | | | 3,044,713 | | | | 272,487 | |
Expiring 03/04/2014 | | UBS AG | | INR | 217,438 | | | | 3,742,800 | | | | 3,440,683 | | | | 302,117 | |
Indonesia Rupiah, | | | | | | | | | | | | | | | | | | |
Expiring 11/15/2013 | | UBS AG | | IDR | 4,464,790 | | | | 407,000 | | | | 395,089 | | | | 11,911 | |
Expiring 11/15/2013 | | UBS AG | | IDR | 7,322,597 | | | | 650,579 | | | | 647,977 | | | | 2,602 | |
Israeli New Shekel, | | | | | | | | | | | | | | | | | | |
Expiring 01/30/2014 | | Credit Suisse First Boston Corp. | | ILS | 16,187 | | | | 4,593,379 | | | | 4,583,625 | | | | 9,754 | |
Japanese Yen, | | | | | | | | | | | | | | | | | | |
Expiring 01/27/2014 | | Citigroup Global Markets | | JPY | 76,537 | | | | 778,400 | | | | 778,837 | | | | (437 | ) |
Expiring 01/27/2014 | | Citigroup Global Markets | | JPY | 76,984 | | | | 780,800 | | | | 783,385 | | | | (2,585 | ) |
Expiring 01/27/2014 | | Citigroup Global Markets | | JPY | 81,491 | | | | 830,800 | | | | 829,242 | | | | 1,558 | |
Expiring 01/27/2014 | | Citigroup Global Markets | | JPY | 102,175 | | | | 1,041,000 | | | | 1,039,728 | | | | 1,272 | |
Malaysian Ringgit, | | | | | | | | | | | | | | | | | | |
Expiring 01/16/2014 | | UBS AG | | MYR | 24,231 | | | | 7,451,022 | | | | 7,637,597 | | | | (186,575 | ) |
Expiring 01/22/2014 | | Citigroup Global Markets | | MYR | 2,512 | | | | 781,300 | | | | 791,425 | | | | (10,125 | ) |
Mexican Peso, | | | | | | | | | | | | | | | | | | |
Expiring 11/04/2013 | | JPMorgan Chase | | MXN | 659 | | | | 50,527 | | | | 50,472 | | | | 55 | |
See Notes to Financial Statements.
| | | | |
| Prudential Global Total Return Fund, Inc. | | | 45 | |
Portfolio of Investments
as of October 31, 2013 continued
| | | | | | | | | | | | | | | | | | |
Sale Contracts | | Counterparty | | Notional
Amount
(000) | | | Value at
Settlement
Date
Receivable | | | Current
Value | | | Unrealized
Appreciation
(Depreciation) | |
Expiring 01/22/2014 | | Citigroup Global Markets | | MXN | 7,767 | | | $ | 597,100 | | | $ | 591,405 | | | $ | 5,695 | |
Expiring 01/22/2014 | | Citigroup Global Markets | | MXN | 10,278 | | | | 785,700 | | | | 782,572 | | | | 3,128 | |
Expiring 01/22/2014 | | Citigroup Global Markets | | MXN | 16,582 | | | | 1,282,700 | | | | 1,262,541 | | | | 20,159 | |
Expiring 01/22/2014 | | Morgan Stanley | | MXN | 13,524 | | | | 1,037,900 | | | | 1,029,741 | | | | 8,159 | |
New Taiwanese Dollar, | | | | | | | | | | | | | | | | | | |
Expiring 11/13/2013 | | UBS AG | | TWD | 97,330 | | | | 3,351,600 | | | | 3,313,799 | | | | 37,801 | |
Expiring 12/06/2013 | | Citigroup Global Markets | | TWD | 56,961 | | | | 1,945,400 | | | | 1,940,344 | | | | 5,056 | |
Expiring 12/26/2013 | | Citigroup Global Markets | | TWD | 45,511 | | | | 1,509,500 | | | | 1,551,052 | | | | (41,552 | ) |
New Zealand Dollar, | | | | | | | | | | | | | | | | | | |
Expiring 01/23/2014 | | Goldman Sachs & Co. | | NZD | 792 | | | | 654,100 | | | | 650,260 | | | | 3,840 | |
Expiring 01/23/2014 | | Goldman Sachs & Co. | | NZD | 1,516 | | | | 1,257,200 | | | | 1,244,380 | | | | 12,820 | |
Expiring 01/23/2014 | | JPMorgan Chase | | NZD | 997 | | | | 838,600 | | | | 818,779 | | | | 19,821 | |
Expiring 01/23/2014 | | Morgan Stanley | | NZD | 1,837 | | | | 1,530,900 | | | | 1,508,769 | | | | 22,131 | |
Expiring 01/23/2014 | | UBS AG | | NZD | 477 | | | | 392,400 | | | | 391,413 | | | | 987 | |
Norwegian Krone, | | | | | | | | | | | | | | | | | | |
Expiring 01/24/2014 | | Deutsche Bank | | NOK | 10,765 | | | | 1,816,400 | | | | 1,802,374 | | | | 14,026 | |
Peruvian Nuevo Sol, | | | | | | | | | | | | | | | | | | |
Expiring 11/04/2013 | | Citigroup Global Markets | | PEN | 2,167 | | | | 786,153 | | | | 781,177 | | | | 4,976 | |
Expiring 11/04/2013 | | Citigroup Global Markets | | PEN | 2,185 | | | | 792,656 | | | | 787,639 | | | | 5,017 | |
Expiring 11/04/2013 | | Citigroup Global Markets | | PEN | 2,320 | | | | 841,355 | | | | 836,029 | | | | 5,326 | |
Expiring 11/04/2013 | | Citigroup Global Markets | | PEN | 6,672 | | | | 2,357,400 | | | | 2,404,845 | | | | (47,445 | ) |
Expiring 02/04/2014 | | Citigroup Global Markets | | PEN | 2,185 | | | | 791,393 | | | | 779,716 | | | | 11,677 | |
Philippine Peso, | | | | | | | | | | | | | | | | | | |
Expiring 01/17/2014 | | Citigroup Global Markets | | PHP | 22,955 | | | | 533,868 | | | | 531,790 | | | | 2,078 | |
Expiring 01/17/2014 | | Citigroup Global Markets | | PHP | 27,777 | | | | 648,700 | | | | 643,500 | | | | 5,200 | |
Expiring 01/17/2014 | | UBS AG | | PHP | 246,257 | | | | 5,698,735 | | | | 5,704,874 | | | | (6,139 | ) |
Polish Zloty, | | | | | | | | | | | | | | | | | | |
Expiring 01/13/2014 | | Deutsche Bank | | PLN | 1,586 | | | | 502,689 | | | | 512,355 | | | | (9,666 | ) |
Romanian Leu, | | | | | | | | | | | | | | | | | | |
Expiring 01/13/2014 | | Citigroup Global Markets | | RON | 1,035 | | | | 308,334 | | | | 315,680 | | | | (7,346 | ) |
Russian Ruble, | | | | | | | | | | | | | | | | | | |
Expiring 01/17/2014 | | Citigroup Global Markets | | RUB | 36,178 | | | | 1,103,900 | | | | 1,112,363 | | | | (8,463 | ) |
Expiring 01/22/2014 | | Citigroup Global Markets | | RUB | 19,515 | | | | 599,900 | | | | 599,605 | | | | 295 | |
Expiring 01/22/2014 | | UBS AG | | RUB | 26,964 | | | | 819,111 | | | | 828,474 | | | | (9,363 | ) |
South Korean Won, | | | | | | | | | | | | | | | | | | |
Expiring 01/17/2014 | | UBS AG | | KRW | 2,183,860 | | | | 2,042,900 | | | | 2,047,517 | | | | (4,617 | ) |
Swedish Krona, | | | | | | | | | | | | | | | | | | |
Expiring 01/24/2014 | | UBS AG | | SEK | 5,020 | | | | 780,800 | | | | 773,035 | | | | 7,765 | |
Expiring 01/24/2014 | | UBS AG | | SEK | 23,790 | | | | 3,669,500 | | | | 3,663,590 | | | | 5,910 | |
Swiss Franc, | | | | | | | | | | | | | | | | | | |
Expiring 01/24/2014 | | Credit Suisse First Boston Corp. | | CHF | 683 | | | | 760,481 | | | | 753,630 | | | | 6,851 | |
See Notes to Financial Statements.
| | | | | | | | | | | | | | | | | | |
Sale Contracts | | Counterparty | | Notional
Amount
(000) | | | Value at
Settlement
Date
Receivable | | | Current
Value | | | Unrealized
Appreciation
(Depreciation) | |
Expiring 01/24/2014 | | Credit Suisse First Boston Corp. | | CHF | 1,170 | | | $ | 1,306,500 | | | $ | 1,290,094 | | | $ | 16,406 | |
Thai Baht, | | | | | | | | | | | | | | | | | | |
Expiring 11/18/2013 | | Barclays Capital Group | | THB | 24,570 | | | | 783,700 | | | | 788,511 | | | | (4,811 | ) |
Expiring 11/18/2013 | | Barclays Capital Group | | THB | 48,580 | | | | 1,543,500 | | | | 1,559,038 | | | | (15,538 | ) |
Expiring 11/18/2013 | | Citigroup Global Markets | | THB | 24,308 | | | | 778,400 | | | | 780,093 | | | | (1,693 | ) |
Expiring 11/18/2013 | | Citigroup Global Markets | | THB | 24,623 | | | | 780,600 | | | | 790,214 | | | | (9,614 | ) |
Expiring 11/18/2013 | | Morgan Stanley | | THB | 26,202 | | | | 832,300 | | | | 840,876 | | | | (8,576 | ) |
Turkish Lira, | | | | | | | | | | | | | | | | | | |
Expiring 01/30/2014 | | Deutsche Bank | | TRY | 1,315 | | | | 654,100 | | | | 647,989 | | | | 6,111 | |
Expiring 01/30/2014 | | JPMorgan Chase | | TRY | 14,200 | | | | 7,064,921 | | | | 6,998,564 | | | | 66,357 | |
Expiring 01/30/2014 | | UBS AG | | TRY | 1,684 | | | | 838,100 | | | | 830,080 | | | | 8,020 | |
| | | | | | | | | | | | | | | | | | |
| | | | | | | | $ | 186,797,986 | | | $ | 184,958,742 | | | $ | 1,839,244 | |
| | | | | | | | | | | | | | | | | | |
Credit default swap agreements outstanding at October 31, 2013:
| | | | | | | | | | | | | | | | | | | | | | | | |
Reference
Entity/
Obligation | | Termination
Date | | | Notional
Amount
(000)#(4) | | | Fixed
Rate | | | Value at
Trade
Date | | | Value at
October 31,
2013(5) | | | Unrealized
Depreciation | |
Exchange-Traded credit default swaps on credit indices—Sell Protection(2) | | | | | |
CDX.NA.IG.20.V1 | | | 06/20/18 | | | | 5,400 | | | | 1.000% | | | $ | (57,518 | ) | | $ | (85,841 | ) | | $ | (28,323 | ) |
CDX.NA.IG.21.V1 | | | 12/20/18 | | | | 4,000 | | | | 1.000% | | | | (41,045 | ) | | | (53,293 | ) | | | (12,248 | ) |
| | | | | | | | | | | | | | | | | | | | | | | | |
| | | | | | | | | | | | | | $ | (98,563 | ) | | $ | (139,134 | ) | | $ | (40,571 | ) |
| | | | | | | | | | | | | | | | | | | | | | | | |
| | | | | | | | | | | | | | | | | | | | | | | | | | |
Reference
Entity/
Obligation | | Termination
Date | | | Fixed
Rate | | | Notional
Amount
(000)#(4) | | | Fair
Value | | | Upfront
Premiums
Paid
(Received) | | | Unrealized
Depreciation | | | Counterparty |
Over-the-counter credit default swaps on corporate issues—Buy Protection(1) |
American International Group, Inc. | | | 03/20/18 | | | | 3.700% | | | | 250 | | | $ | (33,308 | ) | | $ | — | | | $ | (33,308 | ) | | Deutsche Bank |
R.R. Donnelley & Sons Co. | | | 06/20/14 | | | | 1.000% | | | | 600 | | | | (3,841 | ) | | | 6,119 | | | | (9,960 | ) | | Deutsche Bank |
R.R. Donnelley & Sons Co. | | | 09/20/16 | | | | 1.000% | | | | 450 | | | | 502 | | | | 23,094 | | | | (22,592 | ) | | JPMorgan Chase |
SLM Corp. | | | 06/20/14 | | | | 5.000% | | | | 510 | | | | (18,231 | ) | | | 12,596 | | | | (30,827 | ) | | JPMorgan Chase |
Toll Brothers Financial Corp. | | | 03/20/15 | | | | 1.000% | | | | 420 | | | | (4,055 | ) | | | 679 | | | | (4,734 | ) | | Credit Suisse First Boston Corp. |
Westvaco Corp. | | | 09/20/19 | | | | 1.000% | | | | 450 | | | | 4,806 | | | | 5,212 | | | | (406 | ) | | JPMorgan Chase |
| | | | | | | | | | | | | | | | | | | | | | | | | | |
| | | | | | | | | | | | | | $ | (54,127 | ) | | $ | 47,700 | | | $ | (101,827 | ) | | |
| | | | | | | | | | | | | | | | | | | | | | | | | | |
See Notes to Financial Statements.
| | | | |
| Prudential Global Total Return Fund, Inc. | | | 47 | |
Portfolio of Investments
as of October 31, 2013 continued
| | | | | | | | | | | | | | | | | | | | | | | | | | | | |
Reference
Entity/
Obligation | | Termination
Date | | | Fixed
Rate | | | Notional
Amount
(000)#(4) | | | Implied
Credit
Spread at
October 31,
2013(3) | | | Fair
Value | | | Upfront
Premiums
Paid
(Received) | | | Unrealized
Appreciation | | Counterparty |
Over-the-counter credit default swaps on corporate issues—Sell Protection(2) |
Hewlett-Packard Co. | | | 12/20/17 | | | | 1.000% | | | | 800 | | | | 0.108 | % | | $ | (1,737 | ) | | $ | (81,584 | ) | | $79,847 | | Credit Suisse First Boston Corp. |
| | | | | | | | | | | | | | | | | | | | | | | | | | | | |
| | | | | | | | | | | | | | | | | | | | | | | | | | |
Reference
Entity/
Obligation | | Termination
Date | | | Fixed
Rate | | | Notional
Amount
(000)#(4) | | | Fair
Value | | | Upfront
Premiums
Paid
(Received) | | | Unrealized
Depreciation | | | Counterparty |
Over-the-counter credit default swaps on sovereign issues—Buy Protection(1) |
Kingdom of Belgium | | | 03/20/14 | | | | 1.000% | | | | 3,000 | | | $ | (14,827 | ) | | $ | (9,779 | ) | | $ | (5,048 | ) | | JPMorgan Chase |
Republic of France | | | 03/20/14 | | | | 0.250% | | | | 3,000 | | | | (3,235 | ) | | | (779 | ) | | | (2,456 | ) | | JPMorgan Chase |
Republic of Ireland | | | 12/20/13 | | | | 1.000% | | | | 1,300 | | | | (2,937 | ) | | | (874 | ) | | | (2,063 | ) | | Hong Kong & Shanghai Bank |
Republic of Italy | | | 12/20/13 | | | | 1.000% | | | | 6,000 | | | | (10,795 | ) | | | 2,880 | | | | (13,675 | ) | | Hong Kong & Shanghai Bank |
| | | | | | | | | | | | | | | | | | | | | | | | | | |
| | | | | | | | | | | | | | $ | (31,794 | ) | | $ | (8,552 | ) | | $ | (23,242 | ) | | |
| | | | | | | | | | | | | | | | | | | | | | | | | | |
| | | | | | | | | | | | | | | | | | | | | | | | | | | | | | |
Reference
Entity/
Obligation | | Termination
Date | | | Fixed
Rate | | | Notional
Amount
(000)#(4) | | | Implied
Credit
Spread
at
October 31,
2013(3) | | | Fair
Value | | | Upfront
Premiums
Paid
(Received) | | | Unrealized
Appreciation
(Depreciation) | | | Counterparty |
Over-the-counter credit default swaps on sovereign issues—Sell Protection(2) |
Kingdom of Belgium | | | 09/20/15 | | | | 1.000% | | | | 1,300 | | | | 0.009 | % | | $ | 24,064 | | | $ | (41,964 | ) | | $ | 66,028 | | | Hong Kong & Shanghai Bank |
Kingdom of Belgium | | | 03/20/20 | | | | 1.000% | | | | 3,000 | | | | 0.074 | % | | | 51,243 | | | | (14,500 | ) | | | 65,743 | | | Hong Kong & Shanghai Bank |
Republic of Brazil | | | 03/20/18 | | | | 1.000% | | | | 1,500 | | | | 0.156 | % | | | (33,473 | ) | | | (17,514 | ) | | | (15,959 | ) | | Deutsche Bank |
Republic of France | | | 06/20/15 | | | | 0.250% | | | | 5,000 | | | | 0.012 | % | | | 12,359 | | | | (176,316 | ) | | | 188,675 | | | Barclays Capital Group |
Republic of France | | | 06/20/16 | | | | 0.250% | | | | 2,700 | | | | 0.022 | % | | | 3,073 | | | | (156,882 | ) | | | 159,955 | | | Barclays Capital Group |
Republic of France | | | 06/20/17 | | | | 0.250% | | | | 2,500 | | | | 0.035 | % | | | (8,020 | ) | | | (194,311 | ) | | | 186,291 | | | Barclays Capital Group |
See Notes to Financial Statements.
| | | | | | | | | | | | | | | | | | | | | | | | | | | | | | |
Reference
Entity/
Obligation | | Termination
Date | | | Fixed
Rate | | | Notional
Amount
(000)#(4) | | | Implied
Credit
Spread
at
October 31,
2013(3) | | | Fair
Value | | | Upfront
Premiums
Paid
(Received) | | | Unrealized
Appreciation
(Depreciation) | | | Counterparty |
Over-the-counter credit default swaps on sovereign issues—Sell Protection(2) (cont’d.): |
Republic of France | | | 03/20/14 | | | | 0.250% | | | | 5,000 | | | | 0.007 | % | | $ | 5,392 | | | $ | (66,080 | ) | | $ | 71,472 | | | Citigroup Global Markets |
Republic of France | | | 12/20/16 | | | | 0.250% | | | | 4,500 | | | | 0.027 | % | | | (1,155 | ) | | | (353,862 | ) | | | 352,707 | | | Citigroup Global Markets |
Republic of France | | | 09/20/22 | | | | 0.250% | | | | 3,000 | | | | 0.104 | % | | | (187,542 | ) | | | (290,349 | ) | | | 102,807 | | | Hong Kong & Shanghai Bank |
Republic of France | | | 03/20/20 | | | | 0.250% | | | | 3,000 | | | | 0.080 | % | | | (99,386 | ) | | | (188,678 | ) | | | 89,292 | | | JPMorgan Chase |
Republic of France | | | 03/20/22 | | | | 0.250% | | | | 1,250 | | | | 0.109 | % | | | (71,357 | ) | | | (167,253 | ) | | | 95,896 | | | Morgan Stanley |
Republic of France | | | 12/20/16 | | | | 1.000% | | | | 1,000 | | | | 0.027 | % | | | 24,165 | | | | (31,892 | ) | | | 56,057 | | | UBS AG |
Republic of Indonesia | | | 09/20/18 | | | | 1.000% | | | | 2,200 | | | | 0.183 | % | | | (81,374 | ) | | | (122,244 | ) | | | 40,870 | | | UBS AG |
Republic of Ireland | | | 12/20/14 | | | | 1.000% | | | | 2,000 | | | | 0.028 | % | | | 18,856 | | | | (399,762 | ) | | | 418,618 | | | Hong Kong & Shanghai Bank |
Republic of Ireland | | | 06/20/18 | | | | 1.000% | | | | 2,000 | | | | 0.117 | % | | | (13,136 | ) | | | (81,678 | ) | | | 68,542 | | | Hong Kong & Shanghai Bank |
Republic of Italy | | | 12/20/16 | | | | 1.000% | | | | 2,000 | | | | 0.156 | % | | | (32,166 | ) | | | (293,423 | ) | | | 261,257 | | | UBS AG |
Republic of Portugal | | | 12/20/14 | | | | 1.000% | | | | 1,500 | | | | 0.222 | % | | | (18,832 | ) | | | (412,058 | ) | | | 393,226 | | | Barclays Capital Group |
Republic of Portugal | | | 12/20/13 | | | | 1.000% | | | | 1,000 | | | | 0.159 | % | | | 356 | | | | (220,692 | ) | | | 221,048 | | | Hong Kong & Shanghai Bank |
Republic of Portugal | | | 03/20/14 | | | | 1.000% | | | | 400 | | | | 0.159 | % | | | (438 | ) | | | (123,989 | ) | | | 123,551 | | | Morgan Stanley |
| | | | | | | | | | | | | | | | | | | | | | | | | | | | | | |
| | | | | | | | | | | | | | | | | | $ | (407,371 | ) | | $ | (3,353,447 | ) | | $ | 2,946,076 | | | |
| | | | | | | | | | | | | | | | | | | | | | | | | | | | | | |
| (1) | If the Fund is a buyer of protection, it pays the fixed rate. When a credit event occurs, as defined under the terms of that particular swap agreement, the Fund will either (i) receive from the seller of protection an amount equal to the notional amount of the swap and make delivery of the referenced obligation or underlying securities comprising the referenced index or (ii) receive a net settlement amount in the form of cash or securities equal to the notional amount of the swap less the recovery value of the referenced obligation or underlying securities comprising the referenced index. |
See Notes to Financial Statements.
| | | | |
| Prudential Global Total Return Fund, Inc. | | | 49 | |
Portfolio of Investments
as of October 31, 2013 continued
| (2) | If the Fund is a seller of protection, it receives the fixed rate. When a credit event occurs, as defined under the terms of that particular swap agreement, the Fund will either (i) pay to the buyer of protection an amount equal to the notional amount of the swap and take delivery of the referenced obligation or underlying securities comprising the referenced index or (ii) pay a net settlement amount in the form of cash or securities equal to the notional amount of the swap less the recovery value of the referenced obligation or underlying securities comprising the referenced index. |
| (3) | Implied credit spreads, represented in absolute terms, utilized in determining the fair value of credit default swap agreements on corporate issues or sovereign issues of an emerging country as of the reporting date serve as an indicator of the current status of the payment/performance risk and represent the likelihood of risk of default for the credit derivative. The implied credit spread of a particular referenced entity reflects the cost of buying/selling protection and may include up-front payments required to be made to enter into the agreement. Wider credit spreads represent a deterioration of the referenced entity’s credit soundness and a greater likelihood of risk of default or other credit event occurring as defined under the terms of the agreement. |
| (4) | Notional amount represents the maximum potential amount the Fund could be required to pay as a seller of credit protection or receive as a buyer of credit protection if a credit event occurs as defined under the terms of that particular swap agreement. |
| (5) | The fair value of credit default swap agreements on credit indices serves as an indicator of the current status of the payment/performance risk and represents the likelihood of an expected liability (or profit) for the credit derivative should the notional amount of the swap agreement be closed/sold as of the reporting date. Increasing fair value in absolute terms represents a deterioration of the referenced entity’s credit soundness and a greater likelihood of risk of default or other credit event occurring as defined under the terms of the agreement. |
| # | Notional amount is shown in U.S. dollars unless otherwise stated. |
Interest rate swap agreements outstanding at October 31, 2013:
| | | | | | | | | | | | | | | | | | | | | | | | |
Notional
Amount
(000)# | | | Termination
Date | | | Fixed
Rate | | | Floating
Rate | | Value at
Trade
Date | | | Value at
October 31,
2013 | | | Unrealized
Appreciation
(Depreciation) | |
| Exchange-Traded swaps: | |
| CAD | 3,000 | | | | 08/20/23 | | | | 3.134% | | | 3 Month Canadian Banker's Acceptance(1) | | $ | 164 | | | $ | (68,581 | ) | | $ | (68,745 | ) |
| EUR | 10,700 | | | | 09/03/15 | | | | 0.629% | | | 6 Month EURIBOR(1) | | | 214 | | | | (39,371 | ) | | | (39,585 | ) |
| EUR | 600 | | | | 05/09/18 | | | | 0.807% | | | 6 Month LIBOR EUR(2) | | | — | | | | (6,921 | ) | | | (6,921 | ) |
| EUR | 5,550 | | | | 09/03/18 | | | | 1.352% | | | 6 Month EURIBOR(1) | | | 224 | | | | (101,373 | ) | | | (101,597 | ) |
| EUR | 2,000 | | | | 10/24/18 | | | | 0.120% | | | 6 Month EURIBOR(2) | | | 213 | | | | 1,435 | | | | 1,222 | |
| EUR | 700 | | | | 09/03/23 | | | | 2.171% | | | 6 Month EURIBOR(2) | | | 202 | | | | 19,122 | | | | 18,920 | |
| EUR | 1,600 | | | | 10/10/23 | | | | 2.130% | | | 6 Month EURIBOR(2) | | | 220 | | | | 33,320 | | | | 33,100 | |
| EUR | 440 | | | | 07/01/43 | | | | 2.505% | | | 6 Month EURIBOR(2) | | | — | | | | (15,165 | ) | | | (15,165 | ) |
| EUR | 350 | | | | 08/27/43 | | | | 2.775% | | | 6 Month EURIBOR(2) | | | 208 | | | | 15,668 | | | | 15,460 | |
| EUR | 500 | | | | 09/03/43 | | | | 2.691% | | | 6 Month EURIBOR(2) | | | 209 | | | | 9,976 | | | | 9,767 | |
| EUR | 200 | | | | 09/19/43 | | | | 2.740% | | | 6 Month EURIBOR(2) | | | 204 | | | | 6,905 | | | | 6,701 | |
| NOK | 7,000 | | | | 08/26/16 | | | | 2.320% | | | 6 Month NIBOR(2) | | | 26 | | | | 5,260 | | | | 5,234 | |
| NZD | 17,900 | | | | 09/01/15 | | | | 3.858% | | | 3 Month NZD LIBOR(2) | | | 119 | | | | 15,007 | | | | 14,888 | |
See Notes to Financial Statements.
| | | | | | | | | | | | | | | | | | | | | | | | |
Notional
Amount
(000)# | | | Termination
Date | | | Fixed
Rate | | | Floating
Rate | | Value at
Trade
Date | | | Value at
October 31,
2013 | | | Unrealized
Appreciation
(Depreciation) | |
| Exchange-Traded swaps (cont’d.): | |
| PLN | 8,600 | | | | 09/02/18 | | | | 4.020% | | | 6 Month WIBOR(2) | | $ | 56 | | | $ | 63,657 | | | $ | 63,601 | |
| SEK | 13,300 | | | | 08/26/16 | | | | 1.930% | | | 3 Month SEK LIBOR(2) | | | 26 | | | | 16,303 | | | | 16,277 | |
| | 54,300 | | | | 07/17/15 | | | | 0.519% | | | 3 Month LIBOR(1) | | | — | | | | (141,126 | ) | | | (141,126 | ) |
| | 5,800 | | | | 08/10/17 | | | | 1.866% | | | 3 Month LIBOR(2) | | | 155 | | | | 40,289 | | | | 40,134 | |
| | 21,000 | | | | 08/08/19 | | | | 3.111% | | | 3 Month LIBOR(2) | | | 194 | | | | 206,332 | | | | 206,138 | |
| | | | | | | | | | | | | | | | | | | | | | | | |
| | | | | | | | | | | | | | $ | 2,434 | | | $ | 60,737 | | | $ | 58,303 | |
| | | | | | | | | | | | | | | | | | | | | | | | |
| | | | | | | | | | | | | | | | | | | | | | | | | | |
Notional
Amount
(000)# | | | Termination
Date | | | Fixed
Rate | | | Floating
Rate | | Fair
Value | | | Upfront
Premiums
Paid
(Received) | | | Unrealized
Appreciation
(Depreciation) | | | Counterparty |
| Over-the-counter swap agreements: |
| AED | 35,000 | | | | 03/09/15 | | | | 1.020% | | | 3 Month EIBOR(1) | | $ | (84,002 | ) | | $ | — | | | $ | (84,002 | ) | | Citigroup Global Markets |
| AUD | 1,000 | | | | 09/07/21 | | | | 4.945% | | | 6 Month BBSW(2) | | | 48,618 | | | | — | | | | 48,618 | | | Citigroup Global Markets |
| AUD | 1,000 | | | | 08/31/22 | | | | 3.890% | | | 6 Month BBSW(2) | | | (29,562 | ) | | | — | | | | (29,562 | ) | | Citigroup Global Markets |
| AUD | 1,400 | | | | 08/31/22 | | | | 3.920% | | | 6 Month BBSW(2) | | | (38,473 | ) | | | — | | | | (38,473 | ) | | Citigroup Global Markets |
| AUD | 1,700 | | | | 09/21/22 | | | | 3.830% | | | 6 Month BBSW(2) | | | (60,430 | ) | | | — | | | | (60,430 | ) | | Citigroup Global Markets |
| AUD | 400 | | | | 11/07/22 | | | | 3.790% | | | 6 Month BBSW(2) | | | (14,525 | ) | | | — | | | | (14,525 | ) | | Citigroup Global Markets |
| AUD | 2,800 | | | | 08/08/23 | | | | 4.170% | | | 6 Month BBSW(1) | | | 46,319 | | | | — | | | | 46,319 | | | Citigroup Global Markets |
| AUD | 2,000 | | | | 12/19/32 | | | | 4.423% | | | 6 Month BBSW(2) | | | (86,817 | ) | | | — | | | | (86,817 | ) | | Citigroup Global Markets |
| AUD | 650 | | | | 03/15/43 | | | | 4.755% | | | 6 Month BBSW(2) | | | (10,533 | ) | | | — | | | | (10,533 | ) | | Citigroup Global Markets |
| BRL | 5,610 | | | | 01/01/17 | | | | 9.130% | | | 1 day Brazil Interbank Rate(2) | | | (133,067 | ) | | | — | | | | (133,067 | ) | | Barclays Bank PLC |
| BRL | 8,819 | | | | 01/01/17 | | | | 10.580% | | | 1 day Brazil Interbank Rate(2) | | | (72,042 | ) | | | — | | | | (72,042 | ) | | Hong Kong & Shanghai Bank |
| BRL | 7,217 | | | | 01/01/17 | | | | 8.340% | | | 1 Day BZDIOVER(2) | | | (285,478 | ) | | | — | | | | (285,478 | ) | | Citigroup Global Markets |
| BRL | 5,758 | | | | 01/01/17 | | | | 8.870% | | | 1 Day BZDIOVER(2) | | | (181,331 | ) | | | — | | | | (181,331 | ) | | Citigroup Global Markets |
| BRL | 937 | | | | 01/01/21 | | | | 9.400% | | | 1 Day BZDIOVER(2) | | | (60,220 | ) | | | — | | | | (60,220 | ) | | Citigroup Global Markets |
| BRL | 445 | | | | 01/01/21 | | | | 9.960% | | | 1 Day BZDIOVER(2) | | | (19,015 | ) | | | — | | | | (19,015 | ) | | Citigroup Global Markets |
| BRL | 880 | | | | 01/01/21 | | | | 9.980% | | | 1 Day BZDIOVER(2) | | | (36,588 | ) | | | — | | | | (36,588 | ) | | Citigroup Global Markets |
| BRL | 880 | | | | 01/01/21 | | | | 9.980% | | | 1 Day BZDIOVER(2) | | | (36,588 | ) | | | — | | | | (36,588 | ) | | Citigroup Global Markets |
| CAD | 3,200 | | | | 02/22/17 | | | | 1.708% | | | 3 Month Canadian Banker's Acceptance(2) | | | 3,768 | | | | — | | | | 3,768 | | | Citigroup Global Markets |
| CAD | 2,100 | | | | 02/27/17 | | | | 1.625% | | | 3 Month Canadian Banker's Acceptance(2) | | | (3,536 | ) | | | — | | | | (3,536 | ) | | Citigroup Global Markets |
| CAD | 650 | | | | 11/06/17 | | | | 1.645% | | | 3 Month Canadian Banker's Acceptance(2) | | | (3,950 | ) | | | — | | | | (3,950 | ) | | Citigroup Global Markets |
See Notes to Financial Statements.
| | | | |
| Prudential Global Total Return Fund, Inc. | | | 51 | |
Portfolio of Investments
as of October 31, 2013 continued
| | | | | | | | | | | | | | | | | | | | | | | | | | |
Notional
Amount
(000)# | | | Termination
Date | | | Fixed
Rate | | | Floating
Rate | | Fair
Value | | | Upfront
Premiums
Paid
(Received) | | | Unrealized
Appreciation
(Depreciation) | | | Counterparty |
| Over-the-counter swap agreements (cont’d.): |
| CAD | 500 | | | | 12/27/17 | | | | 1.700% | | | 3 Month Canadian Banker's Acceptance(2) | | $ | (2,866 | ) | | $ | — | | | $ | (2,866 | ) | | Citigroup Global Markets |
| CAD | 5,400 | | | | 08/17/22 | | | | 2.370% | | | 3 Month Canadian Banker's Acceptance(2) | | | (140,967 | ) | | | — | | | | (140,967 | ) | | Citigroup Global Markets |
| CAD | 350 | | | | 11/06/22 | | | | 2.203% | | | 3 Month Canadian Banker's Acceptance(2) | | | (13,848 | ) | | | — | | | | (13,848 | ) | | Citigroup Global Markets |
| CAD | 700 | | | | 02/22/42 | | | | 2.865% | | | 3 Month Canadian Banker's Acceptance(1) | | | 73,223 | | | | — | | | | 73,223 | | | Citigroup Global Markets |
| CHF | 3,500 | | | | 07/20/14 | | | | 0.406% | | | 3 Month CHF LIBOR(1) | | | 5,042 | | | | — | | | | 5,042 | | | Credit Suisse First Boston Corp. |
| CHF | 1,000 | | | | 03/01/22 | | | | 1.030% | | | 6 Month CHF LIBOR(2) | | | (9,903 | ) | | | — | | | | (9,903 | ) | | Credit Suisse First Boston Corp. |
| COP | 6,500,000 | | | | 04/25/16 | | | | 3.710% | | | 1 Day COLIBOR OIS(2) | | | (38,537 | ) | | | — | | | | (38,537 | ) | | BNP Paribas |
| COP | 1,000,000 | | | | 06/27/23 | | | | 6.840% | | | 3 Month COLIBOR OIS(2) | | | 40,785 | | | | — | | | | 40,785 | | | Deutsche Bank |
| CZK | 25,000 | | | | 06/27/18 | | | | 1.635% | | | 6 Month PRIBOR(2) | | | 37,023 | | | | — | | | | 37,023 | | | Hong Kong & Shanghai Bank |
| DKK | 31,000 | | | | 01/25/16 | | | | 0.910% | | | 6 Month CIBOR(2) | | | 48,358 | | | | — | | | | 48,358 | | | Deutsche Bank |
| DKK | 3,200 | | | | 03/01/22 | | | | 2.300% | | | 6 Month CIBOR(2) | | | 23,196 | | | | — | | | | 23,196 | | | Credit Suisse First Boston Corp. |
| EUR | 3,000 | | | | 07/20/14 | | | | 0.406% | | | 3 Month EURIBOR(2) | | | 9,292 | | | | — | | | | 9,292 | | | Credit Suisse First Boston Corp. |
| EUR | 3,000 | | | | 08/19/14 | | | | 1.065% | | | 1 Day EUR EONIA OSI(2) | | | 38,986 | | | | — | | | | 38,986 | | | Hong Kong & Shanghai Bank |
| EUR | 10,000 | | | | 12/10/14 | | | | 0.035% | | | 1 Day EUR EONIA OIS(1) | | | 22,090 | | | | — | | | | 22,090 | | | Hong Kong & Shanghai Bank |
| EUR | 1,300 | | | | 08/04/16 | | | | 1.925% | | | 1 Day EUR EONIA OIS(2) | | | 87,750 | | | | — | | | | 87,750 | | | Hong Kong & Shanghai Bank |
| EUR | 1,000 | | | | 08/29/16 | | | | 1.600% | | | 1 Day EUR EONIA(2) | | | 53,544 | | | | — | | | | 53,544 | | | Hong Kong & Shanghai Bank |
| EUR | 500 | | | | 08/30/16 | | | | 1.560% | | | 1 Day EONIA OIS(2) | | | 25,936 | | | | — | | | | 25,936 | | | Hong Kong & Shanghai Bank |
| EUR | 500 | | | | 11/04/16 | | | | 1.310% | | | 1 Day EONIA OIS(2) | | | 28,301 | | | | — | | | | 28,301 | | | Hong Kong & Shanghai Bank |
See Notes to Financial Statements.
| | | | | | | | | | | | | | | | | | | | | | | | | | |
Notional
Amount
(000)# | | | Termination
Date | | | Fixed
Rate | | | Floating
Rate | | Fair
Value | | | Upfront
Premiums
Paid
(Received) | | | Unrealized
Appreciation
(Depreciation) | | | Counterparty |
| Over-the-counter swap agreements (cont’d.): |
| EUR | 500 | | | | 11/07/16 | | | | 1.265% | | | 6 Month EURIBOR(2) | | $ | 26,545 | | | $ | — | | | $ | 26,545 | | | Hong Kong & Shanghai Bank |
| EUR | 1,000 | | | | 12/16/16 | | | | 1.210% | | | 1 Day EUR EONIA(2) | | | 49,777 | | | | — | | | | 49,777 | | | Hong Kong & Shanghai Bank |
| EUR | 5,500 | | | | 12/10/17 | | | | 0.452% | | | 1 Day EUR EONIA OSI(2) | | | (8,817 | ) | | | — | | | | (8,817 | ) | | Hong Kong & Shanghai Bank |
| EUR | 1,200 | | | | 01/14/18 | | | | 0.628% | | | 1 Day EUR EONIA(2) | | | 10,294 | | | | — | | | | 10,294 | | | Hong Kong & Shanghai Bank |
| EUR | 600 | | | | 07/27/22 | | | | 1.772% | | | 6 Month EURIBOR(2) | | | 1,970 | | | | — | | | | 1,970 | | | Citigroup Global Markets |
| EUR | 1,709 | | | | 07/23/42 | | | | 2.246% | | | 6 Month EURIBOR(1) | | | 73,908 | | | | — | | | | 73,908 | | | Royal Bank of Scotland Group PLC |
| EUR | 650 | | | | 09/24/42 | | | | 2.404% | | | 6 Month EURIBOR(2) | | | (37,602 | ) | | | — | | | | (37,602 | ) | | Citigroup Global Markets |
| EUR | 850 | | | | 03/27/43 | | | | 2.327% | | | 6 Month EURIBOR(2) | | | (55,690 | ) | | | — | | | | (55,690 | ) | | Bank of America |
| EUR | 1,871 | | | | 07/23/52 | | | | 2.708% | | | 6 Month EURIBOR(2) | | | (10,824 | ) | | | — | | | | (10,824 | ) | | Royal Bank of Scotland Group PLC |
| GBP | 500 | | | | 08/01/16 | | | | 2.060% | | | 6 Month GBP LIBOR(2) | | | 26,154 | | | | — | | | | 26,154 | | | Citigroup Global Markets |
| GBP | 1,200 | | | | 08/09/16 | | | | 1.894% | | | 6 Month GBP LIBOR(2) | | | 52,671 | | | | — | | | | 52,671 | | | Hong Kong & Shanghai Bank |
| GBP | 2,000 | | | | 08/17/22 | | | | 1.975% | | | 3 Month GBP LIBOR(2) | | | (74,097 | ) | | | — | | | | (74,097 | ) | | Bank of Nova Scotia |
| GBP | 200 | | | | 09/27/22 | | | | 1.790% | | | 3 Month LIBOR GBP(2) | | | (13,442 | ) | | | — | | | | (13,442 | ) | | Hong Kong & Shanghai Bank |
| GBP | 500 | | | | 01/03/23 | | | | 1.895% | | | 3 Month GBP LIBOR(2) | | | (30,018 | ) | | | — | | | | (30,018 | ) | | Hong Kong & Shanghai Bank |
| GBP | 2,600 | | | | 01/13/32 | | | | 2.788% | | | 6 Month GBP LIBOR(2) | | | (182,399 | ) | | | — | | | | (182,399 | ) | | Barclays Capital Group |
| GBP | 1,420 | | | | 04/24/43 | | | | 2.932% | | | 6 Month GBP LIBOR(2) | | | (144,433 | ) | | | — | | | | (144,433 | ) | | Hong Kong & Shanghai Bank |
| HKD | 27,000 | | | | 01/04/18 | | | | 0.805% | | | 3 Month HIBOR(1) | | | 50,353 | | | | — | | | | 50,353 | | | Bank of America |
| HKD | 25,000 | | | | 07/29/18 | | | | 1.625% | | | 3 Month HIBOR(2) | | | 42,500 | | | | — | | | | 42,500 | | | Hong Kong & Shanghai Bank |
| HKD | 25,000 | | | | 10/08/18 | | | | 1.635% | | | 3 Month HIBOR(1) | | | (38,559 | ) | | | — | | | | (38,559 | ) | | Hong Kong & Shanghai Bank |
| HKD | 8,200 | | | | 08/22/22 | | | | 1.560% | | | 3 Month HIBOR(1) | | | 61,860 | | | | — | | | | 61,860 | | | Hong Kong & Shanghai Bank |
| HUF | 330,000 | | | | 03/27/23 | | | | 5.510% | | | 6 Month BUBOR(2) | | | 106,141 | | | | — | | | | 106,141 | | | Deutsche Bank |
| ILS | 25,000 | | | | 03/06/14 | | | | 1.580% | | | 3 Month TELBOR(1) | | | (47,034 | ) | | | — | | | | (47,034 | ) | | Deutsche Bank |
See Notes to Financial Statements.
| | | | |
| Prudential Global Total Return Fund, Inc. | | | 53 | |
Portfolio of Investments
as of October 31, 2013 continued
| | | | | | | | | | | | | | | | | | | | | | | | | | |
Notional
Amount
(000)# | | | Termination
Date | | | Fixed
Rate | | | Floating
Rate | | Fair
Value | | | Upfront
Premiums
Paid
(Received) | | | Unrealized
Appreciation
(Depreciation) | | | Counterparty |
| Over-the-counter swap agreements (cont’d.): |
| ILS | 3,200 | | | | 03/06/23 | | | | 3.525% | | | 3 Month TELBOR(2) | | $ | 27,691 | | | $ | — | | | $ | 27,691 | | | Deutsche Bank |
| ILS | 4,200 | | | | 06/27/23 | | | | 3.730% | | | 3 Month TELBOR(2) | | | 41,051 | | | | — | | | | 41,051 | | | Credit Suisse First Boston Corp. |
| INR | 55,000 | | | | 03/11/14 | | | | 7.600% | | | 1 Day MIBOR(1) | | | 10,786 | | | | — | | | | 10,786 | | | Hong Kong & Shanghai Bank |
| INR | 60,000 | | | | 05/03/23 | | | | 7.000% | | | 1 day MIBOR(2) | | | (83,708 | ) | | | — | | | | (83,708 | ) | | Barclays Capital Group |
| JPY | 300,000 | | | | 01/15/16 | | | | 0.790% | | | 3 Month YEN LIBOR(2) | | | (60,131 | ) | | | — | | | | (60,131 | ) | | Barclays Capital Group |
| JPY | 550,000 | | | | 04/18/20 | | | | 0.563% | | | 6 Month YEN LIBOR(2) | | | 44,358 | | | | — | | | | 44,358 | | | JPMorgan Chase |
| JPY | 186,905 | | | | 05/17/20 | | | | 1.388% | | | 6 Month YEN LIBOR(2) | | | 126,310 | | | | — | | | | 126,310 | | | Citigroup Global Markets |
| JPY | 705,000 | | | | 05/20/20 | | | | 0.698% | | | 6 month YEN LIBOR(2) | | | 131,095 | | | | — | | | | 131,095 | | | Credit Suisse First Boston Corp. |
| JPY | 90,000 | | | | 12/20/20 | | | | 1.353% | | | 3 Month YEN LIBOR(2) | | | 59,147 | | | | — | | | | 59,147 | | | Citigroup Global Markets |
| JPY | 60,000 | | | | 02/02/21 | | | | 1.265% | | | 6 Month YEN LIBOR(2) | | | 34,861 | | | | — | | | | 34,861 | | | Barclays Capital Group |
| JPY | 96,000 | | | | 02/16/21 | | | | 1.365% | | | 6 Month YEN LIBOR(2) | | | 62,722 | | | | — | | | | 62,722 | | | Barclays Capital Group |
| JPY | 50,000 | | | | 06/02/21 | | | | 1.200% | | | 6 Month YEN LIBOR(2) | | | 27,450 | | | | — | | | | 27,450 | | | Barclays Capital Group |
| JPY | 45,000 | | | | 06/16/21 | | | | 1.170% | | | 6 Month YEN LIBOR(2) | | | 23,438 | | | | — | | | | 23,438 | | | Barclays Capital Group |
| JPY | 40,000 | | | | 06/28/21 | | | | 1.123% | | | 6 Month YEN LIBOR(2) | | | 19,159 | | | | — | | | | 19,159 | | | Barclays Capital Group |
| JPY | 30,000 | | | | 07/22/21 | | | | 1.090% | | | 6 Month YEN LIBOR(2) | | | 13,372 | | | | — | | | | 13,372 | | | Citigroup Global Markets |
| JPY | 220,000 | | | | 07/26/22 | | | | 0.745% | | | 6 Month YEN LIBOR(2) | | | 24,555 | | | | — | | | | 24,555 | | | Barclays Capital Group |
| JPY | 55,000 | | | | 11/20/22 | | | | 0.748% | | | 6 Month YEN LIBOR(2) | | | 5,661 | | | | — | | | | 5,661 | | | Barclays Capital Group |
| JPY | 120,000 | | | | 12/27/22 | | | | 0.803% | | | 6 Month YEN LIBOR(2) | | | 18,149 | | | | — | | | | 18,149 | | | Hong Kong & Shanghai Bank |
| JPY | 175,000 | | | | 03/15/23 | | | | 0.755% | | | 6 Month YEN LIBOR(2) | | | 12,221 | | | | — | | | | 12,221 | | | Barclays Capital Group |
| JPY | 145,000 | | | | 04/15/23 | | | | 0.750% | | | 6 Month YEN LIBOR(2) | | | 7,872 | | | | — | | | | 7,872 | | | Credit Suisse First Boston Corp. |
| JPY | 85,500 | | | | 07/21/24 | | | | 1.489% | | | 6 Month YEN LIBOR(2) | | | 64,810 | | | | — | | | | 64,810 | | | Citigroup Global Markets |
| JPY | 60,000 | | | | 07/04/26 | | | | 1.603% | | | 6 Month YEN LIBOR(2) | | | 48,001 | | | | — | | | | 48,001 | | | Citigroup Global Markets |
| JPY | 70,000 | | | | 08/02/26 | | | | 1.534% | | | 6 Month YEN LIBOR(2) | | | 48,647 | | | | — | | | | 48,647 | | | Citigroup Global Markets |
| JPY | 300,000 | | | | 09/03/27 | | | | 1.290% | | | 6 Month YEN LIBOR(2) | | | 78,456 | | | | — | | | | 78,456 | | | Citigroup Global Markets |
| JPY | 35,000 | | | | 10/02/27 | | | | 1.238% | | | 6 Month YEN LIBOR(2) | | | 6,014 | | | | — | | | | 6,014 | | | Barclays Capital Group |
| JPY | 55,000 | | | | 11/05/27 | | | | 1.270% | | | 6 Month YEN LIBOR(2) | | | 13,793 | | | | — | | | | 13,793 | | | Barclays Capital Group |
| JPY | 40,000 | | | | 12/04/27 | | | | 1.261% | | | 6 Month YEN LIBOR(2) | | | 8,793 | | | | — | | | | 8,793 | | | Citigroup Global Markets |
See Notes to Financial Statements.
| | | | | | | | | | | | | | | | | | | | | | | | | | |
Notional
Amount
(000)# | | | Termination
Date | | | Fixed
Rate | | | Floating
Rate | | Fair
Value | | | Upfront
Premiums
Paid
(Received) | | | Unrealized
Appreciation
(Depreciation) | | | Counterparty |
| Over-the-counter swap agreements (cont’d.): |
| JPY | 40,000 | | | | 12/14/27 | | | | 1.235% | | | 6 Month YEN LIBOR(2) | | $ | 7,079 | | | $ | — | | | $ | 7,079 | | | Citigroup Global Markets |
| JPY | 120,000 | | | | 02/20/28 | | | | 1.353% | | | 6 Month YEN LIBOR(2) | | | 36,595 | | | | — | | | | 36,595 | | | Deutsche Bank |
| JPY | 200,000 | | | | 04/16/28 | | | | 1.235% | | | 6 Month YEN LIBOR(2) | | | 21,071 | | | | — | | | | 21,071 | | | Barclays Capital Group |
| JPY | 110,000 | | | | 08/18/31 | | | | 1.750% | | | 6 Month YEN LIBOR(2) | | | 67,319 | | | | — | | | | 67,319 | | | Barclays Capital Group |
| JPY | 25,000 | | | | 08/30/31 | | | | 1.750% | | | 6 Month YEN LIBOR(2) | | | 15,140 | | | | — | | | | 15,140 | | | Barclays Capital Group |
| JPY | 240,000 | | | | 01/18/32 | | | | 1.638% | | | 6 Month YEN LIBOR(2) | | | 94,578 | | | | — | | | | 94,578 | | | Barclays Capital Group |
| JPY | 30,000 | | | | 11/05/32 | | | | 1.563% | | | 6 Month YEN LIBOR(2) | | | 6,578 | | | | — | | | | 6,578 | | | Barclays Capital Group |
| JPY | 160,000 | | | | 11/14/32 | | | | 2.390% | | | 6 Month YEN LIBOR(2) | | | 11,023 | | | | — | | | | 11,023 | | | Citigroup Global Markets |
| JPY | 35,000 | | | | 12/14/32 | | | | 1.575% | | | 6 Month YEN LIBOR(2) | | | 8,978 | | | | — | | | | 8,978 | | | Citigroup Global Markets |
| JPY | 40,000 | | | | 07/09/42 | | | | 1.705% | | | 6 Month YEN LIBOR(2) | | | 4,964 | | | | — | | | | 4,964 | | | Barclays Capital Group |
| JPY | 20,000 | | | | 10/02/42 | | | | 1.659% | | | 6 Month YEN LIBOR(2) | | | (3,173 | ) | | | — | | | | (3,173 | ) | | Barclays Capital Group |
| JPY | 70,000 | | | | 01/28/43 | | | | 1.955% | | | 6 Month YEN LIBOR(2) | | | 43,152 | | | | — | | | | 43,152 | | | JPMorgan Chase |
| JPY | 137,500 | | | | 05/21/43 | | | | 2.003% | | | 6 Month YEN LIBOR(1) | | | (105,688 | ) | | | — | | | | (105,688 | ) | | Credit Suisse First Boston Corp. |
| JPY | 45,000 | | | | 05/28/43 | | | | 2.088% | | | 6 Month YEN LIBOR(1) | | | (44,374 | ) | | | — | | | | (44,374 | ) | | Deutsche Bank |
| JPY | 45,800 | | | | 05/29/43 | | | | 2.013% | | | 6 Month YEN LIBOR(1) | | | (36,190 | ) | | | — | | | | (36,190 | ) | | Morgan Stanley |
| JPY | 100,000 | | | | 06/03/43 | | | | 1.970% | | | 6 Month YEN LIBOR(2) | | | 67,682 | | | | — | | | | 67,682 | | | JPMorgan Chase |
| MXN | 45,000 | | | | 12/02/15 | | | | 5.090% | | | 28 Day Mexican Interbank Rate(2) | | | 63,041 | | | | — | | | | 63,041 | | | Deutsche Bank |
| MXN | 37,000 | | | | 06/20/18 | | | | 6.020% | | | 28 day Mexican Interbank Rate(2) | | | 102,113 | | | | — | | | | 102,113 | | | Credit Suisse First Boston Corp. |
| MXN | 17,100 | | | | 02/18/22 | | | | 6.600% | | | 28 Day Mexican Interbank Rate(2) | | | 25,628 | | | | — | | | | 25,628 | | | Barclays Capital Group |
| MXN | 31,100 | | | | 05/25/22 | | | | 6.370% | | | 28 day Mexican Interbank Rate(2) | | | 10,791 | | | | — | | | | 10,791 | | | Morgan Stanley |
| MXN | 6,000 | | | | 10/26/22 | | | | 5.940% | | | 28 Day Mexican Interbank Rate(2) | | | (15,715 | ) | | | — | | | | (15,715 | ) | | Barclays Capital Group |
| MXN | 25,000 | | | | 12/23/22 | | | | 5.900% | | | 28 Day Mexican Interbank Rate(1) | | | 76,142 | | | | — | | | | 76,142 | | | Royal Bank of Scotland Group PLC |
See Notes to Financial Statements.
| | | | |
| Prudential Global Total Return Fund, Inc. | | | 55 | |
Portfolio of Investments
as of October 31, 2013 continued
| | | | | | | | | | | | | | | | | | | | | | | | | | |
Notional
Amount
(000)# | | | Termination
Date | | | Fixed
Rate | | | Floating
Rate | | Fair
Value | | | Upfront
Premiums
Paid
(Received) | | | Unrealized
Appreciation
(Depreciation) | | | Counterparty |
| Over-the-counter swap agreements (cont’d.): |
| MXN | 15,700 | | | | 04/28/23 | | | | 5.100% | | | 28 Day Mexican Interbank Rate(2) | | $ | (132,439 | ) | | $ | — | | | $ | (132,439 | ) | | Barclays Capital Group |
| MXN | 15,200 | | | | 06/28/23 | | | | 6.670% | | | 28 Day Mexican Interbank Rate(2) | | | 15,699 | | | | — | | | | 15,699 | | | Hong Kong & Shanghai Bank |
| MXN | 17,500 | | | | 04/09/42 | | | | 7.890% | | | 28 Day Mexican Interbank Rate(2) | | | (1,075 | ) | | | — | | | | (1,075 | ) | | Barclays Capital Group |
| NOK | 47,000 | | | | 11/07/14 | | | | 2.170% | | | 6 Month NIBOR(1) | | | (121,055 | ) | | | — | | | | (121,055 | ) | | Citigroup Global Markets |
| NOK | 30,000 | | | | 05/10/16 | | | | 1.935% | | | 6 Month NIBOR(2) | | | (18,147 | ) | | | — | | | | (18,147 | ) | | Royal Bank of Scotland Group PLC |
| NOK | 13,500 | | | | 11/07/17 | | | | 2.550% | | | 6 Month NIBOR(2) | | | 48,708 | | | | — | | | | 48,708 | | | Citigroup Global Markets |
| NOK | 4,500 | | | | 11/07/22 | | | | 3.190% | | | 6 Month NIBOR(2) | | | 17,415 | | | | — | | | | 17,415 | | | Citigroup Global Markets |
| NZD | 3,200 | | | | 08/18/16 | | | | 4.173% | | | 3 Month BBR(2) | | | 39,267 | | | | — | | | | 39,267 | | | Citigroup Global Markets |
| NZD | 1,480 | | | | 03/26/17 | | | | 3.810% | | | 3 Month BBR(2) | | | (2,456 | ) | | | — | | | | (2,456 | ) | | Hong Kong & Shanghai Bank |
| NZD | 1,700 | | | | 08/09/18 | | | | 4.145% | | | 3 Month BBR(2) | | | (477 | ) | | | — | | | | (477 | ) | | Hong Kong & Shanghai Bank |
| NZD | 1,320 | | | | 09/25/22 | | | | 3.790% | | | 3 Month BBR(2) | | | (77,599 | ) | | | — | | | | (77,599 | ) | | Citigroup Global Markets |
| NZD | 910 | | | | 08/09/23 | | | | 4.653% | | | 3 Month BBR(2) | | | (7,904 | ) | | | — | | | | (7,904 | ) | | Hong Kong & Shanghai Bank |
| PLN | 15,000 | | | | 06/28/18 | | | | 3.790% | | | 6 Month WIBOR(2) | | | 77,513 | | | | — | | | | 77,513 | | | Deutsche Bank |
| PLN | 4,900 | | | | 06/27/21 | | | | 5.390% | | | 6 Month WIBOR(2) | | | 183,658 | | | | — | | | | 183,658 | | | UBS AG |
| PLN | 5,700 | | | | 04/12/22 | | | | 5.030% | | | 6 Month WIBOR(2) | | | 203,824 | | | | — | | | | 203,824 | | | Hong Kong & Shanghai Bank |
| PLN | 4,000 | | | | 03/14/23 | | | | 3.810% | | | 6 Month WIBOR(2) | | | 11,562 | | | | — | | | | 11,562 | | | Bank of America |
| PLN | 4,100 | | | | 03/18/23 | | | | 3.660% | | | 6 Month WIBOR(2) | | | (5,872 | ) | | | — | | | | (5,872 | ) | | Hong Kong & Shanghai Bank |
| PLN | 3,600 | | | | 06/27/26 | | | | 5.280% | | | 6 Month WIBOR(1) | | | (162,172 | ) | | | — | | | | (162,172 | ) | | UBS AG |
| PLN | 4,100 | | | | 04/12/27 | | | | 4.810% | | | 6 Month WIBOR(1) | | | (144,333 | ) | | | — | | | | (144,333 | ) | | Hong Kong & Shanghai Bank |
| PLN | 3,500 | | | | 03/18/43 | | | | 3.380% | | | 6 Month WIBOR(1) | | | 68,891 | | | | — | | | | 68,891 | | | Hong Kong & Shanghai Bank |
| RUB | 70,000 | | | | 04/10/23 | | | | 7.470% | | | 3 Month MOSPRIME(2) | | | 96,105 | | | | — | | | | 96,105 | | | Deutsche Bank |
| SEK | 25,000 | | | | 05/10/16 | | | | 1.363% | | | 3 Month STIBOR(2) | | | (4,518 | ) | | | — | | | | (4,518 | ) | | Royal Bank of Scotland Group PLC |
| SEK | 3,700 | | | | 02/27/22 | | | | 2.520% | | | 3 Month STIBOR(2) | | | 7,666 | | | | — | | | | 7,666 | | | Citigroup Global Markets |
See Notes to Financial Statements.
| | | | | | | | | | | | | | | | | | | | | | | | | | |
Notional
Amount
(000)# | | | Termination
Date | | | Fixed
Rate | | | Floating
Rate | | Fair
Value | | | Upfront
Premiums
Paid
(Received) | | | Unrealized
Appreciation
(Depreciation) | | | Counterparty |
| Over-the-counter swap agreements (cont’d.): |
| SEK | 3,000 | | | | 01/16/23 | | | | 2.200% | | | 3 Month STIBOR(2) | | $ | (8,034 | ) | | $ | — | | | $ | (8,034 | ) | | Barclays Capital Group |
| SGD | 1,800 | | | | 01/08/18 | | | | 0.935% | | | 6 Month SOR(2) | | | (9,595 | ) | | | — | | | | (9,595 | ) | | Bank of America |
| SGD | 2,500 | | | | 07/31/18 | | | | 1.650% | | | 6 Month SOR(2) | | | 35,452 | | | | — | | | | 35,452 | | | Hong Kong & Shanghai Bank |
| THB | 100,000 | | | | 05/14/16 | | | | 2.630% | | | 3 Month BIBOR(2) | | | (9,271 | ) | | | — | | | | (9,271 | ) | | Citigroup Global Markets |
| THB | 50,000 | | | | 12/20/17 | | | | 3.230% | | | 6 Month BIBOR(2) | | | 12,911 | | | | — | | | | 12,911 | | | Bank of America |
| TWD | 390,000 | | | | 09/29/15 | | | | 1.090% | | | 3 Month Secondary Market CP Bank Rate(1) | | | (12,583 | ) | | | — | | | | (12,583 | ) | | Bank of America |
| TWD | 40,000 | | | | 12/24/22 | | | | 1.390% | | | 3 Month Secondary Market CP Bank Rate(1) | | | 18,447 | | | | — | | | | 18,447 | | | Hong Kong & Shanghai Bank |
| ZAR | 55,000 | | | | 06/25/18 | | | | 7.440% | | | 3 Month JIBAR(2) | | | 120,496 | | | | — | | | | 120,496 | | | Hong Kong & Shanghai Bank |
| ZAR | 5,000 | | | | 09/03/33 | | | | 8.970% | | | 3 Month JIBAR(2) | | | 24,138 | | | | — | | | | 24,138 | | | Hong Kong & Shanghai Bank |
| | 5,000 | | | | 07/12/14 | | | | 0.518% | | | 3 Month LIBOR(2) | | | 15,996 | | | | — | | | | 15,996 | | | Bank of Nova Scotia |
| | 9,600 | | | | 03/08/15 | | | | 0.383% | | | 3 Month LIBOR(2) | | | 9,724 | | | | — | | | | 9,724 | | | Deutsche Bank |
| | 4,900 | | | | 01/25/16 | | | | 0.496% | | | 3 Month LIBOR(1) | | | (9,739 | ) | | | — | | | | (9,739 | ) | | Deutsche Bank |
| | 6,070 | | | | 06/07/16 | | | | 0.654% | | | 3 Month LIBOR(2) | | | 27,928 | | | | — | | | | 27,928 | | | JPMorgan Chase |
| | 9,625 | | | | 08/31/16 | | | | 0.934% | | | 3 Month LIBOR(2) | | | 93,282 | | | | — | | | | 93,282 | | | Credit Suisse First Boston Corp. |
| | 2,995 | | | | 08/31/16 | | | | 0.975% | | | 3 Month LIBOR(1) | | | (32,683 | ) | | | — | | | | (32,683 | ) | | JPMorgan Chase |
| | 2,995 | | | | 08/31/16 | | | | 0.978% | | | 3 Month LIBOR(1) | | | (33,006 | ) | | | — | | | | (33,006 | ) | | JPMorgan Chase |
| | 11,150 | | | | 11/30/16 | | | | 0.913% | | | 3 Month LIBOR(1) | | | (105,396 | ) | | | — | | | | (105,396 | ) | | JPMorgan Chase |
| | 3,100 | | | | 02/24/17 | | | | 1.192% | | | 3 Month LIBOR(1) | | | (45,296 | ) | | | — | | | | (45,296 | ) | | Citigroup Global Markets |
| | 2,100 | | | | 01/08/18 | | | | 0.935% | | | 3 Month LIBOR(2) | | | (11,311 | ) | | | — | | | | (11,311 | ) | | Bank of America |
| | 4,850 | | | | 02/15/20 | | | | 1.355% | | | 3 Month LIBOR(2) | | | (143,133 | ) | | | — | | | | (143,133 | ) | | Morgan Stanley |
| | 1,100 | | | | 08/24/22 | | | | 1.875% | | | 3 Month LIBOR(2) | | | (51,206 | ) | | | — | | | | (51,206 | ) | | Hong Kong & Shanghai Bank |
| | 720 | | | | 02/24/42 | | | | 2.864% | | | 3 Month LIBOR(2) | | | (94,622 | ) | | | — | | | | (94,622 | ) | | Citigroup Global Markets |
| | | | | | | | | | | | | | | | | | | | | | | | | | |
| | | | | | | | | | | | | | $ | 245,278 | | | $ | — | | | $ | 245,278 | | | |
| | | | | | | | | | | | | | | | | | | | | | | | | | |
| (1) | Fund pays the fixed rate and receives the floating rate. |
| (2) | Fund pays the floating rate and receives the fixed rate. |
| # | Notional amount is shown in U.S. dollars unless otherwise stated. |
See Notes to Financial Statements.
| | | | |
| Prudential Global Total Return Fund, Inc. | | | 57 | |
Portfolio of Investments
as of October 31, 2013 continued
Forward rate agreements outstanding at October 31, 2013:
| | | | | | | | | | | | | | | | | | | | | | | | | | |
Notional
Amount
(000)# | | | Termination
Date | | | Fixed
Rate | | | Floating
Rate | | Fair
Value | | | Upfront
Premiums
Paid
(Received) | | | Unrealized
Appreciation
(Depreciation) | | | Counterparty |
| | 32,500 | | | | 11/14/13 | | | | 1.620% | | | 5 Year CMS(1) | | $ | (46,890 | ) | | $ | — | | | $ | (46,890 | ) | | Goldman Sachs & Co. |
| | 32,500 | | | | 11/14/13 | | | | 2.810% | | | 10 Year CMS(1) | | | (30,983 | ) | | | — | | | | (30,983 | ) | | Goldman Sachs & Co. |
| | 65,000 | | | | 11/14/13 | | | | 3.330% | | | CMM 100(2) | | | 92,544 | | | | — | | | | 92,544 | | | Goldman Sachs & Co. |
| | 25,000 | | | | 11/18/13 | | | | 1.538% | | | 5 Year CMS(1) | | | (12,804 | ) | | | — | | | | (12,804 | ) | | Citigroup Global Markets |
| | 25,000 | | | | 11/18/13 | | | | 2.758% | | | 10 Year CMS(1) | | | (8,100 | ) | | | — | | | | (8,100 | ) | | Citigroup Global Markets |
| | 50,000 | | | | 11/18/13 | | | | 3.250% | | | CMM 100(2) | | | 28,731 | | | | — | | | | 28,731 | | | Citigroup Global Markets |
| | 39,000 | | | | 11/23/13 | | | | 1.479% | | | 5 Year CMS(1) | | | 8,070 | | | | — | | | | 8,070 | | | Citigroup Global Markets |
| | 39,000 | | | | 11/23/13 | | | | 3.170% | | | CMM 100(2) | | | (11,025 | ) | | | — | | | | (11,025 | ) | | Citigroup Global Markets |
| | | | | | | | | | | | | | | | | | | | | | | | | | |
| | | | | | | | | | | | | | $ | 19,543 | | | $ | — | | | $ | 19,543 | | | |
| | | | | | | | | | | | | | | | | | | | | | | | | | |
| (1) | Fund pays the fixed rate and receives the floating rate. |
| (2) | Fund pays the floating rate and receives the fixed rate. |
| # | Notional amount is shown in U.S. dollars unless otherwise stated. |
Currency swap agreements outstanding at October 31, 2013:
| | | | | | | | | | | | | | | | | | | | | | | | | | | | | | |
Notional
Amount
(000)# | | | Fund
Receives | | | Notional
Amount
(000)# | | | Fund
Pays | | Counterparty | | Termination
Date | | | Fair
Value | | | Upfront
Premiums
Paid
(Received) | | | Unrealized
Appreciation
(Depreciation) | |
| | 1,688 | | | | 3 Month LIBOR | | | EUR | 1,300 | | | 3 Month EURIBOR minus 30.5 bps | | Barclays Capital Group | | | 12/04/14 | | | $ | (71,441 | ) | | $ | — | | | $ | (71,441 | ) |
| | 326 | | | | 3 Month LIBOR | | | EUR | 250 | | | 3 Month EURIBOR minus 31.70 bps | | Barclays Capital Group | | | 12/14/15 | | | | (11,851 | ) | | | — | | | | (11,851 | ) |
| | 1,035 | | |
| 3 Month LIBOR
plus 303 bps |
| | EUR | 750 | | | 6.500% | | Citigroup Global Markets | | | 02/10/14 | | | | (32,206 | ) | | | (56,251 | ) | | | 24,045 | |
| | 1,986 | | |
| 3 Month LIBOR
plus 472 bps |
| | EUR | 1,500 | | | 6.750% | | Citigroup Global Markets | | | 07/28/14 | | | | (114,090 | ) | | | (56,992 | ) | | | (57,098 | ) |
| | 1,333 | | |
| 3 Month LIBOR
plus 178 bps |
| | EUR | 1,000 | | | 7.500% | | Citigroup Global Markets | | | 10/14/14 | | | | (99,962 | ) | | | (170,148 | ) | | | 70,186 | |
| | 1,364 | | |
| 3 Month LIBOR
plus 247 bps |
| | EUR | 1,000 | | | 7.500% | | Citigroup Global Markets | | | 10/14/14 | | | | (58,783 | ) | | | (156,521 | ) | | | 97,738 | |
| | 778 | | |
| 3 Month LIBOR
plus 290 bps |
| | EUR | 600 | | | 7.500% | | Citigroup Global Markets | | | 10/14/14 | | | | (73,148 | ) | | | (87,625 | ) | | | 14,477 | |
| | 808 | | |
| 3 Month LIBOR
plus 623 bps |
| | JPY | 62,000 | | | 5.500% | | Citigroup Global Markets | | | 12/15/14 | | | | 172,757 | | | | (12 | ) | | | 172,769 | |
| | 494 | | |
| 3 Month LIBOR
plus 390 bps |
| | EUR | 400 | | | 5.000% | | Citigroup Global Markets | | | 03/18/15 | | | | (72,877 | ) | | | (14,732 | ) | | | (58,145 | ) |
See Notes to Financial Statements.
| | | | | | | | | | | | | | | | | | | | | | | | | | | | | | |
Notional
Amount
(000)# | | | Fund
Receives | | | Notional
Amount
(000)# | | | Fund
Pays | | Counterparty | | Termination
Date | | | Fair
Value | | | Upfront
Premiums
Paid
(Received) | | | Unrealized
Appreciation
(Depreciation) | |
| | 2,105 | | |
| 3 Month LIBOR
plus 190 bps |
| | CHF | 2,000 | | | 2.625% | | Citigroup Global Markets | | | 05/12/15 | | | $ | (145,885 | ) | | $ | (78,305 | ) | | $ | (67,580 | ) |
| | 307 | | |
| 3 Month LIBOR
plus 333 bps |
| | JPY | 24,000 | | | 4.500% | | Citigroup Global Markets | | | 06/08/15 | | | | 59,136 | | | | (12,097 | ) | | | 71,233 | |
| | 257 | | |
| 3 Month LIBOR
plus 313 bps |
| | JPY | 20,000 | | | 4.500% | | Citigroup Global Markets | | | 06/08/15 | | | | 49,218 | | | | (11,241 | ) | | | 60,459 | |
| | 1,246 | | |
| 3 Month LIBOR
plus 498 bps |
| | JPY | 100,000 | | | 4.500% | | Citigroup Global Markets | | | 06/08/15 | | | | 245,212 | | | | 58 | | | | 245,154 | |
| | 649 | | |
| 3 Month LIBOR
plus 225 bps |
| | EUR | 500 | | | 3.750% | | Citigroup Global Markets | | | 10/12/15 | | | | (48,594 | ) | | | (16,422 | ) | | | (32,172 | ) |
| | 690 | | |
| 3 Month LIBOR
plus 197 bps |
| | EUR | 500 | | | 3.750% | | Citigroup Global Markets | | | 10/12/15 | | | | (9,058 | ) | | | (16,600 | ) | | | 7,542 | |
| | 582 | | |
| 3 Month LIBOR
plus 412 bps |
| | EUR | 480 | | | 4.500% | | Citigroup Global Markets | | | 11/30/15 | | | | (99,197 | ) | | | (5,471 | ) | | | (93,726 | ) |
| | 263 | | | | 3 Month LIBOR | | | EUR | 200 | | | 3 Month EURIBOR minus 30.00 bps | | Citigroup Global Markets | | | 12/18/15 | | | | (7,182 | ) | | | — | | | | (7,182 | ) |
| | 651 | | |
| 3 Month LIBOR
plus 310 bps |
| | EUR | 500 | | | 3.625% | | Citigroup Global Markets | | | 02/01/16 | | | | (45,250 | ) | | | 44 | | | | (45,294 | ) |
| | 303 | | |
| 3 Month LIBOR
plus 272 bps |
| | EUR | 227 | | | 4.500% | | Citigroup Global Markets | | | 04/05/16 | | | | (23,840 | ) | | | (15,773 | ) | | | (8,067 | ) |
| | 651 | | |
| 3 Month LIBOR
plus 273 bps |
| | EUR | 500 | | | 4.500% | | Citigroup Global Markets | | | 04/05/16 | | | | (68,945 | ) | | | (22,723 | ) | | | (46,222 | ) |
| | 960 | | |
| 3 Month LIBOR
plus 218 bps |
| | EUR | 700 | | | 4.500% | | Citigroup Global Markets | | | 04/15/16 | | | | (57,847 | ) | | | — | | | | (57,847 | ) |
| | 1,111 | | |
| 3 Month LIBOR
plus 451 bps |
| | JPY | 92,000 | | | 3.750% | | Citigroup Global Markets | | | 11/14/16 | | | | 195,959 | | | | 66 | | | | 195,893 | |
| | 327 | | |
| 3 Month LIBOR
plus 156 bps |
| | CHF | 300 | | | 2.875% | | Citigroup Global Markets | | | 11/23/16 | | | | (24,865 | ) | | | (22,679 | ) | | | (2,186 | ) |
| | 325 | | |
| 3 Month LIBOR
plus 158 bps |
| | CHF | 300 | | | 2.875% | | Citigroup Global Markets | | | 11/23/16 | | | | (26,901 | ) | | | (27,045 | ) | | | 144 | |
| | 1,605 | | |
| 3 month LIBOR
plus 432 bps |
| | JPY | 125,000 | | | 3.450% | | Citigroup Global Markets | | | 03/24/17 | | | | 394,296 | | | | 38,560 | | | | 355,736 | |
| | 122 | | |
| 3 Month LIBOR
plus 208 bps |
| | EUR | 100 | | | 4.250% | | Citigroup Global Markets | | | 07/14/17 | | | | (24,215 | ) | | | (11,428 | ) | | | (12,787 | ) |
| | 244 | | |
| 3 Month LIBOR
plus 220 bps |
| | EUR | 200 | | | 4.250% | | Citigroup Global Markets | | | 07/14/17 | | | | (48,086 | ) | | | (20,832 | ) | | | (27,254 | ) |
| | 1,294 | | | | 3 Month LIBOR | | | EUR | 1,000 | | | 3 Month EURIBOR minus 28.75 bps | | Credit Suisse First Boston Corp. | | | 10/15/14 | | | | (61,164 | ) | | | — | | | | (61,164 | ) |
| | 1,111 | | |
| 3 Month LIBOR
plus 265 bps |
| | CHF | 1,000 | | | 2.625% | | Credit Suisse First Boston Corp. | | | 05/12/15 | | | | 2,485 | | | | (25,901 | ) | | | 28,386 | |
| | 567 | | |
| 3 Month LIBOR
plus 510 bps |
| | CHF | 500 | | | 4.000% | | Credit Suisse First Boston Corp. | | | 05/20/16 | | | | 30,244 | | | | 677 | | | | 29,567 | |
| | 12,789 | | | | 3 Month LIBOR | | | EUR | 9,645 | | | Floating 3 Month EURIBOR minus 26.00 bps | | Deutsche Bank | | | 01/25/15 | | | | (275,151 | ) | | | — | | | | (275,151 | ) |
See Notes to Financial Statements.
| | | | |
| Prudential Global Total Return Fund, Inc. | | | 59 | |
Portfolio of Investments
as of October 31, 2013 continued
| | | | | | | | | | | | | | | | | | | | | | | | | | | | | | |
Notional
Amount
(000)# | | | Fund
Receives | | | Notional
Amount
(000)# | | | Fund
Pays | | Counterparty | | Termination
Date | | | Fair
Value | | | Upfront
Premiums
Paid
(Received) | | | Unrealized
Appreciation
(Depreciation) | |
| | 620 | | | | 3 Month LIBOR | | | CHF | 588 | | | 3 Month CHF LIBOR minus 34.75 bps | | Hong Kong & Shanghai Bank | | | 11/13/13 | | | $ | (27,711 | ) | | $ | — | | | $ | (27,711 | ) |
| | 293 | | | | 3 Month LIBOR | | | EUR | 220 | | | 3 month EURIBOR minus 25.75 bps | | Hong Kong & Shanghai Bank | | | 01/17/15 | | | | (4,740 | ) | | | — | | | | (4,740 | ) |
| | 107 | | | | 3 Month LIBOR | | | CHF | 100 | | | 3 Month CHF LIBOR minus 29.00 bps | | Hong Kong & Shanghai Bank | | | 04/24/15 | | | | (3,042 | ) | | | — | | | | (3,042 | ) |
| | 461 | | | | 3 Month LIBOR | | | EUR | 350 | | | 3 month EURIBOR minus 30.25 bps | | Hong Kong & Shanghai Bank | | | 12/19/15 | | | | (12,361 | ) | | | — | | | | (12,361 | ) |
| TRY | 4,800 | | | | 7.700% | | | | 2,500 | | | 3 Month LIBOR | | Hong Kong & Shanghai Bank | | | 07/19/18 | | | | (24,103 | ) | | | — | | | | (24,103 | ) |
| TRY | 7,729 | | | | 8.820% | | | | 3,800 | | | 3 Month LIBOR | | Hong Kong & Shanghai Bank | | | 09/04/18 | | | | 331,677 | | | | — | | | | 331,677 | |
| | 635 | | | | 3 Month LIBOR | | | EUR | 500 | | | 3 Month EURIBOR minus 31.25 bps | | JPMorgan Chase | | | 11/15/14 | | | | (41,367 | ) | | | — | | | | (41,367 | ) |
| | 147 | | |
| 3 Month LIBOR
plus 398 bps |
| | EUR | 120 | | | 4.500% | | JPMorgan Chase | | | 11/30/15 | | | | (23,588 | ) | | | (2,177 | ) | | | (21,411 | ) |
| | | | | | | | | | | | | | | | | | | | | | | | | | | | | | |
| | | | | | | | | | | | | | | | | | | | $ | (156,466 | ) | | $ | (791,570 | ) | | $ | 635,104 | |
| | | | | | | | | | | | | | | | | | | | | | | | | | | | | | |
| # | Notional amount is shown in U.S. dollars unless otherwise stated. |
Various inputs are used in determining the value of the Fund's investments. These inputs are summarized in the three broad levels listed below.
Level 1—quoted prices generally in active markets for identical securities.
Level 2—other significant observable inputs including, but not limited to, quoted prices for similar securities, interest rates and yield curves, prepayment speeds, foreign currency exchange rates, and amortized cost.
Level 3—significant unobservable inputs for securities valued in accordance with Board approved fair valuation procedures.
The following is a summary of the inputs used as of October 31, 2013 in valuing such portfolio securities:
| | | | | | | | | | | | |
| | | Level 1 | | | Level 2 | | | Level 3 | |
Investments in Securities | | | | | | | | | | | | |
Foreign Bonds | | $ | — | | | $ | 159,090,204 | | | $ | 5,027,381 | |
Asset-Backed Securities | | | | | | | | | | | | |
Collateralized Debt Obligations | | | — | | | | 675,224 | | | | — | |
Collateralized Loan Obligations | | | — | | | | 2,401,674 | | | | — | |
Residential Mortgage-Backed Securities | | | — | | | | 21,886,026 | | | | — | |
See Notes to Financial Statements.
| | | | | | | | | | | | |
| | | Level 1 | | | Level 2 | | | Level 3 | |
Bank Loans | | $ | — | | | $ | 1,376,440 | | | $ | 636,555 | |
Corporate Bonds | | | — | | | | 48,943,360 | | | | 670,317 | |
Municipal Bonds | | | — | | | | 2,978,116 | | | | — | |
U.S. Government Agency Obligation | | | — | | | | 1,480,071 | | | | — | |
Preferred Stock | | | 110,000 | | | | — | | | | — | |
Affiliated Money Market Mutual Fund | | | 7,360,644 | | | | — | | | | — | |
U.S. Treasury Obligation | | | — | | | | 3,018,809 | | | | — | |
Other Financial Instruments* | | | | | | | | | | | | |
Futures Contracts | | | 114,397 | | | | — | | | | — | |
Forward Foreign Currency Exchange Contracts | | | — | | | | (5,308 | ) | | | — | |
Forward Rate Agreements | | | — | | | | — | | | | 19,543 | |
Credit Default Swap Agreements | | | (40,571 | ) | | | 2,900,854 | | | | — | |
Interest Rate Swaps | | | 58,303 | | | | 246,353 | | | | (1,075 | ) |
Currency Swap Agreements | | | — | | | | 635,104 | | | | — | |
| | | | | | | | | | | | |
Total | | $ | 7,602,773 | | | $ | 245,626,927 | | | $ | 6,352,721 | |
| | | | | | | | | | | | |
The following is a reconciliation of assets in which significant unobservable inputs (Level 3) were used in determining fair value:
| | | | | | | | | | | | | | | | | | | | | | | | | | | | |
| | | Foreign
Bonds | | | Collateralized
Loan Obligations,
Debt Obligations
and Other
Asset Backed
Securities | | | Bank
Loans | | | Corporate
Bonds | | | Credit
Default
Swaps | | | Interest
Rate
Swaps | | | Forward Rate
Agreements | |
Balance as of 10/31/12 | | $ | 2,020,650 | | | $ | 17,826 | | | $ | 288,755 | | | $ | 739,080 | | | $ | (3,246 | ) | | $ | 128,968 | | | | — | |
Realized gain (loss) | | | — | | | | 12 | | | | 8,526 | | | | — | | | | — | ** | | | — | ** | | | — | ** |
Change in unrealized appreciation (depreciation)*** | | | (163,304 | ) | | | (145 | ) | | | 19,497 | | | | (15,214 | ) | | | 3,246 | | | | (130,043 | ) | | | 19,543 | |
Purchases | | | 3,150,070 | | | | — | | | | 606,894 | | | | — | | | | — | | | | — | | | | — | |
Sales | | | — | | | | (17,707 | ) | | | (292,949 | ) | | | (53,549 | ) | | | — | | | | — | | | | — | |
Accrued discount/premium | | | 19,965 | | | | 14 | | | | 5,832 | | | | — | | | | — | | | | — | | | | — | |
Transfers into Level 3 | | | — | | | | — | | | | — | | | | — | | | | — | | | | — | | | | — | |
Transfers out of Level 3 | | | — | | | | — | | | | — | | | | — | | | | — | | | | — | | | | — | |
| | | | | | | | | | | | | | | | | | | | | | | | | | | | |
Balance as of 10/31/13 | | $ | 5,027,381 | | | $ | — | | | $ | 636,555 | | | $ | 670,317 | | | $ | — | | | $ | (1,075 | ) | | $ | 19,543 | |
| | | | | | | | | | | | | | | | | | | | | | | | | | | | |
| * | Other financial instruments are derivative instruments not reflected in the Portfolio of Investments, such as futures, forwards and swap contracts, which are recorded at the unrealized appreciation/depreciation on the instrument. |
| ** | The realized loss incurred during the period for other financial instruments was $(1,708). |
| *** | Of which, $(265,189) was included in Net Assets relating to securities held at the reporting period end. |
Included in the table above, under Level 3, are securities that were fair valued using pricing methodologies approved by the Valuation Committee, which contain
| | | | |
| Prudential Global Total Return Fund, Inc. | | | 61 | |
Portfolio of Investments
as of October 31, 2013 continued
unobservable inputs. Such methodologies include, but not limited to, using prices provided by a single broker/dealer, the cost of the investment, and prices of any recent transactions or bids/offers for such securities or any comparable securities.
The industry classification of investments and other assets in excess of liabilities shown as a percentage of net assets as October 31, 2013 was as follows:
| | | | |
Sovereign Bonds | | | 55.1 | % |
Residential Mortgage-Backed Securities | | | 8.5 | |
Banking | | | 5.9 | |
Foreign Agency | | | 4.0 | |
Affiliated Money Market Mutual Fund | | | 2.9 | |
Cable | | | 1.8 | |
Non-Captive Finance | | | 1.7 | |
Capital Goods | | | 1.6 | |
Technology | | | 1.3 | |
Media & Entertainment | | | 1.2 | |
Municipal Bonds | | | 1.2 | |
U.S. Treasury Obligation | | | 1.2 | |
Foods | | | 1.1 | |
Telecommunications | | | 1.0 | |
Insurance | | | 1.0 | |
Electric | | | 0.9 | |
Collateralized Loan Obligations | | | 0.9 | |
Healthcare & Pharmaceutical | | | 0.9 | |
Metals | | | 0.9 | |
U.S. Government Agency Obligation | | | 0.6 | |
Brokerage | | | 0.5 | |
Pipelines & Other | | | 0.5 | |
Paper | | | 0.4 | % |
Automotive | | | 0.4 | |
Chemicals | | | 0.4 | |
Consumer | | | 0.3 | |
Tobacco | | | 0.3 | |
Building Materials & Construction | | | 0.3 | |
Real Estate Investment Trusts | | | 0.3 | |
Energy—Integrated | | | 0.3 | |
Energy—Other | | | 0.3 | |
Aerospace & Defense | | | 0.3 | |
Collateralized Debt Obligations | | | 0.3 | |
Airlines | | | 0.3 | |
Retailers | | | 0.3 | |
Gaming | | | 0.3 | |
Packaging | | | 0.2 | |
Oil, Gas & Consumable Fuels | | | 0.2 | |
Railroads | | | 0.1 | |
| | | | |
| | | 99.7 | |
Other assets in excess of liabilities | | | 0.3 | |
| | | | |
| | | 100.0 | % |
| | | | |
The Fund invested in derivative instruments during the reporting period. The primary types of risk associated with these derivative instruments are credit risk, foreign exchange risk and interest rate risk. The effect of such derivative instruments on the Fund's financial position and financial performance as reflected in the Statement of Assets and Liabilities and Statement of Operations is presented in the summary below.
See Notes to Financial Statements.
Fair values of derivative instruments as of October 31, 2013 as presented in the Statement of Assets and Liabilities:
| | | | | | | | | | | | |
Derivatives not accounted for
as hedging instruments, carried
at fair value | | Asset Derivatives | | | Liability Derivatives | |
| | Balance
Sheet Location | | Fair
Value | | | Balance
Sheet Location | | Fair
Value | |
| Interest rate contracts | | Due to broker—variation margin | | $ | 792,362 | * | | Due to broker—variation margin | | $ | 619,662 | * |
| Interest rate contracts | | Premiums paid for swap agreements | | | 39,405 | | | Premiums received for swap agreements | | | 830,975 | |
| Interest rate contracts | | Unrealized appreciation on over-the-counter swap agreements | | | 5,548,378 | | | Unrealized depreciation on over-the-counter swap agreements | | | 4,667,996 | |
| Interest rate contracts | | Unrealized appreciation on forward rate agreements | | | 129,345 | | | Unrealized depreciation on forward rate agreements | | | 109,802 | |
| Foreign exchange contracts | | Unrealized appreciation on foreign currency exchange contracts | | | 3,063,514 | | | Unrealized depreciation on foreign currency exchange contracts | | | 3,068,822 | |
| Credit contracts | | Premiums paid for swap agreements | | | 50,580 | | | Premiums received for swap agreements | | | 3,446,463 | |
| Credit contracts | | — | | | — | | | Due to broker—variation margin | | | 40,571 | * |
| Credit contracts | | Unrealized appreciation on over-the-counter swap agreements | | | 3,041,882 | | | Unrealized depreciation on over-the-counter swap agreements | | | 141,028 | |
| | | | | | | | | | | | |
Total | | | | $ | 12,665,466 | | | | | $ | 12,925,319 | |
| | | | | | | | | | | | |
| * | Includes cumulative appreciation/depreciation as reported in schedule of open futures and exchange-traded swap contracts. Only unsettled variation margin receivable (payable) is reported within the Statement of Assets and Liabilities. |
See Notes to Financial Statements.
| | | | |
| Prudential Global Total Return Fund, Inc. | | | 63 | |
Portfolio of Investments
as of October 31, 2013 continued
The effects of derivative instruments on the Statement of Operations for the year ended October 31, 2013 are as follows:
| | | | | | | | | | | | | | | | | | | | | | | | | | | | |
Amount of Realized Gain or (Loss) on Derivatives Recognized in Income | |
Derivatives not
accounted for as hedging
instruments, carried at
fair value | | Options
Purchased | | | Options
Written | | | Futures | | | Forward
Rate
Agreements | | | Forward
Currency
Contracts | | | Swaps | | | Total | |
Credit contracts | | $ | — | | | $ | — | | | $ | — | | | $ | — | | | $ | — | | | $ | 789,613 | | | $ | 789,613 | |
Foreign exchange contracts | | | (2,958,303 | ) | | | — | | | | — | | | | — | | | | (13,741,057 | ) | | | — | | | | (16,699,360 | ) |
Interest rate contracts | | | (120,102 | ) | | | (866 | ) | | | 122,107 | | | | 10,990 | | | | — | | | | 2,212,680 | | | | 2,224,809 | |
| | | | | | | | | | | | | | | | | | | | | | | | | | | | |
| | $ | (3,078,405 | ) | | $ | (866 | ) | | $ | 122,107 | | | $ | 10,990 | | | $ | (13,741,057 | ) | | $ | 3,002,293 | | | $ | (13,684,938 | ) |
| | | | | | | | | | | | | | | | | | | | | | | | | | | | |
| | | | | | | | | | | | | | | | | | | | | | | | |
Change in Unrealized Appreciation or (Depreciation) on Derivatives Recognized in Income | |
Derivatives not
accounted for as hedging
instruments, carried at
fair value | | Purchased
Options | | | Futures | | | Forward
Rate
Agreements | | | Swaps | | | Forward
Currency
Contracts | | | Total | |
Interest rate contracts | | $ | — | | | $ | (418,611 | ) | | $ | 19,543 | | | $ | (1,612,292 | ) | | $ | — | | | $ | (2,011,360 | ) |
Foreign exchange contracts | | | 830,777 | | | | — | | | | — | | | | — | | | | 2,184,902 | | | | 3,015,679 | |
Credit contracts | | | — | | | | — | | | | — | | | | 382,898 | | | | — | | | | 382,898 | |
| | | | | | | | | | | | | | | | | | | | | | | | |
Total | | $ | 830,777 | | | $ | (418,611 | ) | | $ | 19,543 | | | $ | (1,229,394 | ) | | $ | 2,184,902 | | | $ | 1,387,217 | |
| | | | | | | | | | | | | | | | | | | | | | | | |
For the year ended October 31, 2013, the Fund’s average volume of derivative activities are as follows:
| | | | | | | | | | | | | | | | | | |
Options
Purchased
(Cost) | | | Futures
Long
Positions
(Value at
Trade Date) | | | Futures
Short
Positions
(Value at
Trade Date) | | | Forward
Currency
Contracts—
Purchased
(Value at
Settlement
Date Payable) | | | Forward
Currency
Contracts—
Sold
(Value at
Settlement
Date Receivable) | |
| $ | 704,658 | | | $ | 63,169,236 | | | $ | 44,537,845 | | | $ | 422,756,939 | | | $ | 290,468,233 | |
| | | | | | | | | | | | | | | | | | | | | | |
Forward
Rate
Agreements
(Notional
Amount in
USD (000)) | | | Interest
Rate
Swaps
(Notional
Amount in
USD (000)) | | | Credit
Default
Swaps as
Buyer
(Notional
Amount in
USD (000)) | | | Credit
Default
Swaps as
Writer
(Notional
Amount in
USD (000)) | | | Currency
Swaps
(Notional
Amount in
USD (000)) | | | Inflation
Swaps
(Notional
Amount in
USD (000)) | |
| $ | 93,956 | | | $ | 419,219 | | | $ | 21,288 | | | $ | 53,130 | | | $ | 39,239 | | | $ | 5,340 | |
See Notes to Financial Statements.
PRUDENTIAL INVESTMENTS»MUTUAL FUNDS
FINANCIAL STATEMENTS
ANNUAL REPORT · OCTOBER 31, 2013
Prudential Global Total Return Fund, Inc.
Statement of Assets and Liabilities
as of October 31, 2013
| | | | |
Assets | | | | |
Investments at value: | | | | |
Unaffiliated Investments (cost $236,212,011) | | $ | 248,294,177 | |
Affiliated Investments (cost $7,360,644) | | | 7,360,644 | |
Cash | | | 190,087 | |
Foreign currency, at value (cost $148,885) | | | 147,738 | |
Unrealized appreciation on swap agreements | | | 8,590,260 | |
Dividends and interest receivable | | | 4,329,743 | |
Unrealized appreciation on forward foreign currency exchange contracts | | | 3,063,514 | |
Receivable for investments sold | | | 2,247,557 | |
Receivable for Fund shares sold | | | 302,196 | |
Unrealized appreciation on forward rate agreements | | | 129,345 | |
Premium paid for swap agreements | | | 89,985 | |
Tax reclaim receivable | | | 39,458 | |
Prepaid expenses | | | 3,338 | |
| | | | |
Total assets | | | 274,788,042 | |
| | | | |
| |
Liabilities | | | | |
Unrealized depreciation on swap agreements | | | 4,809,024 | |
Premium received for swap agreements | | | 4,277,438 | |
Payable for investments purchased | | | 4,090,835 | |
Unrealized depreciation on forward foreign currency exchange contracts | | | 3,068,822 | |
Payable for Fund shares reacquired | | | 1,190,566 | |
Accrued expenses | | | 256,222 | |
Dividends payable | | | 227,098 | |
Management fee payable | | | 142,503 | |
Unrealized depreciation on forward rate agreements | | | 109,802 | |
Distribution fee payable | | | 67,161 | |
Due to broker—variation margin | | | 45,796 | |
Affiliated transfer agent fee payable | | | 17,036 | |
Loan interest payable (Note 7) | | | 95 | |
| | | | |
Total liabilities | | | 18,302,398 | |
| | | | |
| |
Net Assets | | $ | 256,485,644 | |
| | | | |
| | | | | |
Net assets were comprised of: | | | | |
Common stock, at par | | $ | 370,562 | |
Paid-in capital in excess of par | | | 255,462,168 | |
| | | | |
| | | 255,832,730 | |
Distributions in excess of net investment income | | | (7,761,605 | ) |
Accumulated net realized loss on investment and foreign currency transactions | | | (7,604,387 | ) |
Net unrealized appreciation on investments and foreign currencies | | | 16,018,906 | |
| | | | |
Net assets, October 31, 2013 | | $ | 256,485,644 | |
| | | | |
See Notes to Financial Statements.
| | | | |
Class A | | | | |
Net asset value and redemption price per share | | | | |
($161,099,271 ÷ 23,289,929 shares of common stock issued and outstanding) | | $ | 6.92 | |
Maximum sales charge (4.50% of offering price) | | | 0.33 | |
| | | | |
Maximum offering price to public | | $ | 7.25 | |
| | | | |
| |
Class B | | | | |
Net asset value, offering price and redemption price per share
($7,083,904 ÷ 1,024,008 shares of common stock issued and outstanding) | | $ | 6.92 | |
| | | | |
| |
Class C | | | | |
Net asset value, offering price and redemption price per share
($31,423,878 ÷ 4,551,209 shares of common stock issued and outstanding) | | $ | 6.90 | |
| | | | |
| |
Class Q | | | | |
Net asset value, offering price and redemption price per share
($61,531 ÷ 8,864 shares of common stock issued and outstanding) | | $ | 6.94 | |
| | | | |
| |
Class Z | | | | |
Net asset value, offering price and redemption price per share
($56,817,060 ÷ 8,182,213 shares of common stock issued and outstanding) | | $ | 6.94 | |
| | | | |
See Notes to Financial Statements.
| | | | |
| Prudential Global Total Return Fund, Inc. | | | 67 | |
Statement of Operations
Year Ended October 31, 2013
| | | | |
Net Investment Income | | | | |
Income | | | | |
Interest income (net of foreign withholding taxes of $487) | | $ | 12,813,117 | |
Unaffiliated dividend income | | | 7,875 | |
Affiliated dividend income | | | 5,668 | |
| | | | |
Total income | | | 12,826,660 | |
| | | | |
| |
Expenses | | | | |
Management fee | | | 1,983,251 | |
Distribution fee—Class A | | | 450,858 | |
Distribution fee—Class B | | | 72,992 | |
Distribution fee—Class C | | | 360,708 | |
Transfer agent's fees and expenses (including affiliated expense of $78,900) | | | 408,000 | |
Custodian's fees and expenses | | | 296,000 | |
Registration fees | | | 89,000 | |
Shareholders' reports | | | 79,000 | |
Audit fee | | | 65,000 | |
Legal fees and expenses | | | 25,000 | |
Directors' fees | | | 16,000 | |
Insurance | | | 5,000 | |
Loan interest expense (Note 7) | | | 4,332 | |
Miscellaneous | | | 18,717 | |
| | | | |
Total expenses | | | 3,873,858 | |
| | | | |
Net investment income | | | 8,952,802 | |
| | | | |
| |
Realized And Unrealized Gain (Loss) On Investment And Foreign Currency Transactions | | | | |
Net realized gain (loss) on: | | | | |
Investment transactions | | | 232,100 | |
Futures transactions | | | 122,107 | |
Options written transactions | | | (866 | ) |
Forward rate agreement transactions | | | 10,990 | |
Swap agreement transactions | | | 3,002,293 | |
Foreign currency transactions | | | (11,671,512 | ) |
| | | | |
| | | (8,304,888 | ) |
| | | | |
Net change in unrealized appreciation (depreciation) on: | | | | |
Investments (net of change in foreign capital gains taxes $1,078) | | | (3,768,943 | ) |
Foreign currencies | | | 2,222,886 | |
Futures contracts | | | (418,611 | ) |
Forward rate agreements | | | 19,543 | |
Swap agreements | | | (1,229,394 | ) |
| | | | |
| | | (3,174,519 | ) |
| | | | |
Net loss on investment and foreign currency transactions | | | (11,479,407 | ) |
| | | | |
Net Decrease In Net Assets Resulting From Operations | | $ | (2,526,605 | ) |
| | | | |
See Notes to Financial Statements.
Statement of Changes in Net Assets
| | | | | | | | |
| | | Year Ended October 31, | |
| | | 2013 | | | 2012 | |
Increase (Decrease) in Net Assets | | | | | | | | |
Operations | | | | | | | | |
Net investment income | | $ | 8,952,802 | | | $ | 7,923,220 | |
Net realized gain (loss) on investment and foreign currency transactions | | | (8,304,888 | ) | | | 1,283,657 | |
Net change in unrealized appreciation (depreciation) on investments and foreign currencies | | | (3,174,519 | ) | | | 11,503,741 | |
| | | | | | | | |
Net increase (decrease) in net assets resulting from operations | | | (2,526,605 | ) | | | 20,710,618 | |
| | | | | | | | |
| | |
Dividends and Distributions (Note 1) | | | | | | | | |
Dividends from net investment income* | | | | | | | | |
Class A | | | (4,568,804 | ) | | | (6,600,695 | ) |
Class B | | | (151,647 | ) | | | (190,197 | ) |
Class C | | | (748,588 | ) | | | (897,888 | ) |
Class Q | | | (354 | ) | | | (272 | ) |
Class Z | | | (2,160,989 | ) | | | (2,411,147 | ) |
| | | | | | | | |
| | | (7,630,382 | ) | | | (10,100,199 | ) |
| | | | | | | | |
| | |
Tax Return of Capital Distributions | | | | | | | | |
Class A | | | (2,917,322 | ) | | | (610,548 | ) |
Class B | | | (96,831 | ) | | | (17,593 | ) |
Class C | | | (477,997 | ) | | | (83,053 | ) |
Class Q | | | (226 | ) | | | (25 | ) |
Class Z | | | (1,379,858 | ) | | | (223,025 | ) |
| | | | | | | | |
| | | (4,872,234 | ) | | | (934,244 | ) |
| | | | | | | | |
| | |
Fund share transactions (Net of share conversions) (Note 6) | | | | | | | | |
Net proceeds from shares sold | | | 123,867,983 | | | | 152,201,551 | |
Net asset value of shares issued in reinvestment of dividends and distributions | | | 9,379,824 | | | | 8,181,155 | |
Cost of shares reacquired | | | (162,525,904 | ) | | | (90,078,057 | ) |
| | | | | | | | |
Net increase (decrease) in net assets from Fund share transactions | | | (29,278,097 | ) | | | 70,304,649 | |
| | | | | | | | |
Total increase (decrease) | | | (44,307,318 | ) | | | 79,980,824 | |
| | |
Net Assets: | | | | | | | | |
Beginning of year | | | 300,792,962 | | | | 220,812,138 | |
| | | | | | | | |
End of year(a) | | $ | 256,485,644 | | | $ | 300,792,962 | |
| | | | | | | | |
(a) Includes undistributed net investment income of: | | $ | — | | | $ | 540,685 | |
| | | | | | | | |
| * | Dividends from net investment income may include other items that are ordinary income for tax purposes. |
See Notes to Financial Statements.
| | | | |
| Prudential Global Total Return Fund, Inc. | | | 69 | |
Notes to Financial Statements
Prudential Global Total Return Fund, Inc. (the “Fund”) is an open-end management investment company, registered under the Investment Company Act of 1940, as amended (“1940 Act”). The Fund’s investment objective is to seek total return, made up of current income and capital appreciation. The Fund is a non-diversified fund.
Note 1. Accounting Policies
The following accounting policies conform to U.S. generally accepted accounting principles. The Fund consistently follows such policies in the preparation of its financial statements.
Security Valuation: The Fund holds securities and other assets that are fair valued at the close of each day the New York Stock Exchange (“NYSE”) is open for trading. Fair value is the price that would be received to sell an asset or paid to transfer a liability in an orderly transaction between market participants on the measurement date. The Board of Directors (the “Board”) has adopted Valuation Procedures for security valuation under which fair valuation responsibilities have been delegated to Prudential Investments LLC (“PI” or “Manager”). Under the current Valuation Procedures, the established Valuation Committee is responsible for supervising the valuation of portfolio securities and other assets. The Valuation Procedures permit the Fund to utilize independent pricing vendor services, quotations from market makers, and alternative valuation methods when market quotations are either not readily available or not representative of fair value. A record of the Valuation Committee’s actions is subject to the Board’s review, approval, and ratification at its next regularly-scheduled quarterly meeting.
Various inputs determine how the Fund’s investments are valued, all of which are categorized according to the three broad levels (Level 1, 2, or 3) detailed in the table following the Portfolio of Investments.
Common stocks, exchange-traded funds, and derivative instruments that are traded on a national securities exchange are valued at the last sale price as of the close of trading on the applicable exchange. Securities traded via NASDAQ are valued at the NASDAQ official closing price. To the extent these securities are valued at the last sale price or NASDAQ official closing price; they are classified as Level 1 in the fair value hierarchy.
In the event that no sale or official closing price on valuation date exists, these securities are generally valued at the mean between the last reported bid and asked prices, or at the last bid price in the absence of an asked price. These securities are classified as Level 2 in the fair value hierarchy, as the inputs are observable and considered to be significant to the valuation.
Common stocks traded on foreign securities exchanges are valued using pricing vendor services that provide model prices derived using adjustment factors based on information such as local closing price, relevant general and sector indices, currency fluctuations, depositary receipts, and futures, as applicable. Securities valued using such model prices are classified as Level 2 in the fair value hierarchy, as the adjustment factors are observable and considered to be significant to the valuation.
Investments in open-end, non-exchange-traded mutual funds are valued at their net asset values as of the close of the NYSE on the date of valuation. These securities are classified as Level 1 in the fair value hierarchy since they may be purchased or sold at their net asset values on the date of valuation.
Fixed income securities traded in the over-the-counter market are generally valued at prices provided by approved independent pricing vendors. The pricing vendors provide these prices after evaluating observable inputs including, but not limited to yield curves, yield spreads, credit ratings, deal terms, tranche level attributes, default rates, cash flows, prepayment speeds, broker/dealer quotations, and reported trades. Securities valued using such vendor prices are classified as Level 2 in the fair value hierarchy.
Over-the-counter derivative instruments are generally valued using pricing vendor services, which derive the valuation based on inputs such as underlying asset prices, indices, spreads, interest rates, and exchange rates. These instruments are categorized as Level 2 in the fair value hierarchy.
Securities and other assets that cannot be priced according to the methods described above are valued based on pricing methodologies approved by the Board of Directors. In the event that significant unobservable inputs are used when determining such valuations, the securities will be classified as Level 3 in the fair value hierarchy.
When determining the fair value of securities, some of the factors influencing the valuation include: the nature of any restrictions on disposition of the securities; assessment of the general liquidity of the securities; the issuer’s financial condition and the markets in which it does business; the cost of the investment; the size of the
| | | | |
| Prudential Global Total Return Fund, Inc. | | | 71 | |
Notes to Financial Statements
continued
holding and the capitalization of the issuer; the prices of any recent transactions or bids/offers for such securities or any comparable securities; any available analyst media or other reports or information deemed reliable by the investment adviser regarding the issuer or the markets or industry in which it operates. Using fair value to price securities may result in a value that is different from a security’s most recent closing price and from the price used by other mutual funds to calculate their net asset values.
Restricted and Illiquid Securities: Subject to guidelines adopted by the Board, the Fund may invest up to 15% of its net assets in illiquid securities. Illiquid securities are those that, because of the absence of a readily available market or due to legal or contractual restrictions on resale, cannot be sold within seven days in the ordinary course of business at approximately the amount at which the Fund has valued the investment. Therefore, the Fund may find it difficult to sell illiquid securities at the time considered most advantageous by its Subadviser and may incur expenses that would not be incurred in the sale of securities that were freely marketable. Certain securities that would otherwise be considered illiquid because of legal restrictions on resale to the general public may be traded among qualified institutional buyers under Rule 144A of the Securities Act of 1933. These Rule 144A securities, as well as commercial paper that is sold in private placements under Section 4(2) of the Securities Act, may be deemed liquid by the Fund’s Subadviser under the guidelines adopted by the Directors of the Fund. However, the liquidity of the Fund’s investments in Rule 144A securities could be impaired if trading does not develop or declines.
Foreign Currency Translation: The books and records of the Fund are maintained in U.S. dollars. Foreign currency amounts are translated into U.S. dollars on the following basis:
(i) market value of investment securities, other assets and liabilities-at the current rates of exchange.
(ii) purchases and sales of investment securities, income and expenses-at the rates of exchange prevailing on the respective dates of such transactions.
Although the net assets of the Fund are presented at the foreign exchange rates and market values at the close of the period, the Fund does not isolate that portion of the results of operations arising as a result of changes in the foreign exchange rates from
the fluctuations arising from changes in the market prices of long-term portfolio securities held at the end of the period. Similarly, the Fund does not isolate the effect of changes in foreign exchange rates from the fluctuations arising from changes in the market prices of long-term portfolio securities sold during the period. Accordingly, these realized foreign currency gains or losses are included in the reported net realized gains or losses on investment transactions.
Net realized gains or losses on foreign currency transactions represent net foreign exchange gains or losses from sales and maturities of short-term securities and forward currency contracts, disposition of foreign currencies, currency gains or losses realized between the trade and settlement dates on securities transactions, and the difference between the amounts of interest, discount and foreign withholding taxes recorded on the Fund’s books and the U.S. dollar equivalent amounts actually received or paid. Net unrealized currency gains or losses from valuing foreign currency denominated assets and liabilities (other than investments) at period end exchange rates are reflected as a component of net unrealized appreciation (depreciation) on foreign currencies.
Concentration of Risk: The ability of debt securities issuers (other than those issued or guaranteed by the U.S. Government) held by the Fund to meet its obligations may be affected by the economic or political developments in a specific industry, region or country. Foreign security and currency transactions may involve certain considerations and risks not typically associated with those of U.S. companies as a result of, among other factors, the possibility of political or economic instability or the level of governmental supervision and regulation of foreign securities markets.
Financial Futures Contracts: A financial futures contract is an agreement to purchase (long) or sell (short) an agreed amount of securities at a set price for delivery on a future date. Upon entering into a financial futures contract, the Fund is required to pledge to the broker an amount of cash and/or other assets equal to a certain percentage of the contract amount. This amount is known as the “initial margin.” Subsequent payments, known as “variation margin,” are made or received by the Fund each day, depending on the daily fluctuations in the value of the underlying security. Such variation margin is recorded for financial statement purposes on a daily basis as unrealized gain (loss). When the contract expires or is closed, the gain (loss) is realized and is presented in the Statement of Operations as net realized gain (loss) on futures transactions.
The Fund invested in financial futures contracts in order to hedge its existing portfolio securities, or securities the Fund intends to purchase, against fluctuations in value caused by changes in prevailing interest rates or foreign currency exchange rates.
| | | | |
| Prudential Global Total Return Fund, Inc. | | | 73 | |
Notes to Financial Statements
continued
Should interest rates move unexpectedly, the Fund may not achieve the anticipated benefits of the financial futures contracts and may realize a loss. The use of futures transactions involves the risk of imperfect correlation in movements in the price of futures contracts, interest rates and the underlying hedged assets. Financial futures contracts involve elements of risk in excess of the amounts reflected on the Statement of Assets and Liabilities.
Forward Currency Contracts: A forward currency contract is a commitment to purchase or sell a foreign currency at a future date at a negotiated forward rate between two parties. The Fund enters into forward currency contracts in order to hedge its exposure to changes in foreign currency exchange rates on its foreign portfolio holdings or specific receivables and payables denominated in a foreign currency. The contracts are valued daily at current exchange rates and any unrealized gain or loss is included in net unrealized appreciation or depreciation on foreign currencies. Gain or loss is realized on the settlement date of the contract equal to the difference between the settlement value of the original and negotiated forward contracts. This gain or loss, if any, is included in net realized gain (loss) on foreign currency transactions. Risks may arise upon entering into these contracts from the potential inability of the counterparties to meet the terms of their contracts. Forward currency contracts involve risks from currency exchange rate and credit risk in excess of the amounts reflected on the Statement of Assets and Liabilities. The Fund’s maximum risk of loss from counterparty credit risk is the net value of the cash flows to be received from the counterparty at the end of the contract’s life. A master netting arrangement between the Fund and the counterparty permits the Fund to offset amounts payable by the Fund to the same counterparty against amounts to be received; and by the receipt of collateral from the counterparty by the Fund to cover the Fund’s exposure to the counterparty. However, there is no assurance that such mitigating factors are easily enforceable.
Options: The Fund purchased and wrote options in order to hedge against adverse market movements or fluctuations in value caused by changes in prevailing interest rates or foreign currency exchange rates, with respect to securities which the Fund currently owns or intends to purchase. The Fund’s principal reason for writing options is to realize, through receipt of premiums, a greater current return than would be realized on the underlying security alone. When the Fund purchases an option, it pays a premium and an amount equal to that premium is recorded as an asset. When the Fund writes an option, it receives a premium and an amount equal to that
premium is recorded as a liability. The asset or liability is adjusted daily to reflect the current market value of the option. If an option expires unexercised, the Fund realizes a gain or loss to the extent of the premium received or paid. If an option is exercised, the premium received or paid is recorded as an adjustment to the proceeds from the sale or the cost of the purchase in determining whether the Fund has realized a gain or loss. The difference between the premium and the amount received or paid at the closing of a purchase or sale transaction is also treated as a realized gain or loss. Gain or loss on purchased options is included in net realized gain or loss on investment transactions. Gain or loss on written options is presented separately as net realized gain or loss on options written. The Fund, as writer of an option, may have no control over whether the underlying securities may be sold (called) or purchased (put). As a result, the Fund bears the market risk of an unfavorable change in the price of the security underlying the written option. The Fund, as purchaser of an over-the-counter option, bears the risk of the potential inability of the counterparties to meet the terms of their contracts.
With exchange-traded futures and options contracts, there is minimal counterparty credit risk to the Fund since the exchanges’ clearinghouse acts as counterparty to all exchange traded futures and options and guarantees the futures and options contracts against default.
Forward Rate Agreements: Forward rate agreements represent an agreement between counterparties to exchange cash flows based on the difference between two interest rates, applied to a notional principal amount on a fixed future date. The Fund entered into forward rate agreements to gain yield exposure based on anticipated market conditions at the specified termination date of the agreement.
Swap Agreements: The Fund entered into credit default, interest rate and other forms of swap agreements. A swap agreement is an agreement to exchange the return generated by one instrument for the return generated by another instrument. Swap agreements are negotiated in the over-the-counter market and may be executed either directly with counterparty (“OTC Traded”) or through a central clearing facility, such as a registered commodities exchange (“Exchange Traded”). Swap agreements are valued daily at current market value and any change in value is included in the net unrealized appreciation or depreciation on investments. Exchange Traded swaps pay or receive an amount known as “variation margin”, based on daily changes in the valuation of the swap contract. Payments received or paid by the Fund are recorded as realized gains or losses upon termination or maturity of the swap. Risk of loss may exceed amounts recognized on the Statements of Assets and Liabilities. Swap agreements outstanding at period end, if any, are listed on the Portfolio of Investments.
| | | | |
| Prudential Global Total Return Fund, Inc. | | | 75 | |
Notes to Financial Statements
continued
Credit Default Swaps: Credit default swaps involve one party (the protection buyer) making a stream of payments to another party (the protection seller) in exchange for the right to receive a specified payment in the event of a default or as a result of a default (collectively a “credit event”) for the referenced entity (typically corporate issues or sovereign issues of an emerging country) on its obligation; or in the event of a write-down, principal shortfall, interest shortfall or default of all or part of the referenced entities comprising a credit index.
The Fund is subject to credit risk in the normal course of pursuing its investment objectives. The Fund entered into credit default swaps to provide a measure of protection against issuer default. The Fund’s maximum risk of loss from counterparty credit risk for purchased credit default swaps is the inability of the counterparty to honor the contract up to the notional value due to a credit event. A master netting arrangement between the Fund and the counterparty permits the Fund to offset amounts payable by the Fund to the same counterparty against amounts to be received; and by the receipt of collateral from the counterparty by the Fund to cover the Fund’s exposure to the counterparty. However, there is no assurance that such mitigating factors are easily enforceable.
As a seller of protection on credit default swap agreements, the Fund generally receives an agreed upon payment from the buyer of protection throughout the term of the swap, provided no credit event occurs. As the seller, the Fund effectively increases its investment risk because, in addition to its total net assets, the Fund may be subject to investment exposure on the notional amount of the swap.
The maximum amount of the payment that the Fund, as a seller of protection, could be required to make under a credit default swap agreement would be equal to the notional amount of the underlying security or index contract as a result of a credit event. This potential amount will be partially offset by any recovery values of the respective referenced obligations, or net amounts received from the settlement of buy protection credit default swap agreements which the Fund entered for the same referenced entity or index. As a buyer of protection, the Fund generally receives an amount up to the notional value of the swap if a credit event occurs.
Implied credit spreads, represented in absolute terms, utilized in determining the market value of credit default swap agreements on corporate or sovereign issues of an emerging country as of period end are disclosed in the footnotes to the Portfolio of
Investments, if applicable. These spreads serve as indicators of the current status of the payment/performance risk and represent the likelihood of default risk for the credit derivative. The implied credit spread of a particular referenced entity reflects the cost of buying/selling protection and may include upfront payments required to enter into the agreement. For credit default swap agreements on asset-backed securities and credit indices, the quoted market prices and resulting values serve as indicators of the current status of the payment/performance risk. Wider credits spreads and increased market value in absolute terms, when compared to the notional amount of the swap, represent a deterioration of the referenced entity’s credit soundness and a greater likelihood of risk of default or other credit event occurring as defined under the terms of the agreement.
Interest Rate Swaps: Interest rate swaps represent an agreement between counterparties to exchange cash flows based on the difference between two interest rates, applied to a notional principal amount for a specified period. The Fund used interest rate swaps to maintain its ability to generate steady cash flow by receiving a stream of fixed-rate payments and to increase exposure to prevailing market rates by receiving floating rate payments. The Fund is subject to interest rate risk exposure in the normal course of pursuing its investment objectives.
Currency Swaps: The Fund entered into currency swap agreements primarily to gain yield exposure on foreign bonds. Currency swap agreements involve two parties exchanging two different currencies with an agreement to reverse the exchange at a later date at specified exchange rates.
Inflation Swaps: The Fund entered into inflation swap agreements to provide a measure of protection against the effect of inflation on yield. Inflation swap agreements involve two parties exchanging cash flows at a later date at rates related to inflation indices.
The Fund’s maximum risk of loss from counterparty credit risk is the discounted net value of the cash flows to be received from the counterparty over the contract’s remaining life. A master netting arrangement between the Fund and the counterparty permits the Fund to offset amounts payable by the Fund to the same counterparty against amounts to be received; and by the receipt of collateral from the counterparty by the Fund to cover the Fund’s exposure to the counterparty. However, there is no assurance that such mitigating factors are easily enforceable.
In addition to each instrument’s primary underlying risk exposure (e.g. interest rate, credit, equity or foreign exchange, etc.), swap agreements involve, to varying degrees, elements of credit, market and documentation risk. Such risks involve the possibility
| | | | |
| Prudential Global Total Return Fund, Inc. | | | 77 | |
Notes to Financial Statements
continued
that no liquid market for these agreements will exist, the counterparty to the agreement may default on its obligation to perform or disagree on the contractual terms of the agreement, and changes in net interest rates will be unfavorable. In connection with these agreements, securities in the portfolio may be identified as collateral or received as collateral from the counterparty in accordance with the terms of the respective swap agreements to provide or receive assets of value and to serve as recourse in the event of default or bankruptcy/insolvency of either party. Such over-the-counter derivative agreements include conditions which when materialized, give the counterparty the right to cause an early termination of the transactions under those agreements. Any election by the counterparty for early termination of the contract(s) may impact the amounts reported on financial statements. As of October 31, 2013, the Fund has not met conditions under such agreements, which give the counterparty the right to call for an early termination.
Forward currency contracts, written options, forward rate agreements, swaps and financial futures contracts involve elements of both market and credit risk in excess of the amounts reflected on the Statement of Assets and Liabilities.
Lower rated or unrated securities are more likely to react to developments affecting market risk (general market liquidity) and credit risk (an issuer’s inability to meet principal and interest payments on its obligations) than are more highly rated securities, which react primarily to movements in the general level of interest rates.
The ability of issuers of debt securities held by the Fund to meet their obligations may be affected by economic developments in a specific industry or region.
Securities Transactions and Net Investment Income: Securities transactions are recorded on the trade date. Realized gains or losses from investment and currency transactions are calculated on the identified cost basis. Dividend income is recorded on the ex-dividend date. Interest income, including amortization of premium and accretion of discount on debt securities, as required, is recorded on an accrual basis. Expenses are recorded on an accrual basis, which may require the use of certain estimates by management that may differ from actual.
Net investment income or loss (other than distribution fees which are charged directly to the respective class) and unrealized and realized gains or losses are allocated daily to each class of shares based upon the relative proportion of adjusted net assets of each class at the beginning of the day.
Dividends and Distributions: The Fund declares dividends from net investment income daily and payment is made monthly. Distributions from net realized capital and currency gains, if any, are paid annually. Foreign currency losses may reduce the amount of dividends of net investment income. Dividends and distributions are determined in accordance with federal income tax regulations which may differ from generally accepted accounting principles. Permanent book/tax differences relating to income and gains are reclassified to paid-in capital when they arise.
Taxes: For federal income tax purposes, the Fund is treated as a separate taxpaying entity. It is the Fund’s policy to continue to meet the requirements of the Internal Revenue Code applicable to regulated investment companies and to distribute all of its taxable net income and capital gains, if any, to its shareholders. Therefore, no federal income tax provision is required. Withholding taxes on foreign interest are recorded, net of reclaimable amounts, at the time the related income is earned.
Estimates: The preparation of the financial statements requires management to make estimates and assumptions that affect the reported amounts and disclosures in the financial statements. Actual results could differ from those amounts.
Note 2. Agreements
The Fund has a management agreement with PI. Pursuant to this agreement, PI has responsibility for all investment advisory services and supervises the subadvisor’s performance of such services. PI has entered into a subadvisory agreement with Prudential Investment Management, Inc. (“PIM”). The subadvisory agreement provides that PIM will furnish investment advisory services in connection with the management of the Fund. In connection therewith, PIM is obligated to keep certain books and records of the Fund. PI pays for the services of PIM, the cost of compensation of officers of the Fund, occupancy and certain clerical and bookkeeping costs of the Fund. The Fund bears all other costs and expenses.
The management fee paid to PI is accrued daily and payable monthly at an annual rate of ..65% of the Fund’s average daily net assets up to $1 billion and .60% of such assets in excess of $1 billion. The effective management fee rate was .65% for the year ended October 31, 2013.
PI has voluntarily agreed to reimburse the Fund in order to limit operating expenses (excluding distribution and service (12b-1) fees, interest, taxes, brokerage commissions and certain extraordinary expenses) to 1.10% of the Fund’s average daily net assets. For the year ended October 31, 2013, the Fund did not exceed the 1.10% expense limit.
| | | | |
| Prudential Global Total Return Fund, Inc. | | | 79 | |
Notes to Financial Statements
continued
The Fund has a distribution agreement with Prudential Investment Management Services LLC (“PIMS”), which acts as the distributor of the Class A, Class B, Class C, Class Q and Class Z shares of the Fund. The Fund compensates PIMS for distributing and servicing the Fund’s Class A, Class B and Class C shares, pursuant to plans of distribution (the “Class A, B and C Plans”), regardless of expenses actually incurred by PIMS. The distribution fees are accrued daily and payable monthly. No distribution or service fees are paid to PIMS as distributor of the Class Q and Class Z shares of the Fund. Pursuant to the Class A, B and C plans, the Fund compensates PIMS for distribution related activities at an annual rate of up to .30%, 1% and 1% of the average daily net assets of the Class A, B, and C shares, respectively. Through February 28, 2015, PIMS has contractually agreed to limit such fees to .25% of the average daily net assets of the Class A shares.
PIMS has advised the Fund that it has received $288,278 in front-end sales charges resulting from sales of Class A shares during the year ended October 31, 2013. From these fees, PIMS paid such sales charges to affiliated broker-dealers, which in turn paid commissions to salespersons and incurred other distribution costs.
PIMS has advised the Fund that for the year ended October 31, 2013, it received $3,803, $22,226 and $10,206 in contingent deferred sales charges imposed upon redemptions by certain Class A, Class B and Class C shareholders, respectively.
PI, PIM and PIMS are indirect, wholly-owned subsidiaries of Prudential Financial, Inc. (“Prudential”).
Note 3. Other Transactions with Affiliates
Prudential Mutual Fund Services LLC (“PMFS”), an affiliate of PI and an indirect, wholly-owned subsidiary of Prudential, serves as the Fund’s transfer agent. Transfer agent’s fees and expenses in the Statement of Operations include certain out-of-pocket expenses paid to non-affiliates, where applicable.
The Fund invests in the Prudential Core Taxable Money Market Fund (the “Core Fund”), a portfolio of the Prudential Investment Portfolios 2, registered under the 1940 Act and managed by PI. Earnings from the Core Fund are disclosed on the Statement of Operations as affiliated dividend income.
Note 4. Portfolio Securities
Purchases and sales of portfolio securities, other than short-term investments and U.S. Government securities, for the year ended October 31, 2013, were $153,894,536 and $197,174,338, respectively.
Transactions in options written during the year ended October 31, 2013, were as follows:
| | | | | | | | |
| | | Notional
Amount | | | Premiums
Received | |
Options outstanding at October 31, 2012 | | $ | — | | | $ | — | |
Options written | | | 5,164,006 | | | | 48,412 | |
Options terminated in closing purchase transactions | | | (5,164,006 | ) | | | (48,412 | ) |
Options expired | | | — | | | | — | |
| | | | | | | | |
Options outstanding at October 31, 2013 | | $ | — | | | $ | — | |
| | | | | | | | |
Note 5. Distributions and Tax Information
Distributions to shareholders, which are determined in accordance with federal income tax regulations and which may differ from generally accepted accounting principles, are recorded on the ex-dividend date. In order to present distributions in excess of net investment income, accumulated net realized loss on investment and foreign currency transactions and paid-in capital in excess of par on the Statement of Assets and Liabilities that more closely represent their tax character, certain adjustments have been made to distributions in excess of net investment income, accumulated net realized loss on investment and foreign currency transactions and paid-in capital in excess of par. For the year ended October 31, 2013, the adjustments were to increase distributions in excess of net investment income by $9,624,710, decrease accumulated net realized loss on investment and foreign currency transactions by $9,598,512 and increase paid-in capital in excess of par by $26,198 due to reclassification of foreign currency loss, reclass of paydown and swap gain (loss) and differences in the treatment of premium amortization. Net investment income, net realized gain (loss) on investment and foreign currency transactions and net assets were not affected by this change.
For the year ended October 31, 2013, the tax character of dividends paid as reflected in the Statement of Changes in Net Assets were $7,630,382 of ordinary income and $4,872,234 of tax return of capital. For the year ended October 31, 2012, the tax character of dividends paid were $10,100,199 of ordinary income and $934,244 of tax return of capital.
As of October 31, 2013, the Fund did not have any distributable earnings on a tax basis.
| | | | |
| Prudential Global Total Return Fund, Inc. | | | 81 | |
Notes to Financial Statements
continued
The United States federal income tax basis of the Fund’s investments and the net unrealized appreciation as of October 31, 2013 were as follows:
| | | | | | | | | | |
Tax Basis | | Appreciation | | Depreciation | | Net
Unrealized
Appreciation | | Other Cost
Basis
Adjustments | | Total Net
Unrealized
Appreciation |
| $253,425,298 | | $6,726,763 | | $(4,497,240) | | $2,229,523 | | $3,436,432 | | $5,665,955 |
The difference between book and tax basis is primarily attributable to deferred losses on wash sales, difference in the treatment of premium amortization and other book to tax differences. The other cost basis adjustments are primarily attributable to appreciation (depreciation) of foreign currencies, swaps, futures and mark-to-market of receivables and payables.
Under the Regulated Investment Company Modernization Act of 2010 (the “Act”), the Fund is permitted to carryforward capital losses incurred in the fiscal year ended October 31, 2012 and October 31, 2013 (“post-enactment losses”) for an unlimited period. Post-enactment losses are required to be utilized before the utilization of losses incurred prior to the effective date of the Act. As a result of this ordering rule, capital loss carryforwards related to taxable years ending before October 31, 2012 (“pre-enactment losses”) may have an increased likelihood to expire unused. The Fund utilized approximately $2,042,000 of its pre-enactment losses to offset net taxable gains realized in the fiscal year ended October 31, 2013. No capital gains distributions are expected to be paid to shareholders until net gains have been realized in excess of such losses. As of October 31, 2013, the pre and post-enactment losses were approximately:
| | | | |
Post-Enactment Losses: | | $ | 0 | |
| | | | |
Pre-Enactment Losses: | | | | |
Expiring 2016 | | $ | 2,537,000 | |
Expiring 2017 | | | 2,476,000 | |
| | | | |
| | $ | 5,013,000 | |
| | | | |
Management has analyzed the Fund’s tax positions taken on federal income tax returns for all open tax years and has concluded that no provision for income tax is required in the Fund’s financial statements for the current reporting period. The Fund’s federal and state income and federal excise tax returns for tax years for which the applicable statutes of limitations have not expired are subject to examination by the Internal Revenue Service and state departments of revenue.
Note 6. Capital
The Fund offers Class A, Class B, Class C, Class Q and Class Z shares. Class A shares are sold with a front-end sales charge of up to 4.50%. All investors who purchase Class A shares in an amount of $1 million or more and sell these shares within 12 months of purchase are subject to a contingent deferred sales charge (“CDSC”) of 1%, although the CDSC is waived for purchases by certain retirement and/or benefit plans. Class B shares are sold with a CDSC which declines from 5% to zero depending on the period of time the shares are held. Class B shares automatically convert to Class A shares on a quarterly basis approximately seven years after purchase. Class C shares are sold with a CDSC of 1% on shares redeemed within the first 12 months after purchase. A special exchange privilege is also available for shareholders who qualified to purchase Class A shares at net asset value. Class Q and Class Z shares are not subject to any sales or redemption charge and are offered exclusively for sale to a limited group of investors.
Under certain circumstances, an exchange may be made from specified share classes of the Fund to one or more other share classes of the Fund as presented in the table of transactions in shares of common stock.
There are 2 billion authorized shares of common stock at $.01 par value per share, designated Class A, Class B, Class C, Class Q and Class Z, each of which consists of 500 million, 200 million, 400 million, 400 million and 500 million authorized shares, respectively.
As of October 31, 2013, Prudential Financial, Inc. through its affiliates owned 1,546 Class Q shares of the Fund.
| | | | |
| Prudential Global Total Return Fund, Inc. | | | 83 | |
Notes to Financial Statements
continued
Transactions in shares of common stock were as follows:
| | | | | | | | |
Class A | | Shares | | | Amount | |
Year ended October 31, 2013: | | | | | | | | |
Shares sold | | | 7,776,808 | | | $ | 55,202,078 | |
Shares issued in reinvestment of dividends | | | 850,609 | | | | 5,921,669 | |
Shares reacquired | | | (9,817,174 | ) | | | (68,048,037 | ) |
| | | | | | | | |
Net increase (decrease) in shares outstanding before conversion | | | (1,189,757 | ) | | | (6,924,290 | ) |
Shares issued upon conversion from Class B and Class Z | | | 98,172 | | | | 685,544 | |
Shares reacquired upon conversion into Class Z | | | (178,014 | ) | | | (1,255,113 | ) |
| | | | | | | | |
Net increase (decrease) in shares outstanding | | | (1,269,599 | ) | | $ | (7,493,859 | ) |
| | | | | | | | |
Year ended October 31, 2012: | | | | | | | | |
Shares sold | | | 9,649,370 | | | $ | 66,221,366 | |
Shares issued in reinvestment of dividends | | | 840,103 | | | | 5,757,402 | |
Shares reacquired | | | (8,020,577 | ) | | | (54,784,066 | ) |
| | | | | | | | |
Net increase (decrease) in shares outstanding before conversion | | | 2,468,896 | | | | 17,194,702 | |
Shares issued upon conversion from Class B and Class Z | | | 73,630 | | | | 504,762 | |
Shares reacquired upon conversion into Class Z | | | (24,177 | ) | | | (163,934 | ) |
| | | | | | | | |
Net increase (decrease) in shares outstanding | | | 2,518,349 | | | $ | 17,535,530 | |
| | | | | | | | |
Class B | | | | | | |
Year ended October 31, 2013: | | | | | | | | |
Shares sold | | | 361,917 | | | $ | 2,568,479 | |
Shares issued in reinvestment of dividends | | | 23,697 | | | | 164,818 | |
Shares reacquired | | | (246,478 | ) | | | (1,709,180 | ) |
| | | | | | | | |
Net increase (decrease) in shares outstanding before conversion | | | 139,136 | | | | 1,024,117 | |
Shares reacquired upon conversion into Class A | | | (51,536 | ) | | | (360,766 | ) |
| | | | | | | | |
Net increase (decrease) in shares outstanding | | | 87,600 | | | $ | 663,351 | |
| | | | | | | | |
Year ended October 31, 2012: | | | | | | | | |
Shares sold | | | 410,139 | | | $ | 2,826,554 | |
Shares issued in reinvestment of dividends | | | 20,247 | | | | 138,645 | |
Shares reacquired | | | (148,025 | ) | | | (1,017,877 | ) |
| | | | | | | | |
Net increase (decrease) in shares outstanding before conversion | | | 282,361 | | | | 1,947,322 | |
Shares reacquired upon conversion into Class A | | | (64,015 | ) | | | (439,691 | ) |
| | | | | | | | |
Net increase (decrease) in shares outstanding | | | 218,346 | | | $ | 1,507,631 | |
| | | | | | | | |
| | | | | | | | |
Class C | | Shares | | | Amount | |
Year ended October 31, 2013: | | | | | | | | |
Shares sold | | | 2,066,356 | | | $ | 14,676,434 | |
Shares issued in reinvestment of dividends | | | 130,054 | | | | 903,558 | |
Shares reacquired | | | (2,239,727 | ) | | | (15,455,462 | ) |
| | | | | | | | |
Net increase (decrease) in shares outstanding before conversion | | | (43,317 | ) | | | 124,530 | |
Shares reacquired upon conversion into Class Z | | | (131,719 | ) | | | (916,464 | ) |
| | | | | | | | |
Net increase (decrease) in shares outstanding | | | (175,036 | ) | | $ | (791,934 | ) |
| | | | | | | | |
Year ended October 31, 2012: | | | | | | | | |
Shares sold | | | 2,747,473 | | | $ | 18,846,010 | |
Shares issued in reinvestment of dividends | | | 99,322 | | | | 679,917 | |
Shares reacquired | | | (896,034 | ) | | | (6,166,575 | ) |
| | | | | | | | |
Net increase (decrease) in shares outstanding before conversion | | | 1,950,761 | | | | 13,359,352 | |
Shares reacquired upon conversion into Class Z | | | (8,795 | ) | | | (61,900 | ) |
| | | | | | | | |
Net increase (decrease) in shares outstanding | | | 1,941,966 | | | $ | 13,297,452 | |
| | | | | | | | |
Class Q | | | | | | |
Year ended October 31, 2013: | | | | | | | | |
Shares sold | | | 7,304 | | | $ | 50,103 | |
Shares issued in reinvestment of dividends | | | 83 | | | | 580 | |
| | | | | | | | |
Net increase (decrease) in shares outstanding | | | 7,387 | | | $ | 50,683 | |
| | | | | | | | |
Period ended October 31, 2012*: | | | | | | | | |
Shares sold | | | 1,435 | | | $ | 10,000 | |
Shares issued in reinvestment of dividends | | | 42 | | | | 297 | |
| | | | | | | | |
Net increase (decrease) in shares outstanding | | | 1,477 | | | $ | 10,297 | |
| | | | | | | | |
Class Z | | | | | | |
Year ended October 31, 2013: | | | | | | | | |
Shares sold | | | 7,203,534 | | | $ | 51,370,889 | |
Shares issued in reinvestment of dividends | | | 340,851 | | | | 2,389,199 | |
Shares reacquired | | | (11,117,481 | ) | | | (77,313,225 | ) |
| | | | | | | | |
Net increase (decrease) in shares outstanding before conversion | | | (3,573,096 | ) | | | (23,553,137 | ) |
Shares issued upon conversion from Class A and Class C | | | 308,419 | | | | 2,171,577 | |
Shares reacquired upon conversion into Class A | | | (46,453 | ) | | | (324,778 | ) |
| | | | | | | | |
Net increase (decrease) in shares outstanding | | | (3,311,130 | ) | | $ | (21,706,338 | ) |
| | | | | | | | |
Year ended October 31, 2012: | | | | | | | | |
Shares sold | | | 9,288,412 | | | $ | 64,297,621 | |
Shares issued in reinvestment of dividends | | | 232,286 | | | | 1,604,894 | |
Shares reacquired | | | (4,087,278 | ) | | | (28,109,539 | ) |
| | | | | | | | |
Net increase (decrease) in shares outstanding before conversion | | | 5,433,420 | | | | 37,792,976 | |
Shares issued upon conversion from Class A and Class C | | | 32,834 | | | | 225,834 | |
Shares reacquired upon conversion into Class A | | | (9,567 | ) | | | (65,071 | ) |
| | | | | | | | |
Net increase (decrease) in shares outstanding | | | 5,456,687 | | | $ | 37,953,739 | |
| | | | | | | | |
| * | Commencement of offering was February 3, 2012. |
| | | | |
| Prudential Global Total Return Fund, Inc. | | | 85 | |
Notes to Financial Statements
continued
Note 7. Borrowings
The Fund, along with other affiliated registered investment companies (the “Funds”), is a party to a Syndicated Credit Agreement (“SCA”) with a group of banks. The purpose of the SCA is to provide an alternative source of temporary funding for capital share redemptions. The SCA provides for a commitment of $900 million for the period November 15, 2012 through November 4, 2013. The Funds pay an annualized commitment fee of 0.08% on the unused portion of the SCA. Prior to November 15, 2012, the Funds had another SCA with substantially similar terms. Interest on any borrowings under the SCA is paid at contracted market rates. The commitment fee for the unused amount is accrued daily and paid quarterly.
Subsequent to the fiscal year end, the SCA has been renewed effective November 5, 2013 at substantially similar terms through November 4, 2014.
The Fund utilized the SCA during the year ended October 31, 2013. The average daily balance for the 70 days that the Fund had loans outstanding during the period was approximately $1,547,000, borrowed at a weighted average interest rate of 1.44%. At October 31, 2013, the Fund did not have an outstanding loan amount.
Note 8. New Accounting Pronouncement
In January 2013, the Financial Accounting Standards Board (“FASB”) issued Accounting Standards Update (“ASU”) No. 2013-01 “Clarifying the Scope of Disclosures about Offsetting Assets and Liabilities” which replaced ASU No. 2011-11 “Disclosures about Offsetting Assets and Liabilities”. The updates create new disclosure requirements requiring entities to disclose both gross and net information for derivatives and other financial instruments that are either offset in the Statement of Assets and Liabilities or subject to an enforceable master netting arrangement or similar agreement. The disclosure requirements are effective for annual reporting periods beginning on or after January 1, 2013 and interim periods within those annual periods. Management is currently evaluating the application of ASU No. 2013-01 and its impact, if any, on the Fund’s financial statements.
Financial Highlights
| | | | | | | | | | | | | | | | | | | | |
| Class A Shares | |
| | | Year Ended October 31, | |
| | | 2013 | | | 2012 | | | 2011 | | | 2010 | | | 2009 | |
| Per Share Operating Performance(a): | | | | | | | | | | | | | | | | | | | | |
| Net Asset Value, Beginning Of Year | | | $7.21 | | | | $6.99 | | | | $7.42 | | | | $7.20 | | | | $5.76 | |
| Income (loss) from investment operations: | | | | | | | | | | | | | | | | | | | | |
| Net investment income | | | .21 | | | | .22 | | | | .23 | | | | .27 | | | | .30 | |
| Net realized and unrealized gain (loss) on investment and foreign currency transactions | | | (.21 | ) | | | .31 | | | | .05 | | | | .66 | | | | 1.46 | |
| Total from investment operations | | | - | (e) | | | .53 | | | | .28 | | | | .93 | | | | 1.76 | |
| Less Dividends and Distributions: | | | | | | | | | | | | | | | | | | | | |
| Dividends from net investment income* | | | (.18 | ) | | | (.28 | ) | | | (.71 | ) | | | (.71 | ) | | | (.32 | ) |
| Tax return of capital distributions | | | (.11 | ) | | | (.03 | ) | | | - | | | | - | | | | - | |
| Total dividends and distributions | | | (.29 | ) | | | (.31 | ) | | | (.71 | ) | | | (.71 | ) | | | (.32 | ) |
| Net asset value, end of year | | | $6.92 | | | | $7.21 | | | | $6.99 | | | | $7.42 | | | | $7.20 | |
| Total Return(b): | | | .07% | | | | 7.86% | | | | 4.60% | | | | 14.25% | | | | 31.42% | |
| |
| Ratios/Supplemental Data: | |
| Net assets, end of year (000) | | | $161,099 | | | | $176,970 | | | | $154,056 | | | | $123,507 | | | | $114,554 | |
| Average net assets (000) | | | $180,342 | | | | $162,268 | | | | $125,292 | | | | $112,110 | | | | $103,462 | |
| Ratios to average net assets(c)(d): | | | | | | | | | | | | | | | | | | | | |
| Expenses after waivers and/or expense reimbursement | | | 1.23% | | | | 1.31% | | | | 1.35% | | | | 1.35% | | | | 1.35% | |
| Expenses before waivers and/or expense reimbursement | | | 1.28% | | | | 1.36% | | | | 1.44% | | | | 1.47% | | | | 1.56% | |
| Net investment income | | | 2.99% | | | | 3.17% | | | | 3.28% | | | | 3.97% | | | | 4.78% | |
| Portfolio turnover rate | | | 79% | | | | 97% | | | | 203% | | | | 117% | | | | 164% | |
(a) Calculated based on average shares outstanding during the year.
(b) Total return does not consider the effects of sales loads. Total return is calculated assuming a purchase of a share on the first day and a sale on the last day of each year reported, and includes reinvestment of dividends and distributions. Total returns may reflect adjustments to conform to generally accepted accounting principles.
(c) Does not include expenses of the underlying portfolios in which the Fund invests.
(d) The distributor of the Fund has contractually agreed to limit its distribution and service (12b-1) fees to .25% of the average daily net assets of the Class A shares through February 28, 2015.
(e) Less than $.005 per share.
* Dividends from net investment income include other items that are ordinary income for tax purposes.
See Notes to Financial Statements.
| | | | |
| Prudential Global Total Return Fund, Inc. | | | 87 | |
Financial Highlights
continued
| | | | | | | | | | | | | | | | | | | | |
| Class B Shares | | | | | | | | | | | | | | | |
| | | Year Ended October 31, | |
| | | 2013 | | | 2012 | | | 2011 | | | 2010 | | | 2009 | |
| Per Share Operating Performance(a): | | | | | | | | | | | | | | | | | | | | |
| Net Asset Value, Beginning Of Year | | | $7.21 | | | | $6.99 | | | | $7.41 | | | | $7.19 | | | | $5.76 | |
| Income (loss) from investment operations: | | | | | | | | | | | | | | | | | | | | |
| Net investment income | | | .16 | | | | .17 | | | | .17 | | | | .22 | | | | .25 | |
| Net realized and unrealized gain (loss) on investment and foreign currency transactions | | | (.21 | ) | | | .30 | | | | .06 | | | | .66 | | | | 1.45 | |
| Total from investment operations | | | (.05 | ) | | | .47 | | | | .23 | | | | .88 | | | | 1.70 | |
| Less Dividends and Distributions: | | | | | | | | | | | | | | | | | | | | |
| Dividends from net investment income* | | | (.13 | ) | | | (.22 | ) | | | (.65 | ) | | | (.66 | ) | | | (.27 | ) |
| Tax return of capital distributions | | | (.11 | ) | | | (.03 | ) | | | - | | | | - | | | | - | |
| Total dividends and distributions | | | (.24 | ) | | | (.25 | ) | | | (.65 | ) | | | (.66 | ) | | | (.27 | ) |
| Net asset value, end of year | | | $6.92 | | | | $7.21 | | | | $6.99 | | | | $7.41 | | | | $7.19 | |
| Total Return(b): | | | (.68)% | | | | 7.06% | | | | 3.86% | | | | 13.40% | | | | 30.25% | |
| |
| Ratios/Supplemental Data: | | | | | | | | | | | | | | | |
| Net assets, end of year (000) | | | $7,084 | | | | $6,748 | | | | $5,018 | | | | $3,312 | | | | $2,920 | |
| Average net assets (000) | | | $7,299 | | | | $5,744 | | | | $3,465 | | | | $3,082 | | | | $2,927 | |
| Ratios to average net assets(c): | | | | | | | | | | | | | | | | | | | | |
| Expenses after waivers and/or expense reimbursement | | | 1.98% | | | | 2.06% | | | | 2.10% | | | | 2.10% | | | | 2.10% | |
| Expenses before waivers and/or expense reimbursement | | | 1.98% | | | | 2.06% | | | | 2.14% | | | | 2.17% | | | | 2.26% | |
| Net investment income | | | 2.25% | | | | 2.40% | | | | 2.52% | | | | 3.23% | | | | 4.03% | |
| Portfolio turnover rate | | | 79% | | | | 97% | | | | 203% | | | | 117% | | | | 164% | |
(a) Calculated based on average shares outstanding during the year.
(b) Total return does not consider the effects of sales loads. Total return is calculated assuming a purchase of a share on the first day and a sale on the last day of each year reported, and includes reinvestment of dividends and distributions. Total returns may reflect adjustments to conform to generally accepted accounting principles.
(c) Does not include expenses of the underlying portfolios in which the Fund invests.
* Dividends from net investment income include other items that are ordinary income for tax purposes.
See Notes to Financial Statements.
| | | | | | | | | | | | | | | | | | | | |
| Class C Shares | |
| | | Year Ended October 31, | |
| | | 2013 | | | 2012 | | | 2011 | | | 2010 | | | 2009 | |
| Per Share Operating Performance(a): | | | | | | | | | | | | | | | | | | | | |
| Net Asset Value, Beginning Of Year | | | $7.19 | | | | $6.97 | | | | $7.39 | | | | $7.17 | | | | $5.74 | |
| Income (loss) from investment operations: | | | | | | | | | | | | | | | | | | | | |
| Net investment income | | | .16 | | | | .17 | | | | .17 | | | | .23 | | | | .27 | |
| Net realized and unrealized gain (loss) on investment and foreign currency transactions | | | (.21 | ) | | | .31 | | | | .07 | | | | .67 | | | | 1.45 | |
| Total from investment operations | | | (.05 | ) | | | .48 | | | | .24 | | | | .90 | | | | 1.72 | |
| Less Dividends and Distributions: | | | | | | | | | | | | | | | | | | | | |
| Dividends from net investment income* | | | (.13 | ) | | | (.23 | ) | | | (.66 | ) | | | (.68 | ) | | | (.29 | ) |
| Tax return of capital distributions | | | (.11 | ) | | | (.03 | ) | | | - | | | | - | | | | - | |
| Total dividends and distributions | | | (.24 | ) | | | (.26 | ) | | | (.66 | ) | | | (.68 | ) | | | (.29 | ) |
| Net asset value, end of year | | | $6.90 | | | | $7.19 | | | | $6.97 | | | | $7.39 | | | | $7.17 | |
| Total Return(b): | | | (.68)% | | | | 7.08% | | | | 4.00% | | | | 13.75% | | | | 30.73% | |
| |
| Ratios/Supplemental Data: | |
| Net assets, end of year (000) | | | $31,424 | | | | $33,988 | | | | $19,408 | | | | $6,180 | | | | $4,236 | |
| Average net assets (000) | | | $36,071 | | | | $27,739 | | | | $10,010 | | | | $4,563 | | | | $3,467 | |
| Ratios to average net assets(c)(d): | | | | | | | | | | | | | | | | | | | | |
| Expenses after waivers and/or expense reimbursement | | | 1.98% | | | | 2.06% | | | | 2.05% | | | | 1.85% | | | | 1.85% | |
| Expenses before waivers and/or expense reimbursement | | | 1.98% | | | | 2.06% | | | | 2.14% | | | | 2.17% | | | | 2.26% | |
| Net investment income | | | 2.24% | | | | 2.39% | | | | 2.56% | | | | 3.45% | | | | 4.28% | |
| Portfolio turnover rate | | | 79% | | | | 97% | | | | 203% | | | | 117% | | | | 164% | |
(a) Calculated based on average shares outstanding during the year.
(b) Total return does not consider the effects of sales loads. Total return is calculated assuming a purchase of a share on the first day and a sale on the last day of each year reported, and includes reinvestment of dividends and distributions. Total returns may reflect adjustments to conform to generally accepted accounting principles.
(c) Does not include expenses of the underlying portfolios in which the Fund invests.
(d) The distributor of the Fund had contractually agreed to limit its distribution and service (12b-1) fees to .75% of the average daily net assets of the Class C shares through February 28, 2011.
* Dividends from net investment income include other items that are ordinary income for tax purposes.
See Notes to Financial Statements.
| | | | |
| Prudential Global Total Return Fund, Inc. | | | 89 | |
Financial Highlights
continued
| | | | | | | | | | |
| Class Q Shares | |
| | | Year Ended
October 31, | | | | | February 3,
2012(d)
through
October 31, | |
| | | 2013 | | | | | 2012 | |
| Per Share Operating Performance(a): | | | | | | | | | | |
| Net Asset Value, Beginning Of Period | | | $7.23 | | | | | | $6.97 | |
| Income from investment operations: | | | | | | | | | | |
| Net investment income | | | .24 | | | | | | .18 | |
| Net realized and unrealized gain (loss) on investment and foreign currency transactions | | | (.21 | ) | | | | | .28 | |
| Total from investment operations | | | .03 | | | | | | .46 | |
| Less Dividends and Distributions: | | | | | | | | | | |
| Dividends from net investment income | | | (.21 | ) | | | | | (.19 | ) |
| Tax return of capital distributions | | | (.11 | ) | | | | | (.01 | ) |
| Total dividends and distributions | | | (.32 | ) | | | | | (.20 | ) |
| Net asset value, end of period | | | $6.94 | | | | | | $7.23 | |
| Total Return(b): | | | .46% | | | | | | 6.81% | |
| |
| Ratios/Supplemental Data: | | | | | | | | |
| Net assets, end of period (000) | | | $62 | | | | | | $11 | |
| Average net assets (000) | | | $13 | | | | | | $10 | |
| Ratios to average net assets(c): | | | | | | | | | | |
| Expenses | | | .85% | | | | | | .92% | (e) |
| Net investment income | | | 3.48% | | | | | | 3.42% | (e) |
| Portfolio turnover rate | | | 79% | | | | | | 97% | (f) |
(a) Calculated based on average shares outstanding during the period.
(b) Total return is calculated assuming a purchase of a share on the first day and a sale on the last day of each period reported, and includes reinvestment of dividends and distributions. Total returns may reflect adjustments to conform to generally accepted accounting principles. Total returns for periods less than one full year are not annualized.
(c) Does not include expenses of the underlying portfolios in which the Fund invests.
(d) Commencement of offering.
(e) Annualized.
(f) Not annualized.
See Notes to Financial Statements.
| | | | | | | | | | | | | | | | | | | | |
| Class Z Shares | | | | |
| | | Year Ended October 31, | |
| | | 2013 | | | 2012 | | | 2011 | | | 2010 | | | 2009 | |
| Per Share Operating Performance(a): | | | | | | | | | | | | | | | | | | | | |
| Net Asset Value, Beginning Of Year | | | $7.23 | | | | $7.01 | | | | $7.44 | | | | $7.22 | | | | $5.78 | |
| Income (loss) from investment operations: | | | | | | | | | | | | | | | | | | | | |
| Net investment income | | | .22 | | | | .23 | | | | .22 | | | | .28 | | | | .32 | |
| Net realized and unrealized gain (loss) on investment and foreign currency transactions | | | (.20 | ) | | | .31 | | | | .08 | | | | .67 | | | | 1.45 | |
| Total from investment operations | | | .02 | | | | .54 | | | | .30 | | | | .95 | | | | 1.77 | |
| Less Dividends and Distributions: | | | | | | | | | | | | | | | | | | | | |
| Dividends from net investment income* | | | (.20 | ) | | | (.29 | ) | | | (.73 | ) | | | (.73 | ) | | | (.33 | ) |
| Tax return of capital distributions | | | (.11 | ) | | | (.03 | ) | | | - | | | | - | | | | - | |
| Total dividends and distributions | | | (.31 | ) | | | (.32 | ) | | | (.73 | ) | | | (.73 | ) | | | (.33 | ) |
| Net asset value, end of year | | | $6.94 | | | | $7.23 | | | | $7.01 | | | | $7.44 | | | | $7.22 | |
| Total Return(b): | | | .31% | | | | 8.10% | | | | 4.87% | | | | 14.49% | | | | 31.62% | |
| |
| Ratios/Supplemental Data: | | | | | | | | | | | | | | | |
| Net assets, end of year (000) | | | $56,817 | | | | $83,077 | | | | $42,330 | | | | $4,978 | | | | $3,141 | |
| Average net assets (000) | | | $81,390 | | | | $58,999 | | | | $12,813 | | | | $3,507 | | | | $1,942 | |
| Ratios to average net assets(c): | | | | | | | | | | | | | | | | | | | | |
| Expenses after waivers and/or expense reimbursement | | | .98% | | | | 1.06% | | | | 1.10% | | | | 1.10% | | | | 1.10% | |
| Expenses before waivers and/or expense reimbursement | | | .98% | | | | 1.06% | | | | 1.14% | | | | 1.17% | | | | 1.26% | |
| Net investment income | | | 3.18% | | | | 3.37% | | | | 3.50% | | | | 4.25% | | | | 5.03% | |
| Portfolio turnover rate | | | 79% | | | | 97% | | | | 203% | | | | 117% | | | | 164% | |
(a) Calculated based on average shares outstanding during the year.
(b) Total return is calculated assuming a purchase of a share on the first day and a sale on the last day of each year reported, and includes reinvestment of dividends and distributions. Total returns may reflect adjustments to conform to generally accepted accounting principles.
(c) Does not include expenses of the underlying portfolios in which the Fund invests.
* Dividends from net investment income include other items that are ordinary income for tax purposes.
See Notes to Financial Statements.
| | | | |
| Prudential Global Total Return Fund, Inc. | | | 91 | |
Report of Independent Registered Public
Accounting Firm
The Board of Directors and Shareholders
Prudential Global Total Return Fund, Inc.:
We have audited the accompanying statement of assets and liabilities of Prudential Global Total Return Fund, Inc. (hereafter referred to as the “Fund”), including the portfolio of investments, as of October 31, 2013 and the related statement of operations for the year then ended, the statements of changes in net assets for each of the years in the two-year period then ended and the financial highlights for each of the years in the five-year period then ended. These financial statements and financial highlights are the responsibility of the Fund’s management. Our responsibility is to express an opinion on these financial statements and financial highlights based on our audits.
We conducted our audits in accordance with the standards of the Public Company Accounting Oversight Board (United States). Those standards require that we plan and perform the audit to obtain reasonable assurance about whether the financial statements and financial highlights are free of material misstatement. An audit includes examining, on a test basis, evidence supporting the amounts and disclosures in the financial statements. Our procedures included confirmation of securities owned as of October 31, 2013, by correspondence with the custodian, transfer agent and brokers or by other appropriate auditing procedures when replies from brokers were not received. An audit also includes assessing the accounting principles used and significant estimates made by management, as well as evaluating the overall financial statement presentation. We believe that our audits provide a reasonable basis for our opinion.
In our opinion, the financial statements and financial highlights referred to above present fairly, in all material respects, the financial position of the Fund as of October 31, 2013, and the results of its operations for the year then ended, the changes in its net assets for each of the years in the two-year period then ended and the financial highlights for each of the years in the five-year period then ended, in conformity with U.S. generally accepted accounting principles.

New York, New York
December 23, 2013
Federal Income Tax Information
(Unaudited)
For the year ended October 31, 2013, the Fund reports the maximum amount allowable but not less than 43.96% as interest related dividends in accordance with Sections 871(k)(1) and 881(e)(1) of the Internal Revenue Code.
In January 2014, you will be advised on IRS Form 1099-DIV or substitute 1099-DIV as to the federal tax status of distributions received by you in calendar year 2013.
| | | | |
| Prudential Global Total Return Fund, Inc. | | | 93 | |
INFORMATION ABOUT BOARD MEMBERS AND OFFICERS
(Unaudited)
Information about Board Members and Officers of the Fund is set forth below. Board Members who are not deemed to be “interested persons” of the Fund, as defined in the 1940 Act, are referred to as “Independent Board Members.” Board Members who are deemed to be “interested persons” of the Fund are referred to as “Interested Board Members.” The Board Members are responsible for the overall supervision of the operations of the Fund and perform the various duties imposed on the directors of investment companies by the 1940 Act. The Board in turn elects the Officers, who are responsible for administering the day-to-day operations of the Fund.
| | | | |
| Independent Board Members(1) |
Name, Address, Age Position(s) Portfolios Overseen | | Principal Occupation(s) During Past Five Years | | Other Directorships Held |
Ellen S. Alberding (55) Board Member Portfolios Overseen: 64 | | President and Board Member, The Joyce Foundation (charitable foundation) (since 2002); Vice Chair, City Colleges of Chicago (community college system) (since 2011); Trustee, Skills for America’s Future (national initiative to connect employers to community colleges) (since 2011); Trustee, National Park Foundation (charitable foundation for national park system) (since 2009); Trustee, Economic Club of Chicago (since 2009). | | None. |
Kevin J. Bannon (61) Board Member Portfolios Overseen: 64 | | Managing Director (since April 2008) and Chief Investment Officer (since October 2008) of Highmount Capital LLC (registered investment adviser); formerly Executive Vice President and Chief Investment Officer (April 1993-August 2007) of Bank of New York Company; President (May 2003-May 2007) of BNY Hamilton Family of Mutual Funds. | | Director of Urstadt Biddle Properties (since September 2008). |
Linda W. Bynoe (61) Board Member Portfolios Overseen: 64 | | President and Chief Executive Officer (since March 1995) and formerly Chief Operating Officer (December 1989-February 1995) of Telemat Ltd. (management consulting); formerly Vice President (January 1985-June 1989) at Morgan Stanley & Co (broker-dealer). | | Director of Simon Property Group, Inc. (retail real estate) (May 2003-May 2012); Director of Anixter International, Inc. (communication products distributor) (since January 2006); Director of Northern Trust Corporation (financial services) (since April 2006); Trustee of Equity Residential (residential real estate) (since December 2009). |
Prudential Global Total Return Fund, Inc.
| | | | |
| Independent Board Members(1) |
Name, Address, Age Position(s) Portfolios Overseen | | Principal Occupation(s) During Past Five Years | | Other Directorships Held |
Keith F. Hartstein (57) Board Member Portfolios Overseen: 64 | | Formerly President and Chief Executive Officer (2005-2012), Senior Vice President (2004-2005), Senior Vice President of Sales and Marketing (1997-2004), and various executive management positions (1990-1997), John Hancock Funds, LLC (asset management); Chairman, Investment Company Institute’s Sales Force Marketing Committee (2003-2008). | | None. |
Michael S. Hyland, CFA (68) Board Member Portfolios Overseen: 64 | | Independent Consultant (since February 2005); formerly Senior Managing Director (July 2001-February 2005) of Bear Stearns & Co, Inc.; Global Partner, INVESCO (1999-2001); Managing Director and President of Salomon Brothers Asset Management (1989-1999). | | None. |
Douglas H. McCorkindale (74) Board Member Portfolios Overseen: 64 | | Formerly Chairman (February 2001-June 2006), Chief Executive Officer (June 2000-July 2005), President (September 1997-July 2005) and Vice Chairman (March 1984-May 2000) of Gannett Co. Inc. (publishing and media). | | Director of Lockheed Martin Corp. (aerospace and defense) (since May 2001). |
Stephen P. Munn (71) Board Member Portfolios Overseen: 64 | | Lead Director (since 2007) and formerly Chairman (1993-2007) of Carlisle Companies Incorporated (manufacturer of industrial products). | | Lead Director (since 2007) of Carlisle Companies Incorporated (manufacturer of industrial products). |
James E. Quinn (61) Board Member Portfolios Overseen: 64 | | Formerly President (2003-2012) and Director (2003-2008), and Vice Chairman and Director (1998-2003), Tiffany & Company (jewelry retailing); Director, Mutual of America Capital Management Corporation (asset management) (since 1996); Director, Hofstra University (since 2008); Vice Chairman, Museum of the City of New York (since 1984). | | Director of Deckers Outdoor Corporation (footwear manufacturer) (since 2011). |
Richard A. Redeker (70) Board Member & Independent Chair Portfolios Overseen: 64 | | Retired Mutual Fund Senior Executive (44 years); Management Consultant; Independent Directors Council (organization of 2,800 Independent Mutual Fund Directors)-Executive Committee, Chair of Policy Steering Committee, Governing Council. | | None. |
Visit our website at www.prudentialfunds.com
| | | | |
| Independent Board Members(1) |
Name, Address, Age Position(s) Portfolios Overseen | | Principal Occupation(s) During Past Five Years | | Other Directorships Held |
Robin B. Smith (74) Board Member Portfolios Overseen: 64 | | Chairman of the Board (since January 2003) of Publishers Clearing House (direct marketing); Member of the Board of Directors of ADLPartner (marketing) (since December 2010); formerly Chairman and Chief Executive Officer (August 1996-January 2003) of Publishers Clearing House. | | Formerly Director of BellSouth Corporation (telecommunications) (1992-2006). |
Stephen G. Stoneburn (70) Board Member Portfolios Overseen: 64 | | Chairman, (since July 2011), President and Chief Executive Officer (since June 1996) of Quadrant Media Corp. (publishing company); formerly President (June 1995-June 1996) of Argus Integrated Media, Inc.; Senior Vice President and Managing Director (January 1993-1995) of Cowles Business Media; Senior Vice President of Fairchild Publications, Inc. (1975-1989). | | None. |
| | | | |
| Interested Board Members(1) |
Name, Address, Age Position(s) Portfolios Overseen | | Principal Occupation(s) During Past Five Years | | Other Directorships Held |
Stuart S. Parker (51) Board Member & President Portfolios Overseen: 59 | | President of Prudential Investments LLC (since January 2012); Executive Vice President of Prudential Investment Management Services LLC (since December 2012); Executive Vice President of Jennison Associates LLC and Head of Retail Distribution of Prudential Investments LLC (June 2005 - December 2011). | | None. |
Scott E. Benjamin (40) Board Member & Vice President Portfolios Overseen: 64 | | Executive Vice President (since June 2009) of Prudential Investments LLC; Executive Vice President (June 2009-June 2012) and Vice President (since June 2012) of Prudential Investment Management Services LLC; Executive Vice President (since September 2009) of AST Investment Services, Inc.; Senior Vice President of Product Development and Marketing, Prudential Investments (since February 2006); Vice President of Product Development and Product Management, Prudential Investments (2003-2006). | | None. |
Prudential Global Total Return Fund, Inc.
| (1) | The year that each Board Member joined the Fund’s Board is as follows: |
Ellen S. Alberding, 2013; Kevin J. Bannon, 2008; Linda W. Bynoe, 2005; Keith F. Hartstein, 2013; Michael S. Hyland, 2008; 2003; Douglas H. McCorkindale, 1996; Stephen P. Munn, 2008; James E. Quinn, 2013; Richard A. Redeker, 1993; Robin B. Smith, 1996; Stephen G. Stoneburn, 2003; Stuart S. Parker, Board Member since 2012 and President since 2012; Scott E. Benjamin, Board Member since 2010 and Vice President since 2009.
| | | | |
| Fund Officers(a) |
Name, Address and Age Position with Fund | | Principal Occupation(s) During Past Five Years | | Length of Service as Fund Officer |
Raymond A. O’Hara (58) Chief Legal Officer | | Vice President and Corporate Counsel (since July 2010) of Prudential Insurance Company of America (Prudential); Vice President (March 2011-Present) of Pruco Life Insurance Company and Pruco Life Insurance Company of New Jersey; Vice President and Corporate Counsel (March 2011-Present) of Prudential Annuities Life Assurance Corporation; Chief Legal Officer of Prudential Investments LLC (since June 2012); Chief Legal Officer of Prudential Mutual Fund Services LLC (since June 2012) and Corporate Counsel of AST Investment Services, Inc. (since June 2012); formerly Assistant Vice President and Corporate Counsel (September 2008-July 2010) of The Hartford Financial Services Group, Inc.; formerly Associate (September 1980-December 1987) and Partner (January 1988–August 2008) of Blazzard & Hasenauer, P.C. (formerly, Blazzard, Grodd & Hasenauer, P.C.). | | Since 2012 |
Deborah A. Docs (55) Secretary | | Vice President and Corporate Counsel (since January 2001) of Prudential; Vice President (since December 1996) and Assistant Secretary (since March 1999) of Prudential Investments LLC; formerly Vice President and Assistant Secretary (May 2003-June 2005) of AST Investment Services, Inc. | | Since 2004 |
Jonathan D. Shain (55) Assistant Secretary | | Vice President and Corporate Counsel (since August 1998) of Prudential; Vice President and Assistant Secretary (since May 2001) of Prudential Investments LLC; Vice President and Assistant Secretary (since February 2001) of Prudential Mutual Fund Services LLC; formerly Vice President and Assistant Secretary (May 2003-June 2005) of AST Investment Services, Inc. | | Since 2005 |
Claudia DiGiacomo (39) Assistant Secretary | | Vice President and Corporate Counsel (since January 2005) of Prudential; Vice President and Assistant Secretary of Prudential Investments LLC (since December 2005); Associate at Sidley Austin Brown & Wood LLP (1999-2004). | | Since 2005 |
Andrew R. French (51) Assistant Secretary | | Vice President and Corporate Counsel (since February 2010) of Prudential; formerly Director and Corporate Counsel (2006-2010) of Prudential; Vice President and Assistant Secretary (since January 2007) of Prudential Investments LLC; Vice President and Assistant Secretary (since January 2007) of Prudential Mutual Fund Services LLC. | | Since 2006 |
Visit our website at www.prudentialfunds.com
| | | | |
| Fund Officers(a) |
Name, Address and Age Position with Fund | | Principal Occupation(s) During Past Five Years | | Length of Service as Fund Officer |
Amanda S. Ryan (35) Assistant Secretary | | Director and Corporate Counsel (since March 2012) of Prudential; Director and Assistant Secretary (since June 2012) of Prudential Investments LLC; Associate at Ropes & Gray LLP (2008-2012). | | Since 2012 |
Bruce Karpati (43) Chief Compliance Officer | | Chief Compliance Officer of the Prudential Investments Funds, Target Funds, Advanced Series Trust, the Prudential Series Fund and Prudential’s Gibraltar Fund, Inc. (May 2013 - Present); formerly National Chief (May 2012 - May 2013) and Co-Chief (January 2010 - May 2012) of the Asset Management Unit, Division of Enforcement, of the U.S. Securities and Exchange Commission; Assistant Regional Director (January 2005 - January 2010) of the U.S. Securities and Exchange Commission. | | Since 2013 |
Theresa C. Thompson (51) Deputy Chief Compliance Officer | | Vice President, Compliance, Prudential Investments LLC (since April 2004); and Director, Compliance, Prudential Investments LLC (2001-2004). | | Since 2008 |
Richard W. Kinville (45) Anti-Money Laundering Compliance Officer | | Vice President, Corporate Compliance, Anti-Money Laundering Unit (since January 2005) of Prudential; committee member of the American Council of Life Insurers Anti-Money Laundering and Critical Infrastructure Committee (since January 2007); formerly Investigator and Supervisor in the Special Investigations Unit for the New York Central Mutual Fire Insurance Company (August 1994-January 1999); Investigator in AXA Financial’s Internal Audit Department and Manager in AXA’s Anti-Money Laundering Office (January 1999-January 2005); first chair of the American Council of Life Insurers Anti-Money Laundering and Critical Infrastructure Committee (June 2007-December 2009). | | Since 2011 |
Grace C. Torres (54) Treasurer and Principal Financial and Accounting Officer | | Assistant Treasurer (since March 1999) and Senior Vice President (since September 1999) of Prudential Investments LLC; Assistant Treasurer (since May 2003) and Vice President (since June 2005) of AST Investment Services, Inc.; Senior Vice President and Assistant Treasurer (since May 2003) of Prudential Annuities Advisory Services, Inc.; formerly Senior Vice President (May 2003-June 2005) of AST Investment Services, Inc. | | Since 1998 |
M. Sadiq Peshimam (49) Assistant Treasurer | | Vice President (since 2005) of Prudential Investments LLC. | | Since 2006 |
Peter Parrella (55) Assistant Treasurer | | Vice President (since 2007) and Director (2004-2007) within Prudential Mutual Fund Administration; formerly Tax Manager at SSB Citi Fund Management LLC (1997-2004). | | Since 2007 |
| (a) | Excludes Mr. Parker and Mr. Benjamin, interested Board Members who also serve as President and Vice President, respectively. |
Prudential Global Total Return Fund, Inc.
Explanatory Notes to Tables:
| • | | Board Members are deemed to be “Interested,” as defined in the 1940 Act, by reason of their affiliation with Prudential Investments LLC and/or an affiliate of Prudential Investments LLC. |
| • | | Unless otherwise noted, the address of all Board Members and Officers is c/o Prudential Investments LLC, Gateway Center Three, 100 Mulberry Street, Newark, New Jersey 07102-4077. |
| • | | There is no set term of office for Board Members or Officers. The Board Members have adopted a retirement policy, which calls for the retirement of Board Members on December 31 of the year in which they reach the age of 75. |
| • | | “Other Directorships Held” includes only directorships of companies required to register or file reports with the SEC under the 1934 Act (that is, “public companies”) or other investment companies registered under the 1940 Act. |
| • | | “Portfolios Overseen” includes all investment companies managed by Prudential Investments LLC. The investment companies for which Prudential Investments LLC serves as manager include the Prudential Investments Mutual Funds, The Prudential Variable Contract Accounts, Target Mutual Funds, Prudential Short Duration High Yield Fund, Inc., Prudential Global Short Duration High Yield Fund, Inc., The Prudential Series Fund, Prudential’s Gibraltar Fund, Inc. and the Advanced Series Trust. |
Visit our website at www.prudentialfunds.com
Approval of Advisory Agreements
The Fund’s Board of Directors
The Board of Directors (the “Board”) of Prudential Global Total Return Fund, Inc. (the “Fund”) consists of ten individuals, eight of whom are not “interested persons” of the Fund, as defined in the Investment Company Act of 1940, as amended (the “1940 Act”) (the “Independent Directors”).1 The Board is responsible for the oversight of the Fund and its operations, and performs the various duties imposed on the directors of investment companies by the 1940 Act. The Independent Directors have retained independent legal counsel to assist them in connection with their duties. The Chair of the Board is an Independent Director. The Board has established three standing committees: the Audit Committee, the Nominating and Governance Committee, and the Investment Committee. Each committee is chaired by, and composed of, Independent Directors.
Annual Approval of the Fund’s Advisory Agreements
As required under the 1940 Act, the Board determines annually whether to renew the Fund’s management agreement with Prudential Investments LLC (“PI”) and the Fund’s subadvisory agreement with Prudential Investment Management, Inc. (“PIM”). In considering the renewal of the agreements, the Board, including all of the Independent Directors, met on June 4-6, 2013 and approved the renewal of the agreements through July 31, 2014, after concluding that the renewal of the agreements was in the best interests of the Fund and its shareholders.
In advance of the meetings, the Board requested and received materials relating to the agreements, and had the opportunity to ask questions and request further information in connection with its consideration. Among other things, the Board considered comparative fee information from PI and PIM. Also, the Board considered comparisons with other mutual funds in relevant Peer Universes and Peer Groups, as is further discussed below.
In approving the agreements, the Board, including the Independent Directors advised by independent legal counsel, considered the factors it deemed relevant, including the nature, quality and extent of services provided by PI and the subadviser, the performance of the Fund, the profitability of PI and its affiliates, expenses and fees, and the potential for economies of scale that may be shared with the Fund and its shareholders as the Fund’s assets grow. In their deliberations, the Directors did not identify any single factor which alone was responsible for the Board’s decision to approve the agreements with respect to the Fund. In connection with its deliberations, the Board considered information provided by PI throughout the year at regular Board
| 1 | Ms. Alberding and Messrs. Hartstein and Quinn were elected to the Board effective September 1, 2013. |
Prudential Global Total Return Fund, Inc.
Approval of Advisory Agreements (continued)
meetings, presentations from portfolio managers and other information, as well as information furnished at or in advance of the meetings on June 4-6, 2013.
The Directors determined that the overall arrangements between the Fund and PI, which serves as the Fund’s investment manager pursuant to a management agreement, and between PI and PIM, which serves as the Fund’s subadviser pursuant to the terms of a subadvisory agreement with PI, are in the best interests of the Fund and its shareholders in light of the services performed, fees charged and such other matters as the Directors considered relevant in the exercise of their business judgment.
The material factors and conclusions that formed the basis for the Directors’ reaching their determinations to approve the continuance of the agreements are separately discussed below.
Nature, Quality and Extent of Services
The Board received and considered information regarding the nature, quality and extent of services provided to the Fund by PI and PIM. The Board considered the services provided by PI, including but not limited to the oversight of the subadviser for the Fund, as well as the provision of fund recordkeeping, compliance, and other services to the Fund. With respect to PI’s oversight of the subadviser, the Board noted that PI’s Strategic Investment Research Group (“SIRG”), which is a business unit of PI, is responsible for monitoring and reporting to PI’s senior management on the performance and operations of the subadviser. The Board also considered that PI pays the salaries of all of the officers and non-independent Directors of the Fund. The Board also considered the investment subadvisory services provided by PIM, as well as adherence to the Fund’s investment restrictions and compliance with applicable Fund policies and procedures. The Board considered PI’s evaluation of the subadviser, as well as PI’s recommendation, based on its review of the subadviser, to renew the subadvisory agreement.
The Board considered the qualifications, backgrounds and responsibilities of PI’s senior management responsible for the oversight of the Fund and PIM, and also considered the qualifications, backgrounds and responsibilities of PIM’s portfolio managers who are responsible for the day-to-day management of the Fund’s portfolio. The Board was provided with information pertaining to PI’s and PIM’s organizational structure, senior management, investment operations, and other relevant information pertaining to both PI and PIM. The Board also noted that it received favorable compliance reports from the Fund’s Chief Compliance Officer (“CCO”) as to both PI and PIM. The Board noted that PIM is affiliated with PI.
Visit our website at www.prudentialfunds.com
The Board concluded that it was satisfied with the nature, extent and quality of the investment management services provided by PI and the subadvisory services provided to the Fund by PIM, and that there was a reasonable basis on which to conclude that the Fund benefits from the services provided by PI and PIM under the management and subadvisory agreements.
Costs of Services and Profits Realized by PI
The Board was provided with information on the profitability of PI and its affiliates in serving as the Fund’s investment manager. The Board discussed with PI the methodology utilized in assembling the information regarding profitability and considered its reasonableness. The Board recognized that it is difficult to make comparisons of profitability from fund management contracts because comparative information is not generally publicly available and is affected by numerous factors, including the structure of the particular adviser, the types of funds it manages, its business mix, numerous assumptions regarding allocations and the adviser’s capital structure and cost of capital. The Board separately considered information regarding the profitability of the subadviser, an affiliate of PI. Taking these factors into account, the Board concluded that the profitability of PI and its affiliates in relation to the services rendered was not unreasonable.
Economies of Scale
The Board noted that the management fee schedule for the Fund includes breakpoints, which have the effect of decreasing the fee rate as assets increase, but at the current level of assets, the Fund does not realize the effect of those rate reductions. The Board received and discussed information concerning whether PI realizes economies of scale as the Fund’s assets grow beyond current levels. The Board took note that the Fund’s fee structure would result in benefits to Fund shareholders when (and if) assets reach the levels at which the fee rate is reduced. These benefits will accrue whether or not PI is then realizing any economies of scale. The Board recognized the inherent limitations of any analysis of economies of scale, stemming largely from the Board’s understanding that most of PI’s costs are not specific to any individual funds, but rather are incurred across a variety of products and services.
Other Benefits to PI and PIM
The Board considered potential ancillary benefits that might be received by PI and PIM and their affiliates as a result of their relationship with the Fund. The Board concluded that potential benefits to be derived by PI included fees received by affiliates of PI for serving as the Fund’s securities lending agent, transfer agency fees received by the Fund’s transfer agent (which is affiliated with PI), as well as benefits to
Prudential Global Total Return Fund, Inc.
Approval of Advisory Agreements (continued)
its reputation or other intangible benefits resulting from PI’s association with the Fund. The Board concluded that the potential benefits to be derived by PIM included those generally resulting from an increase in assets under management, specifically, potential access to additional research resources and benefits to its reputation. The Board concluded that the benefits derived by PI and PIM were consistent with the types of benefits generally derived by investment managers and subadvisers to mutual funds.
Performance of the Fund / Fees and Expenses
The Board considered certain additional specific factors and made related conclusions relating to the historical performance of the Fund for the one-, three-, five- and ten-year periods ended December 31, 2012.
The Board also considered the Fund’s actual management fee, as well as the Fund’s net total expense ratio, for the fiscal year ended October 31, 2012. The Board considered the management fee for the Fund as compared to the management fee charged by PI to other funds and the fee charged by other advisers to comparable mutual funds in a Peer Group. The actual management fee represents the fee rate actually paid by Fund shareholders and includes any fee waivers or reimbursements. The net total expense ratio for the Fund represents the actual expense ratio incurred by Fund shareholders.
The mutual funds included in the Peer Universe (a custom peer group of un-hedged mutual funds included in the Lipper Global Income Funds Performance Universe)2 and the Peer Group were objectively determined by Lipper Inc. (“Lipper”), an independent provider of mutual fund data. To the extent that PI deemed appropriate, and for reasons addressed in detail with the Board, PI may have provided supplemental data compiled by Lipper for the Board’s consideration. The comparisons placed the Fund in various quartiles, with the first quartile being the best 25% of the mutual funds (for performance, the best performing mutual funds and, for expenses, the lowest cost mutual funds).
The section below summarizes key factors considered by the Board and the Board’s conclusions regarding the Fund’s performance, fees and overall expenses. The table sets forth gross performance comparisons (which do not reflect the impact on
| 2 | The Fund was compared to the group of un-hedged mutual funds included in the Lipper Global Income Funds Performance Universe, although Lipper classifies the Fund in its Global Income Funds Performance Universe. The Fund was compared to the group of un-hedged mutual funds included in the Global Income Funds Performance Universe because PI believes that these funds provide a more appropriate basis for Fund performance comparisons. |
Visit our website at www.prudentialfunds.com
performance of fund expenses, or any subsidies, expense caps or waivers that may be applicable) with the Peer Universe, actual management fees with the Peer Group (which reflect the impact of any subsidies or fee waivers), and net total expenses with the Peer Group, each of which were key factors considered by the Board.
| | | | | | | | |
| Performance | | 1 Year | | 3 Years | | 5 Years | | 10 Years |
| | | 1st Quartile | | 1st Quartile | | 1st Quartile | | 2nd Quartile |
| Actual Management Fees: 4th Quartile |
| Net Total Expenses: 4th Quartile |
| | • | | The Board noted that the Fund outperformed its benchmark index over all periods. |
| | • | | The Board accepted PI’s recommendation to continue the existing voluntary expense cap of 1.10% (exclusive of 12b-1 fees and certain other fees). |
| | • | | The Board noted information provided by PI indicating that the Fund’s ranking for net total expenses was significantly impacted by higher custody fees incurred as a result of the Fund’s foreign investments. |
| | • | | The Board concluded that, in light of the Fund’s competitive performance, it would be in the best interests of the Fund and its shareholders to renew the agreements. |
| | • | | The Board concluded that the management fees (including subadvisory fees) and total expenses were reasonable in light of the services provided. |
* * *
After full consideration of these factors, the Board concluded that the approval of the agreements was in the best interests of the Fund and its shareholders.
Prudential Global Total Return Fund, Inc.
| | | | |
| n MAIL | | n TELEPHONE | | n WEBSITE |
Gateway Center Three 100 Mulberry Street Newark, NJ 07102 | | (800) 225-1852
| | www.prudentialfunds.com |
|
| PROXY VOTING |
| The Board of Directors of the Fund has delegated to the Fund’s investment subadviser the responsibility for voting any proxies and maintaining proxy recordkeeping with respect to the Fund. A description of these proxy voting policies and procedures is available without charge, upon request, by calling (800) 225-1852 or by visiting the Securities and Exchange Commission’s website at www.sec.gov. Information regarding how the Fund voted proxies relating to portfolio securities during the most recent 12-month period ended June 30 is available on the Fund’s website and on the Securities and Exchange Commission’s website. |
|
| DIRECTORS |
| Ellen S. Alberding • Kevin J. Bannon • Scott E. Benjamin • Linda W. Bynoe • Keith F. Hartstein • Michael S. Hyland • Douglas H. McCorkindale • Stephen P. Munn • Stuart S. Parker • James E. Quinn • Richard A. Redeker • Robin B. Smith • Stephen G. Stoneburn |
|
| OFFICERS |
Stuart S. Parker, President • Scott E. Benjamin, Vice President • Grace C. Torres, Treasurer and Principal Financial and Accounting Officer • Raymond A. O’Hara, Chief Legal Officer • Deborah A. Docs, Secretary • Bruce Karpati, Chief Compliance Officer • Theresa C. Thompson, Deputy Chief Compliance Officer • Richard W. Kinville, Anti-Money Laundering Compliance Officer • Jonathan D. Shain, Assistant Secretary • Claudia DiGiacomo, Assistant Secretary • Amanda S. Ryan, Assistant Secretary • Andrew R. French, Assistant Secretary •
M. Sadiq Peshimam, Assistant Treasurer • Peter Parrella, Assistant Treasurer |
| | | | |
| MANAGER | | Prudential Investments LLC | | Gateway Center Three
100 Mulberry Street
Newark, NJ 07102 |
|
| INVESTMENT SUBADVISER | | Prudential Investment
Management, Inc. | | Gateway Center Two
100 Mulberry Street
Newark, NJ 07102 |
|
| DISTRIBUTOR | | Prudential Investment
Management Services LLC | | Gateway Center Three
100 Mulberry Street
Newark, NJ 07102 |
|
| CUSTODIAN | | The Bank of New York Mellon | | One Wall Street
New York, NY 10286 |
|
| TRANSFER AGENT | | Prudential Mutual Fund
Services LLC | | PO Box 9658
Providence, RI 02940 |
|
INDEPENDENT REGISTERED
PUBLIC ACCOUNTING FIRM | | KPMG LLP | | 345 Park Avenue
New York, NY 10154 |
|
| FUND COUNSEL | | Willkie Farr & Gallagher LLP | | 787 Seventh Avenue
New York, NY 10019 |
|
| An investor should consider the investment objectives, risks, charges, and expenses of the Fund carefully before investing. The prospectus and summary prospectus contain this and other information about the Fund. An investor may obtain a prospectus and summary prospectus by visiting our website at www.prudentialfunds.com or by calling (800) 225-1852. The prospectus and summary prospectus should be read carefully before investing. |
|
| E-DELIVERY |
| To receive your mutual fund documents online, go to www.prudentialfunds.com/edelivery and enroll. Instead of receiving printed documents by mail, you will receive notification via email when new materials are available. You can cancel your enrollment or change your email address at any time by visiting the website address above. |
|
| SHAREHOLDER COMMUNICATIONS WITH DIRECTORS |
| Shareholders can communicate directly with the Board of Directors by writing to the Chair of the Board, Prudential Global Total Return Fund, Inc., Prudential Investments, Attn: Board of Directors, 100 Mulberry Street, Gateway Center Three, Newark, NJ 07102. Shareholders can communicate directly with an individual Director by writing to the same address. Communications are not screened before being delivered to the addressee. |
|
| AVAILABILITY OF PORTFOLIO SCHEDULE |
| The Fund files its complete schedule of portfolio holdings with the Securities and Exchange Commission for the first and third quarters of each fiscal year on Form N-Q. The Fund’s Forms N-Q are available on the Commission’s website at www.sec.gov. The Fund’s Forms N-Q may also be reviewed and copied at the Commission’s Public Reference Room in Washington, D.C. Information on the operation and location of the Public Reference Room may be obtained by calling 1-800-SEC-0330. The Fund’s schedule of portfolio holdings is also available on the Fund’s website as of the end of each month. |
|
| The Fund’s Statement of Additional Information contains additional information about the Fund’s Directors and is available without charge, upon request, by calling (800) 225-1852. |
Mutual Funds:
| | | | |
| ARE NOT INSURED BY THE FDIC OR ANY FEDERAL GOVERNMENT AGENCY | | MAY LOSE VALUE | | ARE NOT A DEPOSIT OF OR GUARANTEED BY ANY BANK OR ANY BANK AFFILIATE |

PRUDENTIAL GLOBAL TOTAL RETURN FUND, INC.
| | | | | | | | | | |
| SHARE CLASS | | A | | B | | C | | Q | | Z |
| NASDAQ | | GTRAX | | PBTRX | | PCTRX | | PGTQX | | PZTRX |
| CUSIP | | 74439A103 | | 74439A202 | | 74439A301 | | 74439A509 | | 74439A400 |
MF169E 0255314-00001-00
Item 2 – Code of Ethics — See Exhibit (a)
As of the end of the period covered by this report, the registrant has adopted a code of ethics (the “Section 406 Standards for Investment Companies – Ethical Standards for Principal Executive and Financial Officers”) that applies to the registrant’s Principal Executive Officer and Principal Financial Officer; the registrant’s Principal Financial Officer also serves as the Principal Accounting Officer.
The registrant hereby undertakes to provide any person, without charge, upon request, a copy of the code of ethics. To request a copy of the code of ethics, contact the registrant 800-225-1852, and ask for a copy of the Section 406 Standards for Investment Companies - Ethical Standards for Principal Executive and Financial Officers.
Item 3 – Audit Committee Financial Expert –
The registrant’s Board has determined that Mr. Stephen P. Munn, member of the Board’s Audit Committee is an “audit committee financial expert,” and that he is “independent,” for purposes of this Item.
Item 4 – Principal Accountant Fees and Services –
(a) Audit Fees
For the fiscal years ended October 31, 2013 and October 31, 2012, KPMG LLP (“KPMG”), the Registrant’s principal accountant, billed the Registrant $60,000 and $60,000, respectively, for professional services rendered for the audit of the Registrant’s annual financial statements or services that are normally provided in connection with statutory and regulatory filings.
(b) Audit-Related Fees
None.
(c) Tax Fees
None.
(d) All Other Fees
None.
(e) (1) Audit Committee Pre-Approval Policies and Procedures
THE PRUDENTIAL MUTUAL FUNDS
AUDIT COMMITTEE POLICY
on
Pre-Approval of Services Provided by the Independent Accountants
The Audit Committee of each Prudential Mutual Fund is charged with the responsibility to monitor the independence of the Fund’s independent accountants. As part of this responsibility, the Audit Committee must pre-approve any independent accounting firm’s engagement to render audit and/or permissible non-audit services, as required by law. In evaluating a proposed engagement of the independent accountants, the Audit Committee will assess the effect that the engagement might reasonably be expected to have on the accountant’s independence. The Committee’s evaluation will be based on:
| | • | | a review of the nature of the professional services expected to be provided, |
| | • | | a review of the safeguards put into place by the accounting firm to safeguard independence, and |
| | • | | periodic meetings with the accounting firm. |
Policy for Audit and Non-Audit Services Provided to the Funds
On an annual basis, the scope of audits for each Fund, audit fees and expenses, and audit-related and non-audit services (and fees proposed in respect thereof) proposed to be performed by the Fund’s independent accountants will be presented by the Treasurer and the independent accountants to the Audit Committee for review and, as appropriate, approval prior to the initiation of such services. Such presentation shall be accompanied by confirmation by both the Treasurer and the independent accountants that the proposed services will not adversely affect the independence of the independent accountants. Proposed services shall be described in sufficient detail to enable the Audit Committee to assess the appropriateness of such services and fees, and the compatibility of the provision of such services with the auditor’s independence. The Committee shall receive periodic reports on the progress of the audit and other services which are approved by the Committee or by the Committee Chair pursuant to authority delegated in this Policy.
The categories of services enumerated under “Audit Services”, “Audit-related Services”, and “Tax Services” are intended to provide guidance to the Treasurer and the independent accountants as to those categories of services which the Committee believes are generally consistent with the independence of the independent accountants and which the Committee (or the Committee Chair) would expect upon the presentation of specific proposals to pre-approve. The enumerated categories are not intended as an exclusive list of audit, audit-related or tax services, which the Committee (or the Committee Chair) would consider for pre-approval.
Audit Services
The following categories of audit services are considered to be consistent with the role of the Fund’s independent accountants:
| | • | | Annual Fund financial statement audits |
| | • | | Seed audits (related to new product filings, as required) |
| | • | | SEC and regulatory filings and consents |
Audit-related Services
The following categories of audit-related services are considered to be consistent with the role of the Fund’s independent accountants:
| | • | | Accounting consultations |
| | • | | Fund merger support services |
| | • | | Agreed Upon Procedure Reports |
| | • | | Other Internal Control Reports |
Individual audit-related services that fall within one of these categories and are not presented to the Audit Committee as part of the annual pre-approval process will be subject to pre-approval by the Committee Chair (or any other Committee member on whom this responsibility has been delegated) so long as the estimated fee for those services does not exceed $50,000.
Tax Services
The following categories of tax services are considered to be consistent with the role of the Fund’s independent accountants:
| | • | | Tax compliance services related to the filing or amendment of the following: |
| | • | | Federal, state and local income tax compliance; and, |
| | • | | Sales and use tax compliance |
| | • | | Timely RIC qualification reviews |
| | • | | Tax distribution analysis and planning |
| | • | | Tax authority examination services |
| | • | | Tax appeals support services |
| | • | | Accounting methods studies |
| | • | | Fund merger support services |
| | • | | Tax consulting services and related projects |
Individual tax services that fall within one of these categories and are not presented to the Audit Committee as part of the annual pre-approval process will be subject to pre-approval by the Committee Chair (or any other Committee member on whom this responsibility has been delegated) so long as the estimated fee for those services does not exceed $50,000.
Other Non-audit Services
Certain non-audit services that the independent accountants are legally permitted to render will be subject to pre-approval by the Committee or by one or more Committee members to whom the Committee has delegated this authority and who will report to the full Committee any pre-approval decisions made pursuant to this Policy. Non-audit services presented for pre-approval pursuant to this paragraph will be accompanied by a confirmation from both the Treasurer and the independent accountants that the proposed services will not adversely affect the independence of the independent accountants.
Proscribed Services
The Fund’s independent accountants will not render services in the following categories of non-audit services:
| | • | | Bookkeeping or other services related to the accounting records or financial statements of the Fund |
| | • | | Financial information systems design and implementation |
| | • | | Appraisal or valuation services, fairness opinions, or contribution-in-kind reports |
| | • | | Internal audit outsourcing services |
| | • | | Management functions or human resources |
| | • | | Broker or dealer, investment adviser, or investment banking services |
| | • | | Legal services and expert services unrelated to the audit |
| | • | | Any other service that the Public Company Accounting Oversight Board determines, by regulation, is impermissible. |
Pre-approval of Non-Audit Services Provided to Other Entities Within the Prudential Fund Complex
Certain non-audit services provided to Prudential Investments LLC or any of its affiliates that also provide ongoing services to the Prudential Mutual Funds will be subject to pre-approval by the Audit Committee. The only non-audit services provided to these entities that will require pre-approval are those related directly to the operations and financial reporting of the Funds. Individual projects that are not presented to the Audit Committee as part of the annual pre-approval process will be subject to pre-approval by the Committee Chair (or any other Committee member on whom this responsibility has been delegated) so long as the estimated fee for those services does not exceed $50,000. Services presented for pre-approval pursuant to this paragraph will be accompanied by a confirmation from both the Treasurer and the independent accountants that the proposed services will not adversely affect the independence of the independent accountants.
Although the Audit Committee will not pre-approve all services provided to Prudential Investments LLC and its affiliates, the Committee will receive an annual report from the Fund’s independent accounting firm showing the aggregate fees for all services provided to Prudential Investments and its affiliates.
(e) (2) Percentage of services referred to in 4(b) – 4(d) that were approved by the audit committee –
Not applicable.
(f) Percentage of hours expended attributable to work performed by other than full time employees of principal accountant if greater than 50%.
The percentage of hours expended on the principal accountant’s engagement to audit the registrant’s financial statements for the most recent fiscal year that were attributed to work performed by persons other than the principal accountant’s full-time, permanent employees was 0%.
(g) Non-Audit Fees
Not applicable to Registrant for the fiscal years 2013 and 2012. The aggregate non-audit fees billed by KPMG for services rendered to the registrant’s investment adviser and any entity controlling, controlled by, or under common control with the investment adviser that provides ongoing services to the registrant for the fiscal years 2013 and 2012 was $0 and $0, respectively.
(h) Principal Accountant’s Independence
Not applicable as KPMG has not provided non-audit services to the registrant’s investment adviser and any entity controlling, controlled by, or under common control with the investment adviser that provides ongoing services to the registrant that were not pre-approved pursuant to Rule 2-01(c)(7)(ii) of Regulation S-X.
Item 5 – Audit Committee of Listed Registrants – Not applicable.
Item 6 – Schedule of Investments – The schedule is included as part of the report to shareholders filed under Item 1 of this Form.
Item 7 – Disclosure of Proxy Voting Policies and Procedures for Closed-End Management Investment Companies – Not applicable.
Item 8 – Portfolio Managers of Closed-End Management Investment Companies – Not applicable.
| Item 9 – | Purchases of Equity Securities by Closed-End Management Investment Company and Affiliated Purchasers – Not applicable. |
Item 10 – Submission of Matters to a Vote of Security Holders – Not applicable.
Item 11 – Controls and Procedures
| | (a) | It is the conclusion of the registrant’s principal executive officer and principal financial officer that the effectiveness of the registrant’s current disclosure controls and procedures (such disclosure controls and procedures having been evaluated within 90 days of the date of this filing) provide reasonable assurance that the information required to be disclosed by the registrant has been recorded, processed, summarized and reported within the time period specified in the Commission’s rules and forms and that the information required to be disclosed by the registrant has been accumulated and communicated to the registrant’s principal executive officer and principal financial officer in order to allow timely decisions regarding required disclosure. |
| | (b) | There has been no significant change in the registrant’s internal control over financial reporting that occurred during the registrant’s most recent fiscal quarter of the period covered by this report that has materially affected, or is likely to materially affect, the registrant’s internal control over financial reporting. |
Item 12 – Exhibits
| | | | |
| | (a) | | (1) Code of Ethics – Attached hereto as Exhibit EX-99.CODE-ETH |
| | |
| | | | (2) Certifications pursuant to Section 302 of the Sarbanes-Oxley Act – Attached hereto as Exhibit EX-99.CERT. |
| | |
| | | | (3) Any written solicitation to purchase securities under Rule 23c-1. – Not applicable. |
| | |
| | (b) | | Certifications pursuant to Section 906 of the Sarbanes-Oxley Act – Attached hereto as Exhibit EX-99.906CERT. |
SIGNATURES
Pursuant to the requirements of the Securities Exchange Act of 1934 and the Investment Company Act of 1940, the registrant has duly caused this report to be signed on its behalf by the undersigned, thereunto duly authorized.
| | |
| Registrant: | | Prudential Global Total Return Fund, Inc. |
| |
| By: | | /s/ Deborah A. Docs |
| | Deborah A. Docs |
| | Secretary |
| |
| Date: | | December 19, 2013 |
Pursuant to the requirements of the Securities Exchange Act of 1934 and the Investment Company Act of 1940, this report has been signed below by the following persons on behalf of the registrant and in the capacities and on the dates indicated.
| | |
| By: | | /s/ Stuart S. Parker |
| | Stuart S. Parker |
| | President and Principal Executive Officer |
| |
| Date: | | December 19, 2013 |
| |
| By: | | /s/ Grace C. Torres |
| | Grace C. Torres |
| | Treasurer and Principal Financial Officer |
| |
| Date: | | December 19, 2013 |