Item 1: Report to Shareholders| Capital Appreciation Fund | December 31, 2006 |
The views and opinions in this report were current as of December 31, 2006. They are not guarantees of performance or investment results and should not be taken as investment advice. Investment decisions reflect a variety of factors, and the managers reserve the right to change their views about individual stocks, sectors, and the markets at any time. As a result, the views expressed should not be relied upon as a forecast of the fund’s future investment intent. The report is certified under the Sarbanes-Oxley Act, which requires mutual funds and other public companies to affirm that, to the best of their knowledge, the information in their financial reports is fairly and accurately stated in all material respects.
REPORTS ON THE WEB
Sign up for our E-mail Program, and you can begin to receive updated fund reports and prospectuses online rather than through the mail. Log in to your account at troweprice.com for more information.
Fellow Shareholders
2006 was another rewarding year for equity investors and the Capital Appreciation Fund. While we are pleased with the absolute return in 2006, it’s the process underpinning the return and the level of risk taken to achieve the return that we believe points to future years of respectable results: Your fund’s return in the past year represented 92% of the S&P 500’s return and only 76% of its volatility, a common measure of risk.
HIGHLIGHTS
• The fund’s 14.5% return in the past year represented 92% of the S&P 500’s return and only 76% of its volatility, a common measure of risk.
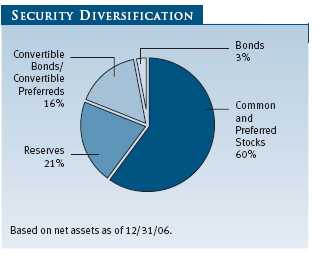
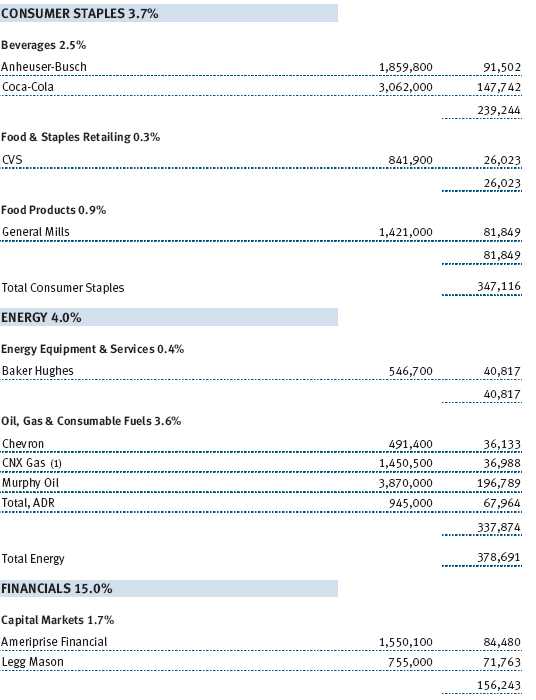
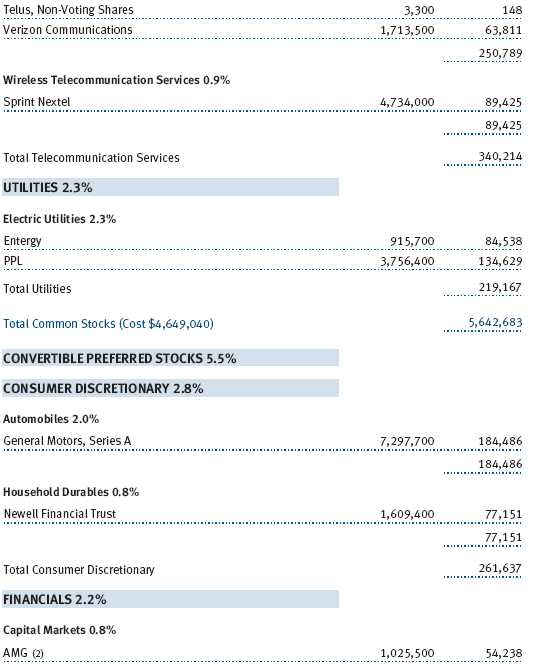
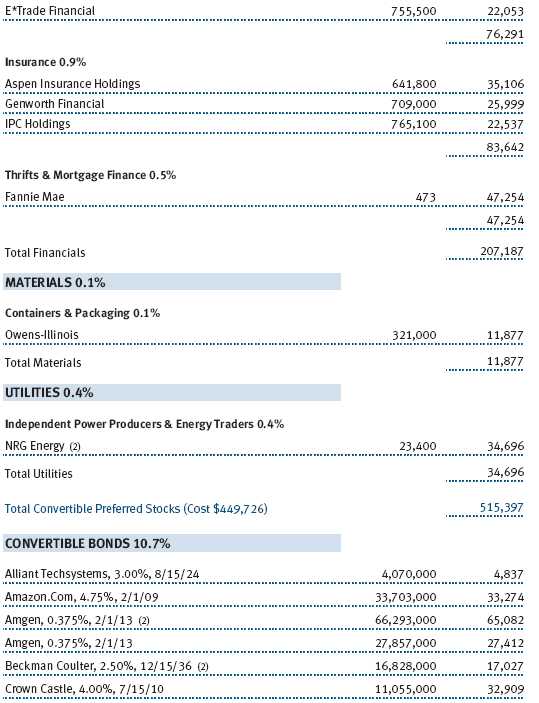
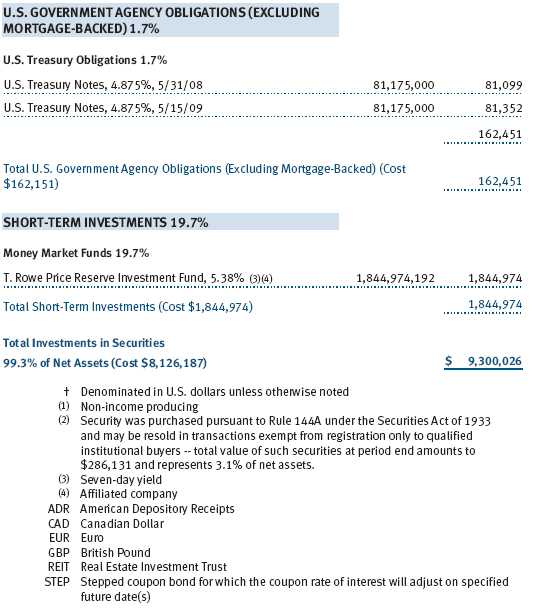
• As of December 31, 2006, we had 60% of your assets in equities, 21% in cash, 16% in convertible securities, and 3% in traditional fixed-income securities.
• We are maintaining higher-than-normal cash levels given the low yields offered by fixed-income investments.
• Based on our cautious outlook, we have been increasing the defensive posture of the fund over the past six to nine months.
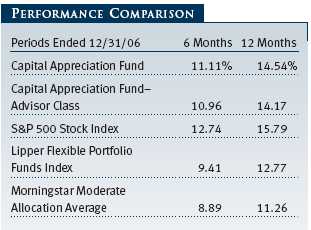
Your fund returned 14.54% in 2006, with 11.11% of the return coming since our last report in June. (Returns for the fund’s Advisor Class shares were slightly lower due to their differing fee structure.) These 6- and 12-month results compare favorably with our Lipper and Morningstar peer groups. While we modestly trailed the all-equity S&P 500 benchmark, we took less risk, holding close to a fifth of your assets in relatively high-yielding money market instruments. The good results were largely a function of security selection, as your fund ended the year with a defensive posture consistent with our objective of preserving shareholder capital. Healthy exposure to once down-and-out sectors such as telecommunications (up 32.1% in 2006) and consumer discretionary (up 17.2%) benefited performance in both the 6- and 12-month periods.
You may notice that the Capital Appreciation Fund added another peer group during this period alongside the Lipper Flexible Portfolio category. We believe the Morningstar Moderate Allocation category is compatible with your fund’s investment approach. In addition to paying careful attention to absolute returns, we monitor our performance versus these two recognizable multi-asset class benchmarks as well as the broader equity markets as represented by indices such as the S&P 500.
INVESTMENT OBJECTIVE AND PROCESS
After four consecutive years of positive stock returns and a torrent of global liquidity that has driven the risk premium out of many financial assets, we think it makes sense to review our investment process in some detail. We would also like to reiterate what we will and will not do as stewards of your capital.
The Capital Appreciation Fund’s objective is to generate an equity-like return over the longer term with lower volatility than the S&P 500. We are fundamental, bottom-up investors with a long time horizon. When contemplating an investment, we are typically as preoccupied with figuring out how much money we can lose as we are in ascertaining upside potential. This focus on the downside of each investment, in the context of our task to generate equity-like returns, makes for some lean years from time to time—typically during speculative markets. For example, your fund returned 7.1% in 1999 while the S&P 500 returned 21.04%. Our long-term shareholders have come to expect this risk-aware approach and inevitable bouts of relative underperformance during speculative markets. However, for shareholders who have joined us recently, rest assured that we will continue to avoid chasing securities that we believe are trading at significant premiums to their intrinsic value. Stated differently, we hope to participate in the upside afforded by robust equity markets, but we will earn our keep as stewards of your capital by seeking to avoid significant losses during difficult periods.
With respect to asset classes, we will maintain at least 50% and generally not more than 70% of your assets in equities and fill out the remainder of the portfolio with convertible securities (hybrid instruments that have both bond- and equity-like characteristics), fixed-income securities, and cash. When we find a company that we believe is trading at a significant discount to its intrinsic value, we tend to make sizable investments and may own securities in more than one portion of a firm’s capital structure.
Our investment process starts with the objective outlined above. To achieve our objective, we employ flexible portfolio management by allocating your capital among the most attractive investments we can find in equities, convertible securities, fixed-income securities, and cash. This is not a top-down approach. While it involves an awareness of the relative attractiveness of various asset classes, our approach mostly involves looking at a variety of companies on a name-by-name basis and finding the most attractive portion of the capital structure—in other words, the most attractive way to invest in the company—from a risk-return perspective. As of December 31, 2006, we had 60% of your assets in equities, 21% in cash, 16% in convertible securities and 3% in traditional fixed-income securities.
Your fund’s flexibility to invest across asset classes is a very important part of the investment process, one that we believe gives us an edge over peers that must maintain strict asset allocation formulas regardless of risk. An example of our risk-aware investment process in action is our current allocation among cash and traditional fixed-income securities. Today, low-risk money market instruments earn over 5% for our shareholders, while 10-year Treasury bonds yield only 4.7% and expose investors to capital losses if longer-term interest rates increase from current low levels. Moreover, the spreads (or yield differentials) that investors are earning today over Treasury securities by taking on additional risk in investment-grade and high-yield corporate bonds are notable for how extraordinarily unattractive they are from a historical perspective.
We believe there are numerous ways to lose money today in the bond market, including rising long-term interest rates, a gradual reversion to the mean in terms of credit spreads, a sudden shock to the system that causes credit spreads to widen, and the enormous risk investment-grade bond investors face from the trillion-plus dollars of private equity money ready to be put to work in the form of leveraged buyouts (LBOs)—which are typically good news for equity investors and investment bankers and very bad news for bondholders. Until the risk-return equation looks better to us in the fixed-income markets, we will likely maintain higher-than-normal cash levels—especially while money market yields exceed those of Treasury bonds.
In addition to flexible portfolio management, rigorous fundamental research and disciplined valuation work are the cornerstones of our investment process. As co-managers, we are privileged to work with over 100 of the finest global research professionals in our industry. These dedicated in-house investment professionals are experts in their areas of analytical responsibility. They bring your fund a steady flow of investment ideas, help ascertain the downside embedded in potential investments, and provide real-time insight to help us navigate the dynamic investment terrain. We generally approach an investment with a three-year time horizon, utilizing both an absolute valuation and, to a somewhat lesser extent, a relative valuation framework to find companies trading well below what we think they are worth. We supplement our own analytical work and that of our analysts with a number of proprietary valuation screens and quantitative models to help us meet our investment objective.
In the final analysis, however, our approach is simple: seek to buy $1.00 worth of assets for $0.60 or $0.70 cents, wait for the market to recognize the inefficiency, and work as hard to reduce risk as to maximize gains. Also, we never want to buy so much of any one security that the overall portfolio would suffer a material loss if we are wrong in our analysis. This time-tested investment process requires patience, is not exciting, has not changed since your fund’s inception in 1986, and will not change going forward. We endeavor to win by not losing.
PORTFOLIO REVIEW
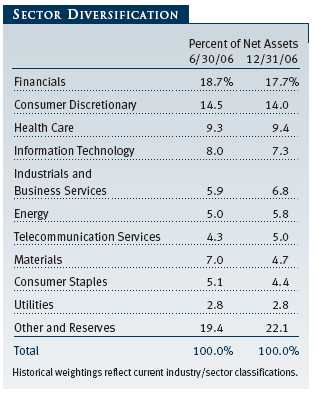
Your fund benefited from strong absolute returns across much of the portfolio. On a sector basis, the notable contributors over the past six months were consumer discretionary, financials, telecommunications, and information technology. For the 12-month period, consumer discretionary, financials, telecommunication services, and industrials led the way. Equities and convertible securities comprised the bulk of the noncash portion of the portfolio for the entire year. Turnover was higher than usual in the first half of 2006, at 32.3% (64.6% annualized), as we reduced our exposure to volatile, cyclical areas of the market that had generated strong multiyear returns, including energy, materials, transportation, and capital markets, while increasing our exposure to a number of attractively valued securities in defensive areas such as health care, consumer staples, and telecommunications.
Turnover in the second half of 2006 decreased to 21.4% (43% annualized) and trailed off to 9.4% (38% annualized) in the fourth quarter of the year. For the year, turnover was 53.7%. We expect our annual turnover to fall generally into a range of 25% to 40%. This level of turnover is significantly lower than that of our peers and is driven by several factors. First, we generally take a three-year time horizon when making an equity investment, which translates roughly into a 33% annual turnover for the largest portion of your portfolio. Moreover, we typically invest 10% to 20% of your portfolio in convertible bonds, and this asset class has a higher level of forced turnover due to maturity dates and put and call option features embedded in the securities. Finally, recycling successful investments across asset classes into areas with greater risk-adjusted return potential is an ongoing part of your fund’s investment program.
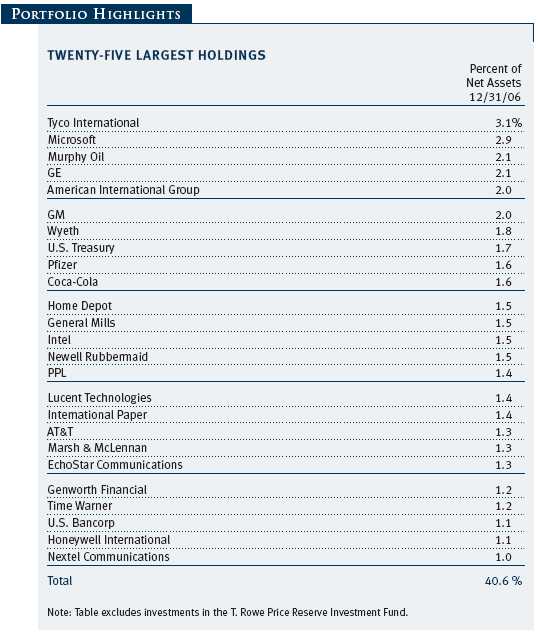
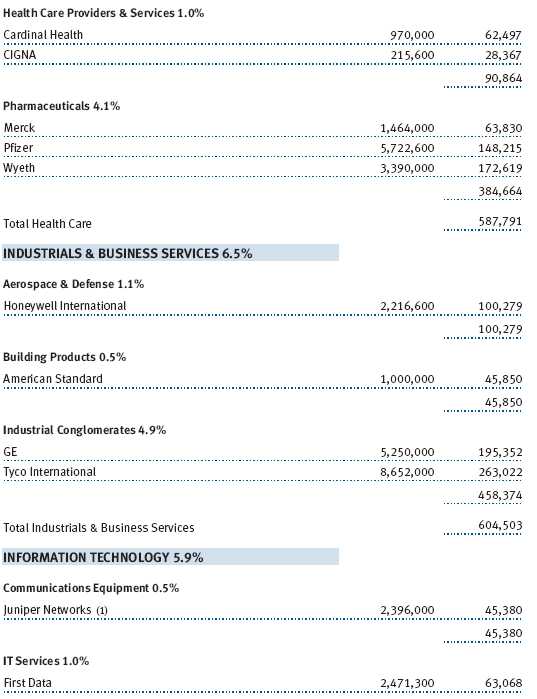
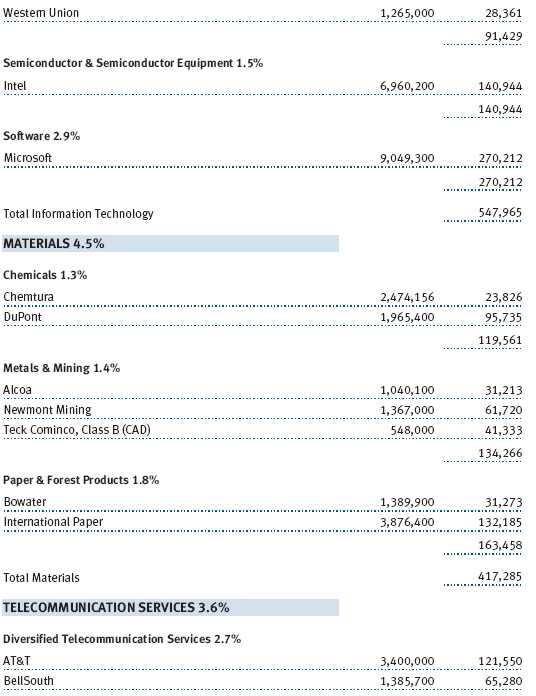
Notable contributors to performance for the 6- and 12-month periods include Liberty Media (now Liberty Capital and Liberty Interactive) and Microsoft. We think all three securities continue to offer an attractive risk/reward proposition for patient investors. In the first half of the year, Liberty Media effectively split itself into two companies. Liberty Interactive, which owns home shopping network QVC, has been using its strong free cash flow generation to buy back its undervalued stock. The buybacks, combined with stronger-than-expected fundamentals, drove its share price up nearly 25% in the second half of 2006. Liberty Capital, which owns interests in private and publicly held media and telecommunications companies, gained as the value of many of its investments appreciated. Further, in the second half of the year, Liberty Capital agreed to trade its stake in News Corp. for a large ownership in DirecTV in a tax-efficient transaction that drove further gains. Despite the increase in Liberty Capital’s share price from around $80 per share to the high $90s, we peg the value of its assets much higher. Microsoft, even after strong second-half price appreciation, still represents a favorable reward/risk profile given its sturdy balance sheet, upcoming product cycle, strong earnings, free cash flow generation, and aggressive share repurchases. (Please refer to our portfolio of investments for a complete listing of our holdings and the amount each represents in the portfolio.)
Notable detractors from performance in the 6- and 12-month periods include Murphy Oil and Newmont Mining. Although we feel as strongly about the long-term prospects for Murphy Oil as we do about the companies mentioned above, the stock has been a disappointing investment recently primarily because of issues we think are temporary. The company has disappointed investors with a series of unproductive exploration endeavors and experienced significant damage to its Louisiana refining operations during Hurricane Katrina. We see a couple of ways to win over time with Murphy Oil. First, Murphy should nearly double its production profile over the next several years as projects in Malaysia come on line. This growth profile distinguishes Murphy from most of its peers that will struggle to grow production meaningfully. Second, the company has a much smaller market capitalization than the large integrated oil companies (also referred to as “the majors”). Since the majors have a surplus of capital and a shortage of growth prospects, there is potential for Murphy to create a great deal of value for its shareholders through its sale to a larger firm.
Like Murphy, Newmont Mining struggled with operational issues in 2006 and was a negative contributor to your fund’s performance. Newmont Mining is primarily a gold mining company and was one of the big multiyear commodity winners we alluded to earlier in this letter. The stock price increased from less than $14 per share in late 2000 to $60 per share in late 2005. At year-end 2005, Newmont was a top-10 holding in your fund, and we meaningfully reduced our position in 2006, booking large gains. Unfortunately, we kept enough of this gold proxy in the portfolio to impact your returns negatively as production and operational challenges at the company resulted in a sharp sell-off.
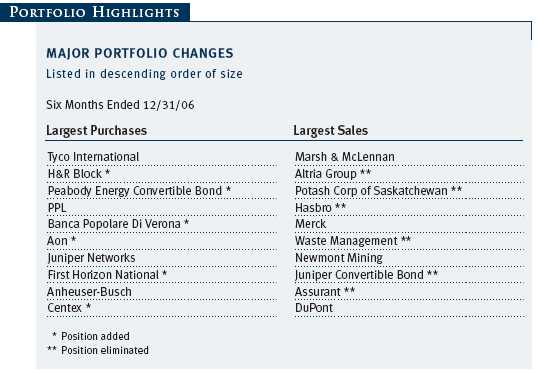
Since June, our selling activity continued a pattern of booking gains on multiyear winners with a cyclical component. We eliminated Potash and Waste Management and reduced our exposure to Newmont Mining and DuPont. Other sales were based purely on our decision to book gains on securities that, as a result of their appreciation, have a less attractive risk/reward profile than other alternatives. We eliminated toy manufacturer Hasbro, niche insurer Assurant, and tobacco giant Altria.
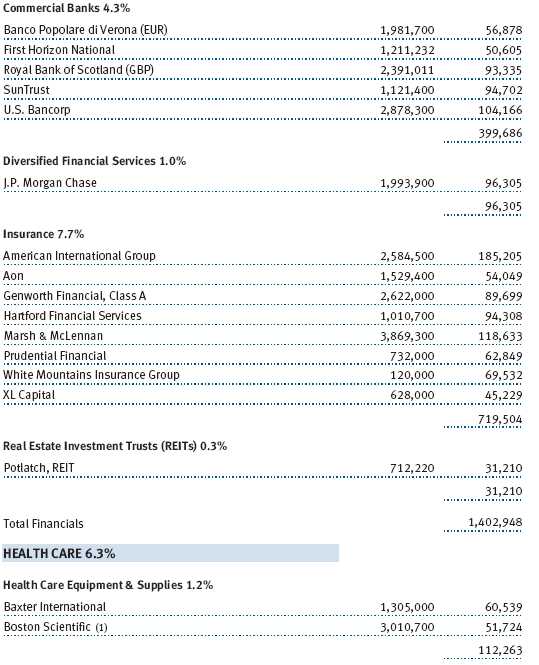
On the buy side, we started positions in tax preparer H&R Block and insurance broker Aon, which fit our criteria in a number of dimensions. Both companies are repurchasing significant amounts of their undervalued stock, are trading at attractive valuations, and can be purchased at a significant discount to a sum of their parts. Both securities have strong free cash flow and excellent balance sheets. Finally, if the frenzy of LBO activity continues unabated in 2007, we expect both companies to show up on a short list of targets for a number of opportunistic buyers.
We also purchased convertible bonds issued by coal producer Peabody Energy, a somewhat different, but no less compelling, opportunity for your fund. Peabody is a pure play on coal, a volatile commodity with an even more volatile set of investors. As we write, warm weather across the country is driving up inventories and driving away investors, but the long-term outlook for coal is favorable given high natural gas prices and limited nuclear power generating capacity. The convertible bond we purchased now yields more than 5%, limits our downside if the stock continues to weaken, and offers solid participation in the upside if our investment thesis is correct. Our strategy with the Peabody Energy convertible bond is a microcosm of what we are trying to accomplish on your behalf with the Capital Appreciation Fund—generate an equity-like return without equity-like risk.
OUTLOOK
After four consecutive years of positive stock market returns, a bond market characterized by low absolute bond yields and narrow credit spreads, very positive investor sentiment, and an inevitable slowing of corporate profit growth given record profit margins for the S&P 500, we are more cautious in our outlook than we have been in prior years. Balancing these concerns are healthy corporate balance sheets, equity valuations that are fair but not expensive, and a Federal Reserve that is likely at or near the end of its program of short-term interest rate increases. With this backdrop and our risk-aware approach, we have been steadily increasing the defensive posture of your fund over the last six to nine months by focusing on less economically sensitive companies, equity securities with higher dividend yields, companies trading at large discounts to the sum of their parts, and attractive convertible securities that limit downside risk.
IN CLOSING
The investment advisory committee that works with the co-chairmen and oversees your fund consists of experienced research analysts and senior portfolio managers with expertise across the capital structure. These dedicated individuals are focused on perpetuating your fund’s strict adherence to its investment objective: to generate equity-like returns over time with lower risk than the broader equity market. The media have reported that your fund is the only U.S. equity or balanced fund with positive returns in each of the last 16 calendar years, a fact that is both an interesting statistic and a fortuitous function of the calendar. However, it is not a reason to commit capital to this strategy. With a charter that requires we hold at least 50% of assets in common stocks—the riskiest portion of the capital structure—and a goal to generate equity-like returns over a cycle with reduced volatility, our endeavor to fulfill our obligation to shareholders requires accepting the risk of capital losses. This strategy will, inevitably, lead to a capital loss in one or more future calendar years.
To be sure, we personally detest losing money, and our interests are closely aligned with those of our fellow shareholders—as of this writing we both have 100% of our retirement funds invested in the Capital Appreciation Fund, and we remain committed to increasing our holdings in your fund over time. We are also committed to continue working closely with our stellar team of investment analysts and fellow portfolio managers in the pursuit of equity-like returns over the long term, while taking care to expose our shareholders to lower levels of volatility and provide as much capital preservation as possible during difficult market environments.
Respectfully submitted,

Jeffrey W. Arricale
Executive vice president of the fund and co-chairman of its Investment
Advisory Committee

David R. Giroux
Executive vice president of the fund and co-chairman of its Investment
Advisory Committee
January 19, 2007
The committee co-chairmen have day-to-day responsibility for managing the portfolio and work with committee members in developing and executing the fund’s investment program.
RISKS OF INVESTING
As with all stock and bond mutual funds, the fund’s share price can fall because of weakness in the stock or bond markets, a particular industry, or specific holdings. Stock markets can decline for many reasons, including adverse political or economic developments, changes in investor psychology, or heavy institutional selling. The prospects for an industry or company may deteriorate because of a variety of factors, including disappointing earnings or changes in the competitive environment. In addition, the investment manager’s assessment of companies held in a fund may prove incorrect, resulting in losses or poor performance even in rising markets. A sizable cash or fixed-income position may hinder the fund from participating fully in a strong, rapidly rising bull market. In addition, significant exposure to bonds increases the risk that the fund’s share value could be hurt by rising interest rates or credit downgrades or defaults. Convertible securities are also exposed to price fluctuations of the company’s stock.
GLOSSARY
Lipper indexes: Fund benchmarks that consist of a small number of the largest mutual funds in a particular category as tracked by Lipper Inc.
Morningstar Moderate Allocation Average: Tracks the performance of funds that seek both moderate capital appreciation and income by investing in stocks, bonds, and cash.
S&P 500 Stock Index: An unmanaged index that tracks the stocks of 500 primarily large-cap U.S. companies.
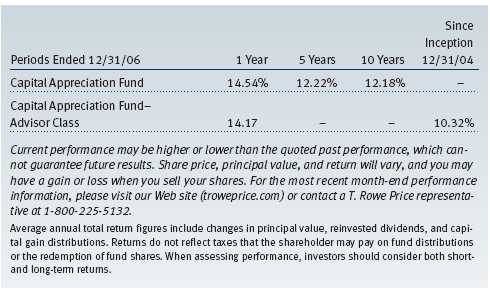
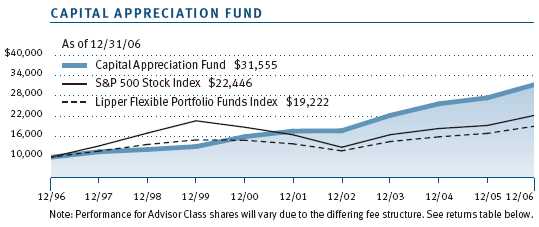
This chart shows the value of a hypothetical $10,000 investment in the fund over the past 10 fiscal year periods or since inception (for funds lacking 10-year records). The result is compared with benchmarks, which may include a broad-based market index and a peer group average or index. Market indexes do not include expenses, which are deducted from fund returns as well as mutual fund averages and indexes.
| AVERAGE ANNUAL COMPOUND TOTAL RETURN |
This table shows how the fund would have performed each year if its actual (or cumulative) returns had been earned at a constant rate.
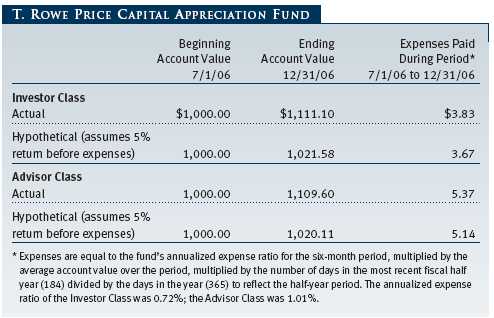
As a mutual fund shareholder, you may incur two types of costs: (1) transaction costs, such as redemption fees or sales loads, and (2) ongoing costs, including management fees, distribution and service (12b-1) fees, and other fund expenses. The following example is intended to help you understand your ongoing costs (in dollars) of investing in the fund and to compare these costs with the ongoing costs of investing in other mutual funds. The example is based on an investment of $1,000 invested at the beginning of the most recent six-month period and held for the entire period.
Please note that the fund has two share classes: The original share class (“investor class”) charges no distribution and service (12b-1) fee. Advisor Class shares are offered only through unaffiliated brokers and other financial intermediaries and charge a 0.25% 12b-1 fee. Each share class is presented separately in the table.
Actual Expenses
The first line of the following table (“Actual”) provides information about actual account values and expenses based on the fund’s actual returns. You may use the information in this line, together with your account balance, to estimate the expenses that you paid over the period. Simply divide your account value by $1,000 (for example, an $8,600 account value divided by $1,000 = 8.6), then multiply the result by the number in the first line under the heading “Expenses Paid During Period” to estimate the expenses you paid on your account during this period.
Hypothetical Example for Comparison Purposes
The information on the second line of the table (“Hypothetical”) is based on hypothetical account values and expenses derived from the fund’s actual expense ratio and an assumed 5% per year rate of return before expenses (not the fund’s actual return). You may compare the ongoing costs of investing in the fund with other funds by contrasting this 5% hypothetical example and the 5% hypothetical examples that appear in the shareholder reports of the other funds. The hypothetical account values and expenses may not be used to estimate the actual ending account balance or expenses you paid for the period.
Note: T. Rowe Price charges an annual small-account maintenance fee of $10, generally for accounts with less than $2,000 ($500 for UGMA/UTMA). The fee is waived for any investor whose T. Rowe Price mutual fund accounts total $25,000 or more, accounts employing automatic investing, and IRAs and other retirement plan accounts that utilize a prototype plan sponsored by T. Rowe Price (although a separate custodial or administrative fee may apply to such accounts). This fee is not included in the accompanying table. If you are subject to the fee, keep it in mind when you are estimating the ongoing expenses of investing in the fund and when comparing the expenses of this fund with other funds.
You should also be aware that the expenses shown in the table highlight only your ongoing costs and do not reflect any transaction costs, such as redemption fees or sales loads. Therefore, the second line of the table is useful in comparing ongoing costs only and will not help you determine the relative total costs of owning different funds. To the extent a fund charges transaction costs, however, the total cost of owning that fund is higher.
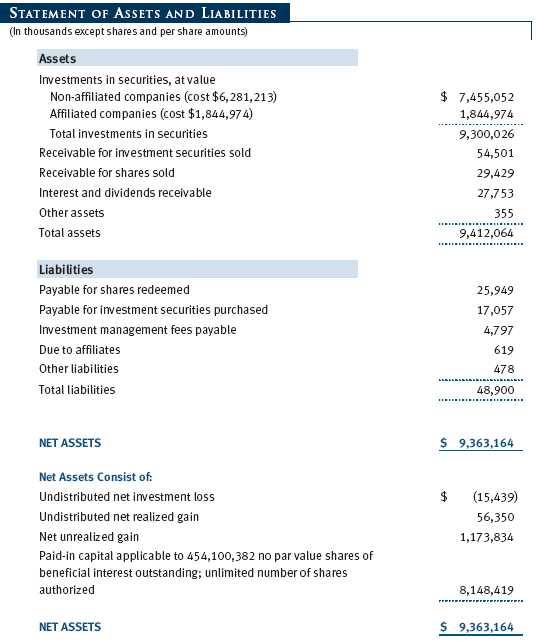
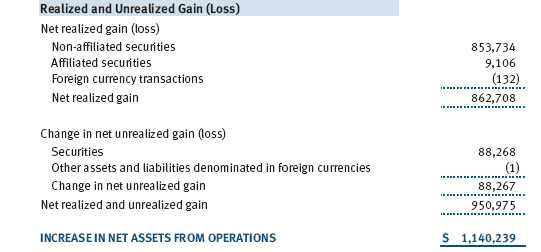
The accompanying notes are an integral part of these financial statements.
The accompanying notes are an integral part of these financial statements.


The accompanying notes are an integral part of these financial statements.

The accompanying notes are an integral part of these financial statements.

The accompanying notes are an integral part of these financial statements.

The accompanying notes are an integral part of these financial statements.
| NOTES TO FINANCIAL STATEMENTS |
NOTE 1 - SIGNIFICANT ACCOUNTING POLICIES
T. Rowe Price Capital Appreciation Fund (the fund), is registered under the Investment Company Act of 1940 (the 1940 Act) as a diversified open-end management investment company. The fund seeks long-term capital appreciation by investing primarily in common stocks. It may also hold fixed-income and other securities to help preserve principal value. The fund has two classes of shares: the Capital Appreciation Fund original share class, referred to in this report as the Investor Class, offered since June 30, 1986, and Capital Appreciation Fund—Advisor Class (Advisor Class), offered since December 31, 2004. Advisor Class shares are sold only through unaffiliated brokers and other unaffiliated financial intermediaries that are compensated by the class for distribution, shareholder servicing, and/or certain administrative services under a Board-approved Rule 12b-1 plan. Each class has exclusive voting rights on matters related solely to that class, separate voting rights on matters that relate to both classes, and, in all other respects, the same rights and obligations as the other class.
The accompanying financial statements were prepared in accordance with accounting principles generally accepted in the United States of America, which require the use of estimates made by fund management. Fund management believes that estimates and security valuations are appropriate; however, actual results may differ from those estimates, and the security valuations reflected in the financial statements may differ from the value the fund ultimately realizes upon sale of the securities.
Valuation The fund values its investments and computes its net asset value per share at the close of the New York Stock Exchange (NYSE), normally 4 p.m. ET, each day that the NYSE is open for business. Equity securities listed or regularly traded on a securities exchange or in the over-the-counter (OTC) market are valued at the last quoted sale price or, for certain markets, the official closing price at the time the valuations are made, except for OTC Bulletin Board securities, which are valued at the mean of the latest bid and asked prices. A security that is listed or traded on more than one exchange is valued at the quotation on the exchange determined to be the primary market for such security. Listed securities not traded on a particular day are valued at the mean of the latest bid and asked prices for domestic securities and the last quoted sale price for international securities.
Debt securities are generally traded in the over-the-counter market. Securities with original maturities of one year or more are valued at prices furnished by dealers who make markets in such securities or by an independent pricing service, which considers yield or price of bonds of comparable quality, coupon, maturity, and type, as well as prices quoted by dealers who make markets in such securities. Securities with original maturities of less than one year are valued at amortized cost in local currency, which approximates fair value when combined with accrued interest.
Investments in mutual funds are valued at the mutual fund’s closing net asset value per share on the day of valuation.
Other investments, including restricted securities, and those for which the above valuation procedures are inappropriate or are deemed not to reflect fair value are stated at fair value as determined in good faith by the T. Rowe Price Valuation Committee, established by the fund’s Board of Trustees.
Most foreign markets close before the close of trading on the NYSE. If the fund determines that developments between the close of a foreign market and the close of the NYSE will, in its judgment, materially affect the value of some or all of its portfolio securities, which in turn will affect the fund’s share price, the fund will adjust the previous closing prices to reflect the fair value of the securities as of the close of the NYSE, as determined in good faith by the T. Rowe Price Valuation Committee, established by the fund’s Board of Trustees. A fund may also fair value securities in other situations, such as when a particular foreign market is closed but the fund is open. In deciding whether to make fair value adjustments, the fund reviews a variety of factors, including developments in foreign markets, the performance of U.S. securities markets, and the performance of instruments trading in U.S. markets that represent foreign securities and baskets of foreign securities. The fund uses outside pricing services to provide it with closing market prices and information used for adjusting those prices. The fund cannot predict when and how often it will use closing prices and when it will adjust those prices to reflect fair value. As a means of evaluating its fair value process, the fund routinely compares closing market prices, the next day’s opening prices in the same markets, and adjusted prices.
Currency Translation Assets, including investments, and liabilities denominated in foreign currencies are translated into U.S. dollar values each day at the prevailing exchange rate, using the mean of the bid and asked prices of such currencies against U.S. dollars as quoted by a major bank. Purchases and sales of securities, income, and expenses are translated into U.S. dollars at the prevailing exchange rate on the date of the transaction. The effect of changes in foreign currency exchange rates on realized and unrealized security gains and losses is reflected as a component of security gains and losses.
Class Accounting The Advisor Class pays distribution, shareholder servicing, and/or certain administrative expenses in the form of Rule 12b-1 fees, in an amount not exceeding 0.25% of the class’s average daily net assets. Shareholder servicing, prospectus, and shareholder report expenses incurred by each class are charged directly to the class to which they relate. Expenses common to both classes, investment income, and realized and unrealized gains and losses are allocated to the classes based upon the relative daily net assets of each class.
Rebates and Credits Subject to best execution, the fund may direct certain security trades to brokers who have agreed to rebate a portion of the related brokerage commission to the fund in cash. Commission rebates are reflected as realized gain on securities in the accompanying financial statements and totaled $295,000 for the year ended December 31, 2006. Additionally, the fund earns credits on temporarily uninvested cash balances at the custodian that reduce the fund’s custody charges. Custody expense in the accompanying financial statements is presented before reduction for credits, which are reflected as expenses paid indirectly.
In-Kind Redemptions In accordance with guidelines described in the fund’s prospectus, the fund may distribute portfolio securities rather than cash as payment for a redemption of fund shares (in-kind redemption). For financial reporting purposes, the fund recognizes a gain on in-kind redemptions to the extent the value of the distributed securities on the date of redemption exceeds the cost of those securities. Gains and losses realized on in-kind redemptions are not recognized for tax purposes and are reclassified from undistributed realized gain (loss) to paid-in capital. During the year ended December 31, 2006, the fund realized $23,104,000 of net gain on $83,098,000 of in-kind redemptions.
Investment Transactions, Investment Income, and Distributions Income and expenses are recorded on the accrual basis. Premiums and discounts on debt securities are amortized for financial reporting purposes. Dividends received from mutual fund investments are reflected as dividend income; capital gain distributions are reflected as realized gain/loss. Dividend income and capital gain distributions are recorded on the ex-dividend date. Investment transactions are accounted for on the trade date. Realized gains and losses are reported on the identified cost basis. Distributions to shareholders are recorded on the ex-dividend date. Income distributions are declared and paid by each class on an annual basis. Capital gain distributions, if any, are declared and paid by the fund, typically on an annual basis.
New Accounting Pronouncements In June 2006, the Financial Accounting Standards Board (“FASB”) issued FASB Interpretation No. 48 (“FIN 48”), Accounting for Uncertainty in Income Taxes, a clarification of FASB Statement No. 109, Accounting for Income Taxes. FIN 48 establishes financial reporting rules regarding recognition and measurement of tax positions taken or expected to be taken on a tax return. Management is evaluating the anticipated impact, if any, that FIN 48 will have on the fund upon adoption, which, pursuant to a delay granted by the U.S. Securities and Exchange Commission, is expected to be on the last business day of the fund’s semi-annual period, June 29, 2007.
In September 2006, the FASB released the Statement of Financial Accounting Standard No. 157 (“FAS 157”), Fair Value Measurements. FAS 157 clarifies the definition of fair value and establishes the framework for measuring fair value, as well as proper disclosure of this methodology in the financial statements. It will be effective for the fund’s fiscal year beginning January 1, 2008. Management is evaluating the effects of FAS 157; however, it is not expected to have a material impact on the fund’s net assets or results of operations.
NOTE 2 - INVESTMENT TRANSACTIONS
Consistent with its investment objective, the fund engages in the following practices to manage exposure to certain risks or to enhance performance. The investment objective, policies, program, and risk factors of the fund are described more fully in the fund’s prospectus and Statement of Additional Information.
Restricted Securities The fund may invest in securities that are subject to legal or contractual restrictions on resale. Although certain of these securities may be readily sold, for example, under Rule 144A, others may be illiquid, their sale may involve substantial delays and additional costs, and prompt sale at an acceptable price may be difficult.
Securities Lending The fund lends its securities to approved brokers to earn additional income. It receives as collateral cash and U.S. government securities valued at 102% to 105% of the value of the securities on loan. Cash collateral is invested in a money market pooled trust managed by the fund’s lending agent in accordance with investment guidelines approved by fund management. Collateral is maintained over the life of the loan in an amount not less than the value of loaned securities, as determined at the close of fund business each day; any additional collateral required due to changes in security values is delivered to the fund the next business day. Although risk is mitigated by the collateral, the fund could experience a delay in recovering its securities and a possible loss of income or value if the borrower fails to return the securities. Securities lending revenue recognized by the fund consists of earnings on invested collateral and borrowing fees, net of any rebates to the borrower and compensation to the lending agent. At December 31, 2006, there were no securities on loan.
Other Purchases and sales of portfolio securities, other than short-term securities, aggregated $3,992,283,000 and $3,591,806,000, respectively, for the year ended December 31, 2006.
NOTE 3 - FEDERAL INCOME TAXES
No provision for federal income taxes is required since the fund intends to continue to qualify as a regulated investment company under Subchapter M of the Internal Revenue Code and distribute to shareholders all of its taxable income and gains. Federal income tax regulations differ from generally accepted accounting principles; therefore, distributions determined in accordance with tax regulations may differ significantly in amount or character from net investment income and realized gains for financial reporting purposes. Financial reporting records are adjusted for permanent book/tax differences to reflect tax character. Financial records are not adjusted for temporary differences.
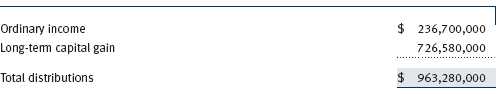
Distributions during the year ended December 31, 2006, were characterized as follows for tax purposes:
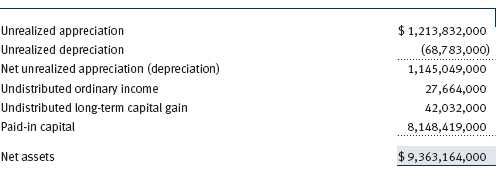
At December 31, 2006, the tax-basis components of net assets were as follows:
For the year ended December 31, 2006, the fund recorded the following permanent reclassifications to reflect tax character. Reclassifications to paid-in capital relate primarily to redemptions in kind and a tax practice that treats a portion of the proceeds from each redemption of capital shares as a distribution of taxable net investment income and/or realized capital gain. Results of operations and net assets were not affected by these reclassifications.
At December 31, 2006, the cost of investments for federal income tax purposes was $8,154,972,000.
NOTE 4 - ACQUISITION
On June 19, 2006, the fund acquired substantially all of the assets of the Preferred Asset Allocation Fund (the acquired fund), pursuant to the Agreement and Plan of Reorganization dated February 15, 2006, and approved by shareholders of the acquired fund on June 9, 2006. The acquisition was accomplished by a tax-free exchange of 2,335,428 shares of the fund (with a value of $47,760,000) for the 3,785,570 shares of the acquired fund outstanding on June 19, 2006. The net assets of the acquired fund at that date included $5,188,000 of unrealized depreciation. Net assets of the acquired fund were combined with those of the fund, resulting in aggregate net assets of $7,878,477,000 immediately after the acquisition.
NOTE 5 - RELATED PARTY TRANSACTIONS
The fund is managed by T. Rowe Price Associates, Inc. (the manager or Price Associates), a wholly owned subsidiary of T. Rowe Price Group, Inc. The investment management agreement between the fund and the manager provides for an annual investment management fee, which is computed daily and paid monthly. The fee consists of an individual fund fee, equal to 0.30% of the fund’s average daily net assets, and a group fee. The group fee rate is calculated based on the combined net assets of certain mutual funds sponsored by Price Associates (the group) applied to a graduated fee schedule, with rates ranging from 0.48% for the first $1 billion of assets to 0.29% for assets in excess of $160 billion. The fund’s group fee is determined by applying the group fee rate to the fund’s average daily net assets. At December 31, 2006, the effective annual group fee rate was 0.31%.
The Advisor Class is also subject to a contractual expense limitation through April 30, 2007. During the limitation period, the manager is required to waive its management fee and reimburse the class for any expenses, excluding interest, taxes, brokerage commissions, and extraordinary expenses, that would otherwise cause the class’s ratio of total expenses to average net assets (expense ratio) to exceed its expense limitation of 1.10% . For a period of three years after the date of any reimbursement or waiver, each class is required to repay the manager for expenses previously reimbursed and management fees waived to the extent the class’s net assets have grown or expenses have declined sufficiently to allow repayment without causing the class’s expense ratio to exceed its expense limitation. At December 31, 2006, there were no amounts subject to repayment.
In addition, the fund has entered into service agreements with Price Associates and two wholly owned subsidiaries of Price Associates (collectively, Price). Price Associates computes the daily share prices and provides certain other administrative services to the fund. T. Rowe Price Services, Inc., provides shareholder and administrative services in its capacity as the fund’s transfer and dividend disbursing agent. T. Rowe Price Retirement Plan Services, Inc., provides subaccounting and recordkeeping services for certain retirement accounts invested in the Investor Class. For the year ended December 31, 2006, expenses incurred pursuant to these service agreements were $94,000 for Price Associates, $4,376,000 for T. Rowe Price Services, Inc., and $1,661,000 for T. Rowe Price Retirement Plan Services, Inc. The total amount payable at period-end pursuant to these service agreements is reflected as Due to Affiliates in the accompanying financial statements.
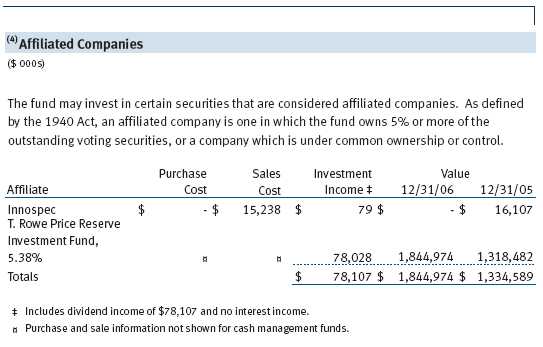
The fund may invest in the T. Rowe Price Reserve Investment Fund and the T. Rowe Price Government Reserve Investment Fund (collectively, the T. Rowe Price Reserve Funds), open-end management investment companies managed by Price Associates and affiliates of the fund. The T. Rowe Price Reserve Funds are offered as cash management options to mutual funds, trusts, and other accounts managed by Price Associates and/or its affiliates, and are not available for direct purchase by members of the public. The T. Rowe Price Reserve Funds pay no investment management fees.
| REPORT OF INDEPENDENT REGISTERED PUBLIC ACCOUNTING FIRM |
To the Board of Directors and Shareholders of T. Rowe Price Capital Appreciation Fund
In our opinion, the accompanying statement of assets and liabilities, including the portfolio of investments, and the related statements of operations and of changes in net assets and the financial highlights present fairly, in all material respects, the financial position of T. Rowe Price Capital Appreciation Fund, (the “Fund”) at December 31, 2006, the results of its operations for the year then ended, the changes in its net assets for each of the two years in the period then ended and the financial highlights for each of the fiscal periods presented, in conformity with accounting principles generally accepted in the United States of America. These financial statements and financial highlights (hereafter referred to as “financial statements”) are the responsibility of the Fund’s management; our responsibility is to express an opinion on these financial statements based on our audits. We conducted our audits of these financial statements in accordance with the auditing standards of the Public Company Accounting Oversight Board (United States). Those standards require that we plan and perform the audit to obtain reasonable assurance about whether the financial statements are free of material misstatement. An audit includes examining, on a test basis, evidence supporting the amounts and disclosures in the financial statements, assessing the accounting principles used and significant estimates made by management, and evaluating the overall financial statement presentation. We believe that our audits, which included confirmation of securities at December 31, 2006 by correspondence with the custodian and by agreement to the underlying ownership records for T. Rowe Price Reserve Investment Fund, provide a reasonable basis for our opinion.
PricewaterhouseCoopers LLP
Baltimore, Maryland
February 12, 2007
| TAX INFORMATION (UNAUDITED) FOR THE TAX YEAR ENDED 12/31/06 |
We are providing this information as required by the Internal Revenue Code. The amounts shown may differ from those elsewhere in this report because of differences between tax and financial reporting requirements.
The fund’s distributions to shareholders included:
• $52,521,000 from short-term capital gains,
• $783,360,000 from long-term capital gains, all of which was subject to the 15% rate gains category.
For taxable non-corporate shareholders, $119,375,000 of the fund’s income represents qualified dividend income subject to the 15% rate category.
For corporate shareholders, $108,715,000 of the fund’s income qualifies for the dividends-received deduction.
| INFORMATION ON PROXY VOTING POLICIES, PROCEDURES, AND RECORDS |
A description of the policies and procedures used by T. Rowe Price funds and portfolios to determine how to vote proxies relating to portfolio securities is available in each fund’s Statement of Additional Information, which you may request by calling 1-800-225-5132 or by accessing the SEC’s Web site, www.sec.gov. The description of our proxy voting policies and procedures is also available on our Web site, www.troweprice.com. To access it, click on the words “Company Info” at the top of our homepage for individual investors. Then, in the window that appears, click on the “Proxy Voting Policy” navigation button in the top left corner.
Each fund’s most recent annual proxy voting record is available on our Web site and through the SEC’s Web site. To access it through our Web site, follow the directions above, then click on the words “Proxy Voting Record” at the bottom of the Proxy Voting Policy page.
| HOW TO OBTAIN QUARTERLY PORTFOLIO HOLDINGS |
The fund files a complete schedule of portfolio holdings with the Securities and Exchange Commission for the first and third quarters of each fiscal year on Form N-Q. The fund’s Form N-Q is available electronically on the SEC’s Web site (www.sec.gov); hard copies may be reviewed and copied at the SEC’s Public Reference Room, 450 Fifth St. N.W., Washington, DC 20549. For more information on the Public Reference Room, call 1-800-SEC-0330.
| ABOUT THE FUND’S TRUSTEES AND OFFICERS |
Your fund is governed by a Board of Trustees that meets regularly to review a wide variety of matters affecting the fund, including performance, investment programs, compliance matters, advisory fees and expenses, service providers, and other business affairs. The Board of Trustees elects the fund’s officers, who are listed in the final table. At least 75% of Board members are independent of T. Rowe Price Associates, Inc. (T. Rowe Price), and T. Rowe Price International, Inc. (T. Rowe Price International); “inside” or “interested” trustees are officers of T. Rowe Price. The business address of each trustee and officer is 100 East Pratt Street, Baltimore, Maryland 21202. The Statement of Additional Information includes additional information about the fund trustees and is available without charge by calling a T. Rowe Price representative at 1-800-225-5132.
| Independent Trustees | |
| |
| Name | |
| (Year of Birth) | Principal Occupation(s) During Past 5 Years and Directorships of |
| Year Elected * | Other Public Companies |
| |
| Jeremiah E. Casey | Director, Allfirst Financial Inc. (previously First Maryland Bankcorp) |
| (1940) | (1983 to 2002); Director, National Life Insurance (2001 to 2005); |
| 2005 | Director, The Rouse Company, real estate developers (1990 to 2004) |
| |
| Anthony W. Deering | Chairman, Exeter Capital, LLC, a private investment firm (2004 to pres- |
| (1945) | ent); Director, Vornado Real Estate Investment Trust (3/04 to present); |
| 2001 | Director, Mercantile Bankshares (4/03 to present); Member, Advisory |
| | Board, Deutsche Bank North America (2004 to present); Director, |
| | Chairman of the Board, and Chief Executive Officer, The Rouse |
| | Company, real estate developers (1997 to 2004) |
| |
| Donald W. Dick, Jr. | Principal, EuroCapital Advisors, LLC, an acquisition and management |
| (1943) | advisory firm; Chairman, President, and Chief Executive Officer, |
| 1986 | The Haven Group, a custom manufacturer of modular homes (1/04 |
| | to present) |
| |
| David K. Fagin | Chairman and President, Nye Corporation (6/88 to present); Director, |
| (1938) | Canyon Resources Corp., Golden Star Resources Ltd. (5/92 to present), |
| 1988 | and Pacific Rim Mining Corp. (2/02 to present) |
| |
| Karen N. Horn | Director, Federal National Mortgage Association (9/06 to present); |
| (1943) | Managing Director and President, Global Private Client Services, Marsh |
| 2003 | Inc. (1999 to 2003); Director, Georgia Pacific (5/04 to 12/05), Eli Lilly |
| | and Company, and Simon Property Group |
| |
| Theo C. Rodgers | President, A&R Development Corporation |
| (1941) | |
| 2005 | |
| John G. Schreiber | Owner/President, Centaur Capital Partners, Inc., a real estate invest- |
| (1946) | ment company; Partner, Blackstone Real Estate Advisors, L.P. |
| 2001 | |
| |
| * Each independent trustee oversees 115 T. Rowe Price portfolios and serves until retirement, resignation, or |
| election of a successor. | |
| Inside Trustees | |
| |
| Name | |
| (Year of Birth) | |
| Year Elected * | |
| [Number of T. Rowe Price | Principal Occupation(s) During Past 5 Years and Directorships of |
| Portfolios Overseen] | Other Public Companies |
| |
| Edward C. Bernard | Director and Vice President, T. Rowe Price and T. Rowe Price Group, |
| (1956) | Inc.; Chairman of the Board, Director, and President, T. Rowe Price |
| 2006 | Investment Services, Inc.; Chairman of the Board and Director, T. Rowe |
| [115] | Price International, Inc., T. Rowe Price Retirement Plan Services, Inc., |
| | T. Rowe Price Services, Inc., and T. Rowe Price Savings Bank; Director, |
| | T. Rowe Price Global Asset Management Limited and T. Rowe Price |
| | Global Investment Services Limited; Chief Executive Officer, Chairman |
| | of the Board, Director, and President, T. Rowe Price Trust Company; |
| | Chairman of the Board, all funds |
| |
| Brian C. Rogers, CFA, CIC | Chief Investment Officer, Director, and Vice President, T. Rowe Price |
| (1955) | and T. Rowe Price Group, Inc.; Vice President, T. Rowe Price Trust |
| 2006 | Company; Vice President, Capital Appreciation Fund |
| [62] | |
| |
| *Each inside trustee serves until retirement, resignation, or election of a successor. |
| Officers | |
| |
| Name (Year of Birth) | |
| Title and Fund(s) Served | Principal Occupation(s) |
| |
| Jeffrey W. Arricale, CPA (1971) | Vice President, T. Rowe Price and T. Rowe Price |
| Executive Vice President, | Group, Inc. |
| Capital Appreciation Fund | |
| |
| Andrew M. Brooks (1956) | Vice President, T. Rowe Price and T. Rowe Price |
| Vice President, Capital Appreciation Fund | Group, Inc. |
| |
| Joseph A. Carrier, CPA (1960) | Vice President, T. Rowe Price, T. Rowe Price |
| Treasurer, Capital Appreciation Fund | Group, Inc., T. Rowe Price Investment Services, |
| | Inc., and T. Rowe Price Trust Company |
| |
| Roger L. Fiery III, CPA (1959) | Vice President, T. Rowe Price, T. Rowe Price |
| Vice President, Capital Appreciation Fund | Group, Inc., T. Rowe Price International, Inc., |
| | and T. Rowe Price Trust Company |
| |
| Mark S. Finn, CFA, CPA (1963) | Vice President, T. Rowe Price and T. Rowe Price |
| Vice President, Capital Appreciation Fund | Group, Inc. |
| |
| John R. Gilner (1961) | Chief Compliance Officer and Vice President, |
| Chief Compliance Officer, | T. Rowe Price; Vice President, T. Rowe Price |
| Capital Appreciation Fund | Group, Inc., and T. Rowe Price Investment |
| | Services, Inc. |
| |
| David R. Giroux, CFA (1975) | Vice President, T. Rowe Price and T. Rowe Price |
| Executive Vice President, | Group, Inc. |
| Capital Appreciation Fund | |
| |
| Gregory S. Golczewski (1966) | Vice President, T. Rowe Price and T. Rowe Price |
| Vice President, Capital Appreciation Fund | Trust Company |
| |
| Henry H. Hopkins (1942) | Director and Vice President, T. Rowe Price |
| Vice President, Capital Appreciation Fund | Investment Services, Inc., T. Rowe Price Services, |
| | Inc., and T. Rowe Price Trust Company; Vice |
| | President, T. Rowe Price, T. Rowe Price Group, |
| | Inc., T. Rowe Price International, Inc., and |
| | T. Rowe Price Retirement Plan Services, Inc. |
| |
| David M. Lee, CFA (1962) | Vice President, T. Rowe Price and T. Rowe Price |
| Vice President, Capital Appreciation Fund | Group, Inc. |
| |
| John D. Linehan, CFA (1965) | Vice President, T. Rowe Price and T. Rowe Price |
| President, Capital Appreciation Fund | Group, Inc. |
| Patricia B. Lippert (1953) | Assistant Vice President, T. Rowe Price and |
| Secretary, Capital Appreciation Fund | T. Rowe Price Investment Services, Inc. |
| |
| Michael J. McGonigle (1966) | Vice President, T. Rowe Price and T. Rowe Price |
| Vice President, Capital Appreciation Fund | Group, Inc. |
| |
| Sudhir Nanda, Ph.D., CFA (1959) | Vice President, T. Rowe Price and T. Rowe Price |
| Vice President, Capital Appreciation Fund | Group, Inc. |
| |
| William J. Stromberg, CFA (1960) | Vice President, T. Rowe Price, T. Rowe Price |
| Vice President, Capital Appreciation Fund | Group, Inc., and T. Rowe Price Trust Company |
| |
| David J. Wallack (1960) | Vice President, T. Rowe Price and T. Rowe Price |
| Vice President, Capital Appreciation Fund | Group, Inc. |
| |
| Julie L. Waples (1970) | Vice President, T. Rowe Price |
| Vice President, Capital Appreciation Fund | |
| |
| Unless otherwise noted, officers have been employees of T. Rowe Price or T. Rowe Price International for at |
| least five years. | |
Item 2. Code of Ethics.
The registrant has adopted a code of ethics, as defined in Item 2 of Form N-CSR, applicable to its principal executive officer, principal financial officer, principal accounting officer or controller, or persons performing similar functions. A copy of this code of ethics is filed as an exhibit to this Form N-CSR. No substantive amendments were approved or waivers were granted to this code of ethics during the period covered by this report.
Item 3. Audit Committee Financial Expert.
The registrant’s Board of Directors/Trustees has determined that Mr. Donald W. Dick Jr. qualifies as an audit committee financial expert, as defined in Item 3 of Form N-CSR. Mr. Dick is considered independent for purposes of Item 3 of Form N-CSR.
Item 4. Principal Accountant Fees and Services.
(a) – (d) Aggregate fees billed to the registrant for the last two fiscal years for professional services rendered by the registrant’s principal accountant were as follows:
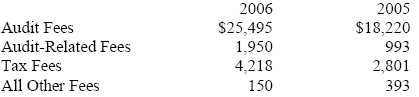
Audit fees include amounts related to the audit of the registrant’s annual financial statements and services normally provided by the accountant in connection with statutory and regulatory filings. Audit-related fees include amounts reasonably related to the performance of the audit of the registrant’s financial statements and specifically include the issuance of a report on internal controls and, if applicable for 2006, agreed-upon procedures related to fund acquisitions. Tax fees include amounts related to services for tax compliance, tax planning, and tax advice. The nature of these services specifically includes the review of distribution calculations and the preparation of Federal, state, and excise tax returns. Reclassification from tax fees to audit fees of fiscal 2005 amounts related to the auditing of tax disclosures within the registrant’s annual financial statements has been made in order to conform to fiscal 2006 presentation. All other fees include the registrant’s pro-rata share of amounts for agreed-upon procedures in conjunction with service contract approvals by the registrant’s Board of Directors/Trustees.
(e)(1) The registrant’s audit committee has adopted a policy whereby audit and non-audit services performed by the registrant’s principal accountant for the registrant, its investment adviser, and any entity controlling, controlled by, or under common control with the investment adviser that provides ongoing services to the registrant require pre-approval in advance at regularly scheduled audit committee meetings. If such a service is required between regularly scheduled audit committee meetings, pre-approval may be authorized by one audit committee member with ratification at the next scheduled audit committee meeting. Waiver of pre-approval for audit or non-audit services requiring fees of a de minimis amount is not permitted.
(2) No services included in (b) – (d) above were approved pursuant to paragraph (c)(7)(i)(C) of Rule 2-01 of Regulation S-X.
(f) Less than 50 percent of the hours expended on the principal accountant’s engagement to audit the registrant’s financial statements for the most recent fiscal year were attributed to work performed by persons other than the principal accountant’s full-time, permanent employees.
(g) The aggregate fees billed for the most recent fiscal year and the preceding fiscal year by the registrant’s principal accountant for non-audit services rendered to the registrant, its investment adviser, and any entity controlling, controlled by, or under common control with the investment adviser that provides ongoing services to the registrant were $1,401,000 and $883,000, respectively, and were less than the aggregate fees billed for those same periods by the registrant’s principal accountant for audit services rendered to the T. Rowe Price Funds. Preceding fiscal year amount reflects the reclassification of tax fees described in (a) – (d) above.
(h) All non-audit services rendered in (g) above were pre-approved by the registrant’s audit committee. Accordingly, these services were considered by the registrant’s audit committee in maintaining the principal accountant’s independence.Item 5. Audit Committee of Listed Registrants.
Not applicable.
Item 6. Schedule of Investments.
Not applicable. The complete schedule of investments is included in Item 1 of this Form N-CSR.
Item 7. Disclosure of Proxy Voting Policies and Procedures for Closed-End Management Investment Companies.
Not applicable.
Item 8. Portfolio Managers of Closed-End Management Investment Companies.
Not applicable.
Item 9. Purchases of Equity Securities by Closed-End Management Investment Company and Affiliated Purchasers.
Not applicable.
Item 10. Submission of Matters to a Vote of Security Holders.
Not applicable.
Item 11. Controls and Procedures.
(a) The registrant’s principal executive officer and principal financial officer have evaluated the registrant’s disclosure controls and procedures within 90 days of this filing and have concluded that the registrant’s disclosure controls and procedures were effective, as of that date, in ensuring that information required to be disclosed by the registrant in this Form N-CSR was recorded, processed, summarized, and reported timely.
(b) The registrant’s principal executive officer and principal financial officer are aware of no change in the registrant’s internal control over financial reporting that occurred during the registrant’s second fiscal quarter covered by this report that has materially affected, or is reasonably likely to materially affect, the registrant’s internal control over financial reporting.
Item 12. Exhibits.
(a)(1) The registrant’s code of ethics pursuant to Item 2 of Form N-CSR is attached.
(2) Separate certifications by the registrant's principal executive officer and principal financial officer, pursuant to Section 302 of the Sarbanes-Oxley Act of 2002 and required by Rule 30a-2(a) under the Investment Company Act of 1940, are attached.
(3) Written solicitation to repurchase securities issued by closed-end companies: not applicable.
(b) A certification by the registrant's principal executive officer and principal financial officer, pursuant to Section 906 of the Sarbanes-Oxley Act of 2002 and required by Rule 30a-2(b) under the Investment Company Act of 1940, is attached.
| | |
SIGNATURES |
| |
| | Pursuant to the requirements of the Securities Exchange Act of 1934 and the Investment |
| Company Act of 1940, the registrant has duly caused this report to be signed on its behalf by the |
| undersigned, thereunto duly authorized. |
| |
| T. Rowe Price Capital Appreciation Fund |
| |
| |
| |
| By | /s/ Edward C. Bernard |
| | Edward C. Bernard |
| | Principal Executive Officer |
| |
| Date | February 16, 2007 |
| |
| |
| | Pursuant to the requirements of the Securities Exchange Act of 1934 and the Investment |
| Company Act of 1940, this report has been signed below by the following persons on behalf of |
| the registrant and in the capacities and on the dates indicated. |
| |
| |
| By | /s/ Edward C. Bernard |
| | Edward C. Bernard |
| | Principal Executive Officer |
| |
| Date | February 16, 2007 |
| |
| |
| |
| By | /s/ Joseph A. Carrier |
| | Joseph A. Carrier |
| | Principal Financial Officer |
| |
| Date | February 16, 2007 |