| UNITED STATES |
| SECURITIES AND EXCHANGE COMMISSION |
| Washington, D.C. 20549 |
| |
FORM N-CSR |
| |
CERTIFIED SHAREHOLDER REPORT OF REGISTERED |
MANAGEMENT INVESTMENT COMPANIES |
| |
| |
| |
| Investment Company Act File Number: 811-4519 |
|
| |
| T. Rowe Price Capital Appreciation Fund |
|
| (Exact name of registrant as specified in charter) |
| |
| 100 East Pratt Street, Baltimore, MD 21202 |
|
| (Address of principal executive offices) |
| |
| David Oestreicher |
| 100 East Pratt Street, Baltimore, MD 21202 |
|
| (Name and address of agent for service) |
| |
| |
| Registrant’s telephone number, including area code: (410) 345-2000 |
| |
| |
| Date of fiscal year end: December 31 |
| |
| |
| Date of reporting period: December 31, 2009 |
Item 1: Report to Shareholders| Capital Appreciation Fund | December 31, 2009 |
The views and opinions in this report were current as of December 31, 2009. They are not guarantees of performance or investment results and should not be taken as investment advice. Investment decisions reflect a variety of factors, and the managers reserve the right to change their views about individual stocks, sectors, and the markets at any time. As a result, the views expressed should not be relied upon as a forecast of the fund’s future investment intent. The report is certified under the Sarbanes-Oxley Act, which requires mutual funds and other public companies to affirm that, to the best of their knowledge, the information in their financial reports is fairly and accurately stated in all material respects.
REPORTS ON THE WEB
Sign up for our E-mail Program, and you can begin to receive updated fund reports and prospectuses online rather than through the mail. Log in to your account at troweprice.com for more information.
Manager’s Letter
Fellow Shareholders
After a very challenging 2008, when a variety of asset classes experienced their worst returns in a generation, the outlook at the beginning of 2009 did not appear materially brighter. The global economic environment was continuing to worsen, unemployment was increasing, the capital markets were still frozen, and the benefits from fiscal and monetary stimulus had yet to be felt. At the same time market sentiment was poor, valuations were low, and there was a significant amount of investor money on the sidelines.
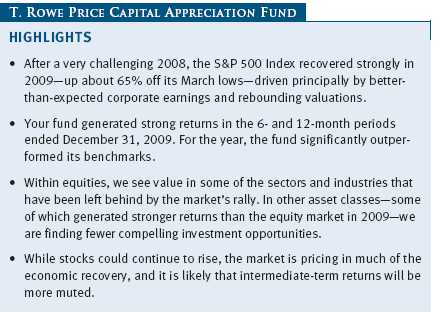
It now appears that in March 2009 the global economy and U.S. stock market troughed. Furthermore, the U.S. recession likely ended in June. A combination of unprecedented global monetary and fiscal stimulus, inventories slashed to levels that could not be cut further, and easier economic comparisons are some of the principal factors behind the still very early stage of the economic recovery. The S&P 500 recovered strongly in 2009 (up about 65% off its March lows), driven principally by better-than-expected corporate earnings (mostly from aggressive cost-cutting) and valuations rebounding from the depressed levels seen earlier in the year.

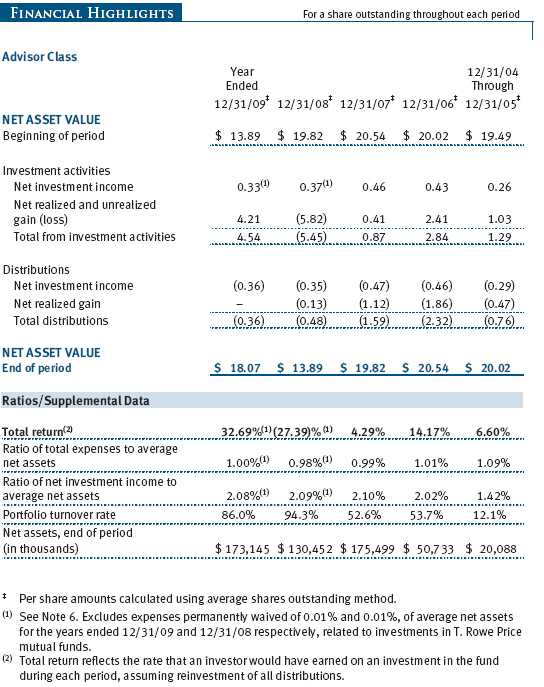
Against this backdrop, the Capital Appreciation Fund generated strong returns of 16.59% and 33.05% in the 6- and 12-month periods ended December 31, 2009, respectively. (The performance of Advisor Class shares was slightly lower, reflecting a different fee structure.) For the year, we beat the S&P 500 and our peer group benchmarks by a wide margin, as shown in the Performance Comparison table on page 1. In the last six months of the year, your fund trailed the broad equity market and one of our peer benchmarks as we reduced our equity exposure during the market’s recovery. However, it is important to point out that we do not manage the fund to either of these aforementioned benchmarks. The Capital Appreciation Fund has a very different mandate than most of its peers. It is a unique fund with a focus on long-term capital preservation and capital appreciation that does not fit neatly into most benchmarks.
I think it is worth taking a minute to further explain the returns your fund generated last year. In 2009, we were pleased to beat the S&P 500 returns with significantly less risk than that of the market: 125% of the market’s return with 73% of its risk. (We arrived at this number by comparing the standard deviation of the S&P 500, calculated using monthly observations (21.33), with that of the fund (15.50) in 2009. Standard deviation indicates the volatility of a portfolio’s total returns as measured against its mean performance. In general, the higher the standard deviation, the greater the volatility or risk. The S&P 500 Index is an unmanaged equity benchmark that tracks the performance of 500 mostly large-cap U.S. stocks.) However, 2009 was an unusual year for two main reasons. First, some of the traditional lower-risk alternative asset classes in which Capital Appreciation regularly invests, such as convertibles, leveraged loans, and high yield debt, all generated stronger returns than the equity market. Your fund aggressively bought these asset classes in the back half of 2008 when prices were depressed amid forced hedge fund selling. As of now, the valuation of each of these asset classes has returned to more normal levels. Second, near the market bottom in February and March, your fund was more aggressively positioned than normal as we took advantage of a unique opportunity to buy equities with significant upside and limited downside potential.
Given our long-term focus on capital preservation and our risk-aware investment strategy, we would not normally expect to beat the market in most strong up markets (like 2009). Our goal in strong equity markets continues to be to generate strong absolute risk-adjusted returns, but in these markets we are likely to trail the market as we are never fully invested in equities. In down markets, we would hope to significantly outperform the market while in normal markets, we would aspire to generate market returns with materially less risk. Over a market cycle, we would hope that translates into market returns or better with less risk.
As I wrote in my last letter to you, this fund is not managed in an attempt to surpass the market every month, quarter, or year. Our goal is long-term capital preservation and capital appreciation. It is our record against these goals in which I am the most pleased. Over the last three difficult years, your fund has generated a cumulative positive return of 1.32%, whereas the S&P 500 declined by 15.95%. These cumulative returns translate into annualized returns of 0.44% for the fund and -5.63% for the index, as shown in the table below. Preserving shareholder capital over the intermediate term is an important objective for the fund that influences every investment decision we make.

PORTFOLIO REVIEW
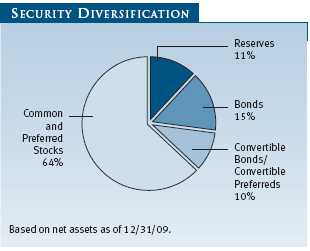
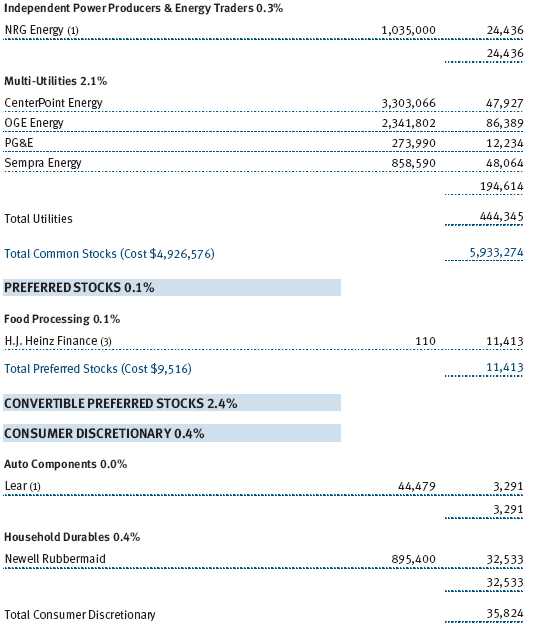
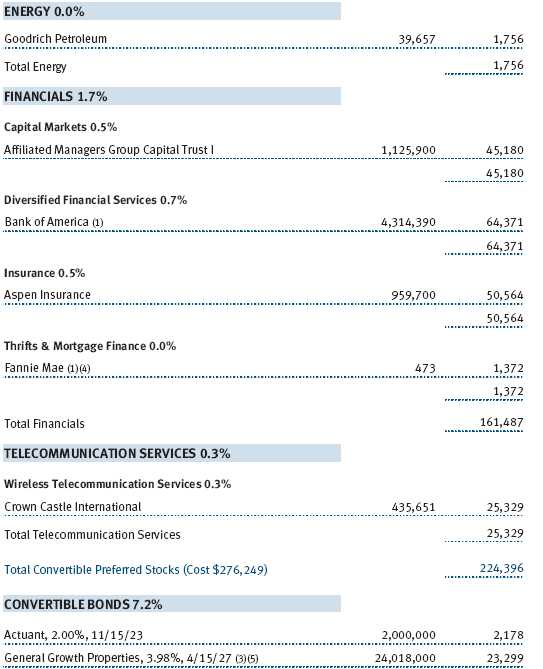
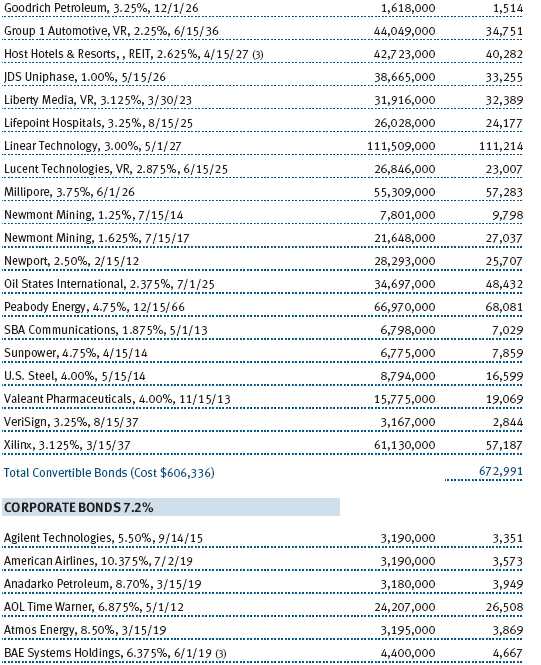
Our convertibles holdings were the strongest asset class for your fund in 2009 as well as in the second half of the year. Our convertible holdings appreciated 49.66% and 25.15% in 2009 and the second half, respectively. These returns were materially greater than that of the U.S. equity market. The strong returns were a function of the unusually depressed prices of late 2008 reverting to normal, improving corporate bond spreads and our holdings modestly outperforming the broader convertible indices. After having increased our exposure to convertibles in the second half of 2008, we have been steadily reducing our exposure as this asset class has appreciated closer to fair value.
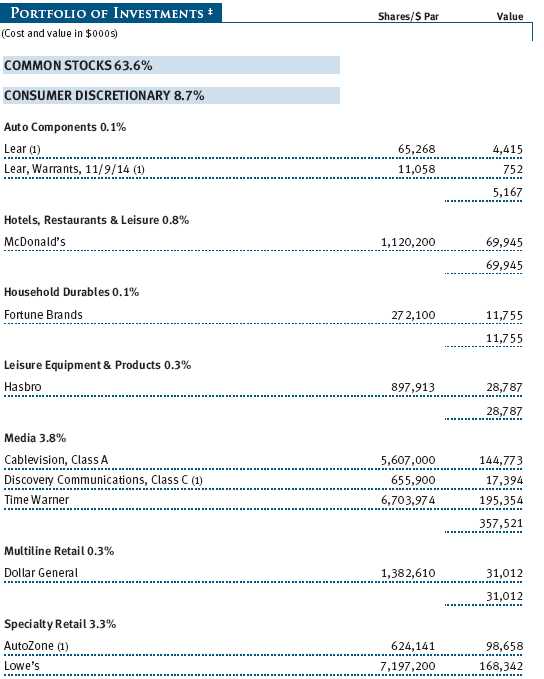
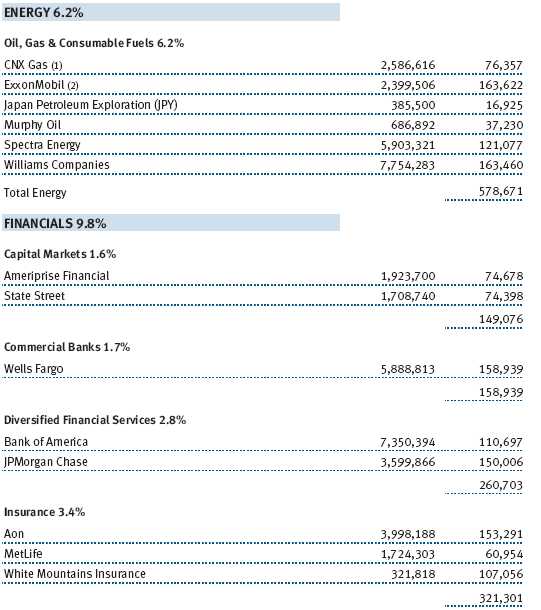
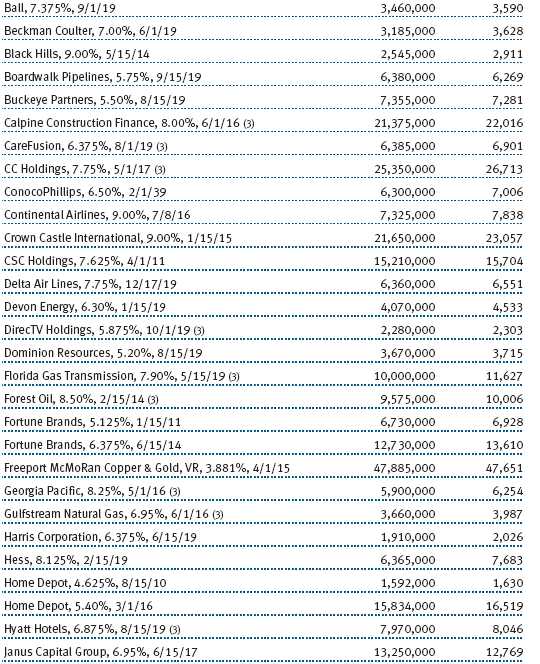
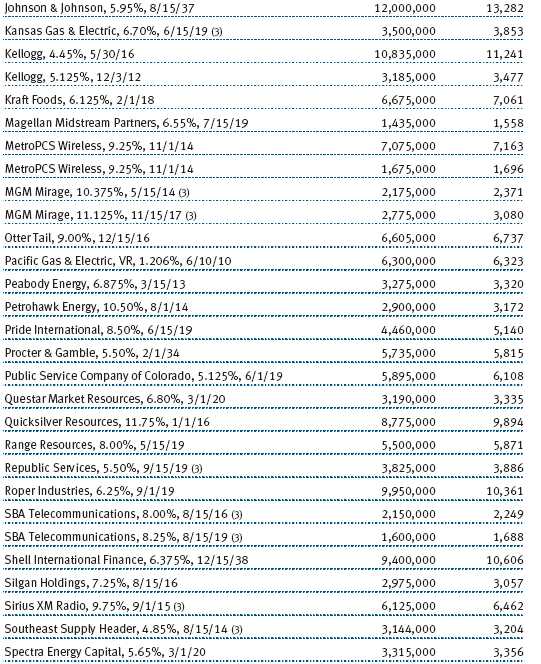
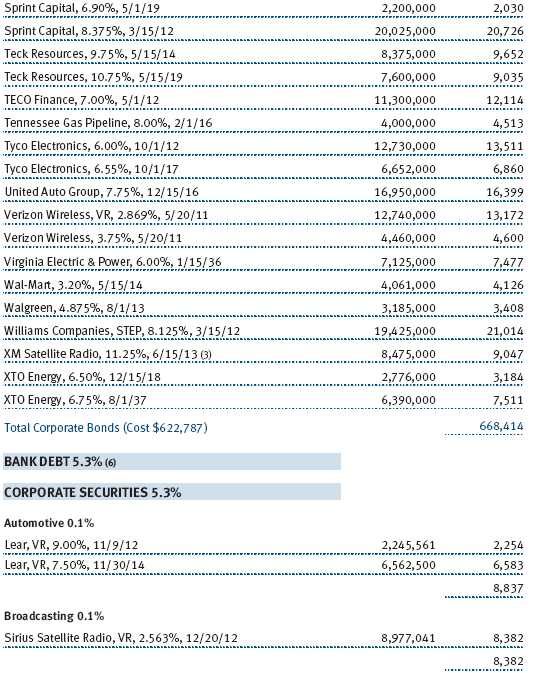
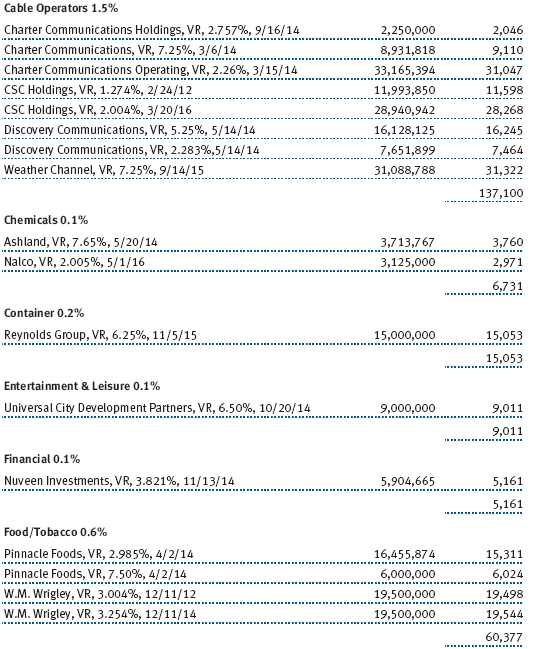
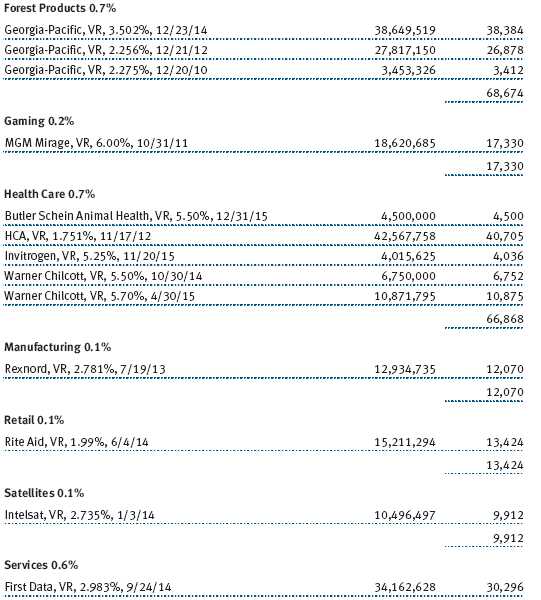
For 2009, our bonds also outperformed the equity market and significantly outperformed the bond market. Like the convertible market, the leveraged loan asset class (which makes up over half of our bonds) fell to irrationally low levels in late 2008, driven by forced hedge fund selling and credit market weakness. We took advantage of this opportunity to buy high-quality leveraged loans of Weather Channel, Wrigley, and Cablevision. In addition, we continued to add to this asset class in the second half of 2009 with new positions in First Data, Rite Aid, and Pinnacle Foods. While leveraged loans have appreciated significantly, we believe there is the potential for further gains and have not been lowering our exposure. (Please refer to the portfolio of investments for a complete listing of holdings and the amount each represents in the portfolio.)
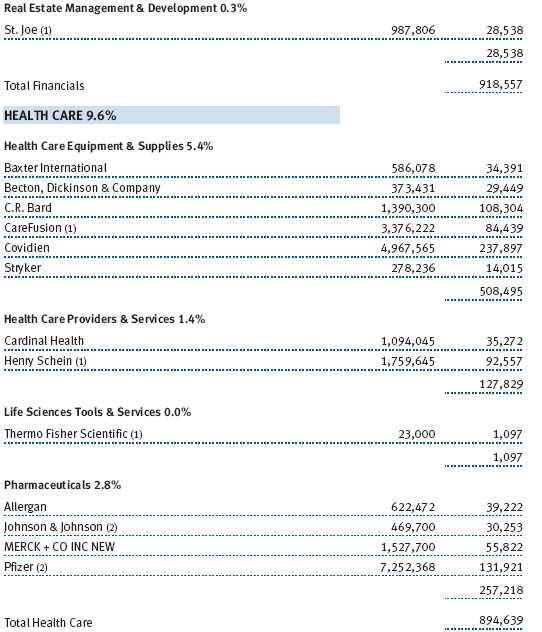
Within the equity part of the portfolio, our health care investments contributed to your fund’s absolute and relative returns in the second half of the year. Health care went from a large underweight in the first part of the year to a reasonable overweight in the second half as the health care sector lagged the equity market during the market recovery. Based on our analysis, the market remains overly focused on the potential negative ramifications of health care reform and the sector’s lower level of economic sensitivity relative to other sectors. These concerns drove valuations to more reasonable levels and allowed us to increase or initiate positions in Allergan, CareFusion, and Covidien at attractive prices.
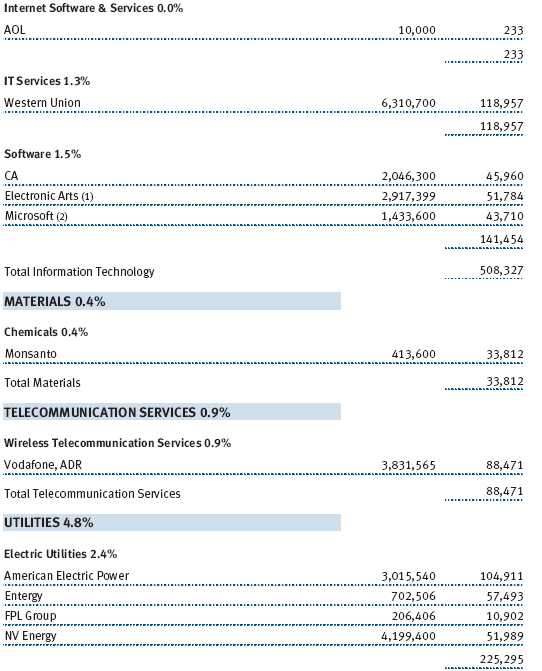
The technology sector was the largest absolute positive equity contributor to your fund in the second half but was also the worst relative contributor. Our large investment in Tyco Electronics was a positive contributor on an absolute and relative basis, driven by improving automotive demand, strong free cash flow that allowed the company to reduce its debt, and strong execution on a large restructuring program that allowed the company to lower its cost structure. However, we did not own any of the higher-multiple technology stocks that represent a material portion of the technology sector as they simply don’t meet our investment criteria. While avoiding these higher-multiple stocks in the second half hurt our relative performance, we believe (and history suggests) that high-multiple, richly valued stocks tend to underperform the market with greater risk. As such, they are not consistent with our twin goals of capital preservation and capital appreciation nor with our risk-aware investment strategy.
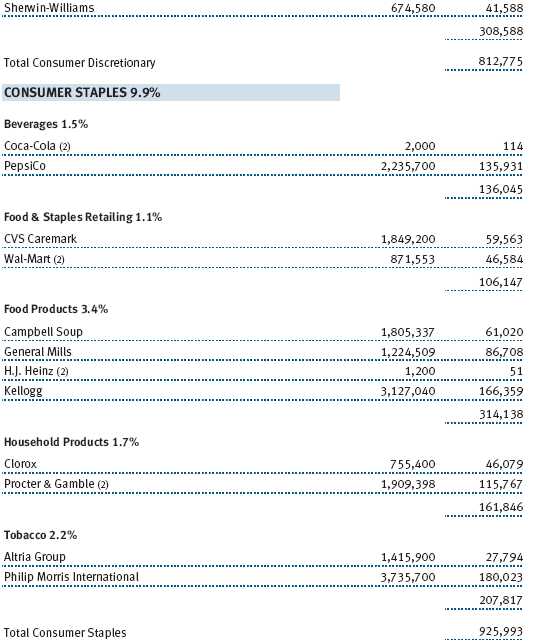
Our investments in the consumer discretionary sector were a positive contributor to your fund’s absolute and relative performance as the sector outperformed the market. Two new holdings in the fund were McDonald’s and AutoZone. Both stocks trailed the market early in the recovery and traded down to very attractive absolute and relative valuations. Both companies exhibit very shareholder-friendly capital allocation strategies that entail returning the bulk of their free cash flow to shareholders in the form of dividends and stock buybacks. While past performance cannot guarantee future results, over time, we have observed that stocks of companies that exhibit similar behavior tend to outperform the market over the long term.
PORTFOLIO STRATEGY AND OUTLOOK
As we look at the world today, the evidence suggests that U.S. and global economies are recovering. U.S. gross domestic product (GDP) growth turned positive in the third quarter of 2009, firms are no longer cutting inventories, and many of the leading economic indicators are foreshadowing positive trends at least through the first half of 2010. Emerging markets economies appear to be experiencing accelerating growth and improved exports and imports led by China. Finally, the U.S. unemployment rate appears to be peaking at around 10%, with early leading indicators such as temporary employment already improving, suggesting the U.S. unemployment rate will decline in 2010.
While an improving economy is a positive sign, the equity market tends to be a discounting mechanism. With the equity market up 65% from its March lows and currently trading for 15 times forward earnings, the market is pricing in much of the economic recovery. This is not to say that the market cannot move higher. However, with valuations having returned to their long-term average and investor sentiment more positive, it is more likely that intermediate-term equity market returns will be more muted. This is consistent with how stock markets perform in concert with prior recessions.
From a more micro level, we are finding fewer compelling investment opportunities than we were a year or even three months ago. The convertible market has climbed closer to fair value. High yield and investment-grade credit spreads have fallen to levels where we are no longer adding exposure. While long-term interest rates have begun to rise, we still see 10-year U.S. government bond yields below 4% as unattractive. As a result, we have very limited exposure to fixed rate debt.
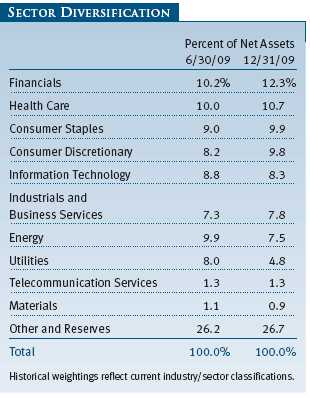
Within equities, we see value in some of the sectors and industries that have been left behind by the market’s rally, such as health care, consumer staples, utilities, and select consumer discretionary stocks. We believe valuations within these sectors are reasonably attractive on both an absolute and relative basis. Moreover, these sectors tend to offer attractive dividend yields and more downside protection if the economy and/or stock market were to stumble. Additionally, we are overweight in the financials sector. This sector underperformed the market in 2007, 2008, and 2009 and is still inexpensive on a more normalized earnings basis.
IN CLOSING
As always, I would like to thank the members of the fund’s Investment Advisory Committee for their valuable input throughout the year. This team, which comprises portfolio managers, quantitative experts, fixed income analysts, and equity analysts with many decades of combined investment experience, is responsible for the oversight of your fund and is supported by a growing global equity and fixed income platform of more than 170 analysts.
Thank you for the confidence you have placed in us and in T. Rowe Price.
Respectfully submitted,

David R. Giroux
Chairman of the fund’s Investment Advisory Committee
January 27, 2010
The committee chairman has day-to-day responsibility for managing the portfolio and works with committee members in developing and executing the fund’s investment program.
RISKS OF INVESTING
As with all stock and bond mutual funds, the fund’s share price can fall because of weakness in the stock or bond markets, a particular industry, or specific holdings. Stock markets can decline for many reasons, including adverse political or economic developments, changes in investor psychology, or heavy institutional selling. The prospects for an industry or company may deteriorate because of a variety of factors, including disappointing earnings or changes in the competitive environment. In addition, the investment manager’s assessment of companies held in a fund may prove incorrect, resulting in losses or poor performance even in rising markets. A sizable cash or fixed income position may hinder the fund from participating fully in a strong, rapidly rising bull market. In addition, significant exposure to bonds increases the risk that the fund’s share value could be hurt by rising interest rates or credit downgrades or defaults. Convertible securities are also exposed to price fluctuations of the company’s stock.
GLOSSARY
Lipper indexes: Fund benchmarks that consist of a small number of the largest mutual funds in a particular category as tracked by Lipper Inc.
Morningstar Moderate Allocation Average: Tracks the performance of funds that seek both moderate capital appreciation and income by investing in stocks, bonds, and cash.
Price/earnings (P/E) ratio: A ratio that shows the “multiple” of earnings at which a stock is selling. It is calculated by dividing a stock’s current price by its current earnings per share. For example, if a stock’s price is $60 per share and the issuing company earns $2 per share, the P/E ratio is $60/$2, or 30.
S&P 500 Stock Index: An unmanaged index that tracks the stocks of 500 primarily large-cap U.S. companies.

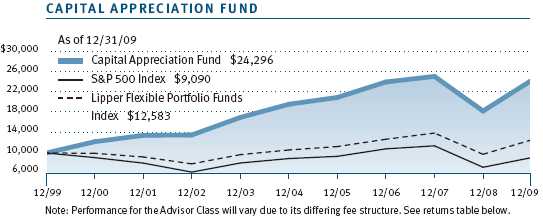
Performance and Expenses
This chart shows the value of a hypothetical $10,000 investment in the fund over the past 10 fiscal year periods or since inception (for funds lacking 10-year records). The result is compared with benchmarks, which may include a broad-based market index and a peer group average or index. Market indexes do not include expenses, which are deducted from fund returns as well as mutual fund averages and indexes.
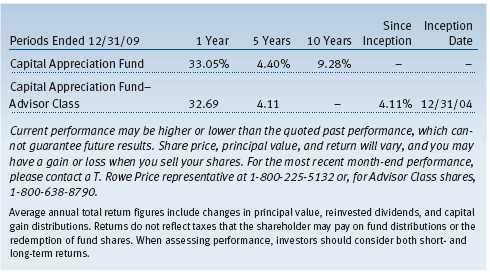
| AVERAGE ANNUAL COMPOUND TOTAL RETURN |
This table shows how the fund would have performed each year if its actual (or cumulative) returns had been earned at a constant rate.
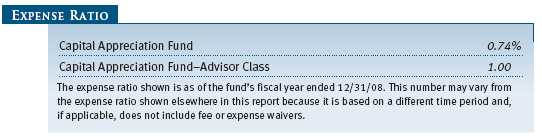
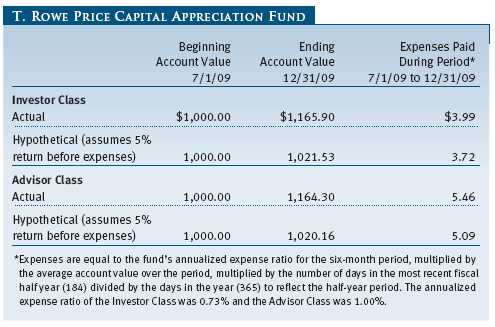
As a mutual fund shareholder, you may incur two types of costs: (1) transaction costs, such as redemption fees or sales loads, and (2) ongoing costs, including management fees, distribution and service (12b-1) fees, and other fund expenses. The following example is intended to help you understand your ongoing costs (in dollars) of investing in the fund and to compare these costs with the ongoing costs of investing in other mutual funds. The example is based on an investment of $1,000 invested at the beginning of the most recent six-month period and held for the entire period.
Please note that the fund has two share classes: The original share class (“investor class”) charges no distribution and service (12b-1) fee, and the Advisor Class shares are offered only through unaffiliated brokers and other financial intermediaries and charge a 0.25% 12b-1 fee. Each share class is presented separately in the table.
Actual Expenses
The first line of the following table (“Actual”) provides information about actual account values and expenses based on the fund’s actual returns. You may use the information in this line, together with your account balance, to estimate the expenses that you paid over the period. Simply divide your account value by $1,000 (for example, an $8,600 account value divided by $1,000 = 8.6), then multiply the result by the number in the first line under the heading “Expenses Paid During Period” to estimate the expenses you paid on your account during this period.
Hypothetical Example for Comparison Purposes
The information on the second line of the table (“Hypothetical”) is based on hypothetical account values and expenses derived from the fund’s actual expense ratio and an assumed 5% per year rate of return before expenses (not the fund’s actual return). You may compare the ongoing costs of investing in the fund with other funds by contrasting this 5% hypothetical example and the 5% hypothetical examples that appear in the shareholder reports of the other funds. The hypothetical account values and expenses may not be used to estimate the actual ending account balance or expenses you paid for the period.
Note: T. Rowe Price charges an annual small-account maintenance fee of $10, generally for accounts with less than $2,000 ($500 for UGMA/UTMA). The fee is waived for any investor whose T. Rowe Price mutual fund accounts total $25,000 or more, accounts employing automatic investing, and IRAs and other retirement plan accounts that utilize a prototype plan sponsored by T. Rowe Price (although a separate custodial or administrative fee may apply to such accounts). This fee is not included in the accompanying table. If you are subject to the fee, keep it in mind when you are estimating the ongoing expenses of investing in the fund and when comparing the expenses of this fund with other funds.
You should also be aware that the expenses shown in the table highlight only your ongoing costs and do not reflect any transaction costs, such as redemption fees or sales loads. Therefore, the second line of the table is useful in comparing ongoing costs only and will not help you determine the relative total costs of owning different funds. To the extent a fund charges transaction costs, however, the total cost of owning that fund is higher.
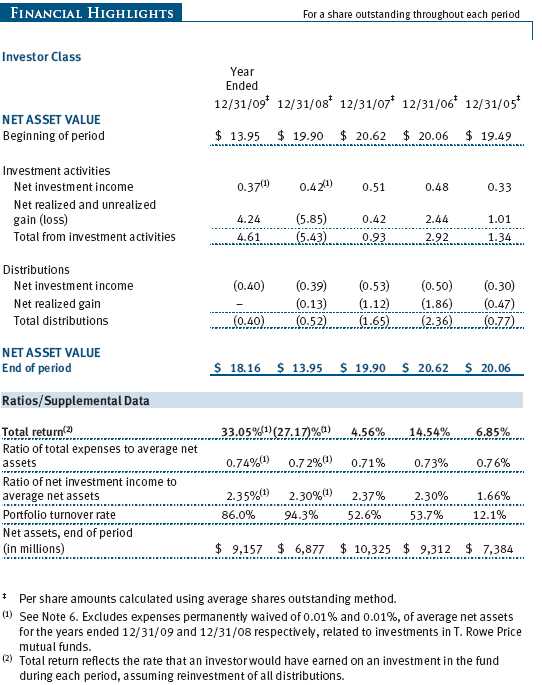
The accompanying notes are an integral part of these financial statements.
The accompanying notes are an integral part of these financial statements.


The accompanying notes are an integral part of these financial statements.

The accompanying notes are an integral part of these financial statements.
The accompanying notes are an integral part of these financial statements.
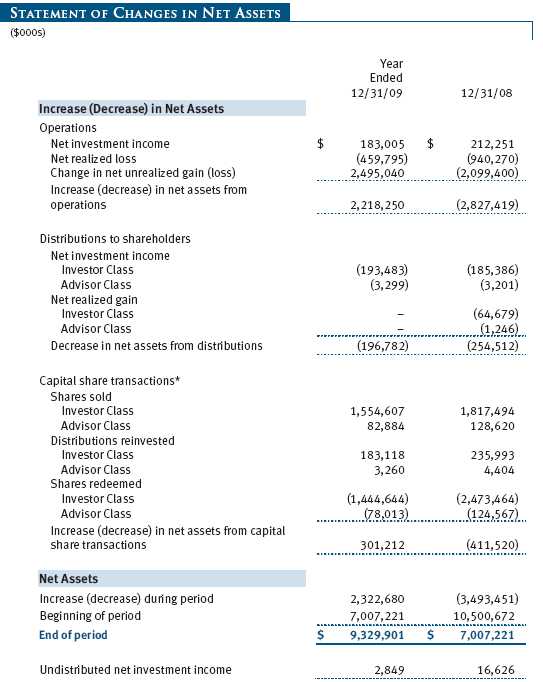
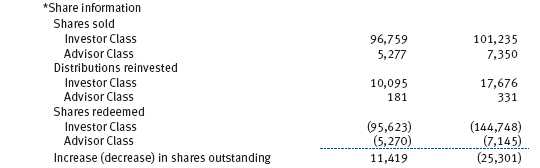
The accompanying notes are an integral part of these financial statements.
| NOTES TO FINANCIAL STATEMENTS |
T. Rowe Price Capital Appreciation Fund (the fund), is registered under the Investment Company Act of 1940 (the 1940 Act) as a diversified, open-end management investment company. The fund seeks long-term capital appreciation by investing primarily in common stocks. It may also hold fixed-income and other securities to help preserve principal value. The fund has two classes of shares: the Capital Appreciation Fund original share class, referred to in this report as the Investor Class, offered since June 30, 1986, and the Capital Appreciation Fund—Advisor Class (Advisor Class), offered since December 31, 2004. Advisor Class shares are sold only through unaffiliated brokers and other unaffiliated financial intermediaries that are compensated by the class for distribution, shareholder servicing, and/or certain administrative services under a Board-approved Rule 12b-1 plan. Each class has exclusive voting rights on matters related solely to that class; separate voting rights on matters that relate to both classes; and, in all other respects, the same rights and obligations as the other class.
NOTE 1 - SIGNIFICANT ACCOUNTING POLICIES
Basis of Preparation The accompanying financial statements were prepared in accordance with accounting principles generally accepted in the United States of America (GAAP), which require the use of estimates made by fund management. Fund management believes that estimates and security valuations are appropriate; however, actual results may differ from those estimates, and the security valuations reflected in the accompanying financial statements may differ from the value ultimately realized upon sale of the securities. Further, fund management believes that no events have occurred between December 31, 2009, the date of this report, and February 25, 2010, the date of issuance of the financial statements, that require adjustment of, or disclosure in, the accompanying financial statements.
Investment Transactions, Investment Income, and Distributions Income and expenses are recorded on the accrual basis. Premiums and discounts on debt securities are amortized for financial reporting purposes. Dividends received from mutual fund investments are reflected as dividend income; capital gain distributions are reflected as realized gain/loss. Dividend income and capital gain distributions are recorded on the ex-dividend date. Income tax-related interest and penalties, if incurred, would be recorded as income tax expense. Investment transactions are accounted for on the trade date. Realized gains and losses are reported on the identified cost basis. Distributions to shareholders are recorded on the ex-dividend date. Income distributions are declared and paid by each class annually. Capital gain distributions, if any, are generally declared and paid by the fund, annually.
Currency Translation Assets, including investments, and liabilities denominated in foreign currencies are translated into U.S. dollar values each day at the prevailing exchange rate, using the mean of the bid and asked prices of such currencies against U.S. dollars as quoted by a major bank. Purchases and sales of securities, income, and expenses are translated into U.S. dollars at the prevailing exchange rate on the date of the transaction. The effect of changes in foreign currency exchange rates on realized and unrealized security gains and losses is reflected as a component of security gains and losses.
Class Accounting The Advisor Class pays distribution, shareholder servicing, and/or certain administrative expenses in the form of Rule 12b-1 fees, in an amount not exceeding 0.25% of the class’s average daily net assets. Shareholder servicing, prospectus, and shareholder report expenses incurred by each class are charged directly to the class to which they relate. Expenses common to both classes, investment income, and realized and unrealized gains and losses are allocated to the classes based upon the relative daily net assets of each class.
Rebates and Credits Subject to best execution, the fund may direct certain security trades to brokers who have agreed to rebate a portion of the related brokerage commission to the fund in cash. Commission rebates are reflected as realized gain on securities in the accompanying financial statements and totaled $176,000 for the year ended December 31, 2009. Additionally, the fund earns credits on temporarily uninvested cash balances held at the custodian, which reduce the fund’s custody charges. Custody expense in the accompanying financial statements is presented before reduction for credits.
New Accounting Pronouncement On January 1, 2009, the fund adopted new accounting guidance that requires enhanced disclosures about derivative and hedging activities, including how such activities are accounted for and their effect on financial position, performance, and cash flows. Adoption of this guidance had no impact on the fund’s net assets or results of operations.
NOTE 2 - VALUATION
The fund’s investments are reported at fair value as defined under GAAP. The fund determines the values of its assets and liabilities and computes its net asset value per share at the close of the New York Stock Exchange (NYSE), normally 4 p.m. ET, each day that the NYSE is open for business.
Valuation Methods Equity securities listed or regularly traded on a securities exchange or in the over-the-counter (OTC) market are valued at the last quoted sale price or, for certain markets, the official closing price at the time the valuations are made, except for OTC Bulletin Board securities, which are valued at the mean of the latest bid and asked prices. A security that is listed or traded on more than one exchange is valued at the quotation on the exchange determined to be the primary market for such security. Listed securities not traded on a particular day are valued at the mean of the latest bid and asked prices for domestic securities and the last quoted sale price for international securities.
Debt securities are generally traded in the OTC market. Securities with remaining maturities of one year or more at the time of acquisition are valued at prices furnished by dealers who make markets in such securities or by an independent pricing service, which considers the yield or price of bonds of comparable quality, coupon, maturity, and type, as well as prices quoted by dealers who make markets in such securities. Securities with remaining maturities of less than one year at the time of acquisition generally use amortized cost in local currency to approximate fair value. However, if amortized cost is deemed not to reflect fair value or the fund holds a significant amount of such securities with remaining maturities of more than 60 days, the securities are valued at prices furnished by dealers who make markets in such securities or by an independent pricing service.
Investments in mutual funds are valued at the mutual fund’s closing net asset value per share on the day of valuation. Purchased and written options are valued at the mean of the closing bid and asked prices. Options on futures contracts are valued at the last sale price.
Other investments, including restricted securities, and those financial instruments for which the above valuation procedures are inappropriate or are deemed not to reflect fair value are stated at fair value as determined in good faith by the T. Rowe Price Valuation Committee, established by the fund’s Board of Trustees.
For valuation purposes, the last quoted prices of non-U.S. equity securities may be adjusted under the circumstances described below. If the fund determines that developments between the close of a foreign market and the close of the NYSE will, in its judgment, materially affect the value of some or all of its portfolio securities, the fund will adjust the previous closing prices to reflect what it believes to be the fair value of the securities as of the close of the NYSE. In deciding whether it is necessary to adjust closing prices to reflect fair value, the fund reviews a variety of factors, including developments in foreign markets, the performance of U.S. securities markets, and the performance of instruments trading in U.S. markets that represent foreign securities and baskets of foreign securities. A fund may also fair value securities in other situations, such as when a particular foreign market is closed but the fund is open. The fund uses outside pricing services to provide it with closing prices and information to evaluate and/or adjust those prices. The fund cannot predict how often it will use closing prices and how often it will determine it necessary to adjust those prices to reflect fair value. As a means of evaluating its security valuation process, the fund routinely compares closing prices, the next day’s opening prices in the same markets, and adjusted prices.
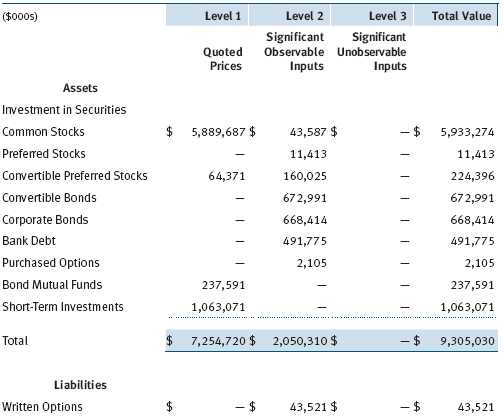
Valuation Inputs Various inputs are used to determine the value of the fund’s financial instruments. These inputs are summarized in the three broad levels listed below:
Level 1 – quoted prices in active markets for identical securities
Level 2 – observable inputs other than Level 1 quoted prices (including, but not limited to, quoted prices for similar securities, interest rates, prepayment speeds, and credit risk)
Level 3 – unobservable inputs
Observable inputs are those based on market data obtained from sources independent of the fund, and unobservable inputs reflect the fund’s own assumptions based on the best information available. The input levels are not necessarily an indication of the risk or liquidity associated with financial instruments at that level. For example, non-U.S. equity securities actively traded in foreign markets generally are reflected in Level 2 despite the availability of closing prices because the fund evaluates and determines whether those closing prices reflect fair value at the close of the NYSE or require adjustment, as described above. The following table summarizes the fund’s financial instruments, based on the inputs used to determine their values on December 31, 2009:
NOTE 3 - DERIVATIVE INSTRUMENTS
During the year ended December 31, 2009, the fund invested in derivative instruments. As defined by GAAP, a derivative is a financial instrument whose value is derived from an underlying security price, foreign exchange rate, interest rate, index of prices or rates, or other variable; it requires little or no initial investment and permits or requires net settlement. The fund invests in derivatives only if the expected risks and rewards are consistent with its investment objectives, policies, and overall risk profile, as described in its prospectus and Statement of Additional Information. The fund may use derivatives for a variety of purposes, such as seeking to hedge against declines in principal value, increase yield, invest in an asset with greater efficiency and at a lower cost than is possible through direct investment, or to adjust credit exposure. The risks associated with the use of derivatives are different from, and potentially much greater than, the risks associated with investing directly in the instruments on which the derivatives are based. Investments in derivatives can magnify returns positively or negatively; however, the fund at all times maintains sufficient cash reserves, liquid assets, or other SEC-permitted asset types to cover the settlement obligations under its open derivative contracts. During the year ended December 31, 2009, the fund’s exposure to derivatives, based on underlying notional amounts, was generally between 0% and 1% of net assets.
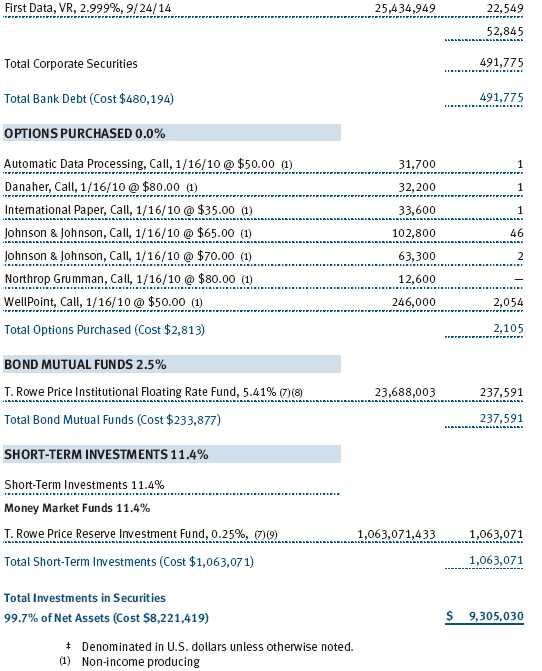
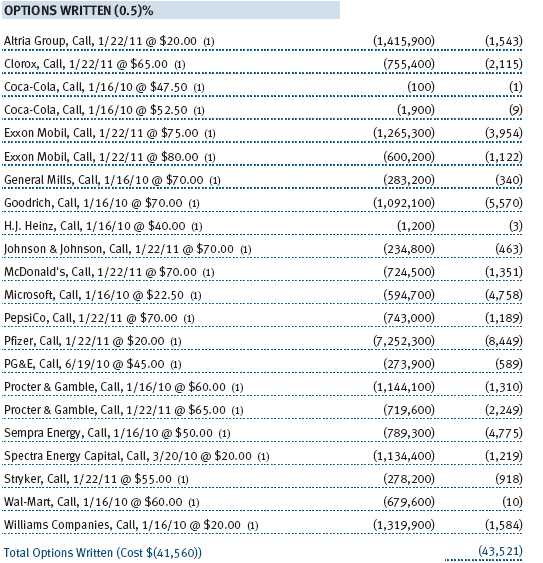
The fund values its derivatives at fair value, as described below and in Note 2, and recognizes changes in fair value currently in its results of operations. Accordingly, the fund does not follow hedge accounting, even for derivatives employed as economic hedges. As of December 31, 2009, the fund held equity derivatives with a fair value of $2,105,000, included in Investments in Securities, and $43,521,000, included in Written Options, on the accompanying Statement of Assets and Liabilities.
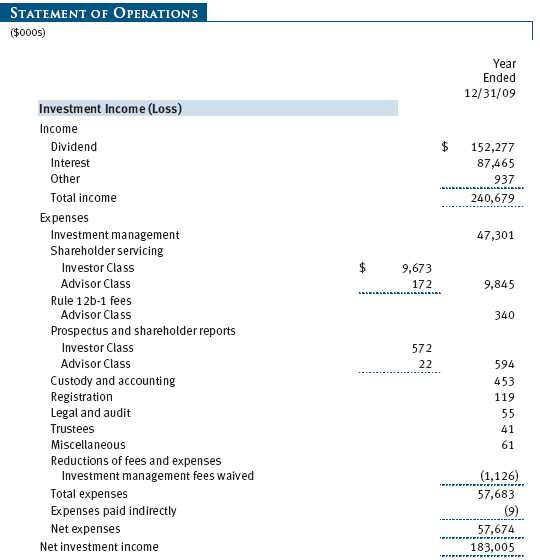
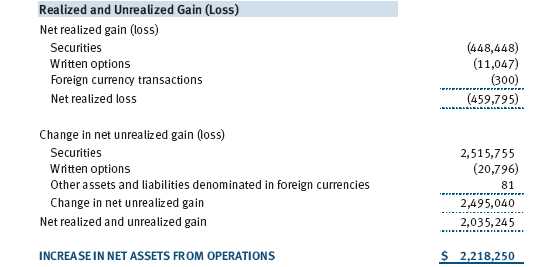
Additionally, the amount of gains and losses on derivative instruments recognized in fund earnings during the year ended December 31, 2009, and the related location on the accompanying Statement of Operations is summarized in the following table by primary underlying risk exposure:

Counterparty risk related to exchange-traded derivatives, including futures and options contracts, is minimal because the exchange’s clearinghouse provides protection against defaults. Additionally, for exchange-traded derivatives, each broker in its sole discretion may change margin requirements applicable to the fund.
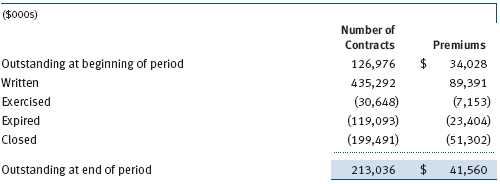
Options The fund is subject to equity price risk in the normal course of pursuing its investment objectives and uses options to help manage such risk. The fund may use call and put options to manage exposure to interest rates, security prices, foreign currencies, and credit quality; as an efficient means of adjusting exposure to all or a part of a target market; to enhance income; as a cash management tool; and/or to adjust credit exposure. Call and put options give the holder the right, in return for a premium paid, to purchase or sell, respectively, a security at a specified exercise price at any time during the period of the option. Options are included in net assets at fair value; purchased options are included in Investments in Securities; and written options are separately reflected as a liability on the accompanying Statement of Assets and Liabilities. Premiums on unexercised, expired options are recorded as realized gains or losses; premiums on exercised options are recorded as an adjustment to the proceeds from the sale or cost of the purchase. The difference between the premium and the amount received or paid in a closing transaction is also treated as realized gain or loss. Risks related to the use of options include possible illiquidity of the options markets; trading restrictions imposed by an exchange; movements in underlying security values; and for written options, potential losses in excess of the fund’s initial investment. Transactions in written options and related premiums received during the year ended December 31, 2009, were as follows:
NOTE 4 - OTHER INVESTMENT TRANSACTIONS
Consistent with its investment objective, the fund engages in the following practices to manage exposure to certain risks and/or to enhance performance. The investment objective, policies, program, and risk factors of the fund are described more fully in the fund’s prospectus and Statement of Additional Information.
Restricted Securities The fund may invest in securities that are subject to legal or contractual restrictions on resale. Prompt sale of such securities at an acceptable price may be difficult and may involve substantial delays and additional costs.
Bank Loans The fund may invest in bank loans, which represent interests in amounts owed by various borrowers to lenders or lending syndicates. A bank or other financial institution (lender) typically acts as agent for all holders and administers the bank loan in accordance with the credit agreement. Investments in bank loans may be in the form of loan assignments or loan participations. A loan assignment transfers direct ownership of all or a portion of specified third-party loans from the lender to the fund. Although loan assignments continue to be administered by the lender, the fund acquires direct rights against the borrower. In contrast, a loan participation generally entitles the fund to receive payments of principal, interest, and any fees that the lender is entitled to receive from the borrower; however, the lender continues to own and administer the loan. As a result, with loan participations, the fund generally has no right to enforce compliance with the terms of the credit agreement with the borrower, and the fund is subject to the credit risk of both the borrower and the lender.
Other Purchases and sales of portfolio securities other than short-term and U.S. government securities aggregated $5,911,764,000 and $6,199,286,000, respectively, for the year ended December 31, 2009. Purchases and sales of U.S. government securities aggregated $150,308,000 and $155,854,000, respectively, for the year ended December 31, 2009.
NOTE 5 - FEDERAL INCOME TAXES
No provision for federal income taxes is required since the fund intends to continue to qualify as a regulated investment company under Subchapter M of the Internal Revenue Code and distribute to shareholders all of its taxable income and gains. Distributions determined in accordance with federal income tax regulations may differ in amount or character from net investment income and realized gains for financial reporting purposes. Financial reporting records are adjusted for permanent book/tax differences to reflect tax character but are not adjusted for temporary differences.
The fund files U.S. federal, state, and local tax returns as required. The fund’s tax returns are subject to examination by the relevant tax authorities until expiration of the applicable statute of limitations, which is generally three years after filing of the tax return but could be longer in certain circumstances.
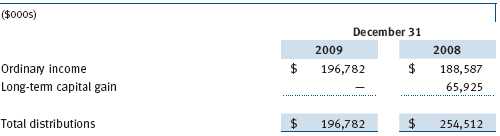
Distributions during the years ended December 31, 2009 and December 31, 2008, were characterized for tax purposes as follows:
At December 31, 2009, the tax-basis cost of investments and components of net assets were as follows:
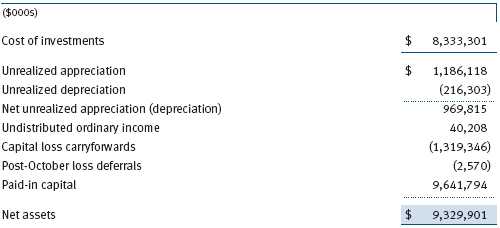
The difference between book-basis and tax-basis net unrealized appreciation (depreciation) is attributable to the deferral of losses from wash sales and the recognition of income on contingent debt obligations for tax purposes. The fund intends to retain realized gains to the extent of available capital loss carryforwards. The fund’s unused capital loss carryforwards as of December 31, 2009, expire: $264,565,000 in fiscal 2016 and $1,054,781,000 in fiscal 2017. In accordance with federal income tax regulations applicable to investment companies, recognition of capital losses on certain transactions realized between November 1 and the fund’s fiscal year end is deferred for tax purposes until the subsequent year (post-October loss deferrals); however, such losses are recognized for financial reporting purposes in the year realized.
NOTE 6 - RELATED PARTY TRANSACTIONS
The fund is managed by T. Rowe Price Associates, Inc. (the manager or Price Associates), a wholly owned subsidiary of T. Rowe Price Group, Inc. The investment management agreement between the fund and the manager provides for an annual investment management fee, which is computed daily and paid monthly. The fee consists of an individual fund fee, equal to 0.30% of the fund’s average daily net assets, and a group fee. The group fee rate is calculated based on the combined net assets of certain mutual funds sponsored by Price Associates (the group) applied to a graduated fee schedule, with rates ranging from 0.48% for the first $1 billion of assets to 0.285% for assets in excess of $220 billion. The fund’s group fee is determined by applying the group fee rate to the fund’s average daily net assets. At December 31, 2009, the effective annual group fee rate was 0.30%.
In addition, the fund has entered into service agreements with Price Associates and two wholly owned subsidiaries of Price Associates (collectively, Price). Price Associates computes the daily share prices and provides certain other administrative services to the fund. T. Rowe Price Services, Inc., provides shareholder and administrative services in its capacity as the fund’s transfer and dividend disbursing agent. T. Rowe Price Retirement Plan Services, Inc., provides subaccounting and recordkeeping services for certain retirement accounts invested in the Investor Class. For the year ended December 31, 2009, expenses incurred pursuant to these service agreements were $143,000 for Price Associates; $4,305,000 for T. Rowe Price Services, Inc.; and $1,799,000 for T. Rowe Price Retirement Plan Services, Inc. The total amount payable at period-end pursuant to these service agreements is reflected as Due to Affiliates in the accompanying financial statements.
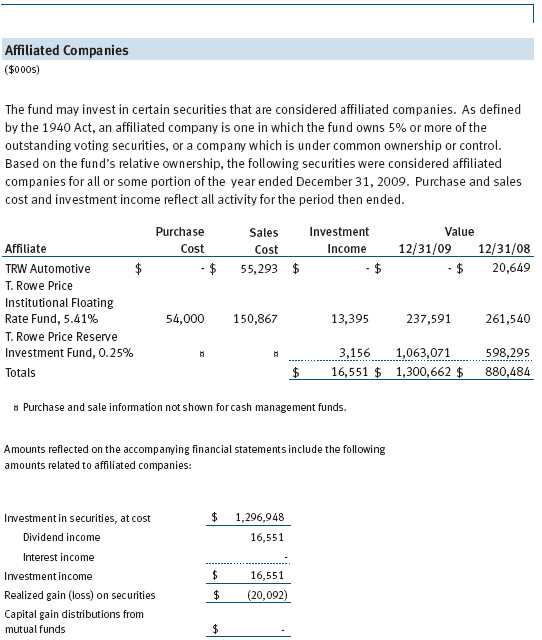
The fund may invest in the T. Rowe Price Reserve Investment Fund and the T. Rowe Price Government Reserve Investment Fund (collectively, the T. Rowe Price Reserve Investment Funds), open-end management investment companies managed by Price Associates and considered affiliates of the fund. The T. Rowe Price Reserve Investment Funds are offered as cash management options to mutual funds, trusts, and other accounts managed by Price Associates and/or its affiliates and are not available for direct purchase by members of the public. The T. Rowe Price Reserve Investment Funds pay no investment management fees.
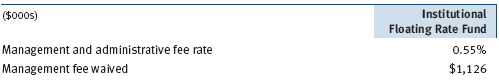
The fund may also invest in certain T. Rowe Price institutional funds (underlying institutional funds) as a means of gaining efficient and cost-effective exposure to certain markets. The underlying institutional funds are open-end management investment companies managed by Price Associates and/or T. Rowe Price International, Inc. (collectively, the Price managers) and are considered affiliates of the fund. Each underlying institutional fund pays an all-inclusive management and administrative fee to its Price manager. To ensure that the fund does not incur duplicate fees, each Price manager has agreed to permanently waive a portion of its management fee charged to the fund in an amount sufficient to fully offset the fees paid by the underlying institutional funds related to fund assets invested therein. Accordingly, the accompanying Statement of Operations includes management fees permanently waived pursuant to this agreement. Annual fee rates and amounts waived within the accompanying Statement of Operations related to shares of the underlying institutional funds for the year ended December 31, 2009, are as follows:
| REPORT OF INDEPENDENT REGISTERED PUBLIC ACCOUNTING FIRM |
To the Board of Trustees and Shareholders of
T. Rowe Price Capital Appreciation Fund
In our opinion, the accompanying statement of assets and liabilities, including the schedule of investments, and the related statements of operations and of changes in net assets and the financial highlights present fairly, in all material respects, the financial position of T. Rowe Price Capital Appreciation Fund (the “Fund”) at December 31, 2009, the results of its operations for the year then ended, the changes in its net assets for each of the two years in the period then ended and the financial highlights for each of the five years in the period then ended, in conformity with accounting principles generally accepted in the United States of America. These financial statements and financial highlights (hereafter referred to as “financial statements”) are the responsibility of the Fund’s management; our responsibility is to express an opinion on these financial statements based on our audits. We conducted our audits of these financial statements in accordance with the standards of the Public Company Accounting Oversight Board (United States). Those standards require that we plan and perform the audit to obtain reasonable assurance about whether the financial statements are free of material misstatement. An audit includes examining, on a test basis, evidence supporting the amounts and disclosures in the financial statements, assessing the accounting principles used and significant estimates made by management, and evaluating the overall financial statement presentation. We believe that our audits, which included confirmation of securities at December 31, 2009 by correspondence with the custodian and brokers, and confirmation of the underlying funds by correspondence with the transfer agent, provide a reasonable basis for our opinion.
PricewaterhouseCoopers LLP
Baltimore, Maryland
February 25, 2010
| TAX INFORMATION (UNAUDITED) FOR THE TAX YEAR ENDED 12/31/09 |
We are providing this information as required by the Internal Revenue Code. The amounts shown may differ from those elsewhere in this report because of differences between tax and financial reporting requirements.
For taxable non-corporate shareholders, $126,034,000 of the fund’s income represents qualified dividend income subject to the 15% rate category.
For corporate shareholders, $109,579,000 of the fund’s income qualifies for the dividends-received deduction.
| INFORMATION ON PROXY VOTING POLICIES, PROCEDURES, AND RECORDS |
A description of the policies and procedures used by T. Rowe Price funds and portfolios to determine how to vote proxies relating to portfolio securities is available in each fund’s Statement of Additional Information, which you may request by calling 1-800-225-5132 or by accessing the SEC’s Web site, www.sec.gov. The description of our proxy voting policies and procedures is also available on our Web site, www.troweprice.com. To access it, click on the words “Our Company” at the top of our corporate homepage. Then, when the next page appears, click on the words “Proxy Voting Policies” on the left side of the page.
Each fund’s most recent annual proxy voting record is available on our Web site and through the SEC’s Web site. To access it through our Web site, follow the directions above, then click on the words “Proxy Voting Records” on the right side of the Proxy Voting Policies page.
| HOW TO OBTAIN QUARTERLY PORTFOLIO HOLDINGS |
The fund files a complete schedule of portfolio holdings with the Securities and Exchange Commission for the first and third quarters of each fiscal year on Form N-Q. The fund’s Form N-Q is available electronically on the SEC’s Web site (www.sec.gov); hard copies may be reviewed and copied at the SEC’s Public Reference Room, 450 Fifth St. N.W., Washington, DC 20549. For more information on the Public Reference Room, call 1-800-SEC-0330.
| ABOUT THE FUND’S TRUSTEES AND OFFICERS |
Your fund is governed by a Board of Trustees (Board) that meets regularly to review a wide variety of matters affecting the fund, including performance, investment programs, compliance matters, advisory fees and expenses, service providers, and other business affairs. The Board elects the fund’s officers, who are listed in the final table. At least 75% of Board members are independent of T. Rowe Price Associates, Inc. (T. Rowe Price), and T. Rowe Price International, Inc. (T. Rowe Price International); “inside” or “interested” trustees are employees or officers of T. Rowe Price. The business address of each trustee and officer is 100 East Pratt Street, Baltimore, Maryland 21202. The Statement of Additional Information includes additional information about the trustees and is available without charge by calling a T. Rowe Price representative at 1-800-225-5132.
| Independent Trustees | |
| |
| Name | |
| (Year of Birth) | Principal Occupation(s) During Past Five Years and Directorships of |
| Year Elected* | Other Public Companies |
| | |
| William R. Brody, M.D., Ph.D. | President and Trustee, Salk Institute for Biological Studies (2009 |
| (1944) | to present); Director, Novartis, Inc. (2009 to present); Director, IBM |
| 2009 | (2007 to present); President and Trustee, Johns Hopkins University |
| | (1996 to 2009); Chairman of Executive Committee and Trustee, |
| | Johns Hopkins Health System (1996 to 2009) |
| | |
| Jeremiah E. Casey | Director, National Life Insurance (2001 to 2005); Director, The Rouse |
| (1940) | Company, real estate developers (1990 to 2004) |
| 2005 | |
| | |
| Anthony W. Deering | Chairman, Exeter Capital, LLC, a private investment firm (2004 to |
| (1945) | present); Director, Under Armour (2008 to present); Director, Vornado |
| 2001 | Real Estate Investment Trust (2004 to present); Director, Mercantile |
| | Bankshares (2002 to 2007); Member, Advisory Board, Deutsche Bank |
| | North America (2004 to present); Director, Chairman of the Board, |
| | and Chief Executive Officer, The Rouse Company, real estate develop- |
| | ers (1997 to 2004) |
| | |
| Donald W. Dick, Jr. | Principal, EuroCapital Advisors, LLC, an acquisition and management |
| (1943) | advisory firm (1995 to present) |
| 1986 | |
| | |
| Karen N. Horn | Director, Eli Lilly and Company (1987 to present); Director, Simon |
| (1943) | Property Group (2004 to present); Director, Norfolk Southern (2008 |
| 2003 | to present); Director, Georgia Pacific (2004 to 2005) |
| | |
| Theo C. Rodgers | President, A&R Development Corporation (1977 to present) |
| (1941) | |
| 2005 | |
| | |
| John G. Schreiber | Owner/President, Centaur Capital Partners, Inc., a real estate invest- |
| (1946) | ment company (1991 to present); Partner, Blackstone Real Estate |
| 2001 | Advisors, L.P. (1992 to present) |
| | |
| Mark R. Tercek | President and Chief Executive Officer, The Nature Conservancy (2008 |
| (1957) | to present); Managing Director, The Goldman Sachs Group, Inc. |
| 2009 | (1984 to 2008) |
| |
| *Each independent trustee oversees 124 T. Rowe Price portfolios and serves until retirement, resignation, or |
| election of a successor. | |
| Inside Trustees | |
| |
| Name | |
| (Year of Birth) | |
| Year Elected* | |
| [Number of T. Rowe Price | Principal Occupation(s) During Past Five Years and Directorships of |
| Portfolios Overseen] | Other Public Companies |
| | |
| Edward C. Bernard | Director and Vice President, T. Rowe Price; Vice Chairman of the Board, |
| (1956) | Director, and Vice President, T. Rowe Price Group, Inc.; Chairman of |
| 2006 | the Board, Director, and President, T. Rowe Price Investment Services, |
| [124] | Inc.; Chairman of the Board and Director, T. Rowe Price Global Asset |
| | Management Limited, T. Rowe Price Global Investment Services |
| | Limited, T. Rowe Price Retirement Plan Services, Inc., T. Rowe Price |
| | Savings Bank, and T. Rowe Price Services, Inc.; Director, T. Rowe Price |
| | International, Inc.; Chief Executive Officer, Chairman of the Board, |
| | Director, and President, T. Rowe Price Trust Company; Chairman of the |
| | Board, all funds |
| | |
| Brian C. Rogers, CFA, CIC | Chief Investment Officer, Director, and Vice President, T. Rowe Price; |
| (1955) | Chairman of the Board, Chief Investment Officer, Director, and Vice |
| 2006 | President, T. Rowe Price Group, Inc.; Vice President, T. Rowe Price |
| [69] | Trust Company |
| |
| *Each inside trustee serves until retirement, resignation, or election of a successor. |
| Officers | |
| |
| Name (Year of Birth) | |
| Position Held With Capital Appreciation Fund | Principal Occupation(s) |
| | |
| Francisco Alonso (1978) | Vice President, T. Rowe Price and T. Rowe Price |
| Vice President | Group, Inc. |
| | |
| Jeffrey W. Arricale, CPA (1971) | Vice President, T. Rowe Price and T. Rowe Price |
| Vice President | Group, Inc. |
| | |
| Ryan Burgess, CFA (1974) | Vice President, T. Rowe Price; formerly intern, |
| Vice President | T. Rowe Price (to 2006); Vice President and |
| | Senior Portfolio Manager, Evergreen Private |
| | Asset Management (to 2005) |
| | |
| Roger L. Fiery III, CPA (1959) | Vice President, T. Rowe Price, T. Rowe Price |
| Vice President | Group, Inc., T. Rowe Price International, Inc., |
| | and T. Rowe Price Trust Company |
| | |
| Mark S. Finn, CFA, CPA (1963) | Vice President, T. Rowe Price and T. Rowe Price |
| Vice President | Group, Inc. |
| | |
| John R. Gilner (1961) | Chief Compliance Officer and Vice President, |
| Chief Compliance Officer | T. Rowe Price; Vice President, T. Rowe Price |
| | Group, Inc., and T. Rowe Price Investment |
| | Services, Inc. |
| | |
| David R. Giroux, CFA (1975) | Vice President, T. Rowe Price, T. Rowe Price |
| President | Group, Inc., and T. Rowe Price Trust Company |
| | |
| Gregory S. Golczewski (1966) | Vice President, T. Rowe Price and T. Rowe Price |
| Vice President | Trust Company |
| | |
| Paul D. Greene II (1978) | Vice President, T. Rowe Price and T. Rowe Price |
| Vice President | Group, Inc.; formerly student, Graduate School |
| | of Business, Stanford University (to 2006); |
| | Finance & Operations Analyst, ArvinMeritor, Inc. |
| | (to 2004) |
| | |
| Gregory K. Hinkle, CPA (1958) | Vice President, T. Rowe Price, T. Rowe Price |
| Treasurer | Group, Inc., and T. Rowe Price Trust Company; |
| | formerly Partner, PricewaterhouseCoopers LLP |
| | (to 2007) |
| | |
| John D. Linehan, CFA (1965) | Vice President, T. Rowe Price, T. Rowe Price |
| Vice President | Group, Inc., and T. Rowe Price Trust Company |
| | |
| Patricia B. Lippert (1953) | Assistant Vice President, T. Rowe Price and |
| Secretary | T. Rowe Price Investment Services, Inc. |
| | |
| Paul M. Massaro, CFA (1975) | Vice President, T. Rowe Price and T. Rowe Price |
| Vice President | Group, Inc. |
| | |
| Heather K. McPherson, CPA (1967) | Vice President, T. Rowe Price and T. Rowe Price |
| Vice President | Group, Inc. |
| | |
| Joseph M. Milano, CFA (1972) | Vice President, T. Rowe Price and T. Rowe Price |
| Vice President | Group, Inc. |
| | |
| Sudhir Nanda, Ph.D., CFA (1959) | Vice President, T. Rowe Price and T. Rowe Price |
| Vice President | Group, Inc. |
| | |
| David Oestreicher (1967) | Director and Vice President, T. Rowe Price |
| Vice President | Investment Services, Inc., T. Rowe Price Trust |
| | Company, and T. Rowe Price Services, Inc.; Vice |
| | President, T. Rowe Price, T. Rowe Price Global |
| | Asset Management Limited, T. Rowe Price Global |
| | Investment Services Limited, T. Rowe Price |
| | Group, Inc., T. Rowe Price International, Inc., and |
| | T. Rowe Price Retirement Plan Services, Inc. |
| | |
| Robert T. Quinn, Jr. (1972) | Vice President, T. Rowe Price and T. Rowe Price |
| Vice President | Group, Inc. |
| | |
| Deborah D. Seidel (1962) | Vice President, T. Rowe Price, T. Rowe Price |
| Vice President | Investment Services, Inc., and T. Rowe Price |
| | Services, Inc. |
| | |
| Gabriel Solomon (1977) | Vice President, T. Rowe Price and T. Rowe Price |
| Vice President | Group, Inc. |
| | |
| William J. Stromberg, CFA (1960) | Director and Vice President, T. Rowe Price; |
| Vice President | Vice President, T. Rowe Price Group, Inc., and |
| | T. Rowe Price Trust Company |
| | |
| Taymour R. Tamaddon, CFA (1976) | Vice President, T. Rowe Price and T. Rowe Price |
| Vice President | Group, Inc. |
| | |
| Susan G. Troll, CPA (1966) | Vice President, T. Rowe Price and T. Rowe Price |
| Vice President | Group, Inc. |
| | |
| Eric L. Veiel, CFA (1972) | Vice President, T. Rowe Price and T. Rowe Price |
| Vice President | Group, Inc.; formerly Senior Equity Analyst, |
| | Wachovia Securities (to 2005) |
| | |
| Julie L. Waples (1970) | Vice President, T. Rowe Price |
| Vice President | |
| | |
| Tamara P. Wiggs (1979) | Vice President, T. Rowe Price; formerly Vice |
| Vice President | President, Institutional Equity Trading, Merrill |
| | Lynch & Co., Inc. (to 2007) |
| |
| Unless otherwise noted, officers have been employees of T. Rowe Price or T. Rowe Price International for at least |
| five years. | |
Item 2. Code of Ethics.
The registrant has adopted a code of ethics, as defined in Item 2 of Form N-CSR, applicable to its principal executive officer, principal financial officer, principal accounting officer or controller, or persons performing similar functions. A copy of this code of ethics is filed as an exhibit to this Form N-CSR. No substantive amendments were approved or waivers were granted to this code of ethics during the period covered by this report.
Item 3. Audit Committee Financial Expert.
The registrant’s Board of Directors/Trustees has determined that Mr. Anthony W. Deering qualifies as an audit committee financial expert, as defined in Item 3 of Form N-CSR. Mr. Deering is considered independent for purposes of Item 3 of Form N-CSR.
Item 4. Principal Accountant Fees and Services.
(a) – (d) Aggregate fees billed to the registrant for the last two fiscal years for professional services rendered by the registrant’s principal accountant were as follows:
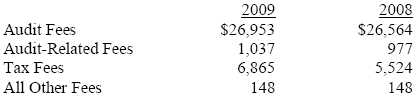
Audit fees include amounts related to the audit of the registrant’s annual financial statements and services normally provided by the accountant in connection with statutory and regulatory filings. Audit-related fees include amounts reasonably related to the performance of the audit of the registrant’s financial statements and specifically include the issuance of a report on internal controls and, if applicable, agreed-upon procedures related to fund acquisitions. Tax fees include amounts related to services for tax compliance, tax planning, and tax advice. The nature of these services specifically includes the review of distribution calculations and the preparation of Federal, state, and excise tax returns. All other fees include the registrant’s pro-rata share of amounts for agreed-upon procedures in conjunction with service contract approvals by the registrant’s Board of Directors/Trustees.
(e)(1) The registrant’s audit committee has adopted a policy whereby audit and non-audit services performed by the registrant’s principal accountant for the registrant, its investment adviser, and any entity controlling, controlled by, or under common control with the investment adviser that provides ongoing services to the registrant require pre-approval in advance at regularly scheduled audit committee meetings. If such a service is required between regularly scheduled audit committee meetings, pre-approval may be authorized by one audit committee member with ratification at the next scheduled audit committee meeting. Waiver of pre-approval for audit or non-audit services requiring fees of a de minimis amount is not permitted.
(2) No services included in (b) – (d) above were approved pursuant to paragraph (c)(7)(i)(C) of Rule 2-01 of Regulation S-X.
(f) Less than 50 percent of the hours expended on the principal accountant’s engagement to audit the registrant’s financial statements for the most recent fiscal year were attributed to work performed by persons other than the principal accountant’s full-time, permanent employees.
(g) The aggregate fees billed for the most recent fiscal year and the preceding fiscal year by the registrant’s principal accountant for non-audit services rendered to the registrant, its investment adviser, and any entity controlling, controlled by, or under common control with the investment adviser that provides ongoing services to the registrant were $1,879,000 and $1,922,000, respectively.
(h) All non-audit services rendered in (g) above were pre-approved by the registrant’s audit committee. Accordingly, these services were considered by the registrant’s audit committee in maintaining the principal accountant’s independence.
Item 5. Audit Committee of Listed Registrants.
Not applicable.
Item 6. Investments.
(a) Not applicable. The complete schedule of investments is included in Item 1 of this Form N-CSR.
(b) Not applicable.
Item 7. Disclosure of Proxy Voting Policies and Procedures for Closed-End Management Investment Companies.
Not applicable.
Item 8. Portfolio Managers of Closed-End Management Investment Companies.
Not applicable.
Item 9. Purchases of Equity Securities by Closed-End Management Investment Company and Affiliated Purchasers.
Not applicable.
Item 10. Submission of Matters to a Vote of Security Holders.
Not applicable.
Item 11. Controls and Procedures.
(a) The registrant’s principal executive officer and principal financial officer have evaluated the registrant’s disclosure controls and procedures within 90 days of this filing and have concluded that the registrant’s disclosure controls and procedures were effective, as of that date, in ensuring that information required to be disclosed by the registrant in this Form N-CSR was recorded, processed, summarized, and reported timely.
(b) The registrant’s principal executive officer and principal financial officer are aware of no change in the registrant’s internal control over financial reporting that occurred during the registrant’s second fiscal quarter covered by this report that has materially affected, or is reasonably likely to materially affect, the registrant’s internal control over financial reporting.
Item 12. Exhibits.
(a)(1) The registrant’s code of ethics pursuant to Item 2 of Form N-CSR is attached.
(2) Separate certifications by the registrant's principal executive officer and principal financial officer, pursuant to Section 302 of the Sarbanes-Oxley Act of 2002 and required by Rule 30a-2(a) under the Investment Company Act of 1940, are attached.
(3) Written solicitation to repurchase securities issued by closed-end companies: not applicable.
(b) A certification by the registrant's principal executive officer and principal financial officer, pursuant to Section 906 of the Sarbanes-Oxley Act of 2002 and required by Rule 30a-2(b) under the Investment Company Act of 1940, is attached.
| | |
SIGNATURES |
| |
| | Pursuant to the requirements of the Securities Exchange Act of 1934 and the Investment |
| Company Act of 1940, the registrant has duly caused this report to be signed on its behalf by the |
| undersigned, thereunto duly authorized. |
| |
| T. Rowe Price Capital Appreciation Fund |
| |
| |
| |
| By | /s/ Edward C. Bernard |
| | Edward C. Bernard |
| | Principal Executive Officer |
| |
| Date | February 25, 2010 |
| |
| |
| |
| | Pursuant to the requirements of the Securities Exchange Act of 1934 and the Investment |
| Company Act of 1940, this report has been signed below by the following persons on behalf of |
| the registrant and in the capacities and on the dates indicated. |
| |
| |
| By | /s/ Edward C. Bernard |
| | Edward C. Bernard |
| | Principal Executive Officer |
| |
| Date | February 25, 2010 |
| |
| |
| |
| By | /s/ Gregory K. Hinkle |
| | Gregory K. Hinkle |
| | Principal Financial Officer |
| |
| Date | February 25, 2010 |