UNITED STATES
SECURITIES AND EXCHANGE COMMISSION
Washington, D.C. 20549
FORM N-CSR
CERTIFIED SHAREHOLDER REPORT OF REGISTERED
MANAGEMENT INVESTMENT COMPANIES
Investment Company Act File Number: 811-04519
T. Rowe Price Capital Appreciation Fund, Inc.
(Exact name of registrant as specified in charter)
100 East Pratt Street, Baltimore, MD 21202
(Address of principal executive offices)
David Oestreicher
100 East Pratt Street, Baltimore, MD 21202
(Name and address of agent for service)
Registrant’s telephone number, including area code: (410) 345-2000
Date of fiscal year end: December 31
Date of reporting period: December 31, 2024
Item 1. Reports to Shareholders
(a) Report pursuant to Rule 30e-1
Annual Shareholder Report
December 31, 2024
Capital Appreciation Fund
This annual shareholder report contains important information about Capital Appreciation Fund (the "fund") for the period of January 1, 2024 to December 31, 2024. You can find the fund’s prospectus, financial information on Form N‑CSR (which includes required tax information for dividends), holdings, proxy voting information, and other information atwww.troweprice.com/prospectus. You can also request this information without charge by contacting T. Rowe Price at 1‑800‑638‑5660 or info@troweprice.com or contacting your intermediary.
What were the fund costs for the last year? (based on a hypothetical $10,000 investment)
| | Costs of a $10,000 investment | Costs paid as a percentage of a $10,000 investment |
|---|
| Capital Appreciation Fund - Investor Class | $74 | 0.70% |
|---|
What drove fund performance during the past 12 months?
U.S. stocks produced strong gains for the second consecutive year in 2024, and various equity indexes reached all-time highs during the year. The equity market was buoyed by generally favorable corporate earnings and by continuing interest in companies expected to benefit from artificial intelligence developments.
Versus the all-equity S&P 500 Index, the leading contributor to relative performance was an underweight allocation to consumer staples, as the traditionally defensive sector lagged the broader benchmark in a market that strongly favored growth-oriented names. Stock selection in materials also added value, driven by our favorable position in multinational chemical company Linde, which outpaced sector peers.
On the negative side, an overweight allocation to health care was the leading detractor from relative results. While the health care sector advanced, it lagged amid investor preference for more growth-oriented sectors. Stock selection in the information technology sector also weighed on relative results, driven primarily by an average underweight allocation to NVIDIA. While we were underweight to the stock relative to the benchmark, our absolute position in the name was significant and reflected our favorable view of the company.
The fund seeks long-term capital appreciation by investing primarily in common stocks. It also holds fixed income and other securities to help preserve principal value. Notable changes in positioning during the period included adding exposure to health care and information technology and reducing exposure to financials and industrials and business services.
How has the fund performed?
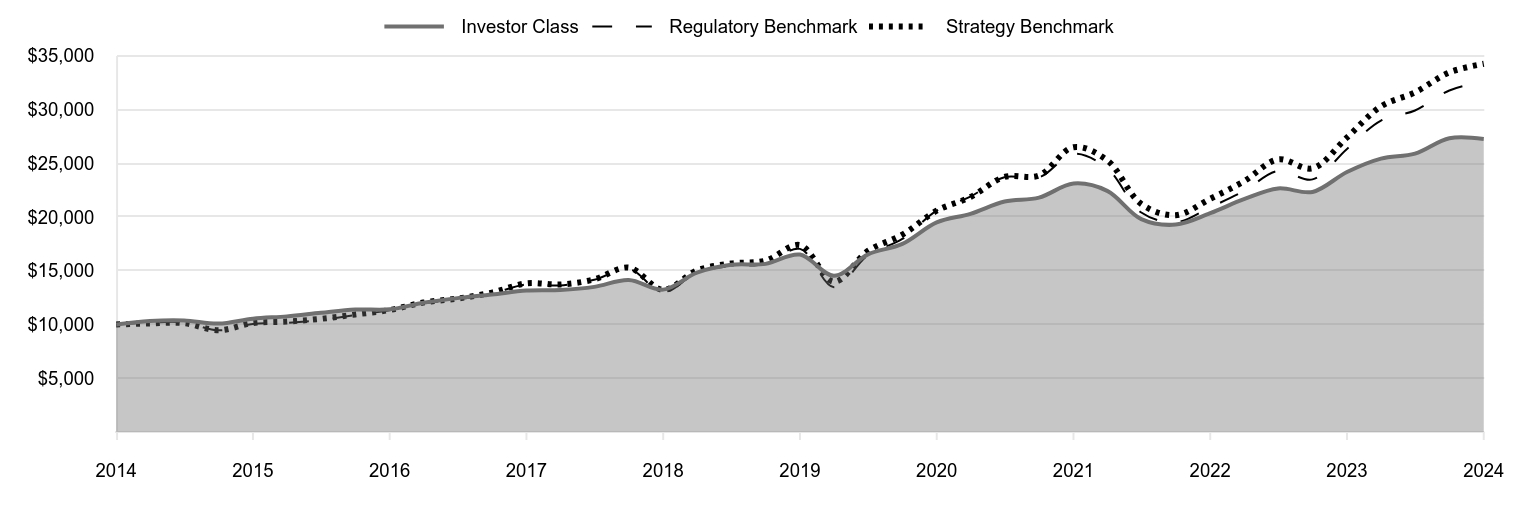
Cumulative Returns of a Hypothetical $10,000 Investment as of December 31, 2024
| Investor Class | Regulatory Benchmark | Strategy Benchmark |
|---|
| 2014 | 10,000 | 10,000 | 10,000 |
|---|
| 2015 | 10,321 | 10,180 | 10,095 |
|---|
| 2015 | 10,371 | 10,194 | 10,123 |
|---|
| 2015 | 10,084 | 9,455 | 9,471 |
|---|
| 2015 | 10,542 | 10,048 | 10,138 |
|---|
| 2016 | 10,756 | 10,145 | 10,275 |
|---|
| 2016 | 11,089 | 10,412 | 10,527 |
|---|
| 2016 | 11,392 | 10,870 | 10,933 |
|---|
| 2016 | 11,408 | 11,327 | 11,351 |
|---|
| 2017 | 12,018 | 11,978 | 12,039 |
|---|
| 2017 | 12,454 | 12,339 | 12,411 |
|---|
| 2017 | 12,785 | 12,903 | 12,967 |
|---|
| 2017 | 13,163 | 13,721 | 13,829 |
|---|
| 2018 | 13,218 | 13,633 | 13,724 |
|---|
| 2018 | 13,498 | 14,163 | 14,195 |
|---|
| 2018 | 14,135 | 15,172 | 15,290 |
|---|
| 2018 | 13,244 | 13,002 | 13,223 |
|---|
| 2019 | 14,821 | 14,828 | 15,027 |
|---|
| 2019 | 15,550 | 15,435 | 15,674 |
|---|
| 2019 | 15,640 | 15,614 | 15,940 |
|---|
| 2019 | 16,503 | 17,035 | 17,386 |
|---|
| 2020 | 14,526 | 13,475 | 13,979 |
|---|
| 2020 | 16,524 | 16,443 | 16,850 |
|---|
| 2020 | 17,497 | 17,957 | 18,355 |
|---|
| 2020 | 19,499 | 20,593 | 20,585 |
|---|
| 2021 | 20,294 | 21,900 | 21,856 |
|---|
| 2021 | 21,437 | 23,705 | 23,724 |
|---|
| 2021 | 21,803 | 23,681 | 23,863 |
|---|
| 2021 | 23,113 | 25,877 | 26,494 |
|---|
| 2022 | 22,431 | 24,512 | 25,276 |
|---|
| 2022 | 19,805 | 20,418 | 21,206 |
|---|
| 2022 | 19,292 | 19,506 | 20,170 |
|---|
| 2022 | 20,353 | 20,907 | 21,696 |
|---|
| 2023 | 21,653 | 22,408 | 23,322 |
|---|
| 2023 | 22,653 | 24,288 | 25,361 |
|---|
| 2023 | 22,331 | 23,497 | 24,531 |
|---|
| 2023 | 24,185 | 26,334 | 27,399 |
|---|
| 2024 | 25,433 | 28,973 | 30,291 |
|---|
| 2024 | 25,897 | 29,904 | 31,589 |
|---|
| 2024 | 27,323 | 31,767 | 33,448 |
|---|
| 2024 | 27,253 | 32,604 | 34,254 |
|---|
202501-4140694, 202502-4108205
Average Annual Total Returns
| | 1 Year | 5 Years | 10 Years |
|---|
| Capital Appreciation Fund (Investor Class) | 12.69% | 10.55% | 10.55% |
|---|
| Russell 3000 Index (Regulatory Benchmark) | 23.81 | 13.86 | 12.55 |
|---|
| S&P 500 Index (Strategy Benchmark) | 25.02 | 14.53 | 13.10 |
|---|
The preceding line graph shows the value of a hypothetical $10,000 investment in the fund over the past 10 fiscal year periods or since inception (for funds lacking 10-year records). The fund’s performance information included in the line graph and table above is compared with a regulatory required index that represents an overall securities market (Regulatory Benchmark). In addition, the line graph and table may also include one or more indexes that more closely aligns to the fund's investment strategy (Strategy Benchmark(s)). Due to new SEC Rules on shareholder reporting the fund adopted a new broad-based securities market index, referred to as the Regulatory Benchmark. Market index returns do not include expenses, which are deducted from fund returns. The fund's total return figures reflect the reinvestment of dividends and capital gains, if any.Neither the fund’s returns nor the index returns reflect the deduction of taxes that a shareholder would pay on fund distributions or redemptions of fund shares.The fund’s past performance is not a good predictor of the fund’s future performance.Updated performance information can be found at www.troweprice.com.
What are some fund statistics?
- Total Net Assets (000s)$64,235,830
- Number of Portfolio Holdings294
- Investment Advisory Fees Paid (000s)$345,888
- Portfolio Turnover Rate85.0%
What did the fund invest in?
Security Allocation (as a % of Net Assets)
| Common and Preferred Stocks | 61.8% |
| Bonds | 34.3 |
| Reserves | 3.9 |
Top Ten Holdings (as a % of Net Assets)
| U.S. Treasury Notes | 14.7% |
| Microsoft | 5.2 |
| Amazon.com | 3.3 |
| Becton Dickinson & Company | 2.9 |
| HUB International | 2.8 |
| NVIDIA | 2.8 |
| Roper Technologies | 2.6 |
| Fortive | 2.5 |
| UnitedHealth Group | 2.5 |
| Revvity | 2.3 |
If you invest directly with T. Rowe Price, you can elect to receive future shareholder reports or other important documents through electronic delivery by enrolling at www.troweprice.com/paperless. If you invest through a financial intermediary such as an investment advisor, a bank, retirement plan sponsor or a brokerage firm, please contact that organization and ask if it can provide electronic delivery.
Frank Russell Company "LSE" and S&P do not accept any liability for any errors or omissions in the indexes or data, and hereby expressly disclaim all warranties of originality, accuracy, completeness, timeliness, merchantability and fitness for a particular purpose. No party may rely on any indexes or data contained in this communication. Visit www.troweprice.com/en/us/market-data-disclosures for additional legal notices & disclaimers.
Capital Appreciation Fund
Investor Class (PRWCX)
T. Rowe Price Investment Services, Inc.
100 East Pratt Street
Baltimore, MD 21202
Annual Shareholder Report
December 31, 2024
Capital Appreciation Fund
This annual shareholder report contains important information about Capital Appreciation Fund (the "fund") for the period of January 1, 2024 to December 31, 2024. You can find the fund’s prospectus, financial information on Form N‑CSR (which includes required tax information for dividends), holdings, proxy voting information, and other information atwww.troweprice.com/prospectus. You can also request this information without charge by contacting T. Rowe Price at 1‑800‑638‑5660 or info@troweprice.com or contacting your intermediary.
What were the fund costs for the last year? (based on a hypothetical $10,000 investment)
| | Costs of a $10,000 investment | Costs paid as a percentage of a $10,000 investment |
|---|
| Capital Appreciation Fund - Advisor Class | $102 | 0.96% |
|---|
What drove fund performance during the past 12 months?
U.S. stocks produced strong gains for the second consecutive year in 2024, and various equity indexes reached all-time highs during the year. The equity market was buoyed by generally favorable corporate earnings and by continuing interest in companies expected to benefit from artificial intelligence developments.
Versus the all-equity S&P 500 Index, the leading contributor to relative performance was an underweight allocation to consumer staples, as the traditionally defensive sector lagged the broader benchmark in a market that strongly favored growth-oriented names. Stock selection in materials also added value, driven by our favorable position in multinational chemical company Linde, which outpaced sector peers.
On the negative side, an overweight allocation to health care was the leading detractor from relative results. While the health care sector advanced, it lagged amid investor preference for more growth-oriented sectors. Stock selection in the information technology sector also weighed on relative results, driven primarily by an average underweight allocation to NVIDIA. While we were underweight to the stock relative to the benchmark, our absolute position in the name was significant and reflected our favorable view of the company.
The fund seeks long-term capital appreciation by investing primarily in common stocks. It also holds fixed income and other securities to help preserve principal value. Notable changes in positioning during the period included adding exposure to health care and information technology and reducing exposure to financials and industrials and business services.
How has the fund performed?
Cumulative Returns of a Hypothetical $10,000 Investment as of December 31, 2024
| Advisor Class | Regulatory Benchmark | Strategy Benchmark |
|---|
| 2014 | 10,000 | 10,000 | 10,000 |
|---|
| 2015 | 10,313 | 10,180 | 10,095 |
|---|
| 2015 | 10,355 | 10,194 | 10,123 |
|---|
| 2015 | 10,062 | 9,455 | 9,471 |
|---|
| 2015 | 10,512 | 10,048 | 10,138 |
|---|
| 2016 | 10,715 | 10,145 | 10,275 |
|---|
| 2016 | 11,041 | 10,412 | 10,527 |
|---|
| 2016 | 11,334 | 10,870 | 10,933 |
|---|
| 2016 | 11,342 | 11,327 | 11,351 |
|---|
| 2017 | 11,937 | 11,978 | 12,039 |
|---|
| 2017 | 12,361 | 12,339 | 12,411 |
|---|
| 2017 | 12,675 | 12,903 | 12,967 |
|---|
| 2017 | 13,041 | 13,721 | 13,829 |
|---|
| 2018 | 13,087 | 13,633 | 13,724 |
|---|
| 2018 | 13,357 | 14,163 | 14,195 |
|---|
| 2018 | 13,977 | 15,172 | 15,290 |
|---|
| 2018 | 13,091 | 13,002 | 13,223 |
|---|
| 2019 | 14,635 | 14,828 | 15,027 |
|---|
| 2019 | 15,343 | 15,435 | 15,674 |
|---|
| 2019 | 15,423 | 15,614 | 15,940 |
|---|
| 2019 | 16,259 | 17,035 | 17,386 |
|---|
| 2020 | 14,300 | 13,475 | 13,979 |
|---|
| 2020 | 16,259 | 16,443 | 16,850 |
|---|
| 2020 | 17,201 | 17,957 | 18,355 |
|---|
| 2020 | 19,152 | 20,593 | 20,585 |
|---|
| 2021 | 19,925 | 21,900 | 21,856 |
|---|
| 2021 | 21,027 | 23,705 | 23,724 |
|---|
| 2021 | 21,374 | 23,681 | 23,863 |
|---|
| 2021 | 22,641 | 25,877 | 26,494 |
|---|
| 2022 | 21,958 | 24,512 | 25,276 |
|---|
| 2022 | 19,377 | 20,418 | 21,206 |
|---|
| 2022 | 18,862 | 19,506 | 20,170 |
|---|
| 2022 | 19,884 | 20,907 | 21,696 |
|---|
| 2023 | 21,140 | 22,408 | 23,322 |
|---|
| 2023 | 22,103 | 24,288 | 25,361 |
|---|
| 2023 | 21,777 | 23,497 | 24,531 |
|---|
| 2023 | 23,566 | 26,334 | 27,399 |
|---|
| 2024 | 24,766 | 28,973 | 30,291 |
|---|
| 2024 | 25,196 | 29,904 | 31,589 |
|---|
| 2024 | 26,573 | 31,767 | 33,448 |
|---|
| 2024 | 26,492 | 32,604 | 34,254 |
|---|
202501-4140694, 202502-4108205
Average Annual Total Returns
| | 1 Year | 5 Years | 10 Years |
|---|
| Capital Appreciation Fund (Advisor Class) | 12.41% | 10.26% | 10.23% |
|---|
| Russell 3000 Index (Regulatory Benchmark) | 23.81 | 13.86 | 12.55 |
|---|
| S&P 500 Index (Strategy Benchmark) | 25.02 | 14.53 | 13.10 |
|---|
The preceding line graph shows the value of a hypothetical $10,000 investment in the fund over the past 10 fiscal year periods or since inception (for funds lacking 10-year records). The fund’s performance information included in the line graph and table above is compared with a regulatory required index that represents an overall securities market (Regulatory Benchmark). In addition, the line graph and table may also include one or more indexes that more closely aligns to the fund's investment strategy (Strategy Benchmark(s)). Due to new SEC Rules on shareholder reporting the fund adopted a new broad-based securities market index, referred to as the Regulatory Benchmark. Market index returns do not include expenses, which are deducted from fund returns. The fund's total return figures reflect the reinvestment of dividends and capital gains, if any.Neither the fund’s returns nor the index returns reflect the deduction of taxes that a shareholder would pay on fund distributions or redemptions of fund shares.The fund’s past performance is not a good predictor of the fund’s future performance.Updated performance information can be found at www.troweprice.com.
What are some fund statistics?
- Total Net Assets (000s)$64,235,830
- Number of Portfolio Holdings294
- Investment Advisory Fees Paid (000s)$345,888
- Portfolio Turnover Rate85.0%
What did the fund invest in?
Security Allocation (as a % of Net Assets)
| Common and Preferred Stocks | 61.8% |
| Bonds | 34.3 |
| Reserves | 3.9 |
Top Ten Holdings (as a % of Net Assets)
| U.S. Treasury Notes | 14.7% |
| Microsoft | 5.2 |
| Amazon.com | 3.3 |
| Becton Dickinson & Company | 2.9 |
| HUB International | 2.8 |
| NVIDIA | 2.8 |
| Roper Technologies | 2.6 |
| Fortive | 2.5 |
| UnitedHealth Group | 2.5 |
| Revvity | 2.3 |
If you invest directly with T. Rowe Price, you can elect to receive future shareholder reports or other important documents through electronic delivery by enrolling at www.troweprice.com/paperless. If you invest through a financial intermediary such as an investment advisor, a bank, retirement plan sponsor or a brokerage firm, please contact that organization and ask if it can provide electronic delivery.
Frank Russell Company "LSE" and S&P do not accept any liability for any errors or omissions in the indexes or data, and hereby expressly disclaim all warranties of originality, accuracy, completeness, timeliness, merchantability and fitness for a particular purpose. No party may rely on any indexes or data contained in this communication. Visit www.troweprice.com/en/us/market-data-disclosures for additional legal notices & disclaimers.
Capital Appreciation Fund
Advisor Class (PACLX)
T. Rowe Price Investment Services, Inc.
100 East Pratt Street
Baltimore, MD 21202
Annual Shareholder Report
December 31, 2024
Capital Appreciation Fund
This annual shareholder report contains important information about Capital Appreciation Fund (the "fund") for the period of January 1, 2024 to December 31, 2024. You can find the fund’s prospectus, financial information on Form N‑CSR (which includes required tax information for dividends), holdings, proxy voting information, and other information atwww.troweprice.com/prospectus. You can also request this information without charge by contacting T. Rowe Price at 1‑800‑638‑5660 or info@troweprice.com or contacting your intermediary.
What were the fund costs for the last year? (based on a hypothetical $10,000 investment)
| | Costs of a $10,000 investment | Costs paid as a percentage of a $10,000 investment |
|---|
| Capital Appreciation Fund - I Class | $61 | 0.57% |
|---|
What drove fund performance during the past 12 months?
U.S. stocks produced strong gains for the second consecutive year in 2024, and various equity indexes reached all-time highs during the year. The equity market was buoyed by generally favorable corporate earnings and by continuing interest in companies expected to benefit from artificial intelligence developments.
Versus the all-equity S&P 500 Index, the leading contributor to relative performance was an underweight allocation to consumer staples, as the traditionally defensive sector lagged the broader benchmark in a market that strongly favored growth-oriented names. Stock selection in materials also added value, driven by our favorable position in multinational chemical company Linde, which outpaced sector peers.
On the negative side, an overweight allocation to health care was the leading detractor from relative results. While the health care sector advanced, it lagged amid investor preference for more growth-oriented sectors. Stock selection in the information technology sector also weighed on relative results, driven primarily by an average underweight allocation to NVIDIA. While we were underweight to the stock relative to the benchmark, our absolute position in the name was significant and reflected our favorable view of the company.
The fund seeks long-term capital appreciation by investing primarily in common stocks. It also holds fixed income and other securities to help preserve principal value. Notable changes in positioning during the period included adding exposure to health care and information technology and reducing exposure to financials and industrials and business services.
How has the fund performed?
Cumulative Returns of a Hypothetical $500,000 Investment as of December 31, 2024

| I Class | Regulatory Benchmark | Strategy Benchmark |
|---|
| 12/17/15 | 500,000 | 500,000 | 500,000 |
|---|
| 12/31/15 | 502,204 | 501,104 | 500,805 |
|---|
| 3/31/16 | 512,425 | 505,956 | 507,555 |
|---|
| 6/30/16 | 528,657 | 519,265 | 520,017 |
|---|
| 9/30/16 | 543,086 | 542,101 | 540,048 |
|---|
| 12/31/16 | 544,074 | 564,920 | 560,701 |
|---|
| 3/31/17 | 573,343 | 597,365 | 594,714 |
|---|
| 6/30/17 | 594,309 | 615,379 | 613,080 |
|---|
| 9/30/17 | 610,085 | 643,510 | 640,548 |
|---|
| 12/31/17 | 628,290 | 684,291 | 683,111 |
|---|
| 3/31/18 | 631,177 | 679,881 | 677,925 |
|---|
| 6/30/18 | 644,724 | 706,321 | 701,204 |
|---|
| 9/30/18 | 675,373 | 756,638 | 755,272 |
|---|
| 12/31/18 | 633,044 | 648,422 | 653,161 |
|---|
| 3/31/19 | 708,628 | 739,483 | 742,304 |
|---|
| 6/30/19 | 743,439 | 769,766 | 774,252 |
|---|
| 9/30/19 | 747,969 | 778,714 | 787,401 |
|---|
| 12/31/19 | 789,437 | 849,557 | 858,818 |
|---|
| 3/31/20 | 695,179 | 672,002 | 690,507 |
|---|
| 6/30/20 | 790,953 | 820,028 | 832,359 |
|---|
| 9/30/20 | 837,703 | 895,532 | 906,684 |
|---|
| 12/31/20 | 933,968 | 1,027,010 | 1,016,830 |
|---|
| 3/31/21 | 972,268 | 1,092,194 | 1,079,619 |
|---|
| 6/30/21 | 1,027,255 | 1,182,188 | 1,171,913 |
|---|
| 9/30/21 | 1,045,311 | 1,180,986 | 1,178,735 |
|---|
| 12/31/21 | 1,108,310 | 1,290,553 | 1,308,715 |
|---|
| 3/31/22 | 1,075,951 | 1,222,431 | 1,248,534 |
|---|
| 6/30/22 | 950,408 | 1,018,271 | 1,047,506 |
|---|
| 9/30/22 | 926,139 | 972,809 | 996,360 |
|---|
| 12/31/22 | 977,115 | 1,042,677 | 1,071,695 |
|---|
| 3/31/23 | 1,039,911 | 1,117,544 | 1,152,041 |
|---|
| 6/30/23 | 1,088,241 | 1,211,271 | 1,252,754 |
|---|
| 9/30/23 | 1,073,117 | 1,171,858 | 1,211,746 |
|---|
| 12/31/23 | 1,162,586 | 1,313,323 | 1,353,419 |
|---|
| 3/31/24 | 1,222,944 | 1,444,909 | 1,496,285 |
|---|
| 6/30/24 | 1,245,578 | 1,491,377 | 1,560,382 |
|---|
| 9/30/24 | 1,314,510 | 1,584,277 | 1,652,235 |
|---|
| 12/31/24 | 1,311,824 | 1,625,996 | 1,692,040 |
|---|
202501-4140694, 202502-4108205
Average Annual Total Returns
| | 1 Year | 5 Years | Since Inception 12/17/15 |
|---|
| Capital Appreciation Fund (I Class) | 12.84% | 10.69% | 11.26% |
|---|
| Russell 3000 Index (Regulatory Benchmark) | 23.81 | 13.86 | 13.94 |
|---|
| S&P 500 Index (Strategy Benchmark) | 25.02 | 14.53 | 14.44 |
|---|
The preceding line graph shows the value of a hypothetical $500,000 investment in the fund over the past 10 fiscal year periods or since inception (for funds lacking 10-year records). The fund’s performance information included in the line graph and table above is compared with a regulatory required index that represents an overall securities market (Regulatory Benchmark). In addition, the line graph and table may also include one or more indexes that more closely aligns to the fund's investment strategy (Strategy Benchmark(s)). Due to new SEC Rules on shareholder reporting the fund adopted a new broad-based securities market index, referred to as the Regulatory Benchmark. Market index returns do not include expenses, which are deducted from fund returns. The fund's total return figures reflect the reinvestment of dividends and capital gains, if any.Neither the fund’s returns nor the index returns reflect the deduction of taxes that a shareholder would pay on fund distributions or redemptions of fund shares.The fund’s past performance is not a good predictor of the fund’s future performance.Updated performance information can be found at www.troweprice.com.
What are some fund statistics?
- Total Net Assets (000s)$64,235,830
- Number of Portfolio Holdings294
- Investment Advisory Fees Paid (000s)$345,888
- Portfolio Turnover Rate85.0%
What did the fund invest in?
Security Allocation (as a % of Net Assets)
| Common and Preferred Stocks | 61.8% |
| Bonds | 34.3 |
| Reserves | 3.9 |
Top Ten Holdings (as a % of Net Assets)
| U.S. Treasury Notes | 14.7% |
| Microsoft | 5.2 |
| Amazon.com | 3.3 |
| Becton Dickinson & Company | 2.9 |
| HUB International | 2.8 |
| NVIDIA | 2.8 |
| Roper Technologies | 2.6 |
| Fortive | 2.5 |
| UnitedHealth Group | 2.5 |
| Revvity | 2.3 |
If you invest directly with T. Rowe Price, you can elect to receive future shareholder reports or other important documents through electronic delivery by enrolling at www.troweprice.com/paperless. If you invest through a financial intermediary such as an investment advisor, a bank, retirement plan sponsor or a brokerage firm, please contact that organization and ask if it can provide electronic delivery.
Frank Russell Company "LSE" and S&P do not accept any liability for any errors or omissions in the indexes or data, and hereby expressly disclaim all warranties of originality, accuracy, completeness, timeliness, merchantability and fitness for a particular purpose. No party may rely on any indexes or data contained in this communication. Visit www.troweprice.com/en/us/market-data-disclosures for additional legal notices & disclaimers.
Capital Appreciation Fund
I Class (TRAIX)
T. Rowe Price Investment Services, Inc.
100 East Pratt Street
Baltimore, MD 21202
Item 1. (b) Notice pursuant to Rule 30e-3.
Not applicable.
Item 2. Code of Ethics.
The registrant has adopted a code of ethics, as defined in Item 2 of Form N-CSR, applicable to its principal executive officer, principal financial officer, principal accounting officer or controller, or persons performing similar functions. A copy of this code of ethics is filed as an exhibit to this Form N-CSR. No substantive amendments were approved or waivers were granted to this code of ethics during the period covered by this report.
Item 3. Audit Committee Financial Expert.
The registrant’s Board of Directors has determined that Mr. Paul F. McBride qualifies as an audit committee financial expert, as defined in Item 3 of Form N-CSR. Mr. McBride is considered independent for purposes of Item 3 of Form N-CSR.
Item 4. Principal Accountant Fees and Services.
(a) – (d) Aggregate fees billed for the last two fiscal years for professional services rendered to, or on behalf of, the registrant by the registrant’s principal accountant were as follows:
| | | | | | | | | | |
| | | 2024 | | | 2023 | | | |
Audit Fees | | $ | 46,029 | | | $ | 46,733 | |
Audit-Related Fees | | | - | | | | - | |
Tax Fees | | | - | | | | - | |
All Other Fees | | | - | | | | - | |
Audit fees include amounts related to the audit of the registrant’s annual financial statements and services normally provided by the accountant in connection with statutory and regulatory filings. Audit-related fees include amounts reasonably related to the performance of the audit of the registrant’s financial statements and specifically include the issuance of a report on internal controls and, if applicable, agreed-upon procedures related to fund acquisitions. Tax fees include amounts related to services for tax compliance, tax planning, and tax advice. The nature of these services specifically includes the review of distribution calculations and the preparation of Federal, state, and excise tax returns. All other fees include the registrant’s pro-rata share of amounts for agreed-upon procedures in conjunction with service contract approvals by the registrant’s Board of Directors/Trustees.
(e)(1) The registrant’s audit committee has adopted a policy whereby audit and non-audit services performed by the registrant’s principal accountant for the registrant, its investment adviser, and any entity controlling, controlled by, or under common control with the investment adviser that provides ongoing services to the registrant require pre-approval in advance at regularly scheduled audit committee meetings. If such a service is required between regularly scheduled audit committee meetings, pre-approval may be authorized by one audit committee member with ratification at the next scheduled audit committee meeting. Waiver of pre-approval for audit or non-audit services requiring fees of a de minimis amount is not permitted.
(2) No services included in (b) – (d) above were approved pursuant to paragraph (c)(7)(i)(C) of Rule 2-01 of Regulation S-X.
(f) Less than 50 percent of the hours expended on the principal accountant’s engagement to audit the registrant’s financial statements for the most recent fiscal year were attributed to work performed by persons other than the principal accountant’s full-time, permanent employees.
(g) The aggregate fees billed for the most recent fiscal year and the preceding fiscal year by the registrant’s principal accountant for non-audit services rendered to the registrant, its investment adviser, and any entity controlling, controlled by, or under common control with the investment adviser that provides ongoing services to the registrant were $1,262,000 and $1,524,000, respectively.
(h) All non-audit services rendered in (g) above were pre-approved by the registrant’s audit committee. Accordingly, these services were considered by the registrant’s audit committee in maintaining the principal accountant’s independence.
(i) Not applicable.
(j) Not applicable.
Item 5. Audit Committee of Listed Registrants.
Not applicable.
Item 6. Investments.
(a) Not applicable. The complete schedule of investments is included in Item 7 of this Form N-CSR.
(b) Not applicable.
Item 7. Financial Statements and Financial Highlights for Open-End Management Investment Companies.
(a – b) Report pursuant to Regulation S-X.
Financial
Highlights
Portfolio
of
Investments
Financial
Statements
and
Notes
Additional
Fund
Information
Financial
Statements
and
Other
Information
For
more
insights
from
T.
Rowe
Price
investment
professionals,
go
to
troweprice.com
.
T.
ROWE
PRICE
PRWCX
Capital
Appreciation
Fund
PACLX
Capital
Appreciation
Fund–
.
Advisor Class
TRAIX
Capital
Appreciation
Fund–
.
I Class
T.
ROWE
PRICE
Capital
Appreciation
Fund
For
a
share
outstanding
throughout
each
period
The
accompanying
notes
are
an
integral
part
of
these
financial
statements.
Investor
Class
..
Year
..
..
Ended
.
12/31/24
12/31/23
12/31/22
12/31/21
12/31/20
NET
ASSET
VALUE
Beginning
of
period
$
33.91
$
29.73
$
36.96
$
34.11
$
31.22
Investment
activities
Net
investment
income
(1)(2)
0.81
0.77
0.49
0.35
0.40
Net
realized
and
unrealized
gain/loss
3.49
4.81
(4.91)
5.91
5.21
Total
from
investment
activities
4.30
5.58
(4.42)
6.26
5.61
Distributions
Net
investment
income
(0.80)
(0.71)
(0.47)
(0.35)
(0.40)
Net
realized
gain
(2.79)
(0.69)
(2.34)
(3.06)
(2.32)
Total
distributions
(3.59)
(1.40)
(2.81)
(3.41)
(2.72)
NET
ASSET
VALUE
End
of
period
$
34.62
$
33.91
$
29.73
$
36.96
$
34.11
Ratios/Supplemental
Data
Total
return
(2)(3)
12.69%
18.83%
(11.94)%
18.53%
18.16%
Ratios
to
average
net
assets:
(2)
Gross
expenses
before
waivers/payments
by
Price
Associates
0.72%
0.73%
0.73%
0.70%
0.70%
Net
expenses
after
waivers/
payments
by
Price
Associates
0.70%
0.70%
0.71%
0.68%
0.69%
Net
investment
income
2.23%
2.38%
1.45%
0.95%
1.26%
Portfolio
turnover
rate
85.0%
65.1%
83.9%
47.8%
87.3%
Net
assets,
end
of
period
(in
millions)
$34,860
$31,624
$26,104
$40,460
$35,253
0%
0%
0%
0%
0%
(1)
Per
share
amounts
calculated
using
average
shares
outstanding
method.
(2)
Includes
the
impact
of
expense-related
arrangements
with
Price
Associates.
(3)
Total
return
reflects
the
rate
that
an
investor
would
have
earned
on
an
investment
in
the
fund
during
each
period,
assuming
reinvestment
of
all
distributions,
and
payment
of
no
redemption
or
account
fees,
if
applicable.
T.
ROWE
PRICE
Capital
Appreciation
Fund
For
a
share
outstanding
throughout
each
period
The
accompanying
notes
are
an
integral
part
of
these
financial
statements.
Advisor
Class
..
Year
..
..
Ended
.
12/31/24
12/31/23
12/31/22
12/31/21
12/31/20
NET
ASSET
VALUE
Beginning
of
period
$
33.39
$
29.30
$
36.49
$
33.70
$
30.88
Investment
activities
Net
investment
income
(1)(2)
0.70
0.68
0.40
0.24
0.31
Net
realized
and
unrealized
gain/loss
3.45
4.73
(4.85)
5.84
5.13
Total
from
investment
activities
4.15
5.41
(4.45)
6.08
5.44
Distributions
Net
investment
income
(0.71)
(0.63)
(0.40)
(0.23)
(0.30)
Net
realized
gain
(2.79)
(0.69)
(2.34)
(3.06)
(2.32)
Total
distributions
(3.50)
(1.32)
(2.74)
(3.29)
(2.62)
NET
ASSET
VALUE
End
of
period
$
34.04
$
33.39
$
29.30
$
36.49
$
33.70
Ratios/Supplemental
Data
Total
return
(2)(3)
12.41%
18.52%
(12.18)%
18.22%
17.80%
Ratios
to
average
net
assets:
(2)
Gross
expenses
before
waivers/payments
by
Price
Associates
0.99%
0.99%
0.99%
0.99%
1.00%
Net
expenses
after
waivers/payments
by
Price
Associates
0.96%
0.96%
0.97%
0.97%
0.99%
Net
investment
income
1.96%
2.12%
1.22%
0.66%
0.97%
Portfolio
turnover
rate
85.0%
65.1%
83.9%
47.8%
87.3%
Net
assets,
end
of
period
(in
millions)
$790
$759
$654
$795
$770
0%
0%
0%
0%
0%
(1)
Per
share
amounts
calculated
using
average
shares
outstanding
method.
(2)
Includes
the
impact
of
expense-related
arrangements
with
Price
Associates.
(3)
Total
return
reflects
the
rate
that
an
investor
would
have
earned
on
an
investment
in
the
fund
during
each
period,
assuming
reinvestment
of
all
distributions,
and
payment
of
no
redemption
or
account
fees,
if
applicable.
T.
ROWE
PRICE
Capital
Appreciation
Fund
For
a
share
outstanding
throughout
each
period
The
accompanying
notes
are
an
integral
part
of
these
financial
statements.
I
Class
..
Year
..
..
Ended
.
12/31/24
12/31/23
12/31/22
12/31/21
12/31/20
NET
ASSET
VALUE
Beginning
of
period
$
33.90
$
29.72
$
36.99
$
34.14
$
31.24
Investment
activities
Net
investment
income
(1)(2)
0.85
0.81
0.56
0.40
0.44
Net
realized
and
unrealized
gain/loss
3.50
4.82
(4.95)
5.91
5.22
Total
from
investment
activities
4.35
5.63
(4.39)
6.31
5.66
Distributions
Net
investment
income
(0.85)
(0.76)
(0.54)
(0.40)
(0.44)
Net
realized
gain
(2.79)
(0.69)
(2.34)
(3.06)
(2.32)
Total
distributions
(3.64)
(1.45)
(2.88)
(3.46)
(2.76)
NET
ASSET
VALUE
End
of
period
$
34.61
$
33.90
$
29.72
$
36.99
$
34.14
Ratios/Supplemental
Data
Total
return
(2)(3)
12.84%
18.98%
(11.84)%
18.67%
18.31%
Ratios
to
average
net
assets:
(2)
Gross
expenses
before
waivers/payments
by
Price
Associates
0.60%
0.60%
0.60%
0.59%
0.59%
Net
expenses
after
waivers/payments
by
Price
Associates
0.57%
0.58%
0.58%
0.57%
0.58%
Net
investment
income
2.35%
2.50%
1.67%
1.06%
1.37%
Portfolio
turnover
rate
85.0%
65.1%
83.9%
47.8%
87.3%
Net
assets,
end
of
period
(in
millions)
$28,586
$24,084
$18,698
$12,654
$8,901
0%
0%
0%
0%
0%
(1)
Per
share
amounts
calculated
using
average
shares
outstanding
method.
(2)
Includes
the
impact
of
expense-related
arrangements
with
Price
Associates.
(3)
Total
return
reflects
the
rate
that
an
investor
would
have
earned
on
an
investment
in
the
fund
during
each
period,
assuming
reinvestment
of
all
distributions,
and
payment
of
no
redemption
or
account
fees,
if
applicable.
T.
ROWE
PRICE
Capital
Appreciation
Fund
December
31,
2024
Shares/Par
$
Value
(Cost
and
value
in
$000s)
‡
ASSET-BACKED
SECURITIES
0.0%
Domino's
Pizza
Master
Issuer
Series 2017-1A,
Class
A23
4.118%,
7/25/47 (1)
22,249,988
21,659
Domino's
Pizza
Master
Issuer
Series 2019-1A,
Class
A2
3.668%,
10/25/49 (1)
17,777,472
16,468
Total
Asset-Backed
Securities
(Cost
$39,847)
38,127
BANK
LOANS
7.8%
(2)
ADMI,
FRN
1M
TSFR
+
3.38%,
7.846%,
12/23/27
20,608,447
20,136
ADMI,
FRN
1M
TSFR
+
3.75%,
8.221%,
12/23/27
58,858,541
57,755
ADMI,
FRN
1M
TSFR
+
5.75%,
10.107%,
12/23/27
5,695,064
5,706
Alliant
Holdings
Intermediate,
FRN
1M
TSFR
+
2.75%,
7.106%,
9/19/31
74,632,460
74,749
AmWINS
Group,
FRN
1M
TSFR
+
2.25%,
6.721%,
2/19/28 (3)
145,508,930
145,879
Applied
Systems,
FRN
3M
TSFR
+
3.00%,
7.329%,
2/24/31 (3)
504,752,121
509,285
Applied
Systems,
FRN
3M
TSFR
+
5.25%,
9.579%,
2/23/32
68,596,360
70,483
AssuredPartners,
FRN
1M
TSFR
+
3.50%,
7.857%,
2/14/31
241,947,521
242,264
AthenaHealth
Group,
FRN
1M
TSFR
+
3.25%,
7.607%,
2/15/29
167,798,917
167,979
Avantor
Funding,
FRN
1M
TSFR
+
2.00%,
6.457%,
11/8/27
739,565
743
Azalea
Topco,
FRN
1M
TSFR
+
3.25%,
7.607%,
4/30/31
114,815,243
115,031
BroadStreet
Partners,
FRN
1M
TSFR
+
3.00%,
7.357%,
6/13/31 (3)
206,033,421
206,538
CCC
Intelligent
Solutions,
FRN
1M
TSFR
+
2.25%,
6.721%,
9/21/28 (3)
8,852,684
8,878
CPI
Holdco,
FRN
1M
TSFR
+
2.25%,
5/29/31 (3)
85,334,000
85,227
Ellucian
Holdings,
FRN
1M
TSFR
+
3.00%,
7.357%,
10/9/29
105,911,000
106,520
Epicor
Software,
FRN
1M
TSFR
+
2.75%,
7.107%,
5/30/31
107,660,651
108,344
Filtration
Group,
FRN
1M
EURIBOR
+
4.25%,
7.113%,
10/21/28
(EUR)
65,339,526
68,105
T.
ROWE
PRICE
Capital
Appreciation
Fund
Shares/Par
$
Value
(Cost
and
value
in
$000s)
‡
Filtration
Group,
FRN
1M
TSFR
+
3.50%,
7.971%,
10/21/28
289,349,415
291,303
Heartland
Dental,
FRN
1M
TSFR
+
4.50%,
8.857%,
4/28/28
26,978,579
26,998
Hilton
Domestic
Operating,
FRN
1M
TSFR
+
1.75%,
6.088%,
11/8/30
159,708,459
160,408
HUB
International,
FRN
3M
TSFR
+
2.75%,
7.367%,
6/20/30
821,720,475
825,829
Icon
Parent,
FRN
1M
TSFR
+
3.00%,
7.516%,
11/13/31
95,146,500
95,414
Icon
Parent,
FRN
1M
TSFR
+
5.00%,
9.516%,
11/12/32 (3)
56,930,700
57,714
Informatica,
FRN
1M
TSFR
+
2.25%,
6.607%,
10/27/28
28,429,383
28,524
IRB
Holding,
FRN
1M
TSFR
+
2.50%,
6.857%,
12/15/27
96,964,074
96,985
Loire
Finco
Luxembourg,
FRN
1M
TSFR
+
3.50%,
7.957%,
4/21/27
153,617,931
152,563
Loire
Finco
Luxembourg,
FRN
1M
TSFR
+
3.75%,
8.207%,
4/21/27
28,574,720
28,360
Medline
Borrower,
FRN
1M
TSFR
+
2.25%,
6.607%,
10/23/28 (3)
42,886,267
43,002
Quartz
Acquireco,
FRN
3M
TSFR
+
2.75%,
7.079%,
6/28/30
29,840,248
30,027
SBA
Senior
Finance
II,
FRN
1M
TSFR
+
1.75%,
6.11%,
1/25/31
102,244,231
102,209
SkyMiles
IP,
FRN
3M
TSFR
+
3.75%,
8.367%,
10/20/27
57,977,287
58,947
Storable,
FRN
1M
TSFR
+
3.50%,
7.857%,
4/17/28
65,332,118
65,720
TIH
Insurance
Holdings,
FRN
3M
TSFR
+
4.75%,
9.079%,
5/6/32
38,225,703
39,046
Trans
Union,
FRN
1M
TSFR
+
1.75%,
6.207%,
11/16/26
7,273,252
7,271
TransDigm,
FRN
3M
TSFR
+
2.75%,
7.079%,
8/24/28
11,861,910
11,894
TransDigm,
FRN
3M
TSFR
+
2.75%,
7.079%,
3/22/30 (3)
92,645,042
92,898
UKG,
FRN
3M
TSFR
+
3.00%,
7.617%,
2/10/31
323,242,090
325,291
USI,
FRN
1M
TSFR
+
2.25%,
11/23/29 (3)
125,216,555
124,889
USI,
FRN
1M
TSFR
+
2.25%,
9/27/30 (3)
185,792,939
185,282
T.
ROWE
PRICE
Capital
Appreciation
Fund
Shares/Par
$
Value
(Cost
and
value
in
$000s)
‡
Varsity
Brands,
FRN
3M
TSFR
+
3.75%,
8.271%,
8/26/31
168,249,000
168,291
Total
Bank
Loans
(Cost
$4,979,310)
5,012,487
BOND
MUTUAL
FUNDS
1.4%
T.
Rowe
Price
Institutional
Floating
Rate
Fund
–
Institutional
Class,
7.37% (4)(5)
96,908,711
919,663
Total
Bond
Mutual
Funds
(Cost
$935,296)
919,663
COMMON
STOCKS
60.5%
COMMUNICATION
SERVICES
3.3%
Interactive
Media
&
Services
3.3%
Alphabet,
Class
A (6)
7,225,408
1,367,770
Meta
Platforms,
Class
A (6)
1,300,429
761,414
Total
Communication
Services
2,129,184
CONSUMER
DISCRETIONARY
5.2%
Broadline
Retail
3.4%
Amazon.com (6)(7)
9,834,107
2,157,505
2,157,505
Diversified
Consumer
Services
0.7%
Service
Corp.
International
5,906,494
471,456
471,456
Hotels,
Restaurants
&
Leisure
1.1%
Hilton
Worldwide
Holdings
1,299,246
321,122
Yum!
Brands (6)
2,736,400
367,115
688,237
Total
Consumer
Discretionary
3,317,198
ENERGY
1.4%
Oil,
Gas
&
Consumable
Fuels
1.4%
Canadian
Natural
Resources
22,066,648
681,198
Expand
Energy
2,117,802
210,827
Total
Energy
892,025
FINANCIALS
2.5%
Financial
Services
2.3%
Mastercard,
Class
A
1,466,069
771,988
Visa,
Class
A (6)
2,287,246
722,861
1,494,849
T.
ROWE
PRICE
Capital
Appreciation
Fund
Shares/Par
$
Value
(Cost
and
value
in
$000s)
‡
Insurance
0.2%
Hockey
Parent
Holdings,
Acquisition
Date:
9/14/23,
Cost $123,055 (7)(8)(9)
123,055
135,379
135,379
Total
Financials
1,630,228
HEALTH
CARE
15.0%
Biotechnology
0.1%
Biogen (7)
246,970
37,767
37,767
Health
Care
Equipment
&
Supplies
4.0%
Abbott
Laboratories
5,425,878
613,721
Becton
Dickinson
&
Company (6)
7,982,344
1,810,954
GE
HealthCare
Technologies
2,031,600
158,831
2,583,506
Health
Care
Providers
&
Services
4.6%
Humana
1,038,611
263,506
McKesson
1,885,838
1,074,758
UnitedHealth
Group
3,130,788
1,583,740
2,922,004
Life
Sciences
Tools
&
Services
5.7%
Danaher
5,078,136
1,165,686
Revvity (4)
13,158,721
1,468,645
Thermo
Fisher
Scientific (6)
2,028,398
1,055,234
3,689,565
Pharmaceuticals
0.6%
Eli
Lilly
502,122
387,638
387,638
Total
Health
Care
9,620,480
INDUSTRIALS
&
BUSINESS
SERVICES
8.1%
Aerospace
&
Defense
1.2%
RTX
6,803,871
787,344
787,344
Commercial
Services
&
Supplies
1.4%
Veralto
4,129,208
420,560
Waste
Connections
2,804,672
481,225
901,785
Industrial
Conglomerates
2.6%
Roper
Technologies (6)
3,151,726
1,638,425
1,638,425
T.
ROWE
PRICE
Capital
Appreciation
Fund
Shares/Par
$
Value
(Cost
and
value
in
$000s)
‡
Machinery
2.9%
Fortive (4)
21,417,926
1,606,345
Ingersoll
Rand
2,609,974
236,098
1,842,443
Total
Industrials
&
Business
Services
5,169,997
INFORMATION
TECHNOLOGY
17.4%
Electronic
Equipment,
Instruments
&
Components
0.4%
Teledyne
Technologies (7)
593,319
275,377
275,377
Semiconductors
&
Semiconductor
Equipment
4.2%
Advanced
Micro
Devices (7)
2,926,949
353,546
Broadcom
1,417,100
328,541
Marvell
Technology
1,895,287
209,334
NVIDIA (6)
13,353,160
1,793,196
2,684,617
Software
10.9%
Aurora
Innovation (4)(7)
133,974,250
844,038
Autodesk (7)
1,526,457
451,175
Intuit
1,185,511
745,094
Microsoft (6)
7,982,639
3,364,682
PTC (4)(7)
7,107,093
1,306,781
Salesforce
916,267
306,335
7,018,105
Technology
Hardware,
Storage
&
Peripherals
1.9%
Apple
4,897,396
1,226,406
1,226,406
Total
Information
Technology
11,204,505
UTILITIES
4.0%
Multi-Utilities
4.0%
Ameren (6)
11,107,293
990,104
CenterPoint
Energy
30,474,880
966,968
DTE
Energy
932,569
112,608
NiSource
13,872,077
509,937
Total
Utilities
2,579,617
Total
Miscellaneous
Common
Stocks
3.6% (10)
2,352,800
Total
Common
Stocks
(Cost
$27,467,103)
38,896,034
T.
ROWE
PRICE
Capital
Appreciation
Fund
Shares/Par
$
Value
(Cost
and
value
in
$000s)
‡
CONVERTIBLE
PREFERRED
STOCKS
1.0%
INFORMATION
TECHNOLOGY
0.7%
Software
0.7%
Waymo,
Series
A-2,
Acquisition
Date:
5/8/20,
Cost $183,922 (7)
(8)(9)
2,141,932
171,997
Waymo,
Series
B-2,
Acquisition
Date:
6/11/21,
Cost $16,282 (7)
(8)(9)
177,514
14,381
Waymo,
Series
C-2,
Acquisition
Date:
1/12/24
-
9/27/24,
Cost $279,599 (7)(8)(9)
3,575,381
279,599
Total
Information
Technology
465,977
Total
Miscellaneous
Convertible
Preferred
Stocks
0.3% (10)
172,490
Total
Convertible
Preferred
Stocks
(Cost
$621,628)
638,467
CORPORATE
BONDS
10.4%
Alliant
Holdings
Intermediate,
5.875%,
11/1/29 (1)
17,837,000
17,034
Alliant
Holdings
Intermediate,
6.75%,
10/15/27 (1)
50,618,000
50,112
Alliant
Holdings
Intermediate,
6.75%,
4/15/28 (1)
112,411,000
112,130
Alliant
Holdings
Intermediate,
7.00%,
1/15/31 (1)
81,458,000
81,763
American
Tower,
1.50%,
1/31/28
5,752,000
5,188
American
Tower,
1.875%,
10/15/30
25,734,000
21,507
American
Tower,
2.10%,
6/15/30
20,076,000
17,204
American
Tower,
2.90%,
1/15/30
20,560,000
18,513
American
Tower,
3.80%,
8/15/29
29,517,000
27,955
AmWINS
Group,
6.375%,
2/15/29 (1)
37,102,000
37,241
AssuredPartners,
7.50%,
2/15/32 (1)
16,331,000
17,597
Avantor
Funding,
3.875%,
11/1/29 (1)
96,931,000
88,449
Avantor
Funding,
4.625%,
7/15/28 (1)
144,048,000
136,846
Ball,
6.00%,
6/15/29
54,640,000
54,913
Becton
Dickinson
&
Company,
3.70%,
6/6/27
20,154,000
19,662
Biogen,
3.15%,
5/1/50
89,552,000
56,227
Biogen,
3.25%,
2/15/51
4,277,000
2,685
Biogen,
5.20%,
9/15/45
24,647,000
22,042
Booz
Allen
Hamilton,
3.875%,
9/1/28 (1)
33,575,000
31,764
Booz
Allen
Hamilton,
4.00%,
7/1/29 (1)
21,029,000
19,817
Booz
Allen
Hamilton,
5.95%,
8/4/33
34,622,000
35,411
Broadcom,
4.15%,
4/15/32 (1)
25,887,000
24,331
Broadridge
Financial
Solutions,
2.60%,
5/1/31
9,451,000
8,063
BroadStreet
Partners,
5.875%,
4/15/29 (1)
60,561,000
58,593
CCO
Holdings,
5.00%,
2/1/28 (1)
256,263,000
246,333
CCO
Holdings,
5.125%,
5/1/27 (1)
335,581,000
329,708
CCO
Holdings,
5.50%,
5/1/26 (1)
17,243,000
17,157
T.
ROWE
PRICE
Capital
Appreciation
Fund
Shares/Par
$
Value
(Cost
and
value
in
$000s)
‡
Cedar
Fair,
5.25%,
7/15/29
57,540,000
55,167
Cedar
Fair,
5.375%,
4/15/27
94,597,000
93,296
Cedar
Fair,
6.50%,
10/1/28
63,975,000
63,975
Charles
River
Laboratories
International,
3.75%,
3/15/29 (1)
48,673,000
44,597
Charles
River
Laboratories
International,
4.00%,
3/15/31 (1)
39,694,000
35,328
Charles
River
Laboratories
International,
4.25%,
5/1/28 (1)
46,316,000
43,942
Clarios
Global,
6.25%,
5/15/26 (1)
21,386,000
21,386
Clarios
Global,
8.50%,
5/15/27 (1)
76,251,000
76,632
Clarivate
Science
Holdings,
3.875%,
7/1/28 (1)
10,482,000
9,735
Clarivate
Science
Holdings,
4.875%,
7/1/29 (1)
7,480,000
6,947
Crowdstrike
Holdings,
3.00%,
2/15/29
5,722,000
5,178
Crown
Castle,
4.30%,
2/15/29
7,805,000
7,552
Crown
Castle,
4.90%,
9/1/29
29,930,000
29,560
Crown
Castle,
5.20%,
9/1/34
49,885,000
48,510
Crown
Castle,
5.60%,
6/1/29
5,974,000
6,091
Delta
Air
Lines,
4.75%,
10/20/28 (1)
63,966,120
62,973
Ellucian
Holdings,
6.50%,
12/1/29 (1)
35,120,000
35,208
Gartner,
3.625%,
6/15/29 (1)
40,068,000
37,195
Gartner,
3.75%,
10/1/30 (1)
19,418,000
17,711
Gartner,
4.50%,
7/1/28 (1)
30,844,000
29,988
GE
HealthCare
Technologies,
5.65%,
11/15/27
14,651,000
15,016
GFL
Environmental,
4.00%,
8/1/28 (1)
19,224,000
18,167
GFL
Environmental,
4.375%,
8/15/29 (1)
20,383,000
19,211
GFL
Environmental,
4.75%,
6/15/29 (1)
57,536,000
55,234
GFL
Environmental,
6.75%,
1/15/31 (1)
16,221,000
16,667
Hilton
Domestic
Operating,
3.625%,
2/15/32 (1)
100,484,000
87,170
Hilton
Domestic
Operating,
3.75%,
5/1/29 (1)
79,240,000
72,802
Hilton
Domestic
Operating,
4.00%,
5/1/31 (1)
106,155,000
95,540
Hilton
Domestic
Operating,
4.875%,
1/15/30
64,939,000
62,179
Hilton
Domestic
Operating,
5.375%,
5/1/25 (1)
32,300,000
32,260
Hilton
Domestic
Operating,
5.75%,
5/1/28 (1)
74,282,000
74,003
Hilton
Domestic
Operating,
5.875%,
4/1/29 (1)
39,383,000
39,186
Hilton
Worldwide
Finance,
4.875%,
4/1/27
31,752,000
31,236
Hologic,
3.25%,
2/15/29 (1)
23,463,000
21,205
Howmet
Aerospace,
3.00%,
1/15/29
34,288,000
31,822
Howmet
Aerospace,
5.90%,
2/1/27
34,720,000
35,429
HUB
International,
5.625%,
12/1/29 (1)
34,495,000
33,331
HUB
International,
7.25%,
6/15/30 (1)
590,152,000
604,906
HUB
International,
7.375%,
1/31/32 (1)
325,788,000
330,675
IQVIA,
5.00%,
5/15/27 (1)
42,949,000
42,144
IQVIA,
5.70%,
5/15/28
70,797,000
71,505
IQVIA,
6.50%,
5/15/30 (1)
27,385,000
27,796
KFC
Holding,
4.75%,
6/1/27 (1)
138,818,000
136,042
T.
ROWE
PRICE
Capital
Appreciation
Fund
Shares/Par
$
Value
(Cost
and
value
in
$000s)
‡
Korn
Ferry,
4.625%,
12/15/27 (1)
32,930,000
31,613
Lamar
Media,
3.625%,
1/15/31
4,629,000
4,056
Lamar
Media,
3.75%,
2/15/28
29,070,000
27,217
Lamar
Media,
4.875%,
1/15/29
5,192,000
4,978
Life
Time,
5.75%,
1/15/26 (1)
51,846,000
51,820
Life
Time,
6.00%,
11/15/31 (1)
13,703,000
13,532
Marriott
International,
Series R,
3.125%,
6/15/26
4,100,000
4,006
Martin
Marietta
Materials,
2.40%,
7/15/31
6,639,000
5,668
Medline
Borrower,
6.25%,
4/1/29 (1)
43,328,000
43,761
Mileage
Plus
Holdings,
6.50%,
6/20/27 (1)
49,207,419
49,330
Mirant,
EC,
7.90%,
7/15/09 (1)(7)(8)
16,000,000
—
Motorola
Solutions,
2.30%,
11/15/30
6,639,000
5,687
Motorola
Solutions,
2.75%,
5/24/31
4,648,000
4,011
MSCI,
3.25%,
8/15/33 (1)
54,831,000
46,476
MSCI,
3.625%,
9/1/30 (1)
77,654,000
70,602
MSCI,
3.625%,
11/1/31 (1)
59,421,000
53,267
MSCI,
3.875%,
2/15/31 (1)
61,356,000
56,308
MSCI,
4.00%,
11/15/29 (1)
65,412,000
61,501
Panther
Escrow
Issuer,
7.125%,
6/1/31 (1)
8,972,000
9,039
PRA
Health
Sciences,
2.875%,
7/15/26 (1)
16,684,000
16,100
PTC,
4.00%,
2/15/28 (1)(4)
29,864,000
28,259
Revvity,
3.30%,
9/15/29 (4)
9,362,000
8,615
Ryan
Specialty,
4.375%,
2/1/30 (1)
13,021,000
12,207
Ryan
Specialty,
5.875%,
8/1/32 (1)
34,437,000
33,963
SBA
Communications,
3.125%,
2/1/29
106,254,000
96,027
SBA
Communications,
3.875%,
2/15/27
94,438,000
90,424
SBA
Tower
Trust,
6.599%,
1/15/28 (1)
2,575,000
2,637
Sensata
Technologies,
3.75%,
2/15/31 (1)
26,891,000
23,462
Sensata
Technologies,
4.00%,
4/15/29 (1)
9,024,000
8,260
Sensata
Technologies,
4.375%,
2/15/30 (1)
12,280,000
11,175
Sensata
Technologies,
5.875%,
9/1/30 (1)
19,842,000
19,285
Service
Corp.
International,
3.375%,
8/15/30
25,630,000
22,426
Service
Corp.
International,
4.625%,
12/15/27
5,256,000
5,105
Service
Corp.
International,
5.75%,
10/15/32
34,093,000
33,028
Six
Flags
Entertainment,
5.50%,
4/15/27 (1)
115,407,000
114,253
Six
Flags
Theme
Parks,
7.00%,
7/1/25 (1)
16,312,000
16,312
Surgery
Center
Holdings,
7.25%,
4/15/32 (1)
35,491,000
36,112
Teleflex,
4.25%,
6/1/28 (1)
5,399,000
5,102
Teleflex,
4.625%,
11/15/27
37,154,000
35,900
TransDigm,
4.625%,
1/15/29
20,636,000
19,243
TransDigm,
5.50%,
11/15/27
72,122,000
70,680
TransDigm,
6.375%,
3/1/29 (1)
163,459,000
163,663
TransDigm,
6.625%,
3/1/32 (1)
128,153,000
129,274
T.
ROWE
PRICE
Capital
Appreciation
Fund
Shares/Par
$
Value
(Cost
and
value
in
$000s)
‡
TransDigm,
7.125%,
12/1/31 (1)
77,268,000
79,103
UKG,
6.875%,
2/1/31 (1)
31,658,000
31,975
USI,
7.50%,
1/15/32 (1)
130,102,000
134,656
Vail
Resorts,
6.50%,
5/15/32 (1)
32,891,000
33,055
VICI
Properties,
3.75%,
2/15/27 (1)
19,848,000
19,178
VICI
Properties,
4.125%,
8/15/30 (1)
14,953,000
13,860
VICI
Properties,
4.625%,
12/1/29 (1)
4,979,000
4,772
VICI
Properties,
5.125%,
5/15/32
13,278,000
12,939
VICI
Properties,
5.75%,
2/1/27 (1)
14,033,000
14,110
VICI
Properties,
5.75%,
4/1/34
36,053,000
36,299
VMware,
4.70%,
5/15/30
15,546,000
15,223
Yum!
Brands,
3.625%,
3/15/31
58,638,000
51,821
Yum!
Brands,
4.625%,
1/31/32
103,021,000
95,294
Yum!
Brands,
4.75%,
1/15/30 (1)
46,941,000
44,829
Yum!
Brands,
5.35%,
11/1/43
73,445,000
70,691
Yum!
Brands,
5.375%,
4/1/32
121,538,000
117,740
Yum!
Brands,
6.875%,
11/15/37
36,517,000
39,712
Total
Miscellaneous
Corporate
Bonds
0.1% (10)
35,309
Total
Corporate
Bonds
(Cost
$6,612,912)
6,637,692
PREFERRED
STOCKS
0.3%
FINANCIALS
0.2%
Insurance
0.2%
AH
Parent,
Series
A,
Acquisition
Date:
9/27/24,
Cost $140,396 (7)(8)(9)
142,534
139,708
Total
Financials
139,708
UTILITIES
0.1%
Electric
Utilities
0.1%
CMS
Energy,
5.875%,
10/15/78 (4)
1,186,805
27,213
CMS
Energy,
5.875%,
3/1/79 (4)
1,463
34
Total
Utilities
27,247
Total
Preferred
Stocks
(Cost
$170,103)
166,955
U.S.
GOVERNMENT
AGENCY
OBLIGATIONS
(EXCLUDING
MORTGAGE-BACKED)
14.7%
U.S.
Treasury
Obligations
14.7%
U.S.
Treasury
Notes,
3.50%,
9/30/29
666,434,300
641,547
U.S.
Treasury
Notes,
3.625%,
8/31/29
2,679,572,000
2,595,835
U.S.
Treasury
Notes,
4.125%,
10/31/29
5,403,973,000
5,344,023
T.
ROWE
PRICE
Capital
Appreciation
Fund
Shares/Par
$
Value
(Cost
and
value
in
$000s)
‡
U.S.
Treasury
Notes,
4.25%,
11/15/34
866,651,000
844,579
9,425,984
Total
U.S.
Government
Agency
Obligations
(Excluding
Mortgage-Backed)
(Cost
$9,583,478)
9,425,984
SHORT-TERM
INVESTMENTS
4.2%
Money
Market
Funds
4.2%
T.
Rowe
Price
Government
Reserve
Fund,
4.53% (4)(11)
2,718,235,044
2,718,235
Total
Short-Term
Investments
(Cost
$2,718,235)
2,718,235
Total
Investments
in
Securities
100.3%
of
Net
Assets
(Cost
$53,127,912)
$
64,453,644
‡
Shares/Par
and
Notional
Amount
are
denominated
in
U.S.
dollars
unless
otherwise
noted.
(1)
Security
was
purchased
pursuant
to
Rule
144A
under
the
Securities
Act
of
1933
and
may
be
resold
in
transactions
exempt
from
registration
only
to
qualified
institutional
buyers.
Total
value
of
such
securities
at
period-end
amounts
to
$4,917,834
and
represents
7.7%
of
net
assets.
(2)
Bank
loan
positions
may
involve
multiple
underlying
tranches.
In
those
instances,
the
position
presented
reflects
the
aggregate
of
those
respective
underlying
tranches
and
the
rate
presented
reflects
the
weighted
average
rate
of
the
settled
positions.
(3)
All
or
a
portion
of
this
loan
is
unsettled
as
of
December
31,
2024.
The
interest
rate
for
unsettled
loans
will
be
determined
upon
settlement
after
period
end.
(4)
Affiliated
Companies
(5)
SEC
30-day
yield
(6)
At
December
31,
2024,
all
or
a
portion
of
this
security
is
pledged
as
collateral
and/or
margin
deposit
to
cover
future
funding
obligations.
(7)
Non-income
producing
(8)
See
Note
2.
Level
3
in
fair
value
hierarchy.
(9)
Security
cannot
be
offered
for
public
resale
without
first
being
registered
under
the
Securities
Act
of
1933
and
related
rules
("restricted
security").
Acquisition
date
represents
the
day
on
which
an
enforceable
right
to
acquire
such
security
is
obtained
and
is
presented
along
with
related
cost
in
the
security
description.
The
fund
may
have
registration
rights
for
certain
restricted
securities.
Any
costs
related
to
such
registration
are
generally
borne
by
the
issuer.
The
aggregate
value
of
restricted
securities
(excluding
144A
holdings)
at
period
end
amounts
to
$741,064
and
represents
1.2%
of
net
assets.
(10)
The
identity
of
certain
securities
has
been
concealed
to
protect
the
fund
while
it
completes
a
purchase
or
selling
program
for
the
securities.
T.
ROWE
PRICE
Capital
Appreciation
Fund
.
.
.
.
.
.
.
.
.
.
(11)
Seven-day
yield
1M
EURIBOR
One
month
EURIBOR
(Euro
interbank
offered
rate)
1M
TSFR
One
month
term
SOFR
(Secured
overnight
financing
rate)
3M
TSFR
Three
month
term
SOFR
(Secured
overnight
financing
rate)
EC
Escrow
CUSIP;
represents
a
beneficial
interest
in
a
residual
pool
of
assets;
the
amount
and
timing
of
future
distributions,
if
any,
is
uncertain;
when
presented,
interest
rate
and
maturity
date
are
those
of
the
original
security.
EUR
Euro
FRN
Floating
Rate
Note
OTC
Over-the-counter
VR
Variable
Rate;
rate
shown
is
effective
rate
at
period-end.
The
rates
for
certain
variable
rate
securities
are
not
based
on
a
published
reference
rate
and
spread
but
are
determined
by
the
issuer
or
agent
and
based
on
current
market
conditions.
T.
ROWE
PRICE
Capital
Appreciation
Fund
(Amounts
in
000s,
except
for
contracts)
OPTIONS
WRITTEN
(0.2)%
OTC
Options
Written (0.2)%
Counterparty
Description
Contracts
Notional
Amount
$
Value
Bank
of
America
Intuit,
Call,
1/17/25
@
$660.00
684
42,989
(
270
)
Bank
of
America
Intuit,
Call,
1/17/25
@
$700.00
341
21,432
(
23
)
Bank
of
America
Intuit,
Call,
1/17/25
@
$740.00
341
21,432
(
10
)
Bank
of
America
Meta
Platforms,
Class
A,
Call,
1/17/25
@
$590.00
681
39,873
(
938
)
Bank
of
America
Meta
Platforms,
Class
A,
Call,
1/17/25
@
$600.00
2,049
119,971
(
1,952
)
Barclays
Bank
DTE
Energy,
Call,
1/17/25
@
$130.00
852
10,288
(
23
)
Barclays
Bank
DTE
Energy,
Call,
1/17/25
@
$135.00
2,904
35,066
(
58
)
Barclays
Bank
Hilton
Worldwide
Holdings,
Call,
1/17/25
@
$220.00
1,651
40,806
(
4,672
)
Barclays
Bank
Hilton
Worldwide
Holdings,
Call,
1/17/25
@
$230.00
1,651
40,806
(
3,005
)
Barclays
Bank
Hilton
Worldwide
Holdings,
Call,
1/17/25
@
$250.00
2,736
67,623
(
903
)
Citibank
UnitedHealth
Group,
Call,
1/17/25
@
$580.00
2,096
106,028
(
164
)
Citibank
Waste
Connections,
Call,
3/21/25
@
$190.00
1,707
29,289
(
213
)
Goldman
Sachs
Abbott
Laboratories,
Call,
1/17/25
@
$120.00
1,704
19,274
(
42
)
Goldman
Sachs
Abbott
Laboratories,
Call,
1/17/25
@
$125.00
1,704
19,274
(
15
)
Goldman
Sachs
McKesson,
Call,
1/17/25
@
$600.00
1,061
60,468
(
220
)
Goldman
Sachs
McKesson,
Call,
1/17/25
@
$620.00
1,061
60,468
(
172
)
Goldman
Sachs
McKesson,
Call,
1/17/25
@
$640.00
223
12,709
(
19
)
Goldman
Sachs
McKesson,
Call,
1/17/25
@
$680.00
222
12,652
(
49
)
Goldman
Sachs
RTX,
Call,
1/17/25
@
$115.00
2,642
30,573
(
736
)
Goldman
Sachs
RTX,
Call,
1/17/25
@
$120.00
2,642
30,573
(
193
)
Goldman
Sachs
RTX,
Call,
1/17/25
@
$125.00
1,703
19,707
(
20
)
T.
ROWE
PRICE
Capital
Appreciation
Fund
(Amounts
in
000s,
except
for
contracts)
Counterparty
Description
Contracts
Notional
Amount
$
Value
Goldman
Sachs
RTX,
Call,
1/17/25
@
$130.00
5,798
67,095
(
12
)
Goldman
Sachs
Teledyne
Technologies,
Call,
3/21/25
@
$460.00
342
15,873
(
766
)
Goldman
Sachs
Visa,
Class
A,
Call,
1/17/25
@
$290.00
2,051
64,820
(
5,579
)
Goldman
Sachs
Visa,
Class
A,
Call,
1/17/25
@
$300.00
2,043
64,567
(
3,611
)
Goldman
Sachs
Visa,
Class
A,
Call,
1/17/25
@
$305.00
1,395
44,088
(
1,869
)
Goldman
Sachs
Visa,
Class
A,
Call,
1/17/25
@
$310.00
1,395
44,088
(
1,269
)
Goldman
Sachs
Visa,
Class
A,
Call,
1/17/25
@
$315.00
1,396
44,119
(
803
)
JPMorgan
Chase
Apple,
Call,
1/17/25
@
$200.00
3,963
99,241
(
20,271
)
JPMorgan
Chase
Apple,
Call,
1/17/25
@
$215.00
3,963
99,241
(
14,346
)
JPMorgan
Chase
Apple,
Call,
1/17/25
@
$250.00
3,407
85,318
(
1,576
)
JPMorgan
Chase
Mastercard,
Class
A,
Call,
1/17/25
@
$480.00
868
45,706
(
4,119
)
JPMorgan
Chase
Mastercard,
Class
A,
Call,
1/17/25
@
$490.00
1,209
63,662
(
4,606
)
JPMorgan
Chase
Mastercard,
Class
A,
Call,
1/17/25
@
$500.00
869
45,759
(
2,481
)
JPMorgan
Chase
Mastercard,
Class
A,
Call,
1/17/25
@
$515.00
341
17,956
(
529
)
JPMorgan
Chase
Mastercard,
Class
A,
Call,
1/17/25
@
$520.00
1,367
71,982
(
1,692
)
JPMorgan
Chase
Thermo
Fisher
Scientific,
Call,
1/17/25
@
$650.00
1,001
52,075
(
3
)
JPMorgan
Chase
Thermo
Fisher
Scientific,
Call,
1/17/25
@
$660.00
683
35,532
(
29
)
JPMorgan
Chase
Thermo
Fisher
Scientific,
Call,
1/17/25
@
$670.00
681
35,428
(
109
)
JPMorgan
Chase
UnitedHealth
Group,
Call,
1/17/25
@
$600.00
2,209
111,745
(
87
)
JPMorgan
Chase
Yum!
Brands,
Call,
1/17/25
@
$145.00
3,276
43,951
(
16
)
JPMorgan
Chase
Yum!
Brands,
Call,
1/17/25
@
$150.00
7,434
99,735
(
19
)
UBS
Investment
Bank
Danaher,
Call,
1/17/25
@
$290.00
684
15,701
(
2
)
T.
ROWE
PRICE
Capital
Appreciation
Fund
(Amounts
in
000s,
except
for
contracts)
Counterparty
Description
Contracts
Notional
Amount
$
Value
UBS
Investment
Bank
Danaher,
Call,
1/17/25
@
$300.00
7,116
163,348
(
71
)
UBS
Investment
Bank
Danaher,
Call,
1/16/26
@
$330.00
3,437
78,896
(
756
)
UBS
Investment
Bank
McKesson,
Call,
1/17/25
@
$620.00
2,652
151,140
(
431
)
UBS
Investment
Bank
Veralto,
Call,
1/17/25
@
$110.00
1,849
18,832
(
69
)
UBS
Investment
Bank
Veralto,
Call,
1/17/25
@
$115.00
2,701
27,510
(
54
)
UBS
Investment
Bank
Veralto,
Call,
1/17/25
@
$120.00
4,265
43,439
(
53
)
Wells
Fargo
Bank
Alphabet,
Class
A,
Call,
1/17/25
@
$175.00
852
16,128
(
1,327
)
Wells
Fargo
Bank
Alphabet,
Class
A,
Call,
1/17/25
@
$180.00
3,586
67,883
(
3,980
)
Wells
Fargo
Bank
Alphabet,
Class
A,
Call,
1/17/25
@
$185.00
852
16,128
(
609
)
Wells
Fargo
Bank
Amazon.com,
Call,
1/17/25
@
$200.00
6,138
134,662
(
12,660
)
Wells
Fargo
Bank
Aurora
Innovation,
Call,
1/17/25
@
$7.00
13,661
8,606
(
307
)
Wells
Fargo
Bank
Microsoft,
Call,
1/17/25
@
$465.00
1,362
57,408
(
15
)
Wells
Fargo
Bank
Yum!
Brands,
Call,
1/17/25
@
$140.00
2,885
38,705
(
58
)
Wells
Fargo
Bank
Yum!
Brands,
Call,
1/17/25
@
$145.00
8,096
108,616
(
40
)
Wells
Fargo
Bank
Yum!
Brands,
Call,
1/17/25
@
$150.00
5,673
76,109
(
14
)
Total
Options
Written
(Premiums
$(119,732))
$
(
97,935
)
T.
ROWE
PRICE
Capital
Appreciation
Fund
AFFILIATED
COMPANIES
($000s)
The
fund
may
invest
in
certain
securities
that
are
considered
affiliated
companies.
As
defined
by
the
1940
Act,
an
affiliated
company
is
one
in
which
the
fund
owns
5%
or
more
of
the
outstanding
voting
securities,
or
a
company
that
is
under
common
ownership
or
control.
The
following
securities
were
considered
affiliated
companies
for
all
or
some
portion
of
the
year
ended
December
31,
2024.
Net
realized
gain
(loss),
investment
income,
change
in
net
unrealized
gain/loss,
and
purchase
and
sales
cost
reflect
all
activity
for
the
period
then
ended.
Affiliate
Net
Realized
Gain
(Loss)
Change
in
Net
Unrealized
Gain/Loss
Investment
Income
Aurora
Innovation
$
(
2,131
)
$
349,209
$
—
CMS
Energy,
5.875%,
10/15/78
(
270
)
(
2,045
)
1,935
CMS
Energy,
5.875%,
3/1/79
(
365
)
33
856
Fortive
18,040
26,234
5,825
PTC
404
46,529
—
PTC,
4.00%,
2/15/28
1
166
866
Revvity
1,341
23,789
3,093
Revvity,
3.30%,
9/15/29
—
4
140
T.
Rowe
Price
Institutional
Floating
Rate
Fund
–
Institutional
Class,
7.37%
—
2,842
74,176
T.
Rowe
Price
Government
Reserve
Fund,
4.53%
—
—
161,695
Affiliates
not
held
at
period
end
33,151
2,978
4,202
Totals
$
50,171
#
$
449,739
$
252,788
+
T.
ROWE
PRICE
Capital
Appreciation
Fund
The
accompanying
notes
are
an
integral
part
of
these
financial
statements.
AFFILIATED
COMPANIES
(CONTINUED)
($000s)
Supplementary
Investment
Schedule
Affiliate
Value
12/31/23
Purchase
Cost
Sales
Cost
Value
12/31/24
Aurora
Innovation
$
*
$
179,551
$
9,075
$
844,038
CMS
Energy
—
238,318
238,318
—
CMS
Energy,
5.875%,
10/15/78
40,812
—
11,554
27,213
CMS
Energy,
5.875%,
3/1/79
30,096
—
30,095
34
Fortive
*
531,047
135,335
1,606,345
PTC
*
797,109
1,136
1,306,781
PTC,
4.00%,
2/15/28
*
22,156
35
28,259
Revvity
1,090,876
354,760
780
1,468,645
Revvity,
3.30%,
9/15/29
—
8,619
8
8,615
SCE
Trust
IV,
Series
J,
VR,
5.375%
21,835
—
24,813
—
T.
Rowe
Price
Institutional
Floating
Rate
Fund
–
Institutional
Class,
7.37%
842,670
74,151
—
919,663
T.
Rowe
Price
Government
Reserve
Fund,
4.53%
3,237,133
¤
¤
2,718,235
Total
$
8,927,828
^
#
Capital
gain
distributions
from
underlying
Price
funds
represented
$0
of
the
net
realized
gain
(loss).
+
Investment
income
comprised
$251,782
of
dividend
income
and
$1,006
of
interest
income.
*
On
the
date
indicated,
issuer
was
held
but
not
considered
an
affiliated
company.
¤
Purchase
and
sale
information
not
shown
for
cash
management
funds.
^
The
cost
basis
of
investments
in
affiliated
companies
was
$8,158,314.
T.
ROWE
PRICE
Capital
Appreciation
Fund
December
31,
2024
Statement
of
Assets
and
Liabilities
($000s,
except
shares
and
per
share
amounts)
Assets
Investments
in
securities,
at
value
(cost
$53,127,912)
$
64,453,644
Interest
and
dividends
receivable
222,553
Receivable
for
investment
securities
sold
179,774
Receivable
for
shares
sold
91,943
Foreign
currency
(cost
$24,702)
23,530
Cash
2,069
Other
assets
637
Total
assets
64,974,150
Liabilities
Payable
for
investment
securities
purchased
547,216
Options
written
(premiums
$119,732)
97,935
Payable
for
shares
redeemed
57,478
Investment
management
fees
payable
31,097
Due
to
affiliates
859
Payable
to
directors
50
Other
liabilities
3,685
Total
liabilities
738,320
NET
ASSETS
$
64,235,830
T.
ROWE
PRICE
Capital
Appreciation
Fund
December
31,
2024
Statement
of
Assets
and
Liabilities
($000s,
except
shares
and
per
share
amounts)
The
accompanying
notes
are
an
integral
part
of
these
financial
statements.
Net
Assets
Consist
of:
Total
distributable
earnings
(loss)
$
11,727,894
Paid-in
capital
applicable
to
1,855,871,135
shares
of
$0.0001
par
value
capital
stock
outstanding;
4,000,000,000
shares
authorized
52,507,936
NET
ASSETS
$
64,235,830
NET
ASSET
VALUE
PER
SHARE
Investor
Class
(Net
assets:
$34,859,959;
Shares
outstanding:
1,006,794,486)
$
34.62
Advisor
Class
(Net
assets:
$790,317;
Shares
outstanding:
23,218,524)
$
34.04
I
Class
(Net
assets:
$28,585,554;
Shares
outstanding:
825,858,125)
$
34.61
T.
ROWE
PRICE
Capital
Appreciation
Fund
Year
Ended
12/31/24
Investment
Income
(Loss)
Income
.
Interest
$
1,165,194
Dividend
(net
of
foreign
taxes
of
$7,974)
643,654
Total
income
1,808,848
Expenses
Investment
management
361,002
Shareholder
servicing
Investor
Class
$
44,777
Advisor
Class
1,174
I
Class
2,553
48,504
Rule
12b-1
fees
Advisor
Class
1,972
Prospectus
and
shareholder
reports
Investor
Class
882
Advisor
Class
11
I
Class
407
1,300
Registration
1,141
Custody
and
accounting
1,103
Directors
202
Legal
and
audit
62
Miscellaneous
285
Waived
/
paid
by
Price
Associates
(
15,114
)
Total
expenses
400,457
Net
investment
income
1,408,391
T.
ROWE
PRICE
Capital
Appreciation
Fund
The
accompanying
notes
are
an
integral
part
of
these
financial
statements.
Year
Ended
12/31/24
Realized
and
Unrealized
Gain
/
Loss
–
Net
realized
gain
(loss)
Securities
5,403,305
Options
written
(
77,241
)
Foreign
currency
transactions
62
Net
realized
gain
5,326,126
Change
in
net
unrealized
gain
/
loss
Securities
610,609
Options
written
(
20,245
)
Other
assets
and
liabilities
denominated
in
foreign
currencies
(
1,513
)
Change
in
net
unrealized
gain
/
loss
588,851
Net
realized
and
unrealized
gain
/
loss
5,914,977
INCREASE
IN
NET
ASSETS
FROM
OPERATIONS
$
7,323,368
T.
ROWE
PRICE
Capital
Appreciation
Fund
Statement
of
Changes
in
Net
Assets
Year
.
.
.
.
.
.
.
.
.
.
.
.
.
.
Ended
.
.
.
.
.
.
.
.
.
.
.
.
.
.
12/31/24
12/31/23
Increase
(Decrease)
in
Net
Assets
Operations
Net
investment
income
$
1,408,391
$
1,228,566
Net
realized
gain
5,326,126
1,564,681
Change
in
net
unrealized
gain
/
loss
588,851
5,979,174
Increase
in
net
assets
from
operations
7,323,368
8,772,421
Distributions
to
shareholders
Net
earnings
Investor
Class
(
3,313,494
)
(
1,261,594
)
Advisor
Class
(
74,183
)
(
28,937
)
I
Class
(
2,755,238
)
(
991,750
)
Decrease
in
net
assets
from
distributions
(
6,142,915
)
(
2,282,281
)
Capital
share
transactions
*
Shares
sold
Investor
Class
5,686,733
5,601,567
Advisor
Class
93,884
96,015
I
Class
5,045,061
4,316,299
Distributions
reinvested
Investor
Class
3,228,830
1,231,465
Advisor
Class
72,939
28,468
I
Class
2,649,688
955,112
Shares
redeemed
Investor
Class
(
6,368,311
)
(
5,000,242
)
Advisor
Class
(
152,568
)
(
111,230
)
I
Class
(
3,667,479
)
(
2,597,015
)
Increase
in
net
assets
from
capital
share
transactions
6,588,777
4,520,439
T.
ROWE
PRICE
Capital
Appreciation
Fund
Statement
of
Changes
in
Net
Assets
The
accompanying
notes
are
an
integral
part
of
these
financial
statements.
Year
.
.
.
.
.
.
.
.
.
.
.
.
.
.
Ended
.
.
.
.
.
.
.
.
.
.
.
.
.
.
12/31/24
12/31/23
Net
Assets
Increase
during
period
7,769,230
11,010,579
Beginning
of
period
56,466,600
45,456,021
End
of
period
$
64,235,830
$
56,466,600
*Share
information
(000s)
Shares
sold
Investor
Class
157,250
172,383
Advisor
Class
2,647
3,015
I
Class
139,988
132,898
Distributions
reinvested
Investor
Class
93,265
36,586
Advisor
Class
2,143
859
I
Class
76,581
28,384
Shares
redeemed
Investor
Class
(
176,203
)
(
154,453
)
Advisor
Class
(
4,282
)
(
3,497
)
I
Class
(
101,158
)
(
79,952
)
Increase
in
shares
outstanding
190,231
136,223
T.
ROWE
PRICE
Capital
Appreciation
Fund
NOTES
TO
FINANCIAL
STATEMENTS
T.
Rowe
Price
Capital
Appreciation
Fund,
Inc. (the
corporation) is
registered
under
the
Investment
Company
Act
of
1940
(the
1940
Act).
The
Capital
Appreciation
Fund
(the
fund)
is a
diversified, open-end
management
investment
company
established
by
the
corporation. The
fund
seeks long-term
capital
appreciation
by
investing
primarily
in
common
stocks.
It
may
also
hold
fixed-income
and
other
securities
to
help
preserve
principal
value.
The
fund
has three classes
of
shares:
the
Capital
Appreciation
Fund
(Investor
Class),
the
Capital
Appreciation
Fund–Advisor
Class
(Advisor
Class)
and
the
Capital
Appreciation
Fund–I
Class
(I
Class).
Advisor
Class
shares
are
sold
only
through
various
brokers
and
other
financial
intermediaries.
I
Class
shares
require
a
$500,000
initial
investment
minimum,
although
the
minimum
generally
is
waived
or
reduced
for
financial
intermediaries,
eligible
retirement
plans,
and
certain
other
accounts.
The
Advisor
Class
operates
under
a
Board-approved
Rule
12b-1
plan
pursuant
to
which
the
class
compensates
financial
intermediaries
for
distribution,
shareholder
servicing,
and/or
certain
administrative
services;
the
Investor
and
I
Classes
do
not
pay
Rule
12b-1
fees. Each
class
has
exclusive
voting
rights
on
matters
related
solely
to
that
class;
separate
voting
rights
on
matters
that
relate
to
all
classes;
and,
in
all
other
respects,
the
same
rights
and
obligations
as
the
other
classes.
NOTE
1
-
SIGNIFICANT
ACCOUNTING
POLICIES
Basis
of
Preparation
The fund
is
an
investment
company
and
follows
accounting
and
reporting
guidance
in
the
Financial
Accounting
Standards
Board
(FASB)
Accounting
Standards
Codification
Topic
946
(ASC
946).
The
accompanying
financial
statements
were
prepared
in
accordance
with
accounting
principles
generally
accepted
in
the
United
States
of
America
(GAAP),
including,
but
not
limited
to,
ASC
946.
GAAP
requires
the
use
of
estimates
made
by
management.
Management
believes
that
estimates
and
valuations
are
appropriate;
however,
actual
results
may
differ
from
those
estimates,
and
the
valuations
reflected
in
the
accompanying
financial
statements
may
differ
from
the
value
ultimately
realized
upon
sale
or
maturity.
Investment
Transactions,
Investment
Income,
and
Distributions
Investment
transactions
are
accounted
for
on
the
trade
date
basis.
Income
and
expenses
are
recorded
on
the
accrual
basis.
Realized
gains
and
losses
are
reported
on
the
identified
cost
basis. Premiums
and
discounts
on
debt
securities
are
amortized
for
financial
reporting
purposes. Paydown
gains
and
losses
are
T.
ROWE
PRICE
Capital
Appreciation
Fund
recorded
as
an
adjustment
to
interest
income. Income
tax-related
interest
and
penalties,
if
incurred,
are
recorded
as
income
tax
expense. Dividends
received
from other
investment
companies are
reflected
as
dividend income;
capital
gain
distributions
are
reflected
as
realized
gain/loss. Dividend
income and
capital
gain
distributions
are
recorded
on
the
ex-dividend
date. Distributions
from
REITs
are
initially
recorded
as
dividend
income
and,
to
the
extent
such
represent
a
return
of
capital
or
capital
gain
for
tax
purposes,
are
reclassified
when
such
information
becomes
available. Non-cash
dividends,
if
any,
are
recorded
at
the
fair
market
value
of
the
asset
received. Proceeds
from
litigation
payments,
if
any,
are
included
in
either
net
realized
gain
(loss)
or
change
in
net
unrealized
gain/loss
from
securities. Distributions
to
shareholders
are
recorded
on
the
ex-dividend
date. Income
distributions,
if
any,
are
declared
and
paid
by
each
class annually. A
capital
gain
distribution,
if
any, may
also
be
declared
and
paid
by
the
fund
annually.
Currency
Translation
Assets,
including
investments,
and
liabilities
denominated
in
foreign
currencies
are
translated
into
U.S.
dollar
values
each
day
at
the
prevailing
exchange
rate,
using
the
mean
of
the
bid
and
asked
prices
of
such
currencies
against
U.S.
dollars
as
provided
by
an
outside
pricing
service.
Purchases
and
sales
of
securities,
income,
and
expenses
are
translated
into
U.S.
dollars
at
the
prevailing
exchange
rate
on
the
respective
date
of
such
transaction.
The
effect
of
changes
in
foreign
currency
exchange
rates
on
realized
and
unrealized
security
gains
and
losses
is
not
bifurcated
from
the
portion
attributable
to
changes
in
market
prices.
Class
Accounting
Shareholder
servicing,
prospectus,
and
shareholder
report
expenses
incurred
by
each
class
are
charged
directly
to
the
class
to
which
they
relate.
Expenses
common
to
all
classes,
investment
income,
and
realized
and
unrealized
gains
and
losses
are
allocated
to
the
classes
based
upon
the
relative
daily
net
assets
of
each
class.
The
Advisor
Class
pays
Rule
12b-1
fees,
in
an
amount
not
exceeding
0.25%
of
the
class’s
average
daily
net
assets.
In-Kind
Redemptions
In
accordance
with
guidelines
described
in
the
fund’s
prospectus,
and
when
considered
to
be
in
the
best
interest
of
all
shareholders,
the
fund
may
distribute
portfolio
securities
rather
than
cash
as
payment
for
a
redemption
of
fund
shares
(in-kind
redemption).
Gains
and
losses
realized
on
in-kind
redemptions
are
not
recognized
for
tax
purposes
and
are
reclassified
from
undistributed
realized
gain
(loss)
to
paid-in
capital.
During
the
year ended
December
31,
2024,
the
fund
realized
$30,568,000 of
net
gain
on
$79,848,000
of
in-kind
redemptions.
T.
ROWE
PRICE
Capital
Appreciation
Fund
Capital
Transactions
Each
investor’s
interest
in
the
net
assets
of the
fund
is
represented
by
fund
shares. The
fund’s
net
asset
value
(NAV)
per
share
is
computed
at
the
close
of
the
New
York
Stock
Exchange
(NYSE),
normally
4
p.m.
Eastern
time,
each
day
the
NYSE
is
open
for
business.
However,
the
NAV
per
share
may
be
calculated
at
a
time
other
than
the
normal
close
of
the
NYSE
if
trading
on
the
NYSE
is
restricted,
if
the
NYSE
closes
earlier,
or
as
may
be
permitted
by
the
SEC.
Purchases
and
redemptions
of
fund
shares
are
transacted
at
the
next-computed
NAV
per
share,
after
receipt
of
the
transaction
order
by
T.
Rowe
Price
Associates,
Inc.,
or
its
agents.
New
Accounting
Guidance
In December
2023,
the
FASB
issued
Accounting
Standards
Update
(ASU),
ASU
2023-09,
Income
Taxes
(Topic
740)
–
Improvements
to
Income
Taxes
Disclosures,
which
enhances
the
transparency
of
income
tax
disclosures.
The
ASU
requires
public
entities,
on
an
annual
basis,
to
provide
disclosure
of
specific
categories
in
the
rate
reconciliation,
as
well
as
disclosure
of
income
taxes
paid
disaggregated
by
jurisdiction.
The
amendments
under
this
ASU
are
required
to
be
applied
prospectively
and
are
effective
for
fiscal
years
beginning
after
December
15,
2024.
Management
expects
that
adoption
of
the
guidance
will
not
have
a
material
impact
on
the
fund’s
financial
statements.
Indemnification
In
the
normal
course
of
business, the
fund
may
provide
indemnification
in
connection
with
its
officers
and
directors,
service
providers,
and/or
private
company
investments. The
fund’s
maximum
exposure
under
these
arrangements
is
unknown;
however,
the
risk
of
material
loss
is
currently
considered
to
be
remote.
NOTE
2
-
VALUATION
Fair
Value
The
fund’s
financial
instruments
are
valued
at
the
close
of
the
NYSE
and
are
reported
at
fair
value,
which
GAAP
defines
as
the
price
that
would
be
received
to
sell
an
asset
or
paid
to
transfer
a
liability
in
an
orderly
transaction
between
market
participants
at
the
measurement
date. The fund’s
Board
of
Directors
(the
Board)
has
designated
T.
Rowe
Price
Associates,
Inc.
as
the
fund’s
valuation
designee
(Valuation
Designee).
Subject
to
oversight
by
the
Board,
the
Valuation
Designee
performs
the
following
functions
in
performing
fair
value
determinations:
assesses
and
manages
valuation
risks;
establishes
and
applies
fair
value
methodologies;
tests
fair
value
methodologies;
and
evaluates
pricing
vendors
and
pricing
agents.
The
duties
T.
ROWE
PRICE
Capital
Appreciation
Fund
and
responsibilities
of
the
Valuation
Designee
are
performed
by
its
Valuation
Committee. The
Valuation
Designee provides
periodic
reporting
to
the
Board
on
valuation
matters.
Various
valuation
techniques
and
inputs
are
used
to
determine
the
fair
value
of
financial
instruments.
GAAP
establishes
the
following
fair
value
hierarchy
that
categorizes
the
inputs
used
to
measure
fair
value:
Level
1
–
quoted
prices
(unadjusted)
in
active
markets
for
identical
financial
instruments
that
the
fund
can
access
at
the
reporting
date
Level
2
–
inputs
other
than
Level
1
quoted
prices
that
are
observable,
either
directly
or
indirectly
(including,
but
not
limited
to,
quoted
prices
for
similar
financial
instruments
in
active
markets,
quoted
prices
for
identical
or
similar
financial
instruments
in
inactive
markets,
interest
rates
and
yield
curves,
implied
volatilities,
and
credit
spreads)
Level
3
–
unobservable
inputs
(including
the Valuation
Designee’s assumptions
in
determining
fair
value)
Observable
inputs
are
developed
using
market
data,
such
as
publicly
available
information
about
actual
events
or
transactions,
and
reflect
the
assumptions
that
market
participants
would
use
to
price
the
financial
instrument.
Unobservable
inputs
are
those
for
which
market
data
are
not
available
and
are
developed
using
the
best
information
available
about
the
assumptions
that
market
participants
would
use
to
price
the
financial
instrument.
GAAP
requires
valuation
techniques
to
maximize
the
use
of
relevant
observable
inputs
and
minimize
the
use
of
unobservable
inputs.
When
multiple
inputs
are
used
to
derive
fair
value,
the
financial
instrument
is
assigned
to
the
level
within
the
fair
value
hierarchy
based
on
the
lowest-level
input
that
is
significant
to
the
fair
value
of
the
financial
instrument.
Input
levels
are
not
necessarily
an
indication
of
the
risk
or
liquidity
associated
with
financial
instruments
at
that
level
but
rather
the
degree
of
judgment
used
in
determining
those
values.
Valuation
Techniques
Equity
securities,
including
exchange-traded
funds, listed
or
regularly
traded
on
a
securities
exchange
or
in
the
over-the-
counter
(OTC)
market
are
valued
at
the
last
quoted
sale
price
or,
for
certain
markets,
the
official
closing
price
at
the
time
the
valuations
are
made.
OTC
Bulletin
Board
securities
are
valued
at
the
mean
of
the
closing
bid
and
asked
prices.
A
security
that
is
listed
or
traded
on
more
than
one
exchange
is
valued
at
the
quotation
on
the
exchange
determined
to
be
the
primary
market
for
such
security.
Listed
securities
not
traded
on
a
particular
day
are
valued
at
the
mean
of
the
closing
bid
and
asked
prices
for
domestic
securities.
T.
ROWE
PRICE
Capital
Appreciation
Fund
Debt
securities
generally
are
traded
in
the over-the-counter
(OTC)
market
and
are
valued
at
prices
furnished
by
independent
pricing
services
or
by
broker
dealers
who
make
markets
in
such
securities.
When
valuing
securities,
the
independent
pricing
services
consider
factors
such
as,
but
not
limited
to,
the
yield
or
price
of
bonds
of
comparable
quality,
coupon,
maturity,
and
type,
as
well
as
prices
quoted
by
dealers
who
make
markets
in
such
securities.
Investments
in
mutual
funds
are
valued
at
the
mutual
fund’s
closing
NAV
per
share
on
the
day
of
valuation.
Listed
options,
and
OTC
options
with
a
listed
equivalent,
are
valued
at
the
mean
of
the
closing
bid
and
asked
prices
and
exchange-traded
options
on
futures
contracts
are
valued
at
closing
settlement
prices.
Assets
and
liabilities
other
than
financial
instruments,
including
short-
term
receivables
and
payables,
are
carried
at
cost,
or
estimated
realizable
value,
if
less,
which
approximates
fair
value.
Investments
for
which
market
quotations are
not
readily
available
or
deemed
unreliable
are
valued
at
fair
value
as
determined
in
good
faith
by
the
Valuation
Designee.
The
Valuation
Designee
has
adopted
methodologies
for
determining
the
fair
value
of
investments
for
which
market
quotations
are
not
readily
available
or
deemed
unreliable,
including
the
use
of
other
pricing
sources.
Factors
used
in
determining
fair
value
vary
by
type
of
investment
and
may
include
market
or
investment
specific
considerations.
The
Valuation
Designee typically
will
afford
greatest
weight
to
actual
prices
in
arm’s
length
transactions,
to
the
extent
they
represent
orderly
transactions
between
market
participants,
transaction
information
can
be
reliably
obtained,
and
prices
are
deemed
representative
of
fair
value.
However,
the
Valuation
Designee may
also
consider
other
valuation
methods
such
as
market-based
valuation
multiples;
a
discount
or
premium
from
market
value
of
a
similar,
freely
traded
security
of
the
same
issuer;
discounted
cash
flows;
yield
to
maturity;
or
some
combination.
Fair
value
determinations
are
reviewed
on
a
regular
basis.
Because
any
fair
value
determination
involves
a
significant
amount
of
judgment,
there
is
a
degree
of
subjectivity
inherent
in
such
pricing
decisions. Fair
value
prices
determined
by
the
Valuation
Designee could
differ
from
those
of
other
market
participants,
and
it
is
possible
that
the
fair
value
determined
for
a
security
may
be
materially
different
from
the
value
that
could
be
realized
upon
the
sale
of
that
security.
T.
ROWE
PRICE
Capital
Appreciation
Fund
Valuation
Inputs
The
following
table
summarizes
the
fund’s
financial
instruments,
based
on
the
inputs
used
to
determine
their
fair
values
on
December
31,
2024
(for
further
detail
by
category,
please
refer
to
the
accompanying
Portfolio
of
Investments):
($000s)
Level
1
Level
2
Level
3
Total
Value
Assets
Fixed
Income
Securities
1
$
—
$
14,476,598
$
—
$
14,476,598
Bond
Mutual
Funds
919,663
—
—
919,663
Common
Stocks
38,760,655
—
135,379
38,896,034
Convertible
Preferred
Stocks
172,490
—
465,977
638,467
Corporate
Bonds
—
6,637,692
—
6,637,692
Preferred
Stocks
27,247
—
139,708
166,955
Short-Term
Investments
2,718,235
—
—
2,718,235
Total
$
42,598,290
$
21,114,290
$
741,064
$
64,453,644
Liabilities
Options
Written
$
—
$
97,935
$
—
$
97,935
1
Includes
Asset-Backed
Securities,
Bank
Loans
and
U.S.
Government
Agency
Obligations
(Excluding
Mortgage-Backed).
T.
ROWE
PRICE
Capital
Appreciation
Fund
Following
is
a
reconciliation
of
the
fund’s
Level
3
holdings
for
the
year ended
December
31,
2024.
Gain
(loss)
reflects
both
realized
and
change
in
unrealized
gain/loss
on
Level
3
holdings
during
the
period,
if
any,
and
is
included
on
the
accompanying
Statement
of
Operations.
The
change
in
unrealized
gain/loss
on
Level
3
instruments
held
at
December
31,
2024,
totaled $65,689,000 for
the
year ended
December
31,
2024.
NOTE
3
-
DERIVATIVE
INSTRUMENTS
During
the
year ended
December
31,
2024,
the
fund
invested
in
derivative
instruments.
As
defined
by
GAAP,
a
derivative
is
a
financial
instrument
whose
value
is
derived
from
an
underlying
security
price,
foreign
exchange
rate,
interest
rate,
index
of
prices
or
rates,
or
other
variable;
it
requires
little
or
no
initial
investment
and
permits
or
requires
net
settlement
or
delivery
of
cash
or
other
assets.
The
fund
invests
in
derivatives
only
if
the
expected
risks
and
rewards
are
consistent
with
its
investment
objectives,
policies,
and
overall
risk
profile,
as
described
in
its
prospectus
and
Statement
of
Additional
Information.
The
fund
may
use
derivatives
for
a
variety
of
purposes
and
may
use
them
to
establish
both
long
and
short
positions
within
the
fund’s
portfolio.
Potential
uses
include
to
hedge
against
declines
in
principal
value,
increase
yield,
invest
in
an
asset
with
greater
efficiency
and
at
a
lower
cost
than
is
possible
through
direct
investment,
to
enhance
return,
or
to
adjust
credit
exposure.
The
risks
associated
with
the
use
of
derivatives
are
different
from,
and
potentially
much
greater
than,
the
risks
associated
with
investing
directly
in
the
instruments
on
which
the
derivatives
are
based.
($000s)
Beginning
Balance
12/31/23
Gain
(Loss)
During
Period
Total
Purchases
Total
Sales
Ending
Balance
12/31/24
Investment
in
Securities
Bank
Loans
$
5,752
$
(53)
$
12,533
$
(18,232)
$
—
Common
Stocks
123,055
12,324
—
—
135,379
Convertible
Preferred
Stocks
132,324
54,054
279,599
—
465,977
Corporate
Bonds
—
—
—
—
—
Preferred
Stocks
—
(688)
140,396
—
139,708
Total
$
261,13
1
$
65,637
$
432,528
$
(18,232)
$
741,06
4
T.
ROWE
PRICE
Capital
Appreciation
Fund
The
fund
values
its
derivatives
at
fair
value
and
recognizes
changes
in
fair
value
currently
in
its
results
of
operations.
Accordingly,
the
fund
does
not
follow
hedge
accounting,
even
for
derivatives
employed
as
economic
hedges.
Generally,
the
fund
accounts
for
its
derivatives
on
a
gross
basis.
It
does
not
offset
the
fair
value
of
derivative
liabilities
against
the
fair
value
of
derivative
assets
on
its
financial
statements,
nor
does
it
offset
the
fair
value
of
derivative
instruments
against
the
right
to
reclaim
or
obligation
to
return
collateral.
The
following
table
summarizes
the
fair
value
of
the
fund’s
derivative
instruments
held
as
of
December
31,
2024,
and
the
related
location
on
the
accompanying
Statement
of
Assets
and
Liabilities,
presented
by
primary
underlying
risk
exposure:
Additionally,
the
amount
of
gains
and
losses
on
derivative
instruments
recognized
in
fund
earnings
during
the
year ended
December
31,
2024,
and
the
related
location
on
the
accompanying
Statement
of
Operations
is
summarized
in
the
following
table
by
primary
underlying
risk
exposure:
($000s)
Location
on
Statement
of
Assets
and
Liabilities
Fair
Value
Liabilities
Equity
derivatives
Options
Written
$
97,935
Total
$
97,935
($000s)
Location
of
Gain
(Loss)
on
Statement
of
Operations
Options
Written
Realized
Gain
(Loss)
Equity
derivatives
$
(77,241)
Total
$
(77,241)
Change
in
Unrealized
Gain
(Loss)
Equity
derivatives
$
(20,245)
Total
$
(20,245)
T.
ROWE
PRICE
Capital
Appreciation
Fund
Counterparty
Risk
and
Collateral
The
fund
invests
in
derivatives,
such
as
non-cleared
bilateral
swaps,
forward
currency
exchange
contracts,
and/or
OTC
options,
that
are
transacted
and
settle
directly
with
a
counterparty
(bilateral
derivatives),
and
thereby
may
expose
the
fund
to
counterparty
risk.
To
mitigate
this
risk,
the
fund
has
entered
into
master
netting
arrangements
(MNAs)
with
certain
counterparties
that
permit
net
settlement
under
specified
conditions
and,
for
certain
counterparties,
also
require
the
exchange
of
collateral
to
cover
mark-to-market
exposure.
MNAs
may
be
in
the
form
of
International
Swaps
and
Derivatives
Association
master
agreements
(ISDAs)
or
foreign
exchange
letter
agreements
(FX
letters).
MNAs
govern
the
ability
to
offset
amounts
the
fund
owes
a
counterparty
against
amounts
the
counterparty
owes
the
fund
(net
settlement).
Both
ISDAs
and
FX
letters
generally
allow
termination
of
transactions
and
net
settlement
upon
the
occurrence
of
contractually
specified
events,
such
as
failure
to
pay
or
bankruptcy.
In
addition,
ISDAs
specify
other
events,
the
occurrence
of
which
would
allow
one
of
the
parties
to
terminate.
For
example,
a
downgrade
in
credit
rating
of
a
counterparty
below
a
specified
rating
would
allow
the
fund
to
terminate,
while
a
decline
in
the
fund’s
net
assets
of
more
than
a
specified
percentage
would
allow
the
counterparty
to
terminate.
Upon
termination,
all
transactions
with
that
counterparty
would
be
liquidated
and
a
net
termination
amount
determined.
ISDAs
typically
include
collateral
agreements
whereas
FX
letters
do
not.
Collateral
requirements
are
determined
daily
based
on
the
net
aggregate
unrealized
gain
or
loss
on
all
bilateral
derivatives
with
each
counterparty,
subject
to
minimum
transfer
amounts
that
typically
range
from
$100,000
to
$250,000.
Any
additional
collateral
required
due
to
changes
in
security
values
is
typically
transferred
the
next
business
day.
Collateral may
be
in
the
form
of
cash
or
debt
securities
issued
by
the
U.S.
government
or
related
agencies,
although
other
securities
may
be
used
depending
on
the
terms
outlined
in
the
applicable
MNA.
Cash
posted
by
the
fund
is
reflected
as
cash
deposits
in
the
accompanying
financial
statements
and
generally
is
restricted
from
withdrawal
by
the
fund;
securities
posted
by
the
fund
are
so
noted
in
the
accompanying
Portfolio
of
Investments;
both
remain
in
the
fund’s
assets.
Collateral
pledged
by
counterparties
is
not
included
in
the
fund’s
assets
because
the
fund
does
not
obtain
effective
control
over
those
assets.
For
bilateral
derivatives,
collateral
posted
or
received
by
the
fund
is
held
in
a
segregated
account
at
the
fund’s
custodian.
While
typically
not
sold
in
the
same
manner
as
equity
or
fixed
income
securities,
OTC
and
bilateral
derivatives
may
be
unwound
with
counterparties
or
transactions
assigned
to
other
counterparties
to
allow
the
fund
to
exit
the
transaction.
This
ability
T.
ROWE
PRICE
Capital
Appreciation
Fund
is
subject
to
the
liquidity
of
underlying
positions. As
of
December
31,
2024,
securities
valued
at $56,754,000
had
been
posted
by
the
fund
to
counterparties
for
bilateral
derivatives. As
of
December
31,
2024,
no
collateral
was
pledged
by
counterparties
to
the
fund
for
bilateral
derivatives.
Options
The
fund
is
subject
to equity
price
risk in
the
normal
course
of
pursuing
its
investment
objectives
and
uses
options
to
help
manage
such
risk.
The
fund
may
use
options
to
manage
exposure
to
security
prices,
interest
rates,
foreign
currencies,
and
credit
quality;
as
an
efficient
means
of
adjusting
exposure
to
all
or
a
part
of
a
target
market;
to
enhance
income;
as
a
cash
management
tool;
or
to
adjust
credit
exposure.
The
fund
may
buy
or
sell
options
that
can
be
settled
either
directly
with
the
counterparty
(OTC
option)
or
through
a
central
clearinghouse
(exchange-traded
option).
Options
are
included
in
net
assets
at
fair
value,
options
purchased
are
included
in
Investments
in
Securities,
and
options
written
are
separately
reflected
as
a
liability
on
the
accompanying
Statement
of
Assets
and
Liabilities.
Premiums
on
unexercised,
expired
options
are
recorded
as
realized
gains
or
losses
on
the
accompanying
Statement
of
Operations;
premiums
on
exercised
options
are
recorded
as
an
adjustment
to
the
proceeds
from
the
sale
or
cost
of
the
purchase.
The
difference
between
the
premium
and
the
amount
received
or
paid
in
a
closing
transaction
is
also
treated
as
realized
gain
or
loss
on
the
accompanying
Statement
of
Operations.
In
return
for
a
premium
paid,
call
and
put
options
give
the
holder
the
right,
but
not
the
obligation,
to
purchase
or
sell,
respectively,
a
security
at
a
specified
exercise
price. Risks related
to
the
use
of
options
include
possible
illiquidity
of
the
options
markets;
trading
restrictions
imposed
by
an
exchange
or
counterparty;
possible
failure
of
counterparties
to
meet
the
terms
of
the
agreements;
movements
in
the
underlying
asset
values
and,
for
options
written,
the
potential
for
losses
to
exceed
any
premium
received
by
the
fund.
During
the
year ended
December
31,
2024,
the
volume
of
the
fund’s
activity
in
options,
based
on
underlying
notional
amounts,
was
generally
between
4%
and
8%
of
net
assets.
NOTE
4
-
OTHER
INVESTMENT
TRANSACTIONS
Consistent
with
its
investment
objective, the
fund
engages
in
the
following
practices
to
manage
exposure
to
certain
risks
and/or
to
enhance
performance.
The
investment
objective,
policies,
program,
and
risk
factors
of the
fund
are
described
more
fully
in the
fund’s prospectus
and
Statement
of
Additional
Information.
T.
ROWE
PRICE
Capital
Appreciation
Fund
Noninvestment-Grade
Debt
The
fund
invests,
either
directly
or
through
its
investment
in
other
T.
Rowe
Price
funds,
in
noninvestment-grade
debt,
including
“high
yield”
or
“junk”
bonds
or
leveraged
loans.
Noninvestment-grade
debt
issuers
are
more
likely
to
suffer
an
adverse
change
in
financial
condition
that
would
result
in
the
inability
to
meet
a
financial
obligation.
The
noninvestment-
grade
debt
market
may
experience
sudden
and
sharp
price
swings
due
to
a
variety
of
factors
that
may
decrease
the
ability
of
issuers
to
make
principal
and
interest
payments
and
adversely
affect
the
liquidity
or
value,
or
both,
of
such
securities.
Accordingly,
securities
issued
by
such
companies
carry
a
higher
risk
of
default
and
should
be
considered
speculative.
Restricted
Securities
The
fund
invests
in
securities
that
are
subject
to
legal
or
contractual
restrictions
on
resale.
Prompt
sale
of
such
securities
at
an
acceptable
price
may
be
difficult
and
may
involve
substantial
delays
and
additional
costs.
Bank
Loans
The
fund
invests
in
bank
loans,
which
represent
an
interest
in
amounts
owed
by
a
borrower
to
a
syndicate
of
lenders.
Bank
loans
are
generally
noninvestment
grade
and
often
involve
borrowers
whose
financial
condition
is
highly
leveraged.
The
fund
may
invest
in
fixed
and
floating
rate
loans,
which
may
include
senior
floating
rate
loans;
secured
and
unsecured
loans,
second
lien
or
more
junior
loans;
and
bridge
loans
or
bridge
facilities.
Certain
bank
loans
may
be
revolvers
which
are
a
form
of
senior
bank
debt,
where
the
borrower
can
draw
down
the
credit
of
the
revolver
when
it
needs
cash
and
repays
the
credit
when
the
borrower
has
excess
cash.
Certain
loans
may
be
“covenant-lite”
loans,
which
means
the
loans
contain
fewer
maintenance
covenants
than
other
loans
(in
some
cases,
none)
and
do
not
include
terms
which
allow
the
lender
to
monitor
the
performance
of
the
borrower
and
declare
a
default
if
certain
criteria
are
breached.
As
a
result
of
these
risks,
the
fund’s
exposure
to
losses
may
be
increased.
Bank
loans
may
be
in
the
form
of
either
assignments
or
participations.
A
loan
assignment
transfers
all
legal,
beneficial,
and
economic
rights
to
the
buyer,
and
transfer
typically
requires
consent
of
both
the
borrower
and
agent.
In
contrast,
a
loan
participation
generally
entitles
the
buyer
to
receive
the
cash
flows
from
principal,
interest,
and
any
fee
payments
on
a
portion
of
a
loan;
however,
the
seller
continues
to
hold
legal
title
to
that
portion
of
the
loan.
As
a
result,
the
buyer
of
a
loan
participation
generally
has
no
direct
recourse
against
the
borrower
and
is
exposed
to
credit
risk
of
both
the
borrower
and
seller
of
the
participation.
T.
ROWE
PRICE
Capital
Appreciation
Fund
Bank
loans
often
have
extended
settlement
periods,
generally
may
be
repaid
at
any
time
at
the
option
of
the
borrower,
and
may
require
additional
principal
to
be
funded
at
the
borrowers’
discretion
at
a
later
date
(e.g.
unfunded
commitments
and
revolving
debt
instruments).
Until
settlement,
the
fund
maintains
liquid
assets
sufficient
to
settle
its
unfunded
loan
commitments.
The
fund
reflects
both
the
funded
portion
of
a
bank
loan
as
well
as
its
unfunded
commitment
in
the
Portfolio
of
Investments.
However,
if
a
credit
agreement
provides
no
initial
funding
of
a
tranche,
and
funding
of
the
full
commitment
at
a
future
date(s)
is
at
the
borrower’s
discretion
and
considered
uncertain,
a
loan
is
reflected
in
the
Portfolio
of
Investments
only
if,
and
only
to
the
extent
that,
the
fund
has
actually
settled
a
funding
commitment.
Other
Purchases
and
sales
of
portfolio
securities
other
than
in-kind
transactions,
if
any, short-term
and
U.S.
government securities
aggregated $35,011,695,000 and
$35,653,600,000,
respectively,
for
the
year ended
December
31,
2024. Purchases
and
sales
of
U.S.
government
securities
aggregated $17,531,434,000 and
$14,212,155,000,
respectively,
for
the
year ended
December
31,
2024.
NOTE
5
-
FEDERAL
INCOME
TAXES
Generally,
no
provision
for
federal
income
taxes
is
required
since
the
fund
intends
to continue
to
qualify
as
a
regulated
investment
company
under
Subchapter
M
of
the
Internal
Revenue
Code
and
distribute
to
shareholders
all
of
its taxable
income
and
gains.
Distributions
determined
in
accordance
with
federal
income
tax
regulations
may
differ
in
amount
or
character
from
net
investment
income
and
realized
gains
for
financial
reporting
purposes.
The
fund
files
U.S.
federal,
state,
and
local
tax
returns
as
required.
The
fund’s
tax
returns
are
subject
to
examination
by
the
relevant
tax
authorities
until
expiration
of
the
applicable
statute
of
limitations,
which
is
generally
three
years
after
the
filing
of
the
tax
return
but
which
can
be
extended
to
six
years
in
certain
circumstances.
Tax
returns
for
open
years
have
incorporated
no
uncertain
tax
positions
that
require
a
provision
for
income
taxes.
Capital
accounts
within
the
financial
reporting
records
are
adjusted
for
permanent
book/tax
differences
to
reflect
tax
character
but
are
not
adjusted
for
temporary
differences.
The
permanent
book/tax
adjustments,
if
any,
have
no
impact
on
results
of
operations
or
net
assets.
The
permanent
book/tax
adjustments
relate
primarily
to
deemed
distributions
on
shareholder
redemptions.
T.
ROWE
PRICE
Capital
Appreciation
Fund
The
tax
character
of
distributions
paid
for
the
periods
presented
was
as
follows:
At
December
31,
2024,
the
tax-basis
cost
of
investments
(including
derivatives,
if
any)
and
gross
unrealized
appreciation
and
depreciation
were as
follows:
At
December
31,
2024,
the
tax-basis
components
of
accumulated
net
earnings
(loss)
were
as
follows:
Temporary
differences
between
book-basis
and
tax-basis
components
of
total
distributable
earnings
(loss)
arise
when
certain
items
of
income,
gain,
or
loss
are
recognized
in
different
periods
for
financial
statement
purposes
versus
for
tax
purposes;
these
differences
will
reverse
in
a
subsequent
reporting
period.
The
temporary
differences
relate
primarily
to
the
deferral
of
losses
from
wash
sales.
($000s)
December
31,
2024
December
31,
2023
Ordinary
income
(including
short-term
capital
gains,
if
any)
$
2,171,176
$
1,356,554
Long-term
capital
gain
3,971,739
925,727
Total
distributions
$
6,142,915
$
2,282,281
($000s)
Cost
of
investments
$
53,113,714
Unrealized
appreciation
$
12,128,191
Unrealized
depreciation
(887,447)
Net
unrealized
appreciation
(depreciation)
$
11,240,744
($000s)
Undistributed
ordinary
income
$
65,364
Undistributed
long-term
capital
gain
421,786
Net
unrealized
appreciation
(depreciation)
11,240,744
Total
distributable
earnings
(loss)
$
11,727,894
T.
ROWE
PRICE
Capital
Appreciation
Fund
NOTE
6
-
FOREIGN TAXES
The
fund
is
subject
to
foreign
income
taxes
imposed
by
certain
countries
in
which
it
invests.
Additionally,
capital
gains
realized
upon
disposition
of
securities
issued
in
or
by
certain
foreign
countries
are
subject
to
capital
gains
tax
imposed
by
those
countries.
All
taxes
are
computed
in
accordance
with
the
applicable
foreign
tax
law,
and,
to
the
extent
permitted,
capital
losses
are
used
to
offset
capital
gains.
Taxes
attributable
to
income
are
accrued
by
the
fund
as
a
reduction
of
income.
Current
and
deferred
tax
expense
attributable
to
capital
gains
is
reflected
as
a
component
of
realized
or
change
in
unrealized
gain/
loss
on
securities
in
the
accompanying
financial
statements.
To
the
extent
that
the
fund
has
country
specific
capital
loss
carryforwards,
such
carryforwards
are
applied
against
net
unrealized
gains
when
determining
the
deferred
tax
liability.
Any
deferred
tax
liability
incurred
by
the
fund
is
included
in
either
Other
liabilities
or
Deferred
tax
liability
on
the
accompanying
Statement
of
Assets
and
Liabilities.
NOTE
7
-
RELATED
PARTY
TRANSACTIONS
The
fund
is
managed
by
T.
Rowe
Price
Associates,
Inc.
(Price
Associates),
a
wholly
owned
subsidiary
of
T.
Rowe
Price
Group,
Inc.
(Price
Group). Price
Associates
has
entered
into
a
sub-advisory
agreement(s)
with
one
or
more
of
its
wholly
owned
subsidiaries,
to
provide
investment
advisory
services
to
the
fund. The
investment
management
agreement
between
the
fund
and
Price
Associates
provides
for
an
annual
investment
management
fee,
which
is
computed
daily
and
paid
monthly.
The
fee
consists
of
an
individual
fund
fee
equal
to
0.30%
of
the fund’s
average
daily
net
assets,
and
a
group
fee.
The
group
fee
rate
is
calculated
based
on
the
combined
net
assets
of
certain
mutual
funds
sponsored
by
Price
Associates
(the
group)
applied
to
a
graduated
fee
schedule,
with
rates
ranging
from
0.48%
for
the
first
$1
billion
of
assets
to
0.260%
for
assets
in
excess
of
$845
billion.
The
fund’s
group
fee
is
determined
by
applying
the
group
fee
rate
to
the
fund’s
average
daily
net
assets.
At December
31,
2024,
the
effective
annual
group
fee
rate
was
0.28%. Effective
April
30,
2019,
Price
Associates
has
contractually
agreed,
at
least
through
February
28,
2027,
to
waive
a
portion
of
its
management
fee
so
that
an
individual
fund
fee
of 0.27%
is
applied
to
the
fund’s
average
daily
net
assets
that
are
equal
to
or
greater
than $27.5 billion.
Thereafter,
this
agreement
will
automatically
renew
for
one-year
terms
unless
terminated
by
the
fund’s
Board.
Any
fees
waived
under
this
agreement
are
not
subject
to
reimbursement
to
Price
Associates
by
the
fund. The
total
management
fees
T.
ROWE
PRICE
Capital
Appreciation
Fund
waived
were $10,288,000
and
allocated
ratably
in
the
amounts
of
$5,635,000
for
the
Investor
Class,
$131,000
for
the
Advisor
Class,
and
$4,522,000
for
the
I
Class,
for
the
year
ended
December
31,
2024.
The Investor
Class and Advisor
Class are
each
subject
to
a
contractual
expense
limitation
through
the
expense
limitation
dates
indicated
in
the
table
below.
This
agreement
will
continue
through
the
expense
limitation
dates
indicated
in
the
table
below,
and
may
be
renewed,
revised,
or
revoked
only
with
approval
of
the
fund’s
Board.
During
the
limitation
period,
Price
Associates
is required
to
waive
or
pay
any
expenses
(excluding
interest;
expenses
related
to
borrowings,
taxes,
and
brokerage;
non-recurring,
extraordinary
expenses;
and
acquired
fund
fees
and
expenses)
that
would
otherwise
cause
the class’s ratio
of
annualized
total
expenses
to
average
net
assets
(net
expense
ratio)
to
exceed
its
expense
limitation.
Each
class
is
required
to
repay
Price
Associates
for
expenses
previously
waived/paid
to
the
extent
the
class’s net
assets
grow
or
expenses
decline
sufficiently
to
allow
repayment
without
causing
the class’s net
expense
ratio
(after
the
repayment
is
taken
into
account)
to
exceed
the
lesser
of:
(1)
the
expense
limitation
in
place
at
the
time
such
amounts
were
waived;
or
(2)
the class’s
current
expense
limitation.
However,
no
repayment
will
be
made
more
than
three
years
after
the
date
of
a
payment
or
waiver.
T.
ROWE
PRICE
Capital
Appreciation
Fund
The
I
Class
is
also
subject
to
an
operating
expense
limitation
(I
Class
Limit)
pursuant
to
which
Price
Associates
is
contractually
required
to
pay
all
operating
expenses
of
the
I
Class,
excluding
management
fees;
interest;
expenses
related
to
borrowings,
taxes,
and
brokerage; non-recurring,
extraordinary expenses; and
acquired
fund
fees
and
expenses, to
the
extent
such
operating
expenses,
on
an
annualized
basis,
exceed
the
I
Class
Limit. This
agreement
will
continue
through
the
expense
limitation
date
indicated
in
the
table
below,
and
may
be
renewed,
revised,
or
revoked
only
with
approval
of
the
fund’s
Board.
The
I
Class
is
required
to
repay
Price
Associates
for
expenses
previously
paid
to
the
extent
the
class’s
net
assets
grow
or
expenses
decline
sufficiently
to
allow
repayment
without
causing
the
class’s
operating
expenses
(after
the
repayment
is
taken
into
account)
to
exceed
the
lesser
of:
(1)
the
I
Class
Limit
in
place
at
the
time
such
amounts
were
paid;
or
(2)
the
current
I
Class
Limit.
However,
no
repayment
will
be
made
more
than
three
years
after
the
date
of
a
payment
or
waiver.
In
addition,
the
fund
has
entered
into
service
agreements
with
Price
Associates
and
two
wholly
owned
subsidiaries
of
Price
Associates,
each
an
affiliate
of
the
fund
(collectively,
Price).
Price
Associates
provides
certain
accounting
and
administrative
services
to
the
fund.
T.
Rowe
Price
Services,
Inc.
provides
shareholder
and
administrative
services
in
its
capacity
as
the
fund’s
transfer
and
dividend-disbursing
agent.
T.
Rowe
Price
Retirement
Plan
Services,
Inc.
provides
subaccounting
and
recordkeeping
services
for
certain
retirement
accounts
invested
in
the
Investor
Class
and
Advisor
Class.
For
the
year
ended
December
31,
2024,
expenses
incurred
pursuant
to
these
service
agreements
were
$119,000
for
Price
Associates;
$8,083,000
for
T.
Rowe
Price
Services,
Inc.;
and
$1,011,000
for
T.
Rowe
Price
Retirement
Plan
Services,
Inc.
All
amounts
due
to
and
due
from
Price,
exclusive
of
investment
management
fees
payable,
are
presented
net
on
the
accompanying
Statement
of
Assets
and
Liabilities.
Investor
Class
Advisor
Class
I
Class
Expense
limitation/I
Class
Limit
0.94%
1.19%
0.05%
Expense
limitation
date
04/30/26
04/30/26
04/30/26
(Waived)/repaid
during
the
period
($000s)
$—
$—
$—
T.
ROWE
PRICE
Capital
Appreciation
Fund
T.
Rowe
Price
Investment
Services,
Inc.
(Investment
Services)
serves
as
distributor
to
the
fund.
Pursuant
to
an
underwriting
agreement,
no
compensation
for
any
distribution
services
provided
is
paid
to
Investment
Services
by
the
fund
(except
for
12b-1
fees
under
a
Board-approved
Rule
12b-1
plan).
The fund
may
invest
its
cash
reserves
in
certain
open-end
management
investment
companies
managed
by
Price
Associates
and
considered
affiliates
of
the
fund:
the
T.
Rowe
Price
Government
Reserve
Fund
or
the
T.
Rowe
Price
Treasury
Reserve
Fund,
organized
as
money
market
funds
(together,
the
Price
Reserve
Funds).
The
Price
Reserve
Funds
are
offered
as
short-term
investment
options
to
mutual
funds,
trusts,
and
other
accounts
managed
by
Price
Associates
or
its
affiliates
and
are
not
available
for
direct
purchase
by
members
of
the
public.
Cash
collateral
from
securities
lending,
if
any,
is
invested
in
the
T.
Rowe
Price
Government
Reserve Fund. The
Price
Reserve
Funds
pay
no
investment
management
fees.
The
fund
may
also
invest
in
certain
other
T.
Rowe
Price
funds
(Price
Funds)
as
a
means
of
gaining
efficient
and
cost-effective
exposure
to
certain
markets.
The
fund
does
not
invest
for
the
purpose
of
exercising
management
or
control;
however,
investments
by
the
fund
may
represent
a
significant
portion
of
an
underlying
Price
Fund’s
net
assets.
Each
underlying
Price
Fund
is
an
open-
end
management
investment
company
managed
by
Price
Associates
and
is
considered
an
affiliate
of
the
fund.
To
ensure
that
the
fund
does
not
incur
duplicate
management
fees
(paid
by
the
underlying
Price
Fund(s)
and
the
fund),
Price
Associates
has
agreed
to
permanently
waive
a
portion
of
its
management
fee
charged
to
the
fund
in
an
amount
sufficient
to
fully
offset
that
portion
of
management
fees
paid
by
each
underlying
Price
Fund
related
to
the
fund’s
investment
therein.
Annual
management
fee
rates
and
amounts
waived
related
to
investments
in
the
underlying
Price
Fund(s)
for
the
year
ended
December
31,
2024,
are
as
follows:
Total
management
fee
waived
was
allocated
ratably
in
the
amounts
of
$2,645,000,
$61,000
and
$2,120,000 for
the
Investor
Class,
Advisor
Class
and
I
Class,
respectively,
for
the
year ended
December
31,
2024.
($000s)
Effective
Management
Fee
Rate
Management
Fee
Waived
T.
Rowe
Price
Institutional
Floating
Rate
Fund
–
Institutional
Class
0.55%
$
4,826
Total
Management
Fee
Waived
$
4,826
T.
ROWE
PRICE
Capital
Appreciation
Fund
As
of
December
31,
2024,
T.
Rowe
Price
Group,
Inc.,
or
its
wholly
owned
subsidiaries,
owned
1,788,608
shares
of
the
Investor
Class,
representing
less
than
1%
of
the
Investor
Class's
net
assets,
and
4,851,777
shares
of
the
I
Class,
representing
less
than
1%
of
the
I
Class's
net
assets.
The fund may
participate
in
securities
purchase
and
sale
transactions
with
other
funds
or
accounts
advised
by
Price
Associates
(cross
trades),
in
accordance
with
procedures
adopted
by the
fund’s
Board
and
Securities
and
Exchange
Commission
rules,
which
require,
among
other
things,
that
such
purchase
and
sale
cross
trades
be
effected
at
the
independent
current
market
price
of
the
security.
During
the
year
ended
December
31,
2024,
the
fund
had
no
purchases
or
sales
cross
trades
with
other
funds
or
accounts
advised
by
Price
Associates.
NOTE
8
-
SEGMENT
REPORTING
Operating
segments
are
defined
as
components
of
a
company
that
engage
in
business
activities
and
for
which
discrete
financial
information
is
available
and
regularly
reviewed
by
the
chief
operating
decision
maker
(CODM)
in
deciding
how
to
allocate
resources
and
assess
performance.
The
Management
Committee
of
Price
Associates
acts
as
the
fund’s
CODM.
The
fund
makes
investments
in
accordance
with
its
investment
objective
as
outlined
in
the
Prospectus
and
is
considered
one
reportable
segment
because
the
CODM
allocates
resources
and
assesses
the
operating
results
of
the
fund
on
the
whole.
The
fund’s
revenue
is
derived
from
investments
in
portfolio
of
securities.
The
CODM
allocates
resources
and
assesses
performance
based
on
the
operating
results
of
the
fund,
which
is
consistent
with
the
results
presented
in
the
statement
of
operations,
statement
of
changes
in
net
assets
and
financial
highlights.
The
CODM
compares
the
fund’s
performance
to
its
benchmark
index
and
evaluates
the
positioning
of
the
fund
in
relation
to
its
investment
objective.
The
measure
of
segment
assets
is
net
assets
of
the
fund
which
is
disclosed
in
the
statement
of
assets
and
liabilities.
The
accounting
policies
of
the
segment
are
the
same
as
those
described
in
the
summary
of
significant
accounting
policies.
The
financial
statements
include
all
details
of
the
segment
assets,
segment
revenue
and
expenses;
and
reflect
the
financial
results
of
the
segment.
T.
ROWE
PRICE
Capital
Appreciation
Fund
NOTE
9
-
INTERFUND
LENDING
PROGRAM
Price
Associates
has
developed
and
manages
an
interfund
lending
program
that
provides
temporary
liquidity
to
the
T.
Rowe
Price-sponsored
mutual
funds.
The
program
permits
the
borrowing
and
lending
of
cash
between
the
fund
and
other
T.
Rowe
Price-sponsored
mutual
funds
at
rates
beneficial
to
both
the
borrowing
and
lending
funds.
Pursuant
to
program
guidelines,
the
fund
may
lend
up
to
15%
of
its
net
assets,
and
no
more
than
5%
of
its
net
assets
may
be
lent
to
any
one
borrower.
Loans
totaling
10%
or
more
of
a
borrowing
fund’s
total
assets
require
collateralization
at
102%
of
the
value
of
the
loan;
loans
of
less
than
10%
are
unsecured.
During
the
year ended
December
31,
2024,
the
fund
earned $16,000
in
interest
income
related
to
loans
made
to
other
funds
on
two days
in
the
average
amount
of
$42,400,000
and
at
an
average
annual
rate
of
6.96%.
At
December
31,
2024,
there
were
no
loans
outstanding.
NOTE
10
-
OTHER
MATTERS
Unpredictable environmental,
political,
social
and
economic
events,
including
but
not
limited
to,
environmental
or
natural
disasters,
war
and
conflict
(including
Russia’s
military
invasion
of
Ukraine
and
the
conflict
in
Israel,
Gaza
and
surrounding
areas),
terrorism,
geopolitical
developments
(including
trading
and
tariff
arrangements,
sanctions
and
cybersecurity
attacks),
and
public
health
epidemics
(including
the
global
outbreak
of
COVID-19)
and
similar
public
health
threats,
may
significantly
affect
the
economy
and
the
markets
and
issuers
in
which
a
fund
invests.
The
extent
and
duration
of
such
events
and
resulting
market
disruptions
cannot
be
predicted.
These
and
other
similar
events
may
cause
instability
across
global
markets,
including
reduced
liquidity
and
disruptions
in
trading
markets,
while
some
events
may
affect
certain
geographic
regions,
countries,
sectors,
and
industries
more
significantly
than
others,
and
exacerbate
other
pre-existing
political,
social,
and
economic
risks.
The
fund’s
performance
could
be
negatively
impacted
if
the
value
of
a
portfolio
holding
were
harmed
by
these
or
such
events.
Management
actively
monitors
the
risks
and
financial
impacts
arising
from
such
events.
T.
ROWE
PRICE
Capital
Appreciation
Fund
REPORT
OF
INDEPENDENT
REGISTERED
PUBLIC
ACCOUNTING
FIRM
To
the
Board
of
Directors
of
T.
Rowe
Price
Capital
Appreciation
Fund,
Inc.
and
Shareholders
of
T.
Rowe
Price
Capital
Appreciation
Fund
Opinion
on
the
Financial
Statements
We
have
audited
the
accompanying
statement
of
assets
and
liabilities,
including
the
portfolio
of
investments,
of
T.
Rowe
Price
Capital
Appreciation
Fund
(one
of
the
funds
constituting
T.
Rowe
Price
Capital
Appreciation
Fund,
Inc.,
referred
to
hereafter
as
the
"Fund")
as
of
December
31,
2024,
the
related
statement
of
operations
for
the
year
ended
December
31,
2024,
the
statement
of
changes
in
net
assets
for
each
of
the
two
years
in
the
period
ended
December
31,
2024,
including
the
related
notes,
and
the
financial
highlights
for
each
of
the
five
years
in
the
period
ended
December
31,
2024
(collectively
referred
to
as
the
“financial
statements”).
In
our
opinion,
the
financial
statements
present
fairly,
in
all
material
respects,
the
financial
position
of
the
Fund
as
of
December
31,
2024,
the
results
of
its
operations
for
the
year
then
ended,
the
changes
in
its
net
assets
for
each
of
the
two
years
in
the
period
ended
December
31,
2024
and
the
financial
highlights
for
each
of
the
five
years
in
the
period
ended
December
31,
2024
in
conformity
with
accounting
principles
generally
accepted
in
the
United
States
of
America.
Basis
for
Opinion
These
financial
statements
are
the
responsibility
of
the
Fund’s
management.
Our
responsibility
is
to
express
an
opinion
on
the
Fund’s
financial
statements
based
on
our
audits.
We
are
a
public
accounting
firm
registered
with
the
Public
Company
Accounting
Oversight
Board
(United
States)
(PCAOB)
and
are
required
to
be
independent
with
respect
to
the
Fund
in
accordance
with
the
U.S.
federal
securities
laws
and
the
applicable
rules
and
regulations
of
the
Securities
and
Exchange
Commission
and
the
PCAOB.
We
conducted
our
audits
of
these
financial
statements
in
accordance
with
the
standards
of
the
PCAOB.
Those
standards
require
that
we
plan
and
perform
the
audit
to
obtain
reasonable
assurance
about
whether
the
financial
statements
are
free
of
material
misstatement,
whether
due
to
error
or
fraud.
T.
ROWE
PRICE
Capital
Appreciation
Fund
Our
audits
included
performing
procedures
to
assess
the
risks
of
material
misstatement
of
the
financial
statements,
whether
due
to
error
or
fraud,
and
performing
procedures
that
respond
to
those
risks.
Such
procedures
included
examining,
on
a
test
basis,
evidence
regarding
the
amounts
and
disclosures
in
the
financial
statements.
Our
audits
also
included
evaluating
the
accounting
principles
used
and
significant
estimates
made
by
management,
as
well
as
evaluating
the
overall
presentation
of
the
financial
statements.
Our
procedures
included
confirmation
of
securities
owned
as
of
December
31,
2024
by
correspondence
with
the
custodians,
transfer
agent
and
brokers;
when
replies
were
not
received
from
brokers,
we
performed
other
auditing
procedures.
We
believe
that
our
audits
provide
a
reasonable
basis
for
our
opinion.
/s/
PricewaterhouseCoopers
LLP
Baltimore,
Maryland
February
18,
2025
We
have
served
as
the
auditor
of
one
or
more
investment
companies
in
the
T.
Rowe
Price
group
of
investment
companies
since
1973.
REPORT
OF
INDEPENDENT
REGISTERED
PUBLIC
ACCOUNTING
FIRM
(continued)
T.
ROWE
PRICE
Capital
Appreciation
Fund
TAX
INFORMATION
(UNAUDITED)
FOR
THE
TAX
YEAR
ENDED 12/31/24
We
are
providing
this
information
as
required
by
the
Internal
Revenue
Code.
The
amounts
shown
may
differ
from
those
elsewhere
in
this
report
because
of
differences
between
tax
and
financial
reporting
requirements.
The
fund’s
distributions
to
shareholders
included:
$4,165,760,000
from
long-term
capital
gains,
subject
to
a
long-term
capital
gains
tax
rate
of
not
greater
than
20%
For
nonresident
alien
shareholders,
100%
of
short-term
capital
gain
dividends
distributed
by
the
fund
for
the
fiscal
year
are
qualified
short-term
capital
gains.
For
taxable
non-corporate
shareholders,
$407,545,000
of
the
fund's
income
represents
qualified
dividend
income
subject
to
a
long-term
capital
gains
tax
rate
of
not
greater
than
20%.
For
corporate
shareholders,
$348,416,000
of
the
fund's
income
qualifies
for
the
dividends-received
deduction.
For
shareholders
subject
to
interest
expense
deduction
limitation
under
Section
163(j),
$1,155,250,000
of
the
fund’s
income
qualifies
as
a
Section
163(j)
interest
dividend
and
can
be
treated
as
interest
income
for
purposes
of
Section
163(j),
subject
to
holding
period
requirements
and
other
limitations.
100
East
Pratt
Street
Baltimore,
MD
21202
T.
Rowe
Price
Investment
Services,
Inc.
Call
1-800-225-5132
to
request
a
prospectus
or
summary
prospectus;
each
includes
investment
objectives,
risks,
fees,
expenses,
and
other
information
that
you
should
read
and
consider
carefully
before
investing.
F72-050
2/25
Item 8. Changes in and Disagreements with Accountants for Open-End Management Investment Companies.
Not applicable.
Item 9. Proxy Disclosures for Open-End Management Investment Companies.
Not applicable.
Item 10. Remuneration Paid to Directors, Officers, and Others of Open-End Management Investment Companies.
Remuneration paid to Directors is included in Item 7 of this Form N-CSR.
Item 11. Statement Regarding Basis for Approval of Investment Advisory Contract.
If applicable, see Item 7.
Item 12. Disclosure of Proxy Voting Policies and Procedures for Closed-End Management Investment Companies.
Not applicable.
Item 13. Portfolio Managers of Closed-End Management Investment Companies.
Not applicable.
Item 14. Purchases of Equity Securities by Closed-End Management Investment Company and Affiliated Purchasers.
Not applicable.
Item 15. Submission of Matters to a Vote of Security Holders.
There has been no change to the procedures by which shareholders may recommend nominees to the registrant’s board of directors.
Item 16. Controls and Procedures.
(a) The registrant’s principal executive officer and principal financial officer have evaluated the registrant’s disclosure controls and procedures within 90 days of this filing and have concluded that the registrant’s disclosure controls and procedures were effective, as of that date, in ensuring that information required to be disclosed by the registrant in this Form N-CSR was recorded, processed, summarized, and reported timely.
(b) The registrant’s principal executive officer and principal financial officer are aware of no change in the registrant’s internal control over financial reporting that occurred during the period covered by this report that has materially affected, or is reasonably likely to materially affect, the registrant’s internal control over financial reporting.
Item 17. Disclosure of Securities Lending Activities for Closed-End Management Investment Companies.
Not applicable.
Item 18. Recovery of Erroneously Awarded Compensation.
Not applicable.
Item 19. Exhibits.
(a)(1) The registrant’s code of ethics pursuant to Item 2 of Form N-CSR is attached.
(2) Listing standards relating to recovery of erroneously awarded compensation: not applicable.
(3) Separate certifications by the registrant’s principal executive officer and principal financial officer, pursuant to Section 302 of the Sarbanes-Oxley Act of 2002 and required by Rule 30a-2(a) under the Investment Company Act of 1940, are attached.
(b) A certification by the registrant’s principal executive officer and principal financial officer, pursuant to Section 906 of the Sarbanes-Oxley Act of 2002 and required by Rule 30a-2(b) under the Investment Company Act of 1940, is attached.
SIGNATURES
Pursuant to the requirements of the Securities Exchange Act of 1934 and the Investment Company Act of 1940, the registrant has duly caused this report to be signed on its behalf by the undersigned, thereunto duly authorized.
| | | | |
| T. Rowe Price Capital Appreciation Fund, Inc. |
| By | | /s/ David Oestreicher | | |
| | David Oestreicher | | |
| | Principal Executive Officer | | |
| | |
| Date | | February 18, 2025 | | |
Pursuant to the requirements of the Securities Exchange Act of 1934 and the Investment Company Act of 1940, this report has been signed below by the following persons on behalf of the registrant and in the capacities and on the dates indicated.
| | | | |
| By | | /s/ David Oestreicher | | |
| | David Oestreicher | | |
| | Principal Executive Officer | | |
| | |
| Date | | February 18, 2025 | | |
| | | | |
| By | | /s/ Alan S. Dupski | | |
| | Alan S. Dupski | | |
| | Principal Financial Officer | | |
| | |
| Date | | February 18, 2025 | | |