UNITED STATES
SECURITIES AND EXCHANGE COMMISSION
Washington, D.C. 20549
FORM N-CSR
CERTIFIED SHAREHOLDER REPORT OF REGISTERED
MANAGEMENT INVESTMENT COMPANIES
Investment Company Act File Number: 811-04519
| T. Rowe Price Capital Appreciation Fund |
|
| (Exact name of registrant as specified in charter) |
| |
| 100 East Pratt Street, Baltimore, MD 21202 |
|
| (Address of principal executive offices) |
| |
| David Oestreicher |
| 100 East Pratt Street, Baltimore, MD 21202 |
|
| (Name and address of agent for service) |
Registrant’s telephone number, including area code: (410) 345-2000
Date of fiscal year end: December 31
Date of reporting period: June 30, 2017
Item 1. Report to Shareholders
| Capital Appreciation Fund | June 30, 2017 |
The views and opinions in this report were current as of June 30, 2017. They are not guarantees of performance or investment results and should not be taken as investment advice. Investment decisions reflect a variety of factors, and the managers reserve the right to change their views about individual stocks, sectors, and the markets at any time. As a result, the views expressed should not be relied upon as a forecast of the fund’s future investment intent. The report is certified under the Sarbanes-Oxley Act, which requires mutual funds and other public companies to affirm that, to the best of their knowledge, the information in their financial reports is fairly and accurately stated in all material respects.
REPORTS ON THE WEB
Sign up for our Email Program, and you can begin to receive updated fund reports and prospectuses online rather than through the mail. Log in to your account at troweprice.com for more information.
Manager’s Letter
Fellow Shareholders
After two years of almost no earnings growth in both the U.S. and Europe, earnings growth returned in 2017. While we have only seen the results from the first quarter of 2017, it would appear that both the U.S. and Europe are on pace for their fastest earnings per share (EPS) growth in the last five years. There are four main reasons for the recent resurgence, all of which are either low quality, likely to reverse in the near term, or should diminish in magnitude in future years:
| ● | The decline in oil prices from over $100 a barrel in 2014 to $30 a barrel in early 2016 resulted in a massive decline in energy profits for the market. Earnings from the energy sector declined from almost 10% of the market’s earnings in 2014 to around 1% in 2016. With oil prices rebounding to above $50 per barrel (before recently falling into the mid-$40s), the energy sector is likely to be a meaningfully positive contributor to S&P 500 earnings growth in 2017.
|
| ● | The Federal Reserve increased short-term interest rates four times over the last 19 months. This has had a positive impact on bank profits, as banks’ net interest margins expanded nicely in early 2017 after multiple years of declines. In Europe, after years of declining net interest margins, additional equity issuance by banks to stabilize their balance sheets, and multibillion-dollar fines stemming from mortgage and trading abuses, these issues appear to have stabilized. This has created easy earnings comparisons and strong year-over-year earnings growth. |
| ● | The strength of the U.S. dollar has been a persistent headwind: Over the last three years, the strength of the dollar relative to emerging markets currencies, the euro, and the Japanese yen has been a consistent low- to mid-single-digit headwind to S&P 500 earnings growth. With emerging markets currencies stabilizing and rebounding from late-2016 lows against the dollar and with the euro strengthening, it would appear that dollar weakness will likely be a tailwind to S&P 500 profit growth in 2017.
|
| ● | In the U.S., a new accounting standard on the treatment of stock and options compensation has effectively lowered reported tax rates despite having zero impact on cash flow. While it is difficult to judge the full-year impact of this change, we estimate this could have a positive impact of 1% to 3% on earnings growth for the market in 2017. |
So, that is the good news. The bad news is that many of these positive drivers are unlikely to contribute to earnings growth in 2018. Further increases in interest rates by the Fed are expected to provide a lower incremental benefit to bank profits, as future benefits are more likely to be passed on to depositors. Oil prices are already well off their 2017 highs, as domestic shale production and productivity continue to surprise to the upside. If oil prices stay at current levels, oil will once again be a headwind to S&P 500 profits in 2018. In addition, we will no longer see the year-over-year benefit from the tax accounting change starting in the first quarter of 2018.
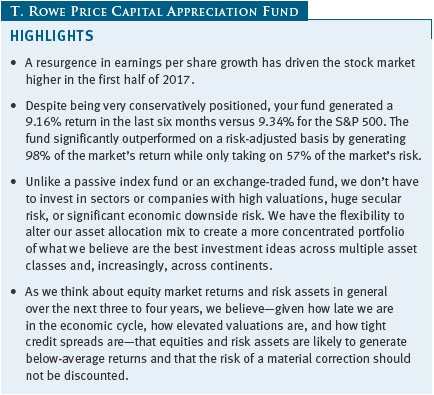
Nevertheless, this resurgence in EPS growth has driven the market higher. In the first half of the year, the S&P 500 returned 9.34%, and European indexes rose in the mid-teens in dollar terms, fueled by strong earnings growth, modestly improving economic growth, and a reduction in political risk following the results of the French presidential election.
So where does this leave us? Despite the 2017 EPS growth resurgence, we are still stuck with the same challenges. Underlying EPS growth is still likely to be in the mid-single digits at best. We are now eight years into an economic recovery, and most indicators (such as auto sales, the unemployment rate, and the flattening yield curve) would suggest that we are in the latter stages of the economic expansion. Excluding the dot-com era, stocks are trading at near-record valuation levels (roughly 18 times projected earnings over the next 12 months) versus long-term averages closer to 14 to 15 times. In addition, we are seeing more and more businesses and industries impacted by secular and competitive pressures that have caused or may cause profit growth to slow or decline. The list of industries impacted by this technological and competitive wave includes retail, legacy technology, energy, autos, hotels, telecommunications, food retailing, consumer staples, and multiple distribution-based businesses.
In summary, we are being asked to pay a higher and higher valuation multiple for earnings that are closer to peak for structurally slower earnings growth. In addition, the quality and sustainability of those earnings are being called into question for more and more market constituents. These challenges are essentially why we have lowered the equity risk profile of the portfolio and lowered our exposure to high yield debt.
We do not want to come across as being too bearish in our positioning. We have no crystal ball to tell us what is going to happen to the U.S. or the global economy in the short term. In fact, we do believe the market is underestimating the potential for modest tax reform, which could lower tax rates and generate an incremental 5% to 10% earnings growth for the S&P 500 in 2018, assuming a reduction in the U.S. corporate tax rate to 25%, which would be more modest than what President Trump has proposed. Nevertheless, as we think about equity market returns and risk assets in general over the next three to four years, we believe—given how late we are in the economic cycle, how elevated valuations are, and how tight credit spreads are—that equities and risk assets are likely to generate below-average returns and that the risk of a material correction should not be discounted.
The good news is that, unlike a passive index fund or an exchange-traded fund, we don’t have to invest in sectors or companies with high valuations, huge secular risk, or significant economic downside risk. We have the flexibility to alter our asset allocation mix to create a more concentrated portfolio of what we believe are the best investment ideas across multiple asset classes and, increasingly, across continents that have exceptional relative risk-adjusted return characteristics.
Before we discuss fund performance, I would like to review the three goals of the Capital Appreciation Fund:
(1) Generate strong risk-adjusted returns annually
(2) Preserve shareholder capital over the intermediate term (i.e., three years)
(3) Generate equity-like returns with less risk than that of the overall market over a full market cycle (i.e., normally five years)
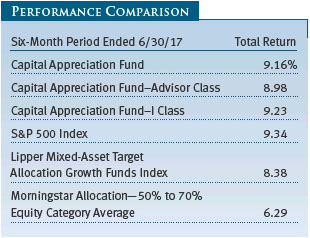
We are pleased to report that the Capital Appreciation Fund accomplished all of these goals. Despite being very conservatively positioned coming into 2017, your fund generated a 9.16% return in the last six months relative to the S&P 500’s 9.34% return. (The performance of the Advisor and I Class shares will vary due to different fee structures.) While the fund very modestly lagged the S&P 500 in absolute terms, it significantly outperformed the market on a risk-adjusted basis by generating 98% of the market’s return while only taking on 57% of the market’s risk. We arrived at this risk number by comparing the standard deviation of the S&P 500 (7.00) with that of the fund (4.01) for the six-month period. Standard deviation indicates the volatility of a portfolio’s total return as measured against its mean performance. In general, the higher the standard deviation, the greater the volatility or risk.
Using a more academic measure of the fund’s risk-adjusted return, your fund produced a Sharpe ratio of 2.21 versus 1.29 for the S&P 500. The Sharpe ratio measures how much a portfolio’s return is above or below the risk-free Treasury rate (excess return) per unit of risk (measured by standard deviation). In general, the larger the number, the better the portfolio’s historical risk-adjusted return.
As for our second goal—capital preservation over the intermediate term—your fund generated a 30.68% cumulative return over the last three years. This has been a relatively simple goal to achieve given how strong equity market returns have been over this time period. However, going forward, as the risk of an equity correction has increased, we are very focused on the achievement of this goal in the future, and our reduction in our equity exposure and risk profile over the last 12 months reflects our desire to achieve this objective in the coming years.
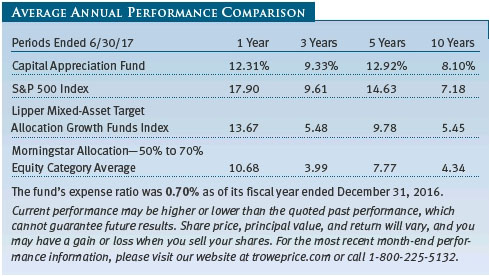
As for our final goal—equity-like returns with less risk than the market over a full market cycle—your fund generated a cumulative 83.59% return over the last five years versus 97.92% for the S&P 500. Based on annualized returns of 12.92% for your fund versus 14.63% for the S&P 500, your fund generated 88% of the market’s return over the last five years while taking on 62% of the market’s risk. While market and economic cycles have historically lasted around five years on average, we tend to think about a full market cycle encompassing at least one materially negative return year. As your fund is not a pure equity fund, it is almost impossible to match the equity market’s return over any period in which we did not have at least one equity market correction. Hence, if we were to extend the analysis to encompass the 2008 bear market and measure the last nine and a half years of fund performance, we would have accomplished this goal by delivering 115% of the market’s return over this period while only taking on 70% of the market’s risk.
With one exception, for the six-month and the 1-, 3-, 5-, and 10-year periods ended June 30, 2017, we outperformed our Lipper and Morningstar peers over every period. On a one-year basis, we did slightly trail our Lipper peers (we were in the 54th percentile). Our Lipper peer group tends to have materially larger allocations to equities than we normally carry, and during strong equity markets, this can be a challenge to overcome. Nevertheless, over the last 3-, 5-, and 10-year periods, and since the current portfolio management team began managing your fund, we are either in the first or second percentile relative to both the Lipper and Morningstar benchmarks. (Based on cumulative total return, the Capital Appreciation Fund ranked 277 of 516, 4 of 461, 5 of 428, and 1 of 320 funds in the Lipper mixed-asset target allocation growth funds universe for the 1-, 3-, 5-, and 10-year periods ended June 30, 2017, respectively. Results may vary for other periods. Past performance cannot guarantee future results.)
However, let me reiterate that we do not manage your fund to beat these benchmarks. The Capital Appreciation Fund has very different objectives than most of its benchmark peers. It is a unique fund with a clear focus on strong risk-adjusted returns, intermediate-term capital preservation, and long-term capital appreciation that does not fit neatly into any current benchmark.
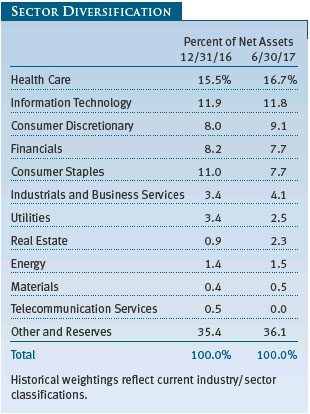
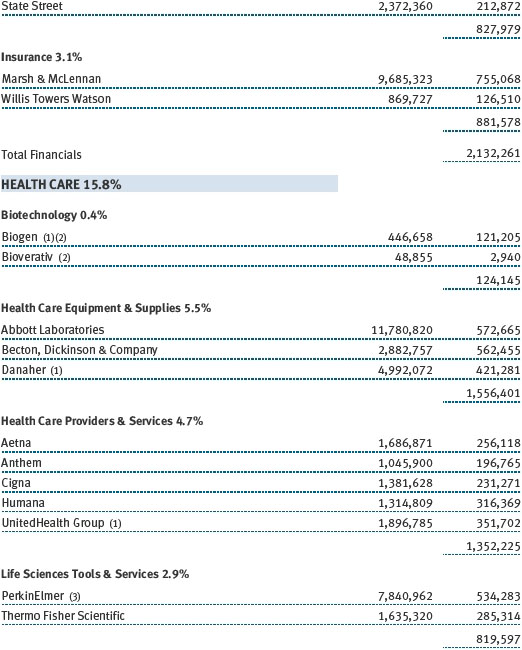
Within the equity portion of the portfolio, our health care holdings were, by far, the strongest contributors to both absolute and relative returns in the first half of 2017. Health care was the second strongest performing sector in the S&P 500 behind information technology and was our largest sector overweight.
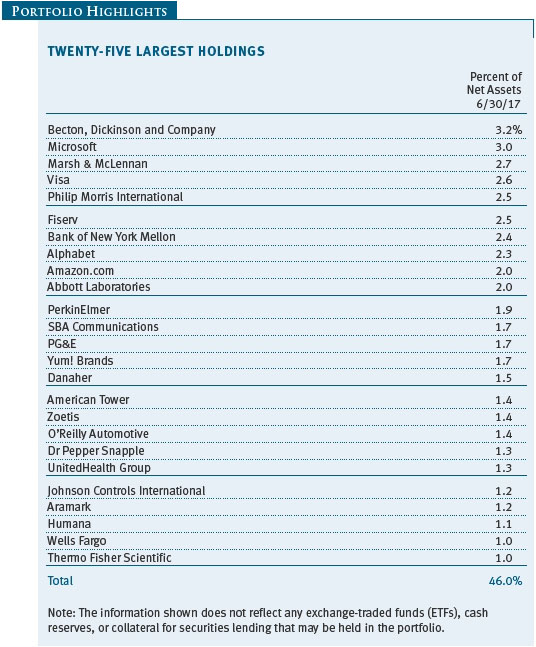
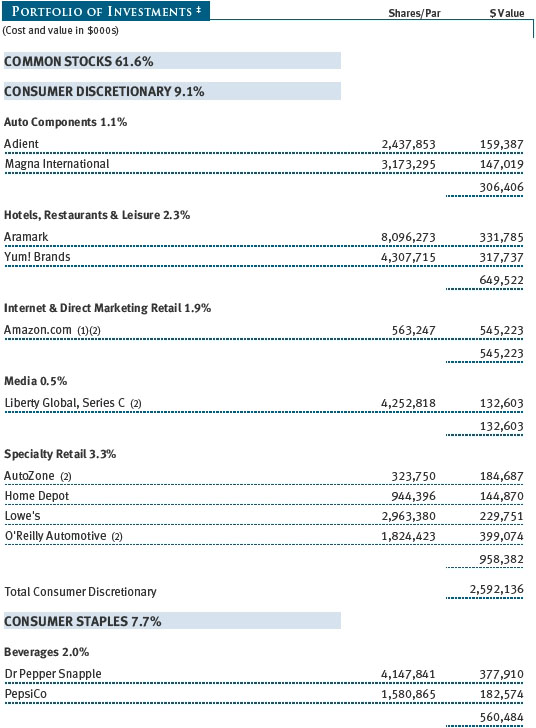
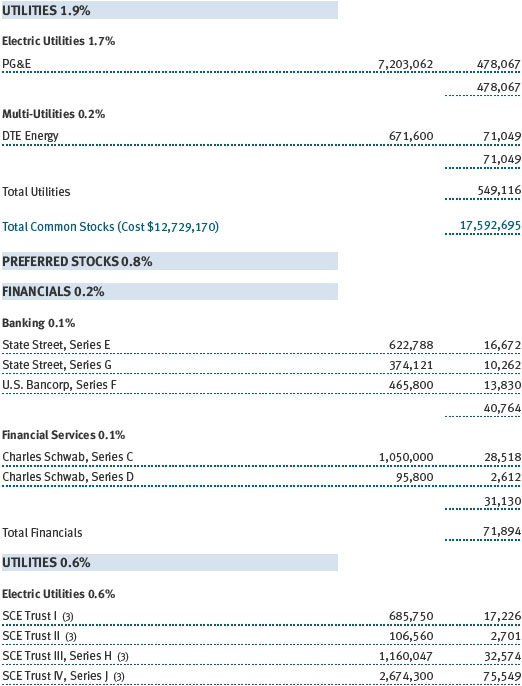
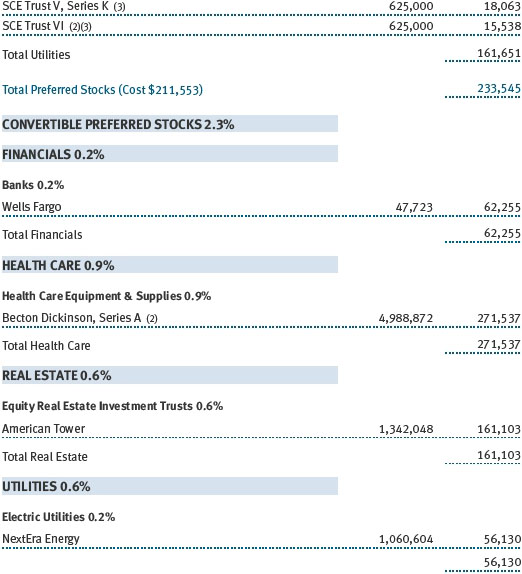
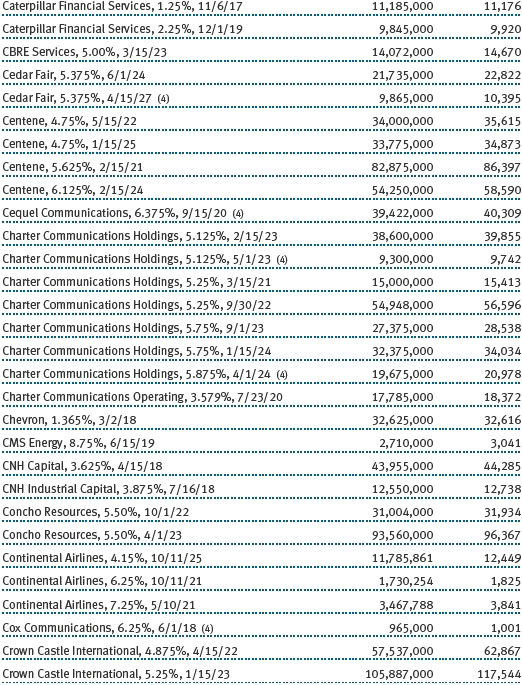
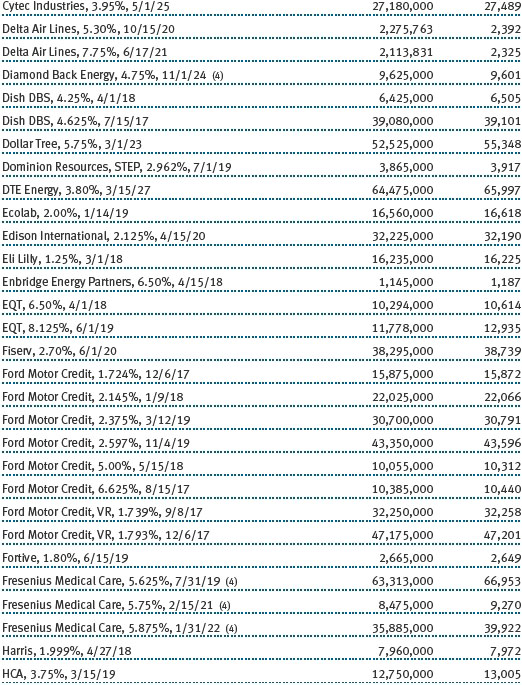
Abbott Laboratories was up 28% in the first half of the year. We wish we could point to some fundamental change that drove this strong performance. In truth, this stock was just too cheap coming into the year, trading at a significant discount to its historical valuation relative to its peers and the market. The market has begun to realize that the headwinds from its infant nutrition business in China should ease by the end of the year and into 2018, as comparisons become easier and excess industry inventory is drawn down over the course of 2017. In addition, we expect improved organic growth trends in 2018 from its St. Jude Medical acquisition. While the stock has had a nice run, we still are favorably inclined to the Abbott story given that it is still trading at a discount to peers and relative to where it trades compared with the market—despite what should be a solid mid-single-digit organic topline growth and 10% EPS growth stock with a solid dividend yield, excellent management, and significant long-term optionality. (Please refer to the portfolio of investments for a detailed list of holdings and the amount each represents in the portfolio.)
While Abbott Laboratories was one of our strongest performers, a number of other large positions outperformed, including PerkinElmer, Becton, Dickinson and Company, Thermo Fisher Scientific, Cigna, Zoetis, Aetna, UnitedHealth Group, and Humana. We have modestly decreased some of our overweight in HMOs due to their strong performance in the first half of the year. While we continue to have a large overweight in health care, we actually have a large underweight in pharmaceutical companies given their high valuations, lower earnings growth, and poor capital allocation, as well as the increasing pressure on drug pricing.
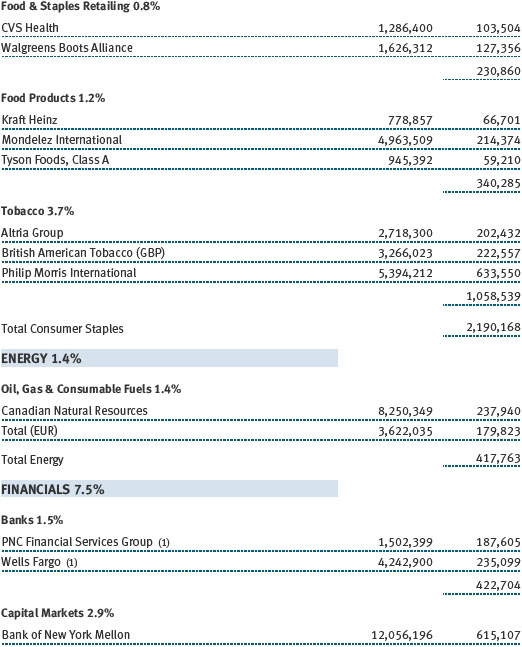
Our equity holdings in the energy sector were a positive contributor to relative returns in the first half of the year. The energy sector was the worst-performing sector of the first half and our second-largest underweight in the portfolio.
Both of our energy holdings outperformed the energy sector. While Canadian Natural Resources tends to be a higher-beta stock within energy, it still outperformed thanks to a brilliant acquisition in Canada at an attractive valuation. Assuming oil holds between $40 and $50 per barrel, this acquisition should materially improve the free cash flow generation of the company and its dividend potential. While we continue to have a negative long-term view of oil, within energy, the risk-adjusted return profile of Canadian Natural Resources is compelling relative to every other energy company we review. It is rare to find a company (especially in energy) with excellent management that owns a lot of the stock personally, creates value through mergers and acquisitions, is committed to returning excess capital to shareholders, and is returns-focused.
Our equity holdings in the consumer discretionary sector detracted from relative returns. While we had some strong performers within the sector, including Amazon.com, Aramark, Yum! Brands, and Adient, these strong contributors were overwhelmed by big declines in O’Reilly Automotive and AutoZone.
Our investments in the automotive aftermarket have been significant positive contributors to your fund’s results over time. O’Reilly Automotive and AutoZone in many ways have been the perfect Capital Appreciation stocks, with low cyclicality, strong earnings growth, and good management teams. In 2017, organic revenue growth began to slow, due largely to a number of transitory factors such as a warm winter, delayed tax receipts, tough comparisons, and weakness in their Hispanic customer base. Unfortunately, the retail industry is littered with stocks that have come under severe pressure due primarily to the online threat from Amazon. Any time retailers report disappointing numbers these days, their stocks get punished whether Amazon is to blame or not. Investors are shooting first and just moving on, and some investors are arguing that the entire retail industry is now uninvestable. We are very mindful of secular risk and try to avoid it at all costs. However, our analysis continues to suggest that “Amazon risk” is a manageable long-term risk and not a material factor driving the weakness in the short term. The automotive aftermarket has unique characteristics that make it the least Amazon-risky part of retail for a variety of reasons, including that many consumers don’t know exactly which part they need to fix their automobile or how to install it (local service matters), commercial customers need parts within an hour or two in most circumstances and cannot wait for one to two days, and the customer base tends to be lower-income and more likely to pay cash (not in the wheelhouse for Amazon). We are disappointed in the performance of these two stocks in 2017 and wish we had held smaller positions. However, from here, with low expectations and now very depressed valuations and easy comparisons likely in 2018, we are willing to maintain our positions.
PORTFOLIO STRATEGY AND OUTLOOK
There is no question that valuations in equities are elevated, and spreads across fixed income are tight relative to history. In 2006 and 2007, when we saw a similar environment, you could at least buy 5- and 10-year Treasuries with yields around 5%. Today the five-year Treasury yield is around 2%, and the 10-year Treasury yield is around 2.3%. While there are no compelling asset classes in which to deploy our shareholders’ money, we may add to longer-duration, high-quality, investment-grade corporate bonds and potentially Treasuries if interest rates rise from here. It is our view that high-quality, investment-grade corporate bonds and Treasuries would be unlikely to generate losses even if rates continued to rise moderately and that they could appreciate meaningfully in a market correction and help buffer losses on our equity investments.
Within our equities, while we feel great about the risk-adjusted returns of our portfolio relative to the market, the absolute valuations of our holdings give us some pause. As a result, we have reduced Capital Appreciation’s risk profile relative to the market (as measured by our delta-weighted equity allocation—see Glossary) to a new low level (since the current management team took over in 2006) in the high 50s. The easiest way to think about this is that if the market goes up or down 1%, your fund should appreciate or depreciate by a high 50s percentage of the market’s change before fees and hopefully alpha generation from security selection.
As a reminder, in late 2008 and 2009, we had a risk profile in the 70s and 80s (again, relative to the market) at the peak of market fear when valuations were depressed. After 2009, it came down into the high 60s. During the 2011 recession scare, we brought it back up to the low to mid-70s. Over the next five years, it steadily came down to the low to mid-60s in 2015–2016. In 2017, we have brought it down once again to the high 50s, as we see fewer compelling risk-adjusted investment opportunities and believe the risk of a material drawdown has increased. As in other years, we are prepared to shift the fund’s risk profile if opportunities present themselves, and we would expect to add to risk assets in the next major correction.
Our high yield and leveraged loan holdings have declined from 17.9% of assets at the end of 2016 to 13.1% at the end of June due to a combination of selective sales, maturities, bonds being called, and choosing not to consent to repricings of leveraged loans. While we are continuing to buy a couple of high-quality, idiosyncratic high yield bonds, we would still expect our exposure to decline in the second half of the year—in the absence of a correction in spreads.
IN CLOSING
We would like to thank the members of the fund’s Investment Advisory Committee for their valuable input in the first half of 2017. This team, which comprises portfolio managers, quantitative analysts, fixed income analysts, associate analysts, and equity analysts with many decades of combined investment experience, is responsible for the oversight of your fund and is supported by a growing equity and fixed income platform of more than 200 analysts.
Respectfully submitted,

David R. Giroux
Chairman of the fund’s Investment Advisory Committee

Steven D. Krichbaum
Associate portfolio manager
July 24, 2017
The committee chairman has day-to-day responsibility for managing the portfolio and works with committee members in developing and executing the fund’s investment program.
RISKS OF INVESTING
As with all stock and bond mutual funds, the fund’s share price can fall because of weakness in the stock or bond markets, a particular industry, or specific holdings. Stock markets can decline for many reasons, including adverse political or economic developments, changes in investor psychology, or heavy institutional selling. The prospects for an industry or company may deteriorate because of a variety of factors, including disappointing earnings or changes in the competitive environment. In addition, the investment manager’s assessment of companies held in a fund may prove incorrect, resulting in losses or poor performance even in rising markets. A sizable cash or fixed income position may hinder the fund from participating fully in a strong, rapidly rising bull market. In addition, significant exposure to bonds increases the risk that the fund’s share value could be hurt by rising interest rates or credit downgrades or defaults. Convertible securities are also exposed to price fluctuations of the company’s stock.
GLOSSARY
Beta: A measure of the market risk of a stock showing how responsive it is to a given market index, such as the S&P 500 Index. By definition, the beta of the benchmark index is 1.00. A fund with a 1.10 beta is expected to perform 10% better than the index in up markets and 10% worse in down markets. Usually, higher betas represent riskier investments.
Credit spreads: The amount of additional yield demanded by bond investors in exchange for buying riskier assets.
Delta-weighted equity allocation: A proprietary measure that adjusts for the impact of covered calls, convertibles, and other derivatives on the effective equity weight of the portfolio. For example, covered calls lower the effective equity weight by reducing potential upside (due to call risk) and downside (due to call premiums).
Duration: A measure of a bond fund’s sensitivity to changes in interest rates. For example, a fund with a duration of five years would fall about 5% in price in response to a one-percentage-point rise in interest rates, and vice versa.
Lipper indexes: Fund benchmarks that consist of a small number of the largest mutual funds in a particular category as tracked by Lipper Inc.
Morningstar Allocation—50% to 70% Equity Category Average: Tracks the performance of funds that seek capital appreciation and income by investing in multiple asset classes, including stocks, bonds, and cash. Equity exposures range from 50% to 70%.
Net interest margin: The spread, or difference, between the interest rates on a bank’s loans to borrowers and the interest rates a bank pays to those who have interest-bearing bank accounts or CDs. Banks can make more profitable loans when the spread widens, and vice versa.
Sharpe ratio: A measure of the risk-adjusted return of a portfolio. The Sharpe ratio measures how much a portfolio’s return is above or below the risk-free Treasury rate (excess return) per unit risk (measured by standard deviation). In general, the larger the number, the better the portfolio’s historical risk-adjusted return.
S&P 500 Index: An unmanaged index that tracks the stocks of 500 primarily large-cap U.S. companies.
Standard deviation: A measure of risk that indicates the volatility of a portfolio’s total returns as measured against its mean performance. In general, the higher the standard deviation, the greater the volatility or risk.
Yield curve: A graphic depiction of the relationship between yields and maturity dates for a set of similar securities. A security with a longer maturity usually has a higher yield. If a short-term security offers a higher yield, then the curve is said to be “inverted.” If short- and long-term bonds are offering equivalent yields, then the curve is said to be “flat.”
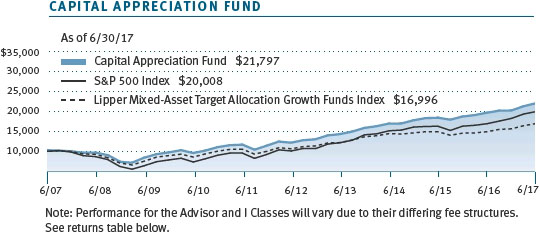
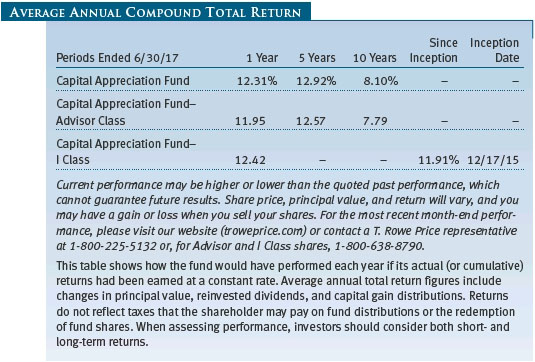
Performance and Expenses
This chart shows the value of a hypothetical $10,000 investment in the fund over the past 10 fiscal year periods or since inception (for funds lacking 10-year records). The result is compared with benchmarks, which may include a broad-based market index and a peer group average or index. Market indexes do not include expenses, which are deducted from fund returns as well as mutual fund averages and indexes.
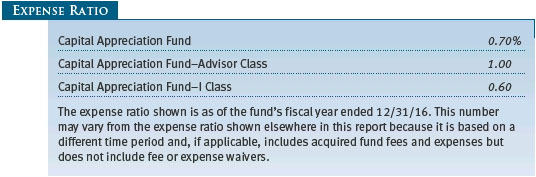
As a mutual fund shareholder, you may incur two types of costs: (1) transaction costs, such as redemption fees or sales loads, and (2) ongoing costs, including management fees, distribution and service (12b-1) fees, and other fund expenses. The following example is intended to help you understand your ongoing costs (in dollars) of investing in the fund and to compare these costs with the ongoing costs of investing in other mutual funds. The example is based on an investment of $1,000 invested at the beginning of the most recent six-month period and held for the entire period.
Please note that the fund has three share classes: The original share class (Investor Class) charges no distribution and service (12b-1) fee, the Advisor Class shares are offered only through unaffiliated brokers and other financial intermediaries and charge a 0.25% 12b-1 fee, and I Class shares are available to institutionally oriented clients and impose no 12b-1 or administrative fee payment. Each share class is presented separately in the table.
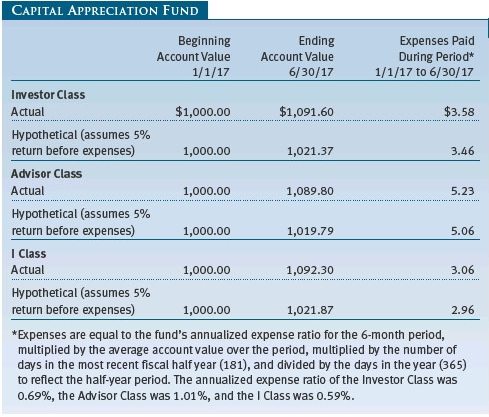
Actual Expenses
The first line of the following table (Actual) provides information about actual account values and expenses based on the fund’s actual returns. You may use the information on this line, together with your account balance, to estimate the expenses that you paid over the period. Simply divide your account value by $1,000 (for example, an $8,600 account value divided by $1,000 = 8.6), then multiply the result by the number on the first line under the heading “Expenses Paid During Period” to estimate the expenses you paid on your account during this period.
Hypothetical Example for Comparison Purposes
The information on the second line of the table (Hypothetical) is based on hypothetical account values and expenses derived from the fund’s actual expense ratio and an assumed 5% per year rate of return before expenses (not the fund’s actual return). You may compare the ongoing costs of investing in the fund with other funds by contrasting this 5% hypothetical example and the 5% hypothetical examples that appear in the shareholder reports of the other funds. The hypothetical account values and expenses may not be used to estimate the actual ending account balance or expenses you paid for the period.
Note: T. Rowe Price charges an annual account service fee of $20, generally for accounts with less than $10,000. The fee is waived for any investor whose T. Rowe Price mutual fund accounts total $50,000 or more; accounts electing to receive electronic delivery of account statements, transaction confirmations, prospectuses, and shareholder reports; or accounts of an investor who is a T. Rowe Price Personal Services or Enhanced Personal Services client (enrollment in these programs generally requires T. Rowe Price assets of at least $250,000). This fee is not included in the accompanying table. If you are subject to the fee, keep it in mind when you are estimating the ongoing expenses of investing in the fund and when comparing the expenses of this fund with other funds.
You should also be aware that the expenses shown in the table highlight only your ongoing costs and do not reflect any transaction costs, such as redemption fees or sales loads. Therefore, the second line of the table is useful in comparing ongoing costs only and will not help you determine the relative total costs of owning different funds. To the extent a fund charges transaction costs, however, the total cost of owning that fund is higher.
Unaudited
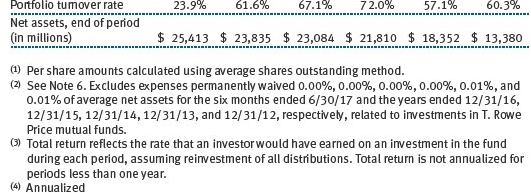
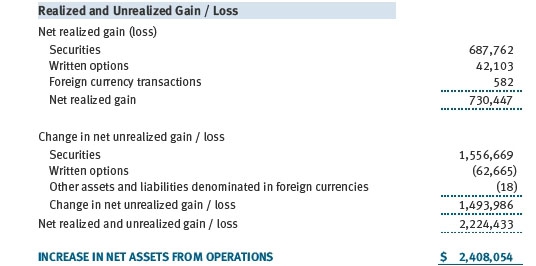
The accompanying notes are an integral part of these financial statements.
Unaudited

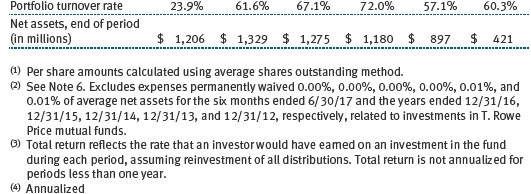
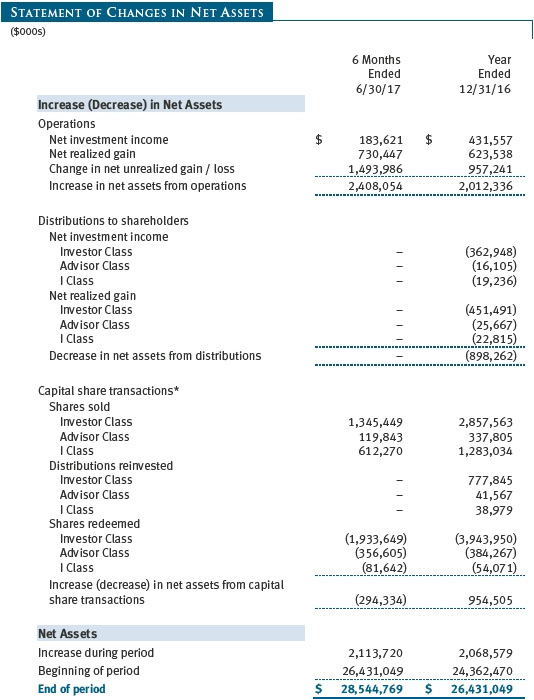
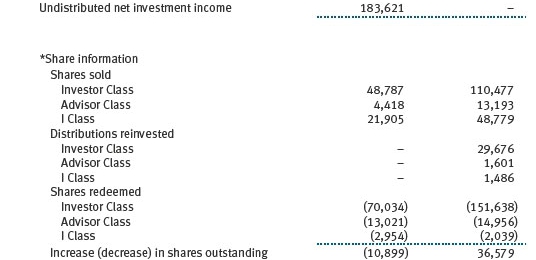
The accompanying notes are an integral part of these financial statements.
Unaudited
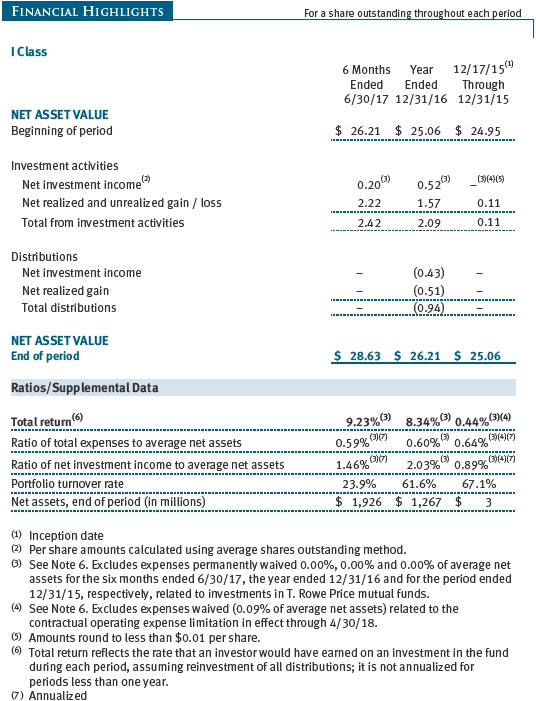
The accompanying notes are an integral part of these financial statements.
Unaudited

The accompanying notes are an integral part of these financial statements.
Unaudited


The accompanying notes are an integral part of these financial statements.
Unaudited

The accompanying notes are an integral part of these financial statements.
Unaudited
The accompanying notes are an integral part of these financial statements.
Unaudited
| Notes to Financial Statements |
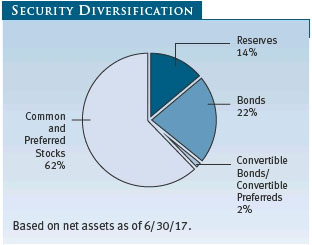
T. Rowe Price Capital Appreciation Fund (the fund), is registered under the Investment Company Act of 1940 (the 1940 Act) as a diversified, open-end management investment company. The fund seeks long-term capital appreciation by investing primarily in common stocks. It may also hold fixed-income and other securities to help preserve principal value. The fund has three classes of shares: the Capital Appreciation Fund (Investor Class), the Capital Appreciation Fund–Advisor Class (Advisor Class), and the Capital Appreciation Fund–I Class (I Class). Advisor Class shares are sold only through unaffiliated brokers and other unaffiliated financial intermediaries. I Class shares generally are available only to investors meeting a $1,000,000 minimum investment or certain other criteria. The Advisor Class operates under a Board-approved Rule 12b-1 plan pursuant to which the class compensates financial intermediaries for distribution, shareholder servicing, and/or certain administrative services; the Investor and I Classes do not pay Rule 12b-1 fees. Each class has exclusive voting rights on matters related solely to that class; separate voting rights on matters that relate to all classes; and, in all other respects, the same rights and obligations as the other classes.
NOTE 1 - SIGNIFICANT ACCOUNTING POLICIES
Basis of Preparation The fund is an investment company and follows accounting and reporting guidance in the Financial Accounting Standards Board (FASB) Accounting Standards Codification Topic 946 (ASC 946). The accompanying financial statements were prepared in accordance with accounting principles generally accepted in the United States of America (GAAP), including, but not limited to, ASC 946. GAAP requires the use of estimates made by management. Management believes that estimates and valuations are appropriate; however, actual results may differ from those estimates, and the valuations reflected in the accompanying financial statements may differ from the value ultimately realized upon sale or maturity.
Investment Transactions, Investment Income, and Distributions Income and expenses are recorded on the accrual basis. Premiums and discounts on debt securities are amortized for financial reporting purposes. Paydown gains and losses are recorded as an adjustment to interest income. Dividends received from mutual fund investments are reflected as dividend income; capital gain distributions are reflected as realized gain/loss. Dividend income and capital gain distributions are recorded on the ex-dividend date. Income tax-related interest and penalties, if incurred, would be recorded as income tax expense. Investment transactions are accounted for on the trade date. Realized gains and losses are reported on the identified cost basis. Distributions from REITs are initially recorded as dividend income and, to the extent such represent a return of capital or capital gain for tax purposes, are reclassified when such information becomes available. Income distributions are declared and paid by each class annually. Distributions to shareholders are recorded on the ex-dividend date. A capital gain distribution may also be declared and paid by the fund annually.
Currency Translation Assets, including investments, and liabilities denominated in foreign currencies are translated into U.S. dollar values each day at the prevailing exchange rate, using the mean of the bid and asked prices of such currencies against U.S. dollars as quoted by a major bank. Purchases and sales of securities, income, and expenses are translated into U.S. dollars at the prevailing exchange rate on the date of the transaction. The effect of changes in foreign currency exchange rates on realized and unrealized security gains and losses is reflected as a component of security gains and losses.
Class Accounting Shareholder servicing, prospectus, and shareholder report expenses incurred by each class are charged directly to the class to which they relate. Expenses common to all classes, investment income, and realized and unrealized gains and losses are allocated to the classes based upon the relative daily net assets of each class. The Advisor Class pays Rule 12b-1 fees, in an amount not exceeding 0.25% of the class’s average daily net assets.
Rebates Subject to best execution, the fund may direct certain security trades to brokers who have agreed to rebate a portion of the related brokerage commission to the fund in cash. Commission rebates are reflected as realized gain on securities in the accompanying financial statements and totaled $64,000 for the six months ended June 30, 2017.
New Accounting Guidance In October 2016, the Securities and Exchange Commission (SEC) issued a new rule, Investment Company Reporting Modernization, which, among other provisions, amends Regulation S-X to require standardized, enhanced disclosures, particularly related to derivatives, in investment company financial statements. Compliance with the guidance is effective for financial statements related to periods ending on or after August 1, 2017; adoption will have no effect on the fund’s net assets or results of operations.
NOTE 2 - VALUATION
The fund’s financial instruments are valued and each class’s net asset value (NAV) per share is computed at the close of the New York Stock Exchange (NYSE), normally 4 p.m. ET, each day the NYSE is open for business. However, the NAV per share may be calculated at a time other than the normal close of the NYSE if trading on the NYSE is restricted, if the NYSE closes earlier, or as may be permitted by the SEC.
Fair Value The fund’s financial instruments are reported at fair value, which GAAP defines as the price that would be received to sell an asset or paid to transfer a liability in an orderly transaction between market participants at the measurement date. The T. Rowe Price Valuation Committee (the Valuation Committee) is an internal committee that has been delegated certain responsibilities by the fund’s Board of Directors (the Board) to ensure that financial instruments are appropriately priced at fair value in accordance with GAAP and the 1940 Act. Subject to oversight by the Board, the Valuation Committee develops and oversees pricing-related policies and procedures and approves all fair value determinations. Specifically, the Valuation Committee establishes procedures to value securities; determines pricing techniques, sources, and persons eligible to effect fair value pricing actions; oversees the selection, services, and performance of pricing vendors; oversees valuation-related business continuity practices; and provides guidance on internal controls and valuation-related matters. The Valuation Committee reports to the Board and has representation from legal, portfolio management and trading, operations, risk management, and the fund’s treasurer.
Various valuation techniques and inputs are used to determine the fair value of financial instruments. GAAP establishes the following fair value hierarchy that categorizes the inputs used to measure fair value:
Level 1 – quoted prices (unadjusted) in active markets for identical financial instruments that the fund can access at the reporting date
Level 2 – inputs other than Level 1 quoted prices that are observable, either directly or indirectly (including, but not limited to, quoted prices for similar financial instruments in active markets, quoted prices for identical or similar financial instruments in inactive markets, interest rates and yield curves, implied volatilities, and credit spreads)
Level 3 – unobservable inputs
Observable inputs are developed using market data, such as publicly available information about actual events or transactions, and reflect the assumptions that market participants would use to price the financial instrument. Unobservable inputs are those for which market data are not available and are developed using the best information available about the assumptions that market participants would use to price the financial instrument. GAAP requires valuation techniques to maximize the use of relevant observable inputs and minimize the use of unobservable inputs. When multiple inputs are used to derive fair value, the financial instrument is assigned to the level within the fair value hierarchy based on the lowest-level input that is significant to the fair value of the financial instrument. Input levels are not necessarily an indication of the risk or liquidity associated with financial instruments at that level but rather the degree of judgment used in determining those values.
Valuation Techniques Equity securities listed or regularly traded on a securities exchange or in the over-the-counter (OTC) market are valued at the last quoted sale price or, for certain markets, the official closing price at the time the valuations are made. OTC Bulletin Board securities are valued at the mean of the closing bid and asked prices. A security that is listed or traded on more than one exchange is valued at the quotation on the exchange determined to be the primary market for such security. Listed securities not traded on a particular day are valued at the mean of the closing bid and asked prices for domestic securities and the last quoted sale or closing price for international securities.
For valuation purposes, the last quoted prices of non-U.S. equity securities may be adjusted to reflect the fair value of such securities at the close of the NYSE. If the fund determines that developments between the close of a foreign market and the close of the NYSE will materially affect the value of some or all of its portfolio securities, the fund will adjust the previous quoted prices to reflect what it believes to be the fair value of the securities as of the close of the NYSE. In deciding whether it is necessary to adjust quoted prices to reflect fair value, the fund reviews a variety of factors, including developments in foreign markets, the performance of U.S. securities markets, and the performance of instruments trading in U.S. markets that represent foreign securities and baskets of foreign securities. The fund may also fair value securities in other situations, such as when a particular foreign market is closed but the fund is open. The fund uses outside pricing services to provide it with quoted prices and information to evaluate or adjust those prices. The fund cannot predict how often it will use quoted prices and how often it will determine it necessary to adjust those prices to reflect fair value. As a means of evaluating its security valuation process, the fund routinely compares quoted prices, the next day’s opening prices in the same markets, and adjusted prices.
Actively traded equity securities listed on a domestic exchange generally are categorized in Level 1 of the fair value hierarchy. Non-U.S. equity securities generally are categorized in Level 2 of the fair value hierarchy despite the availability of quoted prices because, as described above, the fund evaluates and determines whether those quoted prices reflect fair value at the close of the NYSE or require adjustment. OTC Bulletin Board securities, certain preferred securities, and equity securities traded in inactive markets generally are categorized in Level 2 of the fair value hierarchy.
Debt securities generally are traded in the OTC market. Securities with remaining maturities of one year or more at the time of acquisition are valued at prices furnished by dealers who make markets in such securities or by an independent pricing service, which considers the yield or price of bonds of comparable quality, coupon, maturity, and type, as well as prices quoted by dealers who make markets in such securities. Generally, debt securities are categorized in Level 2 of the fair value hierarchy; however, to the extent the valuations include significant unobservable inputs, the securities would be categorized in Level 3.
Investments in mutual funds are valued at the mutual fund’s closing NAV per share on the day of valuation and are categorized in Level 1 of the fair value hierarchy. Listed options, and OTC options with a listed equivalent, are valued at the mean of the closing bid and asked prices and generally are categorized in Level 2 of the fair value hierarchy. Assets and liabilities other than financial instruments, including short-term receivables and payables, are carried at cost, or estimated realizable value, if less, which approximates fair value.
Thinly traded financial instruments and those for which the above valuation procedures are inappropriate or are deemed not to reflect fair value are stated at fair value as determined in good faith by the Valuation Committee. The objective of any fair value pricing determination is to arrive at a price that could reasonably be expected from a current sale. Financial instruments fair valued by the Valuation Committee are primarily private placements, restricted securities, warrants, rights, and other securities that are not publicly traded.
Subject to oversight by the Board, the Valuation Committee regularly makes good faith judgments to establish and adjust the fair valuations of certain securities as events occur and circumstances warrant. For instance, in determining the fair value of an equity investment with limited market activity, such as a private placement or a thinly traded public company stock, the Valuation Committee considers a variety of factors, which may include, but are not limited to, the issuer’s business prospects, its financial standing and performance, recent investment transactions in the issuer, new rounds of financing, negotiated transactions of significant size between other investors in the company, relevant market valuations of peer companies, strategic events affecting the company, market liquidity for the issuer, and general economic conditions and events. In consultation with the investment and pricing teams, the Valuation Committee will determine an appropriate valuation technique based on available information, which may include both observable and unobservable inputs. The Valuation Committee typically will afford greatest weight to actual prices in arm’s length transactions, to the extent they represent orderly transactions between market participants, transaction information can be reliably obtained, and prices are deemed representative of fair value. However, the Valuation Committee may also consider other valuation methods such as market-based valuation multiples; a discount or premium from market value of a similar, freely traded security of the same issuer; or some combination. Fair value determinations are reviewed on a regular basis and updated as information becomes available, including actual purchase and sale transactions of the issue. Because any fair value determination involves a significant amount of judgment, there is a degree of subjectivity inherent in such pricing decisions, and fair value prices determined by the Valuation Committee could differ from those of other market participants. Depending on the relative significance of unobservable inputs, including the valuation technique(s) used, fair valued securities may be categorized in Level 2 or 3 of the fair value hierarchy.
Valuation Inputs The following table summarizes the fund’s financial instruments, based on the inputs used to determine their fair values on June 30, 2017:
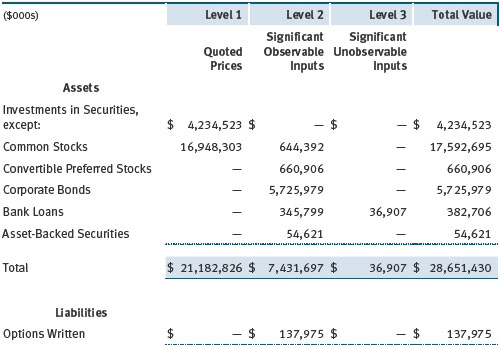
There were no material transfers between Levels 1 and 2 during the six months ended June 30, 2017.
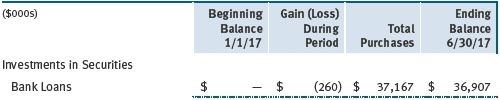
Following is a reconciliation of the fund’s Level 3 holdings for the six months ended June 30, 2017. Gain (loss) reflects both realized and change in unrealized gain/loss on Level 3 holdings during the period, if any, and is included on the accompanying Statement of Operations. The change in unrealized gain/loss on Level 3 instruments held at June 30, 2017, totaled $(260,000) for the six months ended June 30, 2017.
NOTE 3 - DERIVATIVE INSTRUMENTS
During the six months ended June 30, 2017, the fund invested in derivative instruments. As defined by GAAP, a derivative is a financial instrument whose value is derived from an underlying security price, foreign exchange rate, interest rate, index of prices or rates, or other variable; it requires little or no initial investment and permits or requires net settlement. The fund invests in derivatives only if the expected risks and rewards are consistent with its investment objectives, policies, and overall risk profile, as described in its prospectus and Statement of Additional Information. The fund may use derivatives for a variety of purposes, such as seeking to hedge against declines in principal value, increase yield, invest in an asset with greater efficiency and at a lower cost than is possible through direct investment, or to adjust credit exposure. The risks associated with the use of derivatives are different from, and potentially much greater than, the risks associated with investing directly in the instruments on which the derivatives are based. The fund at all times maintains sufficient cash reserves, liquid assets, or other SEC-permitted asset types to cover its settlement obligations under open derivative contracts.
The fund values its derivatives at fair value and recognizes changes in fair value currently in its results of operations. Accordingly, the fund does not follow hedge accounting, even for derivatives employed as economic hedges. Generally, the fund accounts for its derivatives on a gross basis. It does not offset the fair value of derivative liabilities against the fair value of derivative assets on its financial statements, nor does it offset the fair value of derivative instruments against the right to reclaim or obligation to return collateral. As of June 30, 2017, the fund held equity derivatives with a fair value of $137,975,000, included in written options, on the accompanying Statement of Assets and Liabilities.
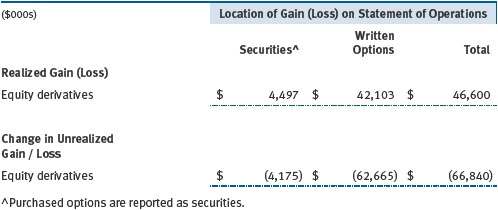
Additionally, the amount of gains and losses on derivative instruments recognized in fund earnings during the six months ended June 30, 2017, and the related location on the accompanying Statement of Operations is summarized in the following table by primary underlying risk exposure:
Counterparty Risk and Collateral The fund invests in derivatives, such as bilateral swaps, forward currency exchange contracts, or OTC options, that are transacted and settle directly with a counterparty (bilateral derivatives), and thereby expose the fund to counterparty risk. To mitigate this risk, the fund has entered into master netting arrangements (MNAs) with certain counterparties that permit net settlement under specified conditions and, for certain counterparties, also require the exchange of collateral to cover mark-to-market exposure. MNAs may be in the form of International Swaps and Derivatives Association master agreements (ISDAs) or foreign exchange letter agreements (FX letters).
MNAs govern the ability to offset amounts the fund owes a counterparty against amounts the counterparty owes the fund (net settlement). Both ISDAs and FX letters generally allow termination of transactions and net settlement upon the occurrence of contractually specified events, such as failure to pay or bankruptcy. In addition, ISDAs specify other events, the occurrence of which would allow one of the parties to terminate. For example, a downgrade in credit rating of a counterparty would allow the fund to terminate while a decline in the fund’s net assets of more than a specified percentage would allow the counterparty to terminate. Upon termination, all transactions with that counterparty would be liquidated and a net termination amount determined. ISDAs include collateral agreements whereas FX letters do not. Collateral requirements are determined daily based on the net aggregate unrealized gain or loss on all bilateral derivatives with each counterparty, subject to minimum transfer amounts that typically range from $100,000 to $250,000. Any additional collateral required due to changes in security values is typically transferred the same business day.
Collateral may be in the form of cash or debt securities issued by the U.S. government or related agencies. Cash posted by the fund is reflected as cash deposits in the accompanying financial statements and generally is restricted from withdrawal by the fund; securities posted by the fund are so noted in the accompanying Portfolio of Investments; both remain in the fund’s assets. Collateral pledged by counterparties is not included in the fund’s assets because the fund does not obtain effective control over those assets. For bilateral derivatives, collateral posted or received by the fund is held in a segregated account at the fund’s custodian. As of June 30, 2017, no collateral was pledged by either the fund or counterparties for bilateral derivatives.
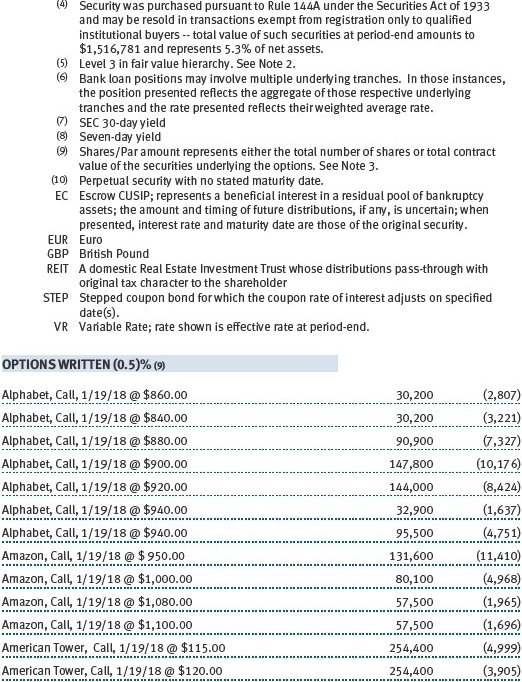
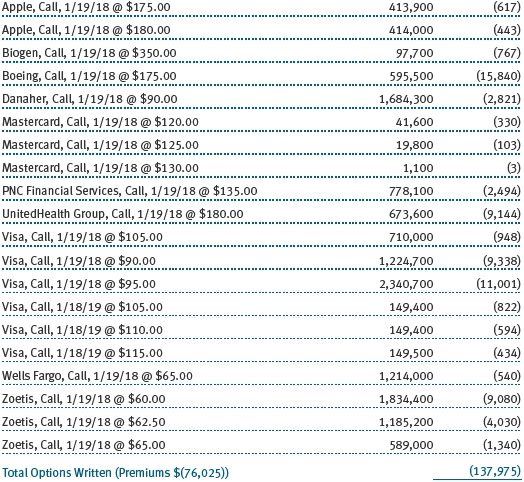
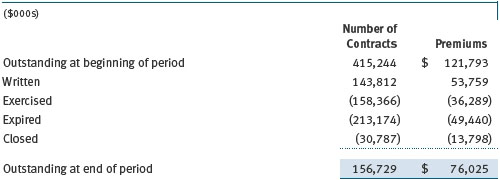
Options The fund is subject to equity price risk in the normal course of pursuing its investment objectives and uses options to help manage such risk. The fund may use options to manage exposure to security prices, interest rates, foreign currencies, and credit quality; as an efficient means of adjusting exposure to all or a part of a target market; to enhance income; as a cash management tool; or to adjust credit exposure. Options are included in net assets at fair value, purchased options are included in Investments in Securities, and written options are separately reflected as a liability on the accompanying Statement of Assets and Liabilities. Premiums on unexercised, expired options are recorded as realized gains or losses; premiums on exercised options are recorded as an adjustment to the proceeds from the sale or cost of the purchase. The difference between the premium and the amount received or paid in a closing transaction is also treated as realized gain or loss. In return for a premium paid, call and put options give the holder the right, but not the obligation, to purchase or sell, respectively, a security at a specified exercise price. Risks related to the use of options include possible illiquidity of the options markets; trading restrictions imposed by an exchange or counterparty; movements in the underlying asset values and, for written options, potential losses in excess of the fund’s initial investment. During the six months ended June 30, 2017, the volume of the fund’s activity in options, based on underlying notional amounts, was generally between 5% and 15% of net assets. Transactions in written options and related premiums received during the six months ended June 30, 2017, were as follows:
NOTE 4 - OTHER INVESTMENT TRANSACTIONS
Consistent with its investment objective, the fund engages in the following practices to manage exposure to certain risks and/or to enhance performance. The investment objective, policies, program, and risk factors of the fund are described more fully in the fund’s prospectus and Statement of Additional Information.
Noninvestment-Grade Debt At June 30, 2017, approximately 13% of the fund’s net assets were invested, either directly or through its investment in T. Rowe Price institutional funds, in noninvestment-grade debt, including “high yield” or “junk” bonds or leveraged loans. The noninvestment-grade debt market may experience sudden and sharp price swings due to a variety of factors, including changes in economic forecasts, stock market activity, large sustained sales by major investors, a high-profile default, or a change in market sentiment. These events may decrease the ability of issuers to make principal and interest payments and adversely affect the liquidity or value, or both, of such securities. Investments in noninvestment-grade holdings may be considered speculative.
Restricted Securities The fund may invest in securities that are subject to legal or contractual restrictions on resale. Prompt sale of such securities at an acceptable price may be difficult and may involve substantial delays and additional costs.
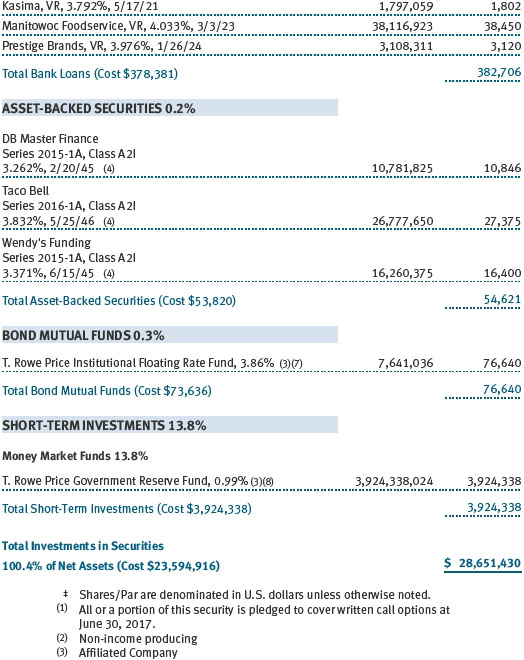
Bank Loans The fund may invest in bank loans, which represent an interest in amounts owed by a borrower to a syndicate of lenders. Bank loans are generally noninvestment grade and often involve borrowers whose financial condition is highly leveraged. Bank loans may be in the form of either assignments or participations. A loan assignment transfers all legal, beneficial, and economic rights to the buyer, and transfer typically requires consent of both the borrower and agent. In contrast, a loan participation generally entitles the buyer to receive the cash flows from principal, interest, and any fee payments on a portion of a loan; however, the seller continues to hold legal title to that portion of the loan. As a result, the buyer of a loan participation generally has no direct recourse against the borrower and is exposed to credit risk of both the borrower and seller of the participation. Bank loans often have extended settlement periods, usually may be repaid at any time at the option of the borrower, and may require additional principal to be funded at the borrowers’ discretion at a later date (unfunded commitments). Until settlement, the fund maintains liquid assets sufficient to settle its unfunded loan commitments. The fund reflects both the funded portion of a bank loan as well as its unfunded commitment in the Portfolio of Investments. However, if a credit agreement provides no initial funding of a tranche, and funding of the full commitment at a future date(s) is at the borrower’s discretion and considered uncertain, a loan is reflected in the Portfolio of Investments only if, and only to the extent that, the fund has actually settled a funding commitment.
Other Purchases and sales of portfolio securities other than short-term securities aggregated $5,749,973,000 and $7,356,418,000, respectively, for the six months ended June 30, 2017.
NOTE 5 - FEDERAL INCOME TAXES
No provision for federal income taxes is required since the fund intends to continue to qualify as a regulated investment company under Subchapter M of the Internal Revenue Code and distribute to shareholders all of its taxable income and gains. Distributions determined in accordance with federal income tax regulations may differ in amount or character from net investment income and realized gains for financial reporting purposes. Financial reporting records are adjusted for permanent book/tax differences to reflect tax character but are not adjusted for temporary differences. The amount and character of tax-basis distributions and composition of net assets are finalized at fiscal year-end; accordingly, tax-basis balances have not been determined as of the date of this report.
At June 30, 2017, the cost of investments for federal income tax purposes was $23,617,730,000. Net unrealized gain aggregated $4,971,769,000 at period-end, of which $5,147,336,000 related to appreciated investments and $175,567,000 related to depreciated investments.
NOTE 6 - RELATED PARTY TRANSACTIONS
The fund is managed by T. Rowe Price Associates, Inc. (Price Associates), a wholly owned subsidiary of T. Rowe Price Group, Inc. (Price Group). The investment management agreement between the fund and Price Associates provides for an annual investment management fee that consists of an individual fund fee and a group fee; management fees are computed daily and paid monthly. The investment management agreement provides for an individual fund fee equal to 0.30% of the fund’s average daily net assets. Effective May 1, 2017 through April 30, 2019, Price Associates agreed to reduce the fund’s individual fee to 0.27% for the portion of average daily net assets equal to or in excess of $27.5 billion. This contractual arrangement will renew automatically for one-year terms thereafter and may be revised, revoked, or terminated only with approval of the fund’s Board. Further, the fund has no obligation to repay fees reduced under this arrangement. The group fee rate is calculated based on the combined net assets of certain mutual funds sponsored by Price Associates (the group) applied to a graduated fee schedule, with rates ranging from 0.48% for the first $1 billion of assets to 0.265% for assets in excess of $650 billion. The fund’s group fee is determined by applying the group fee rate to the fund’s average daily net assets. At June 30, 2017, the effective annual group fee rate was 0.29%.
The I Class is subject to an operating expense limitation (I Class limit) pursuant to which Price Associates is contractually required to pay all operating expenses of the I Class, excluding management fees, interest, expenses related to borrowings, taxes, brokerage, and other non-recurring expenses permitted by the investment management agreement, to the extent such operating expenses, on an annualized basis, exceed 0.05% of average net assets. This agreement will continue until April 30, 2018, and may be renewed, revised, or revoked only with approval of the fund’s Board. The I Class is required to repay Price Associates for expenses previously paid to the extent the class’s net assets grow or expenses decline sufficiently to allow repayment without causing the class’s operating expenses to exceed the I Class limit in effect at the time of the waiver. However, no repayment will be made more than three years after the date of a payment or waiver. For the six months ended June 30, 2017, the I Class operated below its expense limitation.
In addition, the fund has entered into service agreements with Price Associates and two wholly owned subsidiaries of Price Associates (collectively, Price). Price Associates provides certain accounting and administrative services to the fund. T. Rowe Price Services, Inc. provides shareholder and administrative services in its capacity as the fund’s transfer and dividend-disbursing agent. T. Rowe Price Retirement Plan Services, Inc. provides subaccounting and recordkeeping services for certain retirement accounts invested in the Investor Class and I Class. For the six months ended June 30, 2017, expenses incurred pursuant to these service agreements were $41,000 for Price Associates; $2,888,000 for T. Rowe Price Services, Inc.; and $796,000 for T. Rowe Price Retirement Plan Services, Inc. The total amount payable at period-end pursuant to these service agreements is reflected as Due to Affiliates in the accompanying financial statements.
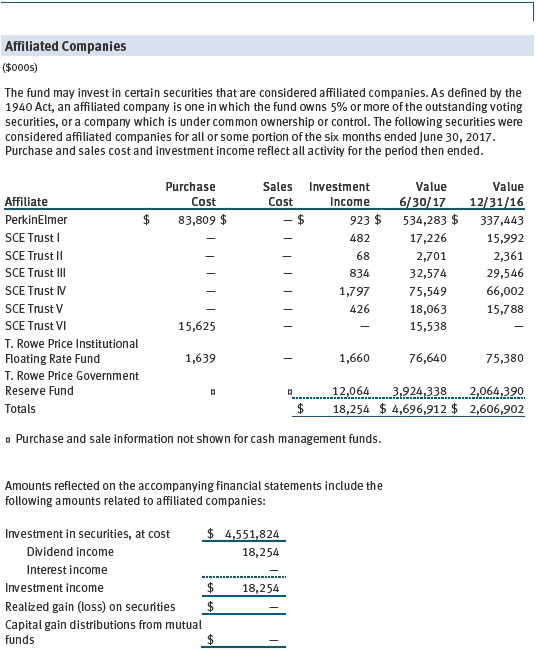
The fund may invest in the T. Rowe Price Government Reserve Fund, the T. Rowe Price Treasury Reserve Fund, or the T. Rowe Price Short-Term Fund (collectively, the Price Reserve Funds), open-end management investment companies managed by Price Associates and considered affiliates of the fund. The Price Reserve Funds are offered as short-term investment options to mutual funds, trusts, and other accounts managed by Price Associates or its affiliates and are not available for direct purchase by members of the public. The Price Reserve Funds pay no investment management fees.
The fund may also invest in certain other T. Rowe Price funds (Price Funds) as a means of gaining efficient and cost-effective exposure to certain markets. The fund does not invest for the purpose of exercising management or control; however, investments by the fund may represent a significant portion of an underlying Price Fund’s net assets. Each underlying Price Fund is an open-end management investment company managed by Price Associates and is considered an affiliate of the fund. To ensure that the fund does not incur duplicate management fees (paid by the underlying Price Fund(s) and the fund), Price Associates has agreed to permanently waive a portion of its management fee charged to the fund in an amount sufficient to fully offset that portion of management fees paid by each underlying Price Fund related to the fund’s investment therein. Annual management fee rates and amounts waived related to investments in the underlying Price Fund(s) for the six months ended June 30, 2017, are as follows:

The fund may participate in securities purchase and sale transactions with other funds or accounts advised by Price Associates (cross trades), in accordance with procedures adopted by the fund’s Board and Securities and Exchange Commission rules, which require, among other things, that such purchase and sale cross trades be effected at the independent current market price of the security. During the six months ended June 30, 2017, the aggregate value of purchases and sales cross trades with other funds or accounts advised by Price Associates was less than 1% of the fund’s net assets as of June 30, 2017.
| Information on Proxy Voting Policies, Procedures, and Records |
A description of the policies and procedures used by T. Rowe Price funds and portfolios to determine how to vote proxies relating to portfolio securities is available in each fund’s Statement of Additional Information. You may request this document by calling 1-800-225-5132 or by accessing the SEC’s website, sec.gov.
The description of our proxy voting policies and procedures is also available on our corporate website. To access it, please visit the following Web page:
https://www3.troweprice.com/usis/corporate/en/utility/policies.html
Scroll down to the section near the bottom of the page that says, “Proxy Voting Policies.” Click on the Proxy Voting Policies link in the shaded box.
Each fund’s most recent annual proxy voting record is available on our website and through the SEC’s website. To access it through T. Rowe Price, visit the website location shown above, and scroll down to the section near the bottom of the page that says, “Proxy Voting Records.” Click on the Proxy Voting Records link in the shaded box.
| How to Obtain Quarterly Portfolio Holdings |
The fund files a complete schedule of portfolio holdings with the Securities and Exchange Commission for the first and third quarters of each fiscal year on Form N-Q. The fund’s Form N-Q is available electronically on the SEC’s website (sec.gov); hard copies may be reviewed and copied at the SEC’s Public Reference Room, 100 F St. N.E., Washington, DC 20549. For more information on the Public Reference Room, call 1-800-SEC-0330.
| Approval of Investment Management Agreement |
Each year, the fund’s Board of Trustees (Board) considers the continuation of the investment management agreement (Advisory Contract) between the fund and its investment advisor, T. Rowe Price Associates, Inc. (Advisor). In that regard, at an in-person meeting held on March 6–7, 2017 (Meeting), the Board, including a majority of the fund’s independent trustees, approved the continuation of the fund’s Advisory Contract. At the Meeting, the Board considered the factors and reached the conclusions described below relating to the selection of the Advisor and the approval of the Advisory Contract. The independent trustees were assisted in their evaluation of the Advisory Contract by independent legal counsel from whom they received separate legal advice and with whom they met separately.
In providing information to the Board, the Advisor was guided by a detailed set of requests for information submitted by independent legal counsel on behalf of the independent trustees. In considering and approving the Advisory Contract, the Board considered the information it believed was relevant, including, but not limited to, the information discussed below. The Board considered not only the specific information presented in connection with the Meeting but also the knowledge gained over time through interaction with the Advisor about various topics. The Board meets regularly and, at each of its meetings, covers an extensive agenda of topics and materials and considers factors that are relevant to its annual consideration of the renewal of the T. Rowe Price funds’ advisory contracts, including performance and the services and support provided to the funds and their shareholders.
Services Provided by the Advisor
The Board considered the nature, quality, and extent of the services provided to the fund by the Advisor. These services included, but were not limited to, directing the fund’s investments in accordance with its investment program and the overall management of the fund’s portfolio, as well as a variety of related activities such as financial, investment operations, and administrative services; compliance; maintaining the fund’s records and registrations; and shareholder communications. The Board also reviewed the background and experience of the Advisor’s senior management team and investment personnel involved in the management of the fund, as well as the Advisor’s compliance record. The Board concluded that it was satisfied with the nature, quality, and extent of the services provided by the Advisor.
Investment Performance of the Fund
The Board took into account discussions with the Advisor and reports that it receives throughout the year relating to fund performance. In connection with the Meeting, the Board reviewed the fund’s net annualized total returns for the 1-, 2-, 3-, 4-, 5-, and 10-year periods as of September 30, 2016, and compared these returns with the performance of a peer group of funds with similar investment programs and a wide variety of other previously agreed-upon comparable performance measures and market data, including those supplied by Broadridge, which is an independent provider of mutual fund data.
On the basis of this evaluation and the Board’s ongoing review of investment results, and factoring in the relative market conditions during certain of the performance periods, the Board concluded that the fund’s performance was satisfactory.
Costs, Benefits, Profits, and Economies of Scale
The Board reviewed detailed information regarding the revenues received by the Advisor under the Advisory Contract and other benefits that the Advisor (and its affiliates) may have realized from its relationship with the fund, including any research received under “soft dollar” agreements and commission-sharing arrangements with broker-dealers. The Board considered that the Advisor may receive some benefit from soft-dollar arrangements pursuant to which research is received from broker-dealers that execute the fund’s portfolio transactions. The Board received information on the estimated costs incurred and profits realized by the Advisor from managing the T. Rowe Price funds. The Board also reviewed estimates of the profits realized from managing the fund in particular, and the Board concluded that the Advisor’s profits were reasonable in light of the services provided to the fund.
The Board also considered whether the fund benefits under the fee levels set forth in the Advisory Contract from any economies of scale realized by the Advisor. Under the Advisory Contract, the fund pays a fee to the Advisor for investment management services composed of two components—a group fee rate based on the combined average net assets of most of the T. Rowe Price funds (including the fund) that declines at certain asset levels and an individual fund fee rate based on the fund’s average daily net assets—and the fund pays its own expenses of operations (subject to an expense limitation agreed to by the Advisor with respect to the fund’s I Class). At the Meeting, the Board approved an arrangement under which the Advisor has agreed to waive a portion of the management fee it is entitled to receive so that an individual fund fee of 0.27% is applied to the fund’s average daily net assets that are equal to or greater than $27.5 billion. Also at the Meeting, the Board approved an additional 0.005% breakpoint to the group fee schedule, effective May 1, 2017. With the new breakpoint, the group fee rate will decline to 0.265% when the combined average net assets of the applicable T. Rowe Price funds exceed $650 billion. The Board concluded that the advisory fee structure for the fund continued to provide for a reasonable sharing of benefits from any economies of scale with the fund’s investors.
Fees and Expenses
The Board was provided with information regarding industry trends in management fees and expenses. Among other things, the Board reviewed data for peer groups that were compiled by Broadridge, which compared: (i) contractual management fees, total expenses, actual management fees, and non-management expenses of the Investor Class of the fund with a group of competitor funds selected by Broadridge (Investor Class Expense Group); (ii) total expenses and actual management fees of the Advisor Class of the fund with a group of competitor funds selected by Broadridge (Advisor Class Expense Group); and (iii) total expenses, actual management fees, and non-management expenses of the Investor Class of the fund with a broader set of funds within the Lipper investment classification (Expense Universe). The Board considered the fund’s contractual management fee rate, actual management fee rate (which reflect the management fees actually received from the fund by the Advisor after any applicable waivers, reductions, or reimbursements), operating expenses, and total expenses (which reflects the net total expense ratio of the fund after any waivers, reductions, or reimbursements) in comparison with the information for the Broadridge peer groups. Broadridge generally constructed the peer groups by seeking the most comparable funds based on similar investment classifications and objectives, expense structure, asset size, and operating components and attributes and ranked funds into quintiles, with the first quintile representing the funds with the lowest relative expenses and the fifth quintile representing the funds with the highest relative expenses. The information provided to the Board indicated that the fund’s contractual management fee ranked in the fifth quintile (Investor Class Expense Group), the fund’s actual management fee rate ranked in the fourth quintile (Investor Class Expense Group), second quintile (Advisor Class Expense Group), and third quintile (Expense Universe), and the fund’s total expenses ranked in the third and fourth quintiles (Investor Class Expense Group), first quintile (Advisor Class Expense Group), and first and second quintiles (Expense Universe).
The Board also reviewed the fee schedules for institutional accounts and private accounts with similar mandates that are advised or subadvised by the Advisor and its affiliates. Management provided the Board with information about the Advisor’s responsibilities and services provided to subadvisory and other institutional account clients, including information about how the requirements and economics of the institutional business are fundamentally different from those of the mutual fund business. The Board considered information showing that the Advisor’s mutual fund business is generally more complex from a business and compliance perspective than its institutional account business and considered various relevant factors, such as the broader scope of operations and oversight, more extensive shareholder communication infrastructure, greater asset flows, heightened business risks, and differences in applicable laws and regulations associated with the Advisor’s proprietary mutual fund business. In assessing the reasonableness of the fund’s management fee rate, the Board considered the differences in the nature of the services required for the Advisor to manage its mutual fund business versus managing a discrete pool of assets as a subadvisor to another institution’s mutual fund or for an institutional account and that the Advisor generally performs significant additional services and assumes greater risk in managing the fund and other T. Rowe Price funds than it does for institutional account clients.
On the basis of the information provided and the factors considered, the Board concluded that the fees paid by the fund under the Advisory Contract are reasonable.
Approval of the Advisory Contract
As noted, the Board approved the continuation of the Advisory Contract. No single factor was considered in isolation or to be determinative to the decision. Rather, the Board concluded, in light of a weighting and balancing of all factors considered, that it was in the best interests of the fund and its shareholders for the Board to approve the continuation of the Advisory Contract (including the fees to be charged for services thereunder).
Item 2. Code of Ethics.
A code of ethics, as defined in Item 2 of Form N-CSR, applicable to its principal executive officer, principal financial officer, principal accounting officer or controller, or persons performing similar functions is filed as an exhibit to the registrant’s annual Form N-CSR. No substantive amendments were approved or waivers were granted to this code of ethics during the registrant’s most recent fiscal half-year.
Item 3. Audit Committee Financial Expert.
Disclosure required in registrant’s annual Form N-CSR.
Item 4. Principal Accountant Fees and Services.
Disclosure required in registrant’s annual Form N-CSR.
Item 5. Audit Committee of Listed Registrants.
Not applicable.
Item 6. Investments.
(a) Not applicable. The complete schedule of investments is included in Item 1 of this Form N-CSR.
(b) Not applicable.
Item 7. Disclosure of Proxy Voting Policies and Procedures for Closed-End Management Investment Companies.
Not applicable.
Item 8. Portfolio Managers of Closed-End Management Investment Companies.
Not applicable.
Item 9. Purchases of Equity Securities by Closed-End Management Investment Company and Affiliated Purchasers.
Not applicable.
Item 10. Submission of Matters to a Vote of Security Holders.
Not applicable.
Item 11. Controls and Procedures.
(a) The registrant’s principal executive officer and principal financial officer have evaluated the registrant’s disclosure controls and procedures within 90 days of this filing and have concluded that the registrant’s disclosure controls and procedures were effective, as of that date, in ensuring that information required to be disclosed by the registrant in this Form N-CSR was recorded, processed, summarized, and reported timely.
(b) The registrant’s principal executive officer and principal financial officer are aware of no change in the registrant’s internal control over financial reporting that occurred during the registrant’s second fiscal quarter covered by this report that has materially affected, or is reasonably likely to materially affect, the registrant’s internal control over financial reporting.
Item 12. Exhibits.
(a)(1) The registrant’s code of ethics pursuant to Item 2 of Form N-CSR is filed with the registrant’s annual Form N-CSR.
(2) Separate certifications by the registrant's principal executive officer and principal financial officer, pursuant to Section 302 of the Sarbanes-Oxley Act of 2002 and required by Rule 30a-2(a) under the Investment Company Act of 1940, are attached.
(3) Written solicitation to repurchase securities issued by closed-end companies: not applicable.
(b) A certification by the registrant's principal executive officer and principal financial officer, pursuant to Section 906 of the Sarbanes-Oxley Act of 2002 and required by Rule 30a-2(b) under the Investment Company Act of 1940, is attached.
SIGNATURES
Pursuant to the requirements of the Securities Exchange Act of 1934 and the Investment Company Act of 1940, the registrant has duly caused this report to be signed on its behalf by the undersigned, thereunto duly authorized.
T. Rowe Price Capital Appreciation Fund
| By | | /s/ Edward C. Bernard |
| | | Edward C. Bernard |
| | | Principal Executive Officer |
| |
| Date | | August 21, 2017 | | | | |
Pursuant to the requirements of the Securities Exchange Act of 1934 and the Investment Company Act of 1940, this report has been signed below by the following persons on behalf of the registrant and in the capacities and on the dates indicated.
| By | | /s/ Edward C. Bernard |
| | | Edward C. Bernard |
| | | Principal Executive Officer |
| |
| Date | | August 21, 2017 | | | | |
| |
| |
| By | | /s/ Catherine D. Mathews |
| | | Catherine D. Mathews |
| | | Principal Financial Officer |
| |
| Date | | August 21, 2017 | | | | |