UNITED STATES
SECURITIES AND EXCHANGE COMMISSION
Washington, D.C. 20549
FORM N-CSR
CERTIFIED SHAREHOLDER REPORT OF REGISTERED
MANAGEMENT INVESTMENT COMPANIES
Investment Company Act File Number: 811-04519
| T. Rowe Price Capital Appreciation Fund, Inc. |
|
| (Exact name of registrant as specified in charter) |
| |
| 100 East Pratt Street, Baltimore, MD 21202 |
|
| (Address of principal executive offices) |
| |
| David Oestreicher |
| 100 East Pratt Street, Baltimore, MD 21202 |
|
| (Name and address of agent for service) |
Registrant’s telephone number, including area code: (410) 345-2000
Date of fiscal year end: December 31
Date of reporting period: June 30, 2019
Item 1. Reports to Shareholders
(a) Report pursuant to Rule 30e-1.
| Capital Appreciation Fund | June 30, 2019 |
| PRWCX | Investor Class |
| PACLX | Advisor Class |
| TRAIX | I Class |
Beginning on January 1, 2021, as permitted by SEC regulations, paper copies of the T. Rowe Price funds’ annual and semiannual shareholder reports will no longer be mailed, unless you specifically request them. Instead, shareholder reports will be made available on the funds’ website (troweprice.com/prospectus), and you will be notified by mail with a website link to access the reports each time a report is posted to the site.
If you already elected to receive reports electronically, you will not be affected by this change and need not take any action. At any time, shareholders who invest directly in T. Rowe Price funds may generally elect to receive reports or other communications electronically by enrolling attroweprice.com/paperlessor, if you are a retirement plan sponsor or invest in the funds through a financial intermediary (such as an investment advisor, broker-dealer, insurance company, or bank), by contacting your representative or your financial intermediary.
You may elect to continue receiving paper copies of future shareholder reports free of charge. To do so, if you invest directly with T. Rowe Price, please call T. Rowe Price as follows: IRA, nonretirement account holders, and institutional investors,1-800-225-5132; small business retirement accounts,1-800-492-7670. If you are a retirement plan sponsor or invest in the T. Rowe Price funds through a financial intermediary, please contact your representative or financial intermediary or follow additional instructions if included with this document. Your election to receive paper copies of reports will apply to all funds held in your account with your financial intermediary or, if you invest directly in the T. Rowe Price funds, with T. Rowe Price. Your election can be changed at any time in the future.
| T. ROWE PRICE CAPITAL APPRECIATION FUND |
|
HIGHLIGHTS
| ■ | Both U.S. equity and fixed income markets delivered strong returns in the first half of 2019, despite widespread expectations for decelerating domestic earnings growth. |
| |
| ■ | Your fund generated a 17.4% absolute return compared with the S&P 500’s 18.5% return. The fund outperformed the market on a risk-adjusted basis. We captured 94% of the S&P 500’s return while taking on only 64% of the market’s risk. |
| |
| ■ | Given that we are in the latter stages of an economic expansion, faced with an inverted yield curve, potential for increased policy uncertainty, and strained relations between the U.S. and China, we have taken a cautious view, reducing the fund’s equity exposure and fixed income duration. |
| |
| ■ | We do not know what future gross domestic product growth will be, and we are not in the recession forecasting business. We deal with probabilities. When the market becomes convinced that there is no risk of a recession and valuations rise, we will take the over and be more conservatively positioned. When the market becomes convinced that there is a high risk of a recession—as it did in November and December of last year—and valuations become more attractive, we will take the under and be more aggressively positioned. |

Log in to your account attroweprice.comfor more information.
*Certain mutual fund accounts that are assessed an annual account service fee can also save money by switching to e-delivery.
Management’s Discussion of Fund Performance
Fellow Shareholders
After a disappointing 2018 in which both U.S. equities and corporate bonds posted negative returns, the first half of 2019 produced stellar returns across equities and fixed income. The S&P 500 Index rose an impressive 18.5%, the J.P. Morgan Domestic High Yield Index rose 9.9%, and U.S. Treasuries rallied as interest rates fell. This occurred despite the fact that U.S. earnings, which grew a very robust 20%+ last year, are expected to decelerate meaningfully to mid-single-digit growth in 2019.
So, what is going on?
In the fourth quarter of 2018 the market essentially became gripped with fear, to put it bluntly. Fear of a Federal Reserve-induced recession as it was raising rates too aggressively. Fear of an inverted yield curve and the historically very negative intermediate-term consequences. Fear of a trade war with China. Those fears drove the market down 20% from its September peak and pushed the market multiple down to 13.8x forward earnings.
Based on our calculations, at the market bottom on Christmas Eve of last year, the market was pricing in a 50% chance of a near-term recession. As recently as September of last year, the market was essentially pricing in a 0% chance of a recession. As a result, the market went from being expensive to being attractive in a relatively short period of time. We took advantage of this opportunity by aggressively adding to equities and went overweight equities on Christmas Eve of last year. This decision has also aided our performance in the first half of 2019, as we will talk about later.
Fast forwarding to the first half of 2019: From a fundamental perspective, not much has really changed despite the strong equity and fixed income returns. The threat of a trade war with China is still a risk. The yield curve remains inverted. U.S. earnings have not surprised to the upside. The large fiscal stimulus that drove outsized gross domestic product (GDP) growth in 2018 is likely to wane in 2019 and potentially be a headwind to growth in 2020–2021. We are at the beginning of an election cycle with two parties that generally have very different views on tax and regulatory policies, which could result in increased policy uncertainty in 2020 and 2021.
The only thing that has really changed is that the Federal Reserve has reversed course and is now likely to start cutting interest rates as opposed to raising them. This has reduced the fears of a Fed-induced recession. However, in an era of very low absolute interest rates, structurally lower growth rates, and a more service-based economy, the impact from small changes in Federal Reserve rates is vastly overestimated by the market. With the notable exception of the housing market—and, to a lesser extent, the automotive market—whether the Federal Reserve sets its target for the federal funds rate at 1.5% or 2.5% is far less important than it used to be. Taking interest rates close to zero and later deploying massive quantitative easing in the U.S. did not result in structurally faster GDP growth coming out of the last recession. Similarly, the move to negative interest rates in Europe and Japan has not revived their moribund economies.
With the market now surpassing its September 2018 peak, investors are betting that the Federal Reserve will cut interest rates and that the lower rates will reignite GDP growth and keep the U.S. out of a recession. It is quite possible that GDP growth may get better (and possible it could get worse), but the impact on growth from Fed policy is very unlikely to be a major factor either way.
So, once again, we find ourselves in a situation in which the market is essentially pricing in a 0% chance of a recession. Given that we are undoubtedly in the latter stages of an economic expansion with an inverted yield curve, potential for increased policy uncertainty, and strained relations with China, this strikes us as being both optimistic and illogical. As a result, we have been gradually paring the risk profile of your fund by reducing our equity exposure and lowering the duration of our corporate debt holdings.
We don’t pretend to know what GDP growth will be in 2019, 2020, or 2021, and we are not in the recession forecasting business. We deal with probabilities. When the market becomes convinced that there is 0% risk of a recession and valuations rise, we will take the over and be more conservatively positioned. When the market becomes convinced that there is a high risk of a recession—as it did in November and December of last year—and valuations become more attractive, we will take the under and be more aggressively positioned. When an outcome is uncertain, like with GDP growth or interest rates, but the market prices in a very high probability of one outcome, taking the opposite view can create a very positively skewed risk-adjusted return. This works for macro variables such as GDP, interest rates, and currency, and it can also work for sectors that can be influenced by these variables.
Last year, your portfolio management team went from being underweight utilities at the start of the year to being massively overweight in February–March, and by September, we were about 1,000 basis points overweight to the sector. There were multiple reasons for this decision, including the fact that utilities’ growth rates have increased due to structural factors, other defensive sectors face secular risks to their business models, and utilities are the one sector that could potentially benefit from a regime change in the U.S. 2020 presidential elections. However, in the very short term, the reason we got this opportunity was because the market was convinced interest rates would go straight up, and no one wants to own utilities when interest rates are going up. Yet, utilities were already trading at discounted valuations that mostly reflected this market perception. Hence, if interest rates increased and valuations fell to absolute trough relative valuation levels, we thought we could still likely generate low-single-digit returns over the intermediate term. Given our mandate of preserving capital over the intermediate term, when a worst-case outcome is low-single-digit returns, that is something that excites us.
But what if interest rates declined? No one thought it was possible, and, again, the market was embedding in the valuations of utilities a very high probability that rates would increase. When interest rates fell, many of our utilities appreciated by 40% or more over the next year or so and vastly outperformed the market. The market had essentially said the odds of interest rates going up were 90%+, when in fact they were probably closer to 50%. We did not know which way rates were going to go, but because the market had put way too high of a probability on an uncertain outcome, we had the opportunity to invest in a very positively skewed risk-adjusted return opportunity that ultimately generated significant alpha for our shareholders.
Finding these types of market inefficiencies and exploiting them for our shareholders has been a meaningful driver of the alpha we have generated for our clients over the last 13 years. It is also what makes this job so much fun at times.
Before we discuss fund performance, I would like to review the three goals of the Capital Appreciation Fund:
(1) Generate strong risk-adjusted returns annually
(2) Preserve shareholder capital over the intermediate term (i.e., three years)
(3) Generate equity-like returns with less risk than that of the overall market over a full market cycle (i.e., normally five years)
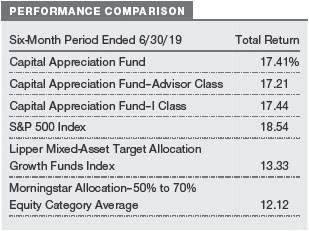
We are pleased to report that the Capital Appreciation Fund generated solid absolute and risk-adjusted returns in the first half of 2019. Your fund generated a 17.4% return relative to the S&P 500’s 18.5% return. (The performance of the Advisor and I Class shares will vary due to different fee structures.)
Your fund outperformed the market on a risk-adjusted basis over this period. We captured 94% of the S&P 500’s return while taking on only 64% of the market’s risk. We arrive at this risk number by comparing the standard deviation of the S&P 500 (12.5) with that of the fund (8.0) for the 12-month period. Standard deviation indicates the volatility of a portfolio’s total return. In general, the higher the standard deviation, the greater the risk.
Using a more academic measure of the fund’s risk-adjusted return, your fund produced a Sharpe ratio of 2.03 versus 1.39 for the S&P 500. The Sharpe ratio measures a portfolio’s return above the risk-free Treasury rate (excess return), divided by the amount of risk taken (measured by standard deviation). The larger the Sharpe ratio, the better the portfolio’s risk-adjusted return.
As for our second goal—capital preservation over the intermediate term—your fund generated a 40.2% cumulative return over the last three years.
As for our final goal—equity-like returns with less risk than the market over a full market cycle—your fund generated a 63.2% cumulative return over the last five years versus 66.3% for the S&P 500. Based on annualized returns of 10.3% for your fund versus 10.7% for the S&P 500, your fund generated 96% of the market’s return over the last five years while taking on 61% of the market’s risk. While market and economic cycles have historically lasted around five years on average, we also tend to think about a full market cycle encompassing at least one ugly return year. While 2018 S&P 500 returns were negative, we would not describe 2018 as an ugly year within a historical construct. As your fund is not a pure equity fund, it would be very difficult to match the equity market’s return over any period in which we did not have at least one major equity market correction. Hence, if we extend the analysis to encompass 2008 and measure the last 10.5 years of fund performance, we would have accomplished this last goal by delivering 110% of the market’s return while taking only 69% of the market’s risk.
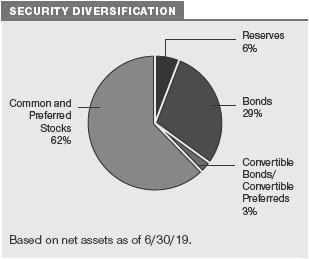
In addition, our equities outperformed the S&P 500 by 581 basis points (24.35% versus 18.54%) during the first half of 2019. Our fixed income investments outperformed the Bloomberg Barclays U.S. Aggregate Bond Index by 145 basis points (7.56% versus 6.11%) over the period. Over the last 1-, 3-, 5-, and 10-year periods, our equities have outperformed the S&P 500 by an average of 1,036, 379, 525, and 441 basis points annualized, respectively.
For the 1-, 3-, 5-, and 10-year periods ended June 30, 2019, we outperformed our Lipper and Morningstar peers over every period. In fact, we are either in the first, second, or third percentile in both peer groupings over all of these time periods. (Based on cumulative total return, the Capital Appreciation Fund ranked 4 of 467, 11 of 440, 1 of 392, and 3 of 292 funds in the Lipper mixed-asset target allocation growth funds universe for the 1-, 3-, 5-, and 10-year periods ended June 30, 2019, respectively.Results may vary for other periods. Past performance cannot guarantee future results.)

However, let us reiterate that we do not manage your fund to beat these benchmarks. The Capital Appreciation Fund has very different objectives than most of its benchmark peers. It is a unique fund with a clear focus on strong risk-adjusted returns, intermediate-term capital preservation, and long-term capital appreciation that does not neatly fit into any current benchmark.
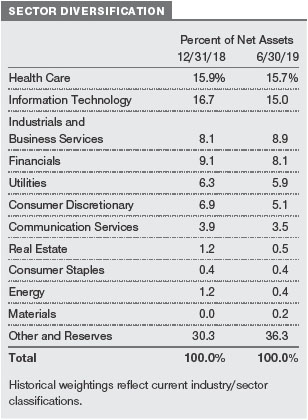
Within the equity portfolio, we added absolute and relative value in all 11 sectors in the first half of the year.
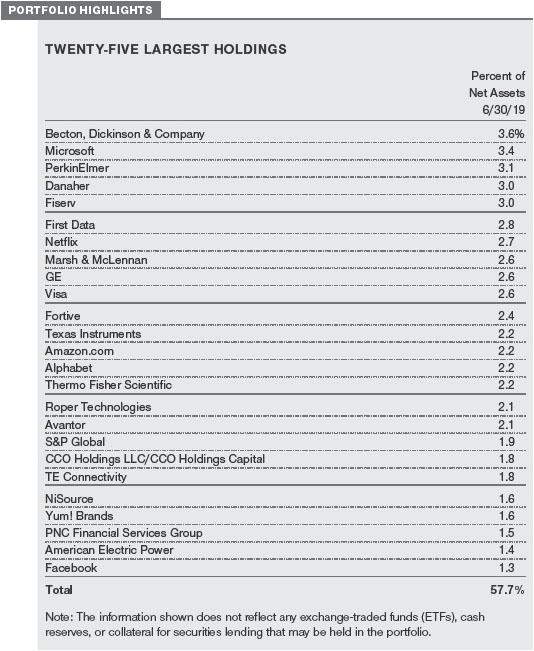
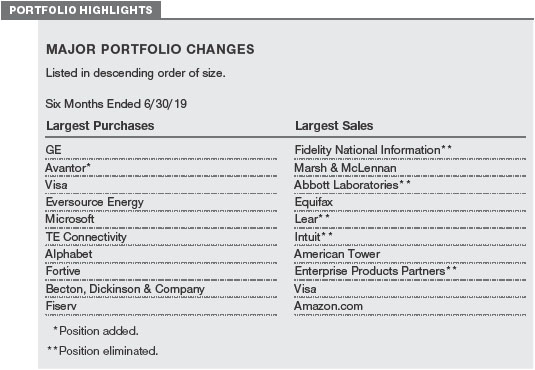
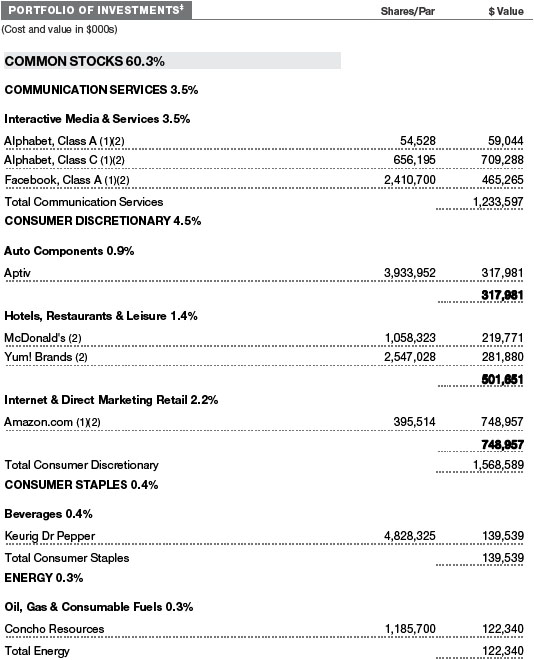
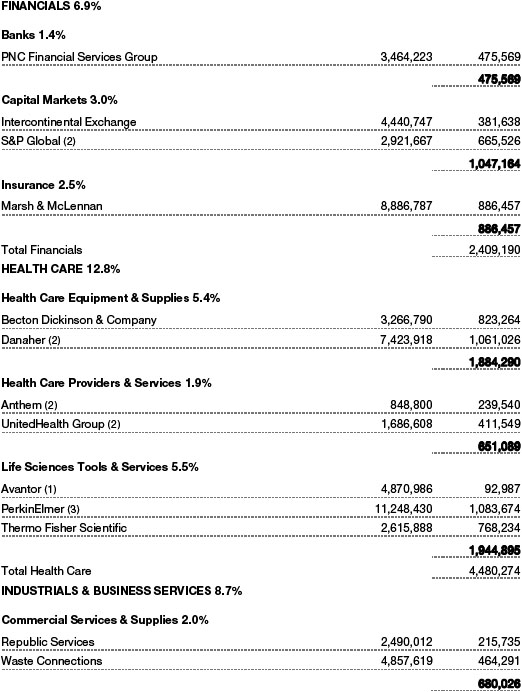
Health care was the biggest source of alpha generation, even though the sector was the worst-performing sector in the S&P 500 in the first half of the year. Our stock selection within this sector benefited substantially from our large investments within the life science tool space.Danaherrose nearly 39% in the first half of the year and was your fund’s top alpha contributor. As we have touched on in previous letters, CEO Thomas Joyce and his team have significantly improved the organic growth profile of the firm through a series of faster-growth acquisitions and internal investment. This has resulted in a material step-up in Danaher’s organic growth rate and in its earnings growth rate beginning last year. However, the real catalyst for Danaher’s surge in the first half of the year was its acquisition ofGE’s biopharma business. This $21.4 billion acquisition has strong secular tailwinds, very high recurring revenue, and mid- to high-single-digit growth, and it is highly complementary to Danaher’s Pall subsidiary that already serves this market. The real coup, though, was the price. Danaher was able to buy this business for a lower valuation multiple than it was trading for at the time, as many of the other logical buyers faced antitrust issues that precluded them from buying this asset. (Please refer to the fund’s portfolio of investments for a complete list of holdings and the amount each represents in the portfolio.)
Also, within life science tools,Thermo Fisher ScientificandPerkinElmerrose by 31% and 23%, respectively. Thermo Fisher Scientific has significant balance sheet capacity to deploy in order to create shareholder value, and PerkinElmer has a series of new products and initiatives that may be able to structurally turn what used to be a 3%–5% organic growth company into a 6%–7% organic growth company. Moreover, PerkinElmer continues to have significant margin expansion opportunity as well. We feel very good about Danaher, Thermo Fisher Scientific, and PerkinElmer, and while their valuations have expanded and the stocks could take a breather in the very short term after such substantial outperformance, the long-term alpha opportunity remains substantial.
The industrials and business services sector generated the second-most alpha for our shareholders in the first half of the year. Within industrials, shares of GE rose 44% after a very difficult 2018. In our last shareholder letter, I was somewhat critical of moving too quickly on GE given the level of uncertainty surrounding the stock, and I stand by that criticism. But while it is still early, as we have learned more about GE over the last six-plus months, many of the concerns we had with regard to the balance sheet, the reinsurance business, GE Capital, and even the power business have turned out to be less negative than we assumed in our original analysis. The only item that has broken the other way is interest rates, where the decline in rates has put upward pressure on GE’s pension and reinsurance liabilities. GE remains a classic Capital Appreciation Fund opportunity. This is a company that was managed horribly for almost two decades, with poor capital allocation, poor business practices, and increasing financial leverage. But with the sale of GE’s biopharma business to Danaher and other asset sales, as well as changes in the company’s culture, improved business practices, and cost-cutting, we strongly believe that GE will emerge as a much more valuable company under CEO Larry Culp’s leadership. While GE still has risks and the decline in interest rates has not helped, we are increasingly confident in the significant shareholder value opportunity present here. In our internal models, GE has more potential upside over the next four years than any of our other holdings.
Financials also generated significant alpha for our shareholders during the first half of 2019, despite the fact that the sector underperformed the market. The biggest driver of alpha wasS&P Global, which rose 35%. While S&P Global is best known for its rating agency business, it has a variety of other attractive businesses, including its index, Platts, and Capital IQ businesses. S&P Global had been on our watch list for many years, and in the second half of 2018, we got our chance. The core rating agency business faced very difficult comparisons, and, with rising interest rates and weaker markets, new debt issuance declined in 2018, particularly in the fourth quarter. We used this short-term weakness to buy a great business at a very attractive valuation. We often say that there is no easier way to make money in the stock market than by buying a great business that is going through some short-term challenges that are pressuring its valuation. We love taking advantage of these time-arbitrage opportunities.
While we were able to outperform the market across all 11 equity sectors, we did have a number of stocks that underperformed.UnitedHealth Groupwas down around 1% in the first half of the year as the market became increasingly concerned about the potential for a change in U.S. presidential administration in 2020 and the impact that could have on health care policy. While we share this concern, we believe that the odds of single payor becoming a legislative reality are slim to none even if the administration were to change. Nevertheless, while we continue to have an overweight exposure to managed care, we proactively moderated the size of our exposure back in 2017.Concho Resourcesalso underperformed the market due to weaker-than-expected oil production growth, very low natural gas prices, and valuation multiple compression. This weakness has continued into the second half of the year as well. While we are disappointed in this, we continue to believe that Concho Resources has very attractive acreage in the middle of the Permian Basin that has a private market value well in excess of where shares are currently trading.
Within fixed income, Treasury yields fell as the Federal Reserve reversed course and investment-grade and high yield spreads compressed alongside the strong upward movement in risk assets. With spreads and risk-free rates coming in, we strategically lowered our duration. At the end of last year, we sold some of our longer-duration Treasuries to enable us to add to equities, and, in 2019, we began to sell down some of our longer-duration investment-grade bonds. As equities rose and their expected future returns fell, the relative attractiveness of very short-duration bonds has increased. As a result, the duration of our fixed income portfolio has fallen from 5.0 years to 2.9 years. A lower duration helps to limit risk if credit spreads increase or interest rates rise.
One investment that we were very proud of this year was our investment in a variety ofFirst Databank debt securities, into which we invested slightly less than $1 billion of your fund’s assets.Fiserv(which we also own) announced the acquisition of First Data in early 2019, and since Fiserv is an investment-grade company, it announced that it would retire First Data bank debt upon closing and issue lower-cost investment-grade debt in its place. This announcement effectively made First Data bank debt a quasi-investment-grade, short-duration credit. While the debt did appreciate in value, it did not appreciate enough, in our view. We were able to back up the truck on this bank debt and believe it is likely we will earn around a 5% annualized return on this purchase at the same time that other very short-duration investment-grade debt is yielding closer to 2.5%–3.0%. As expected, this deal was approved by the antitrust authorities in July and should close soon.
PORTFOLIO OUTLOOK
The value that we hope to deliver for our shareholders comes not from trying to be right on predicting GDP growth, interest rates, currency movements, or what the Fed is going to do next. We don’t have any unique perspective on these matters. Spending considerable time and effort trying to develop stronger opinions on these issues strikes us as a very poor return on time spent. We focus our time on finding asymmetric risk/reward opportunities, such as utilities in 2018, First Data bank debt in 2019, and S&P Global in the second half of last year. We will be patient and wait for opportunities to present themselves and take advantage when the market convinces itself that it can predict the future and places extreme odds that it is correct.
Given the significant market recovery in 2019 in both equities and fixed income, it makes sense to lower the risk profile of the fund just as we did in early to mid-2018. The decision to be conservatively positioned helped us generate positive returns in a down market for equities and corporate bonds last year. The decision to then go overweight equities on Christmas Eve of last year is a principal reason why we were able to capture a significant portion of the market upside in 2019.
While we don’t know what the market and economy have in store for us in the second half of the year, we feel that we are well positioned to take advantage of whatever opportunities present themselves. Over the long term, we are extremely confident in the quality of companies in which we have chosen to invest. These are mostly GARP (growth at a reasonable price) stocks with excellent management teams that use capital allocation to create sustainable long-term value for shareholders.
IN CLOSING
We would like to thank all of the analysts, associate analysts, quantitative analysts, and members of our team (Mike Signore, Chen Tian, Adam Poussard, and Julian Gould) for their assistance in the first half of 2019. The long-term success and exceptional risk-adjusted returns of the strategy are truly a team effort.
Respectfully submitted,

David R. Giroux
Chairman of the fund’s Investment Advisory Committee

Adam Poussard
Associate portfolio manager
July 26, 2019
The committee chairman has day-to-day responsibility for managing the portfolio and works with committee members in developing and executing the fund’s investment program.
The views expressed reflect the opinions of T. Rowe Price as of the date of this report and are subject to change based on changes in market, economic, or other conditions. These views are not intended to be a forecast of future events and are no guarantee of future results.
RISKS OF INVESTING
As with all stock and bond mutual funds, the fund’s share price can fall because of weakness in the stock or bond markets, a particular industry, or specific holdings. Stock markets can decline for many reasons, including adverse political or economic developments, changes in investor psychology, or heavy institutional selling. The prospects for an industry or company may deteriorate because of a variety of factors, including disappointing earnings or changes in the competitive environment. In addition, the investment manager’s assessment of companies held in a fund may prove incorrect, resulting in losses or poor performance even in rising markets. A sizable cash or fixed income position may hinder the fund from participating fully in a strong, rapidly rising bull market. In addition, significant exposure to bonds increases the risk that the fund’s share value could be hurt by rising interest rates or credit downgrades or defaults. Convertible securities are also exposed to price fluctuations of the company’s stock.
GLOSSARY
Beta:A measure of the market risk of a stock showing how responsive it is to a given market index, such as the S&P 500 Stock Index. By definition, the beta of the benchmark index is 1.00. A fund with a 1.10 beta is expected to perform 10% better than the index in up markets and 10% worse in down markets. Usually, higher betas represent riskier investments.
Gross domestic product (GDP):The total market value of all goods and services produced in a country in a given year.
Lipper indexes:Fund benchmarks that consist of a small number of the largest mutual funds in a particular category as tracked by Lipper Inc.
Morningstar Allocation–50% to 70% Equity Category Average:Tracks the performance of funds that seek capital appreciation and income by investing in multiple asset classes, including stocks, bonds, and cash. Equity exposures range from 50% to 70%.
Sharpe ratio:A measure of the risk-adjusted return of a portfolio. The Sharpe ratio measures how much a portfolio’s return is above or below the risk-free Treasury rate (excess return) per unit risk (measured by standard deviation). In general, the larger the number, the better the portfolio’s historical risk-adjusted return.
BENCHMARK INFORMATION
Note: Bloomberg Index Services Ltd. Copyright © 2019, Bloomberg Index Services Ltd. Used with permission.
Information has been obtained from sources believed to be reliable but J.P. Morgan does not warrant its completeness or accuracy. The index is used with permission. The index may not be copied, used, or distributed without J.P. Morgan’s prior written approval. Copyright 2019, J.P. Morgan Chase & Co. All rights reserved.
GROWTH OF $10,000
This chart shows the value of a hypothetical $10,000 investment in the fund over the past 10 fiscal year periods or since inception (for funds lacking 10-year records). The result is compared with benchmarks, which include a broad-based market index and may also include a peer group average or index. Market indexes do not include expenses, which are deducted from fund returns as well as mutual fund averages and indexes.

AVERAGE ANNUAL COMPOUND TOTAL RETURN

EXPENSE RATIO

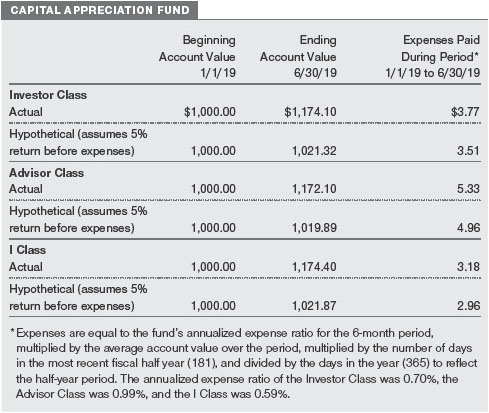
FUND EXPENSE EXAMPLE
As a mutual fund shareholder, you may incur two types of costs: (1) transaction costs, such as redemption fees or sales loads, and (2) ongoing costs, including management fees, distribution and service (12b-1) fees, and other fund expenses. The following example is intended to help you understand your ongoing costs (in dollars) of investing in the fund and to compare these costs with the ongoing costs of investing in other mutual funds. The example is based on an investment of $1,000 invested at the beginning of the most recent six-month period and held for the entire period.
Please note that the fund has three share classes: The original share class (Investor Class) charges no distribution and service (12b-1) fee, the Advisor Class shares are offered only through unaffiliated brokers and other financial intermediaries and charge a 0.25% 12b-1 fee, and I Class shares are available to institutionally oriented clients and impose no 12b-1 or administrative fee payment. Each share class is presented separately in the table.
Actual Expenses
The first line of the following table (Actual) provides information about actual account values and expenses based on the fund’s actual returns. You may use the information on this line, together with your account balance, to estimate the expenses that you paid over the period. Simply divide your account value by $1,000 (for example, an $8,600 account value divided by $1,000 = 8.6), then multiply the result by the number on the first line under the heading “Expenses Paid During Period” to estimate the expenses you paid on your account during this period.
Hypothetical Example for Comparison Purposes
The information on the second line of the table (Hypothetical) is based on hypothetical account values and expenses derived from the fund’s actual expense ratio and an assumed 5% per year rate of return before expenses (not the fund’s actual return). You may compare the ongoing costs of investing in the fund with other funds by contrasting this 5% hypothetical example and the 5% hypothetical examples that appear in the shareholder reports of the other funds. The hypothetical account values and expenses may not be used to estimate the actual ending account balance or expenses you paid for the period.
Note:T. Rowe Price charges an annual account service fee of $20, generally for accounts with less than $10,000. The fee is waived for any investor whose T. Rowe Price mutual fund accounts total $50,000 or more; accounts electing to receive electronic delivery of account statements, transaction confirmations, prospectuses, and shareholder reports; or accounts of an investor who is a T. Rowe Price Personal Services or Enhanced Personal Services client (enrollment in these programs generally requires T. Rowe Price assets of at least $250,000). This fee is not included in the accompanying table. If you are subject to the fee, keep it in mind when you are estimating the ongoing expenses of investing in the fund and when comparing the expenses of this fund with other funds.
You should also be aware that the expenses shown in the table highlight only your ongoing costs and do not reflect any transaction costs, such as redemption fees or sales loads. Therefore, the second line of the table is useful in comparing ongoing costs only and will not help you determine the relative total costs of owning different funds. To the extent a fund charges transaction costs, however, the total cost of owning that fund is higher.
Unaudited

The accompanying notes are an integral part of these financial statements.
Unaudited
The accompanying notes are an integral part of these financial statements.
Unaudited

The accompanying notes are an integral part of these financial statements.
Unaudited


The accompanying notes are an integral part of these financial statements.
Unaudited

The accompanying notes are an integral part of these financial statements.
Unaudited

The accompanying notes are an integral part of these financial statements.
Unaudited
The accompanying notes are an integral part of these financial statements.
Unaudited
| NOTES TO FINANCIAL STATEMENTS |
T. Rowe Price Capital Appreciation Fund, Inc. (the fund) is registered under the Investment Company Act of 1940 (the 1940 Act) as a diversified, open-end management investment company. The fund seeks long-term capital appreciation by investing primarily in common stocks. It may also hold fixed-income and other securities to help preserve principal value. The fund has three classes of shares: the Capital Appreciation Fund (Investor Class), the Capital Appreciation Fund–Advisor Class (Advisor Class), and the Capital Appreciation Fund–I Class (I Class). Advisor Class shares are sold only through unaffiliated brokers and other unaffiliated financial intermediaries. I Class shares require a $1 million initial investment minimum, although the minimum generally is waived for retirement plans, financial intermediaries, and certain other accounts. The Advisor Class operates under a Board-approved Rule 12b-1 plan pursuant to which the class compensates financial intermediaries for distribution, shareholder servicing, and/or certain administrative services; the Investor and I Classes do not pay Rule 12b-1 fees. Each class has exclusive voting rights on matters related solely to that class; separate voting rights on matters that relate to all classes; and, in all other respects, the same rights and obligations as the other classes.
NOTE 1 - SIGNIFICANT ACCOUNTING POLICIES
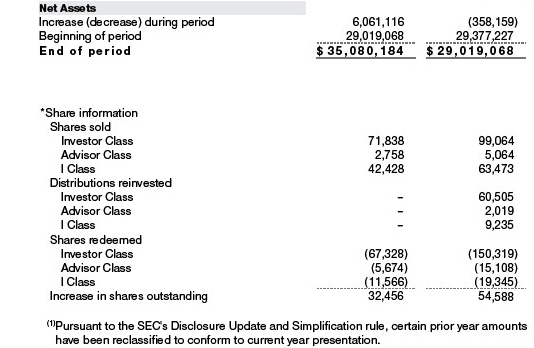
Basis of PreparationThe fund is an investment company and follows accounting and reporting guidance in the Financial Accounting Standards Board (FASB)Accounting Standards CodificationTopic 946 (ASC 946). The accompanying financial statements were prepared in accordance with accounting principles generally accepted in the United States of America (GAAP), including, but not limited to, ASC 946. GAAP requires the use of estimates made by management. Management believes that estimates and valuations are appropriate; however, actual results may differ from those estimates, and the valuations reflected in the accompanying financial statements may differ from the value ultimately realized upon sale or maturity. Certain prior year amounts in the accompanying financial statements and financial highlights have been restated to conform to current year presentation.
Investment Transactions, Investment Income, and DistributionsInvestment transactions are accounted for on the trade date basis. Income and expenses are recorded on the accrual basis. Realized gains and losses are reported on the identified cost basis. Premiums and discounts on debt securities are amortized for financial reporting purposes. Paydown gains and losses are recorded as an adjustment to interest income. Income tax-related interest and penalties, if incurred, are recorded as income tax expense. Dividends received from mutual fund investments are reflected as dividend income; capital gain distributions are reflected as realized gain/loss. Dividend income and capital gain distributions are recorded on the ex-dividend date. Distributions from REITs are initially recorded as dividend income and, to the extent such represent a return of capital or capital gain for tax purposes, are reclassified when such information becomes available. Distributions to shareholders are recorded on the ex-dividend date. Income distributions, if any, are declared and paid by each class annually. A capital gain distribution may also be declared and paid by the fund annually.
Currency TranslationAssets, including investments, and liabilities denominated in foreign currencies are translated into U.S. dollar values each day at the prevailing exchange rate, using the mean of the bid and asked prices of such currencies against U.S. dollars as quoted by a major bank. Purchases and sales of securities, income, and expenses are translated into U.S. dollars at the prevailing exchange rate on the respective date of such transaction. The effect of changes in foreign currency exchange rates on realized and unrealized security gains and losses is not bifurcated from the portion attributable to changes in market prices.
Class AccountingShareholder servicing, prospectus, and shareholder report expenses incurred by each class are charged directly to the class to which they relate. Expenses common to all classes, investment income, and realized and unrealized gains and losses are allocated to the classes based upon the relative daily net assets of each class. The Advisor Class pays Rule 12b-1 fees, in an amount not exceeding 0.25% of the class’s average daily net assets.
New Accounting GuidanceIn March 2017, the FASB issued amended guidance to shorten the amortization period for certain callable debt securities held at a premium. The guidance is effective for fiscal years and interim periods beginning after December 15, 2018. Adoption will have no effect on the fund’s net assets or results of operations.
IndemnificationIn the normal course of business, the fund may provide indemnification in connection with its officers and directors, service providers, and/or private company investments. The fund’s maximum exposure under these arrangements is unknown; however, the risk of material loss is currently considered to be remote.
NOTE 2 - VALUATION
The fund’s financial instruments are valued and each class’s net asset value (NAV) per share is computed at the close of the New York Stock Exchange (NYSE), normally 4 p.m. ET, each day the NYSE is open for business. However, the NAV per share may be calculated at a time other than the normal close of the NYSE if trading on the NYSE is restricted, if the NYSE closes earlier, or as may be permitted by the SEC.
Fair ValueThe fund’s financial instruments are reported at fair value, which GAAP defines as the price that would be received to sell an asset or paid to transfer a liability in an orderly transaction between market participants at the measurement date. The T. Rowe Price Valuation Committee (the Valuation Committee) is an internal committee that has been delegated certain responsibilities by the fund’s Board of Directors (the Board) to ensure that financial instruments are appropriately priced at fair value in accordance with GAAP and the 1940 Act. Subject to oversight by the Board, the Valuation Committee develops and oversees pricing-related policies and procedures and approves all fair value determinations. Specifically, the Valuation Committee establishes procedures to value securities; determines pricing techniques, sources, and persons eligible to effect fair value pricing actions; oversees the selection, services, and performance of pricing vendors; oversees valuation-related business continuity practices; and provides guidance on internal controls and valuation-related matters. The Valuation Committee reports to the Board and has representation from legal, portfolio management and trading, operations, risk management, and the fund’s treasurer.
Various valuation techniques and inputs are used to determine the fair value of financial instruments. GAAP establishes the following fair value hierarchy that categorizes the inputs used to measure fair value:
Level 1 – quoted prices (unadjusted) in active markets for identical financial instruments that the fund can access at the reporting date
Level 2 – inputs other than Level 1 quoted prices that are observable, either directly or indirectly (including, but not limited to, quoted prices for similar financial instruments in active markets, quoted prices for identical or similar financial instruments in inactive markets, interest rates and yield curves, implied volatilities, and credit spreads)
Level 3 – unobservable inputs
Observable inputs are developed using market data, such as publicly available information about actual events or transactions, and reflect the assumptions that market participants would use to price the financial instrument. Unobservable inputs are those for which market data are not available and are developed using the best information available about the assumptions that market participants would use to price the financial instrument. GAAP requires valuation techniques to maximize the use of relevant observable inputs and minimize the use of unobservable inputs. When multiple inputs are used to derive fair value, the financial instrument is assigned to the level within the fair value hierarchy based on the lowest-level input that is significant to the fair value of the financial instrument. Input levels are not necessarily an indication of the risk or liquidity associated with financial instruments at that level but rather the degree of judgment used in determining those values.
Valuation TechniquesEquity securities listed or regularly traded on a securities exchange or in the over-the-counter (OTC) market are valued at the last quoted sale price or, for certain markets, the official closing price at the time the valuations are made. OTC Bulletin Board securities are valued at the mean of the closing bid and asked prices. A security that is listed or traded on more than one exchange is valued at the quotation on the exchange determined to be the primary market for such security. Listed securities not traded on a particular day are valued at the mean of the closing bid and asked prices for domestic securities and the last quoted sale or closing price for international securities.
For valuation purposes, the last quoted prices of non-U.S. equity securities may be adjusted to reflect the fair value of such securities at the close of the NYSE. If the fund determines that developments between the close of a foreign market and the close of the NYSE will affect the value of some or all of its portfolio securities, the fund will adjust the previous quoted prices to reflect what it believes to be the fair value of the securities as of the close of the NYSE. In deciding whether it is necessary to adjust quoted prices to reflect fair value, the fund reviews a variety of factors, including developments in foreign markets, the performance of U.S. securities markets, and the performance of instruments trading in U.S. markets that represent foreign securities and baskets of foreign securities. The fund may also fair value securities in other situations, such as when a particular foreign market is closed but the fund is open. The fund uses outside pricing services to provide it with quoted prices and information to evaluate or adjust those prices. The fund cannot predict how often it will use quoted prices and how often it will determine it necessary to adjust those prices to reflect fair value. As a means of evaluating its security valuation process, the fund routinely compares quoted prices, the next day’s opening prices in the same markets, and adjusted prices.
Actively traded equity securities listed on a domestic exchange generally are categorized in Level 1 of the fair value hierarchy. Non-U.S. equity securities generally are categorized in Level 2 of the fair value hierarchy despite the availability of quoted prices because, as described above, the fund evaluates and determines whether those quoted prices reflect fair value at the close of the NYSE or require adjustment. OTC Bulletin Board securities, certain preferred securities, and equity securities traded in inactive markets generally are categorized in Level 2 of the fair value hierarchy.
Debt securities generally are traded in the OTC market and are valued at prices furnished by dealers who make markets in such securities or by an independent pricing service, which considers the yield or price of bonds of comparable quality, coupon, maturity, and type, as well as prices quoted by dealers who make markets in such securities. Generally, debt securities are categorized in Level 2 of the fair value hierarchy; however, to the extent the valuations include significant unobservable inputs, the securities would be categorized in Level 3.
Investments in mutual funds are valued at the mutual fund’s closing NAV per share on the day of valuation and are categorized in Level 1 of the fair value hierarchy. Listed options, and OTC options with a listed equivalent, are valued at the mean of the closing bid and asked prices and generally are categorized in Level 2 of the fair value hierarchy. Assets and liabilities other than financial instruments, including short-term receivables and payables, are carried at cost, or estimated realizable value, if less, which approximates fair value.
Thinly traded financial instruments and those for which the above valuation procedures are inappropriate or are deemed not to reflect fair value are stated at fair value as determined in good faith by the Valuation Committee. The objective of any fair value pricing determination is to arrive at a price that could reasonably be expected from a current sale. Financial instruments fair valued by the Valuation Committee are primarily private placements, restricted securities, warrants, rights, and other securities that are not publicly traded.
Subject to oversight by the Board, the Valuation Committee regularly makes good faith judgments to establish and adjust the fair valuations of certain securities as events occur and circumstances warrant. For instance, in determining the fair value of an equity investment with limited market activity, such as a private placement or a thinly traded public company stock, the Valuation Committee considers a variety of factors, which may include, but are not limited to, the issuer’s business prospects, its financial standing and performance, recent investment transactions in the issuer, new rounds of financing, negotiated transactions of significant size between other investors in the company, relevant market valuations of peer companies, strategic events affecting the company, market liquidity for the issuer, and general economic conditions and events. In consultation with the investment and pricing teams, the Valuation Committee will determine an appropriate valuation technique based on available information, which may include both observable and unobservable inputs. The Valuation Committee typically will afford greatest weight to actual prices in arm’s length transactions, to the extent they represent orderly transactions between market participants, transaction information can be reliably obtained, and prices are deemed representative of fair value. However, the Valuation Committee may also consider other valuation methods such as market-based valuation multiples; a discount or premium from market value of a similar, freely traded security of the same issuer; or some combination. Fair value determinations are reviewed on a regular basis and updated as information becomes available, including actual purchase and sale transactions of the issue. Because any fair value determination involves a significant amount of judgment, there is a degree of subjectivity inherent in such pricing decisions, and fair value prices determined by the Valuation Committee could differ from those of other market participants. Depending on the relative significance of unobservable inputs, including the valuation technique(s) used, fair valued securities may be categorized in Level 2 or 3 of the fair value hierarchy.
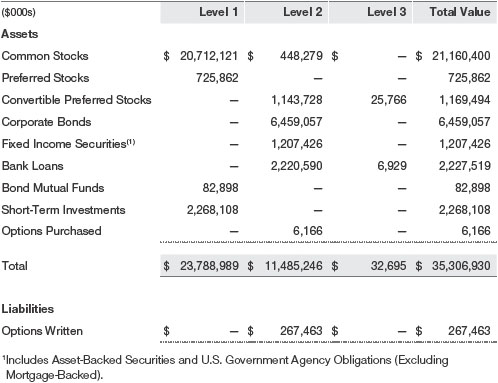
Valuation InputsThe following table summarizes the fund’s financial instruments, based on the inputs used to determine their fair values on June 30, 2019 (for further detail by category, please refer to the accompanying Portfolio of Investments):
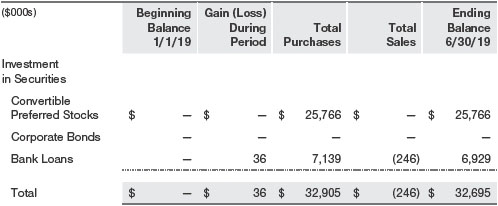
Following is a reconciliation of the fund’s Level 3 holdings for the six months ended June 30, 2019. Gain (loss) reflects both realized and change in unrealized gain/loss on Level 3 holdings during the period, if any, and is included on the accompanying Statement of Operations. The change in unrealized gain/loss on Level 3 instruments held at June 30, 2019, totaled $31,000 for the six months ended June 30, 2019.
NOTE 3 - DERIVATIVE INSTRUMENTS
During the six months ended June 30, 2019, the fund invested in derivative instruments. As defined by GAAP, a derivative is a financial instrument whose value is derived from an underlying security price, foreign exchange rate, interest rate, index of prices or rates, or other variable; it requires little or no initial investment and permits or requires net settlement. The fund invests in derivatives only if the expected risks and rewards are consistent with its investment objectives, policies, and overall risk profile, as described in its prospectus and Statement of Additional Information. The fund may use derivatives for a variety of purposes, such as seeking to hedge against declines in principal value, increase yield, invest in an asset with greater efficiency and at a lower cost than is possible through direct investment, to enhance return, or to adjust credit exposure. The risks associated with the use of derivatives are different from, and potentially much greater than, the risks associated with investing directly in the instruments on which the derivatives are based. The fund at all times maintains sufficient cash reserves, liquid assets, or other SEC-permitted asset types to cover its settlement obligations under open derivative contracts.
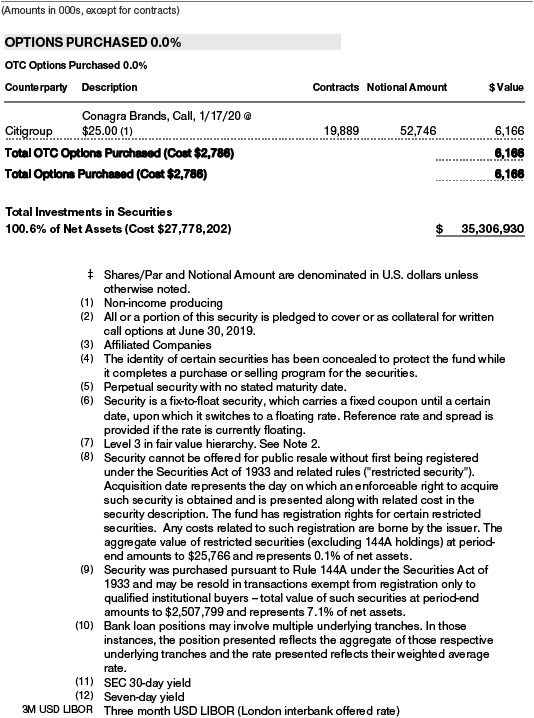
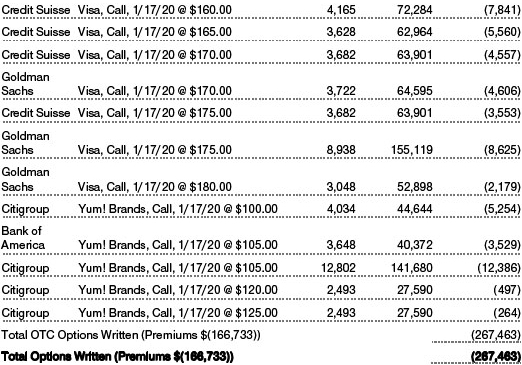
The fund values its derivatives at fair value and recognizes changes in fair value currently in its results of operations. Accordingly, the fund does not follow hedge accounting, even for derivatives employed as economic hedges. Generally, the fund accounts for its derivatives on a gross basis. It does not offset the fair value of derivative liabilities against the fair value of derivative assets on its financial statements, nor does it offset the fair value of derivative instruments against the right to reclaim or obligation to return collateral. As of June 30, 2019, the fund held equity derivatives with a fair value of $6,166,000, included in Securities, and $267,463,000, included in Options Written, on the accompanying Statement of Assets and Liabilities.
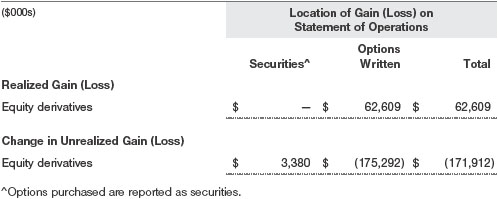
Additionally, the amount of gains and losses on derivative instruments recognized in fund earnings during the six months ended June 30, 2019, and the related location on the accompanying Statement of Operations is summarized in the following table by primary underlying risk exposure:
Counterparty Risk and CollateralThe fund invests in derivatives, such as bilateral swaps, forward currency exchange contracts, or OTC options, that are transacted and settle directly with a counterparty (bilateral derivatives), and thereby may expose the fund to counterparty risk. To mitigate this risk, the fund has entered into master netting arrangements (MNAs) with certain counterparties that permit net settlement under specified conditions and, for certain counterparties, also require the exchange of collateral to cover mark-to-market exposure. MNAs may be in the form of International Swaps and Derivatives Association master agreements (ISDAs) or foreign exchange letter agreements (FX letters).
MNAs govern the ability to offset amounts the fund owes a counterparty against amounts the counterparty owes the fund (net settlement). Both ISDAs and FX letters generally allow termination of transactions and net settlement upon the occurrence of contractually specified events, such as failure to pay or bankruptcy. In addition, ISDAs specify other events, the occurrence of which would allow one of the parties to terminate. For example, a downgrade in credit rating of a counterparty below a specified rating would allow the fund to terminate, while a decline in the fund’s net assets of more than a specified percentage would allow the counterparty to terminate. Upon termination, all transactions with that counterparty would be liquidated and a net termination amount determined. ISDAs include collateral agreements whereas FX letters do not. Collateral requirements are determined daily based on the net aggregate unrealized gain or loss on all bilateral derivatives with each counterparty, subject to minimum transfer amounts that typically range from $100,000 to $250,000. Any additional collateral required due to changes in security values is typically transferred the same business day.
Collateral may be in the form of cash or debt securities issued by the U.S. government or related agencies. Cash posted by the fund is reflected as cash deposits in the accompanying financial statements and generally is restricted from withdrawal by the fund; securities posted by the fund are so noted in the accompanying Portfolio of Investments; both remain in the fund’s assets. Collateral pledged by counterparties is not included in the fund’s assets because the fund does not obtain effective control over those assets. For bilateral derivatives, collateral posted or received by the fund is held in a segregated account at the fund’s custodian. While typically not sold in the same manner as equity or fixed income securities, OTC and bilateral derivatives may be unwound with counterparties or transactions assigned to other counterparties to allow the fund to exit the transaction. This ability is subject to the liquidity of underlying positions. As of June 30, 2019, securities valued at $3,794,524,000 had been pledged or posted by the fund to counterparties for bilateral derivatives. As of June 30, 2019, collateral pledged by counterparties to the fund for bilateral derivatives consisted of $4,920,000 cash.
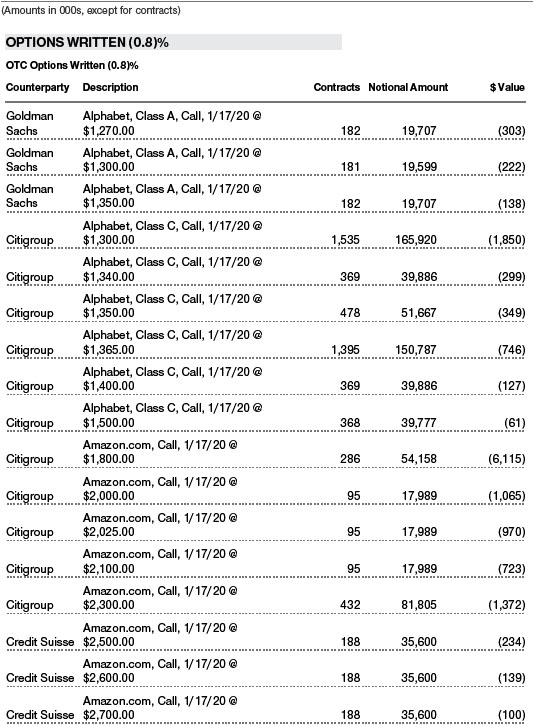
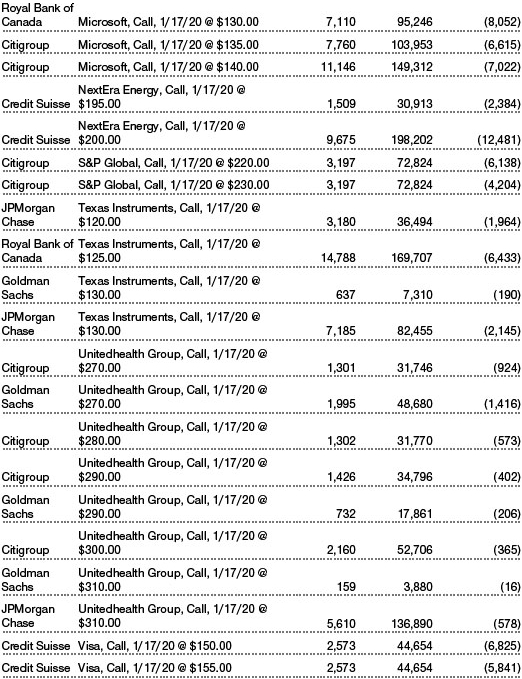
OptionsThe fund is subject to equity price risk in the normal course of pursuing its investment objectives and uses options to help manage such risk. The fund may use options to manage exposure to security prices, interest rates, foreign currencies, and credit quality; as an efficient means of adjusting exposure to all or a part of a target market; to enhance income; as a cash management tool; or to adjust credit exposure. Options are included in net assets at fair value, options purchased are included in Investments in Securities, and Options written are separately reflected as a liability on the accompanying Statement of Assets and Liabilities. Premiums on unexercised, expired options are recorded as realized gains or losses; premiums on exercised options are recorded as an adjustment to the proceeds from the sale or cost of the purchase. The difference between the premium and the amount received or paid in a closing transaction is also treated as realized gain or loss. In return for a premium paid, call and put options give the holder the right, but not the obligation, to purchase or sell, respectively, a security at a specified exercise price. Risks related to the use of options include possible illiquidity of the options markets; trading restrictions imposed by an exchange or counterparty; movements in the underlying asset values and, for options written, potential losses in excess of the fund’s initial investment. During the six months ended June 30, 2019, the volume of the fund’s activity in options, based on underlying notional amounts, was generally between 11% and 16% of net assets.
NOTE 4 - OTHER INVESTMENT TRANSACTIONS
Consistent with its investment objective, the fund engages in the following practices to manage exposure to certain risks and/or to enhance performance. The investment objective, policies, program, and risk factors of the fund are described more fully in the fund’s prospectus and Statement of Additional Information.
Noninvestment-Grade DebtAt June 30, 2019, approximately 20% of the fund’s net assets were invested, either directly or through its investment in T. Rowe Price institutional funds, in noninvestment-grade debt including “high yield” or “junk” bonds or leveraged loans. Noninvestment-grade debt issuers are more likely to suffer an adverse change in financial condition that would result in the inability to meet a financial obligation. The noninvestment-grade debt market may experience sudden and sharp price swings due to a variety of factors, including changes in economic forecasts, stock market activity, large sustained sales by major investors, a high-profile default, or a change in market sentiment. These events may decrease the ability of issuers to make principal and interest payments and adversely affect the liquidity or value, or both, of such securities. Accordingly, securities issued by such companies carry a higher risk of default and should be considered speculative.
Restricted SecuritiesThe fund may invest in securities that are subject to legal or contractual restrictions on resale. Prompt sale of such securities at an acceptable price may be difficult and may involve substantial delays and additional costs.
Bank LoansThe fund may invest in bank loans, which represent an interest in amounts owed by a borrower to a syndicate of lenders. Bank loans are generally noninvestment grade and often involve borrowers whose financial condition is highly leveraged. Bank loans may be in the form of either assignments or participations. A loan assignment transfers all legal, beneficial, and economic rights to the buyer, and transfer typically requires consent of both the borrower and agent. In contrast, a loan participation generally entitles the buyer to receive the cash flows from principal, interest, and any fee payments on a portion of a loan; however, the seller continues to hold legal title to that portion of the loan. As a result, the buyer of a loan participation generally has no direct recourse against the borrower and is exposed to credit risk of both the borrower and seller of the participation. Bank loans often have extended settlement periods, generally may be repaid at any time at the option of the borrower, and may require additional principal to be funded at the borrowers’ discretion at a later date (e.g. unfunded commitments and revolving debt instruments). Until settlement, the fund maintains liquid assets sufficient to settle its unfunded loan commitments. The fund reflects both the funded portion of a bank loan as well as its unfunded commitment in the Portfolio of Investments. However, if a credit agreement provides no initial funding of a tranche and funding of the full commitment at a future date(s) is at the borrower’s discretion and considered uncertain, a loan is reflected in the Portfolio of Investments only if, and only to the extent that, the fund has actually settled a funding commitment.
OtherPurchases and sales of portfolio securities other than short-term securities aggregated $7,855,001,000 and $8,195,827,000, respectively, for the six months ended June 30, 2019.
NOTE 5 - FEDERAL INCOME TAXES
No provision for federal income taxes is required since the fund intends to continue to qualify as a regulated investment company under Subchapter M of the Internal Revenue Code and distribute to shareholders all of its taxable income and gains. Distributions determined in accordance with federal income tax regulations may differ in amount or character from net investment income and realized gains for financial reporting purposes. Financial reporting records are adjusted for permanent book/tax differences to reflect tax character but are not adjusted for temporary differences. The amount and character of tax-basis distributions and composition of net assets are finalized at fiscal year-end; accordingly, tax-basis balances have not been determined as of the date of this report.
At June 30, 2019, the cost of investments for federal income tax purposes was $27,638,891,000. Net unrealized gain aggregated $7,400,576,000 at period-end, of which $7,634,011,000 related to appreciated investments and $233,435,000 related to depreciated investments.
NOTE 6 - RELATED PARTY TRANSACTIONS
The fund is managed by T. Rowe Price Associates, Inc. (Price Associates), a wholly owned subsidiary of T. Rowe Price Group, Inc. (Price Group). The investment management agreement between the fund and Price Associates provides for an annual investment management fee that consists of an individual fund fee and a group fee; management fees are computed daily and paid monthly. The investment management agreement provides for an individual fund fee equal to 0.30% of the fund’s average daily net assets. Through April 30, 2019, Price Associates agreed to reduce the fund’s individual fee to 0.27% for the portion of average daily net assets equal to or in excess of $27.5 billion. This contractual arrangement will renew automatically for one-year terms thereafter and may be terminated only with approval of the fund’s Board. Further, the fund has no obligation to repay fees reduced under this arrangement. The group fee rate is calculated based on the combined net assets of certain mutual funds sponsored by Price Associates (the group) applied to a graduated fee schedule, with rates ranging from 0.48% for the first $1 billion of assets to 0.265% for assets in excess of $650 billion. The fund’s group fee is determined by applying the group fee rate to the fund’s average daily net assets. At June 30, 2019, the effective annual group fee rate was 0.29%.
The I Class is subject to an operating expense limitation (I Class Limit) pursuant to which Price Associates is contractually required to pay all operating expenses of the I Class, excluding management fees; interest; expenses related to borrowings, taxes, and brokerage; and other non-recurring expenses permitted by the investment management agreement, to the extent such operating expenses, on an annualized basis, exceed the I Class Limit. This agreement will continue through the limitation date indicated in the table below, and may be renewed, revised, or revoked only with approval of the fund’s Board. The I Class is required to repay Price Associates for expenses previously paid to the extent the class’s net assets grow or expenses decline sufficiently to allow repayment without causing the class’s operating expenses (after the repayment is taken into account) to exceed the lesser of: (1) the I Class Limit in place at the time such amounts were paid; or (2) the current I Class Limit. However, no repayment will be made more than three years after the date of a payment or waiver.

In addition, the fund has entered into service agreements with Price Associates and two wholly owned subsidiaries of Price Associates, each an affiliate of the fund (collectively, Price). Price Associates provides certain accounting and administrative services to the fund. T. Rowe Price Services, Inc. provides shareholder and administrative services in its capacity as the fund’s transfer and dividend-disbursing agent. T. Rowe Price Retirement Plan Services, Inc. provides subaccounting and recordkeeping services for certain retirement accounts invested in the Investor Class. For the six months ended June 30, 2019, expenses incurred pursuant to these service agreements were $34,000 for Price Associates; $2,671,000 for T. Rowe Price Services, Inc.; and $592,000 for T. Rowe Price Retirement Plan Services, Inc. All amounts due to and due from Price, exclusive of investment management fees payable, are presented net on the accompanying Statement of Assets and Liabilities.
The fund may invest its cash reserves in certain open-end management investment companies managed by Price Associates and considered affiliates of the fund: the T. Rowe Price Government Reserve Fund or the T. Rowe Price Treasury Reserve Fund, organized as money market funds, or the T. Rowe Price Short-Term Fund, a short-term bond fund (collectively, the Price Reserve Funds). The Price Reserve Funds are offered as short-term investment options to mutual funds, trusts, and other accounts managed by Price Associates or its affiliates and are not available for direct purchase by members of the public. Cash collateral from securities lending is invested in the T. Rowe Price Short-Term Fund. The Price Reserve Funds pay no investment management fees.
The fund may also invest in certain other T. Rowe Price funds (Price Funds) as a means of gaining efficient and cost-effective exposure to certain markets. The fund does not invest for the purpose of exercising management or control; however, investments by the fund may represent a significant portion of an underlying Price Fund’s net assets. Each underlying Price Fund is an open-end management investment company managed by Price Associates and is considered an affiliate of the fund. To ensure that the fund does not incur duplicate management fees (paid by the underlying Price Fund(s) and the fund), Price Associates has agreed to permanently waive a portion of its management fee charged to the fund in an amount sufficient to fully offset that portion of management fees paid by each underlying Price Fund related to the fund’s investment therein. Annual management fee rates and amounts waived related to investments in the underlying Price Fund(s) for the six months ended June 30, 2019, are as follows:

Total management fee waived was allocated ratably in the amounts of $185,000 for the Investor Class, $6,000 for the Advisor Class and $31,000 for the I Class, respectively, for the six months ended June 30, 2019.
The fund may participate in securities purchase and sale transactions with other funds or accounts advised by Price Associates (cross trades), in accordance with procedures adopted by the fund’s Board and Securities and Exchange Commission rules, which require, among other things, that such purchase and sale cross trades be effected at the independent current market price of the security. During the six months ended June 30, 2019, the fund had no purchases or sales cross trades with other funds or accounts advised by Price Associates.
INFORMATION ON PROXY VOTING POLICIES, PROCEDURES, AND RECORDS
A description of the policies and procedures used by T. Rowe Price funds and portfolios to determine how to vote proxies relating to portfolio securities is available in each fund’s Statement of Additional Information. You may request this document by calling 1-800-225-5132 or by accessing the SEC’s website, sec.gov.
The description of our proxy voting policies and procedures is also available on our corporate website. To access it, please visit the following Web page:
https://www3.troweprice.com/usis/corporate/en/utility/policies.html
Scroll down to the section near the bottom of the page that says, “Proxy Voting Policies.” Click on the Proxy Voting Policies link in the shaded box.
Each fund’s most recent annual proxy voting record is available on our website and through the SEC’s website. To access it through T. Rowe Price, visit the website location shown above, and scroll down to the section near the bottom of the page that says, “Proxy Voting Records.” Click on the Proxy Voting Records link in the shaded box.
HOW TO OBTAIN QUARTERLY PORTFOLIO HOLDINGS
Effective for reporting periods on or after March 1, 2019, a fund, except a money market fund, files a complete schedule of portfolio holdings with the Securities and Exchange Commission (SEC) for the first and third quarters of each fiscal year as an exhibit to its reports on Form N-PORT. Prior to March 1, 2019, a fund, including a money market fund, filed a complete schedule of portfolio holdings with the SEC for the first and third quarters of each fiscal year on Form N-Q. A money market fund files detailed month-end portfolio holdings information on Form N-MFP with the SEC each month and posts a complete schedule of portfolio holdings on its website (troweprice.com) as of each month-end for the previous six months. A fund’s Forms N-PORT, N-MFP and N-Q are available electronically on the SEC’s website (sec.gov).
APPROVAL OF INVESTMENT MANAGEMENT AGREEMENT
Each year, the fund’s Board of Directors (Board) considers the continuation of the investment management agreement (Advisory Contract) between the fund and its investment advisor, T. Rowe Price Associates, Inc. (Advisor), on behalf of the fund. In that regard, at an in-person meeting held on March 11–12, 2019 (Meeting), the Board, including a majority of the fund’s independent directors, approved the continuation of the fund’s Advisory Contract. At the Meeting, the Board considered the factors and reached the conclusions described below relating to the selection of the Advisor and the approval of the Advisory Contract. The independent directors were assisted in their evaluation of the Advisory Contract by independent legal counsel from whom they received separate legal advice and with whom they met separately.
In providing information to the Board, the Advisor was guided by a detailed set of requests for information submitted by independent legal counsel on behalf of the independent directors. In considering and approving the Advisory Contract, the Board considered the information it believed was relevant, including, but not limited to, the information discussed below. The Board considered not only the specific information presented in connection with the Meeting but also the knowledge gained over time through interaction with the Advisor about various topics. The Board meets regularly and, at each of its meetings, covers an extensive agenda of topics and materials and considers factors that are relevant to its annual consideration of the renewal of the T. Rowe Price funds’ advisory contracts, including performance and the services and support provided to the funds and their shareholders.
Services Provided by the Advisor
The Board considered the nature, quality, and extent of the services provided to the fund by the Advisor. These services included, but were not limited to, directing the fund’s investments in accordance with its investment program and the overall management of the fund’s portfolio, as well as a variety of related activities such as financial, investment operations, and administrative services; compliance; maintaining the fund’s records and registrations; and shareholder communications. The Board also reviewed the background and experience of the Advisor’s senior management team and investment personnel involved in the management of the fund, as well as the Advisor’s compliance record. The Board concluded that it was satisfied with the nature, quality, and extent of the services provided by the Advisor.
Investment Performance of the Fund
The Board took into account discussions with the Advisor and reports that it receives throughout the year relating to fund performance. In connection with the Meeting, the Board reviewed the fund’s net annualized total returns for the 1-, 2-, 3-, 4-, 5-, and 10-year periods as of September 30, 2018, and compared these returns with the performance of a peer group of funds with similar investment programs and a wide variety of other previously agreed-upon comparable performance measures and market data, including those supplied by Broadridge, which is an independent provider of mutual fund data.
On the basis of this evaluation and the Board’s ongoing review of investment results, and factoring in the relative market conditions during certain of the performance periods, the Board concluded that the fund’s performance was satisfactory.
Costs, Benefits, Profits, and Economies of Scale
The Board reviewed detailed information regarding the revenues received by the Advisor under the Advisory Contract and other benefits that the Advisor (and its affiliates) may have realized from its relationship with the fund, including any research received under “soft dollar” agreements and commission-sharing arrangements with broker-dealers. The Board considered that the Advisor may receive some benefit from soft-dollar arrangements pursuant to which research is received from broker-dealers that execute the fund’s portfolio transactions. The Board received information on the estimated costs incurred and profits realized by the Advisor from managing the T. Rowe Price funds. The Board also reviewed estimates of the profits realized from managing the fund in particular, and the Board concluded that the Advisor’s profits were reasonable in light of the services provided to the fund.
The Board also considered whether the fund benefits under the fee levels set forth in the Advisory Contract from any economies of scale realized by the Advisor. Under the Advisory Contract, the fund pays a fee to the Advisor for investment management services composed of two components—a group fee rate based on the combined average net assets of most of the T. Rowe Price funds (including the fund) that declines at certain asset levels and an individual fund fee rate based on the fund’s average daily net assets (subject to a contractual waiver that limits the individual fund fee to 0.27% on assets equal to or greater than $27.5 billion)—and the fund pays its own expenses of operations. The Board concluded that the advisory fee structure for the fund continued to provide for a reasonable sharing of benefits from any economies of scale with the fund’s investors.
Fees and Expenses
The Board was provided with information regarding industry trends in management fees and expenses. Among other things, the Board reviewed data for peer groups that were compiled by Broadridge, which compared: (i) contractual management fees, total expenses, actual management fees, and nonmanagement expenses of the Investor Class of the fund with a group of competitor funds selected by Broadridge (Investor Class Expense Group); (ii) total expenses and actual management fees of the Advisor Class of the fund with a group of competitor funds selected by Broadridge (Advisor Class Expense Group); and (iii) total expenses, actual management fees, and nonmanagement expenses of the Investor Class of the fund with a broader set of funds within the Lipper investment classification (Expense Universe). The Board considered the fund’s contractual management fee rate, actual management fee rate (which reflects the management fees actually received from the fund by the Advisor after any applicable waivers, reductions, or reimbursements), operating expenses, and total expenses (which reflect the net total expense ratio of the fund after any waivers, reductions, or reimbursements) in comparison with the information for the Broadridge peer groups. Broadridge generally constructed the peer groups by seeking the most comparable funds based on similar investment classifications and objectives, expense structure, asset size, and operating components and attributes and ranked funds into quintiles, with the first quintile representing the funds with the lowest relative expenses and the fifth quintile representing the funds with the highest relative expenses. The information provided to the Board indicated that the fund’s contractual management fee ranked in the fourth quintile (Investor Class Expense Group); the fund’s actual management fee rate ranked in the third quintile (Investor Class Expense Group, Advisor Class Expense Group, and Expense Universe); and the fund’s total expenses ranked in the second and third quintiles (Investor Class Expense Group), first quintile (Advisor Class Expense Group), and first and second quintiles (Expense Universe).
The Board also reviewed the fee schedules for institutional accounts and private accounts with similar mandates that are advised or subadvised by the Advisor and its affiliates. Management provided the Board with information about the Advisor’s responsibilities and services provided to subadvisory and other institutional account clients, including information about how the requirements and economics of the institutional business are fundamentally different from those of the mutual fund business. The Board considered information showing that the Advisor’s mutual fund business is generally more complex from a business and compliance perspective than its institutional account business and considered various relevant factors, such as the broader scope of operations and oversight, more extensive shareholder communication infrastructure, greater asset flows, heightened business risks, and differences in applicable laws and regulations associated with the Advisor’s proprietary mutual fund business. In assessing the reasonableness of the fund’s management fee rate, the Board considered the differences in the nature of the services required for the Advisor to manage its mutual fund business versus managing a discrete pool of assets as a subadvisor to another institution’s mutual fund or for an institutional account and that the Advisor generally performs significant additional services and assumes greater risk in managing the fund and other T. Rowe Price funds than it does for institutional account clients.
On the basis of the information provided and the factors considered, the Board concluded that the fees paid by the fund under the Advisory Contract are reasonable.
Approval of the Advisory Contract
As noted, the Board approved the continuation of the Advisory Contract. No single factor was considered in isolation or to be determinative to the decision. Rather, the Board concluded, in light of a weighting and balancing of all factors considered, that it was in the best interests of the fund and its shareholders for the Board to approve the continuation of the Advisory Contract (including the fees to be charged for services thereunder).
Item 1. (b) Notice pursuant to Rule 30e-3.
Not applicable.
Item 2. Code of Ethics.
A code of ethics, as defined in Item 2 of Form N-CSR, applicable to its principal executive officer, principal financial officer, principal accounting officer or controller, or persons performing similar functions is filed as an exhibit to the registrant’s annual Form N-CSR. No substantive amendments were approved or waivers were granted to this code of ethics during the registrant’s most recent fiscal half-year.
Item 3. Audit Committee Financial Expert.
Disclosure required in registrant’s annual Form N-CSR.
Item 4. Principal Accountant Fees and Services.
Disclosure required in registrant’s annual Form N-CSR.
Item 5. Audit Committee of Listed Registrants.
Not applicable.
Item 6. Investments.
(a) Not applicable. The complete schedule of investments is included in Item 1 of this Form N-CSR.
(b) Not applicable.
Item 7. Disclosure of Proxy Voting Policies and Procedures for Closed-End Management Investment Companies.
Not applicable.
Item 8. Portfolio Managers of Closed-End Management Investment Companies.
Not applicable.
Item 9. Purchases of Equity Securities by Closed-End Management Investment Company and Affiliated Purchasers.
Not applicable.
Item 10. Submission of Matters to a Vote of Security Holders.
Not applicable.
Item 11. Controls and Procedures.
(a) The registrant’s principal executive officer and principal financial officer have evaluated the registrant’s disclosure controls and procedures within 90 days of this filing and have concluded that the registrant’s disclosure controls and procedures were effective, as of that date, in ensuring that information required to be disclosed by the registrant in this Form N-CSR was recorded, processed, summarized, and reported timely.
(b) The registrant’s principal executive officer and principal financial officer are aware of no change in the registrant’s internal control over financial reporting that occurred during the period covered by this report that has materially affected, or is reasonably likely to materially affect, the registrant’s internal control over financial reporting.
Item 12. Disclosure of Securities Lending Activities for Closed-End Management Investment Companies.
Not applicable.
Item 13. Exhibits.
(a)(1) The registrant’s code of ethics pursuant to Item 2 of Form N-CSR is filed with the registrant’s annual Form N-CSR.
(2) Separate certifications by the registrant's principal executive officer and principal financial officer, pursuant to Section 302 of the Sarbanes-Oxley Act of 2002 and required by Rule 30a-2(a) under the Investment Company Act of 1940, are attached.
(3) Written solicitation to repurchase securities issued by closed-end companies: not applicable.
(b) A certification by the registrant's principal executive officer and principal financial officer, pursuant to Section 906 of the Sarbanes-Oxley Act of 2002 and required by Rule 30a-2(b) under the Investment Company Act of 1940, is attached.
SIGNATURES
Pursuant to the requirements of the Securities Exchange Act of 1934 and the Investment Company Act of 1940, the registrant has duly caused this report to be signed on its behalf by the undersigned, thereunto duly authorized.
T. Rowe Price Capital Appreciation Fund, Inc.
| By | | /s/ David Oestreicher |
| | | David Oestreicher |
| | | Principal Executive Officer |
| |
| Date | | August 16, 2019 | | | | |
Pursuant to the requirements of the Securities Exchange Act of 1934 and the Investment Company Act of 1940, this report has been signed below by the following persons on behalf of the registrant and in the capacities and on the dates indicated.
| By | | /s/ David Oestreicher |
| | | David Oestreicher |
| | | Principal Executive Officer |
| |
| Date | | August 16, 2019 | | | | |
| |
| |
| By | | /s/ Catherine D. Mathews |
| | | Catherine D. Mathews |
| | | Principal Financial Officer |
| |
| Date | | August 16, 2019 | | | | |