UNITED STATES
SECURITIES AND EXCHANGE COMMISSION
Washington, D.C. 20549
FORM N-CSR
CERTIFIED SHAREHOLDER REPORT OF REGISTERED
MANAGEMENT INVESTMENT COMPANIES
Investment Company Act File Number: 811-04519
| T. Rowe Price Capital Appreciation Fund, Inc. |
|
| (Exact name of registrant as specified in charter) |
| |
| 100 East Pratt Street, Baltimore, MD 21202 |
|
| (Address of principal executive offices) |
| |
| David Oestreicher |
| 100 East Pratt Street, Baltimore, MD 21202 |
|
| (Name and address of agent for service) |
Registrant’s telephone number, including area code: (410) 345-2000
Date of fiscal year end: December 31
Date of reporting period: June 30, 2021
Item 1. Reports to Shareholders
(a) Report pursuant to Rule 30e-1.
| Capital Appreciation Fund | June 30, 2021 |
| PRWCX | Investor Class |
| PACLX | Advisor Class |
| TRAIX | I Class |
| T. ROWE PRICE CAPITAL APPRECIATION FUND |
|
HIGHLIGHTS
| ■ | The U.S. economy was well positioned to recover from the pandemic in 2021, but government stimulus and extended unemployment benefits have supercharged the economy and, in the very near term, inflation. |
| |
| ■ | Your fund generated a 9.94% return versus the S&P 500 Index’s 15.25% increase in the first half of 2021. The fund continued to deliver strong risk-adjusted returns, generating 65% of the S&P 500’s return while taking on just 56% of the index’s risk. |
| |
| ■ | Traditional areas of emphasis for the fund, such as GARP stocks and utilities, have lagged in a speculative market. But we boosted returns with contrarian buys in equities (described below) as well as exposure to high-quality high yield and leveraged loans in fixed income. |
| |
| ■ | With valuations in some market segments at extreme levels, we remain focused on building a portfolio designed to deliver strong absolute returns, excellent risk-adjusted returns, and downside protection should markets decline. |

Log in to your account at troweprice.com for more information.
*Certain mutual fund accounts that are assessed an annual account service fee can also save money by switching to e-delivery.
Management’s Discussion of Fund Performance
Fellow Shareholders
There have been two defining events of the last six to 12 months that I am going to discuss in this opening section: COVID and the massive government stimulus programs in the U.S. With regard to COVID, in much of the developed world, hospitalizations and deaths have dropped dramatically as vaccines have been administered to a majority of the adult population. While cases continue to remain elevated due in part to new variants of COVID, the relationship between cases and hospitalizations and deaths has broken down as the mix of new cases skews more to children and young adults who have yet to be vaccinated. However, this is not true in most of the developing world, where vaccination rates are lagging behind the developed world. Countries such as India, Indonesia, Brazil, and South Africa are witnessing firsthand the destructive power of the horrible virus. It is our expectation that as vaccine manufacturers increase production of vaccines in the second half of this year and into next year, much of the developed world will be able to be vaccinated in 2022. Unfortunately, COVID is not going away and will likely be with us for the foreseeable future; however, the impact on the global economy, supply chains, hospitalizations, and deaths should diminish in 2022 and especially in 2023.
One of the most surprising aspects of the COVID era has been the ability of the world to adapt to the virus and continue to move forward economically. Most developed market economies are now on track to fully recover economically in 2021 or 2022. No country on earth has done more to cushion the blow from COVID than the U.S. The U.S. will likely run north of $6 trillion in deficits in FY20–FY21—$4 trillion more than was previously projected—due to stimulus payments, enhanced unemployment benefits, and payments to businesses impacted by COVID. These deficits are projected to remain elevated over the next couple of years as well. In the very short term, this has resulted in something that has never occurred in the past: a U.S. economy that is likely to be larger in 2021–2022 than it would have been if we had never had the pandemic. Many families with children received more than $10,000 of direct payments and much of that money is driving accelerated growth in the economy as demand for housing, home improvement, eating out, travel, computers, cars, smartphones, air conditioning equipment, and other consumer goods not only rebounds strongly but, in most cases, surpasses pre-pandemic spending levels. The economy was well positioned to recover from the pandemic in 2021, but additional government stimulus in January and March and extended unemployment benefits have supercharged the economy and, in the very near term, inflation.
It has been a long time since we have seen elevated inflation in this country and this concern is causing people to ask whether it is temporary or something more sustainable. The most likely scenario is that inflation rates will come down in 2022 and 2023. The currently elevated inflation is really driven by three factors, all of which should reverse or partially reverse. First, inflation in the pandemic dipped to very low levels and this created an easy comparison, especially in the spring. Second, supply chain challenges, partially due to COVID, are causing upward pressure on prices, and there is simply too much demand for goods and an inability to get those goods to consumers in the quantities they want. Today there is very strong demand for cars and used cars, but chip shortages are limiting the ability of car manufacturers to produce enough cars and this is putting upward pressure on new and used car prices. It is expected that many of these supply chain challenges will improve materially as we exit 2021. Third, as previously mentioned, consumers are awash in cash from stimulus and spending it. Most of the academic evidence on stimulus spending indicates that the majority of this spending will occur in the first 12 months after consumers received it. Our view is that as we enter 2022 and 2023, many of these pro-inflationary pressures will ease and inflation will likely return to more normal or potentially slightly higher rates than the pre-pandemic era. Whether core PCE is 1.8%, 2%, or 2.2% does not matter much. The odds that we start to experience 3% to 5% inflation in 2022 and 2023 appear very low and, even if that did happen, the Federal Reserve would likely raise rates to slow down the economy.
This grand experiment of using trillions of dollars of debt to not only revive the economy but to send it to new highs has worked well in the short term, with the only obvious downside of elevated short-term inflation. The longer-term consequences are yet to be fully understood. To the extent that this is a onetime event and the ratio of deficits to GDP reverts back to 4% to 5% and interest rates remain low, the long-term collateral damage may be limited. To the extent that the rest of world, which has been far more fiscally conservative this cycle, believes that the U.S. has lost its fiscal discipline, the result could be a weaker dollar, higher interest rates, and higher deficits. Time will tell how this plays out.
The near-term challenge is one of tough comparisons. Stimulus spending has created a bit of a sugar high for the U.S. economy and, more specifically, consumer spending. As this stimulus is mostly spent by the second half of 2022 and into 2023, do we go from well-above-average growth in 2021 to below-trend growth in the second half of 2022 and 2023? That is the most likely scenario, based simply on the math.
Now I will remind our shareholders we are not economists. We don’t have GDP forecasts. We don’t design our portfolio based on a macroeconomic viewpoint. The history of the last 20 years is one of mean reversion of economies. When things feel bad (as they did in March of 2020), they tend to feel very good one year later (as they do now) and vice versa. When the macroeconomic consensus is positive, we tend to be a little more conservative, as we are now. When the macroeconomic consensus is negative, we tend to be more aggressive, as we were in March of 2020, December of 2018, September of 2011, and early in 2009. Taking the other side of the macroeconomic consensus has created substantial value for our shareholders over the long term. We continue to go where the market gives us fat pitches and are informed by valuation, sentiment, and our five-year forward internal rate of return estimates. Often these fat pitches occur when a company, sector, or a type of investing falls out of favor because it is out of step with the current macroeconomic consensus. This is one of the most powerful inefficiencies in the market and it is an inefficiency that only seems to grow as the market becomes more and more short-term-focused.
Before we discuss fund performance, I would like to review the three goals of the Capital Appreciation Fund:
(1) Generate strong risk-adjusted returns annually
(2) Preserve shareholder capital over the intermediate term (i.e., three years)
(3) Generate equity-like returns with less risk than that of the overall market over a full market cycle (i.e., normally five years)
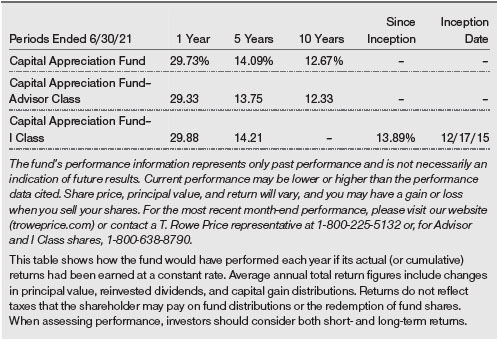
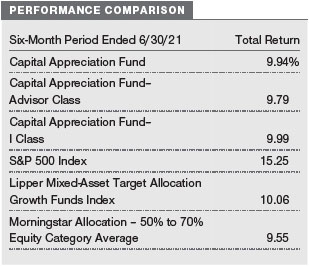
We are pleased to report that the Capital Appreciation Fund generated solid absolute and risk-adjusted returns in the first half of 2021. Your fund generated a 9.94% return relative to the S&P 500’s return of 15.25%. (The performance of the Advisor and I Class shares will vary due to their different fee structures.) Over that same period, your fund generated 65% of the S&P 500’s return while taking on just 56% of the index’s risk.
As for our second goal—capital preservation over the intermediate term—your fund generated a 58.82% cumulative return over the last three years.
As for our final goal—equity-like returns with less risk than the market over a full market cycle—your fund generated a 93.32% cumulative return over the last five years versus 125.36% for the S&P 500. Based on annualized returns of 14.09% for your fund versus 17.65% for the S&P 500, your fund generated 80% of the market’s return over the last five years while taking on 66% of the market’s risk. While market and economic cycles have historically lasted around five years on average, we also tend to think about a full market cycle encompassing at least one year of strong negative returns like 2008. While full-year 2018 and first half of 2020 S&P 500 returns were negative, we would not describe 2018 or the first half of 2020 as a period of strong negative returns within an historical construct. As your fund is not a pure equity fund, it would be very difficult to match the equity market’s return over any period in which we did not have at least one major equity market correction. Hence, if we extend the analysis to encompass 2008 and measure the last 121/2 years of fund performance, we would have accomplished this last goal by delivering 100% of the market’s return while taking only 69% of the market’s risk.
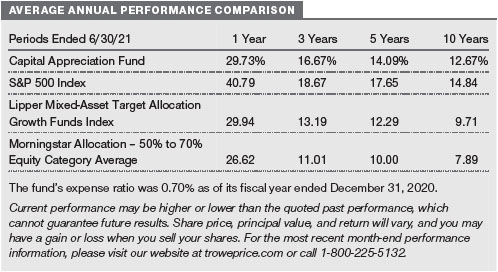
Our equities underperformed the S&P 500 by 41 basis points (14.84% versus 15.25%) during the first half of 2021. However, over the last 1-, 3-, 5-, and 10-year periods, our equities have outperformed the S&P 500 by an average of 294, 505, 317, and 452 basis points annualized, respectively. Our fixed income investments outperformed the Bloomberg Barclays U.S. Aggregate Bond Index by 425 basis points (2.65% versus -1.6%) in the first half of the year. Interest rates rose during the first half and this caused losses in traditional fixed income investments. Our fixed income investments rose in value as we hold primarily high-quality high yield and leveraged loans with very low duration, which should do well if rates increase.
For the 1-, 3-, 5-, and 10-year periods ended June 30, 2021, we outperformed our Lipper and Morningstar peers over every period, except the last year, in which we are at the 50th percentile in Lipper. The Lipper peers tend to have substantially higher equity weights than the Capital Appreciation Fund and Morningstar and, in strong market environments, this can be a difficult challenge to overcome. However, over the last 10 years and also over the last 15 years since the current portfolio manager took over the fund in 2006, we are in the first percentile in both peer groupings. (Based on cumulative total return, the Capital Appreciation Fund ranked 224 of 454, 6 of 433, 11 of 408, and 1 of 291 funds in the Lipper mixed-asset target allocation growth funds universe for the 1-, 3-, 5-, and 10-year periods ended June 30, 2021, respectively. Results may vary for other periods. Past performance cannot guarantee future results.)
However, let us reiterate that we do not manage your fund to beat these benchmarks. The Capital Appreciation Fund has very different objectives than most of its benchmark peers. It is a unique fund with a clear focus on strong risk-adjusted returns, intermediate-term capital preservation, and long-term capital appreciation that does not neatly fit into any current benchmark.
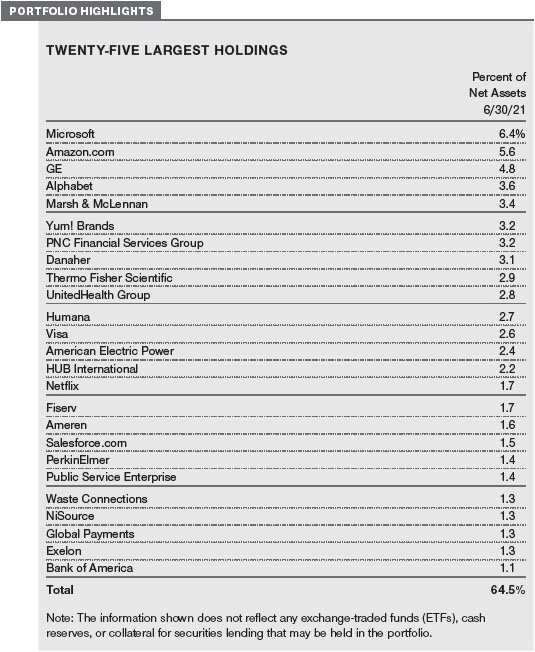
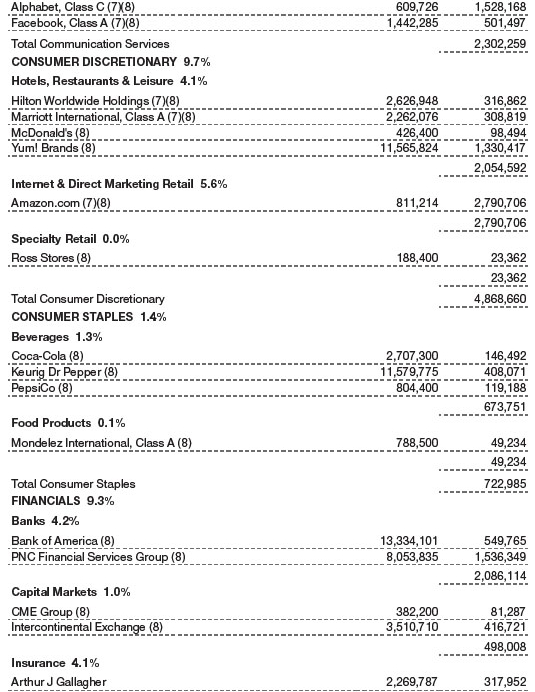
The strongest equity contributor to absolute and relative returns in the first half of 2021 was the communication services sector. Alphabet, the parent of Google, returned an impressive 42.6% in the first half of the year. Alphabet performed strongly as Google’s topline recovered strongly from the pandemic, core operating margins surpassed expectations, the company returned more capital to shareholders, and the company began to disclose losses in its cloud business. While this may sound counterintuitive, cloud losses were greater than expected, and this is actually a good thing. It means that the core earnings power of Google is higher than the market thought. In addition, as Google continues to grow its cloud business it, like AMZN and MSFT, should experience rapid margin expansion in what is a very heavy fixed cost business. During the pandemic in 2021, we took advantage of the weakness in Alphabet to make it a very large bet in the portfolio. As the stock has run over the past six months, we have pulled back on exposure in favor of some laggards, but Alphabet continues to be a large position in your fund and something we feel very good about over the next five years.

The second strongest equity contributor to absolute and relative returns in the first half of 2021 was the health care sector. Shares of Danaher rose 21% in the first half of the year, driven by a faster-than-expected recovery in the core business, strong and more durable COVID-related revenues, and an attractive acquisition in the genomic components business. We took advantage of weakness in Danaher shares earlier in the year to increase our exposure to this very attractive company.
Our equity investments in information technology, while positive, did trail the returns of the overall sector. While owning NXPI and not owning Apple contributed to relative returns, weakness in payment processors was a material drag. Global Payments, Fiserv, and Fleetcor Technologies declined by 13%, 6%, and 6%, respectively, in the first half of the year. These companies did not miss earnings expectations or deploy capital poorly and they all are recovering strongly from the pandemic. The weakness in their stock prices was a function of the market’s concern about secular risk, which has driven their absolute multiples to historically attractive levels and their relative multiples to near all-time lows.
One of the hallmarks of CAF’s investment framework is to avoid secular risk at all cost. The largest structural underweight in your fund is our complete avoidance of companies facing secular risk. This underweight has been a massive contributor to returns over the last decade. Our analysis of the payment processors continues to point to these businesses not being secularly challenged. However, this is the only part of the portfolio where this issue even comes up and these companies do have some fast-growing small competitors that we continue to monitor. While we almost never reduce exposure to stocks on weakness, we have made the decision to lower the combined weight of the processors to a more manageable level to compensate for this risk. In hindsight, it would have been better to come to this conclusion earlier. We apologize for our error here.
Portfolio Outlook
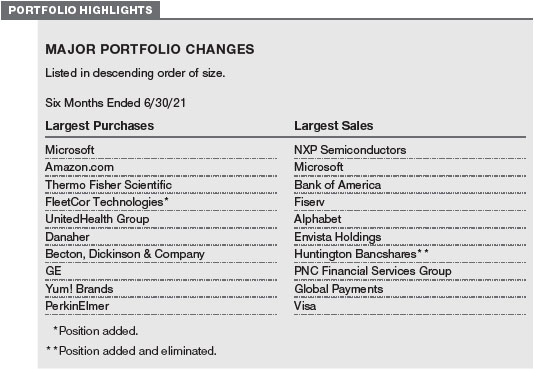
It has been a very difficult market environment for the Capital Appreciation style over the last 18 months. These last 18 months have seen a tug of war for market leadership between the most speculative, expensive part of the growth universe on the one hand and deep-value, low-quality companies on the other. Capital Appreciation historically plays in the center of the market in areas such as growth at a reasonable price (GARP), utilities, and other high-quality names that deliver not only strong absolute returns but exceptional risk-adjusted returns. But utilities, in particular, have completely decoupled from Treasury and corporate bonds unlike at any time in the last 40 years. The areas we focus on have essentially been left behind over the last 18 months in favor of the most speculative parts of the value and growth universe. We have been able to overcome this environmental challenge by going all in on equities in March of 2020, adding to General Electric to make it our largest bet in the middle of the pandemic, adding aggressively to banks back in the third quarter of 2020, underweighting growth and overweighting COVID losers at the time of the vaccine news in November and, more recently, adding aggressively to high-quality growth names such as Microsoft, Amazon, Danaher, and Thermo Fisher Scientific when they fell out of favor. In addition, our exposure to high-quality high yield debt and leveraged loans has aided absolute and relative returns as well. I feel like we have had to work very hard tactically to overcome an environment that has been very challenging for our investment style. In fact, your lead portfolio manager has yet to take a vacation day since 2019. The good news is that we were able to generate equity-like returns in 2020 with materially less risk and, as of the writing of this letter, we are beating more than 85% of our Morningstar and Lipper peers in 2021.
So, what are we doing to navigate this environment? In a speculative market like this, we are trying to keep up as best as we can but at the same time limit downside risk and protect our shareholders if this speculative excess ends. This means owning stocks that have attractive five-year internal rates of return but also limited downside risk. In an environment with low rates and tight spreads, our playbook is to invest in leveraged loans that do well if rates rise and in short-duration high yield that offers okay yields but low downside risk if rates rise or spreads revert to more normalized levels. We continue to write calls on our equity exposure to provide extra income and to essentially “pre-sell” certain stocks if they get to predetermined levels where we want to reduce our exposure.
I do hope and expect that this speculative environment will end within the next one to two years. If economic growth slows and inflation dissipates in 2022 and 2023, the low-quality, cyclical rally should come to an end. On the other end of the investment spectrum, valuations have gone to such an extreme that it is starting to feel dangerous in parts of the SAAS universe, electric vehicles, and recent growth IPOs. But however the next one to two years play out we will continue to focus on building a portfolio designed to deliver strong absolute returns, excellent risk-adjusted returns, and downside protection if, or when, markets go lower.
IN CLOSING
We would like to thank all the analysts, associate analysts, quantitative analysts, and members of our team (Mike Signore, Chen Tian, Nikhil Shah, Vivek Rajeswaran, Brian Solomon, and Jared Duda) for their assistance in the first half of 2021.
Respectfully submitted,
David R. Giroux
Chairman of the fund’s Investment Advisory Committee
7/19/2021
The committee chairman has day-to-day responsibility for managing the portfolio and works with committee members in developing and executing the fund’s investment program
The views expressed reflect the opinions of T. Rowe Price as of the date of this report and are subject to change based on changes in market, economic, or other conditions. These views are not intended to be a forecast of future events and are no guarantee of future results.
RISKS OF INVESTING
As with all stock and bond mutual funds, the fund’s share price can fall because of weakness in the stock or bond markets, a particular industry, or specific holdings. Stock markets can decline for many reasons, including adverse political or economic developments, changes in investor psychology, or heavy institutional selling. The prospects for an industry or company may deteriorate because of a variety of factors, including disappointing earnings or changes in the competitive environment. In addition, the investment manager’s assessment of companies held in a fund may prove incorrect, resulting in losses or poor performance even in rising markets. A sizable cash or fixed income position may hinder the fund from participating fully in a strong, rapidly rising bull market. In addition, significant exposure to bonds increases the risk that the fund’s share value could be hurt by rising interest rates or credit downgrades or defaults. Convertible securities are also exposed to price fluctuations of the company’s stock.
GLOSSARY
Beta: A measure of the market risk of a stock showing how responsive it is to a given market index, such as the S&P 500 Stock Index. By definition, the beta of the benchmark index is 1.00. A fund with a 1.10 beta is expected to perform 10% better than the index in up markets and 10% worse in down markets. Usually, higher betas represent riskier investments.
Gross domestic product (GDP): The total market value of all goods and services produced in a country in a given year.
Lipper indexes: Fund benchmarks that consist of a small number of the largest mutual funds in a particular category as tracked by Lipper Inc.
Morningstar Allocation – 50% to 70% Equity Category Average: Tracks the performance of funds that seek capital appreciation and income by investing in multiple asset classes, including stocks, bonds, and cash. Equity exposures range from 50% to 70%.
Sharpe ratio: A measure of the risk-adjusted return of a portfolio. The Sharpe ratio measures how much a portfolio’s return is above or below the risk-free Treasury rate (excess return) per unit risk (measured by standard deviation). In general, the larger the number, the better the portfolio’s historical risk-adjusted return.
Personal Consumption Expenditures: Also called PCE, this is a measure of consumer spending on durable and non-durable goods, as well as services, during a specific period of time.
BENCHMARK INFORMATION
Note: Bloomberg Index Services Limited. BLOOMBERG® is a trademark and service mark of Bloomberg Finance L.P. and its affiliates (collectively “Bloomberg”). BARCLAYS® is a trademark and service mark of Barclays Bank Plc (collectively with its affiliates, “Barclays”), used under license. Bloomberg or Bloomberg’s licensors, including Barclays, own all proprietary rights in the Bloomberg Barclays Indices. Neither Bloomberg nor Barclays approves or endorses this material, or guarantees the accuracy or completeness of any information herein, or makes any warranty, express or implied, as to the results to be obtained therefrom and, to the maximum extent allowed by law, neither shall have any liability or responsibility for injury or damages arising in connection therewith.
Note: Information has been obtained from sources believed to be reliable but J.P. Morgan does not warrant its completeness or accuracy. The index is used with permission. The index may not be copied, used, or distributed without J.P. Morgan’s prior written approval. Copyright 2021, J.P. Morgan Chase & Co. All rights reserved.
Note: Lipper, a Thomson Reuters Company, is the source for all Lipper content reflected in these materials. Copyright 2021 © Refinitiv. All rights reserved. Any copying, republication or redistribution of Lipper content is expressly prohibited without the prior written consent of Lipper. Lipper shall not be liable for any errors or delays in the content, or for any actions taken in reliance thereon.
Note: ©2021 Morningstar, Inc. All rights reserved. The information contained therein: (1) is proprietary to Morningstar and/or its content providers; (2) may not be copied or distributed; and (3) is not warranted to be accurate, complete, or timely. Neither Morningstar nor its content providers are responsible for any damages or losses arising from any use of this information. Past performance is no guarantee of future results.
Note: ©2021, S&P Global Market Intelligence. Reproduction of any information, data or material, including ratings (Content) in any form is prohibited except with the prior written permission of the relevant party. Such party, its affiliates and suppliers (Content Providers) do not guarantee the accuracy, adequacy, completeness, timeliness or availability of any Content and are not responsible for any errors or omissions (negligent or otherwise), regardless of the cause, or for the results obtained from the use of such Content. In no event shall Content Providers be liable for any damages, costs, expenses, legal fees, or losses (including lost income or lost profit and opportunity costs) in connection with any use of the Content.
GROWTH OF $10,000
This chart shows the value of a hypothetical $10,000 investment in the fund over the past 10 fiscal year periods or since inception (for funds lacking 10-year records). The result is compared with benchmarks, which include a broad-based market index and may also include a peer group average or index. Market indexes do not include expenses, which are deducted from fund returns as well as mutual fund averages and indexes.
AVERAGE ANNUAL COMPOUND TOTAL RETURN
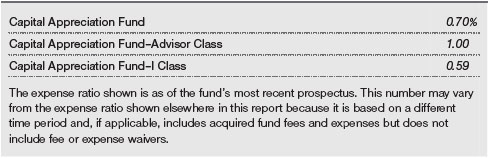
EXPENSE RATIO
FUND EXPENSE EXAMPLE
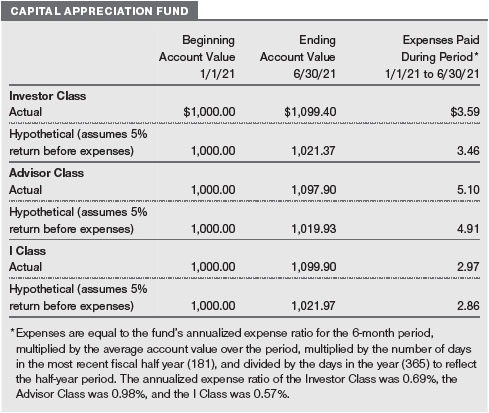
As a mutual fund shareholder, you may incur two types of costs: (1) transaction costs, such as redemption fees or sales loads, and (2) ongoing costs, including management fees, distribution and service (12b-1) fees, and other fund expenses. The following example is intended to help you understand your ongoing costs (in dollars) of investing in the fund and to compare these costs with the ongoing costs of investing in other mutual funds. The example is based on an investment of $1,000 invested at the beginning of the most recent six-month period and held for the entire period.
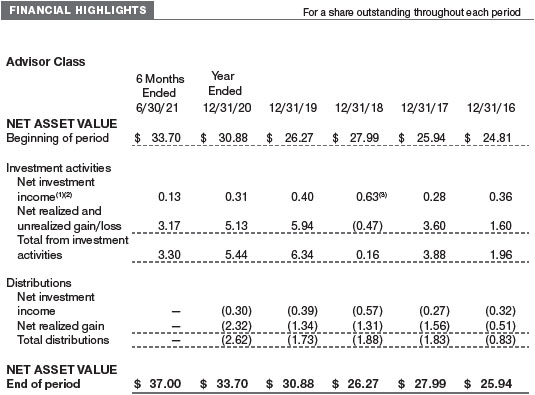
Please note that the fund has three share classes: The original share class (Investor Class) charges no distribution and service (12b-1) fee, the Advisor Class shares are offered only through unaffiliated brokers and other financial intermediaries and charge a 0.25% 12b-1 fee, and I Class shares are available to institutionally oriented clients and impose no 12b-1 or administrative fee payment. Each share class is presented separately in the table.
Actual Expenses
The first line of the following table (Actual) provides information about actual account values and expenses based on the fund’s actual returns. You may use the information on this line, together with your account balance, to estimate the expenses that you paid over the period. Simply divide your account value by $1,000 (for example, an $8,600 account value divided by $1,000 = 8.6), then multiply the result by the number on the first line under the heading “Expenses Paid During Period” to estimate the expenses you paid on your account during this period.
Hypothetical Example for Comparison Purposes
The information on the second line of the table (Hypothetical) is based on hypothetical account values and expenses derived from the fund’s actual expense ratio and an assumed 5% per year rate of return before expenses (not the fund’s actual return). You may compare the ongoing costs of investing in the fund with other funds by contrasting this 5% hypothetical example and the 5% hypothetical examples that appear in the shareholder reports of the other funds. The hypothetical account values and expenses may not be used to estimate the actual ending account balance or expenses you paid for the period.
Note: T. Rowe Price charges an annual account service fee of $20, generally for accounts with less than $10,000. The fee is waived for any investor whose T. Rowe Price mutual fund accounts total $50,000 or more; accounts electing to receive electronic delivery of account statements, transaction confirmations, prospectuses, and shareholder reports; or accounts of an investor who is a T. Rowe Price Personal Services or Enhanced Personal Services client (enrollment in these programs generally requires T. Rowe Price assets of at least $250,000). This fee is not included in the accompanying table. If you are subject to the fee, keep it in mind when you are estimating the ongoing expenses of investing in the fund and when comparing the expenses of this fund with other funds.
You should also be aware that the expenses shown in the table highlight only your ongoing costs and do not reflect any transaction costs, such as redemption fees or sales loads. Therefore, the second line of the table is useful in comparing ongoing costs only and will not help you determine the relative total costs of owning different funds. To the extent a fund charges transaction costs, however, the total cost of owning that fund is higher.
Unaudited
The accompanying notes are an integral part of these financial statements.
Unaudited
The accompanying notes are an integral part of these financial statements.
Unaudited
The accompanying notes are an integral part of these financial statements.
June 30, 2021 (Unaudited)
The accompanying notes are an integral part of these financial statements.
June 30, 2021 (Unaudited)
The accompanying notes are an integral part of these financial statements.
Unaudited
The accompanying notes are an integral part of these financial statements.
Unaudited
The accompanying notes are an integral part of these financial statements.
Unaudited
| NOTES TO FINANCIAL STATEMENTS |
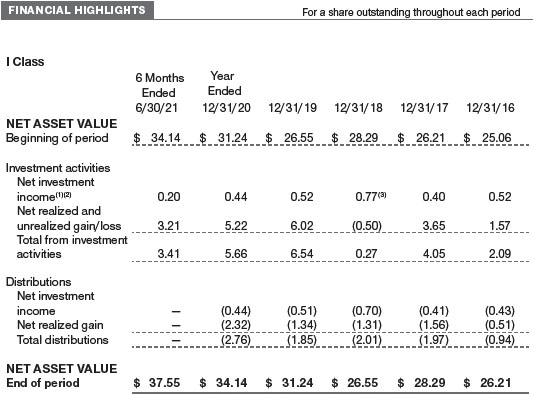
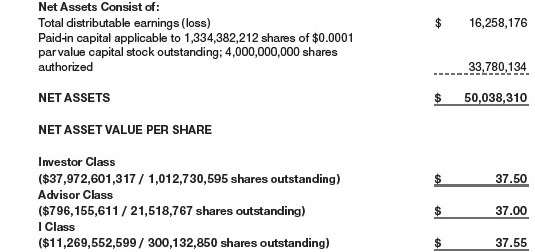
T. Rowe Price Capital Appreciation Fund, Inc. (the fund) is registered under the Investment Company Act of 1940 (the 1940 Act) as a diversified, open-end management investment company. The fund seeks long-term capital appreciation by investing primarily in common stocks. It may also hold fixed-income and other securities to help preserve principal value. The fund has three classes of shares: the Capital Appreciation Fund (Investor Class), the Capital Appreciation Fund–Advisor Class (Advisor Class), and the Capital Appreciation Fund–I Class (I Class). Advisor Class shares are sold only through various brokers and other financial intermediaries. I Class shares require a $1 million initial investment minimum, although the minimum generally is waived for retirement plans, financial intermediaries, and certain other accounts. The Advisor Class operates under a Board-approved Rule 12b-1 plan pursuant to which the class compensates financial intermediaries for distribution, shareholder servicing, and/ or certain administrative services; the Investor and I Classes do not pay Rule 12b-1 fees. Each class has exclusive voting rights on matters related solely to that class; separate voting rights on matters that relate to all classes; and, in all other respects, the same rights and obligations as the other classes.
NOTE 1 - SIGNIFICANT ACCOUNTING POLICIES
Basis of Preparation The fund is an investment company and follows accounting and reporting guidance in the Financial Accounting Standards Board (FASB) Accounting Standards Codification Topic 946 (ASC 946). The accompanying financial statements were prepared in accordance with accounting principles generally accepted in the United States of America (GAAP), including, but not limited to, ASC 946. GAAP requires the use of estimates made by management. Management believes that estimates and valuations are appropriate; however, actual results may differ from those estimates, and the valuations reflected in the accompanying financial statements may differ from the value ultimately realized upon sale or maturity.
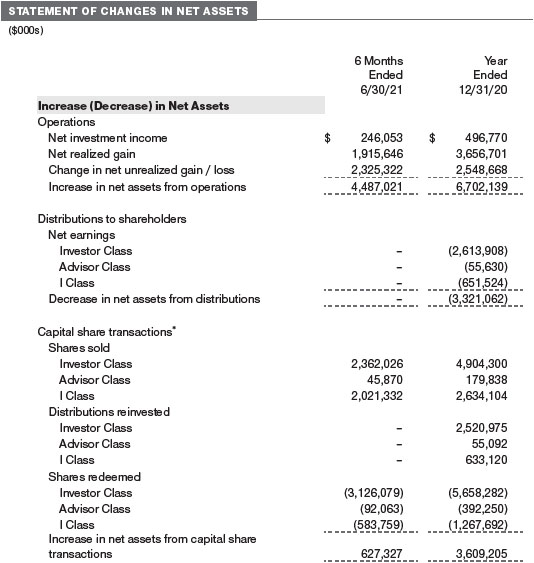
Investment Transactions, Investment Income, and Distributions Investment transactions are accounted for on the trade date basis. Income and expenses are recorded on the accrual basis. Realized gains and losses are reported on the identified cost basis. Premiums and discounts on debt securities are amortized for financial reporting purposes. Paydown gains and losses are recorded as an adjustment to interest income. Income tax-related interest and penalties, if incurred, are recorded as income tax expense. Dividends received from mutual fund investments are reflected as dividend income; capital gain distributions are reflected as realized gain/loss. Dividend income and capital gain distributions are recorded on the ex-dividend date. Distributions from REITs are initially recorded as dividend income and, to the extent such represent a return of capital or capital gain for tax purposes, are reclassified when such information becomes available. Non-cash dividends, if any, are recorded at the fair market value of the asset received. Distributions to shareholders are recorded on the ex-dividend date. Income distributions, if any, are declared and paid by each class annually. A capital gain distribution may also be declared and paid by the fund annually.
Currency Translation Assets, including investments, and liabilities denominated in foreign currencies are translated into U.S. dollar values each day at the prevailing exchange rate, using the mean of the bid and asked prices of such currencies against U.S. dollars as provided by an outside pricing service. Purchases and sales of securities, income, and expenses are translated into U.S. dollars at the prevailing exchange rate on the respective date of such transaction. The effect of changes in foreign currency exchange rates on realized and unrealized security gains and losses is not bifurcated from the portion attributable to changes in market prices.
Class Accounting Shareholder servicing, prospectus, and shareholder report expenses incurred by each class are charged directly to the class to which they relate. Expenses common to all classes, investment income, and realized and unrealized gains and losses are allocated to the classes based upon the relative daily net assets of each class. The Advisor Class pays Rule 12b-1 fees, in an amount not exceeding 0.25% of the class’s average daily net assets.
Capital Transactions Each investor’s interest in the net assets of the fund is represented by fund shares. The fund’s net asset value (NAV) per share is computed at the close of the New York Stock Exchange (NYSE), normally 4 p.m. ET, each day the NYSE is open for business. However, the NAV per share may be calculated at a time other than the normal close of the NYSE if trading on the NYSE is restricted, if the NYSE closes earlier, or as may be permitted by the SEC. Purchases and redemptions of fund shares are transacted at the next-computed NAV per share, after receipt of the transaction order by T. Rowe Price Associates, Inc., or its agents.
New Accounting Guidance In March 2020, the FASB issued Accounting Standards Update (ASU), ASU 2020–04, Reference Rate Reform (Topic 848) – Facilitation of the Effects of Reference Rate Reform on Financial Reporting, which provides optional, temporary relief with respect to the financial reporting of contracts subject to certain types of modifications due to the planned discontinuation of the London Interbank Offered Rate (LIBOR) and other interbank-offered based reference rates as of the end of 2021. The guidance is effective for certain reference rate-related contract modifications that occur during the period March 12, 2020 through December 31, 2022. Management expects that the adoption of the guidance will not have a material impact on the fund's financial statements.
Indemnification In the normal course of business, the fund may provide indemnification in connection with its officers and directors, service providers, and/or private company investments. The fund’s maximum exposure under these arrangements is unknown; however, the risk of material loss is currently considered to be remote.
NOTE 2 - VALUATION
Fair Value The fund’s financial instruments are valued at the close of the NYSE and are reported at fair value, which GAAP defines as the price that would be received to sell an asset or paid to transfer a liability in an orderly transaction between market participants at the measurement date. The T. Rowe Price Valuation Committee (the Valuation Committee) is an internal committee that has been delegated certain responsibilities by the fund’s Board of Directors (the Board) to ensure that financial instruments are appropriately priced at fair value in accordance with GAAP and the 1940 Act. Subject to oversight by the Board, the Valuation Committee develops and oversees pricing-related policies and procedures and approves all fair value determinations. Specifically, the Valuation Committee establishes policies and procedures used in valuing financial instruments, including those which cannot be valued in accordance with normal procedures or using pricing vendors; determines pricing techniques, sources, and persons eligible to effect fair value pricing actions; evaluates the services and performance of the pricing vendors; oversees the pricing process to ensure policies and procedures are being followed; and provides guidance on internal controls and valuation-related matters. The Valuation Committee provides periodic reporting to the Board on valuation matters.
Various valuation techniques and inputs are used to determine the fair value of financial instruments. GAAP establishes the following fair value hierarchy that categorizes the inputs used to measure fair value:
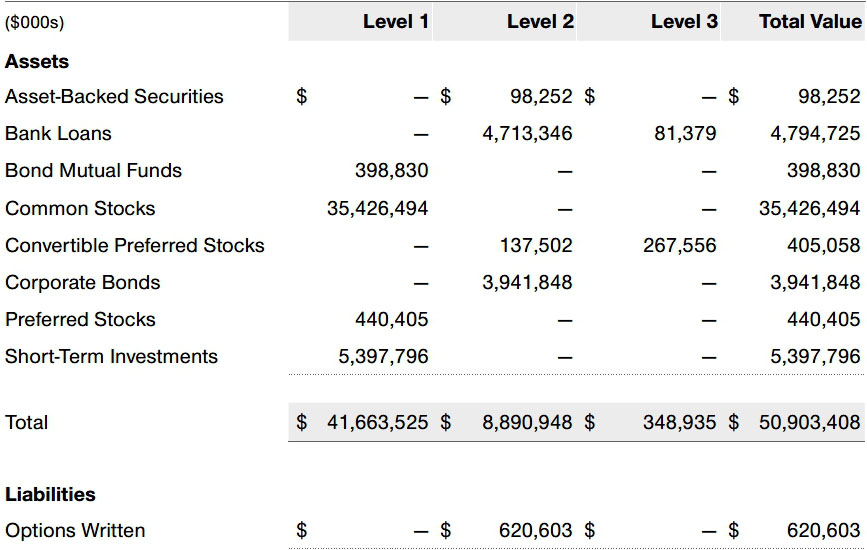
Level 1 – quoted prices (unadjusted) in active markets for identical financial instruments that the fund can access at the reporting date
Level 2 – inputs other than Level 1 quoted prices that are observable, either directly or indirectly (including, but not limited to, quoted prices for similar financial instruments in active markets, quoted prices for identical or similar financial instruments in inactive markets, interest rates and yield curves, implied volatilities, and credit spreads)
Level 3 – unobservable inputs (including the fund's own assumptions in determining fair value)
Observable inputs are developed using market data, such as publicly available information about actual events or transactions, and reflect the assumptions that market participants would use to price the financial instrument. Unobservable inputs are those for which market data are not available and are developed using the best information available about the assumptions that market participants would use to price the financial instrument. GAAP requires valuation techniques to maximize the use of relevant observable inputs and minimize the use of unobservable inputs. When multiple inputs are used to derive fair value, the financial instrument is assigned to the level within the fair value hierarchy based on the lowest-level input that is significant to the fair value of the financial instrument. Input levels are not necessarily an indication of the risk or liquidity associated with financial instruments at that level but rather the degree of judgment used in determining those values.
Valuation Techniques Equity securities, including exchange-traded funds, listed or regularly traded on a securities exchange or in the over-the-counter (OTC) market are valued at the last quoted sale price or, for certain markets, the official closing price at the time the valuations are made. OTC Bulletin Board securities are valued at the mean of the closing bid and asked prices. A security that is listed or traded on more than one exchange is valued at the quotation on the exchange determined to be the primary market for such security. Listed securities not traded on a particular day are valued at the mean of the closing bid and asked prices for domestic securities.
Debt securities generally are traded in the over-the-counter (OTC) market and are valued at prices furnished by independent pricing services or by broker dealers who make markets in such securities. When valuing securities, the independent pricing services consider the yield or price of bonds of comparable quality, coupon, maturity, and type, as well as prices quoted by dealers who make markets in such securities.
Investments in mutual funds are valued at the mutual fund’s closing NAV per share on the day of valuation. Listed options, and OTC options with a listed equivalent, are valued at the mean of the closing bid and asked prices and Exchange-traded options on futures contracts are valued at closing settlement prices. Assets and liabilities other than financial instruments, including short-term receivables and payables, are carried at cost, or estimated realizable value, if less, which approximates fair value.
Investments for which market quotations or market-based valuations are not readily available or deemed unreliable are valued at fair value as determined in good faith by the Valuation Committee, in accordance with fair valuation policies and procedures. The objective of any fair value pricing determination is to arrive at a price that could reasonably be expected from a current sale. Financial instruments fair valued by the Valuation Committee are primarily private placements, restricted securities, warrants, rights, and other securities that are not publicly traded. Factors used in determining fair value vary by type of investment and may include market or investment specific considerations. The Valuation Committee typically will afford greatest weight to actual prices in arm’s length transactions, to the extent they represent orderly transactions between market participants, transaction information can be reliably obtained, and prices are deemed representative of fair value. However, the Valuation Committee may also consider other valuation methods such as market-based valuation multiples; a discount or premium from market value of a similar, freely traded security of the same issuer; discounted cash flows; yield to maturity; or some combination. Fair value determinations are reviewed on a regular basis and updated as information becomes available, including actual purchase and sale transactions of the investment. Because any fair value determination involves a significant amount of judgment, there is a degree of subjectivity inherent in such pricing decisions, and fair value prices determined by the Valuation Committee could differ from those of other market participants.
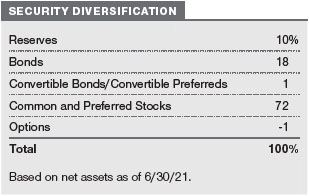
Valuation Inputs The following table summarizes the fund’s financial instruments, based on the inputs used to determine their fair values on June 30, 2021 (for further detail by category, please refer to the accompanying Portfolio of Investments):
NOTE 3 - DERIVATIVE INSTRUMENTS
During the six months ended June 30, 2021, the fund invested in derivative instruments. As defined by GAAP, a derivative is a financial instrument whose value is derived from an underlying security price, foreign exchange rate, interest rate, index of prices or rates, or other variable; it requires little or no initial investment and permits or requires net settlement. The fund invests in derivatives only if the expected risks and rewards are consistent with its investment objectives, policies, and overall risk profile, as described in its prospectus and Statement of Additional Information. The fund may use derivatives for a variety of purposes, such as seeking to hedge against declines in principal value, increase yield, invest in an asset with greater efficiency and at a lower cost than is possible through direct investment, to enhance return, or to adjust credit exposure. The risks associated with the use of derivatives are different from, and potentially much greater than, the risks associated with investing directly in the instruments on which the derivatives are based. The fund at all times maintains sufficient cash reserves, liquid assets, or other SEC-permitted asset types to cover its settlement obligations under open derivative contracts.
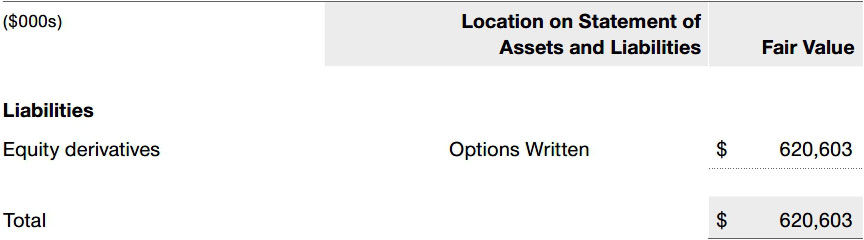
The fund values its derivatives at fair value and recognizes changes in fair value currently in its results of operations. Accordingly, the fund does not follow hedge accounting, even for derivatives employed as economic hedges. Generally, the fund accounts for its derivatives on a gross basis. It does not offset the fair value of derivative liabilities against the fair value of derivative assets on its financial statements, nor does it offset the fair value of derivative instruments against the right to reclaim or obligation to return collateral. The following table summarizes the fair value of the fund’s derivative instruments held as of June 30, 2021, and the related location on the accompanying Statement of Assets and Liabilities, presented by primary underlying risk exposure:
Additionally, the amount of gains and losses on derivative instruments recognized in fund earnings during the six months ended June 30, 2021, and the related location on the accompanying Statement of Operations is summarized in the following table by primary underlying risk exposure:
Counterparty Risk and Collateral The fund invests in derivatives, such as bilateral swaps, forward currency exchange contracts, or OTC options, that are transacted and settle directly with a counterparty (bilateral derivatives), and thereby may expose the fund to counterparty risk. To mitigate this risk, the fund has entered into master netting arrangements (MNAs) with certain counterparties that permit net settlement under specified conditions and, for certain counterparties, also require the exchange of collateral to cover mark-to-market exposure. MNAs may be in the form of International Swaps and Derivatives Association master agreements (ISDAs) or foreign exchange letter agreements (FX letters).
MNAs govern the ability to offset amounts the fund owes a counterparty against amounts the counterparty owes the fund (net settlement). Both ISDAs and FX letters generally allow termination of transactions and net settlement upon the occurrence of contractually specified events, such as failure to pay or bankruptcy. In addition, ISDAs specify other events, the occurrence of which would allow one of the parties to terminate. For example, a downgrade in credit rating of a counterparty below a specified rating would allow the fund to terminate, while a decline in the fund’s net assets of more than a specified percentage would allow the counterparty to terminate. Upon termination, all transactions with that counterparty would be liquidated and a net termination amount determined. ISDAs include collateral agreements whereas FX letters do not. Collateral requirements are determined daily based on the net aggregate unrealized gain or loss on all bilateral derivatives with each counterparty, subject to minimum transfer amounts that typically range from $100,000 to $250,000. Any additional collateral required due to changes in security values is typically transferred the next business day.
Collateral may be in the form of cash or debt securities issued by the U.S. government or related agencies. Cash posted by the fund is reflected as cash deposits in the accompanying financial statements and generally is restricted from withdrawal by the fund; securities posted by the fund are so noted in the accompanying Portfolio of Investments; both remain in the fund’s assets. Collateral pledged by counterparties is not included in the fund’s assets because the fund does not obtain effective control over those assets. For bilateral derivatives, collateral posted by the fund is held in a segregated account at the fund’s custodian.
While typically not sold in the same manner as equity or fixed income securities, OTC and bilateral derivatives may be unwound with counterparties or transactions assigned to other counterparties to allow the fund to exit the transaction. This ability is subject to the liquidity of underlying positions. The following table summarizes the fund’s derivatives at the reporting date by loss exposure to each counterparty after consideration of collateral, if any.

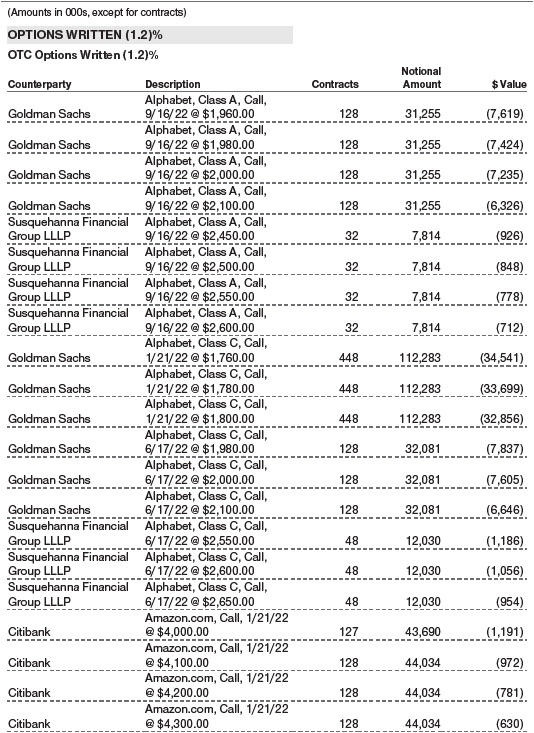
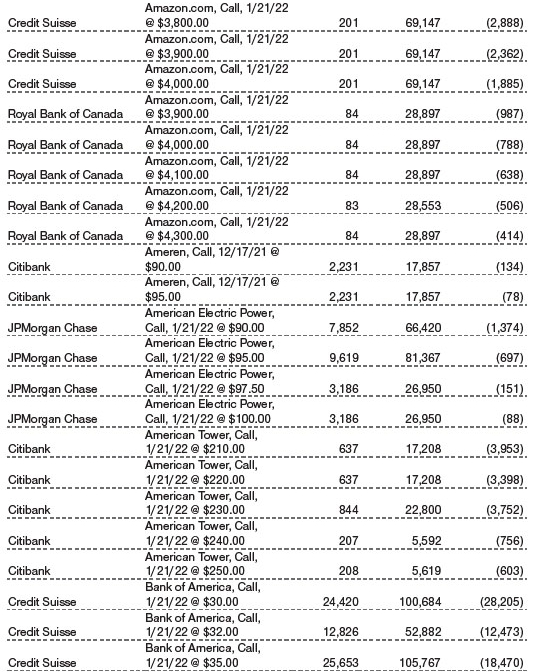
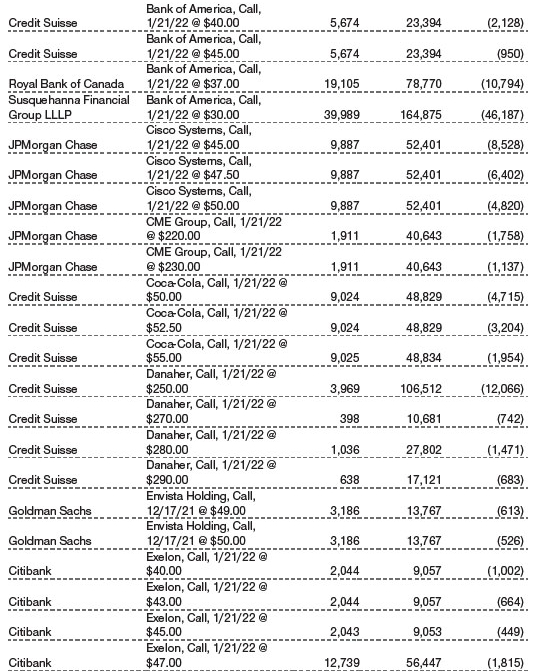
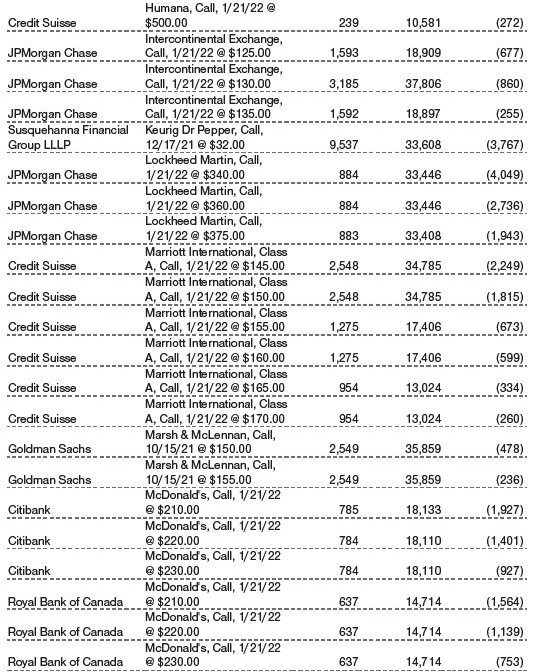
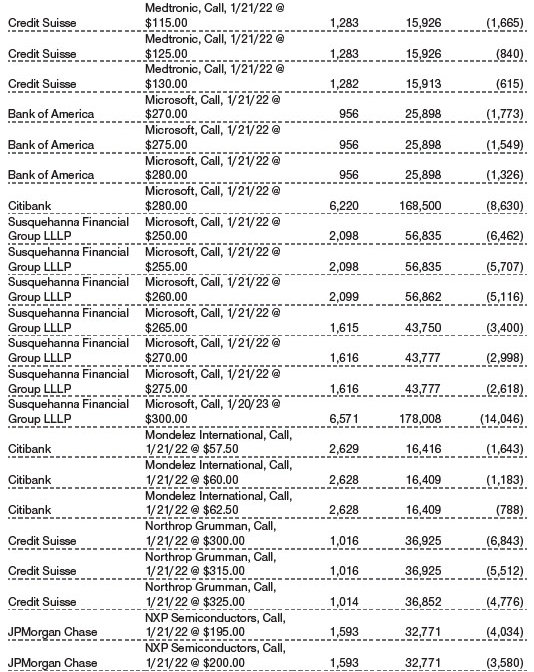
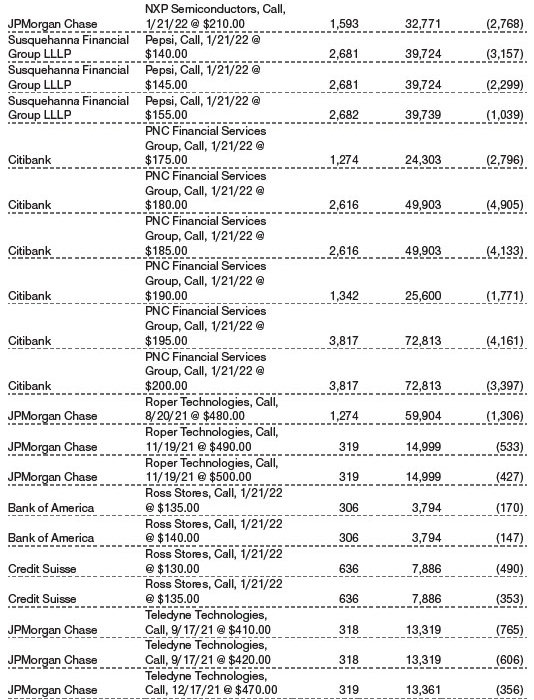
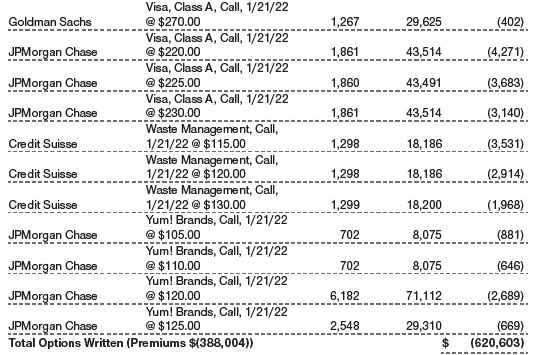
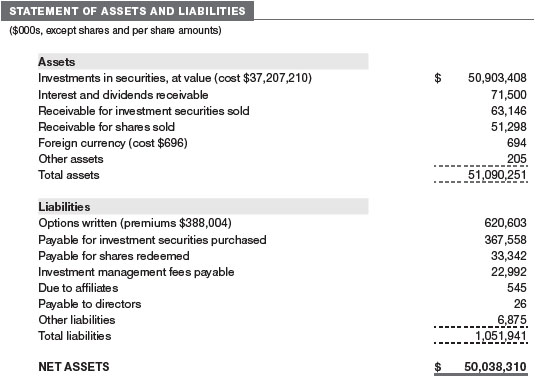
Options The fund is subject to equity price risk in the normal course of pursuing its investment objectives and uses options to help manage such risk. The fund may use options to manage exposure to security prices, interest rates, foreign currencies, and credit quality; as an efficient means of adjusting exposure to all or a part of a target market; to enhance income; as a cash management tool; or to adjust credit exposure. Options are included in net assets at fair value, options purchased are included in Investments in Securities, and Options written are separately reflected as a liability on the accompanying Statement of Assets and Liabilities. Premiums on unexercised, expired options are recorded as realized gains or losses; premiums on exercised options are recorded as an adjustment to the proceeds from the sale or cost of the purchase. The difference between the premium and the amount received or paid in a closing transaction is also treated as realized gain or loss. In return for a premium paid, call and put options give the holder the right, but not the obligation, to purchase or sell, respectively, a security at a specified exercise price. Risks related to the use of options include possible illiquidity of the options markets; trading restrictions imposed by an exchange or counterparty; movements in the underlying asset values and, for options written, potential losses in excess of the fund’s initial investment. During the six months ended June 30, 2021, the volume of the fund’s activity in options, based on underlying notional amounts, was generally between 10% and 12% of net assets.
NOTE 4 - OTHER INVESTMENT TRANSACTIONS
Consistent with its investment objective, the fund engages in the following practices to manage exposure to certain risks and/or to enhance performance. The investment objective, policies, program, and risk factors of the fund are described more fully in the fund’s prospectus and Statement of Additional Information.
Noninvestment-Grade Debt The fund invests, either directly or through its investment in other T. Rowe Price funds, in noninvestment-grade debt, including “high yield” or “junk” bonds or leveraged loans. Noninvestment-grade debt issuers are more likely to suffer an adverse change in financial condition that would result in the inability to meet a financial obligation. The noninvestment-grade debt market may experience sudden and sharp price swings due to a variety of factors that may decrease the ability of issuers to make principal and interest payments and adversely affect the liquidity or value, or both, of such securities. Accordingly, securities issued by such companies carry a higher risk of default and should be considered speculative.
Restricted Securities The fund invests in securities that are subject to legal or contractual restrictions on resale. Prompt sale of such securities at an acceptable price may be difficult and may involve substantial delays and additional costs.
Bank Loans The fund invests in bank loans, which represent an interest in amounts owed by a borrower to a syndicate of lenders. Bank loans are generally noninvestment grade and often involve borrowers whose financial condition is highly leveraged. Bank loans may be in the form of either assignments or participations. A loan assignment transfers all legal, beneficial, and economic rights to the buyer, and transfer typically requires consent of both the borrower and agent. In contrast, a loan participation generally entitles the buyer to receive the cash flows from principal, interest, and any fee payments on a portion of a loan; however, the seller continues to hold legal title to that portion of the loan. As a result, the buyer of a loan participation generally has no direct recourse against the borrower and is exposed to credit risk of both the borrower and seller of the participation. Bank loans often have extended settlement periods, generally may be repaid at any time at the option of the borrower, and may require additional principal to be funded at the borrowers’ discretion at a later date (e.g. unfunded commitments and revolving debt instruments). Until settlement, the fund maintains liquid assets sufficient to settle its unfunded loan commitments. The fund reflects both the funded portion of a bank loan as well as its unfunded commitment in the Portfolio of Investments. However, if a credit agreement provides no initial funding of a tranche and funding of the full commitment at a future date(s) is at the borrower’s discretion and considered uncertain, a loan is reflected in the Portfolio of Investments only if, and only to the extent that, the fund has actually settled a funding commitment.
LIBOR The fund may invest in instruments that are tied to reference rates, including LIBOR. On March 5, 2021, the ICE Benchmark Administration Limited, the administrator of LIBOR, announced its intention to cease publishing a majority of the USD LIBOR settings immediately after publication on June 30, 2023, with the remaining USD LIBOR settings to end immediately after publication on December 31, 2021. There remains uncertainty regarding the future utilization of LIBOR and the nature of any replacement rate. Any potential effects of the transition away from LIBOR on the fund, or on certain instruments in which the fund invests, are not known. The transition process may result in, among other things, an increase in volatility or illiquidity of markets for instruments that currently rely on LIBOR, a reduction in the value of certain instruments held by the fund, or a reduction in the effectiveness of related fund transactions such as hedges. Any such effects could have an adverse impact on the fund's performance.
Other Purchases and sales of portfolio securities other than short-term securities aggregated $12,903,323,000 and $11,475,133,000, respectively, for the six months ended June 30, 2021.
NOTE 5 - FEDERAL INCOME TAXES
No provision for federal income taxes is required since the fund intends to continue to qualify as a regulated investment company under Subchapter M of the Internal Revenue Code and distribute to shareholders all of its taxable income and gains. Distributions determined in accordance with federal income tax regulations may differ in amount or character from net investment income and realized gains for financial reporting purposes. Financial reporting records are adjusted for permanent book/tax differences to reflect tax character but are not adjusted for temporary differences. The amount and character of tax-basis distributions and composition of net assets are finalized at fiscal year-end; accordingly, tax-basis balances have not been determined as of the date of this report.
At June 30, 2021, the cost of investments for federal income tax purposes was $36,995,450,000. Net unrealized gain aggregated $13,287,353,000 at period-end, of which $13,797,035,000 related to appreciated investments and $509,682,000 related to depreciated investments.
NOTE 6 - RELATED PARTY TRANSACTIONS
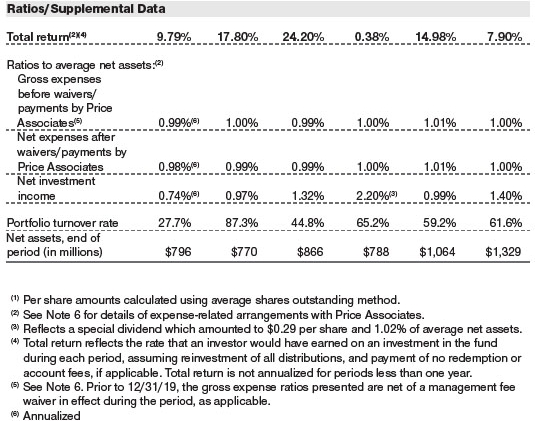
The fund is managed by T. Rowe Price Associates, Inc. (Price Associates), a wholly owned subsidiary of T. Rowe Price Group, Inc. (Price Group). The investment management agreement between the fund and Price Associates provides for an annual investment management fee that consists of an individual fund fee and a group fee; management fees are computed daily and paid monthly. The investment management agreement provides for an individual fund fee equal to 0.30% of the fund’s average daily net assets. The group fee rate is calculated based on the combined net assets of certain mutual funds sponsored by Price Associates (the group) applied to a graduated fee schedule, with rates ranging from 0.48% for the first $1 billion of assets to 0.260% for assets in excess of $845 billion. The fund’s group fee is determined by applying the group fee rate to the fund’s average daily net assets. At June 30, 2021, the effective annual group fee rate was 0.28%. Effective April 30, 2019, Price Associates has contractually agreed, at least through April 30, 2022, to waive a portion of its management fee so that an individual fund fee of 0.27% is applied to the fund’s average daily net assets that are equal to or greater than $27.5 billion. Thereafter, this agreement will automatically renew for one-year terms unless terminated by the fund’s Board. Any fees waived under this agreement are not subject to reimbursement to Price Associates by the fund. The total management fees waived were $2,946,000 and allocated ratably in the amounts of $2,286,000 for the Investor Class, $49,000 for the Advisor Class, and $611,000 for the I Class, for the six months ended June 30, 2021.
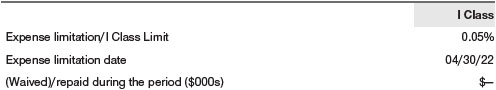
The I Class is subject to an operating expense limitation (I Class Limit) pursuant to which Price Associates is contractually required to pay all operating expenses of the I Class, excluding management fees; interest; expenses related to borrowings, taxes, and brokerage; and other non-recurring expenses permitted by the investment management agreement, to the extent such operating expenses, on an annualized basis, exceed the I Class Limit. This agreement will continue through the expense limitation date indicated in the table below, and may be renewed, revised, or revoked only with approval of the fund’s Board. The I Class is required to repay Price Associates for expenses previously paid to the extent the class’s net assets grow or expenses decline sufficiently to allow repayment without causing the class’s operating expenses (after the repayment is taken into account) to exceed the lesser of: (1) the I Class Limit in place at the time such amounts were paid; or (2) the current I Class Limit. However, no repayment will be made more than three years after the date of a payment or waiver.
In addition, the fund has entered into service agreements with Price Associates and two wholly owned subsidiaries of Price Associates, each an affiliate of the fund (collectively, Price). Price Associates provides certain accounting and administrative services to the fund. T. Rowe Price Services, Inc. provides shareholder and administrative services in its capacity as the fund’s transfer and dividend-disbursing agent. T. Rowe Price Retirement Plan Services, Inc. provides subaccounting and recordkeeping services for certain retirement accounts invested in the Investor Class and Advisor Class. For the six months ended June 30, 2021, expenses incurred pursuant to these service agreements were $35,000 for Price Associates; $3,073,000 for T. Rowe Price Services, Inc.; and $729,000 for T. Rowe Price Retirement Plan Services, Inc. All amounts due to and due from Price, exclusive of investment management fees payable, are presented net on the accompanying Statement of Assets and Liabilities.
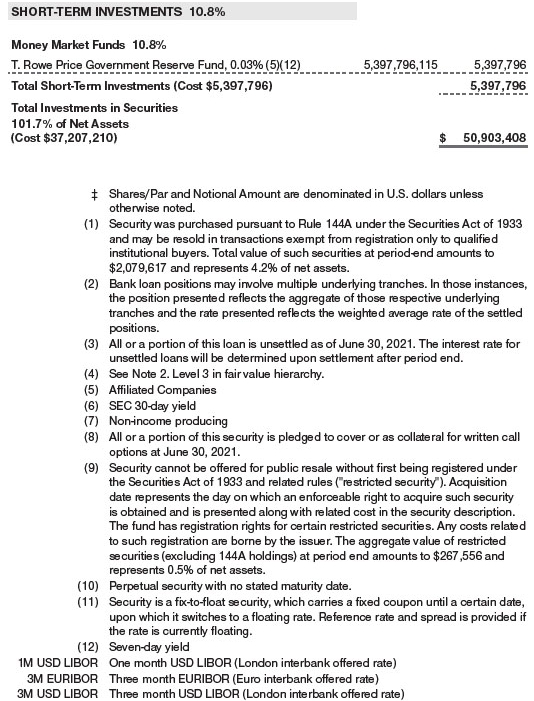
The fund may invest its cash reserves in certain open-end management investment companies managed by Price Associates and considered affiliates of the fund: the T. Rowe Price Government Reserve Fund or the T. Rowe Price Treasury Reserve Fund, organized as money market funds, or the T. Rowe Price Short-Term Fund, a short-term bond fund (collectively, the Price Reserve Funds). The Price Reserve Funds are offered as short-term investment options to mutual funds, trusts, and other accounts managed by Price Associates or its affiliates and are not available for direct purchase by members of the public. Cash collateral from securities lending is invested in the T. Rowe Price Short-Term Fund. The Price Reserve Funds pay no investment management fees.
The fund may also invest in certain other T. Rowe Price funds (Price Funds) as a means of gaining efficient and cost-effective exposure to certain markets. The fund does not invest for the purpose of exercising management or control; however, investments by the fund may represent a significant portion of an underlying Price Fund’s net assets. Each underlying Price Fund is an open-end management investment company managed by Price Associates and is considered an affiliate of the fund. To ensure that the fund does not incur duplicate management fees (paid by the underlying Price Fund(s) and the fund), Price Associates has agreed to permanently waive a portion of its management fee charged to the fund in an amount sufficient to fully offset that portion of management fees paid by each underlying Price Fund related to the fund’s investment therein. Annual management fee rates and amounts waived related to investments in the underlying Price Fund(s) for the six months ended June 30, 2021, are as follows:
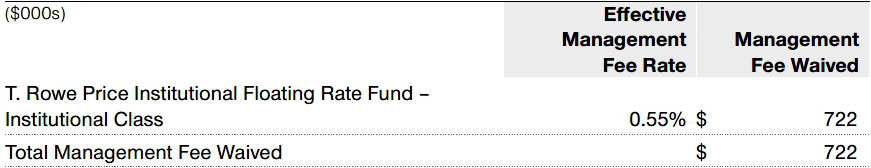
Total management fee waived was allocated ratably in the amounts of $559,000, $12,000 and $151,000 for the Investor Class, Advisor Class, and I Class, respectively, for the six months ended June 30, 2021.
As of June 30, 2021, T. Rowe Price Group, Inc., or its wholly owned subsidiaries, owned 2,690,362 shares of the Investor Class, representing less than 1% of the Investor Class's net assets and 2,454,834 shares of the I Class, representing less than 1% of the I Class’s net assets.
The fund may participate in securities purchase and sale transactions with other funds or accounts advised by Price Associates (cross trades), in accordance with procedures adopted by the fund’s Board and Securities and Exchange Commission rules, which require, among other things, that such purchase and sale cross trades be effected at the independent current market price of the security. During the six months ended June 30, 2021, the fund had no purchases or sales cross trades with other funds or accounts advised by Price Associates.
Effective January 1, 2020, Price Associates has voluntarily agreed to reimburse the fund from its own resources on a monthly basis for the cost of investment research embedded in the cost of the fund’s securities trades. This agreement may be rescinded at any time. For the six months ended June 30, 2021, this reimbursement amounted to $468,000, which is included in Net realized gain (loss) on Securities in the Statement of Operations.
NOTE 7 - INTERFUND LENDING PROGRAM
Price Associates has developed and manages an interfund lending program that provides temporary liquidity to the T. Rowe Price-sponsored mutual funds. The program permits the borrowing and lending of cash between the fund and other T. Rowe Price-sponsored mutual funds at rates beneficial to both the borrowing and lending funds. Pursuant to program guidelines, the fund may lend up to 15% of its net assets, and no more than 5% of its net assets may be lent to any one borrower. Loans totaling 10% or more of a borrowing fund’s total assets require collateralization at 102% of the value of the loan; loans of less than 10% are unsecured. During the six months ended June 30, 2021, the fund earned $2,000 in interest income related to loans made to other funds on one day in the average amount of $47,900,000 and at an average annual rate of 1.64%. At June 30, 2021, there were no loans outstanding.
NOTE 8 - OTHER MATTERS
Unpredictable events such as environmental or natural disasters, war, terrorism, pandemics, outbreaks of infectious diseases, and similar public health threats may significantly affect the economy and the markets and issuers in which a fund invests. Certain events may cause instability across global markets, including reduced liquidity and disruptions in trading markets, while some events may affect certain geographic regions, countries, sectors, and industries more significantly than others, and exacerbate other pre-existing political, social, and economic risks. During 2020, a novel strain of coronavirus (COVID-19) resulted in disruptions to global business activity and caused significant volatility and declines in global financial markets.
These types of events, such as the global pandemic caused by COVID-19, may also cause widespread fear and uncertainty, and result in, among other things: enhanced health screenings, quarantines, cancellations, and travel restrictions, including border closings; disruptions to business operations and supply chains and customer activity; exchange trading suspensions and closures, and overall reduced liquidity of securities, derivatives, and commodities trading markets; reductions in consumer demand and economic output; and significant challenges in healthcare service preparation and delivery. The fund could be negatively impacted if the value of a portfolio holding were harmed by such political or economic conditions or events. In addition, the operations of the fund, its investment advisers, and the fund’s service providers may be significantly impacted, or even temporarily halted, as a result of any impairment to their information technology and other operation systems, extensive employee illnesses or unavailability, government quarantine measures, and restrictions on travel or meetings and other factors related to public emergencies.
Governmental and quasi-governmental authorities and regulators have in the past responded to major economic disruptions with a variety of significant fiscal and monetary policy changes, including but not limited to, direct capital infusions into companies, new monetary programs, and dramatically lower interest rates. An unexpected or quick reversal of these policies, or the ineffectiveness of these policies, could negatively impact overall investor sentiment and further increase volatility in securities markets.
INFORMATION ON PROXY VOTING POLICIES, PROCEDURES, AND RECORDS
A description of the policies and procedures used by T. Rowe Price funds to determine how to vote proxies relating to portfolio securities is available in each fund’s Statement of Additional Information. You may request this document by calling 1-800-225-5132 or by accessing the SEC’s website, sec.gov.
The description of our proxy voting policies and procedures is also available on our corporate website. To access it, please visit the following Web page:
https://www.troweprice.com/corporate/en/utility/policies.html
Scroll down to the section near the bottom of the page that says, “Proxy Voting Policies.” Click on the Proxy Voting Policies link in the shaded box.
Each fund’s most recent annual proxy voting record is available on our website and through the SEC’s website. To access it through T. Rowe Price, visit the website location shown above, and scroll down to the section near the bottom of the page that says, “Proxy Voting Records.” Click on the Proxy Voting Records link in the shaded box.
HOW TO OBTAIN QUARTERLY PORTFOLIO HOLDINGS
The fund files a complete schedule of portfolio holdings with the Securities and Exchange Commission (SEC) for the first and third quarters of each fiscal year as an exhibit to its reports on Form N-PORT. The fund’s reports on Form N-PORT are available electronically on the SEC’s website (sec.gov). In addition, most T. Rowe Price funds disclose their first and third fiscal quarter-end holdings on troweprice.com.
APPROVAL OF INVESTMENT MANAGEMENT AGREEMENT
Each year, the fund’s Board of Directors (Board) considers the continuation of the investment management agreement (Advisory Contract) between the fund and its investment advisor, T. Rowe Price Associates, Inc. (Advisor). In that regard, at a meeting held on March 8–9, 2021 (Meeting), the Board, including all of the fund’s independent directors, approved the continuation of the fund’s Advisory Contract. At the Meeting, the Board considered the factors and reached the conclusions described below relating to the selection of the Advisor and the approval of the Advisory Contract. The independent directors were assisted in their evaluation of the Advisory Contract by independent legal counsel from whom they received separate legal advice and with whom they met separately.
In providing information to the Board, the Advisor was guided by a detailed set of requests for information submitted by independent legal counsel on behalf of the independent directors. In considering and approving the Advisory Contract, the Board considered the information it believed was relevant, including, but not limited to, the information discussed below. The Board considered not only the specific information presented in connection with the Meeting but also the knowledge gained over time through interaction with the Advisor about various topics. The Board meets regularly and, at each of its meetings, covers an extensive agenda of topics and materials and considers factors that are relevant to its annual consideration of the renewal of the T. Rowe Price funds’ advisory contracts, including performance and the services and support provided to the funds and their shareholders.
Services Provided by the Advisor
The Board considered the nature, quality, and extent of the services provided to the fund by the Advisor. These services included, but were not limited to, directing the fund’s investments in accordance with its investment program and the overall management of the fund’s portfolio, as well as a variety of related activities such as financial, investment operations, and administrative services; compliance; maintaining the fund’s records and registrations; and shareholder communications. The Board also reviewed the background and experience of the Advisor’s senior management team and investment personnel involved in the management of the fund, as well as the Advisor’s compliance record. The Board concluded that it was satisfied with the nature, quality, and extent of the services provided by the Advisor.
Investment Performance of the Fund
The Board took into account discussions with the Advisor and reports that it receives throughout the year relating to fund performance. In connection with the Meeting, the Board reviewed the fund’s net annualized total returns for the 1-, 2-, 3-, 4-, 5-, and 10-year periods as of September 30, 2020, and compared these returns with the performance of a peer group of funds with similar investment programs and a wide variety of other previously agreed-upon comparable performance measures and market data, including those supplied by Broadridge, which is an independent provider of mutual fund data.
On the basis of this evaluation and the Board’s ongoing review of investment results, and factoring in the relative market conditions during certain of the performance periods, the Board concluded that the fund’s performance was satisfactory.
Costs, Benefits, Profits, and Economies of Scale
The Board reviewed detailed information regarding the revenues received by the Advisor under the Advisory Contract and other direct and indirect benefits that the Advisor (and its affiliates) may have realized from its relationship with the fund. In considering soft-dollar arrangements pursuant to which research may be received from broker-dealers that execute the fund’s portfolio transactions, the Board noted that the Advisor bears the cost of research services for all client accounts that it advises, including the T. Rowe Price funds. The Board received information on the estimated costs incurred and profits realized by the Advisor from managing the T. Rowe Price funds. The Board also reviewed estimates of the profits realized from managing the fund in particular, and the Board concluded that the Advisor’s profits were reasonable in light of the services provided to the fund.
The Board also considered whether the fund benefits under the fee levels set forth in the Advisory Contract from any economies of scale realized by the Advisor. Under the Advisory Contract, the fund pays a fee to the Advisor for investment management services composed of two components—a group fee rate based on the combined average net assets of most of the T. Rowe Price funds (including the fund) that declines at certain asset levels and an individual fund fee rate that declines at certain asset levels based on the fund’s average daily net assets—and the fund pays its own expenses of operations. The Board concluded that the advisory fee structure for the fund continued to provide for a reasonable sharing of benefits from any economies of scale with the fund’s investors.
Fees and Expenses
The Board was provided with information regarding industry trends in management fees and expenses. Among other things, the Board reviewed data for peer groups that were compiled by Broadridge, which compared: (i) contractual management fees, total expenses, actual management fees, and nonmanagement expenses of the Investor Class of the fund with a group of competitor funds selected by Broadridge (Investor Class Expense Group); (ii) total expenses and actual management fees of the Advisor Class of the fund with a group of competitor funds selected by Broadridge (Advisor Class Expense Group); and (iii) total expenses, actual management fees, and nonmanagement expenses of the Investor Class of the fund with a broader set of funds within the Lipper investment classification (Expense Universe). The Board considered the fund’s contractual management fee rate, actual management fee rate (which reflects the management fees actually received from the fund by the Advisor after any applicable waivers, reductions, or reimbursements), operating expenses, and total expenses (which reflect the net total expense ratio of the fund after any waivers, reductions, or reimbursements) in comparison with the information for the Broadridge peer groups. Broadridge generally constructed the peer groups by seeking the most comparable funds based on similar investment classifications and objectives, expense structure, asset size, and operating components and attributes and ranked funds into quintiles, with the first quintile representing the funds with the lowest relative expenses and the fifth quintile representing the funds with the highest relative expenses. The information provided to the Board indicated that the fund’s contractual management fee ranked in the second quintile (Investor Class Expense Group), the fund’s actual management fee rate ranked in the second quintile (Investor Class Expense Group and Expense Universe) and third quintile (Advisor Class Expense Group), and the fund’s total expenses ranked in second quintile (Investor Class Expense Group, Expense Universe, and Advisor Class Expense Group).
The Board also reviewed the fee schedules for other investment portfolios with similar mandates that are advised or subadvised by the Advisor and its affiliates, including separately managed accounts for institutional and individual investors; subadvised funds; and other sponsored investment portfolios, including collective investment trusts and pooled vehicles organized and offered to investors outside the United States. Management provided the Board with information about the Advisor’s responsibilities and services provided to subadvisory and other institutional account clients, including information about how the requirements and economics of the institutional business are fundamentally different from those of the proprietary mutual fund business. The Board considered information showing that the Advisor’s mutual fund business is generally more complex from a business and compliance perspective than its institutional account business and considered various relevant factors, such as the broader scope of operations and oversight, more extensive shareholder communication infrastructure, greater asset flows, heightened business risks, and differences in applicable laws and regulations associated with the Advisor’s proprietary mutual fund business. In assessing the reasonableness of the fund’s management fee rate, the Board considered the differences in the nature of the services required for the Advisor to manage its mutual fund business versus managing a discrete pool of assets as a subadvisor to another institution’s mutual fund or for an institutional account and that the Advisor generally performs significant additional services and assumes greater risk in managing the fund and other T. Rowe Price funds than it does for institutional account clients, including subadvised funds.
On the basis of the information provided and the factors considered, the Board concluded that the fees paid by the fund under the Advisory Contract are reasonable.
Approval of the Advisory Contract
As noted, the Board approved the continuation of the Advisory Contract. No single factor was considered in isolation or to be determinative to the decision. Rather, the Board concluded, in light of a weighting and balancing of all factors considered, that it was in the best interests of the fund and its shareholders for the Board to approve the continuation of the Advisory Contract (including the fees to be charged for services thereunder).
Item 1. (b) Notice pursuant to Rule 30e-3.
Not applicable.
Item 2. Code of Ethics.
A code of ethics, as defined in Item 2 of Form N-CSR, applicable to its principal executive officer, principal financial officer, principal accounting officer or controller, or persons performing similar functions is filed as an exhibit to the registrant’s annual Form N-CSR. No substantive amendments were approved or waivers were granted to this code of ethics during the registrant’s most recent fiscal half-year.
Item 3. Audit Committee Financial Expert.
Disclosure required in registrant’s annual Form N-CSR.
Item 4. Principal Accountant Fees and Services.
Disclosure required in registrant’s annual Form N-CSR.
Item 5. Audit Committee of Listed Registrants.
Not applicable.
Item 6. Investments.
(a) Not applicable. The complete schedule of investments is included in Item 1 of this Form N-CSR.
(b) Not applicable.
Item 7. Disclosure of Proxy Voting Policies and Procedures for Closed-End Management Investment Companies.
Not applicable.
Item 8. Portfolio Managers of Closed-End Management Investment Companies.
Not applicable.
Item 9. Purchases of Equity Securities by Closed-End Management Investment Company and Affiliated Purchasers.
Not applicable.
Item 10. Submission of Matters to a Vote of Security Holders.
There has been no change to the procedures by which shareholders may recommend nominees to the registrant’s board of directors.
Item 11. Controls and Procedures.
(a) The registrant’s principal executive officer and principal financial officer have evaluated the registrant’s disclosure controls and procedures within 90 days of this filing and have concluded that the registrant’s disclosure controls and procedures were effective, as of that date, in ensuring that information required to be disclosed by the registrant in this Form N-CSR was recorded, processed, summarized, and reported timely.
(b) The registrant’s principal executive officer and principal financial officer are aware of no change in the registrant’s internal control over financial reporting that occurred during the period covered by this report that has materially affected, or is reasonably likely to materially affect, the registrant’s internal control over financial reporting.
Item 12. Disclosure of Securities Lending Activities for Closed-End Management Investment Companies.
Not applicable.
Item 13. Exhibits.
(a)(1) The registrant’s code of ethics pursuant to Item 2 of Form N-CSR is filed with the registrant’s annual Form N-CSR.
(2) Separate certifications by the registrant's principal executive officer and principal financial officer, pursuant to Section 302 of the Sarbanes-Oxley Act of 2002 and required by Rule 30a-2(a) under the Investment Company Act of 1940, are attached.
(3) Written solicitation to repurchase securities issued by closed-end companies: not applicable.
(b) A certification by the registrant's principal executive officer and principal financial officer, pursuant to Section 906 of the Sarbanes-Oxley Act of 2002 and required by Rule 30a-2(b) under the Investment Company Act of 1940, is attached.
SIGNATURES
Pursuant to the requirements of the Securities Exchange Act of 1934 and the Investment Company Act of 1940, the registrant has duly caused this report to be signed on its behalf by the undersigned, thereunto duly authorized.
T. Rowe Price Capital Appreciation Fund, Inc.
| By | | /s/ David Oestreicher |
| | | David Oestreicher |
| | | Principal Executive Officer |
| |
| Date | | August 17, 2021 | | | | |
Pursuant to the requirements of the Securities Exchange Act of 1934 and the Investment Company Act of 1940, this report has been signed below by the following persons on behalf of the registrant and in the capacities and on the dates indicated.
| By | | /s/ David Oestreicher |
| | | David Oestreicher |
| | | Principal Executive Officer |
| |
| Date | | August 17, 2021 | | | | |
| |
| |
| By | | /s/ Alan S. Dupski |
| | | Alan S. Dupski |
| | | Principal Financial Officer |
| |
| Date | | August 17, 2021 | | | | |