UNITED STATES
SECURITIES AND EXCHANGE COMMISSION
Washington, D.C. 20549
Form N-CSR
CERTIFIED SHAREHOLDER REPORT OF REGISTERED
MANAGEMENT INVESTMENT COMPANIES
Investment Company Act file number: 811-4676
Harbor Funds
(Exact name of Registrant as specified in charter)
111 South Wacker Drive, 34th Floor
Chicago, Illinois 60606-4302
(Address of principal executive offices) (Zip code)
| | |
| David G. Van Hooser | | Christopher P. Harvey, Esq. |
| HARBOR FUNDS | | DECHERT LLP |
111 South Wacker Drive, 34th Floor Chicago, Illinois 60606-4302 | | One International Place – 40th Floor
100 Oliver Street |
| | Boston, MA 02110-2605 |
(Name and address of agent for service)
Registrant’s telephone number, including area code: (312) 443-4400
Date of fiscal year end: October 31
Date of reporting period: April 30, 2015
ITEM 1 – REPORTS TO STOCKHOLDERS
The following are copies of reports transmitted to shareholders pursuant to Rule 30e-1 under the Investment Company Act of 1940, as amended (the “1940 Act”) (17 CFR 270.30e-1):

Semi-Annual Report
April 30, 2015
Domestic Equity Funds
| | | | | | |
| | | | |
| | | Institutional
Class | | Administrative
Class | | Investor Class |
| | | |
| Growth | | | | | | |
| | | |
| Harbor Capital Appreciation Fund | | HACAX | | HRCAX | | HCAIX |
| | | |
| Harbor Mid Cap Growth Fund | | HAMGX | | HRMGX | | HIMGX |
| | | |
| Harbor Small Cap Growth Fund | | HASGX | | HRSGX | | HISGX |
| | | |
| Harbor Small Cap Growth Opportunities Fund | | HASOX | | HRSOX | | HISOX |
| | | |
| Value | | | | | | |
| | | |
| Harbor Large Cap Value Fund | | HAVLX | | HRLVX | | HILVX |
| | | |
| Harbor Mid Cap Value Fund | | HAMVX | | HRMVX | | HIMVX |
| | | |
| Harbor Small Cap Value Fund | | HASCX | �� | HSVRX | | HISVX |
Table of Contents
This document must be preceded or accompanied by a Prospectus.
Harbor Domestic Equity Funds
SEMI-ANNUAL REPORT OVERVIEW (Unaudited)
The first half of the fiscal year ended April 30, 2015. The performance figures for each of the Harbor Funds shown below assume the reinvestment of dividends and capital gains, but do not reflect the deduction of taxes that a shareholder would pay on Fund distributions or on the redemption of shares of the Funds. From time to time, certain fees and/or expenses have been voluntarily or contractually waived or reimbursed, which has resulted in higher returns. Without these waivers or reimbursements, the returns would have been lower. Voluntary waivers or reimbursements may be discontinued at any time without notice. For information on the different share classes, please refer to the current prospectus. The returns of the unmanaged indices assume the reinvestment of dividends but do not reflect fees and expenses. The indices are not available for direct investment.
Performance data shown represents past performance, which is no guarantee of future results. Current performance may be higher or lower than the past performance data shown. Investment returns and the value of an investment will fluctuate, and an investor’s shares, when sold, may be worth more or less than their original cost. You can obtain performance data current to the most recent month-end (available within seven business days after the most recent month-end) by calling 800-422-1050 or by visiting harborfunds.com.
| | | | | | | | | | | | |
| | | Unannualized Total Return
6 Months Ended April 30, 2015 | |
| | | Institutional
Class | | | Administrative
Class | | | Investor
Class | |
GROWTH FUNDS | | | | | | | | | | | | |
Harbor Capital Appreciation Fund | | | 7.47 | % | | | 7.32 | % | | | 7.27 | % |
Harbor Mid Cap Growth Fund | | | 7.06 | | | | 6.97 | | | | 6.90 | |
Harbor Small Cap Growth Fund | | | 10.39 | | | | 10.23 | | | | 10.10 | |
Harbor Small Cap Growth Opportunities Fund | | | 2.19 | | | | 2.10 | | | | 1.91 | |
VALUE FUNDS | | | | | | | | | | | | |
Harbor Large Cap Value Fund | | | 6.99 | % | | | 6.85 | % | | | 6.75 | % |
Harbor Mid Cap Value Fund | | | 4.87 | | | | 4.71 | | | | 4.68 | |
Harbor Small Cap Value Fund | | | 3.94 | | | | 3.81 | | | | 3.75 | |
| | | | |
| COMMONLY USED MARKET INDICES | | Unannualized Total Return
6 Months Ended
April 30, 2015 | |
Standard & Poor’s 500 (S&P 500); large cap, domestic equity | | | 4.40 | % |
Russell 1000® Growth; large cap, domestic equity | | | 6.54 | |
Russell Midcap® Growth; mid cap, domestic equity | | | 7.77 | |
Russell 2000® Growth; small cap, domestic equity | | | 7.25 | |
Russell 1000® Value; large cap, domestic equity | | | 2.89 | |
Russell Midcap® Value; mid cap, domestic equity | | | 3.83 | |
Russell 2000® Value; small cap, domestic equity | | | 2.05 | |
1
Harbor Domestic Equity Funds
SEMI-ANNUAL REPORT OVERVIEW—Continued
| | | | | | | | | | | | | | | | | | | | | | | | |
| | | EXPENSE RATIOS1 | | | Morningstar
Average2
(Unaudited) | |
| | | 2011* | | | 2012* | | | 2013* | | | 2014* | | | 2015b | | |
HARBOR DOMESTIC EQUITY FUNDS | | | | | | | | | | | | | | | | | | | | | | | | |
Harbor Capital Appreciation Fund | | | | | | | | | | | | | | | | | | | | | | | | |
Institutional Class | | | 0.66 | % | | | 0.66 | % | | | 0.65 | % | | | 0.65 | % | | | 0.64 | % | | | 0.90 | % |
Administrative Class | | | 0.91 | | | | 0.91 | | | | 0.90 | | | | 0.90 | | | | 0.89 | | | | 1.21 | |
Investor Class | | | 1.03 | | | | 1.03 | | | | 1.02 | | | | 1.02 | | | | 1.01 | | | | 1.27 | |
Harbor Mid Cap Growth Fund | | | | | | | | | | | | | | | | | | | | | | | | |
Institutional Class | | | 0.85 | % | | | 0.85 | % | | | 0.84 | % | | | 0.83 | % | | | 0.84 | % | | | 1.04 | % |
Administrative Class | | | 1.10 | | | | 1.10 | | | | 1.09 | | | | 1.08 | | | | 1.09 | | | | 1.35 | |
Investor Class | | | 1.22 | | | | 1.22 | | | | 1.21 | | | | 1.20 | | | | 1.21 | | | | 1.36 | |
Harbor Small Cap Growth Fund | | | | | | | | | | | | | | | | | | | | | | | | |
Institutional Class | | | 0.84 | % | | | 0.84 | % | | | 0.83 | % | | | 0.83 | % | | | 0.83 | % | | | 1.13 | % |
Administrative Class | | | 1.09 | | | | 1.09 | | | | 1.08 | | | | 1.08 | | | | 1.08 | | | | 1.44 | |
Investor Class | | | 1.21 | | | | 1.21 | | | | 1.20 | | | | 1.20 | | | | 1.20 | | | | 1.47 | |
Harbor Small Cap Growth Opportunities Fund | | | | | | | | | | | | | | | | | | | | | | | | |
Institutional Class | | | N/A | | | | N/A | | | | N/A | | | | 0.90 | %a | | | 0.90 | % | | | 1.13 | % |
Administrative Class | | | N/A | | | | N/A | | | | N/A | | | | 1.15 | a | | | 1.15 | | | | 1.44 | |
Investor Class | | | N/A | | | | N/A | | | | N/A | | | | 1.27 | a | | | 1.27 | | | | 1.47 | |
Harbor Large Cap Value Fund | | | | | | | | | | | | | | | | | | | | | | | | |
Institutional Class | | | 0.68 | % | | | 0.68 | % | | | 0.68 | % | | | 0.68 | % | | | 0.68 | % | | | 0.87 | % |
Administrative Class | | | 0.93 | | | | 0.93 | | | | 0.93 | | | | 0.93 | | | | 0.93 | | | | 1.16 | |
Investor Class | | | 1.05 | | | | 1.05 | | | | 1.05 | | | | 1.05 | | | | 1.05 | | | | 1.20 | |
Harbor Mid Cap Value Fund | | | | | | | | | | | | | | | | | | | | | | | | |
Institutional Class | | | 0.95 | % | | | 0.95 | % | | | 0.93 | % | | | 0.89 | % | | | 0.85 | % | | | 0.96 | % |
Administrative Class | | | 1.20 | | | | 1.20 | | | | 1.18 | | | | 1.14 | | | | 1.11 | | | | 1.28 | |
Investor Class | | | 1.32 | | | | 1.32 | | | | 1.30 | | | | 1.26 | | | | 1.23 | | | | 1.31 | |
Harbor Small Cap Value Fund | | | | | | | | | | | | | | | | | | | | | | | | |
Institutional Class | | | 0.84 | % | | | 0.85 | % | | | 0.84 | % | | | 0.84 | % | | | 0.84 | % | | | 1.08 | % |
Administrative Class | | | 1.09 | | | | 1.10 | | | | 1.09 | | | | 1.09 | | | | 1.09 | | | | 1.47 | |
Investor Class | | | 1.21 | | | | 1.22 | | | | 1.21 | | | | 1.21 | | | | 1.21 | | | | 1.53 | |
| 1 | Harbor Funds’ expense ratios are for operating expenses for the fiscal years ended October 31 (unless otherwise noted) and are shown net of all expense offsets, waivers and reimbursements (see Financial Highlights). |
| 2 | The Morningstar Average includes all actively managed no-load funds in the April 30, 2015 Morningstar Universe with the same investment style as the comparable Harbor fund’s portfolio and with the following additional characteristics for each Harbor Funds share class: Institutional Class contains funds with 12b-1 fees less than or equal to 0.25%; Administrative Class contains funds with 12b-1 fees and which are restricted primarily for use by retirement plans; and Investor Class contains funds with 12b-1 fees and a minimum investment less than $50,000. |
| a | Annualized figures for the period February 1, 2014 (inception) through October 31, 2014. |
| b | Unaudited annualized figures for the six-month period ended April 30, 2015. |
2
Letter from the Chairman
|

David G. Van Hooser Chairman |
Dear Fellow Shareholder:
U.S. stock indices had positive returns for the first half of fiscal 2015, supported by accommodative monetary policies of the Federal Reserve and central banks of other countries. The Wilshire 5000 Total Market Index, a measure of the broad domestic equity market, had a return of 4.64% for the six months ended April 30, 2015. Growth stocks outperformed value stocks across all capitalization ranges.
The positive market performance was achieved despite several investor concerns, including the strength of the U.S. dollar that tends to reduce reported foreign earnings of U.S. headquartered multinational companies and makes U.S. exports more expensive to foreign buyers. Sluggish global economic activity and continuing geopolitical tensions added to investor concerns. The sharp decline in crude oil prices in 2014 was expected to favorably affect consumer spending although severe winter weather in many parts of the country dampened consumer spending.
Harbor Domestic Equity Funds
Harbor’s domestic equity funds generally performed well in the fiscal first half with most funds outperforming their benchmarks.
Harbor Capital Appreciation Fund returned 7.47%, beating its Russell 1000® Growth Index benchmark by 93 basis points, or 0.93 percentage point, while Harbor Mid Cap Growth Fund returned 7.06%, lagging its Russell Midcap® Growth Index benchmark by 71 basis points. (All Harbor returns cited are for each fund’s Institutional Class shares.) Harbor Small Cap Growth Fund recorded a return of 10.39%, beating its Russell 2000® Growth Index benchmark by 314 basis points, while Harbor Small Cap Growth Opportunities Fund returned 2.19%, trailing its Russell 2000® Growth Index benchmark by 506 basis points.
Each of our value-style domestic equity funds outperformed its benchmark index, led by Harbor Large Cap Value Fund, which posted a return of 6.99%, beating its benchmark, the Russell 1000® Value Index, by 410 basis points. Harbor Mid Cap Value Fund returned 4.87%, outpacing its Russell Midcap® Value Index benchmark by 104 basis points, while Harbor Small Cap Value Fund returned 3.94%, outperforming its Russell 2000® Value Index benchmark by 189 basis points.
As always, we recommend that shareholders maintain a long-term perspective in evaluating all of their investments, including Harbor Funds. Comments by the portfolio managers of each domestic equity fund can be found in the pages preceding each Fund’s portfolio of investments.
| | | | | | | | | | | | | | | | | | | | |
| | | RETURNS FOR PERIODS ENDED APRIL 30, 2015 | |
| | | Unannualized | | | | | | Annualized | |
Domestic Equities | �� | 6 Months | | | 1 Year | | | 5 Years | | | 10 Years | | | 30 Years | |
Wilshire 5000 Total Market (entire U.S. stock market) | | | 4.64 | % | | | 12.52 | % | | | 14.26 | % | | | 8.88 | % | | | 11.00 | % |
S&P 500 (large cap stocks) | | | 4.40 | | | | 12.98 | | | | 14.33 | | | | 8.32 | | | | 11.09 | |
Russell Midcap® (mid cap stocks) | | | 5.87 | | | | 13.30 | | | | 15.09 | | | | 10.27 | | | | 12.55 | |
Russell 2000® (small cap stocks) | | | 4.65 | | | | 9.71 | | | | 12.73 | | | | 9.18 | | | | 9.90 | |
Russell 3000® Growth | | | 6.59 | | | | 16.50 | | | | 15.45 | | | | 9.69 | | | | 10.41 | |
Russell 3000® Value | | | 2.82 | | | | 8.96 | | | | 13.15 | | | | 7.54 | | | | 11.24 | |
| | | | | |
International & Global | | | | | | | | | | | | | | | |
MSCI EAFE (ND) (foreign stocks) | | | 6.81 | % | | | 1.66 | % | | | 7.40 | % | | | 5.62 | % | | | 9.04 | % |
MSCI World (ND) (global stocks) | | | 5.09 | | | | 7.41 | | | | 10.51 | | | | 6.87 | | | | 9.44 | |
MSCI Emerging Markets (ND) (emerging markets) | | | 3.92 | | | | 7.80 | | | | 3.02 | | | | 9.58 | | | | N/A | |
| | | | | |
Strategic Markets | | | | | | | | | | | | | | | |
Bloomberg Commodity Index Total ReturnSM | | | -11.87 | % | | | -24.69 | % | | | -5.02 | % | | | -2.44 | % | | | N/A | |
| | | | | |
Fixed Income | | | | | | | | | | | | | | | |
BofA Merrill Lynch U.S. High-Yield (high-yield bonds) | | | 1.51 | % | | | 2.57 | % | | | 8.18 | % | | | 8.28 | % | | | N/A | |
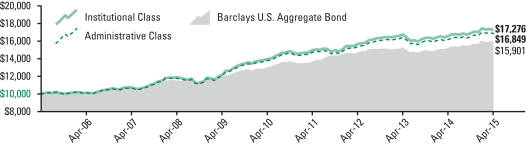
Barclays U.S. Aggregate Bond (domestic bonds) | | | 2.06 | | | | 4.46 | | | | 4.12 | | | | 4.75 | | | | 7.33 | % |
BofA Merrill Lynch 3-Month U.S. Treasury Bill (proxy for money market returns) | | | 0.01 | | | | 0.02 | | | | 0.09 | | | | 1.47 | | | | 3.90 | |
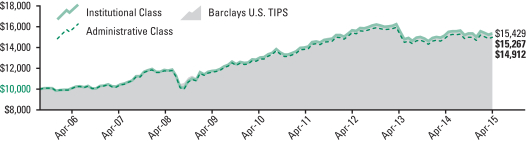
Barclays U.S. TIPS (inflation-linked bonds) | | | 1.28 | | | | 2.48 | | | | 3.96 | | | | 4.43 | | | | N/A | |
3
International Equity, Strategic Markets, and Fixed Income
International stock markets moved higher in the first half of fiscal 2015 as investors responded favorably to new monetary easing initiatives by central banks in Europe, Japan and other countries. The U.S. dollar strengthened against most international currencies, boosting the competitiveness of foreign exporters. Shares of companies based in developed overseas markets returned 6.81%, as measured by the MSCI EAFE (ND) Index, while emerging markets equities returned 3.92%, as measured by the MSCI Emerging Markets (ND) Index. The MSCI World (ND) Index, a measure of global equities including the U.S., returned 5.09%. (All international and global returns are in U.S. dollars.)
Commodity markets finished broadly lower for the first half of fiscal 2015, driven in part by the decline in crude oil prices and the stronger U.S. dollar. The Bloomberg Commodity Index Total ReturnSM, an unmanaged index of futures contracts on a diversified group of physical commodities, returned -11.87%.
Fixed income markets generated modest gains in the first half of fiscal 2015. The Federal Reserve indicated its willingness to begin gradually raising short-term rates if warranted by certain signs of continued economic growth in the U.S. By contrast, against a backdrop of economic weakness and subdued inflation, a number of central banks outside the U.S., including Europe and Japan, introduced new monetary stimulus measures.
The broad U.S. investment-grade bond market returned 2.06% for the fiscal first half, as measured by the Barclays U.S. Aggregate Bond Index. Below investment-grade bonds returned 1.51%, as measured by the BofA Merrill Lynch U.S. High Yield Index. Inflation-linked bonds, as measured by the Barclays U.S. TIPS Index, returned 1.28%. Money market investments again produced barely positive returns as the Federal Reserve continued to hold its federal funds target rate at the 0.0% to 0.25% range.
Disciplined Approach
Although stocks and bonds may provide solid long-term returns, as indicated in the table on the preceding page, financial markets can be very volatile in the short run. Given the uncertainty of markets, a disciplined approach and a diversified portfolio can be useful tools in helping investors to manage risk. At Harbor Funds, we offer a range of actively-managed equity, strategic markets and fixed income funds to assist investors in establishing an investment plan to help achieve their long-term goals.
Thank you for your investment in Harbor Funds.
June 24, 2015

David G. Van Hooser
Chairman
4
Harbor Capital Appreciation Fund
MANAGERS’ COMMENTARY (Unaudited)
SUBADVISER
Jennison Associates LLC
466 Lexington Avenue New York, NY 10017
PORTFOLIO MANAGERS
Spiros Segalas
Since 1990
Kathleen A. McCarragher
Since 2013
Jennison has subadvised the Fund since 1990.
INVESTMENT OBJECTIVE
The Fund seeks long-term growth of capital.
PRINCIPAL STYLE CHARACTERISTICS
Mid to large cap growth stocks

Spiros Segalas

Kathleen A. McCarragher
Management’s Discussion of
Fund Performance
MARKET REVIEW
Weak energy prices and a strong U.S. dollar were key influences on the global economic landscape in the six months ended April 30, 2015. The U.S. remained the strongest of the major global economies. Europe struggled to avert Greece’s looming default even as the country’s new government called for less economic austerity. Tensions between Russia and Ukraine remained elevated with little hint of improvement. China’s growth continued to slow despite talk of stimulus and easing in lending markets. Brazil flirted with recession. Japan showed little economic improvement, although its stock market made steady progress as investors hoped a weaker yen would boost exports. These challenges, combined with uncertainty about the timing and pace of anticipated monetary tightening in the U.S., contributed to continued volatility in global financial markets.
PERFORMANCE
Harbor Capital Appreciation Fund advanced 7.47% (Institutional Class), 7.32% (Administrative Class), and 7.27% (Investor Class) in the six months ended April 30, 2015, outperforming the Russell 1000® Growth Index benchmark, which rose 6.54%. From a longer-term perspective, the Fund outperformed the benchmark for the 10 years ended April 30, 2015, and since its inception in 1987.
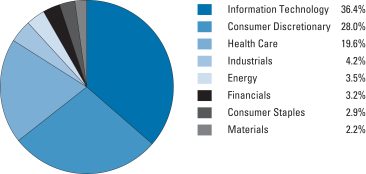
With the exception of Energy and Utilities, every sector in the benchmark advanced, but only Consumer Discretionary, Information Technology, and Health Care outpaced the index as a whole. With substantial weights in these three sectors, the Fund posted strong returns and outperformed the benchmark.
In Consumer Discretionary, major contributors to Fund returns included Amazon.com, Netflix, and Starbucks. Amazon continued to invest in its business to drive unit growth, not only in its core retail operations but also in digital commerce via the mobile market. We like Amazon’s potential for long-term revenue growth and margin expansion, as well as its business opportunities in cloud-computing infrastructure. Internet television network Netflix added millions of net new subscribers. We believe several factors have strengthened the long-term competitive positioning of the company, including a shift toward exclusive deals and original content, increasing pricing power, international expansion, and the company’s scale advantage. The strength of the Starbucks brand and the company’s innovation in mobile and loyalty programs helped drive customer traffic and robust sales.
In the Information Technology sector, Apple’s strength reflected expanding global acceptance of its platform. We expect that new products and updates will sustain the company’s attractive revenue growth. Red Hat, the market-leading vendor of Linux, an open-source computer operating system, benefited from several secular trends, including a shift from the UNIX operating system to Linux, increased use of open-source programs and services, and cloud computing. Tencent Holdings performed well thanks to its leading position in China’s online gaming and instant-messaging markets as well as its growing e-commerce, advertising, and payment-service efforts. In contrast, another Chinese Internet company, Alibaba, was hurt by worries related to changes in keyword search, the
5
Harbor Capital Appreciation Fund
MANAGERS’ COMMENTARY—Continued
| | | | |
TOP TEN HOLDINGS (% of net assets) | |
Apple Inc. | | | 6.2% | |
Facebook Inc. | | | 3.4% | |
MasterCard Inc. | | | 3.4% | |
Amazon.com Inc. | | | 3.3% | |
Visa Inc. | | | 2.6% | |
Biogen Inc. | | | 2.4% | |
NIKE Inc. | | | 2.4% | |
Bristol-Myers Squibb Co. | | | 2.2% | |
Walt Disney Co. | | | 2.2% | |
Actavis plc | | | 2.1% | |
transition to more mobile-device-based transactions, and an at-times-unsettled relationship with its main corporate regulator in China. We believe Alibaba, with its dominant market share, offers an attractive opportunity to invest in the long-term growth of the Chinese e-commerce market, which in our view is meaningfully under-penetrated.
In the Health Care sector, Actavis completed its acquisition of Allergan, which makes dermatology and eye-care products. After several acquisitions, Actavis is now a major pharmaceutical company with a global scope and a product line including both branded and generic drugs. We believe the Allergan acquisition should enhance the rate and duration of Actavis’s growth. Novo Nordisk, the world’s leading maker of insulin, rose as a new insulin product, already available in Europe and other markets, moved closer to approval in the U.S.
Declines in Gilead Sciences and Alexion Pharmaceuticals during the fiscal first half followed strong outperformance by both stocks in the preceding months. Gilead’s weakness reflected indications that hepatitis C drug pricing, as a result of contracts with pharmacy benefits managers, is declining. Gilead’s Sovaldi and Harvoni drugs have set a new standard for hepatitis C treatment, curing the vast majority of patients in about 12 weeks with few side effects. Gilead’s oncology pipeline also looks promising, in our view. We believe the decline in Alexion was probably related to delays in the launch of a new product for a rare genetic metabolic disorder and concerns about competition for its lead product, Soliris. Soliris treats two rare, genetic and potentially life-threatening blood disorders. Alexion is pursuing label-expansion opportunities for Soliris for treatment of other autoimmune and inflammatory diseases.
The Fund’s Energy positions advanced in a difficult environment and outperformed the benchmark sector. Shares of energy exploration and production company Concho Resources performed well. The company has assets in the West Texas Permian Basin, one of the most prolific oil-producing areas in the U.S. Oil equipment and services provider Schlumberger, on the other hand, was pressured as falling energy prices caused its customers to curtail future spending.
OUTLOOK AND STRATEGY
Corporate profit estimates have been reduced to reflect the effects of lower oil prices and the strong dollar. The toll of energy prices on energy companies should have only a minor impact on the Fund’s overall reported earnings, as exposure to the Energy sector is limited.
We believe that the strength of the U.S. dollar is apt to have a broader and meaningful impact on profits of the companies in the portfolio. With a sizable percentage of company earnings coming from international markets, we have lowered our earnings estimates to reflect unfavorable currency translation. Our view is that the translation impact, while detrimental to reported profits, does little to diminish a company’s competitive position or future growth outlook.
As fundamental investors, we examine company and industry prospects over the intermediate and long term, working to understand and anticipate how industries and businesses will change over time. Our goal is to identify companies with sustainable above-average growth. We have constructed a portfolio of companies with what we believe are differentiated products and market opportunities. We have confidence in their ability to deliver earnings growth that outpaces that of the broad market.
This report contains the current opinions of Jennison Associates LLC at the time of its publication and should not be considered as investment advice or a recommendation of any particular security, strategy or investment product. Such opinions are subject to change without notice and securities described herein may no longer be included in, or may at any time be removed from, the Fund’s portfolio. This report is distributed for informational purposes only. Information contained herein has been obtained from sources believed reliable, but not guaranteed.
Equity securities, such as common stocks, are affected by company specific events and by movements in the overall stock markets in which those securities principally trade. An adverse company specific event, or downturn in those stock markets, can depress the value of a particular company’s equity securities. For information on the different share classes and the risks associated with an investment in the Fund, please refer to the current prospectus.
6
Harbor Capital Appreciation Fund
FUND SUMMARY—April 30, 2015 (Unaudited)
| | | | |
INSTITUTIONAL CLASS |
| | | | |
| Fund # | | | | 2012 |
| | |
| Cusip | | | | 411511504 |
| | |
| Ticker | | | | HACAX |
| | |
| Inception Date | | | | 12/29/1987 |
| | |
| Net Expense Ratio | | | | 0.64%a,b |
| | |
| Total Net Assets (000s) | | | | $24,050,556 |
| | | | |
ADMINISTRATIVE CLASS |
| | | | |
| Fund # | | | | 2212 |
| | |
| Cusip | | | | 411511827 |
| | |
| Ticker | | | | HRCAX |
| | |
| Inception Date | | | | 11/01/2002 |
| | |
| Net Expense Ratio | | | | 0.89%a,b |
| | |
| Total Net Assets (000s) | | | | $655,759 |
| | | | |
INVESTOR CLASS |
| | | | |
| Fund # | | | | 2412 |
| | |
| Cusip | | | | 411511819 |
| | |
| Ticker | | | | HCAIX |
| | |
| Inception Date | | | | 11/01/2002 |
| | |
| Net Expense Ratio | | | | 1.01%a,b |
| | |
| Total Net Assets (000s) | | | | $1,963,242 |
| b | Reflective of a contractual fee waiver effective through February 29, 2016. |
PORTFOLIO STATISTICS
| | | | | | | | |
| | | Portfolio | | | Benchmark | |
| | |
Weighted Average Market Cap (MM) | | | $126,525 | | | | $132,262 | |
| | |
Price/Earning Ratio (P/E) | | | 33.2x | | | | 23.9x | |
| | |
Price/Book Ratio (P/B) | | | 8.2x | | | | 6.6x | |
| | |
Beta vs. Russell 1000® Growth Index | | | 1.11 | | | | 1.00 | |
| | |
Portfolio Turnover (6-Month Period Ended 04/30/2015) | | | 21% | c | | | N/A | |
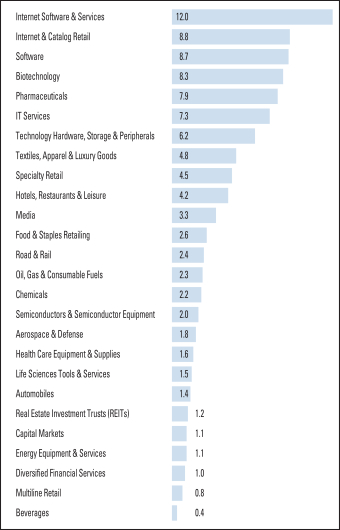
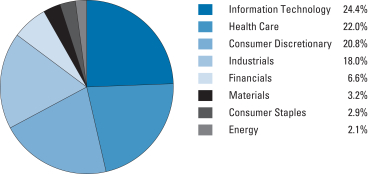
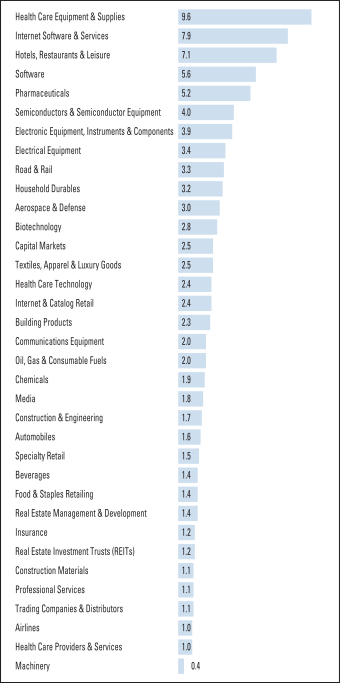
SECTOR ALLOCATION (% of investments)
(Excludes cash and short-term investments)
7
Harbor Capital Appreciation Fund
FUND PERFORMANCE SUMMARY (Unaudited)
Institutional Class
CHANGE IN A $50,000 INVESTMENT
For the period 05/01/2005 through 04/30/2015
| | |
The graph compares a $50,000 investment in the Fund with the performance of the Russell 1000® Growth Index and the S&P 500 Index. The Fund’s performance includes the reinvestment of all dividend and capital gain distributions. | | 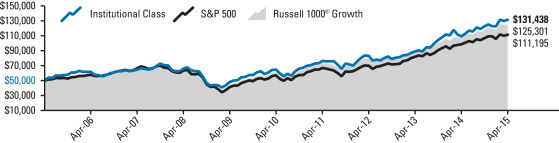 |
| | | | | | | | | | | | | | | | | | | | | | | | | | | | | | | | | | |
Total Returns For the periods ended 04/30/2015 | |  | |
| Harbor Capital Appreciation Fund | | | | | | | | | | | | | | | | | | | | | | | | | | | | | | | | | | |
Institutional Class | | | 7.47% | | | | | | 20.46% | | | | | | 15.23% | | | | | | 10.15% | | | | | | 12/29/1987 | | | | | $ | 131,438 | |
| Comparative Indices | | | | | | | | | | | | | | | | | | | | | | | | | | | | | | | | | | |
Russell 1000® Growth | | | 6.54% | | | | | | 16.67% | | | | | | 15.49% | | | | | | 9.62% | | | | | | — | | | | | $ | 125,301 | |
S&P 500 | | | 4.40% | | | | | | 12.98% | | | | | | 14.33% | | | | | | 8.32% | | | | | | — | | | | | $ | 111,195 | |
Administrative and Investor Classes
CHANGE IN A $10,000 INVESTMENT
For the period 05/01/2005 through 04/30/2015
| | |
The graph compares a $10,000 investment in the Fund with the performance of the Russell 1000® Growth Index and the S&P 500 Index. The Fund’s performance includes the reinvestment of all dividend and capital gain distributions. | | 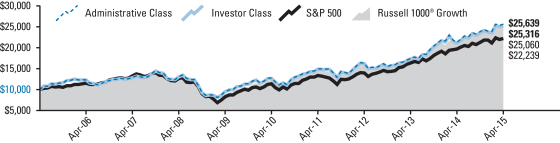 |
| | | | | | | | | | | | | | | | | | | | | | | | | | | | | | | | | | |
Total Returns For the periods ended 04/30/2015 | |  | |
| Harbor Capital Appreciation Fund | | | | | | | | | | | | | | | | | | | | | | | | | | | | | | | | | | |
Administrative Class | | | 7.32% | | | | | | 20.14% | | | | | | 14.95% | | | | | | 9.87% | | | | | | 11/01/2002 | | | | | $ | 25,639 | |
Investor Class | | | 7.27% | | | | | | 20.00% | | | | | | 14.80% | | | | | | 9.73% | | | | | | 11/01/2002 | | | | | $ | 25,316 | |
| Comparative Indices | | | | | | | | | | | | | | | | | | | | | | | | | | | | | | | | | | |
Russell 1000® Growth | | | 6.54% | | | | | | 16.67% | | | | | | 15.49% | | | | | | 9.62% | | | | | | — | | | | | $ | 25,060 | |
S&P 500 | | | 4.40% | | | | | | 12.98% | | | | | | 14.33% | | | | | | 8.32% | | | | | | — | | | | | $ | 22,239 | |
As stated in the Fund’s current prospectus, the expense ratios were 0.66% (Net) and 0.68% (Gross) (Institutional Class); 0.91% (Net) and 0.93% (Gross) (Administrative Class); and 1.03% (Net) and 1.05% (Gross) (Investor Class). The net expense ratios reflect a contractual management fee waiver effective through 02/29/2016. The expense ratios in the prospectus may differ from the actual expense ratios for the period disclosed within this report. The expense ratios shown in the prospectus are based on the prior fiscal year, adjusted to reflect changes, if any, in contractual arrangements that occurred prior to the date of the prospectus.
Performance data shown represents past performance, which is no guarantee of future results. Current performance may be higher or lower than the past performance data shown. Investment returns and the value of an investment will fluctuate, and an investor’s shares, when sold, may be worth more or less than their original cost. You can obtain performance data current to the most recent month-end (available within seven business days after the most recent month-end) by calling 800-422-1050 or visiting harborfunds.com.
The returns shown do not reflect the deduction of taxes that a shareholder would pay on Fund distributions or on the redemption of Fund shares. From time to time, certain fees and/or expenses have been waived or reimbursed, which has resulted in higher returns. Without these waivers and reimbursements, the returns would have been lower.
8
Harbor Capital Appreciation Fund
PORTFOLIO OF INVESTMENTS—April 30, 2015 (Unaudited)
Equity Holdings (% of net assets)
(Excludes net cash and short-term investments of 0.6%)
| | | | | | | | |
COMMON STOCKS—99.4% | |
| | |
| Shares | | | | | Value
(000s) | |
| | AEROSPACE & DEFENSE—1.8% | |
| | 3,290,651 | | | Boeing Co. | | $ | 471,682 | |
| | | | | | | | |
| | AUTOMOBILES—1.4% | |
| | 1,635,392 | | | Tesla Motors Inc.* | | | 369,680 | |
| | | | | | | | |
| | BEVERAGES—0.4% | |
| | 688,569 | | | Monster Beverage Corp.* | | | 94,410 | |
| | | | | | | | |
| | BIOTECHNOLOGY—8.3% | |
| | 1,802,160 | | | Alexion Pharmaceuticals Inc.* | | | 304,979 | |
| | 1,696,755 | | | Biogen Inc.* | | | 634,468 | |
| | 3,994,613 | | | Celgene Corp.* | | | 431,658 | |
| | 3,310,688 | | | Gilead Sciences Inc.* | | | 332,757 | |
| | 880,049 | | | Incyte Corp.* | | | 85,506 | |
| | 367,169 | | | Regeneron Pharmaceuticals Inc.* | | | 167,965 | |
| | 2,141,365 | | | Vertex Pharmaceuticals Inc.* | | | 263,987 | |
| | | | | | | | |
| | | | | | | 2,221,320 | |
| | | | | | | | |
| | CAPITAL MARKETS—1.1% | |
| | 7,571,365 | | | Morgan Stanley | | | 282,488 | |
| | | | | | | | |
| | CHEMICALS—2.2% | |
| | 3,308,789 | | | Monsanto Co. | | | 377,069 | |
| | 773,488 | | | Sherwin-Williams Co. | | | 215,030 | |
| | | | | | | | |
| | | | | | | 592,099 | |
| | | | | | | | |
| | DIVERSIFIED FINANCIAL SERVICES—1.0% | |
| | 2,619,117 | | | McGraw Hill Financial Inc. | | | 273,174 | |
| | | | | | | | |
| | ENERGY EQUIPMENT & SERVICES—1.1% | |
| | 3,111,472 | | | Schlumberger Ltd. | | | 294,376 | |
| | | | | | | | |
| | FOOD & STAPLES RETAILING—2.6% | |
| | 2,953,817 | | | Costco Wholesale Corp. | | | 422,543 | |
| | 3,856,186 | | | Kroger Co. | | | 265,730 | |
| | | | | | | | |
| | | | | | | 688,273 | |
| | | | | | | | |
| | HEALTH CARE EQUIPMENT & SUPPLIES—1.6% | |
| | 9,393,669 | | | Abbott Laboratories | | | 436,054 | |
| | | | | | | | |
| | HOTELS, RESTAURANTS & LEISURE—4.2% | |
| | 418,261 | | | Chipotle Mexican Grill Inc.* | | | 259,882 | |
| | 5,354,215 | | | Marriott International Inc. | | | 428,605 | |
| | 8,976,940 | | | Starbucks Corp. | | | 445,077 | |
| | | | | | | | |
| | | | | | | 1,133,564 | |
| | | | | | | | |
| | INTERNET & CATALOG RETAIL—8.8% | |
| | 2,087,313 | | | Amazon.com Inc.* | | | 880,387 | |
| | 5,406,176 | | | JD.com Inc. ADR (CHN)*,1 | | | 181,431 | |
| | 991,438 | | | Netflix Inc.* | | | 551,735 | |
| | 404,232 | | | Priceline Group Inc.* | | | 500,363 | |
| | 1,660,550 | | | TripAdvisor Inc.* | | | 133,658 | |
| | 3,573,608 | | | Vipshop Holdings Ltd. ADR (CHN)*,1 | | | 101,097 | |
| | | | | | | | |
| | | | | | | 2,348,671 | |
| | | | | | | | |
| | INTERNET SOFTWARE & SERVICES—12.0% | |
| | 3,177,355 | | | Alibaba Group Holding Ltd. ADR (CHN)*,1 | | | 258,287 | |
| | 11,603,414 | | | Facebook Inc.* | | | 914,001 | |
| | 709,529 | | | Google Inc. Class A* | | | 389,368 | |
| | 813,365 | | | Google Inc. Class C | | | 437,053 | |
| | 545,296 | | | LendingClub Corp.* | | | 9,516 | |
| | 2,080,644 | | | LinkedIn Corp.* | | | 524,593 | |
| | 21,978,832 | | | Tencent Holdings Ltd. (CHN) | | | 453,618 | |
| | 5,407,286 | | | Twitter Inc.* | | | 210,668 | |
| | | | | | | | |
| | | | | | | 3,197,104 | |
| | | | | | | | |
| | IT SERVICES—7.3% | |
| | 2,165,607 | | | FleetCor Technologies Inc.* | | | 348,424 | |
| | 10,008,350 | | | MasterCard Inc. | | | 902,853 | |
| | 10,443,553 | | | Visa Inc. | | | 689,797 | |
| | | | | | | | |
| | | | | | | 1,941,074 | |
| | | | | | | | |
| | LIFE SCIENCES TOOLS & SERVICES—1.5% | |
| | 2,234,771 | | | Illumina Inc.* | | | 411,757 | |
| | | | | | | | |
| | MEDIA—3.3% | |
| | 3,183,140 | | | Time Warner Inc. | | | 268,689 | |
| | 5,532,481 | | | Walt Disney Co. | | | 601,491 | |
| | | | | | | | |
| | | | | | | 870,180 | |
| | | | | | | | |
| | MULTILINE RETAIL—0.8% | |
| | 2,872,728 | | | Dollar General Corp. | | | 208,876 | |
| | | | | | | | |
| | OIL, GAS & CONSUMABLE FUELS—2.3% | |
| | 2,737,076 | | | Concho Resources Inc.* | | | 346,678 | |
| | 2,785,603 | | | EOG Resources Inc. | | | 275,636 | |
| | | | | | | | |
| | | | | | | 622,314 | |
| | | | | | | | |
9
Harbor Capital Appreciation Fund
PORTFOLIO OF INVESTMENTS—Continued
| | | | | | | | |
COMMON STOCKS—Continued | |
| | |
| Shares | | | | | Value
(000s) | |
| | PHARMACEUTICALS—7.9% | |
| | 2,016,078 | | | Actavis plc* | | $ | 570,268 | |
| | 9,094,929 | | | Bristol-Myers Squibb Co. | | | 579,620 | |
| | 8,655,555 | | | Novo Nordisk AS ADR (DEN)1 | | | 487,048 | |
| | 1,974,310 | | | Shire plc ADR (IE)1 | | | 480,764 | |
| | | | | | | | |
| | | | | | | 2,117,700 | |
| | | | | | | | |
| | REAL ESTATE INVESTMENT TRUSTS (REITs)—1.2% | |
| | 3,255,332 | | | American Tower Corp. | | | 307,727 | |
| | | | | | | | |
| | ROAD & RAIL—2.4% | |
| | 1,618,915 | | | Canadian Pacific Railway Ltd. (CAN) | | | 308,533 | |
| | 3,064,123 | | | Union Pacific Corp. | | | 325,502 | |
| | | | | | | | |
| | | | | | | 634,035 | |
| | | | | | | | |
| | SEMICONDUCTORS & SEMICONDUCTOR EQUIPMENT— 2.0% | |
| | 6,986,221 | | | ARM Holdings plc ADR (UK)1 | | | 356,227 | |
| | 1,837,586 | | | NXP Semiconductors NV (NET)* | | | 176,629 | |
| | | | | | | | |
| | | | | | | 532,856 | |
| | | | | | | | |
| | SOFTWARE—8.7% | |
| | 6,036,493 | | | Adobe Systems Inc.* | | | 459,135 | |
| | 3,791,043 | | | FireEye Inc.* | | | 156,570 | |
| | 5,185,815 | | | Red Hat Inc.* | | | 390,284 | |
| | 7,504,102 | | | Salesforce.com Inc.* | | | 546,449 | |
| | 4,215,008 | | | Splunk Inc.* | | | 279,645 | |
| | 2,068,058 | | | VMware Inc.* | | | 182,196 | |
| | 3,343,941 | | | Workday Inc.* | | | 305,001 | |
| | | | | | | | |
| | | | | | | 2,319,280 | |
| | | | | | | | |
| | SPECIALTY RETAIL—4.5% | |
| | 14,063,845 | | | Inditex SA (SP) | | | 451,295 | |
| | 1,558,329 | | | O’Reilly Automotive Inc.* | | | 339,451 | |
| | 1,641,728 | | | Tiffany & Co. | | | 143,618 | |
| | 4,215,815 | | | TJX Cos. Inc. | | | 272,089 | |
| | | | | | | | |
| | | | | | | 1,206,453 | |
| | | | | | | | |
| | TECHNOLOGY HARDWARE, STORAGE & PERIPHERALS—6.2% | |
| | 13,203,835 | | | Apple Inc. | | | 1,652,460 | |
| | | | | | | | |
| | TEXTILES, APPAREL & LUXURY GOODS—4.8% | |
| | 4,281,580 | | | Luxottica Group SpA (IT) | | | 281,972 | |
| | 6,573,927 | | | NIKE Inc. | | | 649,767 | |
| | 4,528,615 | | | Under Armour Inc.* | | | 351,194 | |
| | | | | | | | |
| | | | | | | 1,282,933 | |
| | | | | | | | |
| TOTAL COMMON STOCKS
(Cost $16,338,124) | | | 26,510,540 | |
| | | | | | | | |
| | | | | | | | |
SHORT-TERM INVESTMENTS—0.7% | |
| (Cost $194,030) | | | | |
Principal Amount (000s) | | | | | | |
| | REPURCHASE AGREEMENTS | | | | |
| $ | 194,030 | | | Repurchase Agreement with State Street Corp. dated April 30, 2015 due May 01, 2015 at 0.000% collateralized by U.S. Treasury Notes (market value $197,913) | | | 194,030 | |
| | | | | | | | |
| TOTAL INVESTMENTS—100.1%
(Cost $16,532,154) | | | 26,704,570 | |
| | | | | | | | |
| | CASH AND OTHER ASSETS, LESS LIABILITIES—(0.1)% | | | (35,013 | ) |
| | | | | | | | |
| | TOTAL NET ASSETS—100.0% | | $ | 26,669,557 | |
| | | | | | | | |
FAIR VALUE MEASUREMENTS
The following table summarizes the Fund’s investments as of April 30, 2015 based on the inputs used to value them.
| | | | | | | | | | | | | | | | | | | | |
Asset Category | | Quoted Prices
Level 1
(000s) | | Other Significant
Observable Inputs
Level 2
(000s) | | Significant
Unobservable Inputs
Level 3
(000s) | | Total
(000s) |
Common Stocks | | | | | | | | | | | | | | | | | | | | |
Aerospace & Defense | | | $ | 471,682 | | | | $ | — | | | | $ | — | | | | $ | 471,682 | |
Automobiles | | | | 369,680 | | | | | — | | | | | — | | | | | 369,680 | |
Beverages | | | | 94,410 | | | | | — | | | | | — | | | | | 94,410 | |
Biotechnology | | | | 2,221,320 | | | | | — | | | | | — | | | | | 2,221,320 | |
Capital Markets | | | | 282,488 | | | | | — | | | | | — | | | | | 282,488 | |
Chemicals | | | | 592,099 | | | | | — | | | | | — | | | | | 592,099 | |
Diversified Financial Services | | | | 273,174 | | | | | — | | | | | — | | | | | 273,174 | |
Energy Equipment & Services | | | | 294,376 | | | | | — | | | | | — | | | | | 294,376 | |
Food & Staples Retailing | | | | 688,273 | | | | | — | | | | | — | | | | | 688,273 | |
Health Care Equipment & Supplies | | | | 436,054 | | | | | — | | | | | — | | | | | 436,054 | |
Hotels, Restaurants & Leisure | | | | 1,133,564 | | | | | — | | | | | — | | | | | 1,133,564 | |
Internet & Catalog Retail | | | | 2,348,671 | | | | | — | | | | | — | | | | | 2,348,671 | |
Internet Software & Services | | | | 2,743,486 | | | | | 453,618 | | | | | — | | | | | 3,197,104 | |
IT Services | | | | 1,941,074 | | | | | — | | | | | — | | | | | 1,941,074 | |
Life Sciences Tools & Services | | | | 411,757 | | | | | — | | | | | — | | | | | 411,757 | |
Media | | | | 870,180 | | | | | — | | | | | — | | | | | 870,180 | |
Multiline Retail | | | | 208,876 | | | | | — | | | | | — | | | | | 208,876 | |
Oil, Gas & Consumable Fuels | | | | 622,314 | | | | | — | | | | | — | | | | | 622,314 | |
Pharmaceuticals | | | | 2,117,700 | | | | | — | | | | | — | | | | | 2,117,700 | |
10
Harbor Capital Appreciation Fund
PORTFOLIO OF INVESTMENTS—Continued
FAIR VALUE MEASUREMENTS—Continued
| | | | | | | | | | | | | | | | | | | | |
Asset Category | | Quoted Prices
Level 1
(000s) | | Other Significant
Observable Inputs
Level 2
(000s) | | Significant
Unobservable Inputs
Level 3
(000s) | | Total
(000s) |
Real Estate Investment Trusts (REITs) | | | $ | 307,727 | | | | $ | — | | | | $ | — | | | | $ | 307,727 | |
Road & Rail | | | | 634,035 | | | | | — | | | | | — | | | | | 634,035 | |
Semiconductors & Semiconductor | | | | | | | | | | | | | | | | | | | | |
Equipment | | | | 532,856 | | | | | — | | | | | — | | | | | 532,856 | |
Software | | | | 2,319,280 | | | | | — | | | | | — | | | | | 2,319,280 | |
Specialty Retail | | | | 755,158 | | | | | 451,295 | | | | | — | | | | | 1,206,453 | |
Technology Hardware, Storage & | | | | | | | | | | | | | | | | | | | | |
Peripherals | | | | 1,652,460 | | | | | — | | | | | — | | | | | 1,652,460 | |
Textiles, Apparel & Luxury Goods | | | | 1,000,961 | | | | | 281,972 | | | | | — | | | | | 1,282,933 | |
Short-Term Investments | | | | | | | | | | | | | | | | | | | | |
Repurchase Agreements | | | | — | | | | | 194,030 | | | | | — | | | | | 194,030 | |
| | | | | | | | | | | | | | | | | | | | |
Total Investments in Securities | | | $ | 25,323,655 | | | | $ | 1,380,915 | | | | $ | — | | | | $ | 26,704,570 | |
| | | | | | | | | | | | | | | | | | | | |
There were no Level 3 holdings at October 31, 2014 or April 30, 2015, and no transfers between levels during the period.
For more information on valuation inputs and their aggregation into the levels used in the table above, please refer to the Fair Value Measurements and Disclosures in Note 2 of the accompanying Notes to Financial Statements.
| * | Non-income producing security. |
| 1 | ADR after the name of a foreign holding stands for American Depositary Receipts representing ownership of foreign securities. ADRs are issued by U.S. banking institutions. |
The accompanying notes are an integral part of the Financial Statements.
11
Harbor Mid Cap Growth Fund
MANAGERS’ COMMENTARY (Unaudited)
SUBADVISER
Wellington
Management
Company, LLP
280 Congress Street
Boston, MA 02210
PORTFOLIO MANAGERS
Michael T. Carmen, CFA
Since 2005
Stephen Mortimer
Since 2010
Mario E. Abularach, CFA
Since 2006
Wellington
Management
has subadvised
the Fund since 2005.
INVESTMENT OBJECTIVE
The Fund seeks long-term growth of capital.
PRINCIPAL STYLE
CHARACTERISTICS
Mid cap companies
with significant capital
appreciation potential

Michael T. Carmen
Management’s Discussion of
Fund Performance
MARKET REVIEW
The rally in stocks continued into the end of calendar 2014 as global equities rose for the 10th consecutive quarter. The U.S. Federal Reserve helped to support riskier assets after it stated it could be “patient” with regards to starting its policy normalization process. During the fourth quarter of 2014, U.S. equities outperformed non-U.S. equities and emerging market stocks underperformed their developed market counterparts. Global equities continued to surge during the first quarter of 2015, rising for the 11th consecutive quarter. Upon reaching the bull market’s sixth anniversary, the MSCI All Country World Index ended March up 189.5% from its closing low on March 9, 2009. Europe was a bright spot during the first quarter due to further accommodative monetary policy and encouraging economic data, including positive trends in manufacturing, exports, and economic sentiment. Investors responded positively after the European Central Bank announced a €1.14 trillion ($1.3 trillion) open-ended quantitative easing program to combat record-low inflation and stimulate growth in Europe. There were a few worrisome items, including disappointing manufacturing data from China and Japan and fears about Greece’s future in the European Union. U.S. stocks lagged the broader market as some market participants voiced concerns about potential headwinds such as valuations, near-term Federal Reserve tightening, and the strong U.S. dollar’s impact on exports.
In this environment, the Russell Midcap® Growth Index recorded a positive return of 7.77%. Within the index, 8 of 10 sectors posted positive returns. Health Care, Information Technology, and Consumer Staples were the strongest-performing sectors, while Utilities, Energy, and Industrials lagged the broader index.
PERFORMANCE
For the six months ended April 30, 2015, Harbor Mid Cap Growth Fund returned 7.06% (Institutional Class), 6.97% (Administrative Class), and 6.90% (Investor Class), underperforming the 7.77% return of the Russell Midcap® Growth benchmark. Sector allocation, a residual of our bottom-up stock selection process, was the primary detractor from relative performance. An underweighted allocation to the poor-performing Energy sector and an overweight to the strong-performing Health Care sector contributed to relative performance, but were more than offset by a cash position that had a positive return but lagged well behind the overall return of the index. Security selection had a neutral impact on Fund performance. Stock selection was strongest in Consumer Discretionary, Financials, Information Technology, and Energy. Offsetting these positive results was weak selection in Industrials, Health Care, and Materials.
Consumer Discretionary holding Zulily, an online shopping website, was the top detractor from relative results during the fiscal first half. The company had email delivery issues that negatively impacted orders and revenues. The position was eliminated from the Fund prior to the end of the period. Insulet, in the Health Care sector, a manufacturer and developer of a new insulin infusion system for diabetes patients, was also among the top relative detractors, as disappointing recent new-patient growth trends weighed on the stock. The Fund continued to hold the security as we have high expectations and confidence that the company will deliver strong results in coming quarters.
The top contributor to relative performance was Health Care holding DexCom, a developer and manufacturer of continuous glucose monitoring systems for diabetes
12
Harbor Mid Cap Growth Fund
MANAGERS’ COMMENTARY—Continued
| | | | |
TOP TEN HOLDINGS (% of net assets) | |
Netflix Inc. | | | 2.4% | |
DexCom Inc. | | | 2.2% | |
Workday Inc. | | | 2.0% | |
CoStar Group Inc. | | | 1.9% | |
NXP Semiconductors NV | | | 1.9% | |
Akamai Technologies Inc. | | | 1.8% | |
Diamond Resorts International Inc. | | | 1.8% | |
IMAX Corp. | | | 1.8% | |
Actavis plc | | | 1.7% | |
Mylan NV | | | 1.7% | |
management. The company’s pediatric launch proceeded better than expected, and its recently approved “DexCom SHARE” system will utilize Bluetooth technology to allow for glucose monitoring on smartphones. Netflix, a Consumer Discretionary holding, was also among the top contributors. We believe that announcements about plans to address subscriber growth, the most important indicator for the stock, support an outlook for better growth over the coming years. Even after recent strong performance, we believe Netflix has room for continued growth, and we maintain a modestly overweighted position in the stock relative to the index. As of April 30, Netflix and DexCom were the Fund’s two largest holdings.
OUTLOOK AND STRATEGY
Our investment philosophy is based on four key underlying premises. First, we believe that changes in earnings expectations drive security prices. Second, we believe that tangible operating momentum precedes earnings momentum. Third, we believe that quality management will provide us with an opportunity to identify companies that will achieve operating excellence. Finally, we believe that our valuation discipline helps control portfolio risk.
We employ this philosophy, together with a bottom-up fundamental analysis and opportunistic investment approach, in managing the Fund. We consider a broad universe of available stocks within the mid cap market, typically focusing on companies with expected earnings growth of 15% or higher. To narrow the universe of available companies, we rely on intensive bottom-up fundamental proprietary research.
The Fund is largely constructed without regard to benchmark weightings by sector; however, we typically do not expect to exceed the benchmark weight by more than two times in any given sector. Bottom-up investment decisions resulted in increased exposure to Health Care and Information Technology, the Fund’s largest overweight sectors as of April 30. The Fund decreased its exposure to Consumer Discretionary stocks, moving from an overweighted allocation to an underweight during the period. As of April 30, the Fund was most underweight relative to the index in Consumer Staples, Energy, and Financials.
The rally in global equity markets, and particularly in growth stocks, continued in the first half of fiscal 2015. We believe equity markets will continue rewarding quality growth-oriented companies that are attractively valued, which in our view would provide a tailwind for the portfolio. We are confident that the Fund is well-positioned for future growth, with major holdings in undervalued stocks trading at attractive multiples. We believe that many of these holdings have ample room for future acceleration of earnings and that this growth will ultimately be recognized and rewarded in the market.
This report contains the current opinions of Wellington Management Company, LLP at the time of its publication and should not be considered as investment advice or a recommendation of any particular security, strategy or investment product. Such opinions are subject to change without notice and securities described herein may no longer be included in, or may at any time be removed from, the Fund’s portfolio. This report is distributed for informational purposes only. Information contained herein has been obtained from sources believed reliable, but not guaranteed.
Stocks of mid cap companies pose special risks, including possible illiquidity and greater price volatility than stocks of larger, more established companies. Equity securities, such as common stocks, are affected by company specific events and by movements in the overall stock markets in which those securities principally trade. An adverse company specific event, or downturn in those stock markets, can depress the value of a particular company’s equity securities. For information on the different share classes and the risks associated with an investment in the Fund, please refer to the current prospectus.
13
Harbor Mid Cap Growth Fund
FUND SUMMARY—April 30, 2015 (Unaudited)
| | | | |
INSTITUTIONAL CLASS |
| | | | |
| Fund # | | | | 2019 |
| | |
| Cusip | | | | 411511876 |
| | |
| Ticker | | | | HAMGX |
| | |
| Inception Date | | | | 11/01/2000 |
| | |
| Net Expense Ratio | | | | 0.84%a |
| | |
| Total Net Assets (000s) | | | | $312,289 |
| | | | |
ADMINISTRATIVE CLASS |
| | | | |
| Fund # | | | | 2219 |
| | |
| Cusip | | | | 411511793 |
| | |
| Ticker | | | | HRMGX |
| | |
| Inception Date | | | | 11/01/2002 |
| | |
| Net Expense Ratio | | | | 1.09%a |
| | |
| Total Net Assets (000s) | | | | $387,870 |
| | | | |
INVESTOR CLASS |
| | | | |
| Fund # | | | | 2419 |
| | |
| Cusip | | | | 411511785 |
| | |
| Ticker | | | | HIMGX |
| | |
| Inception Date | | | | 11/01/2002 |
| | |
| Net Expense Ratio | | | | 1.21%a |
| | |
| Total Net Assets (000s) | | | | $34,903 |
PORTFOLIO STATISTICS
| | | | | | | | |
| | | Portfolio | | | Benchmark | |
| | |
Weighted Average Market Cap (MM) | | | $12,736 | | | | $14,635 | |
| | |
Price/Earning Ratio (P/E) | | | 46.8x | | | | 27.8x | |
| | |
Price/Book Ratio (P/B) | | | 5.9x | | | | 6.4x | |
| | |
Beta vs. Russell Midcap® Growth Index | | | 1.06 | | | | 1.00 | |
| | |
Portfolio Turnover (6-Month Period Ended 04/30/2015) | | | 42% | b | | | N/A | |
SECTOR ALLOCATION (% of investments)
(Excludes cash and short-term investments)
14
Harbor Mid Cap Growth Fund
FUND PERFORMANCE SUMMARY (Unaudited)
Institutional Class
CHANGE IN A $50,000 INVESTMENT
For the period 05/01/2005 through 04/30/2015
| | |
The graph compares a $50,000 investment in the Fund with the performance of the Russell Midcap® Growth Index. The Fund’s performance includes the reinvestment of all dividend and capital gain distributions. | | 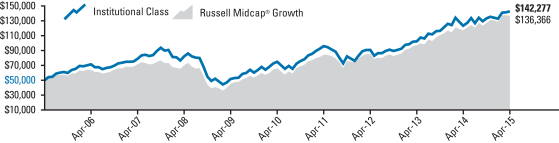 |
| | | | | | | | | | | | | | | | | | | | | | | | | | | | | | | | |
Total Returns For the periods ended 04/30/2015 | | | |
| Harbor Mid Cap Growth Fund | | | | | | | | | | | | | | | | | | | | | | | | | | | | | | | | |
Institutional Class | | | 7.06% | | | | | | 15.77% | | | | | | 13.78% | | | | | | 11.02% | | | | | 11/01/2000 | | | | $ | 142,277 | |
| Comparative Index | | | | | | | | | | | | | | | | | | | | | | | | | | | | | | | | |
Russell Midcap® Growth | | | 7.77% | | | | | | 16.46% | | | | | | 15.59% | | | | | | 10.55% | | | | | — | | | | $ | 136,366 | |
Administrative and Investor Classes
CHANGE IN A $10,000 INVESTMENT
For the period 05/01/2005 through 04/30/2015
| | |
The graph compares a $10,000 investment in the Fund with the performance of the Russell Midcap® Growth Index. The Fund’s performance includes the reinvestment of all dividend and capital gain distributions. | |  |
| | | | | | | | | | | | | | | | | | | | | | | | | | | | | | | | |
Total Returns For the periods ended 04/30/2015 | | | |
| Harbor Mid Cap Growth Fund | | | | | | | | | | | | | | | | | | | | | | | | | | | | | | | | |
Administrative Class | | | 6.97% | | | | | | 15.57% | | | | | | 13.52% | | | | | | 10.76% | | | | | 11/01/2002 | | | | $ | 27,796 | |
Investor Class | | | 6.90% | | | | | | 15.33% | | | | | | 13.37% | | | | | | 10.62% | | | | | 11/01/2002 | | | | $ | 27,436 | |
| Comparative Index | | | | | | | | | | | | | | | | | | | | | | | | | | | | | | | | |
Russell Midcap® Growth | | | 7.77% | | | | | | 16.46% | | | | | | 15.59% | | | | | | 10.55% | | | | | — | | | | $ | 27,273 | |
As stated in the Fund’s current prospectus, the expense ratios were 0.85% (Institutional Class); 1.10% (Administrative Class); and 1.22% (Investor Class). The expense ratios in the prospectus may differ from the actual expense ratios for the period disclosed within this report. The expense ratios shown in the prospectus are based on the prior fiscal year, adjusted to reflect changes, if any, in contractual arrangements that occurred prior to the date of the prospectus.
Performance data shown represents past performance, which is no guarantee of future results. Current performance may be higher or lower than the past performance data shown. Investment returns and the value of an investment will fluctuate, and an investor’s shares, when sold, may be worth more or less than their original cost. You can obtain performance data current to the most recent month-end (available within seven business days after the most recent month-end) by calling 800-422-1050 or visiting harborfunds.com.
The returns shown do not reflect the deduction of taxes that a shareholder would pay on Fund distributions or on the redemption of Fund shares. From time to time, certain fees and/or expenses have been waived or reimbursed, which has resulted in higher returns. Without these waivers and reimbursements, the returns would have been lower.
15
Harbor Mid Cap Growth Fund
PORTFOLIO OF INVESTMENTS—April 30, 2015 (Unaudited)
Equity Holdings (% of net assets)
(Excludes net cash and short-term investments of 4.1%)
| | | | | | | | |
COMMON STOCKS—95.8% | |
| | |
| Shares | | | | | Value
(000s) | |
| | AEROSPACE & DEFENSE—3.0% | |
| | 350,525 | | | DigitalGlobe Inc.* | | $ | 11,277 | |
| | 236,816 | | | Textron Inc. | | | 10,415 | |
| | | | | | | | |
| | | | | | | 21,692 | |
| | | | | | | | |
| | AIRLINES—1.0% | |
| | 111,421 | | | Spirit Airlines Inc.* | | | 7,629 | |
| | | | | | | | |
| | AUTOMOBILES—1.6% | |
| | 50,716 | | | Tesla Motors Inc.* | | | 11,464 | |
| | | | | | | | |
| | BEVERAGES—1.4% | |
| | 73,413 | | | Monster Beverage Corp.* | | | 10,066 | |
| | | | | | | | |
| | BIOTECHNOLOGY—2.8% | |
| | 33,867 | | | Alnylam Pharmaceuticals Inc.* | | | 3,450 | |
| | 6,500 | | | Blueprint Medicines Corp.* | | | 123 | |
| | 49,011 | | | Incyte Corp.* | | | 4,762 | |
| | 59,909 | | | Isis Pharmaceuticals Inc.* | | | 3,398 | |
| | 19,826 | | | Regeneron Pharmaceuticals Inc.* | | | 9,069 | |
| | | | | | | | |
| | | | | | | 20,802 | |
| | | | | | | | |
| | BUILDING PRODUCTS—2.3% | |
| | 222,454 | | | Fortune Brands Home & Security Inc. | | | 9,921 | |
| | 185,300 | | | Owens Corning Inc. | | | 7,164 | |
| | | | | | | | |
| | | | | | | 17,085 | |
| | | | | | | | |
| | CAPITAL MARKETS—2.5% | |
| | 149,085 | | | Julius Baer Group Ltd. (SWS)* | | | 7,803 | |
| | 139,286 | | | Northern Trust Corp. | | | 10,189 | |
| | | | | | | | |
| | | | | | | 17,992 | |
| | | | | | | | |
| | CHEMICALS—1.9% | |
| | 378,916 | | | Platform Specialty Products Corp.* | | | 10,208 | |
| | 144,483 | | | Platform Specialty Products Corp. PIPE*,1 | | | 3,892 | |
| | | | | | | | |
| | | | | | | 14,100 | |
| | | | | | | | |
| | COMMUNICATIONS EQUIPMENT—1.9% | |
| | 124,900 | | | Arista Networks Inc.* | | | 7,995 | |
| | 324,200 | | | Nomad Holdings Ltd. (VG)* | | | 5,835 | x |
| | | | | | | | |
| | | | | | | 13,830 | |
| | | | | | | | |
| | CONSTRUCTION & ENGINEERING—1.7% | |
| | 388,626 | | | AECOM Technology Corp.* | | | 12,265 | |
| | | | | | | | |
| | CONSTRUCTION MATERIALS—1.1% | |
| | 56,927 | | | Martin Marietta Materials Inc. | | | 8,121 | |
| | | | | | | | |
| | ELECTRICAL EQUIPMENT—3.4% | |
| | 57,038 | | | Acuity Brands Inc. | | | 9,523 | |
| | 113,836 | | | AMETEK Inc. | | | 5,967 | |
| | 222,942 | | | Generac Holdings Inc.* | | | 9,294 | |
| | | | | | | | |
| | | | | | | 24,784 | |
| | | | | | | | |
| | ELECTRONIC EQUIPMENT, INSTRUMENTS & COMPONENTS—3.9% | |
| | 272,142 | | | CDW Corp. | | | 10,428 | |
| | 160,835 | | | Cognex Corp.* | | | 7,220 | |
| | 160,462 | | | TE Connectivity Ltd. (SWS) | | | 10,679 | |
| | | | | | | | |
| | | | | | | 28,327 | |
| | | | | | | | |
| | FOOD & STAPLES RETAILING—1.4% | |
| | 221,374 | | | Whole Foods Market Inc. | | | 10,573 | |
| | | | | | | | |
| | HEALTH CARE EQUIPMENT & SUPPLIES—9.6% | |
| | 82,995 | | | Becton Dickinson and Co. | | | 11,691 | |
| | 557,160 | | | Boston Scientific Corp.* | | | 9,929 | |
| | 236,898 | | | DexCom Inc.* | | | 16,007 | |
| | 109,464 | | | HeartWare International Inc.* | | | 8,287 | |
| | 225,400 | | | Hologic Inc.* | | | 7,605 | |
| | 316,704 | | | Insulet Corp.* | | | 9,454 | |
| | 14,954 | | | Intuitive Surgical Inc.* | | | 7,417 | |
| | | | | | | | |
| | | | | | | 70,390 | |
| | | | | | | | |
16
Harbor Mid Cap Growth Fund
PORTFOLIO OF INVESTMENTS—Continued
| | | | | | | | |
COMMON STOCKS—Continued | |
| | |
| Shares | | | | | Value
(000s) | |
| | HEALTH CARE PROVIDERS & SERVICES—1.0% | |
| | 202,266 | | | Envision Healthcare Holdings Inc.* | | $ | 7,678 | |
| | | | | | | | |
| | HEALTH CARE TECHNOLOGY—2.4% | |
| | 104,862 | | | Cerner Corp.* | | | 7,530 | |
| | 388,493 | | | Veeva Systems Inc.* | | | 10,315 | |
| | | | | | | | |
| | | | | | | 17,845 | |
| | | | | | | | |
| | HOTELS, RESTAURANTS & LEISURE—7.1% | |
| | 19,697 | | | Chipotle Mexican Grill Inc.* | | | 12,238 | |
| | 412,276 | | | Diamond Resorts International Inc.* | | | 13,197 | |
| | 263,748 | | | Hilton Worldwide Holdings Inc.* | | | 7,638 | |
| | 58,213 | | | Panera Bread Co.* | | | 10,623 | |
| | 98,031 | | | Wyndham Worldwide Corp. | | | 8,372 | |
| | | | | | | | |
| | | | | | | 52,068 | |
| | | | | | | | |
| | HOUSEHOLD DURABLES—3.2% | |
| | 169,190 | | | GoPro Inc.* | | | 8,473 | |
| | 54,812 | | | Harman International Industries Inc. | | | 7,146 | |
| | 43,991 | | | Whirlpool Corp. | | | 7,725 | |
| | | | | | | | |
| | | | | | | 23,344 | |
| | | | | | | | |
| | INSURANCE—1.2% | |
| | 335,150 | | | Assured Guaranty Ltd. (BM) | | | 8,710 | |
| | | | | | | | |
| | INTERNET & CATALOG RETAIL—2.4% | |
| | 32,050 | | | Netflix Inc.* | | | 17,836 | |
| | | | | | | | |
| | INTERNET SOFTWARE & SERVICES—7.9% | |
| | 178,186 | | | Akamai Technologies Inc.* | | | 13,147 | |
| | 23,000 | | | Apigee Corp.* | | | 333 | |
| | 69,875 | | | CoStar Group Inc.* | | | 14,284 | |
| | 34,313 | | | Equinix Inc. | | | 8,782 | |
| | 11,300 | | | Godaddy Inc.* | | | 283 | |
| | 18,100 | | | New Relic Inc.* | | | 588 | |
| | 161,421 | | | Shutterstock Inc.* | | | 10,894 | |
| | 101,385 | | | Zillow Group Inc.* | | | 9,899 | |
| | | | | | | | |
| | | | | | | 58,210 | |
| | | | | | | | |
| | MACHINERY—0.4% | |
| | 29,800 | | | Middleby Corp.* | | | 3,020 | |
| | | | | | | | |
| | MEDIA—1.8% | |
| | 347,018 | | | IMAX Corp. (CAN)* | | | 12,965 | |
| | | | | | | | |
| | OIL, GAS & CONSUMABLE FUELS—2.0% | |
| | 61,482 | | | Diamondback Energy Inc.* | | | 5,077 | |
| | 69,024 | | | Energen Corp. | | | 4,912 | |
| | 29,255 | | | Pioneer Natural Resources Co. | | | 5,055 | |
| | | | | | | | |
| | | | | | | 15,044 | |
| | | | | | | | |
| | PHARMACEUTICALS—5.2% | |
| | 43,607 | | | Actavis plc* | | | 12,335 | |
| | 88,800 | | | Eisai Co. Ltd. (JP) | | | 5,919 | |
| | 170,759 | | | Mylan NV (NET)* | | | 12,339 | |
| | 72,300 | | | Ono Pharmaceutical Co. Ltd. (JP) | | | 7,836 | |
| | | | | | | | |
| | | | | | | 38,429 | |
| | | | | | | | |
| | PROFESSIONAL SERVICES—1.1% | |
| | 63,109 | | | IHS Inc.* | | | 7,918 | |
| | | | | | | | |
| | REAL ESTATE INVESTMENT TRUSTS (REITs)—1.2% | |
| | 485,110 | | | Paramount Group Inc. | | | 8,887 | |
| | | | | | | | |
| | REAL ESTATE MANAGEMENT & DEVELOPMENT—1.4% | |
| | 276,185 | | | CBRE Group Inc.* | | | 10,589 | |
| | | | | | | | |
| | ROAD & RAIL—3.3% | |
| | 74,708 | | | Genesee & Wyoming Inc.* | | | 6,944 | |
| | 73,472 | | | Kansas City Southern | | | 7,530 | |
| | 154,286 | | | Landstar System Inc. | | | 9,614 | |
| | | | | | | | |
| | | | | | | 24,088 | |
| | | | | | | | |
| | SEMICONDUCTORS & SEMICONDUCTOR EQUIPMENT—4.0% | |
| | 75,272 | | | First Solar Inc.* | | | 4,492 | |
| | 141,260 | | | NXP Semiconductors NV (NET)* | | | 13,578 | |
| | 351,800 | | | Sumco Corp. (JP) | | | 5,308 | |
| | 242,751 | | | SunEdison Inc.* | | | 6,146 | |
| | | | | | | | |
| | | | | | | 29,524 | |
| | | | | | | | |
| | SOFTWARE—5.6% | |
| | 205,774 | | | Mobileye NV (NET)* | | | 9,231 | |
| | 29,505 | | | ServiceNow Inc.* | | | 2,209 | |
| | 173,067 | | | Solera Holdings Inc. | | | 8,397 | |
| | 57,071 | | | Tyler Technologies Inc.* | | | 6,960 | |
| | 158,633 | | | Workday Inc.* | | | 14,469 | |
| | | | | | | | |
| | | | | | | 41,266 | |
| | | | | | | | |
| | SPECIALTY RETAIL—1.5% | |
| | 76,029 | | | Advance Auto Parts Inc. | | | 10,872 | |
| | | | | | | | |
| | TEXTILES, APPAREL & LUXURY GOODS—2.5% | |
| | 260,615 | | | Kate Spade & Co.* | | | 8,522 | |
| | 2,700,330 | | | Samsonite International SA (HK) | | | 9,849 | |
| | | | | | | | |
| | | | | | | 18,371 | |
| | | | | | | | |
| | TRADING COMPANIES & DISTRIBUTORS—1.1% | |
| | 245,416 | | | HD Supply Holdings Inc.* | | | 8,099 | |
| | | | | | | | |
| TOTAL COMMON STOCKS
(Cost $597,064) | | | 703,883 | |
| | | | | | | | |
| | | | | | | | |
RIGHTS/WARRANTS—0.1% | |
| (Cost $3) | | | | |
No. of
Contracts | | | | | | |
| | COMMUNICATIONS EQUIPMENT—0.1% | |
| | 324,200 | | | Nomad Holdings Ltd. (VG)*
$10.50—04/10/2017 | | | 811 | y |
| | | | | | | | |
| | | | | | | | |
SHORT-TERM INVESTMENTS—4.3% | |
| (Cost $31,635) | | | | |
Principal
Amount
(000s) | | | | | | |
| | REPURCHASE AGREEMENTS | | | | |
| $ | 31,635 | | | Repurchase Agreement with Bank of America Corp.
dated April 30, 2015 due May 01, 2015 at 0.090% collateralized by U.S. Treasury Notes
(market value $32,523) | | | 31,635 | |
| | | | | | | | |
| TOTAL INVESTMENTS—100.2%
(Cost $628,702) | | | 736,329 | |
| | | | | | | | |
| | CASH AND OTHER ASSETS, LESS LIABILITIES—(0.2)% | | | (1,267 | ) |
| | | | | | | | |
| | TOTAL NET ASSETS—100.0% | | $ | 735,062 | |
| | | | | | | | |
17
Harbor Mid Cap Growth Fund
PORTFOLIO OF INVESTMENTS—Continued
FAIR VALUE MEASUREMENTS
The following table summarizes the Fund’s investments as of April 30, 2015 based on the inputs used to value them.
| | | | | | | | | | | | | | | | | | | | |
Asset Category | | Quoted Prices
Level 1
(000s) | | Other Significant
Observable Inputs
Level 2
(000s) | | Significant
Unobservable Inputs
Level 3
(000s) | | Total
(000s) |
Common Stocks | | | | | | | | | | | | | | | | | | | | |
Aerospace & Defense | | | $ | 21,692 | | | | $ | — | | | | $ | — | | | | $ | 21,692 | |
Airlines | | | | 7,629 | | | | | — | | | | | — | | | | | 7,629 | |
Automobiles | | | | 11,464 | | | | | — | | | | | — | | | | | 11,464 | |
Beverages | | | | 10,066 | | | | | — | | | | | — | | | | | 10,066 | |
Biotechnology | | | | 20,679 | | | | | 123 | | | | | — | | | | | 20,802 | |
Building Products | | | | 17,085 | | | | | — | | | | | — | | | | | 17,085 | |
Capital Markets | | | | 10,189 | | | | | 7,803 | | | | | — | | | | | 17,992 | |
Chemicals | | | | 10,208 | | | | | 3,892 | | | | | — | | | | | 14,100 | |
Communications Equipment | | | | 7,995 | | | | | — | | | | | 5,835 | | | | | 13,830 | |
Construction & Engineering | | | | 12,265 | | | | | — | | | | | — | | | | | 12,265 | |
Construction Materials | | | | 8,121 | | | | | — | | | | | — | | | | | 8,121 | |
Electrical Equipment | | | | 24,784 | | | | | — | | | | | — | | | | | 24,784 | |
Electronic Equipment, Instruments & Components | | | | 28,327 | | | | | — | | | | | — | | | | | 28,327 | |
Food & Staples Retailing | | | | 10,573 | | | | | — | | | | | — | | | | | 10,573 | |
Health Care Equipment & Supplies | | | | 70,390 | | | | | — | | | | | — | | | | | 70,390 | |
Health Care Providers & Services | | | | 7,678 | | | | | — | | | | | — | | | | | 7,678 | |
Health Care Technology | | | | 17,845 | | | | | — | | | | | — | | | | | 17,845 | |
Hotels, Restaurants & Leisure | | | | 52,068 | | | | | — | | | | | — | | | | | 52,068 | |
Household Durables | | | | 23,344 | | | | | — | | | | | — | | | | | 23,344 | |
Insurance | | | | 8,710 | | | | | — | | | | | — | | | | | 8,710 | |
Internet & Catalog Retail | | | | 17,836 | | | | | — | | | | | — | | | | | 17,836 | |
Internet Software & Services | | | | 58,210 | | | | | — | | | | | — | | | | | 58,210 | |
Machinery | | | | 3,020 | | | | | — | | | | | — | | | | | 3,020 | |
Media | | | | 12,965 | | | | | — | | | | | — | | | | | 12,965 | |
Oil, Gas & Consumable Fuels | | | | 15,044 | | | | | — | | | | | — | | | | | 15,044 | |
Pharmaceuticals | | | | 24,674 | | | | | 13,755 | | | | | — | | | | | 38,429 | |
Professional Services | | | | 7,918 | | | | | — | | | | | — | | | | | 7,918 | |
Real Estate Investment Trusts (REITs) | | | | 8,887 | | | | | — | | | | | — | | | | | 8,887 | |
Real Estate Management & Development | | | | 10,589 | | | | | — | | | | | — | | | | | 10,589 | |
Road & Rail | | | | 24,088 | | | | | — | | | | | — | | | | | 24,088 | |
Semiconductors & Semiconductor Equipment | | | | 24,216 | | | | | 5,308 | | | | | — | | | | | 29,524 | |
Software | | | | 41,266 | | | | | — | | | | | — | | | | | 41,266 | |
Specialty Retail | | | | 10,872 | | | | | — | | | | | — | | | | | 10,872 | |
Textiles, Apparel & Luxury Goods | | | | 8,522 | | | | | 9,849 | | | | | — | | | | | 18,371 | |
Trading Companies & Distributors | | | | 8,099 | | | | | — | | | | | — | | | | | 8,099 | |
Rights/Warrants | | | | | | | | | | | | | | | | | | | | |
Communications Equipment | | | | — | | | | | — | | | | | 811 | | | | | 811 | |
Short-Term Investments | | | | | | | | | | | | | | | | | | | | |
Repurchase Agreements | | | | — | | | | | 31,635 | | | | | — | | | | | 31,635 | |
| | | | | | | | | | | | | | | | | | | | |
Total Investments in Securities | | | $ | 657,318 | | | | $ | 72,365 | | | | $ | 6,646 | | | | $ | 736,329 | |
| | | | | | | | | | | | | | | | | | | | |
The following is a rollforward of the Fund’s Level 3 investments during the period ended April 30, 2015.
| | | | | | | | | | | | | | | | | | | | | | | | | | | | | | | | | | | | | | | | | | | | | |
Valuation Description | | Balance
Beginning at
11/01/2014
(000s) | | Purchases
(000s) | | Sales
(000s) | | Accrued
Discount/
(Premium)
(000s) | | Total
Realized
Gain/(Loss)w
(000s) | | Change in
Unrealized
Appreciation/
(Depreciation)w
(000s) | | Transfers In
Level 3
(000s) | | Transfers
Out of
Level 3
(000s) | | Ending
Balance
as of
04/30/2015w
(000s) |
Common Stocks | | | | | | | | | | | | | | | | | | | | | | | | | | | | | | | | | | | | | | | | | | | | | |
Communications Equipment | | | $ | — | | | | $ | — | | | | $ | — | | | | $ | — | | | | $ | — | | | | $ | — | | | | $ | 5,835 | | | | $ | — | | | | $ | 5,835 | |
Rights/Warrants | | | | | | | | | | | | | | | | | | | | | | | | | | | | | | | | | | | | | | | | | | | | | |
Communications Equipment | | | | — | | | | | — | | | | | — | | | | | — | | | | | — | | | | | — | | | | | 811 | | | | | — | | | | | 811 | |
| | | | | | | | | | | | | | | | | | | | | | | | | | | | | | | | | | | | | | | | | | | | | |
| | | $ | — | | | | $ | — | | | | $ | — | | | | $ | — | | | | $ | — | | | | $ | — | | | | $ | 6,646 | | | | $ | — | | | | $ | 6,646 | |
| | | | | | | | | | | | | | | | | | | | | | | | | | | | | | | | | | | | | | | | | | | | | |
There were no transfers between Levels 1 and 2 during the period.
18
Harbor Mid Cap Growth Fund
PORTFOLIO OF INVESTMENTS—Continued
FAIR VALUE MEASUREMENTS—Continued
The following is a summary of significant unobservable inputs used in the fair valuations of assets and liabilities categorized within Level 3 of the fair value hierarchy.
| | | | | | | | | | | | |
Valuation Descriptions | | Ending Balance
as of 04/30/2015
(000s) | | | Valuation Technique | | Unobservable Inputs | | Input
Value(s) | |
| Investments in Securities | | | | | | | | | | | | |
Common Stocks | | | | | | | | | | | | |
Nomad Holdings Ltd. (VG)* | | $ | 5,835 | | | Market Approach | | Last Traded Price | | $ | 18.00 | |
| | | | | | | | | | | | |
Rights/Warrants | | | | | | | | | | | | |
Nomad Holdings Ltd. (VG)* | | $ | 811 | | | Market Approach | | Last Traded Price of Underlying Security | | $ | 2.50 | |
| | | | | | | | | | | | |
For more information on valuation inputs and their aggregation into the levels used in the table above, please refer to the Fair Value Measurements and Disclosures in Note 2 of the accompanying Notes to Financial Statements.
| * | Non-income producing security. |
| 1 | PIPE after the name of a security stands for Private Investment in Public Equity and there are some restrictions on reselling this security within a certain period. |
| w | The amounts in this category are included in the “Realized and Change in Unrealized Gain/(Loss) on Investment Transactions” section of the Statement of Operations. The net unrealized appreciation/(depreciation) per investment type is below: |
| | | | | |
Valuation Description | | Unrealized
Gain/(Loss)
as of
04/30/2015
(000s) |
Common Stocks | | | $ | 2,597 | |
Rights/Warrants | | | | 808 | |
| | | | | |
| | | $ | 3,405 | |
| | | | | |
| x | Fair Valued in accordance with Harbor Funds Valuation Procedures using last traded price, which is a Level 3 input. |
| y | Fair Valued in accordance with Harbor Funds Valuation Procedures using last traded price of underlying security, which is a Level 3 input. |
The accompanying notes are an integral part of the Financial Statements.
19
Harbor Small Cap Growth Fund
MANAGERS’ COMMENTARY (Unaudited)
SUBADVISER
Westfield Capital Management Company, L.P.
One Financial Center 23rd Floor
Boston, MA 02111
PORTFOLIO MANAGERS
William Muggia
Lead Portfolio Manager Since 2000
Ethan Meyers, CFA
Since 2000
John Montgomery
Since 2011
Bruce Jacobs, CFA
Since 2011
Hamlen Thompson
Since 2011
Westfield has subadvised the Fund since its inception in 2000.
INVESTMENT OBJECTIVE
The Fund seeks long-term growth of capital.
PRINCIPAL STYLE CHARACTERISTICS
Small cap growth stocks demonstrating consistent or accelerating earnings growth

William Muggia

Ethan Meyers

John Montgomery

Bruce Jacobs

Hamlen Thompson
Management’s Discussion of Fund Performance
MARKET REVIEW
Domestic equities rose in the six months ended April 30, 2015. However, the pace of their advance was not uniform, reflecting a variety of investor worries. The U.S. dollar strength weakened the earnings outlooks of most multinational firms. The dramatic collapse of crude oil prices pushed Energy stocks into negative territory. After steady acceleration in 2014, the U.S. economy stalled in the first quarter of 2015, surprising investors and economists to the downside and placing a question mark on the timing of the Federal Reserve’s first rate increase. At the same time, the economies of Europe, Japan, and even China began to show signs of improvement, as massive stimulus by central banks around the world began to have an impact on global economies and risk assets. These factors led to a significant disparity in returns across all financial assets. Prices of long-term U.S. government bonds reached fresh highs, domestically-focused small capitalization stocks outpaced large capitalization multinationals, and Health Care stocks surged across the market capitalization spectrum, leaving economically-sensitive Energy, Materials, and Industrials far behind. Within the Russell universe of indices, growth-style benchmarks considerably outperformed their value counterparts. The performance dichotomy highlighted investors’ sharpened focus on segments that they believe are able to deliver earnings growth against an uncertain economic backdrop.
PERFORMANCE
Harbor Small Cap Growth Fund returned 10.39% (Institutional Class), 10.23% (Administrative Class), and 10.10% (Investor Class) for the six months ended April 30, 2015, outperforming the 7.25% return of the Russell 2000® Growth Index. Health Care was the biggest driver of outperformance, but the portfolio’s holdings in the Industrials, Materials, and Energy sectors also contributed materially to excess returns.
The Health Care sector contributed 170 basis points, or 1.70 percentage points, to relative performance. Stock selection within biotechnology was the primary differentiator, with 11 stocks generating incremental gains relative to the index. The biotechnology industry, where the Fund has been overweight relative to the index, continued to exhibit signs of a secular bull market, powered by a robust mergers and acquisitions environment and a stream of new-product cycles. Cubist Pharmaceuticals surged in December 2014 on news of a buyout of this acute-care biopharmaceutical company by Merck at a 37% premium to where the shares had traded before the announcement. Shares of Prothena advanced as well. In March of this year, Prothena presented favorable data for its antibody that targets Parkinson’s disease. ICON, the world’s fourth-largest contract research organization (CRO), also contributed meaningfully to relative returns. We are enthusiastic about growth prospects for the CRO segment given the share of research and development budgets allocated by biotechnology firms to outsourced services and the broadening spectrum of these services.
Industrials contributed 92 basis points to relative returns. The strength of the U.S. dollar was a key factor impacting the performance of industrial firms, and the portfolio’s focus
20
Harbor Small Cap Growth Fund
MANAGERS’ COMMENTARY—Continued
| | | | |
TOP TEN HOLDINGS (% of net assets) | |
AMAG Pharmaceuticals Inc. | | | 3.2% | |
ICON plc | | | 2.5% | |
Fortinet Inc. | | | 2.4% | |
Team Health Holdings Inc. | | | 2.3% | |
Watsco Inc. | | | 2.1% | |
PTC Therapeutics Inc. | | | 2.0% | |
Restoration Hardware Holdings Inc. | | | 1.9% | |
STERIS Corp. | | | 1.9% | |
Alexander & Baldwin Inc. | | | 1.8% | |
Genesee & Wyoming Inc. | | | 1.8% | |
on U.S.-centric areas of growth benefited performance results. The Fund’s investment in JetBlue Airways, a largely domestic airline operator that has been insulated from both foreign exchange headwinds and global economic woes, was the portfolio’s top absolute and relative performer within the Industrials sector. Hexcel, a manufacturer of lightweight composites for use in aerospace and industrial applications, also augmented performance results. Carbon-fiber composites continued to take share from metal, as end users such as Boeing and Airbus seek increased fuel efficiency and savings.
Materials outperformed, generating 47 basis points of incremental gains. The Fund’s largest exposure to the segment continued to be through chemicals—both specialty and commodity—partially because we view chemical manufacturers as net beneficiaries of lower pricing for oil-based raw materials. Chemtura, which makes petroleum additives and bromine-based products, posted a double-digit gain, as did the Fund’s investment in Trinseo, a manufacturer of emulsion polymers and plastics. We believe that Chemtura should see a boost to profit margins resulting from more-favorable input costs for its fuel-additives business, and it is also beginning to benefit from a more disciplined approach to pricing within the bromine industry. Trinseo’s competitively advantaged rubber chemical business has been growing at a 3%-5% annual rate, demonstrating solid operating margins. We expect this strong performance to continue, buoyed by strong demand for polybutadiene rubber, which is used to make premium tires, a market segment that has been growing faster than the overall industry.
Investments in the Energy sector, which has had a longstanding overweight in the portfolio relative to the index, boosted incremental gains by 40 basis points. Energy companies were the broad market’s worst performers during the fiscal first half, as economic weakness in Europe and Asia, as well as the U.S. shale-oil glut, impacted supply and demand dynamics and put pressure on oil prices. However, the Fund’s largest exposure to Energy was through oil and gas refining companies, which surprised to the upside, as they benefited from falling crude oil prices. West Coast refiner Tesoro was the Fund’s best absolute and relative performer within the sector, and is the Fund’s largest Energy holding. While we continue to like the stock’s fundamental characteristics and long-term appreciation potential, we trimmed the Fund’s investment several times to manage position size. In addition, we think that slowing domestic feedstock supply will likely be a headwind for refining companies in the near term. We have become incrementally more positive on firms within the Energy sector that benefit from rising commodity prices. The oil rig count is down over 40% in calendar 2015 on a year-to-date basis, and we project U.S. production to slow significantly during the second half of the calendar year. It is our opinion that a more balanced oil market will require higher oil prices to meet global demand.
OUTLOOK AND STRATEGY
According to the advance estimate released by the U.S. Bureau of Economic Analysis in the last week of April, real GDP increased at an annual rate of 0.2% in the first quarter of 2015, a significant decline compared to the 2.2% growth in the fourth quarter of 2014. However, we believe that some of this weakness is likely to be transient. Important cyclical indicators, such as reports tracking manufacturing, new orders, and jobless claims, have been either steady or improving. We also think that we are likely to see a further pick-up in global growth, higher crude oil prices, and a weaker U.S. dollar in the second half of the calendar year. We believe that cyclically-oriented companies positioned to benefit from global growth have better earnings prospects against this macroeconomic backdrop. As ever, we endeavor to select companies that offer attractive growth supported by strong fundamentals, while trading at reasonable valuations.
This report contains the current opinions of Westfield Capital Management Company, L.P. at the time of its publication and should not be considered as investment advice or a recommendation of any particular security, strategy or investment product. Such opinions are subject to change without notice and securities described herein may no longer be included in, or may at any time be removed from, the Fund’s portfolio. This report is distributed for informational purposes only. Information contained herein has been obtained from sources believed reliable, but not guaranteed.
Stocks of small cap companies pose special risks, including possible illiquidity and greater price volatility than stocks of larger, more established companies. Equity securities, such as common stocks, are affected by company specific events and by movements in the overall stock markets in which those securities principally trade. An adverse company specific event, or downturn in those stock markets, can depress the value of a particular company’s equity securities. For information on the different share classes and the risks associated with an investment in the Fund, please refer to the current prospectus.
21
Harbor Small Cap Growth Fund
FUND SUMMARY—April 30, 2015 (Unaudited)
| | | | |
INSTITUTIONAL CLASS |
| | | | |
| Fund # | | | | 2010 |
| | |
| Cusip | | | | 411511868 |
| | |
| Ticker | | | | HASGX |
| | |
| Inception Date | | | | 11/01/2000 |
| | |
| Net Expense Ratio | | | | 0.83%a |
| | |
| Total Net Assets (000s) | | | | $620,720 |
| | | | |
ADMINISTRATIVE CLASS |
| | | | |
| Fund # | | | | 2210 |
| | |
| Cusip | | | | 411511769 |
| | |
| Ticker | | | | HRSGX |
| | |
| Inception Date | | | | 11/01/2002 |
| | |
| Net Expense Ratio | | | | 1.08%a |
| | |
| Total Net Assets (000s) | | | | $753 |
| | | | |
INVESTOR CLASS |
| | | | |
| Fund # | | | | 2410 |
| | |
| Cusip | | | | 411511777 |
| | |
| Ticker | | | | HISGX |
| | |
| Inception Date | | | | 11/01/2002 |
| | |
| Net Expense Ratio | | | | 1.20%a |
| | |
| Total Net Assets (000s) | | | | $15,730 |
PORTFOLIO STATISTICS
| | | | | | | | |
| | | Portfolio | | | Benchmark | |
| | |
Weighted Average Market Cap (MM) | | | $2,940 | | | | $2,230 | |
| | |
Price/Earning Ratio (P/E) | | | 33.3x | | | | 32.1x | |
| | |
Price/Book Ratio (P/B) | | | 4.5x | | | | 5.1x | |
| | |
Beta vs. Russell 2000® Growth Index | | | 0.90 | | | | 1.00 | |
| | |
Portfolio Turnover (6-Month Period Ended 04/30/2015) | | | 36% | b | | | N/A | |
SECTOR ALLOCATION (% of investments)
(Excludes cash and short-term investments)
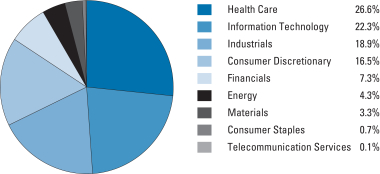
22
Harbor Small Cap Growth Fund
FUND PERFORMANCE SUMMARY (Unaudited)
Institutional Class
CHANGE IN A $50,000 INVESTMENT
For the period 05/01/2005 through 04/30/2015
| | |
The graph compares a $50,000 investment in the Fund with the performance of the Russell 2000® Growth Index. The Fund’s performance includes the reinvestment of all dividend and capital gain distributions. | | 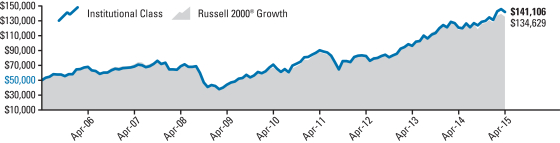 |
| | | | | | | | | | | | | | | | | | | | | | | | | | | | | | | | |
Total Returns For the periods ended 04/30/2015 | | | |
| Harbor Small Cap Growth Fund | | | | | | | | | | | | | | | | | | | | | | | | | | | | | | | | |
Institutional Class | | | 10.39% | | | | | | 17.30% | | | | | | 14.80% | | | | | | 10.93% | | | | | 11/01/2000 | | | | $ | 141,106 | |
| Comparative Index | | | | | | | | | | | | | | | | | | | | | | | | | | | | | | | | |
Russell 2000® Growth | | | 7.25% | | | | | | 14.65% | | | | | | 14.94% | | | | | | 10.41% | | | | | — | | | | $ | 134,629 | |
Administrative and Investor Classes
CHANGE IN A $10,000 INVESTMENT
For the period 05/01/2005 through 04/30/2015
| | |
The graph compares a $10,000 investment in the Fund with the performance of the Russell 2000® Growth Index. The Fund’s performance includes the reinvestment of all dividend and capital gain distributions. | | 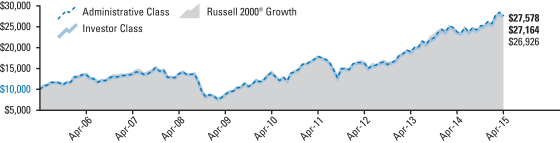 |
| | | | | | | | | | | | | | | | | | | | | | | | | | | | | | | | |
Total Returns For the periods ended 04/30/2015 | | | |
| Harbor Small Cap Growth Fund | | | | | | | | | | | | | | | | | | | | | | | | | | | | | | | | |
Administrative Class | | | 10.23% | | | | | | 16.99% | | | | | | 14.56% | | | | | | 10.68% | | | | | 11/01/2002 | | | | $ | 27,578 | |
Investor Class | | | 10.10% | | | | | | 16.80% | | | | | | 14.37% | | | | | | 10.51% | | | | | 11/01/2002 | | | | $ | 27,164 | |
| Comparative Index | | | | | | | | | | | | | | | | | | | | | | | | | | | | | | | | |
Russell 2000® Growth | | | 7.25% | | | | | | 14.65% | | | | | | 14.94% | | | | | | 10.41% | | | | | — | | | | $ | 26,926 | |
As stated in the Fund’s current prospectus, the expense ratios were 0.84% (Institutional Class); 1.09% (Administrative Class); and 1.21% (Investor Class). The expense ratios in the prospectus may differ from the actual expense ratios for the period disclosed within this report. The expense ratios shown in the prospectus are based on the prior fiscal year, adjusted to reflect changes, if any, in contractual arrangements that occurred prior to the date of the prospectus.
Performance data shown represents past performance, which is no guarantee of future results. Current performance may be higher or lower than the past performance data shown. Investment returns and the value of an investment will fluctuate, and an investor’s shares, when sold, may be worth more or less than their original cost. You can obtain performance data current to the most recent month-end (available within seven business days after the most recent month-end) by calling 800-422-1050 or visiting harborfunds.com.
The returns shown do not reflect the deduction of taxes that a shareholder would pay on Fund distributions or on the redemption of Fund shares. From time to time, certain fees and/or expenses have been waived or reimbursed, which has resulted in higher returns. Without these waivers and reimbursements, the returns would have been lower.
23
Harbor Small Cap Growth Fund
PORTFOLIO OF INVESTMENTS—April 30, 2015 (Unaudited)
Equity Holdings (% of net assets)
(Excludes net cash and short-term investments of 3.9%)
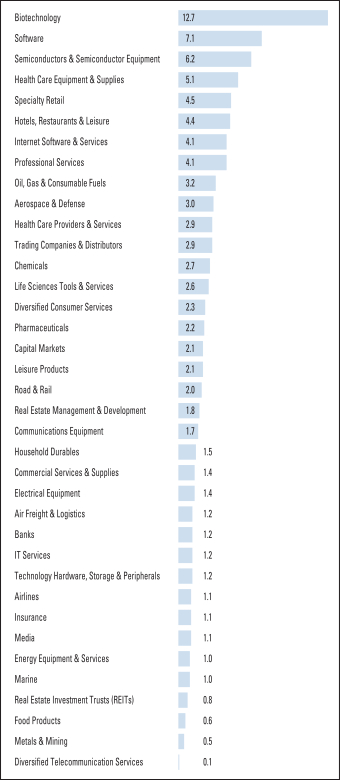
| | | | | | | | |
COMMON STOCKS—96.1% | |
| | |
| Shares | | | | | Value
(000s) | |
| | AEROSPACE & DEFENSE—3.0% | |
| | 190,690 | | | Hexcel Corp. | | $ | 9,563 | |
| | 325,105 | | | TASER International Inc.* | | | 9,815 | |
| | | | | | | | |
| | | | | | | 19,378 | |
| | | | | | | | |
| | AIR FREIGHT & LOGISTICS—1.2% | |
| | 160,066 | | | XPO Logistics Inc.* | | | 7,763 | |
| | | | | | | | |
| | AIRLINES—1.1% | |
| | 343,200 | | | JetBlue Airways Corp.* | | | 7,046 | |
| | | | | | | | |
| | BANKS—1.2% | |
| | 186,710 | | | East West Bancorp Inc. | | | 7,579 | |
| | | | | | | | |
| | BIOTECHNOLOGY—12.7% | |
| | 101,110 | | | Aegerion Pharmaceuticals Inc.* | | | 2,352 | |
| | 403,125 | | | AMAG Pharmaceuticals Inc.* | | | 20,547 | |
| | 781,640 | | | ARIAD Pharmaceuticals Inc.* | | | 6,777 | |
| | 373,822 | | | ChemoCentryx Inc.* | | | 2,501 | |
| | 426,182 | | | Dynavax Technologies Corp.* | | | 8,573 | |
| | 604,277 | | | Merrimack Pharmaceuticals Inc.* | | | 6,707 | |
| | 270,425 | | | Neurocrine Biosciences Inc.* | | | 9,219 | |
| | 282,748 | | | Prothena Corp. plc (IE)* | | | 9,164 | |
| | 214,750 | | | PTC Therapeutics Inc.* | | | 12,616 | |
| | 14,415 | | | Puma Biotechnology Inc.* | | | 2,603 | |
| | | | | | | | |
| | | | | | | 81,059 | |
| | | | | | | | |
| | CAPITAL MARKETS—2.1% | |
| | 673,270 | | | BGC Partners Inc. | | | 6,756 | |
| | 128,050 | | | Stifel Financial Corp.* | | | 6,766 | |
| | | | | | | | |
| | | | | | | 13,522 | |
| | | | | | | | |
| | CHEMICALS—2.7% | |
| | 324,700 | | | Chemtura Corp.* | | | 9,783 | |
| | 161,653 | | | PolyOne Corp. | | | 6,312 | |
| | 36,301 | | | Trinseo SA (LUX)* | | | 827 | |
| | | | | | | | |
| | | | | | | 16,922 | |
| | | | | | | | |
| | COMMERCIAL SERVICES & SUPPLIES—1.4% | |
| | 493,912 | | | Steelcase Inc. | | | 8,678 | |
| | | | | | | | |
| | COMMUNICATIONS EQUIPMENT—1.7% | |
| | 381,170 | | | Finisar Corp.* | | | 7,749 | |
| | 250,554 | | | Ruckus Wireless Inc.* | | | 2,927 | |
| | | | | | | | |
| | | | | | | 10,676 | |
| | | | | | | | |
| | DIVERSIFIED CONSUMER SERVICES—2.3% | |
| | 172,390 | | | Bright Horizons Family Solutions Inc.* | | | 8,668 | |
| | 134,020 | | | Sotheby’s | | | 5,724 | |
| | | | | | | | |
| | | | | | | 14,392 | |
| | | | | | | | |
| | DIVERSIFIED TELECOMMUNICATION SERVICES—0.1% | |
| | 22,945 | | | Cogent Communications Holdings Inc. | | | 803 | |
| | | | | | | | |
| | ELECTRICAL EQUIPMENT—1.4% | |
| | 142,371 | | | Power Solutions International Inc.* | | | 9,083 | |
| | | | | | | | |
| | ENERGY EQUIPMENT & SERVICES—1.0% | |
| | 247,550 | | | Superior Energy Services Inc. | | | 6,313 | |
| | | | | | | | |
| | FOOD PRODUCTS—0.6% | |
| | 424,120 | | | Boulder Brands Inc.* | | | 4,046 | |
| | | | | | | | |
| | HEALTH CARE EQUIPMENT & SUPPLIES—5.1% | |
| | 293,883 | | | Masimo Corp.* | | | 9,922 | |
| | 186,316 | | | STERIS Corp. | | | 12,390 | |
| | 227,270 | | | Tandem Diabetes Care Inc.* | | | 3,034 | |
| | 290,506 | | | Wright Medical Group Inc.* | | | 7,370 | |
| | | | | | | | |
| | | | | | | 32,716 | |
| | | | | | | | |
24
Harbor Small Cap Growth Fund
PORTFOLIO OF INVESTMENTS—Continued
| | | | | | | | |
COMMON STOCKS—Continued | |
| | |
| Shares | | | | | Value
(000s) | |
| | HEALTH CARE PROVIDERS & SERVICES—2.9% | |
| | 104,195 | | | ExamWorks Group Inc.* | | $ | 4,267 | |
| | 241,588 | | | Team Health Holdings Inc.* | | | 14,391 | |
| | | | | | | | |
| | | | | | | 18,658 | |
| | | | | | | | |
| | HOTELS, RESTAURANTS & LEISURE—4.4% | |
| | 380,780 | | | Bloomin’ Brands Inc. | | | 8,628 | |
| | 104,394 | | | Dave & Buster’s Entertainment Inc.* | | | 3,291 | |
| | 171,600 | | | Del Frisco’s Restaurant Group Inc.* | | | 3,461 | |
| | 99,020 | | | Papa John’s International Inc. | | | 6,077 | |
| | 67,105 | | | Vail Resorts Inc. | | | 6,657 | |
| | | | | | | | |
| | | | | | | 28,114 | |
| | | | | | | | |
| | HOUSEHOLD DURABLES—1.5% | |
| | 1,161,820 | | | Standard Pacific Corp.* | | | 9,411 | |
| | | | | | | | |
| | INSURANCE—1.1% | |
| | 416,370 | | | CNO Financial Group Inc. | | | 7,078 | |
| | | | | | | | |
| | INTERNET SOFTWARE & SERVICES—4.1% | |
| | 50,112 | | | CoStar Group Inc.* | | | 10,244 | |
| | 103,597 | | | Demandware Inc.* | | | 6,382 | |
| | 169,013 | | | Gogo Inc.* | | | 3,573 | |
| | 219,120 | | | HomeAway Inc.* | | | 6,124 | |
| | | | | | | | |
| | | | | | | 26,323 | |
| | | | | | | | |
| | IT SERVICES—1.2% | |
| | 65,023 | | | WEX Inc.* | | | 7,329 | |
| | | | | | | | |
| | LEISURE PRODUCTS—2.1% | |
| | 211,764 | | | Brunswick Corp. | | | 10,597 | |
| | 139,780 | | | Malibu Boats Inc.* | | | 2,959 | |
| | | | | | | | |
| | | | | | | 13,556 | |
| | | | | | | | |
| | LIFE SCIENCES TOOLS & SERVICES—2.6% | |
| | 45,670 | | | Bruker Corp.* | | | 866 | |
| | 247,159 | | | ICON plc (IE)* | | | 15,902 | |
| | | | | | | | |
| | | | | | | 16,768 | |
| | | | | | | | |
| | MARINE—1.0% | |
| | 162,450 | | | Matson Inc. | | | 6,579 | |
| | | | | | | | |
| | MEDIA—1.1% | |
| | 175,482 | | | Starz* | | | 6,902 | |
| | | | | | | | |
| | METALS & MINING—0.5% | |
| | 105,980 | | | TimkenSteel Corp. | | | 3,094 | |
| | | | | | | | |
| | OIL, GAS & CONSUMABLE FUELS—3.2% | |
| | 430,004 | | | Navigator Holdings Ltd. (UK)* | | | 9,211 | |
| | 127,950 | | | Tesoro Corp. | | | 10,982 | |
| | | | | | | | |
| | | | | | | 20,193 | |
| | | | | | | | |
| | PHARMACEUTICALS—2.2% | |
| | 567,889 | | | Cardiome Pharma Corp. (CAN)* | | | 4,730 | |
| | 131,730 | | | Pacira Pharmaceuticals Inc.* | | | 9,021 | |
| | | | | | | | |
| | | | | | | 13,751 | |
| | | | | | | | |
| | PROFESSIONAL SERVICES—4.1% | |
| | 128,248 | | | Corporate Executive Board Co. | | | 10,751 | |
| | 156,229 | | | Huron Consulting Group Inc.* | | | 9,470 | |
| | 116,720 | | | WageWorks Inc.* | | | 5,883 | |
| | | | | | | | |
| | | | | | | 26,104 | |
| | | | | | | | |
| | REAL ESTATE INVESTMENT TRUSTS (REITs)—0.8% | |
| | 77,744 | | | National Health Investors Inc. | | | 5,187 | |
| | | | | | | | |
| | REAL ESTATE MANAGEMENT & DEVELOPMENT—1.8% | |
| | 282,555 | | | Alexander & Baldwin Inc. | | | 11,438 | |
| | | | | | | | |
| | ROAD & RAIL—2.0% | |
| | 123,875 | | | Genesee & Wyoming Inc.* | | | 11,514 | |
| | 54,089 | | | Werner Enterprises Inc. | | | 1,454 | |
| | | | | | | | |
| | | | | | | 12,968 | |
| | | | | | | | |
| | SEMICONDUCTORS & SEMICONDUCTOR EQUIPMENT—6.2% | |
| | 388,134 | | | Advanced Energy Industries Inc.* | | | 9,494 | |
| | 132,032 | | | Cavium Inc.* | | | 8,554 | |
| | 145,350 | | | Cirrus Logic Inc.* | | | 4,910 | |
| | 165,930 | | | Monolithic Power Systems Inc. | | | 8,600 | |
| | 86,397 | | | Qorvo Inc.* | | | 5,694 | |
| | 74,780 | | | Silicon Motion Technology Corp. ADR (CYM)1 | | | 2,192 | |
| | | | | | | | |
| | | | | | | 39,444 | |
| | | | | | | | |
| | SOFTWARE—7.1% | |
| | 166,026 | | | Cadence Design Systems Inc.* | | | 3,096 | |
| | 136,010 | | | Commvault Systems Inc.* | | | 6,223 | |
| | 412,990 | | | Fortinet Inc.* | | | 15,586 | |
| | 216,340 | | | Qlik Technologies Inc.* | | | 7,527 | |
| | 39,269 | | | Ultimate Software Group Inc.* | | | 6,527 | |
| | 260,679 | | | Zendesk Inc.* | | | 6,011 | |
| | | | | | | | |
| | | | | | | 44,970 | |
| | | | | | | | |
| | SPECIALTY RETAIL—4.5% | |
| | 78,890 | | | Five Below Inc.* | | | 2,660 | |
| | 89,480 | | | Lithia Motors Inc. | | | 8,924 | |
| | 174,975 | | | Rent-A-Center Inc. | | | 5,179 | |
| | 140,180 | | | Restoration Hardware Holdings Inc.* | | | 12,080 | |
| | | | | | | | |
| | | | | | | 28,843 | |
| | | | | | | | |
| | TECHNOLOGY HARDWARE, STORAGE & PERIPHERALS—1.2% | |
| | 182,340 | | | Electronics For Imaging Inc.* | | | 7,609 | |
| | | | | | | | |
| | TRADING COMPANIES & DISTRIBUTORS—2.9% | |
| | 196,059 | | | Rush Enterprises Inc.* | | | 5,125 | |
| | 110,550 | | | Watsco Inc. | | | 13,298 | |
| | | | | | | | |
| | | | | | | 18,423 | |
| | | | | | | | |
| TOTAL COMMON STOCKS
(Cost $465,567) | | | 612,718 | |
| | | | | | | | |
| | | | | | | | |
SHORT-TERM INVESTMENTS—2.5% | |
| (Cost $15,862) | | | | |
Principal
Amount (000s) | | | | | | |
| | REPURCHASE AGREEMENTS | |
| $ | 15,862 | | | Repurchase Agreement with State Street Corp. dated April 30, 2015 due May 01, 2015 at 0.000% collateralized by U.S. Treasury Bonds (market value $16,180) | | | 15,862 | |
| | | | | | | | |
| TOTAL INVESTMENTS—98.6%
(Cost $481,429) | | | 628,580 | |
| | | | | | | | |
| | CASH AND OTHER ASSETS, LESS LIABILITIES—1.4% | | | 8,623 | |
| | | | | | | | |
| | TOTAL NET ASSETS—100.0% | | $ | 637,203 | |
| | | | | | | | |
25
Harbor Small Cap Growth Fund
PORTFOLIO OF INVESTMENTS—Continued
FAIR VALUE MEASUREMENTS
Repurchase Agreements valued at $15,862 are classified as Level 2. All other holdings at April 30, 2015 (as disclosed in the preceding Portfolio of Investments) are classified as Level 1. There were no Level 3 holdings at October 31, 2014 or April 30, 2015 and no transfers between levels during the period.
For more information on valuation inputs and their aggregation into the levels identified above, please refer to the Fair Value Measurements and Disclosures in Note 2 of the accompanying Notes to Financial Statements.
| * | Non-income producing security. |
| 1 | ADR after the name of a foreign holding stands for American Depositary Receipts representing ownership of foreign securities. ADRs are issued by U.S. banking institutions. |
The accompanying notes are an integral part of the Financial Statements.
26
Harbor Small Cap Growth Opportunities Fund
MANAGERS’ COMMENTARY (Unaudited)
SUBADVISER
Elk Creek Partners, LLC
44 Cook Street Suite 705 Denver, CO 80206
PORTFOLIO MANAGERS
Cam Philpott, CFA
Since 2014
Lance Marx, CFA
Since 2014
David Hand, CFA
Since 2014
Hiren Patel, Ph.D.
Since 2014
Sean McGinnis, CFA
Since 2014
Elk Creek has subadvised the Fund since its inception in 2014.
INVESTMENT OBJECTIVE
The Fund seeks long-term growth of capital.
PRINCIPAL STYLE CHARACTERISTICS:
Small cap stocks with above average growth potential

Cam Philpott

Lance Marx

David Hand

Hiren Patel

Sean McGinnis
Management’s Discussion of
Fund Performance
MARKET REVIEW
Equity markets continued to be volatile over the six months ended April 30, 2015. Small cap stocks rallied into the calendar year end but then sold off in January. As companies reported fourth quarter earnings in February, shares of small cap growth companies, as measured by the Russell 2000 Growth® Index, posted a strong gain but in April the index fell by almost 3%. We believe the combination of weak commodity prices and looming interest rate increases have created a market driven predominantly by short-term, low-conviction trading that has led, in turn, to higher volatility.
PERFORMANCE
Harbor Small Cap Growth Opportunities Fund returned 2.19% (Institutional Class), 2.10% (Administrative), and 1.91% (Investor Class) for the six months ended April 30, 2015. The Fund underperformed its Russell 2000® Growth Index benchmark, which returned 7.25%. Our investment strategy employs a bottom-up process that focuses on finding companies that we believe can achieve growth of revenues and earnings at rates faster than their peers and better than investor expectations. In our view, during this period of volatility and low conviction, investors have been less willing to differentiate among individual stocks.
As is consistent with our team’s investment process, performance in the Fund was driven primarily by stock selection. Selection in the Information Technology, Energy, and Financials sectors helped Fund performance relative to the benchmark. Industrials, Health Care, and Consumer Discretionary were sectors in which stock selection hurt relative performance. Sector weights are typically a result of our individual stock-selection process and not a primary focus of our investment strategy.
We look at stocks individually to find opportunities with significant revenue and earnings growth that we believe to be sustainable. Our investment style and process have generally created a portfolio that is typically overweight stocks in the Information Technology, Health Care, Industrials, and Consumer Discretionary sectors. The portfolio is also normally underweight stocks in the Utilities, Financials, Energy, Materials, and Consumer Staples sectors.
In terms of specific stock attribution for the six months ended April 30, 2015, Volcano, a manufacturer of devices for intravascular cardiology, was a positive stock for the Fund as the company improved its revenue growth rate. Additionally, the company was acquired by Philips for a substantial premium, and we sold the entire position on this news.
Procera Networks, a provider of network services, was a positive contributor as it reported better revenues than expected for the December quarter. The company’s technology is used primarily by carriers and cable operators. We were encouraged by fourth quarter performance and had intended to grow the position upon seeing consistent demand patterns from customers. However, the company was acquired in mid-April before it reported another quarter.
27
Harbor Small Cap Growth Opportunities Fund
MANAGERS’ COMMENTARY—Continued
| | | | |
TOP TEN HOLDINGS (% of net assets) | |
Gogo Inc. | | | 2.3% | |
Synchronoss Technologies Inc. | | | 2.1% | |
WageWorks Inc. | | | 2.1% | |
WebMD Health Corp. | | | 2.1% | |
Dealertrack Technologies Inc. | | | 1.8% | |
DigitalGlobe Inc. | | | 1.8% | |
Cerus Corp. | | | 1.6% | |
Mobile Mini Inc. | | | 1.6% | |
Shutterfly Inc. | | | 1.6% | |
WNS Holdings Ltd. ADR | | | 1.6% | |
H&E Equipment Services, an equipment rental company, was a weak stock for the Fund on the heels of lower oil prices. H&E operates in the U.S. and derives 10%-15% of its revenues from oilfield service rentals. Investors clearly have been concerned about this part of the company’s business. However, the stock’s performance mirrored those of pure oilfield service companies, and we believe that this sell-off has been overdone. Further, H&E does not rent specialized equipment to energy companies, and we believe that likely weak demand from that market segment will be replaced elsewhere as lower energy prices spur general activity. Our core attraction to H&E’s business is chemical-plant construction in the Gulf Coast region that we believe is unlikely to be impacted by the recent drop in crude prices, as those projects are long-term in nature as well as being related more closely to natural gas.
InnerWorkings, a provider of outsourced printing services to large enterprises, was a relatively weak stock for the Fund despite posting strong operating performance. This stock is a good example of many of the Fund’s Industrials sector holdings in that the shares have not performed well recently even though fundamental operating performance has been positive. Investors have been broadly worried about demand trends, and we believe that valuations of InnerWorkings shares, along with those of many other business service stocks, have been compressed as a result of those general fears. Additionally, the shares, like those of other Industrials companies, have been hurt by concerns that the strong U.S. dollar would reduce reported results. On that point, translation effects have reduced reported revenues, but operating income and earnings per share have performed as expected during this period of currency fluctuation. In our view, the company’s fundamentals are positive and improving. We added to this position during price weakness and continue to view these shares as attractive.
OUTLOOK AND STRATEGY
The dramatic drop in crude oil prices over the last six months has many investors concerned that falling demand is the culprit, which in turn causes them to worry about the possibility of a recession. Equity valuations are higher than they were several years ago, and investors also are worried how financial markets and businesses might react to an expected increase in interest rates, although the absolute levels of those interest rates are still historically low.
With this sentiment as a backdrop, we are not surprised that investors have been reacting to the latest economic data point or news event, as we believe that investor behavior has been driven to a considerable degree by short-term factors rather than a long-term perspective. We would point to the volatility in shares of Aruba Networks as a prime example of this type of short-term thought process. The stock declined last November as some investors were disappointed that management did not raise guidance for future earnings; yet only a few months later the company was acquired at significantly higher prices. We sold the Fund’s position on the announcement of the acquisition.
Our investment process is built around identifying companies that we believe have sustainable, long-term growth opportunities. The market can focus too much on a short-term investment horizon at times, and we believe that trading patterns over the past few reporting seasons suggest that we are in such a period. We have not altered the investment process that we believe has served our clients well over time, and we remain disciplined in seeking companies that we believe have an opportunity to sustain growth over the longer term.
This report contains the current opinions of Elk Creek Partners, LLC at the time of its publication and should not be considered as investment advice or a recommendation of any particular security, strategy or investment product. Such opinions are subject to change without notice and securities described herein may no longer be included in, or may at any time be removed from, the Fund’s portfolio. This report is distributed for informational purposes only. Information contained herein has been obtained from sources believed reliable, but not guaranteed.
Stocks of small cap companies pose special risks, including possible illiquidity and greater price volatility than stocks of larger, more established companies. Equity securities, such as common stocks, are affected by company specific events and by movements in the overall stock markets in which those securities principally trade. An adverse company specific event, or downturn in those stock markets, can depress the value of a particular company’s equity securities. For information on the different share classes and the risks associated with an investment in the Fund, please refer to the current prospectus.
28
Harbor Small Cap Growth Opportunities Fund
FUND SUMMARY—April 30, 2015 (Unaudited)
| | | | |
INSTITUTIONAL CLASS |
| | | | |
| Fund # | | | | 2037 |
| | |
| Cusip | | | | 411512668 |
| | |
| Ticker | | | | HASOX |
| | |
| Inception Date | | | | 02/01/2014 |
| | |
| Net Expense Ratio | | | | 0.90%a,b |
| | |
| Total Net Assets (000s) | | | | $152,429 |
| | | | |
ADMINISTRATIVE CLASS |
| | | | |
| Fund # | | | | 2237 |
| | |
| Cusip | | | | 411512650 |
| | |
| Ticker | | | | HRSOX |
| | |
| Inception Date | | | | 02/01/2014 |
| | |
| Net Expense Ratio | | | | 1.15%a,b |
| | |
| Total Net Assets (000s) | | | | $2,495 |
| | | | |
INVESTOR CLASS |
| | | | |
| Fund # | | | | 2437 |
| | |
| Cusip | | | | 411512643 |
| | |
| Ticker | | | | HISOX |
| | |
| Inception Date | | | | 02/01/2014 |
| | |
| Net Expense Ratio | | | | 1.27%a,b |
| | |
| Total Net Assets (000s) | | | | $905 |
| b | Reflective of a contractual expense cap effective through February 29, 2016. |
PORTFOLIO STATISTICS
| | | | | | | | |
| | | Portfolio | | | Benchmark | |
| | |
Weighted Average Market Cap (MM) | | | $1,288 | | | | $2,230 | |
| | |
Price/Earning Ratio (P/E) | | | 39.2x | | | | 32.1x | |
| | |
Price/Book Ratio (P/B) | | | 3.9x | | | | 5.1x | |
| | |
Beta vs. Russell 2000® Growth Index | | | 0.97 | | | | 1.00 | |
| | |
Portfolio Turnover (6-Month Period Ended 04/30/2015) | | | 52% | c | | | N/A | |
SECTOR ALLOCATION (% of investments)
(Excludes cash and short-term investments)
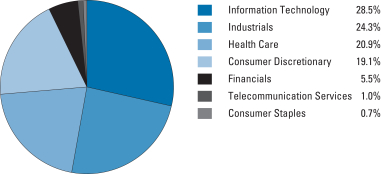
29
Harbor Small Cap Growth Opportunities Fund
FUND PERFORMANCE SUMMARY (Unaudited)
Institutional Class
CHANGE IN A $50,000 INVESTMENT
For the period 02/01/2014 through 04/30/2015
| | |
The graph compares a $50,000 investment in the Fund with the performance of the Russell 2000® Growth Index. The Fund’s performance includes the reinvestment of all dividend and capital gain distributions. | |  |
| | | | | | | | | | | | | | | | | | | | | | | | | | | | | | | | |
Total Returns For the periods ended 04/30/2015 | |  | |
| Harbor Small Cap Growth Opportunities Fund | | | | | | | | | | | | | | | | | | | | | | | | | | | | | | | | |
Institutional Class | | | 2.19% | | | | | | 7.69% | | | | | | N/A | | | | | | 8.01% | | | | | 02/01/2014 | | | | $ | 55,028 | |
| Comparative Index | | | | | | | | | | | | | | | | | | | | | | | | | | | | | | | | |
Russell 2000® Growth | | | 7.25% | | | | | | 14.65% | | | | | | N/A | | | | | | 8.92% | | | | | — | | | | $ | 55,607 | |
Administrative and Investor Classes
CHANGE IN A $10,000 INVESTMENT
For the period 02/01/2014 through 04/30/2015
| | |
The graph compares a $10,000 investment in the Fund with the performance of the Russell 2000® Growth Index. The Fund’s performance includes the reinvestment of all dividend and capital gain distributions. | | 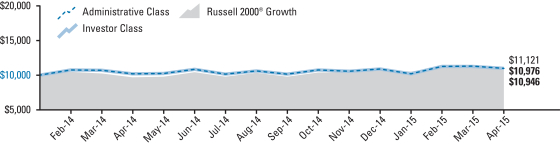 |
| | | | | | | | | | | | | | | | | | | | | | | | | | | | | | | | |
Total Returns For the periods ended 04/30/2015 | |  | |
| Harbor Small Cap Growth Opportunities Fund | | | | | | | | | | | | | | | | | | | | | | | | | | | | | | | | |
Administrative Class | | | 2.10% | | | | | | 7.50% | | | | | | N/A | | | | | | 7.77% | | | | | 02/01/2014 | | | | $ | 10,976 | |
Investor Class | | | 1.91% | | | | | | 7.20% | | | | | | N/A | | | | | | 7.53% | | | | | 02/01/2014 | | | | $ | 10,946 | |
| Comparative Index | | | | | | | | | | | | | | | | | | | | | | | | | | | | | | | | |
Russell 2000® Growth | | | 7.25% | | | | | | 14.65% | | | | | | N/A | | | | | | 8.92% | | | | | — | | | | $ | 11,121 | |
As stated in the Fund’s current prospectus, the expense ratios were 0.90% (Net) and 1.61% (Gross) (Institutional Class); 1.15% (Net) and 1.86% (Gross) (Administrative Class); and 1.27% (Net) and 1.98% (Gross) (Investor Class). The net expense ratios are contractually capped through 02/29/2016. The expense ratios shown in the prospectus are based on the prior fiscal year, adjusted to reflect changes, if any, in contractual arrangements that occurred prior to the date of the prospectus.
Performance data shown represents past performance, which is no guarantee of future results. Current performance may be higher or lower than the past performance data shown. Investment returns and the value of an investment will fluctuate, and an investor’s shares, when sold, may be worth more or less than their original cost. You can obtain performance data current to the most recent month-end (available within seven business days after the most recent month-end) by calling 800-422-1050 or visiting harborfunds.com.
The returns shown do not reflect the deduction of taxes that a shareholder would pay on Fund distributions or on the redemption of Fund shares. From time to time, certain fees and/or expenses have been waived or reimbursed, which has resulted in higher returns. Without these waivers and reimbursements, the returns would have been lower.
30
Harbor Small Cap Growth Opportunities Fund
PORTFOLIO OF INVESTMENTS—April 30, 2015 (Unaudited)
Equity Holdings (% of net assets)
(Excludes net cash and short-term investments of 0.9%)
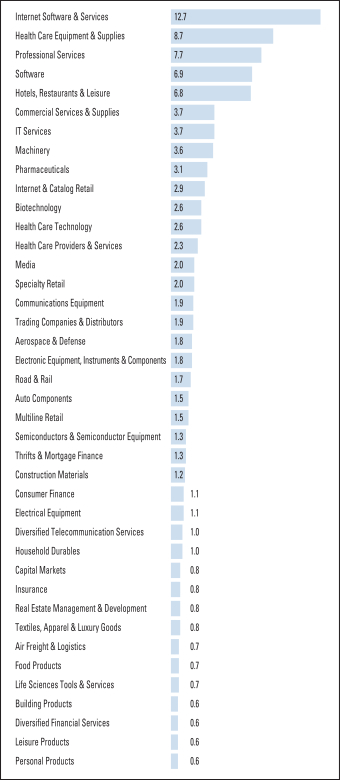
| | | | | | | | |
COMMON STOCKS—99.1% | |
| | |
| Shares | | | | | Value
(000s) | |
| | | | | | | | |
| | AEROSPACE & DEFENSE—1.8% | |
| | 88,574 | | | DigitalGlobe Inc.* | | $ | 2,849 | |
| | | | | | | | |
| | AIR FREIGHT & LOGISTICS—0.7% | |
| | 23,701 | | | Park-Ohio Holdings Corp. | | | 1,098 | |
| | | | | | | | |
| | AUTO COMPONENTS—1.5% | |
| | 54,322 | | | Fox Factory Holding Corp.* | | | 827 | |
| | 52,553 | | | Motorcar Parts of America Inc.* | | | 1,536 | |
| | | | | | | | |
| | | | | | | 2,363 | |
| | | | | | | | |
| | BIOTECHNOLOGY—2.6% | |
| | 185,303 | | | ARIAD Pharmaceuticals Inc.* | | | 1,607 | |
| | 22,671 | | | BioSpecifics Technologies Corp.* | | | 868 | |
| | 75,588 | | | Exact Sciences Corp.* | | | 1,580 | |
| | | | | | | | |
| | | | | | | 4,055 | |
| | | | | | | | |
| | BUILDING PRODUCTS—0.6% | |
| | 11,041 | | | Nortek Inc.* | | | 934 | |
| | | | | | | | |
| | CAPITAL MARKETS—0.8% | |
| | 28,685 | | | Financial Engines Inc. | | | 1,210 | |
| | | | | | | | |
| | COMMERCIAL SERVICES & SUPPLIES—3.7% | |
| | 41,951 | | | Healthcare Services Group Inc. | | | 1,270 | |
| | 322,977 | | | InnerWorkings Inc.* | | | 2,045 | |
| | 64,593 | | | Mobile Mini Inc. | | | 2,489 | |
| | | | | | | | |
| | | | | | | 5,804 | |
| | | | | | | | |
| | COMMUNICATIONS EQUIPMENT—1.9% | |
| | 67,998 | | | Finisar Corp.* | | | 1,382 | |
| | 130,622 | | | Ixia* | | | 1,565 | |
| | | | | | | | |
| | | | | | | 2,947 | |
| | | | | | | | |
| | CONSTRUCTION MATERIALS—1.2% | |
| | 31,047 | | | Caesarstone Sdot-Yam Ltd. (IL) | | | 1,839 | |
| | | | | | | | |
| | CONSUMER FINANCE—1.1% | |
| | 43,879 | | | Encore Capital Group Inc.* | | | 1,774 | |
| | | | | | | | |
| | DIVERSIFIED FINANCIAL SERVICES—0.6% | |
| | 51,332 | | | On Deck Capital Inc.* | | | 988 | |
| | | | | | | | |
| | DIVERSIFIED TELECOMMUNICATION SERVICES—1.0% | |
| | 150,403 | | | Iridium Communications Inc.* | | | 1,530 | |
| | | | | | | | |
| | ELECTRICAL EQUIPMENT—1.1% | |
| | 27,023 | | | Power Solutions International Inc.* | | | 1,724 | |
| | | | | | | | |
| | ELECTRONIC EQUIPMENT, INSTRUMENTS & COMPONENTS—1.8% | |
| | 30,608 | | | FARO Technologies Inc.* | | | 1,219 | |
| | 23,611 | | | OSI Systems Inc.* | | | 1,587 | |
| | | | | | | | |
| | | | | | | 2,806 | |
| | | | | | | | |
| | FOOD PRODUCTS—0.7% | |
| | 122,691 | | | Boulder Brands Inc.* | | | 1,171 | |
| | | | | | | | |
| | HEALTH CARE EQUIPMENT & SUPPLIES—8.7% | |
| | 185,640 | | | Accuray Inc.* | | | 1,509 | |
| | 568,632 | | | Cerus Corp.* | | | 2,525 | |
| | 28,745 | | | Cyberonics Inc.* | | | 1,751 | |
| | 58,942 | | | Cynosure Inc.* | | | 1,970 | |
| | 11,487 | | | ICU Medical Inc.* | | | 969 | |
| | 80,905 | | | Merit Medical Systems Inc.* | | | 1,570 | |
| | 178,201 | | | Novadaq Technologies Inc. (CAN)* | | | 1,926 | |
| | 51,945 | | | Wright Medical Group Inc.* | | | 1,318 | |
| | | | | | | | |
| | | | | | | 13,538 | |
| | | | | | | | |
| | HEALTH CARE PROVIDERS & SERVICES—2.3% | |
| | 112,286 | | | Cross Country Healthcare Inc.* | | | 1,246 | |
| | 56,751 | | | ExamWorks Group Inc.* | | | 2,324 | |
| | | | | | | | |
| | | | | | | 3,570 | |
| | | | | | | | |
31
Harbor Small Cap Growth Opportunities Fund
PORTFOLIO OF INVESTMENTS—Continued
| | | | | | | | |
COMMON STOCKS—Continued | |
| | |
| Shares | | | | | Value
(000s) | |
| | | | | | | | |
| | HEALTH CARE TECHNOLOGY—2.6% | |
| | 83,889 | | | HMS Holdings Corp.* | | $ | 1,427 | |
| | 84,710 | | | Quality Systems Inc. | | | 1,321 | |
| | 114,359 | | | Vocera Communications Inc.* | | | 1,303 | |
| | | | | | | | |
| | | | | | | 4,051 | |
| | | | | | | | |
| | HOTELS, RESTAURANTS & LEISURE—6.8% | |
| | 139,325 | | | Belmond Ltd. (BM)* | | | 1,716 | |
| | 19,645 | | | Churchill Downs Inc. | | | 2,341 | |
| | 58,089 | | | Clubcorp Holdings Inc. | | | 1,272 | |
| | 39,356 | | | Dave & Buster’s Entertainment Inc.* | | | 1,240 | |
| | 64,361 | | | Del Frisco’s Restaurant Group Inc.* | | | 1,298 | |
| | 64,520 | | | La Quinta Holdings Inc.* | | | 1,554 | |
| | 69,403 | | | Penn National Gaming Inc.* | | | 1,116 | |
| | | | | | | | |
| | | | | | | 10,537 | |
| | | | | | | | |
| | HOUSEHOLD DURABLES—1.0% | |
| | 80,082 | | | Century Communities Inc.* | | | 1,531 | |
| | | | | | | | |
| | INSURANCE—0.8% | |
| | 65,985 | | | National General Holdings Corp. | | | 1,276 | |
| | | | | | | | |
| | INTERNET & CATALOG RETAIL—2.9% | |
| | 157,584 | | | EVINE Live Inc.* | | | 939 | |
| | 54,631 | | | NutriSystem Inc. | | | 1,041 | |
| | 56,089 | | | Shutterfly Inc.* | | | 2,510 | |
| | | | | | | | |
| | | | | | | 4,490 | |
| | | | | | | | |
| | INTERNET SOFTWARE & SERVICES—12.7% | |
| | 69,778 | | | Dealertrack Technologies Inc.* | | | 2,743 | |
| | 171,478 | | | Gogo Inc.* | | | 3,625 | |
| | 54,619 | | | HomeAway Inc.* | | | 1,527 | |
| | 20,373 | | | LogMeIn Inc.* | | | 1,308 | |
| | 113,927 | | | MaxPoint Interactive Inc.* | | | 840 | |
| | 88,228 | | | Perficient Inc.* | | | 1,820 | |
| | 104,149 | | | RetailMeNot Inc.* | | | 1,914 | |
| | 53,324 | | | Textura Corp.* | | | 1,395 | |
| | 73,528 | | | WebMD Health Corp.* | | | 3,246 | |
| | 81,553 | | | Xoom Corp.* | | | 1,441 | |
| | | | | | | | |
| | | | | | | 19,859 | |
| | | | | | | | |
| | IT SERVICES—3.7% | |
| | 51,497 | | | Blackhawk Network Holdings Inc.* | | | 1,891 | |
| | 41,108 | | | ExlService Holdings Inc.* | | | 1,415 | |
| | 102,067 | | | WNS Holdings Ltd. ADR (IND)*,1 | | | 2,463 | |
| | | | | | | | |
| | | | | | | 5,769 | |
| | | | | | | | |
| | LEISURE PRODUCTS—0.6% | |
| | 24,655 | | | Arctic Cat Inc. | | | 875 | |
| | | | | | | | |
| | LIFE SCIENCES TOOLS & SERVICES—0.7% | |
| | 30,544 | | | Fluidigm Corp.* | | | 1,144 | |
| | | | | | | | |
| | MACHINERY—3.6% | |
| | 48,067 | | | Barnes Group Inc. | | | 1,928 | |
| | 23,919 | | | CIRCOR International Inc. | | | 1,307 | |
| | 112,964 | | | Mueller Water Products Inc. | | | 1,057 | |
| | 46,305 | | | TriMas Corp.* | | | 1,304 | |
| | | | | | | | |
| | | | | | | 5,596 | |
| | | | | | | | |
| | MEDIA—2.0% | |
| | 88,620 | | | MDC Partners Inc. (CAN) | | | 1,856 | |
| | 81,357 | | | National CineMedia Inc. | | | 1,240 | |
| | | | | | | | |
| | | | | | | 3,096 | |
| | | | | | | | |
| | | | | | | | |
| | MULTILINE RETAIL—1.5% | |
| | 30,173 | | | Fred’s Inc. | | | 509 | |
| | 115,012 | | | Tuesday Morning Corp.* | | | 1,820 | |
| | | | | | | | |
| | | | | | | 2,329 | |
| | | | | | | | |
| | PERSONAL PRODUCTS—0.6% | |
| | 193,651 | | | IGI Laboratories Inc.* | | | 984 | |
| | | | | | | | |
| | PHARMACEUTICALS—3.1% | |
| | 72,426 | | | Depomed Inc.* | | | 1,685 | |
| | 53,837 | | | Medicines Co.* | | | 1,379 | |
| | 289,536 | | | Pernix Therapeutics Holdings Inc.* | | | 1,847 | |
| | | | | | | | |
| | | | | | | 4,911 | |
| | | | | | | | |
| | PROFESSIONAL SERVICES—7.7% | |
| | 22,816 | | | Corporate Executive Board Co. | | | 1,913 | |
| | 29,575 | | | FTI Consulting Inc.* | | | 1,216 | |
| | 76,183 | | | Korn/Ferry International | | | 2,402 | |
| | 62,561 | | | On Assignment Inc.* | | | 2,105 | |
| | 39,143 | | | TrueBlue Inc.* | | | 1,126 | |
| | 64,520 | | | WageWorks Inc.* | | | 3,252 | |
| | | | | | | | |
| | | | | | | 12,014 | |
| | | | | | | | |
| | REAL ESTATE MANAGEMENT & DEVELOPMENT—0.8% | |
| | 34,049 | | | Marcus & Millichap Inc.* | | | 1,205 | |
| | | | | | | | |
| | ROAD & RAIL—1.7% | |
| | 33,535 | | | ArcBest Corp. | | | 1,197 | |
| | 145,949 | | | Quality Distribution Inc.* | | | 1,448 | |
| | | | | | | | |
| | | | | | | 2,645 | |
| | | | | | | | |
| | SEMICONDUCTORS & SEMICONDUCTOR EQUIPMENT—1.3% | |
| | 237,301 | | | Maxlinear Inc.* | | | 2,024 | |
| | | | | | | | |
| | SOFTWARE—6.9% | |
| | 104,740 | | | Callidus Software Inc.* | | | 1,294 | |
| | 28,750 | | | FleetMatics Group plc (IE)* | | | 1,310 | |
| | 29,442 | | | Gigamon Inc.* | | | 866 | |
| | 33,816 | | | Infoblox Inc.* | | | 797 | |
| | 49,635 | | | Qlik Technologies Inc.* | | | 1,727 | |
| | 70,963 | | | Synchronoss Technologies Inc.* | | | 3,256 | |
| | 94,651 | | | TiVo Inc.* | | | 1,046 | |
| | 16,754 | | | Vasco Data Security International Inc.* | | | 426 | |
| | | | | | | | |
| | | | | | | 10,722 | |
| | | | | | | | |
| | SPECIALTY RETAIL—2.0% | |
| | 88,740 | | | Francesca’s Holdings Corp.* | | | 1,502 | |
| | 30,455 | | | Lumber Liquidators Holdings Inc.* | | | 837 | |
| | 35,518 | | | Party City Holdco Inc.* | | | 739 | |
| | | | | | | | |
| | | | | | | 3,078 | |
| | | | | | | | |
| | TEXTILES, APPAREL & LUXURY GOODS—0.8% | |
| | 63,669 | | | Vince Holding Corp.* | | | 1,173 | |
| | | | | | | | |
| | THRIFTS & MORTGAGE FINANCE—1.3% | |
| | 36,265 | | | LendingTree Inc.* | | | 1,996 | |
| | | | | | | | |
| | TRADING COMPANIES & DISTRIBUTORS—1.9% | |
| | 86,674 | | | H&E Equipment Services Inc. | | | 2,142 | |
| | 32,700 | | | Rush Enterprises Inc.* | | | 855 | |
| | | | | | | | |
| | | | | | | 2,997 | |
| | | | | | | | |
| TOTAL COMMON STOCKS
(Cost $152,789) | | | 154,502 | |
| | | | | | | | |
32
Harbor Small Cap Growth Opportunities Fund
PORTFOLIO OF INVESTMENTS—Continued
| | | | | | | | |
SHORT-TERM INVESTMENTS—4.5% | |
| | | | | | | | |
| (Cost $6,954) | |
Principal
Amount
(000s) | | | | | Value
(000s) | |
| | REPURCHASE AGREEMENTS | |
| $ | 6,954 | | | Repurchase Agreement with State Street Corp.
dated April 30, 2015 due May 01, 2015 at 0.000% collateralized by U.S. Treasury Bonds (market value $7,098) . | | $ | 6,954 | |
| | | | | | | | |
| TOTAL INVESTMENTS—103.6%
(Cost $159,743) | | | 161,456 | |
| | | | | | | | |
| | CASH AND OTHER ASSETS, LESS LIABILITIES—(3.6)% | | | (5,627 | ) |
| | | | | | | | |
| | TOTAL NET ASSETS—100.0% | | $ | 155,829 | |
| | | | | | | | |
FAIR VALUE MEASUREMENTS
Repurchase Agreements valued at $6,954 are classified as Level 2. All other holdings at April 30, 2015 (as disclosed in the preceding Portfolio of Investments) are classified as Level 1. There were no Level 3 holdings at October 31, 2014 or April 30, 2015 and no transfers between levels during the period.
For more information on valuation inputs and their aggregation into the levels identified above, please refer to the Fair Value Measurements and Disclosures in Note 2 of the accompanying Notes to Financial Statements.
| * | Non-income producing security. |
| 1 | ADR after the name of a foreign holding stands for American Depositary Receipts representing ownership of foreign securities. ADRs are issued by U.S. banking institutions. |
The accompanying notes are an integral part of the Financial Statements.
33
Harbor Large Cap Value Fund
MANAGER’S COMMENTARY (Unaudited)
SUBADVISER
Aristotle Capital Management, LLC
11100 Santa Monica Boulevard
Suite 1700 Los Angeles, CA 90025
PORTFOLIO MANAGER
Howard Gleicher, CFA
Since 2012
Aristotle has subadvised the Fund since 2012.
INVESTMENT OBJECTIVE
The Fund seeks long-term total return.
PRINCIPAL STYLE CHARACTERISTICS
Large cap value stocks

Howard Gleicher
Management’s Discussion of Fund Performance
MARKET REVIEW
U.S. markets continued their upward advance, albeit at a slower pace, for the six months ended April 30, 2015. Although U.S. equities finished the period with positive momentum, share prices were volatile over the six months as investors shifted their focus from one economic report or news event to the next.
Equities vacillated between caution and optimism on mixed data from around the world. The European Central Bank addressed Europe’s persistent economic troubles by announcing a larger-than-expected bond-buying program, while China reported its slowest economic growth rate in 24 years (still a 7.4% expansion) and began its own form of quantitative easing to encourage spending and lending. Meanwhile, oil prices continued to decline, which pleased consumers but soured energy-related companies. The U.S. economy showed further signs of improvement as unemployment declined and GDP grew. Nonetheless, the Federal Reserve appeared patient, and the timing of the seemingly inevitable yet elusive interest rate hike remained uncertain.
PERFORMANCE
Harbor Large Cap Value Fund returned 6.99% (Institutional Class), 6.85% (Administrative Class), and 6.75% (Investor Class) for the six months ended April 30, 2015, outperforming the 2.89% return of its benchmark, the Russell 1000® Value Index. As is often the case in short-term reporting periods as well as over long periods of time, the outperformance was due largely to security selection. Overall, the Fund was able to outperform in 8 of the 10 economic sectors. From a sector standpoint, the largest positive contributions were found in Consumer Staples and Health Care, while Financials and Utilities lagged.
In Health Care, the Fund’s position in specialty pharmaceutical provider Hospira was a notable contributor. In mid-February, Pfizer made an unsolicited buy-out offer of $17 billion. The offer represented a 40% premium to the prior day’s closing price, sending Hospira’s shares sharply higher. In all, Hospira’s share price rose more than 60% over the fiscal first half. Interestingly, the price offered for the company by Pfizer was in line with our assessment of fair value for the business. We took the opportunity to liquidate the Fund’s position.
Another top contributor was cosmetics and fragrances manufacturer Coty (+44%). The company reported second quarter earnings that were well ahead of expectations. Growth in its Sally Hansen and Rimmel brands offset the negative effects of a stronger dollar.
Detracting from performance was technology giant EMC Corp (-6%). There was no tangible news to account for the weakness other than a perception, caused by a slowing economy, that spending on enterprise storage solutions as well as on cloud-based infrastructure could be weak in the near term. The competitive environment is certainly ramping up, but we believe that EMC’s competitive advantage in storage solutions as well as in multi-environment server software solutions (through its ownership of VMware) remains intact.
Another notable detractor was international banking giant Banco Santander. Based in Madrid, Santander is an international institution with holdings in both the developed and developing worlds. The company announced a secondary offering that, while dilutive in
34
Harbor Large Cap Value Fund
MANAGER’S COMMENTARY—Continued
| | | | |
TOP TEN HOLDINGS (% of net assets) | |
Time Warner Inc. | | | 3.3% | |
Walgreens Boots Alliance Inc. | | | 3.3% | |
Home Depot Inc. | | | 3.2% | |
AbbVie Inc. | | | 3.1% | |
TE Connectivity Ltd. | | | 3.1% | |
General Dynamics Corp. | | | 3.0% | |
Medtronic plc | | | 3.0% | |
Microsoft Corp. | | | 3.0% | |
Adobe Systems Inc. | | | 2.8% | |
Phillips 66 | | | 2.8% | |
the short run, we feel will have a long-term positive impact on the business. That, combined with a strong U.S. dollar, brought the shares down 14% over the past six months.
OUTLOOK AND STRATEGY
We believe that the U.S. economy is normalizing and appears to us to be entering a transition phase, the first one in more than five years. Most global economies have yet to enter this transition. This transition could be one from defense to offense—that is, from an environment in which all external factors were supportive of keeping the economy from entering recession to one of a cyclical normalization of such factors. In our view, some of the shifts could include:
| | • | | Low and/or declining interest rates may turn into modestly rising rates. |
| | • | | Very tight bank lending standards may give way to more realistic loan practices, particularly as they pertain to residential mortgages. |
| | • | | Significant cash accumulation by corporations may now turn into a need for greater capital expenditures to meet growing demand for products and services. |
| | • | | Weak employment markets with benign labor costs could turn quickly into a tight labor market, leading to escalating costs. |
| | • | | Abundant office, factory, retail, and commercial building space may turn into a supply-constrained environment, resulting in higher occupancy costs and reduced flexibility of work spaces. |
While we cannot yet be specific, we believe that history suggests that transitions such as these are unlikely to be without bumps or unintended consequences. As always, we will be mindful of, and diligent in, evaluating these factors in our analysis of businesses while continuing to adhere to our bottom-up, fundamentally focused research process.
This report contains the current opinions of Aristotle Capital Management, LLC at the time of its publication and should not be considered as investment advice or a recommendation of any particular security, strategy or investment product. Such opinions are subject to change without notice and securities described herein may no longer be included in, or may at any time be removed from, the Fund’s portfolio. This report is distributed for informational purposes only. Information contained herein has been obtained from sources believed reliable, but not guaranteed.
Equity securities, such as common stocks, are affected by company specific events and by movements in the overall stock markets in which those securities principally trade. An adverse company specific event, or downturn in those stock markets, can depress the value of a particular company’s equity securities. For information on the different share classes and the risks associated with an investment in the Fund, please refer to the current prospectus.
35
Harbor Large Cap Value Fund
FUND SUMMARY—April 30, 2015 (Unaudited)
| | | | |
INSTITUTIONAL CLASS |
| | | | |
| Fund # | | | | 2013 |
| | |
| Cusip | | | | 411511603 |
| | |
| Ticker | | | | HAVLX |
| | |
| Inception Date | | | | 12/29/1987 |
| | |
| Net Expense Ratio | | | | 0.68%a,b |
| | |
| Total Net Assets (000s) | | | | $217,880 |
| | | | |
ADMINISTRATIVE CLASS |
| | | | |
| Fund # | | | | 2213 |
| | |
| Cusip | | | | 411511751 |
| | |
| Ticker | | | | HRLVX |
| | |
| Inception Date | | | | 11/01/2002 |
| | |
| Net Expense Ratio | | | | 0.93%a,b |
| | |
| Total Net Assets (000s) | | | | $23,598 |
| | | | |
INVESTOR CLASS |
| | | | |
| Fund # | | | | 2413 |
| | |
| Cusip | | | | 411511744 |
| | |
| Ticker | | | | HILVX |
| | |
| Inception Date | | | | 11/01/2002 |
| | |
| Net Expense Ratio | | | | 1.05%a,b |
| | |
| Total Net Assets (000s) | | | | $20,024 |
| b | Reflective of a contractual expense cap effective through February 29, 2016. |
PORTFOLIO STATISTICS
| | | | | | | | |
| | | Portfolio | | | Benchmark | |
| | |
Weighted Average Market Cap (MM) | | | $82,382 | | | | $109,599 | |
| | |
Price/Earning Ratio (P/E) | | | 22.6x | | | | 20.7x | |
| | |
Price/Book Ratio (P/B) | | | 3.4x | | | | 2.2x | |
| | |
Beta vs. Russell 1000® Value Index | | | 1.07 | | | | 1.00 | |
| | |
Portfolio Turnover (6-Month Period Ended 04/30/2015) | | | 8% | c | | | N/A | |
SECTOR ALLOCATION (% of investments)
(Excludes cash and short-term investments)

36
Harbor Large Cap Value Fund
FUND PERFORMANCE SUMMARY (Unaudited)
Institutional Class
CHANGE IN A $50,000 INVESTMENT
For the period 05/01/2005 through 04/30/2015
| | |
The graph compares a $50,000 investment in the Fund with the performance of the Russell 1000® Value Index. The Fund’s performance includes the reinvestment of all dividend and capital gain distributions. | | 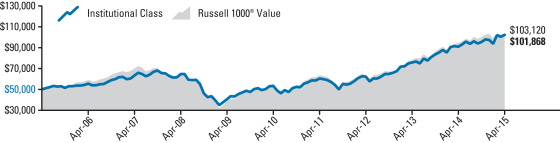 |
| | | | | | | | | | | | | | | | | | | | | | | | | | | | | | | | |
Total Returns For the periods ended 04/30/2015 | | | |
| Harbor Large Cap Value Fund | | | | | | | | | | | | | | | | | | | | | | | | | | | | | | | | |
Institutional Class | | | 6.99% | | | | | | 12.35% | | | | | | 13.80% | | | | | | 7.38% | | | | | 12/29/1987 | | | | $ | 101,868 | |
| Comparative Index | | | | | | | | | | | | | | | | | | | | | | | | | | | | | | | | |
Russell 1000® Value | | | 2.89% | | | | | | 9.31% | | | | | | 13.39% | | | | | | 7.51% | | | | | — | | | | $ | 103,120 | |
Administrative and Investor Classes
CHANGE IN A $10,000 INVESTMENT
For the period 05/01/2005 through 04/30/2015
| | |
The graph compares a $10,000 investment in the Fund with the performance of the Russell 1000® Value Index. The Fund’s performance includes the reinvestment of all dividend and capital gain distributions. | | 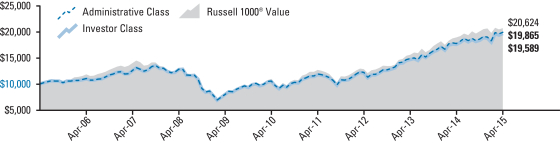 |
| | | | | | | | | | | | | | | | | | | | | | | | | | | | | | | | |
Total Returns For the periods ended 04/30/2015 | | | |
| Harbor Large Cap Value Fund | | | | | | | | | | | | | | | | | | | | | | | | | | | | | | | | |
Administrative Class | | | 6.85% | | | | | | 12.09% | | | | | | 13.51% | | | | | | 7.10% | | | | | 11/01/2002 | | | | $ | 19,865 | |
Investor Class | | | 6.75% | | | | | | 11.82% | | | | | | 13.34% | | | | | | 6.96% | | | | | 11/01/2002 | | | | $ | 19,589 | |
| Comparative Index | | | | | | | | | | | | | | | | | | | | | | | | | | | | | | | | |
Russell 1000® Value | | | 2.89% | | | | | | 9.31% | | | | | | 13.39% | | | | | | 7.51% | | | | | — | | | | $ | 20,624 | |
As stated in the Fund’s current prospectus, the expense ratios were 0.68% (Net) and 0.71% (Gross) (Institutional Class); 0.93% (Net) and 0.96% (Gross) (Administrative Class); and 1.05% (Net) and 1.08% (Gross) (Investor Class). The net expense ratios are contractually capped through 02/29/2016. The expense ratios in the prospectus may differ from the actual expense ratios for the period disclosed within this report. The expense ratios shown in the prospectus are based on the prior fiscal year, adjusted to reflect changes, if any, in contractual arrangements that occurred prior to the date of the prospectus.
Performance data shown represents past performance, which is no guarantee of future results. Current performance may be higher or lower than the past performance data shown. Investment returns and the value of an investment will fluctuate, and an investor’s shares, when sold, may be worth more or less than their original cost. You can obtain performance data current to the most recent month-end (available within seven business days after the most recent month-end) by calling 800-422-1050 or visiting harborfunds.com.
The returns shown do not reflect the deduction of taxes that a shareholder would pay on Fund distributions or on the redemption of Fund shares. From time to time, certain fees and/or expenses have been waived or reimbursed, which has resulted in higher returns. Without these waivers and reimbursements, the returns would have been lower.
37
Harbor Large Cap Value Fund
PORTFOLIO OF INVESTMENTS—April 30, 2015 (Unaudited)
Equity Holdings (% of net assets)
(Excludes net cash and short -term investments of 5.2%)
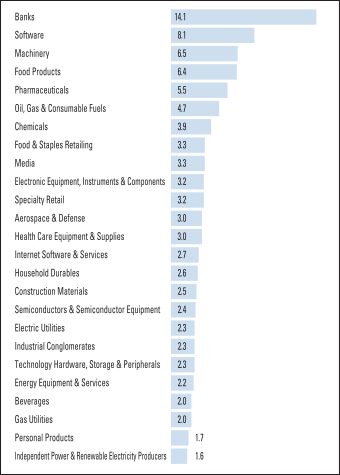
| | | | | | | | |
COMMON STOCKS—94.8% | |
| | |
| Shares | | | | | Value
(000s) | |
| | | | | | | | |
| | AEROSPACE & DEFENSE—3.0% | |
| | 57,000 | | | General Dynamics Corp. | | $ | 7,827 | |
| | | | | | | | |
| | BANKS—14.1% | |
| | 694,898 | | | Banco Santander SA ADR (SP)1 | | | 5,226 | |
| | 430,000 | | | Bank of America Corp. | | | 6,850 | |
| | 20,615 | | | BOK Financial Corp. | | | 1,344 | |
| | 103,000 | | | First Republic Bank | | | 6,004 | |
| | 106,100 | | | JP Morgan Chase & Co. | | | 6,712 | |
| | 40,900 | | | M&T Bank Corp. | | | 4,894 | |
| | 809,000 | | | Mitsubishi UFJ Financial Group Inc. ADR (JP)1 | | | 5,744 | |
| | | | | | | | |
| | | | | | | 36,774 | |
| | | | | | | | |
| | BEVERAGES—2.0% | |
| | 48,100 | | | Diageo plc ADR (UK)1 | | | 5,340 | |
| | | | | | | | |
| | CHEMICALS—3.9% | |
| | 116,200 | | | Dow Chemical Co. | | | 5,926 | |
| | 39,200 | | | Ecolab Inc. | | | 4,390 | |
| | | | | | | | |
| | | | | | | 10,316 | |
| | | | | | | | |
| | CONSTRUCTION MATERIALS—2.5% | |
| | 46,400 | | | Martin Marietta Materials Inc. | | | 6,619 | |
| | | | | | | | |
| | | | | | | | |
| | ELECTRIC UTILITIES—2.3% | |
| | 167,200 | | | ITC Holdings Corp. | | | 6,019 | |
| | | | | | | | |
| | ELECTRONIC EQUIPMENT, INSTRUMENTS & COMPONENTS—3.2% | |
| | 124,000 | | | TE Connectivity Ltd. (SWS) | | | 8,252 | |
| | | | | | | | |
| | ENERGY EQUIPMENT & SERVICES—2.2% | |
| | 115,900 | | | Halliburton Co. | | | 5,673 | |
| | | | | | | | |
| | FOOD & STAPLES RETAILING—3.3% | |
| | 102,500 | | | Walgreens Boots Alliance Inc. | | | 8,500 | |
| | | | | | | | |
| | FOOD PRODUCTS—6.4% | |
| | 44,800 | | | Hershey Co. | | | 4,118 | |
| | 159,100 | | | Mondelez International Inc. | | | 6,105 | |
| | 151,200 | | | Unilever NV (NET) | | | 6,574 | |
| | | | | | | | |
| | | | | | | 16,797 | |
| | | | | | | | |
| | GAS UTILITIES—2.0% | |
| | 80,000 | | | National Fuel Gas Co. | | | 5,156 | |
| | | | | | | | |
| | HEALTH CARE EQUIPMENT & SUPPLIES—3.0% | |
| | 106,600 | | | Medtronic plc (IE) | | | 7,936 | |
| | | | | | | | |
| | HOUSEHOLD DURABLES—2.6% | |
| | 151,000 | | | Lennar Corp. | | | 6,916 | |
| | | | | | | | |
| | INDEPENDENT POWER & RENEWABLE ELECTRICITY PRODUCERS—1.6% | |
| | 308,400 | | | AES Corp. | | | 4,086 | |
| | | | | | | | |
| | INDUSTRIAL CONGLOMERATES—2.3% | |
| | 217,900 | | | General Electric Co. | | | 5,901 | |
| | | | | | | | |
| | INTERNET SOFTWARE & SERVICES—2.7% | |
| | 119,200 | | | eBay Inc.* | | | 6,945 | |
| | | | | | | | |
| | MACHINERY—6.5% | |
| | 52,400 | | | Deere & Co. | | | 4,743 | |
| | 63,100 | | | Illinois Tool Works Inc. | | | 5,905 | |
| | 120,000 | | | Oshkosh Corp. | | | 6,461 | |
| | | | | | | | |
| | | | | | | 17,109 | |
| | | | | | | | |
| | MEDIA—3.3% | |
| | 103,000 | | | Time Warner Inc. | | | 8,694 | |
| | | | | | | | |
| | OIL, GAS & CONSUMABLE FUELS—4.7% | |
| | 93,000 | | | Phillips 66 | | | 7,376 | |
| | 28,600 | | | Pioneer Natural Resources Co. | | | 4,941 | |
| | | | | | | | |
| | | | | | | 12,317 | |
| | | | | | | | |
| | PERSONAL PRODUCTS—1.7% | |
| | 190,000 | | | Coty Inc.* | | | 4,543 | |
| | | | | | | | |
| | PHARMACEUTICALS—5.5% | |
| | 126,000 | | | AbbVie Inc. | | | 8,147 | |
| | 61,600 | | | Novartis AG ADR (SWS)1 | | | 6,271 | |
| | | | | | | | |
| | | | | | | 14,418 | |
| | | | | | | | |
| | SEMICONDUCTORS & SEMICONDUCTOR EQUIPMENT—2.4% | |
| | 114,600 | | | Texas Instruments Inc. | | | 6,213 | |
| | | | | | | | |
| | SOFTWARE—8.1% | |
| | 94,800 | | | Adobe Systems Inc.* | | | 7,211 | |
| | 163,000 | | | Microsoft Corp. | | | 7,928 | |
| | 136,100 | | | Oracle Corp. | | | 5,937 | |
| | | | | | | | |
| | | | | | | 21,076 | |
| | | | | | | | |
| | SPECIALTY RETAIL—3.2% | |
| | 77,800 | | | Home Depot Inc. | | | 8,323 | |
| | | | | | | | |
38
Harbor Large Cap Value Fund
PORTFOLIO OF INVESTMENTS—Continued
| | | | | | | | |
COMMON STOCKS—Continued | |
| | |
| Shares | | | | | Value
(000s) | |
| | | | | | | | |
| | TECHNOLOGY HARDWARE, STORAGE & PERIPHERALS—2.3% | |
| | 225,000 | | | EMC Corp. | | $ | 6,055 | |
| | | | | | | | |
| TOTAL COMMON STOCKS
(Cost $183,735) | | | 247,805 | |
| | | | | | | | |
SHORT-TERM INVESTMENTS—5.2% | |
| (Cost $13,682) | | | | |
Principal
Amount
(000s) | | | | | Value
(000s) | |
| | | | | | | | |
| | REPURCHASE AGREEMENTS | |
| $ | 13,682 | | | Repurchase Agreement with State Street Corp.
dated April 30, 2015 due May 01, 2015 at 0.000% collateralized by U.S. Treasury Bonds (market value $13,957) | | | 13,682 | |
| | | | | | | | |
| TOTAL INVESTMENTS—100.0%
(Cost $197,417) | | | 261,487 | |
| | | | | | | | |
| | CASH AND OTHER ASSETS, LESS LIABILITIES—0.0% | | | 15 | |
| | | | | | | | |
| | TOTAL NET ASSETS—100.0% | | $ | 261,502 | |
| | | | | | | | |
FAIR VALUE MEASUREMENTS
Repurchase Agreements valued at $13,682 are classified as Level 2. All other holdings at April 30, 2015 (as disclosed in the preceding Portfolio of Investments) are classified as Level 1. There were no Level 3 holdings at October 31, 2014 or April 30, 2015 and no transfers between levels during the period.
For more information on valuation inputs and their aggregation into the levels identified above, please refer to the Fair Value Measurements and Disclosures in Note 2 of the accompanying Notes to Financial Statements.
| * | Non-income producing security. |
| 1 | ADR after the name of a foreign holding stands for American Depositary Receipts representing ownership of foreign securities. ADRs are issued by U.S. banking institutions. |
The accompanying notes are an integral part of the Financial Statements.
39
Harbor Mid Cap Value Fund
MANAGERS’ COMMENTARY (Unaudited)
SUBADVISER
LSV Asset Management
155 North Wacker Drive Suite 4600 Chicago, IL 60606
PORTFOLIO MANAGERS
Josef Lakonishok, Ph.D.
Since 2004
Menno Vermeulen, CFA
Since 2004
Puneet Mansharamani, CFA Since 2006
Greg Sleight
Since 2015
Guy Lakonishok, CFA
Since 2015
LSV has subadvised the Fund since 2004.
INVESTMENT OBJECTIVE
The Fund seeks long-term total return.
PRINCIPAL STYLE CHARACTERISTICS
Mid cap value stocks of companies with inexpensive fundamentals and recent momentum, relative to their peers

Josef Lakonishok

Menno Vermeulen

Puneet Mansharamani

Greg Sleight

Guy Lakonishok
Management’s Discussion of Fund Performance
MARKET REVIEW
U.S. equities posted positive returns for the six months ended April 30, 2015, as the S&P 500 Index advanced 4.40%. The Russell Midcap® Index finished up 5.87%, while shares of smaller companies, as measured by the Russell 2000® Index, returned 4.65%. Value stocks lagged growth stocks. Among mid cap stocks, the Russell Midcap® Value Index advanced 3.83%, compared to 7.77% for the Russell Midcap® Growth Index.
Equity markets advanced despite slowing growth around the globe and the end of the Federal Reserve’s quantitative easing program. GDP growth in the U.S. slowed from 5.0% in the third quarter of 2014 to 2.2% in the fourth quarter and a mere 0.2% in the first quarter of 2015. Growth in Europe remained stagnant and China’s growth slowed to approximately 7% in the first quarter. The European Central Bank embarked on a quantitative easing program and China also moved quickly to counter the slowdown with additional stimulus measures. The Federal Reserve ended its bond buying program in October 2014 and dropped its language about being “patient” in increasing rates, setting the stage for the possibility of rate hikes later this year.
Oil prices continued to decline through most of the period before rallying in April. Consumers and the transportation industry benefited from lower oil prices but energy stocks took a hit. Merger and acquisition activity was strong during the fiscal first half and the unemployment rate continued to decline, both of which were positives for the equity markets.
Health Care stocks led the mid cap value market, returning 14% as mergers and acquisitions activity was strong in the sector. Consumer Discretionary stocks were up 9%, led by good returns among retail stocks. The Energy sector declined 13% as oil prices continued to weaken before rebounding somewhat in April. Besides Energy, the only other sector to post a negative return was the Utilities sector, which declined 1.7%.
PERFORMANCE
Harbor Mid Cap Value Fund returned 4.87% (Institutional Class), 4.71% (Administrative Class), and 4.68% (Investor Class), compared to 3.83% for the Russell Midcap® Value Index for the six months ended April 30, 2015. Value stocks lagged their growth counterparts, which had a negative impact on absolute results, given our deep-value bias.
The Fund’s outperformance relative to the benchmark was driven by strong stock selection in multiple sectors, particularly Energy, Industrials, and Consumer Discretionary. However, the Fund’s sector allocations had a negative impact on results. The Fund’s overweight to Energy stocks and underweight to Health Care stocks detracted from performance. Even though the portfolio was overweight to Energy by less than 2 percentage points, Energy stocks declined 13%. Health Care stocks were up 14%. The top individual performers in the Fund included JetBlue Airways, Kohl’s, United Therapeutics, Kroger, Amtrust Financial Services, and Universal Insurance Holdings.
40
Harbor Mid Cap Value Fund
MANAGERS’ COMMENTARY—Continued
| | | | |
TOP TEN HOLDINGS (% of net assets) | |
Public Service Enterprise Group Inc. | | | 1.6% | |
Kohl’s Corp. | | | 1.4% | |
Avery Dennison Corp. | | | 1.3% | |
CIGNA Corp. | | | 1.3% | |
Macy’s Inc. | | | 1.3% | |
Xerox Corp. | | | 1.3% | |
Edison International | | | 1.2% | |
Hartford Financial Services Group Inc. | | | 1.2% | |
Western Digital Corp. | | | 1.2% | |
Quest Diagnostics Inc. | | | 1.1% | |
Detractors included Ensco, Trinity Industries, Xerox, Noble, and a lack of exposure to Health Care stocks Boston Scientific and Hospira, which were among the stronger performers in the index.
OUTLOOK AND STRATEGY
Our portfolio decision making process is strictly quantitative and driven by (1) a proprietary model which ranks securities on fundamental measures of value and indicators of near-term appreciation potential and (2) a portfolio construction process that seeks to control for risk while maximizing expected return. The objective of the model is to pick undervalued stocks with high near-term appreciation potential. The process is purely bottom-up with no emphasis placed on macroeconomic analysis.
Sector weightings are a residual of our bottom-up stock selection process subject to minimum and maximum exposures to sectors and industries. Relative to the Russell Midcap(R) Value benchmark, the Fund as of April 30, 2015, was overweight the Consumer Discretionary and Information Technology sectors while underweight Health Care, Utilities, and Real Estate Investment Trusts.
The most significant changes in relative sector weights in the Fund over the six months were an increase to Information Technology and Consumer Discretionary stocks and a decrease to the Financials and Energy sectors. In the Consumer Discretionary sector we purchased American Axle and Manufacturing, Gap, Harley Davidson, and home builder Ryland Group. In the Technology sector we initiated positions in Avnet, Juniper Networks, QLogic, and Western Union. We sold several stocks that had done well and were no longer attractive from a valuation perspective, including L-3 Communications and Exelis in the Industrials sector and Leidos Holdings and Science Applications International in the Technology sector.
Portfolio valuations moved higher over the six months but the Fund continued to trade at a discount to the value benchmark. As of April 30, the Fund traded at 13.0x forward earnings, compared to 17.6x for the Russell Midcap(R) Value Index, 1.8x book value compared to 1.9x for the benchmark, and 8.4x cash flow compared to 10.9x for the index.
This report contains the current opinions of LSV Asset Management at the time of its publication and should not be considered as investment advice or a recommendation of any particular security, strategy or investment product. Such opinions are subject to change without notice and securities described herein may no longer be included in, or may at any time be removed from, the Fund’s portfolio. This report is distributed for informational purposes only. Information contained herein has been obtained from sources believed reliable, but not guaranteed.
Stocks of mid cap companies pose special risks, including possible illiquidity and greater price volatility than stocks of larger, more established companies. Equity securities, such as common stocks, are affected by company specific events and by movements in the overall stock markets in which those securities principally trade. An adverse company specific event, or downturn in those stock markets, can depress the value of a particular company’s equity securities. For information on the different share classes and the risks associated with an investment in the Fund, please refer to the current prospectus.
41
Harbor Mid Cap Value Fund
FUND SUMMARY—April 30, 2015 (Unaudited)
| | | | |
INSTITUTIONAL CLASS |
| | | | |
| Fund # | | | | 2023 |
| | |
| Cusip | | | | 411511835 |
| | |
| Ticker | | | | HAMVX |
| | |
| Inception Date | | | | 03/01/2002 |
| | |
| Net Expense Ratio | | | | 0.85%a |
| | |
| Total Net Assets (000s) | | | | $356,382 |
| | | | |
ADMINISTRATIVE CLASS |
| | | | |
| Fund # | | | | 2223 |
| | |
| Cusip | | | | 411511728 |
| | |
| Ticker | | | | HRMVX |
| | |
| Inception Date | | | | 11/01/2002 |
| | |
| Net Expense Ratio | | | | 1.11%a |
| | |
| Total Net Assets (000s) | | | | $25,275 |
| | | | |
INVESTOR CLASS |
| | | | |
| Fund # | | | | 2423 |
| | |
| Cusip | | | | 411511736 |
| | |
| Ticker | | | | HIMVX |
| | |
| Inception Date | | | | 11/01/2002 |
| | |
| Net Expense Ratio | | | | 1.23%a |
| | |
| Total Net Assets (000s) | | | | $147,731 |
PORTFOLIO STATISTICS
| | | | | | | | |
| | | Portfolio | | | Benchmark | |
| | |
Weighted Average Market Cap (MM) | | | $9,780 | | | | $11,997 | |
| | |
Price/Earning Ratio (P/E) | | | 15.6x | | | | 22.8x | |
| | |
Price/Book Ratio (P/B) | | | 2.0x | | | | 2.2x | |
| | |
Beta vs. Russell Midcap® Value Index | | | 1.10 | | | | 1.00 | |
| | |
Portfolio Turnover (6-Month Period Ended 04/30/2015) | | | 2% | b | | | N/A | |
SECTOR ALLOCATION (% of investments)
(Excludes cash and short-term investments)
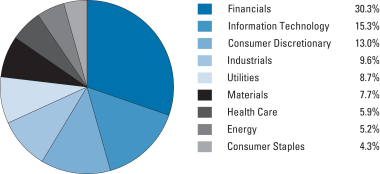
42
Harbor Mid Cap Value Fund
FUND PERFORMANCE SUMMARY (Unaudited)
Institutional Class
CHANGE IN A $50,000 INVESTMENT
For the period 05/01/2005 through 04/30/2015
| | |
The graph compares a $50,000 investment in the Fund with the performance of the Russell Midcap® Value Index. The Fund’s performance includes the reinvestment of all dividend and capital gain distributions. | | 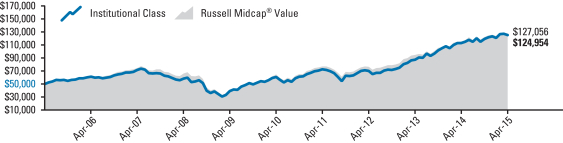 |
| | | | | | | | | | | | | | | | | | | | | | | | | | | | | | | | |
Total Returns For the periods ended 04/30/2015 | | | |
| Harbor Mid Cap Value Fund | | | | | | | | | | | | | | | | | | | | | | | | | | | | | | | | |
Institutional Class | | | 4.87% | | | | | | 10.64% | | | | | | 15.46% | | | | | | 9.59% | | | | | 03/01/2002 | | | | $ | 124,954 | |
| Comparative Index | | | | | | | | | | | | | | | | | | | | | | | | | | | | | | | | |
Russell Midcap® Value | | | 3.83% | | | | | | 9.97% | | | | | | 14.57% | | | | | | 9.77% | | | | | — | | | | $ | 127,056 | |
Administrative and Investor Classes
CHANGE IN A $10,000 INVESTMENT
For the period 05/01/2005 through 04/30/2015
| | |
The graph compares a $10,000 investment in the Fund with the performance of the Russell Midcap® Value Index. The Fund’s performance includes the reinvestment of all dividend and capital gain distributions. | | 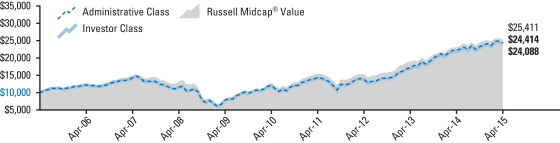 |
| | | | | | | | | | | | | | | | | | | | | | | | | | | | | | | | |
Total Returns For the periods ended 04/30/2015 | | | |
| Harbor Mid Cap Value Fund | | | | | | | | | | | | | | | | | | | | | | | | | | | | | | | | |
Administrative Class | | | 4.71% | | | | | | 10.37% | | | | | | 15.18% | | | | | | 9.34% | | | | | 11/01/2002 | | | | $ | 24,414 | |
Investor Class | | | 4.68% | | | | | | 10.23% | | | | | | 15.05% | | | | | | 9.19% | | | | | 11/01/2002 | | | | $ | 24,088 | |
| Comparative Index | | | | | | | | | | | | | | | | | | | | | | | | | | | | | | | | |
Russell Midcap® Value | | | 3.83% | | | | | | 9.97% | | | | | | 14.57% | | | | | | 9.77% | | | | | — | | | | $ | 25,411 | |
As stated in the Fund’s current prospectus, the expense ratios were 0.90% (Institutional Class); 1.15% (Administrative Class); and 1.27% (Investor Class). The expense ratios in the prospectus may differ from the actual expense ratios for the period disclosed within this report. The expense ratios shown in the prospectus are based on the prior fiscal year, adjusted to reflect changes, if any, in contractual arrangements that occurred prior to the date of the prospectus.
Performance data shown represents past performance, which is no guarantee of future results. Current performance may be higher or lower than the past performance data shown. Investment returns and the value of an investment will fluctuate, and an investor’s shares, when sold, may be worth more or less than their original cost. You can obtain performance data current to the most recent month-end (available within seven business days after the most recent month-end) by calling 800-422-1050 or visiting harborfunds.com.
The returns shown do not reflect the deduction of taxes that a shareholder would pay on Fund distributions or on the redemption of Fund shares. From time to time, certain fees and/or expenses have been waived or reimbursed, which has resulted in higher returns. Without these waivers and reimbursements, the returns would have been lower.
43
Harbor Mid Cap Value Fund
PORTFOLIO OF INVESTMENTS—April 30, 2015 (Unaudited)
Equity Holdings (% of net assets)
(Excludes net cash and short-term investments of 1.1%)
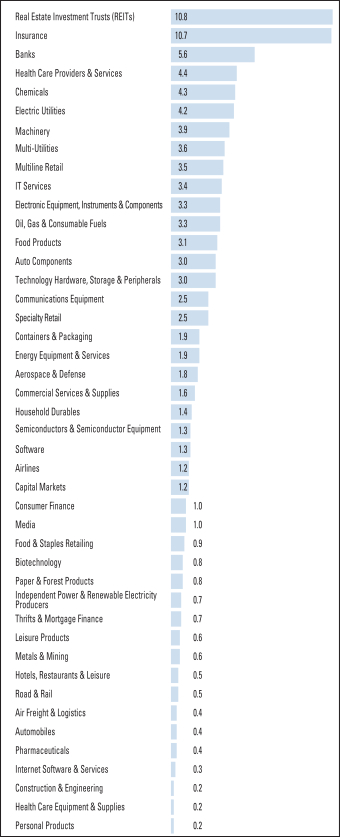
| | | | | | | | |
COMMON STOCKS—98.9% | |
| | |
| Shares | | | | | Value
(000s) | |
| | AEROSPACE & DEFENSE—1.8% | |
| | 3,000 | | | Engility Holdings Inc.* | | $ | 84 | |
| | 25,500 | | | Huntington Ingalls Industries Inc. | | | 3,355 | |
| | 11,400 | | | Northrop Grumman Corp. | | | 1,756 | |
| | 11,700 | | | Orbital Atk Inc. | | | 856 | |
| | 11,800 | | | Raytheon Co. | | | 1,227 | |
| | 37,300 | | | Triumph Group Inc. | | | 2,210 | |
| | 3,511 | | | Vectrus Inc.* | | | 90 | |
| | | | | | | | |
| | | | | | | 9,578 | |
| | | | | | | | |
| | AIR FREIGHT & LOGISTICS—0.4% | |
| | 39,000 | | | Atlas Air Worldwide Holdings Inc.* | | | 1,901 | |
| | | | | | | | |
| | AIRLINES—1.2% | |
| | 45,400 | | | Alaska Air Group Inc. | | | 2,908 | |
| | 161,000 | | | JetBlue Airways Corp.* | | | 3,306 | |
| | | | | | | | |
| | | | | | | 6,214 | |
| | | | | | | | |
| | AUTO COMPONENTS—3.0% | |
| | 118,200 | | | American Axle & Manufacturing Holdings Inc.* | | | 2,947 | |
| | 14,700 | | | Autoliv Inc. | | | 1,745 | |
| | 151,500 | | | Goodyear Tire & Rubber Co. | | | 4,297 | |
| | 40,200 | | | Lear Corp. | | | 4,463 | |
| | 25,200 | | | TRW Automotive Holdings Corp.* | | | 2,648 | |
| | | | | | | | |
| | | | | | | 16,100 | |
| | | | | | | | |
| | AUTOMOBILES—0.4% | |
| | 38,500 | | | Harley-Davidson Inc. | | | 2,164 | |
| | | | | | | | |
| | BANKS—5.6% | |
| | 83,600 | | | Banco Latinoamericano de Comercio Exterior SA (PA) | | | 2,656 | |
| | 98,700 | | | CIT Group Inc. | | | 4,445 | |
| | 157,600 | | | Fifth Third Bancorp. | | | 3,152 | |
| | 388,700 | | | Huntington Bancshares Inc. | | | 4,221 | |
| | 347,900 | | | KeyCorp. | | | 5,027 | |
| | 72,500 | | | NBT Bancorp Inc. | | | 1,751 | |
| | 4,800 | | | PNC Financial Services Group Inc. | | | 440 | |
| | 289,400 | | | Regions Financial Corp. | | | 2,845 | |
| | 118,200 | | | SunTrust Banks Inc. | | | 4,905 | |
| | | | | | | | |
| | | | | | | 29,442 | |
| | | | | | | | |
| | BIOTECHNOLOGY—0.8% | |
| | 9,900 | | | Myriad Genetics Inc.* | | | 327 | |
| | 25,700 | | | United Therapeutics Corp.* | | | 4,104 | |
| | | | | | | | |
| | | | | | | 4,431 | |
| | | | | | | | |
| | CAPITAL MARKETS—1.2% | |
| | 19,400 | | | Ameriprise Financial Inc. | | | 2,430 | |
| | 97,600 | | | Investment Technology Group Inc. | | | 2,781 | |
| | 13,400 | | | State Street Corp. | | | 1,033 | |
| | | | | | | | |
| | | | | | | 6,244 | |
| | | | | | | | |
| | CHEMICALS—4.3% | |
| | 32,500 | | | Cabot Corp. | | | 1,389 | |
| | 55,600 | | | Celanese Corp. | | | 3,690 | |
| | 13,800 | | | CF Industries Holdings Inc. | | | 3,967 | |
| | 63,000 | | | Eastman Chemical Co. | | | 4,802 | |
| | 179,900 | | | Huntsman Corp. | | | 4,147 | |
| | 71,100 | | | Mosaic Co. | | | 3,128 | |
| | 48,600 | | | Olin Corp. | | | 1,435 | |
| | | | | | | | |
| | | | | | | 22,558 | |
| | | | | | | | |
| | COMMERCIAL SERVICES & SUPPLIES—1.6% | |
| | 49,600 | | | ADT Corp. | | | 1,865 | |
| | 73,900 | | | Brink’s Co. | | | 1,956 | |
| | 136,300 | | | Pitney Bowes Inc. | | | 3,049 | |
44
Harbor Mid Cap Value Fund
PORTFOLIO OF INVESTMENTS—Continued
| | | | | | | | |
COMMON STOCKS—Continued | |
| | |
| Shares | | | | | Value
(000s) | |
| | COMMERCIAL SERVICES & SUPPLIES—Continued | |
| | 87,100 | | | R.R. Donnelley & Sons Co. | | $ | 1,622 | |
| | | | | | | | |
| | | | | | | 8,492 | |
| | | | | | | | |
| | COMMUNICATIONS EQUIPMENT—2.5% | |
| | 384,200 | | | Brocade Communications Systems Inc. | | | 4,341 | |
| | 40,200 | | | Harris Corp. | | | 3,226 | |
| | 136,200 | | | Juniper Networks Inc. | | | 3,600 | |
| | 67,900 | | | NETGEAR Inc.* | | | 2,055 | |
| | | | | | | | |
| | | | | | | 13,222 | |
| | | | | | | | |
| | CONSTRUCTION & ENGINEERING—0.2% | |
| | 42,500 | | | Tutor Perini Corp.* | | | 901 | |
| | | | | | | | |
| | CONSUMER FINANCE—1.0% | |
| | 44,700 | | | Discover Financial Services | | | 2,592 | |
| | 75,900 | | | Navient Corp. | | | 1,483 | |
| | 23,100 | | | Nelnet Inc. | | | 1,034 | |
| | | | | | | | |
| | | | | | | 5,109 | |
| | | | | | | | |
| | CONTAINERS & PACKAGING—1.9% | |
| | 124,000 | | | Avery Dennison Corp. | | | 6,893 | |
| | 29,100 | | | Owens-Illinois Inc.* | | | 696 | |
| | 42,800 | | | Rock-Tenn Co. | | | 2,696 | |
| | | | | | | | |
| | | | | | | 10,285 | |
| | | | | | | | |
| | ELECTRIC UTILITIES—4.2% | |
| | 32,900 | | | American Electric Power Co. Inc. | | | 1,871 | |
| | 104,700 | | | Edison International | | | 6,380 | |
| | 69,300 | | | Entergy Corp. | | | 5,349 | |
| | 169,700 | | | FirstEnergy Corp. | | | 6,094 | |
| | 79,600 | | | Portland General Electric Co. | | | 2,799 | |
| | | | | | | | |
| | | | | | | 22,493 | |
| | | | | | | | |
| | ELECTRONIC EQUIPMENT, INSTRUMENTS & COMPONENTS—3.3% | |
| | 65,500 | | | Avnet Inc. | | | 2,792 | |
| | 132,800 | | | Corning Inc. | | | 2,780 | |
| | 397,800 | | | Flextronics International Ltd. (SGP)* | | | 4,585 | |
| | 30,800 | | | Ingram Micro Inc.* | | | 775 | |
| | 44,200 | | | TE Connectivity Ltd. (SWS) | | | 2,942 | |
| | 34,600 | | | Tech Data Corp.* | | | 1,950 | |
| | 154,200 | | | Vishay Intertechnology Inc. | | | 1,955 | |
| | | | | | | | |
| | | | | | | 17,779 | |
| | | | | | | | |
| | ENERGY EQUIPMENT & SERVICES—1.9% | |
| | 37,800 | | | Atwood Oceanics Inc. | | | 1,262 | |
| | 49,700 | | | Ensco plc (UK) | | | 1,356 | |
| | 17,000 | | | Helmerich & Payne Inc. | | | 1,325 | |
| | 136,300 | | | Hercules Offshore Inc.* | | | 110 | |
| | 47,300 | | | National Oilwell Varco Inc. | | | 2,574 | |
| | 94,400 | | | Noble Corp. plc (UK) | | | 1,634 | |
| | 21,633 | | | Paragon Offshore plc (UK) | | | 39 | |
| | 61,700 | | | Superior Energy Services Inc. | | | 1,573 | |
| | | | | | | | |
| | | | | | | 9,873 | |
| | | | | | | | |
| | FOOD & STAPLES RETAILING—0.9% | |
| | 42,333 | | | Kroger Co. | | | 2,917 | |
| | 195,800 | | | SUPERVALU Inc.* | | | 1,721 | |
| | | | | | | | |
| | | | | | | 4,638 | |
| | | | | | | | |
| | FOOD PRODUCTS—3.1% | |
| | 28,500 | | | Archer Daniels Midland Co. | | | 1,393 | |
| | 31,800 | | | Bunge Ltd. (BM) | | | 2,747 | |
| | 74,900 | | | Cal-Maine Foods Inc. | | | 3,349 | |
| | 67,500 | | | ConAgra Foods Inc. | | | 2,440 | |
| | 46,200 | | | Fresh Del Monte Produce Inc. | | | 1,706 | |
| | 23,200 | | | Ingredion Inc. | | | 1,842 | |
| | FOOD PRODUCTS—Continued | |
| | 300 | | | Seaboard Corp.* | | | 1,080 | |
| | 49,000 | | | Tyson Foods Inc. | | | 1,935 | |
| | | | | | | | |
| | | | | | | 16,492 | |
| | | | | | | | |
| | HEALTH CARE EQUIPMENT & SUPPLIES—0.2% | |
| | 9,800 | | | Zimmer Holdings Inc. | | | 1,076 | |
| | | | | | | | |
| | HEALTH CARE PROVIDERS & SERVICES—4.4% | |
| | 22,400 | | | Aetna Inc. | | | 2,394 | |
| | 17,000 | | | Chemed Corp. | | | 1,959 | |
| | 56,700 | | | CIGNA Corp. | | | 7,067 | |
| | 70,300 | | | HealthSouth Corp. | | | 3,179 | |
| | 85,468 | | | Quest Diagnostics Inc. | | | 6,104 | |
| | 97,800 | | | Select Medical Holdings Corp. | | | 1,423 | |
| | 71,311 | | | Triple-S Management Corp. (PRI)* | | | 1,335 | |
| | | | | | | | |
| | | | | | | 23,461 | |
| | | | | | | | |
| | HOTELS, RESTAURANTS & LEISURE—0.5% | |
| | 44,400 | | | Brinker International Inc. | | | 2,458 | |
| | | | | | | | |
| | HOUSEHOLD DURABLES—1.4% | |
| | 59,500 | | | Ryland Group Inc. | | | 2,453 | |
| | 27,600 | | | Whirlpool Corp. | | | 4,846 | |
| | | | | | | | |
| | | | | | | 7,299 | |
| | | | | | | | |
| | INDEPENDENT POWER & RENEWABLE ELECTRICITY PRODUCERS—0.7% | |
| | 296,100 | | | AES Corp. | | | 3,923 | |
| | | | | | | | |
| | INSURANCE—10.7% | |
| | 17,800 | | | Aflac Inc. | | | 1,122 | |
| | 41,200 | | | Allied World Assurance Co. Holdings AG (SWS) | | | 1,695 | |
| | 15,600 | | | Allstate Corp. | | | 1,087 | |
| | 25,100 | | | American Equity Investment Life Holding Co. | | | 676 | |
| | 47,574 | | | American Financial Group Inc. | | | 3,007 | |
| | 41,500 | | | AmTrust Financial Services Inc. | | | 2,468 | |
| | 36,300 | | | Aspen Insurance Holdings Ltd. (BM) | | | 1,696 | |
| | 51,900 | | | Axis Capital Holdings Ltd. (BM) | | | 2,702 | |
| | 77,100 | | | Endurance Specialty Holdings Ltd. (BM) | | | 4,655 | |
| | 24,300 | | | Everest Re Group Ltd. (BM) | | | 4,348 | |
| | 150,800 | | | Hartford Financial Services Group Inc. | | | 6,148 | |
| | 46,134 | | | Horace Mann Educators Corp. | | | 1,567 | |
| | 77,000 | | | Lincoln National Corp. | | | 4,350 | |
| | 133,300 | | | Maiden Holdings Ltd. (BM) | | | 1,937 | |
| | 19,000 | | | PartnerRe Ltd. (BM) | | | 2,432 | |
| | 46,000 | | | Principal Financial Group Inc. | | | 2,352 | |
| | 33,000 | | | StanCorp Financial Group Inc. | | | 2,379 | |
| | 80,741 | | | Universal Insurance Holdings Inc. | | | 1,939 | |
| | 101,700 | | | Unum Group | | | 3,474 | |
| | 77,600 | | | Validus Holdings Ltd. (BM) | | | 3,246 | |
| | 89,700 | | | XL Group plc (IE) | | | 3,326 | |
| | | | | | | | |
| | | | | | | 56,606 | |
| | | | | | | | |
| | INTERNET SOFTWARE & SERVICES—0.3% | |
| | 190,700 | | | Dhi Group Inc.* | | | 1,449 | |
| | | | | | | | |
| | IT SERVICES—3.4% | |
| | 74,000 | | | Amdocs Ltd. | | | 4,075 | |
| | 110,756 | | | Convergys Corp. | | | 2,512 | |
| | 228,100 | | | Western Union Co. | | | 4,626 | |
| | 584,900 | | | Xerox Corp. | | | 6,726 | |
| | | | | | | | |
| | | | | | | 17,939 | |
| | | | | | | | |
| | LEISURE PRODUCTS—0.6% | |
| | 154,461 | | | Smith & Wesson Holding Corp.* | | | 2,296 | |
| | 23,400 | | | Vista Outdoor Inc.* | | | 1,024 | |
| | | | | | | | |
| | | | | | | 3,320 | |
| | | | | | | | |
45
Harbor Mid Cap Value Fund
PORTFOLIO OF INVESTMENTS—Continued
| | | | | | | | |
COMMON STOCKS—Continued | |
| | |
| Shares | | | | | Value
(000s) | |
| | MACHINERY—3.9% | |
| | 42,500 | | | AGCO Corp. | | $ | 2,189 | |
| | 112,100 | | | Briggs & Stratton Corp. | | | 2,192 | |
| | 161,900 | | | Meritor Inc.* | | | 2,124 | |
| | 60,200 | | | Oshkosh Corp. | | | 3,241 | |
| | 28,600 | | | Parker Hannifin Corp. | | | 3,414 | |
| | 55,300 | | | Timken Co. | | | 2,173 | |
| | 74,200 | | | Trinity Industries Inc. | | | 2,010 | |
| | 223,900 | | | Wabash National Corp.* | | | 3,139 | |
| | | | | | | | |
| | | | | | | 20,482 | |
| | | | | | | | |
| | MEDIA—1.0% | |
| | 56,159 | | | EW Scripps Co. | | | 1,308 | |
| | 52,900 | | | Gannett Co. Inc. | | | 1,815 | |
| | 21,157 | | | Journal Media Group Inc.* | | | 197 | |
| | 55,200 | | | Starz* | | | 2,171 | |
| | | | | | | | |
| | | | | | | 5,491 | |
| | | | | | | | |
| | METALS & MINING—0.6% | |
| | 9,200 | | | Cliffs Natural Resources Inc. | | | 55 | |
| | 22,400 | | | Reliance Steel & Aluminum Co. | | | 1,450 | |
| | 69,200 | | | United States Steel Corp. | | | 1,662 | |
| | | | | | | | |
| | | | | | | 3,167 | |
| | | | | | | | |
| | MULTILINE RETAIL—3.5% | |
| | 33,600 | | | Dillard’s Inc. | | | 4,421 | |
| | 102,200 | | | Kohl’s Corp. | | | 7,323 | |
| | 102,800 | | | Macy’s Inc. | | | 6,644 | |
| | | | | | | | |
| | | | | | | 18,388 | |
| | | | | | | | |
| | MULTI-UTILITIES—3.6% | |
| | 124,800 | | | Ameren Corp. | | | 5,109 | |
| | 55,900 | | | Avista Corp. | | | 1,823 | |
| | 202,500 | | | Public Service Enterprise Group Inc. | | | 8,412 | |
| | 72,000 | | | SCANA Corp. | | | 3,815 | |
| | | | | | | | |
| | | | | | | 19,159 | |
| | | | | | | | |
| | OIL, GAS & CONSUMABLE FUELS—3.3% | |
| | 53,500 | | | Energy XXI Ltd. (BM) | | | 234 | |
| | 19,500 | | | Hess Corp. | | | 1,499 | |
| | 39,500 | | | Marathon Oil Corp. | | | 1,228 | |
| | 49,200 | | | Marathon Petroleum Corp. | | | 4,850 | |
| | 36,500 | | | Murphy Oil Corp. | | | 1,738 | |
| | 57,800 | | | Tesoro Corp. | | | 4,961 | |
| | 54,200 | | | Valero Energy Corp. plc | | | 3,084 | |
| | | | | | | | |
| | | | | | | 17,594 | |
| | | | | | | | |
| | PAPER & FOREST PRODUCTS—0.8% | |
| | 98,600 | | | Domtar Corp. | | | 4,262 | |
| | | | | | | | |
| | PERSONAL PRODUCTS—0.2% | |
| | 8,400 | | | USANA Health Sciences Inc.* | | | 955 | |
| | | | | | | | |
| | PHARMACEUTICALS—0.4% | |
| | 34,400 | | | Lannett Co. Inc.* | | | 1,978 | |
| | | | | | | | |
| | REAL ESTATE INVESTMENT TRUSTS (REITs)—10.8% | |
| | 242,900 | | | Annaly Capital Management Inc. | | | 2,446 | |
| | 181,700 | | | Brandywine Realty Trust | | | 2,649 | |
| | 97,600 | | | Capstead Mortgage Corp. | | | 1,137 | |
| | 286,300 | | | CBL & Associates Properties Inc. | | | 5,156 | |
| | 54,200 | | | Digital Realty Trust Inc. | | | 3,437 | |
| | 148,500 | | | DuPont Fabros Technology Inc. | | | 4,626 | |
| | REAL ESTATE INVESTMENT TRUSTS (REITs)—Continued | |
| | 110,900 | | | Equity Commonwealth* | | | 2,796 | |
| | 498,900 | | | Hersha Hospitality Trust | | | 3,208 | |
| | 158,100 | | | Hospitality Properties Trust | | | 4,756 | |
| | 104,800 | | | Inland Real Estate Corp. | | | 1,078 | |
| | 89,300 | | | Lexington Realty Trust | | | 828 | |
| | 202,700 | | | MFA Financial Inc. | | | 1,575 | |
| | 91,600 | | | OMEGA Healthcare Investors Inc. | | | 3,306 | |
| | 61,100 | | | PennyMac Mortgage Investment Trust | | | 1,280 | |
| | 276,077 | | | Piedmont Office Realty Trust Inc. | | | 4,826 | |
| | 217,400 | | | Rouse Properties Inc. | | | 3,798 | |
| | 43,500 | | | Select Income REIT | | | 1,009 | |
| | 193,900 | | | Senior Housing Properties Trust | | | 3,969 | |
| | 162,500 | | | Summit Hotel Properties Inc. | | | 2,140 | |
| | 139,597 | | | Sunstone Hotel Investors Inc. | | | 2,175 | |
| | 121,000 | | | Two Harbors Investment Corp. | | | 1,270 | |
| | | | | | | | |
| | | | | | | 57,465 | |
| | | | | | | | |
| | ROAD & RAIL—0.5% | |
| | 74,200 | | | ArcBest Corp. | | | 2,649 | |
| | | | | | | | |
| | SEMICONDUCTORS & SEMICONDUCTOR EQUIPMENT—1.3% | |
| | 647,500 | | | Amkor Technology Inc.* | | | 4,552 | |
| | 76,500 | | | Omnivision Technologies Inc.* | | | 2,134 | |
| | | | | | | | |
| | | | | | | 6,686 | |
| | | | | | | | |
| | SOFTWARE—1.3% | |
| | 76,300 | | | CA Inc. | | | 2,424 | |
| | 179,100 | | | Symantec Corp. | | | 4,464 | |
| | | | | | | | |
| | | | | | | 6,888 | |
| | | | | | | | |
| | SPECIALTY RETAIL—2.5% | |
| | 69,500 | | | Finish Line Inc. | | | 1,705 | |
| | 37,400 | | | Foot Locker Inc. | | | 2,224 | |
| | 53,400 | | | GameStop Corp. | | | 2,058 | |
| | 138,900 | | | Gap Inc. | | | 5,506 | |
| | 23,700 | | | Outerwall Inc. | | | 1,574 | |
| | 20,500 | | | RadioShack Corp.* | | | 3 | |
| | | | | | | | |
| | | | | | | 13,070 | |
| | | | | | | | |
| | TECHNOLOGY HARDWARE, STORAGE & PERIPHERALS—3.0% | |
| | 32,500 | | | Lexmark International Inc. | | | 1,443 | |
| | 65,160 | | | NetApp Inc. | | | 2,362 | |
| | 115,600 | | | QLogic Corp.* | | | 1,699 | |
| | 68,400 | | | Seagate Technology plc (IE) | | | 4,016 | |
| | 65,200 | | | Western Digital Corp. | | | 6,373 | |
| | | | | | | | |
| | | | | | | 15,893 | |
| | | | | | | | |
| | THRIFTS & MORTGAGE FINANCE—0.7% | |
| | 72,700 | | | Home Loan Servicing Solutions Ltd. | | | 49 | |
| | 63,100 | | | Radian Group Inc. | | | 1,127 | |
| | 116,000 | | | Washington Federal Inc. | | | 2,506 | |
| | | | | | | | |
| | | | | | | 3,682 | |
| | | | | | | | |
| | TOBACCO—0.0% | |
| | 5,300 | | | Universal Corp. | | | 249 | |
| | | | | | | | |
| TOTAL COMMON STOCKS
(Cost $469,449) | | | 523,505 | |
| | | | | | | | |
46
Harbor Mid Cap Value Fund
PORTFOLIO OF INVESTMENTS—Continued
| | | | | | | | |
SHORT-TERM INVESTMENTS—1.9% | |
| (Cost $10,267) | | | | |
Principal
Amount
(000s) | | | | | Value
(000s) | |
| | REPURCHASE AGREEMENTS | |
| $ | 10,267 | | | Repurchase Agreement with State Street Corp. dated April 30, 2015 due May 01, 2015 at 0.000% collateralized by U.S. Treasury Bonds (market value $10,474) | | $ | 10,267 | |
| | | | | | | | |
| TOTAL INVESTMENTS—100.8%
(Cost $479,716) | | | 533,772 | |
| | | | | | | | |
| | CASH AND OTHER ASSETS, LESS LIABILITIES—(0.8)% | | | (4,384 | ) |
| | | | | | | | |
| | TOTAL NET ASSETS—100.0% | | $ | 529,388 | |
| | | | | | | | |
FAIR VALUE MEASUREMENTS
Repurchase Agreements valued at $10,267 are classified as Level 2. All other holdings at April 30, 2015 (as disclosed in the preceding Portfolio of Investments) are classified as Level 1. There were no Level 3 holdings at October 31, 2014 or April 30, 2015 and no transfers between levels during the period.
For more information on valuation inputs and their aggregation into the levels identified above, please refer to the Fair Value Measurements and Disclosures in Note 2 of the accompanying Notes to Financial Statements.
| * | Non-income producing security. |
The accompanying notes are an integral part of the Financial Statements.
47
Harbor Small Cap Value Fund
MANAGER’S COMMENTARY (Unaudited)
SUBADVISER
EARNEST Partners LLC
1180 Peachtree Street NE Suite 2300
Atlanta, GA 30309
PORTFOLIO MANAGER
Paul Viera
Since 2001
EARNEST Partners
has subadvised the Fund since
its inception in 2001.
INVESTMENT OBJECTIVE
The Fund seeks long-term total return.
PRINCIPAL STYLE CHARACTERISTICS
Small cap value stocks

Paul Viera
Management’s Discussion of
Fund Performance
MARKET REVIEW
Equity markets were volatile to start off calendar year 2015 after a positive final two months of 2014. The U.S. small cap value market ended the fiscal first half in positive territory, with the Russell 2000® Value Index rising 2.05% for the six months ended April 30, 2015. Investors remained cautiously optimistic during the beginning of 2015 as the Federal Reserve continued to contemplate the timing and magnitude of future interest rate hikes amid a modestly improving economic backdrop.
The U.S. economy continued to push forward, albeit with some deceleration. GDP growth for the fourth quarter of 2014 was 2.2%, yet dropped to 0.2% for the first quarter of 2015. Similar to the first quarter of 2014, a prolonged winter with record levels of cold and snow in several parts of the U.S. impacted everything from retail sales to housing starts. Additionally, a labor dispute at ports on the West Coast impacted trade and retail inventory. Job growth slowed as a result, with 189,000 new jobs in March, following an average of over 255,000 new jobs added in each of the prior four months.
Oil prices continued to decline. The U.S. and Iran continued discussions around a nuclear pact that would remove sanctions on the Middle Eastern country subject to formal agreement by the end of June. These negotiations, along with worldwide economic weakness, pressured oil prices. U.S. energy companies responded to sinking prices by sharply reducing orders for equipment. Lower gasoline prices, rising disposable income, and declining unemployment contributed to higher levels of consumer confidence.
The Federal Reserve indicated that it will remain supportive of the economy and wants to see further labor market improvement and inflation closer to its 2% target before raising interest rates. The Fed also indicated that it plans to increase rates at a slower pace relative to past recoveries, citing the still delicate, although improving, state of the economy. Meanwhile, the yield on the 10-year U.S. Treasury note continued to decline, finishing the period at 2% after falling to as low as 1.6%. Despite the decline, absolute levels of interest rates in the U.S. remained significantly higher than those in other developed markets such as Germany and Japan, with 10-year yields of less than 0.5%.
PERFORMANCE
Harbor Small Cap Value Fund returned 3.94% (Institutional Class), 3.81% (Administrative Class), and 3.75% (Investor Class) for the six months ended April 30, 2015, outperforming the broader small cap value market, as represented by the 2.05% return of the Russell 2000® Value Index. The outperformance was driven primarily by stock selection.
Boosted by acquisition activity and robust earnings growth, Heath Care was the best-performing sector for both the index and the Fund. Utilities did well for the total period as investors sought out dividend yield given the low-interest-rate environment, but trailed in the last few months as the prospect of rate increases reversed some of the sector’s gains. Performance for the Fund was driven by positive stock selection in nearly all sectors, with particularly strong performance in the Consumer Discretionary, Information Technology, and Financials spaces.
Financials holding Stifel Financial provides retail and institutional brokerage services that include investment banking, private wealth management, and financial planning. In an
48
Harbor Small Cap Value Fund
MANAGER’S COMMENTARY—Continued
| | | | |
TOP TEN HOLDINGS (% of net assets) | |
Hexcel Corp. | | | 3.8% | |
Snap-on Inc. | | | 2.9% | |
EnerSys | | | 2.8% | |
MEDNAX Inc. | | | 2.7% | |
Valspar Corp. | | | 2.7% | |
Global Payments Inc. | | | 2.6% | |
Bristow Group Inc. | | | 2.5% | |
Cantel Medical Corp. | | | 2.4% | |
Franklin Electric Co. Inc. | | | 2.4% | |
Life Time Fitness Inc. | | | 2.4% | |
effort to bolster the firm’s independent adviser channel, Stifel announced plans to acquire Sterne Agee, a financial services firm that specializes in institutional investment and wealth-management services. The merger is expected to boost annual revenue by over $300 million and add 600 independent financial advisers to Stifel’s existing base. The move was viewed positively by investors and shares rose 11% in the fiscal first half. We believe that financial advisers will continue to be attracted to the firm’s platform, which provides the freedom to run their own advisory businesses while also providing the support of a large corporation. Stifel’s private wealth-management business, which is driven mainly by financial advisers, has been gaining market share from larger competitors. Our view is that this trend should carry forward as Stifel’s management team is committed to driving growth via focused expansion of the firm’s advisory force.
Industrials holding Snap-On is a leading developer, manufacturer, and marketer of hand tools and diagnostic solutions for professional tool users. The company’s products and services include power tools, information and management systems, and shop equipment used in industries such as auto repair, agriculture, and aerospace. Shares rose 14% following better-than-expected earnings and ongoing fundamental improvements. Snap-On has benefited from higher demand in critical industries, as well as growth within its European hand-tool business. Management continued to pursue growth opportunities by enhancing its franchise-dealer-van network, further penetrating existing repair-shop markets with new product offerings, and expanding into emerging markets. We believe that the company should also benefit from further margin expansion stemming from restructuring efforts that have been put in place over the past several years.
OUTLOOK AND STRATEGY
As of April 30, 2015, the Fund was overweight in the Industrials, Energy, Health Care, Information Technology, Materials, and Telecommunications sectors and was underweight in Financials, Utilities, Consumer Staples, and Consumer Discretionary. These weightings are an outgrowth of our fundamental, bottom-up stock selection process.
In managing Harbor Small Cap Value Fund, we seek companies with share prices that we believe do not fully reflect their earnings-growth outlook. Going forward, we will continue to employ our three-step investment methodology: screen the broad universe to identify stocks that are best positioned to outperform; measure and manage downside risk to the benchmark; and perform in-depth, thorough, fundamental research to find what we believe are the best stocks to include in the Fund.
This report contains the current opinions of EARNEST Partners LLC at the time of its publication and should not be considered as investment advice or a recommendation of any particular security, strategy or investment product. Such opinions are subject to change without notice and securities described herein may no longer be included in, or may at any time be removed from, the Fund’s portfolio. This report is distributed for informational purposes only. Information contained herein has been obtained from sources believed reliable, but not guaranteed.
Stocks of small cap companies pose special risks, including possible illiquidity and greater price volatility than stocks of larger, more established companies. Equity securities, such as common stocks, are affected by company specific events and by movements in the overall stock markets in which those securities principally trade. An adverse company specific event, or downturn in those stock markets, can depress the value of a particular company’s equity securities. For information on the different share classes and the risks associated with an investment in the Fund, please refer to the current prospectus.
49
Harbor Small Cap Value Fund
FUND SUMMARY—April 30, 2015 (Unaudited)
| | | | |
INSTITUTIONAL CLASS |
| | | | |
| Fund # | | | | 2022 |
| | |
| Cusip | | | | 411511843 |
| | |
| Ticker | | | | HASCX |
| | |
| Inception Date | | | | 12/14/2001 |
| | |
| Net Expense Ratio | | | | 0.84%a |
| | |
| Total Net Assets (000s) | | | | $838,488 |
| | | | |
ADMINISTRATIVE CLASS |
| | | | |
| Fund # | | | | 2222 |
| | |
| Cusip | | | | 411511710 |
| | |
| Ticker | | | | HSVRX |
| | |
| Inception Date | | | | 11/01/2002 |
| | |
| Net Expense Ratio | | | | 1.09%a |
| | |
| Total Net Assets (000s) | | | | $1,391 |
| | | | |
INVESTOR CLASS |
| | | | |
| Fund # | | | | 2422 |
| | |
| Cusip | | | | 411511694 |
| | |
| Ticker | | | | HISVX |
| | |
| Inception Date | | | | 11/01/2002 |
| | |
| Net Expense Ratio | | | | 1.21%a |
| | |
| Total Net Assets (000s) | | | | $17,811 |
PORTFOLIO STATISTICS
| | | | | | | | | | |
| | | Portfolio | | Benchmark |
| | |
Weighted Average Market Cap (MM) | | | | $3,531 | | | | | $1,780 | |
| | |
Price/Earning Ratio (P/E) | | | | 22.6x | | | | | 23.1x | |
| | |
Price/Book Ratio (P/B) | | | | 2.7x | | | | | 1.7x | |
| | |
Beta vs. Russell 2000® Value Index | | | | 0.95 | | | | | 1.00 | |
| | |
Portfolio Turnover (6-Month Period Ended 04/30/2015) | | | | 6% | b | | | | N/A | |
SECTOR ALLOCATION (% of investments)
(Excludes cash and short-term investments)
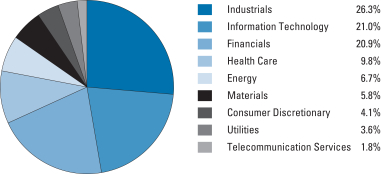
50
Harbor Small Cap Value Fund
FUND PERFORMANCE SUMMARY (Unaudited)
Institutional Class
CHANGE IN A $50,000 INVESTMENT
For the period 05/01/2005 through 04/30/2015
| | |
The graph compares a $50,000 investment in the Fund with the performance of the Russell 2000® Value Index. The Fund’s performance includes the reinvestment of all dividend and capital gain distributions. | | 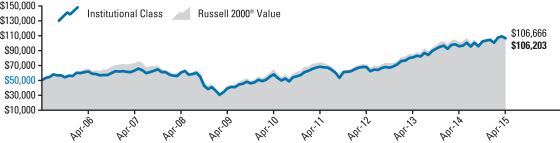 |
| | | | | | | | | | | | | | | | | | | | | | | | | | | | | | | | |
Total Returns For the periods ended 04/30/2015 | | | |
| Harbor Small Cap Value Fund | | | | | | | | | | | | | | | | | | | | | | | | | | | | | | | | |
Institutional Class | | | 3.94% | | | | | | 10.88% | | | | | | 12.97% | | | | | | 7.82% | | | | | 12/14/2001 | | | | $ | 106,203 | |
| Comparative Index | | | | | | | | | | | | | | | | | | | | | | | | | | | | | | | | |
Russell 2000® Value | | | 2.05% | | | | | | 4.89% | | | | | | 10.55% | | | | | | 7.87% | | | | | — | | | | $ | 106,666 | |
Administrative and Investor Classes
CHANGE IN A $10,000 INVESTMENT
For the period 05/01/2005 through 04/30/2015
| | |
The graph compares a $10,000 investment in the Fund with the performance of the Russell 2000® Value Index. The Fund’s performance includes the reinvestment of all dividend and capital gain distributions. | | 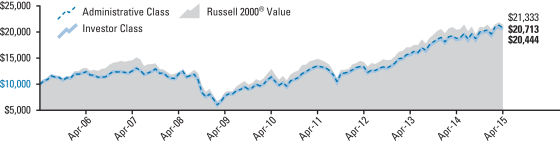 |
| | | | | | | | | | | | | | | | | | | | | | | | | | | | | | | | |
Total Returns For the periods ended 04/30/2015 | | | |
| Harbor Small Cap Value Fund | | | | | | | | | | | | | | | | | | | | | | | | | | | | | | | | |
Administrative Class | | | 3.81% | | | | | | 10.64% | | | | | | 12.69% | | | | | | 7.55% | | | | | 11/01/2002 | | | | $ | 20,713 | |
Investor Class | | | 3.75% | | | | | | 10.52% | | | | | | 12.55% | | | | | | 7.41% | | | | | 11/01/2002 | | | | $ | 20,444 | |
| Comparative Index | | | | | | | | | | | | | | | | | | | | | | | | | | | | | | | | |
Russell 2000® Value | | | 2.05% | | | | | | 4.89% | | | | | | 10.55% | | | | | | 7.87% | | | | | — | | | | $ | 21,333 | |
As stated in the Fund’s current prospectus, the expense ratios were 0.85% (Institutional Class); 1.10% (Administrative Class); and 1.22% (Investor Class). The expense ratios in the prospectus may differ from the actual expense ratios for the period disclosed within this report. The expense ratios shown in the prospectus are based on the prior fiscal year, adjusted to reflect changes, if any, in contractual arrangements that occurred prior to the date of the prospectus.
Performance data shown represents past performance, which is no guarantee of future results. Current performance may be higher or lower than the past performance data shown. Investment returns and the value of an investment will fluctuate, and an investor’s shares, when sold, may be worth more or less than their original cost. You can obtain performance data current to the most recent month-end (available within seven business days after the most recent month-end) by calling 800-422-1050 or visiting harborfunds.com.
The returns shown do not reflect the deduction of taxes that a shareholder would pay on Fund distributions or on the redemption of Fund shares. From time to time, certain fees and/or expenses have been waived or reimbursed, which has resulted in higher returns. Without these waivers and reimbursements, the returns would have been lower.
51
Harbor Small Cap Value Fund
PORTFOLIO OF INVESTMENTS—April 30, 2015 (Unaudited)
Equity Holdings (% of net assets)
(Excludes net cash and short-term investments of 2.3%)
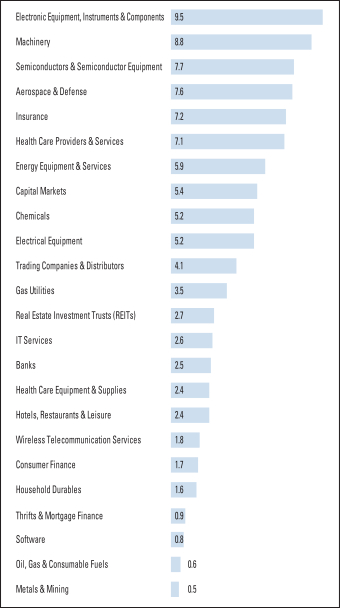
| | | | | | | | |
COMMON STOCKS—97.7% | |
| | |
| Shares | | | | | Value
(000s) | |
| | AEROSPACE & DEFENSE—7.6% | |
| | 649,555 | | | Hexcel Corp. | | $ | 32,575 | |
| | 219,688 | | | Moog Inc.* | | | 15,352 | |
| | 167,167 | | | Teledyne Technologies Inc.* | | | 17,548 | |
| | | | | | | | |
| | | | | | | 65,475 | |
| | | | | | | | |
| | BANKS—2.5% | |
| | 440,589 | | | Trustmark Corp. | | | 10,486 | |
| | 298,620 | | | United Bankshares Inc. | | | 11,222 | |
| | | | | | | | |
| | | | | | | 21,708 | |
| | | | | | | | |
| | CAPITAL MARKETS—5.4% | |
| | 306,723 | | | Eaton Vance Corp. | | | 12,600 | |
| | 318,323 | | | Raymond James Financial Inc. | | | 17,995 | |
| | 301,742 | | | Stifel Financial Corp.* | | | 15,944 | |
| | | | | | | | |
| | | | | | | 46,539 | |
| | | | | | | | |
| | CHEMICALS—5.2% | |
| | 205,777 | | | Cabot Corp. | | | 8,795 | |
| | 194,355 | | | Scotts Miracle-Gro Co.* | | | 12,538 | |
| | 284,985 | | | Valspar Corp. | | | 23,112 | |
| | | | | | | | |
| | | | | | | 44,445 | |
| | | | | | | | |
| | CONSUMER FINANCE—1.7% | |
| | 404,045 | | | Cash America International Inc. | | | 10,473 | |
| | 217,750 | | | Enova International Inc.* | | | 4,030 | |
| | | | | | | | |
| | | | | | | 14,503 | |
| | | | | | | | |
| | ELECTRICAL EQUIPMENT—5.2% | |
| | 350,560 | | | EnerSys | | | 23,803 | |
| | 578,696 | | | Franklin Electric Co. Inc. | | | 20,926 | |
| | | | | | | | |
| | | | | | | 44,729 | |
| | | | | | | | |
| | ELECTRONIC EQUIPMENT, INSTRUMENTS & COMPONENTS—9.5% | |
| | 540,548 | | | Checkpoint Systems Inc.* | | | 5,600 | |
| | 212,013 | | | Coherent Inc.* | | | 12,721 | |
| | 487,991 | | | FLIR Systems Inc. | | | 15,074 | |
| | 247,122 | | | Itron Inc.* | | | 8,862 | |
| | 166,193 | | | Littelfuse Inc. | | | 16,285 | |
| | 183,900 | | | OSI Systems Inc.* | | | 12,360 | |
| | 499,292 | | | Sanmina Corp.* | | | 10,150 | |
| | | | | | | | |
| | | | | | | 81,052 | |
| | | | | | | | |
| | ENERGY EQUIPMENT & SERVICES—5.9% | |
| | 337,671 | | | Bristow Group Inc. | | | 20,980 | |
| | 156,605 | | | Core Laboratories NV | | | 20,559 | |
| | 924,608 | | | Newpark Resources Inc.* | | | 9,486 | |
| | | | | | | | |
| | | | | | | 51,025 | |
| | | | | | | | |
| | GAS UTILITIES—3.5% | |
| | 237,934 | | | South Jersey Industries Inc. | | | 12,551 | |
| | 317,268 | | | WGL Holdings Inc. | | | 17,453 | |
| | | | | | | | |
| | | | | | | 30,004 | |
| | | | | | | | |
| | HEALTH CARE EQUIPMENT & SUPPLIES—2.4% | |
| | 463,322 | | | Cantel Medical Corp. | | | 20,752 | |
| | | | | | | | |
| | HEALTH CARE PROVIDERS & SERVICES—7.1% | |
| | 286,010 | | | Centene Corp.* | | | 17,730 | |
| | 323,914 | | | MEDNAX Inc.* | | | 22,927 | |
| | 343,045 | | | Molina Healthcare Inc.* | | | 20,318 | |
| | | | | | | | |
| | | | | | | 60,975 | |
| | | | | | | | |
| | HOTELS, RESTAURANTS & LEISURE—2.4% | |
| | 291,520 | | | Life Time Fitness Inc.* | | | 20,844 | |
| | | | | | | | |
| | HOUSEHOLD DURABLES—1.6% | |
| | 311,165 | | | Meritage Homes Corp.* | | | 13,309 | |
| | | | | | | | |
| | INSURANCE—7.2% | |
| | 608,134 | | | American Equity Investment Life Holding Co. | | | 16,389 | |
| | 308,774 | | | Horace Mann Educators Corp. | | | 10,489 | |
| | 207,055 | | | Reinsurance Group of America Inc. | | | 18,971 | |
| | 198,389 | | | State Auto Financial Corp. | | | 4,686 | |
| | 378,715 | | | United Fire Group Inc. | | | 11,312 | |
| | | | | | | | |
| | | | | | | 61,847 | |
| | | | | | | | |
| | IT SERVICES—2.6% | |
| | 219,250 | | | Global Payments Inc. | | | 21,986 | |
| | | | | | | | |
52
Harbor Small Cap Value Fund
PORTFOLIO OF INVESTMENTS—Continued
| | | | | | | | |
COMMON STOCKS—Continued | |
| | |
| Shares | | | | | Value
(000s) | |
| | MACHINERY—8.8% | |
| | 252,159 | | | Albany International Corp. | | $ | 9,885 | |
| | 360,610 | | | Altra Industrial Motion Corp. | | | 9,509 | |
| | 1,563,370 | | | Mueller Water Products Inc. | | | 14,633 | |
| | 167,645 | | | Snap-on Inc. | | | 25,071 | |
| | 411,706 | | | Timken Co. | | | 16,176 | |
| | | | | | | | |
| | | | | | | 75,274 | |
| | | | | | | | |
| | METALS & MINING—0.5% | |
| | 138,882 | | | TimkenSteel Corp. | | | 4,054 | |
| | | | | | | | |
| | OIL, GAS & CONSUMABLE FUELS—0.6% | |
| | 109,178 | | | ONEOK Inc. | | | 5,251 | |
| | | | | | | | |
| | REAL ESTATE INVESTMENT TRUSTS (REITs)—2.7% | |
| | 833,923 | | | First Potomac Realty Trust | | | 8,940 | |
| | 1,007,968 | | | Medical Properties Trust Inc. | | | 14,091 | |
| | | | | | | | |
| | | | | | | 23,031 | |
| | | | | | | | |
| | SEMICONDUCTORS & SEMICONDUCTOR EQUIPMENT—7.7% | |
| | 336,469 | | | Cabot Microelectronics Corp.* | | | 15,915 | |
| | 1,345,484 | | | Entegris Inc.* | | | 17,909 | |
| | 803,754 | | | Fairchild Semiconductor International Inc.* | | | 14,600 | |
| | 346,825 | | | Monolithic Power Systems Inc. | | | 17,976 | |
| | | | | | | | |
| | | | | | | 66,400 | |
| | | | | | | | |
| | SOFTWARE—0.8% | |
| | 382,040 | | | Epiq Systems Inc. | | | 6,842 | |
| | | | | | | | |
| | THRIFTS & MORTGAGE FINANCE—0.9% | |
| | 583,925 | | | Astoria Financial Corp. | | | 7,690 | |
| | | | | | | | |
| | TRADING COMPANIES & DISTRIBUTORS—4.1% | |
| | 326,395 | | | CAI International Inc.* | | | 7,775 | |
| | 325,332 | | | GATX Corp. | | | 17,698 | |
| | 250,411 | | | TAL International Group Inc.* | | | 9,651 | |
| | | | | | | | |
| | | | | | | 35,124 | |
| | | | | | | | |
| | WIRELESS TELECOMMUNICATION SERVICES—1.8% | |
| | 131,295 | | | SBA Communications Corp.* | | | 15,207 | |
| | | | | | | | |
| TOTAL COMMON STOCKS
(Cost $586,651) | | | 838,066 | |
| | | | | | | | |
| | | | | | | | |
SHORT-TERM INVESTMENTS—2.3% | |
| (Cost $19,729) | | | | |
Principal Amount (000s) | | | | | | |
| | REPURCHASE AGREEMENTS | |
| $ | 19,729 | | | Repurchase Agreement with State Street Corp.
dated April 30, 2015 due May 01, 2015 at 0.000% collateralized by U.S. Treasury Bonds
(market value $20,129) | | | 19,729 | |
| | | | | | | | |
| TOTAL INVESTMENTS—100.0%
(Cost $606,380) | | | 857,795 | |
| | | | | | | | |
| | CASH AND OTHER ASSETS, LESS LIABILITIES—0.0% | | | (105 | ) |
| | | | | | | | |
| | TOTAL NET ASSETS—100.0% | | $ | 857,690 | |
| | | | | | | | |
FAIR VALUE MEASUREMENTS
Repurchase Agreements valued at $19,729 are classified as Level 2. All other holdings at April 30, 2015 (as disclosed in the preceding Portfolio of Investments) are classified as Level 1. There were no Level 3 holdings at October 31, 2014 or April 30, 2015 and no transfers between levels during the period.
For more information on valuation inputs and their aggregation into the levels identified above, please refer to the Fair Value Measurements and Disclosures in Note 2 of the accompanying Notes to Financial Statements.
| * | Non-income producing security. |
The accompanying notes are an integral part of the Financial Statements.
53
[THIS PAGE INTENTIONALLY LEFT BLANK]
54
Harbor Domestic Equity Funds
STATEMENTS OF ASSETS AND LIABILITIES—April 30, 2015 (Unaudited)
(All amounts in thousands, except per share amounts)
| | | | | | | | | | | | | | | | | | | | | | | | | | | | |
| | | | | | | |
| | | Harbor
Capital
Appreciation Fund | | | Harbor
Mid Cap
Growth Fund | | | Harbor
Small Cap
Growth Fund | | | Harbor
Small Cap
Growth
Opportunities
Fund | | | Harbor
Large Cap
Value Fund | | | Harbor
Mid Cap
Value Fund | | | Harbor
Small Cap
Value Fund | |
ASSETS | | | | | | | | | | | | | | | | | | | | | | | | | | | | |
Investments, at identified cost * | | $ | 16,532,154 | | | $ | 628,702 | | | $ | 481,429 | | | $ | 159,743 | | | $ | 197,417 | | | $ | 479,716 | | | $ | 606,380 | |
Investments, at value | | $ | 26,510,540 | | | $ | 704,694 | | | $ | 612,718 | | | $ | 154,502 | | | $ | 247,805 | | | $ | 523,505 | | | $ | 838,066 | |
Repurchase agreements | | | 194,030 | | | | 31,635 | | | | 15,862 | | | | 6,954 | | | | 13,682 | | | | 10,267 | | | | 19,729 | |
Cash | | | 1 | | | | 1 | | | | 1 | | | | — | | | | 1 | | | | — | | | | — | |
Receivables for: | | | | | | | | | | | | | | | | | | | | | | | | | | | | |
Investments sold | | | 154,441 | | | | 1,387 | | | | 11,662 | | | | 1,677 | | | | — | | | | — | | | | 176 | |
Foreign currency spot contracts | | | — | | | | 1 | | | | — | | | | — | | | | — | | | | — | | | | — | |
Capital shares sold | | | 41,530 | | | | 4,659 | | | | 234 | | | | 476 | | | | 345 | | | | 885 | | | | 665 | |
Dividends | | | 11,045 | | | | 151 | | | | 157 | | | | — | | | | 355 | | | | 442 | | | | 475 | |
Withholding tax | | | 1,456 | | | | — | | | | — | | | | — | | | | — | | | | — | | | | — | |
Prepaid registration fees | | | 42 | | | | 25 | | | | 19 | | | | 14 | | | | 19 | | | | 37 | | | | 27 | |
Prepaid fund insurance | | | 64 | | | | 2 | | | | 2 | | | | — | | | | 1 | | | | 1 | | | | 2 | |
Other assets | | | 645 | | | | 28 | | | | 24 | | | | 5 | | | | 16 | | | | 5 | | | | 36 | |
Total Assets | | | 26,913,794 | | | | 742,583 | | | | 640,679 | | | | 163,628 | | | | 262,224 | | | | 535,142 | | | | 859,176 | |
LIABILITIES | | | | | | | | | | | | | | | | | | | | | | | | | | | | |
Payables for: | | | | | | | | | | | | | | | | | | | | | | | | | | | | |
Investments purchased | | | 211,865 | | | | 3,959 | | | | 2,876 | | | | 7,649 | | | | — | | | | 4,820 | | | | 329 | |
Capital shares reacquired | | | 15,864 | | | | 2,887 | | | | 99 | | | | 29 | | | | 536 | | | | 482 | | | | 456 | |
Accrued expenses: | | | | | | | | | | | | | | | | | | | | | | | | | | | | |
Management fees | | | 12,263 | | | | 457 | | | | 409 | | | | 99 | | | | 129 | | | | 328 | | | | 537 | |
12b-1 fees | | | 543 | | | | 87 | | | | 4 | | | | 1 | | | | 9 | | | | 36 | | | | 4 | |
Transfer agent fees | | | 1,572 | | | | 42 | | | | 36 | | | | 8 | | | | 15 | | | | 42 | | | | 46 | |
Trustees’ fees and expenses | | | 105 | | | | 3 | | | | 3 | | | | — | | | | 1 | | | | 1 | | | | 3 | |
Other | | | 2,025 | | | | 86 | | | | 49 | | | | 13 | | | | 32 | | | | 45 | | | | 111 | |
Total Liabilities | | | 244,237 | | | | 7,521 | | | | 3,476 | | | | 7,799 | | | | 722 | | | | 5,754 | | | | 1,486 | |
NET ASSETS | | $ | 26,669,557 | | | $ | 735,062 | | | $ | 637,203 | | | $ | 155,829 | | | $ | 261,502 | | | $ | 529,388 | | | $ | 857,690 | |
Net Assets Consist of: | | | | | | | | | | | | | | | | | | | | | | | | | | | | |
Paid-in capital | | $ | 15,413,559 | | | $ | 585,527 | | | $ | 441,265 | | | $ | 151,483 | | | $ | 188,294 | | | $ | 471,290 | | | $ | 577,457 | |
Accumulated undistributed net investment income/(loss) | | | 17,414 | | | | (2,502 | ) | | | (975 | ) | | | (295 | ) | | | 1,049 | | | | 2,022 | | | | 662 | |
Accumulated net realized gain/(loss) | | | 1,066,196 | | | | 44,411 | | | | 49,762 | | | | 2,928 | | | | 8,089 | | | | 2,020 | | | | 28,156 | |
Unrealized appreciation/(depreciation) of investments and translation of assets and liabilities in foreign currencies | | | 10,172,388 | | | | 107,626 | | | | 147,151 | | | | 1,713 | | | | 64,070 | | | | 54,056 | | | | 251,415 | |
| | | $ | 26,669,557 | | | $ | 735,062 | | | $ | 637,203 | | | $ | 155,829 | | | $ | 261,502 | | | $ | 529,388 | | | $ | 857,690 | |
NET ASSET VALUE PER SHARE BY CLASS | | | | | | | | | | | | | | | | | | | | | | | | | |
Institutional Class | | | | | | | | | | | | | | | | | | | | | | | | | | | | |
Net assets | | $ | 24,050,556 | | | $ | 312,289 | | | $ | 620,720 | | | $ | 152,429 | | | $ | 217,880 | | | $ | 356,382 | | | $ | 838,488 | |
Shares of beneficial interest1 | | | 384,581 | | | | 30,353 | | | | 42,577 | | | | 13,922 | | | | 17,879 | | | | 16,988 | | | | 30,783 | |
Net asset value per share2 | | $ | 62.54 | | | $ | 10.29 | | | $ | 14.58 | | | $ | 10.95 | | | $ | 12.19 | | | $ | 20.98 | | | $ | 27.24 | |
Administrative Class | | | | | | | | | | | | | | | | | | | | | | | | | | | | |
Net assets | | $ | 655,759 | | | $ | 387,870 | | | $ | 753 | | | $ | 2,495 | | | $ | 23,598 | | | $ | 25,275 | | | $ | 1,391 | |
Shares of beneficial interest1 | | | 10,597 | | | | 38,883 | | | | 54 | | | | 229 | | | | 1,938 | | | | 1,195 | | | | 51 | |
Net asset value per share2 | | $ | 61.88 | | | $ | 9.98 | | | $ | 13.94 | | | $ | 10.92 | | | $ | 12.18 | | | $ | 21.14 | | | $ | 27.14 | |
Investor Class | | | | | | | | | | | | | | | | | | | | | | | | | | | | |
Net assets | | $ | 1,963,242 | | | $ | 34,903 | | | $ | 15,730 | | | $ | 905 | | | $ | 20,024 | | | $ | 147,731 | | | $ | 17,811 | |
Shares of beneficial interest1 | | | 32,095 | | | | 3,577 | | | | 1,169 | | | | 83 | | | | 1,630 | | | | 7,056 | | | | 667 | |
Net asset value per share2 | | $ | 61.17 | | | $ | 9.76 | | | $ | 13.46 | | | $ | 10.89 | | | $ | 12.28 | | | $ | 20.94 | | | $ | 26.69 | |
| * | Including repurchase agreements and short-term investments. |
| 1 | Par value $0.01 (unlimited authorizations). |
| 2 | Per share amounts can be recalculated to the amounts disclosed herein when total net assets and shares of beneficial interest are not rounded to thousands. |
The accompanying notes are an integral part of the Financial Statements.
55
Harbor Domestic Equity Funds
STATEMENTS OF OPERATIONS—Six Months Ended April 30, 2015 (Unaudited)
(All amounts in thousands)
| | | | | | | | | | | | | | | | | | | | | | | | | | | | |
| | | Harbor
Capital
Appreciation Fund | | | Harbor
Mid Cap
Growth Fund | | | Harbor
Small Cap
Growth Fund | | | Harbor
Small Cap
Growth
Opportunities
Fund | | | Harbor
Large Cap
Value Fund | | | Harbor
Mid Cap
Value Fund | | | Harbor
Small Cap
Value Fund | |
Investment Income | | | | | | | | | | | | | | | | | | | | | | | | | | | | |
Dividends | | $ | 111,636 | | | $ | 1,776 | | | $ | 1,997 | | | $ | 211 | | | $ | 2,483 | | | $ | 5,217 | | | $ | 4,682 | |
Net securities lending income | | | 43 | | | | — | | | | — | | | | — | | | | — | | | | — | | | | — | |
Interest | | | — | | | | 9 | | | | — | | | | — | | | | — | | | | — | | | | — | |
Foreign taxes withheld | | | (1,816 | ) | | | (22 | ) | | | — | | | | (3 | ) | | | (30 | ) | | | — | | | | (24 | ) |
Total Investment Income | | | 109,863 | | | | 1,763 | | | | 1,997 | | | | 208 | | | | 2,453 | | | | 5,217 | | | | 4,658 | |
Operating Expenses | | | | | | | | | | | | | | | | | | | | | | | | | | | | |
Management fees | | | 76,376 | | | | 2,655 | | | | 2,342 | | | | 415 | | | | 747 | | | | 1,572 | | | | 2,836 | |
12b-1 fees: | | | | | | | | | | | | | | | | | | | | | | | | | | | | |
Administrative Class | | | 787 | | | | 464 | | | | 1 | | | | 1 | | | | 28 | | | | 25 | | | | 4 | |
Investor Class | | | 2,397 | | | | 44 | | | | 18 | | | | 2 | | | | 25 | | | | 151 | | | | 22 | |
Shareholder communications | | | 801 | | | | 18 | | | | 9 | | | | — | | | | 3 | | | | 18 | | | | 36 | |
Custodian fees | | | 317 | | | | 41 | | | | 21 | | | | 38 | | | | 11 | | | | 26 | | | | 16 | |
Transfer agent fees: | | | | | | | | | | | | | | | | | | | | | | | | | | | | |
Institutional Class | | | 7,074 | | | | 93 | | | | 188 | | | | 34 | | | | 64 | | | | 86 | | | | 227 | |
Administrative Class | | | 194 | | | | 115 | | | | — | | | | — | | | | 7 | | | | 6 | | | | 1 | |
Investor Class | | | 1,742 | | | | 32 | | | | 13 | | | | 2 | | | | 18 | | | | 110 | | | | 16 | |
Professional fees | | | 202 | | | | 6 | | | | 5 | | | | 1 | | | | 2 | | | | 10 | | | | 6 | |
Trustees’ fees and expenses | | | 263 | | | | 8 | | | | 7 | | | | 1 | | | | 2 | | | | 4 | | | | 8 | |
Registration fees | | | 93 | | | | 23 | | | | 23 | | | | 32 | | | | 22 | | | | 32 | | | | 32 | |
Miscellaneous | | | 101 | | | | 7 | | | | 7 | | | | 4 | | | | 5 | | | | 6 | | | | 7 | |
Total expenses | | | 90,347 | | | | 3,506 | | | | 2,634 | | | | 530 | | | | 934 | | | | 2,046 | | | | 3,211 | |
Management fees waived | | | (4,078 | ) | | | — | | | | — | | | | — | | | | — | | | | — | | | | — | |
Transfer agent fees waived | | | (283 | ) | | | (8 | ) | | | (7 | ) | | | (1 | ) | | | (3 | ) | | | (5 | ) | | | (9 | ) |
Other expenses reimbursed | | | — | | | | — | | | | — | | | | (26 | ) | | | (20 | ) | | | — | | | | — | |
Custodial expense reductions | | | (1 | ) | | | — | | | | — | | | | — | | | | — | | | | — | | | | — | |
Net expenses | | | 85,985 | | | | 3,498 | | | | 2,627 | | | | 503 | | | | 911 | | | | 2,041 | | | | 3,202 | |
Net Investment Income/(Loss) | | | 23,878 | | | | (1,735 | ) | | | (630 | ) | | | (295 | ) | | | 1,542 | | | | 3,176 | | | | 1,456 | |
Realized and Change in Net Unrealized Gain/(Loss) on Investment Transactions | | | | | | | | | | | | | | | | | | | | | | | | | | | | |
Net realized gain/(loss) on: | | | | | | | | | | | | | | | | | | | | | | | | | | | | |
Investments | | | 1,158,331 | | | | 46,818 | | | | 51,157 | | | | 3,224 | | | | 9,203 | | | | 1,900 | | | | 29,561 | |
Foreign currency transactions | | | (109 | ) | | | (13 | ) | | | — | | | | — | | | | (1 | ) | | | — | | | | — | |
Change in net unrealized appreciation/(depreciation) on: | | | | | | | | | | | | | | | | | | | | | | | | | | | | |
Investments | | | 662,381 | | | | 3,569 | | | | 11,021 | | | | (111 | ) | | | 6,216 | | | | 11,259 | | | | (5,253 | ) |
Translations of assets and liabilities in foreign currencies | | | 17 | | | | 2 | | | | — | | | | — | | | | 1 | | | | — | | | | — | |
Net gain/(loss) on investment transactions | | | 1,820,620 | | | | 50,376 | | | | 62,178 | | | | 3,113 | | | | 15,419 | | | | 13,159 | | | | 24,308 | |
Net Increase/(Decrease) in Net Assets Resulting from Operations | | $ | 1,844,498 | | | $ | 48,641 | | | $ | 61,548 | | | $ | 2,818 | | | $ | 16,961 | | | $ | 16,335 | | | $ | 25,764 | |
The accompanying notes are an integral part of the Financial Statements.
56
Harbor Domestic Equity Funds
STATEMENTS OF CHANGES IN NET ASSETS
(All amounts in thousands)
| | | | | | | | | | | | | | | | | | | | | | | | |
| | | Harbor
Capital Appreciation Fund | | |
Harbor
Mid Cap Growth Fund | | | Harbor
Small Cap Growth Fund | |
| | | November 1,
2014
through
April 30,
2015 | | | November 1,
2013
through
October 31,
2014 | | | November 1,
2014
through
April 30,
2015 | | | November 1,
2013
through
October 31,
2014 | | | November 1,
2014
through
April 30,
2015 | | | November 1,
2013
through
October 31,
2014 | |
INCREASE/(DECREASE) IN NET ASSETS | | | (Unaudited) | | | | | | | | (Unaudited) | | | | | | | | (Unaudited) | | | | | |
Operations: | | | | | | | | | | | | | | | | | | | | | | | | |
Net investment income/(loss) | | $ | 23,878 | | | $ | 16,958 | | | $ | (1,735 | ) | | $ | (3,731 | ) | | $ | (630 | ) | | $ | (1,883 | ) |
Net realized gain/(loss) on investments | | | 1,158,222 | | | | 1,755,868 | | | | 46,805 | | | | 131,783 | | | | 51,157 | | | | 107,103 | |
Change in net unrealized appreciation/(depreciation) of investments | | | 662,398 | | | | 1,865,702 | | | | 3,571 | | | | (24,105 | ) | | | 11,021 | | | | (28,149 | ) |
Net increase/(decrease) in assets resulting from operations | | | 1,844,498 | | | | 3,638,528 | | | | 48,641 | | | | 103,947 | | | | 61,548 | | | | 77,071 | |
Distributions to Shareholders | | | | | | | | | | | | | | | | | | | | | | | | |
Net investment income: | | | | | | | | | | | | | | | | | | | | | | | | |
Institutional Class | | | (17,426 | ) | | | (15,907 | ) | | | — | | | | — | | | | — | | | | 1 | |
Administrative Class | | | — | | | | — | | | | — | | | | — | | | | — | | | | — | |
Investor Class | | | — | | | | — | | | | — | | | | — | | | | — | | | | — | |
Net realized gain on investments: | | | | | | | | | | | | | | | | | | | | | | | | |
Institutional Class | | | (1,362,695 | ) | | | (609,875 | ) | | | (48,715 | ) | | | (50,232 | ) | | | (87,734 | ) | | | (79,831 | ) |
Administrative Class | | | (40,498 | ) | | | (19,050 | ) | | | (59,287 | ) | | | (64,976 | ) | | | (103 | ) | | | (92 | ) |
Investor Class | | | (115,034 | ) | | | (56,815 | ) | | | (5,792 | ) | | | (5,715 | ) | | | (2,245 | ) | | | (3,394 | ) |
Total distributions to shareholders | | | (1,535,653 | ) | | | (701,647 | ) | | | (113,794 | ) | | | (120,923 | ) | | | (90,082 | ) | | | (83,316 | ) |
Net Increase/(Decrease) Derived from Capital Share Transactions | | | 1,335,973 | | | | 327,523 | | | | 71,446 | | | | (21,916 | ) | | | 47,345 | | | | (1,503 | ) |
Net increase/(decrease) in net assets | | | 1,644,818 | | | | 3,264,404 | | | | 6,293 | | | | (38,892 | ) | | | 18,811 | | | | (7,748 | ) |
Net Assets | | | | | | | | | | | | | | | | | | | | | | | | |
Beginning of period | | | 25,024,739 | | | | 21,760,335 | | | | 728,769 | | | | 767,661 | | | | 618,392 | | | | 626,140 | |
End of period* | | $ | 26,669,557 | | | $ | 25,024,739 | | | $ | 735,062 | | | $ | 728,769 | | | $ | 637,203 | | | $ | 618,392 | |
* Includes accumulated undistributed net investment income/(loss) of: | | $ | 17,414 | | | $ | 10,962 | | | $ | (2,502 | ) | | $ | (767 | ) | | $ | (975 | ) | | $ | (345 | ) |
| a | Commencement of operations. |
The accompanying notes are an integral part of the Financial Statements.
57
| | | | | | | | | | | | | | | | | | | | | | | | | | | | | | |
Harbor
Small Cap Growth
Opportunities Fund | | | Harbor
Large Cap Value Fund | | | Harbor
Mid Cap Value Fund | | | Harbor
Small Cap Value Fund | |
November 1,
2014
through
April 30,
2015 | | | February 1,
2014a
through
October 31,
2014 | | | November 1,
2014
through
April 30,
2015 | | | November 1,
2013
through
October 31,
2014 | | | November 1,
2014
through
April 30,
2015 | | | November 1,
2013
through
October 31,
2014 | | | November 1,
2014
through
April 30,
2015 | | | November 1,
2013
through
October 31,
2014 | |
| | (Unaudited) | | | | | | | | (Unaudited) | | | | | | | | (Unaudited) | | | | | | | | (Unaudited) | | | | | |
| | | | | | | | | | | | | | | | | | | | | | | | | | | | | | |
| $ | (295 | ) | | $ | (119 | ) | | $ | 1,542 | | | $ | 2,783 | | | $ | 3,176 | | | $ | 2,325 | | | $ | 1,456 | | | $ | 1,843 | |
| | 3,224 | | | | 153 | | | | 9,202 | | | | 20,500 | | | | 1,900 | | | | 6,118 | | | | 29,561 | | | | 27,355 | |
| | | | | | | |
| | (111 | ) | | | 1,824 | | | | 6,217 | | | | 5,611 | | | | 11,259 | | | | 18,654 | | | | (5,253 | ) | | | 34,941 | |
| | | | | | | |
| | 2,818 | | | | 1,858 | | | | 16,961 | | | | 28,894 | | | | 16,335 | | | | 27,097 | | | | 25,764 | | | | 64,139 | |
| | | | | | | | | | | | | | | | | | | | | | | | | | | | | | |
| | | | | | | | | | | | | | | | | | | | | | | | | | | | | | |
| | — | | | | — | | | | (1,270 | ) | | | (2,274 | ) | | | (2,051 | ) | | | (938 | ) | | | (1,525 | ) | | | (866 | ) |
| | — | | | | — | | | | (105 | ) | | | (153 | ) | | | (132 | ) | | | (37 | ) | | | — | | | | — | |
| | — | | | | — | | | | (92 | ) | | | (110 | ) | | | (743 | ) | | | (253 | ) | | | — | | | | — | |
| | | | | | | | | | | | | | | | | | | | | | | | | | | | | | |
| | (321 | ) | | | — | | | | (12,992 | ) | | | — | | | | (1,379 | ) | | | — | | | | (23,533 | ) | | | (78,923 | ) |
| | (1 | ) | | | — | | | | (1,357 | ) | | | — | | | | (107 | ) | | | — | | | | (129 | ) | | | (1,842 | ) |
| | (8 | ) | | | — | | | | (1,271 | ) | | | — | | | | (671 | ) | | | — | | | | (601 | ) | | | (2,726 | ) |
| | (330 | ) | | | — | | | | (17,087 | ) | | | (2,537 | ) | | | (5,083 | ) | | | (1,228 | ) | | | (25,788 | ) | | | (84,357 | ) |
| | | | | | | |
| | 93,484 | | | | 57,999 | | | | 17,916 | | | | 12,586 | | | | 216,390 | | | | 170,907 | | | | 125,508 | | | | 203,316 | |
| | 95,972 | | | | 59,857 | | | | 17,790 | | | | 38,943 | | | | 227,642 | | | | 196,776 | | | | 125,484 | | | | 183,098 | |
| | | | | | | | | | | | | | | | | | | | | | | | | | | | | | |
| | 59,857 | | | | — | | | | 243,712 | | | | 204,769 | | | | 301,746 | | | | 104,970 | | | | 732,206 | | | | 549,108 | |
| $ | 155,829 | | | $ | 59,857 | | | $ | 261,502 | | | $ | 243,712 | | | $ | 529,388 | | | $ | 301,746 | | | $ | 857,690 | | | $ | 732,206 | |
| | | | | | | |
| $ | (295 | ) | | $ | — | | | $ | 1,049 | | | $ | 974 | | | $ | 2,022 | | | $ | 1,772 | | | $ | 662 | | | $ | 731 | |
58
Harbor Domestic Equity Funds
STATEMENTS OF CHANGES IN NET ASSETS—CAPITAL STOCK ACTIVITY
(All amounts in thousands)
| | | | | | | | | | | | | | | | | | | | | | | | |
| | |
Harbor
Capital Appreciation Fund | | | Harbor
Mid Cap Growth Fund | | | Harbor
Small Cap Growth Fund | |
| | | November 1,
2014
through
April 30,
2015 | | | November 1,
2013
through
October 31,
2014 | | | November 1,
2014
through
April 30,
2015 | | | November 1,
2013
through
October 31,
2014 | | | November 1,
2014
through
April 30,
2015 | | | November 1,
2013
through
October 31,
2014 | |
| | | (Unaudited) | | | | | | | | (Unaudited) | | | | | | | | (Unaudited) | | | | | |
AMOUNT ($) | | | | | | | | | | | | | | | | | | | | | | | | |
Institutional Class | | | | | | | | | | | | | | | | | | | | | | | | |
Net proceeds from sale of shares | | $ | 2,122,256 | | | $ | 3,928,001 | | | $ | 30,448 | | | $ | 58,686 | | | $ | 21,992 | | | $ | 60,651 | |
Reinvested distributions | | | 1,244,437 | | | | 567,665 | | | | 44,858 | | | | 42,529 | | | | 84,420 | | | | 79,239 | |
Cost of shares reacquired | | | (2,129,105 | ) | | | (3,964,601 | ) | | | (41,483 | ) | | | (113,076 | ) | | | (61,533 | ) | | | (132,533 | ) |
Net increase/(decrease) in net assets | | $ | 1,237,588 | | | $ | 531,065 | | | $ | 33,823 | | | $ | (11,861 | ) | | $ | 44,879 | | | $ | 7,357 | |
Administrative Class | | | | | | | | | | | | | | | | | | | | | | | | |
Net proceeds from sale of shares | | $ | 147,553 | | | $ | 170,506 | | | $ | 40,996 | | | $ | 66,064 | | | $ | 103 | | | $ | 308 | |
Reinvested distributions | | | 39,175 | | | | 17,667 | | | | 59,282 | | | | 64,971 | | | | 103 | | | | 92 | |
Cost of shares reacquired | | | (119,284 | ) | | | (289,016 | ) | | | (63,097 | ) | | | (144,294 | ) | | | (70 | ) | | | (378 | ) |
Net increase/(decrease) in net assets | | $ | 67,444 | | | $ | (100,843 | ) | | $ | 37,181 | | | $ | (13,259 | ) | | $ | 136 | | | $ | 22 | |
Investor Class | | | | | | | | | | | | | | | | | | | | | | | | |
Net proceeds from sale of shares | | $ | 323,552 | | | $ | 533,477 | | | $ | 2,788 | | | $ | 15,864 | | | $ | 1,586 | | | $ | 2,402 | |
Reinvested distributions | | | 112,162 | | | | 55,284 | | | | 5,754 | | | | 5,686 | | | | 2,244 | | | | 3,394 | |
Cost of shares reacquired | | | (404,773 | ) | | | (691,460 | ) | | | (8,100 | ) | | | (18,346 | ) | | | (1,500 | ) | | | (14,678 | ) |
Net increase/(decrease) in net assets | | $ | 30,941 | | | $ | (102,699 | ) | | $ | 442 | | | $ | 3,204 | | | $ | 2,330 | | | $ | (8,882 | ) |
SHARES | | | | | | | | | | | | | | | | | | | | | | | | |
Institutional Class | | | | | | | | | | | | | | | | | | | | | | | | |
Shares sold | | | 34,663 | | | | 67,993 | | | | 3,004 | | | | 5,330 | | | | 1,503 | | | | 4,070 | |
Shares issued due to reinvestment of distributions | | | 21,186 | | | | 10,403 | | | | 4,649 | | | | 4,113 | | | | 6,180 | | | | 5,561 | |
Shares reacquired | | | (34,838 | ) | | | (68,834 | ) | | | (4,115 | ) | | | (10,160 | ) | | | (4,163 | ) | | | (8,817 | ) |
Net increase/(decrease) in shares outstanding | | | 21,011 | | | | 9,562 | | | | 3,538 | | | | (717 | ) | | | 3,520 | | | | 814 | |
Beginning of period | | | 363,570 | | | | 354,008 | | | | 26,815 | | | | 27,532 | | | | 39,057 | | | | 38,243 | |
End of period | | | 384,581 | | | | 363,570 | | | | 30,353 | | | | 26,815 | | | | 42,577 | | | | 39,057 | |
Administrative Class | | | | | | | | | | | | | | | | | | | | | | | | |
Shares sold | | | 2,438 | | | | 2,970 | | | | 4,182 | | | | 6,075 | | | | 8 | | | | 21 | |
Shares issued due to reinvestment of distributions | | | 673 | | | | 326 | | | | 6,333 | | | | 6,426 | | | | 8 | | | | 7 | |
Shares reacquired | | | (2,002 | ) | | | (5,106 | ) | | | (6,132 | ) | | | (13,410 | ) | | | (5 | ) | | | (26 | ) |
Net increase/(decrease) in shares outstanding | | | 1,109 | | | | (1,810 | ) | | | 4,383 | | | | (909 | ) | | | 11 | | | | 2 | |
Beginning of period | | | 9,488 | | | | 11,298 | | | | 34,500 | | | | 35,409 | | | | 43 | | | | 41 | |
End of period | | | 10,597 | | | | 9,488 | | | | 38,883 | | | | 34,500 | | | | 54 | | | | 43 | |
Investor Class | | | | | | | | | | | | | | | | | | | | | | | | |
Shares sold | | | 5,443 | | | | 9,438 | | | | 288 | | | | 1,425 | | | | 116 | | | | 171 | |
Shares issued due to reinvestment of distributions | | | 1,950 | | | | 1,030 | | | | 628 | | | | 572 | | | | 178 | | | | 253 | |
Shares reacquired | | | (6,749 | ) | | | (12,106 | ) | | | (800 | ) | | | (1,657 | ) | | | (112 | ) | | | (1,065 | ) |
Net increase/(decrease) in shares outstanding | | | 644 | | | | (1,638 | ) | | | 116 | | | | 340 | | | | 182 | | | | (641 | ) |
Beginning of period | | | 31,451 | | | | 33,089 | | | | 3,461 | | | | 3,121 | | | | 987 | | | | 1,628 | |
End of period | | | 32,095 | | | | 31,451 | | | | 3,577 | | | | 3,461 | | | | 1,169 | | | | 987 | |
| a | Commencement of operations. |
The accompanying notes are an integral part of the Financial Statements.
59
| | | | | | | | | | | | | | | | | | | | | | | | | | | | | | |
Harbor
Small Cap Growth
Opportunities Fund | | | Harbor
Large Cap Value Fund | | | Harbor
Mid Cap Value Fund | | | Harbor
Small Cap Value Fund | |
November 1,
2014
through
April 30,
2015 | | | February 1,
2014a
through
October 31,
2014 | | | November 1,
2014
through
April 30,
2015 | | | November 1,
2013
through
October 31,
2014 | | | November 1,
2014
through
April 30,
2015 | | | November 1,
2013
through
October 31,
2014 | | | November 1,
2014
through
April 30,
2015 | | | November 1,
2013
through
October 31,
2014 | |
| | (Unaudited) | | | | | | | | (Unaudited) | | | | | | | | (Unaudited) | | | | | | | | (Unaudited) | | | | | |
| | | | | | | | | | | | | | | | | | | | | | | | | | | | | | |
| | | | | | | | | | | | | | | | | | | | | | | | | | | | | | |
| $ | 98,841 | | | $ | 57,098 | | | $ | 20,532 | | | $ | 70,327 | | | $ | 184,753 | | | $ | 130,475 | | | $ | 228,049 | | | $ | 301,727 | |
| | 297 | | | | — | | | | 14,099 | | | | 2,260 | | | | 3,275 | | | | 932 | | | | 20,490 | | | | 57,931 | |
| | (6,970 | ) | | | (1,104 | ) | | | (19,233 | ) | | | (72,033 | ) | | | (34,461 | ) | | | (36,420 | ) | | | (119,170 | ) | | | (151,725 | ) |
| $ | 92,168 | | | $ | 55,994 | | | $ | 15,398 | | | $ | 554 | | | $ | 153,567 | | | $ | 94,987 | | | $ | 129,369 | | | $ | 207,933 | |
| | | | | | | | | | | | | | | | | | | | | | | | | | | | | | |
| $ | 2,341 | | | $ | 867 | | | $ | 3,252 | | | $ | 6,902 | | | $ | 11,701 | | | $ | 12,352 | | | $ | 143 | | | $ | 960 | |
| | 1 | | | | — | | | | 1,462 | | | | 153 | | | | 237 | | | | 37 | | | | 129 | | | | 1,842 | |
| | (53 | ) | | | (601 | ) | | | (2,099 | ) | | | (1,611 | ) | | | (1,954 | ) | | | (2,151 | ) | | | (4,655 | ) | | | (8,339 | ) |
| $ | 2,289 | | | $ | 266 | | | $ | 2,615 | | | $ | 5,444 | | | $ | 9,984 | | | $ | 10,238 | | | $ | (4,383 | ) | | $ | (5,537 | ) |
| | | | | | | | | | | | | | | | | | | | | | | | | | | | | | |
| $ | 56 | | | $ | 1,843 | | | $ | 1,385 | | | $ | 14,132 | | | $ | 72,222 | | | $ | 94,776 | | | $ | 2,000 | | | $ | 3,254 | |
| | 9 | | | | — | | | | 1,292 | | | | 108 | | | | 1,387 | | | | 251 | | | | 592 | | | | 2,696 | |
| | (1,038 | ) | | | (104 | ) | | | (2,774 | ) | | | (7,652 | ) | | | (20,770 | ) | | | (29,345 | ) | | | (2,070 | ) | | | (5,030 | ) |
| $ | (973 | ) | | $ | 1,739 | | | $ | (97 | ) | | $ | 6,588 | | | $ | 52,839 | | | $ | 65,682 | | | $ | 522 | | | $ | 920 | |
| | | | | | | | | | | | | | | | | | | | | | | | | | | | | | |
| | | | | | | | | | | | | | | | | | | | | | | | | | | | | | |
| | 9,176 | | | | 5,472 | | | | 1,724 | | | | 5,900 | | | | 8,868 | | | | 6,739 | | | | 8,266 | | | | 11,609 | |
| | | | | | | |
| | 28 | | | | — | | | | 1,214 | | | | 198 | | | | 159 | | | | 52 | | | | 777 | | | | 2,345 | |
| | (645 | ) | | | (109 | ) | | | (1,616 | ) | | | (6,067 | ) | | | (1,645 | ) | | | (1,885 | ) | | | (4,361 | ) | | | (5,836 | ) |
| | 8,559 | | | | 5,363 | | | | 1,322 | | | | 31 | | | | 7,382 | | | | 4,906 | | | | 4,682 | | | | 8,118 | |
| | 5,363 | | | | — | | | | 16,557 | | | | 16,526 | | | | 9,606 | | | | 4,700 | | | | 26,101 | | | | 17,983 | |
| | 13,922 | | | | 5,363 | | | | 17,879 | | | | 16,557 | | | | 16,988 | | | | 9,606 | | | | 30,783 | | | | 26,101 | |
| | | | | | | | | | | | | | | | | | | | | | | | | | | | | | |
| | 208 | | | | 84 | | | | 274 | | | | 596 | | | | 556 | | | | 634 | | | | 5 | | | | 37 | |
| | | | | | | |
| | — | | | | — | | | | 126 | | | | 13 | | | | 11 | | | | 2 | | | | 5 | | | | 74 | |
| | (4 | ) | | | (59 | ) | | | (174 | ) | | | (138 | ) | | | (93 | ) | | | (112 | ) | | | (169 | ) | | | (324 | ) |
| | 204 | | | | 25 | | | | 226 | | | | 471 | | | | 474 | | | | 524 | | | | (159 | ) | | | (213 | ) |
| | 25 | | | | — | | | | 1,712 | | | | 1,241 | | | | 721 | | | | 197 | | | | 210 | | | | 423 | |
| | 229 | | | | 25 | | | | 1,938 | | | | 1,712 | | | | 1,195 | | | | 721 | | | | 51 | | | | 210 | |
| | | | | | | | | | | | | | | | | | | | | | | | | | | | | | |
| | 5 | | | | 178 | | | | 115 | | | | 1,179 | | | | 3,464 | | | | 4,919 | | | | 74 | | | | 127 | |
| | | | | | | |
| | 1 | | | | — | | | | 110 | | | | 9 | | | | 68 | | | | 14 | | | | 23 | | | | 111 | |
| | (91 | ) | | | (10 | ) | | | (233 | ) | | | (641 | ) | | | (1,000 | ) | | | (1,510 | ) | | | (78 | ) | | | (199 | ) |
| | (85 | ) | | | 168 | | | | (8 | ) | | | 547 | | | | 2,532 | | | | 3,423 | | | | 19 | | | | 39 | |
| | 168 | | | | — | | | | 1,638 | | | | 1,091 | | | | 4,524 | | | | 1,101 | | | | 648 | | | | 609 | |
| | 83 | | | | 168 | | | | 1,630 | | | | 1,638 | | | | 7,056 | | | | 4,524 | | | | 667 | | | | 648 | |
60
Harbor Domestic Equity Funds Financial Highlights
SELECTED DATA FOR A SHARE OUTSTANDING FOR THE PERIODS PRESENTED
| | | | | | | | | | | | | | | | | | | | | | | | |
HARBOR CAPITAL APPRECIATION FUND | |
| | | Institutional Class | |
| | | 6-Month
Period Ended
April 30, 2015 | | | Year Ended October 31, | |
| | | | 2014 | | | 2013 | | | 2012 | | | 2011 | | | 2010 | |
| | | (Unaudited) | | | | | | | | | | | | | | | | |
Net asset value beginning of period | | $ | 61.97 | | | $ | 54.71 | | | $ | 41.44 | | | $ | 38.34 | | | $ | 34.73 | | | $ | 30.30 | |
Income from Investment Operations | | | | | | | | | | | | | | | | | | | | | | | | |
Net investment income/(loss)a | | | 0.07 | e | | | 0.06 | | | | 0.16 | | | | 0.07 | | | | 0.05 | | | | 0.08 | |
Net realized and unrealized gains/(losses) on investments | | | 4.32 | | | | 8.98 | | | | 13.28 | | | | 3.07 | | | | 3.64 | | | | 4.44 | |
Total from investment operations | | | 4.39 | | | | 9.04 | | | | 13.44 | | | | 3.14 | | | | 3.69 | | | | 4.52 | |
Less Distributions | | | | | | | | | | | | | | | | | | | | | | | | |
Dividends from net investment income | | | (0.05 | ) | | | (0.05 | ) | | | (0.17 | ) | | | (0.04 | ) | | | (0.08 | ) | | | (0.09 | ) |
Distributions from net realized capital gains1 | | | (3.77 | ) | | | (1.73 | ) | | | — | | | | — | | | | — | | | | — | |
Total distributions | | | (3.82 | ) | | | (1.78 | ) | | | (0.17 | ) | | | (0.04 | ) | | | (0.08 | ) | | | (0.09 | ) |
Net asset value end of period | | | 62.54 | | | | 61.97 | | | | 54.71 | | | | 41.44 | | | | 38.34 | | | | 34.73 | |
Net assets end of period (000s) | | $ | 24,050,556 | | | $ | 22,531,379 | | | $ | 19,366,148 | | | $ | 14,752,873 | | | $ | 10,682,886 | | | $ | 8,961,461 | |
Ratios and Supplemental Data (%) | | | | | | | | | | | | | | | | | | | | | | | | |
Total returnb | | | 7.47 | %c | | | 16.95 | % | | | 32.55 | % | | | 8.21 | % | | | 10.63 | % | | | 14.93 | % |
Ratio of total expenses to average net assets2 | | | 0.68 | d | | | 0.67 | | | | 0.68 | | | | 0.68 | | | | 0.68 | | | | 0.70 | |
Ratio of net expenses to average net assetsa | | | 0.64 | d | | | 0.65 | | | | 0.65 | | | | 0.66 | | | | 0.66 | | | | 0.68 | |
Ratio of net investment income to average net Assetsa | | | 0.22 | d | | | 0.11 | | | | 0.35 | | | | 0.20 | | | | 0.14 | | | | 0.24 | |
Portfolio turnover | | | 21 | c | | | 34 | | | | 48 | | | | 41 | | | | 53 | | | | 68 | |
| | | | | | | | | | | | | | | | | | | | | | | | |
HARBOR MID CAP GROWTH FUND | |
| | | Institutional Class | |
| | | 6-Month
Period Ended
April 30, 2015 | | | Year Ended October 31, | |
| | | | 2014 | | | 2013 | | | 2012 | | | 2011 | | | 2010 | |
| | | (Unaudited) | | | | | | | | | | | | | | | | |
Net asset value beginning of period | | $ | 11.43 | | | $ | 11.76 | | | $ | 9.22 | | | $ | 8.46 | | | $ | 7.82 | | | $ | 6.20 | |
Income from Investment Operations | | | | | | | | | | | | | | | | | | | | | | | | |
Net investment income/(loss)a | | | (0.02 | )e | | | (0.04 | ) | | | (0.03 | ) | | | (0.02 | ) | | | (0.03 | ) | | | (0.02 | ) |
Net realized and unrealized gains/(losses) on investments | | | 0.71 | | | | 1.55 | | | | 2.76 | | | | 0.78 | | | | 0.67 | | | | 1.64 | |
Total from investment operations | | | 0.69 | | | | 1.51 | | | | 2.73 | | | | 0.76 | | | | 0.64 | | | | 1.62 | |
Less Distributions | | | | | | | | | | | | | | | | | | | | | | | | |
Dividends from net investment income | | | — | | | | — | | | | — | | | | — | | | | — | | | | — | |
Distributions from net realized capital gains1 | | | (1.83 | ) | | | (1.84 | ) | | | (0.19 | ) | | | — | | | | — | | | | — | |
Total distributions | | | (1.83 | ) | | | (1.84 | ) | | | (0.19 | ) | | | — | | | | — | | | | — | |
Net asset value end of period | | | 10.29 | | | | 11.43 | | | | 11.76 | | | | 9.22 | | | | 8.46 | | | | 7.82 | |
Net assets end of period (000s) | | $ | 312,289 | | | $ | 306,371 | | | $ | 323,666 | | | $ | 286,490 | | | $ | 345,875 | | | $ | 298,295 | |
Ratios and Supplemental Data (%) | | | | | | | | | | | | | | | | | | | | | | | | |
Total returnb | | | 7.06 | %c | | | 14.45 | % | | | 30.13 | % | | | 8.98 | % | | | 8.18 | % | | | 26.13 | % |
Ratio of total expenses to average net assets2 | | | 0.84 | d | | | 0.84 | | | | 0.84 | | | | 0.85 | | | | 0.86 | | | | 0.89 | |
Ratio of net expenses to average net assetsa | | | 0.84 | d | | | 0.83 | | | | 0.84 | | | | 0.85 | | | | 0.85 | | | | 0.87 | |
Ratio of net investment income to average net assetsa | | | (0.34 | )d | | | (0.34 | ) | | | (0.27 | ) | | | (0.31 | ) | | | (0.34 | ) | | | (0.29 | ) |
Portfolio turnover | | | 42 | c | | | 95 | | | | 111 | | | | 123 | | | | 111 | | | | 117 | |
See page 67 for notes to Financial Highlights.
The accompanying notes are an integral part of the Financial Statements.
61
| | | | | | | | | | | | | | | | | | | | | | | | | | | | | | | | | | | | | | | | | | | | | | |
| | | | | | |
| Administrative Class | | | Investor Class | |
6-Month
Period
Ended
April 30,
2015 | | | Year Ended October 31, | | | 6-Month
Period
Ended
April 30,
2015 | | | Year Ended October 31, | |
| | 2014 | | | 2013 | | | 2012 | | | 2011 | | | 2010 | | | | 2014 | | | 2013 | | | 2012 | | | 2011 | | | 2010 | |
| (Unaudited) | | | | | | | | | | | | | | | | | | (Unaudited) | | | | | | | | | | | | | | | | |
| $ | 61.39 | | | $ | 54.29 | | | $ | 41.12 | | | $ | 38.09 | | | $ | 34.52 | | | $ | 30.13 | | | $ | 60.76 | | | $ | 53.82 | | | $ | 40.79 | | | $ | 37.83 | | | $ | 34.32 | | | $ | 29.97 | |
| | | | | | | | | | | | | | | | | | | | | | | | | | | | | | | | | | | | | | | | | | | | | | |
| | (0.01 | )e | | | (0.11 | ) | | | 0.02 | | | | — | *,f | | | (0.03 | ) | | | 0.01 | | | | (0.04 | )e | | | (0.17 | ) | | | (0.01 | ) | | | 0.02 | | | | (0.09 | ) | | | (0.01 | ) |
| | 4.27 | | | | 8.94 | | | | 13.21 | | | | 3.03 | | | | 3.60 | | | | 4.40 | | | | 4.22 | | | | 8.84 | | | | 13.07 | | | | 2.94 | | | | 3.60 | | | | 4.36 | |
| | 4.26 | | | | 8.83 | | | | 13.23 | | | | 3.03 | | | | 3.57 | | | | 4.41 | | | | 4.18 | | | | 8.67 | | | | 13.06 | | | | 2.96 | | | | 3.51 | | | | 4.35 | |
| | | | | | | | | | | | | | | | | | | | | | | | | | | | | | | | | | | | | | | | | | | | | | |
| | — | | | | — | | | | (0.06 | ) | | | — | | | | — | | | | (0.02 | ) | | | — | | | | — | | | | (0.03 | ) | | | — | | | | — | | | | — | |
| | (3.77 | ) | | | (1.73 | ) | | | — | | | | — | | | | — | | | | — | | | | (3.77 | ) | | | (1.73 | ) | | | — | | | | — | | | | — | | | | — | |
| | (3.77 | ) | | | (1.73 | ) | | | (0.06 | ) | | | — | | | | — | | | | (0.02 | ) | | | (3.77 | ) | | | (1.73 | ) | | | (0.03 | ) | | | — | | | | — | | | | — | |
| | 61.88 | | | | 61.39 | | | | 54.29 | | | | 41.12 | | | | 38.09 | | | | 34.52 | | | | 61.17 | | | | 60.76 | | | | 53.82 | | | | 40.79 | | | | 37.83 | | | | 34.32 | |
| $ | 655,759 | | | $ | 582,430 | | | $ | 613,413 | | | $ | 597,023 | | | $ | 487,025 | | | $ | 413,057 | | | $ | 1,963,242 | | | $ | 1,910,930 | | | $ | 1,780,774 | | | $ | 1,360,248 | | | $ | 785,328 | | | $ | 862,043 | |
| | | | | | | | | | | | | | | | | | | | | | | | | | | | | | | | | | | | | | | | | | | | | | |
| | 7.32 | %c | | | 16.69 | % | | | 32.21 | % | | | 7.95 | % | | | 10.34 | % | | | 14.65 | % | | | 7.27 | %c | | | 16.53 | % | | | 32.04 | % | | | 7.82 | % | | | 10.23 | % | | | 14.51 | % |
| | 0.93 | d | | | 0.92 | | | | 0.93 | | | | 0.93 | | | | 0.93 | | | | 0.95 | | | | 1.05 | d | | | 1.04 | | | | 1.05 | | | | 1.05 | | | | 1.05 | | | | 1.07 | |
| | 0.89 | d | | | 0.90 | | | | 0.90 | | | | 0.91 | | | | 0.91 | | | | 0.93 | | | | 1.01 | d | | | 1.02 | | | | 1.02 | | | | 1.03 | | | | 1.03 | | | | 1.05 | |
| | (0.03 | )d | | | (0.14 | ) | | | 0.11 | | | | (0.04 | ) | | | (0.10 | ) | | | (0.01 | ) | | | (0.14 | )d | | | (0.26 | ) | | | (0.03 | ) | | | (0.18 | ) | | | (0.22 | ) | | | (0.14 | ) |
| | 21 | c | | | 34 | | | | 48 | | | | 41 | | | | 53 | | | | 68 | | | | 21 | c | | | 34 | | | | 48 | | | | 41 | | | | 53 | | | | 68 | |
| | | | | | | | | | | | | | | | | | | | | | | | | | | | | | | | | | | | | | | | | | | | | | |
| | | | | | |
| Administrative Class | | | Investor Class | |
6-Month
Period
Ended
April 30,
2015 | | | Year Ended October 31, | | | 6-Month
Period
Ended
April 30,
2015 | | | Year Ended October 31, | |
| | 2014 | | | 2013 | | | 2012 | | | 2011 | | | 2010 | | | | 2014 | | | 2013 | | | 2012 | | | 2011 | | | 2010 | |
| (Unaudited) | | | | | | | | | | | | | | | | | | (Unaudited) | | | | | | | | | | | | | | | | |
| $ | 11.15 | | | $ | 11.54 | | | $ | 9.08 | | | $ | 8.35 | | | $ | 7.74 | | | $ | 6.15 | | | $ | 10.95 | | | $ | 11.37 | | | $ | 8.96 | | | $ | 8.25 | | | $ | 7.66 | | | $ | 6.09 | |
| | | | | | | | | | | | | | | | | | | | | | | | | | | | | | | | | | | | | | | | | | | | | | |
| | (0.03 | )e | | | (0.07 | ) | | | (0.05 | ) | | | (0.06 | ) | | | (0.05 | ) | | | (0.04 | ) | | | (0.03 | )e | | | (0.05 | ) | | | (0.12 | ) | | | (0.09 | ) | | | (0.11 | ) | | | (0.06 | ) |
| | 0.69 | | | | 1.52 | | | | 2.70 | | | | 0.79 | | | | 0.66 | | | | 1.63 | | | | 0.67 | | | | 1.47 | | | | 2.72 | | | | 0.80 | | | | 0.70 | | | | 1.63 | |
| | 0.66 | | | | 1.45 | | | | 2.65 | | | | 0.73 | | | | 0.61 | | | | 1.59 | | | | 0.64 | | | | 1.42 | | | | 2.60 | | | | 0.71 | | | | 0.59 | | | | 1.57 | |
| | | | | | | | | | | | | | | | | | | | | | | | | | | | | | | | | | | | | | | | | | | | | | |
| | — | | | | — | | | | — | | | | — | | | | — | | | | — | | | | — | | | | — | | | | — | | | | — | | | | — | | | | — | |
| | (1.83 | ) | | | (1.84 | ) | | | (0.19 | ) | | | — | | | | — | | | | — | | | | (1.83 | ) | | | (1.84 | ) | | | (0.19 | ) | | | — | | | | — | | | | — | |
| | (1.83 | ) | | | (1.84 | ) | | | (0.19 | ) | | | — | | | | — | | | | — | | | | (1.83 | ) | | | (1.84 | ) | | | (0.19 | ) | | | — | | | | — | | | | — | |
| | 9.98 | | | | 11.15 | | | | 11.54 | | | | 9.08 | | | | 8.35 | | | | 7.74 | | | | 9.76 | | | | 10.95 | | | | 11.37 | | | | 8.96 | | | | 8.25 | | | | 7.66 | |
| $ | 387,870 | | | $ | 384,511 | | | $ | 408,494 | | | $ | 315,975 | | | $ | 325,525 | | | $ | 287,256 | | | $ | 34,903 | | | $ | 37,887 | | | $ | 35,501 | | | $ | 33,543 | | | $ | 35,830 | | | $ | 49,035 | |
| | | | | | | | | | | | | | | | | | | | | | | | | | | | | | | | | | | | | | | | | | | | | | |
| | 6.97 | %c | | | 14.16 | % | | | 29.70 | % | | | 8.74 | % | | | 7.88 | % | | | 25.85 | % | | | 6.90 | %c | | | 14.09 | % | | | 29.54 | % | | | 8.61 | % | | | 7.70 | % | | | 25.78 | % |
| | 1.09 | d | | | 1.09 | | | | 1.09 | | | | 1.10 | | | | 1.11 | | | | 1.14 | | | | 1.21 | d | | | 1.21 | | | | 1.21 | | | | 1.22 | | | | 1.23 | | | | 1.26 | |
| | 1.09 | d | | | 1.08 | | | | 1.09 | | | | 1.10 | | | | 1.10 | | | | 1.12 | | | | 1.21 | d | | | 1.20 | | | | 1.21 | | | | 1.22 | | | | 1.22 | | | | 1.24 | |
| | ( 0.59 | )d | | | (0.59 | ) | | | (0.52 | ) | | | (0.55 | ) | | | (0.59 | ) | | | (0.54 | ) | | | ( 0.71 | )d | | | (0.71 | ) | | | (0.63 | ) | | | (0.68 | ) | | | (0.69 | ) | | | (0.66 | ) |
| | 42 | c | | | 95 | | | | 111 | | | | 123 | | | | 111 | | | | 117 | | | | 42 | c | | | 95 | | | | 111 | | | | 123 | | | | 111 | | | | 117 | |
62
Harbor Domestic Equity Funds Financial Highlights—Continued
SELECTED DATA FOR A SHARE OUTSTANDING FOR THE PERIODS PRESENTED
| | | | | | | | | | | | | | | | | | | | | | | | |
HARBOR SMALL CAP GROWTH FUND | |
| | | Institutional Class | |
| | | 6-Month
Period Ended April 30, 2015 | | | Year Ended October 31, | |
| | | | 2014 | | | 2013 | | | 2012 | | | 2011 | | | 2010 | |
| | | (Unaudited) | | | | | | | | | | | | | | | | |
Net asset value beginning of period | | $ | 15.45 | | | $ | 15.72 | | | $ | 11.81 | | | $ | 12.07 | | | $ | 11.88 | | | $ | 8.86 | |
Income from Investment Operations | | | | | | | | | | | | | | | | | | | | | | | | |
Net investment income/(loss)a | | | (0.01 | )e | | | (0.05 | ) | | | 0.03 | | | | (0.02 | ) | | | (0.04 | ) | | | (0.05 | ) |
Net realized and unrealized gains/(losses) on investments | | | 1.46 | | | | 1.91 | | | | 4.48 | | | | 0.74 | | | | 0.65 | | | | 3.07 | |
Total from investment operations | | | 1.45 | | | | 1.86 | | | | 4.51 | | | | 0.72 | | | | 0.61 | | | | 3.02 | |
Less Distributions | | | | | | | | | | | | | | | | | | | | | | | | |
Dividends from net investment income | | | — | | | | — | | | | (0.04 | ) | | | — | | | | — | | | | — | |
Distributions from net realized capital gains1 | | | (2.32 | ) | | | (2.13 | ) | | | (0.56 | ) | | | (0.98 | ) | | | (0.42 | ) | | | — | |
Total distributions | | | (2.32 | ) | | | (2.13 | ) | | | (0.60 | ) | | | (0.98 | ) | | | (0.42 | ) | | | — | |
Net asset value end of period | | | 14.58 | | | | 15.45 | | | | 15.72 | | | | 11.81 | | | | 12.07 | | | | 11.88 | |
Net assets end of period (000s) | | $ | 620,720 | | | $ | 603,476 | | | $ | 601,255 | | | $ | 474,417 | | | $ | 428,234 | | | $ | 391,571 | |
Ratios and Supplemental Data (%) | | | | | | | | | | | | | | | | | | | | | | | | |
Total returnb | | | 10.39 | %c | | | 12.94 | % | | | 39.90 | % | | | 6.88 | % | | | 5.00 | % | | | 34.09 | % |
Ratio of total expenses to average net assets2 | | | 0.83 | d | | | 0.83 | | | | 0.83 | | | | 0.85 | | | | 0.85 | | | | 0.87 | |
Ratio of net expenses to average net assetsa | | | 0.83 | d | | | 0.83 | | | | 0.83 | | | | 0.84 | | | | 0.84 | | | | 0.85 | |
Ratio of net investment income to average net assetsa | | | (0.19 | )d | | | (0.29 | ) | | | 0.22 | | | | (0.16 | ) | | | (0.32 | ) | | | (0.45 | ) |
Portfolio turnover | | | 36 | c | | | 76 | | | | 73 | | | | 63 | | | | 77 | | | | 82 | |
| | | | | | | | | | | | | | | | | | | | | | | | |
| | | | | | | | | | | | | | | | | | | | | | | | |
HARBOR SMALL CAP GROWTH OPPORTUNITIES FUND | | | | | | | | | | | | | | | | | | | | | | | | |
| | | Institutional Class | | | Administrative Class | | | Investor Class | |
| | | 6-Month
Period Ended April 30, 2015 | | | 2014g | | | 6-Month
Period Ended April 30, 2015 | | | 2014g | | | 6-Month
Period Ended April 30, 2015 | | | 2014g | |
| | | (Unaudited) | | | | | | (Unaudited) | | | | | | (Unaudited) | | | | |
Net asset value beginning of period | | $ | 10.77 | | | $ | 10.00 | | | $ | 10.75 | | | $ | 10.00 | | | $ | 10.74 | | | $ | 10.00 | |
Income from Investment Operations | | | | | | | | | | | | | | | | | | | | | | | | |
Net investment income/(loss)a | | | (0.03 | )e | | | (0.02 | ) | | | (0.04 | )e | | | (0.09 | ) | | | (0.04 | )e | | | (0.05 | ) |
Net realized and unrealized gains/(losses) on investments | | | 0.26 | | | | 0.79 | | | | 0.26 | | | | 0.84 | | | | 0.24 | | | | 0.79 | |
Total from investment operations | | | 0.23 | | | | 0.77 | | | | 0.22 | | | | 0.75 | | | | 0.20 | | | | 0.74 | |
Less Distributions | | | | | | | | | | | | | | | | | | | | | | | | |
Dividends from net investment income | | | — | | | | — | | | | — | | | | — | | | | — | | | | — | |
Distributions from net realized capital gains1 | | | (0.05 | ) | | | — | | | | (0.05 | ) | | | — | | | | (0.05 | ) | | | — | |
Total distributions | | | (0.05 | ) | | | — | | | | (0.05 | ) | | | — | | | | (0.05 | ) | | | — | |
Net asset value end of period | | | 10.95 | | | | 10.77 | | | | 10.92 | | | | 10.75 | | | | 10.89 | | | | 10.74 | |
Net assets end of period (000s) | | $ | 152,429 | | | $ | 57,779 | | | $ | 2,495 | | | $ | 269 | | | $ | 905 | | | $ | 1,809 | |
Ratios and Supplemental Data (%) | | | | | | | | | | | | | | | | | | | | | | | | |
Total returnb | | | 2.19 | %c | | | 7.70 | %c | | | 2.10 | %c | | | 7.50 | %c | | | 1.91 | %c | | | 7.40 | %c |
Ratio of total expenses to average net assets2 | | | 0.95 | d | | | 1.60 | d | | | 1.20 | d | | | 1.85 | d | | | 1.32 | d | | | 1.97 | d |
Ratio of net expenses to average net assetsa | | | 0.90 | d | | | 0.90 | d | | | 1.15 | d | | | 1.15 | d | | | 1.27 | d | | | 1.27 | d |
Ratio of net investment income to average net assetsa | | | (0.53 | )d | | | (0.67 | )d | | | (0.79 | )d | | | (0.90 | )d | | | (0.83 | )d | | | (1.03 | )d |
Portfolio turnover | | | 52 | c | | | 55 | c | | | 52 | c | | | 55 | c | | | 52 | c | | | 55 | c |
See page 67 for notes to Financial Highlights.
The accompanying notes are an integral part of the Financial Statements.
63
| | | | | | | | | | | | | | | | | | | | | | | | | | | | | | | | | | | | | | | | | | | | | | |
| | | | | | |
| Administrative Class | | | Investor Class | |
6-Month
Period Ended
April 30, 2015 | | | Year Ended October 31, | | | 6-Month
Period Ended April 30, 2015 | | | Year Ended October 31, | |
| | 2014 | | | 2013 | | | 2012 | | | 2011 | | | 2010 | | | | 2014 | | | 2013 | | | 2012 | | | 2011 | | | 2010 | |
| (Unaudited) | | | | | | | | | | | | | | | | | | (Unaudited) | | | | | | | | | | | | | | | | |
| $ | 14.89 | | | $ | 15.26 | | | $ | 11.46 | | | $ | 11.77 | | | $ | 11.62 | | | $ | 8.68 | | | $ | 14.47 | | | $ | 14.90 | | | $ | 11.22 | | | $ | 11.57 | | | $ | 11.44 | | | $ | 8.56 | |
| | | | | | | | | | | | | | | | | | | | | | | | | | | | | | | | | | | | | | | | | | | | | | |
| | (0.03 | )e | | | 0.54 | f | | | (7.68 | )f | | | (5.65 | )f | | | (0.06 | ) | | | (0.07 | ) | | | (0.04 | )e | | | (0.51 | ) | | | (0.06 | ) | | | (0.11 | ) | | | (0.15 | ) | | | (0.11 | ) |
| | 1.40 | | | | 1.22 | | | | 12.04 | | | | 6.32 | | | | 0.63 | | | | 3.01 | | | | 1.35 | | | | 2.21 | | | | 4.30 | | | | 0.74 | | | | 0.70 | | | | 2.99 | |
| | 1.37 | | | | 1.76 | | | | 4.36 | | | | 0.67 | | | | 0.57 | | | | 2.94 | | | | 1.31 | | | | 1.70 | | | | 4.24 | | | | 0.63 | | | | 0.55 | | | | 2.88 | |
| | | | | | | | | | | | | | | | | | | | | | | | | | | | | | | | | | | | | | | | | | | | | | |
| | — | | | | — | | | | — | | | | — | | | | — | | | | — | | | | — | | | | — | | | | — | | | | — | | | | — | | | | — | |
| | (2.32 | ) | | | (2.13 | ) | | | (0.56 | ) | | | (0.98 | ) | | | (0.42 | ) | | | — | | | | (2.32 | ) | | | (2.13 | ) | | | (0.56 | ) | | | (0.98 | ) | | | (0.42 | ) | | | — | |
| | (2.32 | ) | | | (2.13 | ) | | | (0.56 | ) | | | (0.98 | ) | | | (0.42 | ) | | | — | | | | (2.32 | ) | | | (2.13 | ) | | | (0.56 | ) | | | (0.98 | ) | | | (0.42 | ) | | | — | |
| | 13.94 | | | | 14.89 | | | | 15.26 | | | | 11.46 | | | | 11.77 | | | | 11.62 | | | | 13.46 | | | | 14.47 | | | | 14.90 | | | | 11.22 | | | | 11.57 | | | | 11.44 | |
| $ | 753 | | | $ | 650 | | | $ | 636 | | | $ | 1,122 | | | $ | 36,936 | | | $ | 35,048 | | | $ | 15,730 | | | $ | 14,266 | | | $ | 24,249 | | | $ | 19,530 | | | $ | 22,008 | | | $ | 25,841 | |
| | | | | | | | | | | | | | | | | | | | | | | | | | | | | | | | | | | | | | | | | | | | | | |
| | 10.23 | %c | | | 12.65 | % | | | 39.72 | % | | | 6.61 | % | | | 4.76 | % | | | 33.87 | % | | | 10.10 | %c | | | 12.53 | % | | | 39.50 | % | | | 6.37 | % | | | 4.66 | % | | | 33.64 | % |
| | 1.08 | d | | | 1.08 | | | | 1.08 | | | | 1.10 | | | | 1.10 | | | | 1.12 | | | | 1.20 | d | | | 1.20 | | | | 1.20 | | | | 1.22 | | | | 1.22 | | | | 1.24 | |
| | 1.08 | d | | | 1.08 | | | | 1.08 | | | | 1.09 | | | | 1.09 | | | | 1.10 | | | | 1.20 | d | | | 1.20 | | | | 1.20 | | | | 1.21 | | | | 1.21 | | | | 1.22 | |
| | (0.45 | )d | | | (0.54 | ) | | | 0.19 | | | | (0.74 | ) | | | (0.54 | ) | | | (0.70 | ) | | | (0.56 | )d | | | (0.66 | ) | | | (0.16 | ) | | | (0.55 | ) | | | (0.59 | ) | | | (0.82 | ) |
| | 36 | c | | | 76 | | | | 73 | | | | 63 | | | | 77 | | | | 82 | | | | 36 | c | | | 76 | | | | 73 | | | | 63 | | | | 77 | | | | 82 | |
64
Harbor Domestic Equity Funds Financial Highlights—Continued
SELECTED DATA FOR A SHARE OUTSTANDING FOR THE PERIODS PRESENTED
| | | | | | | | | | | | | | | | | | | | | | | | |
HARBOR LARGE CAP VALUE FUND | |
| | | Institutional Class | |
| | | 6-Month
Period Ended
April 30, 2015 | | | Year Ended October 31, | |
| | | | 2014 | | | 2013 | | | 2012 | | | 2011 | | | 2010 | |
| | | (Unaudited) | | | | | | | | | | | | | | | | |
Net asset value beginning of period | | $ | 12.24 | | | $ | 10.85 | | | $ | 8.52 | | | $ | 7.44 | | | $ | 7.19 | | | $ | 6.63 | |
Income from Investment Operations | | | | | | | | | | | | | | | | | | | | | | | | |
Net investment income/(loss)a | | | 0.08 | e | | | 0.15 | | | | 0.14 | | | | 0.21 | | | | 0.12 | | | | 0.11 | |
Net realized and unrealized gains/(losses) on investments | | | 0.74 | | | | 1.37 | | | | 2.31 | | | | 1.06 | | | | 0.25 | | | | 0.55 | |
Total from investment operations | | | 0.82 | | | | 1.52 | | | | 2.45 | | | | 1.27 | | | | 0.37 | | | | 0.66 | |
Less Distributions | | | | | | | | | | | | | | | | | | | | | | | | |
Dividends from net investment income | | | (0.08 | ) | | | (0.13 | ) | | | (0.12 | ) | | | (0.19 | ) | | | (0.12 | ) | | | (0.10 | ) |
Distributions from net realized capital gains1 | | | (0.79 | ) | | | — | | | | — | | | | — | | | | — | | | | — | |
Total distributions | | | (0.87 | ) | | | (0.13 | ) | | | (0.12 | ) | | | (0.19 | ) | | | (0.12 | ) | | | (0.10 | ) |
Net asset value end of period | | | 12.19 | | | | 12.24 | | | | 10.85 | | | | 8.52 | | | | 7.44 | | | | 7.19 | |
Net assets end of period (000s) | | $ | 217,880 | | | $ | 202,596 | | | $ | 179,382 | | | $ | 140,323 | | | $ | 261,032 | | | $ | 304,723 | |
Ratios and Supplemental Data (%) | | | | | | | | | | | | | | | | | | | | | | | | |
Total returnb | | | 6.99 | %c | | | 14.13 | % | | | 29.06 | % | | | 17.41 | % | | | 5.14 | % | | | 10.02 | % |
Ratio of total expenses to average net assets2 | | | 0.70 | d | | | 0.70 | | | | 0.71 | | | | 0.72 | | | | 0.71 | | | | 0.74 | |
Ratio of net expenses to average net assetsa | | | 0.68 | d | | | 0.68 | | | | 0.68 | | | | 0.68 | | | | 0.68 | | | | 0.68 | |
Ratio of net investment income to average net assetsa | | | 1.29 | d | | | 1.26 | | | | 1.43 | | | | 1.88 | | | | 1.63 | | | | 1.63 | |
Portfolio turnover | | | 8 | c | | | 32 | | | | 26 | | | | 125 | | | | 43 | | | | 49 | |
| | | | | | | | | | | | | | | | | | | | | | | | |
HARBOR MID CAP VALUE FUND | |
| | | Institutional Class | |
| | | 6-Month
Period Ended
April 30, 2015 | | | Year Ended October 31, | |
| | | | 2014 | | | 2013 | | | 2012 | | | 2011 | | | 2010 | |
| | | (Unaudited) | | | | | | | | | | | | | | | | |
Net asset value beginning of period | | $ | 20.32 | | | $ | 17.50 | | | $ | 12.64 | | | $ | 11.19 | | | $ | 11.00 | | | $ | 9.07 | |
Income from Investment Operations | | | | | | | | | | | | | | | | | | | | | | | | |
Net investment income/(loss)a | | | 0.17 | e | | | 0.18 | | | | 0.28 | | | | 0.22 | | | | 0.14 | | | | 0.14 | |
Net realized and unrealized gains/(losses) on investments | | | 0.81 | | | | 2.84 | | | | 4.86 | | | | 1.38 | | | | 0.17 | | | | 1.93 | |
Total from investment operations | | | 0.98 | | | | 3.02 | | | | 5.14 | | | | 1.60 | | | | 0.31 | | | | 2.07 | |
Less Distributions | | | | | | | | | | | | | | | | | | | | | | | | |
Dividends from net investment income | | | (0.19 | ) | | | (0.20 | ) | | | (0.28 | ) | | | (0.15 | ) | | | (0.12 | ) | | | (0.14 | ) |
Distributions from net realized capital gains1 | | | (0.13 | ) | | | — | | | | — | | | | — | | | | — | | | | — | |
Total distributions | | | (0.32 | ) | | | (0.20 | ) | | | (0.28 | ) | | | (0.15 | ) | | | (0.12 | ) | | | (0.14 | ) |
Net asset value end of period | | | 20.98 | | | | 20.32 | | | | 17.50 | | | | 12.64 | | | | 11.19 | | | | 11.00 | |
Net assets end of period (000s) | | $ | 356,382 | | | $ | 195,247 | | | $ | 82,231 | | | $ | 63,551 | | | $ | 56,428 | | | $ | 48,659 | |
Ratios and Supplemental Data (%) | | | | | | | | | | | | | | | | | | | | | | | | |
Total returnb | | | 4.87 | %c | | | 17.39 | % | | | 41.48 | % | | | 14.50 | % | | | 2.81 | % | | | 23.08 | % |
Ratio of total expenses to average net assets2 | | | 0.86 | d | | | 0.89 | | | | 0.93 | | | | 0.99 | | | | 1.08 | | | | 1.05 | |
Ratio of net expenses to average net assetsa | | | 0.85 | d | | | 0.89 | | | | 0.93 | | | | 0.95 | | | | 0.95 | | | | 0.95 | |
Ratio of net investment income to average net assetsa | | | 1.63 | d | | | 1.40 | | | | 1.87 | | | | 1.79 | | | | 1.21 | | | | 1.33 | |
Portfolio turnover | | | 2 | c | | | 13 | | | | 18 | | | | 37 | | | | 32 | | | | 28 | |
See page 67 for notes to Financial Highlights.
The accompanying notes are an integral part of the Financial Statements.
65
| | | | | | | | | | | | | | | | | | | | | | | | | | | | | | | | | | | | | | | | | | | | | | |
| | | | | | |
| Administrative Class | | | Investor Class | |
6-Month
Period Ended
April 30, 2015 | | | Year Ended October 31, | | | 6-Month
Period Ended
April 30, 2015 | | | Year Ended October 31, | |
| | 2014 | | | 2013 | | | 2012 | | | 2011 | | | 2010 | | | | 2014 | | | 2013 | | | 2012 | | | 2011 | | | 2010 | |
| (Unaudited) | | | | | | | | | | | | | | | | | | (Unaudited) | | | | | | | | | | | | | | | | |
| $ | 12.23 | | | $ | 10.85 | | | $ | 8.51 | | | $ | 7.43 | | | $ | 7.19 | | | $ | 6.61 | | | $ | 12.33 | | | $ | 10.94 | | | $ | 8.59 | | | $ | 7.49 | | | $ | 7.24 | | | $ | 6.67 | |
| | | | | | | | | | | | | | | | | | | | | | | | | | | | | | | | | | | | | | | | | | | | | | |
| | 0.06 | e | | | 0.15 | | | | 0.16 | f | | | — | *,f | | | 0.11 | | | | 0.10 | | | | 0.05 | e | | | 0.13 | | | | 0.09 | | | | 0.13 | | | | 0.05 | | | | 0.09 | |
| | 0.74 | | | | 1.34 | | | | 2.27 | | | | 1.25 | | | | 0.23 | | | | 0.55 | | | | 0.75 | | | | 1.35 | | | | 2.34 | | | | 1.13 | | | | 0.29 | | | | 0.55 | |
| | 0.80 | | | | 1.49 | | | | 2.43 | | | | 1.25 | | | | 0.34 | | | | 0.65 | | | | 0.80 | | | | 1.48 | | | | 2.43 | | | | 1.26 | | | | 0.34 | | | | 0.64 | |
| | | | | | | | | | | | | | | | | | | | | | | | | | | | | | | | | | | | | | | | | | | | | | |
| | (0.06 | ) | | | (0.11 | ) | | | (0.09 | ) | | | (0.17 | ) | | | (0.10 | ) | | | (0.07 | ) | | | (0.06 | ) | | | (0.09 | ) | | | (0.08 | ) | | | (0.16 | ) | | | (0.09 | ) | | | (0.07 | ) |
| | (0.79 | ) | | | — | | | | — | | | | — | | | | — | | | | — | | | | (0.79 | ) | | | — | | | | — | | | | — | | | | — | | | | — | |
| | (0.85 | ) | | | (0.11 | ) | | | (0.09 | ) | | | (0.17 | ) | | | (0.10 | ) | | | (0.07 | ) | | | (0.85 | ) | | | (0.09 | ) | | | (0.08 | ) | | | (0.16 | ) | | | (0.09 | ) | | | (0.07 | ) |
| | 12.18 | | | | 12.23 | | | | 10.85 | | | | 8.51 | | | | 7.43 | | | | 7.19 | | | | 12.28 | | | | 12.33 | | | | 10.94 | | | | 8.59 | | | | 7.49 | | | | 7.24 | |
| $ | 23,598 | | | $ | 20,927 | | | $ | 13,453 | | | $ | 7,823 | | | $ | 23,251 | | | $ | 18,369 | | | $ | 20,024 | | | $ | 20,189 | | | $ | 11,934 | | | $ | 11,058 | | | $ | 8,603 | | | $ | 26,370 | |
| | | | | | | | | | | | | | | | | | | | | | | | | | | | | | | | | | | | | | | | | | | | | | |
| | 6.85 | %c | | | 13.78 | % | | | 28.76 | % | | | 17.15 | % | | | 4.74 | % | | | 9.93 | % | | | 6.75 | %c | | | 13.62 | % | | | 28.52 | % | | | 17.04 | % | | | 4.67 | % | | | 9.65 | % |
| | 0.95 | d | | | 0.95 | | | | 0.96 | | | | 0.97 | | | | 0.96 | | | | 0.99 | | | | 1.07 | d | | | 1.07 | | | | 1.08 | | | | 1.09 | | | | 1.09 | | | | 1.11 | |
| | 0.93 | d | | | 0.93 | | | | 0.93 | | | | 0.93 | | | | 0.93 | | | | 0.93 | | | | 1.05 | d | | | 1.05 | | | | 1.05 | | | | 1.05 | | | | 1.05 | | | | 1.07 | |
| | 1.04 | d | | | 1.02 | | | | 1.16 | | | | 1.59 | | | | 1.37 | | | | 1.41 | | | | 0.92 | d | | | 0.88 | | | | 1.04 | | | | 1.41 | | | | 1.27 | | | | 1.28 | |
| | 8 | c | | | 32 | | | | 26 | | | | 125 | | | | 43 | | | | 49 | | | | 8 | c | | | 32 | | | | 26 | | | | 125 | | | | 43 | | | | 49 | |
| | | | | | | | | | | | | | | | | | | | | | | | | | | | | | | | | | | | | | | | | | | | | | |
| | | | | | |
| Administrative Class | | | Investor Class | |
6-Month
Period Ended
April 30, 2015 | | | Year Ended October 31, | | | 6-Month
Period Ended
April 30, 2015 | | | Year Ended October 31, | |
| | 2014 | | | 2013 | | | 2012 | | | 2011 | | | 2010 | | | | 2014 | | | 2013 | | | 2012 | | | 2011 | | | 2010 | |
| (Unaudited) | | | | | | | | | | | | | | | | | | (Unaudited) | | | | | | | | | | | | | | | | |
| $ | 20.47 | | | $ | 17.64 | | | $ | 12.74 | | | $ | 11.28 | | | $ | 11.10 | | | $ | 9.04 | | | $ | 20.27 | | | $ | 17.49 | | | $ | 12.63 | | | $ | 11.17 | | | $ | 10.99 | | | $ | 9.07 | |
| | | | | | | | | | | | | | | | | | | | | | | | | | | | | | | | | | | | | | | | | | | | | | |
| | 0.14 | e | | | 0.25 | | | | 0.23 | | | | 0.18 | | | | 0.12 | | | | 0.35 | | | | 0.13 | e | | | 0.17 | | | | 0.13 | | | | 0.20 | | | | 0.11 | | | | 0.07 | |
| | 0.82 | | | | 2.75 | | | | 4.92 | | | | 1.40 | | | | 0.17 | | | | 1.71 | | | | 0.81 | | | | 2.78 | | | | 4.96 | | | | 1.35 | | | | 0.16 | | | | 1.96 | |
| | 0.96 | | | | 3.00 | | | | 5.15 | | | | 1.58 | | | | 0.29 | | | | 2.06 | | | | 0.94 | | | | 2.95 | | | | 5.09 | | | | 1.55 | | | | 0.27 | | | | 2.03 | |
| | | | | | | | | | | | | | | | | | | | | | | | | | | | | | | | | | | | | | | | | | | | | | |
| | (0.16 | ) | | | (0.17 | ) | | | (0.25 | ) | | | (0.12 | ) | | | (0.11 | ) | | | — | | | | (0.14 | ) | | | (0.17 | ) | | | (0.23 | ) | | | (0.09 | ) | | | (0.09 | ) | | | (0.11 | ) |
| | (0.13 | ) | | | — | | | | — | | | | — | | | | — | | | | — | | | | (0.13 | ) | | | — | | | | — | | | | — | | | | — | | | | — | |
| | (0.29 | ) | | | (0.17 | ) | | | (0.25 | ) | | | (0.12 | ) | | | (0.11 | ) | | | — | | | | (0.27 | ) | | | (0.17 | ) | | | (0.23 | ) | | | (0.09 | ) | | | (0.09 | ) | | | (0.11 | ) |
| | 21.14 | | | | 20.47 | | | | 17.64 | | | | 12.74 | | | | 11.28 | | | | 11.10 | | | | 20.94 | | | | 20.27 | | | | 17.49 | | | | 12.63 | | | | 11.17 | | | | 10.99 | |
| $ | 25,275 | | | $ | 14,775 | | | $ | 3,479 | | | $ | 1,274 | | | $ | 1,114 | | | $ | 940 | | | $ | 147,731 | | | $ | 91,724 | | | $ | 19,260 | | | $ | 3,087 | | | $ | 3,794 | | | $ | 4,493 | |
| | | | | | | | | | | | | | | | | | | | | | | | | | | | | | | | | | | | | | | | | | | | | | |
| | 4.71 | %c | | | 17.15 | % | | | 41.17 | % | | | 14.17 | % | | | 2.61 | % | | | 22.79 | % | | | 4.68 | %c | | | 16.97 | % | | | 40.99 | % | | | 14.06 | % | | | 2.45 | % | | | 22.60 | % |
| | 1.11 | d | | | 1.14 | | | | 1.19 | | | | 1.24 | | | | 1.33 | | | | 1.30 | | | | 1.23 | d | | | 1.26 | | | | 1.31 | | | | 1.36 | | | | 1.45 | | | | 1.42 | |
| | 1.11 | d | | | 1.14 | | | | 1.18 | | | | 1.20 | | | | 1.20 | | | | 1.20 | | | | 1.23 | d | | | 1.26 | | | | 1.30 | | | | 1.32 | | | | 1.32 | | | | 1.32 | |
| | 1.38 | d | | | 1.13 | | | | 1.58 | | | | 1.53 | | | | 0.95 | | | | 0.83 | | | | 1.27 | d | | | 1.01 | | | | 1.21 | | | | 1.43 | | | | 0.83 | | | | 0.93 | |
| | 2 | c | | | 13 | | | | 18 | | | | 37 | | | | 32 | | | | 28 | | | | 2 | c | | | 13 | | | | 18 | | | | 37 | | | | 32 | | | | 28 | |
66
Harbor Domestic Equity Funds Financial Highlights—Continued
SELECTED DATA FOR A SHARE OUTSTANDING FOR THE PERIODS PRESENTED
| | | | | | | | | | | | | | | | | | | | | | | | |
HARBOR SMALL CAP VALUE FUND | |
| | | Institutional Class | |
| | | 6-Month
Period Ended
April 30, 2015 | | | Year Ended October 31, | |
| | | | 2014 | | | 2013 | | | 2012 | | | 2011 | | | 2010 | |
| | | (Unaudited) | | | | | | | | | | | | | | | | |
Net asset value beginning of period | | $ | 27.17 | | | $ | 28.89 | | | $ | 21.41 | | | $ | 19.59 | | | $ | 17.85 | | | $ | 14.88 | |
Income from Investment Operations | | | | | | | | | | | | | | | | | | | | | | | | |
Net investment income/(loss)a | | | 0.05 | e | | | 0.06 | | | | 0.13 | | | | 0.23 | | | | 0.08 | | | | 0.07 | |
Net realized and unrealized gains/(losses) on investments | | | 0.99 | | | | 2.68 | | | | 7.84 | | | | 1.64 | | | | 1.74 | | | | 2.97 | |
Total from investment operations | | | 1.04 | | | | 2.74 | | | | 7.97 | | | | 1.87 | | | | 1.82 | | | | 3.04 | |
Less Distributions | | | | | | | | | | | | | | | | | | | | | | | | |
Dividends from net investment income | | | (0.06 | ) | | | (0.05 | ) | | | (0.22 | ) | | | (0.05 | ) | | | (0.08 | ) | | | (0.07 | ) |
Distributions from net realized capital gains1 | | | (0.91 | ) | | | (4.41 | ) | | | (0.27 | ) | | | — | | | | — | | | | — | |
Total distributions | | | (0.97 | ) | | | (4.46 | ) | | | (0.49 | ) | | | (0.05 | ) | | | (0.08 | ) | | | (0.07 | ) |
Net asset value end of period | | | 27.24 | | | | 27.17 | | | | 28.89 | | | | 21.41 | | | | 19.59 | | | | 17.85 | |
Net assets end of period (000s) | | $ | 838,488 | | | $ | 709,251 | | | $ | 519,607 | | | $ | 473,100 | | | $ | 543,488 | | | $ | 611,885 | |
Ratios and Supplemental Data (%) | | | | | | | | | | | | | | | | | | | | | | | | |
Total returnb | | | 3.94 | %c | | | 11.03 | % | | | 37.91 | % | | | 9.60 | % | | | 10.17 | % | | | 20.50 | % |
Ratio of total expenses to average net assets2 | | | 0.84 | d | | | 0.84 | | | | 0.84 | | | | 0.86 | | | | 0.86 | | | | 0.88 | |
Ratio of net expenses to average net assetsa | | | 0.84 | d | | | 0.84 | | | | 0.84 | | | | 0.85 | | | | 0.84 | | | | 0.85 | |
Ratio of net investment income to average net assetsa | | | 0.39 | d | | | 0.33 | | | | 0.45 | | | | 0.97 | | | | 0.31 | | | | 0.39 | |
Portfolio turnover | | | 6 | c | | | 13 | | | | 22 | | | | 14 | | | | 12 | | | | 12 | |
| 1 | Includes both short-term and long-term capital gains. |
| 2 | Percentage does not reflect reduction for credit balance arrangements (see Note 2 of the accompanying Notes to Financial Statements). |
| a | Reflects the Adviser’s waiver, if any, of its management fees and/or other operating expenses. |
| b | The total returns would have been lower had certain expenses not been waived during the periods shown. |
| e | Amounts are allocated based upon average shares outstanding during the period. |
| f | The amount shown for a share outstanding does not correspond with the aggregate net investment income/(loss) for the period due to the timing of the sales and purchases of shares in relation to fluctuating market values of the investments of the Fund. |
| g | For the period February 1, 2014 (inception) through October 31, 2014. |
The accompanying notes are an integral part of the Financial Statements.
67
| | | | | | | | | | | | | | | | | | | | | | | | | | | | | | | | | | | | | | | | | | | | | | |
| | | | | | |
| Administrative Class | | | Investor Class | |
6-Month
Period Ended April 30, 2015 | | | Year Ended October 31, | | | 6-Month
Period Ended April 30, 2015 | | | Year Ended October 31, | |
| | 2014 | | | 2013 | | | 2012 | | | 2011 | | | 2010 | | | | 2014 | | | 2013 | | | 2012 | | | 2011 | | | 2010 | |
| (Unaudited) | | | | | | | | | | | | | | | | | | (Unaudited) | | | | | | | | | | | | | | | | |
| $ | 27.05 | | | $ | 28.80 | | | $ | 21.34 | | | $ | 19.52 | | | $ | 17.79 | | | $ | 14.82 | | | $ | 26.63 | | | $ | 28.45 | | | $ | 21.08 | | | $ | 19.31 | | | $ | 17.60 | | | $ | 14.67 | |
| | | | | | | | | | | | | | | | | | | | | | | | | | | | | | | | | | | | | | | | | | | | | | |
| | 0.03 | e | | | (0.12 | ) | | | 0.01 | | | | 0.20 | | | | 0.02 | | | | (0.03 | ) | | | — | * | | | 0.09 | | | | (0.09 | ) | | | (0.19 | )f | | | (0.72 | )f | | | (0.06 | ) |
| | 0.97 | | | | 2.78 | | | | 7.87 | | | | 1.62 | | | | 1.73 | | | | 3.03 | | | | 0.97 | | | | 2.50 | | | | 7.86 | | | | 1.96 | | | | 2.43 | | | | 3.01 | |
| | 1.00 | | | | 2.66 | | | | 7.88 | | | | 1.82 | | | | 1.75 | | | | 3.00 | | | | 0.97 | | | | 2.59 | | | | 7.77 | | | | 1.77 | | | | 1.71 | | | | 2.95 | |
| | | | | | | | | | | | | | | | | | | | | | | | | | | | | | | | | | | | | | | | | | | | | | |
| | — | | | | — | | | | (0.15 | ) | | | — | * | | | (0.02 | ) | | | (0.03 | ) | | | — | | | | — | | | | (0.13 | ) | | | — | | | | — | * | | | (0.02 | ) |
| | (0.91 | ) | | | (4.41 | ) | | | (0.27 | ) | | | — | | | | — | | | | — | | | | (0.91 | ) | | | (4.41 | ) | | | (0.27 | ) | | | — | | | | — | | | | — | |
| | (0.91 | ) | | | (4.41 | ) | | | (0.42 | ) | | | — | * | | | (0.02 | ) | | | (0.03 | ) | | | (0.91 | ) | | | (4.41 | ) | | | (0.40 | ) | | | — | | | | — | * | | | (0.02 | ) |
| | 27.14 | | | | 27.05 | | | | 28.80 | | | | 21.34 | | | | 19.52 | | | | 17.79 | | | | 26.69 | | | | 26.63 | | | | 28.45 | | | | 21.08 | | | | 19.31 | | | | 17.60 | |
| $ | 1,391 | | | $ | 5,690 | | | $ | 12,171 | | | $ | 8,786 | | | $ | 24,180 | | | $ | 20,185 | | | $ | 17,811 | | | $ | 17,265 | | | $ | 17,330 | | | $ | 13,820 | | | $ | 16,461 | | | $ | 41,740 | |
| | | | | | | | | | | | | | | | | | | | | | | | | | | | | | | | | | | | | | | | | | | | | | |
| | 3.81 | %c | | | 10.74 | % | | | 37.54 | % | | | 9.35 | % | | | 9.84 | % | | | 20.29 | % | | | 3.75 | %c | | | 10.61 | % | | | 37.41 | % | | | 9.17 | % | | | 9.74 | % | | | 20.10 | % |
| | 1.09 | d | | | 1.09 | | | | 1.09 | | | | 1.10 | | | | 1.11 | | | | 1.13 | | | | 1.21 | d | | | 1.21 | | | | 1.21 | | | | 1.23 | | | | 1.23 | | | | 1.25 | |
| | 1.09 | d | | | 1.09 | | | | 1.09 | | | | 1.10 | | | | 1.09 | | | | 1.10 | | | | 1.21 | d | | | 1.21 | | | | 1.21 | | | | 1.22 | | | | 1.21 | | | | 1.22 | |
| | 0.25 | d | | | 0.10 | | | | 0.20 | | | | 1.10 | | | | 0.06 | | | | 0.12 | | | | 0.03 | d | | | (0.04 | ) | | | 0.07 | | | | 0.63 | | | | (0.06 | ) | | | 0.02 | |
| | 6 | c | | | 13 | | | | 22 | | | | 14 | | | | 12 | | | | 12 | | | | 6 | c | | | 13 | | | | 22 | | | | 14 | | | | 12 | | | | 12 | |
68
Harbor Domestic Equity Funds
NOTES TO FINANCIAL STATEMENTS—April 30, 2015 (Unaudited)
(Currency in thousands)
NOTE 1—ORGANIZATIONAL MATTERS
Harbor Funds (the “Trust”) is registered under the Investment Company Act of 1940, as amended (the “Investment Company Act”), as an open-end management investment company. The Trust consists of 28 separate portfolios. The portfolios covered by this report include: Harbor Capital Appreciation Fund, Harbor Mid Cap Growth Fund, Harbor Small Cap Growth Fund, Harbor Small Cap Growth Opportunities Fund, Harbor Large Cap Value Fund, Harbor Mid Cap Value Fund and Harbor Small Cap Value Fund (individually or collectively referred to as a “Fund” or the “Funds,” respectively). Harbor Capital Advisors, Inc. (the “Adviser” or “Harbor Capital”) is the investment adviser for the Funds.
The Funds may offer up to three classes of shares, designated as Institutional Class, Administrative Class and Investor Class. The shares of each class represent an interest in the same portfolio of investments of the respective Fund and have equal rights to voting, redemptions, dividends, and liquidations, except that: (i) certain expenses, subject to the approval of the Trust’s Board of Trustees (the “Board of Trustees”), may be applied differently to each class of shares in accordance with current regulations of the Securities and Exchange Commission and the Internal Revenue Service; and (ii) shareholders of a class that bears distribution and service expenses under terms of a distribution plan have exclusive voting rights as to that distribution plan.
NOTE 2—SIGNIFICANT ACCOUNTING POLICIES
The following is a summary of significant accounting policies followed by the Trust in the preparation of its financial statements. Each Fund follows the investment company reporting requirements under U.S. Generally Accepted Accounting Principles (“U.S. GAAP”). The preparation of financial statements in accordance with U.S. GAAP requires management to make estimates and assumptions that affect the reported amounts and disclosures in the financial statements. Actual results may differ from those estimates.
For a detailed discussion of financial assets and liabilities subject to an enforceable master netting arrangement or similar agreement please refer to the descriptions of Repurchase Agreements in Note 2—Significant Accounting Policies and Securities Lending in Note 3—Investment Portfolio Transactions.
Security Valuation
Equity securities (including common stock, preferred stock, and convertible preferred stock) and financial derivative instruments (such as options contracts) that are traded on a national security exchange (except securities listed on the National Association of Securities Dealers Automated Quotation (“NASDAQ”) system and United Kingdom securities), are valued at the last sale price on a national exchange or system on which they are principally traded as of the valuation date. Securities listed on the NASDAQ system or a United Kingdom exchange are valued at the official closing price of those securities. In the case of securities for which there are no sales on the valuation day, (i) securities traded principally on a U.S. exchange, including NASDAQ, are valued at the mean between the closing bid and ask price; and (ii) securities traded principally on a foreign exchange, including United Kingdom securities, are valued at the official bid price determined as of the close of the primary exchange. Securities of open-end registered investment companies that are held by a Fund are valued at net asset value. To the extent these securities are actively traded and fair valuation adjustments are not applied, they are normally categorized as Level 1 in the fair value hierarchy. Equity securities traded on inactive markets or valued by reference to similar instruments are normally categorized as Level 2 in the fair value hierarchy. For more information on the fair value hierarchy, please refer to the Fair Value Measurements and Disclosures section in Note 2.
Short-term securities with a remaining maturity of less than 60 days at the time they are acquired are generally stated at amortized cost, which approximates fair value. Securities that are valued at amortized cost are normally categorized as Level 2 in the fair value hierarchy.
When reliable market quotations or evaluated prices supplied by a pricing vendor are not readily available or are not believed to accurately reflect fair value, securities are priced at their fair value as determined by the Trust’s Valuation Committee (the “Valuation Committee”) pursuant to procedures adopted, and subject to oversight, by the Board of Trustees.
69
Harbor Domestic Equity Funds
NOTES TO FINANCIAL STATEMENTS—Continued
(Currency in thousands)
NOTE 2—SIGNIFICANT ACCOUNTING POLICIES—Continued
The Valuation Committee is comprised of a trustee and officers of the Trust and employees of Harbor Capital with relevant experience or responsibilities. Each security for which the Valuation Committee determines a fair value, including the basis for the fair value decision, is reviewed by the Board of Trustees at its regularly scheduled board meetings.
When a fair valuation method is applied by the Valuation Committee or a Fund’s subadviser, securities will be priced by a method that the Valuation Committee or subadviser believes accurately reflects fair value. Securities valued using fair valuation methods that incorporate significant unobservable inputs are normally categorized as Level 3 in the fair value hierarchy. Examples of possible fair valuation methodologies used in determining the fair value of securities categorized as Level 3 in the fair value hierarchy include, but are not limited to, benchmark pricing and indicative market quotations.
When benchmark pricing is used, the base price of a debt security is set and then subsequently adjusted in proportion to the market value changes of an index or similar security (the “benchmark security”) that trades in an active market or for which other observable inputs are available. The base price may be a broker-dealer quote, transaction price, or an internal value as derived by analysis of market data. The base price of the security may be reset on a periodic basis based on the availability of market data and procedures approved by a Fund’s subadviser. If the benchmark security is categorized as Level 2 in the fair value hierarchy due to the lack of an active market for that security, any security adjusted in proportion to the market value of the benchmark security may be categorized as Level 3 in the fair value hierarchy. Significant changes in the unobservable inputs of the benchmark pricing process (i.e., the base price) would result in direct and proportional changes in the fair value of the security. The reasonability of the fair value is reviewed by the subadviser on a periodic basis and may be amended as the availability of market data indicates a material change.
If evaluated pricing through a third party pricing vendor is not available or deemed to be indicative of fair value, a Fund’s subadviser may elect to obtain indicative market quotations (“broker quotes”) directly from a broker-dealer or passed through from a third-party pricing vendor. Indicative market quotations are typically received from established market participants. In the event that the source of fair value is from a single-sourced broker quote, but the subadviser does not have the transparency to view the underlying inputs that support the market quotation these securities are categorized as Level 3 in the fair value hierarchy. Significant changes in the broker quote would have direct and proportional changes in the fair value of the security.
A Fund may also use fair value pricing if the value of some or all of the Fund’s securities have been materially affected by events occurring before the Fund’s pricing time but after the close of the primary markets or exchanges on which the security is traded. This most commonly occurs with foreign securities, but may occur with other securities as well. In such cases, the Fund may apply a fair value factor supplied by the pricing service to a foreign security’s market close value to reflect changes in value that may have occurred between the close of the primary market or exchange on which the security is traded and the Fund’s pricing time. That factor may be derived using observable inputs such as a comparison of the trading patterns of a foreign security to intraday trading in the U.S. markets that are highly correlated to the foreign security or other information that becomes available after the close of the foreign market on which the security principally traded. Fair value pricing is inherently subjective and reflects good faith judgments based on available information. When fair value pricing is employed, the prices of securities used by a Fund to calculate its net asset value may differ from market quotations, official closing prices or evaluated prices for the same securities, which means that the Fund may value those securities higher or lower than another given fund that uses market quotations, official closing prices or evaluated prices supplied by a pricing vendor in its calculation of net asset value. Securities valued using observable inputs, such as those described above, are normally categorized as Level 2 in the fair value hierarchy.
Fair Value Measurements and Disclosures
Various inputs may be used to determine the value of each Fund’s investments, which are summarized in three broad categories defined as Level 1, Level 2 and Level 3. The inputs or methodologies used for valuing securities are not necessarily an indication of the risk associated with investing in those securities. The assignment of an investment to Level 1, 2 or 3 is based on the lowest level of significant inputs used to determine its fair value.
70
Harbor Domestic Equity Funds
NOTES TO FINANCIAL STATEMENTS—Continued
(Currency in thousands)
NOTE 2—SIGNIFICANT ACCOUNTING POLICIES—Continued
| | |
| Level 1— | | Quoted prices in active markets for identical securities. |
| Level 2— | | Other significant observable inputs (including quoted prices for similar securities, interest rates, prepayment speeds, credit risk, etc.). |
| Level 3— | | Significant unobservable inputs are used in situations where quoted prices or other observable inputs are not available or are deemed unreliable. Significant unobservable inputs may include the Funds’ own assumptions. |
Transfers between Levels, if any, are recognized as of the last day in the fiscal quarter of the period in which the event or change in circumstances that caused the reclassification occurred. For fair valuations using significant unobservable inputs, a reconciliation of the beginning to ending balances for reported fair values is provided that presents changes attributable to realized and unrealized gains and losses and purchases, sales, and transfers in/out of the Level 3 category during the period. A table that includes a categorization of investments into Level 1, Level 2 or Level 3, transfers between Levels, if any, and a Level 3 reconciliation, including details of significant unobservable inputs used, when applicable, can be found at the end of each Fund’s Portfolio of Investments schedule.
The Funds used observable inputs in their valuation methodologies whenever they were available and deemed reliable.
U.S. Government Securities
U.S. government securities include securities issued by U.S. government agencies or government-sponsored enterprises that may not be guaranteed by the U.S. Treasury. The Government National Mortgage Association (“GNMA” or “Ginnie Mae”), a wholly owned U.S. government corporation, is authorized to guarantee, with the full faith and credit of the U.S. government, the timely payment of principal and interest on securities issued by institutions approved by GNMA and backed by pools of mortgages insured by the Federal Housing Administration or guaranteed by the Department of Veterans Affairs. Government-related guarantors (i.e., not backed by the full faith and credit of the U.S. government) include the Federal National Mortgage Association (“FNMA” or “Fannie Mae”) and the Federal Home Loan Mortgage Corporation (“FHLMC” or “Freddie Mac”). On September 7, 2008, the Federal Housing Finance Agency placed Fannie Mae and Freddie Mac in conservatorship, while the U.S. Treasury agreed to purchase preferred stock as needed to ensure that both Fannie Mae and Freddie Mac maintain a positive net worth (guaranteeing up to $100 billion for each entity). As a consequence, certain fixed income securities of Fannie Mae and Freddie Mac have more explicit U.S. government support.
Repurchase Agreements
In a repurchase agreement, a Fund buys a security at one price and simultaneously agrees to sell it back at a higher price. Such agreements must be adequately collateralized to cover the counterparty’s obligation to the Fund to close out the repurchase agreement. During the period, each Fund entered into repurchase agreements with domestic or foreign banks or with a member firm of the Financial Industry Regulatory Authority, Inc., or an affiliate of a member firm that is a primary dealer in U.S. government securities. Each repurchase agreement counterparty must meet the minimum credit quality requirements applicable to the respective Fund and any other appropriate counterparty criteria as determined by the Fund’s subadviser. The minimum credit quality requirements are those applicable to a Fund’s purchase of securities such that if a Fund is permitted to only purchase securities that are rated investment-grade (or the equivalent if unrated), that Fund could only enter into repurchase agreements with counterparties that have debt outstanding that is rated investment-grade (or the equivalent if unrated). The securities are regularly monitored to ensure that the collateral is adequate. A Fund seeks to further mitigate its counterparty risk by entering into master repurchase agreements with its counterparties. The master repurchase agreements provide that, in the event of a counterparty’s default, including bankruptcy, the Fund may terminate any repurchase agreements with that counterparty, determine the net amount owned, and sell or retain the collateral up to the net amount owed to the Fund. A counterparty’s default may cause the Fund to suffer losses, including loss of interest on or principal of the securities and costs associated with delay and enforcement of the terms of the master repurchase agreement.
71
Harbor Domestic Equity Funds
NOTES TO FINANCIAL STATEMENTS—Continued
(Currency in thousands)
NOTE 2—SIGNIFICANT ACCOUNTING POLICIES—Continued
Options
An option, including rights and warrants, is a contract that offers the buyer the right, but not the obligation, to buy (call) or sell (put) a security or other financial asset at an agreed-upon price (the strike price) during a certain period of time or on a specific date (exercise date). During the period, Harbor Mid Cap Growth Fund purchased option contracts to manage its exposure to equity prices. Call options tend to increase a Fund’s exposure to the underlying instrument, if purchased, and decrease exposure to the underlying instrument, if written. Put options tend to decrease a Fund’s exposure to the underlying instrument, if purchased, and increase exposure to the underlying instrument, if written.
When a Fund purchases an option, it pays a premium. If a purchased option expires, a Fund realizes a loss in the amount of the premium. If a Fund enters into a closing sale transaction, it realizes a gain or loss, depending on whether the proceeds from the sale are greater or less than the cost of the option. If a call option is exercised by a Fund, the cost of the securities acquired by exercising the call is increased by the premium paid to buy the call. If a put option is exercised by a Fund, it realizes a gain or loss from the sale of the underlying security and the proceeds from such sale are decreased by the premium originally paid. The risk associated with purchasing options is limited to the premium paid. A Fund’s maximum risk of loss from counterparty credit risk is also limited to the premium paid for the contract.
Foreign Currency Spot Contracts
A foreign currency spot contract is an agreement between two parties to buy and sell currencies at the current market rate for settlement within two business days. During the period, Harbor Capital Appreciation Fund, Harbor Mid Cap Growth Fund, and Harbor Large Cap Value Fund used foreign currency spot contracts to facilitate transactions in foreign securities or to convert foreign currency receipts into U.S. dollars.
The foreign currency spot contract is marked-to-market daily for settlements beyond one day, and any change in market value is recorded as an unrealized gain or loss. When the contract is closed, the Fund records a realized gain or loss equal to the difference between the value on the open and close date. Risk of losses may arise from changes in the value of the foreign currency or if the counterparties do not perform under the contract’s terms. The maximum potential loss from such contracts is the aggregate face value in U.S. dollars at the time the contract was opened.
Foreign Currency Translations
Purchases and sales of securities are translated into U.S. dollars at the current exchange rate on the respective dates of the transactions. Income and withholding taxes are translated at the prevailing exchange rate when accrued or incurred. The accounting records of the Funds are maintained in U.S. dollars. Investment securities and other assets and liabilities denominated in a foreign currency are translated into U.S. dollars based on the current exchange rates at April 30, 2015.
Reported net realized gains and losses on foreign currency transactions represent net gains and losses from sales and maturities of foreign currency contracts, disposition of foreign currencies, currency gains and losses realized between the trade and settlement dates on securities transactions, and the difference between the amount of investment income accrued and tax reclaims receivable and the U.S. dollar amount actually received. The effects of changes in foreign currency exchange rates on investments in securities are included in the net realized and unrealized gain or loss on investments in the Statement of Operations.
Investment Income
Dividends declared on portfolio securities are accrued on the ex-dividend date. For foreign securities held, certain dividends are recorded after the ex-dividend date, but as soon as the respective Fund is notified of such dividends. Interest income is accrued daily as earned. Discounts and premiums on fixed income securities purchased are amortized over the life of the respective securities using the effective yield method.
72
Harbor Domestic Equity Funds
NOTES TO FINANCIAL STATEMENTS—Continued
(Currency in thousands)
NOTE 2—SIGNIFICANT ACCOUNTING POLICIES—Continued
Securities Transactions
Securities transactions are accounted for on the trade date (the date the order to buy or sell is executed). Realized gains or losses on security transactions are determined on the basis of identified cost for both federal income tax and financial reporting purposes.
Proceeds from Litigation
The Funds may receive proceeds from shareholder litigation settlements involving current and/or previously held portfolio holdings. Any proceeds received from litigation involving portfolio holdings are reflected in the Statement of Operations in realized gain/(loss) if the security has been disposed of by a Fund or in unrealized gain/(loss) if the security is still held by a Fund.
Distribution to Shareholders
Distributions on Fund shares are recorded on the ex-dividend date.
Expenses
Expenses incurred by the Trust are charged directly to the Fund that incurred such expense whenever possible. With respect to expenses incurred by any two or more Harbor Funds where amounts cannot be identified on a fund by fund basis, such expenses are generally allocated in proportion to the average net assets or the number of shareholders of each Fund.
Custodian
The Funds have credit balance arrangements with the Funds’ custodian whereby uninvested cash is invested in a short-term investment vehicle and amounts earned constitute an expense credit that is applied against gross custody expenses. Such custodial expense reductions are reflected on the accompanying Statement of Operations.
Class Allocations
Income, common expenses and realized and unrealized gains/(losses) are determined at the Fund level and allocated daily to each class of shares based on the applicable net assets of the respective classes. Distribution and service fees, if any, and transfer agent fees are calculated daily at the class level based on the applicable net assets of each class and the specific expense rate(s) applicable to each class.
Taxes
Each Fund is treated as a separate entity for federal tax purposes. Each Fund’s policy is to meet the requirements of Subchapter M of the Internal Revenue Code applicable to regulated investment companies and to distribute to its shareholders all of its taxable income within the prescribed time. It is also the intention of each Fund to distribute an amount sufficient to avoid imposition of any excise tax under Section 4982 of the Internal Revenue Code. Therefore, no provision has been made for federal taxes on income, capital gains or unrealized appreciation of securities held or excise taxes on income and capital gains.
The Funds may be subject to taxes imposed by countries in which they invest. Such taxes are generally based on income and/or capital gains earned or repatriated. Taxes are accrued and applied to net investment income, net realized gains and unrealized appreciation as such income and/or gains are earned.
Management has analyzed each Fund’s tax positions for all open tax years (in particular, U.S. federal income tax returns for the tax years ended October 31, 2011–2013), including all positions expected to be taken upon filing the 2014 tax return, in all material jurisdictions where the Funds operate, and has concluded that no provision for income tax is required in any Fund’s financial statements. The Funds will recognize interest and penalties, if any, related to unrecognized tax benefits as income tax expense in the Statement of Operations.
73
Harbor Domestic Equity Funds
NOTES TO FINANCIAL STATEMENTS—Continued
(Currency in thousands)
NOTE 2—SIGNIFICANT ACCOUNTING POLICIES—Continued
New Accounting Pronouncement
In June 2014, the Financial Accounting Standards Board (“FASB”) issued Accounting Standards Update (“ASU”) 2014-11, Transfers and Servicing (“ASU 2014-11”) which expands secured borrowing accounting for certain repurchase agreements. ASU 2014-11 will also require additional disclosures for certain transactions accounted for as sales, in order to provide financial statement users with information to compare to similar transactions accounted for as secured borrowings. ASU 2014-11 will become effective for interim or annual periods beginning after December 15, 2014. Management is evaluating the implications of this pronouncement and the impact it will have on the financial statement disclosures.
In May 2015, FASB issued ASU 2015-07, Disclosures for Investments in Certain Entities That Calculate Net Asset Value per Share (or Its Equivalent) (“ASU 2015-07”) which removes the requirement to make certain fair value disclosures for investments that are eligible to be measured at fair value using the net asset value per share. ASU 2015-07 becomes effective for interim or annual periods beginning after December 15, 2015. Management is evaluating the implications of this pronouncement and the impact it will have on the financial statement disclosures.
NOTE 3—INVESTMENT PORTFOLIO TRANSACTIONS
Purchases and sales of investments, other than short-term securities, for each Fund for the six-month period ended April 30, 2015 are as follows:
| | | | | | | | | | |
| | | Purchases | | Sales |
GROWTH FUNDS | | | | | | | | | | |
Harbor Capital Appreciation Fund | | | $ | 5,262,120 | | | | $ | 5,219,319 | |
Harbor Mid Cap Growth Fund | | | | 290,212 | | | | | 345,022 | |
Harbor Small Cap Growth Fund | | | | 219,473 | | | | | 256,654 | |
Harbor Small Cap Growth Opportunities Fund | | | | 159,802 | | | | | 55,952 | |
VALUE FUNDS | | | | | | | | | | |
Harbor Large Cap Value Fund | | | $ | 18,943 | | | | $ | 20,191 | |
Harbor Mid Cap Value Fund | | | | 221,312 | | | | | 8,031 | |
Harbor Small Cap Value Fund | | | | 199,935 | | | | | 43,423 | |
Securities Lending
Each Fund may engage in securities lending, whereby a Fund lends its securities to financial institutions in order to increase its income. During the period, Harbor Capital Appreciation Fund engaged in securities lending. Securities loans are required to be secured at all times during the term of the loan by cash collateral that is at least equal to the value of the loaned securities determined at the close of the Fund’s business day. Any additional collateral that may be required to secure the loan is delivered to the Fund the next business day. The cash collateral is maintained on the Fund’s behalf by the lending agent (State Street Bank & Trust Company) and is invested in the State Street Navigator Securities Lending Prime Portfolio, a money market mutual fund that seeks to provide income while maintaining a stable net asset value of $1.00. There is no assurance that the State Street Navigator Securities Lending Prime Portfolio will maintain a stable net asset value and the Fund is subject to the risk of loss on the cash collateral invested. This collateral is recognized as a liability in the Statement of Assets and Liabilities. During the term of the loan, the Fund will continue to receive any interest or dividends, or amounts equivalent thereto, on the loaned securities, in addition to receiving a fee from the borrower and earning interest on the investment of the cash collateral. The Fund may pay reasonable fees in connection with a loan of its securities and may share the interest earned on the collateral with the borrower. Net securities lending income is disclosed as such in the Statement of Operations. Securities loans may be terminated at the option of the borrower or the Fund. Upon termination of the loan, the borrower will return to the lender securities that are identical to the loaned securities. The Fund bears the risk of delay in recovery of, or loss of rights in, the securities loaned and the risk that the value of the collateral falls below the value of the securities on loan at the time of default by the borrower. A Fund had sought to mitigate this borrower risk by entering into a securities lending authorization agreement with its lending agent. The securities lending authorization agreement provides that, in the event of a borrower’s default, including bankruptcy, the lending agent will request that all
74
Harbor Domestic Equity Funds
NOTES TO FINANCIAL STATEMENTS—Continued
(Currency in thousands)
NOTE 3—INVESTMENT PORTFOLIO TRANSACTIONS—Continued
loaned securities be returned by the borrower. In the event the borrower is unable or unwilling to return the loaned securities to the lending agent, the lending agent may apply the proceeds of the cash collateral from the loaned securities towards the purchase of replacement securities. If such proceeds are insufficient or the collateral is unavailable, the lending agent will purchase replacement securities at its sole expense. If the lending agent is unable to purchase replacement securities, it may credit to the relevant Fund’s account an amount equal to the market value of the unreturned loaned securities. As of April 30, 2015, Harbor Capital Appreciation Fund had no securities out on loan.
NOTE 4—FEES AND OTHER TRANSACTIONS WITH AFFILIATES
Investment Adviser
Harbor Capital is an indirect, wholly-owned subsidiary of Robeco Groep N.V. (“Robeco”). Robeco is majority owned by ORIX Corporation (“ORIX”). Harbor Capital is the Trust’s investment adviser and is also responsible for administrative and other services.
Each Fund has a separate advisory agreement with Harbor Capital. The agreements provide for fees based on an annual percentage rate of average daily net assets as follows:
| | | | | | | | | | |
| | | Contractual Rate | | Actual Rateb |
GROWTH FUNDS | | | | | | | | | | |
Harbor Capital Appreciation Fund | | | | 0.60 | %a | | | | 0.57 | % |
Harbor Mid Cap Growth Fund | | | | 0.75 | | | | | 0.75 | |
Harbor Small Cap Growth Fund | | | | 0.75 | | | | | 0.75 | |
Harbor Small Cap Growth Opportunities Fund | | | | 0.75 | | | | | 0.75 | |
VALUE FUNDS | | | | | | | | | | |
Harbor Large Cap Value Fund | | | | 0.60 | % | | | | 0.60 | % |
Harbor Mid Cap Value Fund | | | | 0.75 | | | | | 0.75 | |
Harbor Small Cap Value Fund | | | | 0.75 | | | | | 0.75 | |
| a | Effective March 1, 2015 the Adviser has contractually agreed to reduce the management fee to 0.57% on assets between $5 billion and $10 billion and 0.54% on assets over $10 billion through February 29, 2016. Previously, the Adviser had contractually reduced the management fee to 0.58% on assets between $5 billion and $10 billion, 0.57% on assets between $10 billion and $15 billion, and 0.56% on assets over $15 billion. |
| b | Annualized for the six-month period ended April 30, 2015. |
Harbor Capital has from time to time voluntarily or contractually agreed not to impose a portion of its management fees and/or to bear a portion of the expenses incurred in the operation of certain Funds in order to limit Fund expenses. Such waivers, if any, are reflected on the accompanying Statements of Operations for the respective Funds. Harbor Capital has entered into a contractual expense limitation agreement with Harbor Small Cap Growth Opportunities Fund and Harbor Large Cap Value Fund limiting the total expenses for Harbor Small Cap Growth Opportunities Fund to 0.90%, 1.15%, and 1.27% for the Institutional Class, Administrative Class, and Investor Class, respectively, and Harbor Large Cap Value Fund to 0.68%, 0.93% and 1.05% for the Institutional Class, Administrative Class, and Investor Class, respectively. The contractual expense limitations are effective through February 29, 2016. All expense limitations are inclusive of the transfer agent fee waiver discussed in the Transfer Agent section below.
Distributor
Harbor Funds Distributors, Inc. (“Harbor Funds Distributors” or the “Distributor”), a wholly-owned subsidiary of Harbor Capital, is the distributor for Harbor Funds shares. Under the Trust’s current distribution plans pursuant to Rule 12b-1 under the Investment Company Act with respect to each Fund’s Administrative and Investor Class shares (collectively, the “12b-1 Plans”), as applicable, each Fund pays the Distributor compensation at the annual rate of 0.25% of the average daily net assets of its Administrative and Investor Class shares. The 12b-1 Plans compensate the Distributor for the purpose of financing any activity that is primarily intended to result in the sale of Administrative and Investor Class shares of
75
Harbor Domestic Equity Funds
NOTES TO FINANCIAL STATEMENTS—Continued
(Currency in thousands)
NOTE 4—FEES AND OTHER TRANSACTIONS WITH AFFILIATES—Continued
the Funds or for recordkeeping services or the servicing of shareholder accounts in the Administrative and Investor Class shares of the Funds. Such activities include, but are not limited to: printing of prospectuses and statements of additional information and reports for prospective shareholders (i.e., other than existing shareholders); preparation and distribution of advertising material and sales literature; expenses of organizing and conducting sales seminars; supplemental payments to dealers or other institutions such as asset-based sales charges, payments of recordkeeping fees under recordkeeping arrangements, or payments of service fees under shareholder service arrangements; and costs of administering the 12b-1 Plans.
Amounts payable by a Fund under the 12b-1 Plans need not be directly related to the expenses actually incurred by the Distributor on behalf of each Fund. The 12b-1 Plans do not obligate the Funds to reimburse the Distributor for the actual expenses the Distributor may incur in fulfilling its obligations under the 12b-1 Plans. Thus, even if the Distributor’s actual expenses exceed the fee payable to the Distributor at any given time, the Funds will not be obligated to pay more than that fee. If the Distributor’s expenses are less than the fee it receives, the Distributor will retain the difference.
The fees attributable to each Fund’s respective class are shown on the accompanying Statement of Operations.
Transfer Agent
Harbor Services Group, Inc. (“Harbor Services Group”), a wholly-owned subsidiary of Harbor Capital, is the transfer and shareholder servicing agent for the Funds. The transfer agency and service agreement is reviewed and approved annually by the Board of Trustees and provides currently for compensation up to the following amounts per class of each Fund:
| | |
Share Class | | Transfer Agent Feesa |
Institutional | | 0.065% of the average daily net assets of all Institutional Class shares |
Administrative | | 0.065% of the average daily net assets of all Administrative Class shares |
Investor | | 0.185% of the average daily net assets of all Investor Class shares |
| a | For the period November 1, 2014 through February 28, 2015, the Transfer Agent Fees for Institutional and Administrative Class shares was 0.06% and 0.18% for the Investor Class shares. |
Harbor Services Group has voluntarily waived a portion of its transfer agent fees during the six-month period ended April 30, 2015. Fees incurred for these transfer agent services are shown on each Fund’s Statement of Operations. The voluntary waiver may be discontinued at any time.
Shareholders
On April 30, 2015, Harbor Capital, Harbor Funds Distributors, and Harbor Services Group, collectively held the following shares of beneficial interest in the Funds:
| | | | | | | | | | | | | | | | | | | | | | | | | |
| | | Number of Shares Owned by
Harbor Capital,
Harbor Funds Distributors, and
Harbor Services Group | | |
| | | Institutional
Class | | Administrative
Class | | Investor
Class | | Total | | Percentage of
Outstanding Shares |
GROWTH FUNDS | | | | | | | | | | | | | | | | | | | | | | | | | |
Harbor Capital Appreciation Fund | | | | 31,860 | | | | | 2 | | | | | 4 | | | | | 31,866 | | | | | 0.0 | % |
Harbor Mid Cap Growth Fund | | | | 100,687 | | | | | 7 | | | | | 14 | | | | | 100,708 | | | | | 0.1 | |
Harbor Small Cap Growth Fund | | | | 39,832 | | | | | 5 | | | | | 11 | | | | | 39,848 | | | | | 0.1 | |
Harbor Small Cap Growth Opportunities Fund | | | | 1,278,722 | | | | | 25,128 | | | | | 25,128 | | | | | 1,328,978 | | | | | 9.4 | |
VALUE FUNDS | | | | | | | | | | | | | | | | | | | | | | | | | |
Harbor Large Cap Value Fund | | | | 80,196 | | | | | 4 | | | | | 9 | | | | | 80,209 | | | | | 0.4 | % |
Harbor Mid Cap Value Fund | | | | 49,721 | | | | | 3 | | | | | 6 | | | | | 49,730 | | | | | 0.2 | |
Harbor Small Cap Value Fund | | | | 20,792 | | | | | 2 | | | | | 4 | | | | | 20,798 | | | | | 0.1 | |
76
Harbor Domestic Equity Funds
NOTES TO FINANCIAL STATEMENTS—Continued
(Currency in thousands)
NOTE 4—FEES AND OTHER TRANSACTIONS WITH AFFILIATES—Continued
Independent Trustees
The fees and expenses of the Independent Trustees are shown on each Fund’s Statement of Operations. The Independent Trustees’ remuneration for all Domestic Equity Funds totaled $277 for the six-month period ended April 30, 2015.
The Board of Trustees has adopted a Deferred Compensation Plan for Independent Trustees (the “Plan”), which enables Trustees to elect to defer receipt of all or a portion of the annual compensation they are entitled to receive from the Trust. For purposes of determining the amount owed to a Trustee under the Plan, deferred amounts are treated as though they had been invested in shares of the Fund(s) selected by the Trustee. While not required to do so, each Fund makes an investment equal to the Trustee’s investment election. The deferred compensation liability and the offsetting deferred compensation investment asset are included as a component of “Liabilities; Other” and “Other assets”, respectively, in the Statement of Assets and Liabilities. Such amounts fluctuate with changes in the market value of the selected securities. The deferred compensation and related mark-to-market impact liability and an offsetting investment asset will remain on each Fund’s Statement of Assets and Liabilities until distributed in accordance with the Plan.
Indemnification
Under the Trust’s organizational documents, its officers and Trustees are indemnified against certain liabilities arising out of the performance of their duties to the Trust. In addition, in the normal course of business the Trust enters into contracts that provide general indemnities to other parties. The Trust’s maximum exposure under these arrangements is unknown as this would involve future claims that may be made against the Trust that have not yet occurred. The risk of material loss as a result of such indemnification claims is considered remote.
NOTE 5—TAX INFORMATION
The identified cost for federal income tax purposes of investments owned by each Fund (including earned discount on corporate short-term notes and commercial paper) and their respective gross unrealized appreciation and depreciation at April 30, 2015 are as follows:
| | | | | | | | | | | | | | | | | | | | |
| | | | | Gross Unrealized | | Net Unrealized
Appreciation/
(Depreciation) |
| | | Identified Cost | | Appreciation | | (Depreciation) | |
GROWTH FUNDS | | | | | | | | | | | | | | | | | | | | |
Harbor Capital Appreciation Fund | | | $ | 16,532,154 | | | | $ | 10,295,070 | | | | $ | (122,654 | ) | | | $ | 10,172,416 | |
Harbor Mid Cap Growth Fund | | | | 628,702 | | | | | 124,416 | | | | | (16,789 | ) | | | | 107,627 | |
Harbor Small Cap Growth Fund | | | | 481,429 | | | | | 162,498 | | | | | (15,347 | ) | | | | 147,151 | |
Harbor Small Cap Growth Opportunities Fund | | | | 159,743 | | | | | 9,640 | | | | | (7,927 | ) | | | | 1,713 | |
VALUE FUNDS | | | | | | | | | | | | | | | | | | | | |
Harbor Large Cap Value Fund | | | $ | 197,417 | | | | $ | 64,449 | | | | $ | (379 | ) | | | $ | 64,070 | |
Harbor Mid Cap Value Fund | | | | 479,716 | | | | | 68,324 | | | | | (14,268 | ) | | | | 54,056 | |
Harbor Small Cap Value Fund | | | | 606,380 | | | | | 260,321 | | | | | (8,906 | ) | | | | 251,415 | |
NOTE 6—DERIVATIVES
The Funds’ derivative holdings do not qualify for hedge accounting treatment and as such are recorded at current fair value. For a detailed discussion of risks related to these investments please refer to the descriptions of each type of derivative instrument in Note 2—Significant Accounting Policies.
Each Fund’s derivative instruments outstanding as of the six-month period ended April 30, 2015, if any, as disclosed in the Portfolios of Investments, and the related amounts of realized and changes in unrealized gains and losses on derivative instruments during the period as disclosed in the Statement of Operations, are indicators of the volume of derivative activity for these Funds. The derivatives held by each Fund are not subject to master netting arrangements.
77
Harbor Domestic Equity Funds
NOTES TO FINANCIAL STATEMENTS—Continued
(Currency in thousands)
NOTE 6—DERIVATIVES—Continued
Derivative Instruments
At April 30, 2015, the fair values of derivatives, by primary risk exposure, were reflected in the Statement of Assets and Liabilities as follows:
| | | | | |
HARBOR MID CAP GROWTH FUND | | | | | |
Statement of Assets and Liabilities Caption | | Equity
Contracts |
Assets | | | | | |
Investments, at value (rights/warrants) | | | $ | 811 | |
Realized net gain/(loss) and the change in unrealized appreciation/(depreciation) on derivatives for the six-month period ended April 30, 2015, were:
| | | | | |
HARBOR MID CAP GROWTH FUND | | | | | |
Change in Unrealized Appreciation/(Depreciation) on Derivatives | | Equity
Contracts |
Investments (rights/warrants) | | | $ | 638 | |
NOTE 7—LEGAL PROCEEDINGS
Tribune Company
Harbor Mid Cap Value Fund has been named as a defendant and/or as a putative member of a proposed defendant class in Kirschner v. FitzSimons (In re Tribune Co.), No. 12-2652 (S.D.N.Y.) (the “FitzSimons action”); Deutsche Bank v. Ohlson Enterprises, No. 12-0064 (S.D.N.Y.) (the “Deutsche Bank action”); and Niese v. ABN AMRO Clearing Chicago LLC, No. 12-0555 (S.D.N.Y.) (the “Niese action”), as a result of its ownership of shares in the Tribune Company (“Tribune”) in 2007, when Tribune effected a leveraged buyout transaction (“LBO”) by which Tribune converted to a privately-held company. The plaintiffs in these lawsuits have alleged that, in connection with the LBO, insiders and shareholders were paid for their Tribune stock using financing that the insiders knew would, and ultimately did, leave Tribune insolvent. The plaintiffs have asserted claims for fraudulent conveyance against Harbor Mid Cap Value Fund and other former Tribune shareholders.
All three lawsuits have been consolidated with the majority of the other Tribune-related lawsuits in the multidistrict litigation proceeding In re Tribune Co. Fraudulent Conveyance Litig., No. 11-2296 (S.D.N.Y.) (the “MDL Proceeding”).
On September 23, 2013, the District Court granted the defendants’ omnibus motion to dismiss the Deutsche Bank and Niese actions, on the basis that the plaintiffs lacked standing. On September 30, 2013, the plaintiffs filed a notice of appeal of the September 23 order. On October 28, 2013, the defendants filed a joint notice of cross-appeal of that same order. These appeals have been fully briefed, and oral argument took place on November 5, 2014. The Court has not yet issued a decision on the appeals.
On May 23, 2014, the defendants filed motions to dismiss the FitzSimons action, including a global motion to dismiss Count I, which is the claim brought against former Tribune shareholders for intentional fraudulent conveyance under U.S. federal law. The Court has not yet issued a decision on any of these motions.
None of these lawsuits alleges any wrongdoing on the part of Harbor Mid Cap Value Fund. Harbor Mid Cap Value Fund held shares of Tribune and tendered these shares as part of Tribune’s LBO. The value of the proceeds received by Harbor Mid Cap Value Fund was approximately $299. Harbor Mid Cap Value Fund’s cost basis in the shares of Tribune was approximately $262. At this stage of the proceedings, Harbor Mid Cap Value Fund is not able to make a reliable prediction as to the outcome of these lawsuits or the effect, if any, on the Fund’s net asset value.
78
Harbor Domestic Equity Funds
NOTES TO FINANCIAL STATEMENTS—Continued
(Currency in thousands)
NOTE 7—LEGAL PROCEEDINGS—Continued
Lyondell Chemical Company
In October 2011, Harbor Capital received subpoenas in connection with two cases: Weisfelner, as Trustee of the LB Creditor Trust v. Fund 1 (In re Lyondell Co.), No. 10-4609 (Bankr. S.D.N.Y.) (the “Creditor Trust action”) and Weisfelner, as Trustee of the LB Litigation Trust v. A. Holmes & H. Holmes TTEE (In re Lyondell Co.), No. 10-5525 (Bankr. S.D.N.Y.) (the “Litigation Trust action”). Both cases, and a related case entitled Weisfelner, as Trustee of the LB Creditor Trust v. Reichman, No. 12-1570 (Bankr. S.D.N.Y.) (the “Reichman action”), arise out of the bankruptcy of Lyondell Chemical Company (“Lyondell”), shares of which were previously owned by Harbor Mid Cap Value Fund. Similar to the claims made in the Tribune matter, these actions seek to have set aside and recovered as fraudulent transfers from former Lyondell shareholders the consideration paid to them pursuant to the cash out merger of Lyondell shareholders in connection with the combination of Lyondell and Basell AF in 2007. Lyondell filed for bankruptcy in 2008.
The Litigation Trust action and the Reichman action name classes of defendants of persons or entities that received proceeds from the Lyondell merger transaction, and the Creditor Trust action names hundreds of anonymously identified defendants. Because Harbor Mid Cap Value Fund was a beneficial owner of Lyondell stock and received proceeds from the Lyondell merger transaction, it is possible that Harbor Mid Cap Value Fund will be identified as a defendant or is already captured within the definition of the putative classes in the Litigation Trust action or Reichman action. It may also be one of the anonymously identified defendants in the Creditor Trust action.
On May 8, 2014, the plaintiff in the Litigation Trust action filed a motion to certify the defendant class generally comprised of all former Lyondell shareholders that received proceeds in exchange for their shares in the 2007 merger transaction.
On July 2, 2014, the Bankruptcy Court issued a case management order. Under the terms of the order, the defendants were permitted to file an “omnibus” motion to dismiss the complaints in all of the Lyondell actions on July 30, 2014. The omnibus motion was limited to grounds for dismissal that are applicable to all defendants in such action. No potential defense (including, without limitation, lack of personal jurisdiction, insufficiency of service of process, or any other non-omnibus ground for dismissal of the complaint in any or all of the actions) shall be waived by a defendant’s failure to assert any such potential defense in an omnibus motion to dismiss.
On July 30, 2014, the defendants filed a motion to dismiss all of the Lyondell lawsuits pursuant to the Bankruptcy Court’s July 2, 2014 order.
On January 14 and 15, 2015, the Court held oral arguments on the motion to dismiss and on the motion for the class certification. The Court has not yet issued a decision on these motions. Discovery on the merits is underway and is scheduled to end in 2016.
None of these lawsuits alleges any wrongdoing on the part of Harbor Mid Cap Value Fund. Harbor Mid Cap Value Fund received approximately $1,439 in cash proceeds from the cash out merger. Harbor Mid Cap Value Fund’s cost basis in the shares of Lyondell was approximately $931. At this stage of the proceedings, Harbor Mid Cap Value Fund is not able to make a reliable prediction as to the outcome of these lawsuits or the effect, if any, on the Fund’s net asset value.
NOTE 8—SUBSEQUENT EVENTS
Through the date the financial statements were issued, no subsequent events or transactions had occurred that would have materially impacted the financial statements or related disclosures as presented herein.
79
Harbor Domestic Equity Funds
FEES AND EXPENSE EXAMPLE (Unaudited)
Example
As a shareholder of a Fund, you incur two types of costs: (1) transaction costs, including redemption fees (if any) and (2) ongoing costs, including management fees, distribution and service (12b-1) fees, and other Fund expenses. This example is intended to help you understand your ongoing costs (in dollars) of investing in a Fund and to compare these costs with the ongoing costs of investing in other mutual funds.
The example is based on an investment of $1,000 invested at the beginning of the period and held for the entire period November 1, 2014 through April 30, 2015.
Actual Expenses
The first line of the table below provides information about actual account values and actual expenses for each share class. You may use the information in the respective class line, together with the amount you invested, to estimate the expenses that you paid over the period. Simply divide your account value by $1,000 (for example, an $8,600 account value divided by $1,000 = 8.6), then multiply the result by the number in the first line of the respective class under the heading entitled “Expenses Paid During Period” to estimate the expenses you paid on your account during this period.
Hypothetical Example for Comparison Purposes
The second line of the table for each share class below provides information about hypothetical account values and hypothetical expenses based on the respective Fund’s actual expense ratio and an assumed rate of return of 5% per year before expenses, which is not the respective Fund’s actual return. The hypothetical account values and expenses may not be used to estimate the actual ending account balance or expenses you paid for the period. You may use this information to compare the ongoing costs of investing in a Fund to other funds. To do so, compare this 5% hypothetical example with the 5% hypothetical examples that appear in the shareholder reports of the other funds.
Please note that the expenses shown in the table are meant to highlight your ongoing costs only and do not reflect any transactional costs, such as redemption fees. Therefore, the second line of the table is useful in comparing ongoing costs only, and will not help you determine the relative total costs of owning different funds. In addition, if these transactional costs were included, your costs would have been higher.
| | | | | | | | | | | | | | | | |
| | | Annualized
Expense Ratios* | | | Expenses Paid
During Period** | | | Beginning Account
Value
(November 1, 2014) | | | Ending Account
Value
(April 30, 2015) | |
Harbor Capital Appreciation Fund | | | | | | | | | | | | | | | | |
Institutional Class | | | 0.64% | | | | | | | | | | | | | |
Actual | | | | | | $ | 3.29 | | | $ | 1,000 | | | $ | 1,074.70 | |
Hypothetical (5% return) | | | | | | | 3.21 | | | | 1,000 | | | | 1,021.54 | |
Administrative Class | | | 0.89% | | | | | | | | | | | | | |
Actual | | | | | | $ | 4.57 | | | $ | 1,000 | | | $ | 1,073.20 | |
Hypothetical (5% return) | | | | | | | 4.46 | | | | 1,000 | | | | 1,020.27 | |
Investor Class | | | 1.01% | | | | | | | | | | | | | |
Actual | | | | | | $ | 5.19 | | | $ | 1,000 | | | $ | 1,072.70 | |
Hypothetical (5% return) | | | | | | | 5.06 | | | | 1,000 | | | | 1,019.66 | |
Harbor Mid Cap Growth Fund | | | | | | | | | | | | | | | | |
Institutional Class | | | 0.84% | | | | | | | | | | | | | |
Actual | | | | | | $ | 4.32 | | | $ | 1,000 | | | $ | 1,070.60 | |
Hypothetical (5% return) | | | | | | | 4.21 | | | | 1,000 | | | | 1,020.53 | |
Administrative Class | | | 1.09% | | | | | | | | | | | | | |
Actual | | | | | | $ | 5.60 | | | $ | 1,000 | | | $ | 1,069.70 | |
Hypothetical (5% return) | | | | | | | 5.46 | | | | 1,000 | | | | 1,019.26 | |
Investor Class | | | 1.21% | | | | | | | | | | | | | |
Actual | | | | | | $ | 6.21 | | | $ | 1,000 | | | $ | 1,069.00 | |
Hypothetical (5% return) | | | | | | | 6.06 | | | | 1,000 | | | | 1,018.65 | |
80
Harbor Domestic Equity Funds
FEES AND EXPENSE EXAMPLE—Continued
| | | | | | | | | | | | | | | | | | | | |
| | | Annualized
Expense Ratios* | | Expenses Paid
During Period** | | Beginning Account
Value
(November 1, 2014) | | Ending Account
Value
(April 30, 2015) |
Harbor Small Cap Growth Fund | | | | | | | | | | | | | | | | | | | | |
Institutional Class | | | | 0.83% | | | | | | | | | | | | | | | | |
Actual | | | | | | | | $ | 4.33 | | | | $ | 1,000 | | | | $ | 1,103.90 | |
Hypothetical (5% return) | | | | | | | | | 4.16 | | | | | 1,000 | | | | | 1,020.58 | |
Administrative Class | | | | 1.08% | | | | | | | | | | | | | | | | |
Actual | | | | | | | | $ | 5.63 | | | | $ | 1,000 | | | | $ | 1,102.30 | |
Hypothetical (5% return) | | | | | | | | | 5.41 | | | | | 1,000 | | | | | 1,019.31 | |
Investor Class | | | | 1.20% | | | | | | | | | | | | | | | | |
Actual | | | | | | | | $ | 6.25 | | | | $ | 1,000 | | | | $ | 1,101.00 | |
Hypothetical (5% return) | | | | | | | | | 6.01 | | | | | 1,000 | | | | | 1,018.70 | |
Harbor Small Cap Growth Opportunities Fund | | | | | | | | | | | | | | | | |
Institutional Class | | | | 0.90% | | | | | | | | | | | | | | | | |
Actual | | | | | | | | $ | 4.51 | | | | $ | 1,000 | | | | $ | 1,021.90 | |
Hypothetical (5% return) | | | | | | | | | 4.51 | | | | | 1,000 | | | | | 1,020.22 | |
Administrative Class | | | | 1.15% | | | | | | | | | | | | | | | | |
Actual | | | | | | | | $ | 5.76 | | | | $ | 1,000 | | | | $ | 1,021.00 | |
Hypothetical (5% return) | | | | | | | | | 5.76 | | | | | 1,000 | | | | | 1,018.95 | |
Investor Class | | | | 1.27% | | | | | | | | | | | | | | | | |
Actual | | | | | | | | $ | 6.36 | | | | $ | 1,000 | | | | $ | 1,019.10 | |
Hypothetical (5% return) | | | | | | | | | 6.36 | | | | | 1,000 | | | | | 1,018.34 | |
Harbor Large Cap Value Fund | | | | | | | | | | | | | | | | | | | | |
Institutional Class | | | | 0.68% | | | | | | | | | | | | | | | | |
Actual | | | | | | | | $ | 3.49 | | | | $ | 1,000 | | | | $ | 1,069.90 | |
Hypothetical (5% return) | | | | | | | | | 3.41 | | | | | 1,000 | | | | | 1,021.34 | |
Administrative Class | | | | 0.93% | | | | | | | | | | | | | | | | |
Actual | | | | | | | | $ | 4.77 | | | | $ | 1,000 | | | | $ | 1,068.50 | |
Hypothetical (5% return) | | | | | | | | | 4.66 | | | | | 1,000 | | | | | 1,020.07 | |
Investor Class | | | | 1.05% | | | | | | | | | | | | | | | | |
Actual | | | | | | | | $ | 5.39 | | | | $ | 1,000 | | | | $ | 1,067.50 | |
Hypothetical (5% return) | | | | | | | | | 5.26 | | | | | 1,000 | | | | | 1,019.46 | |
Harbor Mid Cap Value Fund | | | | | | | | | | | | | | | | | | | | |
Institutional Class | | | | 0.85% | | | | | | | | | | | | | | | | |
Actual | | | | | | | | $ | 4.32 | | | | $ | 1,000 | | | | $ | 1,048.70 | |
Hypothetical (5% return) | | | | | | | | | 4.26 | | | | | 1,000 | | | | | 1,020.42 | |
Administrative Class | | | | 1.11% | | | | | | | | | | | | | | | | |
Actual | | | | | | | | $ | 5.63 | | | | $ | 1,000 | | | | $ | 1,047.10 | |
Hypothetical (5% return) | | | | | | | | | 5.56 | | | | | 1,000 | | | | | 1,019.15 | |
Investor Class | | | | 1.23% | | | | | | | | | | | | | | | | |
Actual | | | | | | | | $ | 6.24 | | | | $ | 1,000 | | | | $ | 1,046.80 | |
Hypothetical (5% return) | | | | | | | | | 6.16 | | | | | 1,000 | | | | | 1,018.54 | |
Harbor Small Cap Value Fund | | | | | | | | | | | | | | | | | | | | |
Institutional Class | | | | 0.84% | | | | | | | | | | | | | | | | |
Actual | | | | | | | | $ | 4.25 | | | | $ | 1,000 | | | | $ | 1,039.40 | |
Hypothetical (5% return) | | | | | | | | | 4.21 | | | | | 1,000 | | | | | 1,020.53 | |
Administrative Class | | | | 1.09% | | | | | | | | | | | | | | | | |
Actual | | | | | | | | $ | 5.51 | | | | $ | 1,000 | | | | $ | 1,038.10 | |
Hypothetical (5% return) | | | | | | | | | 5.46 | | | | | 1,000 | | | | | 1,019.26 | |
Investor Class | | | | 1.21% | | | | | | | | | | | | | | | | |
Actual | | | | | | | | $ | 6.11 | | | | $ | 1,000 | | | | $ | 1,037.50 | |
Hypothetical (5% return) | | | | | | | | | 6.06 | | | | | 1,000 | | | | | 1,018.65 | |
| * | Reflective of all fee waivers and expense reimbursements. |
| ** | Expenses are equal to the Fund’s annualized net expense ratio, multiplied by the average account value over the period, multiplied by 181/365 (to reflect the one-half year period). |
81
Harbor Domestic Equity Funds
ADDITIONAL INFORMATION (Unaudited)
PROXY VOTING
The Funds have adopted Proxy Voting Policies and Procedures under which the Funds vote proxies relating to securities held by the Funds. In addition, the Funds file Form N-PX, with its complete proxy voting record for the 12 months ended June 30th, no later than August 31st of each year. A description of the Funds’ Proxy Voting Policies and Procedures and the Funds’ proxy voting record (Form N-PX) is available (i) without charge, upon request, by calling Harbor Funds toll-free at 800-422-1050; (ii) on the Funds’ website at harborfunds.com; and (iii) on the SEC’s website at www.sec.gov.
HOUSEHOLDING
Harbor Funds has adopted a policy that allows it to send only one copy of a Fund’s prospectus, proxy material, annual report and semi-annual report to certain shareholders residing at the same household. This reduces Fund expenses, which benefits you and other shareholders. If you need additional copies or do not want your mailings to be “householded,” please call the Shareholder Servicing Agent at 800-422-1050. Individual copies will be sent within thirty (30) days after the Shareholder Servicing Agent receives your instructions. Your consent to householding is considered valid until revoked.
QUARTERLY PORTFOLIO DISCLOSURES
Each Fund files a complete portfolio of investments with the Securities and Exchange Commission for the first and third quarters of each fiscal year on Form N-Q. The Funds’ Form N-Q is available (i) without charge, upon request, by calling Harbor Funds toll-free at 800-422-1050, (ii) on the Funds’ website at harborfunds.com, and (iii) on the SEC’s web site at www.sec.gov. The form may also be viewed and copied at the Commission’s Public Reference Room in Washington, D.C. Information regarding the operations of the Public Reference Room may also be obtained by calling 800-SEC-0330.
ADVISORY AGREEMENT APPROVALS
FACTORS CONSIDERED BY THE TRUSTEES IN APPROVING THE INVESTMENT ADVISORY AGREEMENTS AND SUBADVISORY AGREEMENTS OF THE DOMESTIC EQUITY FUNDS
The Investment Company Act of 1940, as amended, requires that the Investment Advisory and Subadvisory Agreement of each Fund be approved initially, and following an initial two-year term, at least annually, by the Harbor Funds Board of Trustees, including a majority of the Independent Trustees voting separately.
At an in-person meeting of the Board of Trustees held on February 8, 9, and 10, 2015 (the “Meeting”), the Board, including the Independent Trustees voting separately, considered and approved the continuation of each Investment Advisory Agreement with Harbor Capital Advisors, Inc., the adviser to each Fund (the “Adviser”), and each Subadvisory Agreement with each Fund’s subadviser (each, a “Subadviser”) with respect to Harbor Capital Appreciation Fund, Harbor Mid Cap Growth Fund, Harbor Small Cap Growth Fund, Harbor Small Cap Growth Opportunities Fund, Harbor Large Cap Value Fund, Harbor Mid Cap Value Fund and Harbor Small Cap Value Fund.
In evaluating each Investment Advisory Agreement and each Subadvisory Agreement, the Trustees reviewed materials furnished by the Adviser and each Subadviser, including information about their respective affiliates, personnel, and operations and also relied upon their knowledge of the Adviser and Subadvisers resulting from their quarterly meetings, periodic telephonic meetings and other prior communications. At the Meeting, which had been called for the purpose of considering the continuation of the relevant Investment Advisory Agreements and Subadvisory Agreements, and at prior meetings, the Trustees, including the Independent Trustees, requested and received materials and presentations relating to Fund performance and the services rendered by the Adviser and each Subadviser. The Trustees also discussed with representatives of the Adviser, at the Meeting and at prior meetings, Harbor Funds’ operations and the Adviser’s ability, consistent with the “manager of managers” structure of Harbor Funds, to (i) identify and recommend to the Trustees a subadviser for each Fund, (ii) monitor and oversee the performance and investment capabilities of each Subadviser, and (iii) recommend the replacement of a subadviser where appropriate.
At the Meeting, the Trustees, including all of the Independent Trustees voting separately, determined that the terms of each Investment Advisory Agreement and each Subadvisory Agreement with respect to Harbor Capital Appreciation Fund, Harbor Mid Cap Growth Fund, Harbor Small Cap Growth Fund, Harbor Small Cap Growth Opportunities Fund, Harbor Large Cap Value Fund, Harbor Mid Cap Value Fund and Harbor Small Cap Value Fund were fair and reasonable and approved the continuation for a one-year period of each such Investment Advisory Agreement and Subadvisory Agreement as being in the best interests of the respective Fund and its shareholders.
82
Harbor Domestic Equity Funds
ADDITIONAL INFORMATION—Continued
In their deliberations, the Independent Trustees had the opportunity to meet privately without representatives of the Adviser or any Subadviser present and were represented throughout the process by legal counsel to the Independent Trustees and the Funds.
In considering the approval of each Fund’s Investment Advisory Agreement and Subadvisory Agreement, the Board of Trustees, including the Independent Trustees, evaluated a number of factors it considered relevant to its determination. The Board did not identify any single factor as all-important or controlling, and individual Trustees did not necessarily attribute the same weight or importance to each factor.
Among the factors considered by the Trustees in approving the Investment Advisory Agreements were the following:
| | • | | the nature, extent, and quality of the services provided by the Adviser, including the background, education, expertise and experience of the investment professionals of the Adviser; |
| | • | | the favorable history, reputation, qualifications and background of the Adviser, as well as the qualifications of its personnel; |
| | • | | the profitability of the Adviser with respect to each Fund, including the effect of revenues of Harbor Services Group, Inc. (“Harbor Services Group”), the Funds’ transfer agent, and Harbor Funds Distributors, Inc. (“Harbor Funds Distributors”), the Funds’ principal underwriter, on such profitability; |
| | • | | the fees charged by the Adviser for investment advisory services, including, in each case, the portion of the fee to be retained by the Adviser, after payment of the Subadviser’s fee, for the subadviser oversight, administration and “manager of managers” services the Adviser provides; |
| | • | | the extent to which economies of scale might be realized as each Fund grows, and the extent to which each Fund’s advisory fee level reflects any economies of scale for the benefit of Fund investors; |
| | • | | the fees and expense ratios of each Fund relative to the quality of services provided and the fees and expense ratios of similar investment companies; |
| | • | | the investment performance of each Fund in comparison to peer groups and certain relevant benchmark indices and the Adviser’s efforts to address circumstances of underperformance where applicable; |
| | • | | the compensation received by Harbor Services Group and Harbor Funds Distributors in consideration of the services each provides to the Funds, and any other “fall out” benefits that inure to the Adviser and its affiliates as a result of their relationship with the Funds; |
| | • | | information received at regular meetings throughout the year related to Fund performance and services rendered by the Adviser, as well as each of the Subadvisers, and research arrangements with brokers who execute transactions on behalf of each Subadviser; |
| | • | | information contained in materials provided by the Adviser and compiled by Lipper, Inc. (“Lipper”) as to the investment returns, advisory fees and total expense ratios of the Institutional Class of each Fund (and, in certain cases, total expense ratios of certain other classes) relative to those of other investment companies with similar objectives and strategies managed by other investment advisers, consisting both of a peer group of funds as well as a broader universe of funds compiled by Lipper; and |
| | • | | information contained in materials compiled by Morningstar, Inc. (“Morningstar”) as to the investment returns of the Institutional Class of each Fund relative to those of other investment companies with similar objectives and strategies managed by other investment advisers. |
Among the factors considered by the Trustees in approving the Subadvisory Agreements were the following:
| | • | | the nature, extent, and quality of the services provided by each Subadviser, including the background, education, expertise and experience of the investment professionals of each Subadviser providing services to the Funds; |
| | • | | the favorable history, reputation, qualifications and background of each Subadviser, as well as the qualifications of their respective personnel; |
| | • | | the fees charged by each Subadviser for subadvisory services, which fees are paid by the Adviser, not by the Funds; |
83
Harbor Domestic Equity Funds
ADDITIONAL INFORMATION—Continued
| | • | | information contained in materials provided by the Adviser and compiled by Lipper as to the investment returns of the Institutional Class of each Fund relative to those of other investment companies with similar objectives and strategies managed by other investment advisers, consisting both of a peer group of funds as well as a broader universe of funds compiled by Lipper; and |
| | • | | information contained in materials compiled by Morningstar as to the investment returns of the Institutional Class of each Fund relative to those of other investment companies with similar objectives and strategies managed by other investment advisers. |
Nature, Scope and Extent of Services
The Trustees separately considered the nature, scope and extent of the services provided by the Adviser and each Subadviser. In their deliberations as to the approval of each Fund’s Investment Advisory Agreement and Subadvisory Agreement, the Trustees were mindful of the fact that, by choosing to invest in a Fund, the shareholders had entrusted the Adviser with the responsibility, subject to the approval of the Trustees, for selecting such Fund’s Subadviser, overseeing and monitoring that Subadviser’s performance and replacing the Subadviser if necessary. The Trustees also considered as relevant to their determination the favorable history, reputation, qualifications and background of the Adviser and each Subadviser, as well as the qualifications of their respective personnel.
The Adviser’s Services. The Board evaluated the nature, scope and extent of the Adviser’s services in light of the Board’s experience with the Adviser, as well as materials provided by the Adviser as part of its comprehensive written response to the 15(c) request letter prepared by legal counsel to the Independent Trustees in consultation with the Independent Trustees concerning the financial and other resources devoted by the Adviser to Harbor Funds, including the breadth and depth of experience and expertise of the investment, administrative, legal and compliance professionals dedicated to Harbor Funds’ operations. The Trustees noted that the Adviser had a favorable long-term record of identifying mutual fund products that proved to be attractive to investors, and selecting subadvisers to manage such funds. The Trustees determined that the Adviser had the expertise and resources to identify, select, oversee and monitor each Subadviser and to operate effectively as the “manager of managers” for the Funds.
The Subadvisers’ Services. The Trustees’ consideration of the services provided by the Subadvisers included a review of each Subadviser’s portfolio managers, investment philosophy, style and processes and record of consistency therewith, the volatility of its results, its approach to controlling risk, and the quality and extent of its investment capabilities and resources, including the nature and extent of research it receives from broker-dealers (to the extent applicable) and other sources. In their deliberations with respect to each Fund, the Trustees considered the history of Harbor Funds’ relationship with each Subadviser and Harbor Funds’ experience with each Subadviser in this capacity.
The Trustees also considered each Subadviser’s breadth and depth of experience and investment results in managing other accounts similar to the respective Fund. The Trustees received a presentation at the Meeting by investment professionals from the Subadviser for Harbor Large Cap Value Fund. The Trustees had received presentations by investment professionals from the Subadvisors for Harbor Capital Appreciation Fund, Harbor Mid Cap Growth Fund, Harbor Small Cap Growth Fund, Harbor Small Cap Growth Opportunities Fund, Harbor Mid Cap Value Fund and Harbor Small Cap Value Fund at meetings of the Board of Trustees held in 2014. The Trustees reviewed information concerning each Subadviser’s historical investment results in managing accounts and/or funds, as applicable, in a manner substantially similar to the relevant Fund.
Investment Performance, Advisory Fees and Expense Ratios
In considering each Fund’s performance, advisory fees and expense ratio, the Trustees requested and received from the Adviser data compiled by Lipper and Morningstar. The Trustees also received information explaining the methodology for compilation of certain of this information and what it was intended to demonstrate. The Trustees analyzed the Institutional Class performance of each Fund, the advisory fees of each Fund, and the Institutional Class expenses of each Fund (after giving effect to waivers and/or reimbursements, if applicable, that reduced the fees or expenses of the Fund or its peer funds) and made certain observations and findings as to each Fund as noted below. The Trustees also identified and reviewed certain Administrative Class and Investor Class comparative fee and expense information they considered relevant to their deliberations.
84
Harbor Domestic Equity Funds
ADDITIONAL INFORMATION—Continued
Harbor Capital Appreciation Fund. In consideration of the Investment Advisory Agreement and Subadvisory Agreement for the Harbor Capital Appreciation Fund (inception date of December 29, 1987), the Trustees noted that the Fund’s Institutional Class had outperformed the universe medians according to Lipper data for the two-, three-, four- and five-year periods ended December 31, 2014 and outperformed the group medians for the one-, two-, three-, and four-year periods ended December 31, 2014. The Fund’s performance for the one-year period ended December 31, 2014 trailed the universe median and its performance for the five-year period ended December 31, 2014 trailed the group median. The Fund’s one-, three- and five-year rolling returns as of December 31, 2014 ranked in the third, second and third quartiles, respectively, according to Morningstar. The Trustees also considered that the Fund had outperformed its benchmark, the Russell 1000® Growth Index, for the three- and ten-year periods ended December 31, 2014 while underperforming its benchmark for the one- and five-year periods ended December 31, 2014.
The Trustees considered the expertise of Jennison Associates LLC (“Jennison”) in managing assets generally and specifically with respect to the Fund’s asset class, noting that Jennison managed approximately $55.32 billion in assets in this asset class, out of a firm-wide total of approximately $184 billion in assets under management. The Trustees also noted the significant experience of the Fund’s portfolio managers in this asset class, noting that one was a founding member of Jennison.
The Trustees observed that the Lipper comparison of contractual management fees for the Fund’s expense group, assuming an asset level of $25.025 billion, showed that the Fund’s contractual management fee was slightly above the group median for the Institutional Class. The actual total expense ratio for the Institutional Class of the Fund, however, was below both the group and universe medians. The Trustees also considered Harbor Capital’s original proposal for additional voluntary advisory fee waiver breakpoints for the Fund and negotiated with Harbor Capital a modified voluntary breakpoint schedule, each until at least February 29, 2016. The Trustees noted that under the modified voluntary advisory fee breakpoint schedule: (i) the 0.02% advisory fee waiver (from 0.60% to 0.58%) on net assets between $5 billion and $10 billion would increase to 0.03% (from 0.60% to 0.57%); (ii) the 0.03% advisory fee waiver (from 0.60% to 0.57%) on net assets above $10 billion up to $15 billion would be replaced with a 0.06% advisory fee waiver on all net assets above $10 billion (from 0.60% to 0.54%); and (iii) the breakpoint currently in effect at $15 billion would be removed entirely. It was noted that the revised breakpoints would have both an immediate further fee reduction effect, and, as the Fund grows, a future continuing one. The Trustees noted that Harbor Capital’s profitability in operating the Fund was not excessive.
Harbor Mid Cap Growth Fund. In consideration of the Investment Advisory Agreement and Subadvisory Agreement for the Harbor Mid Cap Growth Fund (inception date of November 1, 2000), the Trustees noted that, according to the Lipper report, the Fund’s Institutional Class had outperformed its Lipper group median for the three-year period ended December 31, 2014 and underperformed its group medians for the one-, two-, four- and five-year periods ended December 31, 2014. The Trustees further noted that, according to the Lipper report, it had outperformed its Lipper universe medians for the three-year period ended December 31, 2014 and underperformed its universe medians for the one-, two-, four- and five-year periods ended December 31, 2014. The Trustees considered the fact that, in comparison to its universe of other mid cap growth funds, as identified by Morningstar, the Fund’s one- and five-year rolling returns ranked in the third quartile as of December 31, 2014 while the Fund’s three-year rolling return ranked in the first quartile as of the same date. The Trustees also considered that the Fund had underperformed its benchmark, the Russell Midcap® Growth Index, for the one- and five-year periods ended December 31, 2014 but had outperformed its benchmark index for the three-year period ended December 31, 2014 and matched the return of its benchmark index for the ten-year period ended December 31, 2014. The Trustees discussed how the performance of this manager in this strategy moves in cycles that can result in periods of underperformance.
The Trustees considered the expertise of Wellington Management Company LLP (“Wellington”) in managing assets generally and in the mid cap growth asset class specifically, noting that Wellington managed approximately $3.9 billion in assets in this asset class, out of a firm-wide total of approximately $914 billion in assets under management. The Trustees noted the significant experience of the Fund’s portfolio managers.
The Trustees observed that the Lipper comparison of contractual management fees for the Fund’s expense group, assuming an asset level of $750 million, showed that the Fund’s contractual management fee was below the group median for the Institutional Class. The Lipper data also showed that the actual total expense ratio for the Fund’s Institutional Class was below both the group and universe medians. The Trustees noted that Harbor Capital’s profitability in managing the Fund was not excessive.
85
Harbor Domestic Equity Funds
ADDITIONAL INFORMATION—Continued
Harbor Small Cap Growth Fund. In consideration of the Investment Advisory Agreement and Subadvisory Agreement for the Harbor Small Cap Growth Fund (inception date of November 1, 2000), the Trustees noted that, according to the Lipper report, the Fund’s Institutional Class performance exceeded its universe medians for the one-, two-, three-, four- and five-year periods ended December 31, 2014, outperformed its group medians for the one-, two-, three- and five-year periods ended December 31, 2014, and underperformed its group median for the four-year period ended December 31, 2014. The Morningstar data presented ranked the Fund’s one- and three-year rolling returns as of December 31, 2014 in the first quartile and its five-year rolling return as of December 31, 2014 in the second quartile. The Trustees also considered the fact that Harbor Small Cap Growth Fund had outperformed its benchmark, the Russell 2000® Growth Index, for the one-, three-, five- and ten-year periods ended December 31, 2014.
The Trustees considered the expertise of Westfield Capital Management Company, L.P. (“Westfield”) in managing assets generally and in the small cap growth asset class specifically, noting that Westfield managed approximately $2.04 billion in assets in this asset class, out of a firm-wide total of approximately $17.48 billion in assets under management. The Trustees also discussed the experience of the Fund’s portfolio managers in this asset class.
The Trustees observed that the Lipper comparison of contractual management fees for the Fund’s expense group, assuming an asset level of $625 million, showed the Fund’s contractual management fee was below the group median for the Institutional Class. The Trustees also noted that the Fund’s actual total expense ratio for the Institutional Class was below the Lipper group and universe median expense ratios. The Trustees noted that the Fund had in place a “soft close” with respect to certain new accounts and was thus unlikely to grow significantly in size in the near future. The Trustees noted that Harbor Capital’s profitability in operating the Fund was not excessive.
Harbor Small Cap Growth Opportunities Fund. In consideration of the Investment Advisory Agreement and Subadvisory Agreement for the Harbor Small Cap Growth Opportunities Fund (inception date of February 1, 2014), the Trustees noted that, according to the Lipper report, the Fund’s Institutional Class performance underperformed its group median and outperformed its universe median, in each case for the period from the Fund’s inception date through December 31, 2014. The Trustees noted that no Morningstar data regarding the Fund’s rolling returns was yet available. The Trustees also considered the fact that Harbor Small Cap Growth Opportunities Fund had outperformed its benchmark, the Russell 2000® Growth Index, for the since inception period ended December 31, 2014. The Trustees noted that the short time period since the Fund’s inception did not support any significant conclusion about the performance of Elk Creek Partners, LLC (“Elk Creek”).
The Trustees considered the expertise of the Fund’s subadviser, Elk Creek in managing assets generally and in the small cap growth asset class specifically, noting that Elk Creek managed approximately $500.2 million in assets in this asset class, out of a firm-wide total of approximately $800.8 million in assets under management. The Trustees also discussed the experience of the Fund’s portfolio managers in this asset class, including their experience prior to forming Elk Creek.
The Trustees observed that the Lipper comparison of contractual management fees for the Fund’s expense group, assuming an asset level of $75 million, showed the Fund’s contractual management fee was below the group median for the Institutional Class. The Trustees also noted that the Fund’s actual total expense ratio for the Institutional Class was below the Lipper group and universe median expense ratios. The Trustees also considered that Harbor Capital proposed to continue the Fund’s existing contractual fee waiver/expense reimbursement arrangement until at least February 29, 2016. The Trustees noted that Harbor Capital’s profitability in operating the Fund was negative.
Harbor Large Cap Value Fund. In consideration of the Investment Advisory Agreement and Subadvisory Agreement for the Harbor Large Cap Value Fund (inception date of December 29, 1987), the Trustees noted the Fund’s Institutional Class outperformance relative to its group medians for the one-, three-, four- and five-year periods ended December 31, 2014, its underperformance relative to its group median for the two-year period ended December 31, 2014, its outperformance relative to its Lipper universe medians for the three- and four-year periods ended December 31, 2014, and its underperformance relative to its Lipper universe medians for the one-, two- and five-year periods ended December 31, 2014. The Morningstar data presented showed that the Fund’s one-, three- and five-year rolling returns ranked in the third, second and third quartiles, respectively, for the periods ended December 31, 2014. The Trustees also noted that the Fund had underperformed its benchmark, the Russell 1000® Value Index, for the one-, three-, five- and ten-year periods ended December 31, 2014. The Trustees noted that the Fund had changed subadvisers in May of 2012, engaging Aristotle to manage the Fund.
The Trustees considered the expertise of Aristotle in managing assets generally and in the large cap value asset class specifically, noting that Aristotle managed approximately $7.14 billion in assets in the value equity strategy used for the
86
Harbor Domestic Equity Funds
ADDITIONAL INFORMATION—Continued
Fund, out of a firm-wide total of approximately $8.85 billion in assets under management. The Trustees also discussed the significant experience of the Fund’s portfolio manager, including his experience prior to joining Aristotle.
The Trustees noted that the Lipper comparison of contractual management fees for the Fund’s expense group, assuming an asset level of $250 million, showed the Fund’s management fee was below the group median for the Institutional Class, and the actual total expense ratio for the Fund’s Institutional Class was below its group and universe median expense ratios. The Trustees also considered that Harbor Capital proposed to continue the Fund’s existing contractual fee waiver/expense reimbursement arrangement until at least February 29, 2016. The Trustees noted that the Adviser’s profitability in managing the Fund was not excessive.
Harbor Mid Cap Value Fund. In consideration of the Investment Advisory Agreement and Subadvisory Agreement for the Harbor Mid Cap Value Fund (inception date of March 1, 2002), the Trustees noted that the Fund’s Institutional Class performance was above both its Lipper group and universe medians for the one-, two-, three-, four- and five-year periods ended December 31, 2014. The Morningstar data presented showed that the Fund’s one-, three- and five-year rolling returns each ranked in the first quartile for the periods ended December 31, 2014. The Trustees considered the fact that the Fund had outperformed its benchmark, the Russell Midcap® Value Index, for the three- and five-year periods ended December 31, 2014, but underperformed its benchmark index for the one- and ten-year periods ended December 31, 2014.
The Trustees considered the expertise of LSV Asset Management (“LSV”) in managing assets generally and in the mid cap value asset class specifically, noting that LSV managed approximately $2.2 billion in assets in this asset class, out of a firm-wide total of approximately $89 billion in assets under management. The Trustees also considered that LSV applies a similar quantitative approach to managing assets in the mid cap value asset class as it does for its other value products, and that the long-term performance generated by LSV across its various value products has been favorable. The Trustees reviewed the expertise of the Fund’s portfolio managers in this asset class, noting that one of the three portfolio managers was a founding partner of LSV.
The Trustees noted that the Lipper comparison of contractual management fees for the Fund’s expense group, assuming an asset level of $325 million, showed the Fund’s management fee was below the group median for the Institutional Class. The actual total expense ratio for the Fund’s Institutional Class was below the group median expense ratio and the universe median expense ratio. The Trustees noted that the Adviser’s profitability in managing the Fund was not excessive.
Harbor Small Cap Value Fund. In consideration of the Investment Advisory Agreement and Subadvisory Agreement for the Harbor Small Cap Value Fund (inception date of December 14, 2001), the Trustees noted the Fund’s Institutional Class outperformance relative to its Lipper group medians for the one-, two-, three-, four- and five-year periods ended December 31, 2014, its outperformance relative to its Lipper universe medians for the one-, two-, four- and five-year periods ended December 31, 2014, and its underperformance relative to its Lipper universe median for the three-year period ended December 31, 2014. According to the Morningstar data presented, the Fund’s one-, three- and five-year rolling returns ranked in the first, second and second quartiles, respectively, for the period ended December 31, 2014. The Trustees also considered the fact that the Fund outperformed its benchmark, the Russell 2000® Value Index, for the one-, three-, five- and ten-year periods ended December 31, 2014.
The Trustees considered the expertise of EARNEST Partners LLC (“EARNEST”) in managing assets generally and in the small cap value asset class specifically, noting that EARNEST managed approximately $3.69 billion in assets in this asset class out of $23.18 billion firm wide total. The Trustees also noted the experience of the Fund’s portfolio manager in this asset class, noting that he is the founder of EARNEST.
They observed that the Lipper comparison of contractual management fees for the Fund’s expense group, assuming an asset level of $750 million, showed the Fund’s management fee was below the group median for the Institutional Class. The actual total expense ratio for the Fund’s Institutional Class was below the group and universe median expense ratios. The Trustees noted that Harbor Capital’s profitability in operating the Fund was not excessive.
* * *
The Trustees also separately considered the allocation between the Adviser and each Subadviser of the relevant Fund’s investment advisory fee (i.e., the amount of the advisory fee retained by the Adviser relative to that paid to the relevant Subadviser as a subadvisory fee). They determined in each case that the allocation was reasonable and the product of arm’s length negotiation between the Adviser and Subadviser.
87
Harbor Domestic Equity Funds
ADDITIONAL INFORMATION—Continued
Profitability
The Trustees also considered the Adviser’s profitability in managing each of the Funds (as well as on a fund complex-wide basis) as presented by the Adviser, and the allocation methodology used by the Adviser to compute such profitability. The Trustees acknowledged that a reasonable level of profitability was important to provide suitable incentives for the Adviser to continue to attract and maintain high-quality personnel and to invest in infrastructure and other resources to support and enhance the Funds’ operations. In considering the Adviser’s profitability generally, the Trustees also reviewed the compensation received by Harbor Services Group and Harbor Funds Distributors in consideration of the transfer agency and distribution services, respectively, that are provided to Harbor Funds, and any other benefits enjoyed by the Adviser and its affiliates as a result of their relationship with Harbor Funds. The Trustees noted that the Adviser was, in certain cases, waiving a portion of its advisory fee and/or reimbursing a portion of Fund expenses. The Trustees determined that the Adviser’s profitability in managing each Fund was not excessive.
Economies of Scale
The Trustees also considered the extent to which economies of scale might be realized as each Fund grows, and the extent to which each Fund’s advisory fee level reflects these economies of scale for the benefit of Fund investors. The Trustees specifically considered whether any advisory fee reduction “breakpoints” should be added to the advisory fee payable by any Fund. As noted above, the Trustees concluded that the Adviser’s profitability in each case was not excessive. They concluded that the Funds’ fee structures reflected economies of scale to date and that breakpoints in these fee structures were not required at the present time. The Trustees noted they intend to monitor each Fund’s asset growth in connection with future reviews of each Fund’s Investment Advisory Agreement to determine whether breakpoints may be appropriate at such time.
88
Harbor Domestic Equity Funds
ADDITIONAL INFORMATION—Continued
TRUSTEES AND OFFICERS
(As of June 2015)
The business and affairs of the Trust shall be managed by or under the direction of the Trustees, and they shall have all powers necessary or desirable to carry out that responsibility. The Trustees shall have full power and authority to take or refrain from taking any action and to execute any contracts and instruments that they may consider necessary or desirable in the management of the Trust. Any determination made by the Trustees in good faith as to what is in the interests of the Trust shall be conclusive. Information pertaining to the Trustees and Officers of Harbor Funds is set forth below. The address of each Trustee and Officer is: [Name of Trustee or Officer] c/o Harbor Funds, 111 South Wacker Drive, 34th Floor, Chicago, IL 60606-4302.
The Harbor Funds’ Statement of Additional Information includes additional information about the Trust’s Trustees and is available without charge by calling 800-422-1050 or at the Trust’s website at harborfunds.com.
| | | | | | | | |
Name (Age) Position(s) with Fund Address | | Term of
Office and
Length of
Time Served1 | | Principal Occupation(s) During Past Five Years | | Number of
Portfolios in
Fund Complex
Overseen by
Trustee | | Other Directorships
of Public Companies
and Other Registered
Investment
Companies Held by
Trustee During Past
Five Years |
| INDEPENDENT TRUSTEES |
Scott M. Amero (51) Trustee | | Since 2014 | | Trustee, Rare (conservation non-profit) (2011-Present); Trustee, Berkshire School (2014-Present); BlackRock, Inc., (publicly traded investment management firm) Vice Chairman and Global Chief Investment Officer, Fixed Income (2010), Vice Chairman and Global Chief Investment Officer, Fixed Income, and Co-Head, Fixed Income Portfolio Management (2007-2010). | | 28 | | Director, Anthracite Capital, Inc. (2005-2010). |
| | | | |
Raymond J. Ball (70) Trustee | | Since 2006 | | Sidney Davidson Distinguished Service Professor of Accounting, University of Chicago Booth School of Business (2000-Present); Academic Affiliate, Analysis Group (litigation consulting firm) (2000-Present); Financial Reporting Faculty Advisory Group of the Institute of Chartered Accountants in England and Wales (2008-Present); and Advisory Board of the Center for Accounting Research & Education at University of Notre Dame (2006-Present). | | 28 | | None |
| | | | |
Donna J. Dean (63) Trustee | | Since 2010 | | Chief Investment Officer of the Rockefeller Foundation (a private foundation) (1995-Present); and Trustee of Queens University of Charlotte, North Carolina (2000-2014). | | 28 | | None |
| | | | |
Randall A. Hack (68) Trustee | | Since 2010 | | Founder and Senior Managing Director of Capstone Capital LLC (a private investment firm) (2003-Present); Director of Tower Development Corporation (cell tower developer) (2009-Present); and Advisory Director of Berkshire Partners (a private equity firm) (2002-2013). | | 28 | | Director of FiberTower Corporation (2002-2011). |
| | | | |
Robert Kasdin (57) Trustee | | Since 2014 | | Senior Vice President and Chief Operating Officer, Johns Hopkins Medicine (2015-Present); Senior Executive Vice President, Columbia University (2002-2015); Trustee, National September 11 Memorial & Museum at the World Trade Center (2005-Present); Trustee, The Metropolitan Museum of Art (2014-Present); Trustee (2004-2014) and President of the Board of Trustees (2006-2011), The Dalton School; Trustee, ARTstor Digital Library (a nonprofit digital images resource) (2013-Present); Director, Apollo Commercial Real Estate Finance, Inc. (2014-Present); and Director, Noranda Aluminum Holdings Corp. (2007-2014). | | 28 | | Director of Noranda Aluminum Holdings Corp. (2007–2014); and Director of Apollo Commercial Real Estate Finance, Inc. (2014-Present). |
| | | | |
Rodger F. Smith (74) Trustee | | Since 1987 | | Managing Director, Greenwich Associates (a research based consulting firm) (1976-Present); and Chair of Trust Advisory Committee of Tau Beta Pi Association (engineering honor society) (1985-Present). | | 28 | | None |
| | | | |
Ann M. Spruill (61) Trustee | | Since 2014 | | Partner (1993-2008), Member of Executive Committee (1996-2008), Member Board of Directors (2000-2008), Grantham, Mayo, Van Otterloo & Co. LLC (private investment management firm) (with the firm since 1990); Member Investment Committee and Chair of Global Equities, Museum of Fine Arts, Boston (2000-Present); and Trustee, Financial Accounting Foundation (2014-Present). | | 28 | | None |
| INTERESTED TRUSTEE |
David G. Van Hooser (68)* Chairman, Trustee and President | | Since 2000 | | President (2002-Present), Director and Chairman of the Board (2000-Present), Harbor Capital Advisors, Inc.; Chief Executive Officer (2007-Present), Chief Financial Officer (2012-Present), Treasurer (2007-2012) and Director (2000-Present), Harbor Funds Distributors, Inc.; and Director (2000-Present), Harbor Services Group, Inc. | | 28 | | None |
89
Harbor Domestic Equity Funds
ADDITIONAL INFORMATION—Continued
| | | | | | | | |
Name (Age) Position(s) with Fund Address | | Term of
Office and
Length of
Time Served1 | | Principal Occupation(s) During Past Five Years |
| FUND OFFICERS NOT LISTED ABOVE** |
Charles F. McCain (45) Chief Compliance Officer | | Since 2004 | | Executive Vice President and General Counsel (2004-Present) and Chief Compliance Officer (2004-2014), Harbor Capital Advisors, Inc.; Director (2007-Present) and Chief Compliance Officer (2004-Present), Harbor Services Group, Inc.; and Director, Executive Vice President and Chief Compliance Officer (2007-Present), Harbor Funds Distributors, Inc. |
| | |
Anmarie S. Kolinski (43) Treasurer | | Since 2007 | | Executive Vice President and Chief Financial Officer (2007-Present), Harbor Capital Advisors, Inc.; Chief Financial Officer (2007-Present), Harbor Services Group, Inc.; and Treasurer (2012-Present), Harbor Funds Distributors, Inc. |
| | |
Erik D. Ojala (40) Vice President and Secretary; AML Compliance Officer | | Since 2007;
Since 2010 | | Senior Vice President and Associate General Counsel (2007-Present) and Secretary (2010-Present), Harbor Capital Advisors, Inc.; and Assistant Secretary (2014-Present), Harbor Services Group, Inc. |
| | |
Brian L. Collins (46) Vice President | | Since 2005 | | Executive Vice President and Chief Investment Officer (2004-Present), Harbor Capital Advisors, Inc. |
| | |
Charles P. Ragusa (56) Vice President | | Since 2007 | | Executive Vice President (2007-Present), Harbor Capital Advisors, Inc.; President (2007-Present), Harbor Services Group, Inc.; and Executive Vice President and AML Compliance Officer (2007-Present), Harbor Funds Distributors, Inc. |
| | |
Jodie L. Crotteau (43) Assistant Secretary | | Since 2014 | | Senior Vice President and Chief Compliance Officer, Harbor Capital Advisors, Inc. (2014-Present); Vice President and Chief Compliance Officer, Grosvenor Registered Funds (2011-2014); Vice President, Grosvenor Capital Management, L.P. (2010-2014); Assistant Secretary (2005-2010) and AML Compliance Officer (2007-2010), Harbor Funds; Vice President, Secretary and Compliance Director (2007-2010), Harbor Capital Advisors, Inc.; Assistant Secretary (2005-2010), Harbor Services Group, Inc.; and Assistant Secretary (2007-2010), Harbor Funds Distributors, Inc. |
| | |
Susan A. DeRoche (62) Assistant Secretary | | Since 2006 | | Senior Vice President and Compliance Director (2007-Present) and Assistant Secretary (2006-Present), Harbor Capital Advisors, Inc.; Senior Vice President (2011–Present) and Secretary (2007-Present), Harbor Funds Distributors, Inc.; and Secretary (2014-Present) and Assistant Secretary (2012-2013), Harbor Services Group, Inc. |
| | |
John M. Paral (46) Assistant Treasurer | | Since 2013 | | Vice President (2012-Present) and Financial Reporting Manager (2007-2012), Harbor Capital Advisors, Inc. |
| 1 | Each Trustee serves for an indefinite term, until his successor is elected. Each Officer is elected annually. |
| * | Mr. Van Hooser is deemed an “Interested Trustee” due to his affiliation with the Adviser and Distributor of Harbor Funds. |
| ** | Officers of the Funds are “interested persons” as defined in the Investment Company Act. |
90
THIS PRIVACY STATEMENT IS NOT PART OF THIS REPORT
Harbor’s Privacy Statement
The following privacy statement is issued by Harbor Funds and each series of Harbor Funds and its affiliates, Harbor Capital Advisors, Inc., Harbor Services Group, Inc. and Harbor Funds Distributors, Inc. These measures reflect our commitment to maintaining the privacy of your confidential information. We appreciate the confidence you have shown by entrusting us with your assets.
Personal Information | It is our policy to respect the privacy of current and former shareholders and to protect personal information entrusted to us. We do not sell your personal information to anyone. |
| | In the course of providing products and services, we collect non-public personal information about you from the following sources: applications, forms, our website (including any information captured through our use of “cookies”), through mobile applications, by telephone and in correspondence and transactions with us, our affiliates or other parties. |
| | The non-public personal information collected may include name, address, e-mail address, telephone/fax numbers, account number, social security or taxpayer identification number, investment activity, and bank account information. |
| | When you visit us through our website or a mobile application, we may collect technical and navigational information, such as computer browser type, Internet protocol address, pages visited and average time spent on our website. We may use this information to alert you to software compatibility issues, or to improve our web design and functionality. We use “cookies” and similar files that may be placed on your hard drive for security purposes, to facilitate site navigation and to personalize the appearance of our site. |
Information Sharing | We occasionally disclose non-public personal information about our current or former shareholders with affiliated and non-affiliated parties, as permitted or required by law or regulation. In the normal course of servicing our shareholders, information we collect may be shared with non-affiliated companies that perform support services on our behalf or to other firms that assist us in providing you with products and services, such as custodians, transfer agents, broker-dealers and marketing service firms, as well as with other financial institutions. These companies may not use the information for any other purpose and we require them to keep the information they handle confidential. We may also share information with affiliates that are engaged in a variety of financial services in order to better service your account(s). |
| | When information is shared with third parties, they are not permitted to use the information for any purpose other than to assist our servicing of your account(s) or as permitted by law. |
| | If you close your account(s) or if we lose contact with you, we will continue to share information in accordance with our current privacy policy and practices. |
Access to Information | Access to non-public personal information is limited to employees, agents or other parties who need to know that information to perform their jobs, such as servicing your account(s), resolving problems or informing you of new products or services. |
Security | We maintain physical, electronic and procedural safeguards that comply with industry standards to protect your non-public personal information. |
| | For shareholders accessing information through our website or a mobile application, various forms of Internet security, such as data encryption firewall barriers, user names and passwords, and other tools are used. For additional information regarding our security measures, visit the terms and conditions of use on our website at harborfunds.com. If you have any questions or concerns about how we maintain the privacy of your non-public personal information, please contact us at 800-422-1050 Monday through Friday, between the hours of 8:00 a.m. and 6:00 p.m. Eastern time. |
We recommend that you read and retain this notice for your personal files
Eff. November 2013
91
Glossary
12b-1 Fee—A mutual fund fee, named for the SEC rule that permits it, used to pay for broker-dealer compensation and other distribution costs. If a fund has a 12b-1 fee, it will be disclosed in the fee table of a fund’s prospectus.
ADR—ADR after the name of a foreign holding stands for American Depositary Receipts representing ownership of foreign securities. ADRs are issued by U.S. banking institutions.
Average Market Capitalization—The average market capitalization of a fund’s equity portfolio gives you a measure of the size of the companies in which the fund invests. Market capitalization is calculated by multiplying the number of a company’s shares outstanding by its price per share.
Average Weighted Coupon—A calculation from a fund’s portfolio by weighting the coupon of each bond by its relative size in the portfolio.
Barclays U.S. Aggregate Bond Index—The Barclays U.S. Aggregate Bond Index is an unmanaged index of investment-grade fixed-rate debt issues with maturities of at least one year. This unmanaged index does not reflect fees and expenses and is not available for direct investment.
Barclays U.S. TIPS Index—The Barclays U.S. TIPS Index is an unmanaged market index comprised of all U.S. Treasury Inflation Protected Securities rated investment grade (Baa3 or better), have at least one year to final maturity, and at least $250 million par amount outstanding. This unmanaged index does not reflect fees and expenses and is not available for direct investment.
Beta—A measure of market-related risk. The beta of every index is 1.00, no matter how volatile the index is. A beta less than one means the portfolio is less volatile than the index. A beta higher than one indicates more volatility than the index.
Bloomberg Commodity Index Total ReturnSM—The Bloomberg Commodity Index Total ReturnSM is a broadly diversified index that tracks the commodities markets through commodity futures contracts. This unmanaged index does not reflect fees and expenses and is not available for direct investment.
BofA Merrill Lynch All U.S. Convertibles Ex Mandatory Index—The BofA Merrill Lynch All U.S. Convertibles Ex Mandatory Index is broadly representative of the U.S. convertible securities market, consisting of publicly traded issues, denominated in U.S. dollars, of all credit qualities, and excluding mandatory (equity-linked) convertibles. This unmanaged index does not reflect fees and expenses and is not available for direct investment.
BofA Merrill Lynch U.S. Dollar 3-Month LIBOR Constant Maturity Index—The BofA Merrill Lynch U.S. Dollar 3-Month LIBOR Constant Maturity Index tracks the performance of a synthetic asset paying Libor to a stated maturity. The index is based on the assumed purchase at par of a synthetic instrument having exactly its stated maturity and with a coupon equal to that day’s fixing rate. That issue is assumed to be sold the following business day (priced at a yield equal to the current day fixing rate) and rolled into a new instrument. This unmanaged index does not reflect fees and expenses and is not available for direct investment.
BofA Merrill Lynch 3-Month U.S. Treasury Bill Index—The BofA Merrill Lynch 3-Month U.S. Treasury Bill Index is comprised of a single U.S. Treasury Bill issue purchased at the beginning of each month and held for a full month, at which time that issue is sold and rolled into a newly selected issue. The issue selected each month is that having a maturity date closest to, but not beyond 90 days from the rebalance date.
BofA Merrill Lynch U.S. High Yield Index—The BofA Merrill Lynch U.S. High Yield Index is an unmanaged index that tracks the performance of below investment grade U.S. dollar-denominated corporate bonds publicly issued in the U.S. domestic market. All bonds are U.S. dollar denominated and rated Split BBB and below. This unmanaged index does not reflect fees and expenses and is not available for direct investment.
BofA Merrill Lynch U.S. Non-Distressed High Yield Index—The BofA Merrill Lynch U.S. Non-Distressed High Yield Index is a subset of the BofA Merrill Lynch U.S. High Yield Index including all securities with an option-adjusted spread less than 1,000 basis points. The unmanaged index does not reflect fees and expenses and is not available for direct investment.
Bottom-Up Equity Management Style—A management style that de-emphasizes the significance of economic and market cycles, focusing instead on the analysis of individual stocks.
Capital Gains Distribution—Profits distributed to shareholders resulting from the sale of securities held in the fund’s portfolio.
Credit Risk—The possibility that a bond issuer may not be able to pay interest and repay its debt.
92
Glossary—Continued
CUSIP Number—Identification number assigned to every stock, corporate bond and municipal bond by the Committee on Uniform Securities Identification Procedures (CUSIP), which is established by the American Bankers Association.
Diversification—The practice of investing broadly across securities of a number of issuers to reduce risk.
Duration—A common gauge of the price sensitivity of a fixed income asset or portfolio to a change in interest rates.
Emerging Markets—Emerging markets are countries with relatively young stock and bond markets. Examples include Brazil and Thailand. Typically, emerging-markets investments have the potential for losses and gains larger than those of developed-market investments.
Expense Ratio—The Fund’s total annual operating expenses (including management fees, distribution (12b-1) fees and other expenses) expressed as a percentage of average net assets.
Family of Funds—A group of mutual funds, each typically with its own investment objective, managed and distributed by the same company.
GDR—GDR after the name of a holding stands for Global Depositary Receipt representing ownership of foreign securities. GDRs are issued by either U.S. or non-U.S. banking organizations.
Inception Date—The date on which the Fund commenced operations.
Investment Objective—The goal that an investor and mutual fund pursue together (e.g., current income, long-term capital growth, etc.)
Median Market Cap—An indicator of the size of companies in which a fund invests; the midpoint of market capitalization (market price x shares outstanding) of a fund’s stocks, weighted by the proportion of the fund’s assets invested in each stock. Stocks representing half of the fund’s assets have market capitalizations above the median, and the rest are below it.
MSCI All Country World Index—The MSCI All Country World Index is a free float-adjusted market capitalization weighted index that is designed to measure the equity market performance of developed and emerging markets. This unmanaged index does not reflect fees and expenses and is not available for direct investment.
MSCI All Country World Ex. U.S. (ND) Index—The MSCI All Country World Ex. U.S. is a free float-adjusted market capitalization weighted index that is designed to measure equity market performance in the global developed and emerging markets, excluding the United States. This unmanaged index does not reflect fees and expenses and is not available for direct investment.
MSCI EAFE (ND) Index—The MSCI EAFE (ND) Index is an unmanaged index generally representative of major overseas stock markets. This unmanaged index does not reflect fees and expenses and is not available for direct investment.
MSCI Emerging Markets (ND) Index—The MSCI Emerging Markets (ND) Index is a market capitalization weighted index of equity securities in more than 20 emerging market economies. This unmanaged index does not reflect fees and expenses and is not available for direct investment.
MSCI World (ND) Index—The MSCI World (ND) Index is a free float-adjusted market capitalization index that is designed to measure global developed market equity performance. This unmanaged index does not reflect fees and expenses and is not available for direct investment.
Net Asset Value (NAV)—The per share value of a mutual fund, determined by subtracting the fund’s liabilities from its assets and dividing by the number of shares outstanding. Mutual funds calculate their NAVs at least once each business day.
No-Load Fund—A mutual fund whose shares are sold without a sales commission and without a 12b-1 fee of more than 0.25% per year. Harbor funds are no-load.
Open-End Investment Company—The legal name for a mutual fund, indicating that it stands ready to redeem (buy back) its shares from investors on any business day. Harbor Funds is an open-end investment company.
Operating Expenses—Business costs paid from a fund’s assets before earnings are distributed to shareholders. These include management fees and 12b-1 fees and other expenses.
Portfolio Manager—A specialist employed by a mutual fund’s adviser or subadviser to invest the fund’s assets in accordance with predetermined investment objectives.
93
Glossary—Continued
Portfolio Turnover—A measure of the trading activity in a fund’s investment portfolio (how often securities are bought and sold by a fund). Funds with high turnover rates incur higher transaction costs and may be more likely to distribute capital gains (which may be taxable to investors).
Price to Book Ratio (P/B)—A ratio used to compare a stock’s market value to its book value. It is calculated by dividing the current closing price of the stock by the latest quarter’s book value. For a fund, the weighted average price/book ratio of the stocks it holds.
Price to Earnings Ratio (P/E)—The ratio of a stock’s current price to its per-share earnings over the past year. For a fund, the weighted average P/E of the stocks it holds. P/E is an indicator of market expectations about corporate prospects; the higher the P/E, the greater the market expectations are for a company’s future growth.
Prospectus—The official document that describes a mutual fund to prospective investors. The prospectus contains information required by the SEC, such as investment objectives and policies, risks, services and fees.
Record Date—The date on which a shareholder must officially own shares in order to be entitled to a dividend.
Redemption Fee—Fee charged to shareholders by a mutual fund when they sell shares within a specified period after purchase. The time limit and size of fee vary among funds. The fee is paid to the fund, not the fund’s investment adviser. Its purpose is to protect long-term investors from the impact of short-term traders.
REITs (Real Estate Investment Trust)—REITs invest in real estate or loans secured by real estate and issue shares in such investments. A REIT is similar to a closed-end mutual fund.
Repurchase Agreement (Repo)—A form of short-term borrowing for dealers in government securities. The dealer sells the government securities to investors, usually on an overnight basis, and buys them back the following day. For the party selling the security (and agreeing to repurchase it in the future), it is a repo. For the party on the other end of the transaction (buying the security and agreeing to sell back in the future), it is a reverse repurchase agreement.
Risk/Reward (or Return)—The relationship between the degree of risk associated with an investment and its return potential. Typically, the higher the potential return of an investment, the greater the risk.
Russell 1000® Growth Index—The Russell 1000® Growth Index is an unmanaged index generally representative of the U.S. market for larger capitalization growth stocks. This unmanaged index does not reflect fees and expenses and is not available for direct investment. The Russell 1000® Growth Index and Russell® are trademarks of Russell Investments.
Russell 1000® Value Index—The Russell 1000® Value Index is an unmanaged index generally representative of the U.S. market for larger capitalization value stocks. This unmanaged index does not reflect fees and expenses and is not available for direct investment. The Russell 1000® Value Index and Russell® are trademarks of Russell Investments.
Russell 2000® Index—The Russell 2000® Index measures the performance of the small-cap segment of the U.S. equity universe. The Russell 2000® Index is a subset of the Russell 3000® Index representing approximately 10% of the total market capitalization of that index. It includes approximately 2,000 of the smallest securities based on a combination of their market cap and current index membership. The Russell 2000® Index is constructed to provide a comprehensive and unbiased small-cap barometer and is completely reconstituted annually to ensure larger stocks do not distort the performance and characteristics of the true small-cap opportunity set. This unmanaged index does not reflect fees and expenses and is not available for direct investment. The Russell 3000® Index and Russell® are trademarks of Russell Investments.
Russell 2000® Growth Index—The Russell 2000® Growth Index is an unmanaged index representing the smallest 2,000 stocks with the highest price-to-book ratio and future earnings. This unmanaged index does not reflect fees and expenses and is not available for direct investment. The Russell 2000® Growth Index and Russell® are trademarks of Russell Investments.
Russell 2000® Value Index—The Russell 2000® Value Index is an unmanaged index representing the smallest 2,000 stocks with the lowest price-to-book ratio and future earnings. This unmanaged index does not reflect fees and expenses and is not available for direct investment. The Russell 2000® Value Index and Russell® are trademarks of Russell Investments.
Russell 3000® Index—The Russell 3000® Index measures the performance of the largest 3,000 U.S. companies representing approximately 98% of the investable U.S. equity market. The Russell 3000® Index is constructed to provide a comprehensive, unbiased and stable barometer of the broad market and is completely reconstituted annually to ensure new and growing equities are reflected. This unmanaged index does not reflect fees and expenses and is not available for direct investment. The Russell 3000® Index and Russell® are trademarks of Russell Investments.
94
Glossary—Continued
Russell 3000® Growth Index—The Russell 3000® Growth Index measures the performance of the broad growth segment of the U.S. equity universe. It includes those Russell 3000 companies with higher price-to-book ratios and higher forecasted growth values. The Russell 3000® Growth Index is constructed to provide a comprehensive, unbiased, and stable barometer of the broad growth market. The index is completely reconstituted annually to ensure new and growing equities are included and that the represented companies continue to reflect growth characteristics. This unmanaged index does not reflect fees and expenses and is not available for direct investment. The Russell 3000® Growth Index and Russell® are trademarks of Russell Investments.
Russell 3000® Value Index—The Russell 3000® Value Index measures the performance of the broad value segment of U.S. equity value universe. It includes those Russell 3000 companies with lower price-to-book ratios and lower forecasted growth values. The Russell 3000® Value Index is constructed to provide a comprehensive, unbiased, and stable barometer of the broad value market. The index is completely reconstituted annually to ensure new and growing equities are included and that the represented companies continue to reflect value characteristics. This unmanaged index does not reflect fees and expenses and is not available for direct investment. The Russell 3000® Value Index and Russell® are trademarks of Russell Investments.
Russell Midcap® Growth Index—The Russell Midcap® Growth Index is an unmanaged index generally representative of the U.S. market for medium capitalization growth stocks. This unmanaged index does not reflect fees and expenses and is not available for direct investment. The Russell Midcap® Growth Index and Russell® are trademarks of Russell Investments.
Russell Midcap® Value Index—The Russell Midcap® Value Index is an unmanaged index generally representative of the U.S. market for medium capitalization value stocks. This unmanaged index does not reflect fees and expenses and is not available for direct investment. The Russell Midcap® Value Index and Russell® are trademarks of Russell Investments.
S&P 500 Index—The S&P 500 Index is an unmanaged index generally representative of the U.S. stock market. This unmanaged index does not reflect fees and expenses and is not available for direct investment.
Statement of Additional Information (SAI)—The supplementary document to a prospectus that contains more detailed information about a mutual fund; also known as “Part B” of a fund’s registration statement.
TBAs—A term used to describe a forward mortgage-backed securities trade. Pass-through securities issued by Freddie Mac, Fannie Mae and Ginnie Mae trade in the TBA market. The term TBA is derived from the fact that the actual mortgage- backed security that will be delivered to fulfill a TBA trade is not designated at the time the trade is made. The securities are “to be announced” 48 hours prior to the established trade settlement date.
Treasury Inflation-Protected Securities (TIPS)—TIPS are securities in which the principal amount is adjusted for inflation and interest payments are applied to the inflation-adjusted principal.
Top-Down Equity Management Style—Investment style that begins with an assessment of the overall economic environment and makes a general asset allocation decision regarding various sectors of the financial markets and various industries.
Total Return—Return on an investment over a specified period, including price appreciation (or depreciation) plus any income, expressed as an average annual compound of return.
Weighted Average Duration—Duration is a time measure of a bond’s interest-rate sensitivity, based on the weighted average of the time periods over which a bond’s cash flows accrue to the bondholder. Time periods are weighted by multiplying by the present value of its cash flow divided by the bond’s price. (A bond’s cash flows consist of coupon payments and repayment of capital.) A bond’s duration will almost always be shorter than its maturity, with the exception of zero-coupon bonds, for which maturity and duration are equal.
Weighted Average Maturity—The average length of time until principal must be repaid for all bonds in a mutual fund portfolio on a dollar weighted basis.
Yield—A measure of net income (dividends and interest) earned by the securities in the fund’s portfolio less fund expenses during a specified period. A fund’s yield is expressed as a percentage of the maximum offering price per share on a specified date.
Yield to Maturity—The term used to describe the rate of return an investor will receive if a long-term, interest-bearing security, such as a bond, is held to its maturity date. Yield to maturity is greater than the coupon rate if the bond is selling at a discount and less than the coupon rate if it is selling at a premium.
95
| | | | | | |
| 111 South Wacker Drive, 34th Floor | | Chicago, IL 60606-4302 | | 800-422-1050 | | harborfunds.com |
Trustees & Officers
David G. Van Hooser
Chairman, President & Trustee
Scott M. Amero
Trustee
Raymond J. Ball
Trustee
Donna J. Dean
Trustee
Randall A. Hack
Trustee
Robert Kasdin
Trustee
Rodger F. Smith
Trustee
Ann M. Spruill
Trustee
Charles F. McCain
Chief Compliance Officer
Anmarie S. Kolinski
Treasurer
Erik D. Ojala
Vice President, Secretary & AML Compliance Officer
Brian L. Collins
Vice President
Charles P. Ragusa
Vice President
Jodie L. Crotteau
Assistant Secretary
Susan A. DeRoche
Assistant Secretary
John M. Paral
Assistant Treasurer
Investment Adviser
Harbor Capital Advisors, Inc.
111 South Wacker Drive
34th Floor
Chicago, IL 60606-4302
312-443-4400
Distributor & Principal Underwriter
Harbor Funds Distributors, Inc.
111 South Wacker Drive
34th Floor
Chicago, IL 60606-4302
312-443-4600
Shareholder Servicing Agent
Harbor Services Group, Inc.
P.O. Box 804660
Chicago, IL 60680-4108
800-422-1050
Custodian
State Street Bank & Trust Company
State Street Financial Center
1 Lincoln Street
Boston, MA 02111-2900

Semi-Annual Report
April 30, 2015
International & Global Funds
| | | | | | |
| | | | |
| | | Institutional Class | | Administrative Class | | Investor Class |
| | | |
| Harbor International Fund | | HAINX | | HRINX | | HIINX |
| | | |
| Harbor International Growth Fund | | HAIGX | | HRIGX | | HIIGX |
| | | |
| Harbor Global Growth Fund | | HGGAX | | HRGAX | | HGGIX |
| | | |
| Harbor Emerging Markets Equity Fund | | HAEMX | | HREMX | | HIEEX |
Table of Contents
This document must be preceded or accompanied by a Prospectus.
Harbor International & Global Funds
SEMI-ANNUAL REPORT OVERVIEW (Unaudited)
The first half of the fiscal year ended April 30, 2015. The performance figures for each of the Harbor Funds shown below assume the reinvestment of dividends and capital gains, but do not reflect the deduction of taxes that a shareholder would pay on Fund distributions or on the redemption of shares of the Funds. From time to time, certain fees and/or expenses have been voluntarily or contractually waived or reimbursed, which has resulted in higher returns. Without these waivers or reimbursements, the returns would have been lower. Voluntary waivers or reimbursements may be discontinued at any time without notice. For information on the different share classes, please refer to the current prospectus. The returns of the unmanaged indices assume the reinvestment of dividends but do not reflect fees and expenses. The indices are not available for direct investment.
Performance data shown represents past performance, which is no guarantee of future results. Current performance may be higher or lower than the past performance data shown. Investment returns and the value of an investment will fluctuate, and an investor’s shares, when sold, may be worth more or less than their original cost. You can obtain performance data current to the most recent month-end (available within seven business days after the most recent month-end) by calling 800-422-1050 or by visiting harborfunds.com.
| | | | | | | | | | | | |
| | | Unannualized Total Return
6 Months Ended April 30, 2015 | |
| | | Institutional
Class | | | Administrative
Class | | | Investor
Class | |
INTERNATIONAL & GLOBAL FUNDS | | | | | | | | | | | | |
Harbor International Fund | | | 7.69 | % | | | 7.55 | % | | | 7.48 | % |
Harbor International Growth Fund | | | 7.75 | | | | 7.59 | | | | 7.53 | |
Harbor Global Growth Fund | | | 3.92 | | | | 3.83 | | | | 3.71 | |
Harbor Emerging Markets Equity Fund | | | 0.10 | | | | -0.07 | | | | -0.04 | |
| | | | |
| COMMONLY USED MARKET INDICES | | Unannualized Total Return
6 Months Ended
April 30, 2015 | |
MSCI EAFE (ND); international equity | | | 6.81 | % |
MSCI All Country World Ex. U.S. (ND); global equity | | | 5.56 | |
MSCI All Country World (ND); global equity | | | 4.97 | |
MSCI Emerging Markets (ND); global equity | | | 3.92 | |
| | | | | | | | | | | | | | | | | | | | | | | | |
| | | EXPENSE RATIOS1 | | | Morningstar
Average2
(unaudited) | |
| | | 2011* | | | 2012* | | | 2013* | | | 2014* | | | 2015a | | |
HARBOR INTERNATIONAL & GLOBAL FUNDS | | | | | | | | | | | | | | | | | | | | | | | | |
Harbor International Fund | | | | | | | | | | | | | | | | | | | | | | | | |
Institutional Class | | | 0.77 | % | | | 0.77 | % | | | 0.74 | % | | | 0.73 | % | | | 0.73 | % | | | 0.99 | % |
Administrative Class | | | 1.02 | | | | 1.02 | | | | 0.99 | | | | 0.98 | | | | 0.98 | | | | 1.32 | |
Investor Class | | | 1.14 | | | | 1.14 | | | | 1.11 | | | | 1.10 | | | | 1.10 | | | | 1.37 | |
Harbor International Growth Fund | | | | | | | | | | | | | | | | | | | | | | | | |
Institutional Class | | | 0.86 | % | | | 0.87 | % | | | 0.89 | % | | | 0.85 | % | | | 0.85 | % | | | 1.03 | % |
Administrative Class | | | 1.11 | | | | 1.12 | | | | 1.14 | | | | 1.10 | | | | 1.10 | | | | 1.41 | |
Investor Class | | | 1.23 | | | | 1.24 | | | | 1.26 | | | | 1.22 | | | | 1.22 | | | | 1.43 | |
Harbor Global Growth Fund | | | | | | | | | | | | | | | | | | | | | | | | |
Institutional Class | | | 1.00 | % | | | 0.96 | % | | | 0.90 | % | | | 0.90 | % | | | 0.90 | % | | | 1.03 | % |
Administrative Class | | | 1.25 | | | | 1.21 | | | | 1.15 | | | | 1.15 | | | | 1.15 | | | | 1.21 | |
Investor Class | | | 1.37 | | | | 1.30 | | | | 1.27 | | | | 1.27 | | | | 1.27 | | | | 1.31 | |
Harbor Emerging Markets Equity Fund | | | | | | | | | | | | | | | | | | | | | | | | |
Institutional Class | | | N/A | | | | N/A | | | | N/A | | | | 1.25 | % | | | 1.21 | % | | | 1.30 | % |
Administrative Class | | | N/A | | | | N/A | | | | N/A | | | | 1.50 | | | | 1.47 | | | | 1.65 | |
Investor Class | | | N/A | | | | N/A | | | | N/A | | | | 1.62 | | | | 1.59 | | | | 1.66 | |
| 1 | Harbor Funds’ expense ratios are for operating expenses for the fiscal years ended October 31 (unless otherwise noted) and are shown net of all expense offsets, waivers and reimbursements (see Financial Highlights). |
| 2 | The Morningstar Average includes all actively managed no-load funds in the April 30, 2015 Morningstar Universe with the same investment style as the comparable Harbor fund’s portfolio and with the following additional characteristics for each Harbor Funds share class: Institutional Class contains funds with 12b-1 fees less than or equal to 0.25%; Administrative Class contains funds with 12b-1 fees and which are restricted primarily for use by retirement plans; and Investor Class contains funds with 12b-1 fees and a minimum investment less than $50,000. |
| a | Unaudited annualized figures for the six-month period ended April 30, 2015. |
1
Letter from the Chairman

David G. Van Hooser
Chairman
Dear Fellow Shareholder:
International stock markets moved higher in the first half of fiscal 2015 as investors responded favorably to accommodative initiatives by central banks in Europe, Japan and other countries. The U.S. dollar strengthened against most international currencies, enhancing the competitiveness of foreign exporters. A sharp decline in crude oil prices was regarded as a favorable development for consumers and energy-importing economies.
Shares of companies based in developed overseas markets returned 6.81%, as measured by the MSCI EAFE (ND) Index, while emerging markets equities returned 3.92%, as measured by the MSCI Emerging Markets (ND) Index. The MSCI World (ND) Index, a measure of global equities including the U.S., returned 5.09%. (All international and global returns are in U.S. dollars.)
Harbor International and Global Equity Funds
Harbor International Fund returned 7.69%, outperforming its MSCI EAFE (ND) Index benchmark by 88 basis points, or 0.88 percentage point. (All Harbor returns cited are for each fund’s Institutional Class shares.) Harbor International also continued to outperform the index for the latest 5-year and 10-year periods and since its inception in 1987.
Harbor International Growth Fund recorded a return of 7.75%, beating its benchmark, the MSCI All Country World Ex. U.S. (ND) Index, by 219 basis points. Harbor Global Growth Fund posted a return of 3.92%, lagging its MSCI All Country World (ND) Index benchmark by 105 basis points. Although it underperformed over the latest six months, Harbor Global Growth continued to outpace the index since its inception in 2009 as well as for the five years ended April 30, 2015. Harbor Emerging Markets Equity Fund returned 0.10%, underperforming its MSCI Emerging Markets (ND) Index by 382 basis points.
As always, we recommend that shareholders maintain a long-term perspective in evaluating all of their investments, including Harbor Funds. Comments by the portfolio managers of each international and global equity fund can be found in the pages preceding each Fund’s portfolio of investments.
| | | | | | | | | | | | | | | | | | | | |
| | | RETURNS FOR PERIODS ENDED APRIL 30, 2015 | |
| | | Unannualized | | | | | | Annualized | |
International & Global | | 6 Months | | | 1 Year | | | 5 Years | | | 10 Years | | | 30 Years | |
MSCI EAFE (ND) (foreign stocks) | | | 6.81 | % | | | 1.66 | % | | | 7.40 | % | | | 5.62 | % | | | 9.04 | % |
MSCI World (ND) (global stocks) | | | 5.09 | | | | 7.41 | | | | 10.51 | | | | 6.87 | | | | 9.44 | |
MSCI Emerging Markets (ND) (emerging markets) | | | 3.92 | | | | 7.80 | | | | 3.02 | | | | 9.58 | | | | N/A | |
| | | | | |
Domestic Equities | | | | | | | | | | | | | | | |
Wilshire 5000 Total Market (entire U.S. stock market) | | | 4.64 | % | | | 12.52 | % | | | 14.26 | % | | | 8.88 | % | | | 11.00 | % |
S&P 500 (large cap stocks) | | | 4.40 | | | | 12.98 | | | | 14.33 | | | | 8.32 | | | | 11.09 | |
Russell Midcap® (mid cap stocks) | | | 5.87 | | | | 13.30 | | | | 15.09 | | | | 10.27 | | | | 12.55 | |
Russell 2000® (small cap stocks) | | | 4.65 | | | | 9.71 | | | | 12.73 | | | | 9.18 | | | | 9.90 | |
Russell 3000® Growth | | | 6.59 | | | | 16.50 | | | | 15.45 | | | | 9.69 | | | | 10.41 | |
Russell 3000® Value | | | 2.82 | | | | 8.96 | | | | 13.15 | | | | 7.54 | | | | 11.24 | |
| | | | | |
Strategic Markets | | | | | | | | | | | | | | | |
Bloomberg Commodity Index Total ReturnSM | | | -11.87 | % | | | -24.69 | % | | | -5.02 | % | | | -2.44 | % | | | N/A | |
| | | | | |
Fixed Income | | | | | | | | | | | | | | | |
BofA Merrill Lynch U.S. High-Yield (high-yield bonds) | | | 1.51 | % | | | 2.57 | % | | | 8.18 | % | | | 8.28 | % | | | N/A | |
Barclays U.S. Aggregate Bond (domestic bonds) | | | 2.06 | | | | 4.46 | | | | 4.12 | | | | 4.75 | | | | 7.33 | % |
BofA Merrill Lynch 3-Month U.S. Treasury Bill (proxy for money market returns) | | | 0.01 | | | | 0.02 | | | | 0.09 | | | | 1.47 | | | | 3.90 | |
Barclays U.S. TIPS (inflation-linked bonds) | | | 1.28 | | | | 2.48 | | | | 3.96 | | | | 4.43 | | | | N/A | |
Domestic Equity, Strategic Markets, and Fixed Income
U.S. stock indices had positive returns for the first half of fiscal 2015, supported by accommodative monetary policies of the Federal Reserve and central banks of other countries. The Wilshire 5000 Total Market Index, a measure of the broad domestic equity market, had a return of 4.64% for the six months ended April 30, 2015. Growth stocks outperformed value stocks across all capitalization ranges.
2
Commodity markets finished broadly lower for the first half of fiscal 2015, driven in part by the decline in crude oil prices and the stronger U.S. dollar. The Bloomberg Commodity Index Total ReturnSM, an unmanaged index of futures contracts on a diversified group of physical commodities, returned -11.87%.
Fixed income markets generated modest gains in the first half of fiscal 2015. The Federal Reserve indicated its willingness to begin gradually raising short-term rates if warranted by certain signs of continued economic growth in the U.S. By contrast, against a backdrop of economic weakness and subdued inflation, a number of central banks outside the U.S., including Europe and Japan, introduced new monetary stimulus measures.
The broad U.S. investment-grade bond market returned 2.06% for the fiscal first half, as measured by the Barclays U.S. Aggregate Bond Index. Below investment-grade bonds returned 1.51%, as measured by the BofA Merrill Lynch U.S. High Yield Index. Inflation-linked bonds, as measured by the Barclays U.S. TIPS Index, returned 1.28%. Money market investments again produced barely positive returns as the Federal Reserve continued to hold its federal funds target rate at the 0.0% to 0.25% range.
Disciplined Approach
Although stocks and bonds may provide solid long-term returns, as indicated in the table on the preceding page, financial markets can be very volatile in the short run. Given the uncertainty of markets, a disciplined approach and a diversified portfolio can be useful tools in helping investors to manage risk. At Harbor Funds, we offer a range of actively-managed equity, strategic markets and fixed income funds to assist investors in establishing an investment plan to help achieve their long-term goals.
Thank you for your investment in Harbor Funds.
June 24, 2015

David G. Van Hooser
Chairman
3
Harbor International Fund
MANAGERS’ COMMENTARY (Unaudited)
SUBADVISER
Northern Cross, LLC
125 Summer Street
Suite 1410
Boston, MA 02110
PORTFOLIO MANAGERS
Howard Appleby, CFA
Since 2009
Jean-Francois Ducrest
Since 2009
James LaTorre, CFA
Since 2009
Northern Cross, LLC
has subadvised the
Fund since 2009.
INVESTMENT OBJECTIVE
The Fund seeks long-term total return,
principally from growth
of capital.
PRINCIPAL STYLE CHARACTERISTICS
International large cap
value oriented stocks

Howard Appleby

Jean-Francois Ducrest

James LaTorre
Management’s Discussion of Fund Performance
MARKET REVIEW
International equities posted positive results for the first half of fiscal 2015, with the MSCI EAFE (ND) Index recording a return of 6.81% for the six months ended April 30, 2015. (All international and global returns are in U.S. dollars.) The index is a measure of stocks in developed overseas markets. By comparison, shares of developing-markets companies returned 3.92%, as measured by the MSCI Emerging Markets (ND) Index, while U.S. equities, as measured by the S&P 500 Index, returned 4.40%.
Eight of the 10 economic sectors of the MSCI EAFE (ND) Index posted positive returns, led by Consumer Discretionary and Information Technology, which registered double-digit gains. Energy and Utilities were the only sectors to lose ground. Shares of Japanese companies, representing about 21% of the MSCI EAFE (ND) Index and posting an aggregate return of 13%, provided the biggest boost to index performance on a country-level basis. Other leading country-level contributors included Germany, France, and Switzerland.
PERFORMANCE
Harbor International Fund returned 7.69% (Institutional Class), 7.55% (Administrative Class), and 7.48% (Investor Class) for the fiscal first half, outpacing the 6.81% return of the MSCI EAFE (ND) Index. From a longer-term perspective, the Fund continued to outperform the benchmark since its inception in 1987 and for the 5 years and 10 years ended April 30, 2015.
Stock selection, especially in the Health Care, Industrials, and Energy sectors, was an important contributor to Fund performance relative to the index for the first half of fiscal 2015. Sector positioning also aided relative performance, as the Fund had a below-benchmark exposure to Energy stocks and no investment in the Utilities sector—the two weakest-performing areas of index. From a country-level perspective, a smaller-than-index allocation to shares of Japanese companies hurt relative performance, but this was more than offset by favorable stock selection, especially in the United Kingdom, France, Germany, and Sweden. Sector positioning and country weights generally are a reflection of individual stock selection decisions rather than an active element of the Fund’s investment strategy.
Almost all of the Fund’s holdings in the Health Care sector posted double-digit returns. Top contributors in the sector included Danish insulin maker Novo Nordisk, Swiss drug maker Novartis, Irish pharmaceutical company Shire, and French ophthalmic lens maker Essilor International. Leading contributors in the Industrials sector included Japanese industrial-robotics company Fanuc, U.K.-based engine-manufacturer Rolls-Royce, and Swedish truck maker Volvo. Fanuc’s shares rose 30% in the fiscal first half. In April, the company’s management announced plans to buy back shares and double its dividend.
The Fund’s only two holdings in the Energy sector, oil and natural gas company BG Group and oilfield-services provider Schlumberger, both posted positive returns while Energy names in the index had an aggregate return of -6%. BG Group was sold from the portfolio after agreeing in April to be acquired by Royal Dutch Shell in a transaction that represented a 50% premium to BG’s share price.
4
Harbor International Fund
MANAGERS’ COMMENTARY—Continued
| | | | |
TOP TEN HOLDINGS (% of net assets) | |
Novo Nordisk AS | | | 3.2% | |
FANUC Corp. | | | 2.8% | |
Novartis AG | | | 2.7% | |
Roche Holding AG | | | 2.7% | |
Rolls-Royce Holdings plc | | | 2.6% | |
Lloyds Banking Group plc | | | 2.5% | |
Banco Bilbao Vizcaya Argentaria SA | | | 2.4% | |
Schneider Electric SE | | | 2.4% | |
SAP SE | | | 2.3% | |
Unibail-Rodamco SE | | | 2.3% | |
Other top contributors to Fund performance included German auto makers Daimler and Volkswagen, in the Consumer Discretionary sector; French cosmetics group L’Oreal and Belgium-headquartered brewer Anheuser-Busch InBev, in the Consumer Staples sector; and Japanese insurer Tokio Marine Holdings, a Financials sector stock. Several Financials stocks were among portfolio holdings that detracted from returns, including Spanish banks Banco Bilbao Vizcaya Argentaria and Banco Santander, Brazilian banks Banco Bradesco and Itau Unibanco Holding, and U.K.-based Lloyds Banking Group. Other detractors included mining and energy company Freeport McMoran, Malaysian conglomerate Genting, and Japanese construction-equipment maker Komatsu.
Currency effects hurt absolute returns as reported in U.S. dollars but were essentially neutral in terms of relative performance. The strength of the dollar weighed on the performance of foreign shares for U.S.-based investors, as their returns were reduced when translated back into the U.S. currency. This had the effect of reducing index and Fund returns both by about seven percentage points for the fiscal first half.
OUTLOOK AND STRATEGY
As of April 30, 2015, the Fund’s biggest overweights relative to the MSCI EAFE (ND) Index were in the Industrials, Consumer Staples, and Health Care sectors. The biggest underweights were in Telecommunication Services and Utilities, where the portfolio had no exposure, and in the Energy sector. Relative to the benchmark, the Fund’s largest country exposures were in France and Switzerland, while the biggest underweights were in Japan, the United Kingdom, and Australia.
A key element of our investment philosophy is the belief that thorough and patient due diligence provides the best opportunities to invest in companies that will deliver long-term profit-margin expansion. We continue to focus on finding companies with long-term catalysts, a process that we believe leads to consistency and sustainability of individual stock performance.
The portfolio includes many global franchises that we believe should be able to demonstrate pricing power and benefit from a combination of earnings upgrades and higher relative valuations as the global economy gradually recovers. In addition, many of these companies have well-established positions in major developing economies.
Currency effects were an important factor in international equity markets in the fiscal first half as the U.S. dollar strengthened against most currencies. Although the strength of the U.S. currency had the effect of reducing international equity returns as expressed in dollars, we believe that many of the European-based companies in the portfolio should benefit from a weaker euro.
This report contains the current opinions of Northern Cross, LLC at the time of its publication and should not be considered as investment advice or a recommendation of any particular security, strategy or investment product. Such opinions are subject to change without notice and securities described herein may no longer be included in, or may at any time be removed from, the Fund’s portfolio. This report is distributed for informational purposes only. Information contained herein has been obtained from sources believed reliable, but not guaranteed.
Investing in international and emerging markets poses special risks, including potentially greater price volatility due to social, political and economic factors, as well as currency exchange rate fluctuations. These risks are more severe for securities of issuers in emerging market regions. For information on the different share classes and the risks associated with an investment in the Fund, please refer to the current prospectus.
5
Harbor International Fund
FUND SUMMARY—April 30, 2015 (Unaudited)
| | | | |
INSTITUTIONAL CLASS |
| | | | |
| Fund # | | | | 2011 |
| | |
| Cusip | | | | 411511306 |
| | |
| Ticker | | | | HAINX |
| | |
Inception
Date | | | | 12/29/1987 |
| | |
| Net Expense Ratio | | | | 0.73%a,b |
| | |
| Total Net Assets (000s) | | | | $44,949,452 |
| | | | |
ADMINISTRATIVE CLASS |
| | | | |
| Fund # | | | | 2211 |
| | |
| Cusip | | | | 411511652 |
| | |
| Ticker | | | | HRINX |
| | |
Inception
Date | | | | 11/01/2002 |
| | |
Net Expense Ratio | | | | 0.98%a,b |
| | |
Total Net Assets (000s) | | | | $915,111 |
| | | | |
INVESTOR CLASS |
| | | | |
| Fund # | | | | 2411 |
| | |
| Cusip | | | | 411511645 |
| | |
| Ticker | | | | HIINX |
| | |
Inception
Date | | | | 11/01/2002 |
| | |
Net Expense Ratio | | | | 1.10%a,b |
| | |
Total Net Assets (000s) | | | | $4,522,869 |
| b | Reflective of a contractual fee waiver effective through February 29, 2016. |
PORTFOLIO STATISTICS
| | | | | | | | |
| | | Portfolio | | | Benchmark | |
| | |
Number of Countries | | | 18 | | | | 24 | |
| | |
Weighted Average Market Cap (MM) | | | $70,639 | | | | $64,453 | |
| | |
Price/Earning Ratio (P/E) | | | 19.8x | | | | 20.9x | |
| | |
Price/Book Ratio (P/B) | | | 2.6x | | | | 2.2x | |
| | |
Beta vs. MSCI EAFE (ND) Index | | | 0.93 | | | | 1.00 | |
| | |
Portfolio Turnover (6-Month Period Ended 04/30/2015) | | | 12% | c | | | N/A | |
SECTOR ALLOCATION (% of investments)
(Excludes cash and short-term investments)
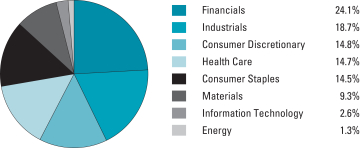
REGION BREAKDOWN (% of investments)
(Excludes cash and short-term investments)
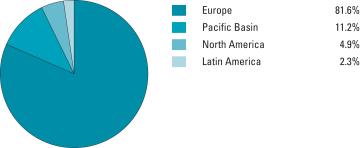
6
Harbor International Fund
FUND PERFORMANCE SUMMARY (Unaudited)
Institutional Class
CHANGE IN A $50,000 INVESTMENT
For the period 05/01/2005 through 04/30/2015
| | |
The graph compares a $50,000 investment in the Fund with the performance of the MSCI EAFE (ND) Index. The Fund’s performance includes the reinvestment of all dividend and capital gain distributions. | | 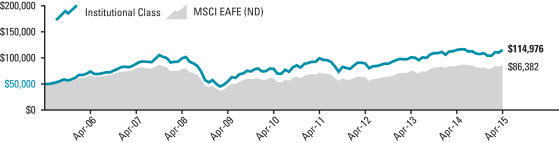 |
| | | | | | | | | | | | | | | | | | | | | | | | |
Total Returns For the periods ended 04/30/2015 | |  | |
| Harbor International Fund | | | | | | | | | | | | | | | | | | | | | | | | |
Institutional Class | | | 7.69 | % | | | -0.10 | % | | | 7.92 | % | | | 8.69 | % | | | 12/29/1987 | | | $ | 114,976 | |
| Comparative Index | | | | | | | | | | | | | | | | | | | | | | | | |
MSCI EAFE (ND) | | | 6.81 | % | | | 1.66 | % | | | 7.40 | % | | | 5.62 | % | | | — | | | $ | 86,382 | |
Administrative and Investor Classes
CHANGE IN A $10,000 INVESTMENT
For the period 05/01/2005 through 04/30/2015
| | |
The graph compares a $10,000 investment in the Fund with the performance of the MSCI EAFE (ND) Index. The Fund’s performance includes the reinvestment of all dividend and capital gain distributions. | | 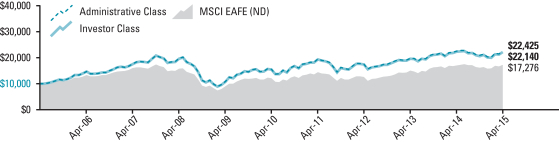 |
| | | | | | | | | | | | | | | | | | | | | | | | |
Total Returns For the periods ended 04/30/2015 | |  | |
| Harbor International Fund | | | | | | | | | | | | | | | | | | | | | | | | |
Administrative Class | | | 7.55 | % | | | -0.36 | % | | | 7.65 | % | | | 8.41 | % | | | 11/01/2002 | | | $ | 22,425 | |
Investor Class | | | 7.48 | % | | | -0.48 | % | | | 7.52 | % | | | 8.28 | % | | | 11/01/2002 | | | $ | 22,140 | |
| Comparative Index | | | | | | | | | | | | | | | | | | | | | | | | |
MSCI EAFE (ND) | | | 6.81 | % | | | 1.66 | % | | | 7.40 | % | | | 5.62 | % | | | — | | | $ | 17,276 | |
As stated in the Fund’s current prospectus, the expense ratios were 0.75% (Net) and 0.77% (Gross) (Institutional Class); 1.00% (Net) and 1.02% (Gross) (Administrative Class); and 1.12% (Net) and 1.14% (Gross) (Investor Class). The net expense ratios reflect a contractual management fee waiver through 02/29/2016. The expense ratios in the prospectus may differ from the actual expense ratios for the period disclosed within this report. The expense ratios shown in the prospectus are based on the prior fiscal year, adjusted to reflect changes, if any, in contractual arrangements that occurred prior to the date of the prospectus.
Performance data shown represents past performance, which is no guarantee of future results. Current performance may be higher or lower than the past performance data shown. Investment returns and the value of an investment will fluctuate, and an investor’s shares, when sold, may be worth more or less than their original cost. You can obtain performance data current to the most recent month-end (available within seven business days after the most recent month-end) by calling 800-422-1050 or visiting harborfunds.com.
The returns shown do not reflect the deduction of taxes that a shareholder would pay on Fund distributions or on the redemption of Fund shares. From time to time, certain fees and/or expenses have been waived or reimbursed, which has resulted in higher returns. Without these waivers and reimbursements, the returns would have been lower.
7
Harbor International Fund
PORTFOLIO OF INVESTMENTS—April 30, 2015 (Unaudited)
Equity Holdings by Country (% of net assets)
(Excludes net cash and short-term investments of 2.7%)
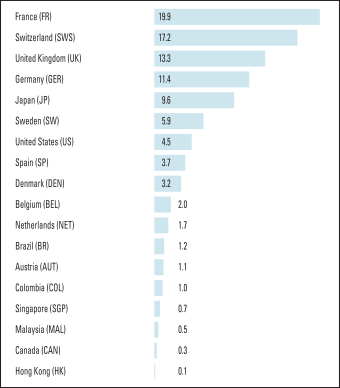
| | | | | | | | |
COMMON STOCKS—94.7% | |
| | |
| Shares | | | | | Value
(000s) | |
| | | | | | | | |
| | AEROSPACE & DEFENSE—2.6% | |
| | 80,837,163 | | | Rolls-Royce Holdings plc (UK)* | | $ | 1,288,779 | |
| | | | | | | | |
| | AUTO COMPONENTS—1.7% | |
| | 7,755,358 | | | Cie Generale des Etablissements Michelin (FR) | | | 864,845 | |
| | | | | | | | |
| | AUTOMOBILES—1.6% | |
| | 8,168,963 | | | Daimler AG (GER) | | | 785,419 | |
| | | | | | | | |
| �� | BANKS—11.1% | |
| | 120,853,911 | | | Banco Bilbao Vizcaya Argentaria SA (SP) | | | 1,214,349 | |
| | 86,414,687 | | | Banco Santander SA (SP) | | | 653,344 | |
| | 10,685,853 | | | Bancolombia SA ADR (COL)1 | | | 483,749 | |
| | 19,216,994 | | | Erste Group Bank AG (AUT) | | | 542,565 | |
| | 24,795,775 | | | Itau Unibanco Holding SA ADR (BR)1 | | | 317,882 | |
| | 1,074,879,979 | | | Lloyds Banking Group plc (UK)* | | | 1,272,955 | |
| | 47,668,664 | | | Standard Chartered plc (UK) | | | 780,441 | |
| | 17,759,786 | | | United Overseas Bank Ltd. (SGP) | | | 327,934 | |
| | | | | | | | |
| | | | | | | 5,593,219 | |
| | | | | | | | |
| | BEVERAGES—7.7% | |
| | 8,310,560 | | | Anheuser-Busch InBev NV (BEL) | | | 1,011,796 | |
| | 38,465,530 | | | Diageo plc (UK) | | | 1,067,894 | |
| | 10,734,208 | | | Heineken NV (NET)2 | | | 845,619 | |
| | 7,647,668 | | | Pernod Ricard SA (FR) | | | 950,482 | |
| | | | | | | | |
| | | | | | | 3,875,791 | |
| | | | | | | | |
| | BUILDING PRODUCTS—1.2% | |
| | 10,301,097 | | | Compagnie de Saint-Gobain (FR) | | | 468,155 | |
| | 5,454,100 | | | LIXIL Group Corp. (JP) | | | 113,683 | |
| | | | | | | | |
| | | | | | | 581,838 | |
| | | | | | | | |
| | | | | | | | |
| | CAPITAL MARKETS—2.0% | |
| | 50,403,755 | | | UBS Group AG (SWS)* | | | 1,006,932 | |
| | | | | | | | |
| | CHEMICALS—4.5% | |
| | 3,813,605 | | | Air Liquide SA (FR) | | | 498,745 | |
| | 4,801,614 | | | Linde AG (GER) | | | 938,281 | |
| | 2,531,149 | | | Syngenta AG (SWS) | | | 846,997 | |
| | | | | | | | |
| | | | | | | 2,284,023 | |
| | | | | | | | |
| | CONSTRUCTION MATERIALS—1.6% | |
| | 10,310,884 | | | Holcim Ltd. (SWS)* | | | 828,278 | |
| | | | | | | | |
| | DIVERSIFIED FINANCIAL SERVICES—1.6% | |
| | 19,274,353 | | | Investor AB (SW) | | | 785,386 | |
| | | | | | | | |
| | ELECTRICAL EQUIPMENT—4.9% | |
| | 33,183,745 | | | ABB Ltd. (SWS)* | | | 727,137 | |
| | 9,164,331 | | | Legrand SA (FR) | | | 529,906 | |
| | 16,460,570 | | | Schneider Electric SE (FR)2 | | | 1,230,401 | |
| | | | | | | | |
| | | | | | | 2,487,444 | |
| | | | | | | | |
| | ELECTRONIC EQUIPMENT, INSTRUMENTS & COMPONENTS—0.2% | |
| | 2,098,300 | | | Omron Corp. (JP) | | | 96,350 | |
| | | | | | | | |
| | ENERGY EQUIPMENT & SERVICES—1.3% | |
| | 6,920,485 | | | Schlumberger Ltd. (US) | | | 654,747 | |
| | | | | | | | |
| | FOOD PRODUCTS—2.0% | |
| | 12,680,524 | | | Nestlé SA (SWS) | | | 983,808 | |
| | | | | | | | |
| | HEALTH CARE EQUIPMENT & SUPPLIES—2.1% | |
| | 8,742,277 | | | Essilor International SA (FR) | | | 1,065,072 | |
| | | | | | | | |
| | HEALTH CARE PROVIDERS & SERVICES—1.7% | |
| | 4,366,990 | | | Fresenius Medical Care AG & Co. KGaA (GER) | | | 367,009 | |
| | 8,385,768 | | | Fresenius SE & Co. KGaA (GER) | | | 498,894 | |
| | | | | | | | |
| | | | | | | 865,903 | |
| | | | | | | | |
| | HOTELS, RESTAURANTS & LEISURE—2.9% | |
| | 4,409,957 | | | Accor SA (FR)2 | | | 241,819 | |
| | 79,787,300 | | | Genting Bhd (MAL) | | | 195,859 | |
| | 17,482,073 | | | Las Vegas Sands Corp. (US) | | | 924,452 | |
| | 815,497 | | | Wynn Resorts Ltd. (US) | | | 90,577 | |
| | | | | | | | |
| | | | | | | 1,452,707 | |
| | | | | | | | |
| | HOUSEHOLD PRODUCTS—1.3% | |
| | 7,572,885 | | | Reckitt Benckiser Group plc (UK) | | | 674,020 | |
| | | | | | | | |
| | INSURANCE—5.7% | |
| | 6,365,290 | | | Allianz SE (GER)2 | | | 1,083,465 | |
| | 41,239,043 | | | AXA SA (FR)2 | | | 1,042,764 | |
| | 18,392,600 | | | Tokio Marine Holdings Inc. (JP) | | | 749,787 | |
| | | | | | | | |
| | | | | | | 2,876,016 | |
| | | | | | | | |
| | MACHINERY—9.5% | |
| | 31,731,795 | | | Atlas Copco AB (SW)2 | | | 990,444 | |
| | 6,532,300 | | | FANUC Corp. (JP) | | | 1,436,862 | |
| | 21,537,300 | | | Komatsu Ltd. (JP) | | | 433,311 | |
| | 37,048,703 | | | Sandvik AB (SW)2 | | | 468,261 | |
| | 2,632,700 | | | SMC Corp. (JP) | | | 791,974 | |
| | 49,961,776 | | | Volvo AB (SW) | | | 690,232 | |
| | | | | | | | |
| | | | | | | 4,811,084 | |
| | | | | | | | |
| | MEDIA—1.7% | |
| | 11,185,700 | | | Dentsu Inc. (JP) | | | 521,418 | |
| | 8,446,271 | | | JCDecaux SA (FR) | | | 333,662 | |
| | | | | | | | |
| | | | | | | 855,080 | |
| | | | | | | | |
8
Harbor International Fund
PORTFOLIO OF INVESTMENTS—Continued
| | | | | | | | |
COMMON STOCKS—Continued | |
| | |
| Shares | | | | | Value
(000s) | |
| | | | | | | | |
| | METALS & MINING—2.9% | |
| | 9,225,538 | | | Anglo American plc (UK) | | $ | 156,304 | |
| | 8,698,308 | | | Anglo American plc ADR (UK)1 | | | 73,936 | |
| | 11,093,119 | | | Barrick Gold Corp. (CAN) | | | 144,432 | |
| | 25,242,618 | | | Freeport-McMoRan Inc. (US) | | | 587,396 | |
| | 104,866,949 | | | Glencore plc (UK)* | | | 498,177 | |
| | | | | | | | |
| | | | | | | 1,460,245 | |
| | | | | | | | |
| | PERSONAL PRODUCTS—1.7% | |
| | 4,446,174 | | | L’Oreal SA (FR)2 | | | 848,512 | |
| | | | | | | | |
| | PHARMACEUTICALS—10.4% | |
| | 48,650,545 | | | Indivior plc (UK)* | | | 148,792 | |
| | 13,517,679 | | | Novartis AG (SWS) | | | 1,379,778 | |
| | 28,589,155 | | | Novo Nordisk AS (DEN) | | | 1,605,014 | |
| | 4,662,879 | | | Roche Holding AG (SWS) | | | 1,334,307 | |
| | 9,762,211 | | | Shire plc (UK) | | | 793,312 | |
| | | | | | | | |
| | | | | | | 5,261,203 | |
| | | | | | | | |
| | REAL ESTATE INVESTMENT TRUSTS (REITs)—2.3% | |
| | 4,135,905 | | | Unibail-Rodamco SE (FR) | | | 1,141,967 | |
| | | | | | | | |
| | REAL ESTATE MANAGEMENT & DEVELOPMENT—0.1% | |
| | 572,500 | | | Ck Hutchison Holdings Ltd. (HK) | | | 12,404 | |
| | 9,826,000 | | | Hang Lung Properties Ltd. (HK) | | | 33,154 | |
| | 891,000 | | | Mitsubishi Estate Co. Ltd. (JP) | | | 20,972 | |
| | | | | | | | |
| | | | | | | 66,530 | |
| | | | | | | | |
| | SOFTWARE—2.3% | |
| | 15,494,696 | | | SAP SE (GER) | | | 1,170,857 | |
| | | | | | | | |
| | TEXTILES, APPAREL & LUXURY GOODS—4.6% | |
| | 10,521,747 | | | Cie Financiere Richemont SA (SWS) | | | 937,834 | |
| | 160,588 | | | Hermes International SA (FR) | | | 60,562 | |
| | 3,883,591 | | | LVMH Moet Hennessy Louis Vuitton SE (FR) | | | 679,109 | |
| | 1,460,050 | | | Swatch Group AG (SWS) | | | 652,723 | |
| | | | | | | | |
| | | | | | | 2,330,228 | |
| | | | | | | | |
| | TOBACCO—1.5% | |
| | 21,221,700 | | | Japan Tobacco Inc. (JP) | | | 741,080 | |
| | | | | | | | |
| TOTAL COMMON STOCKS
(Cost $34,972,294) | | | 47,737,363 | |
| | | | | | | | |
| | | | | | | | |
PREFERRED STOCKS—2.5% | |
| | AEROSPACE & DEFENSE—0.0% | |
| | 11,398,039,983 | | | Rolls-Royce Holdings plc (UK)* | | | 17,496 | x |
| | | | | | | | |
| | AUTOMOBILES—1.9% | |
| | 3,610,541 | | | Volkswagen AG (GER)2 | | | 929,518 | |
| | | | | | | | |
| | BANKS—0.6% | |
| | 29,854,820 | | | Banco Bradesco SA (BR) | | | 318,668 | |
| | | | | | | | |
| TOTAL PREFERRED STOCKS
(Cost $921,354) | | | 1,265,682 | |
| | | | | | | | |
| | | | | | | | |
RIGHTS/WARRANTS—0.1% | |
| | |
No. of
Contracts | | | | | Value
(000s) | |
| | | | | | | | |
| | BANKS—0.0% | |
| | 86,414,687 | | | Banco Santander SA (SP)
05/05/2015 | | | 14,203 | |
| | | | | | | | |
| | HOTELS, RESTAURANTS & LEISURE—0.1% | |
| | 30,633,782 | | | Genting Bhd (MAL)
MYR$7.96–12/18/2018 | | | 15,913 | |
| | | | | | | | |
| TOTAL RIGHTS/WARRANTS
(Cost $28,239) | | | 30,116 | |
| | | | | |
| | | | | |
SHORT-TERM INVESTMENTS—10.1% | |
Principal
Amount
(000s) | | | | | | |
| | COMMERCIAL PAPER—2.2% | |
| | | | Exxon Mobil Corp. | | | | |
| $ | 100,000 | | | 0.050%–05/01/2015 | | | 100,000 | |
| | 450,000 | | | 0.060%–05/01/2015-05/12/2015 | | | 450,000 | |
| | 250,000 | | | 0.070%–05/04/2015-05/07/2015 | | | 250,000 | |
| | | | | | | | |
| | | | | | | 800,000 | |
| | | | | | | | |
| | | | Toyota Motor Credit | | | | |
| | 250,000 | | | 0.070%–05/05/2015-05/22/2015 | | | 250,000 | |
| | 50,000 | | | 0.090%–05/20/2015 | | | 50,000 | |
| | | | | | | | |
| | | | | | | 300,000 | |
| | | | | | | | |
| | | | | | | 1,100,000 | |
| | | | | | | | |
| | REPURCHASE AGREEMENTS—0.2% | |
| | 112,986 | | | Repurchase Agreement with State Street Corp.
dated April 30, 2015 due May 01, 2015 at 0.000% collateralized by Federal National Mortgage Association Notes (market value $115,246) | | | 112,986 | |
| | | | | | | | |
| | | | | | | | |
| Shares | | | | | | |
| | INVESTMENT COMPANY-SECURITIES LENDING INVESTMENT FUND—7.7% | |
| | 3,872,214,484 | | | State Street Navigator Securities Lending Prime Portfolio (1-day yield of 0.150%)3 | | | 3,872,214 | |
| | | | | | | | |
| TOTAL SHORT-TERM INVESTMENTS
(Cost $5,085,200) | | | 5,085,200 | |
| | | | | | | | |
| TOTAL INVESTMENTS—107.4%
(Cost $41,007,087) | | | 54,118,361 | |
| | | | | | | | |
| | CASH AND OTHER ASSETS, LESS LIABILITIES—(7.4)% | | | (3,730,929 | ) |
| | | | | | | | |
| | TOTAL NET ASSETS—100.0% | | $ | 50,387,432 | |
| | | | | | | | |
9
Harbor International Fund
PORTFOLIO OF INVESTMENTS—Continued
FAIR VALUE MEASUREMENTS
The following table summarizes the Fund’s investments as of April 30, 2015 based on the inputs used to value them.
| | | | | | | | | | | | | | | | |
Asset Category | | Quoted Prices
Level 1
(000s) | | | Other Significant
Observable Inputs
Level 2
(000s) | | | Significant
Unobservable Inputs
Level 3
(000s) | | | Total
(000s) | |
Common Stocks | | | | | | | | | | | | | | | | |
Europe | | $ | 73,936 | | | $ | 38,985,404 | | | $ | — | | | $ | 39,059,340 | |
Latin America | | | 801,631 | | | | — | | | | — | | | | 801,631 | |
North America | | | 2,311,027 | | | | 90,577 | | | | — | | | | 2,401,604 | |
Pacific Basin | | | — | | | | 5,474,788 | | | | — | | | | 5,474,788 | |
Preferred Stocks | | | | | | | | | | | | | | | | |
Europe | | | — | | | | 929,518 | | | | 17,496 | | | | 947,014 | |
Latin America | | | 318,668 | | | | — | | | | — | | | | 318,668 | |
Rights/Warrants | | | | | | | | | | | | | | | | |
Europe | | | — | | | | 14,203 | | | | — | | | | 14,203 | |
Pacific Basin | | | 15,913 | | | | — | | | | — | | | | 15,913 | |
Short-Term Investments | | | | | | | | | | | | | | | | |
Commercial Paper | | | — | | | | 1,100,000 | | | | — | | | | 1,100,000 | |
Repurchase Agreements | | | — | | | | 112,986 | | | | — | | | | 112,986 | |
Investment Company-Securities Lending Investment Fund | | | — | | | | 3,872,214 | | | | — | | | | 3,872,214 | |
| | | | | | | | | | | | | | | | |
Total Investments in Securities | | $ | 3,521,175 | | | $ | 50,579,690 | | | $ | 17,496 | | | $ | 54,118,361 | |
| | | | | | | | | | | | | | | | |
The following is a rollforward of the Fund’s Level 3 investments during the period ended April 30, 2015.
| | | | | | | | | | | | | | | | | | | | | | | | | | | | | | | | | | | | |
Valuation Description | | Balance
Beginning at
11/01/2014
(000s) | | | Purchases
(000s) | | | Sales
(000s) | | | Accrued
Discount/
(Premium)
(000s) | | | Total
Realized
Gain/(Loss)w
(000s) | | | Change in
Unrealized
Appreciation/
(Depreciation)w
(000s) | | | Transfers
In Level 3
(000s) | | | Transfers
Out of
Level 3
(000s) | | | Ending
Balance
as of
04/30/2015w
(000s) | |
Preferred Stocks | | $ | 10,925 | | | $ | 17,142 | | | $ | (10,962 | ) | | $ | — | | | $ | — | | | $ | 391 | | | $ | — | | | $ | — | | | $ | 17,496 | |
| | | | | | | | | | | | | | | | | | | | | | | | | | | | | | | | | | | | |
Of the Level 1 investments presented above, certain Preferred Stocks valued at $318,668 were categorized in Level 2 at October 31, 2014. Transfers from Level 2 to Level 1 were the result of exchange traded securities where quoted prices from an active market were not available (Level 2), and have become available (Level 1).
The following is a summary of significant unobservable inputs used in the fair valuations of assets and liabilities categorized within Level 3 of the fair value hierarchy.
| | | | | | | | | | | | |
Valuation Descriptions | | Ending Balance
as of 04/30/2015
(000s) | | | Valuation Technique | | Unobservable Inputs | | Input
Value(s) | |
| Investments in Securities | | | | | | | | | | | | |
Preferred Stocks | | | | | | | | | | | | |
Rolls-Royce Holdings plc (UK)* | | $ | 17,496 | | | Market Approach | | Pre-Traded Price | | £ | 0.001 | |
| | | | | | | | | | | | |
For more information on valuation inputs and their aggregation into the levels used in the table above, please refer to the Fair Value Measurements and Disclosures in Note 2 of the accompanying Notes to Financial Statements.
| * | Non-income producing security. |
| 1 | ADR after the name of a foreign holding stands for American Depositary Receipts representing ownership of foreign securities. ADRs are issued by U.S. banking institutions. |
| 2 | A portion or all of this security was out on loan as of April 30, 2015. |
| 3 | Represents the investment of collateral received from securities lending activities. |
| w | The amounts in this category are included in the “Realized and Change in Unrealized Gain/(Loss) on Investment Transactions” section of the Statement of Operations. The net unrealized appreciation/(depreciation) per investment type is below: |
| | | | |
Valuation Description | | Unrealized
Gain/(Loss) as of
04/30/2015
(000s) | |
Preferred Stocks | | $ | 354 | |
| | | | |
| x | Fair valued in accordance with Harbor Funds Valuation Procedures using pre-traded price, which is a Level 3 input. |
The accompanying notes are an integral part of the Financial Statements.
10
Harbor International Growth Fund
MANAGERS’ COMMENTARY (Unaudited)
SUBADVISER
Baillie Gifford Overseas Limited
Calton Square
1 Greenside Row
Edinburgh, Scotland
United Kingdom EHI 3AN
PORTFOLIO MANAGERS
Gerard Callahan
Since 2013
Iain Campbell
Since 2013
Joe Faraday, CFA
Since 2013
Moritz Sitte, CFA
Since 2014
Sophie Earnshaw, CFA
Since 2014
Tom Walsh, CFA
Since 2014
Baillie Gifford has subadvised the Fund since 2013.
INVESTMENT OBJECTIVE
The Fund seeks long-term growth of capital.
PRINCIPAL STYLE CHARACTERISTICS
Foreign companies selected for long-term growth potential

Gerard Callahan

Iain Campbell

Joe Faraday

Moritz Sitte

Sophie Earnshaw

Tom Walsh
Management’s Discussion of Fund Performance
MARKET REVIEW
International stock markets rose over the six months ended April 30, 2015. The MSCI All Country World Ex U.S. (ND) Index, a measure of stocks in both developed and emerging overseas markets, returned 5.56%. (All international and global returns are in U.S. dollars.)
A sharp and unexpected fall in the price of oil affected many energy stocks and large oil-exporting countries. Energy was the worst-performing sector in the index, returning -6%. With growth in global demand for oil slowing, a combination of increasing production in the U.S. and the reluctance of larger OPEC partners to ease production pushed prices down.
At a regional level, European stock markets were strong, and it seemed that market participants were optimistic that a weaker currency and lower energy prices would be helpful to European corporate profits. Stocks in Japan and China posted double-digit returns and were major contributors to index performance.
PERFORMANCE
Harbor International Growth Fund returned 7.75% (Institutional Class), 7.59% (Administrative Class), and 7.53% (Investor Class) for the six months ended April 30, 2015, outperforming the 5.56% return of the MSCI All Country World Ex U.S. (ND) Index.
The Fund is constructed stock by stock, with each holding debated and selected on merit by the six investment managers. They seek to invest in companies which they believe are capable of delivering superior growth in earnings and cash flows over long periods of time. They aim to differentiate the Fund from the majority of the market by taking a long-term view, in the belief that market participants often undervalue long-term growth potential in favor of an expectation of short-term certainty.
The Fund’s industry, sector, and currency exposures are simply outputs of this bottom-up process. It has resulted in overweight positions relative to the benchmark index in the Consumer Staples and Consumer Discretionary sectors. These overweights increased slightly over the past six months. The Fund’s long-standing underweight position in the Energy sector contributed to performance during the fiscal first half.
At the regional level, the Fund remained overweight in shares of companies based in developed Asian economies and the United Kingdom, and slightly underweight in emerging markets. The Fund’s U.K. and Japanese-listed holdings contributed to performance in aggregate as a result of stock selection, while Chinese exposure was the largest detractor from relative performance.
The top individual contributors to performance were e-commerce related businesses. We believe that these companies have the potential to grow quickly for several years as
11
Harbor International Growth Fund
MANAGERS’ COMMENTARY—Continued
| | | | |
TOP TEN HOLDINGS (% of net assets) | | | | |
Roche Holding AG | | | 2.8% | |
Novo Nordisk AS | | | 2.7% | |
Investment AB Kinnevik | | | 2.5% | |
Naspers Ltd. | | | 2.5% | |
Shimano Inc. | | | 2.3% | |
BG Group plc | | | 2.2% | |
Svenska Handelsbanken AB | | | 2.2% | |
ASOS plc | | | 2.1% | |
Kao Corp. | | | 2.1% | |
Rakuten Inc. | | | 2.1% | |
consumers continue to migrate online. While their share prices can be volatile over shorter periods, such as this one, we prefer to make a longer-term assessment of the fundamental attributes of each business, rather than trying to second-guess fluctuations in share price.
Shares in the Japanese online marketplace business Rakuten responded to encouraging operating results from the company. We believe that Rakuten’s dominant position in Japan leaves it well placed to continue to grow as online shopping expands. The company is also investing in other nascent forms of e-commerce, which in our view could create significant value for shareholders in the future. We continue to monitor the company’s use of capital closely.
The U.K.-listed online fashion retailer ASOS was also a top contributor, following a difficult period for the company. The business is expanding beyond the U.K and is now employing more sophisticated regional pricing as well as continuing its investment in overseas distribution. We view both of these developments as positive, as they should help the company to continue its international expansion.
The largest single detractor from performance was another online business, Chinese search engine Baidu. The company reported lower-than-expected profits, after a period of slower consumer spending and an increase in marketing expense by the company. Looking beyond these results, we were interested to note that Baidu’s mobile search revenue surpassed its revenue from PC-based searches for the first time. Our view is that the company appears to have made a successful transition to mobile devices and has continued to expand the range of services it offers to consumers.
OUTLOOK AND STRATEGY
We believe that the bulk of our time is best spent looking for new company-specific opportunities for investment. Above all, we believe that our strategy of investing in a diversified group of high-quality, growing businesses, run by capable and trustworthy management, should enhance the Fund’s ability to weather good times and bad, and to deliver attractive long-term returns.
We are encouraged by the reasonable start for international stock markets in calendar 2015. We believe that there are signs of continued recovery in the European economy and greater traction in the Japanese reforms being enacted under Prime Minister Shinzo Abe. As always, there are areas of the world to worry about, such as ongoing instability in Ukraine and in parts of the Middle East. Greece’s negotiations with its creditors could still upset the recovery in the euro area, should they end unresolved.
Against this backdrop, we continue to find what we believe are many compelling opportunities for investigation. We believe that the Fund contains an exciting selection of growing companies, and are enthusiastic about its long-term potential.
This report contains the current opinions of Baillie Gifford Overseas Limited at the time of its publication and should not be considered as investment advice or a recommendation of any particular security, strategy or investment product. Such opinions are subject to change without notice and securities described herein may no longer be included in, or may at any time be removed from, the Fund’s portfolio. This report is distributed for informational purposes only. Information contained herein has been obtained from sources believed reliable, but not guaranteed.
Investing in international and emerging markets poses special risks, including potentially greater price volatility due to social, political and economic factors, as well as currency exchange rate fluctuations. These risks are more severe for securities of issuers in emerging market regions. For information on the different share classes and the risks associated with an investment in the Fund, please refer to the current prospectus.
12
Harbor International Growth Fund
FUND SUMMARY—April 30, 2015 (Unaudited)
| | | | |
INSTITUTIONAL CLASS |
| | | | |
| Fund # | | | | 2017 |
| | |
| Cusip | | | | 411511801 |
| | |
| Ticker | | | | HAIGX |
| | |
Inception
Date | | | | 11/01/1993 |
| | |
Net Expense Ratio | | | | 0.85%a,b |
| | |
Total Net Assets (000s) | | | | $233,727 |
| | | | |
ADMINISTRATIVE CLASS |
| | | | |
| Fund # | | | | 2217 |
| | |
| Cusip | | | | 411511637 |
| | |
| Ticker | | | | HRIGX |
| | |
Inception
Date | | | | 11/01/2002 |
| | |
Net Expense Ratio | | | | 1.10%a,b |
| | |
Total Net Assets (000s) | | | | $1,329 |
| | | | |
INVESTOR CLASS |
| | | | |
| Fund # | | | | 2417 |
| | |
| Cusip | | | | 411511629 |
| | |
| Ticker | | | | HIIGX |
| | |
Inception
Date | | | | 11/01/2002 |
| | |
Net Expense Ratio | | | | 1.22%a,b |
| | |
Total Net Assets (000s) | | | | $17,539 |
| b | Reflective of a contractual expense cap effective through February 29, 2016. |
PORTFOLIO STATISTICS
| | | | | | | | |
| | | Portfolio | | | Benchmark | |
| | |
Number of Countries | | | 26 | | | | 47 | |
| | |
Weighted Average Market Cap (MM) | | | $41,392 | | | | $60,343 | |
| | |
Price/Earning Ratio (P/E) | | | 21.1x | | | | 20.0x | |
| | |
Price/Book Ratio (P/B) | | | 4.1x | | | | 2.2x | |
| | |
Beta vs. MSCI All Country World Ex. U.S. (ND) Index | | | 0.96 | | | | 1.00 | |
| | |
Portfolio Turnover (6-Month Period Ended 04/30/2015) | | | 5% | c | | | N/A | |
SECTOR ALLOCATION (% of investments)
(Excludes cash and short-term investments)
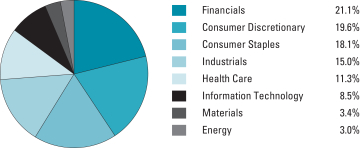
REGION BREAKDOWN (% of investments)
(Excludes cash and short-term investments)
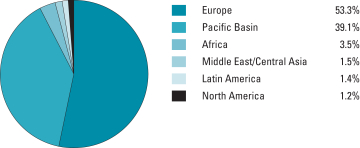
13
Harbor International Growth Fund
FUND PERFORMANCE SUMMARY (Unaudited)
Institutional Class
CHANGE IN A $50,000 INVESTMENT
For the period 05/01/2005 through 04/30/2015
| | |
The graph compares a $50,000 investment in the Fund with the performance of the MSCI All Country World Ex. U.S. (ND) Index. The Fund’s performance includes the reinvestment of all dividend and capital gain distributions. | | 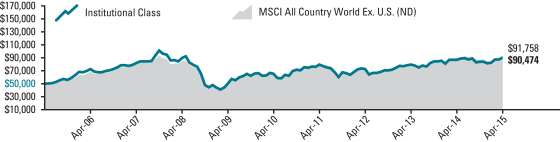 |
| | | | | | | | | | | | | | | | | | | | | | | | |
Total Returns For the periods ended 04/30/2015 | |  | |
| Harbor International Growth Fund | | | | | | | | | | | | | | | | | | | | | | | | |
Institutional Class | | | 7.75 | % | | | 3.92 | % | | | 6.73 | % | | | 6.11 | % | | | 11/01/1993 | | | $ | 90,474 | |
| Comparative Index | | | | | | | | | | | | | | | | | | | | | | | | |
MSCI All Country World Ex. U.S. (ND) | | | 5.56 | % | | | 2.63 | % | | | 6.04 | % | | | 6.26 | % | | | — | | | $ | 91,758 | |
Administrative and Investor Classes
CHANGE IN A $10,000 INVESTMENT
For the period 05/01/2005 through 04/30/2015
| | |
The graph compares a $10,000 investment in the Fund with the performance of the MSCI All Country World Ex. U.S. (ND) Index. The Fund’s performance includes the reinvestment of all dividend and capital gain distributions. | | 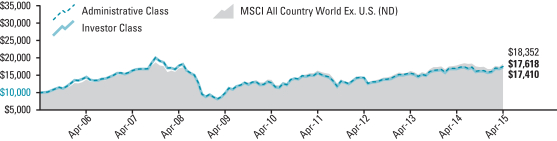 |
| | | | | | | | | | | | | | | | | | | | | | | | |
Total Returns For the periods ended 04/30/2015 | | | |
| Harbor International Growth Fund | | | | | | | | | | | | | | | | | | | | | | | | |
Administrative Class | | | 7.59 | % | | | 3.58 | % | | | 6.43 | % | | | 5.83 | % | | | 11/01/2002 | | | $ | 17,618 | |
Investor Class | | | 7.53 | % | | | 3.52 | % | | | 6.31 | % | | | 5.70 | % | | | 11/01/2002 | | | $ | 17,410 | |
| Comparative Index | | | | | | | | | | | | | | | | | | | | | | | | |
MSCI All Country World Ex. U.S. (ND) | | | 5.56 | % | | | 2.63 | % | | | 6.04 | % | | | 6.26 | % | | | — | | | $ | 18,352 | |
As stated in the Fund’s current prospectus, the expense ratios were 0.85% (Net) and 0.89% (Gross) (Institutional Class); 1.10% (Net) and 1.14% (Gross) (Administrative Class); and 1.22% (Net) and 1.26% (Gross) (Investor Class). The net expense ratios are contractually capped through 02/29/2016. The expense ratios in the prospectus may differ from the actual expense ratios for the period disclosed within this report. The expense ratios shown in the prospectus are based on the prior fiscal year, adjusted to reflect changes, if any, in contractual arrangements that occurred prior to the date of the prospectus.
Performance data shown represents past performance, which is no guarantee of future results. Current performance may be higher or lower than the past performance data shown. Investment returns and the value of an investment will fluctuate, and an investor’s shares, when sold, may be worth more or less than their original cost. You can obtain performance data current to the most recent month-end (available within seven business days after the most recent month-end) by calling 800-422-1050 or visiting harborfunds.com.
The returns shown do not reflect the deduction of taxes that a shareholder would pay on Fund distributions or on the redemption of Fund shares. From time to time, certain fees and/or expenses have been waived or reimbursed, which has resulted in higher returns. Without these waivers and reimbursements, the returns would have been lower.
14
Harbor International Growth Fund
PORTFOLIO OF INVESTMENTS—April 30, 2015 (Unaudited)
Equity Holdings by Country (% of net assets)
(Excludes net cash and short-term investments of 1.4%)
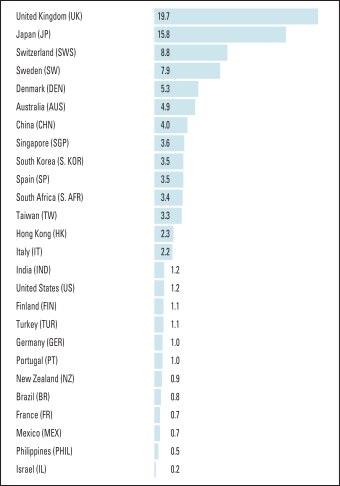
| | | | | | | | |
COMMON STOCKS—98.6% | |
| | |
| Shares | | | | | Value
(000s) | |
| | | | | | | | |
| | AUTOMOBILES—1.2% | |
| | 170,471 | | | Mahindra & Mahindra Ltd. GDR (IND)1 | | $ | 3,065 | |
| | | | | | | | |
| | BANKS—7.8% | |
| | 453,000 | | | BOC Hong Kong Holdings Ltd. (HK) | | | 1,760 | |
| | 152,803 | | | Itau Unibanco Holding SA ADR (BR)2 | | | 1,959 | |
| | 217,051 | | | Standard Chartered plc (UK) | | | 3,554 | |
| | 118,202 | | | Svenska Handelsbanken AB (SW) | | | 5,456 | |
| | 860,147 | | | Turkiye Garanti Bankasi AS ADR (TUR)2 | | | 2,850 | |
| | 220,274 | | | United Overseas Bank Ltd. (SGP) | | | 4,067 | |
| | | | | | | | |
| | | | | | | 19,646 | |
| | | | | | | | |
| | BEVERAGES—5.9% | |
| | 102,700 | | | Asahi Group Holdings Ltd. (JP) | | | 3,302 | |
| | 51,855 | | | Carlsberg AS (DEN) | | | 4,728 | |
| | 67,857 | | | Coca-Cola Enterprises Inc. (US) | | | 3,013 | |
| | 388,967 | | | Treasury Wine Estates Ltd. (AUS) | | | 1,706 | |
| | 344,000 | | | Tsingtao Brewery Co. Ltd. (CHN) | | | 2,197 | |
| | | | | | | | |
| | | | | | | 14,946 | |
| | | | | | | | |
| | | | | | | | |
| | BIOTECHNOLOGY—0.5% | |
| | 256,050 | | | Mesoblast Ltd. (AUS)* | | | 725 | |
| | 245,344 | | | Protalix BioTherapeutics Inc. (IL)* | | | 540 | |
| | | | | | | | |
| | | | | | | 1,265 | |
| | | | | | | | |
| | BUILDING PRODUCTS—1.2% | |
| | 8,924 | | | Geberit AG (SWS) | | | 3,161 | |
| | | | | | | | |
| | CAPITAL MARKETS—3.5% | |
| | 276,726 | | | Hargreaves Lansdown plc (UK) | | | 5,198 | |
| | 309,613 | | | Jupiter Fund Management plc (UK) | | | 2,039 | |
| | 86,895 | | | UBS Group AG (SWS)* | | | 1,736 | |
| | | | | | | | |
| | | | | | | 8,973 | |
| | | | | | | | |
| | CHEMICALS—2.2% | |
| | 73,983 | | | Johnson Matthey plc (UK) | | | 3,783 | |
| | 38,537 | | | Novozymes AS (DEN) | | | 1,778 | |
| | | | | | | | |
| | | | | | | 5,561 | |
| | | | | | | | |
| | COMMERCIAL SERVICES & SUPPLIES—0.9% | |
| | 269,839 | | | Brambles Ltd. (AUS) | | | 2,300 | |
| | | | | | | | |
| | DIVERSIFIED FINANCIAL SERVICES—5.7% | |
| | 32,464 | | | Corp. Financiera Alba SA (SP) | | | 1,649 | |
| | 72,025 | | | Exor SpA (IT) | | | 3,323 | |
| | 182,082 | | | Investment AB Kinnevik (SW) | | | 6,275 | |
| | 79,549 | | | Investor AB (SW) | | | 3,242 | |
| | | | | | | | |
| | | | | | | 14,489 | |
| | | | | | | | |
| | ELECTRICAL EQUIPMENT—0.7% | |
| | 32,273 | | | Legrand SA (FR) | | | 1,866 | |
| | | | | | | | |
| | ELECTRONIC EQUIPMENT, INSTRUMENTS & COMPONENTS—1.3% | |
| | 533,752 | | | Hon Hai Precision Industry Co. Ltd. GDR (TW)1 | | | 3,228 | |
| | | | | | | | |
| | ENERGY EQUIPMENT & SERVICES—0.8% | |
| | 194,796 | | | John Wood Group plc (UK) | | | 2,052 | |
| | | | | | | | |
| | FOOD & STAPLES RETAILING—5.3% | |
| | 304,902 | | | Clicks Group Ltd. (S. AFR) | | | 2,337 | |
| | 481,552 | | | Distribuidora Internacional de Alimentacion SA (SP) | | | 3,857 | |
| | 169,078 | | | Jeronimo Martins SGPS SA (PT) | | | 2,466 | |
| | 1,381,400 | | | Puregold Price Club Inc. (PHIL) | | | 1,229 | |
| | 37,800 | | | Sugi Holdings Co. Ltd. (JP) | | | 1,842 | |
| | 693,300 | | | Wal-Mart de Mexico SAB de CV (MEX) | | | 1,631 | |
| | | | | | | | |
| | | | | | | 13,362 | |
| | | | | | | | |
| | FOOD PRODUCTS—3.5% | |
| | 55,102 | | | Nestlé SA (SWS) | | | 4,275 | |
| | 102,693 | | | Unilever plc (UK) | | | 4,502 | |
| | | | | | | | |
| | | | | | | 8,777 | |
| | | | | | | | |
| | HEALTH CARE EQUIPMENT & SUPPLIES—3.9% | |
| | 76,841 | | | Cochlear Ltd. (AUS) | | | 5,060 | |
| | 48,340 | | | Mindray Medical International Ltd. ADR (CHN)2 | | | 1,493 | |
| | 90,800 | | | Olympus Corp. (JP)* | | | 3,269 | |
| | | | | | | | |
| | | | | | | 9,822 | |
| | | | | | | | |
| | HOTELS, RESTAURANTS & LEISURE—1.9% | |
| | 660,000 | | | Cafe de Coral Holdings Ltd. (HK) | | | 2,458 | |
| | 355,122 | | | Mitchells & Butlers plc (UK)* | | | 2,268 | |
| | | | | | | | |
| | | | | | | 4,726 | |
| | | | | | | | |
| | INDUSTRIAL CONGLOMERATES—2.0% | |
| | 57,200 | | | Jardine Matheson Holdings Ltd. (SGP) | | | 3,534 | |
| | 43,000 | | | Jardine Strategic Holdings Ltd. (SGP) | | | 1,476 | |
| | | | | | | | |
| | | | | | | 5,010 | |
| | | | | | | | |
15
Harbor International Growth Fund
PORTFOLIO OF INVESTMENTS—Continued
| | | | | | | | |
COMMON STOCKS—Continued | |
| | |
| Shares | | | | | Value
(000s) | |
| | | | | | | | |
| | INSURANCE—3.7% | |
| | 177,700 | | | MS&AD Insurance Group Holdings Inc. (JP) | | $ | 5,085 | |
| | 16,253 | | | Samsung Fire & Marine Insurance Co. Ltd. (S. KOR) | | | 4,282 | |
| | | | | | | | |
| | | | | | | 9,367 | |
| | | | | | | | |
| | INTERNET & CATALOG RETAIL—5.7% | |
| | 91,504 | | | ASOS plc (UK)* | | | 5,257 | |
| | 44,500 | | | JD.com Inc. ADR (CHN)*,2 | | | 1,493 | |
| | 304,800 | | | Rakuten Inc. (JP) | | | 5,325 | |
| | 790,050 | | | Trade Me Group Ltd. (NZ) | | | 2,301 | |
| | | | | | | | |
| | | | | | | 14,376 | |
| | | | | | | | |
| | INTERNET SOFTWARE & SERVICES—2.7% | |
| | 448,803 | | | Auto Trader Group plc (UK)*,3 | | | 1,874 | |
| | 24,700 | | | Baidu Inc. ADR (CHN)*,2 | | | 4,947 | |
| | | | | | | | |
| | | | | | | 6,821 | |
| | | | | | | | |
| | LEISURE PRODUCTS—2.8% | |
| | 35,700 | | | Sankyo Co. Ltd. (JP) | | | 1,352 | |
| | 39,700 | | | Shimano Inc. (JP) | | | 5,687 | |
| | | | | | | | |
| | | | | | | 7,039 | |
| | | | | | | | |
| | LIFE SCIENCES TOOLS & SERVICES—1.3% | |
| | 10,322 | | | Mettler-Toledo International Inc. (SWS)* | | | 3,272 | |
| | | | | | | | |
| | MACHINERY—8.0% | |
| | 176,907 | | | Atlas Copco AB (SW)4 | | | 4,926 | |
| | 267,018 | | | CNH Industrial NV (IT) | | | 2,346 | |
| | 64,838 | | | Kone OYJ (FIN) | | | 2,789 | |
| | 16,897 | | | Schindler Holding AG (SWS) | | | 2,858 | |
| | 8,100 | | | SMC Corp. (JP) | | | 2,437 | |
| | 140,500 | | | THK Co. Ltd. (JP) | | | 3,530 | |
| | 50,778 | | | Weir Group plc (UK) | | | 1,460 | |
| | | | | | | | |
| | | | | | | 20,346 | |
| | | | | | | | |
| | MEDIA—4.1% | |
| | 39,941 | | | Naspers Ltd. (S. AFR) | | | 6,266 | |
| | 83,893 | | | Rightmove plc (UK) | | | 4,061 | |
| | | | | | | | |
| | | | | | | 10,327 | |
| | | | | | | | |
| | METALS & MINING—1.2% | |
| | 75,594 | | | BHP Billiton plc (UK) | | | 1,817 | |
| | 288,003 | | | KAZ Minerals plc (UK)*,4 | | | 1,145 | |
| | | | | | | | |
| | | | | | | 2,962 | |
| | | | | | | | |
| | OIL, GAS & CONSUMABLE FUELS—2.1% | |
| | 300,005 | | | BG Group plc (UK) | | | 5,434 | |
| | | | | | | | |
| | PERSONAL PRODUCTS—3.2% | |
| | 109,600 | | | Kao Corp. (JP) | | | 5,248 | |
| | 153,600 | | | Shiseido Co. Ltd. (JP) | | | 2,767 | |
| | | | | | | | |
| | | | | | | 8,015 | |
| | | | | | | | |
| | PHARMACEUTICALS—5.5% | |
| | 120,016 | | | Novo Nordisk AS (DEN) | | | 6,738 | |
| | 24,815 | | | Roche Holding AG (SWS) | | | 7,101 | |
| | | | | | | | |
| | | | | | | 13,839 | |
| | | | | | | | |
| | PROFESSIONAL SERVICES—1.9% | |
| | 58,251 | | | Intertek Group plc (UK) | | | 2,328 | |
| | 190,716 | | | Seek Ltd. (AUS) | | | 2,439 | |
| | | | | | | | |
| | | | | | | 4,767 | |
| | | | | | | | |
| | SEMICONDUCTORS & SEMICONDUCTOR EQUIPMENT—2.6% | |
| | 476,003 | | | Imagination Technologies Group plc (UK)* | | | 1,430 | |
| | 205,800 | | | Taiwan Semiconductor Manufacturing Co. Ltd. ADR (TW)2 | | | 5,030 | |
| | | | | | | | |
| | | | | | | 6,460 | |
| | | | | | | | |
| | SPECIALTY RETAIL—1.4% | |
| | 108,715 | | | Inditex SA (SP) | | | 3,489 | |
| | | | | | | | |
| | TECHNOLOGY HARDWARE, STORAGE & PERIPHERALS—1.8% | |
| | 3,478 | | | Samsung Electronics Co. Ltd. (S. KOR) | | | 4,564 | |
| | | | | | | | |
| | TEXTILES, APPAREL & LUXURY GOODS—2.3% | |
| | 31,929 | | | adidas AG (GER) | | | 2,616 | |
| | 68,237 | | | Burberry Group plc (UK) | | | 1,819 | |
| | 1,358,000 | | | Li & Fung Ltd. (HK) | | | 1,383 | |
| | | | | | | | |
| | | | | | | 5,818 | |
| | | | | | | | |
| TOTAL COMMON STOCKS
(Cost $236,019) | | | 249,145 | |
| | | | | |
| | | | | | | | |
SHORT-TERM INVESTMENTS—3.4% | |
Principal
Amount
(000s) | | | | | | |
| | REPURCHASE AGREEMENTS—1.1% | | | | |
| $ | 2,785 | | | Repurchase Agreement with State Street Corp.
dated April 30, 2015 due May 01, 2015 at 0.000% collateralized by U.S. Treasury Bonds
(market value $2,845) | | | 2,785 | |
| | | | | | | | |
| | | | | | | | |
| Shares | | | | | | |
| | INVESTMENT COMPANY-SECURITIES LENDING INVESTMENT FUND—2.3% | |
| | 5,775,655 | | | State Street Navigator Securities Lending Prime Portfolio (1-day yield of 0.150%)5 | | | 5,776 | |
| | | | | | | | |
| TOTAL SHORT-TERM INVESTMENTS
(Cost $8,561) | | | 8,561 | |
| | | | | | | | |
| TOTAL INVESTMENTS—102.0%
(Cost $244,580) | | | 257,706 | |
| | | | | | | | |
| | CASH AND OTHER ASSETS, LESS LIABILITIES—(2.0)% | | | (5,109 | ) |
| | | | | | | | |
| | TOTAL NET ASSETS—100.0% | | $ | 252,595 | |
| | | | | | | | |
16
Harbor International Growth Fund
PORTFOLIO OF INVESTMENTS—Continued
FAIR VALUE MEASUREMENTS
The following table summarizes the Fund’s investments as of April 30, 2015 based on the inputs used to value them.
| | | | | | | | | | | | | | | | |
Asset Category | | Quoted Prices
Level 1
(000s) | | | Other Significant
Observable Inputs
Level 2
(000s) | | | Significant
Unobservable Inputs
Level 3
(000s) | | | Total
(000s) | |
Common Stocks | | | | | | | | | | | | | | | | |
Africa | | $ | — | | | $ | 8,603 | | | $ | — | | | $ | 8,603 | |
Europe | | | 5,146 | | | | 127,672 | | | | — | | | | 132,818 | |
Latin America | | | 3,590 | | | | — | | | | — | | | | 3,590 | |
Middle East/Central Asia | | | 540 | | | | 3,065 | | | | — | | | | 3,605 | |
North America | | | 3,013 | | | | — | | | | — | | | | 3,013 | |
Pacific Basin | | | 12,963 | | | | 84,553 | | | | — | | | | 97,516 | |
Short-Term Investments | | | | | | | | | | | | | | | | |
Repurchase Agreements | | | — | | | | 2,785 | | | | — | | | | 2,785 | |
Investment Company-Securities Lending Investment Fund | | | — | | | | 5,776 | | | | — | | | | 5,776 | |
| | | | | | | | | | | | | | | | |
Total Investments in Securities | | $ | 25,252 | | | $ | 232,454 | | | $ | — | | | $ | 257,706 | |
| | | | | | | | | | | | | | | | |
There were no Level 3 holdings at October 31, 2014 or April 30, 2015, and no transfers between levels during the period.
For more information on valuation inputs and their aggregation into the levels used in the table above, please refer to the Fair Value Measurements and Disclosures in Note 2 of the accompanying Notes to Financial Statements.
| * | Non-income producing security. |
| 1 | GDR after the name of a holding stands for Global Depositary Receipts representing ownership of foreign securities. GDRs are issued by either U.S. or non-U.S. banking organizations. |
| 2 | ADR after the name of a foreign holding stands for American Depositary Receipts representing ownership of foreign securities. ADRs are issued by U.S. banking institutions. |
| 3 | Securities purchased in a transaction exempt from registration under Rule 144A of the Securities Act of 1933. These securities may be resold in transactions exempt from registration, normally to qualified institutional buyers. The Fund has no right to demand registration of these securities. These securities are priced by an independent pricing service in accordance with Harbor Funds Valuation Procedures. At April 30, 2015, the aggregate value of these securities was $1,874 or 1% of net assets. |
| 4 | A portion or all of this security was out on loan as of April 30, 2015. |
| 5 | Represents the investment of collateral received from securities lending activities. |
The accompanying notes are an integral part of the Financial Statements.
17
Harbor Global Growth Fund
MANAGER’S COMMENTARY (Unaudited)
SUBADVISER
Marsico Capital Management, LLC
1200 17th Street Suite 1600 Denver, CO 80202
PORTFOLIO MANAGERS
Thomas F. Marsico
Since 2009
Marsico has subadvised the Fund since its inception in 2009.
INVESTMENT OBJECTIVE
The Fund seeks long-term growth of capital.
PRINCIPAL STYLE CHARACTERISTICS
Companies throughout the world selected for long-term growth potential

Thomas F. Marsico
Management’s Discussion of
Fund Performance
MARKET REVIEW
Global equities posted positive returns for the six months ended April 30, 2015. The first half of fiscal 2015 was a volatile period for the markets, as plummeting crude oil and commodity prices stoked fears of slowing global growth. The decline in oil prices stemmed in part from slowing growth in demand, as reflected in a softer rate of economic growth in China and stagnating growth in Europe. Accommodative monetary policy by central banks overseas—particularly in Europe and Japan—and relatively healthy U.S. economic conditions buoyed equity market performance.
The U.S. dollar strengthened compared to a variety of international currencies as many foreign central banks were in stimulus mode, while the U.S. Federal Reserve considered tightening measures. The dollar traded at a 12-year high versus the euro and an 8-year high against the Japanese yen before giving back some of its gains late in the period. Positive effects of a rising dollar on the U.S. economy included lower import and commodity prices. At the same time, the strengthening U.S. currency reduced the dollar value of international revenues and earnings, creating headwinds for U.S. multinational companies with large foreign operations. Similarly, U.S. investors generally experienced more muted gains after international investment performance was translated from local currencies into U.S. dollars.
Developed international equity markets returned 6.81%, as measured by the MSCI EAFE (ND) Index, outperforming the 4.40% return of U.S. equities, as measured by the S&P 500 Index. (All international and global returns cited are in U.S. dollars.) The comparatively better performance of developed international markets may have been partially attributable to expectations of additional quantitative easing from both the European Central Bank and the Bank of Japan.
The MSCI All Country World (ND) Index posted a return of 4.97%. Eight out of 10 sectors of the index registered positive returns. Consumer Discretionary was the strongest-performing sector, rising nearly 12%. Health Care and Information Technology were other leading sectors, with returns of 9% and 8%, respectively. Energy and Utilities were the weakest-performing sectors of the index with returns of -6% and -3%, respectively.
PERFORMANCE
Harbor Global Growth Fund posted a positive return but underperformed its benchmark index. The Fund returned 3.92% (Institutional Class), 3.83% (Administrative Class), and 3.71% (Investor Class) for the fiscal first half, compared with the 4.97% return of the MSCI All Country World (ND) Index.
A few of the Fund’s consumer-related holdings posted negative returns and were significant detractors from performance. Shares of Chinese e-commerce company Alibaba sharply declined after the company reported revenue for the fourth calendar quarter that missed Wall Street estimates. Wynn Macau struggled during a period of weaker Chinese economic data and the Chinese government’s anti-corruption campaign, which tended to restrain gaming activity in Macau. Tata Motors shares slumped after the company reported weaker-than-expected results from its Indian automobile market. The stock price of electric vehicle manufacturer Tesla Motors fell as concerns rose that lower gas prices could reduce demand for fuel-efficient cars. The Fund sold its Wynn Macau and Tesla holdings but maintained positions in Alibaba and Tata Motors.
18
Harbor Global Growth Fund
MANAGER’S COMMENTARY—Continued
| | | | |
TOP TEN HOLDINGS (% of net assets) | |
Biogen Inc. | | | 4.3% | |
Apple Inc. | | | 4.1% | |
Facebook Inc. | | | 4.1% | |
Canadian Pacific Railway Ltd. | | | 3.8% | |
Domino’s Pizza Group plc | | | 3.8% | |
Liberty Global plc | | | 3.7% | |
Sherwin-Williams Co. | | | 3.7% | |
ASML Holding NV | | | 3.5% | |
Novartis AG | | | 3.2% | |
Walt Disney Co. | | | 3.1% | |
In the Health Care sector, biotechnology company Gilead Sciences and Swiss pharmaceutical company Roche Holding posted negative returns prior to being sold from the Fund in favor of other investments. Pacira Pharmaceuticals, a manufacturer of products to address post-surgical pain, posted a double-digit stock price decline. The company’s stock weakened after the U.S. Department of Justice issued a subpoena to review marketing materials and promotional practices for one of Pacira’s flagship products. The Fund maintained its position in Pacira based on our valuation of its intellectual property.
Industrials holding Canadian Pacific Railway was negatively affected by declining oil prices. We continued to maintain a position in the company, as a sizable portion of its crude oil business is sourced from western Canada in projects that we believe are likely to produce oil for shipment by rail, even in a lower oil price environment.
Stock selection in the Information Technology sector aided Fund performance. Chinese Internet services company Tencent Holdings posted a sizable stock price gain as the company generated strong revenue from its online gaming and advertising segments. Semiconductor maker ARM Holdings also generated a strong return. Apple posted a double-digit positive return, aided by strong sales of iPhones.
While several Fund holdings within the Consumer Discretionary and Health Care sectors posted negative returns, others generated strong performance. Liberty Global, the largest international cable television company, reported robust growth in its European broadband business. Walt Disney experienced strong revenue growth in its studio and consumer products businesses, driven by continued success of its animated film, “Frozen.” United Kingdom-based Domino’s Pizza Group was another leading holding within the Consumer Discretionary sector. Health Care holdings Novartis, UnitedHealth Group, and Juno Therapeutics each had a positive effect on performance. Shares of paint manufacturer Sherwin-Williams, a Materials sector holding, rose sharply, buoyed by stronger-than-expected sales.
Although active currency management is not a central facet of the Fund’s investment process, fluctuations in major world currencies can at times affect performance. In the fiscal first half, the Fund did well compared to the benchmark by having greater exposure to securities denominated in the U.S. dollar, which strengthened versus most major world currencies. An overweight allocation to investments denominated in the Swiss franc also aided performance, as did the Fund’s relatively small exposure to the Japanese yen and Australian dollar.
From a sector allocation perspective, the Fund benefited as compared to its benchmark index by having overweight allocations to the strong-performing Consumer Discretionary and Health Care sectors, while being underweight in the weak-performing Energy sector.
OUTLOOK AND STRATEGY
As of April 30, 2015, the Fund’s largest sector overweights relative to the index were the Consumer Discretionary, Health Care, and Information Technology sectors. The most significant underweights relative to the index were Financials, Consumer Staples, and Energy. The Fund had no exposure to the Utilities, Consumer Staples, and Telecommunication Services sectors and sold its positions in the Financials and Energy sectors prior to period-end. In terms of country allocations, the Fund’s most significant weightings were the U.S., the United Kingdom, and Switzerland.
This report contains the current opinions of Marsico Capital Management, LLC at the time of its publication and should not be considered as investment advice or a recommendation of any particular security, strategy or investment product. Such opinions are subject to change without notice and securities described herein may no longer be included in, or may at any time be removed from, the Fund’s portfolio. This report is distributed for informational purposes only. Information contained herein has been obtained from sources believed reliable, but not guaranteed.
Investing in international and emerging markets poses special risks, including potentially greater price volatility due to social, political and economic factors, as well as currency exchange rate fluctuations. These risks are more severe for securities of issuers in emerging market regions. For information on the different share classes and the risks associated with an investment in the Fund, please refer to the current prospectus.
19
Harbor Global Growth Fund
FUND SUMMARY—April 30, 2015 (Unaudited)
| | | | |
INSTITUTIONAL CLASS |
| | | | |
| Fund # | | | | 2030 |
| | |
| Cusip | | | | 411512874 |
| | |
| Ticker | | | | HGGAX |
| | |
| Inception Date | | | | 03/01/2009 |
| | |
| Net Expense Ratio | | | | 0.90%a,b |
| | |
| Total Net Assets (000s) | | | | $34,947 |
| | | | |
ADMINISTRATIVE CLASS |
| | | | |
| Fund # | | | | 2230 |
| | |
| Cusip | | | | 411512866 |
| | |
| Ticker | | | | HRGAX |
| | |
| Inception Date | | | | 03/01/2009 |
| | |
| Net Expense Ratio | | | | 1.15%a,b |
| | |
| Total Net Assets (000s) | | | | $1,043 |
| | | | |
INVESTOR CLASS |
| | | | |
| Fund # | | | | 2430 |
| | |
| Cusip | | | | 411512858 |
| | |
| Ticker | | | | HGGIX |
| | |
| Inception Date | | | | 03/01/2009 |
| | |
| Net Expense Ratio | | | | 1.27%a,b |
| | |
| Total Net Assets (000s) | | | | $12,698 |
| b | Reflective of a contractual expense cap effective through February 29, 2016. |
PORTFOLIO STATISTICS
| | | | | | | | |
| | | Portfolio | | | Benchmark | |
| | |
Number of Countries | | | 11 | | | | 47 | |
| | |
Weighted Average Market Cap (MM) | | | $100,271 | | | | $94,918 | |
| | |
Price/Earning Ratio (P/E) | | | 30.1x | | | | 21.1x | |
| | |
Price/Book Ratio (P/B) | | | 7.0x | | | | 3.0x | |
| | |
Beta vs. MSCI All Country World (ND) Index | | | 0.93 | | | | 1.00 | |
| | |
Portfolio Turnover (6-Month Period Ended 04/30/2015) | | | 53% | c | | | N/A | |
SECTOR ALLOCATION (% of investments)
(Excludes cash and short-term investments)
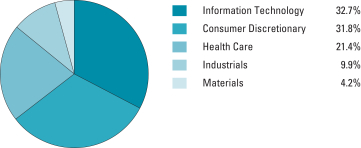
REGION BREAKDOWN (% of investments)
(Excludes cash and short-term investments)
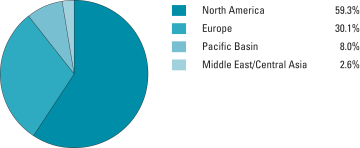
20
Harbor Global Growth Fund
FUND PERFORMANCE SUMMARY (Unaudited)
Institutional Class
CHANGE IN A $50,000 INVESTMENT
For the period 03/01/2009 through 04/30/2015
| | |
The graph compares a $50,000 investment in the Fund with the performance of the MSCI All Country World (ND) Index. The Fund’s performance includes the reinvestment of all dividend and capital gain distributions. | | 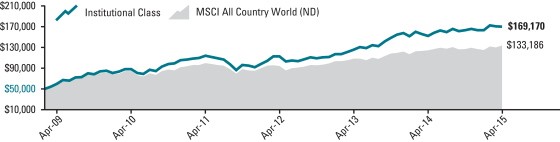 |
| | | | | | | | | | | | | | | | | | | | | | | | |
Total Returns For the periods ended 04/30/2015 | |  | |
| Harbor Global Growth Fund | | | | | | | | | | | | | | | | | | | | | | | | |
Institutional Class | | | 3.92 | % | | | 11.41 | % | | | 13.92 | % | | | 21.85 | % | | | 03/01/2009 | | | $ | 169,170 | |
| Comparative Index | | | | | | | | | | | | | | | | | | | | | | | | |
MSCI All Country World (ND) | | | 4.97 | % | | | 7.46 | % | | | 9.58 | % | | | 17.22 | % | | | — | | | $ | 133,186 | |
Administrative and Investor Classes
CHANGE IN A $10,000 INVESTMENT
For the period 03/01/2009 through 04/30/2015
| | |
The graph compares a $10,000 investment in the Fund with the performance of the MSCI All Country World (ND) Index. The Fund’s performance includes the reinvestment of all dividend and capital gain distributions. | | 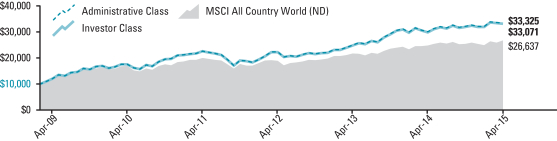 |
| | | | | | | | | | | | | | | | | | | | | | | | |
Total Returns For the periods ended 04/30/2015 | |  | |
| Harbor Global Growth Fund | | | | | | | | | | | | | | | | | | | | | | | | |
Administrative Class | | | 3.83 | % | | | 11.17 | % | | | 13.65 | % | | | 21.55 | % | | | 03/01/2009 | | | $ | 33,325 | |
Investor Class | | | 3.71 | % | | | 11.03 | % | | | 13.50 | % | | | 21.40 | % | | | 03/01/2009 | | | $ | 33,071 | |
| Comparative Index | | | | | | | | | | | | | | | | | | | | | | | | |
MSCI All Country World (ND) | | | 4.97 | % | | | 7.46 | % | | | 9.58 | % | | | 17.22 | % | | | — | | | $ | 26,637 | |
As stated in the Fund’s current prospectus, the expense ratios were 0.90% (Net) and 1.09% (Gross) (Institutional Class); 1.15% (Net) and 1.34% (Gross) (Administrative Class); and 1.27% (Net) and 1.46% (Gross) (Investor Class). The net expense ratios are contractually capped through 02/29/2016. The expense ratios in the prospectus may differ from the actual expense ratios for the period disclosed within this report. The expense ratios shown in the prospectus are based on the prior fiscal year, adjusted to reflect changes, if any, in contractual arrangements that occurred prior to the date of the prospectus.
Performance data shown represents past performance, which is no guarantee of future results. Current performance may be higher or lower than the past performance data shown. Investment returns and the value of an investment will fluctuate, and an investor’s shares, when sold, may be worth more or less than their original cost. You can obtain performance data current to the most recent month-end (available within seven business days after the most recent month-end) by calling 800-422-1050 or visiting harborfunds.com.
The returns shown do not reflect the deduction of taxes that a shareholder would pay on Fund distributions or on the redemption of Fund shares. From time to time, certain fees and/or expenses have been waived or reimbursed, which has resulted in higher returns. Without these waivers and reimbursements, the returns would have been lower.
21
Harbor Global Growth Fund
PORTFOLIO OF INVESTMENTS—April 30, 2015 (Unaudited)
Equity Holdings by Country (% of net assets)
(Excludes net cash and short-term investments of 11.6%)
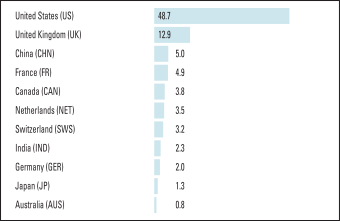
| | | | | | | | |
COMMON STOCKS—88.4% | |
| | |
| Shares | | | | | Value
(000s) | |
| | | | | | | | |
| | AEROSPACE & DEFENSE—4.9% | |
| | 131,649 | | | BAE Systems plc (UK) | | $ | 1,020 | |
| | 18,990 | | | Safran SA (FR) | | | 1,387 | |
| | | | | | | | |
| | | | | | | 2,407 | |
| | | | | | | | |
| | AUTOMOBILES—4.3% | |
| | 8,432 | | | Bayerische Motoren Werke AG (GER) | | | 995 | |
| | 27,023 | | | Tata Motors Ltd. ADR (IND)1 | | | 1,113 | |
| | | | | | | | |
| | | | | | | 2,108 | |
| | | | | | | | |
| | BIOTECHNOLOGY—6.8% | |
| | 5,534 | | | Biogen Inc. (US)* | | | 2,069 | |
| | 9,926 | | | Vertex Pharmaceuticals Inc. (US)* | | | 1,224 | |
| | | | | | | | |
| | | | | | | 3,293 | |
| | | | | | | | |
| | CHEMICALS—3.7% | |
| | 6,439 | | | Sherwin-Williams Co. (US) | | | 1,790 | |
| | | | | | | | |
| | HEALTH CARE PROVIDERS & SERVICES—2.3% | |
| | 10,031 | | | UnitedHealth Group Inc. (US) | | | 1,117 | |
| | | | | | | | |
| | HOTELS, RESTAURANTS & LEISURE—8.1% | |
| | 723 | | | Chipotle Mexican Grill Inc. (US)* | | | 449 | |
| | 13,023 | | | Domino’s Pizza Enterprises Ltd. (AUS) | | | 375 | |
| | 153,572 | | | Domino’s Pizza Group plc (UK) | | | 1,858 | |
| | 26,499 | | | Norwegian Cruise Line Holdings Ltd. (US)* | | | 1,285 | |
| | | | | | | | |
| | | | | | | 3,967 | |
| | | | | | | | |
| | INTERNET SOFTWARE & SERVICES—11.7% | |
| | 11,856 | | | Alibaba Group Holding Ltd. ADR (CHN)*,1 | | | 964 | |
| | 115,351 | | | Auto Trader Group plc (UK)*,2 | | | 481 | |
| | 25,686 | | | Facebook Inc. (US)* | | | 2,023 | |
| | 2,894 | | | LinkedIn Corp. (US)* | | | 730 | |
| | 71,800 | | | Tencent Holdings Ltd. (CHN) | | | 1,482 | |
| | | | | | | | |
| | | | | | | 5,680 | |
| | | | | | | | |
| | IT SERVICES—4.7% | |
| | 6,098 | | | FleetCor Technologies Inc. (US)* | | | 981 | |
| | 19,960 | | | Visa Inc. (US) | | | 1,319 | |
| | | | | | | | |
| | | | | | | 2,300 | |
| | | | | | | | |
| | | | | | | | |
| | MEDIA—7.3% | |
| | 6,317 | | | JCDecaux SA (FR) | | | 250 | |
| | 35,789 | | | Liberty Global plc (UK)* | | | 1,806 | |
| | 13,743 | | | Walt Disney Co. (US) | | | 1,494 | |
| | | | | | | | |
| | | | | | | 3,550 | |
| | | | | | | | |
| | MULTILINE RETAIL—1.8% | |
| | 11,579 | | | Dollar Tree Inc. (US)* | | | 885 | |
| | | | | | | | |
| | PHARMACEUTICALS—9.9% | |
| | 4,692 | | | Actavis plc (US)* | | | 1,327 | |
| | 15,357 | | | Novartis AG (SWS) | | | 1,568 | |
| | 13,374 | | | Pacira Pharmaceuticals Inc. (US)* | | | 916 | |
| | 4,614 | | | Valeant Pharmaceuticals International Inc. (US)* | | | 1,001 | |
| | | | | | | | |
| | | | | | | 4,812 | |
| | | | | | | | |
| | ROAD & RAIL—3.8% | |
| | 9,666 | | | Canadian Pacific Railway Ltd. (CAN) | | | 1,843 | |
| | | | | | | | |
| | SEMICONDUCTORS & SEMICONDUCTOR EQUIPMENT—5.8% | |
| | 65,465 | | | ARM Holdings plc (UK) | | | 1,112 | |
| | 15,883 | | | ASML Holding NV (NET) | | | 1,700 | |
| | | | | | | | |
| | | | | | | 2,812 | |
| | | | | | | | |
| | SOFTWARE—2.7% | |
| | 11,873 | | | Electronic Arts Inc. (US)* | | | 690 | |
| | 3,700 | | | Nintendo Co. Ltd. (JP) | | | 621 | |
| | | | | | | | |
| | | | | | | 1,311 | |
| | | | | | | | |
| | SPECIALTY RETAIL—0.9% | |
| | 3,496 | | | Signet Jewelers Ltd. (US) | | | 469 | |
| | | | | | | | |
| | TECHNOLOGY HARDWARE, STORAGE & PERIPHERALS—4.1% | |
| | 15,817 | | | Apple Inc. (US) | | | 1,980 | |
| | | | | | | | |
| | TEXTILES, APPAREL & LUXURY GOODS—5.6% | |
| | 2,059 | | | Hermes International SA (FR) | | | 776 | |
| | 9,142 | | | Lululemon Athletica Inc. (US)* | | | 582 | |
| | 13,771 | | | NIKE Inc. (US) | | | 1,361 | |
| | | | | | | | |
| | | | | | | 2,719 | |
| | | | | | | | |
| TOTAL COMMON STOCKS
(Cost $37,826) | | | 43,043 | |
| | | | | |
| | | | | | | | |
SHORT-TERM INVESTMENTS—7.6% | |
| (Cost $3,712) | | | | |
Principal
Amount
(000s) | | | | | | |
| | REPURCHASE AGREEMENTS | |
| $ | 3,712 | | | Repurchase Agreement with State Street Corp.
dated April 30, 2015 due May 01, 2015 at 0.000% collateralized by Federal National Mortgage Association Notes (market value $3,790) | | | 3,712 | |
| | | | | | | | |
| TOTAL INVESTMENTS—96.0%
(Cost $41,538) | | | 46,755 | |
| | | | | | | | |
| | CASH AND OTHER ASSETS, LESS LIABILITIES—4.0% | | | 1,933 | |
| | | | | | | | |
| | TOTAL NET ASSETS—100.0% | | $ | 48,688 | |
| | | | | | | | |
22
Harbor Global Growth Fund
PORTFOLIO OF INVESTMENTS—Continued
FAIR VALUE MEASUREMENTS
The following table summarizes the Fund’s investments as of April 30, 2015 based on the inputs used to value them.
| | | | | | | | | | | | | | | | |
Asset Category | | Quoted Prices
Level 1
(000s) | | | Other Significant
Observable Inputs
Level 2
(000s) | | | Significant
Unobservable Inputs
Level 3
(000s) | | | Total
(000s) | |
Common Stocks | | | | | | | | | | | | | | | | |
Europe | | $ | 3,987 | | | $ | 8,966 | | | $ | — | | | $ | 12,953 | |
Middle East/Central Asia | | | 1,113 | | | | — | | | | — | | | | 1,113 | |
North America | | | 25,535 | | | | — | | | | — | | | | 25,535 | |
Pacific Basin | | | 964 | | | | 2,478 | | | | — | | | | 3,442 | |
Short-Term Investments | | | | | | | | | | | | | | | | |
Repurchase Agreements | | | — | | | | 3,712 | | | | — | | | | 3,712 | |
| | | | | | | | | | | | | | | | |
Total Investments in Securities | | $ | 31,599 | | | $ | 15,156 | | | $ | — | | | $ | 46,755 | |
| | | | | | | | | | | | | | | | |
There were no Level 3 holdings at October 31, 2014 or April 30, 2015, and no transfers between levels during the period.
For more information on valuation inputs and their aggregation into the levels used in the table above, please refer to the Fair Value Measurements and Disclosures in Note 2 of the accompanying Notes to Financial Statements.
| * | Non-income producing security. |
| 1 | ADR after the name of a foreign holding stands for American Depositary Receipts representing ownership of foreign securities. ADRs are issued by U.S. banking institutions. |
| 2 | Securities purchased in a transaction exempt from registration under Rule 144A of the Securities Act of 1933. These securities may be resold in transactions exempt from registration, normally to qualified institutional buyers. The Fund has no right to demand registration of these securities. These securities are priced by an independent pricing service in accordance with Harbor Funds Valuation Procedures. At April 30, 2015, the aggregate value of these securities was $481 or 1% of net assets. |
The accompanying notes are an integral part of the Financial Statements.
23
Harbor Emerging Markets Equity Fund
MANAGERS’ COMMENTARY (Unaudited)
SUBADVISER
Oaktree Capital Management, L.P.
333 South Grand Avenue,
28th Floor
Los Angeles, CA 90071
PORTFOLIO MANAGERS
Frank Carroll
Since 2013
Tim Jensen
Since 2013
Oaktree has subadvised the Fund since its inception in 2013.
INVESTMENT OBJECTIVE
The Fund seeks long-term growth of capital.
PRINCIPLE STYLE CHARACTERISTICS
Equity securities of emerging market companies of any size

Frank Carroll

Tim Jensen
Management’s Discussion of Fund Performance
MARKET REVIEW
Emerging markets equities traded within a volatile range before generating respectable returns for the six months ended April 30, 2015. The MSCI Emerging Markets (ND) Index posted a return of 3.92%. The gain masked a significant dispersion of returns at the country, sector, and stock levels. Only 7 of the 23 countries included in the index generated positive returns but the largest benchmark constituent, China, was also the strongest market and the biggest contributor to the index’s positive return. Six of the markets that generated negative returns fell by more than 10%. Only 5 of the 10 economic sectors generated positive returns; Information Technology was the strongest while Energy performed the worst.
A strong U.S. dollar was a headwind for much of the period, but emerging market currency movements were far from uniform. The Chinese yuan was stable while other Asian currencies depreciated modestly. Latin American currencies, including the Brazilian real, the Mexican peso, and the Colombian peso, depreciated sharply due to price weakness in the commodities they exported, current account deficits, or domestic issues. Most emerging market currencies recovered somewhat after the U.S. Federal Reserve meeting in March, when the Fed signaled that interest rate hikes would occur later than expected.
The rapid collapse in the price of oil late in calendar 2014 was unexpected by the markets and disruptive. Russia, the Persian Gulf countries, Colombia, and several other economies are highly dependent on oil exports, and their markets performed poorly at the end of 2014. Metals prices, led by iron ore, also fell dramatically, damaging the terms of trade of Brazil, Chile, and several other countries. Although lower oil and metals prices are net positives for the economies of countries accounting for over two-thirds of the emerging markets index, volatile trading dragged most of the markets down into early January. The stabilization of oil prices and subsequent modest price increases drove a partial recovery of equity prices in Russia and other commodity markets in the last few months of the fiscal first half. We believe that most Asian economies should benefit from lower oil and commodity prices and should have room to ease monetary policy further, given low inflation.
Based on information compiled by data provider EPFR Global, emerging market equity funds continued to see outflows during the first half of fiscal 2015. In the absence of inflows into the asset class or a trending market, capital seemed to shift quickly from one market to another. Additionally, companies that missed expectations or reduced guidance could be severely punished by the market. These rotations could be sudden and violent— yet reversible if news suddenly shifted.
PERFORMANCE
Harbor Emerging Markets Equity Fund returned 0.10% (Institutional Class), -0.07% (Administrative Class), and -0.04% (Investor Class) for the six months ended April 30, 2015, compared with the 3.92% return of its MSCI Emerging Markets (ND) Index benchmark. Consistent with our bottom-up investment process, stock selection effects explained the bulk of the Fund’s underperformance.
Relative performance was hurt primarily by weak stock selection in China, which more than offset the benefit of the Fund’s overweight allocation to that market. The Fund was overweight China throughout the period, but performance suffered from unfavorable stock
24
Harbor Emerging Markets Equity Fund
MANAGERS’ COMMENTARY—Continued
| | | | |
TOP TEN HOLDINGS (% of net assets) | |
Samsung Electronics Co. Ltd. | | | 6.6% | |
Taiwan Semiconductor Manufacturing Co. Ltd. ADR | | | 3.7% | |
Industrial & Commercial Bank of China Ltd. | | | 3.1% | |
Petroleo Brasileiro SA ADR | | | 2.8% | |
China Unicom Hong Kong Ltd. | | | 2.4% | |
Naspers Ltd. | | | 2.4% | |
Itau Unibanco Holding SA ADR | | | 2.2% | |
China Pacific Insurance Group Co. Ltd. | | | 2.1% | |
BRF SA ADR | | | 2.0% | |
Cemex SAB de CV ADR | | | 2.0% | |
picks in a number of sectors. Stock selection and larger-than-index exposures in Brazil and Turkey also hurt relative performance. Strong stock selection in South Africa and individual positions in Thailand, Indonesia, and South Korea contributed positively. Positive stock selection in the Financials sector was more than offset by negative selection among Consumer Discretionary and Information Technology companies. Consumer Discretionary laggards included several Macau gaming companies, Indian auto manufacturer Tata Motors, and B2W, a Brazilian e-commerce company. Strong performers among Financials included Chinese bank ICBC, China Pacific Insurance, Hong Kong based property developer China Overseas Land and Investment, and Hungary-based OTP Bank.
OUTLOOK AND STRATEGY
As part of a broader economic reform effort, the Chinese government has been working to develop its capital markets, liberalize interest rates and foreign exchange markets, and internationalize the yuan. The current administration has implemented a series of measures to support the development of Chinese equity markets. Access to the domestic equity markets in Shenzhen and Shanghai has been limited in the past, while Chinese investors faced impediments to investing outward into Hong Kong. The government has started to integrate these markets and we expect this process to continue gradually. The Chinese shares we have traditionally invested in are listed primarily in Hong Kong. Most Chinese companies that are listed in both Hong Kong and in a domestic exchange have tended to trade at a discount in Hong Kong. Now that Chinese investors can more easily invest in Hong Kong, the discounts have started to narrow. We believe the combination of monetary policy easing, state-owned enterprise reforms, and the entrance of a large group of incremental investors could make this an attractive time to invest in Chinese equities in Hong Kong.
At the end of the fiscal first half, emerging markets equities traded at discounts to developed markets based on price/book and price/earnings ratios. The portfolio’s 68 positions at April 30 traded at a weighted average of 1.7 times book value. The portfolio traded at a multiple of 12.7 times consensus expected earnings, a slight premium to the index. Relative to the index, the portfolio held overweight exposures in China, India, Brazil, Mexico, and Russia. Underweight markets included South Korea, Taiwan, Malaysia, and South Africa. By sector, the portfolio was overweight in Consumer Discretionary and Information Technology stocks while underweight in Financials and Utilities.
This report contains the current opinions of Oaktree Capital Management, L.P. at the time of its publication and should not be considered as investment advice or a recommendation of any particular security, strategy or investment product. Such opinions are subject to change without notice and securities described herein may no longer be included in, or may at any time be removed from, the Fund’s portfolio. This report is distributed for informational purposes only. Information contained herein has been obtained from sources believed reliable, but not guaranteed.
Investing in international and emerging markets poses special risks, including potentially greater price volatility due to social, political and economic factors, as well as currency exchange rate fluctuations. These risks are more severe for securities of issuers in emerging market regions. For information on the different share classes and the risks associated with an investment in the Fund, please refer to the current prospectus.
25
Harbor Emerging Markets Equity Fund
FUND SUMMARY—April 30, 2015 (Unaudited)
| | | | |
INSTITUTIONAL CLASS |
| | | | |
| Fund # | | | | 2036 |
| | |
| Cusip | | | | 411512692 |
| | |
| Ticker | | | | HAEMX |
| | |
Inception
Date | | | | 11/01/2013 |
| | |
Net Expense Ratio | | | | 1.21%a ,b |
| | |
Total Net Assets (000s) | | | | $46,690 |
| | | | |
ADMINISTRATIVE CLASS |
| | | | |
| Fund # | | | | 2236 |
| | |
| Cusip | | | | 411512684 |
| | |
| Ticker | | | | HREMX |
| | |
Inception
Date | | | | 11/01/2013 |
| | |
Net Expense Ratio | | | | 1.47%a ,b |
| | |
Total Net Assets (000s) | | | | $250 |
| | | | |
INVESTOR CLASS |
| | | | |
| Fund # | | | | 2436 |
| | |
| Cusip | | | | 411512676 |
| | |
| Ticker | | | | HIEEX |
| | |
Inception
Date | | | | 11/01/2013 |
| | |
Net Expense Ratio | | | | 1.59%a,b |
| | |
Total Net Assets (000s) | | | | $490 |
| b | Reflective of a contractual expense cap effective through February 29, 2016. |
PORTFOLIO STATISTICS
| | | | | | | | |
| | | Portfolio | | | Benchmark | |
| | |
Number of Countries | | | 17 | | | | 25 | |
| | |
Weighted Average Market Cap (MM) | | | $56,010 | | | | $54,252 | |
| | |
Price/Earning Ratio (P/E) | | | 15.7x | | | | 16.9x | |
| | |
Price/Book Ratio (P/B) | | | 2.3x | | | | 2.2x | |
| | |
Beta vs. MSCI Emerging Markets (ND) Index | | | 0.91 | | | | 1.00 | |
| | |
Portfolio Turnover (6-Month Period Ended 04/30/2015) | | | 33% | c | | | N/A | |
SECTOR ALLOCATION (% of investments)
(Excludes cash and short-term investments)
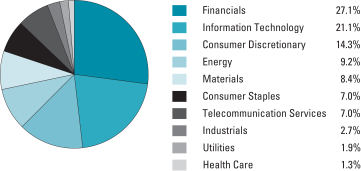
REGION BREAKDOWN (% of investments)
(Excludes cash and short-term investments)
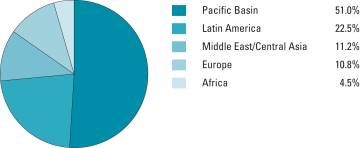
26
Harbor Emerging Markets Equity Fund
FUND PERFORMANCE SUMMARY (Unaudited)
Institutional Class
CHANGE IN A $50,000 INVESTMENT
For the period 11/01/2013 through 04/30/2015
| | |
The graph compares a $50,000 investment in the Fund with the performance of the MSCI Emerging Markets (ND) Index. The Fund’s performance includes the reinvestment of all dividend and capital gain distributions. | | 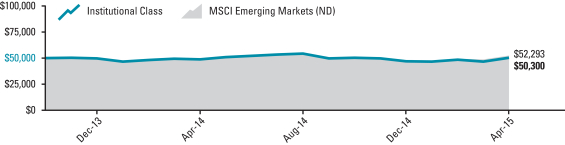 |
| | | | | | | | | | | | | | | | | | | | | | | | |
Total Returns For the periods ended 04/30/2015 | |  | |
| Harbor Emerging Markets Equity Fund | | | | | | | | | | | | | | | | | | | | | | | | |
Institutional Class | | | 0.10 | % | | | 3.50 | % | | | N/A | | | | 0.40 | % | | | 11/1/2013 | | | $ | 50,300 | |
| Comparative Index | | | | | | | | | | | | | | | | | | | | | | | | |
MSCI Emerging Markets (ND) | | | 3.92 | % | | | 7.80 | % | | | N/A | | | | 3.04 | % | | | — | | | $ | 52,293 | |
Administrative and Investor Classes
CHANGE IN A $10,000 INVESTMENT
For the period 11/01/2013 through 04/30/2015
| | |
The graph compares a $10,000 investment in the Fund with the performance of the MSCI Emerging Markets (ND) Index. The Fund’s performance includes the reinvestment of all dividend and capital gain distributions. | | 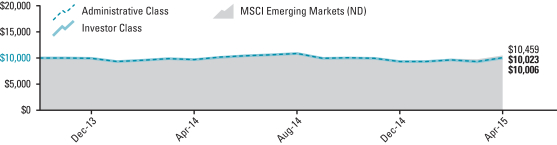 |
| | | | | | | | | | | | | | | | | | | | | | | | |
Total Returns For the periods ended 04/30/2015 | |  | |
| Harbor Emerging Markets Equity Fund | | | | | | | | | | | | | | | | | | | | | | | | |
Administrative Class | | | -0.07 | % | | | 3.33 | % | | | N/A | | | | 0.15 | % | | | 11/1/2013 | | | $ | 10,023 | |
Investor Class | | | -0.04 | % | | | 3.16 | % | | | N/A | | | | 0.04 | % | | | 11/1/2013 | | | $ | 10,006 | |
| Comparative Index | | | | | | | | | | | | | | | | | | | | | | | | |
MSCI Emerging Markets (ND) | | | 3.92 | % | | | 7.80 | % | | | N/A | | | | 3.04 | % | | | — | | | $ | 10,459 | |
As stated in the Fund’s current prospectus, the expense ratios were 1.15% (Net) and 2.35% (Gross) (Institutional Class); 1.40% (Net) and 2.60% (Gross) (Administrative Class); and 1.52% (Net) and 2.72% (Gross) (Investor Class). The net expense ratios are contractually capped through 02/29/2016. The expense ratios in the prospectus may differ from the actual expense ratios for the period disclosed within this report. The expense ratios shown in the prospectus are based on the prior fiscal year, adjusted to reflect changes, if any, in contractual arrangements that occurred prior to the date of the prospectus.
Performance data shown represents past performance, which is no guarantee of future results. Current performance may be higher or lower than the past performance data shown. Investment returns and the value of an investment will fluctuate, and an investor’s shares, when sold, may be worth more or less than their original cost. You can obtain performance data current to the most recent month-end (available within seven business days after the most recent month-end) by calling 800-422-1050 or visiting harborfunds.com.
The returns shown do not reflect the deduction of taxes that a shareholder would pay on Fund distributions or on the redemption of Fund shares. From time to time, certain fees and/or expenses have been waived or reimbursed, which has resulted in higher returns. Without these waivers and reimbursements, the returns would have been lower.
27
Harbor Emerging Markets Equity Fund
PORTFOLIO OF INVESTMENTS—April 30, 2015 (Unaudited)
Equity Holdings by Country (% of net assets)
(Excludes net cash and short-term investments of 2.4%)
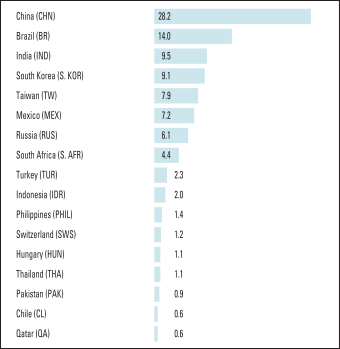
| | | | | | | | |
COMMON STOCKS—97.6% | |
| | |
| Shares | | | | | Value
(000s) | |
| | AUTOMOBILES—2.7% | |
| | 4,308 | | | Hyundai Motor Co. (S. KOR) | | $ | 676 | |
| | 14,500 | | | Tata Motors Ltd. ADR (IND)1 | | | 597 | |
| | | | | | | | |
| | | | 1,273 | |
| | | | | | | | |
| | BANKS—17.2% | |
| | 64,710 | | | Axis Bank Ltd. PN (IND)*,2 | | | 578 | |
| | 13,563 | | | Banco Santander Chile ADR (CL)1 | | | 296 | |
| | 716,400 | | | Bank Rakyat Indonesia Persero Tbk PT (IDR) | | | 640 | |
| | 655,000 | | | China Construction Bank Corp. (CHN) | | | 636 | |
| | 96,435 | | | Grupo Financiero Banorte SAB de CV (MEX) | | | 547 | |
| | 85,610 | | | ICICI Bank Ltd. ADR (IND)1 | | | 936 | |
| | 1,688,000 | | | Industrial & Commercial Bank of China Ltd. (CHN) | | | 1,469 | |
| | 82,925 | | | Itau Unibanco Holding SA ADR (BR)1 | | | 1,063 | |
| | 550,000 | | | Mega Financial Holding Co. Ltd. (TW) | | | 489 | |
| | 23,776 | | | OTP Bank plc (HUN) | | | 526 | |
| | 117,534 | | | Turkiye Halk Bankasi AS (TUR) | | | 595 | |
| | 73,100 | | | United Bank Ltd. (PAK) | | | 127 | |
| | 153,945 | | | United Bank Ltd. PN (PAK)*,2,3 | | | 269 | |
| | | | | | | | |
| | | | 8,171 | |
| | | | | | | | |
| | BEVERAGES—1.0% | |
| | 27,401 | | | Coca-Cola Icecek AS (TUR) | | | 464 | |
| | | | | | | | |
| | CAPITAL MARKETS—2.3% | |
| | 963,100 | | | China Cinda Asset Management Co. Ltd. (CHN)* | | | 569 | |
| | 899,800 | | | Yuanta Financial Holding Co. Ltd. (TW) | | | 523 | |
| | | | | | | | |
| | | | 1,092 | |
| | | | | | | | |
| | CHEMICALS—1.3% | |
| | 29,496 | | | PhosAgro OAO GDR (RUS)4 | | | 360 | |
| | 2,684,000 | | | Tianhe Chemicals Group Ltd. (CHN)*,3 | | | 242 | x |
| | | | | | | | |
| | | | 602 | |
| | | | | | | | |
| | CONSTRUCTION & ENGINEERING—0.9% | |
| | 17,100 | | | Larsen & Toubro Ltd. PN (IND)*,2 | | | 439 | |
| | | | | | | | |
| | CONSTRUCTION MATERIALS—3.0% | |
| | 121,500 | | | Anhui Conch Cement Co. Ltd. (CHN) | | | 492 | |
| | 98,966 | | | Cemex SAB de CV ADR (MEX)*,1 | | | 952 | |
| | | | | | | | |
| | | | 1,444 | |
| | | | | | | | |
| | DIVERSIFIED TELECOMMUNICATION SERVICES—3.5% | |
| | 598,000 | | | China Unicom Hong Kong Ltd. (CHN) | | | 1,123 | |
| | 31,611 | | | Telefonica Brasil SA ADR (BR)*,1 | | | 519 | |
| | | | | | | | |
| | | | 1,642 | |
| | | | | | | | |
| | ELECTRIC UTILITIES—1.1% | |
| | 109,078 | | | Cia Energetica de Minas Gerais ADR (BR)*,1 | | | 537 | |
| | | | | | | | |
| | ELECTRONIC EQUIPMENT, INSTRUMENTS & COMPONENTS—1.0% | |
| | 81,000 | | | Delta Electronics Inc. (TW) | | | 487 | |
| | | | | | | | |
| | FOOD & STAPLES RETAILING—1.8% | |
| | 15,195 | | | Magnit PJSC GDR (RUS)4 | | | 834 | |
| | | | | | | | |
| | FOOD PRODUCTS—4.1% | |
| | 45,217 | | | BRF SA ADR (BR)*,1 | | | 971 | |
| | 309,900 | | | Indofood CBP Sukses Makmur Tbk PT (IDR) | | | 314 | |
| | 136,370 | | | Universal Robina Corp. (PHIL) | | | 665 | |
| | | | | | | | |
| | | | 1,950 | |
| | | | | | | | |
| | HOTELS, RESTAURANTS & LEISURE—2.4% | |
| | 145,000 | | | Galaxy Entertainment Group Ltd. (CHN)* . | | | 697 | |
| | 105,618 | | | Sands China Ltd. (CHN) | | | 429 | |
| | | | | | | | |
| | | | 1,126 | |
| | | | | | | | |
| | HOUSEHOLD DURABLES—1.1% | |
| | 189,989 | | | Haier Electronics Group Co. Ltd. (CHN) | | | 543 | |
| | | | | | | | |
| | INDEPENDENT POWER & RENEWABLE ELECTRICITY PRODUCERS—0.7% | |
| | 612,000 | | | Huadian Fuxin Energy Corp. Ltd. (CHN) | | | 329 | |
| | | | | | | | |
| | INDUSTRIAL CONGLOMERATES—0.6% | |
| | 7,424 | | | Industries Qatar QSC (QA) | | | 295 | |
| | | | | | | | |
| | INSURANCE—5.1% | |
| | 71,800 | | | BB Seguridade Participacoes SA (BR) | | | 840 | |
| | 182,600 | | | China Pacific Insurance Group Co. Ltd. (CHN) | | | 990 | |
| | 53,300 | | | Discovery Ltd. (S. AFR) | | | 591 | |
| | | | | | | | |
| | | | | | | 2,421 | |
| | | | | | | | |
| | INTERNET & CATALOG RETAIL—2.4% | |
| | 60,006 | | | B2W Cia Digital (BR)* | | | 545 | |
| | 17,462 | | | JD.com Inc. ADR (CHN)*,1 | | | 586 | |
| | | | | | | | |
| | | | | | | 1,131 | |
| | | | | | | | |
| | INTERNET SOFTWARE & SERVICES—2.1% | |
| | 25,100 | | | Tencent Holdings Ltd. (CHN) | | | 518 | |
| | 24,600 | | | Yandex NV (RUS)* | | | 473 | |
| | | | | | | | |
| | | | | | | 991 | |
| | | | | | | | |
| | MEDIA—4.1% | |
| | 23,000 | | | Grupo Televisa SAB ADR (MEX)*,1 | | | 837 | |
| | 7,206 | | | Naspers Ltd. (S. AFR) | | | 1,131 | |
| | | | | | | | |
| | | | | | | 1,968 | |
| | | | | | | | |
| | METALS & MINING—3.9% | |
| | 31,400 | | | AngloGold Ashanti Ltd. ADR (S. AFR)*,1 | | | 356 | |
| | 190,500 | | | Grupo Mexico SAB de CV (MEX) | | | 589 | |
| | 150,100 | | | Vale SA ADR (BR)1 | | | 908 | |
| | | | | | | | |
| | | | | | | 1,853 | |
| | | | | | | | |
28
Harbor Emerging Markets Equity Fund
PORTFOLIO OF INVESTMENTS—Continued
| | | | | | | | |
COMMON STOCKS—Continued | |
| | |
| Shares | | | | | Value
(000s) | |
| | OIL, GAS & CONSUMABLE FUELS—9.0% | |
| | 178,500 | | | China Shenhua Energy Co. Ltd. (CHN) | | $ | 462 | |
| | 75,781 | | | Coal India Ltd. PN (IND)*,2,3 | | | 433 | |
| | 14,002 | | | Lukoil OAO ADR (RUS)1 | | | 716 | |
| | 354,000 | | | PetroChina Co. Ltd. (CHN) | | | 457 | |
| | 137,700 | | | Petroleo Brasileiro SA ADR (BR)*,1 | | | 1,308 | |
| | 66,617 | | | Reliance Industries Ltd. PN (IND)*,2 | | | 905 | |
| | | | | | | | |
| | | | | | | 4,281 | |
| | | | | | | | |
| | PHARMACEUTICALS—1.3% | |
| | 471,156 | | | Luye Pharma Group Ltd. (CHN)* | | | 603 | |
| | | | | | | | |
| | REAL ESTATE MANAGEMENT & DEVELOPMENT—1.8% | |
| | 208,000 | | | China Overseas Land & Investment Ltd. (CHN) | | | 865 | |
| | | | | | | | |
| | SEMICONDUCTORS & SEMICONDUCTOR EQUIPMENT—9.7% | |
| | 52,600 | | | ASM Pacific Technology Ltd. (CHN) | | | 588 | |
| | 333,000 | | | Epistar Corp. (TW) | | | 520 | |
| | 1,659,000 | | | GCL-Poly Energy Holdings Ltd. (CHN)* | | | 500 | |
| | 12,471 | | | SK Hynix Inc. (S. KOR)* | | | 533 | |
| | 72,100 | | | Taiwan Semiconductor Manufacturing Co. Ltd. ADR (TW)1 | | | 1,762 | |
| | 58,200 | | | Trina Solar Ltd. ADR (CHN)*,1 | | | 711 | |
| | | | | | | | |
| | | | | | | 4,614 | |
| | | | | | | | |
| | SPECIALTY RETAIL—1.2% | |
| | 3,790 | | | Dufry AG (SWS)* | | | 557 | |
| | | | | | | | |
| | TECHNOLOGY HARDWARE, STORAGE & PERIPHERALS—7.8% | |
| | 328,000 | | | Lenovo Group Ltd. (CHN) | | | 564 | |
| | 2,375 | | | Samsung Electronics Co. Ltd. (S. KOR) | | | 3,116 | |
| | | | | | | | |
| | | | | | | 3,680 | |
| | | | | | | | |
| | TRANSPORTATION INFRASTRUCTURE—1.1% | |
| | 58,000 | | | Airports of Thailand plc (THA) | | | 509 | |
| | | | | | | | |
| | WIRELESS TELECOMMUNICATION SERVICES—3.4% | |
| | 24,400 | | | America Movil SAB de CV ADR (MEX)1 | | | 510 | |
| | 104,748 | | | Bharti Airtel Ltd. PN (IND)*,2 | | | 628 | |
| | 39,465 | | | Mobile TeleSystems OJSC ADR (RUS)1 | | | 477 | |
| | | | | | | | |
| | | | | | | 1,615 | |
| | | | | | | | |
| TOTAL COMMON STOCKS
(Cost $44,627) | | | 46,316 | |
| | | | | |
| | | | | | | | |
SHORT-TERM INVESTMENTS—0.7% | |
| (Cost $312) | |
Principal
Amount
(000s) | | | | | | |
| | REPURCHASE AGREEMENTS | |
| $ | 312 | | | Repurchase Agreement with State Street Corp.
dated April 30, 2015 due May 01, 2015 at 0.000% collateralized by U.S. Treasury Bonds
(market value $319) | | | 312 | |
| | | | | | | | |
| TOTAL INVESTMENTS—98.3%
(Cost $44,939) | | | 46,628 | |
| | | | | | | | |
| | CASH AND OTHER ASSETS, LESS LIABILITIES—1.7% | | | 802 | |
| | | | | | | | |
| | TOTAL NET ASSETS—100.0% | | $ | 47,430 | |
| | | | | | | | |
FAIR VALUE MEASUREMENTS
The following table summarizes the Fund’s investments as of April 30, 2015 based on the inputs used to value them.
| | | | | | | | | | | | | | | | |
Asset Category | | Quoted Prices
Level 1
(000s) | | | Other Significant
Observable Inputs
Level 2
(000s) | | | Significant
Unobservable Inputs
Level 3
(000s) | | | Total
(000s) | |
Common Stocks | | | | | | | | | | | | | | | | |
Africa | | $ | 356 | | | $ | 1,722 | | | $ | — | | | $ | 2,078 | |
Europe | | | 950 | | | | 4,052 | | | | — | | | | 5,002 | |
Latin America | | | 10,422 | | | | — | | | | — | | | | 10,422 | |
Middle East/Central Asia | | | 4,785 | | | | 422 | | | | — | | | | 5,207 | |
Pacific Basin | | | 3,059 | | | | 20,306 | | | | 242 | | | | 23,607 | |
Short-Term Investments | | | | | | | | | | | | | | | | |
Repurchase Agreements | | | — | | | | 312 | | | | — | | | | 312 | |
| | | | | | | | | | | | | | | | |
Total Investments in Securities | | $ | 19,572 | | | $ | 26,814 | | | $ | 242 | | | $ | 46,628 | |
| | | | | | | | | | | | | | | | |
The following is a rollforward of the Fund’s Level 3 investments during the period ended April 30, 2015.
| | | | | | | | | | | | | | | | | | | | | | | | | | | | | | | | | | | | |
Valuation Description | | Balance
Beginning at
11/01/2014
(000s) | | | Purchases
(000s) | | | Sales
(000s) | | | Accrued
Discount/
(Premium)
(000s) | | | Total
Realized
Gain/(Loss)
(000s) | | | Change in
Unrealized
Appreciation/
(Depreciation)
(000s) | | | Transfers
In Level 3
(000s) | | | Transfers
Out of
Level 3
(000s) | | | Ending
Balance
as of
04/30/2015
(000s) | |
Common Stocks | | $ | — | | | $ | — | | | $ | — | | | $ | — | | | $ | — | | | $ | — | | | $ | 242 | | | $ | — | | | $ | 242 | |
| | | | | | | | | | | | | | | | | | | | | | | | | | | | | | | | | | | | |
Of the Level 2 investments presented above, certain Common Stocks valued at $603 were categorized in Level 1 at October 31, 2014. Transfers from Level 1 to Level 2 were the result of exchange traded securities where quoted prices from an active market were available (Level 1), and have become unavailable (Level 2).
29
Harbor Emerging Markets Equity Fund
PORTFOLIO OF INVESTMENTS—Continued
FAIR VALUE MEASUREMENTS—Continued
The following is a summary of significant unobservable inputs used in the fair valuations of assets and liabilities categorized within Level 3 of the fair value hierarchy.
| | | | | | | | | | | | |
Valuation Descriptions | | Ending Balance
as of 04/30/2015
(000s) | | | Valuation Technique | | Unobservable
Inputs | | Input
Value(s) | |
| Investments in Securities | | | | | | | | | | | | |
Common Stocks | | | | | | | | | | | | |
Tianhe Chemicals Group Ltd. (CHN)*,3 | | $ | 242 | | | Market Approach | | Last Traded Price | | HK$ | 0.70 | |
| | | | | | | | | | | | |
For more information on valuation inputs and their aggregation into the levels used in the table above, please refer to the Fair Value Measurements and Disclosures in Note 2 of the accompanying Notes to Financial Statements.
| * | Non-income producing security. |
| 1 | ADR after the name of a foreign holding stands for American Depositary Receipts representing ownership of foreign securities. ADRs are issued by U.S. banking institutions. |
| 2 | PN after the name of a holding stands for Participatory Notes representing ownership of Indian/Pakistani securities. PNs are issued by foreign banking organizations. |
| 3 | Securities purchased in a transaction exempt from registration under Rule 144A of the Securities Act of 1933. These securities may be resold in transactions exempt from registration, normally to qualified institutional buyers. The Fund has no right to demand registration of these securities. These securities are priced by an independent pricing service in accordance with Harbor Funds Valuation Procedures. At April 30, 2015, the aggregate value of these securities was $944 or 2% of net assets. |
| 4 | GDR after the name of a holding stands for Global Depositary Receipts representing ownership of foreign securities. GDRs are issued by either U.S. or non-U.S. banking organizations. |
| w | The amounts in this category are included in the “Realized and Change in Unrealized Gain/(Loss) on Investment Transactions” section of the Statement of Operations. The net unrealized appreciation/(depreciation) per investment type is below: |
| | | | |
Valuation Description | | Unrealized
Gain/(Loss) as of
04/30/2015
(000s) | |
Common Stocks | | $ | (269 | ) |
| | | | |
| x | Fair Valued in accordance with Harbor Funds Valuation Procedures using Last Traded Price, which is a Level 3 input. |
The accompanying notes are an integral part of the Financial Statements.
30
[THIS PAGE INTENTIONALLY LEFT BLANK]
31
Harbor International & Global Funds
STATEMENTS OF ASSETS AND LIABILITIES—April 30, 2015 (Unaudited)
(All amounts in thousands, except per share amounts)
| | | | | | | | | | | | | | | | |
| | | Harbor
International
Fund | | | Harbor
International Growth
Fund | | | Harbor
Global Growth
Fund | | | Harbor
Emerging Markets
Equity Fund | |
ASSETS | | | | | | | | | | | | | | | | |
Investments, at identified cost* | | $ | 41,007,087 | | | $ | 244,580 | | | $ | 41,538 | | | $ | 44,939 | |
Investments, at value (Including securities loaned of $3,735,609, $5,559, $0 and $0) | | $ | 54,005,375 | | | $ | 254,921 | | | $ | 43,043 | | | $ | 46,316 | |
Repurchase agreements | | | 112,986 | | | | 2,785 | | | | 3,712 | | | | 312 | |
Cash | | | 100,001 | | | | — | | | | 1 | | | | 1 | |
Foreign currency, at value (cost: $6,921, $118, $0 and $2) | | | 7,046 | | | | 112 | | | | — | | | | 1 | |
Receivables for: | | | | | | | | | | | | | | | | |
Investments sold | | | 132,940 | | | | — | | | | 2,155 | | | | 1,214 | |
Foreign currency spot contracts | | | 110 | | | | — | | | | 1 | | | | — | |
Capital shares sold | | | 46,857 | | | | 74 | | | | 26 | | | | 1 | |
Dividends | | | 224,170 | | | | 656 | | | | 42 | | | | 45 | |
Interest | | | 21 | | | | — | | | | — | | | | — | |
Securities lending income | | | 3,167 | | | | 3 | | | | — | | | | — | |
Withholding tax | | | 88,381 | | | | 268 | | | | 30 | | | | — | |
Prepaid registration fees | | | 4 | | | | 18 | | | | 18 | | | | 9 | |
Prepaid fund insurance | | | 125 | | | | 1 | | | | — | | | | — | |
Other assets | | | 1,531 | | | | 46 | | | | 6 | | | | 11 | |
Total Assets | | | 54,722,714 | | | | 258,884 | | | | 49,034 | | | | 47,910 | |
LIABILITIES | | | | | | | | | | | | | | | | |
Payables for: | | | | | | | | | | | | | | | | |
Investments purchased | | | 149,130 | | | | — | | | | 252 | | | | 397 | |
Capital shares reacquired | | | 265,162 | | | | 208 | | | | 41 | | | | 1 | |
Collateral for securities loaned | | | 3,872,214 | | | | 5,776 | | | | — | | | | — | |
Accrued expenses: | | | | | | | | | | | | | | | | |
Management fees | | | 26,646 | | | | 156 | | | | 30 | | | | 37 | |
12b-1 fees | | | 1,130 | | | | 4 | | | | 3 | | | | — | |
Transfer agent fees | | | 3,018 | | | | 15 | | | | 3 | | | | 3 | |
Trustees’ fees and expenses | | | 224 | | | | 1 | | | | — | | | | — | |
Other | | | 17,758 | | | | 129 | | | | 17 | | | | 42 | |
Total Liabilities | | | 4,335,282 | | | | 6,289 | | | | 346 | | | | 480 | |
NET ASSETS | | $ | 50,387,432 | | | $ | 252,595 | | | $ | 48,688 | | | $ | 47,430 | |
Net Assets Consist of: | | | | | | | | | | | | | | | | |
Paid-in capital | | $ | 36,209,518 | | | $ | 403,569 | | | $ | 42,075 | | | $ | 46,172 | |
Accumulated undistributed net investment income/(loss) | | | (121,260 | ) | | | 768 | | | | (13 | ) | | | (19 | ) |
Accumulated net realized gain/(loss) | | | 1,188,536 | | | | (164,861 | ) | | | 1,406 | | | | (401 | ) |
Unrealized appreciation/(depreciation) of investments and translation of assets and liabilities in foreign currencies | | | 13,110,638 | | | | 13,119 | | | | 5,220 | | | | 1,678 | |
| | | $ | 50,387,432 | | | $ | 252,595 | | | $ | 48,688 | | | $ | 47,430 | |
NET ASSET VALUE PER SHARE BY CLASS | | | | | | | | | | | | | | | | |
Institutional Class | | | | | | | | | | | | | | | | |
Net assets | | $ | 44,949,452 | | | $ | 233,727 | | | $ | 34,947 | | | $ | 46,690 | |
Shares of beneficial interest1 | | | 626,215 | | | | 17,278 | | | | 1,586 | | | | 4,664 | |
Net asset value per share2 | | $ | 71.78 | | | $ | 13.53 | | | $ | 22.03 | | | $ | 10.01 | |
Administrative Class | | | | | | | | | | | | | | | | |
Net assets | | $ | 915,111 | | | $ | 1,329 | | | $ | 1,043 | | | $ | 250 | |
Shares of beneficial interest1 | | | 12,801 | | | | 99 | | | | 47 | | | | 25 | |
Net asset value per share2 | | $ | 71.49 | | | $ | 13.46 | | | $ | 21.88 | | | $ | 10.00 | |
Investor Class | | | | | | | | | | | | | | | | |
Net assets | | $ | 4,522,869 | | | $ | 17,539 | | | $ | 12,698 | | | $ | 490 | |
Shares of beneficial interest1 | | | 63,682 | | | | 1,305 | | | | 584 | | | | 49 | |
Net asset value per share2 | | $ | 71.02 | | | $ | 13.44 | | | $ | 21.73 | | | $ | 9.99 | |
| * | Including repurchase agreements and short-term investments. |
| 1 | Par value $0.01 (unlimited authorizations). |
| 2 | Per share amounts can be recalculated to the amounts disclosed herein when total net assets and shares of beneficial interest are not rounded to thousands. |
The accompanying notes are an integral part of the Financial Statements.
32
Harbor International & Global Funds
STATEMENTS OF OPERATIONS—Six Months Ended April 30, 2015 (Unaudited)
(All amounts in thousands)
| | | | | | | | | | | | | | | | |
| | | Harbor
International
Fund | | | Harbor
International Growth
Fund | | | Harbor
Global Growth
Fund | | | Harbor
Emerging Markets
Equity Fund | |
Investment Income | | | | | | | | | | | | | | | | |
Dividends | | $ | 651,532 | | | $ | 2,587 | | | $ | 202 | | | $ | 229 | |
Net securities lending income | | | 10,608 | | | | 36 | | | | — | | | | — | |
Interest | | | 418 | | | | — | | | | — | | | | — | |
Foreign taxes withheld | | | (57,632 | ) | | | (247 | ) | | | (12 | ) | | | (33 | ) |
Total Investment Income | | | 604,926 | | | | 2,376 | | | | 190 | | | | 196 | |
Operating Expenses | | | | | | | | | | | | | | | | |
Management fees | | | 162,110 | | | | 859 | | | | 152 | | | | 157 | |
12b-1 fees: | | | | | | | | | | | | | | | | |
Administrative Class | | | 1,114 | | | | 1 | | | | 1 | | | | — | |
Investor Class | | | 5,675 | | | | 21 | | | | 13 | | | | 1 | |
Shareholder communications | | | 1,255 | | | | 5 | | | | 1 | | | | — | |
Custodian fees | | | 3,096 | | | | 49 | | | | 14 | | | | 56 | |
Transfer agent fees: | | | | | | | | | | | | | | | | |
Institutional Class | | | 13,152 | | | | 65 | | | | 9 | | | | 10 | |
Administrative Class | | | 275 | | | | — | | | | — | | | | — | |
Investor Class | | | 4,124 | | | | 16 | | | | 9 | | | | — | |
Professional fees | | | 419 | | | | 14 | | | | 3 | | | | 5 | |
Trustees’ fees and expenses | | | 514 | | | | 2 | | | | — | | | | — | |
Registration fees | | | 160 | | | | 21 | | | | 22 | | | | 34 | |
Miscellaneous | | | 201 | | | | 8 | | | | 4 | | | | 4 | |
Total expenses | | | 192,095 | | | | 1,061 | | | | 228 | | | | 267 | |
Management fees waived | | | (5,532 | ) | | | — | | | | — | | | | — | |
Transfer agent fees waived | | | (531 | ) | | | (3 | ) | | | — | | | | — | |
Other expenses reimbursed | | | — | | | | (52 | ) | | | (26 | ) | | | (66 | ) |
Custodial expense reductions | | | (2 | ) | | | — | | | | — | | | | — | |
Net expenses | | | 186,030 | | | | 1,006 | | | | 202 | | | | 201 | |
Net Investment Income/(Loss) | | | 418,896 | | | | 1,370 | | | | (12 | ) | | | (5 | ) |
Realized and Change in Net Unrealized Gain/(Loss) on Investment Transactions | | | | | | | | | | | | | | | | |
Net realized gain/(loss) on: | | | | | | | | | | | | | | | | |
Investments | | | 1,678,588 | | | | 56 | | | | 1,401 | | | | (45 | ) |
Foreign currency transactions | | | (6,782 | ) | | | 20 | | | | 5 | | | | (9 | ) |
Change in net unrealized appreciation/(depreciation) on: | | | | | | | | | | | | | | | | |
Investments | | | 1,507,906 | | | | 17,143 | | | | (126 | ) | | | 1,348 | |
Translations of assets and liabilities in foreign currencies | | | 5,628 | | | | 40 | | | | 3 | | | | — | |
Net gain/(loss) on investment transactions | | | 3,185,340 | | | | 17,259 | | | | 1,283 | | | | 1,294 | |
Net Increase/(Decrease) in Net Assets Resulting from Operations | | $ | 3,604,236 | | | $ | 18,629 | | | $ | 1,271 | | | $ | 1,289 | |
The accompanying notes are an integral part of the Financial Statements.
33
Harbor International & Global Funds
STATEMENTS OF CHANGES IN NET ASSETS
(All amounts in thousands)
| | | | | | | | | | | | | | | | |
| | | Harbor
International Fund | | | Harbor
International Growth Fund | |
| | | November 1,
2014
through
April 30,
2015 | | | November 1,
2013
through
October 31,
2014 | | | November 1,
2014
through
April 30,
2015 | | | November 1,
2013
through
October 31,
2014 | |
INCREASE/(DECREASE) IN NET ASSETS | | | (Unaudited) | | | | | | | | (Unaudited) | | | | | |
Operations: | | | | | | | | | | | | | | | | |
Net investment income/(loss) | | $ | 418,896 | | | $ | 882,454 | | | $ | 1,370 | | | $ | 2,726 | |
Net realized gain/(loss) on investments | | | 1,671,806 | | | | 1,679,104 | | | | 76 | | | | 8,114 | |
Change in net unrealized appreciation/(depreciation) of investments | | | 1,513,534 | | | | (3,490,272 | ) | | | 17,183 | | | | (13,872 | ) |
Net increase/(decrease) in assets resulting from operations | | | 3,604,236 | | | | (928,714 | ) | | | 18,629 | | | | (3,032 | ) |
Distributions to Shareholders | | | | | | | | | | | | | | | | |
Net investment income: | | | | | | | | | | | | | | | | |
Institutional Class | | | (900,562 | ) | | | (847,190 | ) | | | (2,885 | ) | | | (2,923 | ) |
Administrative Class | | | (13,412 | ) | | | (55,429 | ) | | | (8 | ) | | | (15 | ) |
Investor Class | | | (80,120 | ) | | | (95,371 | ) | | | (190 | ) | | | (217 | ) |
Net realized gain on investments: | | | | | | | | | | | | | | | | |
Institutional Class | | | — | | | | — | | | | — | | | | — | |
Administrative Class | | | — | | | | — | | | | — | | | | — | |
Investor Class | | | — | | | | — | | | | — | | | | — | |
Total distributions to shareholders | | | (994,094 | ) | | | (997,990 | ) | | | (3,083 | ) | | | (3,155 | ) |
Net Increase/(Decrease) Derived from Capital Share Transactions | | | (1,355,558 | ) | | | 3,054,340 | | | | 22,883 | | | | 2,564 | |
Net increase/(decrease) in net assets | | | 1,254,584 | | | | 1,127,636 | | | | 38,429 | | | | (3,623 | ) |
Net Assets | | | | | | | | | | | | | | | | |
Beginning of period | | | 49,132,848 | | | | 48,005,212 | | | | 214,166 | | | | 217,789 | |
End of period* | | $ | 50,387,432 | | | $ | 49,132,848 | | | $ | 252,595 | | | $ | 214,166 | |
* Includes accumulated undistributed net investment income/(loss) of: | | $ | (121,260 | ) | | $ | 453,938 | | | $ | 768 | | | $ | 2,481 | |
The accompanying notes are an integral part of the Financial Statements.
34
| | | | | | | | | | | | | | |
Harbor
Global Growth Fund | | | Harbor
Emerging Markets Equity Fund | |
November 1,
2014
through
April 30,
2015 | | | November 1,
2013
through
October 31,
2014 | | | November 1,
2014
through
April 30,
2015 | | | November 1,
2013
through
October 31,
2014 | |
| | (Unaudited) | | | | | | | | (Unaudited) | | | | | |
| | | | | | | | | | | | | | |
| $ | (12 | ) | | $ | 46 | | | $ | (5 | ) | | $ | 129 | |
| | 1,406 | | | | 4,584 | | | | (54 | ) | | | (356 | ) |
| | (123 | ) | | | (1,398 | ) | | | 1,348 | | | | 330 | |
| | 1,271 | | | | 3,232 | | | | 1,289 | | | | 103 | |
| | | | | | | | | | | | | | |
| | | | | | | | | | | | | | |
| | (40 | ) | | | (70 | ) | | | (133 | ) | | | — | |
| | — | | | | — | | | | — | | | | — | |
| | — | | | | — | | | | (1 | ) | | | — | |
| | | | | | | | | | | | | | |
| | (2,920 | ) | | | (2,264 | ) | | | — | | | | — | |
| | (93 | ) | | | (56 | ) | | | — | | | | — | |
| | (997 | ) | | | (564 | ) | | | — | | | | — | |
| | (4,050 | ) | | | (2,954 | ) | | | (134 | ) | | | — | |
| | 15,480 | | | | 4,425 | | | | 18,277 | | | | 27,895 | |
| | 12,701 | | | | 4,703 | | | | 19,432 | | | | 27,998 | |
| | | | | | | | | | | | | | |
| | 35,987 | | | | 31,284 | | | | 27,998 | | | | — | |
| $ | 48,688 | | | $ | 35,987 | | | $ | 47,430 | | | $ | 27,998 | |
| $ | (13 | ) | | $ | 39 | | | $ | (19 | ) | | $ | 120 | |
35
Harbor International & Global Funds
STATEMENTS OF CHANGES IN NET ASSETS—CAPITAL STOCK ACTIVITY
(All amounts in thousands)
| | | | | | | | | | | | | | | | |
| | | Harbor
International Fund | | | Harbor
International Growth Fund | |
| | | November 1,
2014
through
April 30,
2015 | | | November 1,
2013
through
October 31,
2014 | | | November 1,
2014
through
April 30,
2015 | | | November 1,
2013
through
October 31,
2014 | |
| | | (Unaudited) | | | | | | | | (Unaudited) | | | | | |
AMOUNT ($) | | | | | | | | | | | | | | | | |
Institutional Class | | | | | | | | | | | | | | | | |
Net proceeds from sale of shares | | $ | 4,118,073 | | | $ | 11,106,987 | | | $ | 39,340 | | | $ | 88,096 | |
Reinvested distributions | | | 775,192 | | | | 717,975 | | | | 2,831 | | | | 2,775 | |
Cost of shares reacquired | | | (5,649,396 | ) | | | (6,479,053 | ) | | | (18,914 | ) | | | (85,369 | ) |
Net increase/(decrease) in net assets | | $ | (756,131 | ) | | $ | 5,345,909 | | | $ | 23,257 | | | $ | 5,502 | |
Administrative Class | | | | | | | | | | | | | | | | |
Net proceeds from sale of shares | | $ | 125,680 | | | $ | 729,143 | | | $ | 733 | | | $ | 440 | |
Reinvested distributions | | | 12,596 | | | | 54,458 | | | | 8 | | | | 14 | |
Cost of shares reacquired | | | (235,238 | ) | | | (2,761,360 | ) | | | (188 | ) | | | (707 | ) |
Net increase/(decrease) in net assets | | $ | (96,962 | ) | | $ | (1,977,759 | ) | | $ | 553 | | | $ | (253 | ) |
Investor Class | | | | | | | | | | | | | | | | |
Net proceeds from sale of shares | | $ | 519,007 | | | $ | 1,308,752 | | | $ | 1,312 | | | $ | 2,668 | |
Reinvested distributions | | | 74,364 | | | | 90,500 | | | | 188 | | | | 214 | |
Cost of shares reacquired | | | (1,095,836 | ) | | | (1,713,062 | ) | | | (2,427 | ) | | | (5,567 | ) |
Net increase/(decrease) in net assets | | $ | (502,465 | ) | | $ | (313,810 | ) | | $ | (927 | ) | | $ | (2,685 | ) |
SHARES | | | | | | | | | | | | | | | | |
Institutional Class | | | | | | | | | | | | | | | | |
Shares sold | | | 60,978 | | | | 155,552 | | | | 3,148 | | | | 6,640 | |
Shares issued due to reinvestment of distributions | | | 11,779 | | | | 10,618 | | | | 230 | | | | 223 | |
Shares reacquired | | | (83,690 | ) | | | (91,678 | ) | | | (1,474 | ) | | | (6,587 | ) |
Net increase/(decrease) in shares outstanding | | | (10,933 | ) | | | 74,492 | | | | 1,904 | | | | 276 | |
Beginning of period | | | 637,148 | | | | 562,656 | | | | 15,374 | | | | 15,098 | |
End of period | | | 626,215 | | | | 637,148 | | | | 17,278 | | | | 15,374 | |
Administrative Class | | | | | | | | | | | | | | | | |
Shares sold | | | 1,874 | | | | 10,337 | | | | 59 | | | | 34 | |
Shares issued due to reinvestment of distributions | | | 192 | | | | 811 | | | | 1 | | | | 1 | |
Shares reacquired | | | (3,514 | ) | | | (38,167 | ) | | | (14 | ) | | | (53 | ) |
Net increase/(decrease) in shares outstanding | | | (1,448 | ) | | | (27,019 | ) | | | 46 | | | | (18 | ) |
Beginning of period | | | 14,249 | | | | 41,268 | | | | 53 | | | | 71 | |
End of period | | | 12,801 | | | | 14,249 | | | | 99 | | | | 53 | |
Investor Class | | | | | | | | | | | | | | | | |
Shares sold | | | 7,765 | | | | 18,684 | | | | 104 | | | | 207 | |
Shares issued due to reinvestment of distributions | | | 1,140 | | | | 1,351 | | | | 15 | | | | 17 | |
Shares reacquired | | | (16,416 | ) | | | (24,359 | ) | | | (193 | ) | | | (431 | ) |
Net increase/(decrease) in shares outstanding | | | (7,511 | ) | | | (4,324 | ) | | | (74 | ) | | | (207 | ) |
Beginning of period | | | 71,193 | | | | 75,517 | | | | 1,379 | | | | 1,586 | |
End of period | | | 63,682 | | | | 71,193 | | | | 1,305 | | | | 1,379 | |
The accompanying notes are an integral part of the Financial Statements.
36
| | | | | | | | | | | | | | |
Harbor
Global Growth Fund | | | Harbor
Emerging Markets Equity Fund | |
November 1,
2014
through
April 30,
2015 | | | November 1,
2013
through
October 31,
2014 | | | November 1,
2014
through
April 30,
2015 | | | November 1,
2013
through
October 31,
2014 | |
| | (Unaudited) | | | | | | | | (Unaudited) | | | | | |
| | | | | | | | | | | | | | |
| | | | | | | | | | | | | | |
| $ | 10,619 | | | $ | 4,502 | | | $ | 23,089 | | | $ | 27,258 | |
| | 2,883 | | | | 2,279 | | | | 133 | | | | — | |
| | (3,116 | ) | | | (5,137 | ) | | | (4,982 | ) | | | (69 | ) |
| $ | 10,386 | | | $ | 1,644 | | | $ | 18,240 | | | $ | 27,189 | |
| | | | | | | | | | | | | | |
| $ | 345 | | | $ | 172 | | | $ | — | | | $ | 250 | |
| | 93 | | | | 56 | | | | — | | | | — | |
| | (138 | ) | | | — | | | | — | | | | — | |
| $ | 300 | | | $ | 228 | | | $ | — | | | $ | 250 | |
| | | | | | | | | | | | | | |
| $ | 5,309 | | | $ | 4,150 | | | $ | 86 | | | $ | 474 | |
| | 995 | | | | 563 | | | | 1 | | | | — | |
| | (1,510 | ) | | | (2,160 | ) | | | (50 | ) | | | (18 | ) |
| $ | 4,794 | | | $ | 2,553 | | | $ | 37 | | | $ | 456 | |
| | | | | | | | | | | | | | |
| | | | | | | | | | | | | | |
| | 476 | | | | 196 | | | | 2,462 | | | | 2,723 | |
| | 135 | | | | 103 | | | | 15 | | | | — | |
| | (143 | ) | | | (221 | ) | | | (529 | ) | | | (7 | ) |
| | 468 | | | | 78 | | | | 1,948 | | | | 2,716 | |
| | 1,118 | | | | 1,040 | | | | 2,716 | | | | — | |
| | 1,586 | | | | 1,118 | | | | 4,664 | | | | 2,716 | |
| | | | | | | | | | | | | | |
| | 15 | | | | 8 | | | | — | | | | 25 | |
| | 4 | | | | 2 | | | | — | | | | — | |
| | (6 | ) | | | — | | | | — | | | | — | |
| | 13 | | | | 10 | | | | — | | | | 25 | |
| | 34 | | | | 24 | | | | 25 | | | | — | |
| | 47 | | | | 34 | | | | 25 | | | | 25 | |
| | | | | | | | | | | | | | |
| | 242 | | | | 181 | | | | 9 | | | | 47 | |
| | 47 | | | | 25 | | | | — | | | | — | |
| | (70 | ) | | | (96 | ) | | | (5 | ) | | | (2 | ) |
| | 219 | | | | 110 | | | | 4 | | | | 45 | |
| | 365 | | | | 255 | | | | 45 | | | | — | |
| | 584 | | | | 365 | | | | 49 | | | | 45 | |
37
Harbor International & Global Funds Financial Highlights
SELECTED DATA FOR A SHARE OUTSTANDING FOR THE PERIODS PRESENTED
| | | | | | | | | | | | | | | | | | | | | | | | |
HARBOR INTERNATIONAL FUND | | | | | |
| | | Institutional Class | |
| | | 6-Month
Period Ended
April 30, 2015 | | | Year Ended October 31, | |
| | | | 2014 | | | 2013 | | | 2012 | | | 2011 | | | 2010 | |
| | | (Unaudited) | | | | | | | | | | | | | | | | |
Net asset value beginning of period | | $ | 68.09 | | | $ | 70.79 | | | $ | 59.12 | | | $ | 56.19 | | | $ | 59.13 | | | $ | 51.72 | |
Income from Investment Operations | | | | | | | | | | | | | | | | | | | | | | | | |
Net investment income/(loss)a | | | 0.60 | g | | | 1.25 | | | | 1.24 | | | | 1.10 | | | | 1.25 | | | | 0.81 | |
Net realized and unrealized gains/(losses) on investments | | | 4.51 | | | | (2.45 | ) | | | 11.69 | | | | 3.15 | | | | (3.32 | ) | | | 7.30 | |
Total from investment operations | | | 5.11 | | | | (1.20 | ) | | | 12.93 | | | | 4.25 | | | | (2.07 | ) | | | 8.11 | |
Less Distributions | | | | | | | | | | | | | | | | | | | | | | | | |
Dividends from net investment income | | | (1.42 | ) | | | (1.50 | ) | | | (1.26 | ) | | | (1.32 | ) | | | (0.87 | ) | | | (0.70 | ) |
Distributions from net realized capital gains1 | | | — | | | | — | | | | — | | | | — | | | | — | | | | — | |
Total distributions | | | (1.42 | ) | | | (1.50 | ) | | | (1.26 | ) | | | (1.32 | ) | | | (0.87 | ) | | | (0.70 | ) |
Proceeds from redemption fees | | | — | | | | — | | | | — | * | | | — | * | | | — | * | | | — | * |
Net asset value end of period | | | 71.78 | | | | 68.09 | | | | 70.79 | | | | 59.12 | | | | 56.19 | | | | 59.13 | |
Net assets end of period (000s) | | $ | 44,949,452 | | | $ | 43,385,100 | | | $ | 39,828,959 | | | $ | 29,723,443 | | | $ | 25,562,291 | | | $ | 25,798,545 | |
Ratios and Supplemental Data (%) | | | | | | | | | | | | | | | | | | | | | | | | |
Total returnb | | | 7.69 | %c | | | (1.69 | )% | | | 22.19 | % | | | 7.95 | % | | | (3.57 | )% | | | 15.83 | % |
Ratio of total expenses to average net assets2 | | | 0.76 | d | | | 0.76 | | | | 0.76 | | | | 0.78 | | | | 0.79 | | | | 0.82 | |
Ratio of net expenses to average net assetsa | | | 0.73 | d | | | 0.73 | | | | 0.74 | | | | 0.77 | | | | 0.77 | | | | 0.79 | |
Ratio of net investment income to average net assetsa | | | 1.79 | d | | | 1.78 | | | | 1.96 | | | | 1.96 | | | | 2.07 | | | | 1.56 | |
Portfolio turnover | | | 12 | c | | | 11 | | | | 10 | | | | 11 | | | | 12 | | | | 14 | |
| | | | | | | | | | | | | | | | | | | | | | | | |
HARBOR INTERNATIONAL GROWTH FUND | | | | | |
| | | Institutional Class | |
| | | 6-Month
Period Ended
April 30, 2015 | | | Year Ended October 31, | |
| | | | 2014 | | | 2013e | | | 2012 | | | 2011 | | | 2010 | |
| | | (Unaudited) | | | | | | | | | | | | | | | | |
Net asset value beginning of period | | $ | 12.75 | | | $ | 13.01 | | | $ | 11.60 | | | $ | 11.10 | | | $ | 11.98 | | | $ | 10.54 | |
Income from Investment Operations | | | | | | | | | | | | | | | | | | | | | | | | |
Net investment income/(loss)a | | | 0.08 | g | | | 0.16 | | | | 0.44 | | | | 0.44 | | | | 0.06 | | | | 0.09 | |
Net realized and unrealized gains/(losses) on investments | | | 0.89 | | | | (0.23 | ) | | | 1.67 | | | | 0.06 | | | | (0.72 | ) | | | 1.45 | |
Total from investment operations | | | 0.97 | | | | (0.07 | ) | | | 2.11 | | | | 0.50 | | | | (0.66 | ) | | | 1.54 | |
Less Distributions | | | | | | | | | | | | | | | | | | | | | | | | |
Dividends from net investment income | | | (0.19 | ) | | | (0.19 | ) | | | (0.70 | ) | | | — | | | | (0.22 | ) | | | (0.10 | ) |
Distributions from net realized capital gains1 | | | — | | | | — | | | | — | | | | — | | | | — | | | | — | |
Total distributions | | | (0.19 | ) | | | (0.19 | ) | | | (0.70 | ) | | | — | | | | (0.22 | ) | | | (0.10 | ) |
Proceeds from redemption fees | | | — | | | | — | | | | — | * | | | — | * | | | — | * | | | — | * |
Net asset value end of period | | | 13.53 | | | | 12.75 | | | | 13.01 | | | | 11.60 | | | | 11.10 | | | | 11.98 | |
Net assets end of period (000s) | | $ | 233,727 | | | $ | 196,062 | | | $ | 196,412 | | | $ | 324,404 | | | $ | 1,394,916 | | | $ | 1,774,192 | |
Ratios and Supplemental Data (%) | | | | | | | | | | | | | | | | | | | | | | | | |
Total returnb | | | 7.75 | %c | | | (0.54 | )% | | | 19.09 | % | | | 4.50 | % | | | (5.63 | )% | | | 14.76 | % |
Ratio of total expenses to average net assets2 | | | 0.90 | d | | | 0.88 | | | | 0.93 | | | | 0.87 | | | | 0.87 | | | | 0.90 | |
Ratio of net expenses to average net assetsa | | | 0.85 | d | | | 0.85 | | | | 0.89 | | | | 0.87 | | | | 0.86 | | | | 0.87 | |
Ratio of net investment income to average net assetsa | | | 1.23 | d | | | 1.23 | | | | 1.38 | | | | 1.22 | | | | 0.61 | | | | 0.97 | |
Portfolio turnover | | | 5 | c | | | 30 | | | | 166 | | | | 70 | | | | 112 | | | | 123 | |
See page 41 for notes to the Financial Highlights.
The accompanying notes are an integral part of the Financial Statements.
38
| | | | | | | | | | | | | | | | | | | | | | | | | | | | | | | | | | | | | | | | | | | | | | |
| | | | | | | | | | | | | | | | | | | | | | | | | | | | | | | | | | | | | | | | | | | | | | |
| Administrative Class | | | Investor Class | |
6-Month
Period Ended
April 30, 2015 | | | Year Ended October 31, | | | 6-Month
Period Ended
April 30, 2015 | | | Year Ended October 31, | |
| | 2014 | | | 2013 | | | 2012 | | | 2011 | | | 2010 | | | | 2014 | | | 2013 | | | 2012 | | | 2011 | | | 2010 | |
| (Unaudited) | | | | | | | | | | | | | | | | | | (Unaudited) | | | | | | | | | | | | | | | | |
| $ | 67.48 | | | $ | 70.18 | | | $ | 58.63 | | | $ | 55.72 | | | $ | 58.67 | | | $ | 51.36 | | | $ | 67.23 | | | $ | 69.92 | | | $ | 58.42 | | | $ | 55.51 | | | $ | 58.44 | | | $ | 51.16 | |
| | | | | | | | | | | | | | | | | | | | | | | | | | | | | | | | | | | | | | | | | | | | | | |
| | 0.50 | g | | | 1.91 | f | | | 1.03 | | | | 0.99 | | | | 1.07 | | | | 0.70 | | | | 0.46 | g | | | 1.07 | | | | 1.01 | | | | 0.87 | | | | 1.01 | | | | 0.66 | |
| | 4.51 | | | | (3.27 | ) | | | 11.63 | | | | 3.09 | | | | (3.27 | ) | | | 7.23 | | | | 4.47 | | | | (2.51 | ) | | | 11.54 | | | | 3.14 | | | | (3.27 | ) | | | 7.17 | |
| | 5.01 | | | | (1.36 | ) | | | 12.66 | | | | 4.08 | | | | (2.20 | ) | | | 7.93 | | | | 4.93 | | | | (1.44 | ) | | | 12.55 | | | | 4.01 | | | | (2.26 | ) | | | 7.83 | |
| | | | | | | | | | | | | | | | | | | | | | | | | | | | | | | | | | | | | | | | | | | | | | |
| | (1.00 | ) | | | (1.34 | ) | | | (1.11 | ) | | | (1.17 | ) | | | (0.75 | ) | | | (0.62 | ) | | | (1.14 | ) | | | (1.25 | ) | | | (1.05 | ) | | | (1.10 | ) | | | (0.67 | ) | | | (0.55 | ) |
| | — | | | | — | | | | — | | | | — | | | | — | | | | — | | | | — | | | | — | | | | — | | | | — | | | | — | | | | — | |
| | (1.00 | ) | | | (1.34 | ) | | | (1.11 | ) | | | (1.17 | ) | | | (0.75 | ) | | | (0.62 | ) | | | (1.14 | ) | | | (1.25 | ) | | | (1.05 | ) | | | (1.10 | ) | | | (0.67 | ) | | | (0.55 | ) |
| | — | | | | — | | | | — | * | | | — | * | | | — | * | | | — | * | | | — | | | | — | | | | — | * | | | — | * | | | — | * | | | — | * |
| | 71.49 | | | | 67.48 | | | | 70.18 | | | | 58.63 | | | | 55.72 | | | | 58.67 | | | | 71.02 | | | | 67.23 | | | | 69.92 | | | | 58.42 | | | | 55.51 | | | | 58.44 | |
| $ | 915,111 | | | $ | 961,478 | | | $ | 2,896,387 | | | $ | 2,210,914 | | | $ | 2,071,762 | | | $ | 1,852,148 | | | $ | 4,522,869 | | | $ | 4,786,270 | | | $ | 5,279,866 | | | $ | 4,169,704 | | | $ | 3,524,376 | | | $ | 3,586,143 | |
| | | | | | | | | | | | | | | | | | | | | | | | | | | | | | | | | | | | | | | | | | | | | | |
| | 7.55 | %c | | | (1.93 | )% | | | 21.87 | % | | | 7.67 | % | | | (3.82 | )% | | | 15.56 | % | | | 7.48 | %c | | | (2.05 | )% | | | 21.76 | % | | | 7.54 | % | | | (3.93 | )% | | | 15.41 | % |
| | 1.01 | d | | | 1.01 | | | | 1.01 | | | | 1.03 | | | | 1.04 | | | | 1.07 | | | | 1.13 | d | | | 1.13 | | | | 1.13 | | | | 1.15 | | | | 1.16 | | | | 1.19 | |
| | 0.98 | d | | | 0.98 | | | | 0.99 | | | | 1.02 | | | | 1.02 | | | | 1.04 | | | | 1.10 | d | | | 1.10 | | | | 1.11 | | | | 1.14 | | | | 1.14 | | | | 1.16 | |
| | 1.50 | d | | | 1.85 | | | | 1.66 | | | | 1.71 | | | | 1.83 | | | | 1.30 | | | | 1.38 | d | | | 1.46 | | | | 1.60 | | | | 1.60 | | | | 1.70 | | | | 1.23 | |
| | 12 | c | | | 11 | | | | 10 | | | | 11 | | | | 12 | | | | 14 | | | | 12 | c | | | 11 | | | | 10 | | | | 11 | | | | 12 | | | | 14 | |
| | | | | | | | | | | | | | | | | | | | | | | | | | | | | | | | | | | | | | | | | | | | | | |
| | | | | | | | | | | | | | | | | | | | | | | | | | | | | | | | | | | | | | | | | | | | | | |
| Administrative Class | | | Investor Class | |
6-Month
Period Ended
April 30, 2015 | | | Year Ended October 31, | | | 6-Month
Period Ended
April 30, 2015 | | | Year Ended October 31, | |
| | 2014 | | | 2013e | | | 2012 | | | 2011 | | | 2010 | | | | 2014 | | | 2013e | | | 2012 | | | 2011 | | | 2010 | |
| (Unaudited) | | | | | | | | | | | | | | | | | | (Unaudited) | | | | | | | | | | | | | | | | |
| $ | 12.66 | | | $ | 12.93 | | | $ | 11.52 | | | $ | 11.06 | | | $ | 11.94 | | | $ | 10.50 | | | $ | 12.64 | | | $ | 12.89 | | | $ | 11.50 | | | $ | 11.05 | | | $ | 11.94 | | | $ | 10.51 | |
| | | | | | | | | | | | | | | | | | | | | | | | | | | | | | | | | | | | | | | | | | | | | | |
| | 0.08 | g | | | (0.08 | ) | | | 0.01 | | | | 0.11 | | | | 0.02 | | | | 0.09 | | | | 0.05 | g | | | — | * | | | 0.06 | | | | 0.05 | | | | (0.18 | ) | | | 0.06 | |
| | 0.87 | | | | (0.03 | ) | | | 2.07 | | | | 0.35 | | | | (0.71 | ) | | | 1.43 | | | | 0.89 | | | | (0.11 | ) | | | 1.99 | | | | 0.40 | | | | (0.53 | ) | | | 1.45 | |
| | 0.95 | | | | (0.11 | ) | | | 2.08 | | | | 0.46 | | | | (0.69 | ) | | | 1.52 | | | | 0.94 | | | | (0.11 | ) | | | 2.05 | | | | 0.45 | | | | (0.71 | ) | | | 1.51 | |
| | | | | | | | | | | | | | | | | | | | | | | | | | | | | | | | | | | | | | | | | | | | | | |
| | (0.15 | ) | | | (0.16 | ) | | | (0.67 | ) | | | — | | | | (0.19 | ) | | | (0.08 | ) | | | (0.14 | ) | | | (0.14 | ) | | | (0.66 | ) | | | — | | | | (0.18 | ) | | | (0.08 | ) |
| | — | | | | — | | | | — | | | | — | | | | — | | | | — | | | | — | | | | — | | | | — | | | | — | | | | — | | | | — | |
| | (0.15 | ) | | | (0.16 | ) | | | (0.67 | ) | | | — | | | | (0.19 | ) | | | (0.08 | ) | | | (0.14 | ) | | | (0.14 | ) | | | (0.66 | ) | | | — | | | | (0.18 | ) | | | (0.08 | ) |
| | — | | | | — | | | | — | * | | | — | * | | | — | | | | — | | | | — | | | | — | | | | — | * | | | — | * | | | — | * | | | — | * |
| | 13.46 | | | | 12.66 | | | | 12.93 | | | | 11.52 | | | | 11.06 | | | | 11.94 | | | | 13.44 | | | | 12.64 | | | | 12.89 | | | | 11.50 | | | | 11.05 | | | | 11.94 | |
| $ | 1,329 | | | $ | 675 | | | $ | 919 | | | $ | 1,027 | | | $ | 1,287 | | | $ | 1,684 | | | $ | 17,539 | | | $ | 17,429 | | | $ | 20,458 | | | $ | 20,203 | | | $ | 25,291 | | | $ | 69,935 | |
| | | | | | | | | | | | | | | | | | | | | | | | | | | | | | | | | | | | | | | | | | | | | | |
| | 7.59 | %c | | | (0.83 | )% | | | 18.89 | % | | | 4.16 | % | | | (5.90 | )% | | | 14.56 | % | | | 7.53 | %c | | | (0.85 | )% | | | 18.60 | % | | | 4.07 | % | | | (6.04 | )% | | | 14.40 | % |
| | 1.15 | d | | | 1.13 | | | | 1.18 | | | | 1.12 | | | | 1.12 | | | | 1.15 | | | | 1.27 | d | | | 1.25 | | | | 1.30 | | | | 1.24 | | | | 1.25 | | | | 1.27 | |
| | 1.10 | d | | | 1.10 | | | | 1.14 | | | | 1.12 | | | | 1.11 | | | | 1.13 | | | | 1.22 | d | | | 1.22 | | | | 1.26 | | | | 1.24 | | | | 1.23 | | | | 1.25 | |
| | 1.33 | d | | | 1.08 | | | | 1.09 | | | | 0.90 | | | | 0.34 | | | | 0.72 | | | | 0.76 | d | | | 0.87 | | | | 0.98 | | | | 0.80 | | | | 0.12 | | | | 0.59 | |
| | 5 | c | | | 30 | | | | 166 | | | | 70 | | | | 112 | | | | 123 | | | | 5 | c | | | 30 | | | | 166 | | | | 70 | | | | 112 | | | | 123 | |
39
Harbor International & Global Funds Financial Highlights—Continued
SELECTED DATA FOR A SHARE OUTSTANDING FOR THE PERIODS PRESENTED
| | | | | | | | | | | | | | | | | | | | | | | | |
HARBOR GLOBAL GROWTH FUND | | | | | |
| | | Institutional Class | |
| | | 6-Month
Period Ended
April 30, 2015 | | | Year Ended October 31, | |
| | | | 2014 | | | 2013 | | | 2012 | | | 2011 | | | 2010 | |
| | | (Unaudited) | | | | | | | | | | | | | | | | |
Net asset value beginning of period | | $ | 23.79 | | | $ | 23.78 | | | $ | 17.99 | | | $ | 15.88 | | | $ | 18.07 | | | $ | 15.61 | |
Income from Investment Operations | | | | | | | | | | | | | | | | | | | | | | | | |
Net investment income/(loss)a | | | — | *,g | | | 0.05 | | | | 0.08 | | | | 0.06 | | | | 0.07 | | | | 0.01 | |
Net realized and unrealized gains/(losses) on investments | | | 0.84 | | | | 2.18 | | | | 6.26 | | | | 2.05 | | | | (0.30 | ) | | | 3.71 | |
Total from investment operations | | | 0.84 | | | | 2.23 | | | | 6.34 | | | | 2.11 | | | | (0.23 | ) | | | 3.72 | |
Less Distributions | | | | | | | | | | | | | | | | | | | | | | | | |
Dividends from net investment income | | | (0.03 | ) | | | (0.07 | ) | | | (0.06 | ) | | | — | | | | (0.16 | ) | | | (0.09 | ) |
Distributions from net realized capital gains1 | | | (2.57 | ) | | | (2.15 | ) | | | (0.49 | ) | | | — | | | | (1.81 | ) | | | (1.17 | ) |
Total distributions | | | (2.60 | ) | | | (2.22 | ) | | | (0.55 | ) | | | — | | | | (1.97 | ) | | | (1.26 | ) |
Proceeds from redemption fees | | | — | | | | — | | | | — | * | | | — | * | | | 0.01 | | | | — | * |
Net asset value end of period | | | 22.03 | | | | 23.79 | | | | 23.78 | | | | 17.99 | | | | 15.88 | | | | 18.07 | |
Net assets end of period (000s) | | $ | 34,947 | | | $ | 26,601 | | | $ | 24,734 | | | $ | 16,290 | | | $ | 13,772 | | | $ | 9,578 | |
Ratios and Supplemental Data (%) | | | | | | | | | | | | | | | | | | | | | | | | |
Total returnb | | | 3.92 | %c | | | 10.08 | % | | | 36.24 | % | | | 13.29 | % | | | (2.02 | )% | | | 25.30 | % |
Ratio of total expenses to average net assets2 | | | 1.03 | d | | | 1.08 | | | | 1.24 | | | | 1.60 | | | | 1.68 | | | | 2.28 | |
Ratio of net expenses to average net assetsa | | | 0.90 | d | | | 0.90 | | | | 0.90 | | | | 0.96 | | | | 1.00 | | | | 1.00 | |
Ratio of net investment income to average net assetsa | | | 0.03 | d | | | 0.22 | | | | 0.44 | | | | 0.39 | | | | (0.01 | ) | | | (0.06 | ) |
Portfolio turnover | | | 53 | c | | | 141 | | | | 110 | | | | 91 | | | | 107 | | | | 118 | |
| | | | | | | | | | | | | | | | | | | | | | | | |
| | | | | | | | | | | | | | | | | | | | | | | | |
HARBOR EMERGING MARKETS EQUITY FUND | | | | | | | | | | | | |
| | | Institutional Class | | | Administrative Class | | | Investor Class | |
| | | 6-Month
Period Ended
April 30, 2015 | | | Year Ended
October 31,
2014 | | | 6-Month
Period Ended
April 30, 2015 | | | Year Ended
October 31,
2014 | | | 6-Month
Period Ended
April 30, 2015 | | | Year Ended
October 31,
2014 | |
| | | (Unaudited) | | | | | | (Unaudited) | | | | | | (Unaudited) | | | | |
Net asset value beginning of period | | $ | 10.05 | | | $ | 10.00 | | | $ | 10.03 | | | $ | 10.00 | | | $ | 10.01 | | | $ | 10.00 | |
Income from Investment Operations | | | | | | | | | | | | | | | | | | | | | | | | |
Net investment income/(loss)a | | | — | *,g | | | 0.05 | | | | (0.02 | )g | | | 0.05 | | | | (0.02 | )g | | | 0.03 | |
Net realized and unrealized gains/(losses) on investments | | | 0.01 | | | | — | * | | | 0.01 | | | | (0.02 | ) | | | 0.02 | | | | (0.02 | ) |
Total from investment operations | | | 0.01 | | | | 0.05 | | | | (0.01 | ) | | | 0.03 | | | | — | * | | | 0.01 | |
Less Distributions | | | | | | | | | | | | | | | | | | | | | | | | |
Dividends from net investment income | | | (0.05 | ) | | | — | | | | (0.02 | ) | | | — | | | | (0.02 | ) | | | — | |
Distributions from net realized capital gains1 | | | — | | | | — | | | | — | | | | — | | | | — | | | | — | |
Total distributions | | | (0.05 | ) | | | — | | | | (0.02 | ) | | | — | | | | (0.02 | ) | | | — | |
Net asset value end of period | | | 10.01 | | | | 10.05 | | | | 10.00 | | | | 10.03 | | | | 9.99 | | | | 10.01 | |
Net assets end of period (000s) | | $ | 46,690 | | | $ | 27,294 | | | $ | 250 | | | $ | 250 | | | $ | 490 | | | $ | 454 | |
Ratios and Supplemental Data (%) | | | | | | | | | | | | | | | | | | | | | | | | |
Total returnb | | | 0.10 | %c | | | 0.50 | % | | | (0.07 | )%c | | | 0.30 | % | | | (0.04 | )%c | | | 0.10 | % |
Ratio of total expenses to average net assets2 | | | 1.61 | d | | | 2.34 | | | | 1.86 | d | | | 2.59 | | | | 1.98 | d | | | 2.71 | |
Ratio of net expenses to average net assetsa | | | 1.21 | d | | | 1.25 | | | | 1.47 | d | | | 1.50 | | | | 1.59 | d | | | 1.62 | |
Ratio of net investment income to average net assetsa | | | (0.02 | )d | | | 0.78 | | | | (0.37 | )d | | | 0.47 | | | | (0.48 | )d | | | 0.45 | |
Portfolio turnover | | | 33 | c | | | 50 | | | | 33 | c | | | 50 | | | | 33 | c | | | 50 | |
The accompanying notes are an integral part of the Financial Statements.
40
| | | | | | | | | | | | | | | | | | | | | | | | | | | | | | | | | | | | | | | | | | | | | | |
| | |
| Administrative Class | | | Investor Class | |
6-Month
Period Ended
April 30, 2015 | | | Year Ended October 31, | | | 6-Month
Period Ended
April 30, 2015 | | | Year Ended October 31, | |
| | 2014 | | | 2013 | | | 2012 | | | 2011 | | | 2010 | | | | 2014 | | | 2013 | | | 2012 | | | 2011 | | | 2010 | |
| (Unaudited) | | | | | | | | | | | | | | | | | | (Unaudited) | | | | | | | | | | | | | | | | |
| $ | 23.63 | | | $ | 23.65 | | | $ | 17.90 | | | $ | 15.83 | | | $ | 18.03 | | | $ | 15.59 | | | $ | 23.51 | | | $ | 23.54 | | | $ | 17.83 | | | $ | 15.80 | | | $ | 17.99 | | | $ | 15.57 | |
| | | | | | | | | | | | | | | | | | | | | | | | | | | | | | | | | | | | | | | | | | | | | | |
| | (0.02 | )g | | | 0.01 | | | | 0.04 | | | | 0.03 | | | | (0.02 | ) | | | (0.05 | ) | | | (0.04 | )g | | | (0.03 | ) | | | 0.01 | | | | (0.01 | ) | | | 0.07 | | | | (0.06 | ) |
| | 0.84 | | | | 2.14 | | | | 6.22 | | | | 2.04 | | | | (0.25 | ) | | | 3.72 | | | | 0.83 | | | | 2.15 | | | | 6.20 | | | | 2.04 | | | | (0.36 | ) | | | 3.70 | |
| | 0.82 | | | | 2.15 | | | | 6.26 | | | | 2.07 | | | | (0.27 | ) | | | 3.67 | | | | 0.79 | | | | 2.12 | | | | 6.21 | | | | 2.03 | | | | (0.29 | ) | | | 3.64 | |
| | | | | | | | | | | | | | | | | | | | | | | | | | | | | | | | | | | | | | | | | | | | | | |
| | — | | | | (0.02 | ) | | | (0.02 | ) | | | — | | | | (0.12 | ) | | | (0.06 | ) | | | — | | | | — | * | | | (0.01 | ) | | | — | | | | (0.10 | ) | | | (0.05 | ) |
| | (2.57 | ) | | | (2.15 | ) | | | (0.49 | ) | | | — | | | | (1.81 | ) | | | (1.17 | ) | | | (2.57 | ) | | | (2.15 | ) | | | (0.49 | ) | | | — | | | | (1.81 | ) | | | (1.17 | ) |
| | (2.57 | ) | | | (2.17 | ) | | | (0.51 | ) | | | — | | | | (1.93 | ) | | | (1.23 | ) | | | (2.57 | ) | | | (2.15 | ) | | | (0.50 | ) | | | — | | | | (1.91 | ) | | | (1.22 | ) |
| | — | | | | — | | | | — | * | | | — | * | | | — | | | | — | | | | — | | | | — | | | | — | * | | | — | * | | | 0.01 | | | | — | |
| | 21.88 | | | | 23.63 | | | | 23.65 | | | | 17.90 | | | | 15.83 | | | | 18.03 | | | | 21.73 | | | | 23.51 | | | | 23.54 | | | | 17.83 | | | | 15.80 | | | | 17.99 | |
| $ | 1,043 | | | $ | 802 | | | $ | 562 | | | $ | 371 | | | $ | 285 | | | $ | 292 | | | $ | 12,698 | | | $ | 8,584 | | | $ | 5,988 | | | $ | 3,189 | | | $ | 1,294 | | | $ | 592 | |
| | | | | | | | | | | | | | | | | | | | | | | | | | | | | | | | | | | | | | | | | | | | | | |
| | 3.83 | %c | | | 9.77 | % | | | 35.89 | % | | | 13.08 | % | | | (2.32 | )% | | | 24.96 | % | | | 3.71 | %c | | | 9.68 | % | | | 35.76 | % | | | 12.85 | % | | | (2.36 | )% | | | 24.82 | % |
| | 1.28 | d | | | 1.33 | | | | 1.49 | | | | 1.85 | | | | 1.93 | | | | 2.54 | | | | 1.40 | d | | | 1.45 | | | | 1.61 | | | | 1.98 | | | | 2.06 | | | | 2.66 | |
| | 1.15 | d | | | 1.15 | | | | 1.15 | | | | 1.21 | | | | 1.25 | | | | 1.25 | | | | 1.27 | d | | | 1.27 | | | | 1.27 | | | | 1.30 | | | | 1.37 | | | | 1.37 | |
| | (0.21 | )d | | | (0.01 | ) | | | 0.17 | | | | 0.14 | | | | (0.27 | ) | | | (0.31 | ) | | | (0.32 | )d | | | (0.17 | ) | | | 0.04 | | | | (0.01 | ) | | | (0.39 | ) | | | (0.39 | ) |
| | 53 | c | | | 141 | | | | 110 | | | | 91 | | | | 107 | | | | 118 | | | | 53 | c | | | 141 | | | | 110 | | | | 91 | | | | 107 | | | | 118 | |
| | | | | | | | | | | | | | | | | | | | | | | | | | | | | | | | | | | | | | | | | | | | | | |
| 1 | Includes both short-term and long-term capital gains. |
| 2 | Percentage does not reflect reduction for credit balance arrangements (see Note 2 of the accompanying Notes to Financial Statements). |
| a | Reflects the Adviser’s waiver, if any, of its management fees and/or other operating expenses. |
| b | The total returns would have been lower had certain expenses not been waived during the periods shown. |
| e | Effective May 21, 2013, Harbor International Growth Fund appointed Baillie Gifford Overseas Limited as its Subadviser. |
| f | The amount shown for a share outstanding does not correspond with the aggregate net investment income/(loss) for the period due to the timing of the sales and purchases of shares in relation to fluctuating market values of the investments of the Fund. |
| g | Amounts are allocated based upon average shares outstanding during the period. |
41
Harbor International & Global Funds
NOTES TO FINANCIAL STATEMENTS—April 30, 2015 (Unaudited)
(Currency in thousands)
NOTE 1—ORGANIZATIONAL MATTERS
Harbor Funds (the “Trust”) is registered under the Investment Company Act of 1940, as amended (the “Investment Company Act”), as an open-end management investment company. The Trust consists of 28 separate portfolios. The portfolios covered by this report include: Harbor International Fund, Harbor International Growth Fund, Harbor Global Growth Fund and Harbor Emerging Markets Equity Fund (individually or collectively referred to as a “Fund” or the “Funds,” respectively). Harbor Capital Advisors, Inc. (the “Adviser” or “Harbor Capital”) is the investment adviser for the Funds.
The Funds may offer up to three classes of shares, designated as Institutional Class, Administrative Class and Investor Class. The shares of each class represent an interest in the same portfolio of investments of the respective Fund and have equal rights to voting, redemptions, dividends, and liquidations, except that: (i) certain expenses, subject to the approval of the Trust’s Board of Trustees (the “Board of Trustees”), may be applied differently to each class of shares in accordance with current regulations of the Securities and Exchange Commission and the Internal Revenue Service; and (ii) shareholders of a class that bears distribution and service expenses under terms of a distribution plan have exclusive voting rights as to that distribution plan.
NOTE 2—SIGNIFICANT ACCOUNTING POLICIES
The following is a summary of significant accounting policies followed by the Trust in the preparation of its financial statements. Each Fund follows the investment company reporting requirements under U.S. Generally Accepted Accounting Principles (“U.S. GAAP”). The preparation of financial statements in accordance with U.S. GAAP requires management to make estimates and assumptions that affect the reported amounts and disclosures in the financial statements. Actual results may differ from those estimates.
For a detailed discussion of financial assets and liabilities subject to an enforceable master netting arrangement or similar agreement please refer to the descriptions of Repurchase Agreements in Note 2—Significant Accounting Policies and Securities Lending in Note 3—Investment Portfolio Transactions.
Security Valuation
Equity securities (including common stock, preferred stock, and convertible preferred stock) and financial derivative instruments (such as options contracts) that are traded on a national security exchange (except securities listed on the National Association of Securities Dealers Automated Quotation (“NASDAQ”) system and United Kingdom securities), are valued at the last sale price on a national exchange or system on which they are principally traded as of the valuation date. Securities listed on the NASDAQ system or a United Kingdom exchange are valued at the official closing price of those securities. In the case of securities for which there are no sales on the valuation day, (i) securities traded principally on a U.S. exchange, including NASDAQ, are valued at the mean between the closing bid and ask price; and (ii) securities traded principally on a foreign exchange, including United Kingdom securities, are valued at the official bid price determined as of the close of the primary exchange. Securities of open-end registered investment companies that are held by a Fund are valued at net asset value. To the extent these securities are actively traded and fair valuation adjustments are not applied, they are normally categorized as Level 1 in the fair value hierarchy. Equity securities traded on inactive markets or valued by reference to similar instruments are normally categorized as Level 2 in the fair value hierarchy. For more information on the fair value hierarchy, please refer to the Fair Value Measurements and Disclosures section in Note 2.
Short-term securities with a remaining maturity of less than 60 days at the time they are acquired are generally stated at amortized cost, which approximates fair value. Securities that are valued at amortized cost are normally categorized as Level 2 in the fair value hierarchy.
Over-the-counter (“OTC”) financial derivative instruments, such as forward currency contracts, options contracts and swap agreements, derive their value from underlying asset prices, indices, reference rates and other inputs, or a combination of these factors. These instruments are valued using evaluated prices furnished by a pricing service selected by the Board of
42
Harbor International & Global Funds
NOTES TO FINANCIAL STATEMENTS—Continued
(Currency in thousands)
NOTE 2—SIGNIFICANT ACCOUNTING POLICIES—Continued
Trustees. In certain cases, when a valuation is not readily available from a pricing service, the Fund’s subadviser provides a valuation, typically using its own proprietary models. Depending on the instrument and the terms of the transaction, the value of the derivative instrument can be determined by a pricing service or subadviser using a series of techniques, including simulation pricing models. The pricing models use inputs, such as issuer details, indices, spreads, interest rates, yield curves, dividends and exchange rates, that are observed from actively quoted markets. Derivative instruments that use valuation techniques and inputs similar to those described above are normally categorized in Level 2 of the fair value hierarchy.
When reliable market quotations or evaluated prices supplied by a pricing vendor are not readily available or are not believed to accurately reflect fair value, securities are priced at their fair value as determined by the Trust’s Valuation Committee (the “Valuation Committee”) pursuant to procedures adopted, and subject to oversight, by the Board of Trustees. The Valuation Committee is comprised of a trustee and officers of the Trust and employees of Harbor Capital with relevant experience or responsibilities. Each security for which the Valuation Committee determines a fair value, including the basis for the fair value decision, is reviewed by the Board of Trustees at its regularly scheduled board meetings.
When a fair valuation method is applied by the Valuation Committee or a Fund’s subadviser, securities will be priced by a method that the Valuation Committee or subadviser believes accurately reflects fair value. Securities valued using fair valuation methods that incorporate significant unobservable inputs are normally categorized as Level 3 in the fair value hierarchy. Examples of possible fair valuation methodologies used in determining the fair value of securities categorized as Level 3 in the fair value hierarchy include, but are not limited to, benchmark pricing and indicative market quotations.
When benchmark pricing is used, the base price of a debt security is set and then subsequently adjusted in proportion to the market value changes of an index or similar security (the “benchmark security”) that trades in an active market or for which other observable inputs are available. The base price may be a broker-dealer quote, transaction price, or an internal value as derived by analysis of market data. The base price of the security may be reset on a periodic basis based on the availability of market data and procedures approved by a Fund’s subadviser. If the benchmark security is categorized as Level 2 in the fair value hierarchy due to the lack of an active market for that security, any security adjusted in proportion to the market value of the benchmark security may be categorized as Level 3 in the fair value hierarchy. Significant changes in the unobservable inputs of the benchmark pricing process (i.e., the base price) would result in direct and proportional changes in the fair value of the security. The reasonability of the fair value is reviewed by the subadviser on a periodic basis and may be amended as the availability of market data indicates a material change.
If evaluated pricing through a third party pricing vendor is not available or deemed to be indicative of fair value, a Fund’s subadviser may elect to obtain indicative market quotations (“broker quotes”) directly from a broker-dealer or passed through from a third-party pricing vendor. Indicative market quotations are typically received from established market participants. In the event that the source of fair value is from a single-sourced broker quote, but the subadviser does not have the transparency to view the underlying inputs that support the market quotation these securities are categorized as Level 3 in the fair value hierarchy. Significant changes in the broker quote would have direct and proportional changes in the fair value of the security.
A Fund may also use fair value pricing if the value of some or all of the Fund’s securities have been materially affected by events occurring before the Fund’s pricing time but after the close of the primary markets or exchanges on which the security is traded. This most commonly occurs with foreign securities, but may occur with other securities as well. In such cases, the Fund may apply a fair value factor supplied by the pricing service to a foreign security’s market close value to reflect changes in value that may have occurred between the close of the primary market or exchange on which the security is traded and the Fund’s pricing time. That factor may be derived using observable inputs such as a comparison of the trading patterns of a foreign security to intraday trading in the U.S. markets that are highly correlated to the foreign security or other information that becomes available after the close of the foreign market on which the security principally traded. Fair value pricing is inherently subjective and reflects good faith judgments based on available information. When fair value pricing is employed, the prices of securities used by a Fund to calculate its net asset value may differ from market
43
Harbor International & Global Funds
NOTES TO FINANCIAL STATEMENTS—Continued
(Currency in thousands)
NOTE 2—SIGNIFICANT ACCOUNTING POLICIES—Continued
quotations, official closing prices or evaluated prices for the same securities, which means that the Fund may value those securities higher or lower than another given fund that uses market quotations, official closing prices or evaluated prices supplied by a pricing vendor in its calculation of net asset value. Securities valued using observable inputs, such as those described above, are normally categorized as Level 2 in the fair value hierarchy.
Fair Value Measurements and Disclosures
Various inputs may be used to determine the value of each Fund’s investments, which are summarized in three broad categories defined as Level 1, Level 2 and Level 3. The inputs or methodologies used for valuing securities are not necessarily an indication of the risk associated with investing in those securities. The assignment of an investment to Level 1, 2 or 3 is based on the lowest level of significant inputs used to determine its fair value.
| | |
| Level 1— | | Quoted prices in active markets for identical securities. |
| Level 2— | | Other significant observable inputs (including quoted prices for similar securities, interest rates, prepayment speeds, credit risk, etc.). |
| Level 3— | | Significant unobservable inputs are used in situations where quoted prices or other observable inputs are not available or are deemed unreliable. Significant unobservable inputs may include the Funds’ own assumptions. |
Transfers between Levels, if any, are recognized as of the last day in the fiscal quarter of the period in which the event or change in circumstances that caused the reclassification occurred. For fair valuations using significant unobservable inputs, a reconciliation of the beginning to ending balances for reported fair values is provided that presents changes attributable to realized and unrealized gains and losses and purchases, sales, and transfers in/out of the Level 3 category during the period. A table that includes a categorization of investments into Level 1, Level 2 or Level 3, transfers between Levels, if any, and a Level 3 reconciliation, including details of significant unobservable inputs used, when applicable, can be found at the end of each Fund’s Portfolio of Investments schedule.
The Funds used observable inputs in their valuation methodologies whenever they were available and deemed reliable.
U.S. Government Securities
U.S. government securities include securities issued by U.S. government agencies or government-sponsored enterprises that may not be guaranteed by the U.S. Treasury. The Government National Mortgage Association (“GNMA” or “Ginnie Mae”), a wholly owned U.S. government corporation, is authorized to guarantee, with the full faith and credit of the U.S. government, the timely payment of principal and interest on securities issued by institutions approved by GNMA and backed by pools of mortgages insured by the Federal Housing Administration or guaranteed by the Department of Veterans Affairs. Government-related guarantors (i.e., not backed by the full faith and credit of the U.S. government) include the Federal National Mortgage Association (“FNMA” or “Fannie Mae”) and the Federal Home Loan Mortgage Corporation (“FHLMC” or “Freddie Mac”). On September 7, 2008, the Federal Housing Finance Agency placed Fannie Mae and Freddie Mac in conservatorship, while the U.S. Treasury agreed to purchase preferred stock as needed to ensure that both Fannie Mae and Freddie Mac maintain a positive net worth (guaranteeing up to $100 billion for each entity). As a consequence, certain fixed income securities of Fannie Mae and Freddie Mac have more explicit U.S. government support.
Repurchase Agreements
In a repurchase agreement, a Fund buys a security at one price and simultaneously agrees to sell it back at a higher price. Such agreements must be adequately collateralized to cover the counterparty’s obligation to the Fund to close out the repurchase agreement. During the period, each Fund entered into repurchase agreements with domestic or foreign banks or with a member firm of the Financial Industry Regulatory Authority, Inc., or an affiliate of a member firm that is a primary dealer in U.S. government securities. Each repurchase agreement counterparty must meet the minimum credit quality requirements applicable to the respective Fund and any other appropriate counterparty criteria as determined by the Fund’s subadviser. The minimum credit quality requirements are those applicable to a Fund’s purchase of securities
44
Harbor International & Global Funds
NOTES TO FINANCIAL STATEMENTS—Continued
(Currency in thousands)
NOTE 2—SIGNIFICANT ACCOUNTING POLICIES—Continued
such that if a Fund is permitted to only purchase securities that are rated investment-grade (or the equivalent if unrated), that Fund could only enter into repurchase agreements with counterparties that have debt outstanding that is rated investment-grade (or the equivalent if unrated). The securities are regularly monitored to ensure that the collateral is adequate. A Fund seeks to further mitigate its counterparty risk by entering into master repurchase agreements with its counterparties. The master repurchase agreements provide that, in the event of a counterparty’s default, including bankruptcy, the Fund may terminate any repurchase agreements with that counterparty, determine the net amount owned, and sell or retain the collateral up to the net amount owed to the Fund. A counterparty’s default may cause the Fund to suffer losses, including loss of interest on or principal of the securities and costs associated with delay and enforcement of the terms of the master repurchase agreement.
Options
An option, including rights and warrants, is a contract that offers the buyer the right, but not the obligation, to buy (call) or sell (put) a security or other financial asset at an agreed-upon price (the strike price) during a certain period of time or on a specific date (exercise date). During the period, Harbor International Fund, Harbor Global Growth Fund, and Harbor Emerging Markets Equity Fund purchased option contracts to manage its exposure to equity prices. Call options tend to increase a Fund’s exposure to the underlying instrument, if purchased, and decrease exposure to the underlying instrument, if written. Put options tend to decrease a Fund’s exposure to the underlying instrument, if purchased, and increase exposure to the underlying instrument, if written.
When a Fund purchases an option, it pays a premium. If a purchased option expires, a Fund realizes a loss in the amount of the premium. If a Fund enters into a closing sale transaction, it realizes a gain or loss, depending on whether the proceeds from the sale are greater or less than the cost of the option. If a call option is exercised by a Fund, the cost of the securities acquired by exercising the call is increased by the premium paid to buy the call. If a put option is exercised by a Fund, it realizes a gain or loss from the sale of the underlying security and the proceeds from such sale are decreased by the premium originally paid. The risk associated with purchasing options is limited to the premium paid. A Fund’s maximum risk of loss from counterparty credit risk is also limited to the premium paid for the contract.
Foreign Currency Spot Contracts
A foreign currency spot contract is an agreement between two parties to buy and sell currencies at the current market rate for settlement within two business days. During the period, each Fund used foreign currency spot contracts to facilitate transactions in foreign securities or to convert foreign currency receipts into U.S. dollars.
The foreign currency spot contract is marked-to-market daily for settlements beyond one day, and any change in market value is recorded as an unrealized gain or loss. When the contract is closed, the Fund records a realized gain or loss equal to the difference between the value on the open and close date. Risk of losses may arise from changes in the value of the foreign currency or if the counterparties do not perform under the contract’s terms. The maximum potential loss from such contracts is the aggregate face value in U.S. dollars at the time the contract was opened.
Foreign Currency Translations
Purchases and sales of securities are translated into U.S. dollars at the current exchange rate on the respective dates of the transactions. Income and withholding taxes are translated at the prevailing exchange rate when accrued or incurred. The accounting records of the Funds are maintained in U.S. dollars. Investment securities and other assets and liabilities denominated in a foreign currency are translated into U.S. dollars based on the current exchange rates at April 30, 2015.
Reported net realized gains and losses on foreign currency transactions represent net gains and losses from sales and maturities of foreign currency contracts, disposition of foreign currencies, currency gains and losses realized between the trade and settlement dates on securities transactions, and the difference between the amount of investment income accrued and tax reclaims receivable and the U.S. dollar amount actually received. The effects of changes in foreign currency exchange rates on investments in securities are included in the net realized and unrealized gain or loss on investments in the Statement of Operations.
45
Harbor International & Global Funds
NOTES TO FINANCIAL STATEMENTS—Continued
(Currency in thousands)
NOTE 2—SIGNIFICANT ACCOUNTING POLICIES—Continued
Investment Income
Dividends declared on portfolio securities are accrued on the ex-dividend date. For foreign securities held, certain dividends are recorded after the ex-dividend date, but as soon as the respective Fund is notified of such dividends. Interest income is accrued daily as earned. Discounts and premiums on fixed income securities purchased are amortized over the life of the respective securities using the effective yield method.
Securities Transactions
Securities transactions are accounted for on the trade date (the date the order to buy or sell is executed). Realized gains or losses on security transactions are determined on the basis of identified cost for both federal income tax and financial reporting purposes.
Proceeds from Litigation
The Funds may receive proceeds from shareholder litigation settlements involving current and/or previously held portfolio holdings. Any proceeds received from litigation involving portfolio holdings are reflected in the Statement of Operations in realized gain/(loss) if the security has been disposed of by a Fund or in unrealized gain/(loss) if the security is still held by a Fund.
Distribution to Shareholders
Distributions on Fund shares are recorded on the ex-dividend date.
Expenses
Expenses incurred by the Trust are charged directly to the Fund that incurred such expense whenever possible. With respect to expenses incurred by any two or more Harbor Funds where amounts cannot be identified on a fund by fund basis, such expenses are generally allocated in proportion to the average net assets or the number of shareholders of each Fund.
Custodian
The Funds have credit balance arrangements with the Funds’ custodian whereby uninvested cash is invested in a short-term investment vehicle and amounts earned constitute an expense credit that is applied against gross custody expenses. Such custodial expense reductions are reflected on the accompanying Statement of Operations.
Class Allocations
Income, common expenses and realized and unrealized gains/(losses) are determined at the Fund level and allocated daily to each class of shares based on the applicable net assets of the respective classes. Distribution and service fees, if any, and transfer agent fees are calculated daily at the class level based on the applicable net assets of each class and the specific expense rate(s) applicable to each class.
Taxes
Each Fund is treated as a separate entity for federal tax purposes. Each Fund’s policy is to meet the requirements of Subchapter M of the Internal Revenue Code applicable to regulated investment companies and to distribute to its shareholders all of its taxable income within the prescribed time. It is also the intention of each Fund to distribute an amount sufficient to avoid imposition of any excise tax under Section 4982 of the Internal Revenue Code. Therefore, no provision has been made for federal taxes on income, capital gains or unrealized appreciation of securities held or excise taxes on income and capital gains.
46
Harbor International & Global Funds
NOTES TO FINANCIAL STATEMENTS—Continued
(Currency in thousands)
NOTE 2—SIGNIFICANT ACCOUNTING POLICIES—Continued
The Funds may be subject to taxes imposed by countries in which they invest. Such taxes are generally based on income and/or capital gains earned or repatriated. Taxes are accrued and applied to net investment income, net realized gains and unrealized appreciation as such income and/or gains are earned.
Management has analyzed each Fund’s tax positions for all open tax years (in particular, U.S. federal income tax returns for the tax years ended October 31, 2011–2013), including all positions expected to be taken upon filing the 2014 tax return, in all material jurisdictions where the Funds operate, and has concluded that no provision for income tax is required in any Fund’s financial statements. The Funds will recognize interest and penalties, if any, related to unrecognized tax benefits as income tax expense in the Statement of Operations.
New Accounting Pronouncement
In June 2014, the Financial Accounting Standards Board (“FASB”) issued Accounting Standards Update (“ASU”) 2014-11, Transfers and Servicing (“ASU 2014-11”) which expands secured borrowing accounting for certain repurchase agreements. ASU 2014-11 will also require additional disclosures for certain transactions accounted for as sales, in order to provide financial statement users with information to compare to similar transactions accounted for as secured borrowings. ASU 2014-11 will become effective for interim or annual periods beginning after December 15, 2014. Management is evaluating the implications of this pronouncement and the impact it will have on the financial statement disclosures.
In May 2015, FASB issued ASU 2015-07, Disclosures for Investments in Certain Entities That Calculate Net Asset Value per Share (or Its Equivalent) (“ASU 2015-07”) which removes the requirement to make certain fair value disclosures for investments that are eligible to be measured at fair value using the net asset value per share. ASU 2015-07 becomes effective for interim or annual periods beginning after December 15, 2015. Management is evaluating the implications of this pronouncement and the impact it will have on the financial statement disclosures.
NOTE 3—INVESTMENT PORTFOLIO TRANSACTIONS
Purchases and sales of investments, other than short-term securities, for each Fund for the six-month period ended April 30, 2015 are as follows:
| | | | | | | | |
| | | Purchases | | | Sales | |
Harbor International Fund | | $ | 5,766,446 | | | $ | 6,559,363 | |
Harbor International Growth Fund | | | 32,134 | | | | 11,731 | |
Harbor Global Growth Fund | | | 29,123 | | | | 19,505 | |
Harbor Emerging Markets Equity Fund | | | 28,902 | | | | 10,915 | |
Securities Lending
Each Fund may engage in securities lending, whereby a Fund lends its securities to financial institutions in order to increase its income. During the period, Harbor International Fund and Harbor International Growth Fund engaged in securities lending. Securities loans are required to be secured at all times during the term of the loan by cash collateral that is at least equal to the value of the loaned securities determined at the close of the Fund’s business day. Any additional collateral that may be required to secure the loan is delivered to the Fund the next business day. The cash collateral is maintained on the Fund’s behalf by the lending agent (State Street Bank & Trust Company) and is invested in the State Street Navigator Securities Lending Prime Portfolio, a money market mutual fund that seeks to provide income while maintaining a stable net asset value of $1.00. There is no assurance that the State Street Navigator Securities Lending Prime Portfolio will maintain a stable net asset value and the Fund is subject to the risk of loss on the cash collateral invested. This collateral is recognized as a liability in the Statement of Assets and Liabilities. During the term of the loan, the Fund will continue to receive any interest or dividends, or amounts equivalent thereto, on the loaned securities, in addition to receiving a fee from the borrower and earning interest on the investment of the cash collateral. The Fund may pay reasonable fees in connection with a loan of its securities and may share the interest earned on the collateral with the
47
Harbor International & Global Funds
NOTES TO FINANCIAL STATEMENTS—Continued
(Currency in thousands)
NOTE 3—INVESTMENT PORTFOLIO TRANSACTIONS—Continued
borrower. Net securities lending income is disclosed as such in the Statement of Operations. Securities loans may be terminated at the option of the borrower or the Fund. Upon termination of the loan, the borrower will return to the lender securities that are identical to the loaned securities. The Fund bears the risk of delay in recovery of, or loss of rights in, the securities loaned and the risk that the value of the collateral falls below the value of the securities on loan at the time of default by the borrower. A Fund had sought to mitigate this borrower risk by entering into a securities lending authorization agreement with its lending agent. The securities lending authorization agreement provides that, in the event of a borrower’s default, including bankruptcy, the lending agent will request that all loaned securities be returned by the borrower. In the event the borrower is unable or unwilling to return the loaned securities to the lending agent, the lending agent may apply the proceeds of the cash collateral from the loaned securities towards the purchase of replacement securities. If such proceeds are insufficient or the collateral is unavailable, the lending agent will purchase replacement securities at its sole expense. If the lending agent is unable to purchase replacement securities, it may credit to the relevant Fund’s account an amount equal to the market value of the unreturned loaned securities. The value at April 30, 2015 of securities loaned and related collateral for Harbor International Fund was $3,735,609 and $3,872,214, respectively, and value of securities loaned and related collateral for Harbor International Growth Fund was $5,559 and $5,776, respectively.
NOTE 4—FEES AND OTHER TRANSACTIONS WITH AFFILIATES
Investment Adviser
Harbor Capital is an indirect, wholly-owned subsidiary of Robeco Groep N.V. (“Robeco”). Robeco is majority owned by ORIX Corporation (“ORIX”). Harbor Capital is the Trust’s investment adviser and is also responsible for administrative and other services.
Each Fund has a separate advisory agreement with Harbor Capital. The agreements provide for fees based on an annual percentage rate of average daily net assets as follows:
| | | | | | | | |
| | | Contractual Rate | | | Actual Rateb | |
Harbor International Fund | | | 0.75 | %,0.65%a | | | 0.65 | % |
Harbor International Growth Fund | | | 0.75 | | | | 0.75 | |
Harbor Global Growth Fund | | | 0.75 | | | | 0.75 | |
Harbor Emerging Markets Equity Fund | | | 0.95 | | | | 0.95 | |
| a | The management fee rate is 0.75% on assets up to $12 billion and 0.65% on assets in excess of $12 billion. Effective March 1, 2015, the Adviser has contractually agreed to reduce the management fee to 0.63% on assets between $24 billion and $36 billion, 0.58% on assets between $36 billion and $48 billion, and 0.57% on assets over $48 billion through February 29, 2016. Previously, the Adviser contractually reduced the management fee to 0.63% on assets between $24 billion and $36 billion, and to 0.58% on assets over $36 billion. |
| b | Annualized for the six-month period ended April 30, 2015. |
Harbor Capital has from time to time voluntarily or contractually agreed not to impose a portion of its management fees and/or to bear a portion of the expenses incurred in the operation of certain Funds in order to limit Fund expenses. Such waivers, if any, are reflected on the accompanying Statements of Operations for the respective Funds. Harbor Capital has entered into a contractual expense limitation agreement with Harbor International Growth Fund, Harbor Global Growth Fund and Harbor Emerging Markets Equity Fund limiting the total expenses for Harbor International Growth Fund to 0.85%, 1.10%, and 1.22% for the Institutional Class, Administrative Class, and Investor Class, respectively, Harbor Global Growth Fund to 0.90%, 1.15%, and 1.27% for the Institutional Class, Administrative Class, and Investor Class, respectively, and Harbor Emerging Markets Equity Fund to 1.15%, 1.40% and 1.52% for the Institutional Class, Administrative Class, and Investor Class, respectively. The contractual expense limitations are effective through February 29, 2016. All expense limitations are inclusive of the transfer agent fee waiver discussed in the Transfer Agent section below.
Distributor
Harbor Funds Distributors, Inc. (“Harbor Funds Distributors” or the “Distributor”), a wholly-owned subsidiary of Harbor Capital, is the distributor for Harbor Funds shares. Under the Trust’s current distribution plans pursuant to Rule 12b-1 under
48
Harbor International & Global Funds
NOTES TO FINANCIAL STATEMENTS—Continued
(Currency in thousands)
NOTE 4—FEES AND OTHER TRANSACTIONS WITH AFFILIATES—Continued
the Investment Company Act with respect to each Fund’s Administrative and Investor Class shares (collectively, the “12b-1 Plans”), as applicable, each Fund pays the Distributor compensation at the annual rate of 0.25% of the average daily net assets of its Administrative and Investor Class shares. The 12b-1 Plans compensate the Distributor for the purpose of financing any activity that is primarily intended to result in the sale of Administrative and Investor Class shares of the Funds or for recordkeeping services or the servicing of shareholder accounts in the Administrative and Investor Class shares of the Funds. Such activities include, but are not limited to: printing of prospectuses and statements of additional information and reports for prospective shareholders (i.e., other than existing shareholders); preparation and distribution of advertising material and sales literature; expenses of organizing and conducting sales seminars; supplemental payments to dealers or other institutions such as asset-based sales charges, payments of recordkeeping fees under recordkeeping arrangements, or payments of service fees under shareholder service arrangements; and costs of administering the 12b-1 Plans.
Amounts payable by a Fund under the 12b-1 Plans need not be directly related to the expenses actually incurred by the Distributor on behalf of each Fund. The 12b-1 Plans do not obligate the Funds to reimburse the Distributor for the actual expenses the Distributor may incur in fulfilling its obligations under the 12b-1 Plans. Thus, even if the Distributor’s actual expenses exceed the fee payable to the Distributor at any given time, the Funds will not be obligated to pay more than that fee. If the Distributor’s expenses are less than the fee it receives, the Distributor will retain the difference.
The fees attributable to each Fund’s respective class are shown on the accompanying Statement of Operations.
Transfer Agent
Harbor Services Group, Inc. (“Harbor Services Group”), a wholly-owned subsidiary of Harbor Capital, is the transfer and shareholder servicing agent for the Funds. The transfer agency and service agreement is reviewed and approved annually by the Board of Trustees and provides currently for compensation up to the following amounts per class of each Fund:
| | |
Share Class | | Transfer Agent Feesa |
Institutional | | 0.065% of the average daily net assets of all Institutional Class shares |
Administrative | | 0.065% of the average daily net assets of all Administrative Class shares |
Investor | | 0.185% of the average daily net assets of all Investor Class shares |
| a | For the period November 1, 2014 through February 28, 2015, the Transfer Agent Fees for Institutional and Administrative Class shares was 0.06% and 0.18% for the Investor Class shares. |
Harbor Services Group has voluntarily waived a portion of its transfer agent fees during the six-month period ended April 30, 2015. Fees incurred for these transfer agent services are shown on each Fund’s Statement of Operations. The voluntary waiver may be discontinued at any time.
Shareholders
On April 30, 2015, Harbor Capital, Harbor Funds Distributors, and Harbor Services Group, collectively held the following shares of beneficial interest in the Funds:
| | | | | | | | | | | | | | | | | | | | |
| | | Number of Shares Owned by
Harbor Capital,
Harbor Funds Distributors, and
Harbor Services Group | | | Percentage of
Outstanding Shares | |
| | | Institutional
Class | | | Administrative
Class | | | Investor
Class | | | Total | | |
Harbor International Fund | | | 22,037 | | | | 1 | | | | 4 | | | | 22,042 | | | | 0.0 | % |
Harbor International Growth Fund | | | 66,242 | | | | 3 | | | | 6 | | | | 66,251 | | | | 0.4 | |
Harbor Global Growth Fund | | | 444,339 | | | | 22,847 | | | | 22,829 | | | | 490,015 | | | | 22.1 | |
Harbor Emerging Markets Equity Fund | | | 1,311,182 | | | | 25,057 | | | | 25,042 | | | | 1,361,281 | | | | 28.7 | |
Independent Trustees
The fees and expenses of the Independent Trustees are shown on each Fund’s Statement of Operations. The Independent Trustees’ remuneration for all Funds totaled $487 for the six-month period ended April 30, 2015.
49
Harbor International & Global Funds
NOTES TO FINANCIAL STATEMENTS—Continued
(Currency in thousands)
NOTE 4—FEES AND OTHER TRANSACTIONS WITH AFFILIATES—Continued
The Board of Trustees has adopted a Deferred Compensation Plan for Independent Trustees (the “Plan”), which enables Trustees to elect to defer receipt of all or a portion of the annual compensation they are entitled to receive from the Trust. For purposes of determining the amount owed to a Trustee under the Plan, deferred amounts are treated as though they had been invested in shares of the Fund(s) selected by the Trustee. While not required to do so, each Fund makes an investment equal to the Trustee’s investment election. The deferred compensation liability and the offsetting deferred compensation investment asset are included as a component of “Liabilities; Other” and “Other assets”, respectively, in the Statement of Assets and Liabilities. Such amounts fluctuate with changes in the market value of the selected securities. The deferred compensation and related mark-to-market impact liability and an offsetting investment asset will remain on each Fund’s Statement of Assets and Liabilities until distributed in accordance with the Plan.
Indemnification
Under the Trust’s organizational documents, its officers and Trustees are indemnified against certain liabilities arising out of the performance of their duties to the Trust. In addition, in the normal course of business the Trust enters into contracts that provide general indemnities to other parties. The Trust’s maximum exposure under these arrangements is unknown as this would involve future claims that may be made against the Trust that have not yet occurred. The risk of material loss as a result of such indemnification claims is considered remote.
NOTE 5—TAX INFORMATION
The identified cost for federal income tax purposes of investments owned by each Fund (including earned discount on corporate short-term notes and commercial paper) and their respective gross unrealized appreciation and depreciation at April 30, 2015 are as follows:
| | | | | | | | | | | | | | | | |
| | | | | | Gross Unrealized | | | Net Unrealized
Appreciation/
(Depreciation) | |
| | | Identified Cost | | | Appreciation | | | (Depreciation) | | |
Harbor International Fund* | | $ | 41,007,087 | | | $ | 14,351,923 | | | $ | (1,240,649 | ) | | $ | 13,111,274 | |
Harbor International Growth Fund* | | | 244,580 | | | | 25,939 | | | | (12,813 | ) | | | 13,126 | |
Harbor Global Growth Fund | | | 41,538 | | | | 5,604 | | | | (387 | ) | | | 5,217 | |
Harbor Emerging Markets Equity Fund* | | | 44,939 | | | | 3,658 | | | | (1,969 | ) | | | 1,689 | |
| * | Capital loss carryforwards are available that may reduce taxable income from future net realized gain on investments. |
NOTE 6—DERIVATIVES
The Funds’ derivative holdings do not qualify for hedge accounting treatment and as such are recorded at current fair value. For a detailed discussion of risks related to these investments please refer to the descriptions of each type of derivative instrument in Note 2—Significant Accounting Policies.
Each Fund’s derivative instruments outstanding as of the six-month period ended April 30, 2015, as disclosed in the Portfolios of Investments, and the related amounts of realized and changes in unrealized gains and losses on derivative instruments during the period as disclosed in the Statement of Operations, are indicators of the volume of derivative activity for these Funds. The derivatives held by each Fund are not subject to master netting arrangements.
50
Harbor International & Global Funds
NOTES TO FINANCIAL STATEMENTS—Continued
(Currency in thousands)
NOTE 6—DERIVATIVES—Continued
Derivative Instruments
At April 30, 2015, the fair values of derivatives, by primary risk exposure, were reflected in the Statement of Assets and Liabilities as follows:
HARBOR INTERNATIONAL FUND
| | | | |
Statement of Assets and Liabilities Caption | | Equity
Contracts | |
Assets | | | | |
Investments, at value (rights/warrants) | | $ | 30,116 | |
Realized net gain/(loss) and the change in unrealized appreciation/(depreciation) on derivatives, by primary risk exposure, for the six-month period ended April 30, 2015, were:
HARBOR INTERNATIONAL FUND
| | | | |
Net Realized Gain/(Loss) on Derivatives | | Equity
Contracts | |
Investments (rights/warrants) | | $ | — | a |
| |
Change in Unrealized Appreciation/(Depreciation) on Derivatives | | Equity
Contracts | |
Investments (rights/warrants) | | $ | (8,625 | ) |
| |
| HARBOR EMERGING MARKETS EQUITY FUND | | | | |
| |
Net Realized Gain/(Loss) on Derivatives | | Equity
Contracts | |
Investments (rights/warrants) | | $ | 5 | |
| a | Rounds to less than $1,000. |
NOTE 7—SUBSEQUENT EVENTS
Through the date the financial statements were issued, no subsequent events or transactions had occurred that would have materially impacted the financial statements or related disclosures as presented herein.
51
Harbor International & Global Funds
FEES AND EXPENSE EXAMPLE (Unaudited)
Example
As a shareholder of a Fund, you incur two types of costs: (1) transaction costs, including redemption fees (if any) and (2) ongoing costs, including management fees, distribution and service (12b-1) fees, and other Fund expenses. This example is intended to help you understand your ongoing costs (in dollars) of investing in a Fund and to compare these costs with the ongoing costs of investing in other mutual funds.
The example is based on an investment of $1,000 invested at the beginning of the period and held for the entire period November 1, 2014 through April 30, 2015.
Actual Expenses
The first line of the table below provides information about actual account values and actual expenses for each share class. You may use the information in the respective class line, together with the amount you invested, to estimate the expenses that you paid over the period. Simply divide your account value by $1,000 (for example, an $8,600 account value divided by $1,000 = 8.6), then multiply the result by the number in the first line of the respective class under the heading entitled “Expenses Paid During Period” to estimate the expenses you paid on your account during this period.
Hypothetical Example for Comparison Purposes
The second line of the table for each share class below provides information about hypothetical account values and hypothetical expenses based on the respective Fund’s actual expense ratio and an assumed rate of return of 5% per year before expenses, which is not the respective Fund’s actual return. The hypothetical account values and expenses may not be used to estimate the actual ending account balance or expenses you paid for the period. You may use this information to compare the ongoing costs of investing in a Fund to other funds. To do so, compare this 5% hypothetical example with the 5% hypothetical examples that appear in the shareholder reports of the other funds.
Please note that the expenses shown in the table are meant to highlight your ongoing costs only and do not reflect any transactional costs, such as redemption fees. Therefore, the second line of the table is useful in comparing ongoing costs only, and will not help you determine the relative total costs of owning different funds. In addition, if these transactional costs were included, your costs would have been higher.
| | | | | | | | | | | | | | | | |
| | | Annualized
Expense Ratio* | | | Expenses Paid
During Period** | | | Beginning Account
Value
(November 1, 2014) | | | Ending Account
Value
(April 30, 2015) | |
Harbor International Fund | | | | | | | | | | | | | | | | |
Institutional Class | | | 0.73% | | | | | | | | | | | | | |
Actual | | | | | | | $3.76 | | | $ | 1,000 | | | $ | 1,076.90 | |
Hypothetical (5% return) | | | | | | | 3.66 | | | | 1,000 | | | | 1,021.08 | |
Administrative Class | | | 0.98% | | | | | | | | | | | | | |
Actual | | | | | | | $5.04 | | | $ | 1,000 | | | $ | 1,075.50 | |
Hypothetical (5% return) | | | | | | | 4.91 | | | | 1,000 | | | | 1,019.81 | |
Investor Class | | | 1.10% | | | | | | | | | | | | | |
Actual | | | | | | | $5.65 | | | $ | 1,000 | | | $ | 1,074.80 | |
Hypothetical (5% return) | | | | | | | 5.51 | | | | 1,000 | | | | 1,019.20 | |
Harbor International Growth Fund | | | | | | | | | | | | | | | | |
Institutional Class | | | 0.85% | | | | | | | | | | | | | |
Actual | | | | | | | $4.38 | | | $ | 1,000 | | | $ | 1,077.50 | |
Hypothetical (5% return) | | | | | | | 4.26 | | | | 1,000 | | | | 1,020.47 | |
Administrative Class | | | 1.10% | | | | | | | | | | | | | |
Actual | | | | | | | $5.66 | | | $ | 1,000 | | | $ | 1,075.90 | |
Hypothetical (5% return) | | | | | | | 5.51 | | | | 1,000 | | | | 1,019.20 | |
Investor Class | | | 1.22% | | | | | | | | | | | | | |
Actual | | | | | | | $6.28 | | | $ | 1,000 | | | $ | 1,075.30 | |
Hypothetical (5% return) | | | | | | | 6.11 | | | | 1,000 | | | | 1,018.59 | |
52
Harbor International & Global Funds
FEES AND EXPENSE EXAMPLE—Continued
| | | | | | | | | | | | | | | | |
| | | Annualized
Expense Ratio* | | | Expenses Paid
During Period** | | | Beginning Account
Value
(November 1, 2014) | | | Ending Account
Value
(April 30, 2015) | |
Harbor Global Growth Fund | | | | | | | | | | | | | | | | |
Institutional Class | | | 0.90% | | | | | | | | | | | | | |
Actual | | | | | | $ | 4.55 | | | $ | 1,000 | | | $ | 1,039.20 | |
Hypothetical (5% return) | | | | | | | 4.51 | | | | 1,000 | | | | 1,020.22 | |
Administrative Class | | | 1.15% | | | | | | | | | | | | | |
Actual | | | | | | $ | 5.81 | | | $ | 1,000 | | | $ | 1,038.30 | |
Hypothetical (5% return) | | | | | | | 5.76 | | | | 1,000 | | | | 1,018.95 | |
Investor Class | | | 1.27% | | | | | | | | | | | | | |
Actual | | | | | | $ | 6.42 | | | $ | 1,000 | | | $ | 1,037.10 | |
Hypothetical (5% return) | | | | | | | 6.36 | | | | 1,000 | | | | 1,018.34 | |
Harbor Emerging Markets Equity Fund | | | | | | | | | | | | | | | | |
Institutional Class | | | 1.21% | | | | | | | | | | | | | |
Actual | | | | | | $ | 6.00 | | | $ | 1,000 | | | $ | 1,001.00 | |
Hypothetical (5% return) | | | | | | | 6.06 | | | | 1,000 | | | | 1,018.65 | |
Administrative Class | | | 1.47% | | | | | | | | | | | | | |
Actual | | | | | | $ | 7.29 | | | $ | 1,000 | | | $ | 999.30 | |
Hypothetical (5% return) | | | | | | | 7.35 | | | | 1,000 | | | | 1,017.32 | |
Investor Class | | | 1.59% | | | | | | | | | | | | | |
Actual | | | | | | $ | 7.88 | | | $ | 1,000 | | | $ | 999.60 | |
Hypothetical (5% return) | | | | | | | 7.95 | | | | 1,000 | | | | 1,016.71 | |
| * | Reflective of all fee waivers and expense reimbursements. |
| ** | Expenses are equal to the Fund’s annualized net expense ratio, multiplied by the average account value over the period, multiplied by 181/365 (to reflect the one-half year period). |
53
Harbor International & Global Funds
ADDITIONAL INFORMATION (Unaudited)
PROXY VOTING
The Funds have adopted Proxy Voting Policies and Procedures under which the Funds vote proxies relating to securities held by the Funds. In addition, the Funds file Form N-PX, with its complete proxy voting record for the 12 months ended June 30th, no later than August 31st of each year. A description of the Funds’ Proxy Voting Policies and Procedures and the Funds’ proxy voting record (Form N-PX) is available (i) without charge, upon request, by calling Harbor Funds toll-free at 800-422-1050; (ii) on the Funds’ website at harborfunds.com; and (iii) on the SEC’s website at www.sec.gov.
HOUSEHOLDING
Harbor Funds has adopted a policy that allows it to send only one copy of a Fund’s prospectus, proxy material, annual report and semi-annual report to certain shareholders residing at the same household. This reduces Fund expenses, which benefits you and other shareholders. If you need additional copies or do not want your mailings to be “householded,” please call the Shareholder Servicing Agent at 800-422-1050. Individual copies will be sent within thirty (30) days after the Shareholder Servicing Agent receives your instructions. Your consent to householding is considered valid until revoked.
QUARTERLY PORTFOLIO DISCLOSURES
Each Fund files a complete portfolio of investments with the Securities and Exchange Commission for the first and third quarters of each fiscal year on Form N-Q. The Funds’ Form N-Q is available (i) without charge, upon request, by calling Harbor Funds toll-free at 800-422-1050, (ii) on the Funds’ website at harborfunds.com, and (iii) on the SEC’s web site at www.sec.gov. The form may also be viewed and copied at the Commission’s Public Reference Room in Washington, D.C. Information regarding the operations of the Public Reference Room may also be obtained by calling 800-SEC-0330.
ADVISORY AGREEMENT APPROVALS
FACTORS CONSIDERED BY THE TRUSTEES IN APPROVING THE INVESTMENT ADVISORY AGREEMENTS AND SUBADVISORY AGREEMENTS OF THE INTERNATIONAL & GLOBAL FUNDS
The Investment Company Act of 1940, as amended, requires that the Investment Advisory and Subadvisory Agreement of each Fund be approved initially, and following an initial two-year term, at least annually, by the Harbor Funds Board of Trustees, including a majority of the Independent Trustees voting separately.
At an in-person meeting of the Board of Trustees held on February 8, 9, and 10, 2015 (the “Meeting”), the Board, including the Independent Trustees voting separately, considered and approved the continuation of each Investment Advisory Agreement with Harbor Capital Advisors, Inc., the adviser to each Fund (the “Adviser”), and each Subadvisory Agreement with each Fund’s subadviser (each, a “Subadviser”) with respect to Harbor International Fund, Harbor International Growth Fund, Harbor Global Growth Fund and Harbor Emerging Markets Equity Fund.
In evaluating each Investment Advisory Agreement and each Subadvisory Agreement, the Trustees reviewed materials furnished by the Adviser and each Subadviser, including information about their respective affiliates, personnel, and operations and also relied upon their knowledge of the Adviser and Subadvisers resulting from their quarterly meetings, periodic telephonic meetings and other prior communications. At the Meeting, which had been called for the purpose of considering the continuation of the relevant Investment Advisory Agreements and Subadvisory Agreements, and at prior meetings, the Trustees, including the Independent Trustees, requested and received materials and presentations relating to Fund performance and the services rendered by the Adviser and each Subadviser. The Trustees also discussed with representatives of the Adviser, at the Meeting and at prior meetings, Harbor Funds’ operations and the Adviser’s ability, consistent with the “manager of managers” structure of Harbor Funds, to (i) identify and recommend to the Trustees a subadviser for each Fund, (ii) monitor and oversee the performance and investment capabilities of each Subadviser, and (iii) recommend the replacement of a subadviser where appropriate.
At the Meeting, the Trustees, including all of the Independent Trustees voting separately, determined that the terms of each Investment Advisory Agreement and each Subadvisory Agreement with respect to Harbor International Fund, Harbor International Growth Fund, Harbor Global Growth Fund and Harbor Emerging Markets Equity Fund were fair and reasonable and approved the continuation for a one-year period of each such Investment Advisory Agreement and Subadvisory Agreement as being in the best interests of the respective Fund and its shareholders.
54
Harbor International & Global Funds
ADDITIONAL INFORMATION—Continued
In their deliberations, the Independent Trustees had the opportunity to meet privately without representatives of the Adviser or any Subadviser present and were represented throughout the process by legal counsel to the Independent Trustees and the Funds.
In considering the approval of each Fund’s Investment Advisory Agreement and Subadvisory Agreement, the Board of Trustees, including the Independent Trustees, evaluated a number of factors it considered relevant to its determination. The Board did not identify any single factor as all-important or controlling, and individual Trustees did not necessarily attribute the same weight or importance to each factor.
Among the factors considered by the Trustees in approving the Investment Advisory Agreements were the following:
| | • | | the nature, extent, and quality of the services provided by the Adviser, including the background, education, expertise and experience of the investment professionals of the Adviser; |
| | • | | the favorable history, reputation, qualifications and background of the Adviser, as well as the qualifications of its personnel; |
| | • | | the profitability of the Adviser with respect to each Fund, including the effect of revenues of Harbor Services Group, Inc. (“Harbor Services Group”), the Funds’ transfer agent, and Harbor Funds Distributors, Inc. (“Harbor Funds Distributors”), the Funds’ principal underwriter, on such profitability; |
| | • | | the fees charged by the Adviser for investment advisory services, including, in each case, the portion of the fee to be retained by the Adviser, after payment of the Subadviser’s fee, for the subadviser oversight, administration and “manager of managers” services the Adviser provides; |
| | • | | the extent to which economies of scale might be realized as each Fund grows, and the extent to which each Fund’s advisory fee level reflects any economies of scale for the benefit of Fund investors; |
| | • | | the fees and expense ratios of each Fund relative to the quality of services provided and the fees and expense ratios of similar investment companies; |
| | • | | the investment performance of each Fund in comparison to peer groups and certain relevant benchmark indices and the Adviser’s efforts to address circumstances of underperformance where applicable; |
| | • | | the compensation received by Harbor Services Group and Harbor Funds Distributors in consideration of the services each provides to the Funds, and any other “fall out” benefits that inure to the Adviser and its affiliates as a result of their relationship with the Funds; |
| | • | | information received at regular meetings throughout the year related to Fund performance and services rendered by the Adviser, as well as each of the Subadvisers, and research arrangements with brokers who execute transactions on behalf of each Subadviser; |
| | • | | information contained in materials provided by the Adviser and compiled by Lipper, Inc. (“Lipper”) as to the investment returns, advisory fees and total expense ratios of the Institutional Class of each Fund (and, in certain cases, total expense ratios of certain other classes) relative to those of other investment companies with similar objectives and strategies managed by other investment advisers, consisting both of a peer group of funds as well as a broader universe of funds compiled by Lipper; and |
| | • | | information contained in materials compiled by Morningstar, Inc. (“Morningstar”) as to the investment returns of the Institutional Class of each Fund relative to those of other investment companies with similar objectives and strategies managed by other investment advisers. |
Among the factors considered by the Trustees in approving the Subadvisory Agreements were the following:
| | • | | the nature, extent, and quality of the services provided by each Subadviser, including the background, education, expertise and experience of the investment professionals of each Subadviser providing services to the Funds; |
| | • | | the favorable history, reputation, qualifications and background of each Subadviser, as well as the qualifications of their respective personnel; |
| | • | | the fees charged by each Subadviser for subadvisory services, which fees are paid by the Adviser, not by the Funds; |
55
Harbor International & Global Funds
ADDITIONAL INFORMATION—Continued
| | • | | information contained in materials provided by the Adviser and compiled by Lipper as to the investment returns of the Institutional Class of each Fund relative to those of other investment companies with similar objectives and strategies managed by other investment advisers, consisting both of a peer group of funds as well as a broader universe of funds compiled by Lipper; and |
| | • | | information contained in materials compiled by Morningstar as to the investment returns of the Institutional Class of each Fund relative to those of other investment companies with similar objectives and strategies managed by other investment advisers. |
Nature, Scope and Extent of Services
The Trustees separately considered the nature, scope and extent of the services provided by the Adviser and each Subadviser. In their deliberations as to the approval of each Fund’s Investment Advisory Agreement and Subadvisory Agreement, the Trustees were mindful of the fact that, by choosing to invest in a Fund, the shareholders had entrusted the Adviser with the responsibility, subject to the approval of the Trustees, for selecting such Fund’s Subadviser, overseeing and monitoring that Subadviser’s performance and replacing the Subadviser if necessary. The Trustees also considered as relevant to their determination the favorable history, reputation, qualifications and background of the Adviser and each Subadviser, as well as the qualifications of their respective personnel.
The Adviser’s Services. The Board evaluated the nature, scope and extent of the Adviser’s services in light of the Board’s experience with the Adviser, as well as materials provided by the Adviser as part of its comprehensive written response to the 15(c) request letter prepared by legal counsel to the Independent Trustees in consultation with the Independent Trustees concerning the financial and other resources devoted by the Adviser to Harbor Funds, including the breadth and depth of experience and expertise of the investment, administrative, legal and compliance professionals dedicated to Harbor Funds’ operations. The Trustees noted that the Adviser had a favorable long-term record of identifying mutual fund products that proved to be attractive to investors, and selecting subadvisers to manage such funds. The Trustees determined that the Adviser had the expertise and resources to identify, select, oversee and monitor each Subadviser and to operate effectively as the “manager of managers” for the Funds.
The Subadvisers’ Services. The Trustees’ consideration of the services provided by the Subadvisers included a review of each Subadviser’s portfolio managers, investment philosophy, style and processes and record of consistency therewith, the volatility of its results, its approach to controlling risk, and the quality and extent of its investment capabilities and resources, including the nature and extent of research it receives from broker-dealers (to the extent applicable) and other sources. In their deliberations with respect to each Fund, the Trustees considered the history of Harbor Funds’ relationship with each Subadviser and Harbor Funds’ experience with each Subadviser in this capacity.
The Trustees also considered each Subadviser’s breadth and depth of experience and investment results in managing other accounts similar to the respective Fund. The Trustees had received presentations by investment professionals from the Subadvisers for Harbor International Fund, Harbor International Growth Fund, Harbor Global Growth Fund and Harbor Emerging Markets Equity Fund at meetings of the Board of Trustees held in 2014. The Trustees reviewed information concerning each Subadviser’s historical investment results in managing accounts and/or funds, as applicable, in a manner substantially similar to the relevant Fund.
Investment Performance, Advisory Fees and Expense Ratios
In considering each Fund’s performance, advisory fees and expense ratio, the Trustees requested and received from the Adviser data compiled by Lipper and Morningstar. The Trustees also received information explaining the methodology for compilation of certain of this information and what it was intended to demonstrate. The Trustees analyzed the Institutional Class performance of each Fund, the advisory fees of each Fund, and the Institutional Class expenses of each Fund (after giving effect to waivers and/or reimbursements, if applicable, that reduced the fees or expenses of the Fund or its peer funds) and made certain observations and findings as to each Fund as noted below. The Trustees also identified and reviewed certain Administrative Class and Investor Class comparative fee and expense information they considered relevant to their deliberations.
Harbor International Fund. In consideration of the Investment Advisory Agreement and Subadvisory Agreement for the Harbor International Fund (inception date of December 29, 1987), the Trustees noted the Fund’s Institutional Class underperformance relative to its Lipper universe medians for the one-, two-, three- and four-year periods ended
56
Harbor International & Global Funds
ADDITIONAL INFORMATION—Continued
December 31, 2014 and its outperformance relative to its Lipper universe median for the five-year period ended December 31, 2014. The Fund also underperformed its Lipper group medians for the one-, two-, three-, four- and five-year periods ended December 31, 2014. The Morningstar data presented showed that the Fund’s one-, three- and five-year rolling returns as of December 31, 2014 ranked in the fourth, third and second quartiles, respectively. The Trustees also considered the longer-term record showing the Fund had outperformed its benchmark, the MSCI EAFE® (ND) Index, for the five- and ten-year periods ended December 31, 2014. The Fund underperformed its benchmark for the one- and three-year periods ended December 31, 2014.
The Trustees considered the expertise of Northern Cross, LLC (“Northern Cross”) in managing assets, noting that it manages assets only in the international asset class. The Fund represents $48.66 billion of Northern Cross’s total firm assets under management of $51.96 billion. The Trustees noted that the three principals of Northern Cross who serve as co-portfolio managers of the Fund, also have considerable experience with foreign markets and had each worked with Mr. Hakan Castegren, the Fund’s former portfolio manager, for a number of years.
They observed that the Lipper comparison of contractual management fees for the Fund’s expense group, assuming an asset level of $49.150 billion, showed the Fund’s management fee was below the group median for the Institutional Class. The actual total expense ratio for the Institutional Class was below the group and universe median expense ratios. The Trustees observed that the advisory fee schedule included a contractual breakpoint reducing the fee rate from 75 basis points to 65 basis points on assets over $12 billion. The Trustees also noted the voluntary breakpoints, reducing the fee rate to 63 basis points on assets between $24 billion and $36 billion and to 58 basis points on assets above $36 billion. The Trustees further observed that the Adviser was proposing an additional voluntary breakpoint that would reduce the fee rate to 57 basis points on assets above $48 billion. The Trustees also considered the fact that Harbor Capital proposed to continue this fee arrangement (including the additional voluntary breakpoint) until at least February 29, 2016. The Trustees noted that Harbor Capital’s profitability in operating the Fund was not excessive.
Harbor International Growth Fund. In consideration of the Investment Advisory Agreement for the Harbor International Growth Fund (inception date of November 1, 1993), the Trustees noted the Fund’s Institutional Class performance was below its Lipper group and universe medians for the two-, three-, four- and five-year periods ended December 31, 2014. The Fund outperformed its Lipper group and universe medians for the one-year period ended December 31, 2014. The Trustees noted that, according to Morningstar, the Fund’s one-, three- and five-year rolling returns as of December 31, 2014 ranked in the third, fourth and fourth quartiles, respectively. The Trustees noted that the Fund had underperformed its benchmark, the MSCI ACWI ex. U.S. (ND) Index, for the one-, three-, five- and ten-year periods ended December 31, 2014. The Trustees noted that the Fund had recently changed subadvisers, engaging Baillie Gifford to manage the Fund beginning in May of 2013.
The Trustees considered the expertise of Baillie Gifford Overseas Limited (“Baillie Gifford”) in managing assets generally and in the ACWI ex-US Focus strategy specifically, noting that Baillie Gifford managed approximately $3.6 billion in assets in this strategy, out of a firm-wide total of approximately $178.6 billion in assets under management. The Trustees also noted the experience of the Fund’s portfolio managers in this asset class.
The Trustees noted that the Lipper comparison of contractual management fees for the Fund’s expense group, assuming an asset level of $225 million, showed the Fund’s management fee was below the group median for the Institutional Class. The actual total expense ratio for the Fund’s Institutional Class was below the group and universe median expense ratios. The Trustees also considered that Harbor Capital proposed to continue the Fund’s existing contractual fee waiver/expense reimbursement arrangement until at least February 29, 2016. The Trustees noted that the Adviser’s profitability in managing the Fund was not excessive.
Harbor Global Growth Fund. In consideration of the Investment Advisory Agreement and Subadvisory Agreement for the Harbor Global Growth Fund (inception date of March 1, 2009), the Trustees noted the Fund’s Institutional Class performance was above each of its Lipper group and universe medians for the one-, two-, three-, four- and five-year periods ended December 31, 2014. The Morningstar data presented showed that the Fund’s one-, three- and five-year rolling returns ranked in the third, first and first quartiles, respectively, for the periods ended December 31, 2014. The Trustees noted that the Fund had outperformed its benchmark, the MSCI All Country World (ND) Index, for the three- and five-year periods ended December 31, 2014 and underperformed its benchmark for the one-year period ended December 31, 2014.
The Trustees considered the expertise of Marsico Capital Management, LLC (“Marsico”) in managing assets generally and in the global growth asset class specifically, noting that Marsico managed approximately $279.3 million in assets in this
57
Harbor International & Global Funds
ADDITIONAL INFORMATION—Continued
asset class, out of a firm-wide total of approximately $14.9 billion in assets under management. The Trustees also noted the significant experience of the Fund’s portfolio manager in this asset class.
The Trustees noted that the Lipper comparison of contractual management fees for the Fund’s expense group, assuming an asset level of $50 million, showed the Fund’s management fee was below the group median for the Institutional Class. The actual total expense ratio for the Fund’s Institutional Class was below the group and universe median expense ratios. The Trustees also considered that Harbor Capital proposed to continue the Fund’s existing contractual fee waiver/expense reimbursement arrangement until at least February 29, 2016. They noted that the Adviser’s profitability in managing the Fund was not excessive.
Harbor Emerging Markets Equity Fund. In consideration of the Investment Advisory Agreement and Subadvisory Agreement for the Harbor Emerging Markets Equity Fund (inception date of November 1, 2013), the Trustees noted the Fund’s Institutional Class performance trailed its Lipper group and universe medians for the one-year and since inception periods ended December 31, 2014. The Morningstar data presented ranked the Fund’s one-year rolling return as of December 31, 2014 in the fourth quartile. The Trustees also considered the fact that Harbor Emerging Markets Equity Fund had underperformed its benchmark, the MSCI Emerging Markets Index, for the one-year period ended December 31, 2014. The Trustees noted that the short time period since the Fund’s inception did not support making any significant conclusions about the Fund’s performance.
The Trustees considered the expertise of the Fund’s subadviser, Oaktree, in managing assets generally and in the emerging markets equity asset class specifically, noting that Oaktree managed approximately $3.58 billion in assets in this asset class, out of a firm-wide total of approximately $93.22 billion in assets under management. The Trustees also discussed the experience of the Fund’s portfolio managers in this asset class, including their experience prior to joining Oaktree.
The Trustees observed that the Lipper comparison of contractual management fees for the Fund’s expense group, assuming an asset level of $50 million, showed the Fund’s contractual management fee was below the group median for the Institutional Class. The Trustees also noted that the Fund’s actual total expense ratio for the Institutional Class was below the Lipper group and universe median expense ratios. The Trustees also considered that Harbor Capital proposed to continue the Fund’s existing contractual fee waiver/expense reimbursement arrangement until at least February 29, 2016. The Trustees also noted that the Adviser was proposing that the Fund’s total expense ratio be capped at 1.15% for the Institutional Class, which would be a reduction of 0.10% from the prior year. The Trustees noted that Harbor Capital’s profitability in operating the Fund was negative.
* * *
The Trustees also separately considered the allocation between the Adviser and each Subadviser of the relevant Fund’s investment advisory fee (i.e., the amount of the advisory fee retained by the Adviser relative to that paid to the relevant Subadviser as a subadvisory fee). They determined in each case that the allocation was reasonable and the product of arm’s length negotiation between the Adviser and Subadviser.
Profitability
The Trustees also considered the Adviser’s profitability in managing each of the Funds (as well as on a fund complex-wide basis) as presented by the Adviser, and the allocation methodology used by the Adviser to compute such profitability. The Trustees acknowledged that a reasonable level of profitability was important to provide suitable incentives for the Adviser to continue to attract and maintain high-quality personnel and to invest in infrastructure and other resources to support and enhance the Funds’ operations. In considering the Adviser’s profitability generally, the Trustees also reviewed the compensation received by Harbor Services Group and Harbor Funds Distributors in consideration of the transfer agency and distribution services, respectively, that are provided to Harbor Funds, and any other benefits enjoyed by the Adviser and its affiliates as a result of their relationship with Harbor Funds. The Trustees noted that the Adviser was, in certain cases, waiving a portion of its advisory fee and/or reimbursing a portion of Fund expenses. The Trustees determined that the Adviser’s profitability in managing each Fund was not excessive.
Economies of Scale
The Trustees also considered the extent to which economies of scale might be realized as each Fund grows, and the extent to which each Fund’s advisory fee level reflects these economies of scale for the benefit of Fund investors. The Trustees
58
Harbor International & Global Funds
ADDITIONAL INFORMATION—Continued
specifically considered whether any advisory fee reduction “breakpoints” should be added to the advisory fee payable by any Fund. As noted above, the Trustees concluded that the Adviser’s profitability in each case was not excessive. They concluded that the Funds’ fee structures reflected economies of scale to date and that breakpoints in these fee structures were not required at the present time. The Trustees noted they intend to monitor each Fund’s asset growth in connection with future reviews of each Fund’s Investment Advisory Agreement to determine whether breakpoints may be appropriate at such time.
59
Harbor International & Global Funds
ADDITIONAL INFORMATION—Continued
TRUSTEES AND OFFICERS
(As of June 2015)
The business and affairs of the Trust shall be managed by or under the direction of the Trustees, and they shall have all powers necessary or desirable to carry out that responsibility. The Trustees shall have full power and authority to take or refrain from taking any action and to execute any contracts and instruments that they may consider necessary or desirable in the management of the Trust. Any determination made by the Trustees in good faith as to what is in the interests of the Trust shall be conclusive. Information pertaining to the Trustees and Officers of Harbor Funds is set forth below. The address of each Trustee and Officer is: [Name of Trustee or Officer] c/o Harbor Funds, 111 South Wacker Drive, 34th Floor, Chicago, IL 60606-4302.
The Harbor Funds’ Statement of Additional Information includes additional information about the Trust’s Trustees and is available without charge by calling 800-422-1050 or at the Trust’s website at harborfunds.com.
| | | | | | | | |
Name (Age)
Position(s) with Fund
Address | | Term of
Office and
Length of
Time Served1 | | Principal Occupation(s) During Past Five Years | | Number of
Portfolios in
Fund Complex
Overseen by
Trustee | | Other Directorships
of Public Companies
and Other Registered
Investment
Companies Held by
Trustee During Past
Five Years |
| INDEPENDENT TRUSTEES |
Scott M. Amero (51) Trustee | | Since 2014 | | Trustee, Rare (conservation non-profit) (2011–Present); Trustee, Berkshire School (2014–Present); BlackRock, Inc., (publicly traded investment management firm) Vice Chairman and Global Chief Investment Officer, Fixed Income (2010), Vice Chairman and Global Chief Investment Officer, Fixed Income, and Co-Head, Fixed Income Portfolio Management (2007-2010). | | 28 | | Director, Anthracite Capital, Inc. (2005-2010). |
| | | | |
Raymond J. Ball (70) Trustee | | Since 2006 | | Sidney Davidson Distinguished Service Professor of Accounting, University of Chicago Booth School of Business (2000-Present); Academic Affiliate, Analysis Group (litigation consulting firm) (2000-Present); Financial Reporting Faculty Advisory Group of the Institute of Chartered Accountants in England and Wales (2008-Present); and Advisory Board of the Center for Accounting Research & Education at University of Notre Dame (2006-Present). | | 28 | | None |
| | | | |
Donna J. Dean (63) Trustee | | Since 2010 | | Chief Investment Officer of the Rockefeller Foundation (a private foundation) (1995-Present); and Trustee of Queens University of Charlotte, North Carolina (2000-2014). | | 28 | | None |
| | | | |
Randall A. Hack (68) Trustee | | Since 2010 | | Founder and Senior Managing Director of Capstone Capital LLC (a private investment firm) (2003-Present); Director of Tower Development Corporation (cell tower developer) (2009-Present); and Advisory Director of Berkshire Partners (a private equity firm) (2002-2013). | | 28 | | Director of FiberTower Corporation (2002-2011). |
| | | | |
Robert Kasdin (57) Trustee | | Since 2014 | | Senior Vice President and Chief Operating Officer, Johns Hopkins Medicine (2015-Present); Senior Executive Vice President, Columbia University (2002-2015); Trustee, National September 11 Memorial & Museum at the World Trade Center (2005-Present); Trustee, The Metropolitan Museum of Art (2014-Present); Trustee (2004-2014) and President of the Board of Trustees (2006-2011), The Dalton School; Trustee, ARTstor Digital Library (a nonprofit digital images resource) (2013-Present); Director, Apollo Commercial Real Estate Finance, Inc. (2014-Present); and Director, Noranda Aluminum Holdings Corp. (2007–2014). | | 28 | | Director of Noranda Aluminum Holdings Corp. (2007-2014); and Director of Apollo Commercial Real Estate Finance, Inc. (2014-Present). |
| | | | |
Rodger F. Smith (74) Trustee | | Since 1987 | | Managing Director, Greenwich Associates (a research based consulting firm) (1976-Present); and Chair of Trust Advisory Committee of Tau Beta Pi Association (engineering honor society) (1985-Present). | | 28 | | None |
| | | | |
Ann M. Spruill (61) Trustee | | Since 2014 | | Partner (1993-2008), Member of Executive Committee (1996-2008), Member Board of Directors (2000-2008), Grantham, Mayo, Van Otterloo & Co. LLC (private investment management firm) (with the firm since 1990); Member Investment Committee and Chair of Global Equities, Museum of Fine Arts, Boston (2000-Present); and Trustee, Financial Accounting Foundation (2014-Present). | | 28 | | None |
| INTERESTED TRUSTEE |
| | | | |
David G. Van Hooser (68)* Chairman, Trustee and President | | Since 2000 | | President (2002-Present), Director and Chairman of the Board (2000-Present), Harbor Capital Advisors, Inc.; Chief Executive Officer (2007-Present), Chief Financial Officer (2012-Present), Treasurer (2007-2012) and Director (2000-Present), Harbor Funds Distributors, Inc.; and Director (2000-Present), Harbor Services Group, Inc. | | 28 | | None |
60
Harbor International & Global Funds
ADDITIONAL INFORMATION—Continued
| | | | |
Name (Age) Position(s) with Fund Address | | Term of Office and Length of Time Served1 | | Principal Occupation(s) During Past Five Years |
| FUND OFFICERS NOT LISTED ABOVE** |
Charles F. McCain (45) Chief Compliance Officer | | Since 2004 | | Executive Vice President and General Counsel (2004-Present) and Chief Compliance Officer (2004-2014), Harbor Capital Advisors, Inc.; Director (2007-Present) and Chief Compliance Officer (2004-Present), Harbor Services Group, Inc.; and Director, Executive Vice President and Chief Compliance Officer (2007-Present), Harbor Funds Distributors, Inc. |
| | |
Anmarie S. Kolinski (43) Treasurer | | Since 2007 | | Executive Vice President and Chief Financial Officer (2007-Present), Harbor Capital Advisors, Inc.; Chief Financial Officer (2007-Present), Harbor Services Group, Inc.; and Treasurer (2012-Present), Harbor Funds Distributors, Inc. |
| | |
Erik D. Ojala (40) Vice President and Secretary; AML Compliance Officer | | Since 2007;
Since 2010 | | Senior Vice President and Associate General Counsel (2007-Present) and Secretary (2010-Present), Harbor Capital Advisors, Inc.; and Assistant Secretary (2014-Present), Harbor Services Group, Inc. |
| | |
Brian L. Collins (46) Vice President | | Since 2005 | | Executive Vice President and Chief Investment Officer (2004-Present), Harbor Capital Advisors, Inc. |
| | |
Charles P. Ragusa (56) Vice President | | Since 2007 | | Executive Vice President (2007-Present), Harbor Capital Advisors, Inc.; President (2007-Present), Harbor Services Group, Inc.; and Executive Vice President and AML Compliance Officer (2007-Present), Harbor Funds Distributors, Inc. |
| | |
Jodie L. Crotteau (43) Assistant Secretary | | Since 2014 | | Senior Vice President and Chief Compliance Officer, Harbor Capital Advisors, Inc. (2014-Present); Vice President and Chief Compliance Officer, Grosvenor Registered Funds (2011-2014); Vice President, Grosvenor Capital Management, L.P. (2010-2014); Assistant Secretary (2005-2010) and AML Compliance Officer (2007-2010), Harbor Funds; Vice President, Secretary and Compliance Director (2007-2010), Harbor Capital Advisors, Inc.; Assistant Secretary (2005-2010), Harbor Services Group, Inc.; and Assistant Secretary (2007-2010), Harbor Funds Distributors, Inc. |
| | |
Susan A. DeRoche (62) Assistant Secretary | | Since 2006 | | Senior Vice President and Compliance Director (2007-Present) and Assistant Secretary (2006-Present), Harbor Capital Advisors, Inc.; Senior Vice President (2011-Present) and Secretary (2007-Present), Harbor Funds Distributors, Inc.; and Secretary (2014-Present) and Assistant Secretary (2012-2013), Harbor Services Group, Inc. |
| | |
John M. Paral (46) Assistant Treasurer | | Since 2013 | | Vice President (2012-Present) and Financial Reporting Manager (2007-2012), Harbor Capital Advisors, Inc. |
| 1 | Each Trustee serves for an indefinite term, until his successor is elected. Each Officer is elected annually. |
| * | Mr. Van Hooser is deemed an “Interested Trustee” due to his affiliation with the Adviser and Distributor of Harbor Funds. |
| ** | Officers of the Funds are “interested persons” as defined in the Investment Company Act. |
61
THIS PRIVACY STATEMENT IS NOT PART OF THIS REPORT
Harbor’s Privacy Statement
The following privacy statement is issued by Harbor Funds and each series of Harbor Funds and its affiliates, Harbor Capital Advisors, Inc., Harbor Services Group, Inc. and Harbor Funds Distributors, Inc. These measures reflect our commitment to maintaining the privacy of your confidential information. We appreciate the confidence you have shown by entrusting us with your assets.
Personal Information | It is our policy to respect the privacy of current and former shareholders and to protect personal information entrusted to us. We do not sell your personal information to anyone. |
| | In the course of providing products and services, we collect non-public personal information about you from the following sources: applications, forms, our website (including any information captured through our use of “cookies”), through mobile applications, by telephone and in correspondence and transactions with us, our affiliates or other parties. |
| | The non-public personal information collected may include name, address, e-mail address, telephone/fax numbers, account number, social security or taxpayer identification number, investment activity, and bank account information. |
| | When you visit us through our website or a mobile application, we may collect technical and navigational information, such as computer browser type, Internet protocol address, pages visited and average time spent on our website. We may use this information to alert you to software compatibility issues, or to improve our web design and functionality. We use “cookies” and similar files that may be placed on your hard drive for security purposes, to facilitate site navigation and to personalize the appearance of our site. |
Information Sharing | We occasionally disclose non-public personal information about our current or former shareholders with affiliated and non-affiliated parties, as permitted or required by law or regulation. In the normal course of servicing our shareholders, information we collect may be shared with non-affiliated companies that perform support services on our behalf or to other firms that assist us in providing you with products and services, such as custodians, transfer agents, broker-dealers and marketing service firms, as well as with other financial institutions. These companies may not use the information for any other purpose and we require them to keep the information they handle confidential. We may also share information with affiliates that are engaged in a variety of financial services in order to better service your account(s). |
| | When information is shared with third parties, they are not permitted to use the information for any purpose other than to assist our servicing of your account(s) or as permitted by law. |
| | If you close your account(s) or if we lose contact with you, we will continue to share information in accordance with our current privacy policy and practices. |
Access to Information | Access to non-public personal information is limited to employees, agents or other parties who need to know that information to perform their jobs, such as servicing your account(s), resolving problems or informing you of new products or services. |
Security | We maintain physical, electronic and procedural safeguards that comply with industry standards to protect your non-public personal information. |
| | For shareholders accessing information through our website or a mobile application, various forms of Internet security, such as data encryption firewall barriers, user names and passwords, and other tools are used. For additional information regarding our security measures, visit the terms and conditions of use on our website at harborfunds.com. If you have any questions or concerns about how we maintain the privacy of your non-public personal information, please contact us at 800-422-1050 Monday through Friday, between the hours of 8:00 a.m. and 6:00 p.m. Eastern time. |
We recommend that you read and retain this notice for your personal files
Eff. November 2013
62
Glossary
12b-1 Fee—A mutual fund fee, named for the SEC rule that permits it, used to pay for broker-dealer compensation and other distribution costs. If a fund has a 12b-1 fee, it will be disclosed in the fee table of a fund’s prospectus.
ADR—ADR after the name of a foreign holding stands for American Depositary Receipts representing ownership of foreign securities. ADRs are issued by U.S. banking institutions.
Average Market Capitalization—The average market capitalization of a fund’s equity portfolio gives you a measure of the size of the companies in which the fund invests. Market capitalization is calculated by multiplying the number of a company’s shares outstanding by its price per share.
Average Weighted Coupon—A calculation from a fund’s portfolio by weighting the coupon of each bond by its relative size in the portfolio.
Barclays U.S. Aggregate Bond Index—The Barclays U.S. Aggregate Bond Index is an unmanaged index of investment-grade fixed-rate debt issues with maturities of at least one year. This unmanaged index does not reflect fees and expenses and is not available for direct investment.
Barclays U.S. TIPS Index—The Barclays U.S. TIPS Index is an unmanaged market index comprised of all U.S. Treasury Inflation Protected Securities rated investment grade (Baa3 or better), have at least one year to final maturity, and at least $250 million par amount outstanding. This unmanaged index does not reflect fees and expenses and is not available for direct investment.
Beta—A measure of market-related risk. The beta of every index is 1.00, no matter how volatile the index is. A beta less than one means the portfolio is less volatile than the index. A beta higher than one indicates more volatility than the index.
Bloomberg Commodity Index Total ReturnSM—The Bloomberg Commodity Index Total ReturnSM is a broadly diversified index that tracks the commodities markets through commodity futures contracts. This unmanaged index does not reflect fees and expenses and is not available for direct investment.
BofA Merrill Lynch All U.S. Convertibles Ex Mandatory Index—The BofA Merrill Lynch All U.S. Convertibles Ex Mandatory Index is broadly representative of the U.S. convertible securities market, consisting of publicly traded issues, denominated in U.S. dollars, of all credit qualities, and excluding mandatory (equity-linked) convertibles. This unmanaged index does not reflect fees and expenses and is not available for direct investment.
BofA Merrill Lynch U.S. Dollar 3-Month LIBOR Constant Maturity Index—The BofA Merrill Lynch U.S. Dollar 3-Month LIBOR Constant Maturity Index tracks the performance of a synthetic asset paying Libor to a stated maturity. The index is based on the assumed purchase at par of a synthetic instrument having exactly its stated maturity and with a coupon equal to that day’s fixing rate. That issue is assumed to be sold the following business day (priced at a yield equal to the current day fixing rate) and rolled into a new instrument. This unmanaged index does not reflect fees and expenses and is not available for direct investment.
BofA Merrill Lynch 3-Month U.S. Treasury Bill Index—The BofA Merrill Lynch 3-Month U.S. Treasury Bill Index is comprised of a single U.S. Treasury Bill issue purchased at the beginning of each month and held for a full month, at which time that issue is sold and rolled into a newly selected issue. The issue selected each month is that having a maturity date closest to, but not beyond 90 days from the rebalance date.
BofA Merrill Lynch U.S. High Yield Index—The BofA Merrill Lynch U.S. High Yield Index is an unmanaged index that tracks the performance of below investment grade U.S. dollar-denominated corporate bonds publicly issued in the U.S. domestic market. All bonds are U.S. dollar denominated and rated Split BBB and below. This unmanaged index does not reflect fees and expenses and is not available for direct investment.
BofA Merrill Lynch U.S. Non-Distressed High Yield Index—The BofA Merrill Lynch U.S. Non-Distressed High Yield Index is a subset of the BofA Merrill Lynch U.S. High Yield Index including all securities with an option-adjusted spread less than 1,000 basis points. The unmanaged index does not reflect fees and expenses and is not available for direct investment.
Bottom-Up Equity Management Style—A management style that de-emphasizes the significance of economic and market cycles, focusing instead on the analysis of individual stocks.
Capital Gains Distribution—Profits distributed to shareholders resulting from the sale of securities held in the fund’s portfolio.
Credit Risk—The possibility that a bond issuer may not be able to pay interest and repay its debt.
63
Glossary—Continued
CUSIP Number—Identification number assigned to every stock, corporate bond and municipal bond by the Committee on Uniform Securities Identification Procedures (CUSIP), which is established by the American Bankers Association.
Diversification—The practice of investing broadly across securities of a number of issuers to reduce risk.
Duration—A common gauge of the price sensitivity of a fixed income asset or portfolio to a change in interest rates.
Emerging Markets—Emerging markets are countries with relatively young stock and bond markets. Examples include Brazil and Thailand. Typically, emerging-markets investments have the potential for losses and gains larger than those of developed-market investments.
Expense Ratio—The Fund’s total annual operating expenses (including management fees, distribution (12b-1) fees and other expenses) expressed as a percentage of average net assets.
Family of Funds—A group of mutual funds, each typically with its own investment objective, managed and distributed by the same company.
GDR—GDR after the name of a holding stands for Global Depositary Receipt representing ownership of foreign securities. GDRs are issued by either U.S. or non-U.S. banking organizations.
Inception Date—The date on which the Fund commenced operations.
Investment Objective—The goal that an investor and mutual fund pursue together (e.g., current income, long-term capital growth, etc.)
Median Market Cap—An indicator of the size of companies in which a fund invests; the midpoint of market capitalization (market price x shares outstanding) of a fund’s stocks, weighted by the proportion of the fund’s assets invested in each stock. Stocks representing half of the fund’s assets have market capitalizations above the median, and the rest are below it.
MSCI All Country World Index—The MSCI All Country World Index is a free float-adjusted market capitalization weighted index that is designed to measure the equity market performance of developed and emerging markets. This unmanaged index does not reflect fees and expenses and is not available for direct investment.
MSCI All Country World Ex. U.S. (ND) Index—The MSCI All Country World Ex. U.S. is a free float-adjusted market capitalization weighted index that is designed to measure equity market performance in the global developed and emerging markets, excluding the United States. This unmanaged index does not reflect fees and expenses and is not available for direct investment.
MSCI EAFE (ND) Index—The MSCI EAFE (ND) Index is an unmanaged index generally representative of major overseas stock markets. This unmanaged index does not reflect fees and expenses and is not available for direct investment.
MSCI Emerging Markets (ND) Index—The MSCI Emerging Markets (ND) Index is a market capitalization weighted index of equity securities in more than 20 emerging market economies. This unmanaged index does not reflect fees and expenses and is not available for direct investment.
MSCI World (ND) Index—The MSCI World (ND) Index is a free float-adjusted market capitalization index that is designed to measure global developed market equity performance. This unmanaged index does not reflect fees and expenses and is not available for direct investment.
Net Asset Value (NAV)—The per share value of a mutual fund, determined by subtracting the fund’s liabilities from its assets and dividing by the number of shares outstanding. Mutual funds calculate their NAVs at least once each business day.
No-Load Fund—A mutual fund whose shares are sold without a sales commission and without a 12b-1 fee of more than 0.25% per year. Harbor funds are no-load.
Open-End Investment Company—The legal name for a mutual fund, indicating that it stands ready to redeem (buy back) its shares from investors on any business day. Harbor Funds is an open-end investment company.
Operating Expenses—Business costs paid from a fund’s assets before earnings are distributed to shareholders. These include management fees and 12b-1 fees and other expenses.
Portfolio Manager—A specialist employed by a mutual fund’s adviser or subadviser to invest the fund’s assets in accordance with predetermined investment objectives.
64
Glossary—Continued
Portfolio Turnover—A measure of the trading activity in a fund’s investment portfolio (how often securities are bought and sold by a fund). Funds with high turnover rates incur higher transaction costs and may be more likely to distribute capital gains (which may be taxable to investors).
Price to Book Ratio (P/B)—A ratio used to compare a stock’s market value to its book value. It is calculated by dividing the current closing price of the stock by the latest quarter’s book value. For a fund, the weighted average price/book ratio of the stocks it holds.
Price to Earnings Ratio (P/E)—The ratio of a stock’s current price to its per-share earnings over the past year. For a fund, the weighted average P/E of the stocks it holds. P/E is an indicator of market expectations about corporate prospects; the higher the P/E, the greater the market expectations are for a company’s future growth.
Prospectus—The official document that describes a mutual fund to prospective investors. The prospectus contains information required by the SEC, such as investment objectives and policies, risks, services and fees.
Record Date—The date on which a shareholder must officially own shares in order to be entitled to a dividend.
Redemption Fee—Fee charged to shareholders by a mutual fund when they sell shares within a specified period after purchase. The time limit and size of fee vary among funds. The fee is paid to the fund, not the fund’s investment adviser. Its purpose is to protect long-term investors from the impact of short-term traders.
REITs (Real Estate Investment Trust)—REITs invest in real estate or loans secured by real estate and issue shares in such investments. A REIT is similar to a closed-end mutual fund.
Repurchase Agreement (Repo)—A form of short-term borrowing for dealers in government securities. The dealer sells the government securities to investors, usually on an overnight basis, and buys them back the following day. For the party selling the security (and agreeing to repurchase it in the future), it is a repo. For the party on the other end of the transaction (buying the security and agreeing to sell back in the future), it is a reverse repurchase agreement.
Risk/Reward (or Return)—The relationship between the degree of risk associated with an investment and its return potential. Typically, the higher the potential return of an investment, the greater the risk.
Russell 1000® Growth Index—The Russell 1000® Growth Index is an unmanaged index generally representative of the U.S. market for larger capitalization growth stocks. This unmanaged index does not reflect fees and expenses and is not available for direct investment. The Russell 1000® Growth Index and Russell® are trademarks of Russell Investments.
Russell 1000® Value Index—The Russell 1000® Value Index is an unmanaged index generally representative of the U.S. market for larger capitalization value stocks. This unmanaged index does not reflect fees and expenses and is not available for direct investment. The Russell 1000® Value Index and Russell® are trademarks of Russell Investments.
Russell 2000® Index—The Russell 2000® Index measures the performance of the small-cap segment of the U.S. equity universe. The Russell 2000® Index is a subset of the Russell 3000® Index representing approximately 10% of the total market capitalization of that index. It includes approximately 2,000 of the smallest securities based on a combination of their market cap and current index membership. The Russell 2000® Index is constructed to provide a comprehensive and unbiased small-cap barometer and is completely reconstituted annually to ensure larger stocks do not distort the performance and characteristics of the true small-cap opportunity set. This unmanaged index does not reflect fees and expenses and is not available for direct investment. The Russell 3000® Index and Russell® are trademarks of Russell Investments.
Russell 2000® Growth Index—The Russell 2000® Growth Index is an unmanaged index representing the smallest 2,000 stocks with the highest price-to-book ratio and future earnings. This unmanaged index does not reflect fees and expenses and is not available for direct investment. The Russell 2000® Growth Index and Russell® are trademarks of Russell Investments.
Russell 2000® Value Index—The Russell 2000® Value Index is an unmanaged index representing the smallest 2,000 stocks with the lowest price-to-book ratio and future earnings. This unmanaged index does not reflect fees and expenses and is not available for direct investment. The Russell 2000® Value Index and Russell® are trademarks of Russell Investments.
Russell 3000® Index—The Russell 3000® Index measures the performance of the largest 3,000 U.S. companies representing approximately 98% of the investable U.S. equity market. The Russell 3000® Index is constructed to provide a comprehensive, unbiased and stable barometer of the broad market and is completely reconstituted annually to ensure new and growing equities are reflected. This unmanaged index does not reflect fees and expenses and is not available for direct investment. The Russell 3000® Index and Russell® are trademarks of Russell Investments.
65
Glossary—Continued
Russell 3000® Growth Index—The Russell 3000® Growth Index measures the performance of the broad growth segment of the U.S. equity universe. It includes those Russell 3000 companies with higher price-to-book ratios and higher forecasted growth values. The Russell 3000® Growth Index is constructed to provide a comprehensive, unbiased, and stable barometer of the broad growth market. The index is completely reconstituted annually to ensure new and growing equities are included and that the represented companies continue to reflect growth characteristics. This unmanaged index does not reflect fees and expenses and is not available for direct investment. The Russell 3000® Growth Index and Russell® are trademarks of Russell Investments.
Russell 3000® Value Index—The Russell 3000® Value Index measures the performance of the broad value segment of U.S. equity value universe. It includes those Russell 3000 companies with lower price-to-book ratios and lower forecasted growth values. The Russell 3000® Value Index is constructed to provide a comprehensive, unbiased, and stable barometer of the broad value market. The index is completely reconstituted annually to ensure new and growing equities are included and that the represented companies continue to reflect value characteristics. This unmanaged index does not reflect fees and expenses and is not available for direct investment. The Russell 3000® Value Index and Russell® are trademarks of Russell Investments.
Russell Midcap® Growth Index—The Russell Midcap® Growth Index is an unmanaged index generally representative of the U.S. market for medium capitalization growth stocks. This unmanaged index does not reflect fees and expenses and is not available for direct investment. The Russell Midcap® Growth Index and Russell® are trademarks of Russell Investments.
Russell Midcap® Value Index—The Russell Midcap® Value Index is an unmanaged index generally representative of the U.S. market for medium capitalization value stocks. This unmanaged index does not reflect fees and expenses and is not available for direct investment. The Russell Midcap® Value Index and Russell® are trademarks of Russell Investments.
S&P 500 Index—The S&P 500 Index is an unmanaged index generally representative of the U.S. stock market. This unmanaged index does not reflect fees and expenses and is not available for direct investment.
Statement of Additional Information (SAI)—The supplementary document to a prospectus that contains more detailed information about a mutual fund; also known as “Part B” of a fund’s registration statement.
TBAs—A term used to describe a forward mortgage-backed securities trade. Pass-through securities issued by Freddie Mac, Fannie Mae and Ginnie Mae trade in the TBA market. The term TBA is derived from the fact that the actual mortgage- backed security that will be delivered to fulfill a TBA trade is not designated at the time the trade is made. The securities are “to be announced” 48 hours prior to the established trade settlement date.
Treasury Inflation-Protected Securities (TIPS)—TIPS are securities in which the principal amount is adjusted for inflation and interest payments are applied to the inflation-adjusted principal.
Top-Down Equity Management Style—Investment style that begins with an assessment of the overall economic environment and makes a general asset allocation decision regarding various sectors of the financial markets and various industries.
Total Return—Return on an investment over a specified period, including price appreciation (or depreciation) plus any income, expressed as an average annual compound of return.
Weighted Average Duration—Duration is a time measure of a bond’s interest-rate sensitivity, based on the weighted average of the time periods over which a bond’s cash flows accrue to the bondholder. Time periods are weighted by multiplying by the present value of its cash flow divided by the bond’s price. (A bond’s cash flows consist of coupon payments and repayment of capital.) A bond’s duration will almost always be shorter than its maturity, with the exception of zero-coupon bonds, for which maturity and duration are equal.
Weighted Average Maturity—The average length of time until principal must be repaid for all bonds in a mutual fund portfolio on a dollar weighted basis.
Yield—A measure of net income (dividends and interest) earned by the securities in the fund’s portfolio less fund expenses during a specified period. A fund’s yield is expressed as a percentage of the maximum offering price per share on a specified date.
Yield to Maturity—The term used to describe the rate of return an investor will receive if a long-term, interest-bearing security, such as a bond, is held to its maturity date. Yield to maturity is greater than the coupon rate if the bond is selling at a discount and less than the coupon rate if it is selling at a premium.
66
| | | | | | |
| 111 South Wacker Drive, 34th Floor | | Chicago, IL 60606-4302 | | 800-422-1050 | | harborfunds.com |
Trustees & Officers
David G. Van Hooser
Chairman, President & Trustee
Scott M. Amero
Trustee
Raymond J. Ball
Trustee
Donna J. Dean
Trustee
Randall A. Hack
Trustee
Robert Kasdin
Trustee
Rodger F. Smith
Trustee
Ann M. Spruill
Trustee
Charles F. McCain
Chief Compliance Officer
Anmarie S. Kolinski
Treasurer
Erik D. Ojala
Vice President, Secretary & AML Compliance Officer
Brian L. Collins
Vice President
Charles P. Ragusa
Vice President
Jodie L. Crotteau
Assistant Secretary
Susan A. DeRoche
Assistant Secretary
John M. Paral
Assistant Treasurer
Investment Adviser
Harbor Capital Advisors, Inc.
111 South Wacker Drive
34th Floor
Chicago, IL 60606-4302
312-443-4400
Distributor & Principal Underwriter
Harbor Funds Distributors, Inc.
111 South Wacker Drive
34th Floor
Chicago, IL 60606-4302
312-443-4600
Shareholder Servicing Agent
Harbor Services Group, Inc.
P.O. Box 804660
Chicago, IL 60680-4108
800-422-1050
Custodian
State Street Bank & Trust Company
State Street Financial Center
1 Lincoln Street
Boston, MA 02111-2900

Semi-Annual Report
April 30, 2015
Strategic Markets Funds
| | | | |
| | | |
| | | Institutional Class | | Administrative Class |
| | |
| Harbor Commodity Real Return Strategy Fund | | HACMX | | HCMRX |
| | |
| Harbor Unconstrained Bond Fund | | HAUBX | | HRUBX |
Table of Contents
This document must be preceded or accompanied by a Prospectus.
Harbor Strategic Markets Funds
SEMI-ANNUAL REPORT OVERVIEW (Unaudited)
The first half of the fiscal year ended April 30, 2015. The performance figures for each of the Harbor Funds shown below assume the reinvestment of dividends and capital gains, but do not reflect the deduction of taxes that a shareholder would pay on Fund distributions or on the redemption of shares of the Funds. From time to time, certain fees and/or expenses have been voluntarily or contractually waived or reimbursed, which has resulted in higher returns. Without these waivers or reimbursements, the returns would have been lower. Voluntary waivers or reimbursements may be discontinued at any time without notice. For information on the different share classes, please refer to the current prospectus. The returns of the unmanaged indices assume the reinvestment of dividends but do not reflect fees and expenses. The indices are not available for direct investment.
Performance data shown represents past performance, which is no guarantee of future results. Current performance may be higher or lower than the past performance data shown. Investment returns and the value of an investment will fluctuate, and an investor’s shares, when sold, may be worth more or less than their original cost. You can obtain performance data current to the most recent month-end (available within seven business days after the most recent month-end) by calling 800-422-1050 or by visiting harborfunds.com.
| | | | | | | | |
| | | Unannualized Total Return
6 Months Ended
April 30, 2015 | |
| | | Institutional
Class | | | Administrative
Class | |
HARBOR STRATEGIC MARKETS FUNDS | | | | | | | | |
Harbor Commodity Real Return Strategy Fund | | | -13.07 | % | | | -13.36 | % |
Harbor Unconstrained Bond Fund | | | 0.31 | | | | 0.17 | |
| | | | |
| COMMONLY USED MARKET INDICES | | Unannualized Total Return
6 Months Ended
April 30, 2015 | |
Bloomberg Commodity Index Total ReturnSM; commodities | | | -11.87 | % |
BofA Merrill Lynch USD 3-Month LIBOR Constant Maturity | | | 0.12 | |
Barclays U.S. Aggregate Bond; domestic bonds | | | 2.06 | |
| | | | | | | | | | | | | | | | | | | | | | | | |
| | | EXPENSE RATIOS1 | | | Morningstar
Average2
(Unaudited) | |
| | | 2011* | | | 2012* | | | 2013* | | | 2014* | | | 2015a | | |
HARBOR STRATEGIC MARKETS FUNDS | | | | | | | | | | | | | | | | | | | | | | | | |
Harbor Commodity Real Return Strategy Fund | | | | | | | | | | | | | | | | | | | | | | | | |
Institutional Class | | | 0.94 | % | | | 0.94 | % | | | 0.94 | % | | | 0.94 | % | | | 0.94 | % | | | 1.01 | % |
Administrative Class | | | 1.19 | | | | 1.19 | | | | 1.19 | | | | 1.19 | | | | 1.19 | | | | 1.33 | |
Harbor Unconstrained Bond Fund | | | | | | | | | | | | | | | | | | | | | | | | |
Institutional Class | | | 1.05 | % | | | 1.05 | % | | | 1.05 | % | | | 1.05 | % | | | 1.05 | % | | | 1.05 | % |
Administrative Class | | | 1.30 | | | | 1.30 | | | | 1.30 | | | | 1.30 | | | | 1.30 | | | | 1.30 | |
| 1 | Harbor Funds’ expense ratios are for operating expenses for the fiscal years ended October 31 (unless otherwise noted) and are shown net of all expense offsets, waivers and reimbursements, excluding interest expense (see Financial Highlights). |
| 2 | The Morningstar Average includes all actively managed no-load funds in the April 30, 2015 Morningstar Universe with the same investment style as the comparable Harbor fund’s portfolio and with the following additional characteristics for each Harbor Funds share class: Institutional Class contains funds with 12b-1 fees less than or equal to 0.25%; Administrative Class contains funds with 12b-1 fees and which are restricted primarily for use by retirement plans. |
| a | Unaudited annualized figures for the six-month period ended April 30, 2015. |
1
Letter from the Chairman

David G. Van Hooser
Chairman
Dear Fellow Shareholder:
Commodity markets finished broadly lower for the first half of fiscal 2015, driven in part by a sharp decline in crude oil prices and the stronger U.S. dollar. The Bloomberg Commodity Index Total ReturnSM, an unmanaged index of futures contracts on a diversified group of physical commodities, returned -11.87%.
Fixed income markets generated modest gains in the first half of fiscal 2015. The Federal Reserve indicated its willingness to begin gradually raising short-term rates if warranted by certain signs of continued economic growth in the U.S. By contrast, against a backdrop of economic weakness and subdued inflation, a number of central banks outside the U.S., including Europe and Japan, introduced new monetary stimulus measures.
The yield of the 10-year U.S. Treasury note, a benchmark for mortgage rates and other borrowing costs, closed on April 30, 2015, at 2.05%, down 29 basis points, or 0.29 percentage point, from six months earlier. Yields fall as bond prices rise.
The broad U.S. investment-grade bond market returned 2.06% for the fiscal first half, as measured by the Barclays U.S. Aggregate Bond Index. Below investment-grade bonds returned 1.51%, as measured by the BofA Merrill Lynch U.S. High Yield Index. Inflation-linked bonds, as measured by the Barclays U.S. TIPS Index, returned 1.28%. Money market investments again produced barely positive returns as the Federal Reserve continued to hold its federal funds target rate at the 0.0% to 0.25% range.
Harbor Strategic Markets Funds
Harbor Commodity Real Return Strategy Fund recorded a return of -13.07% for the first half of the fiscal year, trailing its Bloomberg Commodity Index Total ReturnSM benchmark by 120 basis points, or 1.20 percentage points. (All Harbor returns cited are for each fund’s Institutional Class shares.)
Harbor Unconstrained Bond Fund returned 0.31%. The Fund outperformed the BofA Merrill Lynch US Dollar 3-Month LIBOR Constant Maturity Index by 19 basis points and trailed the Barclays U.S. Aggregate Bond Index by 175 basis points.
As always, we recommend that shareholders maintain a long-term perspective in evaluating all of their investments, including Harbor Funds. Comments by the portfolio managers of each strategic markets fund can be found in the pages preceding each Fund’s portfolio of investments.
| | | | | | | | | | | | | | | | | | | | |
| | | RETURNS FOR PERIODS ENDED APRIL 30, 2015 | |
| | | Unannualized | | | | | | Annualized | |
Strategic Markets | | 6 Months | | | 1 Year | | | 5 Years | | | 10 Years | | | 30 Years | |
Bloomberg Commodity Index Total ReturnSM | | | -11.87 | % | | | -24.69 | % | | | -5.02 | % | | | -2.44 | % | | | N/A | |
| | | | | |
Domestic Equities | | | | | | | | | | | | | | | |
Wilshire 5000 Total Market (entire U.S. stock market) | | | 4.64 | % | | | 12.52 | % | | | 14.26 | % | | | 8.88 | % | | | 11.00 | % |
S&P 500 (large cap stocks) | | | 4.40 | | | | 12.98 | | | | 14.33 | | | | 8.32 | | | | 11.09 | |
Russell Midcap® (mid cap stocks) | | | 5.87 | | | | 13.30 | | | | 15.09 | | | | 10.27 | | | | 12.55 | |
Russell 2000® (small cap stocks) | | | 4.65 | | | | 9.71 | | | | 12.73 | | | | 9.18 | | | | 9.90 | |
Russell 3000® Growth | | | 6.59 | | | | 16.50 | | | | 15.45 | | | | 9.69 | | | | 10.41 | |
Russell 3000® Value | | | 2.82 | | | | 8.96 | | | | 13.15 | | | | 7.54 | | | | 11.24 | |
| | | | | |
International & Global | | | | | | | | | | | | | | | |
MSCI EAFE (ND) (foreign stocks) | | | 6.81 | % | | | 1.66 | % | | | 7.40 | % | | | 5.62 | % | | | 9.04 | % |
MSCI World (ND) (global stocks) | | | 5.09 | | | | 7.41 | | | | 10.51 | | | | 6.87 | | | | 9.44 | |
MSCI Emerging Markets (ND) (emerging markets) | | | 3.92 | | | | 7.80 | | | | 3.02 | | | | 9.58 | | | | N/A | |
| | | | | |
Fixed Income | | | | | | | | | | | | | | | |
BofA Merrill Lynch U.S. High Yield (high-yield bonds) | | | 1.51 | % | | | 2.57 | % | | | 8.18 | % | | | 8.28 | % | | | N/A | |
Barclays U.S. Aggregate Bond (domestic bonds) | | | 2.06 | | | | 4.46 | | | | 4.12 | | | | 4.75 | | | | 7.33 | % |
BofA Merrill Lynch 3-Month U.S. Treasury Bill (proxy for money market returns) | | | 0.01 | | | | 0.02 | | | | 0.09 | | | | 1.47 | | | | 3.90 | |
Barclays U.S. TIPS (inflation-linked bonds) | | | 1.28 | | | | 2.48 | | | | 3.96 | | | | 4.43 | | | | N/A | |
2
Domestic Equity and International Equity
U.S. stock indices had positive returns for the first half of fiscal 2015, supported by accommodative monetary policies of the Federal Reserve and central banks of other countries. The Wilshire 5000 Total Market Index, a measure of the broad domestic equity market, had a return of 4.64% for the six months ended April 30, 2015. Growth stocks outperformed value stocks across all capitalization ranges.
International stock markets moved higher in the first half of fiscal 2015 as investors responded favorably to new monetary easing initiatives by central banks in Europe, Japan and other countries. The U.S. dollar strengthened against most international currencies, boosting the competitiveness of foreign exporters. Shares of companies based in developed overseas markets returned 6.81%, as measured by the MSCI EAFE (ND) Index, while emerging markets equities returned 3.92%, as measured by the MSCI Emerging Markets (ND) Index. The MSCI World (ND) Index, a measure of global equities including the U.S., returned 5.09%. (All international and global returns are in U.S. dollars.)
Disciplined Approach
Although stocks and bonds may provide solid long-term returns, as indicated in the table on the preceding page, financial markets can be very volatile in the short run. Given the uncertainty of markets, a disciplined approach and a diversified portfolio can be useful tools in helping investors to manage risk. At Harbor Funds, we offer a range of actively-managed equity, strategic markets and fixed income funds to assist investors in establishing an investment plan to help achieve their long-term goals.
Thank you for your investment in Harbor Funds.
June 24, 2015

David G. Van Hooser
Chairman
3
Harbor Commodity Real Return Strategy Fund
MANAGERS’ COMMENTARY (Unaudited)
SUBADVISER
Pacific Investment Management Company LLC (“PIMCO”)
650 Newport Center Drive
Newport Beach, CA
92660
PORTFOLIO MANAGERS
Mihir P. Worah
Since 2008
Nicholas J. Johnson
Since 2015
Jeremie Banet
Since 2015
PIMCO has subadvised the Fund since its inception in 2008.
INVESTMENT OBJECTIVE
The Fund seeks maximum real return, consistent with prudent investment management.
PRINCIPAL STYLE
CHARACTERISTICS
Commodity-linked derivative instruments backed by a portfolio of inflation-indexed and other fixed income instruments

Mihir P. Worah

Nicholas J. Johnson

Jeremie Banet
Management’s Discussion of Fund Performance
MARKET REVIEW
Commodity markets were weak over the six months ended April 30, 2015, as oil prices fell and the value of the U.S. dollar rose against most international currencies. The Bloomberg Commodity Index Total ReturnSM, an unmanaged index of futures contracts on a diversified group of physical commodities, returned -11.87%. Energy was the worst-performing sector, even given a recovery in prices late in the period. U.S. Treasury Inflation-Protected Securities, or TIPS, underperformed U.S. nominal Treasurys during the period.
U.S. Treasury prices rose over the first fiscal half of 2015 as yields fell, with the majority of the rally occurring in the first three months of the period. Fixed income spread sectors had mixed performance. Corporate bonds and U.S. mortgage-backed securities underperformed like-duration U.S. Treasurys. Emerging market external debt generally outperformed like-duration U.S. Treasurys.
Evidence of global growth divergence continued to influence fixed income markets. The above-noted trends of U.S. dollar strength and lower oil prices, combined with lingering global economic uncertainty, continued from calendar 2014 into 2015, as global markets experienced episodes of heightened volatility.
More than 20 global central banks eased monetary policy in the first quarter of 2015, including the European Central Bank, which announced a long-awaited quantitative easing program. The U.S. was the main outlier in the general pattern of renewed global easing as the Federal Reserve moved away from explicit forward guidance about its next rate hike and emphasized the importance of incoming data. Positive data indicating underlying economic strength, coupled with tailwinds for the consumer from lower oil prices, supported growing evidence that monetary policy in the U.S. appeared to be on track toward becoming less accommodative over the year. In China, property market weakness continued to raise concerns for policymakers. In Japan, lower inflation and weak growth raised skepticism over the ability of economic measures advanced by Prime Minister Shinzo Abe to generate self-sustaining growth.
PERFORMANCE
Harbor Commodity Real Return Strategy Fund returned -13.07% (Institutional Class) and -13.36% (Administrative Class) for the six months ended April 30, 2015, underperforming the -11.87% return of the Bloomberg Commodity Index Total ReturnSM benchmark. From a longer-term perspective, the Fund has outperformed the index since its inception in 2008 and for the five-year period ended April 30, 2015.
The Fund invests in commodity-linked derivative instruments backed by a portfolio of inflation-indexed bonds and other fixed income securities.
The following strategies helped Fund returns for the six months ended April 30, 2015:
| • | | Implementation of value-added commodity structural strategies. |
| • | | Diversified interest rate exposure to developed countries, particularly Italy and Spain, as rates fell. |
4
Harbor Commodity Real Return Strategy Fund
MANAGERS’ COMMENTARY—Continued
| | | | |
TOP TEN ISSUERS (% of net assets) | |
U.S. Treasury | | | 80.5% | |
Italy Buoni Poliennali Del Tesoro | | | 3.8% | |
Bundesobligation | | | 3.1% | |
Spain Government Bond | | | 2.2% | |
Cooperatieve Centrale Raiffeisen-Boerenleenbank BA/NY | | | 1.7% | |
JP Morgan Chase & Co. | | | 1.7% | |
Telefonica Emisiones SAU | | | 1.7% | |
U.K. Gilt | | | 1.7% | |
Ally Financial Inc. | | | 1.4% | |
Brazil Letras Do Tesouro Nacional | | | 1.4% | |
| • | | Holdings of non-agency mortgage-backed securities, which continued to benefit from limited new issue supply and strong investor demand. |
| • | | Currency positioning, specifically long U.S. dollar positions versus the euro and yen, as both currencies weakened relative to the U.S. dollar. |
The following strategies were negative or neutral for returns during the first half of the fiscal year:
| • | | An underweight to the long end of the U.S. yield curve, as longer-maturity yields declined, lifting bond prices higher. |
| • | | Exposure to local interest rates in emerging markets, like Brazil, where rates rose over the period. |
| • | | The use of TIPS collateral, which underperformed U.S. Treasury bills as breakeven inflation levels, as expressed by the yield spread between TIPS and like-duration Treasurys, narrowed. |
OUTLOOK AND STRATEGY
We expect global growth to accelerate modestly over the next six months. We believe that a wave of monetary policy accommodation and a near cessation of fiscal austerity should underpin economic growth, while a still sizable degree of slack in the global economy should keep inflationary pressures well contained. We think that the decline in oil prices should further sustain these trends by transferring wealth from producers to consumers and by keeping headline inflation subdued.
Our view is that the U.S. is on track for modestly above-trend growth of 2.5%-3.0%, with inflation only gradually approaching the Fed’s 2% target. A robust expectation for personal consumption growth forms the foundation of our outlook, as we believe that consumer spending will be supported by a healthy pace of job gains and real incomes boosted by lower energy prices. Both housing and business investment should also contribute to growth, but to a lesser degree. We expect home prices to rise gradually and sales trends to continue, but housing seems likely to remain a small portion of overall economic growth.
We expect the euro-zone economy to expand by 1.25%-1.75%, with inflation remaining low. A combination of tailwinds, including lower oil prices, a weaker euro, and the European Central Bank’s new quantitative easing program, should lift European growth this year, in our view. Going forward, we would expect the European quantitative easing program to serve as a substantial source of liquidity while at the same time anchoring interest rates across member states.
In China, we expect growth in the low 6% range. As China addresses the ongoing slowdown in its property sector and de-leveraging in the shadow-banking system, we expect additional easing from the People’s Bank of China. In Japan, we expect growth of 1.0%-1.5%, with growth recovering from last year’s technical recession. Decisions late last year to delay a value-added tax hike and increase the size of the Bank of Japan’s easing program should provide needed support for the economy.
With respect to portfolio strategy, we plan to:
| • | | Seek relative value opportunities within commodities while balancing the economic outlook with supply trends. |
| • | | Tactically manage real duration within the TIPS collateral portfolio with a focus on the intermediate portion of the yield curve, where we see superior opportunity for roll-down, the price appreciation that typically occurs as fixed income securities start to mature and roll down a steep yield curve. |
| • | | Continue to seek opportunities outside the U.S., where business cycles may anchor rates for a considerable period. |
| • | | Maintain an allocation to non-agency mortgages, as we believe they offer an attractive source of yield. |
| • | | Remain selective in allocations to emerging markets, where we favor Mexican inflation-linked securities given solid fundamentals and attractive breakeven inflation levels relative to nominal bonds. |
| • | | Within currency, maintain our U.S.-dollar bias. We will tactically adjust exposures as market conditions warrant, particularly as we believe that the dollar’s trajectory will likely not be as smooth as it has been over the past few months. |
5
Harbor Commodity Real Return Strategy Fund
MANAGERS’ COMMENTARY—Continued
This report contains the current opinions of Pacific Investment Management Company LLC at the time of its publication and should not be considered as investment advice or a recommendation of any particular security, strategy or investment product. Such opinions are subject to change without notice and securities described herein may no longer be included in, or may at any time be removed from, the Fund’s portfolio. This report is distributed for informational purposes only. Information contained herein has been obtained from sources believed reliable, but not guaranteed.
The Fund invests in commodity-linked instruments, which may be significantly more volatile than other securities. The use of derivative instruments may add additional risk. It also invests in fixed income securities, which fluctuate in price in response to various factors, including changes in interest rates, changes in market conditions and issuer-specific events. The Fund is non- diversified, which means that it may concentrate its assets in a smaller number of issuers, making it more susceptible to risks associated with a single economic, political, or regulatory occurrence than a more diversified portfolio. Since the Fund may hold foreign securities, it may be subject to greater risks than funds invested only in the U.S. These risks are more severe for securities of issuers in emerging market regions. The Fund will seek to gain exposure to the commodity markets primarily through investments in leveraged or unleveraged commodity index-linked notes and through investments in the Harbor Cayman Commodity Fund Ltd., a wholly-owned subsidiary of the Fund. For information on the different share classes and the risks associated with an investment in the Fund, please refer to the current prospectus.
6
Harbor Commodity Real Return Strategy Fund
FUND SUMMARY—April 30, 2015 (Unaudited)
| | | | |
INSTITUTIONAL CLASS |
| | | | |
| Fund # | | | | 2029 |
| | |
| Cusip | | | | 411511397 |
| | |
| Ticker | | | | HACMX |
| | |
Inception
Date | | | | 09/02/2008 |
| | |
| Net Expense Ratio | | | | 0.94%a,b |
| | |
| Total Net Assets (000s) | | | | $148,522 |
| | | | |
ADMINISTRATIVE CLASS |
| | | | |
| Fund # | | | | 2229 |
| | |
| Cusip | | | | 411511389 |
| | |
| Ticker | | | | HCMRX |
| | |
Inception
Date | | | | 09/02/2008 |
| | |
| Net Expense Ratio | | | | 1.19%a,b |
| | |
Total Net
Assets (000s) | | | | $1,007 |
PORTFOLIO STATISTICS
| | | | |
| |
Average Market Coupon | | | 1.19% | |
| |
Yield to Maturity | | | 1.80% | |
| |
Current 30-day Yield (Institutional Class) | | | 0.13% | |
| |
Weighted Average Maturity | | | 2.94 years | |
| |
Weighted Average Duration | | | 1.62 years | |
| |
Portfolio Turnover
(6-Month Period Ended 04/30/2015) | | | 258% | c |
MATURITY PROFILE (% of investments)
| | | | |
| |
0 to 1 yr. | | | 19.07% | |
| |
>1 to 5 | | | 48.43% | |
| |
>5 to 10 | | | 39.77% | |
| |
>10 to 15 | | | -6.40% | |
| |
>15 to 20 | | | 0.30% | |
| |
>20 to 25 | | | 0.73% | |
| |
>25 yrs. | | | -1.90% | |
FUND PERFORMANCE
The graph compares a $10,000 investment in the Fund with the performance of the Bloomberg Commodity Index Total ReturnSM. The Fund’s performance includes the reinvestment of all dividend and capital gain distributions.
CHANGE IN A $10,000 INVESTMENT
For the period 09/02/2008 through 04/30/2015

| | | | | | | | | | | | | | | | | | | | | | | | |
Total Returns For the periods ended 04/30/2015 | |  | |
| Harbor Commodity Real Return Strategy Fund | | | | | | | | | | | | | | | | | | | | | |
Institutional Class | | | -13.07 | % | | | -25.82 | % | | | -3.49 | % | | | -6.17 | % | | | 09/02/2008 | | | $ | 6,545 | |
Administrative Class | | | -13.36 | % | | | -26.16 | % | | | -3.76 | % | | | -6.43 | % | | | 09/02/2008 | | | $ | 6,425 | |
| Comparative Index | | | | | | | | | | | | | | | | | | | | | | | | |
Bloomberg Commodity Index Total ReturnSM | | | -11.87 | % | | | -24.69 | % | | | -5.02 | % | | | -8.57 | % | | | — | | | $ | 5,507 | |
As stated in the Fund’s current prospectus, the expense ratios were 0.98% (Net) and 1.05% (Gross) (Institutional Class); and 1.23% (Net) and 1.30% (Gross) (Administrative Class). The net expense ratios are contractually capped, excluding interest expense incurred by the Fund, if any, through 02/29/2016. The expense ratios in the prospectus may differ from the actual expense ratios for the period disclosed within this report. The expense ratios shown in the prospectus are based on the prior fiscal year, adjusted to reflect changes, if any, in contractual arrangements that occurred prior to the date of the prospectus.
Performance data shown represents past performance, which is no guarantee of future results. Current performance may be higher or lower than the past performance data shown. Investment returns and the value of an investment will fluctuate, and an investor’s shares, when sold, may be worth more or less than their original cost. You can obtain performance data current to the most recent month-end (available within seven business days after the most recent month-end) by calling 800-422-1050 or visiting harborfunds.com.
The returns shown do not reflect the deduction of taxes that a shareholder would pay on Fund distributions or on the redemption of Fund shares. From time to time, certain fees and/or expenses have been waived or reimbursed, which has resulted in higher returns. Without these waivers and reimbursements, the returns would have been lower.
| b | Reflective of a contractual expense cap effective through February 29, 2016. Expense cap excludes interest expense incurred by the Fund, if any. |
7
Harbor Commodity Real Return Strategy Fund
CONSOLIDATED PORTFOLIO OF INVESTMENTS—April 30, 2015 (Unaudited)
Total Investments (% of net assets)
(Excludes net cash, short-term investments and derivative positions of -20.2%)
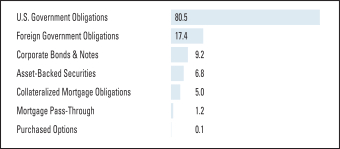
| | | | | | | | |
ASSET-BACKED SECURITIES—6.8% | |
Principal
Amount
(000s) | | | | | Value
(000s) | |
| $ | 4 | | | Argent Securities Inc.
Series 2005-W2 Cl. A2B1
0.381%—10/25/20351 | | $ | 4 | |
| | 154 | | | Bayview Financial Acquisition Trust
Series 2006-D Cl. 1A2
5.660%—12/28/20362 | | | 154 | |
| | 600 | | | Bear Stearns Asset Backed Securities Trust
Series 2006-2 Cl. M1
0.601%—07/25/20361 | | | 593 | |
| | 1,000 | | | Citigroup Mortgage Loan Trust Inc.
Series 2005-HE3 Cl. M2
0.661%—09/25/20351 | | | 948 | |
| | 911 | | | Commercial Industrial Finance Corp.
Series 2007-1A Cl. A1L
0.516%—05/10/20211,3 | | | 908 | |
| | 155 | | | Series 2006-2A Cl. A1L
0.522%—03/01/20211,3 | | | 155 | |
| | | | | | | | |
| | | | | | | 1,063 | |
| | | | | | | | |
| | 220 | | | Countrywide Asset-Backed Certificates
Series 2005-15 Cl. 1AF6
5.525%—04/25/20364 | | | 224 | |
| | 909 | | | First Franklin Mortgage Loan Asset Backed Certificates
Series 2005-FF11 Cl. A2D
0.861%—11/25/20351 | | | 905 | |
| | 811 | | | Hillmark Funding Ltd.
Series 2006-1A Cl. A1
0.512%—05/21/20211,3 | | | 803 | |
| | 1,044 | | | IndyMac Home Equity Loan Trust
Series 2004-2 Cl. A
0.298%—09/28/20361 | | | 1,029 | |
| € | 17 | | | Magi Funding plc
Series I-A Cl. A
0.331%—04/11/20211,3 | | | 19 | |
| $ | 234 | | | MASTR Asset Backed Securities Trust
Series 2006-HE2 Cl. A2
0.421%—06/25/20361 | | | 134 | |
| | 121 | | | Morgan Stanley ABS Capital I Inc. Trust
Series 2006-HE8 Cl. A2FP
0.251%—10/25/20361 | | | 76 | |
| | 600 | | | People’s Choice Home Loan Securities Trust
Series 2005-1 Cl. M4
1.524%—01/25/20351 | | | 510 | |
| | 288 | | | Securitized Asset Backed Receivables LLC Trust
Series 2005-FR5 Cl. A1B
0.461%—08/25/20351 | | | 286 | |
| € | 783 | | | SLM Student Loan Trust
Series 2003-2 Cl. A5
0.287%—12/15/20231 | | | 867 | |
| $ | 369 | | | Small Business Administration Participation Certificates
Series 2007-20K Cl. 1
5.510%—11/01/2027 | | | 414 | |
| 200 | | | Soundview Home Loan Trust
Series 2006-OPT2 Cl. A4
0.461%—05/25/20361 | | | 160 | |
| | 794 | | | Stone Tower Capital LLC
Series 2007-6A Cl. A1
0.504%—04/17/20211,3 | | | 784 | |
| | 939 | | | Structured Asset Investment Loan Trust
Series 2006-BNC2 Cl. A5
0.341%—05/25/20361 | | | 780 | |
| | 403 | | | Venture CLO Ltd.5
Series 2006-7A Cl. A1A
0.505%—01/20/20221,3 | | | 398 | |
| | | | | | | | |
| TOTAL ASSET-BACKED SECURITIES
(Cost $9,702) | | | 10,151 | |
| | | | | | | | |
| | | | | |
COLLATERALIZED MORTGAGE OBLIGATIONS—5.0% | |
| | 23 | | | Banc of America Mortgage Trust
Series 2004-1 Cl. 5A1
6.500%—09/25/2033 | | | 24 | |
| | 1,099 | | | Bear Stearns Alt-A Trust
Series 2004-8 Cl. 1A
0.881%—09/25/20341 | | | 1,072 | |
| | 1,051 | | | Series 2005-5 Cl. 25A1
4.822%—07/25/20354 | | | 870 | |
| | | | | | | | |
| | | | | | | 1,942 | |
| | | | | | | | |
| | 364 | | | ChaseFlex Trust
Series 2007-M1 Cl. 2F4
6.350%—08/25/20372 | | | 306 | |
| | 325 | | | Countrywide Alternative Loan Trust
Series 2005-79CB Cl. A5
5.500%—01/25/2036 | | | 292 | |
| | 107 | | | Series 2006-19CB Cl. A4
6.000%—08/25/20361 | | | 98 | |
| | 174 | | | Series 2007-5CB Cl. 1A13
6.000%—04/25/2037 | | | 150 | |
| | 406 | | | Series 2007-5CB Cl. 1A4
6.000%—04/25/2037 | | | 349 | |
| | | | | | | | |
| | | | | | | 889 | |
| | | | | | | | |
| | 917 | | | Deutsche Alt-A Securities Inc.
Series 2007-OA4 Cl. 1A1B
0.311%—08/25/20471 | | | 770 | |
| | 639 | | | Series 2007-AB1 Cl. A1
0.481%—04/25/20371 | | | 359 | |
| | | | | | | | |
| | | | | | | 1,129 | |
| | | | | | | | |
| € | 164 | | | Granite Mortgages plc
Series 2004-2 Cl. 2A1
0.305%—06/20/20441 | | | 184 | |
| $ | 160 | | | HarborView Mortgage Loan Trust
Series 2005-2 Cl. 2A1A
0.401%—05/19/20351 | | | 134 | |
| | 569 | | | IndyMac IMSC Mortgage Loan Trust
Series 2007-HOA1 Cl. A11
0.361%—07/25/20471 | | | 414 | |
| | 216 | | | Lehman XS Trust
Series 2006-12N Cl. A31A
0.381%—08/25/20461 | | | 166 | |
| | 249 | | | Merrill Lynch Mortgage Investors Trust
Series 2006-1 Cl. 1A
2.476%—02/25/20364 | | | 243 | |
| | 228 | | | Morgan Stanley Mortgage Loan Trust
Series 2006-8AR Cl. 6A1
2.133%—06/25/20364 | | | 223 | |
8
Harbor Commodity Real Return Strategy Fund
CONSOLIDATED PORTFOLIO OF INVESTMENTS—Continued
| | | | | | | | |
COLLATERALIZED MORTGAGE OBLIGATIONS—Continued | |
Principal
Amount
(000s) | | | | | Value
(000s) | |
| $ | 729 | | | Rali Series Trust
Series 2006-QS13 Cl. 1A6
6.000%—09/25/2036 | | $ | 597 | |
| | 127 | | | Residential Asset Securitization Trust
Series 2006-A12 Cl. A2
6.250%—11/25/2036 | | | 94 | |
| | 124 | | | Thornburg Mortgage Securities Trust
Series 2006-4 Cl. A2B
5.874%—07/25/20361 | | | 123 | |
| | 648 | | | Wachovia Mortgage Loan Trust LLC
Series 2005-B Cl. 2A4
2.485%—10/20/20354 | | | 590 | |
| | 385 | | | Washington Mutual Mortgage Pass Through Certificates Trust
Series 2006-AR1 Cl. 2A1A
1.207%—01/25/20461 | | | 373 | |
| | | | | | | | |
| TOTAL COLLATERALIZED MORTGAGE OBLIGATIONS
(Cost $7,100) | | | 7,431 | |
| | | | | | | | |
| | | | | | | | |
CORPORATE BONDS & NOTES—9.2% | |
| | 1,600 | | | Ally Financial Inc.
3.500%—07/18/2016 | | | 1,628 | |
| | 400 | | | 5.500%—02/15/2017 | | | 419 | |
| | | | | | | | |
| | | | | | | 2,047 | |
| | | | | | | | |
| | 100 | | | AT&T Inc.
1.158%—06/30/20204 | | | 101 | |
| | 200 | | | 2.450%—06/30/2020 | | | 200 | |
| | 400 | | | 3.000%—06/30/2022 | | | 398 | |
| | 500 | | | 3.400%—05/15/2025 | | | 496 | |
| | 100 | | | 4.500%—05/15/2035 | | | 98 | |
| | 200 | | | 4.750%—05/15/2046 | | | 196 | |
| | | | | | | | |
| | | | | | | 1,489 | |
| | | | | | | | |
| € | 100 | | | Banco Popular Espanol SA MTN6
11.500%—10/10/20184,7 | | | 130 | |
| | 100 | | | Banco Santander SA
6.250%—09/11/20214,7 | | | 112 | |
| | 200 | | | Barclays plc
6.500%—09/15/20194,7 | | | 229 | |
| £ | 100 | | | BG Energy Capital plc
6.500%—11/30/20724 | | | 168 | |
| $ | 100 | | | Chesapeake Energy Corp.
3.525%—04/15/20194 | | | 96 | |
| | 2,600 | | | Cooperatieve Centrale Raiffeisen-Boerenleenbank BA/NY
0.609%—04/28/20171 | | | 2,601 | |
| | 400 | | | Electricite de France SA
0.735%—01/20/20171,3 | | | 401 | |
| | 100 | | | 1.150%—01/20/20173 | | | 100 | |
| | | | | | | | |
| | | | | | | 501 | |
| | | | | | | | |
| € | 200 | | | Hellenic Railways Organization SA
4.028%—03/17/2017 | | | 152 | |
| $ | 2,600 | | | JP Morgan Chase & Co. MTN6
0.827%—04/25/20181 | | | 2,599 | |
| € | 100 | | | National Bank of Greece SA
3.875%—10/07/2016 | | | 95 | |
| $ | 300 | | | Navient Corp. MTN6
0.000%—11/01/20164,8 | | | 291 | |
| € | 100 | | | Petrobras Global Finance BV
2.750%—01/15/2018 | | | 107 | |
| $ | 100 | | | 3.000%—01/15/2019 | | | 93 | |
| | 200 | | | 4.375%—05/20/2023 | | | 178 | |
| | | | | | | | |
| | | | | | | 378 | |
| | | | | | | | |
| € | 200 | | | SSE plc
5.625%—10/01/20174,7 | | | 244 | |
| $ | 2,500 | | | Telefonica Emisiones SAU
0.915%—06/23/20171 | | $ | 2,495 | |
| | 200 | | | Turkiye Garanti Bankasi AS
2.775%—04/20/20161,3 | | | 201 | |
| | | | | | | | |
| TOTAL CORPORATE BONDS & NOTES
(Cost $14,016) | | | 13,828 | |
| | | | | | | | |
| | | | | | | | |
FOREIGN GOVERNMENT OBLIGATIONS—17.4% | |
| € | 100 | | | Athens Urban Transportation Organisation MTN6
4.851%—09/19/2016 | | | 77 | |
| | 100 | | | Autonomous Community of Catalonia
4.950%—02/11/2020 | | | 128 | |
| R$ | 7,600 | | | Brazil Letras Do Tesouro Nacional
0.000%—01/01/20179 | | | 2,041 | |
| € | 3,885 | | | Bundesobligation Inflation Linked8
0.750%—04/15/2018 | | | 4,599 | |
| COL$ | 572,713 | | | Colombian TES
3.000%—03/25/20338 | | | 212 | |
| € | 689 | | | Deutsche Bundesrepublik Inflation Linked Bond8
1.500%—04/15/2016 | | | 789 | |
| | 1,023 | | | France Government Bond OAT
0.250%—07/25/2018-07/25/20248 | | | 1,223 | |
| | 354 | | | 1.600%—07/25/20158 | | | 405 | |
| | | | | | | | |
| | | | | | | 1,628 | |
| | | | | | | | |
| | 2,397 | | | Italy Buoni Poliennali Del Tesoro
1.700%—09/15/20188 | | | 2,900 | |
| | 344 | | | 2.100%—09/15/20178 | | | 414 | |
| | 701 | | | 2.250%—04/22/20178 | | | 817 | |
| | 397 | | | 2.350%—09/15/20243,8 | | | 532 | |
| | 560 | | | 2.550%—10/22/20168 | | | 651 | |
| | 105 | | | 3.100%—09/15/20268 | | | 153 | |
| | 100 | | | 5.500%—11/01/2022 | | | 147 | |
| | | | | | | | |
| | | | | | | 5,614 | |
| | | | | | | | |
| MEX$ | 4,253 | | | Mexican Bonos
4.750%—06/14/2018 | | | 278 | |
| | 1,900 | | | Mexican Bonos de Proteccion Al Ahorro
3.010%—06/29/20171,8 | | | 125 | |
| | 6,643 | | | Mexican Udibonos
4.000%—11/15/2040-11/08/20468 | | | 468 | |
| | 18,068 | | | 4.500%—12/04/2025-11/22/20358 | | | 1,350 | |
| | | | | | | | |
| | | | | | | 1,818 | |
| | | | | | | | |
| AUD$ | 300 | | | New South Wales Treasury Corp.
2.500%—11/20/20358 | | | 363 | |
| NZD$ | 1,200 | | | New Zealand Government Bond
2.000%—09/20/20258 | | | 965 | |
| CAD$ | 600 | | | Province of Ontario Canada
3.450%—06/02/2045 | | | 538 | |
| € | 600 | | | Slovenia Government Bond
4.700%—11/01/20163 | | | 720 | |
| | 1,300 | | | Spain Government Bond
3.800%—04/30/20243 | | | 1,755 | |
| | 1,000 | | | 5.400%—01/31/20233 | | | 1,473 | |
| | | | | | | | |
| | | | | | | 3,228 | |
| | | | | | | | |
| | 99 | | | Spain Government Inflation Linked Bond8
0.550%—11/30/20193 | | | 116 | |
| | 196 | | | 1.000%—11/30/20303 | | | 233 | |
| | | | | | | | |
| | | | | | | 349 | |
| | | | | | | | |
| £ | 1,482 | | | U.K. Gilt Inflation Linked8
0.125%—03/22/2024 | | | 2,499 | |
| | | | | | | | |
| TOTAL FOREIGN GOVERNMENT OBLIGATIONS
(Cost $29,052) | | | 25,971 | |
| | | | | | | | |
9
Harbor Commodity Real Return Strategy Fund
CONSOLIDATED PORTFOLIO OF INVESTMENTS—Continued
| | | | | | | | |
MORTGAGE PASS-THROUGH—1.2% | |
Principal
Amount
(000s) | | | | | Value
(000s) | |
| $ | 1,300 | | | Federal National Mortgage Association
0.500%—09/28/2015 | | $ | 1,302 | |
| | 435 | | | 4.000%—02/01/2041 | | | 467 | |
| | | | | | | | |
| TOTAL MORTGAGE PASS-THROUGH
(Cost $1,727) | | | 1,769 | |
| | | | | | | | |
| | | | | | | | |
PURCHASED OPTIONS—0.1% | |
No. of
Contracts | | | | | | |
| | 2 | | | Commodity—Crude Oil Futures
$ 48.00—11/17/2015 | | | 2 | |
| | 5 | | | Commodity—Gold Futures
$ 1,255.00—05/26/2015 | | | 1 | |
| | 6 | | | Commodity—Light Sweet Crude Oil Futures
$ 48.00—11/17/2015 | | | 7 | |
| | 6,900,000 | | | Interest Rate Swap Option 1 year
0.800%—01/19/2016 | | | 8 | |
| | 4,650,000 | | | Interest Rate Swap Option 30 year
2.590%—05/22/2015-12/11/2017 | | | 123 | |
| | 100 | | | U.S. Treasury Notes Futures 5 year
$ 108.50—05/22/2015 | | | 1 | |
| | 119 | | | U.S. Treasury Notes Futures 10 year
$ 103.00—05/22/2015 | | | 2 | |
| | | | | | | | |
| TOTAL PURCHASED OPTIONS
(Premiums Paid/Cost $234) | | | 144 | |
| | | | | | | | |
| | | | | | | | |
U.S. GOVERNMENT OBLIGATIONS—80.5% | |
Principal
Amount
(000s) | | | | | | |
| $ | 600 | | | U.S. Treasury Bonds
2.500%—02/15/2045 | | | 570 | |
| | 45,252 | | | U.S. Treasury Inflation Indexed Bonds8
0.125%—04/15/2016-04/15/2018 | | | 46,041 | |
| | 5,747 | | | 0.250%—01/15/2025 | | | 5,830 | |
| | 17,419 | | | 0.625%—07/15/2021 | | | 18,330 | |
| | 1,717 | | | 1.125%—01/15/2021 | | | 1,849 | |
| | 14,642 | | | 1.250%—07/15/2020 | | | 15,943 | |
| | 3,695 | | | 1.375%—07/15/2018-02/15/204411 | | | 4,093 | |
| | 11,483 | | | 1.625%—01/15/2018 | | | 12,263 | |
| | 9,782 | | | 1.875%—07/15/201911 | | | 10,820 | |
| | 772 | | | 2.375%—01/15/2017-01/15/202511 | | | 913 | |
| | 113 | | | 2.625%—07/15/2017 | | | 123 | |
| | 343 | | | 3.875%—04/15/202911 | | | 504 | |
| | | | | | | | |
| | | | | | | 116,709 | |
| | | | | | | | |
| | 3,200 | | | U.S. Treasury Notes
1.750%—03/31/2022 | | | 3,190 | |
| | | | | | | | |
| TOTAL U.S. GOVERNMENT OBLIGATIONS
(Cost $118,970) | | | 120,469 | |
| | | | | | | | |
| | | | | | | | |
SHORT-TERM INVESTMENTS—16.6% | |
| | REPURCHASE AGREEMENTS—12.2% | |
| | 200 | | | Repurchase Agreement with Barclays plc dated April 30, 2015 due May 01, 2015 at 0.210% collateralized by U.S. Treasury Notes (market value $204) | | | 200 | |
| | 3,700 | | | Repurchase Agreement with Citigroup Inc. dated April 30, 2015 due May 01, 2015 at 0.220% collateralized by U.S. Treasury Notes (market value $3,769) | | | 3,700 | |
| 4,300 | | | Repurchase Agreement with Credit Suisse dated April 30, 2015 due May 01, 2015 at 0.210% collateralized by U.S. Treasury Notes (market value $4,391) | | | 4,300 | |
| | 2,200 | | | Repurchase Agreement with Deutsche Bank AG dated April 30, 2015 due May 01, 2015 at 0.220% collateralized by U.S. Treasury Bonds
(market value $2,250) | | | 2,200 | |
| | 3,700 | | | Repurchase Agreement with JP Morgan Chase & Co. dated April 30, 2015 due May 01, 2015 at 0.210% collateralized by U.S. Treasury Inflation Indexed Bonds (market value $3,780) | | | 3,700 | |
| | 477 | | | Repurchase Agreement with State Street Corp. dated April 30, 2015 due May 01, 2015 at 0.000% collateralized by U.S. Treasury Notes
(market value $491) | | | 477 | |
| | 3,700 | | | Repurchase Agreement with Toronto-Dominion Bank dated April 30, 2015 due May 01, 2015 at 0.210% collateralized by U.S. Treasury Bonds
(market value $3,725) | | | 3,700 | |
| | | | | | | | |
| | | | | | | 18,277 | |
| | | | | | | | |
| | U.S. GOVERNMENT AGENCIES—2.4% | |
| | 500 | | | Federal Home Loan Bank Discount Notes
0.072%—05/22/2015 | | | 500 | |
| | 800 | | | 0.111%—05/19/2015 | | | 800 | |
| | 300 | | | 0.170%—09/04/2015-09/09/2015 | | | 300 | |
| | | | | | | | |
| | | | | | | 1,600 | |
| | | | | | | | |
| | 100 | | | Federal Home Loan Mortgage Corp. Discount Notes
0.075%—05/05/2015 | | | 100 | |
| | 500 | | | 0.120%—05/27/2015 | | | 500 | |
| | 1,000 | | | 0.150%—07/07/2015 | | | 999 | |
| | | | | | | | |
| | | | | | | 1,599 | |
| | | | | | | | |
| | 400 | | | Federal National Mortgage Association Discount Notes
0.140%—06/01/2015 | | | 400 | |
| | | | | | | | |
| | | | | | | 3,599 | |
| | | | | | | | |
| | U.S. GOVERNMENT OBLIGATIONS—2.0% | |
| | 701 | | | U.S. Treasury Bills
0.009%—08/06/201511 | | | 701 | |
| | 572 | | | 0.015%—07/16/2015-07/30/201511 | | | 572 | |
| | 772 | | | 0.065%—05/14/2015 | | | 772 | |
| | 844 | | | 0.069%—05/28/2015 | | | 844 | |
| | | | | | | | |
| | | | | | | 2,889 | |
| | | | | | | | |
| TOTAL SHORT-TERM INVESTMENTS
(Cost $24,765) | | | 24,765 | |
| | | | | | | | |
| TOTAL INVESTMENTS—136.8%
(Cost $205,566) | | | 204,528 | |
| | | | | | | | |
| CASH AND OTHER ASSETS, LESS LIABILITIES—(36.8)% | | | (54,999 | ) |
| | | | | | | | |
| TOTAL NET ASSETS—100.0% | | $ | 149,529 | |
| | | | | | | | |
10
Harbor Commodity Real Return Strategy Fund
CONSOLIDATED PORTFOLIO OF INVESTMENTS—Continued
| | | | | | | | | | | | | | | | |
| FUTURES CONTRACTS OPEN AT APRIL 30, 2015 | |
| | | | |
Description | | Number of
Contracts | | | Aggregate
Face Value
(000s) | | | Expiration Date | | | Unrealized
Appreciation/
(Depreciation)
(000s) | |
Euro-Bund Futures 10 year (Sell) | | | 7 | | | € | 700 | | | | 06/08/2015 | | | $ | 5 | |
Mill Wheat Futures (Buy) | | | 16 | | | | 1 | | | | 12/10/2015 | | | | (14 | ) |
Brent Crude Oil Futures (Buy) | | | 1 | | | $ | 1 | | | | 06/15/2015 | | | | 7 | |
Brent Crude Oil Futures (Buy) | | | 1 | | | | 1 | | | | 07/16/2015 | | | | — | |
Brent Crude Oil Futures (Buy) | | | 8 | | | | 8 | | | | 08/14/2015 | | | | 55 | |
Brent Crude Oil Futures (Buy) | | | 4 | | | | 4 | | | | 01/29/2016 | | | | 33 | |
Brent Crude Oil Futures (Buy) | | | 3 | | | | 3 | | | | 04/29/2016 | | | | 23 | |
Brent Crude Oil Futures (Buy) | | | 2 | | | | 2 | | | | 10/31/2017 | | | | (1 | ) |
Brent Crude Oil Futures (Sell) | | | 12 | | | | 12 | | | | 11/13/2015 | | | | (89 | ) |
Brent Crude Oil Futures (Sell) | | | 4 | | | | 4 | | | | 07/29/2016 | | | | (27 | ) |
Brent Crude Oil Futures (Sell) | | | 1 | | | | 1 | | | | 10/31/2016 | | | | (1 | ) |
Brent Crude Oil Futures (Sell) | | | 1 | | | | 1 | | | | 10/31/2018 | | | | 2 | |
Cocoa Futures (Buy) | | | 5 | | | | — | | | | 12/15/2015 | | | | 6 | |
Cocoa Futures (Sell) | | | 5 | | | | — | | | | 07/16/2015 | | | | (6 | ) |
Corn Futures (Buy) | | | 6 | | | | 30 | | | | 03/14/2016 | | | | (8 | ) |
Corn Futures (Sell) | | | 6 | | | | 30 | | | | 12/14/2015 | | | | 8 | |
Cotton Futures (Sell) | | | 1 | | | | 50 | | | | 07/09/2015 | | | | (2 | ) |
Eurodollar Futures-CME 90 day (Sell) | | | 63 | | | | 15,750 | | | | 06/15/2015 | | | | (20 | ) |
Eurodollar Futures-CME 90 day (Sell) | | | 54 | | | | 13,500 | | | | 09/14/2015 | | | | (28 | ) |
Eurodollar Futures-CME 90 day (Sell) | | | 71 | | | | 17,750 | | | | 12/14/2015 | | | | (10 | ) |
Eurodollar Futures-CME 90 day (Sell) | | | 30 | | | | 7,500 | | | | 03/14/2016 | | | | (27 | ) |
Eurodollar Futures-CME 90 day (Sell) | | | 45 | | | | 11,250 | | | | 06/13/2016 | | | | (35 | ) |
Eurodollar Futures-CME 90 day (Sell) | | | 29 | | | | 7,250 | | | | 09/19/2016 | | | | (34 | ) |
Eurodollar Futures-CME 90 day (Sell) | | | 26 | | | | 6,500 | | | | 12/19/2016 | | | | (32 | ) |
Gasoline Futures (Sell) | | | 2 | | | | 84 | | | | 06/30/2015 | | | | (18 | ) |
Gasoline Futures (Sell) | | | 2 | | | | 84 | | | | 11/30/2015 | | | | (12 | ) |
Gold Futures (Buy) | | | 13 | | | | 1 | | | | 06/26/2015 | | | | (20 | ) |
Heating Oil Futures (Buy) | | | 2 | | | | 84 | | | | 11/30/2015 | | | | 11 | |
Light Sweet Crude Oil Futures (Buy) | | | 4 | | | | 4 | | | | 05/19/2015 | | | | 9 | |
Light Sweet Crude Oil Futures (Buy) | | | 5 | | | | 5 | | | | 02/22/2016 | | | | 10 | |
Light Sweet Crude Oil Futures (Buy) | | | 9 | | | | 9 | | | | 05/19/2016 | | | | 33 | |
Light Sweet Crude Oil Futures (Buy) | | | 14 | | | | 14 | | | | 05/20/2016 | | | | (72 | ) |
Light Sweet Crude Oil Futures (Buy) | | | 5 | | | | 5 | | | | 08/22/2016 | | | | 16 | |
Light Sweet Crude Oil Futures (Buy) | | | 20 | | | | 20 | | | | 11/21/2016 | | | | 59 | |
Light Sweet Crude Oil Futures (Buy) | | | 6 | | | | 6 | | | | 11/20/2017 | | | | 8 | |
Light Sweet Crude Oil Futures (Sell) | | | 8 | | | | 8 | | | | 06/22/2015 | | | | (14 | ) |
Light Sweet Crude Oil Futures (Sell) | | | 5 | | | | 5 | | | | 07/21/2015 | | | | (7 | ) |
Light Sweet Crude Oil Futures (Sell) | | | 8 | | | | 8 | | | | 08/19/2015 | | | | (51 | ) |
Light Sweet Crude Oil Futures (Sell) | | | 38 | | | | 38 | | | | 11/20/2015 | | | | (161 | ) |
Light Sweet Crude Oil Futures (Sell) | | | 3 | | | | 3 | | | | 11/19/2018 | | | | (2 | ) |
LLS vs. WTI Light Sweet Crude Oil Swap Futures (Buy) | | | 1 | | | | 1 | | | | 06/30/2015 | | | | 2 | |
Natural Gas Futures (Buy) | | | 1 | | | | 10 | | | | 12/29/2015 | | | | 2 | |
Natural Gas Futures (Buy) | | | 2 | | | | 20 | | | | 02/25/2016 | | | | (1 | ) |
Natural Gas Futures (Sell) | | | 3 | | | | 30 | | | | 11/25/2015 | | | | (3 | ) |
Natural Gas Swap Futures (Buy) | | | 7 | | | | 18 | | | | 12/29/2015 | | | | (17 | ) |
Natural Gas Swap Futures (Buy) | | | 7 | | | | 18 | | | | 01/27/2016 | | | | (17 | ) |
Natural Gas Swap Futures (Buy) | | | 7 | | | | 18 | | | | 02/25/2016 | | | | (18 | ) |
Natural Gas Swap Futures (Buy) | | | 7 | | | | 18 | | | | 03/29/2016 | | | | (20 | ) |
Natural Gas Swap Futures (Buy) | | | 7 | | | | 18 | | | | 04/27/2016 | | | | (20 | ) |
Natural Gas Swap Futures (Buy) | | | 7 | | | | 18 | | | | 05/26/2016 | | | | (19 | ) |
Natural Gas Swap Futures (Buy) | | | 7 | | | | 18 | | | | 06/28/2016 | | | | (19 | ) |
Natural Gas Swap Futures (Buy) | | | 7 | | | | 18 | | | | 07/27/2016 | | | | (19 | ) |
Natural Gas Swap Futures (Buy) | | | 7 | | | | 18 | | | | 08/29/2016 | | | | (19 | ) |
Natural Gas Swap Futures (Buy) | | | 7 | | | | 18 | | | | 09/28/2016 | | | | (18 | ) |
Natural Gas Swap Futures (Buy) | | | 7 | | | | 18 | | | | 10/27/2016 | | | | (17 | ) |
Natural Gas Swap Futures (Buy) | | | 7 | | | | 18 | | | | 11/28/2016 | | | | (14 | ) |
Natural Gas Swap Futures (Buy) | | | 1 | | | | 3 | | | | 12/27/2018 | | | | (3 | ) |
Natural Gas Swap Futures (Buy) | | | 1 | | | | 3 | | | | 01/29/2019 | | | | (3 | ) |
Natural Gas Swap Futures (Buy) | | | 1 | | | | 3 | | | | 02/26/2019 | | | | (3 | ) |
Natural Gas Swap Futures (Buy) | | | 1 | | | | 3 | | | | 03/27/2019 | | | | (3 | ) |
Natural Gas Swap Futures (Buy) | | | 1 | | | | 3 | | | | 04/26/2019 | | | | (3 | ) |
Natural Gas Swap Futures (Buy) | | | 1 | | | | 3 | | | | 05/29/2019 | | | | (3 | ) |
Natural Gas Swap Futures (Buy) | | | 1 | | | | 3 | | | | 06/26/2019 | | | | (3 | ) |
Natural Gas Swap Futures (Buy) | | | 1 | | | | 3 | | | | 07/29/2019 | | | | (3 | ) |
Natural Gas Swap Futures (Buy) | | | 1 | | | | 3 | | | | 08/28/2019 | | | | (3 | ) |
Natural Gas Swap Futures (Buy) | | | 1 | | | | 3 | | | | 09/26/2019 | | | | (3 | ) |
11
Harbor Commodity Real Return Strategy Fund
CONSOLIDATED PORTFOLIO OF INVESTMENTS—Continued
| | | | | | | | | | | | | | | | |
| FUTURES CONTRACTS—Continued | |
| | | | |
Description | | Number of
Contracts | | | Aggregate
Face Value
(000s) | | | Expiration Date | | | Unrealized
Appreciation/
(Depreciation)
(000s) | |
Natural Gas Swap Futures (Buy) | | | 1 | | | $ | 3 | | | | 10/29/2019 | | | $ | (3 | ) |
Natural Gas Swap Futures (Buy) | | | 1 | | | | 3 | | | | 11/26/2019 | | | | (3 | ) |
Platinum Futures (Buy) | | | 2 | | | | — | | | | 07/29/2015 | | | | (2 | ) |
Red Wheat Futures (Buy) | | | 5 | | | | 25 | | | | 07/14/2015 | | | | (8 | ) |
Soybean Futures (Buy) | | | 8 | | | | 40 | | | | 03/14/2016 | | | | 1 | |
Soybean Futures (Sell) | | | 1 | | | | 5 | | | | 07/14/2015 | | | | 3 | |
Soybean Futures (Sell) | | | 7 | | | | 35 | | | | 11/13/2015 | | | | 3 | |
Soybean Oil Futures (Buy) | | | 6 | | | | 360 | | | | 12/14/2015 | | | | 1 | |
Soybean Oil Futures (Sell) | | | 6 | | | | 360 | | | | 07/14/2015 | | | | (1 | ) |
U.S. Treasury Bond Futures 30 year (Buy) | | | 1 | | | | 100 | | | | 06/19/2015 | | | | (5 | ) |
U.S. Treasury Note Futures 5 year (Buy) | | | 100 | | | | 10,000 | | | | 06/30/2015 | | | | 141 | |
U.S. Treasury Note Futures 10 year (Buy) | | | 160 | | | | 16,000 | | | | 06/19/2015 | | | | 75 | |
Wheat Futures (Buy) | | | 2 | | | | 10 | | | | 07/14/2015 | | | | (3 | ) |
Wheat Futures (Buy) | | | 1 | | | | 5 | | | | 09/14/2015 | | | | — | |
Wheat Futures (Buy) | | | 3 | | | | 15 | | | | 12/14/2015 | | | | (6 | ) |
Wheat Futures (Sell) | | | 16 | | | | 80 | | | | 07/14/2015 | | | | 54 | |
Wheat Futures (Sell) | | | 1 | | | | 5 | | | | 09/14/2015 | | | | — | |
| | | | | | | | | | | | | | | | |
Total Futures Contracts | | | $ | (406 | ) |
| | | | | | | | | | | | | | | | |
| | | | | | | | | | | | | | | | | | | | | | |
| WRITTEN OPTIONS OPEN AT APRIL 30, 2015 | |
|
| WRITTEN OPTIONS THAT REQUIRE PERIODIC SETTLEMENT OF VARIATION MARGIN | |
| | | | | | |
Description | | Counterparty | | Number of
Contracts | | | Strike
Price | | | Expiration Date | | | Premiums
Received
(000s) | | | Value
(000s) | |
Commodity—Brent Crude Oil Futures (Put) | | CME Group | | | 1 | | | $ | 52.00 | | | | 05/11/2015 | | | $ | 1 | | | $ | — | |
Commodity—Brent Crude Oil Futures (Put) | | CME Group | | | 2 | | | | 54.00 | | | | 11/10/2015 | | | | 6 | | | | (3 | ) |
Commodity—Brent Crude Oil Futures (Put) | | CME Group | | | 4 | | | | 55.00 | | | | 11/10/2015 | | | | 18 | | | | (6 | ) |
Euro-Bund Futures (Put) | | CME Group | | | 25 | | | | 157.00 | | | | 05/22/2015 | | | | 5 | | | | (26 | ) |
| | | | | | | | | | | | | | | | | | | | | | |
Total Written Options that Require Periodic Settlement of Variation Margin | | | $ | 30 | | | $ | (35 | ) |
| | | | | | | | | | | | | | | | | | | | | | |
| | | | | | | | | | | | | | | | | | | | | | |
|
| WRITTEN OPTIONS NOT SETTLED THROUGH VARIATION MARGIN | |
| | | | | | |
Description | | Counterparty | | Number of
Contracts | | | Strike
Index/
Rate/Price | | | Expiration
Date | | | Premiums
Received
(000s) | | | Value
(000s) | |
Inflation-Linked Swap Option 5 year (Call) | | JP Morgan Chase Bank NA | | | 1,600,000 | | | | 234.810 | j | | | 03/24/2020 | | | $ | 18 | | | $ | (20 | ) |
Inflation-Linked Swap Option 10 year (Call) | | JP Morgan Chase Bank NA | | | 200,000 | | | | 244.170 | j | | | 05/16/2024 | | | | 1 | | | | (1 | ) |
Variance Option S&P GSCI Copper Official Close Index ER (Call) | | Goldman Sachs International | | | 500,000 | | | | 0.360 | v | | | 07/09/2015 | | | | 2 | | | | — | |
Variance Option S&P GSCI Copper Official Close Index ER (Call) | | Goldman Sachs International | | | 1,000,000 | | | | 0.570 | v | | | 05/11/2015 | | | | 6 | | | | — | |
Variance Option S&P GSCI Copper Official Close Index ER (Call) | | Goldman Sachs International | | | 1,000,000 | | | | 0.720 | v | | | 05/11/2015 | | | | 8 | | | | — | |
Credit Default Swap Option 5 year (Put) | | Goldman Sachs International | | | 2,500,000 | | | | 1.000 | % | | | 09/16/2015 | | | | 4 | | | | (5 | ) |
Interest Rate Swap Option 1 year (Call) | | Morgan Stanley Capital Services LLC | | | 6,900,000 | | | | 0.520 | | | | 01/19/2016 | | | | 4 | | | | (2 | ) |
Interest Rate Swap Option 1 year (Call) | | Morgan Stanley Capital Services LLC | | | 6,900,000 | | | | 0.660 | | | | 01/19/2016 | | | | 7 | | | | (5 | ) |
Interest Rate Swap Option 5 year (Put) | | Morgan Stanley Capital Services LLC | | | 4,200,000 | | | | 2.500 | | | | 12/11/2017 | | | | 140 | | | | (109 | ) |
Interest Rate Swap Option 10 year (Call) | | Goldman Sachs Bank USA | | | 1,700,000 | | | | 1.850 | | | | 07/15/2015 | | | | 14 | | | | (6 | ) |
Interest Rate Swap Option 10 year (Put) | | Goldman Sachs Bank USA | | | 1,700,000 | | | | 2.400 | | | | 07/15/2015 | | | | 6 | | | | (9 | ) |
Interest Rate Swap Option 30 year (Call) | | Deutsche Bank AG | | | 3,250,000 | | | | 2.300 | | | | 05/29/2015 | | | | 51 | | | | (13 | ) |
Interest Rate Swap Option 30 year (Call) | | Goldman Sachs Bank USA | | | 1,400,000 | | | | 0.750 | | | | 09/11/2015 | | | | 38 | | | | (29 | ) |
Commodity—Crude Oil Futures (Call) | | CME Group | | | 1 | | | $ | (0.25 | ) | | | 11/19/2015 | | | | — | | | | — | |
Commodity—Crude Oil Futures (Call) | | CME Group | | | 1 | | | | (0.25 | ) | | | 10/19/2015 | | | | — | | | | — | |
Commodity—Crude Oil Futures (Call) | | CME Group | | | 1 | | | | (0.25 | ) | | | 09/21/2015 | | | | — | | | | — | |
Commodity—Crude Oil Futures (Call) | | CME Group | | | 1 | | | | (0.25 | ) | | | 08/19/2015 | | | | — | | | | — | |
Commodity—Crude Oil Futures (Call) | | CME Group | | | 1 | | | | (0.25 | ) | | | 07/20/2015 | | | | — | | | | — | |
Commodity—Crude Oil Futures (Call) | | CME Group | | | 1 | | | | (0.25 | ) | | | 06/19/2015 | | | | — | | | | — | |
Commodity—Crude Oil Futures (Put) | | CME Group | | | 1 | | | | (1.00 | ) | | | 11/19/2015 | | | | — | | | | — | |
Commodity—Crude Oil Futures (Put) | | CME Group | | | 1 | | | | (1.00 | ) | | | 10/19/2015 | | | | — | | | | — | |
Commodity—Crude Oil Futures (Put) | | CME Group | | | 1 | | | | (1.00 | ) | | | 09/21/2015 | | | | — | | | | — | |
Commodity—Crude Oil Futures (Put) | | CME Group | | | 1 | | | | (1.00 | ) | | | 08/19/2015 | | | | — | | | | — | |
Commodity—Crude Oil Futures (Put) | | CME Group | | | 1 | | | | (1.00 | ) | | | 07/20/2015 | | | | — | | | | — | |
Commodity—Crude Oil Futures (Put) | | CME Group | | | 1 | | | | (1.00 | ) | | | 06/19/2015 | | | | — | | | | — | |
Commodity—Gold Futures (Put) | | CME Group | | | 5 | | | | 1,155.00 | | | | 05/26/2015 | | | | 3 | | | | (4 | ) |
Commodity—Natural Gas Futures (Call) | | CME Group | | | 7 | | | | 2.85 | | | | 05/26/2015 | | | | 4 | | | | (5 | ) |
Commodity—Natural Gas Futures (Call) | | CME Group | | | 3 | | | | 1,155.00 | | | | 11/19/2015 | | | | 2 | | | | (2 | ) |
12
Harbor Commodity Real Return Strategy Fund
CONSOLIDATED PORTFOLIO OF INVESTMENTS—Continued
| | | | | | | | | | | | | | | | | | | | | | |
| WRITTEN OPTIONS—Continued | |
|
| WRITTEN OPTIONS NOT SETTLED THROUGH VARIATION MARGIN—Continued | |
| | | | | | |
Description | | Counterparty | | Number of
Contracts | | | Strike
Index/
Rate/Price | | | Expiration
Date | | | Premiums
Received
(000s) | | | Value
(000s) | |
Commodity—Platinum Gold Spread Futures (Put) | | Goldman Sachs International | | | 100 | | | $ | (101.04 | ) | | | 06/18/2015 | | | $ | 1 | | | $ | (1 | ) |
Commodity—Platinum Gold Spread Futures (Put) | | Goldman Sachs International | | | 100 | | | | (65.00 | ) | | | 07/13/2015 | | | | 2 | | | | (2 | ) |
Commodity—Crude Oil Futures (Call) | | Goldman Sachs International | | | 12 | | | | 62.00 | | | | 05/14/2015 | | | | 9 | | | | (30 | ) |
Commodity—Crude Oil Futures (Put) | | Goldman Sachs International | | | 1 | | | | 54.00 | | | | 11/10/2015 | | | | 4 | | | | (1 | ) |
Commodity—Crude Oil Futures (Put) | | Goldman Sachs International | | | 1 | | | | 55.00 | | | | 11/10/2015 | | | | 4 | | | | (1 | ) |
Commodity—WTI Brent Crude Oil Spread Futures (Call) | | CME Group | | | 1 | | | | (5.00 | ) | | | 05/13/2015 | | | | 1 | | | | — | |
Commodity—WTI Brent Crude Oil Spread Futures (Call) | | CME Group | | | 1 | | | | (4.00 | ) | | | 07/15/2015 | | | | — | | | | — | |
Commodity—WTI Brent Crude Oil Spread Futures (Put) | | CME Group | | | 1 | | | | (10.00 | ) | | | 05/13/2015 | | | | — | | | | — | |
Commodity—WTI Brent Crude Oil Spread Futures (Put) | | CME Group | | | 1 | | | | (9.00 | ) | | | 07/15/2015 | | | | 1 | | | | (1 | ) |
Currency Option Euro vs. U.S. Dollar (Put) | | Barclays Bank plc | | | 1,082,000 | | | | 1.05 | | | | 05/05/2015 | | | | 7 | | | | — | |
Currency Option Euro vs. U.S. Dollar (Put) | | BNP Paribas SA | | | 1,611,000 | | | | 1.05 | | | | 05/05/2015 | | | | 11 | | | | — | |
Currency Option U.S. Dollar vs. Brazilian Real (Call) | | Credit Suisse International | | | 1,200,000 | | | | 4.00 | | | | 03/17/2016 | | | | 51 | | | | (25 | ) |
Currency Option U.S. Dollar vs. Brazilian Real (Call) | | Deutsche Bank AG | | | 710,000 | | | | 2.68 | | | | 07/01/2015 | | | | 17 | | | | (88 | ) |
U.S. Treasury Notes 30 year Option (Put) | | Bank of America NA | | | 220,000 | | | | 94.00 | | | | 05/22/2015 | | | | 1 | | | | (3 | ) |
U.S. Treasury Notes 30 year Option (Put) | | Goldman Sachs Bank USA | | | 220,000 | | | | 94.00 | | | | 05/22/2015 | | | | 1 | | | | (3 | ) |
| | | | | | | | | | | | | | | | | | | | | | |
Total Written Options Not Settled Through Variation Margin | | | $ | 418 | | | $ | (365 | ) |
| | | | | | | | | | | | | | | | | | | | | | |
Total Written Options | | | $ | 448 | | | $ | (400 | ) |
| | | | | | | | | | | | | | | | | | | | | | |
| | | | | | | | | | | | | | | | | | |
| FORWARD CURRENCY CONTRACTS OPEN AT APRIL 30, 2015 | |
| | | | | |
Currency | | Counterparty | | Value
(000s) | | | Aggregate
Face Value
(000s) | | | Delivery Date | | | Unrealized
Appreciation/
(Depreciation)
(000s) | |
Australian Dollar (Buy) | | Goldman Sachs Bank USA | | $ | 1,827 | | | $ | 1,806 | | | | 05/06/2015 | | | $ | 21 | |
Australian Dollar (Sell) | | BNP Paribas SA | | | 838 | | | | 816 | | | | 05/06/2015 | | | | (22 | ) |
Australian Dollar (Sell) | | Credit Suisse International | | | 304 | | | | 292 | | | | 05/06/2015 | | | | (12 | ) |
Australian Dollar (Sell) | | Goldman Sachs Bank USA | | | 1,824 | | | | 1,803 | | | | 06/02/2015 | | | | (21 | ) |
Australian Dollar (Sell) | | HSBC Bank USA | | | 685 | | | | 657 | | | | 05/06/2015 | | | | (28 | ) |
Brazilian Real (Buy) | | Bank of America NA | | | 1,978 | | | | 2,202 | | | | 07/02/2015 | | | | (224 | ) |
Brazilian Real (Buy) | | Deutsche Bank AG | | | 3,236 | | | | 3,263 | | | | 05/05/2015 | | | | (27 | ) |
Brazilian Real (Buy) | | Deutsche Bank AG | | | 2,274 | | | | 2,080 | | | | 05/05/2015 | | | | 194 | |
Brazilian Real (Buy) | | Deutsche Bank AG | | | 5,455 | | | | 5,311 | | | | 06/02/2015 | | | | 144 | |
Brazilian Real (Buy) | | Goldman Sachs Bank USA | | | 608 | | | | 570 | | | | 05/05/2015 | | | | 38 | |
Brazilian Real (Buy) | | Goldman Sachs Bank USA | | | 254 | | | | 247 | | | | 06/02/2015 | | | | 7 | |
Brazilian Real (Buy) | | JP Morgan Chase Bank | | | 2,885 | | | | 2,686 | | | | 05/05/2015 | | | | 199 | |
Brazilian Real (Sell) | | Credit Suisse International | | | 2,921 | | | | 3,294 | | | | 07/02/2015 | | | | 373 | |
Brazilian Real (Sell) | | Deutsche Bank AG | | | 5,510 | | | | 5,359 | | | | 05/05/2015 | | | | (151 | ) |
Brazilian Real (Sell) | | Deutsche Bank AG | | | 4,086 | | | | 4,637 | | | | 07/02/2015 | | | | 551 | |
Brazilian Real (Sell) | | Goldman Sachs Bank USA | | | 257 | | | | 250 | | | | 05/05/2015 | | | | (7 | ) |
Brazilian Real (Sell) | | Goldman Sachs Bank USA | | | 351 | | | | 354 | | | | 05/05/2015 | | | | 3 | |
Brazilian Real (Sell) | | JP Morgan Chase Bank | | | 2,884 | | | | 2,908 | | | | 05/05/2015 | | | | 24 | |
Brazilian Real (Sell) | | JP Morgan Chase Bank | | | 3,209 | | | | 3,350 | | | | 04/04/2016 | | | | 141 | |
British Pound Sterling (Buy) | | Bank of America NA | | | 3,303 | | | | 3,266 | | | | 05/06/2015 | | | | 37 | |
British Pound Sterling (Buy) | | HSBC Bank USA | | | 196 | | | | 197 | | | | 06/02/2015 | | | | (1 | ) |
British Pound Sterling (Buy) | | UBS AG | | | 2,563 | | | | 2,488 | | | | 05/06/2015 | | | | 75 | |
British Pound Sterling (Sell) | | Bank of America NA | | | 3,303 | | | | 3,265 | | | | 06/02/2015 | | | | (38 | ) |
British Pound Sterling (Sell) | | Deutsche Bank AG | | | 333 | | | | 321 | | | | 05/06/2015 | | | | (12 | ) |
British Pound Sterling (Sell) | | Goldman Sachs Bank USA | | | 5,534 | | | | 5,353 | | | | 05/06/2015 | | | | (181 | ) |
Canadian Dollar (Sell) | | Credit Suisse International | | | 657 | | | | 627 | | | | 05/06/2015 | | | | (30 | ) |
Colombian Peso (Sell) | | BNP Paribas SA | | | 203 | | | | 211 | | | | 06/03/2015 | | | | 8 | |
Euro Currency (Buy) | | Bank of America NA | | | 544 | | | | 514 | | | | 05/06/2015 | | | | 30 | |
Euro Currency (Buy) | | Citibank NA | | | 34 | | | | 34 | | | | 05/19/2015 | | | | — | |
Euro Currency (Buy) | | Citibank NA | | | 141 | | | | 135 | | | | 05/19/2015 | | | | 6 | |
Euro Currency (Buy) | | Deutsche Bank AG | | | 27,997 | | | | 27,138 | | | | 05/06/2015 | | | | 859 | |
Euro Currency (Buy) | | Goldman Sachs Bank USA | | | 1,891 | | | | 1,814 | | | | 05/06/2015 | | | | 77 | |
Euro Currency (Buy) | | UBS AG | | | 110 | | | | 103 | | | | 05/06/2015 | | | | 7 | |
Euro Currency (Sell) | | BNP Paribas SA | | | 29,274 | | | | 28,068 | | | | 05/06/2015 | | | | (1,206 | ) |
Euro Currency (Sell) | | Citibank NA | | | 5 | | | | 5 | | | | 05/19/2015 | | | | — | |
Euro Currency (Sell) | | Deutsche Bank AG | | | 1,269 | | | | 1,217 | | | | 05/06/2015 | | | | (52 | ) |
Euro Currency (Sell) | | Deutsche Bank AG | | | 28,007 | | | | 27,148 | | | | 06/02/2015 | | | | (859 | ) |
Hungarian Forint (Sell) | | JP Morgan Chase Bank | | | 1,323 | | | | 1,279 | | | | 07/30/2015 | | | | (44 | ) |
Indian Rupee (Buy) | | Barclays Capital | | | 1,454 | | | | 1,481 | | | | 07/24/2015 | | | | (27 | ) |
Indian Rupee (Buy) | | Goldman Sachs Bank USA | | | 1,176 | | | | 1,190 | | | | 05/18/2015 | | | | (14 | ) |
13
Harbor Commodity Real Return Strategy Fund
CONSOLIDATED PORTFOLIO OF INVESTMENTS—Continued
| | | | | | | | | | | | | | | | | | |
| FORWARD CURRENCY CONTRACTS—Continued | |
| | | | | |
Currency | | Counterparty | | Value
(000s) | | | Aggregate
Face Value
(000s) | | | Delivery Date | | | Unrealized
Appreciation/
(Depreciation)
(000s) | |
Indian Rupee (Buy) | | UBS AG | | $ | 2,092 | | | $ | 2,116 | | | | 06/26/2015 | | | $ | (24 | ) |
Japanese Yen (Buy) | | Credit Suisse International | | | 2,212 | | | | 2,203 | | | | 05/08/2015 | | | | 9 | |
Japanese Yen (Buy) | | JP Morgan Chase Bank NA | | | 1,121 | | | | 1,125 | | | | 05/08/2015 | | | | (4 | ) |
Japanese Yen (Sell) | | Bank of America NA | | | 3,331 | | | | 3,329 | | | | 05/08/2015 | | | | (2 | ) |
Japanese Yen (Sell) | | JP Morgan Chase Bank NA | | | 1,121 | | | | 1,125 | | | | 06/03/2015 | | | | 4 | |
Mexican Peso (Buy) | | BNP Paribas SA | | | 366 | | | | 364 | | | | 07/07/2015 | | | | 2 | |
Mexican Peso (Buy) | | Deutsche Bank AG | | | 1,096 | | | | 1,102 | | | | 06/11/2015 | | | | (6 | ) |
Mexican Peso (Buy) | | HSBC Bank USA | | | 778 | | | | 802 | | | | 05/05/2015 | | | | (24 | ) |
Mexican Peso (Buy) | | JP Morgan Chase Bank NA | | | 605 | | | | 609 | | | | 05/05/2015 | | | | (4 | ) |
Mexican Peso (Buy) | | Westpac Banking Corp. | | | 767 | | | | 783 | | | | 05/05/2015 | | | | (16 | ) |
Mexican Peso (Sell) | | Bank of America NA | | | 25 | | | | 25 | | | | 05/05/2015 | | | | — | |
Mexican Peso (Sell) | | Bank of America NA | | | 62 | | | | 63 | | | | 05/05/2015 | | | | 1 | |
Mexican Peso (Sell) | | Bank of America NA | | | 3,255 | | | | 3,281 | | | | 06/09/2015 | | | | 26 | |
Mexican Peso (Sell) | | Barclays Bank plc | | | 86 | | | | 89 | | | | 05/05/2015 | | | | 3 | |
Mexican Peso (Sell) | | BNP Paribas SA | | | 653 | | | | 649 | | | | 05/05/2015 | | | | (4 | ) |
Mexican Peso (Sell) | | Credit Suisse International | | | 217 | | | | 223 | | | | 05/05/2015 | | | | 6 | |
Mexican Peso (Sell) | | Deutsche Bank AG | | | 166 | | | | 170 | | | | 05/05/2015 | | | | 4 | |
Mexican Peso (Sell) | | Goldman Sachs Bank USA | | | 407 | | | | 418 | | | | 05/05/2015 | | | | 11 | |
Mexican Peso (Sell) | | HSBC Bank USA | | | 320 | | | | 317 | | | | 05/05/2015 | | | | (3 | ) |
Mexican Peso (Sell) | | HSBC Bank USA | | | 173 | | | | 174 | | | | 05/05/2015 | | | | 1 | |
Mexican Peso (Sell) | | JP Morgan Chase Bank NA | | | 40 | | | | 40 | | | | 05/05/2015 | | | | — | |
Mexican Peso (Sell) | | JP Morgan Chase Bank NA | | | 602 | | | | 606 | | | | 07/07/2015 | | | | 4 | |
New Zealand Dollar (Sell) | | Credit Suisse International | | | 844 | | | | 822 | | | | 05/06/2015 | | | | (22 | ) |
Polish Zloty (Buy) | | JP Morgan Chase Bank | | | 899 | | | | 864 | | | | 07/30/2015 | | | | 35 | |
Polish Zloty (Sell) | | Barclays Capital | | | 900 | | | | 849 | | | | 07/30/2015 | | | | (51 | ) |
South African Rand (Sell) | | Barclays Bank plc | | | 97 | | | | 96 | | | | 07/30/2015 | | | | (1 | ) |
South Korean Won (Sell) | | Credit Suisse International | | | 762 | | | | 741 | | | | 05/18/2015 | | | | (21 | ) |
| | | | | | | | | | | | | | | | | | |
Total Forward Currency Contracts | | | $ | (238 | ) |
| | | | | | | | | | | | | | | | | | |
| | | | | | | | | | | | | | | | | | | | |
| SWAP AGREEMENTS OPEN AT APRIL 30, 2015 | |
|
CENTRALLY CLEARED SWAP AGREEMENTS INTEREST RATE SWAPS | |
| | | | | | |
Counterparty | | Floating Rate Index | | Pay/Receive
Floating Rate | | Fixed Rate | | | Expiration Date | | | Notional
Amount
(000s) | | | Unrealized
Appreciation/
(Depreciation)
(000s) | |
CME Group | | EUR-EURIBOR-Act/360-Bloomberg 6-Month | | Pay | | | 2.000 | % | | | 09/17/2024 | | | € | 600 | | | $ | (48 | ) |
CME Group | | EUR-EURIBOR-Act/360-Bloomberg 6-Month | | Pay | | | 0.750 | | | | 09/16/2025 | | | | 5,700 | | | | 12 | |
CME Group | | EUR-EURIBOR-Act/360-Bloomberg 6-Month | | Pay | | | 1.250 | | | | 09/16/2045 | | | | 400 | | | | 10 | |
CME Group | | EUR-EURIBOR-Act/360-Bloomberg 6-Month | | Pay | | | 1.500 | | | | 03/16/2046 | | | | 200 | | | | (15 | ) |
CME Group | | British Bankers’ Association LIBOR GBP 6-Month | | Pay | | | 1.250 | | | | 06/17/2017 | | | £ | 7,200 | | | | 28 | |
CME Group | | British Bankers’ Association LIBOR GBP 6-Month | | Pay | | | 1.500 | | | | 09/16/2017 | | | | 5,600 | | | | (1 | ) |
CME Group | | British Bankers’ Association LIBOR GBP 6-Month | | Pay | | | 2.000 | | | | 09/16/2045 | | | | 1,410 | | | | 137 | |
CME Group | | Mexico Interbank TIIE 28 Day | | Pay | | | 4.040 | | | | 02/03/2017 | | | MEX$ | 89,400 | | | | (13 | ) |
CME Group | | Mexico Interbank TIIE 28 Day | | Pay | | | 5.150 | | | | 04/02/2020 | | | | 41,500 | | | | (15 | ) |
CME Group | | Mexico Interbank TIIE 28 Day | | Pay | | | 5.660 | | | | 11/09/2021 | | | | 55,900 | | | | (3 | ) |
CME Group | | British Bankers’ Association LIBOR USD 3-Month | | Pay | | | 3.000 | | | | 12/17/2024 | | | $ | 7,000 | | | | (5 | ) |
CME Group | | British Bankers’ Association LIBOR USD 3-Month | | Pay | | | 2.750 | | | | 06/17/2025 | | | | 5,800 | | | | (18 | ) |
CME Group | | British Bankers’ Association LIBOR USD 3-Month | | Pay | | | 2.750 | | | | 06/19/2043 | | | | 2,600 | | | | (628 | ) |
CME Group | | British Bankers’ Association LIBOR USD 3-Month | | Pay | | | 3.750 | | | | 06/18/2044 | | | | 1,900 | | | | (428 | ) |
| | | | | | | | | | | | | | | | | | | | |
Interest Rate Swaps | | | $ | (987 | ) |
| | | | | | | | | | | | | | | | | | | | |
14
Harbor Commodity Real Return Strategy Fund
CONSOLIDATED PORTFOLIO OF INVESTMENTS—Continued
| | | | | | | | | | | | | | | | | | | | | | | | | | | | | | | | |
| SWAP AGREEMENTS—Continued | |
|
CENTRALLY CLEARED SWAP AGREEMENTS CREDIT DEFAULT SWAPS | |
| | | | | | | | | |
Counterparty | | Reference Entity | | Buy/
Sellb,c | | Pay/Receive
Fixed Rate | | | Expiration
Date | | | Implied
Credit
Spreadd | | | Valuee
(000s) | | | Upfront
Premium
Paid/(Received)
(000s) | | | Notional
Amountf
(000s) | | | Unrealized
Appreciation/
(Depreciation)
(000s) | |
ICE Group | | iTraxx Europe
Series 23 Version 1 | | Buy | | | 1.000 | % | | | 06/20/2020 | | | | 0.601 | % | | $ | (174 | ) | | $ | (178 | ) | | € | 7,300 | | | $ | 4 | |
ICE Group | | Dow Jones CDX North America Investment Grade Index Series 23 | | Buy | | | 1.000 | | | | 12/20/2019 | | | | 0.632 | | | | (55 | ) | | | (56 | ) | | $ | 3,100 | | | | 1 | |
| | | | | | | | | | | | | | | | | | | | | | | | | | | | | | | | |
Credit Default Swaps | | | $ | 5 | |
| | | | | | | | | | | | | | | | | | | | | | | | | | | | | | | | |
| | | | | | | | | | | | | | | | | | | | |
|
OVER-THE-COUNTER (OTC) SWAP AGREEMENTS INTEREST RATE SWAPS | |
| | | | | | |
Counterparty | | Floating Rate Index | | Pay/Receive
Floating Rate | | Fixed Rate | | | Expiration Date | | | Notional
Amount
(000s) | | | Unrealized
Appreciation/
(Depreciation)
(000s) | |
Goldman Sachs Bank USA | | Eurostat Eurozone HICP Ex Tobacco NSA | | Receive | | | 0.900 | % | | | 10/15/2019 | | | € | 1,500 | | | $ | 3 | |
JP Morgan Chase Bank NA | | Eurostat Eurozone HICP Ex Tobacco NSA | | Receive | | | 1.000 | | | | 12/15/2018 | | | | 100 | | | | — | |
Morgan Stanley Capital Services LLC | | Eurostat Eurozone HICP Ex Tobacco NSA | | Receive | | | 1.000 | | | | 11/26/2019 | | | | 100 | | | | — | |
Bank of America NA | | UK Retail Prices Index All Items NSA | | Pay | | | 3.500 | | | | 10/15/2044 | | | £ | 600 | | | | 9 | |
BNP Paribas SA | | UK Retail Prices Index All Items NSA | | Pay | | | 3.125 | | | | 12/15/2024 | | | | 400 | | | | 10 | |
BNP Paribas SA | | UK Retail Prices Index All Items NSA | | Pay | | | 3.550 | | | | 12/11/2044 | | | | 100 | | | | 4 | |
Credit Suisse International | | UK Retail Prices Index All Items NSA | | Pay | | | 3.500 | | | | 10/15/2044 | | | | 200 | | | | 10 | |
Credit Suisse International | | UK Retail Prices Index All Items NSA | | Pay | | | 3.550 | | | | 11/15/2044 | | | | 100 | | | | 5 | |
Goldman Sachs Bank USA | | UK Retail Prices Index All Items NSA | | Pay | | | 3.140 | | | | 01/14/2030 | | | | 710 | | | | (24 | ) |
JP Morgan Chase Bank NA | | UK Retail Prices Index All Items NSA | | Pay | | | 3.528 | | | | 09/23/2044 | | | | 300 | | | | 11 | |
Morgan Stanley Capital Services LLC | | UK Retail Prices Index All Items NSA | | Pay | | | 3.500 | | | | 10/15/2044 | | | | 200 | | | | 6 | |
Barclays Bank plc | | US Consumer Price Index Urban Consumers NSA | | Receive | | | 2.090 | | | | 10/11/2017 | | | $ | 2,800 | | | | (87 | ) |
BNP Paribas SA | | US Consumer Price Index Urban Consumers NSA | | Receive | | | 2.250 | | | | 07/15/2017 | | | | 5,600 | | | | (283 | ) |
Deutsche Bank AG | | US Consumer Price Index Urban Consumers NSA | | Receive | | | 1.000 | | | | 11/19/2016 | | | | 1,500 | | | | (17 | ) |
Deutsche Bank AG | | US Consumer Price Index Urban Consumers NSA | | Receive | | | 1.000 | | | | 11/20/2016 | | | | 2,300 | | | | (26 | ) |
Deutsche Bank AG | | US Consumer Price Index Urban Consumers NSA | | Receive | | | 1.000 | | | | 11/21/2016 | | | | 400 | | | | (5 | ) |
Deutsche Bank AG | | US Consumer Price Index Urban Consumers NSA | | Receive | | | 1.830 | | | | 11/29/2016 | | | | 800 | | | | (16 | ) |
Deutsche Bank AG | | US Consumer Price Index Urban Consumers NSA | | Receive | | | 1.850 | | | | 11/29/2016 | | | | 3,400 | | | | (71 | ) |
Deutsche Bank AG | | US Consumer Price Index Urban Consumers NSA | | Receive | | | 2.173 | | | | 11/01/2018 | | | | 900 | | | | (34 | ) |
Deutsche Bank AG | | US Consumer Price Index Urban Consumers NSA | | Receive | | | 1.730 | | | | 03/04/2019 | | | | 175 | | | | — | |
Goldman Sachs Bank USA | | US Consumer Price Index Urban Consumers NSA | | Receive | | | 1.730 | | | | 04/15/2016 | | | | 3,000 | | | | (59 | ) |
Goldman Sachs Bank USA | | US Consumer Price Index Urban Consumers NSA | | Receive | | | 2.420 | | | | 02/12/2017 | | | | 1,400 | | | | (67 | ) |
Goldman Sachs Bank USA | | US Consumer Price Index Urban Consumers NSA | | Receive | | | 2.210 | | | | 10/11/2018 | | | | 1,700 | | | | (67 | ) |
Royal Bank of Scotland plc | | US Consumer Price Index Urban Consumers NSA | | Receive | | | 1.930 | | | | 10/31/2016 | | | | 6,500 | | | | (153 | ) |
Royal Bank of Scotland plc | | US Consumer Price Index Urban Consumers NSA | | Receive | | | 2.250 | | | | 07/15/2017 | | | | 8,200 | | | | (414 | ) |
| | | | | | | | | | | | | | | | | | | | |
Interest Rate Swaps | | | $ | (1,265 | ) |
| | | | | | | | | | | | | | | | | | | | |
| | | | | | | | | | | | | | | | | | | | | | |
|
OVER-THE-COUNTER (OTC) SWAP AGREEMENTS TOTAL RETURN SWAPS ON INDICES | |
| | | | | | | |
Counterparty | | Floating/Fixed Rate | | Pay/Receive
Floating/Fixed Rate | | Index | | Expiration
Date | | | Notional
Amount
(000s) | | | Number
of Units
(000s) | | | Unrealized
Appreciation/
(Depreciation)
(000s) | |
JP Morgan Chase Bank NA | | 0.350% | | Receive | | JP Morgan FNJ Commodity Index | | | 08/17/2015 | | | $ | 1,801 | | | | 18 | | | $ | 10 | |
Bank of America NA | | U.S. Treasury Bills | | Pay | | Bloomberg Commodity Index Total ReturnSM | | | 08/17/2015 | | | | 22,780 | | | | 111 | | | | 516 | |
BNP Paribas SA | | U.S. Treasury Bills | | Pay | | Bloomberg Commodity Index Total ReturnSM | | | 08/17/2015 | | | | 2,005 | | | | 10 | | | | 43 | |
Citibank NA | | U.S. Treasury Bills | | Pay | | Bloomberg Commodity Index Total ReturnSM | | | 08/17/2015 | | | | 13,783 | | | | 67 | | | | 312 | |
Credit Suisse International | | U.S. Treasury Bills | | Pay | | Bloomberg Commodity Index Total ReturnSM | | | 08/17/2015 | | | | 4,889 | | | | 24 | | | | 111 | |
Deutsche Bank AG | | U.S. Treasury Bills | | Pay | | Bloomberg Commodity Index Total ReturnSM | | | 08/17/2015 | | | | 841 | | | | 4 | | | | 19 | |
Goldman Sachs Bank USA | | U.S. Treasury Bills | | Pay | | Bloomberg Commodity Index Total ReturnSM | | | 08/17/2015 | | | | 13,547 | | | | 52 | | | | 351 | |
JP Morgan Chase Bank NA | | U.S. Treasury Bills | | Pay | | Bloomberg Commodity Index Total ReturnSM | | | 08/17/2015 | | | | 9,593 | | | | 26 | | | | 262 | |
JP Morgan Chase Bank NA | | U.S. Treasury Bills | | Pay | | Bloomberg Commodity Index Total ReturnSM | | | 08/17/2015 | | | | 1 | | | | 399 | | | | (19 | ) |
Morgan Stanley Capital Services LLC | | U.S. Treasury Bills | | Pay | | Bloomberg Commodity Index Total ReturnSM | | | 08/17/2015 | | | | 66,958 | | | | 300 | | | | 1,502 | |
Société Générale Paris | | U.S. Treasury Bills | | Pay | | Bloomberg Commodity Index Total ReturnSM | | | 08/17/2015 | | | | 12,406 | | | | 61 | �� | | | 280 | |
| | | | | | | | | | | | | | | | | | | | | | |
Total Return Swaps on Indices | | | $ | 3,387 | |
| | | | | | | | | | | | | | | | | | | | | | |
15
Harbor Commodity Real Return Strategy Fund
CONSOLIDATED PORTFOLIO OF INVESTMENTS—Continued
| | | | | | | | | | | | | | | | | | |
| SWAP AGREEMENTS—Continued |
| | | | | | | | | | | | | | | | | | | | |
|
OVER-THE-COUNTER (OTC) SWAP AGREEMENTS TOTAL RETURN SWAPS ON COMMODITIES | |
| | | | | | |
Counterparty | | Reference Entity | | Pay/Receive
Fixed Price | | Fixed Price
per Unit | | | Expiration
Date | | | Number
of Units | | | Unrealized
Appreciation/
(Depreciation)
(000s) | |
BNP Paribas SA | | Jet Fuel, Naptha and Fuel Oil vs. Brent Crude Oil | | Receive | | $ | 4.450 | | | | 06/30/2015 | | | | 1,000 | | | $ | 2 | |
BNP Paribas SA | | Jet Fuel, Naptha and Fuel Oil vs. Brent Crude Oil | | Receive | | | 2.800 | | | | 06/30/2015 | | | | 800 | | | | — | |
Goldman Sachs International | | Jet Fuel, Naptha and Fuel Oil vs. Brent Crude Oil | | Receive | | | 2.800 | | | | 06/30/2015 | | | | 200 | | | | — | |
Goldman Sachs International | | Jet Fuel, Naptha and Fuel Oil vs. Brent Crude Oil | | Receive | | | 2.040 | | | | 12/31/2015 | | | | 3,000 | | | | (1 | ) |
Goldman Sachs International | | Jet Fuel, Naptha and Fuel Oil vs. Brent Crude Oil | | Receive | | | 1.940 | | | | 12/31/2015 | | | | 3,000 | | | | (1 | ) |
Goldman Sachs International | | Jet Fuel, Naptha and Fuel Oil vs. Brent Crude Oil | | Receive | | | 1.940 | | | | 03/31/2016 | | | | 3,000 | | | | — | |
Goldman Sachs International | | Jet Fuel, Naptha and Fuel Oil vs. Brent Crude Oil | | Receive | | | 2.040 | | | | 03/31/2016 | | | | 3,000 | | | | — | |
Bank of America NA | | Light Louisiana Sweet Crude Oil vs. Brent Crude Oil Spread | | Receive | | | (2.700 | ) | | | 06/30/2015 | | | | 192 | | | | — | |
Bank of America NA | | Light Louisiana Sweet Crude Oil vs. Brent Crude Oil Spread | | Receive | | | (2.900 | ) | | | 06/30/2015 | | | | 202 | | | | — | |
Bank of America NA | | Light Louisiana Sweet Crude Oil vs. Brent Crude Oil Spread | | Receive | | | (2.850 | ) | | | 06/30/2015 | | | | 112 | | | | — | |
Bank of America NA | | Light Louisiana Sweet Crude Oil vs. Brent Crude Oil Spread | | Receive | | | (2.750 | ) | | | 12/31/2015 | | | | 684 | | | | — | |
Bank of America NA | | Light Louisiana Sweet Crude Oil vs. Brent Crude Oil Spread | | Receive | | | (8.150 | ) | | | 12/31/2015 | | | | 8,000 | | | | 45 | |
BNP Paribas SA | | Light Louisiana Sweet Crude Oil vs. Brent Crude Oil Spread | | Receive | | | (2.550 | ) | | | 12/31/2015 | | | | 1,074 | | | | 1 | |
Citibank NA | | Light Louisiana Sweet Crude Oil vs. Brent Crude Oil Spread | | Receive | | | (2.700 | ) | | | 06/30/2015 | | | | 442 | | | | (1 | ) |
Citibank NA | | Light Louisiana Sweet Crude Oil vs. Brent Crude Oil Spread | | Receive | | | (2.800 | ) | | | 06/30/2015 | | | | 222 | | | | — | |
Citibank NA | | Light Louisiana Sweet Crude Oil vs. Brent Crude Oil Spread | | Receive | | | (2.500 | ) | | | 12/31/2015 | | | | 534 | | | | — | |
Goldman Sachs International | | Light Louisiana Sweet Crude Oil vs. Brent Crude Oil Spread | | Receive | | | (2.600 | ) | | | 06/30/2015 | | | | 220 | | | | — | |
Goldman Sachs International | | Light Louisiana Sweet Crude Oil vs. Brent Crude Oil Spread | | Receive | | | (2.550 | ) | | | 06/30/2015 | | | | 420 | | | | (1 | ) |
Goldman Sachs International | | Light Louisiana Sweet Crude Oil vs. Brent Crude Oil Spread | | Receive | | | (2.400 | ) | | | 12/31/2015 | | | | 642 | | | | 1 | |
Goldman Sachs International | | Light Louisiana Sweet Crude Oil vs. Brent Crude Oil Spread | | Receive | | | (3.000 | ) | | | 12/31/2015 | | | | 990 | | | | — | |
JP Morgan Chase Bank NA | | Light Louisiana Sweet Crude Oil vs. Brent Crude Oil Spread | | Receive | | | (2.300 | ) | | | 12/31/2015 | | | | 1,506 | | | | 1 | |
Morgan Stanley Capital Services LLC | | Light Louisiana Sweet Crude Oil vs. Brent Crude Oil Spread | | Receive | | | (3.300 | ) | | | 12/31/2015 | | | | 760 | | | | (1 | ) |
| | | | | | | | | | | | | | | | | | | | |
Total Return Swaps on Commodities | | | $ | 45 | |
| | | | | | | | | | | | | | | | | | | | |
| | | | | | | | | | | | | | | | | | | | |
|
OVER-THE-COUNTER (OTC) SWAP AGREEMENTS VARIANCE SWAPS ON COMMODITIES | |
| | | | | | |
Counterparty | | Reference Assets | | Pay/Receive
Varianceg | | Initial
Volatility Strike | | | Expiration
Date | | | Notional
Amount
(000s) | | | Unrealized
Appreciation/
(Depreciation)
(000s) | |
Goldman Sachs International | | London Gold Market Fixing Ltd-LBMA PM Fixing Price/USD | | Pay | | $ | 0.060 | | | | 11/25/2015 | | | $ | 90 | | | $ | 3 | |
Goldman Sachs International | | London Gold Market Fixing Ltd-LBMA PM Fixing Price/USD | | Pay | | | 0.080 | | | | 03/24/2020 | | | | 179 | | | | (1 | ) |
Goldman Sachs International | | London Gold Market Fixing Ltd-LBMA PM Fixing Price/USD | | Pay | | | 0.080 | | | | 04/22/2020 | | | | 531 | | | | (2 | ) |
Goldman Sachs International | | London Gold Market Fixing Ltd-LBMA PM Fixing Price/USD | | Pay | | | 0.090 | | | | 04/27/2020 | | | | 341 | | | | 1 | |
Goldman Sachs International | | London Gold Market Fixing Ltd-LBMA PM Fixing Price/USD | | Pay | | | 0.090 | | | | 04/28/2020 | | | | 169 | | | | 1 | |
JP Morgan Chase Bank NA | | London Gold Market Fixing Ltd-LBMA PM Fixing Price/USD | | Pay | | | 0.110 | | | | 04/29/2020 | | | | 152 | | | | — | |
Morgan Stanley Capital Services LLC | | London Gold Market Fixing Ltd-LBMA PM Fixing Price/USD | | Pay | | | 0.050 | | | | 04/21/2016 | | | | 520 | | | | 10 | |
Goldman Sachs International | | London Silver Market Fixing Ltd-LBMA PM Fixing Price/USD | | Pay | | | 0.110 | | | | 11/25/2015 | | | | 70 | | | | (2 | ) |
Morgan Stanley Capital Services LLC | | London Silver Market Fixing Ltd-LBMA PM Fixing Price/USD | | Pay | | | 0.090 | | | | 04/21/2016 | | | | 400 | | | | — | |
Citibank NA | | S&P GSCI Crude Oil Official Close Index | | Pay | | | 0.050 | | | | 05/14/2015 | | | | 52 | | | | (5 | ) |
Citibank NA | | S&P GSCI Crude Oil Official Close Index | | Pay | | | 0.040 | | | | 05/14/2015 | | | | 55 | | | | (6 | ) |
Deutsche Bank AG | | S&P GSCI Crude Oil Official Close Index | | Pay | | | 0.050 | | | | 05/14/2015 | | | | 50 | | | | (4 | ) |
Deutsche Bank AG | | S&P GSCI Crude Oil Official Close Index | | Pay | | | 0.060 | | | | 11/17/2015 | | | | 50 | | | | (6 | ) |
Société Générale Paris | | S&P GSCI Crude Oil Official Close Index | | Pay | | | 0.040 | | | | 05/14/2015 | | | | 59 | | | | (6 | ) |
Deutsche Bank AG | | West Texas Intermediate Crude Oil Futures December 2015 | | Pay | | | 0.040 | | | | 11/17/2015 | | | | 60 | | | | 5 | |
Deutsche Bank AG | | West Texas Intermediate Crude Oil Futures June 2015 | | Pay | | | 0.090 | | | | 05/14/2015 | | | | 192 | | | | 17 | |
Société Générale Paris | | West Texas Intermediate Crude Oil Futures June 2015 | | Pay | | | 0.030 | | | | 05/14/2015 | | | | 67 | | | | 6 | |
| | | | | | | | | | | | | | | | | | | | |
Variance Swaps on Commodities | | | $ | 11 | |
| | | | | | | | | | | | | | | | | | | | |
| | | | | | | | | | | | | | | | | | | | | | | | | | | | | | | | |
|
OVER-THE-COUNTER (OTC) SWAP AGREEMENTS CREDIT DEFAULT SWAPS | |
| | | | | | | | | |
Counterparty | | Reference Entity | | Buy/
Sellb,c | | Pay/Receive
Fixed Rate | | | Expiration
Date | | | Implied
Credit
Spreadd | | | Valuee
(000s) | | | Upfront
Premium
Paid/(Received)
(000s) | | | Notional
Amountf
(000s) | | | Unrealized
Appreciation/
(Depreciation)
(000s) | |
Morgan Stanley Capital Services LLC | | Hellenic Republic | | Sell | | | 1.000 | % | | | 06/20/2015 | | | | 0.635 | % | | $ | (34 | ) | | $ | (9 | ) | | € | 200 | | | $ | (25 | ) |
Goldman Sachs International | | JSC GAZPROM | | Sell | | | 1.000 | | | | 03/20/2016 | | | | 3.767 | | | | (5 | ) | | | (16 | ) | | $ | 200 | | | | 11 | |
16
Harbor Commodity Real Return Strategy Fund
CONSOLIDATED PORTFOLIO OF INVESTMENTS—Continued
| | | | | | | | | | | | | | | | | | |
| SWAP AGREEMENTS—Continued |
| | | | | | | | | | | | | | | | | | | | | | | | | | | | | | | | |
|
OVER-THE-COUNTER (OTC) SWAP AGREEMENTS—Continued CREDIT DEFAULT SWAPS—Continued | |
| | | | | | | | | |
Counterparty | | Reference Entity | | Buy/
Sellb,c | | Pay/Receive
Fixed Rate | | | Expiration
Date | | | Implied
Credit
Spreadd | | | Valuee
(000s) | | | Upfront
Premium
Paid/(Received)
(000s) | | | Notional
Amountf
(000s) | | | Unrealized
Appreciation/
(Depreciation)
(000s) | |
JP Morgan Chase Bank NA | | JSC
GAZPROM | | Sell | | | 1.000 | % | | | 03/20/2016 | | | | 3.767 | % | | $ | (5 | ) | | $ | (15 | ) | | $ | 200 | | | $ | 10 | |
Goldman Sachs International | | Sberbank | | Sell | | | 1.000 | | | | 03/20/2016 | | | | 4.447 | | | | (3 | ) | | | (5 | ) | | | 100 | | | | 2 | |
| | | | | | | | | | | | | | | | | | | | | | | | | | | | | | | | |
Credit Default Swaps | | | $ | (2 | ) |
| | | | | | | | | | | | | | | | | | | | | | | | | | | | | | | | |
Total Swaps | | | $ | 1,194 | |
| | | | | | | | | | | | | | | | | | | | | | | | | | | | | | | | |
| | | | | | | | | | | | |
| FIXED INCOME INVESTMENTS SOLD SHORT AT APRIL 30, 2015 | |
| | | |
Par Value
(000s) | | | Security | | Proceeds
(000s) | | | Value
(000s) | |
| $ | 8,000 | | | Federal National Mortgage Association TBA10 | | $ | 8,324 | | | $ | (8,297 | ) |
| | | | | | | | | | | | |
FAIR VALUE MEASUREMENTS
The following table summarizes the Fund’s investments as of April 30, 2015 based on the inputs used to value them.
| | | | | | | | | | | | | | | | |
Asset Category | | Quoted Prices
Level 1 (000s) | | | Other Significant
Observable Inputs
Level 2 (000s) | | | Significant Unobservable
Inputs Level 3
(000s) | | | Total
(000s) | |
Investments in Securities | | | | | | | | | | | | | | | | |
Asset-Backed Securities | | $ | — | | | $ | 10,151 | | | $ | — | | | $ | 10,151 | |
Collateralized Mortgage Obligations | | | — | | | | 7,431 | | | | — | | | | 7,431 | |
Corporate Bonds & Notes | | | — | | | | 13,828 | | | | — | | | | 13,828 | |
Foreign Government Obligations | | | — | | | | 25,971 | | | | — | | | | 25,971 | |
Mortgage Pass-Through | | | — | | | | 1,769 | | | | — | | | | 1,769 | |
Purchased Options | | | 11 | | | | 133 | | | | — | | | | 144 | |
U.S. Government Obligations | | | — | | | | 120,469 | | | | — | | | | 120,469 | |
Short-Term Investments | | | | | | | | | | | | | | | | |
Repurchase Agreements | | | — | | | | 18,277 | | | | — | | | | 18,277 | |
U.S. Government Agencies | | | — | | | | 3,599 | | | | — | | | | 3,599 | |
U.S. Government Obligations | | | — | | | | 2,889 | | | | — | | | | 2,889 | |
| | | | | | | | | | | | | | | | |
Total Investments in Securities | | $ | 11 | | | $ | 204,517 | | | $ | — | | | $ | 204,528 | |
| | | | | | | | | | | | | | | | |
Financial Derivative Instruments—Assets | | | | | | | | | | | | | | | | |
Forward Currency Contracts | | $ | — | | | $ | 2,900 | | | $ | — | | | $ | 2,900 | |
Futures Contracts | | | 567 | | | | — | | | | — | | | | 567 | |
Swap Agreements | | | — | | | | 3,772 | | | | — | | | | 3,772 | |
| | | | | | | | | | | | | | | | |
Total Financial Derivative Instruments—Assets | | $ | 567 | | | $ | 6,672 | | | $ | — | | | $ | 7,239 | |
| | | | | | | | | | | | | | | | |
Liability Category | | | | | | | | | | | | |
Fixed Income Investments Sold Short | | $ | — | | | $ | (8,297 | ) | | $ | — | | | $ | (8,297 | ) |
| | | | | | | | | | | | | | | | |
Investments in Other Financial Instruments | | | | | | | | | | | | | | | | |
Forward Currency Contracts | | $ | — | | | $ | (3,138 | ) | | $ | — | | | $ | (3,138 | ) |
Futures Contracts | | | (973 | ) | | | — | | | | — | | | | (973 | ) |
Swap Agreements | | | — | | | | (2,578 | ) | | | — | | | | (2,578 | ) |
Written Options | | | (38 | ) | | | (362 | ) | | | — | | | | (400 | ) |
| | | | | | | | | | | | | | | | |
Total Financial Derivative Instruments—Liabilities | | $ | (1,011 | ) | | $ | (6,078 | ) | | $ | — | | | $ | (7,089 | ) |
| | | | | | | | | | | | | | | | |
Total Investments | | $ | (433 | ) | | $ | 196,814 | | | $ | — | | | $ | 196,381 | |
| | | | | | | | | | | | | | | | |
There were no Level 3 holdings at October 31, 2014 or April 30, 2015, and no transfers between levels during the period.
For more information on valuation inputs and their aggregation into the levels used in the table above, please refer to the Fair Value Measurements and Disclosures in Note 2 of the accompanying Notes to Financial Statements.
17
Harbor Commodity Real Return Strategy Fund
CONSOLIDATED PORTFOLIO OF INVESTMENTS—Continued
| 1 | Floating rate security, the stated rate represents the rate in effect at April 30, 2015. |
| 2 | Step coupon security, the stated rate represents the rate in effect at April 30, 2015. |
| 3 | Securities purchased in a transaction exempt from registration under Rule 144A of the Securities Act of 1933. These securities may be resold in transactions exempt from registration, normally to qualified institutional buyers. The Fund has no right to demand registration of these securities. These securities are priced by an independent pricing service in accordance with Harbor Funds Valuation Procedures. At April 30, 2015, the aggregate value of these securities was $8,598 or 6% of net assets. |
| 4 | Variable rate security, the stated rate represents the rate in effect at April 30, 2015. |
| 5 | CLO after the name of a security stands for Collateralized Loan Obligations. |
| 6 | MTN after the name of a security stands for Medium Term Note. |
| 7 | Perpetuity bond, the maturity date represents the next callable date. |
| 8 | Inflation-protected securities (“IPS”) are securities in which the principal amount is adjusted for inflation and interest payments are applied to the inflation-adjusted principal. |
| 10 | TBAs are mortgage-backed securities traded under delayed delivery commitments, settling after April 30, 2015. Although the unit price for the trades has been established, the principal value has not been finalized. However, the amount of the commitments will not fluctuate more than 2% from the principal amount. Income on TBAs is not earned until settlement date (see Note 2 of the accompanying Notes to Financial Statements). |
| 11 | At April 30, 2015, a portion of securities held by the Fund were pledged to cover margin requirements for open future contracts, written options on futures contracts and swap options (see Note 2 of the accompanying Notes to Financial Statements). The securities pledged had an aggregate value of $3,010 or 2% of net assets. |
| b | If the Fund is a buyer of protection and a credit event occurs, as defined under the terms of that particular swap agreement, the Fund will either (i) receive from the seller of protection an amount equal to the notional amount of the swap and deliver the referenced obligation or underlying securities comprising the referenced index or (ii) receive a net settlement amount in the form of cash or securities equal to the notional amount of the swap less the recovery value of the referenced obligation or underlying securities comprising the referenced index. |
| c | If the Fund is a seller of protection and a credit event occurs, as defined under the terms of that particular swap agreement, the Fund will either (i) pay to the buyer of protection an amount equal to the notional amount of the swap and take delivery of the referenced obligation or underlying securities comprising the referenced index or (ii) pay a net settlement amount in the form of cash or securities equal to the notional amount of the swap less the recovery value of the referenced obligation or underlying securities comprising the referenced index. |
| d | Implied credit spreads, represented in absolute terms, utilized in determining the value of credit default swap agreements on corporate issues or sovereign issues of an emerging country as of period end serve as an indicator of the current status of the payment/performance risk and represent the likelihood or risk of default for the credit derivative. The implied credit spread of a particular referenced entity reflects the cost of buying/selling protection and may include upfront payments required to be made to enter into the agreement. Wider credit spreads represent a deterioration of the referenced entity’s credit soundness and a greater likelihood or risk of default or other credit event occurring as defined under the terms of the agreement. A credit spread identified as “Defaulted” indicates a credit event has occurred for the referenced entity or obligation. |
| e | The quoted market prices and resulting values for credit default swap agreements on asset-backed securities and credit indices serve as an indicator of the current status of the payment/performance risk and represent the likelihood of an expected liability (or profit) for the credit derivative should the notional amount of the swap agreement be closed/sold as of the period end. Increasing values, in absolute terms when compared to the notional amount of the swap, represent a deterioration of the referenced entity’s credit soundness and a greater likelihood or risk of default or other credit event occurring as defined under the terms of the agreement. |
| f | The maximum potential amount the Fund could be required to make as a seller of credit protection or receive as a buyer of credit protection if a credit event occurs as defined under the terms of that particular swap agreement. |
| g | At the maturity date, a net cash flow is exchanged, where the payoff amount is equivalent to the difference between the realized price variance of the underlying asset and the strike price multiplied by the notional amount. As a receiver of the realized price variance, the Fund would receive the payoff amount when the realized price variance of the underlying asset is greater than the strike price and would owe the payoff amount when the variance is less than the strike price. As a payer of the realized price variance, the Fund would owe the payoff amount when the realized price variance of the underlying asset is greater than the strike price and would receive the payoff amount when the variance is less than the strike price. |
| j | Amount represents Index Value. |
| v | Amount represents the initial strike value of variance of the price of the underlying commodity or index. |
The accompanying notes are an integral part of the Financial Statements.
18
Harbor Unconstrained Bond Fund
MANAGERS’ COMMENTARY (Unaudited)
SUBADVISER
Pacific Investment Management Company LLC (“PIMCO”)
650 Newport Center Drive
Newport Beach, CA
92660
PORTFOLIO MANAGERS
Marc P. Seidner
Since 2015
Mohsen Fahmi
Since 2014
Daniel J. Ivascyn
Since 2014
PIMCO has subadvised the Fund since its inception in 2010.
INVESTMENT OBJECTIVE
The Fund seeks total return.
PRINCIPAL STYLE
CHARACTERISTICS
Broad range of fixed income instruments without benchmark constraints or significant sector/ instrument limitations

Marc P. Seidner

Mohsen Fahmi

Daniel J. Ivascyn
Management’s Discussion of Fund Performance
MARKET REVIEW
Over the six months ended April 30, 2015, evidence of divergence in global growth patterns continued to impact fixed income markets. Throughout the period, global markets experienced heightened instability as trends from calendar 2014 lingered into 2015, including lower oil prices, generalized U.S. dollar strength, and continued uncertainty as evidenced in episodes of increased volatility, especially among risk assets.
In addition to the European Central Bank’s (“ECB”) foray into quantitative easing, 2015 began with a host of other central banks re-embracing monetary easing. The ECB’s emphasis on preventing deflation took center stage when it launched its highly anticipated quantitative easing program in January. The size of the program exceeded market expectations as it targeted €60 billion in purchases per month. While more than 20 central banks eased monetary policy during the first quarter, the U.S. Federal Reserve remained an outlier as officials reiterated their desire to hike rates sometime this year. Positive data indicating underlying economic strength, coupled with tailwinds for the consumer from lower oil prices, supported growing evidence that monetary policy in the U.S. was on track to become less accommodative over the year.
Ever-lower interest rates in the euro zone helped anchor government bond yields elsewhere, such as in the U.S. and U.K., while the U.S. dollar added to its strong performance by appreciating against most other currencies. In China, property market weakness continued to raise concerns for policymakers, while in Japan lower inflation and growth raised skepticism over the ability of economic programs advanced by Prime Minister Shinzo Abe to generate self-sustaining growth.
U.S. Treasury prices rose as yields fell over the six-month period, with the majority of the rally coming in the first three months. Fixed income spread sectors had mixed performance. Corporate bonds and U.S. mortgage-backed securities underperformed like-duration U.S. Treasurys. Emerging market external debt generally outperformed like-duration U.S. Treasurys.
PERFORMANCE
For the six months ended April 30, 2015, Harbor Unconstrained Bond Fund returned 0.31% (Institutional Class) and 0.17% (Administrative Class), while the BofA Merrill Lynch USD 3-Month LIBOR Constant Maturity Index returned 0.12% and the Barclays U.S. Aggregate Bond Index returned 2.06%.
The following strategies helped Fund returns for the first half of fiscal 2015:
| • | | Currency positioning, specifically long U.S. dollar positions versus the euro and yen, as both currencies weakened relative to the dollar. |
| • | | Holdings of non-agency mortgage-backed securities, which continued to benefit from limited new issue supply and strong investor demand. |
| • | | Diversified interest rate exposure to developed countries, particularly Italy and Spain, as rates fell, lifting bond prices higher. |
19
Harbor Unconstrained Bond Fund
MANAGERS’ COMMENTARY—Continued
| | | | |
TOP TEN ISSUERS (% of net assets) | |
U.S. Treasury | | | 19.4% | |
Volkswagen International Finance NV | | | 3.8% | |
Brazil Letras Do Tesouro Nacional | | | 3.6% | |
Countrywide Asset-Backed Certificates | | | 3.6% | |
American International Group Inc. | | | 3.2% | |
Ford Motor Credit Co. LLC | | | 2.9% | |
JP Morgan Chase & Co. | | | 2.9% | |
Bank of America Corp. | | | 2.6% | |
Ally Financial Inc. | | | 2.4% | |
Bear Stearns Asset Backed Securities Trust | | | 2.4% | |
| • | | Exposure to select corporate and high-yield bonds, particularly financials, which outperformed. |
The following strategies were negative or neutral for returns:
| • | | Short positioning along the U.S. yield curve as U.S. interest rates moved lower. |
| • | | Long exposure to local interest rates in Mexico, as income gains were offset by spread volatility. |
OUTLOOK AND STRATEGY
Looking ahead over the next 6 months, we would expect global growth to accelerate modestly. A wave of monetary policy accommodation should underpin global growth, in our view, while still-sizable economic slack should keep inflationary pressures well contained. We think that the decline in oil prices should further sustain these trends by transferring wealth from producers to consumers and by keeping headline inflation subdued.
We believe that the U.S. is on track for modestly above-trend growth of 2.5%-3.0%, with inflation only gradually approaching the Fed’s 2% target. A robust expectation for personal consumption growth forms the foundation of our outlook. Consumer spending should be supported by a healthy pace of job gains and real incomes boosted by lower energy prices, in our view. Housing and business investment also should contribute to growth, but to a lesser degree. We expect home prices to rise gradually and sales trends to continue, although we expect the housing market to remain a small portion of overall economic growth.
We expect the euro-zone economy to expand by 1.25%-1.75%, with inflation remaining subdued. We believe that a combination of tailwinds—lower oil prices, a weaker euro, and the European Central Bank’s new quantitative easing program—should lift European growth in our view. Going forward, the European quantitative easing program should prove to be a substantial source of liquidity while also serving to anchor interest rates across member states.
In China, we expect growth in the low 6% range. As China addresses the ongoing slowdown in its property sector and de-leveraging in the shadow-banking system, we expect additional easing from the People’s Bank of China. In Japan, we expect growth of 1.0%-1.5%, as the economy recovers from last year’s technical recession. Decisions late last year to delay a value-added tax hike and increase the size of the Bank of Japan’s easing program should provide needed support for the economy.
With respect to portfolio strategy, we plan to:
| • | | Remain short U.S. interest rate risk relative to the benchmark, particularly at the front end of the yield curve, based on the potential for volatility as the Federal Reserve’s first rate hike approaches. |
| • | | Maintain a tactically short position in agency mortgage-backed securities as we believe select spreads are tight, particularly given waning support by the Fed. However, we are still constructive on non-agency mortgages given attractive loss-adjusted yields and strong underlying housing fundamentals. |
| • | | Within investment-grade credit and high-yield corporate bonds, we will continue to favor positions within financials and consumer-related issuers. Individual security selection continues to be an area of emphasis within these markets. |
| • | | With continued divergence in economic growth and central bank policies, we look to maintain our U.S. dollar bias, against the euro and Japanese yen in particular. We look to tactically adjust exposures as market conditions warrant, as we believe that the dollar’s trajectory may not be as smooth as it has been during the past few months. |
| • | | Remain selective in allocations to emerging markets debt, given increasing dispersion in the pace of economic growth. |
| • | | Continue to hold positions in TIPS, or Treasury Inflation-Protected Securities, as we believe that inflation expectations embedded in markets appear too low given the Fed’s goal to reflate the U.S. economy. |
20
Harbor Unconstrained Bond Fund
MANAGERS’ COMMENTARY—Continued
This report contains the current opinions of Pacific Investment Management Company LLC at the time of its publication and should not be considered as investment advice or a recommendation of any particular security, strategy or investment product. Such opinions are subject to change without notice and securities described herein may no longer be included in or may at any time be removed from, the Fund’s portfolio. This report is distributed for informational purposes only. Information contained herein has been obtained from sources believed reliable, but not guaranteed.
Employing an unconstrained investment approach, the Fund may be exposed to certain types of securities, credit qualities, maturities, countries and regions not reflected in other fixed income indices. For example, high-yield, or below investment-grade, securities carry a higher degree of credit risk, and may be speculative and more volatile. Investing in emerging markets may entail risk due to foreign economic and political developments. Also, foreign currency exposure can entail significant volatility and this may be amplified with the currencies of developing countries. As a result, investors considering an investment in the Fund should be prepared to accept significant volatility in the Fund’s performance, particularly over shorter time periods, due to the unconstrained nature of the Fund’s investment approach.
21
Harbor Unconstrained Bond Fund
FUND SUMMARY—April 30, 2015 (Unaudited)
| | | | |
INSTITUTIONAL CLASS |
| | | | |
| Fund # | | | | 2032 |
| | |
| Cusip | | | | 411512817 |
| | |
| Ticker | | | | HAUBX |
| | |
| Inception Date | | | | 04/01/2010 |
| | |
| Net Expense Ratio | | | | 1.05%a,b |
| | |
| Total Net Assets (000s) | | | | $30,547 |
| | | | |
ADMINISTRATIVE CLASS |
| | | | |
| Fund # | | | | 2232 |
| | |
| Cusip | | | �� | 411512791 |
| | |
| Ticker | | | | HRUBX |
| | |
| Inception Date | | | | 04/01/2010 |
| | |
| Net Expense Ratio | | | | 1.30%a,b |
| | |
| Total Net Assets (000s) | | | | $1,133 |
PORTFOLIO STATISTICS
| | | | |
| |
Average Market Coupon | | | 2.06% | |
| |
Yield to Maturity | | | 1.89% | |
| |
Current 30-day Yield (Institutional Class) | | | 0.50% | |
| |
Weighted Average Maturity | | | 1.69 years | |
| |
Weighted Average Duration | | | -0.79 years | |
| |
Portfolio Turnover
(6-Month Period Ended 04/30/2015) | | | 398% | c |
MATURITY PROFILE (% of investments)
| | | | |
| |
0 to 1 yr. | | | 117.81% | |
| |
>1 to 5 | | | -48.07% | |
| |
>5 to 10 | | | 29.67% | |
| |
>10 to 15 | | | -2.00% | |
| |
>15 to 20 | | | 0.00% | |
| |
>20 to 25 | | | 0.56% | |
| |
>25 yrs. | | | 2.03% | |
FUND PERFORMANCE
The graph compares a $10,000 investment in the Fund with the performance of the BofA Merrill Lynch US Dollar 3-Month LIBOR Constant Maturity Index and Barclays U.S. Aggregate Bond Index. The Fund’s performance includes the reinvestment of all dividend and capital gain distributions.
CHANGE IN A $10,000 INVESTMENT
For the period 04/01/2010 through 04/30/2015
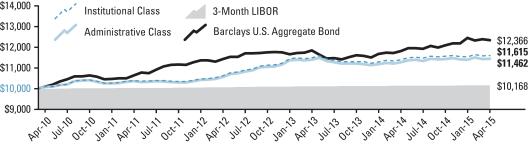
| | | | | | | | | | | | | | | | | | | | | | | | |
Total Returns For the periods ended 04/30/2015 | |  | |
| Harbor Unconstrained Bond Fund | | | | | | | | | | | | | | | | | | | | | | | | |
Institutional Class | | | 0.31 | % | | | 1.82 | % | | | 2.83 | % | | | 2.99 | % | | | 04/01/2010 | | | $ | 11,615 | |
Administrative Class | | | 0.17 | % | | | 1.58 | % | | | 2.58 | % | | | 2.72 | % | | | 04/01/2010 | | | $ | 11,462 | |
| Comparative Indices | | | | | | | | | | | | | | | | | | | | | | | | |
BofA Merrill Lynch USD 3-Month LIBOR Constant Maturity | | | 0.12 | % | | | 0.23 | % | | | 0.33 | % | | | 0.33 | % | | | — | | | $ | 10,168 | |
Barclays U.S. Aggregate Bond | | | 2.06 | % | | | 4.46 | % | | | 4.12 | % | | | 4.27 | % | | | — | | | $ | 12,366 | |
As stated in the Fund’s current prospectus, the expense ratios were 1.05% (Net) and 1.35% (Gross) (Institutional Class); and 1.30% (Net) and 1.60% (Gross) (Administrative Class). The net expense ratios are contractually capped, excluding interest expense incurred by the Fund, if any, through 02/29/2016. The expense ratios in the prospectus may differ from the actual expense ratios for the period disclosed within this report. The expense ratios shown in the prospectus are based on the prior fiscal year, adjusted to reflect changes, if any, in contractual arrangements that occurred prior to the date of the prospectus.
Performance data shown represents past performance, which is no guarantee of future results. Current performance may be higher or lower than the past performance data shown. Investment returns and the value of an investment will fluctuate, and an investor’s shares, when sold, may be worth more or less than their original cost. You can obtain performance data current to the most recent month-end (available within seven business days after the most recent month-end) by calling 800-422-1050 or visiting harborfunds.com.
The returns shown do not reflect the deduction of taxes that a shareholder would pay on Fund distributions or on the redemption of Fund shares. From time to time, certain fees and/or expenses have been waived or reimbursed, which has resulted in higher returns. Without these waivers and reimbursements, the returns would have been lower.
| b | Reflective of a contractual expense cap effective through February 29, 2016. Expense cap excludes interest expense incurred by the Fund, if any. |
22
Harbor Unconstrained Bond Fund
PORTFOLIO OF INVESTMENTS—April 30, 2015 (Unaudited)
Total Investments (% of net assets)
(Excludes net cash, short-term investments and derivative positions of -0.9%)
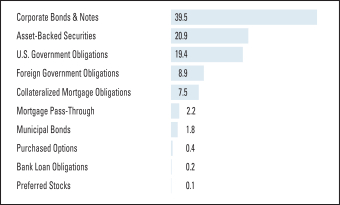
| | | | | | | | |
ASSET-BACKED SECURITIES—20.9% | |
Principal
Amount
(000s) | | | | | Value
(000s) | |
| $ | 43 | | | ACE Securities Corp. Home Equity Loan Trust
Series 2006-OP2 Cl. A1
0.336%—08/25/20361 | | $ | 37 | |
| | 500 | | | Asset Backed Securities Corp. Home Equity Loan Trust
Series 2005-HE6 Cl. M5
0.861%—07/25/20351 | | | 408 | |
| € | 48 | | | Avoca Capital CLO III Plc.2
Series III-X Cl. A
0.348%—09/15/20211 | | | 54 | |
| $ | 892 | | | Bear Stearns Asset Backed Securities Trust
Series 2007-SD2 Cl. 2A1
0.581%—09/25/20461 | | | 769 | |
| | 39 | | | Belle Haven ABS CLO Ltd.2
Series 2004-1A Cl. A1ST
0.639%—11/03/20441,3 | | | 20 | |
| | 80 | | | Series 2004-1A Cl. A1SB
0.679%—11/03/20441,3 | | | 42 | |
| | | | | | | | |
| | | | | | | 62 | |
| | | | | | | | |
| | 400 | | | Countrywide Asset-Backed Certificates
Series 2007-2 Cl. 2A3
0.321%—08/25/20371 | | | 352 | |
| | 469 | | | Series 2007-BC3 Cl. 1A
0.361%—11/25/20471 | | | 366 | |
| | 400 | | | Series 2007-11 Cl. 2A3
0.371%—06/25/20471 | | | 347 | |
| | 100 | | | Series 2006-1 Cl. AF5
5.884%—07/25/20364 | | | 79 | |
| | | | | | | | |
| | | | | | | 1,144 | |
| | | | | | | | |
| | 176 | | | Credit-Based Asset Servicing and Securitization LLC
Series 2007-CB3 Cl. A3
5.731%—03/25/20374 | | | 109 | |
| | 176 | | | Series 2007-CB3 Cl. A4
5.971%—03/25/20374 | | | 110 | |
| | | | | | | | |
| | | | | | | 219 | |
| | | | | | | | |
| | 591 | | | First Franklin Mortgage Loan Trust
Series 2004-FF8 Cl. M3
1.606%—10/25/20341 | | | 490 | |
| | 500 | | | Fremont Home Loan Trust
Series 2005-D Cl. M1
0.591%—11/25/20351 | | | 367 | |
| | 300 | | | Goldentree Loan Opportunities VII Ltd.
Series 2013-7A Cl. A
1.427%—04/25/20251,3 | | | 296 | |
| 54 | | | Huntington CLO Ltd.2
Series 2005-1A Cl. A1A
0.549%—11/05/20401,3 | | | 52 | |
| | 52 | | | Indymac Residential Asset Backed Trust
Series 2007-B Cl. 2A2
0.341%—07/25/20371 | | | 32 | |
| | 200 | | | JP Morgan Mortgage Acquisition Trust
Series 2006-CW1 Cl. A5
0.421%—05/25/20361 | | | 179 | |
| | 670 | | | Morgan Stanley ABS Capital I Inc. Trust
Series 2007-HE2 Cl. A2B
0.271%—01/25/20371 | | | 412 | |
| | 84 | | | Series 2007-NC1 Cl. A2C
0.321%—11/25/20361 | | | 59 | |
| | 97 | | | Series 2006-NC5 Cl. A4
0.331%—10/25/20361 | | | 67 | |
| | | | | | | | |
| | | | | | | 538 | |
| | | | | | | | |
| | 100 | | | Morgan Stanley Capital I Inc. Trust
Series 2006-HE1 Cl. A4
0.471%—01/25/20361 | | | 90 | |
| | 27 | | | Newcastle CLO V Ltd.2
Series 2004-5A Cl. 1
0.607%—12/24/20391,3 | | | 27 | |
| | 300 | | | Oha Credit Partners VIII Ltd.
Series 2013-8A Cl. A
1.395%—04/20/20251,3 | | | 297 | |
| | 69 | | | Ownit Mortgage Loan Asset Backed Certificates
Series 2006-4 Cl. A2C
0.330%—05/25/20371 | | | 48 | |
| | 591 | | | RASC Trust
Series 2003-KS4 Cl. AIIB
0.761%—06/25/20331 | | | 505 | |
| | 55 | | | Securitized Asset Backed Receivables LLC Trust
Series 2004-OP1 Cl. M1
0.946%—02/25/20341 | | | 52 | |
| | 137 | | | Sierra Madre Funding Ltd.
Series 2004-1A Cl. A1A
0.554%—09/07/20391,3 | | | 109 | |
| | 320 | | | Series 2004-1A Cl. ALTB
0.575%—09/07/20391,3 | | | 254 | |
| | | | | | | | |
| | | | | | | 363 | |
| | | | | | | | |
| | 110 | | | SLM Student Loan Trust
Series 2010-A Cl. 2A
3.432%—05/16/20441,3 | | | 116 | |
| | 66 | | | Stone Tower Capital LLC
Series 2007-6A Cl. A1
0.504%—04/17/20211,3 | | | 65 | |
| | 40 | | | Structured Asset Investment Loan Trust
Series 2005-8 Cl. A4
0.541%—10/25/20351 | | | 40 | |
| | 300 | | | Tralee CLO III Ltd.2
Series 2014-3A Cl. A2
1.625%—07/20/20261,3 | | | 298 | |
| | 73 | | | Triaxx Prime CLO2
Series 2007-1A Cl. A1D
0.441%—10/02/20391,3 | | | 58 | |
| | | | | | | | |
| TOTAL ASSET-BACKED SECURITIES
(Cost $5,589) | | | 6,606 | |
| | | | | | | | |
| | | | | | | | |
BANK LOAN OBLIGATIONS—0.2% | |
| (Cost $65) | | | | |
| | 66 | | | HJ Heinz Co.
Term Loan B2
2.775%—06/05/20205 | | | 66 | |
| | | | | | | | |
23
Harbor Unconstrained Bond Fund
PORTFOLIO OF INVESTMENTS—Continued
| | | | | | | | |
COLLATERALIZED MORTGAGE OBLIGATIONS—7.5% | |
Principal
Amount
(000s) | | | | | Value
(000s) | |
| $ | 46 | | | American Home Mortgage Assets Trust
Series 2006-2 Cl. 1A1
1.097%—09/25/20461 | | $ | 33 | |
| | 19 | | | Banc of America Alternative Loan Trust
Series 2003-2 Cl. CB1
5.750%—04/25/2033 | | | 20 | |
| | 62 | | | Banc of America Funding Trust
Series 2007-D Cl. 1A4
0.411%—06/20/20471 | | | 59 | |
| | 14 | | | Series 2004-A Cl. 4A1
2.621%—06/20/20325 | | | 14 | |
| | | | | | | | |
| | | | | | | 73 | |
| | | | | | | | |
| | 61 | | | BCAP LLC Trust
Series 2011 Cl. RR5
5.250%—06/26/20363 | | | 54 | |
| | 30 | | | Bear Stearns Adjustable Rate Mortgage Trust
Series 2005-5 Cl. A2
2.260%—08/25/20351 | | | 31 | |
| | 6 | | | Series 2004-10 Cl. 15A1
2.594%—01/25/20355 | | | 6 | |
| | 14 | | | Series 2005-1 Cl. 4A1
2.719%—03/25/20355 | | | 13 | |
| | | | | | | | |
| | | | | | | 50 | |
| | | | | | | | |
| | 692 | | | Bear Stearns Alt-A Trust
Series 2006-4 Cl. 12A1
0.521%—08/25/20361 | | | 543 | |
| € | 98 | | | Berica ABS Srl
Series 2011-1 Cl. A1
0.321%—12/31/20551 | | | 110 | |
| $ | 50 | | | Citigroup Mortgage Loan Trust Inc.
Series 2005-3 Cl. 1A1
1.821%—08/25/20355 | | | 48 | |
| | 35 | | | First Horizon Mortgage Pass Through Trust
Series 2005-AR4 Cl. 2A1
2.562%—10/25/20355 | | | 31 | |
| € | 3 | | | Granite Mortgages plc
Series 2003-3 Cl. 2A
0.382%—01/20/20441 | | | 4 | |
| £ | 30 | | | Series 2004-3 Cl. 3A2
0.946%—09/20/20441 | | | 46 | |
| | | | | | | | |
| | | | | | | 50 | |
| | | | | | | | |
| $ | 21 | | | Impac CMB Trust
Series 2004-4 Cl. 1A1
0.820%—09/25/20341 | | | 20 | |
| | 9 | | | IndyMac IMSC Mortgage Loan Trust
Series 2004-AR6 Cl. 5A1
2.522%—10/25/20345 | | | 9 | |
| | 8 | | | JP Morgan Alternative Loan Trust
Series 2006-A3 Cl. 1A3
0.331%—07/25/20361 | | | 8 | |
| | 19 | | | JP Morgan Chase Commercial Mortgage Securities Trust
Series 2006-LDP8 Cl. 1A1
5.397%—05/15/2045 | | | 20 | |
| | 269 | | | JP Morgan Mortgage Trust
Series 2006-A2 Cl. 1A1
2.712%—04/25/20365 | | | 244 | |
| | 10 | | | Series 2006-S2 Cl. 2A2
5.875%—06/25/2021 | | | 10 | |
| | | | | | | | |
| | | | | | | 254 | |
| | | | | | | | |
| | 10 | | | MASTR Adjustable Rate Mortgages Trust
Series 2004-4 Cl. 3A1
2.178%—05/25/20345 | | | 10 | |
| 91 | | | Merrill Lynch Mortgage Investors Trust
Series 2003-H Cl. A3A
1.942%—01/25/20295 | | | 91 | |
| | 116 | | | Morgan Stanley Capital I Trust
Series 2007-IQ14 Cl. A1A
5.665%—04/15/20495 | | | 124 | |
| | 46 | | | Structured Asset Securities Corp.
Series 2005-16 Cl. 1A2
5.500%—09/25/2035 | | | 47 | |
| | 57 | | | Wachovia Bank Commercial Mortgage Trust
Series 2006-C27 Cl. 1A1
5.749%—07/15/20455 | | | 59 | |
| | 361 | | | Series 2007-C32 Cl. A1A
5.900%—06/15/20495 | | | 384 | |
| | 48 | | | Series 2007-C33 Cl. 1A1
6.150%—02/15/20515 | | | 52 | |
| | | | | | | | |
| | | | | | | 495 | |
| | | | | | | | |
| | 12 | | | Washington Mutual Mortgage Pass Through Certificates Trust
Series 2005-AR6 Cl. 2A1A
0.411%—04/25/20451 | | | 11 | |
| | 47 | | | Series 2005-AR9 Cl. A1A
0.501%—07/25/20451 | | | 45 | |
| | 98 | | | Series 2007-HY3 Cl. 2A1
2.134%—03/25/20375 | | | 87 | |
| | 167 | | | Series 2007-HY4 Cl. 3A1
4.473%—04/25/20375 | | | 155 | |
| | | | | | | | |
| | | | | | | 298 | |
| | | | | | | | |
| TOTAL COLLATERALIZED MORTGAGE OBLIGATIONS
(Cost $2,275) | | | 2,388 | |
| | | | | | | | |
| | | | | | | | |
CORPORATE BONDS & NOTES—39.5% | |
| | 100 | | | Abbey National Treasury Services plc
4.000%—04/27/2016 | | | 103 | |
| | 400 | | | AbbVie Inc.
1.040%—11/06/20151 | | | 401 | |
| | 100 | | | Actavis Funding SCS
1.523%—03/12/20205 | | | 102 | |
| | 100 | | | AES Corp.
3.262%—06/01/20195 | | | 100 | |
| | 200 | | | Ally Financial Inc.
3.500%—07/18/2016 | | | 204 | |
| | 100 | | | 4.625%—06/26/2015 | | | 100 | |
| | 400 | | | 5.500%—02/15/2017 | | | 419 | |
| | | | | | | | |
| | | | | | | 723 | |
| | | | | | | | |
| | 1,000 | | | American International Group Inc.
2.375%—08/24/2015 | | | 1,005 | |
| | 400 | | | Anglo American Capital plc
1.225%—04/15/20161,3 | | | 400 | |
| | 100 | | | AT&T Inc.
4.750%—05/15/2046 | | | 98 | |
| | 100 | | | Bank of America Corp.
0.588%—08/15/20161 | | | 100 | |
| | 200 | | | 2.000%—01/11/2018 | | | 201 | |
| | 300 | | | 5.750%—12/01/2017 | | | 330 | |
| | 100 | | | 6.500%—08/01/2016 | | | 106 | |
| | | | | | | | |
| | | | | | | 737 | |
| | | | | | | | |
| | 100 | | | Bank of America Corp. MTN6
1.085%—03/22/20161 | | | 100 | |
| | 380 | | | BP Capital Markets plc
0.610%—11/06/20151 | | | 380 | |
| | 200 | | | BPCE SA
5.150%—07/21/20243 | | | 210 | |
24
Harbor Unconstrained Bond Fund
PORTFOLIO OF INVESTMENTS—Continued
| | | | | | | | |
CORPORATE BONDS & NOTES—Continued | |
Principal
Amount
(000s) | | | | | Value
(000s) | |
| $ | 200 | | | CIT Group Inc.
4.250%—08/15/2017 | | $ | 204 | |
| | 100 | | | Citigroup Inc.
1.237%—07/25/20161 | | | 100 | |
| | 100 | | | COX Communications Inc.
5.875%—12/01/20163 | | | 107 | |
| | 200 | | | Ford Motor Credit Co. LLC
2.750%—05/15/2015 | | | 200 | |
| | 300 | | | 4.207%—04/15/2016 | | | 309 | |
| | | | | | | | |
| | | | | | | 509 | |
| | | | | | | | |
| | 400 | | | Ford Motor Credit Co. LLC MTN6
1.054%—01/17/20175 | | | 401 | |
| | 200 | | | Gazprom OAO Via Gaz Capital SA
5.092%—11/29/20153 | | | 202 | |
| | 400 | | | General Mills Inc.
0.579%—01/29/20161 | | | 400 | |
| € | 100 | | | Hellenic Railways Organization SA
4.028%—03/17/2017 | | | 76 | |
| $ | 400 | | | Imperial Tobacco Finance plc
2.050%—02/11/20183 | | | 402 | |
| | 300 | | | International Lease Finance Corp.
8.625%—09/15/2015 | | | 308 | |
| | 100 | | | 8.750%—03/15/2017 | | | 111 | |
| | | | | | | | |
| | | | | | | 419 | |
| | | | | | | | |
| | 100 | | | JP Morgan Chase & Co.
1.177%—01/25/20181 | | | 101 | |
| | 400 | | | 3.450%—03/01/2016 | | | 409 | |
| | | | | | | | |
| | | | | | | 510 | |
| | | | | | | | |
| | 100 | | | JP Morgan Chase & Co. MTN6
0.881%—02/26/20161 | | | 100 | |
| | 300 | | | 1.100%—10/15/2015 | | | 301 | |
| | | | | | | | |
| | | | | | | 401 | |
| | | | | | | | |
| | 200 | | | KBC Bank NV
8.000%—01/25/20235 | | | 223 | |
| | 100 | | | Kroger Co.
2.200%—01/15/2017 | | | 102 | |
| | 100 | | | Merrill Lynch & Co. Inc. MTN6
6.400%—08/28/2017 | | | 110 | |
| | 400 | | | Metropolitan Life Global Funding I
0.395%—06/23/20163,5 | | | 400 | |
| | 100 | | | MGM Resorts International
6.875%—04/01/2016 | | | 104 | |
| | 100 | | | Morgan Stanley
1.750%—02/25/2016 | | | 101 | |
| | 100 | | | Mylan Inc.
1.800%—06/24/2016 | | | 101 | |
| | 200 | | | NBCUniversal Enterprise Inc.
0.812%—04/15/20161,3 | | | 201 | |
| | 100 | | | Petrobras Global Finance BV
2.631%—03/17/20171 | | | 97 | |
| | 100 | | | 5.375%—01/27/2021 | | | 96 | |
| | | | | | | | |
| | | | | | | 193 | |
| | | | | | | | |
| | 300 | | | Pricoa Global Funding 1 MTN6
0.407%—05/16/20161,3 | | | 300 | |
| | 300 | | | Sberbank of Russia Via SB Capital SA
5.499%—07/07/2015 | | | 301 | |
| | 200 | | | Sinopec Group Overseas Development 2014 Ltd.
1.051%—04/10/20171,3 | | | 200 | |
| | 100 | | | SLM Corp. MTN6
8.450%—06/15/2018 | | | 112 | |
| | 200 | | | Verizon Communications Inc.
1.801%—09/15/20161 | | | 203 | |
| | 274 | | | 2.500%—09/15/2016 | | | 280 | |
| | | | | | | | |
| | | | | | | 483 | |
| | | | | | | | |
| 200 | | | Volkswagen Group of America Finance LLC
0.482%—05/23/20161,3 | | | 200 | |
| | 1,200 | | | Volkswagen International Finance NV
1.150%—11/20/20153 | | | 1,205 | |
| | 100 | | | Wells Fargo & Co.
0.479%—10/28/20151 | | | 100 | |
| | | | | | | | |
| TOTAL CORPORATE BONDS & NOTES
(Cost $12,519) | | | 12,526 | |
| | | | | | | | |
| | | | | | | | |
FOREIGN GOVERNMENT OBLIGATIONS—8.9% | |
| R$ | 4,000 | | | Brazil Letras Do Tesouro Nacional
0.000%—10/01/2015-07/01/20177 | | | 1,150 | |
| € | 600 | | | Italy Buoni Poliennali Del Tesoro
2.500%—12/01/2024 | | | 736 | |
| | 200 | | | 5.000%—09/01/2040 | | | 332 | |
| | | | | | | | |
| | | | | | | 1,608 | |
| | | | | | | | |
| $ | 200 | | | Slovenia Government International Bond
5.250%—02/18/2024 | | | 231 | |
| € | 300 | | | Spain Government Bond
2.750%—10/31/20243 | | | 376 | |
| | | | | | | | |
| TOTAL FOREIGN GOVERNMENT OBLIGATIONS
(Cost $3,220) | | | 2,825 | |
| | | | | | | | |
| | | | | | | | |
MORTGAGE PASS-THROUGH—2.2% | |
| $ | 97 | | | Federal Home Loan Mortgage Corp.
1.717%—10/25/20215 | | | 8 | |
| | | | Federal Home Loan Mortgage Corp. REMIC8 | | | | |
| | 61 | | | 11.650%—04/15/20445 | | | 65 | |
| | 56 | | | 13.020%—02/15/20445 | | | 59 | |
| | | | | | | | |
| | | | | | | 124 | |
| | | | | | | | |
| | 7 | | | Federal National Mortgage Association
2.304%—07/01/20321 | | | 7 | |
| | 79 | | | 2.791%—11/01/20421 | | | 82 | |
| | 11 | | | 4.500%—02/01/2026 | | | 12 | |
| | | | | | | | |
| | | | | | | 101 | |
| | | | | | | | |
| | 24 | | | Federal National Mortgage Association REMIC8
0.301%—03/25/20341 | | | 24 | |
| | 400 | | | Government National Mortgage Association TBA9
3.500%—05/21/2043 | | | 422 | |
| | | | | | | | |
| TOTAL MORTGAGE PASS-THROUGH
(Cost $677) | | | 679 | |
| | | | | | | | |
| | | | | | | | |
MUNICIPAL BONDS—1.8% | |
| | 100 | | | Buckeye Tobacco Settlement Financing Authority
5.875%—06/01/2047 | | | 82 | |
| | 100 | | | 6.000%—06/01/2042 | | | 84 | |
| | | | | | | | |
| | | | | | | 166 | |
| | | | | | | | |
| | 100 | | | California State
7.600%—11/01/2040 | | | 156 | |
| | 200 | | | New York City, NY
5.887%—12/01/2024 | | | 245 | |
| | | | | | | | |
| TOTAL MUNICIPAL BONDS
(Cost $442) | | | 567 | |
| | | | | | | | |
| | | | | | | | |
25
Harbor Unconstrained Bond Fund
PORTFOLIO OF INVESTMENTS—Continued
| | | | | | | | |
PREFERRED STOCKS—0.1% | |
| (Cost $24) | | | | |
| Shares | | | | | Value
(000s) | |
| | CONSUMER FINANCE—0.1% | |
| | 900 | | | Ally Financial Inc. | | $ | 24 | |
| | | | | | | | |
| | | | | | | | |
PURCHASED OPTIONS—0.4% | |
No. of
Contracts | | | | | | |
| | 500,000 | | | Currency Option U.S. Dollar vs. Chinese Yuan
$7.50—02/02/2016 | | | 2 | |
| | 500,000 | | | Interest Rate Floor Option
1.180j—11/24/2015 | | | 1 | |
| | 12,300,000 | | | Interest Rate Swap Option 3 year 1 year
2.700%—02/04/2016-02/18/2016 | | | 25 | |
| | 17,800,000 | | | Interest Rate Swap Option 2 year
1.120%—12/01/2015-01/06/2016 | | | 53 | |
| | 1,200,000 | | | Interest Rate Swap Option 30 year
3.550%—10/27/2017-11/27/2017 | | | 51 | |
| | 40 | | | U.S. Treasury Note Futures 10 year
$112.00—05/22/2015 | | | 1 | |
| | | | | | | | |
| TOTAL PURCHASED OPTIONS
(Premiums Paid/Cost $170) | | | 133 | |
| | | | | | | | |
| | | | | | | | |
U.S. GOVERNMENT OBLIGATIONS—19.4% | |
Principal
Amount
(000s) | | | | | | |
| $ | 100 | | | U.S. Treasury Bonds
3.000%—11/15/2044 | | | 105 | |
| | 400 | | | 3.125%—08/15/2044 | | | 431 | |
| | | | | | | | |
| | | | | | | 536 | |
| | | | | | | | |
| | 1,092 | | | U.S. Treasury Inflation Indexed Bonds10
0.125%—07/15/2024 | | | 1,100 | |
| | 1,091 | | | 0.250%—01/15/2025 | | | 1,106 | |
| | 1,067 | | | 2.000%—01/15/2026 | | | 1,269 | |
| | 249 | | | 2.375%—01/15/202511 | | | 303 | |
| | | | | | | | |
| | | | | | | 3,778 | |
| | | | | | | | |
| | 700 | | | U.S. Treasury Notes
1.875%—11/30/2021 | | | 705 | |
| $ | 300 | | | 2.000%—05/31/2021 | | $ | 305 | |
| | 800 | | | 2.125%—09/30/2021 | | | 819 | |
| | | | | | | | |
| | | | | | | 1,829 | |
| | | | | | | | |
| TOTAL U.S. GOVERNMENT OBLIGATIONS
(Cost $6,010) | | | 6,143 | |
| | | | | | | | |
| | | | | | | | |
SHORT-TERM INVESTMENTS—8.2% | |
| | CERTIFICATES OF DEPOSIT—3.1% | |
| | 400 | | | Credit Suisse NY
0.583%—08/24/20151 | | | 400 | |
| | 400 | | | Royal BK of Canada
1.370%—05/07/2015 | | | 331 | |
| | 250 | | | Sumitomo Mitsui Banking Corp.
0.599%—04/29/20165 | | | 250 | |
| | | | | | | | |
| | | | | | | 981 | |
| | | | | | | | |
| | COMMERCIAL PAPER—1.3% | |
| | 400 | | | Vodafone Group plc
0.600%—06/29/2015 | | | 400 | |
| | | | | | | | |
| | REPURCHASE AGREEMENTS—3.8% | |
| | 1,100 | | | Repurchase Agreement with Citigroup Inc. dated April 30, 2015 due May 01, 2015 at 0.220% collateralized by U.S. Treasury Notes
(market value $1,115) | | | 1,100 | |
| | 112 | | | Repurchase Agreement with State Street Corp. dated April 30, 2015 due May 01, 2015 at 0.000% collateralized by U.S. Treasury Notes
(market value $115) | | | 112 | |
| | | | | | | | |
| | | | | | | 1,212 | |
| | | | | | | | |
| TOTAL SHORT-TERM INVESTMENTS
(Cost $2,629) | | | 2,593 | |
| | | | | | | | |
| TOTAL INVESTMENTS—109.1%
(Cost $33,620) | | | 34,550 | |
| | | | | | | | |
| | CASH AND OTHER ASSETS, LESS LIABILITIES—(9.1)% | | | (2,870 | ) |
| | | | | | | | |
| | TOTAL NET ASSETS—100.0% | | $ | 31,680 | |
| | | | | | | | |
| | | | | | | | | | | | | | | | |
| FUTURES CONTRACTS OPEN AT APRIL 30, 2015 | |
| | | | |
Description | | Number of
Contracts | | | Aggregate
Face Value
(000s) | | | Expiration Date | | | Unrealized
Appreciation/
(Depreciation)
(000s) | |
Canadian Government Bond Futures 10 year (Sell) | | | 4 | | | CAD$ | 400 | | | | 06/19/2015 | | | $ | 1 | |
Italian Government Futures 10 year (Buy) | | | 5 | | | € | 500 | | | | 06/08/2015 | | | | (6 | ) |
Eurodollar Futures-CME 90 day (Buy) | | | 25 | | | $ | 6,250 | | | | 12/14/2015 | | | | 13 | |
Eurodollar Futures-CME 90 day (Sell) | | | 11 | | | | 2,750 | | | | 06/15/2015 | | | | (2 | ) |
Eurodollar Futures-CME 90 day (Sell) | | | 6 | | | | 1,500 | | | | 09/14/2015 | | | | (1 | ) |
Eurodollar Futures-CME 90 day (Sell) | | | 7 | | | | 1,750 | | | | 03/14/2016 | | | | (2 | ) |
Eurodollar Futures-CME 90 day (Sell) | | | 1 | | | | 250 | | | | 06/13/2016 | | | | — | |
Eurodollar Futures-CME 90 day (Sell) | | | 29 | | | | 7,250 | | | | 12/19/2016 | | | | (30 | ) |
U.S. Treasury Note Futures 10 year (Buy) | | | 27 | | | | 2,700 | | | | 06/19/2015 | | | | 27 | |
| | | | | | | | | | | | | | | | |
Total Futures Contracts | | | $ | — | |
| | | | | | | | | | | | | | | | |
26
Harbor Unconstrained Bond Fund
PORTFOLIO OF INVESTMENTS—Continued
| | | | | | | | | | | | | | | | | | | | | | |
| WRITTEN OPTIONS OPEN AT APRIL 30, 2015 | |
|
| WRITTEN OPTIONS NOT SETTLED THROUGH VARIATION MARGIN | |
| | | | | | |
Description | | Counterparty | | Number of
Contracts | | | Strike
Index/
Rate/Price | | | Expiration Date | | | Premiums
Received
(000s) | | | Value
(000s) | |
Interest Rate Floor Option (Call) | | Goldman Sachs Bank USA | | | 1,000,000 | | | | 0.850 | % | | | 11/24/2015 | | | $ | 1 | | | $ | (1 | ) |
Interest Rate Swap Option 2 year (Put) | | Bank of America NA | | | 100,000 | | | | 2.500 | | | | 02/04/2016 | | | | — | | | | — | |
Interest Rate Swap Option 2 year (Put) | | Morgan Stanley Capital Services LLC | | | 6,100,000 | | | | 2.500 | | | | 02/18/2016 | | | | 13 | | | | (12 | ) |
Interest Rate Swap Option 2 year (Put) | | Morgan Stanley Capital Services LLC | | | 6,100,000 | | | | 2.500 | | | | 02/04/2016 | | | | 13 | | | | (11 | ) |
Interest Rate Swap Option 5 year (Put) | | Deutsche Bank AG | | | 800,000 | | | | 3.460 | | | | 11/27/2017 | | | | 15 | | | | (9 | ) |
Interest Rate Swap Option 5 year (Put) | | Deutsche Bank AG | | | 800,000 | | | | 3.530 | | | | 11/27/2017 | | | | 17 | | | | (8 | ) |
Interest Rate Swap Option 5 year (Put) | | Deutsche Bank AG | | | 800,000 | | | | 3.550 | | | | 11/27/2017 | | | | 14 | | | | (8 | ) |
Interest Rate Swap Option 5 year (Call) | | Morgan Stanley Capital Services LLC | | | 300,000 | | | | 1.550 | | | | 09/17/2015 | | | | 2 | | | | (2 | ) |
Interest Rate Swap Option 5 year (Put) | | Morgan Stanley Capital Services LLC | | | 300,000 | | | | 2.050 | | | | 09/17/2015 | | | | 2 | | | | (1 | ) |
Interest Rate Swap Option 5 year (Put) | | Morgan Stanley Capital Services LLC | | | 800,000 | | | | 3.530 | | | | 02/29/2016 | | | | 10 | | | | — | |
Interest Rate Swap Option 5 year (Put) | | Morgan Stanley Capital Services LLC | | | 2,600,000 | | | | 3.550 | | | | 10/27/2017 | | | | 45 | | | | (25 | ) |
Interest Rate Swap Option 10 year (Call) | | Bank of America NA | | | 300,000 | | | | 2.150 | | | | 12/01/2015 | | | | 3 | | | | (5 | ) |
Interest Rate Swap Option 10 year (Call) | | Bank of America NA | | | 600,000 | | | | 2.300 | | | | 12/01/2015 | | | | 7 | | | | (14 | ) |
Interest Rate Swap Option 10 year (Call) | | Goldman Sachs Bank USA | | | 1,200,000 | | | | 2.300 | | | | 12/01/2015 | | | | 17 | | | | (29 | ) |
Interest Rate Swap Option 10 year (Call) | | Morgan Stanley Capital Services LLC | | | 700,000 | | | | 1.750 | | | | 07/24/2015 | | | | 5 | | | | (2 | ) |
Interest Rate Swap Option 10 year (Call) | | Morgan Stanley Capital Services LLC | | | 700,000 | | | | 1.750 | | | | 01/06/2016 | | | | 8 | | | | (5 | ) |
Interest Rate Swap Option 10 year (Call) | | Morgan Stanley Capital Services LLC | | | 1,000,000 | | | | 2.000 | | | | 12/16/2015 | | | | 12 | | | | (13 | ) |
Interest Rate Swap Option 10 year (Put) | | Morgan Stanley Capital Services LLC | | | 700,000 | | | | 2.250 | | | | 07/24/2015 | | | | 7 | | | | (8 | ) |
Currency Option Euro vs. U.S. Dollar (Put) | | Bank of America NA | | | 161,000 | | | $ | 1.04 | | | | 06/11/2015 | | | | 1 | | | | — | |
Currency Option Euro vs. U.S. Dollar (Call) | | BNP Paribas SA | | | 300,000 | | | | 1.11 | | | | 05/22/2015 | | | | 2 | | | | (7 | ) |
Currency Option Euro vs. U.S. Dollar (Put) | | BNP Paribas SA | | | 300,000 | | | | 1.03 | | | | 05/22/2015 | | | | 2 | | | | — | |
Currency Option Euro vs. U.S. Dollar (Put) | | BNP Paribas SA | | | 484,000 | | | | 1.04 | | | | 06/11/2015 | | | | 3 | | | | (1 | ) |
Currency Option U.S. Dollar vs. Brazilian Real (Call) | | Bank of America NA | | | 27,000 | | | | 3.62 | | | | 09/10/2015 | | | | 1 | | | | — | |
Currency Option U.S. Dollar vs. Brazilian Real (Call) | | Bank of America NA | | | 34,000 | | | | 3.96 | | | | 03/10/2016 | | | | 1 | | | | (1 | ) |
Currency Option U.S. Dollar vs. Brazilian Real (Call) | | Credit Suisse International | | | 104,000 | | | | 3.62 | | | | 09/10/2015 | | | | 2 | | | | (1 | ) |
Currency Option U.S. Dollar vs. Brazilian Real (Call) | | JP Morgan Chase Bank NA | | | 97,000 | | | | 3.96 | | | | 03/10/2016 | | | | 3 | | | | (2 | ) |
Currency Option U.S. Dollar vs. Chinese Yuan (Call) | | Barclays Bank plc | | | 18,000 | | | | 7.00 | | | | 02/02/2016 | | | | — | | | | — | |
Currency Option U.S. Dollar vs. Chinese Yuan (Call) | | Credit Suisse International | | | 24,400 | | | | 6.90 | | | | 02/02/2016 | | | | — | | | | — | |
Currency Option U.S. Dollar vs. Chinese Yuan (Call) | | JP Morgan Chase Bank NA | | | 225,600 | | | | 6.90 | | | | 02/02/2016 | | | | 2 | | | | (1 | ) |
Currency Option U.S. Dollar vs. Chinese Yuan (Call) | | UBS AG Stamford | | | 232,000 | | | | 7.00 | | | | 02/02/2016 | | | | 2 | | | | — | |
Currency Option Euro vs. Canadian Dollar (Put) | | Bank of America NA | | | 39,000 | | | | 1.38 | | | | 05/22/2015 | | | | — | | | | (1 | ) |
Currency Option Euro vs. Canadian Dollar (Put) | | HSBC Bank USA NA | | | 113,000 | | | | 1.38 | | | | 05/22/2015 | | | | 1 | | | | (2 | ) |
| | | | | | | | | | | | | | | | | | | | | | |
Total Written Options Not Settled Through Variation Margin | | | $ | 211 | | | $ | (169 | ) |
| | | | | | | | | | | | | | | | | | | | | | |
Total Written Options | | | $ | 211 | | | $ | (169 | ) |
| | | | | | | | | | | | | | | | | | | | | | |
| | | | | | | | | | | | | | | | | | |
| FORWARD CURRENCY CONTRACTS OPEN AT APRIL 30, 2015 | |
| | | | | |
Currency | | Counterparty | | Value
(000s) | | | Aggregate
Face Value
(000s) | | | Delivery Date | | | Unrealized
Appreciation/
(Depreciation)
(000s) | |
Australian Dollar (Sell) | | Australia and New Zealand Banking Group | | $ | 21 | | | $ | 21 | | | | 06/02/2015 | | | $ | — | |
Brazilian Real (Buy) | | Bank of America NA | | | 80 | | | | 81 | | | | 05/05/2015 | | | | (1 | ) |
Brazilian Real (Buy) | | Bank of America NA | | | 80 | | | | 77 | | | | 06/02/2015 | | | | 3 | |
Brazilian Real (Buy) | | Deutsche Bank AG | | | 428 | | | | 416 | | | | 05/05/2015 | | | | 12 | |
Brazilian Real (Buy) | | Deutsche Bank AG London | | | 118 | | | | 134 | | | | 07/02/2015 | | | | (16 | ) |
Brazilian Real (Buy) | | HSBC Bank USA | | | 80 | | | | 78 | | | | 05/05/2015 | | | | 2 | |
Brazilian Real (Buy) | | JP Morgan Chase Bank | | | 427 | | | | 431 | | | | 05/05/2015 | | | | (4 | ) |
Brazilian Real (Sell) | | Bank of America NA | | | 80 | | | | 77 | | | | 05/05/2015 | | | | (3 | ) |
Brazilian Real (Sell) | | BNP Paribas SA | | | 631 | | | | 799 | | | | 10/02/2015 | | | | 168 | |
Brazilian Real (Sell) | | Deutsche Bank AG | | | 428 | | | | 431 | | | | 05/05/2015 | | | | 3 | |
Brazilian Real (Sell) | | Deutsche Bank AG | | | 423 | | | | 412 | | | | 06/02/2015 | | | | (11 | ) |
Brazilian Real (Sell) | | HSBC Bank USA | | | 80 | | | | 81 | | | | 05/05/2015 | | | | 1 | |
Brazilian Real (Sell) | | JP Morgan Chase Bank | | | 428 | | | | 398 | | | | 05/05/2015 | | | | (30 | ) |
Brazilian Real (Sell) | | UBS AG | | | 280 | | | | 360 | | | | 01/04/2017 | | | | 80 | |
Brazilian Real (Sell) | | UBS AG | | | 268 | | | | 352 | | | | 07/05/2017 | | | | 84 | |
British Pound Sterling (Sell) | | Deutsche Bank AG | | | 141 | | | | 136 | | | | 05/06/2015 | | | | (5 | ) |
Canadian Dollar (Buy) | | Credit Suisse International | | | 80 | | | | 76 | | | | 05/06/2015 | | | | 4 | |
Canadian Dollar (Sell) | | Bank of America Corp. | | | 328 | | | | 360 | | | | 05/05/2015 | | | | 32 | |
Euro Currency (Buy) | | Bank of America NA | | | 149 | | | | 141 | | | | 05/06/2015 | | | | 8 | |
Euro Currency (Buy) | | Bank of America NA | | | 308 | | | | 301 | | | | 06/02/2015 | | | | 7 | |
Euro Currency (Buy) | | Bank of America NA | | | 26 | | | | 31 | | | | 06/13/2016 | | | | (5 | ) |
Euro Currency (Buy) | | Bank of America NA | | | 627 | | | | 600 | | | | 06/13/2016 | | | | 27 | |
Euro Currency (Buy) | | Bank of America NA | | | 161 | | | | 154 | | | | 06/27/2016 | | | | 7 | |
27
Harbor Unconstrained Bond Fund
PORTFOLIO OF INVESTMENTS—Continued
| | | | | | | | | | | | | | | | | | |
| FORWARD CURRENCY CONTRACTS—Continued | |
| | | | | |
Currency | | Counterparty | | Value
(000s) | | | Aggregate
Face Value
(000s) | | | Delivery Date | | | Unrealized
Appreciation/
(Depreciation)
(000s) | |
Euro Currency (Buy) | | BNP Paribas SA | | $ | 933 | | | $ | 1,113 | | | | 06/15/2015 | | | $ | (180 | ) |
Euro Currency (Buy) | | Credit Suisse International | | | 7 | | | | 8 | | | | 06/15/2015 | | | | (1 | ) |
Euro Currency (Buy) | | Deutsche Bank AG | | | 3,676 | | | | 3,564 | | | | 05/06/2015 | | | | 112 | |
Euro Currency (Buy) | | Deutsche Bank AG | | | 126 | | | | 119 | | | | 06/13/2016 | | | | 7 | |
Euro Currency (Buy) | | Deutsche Bank AG London | | | 115 | | | | 137 | | | | 06/13/2016 | | | | (22 | ) |
Euro Currency (Buy) | | Goldman Sachs Bank USA | | | 27 | | | | 26 | | | | 05/06/2015 | | | | 1 | |
Euro Currency (Buy) | | Goldman Sachs Capital Markets LP | | | 105 | | | | 125 | | | | 06/15/2015 | | | | (20 | ) |
Euro Currency (Buy) | | UBS AG | | | 124 | | | | 119 | | | | 05/06/2015 | | | | 5 | |
Euro Currency (Sell) | | Bank of America Corp. | | | 274 | | | | 332 | | | | 06/15/2015 | | | | 58 | |
Euro Currency (Sell) | | Bank of America Corp. | | | 653 | | | | 788 | | | | 06/13/2016 | | | | 135 | |
Euro Currency (Sell) | | Bank of America Corp. | | | 162 | | | | 196 | | | | 06/27/2016 | | | | 34 | |
Euro Currency (Sell) | | Bank of America NA | | | 781 | | | | 747 | | | | 05/06/2015 | | | | (34 | ) |
Euro Currency (Sell) | | Barclays Bank plc | | | 231 | | | | 278 | | | | 06/15/2015 | | | | 47 | |
Euro Currency (Sell) | | Barclays Bank plc | | | 178 | | | | 216 | | | | 06/27/2016 | | | | 38 | |
Euro Currency (Sell) | | BNP Paribas SA | | | 1,861 | | | | 1,784 | | | | 05/06/2015 | | | | (77 | ) |
Euro Currency (Sell) | | BNP Paribas SA | | | 113 | | | | 136 | | | | 06/15/2015 | | | | 23 | |
Euro Currency (Sell) | | Credit Suisse Group AG | | | 226 | | | | 273 | | | | 06/15/2015 | | | | 47 | |
Euro Currency (Sell) | | Credit Suisse International | | | 200 | | | | 237 | | | | 06/15/2015 | | | | 37 | |
Euro Currency (Sell) | | Deutsche Bank AG | | | 125 | | | | 118 | | | | 05/06/2015 | | | | (7 | ) |
Euro Currency (Sell) | | Deutsche Bank AG | | | 3,561 | | | | 3,452 | | | | 06/02/2015 | | | | (109 | ) |
Euro Currency (Sell) | | Deutsche Bank AG London | | | 240 | | | | 290 | | | | 06/13/2016 | | | | 50 | |
Euro Currency (Sell) | | Goldman Sachs Bank USA | | | 55 | | | | 53 | | | | 05/06/2015 | | | | (2 | ) |
Euro Currency (Sell) | | UBS AG | | | 1,155 | | | | 1,131 | | | | 05/06/2015 | | | | (24 | ) |
Indian Rupee (Buy) | | Goldman Sachs Capital Markets LP | | | 719 | | | | 731 | | | | 06/26/2015 | | | | (12 | ) |
Indian Rupee (Sell) | | JP Morgan Chase Bank | | | 261 | | | | 265 | | | | 06/26/2015 | | | | 4 | |
Indian Rupee (Sell) | | UBS AG | | | 448 | | | | 453 | | | | 06/26/2015 | | | | 5 | |
Japanese Yen (Buy) | | BNP Paribas SA | | | 343 | | | | 344 | | | | 06/03/2015 | | | | (1 | ) |
Japanese Yen (Buy) | | Credit Suisse International | | | 267 | | | | 268 | | | | 05/08/2015 | | | | (1 | ) |
Japanese Yen (Buy) | | JP Morgan Chase Bank NA | | | 1,409 | | | | 1,414 | | | | 05/08/2015 | | | | (5 | ) |
Japanese Yen (Sell) | | Bank of America NA | | | 1,513 | | | | 1,512 | | | | 05/08/2015 | | | | (1 | ) |
Japanese Yen (Sell) | | Deutsche Bank AG London | | | 195 | | | | 324 | | | | 10/11/2016 | | | | 129 | |
Japanese Yen (Sell) | | JP Morgan Chase Bank NA | | | 1,410 | | | | 1,415 | | | | 06/03/2015 | | | | 5 | |
Japanese Yen (Sell) | | UBS AG | | | 163 | | | | 163 | | | | 05/08/2015 | | | | — | |
Mexican Peso (Buy) | | Barclays Bank plc | | | 88 | | | | 89 | | | | 05/05/2015 | | | | (1 | ) |
Mexican Peso (Buy) | | BNP Paribas SA | | | 280 | �� | | | 290 | | | | 05/05/2015 | | | | (10 | ) |
Mexican Peso (Buy) | | BNP Paribas SA | | | 555 | | | | 552 | | | | 07/07/2015 | | | | 3 | |
Mexican Peso (Buy) | | Deutsche Bank AG | | | 553 | | | | 556 | | | | 06/11/2015 | | | | (3 | ) |
Mexican Peso (Buy) | | HSBC Bank USA | | | 236 | | | | 236 | | | | 05/05/2015 | | | | — | |
Mexican Peso (Buy) | | UBS AG | | | 312 | | | | 326 | | | | 05/05/2015 | | | | (14 | ) |
Mexican Peso (Sell) | | Bank of America NA | | | 22 | | | | 22 | | | | 05/05/2015 | | | | — | |
Mexican Peso (Sell) | | Bank of America NA | | | 32 | | | | 32 | | | | 06/09/2015 | | | | — | |
Mexican Peso (Sell) | | Barclays Bank plc | | | 53 | | | | 52 | | | | 05/05/2015 | | | | (1 | ) |
Mexican Peso (Sell) | | BNP Paribas SA | | | 558 | | | | 555 | | | | 05/05/2015 | | | | (3 | ) |
Mexican Peso (Sell) | | Deutsche Bank AG London | | | 284 | | | | 281 | | | | 05/05/2015 | | | | (3 | ) |
Mexican Peso (Sell) | | HSBC Bank USA | | | 34 | | | | 34 | | | | 07/07/2015 | | | | — | |
South Korean Won (Sell) | | Credit Suisse International | | | 360 | | | | 341 | | | | 05/18/2015 | | | | (19 | ) |
| | | | | | | | | | | | | | | | | | |
Total Forward Currency Contracts | | | $ | 553 | |
| | | | | | | | | | | | | | | | | | |
| | | | | | | | | | | | | | | | | | | | |
| SWAP AGREEMENTS OPEN AT APRIL 30, 2015 | |
|
CENTRALLY CLEARED SWAP AGREEMENTS INTEREST RATE SWAPS | |
| | | | | | |
Counterparty | | Floating Rate Index | | Pay/Receive
Floating Rate | | Fixed Rate | | | Expiration Date | | | Notional
Amount
(000s) | | | Unrealized
Appreciation/
(Depreciation)
(000s) | |
CME Group | | EUR-EURIBOR-Act/360-Bloomberg 6-Month | | Pay | | | 0.950 | % | | | 03/25/2025 | | | € | 100 | | | $ | (3 | ) |
CME Group | | EUR-EURIBOR-Act/360-Bloomberg 6-Month | | Pay | | | 0.750 | | | | 09/16/2025 | | | | 1,600 | | | | 22 | |
CME Group | | EUR-EURIBOR-Act/360-Bloomberg 6-Month | | Pay | | | 1.000 | | | | 03/18/2045 | | | | 100 | | | | 1 | |
CME Group | | EUR-EURIBOR-Act/360-Bloomberg 6-Month | | Pay | | | 1.250 | | | | 09/16/2045 | | | | 350 | | | | 27 | |
CME Group | | EUR-EURIBOR-Act/360-Bloomberg 6-Month | | Pay | | | 1.500 | | | | 03/16/2046 | | | | 100 | | | | — | |
28
Harbor Unconstrained Bond Fund
PORTFOLIO OF INVESTMENTS—Continued
| | | | | | | | | | | | | | | | | | | | |
| SWAP AGREEMENTS—Continued | |
|
CENTRALLY CLEARED SWAP AGREEMENTS—Continued INTEREST RATE SWAPS | |
| | | | | | |
Counterparty | | Floating Rate Index | | Pay/Receive
Floating Rate | | Fixed Rate | | | Expiration Date | | | Notional
Amount
(000s) | | | Unrealized
Appreciation/
(Depreciation)
(000s) | |
CME Group | | British Bankers’ Association LIBOR GBP 6-Month | | Pay | | | 1.650 | % | | | 01/22/2020 | | | £ | 200 | | | $ | (3 | ) |
CME Group | | British Bankers’ Association LIBOR GBP 6-Month | | Pay | | | 2.000 | | | | 03/18/2022 | | | | 500 | | | | (9 | ) |
CME Group | | Mexico Interbank TIIE 28 Day | | Pay | | | 5.430 | | | | 11/17/2021 | | | MEX$ | 400 | | | | — | |
CME Group | | Mexico Interbank TIIE 28 Day | | Pay | | | 7.740 | | | | 05/29/2024 | | | | 2,100 | | | | — | |
CME Group | | Mexico Interbank TIIE 28 Day | | Pay | | | 7.650 | | | | 05/30/2024 | | | | 9,500 | | | | 14 | |
CME Group | | Mexico Interbank TIIE 28 Day | | Pay | | | 6.150 | | | | 06/07/2024 | | | | 3,400 | | | | 3 | |
CME Group | | Mexico Interbank TIIE 28 Day | | Pay | | | 7.410 | | | | 08/02/2024 | | | | 7,100 | | | | (2 | ) |
CME Group | | Mexico Interbank TIIE 28 Day | | Pay | | | 5.980 | | | | 08/26/2024 | | | | 400 | | | | (1 | ) |
CME Group | | Mexico Interbank TIIE 28 Day | | Pay | | | 5.860 | | | | 03/25/2025 | | | | 1,100 | | | | (1 | ) |
CME Group | | Mexico Interbank TIIE 28 Day | | Pay | | | 5.890 | | | | 03/26/2025 | | | | 10,000 | | | | (10 | ) |
CME Group | | British Bankers’ Association LIBOR USD 3-Month | | Pay | | | 1.000 | | | | 12/17/2016 | | | $ | 11,000 | | | | (63 | ) |
CME Group | | British Bankers’ Association LIBOR USD 3-Month | | Pay | | | 1.850 | | | | 05/18/2017 | | | | 2,900 | | | | (10 | ) |
CME Group | | British Bankers’ Association LIBOR USD 3-Month | | Pay | | | 1.250 | | | | 06/17/2017 | | | | 1,400 | | | | (8 | ) |
CME Group | | British Bankers’ Association LIBOR USD 3-Month | | Pay | | | 1.750 | | | | 06/17/2018 | | | | 4,600 | | | | (58 | ) |
CME Group | | British Bankers’ Association LIBOR USD 3-Month | | Pay | | | 1.650 | | | | 10/16/2019 | | | | 5,700 | | | | (37 | ) |
CME Group | | British Bankers’ Association LIBOR USD 3-Month | | Pay | | | 2.500 | | | | 12/17/2021 | | | | 3,800 | | | | (111 | ) |
CME Group | | British Bankers’ Association LIBOR USD 3-Month | | Pay | | | 3.000 | | | | 12/17/2024 | | | | 2,000 | | | | (140 | ) |
CME Group | | British Bankers’ Association LIBOR USD 3-Month | | Pay | | | 2.250 | | | | 05/13/2025 | | | | 100 | | | | — | |
| | | | | | | | | | | | | | | | | | | | |
Interest Rate Swaps | | | $ | (389 | ) |
| | | | | | | | | | | | | | | | | | | | |
| | | | | | | | | | | | | | | | | | | | | | | | | | | | | | | | |
|
CENTRALLY CLEARED SWAP AGREEMENTS CREDIT DEFAULT SWAPS | |
| | | | | | | | | |
Counterparty | | Reference Entity | | Buy/
Sellb,c | | Pay/Receive
Fixed Rate | | | Expiration
Date | | | Implied
Credit
Spreadd | | | Valuee
(000s) | | | Upfront
Premium
Paid/(Received)
(000s) | | | Notional
Amountf
(000s) | | | Unrealized
Appreciation/
(Depreciation)
(000s) | |
ICE Group | | Dow Jones CDX North America High Yield Index
Series 24 | | Buy | | | 5.000 | % | | | 06/20/2020 | | | | 3.405 | % | | $ | 69 | | | $ | 60 | | | $ | 900 | | | $ | 9 | |
ICE Group | | Dow Jones CDX North America Investment Grade Index
Series 24 | | Buy | | | 1.000 | | | | 06/20/2020 | | | | 0.635 | | | | 48 | | | | 47 | | | | 2,500 | | | | 1 | |
| | | | | | | | | | | | | | | | | | | | | | | | | | | | | | | | |
Credit Default Swaps | | | $ | 10 | |
| | | | | | | | | | | | | | | | | | | | | | | | | | | | | | | | |
| | | | | | | | | | | | | | | | | | | | |
|
OVER-THE-COUNTER (OTC) SWAP AGREEMENTS INTEREST RATE SWAPS | |
| | | | | | |
Counterparty | | Floating Rate Index | | Pay/Receive
Floating Rate | | Fixed Rate | | | Expiration Date | | | Notional
Amount
(000s) | | | Unrealized
Appreciation/
(Depreciation)
(000s) | |
Bank of America NA | | Brazil Cetip Interbank Deposit | | Pay | | | 12.360 | % | | | 01/02/2018 | | | R$ | 700 | | | $ | (4 | ) |
Bank of America NA | | Brazil Cetip Interbank Deposit | | Pay | | | 11.160 | | | | 01/04/2021 | | | | 900 | | | | (11 | ) |
Bank of America NA | | Brazil Cetip Interbank Deposit | | Pay | | | 12.060 | | | | 01/04/2021 | | | | 300 | | | | (2 | ) |
BNP Paribas SA | | Brazil Cetip Interbank Deposit | | Pay | | | 11.160 | | | | 01/04/2021 | | | | 2,000 | | | | (23 | ) |
BNP Paribas SA | | Brazil Cetip Interbank Deposit | | Pay | | | 12.060 | | | | 01/04/2021 | | | | 800 | | | | (2 | ) |
Credit Suisse International | | Brazil Cetip Interbank Deposit | | Pay | | | 12.360 | | | | 01/02/2018 | | | | 1,700 | | | | (9 | ) |
Credit Suisse International | | Brazil Cetip Interbank Deposit | | Pay | | | 11.680 | | | | 01/04/2021 | | | | 400 | | | | (4 | ) |
Credit Suisse International | | Brazil Cetip Interbank Deposit | | Pay | | | 12.230 | | | | 01/04/2021 | | | | 400 | | | | (1 | ) |
Deutsche Bank AG | | Brazil Cetip Interbank Deposit | | Pay | | | 12.360 | | | | 01/02/2018 | | | | 800 | | | | (4 | ) |
Deutsche Bank AG | | Brazil Cetip Interbank Deposit | | Pay | | | 11.680 | | | | 01/04/2021 | | | | 1,200 | | | | (12 | ) |
Deutsche Bank AG | | Brazil Cetip Interbank Deposit | | Pay | | | 12.230 | | | | 01/04/2021 | | | | 700 | | | | (1 | ) |
Goldman Sachs Bank USA | | Brazil Cetip Interbank Deposit | | Pay | | | 12.180 | | | | 01/02/2018 | | | | 700 | | | | (4 | ) |
HSBC Bank USA NA | | Brazil Cetip Interbank Deposit | | Pay | | | 12.180 | | | | 01/02/2018 | | | | 700 | | | | (4 | ) |
HSBC Bank USA NA | | Brazil Cetip Interbank Deposit | | Pay | | | 11.680 | | | | 01/04/2021 | | | | 100 | | | | (1 | ) |
Morgan Stanley Capital Services LLC | | Brazil Cetip Interbank Deposit | | Pay | | | 12.180 | | | | 01/02/2018 | | | | 700 | | | | (4 | ) |
Morgan Stanley Capital Services LLC | | Brazil Cetip Interbank Deposit | | Pay | | | 11.680 | | | | 01/04/2021 | | | | 300 | | | | (3 | ) |
Morgan Stanley Capital Services LLC | | Brazil Cetip Interbank Deposit | | Pay | | | 12.060 | | | | 01/04/2021 | | | | 500 | | | | (3 | ) |
Bank of America NA | | Eurostat Eurozone HICP Ex Tobacco NSA | | Receive | | | 0.710 | | | | 01/29/2020 | | | € | 400 | | | | 7 | |
BNP Paribas SA | | Eurostat Eurozone HICP Ex Tobacco NSA | | Receive | | | 0.700 | | | | 01/30/2020 | | | | 300 | | | | 5 | |
Goldman Sachs Bank USA | | Eurostat Eurozone HICP Ex Tobacco NSA | | Receive | | | 0.740 | | | | 01/26/2020 | | | | 400 | | | | 6 | |
Goldman Sachs Bank USA | | Eurostat Eurozone HICP Ex Tobacco NSA | | Receive | | | 0.660 | | | | 01/30/2020 | | | | 600 | | | | 10 | |
Goldman Sachs Bank USA | | Eurostat Eurozone HICP Ex Tobacco NSA | | Receive | | | 0.990 | | | | 03/30/2020 | | | | 500 | | | | 2 | |
29
Harbor Unconstrained Bond Fund
PORTFOLIO OF INVESTMENTS—Continued
| | | | | | | | | | | | | | | | | | | | |
| SWAP AGREEMENTS—Continued | |
|
OVER-THE-COUNTER (OTC) SWAP AGREEMENTS—Continued INTEREST RATE SWAPS | |
| | | | | | |
Counterparty | | Floating Rate Index | | Pay/Receive
Floating Rate | | Fixed Rate | | | Expiration Date | | | Notional
Amount
(000s) | | | Unrealized
Appreciation/
(Depreciation)
(000s) | |
Bank of America NA | | UK Retail Prices Index All Items NSA | | Pay | | | 3.550 | % | | | 12/11/2044 | | | £ | 15 | | | $ | 1 | |
BNP Paribas SA | | UK Retail Prices Index All Items NSA | | Pay | | | 3.550 | | | | 12/11/2044 | | | | 10 | | | | — | |
Credit Suisse International | | UK Retail Prices Index All Items NSA | | Pay | | | 3.550 | | | | 11/15/2044 | | | | 10 | | | | 1 | |
Credit Suisse International | | UK Retail Prices Index All Items NSA | | Pay | | | 3.450 | | | | 12/15/2044 | | | | 8 | | | | — | |
Goldman Sachs Bank USA | | UK Retail Prices Index All Items NSA | | Pay | | | 3.140 | | | | 01/14/2030 | | | | 90 | | | | (3 | ) |
Morgan Stanley Capital Services LLC | | UK Retail Prices Index All Items NSA | | Pay | | | 3.550 | | | | 11/15/2044 | | | | 10 | | | | 1 | |
UBS AG Stamford | | UK Retail Prices Index All Items NSA | | Pay | | | 2.950 | | | | 01/12/2025 | | | | 10 | | | | — | |
HSBC Bank USA NA | | Mexico Interbank TIIE 28 Day | | Pay | | | 7.650 | | | | 05/30/2024 | | | MEX$ | 1,500 | | | | 2 | |
| | | | | | | | | | | | | | | | | | | | |
Interest Rate Swaps | | | $ | (60 | ) |
| | | | | | | | | | | | | | | | | | | | |
| | | | | | | | | | | | | | | | | | | | | | | | | | | | | | | | |
|
OVER-THE-COUNTER (OTC) SWAP AGREEMENTS CREDIT DEFAULT SWAPS | |
| | | | | | | | | |
Counterparty | | Reference Entity | | Buy/
Sellb,c | | Pay/Receive
Fixed Rate | | | Expiration
Date | | | Implied
Credit
Spreadd | | | Valuee
(000s) | | | Upfront
Premium
Paid/(Received)
(000s) | | | Notional
Amountf
(000s) | | | Unrealized
Appreciation/
(Depreciation)
(000s) | |
Bank of America NA | | HSBC Bank plc
4.000% due 01/15/2021 | | Sell | | | 1.000 | % | | | 03/20/2019 | | | | 0.485 | % | | $ | 2 | | | $ | 2 | | | € | 100 | | | $ | — | |
Deutsche Bank AG | | HSBC Bank plc
4.000% due 01/15/2021 | | Sell | | | 1.000 | | | | 03/20/2019 | | | | 0.485 | | | | 2 | | | | 1 | | | | 100 | | | | 1 | |
JP Morgan Chase Bank NA | | HSBC Bank plc
4.000% due 01/15/2021 | | Sell | | | 1.000 | | | | 03/20/2019 | | | | 0.485 | | | | 9 | | | | 7 | | | | 400 | | | | 2 | |
BNP Paribas SA | | Berkshire Hathaway Inc.
1.900% due 01/31/2017 | | Sell | | | 1.000 | | | | 06/20/2016 | | | | 0.160 | | | | 1 | | | | 2 | | | $ | 100 | | | | (1 | ) |
Deutsche Bank AG | | Berkshire Hathaway Inc.
1.900% due 01/31/2017 | | Sell | | | 1.000 | | | | 09/20/2016 | | | | 0.198 | | | | 1 | | | | 1 | | | | 100 | | | | — | |
Deutsche Bank AG | | Berkshire Hathaway Inc.
1.900% due 01/31/2017 | | Sell | | | 1.000 | | | | 03/20/2019 | | | | 0.441 | | | | 2 | | | | 2 | | | | 100 | | | | — | |
Deutsche Bank AG | | Berkshire Hathaway Inc.
1.900% due 01/31/2017 | | Sell | | | 1.000 | | | | 12/20/2023 | | | | 0.989 | | | | — | | | | (9 | ) | | | 400 | | | | 9 | |
Goldman Sachs International | | Berkshire Hathaway Inc.
1.900% due 01/31/2017 | | Sell | | | 1.000 | | | | 09/20/2018 | | | | 0.390 | | | | 2 | | | | 3 | | | | 100 | | | | (1 | ) |
JP Morgan Chase Bank NA | | Berkshire Hathaway Inc.
1.900% due 01/31/2017 | | Sell | | | 1.000 | | | | 09/20/2016 | | | | 0.198 | | | | 1 | | | | 2 | | | | 100 | | | | (1 | ) |
Morgan Stanley Capital Services LLC | | Berkshire Hathaway Inc.
1.900% due 01/31/2017 | | Sell | | | 1.000 | | | | 09/20/2016 | | | | 0.198 | | | | 1 | | | | 2 | | | | 100 | | | | (1 | ) |
Goldman Sachs International | | Citigroup Inc.
6.130% due 05/15/2018 | | Sell | | | 1.000 | | | | 03/20/2019 | | | | 0.588 | | | | 2 | | | | 1 | | | | 100 | | | | 1 | |
Goldman Sachs International | | Dow Jones CDX North America
High Yield Index
Series 23 | | Sell | | | 5.000 | | | | 12/20/2019 | | | | 1.806 | | | | 45 | | | | 42 | | | | 300 | | | | 3 | |
Barclays Bank plc | | General Electric Capital Corp.
5.630% due 09/15/2017 | | Sell | | | 1.000 | | | | 09/20/2015 | | | | 0.094 | | | | 1 | | | | 1 | | | | 100 | | | | — | |
Barclays Bank plc | | General Electric Capital Corp.
5.630% due 09/15/2017 | | Sell | | | 1.000 | | | | 09/20/2017 | | | | 0.175 | | | | 2 | | | | 2 | | | | 100 | | | | — | |
Deutsche Bank AG | | General Electric Capital Corp.
5.630% due 09/15/2017 | | Sell | | | 1.000 | | | | 09/20/2015 | | | | 0.094 | | | | 1 | | | | 1 | | | | 100 | | | | — | |
Deutsche Bank AG | | General Electric Capital Corp.
5.630% due 09/15/2017 | | Sell | | | 1.000 | | | | 06/20/2016 | | | | 0.115 | | | | 2 | | | | 3 | | | | 200 | | | | (1 | ) |
Morgan Stanley Capital Services LLC | | General Electric Capital Corp.
5.630% due 09/15/2017 | | Sell | | | 1.000 | | | | 09/20/2015 | | | | 0.094 | | | | 1 | | | | 1 | | | | 100 | | | | — | |
Credit Suisse International | | JP Morgan Chase & Co.
4.750% due 03/01/2015 | | Sell | | | 1.000 | | | | 09/20/2015 | | | | 0.178 | | | | — | | | | — | | | | 100 | | | | — | |
Deutsche Bank AG | | JP Morgan Chase & Co.
4.750% due 03/01/2015 | | Sell | | | 1.000 | | | | 09/20/2015 | | | | 0.178 | | | | 1 | | | | 2 | | | | 200 | | | | (1 | ) |
Bank of America NA | | JSC GAZPROM | | Sell | | | 1.000 | | | | 09/20/2015 | | | | 3.618 | | | | (1 | ) | | | (1 | ) | | | 100 | | | | — | |
Deutsche Bank AG | | Kingdom of Spain
5.500% due 07/30/2017 | | Sell | | | 1.000 | | | | 06/20/2016 | | | | 0.307 | | | | 3 | | | | 4 | | | | 300 | | | | (1 | ) |
Goldman Sachs International | | Kingdom of Spain
5.500% due 07/30/2017 | | Sell | | | 1.000 | | | | 03/20/2019 | | | | 0.658 | | | | 1 | | | | (1 | ) | | | 100 | | | | 2 | |
Morgan Stanley Capital Services LLC | | Kingdom of Spain
5.500% due 07/30/2017 | | Sell | | | 1.000 | | | | 12/20/2019 | | | | 0.728 | | | | 7 | | | | 4 | | | | 500 | | | | 3 | |
30
Harbor Unconstrained Bond Fund
PORTFOLIO OF INVESTMENTS—Continued
| | | | | | | | | | | | |
| SWAP AGREEMENTS—Continued |
| | | | | | | | | | | | | | | | | | | | | | | | | | | | | | | | |
|
OVER-THE-COUNTER (OTC) SWAP AGREEMENTS—Continued CREDIT DEFAULT SWAPS | |
| | | | | | | | | |
Counterparty | | Reference Entity | | Buy/
Sellb,c | | Pay/Receive
Fixed Rate | | | Expiration
Date | | | Implied
Credit
Spreadd | | | Valuee
(000s) | | | Upfront
Premium
Paid/(Received)
(000s) | | | Notional
Amountf
(000s) | | | Unrealized
Appreciation/
(Depreciation)
(000s) | |
Barclays Bank plc | | MetLife, Inc.
4.750% due 02/08/2021 | | Sell | | | 1.000 | % | | | 09/20/2019 | | | | 0.650 | % | | $ | 2 | | | $ | 2 | | | $ | 100 | | | $ | — | |
Goldman Sachs International | | Prudential Financial, Inc.
6.100% due 06/15/2017 | | Sell | | | 1.000 | | | | 09/20/2019 | | | | 0.708 | | | | 1 | | | | 2 | | | | 100 | | | | (1 | ) |
Barclays Bank plc | | Republic of Italy
6.880% due 09/27/2023 | | Sell | | | 1.000 | | | | 12/20/2019 | | | | 1.018 | | | | — | | | | (4 | ) | | | 500 | | | | 4 | |
Deutsche Bank AG | | Republic of Italy
6.880% due 09/27/2023 | | Sell | | | 1.000 | | | | 06/20/2019 | | | | 0.958 | | | | 1 | | | | — | | | | 400 | | | | 1 | |
Deutsche Bank AG | | Republic of Italy
6.880% due 09/27/2023 | | Sell | | | 1.000 | | | | 09/20/2019 | | | | 0.990 | | | | — | | | | 1 | | | | 200 | | | | (1 | ) |
HSBC Bank USA NA | | Republic of Italy
6.880% due 09/27/2023 | | Sell | | | 1.000 | | | | 06/20/2017 | | | | 0.644 | | | | 3 | | | | 4 | | | | 400 | | | | (1 | ) |
HSBC Bank USA NA | | Republic of Italy
6.880% due 09/27/2023 | | Sell | | | 1.000 | | | | 03/20/2019 | | | | 0.932 | | | | — | | | | (2 | ) | | | 100 | | | | 2 | |
Morgan Stanley Capital Services LLC | | Republic of Italy
6.880% due 09/27/2023 | | Sell | | | 1.000 | | | | 12/20/2019 | | | | 1.018 | | | | — | | | | — | | | | 100 | | | | — | |
Bank of America NA | | Russian Federation
7.500% due 03/31/2030 | | Sell | | | 1.000 | | | | 09/20/2015 | | | | 2.853 | | | | (1 | ) | | | (1 | ) | | | 100 | | | | — | |
JP Morgan Chase Bank NA | | State of Qatar
9.750% due 06/15/2030 | | Sell | | | 1.000 | | | | 06/20/2019 | | | | 0.567 | | | | 2 | | | | 2 | | | | 100 | | | | — | |
Credit Suisse International | | Wells Fargo & Co.
0.480% due 10/28/2015 | | Sell | | | 1.000 | | | | 09/20/2017 | | | | 0.189 | | | | 2 | | | | 2 | | | | 100 | | | | — | |
| | | | | | | | | | | | | | | | | | | | | | | | | | | | | | | | |
Credit Default Swaps | | | $ | 18 | |
| | | | | | | | | | | | | | | | | | | | | | | | | | | | | | | | |
Total Swaps | | | $ | (421 | ) |
| | | | | | | | | | | | | | | | | | | | | | | | | | | | | | | | |
| | | | | | | | | | | | |
| FIXED INCOME INVESTMENTS SOLD SHORT AT APRIL 30, 2015 | |
| | | |
Par Value
(000s) | | | Security | | Proceeds
(000s) | | | Value
(000s) | |
| $ | 6,100 | | | Federal National Mortgage Association TBA9 | | $ | 6,479 | | | $ | (6,475 | ) |
| | | | | | | | | | | | |
The following table summarizes the Fund’s investments as of April 30, 2015 based on the inputs used to value them.
| | | | | | | | | | | | | | | | |
Asset Category | | Quoted Prices
Level 1
(000s) | | | Other Significant
Observable Inputs
Level 2 (000s) | | | Significant Unobservable
Inputs Level 3
(000s) | | | Total
(000s) | |
Investments in Securities | | | | | | | | | | | | | | | | |
Asset-Backed Securities | | $ | — | | | $ | 6,606 | | | $ | — | | | $ | 6,606 | |
Bank Loan Obligations | | | — | | | | 66 | | | | — | | | | 66 | |
Collateralized Mortgage Obligations | | | — | | | | 2,388 | | | | — | | | | 2,388 | |
Corporate Bonds & Notes | | | — | | | | 12,526 | | | | — | | | | 12,526 | |
Foreign Government Obligations | | | — | | | | 2,825 | | | | — | | | | 2,825 | |
Mortgage Pass-Through | | | — | | | | 679 | | | | — | | | | 679 | |
Municipal Bonds | | | — | | | | 567 | | | | — | | | | 567 | |
Preferred Stocks | | | 24 | | | | — | | | | — | | | | 24 | |
Purchased Options | | | 1 | | | | 132 | | | | — | | | | 133 | |
U.S. Government Obligations | | | — | | | | 6,143 | | | | — | | | | 6,143 | |
Short-Term Investments | | | | | | | | | | | | | | | | |
Certificates of Deposit | | | — | | | | 981 | | | | — | | | | 981 | |
Commercial Paper | | | — | | | | 400 | | | | — | | | | 400 | |
Repurchase Agreements | | | — | | | | 1,212 | | | | — | | | | 1,212 | |
| | | | | | | | | | | | | | | | |
Total Investments in Securities | | $ | 25 | | | $ | 34,525 | | | $ | — | | | $ | 34,550 | |
| | | | | | | | | | | | | | | | |
31
Harbor Unconstrained Bond Fund
PORTFOLIO OF INVESTMENTS—Continued
| | | | | | |
| FAIR VALUE MEASUREMENTS—Continued |
| | | | | | | | | | | | | | | | |
Asset Category | | Quoted Prices
Level 1
(000s) | | | Other Significant
Observable Inputs
Level 2 (000s) | | | Significant Unobservable
Inputs Level 3
(000s) | | | Total
(000s) | |
Financial Derivative Instruments—Assets | | | | | | | | | | | | | | | | |
Forward Currency Contracts | | $ | — | | | $ | 1,178 | | | $ | — | | | $ | 1,178 | |
Futures Contracts | | | 41 | | | | — | | | | — | | | | 41 | |
Swap Agreements | | | — | | | | 140 | | | | — | | | | 140 | |
| | | | | | | | | | | | | | | | |
Total Financial Derivative Instruments—Assets | | $ | 41 | | | $ | 1,318 | | | $ | — | | | $ | 1,359 | |
| | | | | | | | | | | | | | | | |
| | | | |
Liability Category | | | | | | | | | | | | |
Fixed Income Investments Sold Short | | $ | — | | | $ | (6,475 | ) | | $ | — | | | $ | (6,475 | ) |
| | | | | | | | | | | | | | | | |
Investments in Other Financial Instruments | | | | | | | | | | | | | | | | |
Forward Currency Contracts | | $ | — | | | $ | (625 | ) | | $ | — | | | $ | (625 | ) |
Futures Contracts | | | (41 | ) | | | — | | | | — | | | | (41 | ) |
Swap Agreements | | | — | | | | (561 | ) | | | — | | | | (561 | ) |
Written Options | | | — | | | | (169 | ) | | | — | | | | (169 | ) |
| | | | | | | | | | | | | | | | |
Total Financial Derivative Instruments—Liabilities | | $ | (41 | ) | | $ | (1,355 | ) | | $ | — | | | $ | (1,396 | ) |
| | | | | | | | | | | | | | | | |
Total Investments | | $ | 25 | | | $ | 28,013 | | | $ | — | | | $ | 28,038 | |
| | | | | | | | | | | | | | | | |
There were no Level 3 holdings at October 31, 2014 or April 30, 2015, and no transfers between levels during the period.
For more information on valuation inputs and their aggregation into the levels used in the table above, please refer to the Fair Value Measurements and Disclosures in Note 2 of the accompanying Notes to Financial Statements.
32
Harbor Unconstrained Bond Fund
PORTFOLIO OF INVESTMENTS—Continued
| 1 | Floating rate security, the stated rate represents the rate in effect at April 30, 2015. |
| 2 | CLO after the name of a security stands for Collateralized Loan Obligations. |
| 3 | Securities purchased in a transaction exempt from registration under Rule 144A of the Securities Act of 1933. These securities may be resold in transactions exempt from registration, normally to qualified institutional buyers. The Fund has no right to demand registration of these securities. These securities are priced by an independent pricing service in accordance with Harbor Funds Valuation Procedures. At April 30, 2015, the aggregate value of these securities was $5,891 or 19% of net assets. |
| 4 | Step coupon security, the stated rate represents the rate in effect at April 30, 2015. |
| 5 | Variable rate security, the stated rate represents the rate in effect at April 30, 2015. |
| 6 | MTN after the name of a security stands for Medium Term Note. |
| 8 | REMICs are CMOs which can hold mortgages secured by any type of real property and issue multiple-class securities backed by those mortgages. |
| 9 | TBAs are mortgage-backed securities traded under delayed delivery commitments, settling after April 30, 2015. Although the unit price for the trades has been established, the principal value has not been finalized. However, the amount of the commitments will not fluctuate more than 2% from the principal amount. Income on TBAs is not earned until settlement date (see Note 2 of the accompanying Notes to Financial Statements). |
| 10 | Inflation-protected securities (“IPS”) are securities in which the principal amount is adjusted for inflation and interest payments are applied to the inflation-adjusted principal. |
| 11 | At April 30, 2015, a portion of securities held by the Fund were pledged to cover margin requirements for open future contracts, written options on futures contracts and swap options (see Note 2 of the accompanying Notes to Financial Statements). The securities pledged had an aggregate value of $74 or less than 0% of net assets. |
| b | If the Fund is a buyer of protection and a credit event occurs, as defined under the terms of that particular swap agreement, the Fund will either (i) receive from the seller of protection an amount equal to the notional amount of the swap and deliver the referenced obligation or underlying securities comprising the referenced index or (ii) receive a net settlement amount in the form of cash or securities equal to the notional amount of the swap less the recovery value of the referenced obligation or underlying securities comprising the referenced index. |
| c | If the Fund is a seller of protection and a credit event occurs, as defined under the terms of that particular swap agreement, the Fund will either (i) pay to the buyer of protection an amount equal to the notional amount of the swap and take delivery of the referenced obligation or underlying securities comprising the referenced index or (ii) pay a net settlement amount in the form of cash or securities equal to the notional amount of the swap less the recovery value of the referenced obligation or underlying securities comprising the referenced index. |
| d | Implied credit spreads, represented in absolute terms, utilized in determining the value of credit default swap agreements on corporate issues or sovereign issues of an emerging country as of period end serve as an indicator of the current status of the payment/performance risk and represent the likelihood or risk of default for the credit derivative. The implied credit spread of a particular referenced entity reflects the cost of buying/selling protection and may include upfront payments required to be made to enter into the agreement. Wider credit spreads represent a deterioration of the referenced entity’s credit soundness and a greater likelihood or risk of default or other credit event occurring as defined under the terms of the agreement. A credit spread identified as “Defaulted” indicates a credit event has occurred for the referenced entity or obligation. |
| e | The quoted market prices and resulting values for credit default swap agreements on asset-backed securities and credit indices serve as an indicator of the current status of the payment/performance risk and represent the likelihood of an expected liability (or profit) for the credit derivative should the notional amount of the swap agreement be closed/sold as of the period end. Increasing values, in absolute terms when compared to the notional amount of the swap, represent a deterioration of the referenced entity’s credit soundness and a greater likelihood or risk of default or other credit event occurring as defined under the terms of the agreement. |
| f | The maximum potential amount the Fund could be required to make as a seller of credit protection or receive as a buyer of credit protection if a credit event occurs as defined under the terms of that particular swap agreement. |
| j | Amount represents Index Value. |
The accompanying notes are an integral part of the Financial Statements.
33
Harbor Strategic Markets Funds
STATEMENTS OF ASSETS AND LIABILITIES—April 30, 2015 (Unaudited)
(All amounts in thousands, except per share amounts)
| | | | | | | | |
| | | Harbor Commodity
Real Return
Strategy Fund
(Consolidated) | | | Harbor
Unconstrained Bond
Fund | |
ASSETS | | | | | | | | |
Investments, at identified cost* | | $ | 205,566 | | | $ | 33,620 | |
Investments, at value | | $ | 186,251 | | | $ | 33,338 | |
Repurchase agreements | | | 18,277 | | | | 1,212 | |
Cash-restricted | | | 551 | | | | 497 | |
Cash | | | 262 | | | | 11 | |
Foreign currency, at value (cost: $283 and $397) | | | 298 | | | | 409 | |
Receivables for: | | | | | | | | |
Investments sold | | | 10,851 | | | | 14,093 | |
Foreign currency spot contracts | | | 1 | | | | 2 | |
Capital shares sold | | | 204 | | | | — | |
Interest | | | 425 | | | | 144 | |
Unrealized appreciation on open forward currency contracts | | | 2,900 | | | | 1,178 | |
Unrealized appreciation on OTC swap agreements | | | 3,580 | | | | 63 | |
Swap premiums paid | | | — | | | | 86 | |
Variation margin on options and futures contracts | | | 12 | | | | — | |
Variation margin on centrally cleared swap agreements | | | 267 | | | | 104 | |
Options sold | | | 10 | | | | — | |
Prepaid registration fees | | | — | | | | 14 | |
Prepaid fund insurance | | | 1 | | | | — | |
Other assets | | | 32 | | | | 18 | |
Total Assets | | | 223,922 | | | | 51,169 | |
LIABILITIES | | | | | | | | |
Payables for: | | | | | | | | |
Due to broker | | | 3,600 | | | | 263 | |
Investments purchased | | | 4,302 | | | | 8,144 | |
Foreign currency spot contracts | | | — | | | | 3 | |
Capital shares reacquired | | | 537 | | | | 1 | |
Investments sold short, at value (proceeds: $8,324 and $6,479) | | | 8,297 | | | | 6,475 | |
Written options, at value (premiums received: $418 and $211) | | | 365 | | | | 169 | |
Swap premiums received | | | 81 | | | | — | |
Unrealized depreciation on OTC swap agreements | | | 1,404 | | | | 105 | |
Sale-buyback financing transactions | | | 52,498 | | | | 3,659 | |
Variation margin on options and futures contracts | | | 1 | | | | 1 | |
Unrealized depreciation on open forward currency contracts | | | 3,138 | | | | 625 | |
Accrued expenses: | | | | | | | | |
Management fees | | | 99 | | | | 22 | |
Transfer agent fees | | | 8 | | | | 2 | |
Trustees’ fees and expenses | | | 1 | | | | — | |
Other | | | 62 | | | | 20 | |
Total Liabilities | | | 74,393 | | | | 19,489 | |
NET ASSETS | | $ | 149,529 | | | $ | 31,680 | |
Net Assets Consist of: | | | | | | | | |
Paid-in capital | | $ | 203,405 | | | $ | 31,754 | |
Accumulated undistributed net investment income/(loss) | | | (4,603 | ) | | | (605 | ) |
Accumulated net realized gain/(loss) | | | (48,898 | ) | | | (578 | ) |
Unrealized appreciation/(depreciation) of investments and translation of assets and liabilities in foreign currencies | | | (973 | ) | | | 935 | |
Unrealized appreciation/(depreciation) of other financial instruments | | | 598 | | | | 174 | |
| | | $ | 149,529 | | | $ | 31,680 | |
NET ASSET VALUE PER SHARE BY CLASS | | | | | | | | |
Institutional Class | | | | | | | | |
Net assets | | $ | 148,522 | | | $ | 30,547 | |
Shares of beneficial interest1 | | | 31,901 | | | | 2,940 | |
Net asset value per share2 | | $ | 4.66 | | | $ | 10.39 | |
Administrative Class | | | | | | | | |
Net assets | | $ | 1,007 | | | $ | 1,133 | |
Shares of beneficial interest1 | | | 217 | | | | 110 | |
Net asset value per share2 | | $ | 4.63 | | | $ | 10.34 | |
| * | Including repurchase agreements and short-term investments. |
| 1 | Par value $0.01 (unlimited authorizations). |
| 2 | Per share amounts can be recalculated to the amounts disclosed herein when total net assets and shares of beneficial interest are not rounded to thousands. |
The accompanying notes are an integral part of the Financial Statements.
34
Harbor Strategic Markets Funds
STATEMENTS OF OPERATIONS—Six Months Ended April 30, 2015 (Unaudited)
(All amounts in thousands)
| | | | | | | | |
| | | Harbor Commodity
Real Return
Strategy Fund
(Consolidated) | | | Harbor
Unconstrained Bond
Fund | |
Investment Income | | | | | | | | |
Dividends | | $ | — | | | $ | 1 | |
Interest | | | 1,191 | | | | 362 | |
Amortization | | | (1,211 | ) | | | 12 | |
Gains on principal paydown transactions | | | 141 | | | | 40 | |
Earned inflation/(deflation) adjustments | | | (963 | ) | | | (40 | ) |
Total Investment Income | | | (842 | ) | | | 375 | |
Operating Expenses | | | | | | | | |
Management fees | | | 666 | | | | 147 | |
12b-1 fees: | | | | | | | | |
Administrative Class | | | 1 | | | | 2 | |
Shareholder communications | | | 39 | | | | 4 | |
Custodian fees | | | 122 | | | | 91 | |
Transfer agent fees: | | | | | | | | |
Institutional Class | | | 50 | | | | 10 | |
Administrative Class | | | — | | | | — | |
Professional fees | | | 3 | | | | — | |
Trustees’ fees and expenses | | | 2 | | | | — | |
Registration fees | | | 22 | | | | 18 | |
Miscellaneous | | | 4 | | | | 4 | |
Expenses before interest expense | | | 909 | | | | 276 | |
Interest expense | | | 101 | | | | 1 | |
Total expenses | | | 1,010 | | | | 277 | |
Transfer agent fees waived | | | (2 | ) | | | — | |
Other expenses reimbursed | | | (133 | ) | | | (93 | ) |
Net expenses | | | 875 | | | | 184 | |
Net Investment Income/(Loss) | | | (1,717 | ) | | | 191 | |
Realized and Change in Net Unrealized Gain/(Loss) on Investment Transactions | | | | | | | | |
Net realized gain/(loss) on: | | | | | | | | |
Investments | | | (4,328 | ) | | | 800 | |
Foreign currency transactions | | | 6,618 | | | | 623 | |
Investments sold short | | | (177 | ) | | | (87 | ) |
Swap agreements | | | (29,845 | ) | | | (309 | ) |
Futures contracts | | | 460 | | | | 284 | |
Written options | | | 231 | | | | (50 | ) |
Change in net unrealized appreciation/(depreciation) on: | | | | | | | | |
Investments | | | 802 | | | | (1,022 | ) |
Forwards currency contracts | | | (1,650 | ) | | | (24 | ) |
Investments sold short | | | 82 | | | | 4 | |
Swap agreements | | | 3,110 | | | | (423 | ) |
Futures contracts | | | (262 | ) | | | 16 | |
Written options | | | (204 | ) | | | 46 | |
Translations of assets and liabilities in foreign currencies | | | 247 | | | | 36 | |
Net gain/(loss) on investment transactions | | | (24,916 | ) | | | (106 | ) |
Net Increase/(Decrease) in Net Assets Resulting from Operations | | $ | (26,633 | ) | | $ | 85 | |
The accompanying notes are an integral part of the Financial Statements.
35
Harbor Strategic Markets Funds
STATEMENTS OF CHANGES IN NET ASSETS
(All amounts in thousands)
| | | | | | | | | | | | | | | | |
| | | Harbor Commodity
Real Return
Strategy Fund
(Consolidated) | | | Harbor
Unconstrained Bond
Fund | |
| | | November 1,
2014
through
April 30,
2015 | | | November 1,
2013
through
October 31,
2014 | | | November 1,
2014
through
April 30,
2015 | | | November 1,
2013
through
October 31,
2014 | |
INCREASE/(DECREASE) IN NET ASSETS | | | (Unaudited) | | | | | | | | (Unaudited) | | | | | |
Operations: | | | | | | | | | | | | | | | | |
Net investment income/(loss) | | $ | (1,717 | ) | | $ | 3,288 | | | $ | 191 | | | $ | 473 | |
Net realized gain/(loss) on investments | | | (27,041 | ) | | | (17,852 | ) | | | 1,261 | | | | (1,041 | ) |
Change in net unrealized appreciation/(depreciation) of investments | | | 2,125 | | | | 1,638 | | | | (1,367 | ) | | | 1,505 | |
Net increase/(decrease) in assets resulting from operations | | | (26,633 | ) | | | (12,926 | ) | | | 85 | | | | 937 | |
Distributions to Shareholders | | | | | | | | | | | | | | | | |
Net investment income: | | | | | | | | | | | | | | | | |
Institutional Class | | | (6,835 | ) | | | (344 | ) | | | (1,434 | ) | | | (110 | ) |
Administrative Class | | | (45 | ) | | | (1 | ) | | | (46 | ) | | | (3 | ) |
Net realized gain on investments: | | | | | | | | | | | | | | | | |
Institutional Class | | | — | | | | (6,817 | ) | | | — | | | | — | |
Administrative Class | | | — | | | | (26 | ) | | | — | | | | — | |
Total distributions to shareholders | | | (6,880 | ) | | | (7,188 | ) | | | (1,480 | ) | | | (113 | ) |
Net Increase/(Decrease) Derived from Capital Share Transactions | | | (27,190 | ) | | | (89,733 | ) | | | (4,724 | ) | | | (6,304 | ) |
Net increase/(decrease) in net assets | | | (60,703 | ) | | | (109,847 | ) | | | (6,119 | ) | | | (5,480 | ) |
Net Assets | | | | | | | | | | | | | | | | |
Beginning of period | | | 210,232 | | | | 320,079 | | | | 37,799 | | | | 43,279 | |
End of period* | | $ | 149,529 | | | $ | 210,232 | | | $ | 31,680 | | | $ | 37,799 | |
* Includes accumulated undistributed net investment income/(loss) of: | | $ | (4,603 | ) | | $ | 3,994 | | | $ | (605 | ) | | $ | 684 | |
The accompanying notes are an integral part of the Financial Statements.
36
Harbor Strategic Markets Funds
STATEMENTS OF CHANGES IN NET ASSETS—CAPITAL STOCK ACTIVITY
(All amounts in thousands)
| | | | | | | | | | | | | | | | |
| | | Harbor Commodity
Real Return
Strategy Fund
(Consolidated) | | | Harbor
Unconstrained Bond
Fund | |
| | | November 1,
2014
through
April 30,
2015 | | | November 1,
2013
through
October 31,
2014 | | | November 1,
2014
through
April 30,
2015 | | | November 1,
2013
through
October 31,
2014 | |
| | | (Unaudited) | | | | | | | | (Unaudited) | | | | | |
AMOUNT ($) | | | | | | | | | | | | | | | | |
Institutional Class | | | | | | | | | | | | | | | | |
Net proceeds from sale of shares | | $ | 47,982 | | | $ | 122,921 | | | $ | 3,864 | | | $ | 9,113 | |
Reinvested distributions | | | 6,405 | | | | 6,548 | | | | 1,403 | | | | 106 | |
Cost of shares reacquired | | | (81,559 | ) | | | (219,409 | ) | | | (9,508 | ) | | | (15,928 | ) |
Net increase/(decrease) in net assets | | $ | (27,172 | ) | | $ | (89,940 | ) | | $ | (4,241 | ) | | $ | (6,709 | ) |
Administrative Class | | | | | | | | | | | | | | | | |
Net proceeds from sale of shares | | $ | 165 | | | $ | 714 | | | $ | 132 | | | $ | 696 | |
Reinvested distributions | | | 36 | | | | 21 | | | | 46 | | | | 3 | |
Cost of shares reacquired | | | (219 | ) | | | (528 | ) | | | (661 | ) | | | (294 | ) |
Net increase/(decrease) in net assets | | $ | (18 | ) | | $ | 207 | | | $ | (483 | ) | | $ | 405 | |
SHARES | | | | | | | | | | | | | | | | |
Institutional Class | | | | | | | | | | | | | | | | |
Shares sold | | | 9,920 | | | | 20,432 | | | | 368 | | | | 855 | |
Shares issued due to reinvestment of distributions | | | 1,335 | | | | 1,098 | | | | 136 | | | | 10 | |
Shares reacquired | | | (16,798 | ) | | | (36,104 | ) | | | (909 | ) | | | (1,492 | ) |
Net increase/(decrease) in shares outstanding | | | (5,543 | ) | | | (14,574 | ) | | | (405 | ) | | | (627 | ) |
Beginning of period | | | 37,444 | | | | 52,018 | | | | 3,345 | | | | 3,972 | |
End of period | | | 31,901 | | | | 37,444 | | | | 2,940 | | | | 3,345 | |
Administrative Class | | | | | | | | | | | | | | | | |
Shares sold | | | 34 | | | | 119 | | | | 13 | | | | 66 | |
Shares issued due to reinvestment of distributions | | | 8 | | | | 3 | | | | 5 | | | | — | |
Shares reacquired | | | (47 | ) | | | (87 | ) | | | (62 | ) | | | (28 | ) |
Net increase/(decrease) in shares outstanding | | | (5 | ) | | | 35 | | | | (44 | ) | | | 38 | |
Beginning of period | | | 222 | | | | 187 | | | | 154 | | | | 116 | |
End of period | | | 217 | | | | 222 | | | | 110 | | | | 154 | |
The accompanying notes are an integral part of the Financial Statements.
37
Harbor Strategic Markets Funds
STATEMENT OF CASH FLOWS—Six Months Ended April 30, 2015 (Unaudited)
(All amounts in thousands)
| | | | |
| | | Harbor Commodity
Real Return
Strategy Fund
(Consolidated) | |
Cash flows provided by operating activities: | | | | |
Net decrease in net assets resulting from operations | | $ | (26,633 | ) |
Adjustments to reconcile net decrease in net assets resulting from operations to net cash provided by operating activities: | | | | |
Purchases of long-term securities | | | (602,351 | ) |
Proceeds from sales of long-term securities | | | 689,680 | |
Proceeds from short-term portfolio investments, net | | | 21,919 | |
Decrease in receivable for investments sold | | | 20,111 | |
Increase in foreign spot contracts receivable | | | (1 | ) |
Decrease in interest receivable | | | 654 | |
Increase in variation margin on options and futures contracts | | | (12 | ) |
Increase in variation margin on swap agreements | | | (89 | ) |
Increase in options sold | | | (10 | ) |
Decrease in prepaid registration fees | | | 3 | |
Increase in prepaid fund insurance | | | (1 | ) |
Decrease in other assets | | | 3 | |
Decrease in payable for investments purchased | | | (14,118 | ) |
Decrease in investments sold short | | | (9,603 | ) |
Increase in premiums from options written | | | 99 | |
Decrease in swap premiums received | | | (67 | ) |
Decrease in variation margin on options and futures contracts | | | (102 | ) |
Decrease in management fees payable | | | (49 | ) |
Decrease in transfer agent fees payable | | | (3 | ) |
Increase in other liabilities | | | 25 | |
Net change in unrealized appreciation/(depreciation) on investments | | | (884 | ) |
Net change in unrealized appreciation/(depreciation) on forwards | | | 1,650 | |
Net change in unrealized appreciation/(depreciation) on swaps | | | (1,381 | ) |
Net change in unrealized appreciation/(depreciation) on written options | | | 199 | |
Net realized loss on investments | | | 4,505 | |
Net amortization and earned inflation component | | | 3,502 | |
Net cash provided by operating activities | | | 87,046 | |
Cash flows used for financing activities: | | | | |
Proceeds from shares sold | | | 48,530 | |
Payment on shares redeemed | | | (81,611 | ) |
Cash dividends paid | | | (439 | ) |
Decrease in sale-buyback financing transactions | | | (51,249 | ) |
Decrease in due to broker and cash-restricted | | | (2,209 | ) |
Net cash used for financing activities | | | (86,978 | ) |
Net Increase in Cash | | | 68 | |
Cash and Foreign Currency | | | | |
Beginning of period | | $ | 492 | |
End of period | | | 560 | |
Reinvestment of dividends | | $ | 6,441 | |
Supplemental disclosure of cash flow information: | | | | |
Interest paid during the year | | $ | 101 | |
The accompanying notes are an integral part of the Financial Statements.
38
[THIS PAGE INTENTIONALLY LEFT BLANK]
39
Harbor Strategic Markets Funds Financial Highlights
SELECTED DATA FOR A SHARE OUTSTANDING FOR THE PERIODS PRESENTED
| | | | | | | | | | | | | | | | | | | | | | | | |
HARBOR COMMODITY REAL RETURN STRATEGY FUND (CONSOLIDATED) | |
| | | Institutional Class | |
| | | 6-Month
Period Ended
April 30, 2015 | | | Year Ended October 31, | |
| | | | 2014 | | | 2013 | | | 2012 | | | 2011 | | | 2010 | |
| | | (Unaudited) | | | | | | | | | | | | | | | | |
Net asset value beginning of period | | $ | 5.58 | | | $ | 6.13 | | | $ | 7.38 | | | $ | 7.66 | | | $ | 8.07 | | | $ | 7.28 | |
Income from Investment Operations | | | | | | | | | | | | | | | | | | | | | | | | |
Net investment income/(loss)a | | | (0.05 | )f | | | 0.14 | | | | 0.02 | | | | 0.08 | | | | 0.02 | | | | (0.02 | ) |
Net realized and unrealized gains/(losses) on investments | | | (0.67 | ) | | | (0.55 | ) | | | (1.17 | ) | | | 0.01 | | | | 0.41 | | | | 1.46 | |
Total from investment operations | | | (0.72 | ) | | | (0.41 | ) | | | (1.15 | ) | | | 0.09 | | | | 0.43 | | | | 1.44 | |
Less Distributions | | | | | | | | | | | | | | | | | | | | | | | | |
Dividends from net investment income | | | (0.20 | ) | | | (0.01 | ) | | | (0.08 | ) | | | (0.11 | ) | | | (0.65 | ) | | | (0.64 | ) |
Distributions from net realized capital gains1 | | | — | | | | (0.13 | ) | | | (0.02 | ) | | | (0.26 | ) | | | (0.19 | ) | | | (0.01 | ) |
Total distributions | | | (0.20 | ) | | | (0.14 | ) | | | (0.10 | ) | | | (0.37 | ) | | | (0.84 | ) | | | (0.65 | ) |
Proceeds from redemption fees | | | — | | | | — | | | | — | * | | | — | * | | | — | * | | | — | * |
Net asset value end of period | | | 4.66 | | | | 5.58 | | | | 6.13 | | | | 7.38 | | | | 7.66 | | | | 8.07 | |
Net assets end of period (000s) | | $ | 148,522 | | | $ | 208,996 | | | $ | 318,937 | | | $ | 348,315 | | | $ | 301,478 | | | $ | 150,555 | |
Ratios and Supplemental Data (%) | | | | | | | | | | | | | | | | | | | | | | | | |
Total returnb | | | (13.07 | )%c | | | (6.82 | )% | | | (15.76 | )% | | | 1.73 | % | | | 5.56 | % | | | 21.29 | % |
Ratio of total expenses to average net assets2 | | | 1.23 | d | | | 1.04 | | | | 1.03 | | | | 1.09 | | | | 1.05 | | | | 1.15 | |
Ratio of net expenses to average net assetsa | | | 1.06 | d | | | 0.98 | | | | 0.98 | | | | 1.00 | | | | 0.94 | | | | 0.94 | |
Ratio of net expenses excluding interest expense to average net assetsa | | | 0.94 | d | | | 0.94 | | | | 0.94 | | | | 0.94 | | | | 0.94 | | | | 0.94 | |
Ratio of net investment income to average net assetsa | | | (2.09 | )d | | | 1.23 | | | | 0.45 | | | | 1.21 | | | | 1.79 | | | | 1.11 | |
Portfolio turnover | | | 258 | c | | | 635 | | | | 532 | | | | 474 | | | | 581 | | | | 390 | |
| | | | | | | | | | | | | | | | | | | | | | | | |
| | | | | | | | | | | | | | | | | | | | | | | | |
HARBOR UNCONSTRAINED BOND FUND | |
| | | Institutional Class | |
| | | 6-Month
Period Ended
April 30, 2015 | | | Year Ended October 31, | |
| | | | 2014 | | | 2013 | | | 2012 | | | 2011 | | | 2010e | |
| | | (Unaudited) | | | | | | | | | | | | | | | | |
Net asset value beginning of period | | $ | 10.80 | | | $ | 10.59 | | | $ | 10.65 | | | $ | 10.18 | | | $ | 10.35 | | | $ | 10.00 | |
Income from Investment Operations | | | | | | | | | | | | | | | | | | | | | | | | |
Net investment income/(loss)a | | | 0.06 | f | | | 0.15 | | | | 0.14 | | | | 0.21 | | | | 0.14 | | | | 0.10 | |
Net realized and unrealized gains/(losses) on investments | | | (0.03 | ) | | | 0.09 | | | | 0.02 | | | | 0.55 | | | | (0.22 | ) | | | 0.33 | |
Total from investment operations | | | 0.03 | | | | 0.24 | | | | 0.16 | | | | 0.76 | | | | (0.08 | ) | | | 0.43 | |
Less Distributions | | | | | | | | | | | | | | | | | | | | | | | | |
Dividends from net investment income | | | (0.44 | ) | | | (0.03 | ) | | | (0.22 | ) | | | (0.21 | ) | | | (0.09 | ) | | | (0.08 | ) |
Distributions from net realized capital gains1 | | | — | | | | — | | | | — | | | | (0.08 | ) | | | — | | | | — | |
Total distributions | | | (0.44 | ) | | | (0.03 | ) | | | (0.22 | ) | | | (0.29 | ) | | | (0.09 | ) | | | (0.08 | ) |
Net asset value end of period | | | 10.39 | | | | 10.80 | | | | 10.59 | | | | 10.65 | | | | 10.18 | | | | 10.35 | |
Net assets end of period (000s) | | $ | 30,547 | | | $ | 36,137 | | | $ | 42,054 | | | $ | 30,551 | | | $ | 25,922 | | | $ | 5,676 | |
Ratios and Supplemental Data (%) | | | | | | | | | | | | | | | | | | | | | | | | |
Total returnb | | | 0.31 | %c | | | 2.26 | % | | | 1.56 | % | | | 7.68 | % | | | (0.74 | )% | | | 4.32 | %c |
Ratio of total expenses to average net assets2 | | | 1.60 | d | | | 1.34 | | | | 1.34 | | | | 1.45 | | | | 1.59 | | | | 5.62 | d |
Ratio of net expenses to average net assetsa | | | 1.06 | d | | | 1.05 | | | | 1.05 | | | | 1.07 | | | | 1.05 | | | | 1.05 | d |
Ratio of net expenses excluding interest expense to average net assetsa | | | 1.05 | d | | | 1.05 | | | | 1.05 | | | | 1.05 | | | | 1.05 | | | | 1.05 | d |
Ratio of net investment income to average net assetsa | | | 1.12 | d | | | 1.15 | | | | 1.42 | | | | 2.26 | | | | 1.86 | | | | 1.95 | d |
Portfolio turnover | | | 398 | c | | | 417 | | | | 1,440 | | | | 1,262 | | | | 1,067 | | | | 954 | c |
| 1 | Includes both short-term and long-term capital gains. |
| 2 | Percentage does not reflect reduction for credit balance arrangements (see Note 2 of the accompanying Notes to Financial Statements). |
| a | Reflects the Adviser’s waiver, if any, of its management fees and/or other operating expenses. |
| b | The total returns would have been lower had certain expenses not been waived during the periods shown. |
| e | For the period April 1, 2010 (inception) through October 31, 2010. |
| f | Amounts are allocated based upon average shares outstanding during the period. |
The accompanying notes are an integral part of the Financial Statements.
40
| | | | | | | | | | | | | | | | | | | | | | |
| | | | | | | | | | | | | | | | | | | | | | |
| Administrative Class | |
6-Month
Period Ended
April 30, 2015 | | | Year Ended October 31, | |
| | 2014 | | | 2013 | | | 2012 | | | 2011 | | | 2010 | |
| (Unaudited) | | | | | | | | | | | | | | | | |
| $ | 5.56 | | | $ | 6.12 | | | $ | 7.37 | | | $ | 7.65 | | | $ | 8.06 | | | $ | 7.26 | |
| | | | | | | | | | | | | | | | | | | | | | |
| | (0.06 | )f | | | 0.03 | | | | 0.02 | | | | 0.08 | | | | (0.18 | ) | | | (0.21 | ) |
| | (0.68 | ) | | | (0.45 | ) | | | (1.18 | ) | | | — | | | | 0.59 | | | | 1.64 | |
| | (0.74 | ) | | | (0.42 | ) | | | (1.16 | ) | | | 0.08 | | | | 0.41 | | | | 1.43 | |
| | | | | | | | | | | | | | | | | | | | | | |
| | (0.19 | ) | | | (0.01 | ) | | | (0.07 | ) | | | (0.10 | ) | | | (0.63 | ) | | | 0.62 | ) |
| | — | | | | (0.13 | ) | | | (0.02 | ) | | | (0.26 | ) | | | (0.19 | ) | | | (0.01 | ) |
| | (0.19 | ) | | | (0.14 | ) | | | (0.09 | ) | | | (0.36 | ) | | | (0.82 | ) | | | (0.63 | ) |
| | — | | | | — | | | | — | * | | | — | * | | | — | * | | | — | * |
| | 4.63 | | | | 5.56 | | | | 6.12 | | | | 7.37 | | | | 7.65 | | | | 8.06 | |
| $ | 1,007 | | | $ | 1,236 | | | $ | 1,142 | | | $ | 1,427 | | | $ | 1,132 | | | $ | 385 | |
| | | | | | | | | | | | | | | | | | | | | | |
| | (13.36 | )%c | | | (7.06 | )% | | | (15.93 | )% | | | 1.50 | % | | | 5.31 | % | | | 21.13 | % |
| | 1.48 | d | | | 1.29 | | | | 1.27 | | | | 1.34 | | | | 1.31 | | | | 1.40 | |
| | 1.31 | d | | | 1.23 | | | | 1.23 | | | | 1.26 | | | | 1.19 | | | | 1.19 | |
| | 1.19 | d | | | 1.19 | | | | 1.19 | | | | 1.19 | | | | 1.19 | | | | 1.19 | |
| | (2.34 | )d | | | 1.40 | | | | 0.11 | | | | 1.13 | | | | 1.59 | | | | 0.87 | |
| | 258 | c | | | 635 | | | | 532 | | | | 474 | | | | 581 | | | | 390 | |
| | | | | | | | | | | | | | | | | | | | | | |
| | | | | | | | | | | | | | | | | | | | | | |
| | | | | | | | | | | | | | | | | | | | | | |
| Administrative Class | |
6-Month
Period Ended
April 30, 2015 | | | Year Ended October 31, | |
| | 2014 | | | 2013 | | | 2012 | | | 2011 | | | 2010e | |
| (Unaudited) | | | | | | | | | | | | | | | | |
| $ | 10.75 | | | $ | 10.56 | | | $ | 10.63 | | | $ | 10.17 | | | $ | 10.34 | | | $ | 10.00 | |
| | | | | | | | | | | | | | | | | | | | | | |
| | 0.05 | f | | | 0.08 | | | | 0.08 | | | | 0.27 | | | | 0.14 | | | | 0.10 | |
| | (0.04 | ) | | | 0.13 | | | | 0.06 | | | | 0.46 | | | | (0.24 | ) | | | 0.31 | |
| | 0.01 | | | | 0.21 | | | | 0.14 | | | | 0.73 | | | | (0.10 | ) | | | 0.41 | |
| | | | | | | | | | | | | | | | | | | | | | |
| | (0.42 | ) | | | (0.02 | ) | | | (0.21 | ) | | | (0.19 | ) | | | (0.07 | ) | | | (0.07 | ) |
| | — | | | | — | | | | — | | | | (0.08 | ) | | | — | | | | — | |
| | (0.42 | ) | | | (0.02 | ) | | | (0.21 | ) | | | (0.27 | ) | | | (0.07 | ) | | | (0.07 | ) |
| | 10.34 | | | | 10.75 | | | | 10.56 | | | | 10.63 | | | | 10.17 | | | | 10.34 | |
| $ | 1,133 | | | $ | 1,662 | | | $ | 1,225 | | | $ | 703 | | | $ | 944 | | | $ | 163 | |
| | | | | | | | | | | | | | | | | | | | | | |
| | 0.17 | %c | | | 2.01 | % | | | 1.30 | % | | | 7.38 | % | | | (0.93 | )% | | | 4.09 | %c |
| | 1.85 | d | | | 1.59 | | | | 1.59 | | | | 1.70 | | | | 1.85 | | | | 5.86 | d |
| | 1.31 | d | | | 1.30 | | | | 1.31 | | | | 1.32 | | | | 1.30 | | | | 1.30 | d |
| | 1.30 | d | | | 1.30 | | | | 1.30 | | | | 1.30 | | | | 1.30 | | | | 1.30 | d |
| | 0.88 | d | | | 0.89 | | | | 1.15 | | | | 2.03 | | | | 1.58 | | | | 1.64 | d |
| | 398 | c | | | 417 | | | | 1,440 | | | | 1,262 | | | | 1,067 | | | | 954 | c |
The accompanying notes are an integral part of the Financial Statements.
41
Harbor Strategic Markets Funds
NOTES TO FINANCIAL STATEMENTS—April 30, 2015 (Unaudited)
(Currency in thousands)
NOTE 1—ORGANIZATIONAL MATTERS
Harbor Funds (the “Trust”) is registered under the Investment Company Act of 1940, as amended (the “Investment Company Act”), as an open-end management investment company. The Trust consists of 28 separate portfolios. The portfolios covered by this report include: Harbor Commodity Real Return Strategy Fund and Harbor Unconstrained Bond Fund (individually or collectively referred to as a “Fund” or the “Funds,” respectively). Harbor Capital Advisors, Inc. (the “Adviser” or “Harbor Capital”) is the investment adviser for the Funds.
The Funds may offer up to two classes of shares, designated as Institutional Class and Administrative Class. The shares of each class represent an interest in the same portfolio of investments of the respective Fund and have equal rights to voting, redemptions, dividends, and liquidations, except that: (i) certain expenses, subject to the approval of the Trust’s Board of Trustees (the “Board of Trustees”), may be applied differently to each class of shares in accordance with current regulations of the Securities and Exchange Commission and the Internal Revenue Service; and (ii) shareholders of a class that bears distribution and service expenses under terms of a distribution plan have exclusive voting rights as to that distribution plan.
NOTE 2—SIGNIFICANT ACCOUNTING POLICIES
The following is a summary of significant accounting policies followed by the Trust in the preparation of its financial statements. Each Fund follows the investment company reporting requirements under U.S. Generally Accepted Accounting Principles (“U.S. GAAP”). The preparation of financial statements in accordance with U.S. GAAP requires management to make estimates and assumptions that affect the reported amounts and disclosures in the financial statements. Actual results may differ from those estimates.
Security Valuation
Equity securities (including common stock, preferred stock, and convertible preferred stock) and financial derivative instruments (such as futures contracts, options contracts and centrally cleared swap agreements) that are traded on a national security exchange (except securities listed on the National Association of Securities Dealers Automated Quotation (“NASDAQ”) system and United Kingdom securities), are valued at the last sale price on a national exchange or system on which they are principally traded as of the valuation date. Securities listed on the NASDAQ system or a United Kingdom exchange are valued at the official closing price of those securities. In the case of securities for which there are no sales on the valuation day, (i) securities traded principally on a U.S. exchange, including NASDAQ, are valued at the mean between the closing bid and ask price; and (ii) securities traded principally on a foreign exchange, including United Kingdom securities, are valued at the official bid price determined as of the close of the primary exchange. Securities of open-end registered investment companies that are held by a Fund are valued at net asset value. To the extent these securities are actively traded and fair valuation adjustments are not applied, they are normally categorized as Level 1 in the fair value hierarchy. Equity securities traded on inactive markets or valued by reference to similar instruments are normally categorized as Level 2 in the fair value hierarchy. For more information on the fair value hierarchy, please refer to the Fair Value Measurements and Disclosures section in Note 2.
Debt securities (including corporate bonds, municipal bonds and notes, U.S. government agencies, U.S. Treasury obligations, mortgage-backed and asset-backed securities, foreign government obligations, bank loans, and convertible securities other than short-term securities with a remaining maturity of less than 60 days at the time of acquisition), are valued using evaluated prices furnished by a pricing service selected by the Board of Trustees. An evaluated price represents an assessment by the pricing service using various market inputs of what the pricing service believes is the fair value of a security at a particular point in time. The pricing service determines evaluated prices for debt securities that would be transacted at institutional-size quantities using inputs including, but not limited to, (i) recent transaction prices and dealer quotes, (ii) transaction prices for what the pricing service believes are securities with similar characteristics, (iii) the pricing vendor’s assessment of the risk inherent in the security taking into account criteria such as credit quality, payment history, liquidity and market conditions, and (iv) various correlations and relationships between security price movements and other factors, such as interest rate changes, which are recognized by institutional traders. In the case of mortgage-backed and asset-backed securities, the inputs used by the pricing service may also include information about cash flows, prepayment rates, default rates, delinquency and loss assumptions, collateral characteristics, credit
42
Harbor Strategic Markets Funds
NOTES TO FINANCIAL STATEMENTS—Continued
(Currency in thousands)
NOTE 2—SIGNIFICANT ACCOUNTING POLICIES—Continued
enhancements and other specific information about the particular offering. Because many debt securities trade infrequently, the pricing vendor will often not have current transaction price information available as an input in determining an evaluated price for a particular security. When current transaction price information is available, it is one input into the pricing service’s evaluation process, which means that the evaluated price supplied by the pricing service will frequently differ from that transaction price. Short-term securities with a remaining maturity of less than 60 days at the time of acquisition are generally valued at amortized cost, which approximates fair value. Under this method, investments purchased at a discount or premium are valued by accreting or amortizing the difference between the original purchase price and the maturity value of the issue over the period to effective maturity. Securities that use similar valuation techniques and inputs as described above are normally categorized as Level 2 in the fair value hierarchy.
Over-the-counter (“OTC”) financial derivative instruments, such as forward currency contracts, options contracts, and swap agreements, derive their value from underlying asset prices, indices, reference rates and other inputs, or a combination of these factors. These instruments are valued using evaluated prices furnished by a pricing service selected by the Board of Trustees. In certain cases, when a valuation is not readily available from a pricing service, the Fund’s subadviser provides a valuation, typically using its own proprietary models. Depending on the instrument and the terms of the transaction, the value of the derivative instrument can be determined by a pricing service or subadviser using a series of techniques, including simulation pricing models. The pricing models use inputs, such as issuer details, indices, spreads, interest rates, yield curves, dividends and exchange rates, that are observed from actively quoted markets. Derivative instruments that use valuation techniques and inputs similar to those described above are normally categorized as Level 2 in the fair value hierarchy.
When reliable market quotations or evaluated prices supplied by a pricing vendor are not readily available or are not believed to accurately reflect fair value, securities are priced at their fair value as determined by the Trust’s Valuation Committee (the “Valuation Committee”) pursuant to procedures adopted, and subject to oversight, by the Board of Trustees. The Valuation Committee is comprised of a trustee and officers of the Trust and employees of Harbor Capital with relevant experience or responsibilities. Each security for which the Valuation Committee determines a fair value, including the basis for the fair value decision, is reviewed by the Board of Trustees at its regularly scheduled board meetings.
When a fair valuation method is applied by the Valuation Committee or a Fund’s subadviser, securities will be priced by a method that the Valuation Committee or subadviser believes accurately reflects fair value. Securities valued using fair valuation methods that incorporate significant unobservable inputs are normally categorized as Level 3 in the fair value hierarchy. Examples of possible fair valuation methodologies used in determining the fair value of securities categorized as Level 3 in the fair value hierarchy include, but are not limited to, benchmark pricing and indicative market quotations.
When benchmark pricing is used, the base price of a debt security is set and then subsequently adjusted in proportion to the market value changes of an index or similar security (the “benchmark security”) that trades in an active market or for which other observable inputs are available. The base price may be a broker-dealer quote, transaction price, or an internal value as derived by analysis of market data. The base price of the security may be reset on a periodic basis based on the availability of market data and procedures approved by a Fund’s subadviser. If the benchmark security is categorized as Level 2 of the fair value hierarchy due to the lack of an active market for that security, any security adjusted in proportion to the market value of the benchmark security may be categorized as Level 3 in the fair value hierarchy. Significant changes in the unobservable inputs of the benchmark pricing process (i.e., the base price) would result in direct and proportional changes in the fair value of the security. The reasonability of the fair value is reviewed by the subadviser on a periodic basis and may be amended as the availability of market data indicates a material change.
If evaluated pricing through a third-party pricing vendor is not available or deemed to be indicative of fair value, a Fund’s subadviser may elect to obtain indicative market quotations (“broker quotes”) directly from a broker-dealer or passed through from a third-party pricing vendor. Indicative market quotations are typically received from established market participants. In the event that the source of fair value is from a single-sourced broker quote, but the subadviser does not have the transparency to view the underlying inputs that support the market quotation, these securities are categorized as Level 3 in the fair value hierarchy. Significant changes in the broker quote would have direct and proportional changes in the fair value of the security.
43
Harbor Strategic Markets Funds
NOTES TO FINANCIAL STATEMENTS—Continued
(Currency in thousands)
NOTE 2—SIGNIFICANT ACCOUNTING POLICIES—Continued
A Fund may also use fair value pricing if the value of some or all of the Fund’s securities have been materially affected by events occurring before the Fund’s pricing time but after the close of the primary markets or exchanges on which the security is traded. This most commonly occurs with foreign securities, but may occur with other securities as well. In such cases, the Fund may apply a fair value factor supplied by the pricing service to a foreign security’s market close value to reflect changes in value that may have occurred between the close of the primary market or exchange on which the security is traded and the Fund’s pricing time. That factor may be derived using observable inputs such as a comparison of the trading patterns of a foreign security to intraday trading in the U.S. markets that are highly correlated to the foreign security or other information that becomes available after the close of the foreign market on which the security principally traded. Fair value pricing is inherently subjective and reflects good faith judgments based on available information. When fair value pricing is employed, the prices of securities used by a Fund to calculate its net asset value may differ from market quotations, official closing prices or evaluated prices for the same securities, which means that the Fund may value those securities higher or lower than another given fund that uses market quotations, official closing prices or evaluated prices supplied by a pricing vendor in its calculation of net asset value. Securities valued using observable inputs, such as those described above, are normally categorized as Level 2 of the fair value hierarchy.
Fair Value Measurements and Disclosures
Various inputs may be used to determine the value of each Fund’s investments, which are summarized in three broad categories defined as Level 1, Level 2 and Level 3. The inputs or methodologies used for valuing securities are not necessarily an indication of the risk associated with investing in those securities. The assignment of an investment to Level 1, 2 or 3 is based on the lowest level of significant inputs used to determine its fair value.
| | |
| Level 1— | | Quoted prices in active markets for identical securities. |
| Level 2— | | Other significant observable inputs (including quoted prices for similar securities, interest rates, prepayment speeds, credit risk, etc.). |
| Level 3— | | Significant unobservable inputs are used in situations where quoted prices or other observable inputs are not available or are deemed unreliable. Significant unobservable inputs may include the Funds’ own assumptions. |
Transfers between Levels, if any, are recognized as of the last day in the fiscal quarter of the period in which the event or change in circumstances that caused the reclassification occurred. For fair valuations using significant unobservable inputs, a reconciliation of the beginning to ending balances for reported fair values is provided that presents changes attributable to realized and unrealized gains and losses and purchases, sales, and transfers in/out of the Level 3 category during the period. A table that includes a categorization of investments into Level 1, Level 2 or Level 3, transfers between Levels, if any, and a Level 3 reconciliation, including details of significant unobservable inputs used, when applicable, can be found at the end of each Fund’s Portfolio of Investments schedule.
The Funds used observable inputs in their valuation methodologies whenever they were available and deemed reliable.
Loan Participations and Assignments
Loan participations and loan assignments are direct debt instruments, which are interests in amounts owed by corporate, governmental, or other borrowers to lenders or lending syndicates. During the period, Harbor Unconstrained Bond Fund invested in loan participations and assignments. A Fund’s investments in loans may be in the form of participation in loans or assignments of all or a portion of loans from third parties. A loan is often administered by a bank or other financial institution (the “agent”) that acts as agent for all holders. The agent administers the terms of the loan, as specified in the loan agreement. When investing in a loan participation, the Fund has the right to receive payments of principal, interest and any fees to which it is entitled, only from the agent selling the loan agreement and only upon receipt by the agent of payments from the borrower. As a result, the Fund may be subject to the credit risk of both the borrower and the agent that is selling the loan agreement. When the Fund purchases assignments from agents it acquires direct rights against the borrower on the loan.
44
Harbor Strategic Markets Funds
NOTES TO FINANCIAL STATEMENTS—Continued
(Currency in thousands)
NOTE 2—SIGNIFICANT ACCOUNTING POLICIES—Continued
Inflation-Indexed Bonds
Inflation-indexed bonds are fixed-income securities whose principal value is periodically adjusted based on the rate of inflation. During the period, each Fund invested in inflation-indexed bonds. The interest rate on these bonds is generally fixed at issuance at a rate lower than typical bonds. Over the life of an inflation-indexed bond, however, interest will be paid based on a principal value that is adjusted for inflation. Any increase in the principal amount of an inflation-indexed bond will be included as interest income even though investors do not receive the principal until maturity.
Mortgage-Related and Other Asset-Backed Securities
Mortgage-backed or asset-backed securities include mortgage pass-through securities, collateralized mortgage obligations (“CMOs”), commercial mortgage-backed securities, mortgage dollar roll transactions, CMO residuals, stripped mortgage-backed securities (“SMBSs”) and other securities that directly or indirectly represent a participation in, or are secured by and payable from, mortgage loans on real property. During the period, each Fund invested in mortgage- or other asset-backed securities. The value of some mortgage- or asset-backed securities may be particularly sensitive to changes in prevailing interest rates. Early repayment of principal on some mortgage-related securities may expose a Fund to a lower rate of return upon reinvestment of principal. The value of these securities may fluctuate in response to the market’s perception of the creditworthiness of the issuers. Additionally, although mortgages and mortgage-related securities are generally supported by some form of government or private guarantee and/or insurance, there is no assurance that private guarantors or insurers will meet their obligations.
U.S. Government Securities
During the period, each Fund invested in U.S. government securities. U.S. government securities include securities issued by U.S. government agencies or government-sponsored enterprises that may not be guaranteed by the U.S. Treasury. The Government National Mortgage Association (“GNMA” or “Ginnie Mae”), a wholly owned U.S. government corporation, is authorized to guarantee, with the full faith and credit of the U.S. government, the timely payment of principal and interest on securities issued by institutions approved by GNMA and backed by pools of mortgages insured by the Federal Housing Administration or guaranteed by the Department of Veterans Affairs. Government-related guarantors (i.e., not backed by the full faith and credit of the U.S. government) include the Federal National Mortgage Association (“FNMA” or “Fannie Mae”) and the Federal Home Loan Mortgage Corporation (“FHLMC” or “Freddie Mac”). On September 7, 2008, the Federal Housing Finance Agency placed Fannie Mae and Freddie Mac in conservatorship, while the U.S. Treasury agreed to purchase preferred stock as needed to ensure that both Fannie Mae and Freddie Mac maintain a positive net worth (guaranteeing up to $100 billion for each entity). As a consequence, certain fixed income securities of Fannie Mae and Freddie Mac have more explicit U.S. government support.
Forward Commitments and When-Issued Securities
During the period, each Fund purchased and sold securities on a forward commitment basis, including “TBA” (to be announced) purchase and sale commitments. Purchasing securities on a when-issued or forward commitment basis involves a risk of loss if the value of the security to be purchased declines prior to the settlement date. Such risk is in addition to the risk of decline in value of a Fund’s other assets. Although a Fund would generally purchase securities on a when-issued or forward commitment basis with the intention of acquiring securities for its portfolio, a Fund may dispose of a when-issued security or forward commitment prior to settlement if a subadviser deems it appropriate to do so. Each Fund may enter into a forward commitment sale to hedge its portfolio positions or to sell securities it owned under a delayed delivery arrangement. Sale proceeds are not received until the contractual settlement date. While such a contract is outstanding, a Fund must segregate equivalent deliverable securities or hold an offsetting purchase commitment. A Fund may realize short-term gains or losses upon such purchases and sales. These transactions involve a commitment by a Fund to purchase or sell securities at a future date (ordinarily one or two months later). The price of the underlying securities (usually expressed in terms of yield) and the date when the securities will be delivered and paid for (the settlement date) are fixed at the time the transaction is negotiated. When-issued purchase and forward commitment transactions are negotiated directly with the other party, and such commitments are not traded on exchanges.
45
Harbor Strategic Markets Funds
NOTES TO FINANCIAL STATEMENTS—Continued
(Currency in thousands)
NOTE 2—SIGNIFICANT ACCOUNTING POLICIES—Continued
The value of securities purchased on a when-issued or forward commitment basis and any subsequent fluctuations in their value are reflected in the computation of a Fund’s net asset value starting on the date of the agreement to purchase the securities. A Fund does not earn interest on the securities it has committed to purchase until they are paid for and delivered on the settlement date. When a Fund makes a forward commitment to sell securities it owns, the proceeds to be received upon settlement are included in the Fund’s assets. Fluctuations in the market value of the underlying securities are not reflected in a Fund’s net asset value as long as the commitment to sell remains in effect. Settlement of when-issued purchase and forward commitment transactions generally takes place within two months after the date of the transaction, but a Fund may agree to a longer settlement period.
A Fund will purchase securities on a when-issued basis, or purchase or sell securities on a forward commitment basis, only with the intention of completing the transaction and actually purchasing or selling the securities. If deemed advisable as a matter of investment strategy, however, a Fund may dispose of or renegotiate a commitment after it is entered into. A Fund also may sell securities it has committed to purchase before those securities are delivered to such Fund on the settlement date. A Fund may realize a capital gain or loss in connection with these transactions. When a Fund purchases securities on a when-issued or forward commitment basis, the Fund will maintain in a segregated account with the Fund’s custodian, or set aside or restrict in the subadviser’s records or systems relating to the Fund, cash or liquid assets having a value (determined daily) at least equal to the amount of the Fund’s purchase commitments. In the case of a forward commitment to sell portfolio securities, portfolio holdings will be held in a segregated account with the Fund’s custodian, or set aside or restricted on the subadviser’s records or systems relating to the Fund, while the commitment is outstanding.
Repurchase Agreements
In a repurchase agreement, a Fund buys a security at one price and simultaneously agrees to sell it back at a higher price. Such agreements must be adequately collateralized to cover the counterparty’s obligation to the Fund to close out the repurchase agreement. During the period, each Fund entered into repurchase agreements with domestic or foreign banks or with a member firm of the Financial Industry Regulatory Authority, Inc., or an affiliate of a member firm that is a primary dealer in U.S. government securities. Each repurchase agreement counterparty must meet the minimum credit quality requirements applicable to the respective Fund and any other appropriate counterparty criteria as determined by the Fund’s subadviser. The minimum credit quality requirements are those applicable to a Fund’s purchase of securities such that if a Fund is permitted to only purchase securities that are rated investment-grade (or the equivalent if unrated), that Fund could only enter into repurchase agreements with counterparties that have debt outstanding that is rated investment-grade (or the equivalent if unrated). The securities are regularly monitored to ensure that the collateral is adequate. A Fund seeks to further mitigate its counterparty risk by entering into master repurchase agreements with its counterparties. The master repurchase agreements provide that, in the event of a counterparty’s default, including bankruptcy, the Fund may terminate any repurchase agreements with that counterparty, determine the net amount owned, and sell or retain the collateral up to the net amount owed to the Fund. A counterparty’s default may cause the Fund to suffer losses, including loss of interest on or principal of the securities and costs associated with delay and enforcement of the terms of the master repurchase agreement.
Reverse Repurchase Agreements
A reverse repurchase agreement involves the sale of a portfolio security by a Fund, coupled with an agreement to repurchase the security at a specified time and price. Until the security is repurchased, the Fund is obligated to pay interest, based upon market rates of the time of issuance, on the value of the repurchase agreement. During the period, Harbor Unconstrained Bond Fund entered into reverse repurchase agreements. While a reverse repurchase agreement is outstanding, the Fund continues to receive principal and interest payments on the underlying security. To cover its obligations under reverse repurchase agreements, a Fund will segregate cash or liquid securities, which are marked-to-market daily, with the Fund’s custodian, or set aside or restrict assets in the subadviser’s records or systems relating to the Fund, in an amount not less than the repurchase price, including accrued interest, of the underlying security. Reverse repurchase agreements involve the risk that the market value of the securities sold by a Fund may decline below the repurchase price of the securities and, if the proceeds from the reverse repurchase agreement are invested in securities, that
46
Harbor Strategic Markets Funds
NOTES TO FINANCIAL STATEMENTS—Continued
(Currency in thousands)
NOTE 2—SIGNIFICANT ACCOUNTING POLICIES—Continued
the fair value of the securities purchased may decline below the repurchase price of the securities sold. Activity in reverse repurchase agreements by Harbor Unconstrained Bond Fund for the six-month period ended April 30, 2015 is as follows:
| | | | | | | | | | | | | | | | | | |
Category of Aggregate Short-Term Borrowings | | Balance at End
of the Period | | | Current Interest Rate | | Maximum Amount Outstanding During the Period | | | Average Daily Amount Outstanding During the Period | | | Average Interest Rate During the Period | |
Reverse repurchase agreements | | $ | — | | | N/A | | $ | 973 | | | $ | 315 | | | | 0.095 | % |
Average debt outstanding and average interest rate during the period is calculated based on calendar days.
Sale-Buybacks
A “sale-buyback” transaction consists of a sale of a portfolio security by the Fund to a financial institution (the counterparty) with a simultaneous agreement to repurchase the same or substantially the same security at an agreed-upon price and date. The Fund is not entitled to receive principal and interest payments, if any, made on the security sold to the counterparty during the term of the agreement. During the period, each Fund entered into such financing transactions referred to as sale-buybacks.
The agreed-upon proceeds for securities to be repurchased by the Fund are reflected as a liability on the Statement of Assets and Liabilities. The Fund will recognize net income represented by the price differential between the price received for the transferred security and the agreed-upon repurchase price. This is commonly referred to as the “price drop.” A price drop consists of two components: (i) the foregone interest and inflationary income adjustments, if any, the Fund would have otherwise received had the security not been sold, and (ii) the negotiated financing terms between the Fund and counterparty. Foregone interest and inflationary income adjustments, if any, are recorded as components of interest income on the Statement of Operations. Interest payments based upon negotiated financing terms made by the Fund to counterparties are recorded as a component of interest expense on the Statement of Operations. In periods of increased demand for a security, the Fund may receive a fee for use of the security by the counterparty, which may result in additional interest income to the Fund.
The average amount of borrowings outstanding during the six-month period ended April 30, 2015 was $84,257 at a weighted average interest rate of 0.242% for Harbor Commodity Real Return Strategy Fund and $1,051 at a weighted average interest rate of 0.219% for Harbor Unconstrained Bond Fund.
Short Sales
During the period, each Fund engaged in short-selling, which obligates a Fund to replace a borrowed security by purchasing it at the market price at the time of replacement. Until the security is replaced, such Fund is required to pay any accrued interest or dividends to the lender and also may be required to pay a premium. A Fund would realize a gain if the security declines in price between the date of the short sale and the date on which such Fund replaces the borrowed security. A Fund would incur a loss as a result of the short sale if the price of the security increases between those dates. Until a Fund replaces the borrowed security, subject to pre-arranged exposure levels, it will maintain cash or liquid securities sufficient to cover its short position in a segregated account with the Fund’s custodian or set aside or restricted in the subadviser’s records or systems relating to the Fund. Short sales involve the risk of an unlimited increase in the market price of the borrowed security.
Futures Contracts
A futures contract is an agreement between two parties to buy or sell a specified financial instrument at a set price on a future date. During the period, each Fund used futures contracts to gain exposure to the fixed income asset class with greater efficiency and lower cost than was possible through direct investment, to add value when these securities were attractively priced, or to adjust the portfolio’s sensitivity to changes in interest rates or currency exchange rates. Futures contracts tend to increase or decrease a Fund’s exposure to the underlying instrument or can be used to hedge other Fund investments.
47
Harbor Strategic Markets Funds
NOTES TO FINANCIAL STATEMENTS—Continued
(Currency in thousands)
NOTE 2—SIGNIFICANT ACCOUNTING POLICIES—Continued
Upon entering into a futures contract, a Fund is required to pledge to the broker an amount of cash, U.S. government securities or other liquid securities equal to the minimum “initial margin” requirements of the exchange. Pursuant to the contract, a Fund agrees to receive from or pay to the broker an amount of cash equal to the daily fluctuation in value of the contract referred to as “variation margin.” Such receipts or payments are recorded by a Fund as unrealized gains or losses. When the contract is closed or expires, a Fund records a realized gain or loss equal to the difference between the value of the contract at the time it was opened and the value at the time it was closed. A Fund may suffer losses if it is unable to close out its position because of an illiquid secondary market. There is no assurance that a portfolio manager will be able to close out its position when the portfolio manager considers it appropriate or desirable to do so. In the event of adverse price movements, a Fund may be required to continue making daily cash payments to maintain its required margin. If a Fund has insufficient cash, it may have to sell portfolio securities to meet daily margin requirements at a time when the portfolio manager would not otherwise elect to do so. In addition, a Fund may be required to deliver or take delivery of instruments. The maximum potential loss on a long futures contract is the U.S. dollar value of the notional amount at the time the contract is opened. The potential loss on a short futures contract is unlimited. There is minimal counterparty risk with futures contracts as they are exchange traded and the exchange’s clearinghouse, as counterparty to all exchange traded futures, guarantees the futures against default.
Options
An option, including rights and warrants, is a contract that offers the buyer the right, but not the obligation, to buy (call) or sell (put) a security or other financial asset at an agreed-upon price (the strike price) during a certain period of time or on a specific date (exercise date). During the period, each Fund purchased and wrote (sold) option contracts to manage their exposure to the bond markets and to fluctuations in interest rates and currency values. Call options tend to increase a Fund’s exposure to the underlying instrument, if purchased, and decrease exposure to the underlying instrument, if written. Put options tend to decrease a Fund’s exposure to the underlying instrument, if purchased, and increase exposure to the underlying instrument, if written.
When a Fund purchases an option, it pays a premium. If a purchased option expires, a Fund realizes a loss in the amount of the premium. If a Fund enters into a closing sale transaction, it realizes a gain or loss, depending on whether the proceeds from the sale are greater or less than the cost of the option. If a call option is exercised by a Fund, the cost of the securities acquired by exercising the call is increased by the premium paid to buy the call. If a put option is exercised by a Fund, it realizes a gain or loss from the sale of the underlying security and the proceeds from such sale are decreased by the premium originally paid. The risk associated with purchasing options is limited to the premium paid. A Fund’s maximum risk of loss from counterparty credit risk is also limited to the premium paid for the contract.
When a Fund writes an option, it receives a premium. If a written option expires on its stipulated expiration date, or if a Fund enters into a closing purchase transaction, the Fund realizes a gain (or loss, if the cost of a closing purchase transaction exceeds the premium received when the option was written) without regard to any unrealized gain or loss on the underlying security, and the liability related to such option is extinguished. If a written call option is exercised, a Fund realizes a gain or loss from the sale of the underlying security, and the proceeds of the sale are increased by the premium originally received. If a written put option is exercised, the amount of the premium originally received reduces the cost of the security that a Fund purchases upon exercise of the option.
The risk in writing a call option is that a Fund relinquishes the opportunity to profit if the market price of the underlying security increases and the option is exercised. In writing a put option, a Fund assumes the risk of incurring a loss if the market price of the underlying security decreases and the option is exercised. In addition, there is a risk that a Fund may not be able to enter into a closing transaction because of an illiquid secondary market or if the counterparty does not perform under the contract’s terms.
Swap Agreements
A swap is a contract between two parties to exchange future cash flows at specified intervals (payment dates) based upon a notional principal amount during the agreed-upon life of the contract. Swaps are marked to market daily and changes in value are recorded as unrealized appreciation or depreciation.
48
Harbor Strategic Markets Funds
NOTES TO FINANCIAL STATEMENTS—Continued
(Currency in thousands)
NOTE 2—SIGNIFICANT ACCOUNTING POLICIES—Continued
Upon entering a swap agreement, any payments received or made at the beginning of the measurement period are reflected as such on the Statements of Assets and Liabilities and represent a reconciling value to compensate for differences between the stated terms of the swap agreement and prevailing market conditions (such as credit spreads, currency exchange rates, interest rates, and other relevant factors). These upfront payments are recorded as realized gains or losses on the Statements of Operations upon termination or maturity of the swap. If a liquidation payment is received or made at the termination of the swap, it is recorded as realized gain or loss on the Statements of Operations. Net periodic payments received or paid by the Fund are included as part of realized gains or losses on the Statement of Operations. A Fund will only enter into swap agreements with counterparties that meet the minimum credit quality requirements applicable to the Fund and any other appropriate counterparty criteria as determined by the Fund’s subadviser. The minimum credit quality requirements are similar to those applicable to a Fund’s purchase of securities, such that if the Fund is permitted to only purchase securities that are rated investment-grade (or the equivalent if unrated), the Fund could only enter into one of the below referenced transactions with counterparties that have debt outstanding that is rated investment-grade (or the equivalent if unrated). Entering into swap agreements involves, to varying degrees, elements of credit risk, market risk and interest rate risk in excess of the amount recognized in the Statement of Assets and Liabilities. Such risks include the possibility that there is not a liquid market for these agreements, that the counterparty to the agreements may default on its obligation to perform, or that there may be unfavorable changes in market conditions or interest rates. The Fund’s maximum risk of loss from counterparty credit risk is the discounted value of the net cash flows to be received from the counterparty over the contract’s remaining life or the value of the contract. This risk is typically mitigated by entering into swap agreements with highly-rated counterparties, the existence of a master netting arrangement between the Fund and the counterparty, and the posting of collateral by the counterparty.
Interest Rate Swaps are agreements between counterparties to exchange cash flows or an exchange of commitments to pay or receive interest with respect to the notional amount of principal. During the period, each Fund used interest rate swap agreements to manage their exposure to interest rate changes. Changes in interest rates can have an effect on the value of bond holdings, the amount of interest income earned and the value of the interest rate swaps held.
Credit Default Swaps are agreements between counterparties to buy or sell protection on a debt security, a basket of securities, or an index of obligations against a defined credit event. Under the terms of a credit default swap, the buyer of protection receives credit protection in exchange for making periodic payments to the seller of protection based on a given percentage applied to a notional principal amount. In return for these payments, the seller acts as the guarantor of the creditworthiness of a reference entity, obligation or index. During the period, each Fund used credit default swap agreements as a seller to gain credit exposure to an issuer or to simulate investments in long bond positions that were either unavailable or less attractively priced in the bond market; such Funds used credit default swap agreements as a buyer to provide a measure of protection against defaults of an issuer. An issuer may represent either a single issuer, a “basket” of issuers, or a credit index. A credit index is a basket of credit instruments or exposures designed to be representative of some part of the credit market as a whole.
The buyer in a credit default contract is obligated to pay the seller a periodic stream of payments over the term of the contract provided that no credit event occurs. Credit events may include bankruptcy, failure to pay principal, maturity extension, rating downgrade, or write-down. As a seller, if an underlying credit event occurs, a Fund will either pay the buyer an amount equal to the notional amount of the swap and take delivery of the reference obligation (or underlying securities comprising an index), or pay a net settlement amount of cash equal to the notional amount of the swap less the recovery value of the reference obligation (or underlying securities comprising an index). As a buyer, if an underlying credit event occurs, a Fund will either receive from the seller an amount equal to the notional amount of the swap and deliver the reference obligation (or underlying securities comprising an index) or receive a net settlement. The maximum exposure to loss of the notional value as the seller of credit default swaps outstanding at April 30, 2015 for Harbor Commodity Real Return Strategy Fund and Harbor Unconstrained Bond Fund is $725 and $6,174, respectively.
Total Return Swaps are agreements between counterparties to exchange the return of a given underlying asset, including any income it generates and appreciation in value, in exchange for a set rate, either fixed or variable. During the period, Harbor Commodity Real Return Strategy Fund used total return swap agreements to gain or mitigate exposure to underlying reference assets, securities, or indices.
49
Harbor Strategic Markets Funds
NOTES TO FINANCIAL STATEMENTS—Continued
(Currency in thousands)
NOTE 2—SIGNIFICANT ACCOUNTING POLICIES—Continued
Under the terms of a total return swap, one counterparty pays out the total return of a specific referenced asset or index and in return receives a regular stream of payments. To the extent the total return of an asset or index underlying the transaction exceeds or falls short of the offsetting interest rate obligation, the Fund will receive a payment or make a payment to the counterparty.
Variance Swaps are agreements between counterparties to exchange cash flows based upon the measured variance (or the square of volatility) of a specified underlying asset. One party agrees to exchange a strike price (“Fixed Rate) for the realized price variance (“Floating Rate”) on the underlying asset with respect to the notional amount. During the period, Harbor Commodity Real Return Strategy Fund used variance swap agreements to gain or mitigate exposure to underlying reference assets or securities.
When a variance swap agreement is originated, the strike price is generally set such that the fair value of the swap is zero. At the maturity date, a net cash flow is exchanged where the payoff amount is equal to the difference between the final market price of the asset and the strike price multiplied by the notional amount. As a receiver of the Floating Rate, a Fund receives the payoff amount when the final market price is greater than the strike price and owes the payoff amount when the final market price is less than the strike price. As a payer of the Floating Rate, a Fund owes the payoff amount when the final market price is greater than the strike price, and receives the payoff amount when the final market price is less than the strike price.
Forward Currency Contracts
A forward currency contract is an agreement between two parties to buy and sell currencies at a set price on a future date. During the period, each Fund used forward currency contracts to manage their exposure to changes in exchange rates or as a hedge against foreign exchange risk related to specific transactions or portfolio positions.
The forward currency contract is marked-to-market daily and the change in market value is recorded as an unrealized gain or loss. When the contract is closed, the Fund records a realized gain or loss equal to the difference between the value on the open and close date. Risk of losses may arise from changes in the value of the foreign currency, or if the counterparties do not perform under the contract’s terms. The maximum potential loss from such contracts is the aggregate face value in U.S. dollars at the time the contract was opened. During the period, each Fund entered into collateral agreements with certain counterparties to mitigate counterparty risk associated with forward currency contracts.
Foreign Currency Spot Contracts
A foreign currency spot contract is an agreement between two parties to buy and sell currencies at the current market rate for settlement within two business days. During the period, each Fund used foreign currency spot contracts to facilitate transactions in foreign securities or to convert foreign currency receipts into U.S. dollars.
The foreign currency spot contract is marked-to-market daily for settlements beyond one day, and any change in market value is recorded as an unrealized gain or loss. When the contract is closed, the Fund records a realized gain or loss equal to the difference between the value on the open and close date. Risk of losses may arise from changes in the value of the foreign currency or if the counterparties do not perform under the contract’s terms. The maximum potential loss from such contracts is the aggregate face value in U.S. dollars at the time the contract was opened.
Foreign Currency Translations
Purchases and sales of securities are translated into U.S. dollars at the current exchange rate on the respective dates of the transactions. Income and withholding taxes are translated at the prevailing exchange rate when accrued or incurred. The accounting records of the Funds are maintained in U.S. dollars. Investment securities and other assets and liabilities denominated in a foreign currency are translated into U.S. dollars based on the current exchange rates at April 30, 2015.
50
Harbor Strategic Markets Funds
NOTES TO FINANCIAL STATEMENTS—Continued
(Currency in thousands)
NOTE 2—SIGNIFICANT ACCOUNTING POLICIES—Continued
Reported net realized gains and losses on foreign currency transactions represent net gains and losses from sales and maturities of foreign currency contracts, disposition of foreign currencies, currency gains and losses realized between the trade and settlement dates on securities transactions, and the difference between the amount of investment income accrued and tax reclaims receivable and the U.S. dollar amount actually received. The effects of changes in foreign currency exchange rates on investments in securities are included in the net realized and unrealized gain or loss on investments in the Statement of Operations.
Investment Income
Dividends declared on portfolio securities are accrued on the ex-dividend date. For foreign securities held, certain dividends are recorded after the ex-dividend date, but as soon as the respective Fund is notified of such dividends. Interest income is accrued daily as earned. Discounts and premiums on fixed income securities purchased are amortized over the life of the respective securities using the effective yield method. Paydown gains and losses on mortgage-backed and asset-backed securities are recognized as a component of interest income.
Securities Transactions
Securities transactions are accounted for on the trade date (the date the order to buy or sell is executed). Realized gains or losses on security transactions are determined on the basis of identified cost for both federal income tax and financial reporting purposes.
Proceeds from Litigation
The Funds may receive proceeds from shareholder litigation settlements involving current and/or previously held portfolio holdings. Any proceeds received from litigation involving portfolio holdings are reflected in the Statement of Operations in realized gain/(loss) if the security has been disposed of by a Fund or in unrealized gain/(loss) if the security is still held by a Fund.
Distribution to Shareholders
Distributions on Fund shares are recorded on the ex-dividend date.
Expenses
Expenses incurred by the Trust are charged directly to the Fund that incurred such expense whenever possible. With respect to expenses incurred by any two or more Harbor Funds where amounts cannot be identified on a fund by fund basis, such expenses are generally allocated in proportion to the average net assets or the number of shareholders of each Fund.
Custodian
The Funds have credit balance arrangements with the Funds’ custodian whereby uninvested cash is invested in a short-term investment vehicle and amounts earned constitute an expense credit that is applied against gross custody expenses. Such custodial expense reductions are reflected on the accompanying Statement of Operations.
Class Allocations
Income, common expenses and realized and unrealized gains/(losses) are determined at the Fund level and allocated daily to each class of shares based on the applicable net assets of the respective classes. Distribution and service fees, if any, and transfer agent fees are calculated daily at the class level based on the applicable net assets of each class and the specific expense rate(s) applicable to each class.
51
Harbor Strategic Markets Funds
NOTES TO FINANCIAL STATEMENTS—Continued
(Currency in thousands)
NOTE 2—SIGNIFICANT ACCOUNTING POLICIES—Continued
Basis for Consolidation for the Harbor Commodity Real Return Strategy Fund
Harbor Cayman Commodity Fund, Ltd. (the “Subsidiary”), a Cayman Islands exempted company, was incorporated on August 4, 2008 as a wholly-owned subsidiary acting as an investment vehicle for Harbor Commodity Real Return Strategy Fund in order to gain exposure to certain asset classes consistent with the Fund’s investment objectives and policies specified in its prospectus and statement of additional information. Under the Articles of Association of the Subsidiary, Harbor Commodity Real Return Strategy Fund will remain the sole shareholder of the Subsidiary and retain all rights associated with shares in the Subsidiary. The shares issued by the Subsidiary confer upon a shareholder the right to receive notice of, attend and vote at general meetings of the Subsidiary, rights in a winding-up or repayment of capital and the right to participate in the profits or assets of the Subsidiary. As such, Harbor Commodity Real Return Strategy Fund has consolidated its investment in the Subsidiary into its financial statements and eliminated all intercompany accounts and transactions. As of April 30, 2015, the Subsidiary represented approximately $32,004 or 21% of the net assets of Harbor Commodity Real Return Strategy Fund.
Treatment of Income from Offshore Subsidiary for Harbor Commodity Real Return Strategy Fund
Direct investment by a mutual fund in certain commodity-linked securities and derivative instruments is limited under Subchapter M of the Internal Revenue Code by the requirement that a mutual fund receive no more than ten percent (10%) of its gross income from such investments in order to receive favorable tax treatment as a regulated investment company. The Harbor Commodity Real Return Strategy Fund seeks to gain exposure indirectly to commodity markets by investing in the Subsidiary, which may invest without limitation in commodity-linked securities and derivative instruments. The IRS has issued private letter rulings to other taxpayers concluding that income produced by certain types of commodity-linked notes or a mutual fund’s investment in a controlled foreign corporation (such as the Subsidiary) will constitute qualifying income. The tax treatment of commodity-related derivative instruments may potentially be affected by changes in legislation, regulations or other legally binding authority, which could affect the character, timing and amount of the Harbor Commodity Real Return Strategy Fund’s taxable income and distributions. In late July 2011, the IRS indicated that the granting of private letter rulings is currently suspended. As a result, the Fund is unable to obtain a private letter ruling with respect to its investments or structure, although, based on the analysis in private letter rulings previously issued to other taxpayers, the Fund intends to continue to treat its income from commodity-linked securities and the Subsidiary as qualifying income. If the IRS should make an adverse determination relating to the treatment of such income, the Fund would likely need to significantly change its investment strategy and recognize unrealized gains in order to remain qualified for taxation as a regulated investment company, which could adversely affect the Fund.
Taxes
Each Fund is treated as a separate entity for federal tax purposes. Each Fund’s policy is to meet the requirements of Subchapter M of the Internal Revenue Code applicable to regulated investment companies and to distribute to its shareholders all of its taxable income within the prescribed time. It is also the intention of each Fund to distribute an amount sufficient to avoid imposition of any excise tax under Section 4982 of the Internal Revenue Code. Therefore, no provision has been made for federal taxes on income, capital gains or unrealized appreciation of securities held or excise taxes on income and capital gains.
The Funds may be subject to taxes imposed by countries in which they invest. Such taxes are generally based on income and/or capital gains earned or repatriated. Taxes are accrued and applied to net investment income, net realized gains and unrealized appreciation as such income and/or gains are earned.
Management has analyzed each Fund’s tax positions for all open tax years (in particular, U.S. federal income tax returns for the tax years ended October 31, 2011–2013), including all positions expected to be taken upon filing the 2014 tax return, in all material jurisdictions where the Funds operate, and has concluded that no provision for income tax is required in any Fund’s financial statements. The Funds will recognize interest and penalties, if any, related to unrecognized tax benefits as income tax expense in the Statement of Operations.
52
Harbor Strategic Markets Funds
NOTES TO FINANCIAL STATEMENTS—Continued
(Currency in thousands)
NOTE 2—SIGNIFICANT ACCOUNTING POLICIES—Continued
Consolidated Statement of Cash Flows
U.S. Generally Accepted Accounting Principles (“U.S. GAAP”) requires entities providing financial statements that report both a Statement of Assets and Liabilities and a Statement of Operations to also provide a Statement of Cash Flows for each period for which results of operations are provided. Investment companies that meet certain conditions are exempted from this requirement. One of the conditions that must be satisfied is that the fund have little or no debt outstanding during the period. During the six-month period ended April 30, 2015, Harbor Commodity Real Return Strategy Fund and Harbor Unconstrained Bond Fund entered into repurchase agreements, which are now categorized as sale-buyback financing transactions under the Accounting Standards Update (“ASU”) 2011-03, A Reconsideration of Effective Control for Repurchase Agreements (“ASU 2011-03”). ASU 2011-03 refers to the accounting for repurchase agreements and similar agreements that entitle and obligate a transferor to repurchase or redeem financial assets before their maturity. These transactions resulted in debt being recorded on each Fund’s Statements of Assets and Liabilities. Management has determined that the average level of debt outstanding during the period for Harbor Commodity Real Return Strategy Fund requires the Fund to present a Consolidated Statement of Cash Flows.
New Accounting Pronouncements
In June 2014, the Financial Accounting Standards Board (“FASB”) issued Accounting Standards Update (“ASU”) 2014-11, Transfers and Servicing (“ASU 2014-11”) which expands secured borrowing accounting for certain repurchase agreements. ASU 2014-14 will also require additional disclosures for certain transactions accounted for as sales, in order to provide financial statement users with information to compare to similar transactions accounted for as secured borrowings. ASU 2014-14 will become effective for interim or annual periods beginning after December 15, 2014. Management is evaluating the implications of this pronouncement and the impact it will have on the financial statement disclosures.
In May 2015, FASB issued ASU 2015-07, Disclosures for Investments in Certain Entities That Calculate Net Asset Value per Share (or Its Equivalent) (“ASU 2015-07”) which removes the requirement to make certain fair value disclosures for investments that are eligible to be measured at fair value using the net asset value per share. ASU 2015-07 becomes effective for interim or annual periods beginning after December 15, 2015. Management is evaluating the implications of this pronouncement and the impact it will have on the financial statement disclosures.
NOTE 3—INVESTMENT PORTFOLIO TRANSACTIONS
Purchases and sales of investments, other than short-term securities, for each Fund for the six-month period ended April 30, 2015 are as follows:
| | | | | | | | | | | | | | | | |
| | | Purchases | | | Sales | |
| | | U.S.
Government | | | Other | | | U.S.
Government | | | Other | |
Harbor Commodity Real Return Strategy Fund (Consolidated) | | $ | 584,897 | | | $ | 17,454 | | | $ | 662,249 | | | $ | 27,431 | |
Harbor Unconstrained Bond Fund | | | 94,155 | | | | 5,016 | | | | 91,206 | | | | 6,714 | |
Written Options
Transactions in written options for the six-month period ended April 30, 2015 are summarized as follows:
| | | | | | | | | | | | | | | | | | | | | | | | | | | | | | | | | | | | | | | | |
HARBOR COMMODITY REAL RETURN STRATEGY FUND (CONSOLIDATED) | | | | | | | | | | | | | |
| | | | | |
| | | Swap Options - U.S. | | | Currency Options | | | Commodity Option | | | Options on Futures | | | U.S. Treasury Options | |
| | | Number of
Contracts | | | Premiums
Received | | | Number of
Contracts | | | Premiums
Received | | | Number of
Contracts | | | Premiums
Received | | | Number of
Contracts | | | Premiums
Received | | | Number of
Contracts | | | Premiums
Received | |
Options outstanding at beginning of year | | | 20,200,000 | | | $ | 85 | | | | 710,000 | | | $ | 17 | | | | 4,235,049 | | | $ | 217 | | | | — | | | $ | — | | | | — | | | $ | — | |
Options opened | | | 59,850,000 | | | | 467 | | | | 15,033,000 | | | | 131 | | | | 4,500,202 | | | | 29 | | | | 332 | | | | 252 | | | | 440,000 | | | | 2 | |
Options closed | | | (15,600,000 | ) | | | (140 | ) | | | — | | | | — | | | | (70 | ) | | | (225 | ) | | | (26 | ) | | | (16 | ) | | | — | | | | — | |
Options exercised | | | (3,300,000 | ) | | | (12 | ) | | | (8,925,000 | ) | | | (48 | ) | | | — | | | | — | | | | (28 | ) | | | (12 | ) | | | — | | | | — | |
Options expired | | | (30,800,000 | ) | | | (117 | ) | | | (2,215,000 | ) | | | (14 | ) | | | (6,235,181 | ) | | | (5 | ) | | | (1 | ) | | | (162 | ) | | | — | | | | — | |
| | | | | | | | | | | | | | | | | | | | | | | | | | | | | | | | | | | | | | | | |
Open at 04/30/2015 | | | 30,350,000 | | | $ | 283 | | | | 4,603,000 | | | $ | 86 | | | | 2,500,000 | | | $ | 16 | | | | 277 | | | $ | 62 | | | | 440,000 | | | $ | 2 | |
| | | | | | | | | | | | | | | | | | | | | | | | | | | | | | | | | | | | | | | | |
53
Harbor Strategic Markets Funds
NOTES TO FINANCIAL STATEMENTS—Continued
(Currency in thousands)
NOTE 3—INVESTMENT PORTFOLIO TRANSACTIONS—Continued
| | | | | | | | | | | | | | | | | | | | | | | | | | | | | | | | | | | | | | | | |
HARBOR UNCONSTRAINED BOND FUND | | | | | | | | | | | | | | | | | | | | | | | | | | | | | | | | | | | | | |
| | | | | |
| | | Swap Options - U.S. | | | Currency Options | | | Index Options | | | Interest Rate Options | | | Options on Futures | |
| | | Number of
Contracts | | | Premiums
Received | | | Number of
Contracts | | | Premiums
Received | | | Number of
Contracts | | | Premiums
Received | | | Number of
Contracts | | | Premiums
Received | | | Number of
Contracts | | | Premiums
Received | |
Options outstanding at beginning of year | | | 17,300,000 | | | $ | 64 | | | | 3,139,000 | | | $ | 25 | | | | — | | | $ | — | | | | — | | | $ | — | | | | — | | | $ | — | |
Options opened | | | 43,000,000 | | | | 331 | | | | 9,237,000 | | | | 70 | | | | 2,680 | | | | 21 | | | | 1,000,000 | | | | 1 | | | | 40 | | | | 25 | |
Options closed | | | (11,500,000 | ) | | | (150 | ) | | | (4,267,000 | ) | | | (34 | ) | | | (2,676 | ) | | | (13 | ) | | | — | | | | — | | | | (26 | ) | | | (18 | ) |
Options exercised | | | (2,300,000 | ) | | | (2 | ) | | | (2,130,000 | ) | | | (20 | ) | | | — | | | | — | | | | — | | | | — | | | | (3 | ) | | | (1 | ) |
Options expired | | | (22,600,000 | ) | | | (53 | ) | | | (3,820,000 | ) | | | (21 | ) | | | (4 | ) | | | (8 | ) | | | — | | | | — | | | | (11 | ) | | | (6 | ) |
| | | | | | | | | | | | | | | | | | | | | | | | | | | | | | | | | | | | | | | | |
Open at 04/30/2015 | | | 23,900,000 | | | $ | 190 | | | | 2,159,000 | | | $ | 20 | | | | — | | | $ | — | | | | 1,000,000 | | | $ | 1 | | | | — | | | $ | — | |
| | | | | | | | | | | | | | | | | | | | | | | | | | | | | | | | | | | | | | | | |
Master Netting Arrangements
As described in further detail below, the Funds may enter into Master Netting Agreements that govern the terms of certain transactions. Master Netting Agreements are designed to reduce the counterparty risk associated with relevant transactions by establishing credit protection mechanisms and providing standardization as a means of improving legal certainty. As Master Netting Agreements are specific to the unique operations of different asset types, they allow a Fund to close out and net its total exposure to a counterparty in the event of a default with respect to all of the transactions governed under a single agreement with that counterparty. Master Netting Agreements can also help reduce counterparty risk by specifying collateral posting requirements at pre-arranged exposure levels. Securities and cash pledged as collateral are reflected as assets in the Statement of Assets and Liabilities as either a component of investments at value (securities) or cash-restricted (deposits due from counterparties). Cash collateral received is not typically held in a segregated account and, as such, is reflected as a liability in the Statement of Assets and Liabilities as due to broker. The fair value of any securities received as collateral is not reflected as a component of net asset value.
For the six-month period ended April 30, 2015, Harbor Commodity Real Return Strategy Fund and Harbor Unconstrained Bond Fund have entered into the following Master Netting Agreements:
Master Repurchase Agreements and Global Master Repurchase Agreements, which govern repurchase and reverse repurchase transactions between the Fund and select counterparties.
Master Securities Forward Transaction Agreements, which govern the considerations and factors surrounding the settlement of certain forward settling transactions, such as delayed-delivery or sale-buyback transactions by and between the Fund and select counterparties.
International Swaps and Derivatives Association, Inc. Master Agreements and Credit Support Annexes, which govern OTC market traded financial derivative transactions entered into by the Fund and select counterparties.
Please see Note 7-Offsetting Assets and Liabilities for a summary of current outstanding exposures by counterparty by Funds under terms of Master Agreements with netting provisions that enable a Fund to net its total exposure to a given counterparty.
NOTE 4—FEES AND OTHER TRANSACTIONS WITH AFFILIATES
Investment Adviser
Harbor Capital is an indirect, wholly-owned subsidiary of Robeco Groep N.V. (“Robeco”). Robeco is majority owned by ORIX Corporation (“ORIX”). Harbor Capital is the Trust’s investment adviser and is also responsible for administrative and other services.
54
Harbor Strategic Markets Funds
NOTES TO FINANCIAL STATEMENTS—Continued
(Currency in thousands)
NOTE 4—FEES AND OTHER TRANSACTIONS WITH AFFILIATES—Continued
Each Fund has a separate advisory agreement with Harbor Capital. The agreements provide for fees based on an annual percentage rate of average daily net assets as follows:
| | | | | | | | |
| | | Contractual Rate | | | Actual Ratea | |
Harbor Commodity Real Return Strategy Fund (Consolidated) | | | 0.81 | % | | | 0.81 | % |
Harbor Unconstrained Bond Fund | | | 0.85 | | | | 0.85 | |
| a | Annualized for the six-month period ended April 30, 2015. |
Harbor Capital has from time to time voluntarily or contractually agreed not to impose a portion of its management fees and/or to bear a portion of the expenses incurred in the operation of certain Funds in order to limit Fund expenses. Such waivers, if any, are reflected on the accompanying Statements of Operations for the respective Funds. Harbor Capital has entered into a contractual expense limitation agreement with Harbor Commodity Real Return Strategy Fund limiting the total expenses, not including interest expense, to 0.94% and 1.19% for the Institutional Class and Administrative Class, respectively. In addition, Harbor Capital has contractually agreed to waive the management fee it receives from Harbor Commodity Real Return Strategy Fund in an amount equal to the management fee paid to Harbor Capital by the Subsidiary. This waiver may not be terminated by Harbor Capital and will remain in effect for as long as Harbor Capital’s contract with the Subsidiary is in place. Harbor Capital has also entered into a contractual expense limitation agreement with Harbor Unconstrained Bond Fund limiting the total expenses, not including interest expense, to 1.05% and 1.30% for the Institutional Class and Administrative Class, respectively. The contractual expense limitations are effective through February 29, 2016. All expense limitations are inclusive of the transfer agent fee waiver discussed in the Transfer Agent note below.
Distributor
Harbor Funds Distributors, Inc. (“Harbor Funds Distributors” or the “Distributor”), a wholly-owned subsidiary of Harbor Capital, is the distributor for Harbor Funds’ shares. Under the Trust’s current distribution plans pursuant to Rule 12b-1 under the Investment Company Act with respect to each Fund’s Administrative Class shares (collectively, the “12b-1 Plan”), each Fund pays the Distributor compensation at the annual rate of 0.25% of the average daily net assets of its Administrative Class shares. The 12b-1 Plan compensates the Distributor for the purpose of financing any activity that is primarily intended to result in the sale of Administrative Class shares of the Funds or for recordkeeping services or the servicing of shareholder accounts in the Administrative Class shares of the Funds. Such activities include, but are not limited to: printing of prospectuses and statements of additional information and reports for prospective shareholders (i.e., other than existing shareholders); preparation and distribution of advertising material and sales literature; expenses of organizing and conducting sales seminars; supplemental payments to dealers or other institutions such as asset-based sales charges, payments of recordkeeping fees under recordkeeping arrangements, or payments of service fees under shareholder service arrangements; and costs of administering the 12b-1 Plan.
Amounts payable by a Fund under the 12b-1 Plan need not be directly related to the expenses actually incurred by the Distributor on behalf of each Fund. The 12b-1 Plan does not obligate the Funds to reimburse the Distributor for the actual expenses the Distributor may incur in fulfilling its obligations under the 12b-1 Plan. Thus, even if the Distributor’s actual expenses exceed the fee payable to the Distributor at any given time, the Funds will not be obligated to pay more than that fee. If the Distributor’s expenses are less than the fee it receives, the Distributor will retain the difference.
The fees attributable to each Fund’s respective class are shown on the accompanying Statement of Operations.
Transfer Agent
Harbor Services Group, Inc. (“Harbor Services Group”), a wholly-owned subsidiary of Harbor Capital, is the transfer and shareholder servicing agent for the Funds. The transfer agency and service agreement is reviewed and approved annually by the Board of Trustees and provides currently for compensation up to the following amounts per class of each Fund:
| | |
Share Class | | Transfer Agent Feesa |
Institutional Class | | 0.065% of the average daily net assets of all Institutional Class shares |
Administrative Class | | 0.065% of the average daily net assets of all Administrative Class shares |
| a | For the period November 1, 2014 through February 28, 2015, the Transfer Agent Fees for Institutional and Administrative Class shares was 0.06%. |
55
Harbor Strategic Markets Funds
NOTES TO FINANCIAL STATEMENTS—Continued
(Currency in thousands)
NOTE 4—FEES AND OTHER TRANSACTIONS WITH AFFILIATES—Continued
Harbor Services Group has voluntarily waived a portion of its transfer agent fees during the six-month period ended April 30, 2015. Fees incurred for these transfer agent services are shown on each Fund’s Statement of Operations. The voluntary waiver may be discontinued at any time.
Shareholders
On April 30, 2015, Harbor Capital, Harbor Funds Distributors, and Harbor Services Group, collectively held the following shares of beneficial interest in the Funds:
| | | | | | | | | | | | | | | | |
| | | Number of Shares Owned by
Harbor Capital,
Harbor Funds Distributors, and
Harbor Services Group | | | | |
| | | Institutional
Class | | | Administrative
Class | | | Total | | | Percentage of
Outstanding Shares | |
Harbor Commodity Real Return Strategy Fund (Consolidated) | | | 60,939 | | | | 1 | | | | 60,940 | | | | 0.2 | % |
Harbor Unconstrained Bond Fund | | | 338,596 | | | | 16,627 | | | | 355,223 | | | | 11.6 | |
Independent Trustees
The fees and expenses of the Independent Trustees are shown on each Fund’s Statement of Operations. The Independent Trustees’ remuneration for all Strategic Markets Funds totaled $2 for the six-month period ended April 30, 2015.
The Board of Trustees has adopted a Deferred Compensation Plan for Independent Trustees (the “Plan”), which enables Trustees to elect to defer receipt of all or a portion of the annual compensation they are entitled to receive from the Trust. For purposes of determining the amount owed to a Trustee under the Plan, deferred amounts are treated as though they had been invested in shares of the Fund(s) selected by the Trustee. While not required to do so, each Fund makes an investment equal to the Trustee’s investment election. The deferred compensation liability and the offsetting deferred compensation investment asset are included as a component of “Liabilities; Other” and “Other assets”, respectively, in the Statement of Assets and Liabilities. Such amounts fluctuate with changes in the market value of the selected securities. The deferred compensation and related mark-to-market impact liability and an offsetting investment asset will remain on each Fund’s Statement of Assets and Liabilities until distributed in accordance with the Plan.
Indemnification
Under the Trust’s organizational documents, its officers and Trustees are indemnified against certain liabilities arising out of the performance of their duties to the Trust. In addition, in the normal course of business the Trust enters into contracts that provide general indemnities to other parties. The Trust’s maximum exposure under these arrangements is unknown as this would involve future claims that may be made against the Trust that have not yet occurred. The risk of material loss as a result of such indemnification claims is considered remote.
NOTE 5—TAX INFORMATION
The identified cost for federal income tax purposes of investments owned by each Fund (including earned discount on corporate short-term notes and commercial paper) and their respective gross unrealized appreciation and depreciation at April 30, 2015 are as follows:
| | | | | | | | | | | | | | | | |
| | | | | | Gross Unrealized | | | Net Unrealized
Appreciation/
(Depreciation) | |
| | | Identified Cost | | | Appreciation | | | (Depreciation) | | |
Harbor Commodity Real Return Strategy Fund (Consolidated)* | | $ | 205,566 | | | $ | 3,337 | | | $ | (4,375 | ) | | $ | (1,038 | ) |
Harbor Unconstrained Bond Fund* | | | 33,620 | | | | 1,522 | | | | (592 | ) | | | 930 | |
| * | Capital loss carryforwards are available that may reduce taxable income from future net realized gain on investments. |
56
Harbor Strategic Markets Funds
NOTES TO FINANCIAL STATEMENTS—Continued
(Currency in thousands)
NOTE 6—DERIVATIVES
The Funds’ derivative holdings do not qualify for hedge accounting treatment and as such are recorded at current fair value. For a detailed discussion of risks related to these investments please refer to the descriptions of each type of derivative instrument in Note 2—Significant Accounting Policies.
Each Fund’s derivative instruments outstanding as of the six-month period ended April 30, 2015 as disclosed in the Portfolios of Investments, and the related amounts of realized and changes in unrealized gains and losses on derivative instruments during the period as disclosed in the Statement of Operations, are indicators of the volume of derivative activity for these Funds.
Derivative Instruments
At April 30, 2015, the fair values of derivatives, by primary risk exposure, were reflected in the Statement of Assets and Liabilities as follows:
| | | | | | | | | | | | | | | | | | | | |
HARBOR COMMODITY REAL RETURN STRATEGY FUND (CONSOLIDATED) | | | | | | | | | | | | | | | | | |
| | | | | |
Statement of Assets and Liabilities Caption | | Interest Rate
Contracts | | | Foreign Exchange
Contracts | | | Credit
Contracts | | | Commodity
Contracts | | | Total | |
Assets | | | | | | | | | | | | | | | | | | | | |
Investments, at value (purchased options) | | $ | 134 | | | $ | — | | | $ | — | | | $ | 10 | | | $ | 144 | |
Unrealized appreciation on open forward currency contracts | | | — | | | | 2,900 | | | | — | | | | — | | | | 2,900 | |
Unrealized appreciation on OTC swap agreementsb | | | 58 | | | | — | | | | 23 | | | | 3,499 | | | | 3,580 | |
Variation margin on centrally cleared swap agreementsa,b | | | 187 | | | | — | | | | 5 | | | | — | | | | 192 | |
Variation margin on options and futures contracts (futures)a | | | 221 | | | | — | | | | — | | | | 346 | | | | 567 | |
| | | | | |
Liabilities | | | | | | | | | | | | | | | | | | | | |
Unrealized depreciation on open forward currency contracts | | $ | — | | | $ | (3,138 | ) | | $ | — | | | $ | — | | | $ | (3,138 | ) |
Unrealized depreciation on OTC swap agreementsb | | | (1,323 | ) | | | — | | | | (25 | ) | | | (56 | ) | | | (1,404 | ) |
Variation margin on centrally cleared swap agreementsa,b | | | (1,174 | ) | | | — | | | | — | | | | — | | | | (1,174 | ) |
Variation margin on options and futures contracts (futures)a | | | (191 | ) | | | — | | | | — | | | | (782 | ) | | | (973 | ) |
Variation margin on options and futures contracts (options)a | | | (26 | ) | | | — | | | | — | | | | (9 | ) | | | (35 | ) |
Written options, at value | | | (200 | ) | | | (113 | ) | | | (5 | ) | | | (47 | ) | | | (365 | ) |
|
HARBOR UNCONSTRAINED BOND FUND | |
| | | | | |
Statement of Assets and Liabilities Caption | | Interest Rate
Contracts | | | Foreign Exchange
Contracts | | | Credit
Contracts | | | Commodity
Contracts | | | Total | |
Assets | | | | | | | | | | | | | | | | | | | | |
Investments, at value (purchased options) | | $ | 131 | | | $ | 2 | | | $ | — | | | $ | — | | | $ | 133 | |
Unrealized appreciation on open forward currency contracts | | | — | | | | 1,178 | | | | — | | | | — | | | | 1,178 | |
Unrealized appreciation on OTC swap agreementsb | | | 35 | | | | — | | | | 28 | | | | — | | | | 63 | |
Variation margin on centrally cleared swap agreementsa,b | | | 67 | | | | — | | | | 10 | | | | — | | | | 77 | |
Variation margin on options and futures contracts (futures)a | | | 41 | | | | — | | | | — | | | | — | | | | 41 | |
| | | | | |
Liabilities | | | | | | | | | | | | | | | | | | | | |
Unrealized depreciation on open forward currency contracts | | $ | — | | | $ | (625 | ) | | $ | — | | | $ | — | | | $ | (625 | ) |
Unrealized depreciation on OTC swap agreementsb | | | (95 | ) | | | — | | | | (10 | ) | | | — | | | | (105 | ) |
Variation margin on centrally cleared swap agreementsa,b | | | (456 | ) | | | — | | | | — | | | | — | | | | (456 | ) |
Variation margin on options and futures contracts (futures)a | | | (41 | ) | | | — | | | | — | | | | — | | | | (41 | ) |
Written options, at value | | | (153 | ) | | | (16 | ) | | | — | | | | — | | | | (169 | ) |
| a | Includes cumulative appreciation/depreciation of futures contracts or market value of options contracts as reported in the Portfolio of Investments. Only current variation margin is reported within the Statement of Assets and Liabilities. |
| b | Net of premiums received of $81 for Harbor Commodity Real Return Strategy Fund and net of premiums paid of $86 for Harbor Unconstrained Bond Fund. |
57
Harbor Strategic Markets Funds
NOTES TO FINANCIAL STATEMENTS—Continued
(Currency in thousands)
NOTE 6—DERIVATIVES—Continued
Realized net gain/(loss) and the change in unrealized appreciation/(depreciation) on derivatives, by primary risk exposure, for the six-month period ended April 30, 2015, were:
| | | | | | | | | | | | | | | | | | | | | | | | |
HARBOR COMMODITY REAL RETURN STRATEGY FUND (CONSOLIDATED) | |
| | | | | | |
Net Realized Gain/(Loss) on Derivatives | | Interest Rate
Contracts | | | Foreign Exchange
Contracts | | | Credit
Contracts | | | Equity
Contracts | | | Commodity
Contracts | | | Total | |
Forward currency contracts | | $ | — | | | $ | 6,796 | | | $ | — | | | $ | — | | | $ | — | | | $ | 6,796 | |
Futures contracts | | | 521 | | | | — | | | | — | | | | (3 | ) | | | (58 | ) | | | 460 | |
Investments (purchased options) | | | (104 | ) | | | (1 | ) | | | — | | | | — | | | | (182 | ) | | | (287 | ) |
Written options | | | (121 | ) | | | 13 | | | | 28 | | | | — | | | | 311 | | | | 231 | |
Swaps agreements | | | (4,148 | ) | | | — | | | | (50 | ) | | | — | | | | (25,647 | ) | | | (29,845 | ) |
| | | | | | | | | | | | | | | | | | | | | | | | |
Net realized gain/(loss) on derivatives | | $ | (3,852 | ) | | $ | 6,808 | | | $ | (22 | ) | | $ | (3 | ) | | $ | (25,576 | ) | | $ | (22,645 | ) |
| | | | | | | | | | | | | | | | | | | | | | | | |
| | | | | | |
Change in Unrealized Appreciation/(Depreciation)
on Derivatives | | | | | Interest Rate
Contracts | | | Foreign Exchange
Contracts | | | Credit
Contracts | | | Commodity
Contracts | | | Total | |
Forward currency contracts | | | $ | — | | | $ | (1,650 | ) | | $ | — | | | $ | — | | | $ | (1,650 | ) |
Futures contracts | | | | (313 | ) | | | — | | | | — | | | | 51 | | | | (262 | ) |
Investments (purchased options) | | | | (29 | ) | | | — | | | | — | | | | 151 | | | | 122 | |
Written options | | | | 9 | | | | 2 | | | | (182 | ) | | | (33 | ) | | | (204 | ) |
Swaps agreements | | | | 1,250 | | | | — | | | | (105 | ) | | | 1,965 | | | | 3,110 | |
| | | | | | | | | | | | | | | | | | | | | | | | |
Change in unrealized appreciation/(depreciation) on derivatives | | | $ | 917 | | | $ | (1,648 | ) | | $ | (287 | ) | | $ | 2,134 | | | $ | 1,116 | |
| | | | | | | | | | | | | | | | | | | | | | | | |
| | | | | | |
HARBOR UNCONSTRAINED BOND FUND | | | | | | | | | | | | | | | | | | | | | | | | |
Net Realized Gain/(Loss) on Derivatives | | | | | Interest Rate
Contracts | | | Foreign Exchange
Contracts | | | Credit
Contracts | | | Equity
Contracts | | | Total | |
Forward currency contracts | | | $ | — | | | $ | 599 | | | $ | — | | | $ | — | | | $ | 599 | |
Futures contracts | | | | 284 | | | | — | | | | — | | | | — | | | | 284 | |
Investments (purchased options) | | | | 134 | | | | 2 | | | | (1 | ) | | | — | | | | 135 | |
Written options | | | | (33 | ) | | | (43 | ) | | | 19 | | | | 7 | | | | (50 | ) |
Swaps agreements | | | | (379 | ) | | | — | | | | 70 | | | | — | | | | (309 | ) |
| | | | | | | | | | | | | | | | | | | | | | | | |
Net realized gain/(loss) on derivatives | | | $ | 6 | | | $ | 558 | | | $ | 88 | | | $ | 7 | | | $ | 659 | |
| | | | | | | | | | | | | | | | | | | | | | | | |
| | | | | | |
Change in Unrealized Appreciation/(Depreciation)
on Derivatives | | | | | | | | Interest Rate
Contracts | | | Foreign Exchange
Contracts | | | Credit
Contracts | | | Total | |
Forward currency contracts | | | $ | — | | | $ | (24 | ) | | $ | — | | | $ | (24 | ) |
Futures contracts | | | | 16 | | | | — | | | | — | | | | 16 | |
Investments (purchased options) | | | | (32 | ) | | | (5 | ) | | | — | | | | (37 | ) |
Written options | | | | 8 | | | | 45 | | | | (7 | ) | | | 46 | |
Swaps agreements | | | | (373 | ) | | | — | | | | (50 | ) | | | (423 | ) |
| | | | | | | | | | | | | | | | | | | | | | | | |
Change in unrealized appreciation/(depreciation) on derivatives | | | $ | (381 | ) | | $ | 16 | | | $ | (57 | ) | | $ | (422 | ) |
| | | | | | | | | | | | | | | | | | | | | | | | |
58
Harbor Strategic Markets Funds
NOTES TO FINANCIAL STATEMENTS—Continued
(Currency in thousands)
NOTE 7—OFFSETTING ASSETS AND LIABILITIES
The Funds have adopted Accounting Standards Update (“ASU”) 2013-01, Clarifying the Scope of Disclosures about Offsetting Assets and Liabilities, which was established to enhance disclosures pertaining to the offsetting of derivatives, repurchase agreements, and securities lending transactions or those subject to an enforceable master netting arrangement or similar agreement. ASU 2013-01 requires additional disclosures about the amounts reported on the financial statements to reflect the effect or potential effect of netting arrangements on the Funds’ financial position.
Please see the Master Netting Agreements section in Note 3 for more on Master Netting Agreements and how collateral is reported in the Financial Statements.
The following is a summary by counterparty of the gross value of material Borrowings and Other Financing Transactions and collateral (received)/pledged as of April 30, 2015:
| | | | | | | | | | | | | | | | | | | | | | | | | | | | |
HARBOR COMMODITY REAL RETURN STRATEGY FUND (CONSOLIDATED) | |
| | | | | | | |
Counterparty | | Repurchase
Agreement
Proceeds to be
Received | | | Payable for
Reverse
Repurchase
Agreements | | | Payable for
Sale-Buyback
Transactions | | | Payable for
Short
Sales | | | Total
Borrowings and
Other Financing
Transactions | | | Collateral
(Received)/
Pledged | | | Net
Exposure | |
Harbor Commodity Real Return Strategy Funda | | | | | | | | | | | | | | | | | | | | | |
Global/Master Repurchase Agreement | | | | | | | | | | | | | | | | | | | | | | | | | | | | |
Barclays Bank plc | | $ | 200 | | | $ | — | | | $ | — | | | $ | — | | | $ | 200 | | | $ | (200 | ) | | $ | — | |
Citigroup Global Markets, Inc | | | 3,700 | | | | — | | | | — | | | | — | | | | 3,700 | | | | (3,700 | ) | | | — | |
Credit Suisse Securities (Europe) Ltd | | | 4,300 | | | | — | | | | — | | | | — | | | | 4,300 | | | | (4,300 | ) | | | — | |
Deutsche Bank Securities Inc | | | 2,200 | | | | — | | | | — | | | | — | | | | 2,200 | | | | (2,200 | ) | | | — | |
JP Morgan Chase Bank, NA | | | 3,700 | | | | — | | | | — | | | | — | | | | 3,700 | | | | (3,700 | ) | | | — | |
State Street Bank | | | 477 | | | | — | | | | — | | | | — | | | | 477 | | | | (477 | ) | | | — | |
Toronto-Dominion Bank | | | 3,700 | | | | — | | | | — | | | | — | | | | 3,700 | | | | (3,700 | ) | | | — | |
Master Securities Forward Transactions Agreements | | | | | | | | | | | | | | | | | | | | | | | | | | | | |
Barclays Bank plc | | | — | | | | — | | | | (50,152 | ) | | | — | | | | (50,152 | ) | | | — | | | | (50,152 | ) |
Barclays Capital Inc | | | — | | | | — | | | | — | | | | (2,849 | ) | | | (2,849 | ) | | | — | | | | (2,849 | ) |
Morgan Stanley & Co. International plc | | | — | | | | — | | | | (2,346 | ) | | | — | | | | (2,346 | ) | | | — | | | | (2,346 | ) |
Morgan Stanley Co. Inc | | | — | | | | — | | | | — | | | | (5,448 | ) | | | (5,448 | ) | | | — | | | | (5,448 | ) |
| | | | | | | |
Harbor Cayman Commodity Fund Ltd. (Subsidiary)a | | | | | | | | | | | | | | | | | | | | | | | | | | | | |
| | $ | — | | | $ | — | | | $ | — | | | $ | — | | | $ | — | | | $ | — | | | $ | — | |
| | | | | | | | | | | | | | | | | | | | | | | | | | | | |
Total Borrowings and Other Financing Transactions | | $ | 18,277 | | | $ | — | | | $ | (52,498 | ) | | $ | (8,297 | ) | | | | | | | | | | | | |
| | | | | | | | | | | | | | | | | | | | | | | | | | | | |
| a | The Harbor Commodity Real Return Strategy Fund and its subsidiary, Harbor Cayman Commodity Fund Ltd. are recognized as two separate legal entities as such, exposure cannot be netted. |
| | | | | | | | | | | | | | | | | | | | | | | | | | | | |
HARBOR UNCONSTRAINED BOND FUND | |
Counterparty | | Repurchase
Agreement
Proceeds to be
Received | | | Payable for
Reverse
Repurchase
Agreements | | | Payable for
Sale-Buyback
Transactions | | | Payable
for
Short
Sales | | | Total
Borrowings and
Other Financing
Transactions | | | Collateral
(Received)/
Pledged | | | Net
Exposure | |
Global/Master Repurchase Agreement | | | | | | | | | | | | | | | | | | | | | | | | | | | | |
Citigroup Global Markets, Inc | | $ | 1,100 | | | $ | — | | | $ | — | | | $ | — | | | $ | 1,100 | | | $ | (1,100 | ) | | $ | — | |
State Street Bank | | | 112 | | | | — | | | | — | | | | — | | | | 112 | | | | (112 | ) | | | — | |
Master Securities Forward Transactions Agreements | | | | | | | | | | | | | | | | | | | | | | | | | | | | |
Barclays Bank plc | | | — | | | | — | | | | (1,541 | ) | | | — | | | | (1,541 | ) | | | — | | | | (1,541 | ) |
Citigroup Global Markets, Inc | | | — | | | | — | | | | — | | | | (3,522 | ) | | | (3,522 | ) | | | — | | | | (3,522 | ) |
Credit Suisse Securities (USA) LLC | | | — | | | | — | | | | — | | | | (1,864 | ) | | | (1,864 | ) | | | — | | | | (1,864 | ) |
Morgan Stanley & Co. Inc | | | — | | | | — | | | | — | | | | (1,089 | ) | | | (1,089 | ) | | | — | | | | (1,089 | ) |
Morgan Stanley & Co. International plc | | | — | | | | — | | | | (2,118 | ) | | | — | | | | (2,118 | ) | | | — | | | | (2,118 | ) |
| | | | | | | | | | | | | | | | | | | | | | | | | | | | |
Total Borrowings and Other Financing Transactions | | $ | 1,212 | | | $ | — | | | $ | (3,659 | ) | | $ | (6,475 | ) | | | | | | | | | | | | |
| | | | | | | | | | | | | | | | | | | | | | | | | | | | |
59
Harbor Strategic Markets Funds
NOTES TO FINANCIAL STATEMENTS—Continued
(Currency in thousands)
NOTE 7—OFFSETTING ASSETS AND LIABILITIES—Continued
Harbor Commodity Real Return Strategy Fund (Consolidated) and Harbor Unconstrained Bond Fund have not pledged any securities as collateral under the terms of the above Master Repurchase and Master Securities Forward Transactions agreements as of April 30, 2015.
The following is a summary by counterparty of the value of OTC financial derivative instruments and collateral (received)/pledged as governed by International Swaps and Derivatives Association, Inc. master agreements as of April 30, 2015:
| | | | | | | | | | | | | | | | | | | | | | | | | | | | | | | | | | | | | | | | | | | | |
HARBOR COMMODITY REAL RETURN STRATEGY FUND (CONSOLIDATED) | |
| | | | | |
| | | Financial Derivative Assets | | | Financial Derivative Liabilities | | | | | | | | | | |
Counterparty | | Forward
Currency
Contracts | | | Purchased
Options | | | Swap
Agreements | | | Total Over-
the-Counter | | | Forward
Currency
Contracts | | | Written
Options | | | Swap
Agreements | | | Total Over-
the-Counter | | | Net
Value of
OTC
Derivatives | | | Collateral
(Received)/
Pledged* | | | Net
Exposure | |
Harbor Commodity Real Return Strategy Funda | | | | | | | | | | | | | | | | | | | | | | | | | | | | | |
Bank of America NA | | $ | 94 | | | $ | 3 | | | $ | 9 | | | $ | 106 | | | $ | (264 | ) | | $ | (3 | ) | | $ | — | | | $ | (267 | ) | | $ | (161 | ) | | $ | 161 | | | $ | — | |
Barclays Bank plc | | | 3 | | | | — | | | | — | | | | 3 | | | | (1 | ) | | | — | | | | (87 | ) | | | (88 | ) | | | (85 | ) | | | — | | | | (85 | ) |
Barclays Capital | | | — | | | | — | | | | — | | | | — | | | | (78 | ) | | | — | | | | — | | | | (78 | ) | | | (78 | ) | | | — | | | | (78 | ) |
BNP Paribas SA | | | 10 | | | | — | | | | 14 | | | | 24 | | | | (1,232 | ) | | | — | | | | (283 | ) | | | (1,515 | ) | | | (1,491 | ) | | | 572 | | | | (919 | ) |
Credit Suisse International | | | 388 | | | | — | | | | 15 | | | | 403 | | | | (85 | ) | | | (25 | ) | | | — | | | | (110 | ) | | | 293 | | | | — | | | | 293 | |
Deutsche Bank AG | | | 1,752 | | | | 9 | | | | — | | | | 1,761 | | | | (1,107 | ) | | | (101 | ) | | | (169 | ) | | | (1,377 | ) | | | 384 | | | | — | | | | 384 | |
Goldman Sachs Bank USA | | | 157 | | | | 2 | | | | 3 | | | | 162 | | | | (223 | ) | | | (47 | ) | | | (217 | ) | | | (487 | ) | | | (325 | ) | | | 273 | | | | (52 | ) |
Goldman Sachs International | | | — | | | | — | | | | 13 | | | | 13 | | | | — | | | | (5 | ) | | | — | | | | (5 | ) | | | 8 | | | | — | | | | 8 | |
HSBC Bank USA | | | 1 | | | | — | | | | — | | | | 1 | | | | (56 | ) | | | — | | | | — | | | | (56 | ) | | | (55 | ) | | | — | | | | (55 | ) |
JP Morgan Chase Bank | | | 399 | | | | — | | | | — | | | | 399 | | | | (44 | ) | | | — | | | | — | | | | (44 | ) | | | 355 | | | | — | | | | 355 | |
JP Morgan Chase Bank NA | | | 8 | | | | — | | | | 21 | | | | 29 | | | | (8 | ) | | | (21 | ) | | | — | | | | (29 | ) | | | — | | | | — | | | | — | |
Morgan Stanley Capital Services LLC | | | — | | | | 117 | | | | 6 | | | | 123 | | | | — | | | | (116 | ) | | | (25 | ) | | | (141 | ) | | | (18 | ) | | | — | | | | (18 | ) |
Royal Bank of Scotland plc | | | — | | | | — | | | | — | | | | — | | | | — | | | | — | | | | (567 | ) | | | (567 | ) | | | (567 | ) | | | — | | | | (567 | ) |
UBS AG | | | 82 | | | | — | | | | — | | | | 82 | | | | (24 | ) | | | — | | | | — | | | | (24 | ) | | | 58 | | | | — | | | | 58 | |
Westpac Banking Corp. | | | — | | | | — | | | | — | | | | — | | | | (16 | ) | | | — | | | | — | | | | (16 | ) | | | (16 | ) | | | — | | | | (16 | ) |
| | | | |
Harbor Cayman Commodity Fund Ltd. (Subsidiary)a | | | | | | | | | | | | | | | | | |
Bank of America NA | | $ | — | | | $ | — | | | $ | 561 | | | $ | 561 | | | $ | — | | | $ | — | | | $ | — | | | $ | — | | | $ | 561 | | | $ | — | | | $ | 561 | |
BNP Paribas SA | | | — | | | | — | | | | 46 | | | | 46 | | | | — | | | | — | | | | — | | | | — | | | | 46 | | | | — | | | | 46 | |
Citibank NA | | | 6 | | | | — | | | | 312 | | | | 318 | | | | — | | | | — | | | | (12 | ) | | | (12 | ) | | | 306 | | | | — | | | | 306 | |
Credit Suisse International | | | — | | | | — | | | | 111 | | | | 111 | | | | — | | | | — | | | | — | | | | — | | | | 111 | | | | — | | | | 111 | |
Deutsche Bank AG | | | — | | | | — | | | | 41 | | | | 41 | | | | — | | | | — | | | | (10 | ) | | | (10 | ) | | | 31 | | | | — | | | | 31 | |
Goldman Sachs Bank USA | | | — | | | | — | | | | 351 | | | | 351 | | | | — | | | | — | | | | — | | | | — | | | | 351 | | | | — | | | | 351 | |
Goldman Sachs International | | | — | | | | 3 | | | | 6 | | | | 9 | | | | — | | | | (35 | ) | | | (8 | ) | | | (43 | ) | | | (34 | ) | | | — | | | | (34 | ) |
JP Morgan Chase Bank NA | | | — | | | | — | | | | 273 | | | | 273 | | | | — | | | | — | | | | (19 | ) | | | (19 | ) | | | 254 | | | | — | | | | 254 | |
Morgan Stanley Capital Services LLC | | | — | | | | — | | | | 1,512 | | | | 1,512 | | | | — | | | | — | | | | (1 | ) | | | (1 | ) | | | 1,511 | | | | — | | | | 1,511 | |
Société Générale Paris | | | — | | | | — | | | | 286 | | | | 286 | | | | — | | | | — | | | | (6 | ) | | | (6 | ) | | | 280 | | | | — | | | | 280 | |
| | | | | | | | | | | | | | | | | | | | | | | | | | | | | | | | | | | | | | | | | | | | |
Total Over-the-Counter Exposure | | $ | 2,900 | | | $ | 134 | | | $ | 3,580 | | | $ | 6,614 | | | $ | (3,138 | ) | | $ | (353 | ) | | $ | (1,404 | ) | | $ | (4,895 | ) | | | | | | | | | | | | |
| | | | | | | | | | | | | | | | | | | | | | | | | | | | | | | | | | | | | | | | | | | | |
| * | Of the total collateral received and/or pledged listed in the table above, cash of $3,174 has been received as collateral. |
| a | The Harbor Commodity Real Return Strategy Fund and its subsidiary, Harbor Cayman Commodity Fund Ltd. are recognized as two separate legal entities as such, exposure cannot be netted. |
60
Harbor Strategic Markets Funds
NOTES TO FINANCIAL STATEMENTS—Continued
(Currency in thousands)
NOTE 7—OFFSETTING ASSETS AND LIABILITIES—Continued
| | | | | | | | | | | | | | | | | | | | | | | | | | | | | | | | | | | | | | | | | | | | |
HARBOR UNCONSTRAINED BOND FUND | |
| | | | | |
| | | Financial Derivative Assets | | | Financial Derivative Liabilities | | | | | | | | | | |
Counterparty | | Forward
Currency
Contracts | | | Purchased
Options | | | Swap
Agreements | | | Total Over-
the-Counter | | | Forward
Currency
Contracts | | | Written
Options | | | Swap
Agreements | | | Total Over-
the-Counter | | | Net Value
of OTC
Derivatives | | | Collateral
(Received)/
Pledged* | | | Net
Exposure | |
Australia and New Zealand | | | | | | | | | | | | | | | | | | | | | | | | | | | | | | | | | | | | | | | | | | | | |
Banking Group | | $ | — | | | $ | — | | | $ | — | | | $ | — | | | $ | — | | | $ | — | | | $ | — | | | $ | — | | | $ | — | | | $ | — | | | $ | — | |
Bank of America Corp. | | | 259 | | | | — | | | | — | | | | 259 | | | | — | | | | — | | | | — | | | | — | | | | 259 | | | | — | | | | 259 | |
Bank of America NA | | | 52 | �� | | | 14 | | | | 8 | | | | 74 | | | | (44 | ) | | | (21 | ) | | | (17 | ) | | | (82 | ) | | | (8 | ) | | | — | | | | (8 | ) |
Barclays Bank plc | | | 85 | | | | — | | | | 4 | | | | 89 | | | | (2 | ) | | | — | | | | — | | | | (2 | ) | | | 87 | | | | — | | | | 87 | |
BNP Paribas SA | | | 194 | | | | — | | | | 5 | | | | 199 | | | | (271 | ) | | | (8 | ) | | | (26 | ) | | | (305 | ) | | | (106 | ) | | | — | | | | (106 | ) |
Credit Suisse Group AG | | | 47 | | | | — | | | | — | | | | 47 | | | | — | | | | — | | | | — | | | | — | | | | 47 | | | | — | | | | 47 | |
Credit Suisse International | | | 41 | | | | — | | | | 1 | | | | 42 | | | | (21 | ) | | | (1 | ) | | | (14 | ) | | | (36 | ) | | | 6 | | | | — | | | | 6 | |
Deutsche Bank AG | | | 134 | | | | 26 | | | | 11 | | | | 171 | | | | (135 | ) | | | (25 | ) | | | (21 | ) | | | (181 | ) | | | (10 | ) | | | — | | | | (10 | ) |
Deutsche Bank AG London | | | 179 | | | | — | | | | — | | | | 179 | | | | (41 | ) | | | — | | | | — | | | | (41 | ) | | | 138 | | | | — | | | | 138 | |
Goldman Sachs Bank USA | | | 1 | | | | 18 | | | | 18 | | | | 37 | | | | (2 | ) | | | (30 | ) | | | (7 | ) | | | (39 | ) | | | (2 | ) | | | — | | | | (2 | ) |
Goldman Sachs Capital Markets LP | | | — | | | | — | | | | — | | | | — | | | | (32 | ) | | | — | | | | — | | | | (32 | ) | | | (32 | ) | | | — | | | | (32 | ) |
Goldman Sachs International | | | — | | | | — | | | | 6 | | | | 6 | | | | — | | | | — | | | | (2 | ) | | | (2 | ) | | | 4 | | | | — | | | | 4 | |
HSBC Bank USA | | | 3 | | | | — | | | | — | | | | 3 | | | | — | | | | — | | | | — | | | | — | | | | 3 | | | | — | | | | 3 | |
HSBC Bank USA NA | | | — | | | | — | | | | 4 | | | | 4 | | | | — | | | | (2 | ) | | | (6 | ) | | | (8 | ) | | | (4 | ) | | | — | | | | (4 | ) |
JP Morgan Chase Bank | | | 4 | | | | — | | | | — | | | | 4 | | | | (34 | ) | | | — | | | | — | | | | (34 | ) | | | (30 | ) | | | — | | | | (30 | ) |
JP Morgan Chase Bank NA | | | 5 | | | | 1 | | | | 2 | | | | 8 | | | | (5 | ) | | | (3 | ) | | | (1 | ) | | | (9 | ) | | | (1 | ) | | | — | | | | (1 | ) |
Morgan Stanley Capital Services LLC | | | — | | | | 72 | | | | 4 | | | | 76 | | | | — | | | | (79 | ) | | | (11 | ) | | | (90 | ) | | | (14 | ) | | | — | | | | (14 | ) |
UBS AG | | | 174 | | | | — | | | | — | | | | 174 | | | | (38 | ) | | | — | | | | — | | | | (38 | ) | | | 136 | | | | — | | | | 136 | |
UBS AG Stamford | | | — | | | | 1 | | | | — | | | | 1 | | | | — | | | | — | | | | — | | | | — | | | | 1 | | | | — | | | | 1 | |
| | | | | | | | | | | | | | | | | | | | | | | | | | | | | | | | | | | | | | | | | | | | |
Total Over-the-Counter Exposure | | $ | 1,178 | | | $ | 132 | | | $ | 63 | | | $ | 1,373 | | | $ | (625 | ) | | $ | (169 | ) | | $ | (105 | ) | | $ | (899 | ) | | | | | | | | | | | | |
| | | | | | | | | | | | | | | | | | | | | | | | | | | | | | | | | | | | | | | | | | | | |
| * | Of the total collateral received and/or pledged listed in the table above, cash of $260 has been received as collateral. |
Exchange traded and centrally cleared derivatives are not subject to master netting or similar arrangements.
NOTE 8—SUBSEQUENT EVENTS
Through the date the financial statements were issued, no subsequent events or transactions had occurred that would have materially impacted the financial statements or related disclosures as presented herein.
61
Harbor Strategic Markets Funds
FEES AND EXPENSE EXAMPLE (Unaudited)
Example
As a shareholder of a Fund, you incur two types of costs: (1) transaction costs, including redemption fees (if any) and (2) ongoing costs, including management fees, distribution and service (12b-1) fees, and other Fund expenses. This example is intended to help you understand your ongoing costs (in dollars) of investing in a Fund and to compare these costs with the ongoing costs of investing in other mutual funds.
The example is based on an investment of $1,000 invested at the beginning of the period and held for the entire period November 1, 2014 through April 30, 2015.
Actual Expenses
The first line of the table below provides information about actual account values and actual expenses for each share class. You may use the information in the respective class line, together with the amount you invested, to estimate the expenses that you paid over the period. Simply divide your account value by $1,000 (for example, an $8,600 account value divided by $1,000 = 8.6), then multiply the result by the number in the first line of the respective class under the heading entitled “Expenses Paid During Period” to estimate the expenses you paid on your account during this period.
Hypothetical Example for Comparison Purposes
The second line of the table for each share class below provides information about hypothetical account values and hypothetical expenses based on the respective Fund’s actual expense ratio and an assumed rate of return of 5% per year before expenses, which is not the respective Fund’s actual return. The hypothetical account values and expenses may not be used to estimate the actual ending account balance or expenses you paid for the period. You may use this information to compare the ongoing costs of investing in a Fund to other funds. To do so, compare this 5% hypothetical example with the 5% hypothetical examples that appear in the shareholder reports of the other funds.
Please note that the expenses shown in the table are meant to highlight your ongoing costs only and do not reflect any transactional costs, such as redemption fees. Therefore, the second line of the table is useful in comparing ongoing costs only, and will not help you determine the relative total costs of owning different funds. In addition, if these transactional costs were included, your costs would have been higher.
| | | | | | | | | | | | | | | | |
| | | Annualized
Expense Ratios* | | | Expenses Paid
During Period** | | | Beginning Account
Value
(November 1, 2014) | | | Ending Account
Value
(April 30, 2015) | |
Harbor Commodity Real Return Strategy Fund | | | | | | | | | | | | | |
Institutional Class | | | 0.94% | | | | | | | | | | | | | |
Actual | | | | | | $ | 4.36 | | | $ | 1,000 | | | $ | 869.30 | |
Hypothetical (5% return) | | | | | | | 4.71 | | | | 1,000 | | | | 1,020.02 | |
Administrative Class | | | 1.19% | | | | | | | | | | | | | |
Actual | | | | | | $ | 5.51 | | | $ | 1,000 | | | $ | 866.40 | |
Hypothetical (5% return) | | | | | | | 5.96 | | | | 1,000 | | | | 1,018.75 | |
Harbor Unconstrained Bond Fund | | | | | | | | | | | | | |
Institutional Class | | | 1.05% | | | | | | | | | | | | | |
Actual | | | | | | $ | 5.22 | | | $ | 1,000 | | | $ | 1,003.10 | |
Hypothetical (5% return) | | | | | | | 5.26 | | | | 1,000 | | | | 1,019.46 | |
Administrative Class | | | 1.30% | | | | | | | | | | | | | |
Actual | | | | | | $ | 6.46 | | | $ | 1,000 | | | $ | 1,001.70 | |
Hypothetical (5% return) | | | | | | | 6.51 | | | | 1,000 | | | | 1,018.19 | |
| * | Reflective of all fee waivers and expense reimbursements. |
| ** | Expenses are equal to the Fund’s annualized net expense ratio, multiplied by the average account value over the period, multiplied by 181/365 (to reflect the one-half year period). |
62
Harbor Strategic Markets Funds
ADDITIONAL INFORMATION (Unaudited)
PROXY VOTING
The Funds have adopted Proxy Voting Policies and Procedures under which the Funds vote proxies relating to securities held by the Funds. In addition, the Funds file Form N-PX, with its complete proxy voting record for the 12 months ended June 30th, no later than August 31st of each year. A description of the Funds’ Proxy Voting Policies and Procedures and the Funds’ proxy voting record (Form N-PX) is available (i) without charge, upon request, by calling Harbor Funds toll-free at 800-422-1050; (ii) on the Funds’ website at harborfunds.com; and (iii) on the SEC’s website at www.sec.gov.
HOUSEHOLDING
Harbor Funds has adopted a policy that allows it to send only one copy of a Fund’s prospectus, proxy material, annual report and semi-annual report to certain shareholders residing at the same household. This reduces Fund expenses, which benefits you and other shareholders. If you need additional copies or do not want your mailings to be “householded,” please call the Shareholder Servicing Agent at 800-422-1050. Individual copies will be sent within thirty (30) days after the Shareholder Servicing Agent receives your instructions. Your consent to householding is considered valid until revoked.
QUARTERLY PORTFOLIO DISCLOSURES
Each Fund files a complete portfolio of investments with the Securities and Exchange Commission for the first and third quarters of each fiscal year on Form N-Q. The Funds’ Form N-Q is available (i) without charge, upon request, by calling Harbor Funds toll-free at 800-422-1050, (ii) on the Funds’ website at harborfunds.com, and (iii) on the SEC’s web site at www.sec.gov. The form may also be viewed and copied at the Commission’s Public Reference Room in Washington, D.C. Information regarding the operations of the Public Reference Room may also be obtained by calling 800-SEC-0330.
ADVISORY AGREEMENT APPROVALS
FACTORS CONSIDERED BY THE TRUSTEES IN APPROVING THE INVESTMENT ADVISORY AGREEMENTS AND SUBADVISORY AGREEMENTS OF THE STRATEGIC MARKETS FUNDS
The Investment Company Act of 1940, as amended, requires that the Investment Advisory and Subadvisory Agreement of each Fund be approved initially, and following an initial two-year term, at least annually, by the Harbor Funds Board of Trustees, including a majority of the Independent Trustees voting separately.
At an in-person meeting of the Board of Trustees held on February 8, 9, and 10, 2015 (the “Meeting”), the Board, including the Independent Trustees voting separately, considered and approved the continuation of each Investment Advisory Agreement with Harbor Capital Advisors, Inc., the adviser to each Fund (the “Adviser”), and a Subadvisory Agreement with Pacific Investment Management Company LLC (“PIMCO”), each Fund’s subadviser (the “Subadviser”) with respect to Harbor Commodity Real Return Strategy Fund and Harbor Unconstrained Bond Fund.
In evaluating each Investment Advisory Agreement and each Subadvisory Agreement, the Trustees reviewed materials furnished by the Adviser and the Subadviser, including information about their respective affiliates, personnel, and operations and also relied upon their knowledge of the Adviser and Subadvisers resulting from their quarterly meetings, periodic telephonic meetings and other prior communications. At the Meeting, which had been called for the purpose of considering the continuation of the relevant Investment Advisory Agreements and Subadvisory Agreements, and at prior meetings, the Trustees, including the Independent Trustees, requested and received materials and presentations relating to Fund performance and the services rendered by the Adviser and the Subadviser. The Trustees also discussed with representatives of the Adviser, at the Meeting and at prior meetings, Harbor Funds’ operations and the Adviser’s ability, consistent with the “manager of managers” structure of Harbor Funds, to (i) identify and recommend to the Trustees a subadviser for each Fund, (ii) monitor and oversee the performance and investment capabilities of the Subadviser, and (iii) recommend the replacement of a subadviser where appropriate.
At the Meeting, the Trustees, including all of the Independent Trustees voting separately, determined that the terms of each Investment Advisory Agreement and each Subadvisory Agreement with respect to Harbor Commodity Real Return Strategy Fund and Harbor Unconstrained Bond Fund were fair and reasonable and approved the continuation for a one-year period of each such Investment Advisory Agreement and Subadvisory Agreement as being in the best interests of the respective Fund and its shareholders.
63
Harbor Strategic Markets Funds
ADDITIONAL INFORMATION—Continued
In their deliberations, the Independent Trustees had the opportunity to meet privately without representatives of the Adviser or any Subadviser present and were represented throughout the process by legal counsel to the Independent Trustees and the Funds.
In considering the approval of each Fund’s Investment Advisory Agreement and Subadvisory Agreement, the Board of Trustees, including the Independent Trustees, evaluated a number of factors it considered relevant to its determination. The Board did not identify any single factor as all-important or controlling, and individual Trustees did not necessarily attribute the same weight or importance to each factor.
Among the factors considered by the Trustees in approving the Investment Advisory Agreements were the following:
| | • | | the nature, extent, and quality of the services provided by the Adviser, including the background, education, expertise and experience of the investment professionals of the Adviser; |
| | • | | the favorable history, reputation, qualifications and background of the Adviser, as well as the qualifications of its personnel; |
| | • | | the profitability of the Adviser with respect to each Fund, including the effect of revenues of Harbor Services Group, Inc. (“Harbor Services Group”), the Funds’ transfer agent, and Harbor Funds Distributors, Inc. (“Harbor Funds Distributors”), the Funds’ principal underwriter, on such profitability; |
| | • | | the fees charged by the Adviser for investment advisory services, including, in each case, the portion of the fee to be retained by the Adviser, after payment of the Subadviser’s fee, for the subadviser oversight, administration and “manager of managers” services the Adviser provides; |
| | • | | the extent to which economies of scale might be realized as each Fund grows, and the extent to which each Fund’s advisory fee level reflects any economies of scale for the benefit of Fund investors; |
| | • | | the fees and expense ratios of each Fund relative to the quality of services provided and the fees and expense ratios of similar investment companies; |
| | • | | the investment performance of each Fund in comparison to peer groups and certain relevant benchmark indices and the Adviser’s efforts to address circumstances of underperformance where applicable; |
| | • | | the compensation received by Harbor Services Group and Harbor Funds Distributors in consideration of the services each provides to the Funds, and any other “fall out” benefits that inure to the Adviser and its affiliates as a result of their relationship with the Funds; |
| | • | | information received at regular meetings throughout the year related to Fund performance and services rendered by the Adviser, as well as the Subadviser, and research arrangements with brokers who execute transactions on behalf of the Subadviser; |
| | • | | information contained in materials provided by the Adviser and compiled by Lipper, Inc. (“Lipper”) as to the investment returns, advisory fees and total expense ratios of the Institutional Class of each Fund (and, in certain cases, total expense ratios of certain other classes) relative to those of other investment companies with similar objectives and strategies managed by other investment advisers, consisting both of a peer group of funds as well as a broader universe of funds compiled by Lipper; and |
| | • | | information contained in materials compiled by Morningstar, Inc. (“Morningstar”) as to the investment returns of the Institutional Class of each Fund relative to those of other investment companies with similar objectives and strategies managed by other investment advisers. |
Among the factors considered by the Trustees in approving the Subadvisory Agreements were the following:
| | • | | the nature, extent, and quality of the services provided by the Subadviser, including the background, education, expertise and experience of the investment professionals of the Subadviser providing services to the Funds; |
| | • | | the favorable history, reputation, qualifications and background of the Subadviser, as well as the qualifications of their respective personnel; |
| | • | | the fees charged by the Subadviser for subadvisory services, which fees are paid by the Adviser, not by the Funds; |
64
Harbor Strategic Markets Funds
ADDITIONAL INFORMATION—Continued
| | • | | information contained in materials provided by the Adviser and compiled by Lipper as to the investment returns of the Institutional Class of each Fund relative to those of other investment companies with similar objectives and strategies managed by other investment advisers, consisting both of a peer group of funds as well as a broader universe of funds compiled by Lipper; and |
| | • | | information contained in materials compiled by Morningstar as to the investment returns of the Institutional Class of each Fund relative to those of other investment companies with similar objectives and strategies managed by other investment advisers. |
Nature, Scope and Extent of Services
The Trustees separately considered the nature, scope and extent of the services provided by the Adviser and the Subadviser. In their deliberations as to the approval of each Fund’s Investment Advisory Agreement and Subadvisory Agreement, the Trustees were mindful of the fact that, by choosing to invest in a Fund, the shareholders had entrusted the Adviser with the responsibility, subject to the approval of the Trustees, for selecting such Fund’s Subadviser, overseeing and monitoring that Subadviser’s performance and replacing the Subadviser if necessary. The Trustees also considered as relevant to their determination the favorable history, reputation, qualifications and background of the Adviser and the Subadviser, as well as the qualifications of their respective personnel.
The Adviser’s Services. The Board evaluated the nature, scope and extent of the Adviser’s services in light of the Board’s experience with the Adviser, as well as materials provided by the Adviser as part of its comprehensive written response to the 15(c) request letter prepared by legal counsel to the Independent Trustees in consultation with the Independent Trustees concerning the financial and other resources devoted by the Adviser to Harbor Funds, including the breadth and depth of experience and expertise of the investment, administrative, legal and compliance professionals dedicated to Harbor Funds’ operations. The Trustees noted that the Adviser had a favorable long-term record of identifying mutual fund products that proved to be attractive to investors, and selecting subadvisers to manage such funds. The Trustees determined that the Adviser had the expertise and resources to identify, select, oversee and monitor the Subadviser and to operate effectively as the “manager of managers” for the Funds.
The Subadviser’s Services. The Trustees’ consideration of the services provided by the Subadviser included a review of the Subadviser’s portfolio managers, investment philosophy, style and processes and record of consistency therewith, the volatility of its results, its approach to controlling risk, and the quality and extent of its investment capabilities and resources, including, the nature and extent of research it receives from broker-dealers (to the extent applicable) and other sources. In their deliberations with respect to each Fund, the Trustees considered the history of Harbor Funds’ relationship with the Subadviser and Harbor Funds’ experience with the Subadviser in this capacity.
The Trustees also considered the Subadviser’s breadth and depth of experience and investment results in managing other accounts similar to the respective Fund. The Trustees had received presentations at the meeting by investment professionals from the Subadviser for Harbor Commodity Real Return Strategy Fund and Harbor Unconstrained Bond Fund. The Trustees reviewed information concerning the Subadviser’s historical investment results in managing accounts and/or funds, as applicable, in a manner substantially similar to the relevant Fund.
Investment Performance, Advisory Fees and Expense Ratios
In considering each Fund’s performance, advisory fees and expense ratio, the Trustees requested and received from the Adviser data compiled by Lipper and Morningstar. The Trustees also received information explaining the methodology for compilation of certain of this information and what it was intended to demonstrate. The Trustees analyzed the Institutional Class performance of each Fund, the advisory fees of each Fund, and the Institutional Class expenses of each Fund (after giving effect to waivers and/or reimbursements, if applicable, that reduced the fees or expenses of the Fund or its peer funds) and made certain observations and findings as to each Fund as noted below. The Trustees also identified and reviewed certain Administrative Class and Investor Class comparative fee and expense information they considered relevant to their deliberations.
Harbor Commodity Real Return Strategy Fund. In consideration of the Investment Advisory Agreement and Subadvisory Agreement for the Harbor Commodity Real Return Strategy Fund (inception date of September 2, 2008), the Trustees noted the Fund’s Institutional Class underperformance relative to its Lipper group medians for the two-, three-, four- and five-year periods ended December 31, 2014 and its underperformance versus its Lipper universe medians for the one-, two-
65
Harbor Strategic Markets Funds
ADDITIONAL INFORMATION—Continued
and three-year periods ended December 31, 2014. The Fund outperformed its Lipper universe medians for the four- and five-year periods ended December 31, 2014 and performed at its Lipper group median for the one-year period ended December 31, 2014. According to the Morningstar data presented, the Fund’s one-, three- and five-year rolling returns as of December 31, 2014 were ranked in the second, third and first quartiles, respectively. The Trustees also considered the fact that the Fund outperformed its benchmark, the Bloomberg Commodity Index, for the five-year period ended December 31, 2014, but had underperformed its benchmark for the one- and three-year periods ended December 31, 2014.
The Trustees considered the expertise of PIMCO in managing assets generally and in the commodity and inflation-protection asset classes specifically, noting that PIMCO managed approximately $19.8 billion in commodity assets, out of a firm-wide total of approximately $1.68 trillion in assets under management. The Trustees also noted that the Fund’s portfolio managers had significant experience in the inflation protection/Treasury Inflation Protected Securities (TIPS) and commodities markets.
They observed that the Lipper comparison of contractual management fees for the Fund’s expense group, assuming an asset level of $225 million, showed the Fund’s management fee was below the group median for the Institutional Class. The actual total expense ratio of the Fund’s Institutional Class was below the Lipper group and universe median expense ratios. The Trustees also considered that Harbor Capital proposed to continue the Fund’s existing contractual fee waiver/expense reimbursement arrangement until at least February 29, 2016. They noted that the Adviser’s profitability in managing the Fund was not excessive.
Harbor Unconstrained Bond Fund. In consideration of the Investment Advisory Agreement and Subadvisory Agreement for the Harbor Unconstrained Bond Fund (inception date of April 1, 2010), the Trustees noted the Fund’s Institutional Class performance was above the Lipper group and universe medians for the one-, two- and four-year periods ended December 31, 2014. The Fund’s performance was at the Lipper group and universe medians for the three-year period ended December 31, 2014. For the since-inception period ended December 31, 2014, the Fund’s performance was above the Lipper group median but below the universe median. According to the Morningstar data presented, the Fund’s one- and three-year rolling returns as of December 31, 2014 ranked in the first and third quartiles, respectively. The Trustees also considered the fact that the Fund outperformed its benchmark, the Bank of America Merrill Lynch USD 3-Month Constant Maturity LIBOR Index, for the one- and three-year periods ended December 31, 2014.
The Trustees considered the expertise of PIMCO in managing assets generally and in the bond asset class specifically, noting that PIMCO managed approximately $34 billion in “unconstrained” assets, out of a firm-wide total of approximately $1.68 trillion in assets under management. The Trustees also noted that although the Fund’s prior portfolio manager, Bill Gross, the founder of PIMCO, had departed PIMCO in September 2014, the Fund’s replacement co-portfolio managers each had significant experience in the bond markets.
They observed that the Lipper comparison of contractual management fees for the Fund’s expense group, assuming an asset level of $50 million, showed the Fund’s management fee was above the group median for the Institutional Class. The actual total expense ratio of the Fund’s Institutional Class was above the Lipper group and universe median expense ratios. The Trustees also considered that Harbor Capital proposed to continue the Fund’s existing contractual fee waiver/expense reimbursement arrangement until at least February 29, 2016. They noted that the Adviser’s profitability in managing the Fund was negative.
* * *
The Trustees also separately considered the allocation between the Adviser and the Subadviser of the relevant Fund’s investment advisory fee (i.e., the amount of the advisory fee retained by the Adviser relative to that paid to the Subadviser as a subadvisory fee). They determined in each case that the allocation was reasonable and the product of arm’s length negotiation between the Adviser and Subadviser.
Profitability
The Trustees also considered the Adviser’s profitability in managing each of the Funds (as well as on a fund complex-wide basis) as presented by the Adviser, and the allocation methodology used by the Adviser to compute such profitability. The Trustees acknowledged that a reasonable level of profitability was important to provide suitable incentives for the Adviser to continue to attract and maintain high-quality personnel and to invest in infrastructure and other resources to support and enhance the Funds’ operations. In considering the Adviser’s profitability generally, the Trustees also reviewed the compensation received by Harbor Services Group and Harbor Funds Distributors in consideration of the transfer agency
66
Harbor Strategic Markets Funds
ADDITIONAL INFORMATION—Continued
and distribution services, respectively, that are provided to Harbor Funds, and any other benefits enjoyed by the Adviser and its affiliates as a result of their relationship with Harbor Funds. The Trustees noted that the Adviser was, in certain cases, waiving a portion of its advisory fee and/or reimbursing a portion of Fund expenses. The Trustees determined that the Adviser’s profitability in managing each Fund was not excessive.
Economies of Scale
The Trustees also considered the extent to which economies of scale might be realized as each Fund grows, and the extent to which each Fund’s advisory fee level reflects these economies of scale for the benefit of Fund investors. The Trustees specifically considered whether any advisory fee reduction “breakpoints” should be added to the advisory fee payable by any Fund. As noted above, the Trustees concluded that the Adviser’s profitability in each case was not excessive. They concluded that the Funds’ fee structures reflected economies of scale to date and that breakpoints in these fee structures were not required at the present time. The Trustees noted they intend to monitor each Fund’s asset growth in connection with future reviews of each Fund’s Investment Advisory Agreement to determine whether breakpoints may be appropriate at such time.
67
Harbor Strategic Markets Funds
ADDITIONAL INFORMATION—Continued
TRUSTEES AND OFFICERS
(As of June 2015)
The business and affairs of the Trust shall be managed by or under the direction of the Trustees, and they shall have all powers necessary or desirable to carry out that responsibility. The Trustees shall have full power and authority to take or refrain from taking any action and to execute any contracts and instruments that they may consider necessary or desirable in the management of the Trust. Any determination made by the Trustees in good faith as to what is in the interests of the Trust shall be conclusive. Information pertaining to the Trustees and Officers of Harbor Funds is set forth below. The address of each Trustee and Officer is: [Name of Trustee or Officer] c/o Harbor Funds, 111 South Wacker Drive, 34th Floor, Chicago, IL 60606-4302.
The Harbor Funds’ Statement of Additional Information includes additional information about the Trust’s Trustees and is available without charge by calling 800-422-1050 or at the Trust’s website at harborfunds.com.
| | | | | | | | |
Name (Age) Position(s) with Fund Address | | Term of
Office and
Length of Time Served1 | | Principal Occupation(s) During Past Five Years | | Number of
Portfolios In
Fund Complex Overseen by
Trustee | | Other Directorships
of Public Companies
and Other Registered
Investment
Companies Held by
Trustee During Past
Five Years |
| INDEPENDENT TRUSTEES |
Scott M. Amero (51) Trustee | | Since 2014 | | Trustee, Rare (conservation non-profit) (2011-Present); Trustee, Berkshire School (2014-Present); BlackRock, Inc., (publicly traded investment management firm) Vice Chairman and Global Chief Investment Officer, Fixed Income (2010), Vice Chairman and Global Chief Investment Officer, Fixed Income, and Co-Head, Fixed Income Portfolio Management (2007-2010). | | 28 | | Director, Anthracite Capital, Inc. (2005-2010). |
| | | | |
Raymond J. Ball (70) Trustee | | Since 2006 | | Sidney Davidson Distinguished Service Professor of Accounting, University of Chicago Booth School of Business (2000-Present); Academic Affiliate, Analysis Group (litigation consulting firm) (2000-Present); Financial Reporting Faculty Advisory Group of the Institute of Chartered Accountants in England and Wales (2008-Present); and Advisory Board of the Center for Accounting Research & Education at University of Notre Dame (2006-Present). | | 28 | | None |
| | | | |
Donna J. Dean (63) Trustee | | Since 2010 | | Chief Investment Officer of the Rockefeller Foundation (a private foundation) (1995-Present); and Trustee of Queens University of Charlotte, North Carolina (2000-2014). | | 28 | | None |
| | | | |
Randall A. Hack (68) Trustee | | Since 2010 | | Founder and Senior Managing Director of Capstone Capital LLC (a private investment firm) (2003-Present); Director of Tower Development Corporation (cell tower developer) (2009-Present); and Advisory Director of Berkshire Partners (a private equity firm) (2002-2013). | | 28 | | Director of FiberTower Corporation (2002-2011). |
| | | | |
Robert Kasdin (57) Trustee | | Since 2014 | | Senior Vice President and Chief Operating Officer, Johns Hopkins Medicine (2015-Present); Senior Executive Vice President, Columbia University (2002-2015); Trustee, National September 11 Memorial & Museum at the World Trade Center (2005-Present); Trustee, The Metropolitan Museum of Art (2014-Present); Trustee (2004-2014) and President of the Board of Trustees (2006-2011), The Dalton School; Trustee, ARTstor Digital Library (a nonprofit digital images resource) (2013-Present); Director, Apollo Commercial Real Estate Finance, Inc. (2014-Present); and Director, Noranda Aluminum Holdings Corp. (2007-2014). | | 28 | | Director of Noranda Aluminum Holdings Corp. (2007-2014); and Director of Apollo Commercial Real Estate Finance, Inc. (2014-Present). |
| | | | |
Rodger F. Smith (74) Trustee | | Since 1987 | | Managing Director, Greenwich Associates (a research based consulting firm) (1976-Present); and Chair of Trust Advisory Committee of Tau Beta Pi Association (engineering honor society) (1985-Present). | | 28 | | None |
| | | | |
Ann M. Spruill (61) Trustee | | Since 2014 | | Partner (1993-2008), Member of Executive Committee (1996-2008), Member Board of Directors (2000-2008), Grantham, Mayo, Van Otterloo & Co. LLC (private investment management firm) (with the firm since 1990); Member Investment Committee and Chair of Global Equities, Museum of Fine Arts, Boston (2000-Present); and Trustee, Financial Accounting Foundation (2014-Present). | | 28 | | None |
| INTERESTED TRUSTEE |
| | | | |
David G. Van Hooser (68)* Chairman, Trustee and President | | Since 2000 | | President (2002-Present), Director and Chairman of the Board (2000-Present), Harbor Capital Advisors, Inc.; Chief Executive Officer (2007-Present), Chief Financial Officer (2012-Present), Treasurer (2007-2012) and Director (2000-Present), Harbor Funds Distributors, Inc.; and Director (2000-Present), Harbor Services Group, Inc. | | 28 | | None |
68
Harbor Strategic Markets Funds
ADDITIONAL INFORMATION—Continued
| | | | | | | | |
Name (Age) Position(s) with Fund Address | | Term of Office and Length of Time Served1 | | Principal Occupation(s) During Past Five Years |
| FUND OFFICERS NOT LISTED ABOVE** |
Charles F. McCain (45) Chief Compliance Officer | | Since 2004 | | Executive Vice President and General Counsel (2004-Present) and Chief Compliance Officer (2004-2014), Harbor Capital Advisors, Inc.; Director (2007-Present) and Chief Compliance Officer (2004-Present), Harbor Services Group, Inc.; and Director, Executive Vice President and Chief Compliance Officer (2007-Present), Harbor Funds Distributors, Inc. |
| | |
Anmarie S. Kolinski (43) Treasurer | | Since 2007 | | Executive Vice President and Chief Financial Officer (2007-Present), Harbor Capital Advisors, Inc.; Chief Financial Officer (2007-Present), Harbor Services Group, Inc.; and Treasurer (2012-Present), Harbor Funds Distributors, Inc. |
| | |
Erik D. Ojala (40) Vice President and Secretary; AML Compliance Officer | | Since 2007;
Since 2010 | | Senior Vice President and Associate General Counsel (2007-Present) and Secretary (2010-Present), Harbor Capital Advisors, Inc.; and Assistant Secretary (2014-Present), Harbor Services Group, Inc. |
| | |
Brian L. Collins (46) Vice President | | Since 2005 | | Executive Vice President and Chief Investment Officer (2004-Present), Harbor Capital Advisors, Inc. |
| | |
Charles P. Ragusa (56) Vice President | | Since 2007 | | Executive Vice President (2007-Present), Harbor Capital Advisors, Inc.; President (2007-Present), Harbor Services Group, Inc.; and Executive Vice President and AML Compliance Officer (2007-Present), Harbor Funds Distributors, Inc. |
| | |
Jodie L. Crotteau (43) Assistant Secretary | | Since 2014 | | Senior Vice President and Chief Compliance Officer, Harbor Capital Advisors, Inc. (2014-Present); Vice President and Chief Compliance Officer, Grosvenor Registered Funds (2011-2014); Vice President, Grosvenor Capital Management, L.P. (2010-2014); Assistant Secretary (2005-2010) and AML Compliance Officer (2007-2010), Harbor Funds; Vice President, Secretary and Compliance Director (2007-2010), Harbor Capital Advisors, Inc.; Assistant Secretary (2005-2010), Harbor Services Group, Inc.; and Assistant Secretary (2007-2010), Harbor Funds Distributors, Inc. |
| | |
Susan A. DeRoche (62) Assistant Secretary | | Since 2006 | | Senior Vice President and Compliance Director (2007-Present) and Assistant Secretary (2006-Present), Harbor Capital Advisors, Inc.; Senior Vice President (2011-Present) and Secretary (2007-Present), Harbor Funds Distributors, Inc.; and Secretary (2014-Present) and Assistant Secretary (2012-2013), Harbor Services Group, Inc. |
| | |
John M. Paral (46) Assistant Treasurer | | Since 2013 | | Vice President (2012-Present) and Financial Reporting Manager (2007-2012), Harbor Capital Advisors, Inc. |
| 1 | Each Trustee serves for an indefinite term, until his successor is elected. Each Officer is elected annually. |
| * | Mr. Van Hooser is deemed an “Interested Trustee” due to his affiliation with the Adviser and Distributor of Harbor Funds. |
| ** | Officers of the Funds are “interested persons” as defined in the Investment Company Act. |
69
THIS PRIVACY STATEMENT IS NOT PART OF THIS REPORT
Harbor’s Privacy Statement
The following privacy statement is issued by Harbor Funds and each series of Harbor Funds and its affiliates, Harbor Capital Advisors, Inc., Harbor Services Group, Inc. and Harbor Funds Distributors, Inc. These measures reflect our commitment to maintaining the privacy of your confidential information. We appreciate the confidence you have shown by entrusting us with your assets.
Personal Information | It is our policy to respect the privacy of current and former shareholders and to protect personal information entrusted to us. We do not sell your personal information to anyone. |
| | In the course of providing products and services, we collect non-public personal information about you from the following sources: applications, forms, our website (including any information captured through our use of “cookies”), through mobile applications, by telephone and in correspondence and transactions with us, our affiliates or other parties. |
| | The non-public personal information collected may include name, address, e-mail address, telephone/fax numbers, account number, social security or taxpayer identification number, investment activity, and bank account information. |
| | When you visit us through our website or a mobile application, we may collect technical and navigational information, such as computer browser type, Internet protocol address, pages visited and average time spent on our website. We may use this information to alert you to software compatibility issues, or to improve our web design and functionality. We use “cookies” and similar files that may be placed on your hard drive for security purposes, to facilitate site navigation and to personalize the appearance of our site. |
Information Sharing | We occasionally disclose non-public personal information about our current or former shareholders with affiliated and non-affiliated parties, as permitted or required by law or regulation. In the normal course of servicing our shareholders, information we collect may be shared with non-affiliated companies that perform support services on our behalf or to other firms that assist us in providing you with products and services, such as custodians, transfer agents, broker-dealers and marketing service firms, as well as with other financial institutions. These companies may not use the information for any other purpose and we require them to keep the information they handle confidential. We may also share information with affiliates that are engaged in a variety of financial services in order to better service your account(s). |
| | When information is shared with third parties, they are not permitted to use the information for any purpose other than to assist our servicing of your account(s) or as permitted by law. |
| | If you close your account(s) or if we lose contact with you, we will continue to share information in accordance with our current privacy policy and practices. |
Access to Information | Access to non-public personal information is limited to employees, agents or other parties who need to know that information to perform their jobs, such as servicing your account(s), resolving problems or informing you of new products or services. |
Security | We maintain physical, electronic and procedural safeguards that comply with industry standards to protect your non-public personal information. |
| | For shareholders accessing information through our website or a mobile application, various forms of Internet security, such as data encryption firewall barriers, user names and passwords, and other tools are used. For additional information regarding our security measures, visit the terms and conditions of use on our website at harborfunds.com. If you have any questions or concerns about how we maintain the privacy of your non-public personal information, please contact us at 800-422-1050 Monday through Friday, between the hours of 8:00 a.m. and 6:00 p.m. Eastern time. |
We recommend that you read and retain this notice for your personal files
Eff. November 2013
70
Glossary
12b-1 Fee—A mutual fund fee, named for the SEC rule that permits it, used to pay for broker-dealer compensation and other distribution costs. If a fund has a 12b-1 fee, it will be disclosed in the fee table of a fund’s prospectus.
ADR—ADR after the name of a foreign holding stands for American Depositary Receipts representing ownership of foreign securities. ADRs are issued by U.S. banking institutions.
Average Market Capitalization—The average market capitalization of a fund’s equity portfolio gives you a measure of the size of the companies in which the fund invests. Market capitalization is calculated by multiplying the number of a company’s shares outstanding by its price per share.
Average Weighted Coupon—A calculation from a fund’s portfolio by weighting the coupon of each bond by its relative size in the portfolio.
Barclays U.S. Aggregate Bond Index—The Barclays U.S. Aggregate Bond Index is an unmanaged index of investment-grade fixed-rate debt issues with maturities of at least one year. This unmanaged index does not reflect fees and expenses and is not available for direct investment.
Barclays U.S. TIPS Index—The Barclays U.S. TIPS Index is an unmanaged market index comprised of all U.S. Treasury Inflation Protected Securities rated investment grade (Baa3 or better), have at least one year to final maturity, and at least $250 million par amount outstanding. This unmanaged index does not reflect fees and expenses and is not available for direct investment.
Beta—A measure of market-related risk. The beta of every index is 1.00, no matter how volatile the index is. A beta less than one means the portfolio is less volatile than the index. A beta higher than one indicates more volatility than the index.
Bloomberg Commodity Index Total ReturnSM—The Bloomberg Commodity Index Total ReturnSM is a broadly diversified index that tracks the commodities markets through commodity futures contracts. This unmanaged index does not reflect fees and expenses and is not available for direct investment.
BofA Merrill Lynch All U.S. Convertibles Ex Mandatory Index—The BofA Merrill Lynch All U.S. Convertibles Ex Mandatory Index is broadly representative of the U.S. convertible securities market, consisting of publicly traded issues, denominated in U.S. dollars, of all credit qualities, and excluding mandatory (equity-linked) convertibles. This unmanaged index does not reflect fees and expenses and is not available for direct investment.
BofA Merrill Lynch U.S. Dollar 3-Month LIBOR Constant Maturity Index—The BofA Merrill Lynch U.S. Dollar 3-Month LIBOR Constant Maturity Index tracks the performance of a synthetic asset paying Libor to a stated maturity. The index is based on the assumed purchase at par of a synthetic instrument having exactly its stated maturity and with a coupon equal to that day’s fixing rate. That issue is assumed to be sold the following business day (priced at a yield equal to the current day fixing rate) and rolled into a new instrument. This unmanaged index does not reflect fees and expenses and is not available for direct investment.
BofA Merrill Lynch 3-Month U.S. Treasury Bill Index—The BofA Merrill Lynch 3-Month U.S. Treasury Bill Index is comprised of a single U.S. Treasury Bill issue purchased at the beginning of each month and held for a full month, at which time that issue is sold and rolled into a newly selected issue. The issue selected each month is that having a maturity date closest to, but not beyond 90 days from the rebalance date.
BofA Merrill Lynch U.S. High Yield Index—The BofA Merrill Lynch U.S. High Yield Index is an unmanaged index that tracks the performance of below investment grade U.S. dollar-denominated corporate bonds publicly issued in the U.S. domestic market. All bonds are U.S. dollar denominated and rated Split BBB and below. This unmanaged index does not reflect fees and expenses and is not available for direct investment.
BofA Merrill Lynch U.S. Non-Distressed High Yield Index—The BofA Merrill Lynch U.S. Non-Distressed High Yield Index is a subset of the BofA Merrill Lynch U.S. High Yield Index including all securities with an option-adjusted spread less than 1,000 basis points. The unmanaged index does not reflect fees and expenses and is not available for direct investment.
Bottom-Up Equity Management Style—A management style that de-emphasizes the significance of economic and market cycles, focusing instead on the analysis of individual stocks.
Capital Gains Distribution—Profits distributed to shareholders resulting from the sale of securities held in the fund’s portfolio.
71
Glossary—Continued
Credit Risk—The possibility that a bond issuer may not be able to pay interest and repay its debt.
CUSIP Number—Identification number assigned to every stock, corporate bond and municipal bond by the Committee on Uniform Securities Identification Procedures (CUSIP), which is established by the American Bankers Association.
Diversification—The practice of investing broadly across securities of a number of issuers to reduce risk.
Duration—A common gauge of the price sensitivity of a fixed income asset or portfolio to a change in interest rates.
Emerging Markets—Emerging markets are countries with relatively young stock and bond markets. Examples include Brazil and Thailand. Typically, emerging-markets investments have the potential for losses and gains larger than those of developed-market investments.
Expense Ratio—The Fund’s total annual operating expenses (including management fees, distribution (12b-1) fees and other expenses) expressed as a percentage of average net assets.
Family of Funds—A group of mutual funds, each typically with its own investment objective, managed and distributed by the same company.
GDR—GDR after the name of a holding stands for Global Depositary Receipt representing ownership of foreign securities. GDRs are issued by either U.S. or non-U.S. banking organizations.
Inception Date—The date on which the Fund commenced operations.
Investment Objective—The goal that an investor and mutual fund pursue together (e.g., current income, long-term capital growth, etc.)
Median Market Cap—An indicator of the size of companies in which a fund invests; the midpoint of market capitalization (market price x shares outstanding) of a fund’s stocks, weighted by the proportion of the fund’s assets invested in each stock. Stocks representing half of the fund’s assets have market capitalizations above the median, and the rest are below it.
MSCI All Country World Index—The MSCI All Country World Index is a free float-adjusted market capitalization weighted index that is designed to measure the equity market performance of developed and emerging markets. This unmanaged index does not reflect fees and expenses and is not available for direct investment.
MSCI All Country World Ex. U.S. (ND) Index—The MSCI All Country World Ex. U.S. is a free float-adjusted market capitalization weighted index that is designed to measure equity market performance in the global developed and emerging markets, excluding the United States. This unmanaged index does not reflect fees and expenses and is not available for direct investment.
MSCI EAFE (ND) Index—The MSCI EAFE (ND) Index is an unmanaged index generally representative of major overseas stock markets. This unmanaged index does not reflect fees and expenses and is not available for direct investment.
MSCI Emerging Markets (ND) Index—The MSCI Emerging Markets (ND) Index is a market capitalization weighted index of equity securities in more than 20 emerging market economies. This unmanaged index does not reflect fees and expenses and is not available for direct investment.
MSCI World (ND) Index—The MSCI World (ND) Index is a free float-adjusted market capitalization index that is designed to measure global developed market equity performance. This unmanaged index does not reflect fees and expenses and is not available for direct investment.
Net Asset Value (NAV)—The per share value of a mutual fund, determined by subtracting the fund’s liabilities from its assets and dividing by the number of shares outstanding. Mutual funds calculate their NAVs at least once each business day.
No-Load Fund—A mutual fund whose shares are sold without a sales commission and without a 12b-1 fee of more than 0.25% per year. Harbor funds are no-load.
Open-End Investment Company—The legal name for a mutual fund, indicating that it stands ready to redeem (buy back) its shares from investors on any business day. Harbor Funds is an open-end investment company.
Operating Expenses—Business costs paid from a fund’s assets before earnings are distributed to shareholders. These include management fees and 12b-1 fees and other expenses.
Portfolio Manager—A specialist employed by a mutual fund’s adviser or subadviser to invest the fund’s assets in accordance with predetermined investment objectives.
72
Glossary—Continued
Portfolio Turnover—A measure of the trading activity in a fund’s investment portfolio (how often securities are bought and sold by a fund). Funds with high turnover rates incur higher transaction costs and may be more likely to distribute capital gains (which may be taxable to investors).
Price to Book Ratio (P/B)—A ratio used to compare a stock’s market value to its book value. It is calculated by dividing the current closing price of the stock by the latest quarter’s book value. For a fund, the weighted average price/book ratio of the stocks it holds.
Price to Earnings Ratio (P/E)—The ratio of a stock’s current price to its per-share earnings over the past year. For a fund, the weighted average P/E of the stocks it holds. P/E is an indicator of market expectations about corporate prospects; the higher the P/E, the greater the market expectations are for a company’s future growth.
Prospectus—The official document that describes a mutual fund to prospective investors. The prospectus contains information required by the SEC, such as investment objectives and policies, risks, services and fees.
Record Date—The date on which a shareholder must officially own shares in order to be entitled to a dividend.
Redemption Fee—Fee charged to shareholders by a mutual fund when they sell shares within a specified period after purchase. The time limit and size of fee vary among funds. The fee is paid to the fund, not the fund’s investment adviser. Its purpose is to protect long-term investors from the impact of short-term traders.
REITs (Real Estate Investment Trust)—REITs invest in real estate or loans secured by real estate and issue shares in such investments. A REIT is similar to a closed-end mutual fund.
Repurchase Agreement (Repo)—A form of short-term borrowing for dealers in government securities. The dealer sells the government securities to investors, usually on an overnight basis, and buys them back the following day. For the party selling the security (and agreeing to repurchase it in the future), it is a repo. For the party on the other end of the transaction (buying the security and agreeing to sell back in the future), it is a reverse repurchase agreement.
Risk/Reward (or Return)—The relationship between the degree of risk associated with an investment and its return potential. Typically, the higher the potential return of an investment, the greater the risk.
Russell 1000® Growth Index—The Russell 1000® Growth Index is an unmanaged index generally representative of the U.S. market for larger capitalization growth stocks. This unmanaged index does not reflect fees and expenses and is not available for direct investment. The Russell 1000® Growth Index and Russell® are trademarks of Russell Investments.
Russell 1000® Value Index—The Russell 1000® Value Index is an unmanaged index generally representative of the U.S. market for larger capitalization value stocks. This unmanaged index does not reflect fees and expenses and is not available for direct investment. The Russell 1000® Value Index and Russell® are trademarks of Russell Investments.
Russell 2000® Index—The Russell 2000® Index measures the performance of the small-cap segment of the U.S. equity universe. The Russell 2000® Index is a subset of the Russell 3000® Index representing approximately 10% of the total market capitalization of that index. It includes approximately 2,000 of the smallest securities based on a combination of their market cap and current index membership. The Russell 2000® Index is constructed to provide a comprehensive and unbiased small-cap barometer and is completely reconstituted annually to ensure larger stocks do not distort the performance and characteristics of the true small-cap opportunity set. This unmanaged index does not reflect fees and expenses and is not available for direct investment. The Russell 3000® Index and Russell® are trademarks of Russell Investments.
Russell 2000® Growth Index—The Russell 2000® Growth Index is an unmanaged index representing the smallest 2,000 stocks with the highest price-to-book ratio and future earnings. This unmanaged index does not reflect fees and expenses and is not available for direct investment. The Russell 2000® Growth Index and Russell® are trademarks of Russell Investments.
Russell 2000® Value Index—The Russell 2000® Value Index is an unmanaged index representing the smallest 2,000 stocks with the lowest price-to-book ratio and future earnings. This unmanaged index does not reflect fees and expenses and is not available for direct investment. The Russell 2000® Value Index and Russell® are trademarks of Russell Investments.
Russell 3000® Index—The Russell 3000® Index measures the performance of the largest 3,000 U.S. companies representing approximately 98% of the investable U.S. equity market. The Russell 3000® Index is constructed to provide a comprehensive, unbiased and stable barometer of the broad market and is completely reconstituted annually to ensure new and growing equities are reflected. This unmanaged index does not reflect fees and expenses and is not available for direct investment. The Russell 3000® Index and Russell® are trademarks of Russell Investments.
73
Glossary—Continued
Russell 3000® Growth Index—The Russell 3000® Growth Index measures the performance of the broad growth segment of the U.S. equity universe. It includes those Russell 3000 companies with higher price-to-book ratios and higher forecasted growth values. The Russell 3000® Growth Index is constructed to provide a comprehensive, unbiased, and stable barometer of the broad growth market. The index is completely reconstituted annually to ensure new and growing equities are included and that the represented companies continue to reflect growth characteristics. This unmanaged index does not reflect fees and expenses and is not available for direct investment. The Russell 3000® Growth Index and Russell® are trademarks of Russell Investments.
Russell 3000® Value Index—The Russell 3000® Value Index measures the performance of the broad value segment of U.S. equity value universe. It includes those Russell 3000 companies with lower price-to-book ratios and lower forecasted growth values. The Russell 3000® Value Index is constructed to provide a comprehensive, unbiased, and stable barometer of the broad value market. The index is completely reconstituted annually to ensure new and growing equities are included and that the represented companies continue to reflect value characteristics. This unmanaged index does not reflect fees and expenses and is not available for direct investment. The Russell 3000® Value Index and Russell® are trademarks of Russell Investments.
Russell Midcap® Growth Index—The Russell Midcap® Growth Index is an unmanaged index generally representative of the U.S. market for medium capitalization growth stocks. This unmanaged index does not reflect fees and expenses and is not available for direct investment. The Russell Midcap® Growth Index and Russell® are trademarks of Russell Investments.
Russell Midcap® Value Index—The Russell Midcap® Value Index is an unmanaged index generally representative of the U.S. market for medium capitalization value stocks. This unmanaged index does not reflect fees and expenses and is not available for direct investment. The Russell Midcap® Value Index and Russell® are trademarks of Russell Investments.
S&P 500 Index—The S&P 500 Index is an unmanaged index generally representative of the U.S. stock market. This unmanaged index does not reflect fees and expenses and is not available for direct investment.
Statement of Additional Information (SAI)—The supplementary document to a prospectus that contains more detailed information about a mutual fund; also known as “Part B” of a fund’s registration statement.
TBAs—A term used to describe a forward mortgage-backed securities trade. Pass-through securities issued by Freddie Mac, Fannie Mae and Ginnie Mae trade in the TBA market. The term TBA is derived from the fact that the actual mortgage- backed security that will be delivered to fulfill a TBA trade is not designated at the time the trade is made. The securities are “to be announced” 48 hours prior to the established trade settlement date.
Treasury Inflation-Protected Securities (TIPS)—TIPS are securities in which the principal amount is adjusted for inflation and interest payments are applied to the inflation-adjusted principal.
Top-Down Equity Management Style—Investment style that begins with an assessment of the overall economic environment and makes a general asset allocation decision regarding various sectors of the financial markets and various industries.
Total Return—Return on an investment over a specified period, including price appreciation (or depreciation) plus any income, expressed as an average annual compound of return.
Weighted Average Duration—Duration is a time measure of a bond’s interest-rate sensitivity, based on the weighted average of the time periods over which a bond’s cash flows accrue to the bondholder. Time periods are weighted by multiplying by the present value of its cash flow divided by the bond’s price. (A bond’s cash flows consist of coupon payments and repayment of capital.) A bond’s duration will almost always be shorter than its maturity, with the exception of zero-coupon bonds, for which maturity and duration are equal.
Weighted Average Maturity—The average length of time until principal must be repaid for all bonds in a mutual fund portfolio on a dollar weighted basis.
Yield—A measure of net income (dividends and interest) earned by the securities in the fund’s portfolio less fund expenses during a specified period. A fund’s yield is expressed as a percentage of the maximum offering price per share on a specified date.
Yield to Maturity—The term used to describe the rate of return an investor will receive if a long-term, interest-bearing security, such as a bond, is held to its maturity date. Yield to maturity is greater than the coupon rate if the bond is selling at a discount and less than the coupon rate if it is selling at a premium.
74
| | | | | | |
| 111 South Wacker Drive, 34th Floor | | Chicago, IL 60606-4302 | | 800-422-1050 | | harborfunds.com |
Trustees & Officers
David G. Van Hooser
Chairman, President & Trustee
Scott M. Amero
Trustee
Raymond J. Ball
Trustee
Donna J. Dean
Trustee
Randall A. Hack
Trustee
Robert Kasdin
Trustee
Rodger F. Smith
Trustee
Ann M. Spruill
Trustee
Charles F. McCain
Chief Compliance Officer
Anmarie S. Kolinski
Treasurer
Erik D. Ojala
Vice President, Secretary
& AML Compliance Officer
Brian L. Collins
Vice President
Charles P. Ragusa
Vice President
Jodie L. Crotteau
Assistant Secretary
Susan A. DeRoche
Assistant Secretary
John M. Paral
Assistant Treasurer
Investment Adviser
Harbor Capital Advisors, Inc.
111 South Wacker Drive
34th Floor
Chicago, IL 60606-4302
312-443-4400
Distributor & Principal Underwriter
Harbor Funds Distributors, Inc.
111 South Wacker Drive
34th Floor
Chicago, IL 60606-4302
312-443-4600
Shareholder Servicing Agent
Harbor Services Group, Inc.
P.O. Box 804660
Chicago, IL 60680-4108
800-422-1050
Custodian
State Street Bank & Trust Company
State Street Financial Center
1 Lincoln Street
Boston, MA 02111-2900

Semi-Annual Report
April 30, 2015
Fixed Income Funds
| | | | | | |
| | | | |
| | | Institutional Class | | Administrative Class | | Investor Class |
| | | |
| Harbor Convertible Securities Fund | | HACSX | | HRCSX | | HICSX |
| | | |
| Harbor High-Yield Bond Fund | | HYFAX | | HYFRX | | HYFIX |
| | | |
| Harbor Bond Fund | | HABDX | | HRBDX | | — |
| | | |
| Harbor Real Return Fund | | HARRX | | HRRRX | | — |
| | | |
| Harbor Money Market Fund | | HARXX | | HRMXX | | — |
Table of Contents
This document must be preceded or accompanied by a Prospectus.
Harbor Fixed Income Funds
SEMI-ANNUAL REPORT OVERVIEW (Unaudited)
The first half of the fiscal year ended April 30, 2015. The performance figures for each of the Harbor Funds shown below assume the reinvestment of dividends and capital gains, but do not reflect the deduction of taxes that a shareholder would pay on Fund distributions or on the redemption of shares of the Funds. From time to time, certain fees and/or expenses have been voluntarily or contractually waived or reimbursed, which has resulted in higher returns. Without these waivers or reimbursements, the returns would have been lower. Voluntary waivers or reimbursements may be discontinued at any time without notice. For information on the different share classes, please refer to the current prospectus. The returns of the unmanaged indices assume the reinvestment of dividends but do not reflect fees and expenses. The indices are not available for direct investment.
Performance data shown represents past performance, which is no guarantee of future results. Current performance may be higher or lower than the past performance data shown. Investment returns and the value of an investment will fluctuate, and an investor’s shares, when sold, may be worth more or less than their original cost. You can obtain performance data current to the most recent month-end (available within seven business days after the most recent month-end) by calling 800-422-1050 or by visiting harborfunds.com.
| | | | | | | | | | | | |
| | | Unannualized Total Return
6 Months Ended April 30, 2015 | |
| | | Institutional
Class | | | Administrative
Class | | | Investor
Class | |
HARBOR FIXED INCOME FUNDS | | | | | | | | | | | | |
Harbor Convertible Securities Fund | | | 3.03 | % | | | 2.91 | % | | | 2.84 | % |
Harbor High-Yield Bond Fund | | | 2.40 | | | | 2.17 | | | | 2.11 | |
Harbor Bond Fund | | | 2.17 | | | | 2.11 | | | | N/A | |
Harbor Real Return Fund | | | 0.02 | | | | 0.00 | | | | N/A | |
Harbor Money Market Fund | | | 0.03 | | | | 0.03 | | | | N/A | |
| | | | |
| COMMONLY USED MARKET INDICES | | Unannualized Total Return
6 Months Ended
April 30, 2015 | |
BofA Merrill Lynch All U.S. Convertibles Ex Mandatory; domestic convertible bonds | | | 3.64 | % |
BofA Merrill Lynch U.S. Non-Distressed High Yield; domestic high-yield bonds | | | 1.92 | |
BofA Merrill Lynch U.S. High Yield; domestic high-yield bonds | | | 1.51 | |
Barclays U.S. Aggregate Bond; domestic bonds | | | 2.06 | |
Barclays U.S. TIPS; domestic bonds | | | 1.28 | |
BofA Merrill Lynch 3-Month U.S. Treasury Bill; domestic short-term | | | 0.01 | |
| | | | | | | | | | | | | | | | | | | | | | | | |
| | | EXPENSE RATIOS1 | | | Morningstar
Average2
(Unaudited) | |
| | | 2011* | | | 2012* | | | 2013* | | | 2014* | | | 2015b | | |
HARBOR FIXED INCOME FUNDS | | | | | | | | | | | | | | | | | | | | | | | | |
Harbor Convertible Securities Fund | | | | | | | | | | | | | | | | | | | | | | | | |
Institutional Class | | | 0.85 | %a | | | 0.83 | % | | | 0.79 | % | | | 0.74 | % | | | 0.74 | % | | | 0.87 | % |
Administrative Class | | | 1.10 | a | | | 1.08 | | | | 1.04 | | | | 0.99 | | | | 0.99 | | | | 1.28 | |
Investor Class | | | 1.22 | a | | | 1.20 | | | | 1.16 | | | | 1.11 | | | | 1.11 | | | | 1.48 | |
Harbor High-Yield Bond Fund | | | | | | | | | | | | | | | | | | | | | | | | |
Institutional Class | | | 0.65 | % | | | 0.64 | % | | | 0.64 | % | | | 0.64 | % | | | 0.64 | % | | | 0.78 | % |
Administrative Class | | | 0.90 | | | | 0.89 | | | | 0.89 | | | | 0.89 | | | | 0.89 | | | | 1.13 | |
Investor Class | | | 1.02 | | | | 1.01 | | | | 1.01 | | | | 1.01 | | | | 1.01 | | | | 1.15 | |
Harbor Bond Fund | | | | | | | | | | | | | | | | | | | | | | | | |
Institutional Class | | | 0.53 | % | | | 0.54 | % | | | 0.53 | % | | | 0.54 | % | | | 0.52 | % | | | 0.65 | % |
Administrative Class | | | 0.78 | | | | 0.79 | | | | 0.78 | | | | 0.79 | | | | 0.77 | | | | 1.01 | |
Harbor Real Return Fund | | | | | | | | | | | | | | | | | | | | | | | | |
Institutional Class | | | 0.60 | % | | | 0.59 | % | | | 0.59 | % | | | 0.60 | % | | | 0.59 | % | | | 0.55 | % |
Administrative Class | | | 0.85 | | | | 0.84 | | | | 0.84 | | | | 0.85 | | | | 0.84 | | | | 0.96 | |
Harbor Money Market Fund | | | | | | | | | | | | | | | | | | | | | | | | |
Institutional Class | | | 0.00 | % | | | 0.00 | % | | | 0.00 | % | | | 0.00 | % | | | 0.00 | % | | | 0.12 | % |
Administrative Class | | | 0.00 | | | | 0.00 | | | | 0.00 | | | | 0.00 | | | | 0.00 | | | | 0.13 | |
| 1 | Harbor Funds’ expense ratios are for operating expenses for the fiscal years ended October 31 (unless otherwise noted) and are shown net of all expense offsets, waivers and reimbursements, excluding interest expense (see Financial Highlights). |
| 2 | The Morningstar Average includes all actively managed no-load funds in the April 30, 2015 Morningstar Universe with the same investment style as the comparable Harbor fund’s portfolio and with the following additional characteristics for each Harbor Funds share class: Institutional Class contains funds with 12b-1 fees less than or equal to 0.25%; Administrative Class contains funds with 12b-1 fees and which are restricted primarily for use by retirement plans; and Investor Class contains funds with 12b-1 fees and a minimum investment less than $50,000. |
| a | Annualized for the period May 1, 2011 (inception) through October 31, 2011. |
| b | Unaudited annualized figures for the six-month period ended April 30, 2015. |
1
Letter from the Chairman

David G. Van Hooser
Chairman
Dear Fellow Shareholder:
Fixed income markets generated modest gains in the first half of fiscal 2015. The Federal Reserve indicated its willingness to begin gradually raising short-term rates if warranted by certain signs of continued economic growth in the U.S. By contrast, against a backdrop of economic weakness and subdued inflation, a number of central banks outside the U.S., including Europe and Japan, introduced new monetary stimulus measures.
The yield of the 10-year U.S. Treasury note, a benchmark for mortgage rates and other borrowing costs, closed on April 30, 2015, at 2.05%, down 29 basis points, or 0.29 percentage point, from six months earlier. Yields fall as bond prices rise.
The broad U.S. investment-grade bond market returned 2.06% for the fiscal first half, as measured by the Barclays U.S. Aggregate Bond Index. Below investment-grade bonds returned 1.51%, as measured by the BofA Merrill Lynch U.S. High Yield Index. Inflation-linked bonds, as measured by the Barclays U.S. TIPS Index, returned 1.28%. Money market investments again produced barely positive returns as the Federal Reserve continued to hold its federal funds target rate at the 0.0% to 0.25% range.
Harbor Fixed Income Funds
Harbor Bond Fund recorded a return of 2.17% for the fiscal first half, ahead of its Barclays U.S. Aggregate Bond Index benchmark by 11 basis points, or 0.11 percentage point. (All Harbor returns cited are for each fund’s Institutional Class shares.) The Fund also continued its long-term outperformance of the index, for the latest 5-year and 10-year periods and since its inception in 1987.
Harbor High-Yield Bond Fund returned 2.40%, outperforming its BofA Merrill Lynch U.S. Non-Distressed High Yield Index benchmark by 48 basis points. Harbor Convertible Securities Fund posted a return of 3.03%, lagging its benchmark, the BofA Merrill Lynch All US Convertibles Ex Mandatory Index, by 61 basis points. Harbor Real Return Fund posted a return of 0.02%, underperforming its Barclays U.S. TIPS Index benchmark by 126 basis points. Harbor Money Market Fund returned 0.03%, putting it two basis points ahead of its benchmark, the BofA Merrill Lynch 3-Month U.S. Treasury Bill Index.
As always, we recommend that shareholders maintain a long-term perspective in evaluating all of their investments, including Harbor Funds. Comments by the portfolio managers of each fixed income fund can be found in the pages preceding each Fund’s portfolio of investments.
| | | | | | | | | | | | | | | | | | | | |
| | | RETURNS FOR PERIODS ENDED APRIL 30, 2015 | |
| | | Unannualized | | | | | | Annualized | |
Fixed Income | | 6 Months | | | 1 Year | | | 5 Years | | | 10 Years | | | 30 Years | |
BofA Merrill Lynch U.S. High-Yield (high-yield bonds) | | | 1.51 | % | | | 2.57 | % | | | 8.18 | % | | | 8.28 | % | | | N/A | |
Barclays U.S. Aggregate Bond (domestic bonds) | | | 2.06 | | | | 4.46 | | | | 4.12 | | | | 4.75 | | | | 7.33 | % |
BofA Merrill Lynch 3-Month U.S. Treasury Bill (proxy for money market returns) | | | 0.01 | | | | 0.02 | | | | 0.09 | | | | 1.47 | | | | 3.90 | |
Barclays U.S. TIPS (inflation-linked bonds) | | | 1.28 | | | | 2.48 | | | | 3.96 | | | | 4.43 | | | | N/A | |
| | | | | |
Domestic Equities | | | | | | | | | | | | | | | |
Wilshire 5000 Total Market (entire U.S. stock market) | | | 4.64 | % | | | 12.52 | % | | | 14.26 | % | | | 8.88 | % | | | 11.00 | % |
S&P 500 (large cap stocks) | | | 4.40 | | | | 12.98 | | | | 14.33 | | | | 8.32 | | | | 11.09 | |
Russell Midcap® (mid cap stocks) | | | 5.87 | | | | 13.30 | | | | 15.09 | | | | 10.27 | | | | 12.55 | |
Russell 2000® (small cap stocks) | | | 4.65 | | | | 9.71 | | | | 12.73 | | | | 9.18 | | | | 9.90 | |
Russell 3000® Growth | | | 6.59 | | | | 16.50 | | | | 15.45 | | | | 9.69 | | | | 10.41 | |
Russell 3000® Value | | | 2.82 | | | | 8.96 | | | | 13.15 | | | | 7.54 | | | | 11.24 | |
| | | | | |
International & Global | | | | | | | | | | | | | | | |
MSCI EAFE (ND) (foreign stocks) | | | 6.81 | % | | | 1.66 | % | | | 7.40 | % | | | 5.62 | % | | | 9.04 | % |
MSCI World (ND) (global stocks) | | | 5.09 | | | | 7.41 | | | | 10.51 | | | | 6.87 | | | | 9.44 | |
MSCI Emerging Markets (ND) (emerging markets) | | | 3.92 | | | | 7.80 | | | | 3.02 | | | | 9.58 | | | | N/A | |
| | | | | |
Strategic Markets | | | | | | | | | | | | | | | |
Bloomberg Commodity Index Total ReturnSM | | | -11.87 | % | | | -24.69 | % | | | -5.02 | % | | | -2.44 | % | | | N/A | |
2
Domestic Equity, International Equity, and Strategic Markets
U.S. stock indices had positive returns for the first half of fiscal 2015, supported by accommodative monetary policies of the Federal Reserve and central banks of other countries. The Wilshire 5000 Total Market Index, a measure of the broad domestic equity market, had a return of 4.64% for the six months ended April 30, 2015. Growth stocks outperformed value stocks across all capitalization ranges.
International stock markets moved higher in the first half of fiscal 2015 as investors responded favorably to new monetary easing initiatives by central banks in Europe, Japan and other countries. The U.S. dollar strengthened against most international currencies, boosting the competitiveness of foreign exporters. Shares of companies based in developed overseas markets returned 6.81%, as measured by the MSCI EAFE (ND) Index, while emerging markets equities returned 3.92%, as measured by the MSCI Emerging Markets (ND) Index. The MSCI World (ND) Index, a measure of global equities including the U.S., returned 5.09%. (All international and global returns are in U.S. dollars.)
Commodity markets finished broadly lower for the first half of fiscal 2015, driven in part by the decline in crude oil prices and the stronger U.S. dollar. The Bloomberg Commodity Index Total ReturnSM, an unmanaged index of futures contracts on a diversified group of physical commodities, returned -11.87%.
Disciplined Approach
Although stocks and bonds may provide solid long-term returns, as indicated in the table on the preceding page, financial markets can be very volatile in the short run. Given the uncertainty of markets, a disciplined approach and a diversified portfolio can be useful tools in helping investors to manage risk. At Harbor Funds, we offer a range of actively-managed equity, strategic markets and fixed income funds to assist investors in establishing an investment plan to help achieve their long-term goals.
Thank you for your investment in Harbor Funds.
June 24, 2015

David G. Van Hooser
Chairman
3
Harbor Convertible Securities Fund
MANAGERS’ COMMENTARY (Unaudited)
SUBADVISER
Shenkman Capital Management, Inc.
461 Fifth Avenue
22nd Floor
New York, NY 10017
PORTFOLIO MANAGERS
Mark Shenkman
Since 2011
Raymond F. Condon
Since 2011
Shenkman Capital has subadvised the Fund since its inception in 2011.
INVESTMENT OBJECTIVE
The Fund seeks to maximize total return.
PRINCIPAL STYLE CHARACTERISTICS
Convertible securities

Mark Shenkman

Raymond F. Condon
Management’s Discussion of Fund Performance
MARKET REVIEW
The convertible securities market appreciated 3.64% in the first half of fiscal 2015, as measured by the BofA Merrill Lynch All U.S. Convertibles Ex Mandatory Index. In addition to the potential compression of credit spreads as a function of declining default rates, the main driver for performance was the group of equities underlying the convertibles market index; they posted an aggregate return of 4.32%, virtually in line with the S&P 500 Index return of 4.40%.
Even accounting for the recent market rebound, the profile of underlying valuations in the convertibles market continued to shift toward a somewhat less equity-like condition. Influencing factors for the shift included the influx of multiple new issues, which tend to have more bond-like characteristics, and the retirement of very equity-like, deep-in-the money issues (convertibles trading well above the conversion rate). Despite this recent trend, however, a more equity-like condition still persists. As markets continue to assimilate overall economic and political concerns, we expect to see the convertibles market continue to focus on the growth attributes for underlying equities, given the overall stability in fundamental credit metrics. We also expect that a continuance of the recent pick-up in volatility should provide market participants with multiple entry points and rebalancing opportunities.
New issuance for the six months ended April 30, 2015 stood at 42 deals, totaling $23.8 billion. Redemptions through April totaled $23.9 billion, with acquisitions and debt refinancings accounting for a majority. It is worth noting that new issues over the last 28 months have begun to match redemptions, trailing by just short of $1.6 billion. This could be the beginning of a reversal of the trend of redemptions exceeding new issues that was in place between 2008 and 2011. Lack of supply has continued to be an issue, however, as redemption volume handily outpaced new issue volume during the 2008-2011 period by an average of $25 billion per year. We expect convertible new issue activity to continue to pick up at any sign of a prolonged backup in the corporate/high-yield calendars, as issuers look to take advantage of opportunities to sell into an apparent supply/demand imbalance. We believe that additional catalysts for convertible new issue activity would be a continued improvement in underlying equity prices as well as the potential for higher interest rates.
PERFORMANCE
Harbor Convertible Securities Fund returned 3.03% (Institutional Class), 2.91% (Administrative Class), and 2.84% (Investor Class) for the first half of fiscal 2015, compared with the 3.64% return of the BofA Merrill Lynch All U.S. Convertibles Ex Mandatory Index. The Fund invests primarily in convertible bonds, which can be converted into common stocks at a predetermined price. A key element of our strategy is to realize gains as they present themselves during periods of market strength by gradually reducing the Fund’s exposure to holdings as their market values rise and become more equity-like. The overall market backdrop saw a pickup in episodic volatility despite relatively strong earnings, due to an increase of concerns for the sustainability of economic growth, fueled by the strength of the dollar, a collapse of oil prices, harsh winter conditions, and the timing of the Federal Reserve’s rate increase.
4
Harbor Convertible Securities Fund
MANAGERS’ COMMENTARY—Continued
| | | | |
TOP TEN ISSUERS (% of net assets) | |
Akamai Technologies Inc. | | | 2.4% | |
HomeAway Inc. | | | 2.2% | |
Illumina Inc. | | | 2.2% | |
Omnicare Inc. | | | 2.1% | |
Priceline Group Inc. | | | 2.1% | |
Cepheid Inc. | | | 2.0% | |
Hologic Inc. | | | 2.0% | |
Netsuite Inc. | | | 2.0% | |
Royal Gold Inc. | | | 2.0% | |
Starwood Property Trust Inc. | | | 2.0% | |
From an overall perspective, it is worth noting that 21% of convertibles in the benchmark index at the end of April were trading at an investment premium over 100%; and with a total return of 6.60%, these securities contributed approximately 125 basis points, or 1.25 percentage points, of the benchmark’s 3.64% total return. The portfolio had a zero percent weighting in this sub-sector of the convertible market at the end of the fiscal first half. As a matter of style, we tend to avoid such convertibles, as they have little or no bond characteristics and tend to be closely correlated with underlying equity risk and volatility.
Software-Applications/Systems was the top-performing industry in the Fund, with a contribution of 76 basis points. The Fund’s overweight position in Electronic Arts returned 35% during the six-month period. The company, a leading provider of interactive entertainment software, has adapted to a growing utilization of its products on mobile technology. Health Equipment & Supply was the second best industry, contributing 72 basis points. The Fund benefited from its position in Volcano, a manufacturer of coronary devices, which was acquired by Phillips. In addition, our overweight position in Hologic, a manufacturer of x-ray systems, was a positive contributor as it returned 15% for the period. Biotechnology, led by BioMarin Pharmaceutical, was the Fund’s third best performing industry with a contribution of 42 basis points. BioMarin commercializes enzyme products used in the treatment of rare diseases.
Oil & Gas Products, Oil Services, and Oil Integrated were the worst-performing industries, detracting 115 basis points from performance collectively. The backdrop was a further weakening in the energy sector following the November announcement by OPEC that it would keep production at current levels. As a result, crude oil prices fell sharply, from $80.22 per barrel on October 31, 2014, to a low of $47.06 on March 17, 2015. Following a sharp rig-count reduction in the U.S., we have seen prices begin to stabilize, closing out April at $59.63. We are closely monitoring each of the Fund’s energy holdings to ensure that appropriate financial liquidity controls are in place during this period of price adjustment.
OUTLOOK AND STRATEGY
Our convertible strategy remains focused on the creditworthiness of the companies in which we invest. We believe that the Fund’s relatively conservative positioning, with an average per share price of $106.45 for the portfolio as of April 30, 2015, versus the index average of $152.39, should position us to take advantage of an expected continued tightening of credit spreads while at the same providing a cushion against the potential for increased equity market volatility.
This report contains the current opinions of Shenkman Capital Management, Inc. at the time of its publication and should not be considered as investment advice or a recommendation of any particular security, strategy or investment product. Such opinions are subject to change without notice and securities described herein may no longer be included in, or may at any time be removed from, the Fund’s portfolio. This report is distributed for informational purposes only. Information contained herein has been obtained from sources believed reliable, but not guaranteed.
Convertible securities tend to be of lower credit quality, and the value of a convertible security generally increases and decreases with the value of the underlying common stock, but may also be sensitive to changes in interest rates. A rise in interest rates will likely cause a decrease in the value of convertible securities. Such an event would likely have an adverse effect on the Harbor Convertible Securities Fund. High-yield investing poses additional credit risk related to lower-rated bonds. For information on the different share classes and the risks associated with an investment in the Fund, please refer to the current prospectus.
5
Harbor Convertible Securities Fund
FUND SUMMARY—April 30, 2015 (Unaudited)
| | | | |
INSTITUTIONAL CLASS |
| | | | |
| Fund # | | | | 2034 |
| | |
| Cusip | | | | 411512734 |
| | |
| Ticker | | | | HACSX |
| | |
Inception
Date | | | | 05/01/2011 |
| | |
| Net Expense Ratio | | | | 0.74%a |
| | |
Total Net Assets (000s) | | | | $371,865 |
| | | | |
ADMINISTRATIVE CLASS |
| | | | |
| Fund # | | | | 2234 |
| | |
| Cusip | | | | 411512726 |
| | |
| Ticker | | | | HRCSX |
| | |
Inception
Date | | | | 05/01/2011 |
| | |
| Net Expense Ratio | | | | 0.99%a |
| | |
Total Net Assets (000s) | | | | $384 |
| | | | |
INVESTOR CLASS |
| | | | |
| Fund # | | | | 2434 |
| | |
| Cusip | | | | 411512718 |
| | |
| Ticker | | | | HICSX |
| | |
Inception
Date | | | | 05/01/2011 |
| | |
| Net Expense Ratio | | | | 1.11%a |
| | |
Total Net Assets (000s) | | | | $1,887 |
PORTFOLIO STATISTICS
| | | | | | | | |
| | | Portfolio | | | Benchmark | |
| | |
Average Market Coupon | | | 1.96% | | | | 2.91% | |
| | |
Yield to Maturity | | | -0.03% | | | | -1.65% | |
| | |
Current 30-day Yield (Institutional Class) | | | 0.68% | | | | 2.37% | |
| | |
Weighted Average Maturity | | | 7.03 years | | | | 8.49 years | |
| | |
Weighted Average Duration | | | 3.46 years | | | | 2.45 years | |
| | |
Portfolio Turnover Rate (6-Month Period Ended 04/30/2015) | | | 63% | b | | | N/A | |
SECTOR ALLOCATION (% of investments)
(Excludes cash and short-term investments)
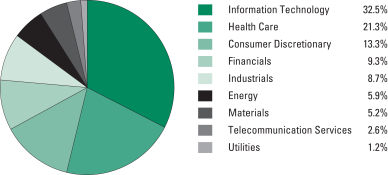
MATURITY PROFILE (% of investments)
| | | | |
| |
0 to 1 yr. | | | 3.43% | |
| |
>1 to 5 | | | 62.78% | |
| |
>5 to 10 | | | 16.05% | |
| |
>10 to 15 | | | 3.70% | |
| |
>15 to 20 | | | 4.61% | |
| |
>20 to 25 | | | 3.58% | |
| |
>25 yrs. | | | 5.85% | |
6
Harbor Convertible Securities Fund
FUND PERFORMANCE SUMMARY (Unaudited)
Institutional Class
CHANGE IN A $10,000 INVESTMENT
For the period 05/01/2011 through 04/30/2015
| | |
The graph compares a $10,000 investment in the Fund with the performance of the BofA Merrill Lynch All U.S. Convertibles Ex Mandatory Index. The Fund’s performance includes the reinvestment of all dividend and capital gain distributions. | | 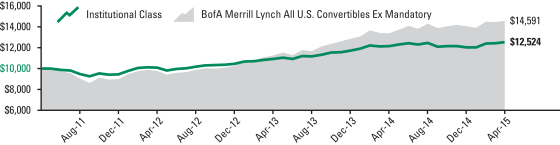 |
| | | | | | | | | | | | | | | | | | | | | | | | |
Total Returns For the periods ended 04/30/2015 | |  | |
| Harbor Convertible Securities Fund | | | | | | | | | | | | | | | | | | | | | | | | |
Institutional Class | | | 3.03 | % | | | 3.03 | % | | | N/A | | | | 5.79 | % | | | 05/01/2011 | | | $ | 12,524 | |
| Comparative Index | | | | | | | | | | | | | | | | | | | | | | | | |
BofA Merrill Lynch All U.S. Convertibles Ex Mandatory | | | 3.64 | % | | | 8.87 | % | | | N/A | | | | 9.91 | % | | | — | | | $ | 14,591 | |
Administrative and Investor Classes
CHANGE IN A $10,000 INVESTMENT
For the period 05/01/2011 through 04/30/2015
| | |
The graph compares a $10,000 investment in the Fund with the performance of the BofA Merrill Lynch All U.S. Convertibles Ex Mandatory Index. The Fund’s performance includes the reinvestment of all dividend and capital gain distributions. | | 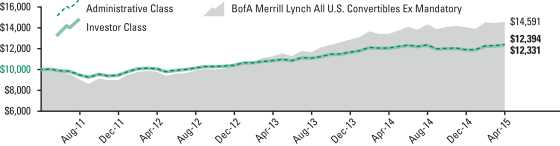 |
| | | | | | | | | | | | | | | | | | | | | | | | |
Total Returns For the periods ended 04/30/2015 | | | |
| Harbor Convertible Securities Fund | | | | | | | | | | | | | | | | | | | | | | | | |
Administrative Class | | | 2.91 | % | | | 2.78 | % | | | N/A | | | | 5.51 | % | | | 05/01/2011 | | | $ | 12,394 | |
Investor Class | | | 2.84 | % | | | 2.64 | % | | | N/A | | | | 5.38 | % | | | 05/01/2011 | | | $ | 12,331 | |
| Comparative Index | | | | | | | | | | | | | | | | | | | | | | | | |
BofA Merrill Lynch All U.S. Convertibles Ex Mandatory | | | 3.64 | % | | | 8.87 | % | | | N/A | | | | 9.91 | % | | | — | | | $ | 14,591 | |
As stated in the Fund’s current prospectus, the expense ratios were 0.75% (Institutional Class); 1.00% (Administrative Class); and 1.12% (Investor Class). The expense ratios in the prospectus may differ from the actual expense ratios for the period disclosed within this report. The expense ratios shown in the prospectus are based on the prior fiscal year, adjusted to reflect changes, if any, in contractual arrangements that occurred prior to the date of the prospectus.
Performance data shown represents past performance, which is no guarantee of future results. Current performance may be higher or lower than the past performance data shown. Investment returns and the value of an investment will fluctuate, and an investor’s shares, when sold, may be worth more or less than their original cost. You can obtain performance data current to the most recent month-end (available within seven business days after the most recent month-end) by calling 800-422-1050 or visiting harborfunds.com.
The returns shown do not reflect the deduction of taxes that a shareholder would pay on Fund distributions or on the redemption of Fund shares. From time to time, certain fees and/or expenses have been waived or reimbursed, which has resulted in higher returns. Without these waivers and reimbursements, the returns would have been lower. The Fund charges a redemption fee of 1% on redemption of shares that are held for less than 90 days.
7
Harbor Convertible Securities Fund
PORTFOLIO OF INVESTMENTS—April 30, 2015 (Unaudited)
Total Investments (% of net assets)
(Excludes net cash and short-term investments of 3.9%)
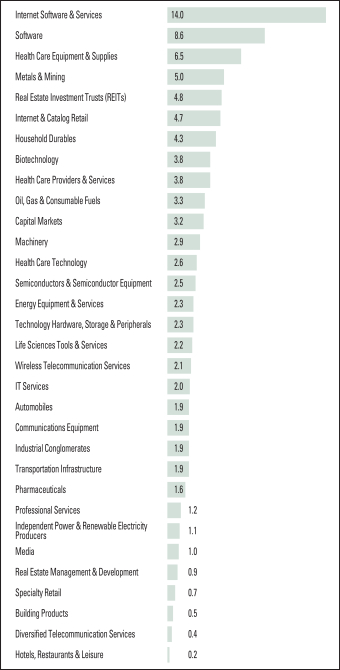
| | | | | | | | |
CONVERTIBLE BONDS—93.6% | |
Principal
Amount
(000s) | | | | | Value
(000s) | |
| | AUTOMOBILES—1.9% | |
| | | | Tesla Motors Inc. | | | | |
| $ | 7,362 | | | 0.250%—03/01/2019 | | $ | 6,962 | |
| | | | | | | | |
| | BIOTECHNOLOGY—3.8% | |
| | | | BioMarin Pharmaceutical Inc. | | | | |
| | 4,804 | | | 0.750%—10/15/2018 | | | 6,588 | |
| | | | Cepheid Inc. | | | | |
| | 6,785 | | | 1.250%—02/01/2021 | | | 7,514 | |
| | | | | | | | |
| | | | | | | 14,102 | |
| | | | | | | | |
| | BUILDING PRODUCTS—0.5% | |
| | | | Griffon Corp. | | | | |
| | 1,425 | | | 4.000%—01/15/20171 | | | 1,815 | |
| | | | | | | | |
| | CAPITAL MARKETS—3.2% | |
| | | | Ares Capital Corp. | | | | |
| | 670 | | | 4.375%—01/15/2019 | | | 705 | |
| | 6,294 | | | 5.125%—06/01/2016 | | | 6,538 | |
| | | | | | | | |
| | | | | | | 7,243 | |
| | | | | | | | |
| | | | Walter Investment Management Corp. | | | | |
| | 6,077 | | | 4.500%—11/01/2019 | | | 4,801 | |
| | | | | | | | |
| | | | | | | 12,044 | |
| | | | | | | | |
| | COMMUNICATIONS EQUIPMENT—1.9% | |
| | | | Brocade Communications Systems Inc. | | | | |
| | 3,530 | | | 1.375%—01/01/20201 | | | 3,664 | |
| | | | Ciena Corp. | | | | |
| | 1,826 | | | 0.875%—06/15/2017 | | | 1,826 | |
| | | | InterDigital Inc. | | | | |
| | 1,590 | | | 1.500%—03/01/20201 | | | 1,629 | |
| | | | | | | | |
| | | | | | | 7,119 | |
| | | | | | | | |
| | ENERGY EQUIPMENT & SERVICES—2.3% | |
| | | | Hornbeck Offshore Services Inc. | | | | |
| | 4,840 | | | 1.500%—09/01/2019 | | | 4,081 | |
| | | | SEACOR Holdings Inc. | | | | |
| | 4,442 | | | 2.500%—12/15/2027 | | | 4,633 | |
| | | | | | | | |
| | | | | | | 8,714 | |
| | | | | | | | |
| | HEALTH CARE EQUIPMENT & SUPPLIES—6.5% | |
| | | | Alere Inc. | | | | |
| | 3,068 | | | 3.000%—05/15/2016 | | | 3,595 | |
| | | | Hologic Inc. | | | | |
| | 1,555 | | | 0.000%—12/15/20432 | | | 1,829 | |
| | 4,475 | | | 2.000%—03/01/20422 | | | 5,608 | |
| | | | | | | | |
| | | | | | | 7,437 | |
| | | | | | | | |
| | | | Integra LifeSciences Holdings Corp. | | | | |
| | 5,575 | | | 1.625%—12/15/2016 | | | 6,314 | |
| | | | NuVasive Inc. | | | | |
| | 4,259 | | | 2.750%—07/01/2017 | | | 5,268 | |
| | | | Wright Medical Group Inc. | | | | |
| | 1,770 | | | 2.000%—02/15/20201 | | | 1,863 | |
| | | | | | | | |
| | | | | | | 24,477 | |
| | | | | | | | |
| | HEALTH CARE PROVIDERS & SERVICES—3.2% | |
| | | | Molina Healthcare Inc. | | | | |
| | 3,625 | | | 1.625%—08/15/2044 | | | 4,303 | |
| | | | Omnicare Inc. | | | | |
| | 6,406 | | | 3.250%—12/15/2035 | | | 7,756 | |
| | | | | | | | |
| | | | | | | 12,059 | |
| | | | | | | | |
8
Harbor Convertible Securities Fund
PORTFOLIO OF INVESTMENTS—Continued
| | | | | | | | |
CONVERTIBLE BONDS—Continued | |
Principal
Amount
(000s) | | | | | Value
(000s) | |
| | HEALTH CARE TECHNOLOGY—2.6% | |
| | | | Allscripts Healthcare Solutions Inc. | | | | |
| $ | 5,591 | | | 1.250%—07/01/2020 | | $ | 5,773 | |
| | | | Medidata Solutions Inc. | | | | |
| | 3,245 | | | 1.000%—08/01/2018 | | | 3,831 | |
| | | | | | | | |
| | | | | | | 9,604 | |
| | | | | | | | |
| | HOUSEHOLD DURABLES—4.3% | |
| | | | Jarden Corp. | | | | |
| | 1,090 | | | 1.875%—09/15/2018 | | | 1,814 | |
| | | | Ryland Group Inc. | | | | |
| | 7,574 | | | 0.250%—06/01/2019 | | | 7,176 | |
| | | | Toll Brothers Finance Corp. | | | | |
| | 7,015 | | | 0.500%—09/15/2032 | | | 7,256 | |
| | | | | | | | |
| | | | | | | 16,246 | |
| | | | | | | | |
| | INDEPENDENT POWER & RENEWABLE ELECTRICITY PRODUCERS—1.1% | |
| | | | NRG Yield Inc. | | | | |
| | 3,671 | | | 3.500%—02/01/20191 | | | 4,224 | |
| | | | | | | | |
| | INDUSTRIAL CONGLOMERATES—1.9% | |
| | | | Siemens Financieringsmaatschappij NV | | | | |
| | 6,250 | | | 1.050%—08/16/2017 | | | 6,929 | |
| | | | | | | | |
| | INTERNET & CATALOG RETAIL—4.7% | |
| | | | Ctrip.com International Ltd. | | | | |
| | 6,435 | | | 1.250%—10/15/2018 | | | 7,123 | |
| | | | Priceline Group Inc. | | | | |
| | 1,625 | | | 0.350%—06/15/2020 | | | 1,924 | |
| | 5,746 | | | 0.900%—09/15/20211 | | | 5,710 | |
| | | | | | | | |
| | | | | | | 7,634 | |
| | | | | | | | |
| | | | Shutterfly Inc. | | | | |
| | 2,750 | | | 0.250%—05/15/2018 | | | 2,722 | |
| | | | | | | | |
| | | | | | | 17,479 | |
| | | | | | | | |
| | INTERNET SOFTWARE & SERVICES—14.0% | |
| | | | Akamai Technologies Inc. | | | | |
| | 8,086 | | | 0.000%—02/15/20193 | | | 8,834 | |
| | | | AOL Inc. | | | | |
| | 3,693 | | | 0.750%—09/01/20191 | | | 3,728 | |
| | | | Blucora Inc. | | | | |
| | 5,685 | | | 4.250%—04/01/2019 | | | 5,362 | |
| | | | Envestnet Inc. | | | | |
| | 917 | | | 1.750%—12/15/2019 | | | 994 | |
| | | | HomeAway Inc. | | | | |
| | 8,635 | | | 0.125%—04/01/2019 | | | 8,182 | |
| | | | j2 Global Inc. | | | | |
| | 877 | | | 3.250%—06/15/2029 | | | 1,046 | |
| | | | LinkedIn Corp. | | | | |
| | 2,480 | | | 0.500%—11/01/20191 | | | 2,762 | |
| | | | Twitter Inc. | | | | |
| | 6,515 | | | 0.250%—09/15/20191 | | | 5,986 | |
| | | | Web.com Group Inc. | | | | |
| | 4,981 | | | 1.000%—08/15/2018 | | | 4,592 | |
| | | | WebMD Health Corp. | | | | |
| | 3,313 | | | 1.500%—12/01/2020 | | | 3,615 | |
| | 2,692 | | | 2.500%—01/31/2018 | | | 2,754 | |
| | | | | | | | |
| | | | | | | 6,369 | |
| | | | | | | | |
| | | | Yahoo! Inc. | | | | |
| | 4,217 | | | 0.000%—12/01/20183 | | | 4,488 | |
| | | | | | | | |
| | | | | | | 52,343 | |
| | | | | | | | |
| | IT SERVICES—2.0% | |
| | | | Cardtronics Inc. | | | | |
| 4,675 | | | 1.000%—12/01/2020 | | | 4,687 | |
| | | | Euronet Worldwide Inc. | | | | |
| | 2,555 | | | 1.500%—10/01/20441 | | | 2,809 | |
| | | | | | | | |
| | | | | | | 7,496 | |
| | | | | | | | |
| | LIFE SCIENCES TOOLS & SERVICES—2.2% | |
| | | | Illumina Inc. | | | | |
| | 7,435 | | | 0.000%—06/15/20191,3 | | | 8,309 | |
| | | | | | | | |
| | MACHINERY—2.9% | |
| | | | Chart Industries Inc. | | | | |
| | 3,036 | | | 2.000%—08/01/2018 | | | 3,207 | |
| | | | Meritor Inc. | | | | |
| | 5,177 | | | 4.000%—02/15/20272 | | | 5,449 | |
| | | | Navistar International Corp. | | | | |
| | 2,466 | | | 4.750%—04/15/2019 | | | 2,305 | |
| | | | | | | | |
| | | | | | | 10,961 | |
| | | | | | | | |
| | MEDIA—1.0% | |
| | | | Live Nation Entertainment Inc. | | | | |
| | 3,470 | | | 2.500%—05/15/20191 | | | 3,602 | |
| | | | | | | | |
| | METALS & MINING—5.0% | |
| | | | Newmont Mining Corp. | | | | |
| | 5,325 | | | 1.625%—07/15/2017 | | | 5,581 | |
| | | | Royal Gold Inc. | | | | |
| | 7,112 | | | 2.875%—06/15/2019 | | | 7,441 | |
| | | | RTI International Metals Inc. | | | | |
| | 4,801 | | | 1.625%—10/15/2019 | | | 5,713 | |
| | | | | | | | |
| | | | | | | 18,735 | |
| | | | | | | | |
| | OIL, GAS & CONSUMABLE FUELS—3.3% | |
| | | | Chesapeake Energy Corp. | | | | |
| | 5,678 | | | 2.500%—05/15/2037 | | | 5,497 | |
| | | | Goodrich Petroleum Corp. | | | | |
| | 2,981 | | | 5.000%—10/01/2032 | | | 1,773 | |
| | | | SEACOR Holdings Inc. | | | | |
| | 1,057 | | | 3.000%—11/15/2028 | | | 966 | |
| | | | Whiting Petroleum Corp. | | | | |
| | 3,500 | | | 1.250%—04/01/20201 | | | 4,187 | |
| | | | | | | | |
| | | | | | | 12,423 | |
| | | | | | | | |
| | PHARMACEUTICALS—0.5% | |
| | | | Teva Pharmaceutical Finance Co. LLC | | | | |
| | 1,180 | | | 0.250%—02/01/2026 | | | 1,688 | |
| | | | | | | | |
| | PROFESSIONAL SERVICES—1.2% | |
| | | | Huron Consulting Group Inc. | | | | |
| | 4,163 | | | 1.250%—10/01/20191 | | | 4,358 | |
| | | | | | | | |
| | REAL ESTATE INVESTMENT TRUSTS (REITs)—4.8% | |
| | | | Extra Space Storage LP | | | | |
| | 3,730 | | | 2.375%—07/01/20331 | | | 4,515 | |
| | | | National Health Investors Inc. | | | | |
| | 6,000 | | | 3.250%—04/01/2021 | | | 6,150 | |
| | | | Starwood Property Trust Inc. | | | | |
| | 6,765 | | | 4.550%—03/01/2018 | | | 7,391 | |
| | | | | | | | |
| | | | | | | 18,056 | |
| | | | | | | | |
| | REAL ESTATE MANAGEMENT & DEVELOPMENT—0.9% | |
| | | | Forest City Enterprises Inc. | | | | |
| | 3,135 | | | 3.625%—08/15/2020 | | | 3,545 | |
| | | | | | | | |
9
Harbor Convertible Securities Fund
PORTFOLIO OF INVESTMENTS—Continued
| | | | | | | | |
CONVERTIBLE BONDS—Continued | |
Principal
Amount
(000s) | | | | | Value
(000s) | |
| | SEMICONDUCTORS & SEMICONDUCTOR EQUIPMENT—2.5% | |
| | | | Lam Research Corp. | | | | |
| $ | 1,505 | | | 0.500%—05/15/2016 | | $ | 1,908 | |
| | | | Microchip Technology Inc. | | | | |
| | 1,760 | | | 1.625%—02/15/20251 | | | 1,808 | |
| | | | NVIDIA Corp. | | | | |
| | 4,595 | | | 1.000%—12/01/2018 | | | 5,640 | |
| | | | | | | | |
| | | | | | | 9,356 | |
| | | | | | | | |
| | SOFTWARE—8.6% | |
| | | | Citrix Systems Inc. | | | | |
| | 3,500 | | | 0.500%—04/15/2019 | | | 3,723 | |
| | | | Electronic Arts Inc. | | | | |
| | 1,020 | | | 0.750%—07/15/2016 | | | 1,868 | |
| | | | NetSuite Inc. | | | | |
| | 7,042 | | | 0.250%—06/01/2018 | | | 7,548 | |
| | | | Nuance Communications Inc. | | | | |
| | 3,648 | | | 2.750%—11/01/2031 | | | 3,655 | |
| | | | Salesforce.com Inc. | | | | |
| | 4,810 | | | 0.250%—04/01/2018 | | | 6,018 | |
| | | | Synchronoss Technologies Inc. | | | | |
| | 1,585 | | | 0.750%—08/15/2019 | | | 1,837 | |
| | | | TiVo Inc. | | | | |
| | 5,825 | | | 2.000%—10/01/20211 | | | 5,614 | |
| | | | Workday Inc. | | | | |
| | 1,503 | | | 0.750%—07/15/2018 | | | 1,894 | |
| | | | | | | | |
| | | | | | | 32,157 | |
| | | | | | | | |
| | SPECIALTY RETAIL—0.7% | |
| | | | Restoration Hardware Holdings Inc. | | | | |
| | 2,620 | | | 0.000%—06/15/20191,3 | | | 2,630 | |
| | | | | | | | |
| | TECHNOLOGY HARDWARE, STORAGE & PERIPHERALS—2.3% | |
| | | | Electronics For Imaging Inc. | | | | |
| | 2,702 | | | 0.750%—09/01/20191 | | | 2,791 | |
| | | | SanDisk Corp. | | | | |
| | 5,480 | | | 0.500%—10/15/2020 | | | 5,665 | |
| | | | | | | | |
| | | | | | | 8,456 | |
| | | | | | | | |
| | TRANSPORTATION INFRASTRUCTURE—1.9% | |
| | | | Macquarie Infrastructure Co. LLC | | | | |
| | 6,145 | | | 2.875%—07/15/2019 | | | 7,194 | |
| | | | | | | | |
| | WIRELESS TELECOMMUNICATION SERVICES—1.9% | |
| | | | Clearwire Communications LLC | | | | |
| | 6,516 | | | 8.250%—12/01/20401 | | | 7,086 | |
| | | | | | | | |
| TOTAL CONVERTIBLE BONDS
(Cost $338,400) | | | 350,169 | |
| | | | | | | | |
CORPORATE BONDS & NOTES—2.5% | |
Principal
Amount
(000s) | | | | | Value
(000s) | |
| | DIVERSIFIED TELECOMMUNICATION SERVICES—0.4% | |
| | | | Intelsat Luxembourg SA | | | | |
| 1,690 | | | 7.750%—06/01/2021 | | | 1,559 | |
| | | | | | | | |
| | HEALTH CARE PROVIDERS & SERVICES—0.6% | |
| | | | HCA Inc. | | | | |
| | 400 | | | 5.375%—02/01/2025 | | | 422 | |
| | | | United Surgical Partners International Inc. | | | | |
| | 1,565 | | | 9.000%—04/01/2020 | | | 1,688 | |
| | | | | | | | |
| | | | | | | 2,110 | |
| | | | | | | | |
| | HOTELS, RESTAURANTS & LEISURE—0.2% | |
| | | | Scientific Games International Inc. | | | | |
| | 1,275 | | | 6.625%—05/15/20211 | | | 936 | |
| | | | | | | | |
| | PHARMACEUTICALS—1.1% | |
| | | | Endo Finance LLC | | | | |
| | 295 | | | 5.750%—01/15/20221 | | | 300 | |
| | 850 | | | 6.000%—02/01/20251 | | | 876 | |
| | | | | | | | |
| | | | | | | 1,176 | |
| | | | | | | | |
| | | | Valeant Pharmaceuticals International Inc. | | | | |
| | 1,200 | | | 6.125%—04/15/20251 | | | 1,241 | |
| | 1,575 | | | 7.500%—07/15/20211 | | | 1,715 | |
| | | | | | | | |
| | | | | | | 2,956 | |
| | | | | | | | |
| | | | | | | 4,132 | |
| | | | | | | | |
| | WIRELESS TELECOMMUNICATION SERVICES—0.2% | |
| | | | T-Mobile USA Inc. | | | | |
| | 725 | | | 6.375%—03/01/2025 | | | 746 | |
| | | | | | | | |
| TOTAL CORPORATE BONDS & NOTES
(Cost $9,697) | | | 9,483 | |
| | | | | | | | |
| | | | | | | | |
SHORT-TERM INVESTMENTS—3.3% | |
| (Cost $12,277) | | | | |
| | REPURCHASE AGREEMENTS | |
| | 12,277 | | | Repurchase Agreement with State Street Corp.
dated April 30, 2015 due May 01, 2015 at 0.000% collateralized by U.S. Treasury Bonds (market value $12,525) | | | 12,277 | |
| | | | | | | | |
| TOTAL INVESTMENTS—99.4%
(Cost $360,374) | | | 371,929 | |
| | | | | | | | |
| | CASH AND OTHER ASSETS, LESS LIABILITIES—0.6% | | | 2,207 | |
| | | | | | | | |
| | TOTAL NET ASSETS—100.0% | | $ | 374,136 | |
| | | | | | | | |
FAIR VALUE MEASUREMENTS
All holdings at April 30, 2015 (as disclosed in the preceding Portfolio of Investments) are classified as Level 2. There were no Level 3 holdings at October 31, 2014 or April 30, 2015, and no transfers between levels during the period.
For more information on valuation inputs and their aggregation into the levels identified above, please refer to the Fair Value Measurements and Disclosures in Note 2 of the accompanying Notes to Financial Statements.
| 1 | Securities purchased in a transaction exempt from registration under Rule 144A of the Securities Act of 1933. These securities may be resold in transactions exempt from registration, normally to qualified institutional buyers. The Fund has no right to demand registration of these securities. These securities are priced by an independent pricing service in accordance with Harbor Funds Valuation Procedures. At April 30, 2015, the aggregate value of these securities was $84,158 or 23% of net assets. |
| 2 | Step coupon security, the stated rate represents the rate in effect at April 30, 2015. |
The accompanying notes are an integral part of the Financial Statements.
10
Harbor High-Yield Bond Fund
MANAGERS’ COMMENTARY (Unaudited)
SUBADVISER
Shenkman Capital Management, Inc.
461 Fifth Avenue 22nd Floor New York, NY 10017
PORTFOLIO MANAGERS
Mark Shenkman
Since 2002
Eric Dobbin
Since 2012
Justin W. Slatky
Since 2012
Steven N. Schweitzer
Since 2012
Mark Flanagan, CFA, CPA
Since 2002
Robert Kricheff
Since 2015
Shenkman Capital has subadvised the Fund since its inception in 2002.
INVESTMENT OBJECTIVE
The Fund seeks total return.
PRINCIPAL STYLE CHARACTERISTICS
High-yield bonds
Mark Shenkman

Eric Dobbin

Justin W. Slatky

Steven N. Schweitzer

Mark Flanagan

Robert Kricheff
Management’s Discussion of Fund Performance
MARKET REVIEW
The U.S. high-yield bond market returned 1.32% for the six months ended April 30, 2015, as measured by an average of the five major high-yield indices. The biggest swing factor for high-yield market performance was a sell-off in oil and gas-related securities late in calendar 2014, as they represented approximately 13% of the overall market. As energy prices bottomed in February, bond prices began to rally.
U.S. Treasury bond prices generally strengthened during the fiscal first half, with the yield of the 10-year Treasury note moving from 2.34% on October 31, 2014, to 2.05% on April 30, 2015. Market participants remained focused on the timing of future Federal Reserve interest rate hikes, with the consensus most recently pointing towards the first rate hike occurring late in calendar 2015. We believe that concern about the pace and extent of rate hikes has been an important contributor to an increase in volatility among longer-duration assets.
The high-yield bond new issue market continued to thrive, with $37.6 billion in primary issuance coming to market in April via 61 transactions, bringing the fiscal year-to-date total to $173.7 billion in 282 deals. Leveraged loan new issue activity accelerated in April as $31.6 billion came to market in 73 transactions, the highest monthly total of calendar 2015, though well below the 2014 average monthly volume of $38.9 billion. The total new issuance for leveraged loans for the first half of fiscal 2015 was $113.8 billion in 304 transactions. Included in the April total was $6.4 billion in re-pricings, which were notably absent from the market during the first quarter. We anticipate new issue activity to accelerate given the increased level of mergers and acquisitions activity now underway.
PERFORMANCE
Harbor High-Yield Bond Fund returned 2.40% (Institutional Class), 2.17% (Administrative Class), and 2.11% (Investor Class) for the six months ended April 30, 2015. The Fund outperformed the BofA Merrill Lynch U.S. Non-Distressed High Yield Index, which returned 1.92%, and the BofA Merrill Lynch U.S. High Yield Index, which returned 1.51%.
From a ratings perspective, the biggest contribution to Fund performance relative to the indices came from security selection within the single-B group. From an industry perspective, the key driver of outperformance was the portfolio’s positive selection and underweighting in Metals/Mining—specifically, not owning several distressed coal companies that continued to experience significant credit deterioration. Additionally, security selection within the Oil & Gas industry also contributed positively, as the portfolio avoided many of the troubled companies within that sector. Selection in Aerospace/Defense and our strategic underweight in Finance/Banking detracted from performance. One additional detractor was not owning any bonds with a maturity of greater than 10 1/2 years, as U.S. Treasurys rallied.
11
Harbor High-Yield Bond Fund
MANAGERS’ COMMENTARY—Continued
| | | | |
TOP TEN ISSUERS (% of net assets) | |
T-Mobile USA Inc. | | | 1.3% | |
Bombardier Inc. | | | 1.1% | |
Cablevision Systems Corp. | | | 1.1% | |
Cequel Communications Holdings I LLC | | | 1.1% | |
DISH DBS Corp. | | | 1.1% | |
NRG Energy Inc. | | | 1.1% | |
Sinclair Television Group Inc. | | | 1.1% | |
Sirius XM Radio Inc. | | | 1.1% | |
Reynolds Group Issuer Inc. | | | 1.0% | |
UPCB Finance VI Ltd. | | | 0.9% | |
At the end of the period, the portfolio’s cash balance was 4.91% and holdings included 208 issuers in 47 industries. Some important portfolio metrics included a yield-to-worst (the most conservative measure of yield) of 5.61%, a current yield of 6.30%, and weighted average credit rating of B+/B2.
OUTLOOK AND STRATEGY
Although recent economic reports have come in below market expectations and foreign exchange headwinds are impacting corporate earnings, we believe that the mix of slow growth and low inflation should provide an excellent backdrop for corporate credit. Additionally, as a percentage of new issuance, leveraged-buyout financing and triple-C rated bonds totaled just 3.1% and 4.5%, respectively, indicating a substantial improvement in overall quality compared with new issuance in the high-yield market prior to the credit crisis. With a low default rate outlook, generally favorable credit conditions, and expectations that any increase in the federal funds rate will be gradual, we believe that the high-yield market continues to be an attractive asset class for income-seeking investors.
This report contains the current opinions of Shenkman Capital Management, Inc. at the time of its publication and should not be considered as investment advice or a recommendation of any particular security, strategy or investment product. Such opinions are subject to change without notice and securities described herein may no longer be included in, or may at any time be removed from, the Fund’s portfolio. This report is distributed for informational purposes only. Information contained herein has been obtained from sources believed reliable, but not guaranteed.
Fixed income investments are affected by interest rate changes and the creditworthiness of the issues held by the Fund. A rise in interest rates will cause a decrease in the value of fixed income securities. Such an event would have an adverse effect on the Harbor High-Yield Bond Fund. High-yield investing poses additional credit risk related to lower-rated bonds. For information on the different share classes and the risks associated with an investment in the Fund, please refer to the current prospectus.
12
Harbor High-Yield Bond Fund
FUND SUMMARY—April 30, 2015 (Unaudited)
| | | | |
INSTITUTIONAL CLASS |
| | | | |
| Fund # | | | | 2024 |
| | |
| Cusip | | | | 411511553 |
| | |
| Ticker | | | | HYFAX |
| | |
| Inception Date | | | | 12/01/2002 |
| | |
| Net Expense Ratio | | | | 0.64%a,b |
| | |
| Total Net Assets (000s) | | | | $1,644,469 |
| | | | |
ADMINISTRATIVE CLASS |
| | | | |
| Fund # | | | | 2224 |
| | |
| Cusip | | | | 411511546 |
| | |
| Ticker | | | | HYFRX |
| | |
| Inception Date | | | | 12/01/2002 |
| | |
| Net Expense Ratio | | | | 0.89%a,b |
| | |
| Total Net Assets (000s) | | | | $4,452 |
| | | | |
INVESTOR CLASS |
| | | | |
| Fund # | | | | 2424 |
| | |
| Cusip | | | | 411511538 |
| | |
| Ticker | | | | HYFIX |
| | |
| Inception Date | | | | 12/01/2002 |
| | |
| Net Expense Ratio | | | | 1.01%a,b |
| | |
| Total Net Assets (000s) | | | | $100,585 |
| b | Reflective of a contractual fee waiver effective through February 29, 2016. |
PORTFOLIO STATISTICS
| | | | | | | | |
| | | Portfolio | | | Benchmark | |
| | |
Average Market Coupon | | | 6.45% | | | | 6.80% | |
| | |
Yield to Maturity | | | 6.19% | | | | 6.45% | |
| | |
Current 30-day Yield (Institutional Class) | | | 4.58% | | | | 6.75% | |
| | |
Weighted Average Maturity | | | 6.38 years | | | | 6.59 years | |
| | |
Weighted Average Duration | | | 3.41 years | | | | 4.05 years | |
| | |
Beta vs. BofA Merrill Lynch U.S. Non-Distressed High Yield Index | | | 1.02 | | | | 1.00 | |
| | |
Portfolio Turnover (6-Month Period Ended 04/30/2015) | | | 34% | c | | | N/A | |
SECTOR ALLOCATION (% of investments)
(Excludes cash and short-term investments)
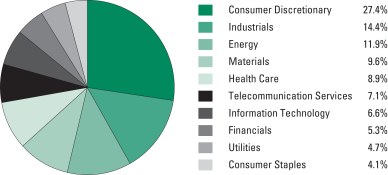
MATURITY PROFILE (% of investments)
| | | | |
| |
0 to 1 yr. | | | 6.68% | |
| |
>1 to 5 | | | 17.56% | |
| |
>5 to 10 | | | 74.38% | |
| |
>10 to 15 | | | 1.38% | |
| |
>15 to 20 | | | 0.00% | |
| |
>20 to 25 | | | 0.00% | |
| |
>25 yrs. | | | 0.00% | |
13
Harbor High-Yield Bond Fund
FUND PERFORMANCE SUMMARY (Unaudited)
Effective March 1, 2015, the Fund’s benchmark changed to the BofA Merrill Lynch U.S. Non-Distressed High Yield Index from the BofA Merrill Lynch U.S. High Yield Index in order to better reflect the subadviser’s investment strategy.
Institutional Class
CHANGE IN A $10,000 INVESTMENT
For the period 05/01/2005 through 04/30/2015
| | |
The graph compares a $10,000 investment in the Fund with the performance of the BofA Merrill Lynch U.S. Non-Distressed High Yield Index and the BofA Merrill Lynch U.S. High Yield Index. The Fund’s performance includes the reinvestment of all dividend and capital gain distributions. | | 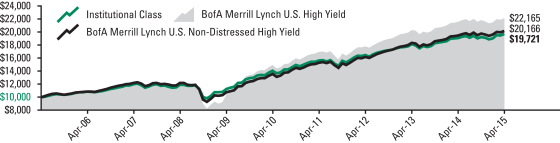 |
| | | | | | | | | | | | | | | | | | | | | | | | |
Total Returns For the periods ended 04/30/2015 | |  | |
| Harbor High-Yield Bond Fund | | | | | | | | | | | | | | | | | | | | | | | | |
Institutional Class | | | 2.40 | % | | | 3.19 | % | | | 6.99 | % | | | 7.03 | % | | | 12/01/2002 | | | $ | 19,721 | |
| Comparative Indices | | | | | | | | | | | | | | | | | | | | | | | | |
BofA Merrill Lynch U.S. Non-Distressed High Yield | | | 1.92 | % | | | 3.44 | % | | | 8.27 | % | | | 7.27 | % | | | | | | $ | 20,166 | |
BofA Merrill Lynch U.S. High Yield | | | 1.51 | % | | | 2.57 | % | | | 8.18 | % | | | 8.28 | % | | | — | | | $ | 22,165 | |
Administrative and Investor Classes
CHANGE IN A $10,000 INVESTMENT
For the period 05/01/2005 through 04/30/2015
| | |
The graph compares a $10,000 investment in the Fund with the performance of the BofA Merrill Lynch U.S. Non-Distressed High Yield Index and the BofA Merrill Lynch U.S. High Yield Index. The Fund’s performance includes the reinvestment of all dividend and capital gain distributions. | | 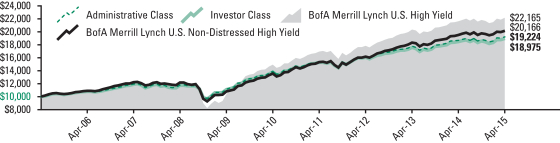 |
| | | | | | | | | | | | | | | | | | | | | | | | |
Total Returns For the periods ended 04/30/2015 | | | |
| Harbor High-Yield Bond Fund | | | | | | | | | | | | | | | | | | | | | | | | |
Administrative Class | | | 2.17 | % | | | 2.83 | % | | | 6.71 | % | | | 6.75 | % | | | 12/01/2002 | | | $ | 19,224 | |
Investor Class | | | 2.11 | % | | | 2.80 | % | | | 6.58 | % | | | 6.61 | % | | | 12/01/2002 | | | $ | 18,975 | |
| Comparative Indices | | | | | | | | | | | | | | | | | | | | | | | | |
BofA Merrill Lynch U.S. Non-Distressed High Yield | | | 1.92 | % | | | 3.44 | % | | | 8.27 | % | | | 7.27 | % | | | | | | $ | 20,166 | |
BofA Merrill Lynch U.S. High Yield | | | 1.51 | % | | | 2.57 | % | | | 8.18 | % | | | 8.28 | % | | | — | | | $ | 22,165 | |
As stated in the Fund’s current prospectus, the expense ratios were 0.65% (Net) and 0.69% (Gross) (Institutional Class); 0.90% (Net) and 0.94% (Gross) (Administrative Class); and 1.02% (Net) and 1.06% (Gross) (Investor Class). The net expense ratios reflect a contractual management fee waiver through 02/29/2016. The expense ratios in the prospectus may differ from the actual expense ratios for the period disclosed within this report. The expense ratios shown in the prospectus are based on the prior fiscal year, adjusted to reflect changes, if any, in contractual arrangements that occurred prior to the date of the prospectus.
Performance data shown represents past performance, which is no guarantee of future results. Current performance may be higher or lower than the past performance data shown. Investment returns and the value of an investment will fluctuate, and an investor’s shares, when sold, may be worth more or less than their original cost. You can obtain performance data current to the most recent month-end (available within seven business days after the most recent month-end) by calling 800-422-1050 or visiting harborfunds.com.
The returns shown do not reflect the deduction of taxes that a shareholder would pay on Fund distributions or on the redemption of Fund shares. From time to time, certain fees and/or expenses have been waived or reimbursed, which has resulted in higher returns. Without these waivers and reimbursements, the returns would have been lower. The Fund charges a redemption fee of 1% on redemption of shares that are held for less than 90 days.
14
Harbor High-Yield Bond Fund
PORTFOLIO OF INVESTMENTS—April 30, 2015 (Unaudited)
Total Investments (% of net assets)
(Excludes net cash and short-term investments of 9.5%)
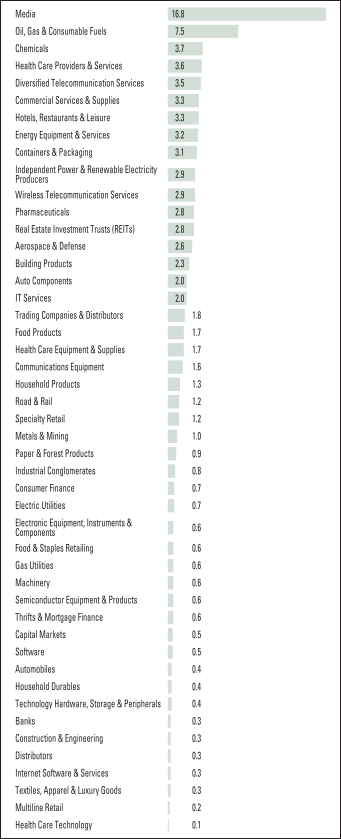
| | | | | | | | |
BANK LOAN OBLIGATIONS—3.8% | |
Principal
Amount
(000s) | | | | | Value
(000s) | |
| | AEROSPACE & DEFENSE—0.5% | |
| | | | Sequa Corp.
Term Loan | | | | |
| $ | 9,899 | | | 5.250%—06/19/20171 | | $ | 9,028 | |
| | | | | | | | |
| | CHEMICALS—0.3% | |
| | | | Solenis International LP
Second-Lien Term Loan | | | | |
| | 5,000 | | | 7.750%—07/31/20221 | | | 4,867 | |
| | | | | | | | |
| | COMMERCIAL SERVICES & SUPPLIES—0.4% | |
| | | | Brand Energy & Infrastructure Services Inc.
Term Loan | | | | |
| | 6,172 | | | 4.750%—11/26/20201 | | | 6,121 | |
| | | | | | | | |
| | CONTAINERS & PACKAGING—0.3% | |
| | | | Mauser U.S. Holdings Inc.
Second-Lien Term Loan | | | | |
| | 6,000 | | | 8.250%—07/31/20221 | | | 5,932 | |
| | | | | | | | |
| | FOOD & STAPLES RETAILING—0.2% | |
| | | | BJ’s Wholesale Club Inc.
Second-Lien Term Loan | | | | |
| | 3,450 | | | 8.500%—03/31/20201 | | | 3,496 | |
| | | | | | | | |
| | HEALTH CARE PROVIDERS & SERVICES—0.4% | |
| | | | Tenet Healthcare Corp. | | | | |
| | 6,775 | | | 4.500%—03/22/20161 | | | 6,775 | |
| | | | | | | | |
| | HOTELS, RESTAURANTS & LEISURE—0.3% | |
| | | | Amaya Holdings BV
Second-Lien Term Loan B | | | | |
| | 4,980 | | | 8.000%—08/01/20221 | | | 5,044 | |
| | | | | | | | |
| | MEDIA—0.9% | |
| | | | IMG Worldwide Holdings LLC
Term Loan B | | | | |
| | 15,662 | | | 5.250%—05/06/20211 | | | 15,720 | |
| | | | | | | | |
| | MULTILINE RETAIL—0.2% | |
| | | | Savers Inc.
Term Loan | | | | |
| | 3,404 | | | 5.000%—10/03/20191 | | | 3,354 | |
| | | | | | | | |
| | OIL, GAS & CONSUMABLE FUELS—0.1% | |
| | | | Azure Midstream Energy LLC
Term Loan A | | | | |
| | 2,103 | | | 7.500%—11/15/20181 | | | 2,087 | |
| | | | | | | | |
| | TRADING COMPANIES & DISTRIBUTORS—0.2% | |
| | | | Neff Rental LLC
Second-Lien Term Loan | | | | |
| | 4,165 | | | 7.250%—06/09/20211 | | | 4,108 | |
| | | | | | | | |
| TOTAL BANK LOAN OBLIGATIONS
(Cost $67,167) | | | 66,532 | |
| | | | | | | | |
| | | | | | | | |
CORPORATE BONDS & NOTES—86.7% | |
| | AEROSPACE & DEFENSE—2.1% | |
| | | | Bombardier Inc. | | | | |
| | 5,000 | | | 6.000%—10/15/20222 | | | 4,725 | |
| | 9,500 | | | 6.125%—01/15/20232 | | | 9,127 | |
| | 5,750 | | | 7.500%—03/15/20252 | | | 5,721 | |
| | | | | | | | |
| | | | | | | 19,573 | |
| | | | | | | | |
| | | | DigitalGlobe Inc. | | | | |
| | 1,225 | | | 5.250%—02/01/20212 | | | 1,240 | |
| | | | Kratos Defense & Security Solutions Inc. | | | | |
| | 3,500 | | | 7.000%—05/15/2019 | | | 3,133 | |
15
Harbor High-Yield Bond Fund
PORTFOLIO OF INVESTMENTS—Continued
| | | | | | | | |
CORPORATE BONDS & NOTES—Continued | |
Principal
Amount
(000s) | | | | | Value
(000s) | |
| | AEROSPACE & DEFENSE—Continued | |
| | | | Spirit AeroSystems Inc. | | | | |
| $ | 4,000 | | | 6.750%—12/15/2020 | | $ | 4,255 | |
| | | | TransDigm Inc. | | | | |
| | 8,000 | | | 6.500%—07/15/2024 | | | 8,159 | |
| | | | | | | | |
| | | | | | | 36,360 | |
| | | | | | | | |
| | AUTO COMPONENTS—2.0% | |
| | | | American Axle & Manufacturing Inc. | | | | |
| | 5,000 | | | 6.625%—10/15/2022 | | | 5,337 | |
| | | | American Tire Distributors Inc. | | | | |
| | 6,000 | | | 10.250%—03/01/20222 | | | 6,315 | |
| | | | Goodyear Tire & Rubber Co. | | | | |
| | 4,624 | | | 6.500%—03/01/2021 | | | 4,915 | |
| | 4,500 | | | 7.000%—05/15/2022 | | | 4,945 | |
| | | | | | | | |
| | | | | | | 9,860 | |
| | | | | | | | |
| | | | Tenneco Inc. | | | | |
| | 5,705 | | | 6.875%—12/15/2020 | | | 6,076 | |
| | | | ZF North America Capital Inc. | | | | |
| | 8,000 | | | 4.750%—04/29/20252 | | | 8,060 | |
| | | | | | | | |
| | | | | | | 35,648 | |
| | | | | | | | |
| | AUTOMOBILES—0.4% | |
| | | | Chrysler Group LLC | | | | |
| | 5,000 | | | 8.250%—06/15/2021 | | | 5,531 | |
| | | | Jaguar Land Rover Automotive plc | | | | |
| | 1,500 | | | 5.625%—02/01/20232 | | | 1,598 | |
| | | | | | | | |
| | | | | | | 7,129 | |
| | | | | | | | |
| | BANKS—0.3% | |
| | | | CIT Group Inc. | | | | |
| | 5,000 | | | 5.500%—02/15/20192 | | | 5,244 | |
| | | | | | | | |
| | BUILDING PRODUCTS—2.3% | |
| | | | Building Materials Corp. of America | | | | |
| | 3,000 | | | 5.375%—11/15/20242 | | | 3,090 | |
| | | | Griffon Corp. | | | | |
| | 10,000 | | | 5.250%—03/01/2022 | | | 10,137 | |
| | | | Hillman Group Inc. | | | | |
| | 7,500 | | | 6.375%—07/15/20222 | | | 7,537 | |
| | | | Masonite International Corp. | | | | |
| | 3,750 | | | 5.625%—03/15/20232 | | | 3,938 | |
| | | | Nortek Inc. | | | | |
| | 7,525 | | | 8.500%—04/15/2021 | | | 8,165 | |
| | | | RSI Home Products Inc. | | | | |
| | 5,000 | | | 6.500%—03/15/20232 | | | 5,238 | |
| | | | Summit Materials LLC | | | | |
| | 2,506 | | | 10.500%—01/31/2020 | | | 2,750 | |
| | | | | | | | |
| | | | | | | 40,855 | |
| | | | | | | | |
| | CAPITAL MARKETS—0.5% | |
| | | | Walter Investment Management Corp. | | | | |
| | 8,700 | | | 7.875%—12/15/2021 | | | 7,830 | |
| | | | | | | | |
| | CHEMICALS—3.4% | |
| | | | Consolidated Energy Finance SA | | | | |
| | 6,750 | | | 6.750%—10/15/20192 | | | 6,919 | |
| | | | Eagle Spinco Inc. | | | | |
| | 1,750 | | | 4.625%—02/15/2021 | | | 1,778 | |
| | | | Evolution Escrow Issuer LLC | | | | |
| | 3,000 | | | 7.500%—03/15/20222 | | | 3,045 | |
| | CHEMICALS—Continued | |
| | | | INEOS Group Holdings SA | | | | |
| 5,000 | | | 5.875%—02/15/20192 | | | 5,075 | |
| | 8,000 | | | 6.125%—08/15/20182 | | | 8,180 | |
| | | | | | | | |
| | | | | | | 13,255 | |
| | | | | | | | |
| | | | Platform Specialty Products Corp. | | | | |
| | 5,000 | | | 6.500%—02/01/20222 | | | 5,250 | |
| | | | Polymer Group Inc. | | | | |
| | 8,500 | | | 6.875%—06/01/20192 | | | 8,107 | |
| | | | PQ Corp. | | | | |
| | 2,850 | | | 8.750%—11/01/20182 | | | 2,971 | |
| | | | Trinseo Materials Operation SCA | | | | |
| | 3,350 | | | 6.750%—05/01/20222 | | | 3,398 | |
| | | | Tronox Finance LLC | | | | |
| | 15,133 | | | 6.375%—08/15/2020 | | | 14,906 | |
| | | | | | | | |
| | | | | | | 59,629 | |
| | | | | | | | |
| | COMMERCIAL SERVICES & SUPPLIES—2.9% | |
| | | | ACCO Brands Corp. | | | | |
| | 5,000 | | | 6.750%—04/30/2020 | | | 5,287 | |
| | | | Brand Energy & Infrastructure Services Inc. | | | | |
| | 7,200 | | | 8.500%—12/01/20212 | | | 6,912 | |
| | | | Casella Waste Systems Inc. | | | | |
| | 2,350 | | | 7.750%—02/15/2019 | | | 2,409 | |
| | | | Clean Harbors Inc. | | | | |
| | 4,500 | | | 5.125%—06/01/2021 | | | 4,613 | |
| | | | Covanta Holding Corp. | | | | |
| | 1,700 | | | 5.875%—03/01/2024 | | | 1,768 | |
| | 6,900 | | | 6.375%—10/01/2022 | | | 7,366 | |
| | | | | | | | |
| | | | | | | 9,134 | |
| | | | | | | | |
| | | | Garda World Security Corp. | | | | |
| | 5,000 | | | 7.250%—11/15/20212 | | | 5,000 | |
| | | | NuStar Logistics LP | | | | |
| | 3,500 | | | 6.750%—02/01/2021 | | | 3,763 | |
| | | | Quad/Graphics Inc. | | | | |
| | 5,000 | | | 7.000%—05/01/2022 | | | 4,834 | |
| | | | West Corp. | | | | |
| | 9,000 | | | 5.375%—07/15/20222 | | | 8,696 | |
| | | | | | | | |
| | | | | | | 50,648 | |
| | | | | | | | |
| | COMMUNICATIONS EQUIPMENT—1.6% | |
| | | | CommScope Holding Co. Inc. | | | | |
| | 5,000 | | | 6.625%—06/01/20202 | | | 5,144 | |
| | | | Hughes Satellite Systems Corp. | | | | |
| | 14,000 | | | 7.625%—06/15/2021 | | | 15,663 | |
| | | | ViaSat Inc. | | | | |
| | 6,900 | | | 6.875%—06/15/2020 | | | 7,371 | |
| | | | | | | | |
| | | | | | | 28,178 | |
| | | | | | | | |
| | CONSTRUCTION & ENGINEERING—0.3% | |
| | | | AECOM | | | | |
| | 3,500 | | | 5.750%—10/15/20222 | | | 3,631 | |
| | 1,000 | | | 5.875%—10/15/20242 | | | 1,039 | |
| | | | | | | | |
| | | �� | | | | 4,670 | |
| | | | | | | | |
| | CONSUMER FINANCE—0.7% | |
| | | | Ally Financial Inc. | | | | |
| | 5,000 | | | 3.750%—11/18/2019 | | | 4,985 | |
| | | | TransUnion Holding Co. Inc. | | | | |
| | 6,450 | | | 9.625%—06/15/2018 | | | 6,515 | |
| | | | | | | | |
| | | | | | | 11,500 | |
| | | | | | | | |
16
Harbor High-Yield Bond Fund
PORTFOLIO OF INVESTMENTS—Continued
| | | | | | | | |
CORPORATE BONDS & NOTES—Continued | |
Principal
Amount
(000s) | | | | | Value
(000s) | |
| | CONTAINERS & PACKAGING—2.8% | |
| | | | Berry Plastics Corp. | | | | |
| $ | 9,000 | | | 5.500%—05/15/2022 | | $ | 9,360 | |
| | | | Plastipak Holdings Inc. | | | | |
| | 6,000 | | | 6.500%—10/01/20212 | | | 6,180 | |
| | | | Reynolds Group Issuer Inc. | | | | |
| | 16,175 | | | 5.750%—10/15/2020 | | | 16,943 | |
| | | | Sealed Air Corp. | | | | |
| | 2,750 | | | 4.875%—12/01/20222 | | | 2,832 | |
| | | | Signode Industrial Group Lux SA | | | | |
| | 8,500 | | | 6.375%—05/01/20222 | | | 8,543 | |
| | | | Silgan Holdings Inc. | | | | |
| | 3,500 | | | 5.000%—04/01/2020 | | | 3,649 | |
| | 1,500 | | | 5.500%—02/01/2022 | | | 1,577 | |
| | | | | | | | |
| | | | | | | 5,226 | |
| | | | | | | | |
| | | | | | | 49,084 | |
| | | | | | | | |
| | DISTRIBUTORS—0.3% | |
| | | | LKQ Corp. | | | | |
| | 5,150 | | | 4.750%—05/15/2023 | | | 5,099 | |
| | | | | | | | |
| | DIVERSIFIED TELECOMMUNICATION SERVICES—3.5% | |
| | | | Altice Financing SA | | | | |
| | 3,000 | | | 6.625%—02/15/20232 | | | 3,105 | |
| | | | Altice SA | | | | |
| | 1,650 | | | 7.625%—02/15/20252 | | | 1,673 | |
| | | | CenturyLink Inc. | | | | |
| | 6,150 | | | 5.625%—04/01/2020 | | | 6,502 | |
| | | | Cincinnati Bell Inc. | | | | |
| | 3,600 | | | 8.750%—03/15/2018 | | | 3,682 | |
| | | | Frontier Communications Corp. | | | | |
| | 5,000 | | | 7.125%—01/15/2023 | | | 5,050 | |
| | | | GCI Inc. | | | | |
| | 7,000 | | | 6.750%—06/01/2021 | | | 7,162 | |
| | | | Intelsat Jackson Holdings SA | | | | |
| | 5,000 | | | 7.250%—10/15/2020 | | | 5,168 | |
| | | | Intelsat Luxembourg SA | | | | |
| | 7,300 | | | 8.125%—06/01/2023 | | | 6,718 | |
| | | | Level 3 Financing Inc. | | | | |
| | 2,600 | | | 5.125%—05/01/20232 | | | 2,597 | |
| | 1,100 | | | 6.125%—01/15/2021 | | | 1,168 | |
| | 3,000 | | | 7.000%—06/01/2020 | | | 3,221 | |
| | | | | | | | |
| | | | | | | 6,986 | |
| | | | | | | | |
| | | | Qwest Capital Funding Inc. | | | | |
| | 3,580 | �� | | 6.500%—11/15/2018 | | | 3,902 | |
| | | | Windstream Corp. | | | | |
| | 3,000 | | | 8.125%—09/01/2018 | | | 3,137 | |
| | | | Zayo Group LLC | | | | |
| | 8,000 | | | 6.000%—04/01/20232 | | | 8,080 | |
| | | | | | | | |
| | | | | | | 61,165 | |
| | | | | | | | |
| | ELECTRIC UTILITIES—0.7% | |
| | | | RJS Power Holdings LLC | | | | |
| | 13,000 | | | 5.125%—07/15/20192 | | | 12,838 | |
| | | | | | | | |
| | ELECTRONIC EQUIPMENT, INSTRUMENTS & COMPONENTS—0.6% | |
| | | | Anixter Inc. | | | | |
| | 5,800 | | | 5.125%—10/01/2021 | | | 6,054 | |
| | | | Belden Inc. | | | | |
| | 5,000 | | | 5.500%—09/01/20222 | | | 5,162 | |
| | | | | | | | |
| | | | | | | 11,216 | |
| | | | | | | | |
| | ENERGY EQUIPMENT & SERVICES—3.2% | |
| | | | CGG SA | | | | |
| 3,800 | | | 6.500%—06/01/2021 | | | 3,097 | |
| | 4,950 | | | 6.875%—01/15/2022 | | | 4,059 | |
| | | | | | | | |
| | | | | | | 7,156 | |
| | | | | | | | |
| | | | Exterran Partners LP | | | | |
| | 4,500 | | | 6.000%—04/01/2021-10/01/2022 | | | 4,415 | |
| | | | Gulfmark Offshore Inc. | | | | |
| | 10,050 | | | 6.375%—03/15/2022 | | | 7,990 | |
| | | | Hornbeck Offshore Services Inc. | | | | |
| | 5,550 | | | 5.000%—03/01/2021 | | | 4,648 | |
| | 3,950 | | | 5.875%—04/01/2020 | | | 3,595 | |
| | | | | | | | |
| | | | | | | 8,243 | |
| | | | | | | | |
| | | | North Atlantic Drilling Ltd. | | | | |
| | 5,100 | | | 6.250%—02/01/20192 | | | 3,850 | |
| | | | Precision Drilling Corp. | | | | |
| | 2,350 | | | 6.625%—11/15/2020 | | | 2,379 | |
| | | | Seadrill Ltd. | | | | |
| | 11,000 | | | 6.125%—09/15/20172 | | | 9,845 | |
| | 300 | | | 6.625%—09/15/20202 | | | 242 | |
| | | | | | | | |
| | | | | | | 10,087 | |
| | | | | | | | |
| | | | Seventy Seven Operating LLC | | | | |
| | 3,900 | | | 6.625%—11/15/2019 | | | 3,120 | |
| | | | Unit Corp. | | | | |
| | 9,740 | | | 6.625%—05/15/2021 | | | 9,399 | |
| | | | | | | | |
| | | | | | | 56,639 | |
| | | | | | | | |
| | FOOD & STAPLES RETAILING—0.4% | |
| | | | Alphabet Holding Co. Inc. | | | | |
| | 6,700 | | | 7.750%—11/01/2017 | | | 6,691 | |
| | | | Rite Aid Corp. | | | | |
| | 650 | | | 6.125%—04/01/20232 | | | 677 | |
| | | | | | | | |
| | | | | | | 7,368 | |
| | | | | | | | |
| | FOOD PRODUCTS—1.7% | |
| | | | Darling Ingredients Inc. | | | | |
| | 1,800 | | | 5.375%—01/15/2022 | | | 1,838 | |
| | | | Dean Foods Co. | | | | |
| | 5,200 | | | 6.500%—03/15/20232 | | | 5,369 | |
| | | | Dole Food Co. Inc. | | | | |
| | 7,350 | | | 7.250%—05/01/20192 | | | 7,534 | |
| | | | HJ Heinz Co. | | | | |
| | 5,000 | | | 4.875%—02/15/20252 | | | 5,472 | |
| | | | Post Holdings Inc. | | | | |
| | 10,500 | | | 6.000%—12/15/20222 | | | 10,277 | |
| | | | | | | | |
| | | | | | | 30,490 | |
| | | | | | | | |
| | GAS UTILITIES—0.6% | |
| | | | Ferrellgas LP | | | | |
| | 4,350 | | | 6.500%—05/01/2021 | | | 4,437 | |
| | | | Suburban Propane Partners LP | | | | |
| | 5,832 | | | 7.375%—08/01/2021 | | | 6,299 | |
| | | | | | | | |
| | | | | | | 10,736 | |
| | | | | | | | |
| | HEALTH CARE EQUIPMENT & SUPPLIES—1.7% | |
| | | | Biomet Inc. | | | | |
| | 9,265 | | | 6.500%—08/01/2020-10/01/2020 | | | 9,765 | |
| | | | Capsugel SA | | | | |
| | 10,250 | | | 7.000%—05/15/20192 | | | 10,474 | |
17
Harbor High-Yield Bond Fund
PORTFOLIO OF INVESTMENTS—Continued
| | | | | | | | |
CORPORATE BONDS & NOTES—Continued | |
Principal
Amount
(000s) | | | | | Value
(000s) | |
| | HEALTH CARE EQUIPMENT & SUPPLIES—Continued | |
| | | | Jll/Delta Dutch Pledgeco BV | | | | |
| $ | 3,900 | | | 8.750%—05/01/20202 | | $ | 3,949 | |
| | | | Mallinckrodt International Finance SA | | | | |
| | 5,000 | | | 5.500%—04/15/20252 | | | 5,125 | |
| | | | | | | | |
| | | | | | | 29,313 | |
| | | | | | | | |
| | HEALTH CARE PROVIDERS & SERVICES—3.2% | |
| | | | Acadia Healthcare Co. Inc. | | | | |
| | 2,000 | | | 5.625%—02/15/20232 | | | 2,055 | |
| | | | Air Medical Merger Sub Corp. | | | | |
| | 5,000 | | | 6.375%—05/15/20232 | | | 4,869 | |
| | | | Community Health Systems Inc. | | | | |
| | 9,841 | | | 6.875%—02/01/2022 | | | 10,493 | |
| | 2,000 | | | 8.000%—11/15/2019 | | | 2,125 | |
| | | | | | | | |
| | | | | | | 12,618 | |
| | | | | | | | |
| | | | DaVita HealthCare Partners Inc. | | | | |
| | 4,750 | | | 5.000%—05/01/2025 | | | 4,753 | |
| | 3,300 | | | 5.750%—08/15/2022 | | | 3,519 | |
| | | | | | | | |
| | | | | | | 8,272 | |
| | | | | | | | |
| | | | Envision Healthcare Corp. | | | | |
| | 6,000 | | | 5.125%—07/01/20222 | | | 6,195 | |
| | | | HCA Holdings Inc. | | | | |
| | 1,550 | | | 6.250%—02/15/2021 | | | 1,696 | |
| | 4,250 | | | 7.750%—05/15/2021 | | | 4,537 | |
| | | | | | | | |
| | | | | | | 6,233 | |
| | | | | | | | |
| | | | MPH Acquisition Holdings LLC | | | | |
| | 7,000 | | | 6.625%—04/01/20222 | | | 7,368 | |
| | | | Surgical Care Affiliates Inc. | | | | |
| | 5,000 | | | 6.000%—04/01/20232 | | | 5,137 | |
| | | | Tenet Healthcare Corp. | | | | |
| | 4,000 | | | 5.000%—03/01/20192 | | | 3,985 | |
| | | | | | | | |
| | | | | | | 56,732 | |
| | | | | | | | |
| | HEALTH CARE TECHNOLOGY—0.1% | |
| | | | MedAssets Inc. | | | | |
| | 2,050 | | | 8.000%—11/15/2018 | | | 2,147 | |
| | | | | | | | |
| | HOTELS, RESTAURANTS & LEISURE—3.0% | |
| | | | Burger King Worldwide Inc. | | | | |
| | 15,000 | | | 6.000%—04/01/20222 | | | 15,563 | |
| | | | Cedar Fair LP | | | | |
| | 5,000 | | | 5.250%—03/15/2021 | | | 5,212 | |
| | | | Isle of Capri Casinos Inc. | | | | |
| | 5,000 | | | 8.875%—06/15/2020 | | | 5,500 | |
| | | | Peninsula Gaming LLC | | | | |
| | 5,000 | | | 8.375%—02/15/20182 | | | 5,250 | |
| | | | Pinnacle Entertainment Inc. | | | | |
| | 5,000 | | | 7.500%—04/15/2021 | | | 5,312 | |
| | 7,050 | | | 8.750%—05/15/2020 | | | 7,429 | |
| | | | | | | | |
| | | | | | | 12,741 | |
| | | | | | | | |
| | | | Scientific Games International Inc. | | | | |
| | 2,150 | | | 6.250%—09/01/2020 | | | 1,575 | |
| | 3,700 | | | 6.625%—05/15/20212 | | | 2,715 | |
| | | | | | | | |
| | | | | | | 4,290 | |
| | | | | | | | |
| | | | Station Casinos LLC | | | | |
| | 3,450 | | | 7.500%—03/01/2021 | | | 3,735 | |
| | | | | | | | |
| | | | | | | 52,291 | |
| | | | | | | | |
| | HOUSEHOLD DURABLES—0.4% | |
| | | | Shea Homes LP | | | | |
| 6,000 | | | 5.875%—04/01/20232 | | | 6,194 | |
| | | | | | | | |
| | HOUSEHOLD PRODUCTS—1.3% | |
| | | | First Quality Finance Co. Inc. | | | | |
| | 11,000 | | | 4.625%—05/15/20212 | | | 10,395 | |
| | | | Prestige Brands Inc. | | | | |
| | 2,750 | | | 8.125%—02/01/2020 | | | 2,970 | |
| | | | Spectrum Brands Inc. | | | | |
| | 2,000 | | | 6.375%—11/15/2020 | | | 2,130 | |
| | 7,000 | | | 6.625%—11/15/2022 | | | 7,525 | |
| | | | | | | | |
| | | | | | | 9,655 | |
| | | | | | | | |
| | | | | | | 23,020 | |
| | | | | | | | |
| | INDEPENDENT POWER & RENEWABLE ELECTRICITY PRODUCERS—2.9% | |
| | | | AES Corp. | | | | |
| | 7,000 | | | 5.500%—04/15/2025 | | | 6,930 | |
| | | | Calpine Corp. | | | | |
| | 6,000 | | | 5.500%—02/01/2024 | | | 6,030 | |
| | 6,200 | | | 5.750%—01/15/2025 | | | 6,255 | |
| | | | | | | | |
| | | | | | | 12,285 | |
| | | | | | | | |
| | | | Dynegy Inc. | | | | |
| | 7,050 | | | 6.750%—11/01/20192 | | | 7,402 | |
| | 5,000 | | | 7.375%—11/01/20222 | | | 5,350 | |
| | | | | | | | |
| | | | | | | 12,752 | |
| | | | | | | | |
| | | | NRG Energy Inc. | | | | |
| | 18,000 | | | 6.250%—05/01/2024 | | | 18,495 | |
| | | | | | | | |
| | | | | | | 50,462 | |
| | | | | | | | |
| | INDUSTRIAL CONGLOMERATES—0.8% | |
| | | | Gardner Denver Inc. | | | | |
| | 8,000 | | | 6.875%—08/15/20212 | | | 7,480 | |
| | | | Gates Global LLC | | | | |
| | 7,000 | | | 6.000%—07/15/20222 | | | 6,562 | |
| | | | | | | | |
| | | | | | | 14,042 | |
| | | | | | | | |
| | INTERNET SOFTWARE & SERVICES—0.3% | |
| | | | Equinix Inc. | | | | |
| | 5,000 | | | 5.750%—01/01/2025 | | | 5,287 | |
| | | | | | | | |
| | IT SERVICES—2.0% | |
| | | | Alliance Data Systems Corp. | | | | |
| | 3,200 | | | 5.375%—08/01/20222 | | | 3,240 | |
| | 11,400 | | | 6.375%—04/01/20202 | | | 11,898 | |
| | | | | | | | |
| | | | | | | 15,138 | |
| | | | | | | | |
| | | | SunGard Data Systems Inc. | | | | |
| | 7,250 | | | 6.625%—11/01/2019 | | | 7,585 | |
| | 4,025 | | | 7.625%—11/15/2020 | | | 4,272 | |
| | | | | | | | |
| | | | | | | 11,857 | |
| | | | | | | | |
| | | | Syniverse Holdings Inc. | | | | |
| | 2,950 | | | 9.125%—01/15/2019 | | | 2,788 | |
| | | | WEX Inc. | | | | |
| | 5,050 | | | 4.750%—02/01/20232 | | | 5,012 | |
| | | | | | | | |
| | | | | | | 34,795 | |
| | | | | | | | |
| | MACHINERY—0.6% | |
| | | | Terex Corp. | | | | |
| | 6,250 | | | 6.500%—04/01/2020 | | | 6,562 | |
| | | | Titan International Inc. | | | | |
| | 3,250 | | | 6.875%—10/01/2020 | | | 2,966 | |
| | | | | | | | |
| | | | | | | 9,528 | |
| | | | | | | | |
18
Harbor High-Yield Bond Fund
PORTFOLIO OF INVESTMENTS—Continued
| | | | | | | | |
CORPORATE BONDS & NOTES—Continued | |
Principal
Amount
(000s) | | | | | Value
(000s) | |
| | MEDIA—15.9% | |
| | | | Altice SA | | | | |
| $ | 3,000 | | | 7.750%—05/15/20222 | | $ | 3,038 | |
| | | | Cablevision Systems Corp. | | | | |
| | 12,000 | | | 5.875%—09/15/2022 | | | 12,765 | |
| | 5,350 | | | 8.000%—04/15/2020 | | | 6,152 | |
| | | | | | | | |
| | | | | | | 18,917 | |
| | | | | | | | |
| | | | CCO Holdings LLC | | | | |
| | 1,500 | | | 5.125%—02/15/2023 | | | 1,488 | |
| | 3,200 | | | 5.125%—05/01/20232 | | | 3,176 | |
| | 5,250 | | | 5.250%—03/15/2021-09/30/2022 | | | 5,269 | |
| | 3,150 | | | 6.500%—04/30/2021 | | | 3,279 | |
| | | | | | | | |
| | | | | | | 13,212 | |
| | | | | | | | |
| | | | Cequel Communications Holdings I LLC | | | | |
| | 2,250 | | | 5.125%—12/15/20212 | | | 2,262 | |
| | 18,000 | | | 6.375%—09/15/20202 | | | 19,057 | |
| | | | | | | | |
| | | | | | | 21,319 | |
| | | | | | | | |
| | | | Clear Channel Worldwide Holdings Inc. | | | | |
| | 10,900 | | | 7.625%—03/15/2020 | | | 11,499 | |
| | | | Cumulus Media Holdings Inc. | | | | |
| | 10,300 | | | 7.750%—05/01/2019 | | | 9,952 | |
| | | | DISH DBS Corp. | | | | |
| | 3,000 | | | 5.000%—03/15/2023 | | | 2,850 | |
| | 9,000 | | | 5.875%—11/15/2024 | | | 8,888 | |
| | 7,000 | | | 6.750%—06/01/2021 | | | 7,429 | |
| | | | | | | | |
| | | | | | | 19,167 | |
| | | | | | | | |
| | | | Gannett Co. Inc. | | | | |
| | 3,500 | | | 6.375%—10/15/2023 | | | 3,802 | |
| | | | Gray Television Inc. | | | | |
| | 5,000 | | | 7.500%—10/01/2020 | | | 5,337 | |
| | | | Lamar Media Corp. | | | | |
| | 6,950 | | | 5.875%—02/01/2022 | | | 7,384 | |
| | | | MDC Partners Inc. | | | | |
| | 8,000 | | | 6.750%—04/01/20202 | | | 8,150 | |
| | | | Mediacom Broadband LLC | | | | |
| | 2,800 | | | 5.500%—04/15/2021 | | | 2,853 | |
| | 3,800 | | | 6.375%—04/01/2023 | | | 4,047 | |
| | | | | | | | |
| | | | | | | 6,900 | |
| | | | | | | | |
| | | | Mediacom Capital Corp. | | | | |
| | 7,000 | | | 7.250%—02/15/2022 | | | 7,525 | |
| | | | Nexstar Broadcasting Inc. | | | | |
| | 5,000 | | | 6.125%—02/15/20222 | | | 5,200 | |
| | 6,550 | | | 6.875%—11/15/2020 | | | 6,976 | |
| | | | | | | | |
| | | | | | | 12,176 | |
| | | | | | | | |
| | | | Numericable-SFR SAS | | | | |
| | 7,500 | | | 6.000%—05/15/20222 | | | 7,692 | |
| | 3,150 | | | 6.250%—05/15/20242 | | | 3,241 | |
| | | | | | | | |
| | | | | | | 10,933 | |
| | | | | | | | |
| | | | Quebecor Media Inc. | | | | |
| | 5,000 | | | 5.750%—01/15/2023 | | | 5,181 | |
| | | | Sinclair Television Group Inc. | | | | |
| | 12,000 | | | 5.375%—04/01/2021 | | | 12,198 | |
| | 4,000 | | | 6.125%—10/01/2022 | | | 4,240 | |
| | 3,300 | | | 6.375%—11/01/2021 | | | 3,506 | |
| | | | | | | | |
| | | | | | | 19,944 | |
| | | | | | | | |
| | MEDIA—Continued | |
| | | | Sirius XM Radio Inc. | | | | |
| 2,750 | | | 4.625%—05/15/20232 | | | 2,678 | |
| | 3,000 | | | 5.375%—04/15/20252 | | | 3,023 | |
| | 4,350 | | | 5.875%—10/01/20202 | | | 4,551 | |
| | 13,000 | | | 6.000%—07/15/20242 | | | 13,520 | |
| | | | | | | | |
| | | | | | | 23,772 | |
| | | | | | | | |
| | | | Time Inc. | | | | |
| | 10,000 | | | 5.750%—04/15/20222 | | | 9,794 | |
| | | | Townsquare Media Inc. | | | | |
| | 5,000 | | | 6.500%—04/01/20232 | | | 5,044 | |
| | | | Unitymedia Hessen GmbH & Co. KG | | | | |
| | 4,900 | | | 5.500%—01/15/20232 | | | 5,151 | |
| | | | Univision Communications Inc. | | | | |
| | 4,300 | | | 5.125%—02/15/20252 | | | 4,343 | |
| | 1,131 | | | 6.750%—09/15/20222 | | | 1,219 | |
| | | | | | | | |
| | | | | | | 5,562 | |
| | | | | | | | |
| | | | UPCB Finance IV Ltd. | | | | |
| | 1,850 | | | 5.375%—01/15/20252 | | | 1,889 | |
| | | | UPCB Finance VI Ltd. | | | | |
| | 14,800 | | | 6.875%—01/15/20222 | | | 15,984 | |
| | | | Virgin Media Finance plc | | | | |
| | 3,000 | | | 6.000%—10/15/20242 | | | 3,114 | |
| | 2,800 | | | 6.375%—04/15/20232 | | | 2,961 | |
| | | | | | | | |
| | | | | | | 6,075 | |
| | | | | | | | |
| | | | Virgin Media Secured Finance plc | | | | |
| | 9,150 | | | 5.250%—01/15/20262 | | | 9,127 | |
| | | | WideOpenWest Finance LLC | | | | |
| | 3,200 | | | 10.250%—07/15/2019 | | | 3,449 | |
| | | | WMG Acquisition Corp. | | | | |
| | 7,500 | | | 6.750%—04/15/20222 | | | 7,163 | |
| | | | | | | | |
| | | | | | | 277,446 | |
| | | | | | | | |
| | METALS & MINING—1.0% | |
| | | | ArcelorMittal | | | | |
| | 3,825 | | | 6.000%—08/05/2020 | | | 4,007 | |
| | 3,900 | | | 6.250%—03/01/2021 | | | 4,093 | |
| | | | | | | | |
| | | | | | | 8,100 | |
| | | | | | | | |
| | | | Constellium NV | | | | |
| | 1,200 | | | 5.750%—05/15/20242 | | | 1,161 | |
| | | | Murray Energy Corp. | | | | |
| | 7,150 | | | 11.250%—04/15/20212 | | | 7,293 | |
| | | | Steel Dynamics Inc. | | | | |
| | 700 | | | 5.125%—10/01/20212 | | | 719 | |
| | | | | | | | |
| | | | | | | 17,273 | |
| | | | | | | | |
| | OIL, GAS & CONSUMABLE FUELS—7.4% | |
| | | | American Energy-Permian Basin LLC | | | | |
| | 5,600 | | | 6.780%—08/01/20192,3 | | | 4,228 | |
| | 1,500 | | | 7.125%—11/01/20202 | | | 1,110 | |
| | | | | | | | |
| | | | | | | 5,338 | |
| | | | | | | | |
| | | | Berry Petroleum Co. LLC | | | | |
| | 1,500 | | | 6.750%—11/01/2020 | | | 1,260 | |
| | | | California Resources Corp. | | | | |
| | 6,450 | | | 6.000%—11/15/2024 | | | 6,095 | |
| | | | Chaparral Energy Inc. | | | | |
| | 6,500 | | | 8.250%—09/01/2021 | | | 5,330 | |
19
Harbor High-Yield Bond Fund
PORTFOLIO OF INVESTMENTS—Continued
| | | | | | | | |
CORPORATE BONDS & NOTES—Continued | |
Principal
Amount
(000s) | | | | | Value
(000s) | |
| | OIL, GAS & CONSUMABLE FUELS—Continued | |
| | | | Chesapeake Energy Corp. | | | | |
| $ | 1,815 | | | 6.125%—02/15/2021 | | $ | 1,833 | |
| | | | Foresight Energy LLC | | | | |
| | 6,000 | | | 7.875%—08/15/20212 | | | 5,850 | |
| | | | Genesis Energy LP | | | | |
| | 4,700 | | | 5.750%—02/15/2021 | | | 4,688 | |
| | | | Halcon Resources Corp. | | | | |
| | 3,000 | | | 8.625%—02/01/20202 | | | 3,129 | |
| | 6,000 | | | 9.750%—07/15/2020 | | | 4,950 | |
| | | | | | | | |
| | | | | | | 8,079 | |
| | | | | | | | |
| | | | Jupiter Resources Inc. | | | | |
| | 6,750 | | | 8.500%—10/01/20222 | | | 5,737 | |
| | | | Linn Energy LLC | | | | |
| | 725 | | | 6.250%—11/01/2019 | | | 616 | |
| | 1,750 | | | 6.500%—09/15/2021 | | | 1,435 | |
| | 5,300 | | | 7.750%—02/01/2021 | | | 4,585 | |
| | 500 | | | 8.625%—04/15/2020 | | | 458 | |
| | | | | | | | |
| | | | | | | 7,094 | |
| | | | | | | | |
| | | | MarkWest Energy Finance Corp. | | | | |
| | 2,320 | | | 6.250%—06/15/2022 | | | 2,465 | |
| | | | Memorial Production Partners LP | | | | |
| | 5,300 | | | 6.875%—08/01/20222 | | | 4,995 | |
| | 4,125 | | | 7.625%—05/01/2021 | | | 4,053 | |
| | | | | | | | |
| | | | | | | 9,048 | |
| | | | | | | | |
| | | | Memorial Resource Development Corp. | | | | |
| | 5,000 | | | 5.875%—07/01/20222 | | | 4,875 | |
| | | | NGL Energy Partners LP | | | | |
| | 5,000 | | | 6.875%—10/15/2021 | | | 5,288 | |
| | | | Oasis Petroleum Inc. | | | | |
| | 8,675 | | | 6.875%—03/15/2022-01/15/2023 | | | 8,860 | |
| | | | Regency Energy Partners LP | | | | |
| | 4,000 | | | 8.375%—06/01/20192 | | | 4,190 | |
| | | | Rice Energy Inc. | | | | |
| | 8,175 | | | 6.250%—05/01/2022 | | | 8,257 | |
| | | | Rosetta Resources Inc. | | | | |
| | 3,185 | | | 5.625%—05/01/2021 | | | 3,205 | |
| | | | Sanchez Energy Corp. | | | | |
| | 3,150 | | | 6.125%—01/15/2023 | | | 3,103 | |
| | | | Tesoro Logistics LP | | | | |
| | 5,000 | | | 5.500%—10/15/20192 | | | 5,312 | |
| | 2,000 | | | 6.250%—10/15/20222 | | | 2,133 | |
| | | | | | | | |
| | | | | | | 7,445 | |
| | | | | | | | |
| | | | Triangle USA Petroleum Corp. | | | | |
| | 8,000 | | | 6.750%—07/15/20222 | | | 6,880 | |
| | | | Vanguard Natural Resources LLC | | | | |
| | 8,950 | | | 7.875%—04/01/2020 | | | 8,928 | |
| | | | Whiting Petroleum Corp. | | | | |
| | 5,650 | | | 6.250%—04/01/20232 | | | 5,858 | |
| | | | | | | | |
| | | | | | | 129,706 | |
| | | | | | | | |
| | PAPER & FOREST PRODUCTS—0.9% | |
| | | | Cascades Inc. | | | | |
| | 7,500 | | | 5.500%—07/15/20222 | | | 7,622 | |
| | | | Resolute Forest Products Inc. | | | | |
| | 8,500 | | | 5.875%—05/15/2023 | | | 8,234 | |
| | | | | | | | |
| | | | | | | 15,856 | |
| | | | | | | | |
| | PHARMACEUTICALS—2.8% | |
| | | | Concordia Healthcare Corp. | | | | |
| 1,650 | | | 7.000%—04/15/20232 | | | 1,679 | |
| | | | Endo Finance LLC | | | | |
| | 13,000 | | | 5.375%—01/15/20232 | | | 12,821 | |
| | 5,200 | | | 5.750%—01/15/20222 | | | 5,278 | |
| | 3,010 | | | 7.000%—12/15/20202 | | | 3,180 | |
| | | | | | | | |
| | | | | | | 21,279 | |
| | | | | | | | |
| | | | Mallinckrodt International Finance SA | | | | |
| | 2,000 | | | 4.750%—04/15/2023 | | | 1,920 | |
| | | | Valeant Pharmaceuticals International Inc. | | | | |
| | 1,850 | | | 5.500%—03/01/20232 | | | 1,878 | |
| | 5,500 | | | 5.625%—12/01/20212 | | | 5,651 | |
| | 9,000 | | | 6.125%—04/15/20252 | | | 9,309 | |
| | 2,500 | | | 6.375%—10/15/20202 | | | 2,644 | |
| | 4,500 | | | 7.500%—07/15/20212 | | | 4,899 | |
| | | | | | | | |
| | | | | | | 24,381 | |
| | | | | | | | |
| | | | | | | 49,259 | |
| | | | | | | | |
| | REAL ESTATE INVESTMENT TRUSTS (REITs)—2.8% | |
| | | | Communications Sales & Leasing Inc. | | | | |
| | 3,000 | | | 8.250%—10/15/20232 | | | 3,086 | |
| | | | CyrusOne LP | | | | |
| | 2,000 | | | 6.375%—11/15/2022 | | | 2,118 | |
| | | | Felcor Lodging LP | | | | |
| | 5,650 | | | 5.625%—03/01/2023 | | | 5,904 | |
| | 7,375 | | | 6.750%—06/01/2019 | | | 7,661 | |
| | | | | | | | |
| | | | | | | 13,565 | |
| | | | | | | | |
| | | | Geo Group Inc. | | | | |
| | 1,500 | | | 5.125%—04/01/2023 | | | 1,552 | |
| | 8,589 | | | 5.875%—01/15/2022-10/15/2024 | | | 9,169 | |
| | | | | | | | |
| | | | | | | 10,721 | |
| | | | | | | | |
| | | | Iron Mountain Inc. | | | | |
| | 10,000 | | | 5.750%—08/15/2024 | | | 10,388 | |
| | | | MPT Operating Partnership LP | | | | |
| | 1,500 | | | 6.875%—05/01/2021 | | | 1,620 | |
| | | | Omega Healthcare Investors Inc. | | | | |
| | 4,200 | | | 6.750%—10/15/2022 | | | 4,424 | |
| | | | RHP Hotel Properties LP | | | | |
| | 3,250 | | | 5.000%—04/15/2021 | | | 3,319 | |
| | | | | | | | |
| | | | | | | 49,241 | |
| | | | | | | | |
| | ROAD & RAIL—1.2% | |
| | | | Hertz Corp. | | | | |
| | 8,000 | | | 5.875%—10/15/2020 | | | 8,180 | |
| | 9,800 | | | 6.250%—10/15/2022 | | | 10,192 | |
| | 650 | | | 6.750%—04/15/2019 | | | 674 | |
| | 1,500 | | | 7.375%—01/15/2021 | | | 1,586 | |
| | | | | | | | |
| | | | | | | 20,632 | |
| | | | | | | | |
| | SEMICONDUCTOR EQUIPMENT & PRODUCTS—0.6% | |
| | | | Micron Technology Inc. | | | | |
| | 10,000 | | | 5.250%—01/15/20242 | | | 9,925 | |
| | | | | | | | |
| | SOFTWARE—0.5% | |
| | | | Infor (US), Inc. | | | | |
| | 3,850 | | | 6.500%—05/15/20222 | | | 3,965 | |
| | | | Nuance Communications Inc. | | | | |
| | 4,200 | | | 5.375%—08/15/20202 | | | 4,263 | |
| | | | | | | | |
| | | | | | | 8,228 | |
| | | | | | | | |
20
Harbor High-Yield Bond Fund
PORTFOLIO OF INVESTMENTS—Continued
| | | | | | | | |
CORPORATE BONDS & NOTES—Continued | |
Principal
Amount
(000s) | | | | | Value
(000s) | |
| | SPECIALTY RETAIL—1.2% | |
| | | | Michaels Stores Inc. | | | | |
| $ | 9,900 | | | 5.875%—12/15/20202 | | $ | 10,321 | |
| | | | Penske Automotive Group Inc. | | | | |
| | 4,000 | | | 5.750%—10/01/2022 | | | 4,220 | |
| | | | Rent-A-Center Inc. | | | | |
| | 6,000 | | | 4.750%—05/01/2021 | | | 5,340 | |
| | 1,701 | | | 6.625%—11/15/2020 | | | 1,688 | |
| | | | | | | | |
| | | | | | | 7,028 | |
| | | | | | | | |
| | | | | | | 21,569 | |
| | | | | | | | |
| | TECHNOLOGY HARDWARE, STORAGE & PERIPHERALS—0.4% | |
| | | | NCR Corp. | | | | |
| | 4,000 | | | 5.000%—07/15/2022 | | | 3,970 | |
| | 3,500 | | | 6.375%—12/15/2023 | | | 3,701 | |
| | | | | | | | |
| | | | | | | 7,671 | |
| | | | | | | | |
| | TEXTILES, APPAREL & LUXURY GOODS—0.3% | |
| | | | Levi Strauss & Co. | | | | |
| | 1,000 | | | 5.000%—05/01/20252 | | | 1,005 | |
| | 3,000 | | | 6.875%—05/01/2022 | | | 3,296 | |
| | | | | | | | |
| | | | | | | 4,301 | |
| | | | | | | | |
| | THRIFTS & MORTGAGE FINANCE—0.6% | |
| | | | Nationstar Mortgage LLC | | | | |
| | 5,250 | | | 6.500%—07/01/2021 | | | 5,138 | |
| | 5,472 | | | 7.875%—10/01/2020 | | | 5,657 | |
| | | | | | | | |
| | | | | | | 10,795 | |
| | | | | | | | |
| | TRADING COMPANIES & DISTRIBUTORS—1.6% | |
| | | | Ashtead Capital Inc. | | | | |
| | 10,221 | | | 6.500%—07/15/20222 | | | 10,994 | |
| | | | Jurassic Holdings III Inc. | | | | |
| | 6,000 | | | 6.875%—02/15/20212 | | | 5,190 | |
| | | | Safway Group Holding LLC | | | | |
| | 10,250 | | | 7.000%—05/15/20182 | | | 10,429 | |
| | | | United Rentals North America Inc. | | | | |
| | 750 | | | 5.500%—07/15/2025 | | | 763 | |
| | | | | | | | |
| | | | | | | 27,376 | |
| | | | | | | | |
| | WIRELESS TELECOMMUNICATION SERVICES—2.9% | |
| | | | SBA Communications Corp. | | | | |
| | 1,350 | | | 5.625%—10/01/2019 | | | 1,424 | |
| | WIRELESS TELECOMMUNICATION SERVICES—Continued | |
| | | | SBA Telecommunications Inc. | | | | |
| 3,050 | | | 5.750%—07/15/2020 | | | 3,210 | |
| | | | Sprint Communications Inc. | | | | |
| | 8,150 | | | 6.000%—11/15/2022 | | | 7,722 | |
| | 5,500 | | | 7.000%—08/15/2020 | | | 5,597 | |
| | | | | | | | |
| | | | | | | 13,319 | |
| | | | | | | | |
| | | | Sprint Corp. | | | | |
| | 3,000 | | | 7.125%—06/15/2024 | | | 2,891 | |
| | 3,750 | | | 7.250%—09/15/2021 | | | 3,773 | |
| | 3,500 | | | 7.625%—02/15/2025 | | | 3,451 | |
| | | | | | | | |
| | | | | | | 10,115 | |
| | | | | | | | |
| | | | T-Mobile USA Inc. | | | | |
| | 6,450 | | | 6.250%—04/01/2021 | | | 6,765 | |
| | 6,750 | | | 6.375%—03/01/2025 | | | 6,949 | |
| | 1,500 | | | 6.500%—01/15/2024 | | | 1,569 | |
| | 3,350 | | | 6.625%—04/01/2023 | | | 3,495 | |
| | 4,000 | | | 6.633%—04/28/2021 | | | 4,235 | |
| | | | | | | | |
| | | | | | | 23,013 | |
| | | | | | | | |
| | | | | | | 51,081 | |
| | | | | | | | |
| TOTAL CORPORATE BONDS & NOTES
(Cost $1,502,761) | | | 1,516,496 | |
| | | | | | | | |
| | | | | | | | |
SHORT-TERM INVESTMENTS—6.8% | |
| (Cost $118,597) | | | | |
| | REPURCHASE AGREEMENTS | |
| | 118,597 | | | Repurchase Agreement with State Street Corp.
dated April 30, 2015 due May 01, 2015 at 0.000% collateralized by U.S. Treasury Bonds
(market value $120,974) | | | 118,597 | |
| | | | | | | | |
| TOTAL INVESTMENTS—97.3%
(Cost $1,688,525) | | | 1,701,625 | |
| | | | | | | | |
| | CASH AND OTHER ASSETS, LESS LIABILITIES—2.7% | | | 47,881 | |
| | | | | | | | |
| | TOTAL NET ASSETS—100.0% | | $ | 1,749,506 | |
| | | | | | | | |
FAIR VALUE MEASUREMENTS
All holdings at April 30, 2015 (as disclosed in the preceding Portfolio of Investments) are classified as Level 2. There were no Level 3 holdings at October 31, 2014 or April 30, 2015, and no transfers between levels during the period.
For more information on valuation inputs and their aggregation into the levels identified above, please refer to the Fair Value Measurements and Disclosures in Note 2 of the accompanying Notes to Financial Statements.
| 1 | Variable rate security, the stated rate represents the rate in effect at April 30, 2015. |
| 2 | Securities purchased in a transaction exempt from registration under Rule 144A of the Securities Act of 1933. These securities may be resold in transactions exempt from registration, normally to qualified institutional buyers. The Fund has no right to demand registration of these securities. These securities are priced by an independent pricing service in accordance with Harbor Funds Valuation Procedures. At April 30, 2015, the aggregate value of these securities was $684,680 or 39% of net assets. |
| 3 | Floating rate security, the stated rate represents the rate in effect at April 30, 2015. |
The accompanying notes are an integral part of the Financial Statements.
21
Harbor Bond Fund
MANAGERS’ COMMENTARY (Unaudited)
SUBADVISER
Pacific Investment Management Company LLC (“PIMCO”)
650 Newport Center Drive
Newport Beach, CA
92660
PORTFOLIO MANAGERS
Scott A. Mather
Since 2014
Mark R. Kiesel
Since 2014
Mihir P. Worah
Since 2014
PIMCO has subadvised the Fund since its inception in 1987.
INVESTMENT OBJECTIVE
The Fund seeks
total return.
PRINCIPAL STYLE CHARACTERISTICS
Intermediate bonds with overall portfolio rated high quality

Scott A. Mather

Mark R. Kiesel

Mihir P. Worah
Management’s Discussion of Fund Performance
MARKET REVIEW
Evidence of global growth divergence continued to impact fixed income markets over the six months ended April 30, 2015. Global markets experienced episodes of heightened volatility as trends from calendar 2014 lingered into 2015, including generalized U.S. dollar strength and lower oil prices.
Calendar 2015 began with a host of central banks beginning and re-embracing monetary easing. Over 20 central banks eased monetary policy in the first quarter, including the European Central Bank. However, the U.S. Federal Reserve remained an outlier as officials reiterated their desire to hike rates sometime this year. Data indicating underlying economic strength, coupled with tailwinds for the consumer from lower oil prices, supported growing evidence that monetary policy in the U.S. was set to become less accommodative over the year.
The European Central Bank’s (“ECB”) emphasis on preventing deflation took center stage when it launched its highly anticipated quantitative easing program in January. The announcement exceeded market expectations as it targeted €60 billion in bond purchases per month. Further, by linking it to inflation objectives, the ECB left the program open-ended. With this announcement, the euro plunged, bond yields fell, and equity markets rallied. Ever-lower interest rates in the euro zone helped anchor government bond yields elsewhere, such as in the U.S. and U.K., while the U.S. dollar added to its strong performance by appreciating against most other currencies.
In China, property market weakness continued to raise concerns for policymakers, while in Japan lower inflation and growth raised skepticism over the ability of Prime Minister Shinzo Abe’s economic program to generate self-sustaining growth.
U.S. Treasury yields fell over the first half of fiscal 2015, with the majority of the rally coming in the first three months. Bond prices rise as yields fall. Fixed income spread sectors had mixed performance over the six months. Corporate bonds and U.S. mortgage-backed securities underperformed like-duration U.S. Treasurys. Emerging market external debt generally outperformed like-duration U.S. Treasurys.
PERFORMANCE
Harbor Bond Fund outperformed the Barclays U.S. Aggregate Bond Index for the six months ended April 30, 2015, and continued to outperform the benchmark over longer time horizons. The Fund returned 2.17% (Institutional Class) and 2.11% (Administrative Class) for the six-month period, compared with the benchmark’s return of 2.06%. The Fund also outperformed the index for the 5-year and 10-year periods ended April 30, 2015, and since the Fund’s inception in 1987.
The following strategies helped Fund returns for the six months ended April 30, 2015:
| • | | Currency positioning, specifically long U.S. dollar positions versus the euro and yen, as both currencies weakened relative to the dollar. |
22
Harbor Bond Fund
MANAGERS’ COMMENTARY—Continued
| | | | |
TOP TEN ISSUERS (% of net assets) | |
U.S. Treasury | | | 32.3% | |
Federal National Mortgage Association TBA | | | 12.7% | |
Federal National Mortgage Association | | | 12.5% | |
Brazil Letras Do Tesouro Nacional | | | 3.8% | |
Bank of America Corp. | | | 1.8% | |
Federal National Mortgage Association REMIC | | | 1.8% | |
Ally Financial Inc. | | | 1.6% | |
Ford Motor Credit Co. LLC | | | 1.6% | |
Denver Public Schools | | | 1.5% | |
Province of Ontario Canada | | | 1.4% | |
| • | | Diversified interest rate exposure to developed countries, particularly Italy and Spain, as rates fell, pushing bond prices higher. |
| • | | Holdings of non-agency mortgage-backed securities, which continued to benefit from limited new issue supply and strong investor demand. |
| • | | Security selection within investment grade corporates as specific issuers outperformed. |
| • | | Tactical exposure to high-yield bonds, as the sector outperformed. |
The following strategies were negative or neutral for returns:
| • | | An underweight to U.S. interest rates, as yields decreased. |
| • | | Positions in U.S. Treasury Inflation-Protected Securities (TIPS), as these securities underperformed nominal government bonds. |
| • | | Positions in select municipal bonds, as yield spreads for the sector widened. |
OUTLOOK AND STRATEGY
Over the next six months, we expect global growth to accelerate modestly. A wave of monetary policy accommodation should underpin global growth, in our view, while still-sizable economic slack should keep inflationary pressures well contained. We think that the decline in oil prices should further sustain these trends by transferring wealth from producers to consumers and by keeping inflation subdued.
We believe that the U.S. is on track for modestly above-trend growth of 2.5%-3.0%, with inflation only gradually approaching the Fed’s 2% target. A robust outlook for personal consumption growth forms the foundation of our outlook. We expect consumer spending to be supported by a still-healthy pace of job gains and real incomes boosted by lower energy prices. Both housing and business investment also will contribute to growth, in our view, but to a lesser degree. We expect home prices to rise gradually and sales trends to continue, but housing to remain a small portion of economic growth.
We expect the euro-zone economy to expand by 1.25%-1.75%, with inflation remaining low. A combination of tailwinds—lower oil prices, a weaker euro, and the European Central Bank’s new quantitative easing program—should lift European growth this year. Going forward, the European quantitative easing program should provide a substantial source of liquidity and also serve to anchor interest rates across member states.
In China, we expect growth in the low 6% range. As China addresses the ongoing slowdown in its property sector and de-leveraging in the shadow-banking system, we expect additional easing from the People’s Bank of China. In Japan, we expect growth of 1.0%-1.5%, and we expect growth to recover from last year’s technical recession. Decisions late in 2014 to delay the next value-added tax hike and increase the size of the Bank of Japan’s easing program should provide needed support for the economy.
With respect to portfolio strategy, we plan to:
| • | | Remain underweight U.S. interest rate risk relative to the benchmark, particularly at the front end and long end of the yield curve. We remain underweight at the very front end of the curve given the potential for volatility as the Fed’s first rate hike approaches. At the long end of the curve, we see less value as the Fed has remained focused on reflating the U.S. economy. |
| • | | Maintain an underweight to agency mortgage-backed securities due to concerns about high valuation levels and the continuing effects of Fed tapering. |
| • | | Remain underweight investment-grade corporate bonds, though positioning in select high-yield issues partially offsets the underweight. We continue to place an emphasis on security selection, preferring companies that we believe are positioned to benefit from increased pricing power and industry consolidation. |
| • | | Remain selective in allocations to emerging markets debt, given increasing dispersion in the pace of economic growth. |
| • | | With continued divergence in economic growth and central bank policies, we look to maintain our long U.S. dollar bias, against the euro and Japanese yen in particular. We will look to tactically adjust exposures as market conditions warrant, as the dollar’s trajectory may not be as smooth as it has been over the past few months. |
| • | | Continue to hold positions in TIPS, as we believe inflation expectations currently embedded in the markets are too low given the Fed’s goal to reflate the U.S. economy. |
23
Harbor Bond Fund
MANAGERS’ COMMENTARY—Continued
This report contains the current opinions of Pacific Investment Management Company LLC at the time of its publication and should not be considered as investment advice or a recommendation of any particular security, strategy or investment product. Such opinions are subject to change without notice and securities described herein may no longer be included in, or may at any time be removed from, the Fund’s portfolio. This report is distributed for informational purposes only. Information contained herein has been obtained from sources believed reliable, but not guaranteed.
Fixed income investments are affected by interest rate changes and the creditworthiness of the issues held by the Fund. A rise in interest rates will cause a decrease in the value of fixed income securities. Such an event would have an adverse effect on the Fund. The use of derivative instruments may add additional risk. There may be a greater risk that the Fund could lose money due to prepayment and extension risks because the Fund invests heavily at times in mortgage-related securities. The Fund may engage in active and frequent trading to achieve its principal investment strategies. References to securities that are backed by the full faith and credit of the U.S. government do not apply to the shares of the Fund. For information on the different share classes and the risks associated with an investment in the Fund, please refer to the current prospectus.
24
Harbor Bond Fund
FUND SUMMARY—April 30, 2015 (Unaudited)
| | | | |
INSTITUTIONAL CLASS |
| | | | |
| Fund # | | | | 2014 |
| | |
| Cusip | | | | 411511108 |
| | |
| Ticker | | | | HABDX |
| | |
| Inception Date | | | | 12/29/1987 |
| | |
| Net Expense Ratio | | | | 0.52%a,b |
| | |
| Total Net Assets (000s) | | | | $3,590,612 |
| | | | |
ADMINISTRATIVE CLASS |
| | | | |
| Fund # | | | | 2214 |
| | |
| Cusip | | | | 411511686 |
| | |
| Ticker | | | | HRBDX |
| | |
| Inception Date | | | | 11/01/2002 |
| | |
| Net Expense Ratio | | | | 0.77%a,b |
| | |
| Total Net Assets (000s) | | | | $79,989 |
PORTFOLIO STATISTICS
| | | | | | | | |
| | | Portfolio | | | Benchmark | |
| | |
Average Market Coupon | | | 3.52% | | | | 3.23% | |
| | |
Yield to Maturity | | | 2.61% | | | | 2.13% | |
| | |
Current 30-day Yield
(Institutional Class) | | | 2.21% | | | | 2.38% | |
| | |
Weighted Average Maturity | | | 7.59 years | | | | 7.73 years | |
| | |
Weighted Average Duration | | | 4.18 years | | | | 5.47 years | |
| | |
Portfolio Turnover
(6-Month Period Ended 04/30/2015) | | | 248% | c | | | N/A | |
MATURITY PROFILE (% of investments)
| | | | |
| |
0 to 1 yr. | | | 40.76% | |
| |
>1 to 5 | | | -4.12% | |
| |
>5 to 10 | | | 42.81% | |
| |
>10 to 15 | | | 11.29% | |
| |
>15 to 20 | | | 0.81% | |
| |
>20 to 25 | | | 3.95% | |
| |
>25 yrs. | | | 4.50% | |
FUND PERFORMANCE
The graph compares a $10,000 investment in the Fund with the performance of the Barclays U.S. Aggregate Bond Index. The Fund’s performance includes the reinvestment of all dividend and capital gain distributions.
CHANGE IN A $10,000 INVESTMENT
For the period 05/01/2005 through 04/30/2015
| | | | | | | | | | | | | | | | | | | | | | | | |
Total Returns For the periods ended 04/30/2015 | |  | |
| Harbor Bond Fund | | | | | | | | | | | | | | | | | | | | | | | | |
Institutional Class | | | 2.17 | % | | | 4.33 | % | | | 4.37 | % | | | 5.62 | % | | | 12/29/1987 | | | $ | 17,276 | |
Administrative Class | | | 2.11 | % | | | 4.14 | % | | | 4.12 | % | | | 5.36 | % | | | 11/01/2002 | | | $ | 16,849 | |
| Comparative Index | | | | | | | | | | | | | | | | | | | | | | | | |
Barclays U.S. Aggregate Bond | | | 2.06 | % | | | 4.46 | % | | | 4.12 | % | | | 4.75 | % | | | — | | | $ | 15,901 | |
As stated in the Fund’s current prospectus, the expense ratios were 0.51% (Net) and 0.57% (Gross) (Institutional Class) and 0.76% (Net) and 0.82% (Gross) (Administrative Class). The net expense ratios reflect a contractual management fee waiver through 02/28/2018 and are contractually capped, excluding interest expense incurred by the Fund, if any, through 02/29/2016. The expense ratios in the prospectus may differ from the actual expense ratios for the fiscal year disclosed within this report. The expense ratios shown in the prospectus are based on the prior fiscal year, adjusted to reflect changes, if any, in contractual arrangements that occurred prior to the date of the prospectus.
Performance data shown represents past performance, which is no guarantee of future results. Current performance may be higher or lower than the past performance data shown. Investment returns and the value of an investment will fluctuate, and an investor’s shares, when sold, may be worth more or less than their original cost. You can obtain performance data current to the most recent month-end (available within seven business days after the most recent month-end) by calling 800-422-1050 or visiting harborfunds.com.
The returns shown do not reflect the deduction of taxes that a shareholder would pay on Fund distributions or on the redemption of Fund shares. From time to time, certain fees and/or expenses have been waived or reimbursed, which has resulted in higher returns. Without these waivers and reimbursements, the returns would have been lower.
| b | Reflective of a contractual fee waiver and expense cap effective through February 29, 2016. Expense cap excludes interest expense incurred by the Fund, if any. |
25
Harbor Bond Fund
PORTFOLIO OF INVESTMENTS—April 30, 2015 (Unaudited)
Total Investments (% of net assets)
(Excludes net cash, short-term investments and derivative positions of –12.1%)
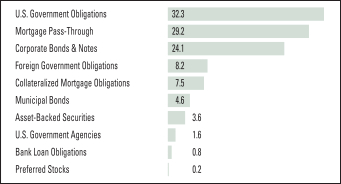
| | | | | | | | |
ASSET-BACKED SECURITIES—3.6% | |
Principal
Amount
(000s) | | | | | Value
(000s) | |
| | | | Access Group Inc.
Series 2008-1 Cl. A | | | | |
| $ | 9,946 | | | 1.577%—10/27/20251 | | $ | 9,962 | |
| | | | Argent Securities Inc.
Series 2006-W4 Cl. A2C | | | | |
| | 7,293 | | | 0.341%—05/25/20361 | | | 2,754 | |
| | 5,500 | | | Series 2005-W2 Cl. A2C
0.541%—10/25/20351 | | | 5,233 | |
| | 939 | | | Series 2004-W11 Cl. M3
1.306%—11/25/20341 | | | 807 | |
| | | | | | | | |
| | | | | | | 8,794 | |
| | | | | | | | |
| | | | Asset Backed Securities Corp. Home Equity
Series 2003-HE4 Cl. M1 | | | | |
| | 8,324 | | | 1.427%—08/15/20331 | | | 7,927 | |
| | | | Bear Stearns Asset Backed Securities Trust
Series 2005-4 Cl. M1 | | | | |
| | 863 | | | 0.681%—01/25/20361 | | | 865 | |
| | | | Countrywide Asset-Backed Certificates
Series 2001-BC3 Cl. A | | | | |
| | 222 | | | 0.661%—12/25/20311 | | | 169 | |
| | 5,494 | | | Series 2005-15 Cl. 1AF3
5.450%—04/25/20362 | | | 5,517 | |
| | | | | | | | |
| | | | | | | 5,686 | |
| | | | | | | | |
| | | | First Franklin Mortgage Loan Trust
Series 2006-FF10 Cl. A4 | | | | |
| | 1,530 | | | 0.331%—07/25/20361 | | | 1,451 | |
| | | | GSAA Trust
Series 2006-20 Cl. 1A2 | | | | |
| | 6,522 | | | 0.361%—12/25/20461 | | | 3,942 | |
| | 2,235 | | | Series 2006-4 Cl. 4A2
0.411%—03/25/20361 | | | 2,044 | |
| | 2,173 | | | Series 2007-9 Cl. A1A
6.000%—08/25/2047 | | | 2,019 | |
| | | | | | | | |
| | | | | | | 8,005 | |
| | | | | | | | |
| | | | GSAMP Trust
Series 2007-FM1 Cl. 2A2 | | | | |
| | 144 | | | 0.251%—12/25/20361 | | | 80 | |
| | | | Home Equity Asset Trust
Series 2005-2 Cl. M4 | | | | |
| | 5,000 | | | 1.231%—07/25/20351 | | | 4,960 | |
| | | | HSI Asset Securitization Corp. Trust
Series 2006-HE2 Cl. 2A3 | | | | |
| | 6,637 | | | 0.351%—12/25/20361 | | | 3,181 | |
| | | | MASTR Asset Backed Securities Trust
Series 2006-HE2 Cl. A2 | | | | |
| 7,418 | | | 0.421%—06/25/20361 | | | 4,257 | |
| | | | Mid-State Trust
Series 2004-1 Cl. A | | | | |
| | 1,800 | | | 6.005%—08/15/2037 | | | 1,895 | |
| | | | Morgan Stanley ABS Capital I
Series 2007-HE1 Cl. A2C | | | | |
| | 2,901 | | | 0.331%—11/25/20361 | | | 1,866 | |
| | | | Morgan Stanley Dean Witter Capital I
Series 2002-HE1 Cl. M1 | | | | |
| | 2,933 | | | 1.081%—07/25/20321 | | | 2,827 | |
| | | | Option One Mortgage Loan Trust
Series 2007-6 Cl. 2A4 | | | | |
| | 5,911 | | | 0.431%—07/25/20371 | | | 3,711 | |
| | | | Park Place Securities Inc.
Series 2005-WCW3 Cl. M1 | | | | |
| | 9,700 | | | 0.661%—08/25/20351 | | | 9,051 | |
| | | | Ramp Trust
Series 2004-RS8 Cl. MII1 | | | | |
| | 1,382 | | | 1.081%—08/25/20341 | | | 1,330 | |
| | | | Securitized Asset Backed Receivables LLC Trust
Series 2005-FR5 Cl. M1 | | | | |
| | 16,793 | | | 0.621%—08/25/20351 | | | 10,863 | |
| | | | SG Mortgage Securities Trust
Series 2006-OPT2 Cl. A3D | | | | |
| | 6,900 | | | 0.391%—10/25/20361 | | | 3,633 | |
| | | | SLM Student Loan Trust
Series 2010-C Cl. A2 | | | | |
| | 794 | | | 2.832%—12/16/20191,3 | | | 802 | |
| | | | Small Business Administration Participation Certificates
Series 2003-20I Cl. 1 | | | | |
| | 132 | | | 5.130%—09/01/2023 | | | 144 | |
| | 4,928 | | | Series 2009-20A Cl. 1
5.720%—01/01/2029 | | | 5,597 | |
| | 12,875 | | | Series 2008-20H Cl. 1
6.020%—08/01/2028 | | | 14,547 | |
| | 205 | | | Series 2001-20A Cl. 1
6.290%—01/01/2021 | | | 223 | |
| | | | | | | | |
| | | | | | | 20,511 | |
| | | | | | | | |
| | | | Soundview Home Equity Loan Trust
Series 2006-WF2 Cl. A1 | | | | |
| | 3,643 | | | 0.311%—12/25/20361 | | | 3,516 | |
| | | | Structured Asset Securities Co.
Series 2007-MN1A Cl. A1 | | | | |
| | 28,408 | | | 0.411%—01/25/20371,3 | | | 18,723 | |
| | | | | | | | |
| TOTAL ASSET-BACKED SECURITIES
(Cost $123,735) | | | 133,896 | |
| | | | | | | | |
| | | | | | | | |
BANK LOAN OBLIGATIONS—0.8% | |
| | | | Chrysler Group LLC
Term Loan B | | | | |
| | 6,549 | | | 3.500%—05/24/20172 | | | 6,568 | |
| | | | Community Health Systems Inc.
Term Loan F | | | | |
| | 6,268 | | | 3.434%—12/31/20182 | | | 6,311 | |
| | | | HCA Inc.
Term Loan A | | | | |
| | 6,749 | | | 2.684%—02/02/20162 | | | 6,760 | |
| | | | Term Loan B5 | | | | |
| | 9,230 | | | 2.934%—03/31/20172 | | | 9,260 | |
| | | | | | | | |
| | | | | | | 16,020 | |
| | | | | | | | |
26
Harbor Bond Fund
PORTFOLIO OF INVESTMENTS—Continued
| | | | | | | | |
BANK LOAN OBLIGATIONS—Continued | |
Principal
Amount
(000s) | | | | | Value
(000s) | |
| | | | MGM Resorts International
Term Loan A | | | | |
| $ | 397 | | | 2.934%—12/20/20172 | | $ | 398 | |
| | | | | | | | |
| TOTAL BANK LOAN OBLIGATIONS
(Cost $29,201) | | | 29,297 | |
| | | | | | | | |
| | | | | | | | |
COLLATERALIZED MORTGAGE OBLIGATIONS—7.5% | |
| | | | Adjustable Rate Mortgage Trust
Series 2006-3 Cl. 4A2 | | | | |
| | 4,810 | | | 0.301%—08/25/20361 | | | 3,140 | |
| € | 4,727 | | | Arran Residential Mortgages Funding plc
Series 2010-1A Cl. A2B
1.448%—05/16/20471,3 | | | 5,337 | |
| $ | 12,592 | | | Banc of America Funding Corp.
Series 2012-R5 Cl. A
0.436%—10/03/20391,3 | | | 12,455 | |
| | 2,245 | | | Series 2007-C Cl. 7A5
0.481%—05/20/20471 | | | 1,867 | |
| | | | | | | | |
| | | | | | | 14,322 | |
| | | | | | | | |
| | | | Banc of America Merrill Lynch Commercial Mortgage Inc.
Series 2007-2 Cl. A4 | | | | |
| | 2,200 | | | 5.782%—04/10/20492 | | | 2,326 | |
| | | | BCAP LLC Trust
Series 2007-AA2 Cl. 12A1 | | | | |
| | 15,012 | | | 0.391%—05/25/20471 | | | 11,183 | |
| | 4,723 | | | Series 2011-RR4 Cl. 8A1
5.250%—02/26/20363 | | | 4,310 | |
| | 8,435 | | | Series 2011-RR5 Cl. 5A1
5.250%—08/26/20373 | | | 8,808 | |
| | 939 | | | Series 2011-RR5 Cl. 12A1
5.421%—03/26/20372,3 | | | 924 | |
| | | | | | | | |
| | | | | | | 25,225 | |
| | | | | | | | |
| | | | Bear Stearns Adjustable Rate Mortgage Trust
Series 2004-10 Cl. 12A3 | | | | |
| | 80 | | | 2.722%—01/25/20352 | | | 79 | |
| | 36 | | | Series 2000-2 Cl. A1
2.750%—11/25/20302 | | | 35 | |
| | 686 | | | Series 2004-1 Cl. 12A5
2.759%—04/25/20341 | | | 675 | |
| | | | | | | | |
| | | | | | | 789 | |
| | | | | | | | |
| | | | Bear Stearns Alt-A Trust
Series 2005-4 Cl. 1A1 | | | | |
| | 606 | | | 0.621%—07/25/20351 | | | 596 | |
| | | | Bear Stearns Commercial Mortgage Securities Trust | | | | |
| | 603 | | | Series 2007-PW15 Cl. A4
5.331%—02/11/2044 | | | 640 | |
| | 1,686 | | | Series 2006-PW11 Cl. A4
5.598%—03/11/20392 | | | 1,722 | |
| | 5,300 | | | Series 2007-PW18 Cl. A4
5.700%—06/11/2050 | | | 5,721 | |
| | 3,539 | | | Series 2007-PW17 Cl. AAB
5.703%—06/11/2050 | | | 3,556 | |
| | 2,297 | | | Series 2006-PW12 Cl. A4
5.887%—09/11/20382 | | | 2,382 | |
| | | | | | | | |
| | | | | | | 14,021 | |
| | | | | | | | |
| | | | Chase Mortgage Finance Corp.
Series 2006-A1 Cl. 4A1 | | | | |
| | 3,970 | | | 5.571%—09/25/20362 | | | 3,578 | |
| | | | Citigroup/Deutsche Bank Commercial Mortgage Trust
Series 2007-CD4 Cl. A4 | | | | |
| | 1,500 | | | 5.322%—12/11/2049 | | | 1,576 | |
| | | | Countrywide Alternative Loan Trust
Series 2005-59 Cl. 1A1 | | | | |
| 14,228 | | | 0.506%—11/20/20351 | | | 11,687 | |
| | 7,333 | | | Series 2006-6BC Cl. 1A2
0.581%—05/25/20361 | | | 5,527 | |
| | 5,826 | | | Series 2005-84 Cl. 1A1
2.479%—02/25/20362 | | | 4,350 | |
| | 5,077 | | | Series 2005-20CB Cl. 2A5
5.500%—07/25/2035 | | | 5,046 | |
| | 1,981 | | | Series 2006-36T2 Cl. 1A4
5.750%—12/25/2036 | | | 1,597 | |
| | 9,541 | | | Series 2006-39CB Cl. 1A20
6.000%—01/25/2037 | | | 8,865 | |
| | | | | | | | |
| | | | | | | 37,072 | |
| | | | | | | | |
| | | | Countrywide Home Loan Mortgage Pass Through Trust
Series 2007-HY5 Cl. 1A1 | | | | |
| | 2,445 | | | 2.641%—09/25/20472 | | | 2,156 | |
| | | | Credit Suisse Commercial Mortgage Trust
Series 2010-9R Cl. 20A5 | | | | |
| | 468 | | | 4.000%—01/27/20373 | | | 470 | |
| | 3,585 | | | Series 2006-C5 Cl. A1A
5.297%—12/15/2039 | | | 3,764 | |
| | | | | | | | |
| | | | | | | 4,234 | |
| | | | | | | | |
| | | | Credit Suisse First Boston Mortgage Securities Corp.
Series 2006-C2 Cl. A3 | | | | |
| | 606 | | | 6.000%—11/25/2035 | | | 496 | |
| | | | Deutsche Alt-A Securities Inc. Mortgage Loan Trust
Series 2007-AR2 Cl. A1 | | | | |
| | 4,087 | | | 0.331%—03/25/20371 | | | 2,955 | |
| | | | DSLA Mortgage Loan Trust
Series 2006-AR1 Cl. 1A1A | | | | |
| | 4,341 | | | 1.048%—03/19/20461 | | | 3,368 | |
| | | | First Horizon Asset Securities Inc. | | | | |
| | | | Series 2005-AR6 Cl. 4A1 | | | | |
| | 3,497 | | | 4.896%—02/25/20362 | | | 3,365 | |
| | | | First Nationwide Trust | | | | |
| | | | Series 2001-3 Cl. 1A1 | | | | |
| | 2 | | | 6.750%—08/21/2031 | | | 2 | |
| | | | Greenwich Capital Commercial Funding Corp. | | | | |
| | | | Series 2007-GG9 Cl. A4 | | | | |
| | 1,500 | | | 5.444%—03/10/2039 | | | 1,581 | |
| | | | GSR Mortgage Loan Trust | | | | |
| | | | Series 2005-AR3 Cl. 3A1 | | | | |
| | 1,176 | | | 2.680%—05/25/20352 | | | 1,136 | |
| | | | Series 2005-AR7 Cl. 6A1 | | | | |
| | 981 | | | 4.965%—11/25/20352 | | | 952 | |
| | | | Series 2006-2F Cl. 2A13 | | | | |
| | 3,946 | | | 5.750%—02/25/2036 | | | 3,894 | |
| | | | | | | | |
| | | | | | | 5,982 | |
| | | | | | | | |
| | | | Harborview Mortgage Loan Trust | | | | |
| | | | Series 2004-8 Cl. 2A3 | | | | |
| | 1,510 | | | 1.001%—11/19/20341 | | | 1,150 | |
| | | | Homebanc Mortgage Trust | | | | |
| | | | Series 2006-H2 Cl. A2 | | | | |
| | 9,721 | | | 0.361%—12/25/20361 | | | 8,467 | |
| | | | Homestar Mortgage Acceptance Corp. | | | | |
| | | | Series 2004-5 Cl. M3 | | | | |
| | 1,532 | | | 1.331%—10/25/20341 | | | 1,283 | |
| | | | IndyMac ARM Trust | | | | |
| | | | Series 2001-H2 Cl. A2 | | | | |
| | 10 | | | 1.707%—01/25/20322 | | | 10 | |
27
Harbor Bond Fund
PORTFOLIO OF INVESTMENTS—Continued
| | | | | | | | |
COLLATERALIZED MORTGAGE OBLIGATIONS—Continued | |
Principal
Amount
(000s) | | | | | Value
(000s) | |
| | | | IndyMac IMSC Mortgage Loan Trust | | | | |
| | | | Series 2007-F2 Cl. 2A1 | | | | |
| $ | 3,555 | | | 6.500%—07/25/2037 | | $ | 2,407 | |
| | | | IndyMac Index Mortgage Loan Trust | | | | |
| | | | Series 2007-AR13 Cl.4A1 | | | | |
| | 19,997 | | | 2.361%—07/25/20372 | | | 12,898 | |
| | | | Series 2005-AR31 Cl. 1A1 | | | | |
| | 2,489 | | | 2.405%—01/25/20362 | | | 2,065 | |
| | | | | | | | |
| | | | | | | 14,963 | |
| | | | | | | | |
| | | | JP Morgan Chase Commercial Mortgage Securities Corp. | | | | |
| | | | Series 2006-LDP9 Cl. A3 | | | | |
| | 5,192 | | | 5.336%—05/15/2047 | | | 5,427 | |
| | | | Series 2007-LDPX Cl. A3 | | | | |
| | 14,109 | | | 5.420%—01/15/2049 | | | 14,931 | |
| | | | Series 2007-LD12 Cl. A4 | | | | |
| | 1,600 | | | 5.882%—02/15/20512 | | | 1,714 | |
| | | | | | | | |
| | | | | | | 22,072 | |
| | | | | | | | |
| | | | JP Morgan Mortgage Trust | | | | |
| | | | Series 2006-A6 Cl. 1A4L | | | | |
| | 6,395 | | | 2.500%—10/25/20362 | | | 5,801 | |
| | | | Series 2006-S1 Cl. 3A1 | | | | |
| | 1,899 | | | 5.500%—04/25/2036 | | | 1,948 | |
| | | | | | | | |
| | | | | | | 7,749 | |
| | | | | | | | |
| | | | JP Morgan Re-REMIC4 | | | | |
| | | | Series 2009-7 Cl. 11A1 | | | | |
| | 177 | | | 2.697%—09/27/20362,3 | | | 176 | |
| | | | Merrill Lynch Mortgage Investors Inc. | | | | |
| | | | Series 2005-3 Cl. 4A | | | | |
| | 238 | | | 0.431%—11/25/20351 | | | 223 | |
| | | | Merrill Lynch/Countrywide Commercial Mortgage Trust | | | | |
| | | | Series 2006-4 Cl. A3 | | | | |
| | 2,287 | | | 5.172%—12/12/2049 | | | 2,395 | |
| | | | Series 2007-6 Cl. A4 | | | | |
| | 1,800 | | | 5.485%—03/12/20512 | | | 1,918 | |
| | | | | | | | |
| | | | | | | 4,313 | |
| | | | | | | | |
| | | | Morgan Stanley Capital I | | | | |
| | | | Series 2006-HQ8 Cl. A4 | | | | |
| | 1,101 | | | 5.599%—03/12/20442 | | | 1,114 | |
| | | | Morgan Stanley Re-REMIC Trust4 | | | | |
| | | | Series 2009-GG10 Cl. A4A | | | | |
| | 1,802 | | | 5.989%—08/12/20452,3 | | | 1,925 | |
| | | | Provident Funding Mortgage Loan Trust | | | | |
| | | | Series 2005-2 Cl. 3A | | | | |
| | 6,824 | | | 2.460%—10/25/20352 | | | 6,805 | |
| | | | Residential Accredit Loans Inc. | | | | |
| | | | Series 2006-QA7 Cl. 2A1 | | | | |
| | 7,216 | | | 0.366%—08/25/20361 | | | 5,747 | |
| | | | Series 2007-QS4 Cl. 3A9 | | | | |
| | 3,785 | | | 6.000%—03/25/2037 | | | 3,190 | |
| | | | | | | | |
| | | | | | | 8,937 | |
| | | | | | | | |
| | | | Residential Asset Securitization Trust | | | | |
| | | | Series 2007-A8 Cl. 2A1 | | | | |
| | 21,688 | | | 6.250%—08/25/2037 | | | 12,874 | |
| | | | Residential Funding Mortgage Securities I | | | | |
| | | | Series 2007-SA1 Cl. 2A2 | | | | |
| | 522 | | | 3.326%—02/25/20372 | | | 419 | |
| | | | Series 2006-SA1 Cl. 2A1 | | | | |
| | 540 | | | 3.781%—02/25/20362 | | | 488 | |
| | | | | | | | |
| | | | | | | 907 | |
| | | | | | | | |
| | | | Silenus European Loan Conduit | | | | |
| | | | Series 25X Cl. A | | | | |
| € | 139 | | | 0.198%—05/15/20191 | | | 157 | |
| | | | Structured Adjustable Rate Mortgage Loan Trust | | | | |
| | | | Series 2007-1 Cl. 1A1 | | | | |
| $ | 4,586 | | | 0.331%—02/25/20371 | | | 3,493 | |
| | | | Series 2001-21A Cl. 3A1 | | | | |
| | 1,551 | | | 2.473%—04/25/20352 | | | 1,539 | |
| | | | | | | | |
| | | | | | | 5,032 | |
| | | | | | | | |
| | | | Structured Asset Mortgage Investments Inc. | | | | |
| | | | Series 2005-AR5 Cl. A2 | | | | |
| | 1,176 | | | 0.431%—07/19/20351 | | | 1,141 | |
| | | | Suntrust Adjustable Rate Mortgage Loan Trust | | | | |
| | | | Series 2007-S1 Cl. 1A | | | | |
| | 1,622 | | | 2.615%—01/25/20372 | | | 1,554 | |
| | | | Wachovia Bank Commercial Mortgage Trust | | | | |
| | | | Series 2007-C32 Cl. A4FL | | | | |
| | 2,600 | | | 0.355%—06/15/20491,3 | | | 2,551 | |
| | | | Series 2006-C23 Cl. A5 | | | | |
| | 11,800 | | | 5.416%—01/15/20452 | | | 12,066 | |
| | | | Series 2007-C31 Cl. A4 | | | | |
| | 6,395 | | | 5.509%—04/15/2047 | | | 6,734 | |
| | | | Series 2007-C33 Cl. A4 | | | | |
| | 5,885 | | | 6.150%—02/15/20512 | | | 6,227 | |
| | | | | | | | |
| | | | | | | 27,578 | |
| | | | | | | | |
| | | | Washington Mutual Mortgage Pass Through Certificates Trust | | | | |
| | | | Series 2005-AR6 Cl. 2A1A | | | | |
| | 901 | | | 0.411%—04/25/20451 | | | 857 | |
| | | | Series 2005-AR13 Cl. A1A1 | | | | |
| | 422 | | | 0.471%—10/25/20451 | | | 394 | |
| | | | Series 2006-AR11 Cl. 3A1A | | | | |
| | 3,596 | | | 1.057%—09/25/20461 | | | 2,906 | |
| | | | | | | | |
| | | | | | | 4,157 | |
| | | | | | | | |
| | | | Wells Fargo Mortgage Backed Securities Trust | | | | |
| | | | Series 2006-AR10 Cl. 1A1 | | | | |
| | 6,950 | | | 2.641%—07/25/20362 | | | 6,798 | |
| | | | | | | | |
| TOTAL COLLATERALIZED MORTGAGE OBLIGATIONS
(Cost $244,490) | | | 273,913 | |
| | | | | | | | |
| | | | | | | | |
CORPORATE BONDS & NOTES—24.1% | |
| | | | Ally Financial Inc. | | | | |
| | 18,000 | | | 2.750%—01/30/2017 | | | 17,982 | |
| | 4,000 | | | 4.625%—06/26/2015 | | | 4,015 | |
| | 28,600 | | | 5.500%—02/15/2017 | | | 29,958 | |
| | 3,900 | | | 6.250%—12/01/2017 | | | 4,188 | |
| | | | | | | | |
| | | | | | | 56,143 | |
| | | | | | | | |
| | | | American Express Bank FSB | | | | |
| | 8,800 | | | 6.000%—09/13/2017 | | | 9,727 | |
| | | | American Express Centurion Bank MTN5 | | | | |
| | 9,500 | | | 6.000%—09/13/2017 | | | 10,501 | |
| | | | American International Group Inc. | | | | |
| | 3,300 | | | 5.050%—10/01/2015 | | | 3,359 | |
| | | | Anglo American Capital plc | | | | |
| | 2,500 | | | 2.625%—04/03/20173 | | | 2,535 | |
| | | | Apple Inc. | | | | |
| | 2,700 | | | 2.850%—05/06/2021 | | | 2,797 | |
| | | | Banco Santander Brasil SA | | | | |
| | 9,800 | | | 4.250%—01/14/20163 | | | 10,026 | |
28
Harbor Bond Fund
PORTFOLIO OF INVESTMENTS—Continued
| | | | | | | | |
CORPORATE BONDS & NOTES—Continued | |
Principal
Amount
(000s) | | | | | Value
(000s) | |
| | | | Banco Santander Chile | | | | |
| $ | 5,300 | | | 1.875%—01/19/20162,3 | | $ | 5,327 | |
| | | | Banco Santander SA | | | | |
| € | 11,800 | | | 6.250%—09/11/20212,6 | | | 13,230 | |
| | | | Bank of America Corp. | | | | |
| $ | 33,200 | | | 6.500%—08/01/2016 | | | 35,308 | |
| | | | Bank of America Corp. MTN5 | | | | |
| | 10,440 | | | 1.085%—03/22/20161 | | | 10,481 | |
| | 18,300 | | | 1.335%—03/22/20181 | | | 18,542 | |
| | | | | | | | |
| | | | | | | 29,023 | |
| | | | | | | | |
| | | | Bank of America NA | | | | |
| | 4,300 | | | 0.676%—05/08/20171 | | | 4,298 | |
| | | | Bank of China Hong Kong Ltd. | | | | |
| | 2,200 | | | 5.550%—02/11/20203 | | | 2,453 | |
| | | | Bank of India London MTN5 | | | | |
| | 2,100 | | | 4.750%—09/30/2015 | | | 2,129 | |
| | | | Barclays Bank plc | | | | |
| | 1,700 | | | 7.750%—04/10/20232 | | | 1,889 | |
| £ | 3,600 | | | 14.000%—06/15/20192,6 | | | 7,440 | |
| | | | | | | | |
| | | | | | | 9,329 | |
| | | | | | | | |
| | | | Barclays plc | | | | |
| € | 2,300 | | | 6.500%—09/15/20192,6 | | | 2,631 | |
| | 700 | | | 8.000%—12/15/20202,6 | | | 869 | |
| | | | | | | | |
| | | | | | | 3,500 | |
| | | | | | | | |
| | | | BB&T Corp. MTN5 | | | | |
| $ | 19,500 | | | 1.131%—06/15/20181 | | | 19,694 | |
| | | | BBVA Bancomer SA | | | | |
| | 2,800 | | | 4.500%—03/10/20163 | | | 2,888 | |
| | 5,700 | | | 6.500%—03/10/20213 | | | 6,398 | |
| | | | | | | | |
| | | | | | | 9,286 | |
| | | | | | | | |
| | | | Bear Stearns Companies LLC | | | | |
| | 4,300 | | | 6.400%—10/02/2017 | | | 4,786 | |
| | | | Blackstone Group LP | | | | |
| | 2,678 | | | 9.625%—03/19/20193 | | | 2,769 | y |
| | | | BM & FBovespa SA | | | | |
| | 2,000 | | | 5.500%—07/16/20203 | | | 2,170 | |
| | | | BNP Paribas SA MTN5 | | | | |
| | 20,300 | | | 0.566%—11/07/20151 | | | 20,323 | |
| | | | BPCE SA | | | | |
| | 38,300 | | | 0.826%—11/18/20161 | | | 38,384 | |
| | | | Braskem Finance Ltd. | | | | |
| | 2,400 | | | 5.750%—04/15/20213 | | | 2,405 | |
| | | | CIT Group Inc. | | | | |
| | 3,700 | | | 5.000%—05/15/2017 | | | 3,839 | |
| | | | Citigroup Inc. | | | | |
| | 17,500 | | | 4.750%—05/19/2015 | | | 17,530 | |
| | | | Citigroup Inc. MTN5 | | | | |
| € | 2,000 | | | 0.706%—05/31/20171 | | | 2,239 | |
| | | | Cooperatieve Centrale Raiffeisen-Boerenleenbank BA/NY | | | | |
| $ | 30,400 | | | 0.542%—11/23/20161 | | | 30,408 | |
| | 14,700 | | | 0.609%—04/28/20171 | | | 14,705 | |
| | | | | | | | |
| | | | | | | 45,113 | |
| | | | | | | | |
| | | | Credit Agricole SA | | | | |
| £ | 3,900 | | | 7.500%—06/23/20262,6 | | | 6,114 | |
| $ | 3,100 | | | 7.875%—01/23/20242,6 | | | 3,304 | |
| | 300 | | | 8.125%—09/19/20332 | | | 340 | |
| | | | | | | | |
| | | | | | | 9,758 | |
| | | | | | | | |
| | | | Credit Suisse New York MTN5 | | | | |
| 8,900 | | | 0.751%—05/26/20171 | | | 8,899 | |
| | | | CSN Islands XI Corp. | | | | |
| | 4,300 | | | 6.875%—09/21/20193 | | | 4,010 | |
| | | | CVS Pass-Through Trust | | | | |
| | 655 | | | 6.943%—01/10/2030 | | | 809 | |
| | | | Dynegy Inc. | | | | |
| | 1,900 | | | 6.750%—11/01/20193 | | | 1,995 | |
| | 3,500 | | | 7.375%—11/01/20223 | | | 3,745 | |
| | 1,800 | | | 7.625%—11/01/20243 | | | 1,944 | |
| | | | | | | | |
| | | | | | | 7,684 | |
| | | | | | | | |
| | | | Export-Import Bank of Korea | | | | |
| | 2,100 | | | 4.000%—01/29/2021 | | | 2,276 | |
| | 12,300 | | | 4.125%—09/09/2015 | | | 12,447 | |
| | 2,200 | | | 5.125%—06/29/2020 | | | 2,509 | |
| | | | | | | | |
| | | | | | | 17,232 | |
| | | | | | | | |
| | | | Ford Motor Credit Co. LLC | | | | |
| | 6,400 | | | 2.750%—05/15/2015 | | | 6,401 | |
| | 1,000 | | | 3.984%—06/15/2016 | | | 1,029 | |
| | 2,200 | | | 8.000%—12/15/2016 | | | 2,429 | |
| | 31,725 | | | 12.000%—05/15/2015 | | | 31,817 | |
| | | | | | | | |
| | | | | | | 41,676 | |
| | | | | | | | |
| | | | Ford Motor Credit Co. LLC MTN5 | | | | |
| | 20,000 | | | 0.706%—11/08/20161 | | | 19,942 | |
| | | | General Motors Financial Co. Inc. | | | | |
| | 2,800 | | | 3.150%—01/15/2020 | | | 2,824 | |
| | 3,000 | | | 4.750%—08/15/2017 | | | 3,173 | |
| | | | | | | | |
| | | | | | | 5,997 | |
| | | | | | | | |
| | | | Gerdau Holdings Inc. | | | | |
| | 4,900 | | | 7.000%—01/20/20203 | | | 5,433 | |
| | | | Goldman Sachs Group Inc. | | | | |
| | 2,700 | | | 3.300%—05/03/2015 | | | 2,700 | |
| | | | Goldman Sachs Group Inc. MTN5 | | | | |
| | 1,500 | | | 0.886%—06/04/20171 | | | 1,498 | |
| | | | GTL Trade Finance Inc. | | | | |
| | 1,500 | | | 7.250%—10/20/2017 | | | 1,639 | |
| | 2,000 | | | 7.250%—10/20/20173 | | | 2,185 | |
| | | | | | | | |
| | | | | | | 3,824 | |
| | | | | | | | |
| | | | Hellenic Railways Organization SA | | | | |
| € | 3,500 | | | 5.014%—12/27/2017 | | | 2,633 | |
| | | | HSBC Holdings plc | | | | |
| $ | 9,600 | | | 6.375%—03/30/20252,6 | | | 9,936 | |
| | | | International Lease Finance Corp. | | | | |
| | 5,100 | | | 5.750%—05/15/2016 | | | 5,279 | |
| | 4,600 | | | 6.750%—09/01/20163 | | | 4,876 | |
| | 9,900 | | | 8.625%—09/15/2015 | | | 10,147 | |
| | | | | | | | |
| | | | | | | 20,302 | |
| | | | | | | | |
| | | | JP Morgan Chase & Co. | | | | |
| | 8,200 | | | 2.250%—01/23/2020 | | | 8,183 | |
| | 7,200 | | | 3.150%—07/05/2016 | | | 7,386 | |
| | 4,100 | | | 3.400%—06/24/2015 | | | 4,118 | |
| | | | | | | | |
| | | | | | | 19,687 | |
| | | | | | | | |
| | | | JP Morgan Chase Bank NA | | | | |
| | 7,000 | | | 6.000%—10/01/2017 | | | 7,739 | |
| | | | Keane Group Holdings LLC | | | | |
| | 24,688 | | | 8.500%—08/08/2019 | | | 23,516 | x |
29
Harbor Bond Fund
PORTFOLIO OF INVESTMENTS—Continued
| | | | | | | | |
CORPORATE BONDS & NOTES—Continued | |
Principal
Amount
(000s) | | | | | Value
(000s) | |
| | | | Merrill Lynch & Co. Inc. | | | | |
| $ | 12,700 | | | 0.829%—05/02/20171 | | $ | 12,606 | |
| | | | Merrill Lynch & Co. Inc. MTN5 | | | | |
| | 5,100 | | | 6.400%—08/28/2017 | | | 5,636 | |
| | 7,800 | | | 6.875%—04/25/2018 | | | 8,902 | |
| | | | | | | | |
| | | | | | | 14,538 | |
| | | | | | | | |
| | | | Mizuho Bank Ltd. | | | | |
| | 1,000 | | | 0.717%—09/25/20171,3 | | | 999 | |
| | | | Morgan Stanley | | | | |
| | 4,500 | | | 5.375%—10/15/2015 | | | 4,594 | |
| | | | Morgan Stanley MTN5 | | | | |
| | 13,000 | | | 0.725%—10/18/20161 | | | 12,996 | |
| | 13,400 | �� | | 1.557%—04/25/20181 | | | 13,645 | |
| | | | | | | | |
| | | | | | | 26,641 | |
| | | | | | | | |
| | | | MSCI Inc. | | | | |
| | 4,250 | | | 5.250%—11/15/20243 | | | 4,431 | |
| | | | Murray Street Investment Trust I | | | | |
| | 7,000 | | | 4.647%—03/09/20177 | | | 7,408 | |
| | | | National Australia Bank Ltd. MTN5 | | | | |
| | 33,900 | | | 0.553%—06/30/20171,3 | | | 33,874 | |
| | | | Nationwide Building Society | | | | |
| | 6,400 | | | 6.250%—02/25/20203 | | | 7,596 | |
| | | | Noble Group Ltd. | | | | |
| | 600 | | | 4.875%—08/05/20153 | | | 602 | |
| | | | Novo Banco SA MTN5 | | | | |
| € | 3,500 | | | 4.750%—01/15/2018 | | | 4,004 | |
| | | | Odebrecht Drilling Norbe VIII/IX Ltd. | | | | |
| $ | 5,440 | | | 6.350%—06/30/20223 | | | 5,089 | |
| | | | Odebrecht Offshore Drilling Finance Ltd. | | | | |
| | 3,701 | | | 6.625%—10/01/20233 | | | 3,183 | |
| | 186 | | | 6.750%—10/01/20233 | | | 160 | |
| | | | | | | | |
| | | | | | | 3,343 | |
| | | | | | | | |
| | | | OneMain Financial Holdings Inc. | | | | |
| | 1,600 | | | 6.750%—12/15/20193 | | | 1,688 | |
| | 1,500 | | | 7.250%—12/15/20213 | | | 1,592 | |
| | | | | | | | |
| | | | | | | 3,280 | |
| | | | | | | | |
| | | | Owens Corning Co. | | | | |
| | 9,300 | | | 4.200%—12/01/2024 | | | 9,505 | |
| | | | Petrobras Global Finance BV | | | | |
| | 1,400 | | | 1.881%—05/20/20161 | | | 1,358 | |
| | 1,200 | | | 2.000%—05/20/2016 | | | 1,174 | |
| | 400 | | | 2.415%—01/15/20192 | | | 371 | |
| | 7,800 | | | 2.631%—03/17/20171 | | | 7,570 | |
| | 1,300 | | | 3.151%—03/17/20202 | | | 1,219 | |
| | 2,100 | | | 3.250%—03/17/2017 | | | 2,066 | |
| | 3,500 | | | 3.500%—02/06/2017 | | | 3,444 | |
| | 1,700 | | | 3.875%—01/27/2016 | | | 1,707 | |
| | 1,200 | | | 4.375%—05/20/2023 | | | 1,070 | |
| | 400 | | | 4.875%—03/17/2020 | | | 385 | |
| | 10,300 | | | 5.375%—01/27/2021 | | | 9,921 | |
| | 2,500 | | | 5.750%—01/20/2020 | | | 2,502 | |
| | 600 | | | 6.125%—10/06/2016 | | | 615 | |
| | | | | | | | |
| | | | | | | 33,402 | |
| | | | | | | | |
| | | | Principal Life Global Funding II | | | | |
| | 23,400 | | | 1.200%—05/19/20173 | | | 23,469 | |
| | | | Qtel International Finance Ltd. | | | | |
| | 400 | | | 3.375%—10/14/20163 | | | 412 | |
| | | | Ras Laffan Liquefied Natural Gas Co. Ltd. III | | | | |
| 700 | | | 5.838%—09/30/20273 | | | 812 | |
| | | | Rio Oil Finance Trust | | | | |
| | 1,700 | | | 6.250%—07/06/20243 | | | 1,692 | |
| | 8,500 | | | 6.750%—01/06/20273 | | | 8,436 | |
| | | | | | | | |
| | | | | | | 10,128 | |
| | | | | | | | |
| | | | Rohm and Haas Co. | | | | |
| | 717 | | | 6.000%—09/15/2017 | | | 792 | |
| | | | Schaeffler Holding Finance BV | | | | |
| € | 3,400 | | | 5.750%—11/15/2021 | | | 4,157 | |
| $ | 3,100 | | | 6.250%—11/15/20193 | | | 3,313 | |
| | | | | | | | |
| | | | | | | 7,470 | |
| | | | | | | | |
| | | | Societe Generale SA | | | | |
| | 5,000 | | | 4.250%—04/14/20253 | | | 4,822 | |
| | | | Southern Gas Networks plc MTN5 | | | | |
| £ | 9,800 | | | 0.856%—10/21/20151 | | | 15,022 | |
| | | | Springleaf Finance Corp. MTN5 | | | | |
| $ | 1,600 | | | 5.400%—12/01/2015 | | | 1,626 | |
| | | | State Bank of India | | | | |
| | 8,100 | | | 4.500%—07/27/20153 | | | 8,161 | |
| | | | Stone Street Trust | | | | |
| | 16,400 | | | 5.902%—12/15/20153 | | | 16,836 | |
| | | | Unicredit SpA | | | | |
| € | 2,200 | | | 6.750%—09/10/20212,6 | | | 2,517 | |
| $ | 4,930 | | | 8.000%—06/03/20242,6 | | | 5,063 | |
| | | | | | | | |
| | | | | | | 7,580 | |
| | | | | | | | |
| | | | United Air Lines Inc. | | | | |
| | 734 | | | 10.400%—05/01/2018 | | | 800 | |
| | | | Verizon Communications Inc. | | | | |
| | 2,900 | | | 2.021%—09/14/20181 | | | 3,015 | |
| | 2,469 | | | 2.500%—09/15/2016 | | | 2,521 | |
| | 9,000 | | | 3.650%—09/14/2018 | | | 9,539 | |
| | | | | | | | |
| | | | | | | 15,075 | |
| | | | | | | | |
| | | | Wells Fargo & Co. | | | | |
| | 17,800 | | | 7.980%—03/15/20182,6 | | | 19,669 | |
| | | | | | | | |
| TOTAL CORPORATE BONDS & NOTES
(Cost $868,208) | | | 886,084 | |
| | | | | | | | |
| | | | | | | | |
FOREIGN GOVERNMENT OBLIGATIONS—8.2% | |
| | | | Autonomous Community of Valencia Spain MTN5 | | | | |
| € | 300 | | | 4.375%—07/16/2015 | | | 341 | |
| | | | Banco Nacional de Desenvolvimento
Economico e Social | | | | |
| | 2,300 | | | 4.125%—09/15/20173 | | | 2,709 | |
| | | | Brazil Letras Do Tesouro Nacional | | | | |
| R$ | 455,200 | | | 0.000%—10/01/2015-01/01/20178 | | | 139,432 | |
| | | | Bundesrepublik Deutschland | | | | |
| € | 1,900 | | | 2.500%—07/04/2044 | | | 3,049 | |
| | 100 | | | 3.250%—07/04/2042 | | | 178 | |
| | 21,000 | | | 4.250%—07/04/2039 | | | 41,413 | |
| | 1,500 | | | 4.750%—07/04/2040 | | | 3,186 | |
| | | | | | | | |
| | | | | | | 47,826 | |
| | | | | | | | |
| | | | Korea Development Bank | | | | |
| $ | 18,600 | | | 4.375%—08/10/2015 | | | 18,776 | |
| | | | Korea Housing Finance Corp. | | | | |
| | 2,200 | | | 4.125%—12/15/20153 | | | 2,244 | |
30
Harbor Bond Fund
PORTFOLIO OF INVESTMENTS—Continued
| | | | | | | | |
FOREIGN GOVERNMENT OBLIGATIONS—Continued | |
Principal
Amount
(000s) | | | | | Value
(000s) | |
| | | | Mexican Bonos | | | | |
| MEX$ | 239,100 | | | 8.000%—06/11/2020 | | $ | 17,452 | |
| | | | Province of Ontario Canada | | | | |
| $ | 6,100 | | | 1.650%—09/27/2019 | | | 6,132 | |
| | 6,400 | | | 3.000%—07/16/2018 | | | 6,749 | |
| CAD$ | 5,600 | | | 3.150%—06/02/2022 | | | 5,017 | |
| $ | 3,800 | | | 4.000%—10/07/2019 | | | 4,186 | |
| CAD$ | 19,100 | | | 4.000%—06/02/2021 | | | 17,907 | |
| | 10,600 | | | 4.200%—06/02/2020 | | | 9,929 | |
| $ | 2,300 | | | 4.400%—04/14/2020 | | | 2,591 | |
| | | | | | | | |
| | | | | | | 52,511 | |
| | | | | | | | |
| | | | Province of Quebec Canada | | | | |
| | 900 | | | 3.500%—07/29/2020 | | | 976 | |
| CAD$ | 3,800 | | | 3.500%—12/01/2022 | | | 3,480 | |
| | 13,900 | | | 4.250%—12/01/2021 | | | 13,256 | |
| | 2,500 | | | 4.500%—12/01/2020 | | | 2,389 | |
| | | | | | | | |
| | | | | | | 20,101 | |
| | | | | | | | |
| TOTAL FOREIGN GOVERNMENT OBLIGATIONS
(Cost $328,986) | | | 301,392 | |
| | | | | | | | |
| | | | | | | | |
MORTGAGE PASS-THROUGH—29.2% | |
| | | | Federal Home Loan Mortgage Corp. | | | | |
| $ | 20 | | | 2.347%—06/01/20241 | | | 21 | |
| | 820 | | | 4.500%—08/01/2040-09/01/2041 | | | 894 | |
| | 115 | | | 5.136%—08/01/20351 | | | 123 | |
| | 2,595 | | | 5.500%—02/01/2038-07/01/2038 | | | 2,949 | |
| | 9,921 | | | 6.000%—07/01/2016-05/01/2040 | | | 11,313 | |
| | | | | | | | |
| | | | | | | 15,300 | |
| | | | | | | | |
| | | | Federal Home Loan Mortgage Corp. REMIC4 | | | | |
| | 52 | | | 0.632%—11/15/20301 | | | 53 | |
| | 108 | | | 8.000%—08/15/2022 | | | 121 | |
| | 19 | | | 9.000%—12/15/2020 | | | 21 | |
| | | | | | | | |
| | | | | | | 195 | |
| | | | | | | | |
| | | | Federal Home Loan Mortgage Corp. Structured Pass Through Securities | | | | |
| | | | Series T-63 Cl. 1A1 | | | | |
| | 191 | | | 1.328%—02/25/20451 | | | 195 | |
| | | | Series E3 Cl. A | | | | |
| | 337 | | | 2.927%—08/15/20322 | | | 352 | |
| | | | | | | | |
| | | | | | | 547 | |
| | | | | | | | |
| | | | Federal Home Loan Mortgage Corp. TBA9 | | | | |
| | 28,000 | | | 4.500%—05/13/2045 | | | 30,447 | |
| | | | Federal Housing Authority Project | | | | |
| | 11 | | | 7.400%—02/01/2021 | | | 11 | y |
| | 1,581 | | | 7.450%—05/01/2021 | | | 1,547 | y |
| | | | | | | | |
| | | | | | | 1,558 | |
| | | | | | | | |
| | | | Federal National Mortgage Association | | | | |
| | 482 | | | 1.536%—10/01/20401 | | | 505 | |
| | 2,233 | | | 2.204%—08/01/20351 | | | 2,384 | |
| | 5,300 | | | 2.310%—08/01/2022 | | | 5,348 | |
| | 2,690 | | | 2.343%—06/01/20351 | | | 2,891 | |
| | 11,492 | | | 2.475%—04/01/2019 | | | 11,852 | |
| | 6,000 | | | 2.870%—09/01/2027 | | | 6,073 | |
| | 3,128 | | | 3.000%—02/01/2021-11/01/2025 | | | 3,278 | |
| | 470 | | | 3.330%—11/01/2021 | | | 498 | |
| | 1,412 | | | 3.500%—04/01/2021-05/01/2027 | | | 1,500 | |
| | 28,925 | | | 4.000%—10/01/2015-10/01/2031 | | | 30,887 | |
| | 24,856 | | | 4.500%—01/01/2018-10/01/2042 | | | 26,800 | |
| | 31,530 | | | 5.000%—12/01/2022-07/01/2044 | | | 35,198 | |
| 180 | | | 5.062%—05/01/20351 | | | 191 | |
| | 97,573 | | | 5.500%—02/01/2023-12/01/2043 | | | 110,592 | |
| | 168,774 | | | 6.000%—07/01/2016-05/01/2041 | | | 193,201 | |
| | | | Series 2003-W1 Cl. 1A1 | | | | |
| | 279 | | | 5.888%—12/25/20422 | | | 313 | |
| | | | | | | | |
| | | | | | | 431,511 | |
| | | | | | | | |
| | | | Federal National Mortgage Association REMIC4 | | | | |
| | | | Series 2006-5 Cl. 3A2 | | | | |
| | 193 | | | 2.194%—05/25/20352 | | | 201 | |
| | | | Series 2011-98 Cl. ZL | | | | |
| | 63,260 | | | 3.500%—10/25/2041 | | | 63,928 | |
| | | | Series 2003-25 Cl. KP | | | | |
| | 1,052 | | | 5.000%—04/25/2033 | | | 1,153 | |
| | | | | | | | |
| | | | | | | 65,282 | |
| | | | | | | | |
| | | | Federal National Mortgage Association TBA9 | | | | |
| | 4,000 | | | 3.000%—07/10/2045 | | | 4,050 | |
| | 84,000 | | | 3.500%—05/18/2030-05/13/2045 | | | 88,399 | |
| | 79,000 | | | 4.000%—06/12/2045 | | | 84,312 | |
| | 76,000 | | | 4.500%—05/13/2045-06/11/2045 | | | 82,673 | |
| | 126,000 | | | 5.000%—05/13/2045 | | | 140,299 | |
| | 48,000 | | | 5.500%—05/13/2045-06/12/2045 | | | 54,312 | |
| | 9,000 | | | 6.000%—05/13/2045 | | | 10,287 | |
| | | | | | | | |
| | | | | | | 464,332 | |
| | | | | | | | |
| | | | Government National Mortgage Association | | | | |
| | 42,751 | | | 5.000%—08/15/2033-07/15/2041 | | | 47,932 | |
| | | | Government National Mortgage Association II | | | | |
| | 823 | | | 1.625%—03/20/2017-02/20/20321 | | | 853 | |
| | 202 | | | 2.000%—08/20/2022-10/20/20251 | | | 209 | |
| | 30 | | | 2.500%—12/20/20241 | | | 30 | |
| | | | | | | | |
| | | | | | | 1,092 | |
| | | | | | | | |
| | | | Government National Mortgage Association TBA9 | | | | |
| | 2,000 | | | 3.000%—05/20/2045 | | | 2,055 | |
| | 3,000 | | | 3.500%—06/18/2045 | | | 3,155 | |
| | 7,000 | | | 5.000%—05/20/2045 | | | 7,827 | |
| | | | | | | | |
| | | | | | | 13,037 | |
| | | | | | | | |
| TOTAL MORTGAGE PASS-THROUGH
(Cost $1,047,046) | | | 1,071,233 | |
| | | | | | | | |
| | | | | | | | |
MUNICIPAL BONDS—4.6% | |
| | | | California Infrastructure & Economic Development Bank | | | | |
| | 2,200 | | | 6.486%—05/15/2049 | | | 2,762 | |
| | | | California State University | | | | |
| | 3,900 | | | 6.434%—11/01/2030 | | | 5,004 | |
| | | | Chicago Transit Authority | | | | |
| | 270 | | | 6.300%—12/01/2021 | | | 296 | |
| | 7,200 | | | 6.899%—12/01/2040 | | | 9,113 | |
| | | | | | | | |
| | | | | | | 9,409 | |
| | | | | | | | |
| | | | Clark County Nevada | | | | |
| | 14,000 | | | 6.350%—07/01/2029 | | | 15,961 | |
| | | | Denver Public Schools | | | | |
| | 39,000 | | | 7.017%—12/15/2037 | | | 53,541 | |
| | | | Los Angeles City CA Wastewater System Revenue | | | | |
| | 2,000 | | | 5.713%—06/01/2039 | | | 2,468 | |
| | | | North Las Vegas City NV | | | | |
| | 20,000 | | | 6.572%—06/01/2040 | | | 17,938 | |
| | | | Orange County Local Transportation Authority | | | | |
| | 10,500 | | | 6.908%—02/15/2041 | | | 14,696 | |
31
Harbor Bond Fund
PORTFOLIO OF INVESTMENTS—Continued
| | | | | | | | |
MUNICIPAL BONDS—Continued | |
Principal
Amount
(000s) | | | | | Value
(000s) | |
| | | | Public Power Generation Agency | | | | |
| $ | 600 | | | 7.242%—01/01/2041 | | $ | 710 | |
| | | | State of California | | | | |
| | 7,800 | | | 7.500%—04/01/2034 | | | 11,503 | |
| | 5,300 | | | 7.550%—04/01/2039 | | | 8,152 | |
| | 5,000 | | | 7.950%—03/01/2036 | | | 6,124 | |
| | | | | | | | |
| | | | | | | 25,779 | |
| | | | | | | | |
| | | | University of California | | | | |
| | 20,270 | | | 4.858%—05/15/2112 | | | 19,820 | |
| | | | | | | | |
| TOTAL MUNICIPAL BONDS
(Cost $137,624) | | | 168,088 | |
| | | | | | | | |
| | | | | | | | |
PREFERRED STOCKS—0.2% | |
| | |
| Shares | | | | | | |
| | BANKS—0.1% | |
| | 80,000 | | | Citigroup Capital XIII | | | 2,071 | |
| | | | | | | | |
| | DIVERSIFIED FINANCIAL SERVICES—0.1% | |
| | 203,000 | | | Ally Financial Inc. | | | 5,380 | |
| | | | | | | | |
| TOTAL PREFERRED STOCKS
(Cost $7,128) | | | 7,451 | |
| | | | | | | | |
| | | | | | | | |
PURCHASED OPTIONS—0.0% | |
| | |
No. of
Contracts | | | | | | |
| | | | Currency Option U.S. Dollar vs. Japanese Yen | | | | |
| | 36,000,000 | | | $121.00—06/04/2015-07/02/2015 | | | 163 | |
| | | | Interest Rate Swap Option 1 year | | | | |
| | 122,400,000 | | | 0.800%—01/19/2016 | | | 142 | |
| | | | Interest Rate Swap Option 2 year | | | | |
| | 82,400,000 | | | 1.100%—01/19/2016-01/30/2018 | | | 560 | |
| | | | Interest Rate Swap Option 3 year | | | | |
| | 41,800,000 | | | 1.150%—07/20/2015 | | | 91 | |
| | | | Interest Rate Swap Option 5 year | | | | |
| | 41,000,000 | | | 1.500%—01/29/2016-01/16/2020 | | | 341 | |
| | | | Interest Rate Swap Option 10 year | | | | |
| | 30,600,000 | | | 1.750%—07/30/2015-01/29/2016 | | | 200 | |
| | | | | | | | |
| TOTAL PURCHASED OPTIONS
(Premiums Paid/Cost $2,262) | | | 1,497 | |
| | | | | | | | |
| | | | | | | | |
RIGHTS/WARRANTS—0.0% | |
| (Cost $15) | | | | |
Shares | | | | | | |
| | AUTOMOBILES—0.0% | | | | |
| | 36,000 | | | General Motors Co. Escrow | | | — | z |
| | | | | | | | |
| | | | | | | | |
U.S. GOVERNMENT AGENCIES—1.6% | |
Principal
Amount
(000s) | | | | | | |
| | | | Federal Home Loan Mortgage Corp. | | | | |
| $ | 9,200 | | | 1.250%—08/01/2019 | | | 9,146 | |
| | 3,100 | | | 2.375%—01/13/2022 | | | 3,170 | |
| $ | 19,000 | | | 3.750%—03/27/2019 | | $ | 20,757 | |
| | | | | | | | |
| | | | | | | 33,073 | |
| | | | | | | | |
| | | | Federal National Mortgage Association | | | | |
| | 9,300 | | | 5.000%—05/11/201711 | | | 10,102 | |
| | 13,000 | | | 5.375%—06/12/201711 | | | 14,261 | |
| | | | | | | | |
| | | | | | | 24,363 | |
| | | | | | | | |
| TOTAL U.S. GOVERNMENT AGENCIES
(Cost $57,137) | | | 57,436 | |
| | | | | | | | |
| | | | | | | | |
U.S. GOVERNMENT OBLIGATIONS—32.3% | |
| | | | U.S. Treasury Bonds | | | | |
| | 55,500 | | | 2.500%—02/15/2045 | | | 52,734 | |
| | 48,300 | | | 2.750%—08/15/2042-11/15/2042 | | | 48,326 | |
| | 47,030 | | | 3.000%—05/15/2042-11/15/2044 | | | 49,439 | |
| | 126,800 | | | 3.125%—02/15/2042-08/15/2044 | | | 136,547 | |
| | 45,500 | | | 3.375%—05/15/204411 | | | 51,301 | |
| | 3,800 | | | 3.750%—11/15/2043 | | | 4,574 | |
| | 5,400 | | | 4.250%—05/15/2039 | | | 6,907 | |
| | 19,200 | | | 4.375%—11/15/2039-05/15/2040 | | | 25,048 | |
| | 12,000 | | | 4.625%—02/15/2040 | | | 16,214 | |
| | 14,900 | | | 6.125%—11/15/2027-08/15/2029 | | | 21,422 | |
| | | | | | | | |
| | | | | | | 412,512 | |
| | | | | | | | |
| | | | U.S. Treasury Inflation Indexed Bonds10 | | | | |
| | 38,740 | | | 0.125%—01/15/2022-07/15/202211 | | | 39,325 | |
| | 12,704 | | | 0.625%—07/15/202111 | | | 13,368 | |
| | 2,908 | | | 0.750%—02/15/2042 | | | 2,915 | |
| | 3,433 | | | 1.125%—01/15/202111 | | | 3,698 | |
| | 7,533 | | | 1.250%—07/15/202011 | | | 8,202 | |
| | 4,229 | | | 1.375%—02/15/2044 | | | 4,923 | |
| | 104,295 | | | 1.750%—01/15/2028 | | | 122,457 | |
| | 71,419 | | | 2.000%—01/15/2026 | | | 84,972 | |
| | 175,316 | | | 2.375%—01/15/2025-01/15/2027 | | | 214,947 | |
| | 39,352 | | | 2.500%—01/15/2029 | | | 50,389 | |
| | 1,306 | | | 3.625%—04/15/2028 | | | 1,846 | |
| | 8,566 | | | 3.875%—04/15/2029 | | | 12,602 | |
| | | | | | | | |
| | | | | | | 559,644 | |
| | | | | | | | |
| | | | U.S. Treasury Notes | | | | |
| | 16,800 | | | 1.375%—03/31/2020 | | | 16,747 | |
| | 88,000 | | | 2.000%—08/31/2021-02/15/202511 | | | 88,290 | |
| | 99,800 | | | 2.250%—11/15/2024 | | | 101,656 | |
| | 5,500 | | | 2.375%—08/15/202411 | | | 5,665 | |
| | | | | | | | |
| | | | | | | 212,358 | |
| | | | | | | | |
| TOTAL U.S. GOVERNMENT OBLIGATIONS
(Cost $1,170,397) | | | 1,184,514 | |
| | | | | | | | |
| | | | | | | | |
SHORT-TERM INVESTMENTS—2.9% | |
| | COMMERCIAL PAPER—1.8% | |
| | | | Ford Motor Credit Co. | | | | |
| | 20,900 | | | 1.100%—11/02/20153 | | | 20,782 | |
| | | | Macquarie Bank Ltd. | | | | |
| | 40,100 | | | 0.542%—05/01/20151,3 | | | 40,100 | |
| | | | Vodafone Group plc | | | | |
| | 3,100 | | | 0.600%—06/29/2015 | | | 3,097 | |
| | | | | | | | |
| | | | | | | 63,979 | |
| | | | | | | | |
| | REPURCHASE AGREEMENTS—0.9% | |
| | 33,800 | | | Repurchase Agreement with Barclays plc
dated April 30, 2015 due May 01, 2015 at 0.200% collateralized by U.S. Treasury Notes (market value $35,268) | | | 33,800 | |
| | | | | | | | |
32
Harbor Bond Fund
PORTFOLIO OF INVESTMENTS—Continued
| | | | | | | | |
SHORT-TERM INVESTMENTS—Continued | |
Principal
Amount
(000s) | | | | | Value
(000s) | |
| | U.S. GOVERNMENT OBLIGATIONS—0.2% | |
| | | | U.S. Treasury Bills | | | | |
| $ | 1,092 | | | 0.009%—08/06/201511 | | $ | 1,092 | |
| | 2,927 | | | 0.015%—07/16/2015-07/30/201511 | | | 2,927 | |
| | 261 | | | 0.016%—06/04/201511 | | | 261 | |
| | 1,446 | | | 0.020%—07/23/201511 | | | 1,446 | |
| | 424 | | | 0.025%—06/11/201511 | | | 424 | |
| | 248 | | | 0.028%—06/25/201511 | | | 248 | |
| | 1,844 | | | 0.036%—09/17/201511 | | | 1,843 | |
| | 281 | | | 0.061%—05/21/201511 | | | 281 | |
| | 371 | | | 0.070%—05/07/201511 | | | 371 | |
| | | | | | | | |
| | | | | | | 8,893 | |
| | | | | | | | |
| TOTAL SHORT-TERM INVESTMENTS
(Cost $106,672) | | | 106,672 | |
| | | | | | | | |
| TOTAL INVESTMENTS—115.0%
(Cost $4,122,901) | | | 4,221,473 | |
| | | | | | | | |
| | CASH AND OTHER ASSETS, LESS LIABILITIES—(15.0)% | | | (550,872 | ) |
| | | | | | | | |
| | TOTAL NET ASSETS—100.0% | | $ | 3,670,601 | |
| | | | | | | | |
| | | | | | | | | | | | | | | | |
| FUTURES CONTRACTS OPEN AT APRIL 30, 2015 | |
| | | | |
Description | | Number of
Contracts | | | Aggregate
Face Value
(000s) | | | Expiration Date | | | Unrealized
Appreciation/
(Depreciation)
(000s) | |
Canadian Government Bond Futures 10 year (Sell) | | | 302 | | | CAD$ | 30,200 | | | | 06/19/2015 | | | $ | 445 | |
Euro-Bund Futures 10 year (Buy) | | | 962 | | | € | 96,200 | | | | 06/08/2015 | | | | (1,301 | ) |
German Government Bond Futures 30 year (Buy) | | | 18 | | | | 1,800 | | | | 06/08/2015 | | | | (62 | ) |
United Kingdom Pound Sterling Interest Rate Futures 90 day (Sell) | | | 776 | | | £ | 97,000 | | | | 03/16/2016 | | | | 143 | |
United Kingdom Pound Sterling Interest Rate Futures 90 day (Sell) | | | 699 | | | | 87,375 | | | | 06/15/2016 | | | | (198 | ) |
Eurodollar Futures-CME 90 day (Sell) | | | 2,822 | | | $ | 705,500 | | | | 12/14/2015 | | | | (1,456 | ) |
Eurodollar Futures-CME 90 day (Sell) | | | 2,112 | | | | 528,000 | | | | 03/14/2016 | | | | (1,058 | ) |
Eurodollar Futures-CME 90 day (Sell) | | | 3,246 | | | | 811,500 | | | | 06/13/2016 | | | | 197 | |
Eurodollar Futures-CME 90 day (Sell) | | | 958 | | | | 239,500 | | | | 09/19/2016 | | | | (323 | ) |
U.S. Treasury Bond Futures 30 year (Buy) | | | 308 | | | | 30,800 | | | | 06/19/2015 | | | | (907 | ) |
U.S. Treasury Note Futures 5 year (Buy) | | | 393 | | | | 39,300 | | | | 06/30/2015 | | | | 552 | |
U.S. Treasury Note Futures 10 year (Buy) | | | 7,197 | | | | 719,700 | | | | 06/19/2015 | | | | 750 | |
| | | | | | | | | | | | | | | | |
Total Futures Contracts | | | $ | (3,218 | ) |
| | | | | | | | | | | | | | | | |
| | | | | | | | | | | | | | | | | | | | | | |
| WRITTEN OPTIONS OPEN AT APRIL 30, 2015 | |
|
| WRITTEN OPTIONS THAT REQUIRE PERIODIC SETTLEMENT OF VARIATION MARGIN | |
| | | | | | |
Description | | Counterparty | | Number of
Contracts | | | Strike
Price | | | Expiration Date | | | Premiums
Received
(000s) | | | Value
(000s) | |
Euro-Bund Futures (Call) | | CME Group | | | 152 | | | $ | 158.50 | | | | 05/22/2015 | | | $ | 70 | | | $ | (27 | ) |
Euro-Bund Futures (Call) | | CME Group | | | 417 | | | | 159.50 | | | | 05/22/2015 | | | | 207 | | | | (28 | ) |
Euro-Bund Futures (Call) | | CME Group | | | 416 | | | | 160.00 | | | | 05/22/2015 | | | | 196 | | | | (19 | ) |
Euro-Bund Futures (Put) | | CME Group | | | 416 | | | | 154.00 | | | | 05/22/2015 | | | | 88 | | | | (70 | ) |
Euro-Bund Futures (Put) | | CME Group | | | 28 | | | | 155.00 | | | | 05/22/2015 | | | | 9 | | | | (9 | ) |
Euro-Bund Futures (Put) | | CME Group | | | 147 | | | | 157.00 | | | | 05/22/2015 | | | | 48 | | | | (152 | ) |
| | | | | | | | | | | | | | | | | | | | | | |
Total Written Options that Require Periodic Settlement of Variation Margin | | | $ | 618 | | | $ | (305 | ) |
| | | | | | | | | | | | | | | | | | | | | | |
33
Harbor Bond Fund
PORTFOLIO OF INVESTMENTS—Continued
| | | | | | | | | | | | | | | | | | | | | | |
| WRITTEN OPTIONS—Continued | |
|
| WRITTEN OPTIONS NOT SETTLED THROUGH VARIATION MARGIN | |
| | | | | | |
Description | | Counterparty | | Number of
Contracts | | | Strike
Index/Rate/Price | | | Expiration Date | | | Premiums
Received
(000s) | | | Value
(000s) | |
Inflation-Linked Swap Option 10 year (Put) | | Citibank NA | | | 14,100,000 | | | | 215.950 | j | | | 03/12/2020 | | | $ | 119 | | | $ | (7 | ) |
Inflation-Linked Swap Option 10 year (Put) | | Citibank NA | | | 33,900,000 | | | | 216.69 | j | | | 04/07/2020 | | | | 302 | | | | (18 | ) |
Inflation-Linked Swap Option 10 year (Put) | | Citibank NA | | | 15,100,000 | | | | 217.97 | j | | | 09/29/2020 | | | | 195 | | | | (9 | ) |
Inflation-Linked Swap Option 10 year (Put) | | Deutsche Bank AG | | | 5,100,000 | | | | 215.95 | j | | | 03/10/2020 | | | | 38 | | | | (3 | ) |
Inflation-Linked Swap Option 10 year (Put) | | Deutsche Bank AG | | | 15,600,000 | | | | 218.01 | j | | | 10/13/2020 | | | | 153 | | | | (9 | ) |
Interest Rate Swap Option 1 year (Call) | | Morgan Stanley Capital Services LLC | | | 81,500,000 | | | | 0.500 | % | | | 01/19/2016 | | | | 49 | | | | (25 | ) |
Interest Rate Swap Option 1 year (Call) | | Morgan Stanley Capital Services LLC | | | 40,900,000 | | | | 0.520 | | | | 01/19/2016 | | | | 25 | | | | (14 | ) |
Interest Rate Swap Option 1 year (Call) | | Morgan Stanley Capital Services LLC | | | 81,500,000 | | | | 0.650 | | | | 01/19/2016 | | | | 90 | | | | (53 | ) |
Interest Rate Swap Option 1 year (Call) | | Morgan Stanley Capital Services LLC | | | 40,900,000 | | | | 0.660 | | | | 01/19/2016 | | | | 41 | | | | (28 | ) |
Interest Rate Swap Option 2 year (Call) | | Goldman Sachs Bank USA | | | 41,700,000 | | | | 0.700 | | | | 01/19/2016 | | | | 63 | | | | (31 | ) |
Interest Rate Swap Option 2 year (Call) | | Goldman Sachs Bank USA | | | 41,700,000 | | | | 0.900 | | | | 01/19/2016 | | | | 113 | | | | (65 | ) |
Interest Rate Swap Option 2 year (Put) | | Goldman Sachs Bank USA | | | 20,500,000 | | | | 2.800 | | | | 01/16/2018 | | | | 256 | | | | (152 | ) |
Interest Rate Swap Option 2 year (Call) | | JP Morgan Chase Bank NA | | | 40,700,000 | | | | 1.100 | | | | 01/30/2018 | | | | 212 | | | | (147 | ) |
Interest Rate Swap Option 2 year (Call) | | JP Morgan Chase Bank NA | | | 40,700,000 | | | | 1.600 | | | | 01/30/2018 | | | | 368 | | | | (269 | ) |
Interest Rate Swap Option 3 year (Call) | | Goldman Sachs Bank USA | | | 41,800,000 | | | | 0.850 | | | | 07/20/2015 | | | | 71 | | | | (14 | ) |
Interest Rate Swap Option 3 year (Call) | | Goldman Sachs Bank USA | | | 41,800,000 | | | | 1.000 | | | | 07/20/2015 | | | | 125 | | | | (39 | ) |
Interest Rate Swap Option 5 year (Call) | | Morgan Stanley Capital Services LLC | | | 20,500,000 | | | | 1.100 | | | | 01/29/2016 | | | | 78 | | | | (45 | ) |
Interest Rate Swap Option 5 year (Call) | | Morgan Stanley Capital Services LLC | | | 20,500,000 | | | | 1.300 | | | | 01/29/2016 | | | | 119 | | | | (77 | ) |
Interest Rate Swap Option 5 year (Put) | | Morgan Stanley Capital Services LLC | | | 136,100,000 | | | | 2.520 | | | | 09/18/2015 | | | | 1,191 | | | | (124 | ) |
Interest Rate Swap Option 5 year (Put) | | Morgan Stanley Capital Services LLC | | | 56,600,000 | | | | 2.600 | | | | 09/14/2015 | | | | 743 | | | | (34 | ) |
Interest Rate Swap Option 10 year (Call) | | Citibank NA | | | 10,100,000 | | | | 1.430 | | | | 07/30/2015 | | | | 60 | | | | (9 | ) |
Interest Rate Swap Option 10 year (Call) | | Citibank NA | | | 10,100,000 | | | | 1.590 | | | | 07/30/2015 | | | | 94 | | | | (17 | ) |
Interest Rate Swap Option 10 year (Call) | | Morgan Stanley Capital Services LLC | | | 20,500,000 | | | | 1.330 | | | | 01/29/2016 | | | | 130 | | | | (59 | ) |
Interest Rate Swap Option 10 year (Call) | | Morgan Stanley Capital Services LLC | | | 20,500,000 | | | | 1.540 | | | | 01/29/2016 | | | | 205 | | | | (102 | ) |
Currency Option U.S. Dollar vs. Brazilian Real (Put) | | Deutsche Bank AG | | | 1,500,000 | | | $ | 3.02 | | | | 05/22/2015 | | | | 15 | | | | (30 | ) |
Currency Option U.S. Dollar vs. Brazilian Real (Put) | | Deutsche Bank AG | | | 4,500,000 | | | | 3.05 | | | | 05/04/2015 | | | | 42 | | | | (83 | ) |
Currency Option U.S. Dollar vs. Brazilian Real (Put) | | Deutsche Bank AG | | | 6,400,000 | | | | 3.08 | | | | 05/27/2015 | | | | 74 | | | | (208 | ) |
Currency Option U.S. Dollar vs. Brazilian Real (Put) | | HSBC Bank USA NA | | | 11,200,000 | | | | 3.08 | | | | 05/14/2015 | | | | 125 | | | | (328 | ) |
Currency Option U.S. Dollar vs. Indian Rupee (Call) | | JP Morgan Chase Bank NA | | | 4,600,000 | | | | 65.00 | | | | 07/15/2015 | | | | 40 | | | | (55 | ) |
Currency Option U.S. Dollar vs. Indian Rupee (Call) | | JP Morgan Chase Bank NA | | | 4,600,000 | | | | 65.00 | | | | 06/05/2015 | | | | 23 | | | | (23 | ) |
Currency Option U.S. Dollar vs. Indian Rupee (Call) | | JP Morgan Chase Bank NA | | | 12,800,000 | | | | 65.90 | | | | 05/12/2015 | | | | 105 | | | | (4 | ) |
Currency Option U.S. Dollar vs. Indian Rupee (Put) | | JP Morgan Chase Bank NA | | | 4,600,000 | | | | 61.50 | | | | 07/15/2015 | | | | 24 | | | | (5 | ) |
Currency Option U.S. Dollar vs. Indian Rupee (Put) | | JP Morgan Chase Bank NA | | | 4,600,000 | | | | 62.00 | | | | 06/05/2015 | | | | 28 | | | | (3 | ) |
Currency Option U.S. Dollar vs. Israeli New Sheqel (Call) | | Citibank NA | | | 7,200,000 | | | | 4.00 | | | | 07/29/2015 | | | | 43 | | | | (51 | ) |
Currency Option U.S. Dollar vs. Israeli New Sheqel (Call) | | Citibank NA | | | 3,300,000 | | | | 4.07 | | | | 05/22/2015 | | | | 27 | | | | (1 | ) |
Currency Option U.S. Dollar vs. Israeli New Sheqel (Call) | | Citibank NA | | | 3,900,000 | | | | 4.10 | | | | 06/11/2015 | | | | 24 | | | | (4 | ) |
Currency Option U.S. Dollar vs. Israeli New Sheqel (Call) | | Citibank NA | | | 5,900,000 | | | | 4.17 | | | | 06/10/2015 | | | | 39 | | | | (3 | ) |
Currency Option U.S. Dollar vs. Israeli New Sheqel (Call) | | Deutsche Bank AG | | | 3,800,000 | | | | 4.00 | | | | 07/27/2015 | | | | 30 | | | | (26 | ) |
Currency Option U.S. Dollar vs. Israeli New Sheqel (Call) | | Deutsche Bank AG | | | 15,200,000 | | | | 4.12 | | | | 05/20/2015 | | | | 120 | | | | (2 | ) |
Currency Option U.S. Dollar vs. Israeli New Sheqel (Call) | | Deutsche Bank AG | | | 4,800,000 | | | | 4.15 | | | | 06/04/2015 | | | | 30 | | | | (2 | ) |
Currency Option U.S. Dollar vs. Israeli New Sheqel (Call) | | Goldman Sachs Bank USA | | | 6,200,000 | | | | 4.10 | | | | 05/15/2015 | | | | 43 | | | | (1 | ) |
Currency Option U.S. Dollar vs. Israeli New Sheqel (Call) | | Goldman Sachs Bank USA | | | 8,200,000 | | | | 4.16 | | | | 06/01/2015 | | | | 34 | | | | (2 | ) |
Currency Option U.S. Dollar vs. Israeli New Sheqel (Call) | | UBS AG Stamford | | | 4,000,000 | | | | 4.11 | | | | 05/14/2015 | | | | 32 | | | | — | |
Currency Option U.S. Dollar vs. Japanese Yen (Put) | | BNP Paribas SA | | | 25,700,000 | | | | 117.00 | | | | 07/02/2015 | | | | 149 | | | | (145 | ) |
Currency Option U.S. Dollar vs. Japanese Yen (Put) | | Citibank NA | | | 6,100,000 | | | | 99.00 | | | | 09/30/2015 | | | | 64 | | | | (1 | ) |
Currency Option U.S. Dollar vs. Japanese Yen (Put) | | Citibank NA | | | 3,500,000 | | | | 112.00 | | | | 05/15/2015 | | | | 60 | | | | — | |
Currency Option U.S. Dollar vs. Japanese Yen (Put) | | Deutsche Bank AG | | | 3,600,000 | | | | 112.50 | | | | 05/22/2015 | | | | 41 | | | | — | |
Currency Option U.S. Dollar vs. Japanese Yen (Put) | | Goldman Sachs Bank USA | | | 9,200,000 | | | | 113.50 | | | | 05/27/2015 | | | | 133 | | | | (2 | ) |
Currency Option U.S. Dollar vs. Japanese Yen (Put) | | JP Morgan Chase Bank NA | | | 9,000,000 | | | | 109.00 | | | | 11/10/2015 | | | | 172 | | | | (28 | ) |
Currency Option U.S. Dollar vs. Japanese Yen (Put) | | JP Morgan Chase Bank NA | | | 1,900,000 | | | | 112.00 | | | | 05/15/2015 | | | | 32 | | | | — | |
Currency Option U.S. Dollar vs. Japanese Yen (Put) | | Société Générale Paris | | | 9,500,000 | | | | 109.00 | | | | 11/19/2015 | | | | 162 | | | | (33 | ) |
Currency Option U.S. Dollar vs. Japanese Yen (Put) | | UBS AG Stamford | | | 4,300,000 | | | | 100.00 | | | | 07/03/2015 | | | | 30 | | | | — | |
Currency Option U.S. Dollar vs. Japanese Yen (Put) | | UBS AG Stamford | | | 5,300,000 | | | | 110.00 | | | | 05/12/2015 | | | | 62 | | | | — | |
U.S. Treasury Notes 10 year Future (Call) | | CME Group | | | 413 | | | | 128.50 | | | | 05/22/2015 | | | | 170 | | | | (170 | ) |
U.S. Treasury Notes 10 year Future (Call) | | CME Group | | | 206 | | | | 129.00 | | | | 05/22/2015 | | | | 70 | | | | (70 | ) |
U.S. Treasury Notes 10 year Future (Call) | | CME Group | | | 406 | | | | 130.00 | | | | 05/22/2015 | | | | 174 | | | | (44 | ) |
U.S. Treasury Notes 10 year Future (Put) | | CME Group | | | 72 | | | | 127.50 | | | | 05/22/2015 | | | | 28 | | | | (21 | ) |
U.S. Treasury Notes 10 year Future (Put) | | CME Group | | | 165 | | | | 128.00 | | | | 05/22/2015 | | | | 85 | | | | (75 | ) |
| | | | | | | | | | | | | | | | | | | | | | |
Total Written Options Not Settled Through Variation Margin | | | $ | 7,170 | | | $ | (2,770 | ) |
| | | | | | | | | | | | | | | | | | | | | | |
Total Written Options | | | $ | 7,788 | | | $ | (3,075 | ) |
| | | | | | | | | | | | | | | | | | | | | | |
34
Harbor Bond Fund
PORTFOLIO OF INVESTMENTS—Continued
| | | | | | | | | | | | | | | | | | |
| FORWARD CURRENCY CONTRACTS OPEN AT APRIL 30, 2015 | |
| | | | | |
Currency | | Counterparty | | Value
(000s) | | | Aggregate
Face Value
(000s) | | | Delivery Date | | | Unrealized
Appreciation/
(Depreciation)
(000s) | |
Australian Dollar (Buy) | | Goldman Sachs Bank USA | | $ | 19,571 | | | $ | 19,341 | | | | 05/06/2015 | | | $ | 230 | |
Australian Dollar (Sell) | | Citibank NA | | | 7,440 | | | | 7,336 | | | | 05/06/2015 | | | | (104 | ) |
Australian Dollar (Sell) | | Credit Suisse International | | | 1,357 | | | | 1,305 | | | | 05/06/2015 | | | | (52 | ) |
Australian Dollar (Sell) | | Goldman Sachs Bank USA | | | 14,408 | | | | 14,178 | | | | 05/06/2015 | | | | (230 | ) |
Australian Dollar (Sell) | | Goldman Sachs Bank USA | | | 19,542 | | | | 19,312 | | | | 06/02/2015 | | | | (230 | ) |
Brazilian Real (Buy) | | Barclays Capital | | | 2,355 | | | | 2,374 | | | | 05/05/2015 | | | | (19 | ) |
Brazilian Real (Buy) | | BNP Paribas SA | | | 5,373 | | | | 5,554 | | | | 05/05/2015 | | | | (181 | ) |
Brazilian Real (Buy) | | Credit Suisse International | | | 1,343 | | | | 1,379 | | | | 05/04/2015 | | | | (36 | ) |
Brazilian Real (Buy) | | Credit Suisse International | | | 3,310 | | | | 3,100 | | | | 05/05/2015 | | | | 210 | |
Brazilian Real (Buy) | | Deutsche Bank AG | | | 23,936 | | | | 24,168 | | | | 05/05/2015 | | | | (232 | ) |
Brazilian Real (Buy) | | Deutsche Bank AG | | | 1,676 | | | | 1,590 | | | | 05/05/2015 | | | | 86 | |
Brazilian Real (Buy) | | Deutsche Bank AG | | | 24,143 | | | | 23,504 | | | | 06/02/2015 | | | | 639 | |
Brazilian Real (Buy) | | Goldman Sachs Bank USA | | | 2,748 | | | | 2,771 | | | | 05/05/2015 | | | | (23 | ) |
Brazilian Real (Buy) | | Goldman Sachs Bank USA | | | 1,392 | | | | 1,340 | | | | 05/05/2015 | | | | 52 | |
Brazilian Real (Buy) | | HSBC Bank USA | | | 1,297 | | | | 1,308 | | | | 05/05/2015 | | | | (11 | ) |
Brazilian Real (Buy) | | JP Morgan Chase Bank | | | 24,388 | | | | 22,705 | | | | 05/05/2015 | | | | 1,683 | |
Brazilian Real (Buy) | | JP Morgan Chase Bank | | | 426 | | | | 480 | | | | 01/03/2018 | | | | (54 | ) |
Brazilian Real (Sell) | | Barclays Capital | | | 2,354 | | | | 2,208 | | | | 05/05/2015 | | | | (146 | ) |
Brazilian Real (Sell) | | BNP Paribas SA | | | 4,031 | | | | 3,822 | | | | 05/05/2015 | | | | (209 | ) |
Brazilian Real (Sell) | | BNP Paribas SA | | | 1,342 | | | | 1,353 | | | | 05/05/2015 | | | | 11 | |
Brazilian Real (Sell) | | BNP Paribas SA | | | 311 | | | | 396 | | | | 07/02/2015 | | | | 85 | |
Brazilian Real (Sell) | | BNP Paribas SA | | | 25,234 | | | | 31,936 | | | | 10/02/2015 | | | | 6,702 | |
Brazilian Real (Sell) | | BNP Paribas SA | | | 17,477 | | | | 22,140 | | | | 01/05/2016 | | | | 4,663 | |
Brazilian Real (Sell) | | BNP Paribas SA | | | 427 | | | | 484 | | | | 01/03/2018 | | | | 57 | |
Brazilian Real (Sell) | | Credit Suisse International | | | 1,342 | | | | 1,300 | | | | 05/04/2015 | | | | (42 | ) |
Brazilian Real (Sell) | | Credit Suisse International | | | 3,311 | | | | 3,338 | | | | 05/05/2015 | | | | 27 | |
Brazilian Real (Sell) | | Deutsche Bank AG | | | 24,382 | | | | 23,716 | | | | 05/05/2015 | | | | (666 | ) |
Brazilian Real (Sell) | | Deutsche Bank AG | | | 1,230 | | | | 1,264 | | | | 05/05/2015 | | | | 34 | |
Brazilian Real (Sell) | | Deutsche Bank AG | | | 13,950 | | | | 16,277 | | | | 07/02/2015 | | | | 2,327 | |
Brazilian Real (Sell) | | Goldman Sachs Bank USA | | | 4,140 | | | | 4,290 | | | | 05/05/2015 | | | | 150 | |
Brazilian Real (Sell) | | Goldman Sachs Bank USA | | | 14,299 | | | | 18,168 | | | | 07/02/2015 | | | | 3,869 | |
Brazilian Real (Sell) | | HSBC Bank USA | | | 1,298 | | | | 1,344 | | | | 05/05/2015 | | | | 46 | |
Brazilian Real (Sell) | | HSBC Bank USA | | | 55,591 | | | | 53,598 | | | | 01/05/2016 | | | | (1,993 | ) |
Brazilian Real (Sell) | | JP Morgan Chase Bank | | | 24,388 | | | | 24,589 | | | | 05/05/2015 | | | | 201 | |
Brazilian Real (Sell) | | JP Morgan Chase Bank | | | 6,255 | | | | 6,025 | | | | 01/05/2016 | | | | (230 | ) |
Brazilian Real (Sell) | | JP Morgan Chase Bank | | | 9,352 | | | | 10,548 | | | | 01/05/2016 | | | | 1,196 | |
Brazilian Real (Sell) | | UBS AG | | | 21,764 | | | | 27,700 | | | | 10/02/2015 | | | | 5,936 | |
British Pound Sterling (Buy) | | Deutsche Bank AG | | | 32,714 | | | | 32,636 | | | | 05/06/2015 | | | | 78 | |
British Pound Sterling (Sell) | | Deutsche Bank AG | | | 32,707 | | | | 32,630 | | | | 06/02/2015 | | | | (77 | ) |
British Pound Sterling (Sell) | | Goldman Sachs Bank USA | | | 32,714 | | | | 31,646 | | | | 05/06/2015 | | | | (1,068 | ) |
Canadian Dollar (Buy) | | Citibank NA | | | 53,843 | | | | 54,175 | | | | 05/06/2015 | | | | (332 | ) |
Canadian Dollar (Sell) | | Citibank NA | | | 53,824 | | | | 54,156 | | | | 06/02/2015 | | | | 332 | |
Canadian Dollar (Sell) | | Société Générale | | | 53,843 | | | | 51,879 | | | | 05/06/2015 | | | | (1,964 | ) |
Euro Currency (Buy) | | Barclays Bank plc | | | 5,752 | | | | 6,841 | | | | 06/15/2015 | | | | (1,089 | ) |
Euro Currency (Buy) | | BNP Paribas SA | | | 9,104 | | | | 10,862 | | | | 06/15/2015 | | | | (1,758 | ) |
Euro Currency (Buy) | | Citibank NA | | | 283,771 | | | | 273,904 | | | | 05/06/2015 | | | | 9,867 | |
Euro Currency (Buy) | | Deutsche Bank AG | | | 17,655 | | | | 17,252 | | | | 06/02/2015 | | | | 403 | |
Euro Currency (Buy) | | Deutsche Bank AG | | | 4,199 | | | | 4,860 | | | | 06/15/2015 | | | | (661 | ) |
Euro Currency (Buy) | | Deutsche Bank AG | | | 14,316 | | | | 17,075 | | | | 06/13/2016 | | | | (2,759 | ) |
Euro Currency (Buy) | | Goldman Sachs Bank USA | | | 24,387 | | | | 23,259 | | | | 05/06/2015 | | | | 1,128 | |
Euro Currency (Buy) | | Goldman Sachs Bank USA | | | 17,113 | | | | 20,375 | | | | 06/15/2015 | | | | (3,262 | ) |
Euro Currency (Buy) | | JP Morgan Chase Bank NA | | | 5,411 | | | | 5,194 | | | | 05/06/2015 | | | | 217 | |
Euro Currency (Buy) | | JP Morgan Chase Bank NA | | | 31,930 | | | | 31,448 | | | | 06/02/2015 | | | | 482 | |
Euro Currency (Buy) | | JP Morgan Chase Bank NA | | | 9,686 | | | | 11,527 | | | | 06/15/2015 | | | | (1,841 | ) |
Euro Currency (Buy) | | Société Générale | | | 17,801 | | | | 21,229 | | | | 06/15/2015 | | | | (3,428 | ) |
Euro Currency (Buy) | | UBS AG | | | 24,706 | | | | 23,628 | | | | 05/06/2015 | | | | 1,078 | |
Euro Currency (Buy) | | UBS AG | | | 2,381 | | | | 2,793 | | | | 06/15/2015 | | | | (412 | ) |
Euro Currency (Sell) | | Barclays Bank plc | | | 18,680 | | | | 22,588 | | | | 06/15/2015 | | | | 3,908 | |
Euro Currency (Sell) | | Barclays Bank plc | | | 22,260 | | | | 26,995 | | | | 06/27/2016 | | | | 4,735 | |
Euro Currency (Sell) | | BNP Paribas SA | | | 1,635 | | | | 1,601 | | | | 05/06/2015 | | | | (34 | ) |
Euro Currency (Sell) | | BNP Paribas SA | | | 13,910 | | | | 16,790 | | | | 06/15/2015 | | | | 2,880 | |
Euro Currency (Sell) | | Citibank NA | | | 19,439 | | | | 18,720 | | | | 05/06/2015 | | | | (719 | ) |
Euro Currency (Sell) | | Citibank NA | | | 280,964 | | | | 271,216 | | | | 06/02/2015 | | | | (9,748 | ) |
Euro Currency (Sell) | | Citibank NA | | | 24,813 | | | | 30,190 | | | | 06/15/2015 | | | | 5,377 | |
Euro Currency (Sell) | | Credit Suisse International | | | 26,649 | | | | 32,194 | | | | 06/15/2015 | | | | 5,545 | |
Euro Currency (Sell) | | Deutsche Bank AG | | | 9,981 | | | | 9,609 | | | | 05/06/2015 | | | | (372 | ) |
35
Harbor Bond Fund
PORTFOLIO OF INVESTMENTS—Continued
| | | | | | | | | | | | | | | | | | |
| FORWARD CURRENCY CONTRACTS—Continued | |
| | | | | |
Currency | | Counterparty | | Value
(000s) | | | Aggregate
Face Value
(000s) | | | Delivery Date | | | Unrealized
Appreciation/
(Depreciation)
(000s) | |
Euro Currency (Sell) | | Deutsche Bank AG | | $ | 11,243 | | | $ | 13,394 | | | | 08/07/2015 | | | $ | 2,151 | |
Euro Currency (Sell) | | Deutsche Bank AG | | | 2,031 | | | | 2,422 | | | | 02/01/2016 | | | | 391 | |
Euro Currency (Sell) | | Deutsche Bank AG | | | 28,597 | | | | 34,552 | | | | 06/13/2016 | | | | 5,955 | |
Euro Currency (Sell) | | UBS AG | | | 307,221 | | | | 300,663 | | | | 05/06/2015 | | | | (6,558 | ) |
Indian Rupee (Buy) | | Citibank NA | | | 5,856 | | | | 5,963 | | | | 06/26/2015 | | | | (107 | ) |
Indian Rupee (Buy) | | Goldman Sachs Bank USA | | | 9,269 | | | | 9,423 | | | | 06/26/2015 | | | | (154 | ) |
Indian Rupee (Buy) | | HSBC Bank USA | | | 4,847 | | | | 4,908 | | | | 06/26/2015 | | | | (61 | ) |
Indian Rupee (Sell) | | UBS AG | | | 6,243 | | | | 6,313 | | | | 06/26/2015 | | | | 70 | |
Japanese Yen (Buy) | | Goldman Sachs Bank USA | | | 15,793 | | | | 15,856 | | | | 05/08/2015 | | | | (63 | ) |
Japanese Yen (Buy) | | JP Morgan Chase Bank NA | | | 110,893 | | | | 111,278 | | | | 05/08/2015 | | | | (385 | ) |
Japanese Yen (Buy) | | JP Morgan Chase Bank NA | | | 3,887 | | | | 3,870 | | | | 05/08/2015 | | | | 17 | |
Japanese Yen (Buy) | | JP Morgan Chase Bank NA | | | 28,711 | | | | 28,821 | | | | 06/03/2015 | | | | (110 | ) |
Japanese Yen (Buy) | | UBS AG | | | 11,885 | | | | 11,844 | | | | 05/08/2015 | | | | 41 | |
Japanese Yen (Sell) | | Credit Suisse International | | | 142,458 | | | | 142,281 | | | | 05/08/2015 | | | | (177 | ) |
Japanese Yen (Sell) | | HSBC Bank USA | | | 15,996 | | | | 18,707 | | | | 08/07/2015 | | | | 2,711 | |
Japanese Yen (Sell) | | JP Morgan Chase Bank NA | | | 110,923 | | | | 111,305 | | | | 06/03/2015 | | | | 382 | |
Mexican Peso (Buy) | | Barclays Bank plc | | | 4,729 | | | | 4,813 | | | | 05/05/2015 | | | | (84 | ) |
Mexican Peso (Buy) | | BNP Paribas SA | | | 15,319 | | | | 15,685 | | | | 05/05/2015 | | | | (366 | ) |
Mexican Peso (Buy) | | BNP Paribas SA | | | 21,381 | | | | 21,257 | | | | 07/07/2015 | | | | 124 | |
Mexican Peso (Buy) | | Citibank NA | | | 5,570 | | | | 5,777 | | | | 05/05/2015 | | | | (207 | ) |
Mexican Peso (Buy) | | Citibank NA | | | 2,083 | | | | 2,080 | | | | 05/05/2015 | | | | 3 | |
Mexican Peso (Buy) | | Credit Suisse International | | | 6,947 | | | | 7,078 | | | | 05/05/2015 | | | | (131 | ) |
Mexican Peso (Buy) | | Deutsche Bank AG | | | 1,713 | | | | 1,747 | | | | 05/05/2015 | | | | (34 | ) |
Mexican Peso (Buy) | | Goldman Sachs Bank USA | | | 3,244 | | | | 3,342 | | | | 05/05/2015 | | | | (98 | ) |
Mexican Peso (Buy) | | HSBC Bank USA | | | 4,892 | | | | 4,997 | | | | 05/05/2015 | | | | (105 | ) |
Mexican Peso (Buy) | | HSBC Bank USA | | | 1,358 | | | | 1,336 | | | | 05/05/2015 | | | | 22 | |
Mexican Peso (Buy) | | JP Morgan Chase Bank NA | | | 434 | | | | 453 | | | | 05/05/2015 | | | | (19 | ) |
Mexican Peso (Buy) | | UBS AG | | | 3,322 | | | | 3,474 | | | | 05/05/2015 | | | | (152 | ) |
Mexican Peso (Buy) | | Westpac Banking Corp. | | | 4,415 | | | | 4,530 | | | | 05/05/2015 | | | | (115 | ) |
Mexican Peso (Sell) | | BNP Paribas SA | | | 21,478 | | | | 21,353 | | | | 05/05/2015 | | | | (125 | ) |
Mexican Peso (Sell) | | BNP Paribas SA | | | 21,624 | | | | 21,996 | | | | 05/05/2015 | | | | 372 | |
Mexican Peso (Sell) | | BNP Paribas SA | | | 6,497 | | | | 6,452 | | | | 06/11/2015 | | | | (45 | ) |
Mexican Peso (Sell) | | Citibank NA | | | 2,958 | | | | 3,024 | | | | 05/05/2015 | | | | 66 | |
Mexican Peso (Sell) | | Deutsche Bank AG | | | 37,053 | | | | 37,267 | | | | 06/11/2015 | | | | 214 | |
Mexican Peso (Sell) | | Goldman Sachs Bank USA | | | 3,890 | | | | 3,925 | | | | 05/05/2015 | | | | 35 | |
Mexican Peso (Sell) | | HSBC Bank USA | | | 4,076 | | | | 4,203 | | | | 05/05/2015 | | | | 127 | |
New Israeli Sheqel (Buy) | | BNP Paribas SA | | | 234 | | | | 229 | | | | 06/11/2015 | | | | 5 | |
New Israeli Sheqel (Sell) | | Barclays Bank plc | | | 58,785 | | | | 56,922 | | | | 06/11/2015 | | | | (1,863 | ) |
New Israeli Sheqel (Sell) | | Goldman Sachs Bank USA | | | 17,177 | | | | 16,847 | | | | 06/11/2015 | | | | (330 | ) |
Swiss Franc (Sell) | | Deutsche Bank AG | | | 739 | | | | 747 | | | | 05/12/2015 | | | | 8 | |
| | | | | | | | | | | | | | | | | | |
Total Forward Currency Contracts | | | $ | 31,657 | |
| | | | | | | | | | | | | | | | | | |
| | | | | | | | | | | | | | | | | | | | |
| SWAP AGREEMENTS OPEN AT APRIL 30, 2015 | |
|
CENTRALLY CLEARED SWAP AGREEMENTS INTEREST RATE SWAPS | |
| | | | | | |
Counterparty | | Floating Rate Index | | Pay/Receive
Floating Rate | | Fixed Rate | | | Expiration Date | | | Notional
Amount
(000s) | | | Unrealized
Appreciation/
(Depreciation)
(000s) | |
CME Group | | Canada Bankers Acceptances-CDOR 3-Month | | Pay | | | 2.700 | % | | | 12/19/2024 | | | CAD$ | 6,500 | | | $ | 76 | |
CME Group | | British Bankers’ Association LIBOR GBP 6-Month | | Pay | | | 1.500 | | | | 09/18/2016 | | | £ | 3,000 | | | | 2 | |
CME Group | | British Bankers’ Association LIBOR GBP 6-Month | | Pay | | | 1.590 | | | | 10/05/2016 | | | | 102,700 | | | | (1,008 | ) |
CME Group | | British Bankers’ Association LIBOR GBP 6-Month | | Pay | | | 1.510 | | | | 10/07/2016 | | | | 14,400 | | | | 10 | |
CME Group | | British Bankers’ Association LIBOR GBP 6-Month | | Pay | | | 1.500 | | | | 09/16/2017 | | | | 94,200 | | | | 128 | |
CME Group | | British Bankers’ Association LIBOR GBP 6-Month | | Pay | | | 1.880 | | | | 10/05/2017 | | | | 40,400 | | | | 150 | |
CME Group | | British Bankers’ Association LIBOR GBP 6-Month | | Pay | | | 1.500 | | | | 12/16/2017 | | | | 87,100 | | | | (370 | ) |
CME Group | | Mexico Interbank TIIE 28 Day | | Pay | | | 3.420 | | | | 06/05/2015 | | | MEX$ | 671,000 | | | | (8 | ) |
CME Group | | Mexico Interbank TIIE 28 Day | | Pay | | | 3.540 | | | | 08/31/2015 | | | | 494,000 | | | | (9 | ) |
CME Group | | Mexico Interbank TIIE 28 Day | | Pay | | | 3.610 | | | | 12/18/2015 | | | | 619,000 | | | | (23 | ) |
CME Group | | Mexico Interbank TIIE 28 Day | | Pay | | | 3.960 | | | | 05/16/2016 | | | | 694,400 | | | | 68 | |
CME Group | | Mexico Interbank TIIE 28 Day | | Pay | | | 5.700 | | | | 01/18/2019 | | | | 144,000 | | | | (30 | ) |
CME Group | | Mexico Interbank TIIE 28 Day | | Pay | | | 5.010 | | | | 10/10/2019 | | | | 41,000 | | | | (50 | ) |
CME Group | | Mexico Interbank TIIE 28 Day | | Pay | | | 4.930 | | | | 01/13/2020 | | | | 97,700 | | | | (93 | ) |
36
Harbor Bond Fund
PORTFOLIO OF INVESTMENTS—Continued
| | | | | | | | | | | | | | | | | | | | |
| SWAP AGREEMENTS—Continued | |
|
CENTRALLY CLEARED SWAP AGREEMENTS—Continued INTEREST RATE SWAPS—Continued | |
| | | | | | |
Counterparty | | Floating Rate Index | | Pay/Receive
Floating Rate | | Fixed Rate | | | Expiration Date | | | Notional
Amount
(000s) | | | Unrealized
Appreciation/
(Depreciation)
(000s) | |
CME Group | | Mexico Interbank TIIE 28 Day | | Pay | | | 5.270 | % | | | 02/05/2020 | | | MEX$ | 853,800 | | | $ | 23 | |
CME Group | | Mexico Interbank TIIE 28 Day | | Pay | | | 6.350 | | | | 06/02/2021 | | | | 213,600 | | | | 86 | |
CME Group | | Mexico Interbank TIIE 28 Day | | Pay | | | 5.610 | | | | 07/07/2021 | | | | 30,800 | | | | (6 | ) |
CME Group | | Mexico Interbank TIIE 28 Day | | Pay | | | 5.840 | | | | 09/14/2021 | | | | 56,400 | | | | (14 | ) |
CME Group | | Mexico Interbank TIIE 28 Day | | Pay | | | 5.570 | | | | 10/08/2021 | | | | 108,200 | | | | (35 | ) |
CME Group | | Mexico Interbank TIIE 28 Day | | Pay | | | 5.430 | | | | 11/17/2021 | | | | 504,300 | | | | (453 | ) |
CME Group | | Mexico Interbank TIIE 28 Day | | Pay | | | 5.920 | | | | 12/08/2021 | | | | 26,400 | | | | 23 | |
CME Group | | Mexico Interbank TIIE 28 Day | | Pay | | | 5.800 | | | | 12/10/2021 | | | | 100 | | | | — | |
CME Group | | Mexico Interbank TIIE 28 Day | | Pay | | | 5.850 | | | | 12/21/2021 | | | | 80,700 | | | | (179 | ) |
CME Group | | Mexico Interbank TIIE 28 Day | | Pay | | | 5.380 | | | | 01/07/2022 | | | | 72,900 | | | | (154 | ) |
CME Group | | Mexico Interbank TIIE 28 Day | | Pay | | | 5.500 | | | | 09/02/2022 | | | | 57,300 | | | | 81 | |
CME Group | | Mexico Interbank TIIE 28 Day | | Pay | | | 6.710 | | | | 09/20/2029 | | | | 16,000 | | | | (63 | ) |
CME Group | | Mexico Interbank TIIE 28 Day | | Pay | | | 6.410 | | | | 11/07/2029 | | | | 238,000 | | | | 20 | |
CME Group | | Mexico Interbank TIIE 28 Day | | Pay | | | 6.840 | | | | 11/27/2029 | | | | 19,300 | | | | 59 | |
CME Group | | Mexico Interbank TIIE 28 Day | | Pay | | | 6.710 | | | | 11/30/2029 | | | | 195,000 | | | | 417 | |
CME Group | | Mexico Interbank TIIE 28 Day | | Pay | | | 6.620 | | | | 02/18/2030 | | | | 17,100 | | | | 25 | |
CME Group | | Mexico Interbank TIIE 28 Day | | Pay | | | 7.020 | | | | 06/08/2034 | | | | 107,100 | | | | (68 | ) |
CME Group | | British Bankers’ Association LIBOR USD 3-Month | | Pay | | | 0.670 | | | | 04/17/2016 | | | $ | 460,400 | | | | (1,040 | ) |
CME Group | | British Bankers’ Association LIBOR USD 3-Month | | Pay | | | 0.750 | | | | 06/17/2016 | | | | 217,000 | | | | (209 | ) |
CME Group | | British Bankers’ Association LIBOR USD 3-Month | | Pay | | | 1.050 | | | | 10/19/2016 | | | | 240,700 | | | | (605 | ) |
CME Group | | British Bankers’ Association LIBOR USD 3-Month | | Pay | | | 1.000 | | | | 04/17/2017 | | | | 535,700 | | | | (3,649 | ) |
CME Group | | British Bankers’ Association LIBOR USD 3-Month | | Pay | | | 1.250 | | | | 06/17/2017 | | | | 48,200 | | | | (114 | ) |
CME Group | | British Bankers’ Association LIBOR USD 3-Month | | Pay | | | 1.500 | | | | 09/16/2017 | | | | 125,900 | | | | (686 | ) |
CME Group | | British Bankers’ Association LIBOR USD 3-Month | | Pay | | | 1.780 | | | | 12/02/2019 | | | | 33,900 | | | | (451 | ) |
CME Group | | British Bankers’ Association LIBOR USD 3-Month | | Pay | | | 1.750 | | | | 03/19/2020 | | | | 265,100 | | | | (4,467 | ) |
CME Group | | British Bankers’ Association LIBOR USD 3-Month | | Pay | | | 2.000 | | | | 06/15/2022 | | | | 204,000 | | | | (209 | ) |
CME Group | | British Bankers’ Association LIBOR USD 3-Month | | Pay | | | 4.250 | | | | 06/15/2041 | | | | 212,200 | | | | (8,748 | ) |
CME Group | | British Bankers’ Association LIBOR USD 3-Month | | Pay | | | 2.750 | | | | 06/19/2043 | | | | 21,700 | | | | (2,673 | ) |
CME Group | | British Bankers’ Association LIBOR USD 3-Month | | Pay | | | 2.500 | | | | 06/15/2045 | | | | 73,600 | | | | 2,166 | |
CME Group | | Federal Funds Effective Rate US | | Pay | | | 0.500 | | | | 06/17/2016 | | | | 46,600 | | | | (10 | ) |
| | | | | | | | | | | | | | | | | | | | |
Interest Rate Swaps | | | $ | (22,090 | ) |
| | | | | | | | | | | | | | | | | | | | |
| | | | | | | | | | | | | | | | | | | | | | | | | | | | | | | | |
|
CENTRALLY CLEARED SWAP AGREEMENTS CREDIT DEFAULT SWAPS | |
| | | | | | | | | |
Counterparty | | Reference Entity | | Buy/
Sellb,c | | Pay/Receive
Fixed Rate | | | Expiration
Date | | | Implied
Credit
Spreadd | | | Valuee
(000s) | | | Upfront
Premium
Paid/(Received)
(000s) | | | Notional
Amountf
(000s) | | | Unrealized
Appreciation/
(Depreciation)
(000s) | |
ICE Group | | iTraxx Europe
Series 23 Version 1
| | Buy | | | 1.000 | % | | | 06/20/2020 | | | | 0.601 | % | | $ | (667 | ) | | $ | (682 | ) | | € | 27,900 | | | $ | 15 | |
| | | | | | | | | | | | | | | | | | | | | | | | | | | | | | | | |
| | | | | | | | | | | | | | | | | | | | |
|
OVER-THE-COUNTER (OTC) SWAP AGREEMENTS INTEREST RATE SWAPS | |
| | | | | | |
Counterparty | | Floating Rate Index | | Pay/Receive
Floating Rate | | Fixed Rate | | | Expiration Date | | | Notional
Amount
(000s) | | | Unrealized
Appreciation/
(Depreciation)
(000s) | |
Morgan Stanley Capital Services LLC | | Brazil Cetip Interbank Deposit | | Pay | | | 11.500 | % | | | 01/04/2021 | | | R$ | 9,700 | | | $ | (115 | ) |
Bank of America NA | | Mexico Interbank TIIE 28 Day | | Pay | | | 6 920 | | | | 11/28/2029 | | | MEX$ | 300 | | | | 1 | |
Goldman Sachs Bank USA | | Mexico Interbank TIIE 28 Day | | Pay | | | 5.750 | | | | 06/05/2023 | | | | 15,300 | | | | 26 | |
| | | | | | | | | | | | | | | | | | | | |
Interest Rate Swaps | | | $ | (88 | ) |
| | | | | | | | | | | | | | | | | | | | |
| | | | | | | | | | | | | | | | | | | | | | | | | | | | | | | | |
|
OVER-THE-COUNTER (OTC) SWAP AGREEMENTS CREDIT DEFAULT SWAPS | |
| | | | | | | | | |
Counterparty | | Reference Entity | | Buy/
Sellb,c | | Pay/Receive
Fixed Rate | | | Expiration
Date | | | Implied
Credit
Spreadd | | | Valuee
(000s) | | | Upfront
Premium
Paid/(Received)
(000s) | | | Notional
Amountf
(000s) | | | Unrealized
Appreciation/
(Depreciation)
(000s) | |
BNP Paribas SA | | United States of America
4.880% due 08/15/2016 | | Sell | | | 0.250 | % | | | 03/20/2016 | | | | 0.076 | % | | $ | 33 | | | $ | (218 | ) | | € | 15,500 | | | $ | 251 | |
37
Harbor Bond Fund
PORTFOLIO OF INVESTMENTS—Continued
| | | | | | | | | | | | |
| SWAP AGREEMENTS—Continued |
| | | | | | | | | | | | | | | | | | | | | | | | | | | | | | | | |
|
OVER-THE-COUNTER (OTC) SWAP AGREEMENTS—Continued CREDIT DEFAULT SWAPS—Continued | |
| | | | | | | | | |
Counterparty | | Reference Entity | | Buy/
Sellb,c | | Pay/Receive
Fixed Rate | | | Expiration
Date | | | Implied
Credit
Spreadd | | | Valuee
(000s) | | | Upfront
Premium
Paid/(Received)
(000s) | | | Notional
Amountf
(000s) | | | Unrealized
Appreciation/
(Depreciation)
(000s) | |
UBS AG Stamford | | United States of America
4.880% due 08/15/2016 | | Sell | | | 0.250 | % | | | 09/20/2015 | | | | 0.076 | % | | $ | 19 | | | $ | (242 | ) | | € | 16,200 | | | $ | 261 | |
Deutsche Bank AG | | Berkshire Hathaway Inc.
1.900% due 01/31/2017 | | Sell | | | 1.000 | | | | 09/20/2016 | | | | 0.198 | | | | 30 | | | | 38 | | | $ | 2,400 | | | | (8 | ) |
Bank of America NA | | Federative Republic of Brazil
12.250% due 03/06/2030 | | Sell | | | 1.000 | | | | 09/20/2015 | | | | 0.750 | | | | 2 | | | | (6 | ) | | | 700 | | | | 8 | |
Barclays Bank plc | | Federative Republic of Brazil
12.250% due 03/06/2030 | | Sell | | | 1.000 | | | | 09/20/2015 | | | | 0.750 | | | | 6 | | | | (19 | ) | | | 2,300 | | | | 25 | |
Barclays Bank plc | | Federative Republic of Brazil
12.250% due 03/06/2030 | | Sell | | | 1.000 | | | | 03/20/2016 | | | | 0.910 | | | | 18 | | | | (47 | ) | | | 7,000 | | | | 65 | |
Citibank NA | | Federative Republic of Brazil
12.250% due 03/06/2030 | | Sell | | | 1.000 | | | | 09/20/2015 | | | | 0.750 | | | | 2 | | | | (16 | ) | | | 1,000 | | | | 18 | |
Citibank NA | | Federative Republic of Brazil
12.250% due 03/06/2030 | | Sell | | | 1.000 | | | | 06/20/2016 | | | | 1.001 | | | | 47 | | | | (81 | ) | | | 25,800 | | | | 128 | |
Deutsche Bank AG | | Federative Republic of Brazil
12.250% due 03/06/2030 | | Sell | | | 1.000 | | | | 06/20/2016 | | | | 1.001 | | | | 28 | | | | (44 | ) | | | 15,200 | | | | 72 | |
HSBC Bank USA NA | | Federative Republic of Brazil
12.250% due 03/06/2030 | | Sell | | | 1.000 | | | | 09/20/2015 | | | | 0.750 | | | | 8 | | | | (25 | ) | | | 3,300 | | | | 33 | |
JP Morgan Chase Bank NA | | Federative Republic of Brazil
12.250% due 03/06/2030 | | Sell | | | 1.000 | | | | 09/20/2015 | | | | 0.750 | | | | 8 | | | | (28 | ) | | | 3,300 | | | | 36 | |
UBS AG Stamford | | Federative Republic of Brazil
12.250% due 03/06/2030 | | Sell | | | 1.000 | | | | 09/20/2015 | | | | 0.750 | | | | 2 | | | | (5 | ) | | | 700 | | | | 7 | |
Deutsche Bank AG | | General Electric Capital Corp.
5.630% due 09/15/2017 | | Sell | | | 1.000 | | | | 09/20/2015 | | | | 0.094 | | | | 17 | | | | 44 | | | | 3,600 | | | | (27 | ) |
Deutsche Bank AG | | JP Morgan Chase & Co.
4.750% due 03/01/2015 | | Sell | | | 1.000 | | | | 09/20/2016 | | | | 0.254 | | | | 55 | | | | 62 | | | | 4,800 | | | | (7 | ) |
Deutsche Bank AG | | Morgan Stanley & Co. LLC
6.000% due 04/28/2015 | | Sell | | | 1.000 | | | | 09/20/2018 | | | | 0.559 | | | | 220 | | | | 185 | | | | 14,100 | | | | 35 | |
Barclays Bank plc | | People’s Republic of China
4.250% due 10/28/2014 | | Sell | | | 1.000 | | | | 12/20/2018 | | | | 0.624 | | | | 9 | | | | 6 | | | | 600 | | | | 3 | |
Citibank NA | | People’s Republic of China
4.250% due 10/28/2014 | | Sell | | | 1.000 | | | | 12/20/2018 | | | | 0.624 | | | | 25 | | | | 16 | | | | 1,700 | | | | 9 | |
Royal Bank of Scotland plc | | People’s Republic of China
4.750% due 10/29/2013 | | Sell | | | 1.000 | | | | 09/20/2016 | | | | 0.281 | | | | 5 | | | | 3 | | | | 400 | | | | 2 | |
Barclays Bank plc | | Petroleo Brasileiro SA Petrobras
8.380% due 12/10/2018 | | Sell | | | 1.000 | | | | 12/20/2019 | | | | 4.088 | | | | (360 | ) | | | (353 | ) | | | 2,900 | | | | (7 | ) |
BNP Paribas SA | | Petroleo Brasileiro SA Petrobras
8.380% due 12/10/2018 | | Sell | | | 1.000 | | | | 06/20/2018 | | | | 3.774 | | | | (72 | ) | | | (130 | ) | | | 900 | | | | 58 | |
BNP Paribas SA | | Petroleo Brasileiro SA Petrobras
8.380% due 12/10/2018 | | Sell | | | 1.000 | | | | 12/20/2019 | | | | 4.088 | | | | (75 | ) | | | (87 | ) | | | 600 | | | | 12 | |
Goldman Sachs International | | Petroleo Brasileiro SA Petrobras
8.380% due 12/10/2018 | | Sell | | | 1.000 | | | | 12/20/2019 | | | | 4.088 | | | | (211 | ) | | | (184 | ) | | | 1,700 | | | | (27 | ) |
HSBC Bank USA NA | | Petroleo Brasileiro SA Petrobras
8.380% due 12/10/2018 | | Sell | | | 1.000 | | | | 12/20/2019 | | | | 4.088 | | | | (124 | ) | | | (92 | ) | | | 1,000 | | | | (32 | ) |
HSBC Bank USA NA | | Petroleo Brasileiro SA Petrobras
8.380% due 12/10/2018 | | Sell | | | 1.000 | | | | 03/20/2020 | | | | 4.133 | | | | (26 | ) | | | (36 | ) | | | 200 | | | | 10 | |
JP Morgan Chase Bank NA | | Petroleo Brasileiro SA Petrobras
8.380% due 12/10/2018 | | Sell | | | 1.000 | | | | 12/20/2019 | | | | 4.088 | | | | (261 | ) | | | (237 | ) | | | 2,100 | | | | (24 | ) |
Morgan Stanley Capital Services LLC | | Petroleo Brasileiro SA Petrobras
8.380% due 12/10/2018 | | Sell | | | 1.000 | | | | 12/20/2019 | | | | 4.088 | | | | (310 | ) | | | (231 | ) | | | 2,500 | | | | (79 | ) |
Deutsche Bank AG | | Republic of Indonesia
6.750% due 03/10/2014 | | Sell | | | 1.000 | | | | 09/20/2015 | | | | 0.386 | | | | 4 | | | | (29 | ) | | | 1,200 | | | | 33 | |
Citibank NA | | Sprint Communications, Inc.
8.380% due 08/15/2017 | | Sell | | | 5.000 | | | | 12/20/2019 | | | | 3.813 | | | | 94 | | | | 87 | | | | 1,700 | | | | 7 | |
Goldman Sachs International | | Sprint Communications, Inc.
8.380% due 08/15/2017 | | Sell | | | 5.000 | | | | 12/20/2019 | | | | 3.813 | | | | 72 | | | | 70 | | | | 1,300 | | | | 2 | |
Deutsche Bank AG | | The Export-Import Bank of
China 4.880% due 07/21/2015 | | Sell | | | 1.000 | | | | 06/20/2017 | | | | 0.501 | | | | 6 | | | | (21 | ) | | | 500 | | | | 27 | |
JP Morgan Chase Bank NA | | The Goldman Sachs Group, Inc.
5.950% due 01/18/2018 | | Sell | | | 1.000 | | | | 06/20/2017 | | | | 0.416 | | | | 14 | | | | 15 | | | | 1,000 | | | | (1 | ) |
Citibank NA | | United Mexican States
7.500% due 04/08/2033 | | Sell | | | 1.000 | | | | 09/20/2015 | | | | 0.467 | | | | 5 | | | | (21 | ) | | | 1,600 | | | | 26 | |
Citibank NA | | United Mexican States
7.500% due 04/08/2033 | | Sell | | | 1.000 | | | | 06/20/2016 | | | | 0.573 | | | | 376 | | | | 10 | | | | 59,600 | | | | 366 | |
Deutsche Bank AG | | United Mexican States
7.500% due 04/08/2033 | | Sell | | | 1.000 | | | | 03/20/2016 | | | | 0.535 | | | | 78 | | | | (104 | ) | | | 14,100 | | | | 182 | |
38
Harbor Bond Fund
PORTFOLIO OF INVESTMENTS—Continued
| | | | | | | | | | | | |
| SWAP AGREEMENTS—Continued |
| | | | | | | | | | | | | | | | | | | | | | | | | | | | | | | | |
|
OVER-THE-COUNTER (OTC) SWAP AGREEMENTS—Continued CREDIT DEFAULT SWAPS—Continued | |
| | | | | | | | | |
Counterparty | | Reference Entity | | Buy/
Sellb,c | | Pay/Receive
Fixed Rate | | | Expiration
Date | | | Implied
Credit
Spreadd | | | Valuee
(000s) | | | Upfront
Premium
Paid/(Received)
(000s) | | | Notional
Amountf
(000s) | | | Unrealized
Appreciation/
(Depreciation)
(000s) | |
HSBC Bank USA NA | | United Mexican States
7.500% due 04/08/2033 | | Sell | | | 1.000 | % | | | 03/20/2016 | | | | 0.535 | % | | $ | 116 | | | $ | (154 | ) | | $ | 20,800 | | | $ | 270 | |
HSBC Bank USA NA | | United Mexican States
5.950% due 03/19/2019 | | Sell | | | 1.000 | | | | 09/20/2016 | | | | 0.648 | | | | 4 | | | | 3 | | | | 600 | | | | 1 | |
JP Morgan Chase Bank NA | | United Mexican States
7.500% due 04/08/2033 | | Sell | | | 0.920 | | | | 03/20/2016 | | | | 0.535 | | | | 1 | | | | — | | | | 300 | | | | 1 | |
JP Morgan Chase Bank NA | | United Mexican States
7.500% due 04/08/2033 | | Sell | | | 1.000 | | | | 09/20/2016 | | | | 0.648 | | | | 6 | | | | 5 | | | | 1,000 | | | | 1 | |
UBS AG Stamford | | United Mexican States
7.500% due 04/08/2033 | | Sell | | | 1.000 | | | | 09/20/2015 | | | | 0.467 | | | | 2 | | | | (7 | ) | | | 600 | | | | 9 | |
Credit Suisse International | | Verizon Communications Inc.
5.500% due 04/01/2017 | | Sell | | | 1.000 | | | | 09/20/2018 | | | | 0.442 | | | | 10 | | | | 14 | | | | 500 | | | | (4 | ) |
| | | | | | | | | | | | | | | | | | | | | | | | | | | | | | | | |
Credit Default Swaps | | | $ | 1,742 | |
| | | | | | | | | | | | | | | | | | | | | | | | | | | | | | | | |
Total Swaps | | | $ | (20,421 | ) |
| | | | | | | | | | | | | | | | | | | | | | | | | | | | | | | | |
The following table summarizes the Fund’s investments as of April 30, 2015 based on the inputs used to value them.
| | | | | | | | | | | | | | | | |
Asset Category | | Quoted Prices
Level 1
(000s) | | | Other Significant
Observable Inputs
Level 2
(000s) | | | Significant
Unobservable
Inputs Level 3
(000s) | | | Total
(000s) | |
Investments in Securities | | | | | | | | | | | | | | | | |
Asset-Backed Securities | | $ | — | | | $ | 133,896 | | | $ | — | | | $ | 133,896 | |
Bank Loan Obligations | | | — | | | | 29,297 | | | | — | | | | 29,297 | |
Collateralized Mortgage Obligations | | | — | | | | 273,913 | | | | — | | | | 273,913 | |
Corporate Bonds & Notes | | | — | | | | 859,799 | | | | 26,285 | | | | 886,084 | |
Foreign Government Obligations | | | — | | | | 301,392 | | | | — | | | | 301,392 | |
Mortgage Pass-Through | | | — | | | | 1,069,675 | | | | 1,558 | | | | 1,071,233 | |
Municipal Bonds | | | — | | | | 168,088 | | | | — | | | | 168,088 | |
Preferred Stocks | | | 7,451 | | | | — | | | | — | | | | 7,451 | |
Purchased Options | | | — | | | | 1,497 | | | | — | | | | 1,497 | |
Rights/Warrants | | | — | | | | — | | | | — | | | | — | |
U.S. Government Agencies | | | — | | | | 57,436 | | | | — | | | | 57,436 | |
U.S. Government Obligations | | | — | | | | 1,184,514 | | | | — | | | | 1,184,514 | |
Short-Term Investments | | | | | | | | | | | | | | | | |
Commercial Paper | | | — | | | | 63,979 | | | | — | | | | 63,979 | |
Repurchase Agreements | | | — | | | | 33,800 | | | | — | | | | 33,800 | |
U.S. Government Obligations | | | — | | | | 8,893 | | | | — | | | | 8,893 | |
| | | | | | | | | | | | | | | | |
Total Investments in Securities | | $ | 7,451 | | | $ | 4,186,179 | | | $ | 27,843 | | | $ | 4,221,473 | |
| | | | | | | | | | | | | | | | |
Financial Derivative Instruments - Assets | | | | | | | | | | | | | | | | |
Forward Currency Contracts | | $ | — | | | $ | 76,928 | | | $ | — | | | $ | 76,928 | |
Futures Contracts | | | 2,087 | | | | — | | | | — | | | | 2,087 | |
Swap Agreements | | | — | | | | 5,334 | | | | — | | | | 5,334 | |
| | | | | | | | | | | | | | | | |
Total Financial Derivative Instruments - Assets | | $ | 2,087 | | | $ | 82,262 | | | $ | — | | | $ | 84,349 | |
| | | | | | | | | | | | | | | | |
| | | | |
Liability Category | | | | | | | | | | | | |
Financial Derivative Instruments - Liabilities | | | | | | | | | | | | | | | | |
Forward Currency Contracts | | $ | — | | | $ | (45,271 | ) | | $ | — | | | $ | (45,271 | ) |
Futures Contracts | | | (5,305 | ) | | | — | | | | — | | | | (5,305 | ) |
Swap Agreements | | | — | | | | (25,755 | ) | | | — | | | | (25,755 | ) |
Written Options | | | (685 | ) | | | (2,390 | ) | | | — | | | | (3,075 | ) |
| | | | | | | | | | | | | | | | |
Total Financial Derivative Instruments - Liabilities | | $ | (5,990 | ) | | $ | (73,416 | ) | | $ | — | | | $ | (79,406 | ) |
| | | | | | | | | | | | | | | | |
Total Investments | | $ | 3,548 | | | $ | 4,195,025 | | | $ | 27,843 | | | $ | 4,226,416 | |
| | | | | | | | | | | | | | | | |
39
Harbor Bond Fund
PORTFOLIO OF INVESTMENTS—Continued
| | | | | | |
| FAIR VALUE MEASUREMENTS—Continued |
The following is a rollforward of the Fund’s Level 3 investments during the period ended April 30, 2015.
| | | | | | | | | | | | | | | | | | | | | | | | | | | | | | | | | | | | |
Valuation Description | | Balance
Beginning at
11/01/2014
(000s) | | | Purchases
(000s) | | | Sales
(000s) | | | Accrued
Discount/
(Premium)
(000s) | | | Total Realized
Gain/(Loss)w
(000s) | | | Change in
Unrealized
Appreciation/
(Depreciation)w
(000s) | | | Transfers
In
Level 3
(000s) | | | Transfers
Out of
Level 3
(000s) | | | Ending
Balance as of
04/30/2015w
(000s) | |
Corporate Bonds & Notes | | $ | 25,000 | | | $ | — | | | $ | (313 | ) | | $ | — | | | $ | 6 | | | $ | (1,177 | ) | | $ | 2,769 | | | $ | — | | | $ | 26,285 | |
Mortgage Pass-Through | | | 1,693 | | | | — | | | | (120 | ) | | | (1 | ) | | | 1 | | | | (15 | ) | | | — | | | | — | | | | 1,558 | |
Rights/Warrants | | | — | | | | — | | | | — | | | | — | | | | — | | | | — | | | | — | | | | — | | | | — | |
| | | | | | | | | | | | | | | | | | | | | | | | | | | | | | | | | | | | |
| | $ | 26,693 | | | $ | — | | | $ | (433 | ) | | $ | (1 | ) | | $ | 7 | | | $ | (1,192 | ) | | $ | 2,769 | | | $ | — | | | $ | 27,843 | |
| | | | | | | | | | | | | | | | | | | | | | | | | | | | | | | | | | | | |
There were no transfers between Levels 1 and 2 during the period.
The following is a summary of significant unobservable inputs used in the fair valuations of assets and liabilities categorized within Level 3 of the fair value hierarchy.
| | | | | | | | | | | | |
Valuation Descriptions | | Ending Balance
as of 04/30/2015
(000s) | | | Valuation Technique | | Unobservable Inputs | | Input
Value(s) | |
| Investments in Securities | | | | | | | | | | | | |
Corporate Bonds & Notes | | | | | | | | | | | | |
Blackstone Group LP 9.625%-03/19/2019 | | $
| 2,769
|
| | Benchmark Pricing | | Base Price | | $ | 103.38 | |
Keane Group Holdings LLC 8.500%-08/08/2019 | | | 23,516 | | | Portfolio Manager Fair Valuation | | Par Value | | | 95.26 | |
| | | | | | | | | | | | |
| | $ | 26,285 | | | | | | | | | |
| | | | | | | | | | | | |
Mortgage Pass-Through | | | | | | | | | | | | |
Federal Housing Authority Project 7.400%-02/01/2021 | | $ | 11 | | | Benchmark Pricing | | Base Price | | $ | 97.86 | |
Federal Housing Authority Project 7.450%-05/01/2021 | | | 1,547 | | | Benchmark Pricing | | Base Price | | | 97.86 | |
| | | | | | | | | | | | |
| | $ | 1,558 | | | | | | | | | |
| | | | | | | | | | | | |
Rights/Warrants | | | | | | | | | | | | |
General Motors Co. Escrow | | $ | — | | | Cash Available in Relation to Claims | | Estimated Recovery Value | | $ | 0.00 | |
| | | | | | | | | | | | |
| | $ | 27,843 | | | | | | | | | |
| | | | | | | | | | | | |
For more information on valuation inputs and their aggregation into the levels used in the table above, please refer to the Fair Value Measurements and Disclosures in Note 2 of the accompanying Notes to Financial Statements.
40
Harbor Bond Fund
PORTFOLIO OF INVESTMENTS—Continued
| 1 | Floating rate security, the stated rate represents the rate in effect at April 30, 2015. |
| 2 | Variable rate security, the stated rate represents the rate in effect at April 30, 2015. |
| 3 | Securities purchased in a transaction exempt from registration under Rule 144A of the Securities Act of 1933. These securities may be resold in transactions exempt from registration, normally to qualified institutional buyers. The Fund has no right to demand registration of these securities. These securities are priced by an independent pricing service in accordance with Harbor Funds Valuation Procedures. At April 30, 2015, the aggregate value of these securities was $310,642 or 9% of net assets. |
| 4 | REMICs are CMOs which can hold mortgages secured by any type of real property and issue multiple-class securities backed by those mortgages. |
| 5 | MTN after the name of a security stands for Medium Term Note. |
| 6 | Perpetuity bond, the maturity date represents the next callable date. |
| 7 | Step coupon security, the stated rate represents the rate in effect at April 30, 2015. |
| 9 | TBAs are mortgage-backed securities traded under delayed delivery commitments, settling after April 30, 2015. Although the unit price for the trades has been established, the principal value has not been finalized. However, the amount of the commitments will not fluctuate more than 2% from the principal amount. Income on TBAs is not earned until settlement date (see Note 2 of the accompanying Notes to Financial Statements). |
| 10 | Inflation-protected securities (“IPS”) are securities in which the principal amount is adjusted for inflation and interest payments are applied to the inflation-adjusted principal. |
| 11 | At April 30, 2015, a portion of securities held by the Fund were pledged to cover margin requirements for open future contracts, written options on futures contracts and swap options (see Note 2 of the accompanying Notes to Financial Statements). The securities pledged had an aggregate value of $57,048 or 2% of net assets. |
| b | If the Fund is a buyer of protection and a credit event occurs, as defined under the terms of that particular swap agreement, the Fund will either (i) receive from the seller of protection an amount equal to the notional amount of the swap and deliver the referenced obligation or underlying securities comprising the referenced index or (ii) receive a net settlement amount in the form of cash or securities equal to the notional amount of the swap less the recovery value of the referenced obligation or underlying securities comprising the referenced index. |
| c | If the Fund is a seller of protection and a credit event occurs, as defined under the terms of that particular swap agreement, the Fund will either (i) pay to the buyer of protection an amount equal to the notional amount of the swap and take delivery of the referenced obligation or underlying securities comprising the referenced index or (ii) pay a net settlement amount in the form of cash or securities equal to the notional amount of the swap less the recovery value of the referenced obligation or underlying securities comprising the referenced index. |
| d | Implied credit spreads, represented in absolute terms, utilized in determining the value of credit default swap agreements on corporate issues or sovereign issues of an emerging country as of period end serve as an indicator of the current status of the payment/performance risk and represent the likelihood or risk of default for the credit derivative. The implied credit spread of a particular referenced entity reflects the cost of buying/selling protection and may include upfront payments required to be made to enter into the agreement. Wider credit spreads represent a deterioration of the referenced entity’s credit soundness and a greater likelihood or risk of default or other credit event occurring as defined under the terms of the agreement. A credit spread identified as “Defaulted” indicates a credit event has occurred for the referenced entity or obligation. |
| e | The quoted market prices and resulting values for credit default swap agreements on asset-backed securities and credit indices serve as an indicator of the current status of the payment/performance risk and represent the likelihood of an expected liability (or profit) for the credit derivative should the notional amount of the swap agreement be closed/sold as of the period end. Increasing values, in absolute terms when compared to the notional amount of the swap, represent a deterioration of the referenced entity’s credit soundness and a greater likelihood or risk of default or other credit event occurring as defined under the terms of the agreement. |
| f | The maximum potential amount the Fund could be required to make as a seller of credit protection or receive as a buyer of credit protection if a credit event occurs as defined under the terms of that particular swap agreement. |
| j | Amount represents Index Value. |
| w | The amounts in this category are included in the “Realized and Change in Unrealized Gain/(Loss) on Investment Transactions” section of the Statement of Operations. The net unrealized appreciation/(depreciation) per investment type is as below: |
| | | | |
Valuation Description | | Unrealized
Gain/(Loss) as of
04/30/2015
(000s) | |
Corporate Bonds & Notes | | $ | (629 | ) |
Mortgage Pass-Through | | | (42 | ) |
Rights/Warrants | | | (15 | ) |
| | | | |
| | $ | (686 | ) |
| | | | |
| x | Valued by subadviser in accordance with Harbor Funds Valuation Procedures using par value, which is a Level 3 input. |
| y | Valued by subadviser in accordance with Harbor Funds Valuation Procedures using quoted prices from other actively traded securities with similar terms, which is a Level 3 input. |
| z | Fair valued in accordance with Harbor Funds Valuation Procedures using estimated recovery value, which is a Level 3 input. |
The accompanying notes are an integral part of the Financial Statements.
41
Harbor Real Return Fund
MANAGERS’ COMMENTARY (Unaudited)
SUBADVISER
Pacific Investment Management Company LLC (“PIMCO”)
650 Newport Center Drive
Newport Beach, CA
92660
PORTFOLIO MANAGERS
Mihir P. Worah
Since 2007
Jeremie Banet
Since 2015
PIMCO has subadvised the Fund since its inception in 2005.
INVESTMENT OBJECTIVE
The Fund seeks maximum real return, consistent with preservation of real capital.
PRINCIPAL STYLE CHARACTERISTICS
Inflation-indexed fixed income securities
Mihir P. Worah

Jeremie Banet
Management’s Discussion of Fund Performance
MARKET REVIEW
Fixed income markets continued to show evidence of global growth divergence over the six months ended April 30, 2015. Trends of U.S. dollar strength, lower oil prices, and lingering global economic uncertainty continued from calendar 2014 into 2015, as global markets experienced episodes of heightened volatility.
The European Central Bank (“ECB”) announced its long-awaited quantitative easing program in January 2015, which was larger than anticipated. In addition to the ECB, more than 20 other central banks also eased monetary policy in the first quarter. The U.S., however, was the main outlier as the Federal Reserve moved away from explicit forward guidance about its next rate hike and emphasized the importance of incoming data. Lingering uncertainty about the pace of growth and low prospects for inflation allowed U.S. Treasurys to rally along with their global peers. In China, property market weakness continued to raise concerns for policymakers, while in Japan lower inflation and growth raised skepticism over the ability of Prime Minister Shinzo Abe’s economic program to generate self-sustaining growth.
U.S. Treasury prices rose over the first half of fiscal 2015 as yields fell, with the majority of the rally coming in the first three months of the period. Fixed income spread sectors had mixed performance. Corporate bonds and U.S. mortgage-backed securities underperformed like-duration U.S. Treasurys. Emerging market external debt generally outperformed like-duration U.S. Treasurys. U.S. Treasury Inflation-Protected Securities, or TIPS, underperformed U.S. nominal Treasurys. In Europe, inflation-linked bonds saw a strong start to 2015 as real yields were supported by the ECB’s quantitative easing announcement, which included purchases of nominal as well as inflation-linked bonds.
PERFORMANCE
Harbor Real Return Fund returned 0.02% (Institutional Class) and 0.00% (Administrative Class) for the fiscal first half, compared with the 1.28% return of the Barclays U.S. TIPS Index benchmark.
The following strategies helped Fund returns for the six months ended April 30, 2015:
| • | | Exposure to Italian inflation-linked bonds, as yields were supported by the start of the ECB’s quantitative easing program. |
| • | | Holdings of non-agency mortgage-backed securities, which continued to benefit from limited new issue supply and strong investor demand. |
| • | | Tactical allocation to corporate bonds, especially financials, as select issuers outperformed. |
| • | | Currency positioning, specifically long U.S. dollar positions versus the euro and yen, as both currencies weakened relative to the dollar. |
The following strategies were negative or neutral for returns:
| • | | Exposure to longer-dated U.S. breakeven levels, as the breakeven curve flattened and longer-dated inflation expectations ended the period marginally lower. Breakeven inflation levels are a measure of the market’s expectation of future inflation, as expressed by the yield spread between U.S. TIPS and like-duration U.S. Treasurys. |
| • | | Exposure to local interest rates in emerging markets, like Brazil, where rates rose over the period, pushing bond prices lower. |
42
Harbor Real Return Fund
MANAGERS’ COMMENTARY—Continued
| | | | |
TOP TEN ISSUERS (% of net assets) | |
U.S. Treasury | | | 89.8% | |
Italy Buoni Poliennali Del Tesoro | | | 3.9% | |
U.K. Gilt | | | 2.8% | |
Bundesobligation | | | 2.3% | |
France Government OAT | | | 1.9% | |
Telefonica Emisiones SAU | | | 1.9% | |
Stone Street Trust | | | 1.6% | |
DBUBS Mortgage Trust | | | 1.5% | |
SLM Student Loan Trust | | | 1.1% | |
New Zealand Government | | | 0.8% | |
OUTLOOK AND STRATEGY
We expect global growth to accelerate modestly over the next six months. A wave of monetary policy accommodation should underpin global growth, in our view, while still-sizable economic slack should keep inflationary pressures well contained. We think that the decline in oil prices should further sustain these trends by transferring wealth from producers to consumers and by keeping inflation subdued.
Our view is that the U.S. appears to be on track for modestly above-trend growth of 2.5%-3.0%, with inflation only gradually approaching the Fed’s 2% target. A robust expectation for personal consumption growth forms the foundation of our outlook. We believe that consumer spending will be supported by a healthy pace of job gains and real incomes boosted by lower energy prices. Housing and business investment also should contribute to growth, but to a lesser degree. We expect home prices to rise gradually and sales trends to continue, with housing nonetheless remaining a small portion of economic growth.
We expect the euro-zone economy to expand by 1.25%-1.75%, although we expect inflation to remain low. A combination of several tailwinds—lower oil prices, a weaker euro, and the ECB’s new quantitative easing program—should lift European growth in our view. Going forward, we would expect the European quantitative easing program to be a substantial source of liquidity while also serving to anchor interest rates across member states.
In China, we expect growth in the low 6% range. As China addresses the ongoing slowdown in its property sector and de-leveraging in the shadow-banking system, we expect additional easing from the People’s Bank of China. In Japan, we expect growth of 1.0%-1.5%, with growth recovering from last year’s technical recession. The decisions late in 2014 to delay the next value-added tax hike and increase the size of the Bank of Japan’s easing program should provide needed support for the economy.
With respect to portfolio strategies, we expect to:
| • | | Remain largely underweight U.S. interest rate risk, focusing on opportunities across real and nominal yield curves. |
| • | | Maintain exposure to long breakeven levels in the U.S. given what in our view is underpriced inflation risk, especially after the recent sell-off in crude oil prices, which caused inflation expectations to narrow substantially. We remain underweight the very front end of the curve given the potential for volatility as the Fed’s first rate hike approaches. |
| • | | Continue to seek opportunities outside the U.S., where business cycles may anchor rates for a considerable period. We see opportunities in sovereign debt in peripheral European countries like Italy and Spain. Additionally, outside of the euro zone, we like New Zealand inflation-linked bonds, which offer attractive real yields and policy maneuverability. |
| • | | Use inflation swaps to enhance exposure to inflation, given a low inflation risk premium between intermediate and longer maturities. |
| • | | Remain selective in allocations to emerging markets, where we favor Mexican inflation-linked securities given solid fundamentals and attractive breakeven inflation levels relative to nominal bonds. |
| • | | Within currency, maintain a bias in favor of the U.S. dollar. We will tactically adjust exposures as market conditions warrant, particularly as we believe that the dollar’s trajectory will likely not be as smooth as it has been over the past few months. |
This report contains the current opinions of Pacific Investment Management Company LLC at the time of its publication and should not be considered as investment advice or a recommendation of any particular security, strategy or investment product. Such opinions are subject to change without notice and securities described herein may no longer be included in, or may at any time be removed from, the Fund’s portfolio. This report is distributed for informational purposes only. Information contained herein has been obtained from sources believed reliable, but not guaranteed.
Fixed income securities are affected by interest rate changes and the creditworthiness of the issues held by the Fund. A rise in interest rates will cause a decrease in the value of fixed income securities. Such an event would have an adverse effect on the Fund. The use of derivative instruments may add additional risk. The Fund is non-diversified which means that it may concentrate its assets in a smaller number of issuers, making it more susceptible to risks associated with a single economic, political or regulatory occurrence than a more diversified portfolio. For information on the different share classes and the risks associated with an investment in the Fund, please refer to the current prospectus.
43
Harbor Real Return Fund
FUND SUMMARY—April 30, 2015 (Unaudited)
| | | | |
INSTITUTIONAL CLASS |
| | | | |
| Fund # | | | | 2025 |
| | |
| Cusip | | | | 411511520 |
| | |
| Ticker | | | | HARRX |
| | |
| Inception Date | | | | 12/01/2005 |
| | |
| Net Expense Ratio | | | | 0.59%a,b |
| | |
| Total Net Assets (000s) | | | | $150,631 |
| | | | |
ADMINISTRATIVE CLASS |
| | | | |
| Fund # | | | | 2225 |
| | |
| Cusip | | | | 411511512 |
| | |
| Ticker | | | | HRRRX |
| | |
| Inception Date | | | | 12/01/2005 |
| | |
| Net Expense Ratio | | | | 0.84%a,b |
| | |
| Total Net Assets (000s) | | | | $3,567 |
PORTFOLIO STATISTICS
| | | | | | | | |
| | | Portfolio | | | Benchmark | |
| | |
Average Market Coupon | | | 1.55% | | | | 0.99% | |
| | |
Yield to Maturity | | | 2.65% | | | | 1.86% | |
| | |
Current 30-day Yield
(Institutional Class) | | | 0.17% | | | | 0.93% | |
| | |
Weighted Average Maturity | | | 8.31 years | | | | 8.46 years | |
| | |
Weighted Average Duration | | | 5.08 years | | | | 5.65 years | |
| | |
Portfolio Turnover
(6-Month Period Ended 04/30/2015) | | | 196% | c | | | N/A | |
MATURITY PROFILE (% of investments)
| | | | |
| |
0 to 1 yr. | | | 32.60% | |
| |
>1 to 5 | | | 3.19% | |
| |
>5 to 10 | | | 48.41% | |
| |
>10 to 15 | | | 3.98% | |
| |
>15 to 20 | | | 0.37% | |
| |
>20 to 25 | | | 0.26% | |
| |
>25 yrs. | | | 11.19% | |
FUND PERFORMANCE
The graph compares a $10,000 investment in the Fund with the performance of the Barclays U.S. TIPS Index. The Fund’s performance includes the reinvestment of all dividend and capital gain distributions.
CHANGE IN A $10,000 INVESTMENT
For the period 12/01/2005 through 04/30/2015
| | | | | | | | | | | | | | | | | | | | | | | | |
Total Returns For the periods ended 04/30/2015 | |  | |
| Harbor Real Return Fund | | | | | | | | | | | | | | | | | | | | | | | | |
Institutional Class | | | 0.02 | % | | | 1.25 | % | | | 3.54 | % | | | 4.60 | % | | | 12/01/2005 | | | $ | 15,267 | |
Administrative Class | | | 0.00 | % | | | 1.05 | % | | | 3.29 | % | | | 4.34 | % | | | 12/01/2005 | | | $ | 14,912 | |
| Comparative Index | | | | | | | | | | | | | | | | | | | | | | | | |
Barclays U.S. TIPS | | | 1.28 | % | | | 2.48 | % | | | 3.96 | % | | | 4.71 | % | | | — | | | $ | 15,429 | |
As stated in the Fund’s current prospectus, the expense ratios were 0.59% (Net) and 0.64% (Gross) (Institutional Class); and 0.84% (Net) and 0.89% (Gross) (Administrative Class). The net expense ratios are contractually capped, excluding interest expense incurred by the Fund, if any, through 02/29/2016. The expense ratios in the prospectus may differ from the actual expense ratios for the period disclosed within this report. The expense ratios shown in the prospectus are based on the prior fiscal year, adjusted to reflect changes, if any, in contractual arrangements that occurred prior to the date of the prospectus.
Performance data shown represents past performance, which is no guarantee of future results. Current performance may be higher or lower than the past performance data shown. Investment returns and the value of an investment will fluctuate, and an investor’s shares, when sold, may be worth more or less than their original cost. You can obtain performance data current to the most recent month-end (available within seven business days after the most recent month-end) by calling 800-422-1050 or visiting harborfunds.com.
The returns shown do not reflect the deduction of taxes that a shareholder would pay on Fund distributions or on the redemption of Fund shares. From time to time, certain fees and/or expenses have been waived or reimbursed, which has resulted in higher returns. Without these waivers and reimbursements, the returns would have been lower.
| b | Reflective of a contractual expense cap effective through February 29, 2016. Expense cap excludes interest expense incurred by the Fund, if any. |
44
Harbor Real Return Fund
PORTFOLIO OF INVESTMENTS—April 30, 2015 (Unaudited)
Total Investments (% of net assets)
(Excludes net cash, short-term investments and derivative positions of –24.5%)

| | | | | | | | |
ASSET-BACKED SECURITIES—3.9% | |
Principal
Amount
(000s) | | | | | Value
(000s) | |
| | | | Aegis Asset Backed Securities Trust
Series 2004-6 Cl. M2 | | | | |
| $ | 800 | | | 1.181%—03/25/20351 | | $ | 743 | |
| | | | Countrywide Asset Backed Certificates
Series 2007-12 Cl. 2A2 | | | | |
| | 229 | | | 0.681%—08/25/20471 | | | 226 | |
| | | | GSAMP Trust
Series 2004-WF Cl. M2 | | | | |
| | 207 | | | 1.831%—10/25/20341 | | | 194 | |
| | | | Hillmark Funding Ltd.
Series 2006-1A Cl. A1 | | | | |
| | 1,081 | | | 0.512%—05/21/20211,2 | | | 1,071 | |
| | | | JP Morgan Mortgage Acquisition Trust
Series 2007-CH5 Cl. A4 | | | | |
| | 700 | | | 0.341%—05/25/20371 | | | 639 | |
| | | | Long Beach Mortgage Loan Trust
Series 2005-WL2 Cl. M2 | | | | |
| | 500 | | | 0.671%—08/25/20351 | | | 420 | |
| | | | Magi Funding plc
Series I-A Cl. A | | | | |
| € | 10 | | | 0.331%—04/11/20211,2 | | | 11 | |
| | | | MASTR Asset Backed Securities Trust
Series 2006-HE2 Cl. A2 | | | | |
| $ | 234 | | | 0.421%—06/25/20361 | | | 134 | |
| | | | Morgan Stanley ABS Capital I Inc. Trust
Series 2006-HE8 Cl. A2FP | | | | |
| | 121 | | | 0.251%—10/25/20361 | | | 76 | |
| | | | Park Place Securities Inc.
Series 2004-WWF1 Cl. M2 | | | | |
| | 83 | | | 1.201%—12/25/20341 | | | 83 | |
| | | | Saxon Asset Securities Trust
Series 2003-1 Cl. AF7 | | | | |
| | 110 | | | 4.034%—06/25/20333 | | | 112 | |
| | | | Securitized Asset Backed Receivables
LLC Trust
Series 2005-FR5 Cl. A1B | | | | |
| | 415 | | | 0.461%—08/25/20351 | | | 412 | |
| | | | SLM Student Loan Trust
Series 2003-2 Cl. A5 | | | | |
| € | 1,516 | | | 0.287%—12/15/20231 | | | 1,680 | |
| | | | Soundview Home Loan Trust
Series 2006-OPT2 Cl. A4 | | | | |
| $ | 200 | | | 0.461%—05/25/20361 | | | 160 | |
| | | | Wood Street CLO BV4
Series II-A Cl. A1 | | | | |
| € | 51 | | | 0.339%—03/29/20211,2 | | | 56 | |
| | | | | | | | |
| TOTAL ASSET-BACKED SECURITIES
(Cost $6,239) | | | 6,017 | |
| | | | | | | | |
COLLATERALIZED MORTGAGE OBLIGATIONS—6.8% | |
Principal
Amount
(000s) | | | | | Value
(000s) | |
| | | | Bear Stearns Adjustable Rate Mortgage Trust
Series 2005-5 Cl. A1 | | | | |
| $ | 5 | | | 2.160%—08/25/20351 | | | 4 | |
| | 8 | | | Series 2005-5 Cl. A2
2.260%—08/25/20351 | | | 8 | |
| | 2 | | | Series 2005-2 Cl. A2
2.515%—03/25/20351 | | | 2 | |
| | 8 | | | Series 2005-2 Cl. A1
2.680%—03/25/20351 | | | 8 | |
| | | | | | | | |
| | | | | | | 22 | |
| | | | | | | | |
| | | | Bear Stearns Alt-A Trust
Series 2005-5 Cl. 25A1 | | | | |
| | 1,435 | | | 4.822%—07/25/20355 | | | 1,189 | |
| | | | Citigroup Mortgage Loan Trust Inc.
Series 2005-12 Cl. 2A1 | | | | |
| | 581 | | | 0.971%—08/25/20351,2 | | | 456 | |
| | | | Countrywide Alternative Loan Trust
Series 2005-79CB Cl. A5 | | | | |
| | 416 | | | 5.500%—01/25/2036 | | | 372 | |
| | 160 | | | Series 2006-19CB Cl. A4
6.000%—08/25/20361 | | | 148 | |
| | 174 | | | Series 2007-5CB Cl. 1A13
6.000%—04/25/2037 | | | 150 | |
| | 638 | | | Series 2007-5CB Cl. 1A4
6.000%—04/25/2037 | | | 549 | |
| | | | | | | | |
| | | | | | | 1,219 | |
| | | | | | | | |
| | | | Countrywide Home Loan Mortgage Pass Through Trust
Series 2004-HYB5 Cl. 2A1 | | | | |
| | 52 | | | 2.349%—04/20/20351 | | | 52 | |
| | | | DBUBS Mortgage Trust
Series 2011-LC2A Cl. A2 | | | | |
| | 2,263 | | | 3.386%—07/10/20442 | | | 2,313 | |
| | | | Deutsche Alt-A Securities Inc.
Series 2007-OA4 Cl. 1A1B | | | | |
| | 917 | | | 0.311%—08/25/20471 | | | 770 | |
| | 639 | | | Series 2007-AB1 Cl. A1
0.481%—04/25/20371 | | | 359 | |
| | | | | | | | |
| | | | | | | 1,129 | |
| | | | | | | | |
| | | | IndyMac IMSC Mortgage Loan Trust
Series 2007-HOA1 Cl. A11 | | | | |
| | 569 | | | 0.361%—07/25/20471 | | | 414 | |
| | | | JP Morgan Mortgage Trust
Series 2005-A3 Cl. 2A1 | | | | |
| | 117 | | | 3.237%—06/25/20355 | | | 116 | |
| | | | Lavender Trust
Series 2010-RR2A Cl. A4 | | | | |
| | 1,114 | | | 6.250%—10/26/20362 | | | 841 | |
| | | | Lehman XS Trust
Series 2006-12N Cl. A31A | | | | |
| | 288 | | | 0.381%—08/25/20461 | | | 222 | |
| | | | Morgan Stanley Mortgage Loan Trust
Series 2006-8AR Cl. 6A1 | | | | |
| | 228 | | | 2.133%—06/25/20365 | | | 223 | |
| | | | Rali Series Trust
Series 2006-QS13 Cl. 1A6 | | | | |
| | 765 | | | 6.000%—09/25/2036 | | | 627 | |
| | | | RBSSP Resecuritization Trust
Series 2010-1 Cl. 2A1 | | | | |
| | 864 | | | 1.962%—07/26/20451,2 | | | 863 | |
| | | | Residential Accredit Loans Inc.
Series 2006-QO6 Cl. A1 | | | | |
| | 121 | | | 0.361%—06/25/20461 | | | 54 | |
45
Harbor Real Return Fund
PORTFOLIO OF INVESTMENTS—Continued
| | | | | | | | |
COLLATERALIZED MORTGAGE OBLIGATIONS—Continued | |
Principal
Amount
(000s) | | | | | Value
(000s) | |
| | | | Residential Asset Securitization Trust
Series 2006-R1 Cl. A2 | | | | |
| $ | 70 | | | 0.581%—01/25/20461 | | $ | 37 | |
| | 683 | | | Series 2006-A12 Cl. A3
6.000%—11/25/2036 | | | 490 | |
| | 127 | | | Series 2006-A12 Cl. A2
6.250%—11/25/2036 | | | 94 | |
| | | | | | | | |
| | | | | | | 621 | |
| | | | | | | | |
| | | | Structured Asset Mortgage Investments Inc.
Series 2006-AR5 Cl. 1A1 | | | | |
| | 70 | | | 0.391%—05/25/20461 | | | 52 | |
| | | | Washington Mutual Mortgage Pass Through Certificates
Series 2003-AR9 Cl. 2A | | | | |
| | 35 | | | 2.441%—09/25/20331 | | | 34 | |
| | | | | | | | |
| TOTAL COLLATERALIZED MORTGAGE OBLIGATIONS
(Cost $10,454) | | | 10,447 | |
| | | | | | | | |
| | | | | | | | |
CORPORATE BONDS & NOTES—7.9% | | | |
| | | | AT&T Inc. | | | | |
| | 100 | | | 1.158%—06/30/20205 | | | 101 | |
| | 100 | | | 2.450%—06/30/2020 | | | 100 | |
| | 300 | | | 3.000%—06/30/2022 | | | 299 | |
| | 400 | | | 3.400%—05/15/2025 | | | 397 | |
| | 100 | | | 4.500%—05/15/2035 | | | 98 | |
| | 200 | | | 4.750%—05/15/2046 | | | 196 | |
| | | | | | | | |
| | | | | | | 1,191 | |
| | | | | | | | |
| | | | Banco Popolare SC MTN6 | | | | |
| € | 500 | | | 3.500%—03/14/2019 | | | 590 | |
| | | | Banco Santander Brasil SA | | | | |
| $ | 300 | | | 4.250%—01/14/20162 | | | 307 | |
| | | | Banco Santander SA | | | | |
| € | 100 | | | 6.250%—09/11/20215,7 | | | 112 | |
| | | | BellSouth Corp. | | | | |
| $ | 300 | | | 4.821%—04/26/20212 | | | 310 | |
| | | | Electricite de France SA | | | | |
| | 800 | | | 0.735%—01/20/20171,2 | | | 802 | |
| | 200 | | | 1.150%—01/20/20172 | | | 201 | |
| | | | | | | | |
| | | | | | | 1,003 | |
| | | | | | | | |
| | | | GATX Financial Corp. | | | | |
| | 1,000 | | | 5.800%—03/01/2016 | | | 1,039 | |
| | | | Hellenic Railways Organization SA | | | | |
| € | 500 | | | 4.028%—03/17/2017 | | | 379 | |
| | | | Intesa Sanpaolo SpA | | | | |
| $ | 400 | | | 3.125%—01/15/2016 | | | 405 | |
| | | | Navient Corp. MTN6 | | | | |
| | 740 | | | 2.225%—05/03/20191,8 | | | 703 | |
| | | | Petrobras Global Finance BV | | | | |
| | 100 | | | 2.631%—03/17/20171 | | | 97 | |
| | 400 | | | 5.375%—01/27/2021 | | | 385 | |
| | | | | | | | |
| | | | | | | 482 | |
| | | | | | | | |
| | | | Stone Street Trust | | | | |
| | 2,400 | | | 5.902%—12/15/20152 | | | 2,464 | |
| | | | Telefonica Emisiones SAU | | | | |
| | 3,000 | | | 0.915%—06/23/20171 | | | 2,994 | |
| | | | Turkiye Garanti Bankasi AS | | | | |
| | 200 | | | 2.775%—04/20/20161,2 | | | 201 | |
| | | | | | | | |
| TOTAL CORPORATE BONDS & NOTES
(Cost $12,252) | | | 12,180 | |
| | | | | | | | |
FOREIGN GOVERNMENT OBLIGATIONS—14.7% | |
Principal
Amount
(000s) | | | | | Value
(000s) | |
| | | | Autonomous Community of Catalonia | | | | |
| € | 300 | | | 4.950%—02/11/2020 | | | 384 | |
| | | | Bundesobligation Inflation Linked8 | | | | |
| | 2,940 | | | 0.750%—04/15/2018 | | | 3,480 | |
| | | | Colombian TES | | | | |
| COL$ | 947,179 | | | 3.000%—03/25/20338 | | | 351 | |
| | | | Deutsche Bundesrepublik Inflation Linked Bond8 | | | | |
| € | 574 | | | 1.500%—04/15/2016 | | | 658 | |
| | | | France Government Bond OAT | | | | |
| | 1,321 | | | 0.250%—07/25/2018-07/25/20248 | | | 1,605 | |
| | 709 | | | 1.600%—07/25/20158 | | | 809 | |
| | 340 | | | 3.500%—04/25/2020 | | | 446 | |
| | | | | | | | |
| | | | | | | 2,860 | |
| | | | | | | | |
| | | | Hellenic Republic Government International Bond MTN6 | | | | |
| ¥ | 100,000 | | | 3.800%—08/08/2017 | | | 554 | |
| | | | Italy Buoni Poliennali Del Tesoro | | | | |
| € | 992 | | | 2.100%—09/15/2016-09/15/20218 | | | 1,234 | |
| | 2,002 | | | 2.250%—04/22/20178 | | | 2,335 | |
| | 894 | | | 2.350%—09/15/20242,8 | | | 1,197 | |
| | 821 | | | 2.550%—10/22/20168 | | | 953 | |
| | 200 | | | 5.000%—09/01/2040 | | | 332 | |
| | | | | | | | |
| | | | | | | 6,051 | |
| | | | | | | | |
| | | | Mexican Bonos | | | | |
| MEX$ | 3,561 | | | 4.750%—06/14/2018 | | | 232 | |
| | | | Mexican Udibonos | | | | |
| | 4,803 | | | 4.000%—11/08/20468 | | | 356 | |
| | 11,260 | | | 4.500%—12/04/20258 | | | 835 | |
| | | | | | | | |
| | | | | | | 1,191 | |
| | | | | | | | |
| | | | New South Wales Treasury Corp. | | | | |
| AUD$ | 100 | | | 2.500%—11/20/20358 | | | 121 | |
| | | | New Zealand Government Bond | | | | |
| NZD$ | 1,600 | | | 2.000%—09/20/20258 | | | 1,286 | |
| | | | Province of Ontario Canada | | | | |
| CAD$ | 600 | | | 3.450%—06/02/2045 | | | 538 | |
| | | | Slovenia Government Bond | | | | |
| € | 400 | | | 4.700%—11/01/20162 | | | 480 | |
| | | | Spain Government Inflation Linked Bond8 | | | | |
| | 197 | | | 1.000%—11/30/20302 | | | 233 | |
| | | | U.K. Gilt Inflation Linked8 | | | | |
| £ | 2,535 | | | 0.125%—03/22/2024-03/22/2058 | | | 4,338 | |
| | | | | | | | |
| TOTAL FOREIGN GOVERNMENT OBLIGATIONS
(Cost $25,279) | | | 22,757 | |
| | | | | | | | |
| | | | | | | | |
MORTGAGE PASS-THROUGH—1.1% | |
| | | | Federal Home Loan Mortgage Corp. REMIC9 | | | | |
| $ | 716 | | | 0.782%—12/15/20371 | | | 724 | |
| | | | Federal National Mortgage Association REMIC9 | | | | |
| | 192 | | | 0.531%—07/25/20371 | | | 193 | |
| | 206 | | | 0.561%—07/25/20371 | | | 208 | |
| | 185 | | | 0.621%—05/25/20361 | | | 185 | |
| | 364 | | | 0.861%—02/25/20411 | | | 369 | |
| | | | | | | | |
| | | | | | | 955 | |
| | | | | | | | |
| TOTAL MORTGAGE PASS-THROUGH
(Cost $1,659) | | | 1,679 | |
| | | | | | | | |
| | | | | | | | |
46
Harbor Real Return Fund
PORTFOLIO OF INVESTMENTS—Continued
| | | | | | | | |
PURCHASED OPTIONS—0.1% | |
No. of
Contracts | | | | | Value
(000s) | |
| | | | Interest Rate Swap Option 1 year | | | | |
| | 7,000,000 | | | 0.800%—01/19/2016 | | $ | 8 | |
| | | | Interest Rate Swap Option 30 year | | | | |
| | 5,400,000 | | | 2.800%—05/29/2015-12/11/2017 | | | 121 | |
| | | | | | | | |
| TOTAL PURCHASED OPTIONS
(Premiums Paid/Cost $216) | | | 129 | |
| | | | | | | | |
| | | | | | | | |
U.S. GOVERNMENT OBLIGATIONS—90.0% | |
Principal
Amount
(000s) | | | | | | |
| | | | U.S. Treasury Bonds | | | | |
| $ | 1,200 | | | 2.500%—02/15/2045 | | | 1,140 | |
| | | | U.S. Treasury Inflation Indexed Bonds8 | | | | |
| | 8,855 | | | 0.125%—04/15/2017-04/15/201910 | | | 9,058 | |
| | 4,360 | | | 0.250%—01/15/2025 | | | 4,423 | |
| | 2,521 | | | 0.375%—07/15/202310 | | | 2,600 | |
| | 28,074 | | | 0.625%—07/15/2021-02/15/2043 | | | 29,536 | |
| | 3,402 | | | 0.750%—02/15/2042-02/15/2045 | | | 3,417 | |
| | 6,026 | | | 1.250%—07/15/2020 | | | 6,562 | |
| | 9,989 | | | 1.375%—02/15/204410 | | | 11,627 | |
| | 11,541 | | | 1.875%—07/15/2019 | | | 12,766 | |
| | 1,362 | | | 2.125%—01/15/2019-02/15/204110 | | | 1,564 | |
| | 45,789 | | | 2.375%—01/15/2025-01/15/2027 | | | 56,049 | |
| | | | | | | | |
| | | | | | | 137,602 | |
| | | | | | | | |
| TOTAL U.S. GOVERNMENT OBLIGATIONS
(Cost $135,475) | | | 138,742 | |
| | | | | | | | |
| | | | | | | | |
SHORT-TERM INVESTMENTS—1.8% | |
Principal
Amount
(000s) | | | | | Value
(000s) | |
| | REPURCHASE AGREEMENTS—0.3% | | | | |
| $ | 447 | | | Repurchase Agreement with State Street Corp. dated April 30, 2015 due May 01, 2015 at 0.000% collateralized by U.S. Treasury Bonds (market value $461) | | $ | 447 | |
| | | | | | | | |
| | U.S. GOVERNMENT AGENCIES—0.8% | |
| | | | Federal Home Loan Bank Discount Notes | | | | |
| | 300 | | | 0.071%—06/12/2015 | | | 300 | |
| | 300 | | | 0.080%—07/24/2015-07/29/2015 | | | 300 | |
| | 300 | | | 0.083%—07/22/2015 | | | 300 | |
| | 400 | | | 0.084%—07/17/2015 | | | 400 | |
| | | | | | | | |
| | | | | | | 1,300 | |
| | | | | | | | |
| | U.S. GOVERNMENT OBLIGATIONS—0.7% | |
| | | | U.S. Treasury Bills | | | | |
| | 312 | | | 0.015%—07/30/201510 | | | 312 | |
| | 491 | | | 0.061%—05/21/201510 | | | 491 | |
| | 261 | | | 0.070%—05/07/201510 | | | 261 | |
| | | | | | | | |
| | | | | | | 1,064 | |
| | | | | | | | |
| TOTAL SHORT-TERM INVESTMENTS
(Cost $2,811) | | | 2,811 | |
| | | | | | | | |
| TOTAL INVESTMENTS—126.3%
(Cost $194,385) | | | 194,762 | |
| | | | | | | | |
| | CASH AND OTHER ASSETS, LESS LIABILITIES—(26.3)% | | | (40,564 | ) |
| | | | | | | | |
| | TOTAL NET ASSETS—100.0% | | $ | 154,198 | |
| | | | | | | | |
| | | | | | | | | | | | | | | | |
| FUTURES CONTRACTS OPEN AT APRIL 30, 2015 | |
| | | | |
Description | | Number of
Contracts | | | Aggregate
Face Value
(000s) | | | Expiration Date | | | Unrealized
Appreciation/
(Depreciation)
(000s) | |
Euro-Bund Futures 10 year (Buy) | | | 30 | | | € | 3,000 | | | | 06/08/2015 | | | $ | (57 | ) |
Eurodollar Futures-CME 90 day (Buy) | | | 78 | | | $ | 19,500 | | | | 06/19/2017 | | | | 84 | |
Eurodollar Futures-CME 90 day (Sell) | | | 15 | | | | 3,750 | | | | 06/15/2015 | | | | (5 | ) |
Eurodollar Futures-CME 90 day (Sell) | | | 50 | | | | 12,500 | | | | 09/14/2015 | | | | (25 | ) |
Eurodollar Futures-CME 90 day (Sell) | | | 62 | | | | 15,500 | | | | 12/14/2015 | | | | (8 | ) |
Eurodollar Futures-CME 90 day (Sell) | | | 67 | | | | 16,750 | | | | 03/14/2016 | �� | | | (51 | ) |
U.S. Treasury Bond Futures 30 year (Buy) | | | 2 | | | | 200 | | | | 06/19/2015 | | | | (9 | ) |
U.S. Treasury Note Futures 5 year (Buy) | | | 12 | | | | 1,200 | | | | 06/30/2015 | | | | 17 | |
U.S. Treasury Note Futures 10 year (Sell) | | | 40 | | | | 4,000 | | | | 06/19/2015 | | | | 12 | |
Ultra U.S. Treasury Note Futures 30 year (Buy) | | | 4 | | | | 400 | | | | 06/19/2015 | | | | (15 | ) |
| | | | | | | | | | | | | | | | |
Total Futures Contracts | | | $ | (57 | ) |
| | | | | | | | | | | | | | | | |
| | | | | | | | | | | | | | | | | | | | |
| WRITTEN OPTIONS OPEN AT APRIL 30, 2015 | |
|
| WRITTEN OPTIONS THAT REQUIRE PERIODIC SETTLEMENT OF VARIATION MARGIN | |
| | | | | | |
Description | | Counterparty | | Number of
Contracts | | Strike
Price | | | Expiration Date | | | Premiums
Received
(000s) | | | Value
(000s) | |
Euro-Bund Futures (Put) | | CME Group | | 6 | | $ | 157.00 | | | | 05/22/2015 | | | $ | 1 | | | $ | (6 | ) |
| | | | | | | | | | | | | | | | | | | | |
| | | | | | | | | | | | | | | | | | | | | | |
|
| WRITTEN OPTIONS NOT SETTLED THROUGH VARIATION MARGIN | |
| | | | | | |
Description | | Counterparty | | Number of
Contracts | | | Strike
Index/Rate/Price | | | Expiration Date | | | Premiums
Received
(000s) | | | Value
(000s) | |
Inflation-Linked Swap Option 4 year (Put) | | Deutsche Bank AG | | | 600,000 | | | | 233.550 | j | | | 01/22/2018 | | | $ | 6 | | | $ | (4 | ) |
Inflation-Linked Swap Option 5 year (Call) | | JP Morgan Chase Bank NA | | | 1,700,000 | | | | 234.81 | j | | | 03/24/2020 | | | | 19 | | | | (21 | ) |
Inflation-Linked Swap Option 10 year (Put) | | Citibank NA | | | 3,600,000 | | | | 216.69 | j | | | 04/07/2020 | | | | 32 | | | | (2 | ) |
47
Harbor Real Return Fund
PORTFOLIO OF INVESTMENTS—Continued
| | | | | | | | | | | | | | | | | | | | | | |
| WRITTEN OPTIONS—Continued | |
|
| WRITTEN OPTIONS NOT SETTLED THROUGH VARIATION MARGIN—Continued | |
| | | | | | |
Description | | Counterparty | | Number of
Contracts | | | Strike
Index/Rate/Price | | | Expiration Date | | | Premiums
Received
(000s) | | | Value
(000s) | |
Inflation-Linked Swap Option 10 year (Put) | | Citibank NA | | | 500,000 | | | | 217.97 | j | | | 09/29/2020 | | | $ | 7 | | | $ | — | |
Inflation-Linked Swap Option 10 year (Call) | | JP Morgan Chase Bank NA | | | 4,000,000 | | | | 243.27 | j | | | 04/22/2024 | | | | 29 | | | | (11 | ) |
Inflation-Linked Swap Option 10 year (Call) | | JP Morgan Chase Bank NA | | | 300,000 | | | | 244.17 | j | | | 05/16/2024 | | | | 2 | | | | (1 | ) |
Interest Rate Swap Option 1 year (Call) | | Morgan Stanley Capital Services LLC | | | 7,000,000 | | | | 0.520 | % | | | 01/19/2016 | | | | 4 | | | | (2 | ) |
Interest Rate Swap Option 1 year (Call) | | Morgan Stanley Capital Services LLC | | | 7,000,000 | | | | 0.660 | | | | 01/19/2016 | | | | 7 | | | | (5 | ) |
Credit Default Swap Option 5 year (Put) | | Goldman Sachs International | | | 4,700,000 | | | | 1.000 | | | | 09/16/2015 | | | | 7 | | | | (10 | ) |
Interest Rate Swap Option 5 year (Put) | | Morgan Stanley Capital Services LLC | | | 4,200,000 | | | | 2.500 | | | | 12/11/2017 | | | | 140 | | | | (109 | ) |
Interest Rate Swap Option 10 year (Call) | | Goldman Sachs Bank USA | | | 300,000 | | | | 1.850 | | | | 07/15/2015 | | | | 3 | | | | (1 | ) |
Interest Rate Swap Option 10 year (Put) | | Goldman Sachs Bank USA | | | 300,000 | | | | 2.400 | | | | 07/15/2015 | | | | 1 | | | | (2 | ) |
Interest Rate Swap Option 30 year (Call) | | Deutsche Bank AG | | | 4,400,000 | | | | 2.300 | | | | 05/29/2015 | | | | 69 | | | | (18 | ) |
Interest Rate Swap Option 30 year (Call) | | Goldman Sachs Bank USA | | | 1,500,000 | | | | 0.750 | | | | 09/11/2015 | | | | 40 | | | | (31 | ) |
Currency Option Euro vs. U.S. Dollar (Put) | | Barclays Bank plc | | | 231,000 | | | $ | 1.05 | | | | 05/05/2015 | | | | 1 | | | | — | |
Currency Option Euro vs. U.S. Dollar (Put) | | BNP Paribas SA | | | 1,161,000 | | | | 1.05 | | | | 05/05/2015 | | | | 8 | | | | — | |
Currency Option U.S. Dollar vs. Brazilian Real (Call) | | Credit Suisse International | | | 1,300,000 | | | | 4.00 | | | | 03/17/2016 | | | | 55 | | | | (27 | ) |
Currency Option U.S. Dollar vs. Brazilian Real (Put) | | Credit Suisse International | | | 1,300,000 | | | | 2.85 | | | | 07/16/2015 | | | | 9 | | | | (10 | ) |
Currency Option U.S. Dollar vs. Brazilian Real (Put) | | Credit Suisse International | | | 1,540,000 | | | | 2.95 | | | | 07/13/2015 | | | | 12 | | | | (25 | ) |
Currency Option U.S. Dollar vs. Brazilian Real (Call) | | Deutsche Bank AG | | | 1,110,000 | | | | 2.68 | | | | 07/01/2015 | | | | 27 | | | | (138 | ) |
| | | | | | | | | | | | | | | | | | | | | | |
Total Written Options Not Settled Through Variation Margin | | | $ | 478 | | | $ | (417 | ) |
| | | | | | | | | | | | | | | | | | | | | | |
Total Written Options | | | $ | 479 | | | $ | (423 | ) |
| | | | | | | | | | | | | | | | | | | | | | |
| | | | | | | | | | | | | | | | | | |
| FORWARD CURRENCY CONTRACTS OPEN AT APRIL 30, 2015 | |
| | | | | |
Currency | | Counterparty | | Value
(000s) | | | Aggregate
Face Value
(000s) | | | Delivery Date | | | Unrealized
Appreciation/
(Depreciation)
(000s) | |
Australian Dollar (Buy) | | Citibank NA | | $ | 1,663 | | | $ | 1,681 | | | | 05/06/2015 | | | $ | (18 | ) |
Australian Dollar (Sell) | | Citibank NA | | | 791 | | | | 770 | | | | 05/06/2015 | | | | (21 | ) |
Australian Dollar (Sell) | | Citibank NA | | | 1,660 | | | | 1,678 | | | | 06/02/2015 | | | | 18 | |
Australian Dollar (Sell) | | Credit Suisse International | | | 125 | | | | 120 | | | | 05/06/2015 | | | | (5 | ) |
Australian Dollar (Sell) | | HSBC Bank USA | | | 747 | | | | 716 | | | | 05/06/2015 | | | | (31 | ) |
Brazilian Real (Buy) | | BNP Paribas SA | | | 213 | | | | 215 | | | | 05/05/2015 | | | | (2 | ) |
Brazilian Real (Buy) | | Credit Suisse International | | | 213 | | | | 213 | | | | 05/05/2015 | | | | — | |
Brazilian Real (Buy) | | Credit Suisse International | | | 278 | | | | 268 | | | | 05/05/2015 | | | | 10 | |
Brazilian Real (Buy) | | Deutsche Bank AG | | | 2,157 | | | | 2,175 | | | | 05/05/2015 | | | | (18 | ) |
Brazilian Real (Buy) | | Deutsche Bank AG | | | 2,137 | | | | 2,080 | | | | 06/02/2015 | | | | 57 | |
Brazilian Real (Buy) | | Deutsche Bank AG | | | 115 | | | | 130 | | | | 07/02/2015 | | | | (15 | ) |
Brazilian Real (Buy) | | HSBC Bank USA | | | 278 | | | | 280 | | | | 05/05/2015 | | | | (2 | ) |
Brazilian Real (Buy) | | JP Morgan Chase Bank | | | 2,157 | | | | 2,008 | | | | 05/05/2015 | | | | 149 | |
Brazilian Real (Sell) | | BNP Paribas SA | | | 213 | | | | 213 | | | | 05/05/2015 | | | | — | |
Brazilian Real (Sell) | | Credit Suisse International | | | 491 | | | | 495 | | | | 05/05/2015 | | | | 4 | |
Brazilian Real (Sell) | | Deutsche Bank AG | | | 2,157 | | | | 2,098 | | | | 05/05/2015 | | | | (59 | ) |
Brazilian Real (Sell) | | HSBC Bank USA | | | 277 | | | | 268 | | | | 05/05/2015 | | | | (9 | ) |
Brazilian Real (Sell) | | JP Morgan Chase Bank | | | 2,157 | | | | 2,175 | | | | 05/05/2015 | | | | 18 | |
Brazilian Real (Sell) | | JP Morgan Chase Bank | | | 1,656 | | | | 1,690 | | | | 04/04/2016 | | | | 34 | |
British Pound Sterling (Buy) | | Deutsche Bank AG | | | 5,032 | | | | 5,020 | | | | 05/06/2015 | | | | 12 | |
British Pound Sterling (Buy) | | JP Morgan Chase Bank NA | | | 203 | | | | 204 | | | | 06/02/2015 | | | | (1 | ) |
British Pound Sterling (Buy) | | UBS AG | | | 761 | | | | 739 | | | | 05/06/2015 | | | | 22 | |
British Pound Sterling (Sell) | | Deutsche Bank AG | | | 5,031 | | | | 5,019 | | | | 06/02/2015 | | | | (12 | ) |
British Pound Sterling (Sell) | | Goldman Sachs Bank USA | | | 5,793 | | | | 5,604 | | | | 05/06/2015 | | | | (189 | ) |
Canadian Dollar (Sell) | | Credit Suisse International | | | 633 | | | | 604 | | | | 05/06/2015 | | | | (29 | ) |
Colombian Peso (Sell) | | BNP Paribas SA | | | 337 | | | | 350 | | | | 06/03/2015 | | | | 13 | |
Euro Currency (Buy) | | Citibank NA | | | 2,055 | | | | 1,968 | | | | 05/19/2015 | | | | 87 | |
Euro Currency (Buy) | | Deutsche Bank AG | | | 110 | | | | 106 | | | | 05/19/2015 | | | | 4 | |
Euro Currency (Buy) | | HSBC Bank USA | | | 86 | | | | 81 | | | | 05/19/2015 | | | | 5 | |
Euro Currency (Buy) | | UBS AG | | | 208 | | | | 197 | | | | 05/19/2015 | | | | 11 | |
Euro Currency (Sell) | | Citibank NA | | | 2,522 | | | | 2,387 | | | | 05/19/2015 | | | | (135 | ) |
Euro Currency (Sell) | | Citibank NA | | | 212 | | | | 215 | | | | 05/19/2015 | | | | 3 | |
Euro Currency (Sell) | | Goldman Sachs Bank USA | | | 342 | | | | 336 | | | | 05/19/2015 | | | | (6 | ) |
Euro Currency (Sell) | | Goldman Sachs Bank USA | | | 23,255 | | | | 23,690 | | | | 05/19/2015 | | | | 435 | |
Euro Currency (Sell) | | HSBC Bank USA | | | 236 | | | | 228 | | | | 05/19/2015 | | | | (8 | ) |
Indian Rupee (Buy) | | Barclays Capital | | | 912 | | | | 929 | | | | 07/24/2015 | | | | (17 | ) |
Indian Rupee (Buy) | | Goldman Sachs Bank USA | | | 738 | | | | 747 | | | | 05/18/2015 | | | | (9 | ) |
Indian Rupee (Buy) | | UBS AG | | | 1,313 | | | | 1,328 | | | | 06/26/2015 | | | | (15 | ) |
Japanese Yen (Buy) | | BNP Paribas SA | | | 2,356 | | | | 2,347 | | | | 05/08/2015 | | | | 9 | |
48
Harbor Real Return Fund
PORTFOLIO OF INVESTMENTS—Continued
| | | | | | | | | | | | | | | | | | |
| FORWARD CURRENCY CONTRACTS—Continued | |
| | | | | |
Currency | | Counterparty | | Value
(000s) | | | Aggregate
Face Value
(000s) | | | Delivery Date | | | Unrealized
Appreciation/
(Depreciation)
(000s) | |
Japanese Yen (Buy) | | JP Morgan Chase Bank NA | | $ | 1,745 | | | $ | 1,751 | | | | 05/08/2015 | | | $ | (6 | ) |
Japanese Yen (Sell) | | Credit Suisse International | | | 4,101 | | | | 4,096 | | | | 05/08/2015 | | | | (5 | ) |
Japanese Yen (Sell) | | JP Morgan Chase Bank NA | | | 1,746 | | | | 1,752 | | | | 06/03/2015 | | | | 6 | |
Mexican Peso (Buy) | | BNP Paribas SA | | | 607 | | | | 603 | | | | 05/05/2015 | | | | 4 | |
Mexican Peso (Buy) | | Credit Suisse International | | | 111 | | | | 116 | | | | 05/05/2015 | | | | (5 | ) |
Mexican Peso (Buy) | | Deutsche Bank AG | | | 1,885 | | | | 1,896 | | | | 06/11/2015 | | | | (11 | ) |
Mexican Peso (Buy) | | HSBC Bank USA | | | 595 | | | | 616 | | | | 05/05/2015 | | | | (21 | ) |
Mexican Peso (Buy) | | JP Morgan Chase Bank NA | | | 643 | | | | 648 | | | | 05/05/2015 | | | | (5 | ) |
Mexican Peso (Sell) | | Barclays Bank plc | | | 84 | | | | 87 | | | | 05/05/2015 | | | | 3 | |
Mexican Peso (Sell) | | BNP Paribas SA | | | 603 | | | | 600 | | | | 07/07/2015 | | | | (3 | ) |
Mexican Peso (Sell) | | Citibank NA | | | 51 | | | | 50 | | | | 05/05/2015 | | | | (1 | ) |
Mexican Peso (Sell) | | Citibank NA | | | 732 | | | | 742 | | | | 05/05/2015 | | | | 10 | |
Mexican Peso (Sell) | | Credit Suisse International | | | 44 | | | | 43 | | | | 05/05/2015 | | | | (1 | ) |
Mexican Peso (Sell) | | Credit Suisse International | | | 203 | | | | 208 | | | | 05/05/2015 | | | | 5 | |
Mexican Peso (Sell) | | Deutsche Bank AG London | | | 78 | | | | 80 | | | | 05/05/2015 | | | | 2 | |
Mexican Peso (Sell) | | Goldman Sachs Bank USA | | | 354 | | | | 362 | | | | 05/05/2015 | | | | 8 | |
Mexican Peso (Sell) | | HSBC Bank USA | | | 328 | | | | 325 | | | | 05/05/2015 | | | | (3 | ) |
Mexican Peso (Sell) | | HSBC Bank USA | | | 80 | | | | 83 | | | | 05/05/2015 | | | | 3 | |
Mexican Peso (Sell) | | HSBC Bank USA | | | 2,183 | | | | 2,177 | | | | 06/09/2015 | | | | (6 | ) |
Mexican Peso (Sell) | | JP Morgan Chase Bank NA | | | 640 | | | | 645 | | | | 07/07/2015 | | | | 5 | |
New Zealand Dollar (Sell) | | Credit Suisse International | | | 1,108 | | | | 1,079 | | | | 05/06/2015 | | | | (29 | ) |
Polish Zloty (Buy) | | JP Morgan Chase Bank | | | 315 | | | | 303 | | | | 07/30/2015 | | | | 12 | |
Polish Zloty (Sell) | | Barclays Capital | | | 180 | | | | 170 | | | | 07/30/2015 | | | | (10 | ) |
South African Rand (Sell) | | Barclays Bank plc | | | 230 | | | | 227 | | | | 07/30/2015 | | | | (3 | ) |
| | | | | | | | | | | | | | | | | | |
Total Forward Currency Contracts | | | $ | 239 | |
| | | | | | | | | | | | | | | | | | |
| | | | | | | | | | | | | | | | | | | | |
| SWAP AGREEMENTS OPEN AT APRIL 30, 2015 | |
|
CENTRALLY CLEARED SWAP AGREEMENTS INTEREST RATE SWAPS | |
| | | | | | |
Counterparty | | Floating Rate Index | | Pay/Receive
Floating Rate | | Fixed Rate | | | Expiration Date | | | Notional
Amount
(000s) | | | Unrealized
Appreciation/
(Depreciation)
(000s) | |
CME Group | | EUR-EURIBOR-Act/360-Bloomberg 6-Month | | Pay | | | 2.000 | % | | | 01/29/2024 | | | € | 100 | | | $ | (13 | ) |
CME Group | | EUR-EURIBOR-Act/360-Bloomberg 6-Month | | Pay | | | 1.000 | | | | 12/17/2024 | | | | 3,100 | | | | (118 | ) |
CME Group | | EUR-EURIBOR-Act/360-Bloomberg 6-Month | | Pay | | | 0.750 | | | | 09/16/2025 | | | | 6,100 | | | | 58 | |
CME Group | | EUR-EURIBOR-Act/360-Bloomberg 6-Month | | Pay | | | 1.250 | | | | 09/16/2045 | | | | 220 | | | | 5 | |
CME Group | | EUR-EURIBOR-Act/360-Bloomberg 6-Month | | Pay | | | 1.500 | | | | 03/16/2046 | | | | 200 | | | | (15 | ) |
CME Group | | British Bankers’ Association LIBOR GBP 6-Month | | Pay | | | 1.250 | | | | 06/17/2017 | | | £ | 7,800 | | | | (27 | ) |
CME Group | | British Bankers’ Association LIBOR GBP 6-Month | | Pay | | | 1.500 | | | | 09/16/2017 | | | | 8,800 | | | | (1 | ) |
CME Group | | British Bankers’ Association LIBOR GBP 6-Month | | Pay | | | 2.000 | | | | 09/16/2025 | | | | 800 | | | | 38 | |
CME Group | | British Bankers’ Association LIBOR GBP 6-Month | | Pay | | | 2.000 | | | | 09/16/2045 | | | | 1,430 | | | | 139 | |
CME Group | | British Bankers’ Association LIBOR JPY 6-Month | | Pay | | | 1.000 | | | | 09/18/2023 | | | ¥ | 40,000 | | | | (1 | ) |
CME Group | | Mexico Interbank TIIE 28 Day | | Pay | | | 4.040 | | | | 02/03/2017 | | | MEX$ | 83,400 | | | | (12 | ) |
CME Group | | Mexico Interbank TIIE 28 Day | | Pay | | | 5.630 | | | | 10/11/2021 | | | | 27,700 | | | | (35 | ) |
CME Group | | Mexico Interbank TIIE 28 Day | | Pay | | | 5.660 | | | | 11/09/2021 | | | | 42,100 | | | | (3 | ) |
CME Group | | British Bankers’ Association LIBOR USD 3-Month | | Pay | | | 3.000 | | | | 12/17/2024 | | | $ | 2,000 | | | | (121 | ) |
CME Group | | British Bankers’ Association LIBOR USD 3-Month | | Pay | | | 2.750 | | | | 06/17/2025 | | | | 6,300 | | | | (37 | ) |
CME Group | | British Bankers’ Association LIBOR USD 3-Month | | Pay | | | 3.500 | | | | 12/18/2043 | | | | 250 | | | | (64 | ) |
| | | | | | | | | | | | | | | | | | | | |
Interest Rate Swaps | | | $ | (207 | ) |
| | | | | | | | | | | | | | | | | | | | |
| | | | | | | | | | | | | | | | | | | | | | | | | | | | | | | | |
|
CENTRALLY CLEARED SWAP AGREEMENTS CREDIT DEFAULT SWAPS | |
| | | | | | | | | |
Counterparty | | Reference Entity | | Buy/
Sellb,c | | Pay/Receive
Fixed Rate | | | Expiration
Date | | | Implied
Credit
Spreadd | | | Valuee
(000s) | | | Upfront
Premium
Paid/(Received)
(000s) | | | Notional
Amountf
(000s) | | | Unrealized
Appreciation/
(Depreciation)
(000s) | |
ICE Group | | iTraxx Europe
Series 23 Version 1 | | Buy | | | 1.000 | % | | | 06/20/2020 | | | | 0.601 | % | | $ | (327 | ) | | $ | (334 | ) | | € | 13,700 | | | $ | 7 | |
ICE Group | | Dow Jones CDX North America
Investment Grade Index
Series 23 | | Buy | | | 1.000 | | | | 12/20/2019 | | | | 0.632 | | | | (60 | ) | | | (61 | ) | | $ | 3,400 | | | | 1 | |
| | | | | | | | | | | | | | | | | | | | | | | | | | | | | | | | |
Credit Default Swaps | | | $ | 8 | |
| | | | | | | | | | | | | | | | | | | | | | | | | | | | | | | | |
49
Harbor Real Return Fund
PORTFOLIO OF INVESTMENTS—Continued
| | | | | | | | | | |
| SWAP AGREEMENTS—Continued |
| | | | | | | | | | | | | | | | | | | | |
|
OVER-THE-COUNTER (OTC) SWAP AGREEMENTS INTEREST RATE SWAPS | |
| | | | | | |
Counterparty | | Floating Rate Index | | Pay/Receive
Floating Rate | | Fixed Rate | | | Expiration Date | | | Notional
Amount
(000s) | | | Unrealized
Appreciation/
(Depreciation)
(000s) | |
HSBC Bank USA NA | | Brazil Cetip Interbank Deposit | | Pay | | | 12.360 | % | | | 01/02/2018 | | | R$ | 1,000 | | | $ | (1 | ) |
UBS AG Stamford | | Brazil Cetip Interbank Deposit | | Pay | | | 12.360 | | | | 01/02/2018 | | | | 100 | | | | — | |
Goldman Sachs Bank USA | | Eurostat Eurozone HICP Ex Tobacco NSA | | Receive | | | 1.050 | | | | 09/15/2019 | | | € | 1,600 | | | | (16 | ) |
BNP Paribas SA | | UK Retail Prices Index All Items NSA | | Pay | | | 3.125 | | | | 12/15/2024 | | | £ | 300 | | | | 7 | |
BNP Paribas SA | | UK Retail Prices Index All Items NSA | | Pay | | | 3.550 | | | | 12/11/2044 | | | | 100 | | | | 4 | |
Citibank NA | | UK Retail Prices Index All Items NSA | | Pay | | | 3.190 | | | | 04/15/2030 | | | | 400 | | | | (15 | ) |
Citibank NA | | UK Retail Prices Index All Items NSA | | Pay | | | 3.500 | | | | 10/15/2044 | | | | 200 | | | | 11 | |
Credit Suisse International | | UK Retail Prices Index All Items NSA | | Pay | | | 3.100 | | | | 12/11/2024 | | | | 200 | | | | 1 | |
Credit Suisse International | | UK Retail Prices Index All Items NSA | | Pay | | | 3.530 | | | | 09/23/2044 | | | | 200 | | | | 9 | |
Credit Suisse International | | UK Retail Prices Index All Items NSA | | Pay | | | 3.500 | | | | 10/15/2044 | | | | 300 | | | | 1 | |
Credit Suisse International | | UK Retail Prices Index All Items NSA | | Pay | | | 3.550 | | | | 11/15/2044 | | | | 100 | | | | 5 | |
Goldman Sachs Bank USA | | UK Retail Prices Index All Items NSA | | Pay | | | 3.140 | | | | 01/14/2030 | | | | 950 | | | | (32 | ) |
Goldman Sachs Bank USA | | UK Retail Prices Index All Items NSA | | Pay | | | 3.360 | | | | 04/15/2035 | | | | 200 | | | | (8 | ) |
JP Morgan Chase Bank NA | | UK Retail Prices Index All Items NSA | | Pay | | | 3.528 | | | | 09/23/2044 | | | | 200 | | | | 8 | |
Morgan Stanley Capital Services LLC | | UK Retail Prices Index All Items NSA | | Pay | | | 3.500 | | | | 10/15/2044 | | | | 200 | | | | 6 | |
UBS AG Stamford | | UK Retail Prices Index All Items NSA | | Pay | | | 2.950 | | | | 01/12/2025 | | | | 200 | | | | (3 | ) |
Barclays Bank plc | | US Consumer Price Index Urban Consumers NSA | | Receive | | | 1.910 | | | | 04/15/2017 | | | $ | 2,700 | | | | (73 | ) |
BNP Paribas SA | | US Consumer Price Index Urban Consumers NSA | | Receive | | | 1.830 | | | | 11/29/2016 | | | | 200 | | | | (4 | ) |
BNP Paribas SA | | US Consumer Price Index Urban Consumers NSA | | Receive | | | 2.250 | | | | 07/15/2017 | | | | 17,000 | | | | (850 | ) |
Deutsche Bank AG | | US Consumer Price Index Urban Consumers NSA | | Receive | | | 1.860 | | | | 11/05/2016 | | | | 2,700 | | | | (57 | ) |
Deutsche Bank AG | | US Consumer Price Index Urban Consumers NSA | | Receive | | | 1.830 | | | | 11/29/2016 | | | | 2,300 | | | | (46 | ) |
Deutsche Bank AG | | US Consumer Price Index Urban Consumers NSA | | Receive | | | 1.850 | | | | 11/29/2016 | | | | 1,900 | | | | (40 | ) |
Deutsche Bank AG | | US Consumer Price Index Urban Consumers NSA | | Receive | | | 2.360 | | | | 01/28/2017 | | | | 1,900 | | | | (88 | ) |
Deutsche Bank AG | | US Consumer Price Index Urban Consumers NSA | | Receive | | | 2.173 | | | | 11/01/2018 | | | | 2,000 | | | | (75 | ) |
Deutsche Bank AG | | US Consumer Price Index Urban Consumers NSA | | Receive | | | 2.500 | | | | 07/15/2022 | | | | 300 | | | | (32 | ) |
Goldman Sachs Bank USA | | US Consumer Price Index Urban Consumers NSA | | Receive | | | 2.420 | | | | 02/12/2017 | | | | 2,000 | | | | (95 | ) |
Goldman Sachs Bank USA | | US Consumer Price Index Urban Consumers NSA | | Receive | | | 2.180 | | | | 10/01/2018 | | | | 1,100 | | | | (41 | ) |
Royal Bank of Scotland plc | | US Consumer Price Index Urban Consumers NSA | | Receive | | | 1.940 | | | | 10/23/2016 | | | | 3,200 | | | | (82 | ) |
Royal Bank of Scotland plc | | US Consumer Price Index Urban Consumers NSA | | Receive | | | 1.930 | | | | 10/31/2016 | | | | 3,700 | | | | (87 | ) |
Royal Bank of Scotland plc | | US Consumer Price Index Urban Consumers NSA | | Receive | | | 2.250 | | | | 07/15/2017 | | | | 2,500 | | | | (130 | ) |
| | | | | | | | | | | | | | | | | | | | |
Interest Rate Swaps | | | $ | (1,723 | ) |
| | | | | | | | | | | | | | | | | | | | |
| | | | | | | | | | | | | | | | | | | | | | | | | | | | | | | | |
|
OVER-THE-COUNTER (OTC) SWAP AGREEMENTS CREDIT DEFAULT SWAPS | |
| | | | | | | | | |
Counterparty | | Reference Entity | | Buy/
Sellb,c | | Pay/Receive
Fixed Rate | | | Expiration
Date | | | Implied
Credit
Spreadd | | | Valuee
(000s) | | | Upfront
Premium
Paid/(Received)
(000s) | | | Notional
Amountf
(000s) | | | Unrealized
Appreciation/
(Depreciation)
(000s) | |
Morgan Stanley Capital Services LLC | | Hellenic Republic | | Sell | | | 1.000 | % | | | 06/20/2015 | | | | 0.635 | % | | $ | (35 | ) | | $ | (10 | ) | | € | 200 | | | $ | (25 | ) |
Citibank NA | | Gatx Corp.
5.800% due 03/01/2016 | | Buy | | | 1.070 | | | | 03/20/2016 | | | | 0.324 | | | | (10 | ) | | | — | | | $ | 1,000 | | | | (10 | ) |
Goldman Sachs International | | JSC GAZPROM | | Sell | | | 1.000 | | | | 03/20/2016 | | | | 3.767 | | | | (5 | ) | | | (16 | ) | | | 200 | | | | 11 | |
JP Morgan Chase Bank NA | | JSC GAZPROM | | Sell | | | 1.000 | | | | 03/20/2016 | | | | 3.767 | | | | (2 | ) | | | (7 | ) | | | 100 | | | | 5 | |
Morgan Stanley Capital Services LLC | | JSC GAZPROM | | Sell | | | 1.000 | | | | 03/20/2016 | | | | 3.767 | | | | (3 | ) | | | (8 | ) | | | 100 | | | | 5 | |
Barclays Bank plc | | Republic of Italy
6.880% due 09/27/2023 | | Sell | | | 1.000 | | | | 03/20/2019 | | | | 0.932 | | | | 1 | | | | (5 | ) | | | 300 | | | | 6 | |
BNP Paribas SA | | Republic of Italy
6.880% due 09/27/2023 | | Sell | | | 1.000 | | | | 03/20/2019 | | | | 0.932 | | | | 1 | | | | (11 | ) | | | 600 | | | | 12 | |
Goldman Sachs International | | Sberbank | | Sell | | | 1.000 | | | | 03/20/2016 | | | | 4.447 | | | | (3 | ) | | | (6 | ) | | | 100 | | | | 3 | |
| | | | | | | | | | | | | | | | | | | | | | | | | | | | | | | | |
Credit Default Swaps | | | $ | 7 | |
| | | | | | | | | | | | | | | | | | | | | | | | | | | | | | | | |
Total Swaps | | | $ | (1,915 | ) |
| | | | | | | | | | | | | | | | | | | | | | | | | | | | | | | | |
FAIR VALUE MEASUREMENTS
Holdings in Futures Contracts and Written Options valued at $(57) and $(6), respectively, are classified as Level 1. All other holdings at April 30, 2015 (as disclosed in the preceding Portfolio of Investments) are classified as Level 2. There were no Level 3 holdings at October 31, 2014 or April 30, 2015 and no transfers between levels during the period.
For more information on valuation inputs and their aggregation into the levels identified above, please refer to the Fair Value Measurements and Disclosures in Note 2 of the accompanying Notes to Financial Statements.
50
Harbor Real Return Fund
PORTFOLIO OF INVESTMENTS—Continued
| 1 | Floating rate security, the stated rate represents the rate in effect at April 30, 2015. |
| 2 | Securities purchased in a transaction exempt from registration under Rule 144A of the Securities Act of 1933. These securities may be resold in transactions exempt from registration, normally to qualified institutional buyers. The Fund has no right to demand registration of these securities. These securities are priced by an independent pricing service in accordance with Harbor Funds Valuation Procedures. At April 30, 2015, the aggregate value of these securities was $11,806 or 8% of net assets. |
| 3 | Step coupon security, the stated rate represents the rate in effect at April 30, 2015. |
| 4 | CLO after the name of a security stands for Collateralized Loan Obligations. |
| 5 | Variable rate security, the stated rate represents the rate in effect at April 30, 2015. |
| 6 | MTN after the name of a security stands for Medium Term Note. |
| 7 | Perpetuity bond, the maturity date represents the next callable date. |
| 8 | Inflation-protected securities (“IPS”) are securities in which the principal amount is adjusted for inflation and interest payments are applied to the inflation-adjusted principal. |
| 9 | REMICs are CMOs which can hold mortgages secured by any type of real property and issue multiple-class securities backed by those mortgages. |
| 10 | At April 30, 2015, a portion of securities held by the Fund were pledged to cover margin requirements for open future contracts, written options on futures contracts and swap options (see Note 2 of the accompanying Notes to Financial Statements). The securities pledged had an aggregate value of $2,384 or 2% of net assets. |
| b | If the Fund is a buyer of protection and a credit event occurs, as defined under the terms of that particular swap agreement, the Fund will either (i) receive from the seller of protection an amount equal to the notional amount of the swap and deliver the referenced obligation or underlying securities comprising the referenced index or (ii) receive a net settlement amount in the form of cash or securities equal to the notional amount of the swap less the recovery value of the referenced obligation or underlying securities comprising the referenced index. |
| c | If the Fund is a seller of protection and a credit event occurs, as defined under the terms of that particular swap agreement, the Fund will either (i) pay to the buyer of protection an amount equal to the notional amount of the swap and take delivery of the referenced obligation or underlying securities comprising the referenced index or (ii) pay a net settlement amount in the form of cash or securities equal to the notional amount of the swap less the recovery value of the referenced obligation or underlying securities comprising the referenced index. |
| d | Implied credit spreads, represented in absolute terms, utilized in determining the value of credit default swap agreements on corporate issues or sovereign issues of an emerging country as of period end serve as an indicator of the current status of the payment/performance risk and represent the likelihood or risk of default for the credit derivative. The implied credit spread of a particular referenced entity reflects the cost of buying/selling protection and may include upfront payments required to be made to enter into the agreement. Wider credit spreads represent a deterioration of the referenced entity’s credit soundness and a greater likelihood or risk of default or other credit event occurring as defined under the terms of the agreement. A credit spread identified as “Defaulted” indicates a credit event has occurred for the referenced entity or obligation. |
| e | The quoted market prices and resulting values for credit default swap agreements on asset-backed securities and credit indices serve as an indicator of the current status of the payment/performance risk and represent the likelihood of an expected liability (or profit) for the credit derivative should the notional amount of the swap agreement be closed/sold as of the period end. Increasing values, in absolute terms when compared to the notional amount of the swap, represent a deterioration of the referenced entity’s credit soundness and a greater likelihood or risk of default or other credit event occurring as defined under the terms of the agreement. |
| f | The maximum potential amount the Fund could be required to make as a seller of credit protection or receive as a buyer of credit protection if a credit event occurs as defined under the terms of that particular swap agreement. |
| j | Amount represents Index Value. |
The accompanying notes are an integral part of the Financial Statements.
51
Harbor Money Market Fund
MANAGER’S COMMENTARY (Unaudited)
SUBADVISER
Fischer Francis Trees & Watts, Inc.
200 Park Avenue
New York, NY 10166
PORTFOLIO MANAGER
Kenneth O’Donnell, CFA
Since 2003
Fischer Francis has subadvised the Fund since its inception in 1987.
INVESTMENT OBJECTIVE
The Fund seeks to provide current income while maintaining liquidity and a stable share price of $1.
PRINCIPAL STYLE CHARACTERISTICS
Very short-term high quality money market instruments

Kenneth O’Donnell
Management’s Discussion of Fund Performance
MARKET REVIEW
U.S. economic growth decelerated during the first half of fiscal 2015, with broad based declines in consumer spending and business investment. The pause in the rate of economic growth followed a period in which the U.S. had expanded at the fastest pace in a decade. Recent weakness may prove to be transitory and attributed to a combination of difficult weather patterns, a commodity-price-related decline in shale oil production, and a surge in the U.S. dollar. Volatility in quarterly GDP has occurred as central banks across advanced economies contemplate divergent monetary policies. The U.S. Federal Reserve and Bank of England are considering reductions in monetary policy accommodation, while the European Central Bank and Bank of Japan continue to provide unprecedented stimulus to combat deflationary pressures.
After winding down its large-scale asset-purchase program in October, the Federal Reserve set the stage for a potential tightening of monetary policy later in calendar 2015 by removing the phrase that it would be “patient” before normalizing monetary policy. With unemployment rates approaching what economists call NAIRU, or the non-accelerating inflation rate of unemployment, the Fed has become increasingly focused on inflation, which has remained below target. NAIRU is a theoretical employment level at which pressures of inflation are neither rising nor falling. The market is forecasting a “lift-off” in monetary policy rates in the fourth quarter, although the Fed has indicated that the first tightening could occur at any meeting. This contrasts with previous communication strategies, during the recession, which provided more specific forward guidance. During the fiscal first half Federal Reserve Chair Janet Yellen continued to assert that monetary policy would remain accommodative and would continue to support growth throughout the early stages of a tightening cycle.
Despite the end of quantitative easing purchases by the Fed and the potential for a shift in U.S. monetary policy, U.S. Treasury note yields trended lower in the first half of fiscal 2015. The rally in the Treasury market coincided with a reduction in global growth, a steep decline in energy prices, and a re-emergence of geopolitical challenges. In the closing weeks of the fiscal period, benchmark 10-year U.S. Treasury note yields remained near 2% as investors assessed the future path of monetary policy. Recent interest rate levels suggest a slower pace of tightening than that indicated in forecasts provided by the Federal Reserve in its recent Statement of Economic Projections.
Money market yields remained anchored to a near-zero interest rate policy throughout the period. Volatility in short-term interest rate markets was low as yields hovered barely above zero. We believe that money market yields are likely to remain at current levels through mid-year, when short-term markets could begin to discount the early stages of monetary tightening later in the year.
PERFORMANCE
Despite the low interest rate environment, Harbor Money Market Fund provided competitive returns. For the six months ended April 30, 2015, the Fund returned 0.03% (Institutional and Administrative Classes). This compares with the return of 0.01% for the Fund’s benchmark, the BofA Merrill Lynch 3-Month U.S. Treasury Bill Index. The duration of the portfolio, a measure of its sensitivity to changes in interest rates, was maintained at roughly 45 days throughout the six-month period.
52
Harbor Money Market Fund
MANAGER’S COMMENTARY—Continued
| | | | |
TOP ISSUERS (% of net assets) | |
Federal Home Loan Bank | | | 86.8% | |
U.S. Treasury | | | 13.5% | |
Federal Home Loan Mortgage Corp. | | | 7.7% | |
Federal National Mortgage Association | | | 2.1% | |
Repurchase Agreement with State Street Corp. | | | 0.2% | |
OUTLOOK AND STRATEGY
Looking ahead, we expect U.S. economic growth to rebound to an annual pace of roughly 3% for the remainder of calendar 2015. We believe that the headwinds that impeded recovery in previous years have abated and fiscal challenges have moderated. We expect that acceleration in private investment will provide support for a sustainable trajectory of domestic growth. In the near term, our view is that the “wealth effect” associated with steady increases in financial and housing markets combined with an improving labor sector should support elevated levels of consumption.
We believe that markets have responded well to the Federal Reserve’s indication of a potential shift in monetary policy, with interest rates trading within a defined range. The next step in the policy sequence is expected to be removal of excess reserves from the banking system. The Fed has indicated that policy-tightening measures will continue to focus on the federal funds rate as the primary metric. We expect the Fed to utilize multiple tools to manage short-term rates, including interest paid on banking reserves and its overnight fixed-rate reserve purchase agreement program, also called the reverse repo facility. Reinvestment of cash flows from securities held on the Fed’s balance sheet will continue beyond the date of the first tightening, in our view. We expect that the complexity and transparency of the policy shift will provide us with ample time to adjust the Fund’s duration profile as short-term interest rates climb.
We have maintained what we believe is a conservative investment strategy for the Fund, limiting investments to U.S. Treasury and agency obligations while complying with the regulatory framework governing money market funds. (Money market funds are regulated by Rule 2a-7 of the Investment Company Act of 1940.)
This report contains the current opinions of Fischer Francis Trees & Watts, Inc. at the time of its publication and should not be considered as investment advice or a recommendation of any particular security, strategy or investment product. Such opinions are subject to change without notice and securities described herein may no longer be included in, or may at any time be removed from, the Fund’s portfolio. This report is distributed for informational purposes only. Information contained herein has been obtained from sources believed reliable, but not guaranteed.
An investment in the Fund is not insured or guaranteed by the FDIC or any other government agency. Although the Fund seeks to preserve the value of your investment at $1.00 per share, it is possible to lose money by investing in the Fund. For information on the different share classes and the risks associated with an investment in the Fund, please refer to the current prospectus.
53
Harbor Money Market Fund
FUND SUMMARY—April 30, 2015 (Unaudited)
| | | | |
INSTITUTIONAL CLASS |
| | | | |
| Fund # | | | | 2015 |
| | |
| Cusip | | | | 411511405 |
| | |
| Ticker | | | | HARXX |
| | |
| Inception Date | | | | 12/29/1987 |
| | |
| Net Expense Ratio | | | | 0.00%a,b |
| | |
| Total Net Assets (000s) | | | | $140,837 |
| | | | |
ADMINISTRATIVE CLASS |
| | | | |
| Fund # | | | | 2215 |
| | |
| Cusip | | | | 411511660 |
| | |
| Ticker | | | | HRMXX |
| | |
| Inception Date | | | | 11/01/2002 |
| | |
| Net Expense Ratio | | | | 0.00%a,b |
| | |
| Total Net Assets (000s) | | | | $1,734 |
PORTFOLIO STATISTICS
| | | | | | | | |
| | | Portfolio | | | Benchmark | |
| | |
Yield to Maturity | | | 0.05% | | | | 0.00% | |
| | |
Weighted Average Maturity | | | 0.09 years | | | | 0.13 years | |
| | |
Weighted Average Duration | | | 0.09 years | | | | 0.14 years | |
FUND PERFORMANCE
The graph compares a $10,000 investment in the Fund with the performance of the BofA Merrill Lynch 3-Month U.S. Treasury Bill Index. The Fund’s performance includes the reinvestment of all dividend and capital gain distributions.
CHANGE IN A $10,000 INVESTMENT
For the period 05/01/2005 through 04/30/2015
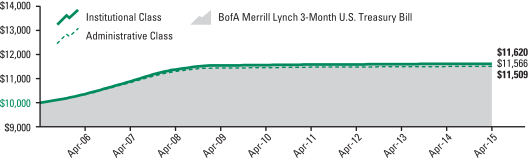
| | | | | | | | | | | | | | | | | | | | | | | | |
Total Returns For the periods ended 04/30/2015 | |  | |
| Harbor Money Market Fund | | | | | | | | | | | | | | | | | | | | | | | | |
Institutional Class | | | 0.03 | % | | | 0.06 | % | | | 0.10 | % | | | 1.51 | % | | | 12/29/1987 | | | $ | 11,620 | |
Administrative Class | | | 0.03 | % | | | 0.06 | % | | | 0.10 | % | | | 1.42 | % | | | 11/01/2002 | | | $ | 11,509 | |
| Comparative Index | | | | | | | | | | | | | | | | | | | | | | | | |
BofA Merrill Lynch 3-Month U.S. Treasury Bill | | | 0.01 | % | | | 0.02 | % | | | 0.09 | % | | | 1.47 | % | | | — | | | $ | 11,566 | |
| Current 7-day subsidizedd SEC yield for period ended 04/30/2015: | | | Institutional Class: 0.07% | | | | Administrative Class: 0.07% | |
| Current 7-day unsubsidizede SEC yield for period ended 04/30/2015: | | | Institutional Class: -0.25% | | | | Administrative Class: -0.50% | |
Performance data shown represents past performance and is no guarantee of future results. Current performance may be higher or lower than past performance data shown. Investment return and yield will vary. You can obtain performance data current to the most recent month-end (available within seven business days after the most recent month-end) by calling 800-422-1050 or visiting harborfunds.com.
The returns shown do not reflect the deduction of taxes that a shareholder would pay on Fund distributions or on the redemption of Fund shares. From time to time, certain fees and/or expenses have been waived or reimbursed, which has resulted in higher returns. Without these waivers and reimbursements, the returns would have been lower. Voluntary waivers and reimbursements may be discontinued at any time without notice. Current yield excludes gains and losses as defined by the Securities and Exchange Commission. The current yield more closely reflects the current earnings of the Fund than the total return.
| b | Reflective of a contractual fee waiver and expense cap effective through February 29, 2016, as well as a voluntary fee waiver that may be discontinued at any time. |
| d | Reflects reimbursement or waivers currently in effect. |
| e | Does not reflect reimbursements or waivers currently in effect. |
54
Harbor Money Market Fund
PORTFOLIO OF INVESTMENTS—April 30, 2015 (Unaudited)
Total Investments (% of net assets)
(Excludes net cash of –10.3%)

| | | | | | | | |
GOVERNMENT AGENCY DEBT—96.6% | |
Principal
Amount
(000s) | | | | | Value
(000s) | |
| | | | Federal Home Loan Bank Discount Notes | | | | |
| $ | 16,910 | | | 0.000%—05/01/2015 | | $ | 16,910 | |
| | 4,000 | | | 0.045%—05/13/2015 | | | 4,000 | |
| | 5,000 | | | 0.055%—05/18/2015 | | | 5,000 | |
| | 14,300 | | | 0.060%—05/26/2015-05/29/2015 | | | 14,299 | |
| | 1,716 | | | 0.065%—06/15/2015 | | | 1,716 | |
| | 6,600 | | | 0.070%—06/10/2015-06/24/2015 | | | 6,599 | |
| | 16,000 | | | 0.071%—06/05/2015-06/12/2015 | | | 15,999 | |
| | 4,600 | | | 0.072%—05/22/2015 | | | 4,600 | |
| | 3,000 | | | 0.073%—06/26/2015 | | | 3,000 | |
| | 6,300 | | | 0.080%—05/27/2015-07/06/2015 | | | 6,299 | |
| | 7,400 | | | 0.083%—07/15/2015-07/22/2015 | | | 7,399 | |
| | 15,000 | | | 0.088%—06/03/2015 | | | 14,999 | |
| | 10,290 | | | 0.095%—05/20/2015 | | | 10,289 | |
| | 2,100 | | | 0.111%—05/19/2015 | | | 2,100 | |
| | 5,000 | | | 0.115%—08/19/2015 | | | 4,998 | |
| | 5,635 | | | 0.170%—09/04/2015 | | | 5,632 | |
| | | | | | | | |
| | | | | | | 123,839 | |
| | | | | | | | |
| | | | Federal Home Loan Mortgage Corp. Discount Notes | | | | |
| | 3,239 | | | 0.060%—06/01/2015 | | | 3,239 | |
| | 4,700 | | | 0.075%—05/05/2015 | | | 4,700 | |
| | 3,000 | | | 0.077%—05/13/2015 | | | 3,000 | |
| | | | | | | | |
| | | | | | | 10,939 | |
| | | | | | | | |
| | | | Federal National Mortgage Association Discount Notes | | | | |
| 1,000 | | | 0.050%—05/06/2015 | | | 1,000 | |
| | 2,000 | | | 0.080%—06/02/2015 | | | 2,000 | |
| | | | | | | | |
| | | | | | | 3,000 | |
| | | | | | | | |
| TOTAL GOVERNMENT AGENCY DEBT
(Cost $137,778) | | | 137,778 | |
| | | | | | | | |
| | | | | | | | |
TREASURY DEBT—13.5% | |
| | | | U.S. Treasury Bills | | | | |
| | 2,300 | | | 0.065%—05/14/2015 | | | 2,300 | |
| | 16,900 | | | 0.070%—05/07/2015 | | | 16,900 | |
| | | | | | | | |
| TOTAL TREASURY DEBT
(Cost $19,200) | | | 19,200 | |
| | | | | | | | |
| | | | | | | | |
REPURCHASE AGREEMENTS—0.2% | |
| (Cost $ 300) | | | | |
| | 300 | | | Repurchase Agreement with State Street Corp.
dated April 30, 2015 due May 01, 2015 at 0.000% collateralized by U.S. Treasury Notes (market value $309) | | | 300 | |
| | | | | | | | |
| TOTAL INVESTMENTS—110.3%
(Cost $ 157,278)1 | | | 157,278 | |
| | | | | | | | |
| | CASH AND OTHER ASSETS, LESS LIABILITIES—(10.3)% | | | (14,707 | ) |
| | | | | | | | |
| | TOTAL NET ASSETS—100.0% | | $ | 142,571 | |
| | | | | | | | |
FAIR VALUE MEASUREMENTS
All holdings at April 30, 2015 (as disclosed in the preceding Portfolio of Investments) are classified as Level 2. There were no Level 3 holdings at October 31, 2014 or April 30, 2015, and no transfers between levels during the period.
For more information on valuation inputs and their aggregation into the levels identified above, please refer to the Fair Value Measurements and Disclosures in Note 2 of the accompanying Notes to Financial Statements.
| 1 | The aggregate identified cost on a tax basis is the same. |
The accompanying notes are an integral part of the Financial Statements.
55
Harbor Fixed Income Funds
STATEMENTS OF ASSETS AND LIABILITIES—April 30, 2015 (Unaudited)
(All amounts in thousands, except per share amounts)
| | | | | | | | | | | | | | | | | | | | |
| | | Harbor
Convertible
Securities Fund | | | Harbor
High-Yield
Bond Fund | | | Harbor
Bond
Fund | | | Harbor
Real Return
Fund | | | Harbor
Money
Market Fund | |
| ASSETS | | | | | | | | | | | | | | | | | | | | |
Investments, at identified cost* | | $ | 360,374 | | | $ | 1,688,525 | | | $ | 4,122,901 | | | $ | 194,385 | | | $ | 157,278 | |
Investments, at value | | $ | 359,652 | | | $ | 1,583,028 | | | $ | 4,187,673 | | | $ | 194,315 | | | $ | 156,978 | |
Repurchase agreements | | | 12,277 | | | | 118,597 | | | | 33,800 | | | | 447 | | | | 300 | |
Cash-restricted | | | — | | | | — | | | | 9,633 | | | | 525 | | | | — | |
Cash | | | — | | | | — | | | | 1,193 | | | | — | | | | — | |
Foreign currency, at value (cost: $0, $0, $5,826, $358 and $0) | | | — | | | | — | | | | 6,125 | | | | 373 | | | | — | |
Receivables for: | | | | | | | | | | | | | | | | | | | | |
Investments sold | | | 4,051 | | | | 1,236 | | | | 464,388 | | | | 939 | | | | — | |
Foreign currency spot contracts | | | — | | | | — | | | | 45 | | | | 1 | | | | — | |
Capital shares sold | | | 335 | | | | 31,654 | | | | 2,355 | | | | 88 | | | | 121 | |
Dividends | | | — | | | | — | | | | 108 | | | | — | | | | — | |
Interest | | | 1,857 | | | | 24,395 | | | | 26,958 | | | | 768 | | | | — | |
Unrealized appreciation on open forward currency contracts | | | — | | | | — | | | | 76,928 | | | | 949 | | | | — | |
Unrealized appreciation on OTC swap agreements | | | — | | | | — | | | | 1,985 | | | | 94 | | | | — | |
Variation margin on centrally cleared swap agreements | | | — | | | | — | | | | 4,590 | | | | 328 | | | | — | |
Options sold | | | — | | | | — | | | | 389 | | | | — | | | | — | |
Withholding tax | | | — | | | | — | | | | 34 | | | | — | | | | — | |
Prepaid registration fees | | | 23 | | | | 24 | | | | 13 | | | | 13 | | | | 14 | |
Prepaid fund insurance | | | 1 | | | | 5 | | | | 12 | | | | 1 | | | | 1 | |
Other assets | | | 5 | | | | 55 | | | | 267 | | | | 27 | | | | 13 | |
Total Assets | | | 378,201 | | | | 1,758,994 | | | | 4,816,496 | | | | 198,868 | | | | 157,427 | |
LIABILITIES | | | | | | | | | | | | | | | | | | | | |
Payables for: | | | | | | | | | | | | | | | | | | | | |
Due to broker | | | — | | | | — | | | | 42,297 | | | | 453 | | | | — | |
Due to custodian | | | — | | | | 2,365 | | | | — | | | | — | | | | — | |
Investments purchased | | | 3,496 | | | | 4,586 | | | | 962,787 | | | | 2,139 | | | | — | |
Foreign currency spot contracts | | | — | | | | — | | | | 94 | | | | — | | | | — | |
Capital shares reacquired | | | 320 | | | | 1,471 | | | | 2,637 | | | | 22 | | | | 14,800 | |
Written options, at value (premiums received: $0, $0, $7,170, $478 and $0) | | | — | | | | — | | | | 2,770 | | | | 417 | | | | — | |
Swap premiums received | | | — | | | | — | | | | 1,875 | | | | 38 | | | | — | |
Unrealized depreciation on OTC swap agreements | | | — | | | | — | | | | 331 | | | | 1,810 | | | | — | |
Sale-buyback financing transactions | | | — | | | | — | | | | 84,953 | | | | 38,934 | | | | — | |
Variation margin on options and futures contracts | | | — | | | | — | | | | 794 | | | | 16 | | | | — | |
Unrealized depreciation on open forward currency contracts | | | — | | | | — | | | | 45,271 | | | | 710 | | | | — | |
Accrued expenses: | | | | | | | | | | | | | | | | | | | | |
Management fees | | | 199 | | | | 787 | | | | 1,346 | | | | 61 | | | | 23 | |
12b-1 fees | | | 1 | | | | 22 | | | | 17 | | | | 1 | | | | 1 | |
Transfer agent fees | | | 19 | | | | 98 | | | | 192 | | | | 8 | | | | 8 | |
Trustees’ fees and expenses | | | 1 | | | | 9 | | | | 28 | | | | 1 | | | | 1 | |
Other | | | 29 | | | | 150 | | | | 503 | | | | 60 | | | | 23 | |
Total Liabilities | | | 4,065 | | | | 9,488 | | | | 1,145,895 | | | | 44,670 | | | | 14,856 | |
NET ASSETS | | $ | 374,136 | | | $ | 1,749,506 | | | $ | 3,670,601 | | | $ | 154,198 | | | $ | 142,571 | |
Net Assets Consist of: | | | | | | | | | | | | | | | | | | | | |
Paid-in capital | | $ | 359,091 | | | $ | 1,731,486 | | | $ | 3,547,621 | | | $ | 182,076 | | | $ | 142,536 | |
Accumulated undistributed net investment income/(loss) | | | (1,761 | ) | | | 8,340 | | | | (6,666 | ) | | | (4,658 | ) | | | 35 | |
Accumulated net realized gain/(loss) | | | 5,251 | | | | (3,420 | ) | | | 18,109 | | | | (21,936 | ) | | | — | |
Unrealized appreciation/(depreciation) of investments and translation of assets and liabilities in foreign currencies | | | 11,555 | | | | 13,100 | | | | 98,806 | | | | 393 | | | | — | |
Unrealized appreciation/(depreciation) of other financial instruments | | | — | | | | — | | | | 12,731 | | | | (1,677 | ) | | | — | |
| | | $ | 374,136 | | | $ | 1,749,506 | | | $ | 3,670,601 | | | $ | 154,198 | | | $ | 142,571 | |
NET ASSET VALUE PER SHARE BY CLASS | | | | | | | | | | | | | | | | | | | | |
Institutional Class | | | | | | | | | | | | | | | | | | | | |
Net assets | | $ | 371,865 | | | $ | 1,644,469 | | | $ | 3,590,612 | | | $ | 150,631 | | | $ | 140,837 | |
Shares of beneficial interest1 | | | 34,004 | | | | 155,340 | | | | 293,321 | | | | 15,833 | | | | 140,837 | |
Net asset value per share2 | | $ | 10.94 | | | $ | 10.59 | | | $ | 12.24 | | | $ | 9.51 | | | $ | 1.00 | |
Administrative Class | | | | | | | | | | | | | | | | | | | | |
Net assets | | $ | 384 | | | $ | 4,452 | | | $ | 79,989 | | | $ | 3,567 | | | $ | 1,734 | |
Shares of beneficial interest1 | | | 35 | | | | 420 | | | | 6,531 | | | | 375 | | | | 1,734 | |
Net asset value per share2 | | $ | 10.93 | | | $ | 10.60 | | | $ | 12.25 | | | $ | 9.51 | | | $ | 1.00 | |
Investor Class | | | | | | | | | | | | | | | | | | | | |
Net assets | | $ | 1,887 | | | $ | 100,585 | | | | N/A | | | | N/A | | | | N/A | |
Shares of beneficial interest1 | | | 173 | | | | 9,490 | | | | |
Net asset value per share2 | | $ | 10.92 | | | $ | 10.60 | | | | |
| * | Including repurchase agreements and short-term investments. |
| 1 | Par value $0.01 (unlimited authorizations). |
| 2 | Per share amounts can be recalculated to the amounts disclosed herein when total net assets and shares of beneficial interest are not rounded to thousands. |
The accompanying notes are an integral part of the Financial Statements.
56
Harbor Fixed Income Funds
STATEMENTS OF OPERATIONS—Six Months Ended April 30, 2015 (Unaudited)
(All amounts in thousands)
| | | | | | | | | | | | | | | | | | | | |
| | | Harbor
Convertible
Securities Fund | | | Harbor
High-Yield
Bond Fund | | | Harbor
Bond
Fund | | | Harbor
Real Return
Fund | | | Harbor
Money Market
Fund | |
Investment Income | | | | | | | | | | | | | | | | | | | | |
Interest | | $ | 3,565 | | | $ | 52,605 | | | $ | 63,064 | | | $ | 1,318 | | | $ | 54 | |
Earned inflation/(deflation) adjustments | | | — | | | | — | | | | (6,313 | ) | | | (1,320 | ) | | | — | |
Gain/(loss) on principal paydown transactions | | | — | | | | — | | | | (1,514 | ) | | | 9 | | | | — | |
Amortization | | | 330 | | | | (606 | ) | | | (11 | ) | | | (806 | ) | | | — | |
Dividends | | | — | | | | — | | | | 295 | | | | — | | | | — | |
Consent fee income | | | — | | | | 322 | | | | — | | | | — | | | | — | |
Total Investment Income | | | 3,895 | | | | 52,321 | | | | 55,521 | | | | (799 | ) | | | 54 | |
Operating Expenses | | | | | | | | | | | | | | | | | | | | |
Management fees | | | 1,149 | | | | 5,047 | | | | 9,367 | | | | 382 | | | | 156 | |
12b-1 fees: | | | | | | | | | | | | | | | | | | | | |
Administrative Class | | | — | | | | 6 | | | | 118 | | | | 4 | | | | 2 | |
Investor Class | | | 2 | | | | 122 | | | | N/A | | | | N/A | | | | N/A | |
Shareholder communications | | | 7 | | | | 39 | | | | 166 | | | | 28 | | | | 1 | |
Custodian fees | | | 15 | | | | 39 | | | | 293 | | | | 60 | | | | 11 | |
Transfer agent fees: | | | — | | | | — | | | | — | | | | — | | | | — | |
Institutional Class | | | 108 | | | | 487 | | | | 1,173 | | | | 48 | | | | 48 | |
Administrative Class | | | — | | | | 1 | | | | 29 | | | | 1 | | | | 1 | |
Investor Class | | | 2 | | | | 89 | | | | N/A | | | | N/A | | | | N/A | |
Professional fees | | | 3 | | | | 15 | | | | 42 | | | | 1 | | | | 2 | |
Trustees’ fees and expenses | | | 4 | | | | 19 | | | | 49 | | | | 2 | | | | 2 | |
Registration fees | | | 24 | | | | 33 | | | | 43 | | | | 22 | | | | 16 | |
Miscellaneous | | | 6 | | | | 12 | | | | 25 | | | | 4 | | | | 4 | |
Expenses before interest expense | | | 1,320 | | | | 5,909 | | | | 11,305 | | | | 552 | | | | 243 | |
Interest expense | | | — | | | | — | | | | 126 | | | | 61 | | | | — | |
Total expenses | | | 1,320 | | | | 5,909 | | | | 11,431 | | | | 613 | | | | 243 | |
Management fees waived | | | — | | | | (336 | ) | | | (669 | ) | | | — | | | | (156 | ) |
Transfer agent fees waived | | | (4 | ) | | | (19 | ) | | | (43 | ) | | | (2 | ) | | | (2 | ) |
Other expenses reimbursed | | | — | | | | — | | | | (318 | ) | | | (77 | ) | | | (85 | ) |
Net expenses | | | 1,316 | | | | 5,554 | | | | 10,401 | | | | 534 | | | | — | |
Net Investment Income/(Loss) | | | 2,579 | | | | 46,767 | | | | 45,120 | | | | (1,333 | ) | | | 54 | |
Realized and Change in Net Unrealized Gain/(Loss) on Investment Transactions | | | | | | | | | | | | | | | | | | | | |
Net realized gain/(loss) on: | | | | | | | | | | | | | | | | | | | | |
Investments | | | 5,361 | | | | (3,358 | ) | | | (241 | ) | | | (224 | ) | | | — | |
Foreign currency transactions | | | — | | | | — | | | | 81,090 | | | | 5,287 | | | | — | |
Investments sold short | | | — | | | | — | | | | (101 | ) | | | — | | | | — | |
Swap agreements | | | — | | | | — | | | | (30,009 | ) | | | (2,595 | ) | | | — | |
Futures contracts | | | — | | | | — | | | | 43,187 | | | | 138 | | | | — | |
Written options | | | — | | | | — | | | | 7,186 | | | | 135 | | | | — | |
Change in net unrealized appreciation/(depreciation) on: | | | | | | | | | | | | | | | | | | | | |
Investments | | | 2,649 | | | | (9,401 | ) | | | (32,247 | ) | | | 1,054 | | | | — | |
Forwards currency contracts | | | — | | | | — | | | | (645 | ) | | | (2,584 | ) | | | — | |
Swap agreements | | | — | | | | — | | | | (24,264 | ) | | | 175 | | | | — | |
Futures contracts | | | — | | | | — | | | | (9,654 | ) | | | (189 | ) | | | — | |
Written options | | | — | | | | — | | | | 2,916 | | | | (106 | ) | | | — | |
Translations of assets and liabilities in foreign currencies | | | — | | | | — | | | | 5,415 | | | | 152 | | | | — | |
Net gain/(loss) on investment transactions | | | 8,010 | | | | (12,759 | ) | | | 42,633 | | | | 1,243 | | | | — | |
Net Increase/(Decrease) in Net Assets Resulting from Operations | | $ | 10,589 | | | $ | 34,008 | | | $ | 87,753 | | | $ | (90 | ) | | $ | 54 | |
The accompanying notes are an integral part of the Financial Statements.
57
Harbor Fixed Income Funds
STATEMENTS OF CHANGES IN NET ASSETS
(All amounts in thousands)
| | | | | | | | | | | | | | | | |
| | | Harbor
Convertible Securities
Fund | | | Harbor
High-Yield Bond
Fund | |
| | | November 1,
2014
through
April 30,
2015 | | | November 1,
2013
through
October 31,
2014 | | | November 1,
2014
through
April 30,
2015 | | | November 1,
2013
through
October 31,
2014 | |
INCREASE/(DECREASE) IN NET ASSETS | | | (Unaudited) | | | | | | | | (Unaudited) | | | | | |
Operations: | | | | | | | | | | | | | | | | |
Net investment income/(loss) | | $ | 2,579 | | | $ | 4,837 | | | $ | 46,767 | | | $ | 99,489 | |
Net realized gain/(loss) on investments | | | 5,361 | | | | 15,888 | | | | (3,358 | ) | | | 38,879 | |
Change in net unrealized appreciation/(depreciation) of investments | | | 2,649 | | | | (7,985 | ) | | | (9,401 | ) | | | (49,734 | ) |
Net increase/(decrease) in assets resulting from operations | | | 10,589 | | | | 12,740 | | | | 34,008 | | | | 88,634 | |
Distributions to Shareholders | | | | | | | | | | | | | | | | |
Net investment income: | | | | | | | | | | | | | | | | |
Institutional Class | | | (4,968 | ) | | | (5,375 | ) | | | (42,249 | ) | | | (98,007 | ) |
Administrative Class | | | (4 | ) | | | (6 | ) | | | (113 | ) | | | (278 | ) |
Investor Class | | | (24 | ) | | | (36 | ) | | | (2,391 | ) | | | (5,662 | ) |
Net realized gain on investments: | | | | | | | | | | | | | | | | |
Institutional Class | | | (13,266 | ) | | | (2,556 | ) | | | (34,090 | ) | | | (43,662 | ) |
Administrative Class | | | (11 | ) | | | (4 | ) | | | (98 | ) | | | (133 | ) |
Investor Class | | | (73 | ) | | | (25 | ) | | | (2,027 | ) | | | (2,586 | ) |
Total distributions to shareholders | | | (18,346 | ) | | | (8,002 | ) | | | (80,968 | ) | | | (150,328 | ) |
Net Increase/(Decrease) Derived from Capital Share Transactions | | | 26,276 | | | | 80,749 | | | | (16,289 | ) | | | (125,678 | ) |
Net increase/(decrease) in net assets | | | 18,519 | | | | 85,487 | | | | (63,249 | ) | | | (187,372 | ) |
Net Assets | | | | | | | | | | | | | | | | |
Beginning of period | | | 355,617 | | | | 270,130 | | | | 1,812,755 | | | | 2,000,127 | |
End of period* | | $ | 374,136 | | | $ | 355,617 | | | $ | 1,749,506 | | | $ | 1,812,755 | |
* Includes accumulated undistributed net investment income/(loss) of: | | $ | (1,761 | ) | | $ | 656 | | | $ | 8,340 | | | $ | 6,326 | |
The accompanying notes are an integral part of the Financial Statements.
58
| | | | | | | | | | | | | | | | | | | | | | |
Harbor
Bond
Fund | | | Harbor
Real Return
Fund | | | Harbor
Money Market
Fund | |
November 1,
2014
through April 30,
2015 | | | November 1,
2013
through
October 31,
2014 | | | November 1,
2014
through
April 30,
2015 | | | November 1,
2013
through
October 31,
2014 | | | November 1,
2014
through
April 30,
2015 | | | November 1,
2013
through
October 31,
2014 | |
| | (Unaudited) | | | | | | | | (Unaudited) | | | | | | | | (Unaudited) | | | | | |
| | | | | | | | | | | | | | | | | | | | | | |
| $ | 45,120 | | | $ | 116,769 | | | $ | (1,333 | ) | | $ | 7,115 | | | $ | 54 | | | $ | 95 | |
| | 101,112 | | | | 88,641 | | | | 2,741 | | | | (8,931 | ) | | | — | | | | — | |
| | (58,479 | ) | | | (9,624 | ) | | | (1,498 | ) | | | 7,260 | | | | — | | | | — | |
| | 87,753 | | | | 195,786 | | | | (90 | ) | | | 5,444 | | | | 54 | | | | 95 | |
| | | | | | | | | | | | | | | | | | | | | | |
| | | | | | | | | | | | | | | | | | | | | | |
| | (61,413 | ) | | | (175,330 | ) | | | (10,579 | ) | | | (1,173 | ) | | | (53 | ) | | | (95 | ) |
| | (1,417 | ) | | | (3,302 | ) | | | (223 | ) | | | (5 | ) | | | (1 | ) | | | — | |
| | N/A | | | | N/A | | | | N/A | | | | N/A | | | | N/A | | | | N/A | |
| | | | | | | | | | | | | | | | | | | | | | |
| | (33,879 | ) | | | — | | | | — | | | | (15,289 | ) | | | — | | | | — | |
| | (855 | ) | | | — | | | | — | | | | (135 | ) | | | — | | | | — | |
| | N/A | | | | N/A | | | | N/A | | | | N/A | | | | N/A | | | | N/A | |
| | (97,564 | ) | | | (178,632 | ) | | | (10,802 | ) | | | (16,602 | ) | | | (54 | ) | | | (95 | ) |
| | (548,068 | ) | | | (2,553,610 | ) | | | (8,360 | ) | | | (223,623 | ) | | | (17,407 | ) | | | 22,560 | |
| | (557,879 | ) | | | (2,536,456 | ) | | | (19,252 | ) | | | (234,781 | ) | | | (17,407 | ) | | | 22,560 | |
| | | | | | | | | | | | | | | | | | | | | | |
| | 4,228,480 | | | | 6,764,936 | | | | 173,450 | | | | 408,231 | | | | 159,978 | | | | 137,418 | |
| $ | 3,670,601 | | | $ | 4,228,480 | | | $ | 154,198 | | | $ | 173,450 | | | $ | 142,571 | | | $ | 159,978 | |
| $ | (6,666 | ) | | $ | 11,044 | | | $ | (4,658 | ) | | $ | 7,477 | | | $ | 35 | | | $ | 35 | |
59
Harbor Fixed Income Funds
STATEMENTS OF CHANGES IN NET ASSETS—CAPITAL STOCK ACTIVITY
(All amounts in thousands)
| | | | | | | | | | | | | | | | |
| | | Harbor
Convertible Securities
Fund | | | Harbor
High-Yield Bond
Fund | |
| | | November 1,
2014
through
April 30,
2015 | | | November 1,
2013
through
October 31,
2014 | | | November 1,
2014
through
April 30,
2015
| | | November 1,
2013
through
October 31,
2014 | |
| | | (Unaudited) | | | | | | | | (Unaudited) | | | | | |
AMOUNT ($) | | | | | | | | | | | | | | | | |
Institutional Class | | | | | | | | | | | | | | | | |
Net proceeds from sale of shares | | $ | 61,676 | | | $ | 147,092 | | | $ | 302,976 | | | $ | 504,485 | |
Net proceeds from redemption fees | | | — | | | | 12 | | | | 6 | | | | 31 | |
Reinvested distributions | | | 4,018 | | | | 1,152 | | | | 47,581 | | | | 81,465 | |
Cost of shares reacquired | | | (39,494 | ) | | | (66,826 | ) | | | (369,427 | ) | | | (699,877 | ) |
Net increase/(decrease) in net assets | | $ | 26,200 | | | $ | 81,430 | | | $ | (18,864 | ) | | $ | (113,896 | ) |
Administrative Class | | | | | | | | | | | | | | | | |
Net proceeds from sale of shares | | $ | 70 | | | $ | 7 | | | $ | 332 | | | $ | 602 | |
Reinvested distributions | | | 16 | | | | 10 | | | | 196 | | | | 400 | |
Cost of shares reacquired | | | — | | | | (144 | ) | | | (721 | ) | | | (1,585 | ) |
Net increase/(decrease) in net assets | | $ | 86 | | | $ | (127 | ) | | $ | (193 | ) | | $ | (583 | ) |
Investor Class | | | | | | | | | | | | | | | | |
Net proceeds from sale of shares | | $ | 110 | | | $ | 1,024 | | | $ | 14,298 | | | $ | 35,560 | |
Net proceeds from redemption fees | | | — | | | | — | | | | 1 | | | | 2 | |
Reinvested distributions | | | 85 | | | | 60 | | | | 4,313 | | | | 7,890 | |
Cost of shares reacquired | | | (205 | ) | | | (1,638 | ) | | | (15,844 | ) | | | (54,651 | ) |
Net increase/(decrease) in net assets | | $ | (10 | ) | | $ | (554 | ) | | $ | 2,768 | | | $ | (11,199 | ) |
SHARES | | | | | | | | | | | | | | | | |
Institutional Class | | | | | | | | | | | | | | | | |
Shares sold | | | 5,700 | | | | 13,047 | | | | 28,920 | | | | 45,788 | |
Shares issued due to reinvestment of distributions | | | 383 | | | | 105 | | | | 4,651 | | | | 7,509 | |
Shares reacquired | | | (3,643 | ) | | | (5,989 | ) | | | (35,561 | ) | | | (63,914 | ) |
Net increase/(decrease) in shares outstanding | | | 2,440 | | | | 7,163 | | | | (1,990 | ) | | | (10,617 | ) |
Beginning of period | | | 31,564 | | | | 24,401 | | | | 157,330 | | | | 167,947 | |
End of period | | | 34,004 | | | | 31,564 | | | | 155,340 | | | | 157,330 | |
Administrative Class | | | | | | | | | | | | | | | | |
Shares sold | | | 6 | | | | — | | | | 32 | | | | 54 | |
Shares issued due to reinvestment of distributions | | | 2 | | | | 1 | | | | 19 | | | | 37 | |
Shares reacquired | | | — | | | | (13 | ) | | | (70 | ) | | | (144 | ) |
Net increase/(decrease) in shares outstanding | | | 8 | | | | (12 | ) | | | (19 | ) | | | (53 | ) |
Beginning of period | | | 27 | | | | 39 | | | | 439 | | | | 492 | |
End of period | | | 35 | | | | 27 | | | | 420 | | | | 439 | |
Investor Class | | | | | | | | | | | | | | | | |
Shares sold | | | 10 | | | | 91 | | | | 1,359 | | | | 3,223 | |
Shares issued due to reinvestment of distributions | | | 8 | | | | 6 | | | | 421 | | | | 726 | |
Shares reacquired | | | (19 | ) | | | (147 | ) | | | (1,510 | ) | | | (4,953 | ) |
Net increase/(decrease) in shares outstanding | | | (1 | ) | | | (50 | ) | | | 270 | | | | (1,004 | ) |
Beginning of period | | | 174 | | | | 224 | | | | 9,220 | | | | 10,224 | |
End of period | | | 173 | | | | 174 | | | | 9,490 | | | | 9,220 | |
The accompanying notes are an integral part of the Financial Statements.
60
| | | | | | | | | | | | | | | | | | | | | | |
Harbor
Bond
Fund | | | Harbor
Real Return
Fund | | | Harbor
Money Market
Fund | |
November
1, 2014
through
April 30,
2015 | | | November 1,
2013
through
October 31,
2014 | | | November 1,
2014
through
April 30,
2015 | | | November 1,
2013
through
October 31,
2014 | | | November 1,
2014
through
April 30,
2015
| | | November 1,
2013
through
October 31,
2014 | |
| | (Unaudited) | | | | | | | | (Unaudited) | | | | | | | | (Unaudited) | | | | | |
| | | | | | | | | | | | | | | | | | | | | | |
| | | | | | | | | | | | | | | | | | | | | | |
| | 197,399 | | | $ | 1,000,508 | | | $ | 13,107 | | | $ | 90,220 | | | $ | 316,874 | | | $ | 662,272 | |
| | — | | | | — | | | | — | | | | — | | | | — | | | | — | |
| | 91,616 | | | | 168,140 | | | | 10,105 | | | | 16,203 | | | | 53 | | | | 94 | |
| | (814,686 | ) | | | (3,685,873 | ) | | | (31,899 | ) | | | (330,071 | ) | | | (333,891 | ) | | | (641,607 | ) |
| $ | (525,671 | ) | | $ | (2,517,225 | ) | | $ | (8,687 | ) | | $ | (223,648 | ) | | $ | (16,964 | ) | | $ | 20,759 | |
| | | | | | | | | | | | | | | | | | | | | | |
| $ | 7,998 | | | $ | 18,220 | | | $ | 1,492 | | | $ | 1,480 | | | $ | 702 | | | $ | 1,836 | |
| | 2,261 | | | | 3,272 | | | | 223 | | | | 139 | | | | 1 | | | | — | |
| | (32,656 | ) | | | (57,877 | ) | | | (1,388 | ) | | | (1,594 | ) | | | (1,146 | ) | | | (35 | ) |
| $ | (22,397 | ) | | $ | (36,385 | ) | | $ | 327 | | | $ | 25 | | | $ | (443 | ) | | $ | 1,801 | |
| | | | | | | | | | | | | | | | | | | | | | |
| | | | | | | | | | | | | | | | | | | | | | |
| | | | | | | | | | | | | | | | | | | | | | |
| | N/A | | | | N/A | | | | N/A | | | | N/A | | | | N/A | | | | N/A | |
| | | | | | | | | | | | | | | | | | | | | | |
| | | | | | | | | | | | | | | | | | | | | | |
| | | | | | | | | | | | | | | | | | | | | | |
| | | | | | | | | | | | | | | | | | | | | | |
| | 16,115 | | | | 82,233 | | | | 1,365 | | | | 8,916 | | | | 316,874 | | | | 662,272 | |
| | 7,621 | | | | 13,908 | | | | 1,086 | | | | 1,644 | | | | 53 | | | | 94 | |
| | (66,449 | ) | | | (302,186 | ) | | | (3,317 | ) | | | (32,739 | ) | | | (333,891 | ) | | | (641,607 | ) |
| | (42,713 | ) | | | (206,045 | ) | | | (866 | ) | | | (22,179 | ) | | | (16,964 | ) | | | 20,759 | |
| | 336,034 | | | | 542,079 | | | | 16,699 | | | | 38,878 | | | | 157,801 | | | | 137,042 | |
| | 293,321 | | | | 336,034 | | | | 15,833 | | | | 16,699 | | | | 140,837 | | | | 157,801 | |
| | | | | | | | | | | | | | | | | | | | | | |
| | 653 | | | | 1,497 | | | | 156 | | | | 144 | | | | 702 | | | | 1,836 | |
| | 188 | | | | 271 | | | | 24 | | | | 14 | | | | 1 | | | | — | |
| | (2,662 | ) | | | (4,749 | ) | | | (147 | ) | | | (156 | ) | | | (1,146 | ) | | | (35 | ) |
| | (1,821 | ) | | | (2,981 | ) | | | 33 | | | | 2 | | | | (443 | ) | | | 1,801 | |
| | 8,352 | | | | 11,333 | | | | 342 | | | | 340 | | | | 2,177 | | | | 376 | |
| | 6,531 | | | | 8,352 | | | | 375 | | | | 342 | | | | 1,734 | | | | 2,177 | |
| | | | | | | | | | | | | | | | | | | | | | |
| | | | | | | | | | | | | | | | | | | | | | |
| | | | | | | | | | | | | | | | | | | | | | |
| | | | | | | | | | | | | | | | | | | | | | |
| | N/A | | | | N/A | | | | N/A | | | | N/A | | | | N/A | | | | N/A | |
| | | | | | | | | | | | | | | | | | | | | | |
| | | | | | | | | | | | | | | | | | | | | | |
61
Harbor Fixed Income Funds
STATEMENT OF CASH FLOWS—Six Months Ended April 30, 2015 (Unaudited)
(All amounts in thousands)
| | | | |
| | | Harbor Real
Return Fund | |
Cash flows provided by operating activities: | | | | |
Net decrease in net assets resulting from operations | | $ | (90 | ) |
Adjustments to reconcile net decrease in net assets resulting from operations to net cash provided by operating activities: | | | | |
Purchases of long-term securities | | | (398,230 | ) |
Proceeds from sales of long-term securities | | | 428,001 | |
Proceeds from short-term portfolio investments, net | | | 2,252 | |
Decrease in receivable for investments sold | | | 3,602 | |
Increase in foreign spot contracts receivable | | | (1 | ) |
Decrease in interest receivable | | | 337 | |
Decrease in variation margin on options and futures contracts | | | 5 | |
Increase in variation margin on swap agreements | | | (250 | ) |
Decrease in withholding tax | | | 1 | |
Decrease in prepaid registration fees | | | 5 | |
Increase in prepaid fund insurance | | | (1 | ) |
Increase in other assets | | | (2 | ) |
Decrease in payable for investments purchased | | | (2,428 | ) |
Increase in premiums from options written | | | 211 | |
Decrease in swap premiums received | | | (41 | ) |
Increase in variation margin on options and futures contracts | | | 16 | |
Decrease in management fees payable | | | (12 | ) |
Decrease in transfer agent fees payable | | | (1 | ) |
Decrease in trustees’ fees payable | | | (1 | ) |
Increase in other liabilities | | | 18 | |
Net change in unrealized appreciation/(depreciation) on investments | | | (1,054 | ) |
Net change in unrealized appreciation/(depreciation) on forwards | | | 2,584 | |
Net change in unrealized appreciation/(depreciation) on swaps | | | 388 | |
Net change in unrealized appreciation/(depreciation) on written options | | | 106 | |
Net realized loss on investments | | | 224 | |
Net amortization and earned inflation component | | | 2,765 | |
Net cash provided by operating activities | | | 38,404 | |
Cash flows used for financing activities: | | | | |
Proceeds from shares sold | | | 14,692 | |
Payment on shares redeemed | | | (34,998 | ) |
Cash dividends paid | | | (474 | ) |
Decrease in sale-buyback financing transactions | | | (15,776 | ) |
Decrease in due to broker and cash-restricted | | | (1,795 | ) |
Net cash used for financing activities | | | (38,351 | ) |
Net Increase in Cash | | | 53 | |
Cash and Foreign Currency | | | | |
Beginning of period | | $ | 320 | |
End of period | | | 373 | |
Reinvestment of dividends | | $ | 10,328 | |
Supplemental disclosure of cash flow information: | | | | |
Interest paid during the year | | $ | 61 | |
The accompanying notes are an integral part of the Financial Statements.
62
[THIS PAGE INTENTIONALLY LEFT BLANK]
63
Harbor Fixed Income Funds Financial Highlights
SELECTED DATA FOR A SHARE OUTSTANDING FOR THE PERIODS PRESENTED
| | | | | | | | | | | | | | | | | | | | |
HARBOR CONVERTIBLE SECURITIES FUND | |
| | | Institutional Class | |
| | | 6-Month
Period Ended
April 30, 2015 | | | Year Ended October 31, | |
| | | | 2014 | | | 2013 | | | 2012 | | | 2011aa | |
Net asset value beginning of period | | $ | 11.20 | | | $ | 10.95 | | | $ | 10.01 | | | $ | 9.49 | | | $ | 10.00 | |
Income from Investment Operations | | | | | | | | | | | | | | | | | | | | |
Net investment income/(loss)a | | | 0.08 | e | | | 0.19 | | | | 0.20 | | | | 0.24 | | | | 0.09 | |
Net realized and unrealized gains/(losses) on investments | | | 0.23 | | | | 0.38 | | | | 0.96 | | | | 0.52 | | | | (0.54 | ) |
Total from investment operations | | | 0.31 | | | | 0.57 | | | | 1.16 | | | | 0.76 | | | | (0.45 | ) |
Less Distributions | | | | | | | | | | | | | | | | | | | | |
Dividends from net investment income | | | (0.15 | ) | | | (0.21 | ) | | | (0.22 | ) | | | (0.24 | ) | | | (0.06 | ) |
Distributions from net realized capital gains1 | | | (0.42 | ) | | | (0.11 | ) | | | — | | | | — | | | | — | |
Total distributions | | | (0.57 | ) | | | (0.32 | ) | | | (0.22 | ) | | | (0.24 | ) | | | (0.06 | ) |
Proceeds from redemption fees | | | — | * | | | — | * | | | — | * | | | — | * | | | — | * |
Net asset value end of period | | | 10.94 | | | | 11.20 | | | | 10.95 | | | | 10.01 | | | | 9.49 | |
Net assets end of period (000s) | | $ | 371,865 | | | $ | 353,370 | | | $ | 267,251 | | | $ | 113,898 | | | $ | 74,531 | |
Ratios and Supplemental Data (%) | | | | | | | | | | | | | | | | | | | | |
Total returnb | | | 3.03 | %c | | | 5.23 | % | | | 11.80 | % | | | 8.18 | % | | | (4.50 | )%c |
Ratio of total expenses to average net assets2 | | | 0.74 | d | | | 0.74 | | | | 0.79 | | | | 0.84 | | | | 1.19 | d |
Ratio of net expenses to average net assetsa | | | 0.74 | d | | | 0.74 | | | | 0.79 | | | | 0.83 | | | | 0.85 | d |
Ratio of net investment income to average net assetsa | | | 1.46 | d | | | 1.58 | | | | 1.82 | | | | 2.48 | | | | 2.36 | d |
Portfolio turnover | | | 63 | c | | | 54 | | | | 45 | | | | 40 | | | | 27 | c |
| | | | | | | | | | | | | | | | | | | | | | | | |
| | | | | | | | | | | | | | | | | | | | | | | | |
HARBOR HIGH-YIELD BOND FUND | |
| | | Institutional Class | |
| | | 6-Month
Period Ended
April 30, 2015 | | | Year Ended October 31, | |
| | | | 2014 | | | 2013 | | | 2012 | | | 2011 | | | 2010 | |
Net asset value beginning of period | | $ | 10.85 | | | $ | 11.19 | | | $ | 11.15 | | | $ | 10.86 | | | $ | 11.23 | | | $ | 10.41 | |
Income from Investment Operations | | | | | | | | | | | | | | | | | | | | | | | | |
Net investment income/(loss)a | | | 0.29 | e | | | 0.60 | | | | 0.64 | | | | 0.65 | | | | 0.71 | | | | 0.68 | |
Net realized and unrealized gains/(losses) on investments | | | (0.05 | ) | | | (0.05 | ) | | | 0.06 | | | | 0.40 | | | | (0.24 | ) | | | 0.88 | |
Total from investment operations | | | 0.24 | | | | 0.55 | | | | 0.70 | | | | 1.05 | | | | 0.47 | | | | 1.56 | |
Less Distributions | | | | | | | | | | | | | | | | | | | | | | | | |
Dividends from net investment income | | | (0.28 | ) | | | (0.62 | ) | | | (0.64 | ) | | | (0.64 | ) | | | (0.68 | ) | | | (0.70 | ) |
Distributions from net realized capital gains1 | | | (0.22 | ) | | | (0.27 | ) | | | (0.02 | ) | | | (0.12 | ) | | | (0.16 | ) | | | (0.05 | ) |
Total distributions | | | (0.50 | ) | | | (0.89 | ) | | | (0.66 | ) | | | (0.76 | ) | | | (0.84 | ) | | | (0.75 | ) |
Proceeds from redemption fees | | | — | * | | | — | * | | | — | * | | | — | * | | | — | * | | | 0.01 | |
Net asset value end of period | | | 10.59 | | | | 10.85 | | | | 11.19 | | | | 11.15 | | | | 10.86 | | | | 11.23 | |
Net assets end of period (000s) | | $ | 1,644,469 | | | $ | 1,707,788 | | | $ | 1,880,044 | | | $ | 2,172,751 | | | $ | 1,565,740 | | | $ | 1,354,531 | |
Ratios and Supplemental Data (%) | | | | | | | | | | | | | | | | | | | | | | | | |
Total returnb | | | 2.40 | %c | | | 5.10 | % | | | 6.55 | % | | | 10.18 | % | | | 4.49 | % | | | 15.67 | % |
Ratio of total expenses to average net assets2 | | | 0.68 | d | | | 0.68 | | | | 0.68 | | | | 0.68 | | | | 0.70 | | | | 0.72 | |
Ratio of net expenses to average net assetsa | | | 0.64 | d | | | 0.64 | | | | 0.64 | | | | 0.64 | | | | 0.65 | | | | 0.67 | |
Ratio of net investment income to average net assetsa | | | 5.58 | d | | | 5.43 | | | | 5.56 | | | | 6.06 | | | | 6.54 | | | | 7.01 | |
Portfolio turnover | | | 34 | c | | | 48 | | | | 57 | | | | 32 | | | | 47 | | | | 39 | |
See page 68 for notes to the Financial Highlights.
The accompanying notes are an integral part of the Financial Statements.
64
| | | | | | | | | | | | | | | | | | | | | | | | | | | | | | | | | | | | | | |
| | | | | | | | | | | | | | | | | | | | | | | | | | | | | | | | | | | | | | |
| Administrative Class | | | Investor Class | |
6-Month
Period Ended
April 30, 2015 | | | Year Ended October 31, | | | 6-Month
Period Ended
April 30, 2015 | | | Year Ended October 31, | |
| | 2014 | | | 2013 | | | 2012 | | | 2011aa | | | | 2014 | | | 2013 | | | 2012 | | | 2011aa | |
| $ | 11.19 | | | $ | 10.94 | | | $ | 10.00 | | | $ | 9.48 | | | $ | 10.00 | | | $ | 11.18 | | | $ | 10.94 | | | $ | 10.00 | | | $ | 9.48 | | | $ | 10.00 | |
| | | | | | | | | | | | | | | | | | | | | | | | | | | | | | | | | | | | | | |
| | 0.06 | | | | 0.13 | | | | 0.16 | | | | 0.22 | | | | 0.09 | | | | 0.06 | | | | 0.11 | | | | 0.16 | | | | 0.20 | | | | 0.07 | |
| | 0.24 | | | | 0.41 | | | | 0.98 | | | | 0.52 | | | | (0.56 | ) | | | 0.23 | | | | 0.40 | | | | 0.97 | | | | 0.53 | | | | (0.54 | ) |
| | 0.30 | | | | 0.54 | | | | 1.14 | | | | 0.74 | | | | (0.47 | ) | | | 0.29 | | | | 0.51 | | | | 1.13 | | | | 0.73 | | | | (0.47 | ) |
| | | | | | | | | | | | | | | | | | | | | | | | | | | | | | | | | | | | | | |
| | (0.14 | ) | | | (0.18 | ) | | | (0.20 | ) | | | (0.22 | ) | | | (0.05 | ) | | | (0.13 | ) | | | (0.16 | ) | | | (0.19 | ) | | | (0.21 | ) | | | (0.05 | ) |
| | (0.42 | ) | | | (0.11 | ) | | | — | | | | — | | | | — | | | | (0.42 | ) | | | (0.11 | ) | | | — | | | | — | | | | — | |
| | (0.56 | ) | | | (0.29 | ) | | | (0.20 | ) | | | (0.22 | ) | | | (0.05 | ) | | | (0.55 | ) | | | (0.27 | ) | | | (0.19 | ) | | | (0.21 | ) | | | (0.05 | ) |
| | — | * | | | — | * | | | — | * | | | — | * | | | — | * | | | — | * | | | — | * | | | — | * | | | — | * | | | — | * |
| | 10.93 | | | | 11.19 | | | | 10.94 | | | | 10.00 | | | | 9.48 | | | | 10.92 | | | | 11.18 | | | | 10.94 | | | | 10.00 | | | | 9.48 | |
| $ | 384 | | | $ | 306 | | | $ | 427 | | | $ | 310 | | | $ | 238 | | | $ | 1,887 | | | $ | 1,941 | | | $ | 2,452 | | | $ | 2,015 | | | $ | 704 | |
| | | | | | | | | | | | | | | | | | | | | | | | | | | | | | | | | | | | | | |
| | 2.91 | %c | | | 4.97 | % | | | 11.55 | % | | | 7.93 | % | | | (4.70 | )%c | | | 2.84 | %c | | | 4.76 | % | | | 11.41 | % | | | 7.83 | % | | | (4.72 | )%c |
| | 0.99 | d | | | 0.99 | | | | 1.04 | | | | 1.09 | | | | 1.44 | d | | | 1.11 | d | | | 1.11 | | | | 1.16 | | | | 1.21 | | | | 1.56 | d |
| | 0.99 | d | | | 0.99 | | | | 1.04 | | | | 1.08 | | | | 1.10 | d | | | 1.11 | d | | | 1.11 | | | | 1.16 | | | | 1.20 | | | | 1.22 | d |
| | 1.21 | d | | | 1.35 | | | | 1.61 | | | | 2.24 | | | | 1.80 | d | | | 1.09 | d | | | 1.24 | | | | 1.49 | | | | 2.07 | | | | 1.98 | d |
| | 63 | c | | | 54 | | | | 45 | | | | 40 | | | | 27 | c | | | 63 | c | | | 54 | | | | 45 | | | | 40 | | | | 27 | c |
| | | | | | | | | | | | | | | | | | | | | | | | | | | | | | | | | | | | | | | | | | | | | | |
| | | | | | | | | | | | | | | | | | | | | | | | | | | | | | | | | | | | | | | | | | | | | | |
| | | | | | | | | | | | | | | | | | | | | | | | | | | | | | | | | | | | | | | | | | | | | | |
| Administrative Class | | | Investor Class | |
6-Month
Period Ended
April 30, 2015 | | | Year Ended October 31, | | | 6-Month
Period Ended
April 30, 2015 | | | Year Ended October 31, | |
| | 2014 | | | 2013 | | | 2012 | | | 2011 | | | 2010 | | | | 2014 | | | 2013 | | | 2012 | | | 2011 | | | 2010 | |
| $ | 10.87 | | | $ | 11.21 | | | $ | 11.16 | | | $ | 10.87 | | | $ | 11.23 | | | $ | 10.41 | | | $ | 10.87 | | | $ | 11.21 | | | $ | 11.16 | | | $ | 10.87 | | | $ | 11.23 | | | $ | 10.40 | |
| | | | | | | | | | | | | | | | | | | | | | | | | | | | | | | | | | | | | | | | | | | | | | |
| | 0.28 | | | | 0.60 | | | | 0.70 | | | | 0.62 | | | | 0.70 | | | | 0.69 | | | | 0.27 | | | | 0.59 | | | | 0.66 | | | | 0.61 | | | | 0.69 | | | | 0.72 | |
| | (0.07 | ) | | | (0.08 | ) | | | (0.02 | ) | | | 0.40 | | | | (0.25 | ) | | | 0.84 | | | | (0.06 | ) | | | (0.08 | ) | | | 0.01 | | | | 0.40 | | | | (0.25 | ) | | | 0.80 | |
| | 0.21 | | | | 0.52 | | | | 0.68 | | | | 1.02 | | | | 0.45 | | | | 1.53 | | | | 0.21 | | | | 0.51 | | | | 0.67 | | | | 1.01 | | | | 0.44 | | | | 1.52 | |
| | | | | | | | | | | | | | | | | | | | | | | | | | | | | | | | | | | | | | | | | | | | | | |
| | (0.26 | ) | | | (0.59 | ) | | | (0.61 | ) | | | (0.61 | ) | | | (0.65 | ) | | | (0.67 | ) | | | (0.26 | ) | | | (0.58 | ) | | | (0.60 | ) | | | (0.60 | ) | | | (0.64 | ) | | | (0.65 | ) |
| | (0.22 | ) | | | (0.27 | ) | | | (0.02 | ) | | | (0.12 | ) | | | (0.16 | ) | | | (0.05 | ) | | | (0.22 | ) | | | (0.27 | ) | | | (0.02 | ) | | | (0.12 | ) | | | (0.16 | ) | | | (0.05 | ) |
| | (0.48 | ) | | | (0.86 | ) | | | (0.63 | ) | | | (0.73 | ) | | | (0.81 | ) | | | (0.72 | ) | | | (0.48 | ) | | | (0.85 | ) | | | (0.62 | ) | | | (0.72 | ) | | | (0.80 | ) | | | (0.70 | ) |
| | — | * | | | — | * | | | — | * | | | — | * | | | — | * | | | 0.01 | | | | — | * | | | — | * | | | — | * | | | — | * | | | — | * | | | 0.01 | |
| | 10.60 | | | | 10.87 | | | | 11.21 | | | | 11.16 | | | | 10.87 | | | | 11.23 | | | | 10.60 | | | | 10.87 | | | | 11.21 | | | | 11.16 | | | | 10.87 | | | | 11.23 | |
| $ | 4,452 | | | $ | 4,773 | | | $ | 5,519 | | | $ | 9,571 | | | $ | 7,906 | | | $ | 7,559 | | | $ | 100,585 | | | $ | 100,194 | | | $ | 114,564 | | | $ | 154,604 | | | $ | 134,399 | | | $ | 135,068 | |
| | | | | | | | | | | | | | | | | | | | | | | | | | | | | | | | | | | | | | | | | | | | | | |
| | 2.17 | %c | | | 4.82 | % | | | 6.33 | % | | | 9.90 | % | | | 4.31 | % | | | 15.32 | % | | | 2.11 | %c | | | 4.70 | % | | | 6.22 | % | | | 9.77 | % | | | 4.18 | % | | | 15.25 | % |
| | 0.93 | d | | | 0.93 | | | | 0.93 | | | | 0.93 | | | | 0.95 | | | | 0.97 | | | | 1.05 | d | | | 1.05 | | | | 1.05 | | | | 1.05 | | | | 1.07 | | | | 1.09 | |
| | 0.89 | d | | | 0.89 | | | | 0.89 | | | | 0.89 | | | | 0.90 | | | | 0.92 | | | | 1.01 | d | | | 1.01 | | | | 1.01 | | | | 1.01 | | | | 1.02 | | | | 1.04 | |
| | 5.34 | d | | | 5.18 | | | | 5.32 | | | | 5.81 | | | | 6.29 | | | | 6.84 | | | | 5.21 | d | | | 5.06 | | | | 5.19 | | | | 5.71 | | | | 6.17 | | | | 6.77 | |
| | 34 | c | | | 48 | | | | 57 | | | | 32 | | | | 47 | | | | 39 | | | | 34 | c | | | 48 | | | | 57 | | | | 32 | | | | 47 | | | | 39 | |
65
Harbor Fixed Income Funds Financial Highlights—Continued
SELECTED DATA FOR A SHARE OUTSTANDING FOR THE PERIODS PRESENTED
| | | | | | | | | | | | | | | | | | | | | | | | |
HARBOR BOND FUND | |
| | | Institutional Class | |
| | | 6-Month
Period Ended
April 30, 2015 | | | Year Ended October 31, | |
| | | | 2014 | | | 2013 | | | 2012 | | | 2011 | | | 2010 | |
Net asset value beginning of period | | $ | 12.28 | | | $ | 12.22 | | | $ | 13.03 | | | $ | 12.20 | | | $ | 13.18 | | | $ | 12.46 | |
Income from Investment Operations | | | | | | | | | | | | | | | | | | | | | | | | |
Net investment income/(loss)a | | | 0.14 | | | | 0.25 | | | | 0.30 | | | | 0.36 | | | | 0.34 | | | | 0.29 | |
Net realized and unrealized gains/(losses) on investments | | | 0.12 | | | | 0.16 | | | | (0.30 | ) | | | 0.76 | | | | (0.28 | ) | | | 0.99 | |
Total from investment operations | | | 0.26 | | | | 0.41 | | | | — | * | | | 1.12 | | | | 0.06 | | | | 1.28 | |
Less Distributions | | | | | | | | | | | | | | | | | | | | | | | | |
Dividends from net investment income | | | (0.19 | ) | | | (0.35 | ) | | | (0.30 | ) | | | (0.27 | ) | | | (0.43 | ) | | | (0.38 | ) |
Distributions from net realized capital gains1 | | | (0.11 | ) | | | — | | | | (0.51 | ) | | | (0.02 | ) | | | (0.61 | ) | | | (0.18 | ) |
Total distributions | | | (0.30 | ) | | | (0.35 | ) | | | (0.81 | ) | | | (0.29 | ) | | | (1.04 | ) | | | (0.56 | ) |
Proceeds from redemption fees | | | — | | | | — | | | | — | | | | — | * | | | — | | | | — | |
Net asset value end of period | | | 12.24 | | | | 12.28 | | | | 12.22 | | | | 13.03 | | | | 12.20 | | | | 13.18 | |
Net assets end of period (000s) | | $ | 3,590,612 | | | $ | 4,125,889 | | | $ | 6,626,361 | | | $ | 7,748,277 | | | $ | 7,374,510 | | | $ | 7,996,353 | |
Ratios and Supplemental Data (%) | | | | | | | | | | | | | | | | | | | | | | | | |
Total returnb | | | 2.17 | %c | | | 3.40 | % | | | (0.05 | )% | | | 9.34 | % | | | 0.63 | % | | | 10.62 | % |
Ratio of total expenses to average net assets2 | | | 0.58 | d | | | 0.56 | | | | 0.56 | | | | 0.57 | | | | 0.57 | | | | 0.59 | |
Ratio of net expenses to average net assetsa | | | 0.53 | d | | | 0.54 | | | | 0.53 | | | | 0.54 | | | | 0.53 | | | | 0.55 | |
Ratio of net expenses excluding interest expense to average net assetsa | | | 0.52 | d | | | 0.54 | | | | 0.53 | | | | 0.54 | | | | 0.53 | | | | 0.55 | |
Ratio of net investment income to average net assetsa | | | 2.32 | d | | | 1.90 | | | | 2.36 | | | | 2.88 | | | | 2.73 | | | | 2.34 | |
Portfolio turnover | | | 248 | c | | | 439 | | | | 446 | | | | 473 | | | | 666 | | | | 675 | |
| | | | | | | | | | | | | | | | | | | | | | | | |
HARBOR REAL RETURN FUND | |
| | | Institutional Class | |
| | | 6-Month
Period Ended
April 30, 2015 | | | Year Ended October 31, | |
| | | | 2014 | | | 2013 | | | 2012 | | | 2011 | | | 2010 | |
Net asset value beginning of period | | $ | 10.18 | | | $ | 10.41 | | | $ | 11 .54 | | | $ | 11.38 | | | $ | 11.21 | | | $ | 10.28 | |
Income from Investment Operations | | | | | | | | | | | | | | | | | | | | | | | | |
Net investment income/(loss)a | | | (0.08 | ) | | | 0.40 | | | | 0.10 | | | | 0.14 | | | | 0.26 | | | | 0.18 | |
Net realized and unrealized gains/(losses) on investments | | | 0.07 | | | | (0.20 | ) | | | (0.84 | ) | | | 0.84 | | | | 0.40 | | | | 1.04 | |
Total from investment operations | | | (0.01 | ) | | | 0.20 | | | | (0.74 | ) | | | 0.98 | | | | 0.66 | | | | 1.22 | |
Less Distributions | | | | | | | | | | | | | | | | | | | | | | | | |
Dividends from net investment income | | | (0.66 | ) | | | (0.03 | ) | | | (0.18 | ) | | | (0.26 | ) | | | (0.17 | ) | | | (0.29 | ) |
Distributions from net realized capital gains1 | | | — | | | | (0.40 | ) | | | (0.21 | ) | | | (0.56 | ) | | | (0.32 | ) | | | — | |
Total distributions | | | (0.66 | ) | | | (0.43 | ) | | | (0.39 | ) | | | (0.82 | ) | | | (0.49 | ) | | | (0.29 | ) |
Net asset value end of period | | | 9.51 | | | | 10.18 | | | | 10.41 | | | | 11.54 | | | | 11.38 | | | | 11.21 | |
Net assets end of period (000s) | | $ | 150,631 | | | $ | 169,969 | | | $ | 404,689 | | | $ | 507,576 | | | $ | 420,429 | | | $ | 297,858 | |
Ratios and Supplemental Data (%) | | | | | | | | | | | | | | | | | | | | | | | | |
Total returnb | | | 0.02 | %c | | | 2.07 | % | | | (6.67 | )% | | | 9.19 | % | | | 6.38 | % | | | 12.11 | % |
Ratio of total expenses to average net assets2 | | | 0.77 | d | | | 0.63 | | | | 0.61 | | | | 0.62 | | | | 0.61 | | | | 0.66 | |
Ratio of net expenses to average net assetsa | | | 0.67 | d | | | 0.62 | | | | 0.61 | | | | 0.62 | | | | 0.60 | | | | 0.60 | |
Ratio of net expenses excluding interest expense to average net assetsa | | | 0.59 | d | | | 0.60 | | | | 0.59 | | | | 0.59 | | | | 0.60 | | | | 0.60 | |
Ratio of net investment income to average net assetsa | | | (1.67 | )d | | | 1.91 | | | | 0.92 | | | | 1.43 | | | | 2.68 | | | | 1.86 | |
Portfolio turnover | | | 196 | c | | | 427 | | | | 285 | | | | 287 | | | | 340 | | | | 309 | |
See page 68 for notes to the Financial Highlights.
The accompanying notes are an integral part of the Financial Statements.
66
| | | | | | | | | | | | | | | | | | | | | | |
| | |
| Administrative Class | |
6-Month
Period Ended
April 30, 2015 | | | Year Ended October 31, | |
| | 2014 | | | 2013 | | | 2012 | | | 2011 | | | 2010 | |
| $ | 12.28 | | | $ | 12.23 | | | $ | 13.03 | | | $ | 12.20 | | | $ | 13.18 | | | $ | 12.45 | |
| | | | | | | | | | | | | | | | | | | | | | |
| | 0.12 | | | | 0.22 | | | | 0.27 | | | | 0.34 | | | | 0.31 | | | | 0.26 | |
| | 0.14 | | | | 0.15 | | | | (0.29 | ) | | | 0.75 | | | | (0.29 | ) | | | 0.99 | |
| | 0.26 | | | | 0.37 | | | | (0.02 | ) | | | 1.09 | | | | 0.02 | | | | 1.25 | |
| | | | | | | | | | | | | | | | | | | | | | |
| | (0.18 | ) | | | (0.32 | ) | | | (0.27 | ) | | | (0.24 | ) | | | (0.39 | ) | | | (0.34 | ) |
| | (0.11 | ) | | | — | | | | (0.51 | ) | | | (0.02 | ) | | | (0.61 | ) | | | (0.18 | ) |
| | (0.29 | ) | | | (0.32 | ) | | | (0.78 | ) | | | (0.26 | ) | | | (1.00 | ) | | | (0.52 | ) |
| | — | | | | — | | | | — | | | | — | * | | | — | | | | — | |
| | 12.25 | | | | 12.28 | | | | 12.23 | | | | 13.03 | | | | 12.20 | | | | 13.18 | |
| $ | 79,989 | | | $ | 102,591 | | | $ | 138,575 | | | $ | 165,468 | | | $ | 173,377 | | | $ | 200,320 | |
| | | | | | | | | | | | | | | | | | | | | | |
| | 2.11 | %c | | | 3.05 | % | | | (0.23 | )% | | | 9.06 | % | | | 0.37 | % | | | 10.32 | % |
| | 0.83 | d | | | 0.81 | | | | 0.81 | | | | 0.82 | | | | 0.82 | | | | 0.84 | |
| | 0.78 | d | | | 0.79 | | | | 0.78 | | | | 0.79 | | | | 0.78 | | | | 0.80 | |
| 0.77 | d | | | 0.79 | | | | 0.78 | | | | 0.79 | | | | 0.78 | | | | 0.80 | |
| | 2.05 | d | | | 1.66 | | | | 2.11 | | | | 2.64 | | | | 2.47 | | | | 2.09 | |
| | 248 | c | | | 439 | | | | 446 | | | | 473 | | | | 666 | | | | 675 | |
| | | | | | | | | | | | | | | | | | | | | | |
| | | | | | | | | | | | | | | | | | | | | | |
| Administrative Class | |
6-Month
Period Ended
April 30, 2015 | | | Year Ended October 31, | |
| | 2014 | | | 2013 | | | 2012 | | | 2011 | | | 2010 | |
| $ | 10.17 | | | $ | 10.41 | | | $ | 11.55 | | | $ | 11.40 | | | $ | 11.23 | | | $ | 10.29 | |
| | | | | | | | | | | | | | | | | | | | | | |
| | (0.09 | ) | | | 0.21 | | | | 0.06 | | | | 0.10 | | | | 0.09 | | | | (0.02 | ) |
| | 0.08 | | | | (0.03 | ) | | | (0.84 | ) | | | 0.85 | | | | 0.55 | | | | 1.21 | |
| | (0.01 | )* | | | 0.18 | | | | (0.78 | ) | | | 0.95 | | | | 0.64 | | | | 1.19 | |
| | | | | | | | | | | | | | | | | | | | | | |
| | (0.65 | ) | | | (0.02 | ) | | | (0.15 | ) | | | (0.24 | ) | | | (0.15 | ) | | | (0.25 | ) |
| | — | | | | (0.40 | ) | | | (0.21 | ) | | | (0.56 | ) | | | (0.32 | ) | | | — | |
| | (0.65 | ) | | | (0.42 | ) | | | (0.36 | ) | | | (0.80 | ) | | | (0.47 | ) | | | (0.25 | ) |
| | 9.51 | | | | 10.17 | | | | 10.41 | | | | 11.55 | | | | 11.40 | | | | 11.23 | |
| $ | 3,567 | | | $ | 3,481 | | | $ | 3,542 | | | $ | 4,968 | | | $ | 3,472 | | | $ | 1,425 | |
| | | | | | | | | | | | | | | | | | | | | | |
| | 0.00 | %c | | | 1.81 | % | | | (6.94 | )% | | | 8.88 | % | | | 6.12 | % | | | 11.77 | % |
| | 1.02 | d | | | 0.88 | | | | 0.86 | | | | 0.87 | | | | 0.87 | | | | 0.91 | |
| | 0.92 | d | | | 0.87 | | | | 0.86 | | | | 0.87 | | | | 0.85 | | | | 0.85 | |
| 0.84 | d | | | 0.85 | | | | 0.84 | | | | 0.84 | | | | 0.85 | | | | 0.85 | |
| | (1.90 | )d | | | 2.08 | | | | 0.69 | | | | 1.18 | | | | 2.26 | | | | 1.59 | |
| | 196 | c | | | 427 | | | | 285 | | | | 287 | | | | 340 | | | | 309 | |
67
Harbor Fixed Income Funds Financial Highlights—Continued
SELECTED DATA FOR A SHARE OUTSTANDING FOR THE PERIODS PRESENTED
| | | | | | | | | | | | | | | | | | | | | | | | |
HARBOR MONEY MARKET FUND | |
| | | Institutional Class | |
| | | 6-Month
Period Ended
April 30, 2015 | | | Year Ended October 31, | |
| | | | 2014 | | | 2013 | | | 2012 | | | 2011 | | | 2010 | |
Net asset value beginning of period | | $ | 1.00 | | | $ | 1.00 | | | $ | 1.00 | | | $ | 1.00 | | | $ | 1.00 | | | $ | 1.00 | |
Income from Investment Operations | | | | | | | | | | | | | | | | | | | | | | | | |
Net investment income/(loss)a | | | — | * | | | — | * | | | — | * | | | — | * | | | — | * | | | — | * |
Net realized and unrealized gains/(losses) on investments | | | — | | | | — | | | | — | | | | — | | | | — | | | | — | |
Total from investment operations | | | — | * | | | — | * | | | — | * | | | — | * | | | — | * | | | — | * |
Less Distributions | | | | | | | | | | | | | | | | | | | | | | | | |
Dividends from net investment income | | | — | * | | | — | * | | | — | * | | | — | * | | | — | * | | | — | * |
Distributions from net realized capital gains1 | | | — | | | | — | | | | — | | | | — | | | | — | | | | — | |
Total distributions | | | — | * | | | — | * | | | — | * | | | — | * | | | — | * | | | — | * |
Net asset value end of period | | | 1.00 | | | | 1.00 | | | | 1.00 | | | | 1.00 | | | | 1.00 | | | | 1.00 | |
Net assets end of period (000s) | | $ | 140,837 | | | $ | 157,801 | | | $ | 137,042 | | | $ | 133,308 | | | $ | 130,758 | | | $ | 147,116 | |
Ratios and Supplemental Data (%) | | | | | | | | | | | | | | | | | | | | | | | | |
Total returnb | | | 0.03 | %c | | | 0.06 | % | | | 0.09 | % | | | 0.08 | % | | | 0.11 | % | | | 0.18 | % |
Ratio of total expenses to average net assets2 | | | 0.31 | d | | | 0.30 | | | | 0.31 | | | | 0.33 | | | | 0.33 | | | | 0.34 | |
Ratio of net expenses to average net assetsa | | | — | | | | — | | | | — | | | | — | | | | — | | | | 0.01 | |
Ratio of net investment income to average net assetsa | | | 0.07 | d | | | 0.06 | | | | 0.09 | | | | 0.08 | | | | 0.11 | | | | 0.17 | |
| 1 | Includes both short-term and long-term capital gains. |
| 2 | Percentage does not reflect reduction for credit balance arrangements (see Note 2 of the accompanying Notes to Financial Statements). |
| a | Reflects the Adviser’s waiver, if any, of its management fees and/or other operating expenses. |
| b | The total returns would have been lower had certain expenses not been waived during the periods shown. |
| e | Amounts are allocated based upon average shares outstanding during the period. |
| aa | For the period May 1, 2011 (inception) through October 31, 2011. |
The accompanying notes are an integral part of the Financial Statements.
68
| | | | | | | | | | | | | | | | | | | | | | |
| | |
| Administrative Class | |
6-Month
Period Ended
April 30, 2015 | | | Year Ended October 31, | |
| | 2014 | | | 2013 | | | 2012 | | | 2011 | | | 2010 | |
| $ | 1.00 | | | $ | 1.00 | | | $ | 1.00 | | | $ | 1.00 | | | $ | 1.00 | | | $ | 1.00 | |
| | | | | | | | | | | | | | | | | | | | | | |
| | — | * | | | — | * | | | — | * | | | — | * | | | — | * | | | — | * |
| | — | | | | — | | | | — | | | | — | | | | — | | | | — | |
| | — | * | | | — | * | | | — | * | | | — | * | | | — | * | | | — | * |
| | | | | | | | | | | | | | | | | | | | | | |
| | — | * | | | — | * | | | — | * | | | — | * | | | — | * | | | — | * |
| | — | | | | — | | | | — | | | | — | | | | — | | | | — | |
| | — | * | | | — | * | | | — | * | | | — | * | | | — | * | | | — | * |
| | 1.00 | | | | 1.00 | | | | 1.00 | | | | 1.00 | | | | 1.00 | | | | 1.00 | |
| $ | 1,734 | | | $ | 2,177 | | | $ | 376 | | | $ | 331 | | | $ | 405 | | | $ | 447 | |
| | | | | | | | | | | | | | | | | | | | | | |
| | 0.03 | %c | | | 0.06 | % | | | 0.09 | % | | | 0.08 | % | | | 0.11 | % | | | 0.18 | % |
| | 0.56 | d | | | 0.55 | | | | 0.56 | | | | 0.58 | | | | 0.59 | | | | 0.59 | |
| | — | | | | — | | | | — | | | | — | | | | — | | | | 0.01 | |
| | 0.07 | d | | | 0.06 | | | | 0.09 | | | | 0.08 | | | | 0.11 | | | | 0.18 | |
69
Harbor Fixed Income Funds
NOTES TO FINANCIAL STATEMENTS—April 30, 2015 (Unaudited)
(Currency in thousands)
NOTE 1—ORGANIZATIONAL MATTERS
Harbor Funds (the “Trust”) is registered under the Investment Company Act of 1940, as amended (the “Investment Company Act”), as an open-end management investment company. The Trust consists of 28 separate portfolios. The portfolios covered by this report include: Harbor Convertible Securities Fund, Harbor High-Yield Bond Fund, Harbor Bond Fund, Harbor Real Return Fund, and Harbor Money Market Fund (individually or collectively referred to as a “Fund” or the “Funds,” respectively). Harbor Capital Advisors, Inc. (the “Adviser” or “Harbor Capital”) is the investment adviser for the Funds.
The Funds may offer up to three classes of shares, designated as Institutional Class, Administrative Class and Investor Class. The shares of each class represent an interest in the same portfolio of investments of the respective Fund and have equal rights to voting, redemptions, dividends, and liquidations, except that: (i) certain expenses, subject to the approval of the Trust’s Board of Trustees (the “Board of Trustees”), may be applied differently to each class of shares in accordance with current regulations of the Securities and Exchange Commission and the Internal Revenue Service; and (ii) shareholders of a class that bears distribution and service expenses under terms of a distribution plan have exclusive voting rights as to that distribution plan.
NOTE 2—SIGNIFICANT ACCOUNTING POLICIES
The following is a summary of significant accounting policies followed by the Trust in the preparation of its financial statements. Each Fund follows the investment company reporting requirements under U.S. Generally Accepted Accounting Principles (“U.S. GAAP”). The preparation of financial statements in accordance with U.S. GAAP requires management to make estimates and assumptions that affect the reported amounts and disclosures in the financial statements. Actual results may differ from those estimates.
Security Valuation
Equity securities (including common stock, preferred stock, and convertible preferred stock) and financial derivative instruments (such as futures contracts, options contracts and centrally cleared swap agreements) that are traded on a national security exchange (except securities listed on the National Association of Securities Dealers Automated Quotation (“NASDAQ”) system and United Kingdom securities), are valued at the last sale price on a national exchange or system on which they are principally traded as of the valuation date. Securities listed on the NASDAQ system or a United Kingdom exchange are valued at the official closing price of those securities. In the case of securities for which there are no sales on the valuation day, (i) securities traded principally on a U.S. exchange, including NASDAQ, are valued at the mean between the closing bid and ask price; and (ii) securities traded principally on a foreign exchange, including United Kingdom securities, are valued at the official bid price determined as of the close of the primary exchange. Securities of open-end registered investment companies that are held by a Fund are valued at net asset value. To the extent these securities are actively traded and fair valuation adjustments are not applied, they are normally categorized as Level 1 in the fair value hierarchy. Equity securities traded on inactive markets or valued by reference to similar instruments are normally categorized as Level 2 in the fair value hierarchy. For more information on the fair value hierarchy, please refer to the Fair Value Measurements and Disclosures section in Note 2.
Debt securities (including corporate bonds, municipal bonds and notes, U.S. government agencies, U.S. treasury obligations, mortgage-backed and asset-backed securities, foreign government obligations, bank loans, and convertible securities other than short-term securities with a remaining maturity of less than 60 days at the time of acquisition), are valued using evaluated prices furnished by a pricing service selected by the Board of Trustees. An evaluated price represents an assessment by the pricing service using various market inputs of what the pricing service believes is the fair value of a security at a particular point in time. The pricing service determines evaluated prices for debt securities that would be transacted at institutional-size quantities using inputs including, but not limited to, (i) recent transaction prices and dealer quotes, (ii) transaction prices for what the pricing service believes are securities with similar characteristics, (iii) the pricing vendor’s assessment of the risk inherent in the security taking into account criteria such as credit quality,
70
Harbor Fixed Income Funds
NOTES TO FINANCIAL STATEMENTS—Continued
(Currency in thousands)
NOTE 2—SIGNIFICANT ACCOUNTING POLICIES—Continued
payment history, liquidity and market conditions, and (iv) various correlations and relationships between security price movements and other factors, such as interest rate changes, which are recognized by institutional traders. In the case of mortgage-backed and asset-backed securities, the inputs used by the pricing service may also include information about cash flows, prepayment rates, default rates, delinquency and loss assumptions, collateral characteristics, credit enhancements and other specific information about the particular offering. Because many debt securities trade infrequently, the pricing vendor will often not have current transaction price information available as an input in determining an evaluated price for a particular security. When current transaction price information is available, it is one input into the pricing service’s evaluation process, which means that the evaluated price supplied by the pricing service will frequently differ from that transaction price. Securities held by Harbor Money Market Fund are valued at amortized cost, which the Adviser has determined, pursuant to the Board of Trustees’ authorization, approximates fair value. Under this method, investments purchased at a discount or premium are valued by accreting or amortizing the difference between the original purchase price and the maturity value of the issue over the period to effective maturity. Short-term securities with a remaining maturity of less than 60 days at the time of acquisition that are held by each Fund other than Harbor Money Market Fund are also generally valued at amortized cost, which approximates fair value. Securities that use similar valuation techniques and inputs as described above are normally categorized as Level 2 in the fair value hierarchy.
Over-the-counter (“OTC”) financial derivative instruments, such as forward currency contracts, options contracts, and swap agreements, derive their value from underlying asset prices, indices, reference rates and other inputs, or a combination of these factors. These instruments are valued using evaluated prices furnished by a pricing service selected by the Board of Trustees. In certain cases, when a valuation is not readily available from a pricing service, the Fund’s subadviser provides a valuation, typically using its own proprietary models. Depending on the instrument and the terms of the transaction, the value of the derivative instrument can be determined by a pricing service or subadviser using a series of techniques, including simulation pricing models. The pricing models use inputs, such as issuer details, indices, spreads, interest rates, yield curves, dividends and exchange rates, that are observed from actively quoted markets. Derivative instruments that use valuation techniques and inputs similar to those described above are normally categorized as Level 2 in the fair value hierarchy.
When reliable market quotations or evaluated prices supplied by a pricing vendor are not readily available or are not believed to accurately reflect fair value, securities are priced at their fair value as determined by the Trust’s Valuation Committee (the “Valuation Committee”) pursuant to procedures adopted, and subject to oversight, by the Board of Trustees. The Valuation Committee is comprised of a trustee and officers of the Trust and employees of Harbor Capital with relevant experience or responsibilities. Each security for which the Valuation Committee determines a fair value, including the basis for the fair value decision, is reviewed by the Board of Trustees at its regularly scheduled board meetings.
When a fair valuation method is applied by the Valuation Committee or a Fund’s subadviser, securities will be priced by a method that the Valuation Committee or subadviser believes accurately reflects fair value. Securities valued using fair valuation methods that incorporate significant unobservable inputs are normally categorized as Level 3 in the fair value hierarchy. Examples of possible fair valuation methodologies used in determining the fair value of securities categorized as Level 3 in the fair value hierarchy include, but are not limited to, benchmark pricing and indicative market quotations.
When benchmark pricing is used, the base price of a debt security is set and then subsequently adjusted in proportion to the market value changes of an index or similar security (the “benchmark security”) that trades in an active market or for which other observable inputs are available. The base price may be a broker-dealer quote, transaction price, or an internal value as derived by analysis of market data. The base price of the security may be reset on a periodic basis based on the availability of market data and procedures approved by a Fund’s subadviser. If the benchmark security is categorized as Level 2 of the fair value hierarchy due to the lack of an active market for that security, any security adjusted in proportion to the market value of the benchmark security may be categorized as Level 3 in the fair value hierarchy. Significant changes in the unobservable inputs of the benchmark pricing process (i.e., the base price) would result in direct and proportional changes in the fair value of the security. The reasonability of the fair value is reviewed by the subadviser on a periodic basis and may be amended as the availability of market data indicates a material change.
71
Harbor Fixed Income Funds
NOTES TO FINANCIAL STATEMENTS—Continued
(Currency in thousands)
NOTE 2—SIGNIFICANT ACCOUNTING POLICIES—Continued
If evaluated pricing through a third-party pricing vendor is not available or deemed to be indicative of fair value, a Fund’s subadviser may elect to obtain indicative market quotations (“broker quotes”) directly from a broker-dealer or passed through from a third-party pricing vendor. Indicative market quotations are typically received from established market participants. In the event that the source of fair value is from a single-sourced broker quote, but the subadviser does not have the transparency to view the underlying inputs that support the market quotation, these securities are categorized as Level 3 in the fair value hierarchy. Significant changes in the broker quote would have direct and proportional changes in the fair value of the security.
A Fund may also use fair value pricing if the value of some or all of the Fund’s securities have been materially affected by events occurring before the Fund’s pricing time but after the close of the primary markets or exchanges on which the security is traded. This most commonly occurs with foreign securities, but may occur with other securities as well. In such cases, the Fund may apply a fair value factor supplied by the pricing service to a foreign security’s market close value to reflect changes in value that may have occurred between the close of the primary market or exchange on which the security is traded and the Fund’s pricing time. That factor may be derived using observable inputs such as a comparison of the trading patterns of a foreign security to intraday trading in the U.S. markets that are highly correlated to the foreign security or other information that becomes available after the close of the foreign market on which the security principally traded. Fair value pricing is inherently subjective and reflects good faith judgments based on available information. When fair value pricing is employed, the prices of securities used by a Fund to calculate its net asset value may differ from market quotations, official closing prices or evaluated prices for the same securities, which means that the Fund may value those securities higher or lower than another given fund that uses market quotations, official closing prices or evaluated prices supplied by a pricing vendor in its calculation of net asset value. Securities valued using observable inputs, such as those described above, are normally categorized as Level 2 of the fair value hierarchy.
Fair Value Measurements and Disclosures
Various inputs may be used to determine the value of each Fund’s investments, which are summarized in three broad categories defined as Level 1, Level 2 and Level 3. The inputs or methodologies used for valuing securities are not necessarily an indication of the risk associated with investing in those securities. The assignment of an investment to Level 1, 2 or 3 is based on the lowest level of significant inputs used to determine its fair value.
| | |
| Level 1— | | Quoted prices in active markets for identical securities. |
| Level 2— | | Other significant observable inputs (including quoted prices for similar securities, interest rates, prepayment speeds, credit risk, etc.). |
| Level 3— | | Significant unobservable inputs are used in situations where quoted prices or other observable inputs are not available or are deemed unreliable. Significant unobservable inputs may include the Funds’ own assumptions. |
Transfers between Levels, if any, are recognized as of the last day in the fiscal quarter of the period in which the event or change in circumstances that caused the reclassification occurred. For fair valuations using significant unobservable inputs, a reconciliation of the beginning to ending balances for reported fair values is provided that presents changes attributable to realized and unrealized gains and losses and purchases, sales, and transfers in/out of the Level 3 category during the period. A table that includes a categorization of investments into Level 1, Level 2 or Level 3, transfers between Levels, if any, and a Level 3 reconciliation, including details of significant unobservable inputs used, when applicable, can be found at the end of each Fund’s Portfolio of Investments schedule.
The Funds used observable inputs in their valuation methodologies whenever they were available and deemed reliable.
Loan Participations and Assignments
Loan participations and loan assignments are direct debt instruments, which are interests in amounts owed by corporate, governmental, or other borrowers to lenders or lending syndicates. During the period, Harbor High-Yield Bond Fund and Harbor Bond Fund invested in loan participations and assignments. A Fund’s investments in loans may be in the form of
72
Harbor Fixed Income Funds
NOTES TO FINANCIAL STATEMENTS—Continued
(Currency in thousands)
NOTE 2—SIGNIFICANT ACCOUNTING POLICIES—Continued
participation in loans or assignments of all or a portion of loans from third parties. A loan is often administered by a bank or other financial institution (the “agent”) that acts as agent for all holders. The agent administers the terms of the loan, as specified in the loan agreement. When investing in a loan participation, the Fund has the right to receive payments of principal, interest and any fees to which it is entitled, only from the agent selling the loan agreement and only upon receipt by the agent of payments from the borrower. As a result, the Fund may be subject to the credit risk of both the borrower and the agent that is selling the loan agreement. When the Fund purchases assignments from agents it acquires direct rights against the borrower on the loan.
Harbor High-Yield Bond Fund has also entered into unfunded loan commitments, which are contractual obligations for future funding. Unfunded loan commitments may include revolving credit facilities, which may obligate the Fund to supply additional cash to the borrower on demand. Unfunded loan commitments represent a future obligation in full, even though a percentage of the notional loan amounts will never be utilized by the borrower. The funded portion of these credit agreements are presented on the Portfolio of Investments. Unfunded loan commitments are marked to market daily and any unrealized appreciation or depreciation is included in the Statement of Assets and Liabilities and the Statement of Operations.
Harbor High-Yield Bond Fund may also receive a commitment fee based on the undrawn portion of the underlying line of credit portion of a loan. In certain circumstances, a Fund may receive a prepayment penalty fee upon the prepayment of a loan by a borrower. Fees earned are recorded as a component of interest income on the Statements of Operations.
As of April 30, 2015, Harbor High-Yield Bond Fund had $23,650 in unfunded loan commitments outstanding.
Inflation-Indexed Bonds
Inflation-indexed bonds are fixed-income securities whose principal value is periodically adjusted based on the rate of inflation. During the period, Harbor Bond Fund and Harbor Real Return Fund invested in inflation-indexed bonds. The interest rate on these bonds is generally fixed at issuance at a rate lower than typical bonds. Over the life of an inflation-indexed bond, however, interest will be paid based on a principal value that is adjusted for inflation. Any increase in the principal amount of an inflation-indexed bond will be included as interest income even though investors do not receive the principal until maturity.
Mortgage-Related and Other Asset-Backed Securities
Mortgage-backed or asset-backed securities include mortgage pass-through securities, collateralized mortgage obligations (“CMOs”), commercial mortgage-backed securities, mortgage dollar roll transactions, CMO residuals, stripped mortgage-backed securities (“SMBSs”) and other securities that directly or indirectly represent a participation in, or are secured by and payable from, mortgage loans on real property. During the period, Harbor Bond Fund and Harbor Real Return Fund invested in mortgage- or other asset-backed securities. The value of some mortgage- or asset-backed securities may be particularly sensitive to changes in prevailing interest rates. Early repayment of principal on some mortgage-related securities may expose a Fund to a lower rate of return upon reinvestment of principal. The value of these securities may fluctuate in response to the market’s perception of the creditworthiness of the issuers. Additionally, although mortgages and mortgage-related securities are generally supported by some form of government or private guarantee and/or insurance, there is no assurance that private guarantors or insurers will meet their obligations.
U.S. Government Securities
During the period, Harbor Bond Fund, Harbor Real Return Fund and Harbor Money Market Fund invested in U.S. government securities. U.S. government securities include securities issued by U.S. government agencies or government-sponsored enterprises that may not be guaranteed by the U.S. Treasury. The Government National Mortgage Association (“GNMA” or “Ginnie Mae”), a wholly owned U.S. government corporation, is authorized to guarantee, with the full faith and credit of the U.S. government, the timely payment of principal and interest on securities issued by
73
Harbor Fixed Income Funds
NOTES TO FINANCIAL STATEMENTS—Continued
(Currency in thousands)
NOTE 2—SIGNIFICANT ACCOUNTING POLICIES—Continued
institutions approved by GNMA and backed by pools of mortgages insured by the Federal Housing Administration or guaranteed by the Department of Veterans Affairs. Government-related guarantors (i.e., not backed by the full faith and credit of the U.S. government) include the Federal National Mortgage Association (“FNMA” or “Fannie Mae”) and the Federal Home Loan Mortgage Corporation (“FHLMC” or “Freddie Mac”). On September 7, 2008, the Federal Housing Finance Agency placed Fannie Mae and Freddie Mac in conservatorship, while the U.S. Treasury agreed to purchase preferred stock as needed to ensure that both Fannie Mae and Freddie Mac maintain a positive net worth (guaranteeing up to $100 billion for each entity). As a consequence, certain fixed income securities of Fannie Mae and Freddie Mac have more explicit U.S. government support.
Forward Commitments and When-Issued Securities
During the period, Harbor Bond Fund purchased and sold securities on a forward commitment basis, including “TBA” (to be announced) purchase and sale commitments. Purchasing securities on a when-issued or forward commitment basis involves a risk of loss if the value of the security to be purchased declines prior to the settlement date. Such risk is in addition to the risk of decline in value of a Fund’s other assets. Although a Fund would generally purchase securities on a when-issued or forward commitment basis with the intention of acquiring securities for its portfolio, a Fund may dispose of a when-issued security or forward commitment prior to settlement if a subadviser deems it appropriate to do so. Each Fund may enter into a forward commitment sale to hedge its portfolio positions or to sell securities it owned under a delayed delivery arrangement. Sale proceeds are not received until the contractual settlement date. While such a contract is outstanding, a Fund must segregate equivalent deliverable securities or hold an offsetting purchase commitment. A Fund may realize short-term gains or losses upon such purchases and sales. These transactions involve a commitment by a Fund to purchase or sell securities at a future date (ordinarily one or two months later). The price of the underlying securities (usually expressed in terms of yield) and the date when the securities will be delivered and paid for (the settlement date) are fixed at the time the transaction is negotiated. When-issued purchase and forward commitment transactions are negotiated directly with the other party, and such commitments are not traded on exchanges.
The value of securities purchased on a when-issued or forward commitment basis and any subsequent fluctuations in their value are reflected in the computation of a Fund’s net asset value starting on the date of the agreement to purchase the securities. A Fund does not earn interest on the securities it has committed to purchase until they are paid for and delivered on the settlement date. When a Fund makes a forward commitment to sell securities it owns, the proceeds to be received upon settlement are included in the Fund’s assets. Fluctuations in the market value of the underlying securities are not reflected in a Fund’s net asset value as long as the commitment to sell remains in effect. Settlement of when-issued purchase and forward commitment transactions generally takes place within two months after the date of the transaction, but a Fund may agree to a longer settlement period.
A Fund will purchase securities on a when-issued basis, or purchase or sell securities on a forward commitment basis, only with the intention of completing the transaction and actually purchasing or selling the securities. If deemed advisable as a matter of investment strategy, however, a Fund may dispose of or renegotiate a commitment after it is entered into. A Fund also may sell securities it has committed to purchase before those securities are delivered to such Fund on the settlement date. A Fund may realize a capital gain or loss in connection with these transactions. When a Fund purchases securities on a when-issued or forward commitment basis, the Fund will maintain in a segregated account with the Fund’s custodian, or set aside or restrict in the subadviser’s records or systems relating to the Fund, cash or liquid assets having a value (determined daily) at least equal to the amount of the Fund’s purchase commitments. In the case of a forward commitment to sell portfolio securities, portfolio holdings will be held in a segregated account with the Fund’s custodian, or set aside or restricted on the subadviser’s records or systems relating to the Fund, while the commitment is outstanding.
Repurchase Agreements
In a repurchase agreement, a Fund buys a security at one price and simultaneously agrees to sell it back at a higher price. Such agreements must be adequately collateralized to cover the counterparty’s obligation to the Fund to close out the repurchase agreement. During the period, each Fund entered into repurchase agreements with domestic or foreign banks
74
Harbor Fixed Income Funds
NOTES TO FINANCIAL STATEMENTS—Continued
(Currency in thousands)
NOTE 2—SIGNIFICANT ACCOUNTING POLICIES—Continued
or with a member firm of the Financial Industry Regulatory Authority, Inc., or an affiliate of a member firm that is a primary dealer in U.S. government securities. Each repurchase agreement counterparty must meet the minimum credit quality requirements applicable to the respective Fund and any other appropriate counterparty criteria as determined by the Fund’s subadviser. The minimum credit quality requirements are those applicable to a Fund’s purchase of securities such that if a Fund is permitted to only purchase securities that are rated investment-grade (or the equivalent if unrated), that Fund could only enter into repurchase agreements with counterparties that have debt outstanding that is rated investment-grade (or the equivalent if unrated). The securities are regularly monitored to ensure that the collateral is adequate. A Fund seeks to further mitigate its counterparty risk by entering into master repurchase agreements with its counterparties. The master repurchase agreements provide that, in the event of a counterparty’s default, including bankruptcy, the Fund may terminate any repurchase agreements with that counterparty, determine the net amount owned, and sell or retain the collateral up to the net amount owed to the Fund. A counterparty’s default may cause the Fund to suffer losses, including loss of interest on or principal of the securities and costs associated with delay and enforcement of the terms of the master repurchase agreement.
Sale-Buybacks
A “sale-buyback” transaction consists of a sale of a portfolio security by the Fund to a financial institution (the counterparty) with a simultaneous agreement to repurchase the same or substantially the same security at an agreed-upon price and date. The Fund is not entitled to receive principal and interest payments, if any, made on the security sold to the counterparty during the term of the agreement. During the period, Harbor Bond Fund and Harbor Real Return Fund entered into such financing transactions referred to as sale-buybacks.
The agreed-upon proceeds for securities to be repurchased by the Fund are reflected as a liability on the Statement of Assets and Liabilities. The Fund will recognize net income represented by the price differential between the price received for the transferred security and the agreed-upon repurchase price. This is commonly referred to as the “price drop.” A price drop consists of two components: (i) the foregone interest and inflationary income adjustments, if any, the Fund would have otherwise received had the security not been sold, and (ii) the negotiated financing terms between the Fund and counterparty. Foregone interest and inflationary income adjustments, if any, are recorded as components of interest income on the Statement of Operations. Interest payments based upon negotiated financing terms made by the Fund to counterparties are recorded as a component of interest expense on the Statement of Operations. In periods of increased demand for a security, the Fund may receive a fee for use of the security by the counterparty, which may result in additional interest income to the Fund.
The average amount of borrowings outstanding during the six-month period ended April 30, 2015 was $179,299 at a weighted average interest rate of 0.142% for the Harbor Bond Fund and $51,138 at a weighted average interest rate of 0.240% for the Harbor Real Return Fund.
Short Sales
During the period, Harbor Bond Fund engaged in short-selling, which obligates a Fund to replace a borrowed security by purchasing it at the market price at the time of replacement. Until the security is replaced, such Fund is required to pay any accrued interest or dividends to the lender and also may be required to pay a premium. A Fund would realize a gain if the security declines in price between the date of the short sale and the date on which the Fund replaces the borrowed security. A Fund would incur a loss as a result of the short sale if the price of the security increases between those dates. Until a Fund replaces the borrowed security, subject to pre-arranged exposure levels, it will maintain cash or liquid securities sufficient to cover its short position in a segregated account with the Fund’s custodian or set aside or restricted in the subadviser’s records or systems relating to the Fund. Short sales involve the risk of an unlimited increase in the market price of the borrowed security.
75
Harbor Fixed Income Funds
NOTES TO FINANCIAL STATEMENTS—Continued
(Currency in thousands)
NOTE 2—SIGNIFICANT ACCOUNTING POLICIES—Continued
Futures Contracts
A futures contract is an agreement between two parties to buy or sell a specified financial instrument at a set price on a future date. During the period, Harbor Bond Fund and Harbor Real Return Fund used futures contracts to gain exposure to the fixed income asset class with greater efficiency and lower cost than was possible through direct investment, to add value when these securities were attractively priced, or to adjust the portfolio’s sensitivity to changes in interest rates or currency exchange rates. Futures contracts tend to increase or decrease a Fund’s exposure to the underlying instrument or can be used to hedge other Fund investments.
Upon entering into a futures contract, a Fund is required to pledge to the broker an amount of cash, U.S. government securities or other liquid securities equal to the minimum “initial margin” requirements of the exchange. Pursuant to the contract, a Fund agrees to receive from or pay to the broker an amount of cash equal to the daily fluctuation in value of the contract referred to as “variation margin.” Such receipts or payments are recorded by a Fund as unrealized gains or losses. When the contract is closed or expires, a Fund records a realized gain or loss equal to the difference between the value of the contract at the time it was opened and the value at the time it was closed. A Fund may suffer losses if it is unable to close out its position because of an illiquid secondary market. There is no assurance that a portfolio manager will be able to close out its position when the portfolio manager considers it appropriate or desirable to do so. In the event of adverse price movements, a Fund may be required to continue making daily cash payments to maintain its required margin. If a Fund has insufficient cash, it may have to sell portfolio securities to meet daily margin requirements at a time when the portfolio manager would not otherwise elect to do so. In addition, a Fund may be required to deliver or take delivery of instruments. The maximum potential loss on a long futures contract is the U.S. dollar value of the notional amount at the time the contract is opened. The potential loss on a short futures contract is unlimited. There is minimal counterparty risk with futures contracts as they are exchange traded and the exchange’s clearinghouse, as counterparty to all exchange traded futures, guarantees the futures against default.
Options
An option, including rights and warrants, is a contract that offers the buyer the right, but not the obligation, to buy (call) or sell (put) a security or other financial asset at an agreed-upon price (the strike price) during a certain period of time or on a specific date (exercise date). During the period, Harbor Bond Fund and Harbor Real Return Fund purchased and wrote (sold) option contracts to manage their exposure to the bond markets and to fluctuations in interest rates and currency values. Call options tend to increase a Fund’s exposure to the underlying instrument, if purchased, and decrease exposure to the underlying instrument, if written. Put options tend to decrease a Fund’s exposure to the underlying instrument, if purchased, and increase exposure to the underlying instrument, if written.
When a Fund purchases an option, it pays a premium. If a purchased option expires, a Fund realizes a loss in the amount of the premium. If a Fund enters into a closing sale transaction, it realizes a gain or loss, depending on whether the proceeds from the sale are greater or less than the cost of the option. If a call option is exercised by a Fund, the cost of the securities acquired by exercising the call is increased by the premium paid to buy the call. If a put option is exercised by a Fund, it realizes a gain or loss from the sale of the underlying security and the proceeds from such sale are decreased by the premium originally paid. The risk associated with purchasing options is limited to the premium paid. A Fund’s maximum risk of loss from counterparty credit risk is also limited to the premium paid for the contract.
When a Fund writes an option, it receives a premium. If a written option expires on its stipulated expiration date, or if a Fund enters into a closing purchase transaction, the Fund realizes a gain (or loss, if the cost of a closing purchase transaction exceeds the premium received when the option was written) without regard to any unrealized gain or loss on the underlying security, and the liability related to such option is extinguished. If a written call option is exercised, a Fund realizes a gain or loss from the sale of the underlying security, and the proceeds of the sale are increased by the premium originally received. If a written put option is exercised, the amount of the premium originally received reduces the cost of the security that a Fund purchases upon exercise of the option.
76
Harbor Fixed Income Funds
NOTES TO FINANCIAL STATEMENTS—Continued
(Currency in thousands)
NOTE 2—SIGNIFICANT ACCOUNTING POLICIES—Continued
The risk in writing a call option is that a Fund relinquishes the opportunity to profit if the market price of the underlying security increases and the option is exercised. In writing a put option, a Fund assumes the risk of incurring a loss if the market price of the underlying security decreases and the option is exercised. In addition, there is a risk that a Fund may not be able to enter into a closing transaction because of an illiquid secondary market or if the counterparty does not perform under the contract’s terms.
Swap Agreements
A swap is a contract between two parties to exchange future cash flows at specified intervals (payment dates) based upon a notional principal amount during the agreed-upon life of the contract. Swaps are marked to market daily and changes in value are recorded as unrealized appreciation or depreciation.
Upon entering a swap agreement, any payments received or made at the beginning of the measurement period are reflected as such on the Statements of Assets and Liabilities and represent a reconciling value to compensate for differences between the stated terms of the swap agreement and prevailing market conditions (such as credit spreads, currency exchange rates, interest rates, and other relevant factors). These upfront payments are recorded as realized gains or losses on the Statements of Operations upon termination or maturity of the swap. If a liquidation payment is received or made at the termination of the swap, it is recorded as realized gain or loss on the Statements of Operations. Net periodic payments received or paid by the Fund are included as part of realized gains or losses on the Statement of Operations. A Fund will only enter into swap agreements with counterparties that meet the minimum credit quality requirements applicable to the Fund and any other appropriate counterparty criteria as determined by the Fund’s subadviser. The minimum credit quality requirements are similar to those applicable to a Fund’s purchase of securities, such that if the Fund is permitted to only purchase securities that are rated investment-grade (or the equivalent if unrated), the Fund could only enter into one of the below referenced transactions with counterparties that have debt outstanding that is rated investment-grade (or the equivalent if unrated). Entering into swap agreements involves, to varying degrees, elements of credit risk, market risk and interest rate risk in excess of the amount recognized in the Statement of Assets and Liabilities. Such risks include the possibility that there is not a liquid market for these agreements, that the counterparty to the agreements may default on its obligation to perform, or that there may be unfavorable changes in market conditions or interest rates. The Fund’s maximum risk of loss from counterparty credit risk is the discounted value of the net cash flows to be received from the counterparty over the contract’s remaining life or the value of the contract. This risk is typically mitigated by entering into swap agreements with highly-rated counterparties, the existence of a master netting arrangement between the Fund and the counterparty, and the posting of collateral by the counterparty.
Interest Rate Swaps are agreements between counterparties to exchange cash flows or an exchange of commitments to pay or receive interest with respect to the notional amount of principal. During the period, Harbor Bond Fund and Harbor Real Return Fund used interest rate swap agreements to manage their exposure to interest rate changes. Changes in interest rates can have an effect on the value of bond holdings, the amount of interest income earned, and the value of interest rate swaps held.
Credit Default Swaps are agreements between counterparties to buy or sell protection on a debt security, a basket of securities, or an index of obligations against a defined credit event. Under the terms of a credit default swap, the buyer of protection receives credit protection in exchange for making periodic payments to the seller of protection based on a given percentage applied to a notional principal amount. In return for these payments, the seller acts as the guarantor of the creditworthiness of a reference entity, obligation or index. During the period, Harbor Bond Fund and Harbor Real Return Fund used credit default swap agreements as a seller to gain credit exposure to an issuer or to simulate investments in long bond positions that were either unavailable or less attractively priced in the bond market; such Funds used credit default swap agreements as a buyer to provide a measure of protection against defaults of an issuer. An issuer may represent either a single issuer, a “basket” of issuers, or a credit index. A credit index is a basket of credit instruments or exposures designed to be representative of some part of the credit market as a whole.
77
Harbor Fixed Income Funds
NOTES TO FINANCIAL STATEMENTS—Continued
(Currency in thousands)
NOTE 2—SIGNIFICANT ACCOUNTING POLICIES—Continued
The buyer in a credit default contract is obligated to pay the seller a periodic stream of payments over the term of the contract provided that no credit event occurs. Credit events may include bankruptcy, failure to pay principal, maturity extension, rating downgrade, or write-down. As a seller, if an underlying credit event occurs, a Fund will either pay the buyer an amount equal to the notional amount of the swap and take delivery of the reference obligation (or underlying securities comprising an index), or pay a net settlement amount of cash equal to the notional amount of the swap less the recovery value of the reference obligation (or underlying securities comprising an index). As a buyer, if an underlying credit event occurs, a Fund will either receive from the seller an amount equal to the notional amount of the swap and deliver the reference obligation (or underlying securities comprising an index) or receive a net settlement. The maximum exposure to loss of the notional value as the seller of credit default swaps outstanding at April 30, 2015 for Harbor Bond Fund and Harbor Real Return Fund was $239,194 and $1,625, respectively.
Forward Currency Contracts
A forward currency contract is an agreement between two parties to buy and sell currencies at a set price on a future date. During the period, Harbor Bond Fund and Harbor Real Return Fund used forward currency contracts to manage their exposure to changes in exchange rates or as a hedge against foreign exchange risk related to specific transactions or portfolio positions.
The forward currency contract is marked-to-market daily and the change in market value is recorded as an unrealized gain or loss. When the contract is closed, the Fund records a realized gain or loss equal to the difference between the value on the open and close date. Risk of losses may arise from changes in the value of the foreign currency, or if the counterparties do not perform under the contract’s terms. The maximum potential loss from such contracts is the aggregate face value in U.S. dollars at the time the contract was opened. During the period, Harbor Bond Fund and Harbor Real Return Fund entered into collateral agreements with certain counterparties to mitigate counterparty risk associated with forward currency contracts.
Foreign Currency Spot Contracts
A foreign currency spot contract is an agreement between two parties to buy and sell currencies at the current market rate for settlement within two business days. During the period, Harbor Bond Fund and Harbor Real Return Fund used foreign currency spot contracts to facilitate transactions in foreign securities or to convert foreign currency receipts into U.S. dollars.
The foreign currency spot contract is marked-to-market daily for settlements beyond one day, and any change in market value is recorded as an unrealized gain or loss. When the contract is closed, the Fund records a realized gain or loss equal to the difference between the value on the open and close date. Risk of losses may arise from changes in the value of the foreign currency or if the counterparties do not perform under the contract’s terms. The maximum potential loss from such contracts is the aggregate face value in U.S. dollars at the time the contract was opened.
Foreign Currency Translations
Purchases and sales of securities are translated into U.S. dollars at the current exchange rate on the respective dates of the transactions. Income and withholding taxes are translated at the prevailing exchange rate when accrued or incurred. The accounting records of the Funds are maintained in U.S. dollars. Investment securities and other assets and liabilities denominated in a foreign currency are translated into U.S. dollars based on the current exchange rates at April 30, 2015.
Reported net realized gains and losses on foreign currency transactions represent net gains and losses from sales and maturities of foreign forward currency contracts, disposition of foreign currencies, currency gains and losses realized between the trade and settlement dates on securities transactions, and the difference between the amount of investment income accrued and tax reclaims receivable and the U.S. dollar amount actually received. The effects of changes in foreign currency exchange rates on investments in securities are included in the net realized and unrealized gain or loss on investments in the Statement of Operations.
78
Harbor Fixed Income Funds
NOTES TO FINANCIAL STATEMENTS—Continued
(Currency in thousands)
NOTE 2—SIGNIFICANT ACCOUNTING POLICIES—Continued
Investment Income
Dividends declared on portfolio securities are accrued on the ex-dividend date. For foreign securities held, certain dividends are recorded after the ex-dividend date, but as soon as the respective Fund is notified of such dividends. Interest income is accrued daily as earned. Discounts and premiums on fixed income securities purchased are amortized over the life of the respective securities using the effective yield method. Paydown gains and losses on mortgage-backed and asset-backed securities are recognized as a component of interest income.
Securities Transactions
Securities transactions are accounted for on the trade date (the date the order to buy or sell is executed). Realized gains or losses on security transactions are determined on the basis of identified cost for both federal income tax and financial reporting purposes.
Proceeds from Litigation
The Funds may receive proceeds from shareholder litigation settlements involving current and/or previously held portfolio holdings. Any proceeds received from litigation involving portfolio holdings are reflected in the Statement of Operations in realized gain/(loss) if the security has been disposed of by a Fund or in unrealized gain/(loss) if the security is still held by a Fund.
Distribution to Shareholders
Distributions on Fund shares are recorded on the ex-dividend date.
Expenses
Expenses incurred by the Trust are charged directly to the Fund that incurred such expense whenever possible. With respect to expenses incurred by any two or more Harbor Funds where amounts cannot be identified on a fund by fund basis, such expenses are generally allocated in proportion to the average net assets or the number of shareholders of each Fund.
Custodian
The Funds have credit balance arrangements with the Funds’ custodian whereby uninvested cash is invested in a short-term investment vehicle and amounts earned constitute an expense credit that is applied against gross custody expenses. Such custodial expense reductions are reflected on the accompanying Statement of Operations.
Class Allocations
Income, common expenses and realized and unrealized gains/(losses) are determined at the Fund level and allocated daily to each class of shares based on the applicable net assets of the respective classes. Distribution and service fees, if any, and transfer agent fees are calculated daily at the class level based on the applicable net assets of each class and the specific expense rate(s) applicable to each class.
Taxes
Each Fund is treated as a separate entity for federal tax purposes. Each Fund’s policy is to meet the requirements of Subchapter M of the Internal Revenue Code applicable to regulated investment companies and to distribute to its shareholders all of its taxable income within the prescribed time. It is also the intention of each Fund to distribute an amount sufficient to avoid imposition of any excise tax under Section 4982 of the Internal Revenue Code. Therefore, no provision has been made for federal taxes on income, capital gains or unrealized appreciation of securities held or excise taxes on income and capital gains.
79
Harbor Fixed Income Funds
NOTES TO FINANCIAL STATEMENTS—Continued
(Currency in thousands)
NOTE 2—SIGNIFICANT ACCOUNTING POLICIES—Continued
The Funds may be subject to taxes imposed by countries in which they invest. Such taxes are generally based on income and/or capital gains earned or repatriated. Taxes are accrued and applied to net investment income, net realized gains and unrealized appreciation as such income and/or gains are earned.
Management has analyzed each Fund’s tax positions for all open tax years (in particular, U.S. federal income tax returns for the tax years ended October 31, 2011–2013), including all positions expected to be taken upon filing the 2014 tax return, in all material jurisdictions where the Funds operate, and has concluded that no provision for income tax is required in any Fund’s financial statements. The Funds will recognize interest and penalties, if any, related to unrecognized tax benefits as income tax expense in the Statement of Operations.
Statement of Cash Flows
U.S. Generally Accepted Accounting Principles (“U.S. GAAP”) requires entities providing financial statements that report both a Statement of Assets and Liabilities and a Statement of Operations to also provide a Statement of Cash Flows for each period for which results of operations are provided. Investment Companies that meet certain conditions are exempted from this requirement. One of the conditions that must be satisfied is that the fund have little or no debt outstanding during the period. During the six-month period ended April 30, 2015, Harbor Real Return Fund and Harbor Bond Fund entered into repurchase agreements, which are now categorized as sale-buyback financing transactions under the Accounting Standards Update (“ASU”) 2011-03, A Reconsideration of Effective Control for Repurchase Agreements (“ASU 2011-03”). ASU 2011-03 refers to the accounting for repurchase agreements and similar agreements that entitle and obligate a transferor to repurchase or redeem financial assets before their maturity. These transactions resulted in debt being recorded on each Fund’s Statements of Assets and Liabilities. Management has determined that the average level of debt outstanding during the period for Harbor Real Return Fund requires the Fund to present a Statement of Cash Flows.
New Accounting Pronouncements
In June 2014, the Financial Accounting Standards Board (“FASB”) issued Accounting Standards Update (“ASU”) 2014-11, Transfers and Servicing (“ASU 2014-11”) which expands secured borrowing accounting for certain repurchase agreements. ASU 2014-14 will also require additional disclosures for certain transactions accounted for as sales, in order to provide financial statement users with information to compare to similar transactions accounted for as secured borrowings. ASU 2014-14 will become effective for interim or annual periods beginning after December 15, 2014. Management is evaluating the implications of this pronouncement and the impact it will have on the financial statement disclosures.
In May 2015, FASB issued ASU 2015-07, Disclosures for Investments in Certain Entities That Calculate Net Asset Value per Share (or Its Equivalent) (“ASU 2015-07”) which removes the requirement to make certain fair value disclosures for investments that are eligible to be measured at fair value using the net asset value per share. ASU 2015-07 becomes effective for interim or annual periods beginning after December 15, 2015. Management is evaluating the implications of this pronouncement and the impact it will have on the financial statement disclosures.
Money Market Fund Reform
The Securities and Exchange Commission recently adopted changes to the rules that govern money market funds. These changes will: (1) permit, subject to the discretion of the Board of Trustees, money market funds to impose a “liquidity fee” (up to 2%) and/or “gates” that temporarily restrict redemptions from the funds, if weekly liquidity levels fall below the required regulatory threshold, and (2) require “institutional” money market funds to operate with a floating net asset value rounded to the fourth decimal place. “Government money market funds,” which are money market funds that limit their investments to cash, U.S. Government Securities, and/or repurchase agreements that are collateralized fully, are exempt from these requirements. These changes may affect the Harbor Money Market Fund’s investment strategies, operations and/or return potential. At this time, management is evaluating the potential impact of these changes which have a phase in compliance period ranging from July 2015 through October 2016.
80
Harbor Fixed Income Funds
NOTES TO FINANCIAL STATEMENTS—Continued
(Currency in thousands)
NOTE 3—INVESTMENT PORTFOLIO TRANSACTIONS
Purchases and sales of investments, other than short-term securities, for each Fund for the six-month period ended April 30, 2015 are as follows:
| | | | | | | | | | | | | | | | |
| | | Purchases | | | Sales | |
| | | U.S.
Government | | | Other | | | U.S.
Government | | | Other | |
Harbor Convertible Securities Fund | | $ | — | | | $ | 220,241 | | | $ | — | | | $ | 219,587 | |
Harbor High-Yield Bond Fund | | | — | | | | 552,850 | | | | — | | | | 659,804 | |
Harbor Bond Fund | | | 9,887,043 | | | | 565,278 | | | | 9,390,034 | | | | 1,008,412 | |
Harbor Real Return Fund | | | 384,011 | | | | 14,219 | | | | 414,212 | | | | 13,789 | |
Written Options
Transactions in written options for the six-month period ended April 30, 2015 are summarized as follows:
| | | | | | | | | | | | | | | | | | | | | | | | |
HARBOR BOND FUND | | | | | | | | | | | | | | | | | | | | | | | | |
| | | Swap Options - U.S. | | | Currency Options | | | Options on Futures | |
| | | Number of
Contracts | | | Premiums
Received | | | Number of
Contracts | | | Premiums
Received | | | Number of
Contracts | | | Premiums
Received | |
Options outstanding at beginning of year | | | 1,377,400,000 | | | $ | 6,479 | | | | 351,600,000 | | | $ | 2,140 | | | | 1,225 | | | $ | 309 | |
Options opened | | | 687,300,000 | | | | 2,481 | | | | 666,300,000 | | | | 5,655 | | | | 19,460 | | | | 474,957 | |
Options closed | | | (8,000,000 | ) | | | (97 | ) | | | (92,700,000 | ) | | | (821 | ) | | | (6,603 | ) | | | (292,341 | ) |
Options exercised | | | (301,300,000 | ) | | | (849 | ) | | | (219,000,000 | ) | | | (1,463 | ) | | | (4,909 | ) | | | (180,090 | ) |
Options expired | | | (863,000,000 | ) | | | (3,174 | ) | | | (510,800,000 | ) | | | (3,708 | ) | | | (6,335 | ) | | | (1,709 | ) |
| | | | | | | | | | | | | | | | | | | | | | | | |
Open at 04/30/2015 | | | 892,400,000 | | | $ | 4,840 | | | | 195,400,000 | | | $ | 1,803 | | | | 2,838 | | | $ | 1,126 | |
| | | | | | | | | | | | | | | | | | | | | | | | |
|
HARBOR REAL RETURN FUND | |
| | | Swap Options - U.S. | | | Currency Options | | | Options on Futures | |
| | | Number of
Contracts | | | Premiums
Received | | | Number of
Contracts | | | Premiums
Received | | | Number of
Contracts | | | Premiums
Received | |
Options outstanding at beginning of year | | | 42,600,000 | | | $ | 196 | | | | 6,610,000 | | | $ | 71 | | | | — | | | $ | — | |
Options opened | | | 56,800,000 | | | | 458 | | | | 14,812,000 | | | | 140 | | | | 140 | | | | 3,716 | |
Options closed | | | (13,400,000 | ) | | | (129 | ) | | | — | | | | — | | | | (30 | ) | | | (3,667 | ) |
Options exercised | | | (4,800,000 | ) | | | (9 | ) | | | (6,361,000 | ) | | | (36 | ) | | | (33 | ) | | | (12 | ) |
Options expired | | | (41,100,000 | ) | | | (150 | ) | | | (8,419,000 | ) | | | (63 | ) | | | (71 | ) | | | (36 | ) |
| | | | | | | | | | | | | | | | | | | | | | | | |
Open at 04/30/2015 | | | 40,100,000 | | | $ | 366 | | | | 6,642,000 | | | $ | 112 | | | | 6 | | | $ | 1 | |
| | | | | | | | | | | | | | | | | | | | | | | | |
Master Netting Arrangements
As described in further detail below, the Funds may enter into certain Master Netting Agreements that govern the terms of certain transactions. Master Netting Agreements are designed to reduce the counterparty risk associated with relevant transactions by establishing credit protection mechanisms and providing standardization as a means of improving legal certainty. As Master Netting Agreements are specific to the unique operations of different asset types, they allow a Fund to close out and net its total exposure to a counterparty in the event of a default with respect to all of the transactions governed under a single agreement with that counterparty. Master Netting Agreements can also help reduce counterparty risk by specifying collateral posting requirements at pre-arranged exposure levels. Securities and cash pledged as collateral are reflected as assets in the Statement of Assets and Liabilities as either a component of investments at value (securities) or cash-restricted (deposits due from counterparties). Cash collateral received is not typically held in a segregated account and, as such, is reflected as a liability in the Statement of Assets and Liabilities as due to broker. The fair value of any securities received as collateral is not reflected as a component of net asset value.
81
Harbor Fixed Income Funds
NOTES TO FINANCIAL STATEMENTS—Continued
(Currency in thousands)
NOTE 3—INVESTMENT PORTFOLIO TRANSACTIONS—Continued
For the six-month period ended April 30, 2015, the following Master Netting Agreements have been entered into by one or more of the Funds:
Master Repurchase Agreements and Global Master Repurchase Agreements, which govern repurchase, reverse repurchase, and sale-buyback transactions between the Fund and select counterparties. As of April 30, 2015, Harbor Convertible Securities Fund, Harbor High Yield Bond Fund and Harbor Bond Fund had investment exposures subject to the terms of these agreements.
Master Securities Forward Transaction Agreements, which govern the considerations and factors surrounding the settlement of certain forward settling transactions, such as delayed-delivery or sale-buyback transactions by and between the Fund and select counterparties. As of April 30, 2015, Harbor Bond Fund and Harbor Real Return Fund had investment exposures subject to the terms of these agreements.
International Swaps and Derivatives Association, Inc. Master Agreements and Credit Support Annexes, which govern Over-The-Counter (OTC) market traded financial derivative transactions entered into by the Fund and select counterparties. As of April 30, 2015, Harbor Bond Fund and Harbor Real Return Fund had investment exposures subject to the terms of these agreements.
Please see Note 7—Offsetting Assets and Liabilities for a summary of current outstanding exposures by counterparty by Funds under terms of Master Agreements with netting provisions that enable a Fund to net its total exposure to a given counterparty.
NOTE 4—FEES AND OTHER TRANSACTIONS WITH AFFILIATES
Investment Adviser
Harbor Capital is an indirect, wholly-owned subsidiary of Robeco Groep N.V. (“Robeco”). Robeco is majority owned by ORIX Corporation (“ORIX”). Harbor Capital is the Trust’s investment adviser and is also responsible for administrative and other services.
Each Fund has a separate advisory agreement with Harbor Capital. The agreements provide for fees based on an annual percentage rate of average daily net assets as follows:
| | | | | | | | |
| | | Contractual Rate | | | Actual Rated | |
Harbor Convertible Securities Fund | | | 0.65 | % | | | 0.65 | % |
Harbor High-Yield Bond Fund | | | 0.60 | a | | | 0.56 | |
Harbor Bond Fund | | | 0.48 | b | | | 0.46 | |
Harbor Real Return Fund | | | 0.48 | | | | 0.48 | |
Harbor Money Market Fund | | | 0.20 | c | | | 0.00 | |
| a | The Adviser has contractually agreed to reduce the management fee to 0.56% through February 29, 2016. |
| b | The Adviser has contractually agreed to reduce the management fee to 0.43% on assets between $1 billion and $3 billion and 0.405% on assets greater than $3 billion through February 28, 2018. |
| c | The Adviser has contractually agreed to reduce the management fee to 0.18% through February 29, 2016. |
| d | Annualized for the six-month period ended April 30, 2015. |
Harbor Capital has from time to time voluntarily or contractually agreed not to impose a portion of its management fees and/or to bear a portion of the expenses incurred in the operation of certain Funds in order to limit Fund expenses. Such waivers, if any, are reflected on the accompanying Statements of Operations for the respective Funds. Harbor Capital has entered into contractual expense limitation agreements with: Harbor Bond Fund limiting the Fund’s operating expenses, excluding interest expense (if any), to 0.51% and 0.76% for the Institutional Class and Administrative Class, respectively; Harbor Real Return Fund limiting the Fund’s operating expenses, excluding interest expense (if any), to 0.57% and 0.82% for the Institutional Class and Administrative Class, respectively; and Harbor Money Market Fund limiting the Fund’s operating expenses, excluding interest expense (if any), to 0.28% and 0.53% for the Institutional Class and Administrative Class, respectively. The contractual expense limitation agreements are effective through February 29, 2016. Since December 9, 2009, Harbor Capital has voluntarily reimbursed all expenses of the Harbor Money Market Fund resulting in actual expense ratios for the six-month period ended April 30, 2015 of 0.00% and 0.00% for the Institutional Class and Administrative Class, respectively. All expense limitations are inclusive of the transfer agent fee waiver discussed in the Transfer Agent note below.
82
Harbor Fixed Income Funds
NOTES TO FINANCIAL STATEMENTS—Continued
(Currency in thousands)
NOTE 4—FEES AND OTHER TRANSACTIONS WITH AFFILIATES—Continued
Distributor
Harbor Funds Distributors, Inc. (“Harbor Funds Distributors” or the “Distributor”), a wholly-owned subsidiary of Harbor Capital, is the distributor for Harbor Funds’ shares. Under the Trust’s current distribution plans pursuant to Rule 12b-1 under the Investment Company Act with respect to each Fund’s Administrative and Investor Class shares (collectively, the “12b-1 Plans”), as applicable, each Fund pays the Distributor compensation at the annual rate of 0.25% of the average daily net assets of its Administrative and Investor Class shares. The 12b-1 Plans compensate the Distributor for the purpose of financing any activity that is primarily intended to result in the sale of Administrative and Investor Class shares of the Funds or for recordkeeping services or the servicing of shareholder accounts in the Administrative and Investor Class shares of the Funds. Such activities include, but are not limited to: printing of prospectuses and statements of additional information and reports for prospective shareholders (i.e., other than existing shareholders); preparation and distribution of advertising material and sales literature; expenses of organizing and conducting sales seminars; supplemental payments to dealers or other institutions such as asset-based sales charges, payments of recordkeeping fees under recordkeeping arrangements, or payments of service fees under shareholder service arrangements; and costs of administering the 12b-1 Plans.
Amounts payable by a Fund under the 12b-1 Plans need not be directly related to the expenses actually incurred by the Distributor on behalf of each Fund. The 12b-1 Plans do not obligate the Funds to reimburse the Distributor for the actual expenses the Distributor may incur in fulfilling its obligations under the 12b-1 Plans. Thus, even if the Distributor’s actual expenses exceed the fee payable to the Distributor at any given time, the Funds will not be obligated to pay more than that fee. If the Distributor’s expenses are less than the fee it receives, the Distributor will retain the difference.
The fees attributable to each Fund’s respective class are shown on the accompanying Statement of Operations.
Transfer Agent
Harbor Services Group, Inc. (“Harbor Services Group”), a wholly-owned subsidiary of Harbor Capital, is the transfer and shareholder servicing agent for the Funds. The transfer agency and service agreement is reviewed and approved annually by the Board of Trustees and provides currently for compensation up to the following amounts per class of each Fund:
| | |
Share Class | | Transfer Agent Feesa |
Institutional Class | | 0.065% of the average daily net assets of all Institutional Class shares |
Administrative Class | | 0.065% of the average daily net assets of all Administrative Class shares |
Investor Class | | 0.185% of the average daily net assets of all Investor Class shares |
| a | For the period November 1, 2014 through February 28, 2015, the Transfer Agent Fees for Institutional and Administrative Class shares was 0.06% and 0.18% for the Investor Class shares. |
Harbor Services Group has voluntarily waived a portion of its transfer agent fees during the six-month period ended April 30, 2015. Fees incurred for these transfer agent services are shown on each Fund’s Statement of Operations. The voluntary waiver may be discontinued at any time.
Shareholders
On April 30, 2015, Harbor Capital, Harbor Funds Distributors, and Harbor Services Group, collectively held the following shares of beneficial interest in the Funds:
| | | | | | | | | | | | | | | | | | | | |
| | | Number of Shares Owned by
Harbor Capital,
Harbor Funds Distributors, and
Harbor Services Group | | | Percentage of
Outstanding Shares | |
| | | Institutional
Class | | | Administrative
Class | | | Investor
Class | | | Total | | | | |
Harbor Convertible Securities Fund | | | 77,426 | | | | 28,349 | | | | 28,232 | | | | 134,007 | | | | 0.4 | % |
Harbor High-Yield Bond Fund | | | 52,616 | | | | 5 | | | | 12 | | | | 52,633 | | | | 0.0 | |
Harbor Bond Fund | | | 27,681 | | | | 4 | | | | N/A | | | | 27,685 | | | | 0.0 | |
Harbor Real Return Fund | | | 12,571 | | | | 4 | | | | N/A | | | | 12,575 | | | | 0.1 | |
Harbor Money Market Fund | | | 71,889,394 | | | | 25,201 | | | | N/A | | | | 71,914,595 | | | | 50.5 | |
83
Harbor Fixed Income Funds
NOTES TO FINANCIAL STATEMENTS—Continued
(Currency in thousands)
NOTE 4—FEES AND OTHER TRANSACTIONS WITH AFFILIATES—Continued
Independent Trustees
The fees and expenses of the Independent Trustees are shown on each Fund’s Statement of Operations. The Independent Trustees’ remuneration for all Fixed Income Funds totaled $72 for the six-month period ended April 30, 2015.
The Board of Trustees has adopted a Deferred Compensation Plan for Independent Trustees (the “Plan”), which enables Trustees to elect to defer receipt of all or a portion of the annual compensation they are entitled to receive from the Trust. For purposes of determining the amount owed to a Trustee under the Plan, deferred amounts are treated as though they had been invested in shares of the Fund(s) selected by the Trustee. While not required to do so, each Fund makes an investment equal to the Trustee’s investment election. The deferred compensation liability and the offsetting deferred compensation investment asset are included as a component of “Liabilities; Other” and “Other assets”, respectively, in the Statement of Assets and Liabilities. Such amounts fluctuate with changes in the market value of the selected securities. The deferred compensation and related mark-to-market impact liability and an offsetting investment asset will remain on each Fund’s Statement of Assets and Liabilities until distributed in accordance with the Plan.
Redemption Fee
A 1% redemption fee is charged on shares of Harbor Convertible Securities Fund and Harbor High-Yield Bond Fund that are redeemed within 90 days from their date of purchase. All redemption fees are recorded by the Fund as paid-in capital. For the six-month period ended April 30, 2015 redemption fee proceeds are as follows:
| | | | |
| | | Amount | |
Harbor Convertible Securities Fund | | $ | — | |
Harbor High-Yield Bond Fund | | | 7 | |
Indemnification
Under the Trust’s organizational documents, its officers and Trustees are indemnified against certain liabilities arising out of the performance of their duties to the Trust. In addition, in the normal course of business the Trust enters into contracts that provide general indemnities to other parties. The Trust’s maximum exposure under these arrangements is unknown as this would involve future claims that may be made against the Trust that have not yet occurred. The risk of material loss as a result of such indemnification claims is considered remote.
NOTE 5—TAX INFORMATION
The identified cost for federal income tax purposes of investments owned by each Fund (including earned discount on corporate short-term notes and commercial paper) and their respective gross unrealized appreciation and depreciation at April 30, 2015 are as follows:
| | | | | | | | | | | | | | | | |
| | | Identified Cost | | | Gross Unrealized | | | Net Unrealized
Appreciation/
(Depreciation) | |
| | | | Appreciation | | | (Depreciation) | | |
Harbor Convertible Securities Fund | | $ | 360,374 | | | $ | 17,906 | | | $ | (6,351 | ) | | $ | 11,555 | |
Harbor High-Yield Bond Fund | | | 1,688,525 | | | | 41,124 | | | | (28,024 | ) | | | 13,100 | |
Harbor Bond Fund | | | 4,122,901 | | | | 152,756 | | | | (54,184 | ) | | | 98,572 | |
Harbor Real Return Fund* | | | 194,385 | | | | 4,471 | | | | (4,094 | ) | | | 377 | |
Harbor Money Market Fund | | | 157,278 | | | | — | | | | — | | | | — | |
| * | Capital loss carryforwards are available that may reduce taxable income from future net realized gain on investments. |
84
Harbor Fixed Income Funds
NOTES TO FINANCIAL STATEMENTS—Continued
(Currency in thousands)
NOTE 6—DERIVATIVES
The Funds’ derivative holdings do not qualify for hedge accounting treatment and as such are recorded at fair value. For a detailed discussion of risks related to these investments please refer to the descriptions of each type of derivative instrument in Note 2—Significant Accounting Policies.
Each Fund’s derivative instruments outstanding as of the six-month period ended April 30, 2015, if any, as disclosed in the Portfolios of Investments, and the related amounts of realized and changes in unrealized gains and losses on derivative instruments during the period as disclosed in the Statement of Operations, are indicators of the volume of derivative activity for these Funds.
Derivative Instruments
At April 30, 2015, the fair values of derivatives, by primary risk exposure, were reflected in the Statement of Assets and Liabilities as follows:
| | | | | | | | | | | | | | | | |
HARBOR BOND FUND | | | | | | | | | | | | | | | | |
Statement of Assets and Liabilities Caption | | Interest Rate
Contracts | | | Foreign Exchange
Contracts | | | Credit
Contracts | | | Total | |
Assets | | | | | | | | | | | | | | | | |
Investments, at value (purchased options) | | $ | 1,334 | | | $ | 163 | | | $ | — | | | $ | 1,497 | |
Unrealized appreciation on open forward currency contracts | | | — | | | | 76,928 | | | | — | | | | 76,928 | |
Unrealized appreciation on OTC swap agreementsb | | | 27 | | | | — | | | | 1,958 | | | | 1,985 | |
Variation margin on centrally cleared swap agreementsa,b | | | 3,334 | | | | — | | | | 15 | | | | 3,349 | |
Variation margin on options and futures contracts (futures)a | | | 2,087 | | | | — | | | | — | | | | 2,087 | |
| | | | |
Liabilities | | | | | | | | | | | | | | | | |
Unrealized depreciation on open forward currency contracts | | $ | — | | | $ | (45,271 | ) | | $ | — | | | $ | (45,271 | ) |
Unrealized depreciation on OTC swap agreementsb | | | (115 | ) | | | — | | | | (216 | ) | | | (331 | ) |
Variation margin on centrally cleared swap agreementsa,b | | | (25,424 | ) | | | — | | | | — | | | | (25,424 | ) |
Variation margin on options and futures contracts (futures)a | | | (5,305 | ) | | | — | | | | — | | | | (5,305 | ) |
Variation margin on options and futures contracts (options)a | | | (305 | ) | | | — | | | | — | | | | (305 | ) |
Written options, at value | | | (1,730 | ) | | | (1,040 | ) | | | — | | | | (2,770 | ) |
| | | | |
HARBOR REAL RETURN FUND | | | | | | | | | | | | | | | | |
Statement of Assets and Liabilities Caption | | Interest Rate
Contracts | | | Foreign Exchange
Contracts | | | Credit
Contracts | | | Total | |
Assets | | | | | | | | | | | | | | | | |
Investments, at value (purchased options) | | $ | 129 | | | $ | — | | | $ | — | | | $ | 129 | |
Unrealized appreciation on open forward currency contracts | | | — | | | | 949 | | | | — | | | | 949 | |
Unrealized appreciation on OTC swap agreementsb | | | 52 | | | | — | | | | 42 | | | | 94 | |
Variation margin on centrally cleared swap agreementsa,b | | | 240 | | | | — | | | | 8 | | | | 248 | |
Variation margin on options and futures contracts (futures)a | | | 113 | | | | — | | | | — | | | | 113 | |
| | | | |
Liabilities | | | | | | | | | | | | | | | | |
Unrealized depreciation on open forward currency contracts | | $ | — | | | $ | (710 | ) | | $ | — | | | $ | (710 | ) |
Unrealized depreciation on OTC swap agreementsb | | | (1,775 | ) | | | — | | | | (35 | ) | | | (1,810 | ) |
Variation margin on centrally cleared swap agreementsa,b | | | (447 | ) | | | — | | | | — | | | | (447 | ) |
Variation margin on options and futures contracts (futures)a | | | (170 | ) | | | — | | | | — | | | | (170 | ) |
Variation margin on options and futures contracts (options)a | | | (6 | ) | | | — | | | | — | | | | (6 | ) |
Written options, at value | | | (207 | ) | | | (200 | ) | | | (10 | ) | | | (417 | ) |
| a | Includes cumulative appreciation/depreciation of futures contracts or market value of options contracts as reported in the Portfolio of Investments. Only current variation margin is reported within the Statement of Assets and Liabilities. |
| b | Net of premiums received of $1,875 and $38 for Harbor Bond Fund and Harbor Real Return Fund, respectively. |
85
Harbor Fixed Income Funds
NOTES TO FINANCIAL STATEMENTS—Continued
(Currency in thousands)
NOTE 6—DERIVATIVES—Continued
Realized net gain/(loss) and the change in unrealized appreciation/(depreciation) on derivatives, by primary risk exposure, for the six-month period ended April 30, 2015, were:
| | | | | | | | | | | | | | | | |
HARBOR BOND FUND | | | | | | | | | | | | | | | | |
Net Realized Gain/(Loss) on Derivatives | | Interest Rate
Contracts | | | Foreign Exchange
Contracts | | | Credit
Contracts | | | Total | |
Forward currency contracts | | $ | — | | | $ | 81,200 | | | $ | — | | | $ | 81,200 | |
Futures contracts | | | 43,187 | | | | — | | | | — | | | | 43,187 | |
Investments (purchased options) | | | (17 | ) | | | (35 | ) | | | — | | | | (52 | ) |
Written options | | | 5,515 | | | | 1,624 | | | | 47 | | | | 7,186 | |
Swaps agreements | | | (12,770 | ) | | | — | | | | (17,239 | ) | | | (30,009 | ) |
| | | | | | | | | | | | | | | | |
Net realized gain/(loss) on derivatives | | $ | 35,915 | | | $ | 82,789 | | | $ | (17,192 | ) | | $ | 101,512 | |
| | | | | | | | | | | | | | | | |
| | | | |
Change in Unrealized Appreciation/(Depreciation) on Derivatives | | Interest Rate
Contracts | | | Foreign Exchange
Contracts | | | Credit
Contracts | | | Total | |
Forward currency contracts | | $ | — | | | $ | (645 | ) | | $ | — | | | $ | (645 | ) |
Futures contracts | | | (9,654 | ) | | | — | | | | — | | | | (9,654 | ) |
Investments (purchased options) | | | (765 | ) | | | — | | | | — | | | | (765 | ) |
Written options | | | 2,125 | | | | 877 | | | | (86 | ) | | | 2,916 | |
Swaps agreements | | | (28,341 | ) | | | — | | | | 4,077 | | | | (24,264 | ) |
| | | | | | | | | | | | | | | | |
Change in unrealized appreciation/(depreciation) on derivatives | | $ | (36,635 | ) | | $ | 232 | | | $ | 3,991 | | | $ | (32,412 | ) |
| | | | | | | | | | | | | | | | |
| | | | |
HARBOR REAL RETURN FUND | | | | | | | | | | | | | | | | |
Net Realized Gain/(Loss) on Derivatives | | Interest Rate
Contracts | | | Foreign Exchange
Contracts | | | Credit
Contracts | | | Total | |
Forward currency contracts | | $ | — | | | $ | 5,599 | | | $ | — | | | $ | 5,599 | |
Futures contracts | | | 138 | | | | — | | | | — | | | | 138 | |
Investments (purchased options) | | | (112 | ) | | | — | | | | — | | | | (112 | ) |
Written options | | | 54 | | | | 63 | | | | 18 | | | | 135 | |
Swaps agreements | | | (2,567 | ) | | | — | | | | (28 | ) | | | (2,595 | ) |
| | | | | | | | | | | | | | | | |
Net realized gain/(loss) on derivatives | | $ | (2,487 | ) | | $ | 5,662 | | | $ | (10 | ) | | $ | 3,165 | |
| | | | | | | | | | | | | | | | |
| | | | |
Change in Unrealized Appreciation/(Depreciation) on Derivatives | | Interest Rate
Contracts | | | Foreign Exchange
Contracts | | | Credit
Contracts | | | Total | |
Forward currency contracts | | $ | — | | | $ | (2,584 | ) | | $ | — | | | $ | (2,584 | ) |
Futures contracts | | | (189 | ) | | | — | | | | — | | | | (189 | ) |
Investments (purchased options) | | | (20 | ) | | | — | | | | — | | | | (20 | ) |
Written options | | | 13 | | | | (86 | ) | | | (33 | ) | | | (106 | ) |
Swaps agreements | | | 238 | | | | — | | | | (63 | ) | | | 175 | |
| | | | | | | | | | | | | | | | |
Change in unrealized appreciation/(depreciation) on derivatives | | $ | 42 | | | $ | (2,670 | ) | | $ | (96 | ) | | $ | (2,724 | ) |
| | | | | | | | | | | | | | | | |
NOTE 7—OFFSETTING ASSETS AND LIABILITIES
The Funds have adopted Accounting Standards Update (“ASU”) 2013-01, Clarifying the Scope of Disclosures about Offsetting Assets and Liabilities, which was established to enhance disclosures pertaining to the offsetting of derivatives, repurchase agreements, and securities lending transactions or those subject to an enforceable master netting arrangement or similar agreement. ASU 2013-01 requires additional disclosures about the amounts reported on the financial statements to reflect the effect or potential effect of netting arrangements on the Funds’ financial position.
Please see the Master Netting Agreements section in Note 3 for more on Master Netting Agreements and how collateral is reported in the Financial Statements.
86
Harbor Fixed Income Funds
NOTES TO FINANCIAL STATEMENTS—Continued
(Currency in thousands)
NOTE 7—OFFSETTING ASSETS AND LIABILITIES—Continued
The following is a summary by counterparty of the gross value of material Borrowings and Other Financing Transactions and collateral (received)/pledged as of April 30, 2015:
| | | | | | | | | | | | | | | | | | | | | | | | | | | | |
HARBOR BOND FUND | | | | | | | | | | | | | | | | | | | | | | | | | | | | |
Counterparty | | Repurchase
Agreement
Proceeds to be
Received | | | Payable for
Reverse
Repurchase
Agreements | | | Payable for
Sale-Buyback
Transactions | | | Payable for
Short Sales | | | Total
Borrowings and
Other Financing
Transactions | | | Collateral
(Received)/
Pledged | | | Net
Exposure | |
Global/Master Repurchase Agreement | | | | | | | | | | | | | | | | | | | | | | | | | | | | |
Barclays Bank plc | | $ | 33,800 | | | $ | — | | | $ | — | | | $ | — | | | $ | 33,800 | | | $ | (33,800 | ) | | $ | — | |
| | | | | | | |
Master Securities Forward Transactions Agreements | | | | | | | | | | | | | | | | | | | | | | | | | | | | |
Barclays Bank plc | | $ | — | | | $ | — | | | $ | (84,953 | ) | | $ | — | | | $ | (84,953 | ) | | $ | — | | | $ | (84,953 | ) |
| | | | | | | | | | | | | | | | | | | | | | | | | | | | |
Total Borrowings and Other Financing Transactions | | $ | 33,800 | | | $ | — | | | $ | (84,953 | ) | | $ | — | | | | | | | | | | | | | |
| | | | | | | | | | | | | | | | | | | | | | | | | | | | |
| | | | | |
HARBOR REAL RETURN FUND | | | | | | | | | | | | | | | | | | | | | |
Counterparty | | Repurchase
Agreement
Proceeds to be
Received | | | Payable for
Reverse
Repurchase
Agreements | | | Payable for
Sale-Buyback
Transactions | | | Payable for
Short Sales | | | Total
Borrowings and
Other Financing
Transactions | | | Collateral
(Received)/
Pledged | | | Net
Exposure | |
Global/Master Repurchase Agreement | | | | | | | | | | | | | | | | | | | | | | | | | | | | |
State Street Bank | | $ | 447 | | | $ | — | | | $ | — | | | $ | — | | | $ | 447 | | | $ | (447 | ) | | $ | — | |
| | | | | | | |
Master Securities Forward Transactions Agreements | | | | | | | | | | | | | | | | | | | | | | | | | | | | |
Barclays Bank plc | | $ | — | | | $ | — | | | $ | (38,934 | ) | | $ | — | | | $ | (38,934 | ) | | $ | — | | | $ | (38,934 | ) |
| | | | | | | | | | | | | | | | | | | | | | | | | | | | |
Total Borrowings and Other Financing Transactions | | $ | 447 | | | $ | — | | | $ | (38,934 | ) | | $ | — | | | | | | | | | | | | | |
| | | | | | | | | | | | | | | | | | | | | | | | | | | | |
Harbor Bond Fund and Harbor Real Return Fund have not pledged any securities as collateral under the terms of the above Master Repurchase and Master Securities Forward Transactions agreements as of April 30, 2015.
The following is a summary by counterparty of the gross value of OTC financial derivative instruments and collateral (received)/pledged as governed by International Swaps and Derivatives Association, Inc. master agreements as of April 30, 2015:
| | | | | | | | | | | | | | | | | | | | | | | | | | | | | | | | | | | | | | | | | | | | |
HARBOR BOND FUND | | | | | | | | | |
| | | Financial Derivative Assets | | | Financial Derivative Liabilities | | | | | | | | | | |
Counterparty | | Forward
Currency
Contracts | | | Purch
ased
Options | | | Swap
Agree
ments | | | Total
Over
the
Counter | | | Forward
Currency
Contracts | | | Written
Options | | | Swap
Agree
ments | | | Total
Over
the
Counter | | | Net
Value
of OTC
Deriv
atives | | | Collateral
(Received)/
Pledged | | | Net
Exposure | |
Bank of America NA | | $ | — | | | $ | — | | | $ | 9 | | | $ | 9 | | | $ | — | | | $ | — | | | $ | — | | | $ | — | | | $ | 9 | | | $ | — | | | $ | 9 | |
Barclays Bank plc | | | 8,643 | | | | — | | | | 93 | | | | 8,736 | | | | (3,036 | ) | | | — | | | | (7 | ) | | | (3,043 | ) | | | 5,693 | | | | — | | | | 5,693 | |
Barclays Capital | | | — | | | | — | | | | — | | | | — | | | | (165 | ) | | | — | | | | — | | | | (165 | ) | | | (165 | ) | | | — | | | | (165 | ) |
BNP Paribas SA | | | 14,899 | | | | 147 | | | | 321 | | | | 15,367 | | | | (2,718 | ) | | | (145 | ) | | | — | | | | (2,863 | ) | | | 12,504 | | | | — | | | | 12,504 | |
Citibank NA | | | 15,645 | | | | 31 | | | | 554 | | | | 16,230 | | | | (11,217 | ) | | | (120 | ) | | | — | | | | (11,337 | ) | | | 4,893 | | | | — | | | | 4,893 | |
Credit Suisse International | | | 5,782 | | | | — | | | | — | | | | 5,782 | | | | (438 | ) | | | — | | | | (4 | ) | | | (442 | ) | | | 5,340 | | | | — | | | | 5,340 | |
Deutsche Bank AG | | | 12,286 | | | | — | | | | 349 | | | | 12,635 | | | | (4,801 | ) | | | (363 | ) | | | (42 | ) | | | (5,206 | ) | | | 7,429 | | | | — | | | | 7,429 | |
Goldman Sachs Bank USA | | | 5,464 | | | | 427 | | | | 26 | | | | 5,917 | | | | (5,458 | ) | | | (306 | ) | | | — | | | | (5,764 | ) | | | 153 | | | | 1,398 | | | | 1,551 | |
Goldman Sachs International | | | — | | | | — | | | | 2 | | | | 2 | | | | — | | | | — | | | | (27 | ) | | | (27 | ) | | | (25 | ) | | | — | | | | (25 | ) |
HSBC Bank USA | | | 2,906 | | | | — | | | | — | | | | 2,906 | | | | (2,170 | ) | | | — | | | | — | | | | (2,170 | ) | | | 736 | | | | — | | | | 736 | |
HSBC Bank USA NA | | | — | | | | 16 | | | | 314 | | | | 330 | | | | — | | | | (328 | ) | | | (32 | ) | | | (360 | ) | | | (30 | ) | | | 30 | | | | — | |
JP Morgan Chase Bank | | | 3,080 | | | | — | | | | — | | | | 3,080 | | | | (284 | ) | | | — | | | | — | | | | (284 | ) | | | 2,796 | | | | — | | | | 2,796 | |
JP Morgan Chase Bank NA | | | 1,098 | | | | 440 | | | | 38 | | | | 1,576 | | | | (2,355 | ) | | | (534 | ) | | | (25 | ) | | | (2,914 | ) | | | (1,338 | ) | | | — | | | | (1,338 | ) |
Morgan Stanley Capital Services LLC | | | — | | | | 436 | | | | — | | | | 436 | | | | — | | | | (561 | ) | | | (194 | ) | | | (755 | ) | | | (319 | ) | | | 319 | | | | — | |
87
Harbor Fixed Income Funds
NOTES TO FINANCIAL STATEMENTS—Continued
(Currency in thousands)
NOTE 7—OFFSETTING ASSETS AND LIABILITIES—Continued
| | | | | | | | | | | | | | | | | | | | | | | | | | | | | | | | | | | | | | | | | | | | |
HARBOR BOND FUND | | | | | | | | | |
| | | Financial Derivative Assets | | | Financial Derivative Liabilities | | | | | | | | | | |
Counterparty | | Forward
Currency
Contracts | | | Purch
ased
Options | | | Swap
Agree
ments | | | Total
Over
the
Counter | | | Forward
Currency
Contracts | | | Written
Options | | | Swap
Agree
ments | | | Total
Over
the
Counter | | | Net
Value
of OTC
Deriv
atives | | | Collateral
(Received)/
Pledged | | | Net
Exposure | |
Royal Bank of Scotland plc | | $ | — | | | $ | — | | | $ | 2 | | | $ | 2 | | | $ | — | | | $ | — | | | $ | — | | | $ | — | | | $ | 2 | | | $ | — | | | $ | 2 | |
Société Générale | | | — | | | | — | | | | — | | | | — | | | | (5,392 | ) | | | — | | | | — | | | | (5,392 | ) | | | (5,392 | ) | | | — | | | | (5,392 | ) |
Société Générale Paris | | | — | | | | — | | | | — | | | | — | | | | — | | | | (33 | ) | | | — | | | | (33 | ) | | | (33 | ) | | | 33 | | | | — | |
UBS AG | | | 7,125 | | | | — | | | | — | | | | 7,125 | | | | (7,122 | ) | | | — | | | | — | | | | (7,122 | ) | | | 3 | | | | — | | | | 3 | |
UBS AG Stamford | | | — | | | | — | | | | 277 | | | | 277 | | | | — | | | | — | | | | — | | | | — | | | | 277 | | | | — | | | | 277 | |
Westpac Banking Corp. | | | — | | | | — | | | | — | | | | — | | | | (115 | ) | | | — | | | | — | | | | (115 | ) | | | (115 | ) | | | — | | | | (115 | ) |
| | | | | | | | | | | | | | | | | | | | | | | | | | | | | | | | | | | | | | | | | | | | |
Total Over-the-Counter Exposure | | $ | 76,928 | | | $ | 1,497 | | | $ | 1,985 | | | $ | 80,410 | | | $ | (45,271 | ) | | $ | (2,390 | ) | | $ | (331 | ) | | $ | (47,992 | ) | | | | | | | | | | | | |
| | | | | | | | | | | | | | | | | | | | | | | | | | | | | | | | | | | | | | | | | | | | |
| * | Of the total collateral received and/or pledged listed in the table above, cash of $33,710 has been received as collateral. |
| | | | | | | | | | | | | | | | | | | | | | | | | | | | | | | | | | | | | | | | | | | | |
HARBOR REAL RETURN FUND | | | | | | | | | | | | | | | | | | | | | | | | | | | | | | | | | |
| | | Financial Derivative Assets | | | Financial Derivative Liabilities | | | | | | | | | | |
Counterparty | | Forward
Currency
Contracts | | | Purchased
Options | | | Swap
Agree
ments | | | Total
Over the
Counter | | | Forward
Currency
Contracts | | | Written
Options | | | Swap
Agree
ments | | | Total
Over the
Counter | | | Net
Value
of OTC
Deriva
tives | | | Collateral
(Recei
ved)/
Pledged | | | Net
Exposure | |
Barclays Bank plc | | $ | 3 | | | $ | — | | | $ | 6 | | | $ | 9 | | | $ | (3 | ) | | $ | — | | | $ | (73 | ) | | $ | (76 | ) | | $ | (67 | ) | | $ | — | | | $ | (67 | ) |
Barclays Capital | | | — | | | | — | | | | — | | | | — | | | | (27 | ) | | | — | | | | — | | | | (27 | ) | | | (27 | ) | | | — | | | | (27 | ) |
BNP Paribas SA | | | 26 | | | | — | | | | 23 | | | | 49 | | | | (5 | ) | | | — | | | | (854 | ) | | | (859 | ) | | | (810 | ) | | | 810 | | | | — | |
Citibank NA | | | 118 | | | | — | | | | 11 | | | | 129 | | | | (175 | ) | | | (2 | ) | | | (25 | ) | | | (202 | ) | | | (73 | ) | | | — | | | | (73 | ) |
Credit Suisse International | | | 19 | | | | — | | | | 16 | | | | 35 | | | | (74 | ) | | | (62 | ) | | | — | | | | (136 | ) | | | (101 | ) | | | — | | | | (101 | ) |
Deutsche Bank AG | | | 73 | | | | 12 | | | | — | | | | 85 | | | | (115 | ) | | | (160 | ) | | | (338 | ) | | | (613 | ) | | | (528 | ) | | | 528 | | | | — | |
Deutsche Bank AG London | | | 2 | | | | — | | | | — | | | | 2 | | | | — | | | | — | | | | — | | | | — | | | | 2 | | | | — | | | | 2 | |
Goldman Sachs Bank USA | | | 443 | | | | — | | | | — | | | | 443 | | | | (204 | ) | | | (34 | ) | | | (192 | ) | | | (430 | ) | | | 13 | | | | — | | | | 13 | |
Goldman Sachs International | | | — | | | | — | | | | 14 | | | | 14 | | | | — | | | | (10 | ) | | | — | | | | (10 | ) | | | 4 | | | | — | | | | 4 | |
HSBC Bank USA | | | 8 | | | | — | | | | — | | | | 8 | | | | (80 | ) | | | — | | | | — | | | | (80 | ) | | | (72 | ) | | | — | | | | (72 | ) |
HSBC Bank USA NA | | | — | | | | — | | | | — | | | | — | | | | — | | | | — | | | | (1 | ) | | | (1 | ) | | | (1 | ) | | | — | | | | (1 | ) |
JP Morgan Chase Bank | | | 213 | | | | — | | | | — | | | | 213 | | | | — | | | | — | | | | — | | | | — | | | | 213 | | | | — | | | | 213 | |
JP Morgan Chase Bank NA | | | 11 | | | | — | | | | 13 | | | | 24 | | | | (12 | ) | | | (33 | ) | | | — | | | | (45 | ) | | | (21 | ) | | | — | | | | (21 | ) |
Morgan Stanley Capital Services LLC | | | — | | | | 117 | | | | 11 | | | | 128 | | | | — | | | | (116 | ) | | | (25 | ) | | | (141 | ) | | | (13 | ) | | | 13 | | | | — | |
Royal Bank of Scotland plc | | | — | | | | — | | | | — | | | | — | | | | — | | | | — | | | | (299 | ) | | | (299 | ) | | | (299 | ) | | | — | | | | (299 | ) |
UBS AG | | | 33 | | | | — | | | | — | | | | 33 | | | | (15 | ) | | | — | | | | — | | | | (15 | ) | | | 18 | | | | — | | | | 18 | |
UBS AG Stamford | | | — | | | | — | | | | — | | | | — | | | | — | | | | — | | | | (3 | ) | | | (3 | ) | | | (3 | ) | | | — | | | | (3 | ) |
| | | | | | | | | | | | | | | | | | | | | | | | | | | | | | | | | | | | | | | | | | | | |
Total Over-the-Counter Exposure | | $ | 949 | | | $ | 129 | | | $ | 94 | | | $ | 1,172 | | | $ | (710 | ) | | $ | (417 | ) | | $ | (1,810 | ) | | $ | (2,937 | ) | | | | | | | | | | | | |
| | | | | | | | | | | | | | | | | | | | | | | | | | | | | | | | | | | | | | | | | | | | |
| * | Of the total collateral received and/or pledged listed in the table above, cash of $590 has been received as collateral. |
Exchange traded and centrally cleared derivatives are not subject to master netting or similar arrangements.
NOTE 8—SUBSEQUENT EVENTS
Through the date the financial statements were issued, no subsequent events or transactions had occurred that would have materially impacted the financial statements or related disclosures as presented herein.
88
Harbor Fixed Income Funds
FEES AND EXPENSE EXAMPLE (Unaudited)
Example
As a shareholder of a Fund, you incur two types of costs: (1) transaction costs, including redemption fees (if any) and (2) ongoing costs, including management fees, distribution and service (12b-1) fees, and other Fund expenses. This example is intended to help you understand your ongoing costs (in dollars) of investing in a Fund and to compare these costs with the ongoing costs of investing in other mutual funds.
The example is based on an investment of $1,000 invested at the beginning of the period and held for the entire period November 1, 2014 through April 30, 2015.
Actual Expenses
The first line of the table below provides information about actual account values and actual expenses for each share class. You may use the information in the respective class line, together with the amount you invested, to estimate the expenses that you paid over the period. Simply divide your account value by $1,000 (for example, an $8,600 account value divided by $1,000 = 8.6), then multiply the result by the number in the first line of the respective class under the heading entitled “Expenses Paid During Period” to estimate the expenses you paid on your account during this period.
Hypothetical Example for Comparison Purposes
The second line of the table for each share class below provides information about hypothetical account values and hypothetical expenses based on the respective Fund’s actual expense ratio and an assumed rate of return of 5% per year before expenses, which is not the respective Fund’s actual return. The hypothetical account values and expenses may not be used to estimate the actual ending account balance or expenses you paid for the period. You may use this information to compare the ongoing costs of investing in a Fund to other funds. To do so, compare this 5% hypothetical example with the 5% hypothetical examples that appear in the shareholder reports of the other funds.
Please note that the expenses shown in the table are meant to highlight your ongoing costs only and do not reflect any transactional costs, such as redemption fees. Therefore, the second line of the table is useful in comparing ongoing costs only, and will not help you determine the relative total costs of owning different funds. In addition, if these transactional costs were included, your costs would have been higher.
| | | | | | | | | | | | | | | | |
| | | Annualized
Expense Ratios* | | | Expenses Paid
During Period** | | | Beginning Account
Value
(November 1, 2014) | | | Ending Account
Value
(April 30, 2015) | |
Harbor Convertible Securities Fund | | | | | | | | | | | | | |
Institutional Class | | | 0.74% | | | | | | | | | | | | | |
Actual | | | | | | $ | 3.73 | | | $ | 1,000 | | | $ | 1,030.30 | |
Hypothetical (5% return) | | | | | | | 3.71 | | | | 1,000 | | | | 1,021.03 | |
Administrative Class | | | 0.99% | | | | | | | | | | | | | |
Actual | | | | | | $ | 4.98 | | | $ | 1,000 | | | $ | 1,029.10 | |
Hypothetical (5% return) | | | | | | | 4.96 | | | | 1,000 | | | | 1,019.76 | |
Investor Class | | | 1.11% | | | | | | | | | | | | | |
Actual | | | | | | $ | 5.58 | | | $ | 1,000 | | | $ | 1,028.40 | |
Hypothetical (5% return) | | | | | | | 5.56 | | | | 1,000 | | | | 1,019.15 | |
Harbor High-Yield Bond Fund | | | | | | | | | | | | | | | | |
Institutional Class | | | 0.64% | | | | | | | | | | | | | |
Actual | | | | | | $ | 3.21 | | | $ | 1,000 | | | $ | 1,024.00 | |
Hypothetical (5% return) | | | | | | | 3.21 | | | | 1,000 | | | | 1,021.54 | |
Administrative Class | | | 0.89% | | | | | | | | | | | | | |
Actual | | | | | | $ | 4.46 | | | $ | 1,000 | | | $ | 1,021.70 | |
Hypothetical (5% return) | | | | | | | 4.46 | | | | 1,000 | | | | 1,020.27 | |
Investor Class | | | 1.01% | | | | | | | | | | | | | |
Actual | | | | | | $ | 5.06 | | | $ | 1,000 | | | $ | 1,021.10 | |
Hypothetical (5% return) | | | | | | | 5.06 | | | | 1,000 | | | | 1,019.66 | |
89
Harbor Fixed Income Funds
FEES AND EXPENSE EXAMPLE—Continued
| | | | | | | | | | | | | | | | |
| | | Annualized
Expense Ratios* | | | Expenses Paid
During Period** | | | Beginning Account
Value
(November 1, 2014) | | | Ending Account
Value
(April 30, 2015) | |
Harbor Bond Fund | | | | | | | | | | | | | | | | |
Institutional Class | | | 0.52% | | | | | | | | | | | | | |
Actual | | | | | | $ | 2.61 | | | $ | 1,000 | | | $ | 1,021.70 | |
Hypothetical (5% return) | | | | | | | 2.61 | | | | 1,000 | | | | 1,022.15 | |
Administrative Class | | | 0.77% | | | | | | | | | | | | | |
Actual | | | | | | $ | 3.86 | | | $ | 1,000 | | | $ | 1,021.10 | |
Hypothetical (5% return) | | | | | | | 3.86 | | | | 1,000 | | | | 1,020.88 | |
Harbor Real Return Fund | | | | | | | | | | | | | | | | |
Institutional Class | | | 0.59% | | | | | | | | | | | | | |
Actual | | | | | | $ | 2.93 | | | $ | 1,000 | | | $ | 1,000.20 | |
Hypothetical (5% return) | | | | | | | 2.96 | | | | 1,000 | | | | 1,021.80 | |
Administrative Class | | | 0.84% | | | | | | | | | | | | | |
Actual | | | | | | $ | 4.17 | | | $ | 1,000 | | | $ | 1,000.00 | |
Hypothetical (5% return) | | | | | | | 4.21 | | | | 1,000 | | | | 1,020.53 | |
Harbor Money Market Fund | | | | | | | | | | | | | | | | |
Institutional Class | | | 0.00% | | | | | | | | | | | | | |
Actual | | | | | | $ | 0.00 | | | $ | 1,000 | | | $ | 1,000.30 | |
Hypothetical (5% return) | | | | | | | 0.00 | | | | 1,000 | | | | 1,024.79 | |
Administrative Class | | | 0.00% | | | | | | | | | | | | | |
Actual | | | | | | $ | 0.00 | | | $ | 1,000 | | | $ | 1,000.30 | |
Hypothetical (5% return) | | | | | | | 0.00 | | | | 1,000 | | | | 1,024.79 | |
| * | Reflective of all fee waivers and expense reimbursements. |
| ** | Expenses are equal to the Fund’s annualized net expense ratio, multiplied by the average account value over the period, multiplied by 181/365 (to reflect the one-half year period). |
90
Harbor Fixed Income Funds
ADDITIONAL INFORMATION (Unaudited)
PROXY VOTING
The Funds have adopted Proxy Voting Policies and Procedures under which the Funds vote proxies relating to securities held by the Funds. In addition, the Funds file Form N-PX, with its complete proxy voting record for the 12 months ended June 30th, no later than August 31st of each year. A description of the Funds’ Proxy Voting Policies and Procedures and the Funds’ proxy voting record (Form N-PX) is available (i) without charge, upon request, by calling Harbor Funds toll-free at 800-422-1050; (ii) on the Funds’ website at harborfunds.com; and (iii) on the SEC’s website at www.sec.gov.
HOUSEHOLDING
Harbor Funds has adopted a policy that allows it to send only one copy of a Fund’s prospectus, proxy material, annual report and semi-annual report to certain shareholders residing at the same household. This reduces Fund expenses, which benefits you and other shareholders. If you need additional copies or do not want your mailings to be “householded,” please call the Shareholder Servicing Agent at 800-422-1050. Individual copies will be sent within thirty (30) days after the Shareholder Servicing Agent receives your instructions. Your consent to householding is considered valid until revoked.
QUARTERLY PORTFOLIO DISCLOSURES
Each Fund files a complete portfolio of investments with the Securities and Exchange Commission for the first and third quarters of each fiscal year on Form N-Q. The Funds’ Form N-Q is available (i) without charge, upon request, by calling Harbor Funds toll-free at 800-422-1050, (ii) on the Funds’ website at harborfunds.com, and (iii) on the SEC’s web site at www.sec.gov. The form may also be viewed and copied at the Commission’s Public Reference Room in Washington, D.C. Information regarding the operations of the Public Reference Room may also be obtained by calling 800-SEC-0330.
ADVISORY AGREEMENT APPROVALS
FACTORS CONSIDERED BY THE TRUSTEES IN APPROVING THE INVESTMENT ADVISORY AGREEMENTS AND SUBADVISORY AGREEMENTS OF THE FIXED INCOME FUNDS
The Investment Company Act of 1940, as amended, requires that the Investment Advisory and Subadvisory Agreement of each Fund be approved initially, and following an initial two-year term, at least annually, by the Harbor Funds Board of Trustees, including a majority of the Independent Trustees voting separately.
At an in-person meeting of the Board of Trustees held on February 8, 9, and 10, 2015 (the “Meeting”), the Board, including the Independent Trustees voting separately, considered and approved the continuation of each Investment Advisory Agreement with Harbor Capital Advisors, Inc., the adviser to each Fund (the “Adviser”), and each Subadvisory Agreement with each Fund’s subadviser (each, a “Subadviser”) with respect to Harbor Convertible Securities Fund, Harbor High-Yield Bond Fund, Harbor Bond Fund, Harbor Real Return Fund and Harbor Money Market Fund.
In evaluating each Investment Advisory Agreement and each Subadvisory Agreement, the Trustees reviewed materials furnished by the Adviser and each Subadviser, including information about their respective affiliates, personnel, and operations and also relied upon their knowledge of the Adviser and Subadvisers resulting from their quarterly meetings, periodic telephonic meetings and other prior communications. At the Meeting, which had been called for the purpose of considering the continuation of the relevant Investment Advisory Agreements and Subadvisory Agreements, and at prior meetings, the Trustees, including the Independent Trustees, requested and received materials and presentations relating to Fund performance and the services rendered by the Adviser and each Subadviser. The Trustees also discussed with representatives of the Adviser, at the Meeting and at prior meetings, Harbor Funds’ operations and the Adviser’s ability, consistent with the “manager of managers” structure of Harbor Funds, to (i) identify and recommend to the Trustees a subadviser for each Fund, (ii) monitor and oversee the performance and investment capabilities of each Subadviser, and (iii) recommend the replacement of a subadviser where appropriate.
At the Meeting, the Trustees, including all of the Independent Trustees voting separately, determined that the terms of each Investment Advisory Agreement and each Subadvisory Agreement with respect to Harbor Convertible Securities Fund, Harbor High-Yield Bond Fund, Harbor Bond Fund, Harbor Real Return Fund and Harbor Money Market Fund were fair and reasonable and approved the continuation for a one-year period of each such Investment Advisory Agreement and Subadvisory Agreement as being in the best interests of the respective Fund and its shareholders.
91
Harbor Fixed Income Funds
ADDITIONAL INFORMATION—(Continued)
In their deliberations, the Independent Trustees had the opportunity to meet privately without representatives of the Adviser or any Subadviser present and were represented throughout the process by legal counsel to the Independent Trustees and the Funds.
In considering the approval of each Fund’s Investment Advisory Agreement and Subadvisory Agreement, the Board of Trustees, including the Independent Trustees, evaluated a number of factors it considered relevant to its determination. The Board did not identify any single factor as all-important or controlling, and individual Trustees did not necessarily attribute the same weight or importance to each factor.
Among the factors considered by the Trustees in approving the Investment Advisory Agreements were the following:
| | • | | the nature, extent, and quality of the services provided by the Adviser, including the background, education, expertise and experience of the investment professionals of the Adviser; |
| | • | | the favorable history, reputation, qualifications and background of the Adviser, as well as the qualifications of its personnel; |
| | • | | the profitability of the Adviser with respect to each Fund, including the effect of revenues of Harbor Services Group, Inc. (“Harbor Services Group”), the Funds’ transfer agent, and Harbor Funds Distributors, Inc. (“Harbor Funds Distributors”), the Funds’ principal underwriter, on such profitability; |
| | • | | the fees charged by the Adviser for investment advisory services, including, in each case, the portion of the fee to be retained by the Adviser, after payment of the Subadviser’s fee, for the subadviser oversight, administration and “manager of managers” services the Adviser provides; |
| | • | | the extent to which economies of scale might be realized as each Fund grows, and the extent to which each Fund’s advisory fee level reflects any economies of scale for the benefit of Fund investors; |
| | • | | the fees and expense ratios of each Fund relative to the quality of services provided and the fees and expense ratios of similar investment companies; |
| | • | | the investment performance of each Fund in comparison to peer groups and certain relevant benchmark indices and the Adviser’s efforts to address circumstances of underperformance where applicable; |
| | • | | the compensation received by Harbor Services Group and Harbor Funds Distributors in consideration of the services each provides to the Funds, and any other “fall out” benefits that inure to the Adviser and its affiliates as a result of their relationship with the Funds; |
| | • | | information received at regular meetings throughout the year related to Fund performance and services rendered by the Adviser, as well as each of the Subadvisers, and research arrangements with brokers who execute transactions on behalf of each Subadviser; |
| | • | | information contained in materials provided by the Adviser and compiled by Lipper, Inc. (“Lipper”) as to the investment returns, advisory fees and total expense ratios of the Institutional Class of each Fund (and, in certain cases, total expense ratios of certain other classes) relative to those of other investment companies with similar objectives and strategies managed by other investment advisers, consisting both of a peer group of funds as well as a broader universe of funds compiled by Lipper; and |
| | • | | information contained in materials compiled by Morningstar, Inc. (“Morningstar”) as to the investment returns of the Institutional Class of each Fund relative to those of other investment companies with similar objectives and strategies managed by other investment advisers. |
Among the factors considered by the Trustees in approving the Subadvisory Agreements were the following:
| | • | | the nature, extent, and quality of the services provided by each Subadviser, including the background, education, expertise and experience of the investment professionals of each Subadviser providing services to the Funds; |
| | • | | the favorable history, reputation, qualifications and background of each Subadviser, as well as the qualifications of their respective personnel; |
| | • | | the fees charged by each Subadviser for subadvisory services, which fees are paid by the Adviser, not by the Funds; |
92
Harbor Fixed Income Funds
ADDITIONAL INFORMATION—(Continued)
| | • | | information contained in materials provided by the Adviser and compiled by Lipper as to the investment returns of the Institutional Class of each Fund relative to those of other investment companies with similar objectives and strategies managed by other investment advisers, consisting both of a peer group of funds as well as a broader universe of funds compiled by Lipper; and |
| | • | | information contained in materials compiled by Morningstar as to the investment returns of the Institutional Class of each Fund relative to those of other investment companies with similar objectives and strategies managed by other investment advisers. |
Nature, Scope and Extent of Services
The Trustees separately considered the nature, scope and extent of the services provided by the Adviser and each Subadviser. In their deliberations as to the approval of each Fund’s Investment Advisory Agreement and Subadvisory Agreement, the Trustees were mindful of the fact that, by choosing to invest in a Fund, the shareholders had entrusted the Adviser with the responsibility, subject to the approval of the Trustees, for selecting such Fund’s Subadviser, overseeing and monitoring that Subadviser’s performance and replacing the Subadviser if necessary. The Trustees also considered as relevant to their determination the favorable history, reputation, qualifications and background of the Adviser and each Subadviser, as well as the qualifications of their respective personnel.
The Adviser’s Services. The Board evaluated the nature, scope and extent of the Adviser’s services in light of the Board’s experience with the Adviser, as well as materials provided by the Adviser as part of its comprehensive written response to the 15(c) request letter prepared by legal counsel to the Independent Trustees in consultation with the Independent Trustees concerning the financial and other resources devoted by the Adviser to Harbor Funds, including the breadth and depth of experience and expertise of the investment, administrative, legal and compliance professionals dedicated to Harbor Funds’ operations. The Trustees noted that the Adviser had a favorable long-term record of identifying mutual fund products that proved to be attractive to investors, and selecting subadvisers to manage such funds. The Trustees determined that the Adviser had the expertise and resources to identify, select, oversee and monitor each Subadviser and to operate effectively as the “manager of managers” for the Funds.
The Subadvisers’ Services. The Trustees’ consideration of the services provided by the Subadvisers included a review of each Subadviser’s portfolio managers, investment philosophy, style and processes and record of consistency therewith, the volatility of its results, its approach to controlling risk, and the quality and extent of its investment capabilities and resources, including the nature and extent of research it receives from broker-dealers (to the extent applicable) and other sources. In their deliberations with respect to each Fund, the Trustees considered the history of Harbor Funds’ relationship with each Subadviser and Harbor Funds’ experience with each Subadviser in this capacity.
The Trustees also considered each Subadviser’s breadth and depth of experience and investment results in managing other accounts similar to the respective Fund. The Trustees received a presentation at the Meeting by investment professionals from the Subadviser for Harbor Bond Fund and Harbor Real Return Fund. The Trustees had received presentations by investment professionals from the Subadvisers for Harbor Convertible Securities Fund, Harbor High-Yield Bond Fund and Harbor Money Market Fund at meetings of the Board of Trustees held in 2014. The Trustees reviewed information concerning each Subadviser’s historical investment results in managing accounts and/or funds, as applicable, in a manner substantially similar to the relevant Fund.
Investment Performance, Advisory Fees and Expense Ratios
In considering each Fund’s performance, advisory fees and expense ratio, the Trustees requested and received from the Adviser data compiled by Lipper and Morningstar. The Trustees also received information explaining the methodology for compilation of certain of this information and what it was intended to demonstrate. The Trustees analyzed the Institutional Class performance of each Fund, the advisory fees of each Fund, and the Institutional Class expenses of each Fund (after giving effect to waivers and/or reimbursements, if applicable, that reduced the fees or expenses of the Fund or its peer funds) and made certain observations and findings as to each Fund as noted below. The Trustees also identified and reviewed certain Administrative Class and Investor Class comparative fee and expense information they considered relevant to their deliberations.
Harbor Convertible Securities Fund. In consideration of the Investment Advisory Agreement and Subadvisory Agreement for the Harbor Convertible Securities Fund (inception date of May 1, 2011), the Trustees noted the Fund’s underperformance relative to its Lipper group and universe medians for the one-year, two-year, three-year and since
93
Harbor Fixed Income Funds
ADDITIONAL INFORMATION—(Continued)
inception periods ended December 31, 2014. The Fund’s one- and three-year rolling returns as of December 31, 2014 each ranked in the fourth quartile according to Morningstar data. The Trustees also considered the fact that the Fund had underperformed its benchmark, the Bank of America Merrill Lynch All US Convertibles Ex Mandatory Index, for the one- and three-year periods ended December 31, 2014.
The Trustees considered the expertise of Shenkman Capital Management, Inc. (“Shenkman Capital”) in managing assets generally and in the convertible securities asset class specifically, noting that Shenkman Capital managed approximately $1.1 billion in assets in this asset class, out of a firm-wide total of $27 billion in assets under management. The Trustees also noted the significant experience of the Fund’s portfolio managers in this asset class, including the lead portfolio manager’s experience prior to joining Shenkman Capital.
They observed that the Lipper comparison of contractual management fees for the Fund’s expense group, assuming an asset level of $375 million, showed the Fund’s management fee was below the group median for the Institutional Class. The actual total expense ratio of the Fund’s Institutional Class was below the group and universe medians. The Trustees noted that Harbor Capital’s profitability in operating the Fund was not excessive.
Harbor High-Yield Bond Fund. In consideration of the Investment Advisory Agreement and Subadvisory Agreement for the Harbor High-Yield Bond Fund (inception date of December 1, 2002), the Trustees noted the Fund’s underperformance relative to its Lipper group and universe medians for each of the two-, three-, four- and five-year periods ended December 31, 2014. The Fund’s one-year performance was at the group median and exceeded the universe median for the period ended December 31, 2014. The Fund’s one-, three- and five-year rolling returns as of December 31, 2014 ranked in the second, fourth and fourth quartiles, respectively, according to Morningstar data. The Trustees also considered the fact that the Fund had underperformed its benchmarks, the Bank of America Merrill Lynch U.S. High Yield Index and the Bank of America Merrill Lynch U.S. Non-Distressed High Yield Index, for the one-, three-, five- and ten-year periods ended December 31, 2014. The Trustees observed that the periods in which the Fund had underperformed had been characterized by outperformance in the lower credits quality end of the high yield sector, and that the Fund’s subadviser had a history of underperforming in these periods and outperforming in periods where higher quality high yield bonds outperformed.
The Trustees considered the expertise of Shenkman Capital in managing assets generally and in the high-yield asset class specifically, noting that Shenkman Capital managed approximately $11.9 billion in assets in this asset class, out of a firm-wide total of $27 billion in assets under management. The Trustees also noted the significant experience of the Fund’s portfolio managers in this asset class, one of whom is the founder of the firm.
They observed that the Lipper comparison of contractual management fees for the Fund’s expense group, assuming an asset level of $1.825 billion, showed the Fund’s management fee was above the group median for the Institutional Class. The actual total expense ratio of the Fund’s Institutional Class was below the group and universe medians. The Trustees also considered that Harbor Capital proposed to continue the Fund’s existing contractual fee waiver/expense reimbursement arrangement until at least February 29, 2016. The Trustees noted that Harbor Capital’s profitability in operating the Fund was not excessive.
Harbor Bond Fund. In consideration of the Investment Advisory Agreement and Subadvisory Agreement for the Harbor Bond Fund (inception date of December 29, 1987), the Trustees noted the Fund’s outperformance relative to its Lipper group median for the three-year period ended December 31, 2014 and its underperformance relative to its Lipper group medians for the one-, two-, four- and five-year periods ended December 31, 2014. The Fund outperformed relative to its Lipper universe medians for the three- and four-year periods ended December 31, 2014 while underperforming relative to its Lipper universe medians for the one-, two- and five-year periods ended December 31, 2014. The Fund’s one-, three- and five-year rolling returns as of December 31, 2014 ranked in the third, second and third quartiles, respectively, according to Morningstar data. The Trustees also considered the fact that Harbor Bond Fund had outperformed its benchmark, the Barclays U.S. Aggregate Bond Index, for the three-, five- and ten-year periods ended December 31, 2014 while underperforming its benchmark index for the one-year period ended December 31, 2014.
The Trustees considered the expertise of PIMCO in managing assets generally and in the bond asset class specifically, noting that PIMCO managed approximately $377.2 billion in “total return” assets, out of a firm-wide total of approximately $1.68 trillion in assets under management. The Trustees also noted that although the Fund’s prior portfolio manager, Bill Gross, the founder of PIMCO, had departed PIMCO in September 2014, the Fund’s replacement co-portfolio managers each had significant experience in the bond markets.
94
Harbor Fixed Income Funds
ADDITIONAL INFORMATION—(Continued)
They observed that the Lipper comparison of contractual management fees for the Fund’s expense group, assuming an asset level of $4.250 billion, showed the Fund’s management fee was above the group median for the Institutional Class. The actual total expense ratio of the Fund’s Institutional Class was at the Lipper group median and below the universe median. The Trustees also considered that the Adviser was proposing to add certain voluntary advisory fee breakpoints following the recent renegotiation of the subadvisory fee between the Adviser and PIMCO. The Trustees noted that under the revised voluntary advisory fee breakpoint schedule, there would be a 0.05% advisory fee waiver (from 0.48% to 0.43%) on net assets between $1 billion and $3 billion and a 0.075% advisory fee waiver (from 0.48% to 0.405%) on net assets in excess of $3 billion. The Trustees further noted that the Adviser was also proposing that the Fund’s total expense ratio be capped at 0.51% for Institutional Class shares, representing a 0.03% reduction of the Fund’s total expense ratio. The Trustees also considered that Harbor Capital proposed to continue the Fund’s existing contractual fee waiver/expense reimbursement arrangement until at least February 29, 2016. The Trustees noted that Harbor Capital’s profitability in operating the Fund was not excessive.
Harbor Real Return Fund. In consideration of the Investment Advisory Agreement and Subadvisory Agreement for the Harbor Real Return Fund (inception date of December 1, 2005), the Trustees noted the Fund’s outperformance relative to its Lipper group medians for the three- and five-year periods ended December 31, 2014. The Fund underperformed its Lipper group medians for the one-, two- and four-year periods ended December 31, 2014. The Fund outperformed its Lipper universe medians for the three-, four- and five-year periods ended December 31, 2014. The Fund performed at its Lipper universe median for the one-year period ended December 31, 2014 and below its Lipper universe median for the two-year period ended December 31, 2014. According to the Morningstar data presented, the Fund’s one-, three- and five-year rolling returns as of December 31, 2014 were ranked in the third, second and second quartiles, respectively. The Trustees also considered the fact that the Fund underperformed its benchmark, the Barclays U.S. TIPS Index, for the one-, three- and five-year periods ended December 31, 2014.
The Trustees considered the expertise of PIMCO in managing assets generally and in the inflation-protection asset class specifically, noting that PIMCO managed approximately $65.7 billion in “real return” assets, out of a firm-wide total of approximately $1.68 trillion in assets under management. The Trustees also noted that the Fund’s portfolio managers had significant experience in the inflation protection/TIPS market.
They observed that the Lipper comparison of contractual management fees for the Fund’s expense group, assuming an asset level of $175 million, showed the Fund’s management fee was below the group median for the Institutional Class. The actual total expense ratio of the Fund’s Institutional Class was below the Lipper group and universe medians. The Trustees also considered that Harbor Capital proposed to continue the Fund’s existing contractual fee waiver/expense reimbursement arrangement until at least February 29, 2016. The Trustees also considered that the Adviser was proposing to add certain voluntary advisory fee breakpoints following the recent renegotiation of the subadvisory fee between the Adviser and PIMCO. The Trustees noted that under the revised voluntary advisory fee breakpoint schedule, there would be a 0.05% advisory fee waiver (from 0.48% to 0.43%) on net assets between $1 billion and $3 billion and a 0.075% advisory fee waiver (from 0.48% to 0.405%) on net assets in excess of $3 billion. The Trustees further noted that the Adviser was also proposing that the Fund’s total expense ratio be capped at 0.57% for Institutional Class shares, representing a 0.03% reduction of the Fund’s total voluntary capped expense ratio. The Trustees noted that Harbor Capital’s profitability in operating this Fund was not excessive.
Harbor Money Market Fund. In consideration of the Investment Advisory Agreement and Subadvisory Agreement for the Harbor Money Market Fund (inception date of December 29, 1987), the Trustees noted the Fund’s outperformance relative to its group and universe medians for each of the one-, two-, three-, four- and five-year periods ended December 31, 2014 according to Lipper. According to the Morningstar data presented, the Fund’s one-, three- and five-year rolling returns as of December 31, 2014 were each ranked in the first quartile. The Trustees considered the Fund’s performance record relative to its benchmark, the Bank of America Merrill Lynch 3-Month U.S. Treasury Bill Index, noting that the Fund had outperformed the benchmark for the one-, three-, five- and ten-year periods ended December 31, 2014.
The Trustees noted the fact that the Fund does not have asset levels comparable to many of its Lipper peers, some of which are very large institutional-oriented money market funds. The Trustees also noted statements by Fischer Francis Trees & Watts, Inc. (“FFTW”), that the firm continues to take a conservative approach to managing the Fund to seek to ensure sufficient liquidity.
The Trustees considered the expertise of FFTW in managing assets generally and in the short duration fixed income asset class specifically, noting that FFTW managed approximately $11.1 billion of short duration assets, out of a firm-wide total
95
Harbor Fixed Income Funds
ADDITIONAL INFORMATION—(Continued)
of approximately $51.82 billion in assets under management. The Trustees also noted the experience of the Fund’s portfolio manager in this asset class both with FFTW and at prior advisory firms.
The Trustees considered that the Lipper comparison of contractual management fees for the Fund’s expense group, assuming an asset level of $175 million, showed that the Fund’s management fee was below the group median for the Institutional Class. The actual total expense ratio of the Fund’s Institutional Class was below the group and universe medians. The Trustees also considered the extent to which Harbor Capital was waiving its fees and/or reimbursing the Fund’s expenses that Harbor Capital proposed to continue until at least February 29, 2016. The Trustees noted that Harbor Capital’s profitability in managing the Fund was negative.
* * *
The Trustees also separately considered the allocation between the Adviser and each Subadviser of the relevant Fund’s investment advisory fee (i.e., the amount of the advisory fee retained by the Adviser relative to that paid to the relevant Subadviser as a subadvisory fee). They determined in each case that the allocation was reasonable and the product of arm’s length negotiation between the Adviser and Subadviser.
Profitability
The Trustees also considered the Adviser’s profitability in managing each of the Funds (as well as on a fund complex-wide basis) as presented by the Adviser, and the allocation methodology used by the Adviser to compute such profitability. The Trustees acknowledged that a reasonable level of profitability was important to provide suitable incentives for the Adviser to continue to attract and maintain high-quality personnel and to invest in infrastructure and other resources to support and enhance the Funds’ operations. In considering the Adviser’s profitability generally, the Trustees also reviewed the compensation received by Harbor Services Group and Harbor Funds Distributors in consideration of the transfer agency and distribution services, respectively, that are provided to Harbor Funds, and any other benefits enjoyed by the Adviser and its affiliates as a result of their relationship with Harbor Funds. The Trustees noted that the Adviser was, in certain cases, waiving a portion of its advisory fee and/or reimbursing a portion of Fund expenses. The Trustees determined that the Adviser’s profitability in managing each Fund was not excessive.
Economies of Scale
The Trustees also considered the extent to which economies of scale might be realized as each Fund grows, and the extent to which each Fund’s advisory fee level reflects these economies of scale for the benefit of Fund investors. The Trustees specifically considered whether any advisory fee reduction “breakpoints” should be added to the advisory fee payable by any Fund. As noted above, the Trustees concluded that the Adviser’s profitability in each case was not excessive. They concluded that the Funds’ fee structures reflected economies of scale to date and that breakpoints in these fee structures were not required at the present time. The Trustees noted they intend to monitor each Fund’s asset growth in connection with future reviews of each Fund’s Investment Advisory Agreement to determine whether breakpoints may be appropriate at such time.
96
Harbor Fixed Income Funds
ADDITIONAL INFORMATION—Continued
TRUSTEES AND OFFICERS
(As of June 2015)
The business and affairs of the Trust shall be managed by or under the direction of the Trustees, and they shall have all powers necessary or desirable to carry out that responsibility. The Trustees shall have full power and authority to take or refrain from taking any action and to execute any contracts and instruments that they may consider necessary or desirable in the management of the Trust. Any determination made by the Trustees in good faith as to what is in the interests of the Trust shall be conclusive. Information pertaining to the Trustees and Officers of Harbor Funds is set forth below. The address of each Trustee and Officer is: [Name of Trustee or Officer] c/o Harbor Funds, 111 South Wacker Drive, 34th Floor, Chicago, IL 60606-4302.
The Harbor Funds’ Statement of Additional Information includes additional information about the Trust’s Trustees and is available without charge by calling 800-422-1050 or at the Trust’s website at harborfunds.com.
| | | | | | | | |
Name (Age) Position(s) with Fund Address | | Term of
Office and
Length of
Time Served1 | | Principal Occupation(s) During Past Five Years | | Number of
Portfolios in
Fund Complex
Overseen by
Trustee | | Other Directorships of Public Companies and
Other Registered Investment
Companies Held by
Trustee During Past
Five Years |
| INDEPENDENT TRUSTEES |
Scott M. Amero (51) Trustee | | Since 2014 | | Trustee, Rare (conservation non-profit) (2011–Present); Trustee, Berkshire School (2014–Present); BlackRock, Inc., (publicly traded investment management firm) Vice Chairman and Global Chief Investment Officer, Fixed Income (2010), Vice Chairman and Global Chief Investment Officer, Fixed Income, and Co-Head, Fixed Income Portfolio Management (2007-2010). | | 28 | | Director, Anthracite Capital, Inc. (2005-2010). |
| | | | |
Raymond J. Ball (70) Trustee | | Since 2006 | | Sidney Davidson Distinguished Service Professor of Accounting, University of Chicago Booth School of Business (2000-Present); Academic Affiliate, Analysis Group (litigation consulting firm) (2000-Present); Financial Reporting Faculty Advisory Group of the Institute of Chartered Accountants in England and Wales (2008-Present); and Advisory Board of the Center for Accounting Research & Education at University of Notre Dame (2006-Present). | | 28 | | None |
| | | | |
Donna J. Dean (63) Trustee | | Since 2010 | | Chief Investment Officer of the Rockefeller Foundation (a private foundation) (1995-Present); and Trustee of Queens University of Charlotte, North Carolina (2000-2014). | | 28 | | None |
| | | | |
Randall A. Hack (68) Trustee | | Since 2010 | | Founder and Senior Managing Director of Capstone Capital LLC (a private investment firm) (2003-Present); Director of Tower Development Corporation (cell tower developer) (2009-Present); and Advisory Director of Berkshire Partners (a private equity firm) (2002-2013). | | 28 | | Director of FiberTower Corporation (2002-2011). |
| | | | |
Robert Kasdin (57) Trustee | | Since 2014 | | Senior Vice President and Chief Operating Officer, Johns Hopkins Medicine (2015-Present); Senior Executive Vice President, Columbia University (2002-2015); Trustee, National September 11 Memorial & Museum at the World Trade Center (2005-Present); Trustee, The Metropolitan Museum of Art (2014-Present); Trustee (2004-2014) and President of the Board of Trustees (2006-2011), The Dalton School; Trustee, ARTstor Digital Library (a nonprofit digital images resource) (2013-Present); Director, Apollo Commercial Real Estate Finance, Inc. (2014-Present); and Director, Noranda Aluminum Holdings Corp. (2007-2014). | | 28 | | Director of Noranda Aluminum Holdings Corp. (2007-2014); and Director of Apollo Commercial Real Estate Finance, Inc. (2014-Present). |
| | | | |
Rodger F. Smith (74) Trustee | | Since 1987 | | Managing Director, Greenwich Associates (a research based consulting firm) (1976-Present); and Chair of Trust Advisory Committee of Tau Beta Pi Association (engineering honor society) (1985-Present). | | 28 | | None |
| | | | |
Ann M. Spruill (61) Trustee | | Since 2014 | | Partner (1993-2008), Member of Executive Committee (1996-2008), Member Board of Directors (2000-2008), Grantham, Mayo, Van Otterloo & Co. LLC (private investment management firm) (with the firm since 1990); Member Investment Committee and Chair of Global Equities, Museum of Fine Arts, Boston (2000-Present); and Trustee, Financial Accounting Foundation (2014-Present). | | 28 | | None |
97
Harbor Fixed Income Funds
ADDITIONAL INFORMATION—Continued
| | | | | | | | |
Name (Age) Position(s) with Fund Address | | Term of
Office and
Length of
Time Served1 | | Principal Occupation(s) During Past Five Years | | Number of
Portfolios in
Fund Complex
Overseen by
Trustee | | Other Directorships of Public Companies and
Other Registered Investment
Companies Held by
Trustee During Past
Five Years |
| INTERESTED TRUSTEE |
David G. Van Hooser (68)* Chairman, Trustee and President | | Since
2000 | | President (2002-Present), Director and Chairman of the Board (2000-Present), Harbor Capital Advisors, Inc.; Chief Executive Officer (2007-Present), Chief Financial Officer (2012-Present), Treasurer (2007-2012) and Director (2000-Present), Harbor Funds Distributors, Inc.; and Director (2000-Present), Harbor Services Group, Inc. | | 28 | | None |
| | | | | | | | |
| | |
Name (Age) Position(s) with Fund Address | | Term of
Office and
Length of
Time Served1 | | Principal Occupation(s) During Past Five Years |
| FUND OFFICERS NOT LISTED ABOVE** |
Charles F. McCain (45) Chief Compliance Officer | | Since 2004 | | Executive Vice President and General Counsel (2004-Present) and Chief Compliance Officer (2004-2014), Harbor Capital Advisors, Inc.; Director (2007-Present) and Chief Compliance Officer (2004-Present), Harbor Services Group, Inc.; and Director, Executive Vice President and Chief Compliance Officer (2007-Present), Harbor Funds Distributors, Inc. |
| | |
Anmarie S. Kolinski (43) Treasurer | | Since 2007 | | Executive Vice President and Chief Financial Officer (2007-Present), Harbor Capital Advisors, Inc.; Chief Financial Officer (2007-Present), Harbor Services Group, Inc.; and Treasurer (2012-Present), Harbor Funds Distributors, Inc. |
| | |
Erik D. Ojala (40) Vice President and Secretary; AML Compliance Officer | | Since 2007;
Since 2010 | | Senior Vice President and Associate General Counsel (2007-Present) and Secretary (2010-Present), Harbor Capital Advisors, Inc.; and Assistant Secretary (2014-Present), Harbor Services Group, Inc. |
| | |
Brian L. Collins (46) Vice President | | Since 2005 | | Executive Vice President and Chief Investment Officer (2004-Present), Harbor Capital Advisors, Inc. |
| | |
Charles P. Ragusa (56) Vice President | | Since 2007 | | Executive Vice President (2007-Present), Harbor Capital Advisors, Inc.; President (2007-Present), Harbor Services Group, Inc.; and Executive Vice President and AML Compliance Officer (2007-Present), Harbor Funds Distributors, Inc. |
| | |
Jodie L. Crotteau (43) Assistant Secretary | | Since 2014 | | Senior Vice President and Chief Compliance Officer, Harbor Capital Advisors, Inc. (2014-Present); Vice President and Chief Compliance Officer, Grosvenor Registered Funds (2011-2014); Vice President, Grosvenor Capital Management, L.P. (2010-2014); Assistant Secretary (2005-2010) and AML Compliance Officer (2007-2010), Harbor Funds; Vice President, Secretary and Compliance Director (2007-2010), Harbor Capital Advisors, Inc.; Assistant Secretary (2005-2010), Harbor Services Group, Inc.; and Assistant Secretary (2007-2010), Harbor Funds Distributors, Inc. |
| | |
Susan A. DeRoche (62) Assistant Secretary | | Since 2006 | | Senior Vice President and Compliance Director (2007-Present) and Assistant Secretary (2006-Present), Harbor Capital Advisors, Inc.; Senior Vice President (2011–Present) and Secretary (2007-Present), Harbor Funds Distributors, Inc.; and Secretary (2014-Present) and Assistant Secretary (2012-2013), Harbor Services Group, Inc. |
| | |
John M. Paral (46) Assistant Treasurer | | Since 2013 | | Vice President (2012-Present) and Financial Reporting Manager (2007-2012), Harbor Capital Advisors, Inc. |
| 1 | Each Trustee serves for an indefinite term, until his successor is elected. Each Officer is elected annually. |
| * | Mr. Van Hooser is deemed an “Interested Trustee” due to his affiliation with the Adviser and Distributor of Harbor Funds. |
| ** | Officers of the Funds are “interested persons” as defined in the Investment Company Act. |
98
THIS PRIVACY STATEMENT IS NOT PART OF THIS REPORT
Harbor’s Privacy Statement
The following privacy statement is issued by Harbor Funds and each series of Harbor Funds and its affiliates, Harbor Capital Advisors, Inc., Harbor Services Group, Inc. and Harbor Funds Distributors, Inc. These measures reflect our commitment to maintaining the privacy of your confidential information. We appreciate the confidence you have shown by entrusting us with your assets.
Personal Information | It is our policy to respect the privacy of current and former shareholders and to protect personal information entrusted to us. We do not sell your personal information to anyone. |
| | In the course of providing products and services, we collect non-public personal information about you from the following sources: applications, forms, our website (including any information captured through our use of “cookies”), through mobile applications, by telephone and in correspondence and transactions with us, our affiliates or other parties. |
| | The non-public personal information collected may include name, address, e-mail address, telephone/fax numbers, account number, social security or taxpayer identification number, investment activity, and bank account information. |
| | When you visit us through our website or a mobile application, we may collect technical and navigational information, such as computer browser type, Internet protocol address, pages visited and average time spent on our website. We may use this information to alert you to software compatibility issues, or to improve our web design and functionality. We use “cookies” and similar files that may be placed on your hard drive for security purposes, to facilitate site navigation and to personalize the appearance of our site. |
Information Sharing | We occasionally disclose non-public personal information about our current or former shareholders with affiliated and non-affiliated parties, as permitted or required by law or regulation. In the normal course of servicing our shareholders, information we collect may be shared with non-affiliated companies that perform support services on our behalf or to other firms that assist us in providing you with products and services, such as custodians, transfer agents, broker-dealers and marketing service firms, as well as with other financial institutions. These companies may not use the information for any other purpose and we require them to keep the information they handle confidential. We may also share information with affiliates that are engaged in a variety of financial services in order to better service your account(s). |
| | When information is shared with third parties, they are not permitted to use the information for any purpose other than to assist our servicing of your account(s) or as permitted by law. |
| | If you close your account(s) or if we lose contact with you, we will continue to share information in accordance with our current privacy policy and practices. |
Access to Information | Access to non-public personal information is limited to employees, agents or other parties who need to know that information to perform their jobs, such as servicing your account(s), resolving problems or informing you of new products or services. |
Security | We maintain physical, electronic and procedural safeguards that comply with industry standards to protect your non-public personal information. |
| | For shareholders accessing information through our website or a mobile application, various forms of Internet security, such as data encryption firewall barriers, user names and passwords, and other tools are used. For additional information regarding our security measures, visit the terms and conditions of use on our website at harborfunds.com. If you have any questions or concerns about how we maintain the privacy of your non-public personal information, please contact us at 800-422-1050 Monday through Friday, between the hours of 8:00 a.m. and 6:00 p.m. Eastern time. |
We recommend that you read and retain this notice for your personal files
Eff. November 2013
99
Glossary
12b-1 Fee—A mutual fund fee, named for the SEC rule that permits it, used to pay for broker-dealer compensation and other distribution costs. If a fund has a 12b-1 fee, it will be disclosed in the fee table of a fund’s prospectus.
ADR—ADR after the name of a foreign holding stands for American Depositary Receipts representing ownership of foreign securities. ADRs are issued by U.S. banking institutions.
Average Market Capitalization—The average market capitalization of a fund’s equity portfolio gives you a measure of the size of the companies in which the fund invests. Market capitalization is calculated by multiplying the number of a company’s shares outstanding by its price per share.
Average Weighted Coupon—A calculation from a fund’s portfolio by weighting the coupon of each bond by its relative size in the portfolio.
Barclays U.S. Aggregate Bond Index—The Barclays U.S. Aggregate Bond Index is an unmanaged index of investment-grade fixed-rate debt issues with maturities of at least one year. This unmanaged index does not reflect fees and expenses and is not available for direct investment.
Barclays U.S. TIPS Index—The Barclays U.S. TIPS Index is an unmanaged market index comprised of all U.S. Treasury Inflation Protected Securities rated investment grade (Baa3 or better), have at least one year to final maturity, and at least $250 million par amount outstanding. This unmanaged index does not reflect fees and expenses and is not available for direct investment.
Beta—A measure of market-related risk. The beta of every index is 1.00, no matter how volatile the index is. A beta less than one means the portfolio is less volatile than the index. A beta higher than one indicates more volatility than the index.
Bloomberg Commodity Index Total ReturnSM—The Bloomberg Commodity Index Total ReturnSM is a broadly diversified index that tracks the commodities markets through commodity futures contracts. This unmanaged index does not reflect fees and expenses and is not available for direct investment.
BofA Merrill Lynch All U.S. Convertibles Ex Mandatory Index—The BofA Merrill Lynch All U.S. Convertibles Ex Mandatory Index is broadly representative of the U.S. convertible securities market, consisting of publicly traded issues, denominated in U.S. dollars, of all credit qualities, and excluding mandatory (equity-linked) convertibles. This unmanaged index does not reflect fees and expenses and is not available for direct investment.
BofA Merrill Lynch U.S. Dollar 3-Month LIBOR Constant Maturity Index—The BofA Merrill Lynch U.S. Dollar 3-Month LIBOR Constant Maturity Index tracks the performance of a synthetic asset paying Libor to a stated maturity. The index is based on the assumed purchase at par of a synthetic instrument having exactly its stated maturity and with a coupon equal to that day’s fixing rate. That issue is assumed to be sold the following business day (priced at a yield equal to the current day fixing rate) and rolled into a new instrument. This unmanaged index does not reflect fees and expenses and is not available for direct investment.
BofA Merrill Lynch 3-Month U.S. Treasury Bill Index—The BofA Merrill Lynch 3-Month U.S. Treasury Bill Index is comprised of a single U.S. Treasury Bill issue purchased at the beginning of each month and held for a full month, at which time that issue is sold and rolled into a newly selected issue. The issue selected each month is that having a maturity date closest to, but not beyond 90 days from the rebalance date.
BofA Merrill Lynch U.S. High Yield Index—The BofA Merrill Lynch U.S. High Yield Index is an unmanaged index that tracks the performance of below investment grade U.S. dollar-denominated corporate bonds publicly issued in the U.S. domestic market. All bonds are U.S. dollar denominated and rated Split BBB and below. This unmanaged index does not reflect fees and expenses and is not available for direct investment.
BofA Merrill Lynch U.S. Non-Distressed High Yield Index—The BofA Merrill Lynch U.S. Non-Distressed High Yield Index is a subset of the BofA Merrill Lynch U.S. High Yield Index including all securities with an option-adjusted spread less than 1,000 basis points. The unmanaged index does not reflect fees and expenses and is not available for direct investment.
Bottom-Up Equity Management Style—A management style that de-emphasizes the significance of economic and market cycles, focusing instead on the analysis of individual stocks.
Capital Gains Distribution—Profits distributed to shareholders resulting from the sale of securities held in the fund’s portfolio.
Credit Risk—The possibility that a bond issuer may not be able to pay interest and repay its debt.
100
Glossary—Continued
CUSIP Number—Identification number assigned to every stock, corporate bond and municipal bond by the Committee on Uniform Securities Identification Procedures (CUSIP), which is established by the American Bankers Association.
Diversification—The practice of investing broadly across securities of a number of issuers to reduce risk.
Duration—A common gauge of the price sensitivity of a fixed income asset or portfolio to a change in interest rates.
Emerging Markets—Emerging markets are countries with relatively young stock and bond markets. Examples include Brazil and Thailand. Typically, emerging-markets investments have the potential for losses and gains larger than those of developed-market investments.
Expense Ratio—The Fund’s total annual operating expenses (including management fees, distribution (12b-1) fees and other expenses) expressed as a percentage of average net assets.
Family of Funds—A group of mutual funds, each typically with its own investment objective, managed and distributed by the same company.
GDR—GDR after the name of a holding stands for Global Depositary Receipt representing ownership of foreign securities. GDRs are issued by either U.S. or non-U.S. banking organizations.
Inception Date—The date on which the Fund commenced operations.
Investment Objective—The goal that an investor and mutual fund pursue together (e.g., current income, long-term capital growth, etc.)
Median Market Cap—An indicator of the size of companies in which a fund invests; the midpoint of market capitalization (market price x shares outstanding) of a fund’s stocks, weighted by the proportion of the fund’s assets invested in each stock. Stocks representing half of the fund’s assets have market capitalizations above the median, and the rest are below it.
MSCI All Country World Index—The MSCI All Country World Index is a free float-adjusted market capitalization weighted index that is designed to measure the equity market performance of developed and emerging markets. This unmanaged index does not reflect fees and expenses and is not available for direct investment.
MSCI All Country World Ex. U.S. (ND) Index—The MSCI All Country World Ex. U.S.is a free float-adjusted market capitalization weighted index that is designed to measure equity market performance in the global developed and emerging markets, excluding the United States. This unmanaged index does not reflect fees and expenses and is not available for direct investment.
MSCI EAFE (ND) Index—The MSCI EAFE (ND) Index is an unmanaged index generally representative of major overseas stock markets. This unmanaged index does not reflect fees and expenses and is not available for direct investment.
MSCI Emerging Markets (ND) Index—The MSCI Emerging Markets (ND) Index is a market capitalization weighted index of equity securities in more than 20 emerging market economies. This unmanaged index does not reflect fees and expenses and is not available for direct investment.
MSCI World (ND) Index—The MSCI World (ND) Index is a free float-adjusted market capitalization index that is designed to measure global developed market equity performance. This unmanaged index does not reflect fees and expenses and is not available for direct investment.
Net Asset Value (NAV)—The per share value of a mutual fund, determined by subtracting the fund’s liabilities from its assets and dividing by the number of shares outstanding. Mutual funds calculate their NAVs at least once each business day.
No-Load Fund—A mutual fund whose shares are sold without a sales commission and without a 12b-1 fee of more than 0.25% per year. Harbor funds are no-load.
Open-End Investment Company—The legal name for a mutual fund, indicating that it stands ready to redeem (buy back) its shares from investors on any business day. Harbor Funds is an open-end investment company.
Operating Expenses—Business costs paid from a fund’s assets before earnings are distributed to shareholders. These include management fees and 12b-1 fees and other expenses.
Portfolio Manager—A specialist employed by a mutual fund’s adviser or subadviser to invest the fund’s assets in accordance with predetermined investment objectives.
101
Glossary—Continued
Portfolio Turnover—A measure of the trading activity in a fund’s investment portfolio (how often securities are bought and sold by a fund). Funds with high turnover rates incur higher transaction costs and may be more likely to distribute capital gains (which may be taxable to investors).
Price to Book Ratio (P/B)—A ratio used to compare a stock’s market value to its book value. It is calculated by dividing the current closing price of the stock by the latest quarter’s book value. For a fund, the weighted average price/book ratio of the stocks it holds.
Price to Earnings Ratio (P/E)—The ratio of a stock’s current price to its per-share earnings over the past year. For a fund, the weighted average P/E of the stocks it holds. P/E is an indicator of market expectations about corporate prospects; the higher the P/E, the greater the market expectations are for a company’s future growth.
Prospectus—The official document that describes a mutual fund to prospective investors. The prospectus contains information required by the SEC, such as investment objectives and policies, risks, services and fees.
Record Date—The date on which a shareholder must officially own shares in order to be entitled to a dividend.
Redemption Fee—Fee charged to shareholders by a mutual fund when they sell shares within a specified period after purchase. The time limit and size of fee vary among funds. The fee is paid to the fund, not the fund’s investment adviser. Its purpose is to protect long-term investors from the impact of short-term traders.
REITs (Real Estate Investment Trust)—REITs invest in real estate or loans secured by real estate and issue shares in such investments. A REIT is similar to a closed-end mutual fund.
Repurchase Agreement (Repo)—A form of short-term borrowing for dealers in government securities. The dealer sells the government securities to investors, usually on an overnight basis, and buys them back the following day. For the party selling the security (and agreeing to repurchase it in the future), it is a repo. For the party on the other end of the transaction (buying the security and agreeing to sell back in the future), it is a reverse repurchase agreement.
Risk/Reward (or Return)—The relationship between the degree of risk associated with an investment and its return potential. Typically, the higher the potential return of an investment, the greater the risk.
Russell 1000® Growth Index—The Russell 1000® Growth Index is an unmanaged index generally representative of the U.S. market for larger capitalization growth stocks. This unmanaged index does not reflect fees and expenses and is not available for direct investment. The Russell 1000® Growth Index and Russell® are trademarks of Russell Investments.
Russell 1000® Value Index—The Russell 1000® Value Index is an unmanaged index generally representative of the U.S. market for larger capitalization value stocks. This unmanaged index does not reflect fees and expenses and is not available for direct investment. The Russell 1000® Value Index and Russell® are trademarks of Russell Investments.
Russell 2000® Index—The Russell 2000® Index measures the performance of the small-cap segment of the U.S. equity universe. The Russell 2000® Index is a subset of the Russell 3000® Index representing approximately 10% of the total market capitalization of that index. It includes approximately 2,000 of the smallest securities based on a combination of their market cap and current index membership. The Russell 2000® Index is constructed to provide a comprehensive and unbiased small-cap barometer and is completely reconstituted annually to ensure larger stocks do not distort the performance and characteristics of the true small-cap opportunity set. This unmanaged index does not reflect fees and expenses and is not available for direct investment. The Russell 3000® Index and Russell® are trademarks of Russell Investments.
Russell 2000® Growth Index—The Russell 2000® Growth Index is an unmanaged index representing the smallest 2,000 stocks with the highest price-to-book ratio and future earnings. This unmanaged index does not reflect fees and expenses and is not available for direct investment. The Russell 2000® Growth Index and Russell® are trademarks of Russell Investments.
Russell 2000® Value Index—The Russell 2000® Value Index is an unmanaged index representing the smallest 2,000 stocks with the lowest price-to-book ratio and future earnings. This unmanaged index does not reflect fees and expenses and is not available for direct investment. The Russell 2000® Value Index and Russell® are trademarks of Russell Investments.
Russell 3000® Index—The Russell 3000® Index measures the performance of the largest 3,000 U.S. companies representing approximately 98% of the investable U.S. equity market. The Russell 3000® Index is constructed to provide a comprehensive, unbiased and stable barometer of the broad market and is completely reconstituted annually to ensure new and growing equities are reflected. This unmanaged index does not reflect fees and expenses and is not available for direct investment. The Russell 3000® Index and Russell® are trademarks of Russell Investments.
102
Glossary—Continued
Russell 3000® Growth Index—The Russell 3000® Growth Index measures the performance of the broad growth segment of the U.S. equity universe. It includes those Russell 3000 companies with higher price-to-book ratios and higher forecasted growth values. The Russell 3000® Growth Index is constructed to provide a comprehensive, unbiased, and stable barometer of the broad growth market. The index is completely reconstituted annually to ensure new and growing equities are included and that the represented companies continue to reflect growth characteristics. This unmanaged index does not reflect fees and expenses and is not available for direct investment. The Russell 3000® Growth Index and Russell® are trademarks of Russell Investments.
Russell 3000® Value Index—The Russell 3000® Value Index measures the performance of the broad value segment of U.S. equity value universe. It includes those Russell 3000 companies with lower price-to-book ratios and lower forecasted growth values. The Russell 3000® Value Index is constructed to provide a comprehensive, unbiased, and stable barometer of the broad value market. The index is completely reconstituted annually to ensure new and growing equities are included and that the represented companies continue to reflect value characteristics. This unmanaged index does not reflect fees and expenses and is not available for direct investment. The Russell 3000® Value Index and Russell® are trademarks of Russell Investments.
Russell Midcap® Growth Index—The Russell Midcap® Growth Index is an unmanaged index generally representative of the U.S. market for medium capitalization growth stocks. This unmanaged index does not reflect fees and expenses and is not available for direct investment. The Russell Midcap® Growth Index and Russell® are trademarks of Russell Investments.
Russell Midcap® Value Index—The Russell Midcap® Value Index is an unmanaged index generally representative of the U.S. market for medium capitalization value stocks. This unmanaged index does not reflect fees and expenses and is not available for direct investment. The Russell Midcap® Value Index and Russell® are trademarks of Russell Investments.
S&P 500 Index—The S&P 500 Index is an unmanaged index generally representative of the U.S. stock market. This unmanaged index does not reflect fees and expenses and is not available for direct investment.
Statement of Additional Information (SAI)—The supplementary document to a prospectus that contains more detailed information about a mutual fund; also known as “Part B” of a fund’s registration statement.
TBAs—A term used to describe a forward mortgage-backed securities trade. Pass-through securities issued by Freddie Mac, Fannie Mae and Ginnie Mae trade in the TBA market. The term TBA is derived from the fact that the actual mortgage- backed security that will be delivered to fulfill a TBA trade is not designated at the time the trade is made. The securities are “to be announced” 48 hours prior to the established trade settlement date.
Treasury Inflation-Protected Securities (TIPS)—TIPS are securities in which the principal amount is adjusted for inflation and interest payments are applied to the inflation-adjusted principal.
Top-Down Equity Management Style—Investment style that begins with an assessment of the overall economic environment and makes a general asset allocation decision regarding various sectors of the financial markets and various industries.
Total Return—Return on an investment over a specified period, including price appreciation (or depreciation) plus any income, expressed as an average annual compound of return.
Weighted Average Duration—Duration is a time measure of a bond’s interest-rate sensitivity, based on the weighted average of the time periods over which a bond’s cash flows accrue to the bondholder. Time periods are weighted by multiplying by the present value of its cash flow divided by the bond’s price. (A bond’s cash flows consist of coupon payments and repayment of capital.) A bond’s duration will almost always be shorter than its maturity, with the exception of zero-coupon bonds, for which maturity and duration are equal.
Weighted Average Maturity—The average length of time until principal must be repaid for all bonds in a mutual fund portfolio on a dollar weighted basis.
Yield—A measure of net income (dividends and interest) earned by the securities in the fund’s portfolio less fund expenses during a specified period. A fund’s yield is expressed as a percentage of the maximum offering price per share on a specified date.
Yield to Maturity—The term used to describe the rate of return an investor will receive if a long-term, interest-bearing security, such as a bond, is held to its maturity date. Yield to maturity is greater than the coupon rate if the bond is selling at a discount and less than the coupon rate if it is selling at a premium.
103
| | | | | | |
| 111 South Wacker Drive, 34th Floor | | Chicago, IL 60606-4302 | | 800-422-1050 | | harborfunds.com |
Trustees & Officers
David G. Van Hooser
Chairman, President & Trustee
Scott M. Amero
Trustee
Raymond J. Ball
Trustee
Donna J. Dean
Trustee
Randall A. Hack
Trustee
Robert Kasdin
Trustee
Rodger F. Smith
Trustee
Ann M. Spruill
Trustee
Charles F. McCain
Chief Compliance Officer
Anmarie S. Kolinski
Treasurer
Erik D. Ojala
Vice President, Secretary & AML Compliance Officer
Brian L. Collins
Vice President
Charles P. Ragusa
Vice President
Jodie L. Crotteau
Assistant Secretary
Susan A. DeRoche
Assistant Secretary
John M. Paral
Assistant Treasurer
Investment Adviser
Harbor Capital Advisors, Inc.
111 South Wacker Drive
34th Floor
Chicago, IL 60606-4302
312-443-4400
Distributor & Principal Underwriter
Harbor Funds Distributors, Inc.
111 South Wacker Drive
34th Floor
Chicago, IL 60606-4302
312-443-4600
Shareholder Servicing Agent
Harbor Services Group, Inc.
P.O. Box 804660
Chicago, IL 60680-4108
800-422-1050
Custodian
State Street Bank & Trust Company
State Street Financial Center
1 Lincoln Street Boston,
MA 02111-2900

Semi-Annual Report
April 30, 2015
Target Retirement Funds
| | | | | | |
| | | | |
| | | Institutional
Class | | Administrative
Class | | Investor
Class |
| | | |
| Harbor Target Retirement Income Fund | | HARAX | | HARBX | | HARCX |
| | | |
| Harbor Target Retirement 2015 Fund | | HARGX | | HARHX | | HARIX |
| | | |
| Harbor Target Retirement 2020 Fund | | HARJX | | HARKX | | HARLX |
| | | |
| Harbor Target Retirement 2025 Fund | | HARMX | | HARNX | | HAROX |
| | | |
| Harbor Target Retirement 2030 Fund | | HARPX | | HARQX | | HARTX |
| | | |
| Harbor Target Retirement 2035 Fund | | HARUX | | HARVX | | HARWX |
| | | |
| Harbor Target Retirement 2040 Fund | | HARYX | | HARZX | | HABBX |
| | | |
| Harbor Target Retirement 2045 Fund | | HACCX | | HADDX | | HAEEX |
| | | |
| Harbor Target Retirement 2050 Fund | | HAFFX | | HAGGX | | HAHHX |
| | | |
| Harbor Target Retirement 2055 Fund | | HATRX | | HATAX | | HATTX |
Table of Contents
This document must be preceded or accompanied by a Prospectus.
Harbor Target Retirement Funds
SEMI-ANNUAL REPORT OVERVIEW (Unaudited)
The first half of the fiscal year ended April 30, 2015. The performance figures for each of the Harbor Funds shown below assume the reinvestment of dividends and capital gains, but do not reflect the deduction of taxes that a shareholder would pay on Fund distributions or on the redemption of shares of the Funds. Returns for periods less than one year are not annualized. From time to time, certain fees and/or expenses have been voluntarily or contractually waived or reimbursed, which has resulted in higher returns. Without these waivers or reimbursements, the returns would have been lower. Voluntary waivers or reimbursements may be discontinued at any time without notice. For information on the different share classes, please refer to the current prospectus. The returns of the unmanaged indices assume the reinvestment of dividends but do not reflect fees and expenses. The indices are not available for direct investment.
Performance data shown represents past performance, which is no guarantee of future results. Current performance may be higher or lower than the past performance data shown. Investment returns and the value of an investment will fluctuate, and an investor’s shares, when sold, may be worth more or less than their original cost. You can obtain performance data current to the most recent month-end (available within seven business days after the most recent month-end) by calling 800-422-1050 or by visiting harborfunds.com.
| | | | | | | | | | | | |
| | | Unannualized Total Return
6 Months Ended April 30, 2015 | |
| HARBOR TARGET RETIREMENT FUNDS | | Institutional
Class | | | Administrative
Class | | | Investor
Class | |
Harbor Target Retirement Income Fund | | | 2.53 | % | | | 2.42 | % | | | 2.42 | % |
Harbor Target Retirement 2015 Fund | | | 2.64 | | | | 2.56 | | | | 2.64 | |
Harbor Target Retirement 2020 Fund | | | 3.22 | | | | 3.22 | | | | 3.22 | |
Harbor Target Retirement 2025 Fund | | | 3.36 | | | | 3.37 | | | | 3.37 | |
Harbor Target Retirement 2030 Fund | | | 3.61 | | | | 3.73 | �� | | | 3.73 | |
Harbor Target Retirement 2035 Fund | | | 4.04 | | | | 4.04 | | | | 4.04 | |
Harbor Target Retirement 2040 Fund | | | 4.73 | | | | 4.72 | | | | 4.72 | |
Harbor Target Retirement 2045 Fund | | | 5.20 | | | | 5.21 | | | | 5.21 | |
Harbor Target Retirement 2050 Fund | | | 5.95 | | | | 5.94 | | | | 5.94 | |
Harbor Target Retirement 2055 Fund | | | 6.45 | | | | 6.34 | | | | 6.34 | |
UNDERLYING HARBOR FUNDS PERFORMANCE (INSTITUTIONAL CLASS SHARES)
| | | | | | | | | | | | | | | | | | | | | | | | | | | | | | | | |
| | | Total Return for the Period
Ended April 30, 2015 | | | | | | Expense Ratios*,a | |
| EQUITY & COMMODITY FUNDS | | 6 Monthsb | | | One
Year | | | Five
Yearsa | | | Ten
Yearsa | | | Since
Inceptiona | | | Inception
Date | | | Net | | | Gross | |
Harbor Capital Appreciation Fund | | | 7.47 | % | | | 20.46 | % | | | 15.23 | % | | | 10.15 | % | | | 11.59 | % | | | 12/29/1987 | | | | 0.66 | %c | | | 0.68 | % |
Harbor Mid Cap Growth Fund | | | 7.06 | | | | 15.77 | | | | 13.78 | | | | 11.02 | | | | 3.90 | | | | 11/01/2000 | | | | 0.85 | | | | 0.85 | |
Harbor Small Cap Growth Fund | | | 10.39 | | | | 17.30 | | | | 14.80 | | | | 10.93 | | | | 9.06 | | | | 11/01/2000 | | | | 0.84 | | | | 0.84 | |
Harbor Small Cap Growth Opportunities Fund | | | 2.19 | | | | 7.69 | | | | N/A | | | | N/A | | | | 8.01 | | | | 02/01/2014 | | | | 0.90 | d | | | 1.61 | |
Harbor Large Cap Value Fund | | | 6.99 | | | | 12.35 | | | | 13.80 | | | | 7.38 | | | | 9.98 | | | | 12/29/1987 | | | | 0.68 | d | | | 0.71 | |
Harbor Mid Cap Value Fund | | | 4.87 | | | | 10.64 | | | | 15.46 | | | | 9.59 | | | | 8.61 | | | | 03/01/2002 | | | | 0.90 | | | | 0.90 | |
Harbor Small Cap Value Fund | | | 3.94 | | | | 10.88 | | | | 12.97 | | | | 7.82 | | | | 10.61 | | | | 12/14/2001 | | | | 0.85 | | | | 0.85 | |
Harbor International Fund | | | 7.69 | | | | -0.10 | | | | 7.92 | | | | 8.69 | | | | 11.65 | | | | 12/29/1987 | | | | 0.75 | c | | | 0.77 | |
Harbor International Growth Fund | | | 7.75 | | | | 3.92 | | | | 6.73 | | | | 6.11 | | | | 3.67 | | | | 11/01/1993 | | | | 0.85 | d | | | 0.89 | |
Harbor Global Growth Fund | | | 3.92 | | | | 11.41 | | | | 13.92 | | | | N/A | | | | 21.85 | | | | 03/01/2009 | | | | 0.90 | d | | | 1.09 | |
Harbor Emerging Markets Equity Fund | | | 0.10 | | | | 3.50 | | | | N/A | | | | N/A | | | | 0.40 | | | | 11/01/2013 | | | | 1.15 | d | | | 2.35 | |
Harbor Commodity Real Return Strategy Fund | | | -13.07 | | | | -25.82 | | | | -3.49 | | | | N/A | | | | -6.17 | | | | 09/02/2008 | | | | 0.98 | d | | | 1.05 | |
| | | | | | | | |
FIXED INCOME FUNDS | | | | | | | | | | | | | | | | | | | | | | | | | | | | | | | | |
Harbor Unconstrained Bond Fund | | | 0.31 | % | | | 1.82 | % | | | 2.83 | % | | | N/A | | | | 2.99 | % | | | 04/01/2010 | | | | 1.05 | %d | | | 1.35 | % |
Harbor Convertible Securities Fund | | | 3.03 | | | | 3.03 | | | | N/A | | | | N/A | | | | 5.79 | | | | 05/01/2011 | | | | 0.75 | | | | 0.75 | |
Harbor High-Yield Bond Fund | | | 2.40 | | | | 3.19 | | | | 6.99 | | | | 7.03 | % | | | 7.77 | | | | 12/01/2002 | | | | 0.65 | c | | | 0.69 | |
Harbor Bond Fund | | | 2.17 | | | | 4.33 | | | | 4.37 | | | | 5.62 | | | | 7.50 | | | | 12/29/1987 | | | | 0.51 | d,g | | | 0.57 | |
Harbor Real Return Fund | | | 0.02 | | | | 1.25 | | | | 3.54 | | | | N/A | | | | 4.60 | | | | 12/01/2005 | | | | 0.59 | d | | | 0.64 | |
| | | | | | | | |
SHORT-TERM INVESTMENTS | | | | | | | | | | | | | | | | | | | | | | | | | | | | | | | | |
Harbor Money Market Fund | | | 0.03 | % | | | 0.06 | % | | | 0.10 | % | | | 1.51 | % | | | 3.47 | % | | | 12/29/1987 | | | | 0.28 | %c,d | | | 0.31 | % |
Current 7-day subsidizede SEC yield for period ended 04/30/2015: 0.07% | | | | | | | | | | | | | | | | | | | | | | | | | |
Current 7-day unsubsidizedf SEC yield for period ended 04/30/2015: -0.25% | | | | | | | | | | | | | | | | | | | | | | | | | |
| | | | |
| COMMONLY USED MARKET INDICES | | Unannualized Total Return
6 Months Ended
April 30, 2015 | |
Russell 3000® Index; entire U.S. stock market | | | 4.74 | % |
MSCI EAFE (ND) Index; international equity | | | 6.81 | |
Barclays U.S. Aggregate Bond Index; domestic bonds | | | 2.06 | |
| * | All mutual funds have expense ratios which represent what shareholders pay for operating expenses and management fees. Expense ratios are expressed as an annualized percentage of a fund’s average net assets paid out in expenses. Net expense ratios reflect adjustments due to voluntary or contractual fee waivers or expense reimbursements. Expense ratio information is as of the funds current prospectus, as revised and supplemented to date. |
| c | Reflects contractual management fee reduction through 02/29/2016. |
| d | Contractual limitation on Fund operating expenses through 02/29/2016. |
| e | Reflects reimbursement or waivers currently in effect. |
| f | Does not reflect reimbursements or waivers currently in effect. |
| g | Reflects contractual management fee reduction through 02/28/2018. |
1
Harbor Target Retirement Funds
SEMI-ANNUAL REPORT OVERVIEW—Continued
TARGET ASSET ALLOCATION
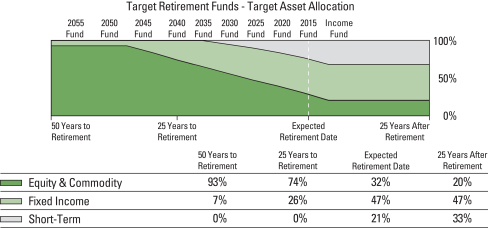
Over time, the allocation to asset classes and underlying Harbor funds will change in a predetermined manner as shown in the chart above. The chart shows the shifting of asset classes over time and illustrates how each Target Retirement Fund’s (except Harbor Target Retirement Income Fund) asset mix becomes more conservative as time elapses.
The principal value of the Funds is not guaranteed at any time, including the target retirement date.
INVESTMENT STYLES
The Target Retirement Funds are constructed based on Harbor Capital Advisors’ investment experience that, over the long term, stocks generally provide greater growth opportunities and greater risk than bonds, and bonds generally provide more income and lower volatility than stocks. The year in the Fund name refers to the approximate year (the target date) when an investor in the Fund would leave the work force and enter retirement and likely stop making new investments in the Fund. Harbor Target Retirement Income Fund is designed for investors currently in retirement. The year-specific Target Retirement Funds strive to produce more income and lower volatility as the target year approaches.
Harbor Capital Advisors allocates each Fund’s assets among the underlying Harbor funds based on the Fund’s investment objectives and policies. The asset allocation for each Fund (other than the Harbor Target Retirement Income Fund) will change over time as the target date indicated in the Fund’s name draws closer.
HARBOR TARGET RETIREMENT FUNDS – ACTUAL ALLOCATION AS OF APRIL 30, 2015
| | | | | | | | | | | | | | | | | | | | | | | | | | | | | | | | | | | | | | | | | | | | | | | | | | | | | | | | | | | | | | | | |
| | | | | | | Income | | | | | 2015 | | | | | 2020 | | | | | 2025 | | | | | 2030 | | | | | 2035 | | | | | 2040 | | | | | 2045 | | | | | 2050 | | | | | 2055 | | | |
| | Domestic Equity & Commodity Funds | | | | | | | | | | | | | | | | | | | | | | | | | | | | | | | | | | | | | | | | | | | | | | | | | | | | | | | | | | | | | | |
| | Harbor Capital Appreciation Fund | | | | | 3 | % | | | | | 3 | % | | | | | 4 | % | | | | | 5 | % | | | | | 6 | % | | | | | 7 | % | | | | | 9 | % | | | | | 10 | % | | | | | 11 | % | | | | | 11 | % | | |
| | Harbor Mid Cap Growth Fund | | | | | 1 | | | | | | 2 | | | | | | 2 | | | | | | 2 | | | | | | 3 | | | | | | 4 | | | | | | 4 | | | | | | 5 | | | | | | 6 | | | | | | 6 | | | |
| | Harbor Small Cap Growth Fund | | | | | 1 | | | | | | 2 | | | | | | 2 | | | | | | 2 | | | | | | 3 | | | | | | 3 | | | | | | 4 | | | | | | 4 | | | | | | 5 | | | | | | 5 | | | |
| | Harbor Large Cap Value Fund | | | | | 3 | | | | | | 4 | | | | | | 5 | | | | | | 6 | | | | | | 7 | | | | | | 9 | | | | | | 10 | | | | | | 12 | | | | | | 13 | | | | | | 14 | | | |
| | Harbor Mid Cap Value Fund | | | | | 2 | | | | | | 3 | | | | | | 3 | | | | | | 4 | | | | | | 5 | | | | | | 6 | | | | | | 7 | | | | | | 8 | | | | | | 9 | | | | | | 9 | | | |
| | Harbor Small Cap Value Fund | | | | | 1 | | | | | | 2 | | | | | | 3 | | | | | | 3 | | | | | | 3 | | | | | | 4 | | | | | | 5 | | | | | | 5 | | | | | | 6 | | | | | | 6 | | | |
| | | Harbor Commodity Real Return Strategy Fund | | | | | 0 | | | | | | 1 | | | | | | 3 | | | | | | 4 | | | | | | 5 | | | | | | 5 | | | | | | 4 | | | | | | 4 | | | | | | 3 | | | | | | 3 | | | |
| | Total Domestic Equity & Commodity Funds | | | | | 11 | | | | | | 17 | | | | | | 22 | | | | | | 26 | | | | | | 32 | | | | | | 38 | | | | | | 43 | | | | | | 48 | | | | | | 53 | | | | | | 54 | | | |
| | International & Global Funds | | | | | | | | | | | | | | | | | | | | | | | | | | | | | | | | | | | | | | | | | | | | | | | | | | | | | | | | | | | | | | |
| | Harbor International Fund | | | | | 5 | | | | | | 6 | | | | | | 8 | | | | | | 9 | | | | | | 11 | | | | | | 13 | | | | | | 15 | | | | | | 18 | | | | | | 20 | | | | | | 20 | | | |
| | Harbor International Growth Fund | | | | | 3 | | | | | | 4 | | | | | | 5 | | | | | | 6 | | | | | | 7 | | | | | | 9 | | | | | | 10 | | | | | | 12 | | | | | | 14 | | | | | | 14 | | | |
| | | Harbor Global Growth Fund | | | | | 1 | | | | | | 2 | | | | | | 2 | | | | | | 2 | | | | | | 3 | | | | | | 3 | | | | | | 4 | | | | | | 4 | | | | | | 4 | | | | | | 5 | | | |
| | Total International & Global Funds | | | | | 9 | | | | | | 12 | | | | | | 15 | | | | | | 17 | | | | | | 21 | | | | | | 25 | | | | | | 29 | | | | | | 34 | | | | | | 38 | | | | | | 39 | | | |
| | Fixed Income Funds | | | | | | | | | | | | | | | | | | | | | | | | | | | | | | | | | | | | | | | | | | | | | | | | | | | | | | | | | | | | | | |
| | Harbor Unconstrained Bond Fund | | | | | 6 | | | | | | 6 | | | | | | 6 | | | | | | 6 | | | | | | 5 | | | | | | 4 | | | | | | 3 | | | | | | 2 | | | | | | 1 | | | | | | 1 | | | |
| | Harbor Convertible Securities Fund | | | | | 0 | | | | | | 0 | | | | | | 4 | | | | | | 4 | | | | | | 4 | | | | | | 1 | | | | | | 0 | | | | | | 0 | | | | | | 0 | | | | | | 0 | | | |
| | Harbor High-Yield Bond Fund | | | | | 11 | | | | | | 13 | | | | | | 15 | | | | | | 16 | | | | | | 14 | | | | | | 12 | | | | | | 10 | | | | | | 7 | | | | | | 4 | | | | | | 3 | | | |
| | Harbor Bond Fund | | | | | 37 | | | | | | 33 | | | | | | 28 | | | | | | 24 | | | | | | 20 | | | | | | 18 | | | | | | 14 | | | | | | 9 | | | | | | 4 | | | | | | 3 | | | |
| | | Harbor Real Return Fund | | | | | 16 | | | | | | 11 | | | | | | 9 | | | | | | 7 | | | | | | 4 | | | | | | 2 | | | | | | 1 | | | | | | 0 | | | | | | 0 | | | | | | 0 | | | |
| | Total Fixed Income Funds | | | | | 70 | | | | | | 63 | | | | | | 62 | | | | | | 57 | | | | | | 47 | | | | | | 37 | | | | | | 28 | | | | | | 18 | | | | | | 9 | | | | | | 7 | | | |
| | Short-Term Investments | | | | | | | | | | | | | | | | | | | | | | | | | | | | | | | | | | | | | | | | | | | | | | | | | | | | | | | | | | | | | | |
| | | Harbor Money Market Fund | | | | | 10 | | | | | | 8 | | | | | | 1 | | | | | | 0 | | | | | | 0 | | | | | | 0 | | | | | | 0 | | | | | | 0 | | | | | | 0 | | | | | | 0 | | | |
| | Total Short-Term Investments | | | | | 10 | | | | | | 8 | | | | | | 1 | | | | | | 0 | | | | | | 0 | | | | | | 0 | | | | | | 0 | | | | | | 0 | | | | | | 0 | | | | | | 0 | | | |
| | | | | | | 100 | % | | | | | 100 | % | | | | | 100 | % | | | | | 100 | % | | | | | 100 | % | | | | | 100 | % | | | | | 100 | % | | | | | 100 | % | | | | | 100 | % | | | | | 100 | % | | |
2
Letter from the Chairman

David G. Van Hooser
Chairman
Dear Fellow Shareholder:
U.S. and international stocks recorded respectable gains for the first half of fiscal 2015. Fixed income markets posted positive results, while commodities declined.
Harbor Target Retirement Funds
Shares of U.S. and foreign-based companies were both key contributors to returns for the Harbor Target Retirement Funds for the six months ended April 30, 2015. Harbor Target Retirement Income Fund, which had the smallest equity allocation (about 20% of its portfolio), recorded a return of 2.53%, while Harbor Target Retirement 2055 Fund, which had approximately 90% of its portfolio invested in stocks, returned 6.45%. (All Harbor returns cited are for each fund’s Institutional Class shares.) Among other areas of Target Retirement portfolios, fixed income funds had positive returns while commodities finished in negative territory.
Notable performances included that of Harbor Large Cap Value Fund, which had a return of 6.99%, beating its benchmark, the Russell 1000® Value Index, by 410 basis points, or 4.10 percentage points. Harbor International Fund, the largest single equity fund allocation in the Target Retirement portfolios, returned 7.69%, outperforming its MSCI EAFE (ND) Index benchmark by 88 basis points. Harbor Small Cap Growth Fund, with a return of 10.39%, outperformed its benchmark, the Russell 2000® Growth Index, by 314 basis points. Harbor Bond Fund, the largest fixed income component of the portfolios, returned 2.17%, beating its Barclays U.S. Aggregate Bond Index benchmark by 11 basis points.
| | | | | | | | | | | | | | | | | | | | |
| | | RETURNS FOR PERIODS ENDED APRIL 30, 2015 | |
| | | Unannualized | | | | | | Annualized | |
Domestic Equities | | 6 Months | | | 1 Year | | | 5 Years | | | 10 Years | | | 30 Years | |
Wilshire 5000 Total Market (entire U.S. stock market) | | | 4.64 | % | | | 12.52 | % | | | 14.26 | % | | | 8.88 | % | | | 11.00 | % |
S&P 500 (large cap stocks) | | | 4.40 | | | | 12.98 | | | | 14.33 | | | | 8.32 | | | | 11.09 | |
Russell Midcap® (mid cap stocks) | | | 5.87 | | | | 13.30 | | | | 15.09 | | | | 10.27 | | | | 12.55 | |
Russell 2000® (small cap stocks) | | | 4.65 | | | | 9.71 | | | | 12.73 | | | | 9.18 | | | | 9.90 | |
Russell 3000® Growth | | | 6.59 | | | | 16.50 | | | | 15.45 | | | | 9.69 | | | | 10.41 | |
Russell 3000® Value | | | 2.82 | | | | 8.96 | | | | 13.15 | | | | 7.54 | | | | 11.24 | |
| | | | | |
International & Global | | | | | | | | | | | | | | | |
MSCI EAFE (ND) (foreign stocks) | | | 6.81 | % | | | 1.66 | % | | | 7.40 | % | | | 5.62 | % | | | 9.04 | % |
MSCI World (ND) (global stocks) | | | 5.09 | | | | 7.41 | | | | 10.51 | | | | 6.87 | | | | 9.44 | |
MSCI Emerging Markets (ND) (emerging markets) | | | 3.92 | | | | 7.80 | | | | 3.02 | | | | 9.58 | | | | N/A | |
| | | | | |
Strategic Markets | | | | | | | | | | | | | | | |
Bloomberg Commodity Index Total ReturnSM | | | -11.87 | % | | | -24.69 | % | | | -5.02 | % | | | -2.44 | % | | | N/A | |
| | | | | |
Fixed Income | | | | | | | | | | | | | | | |
BofA Merrill Lynch U.S. High-Yield (high-yield bonds) | | | 1.51 | % | | | 2.57 | % | | | 8.18 | % | | | 8.28 | % | | | N/A | |
Barclays U.S. Aggregate Bond (domestic bonds) | | | 2.06 | | | | 4.46 | | | | 4.12 | | | | 4.75 | | | | 7.33 | % |
BofA Merrill Lynch 3-Month U.S. Treasury Bill (proxy for money market returns) | | | 0.01 | | | | 0.02 | | | | 0.09 | | | | 1.47 | | | | 3.90 | |
Barclays U.S. TIPS (inflation-linked bonds) | | | 1.28 | | | | 2.48 | | | | 3.96 | | | | 4.43 | | | | N/A | |
Domestic Equity
U.S. stock indices had positive returns for the first half of fiscal 2015, supported by accommodative monetary policies of the Federal Reserve and central banks of other countries. The Wilshire 5000 Total Market Index, a measure of the broad domestic equity market, had a return of 4.64% for the six months ended April 30, 2015. Growth stocks outperformed value stocks across all capitalization ranges.
International Equity
International stock markets moved higher in the first half of fiscal 2015 as investors responded favorably to new monetary easing initiatives by central banks in Europe, Japan and other countries. The U.S. dollar strengthened against most international currencies, boosting the competitiveness of foreign exporters.
Shares of companies based in developed overseas markets returned 6.81%, as measured by the MSCI EAFE (ND) Index, while emerging markets equities returned 3.92%, as measured by the MSCI Emerging Markets (ND) Index. The MSCI World (ND) Index, a measure of global equities including the U.S., returned 5.09%. (All international and global returns are in U.S. dollars.)
3
Strategic Markets and Fixed Income
Commodity markets finished broadly lower for the first half of fiscal 2015, driven in part by the decline in crude oil prices and the stronger U.S. dollar. The Bloomberg Commodity Index Total ReturnSM, an unmanaged index of futures contracts on a diversified group of physical commodities, returned -11.87%.
Fixed income markets generated modest gains in the first half of fiscal 2015. The Federal Reserve indicated its willingness to begin gradually raising short-term rates if warranted by certain signs of continued economic growth in the U.S. By contrast, against a backdrop of economic weakness and subdued inflation, a number of central banks outside the U.S., including Europe and Japan, introduced new monetary stimulus measures.
The broad U.S. investment-grade bond market returned 2.06% for the fiscal first half, as measured by the Barclays U.S. Aggregate Bond Index. Below investment-grade bonds returned 1.51%, as measured by the BofA Merrill Lynch U.S. High Yield Index. Inflation-linked bonds, as measured by the Barclays U.S. TIPS Index, returned 1.28%. Money market investments again produced barely positive returns as the Federal Reserve continued to hold its federal funds target rate at the 0.0% to 0.25% range.
Disciplined Approach
Although stocks and bonds may provide solid long-term returns, as indicated in the table on the preceding page, financial markets can be very volatile in the short run. Given the uncertainty of markets, a disciplined approach and a diversified portfolio can be useful tools in helping investors to manage risk. At Harbor Funds, we offer a range of actively-managed equity, strategic markets and fixed income funds to assist investors in establishing an investment plan to help achieve their long-term goals.
A number of these funds are included in the portfolios of the Harbor Target Retirement Funds, which are designed to help investors keep an asset allocation consistent with their age and expected retirement date as they invest and plan for their retirement years.
Thank you for your investment in Harbor Funds.
June 24, 2015

David G. Van Hooser
Chairman
4
Harbor Target Retirement Income Fund
MANAGERS’ COMMENTARY (Unaudited)
ADVISER
Harbor Capital
Advisors, Inc.
111 South Wacker Drive
34th Floor
Chicago, IL 60606
PORTFOLIO MANAGERS
Brian L. Collins, CFA
Since 2009
Paul C. Herbert, CFA
Since 2009
Linda M. Molenda
Since 2009
David G. Van Hooser
Since 2009
Harbor Capital has managed the Fund since its inception
in 2009.
INVESTMENT OBJECTIVE
The Fund seeks current income and some capital appreciation.
MARKET REVIEW
U.S. and international equity markets finished higher for the six months ended April 30, 2015. Fixed income investments recorded positive returns, while commodity prices posted a sharp decline.
U.S. equities returned 4.74% for the first half of fiscal 2015, as measured by the Russell 3000® Index. Growth stocks set the pace, with the Russell 3000® Growth Index posting a return of 6.59%, compared to 2.82% by the Russell 3000® Value Index. Mid cap stocks modestly outperformed both large caps and small caps. The S&P 500 Index returned 4.40%, with 8 of its 10 economic sectors posting positive returns. The Consumer Discretionary, Health Care, and Information Technology sectors were the best-performing areas of the index, while the Energy and Utilities sectors had negative returns.
International stocks, as measured by the MSCI EAFE (ND) Index, returned 6.81%, modestly outperforming U.S. equities. (All international and global returns are in U.S. dollars.) The index is a measure of stocks in developed markets outside the U.S. Eight of the 10 sectors within the index had positive returns, led by Consumer Discretionary, Information Technology, and Health Care stocks. Energy and Utilities were the only sectors to lose ground. Shares of companies based in developing economies also advanced, with the MSCI Emerging Markets (ND) Index registering a return of 3.92%.
Among fixed income investments, the broad U.S. investment-grade bond market returned 2.06%, as measured by the Barclays U.S. Aggregate Bond Index. Speculative-grade bonds, as measured by the BofA Merrill Lynch U.S. High-Yield Index, returned 1.51%. Inflation-linked bonds returned 1.28%, as measured by the Barclays U.S. TIPS Index, while the BofA Merrill Lynch 3-month U.S. Treasury Bill Index, a benchmark for money market returns, posted a return of 0.01%.
Following a decline over the prior 12 months, commodity prices fell further in the first half of fiscal 2015. The Bloomberg Commodity Index Total ReturnSM, an unmanaged index of futures contracts on a diversified group of physical commodities, returned -11.87%.
PERFORMANCE
Harbor Target Retirement Income Fund recorded returns of 2.53% (Institutional Class) and 2.42% (Administrative and Investor Classes) for the six months ended April 30, 2015. Underlying fund investments in U.S. stocks, international equities, and bonds all made positive contributions to Fund performance.
U.S. stock markets were a key source of returns for the Fund, as all U.S. equity funds in the portfolio generated positive results. (All underlying fund returns cited are for the fund’s Institutional Class shares.) Harbor Small Cap Growth Fund returned 10.39%, the highest absolute return among all funds in the portfolio. It outperformed its benchmark, the Russell 2000® Growth Index, by 314 basis points, or 3.14 percentage points. Harbor Small Cap Value Fund returned 3.94%, outperforming its Russell 2000® Value Index benchmark by 189 basis points. Among funds focused primarily on larger U.S. companies, Harbor Capital Appreciation Fund returned 7.47%, beating its Russell 1000® Growth Index benchmark by 93 basis points, while Harbor Large Cap Value Fund returned 6.99%, ahead of its benchmark, the Russell 1000® Value Index, by 410 basis points. Harbor Mid Cap Growth Fund returned 7.06%, lagging its benchmark, the Russell Midcap® Growth Index, by 71 basis points, while Harbor Mid Cap Value Fund returned 4.87%, outperforming its Russell Midcap® Value Index benchmark by 104 basis points.
A rebound in international stocks, which had lagged behind U.S. equities in the prior fiscal year, also boosted Fund performance in the first half of fiscal 2015. Harbor International Fund returned 7.69%, outperforming its MSCI EAFE (ND) Index benchmark by 88 basis points. Harbor International Growth Fund returned 7.75%,
5
Harbor Target Retirement Income Fund
MANAGERS’ COMMENTARY—Continued
beating its MSCI All Country World Ex. US (ND) Index benchmark by 219 basis points. Harbor Global Growth Fund returned 3.92%, trailing its benchmark, the MSCI All Country World (ND) Index, by 105 basis points.
Fixed income funds in the portfolio all recorded positive results. Harbor Bond Fund posted a return of 2.17%, beating its Barclays U.S. Aggregate Bond Index benchmark by 11 basis points, while Harbor Unconstrained Bond Fund returned 0.31%, trailing the same index by 175 points. Harbor High-Yield Bond Fund returned 2.40%, outpacing its BofA Merrill Lynch U.S. Non-Distressed High Yield Index benchmark by 48 basis points. Harbor Real Return Fund, which invests primarily in inflation-indexed bonds, returned 0.02%, underperforming its Barclays U.S. TIPS Index benchmark by 126 basis points. Harbor Money Market Fund returned 0.03%, beating its BofA Merrill Lynch 3-Month U.S. Treasury Bill Index benchmark by 2 basis points.
This report contains the current opinions of Harbor Capital Advisors, Inc. at the time of its publication and should not be considered as investment advice or a recommendation of any particular security, strategy or investment product. Such opinions are subject to change without notice and securities described herein may no longer be included in, or may at any time be removed from, the Fund’s portfolio. This report is distributed for informational purposes only. Information contained herein has been obtained from sources believed reliable, but not guaranteed.
The Fund invests in a variety of underlying Harbor funds that are subject to risks associated with their particular investment strategies. By investing in several underlying funds, the Fund has partial exposure to the risks of many different areas of the market. An investment in the Fund is not guaranteed. An investor may experience losses. There is no guarantee that the Fund will provide adequate income through retirement. For information on the different share classes and the risks associated with an investment in the Fund, please refer to the current prospectus.
6
Harbor Target Retirement Income Fund
FUND SUMMARY—April 30, 2015 (Unaudited)
| | | | |
INSTITUTIONAL CLASS |
| | | | |
| Fund # | | | | 2600 |
| | |
| Cusip | | | | 411511371 |
| | |
| Ticker | | | | HARAX |
| | |
| Inception Date | | | | 01/02/2009 |
| | |
| Net Expense Ratio | | | | 0.61%a |
| | |
| Total Net Assets (000s) | | | | $17,075 |
| | | | |
ADMINISTRATIVE CLASS |
| | | | |
| Fund # | | | | 2700 |
| | |
| Cusip | | | | 411511363 |
| | |
| Ticker | | | | HARBX |
| | |
| Inception Date | | | | 01/02/2009 |
| | |
| Net Expense Ratio | | | | 0.61%a |
| | |
| Total Net Assets (000s) | | | | $15 |
| | | | |
INVESTOR CLASS |
| | | | |
| Fund # | | | | 2800 |
| | |
| Cusip | | | | 411511355 |
| | |
| Ticker | | | | HARCX |
| | |
| Inception Date | | | | 01/02/2009 |
| | |
| Net Expense Ratio | | | | 0.61%a |
| | |
| Total Net Assets (000s) | | | | $16 |
| a | Annualized. The Adviser has contractually agreed to limit the Fund’s operating expense to: (i) the amount of the acquired funds’ fees and expenses; (ii) compensation of the Independent Trustees; (iii) certain other expenses such as extraordinary items; and (iv) (a) for the Administrative and Investor Classes, distribution and service (12b-1) fees and (b) for the Investor Class, certain transfer agent fees. The net expense ratio shown will not correlate to the expense ratio shown in the Financial Highlights table because that ratio does not include the acquired funds’ fees and expenses. |
ASSET ALLOCATION (% of Investments)
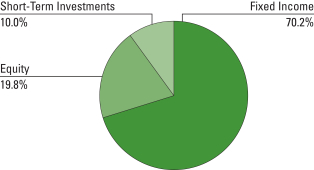
| | | | |
| |
Equity | | | | |
| |
Harbor International Fund | | | 4.4% | |
| |
Harbor International Growth Fund | | | 3.1% | |
| |
Harbor Large Cap Value Fund | | | 3.0% | |
| |
Harbor Capital Appreciation Fund | | | 2.5% | |
| |
Harbor Mid Cap Value Fund | | | 1.9% | |
| |
Harbor Small Cap Value Fund | | | 1.4% | |
| |
Harbor Mid Cap Growth Fund | | | 1.3% | |
| |
Harbor Global Growth Fund | | | 1.1% | |
| |
Harbor Small Cap Growth Fund | | | 1.1% | |
Fixed Income | | | | |
| |
Harbor Bond Fund | | | 37.3% | |
| |
Harbor Real Return Fund | | | 15.6% | |
| |
Harbor High-Yield Bond Fund | | | 11.1% | |
| |
Harbor Unconstrained Bond Fund | | | 6.2% | |
| |
Short-Term Investments | | | | |
| |
Harbor Money Market Fund | | | 10.0% | |
7
Harbor Target Retirement Income Fund
FUND PERFORMANCE SUMMARY (Unaudited)
Institutional Class
CHANGE IN A $50,000 INVESTMENT
For the period 01/02/2009 through 04/30/2015
| | |
The graph compares a $50,000 investment in the Fund with the performance of broad based market indices. The Fund’s performance includes the reinvestment of all dividend and capital gain distributions. | | 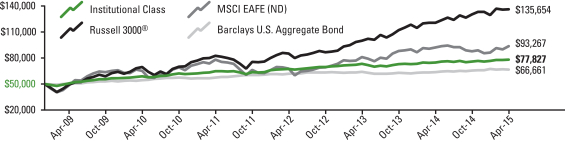 |
| | | | | | | | | | | | | | | | | | | | | | | | | | | | | | | | |
Total Returns For the periods ended 04/30/2015 | |  | |
| Harbor Target Retirement Income Fund | | | | | | | | | | | | | | | | | | | | | | | | | | | | | | | | |
Institutional Class | | | 2.53% | | | | | | 4.33% | | | | | | 5.76% | | | | | | 7.24% | | | | | 01/02/2009 | | | | $ | 77,827 | |
| Comparative Indices | | | | | | | | | | | | | | | | | | | | | | | | | | | | | | | | |
Russell 3000® | | | 4.74% | | | | | | 12.74% | | | | | | 14.33% | | | | | | 17.09% | | | | | — | | | | $ | 135,654 | |
MSCI EAFE (ND) | | | 6.81% | | | | | | 1.66% | | | | | | 7.40% | | | | | | 10.36% | | | | | — | | | | $ | 93,267 | |
Barclays U.S. Aggregate Bond | | | 2.06% | | | | | | 4.46% | | | | | | 4.12% | | | | | | 4.65% | | | | | — | | | | $ | 66,661 | |
Administrative and Investor Classes
CHANGE IN A $10,000 INVESTMENT
For the period 01/02/2009 through 04/30/2015
| | |
The graph compares a $10,000 investment in the Fund with the performance of broad based market indices. The Fund’s performance includes the reinvestment of all dividend and capital gain distributions. | | 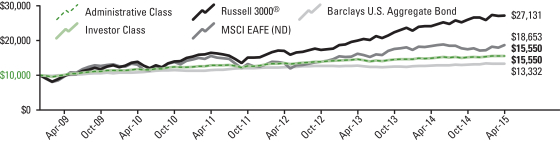 |
| | | | | | | | | | | | | | | | | | | | | | | | | | | | | | | | |
Total Returns For the periods ended 04/30/2015 | |  | |
| Harbor Target Retirement Income Fund | | | | | | | | | | | | | | | | | | | | | | | | | | | | | | | | |
Administrative Class | | | 2.42% | | | | | | 4.22% | | | | | | 5.75% | | | | | | 7.23% | | | | | 01/02/2009 | | | | $ | 15,550 | |
Investor Class | | | 2.42% | | | | | | 4.22% | | | | | | 5.75% | | | | | | 7.23% | | | | | 01/02/2009 | | | | $ | 15,550 | |
| Comparative Indices | | | | | | | | | | | | | | | | | | | | | | | | | | | | | | | | |
Russell 3000® | | | 4.74% | | | | | | 12.74% | | | | | | 14.33% | | | | | | 17.09% | | | | | — | | | | $ | 27,131 | |
MSCI EAFE (ND) | | | 6.81% | | | | | | 1.66% | | | | | | 7.40% | | | | | | 10.36% | | | | | — | | | | $ | 18,653 | |
Barclays U.S. Aggregate Bond | | | 2.06% | | | | | | 4.46% | | | | | | 4.12% | | | | | | 4.65% | | | | | — | | | | $ | 13,332 | |
As stated in the Fund’s current prospectus, the expense ratios were 0.63% (Institutional Class), 0.88% (Administrative Class) and 1.00% (Investor Class). The Adviser has contractually agreed to limit the Fund’s operating expenses to: (i) the amount of the acquired funds’ fees and expenses; (ii) compensation of the Independent Trustees; (iii) certain other expenses such as extraordinary items; and (iv) (a) for the Administrative and Investor Classes, distribution and service (12b-1) fees and (b) for the Investor Class, certain transfer agent fees. The expense ratios in the prospectus may differ from the actual expense ratios for the period disclosed within this report. The expense ratios shown in the prospectus are based on the prior fiscal year, adjusted to reflect changes, if any, in contractual arrangements that occurred prior to the date of the prospectus.
Performance data shown represents past performance, which is no guarantee of future results. Current performance may be higher or lower than the past performance data shown. Investment returns and the value of an investment will fluctuate, and an investor’s shares, when sold, may be worth more or less than their original cost. You can obtain performance data current to the most recent month-end (available within seven business days after the most recent month-end) by calling 800-422-1050 or visiting harborfunds.com.
The returns shown do not reflect the deduction of taxes that a shareholder would pay on Fund distributions or on the redemption of Fund shares. From time to time, certain fees and/or expenses have been waived or reimbursed, which has resulted in higher returns. Without these waivers and reimbursements, the returns would have been lower. Voluntary waivers and reimbursements may be discontinued at any time without notice.
8
Harbor Target Retirement Income Fund†
PORTFOLIO OF INVESTMENTS—April 30, 2015 (Unaudited)
| | | | | | | | |
HARBOR EQUITY FUNDS—19.8% | |
| | |
| Shares | | | | | Value
(000s) | |
| | | | | | | | |
| | HARBOR DOMESTIC EQUITY FUNDS—11.2% | | | | |
| | 6,853 | | | Harbor Capital Appreciation Fund | | $ | 428 | |
| | 21,261 | | | Harbor Mid Cap Growth Fund | | | 219 | |
| | 13,214 | | | Harbor Small Cap Growth Fund | | | 193 | |
| | 42,063 | | | Harbor Large Cap Value Fund | | | 513 | |
| | 15,693 | | | Harbor Mid Cap Value Fund | | | 329 | |
| | 8,782 | | | Harbor Small Cap Value Fund | | | 239 | |
| | | | | | | | |
| | | | | | | 1,921 | |
| | | | | | | | |
| | HARBOR INTERNATIONAL EQUITY FUNDS—8.6% | | | | |
| | 10,563 | | | Harbor International Fund | | | 758 | |
| | 38,749 | | | Harbor International Growth Fund | | | 525 | |
| | 8,136 | | | Harbor Global Growth Fund | | | 179 | |
| | | | | | | | |
| | | | | | | 1,462 | |
| | | | | | | | |
| TOTAL HARBOR EQUITY FUNDS
(Cost $2,936) | | | 3,383 | |
| | | | | | | | |
| | | | | | | | |
| | 102,500 | | | Harbor Unconstrained Bond Fund | | | 1,065 | |
| | 178,369 | | | Harbor High-Yield Bond Fund | | | 1,889 | |
| | 521,702 | | | Harbor Bond Fund | | | 6,385 | |
| | 280,328 | | | Harbor Real Return Fund | | | 2,666 | |
| | | | | | | | |
| TOTAL HARBOR FIXED INCOME FUNDS
(Cost $12,400) | | | 12,005 | |
| | | | | | | | |
| | | | | | | | |
SHORT-TERM INVESTMENTS—10.0% | |
| (Cost $1,718) | | | | |
| | 1,717,762 | | | Harbor Money Market Fund | | | 1,718 | |
| | | | | | | | |
| TOTAL INVESTMENTS—100.0%
(Cost $17,054) | | | 17,106 | |
| | | | | | | | |
| | CASH AND OTHER ASSETS, LESS LIABILITIES—0.0% | | | — | a |
| | | | | | | | |
| | TOTAL NET ASSETS—100.0% | | $ | 17,106 | |
| | | | | | | | |
FAIR VALUE MEASUREMENTS
All holdings at April 30, 2015 (as disclosed in the preceding Portfolio of Investments) are classified as Level 1. There were no Level 3 holdings at October 31, 2014 or April 30, 2015, and no transfers between levels during the period.
For more information on valuation inputs and their aggregation into the levels identified above, please refer to the Fair Value Measurements and Disclosures in Note 2 of the accompanying Notes to Financial Statements.
| † | The Harbor Target Retirement Income Fund is investing in Institutional Class shares of affiliated Harbor Funds. |
| a | Rounds to less than $1,000. |
The accompanying notes are an integral part of the Financial Statements.
9
Harbor Target Retirement 2015 Fund
MANAGERS’ COMMENTARY (Unaudited)
ADVISER
Harbor Capital Advisors, Inc.
111 South Wacker Drive
34th Floor
Chicago, IL 60606
PORTFOLIO MANAGERS
Brian L. Collins, CFA
Since 2009
Paul C. Herbert, CFA
Since 2009
Linda M. Molenda
Since 2009
David G. Van Hooser
Since 2009
Harbor Capital has
managed the Fund since its inception in 2009.
INVESTMENT OBJECTIVE
The Fund seeks capital appreciation and current income consistent with the Fund’s current asset allocation.
MARKET REVIEW
U.S. and international equity markets finished higher for the six months ended April 30, 2015. Fixed income investments recorded positive returns, while commodity prices posted a sharp decline.
U.S. equities returned 4.74% for the first half of fiscal 2015, as measured by the Russell 3000® Index. Growth stocks set the pace, with the Russell 3000® Growth Index posting a return of 6.59%, compared to 2.82% by the Russell 3000® Value Index. Mid cap stocks modestly outperformed both large caps and small caps. The S&P 500 Index returned 4.40%, with 8 of its 10 economic sectors posting positive returns. The Consumer Discretionary, Health Care, and Information Technology sectors were the best-performing areas of the index, while the Energy and Utilities sectors had negative returns.
International stocks, as measured by the MSCI EAFE (ND) Index, returned 6.81%, modestly outperforming U.S. equities. (All international and global returns are in U.S. dollars.) The index is a measure of stocks in developed markets outside the U.S. Eight of the 10 sectors within the index had positive returns, led by Consumer Discretionary, Information Technology, and Health Care stocks. Energy and Utilities were the only sectors to lose ground. Shares of companies based in developing economies also advanced, with the MSCI Emerging Markets (ND) Index registering a return of 3.92%.
Among fixed income investments, the broad U.S. investment-grade bond market returned 2.06%, as measured by the Barclays U.S. Aggregate Bond Index. Speculative-grade bonds, as measured by the BofA Merrill Lynch U.S. High-Yield Index, returned 1.51%. Inflation-linked bonds returned 1.28%, as measured by the Barclays U.S. TIPS Index, while the BofA Merrill Lynch 3-month U.S. Treasury Bill Index, a benchmark for money market returns, posted a return of 0.01%.
Following a decline over the prior 12 months, commodity prices fell further in the first half of fiscal 2015. The Bloomberg Commodity Index Total ReturnSM, an unmanaged index of futures contracts on a diversified group of physical commodities, returned -11.87%.
PERFORMANCE
Harbor Target Retirement 2015 Fund returned 2.64% (Institutional and Investor Classes) and 2.56% (Administrative Class) for the six months ended April 30, 2015. Underlying fund investments in U.S. stocks, international equities, and bonds all made positive contributions to Fund performance, while commodities lost ground.
U.S. stock markets were a key source of returns for the Fund, as all U.S. equity funds in the portfolio generated positive results. (All underlying fund returns cited are for the fund’s Institutional Class shares.) Harbor Small Cap Growth Fund returned 10.39%, the highest absolute return among all funds in the portfolio. It outperformed its benchmark, the Russell 2000® Growth Index, by 314 basis points, or 3.14 percentage points. Harbor Small Cap Value Fund returned 3.94%, outperforming its Russell 2000® Value Index benchmark by 189 basis points. Among funds focused primarily on larger U.S. companies, Harbor Capital Appreciation Fund returned 7.47%, beating its Russell 1000® Growth Index benchmark by 93 basis points, while Harbor Large Cap Value Fund returned 6.99%, ahead of its benchmark, the Russell 1000® Value Index, by 410 basis points. Harbor Mid Cap Growth Fund returned 7.06%, lagging its benchmark, the Russell Midcap® Growth Index, by 71 basis points, while Harbor Mid Cap Value Fund returned 4.87%, outperforming its Russell Midcap® Value Index benchmark by 104 basis points.
A rebound in international stocks, which had lagged behind U.S. equities in the prior fiscal year, also boosted Fund performance in the first half of fiscal 2015. Harbor International Fund returned 7.69%, outperforming its MSCI EAFE (ND) Index
10
Harbor Target Retirement 2015 Fund
MANAGERS’ COMMENTARY—Continued
benchmark by 88 basis points. Harbor International Growth Fund returned 7.75%, beating its MSCI All Country World Ex. US (ND) Index benchmark by 219 basis points. Harbor Global Growth Fund returned 3.92%, trailing its benchmark, the MSCI All Country World (ND) Index, by 105 basis points.
Fixed income funds in the portfolio all recorded positive results. Harbor Bond Fund posted a return of 2.17%, beating its Barclays U.S. Aggregate Bond Index benchmark by 11 basis points, while Harbor Unconstrained Bond Fund returned 0.31%, trailing the same index by 175 points. Harbor High-Yield Bond Fund returned 2.40%, outpacing its BofA Merrill Lynch U.S. Non-Distressed High Yield Index benchmark by 48 basis points. Harbor Real Return Fund, which invests primarily in inflation-indexed bonds, returned 0.02%, underperforming its Barclays U.S. TIPS Index benchmark by 126 basis points. Harbor Money Market Fund returned 0.03%, beating its BofA Merrill Lynch 3-Month U.S. Treasury Bill Index benchmark by 2 basis points.
Harbor Commodity Real Return Strategy Fund was the only area of the portfolio to finish in negative territory, posting a return of -13.07%. The Fund invests in commodity-linked derivative instruments backed by a portfolio of inflation-indexed bonds and other fixed income securities. The Fund trailed its Bloomberg Commodity Index Total ReturnSM benchmark by 120 basis points.
This report contains the current opinions of Harbor Capital Advisors, Inc. at the time of its publication and should not be considered as investment advice or a recommendation of any particular security, strategy or investment product. Such opinions are subject to change without notice and securities described herein may no longer be included in, or may at any time be removed from, the Fund’s portfolio. This report is distributed for informational purposes only. Information contained herein has been obtained from sources believed reliable, but not guaranteed.
The Fund invests in a variety of underlying Harbor funds that are subject to risks associated with their particular investment strategies. By investing in several underlying funds, the Fund has partial exposure to the risks of many different areas of the market. An investment in the Fund is not guaranteed. An investor may experience losses, including losses near, at, or after the target year. There is no guarantee that the Fund will provide adequate income at or after the target year. For information on the different share classes and the risks associated with an investment in the Fund, please refer to the current prospectus.
11
Harbor Target Retirement 2015 Fund
FUND SUMMARY—April 30, 2015 (Unaudited)
| | | | |
INSTITUTIONAL CLASS |
| | | | |
| Fund # | | | | 2602 |
| | |
| Cusip | | | | 411511314 |
| | |
| Ticker | | | | HARGX |
| | |
Inception
Date | | | | 01/02/2009 |
| | |
Net Expense Ratio | | | | 0.64%a |
| | |
Total Net Assets (000s) | | | | $10,600 |
| | | | |
ADMINISTRATIVE CLASS |
| | | | |
| Fund # | | | | 2702 |
| | |
| Cusip | | | | 411511298 |
| | |
| Ticker | | | | HARHX |
| | |
Inception
Date | | | | 01/02/2009 |
| | |
Net Expense Ratio | | | | 0.64%a |
| | |
Total Net Assets (000s) | | | | $17 |
| | | | |
INVESTOR CLASS |
| | | | |
| Fund # | | | | 2802 |
| | |
| Cusip | | | | 411511280 |
| | |
| Ticker | | | | HARIX |
| | |
| Inception Date | | | | 01/02/2009 |
| | |
Net Expense Ratio | | | | 0.64%a |
| | |
Total Net Assets (000s) | | | | $17 |
| a | Annualized. The Adviser has contractually agreed to limit the Fund’s operating expense to: (i) the amount of the acquired funds’ fees and expenses; (ii) compensation of the Independent Trustees; (iii) certain other expenses such as extraordinary items; and (iv) (a) for the Administrative and Investor Classes, distribution and service (12b-1) fees and (b) for the Investor Class, certain transfer agent fees. The net expense ratio shown will not correlate to the expense ratio shown in the Financial Highlights table because that ratio does not include the acquired funds’ fees and expenses. |
ASSET ALLOCATION (% of Investments)
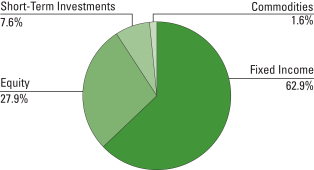
| | | | |
| |
Equity | | | | |
| |
Harbor International Fund | | | 6.3% | |
| |
Harbor International Growth Fund | | | 4.3% | |
| |
Harbor Large Cap Value Fund | | | 4.2% | |
| |
Harbor Capital Appreciation Fund | | | 3.5% | |
| |
Harbor Mid Cap Value Fund | | | 2.7% | |
| |
Harbor Small Cap Value Fund | | | 2.0% | |
| |
Harbor Mid Cap Growth Fund | | | 1.8% | |
| |
Harbor Small Cap Growth Fund | | | 1.6% | |
| |
Harbor Global Growth Fund | | | 1.5% | |
Commodities | | | | |
| |
Harbor Commodity Real Return Strategy Fund | | | 1.6% | |
| |
Fixed Income | | | | |
| |
Harbor Bond Fund | | | 32.7% | |
| |
Harbor High-Yield Bond Fund | | | 12.5% | |
| |
Harbor Real Return Fund | | | 11.5% | |
| |
Harbor Unconstrained Bond Fund | | | 6.2% | |
| |
Short-Term Investments | | | | |
| |
Harbor Money Market Fund | | | 7.6% | |
12
Harbor Target Retirement 2015 Fund
FUND PERFORMANCE SUMMARY (Unaudited)
Institutional Class
CHANGE IN A $50,000 INVESTMENT
For the period 01/02/2009 through 04/30/2015
| | |
The graph compares a $50,000 investment in the Fund with the performance of broad based market indices. The Fund’s performance includes the reinvestment of all dividend and capital gain distributions. | | 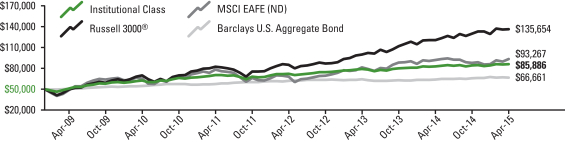 |
| | | | | | | | | | | | | | | | | | | | | | | | | | | | | | | | |
Total Returns For the periods ended 04/30/2015 | | | |
| Harbor Target Retirement 2015 Fund | | | | | | | | | | | | | | | | | | | | | | | | | | | | | | | | |
Institutional Class | | | 2.64% | | | | | | 4.16% | | | | | | 6.66% | | | | | | 8.93% | | | | | 01/02/2009 | | | | $ | 85,886 | |
| Comparative Indices | | | | | | | | | | | | | | | | | | | | | | | | | | | | | | | | |
Russell 3000® | | | 4.74% | | | | | | 12.74% | | | | | | 14.33% | | | | | | 17.09% | | | | | — | | | | $ | 135,654 | |
MSCI EAFE (ND) | | | 6.81% | | | | | | 1.66% | | | | | | 7.40% | | | | | | 10.36% | | | | | — | | | | $ | 93,267 | |
Barclays U.S. Aggregate Bond | | | 2.06% | | | | | | 4.46% | | | | | | 4.12% | | | | | | 4.65% | | | | | — | | | | $ | 66,661 | |
Administrative and Investor Classes
CHANGE IN A $10,000 INVESTMENT
For the period 01/02/2009 through 04/30/2015
| | |
The graph compares a $10,000 investment in the Fund with the performance of broad based market indices. The Fund’s performance includes the reinvestment of all dividend and capital gain distributions. | | 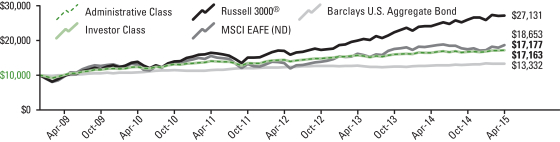 |
| | | | | | | | | | | | | | | | | | | | | | | | | | | | | | | | |
Total Returns For the periods ended 04/30/2015 | | | |
| Harbor Target Retirement 2015 Fund | | | | | | | | | | | | | | | | | | | | | | | | | | | | | | | | |
Administrative Class | | | 2.56% | | | | | | 4.07% | | | | | | 6.64% | | | | | | 8.91% | | | | | 01/02/2009 | | | | $ | 17,163 | |
Investor Class | | | 2.64% | | | | | | 4.16% | | | | | | 6.66% | | | | | | 8.93% | | | | | 01/02/2009 | | | | $ | 17,177 | |
| Comparative Indices | | | | | | | | | | | | | | | | | | | | | | | | | | | | | | | | |
Russell 3000® | | | 4.74% | | | | | | 12.74% | | | | | | 14.33% | | | | | | 17.09% | | | | | — | | | | $ | 27,131 | |
MSCI EAFE (ND) | | | 6.81% | | | | | | 1.66% | | | | | | 7.40% | | | | | | 10.36% | | | | | — | | | | $ | 18,653 | |
Barclays U.S. Aggregate Bond | | | 2.06% | | | | | | 4.46% | | | | | | 4.12% | | | | | | 4.65% | | | | | — | | | | $ | 13,332 | |
As stated in the Fund’s current prospectus, the expense ratios were 0.65% (Institutional Class), 0.90% (Administrative Class) and 1.02% (Investor Class). The Adviser has contractually agreed to limit the Fund’s operating expenses to: (i) the amount of the acquired funds’ fees and expenses; (ii) compensation of the Independent Trustees; (iii) certain other expenses such as extraordinary items; and (iv) (a) for the Administrative and Investor Classes, distribution and service (12b-1) fees and (b) for the Investor Class, certain transfer agent fees. The expense ratios in the prospectus may differ from the actual expense ratios for the period disclosed within this report. The expense ratios shown in the prospectus are based on the prior fiscal year, adjusted to reflect changes, if any, in contractual arrangements that occurred prior to the date of the prospectus.
Performance data shown represents past performance, which is no guarantee of future results. Current performance may be higher or lower than the past performance data shown. Investment returns and the value of an investment will fluctuate, and an investor’s shares, when sold, may be worth more or less than their original cost. You can obtain performance data current to the most recent month-end (available within seven business days after the most recent month-end) by calling 800-422-1050 or visiting harborfunds.com.
The returns shown do not reflect the deduction of taxes that a shareholder would pay on Fund distributions or on the redemption of Fund shares. From time to time, certain fees and/or expenses have been waived or reimbursed, which has resulted in higher returns. Without these waivers and reimbursements, the returns would have been lower. Voluntary waivers and reimbursements may be discontinued at any time without notice.
13
Harbor Target Retirement 2015 Fund†
PORTFOLIO OF INVESTMENTS—April 30, 2015 (Unaudited)
| | | | | | | | |
HARBOR EQUITY FUNDS—27.9% | |
| | |
| Shares | | | | | Value
(000s) | |
| | | | | | | | |
| | HARBOR DOMESTIC EQUITY FUNDS—15.8% | |
| | 5,989 | | | Harbor Capital Appreciation Fund | | $ | 375 | |
| | 18,573 | | | Harbor Mid Cap Growth Fund | | | 191 | |
| | 11,495 | | | Harbor Small Cap Growth Fund | | | 168 | |
| | 36,852 | | | Harbor Large Cap Value Fund | | | 449 | |
| | 13,602 | | | Harbor Mid Cap Value Fund | | | 285 | |
| | 7,602 | | | Harbor Small Cap Value Fund | | | 207 | |
| | | | | | | | |
| | | | | | | 1,675 | |
| | | | | | | | |
| | HARBOR INTERNATIONAL EQUITY FUNDS—12.1% | |
| | 9,331 | | | Harbor International Fund | | | 670 | |
| | 34,078 | | | Harbor International Growth Fund | | | 461 | |
| | 7,090 | | | Harbor Global Growth Fund | | | 156 | |
| | | | | | | | |
| | | | | | | 1,287 | |
| | | | | | | | |
| TOTAL HARBOR EQUITY FUNDS
(Cost $2,768) | | | 2,962 | |
| | | | | | | | |
| | | | | | | | |
HARBOR COMMODITY FUNDS—1.6% | |
| (Cost $212) | | | | |
| | 37,683 | | | Harbor Commodity Real Return Strategy Fund | | | 175 | |
| | | | | | | | |
HARBOR FIXED INCOME FUNDS—62.9% | |
| | |
| Shares | | | | | Value
(000s) | |
| | | | | | | | |
| | 63,765 | | | Harbor Unconstrained Bond Fund | | | 663 | |
| | 125,063 | | | Harbor High-Yield Bond Fund | | | 1,324 | |
| | 284,371 | | | Harbor Bond Fund | | | 3,481 | |
| | 127,881 | | | Harbor Real Return Fund | | | 1,216 | |
| | | | | | | | |
| TOTAL HARBOR FIXED INCOME FUNDS
(Cost $6,863) | | | 6,684 | |
| | | | | | | | |
| | | | | | | | |
SHORT-TERM INVESTMENTS—7.6% | |
| (Cost $813) | | | | |
| | 813,136 | | | Harbor Money Market Fund | | | 813 | |
| | | | | | | | |
| TOTAL INVESTMENTS—100.0%
(Cost $10,656) | | | 10,634 | |
| | | | | | | | |
| | CASH AND OTHER ASSETS, LESS LIABILITIES—0.0% | | | — | a |
| | | | | | | | |
| | TOTAL NET ASSETS—100.0% | | $ | 10,634 | |
| | | | | | | | |
FAIR VALUE MEASUREMENTS
All holdings at April 30, 2015 (as disclosed in the preceding Portfolio of Investments) are classified as Level 1. There were no Level 3 holdings at October 31, 2014 or April 30, 2015, and no transfers between levels during the period.
For more information on valuation inputs and their aggregation into the levels identified above, please refer to the Fair Value Measurements and Disclosures in Note 2 of the accompanying Notes to Financial Statements.
| † | The Harbor Target Retirement 2015 Fund is investing in Institutional Class shares of affiliated Harbor Funds. |
| a | Rounds to less than $1,000. |
The accompanying notes are an integral part of the Financial Statements.
14
Harbor Target Retirement 2020 Fund
MANAGERS’ COMMENTARY (Unaudited)
ADVISER
Harbor Capital Advisors, Inc.
111 South Wacker Drive
34th Floor
Chicago, IL 60606
PORTFOLIO MANAGERS
Brian L. Collins, CFA
Since 2009
Paul C. Herbert, CFA
Since 2009
Linda M. Molenda
Since 2009
David G. Van Hooser
Since 2009
Harbor Capital has
managed the Fund since its inception in 2009.
INVESTMENT OBJECTIVE
The Fund seeks capital appreciation and current income consistent with the Fund’s current asset allocation.
MARKET REVIEW
U.S. and international equity markets finished higher for the six months ended April 30, 2015. Fixed income investments recorded positive returns, while commodity prices posted a sharp decline.
U.S. equities returned 4.74% for the first half of fiscal 2015, as measured by the Russell 3000® Index. Growth stocks set the pace, with the Russell 3000® Growth Index posting a return of 6.59%, compared to 2.82% by the Russell 3000® Value Index. Mid cap stocks modestly outperformed both large caps and small caps. The S&P 500 Index returned 4.40%, with 8 of its 10 economic sectors posting positive returns. The Consumer Discretionary, Health Care, and Information Technology sectors were the best-performing areas of the index, while the Energy and Utilities sectors had negative returns.
International stocks, as measured by the MSCI EAFE (ND) Index, returned 6.81%, modestly outperforming U.S. equities. (All international and global returns are in U.S. dollars.) The index is a measure of stocks in developed markets outside the U.S. Eight of the 10 sectors within the index had positive returns, led by Consumer Discretionary, Information Technology, and Health Care stocks. Energy and Utilities were the only sectors to lose ground. Shares of companies based in developing economies also advanced, with the MSCI Emerging Markets (ND) Index registering a return of 3.92%.
Among fixed income investments, the broad U.S. investment-grade bond market returned 2.06%, as measured by the Barclays U.S. Aggregate Bond Index. Speculative-grade bonds, as measured by the BofA Merrill Lynch U.S. High-Yield Index, returned 1.51%. Inflation-linked bonds returned 1.28%, as measured by the Barclays U.S. TIPS Index, while the BofA Merrill Lynch 3-month U.S. Treasury Bill Index, a benchmark for money market returns, posted a return of 0.01%.
Following a decline over the prior 12 months, commodity prices fell further in the first half of fiscal 2015. The Bloomberg Commodity Index Total ReturnSM, an unmanaged index of futures contracts on a diversified group of physical commodities, returned -11.87%.
PERFORMANCE
Harbor Target Retirement 2020 Fund returned 3.22% (Institutional, Administrative and Investor Classes) for the six months ended April 30, 2015. Underlying fund investments in U.S. stocks, international equities, and bonds all made positive contributions to Fund performance, while commodities lost ground.
U.S. stock markets were a key source of returns for the Fund, as all U.S. equity funds in the portfolio generated positive results. (All underlying fund returns cited are for the fund’s Institutional Class shares.) Harbor Small Cap Growth Fund returned 10.39%, the highest absolute return among all funds in the portfolio. It outperformed its benchmark, the Russell 2000® Growth Index, by 314 basis points, or 3.14 percentage points. Harbor Small Cap Value Fund returned 3.94%, outperforming its Russell 2000® Value Index benchmark by 189 basis points. Among funds focused primarily on larger U.S. companies, Harbor Capital Appreciation Fund returned 7.47%, beating its Russell 1000® Growth Index benchmark by 93 basis points, while Harbor Large Cap Value Fund returned 6.99%, ahead of its benchmark, the Russell 1000® Value Index, by 410 basis points. Harbor Mid Cap Growth Fund returned 7.06%, lagging its benchmark, the Russell Midcap® Growth Index, by 71 basis points, while Harbor Mid Cap Value Fund returned 4.87%, outperforming its Russell Midcap® Value Index benchmark by 104 basis points.
A rebound in international stocks, which had lagged behind U.S. equities in the prior fiscal year, also boosted Fund performance in the first half of fiscal 2015. Harbor International Fund returned 7.69%, outperforming its MSCI EAFE (ND) Index
15
Harbor Target Retirement 2020 Fund
MANAGERS’ COMMENTARY—Continued
benchmark by 88 basis points. Harbor International Growth Fund returned 7.75%, beating its MSCI All Country World Ex. US (ND) Index benchmark by 219 basis points. Harbor Global Growth Fund returned 3.92%, trailing its benchmark, the MSCI All Country World (ND) Index, by 105 basis points.
Fixed income funds in the portfolio all recorded positive results. Harbor Bond Fund posted a return of 2.17%, beating its Barclays U.S. Aggregate Bond Index benchmark by 11 basis points, while Harbor Unconstrained Bond Fund returned 0.31%, trailing the same index by 175 points. Harbor High-Yield Bond Fund returned 2.40%, outpacing its BofA Merrill Lynch U.S. Non-Distressed High Yield Index benchmark by 48 basis points. Harbor Convertible Securities Fund returned 3.03%, lagging its BofA Merrill Lynch All U.S. Convertibles Ex Mandatory Index benchmark by 61 basis points. Harbor Real Return Fund, which invests primarily in inflation-indexed bonds, returned 0.02%, underperforming its Barclays U.S. TIPS Index benchmark by 126 basis points. Harbor Money Market Fund returned 0.03%, beating its BofA Merrill Lynch 3-Month U.S. Treasury Bill Index benchmark by 2 basis points.
Harbor Commodity Real Return Strategy Fund was the only area of the portfolio to finish in negative territory, posting a return of -13.07%. The Fund invests in commodity-linked derivative instruments backed by a portfolio of inflation-indexed bonds and other fixed income securities. The Fund trailed its Bloomberg Commodity Index Total ReturnSM benchmark by 120 basis points.
This report contains the current opinions of Harbor Capital Advisors, Inc. at the time of its publication and should not be considered as investment advice or a recommendation of any particular security, strategy or investment product. Such opinions are subject to change without notice and securities described herein may no longer be included in, or may at any time be removed from, the Fund’s portfolio. This report is distributed for informational purposes only. Information contained herein has been obtained from sources believed reliable, but not guaranteed.
The Fund invests in a variety of underlying Harbor funds that are subject to risks associated with their particular investment strategies. By investing in several underlying funds, the Fund has partial exposure to the risks of many different areas of the market. An investment in the Fund is not guaranteed. An investor may experience losses, including losses near, at, or after the target year. There is no guarantee that the Fund will provide adequate income at or after the target year. For information on the different share classes and the risks associated with an investment in the Fund, please refer to the current prospectus.
16
Harbor Target Retirement 2020 Fund
FUND SUMMARY—April 30, 2015 (Unaudited)
| | | | |
INSTITUTIONAL CLASS |
| | | | |
| Fund # | | | | 2603 |
| | |
| Cusip | | | | 411511272 |
| | |
| Ticker | | | | HARJX |
| | |
| Inception Date | | | | 01/02/2009 |
| | |
| Net Expense Ratio | | | | 0.69%a |
| | |
| Total Net Assets (000s) | | | | $28,592 |
| | | | |
ADMINISTRATIVE CLASS |
| | | | |
| Fund # | | | | 2703 |
| | |
| Cusip | | | | 411511264 |
| | |
| Ticker | | | | HARKX |
| | |
| Inception Date | | | | 01/02/2009 |
| | |
| Net Expense Ratio | | | | 0.69%a |
| | |
| Total Net Assets (000s) | | | | $18 |
| | | | |
INVESTOR CLASS |
| | | | |
| Fund # | | | | 2803 |
| | |
| Cusip | | | | 411511256 |
| | |
| Ticker | | | | HARLX |
| | |
| Inception Date | | | | 01/02/2009 |
| | |
| Net Expense Ratio | | | | 0.69%a |
| | |
| Total Net Assets (000s) | | | | $18 |
| a | Annualized. The Adviser has contractually agreed to limit the Fund’s operating expense to: (i) the amount of the acquired funds’ fees and expenses; (ii) compensation of the Independent Trustees; (iii) certain other expenses such as extraordinary items; and (iv) (a) for the Administrative and Investor Classes, distribution and service (12b-1) fees and (b) for the Investor Class, certain transfer agent fees. The net expense ratio shown will not correlate to the expense ratio shown in the Financial Highlights table because that ratio does not include the acquired funds’ fees and expenses. |
ASSET ALLOCATION (% of Investments)
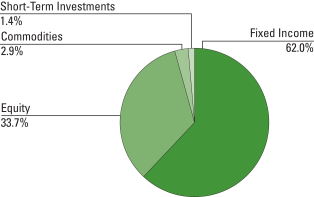
| | | | |
| |
Equity | | | | |
| |
Harbor International Fund | | | 7.6% | |
| |
Harbor International Growth Fund | | | 5.2% | |
| |
Harbor Large Cap Value Fund | | | 5.1% | |
| |
Harbor Capital Appreciation Fund | | | 4.2% | |
| |
Harbor Mid Cap Value Fund | | | 3.3% | |
| |
Harbor Small Cap Value Fund | | | 2.4% | |
| |
Harbor Mid Cap Growth Fund | | | 2.2% | |
| |
Harbor Small Cap Growth Fund | | | 1.9% | |
| |
Harbor Global Growth Fund | | | 1.8% | |
| | | | |
| |
Commodities | | | | |
| |
Harbor Commodity Real Return Strategy Fund | | | 2.9% | |
| |
Fixed Income | | | | |
| |
Harbor Bond Fund | | | 27.6% | |
| |
Harbor High-Yield Bond Fund | | | 15.2% | |
| |
Harbor Real Return Fund | | | 8.9% | |
| |
Harbor Unconstrained Bond Fund | | | 6.3% | |
| |
Harbor Convertible Securities Fund | | | 4.0% | |
| |
Short-Term Investments | | | | |
| |
Harbor Money Market Fund | | | 1.4% | |
17
Harbor Target Retirement 2020 Fund
FUND PERFORMANCE SUMMARY (Unaudited)
Institutional Class
CHANGE IN A $50,000 INVESTMENT
For the period 01/02/2009 through 04/30/2015
| | |
The graph compares a $50,000 investment in the Fund with the performance of broad based market indices. The Fund’s performance includes the reinvestment of all dividend and capital gain distributions. | | 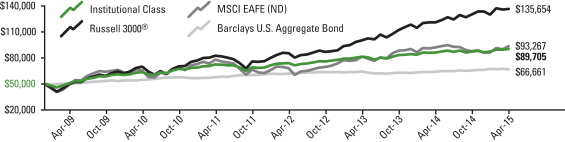 |
| | | | | | | | | | | | | | | | | | | | | | | | | | | | | | | | |
Total Returns For the periods ended 04/30/2015 | | | |
| Harbor Target Retirement 2020 Fund | | | | | | | | | | | | | | | | | | | | | | | | | | | | | | | | |
Institutional Class | | | 3.22% | | | | | | 4.60% | | | | | | 7.22% | | | | | | 9.68% | | | | | 01/02/2009 | | | | $ | 89,705 | |
| Comparative Indices | | | | | | | | | | | | | | | | | | | | | | | | | | | | | | | | |
Russell 3000® | | | 4.74% | | | | | | 12.74% | | | | | | 14.33% | | | | | | 17.09% | | | | | — | | | | $ | 135,654 | |
MSCI EAFE (ND) | | | 6.81% | | | | | | 1.66% | | | | | | 7.40% | | | | | | 10.36% | | | | | — | | | | $ | 93,267 | |
Barclays U.S. Aggregate Bond | | | 2.06% | | | | | | 4.46% | | | | | | 4.12% | | | | | | 4.65% | | | | | — | | | | $ | 66,661 | |
Administrative and Investor Classes
CHANGE IN A $10,000 INVESTMENT
For the period 01/02/2009 through 04/30/2015
| | |
The graph compares a $10,000 investment in the Fund with the performance of broad based market indices. The Fund’s performance includes the reinvestment of all dividend and capital gain distributions. | | 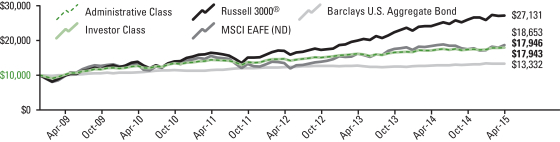 |
| | | | | | | | | | | | | | | | | | | | | | | | | | | | | | | | |
Total Returns For the periods ended 04/30/2015 | | | |
| Harbor Target Retirement 2020 Fund | | | | | | | | | | | | | | | | | | | | | | | | | | | | | | | | |
Administrative Class | | | 3.22% | | | | | | 4.70% | | | | | | 7.22% | | | | | | 9.68% | | | | | 01/02/2009 | | | | $ | 17,946 | |
Investor Class | | | 3.22% | | | | | | 4.70% | | | | | | 7.22% | | | | | | 9.68% | | | | | 01/02/2009 | | | | $ | 17,943 | |
| Comparative Indices | | | | | | | | | | | | | | | | | | | | | | | | | | | | | | | | |
Russell 3000® | | | 4.74% | | | | | | 12.74% | | | | | | 14.33% | | | | | | 17.09% | | | | | — | | | | $ | 27,131 | |
MSCI EAFE (ND) | | | 6.81% | | | | | | 1.66% | | | | | | 7.40% | | | | | | 10.36% | | | | | — | | | | $ | 18,653 | |
Barclays U.S. Aggregate Bond | | | 2.06% | | | | | | 4.46% | | | | | | 4.12% | | | | | | 4.65% | | | | | — | | | | $ | 13,332 | |
As stated in the Fund’s current prospectus, the expense ratios were 0.68% (Institutional Class), 0.93% (Administrative Class) and 1.05% (Investor Class). The Adviser has contractually agreed to limit the Fund’s operating expenses to: (i) the amount of the acquired funds’ fees and expenses; (ii) compensation of the Independent Trustees; (iii) certain other expenses such as extraordinary items; and (iv) (a) for the Administrative and Investor Classes, distribution and service (12b-1) fees and (b) for the Investor Class, certain transfer agent fees. The expense ratios in the prospectus may differ from the actual expense ratios for the period disclosed within this report. The expense ratios shown in the prospectus are based on the prior fiscal year, adjusted to reflect changes, if any, in contractual arrangements that occurred prior to the date of the prospectus.
Performance data shown represents past performance, which is no guarantee of future results. Current performance may be higher or lower than the past performance data shown. Investment returns and the value of an investment will fluctuate, and an investor’s shares, when sold, may be worth more or less than their original cost. You can obtain performance data current to the most recent month-end (available within seven business days after the most recent month-end) by calling 800-422-1050 or visiting harborfunds.com.
The returns shown do not reflect the deduction of taxes that a shareholder would pay on Fund distributions or on the redemption of Fund shares. From time to time, certain fees and/or expenses have been waived or reimbursed, which has resulted in higher returns. Without these waivers and reimbursements, the returns would have been lower. Voluntary waivers and reimbursements may be discontinued at any time without notice.
18
Harbor Target Retirement 2020 Fund†
PORTFOLIO OF INVESTMENTS—April 30, 2015 (Unaudited)
| | | | | | | | |
HARBOR EQUITY FUNDS—33.7% | |
| | |
| Shares | | | | | Value
(000s) | |
| | | | | | | | |
| | HARBOR DOMESTIC EQUITY FUNDS—19.1% | |
| | 19,479 | | | Harbor Capital Appreciation Fund | | $ | 1,218 | |
| | 60,384 | | | Harbor Mid Cap Growth Fund | | | 622 | |
| | 37,537 | | | Harbor Small Cap Growth Fund | | | 547 | |
| | 120,535 | | | Harbor Large Cap Value Fund | | | 1,469 | |
| | 44,557 | | | Harbor Mid Cap Value Fund | | | 935 | |
| | 24,930 | | | Harbor Small Cap Value Fund | | | 679 | |
| | | | | | | | |
| | | | | | | 5,470 | |
| | | | | | | | |
| | HARBOR INTERNATIONAL EQUITY FUNDS—14.6% | |
| | 30,348 | | | Harbor International Fund | | | 2,179 | |
| | 111,184 | | | Harbor International Growth Fund | | | 1,504 | |
| | 23,129 | | | Harbor Global Growth Fund | | | 509 | |
| | | | | | | | |
| | | | | | | 4,192 | |
| | | | | | | | |
| TOTAL HARBOR EQUITY FUNDS
(Cost $8,278) | | | 9,662 | |
| | | | | | | | |
| | | | | | | | |
HARBOR COMMODITY FUNDS—2.9% | |
| (Cost $1,061) | | | | |
| | 176,238 | | | Harbor Commodity Real Return Strategy Fund | | | 821 | |
| | | | | | | | |
HARBOR FIXED INCOME FUNDS—62.0% | |
| | |
| Shares | | | | | Value
(000s) | |
| | | | | | | | |
| | 172,225 | | | Harbor Unconstrained Bond Fund | | | 1,790 | |
| | 104,216 | | | Harbor Convertible Securities Fund | | | 1,140 | |
| | 412,263 | | | Harbor High-Yield Bond Fund | | | 4,366 | |
| | 645,059 | | | Harbor Bond Fund | | | 7,896 | |
| | 268,075 | | | Harbor Real Return Fund | | | 2,549 | |
| | | | | | | | |
| TOTAL HARBOR FIXED INCOME FUNDS
(Cost $18,205) | | | 17,741 | |
| | | | | | | | |
| | | | | | | | |
SHORT-TERM INVESTMENTS—1.4% | |
| (Cost $404) | | | | |
| | 403,942 | | | Harbor Money Market Fund | | | 404 | |
| | | | | | | | |
| TOTAL INVESTMENTS—100.0%
(Cost $27,948) | | | 28,628 | |
| | | | | | | | |
| | CASH AND OTHER ASSETS, LESS LIABILITIES—0.0% | | | — | a |
| | | | | | | | |
| | TOTAL NET ASSETS—100.0% | | $ | 28,628 | |
| | | | | | | | |
FAIR VALUE MEASUREMENTS
All holdings at April 30, 2015 (as disclosed in the preceding Portfolio of Investments) are classified as Level 1. There were no Level 3 holdings at October 31, 2014 or April 30, 2015, and no transfers between levels during the period.
For more information on valuation inputs and their aggregation into the levels identified above, please refer to the Fair Value Measurements and Disclosures in Note 2 of the accompanying Notes to Financial Statements.
| † | The Harbor Target Retirement 2020 Fund is investing in Institutional Class shares of affiliated Harbor Funds. |
| a | Rounds to less than $1,000. |
The accompanying notes are an integral part of the Financial Statements.
19
Harbor Target Retirement 2025 Fund
MANAGERS’ COMMENTARY (Unaudited)
ADVISER
Harbor Capital Advisors, Inc.
111 South Wacker Drive
34th Floor
Chicago, IL 60606
PORTFOLIO MANAGERS
Brian L. Collins, CFA
Since 2009
Paul C. Herbert, CFA
Since 2009
Linda M. Molenda
Since 2009
David G. Van Hooser
Since 2009
Harbor Capital has managed the Fund since its inception in 2009.
INVESTMENT OBJECTIVE
The Fund seeks capital appreciation and current income consistent with the Fund’s current asset allocation.
MARKET REVIEW
U.S. and international equity markets finished higher for the six months ended April 30, 2015. Fixed income investments recorded positive returns, while commodity prices posted a sharp decline.
U.S. equities returned 4.74% for the first half of fiscal 2015, as measured by the Russell 3000® Index. Growth stocks set the pace, with the Russell 3000® Growth Index posting a return of 6.59%, compared to 2.82% by the Russell 3000® Value Index. Mid cap stocks modestly outperformed both large caps and small caps. The S&P 500 Index returned 4.40%, with 8 of its 10 economic sectors posting positive returns. The Consumer Discretionary, Health Care, and Information Technology sectors were the best-performing areas of the index, while the Energy and Utilities sectors had negative returns.
International stocks, as measured by the MSCI EAFE (ND) Index, returned 6.81%, modestly outperforming U.S. equities. (All international and global returns are in U.S. dollars.) The index is a measure of stocks in developed markets outside the U.S. Eight of the 10 sectors within the index had positive returns, led by Consumer Discretionary, Information Technology, and Health Care stocks. Energy and Utilities were the only sectors to lose ground. Shares of companies based in developing economies also advanced, with the MSCI Emerging Markets (ND) Index registering a return of 3.92%.
Among fixed income investments, the broad U.S. investment-grade bond market returned 2.06%, as measured by the Barclays U.S. Aggregate Bond Index. Speculative-grade bonds, as measured by the BofA Merrill Lynch U.S. High-Yield Index, returned 1.51%. Inflation-linked bonds returned 1.28%, as measured by the Barclays U.S. TIPS Index, while the BofA Merrill Lynch 3-month U.S. Treasury Bill Index, a benchmark for money market returns, posted a return of 0.01%.
Following a decline over the prior 12 months, commodity prices fell further in the first half of fiscal 2015. The Bloomberg Commodity Index Total ReturnSM, an unmanaged index of futures contracts on a diversified group of physical commodities, returned -11.87%.
PERFORMANCE
Harbor Target Retirement 2025 Fund returned 3.36% (Institutional Class) and 3.37% (Administrative and Investor Classes) for the six months ended April 30, 2015. Underlying fund investments in U.S. stocks, international equities, and bonds all made positive contributions to Fund performance, while commodities lost ground.
U.S. stock markets were a key source of returns for the Fund, as all U.S. equity funds in the portfolio generated positive results. (All underlying fund returns cited are for the fund’s Institutional Class shares.) Harbor Small Cap Growth Fund returned 10.39%, the highest absolute return among all funds in the portfolio. It outperformed its benchmark, the Russell 2000® Growth Index, by 314 basis points, or 3.14 percentage points. Harbor Small Cap Value Fund returned 3.94%, outperforming its Russell 2000® Value Index benchmark by 189 basis points. Among funds focused primarily on larger U.S. companies, Harbor Capital Appreciation Fund returned 7.47%, beating its Russell 1000® Growth Index benchmark by 93 basis points, while Harbor Large Cap Value Fund returned 6.99%, ahead of its benchmark, the Russell 1000® Value Index, by 410 basis points. Harbor Mid Cap Growth Fund returned 7.06%, lagging its benchmark, the Russell Midcap® Growth Index, by 71 basis points, while Harbor Mid Cap Value Fund returned 4.87%, outperforming its Russell Midcap® Value Index benchmark by 104 basis points.
A rebound in international stocks, which had lagged behind U.S. equities in the prior fiscal year, also boosted Fund performance in the first half of fiscal 2015. Harbor International Fund returned 7.69%, outperforming its MSCI EAFE (ND) Index
20
Harbor Target Retirement 2025 Fund
MANAGERS’ COMMENTARY—Continued
benchmark by 88 basis points. Harbor International Growth Fund returned 7.75%, beating its MSCI All Country World Ex. US (ND) Index benchmark by 219 basis points. Harbor Global Growth Fund returned 3.92%, trailing its benchmark, the MSCI All Country World (ND) Index, by 105 basis points.
Fixed income funds in the portfolio all recorded positive results. Harbor Bond Fund posted a return of 2.17%, beating its Barclays U.S. Aggregate Bond Index benchmark by 11 basis points, while Harbor Unconstrained Bond Fund returned 0.31%, trailing the same index by 175 points. Harbor High-Yield Bond Fund returned 2.40%, outpacing its BofA Merrill Lynch U.S. Non-Distressed High Yield Index benchmark by 48 basis points. Harbor Convertible Securities Fund returned 3.03%, lagging its BofA Merrill Lynch All U.S. Convertibles Ex Mandatory Index benchmark by 61 basis points. Harbor Real Return Fund, which invests primarily in inflation-indexed bonds, returned 0.02%, underperforming its Barclays U.S. TIPS Index benchmark by 126 basis points.
Harbor Commodity Real Return Strategy Fund was the only area of the portfolio to finish in negative territory, posting a return of -13.07%. The Fund invests in commodity-linked derivative instruments backed by a portfolio of inflation-indexed bonds and other fixed income securities. The Fund trailed its Bloomberg Commodity Index Total ReturnSM benchmark by 120 basis points.
This report contains the current opinions of Harbor Capital Advisors, Inc. at the time of its publication and should not be considered as investment advice or a recommendation of any particular security, strategy or investment product. Such opinions are subject to change without notice and securities described herein may no longer be included in, or may at any time be removed from, the Fund’s portfolio. This report is distributed for informational purposes only. Information contained herein has been obtained from sources believed reliable, but not guaranteed.
The Fund invests in a variety of underlying Harbor funds that are subject to risks associated with their particular investment strategies. By investing in several underlying funds, the Fund has partial exposure to the risks of many different areas of the market. An investment in the Fund is not guaranteed. An investor may experience losses, including losses near, at, or after the target year. There is no guarantee that the Fund will provide adequate income at or after the target year. For information on the different share classes and the risks associated with an investment in the Fund, please refer to the current prospectus.
21
Harbor Target Retirement 2025 Fund
FUND SUMMARY—April 30, 2015 (Unaudited)
| | | | |
INSTITUTIONAL CLASS |
| | | | |
| Fund # | | | | 2604 |
| | |
| Cusip | | | | 411511249 |
| | |
| Ticker | | | | HARMX |
| | |
| Inception Date | | | | 01/02/2009 |
| | |
| Net Expense Ratio | | | | 0.71%a |
| | |
| Total Net Assets (000s) | | | | $11,325 |
| | | | |
ADMINISTRATIVE CLASS |
| | | | |
| Fund # | | | | 2704 |
| | |
| Cusip | | | | 411511231 |
| | |
| Ticker | | | | HARNX |
| | |
| Inception Date | | | | 01/02/2009 |
| | |
| Net Expense Ratio | | | | 0.71%a |
| | |
| Total Net Assets (000s) | | | | $19 |
| | | | |
INVESTOR CLASS |
| | | | |
| Fund # | | | | 2804 |
| | |
| Cusip | | | | 411511223 |
| | |
| Ticker | | | | HAROX |
| | |
| Inception Date | | | | 01/02/2009 |
| | |
| Net Expense Ratio | | | | 0.71%a |
| | |
| Total Net Assets (000s) | | | | $18 |
| a | Annualized. The Adviser has contractually agreed to limit the Fund’s operating expense to: (i) the amount of the acquired funds’ fees and expenses; (ii) compensation of the Independent Trustees; (iii) certain other expenses such as extraordinary items; and (iv) (a) for the Administrative and Investor Classes, distribution and service (12b-1) fees and (b) for the Investor Class, certain transfer agent fees. The net expense ratio shown will not correlate to the expense ratio shown in the Financial Highlights table because that ratio does not include the acquired funds’ fees and expenses. |
ASSET ALLOCATION (% of Investments)
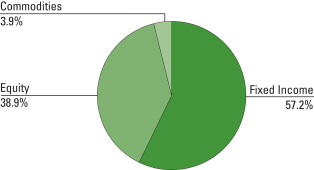
| | | | |
| |
Equity | | | | |
| |
Harbor International Fund | | | 8.8% | |
| |
Harbor International Growth Fund | | | 6.1% | |
| |
Harbor Large Cap Value Fund | | | 5.9% | |
| |
Harbor Capital Appreciation Fund | | | 5.0% | |
| |
Harbor Mid Cap Value Fund | | | 3.7% | |
| |
Harbor Small Cap Value Fund | | | 2.7% | |
| |
Harbor Mid Cap Growth Fund | | | 2.5% | |
| |
Harbor Small Cap Growth Fund | | | 2.2% | |
| |
Harbor Global Growth Fund | | | 2.0% | |
Commodities | | | | |
| |
Harbor Commodity Real Return Strategy Fund | | | 3.9% | |
| |
Fixed Income | | | | |
| |
Harbor Bond Fund | | | 24.1% | |
| |
Harbor High-Yield Bond Fund | | | 16.1% | |
| |
Harbor Real Return Fund | | | 6.7% | |
| |
Harbor Unconstrained Bond Fund | | | 5.7% | |
| |
Harbor Convertible Securities Fund | | | 4.6% | |
22
Harbor Target Retirement 2025 Fund
FUND PERFORMANCE SUMMARY (Unaudited)
Institutional Class
CHANGE IN A $50,000 INVESTMENT
For the period 01/02/2009 through 04/30/2015
| | |
The graph compares a $50,000 investment in the Fund with the performance of broad based market indices. The Fund’s performance includes the reinvestment of all dividend and capital gain distributions. | | 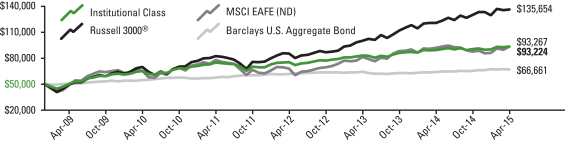 |
| | | | | | | | | | | | | | | | | | | | | | | | | | | | | | | | |
Total Returns For the periods ended 04/30/2015 | | | |
| Harbor Target Retirement 2025 Fund | | | | | | | | | | | | | | | | | | | | | | | | | | | | | | | | |
Institutional Class | | | 3.36% | | | | | | 4.60% | | | | | | 7.54% | | | | | | 10.35% | | | | | 01/02/2009 | | | | $ | 93,224 | |
| Comparative Indices | | | | | | | | | | | | | | | | | | | | | | | | | | | | | | | | |
Russell 3000® | | | 4.74% | | | | | | 12.74% | | | | | | 14.33% | | | | | | 17.09% | | | | | — | | | | $ | 135,654 | |
MSCI EAFE (ND) | | | 6.81% | | | | | | 1.66% | | | | | | 7.40% | | | | | | 10.36% | | | | | — | | | | $ | 93,267 | |
Barclays U.S. Aggregate Bond | | | 2.06% | | | | | | 4.46% | | | | | | 4.12% | | | | | | 4.65% | | | | | — | | | | $ | 66,661 | |
Administrative and Investor Classes
CHANGE IN A $10,000 INVESTMENT
For the period 01/02/2009 through 04/30/2015
| | |
The graph compares a $10,000 investment in the Fund with the performance of broad based market indices. The Fund’s performance includes the reinvestment of all dividend and capital gain distributions. | | 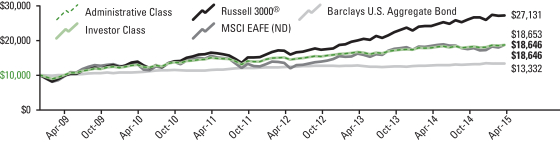 |
| | | | | | | | | | | | | | | | | | | | | | | | | | | | | | | | |
Total Returns For the periods ended 04/30/2015 | | | |
| Harbor Target Retirement 2025 Fund | | | | | | | | | | | | | | | | | | | | | | | | | | | | | | | | |
Administrative Class | | | 3.37% | | | | | | 4.61% | | | | | | 7.54% | | | | | | 10.35% | | | | | 01/02/2009 | | | | $ | 18,646 | |
Investor Class | | | 3.37% | | | | | | 4.61% | | | | | | 7.54% | | | | | | 10.35% | | | | | 01/02/2009 | | | | $ | 18,646 | |
| Comparative Indices | | | | | | | | | | | | | | | | | | | | | | | | | | | | | | | | |
Russell 3000® | | | 4.74% | | | | | | 12.74% | | | | | | 14.33% | | | | | | 17.09% | | | | | — | | | | $ | 27,131 | |
MSCI EAFE (ND) | | | 6.81% | | | | | | 1.66% | | | | | | 7.40% | | | | | | 10.36% | | | | | — | | | | $ | 18,653 | |
Barclays U.S. Aggregate Bond | | | 2.06% | | | | | | 4.46% | | | | | | 4.12% | | | | | | 4.65% | | | | | — | | | | $ | 13,332 | |
As stated in the Fund’s current prospectus, the expense ratios were 0.70% (Institutional Class), 0.95% (Administrative Class) and 1.07% (Investor Class). The Adviser has contractually agreed to limit the Fund’s operating expenses to: (i) the amount of the acquired funds’ fees and expenses; (ii) compensation of the Independent Trustees; (iii) certain other expenses such as extraordinary items; and (iv) (a) for the Administrative and Investor Classes, distribution and service (12b-1) fees and (b) for the Investor Class, certain transfer agent fees. The expense ratios in the prospectus may differ from the actual expense ratios for the period disclosed within this report. The expense ratios shown in the prospectus are based on the prior fiscal year, adjusted to reflect changes, if any, in contractual arrangements that occurred prior to the date of the prospectus.
Performance data shown represents past performance, which is no guarantee of future results. Current performance may be higher or lower than the past performance data shown. Investment returns and the value of an investment will fluctuate, and an investor’s shares, when sold, may be worth more or less than their original cost. You can obtain performance data current to the most recent month-end (available within seven business days after the most recent month-end) by calling 800-422-1050 or visiting harborfunds.com.
The returns shown do not reflect the deduction of taxes that a shareholder would pay on Fund distributions or on the redemption of Fund shares. From time to time, certain fees and/or expenses have been waived or reimbursed, which has resulted in higher returns. Without these waivers and reimbursements, the returns would have been lower. Voluntary waivers and reimbursements may be discontinued at any time without notice.
23
Harbor Target Retirement 2025 Fund†
PORTFOLIO OF INVESTMENTS—April 30, 2015 (Unaudited)
| | | | | | | | |
HARBOR EQUITY FUNDS—38.9% | |
| | |
| Shares | | | | | Value
(000s) | |
| | | | | | | | |
| | | | | | | | |
| | HARBOR DOMESTIC EQUITY FUNDS—22.0% | |
| | 8,968 | | | Harbor Capital Appreciation Fund | | $ | 561 | |
| | 27,774 | | | Harbor Mid Cap Growth Fund | | | 286 | |
| | 17,171 | | | Harbor Small Cap Growth Fund | | | 250 | |
| | 54,799 | | | Harbor Large Cap Value Fund | | | 668 | |
| | 20,217 | | | Harbor Mid Cap Value Fund | | | 424 | |
| | 11,302 | | | Harbor Small Cap Value Fund | | | 308 | |
| | | | | | | | |
| | | | | | | 2,497 | |
| | | | | | | | |
| | HARBOR INTERNATIONAL EQUITY FUNDS—16.9% | |
| | 13,976 | | | Harbor International Fund | | | 1,003 | |
| | 50,943 | | | Harbor International Growth Fund | | | 689 | |
| | 10,598 | | | Harbor Global Growth Fund | | | 234 | |
| | | | | | | | |
| | | | | | | 1,926 | |
| | | | | | | | |
| TOTAL HARBOR EQUITY FUNDS
(Cost $3,959) | | | 4,423 | |
| | | | | | | | |
| | | | | | | | |
HARBOR COMMODITY FUNDS—3.9% | |
| (Cost $556) | | | | |
| | 95,817 | | | Harbor Commodity Real Return Strategy Fund | | | 446 | |
| | | | | | | | |
HARBOR FIXED INCOME FUNDS—57.2% | |
| | |
| Shares | | | | | Value
(000s) | |
| | | | | | | | |
| | | | | | | | |
| | 62,660 | | | Harbor Unconstrained Bond Fund | | $ | 651 | |
| | 47,605 | | | Harbor Convertible Securities Fund | | | 521 | |
| | 173,053 | | | Harbor High-Yield Bond Fund | | | 1,832 | |
| | 223,106 | | | Harbor Bond Fund | | | 2,731 | |
| | 79,691 | | | Harbor Real Return Fund | | | 758 | |
| | | | | | | | |
| TOTAL HARBOR FIXED INCOME FUNDS
(Cost $6,582) | | | 6,493 | |
| | | | | | | | |
| TOTAL INVESTMENTS—100.0%
(Cost $11,097) | | | 11,362 | |
| | | | | | | | |
| | CASH AND OTHER ASSETS, LESS LIABILITIES—0.0% | | | — | a |
| | | | | | | | |
| | TOTAL NET ASSETS—100.0% | | $ | 11,362 | |
| | | | | | | | |
FAIR VALUE MEASUREMENTS
All holdings at April 30, 2015 (as disclosed in the preceding Portfolio of Investments) are classified as Level 1. There were no Level 3 holdings at October 31, 2014 or April 30, 2015, and no transfers between levels during the period.
For more information on valuation inputs and their aggregation into the levels identified above, please refer to the Fair Value Measurements and Disclosures in Note 2 of the accompanying Notes to Financial Statements.
| † | The Harbor Target Retirement 2025 Fund is investing in Institutional Class shares of affiliated Harbor Funds. |
| a | Rounds to less than $1,000. |
The accompanying notes are an integral part of the Financial Statements.
24
Harbor Target Retirement 2030 Fund
MANAGERS’ COMMENTARY (Unaudited)
ADVISER
Harbor Capital Advisors, Inc.
111 South Wacker Drive
34th Floor
Chicago, IL 60606
PORTFOLIO MANAGERS
Brian L. Collins, CFA
Since 2009
Paul C. Herbert, CFA
Since 2009
Linda M. Molenda
Since 2009
David G. Van Hooser
Since 2009
Harbor Capital has managed the Fund since its inception in 2009.
INVESTMENT OBJECTIVE
The Fund seeks capital appreciation and current income consistent with the Fund’s current asset allocation.
MARKET REVIEW
U.S. and international equity markets finished higher for the six months ended April 30, 2015. Fixed income investments recorded positive returns, while commodity prices posted a sharp decline.
U.S. equities returned 4.74% for the first half of fiscal 2015, as measured by the Russell 3000® Index. Growth stocks set the pace, with the Russell 3000® Growth Index posting a return of 6.59%, compared to 2.82% by the Russell 3000® Value Index. Mid cap stocks modestly outperformed both large caps and small caps. The S&P 500 Index returned 4.40%, with 8 of its 10 economic sectors posting positive returns. The Consumer Discretionary, Health Care, and Information Technology sectors were the best-performing areas of the index, while the Energy and Utilities sectors had negative returns.
International stocks, as measured by the MSCI EAFE (ND) Index, returned 6.81%, modestly outperforming U.S. equities. (All international and global returns are in U.S. dollars.) The index is a measure of stocks in developed markets outside the U.S. Eight of the 10 sectors within the index had positive returns, led by Consumer Discretionary, Information Technology, and Health Care stocks. Energy and Utilities were the only sectors to lose ground. Shares of companies based in developing economies also advanced, with the MSCI Emerging Markets (ND) Index registering a return of 3.92%.
Among fixed income investments, the broad U.S. investment-grade bond market returned 2.06%, as measured by the Barclays U.S. Aggregate Bond Index. Speculative-grade bonds, as measured by the BofA Merrill Lynch U.S. High-Yield Index, returned 1.51%. Inflation-linked bonds returned 1.28%, as measured by the Barclays U.S. TIPS Index, while the BofA Merrill Lynch 3-month U.S. Treasury Bill Index, a benchmark for money market returns, posted a return of 0.01%.
Following a decline over the prior 12 months, commodity prices fell further in the first half of fiscal 2015. The Bloomberg Commodity Index Total ReturnSM, an unmanaged index of futures contracts on a diversified group of physical commodities, returned -11.87%.
PERFORMANCE
Harbor Target Retirement 2030 Fund returned 3.61% (Institutional Class) and 3.73% (Administrative and Investor Classes) for the six months ended April 30, 2015. Underlying fund investments in U.S. stocks, international equities, and bonds all made positive contributions to Fund performance, while commodities lost ground.
U.S. stock markets were a key source of returns for the Fund, as all U.S. equity funds in the portfolio generated positive results. (All underlying fund returns cited are for the fund’s Institutional Class shares.) Harbor Small Cap Growth Fund returned 10.39%, the highest absolute return among all funds in the portfolio. It outperformed its benchmark, the Russell 2000® Growth Index, by 314 basis points, or 3.14 percentage points. Harbor Small Cap Value Fund returned 3.94%, outperforming its Russell 2000® Value Index benchmark by 189 basis points. Among funds focused primarily on larger U.S. companies, Harbor Capital Appreciation Fund returned 7.47%, beating its Russell 1000® Growth Index benchmark by 93 basis points, while Harbor Large Cap Value Fund returned 6.99%, ahead of its benchmark, the Russell 1000® Value Index, by 410 basis points. Harbor Mid Cap Growth Fund returned 7.06%, lagging its benchmark, the Russell Midcap® Growth Index, by 71 basis points, while Harbor Mid Cap Value Fund returned 4.87%, outperforming its Russell Midcap® Value Index benchmark by 104 basis points.
A rebound in international stocks, which had lagged behind U.S. equities in the prior fiscal year, also boosted Fund performance in the first half of fiscal 2015. Harbor International Fund returned 7.69%, outperforming its MSCI EAFE (ND) Index
25
Harbor Target Retirement 2030 Fund
MANAGERS’ COMMENTARY—Continued
benchmark by 88 basis points. Harbor International Growth Fund returned 7.75%, beating its MSCI All Country World Ex. US (ND) Index benchmark by 219 basis points. Harbor Global Growth Fund returned 3.92%, trailing its benchmark, the MSCI All Country World (ND) Index, by 105 basis points.
Fixed income funds in the portfolio all recorded positive results. Harbor Bond Fund posted a return of 2.17%, beating its Barclays U.S. Aggregate Bond Index benchmark by 11 basis points, while Harbor Unconstrained Bond Fund returned 0.31%, trailing the same index by 175 points. Harbor High-Yield Bond Fund returned 2.40%, outpacing its BofA Merrill Lynch U.S. Non-Distressed High Yield Index benchmark by 48 basis points. Harbor Convertible Securities Fund returned 3.03%, lagging its BofA Merrill Lynch All U.S. Convertibles Ex Mandatory Index benchmark by 61 basis points. Harbor Real Return Fund, which invests primarily in inflation-indexed bonds, returned 0.02%, underperforming its Barclays U.S. TIPS Index benchmark by 126 basis points.
Harbor Commodity Real Return Strategy Fund was the only area of the portfolio to finish in negative territory, posting a return of -13.07%. The Fund invests in commodity-linked derivative instruments backed by a portfolio of inflation-indexed bonds and other fixed income securities. The Fund trailed its Bloomberg Commodity Index Total ReturnSM benchmark by 120 basis points.
This report contains the current opinions of Harbor Capital Advisors, Inc. at the time of its publication and should not be considered as investment advice or a recommendation of any particular security, strategy or investment product. Such opinions are subject to change without notice and securities described herein may no longer be included in, or may at any time be removed from, the Fund’s portfolio. This report is distributed for informational purposes only. Information contained herein has been obtained from sources believed reliable, but not guaranteed.
The Fund invests in a variety of underlying Harbor funds that are subject to risks associated with their particular investment strategies. By investing in several underlying funds, the Fund has partial exposure to the risks of many different areas of the market. An investment in the Fund is not guaranteed. An investor may experience losses, including losses near, at, or after the target year. There is no guarantee that the Fund will provide adequate income at or after the target year. For information on the different share classes and the risks associated with an investment in the Fund, please refer to the current prospectus.
26
Harbor Target Retirement 2030 Fund
FUND SUMMARY—April 30, 2015 (Unaudited)
| | | | |
INSTITUTIONAL CLASS |
| | | | |
| Fund # | | | | 2605 |
| | |
| Cusip | | | | 411512700 |
| | |
| Ticker | | | | HARPX |
| | |
| Inception Date | | | | 01/02/2009 |
| | |
| Net Expense Ratio | | | | 0.73%a |
| | |
| Total Net Assets (000s) | | | | $26,940 |
| | | | |
ADMINISTRATIVE CLASS |
| | | | |
| Fund # | | | | 2705 |
| | |
| Cusip | | | | 411512882 |
| | |
| Ticker | | | | HARQX |
| | |
| Inception Date | | | | 01/02/2009 |
| | |
| Net Expense Ratio | | | | 0.73%a |
| | |
| Total Net Assets (000s) | | | | $19 |
| | | | |
INVESTOR CLASS |
| | | | |
| Fund # | | | | 2805 |
| | |
| Cusip | | | | 411512809 |
| | |
| Ticker | | | | HARTX |
| | |
| Inception Date | | | | 01/02/2009 |
| | |
| Net Expense Ratio | | | | 0.73%a |
| | |
| Total Net Assets (000s) | | | | $20 |
| a | Annualized. The Adviser has contractually agreed to limit the Fund’s operating expense to: (i) the amount of the acquired funds’ fees and expenses; (ii) compensation of the Independent Trustees; (iii) certain other expenses such as extraordinary items; and (iv) (a) for the Administrative and Investor Classes, distribution and service (12b-1) fees and (b) for the Investor Class, certain transfer agent fees. The net expense ratio shown will not correlate to the expense ratio shown in the Financial Highlights table because that ratio does not include the acquired funds’ fees and expenses. |
ASSET ALLOCATION (% of Investments)
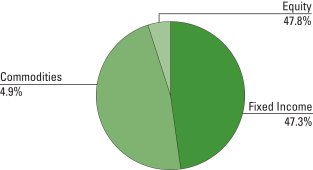
| | | | |
| |
Equity | | | | |
| |
Harbor International Fund | | | 10.8% | |
| |
Harbor International Growth Fund | | | 7.4% | |
| |
Harbor Large Cap Value Fund | | | 7.3% | |
| |
Harbor Capital Appreciation Fund | | | 6.0% | |
| |
Harbor Mid Cap Value Fund | | | 4.6% | |
| |
Harbor Small Cap Value Fund | | | 3.4% | |
| |
Harbor Mid Cap Growth Fund | | | 3.1% | |
| |
Harbor Small Cap Growth Fund | | | 2.7% | |
| |
Harbor Global Growth Fund | | | 2.5% | |
Commodities | | | | |
| |
Harbor Commodity Real Return Strategy Fund | | | 4.9% | |
| |
Fixed Income | | | | |
| |
Harbor Bond Fund | | | 20.3% | |
| |
Harbor High-Yield Bond Fund | | | 14.6% | |
| |
Harbor Unconstrained Bond Fund | | | 4.7% | |
| |
Harbor Real Return Fund | | | 3.9% | |
| |
Harbor Convertible Securities Fund | | | 3.8% | |
27
Harbor Target Retirement 2030 Fund
FUND PERFORMANCE SUMMARY (Unaudited)
Institutional Class
CHANGE IN A $50,000 INVESTMENT
For the period 01/02/2009 through 04/30/2015
| | |
The graph compares a $50,000 investment in the Fund with the performance of broad based market indices. The Fund’s performance includes the reinvestment of all dividend and capital gain distributions. | | 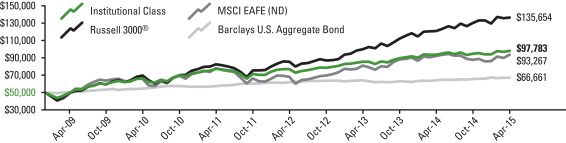 |
| | | | | | | | | | | | | | | | | | | | | | | | | | | | | | | | |
Total Returns For the periods ended 04/30/2015 | | | |
| Harbor Target Retirement 2030 Fund | | | | | | | | | | | | | | | | | | | | | | | | | | | | | | | | |
Institutional Class | | | 3.61% | | | | | | 4.76% | | | | | | 8.19% | | | | | | 11.19% | | | | | 01/02/2009 | | | | $ | 97,783 | |
| Comparative Indices | | | | | | | | | | | | | | | | | | | | | | | | | | | | | | | | |
Russell 3000® | | | 4.74% | | | | | | 12.74% | | | | | | 14.33% | | | | | | 17.09% | | | | | — | | | | $ | 135,654 | |
MSCI EAFE (ND) | | | 6.81% | | | | | | 1.66% | | | | | | 7.40% | | | | | | 10.36% | | | | | — | | | | $ | 93,267 | |
Barclays U.S. Aggregate Bond | | | 2.06% | | | | | | 4.66% | | | | | | 4.12% | | | | | | 4.65% | | | | | — | | | | $ | 66,661 | |
Administrative and Investor Classes
CHANGE IN A $10,000 INVESTMENT
For the period 01/02/2009 through 04/30/2015
| | |
The graph compares a $10,000 investment in the Fund with the performance of broad based market indices. The Fund’s performance includes the reinvestment of all dividend and capital gain distributions. | | 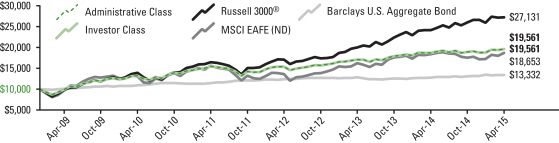 |
| | | | | | | | | | | | | | | | | | | | | | | | | | | | | | | | |
Total Returns For the periods ended 04/30/2015 | | | |
| Harbor Target Retirement 2030 Fund | | | | | | | | | | | | | | | | | | | | | | | | | | | | | | | | |
Administrative Class | | | 3.73% | | | | | | 4.88% | | | | | | 8.19% | | | | | | 11.19% | | | | | 01/02/2009 | | | | $ | 19,561 | |
Investor Class | | | 3.73% | | | | | | 4.88% | | | | | | 8.19% | | | | | | 11.19% | | | | | 01/02/2009 | | | | $ | 19,561 | |
| Comparative Indices | | | | | | | | | | | | | | | | | | | | | | | | | | | | | | | | |
Russell 3000® | | | 4.74% | | | | | | 12.74% | | | | | | 14.33% | | | | | | 17.09% | | | | | — | | | | $ | 27,131 | |
MSCI EAFE (ND) | | | 6.81% | | | | | | 1.66% | | | | | | 7.40% | | | | | | 10.36% | | | | | — | | | | $ | 18,653 | |
Barclays U.S. Aggregate Bond | | | 2.06% | | | | | | 4.66% | | | | | | 4.12% | | | | | | 4.65% | | | | | — | | | | $ | 13,332 | |
As stated in the Fund’s current prospectus, the expense ratios were 0.72% (Institutional Class), 0.97% (Administrative Class) and 1.09% (Investor Class). The Adviser has contractually agreed to limit the Fund’s operating expenses to: (i) the amount of the acquired funds’ fees and expenses; (ii) compensation of the Independent Trustees; (iii) certain other expenses such as extraordinary items; and (iv) (a) for the Administrative and Investor Classes, distribution and service (12b-1) fees and (b) for the Investor Class, certain transfer agent fees. The expense ratios in the prospectus may differ from the actual expense ratios for the period disclosed within this report. The expense ratios shown in the prospectus are based on the prior fiscal year, adjusted to reflect changes, if any, in contractual arrangements that occurred prior to the date of the prospectus.
Performance data shown represents past performance, which is no guarantee of future results. Current performance may be higher or lower than the past performance data shown. Investment returns and the value of an investment will fluctuate, and an investor’s shares, when sold, may be worth more or less than their original cost. You can obtain performance data current to the most recent month-end (available within seven business days after the most recent month-end) by calling 800-422-1050 or visiting harborfunds.com.
The returns shown do not reflect the deduction of taxes that a shareholder would pay on Fund distributions or on the redemption of Fund shares. From time to time, certain fees and/or expenses have been waived or reimbursed, which has resulted in higher returns. Without these waivers and reimbursements, the returns would have been lower. Voluntary waivers and reimbursements may be discontinued at any time without notice.
28
Harbor Target Retirement 2030 Fund†
PORTFOLIO OF INVESTMENTS—April 30, 2015 (Unaudited)
| | | | | | | | |
HARBOR EQUITY FUNDS—47.8% | |
| | |
| Shares | | | | | Value
(000s) | |
| | | | | | | | |
| | HARBOR DOMESTIC EQUITY FUNDS—27.1% | |
| | 26,080 | | | Harbor Capital Appreciation Fund | | $ | 1,631 | |
| | 81,235 | | | Harbor Mid Cap Growth Fund | | | 836 | |
| | 50,340 | | | Harbor Small Cap Growth Fund | | | 734 | |
| | 160,751 | | | Harbor Large Cap Value Fund | | | 1,960 | |
| | 59,274 | | | Harbor Mid Cap Value Fund | | | 1,244 | |
| | 33,205 | | | Harbor Small Cap Value Fund | | | 904 | |
| | | | | | | | |
| | | | | | | 7,309 | |
| | | | | | | | |
| | HARBOR INTERNATIONAL EQUITY FUNDS—20.7% | |
| | 40,410 | | | Harbor International Fund | | | 2,901 | |
| | 148,158 | | | Harbor International Growth Fund | | | 2,004 | |
| | 31,053 | | | Harbor Global Growth Fund | | | 684 | |
| | | | | | | | |
| | | | | | | 5,589 | |
| | | | | | | | |
| TOTAL HARBOR EQUITY FUNDS
(Cost $10,531) | | | 12,898 | |
| | | | | | | | |
| | | | | | | | |
HARBOR COMMODITY FUNDS—4.9% | |
| (Cost $1,736) | | | | |
| | 285,363 | | | Harbor Commodity Real Return Strategy Fund | | | 1,330 | |
| | | | | | | | |
HARBOR FIXED INCOME FUNDS—47.3% | |
| | |
| Shares | | | | | Value
(000s) | |
| | | | | | | | |
| | 122,955 | | | Harbor Unconstrained Bond Fund | | | 1,278 | |
| | 93,621 | | | Harbor Convertible Securities Fund | | | 1,024 | |
| | 371,700 | | | Harbor High-Yield Bond Fund | | | 3,936 | |
| | 447,503 | | | Harbor Bond Fund | | | 5,477 | |
| | 108,926 | | | Harbor Real Return Fund | | | 1,036 | |
| | | | | | | | |
| TOTAL HARBOR FIXED INCOME FUNDS
(Cost $12,966) | | | 12,751 | |
| | | | | | | | |
| TOTAL INVESTMENTS—100.0%
(Cost $25,233) | | | 26,979 | |
| | | | | | | | |
| | CASH AND OTHER ASSETS, LESS LIABILITIES—0.0% | | | — | a |
| | | | | | | | |
| | TOTAL NET ASSETS—100.0% | | $ | 26,979 | |
| | | | | | | | |
FAIR VALUE MEASUREMENTS
All holdings at April 30, 2015 (as disclosed in the preceding Portfolio of Investments) are classified as Level 1. There were no Level 3 holdings at October 31, 2014 or April 30, 2015, and no transfers between levels during the period.
For more information on valuation inputs and their aggregation into the levels identified above, please refer to the Fair Value Measurements and Disclosures in Note 2 of the accompanying Notes to Financial Statements.
| † | The Harbor Target Retirement 2030 Fund is investing in Institutional Class shares of affiliated Harbor Funds. |
| a | Rounds to less than $1,000. |
The accompanying notes are an integral part of the Financial Statements.
29
Harbor Target Retirement 2035 Fund
MANAGERS’ COMMENTARY (Unaudited)
ADVISER
Harbor Capital Advisors, Inc.
111 South Wacker Drive
34th Floor
Chicago, IL 60606
PORTFOLIO MANAGERS
Brian L. Collins, CFA
Since 2009
Paul C. Herbert, CFA
Since 2009
Linda M. Molenda
Since 2009
David G. Van Hooser
Since 2009
Harbor Capital has managed the Fund since its inception in 2009.
INVESTMENT OBJECTIVE
The Fund seeks capital appreciation and current income consistent with the Fund’s current asset allocation.
MARKET REVIEW
U.S. and international equity markets finished higher for the six months ended April 30, 2015. Fixed income investments recorded positive returns, while commodity prices posted a sharp decline.
U.S. equities returned 4.74% for the first half of fiscal 2015, as measured by the Russell 3000® Index. Growth stocks set the pace, with the Russell 3000® Growth Index posting a return of 6.59%, compared to 2.82% by the Russell 3000® Value Index. Mid cap stocks modestly outperformed both large caps and small caps. The S&P 500 Index returned 4.40%, with 8 of its 10 economic sectors posting positive returns. The Consumer Discretionary, Health Care, and Information Technology sectors were the best-performing areas of the index, while the Energy and Utilities sectors had negative returns.
International stocks, as measured by the MSCI EAFE (ND) Index, returned 6.81%, modestly outperforming U.S. equities. (All international and global returns are in U.S. dollars.) The index is a measure of stocks in developed markets outside the U.S. Eight of the 10 sectors within the index had positive returns, led by Consumer Discretionary, Information Technology, and Health Care stocks. Energy and Utilities were the only sectors to lose ground. Shares of companies based in developing economies also advanced, with the MSCI Emerging Markets (ND) Index registering a return of 3.92%.
Among fixed income investments, the broad U.S. investment-grade bond market returned 2.06%, as measured by the Barclays U.S. Aggregate Bond Index. Speculative-grade bonds, as measured by the BofA Merrill Lynch U.S. High-Yield Index, returned 1.51%. Inflation-linked bonds returned 1.28%, as measured by the Barclays U.S. TIPS Index, while the BofA Merrill Lynch 3-month U.S. Treasury Bill Index, a benchmark for money market returns, posted a return of 0.01%.
Following a decline over the prior 12 months, commodity prices fell further in the first half of fiscal 2015. The Bloomberg Commodity Index Total ReturnSM, an unmanaged index of futures contracts on a diversified group of physical commodities, returned -11.87%.
PERFORMANCE
Harbor Target Retirement 2035 Fund returned 4.04% (Institutional, Administrative, and Investor Classes) for the six months ended April 30, 2015. Underlying fund investments in U.S. stocks, international equities, and bonds all made positive contributions to Fund performance, while commodities lost ground.
U.S. stock markets were a key source of returns for the Fund, as all U.S. equity funds in the portfolio generated positive results. (All underlying fund returns cited are for the fund’s Institutional Class shares.) Harbor Small Cap Growth Fund returned 10.39%, the highest absolute return among all funds in the portfolio. It outperformed its benchmark, the Russell 2000® Growth Index, by 314 basis points, or 3.14 percentage points. Harbor Small Cap Value Fund returned 3.94%, outperforming its Russell 2000® Value Index benchmark by 189 basis points. Among funds focused primarily on larger U.S. companies, Harbor Capital Appreciation Fund returned 7.47%, beating its Russell 1000® Growth Index benchmark by 93 basis points, while Harbor Large Cap Value Fund returned 6.99%, ahead of its benchmark, the Russell 1000® Value Index, by 410 basis points. Harbor Mid Cap Growth Fund returned 7.06%, lagging its benchmark, the Russell Midcap® Growth Index, by 71 basis points, while Harbor Mid Cap Value Fund returned 4.87%, outperforming its Russell Midcap® Value Index benchmark by 104 basis points.
A rebound in international stocks, which had lagged behind U.S. equities in the prior fiscal year, also boosted Fund performance in the first half of fiscal 2015. Harbor International Fund returned 7.69%, outperforming its MSCI EAFE (ND) Index
30
Harbor Target Retirement 2035 Fund
MANAGERS’ COMMENTARY—Continued
benchmark by 88 basis points. Harbor International Growth Fund returned 7.75%, beating its MSCI All Country World Ex. US (ND) Index benchmark by 219 basis points. Harbor Global Growth Fund returned 3.92%, trailing its benchmark, the MSCI All Country World (ND) Index, by 105 basis points.
Fixed income funds in the portfolio all recorded positive results. Harbor Bond Fund posted a return of 2.17%, beating its Barclays U.S. Aggregate Bond Index benchmark by 11 basis points, while Harbor Unconstrained Bond Fund returned 0.31%, trailing the same index by 175 points. Harbor High-Yield Bond Fund returned 2.40%, outpacing its BofA Merrill Lynch U.S. Non-Distressed High Yield Index benchmark by 48 basis points. Harbor Convertible Securities Fund returned 3.03%, lagging its BofA Merrill Lynch All U.S. Convertibles Ex Mandatory Index benchmark by 61 basis points. Harbor Real Return Fund, which invests primarily in inflation-indexed bonds, returned 0.02%, underperforming its Barclays U.S. TIPS Index benchmark by 126 basis points.
Harbor Commodity Real Return Strategy Fund was the only area of the portfolio to finish in negative territory, posting a return of -13.07%. The Fund invests in commodity-linked derivative instruments backed by a portfolio of inflation-indexed bonds and other fixed income securities. The Fund trailed its Bloomberg Commodity Index Total ReturnSM benchmark by 120 basis points.
This report contains the current opinions of Harbor Capital Advisors, Inc. at the time of its publication and should not be considered as investment advice or a recommendation of any particular security, strategy or investment product. Such opinions are subject to change without notice and securities described herein may no longer be included in, or may at any time be removed from, the Fund’s portfolio. This report is distributed for informational purposes only. Information contained herein has been obtained from sources believed reliable, but not guaranteed.
The Fund invests in a variety of underlying Harbor funds that are subject to risks associated with their particular investment strategies. By investing in several underlying funds, the Fund has partial exposure to the risks of many different areas of the market. An investment in the Fund is not guaranteed. An investor may experience losses, including losses near, at, or after the target year. There is no guarantee that the Fund will provide adequate income at or after the target year. For information on the different share classes and the risks associated with an investment in the Fund, please refer to the current prospectus.
31
Harbor Target Retirement 2035 Fund
FUND SUMMARY—April 30, 2015 (Unaudited)
| | | | |
INSTITUTIONAL CLASS |
| | | | |
| Fund # | | | | 2606 |
| | |
| Cusip | | | | 411512106 |
| | |
| Ticker | | | | HARUX |
| | |
| Inception Date | | | | 01/02/2009 |
| | |
| Net Expense Ratio | | | | 0.73%a |
| | |
| Total Net Assets (000s) | | | | $9,158 |
| | | | |
ADMINISTRATIVE CLASS |
| | | | |
| Fund # | | | | 2706 |
| | |
| Cusip | | | | 411512304 |
| | |
| Ticker | | | | HARVX |
| | |
| Inception Date | | | | 01/02/2009 |
| | |
| Net Expense Ratio | | | | 0.73%a |
| | |
| Total Net Assets (000s) | | | | $20 |
| | | | |
INVESTOR CLASS |
| | | | |
| Fund # | | | | 2806 |
| | |
| Cusip | | | | 411512205 |
| | |
| Ticker | | | | HARWX |
| | |
| Inception Date | | | | 01/02/2009 |
| | |
| Net Expense Ratio | | | | 0.73%a |
| | |
| Total Net Assets (000s) | | | | $20 |
| a | Annualized. The Adviser has contractually agreed to limit the Fund’s operating expense to: (i) the amount of the acquired funds’ fees and expenses; (ii) compensation of the Independent Trustees; (iii) certain other expenses such as extraordinary items; and (iv) (a) for the Administrative and Investor Classes, distribution and service (12b-1) fees and (b) for the Investor Class, certain transfer agent fees. The net expense ratio shown will not correlate to the expense ratio shown in the Financial Highlights table because that ratio does not include the acquired funds’ fees and expenses. |
ASSET ALLOCATION (% of Investments)
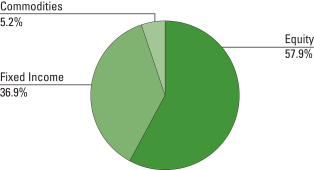
| | | | |
| |
Equity | | | | |
| |
Harbor International Fund | | | 13.1% | |
| |
Harbor International Growth Fund | | | 9.0% | |
| |
Harbor Large Cap Value Fund | | | 8.8% | |
| |
Harbor Capital Appreciation Fund | | | 7.3% | |
| |
Harbor Mid Cap Value Fund | | | 5.5% | |
| |
Harbor Small Cap Value Fund | | | 4.0% | |
| |
Harbor Mid Cap Growth Fund | | | 3.8% | |
| |
Harbor Small Cap Growth Fund | | | 3.3% | |
| |
Harbor Global Growth Fund | | | 3.1% | |
Commodities | | | | |
| |
Harbor Commodity Real Return Strategy Fund | | | 5.2% | |
| |
Fixed Income | | | | |
| |
Harbor Bond Fund | | | 18.1% | |
| |
Harbor High-Yield Bond Fund | | | 12.7% | |
| |
Harbor Unconstrained Bond Fund | | | 3.7% | |
| |
Harbor Real Return Fund | | | 1.7% | |
| |
Harbor Convertible Securities Fund | | | 0.7% | |
32
Harbor Target Retirement 2035 Fund
FUND PERFORMANCE SUMMARY (Unaudited)
Institutional Class
CHANGE IN A $50,000 INVESTMENT
For the period 01/02/2009 through 04/30/2015
| | |
The graph compares a $50,000 investment in the Fund with the performance of broad based indices. The Fund’s performance includes the reinvestment of all dividend and capital gain distributions. | | 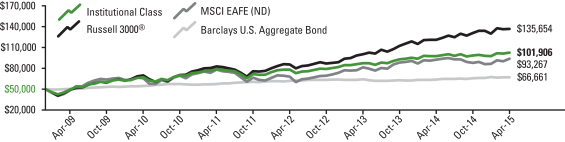 |
| | | | | | | | | | | | | | | | | | | | | | | | | | | | | | | | |
Total Returns For the periods ended 04/30/2015 | | | |
| Harbor Target Retirement 2035 Fund | | | | | | | | | | | | | | | | | | | | | | | | | | | | | | | | |
Institutional Class | | | 4.04% | | | | | | 5.23% | | | | | | 8.87% | | | | | | 11.91% | | | | | 01/02/2009 | | | | $ | 101,906 | |
| Comparative Indices | | | | | | | | | | | | | | | | | | | | | | | | | | | | | | | | |
Russell 3000® | | | 4.74% | | | | | | 12.74% | | | | | | 14.33% | | | | | | 17.09% | | | | | — | | | | $ | 135,654 | |
MSCI EAFE (ND) | | | 6.81% | | | | | | 1.66% | | | | | | 7.40% | | | | | | 10.36% | | | | | — | | | | $ | 93,267 | |
Barclays U.S. Aggregate Bond | | | 2.06% | | | | | | 4.46% | | | | | | 4.12% | | | | | | 4.65% | | | | | — | | | | $ | 66,661 | |
Administrative and Investor Classes
CHANGE IN A $10,000 INVESTMENT
For the period 01/02/2009 through 04/30/2015
| | |
The graph compares a $10,000 investment in the Fund with the performance of broad based indices. The Fund’s performance includes the reinvestment of all dividend and capital gain distributions. | | 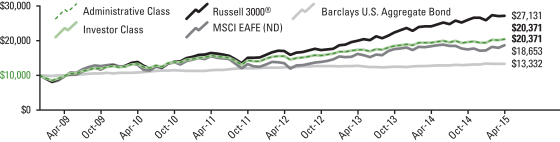 |
| | | | | | | | | | | | | | | | | | | | | | | | | | | | | | | | |
Total Returns For the periods ended 04/30/2015 | | | |
| Harbor Target Retirement 2035 Fund | | | | | | | | | | | | | | | | | | | | | | | | | | | | | | | | |
Administrative Class | | | 4.04% | | | | | | 5.24% | | | | | | 8.86% | | | | | | 11.90% | | | | | 01/02/2009 | | | | $ | 20,371 | |
Investor Class | | | 4.04% | | | | | | 5.24% | | | | | | 8.86% | | | | | | 11.90% | | | | | 01/02/2009 | | | | $ | 20,371 | |
| Comparative Indices | | | | | | | | | | | | | | | | | | | | | | | | | | | | | | | | |
Russell 3000® | | | 4.74% | | | | | | 12.74% | | | | | | 14.33% | | | | | | 17.09% | | | | | — | | | | $ | 27,131 | |
MSCI EAFE (ND) | | | 6.81% | | | | | | 1.66% | | | | | | 7.40% | | | | | | 10.36% | | | | | — | | | | $ | 18,653 | |
Barclays U.S. Aggregate Bond | | | 2.06% | | | | | | 4.46% | | | | | | 4.12% | | | | | | 4.65% | | | | | — | | | | $ | 13,332 | |
As stated in the Fund’s current prospectus, the expense ratios were 0.73% (Institutional Class), 0.98% (Administrative Class) and 1.10% (Investor Class). The Adviser has contractually agreed to limit the Fund’s operating expenses to: (i) the amount of the acquired funds’ fees and expenses; (ii) compensation of the Independent Trustees; (iii) certain other expenses such as extraordinary items; and (iv) (a) for the Administrative and Investor Classes, distribution and service (12b-1) fees and (b) for the Investor Class, certain transfer agent fees. The expense ratios in the prospectus may differ from the actual expense ratios for the period disclosed within this report. The expense ratios shown in the prospectus are based on the prior fiscal year, adjusted to reflect changes, if any, in contractual arrangements that occurred prior to the date of the prospectus.
Performance data shown represents past performance, which is no guarantee of future results. Current performance may be higher or lower than the past performance data shown. Investment returns and the value of an investment will fluctuate, and an investor’s shares, when sold, may be worth more or less than their original cost. You can obtain performance data current to the most recent month-end (available within seven business days after the most recent month-end) by calling 800-422-1050 or visiting harborfunds.com.
The returns shown do not reflect the deduction of taxes that a shareholder would pay on Fund distributions or on the redemption of Fund shares. From time to time, certain fees and/or expenses have been waived or reimbursed, which has resulted in higher returns. Without these waivers and reimbursements, the returns would have been lower. Voluntary waivers and reimbursements may be discontinued at any time without notice.
33
Harbor Target Retirement 2035 Fund†
PORTFOLIO OF INVESTMENTS—April 30, 2015 (Unaudited)
| | | | | | | | |
HARBOR EQUITY FUNDS—57.9% | |
| | |
| Shares | | | | | Value
(000s) | |
| | | | | | | | |
| | HARBOR DOMESTIC EQUITY FUNDS—32.7% | |
| | 10,792 | | | Harbor Capital Appreciation Fund | | $ | 675 | |
| | 33,494 | | | Harbor Mid Cap Growth Fund | | | 345 | |
| | 20,737 | | | Harbor Small Cap Growth Fund | | | 302 | |
| | 66,185 | | | Harbor Large Cap Value Fund | | | 807 | |
| | 24,324 | | | Harbor Mid Cap Value Fund | | | 510 | |
| | 13,640 | | | Harbor Small Cap Value Fund | | | 372 | |
| | | | | | | | |
| | | | | | | 3,011 | |
| | | | | | | | |
| | HARBOR INTERNATIONAL EQUITY FUNDS—25.2% | |
| | 16,805 | | | Harbor International Fund | | | 1,206 | |
| | 61,453 | | | Harbor International Growth Fund | | | 831 | |
| | 12,785 | | | Harbor Global Growth Fund | | | 282 | |
| | | | | | | | |
| | | | | | | 2,319 | |
| | | | | | | | |
| TOTAL HARBOR EQUITY FUNDS
(Cost $4,975) | | | 5,330 | |
| | | | | | | | |
| | | | | | | | |
HARBOR COMMODITY FUNDS—5.2% | |
| (Cost $579) | | | | |
| | 102,263 | | | Harbor Commodity Real Return Strategy Fund | | | 476 | |
| | | | | | | | |
HARBOR FIXED INCOME FUNDS—36.9% | |
| | |
| Shares | | | | | Value
(000s) | |
| | | | | | | | |
| | 32,674 | | | Harbor Unconstrained Bond Fund | | | 339 | |
| | 6,068 | | | Harbor Convertible Securities Fund | | | 66 | |
| | 110,083 | | | Harbor High-Yield Bond Fund | | | 1,166 | |
| | 135,753 | | | Harbor Bond Fund | | | 1,662 | |
| | 16,676 | | | Harbor Real Return Fund | | | 159 | |
| | | | | | | | |
| TOTAL HARBOR FIXED INCOME FUNDS
(Cost $3,429) | | | 3,392 | |
| | | | | | | | |
| TOTAL INVESTMENTS—100.0%
(Cost $8,983) | | | 9,198 | |
| | | | | | | | |
| | CASH AND OTHER ASSETS, LESS LIABILITIES—0.0% | | | — | a |
| | | | | | | | |
| | TOTAL NET ASSETS—100.0% | | $ | 9,198 | |
| | | | | | | | |
FAIR VALUE MEASUREMENTS
All holdings at April 30, 2015 (as disclosed in the preceding Portfolio of Investments) are classified as Level 1. There were no Level 3 holdings at October 31, 2014 or April 30, 2015, and no transfers between levels during the period.
For more information on valuation inputs and their aggregation into the levels identified above, please refer to the Fair Value Measurements and Disclosures in Note 2 of the accompanying Notes to Financial Statements.
| † | The Harbor Target Retirement 2035 Fund is investing in Institutional Class shares of affiliated Harbor Funds. |
| a | Rounds to less than $1,000. |
The accompanying notes are an integral part of the Financial Statements.
34
Harbor Target Retirement 2040 Fund
MANAGERS’ COMMENTARY (Unaudited)
ADVISER
Harbor Capital Advisors, Inc.
111 South Wacker Drive
34th Floor
Chicago, IL 60606
PORTFOLIO MANAGERS
Brian L. Collins, CFA
Since 2009
Paul C. Herbert, CFA
Since 2009
Linda M. Molenda
Since 2009
David G. Van Hooser
Since 2009
Harbor Capital has managed the Fund since its inception in 2009.
INVESTMENT OBJECTIVE
The Fund seeks capital appreciation and current income consistent with the Fund’s current asset allocation.
MARKET REVIEW
U.S. and international equity markets finished higher for the six months ended April 30, 2015. Fixed income investments recorded positive returns, while commodity prices posted a sharp decline.
U.S. equities returned 4.74% for the first half of fiscal 2015, as measured by the Russell 3000® Index. Growth stocks set the pace, with the Russell 3000® Growth Index posting a return of 6.59%, compared to 2.82% by the Russell 3000® Value Index. Mid cap stocks modestly outperformed both large caps and small caps. The S&P 500 Index returned 4.40%, with 8 of its 10 economic sectors posting positive returns. The Consumer Discretionary, Health Care, and Information Technology sectors were the best-performing areas of the index, while the Energy and Utilities sectors had negative returns.
International stocks, as measured by the MSCI EAFE (ND) Index, returned 6.81%, modestly outperforming U.S. equities. (All international and global returns are in U.S. dollars.) The index is a measure of stocks in developed markets outside the U.S. Eight of the 10 sectors within the index had positive returns, led by Consumer Discretionary, Information Technology, and Health Care stocks. Energy and Utilities were the only sectors to lose ground. Shares of companies based in developing economies also advanced, with the MSCI Emerging Markets (ND) Index registering a return of 3.92%.
Among fixed income investments, the broad U.S. investment-grade bond market returned 2.06%, as measured by the Barclays U.S. Aggregate Bond Index. Speculative-grade bonds, as measured by the BofA Merrill Lynch U.S. High-Yield Index, returned 1.51%. Inflation-linked bonds returned 1.28%, as measured by the Barclays U.S. TIPS Index, while the BofA Merrill Lynch 3-month U.S. Treasury Bill Index, a benchmark for money market returns, posted a return of 0.01%.
Following a decline over the prior 12 months, commodity prices fell further in the first half of fiscal 2015. The Bloomberg Commodity Index Total ReturnSM, an unmanaged index of futures contracts on a diversified group of physical commodities, returned -11.87%.
PERFORMANCE
Harbor Target Retirement 2040 Fund returned 4.73% (Institutional Class) and 4.72% (Administrative and Investor Classes) for the six months ended April 30, 2015. Underlying fund investments in U.S. stocks, international equities, and bonds all made positive contributions to Fund performance, while commodities lost ground.
U.S. stock markets were a key source of returns for the Fund, as all U.S. equity funds in the portfolio generated positive results. (All underlying fund returns cited are for the fund’s Institutional Class shares.) Harbor Small Cap Growth Fund returned 10.39%, the highest absolute return among all funds in the portfolio. It outperformed its benchmark, the Russell 2000® Growth Index, by 314 basis points, or 3.14 percentage points. Harbor Small Cap Value Fund returned 3.94%, outperforming its Russell 2000® Value Index benchmark by 189 basis points. Among funds focused primarily on larger U.S. companies, Harbor Capital Appreciation Fund returned 7.47%, beating its Russell 1000® Growth Index benchmark by 93 basis points, while Harbor Large Cap Value Fund returned 6.99%, ahead of its benchmark, the Russell 1000® Value Index, by 410 basis points. Harbor Mid Cap Growth Fund returned 7.06%, lagging its benchmark, the Russell Midcap® Growth Index, by 71 basis points, while Harbor Mid Cap Value Fund returned 4.87%, outperforming its Russell Midcap® Value Index benchmark by 104 basis points.
A rebound in international stocks, which had lagged behind U.S. equities in the prior fiscal year, also boosted Fund performance in the first half of fiscal 2015. Harbor International Fund returned 7.69%, outperforming its MSCI EAFE (ND) Index
35
Harbor Target Retirement 2040 Fund
MANAGERS’ COMMENTARY—Continued
benchmark by 88 basis points. Harbor International Growth Fund returned 7.75%, beating its MSCI All Country World Ex. US (ND) Index benchmark by 219 basis points. Harbor Global Growth Fund returned 3.92%, trailing its benchmark, the MSCI All Country World (ND) Index, by 105 basis points.
Fixed income funds in the portfolio all recorded positive results. Harbor Bond Fund posted a return of 2.17%, beating its Barclays U.S. Aggregate Bond Index benchmark by 11 basis points, while Harbor Unconstrained Bond Fund returned 0.31%, trailing the same index by 175 points. Harbor High-Yield Bond Fund returned 2.40%, outpacing its BofA Merrill Lynch U.S. Non-Distressed High Yield Index benchmark by 48 basis points. Harbor Real Return Fund, which invests primarily in inflation-indexed bonds, returned 0.02%, underperforming its Barclays U.S. TIPS Index benchmark by 126 basis points.
Harbor Commodity Real Return Strategy Fund was the only area of the portfolio to finish in negative territory, posting a return of -13.07%. The Fund invests in commodity-linked derivative instruments backed by a portfolio of inflation-indexed bonds and other fixed income securities. The Fund trailed its Bloomberg Commodity Index Total ReturnSM benchmark by 120 basis points.
This report contains the current opinions of Harbor Capital Advisors, Inc. at the time of its publication and should not be considered as investment advice or a recommendation of any particular security, strategy or investment product. Such opinions are subject to change without notice and securities described herein may no longer be included in, or may at any time be removed from, the Fund’s portfolio. This report is distributed for informational purposes only. Information contained herein has been obtained from sources believed reliable, but not guaranteed.
The Fund invests in a variety of underlying Harbor funds that are subject to risks associated with their particular investment strategies. By investing in several underlying funds, the Fund has partial exposure to the risks of many different areas of the market. An investment in the Fund is not guaranteed. An investor may experience losses, including losses near, at, or after the target year. There is no guarantee that the Fund will provide adequate income at or after the target year. For information on the different share classes and the risks associated with an investment in the Fund, please refer to the current prospectus.
36
Harbor Target Retirement 2040 Fund
FUND SUMMARY—April 30, 2015 (Unaudited)
| | | | |
INSTITUTIONAL CLASS |
| | | | |
| Fund # | | | | 2607 |
| | |
| Cusip | | | | 411512403 |
| | |
| Ticker | | | | HARYX |
| | |
| Inception Date | | | | 01/02/2009 |
| | |
| Net Expense Ratio | | | | 0.74%a |
| | |
| Total Net Assets (000s) | | | | $20,039 |
| | | | |
ADMINISTRATIVE CLASS |
| | | | |
| Fund # | | | | 2707 |
| | |
| Cusip | | | | 411512601 |
| | |
| Ticker | | | | HARZX |
| | |
| Inception Date | | | | 01/02/2009 |
| | |
| Net Expense Ratio | | | | 0.74%a |
| | |
| Total Net Assets (000s) | | | | $21 |
| | | | |
INVESTOR CLASS |
| | | | |
| Fund # | | | | 2807 |
| | |
| Cusip | | | | 411512502 |
| | |
| Ticker | | | | HABBX |
| | |
| Inception Date | | | | 01/02/2009 |
| | |
| Net Expense Ratio | | | | 0.74%a |
| | |
| Total Net Assets (000s) | | | | $21 |
| a | Annualized. The Adviser has contractually agreed to limit the Fund’s operating expense to: (i) the amount of the acquired funds’ fees and expenses; (ii) compensation of the Independent Trustees; (iii) certain other expenses such as extraordinary items; and (iv) (a) for the Administrative and Investor Classes, distribution and service (12b-1) fees and (b) for the Investor Class, certain transfer agent fees. The net expense ratio shown will not correlate to the expense ratio shown in the Financial Highlights table because that ratio does not include the acquired funds’ fees and expenses. |
ASSET ALLOCATION (% of Investments)
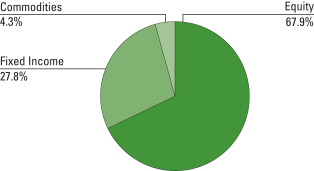
| | | | |
| |
Equity | | | | |
| |
Harbor International Fund | | | 15.3% | |
| |
Harbor International Growth Fund | | | 10.5% | |
| |
Harbor Large Cap Value Fund | | | 10.3% | |
| |
Harbor Capital Appreciation Fund | | | 8.6% | |
| |
Harbor Mid Cap Value Fund | | | 6.5% | |
| |
Harbor Small Cap Value Fund | | | 4.8% | |
| |
Harbor Mid Cap Growth Fund | | | 4.4% | |
| |
Harbor Small Cap Growth Fund | | | 3.9% | |
| |
Harbor Global Growth Fund | | | 3.6% | |
Commodities | | | | |
| |
Harbor Commodity Real Return Strategy Fund | | | 4.3% | |
| |
Fixed Income | | | | |
| |
Harbor Bond Fund | | | 14.1% | |
| |
Harbor High-Yield Bond Fund | | | 9.8% | |
| |
Harbor Unconstrained Bond Fund | | | 2.8% | |
| |
Harbor Real Return Fund | | | 1.1% | |
37
Harbor Target Retirement 2040 Fund
FUND PERFORMANCE SUMMARY (Unaudited)
Institutional Class
CHANGE IN A $50,000 INVESTMENT
For the period 01/02/2009 through 04/30/2015
| | |
The graph compares a $50,000 investment in the Fund with the performance of broad based market indices. The Fund’s performance includes the reinvestment of all dividend and capital gain distributions. | | 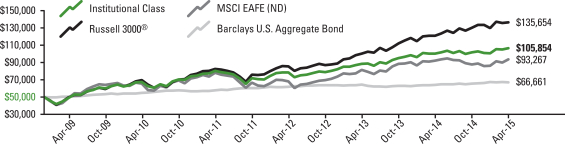 |
| | | | | | | | | | | | | | | | | | | | | | | | | | | | | | | | |
Total Returns For the periods ended 04/30/2015 | | | |
| Harbor Target Retirement 2040 Fund | | | | | | | | | | | | | | | | | | | | | | | | | | | | | | | | |
Institutional Class | | | 4.73% | | | | | | 6.13% | | | | | | 9.50% | | | | | | 12.59% | | | | | 01/02/2009 | | | | $ | 105,854 | |
| Comparative Indices | | | | | | | | | | | | | | | | | | | | | | | | | | | | | | | | |
Russell 3000® | | | 4.74% | | | | | | 12.74% | | | | | | 14.33% | | | | | | 17.09% | | | | | — | | | | $ | 135,654 | |
MSCI EAFE (ND) | | | 6.81% | | | | | | 1.66% | | | | | | 7.40% | | | | | | 10.36% | | | | | — | | | | $ | 93,267 | |
Barclays U.S. Aggregate Bond | | | 2.06% | | | | | | 4.46% | | | | | | 4.12% | | | | | | 4.65% | | | | | — | | | | $ | 66,661 | |
Administrative and Investor Classes
CHANGE IN A $10,000 INVESTMENT
For the period 01/02/2009 through 04/30/2015
| | |
The graph compares a $10,000 investment in the Fund with the performance of broad based market indices. The Fund’s performance includes the reinvestment of all dividend and capital gain distributions. | | 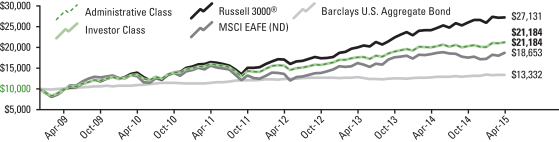 |
| | | | | | | | | | | | | | | | | | | | | | | | | | | | | | | | |
Total Returns For the periods ended 04/30/2015 | | | |
| Harbor Target Retirement 2040 Fund | | | | | | | | | | | | | | | | | | | | | | | | | | | | | | | | |
Administrative Class | | | 4.72% | | | | | | 6.23% | | | | | | 9.52% | | | | | | 12.60% | | | | | 01/02/2009 | | | | $ | 21,184 | |
Investor Class | | | 4.72% | | | | | | 6.23% | | | | | | 9.52% | | | | | | 12.60% | | | | | 01/02/2009 | | | | $ | 21,184 | |
| Comparative Indices | | | | | | | | | | | | | | | | | | | | | | | | | | | | | | | | |
Russell 3000® | | | 4.74% | | | | | | 12.74% | | | | | | 14.33% | | | | | | 17.09% | | | | | — | | | | $ | 27,131 | |
MSCI EAFE (ND) | | | 6.81% | | | | | | 1.66% | | | | | | 7.40% | | | | | | 10.36% | | | | | — | | | | $ | 18,653 | |
Barclays U.S. Aggregate Bond | | | 2.06% | | | | | | 4.46% | | | | | | 4.12% | | | | | | 4.65% | | | | | — | | | | $ | 13,332 | |
As stated in the Fund’s current prospectus, the expense ratios were 0.75% (Institutional Class), 1.00% (Administrative Class) and 1.12% (Investor Class). The Adviser has contractually agreed to limit the Fund’s operating expenses to: (i) the amount of the acquired funds’ fees and expenses; (ii) compensation of the Independent Trustees; (iii) certain other expenses such as extraordinary items; and (iv) (a) for the Administrative and Investor Classes, distribution and service (12b-1) fees and (b) for the Investor Class, certain transfer agent fees. The expense ratios in the prospectus may differ from the actual expense ratios for the period disclosed within this report. The expense ratios shown in the prospectus are based on the prior fiscal year, adjusted to reflect changes, if any, in contractual arrangements that occurred prior to the date of the prospectus.
Performance data shown represents past performance, which is no guarantee of future results. Current performance may be higher or lower than the past performance data shown. Investment returns and the value of an investment will fluctuate, and an investor’s shares, when sold, may be worth more or less than their original cost. You can obtain performance data current to the most recent month-end (available within seven business days after the most recent month-end) by calling 800-422-1050 or visiting harborfunds.com.
The returns shown do not reflect the deduction of taxes that a shareholder would pay on Fund distributions or on the redemption of Fund shares. From time to time, certain fees and/or expenses have been waived or reimbursed, which has resulted in higher returns. Without these waivers and reimbursements, the returns would have been lower. Voluntary waivers and reimbursements may be discontinued at any time without notice.
38
Harbor Target Retirement 2040 Fund†
PORTFOLIO OF INVESTMENTS—April 30, 2015 (Unaudited)
| | | | | | | | |
HARBOR EQUITY FUNDS—67.9% | |
| | |
| Shares | | | | | Value
(000s) | |
| | | | | | | | |
| | HARBOR DOMESTIC EQUITY FUNDS—38.5% | |
| | 27,651 | | | Harbor Capital Appreciation Fund | | $ | 1,729 | |
| | 85,861 | | | Harbor Mid Cap Growth Fund | | | 883 | |
| | 53,277 | | | Harbor Small Cap Growth Fund | | | 777 | |
| | 169,074 | | | Harbor Large Cap Value Fund | | | 2,061 | |
| | 62,569 | | | Harbor Mid Cap Value Fund | | | 1,313 | |
| | 35,097 | | | Harbor Small Cap Value Fund | | | 956 | |
| | | | | | | | |
| | | | | | | 7,719 | |
| | | | | | | | |
| | HARBOR INTERNATIONAL EQUITY FUNDS—29.4% | |
| | 42,727 | | | Harbor International Fund | | | 3,067 | |
| | 156,897 | | | Harbor International Growth Fund | | | 2,123 | |
| | 32,716 | | | Harbor Global Growth Fund | | | 720 | |
| | | | | | | | |
| | | | | | | 5,910 | |
| | | | | | | | |
| TOTAL HARBOR EQUITY FUNDS
(Cost $11,002) | | | 13,629 | |
| | | | | | | | |
| | | | | | | | |
HARBOR COMMODITY FUNDS—4.3% | |
| (Cost $1,123) | | | | |
| | 184,766 | | | Harbor Commodity Real Return Strategy Fund | | | 861 | |
| | | | | | | | |
HARBOR FIXED INCOME FUNDS—27.8% | |
| | |
| Shares | | | | | Value
(000s) | |
| | | | | | | | |
| | 53,917 | | | Harbor Unconstrained Bond Fund | | | 560 | |
| | 185,648 | | | Harbor High-Yield Bond Fund | | | 1,966 | |
| | 231,489 | | | Harbor Bond Fund | | | 2,834 | |
| | 24,320 | | | Harbor Real Return Fund | | | 231 | |
| | | | | | | | |
| TOTAL HARBOR FIXED INCOME FUNDS
(Cost $5,678) | | | 5,591 | |
| | | | | | | | |
| TOTAL INVESTMENTS—100.0%
(Cost $17,803) | | | 20,081 | |
| | | | | | | | |
| | CASH AND OTHER ASSETS, LESS LIABILITIES—0.0% | | | — | a |
| | | | | | | | |
| | TOTAL NET ASSETS—100.0% | | $ | 20,081 | |
| | | | | | | | |
FAIR VALUE MEASUREMENTS
All holdings at April 30, 2015 (as disclosed in the preceding Portfolio of Investments) are classified as Level 1. There were no Level 3 holdings at October 31, 2014 or April 30, 2015, and no transfers between levels during the period.
For more information on valuation inputs and their aggregation into the levels identified above, please refer to the Fair Value Measurements and Disclosures in Note 2 of the accompanying Notes to Financial Statements.
| † | The Harbor Target Retirement 2040 Fund is investing in Institutional Class shares of affiliated Harbor Funds. |
| a | Rounds to less than $1,000. |
The accompanying notes are an integral part of the Financial Statements.
39
Harbor Target Retirement 2045 Fund
MANAGERS’ COMMENTARY (Unaudited)
ADVISER
Harbor Capital Advisors, Inc.
111 South Wacker Drive 34th Floor Chicago, IL 60606
PORTFOLIO MANAGERS
Brian L. Collins, CFA
Since 2009
Paul C. Herbert, CFA
Since 2009
Linda M. Molenda Since 2009
David G. Van Hooser Since 2009
Harbor Capital has managed the Fund since its inception in 2009.
INVESTMENT OBJECTIVE
The Fund seeks capital appreciation and current income consistent with the Fund’s current asset allocation.
MARKET REVIEW
U.S. and international equity markets finished higher for the six months ended April 30, 2015. Fixed income investments recorded positive returns, while commodity prices posted a sharp decline.
U.S. equities returned 4.74% for the first half of fiscal 2015, as measured by the Russell 3000® Index. Growth stocks set the pace, with the Russell 3000® Growth Index posting a return of 6.59%, compared to 2.82% by the Russell 3000® Value Index. Mid cap stocks modestly outperformed both large caps and small caps. The S&P 500 Index returned 4.40%, with 8 of its 10 economic sectors posting positive returns. The Consumer Discretionary, Health Care, and Information Technology sectors were the best-performing areas of the index, while the Energy and Utilities sectors had negative returns.
International stocks, as measured by the MSCI EAFE (ND) Index, returned 6.81%, modestly outperforming U.S. equities. (All international and global returns are in U.S. dollars.) The index is a measure of stocks in developed markets outside the U.S. Eight of the 10 sectors within the index had positive returns, led by Consumer Discretionary, Information Technology, and Health Care stocks. Energy and Utilities were the only sectors to lose ground. Shares of companies based in developing economies also advanced, with the MSCI Emerging Markets (ND) Index registering a return of 3.92%.
Among fixed income investments, the broad U.S. investment-grade bond market returned 2.06%, as measured by the Barclays U.S. Aggregate Bond Index. Speculative-grade bonds, as measured by the BofA Merrill Lynch U.S. High-Yield Index, returned 1.51%. Inflation-linked bonds returned 1.28%, as measured by the Barclays U.S. TIPS Index, while the BofA Merrill Lynch 3-month U.S. Treasury Bill Index, a benchmark for money market returns, posted a return of 0.01%.
Following a decline over the prior 12 months, commodity prices fell further in the first half of fiscal 2015. The Bloomberg Commodity Index Total ReturnSM, an unmanaged index of futures contracts on a diversified group of physical commodities, returned -11.87%.
PERFORMANCE
Harbor Target Retirement 2045 Fund returned 5.20% (Institutional Class) and 5.21% (Administrative and Investor Classes) for the six months ended April 30, 2015. Underlying fund investments in U.S. stocks, international equities, and bonds all made positive contributions to Fund performance, while commodities lost ground.
U.S. stock markets were a key source of returns for the Fund, as all U.S. equity funds in the portfolio generated positive results. (All underlying fund returns cited are for the fund’s Institutional Class shares.) Harbor Small Cap Growth Fund returned 10.39%, the highest absolute return among all funds in the portfolio. It outperformed its benchmark, the Russell 2000® Growth Index, by 314 basis points, or 3.14 percentage points. Harbor Small Cap Value Fund returned 3.94%, outperforming its Russell 2000® Value Index benchmark by 189 basis points. Among funds focused primarily on larger U.S. companies, Harbor Capital Appreciation Fund returned 7.47%, beating its Russell 1000® Growth Index benchmark by 93 basis points, while Harbor Large Cap Value Fund returned 6.99%, ahead of its benchmark, the Russell 1000® Value Index, by 410 basis points. Harbor Mid Cap Growth Fund returned 7.06%, lagging its benchmark, the Russell Midcap® Growth Index, by 71 basis points, while Harbor Mid Cap Value Fund returned 4.87%, outperforming its Russell Midcap® Value Index benchmark by 104 basis points.
A rebound in international stocks, which had lagged behind U.S. equities in the prior fiscal year, also boosted Fund performance in the first half of fiscal 2015. Harbor International Fund returned 7.69%, outperforming its MSCI EAFE (ND) Index
40
Harbor Target Retirement 2045 Fund
MANAGERS’ COMMENTARY—Continued
benchmark by 88 basis points. Harbor International Growth Fund returned 7.75%, beating its MSCI All Country World Ex. US (ND) Index benchmark by 219 basis points. Harbor Global Growth Fund returned 3.92%, trailing its benchmark, the MSCI All Country World (ND) Index, by 105 basis points.
Fixed income funds in the portfolio all recorded positive results. Harbor Bond Fund posted a return of 2.17%, beating its Barclays U.S. Aggregate Bond Index benchmark by 11 basis points, while Harbor Unconstrained Bond Fund returned 0.31%, trailing the same index by 175 points. Harbor High-Yield Bond Fund returned 2.40%, outpacing its BofA Merrill Lynch U.S. Non-Distressed High Yield Index benchmark by 48 basis points. Harbor Real Return Fund, which invests primarily in inflation-indexed bonds, returned 0.02%, underperforming its Barclays U.S. TIPS Index benchmark by 126 basis points.
Harbor Commodity Real Return Strategy Fund was the only area of the portfolio to finish in negative territory, posting a return of -13.07%. The Fund invests in commodity-linked derivative instruments backed by a portfolio of inflation-indexed bonds and other fixed income securities. The Fund trailed its Bloomberg Commodity Index Total ReturnSM benchmark by 120 basis points.
This report contains the current opinions of Harbor Capital Advisors, Inc. at the time of its publication and should not be considered as investment advice or a recommendation of any particular security, strategy or investment product. Such opinions are subject to change without notice and securities described herein may no longer be included in, or may at any time be removed from, the Fund’s portfolio. This report is distributed for informational purposes only. Information contained herein has been obtained from sources believed reliable, but not guaranteed.
The Fund invests in a variety of underlying Harbor funds that are subject to risks associated with their particular investment strategies. By investing in several underlying funds, the Fund has partial exposure to the risks of many different areas of the market. An investment in the Fund is not guaranteed. An investor may experience losses, including losses near, at, or after the target year. There is no guarantee that the Fund will provide adequate income at or after the target year. For information on the different share classes and the risks associated with an investment in the Fund, please refer to the current prospectus.
41
Harbor Target Retirement 2045 Fund
FUND SUMMARY—April 30, 2015 (Unaudited)
| | | | |
INSTITUTIONAL CLASS |
| | | | |
| Fund # | | | | 2608 |
| | |
| Cusip | | | | 411511181 |
| | |
| Ticker | | | | HACCX |
| | |
| Inception Date | | | | 01/02/2009 |
| | |
| Net Expense Ratio | | | | 0.75%a |
| | |
| Total Net Assets (000s) | | | | $4,902 |
| | | | |
ADMINISTRATIVE CLASS |
| | | | |
| Fund # | | | | 2708 |
| | |
| Cusip | | | | 411511173 |
| | |
| Ticker | | | | HADDX |
| | |
| Inception Date | | | | 01/02/2009 |
| | |
| Net Expense Ratio | | | | 0.75%a |
| | |
| Total Net Assets (000s) | | | | $22 |
| | | | |
INVESTOR CLASS |
| | | | |
| Fund # | | | | 2808 |
| | |
| Cusip | | | | 411511165 |
| | |
| Ticker | | | | HAEEX |
| | |
| Inception Date | | | | 01/02/2009 |
| | |
| Net Expense Ratio | | | | 0.75%a |
| | |
| Total Net Assets (000s) | | | | $22 |
| a | Annualized. The Adviser has contractually agreed to limit the Fund’s operating expense to: (i) the amount of the acquired funds’ fees and expenses; (ii) compensation of the Independent Trustees; (iii) certain other expenses such as extraordinary items; and (iv) (a) for the Administrative and Investor Classes, distribution and service (12b-1) fees and (b) for the Investor Class, certain transfer agent fees. The net expense ratio shown will not correlate to the expense ratio shown in the Financial Highlights table because that ratio does not include the acquired funds’ fees and expenses. |
ASSET ALLOCATION (% of Investments)
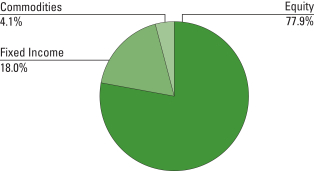
| | | | |
| |
Equity | | | | |
| |
Harbor International Fund | | | 17.6% | |
| |
Harbor International Growth Fund | | | 12.1% | |
| |
Harbor Large Cap Value Fund | | | 11.8% | |
| |
Harbor Capital Appreciation Fund | | | 9.8% | |
| |
Harbor Mid Cap Value Fund | | | 7.5% | |
| |
Harbor Small Cap Value Fund | | | 5.5% | |
| |
Harbor Mid Cap Growth Fund | | | 5.0% | |
| |
Harbor Small Cap Growth Fund | | | 4.4% | |
| |
Harbor Global Growth Fund | | | 4.2% | |
Commodities | | | | |
| |
Harbor Commodity Real Return Strategy Fund | | | 4.1% | |
| |
Fixed Income | | | | |
| |
Harbor Bond Fund | | | 9.0% | |
| |
Harbor High-Yield Bond Fund | | | 7.0% | |
| |
Harbor Unconstrained Bond Fund | | | 1.8% | |
| |
Harbor Real Return Fund | | | 0.2% | |
42
Harbor Target Retirement 2045 Fund
FUND PERFORMANCE SUMMARY (Unaudited)
Institutional Class
CHANGE IN A $50,000 INVESTMENT
For the period 01/02/2009 through 04/30/2015
| | |
The graph compares a $50,000 investment in the Fund with the performance of broad based market indices. The Fund’s performance includes the reinvestment of all dividend and capital gain distributions. | | 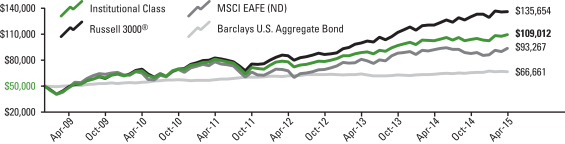 |
| | | | | | | | | | | | | | | | | | | | | | | | | | | | | | | | |
Total Returns For the periods ended 04/30/2015 | | | |
| Harbor Target Retirement 2045 Fund | | | | | | | | | | | | | | | | | | | | | | | | | | | | | | | | |
Institutional Class | | | 5.20% | | | | | | 6.68% | | | | | | 10.06% | | | | | | 13.11% | | | | | 01/02/2009 | | | | $ | 109,012 | |
| Comparative Indices | | | | | | | | | | | | | | | | | | | | | | | | | | | | | | | | |
Russell 3000® | | | 4.74% | | | | | | 12.74% | | | | | | 14.33% | | | | | | 17.09% | | | | | — | | | | $ | 135,654 | |
MSCI EAFE (ND) | | | 6.81% | | | | | | 1.66% | | | | | | 7.40% | | | | | | 10.36% | | | | | — | | | | $ | 93,267 | |
Barclays U.S. Aggregate Bond | | | 2.06% | | | | | | 4.46% | | | | | | 4.12% | | | | | | 4.65% | | | | | — | | | | $ | 66,661 | |
Administrative and Investor Classes
CHANGE IN A $10,000 INVESTMENT
For the period 01/02/2009 through 04/30/2015
| | |
The graph compares a $10,000 investment in the Fund with the performance of broad based market indices. The Fund’s performance includes the reinvestment of all dividend and capital gain distributions. | | 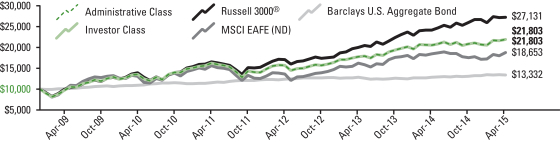 |
| | | | | | | | | | | | | | | | | | | | | | | | | | | | | | | | |
Total Returns For the periods ended 04/30/2015 | | | |
| Harbor Target Retirement 2045 Fund | | | | | | | | | | | | | | | | | | | | | | | | | | | | | | | | |
Administrative Class | | | 5.21% | | | | | | 6.69% | | | | | | 10.06% | | | | | | 13.11% | | | | | 01/02/2009 | | | | $ | 21,803 | |
Investor Class | | | 5.21% | | | | | | 6.69% | | | | | | 10.06% | | | | | | 13.11% | | | | | 01/02/2009 | | | | $ | 21,803 | |
| Comparative Indices | | | | | | | | | | | | | | | | | | | | | | | | | | | | | | | | |
Russell 3000® | | | 4.74% | | | | | | 12.74% | | | | | | 14.33% | | | | | | 17.09% | | | | | — | | | | $ | 27,131 | |
MSCI EAFE (ND) | | | 6.81% | | | | | | 1.66% | | | | | | 7.40% | | | | | | 10.36% | | | | | — | | | | $ | 18,653 | |
Barclays U.S. Aggregate Bond | | | 2.06% | | | | | | 4.46% | | | | | | 4.12% | | | | | | 4.65% | | | | | — | | | | $ | 13,332 | |
As stated in the Fund’s current prospectus, the expense ratios were 0.76% (Institutional Class), 1.01% (Administrative Class) and 1.13% (Investor Class). The Adviser has contractually agreed to limit the Fund’s operating expenses to: (i) the amount of the acquired funds’ fees and expenses; (ii) compensation of the Independent Trustees; (iii) certain other expenses such as extraordinary items; and (iv) (a) for the Administrative and Investor Classes, distribution and service (12b-1) fees and (b) for the Investor Class, certain transfer agent fees. The expense ratios in the prospectus may differ from the actual expense ratios for the period disclosed within this report. The expense ratios shown in the prospectus are based on the prior fiscal year, adjusted to reflect changes, if any, in contractual arrangements that occurred prior to the date of the prospectus.
Performance data shown represents past performance, which is no guarantee of future results. Current performance may be higher or lower than the past performance data shown. Investment returns and the value of an investment will fluctuate, and an investor’s shares, when sold, may be worth more or less than their original cost. You can obtain performance data current to the most recent month-end (available within seven business days after the most recent month-end) by calling 800-422-1050 or visiting harborfunds.com.
The returns shown do not reflect the deduction of taxes that a shareholder would pay on Fund distributions or on the redemption of Fund shares. From time to time, certain fees and/or expenses have been waived or reimbursed, which has resulted in higher returns. Without these waivers and reimbursements, the returns would have been lower. Voluntary waivers and reimbursements may be discontinued at any time without notice.
43
Harbor Target Retirement 2045 Fund†
PORTFOLIO OF INVESTMENTS—April 30, 2015 (Unaudited)
| | | | | | | | |
HARBOR EQUITY FUNDS—77.9% | |
| | |
| Shares | | | | | Value
(000s) | |
| | | | | | | | |
| | HARBOR DOMESTIC EQUITY FUNDS—44.0% | |
| | 7,774 | | | Harbor Capital Appreciation Fund | | $ | 486 | |
| | 24,085 | | | Harbor Mid Cap Growth Fund | | | 248 | |
| | 15,006 | | | Harbor Small Cap Growth Fund | | | 219 | |
| | 47,799 | | | Harbor Large Cap Value Fund | | | 583 | |
| | 17,682 | | | Harbor Mid Cap Value Fund | | | 371 | |
| | 9,895 | | | Harbor Small Cap Value Fund | | | 269 | |
| | | | | | | | |
| | | | | | | 2,176 | |
| | | | | | | | |
| | HARBOR INTERNATIONAL EQUITY FUNDS—33.9% | |
| | 12,142 | | | Harbor International Fund | | | 871 | |
| | 44,263 | | | Harbor International Growth Fund | | | 599 | |
| | 9,255 | | | Harbor Global Growth Fund | | | 204 | |
| | | | | | | | |
| | | | | | | 1,674 | |
| | | | | | | | |
| TOTAL HARBOR EQUITY FUNDS
(Cost $3,403) | | | 3,850 | |
| | | | | | | | |
| | | | | | | | |
HARBOR COMMODITY FUNDS—4.1% | |
| (Cost $250) | | | | |
| | 43,788 | | | Harbor Commodity Real Return Strategy Fund | | | 204 | |
| | | | | | | | |
HARBOR FIXED INCOME FUNDS—18.0% | |
| | |
| Shares | | | | | Value
(000s) | |
| | | | | | | | |
| | 8,614 | | | Harbor Unconstrained Bond Fund | | | 90 | |
| | 32,609 | | | Harbor High-Yield Bond Fund | | | 345 | |
| | 36,475 | | | Harbor Bond Fund | | | 446 | |
| | 1,135 | | | Harbor Real Return Fund | | | 11 | |
| | | | | | | | |
| TOTAL HARBOR FIXED INCOME FUNDS
(Cost $902) | | | 892 | |
| | | | | | | | |
| TOTAL INVESTMENTS—100.0%
(Cost $4,555) | | | 4,946 | |
| | | | | | | | |
| | CASH AND OTHER ASSETS, LESS LIABILITIES—0.0% | | | — | a |
| | | | | | | | |
| | TOTAL NET ASSETS—100.0% | | $ | 4,946 | |
| | | | | | | | |
FAIR VALUE MEASUREMENTS
All holdings at April 30, 2015 (as disclosed in the preceding Portfolio of Investments) are classified as Level 1. There were no Level 3 holdings at October 31, 2014 or April 30, 2015, and no transfers between levels during the period.
For more information on valuation inputs and their aggregation into the levels identified above, please refer to the Fair Value Measurements and Disclosures in Note 2 of the accompanying Notes to Financial Statements.
| † | The Harbor Target Retirement 2045 Fund is investing in Institutional Class shares of affiliated Harbor Funds. |
| a | Rounds to less than $1,000. |
The accompanying notes are an integral part of the Financial Statements.
44
Harbor Target Retirement 2050 Fund
MANAGERS’ COMMENTARY (Unaudited)
ADVISER
Harbor Capital
Advisors, Inc.
111 South Wacker Drive
34th Floor
Chicago, IL 60606
PORTFOLIO MANAGERS
Brian L. Collins, CFA
Since 2009
Paul C. Herbert, CFA
Since 2009
Linda M. Molenda
Since 2009
David G. Van Hooser
Since 2009
Harbor Capital has managed the Fund since its inception
in 2009.
INVESTMENT OBJECTIVE
The Fund seeks capital appreciation and current income consistent with the Fund’s current asset allocation.
MARKET REVIEW
U.S. and international equity markets finished higher for the six months ended April 30, 2015. Fixed income investments recorded positive returns, while commodity prices posted a sharp decline.
U.S. equities returned 4.74% for the first half of fiscal 2015, as measured by the Russell 3000® Index. Growth stocks set the pace, with the Russell 3000® Growth Index posting a return of 6.59%, compared to 2.82% by the Russell 3000® Value Index. Mid cap stocks modestly outperformed both large caps and small caps. The S&P 500 Index returned 4.40%, with 8 of its 10 economic sectors posting positive returns. The Consumer Discretionary, Health Care, and Information Technology sectors were the best-performing areas of the index, while the Energy and Utilities sectors had negative returns.
International stocks, as measured by the MSCI EAFE (ND) Index, returned 6.81%, modestly outperforming U.S. equities. (All international and global returns are in U.S. dollars.) The index is a measure of stocks in developed markets outside the U.S. Eight of the 10 sectors within the index had positive returns, led by Consumer Discretionary, Information Technology, and Health Care stocks. Energy and Utilities were the only sectors to lose ground. Shares of companies based in developing economies also advanced, with the MSCI Emerging Markets (ND) Index registering a return of 3.92%.
Among fixed income investments, the broad U.S. investment-grade bond market returned 2.06%, as measured by the Barclays U.S. Aggregate Bond Index. Speculative-grade bonds, as measured by the BofA Merrill Lynch U.S. High-Yield Index, returned 1.51%. Inflation-linked bonds returned 1.28%, as measured by the Barclays U.S. TIPS Index, while the BofA Merrill Lynch 3-month U.S. Treasury Bill Index, a benchmark for money market returns, posted a return of 0.01%.
Following a decline over the prior 12 months, commodity prices fell further in the first half of fiscal 2015. The Bloomberg Commodity Index Total ReturnSM, an unmanaged index of futures contracts on a diversified group of physical commodities, returned -11.87%.
PERFORMANCE
Harbor Target Retirement 2050 Fund returned 5.95% (Institutional Class) and 5.94% (Administrative and Investor Classes) for the six months ended April 30, 2015. Underlying fund investments in U.S. stocks, international equities, and bonds all made positive contributions to Fund performance, while commodities lost ground.
U.S. stock markets were a key source of returns for the Fund, as all U.S. equity funds in the portfolio generated positive results. (All underlying fund returns cited are for the fund’s Institutional Class shares.) Harbor Small Cap Growth Fund returned 10.39%, the highest absolute return among all funds in the portfolio. It outperformed its benchmark, the Russell 2000® Growth Index, by 314 basis points, or 3.14 percentage points. Harbor Small Cap Value Fund returned 3.94%, outperforming its Russell 2000® Value Index benchmark by 189 basis points. Among funds focused primarily on larger U.S. companies, Harbor Capital Appreciation Fund returned 7.47%, beating its Russell 1000® Growth Index benchmark by 93 basis points, while Harbor Large Cap Value Fund returned 6.99%, ahead of its benchmark, the Russell 1000® Value Index, by 410 basis points. Harbor Mid Cap Growth Fund returned 7.06%, lagging its benchmark, the Russell Midcap® Growth Index, by 71 basis points, while Harbor Mid Cap Value Fund returned 4.87%, outperforming its Russell Midcap® Value Index benchmark by 104 basis points.
A rebound in international stocks, which had lagged behind U.S. equities in the prior fiscal year, also boosted Fund performance in the first half of fiscal 2015. Harbor International Fund returned 7.69%, outperforming its MSCI EAFE (ND) Index
45
Harbor Target Retirement 2050 Fund
MANAGERS’ COMMENTARY—Continued
benchmark by 88 basis points. Harbor International Growth Fund returned 7.75%, beating its MSCI All Country World Ex. US (ND) Index benchmark by 219 basis points. Harbor Global Growth Fund returned 3.92%, trailing its benchmark, the MSCI All Country World (ND) Index, by 105 basis points.
Fixed income funds in the portfolio all recorded positive results. Harbor Bond Fund posted a return of 2.17%, beating its Barclays U.S. Aggregate Bond Index benchmark by 11 basis points, while Harbor Unconstrained Bond Fund returned 0.31%, trailing the same index by 175 points. Harbor High-Yield Bond Fund returned 2.40%, outpacing its BofA Merrill Lynch U.S. Non-Distressed High Yield Index benchmark by 48 basis points.
Harbor Commodity Real Return Strategy Fund was the only area of the portfolio to finish in negative territory, posting a return of -13.07%. The Fund invests in commodity-linked derivative instruments backed by a portfolio of inflation-indexed bonds and other fixed income securities. The Fund trailed its Bloomberg Commodity Index Total ReturnSM benchmark by 120 basis points.
This report contains the current opinions of Harbor Capital Advisors, Inc. at the time of its publication and should not be considered as investment advice or a recommendation of any particular security, strategy or investment product. Such opinions are subject to change without notice and securities described herein may no longer be included in, or may at any time be removed from, the Fund’s portfolio. This report is distributed for informational purposes only. Information contained herein has been obtained from sources believed reliable, but not guaranteed.
The Fund invests in a variety of underlying Harbor funds that are subject to risks associated with their particular investment strategies. By investing in several underlying funds, the Fund has partial exposure to the risks of many different areas of the market. An investment in the Fund is not guaranteed. An investor may experience losses, including losses near, at, or after the target year. There is no guarantee that the Fund will provide adequate income at or after the target year. For information on the different share classes and the risks associated with an investment in the Fund, please refer to the current prospectus.
46
Harbor Target Retirement 2050 Fund
FUND SUMMARY—April 30, 2015 (Unaudited)
| | | | |
INSTITUTIONAL CLASS |
| | | | |
| Fund # | | | | 2609 |
| | |
| Cusip | | | | 411511157 |
| | |
| Ticker | | | | HAFFX |
| | |
| Inception Date | | | | 01/02/2009 |
| | |
| Net Expense Ratio | | | | 0.77%a |
| | |
| Total Net Assets (000s) | | | | $20,965 |
| | | | |
ADMINISTRATIVE CLASS |
| | | | |
| Fund # | | | | 2709 |
| | |
| Cusip | | | | 411511140 |
| | |
| Ticker | | | | HAGGX |
| | |
| Inception Date | | | | 01/02/2009 |
| | |
| Net Expense Ratio | | | | 0.77%a |
| | |
| Total Net Assets (000s) | | | | $22 |
| | | | |
INVESTOR CLASS |
| | | | |
| Fund # | | | | 2809 |
| | |
| Cusip | | | | 411511132 |
| | |
| Ticker | | | | HAHHX |
| | |
| Inception Date | | | | 01/02/2009 |
| | |
| Net Expense Ratio | | | | 0.77%a |
| | |
| Total Net Assets (000s) | | | | $23 |
ASSET ALLOCATION (% of Investments)
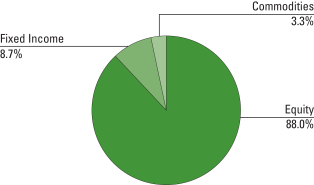
| | | | |
| |
Equity | | | | |
| |
Harbor International Fund | | | 19.9% | |
| |
Harbor International Growth Fund | | | 13.8% | |
| |
Harbor Large Cap Value Fund | | | 13.3% | |
| |
Harbor Capital Appreciation Fund | | | 11.2% | |
| |
Harbor Mid Cap Value Fund | | | 8.4% | |
| |
Harbor Small Cap Value Fund | | | 6.1% | |
| |
Harbor Mid Cap Growth Fund | | | 5.7% | |
| |
Harbor Small Cap Growth Fund | | | 5.0% | |
| |
Harbor Global Growth Fund | | | 4.6% | |
| | | | |
| |
Commodities | | | | |
| |
Harbor Commodity Real Return Strategy Fund | | | 3.3% | |
| |
Fixed Income | | | | |
| |
Harbor Bond Fund | | | 4.3% | |
| |
Harbor High-Yield Bond Fund | | | 3.5% | |
| |
Harbor Unconstrained Bond Fund | | | 0.9% | |
| a | Annualized. The Adviser has contractually agreed to limit the Fund’s operating expense to: (i) the amount of the acquired funds’ fees and expenses; (ii) compensation of the Independent Trustees; (iii) certain other expenses such as extraordinary items; and (iv) (a) for the Administrative and Investor Classes, distribution and service (12b-1) fees and (b) for the Investor Class, certain transfer agent fees. The net expense ratio shown will not correlate to the expense ratio shown in the Financial Highlights table because that ratio does not include the acquired funds’ fees and expenses. |
47
Harbor Target Retirement 2050 Fund
FUND PERFORMANCE SUMMARY (Unaudited)
Institutional Class
CHANGE IN A $50,000 INVESTMENT
For the period 01/02/2009 through 04/30/2015
| | |
The graph compares a $50,000 investment in the Fund with the performance of broad based market indices. The Fund’s performance includes the reinvestment of all dividend and capital gain distributions. | | 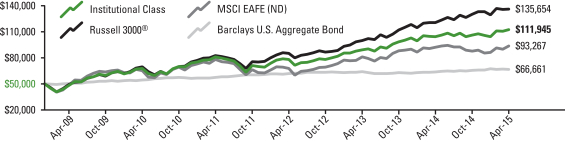 |
| | | | | | | | | | | | | | | | | | | | | | | | | | | | | | | | |
Total Returns For the periods ended 04/30/2015 | | | |
| Harbor Target Retirement 2050 Fund | | | | | | | | | | | | | | | | | | | | | | | | | | | | | | | | |
Institutional Class | | | 5.95% | | | | | | 7.65% | | | | | | 10.65% | | | | | | 13.59% | | | | | 01/02/2009 | | | | $ | 111,945 | |
| Comparative Indices | | | | | | | | | | | | | | | | | | | | | | | | | | | | | | | | |
Russell 3000® | | | 4.74% | | | | | | 12.74% | | | | | | 14.33% | | | | | | 17.09% | | | | | — | | | | $ | 135,654 | |
MSCI EAFE (ND) | | | 6.81% | | | | | | 1.66% | | | | | | 7.40% | | | | | | 10.36% | | | | | — | | | | $ | 93,267 | |
Barclays U.S. Aggregate Bond | | | 2.06% | | | | | | 4.46% | | | | | | 4.12% | | | | | | 4.65% | | | | | — | | | | $ | 66,661 | |
Administrative and Investor Classes
CHANGE IN A $10,000 INVESTMENT
For the period 01/02/2009 through 04/30/2015
| | |
The graph compares a $10,000 investment in the Fund with the performance of broad based market indices. The Fund’s performance includes the reinvestment of all dividend and capital gain distributions. | | 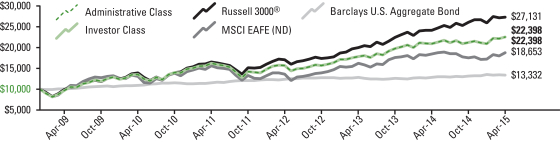 |
| | | | | | | | | | | | | | | | | | | | | | | | | | | | | | | | |
Total Returns For the periods ended 04/30/2015 | | | |
| Harbor Target Retirement 2050 Fund | | | | | | | | | | | | | | | | | | | | | | | | | | | | | | | | |
Administrative Class | | | 5.94% | | | | | | 7.64% | | | | | | 10.66% | | | | | | 13.60% | | | | | 01/02/2009 | | | | $ | 22,398 | |
Investor Class | | | 5.94% | | | | | | 7.64% | | | | | | 10.66% | | | | | | 13.60% | | | | | 01/02/2009 | | | | $ | 22,398 | |
| Comparative Indices | | | | | | | | | | | | | | | | | | | | | | | | | | | | | | | | |
Russell 3000® | | | 4.74% | | | | | | 12.74% | | | | | | 14.33% | | | | | | 17.09% | | | | | — | | | | $ | 27,131 | |
MSCI EAFE (ND) | | | 6.81% | | | | | | 1.66% | | | | | | 7.40% | | | | | | 10.36% | | | | | — | | | | $ | 18,653 | |
Barclays U.S. Aggregate Bond | | | 2.06% | | | | | | 4.46% | | | | | | 4.12% | | | | | | 4.65% | | | | | — | | | | $ | 13,332 | |
As stated in the Fund’s current prospectus, the expense ratios were 0.78% (Institutional Class), 1.03% (Administrative Class) and 1.15% (Investor Class). The Adviser has contractually agreed to limit the Fund’s operating expenses to: (i) the amount of the acquired funds’ fees and expenses; (ii) compensation of the Independent Trustees; (iii) certain other expenses such as extraordinary items; and (iv) (a) for the Administrative and Investor Classes, distribution and service (12b-1) fees and (b) for the Investor Class, certain transfer agent fees. The expense ratios in the prospectus may differ from the actual expense ratios for the period disclosed within this report. The expense ratios shown in the prospectus are based on the prior fiscal year, adjusted to reflect changes, if any, in contractual arrangements that occurred prior to the date of the prospectus.
Performance data shown represents past performance, which is no guarantee of future results. Current performance may be higher or lower than the past performance data shown. Investment returns and the value of an investment will fluctuate, and an investor’s shares, when sold, may be worth more or less than their original cost. You can obtain performance data current to the most recent month-end (available within seven business days after the most recent month-end) by calling 800-422-1050 or visiting harborfunds.com.
The returns shown do not reflect the deduction of taxes that a shareholder would pay on Fund distributions or on the redemption of Fund shares. From time to time, certain fees and/or expenses have been waived or reimbursed, which has resulted in higher returns. Without these waivers and reimbursements, the returns would have been lower. Voluntary waivers and reimbursements may be discontinued at any time without notice.
48
Harbor Target Retirement 2050 Fund†
PORTFOLIO OF INVESTMENTS—April 30, 2015 (Unaudited)
| | | | | | | | |
HARBOR EQUITY FUNDS—88.0% | |
| | |
| Shares | | | | | Value
(000s) | |
| | | | | | | | |
| | HARBOR DOMESTIC EQUITY FUNDS—49.7% | |
| | 37,431 | | | Harbor Capital Appreciation Fund | | $ | 2,341 | |
| | 116,149 | | | Harbor Mid Cap Growth Fund | | | 1,195 | |
| | 71,751 | | | Harbor Small Cap Growth Fund | | | 1,046 | |
| | 229,079 | | | Harbor Large Cap Value Fund | | | 2,793 | |
| | 84,223 | | | Harbor Mid Cap Value Fund | | | 1,767 | |
| | 47,188 | | | Harbor Small Cap Value Fund | | | 1,285 | |
| | | | | | | | |
| | | | | | | 10,427 | |
| | | | | | | | |
| | HARBOR INTERNATIONAL EQUITY FUNDS—38.3% | |
| | 58,347 | | | Harbor International Fund | | | 4,188 | |
| | 213,446 | | | Harbor International Growth Fund | | | 2,888 | |
| | 44,264 | | | Harbor Global Growth Fund | | | 975 | |
| | | | | | | | |
| | | | | | | 8,051 | |
| | | | | | | | |
| TOTAL HARBOR EQUITY FUNDS
(Cost $15,184) | | | 18,478 | |
| | | | | | | | |
| | | | | | | | |
HARBOR COMMODITY FUNDS—3.3% | |
| (Cost $880) | | | | |
| | 149,036 | | | Harbor Commodity Real Return Strategy Fund | | | 695 | |
| | | | | | | | |
HARBOR FIXED INCOME FUNDS—8.7% | |
| | |
| Shares | | | | | Value
(000s) | |
| | | | | | | | |
| | 17,706 | | | Harbor Unconstrained Bond Fund | | | 184 | |
| | 69,918 | | | Harbor High-Yield Bond Fund | | | 740 | |
| | 74,597 | | | Harbor Bond Fund | | | 913 | |
| | | | | | | | |
| TOTAL HARBOR FIXED INCOME FUNDS
(Cost $1,857) | | | 1,837 | |
| | | | | | | | |
| TOTAL INVESTMENTS—100.0%
(Cost $17,921) | | | 21,010 | |
| | | | | | | | |
| | CASH AND OTHER ASSETS, LESS LIABILITIES—0.0% | | | — | a |
| | | | | | | | |
| | TOTAL NET ASSETS—100.0% | | $ | 21,010 | |
| | | | | | | | |
FAIR VALUE MEASUREMENTS
All holdings at April 30, 2015 (as disclosed in the preceding Portfolio of Investments) are classified as Level 1. There were no Level 3 holdings at October 31, 2014 or April 30, 2015, and no transfers between levels during the period.
For more information on valuation inputs and their aggregation into the levels identified above, please refer to the Fair Value Measurements and Disclosures in Note 2 of the accompanying Notes to Financial Statements.
| † | The Harbor Target Retirement 2050 Fund is investing in Institutional Class shares of affiliated Harbor Funds. |
| a | Rounds to less than $1,000. |
The accompanying notes are an integral part of the Financial Statements.
49
Harbor Target Retirement 2055 Fund
MANAGERS’ COMMENTARY (Unaudited)
ADVISER
Harbor Capital Advisors, Inc.
111 South Wacker Drive
34th Floor
Chicago, IL 60606
PORTFOLIO MANAGERS
Brian L. Collins, CFA
Since 2014
Paul C. Herbert, CFA
Since 2014
Linda M. Molenda
Since 2014
David G. Van Hooser
Since 2014
Harbor Capital has managed the Fund since its inception
in 2014.
INVESTMENT OBJECTIVE
The Fund seeks capital appreciation and current income consistent with the Fund’s current asset allocation.
MARKET REVIEW
U.S. and international equity markets finished higher for the six months ended April 30, 2015. Fixed income investments recorded positive returns, while commodity prices posted a sharp decline.
U.S. equities returned 4.74% for the first half of fiscal 2015, as measured by the Russell 3000® Index. Growth stocks set the pace, with the Russell 3000® Growth Index posting a return of 6.59%, compared to 2.82% by the Russell 3000® Value Index. Mid cap stocks modestly outperformed both large caps and small caps. The S&P 500 Index returned 4.40%, with 8 of its 10 economic sectors posting positive returns. The Consumer Discretionary, Health Care, and Information Technology sectors were the best-performing areas of the index, while the Energy and Utilities sectors had negative returns.
International stocks, as measured by the MSCI EAFE (ND) Index, returned 6.81%, modestly outperforming U.S. equities. (All international and global returns are in U.S. dollars.) The index is a measure of stocks in developed markets outside the U.S. Eight of the 10 sectors within the index had positive returns, led by Consumer Discretionary, Information Technology, and Health Care stocks. Energy and Utilities were the only sectors to lose ground. Shares of companies based in developing economies also advanced, with the MSCI Emerging Markets (ND) Index registering a return of 3.92%.
Among fixed income investments, the broad U.S. investment-grade bond market returned 2.06%, as measured by the Barclays U.S. Aggregate Bond Index. Speculative-grade bonds, as measured by the BofA Merrill Lynch U.S. High-Yield Index, returned 1.51%. Inflation-linked bonds returned 1.28%, as measured by the Barclays U.S. TIPS Index, while the BofA Merrill Lynch 3-month U.S. Treasury Bill Index, a benchmark for money market returns, posted a return of 0.01%.
Following a decline over the prior 12 months, commodity prices fell further in the first half of fiscal 2015. The Bloomberg Commodity Index Total ReturnSM, an unmanaged index of futures contracts on a diversified group of physical commodities, returned -11.87%.
PERFORMANCE
Harbor Target Retirement 2055 Fund returned 6.45% (Institutional Class) and 6.34% (Administrative and Investor Classes) for the six months ended April 30, 2015. Underlying fund investments in U.S. stocks, international equities, and bonds all made positive contributions to Fund performance, while commodities lost ground.
U.S. stock markets were a key source of returns for the Fund, as all U.S. equity funds in the portfolio generated positive results. (All underlying fund returns cited are for the fund’s Institutional Class shares.) Harbor Small Cap Growth Fund returned 10.39%, the highest absolute return among all funds in the portfolio. It outperformed its benchmark, the Russell 2000® Growth Index, by 314 basis points, or 3.14 percentage points. Harbor Small Cap Value Fund returned 3.94%, outperforming its Russell 2000® Value Index benchmark by 189 basis points. Among funds focused primarily on larger U.S. companies, Harbor Capital Appreciation Fund returned 7.47%, beating its Russell 1000® Growth Index benchmark by 93 basis points, while Harbor Large Cap Value Fund returned 6.99%, ahead of its benchmark, the Russell 1000® Value Index, by 410 basis points. Harbor Mid Cap Growth Fund returned 7.06%, lagging its benchmark, the Russell Midcap® Growth Index, by 71 basis points, while Harbor Mid Cap Value Fund returned 4.87%, outperforming its Russell Midcap® Value Index benchmark by 104 basis points.
A rebound in international stocks, which had lagged behind U.S. equities in the prior fiscal year, also boosted Fund performance in the first half of fiscal 2015. Harbor International Fund returned 7.69%, outperforming its MSCI EAFE (ND) Index
50
Harbor Target Retirement 2055 Fund
MANAGERS’ COMMENTARY—Continued
benchmark by 88 basis points. Harbor International Growth Fund returned 7.75%, beating its MSCI All Country World Ex. US (ND) Index benchmark by 219 basis points. Harbor Global Growth Fund returned 3.92%, trailing its benchmark, the MSCI All Country World (ND) Index, by 105 basis points.
Fixed income funds in the portfolio all recorded positive results. Harbor Bond Fund posted a return of 2.17%, beating its Barclays U.S. Aggregate Bond Index benchmark by 11 basis points, while Harbor Unconstrained Bond Fund returned 0.31%, trailing the same index by 175 points. Harbor High-Yield Bond Fund returned 2.40%, outpacing its BofA Merrill Lynch U.S. Non-Distressed High Yield Index benchmark by 48 basis points.
Harbor Commodity Real Return Strategy Fund was the only area of the portfolio to finish in negative territory, posting a return of -13.07%. The Fund invests in commodity-linked derivative instruments backed by a portfolio of inflation-indexed bonds and other fixed income securities. The Fund trailed its Bloomberg Commodity Index Total ReturnSM benchmark by 120 basis points.
This report contains the current opinions of Harbor Capital Advisors, Inc. at the time of its publication and should not be considered as investment advice or a recommendation of any particular security, strategy or investment product. Such opinions are subject to change without notice and securities described herein may no longer be included in, or may at any time be removed from, the Fund’s portfolio. This report is distributed for informational purposes only. Information contained herein has been obtained from sources believed reliable, but not guaranteed.
The Fund invests in a variety of underlying Harbor funds that are subject to risks associated with their particular investment strategies. By investing in several underlying funds, the Fund has partial exposure to the risks of many different areas of the market. An investment in the Fund is not guaranteed. An investor may experience losses, including losses near, at, or after the target year. There is no guarantee that the Fund will provide adequate income at or after the target year. For information on the different share classes and the risks associated with an investment in the Fund, please refer to the current prospectus.
51
Harbor Target Retirement 2055 Fund
FUND SUMMARY—April 30, 2015 (Unaudited)
| | | | |
INSTITUTIONAL CLASS |
| | | | |
| Fund # | | | | 2610 |
| | |
| Cusip | | | | 411512635 |
| | |
| Ticker | | | | HATRX |
| | |
Inception
Date | | | | 11/01/2014 |
| | |
| Net Expense Ratio | | | | 0.77%a |
| | |
| Total Net Assets (000s) | | | | $413 |
| | | | |
ADMINISTRATIVE CLASS |
| | | | |
| Fund # | | | | 2710 |
| | |
| Cusip | | | | 411512627 |
| | |
| Ticker | | | | HATAX |
| | |
| Inception Date | | | | 11/01/2014 |
| | |
| Net Expense Ratio | | | | 0.77%a |
| | |
| Total Net Assets (000s) | | | | $11 |
| | | | |
INVESTOR CLASS |
| | | | |
| Fund # | | | | 2810 |
| | |
| Cusip | | | | 411512619 |
| | |
| Ticker | | | | HATTX |
| | |
| Inception Date | | | | 11/01/2014 |
| | |
| Net Expense Ratio | | | | 0.77%a |
| | |
| Total Net Assets (000s) | | | | $11 |
| a | Annualized. The Adviser has contractually agreed to limit the Fund’s operating expense to: (i) the amount of the acquired funds’ fees and expenses; (ii) compensation of the Independent Trustees; (iii) certain other expenses such as extraordinary items; and (iv) (a) for the Administrative and Investor Classes, distribution and service (12b-1) fees and (b) for the Investor Class, certain transfer agent fees. The net expense ratio shown will not correlate to the expense ratio shown in the Financial Highlights table because that ratio does not include the acquired funds’ fees and expenses. |
ASSET ALLOCATION (% of Investments)
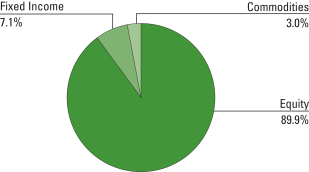
| | | | |
| |
Equity | | | | |
| |
Harbor International Fund | | | 20.0% | |
| |
Harbor International Growth Fund | | | 14.0% | |
| |
Harbor Large Cap Value Fund | | | 13.6% | |
| |
Harbor Capital Appreciation Fund | | | 11.3% | |
| |
Harbor Mid Cap Value Fund | | | 8.7% | |
| |
Harbor Small Cap Value Fund | | | 6.4% | |
| |
Harbor Mid Cap Growth Fund | | | 5.7% | |
| |
Harbor Small Cap Growth Fund | | | 5.3% | |
| |
Harbor Global Growth Fund | | | 4.9% | |
Commodities | | | | |
| |
Harbor Commodity Real Return Strategy Fund | | | 3.0% | |
| |
Fixed Income | | | | |
| |
Harbor Bond Fund | | | 3.7% | |
| |
Harbor High-Yield Bond Fund | | | 2.7% | |
| |
Harbor Unconstrained Bond Fund | | | 0.7% | |
52
Harbor Target Retirement 2055 Fund
FUND PERFORMANCE SUMMARY (Unaudited)
Institutional Class
CHANGE IN A $50,000 INVESTMENT
For the period 11/01/2014 through 04/30/2015
| | |
The graph compares a $50,000 investment in the Fund with the performance of broad based market indices. The Fund’s performance includes the reinvestment of all dividend and capital gain distributions. | | 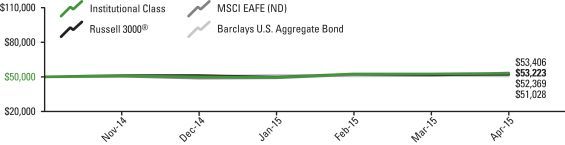 |
| | | | | | | | | | | | | | | | | | |
Total Returns For the periods ended 04/30/2015 | |  | |
| Harbor Target Retirement 2055 Fund | | | | | | | | | | | | | | | | | | |
Institutional Class | | | 6.45 | % | | N/A | | N/A | | | 6.45 | % | | 11/01/2014 | | $ | 53,223 | |
| Comparative Indices | | | | | | | | | | | | | | | | | | |
Russell 3000® | | | 4.74 | % | | N/A | | N/A | | | 4.74 | % | | — | | $ | 52,369 | |
MSCI EAFE (ND) | | | 6.81 | % | | N/A | | N/A | | | 6.81 | % | | — | | $ | 53,406 | |
Barclays U.S. Aggregate Bond | | | 2.06 | % | | N/A | | N/A | | | 2.06 | % | | — | | $ | 51,028 | |
Administrative and Investor Classes
CHANGE IN A $10,000 INVESTMENT
For the period 11/01/2014 through 04/30/2015
| | |
The graph compares a $10,000 investment in the Fund with the performance of broad based market indices. The Fund’s performance includes the reinvestment of all dividend and capital gain distributions. | | 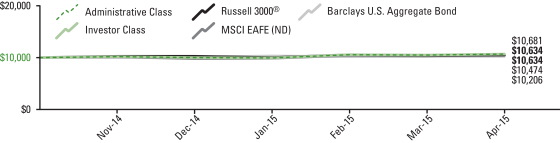 |
| | | | | | | | | | | | | | | | | | |
Total Returns For the periods ended 04/30/20145 | | | |
| Harbor Target Retirement 2055 Fund | | | | | | | | | | | | | | | | | | |
Administrative Class | | | 6.34 | % | | N/A | | N/A | | | 6.34 | % | | 11/01/2014 | | $ | 10,634 | |
Investor Class | | | 6.34 | % | | N/A | | N/A | | | 6.34 | % | | 11/01/2014 | | $ | 10,634 | |
| Comparative Indices | | | | | | | | | | | | | | | | | | |
Russell 3000® | | | 4.74 | % | | N/A | | N/A | | | 4.74 | % | | — | | $ | 10,474 | |
MSCI EAFE (ND) | | | 6.81 | % | | N/A | | N/A | | | 6.81 | % | | — | | $ | 10,681 | |
Barclays U.S. Aggregate Bond | | | 2.06 | % | | N/A | | N/A | | | 2.06 | % | | — | | $ | 10,206 | |
As stated in the Fund’s current prospectus, the expense ratios were 0.78% (Institutional Class), 1.03% (Administrative Class) and 1.15% (Investor Class). The Adviser has contractually agreed to limit the Fund’s operating expenses to: (i) the amount of the acquired funds’ fees and expenses; (ii) compensation of the Independent Trustees; (iii) certain other expenses such as extraordinary items; and (iv) (a) for the Administrative and Investor Classes, distribution and service (12b-1) fees and (b) for the Investor Class, certain transfer agent fees. The expense ratios in the prospectus may differ from the actual expense ratios for the period disclosed within this report. The expense ratios shown in the prospectus are based on the prior fiscal year, adjusted to reflect changes, if any, in contractual arrangements that occurred prior to the date of the prospectus.
Performance data shown represents past performance, which is no guarantee of future results. Current performance may be higher or lower than the past performance data shown. Investment returns and the value of an investment will fluctuate, and an investor’s shares, when sold, may be worth more or less than their original cost. You can obtain performance data current to the most recent month-end (available within seven business days after the most recent month-end) by calling 800-422-1050 or visiting harborfunds.com.
The returns shown do not reflect the deduction of taxes that a shareholder would pay on Fund distributions or on the redemption of Fund shares. From time to time, certain fees and/or expenses have been waived or reimbursed, which has resulted in higher returns. Without these waivers and reimbursements, the returns would have been lower. Voluntary waivers and reimbursements may be discontinued at any time without notice.
53
Harbor Target Retirement 2055 Fund†
PORTFOLIO OF INVESTMENTS—April 30, 2015 (Unaudited)
| | | | | | | | |
HARBOR EQUITY FUNDS—89.9% | |
| | |
| Shares | | | | | Value
(000s) | |
| | | | | | | | |
| | | | | | | | |
| | HARBOR DOMESTIC EQUITY FUNDS—51.0% | |
| | 789 | | | Harbor Capital Appreciation Fund | | $ | 49 | |
| | 2,457 | | | Harbor Mid Cap Growth Fund | | | 25 | |
| | 1,544 | | | Harbor Small Cap Growth Fund | | | 23 | |
| | 4,858 | | | Harbor Large Cap Value Fund | | | 59 | |
| | 1,808 | | | Harbor Mid Cap Value Fund | | | 38 | |
| | 1,015 | | | Harbor Small Cap Value Fund | | | 28 | |
| | | | | | | | |
| | | | | | | 222 | |
| | | | | | | | |
| | HARBOR INTERNATIONAL EQUITY FUNDS—38.9% | |
| | 1,218 | | | Harbor International Fund | | | 87 | |
| | 4,469 | | | Harbor International Growth Fund | | | 61 | |
| | 941 | | | Harbor Global Growth Fund | | | 21 | |
| | | | | | | | |
| | | | | | | 169 | |
| | | | | | | | |
| TOTAL HARBOR EQUITY FUNDS
(Cost $378) | | | 391 | |
| | | | | | | | |
| | | | | | | | |
HARBOR COMMODITY FUNDS—3.0% | |
| (Cost $13) | | | | |
| | 2,863 | | | Harbor Commodity Real Return Strategy Fund | | | 13 | |
| | | | | | | | |
HARBOR FIXED INCOME FUNDS—7.1% | |
| | |
| Shares | | | | | Value
(000s) | |
| | | | | | | | |
| | | | | | | | |
| | 295 | | | Harbor Unconstrained Bond Fund | | | 3 | |
| | 1,158 | | | Harbor High-Yield Bond Fund | | | 12 | |
| | 1,247 | | | Harbor Bond Fund | | | 16 | |
| | | | | | | | |
| TOTAL HARBOR FIXED INCOME FUNDS
(Cost $31) | | | 31 | |
| | | | | | | | |
| TOTAL INVESTMENTS—100.0%
(Cost $422) | | | 435 | |
| | | | | | | | |
| | CASH AND OTHER ASSETS, LESS LIABILITIES—(0.0)% | | | — | a |
| | | | | | | | |
| | TOTAL NET ASSETS—100.0% | | $ | 435 | |
| | | | | | | | |
FAIR VALUE MEASUREMENTS
All holdings at April 30, 2015 (as disclosed in the preceding Portfolio of Investments) are classified as Level 1. There were no Level 3 holdings at November 1, 2014 or April 30, 2015, and no transfers between levels during the period.
For more information on valuation inputs and their aggregation into the levels identified above, please refer to the Fair Value Measurements and Disclosures in Note 2 of the accompanying Notes to Financial Statements.
| † | The Harbor Target Retirement 2055 Fund is investing in Institutional Class shares of affiliated Harbor Funds. |
| a | Rounds to less than $1,000. |
The accompanying notes are an integral part of the Financial Statements.
54
Harbor Target Retirement Funds
STATEMENTS OF ASSETS AND LIABILITIES—April 30, 2015 (Unaudited)
(All amounts in thousands, except per share amounts)
| | | | | | | | | | | | | | | | | | | | | | | | | | | | | | | | | | | | | | | | |
| | | Harbor
Target
Retirement
Income
Fund | | | Harbor
Target
Retirement
2015
Fund | | | Harbor
Target
Retirement
2020
Fund | | | Harbor
Target
Retirement
2025
Fund | | | Harbor
Target
Retirement
2030
Fund | | | Harbor
Target
Retirement
2035
Fund | | | Harbor
Target
Retirement
2040
Fund | | | Harbor
Target
Retirement
2045
Fund | | | Harbor
Target
Retirement
2050
Fund | | | Harbor
Target
Retirement
2055
Fund | |
ASSETS | | | | | | | | | | | | | | | | | | | | | | | | | | | | | | | | | | | | | | | | |
Investments, at identified cost | | $ | 17,054 | | | $ | 10,656 | | | $ | 27,948 | | | $ | 11,097 | | | $ | 25,233 | | | $ | 8,983 | | | $ | 17,803 | | | $ | 4,555 | | | $ | 17,921 | | | $ | 422 | |
Investments in affiliated funds, at value | | $ | 17,106 | | | $ | 10,634 | | | $ | 28,628 | | | $ | 11,362 | | | $ | 26,979 | | | $ | 9,198 | | | $ | 20,081 | | | $ | 4,946 | | | $ | 21,010 | | | $ | 435 | |
Receivables for: | | | | | | | | | | | | | | | | | | | | | | | | | | | | | | | | | | | | | | | | |
Investments in affiliated funds sold | | | 4 | | | | — | | | | — | | | | — | | | | — | | | | — | | | | 40 | | | | — | | | | — | | | | — | |
Capital shares sold | | | 102 | | | | 31 | | | | — | | | | 51 | | | | — | | | | — | | | | — | | | | — | | | | 4 | | | | — | |
Total Assets | | | 17,212 | | | | 10,665 | | | | 28,628 | | | | 11,413 | | | | 26,979 | | | | 9,198 | | | | 20,121 | | | | 4,946 | | | | 21,014 | | | | 435 | |
LIABILITIES | | | | | | | | | | | | | | | | | | | | | | | | | | | | | | | | | | | | | | | | |
Payables for: | | | | | | | | | | | | | | | | | | | | | | | | | | | | | | | | | | | | | | | | |
Investments in affiliated funds purchased | | | — | | | | — | | | | — | | | | — | | | | — | | | | — | | | | — | | | | — | | | | 2 | | | | — | |
Capital shares reacquired | | | 106 | | | | 31 | | | | — | | | | 51 | | | | — | | | | — | | | | 40 | | | | — | | | | 2 | | | | — | |
Total Liabilities | | | 106 | | | | 31 | | | | — | | | | 51 | | | | — | | | | — | | | | 40 | | | | — | | | | 4 | | | | — | |
NET ASSETS | | $ | 17,106 | | | $ | 10,634 | | | $ | 28,628 | | | $ | 11,362 | | | $ | 26,979 | | | $ | 9,198 | | | $ | 20,081 | | | $ | 4,946 | | | $ | 21,010 | | | $ | 435 | |
Net Assets Consist of: | | | | | | | | | | | | | | | | | | | | | | | | | | | | | | | | | | | | | | | | |
Paid-in capital | | $ | 16,778 | | | $ | 10,530 | | | $ | 26,854 | | | $ | 10,845 | | | $ | 24,317 | | | $ | 8,732 | | | $ | 16,790 | | | $ | 4,354 | | | $ | 16,588 | | | $ | 418 | |
Accumulated undistributed net investment income/(loss) | | | (31 | ) | | | (1 | ) | | | (5 | ) | | | (2 | ) | | | (15 | ) | | | (8 | ) | | | (39 | ) | | | (13 | ) | | | (67 | ) | | | — | |
Accumulated net realized gain/(loss) | | | 307 | | | | 127 | | | | 1,099 | | | | 254 | | | | 931 | | | | 259 | | | | 1,052 | | | | 214 | | | | 1,400 | | | | 4 | |
Unrealized appreciation/(depreciation) of investments | | | 52 | | | | (22 | ) | | | 680 | | | | 265 | | | | 1,746 | | | | 215 | | | | 2,278 | | | | 391 | | | | 3,089 | | | | 13 | |
| | | $ | 17,106 | | | $ | 10,634 | | | $ | 28,628 | | | $ | 11,362 | | | $ | 26,979 | | | $ | 9,198 | | | $ | 20,081 | | | $ | 4,946 | | | $ | 21,010 | | | $ | 435 | |
NET ASSET VALUE PER SHARE BY CLASS | | | | | | | | | | | | | | | | | | | | | | | | | |
Institutional Class | | | | | | | | | | | | | | | | | | | | | | | | | | | | | | | | | | | | | |
Net assets | | $ | 17,075 | | | $ | 10,600 | | | $ | 28,592 | | | $ | 11,325 | | | $ | 26,940 | | | $ | 9,158 | | | $ | 20,039 | | | $ | 4,902 | | | $ | 20,965 | | | $ | 413 | |
Shares of beneficial interest1 | | | 1,804 | | | | 961 | | | | 2,795 | | | | 890 | | | | 2,833 | | | | 651 | | | | 2,134 | | | | 331 | | | | 1,940 | | | | 39 | |
Net asset value per share2 | | $ | 9.47 | | | $ | 11.04 | | | $ | 10.23 | | | $ | 12.72 | | | $ | 9.51 | | | $ | 14.06 | | | $ | 9.39 | | | $ | 14.81 | | | $ | 10.81 | | | $ | 10.49 | |
Administrative Class | | | | | | | | | | | | | | | | | | | | | | | | | | | | | | | | | | | | | |
Net assets | | $ | 15 | | | $ | 17 | | | $ | 18 | | | $ | 19 | | | $ | 19 | | | $ | 20 | | | $ | 21 | | | $ | 22 | | | $ | 22 | | | $ | 11 | |
Shares of beneficial interest1 | | | 2 | | | | 1 | | | | 2 | | | | 1 | | | | 2 | | | | 1 | | | | 2 | | | | 1 | | | | 2 | | | | 1 | |
Net asset value per share2 | | $ | 9.46 | | | $ | 11.03 | | | $ | 10.23 | | | $ | 12.72 | | | $ | 9.51 | | | $ | 14.05 | | | $ | 9.40 | | | $ | 14.81 | | | $ | 10.82 | | | $ | 10.48 | |
Investor Class | | | | | | | | | | | | | | | | | | | | | | | | | | | | | | | | | | | | | | | | |
Net assets | | $ | 16 | | | $ | 17 | | | $ | 18 | | | $ | 18 | | | $ | 20 | | | $ | 20 | | | $ | 21 | | | $ | 22 | | | $ | 23 | | | $ | 11 | |
Shares of beneficial interest1 | | | 2 | | | | 1 | | | | 2 | | | | 1 | | | | 2 | | | | 1 | | | | 2 | | | | 1 | | | | 2 | | | | 1 | |
Net asset value per share2 | | $ | 9.46 | | | $ | 11.04 | | | $ | 10.23 | | | $ | 12.72 | | | $ | 9.51 | | | $ | 14.05 | | | $ | 9.40 | | | $ | 14.81 | | | $ | 10.82 | | | $ | 10.48 | |
| 1 | Par value $0.01 (unlimited authorizations). |
| 2 | Per share amounts can be recalculated to the amounts disclosed herein when total net assets and shares of beneficial interest are not rounded to thousands. |
The accompanying notes are an integral part of the Financial Statements.
55
Harbor Target Retirement Funds
STATEMENTS OF OPERATIONS—Six Months Ended April 30, 2015 (Unaudited)
(All amounts in thousands)
| | | | | | | | | | | | | | | | | | | | | | | | | | | | | | | | | | | | | | | | |
| | | | | | | | | | |
| | | Harbor
Target
Retirement
Income
Fund | | | Harbor
Target
Retirement
2015
Fund | | | Harbor
Target
Retirement
2020
Fund | | | Harbor
Target
Retirement
2025
Fund | | | Harbor
Target
Retirement
2030
Fund | | | Harbor
Target
Retirement
2035
Fund | | | Harbor
Target
Retirement
2040
Fund | | | Harbor
Target
Retirement
2045
Fund | | | Harbor
Target
Retirement
2050
Fund | | | Harbor
Target
Retirement
2055
Fund | |
Investment Income | | | | | | | | | | | | | | | | | | | | | | | | | | | | | | | | | | | | | | | | |
Dividends from affiliated funds | | $ | 420 | | | $ | 241 | | | $ | 648 | | | $ | 219 | | | $ | 452 | | | $ | 127 | | | $ | 274 | | | $ | 55 | | | $ | 227 | | | $ | 1 | |
Total Investment Income | | | 420 | | | | 241 | | | | 648 | | | | 219 | | | | 452 | | | | 127 | | | | 274 | | | | 55 | | | | 227 | | | | 1 | |
Operating Expenses | | | | | | | | | | | | | | | | | | | | | | | | | | | | | | | | | | | | | | | | |
12b-1 fees: | | | | | | | | | | | | | | | | | | | | | | | | | | | | | | | | | | | | | | | | |
Administrative Classa | | | — | | | | — | | | | — | | | | — | | | | — | | | | — | | | | — | | | | — | | | | — | | | | — | |
Investor Classa | | | — | | | | — | | | | — | | | | — | | | | — | | | | — | | | | — | | | | — | | | | — | | | | — | |
Transfer agent fees: | | | | | | | | | | | | | | | | | | | | | | | | | | | | | | | | | | | | | | | | |
Investor Classa | | | — | | | | — | | | | — | | | | — | | | | — | | | | — | | | | — | | | | — | | | | — | | | | — | |
Total expensesa | | | — | | | | — | | | | — | | | | — | | | | — | | | | — | | | | — | | | | — | | | | — | | | | — | |
Expenses waiveda | | | — | | | | — | | | | — | | | | — | | | | — | | | | — | | | | — | | | | — | | | | — | | | | — | |
Net expenses | | | — | | | | — | | | | — | | | | — | | | | — | | | | — | | | | — | | | | — | | | | — | | | | — | |
Net Investment Income/(Loss) | | | 420 | | | | 241 | | | | 648 | | | | 219 | | | | 452 | | | | 127 | | | | 274 | | | | 55 | | | | 227 | | | | 1 | |
Realized and Change in Net Unrealized Gain/(Loss) on Investment Transactions | | | | | | | | | | | | | | | | | | | | | | | | | | | | | | | | | | | | | | | | |
Net realized gain/(loss) on: | | | | | | | | | | | | | | | | | | | | | | | | | | | | | | | | | | | | | | | | |
Sale of affiliated funds | | | 108 | | | | 39 | | | | 674 | | | | 96 | | | | 382 | | | | 70 | | | | 482 | | | | 63 | | | | 644 | | | | — | |
Distributions received from affiliated funds | | | 264 | | | | 216 | | | | 657 | | | | 256 | | | | 686 | | | | 246 | | | | 655 | | | | 167 | | | | 840 | | | | 4 | |
Change in net unrealized appreciation/(depreciation) on: | | | | | | | | | | | | | | | | | | | | | | | | | | | | | | | | | | | | | | | | |
Affiliated funds | | | (379 | ) | | | (213 | ) | | | (1,059 | ) | | | (210 | ) | | | (546 | ) | | | (86 | ) | | | (511 | ) | | | (49 | ) | | | (545 | ) | | | 13 | |
Net gain/(loss) on investment transactions | | | (7 | ) | | | 42 | | | | 272 | | | | 142 | | | | 522 | | | | 230 | | | | 626 | | | | 181 | | | | 939 | | | | 17 | |
Net Increase/(Decrease) in Net Assets Resulting from Operations | | $ | 413 | | | $ | 283 | | | $ | 920 | | | $ | 361 | | | $ | 974 | | | $ | 357 | | | $ | 900 | | | $ | 236 | | | $ | 1,166 | | | $ | 18 | |
| a | Rounds to less than $1,000. |
The accompanying notes are an integral part of the Financial Statements.
56
Harbor Target Retirement Funds
STATEMENTS OF CHANGES IN NET ASSETS
(All amounts in thousands)
| | | | | | | | | | | | | | | | | | | | | | | | | | | | | | | | |
| | | Harbor
Target Retirement
Income Fund | | | Harbor
Target Retirement
2015 Fund | | | Harbor
Target Retirement
2020 Fund | | | Harbor
Target Retirement
2025 Fund | |
| | | November 1,
2014
through
April 30,
2015 | | | November 1,
2013
through
October 31,
2014 | | | November 1,
2014
through
April 30,
2015 | | | November 1,
2013
through
October 31,
2014 | | | November 1,
2014
through
April 30,
2015 | | | November 1,
2013
through
October 31,
2014 | | | November 1,
2014
through
April 30,
2015 | | | November 1,
2013
through
October 31,
2014 | |
INCREASE/(DECREASE) IN NET ASSETS | | | (Unaudited) | | | | | | | | (Unaudited) | | | | | | | | (Unaudited) | | | | | | | | (Unaudited) | | | | | |
Operations: | | | | | | | | | | | | | | | | | | | | | | | | | | | | | | | | |
Net investment income/(loss) | | $ | 420 | | | $ | 328 | | | $ | 241 | | | $ | 263 | | | $ | 648 | | | $ | 637 | | | $ | 219 | | | $ | 213 | |
Net realized gain/(loss) on sale of affiliated funds | | | 108 | | | | 290 | | | | 39 | | | | 377 | | | | 674 | | | | 641 | | | | 96 | | | | 440 | |
Realized gain distributions received from affiliated funds | | | 264 | | | | 259 | | | | 216 | | | | 238 | | | | 657 | | | | 582 | | | | 256 | | | | 204 | |
Change in net unrealized appreciation/(depreciation) on affiliated funds | | | (379 | ) | | | (208 | ) | | | (213 | ) | | | (312 | ) | | | (1,059 | ) | | | (427 | ) | | | (210 | ) | | | (304 | ) |
Net increase/(decrease) in assets resulting from operations | | | 413 | | | | 669 | | | | 283 | | | | 566 | | | | 920 | | | | 1,433 | | | | 361 | | | | 553 | |
Distributions to Shareholders | | | | | | | | | | | | | | | | | | | | | | | | | | | | | | | | |
Net investment income: | | | | | | | | | | | | | | | | | | | | | | | | | | | | | | | | |
Institutional Class | | | (466 | ) | | | (432 | ) | | | (373 | ) | | | (327 | ) | | | (972 | ) | | | (783 | ) | | | (327 | ) | | | (247 | ) |
Administrative Class | | | — | | | | — | | | | — | | | | — | | | | — | | | | (1 | ) | | | — | | | | (1 | ) |
Investor Class | | | — | | | | (1 | ) | | | (1 | ) | | | — | | | | — | | | | — | | | | (1 | ) | | | — | |
Net realized gain on investments: | | | | | | | | | | | | | | | | | | | | | | | | | | | | | | | | |
Institutional Class | | | (441 | ) | | | (335 | ) | | | (511 | ) | | | (428 | ) | | | (1,066 | ) | | | (957 | ) | | | (607 | ) | | | (201 | ) |
Administrative Class | | | (1 | ) | | | — | | | | (1 | ) | | | (1 | ) | | | (1 | ) | | | — | | | | (1 | ) | | | — | |
Investor Class | | | — | | | | — | | | | (1 | ) | | | (1 | ) | | | (1 | ) | | | — | | | | (1 | ) | | | — | |
Total distributions to shareholders | | | (908 | ) | | | (768 | ) | | | (887 | ) | | | (757 | ) | | | (2,040 | ) | | | (1,741 | ) | | | (937 | ) | | | (449 | ) |
Net Increase/(Decrease) Derived from Capital Share Transactions | | | 161 | | | | 2,000 | | | | 4 | | | | 739 | | | | (1,411 | ) | | | 4,037 | | | | 1,290 | | | | 1,782 | |
Net increase/(decrease) in net assets | | | (334 | ) | | | 1,901 | | | | (600 | ) | | | 548 | | | | (2,531 | ) | | | 3,729 | | | | 714 | | | | 1,886 | |
Net Assets | | | | | | | | | | | | | | | | | | | | | | | | | | | | | | | | |
Beginning of period | | | 17,440 | | | | 15,539 | | | | 11,234 | | | | 10,686 | | | | 31,159 | | | | 27,430 | | | | 10,648 | | | | 8,762 | |
End of period* | | $ | 17,106 | | | $ | 17,440 | | | $ | 10,634 | | | $ | 11,234 | | | $ | 28,628 | | | $ | 31,159 | | | $ | 11,362 | | | $ | 10,648 | |
* Includes accumulated undistributed net investment income/(loss) of: | | $ | (31 | ) | | $ | 15 | | | $ | (1 | ) | | $ | 132 | | | $ | (5 | ) | | $ | 319 | | | $ | (2 | ) | | $ | 107 | |
The accompanying notes are an integral part of the Financial Statements.
57
| | | | | | | | | | | | | | | | | | | | | | | | | | | | | | | | | | | | | | | | | | |
Harbor
Target Retirement
2030 Fund | | | Harbor
Target Retirement
2035 Fund | | | Harbor
Target Retirement
2040 Fund | | | Harbor
Target Retirement
2045 Fund | | | Harbor
Target Retirement
2050 Fund | | | Harbor
Target Retirement
2055 Fund | |
November 1,
2014
through
April 30,
2015 | | | November 1,
2013
through
October 31,
2014 | | | November 1,
2014
through
April 30,
2015 | | | November 1,
2013
through
October 31,
2014 | | | November 1,
2014
through
April 30,
2015 | | | November 1,
2013
through
October 31,
2014 | | | November 1,
2014
through
April 30,
2015 | | | November 1,
2013
through
October 31,
2014 | | | November 1,
2014
through
April 30,
2015 | | | November 1,
2013
through
October 31,
2014 | | | November 1,
2014
through
April 30,
2015 | |
| | (Unaudited) | | | | | | | | (Unaudited) | | | | | | | | (Unaudited) | | | | | | | | (Unaudited) | | | | | | | | (Unaudited) | | | | | | | | (Unaudited) | |
| | | | | | | | | | | | | | | | | | | | | | | | | | | | | | | | | | | | | | | | | | |
| $ | 452 | | | $ | 486 | | | $ | 127 | | | $ | 115 | | | $ | 274 | | | $ | 302 | | | $ | 55 | | | $ | 53 | | | $ | 227 | | | $ | 240 | | | $ | 1 | |
| | | | | | | | | | |
| | 382 | | | | 1,045 | | | | 70 | | | | 427 | | | | 482 | | | | 886 | | | | 63 | | | | 141 | | | | 644 | | | | 1,309 | | | | — | |
| | | | | | | | | | |
| | 686 | | | | 580 | | | | 246 | | | | 143 | | | | 655 | | | | 530 | | | | 167 | | | | 113 | | | | 840 | | | | 659 | | | | 4 | |
| | | | | | | | | | |
| | (546 | ) | | | (760 | ) | | | (86 | ) | | | (348 | ) | | | (511 | ) | | | (474 | ) | | | (49 | ) | | | (51 | ) | | | (545 | ) | | | (733 | ) | | | 13 | |
| | | | | | | | | | | | | | | | | | | | | | | | | | | | | | | | | | | | | | | | | | |
| | 974 | | | | 1,351 | | | | 357 | | | | 337 | | | | 900 | | | | 1,244 | | | | 236 | | | | 256 | | | | 1,166 | | | | 1,475 | | | | 18 | |
| | | | | | | | | | | | | | | | | | | | | | | | | | | | | | | | | | | | | | | | | | |
| | | | | | | | | | | | | | | | | | | | | | | | | | | | | | | | | | | | | | | | | | |
| | (687 | ) | | | (618 | ) | | | (192 | ) | | | (121 | ) | | | (422 | ) | | | (413 | ) | | | (82 | ) | | | (72 | ) | | | (340 | ) | | | (381 | ) | | | (1 | ) |
| | (1 | ) | | | (1 | ) | | | — | | | | (1 | ) | | | (1 | ) | | | — | | | | — | | | | (1 | ) | | | (1 | ) | | | (1 | ) | | | — | |
| | (1 | ) | | | — | | | | — | | | | (1 | ) | | | — | | | | — | | | | — | | | | (1 | ) | | | — | | | | — | | | | — | |
| | | | | | | | | | | | | | | | | | | | | | | | | | | | | | | | | | | | | | | | | | |
| | (1,450 | ) | | | (1,098 | ) | | | (547 | ) | | | (52 | ) | | | (1,261 | ) | | | (1,030 | ) | | | (229 | ) | | | (93 | ) | | | (1,784 | ) | | | (1,100 | ) | | | — | |
| | (1 | ) | | | — | | | | (2 | ) | | | — | | | | (1 | ) | | | (1 | ) | | | (1 | ) | | | — | | | | (2 | ) | | | (1 | ) | | | — | |
| | (1 | ) | | | (1 | ) | | | (2 | ) | | | — | | | | (1 | ) | | | (1 | ) | | | (1 | ) | | | (1 | ) | | | (2 | ) | | | (1 | ) | | | — | |
| | (2,141 | ) | | | (1,718 | ) | | | (743 | ) | | | (175 | ) | | | (1,686 | ) | | | (1,445 | ) | | | (313 | ) | | | (168 | ) | | | (2,129 | ) | | | (1,484 | ) | | | (1 | ) |
| | | | | | | | | | | | | | | | | | | | | | | | | | | | | | | | | | | | | | | | | | |
| | 3,381 | | | | 1,102 | | | | 1,837 | | | | 2,151 | | | | 1,894 | | | | 1,173 | | | | 742 | | | | 814 | | | | 1,497 | | | | 1,276 | | | | 418 | |
| | 2,214 | | | | 735 | | | | 1,451 | | | | 2,313 | | | | 1,108 | | | | 972 | | | | 665 | | | | 902 | | | | 534 | | | | 1,267 | | | | 435 | |
| | | | | | | | | | | | | | | | | | | | | | | | | | | | | | | | | | | | | | | | | | |
| | 24,765 | | | | 24,030 | | | | 7,747 | | | | 5,434 | | | | 18,973 | | | | 18,001 | | | | 4,281 | | | | 3,379 | | | | 20,476 | | | | 19,209 | | | | — | |
| $ | 26,979 | | | $ | 24,765 | | | $ | 9,198 | | | $ | 7,747 | | | $ | 20,081 | | | $ | 18,973 | | | $ | 4,946 | | | $ | 4,281 | | | $ | 21,010 | | | $ | 20,476 | | | $ | 435 | |
| | | | | | | | | | |
| $ | (15 | ) | | $ | 222 | | | $ | (8 | ) | | $ | 57 | | | $ | (39 | ) | | $ | 110 | | | $ | (13 | ) | | $ | 14 | | | $ | (67 | ) | | $ | 47 | | | $ | — | |
58
Harbor Target Retirement Funds
STATEMENTS OF CHANGES IN NET ASSETS—CAPITAL STOCK ACTIVITY
(All amounts in thousands)
| | | | | | | | | | | | | | | | | | | | | | | | | | | | | | | | |
| | | Harbor
Target Retirement
Income Fund | | | Harbor
Target Retirement
2015 Fund | | | Harbor
Target Retirement
2020 Fund | | | Harbor
Target Retirement
2025 Fund | |
| | | November 1,
2014
through
April 30,
2015 | | | November 1,
2013
through
October 31,
2014 | | | November 1,
2014
through
April 30,
2015 | | | November 1,
2013
through
October 31,
2014 | | | November 1,
2014
through
April 30,
2015 | | | November 1,
2013
through
October 31,
2014 | | | November 1,
2014
through
April 30,
2015 | | | November 1,
2013
through
October 31,
2014 | |
| | | (Unaudited) | | | | | | | | (Unaudited) | | | | | | | | (Unaudited) | | | | | | | | (Unaudited) | | | | | |
AMOUNT ($) | | | | | | | | | | | | | | | | | | | | | | | | | | | | | | | | |
Institutional Class | | | | | | | | | | | | | | | | | | | | | | | | | | | | | | | | |
Net proceeds from sale of shares | | $ | 1,012 | | | $ | 4,009 | | | $ | 546 | | | $ | 4,879 | | | $ | 2,503 | | | $ | 7,349 | | | $ | 1,426 | | | $ | 4,116 | |
Reinvested distributions | | | 907 | | | | 765 | | | | 885 | | | | 755 | | | | 2,038 | | | | 1,739 | | | | 933 | | | | 448 | |
Cost of shares reacquired | | | (1,759 | ) | | | (2,775 | ) | | | (1,429 | ) | | | (4,897 | ) | | | (5,954 | ) | | | (5,052 | ) | | | (1,072 | ) | | | (2,783 | ) |
Net increase/(decrease) in net assets | | $ | 160 | | | $ | 1,999 | | | $ | 2 | | | $ | 737 | | | $ | (1,413 | ) | | $ | 4,036 | | | $ | 1,287 | | | $ | 1,781 | |
Administrative Class | | | | | | | | | | | | | | | | | | | | | | | | | | | | | | | | |
Net proceeds from sale of shares | | $ | — | | | $ | — | | | $ | — | | | $ | — | | | $ | — | | | $ | — | | | $ | — | | | $ | — | |
Reinvested distributions | | | 1 | | | | — | | | | 1 | | | | 1 | | | | 1 | | | | 1 | | | | 1 | | | | 1 | |
Net increase/(decrease) in net assets | | $ | 1 | | | $ | — | | | $ | 1 | | | $ | 1 | | | $ | 1 | | | $ | 1 | | | $ | 1 | | | $ | 1 | |
Investor Class | | | | | | | | | | | | | | | | | | | | | | | | | | | | | | | | |
Net proceeds from sale of shares | | $ | — | | | $ | — | | | $ | — | | | $ | — | | | $ | — | | | $ | — | | | $ | — | | | $ | — | |
Reinvested distributions | | | — | | | | 1 | | | | 1 | | | | 1 | | | | 1 | | | | — | | | | 2 | | | | — | |
Net increase/(decrease) in net assets | | $ | — | | | $ | 1 | | | $ | 1 | | | $ | 1 | | | $ | 1 | | | $ | — | | | $ | 2 | | | $ | — | |
SHARES | | | | | | | | | | | | | | | | | | | | | | | | | | | | | | | | |
Institutional Class | | | | | | | | | | | | | | | | | | | | | | | | | | | | | | | | |
Shares sold | | | 107 | | | | 413 | | | | 50 | | | | 417 | | | | 246 | | | | 694 | | | | 112 | | | | 309 | |
Shares issued due to reinvestment of distributions | | | 98 | | | | 80 | | | | 83 | | | | 67 | | | | 207 | | | | 171 | | | | 76 | | | | 35 | |
Shares reacquired | | | (186 | ) | | | (285 | ) | | | (131 | ) | | | (423 | ) | | | (585 | ) | | | (481 | ) | | | (86 | ) | | | (206 | ) |
Net increase/(decrease) in shares outstanding | | | 19 | | | | 208 | | | | 2 | | | | 61 | | | | (132 | ) | | | 384 | | | | 102 | | | | 138 | |
Beginning of period | | | 1,785 | | | | 1,577 | | | | 959 | | | | 898 | | | | 2,927 | | | | 2,543 | | | | 788 | | | | 650 | |
End of period | | | 1,804 | | | | 1,785 | | | | 961 | | | | 959 | | | | 2,795 | | | | 2,927 | | | | 890 | | | | 788 | |
Administrative Class | | | | | | | | | | | | | | | | | | | | | | | | | | | | | | | | |
Shares sold | | | — | | | | — | | | | — | | | | — | | | | — | | | | — | | | | — | | | | — | |
Shares issued due to reinvestment of distributions | | | — | | | | 1 | | | | — | | | | — | | | | — | | | | 1 | | | | — | | | | — | |
Net increase/(decrease) in shares outstanding | | | — | | | | 1 | | | | — | | | | — | | | | — | | | | 1 | | | | — | | | | — | |
Beginning of period | | | 2 | | | | 1 | | | | 1 | | | | 1 | | | | 2 | | | | 1 | | | | 1 | | | | 1 | |
End of period | | | 2 | | | | 2 | | | | 1 | | | | 1 | | | | 2 | | | | 2 | | | | 1 | | | | 1 | |
Investor Class | | | | | | | | | | | | | | | | | | | | | | | | | | | | | | | | |
Shares sold | | | — | | | | — | | | | — | | | | — | | | | — | | | | — | | | | — | | | | — | |
Shares issued due to reinvestment of distributions | | | — | | | | 1 | | | | — | | | | — | | | | — | | | | 1 | | | | — | | | | — | |
Net increase/(decrease) in shares outstanding | | | — | | | | 1 | | | | — | | | | — | | | | — | | | | 1 | | | | — | | | | — | |
Beginning of period | | | 2 | | | | 1 | | | | 1 | | | | 1 | | | | 2 | | | | 1 | | | | 1 | | | | 1 | |
End of period | | | 2 | | | | 2 | | | | 1 | | | | 1 | | | | 2 | | | | 2 | | | | 1 | | | | 1 | |
The accompanying notes are an integral part of the Financial Statements.
59
| | | | | | | | | | | | | | | | | | | | | | | | | | | | | | | | | | | | | | | | | | |
Harbor
Target Retirement
2030 Fund | | | Harbor
Target Retirement
2035 Fund | | | Harbor
Target Retirement
2040 Fund | | | Harbor
Target Retirement
2045 Fund | | | Harbor
Target Retirement
2050 Fund | | | Harbor
Target Retirement
2055 Fund | |
November 1,
2014
through
April 30,
2015 | | | November 1,
2013
through
October 31,
2014 | | | November 1,
2014
through
April 30,
2015 | | | November 1,
2013
through
October 31,
2014 | | | November 1,
2014
through
April 30,
2015 | | | November 1,
2013
through
October 31,
2014 | | | November 1,
2014
through
April 30,
2015 | | | November 1,
2013
through
October 31,
2014 | | | November 1,
2014
through
April 30,
2015 | | | November 1,
2013
through
October 31,
2014 | | | November 1,
2014
through
April 30,
2015 | |
| | (Unaudited) | | | | | | | | (Unaudited) | | | | | | | | (Unaudited) | | | | | | | | (Unaudited) | | | | | | | | (Unaudited) | | | | | | | | (Unaudited) | |
| | | | | | | | | | | | | | | | | | | | | | | | | | | | | | | | | | | | | | | | | | |
| | | | | | | | | | | | | | | | | | | | | | | | | | | | | | | | | | | | | | | | | | |
| $ | 3,501 | | | $ | 4,596 | | | $ | 1,441 | | | $ | 4,352 | | | $ | 1,930 | | | $ | 3,175 | | | $ | 740 | | | $ | 1,338 | | | $ | 1,644 | | | $ | 4,016 | | | $ | 408 | |
| | 2,137 | | | | 1,716 | | | | 739 | | | | 173 | | | | 1,683 | | | | 1,442 | | | | 311 | | | | 165 | | | | 2,124 | | | | 1,481 | | | | 1 | |
| | (2,261 | ) | | | (5,212 | ) | | | (347 | ) | | | (2,376 | ) | | | (1,722 | ) | | | (3,446 | ) | | | (311 | ) | | | (691 | ) | | | (2,275 | ) | | | (4,223 | ) | | | (11 | ) |
| $ | 3,377 | | | $ | 1,100 | | | $ | 1,833 | | | $ | 2,149 | | | $ | 1,891 | | | $ | 1,171 | | | $ | 740 | | | $ | 812 | | | $ | 1,493 | | | $ | 1,274 | | | $ | 398 | |
| | | | | | | | | | | | | | | | | | | | | | | | | | | | | | | | | | | | | | | | | | |
| $ | — | | | $ | — | | | $ | — | | | $ | — | | | $ | — | | | $ | — | | | $ | — | | | $ | — | | | $ | — | | | $ | — | | | $ | 10 | |
| | 2 | | | | 1 | | | | 2 | | | | 1 | | | | 2 | | | | 1 | | | | 1 | | | | 1 | | | | 2 | | | | 1 | | | | — | |
| $ | 2 | | | $ | 1 | | | $ | 2 | | | $ | 1 | | | $ | 2 | | | $ | 1 | | | $ | 1 | | | $ | 1 | | | $ | 2 | | | $ | 1 | | | $ | 10 | |
| | | | | | | | | | | | | | | | | | | | | | | | | | | | | | | | | | | | | | | | | | |
| $ | — | | | $ | — | | | $ | — | | | $ | — | | | $ | — | | | $ | — | | | $ | — | | | $ | — | | | $ | — | | | $ | — | | | $ | 10 | |
| | 2 | | | | 1 | | | | 2 | | | | 1 | | | | 1 | | | | 1 | | | | 1 | | | | 1 | | | | 2 | | | | 1 | | | | — | |
| $ | 2 | | | $ | 1 | | | $ | 2 | | | $ | 1 | | | $ | 1 | | | $ | 1 | | | $ | 1 | | | $ | 1 | | | $ | 2 | | | $ | 1 | | | $ | 10 | |
| | | | | | | | | | | | | | | | | | | | | | | | | | | | | | | | | | | | | | | | | | |
| | | | | | | | | | | | | | | | | | | | | | | | | | | | | | | | | | | | | | | | | | |
| | 374 | | | | 461 | | | | 104 | | | | 294 | | | | 209 | | | | 324 | | | | 51 | | | | 89 | | | | 155 | | | | 355 | | | | 40 | |
|
234 |
| | | 179 | | | | 55 | | | | 12 | | | | 188 | | | | 155 | | | | 22 | | | | 11 | | | | 207 | | | | 138 | | | | — | |
| | (240 | ) | | | (523 | ) | | | (25 | ) | | | (161 | ) | | | (187 | ) | | | (350 | ) | | | (21 | ) | | | (46 | ) | | | (214 | ) | | | (374 | ) | | | (1 | ) |
| 368 | | | | 117 | | | | 134 | | | | 145 | | | | 210 | | | | 129 | | | | 52 | | | | 54 | | | | 148 | | | | 119 | | | | 39 | |
| | 2,465 | | | | 2,348 | | | | 517 | | | | 372 | | | | 1,924 | | | | 1,795 | | | | 279 | | | | 225 | | | | 1,792 | | | | 1,673 | | | | — | |
| | 2,833 | | | | 2,465 | | | | 651 | | | | 517 | | | | 2,134 | | | | 1,924 | | | | 331 | | | | 279 | | | | 1,940 | | | | 1,792 | | | | 39 | |
| | | | | | | | | | | | | | | | | | | | | | | | | | | | | | | | | | | | | | | | | | |
| | — | | | | — | | | | — | | | | — | | | | — | | | | — | | | | — | | | | — | | | | — | | | | — | | | | 1 | |
|
— |
| | | — | | | | — | | | | — | | | | — | | | | — | | | | — | | | | — | | | | | | | | | | | | | |
| — | | | | — | | | | — | | | | — | | | | — | | | | — | | | | — | | | | — | | | | — | | | | — | | | | 1 | |
| | 2 | | | | 2 | | | | 1 | | | | 1 | | | | 2 | | | | 2 | | | | 1 | | | | 1 | | | | 2 | | | | 2 | | | | — | |
| | 2 | | | | 2 | | | | 1 | | | | 1 | | | | 2 | | | | 2 | | | | 1 | | | | 1 | | | | 2 | | | | 2 | | | | 1 | |
60
Harbor Target Retirement Funds Financial Highlights
SELECTED DATA FOR A SHARE OUTSTANDING FOR THE PERIODS PRESENTED
| | | | | | | | | | | | | | | | | | | | | | | | |
HARBOR TARGET RETIREMENT INCOME FUND | |
| | | Institutional Class | |
| | | 6-Month
Period Ended
April 30, 2015 | | | Year Ended October 31, | |
| | | | 2014 | | | 2013 | | | 2012 | | | 2011 | | | 2010 | |
| | | (Unaudited) | | | | | | | | | | | | | | | | |
Net asset value beginning of period | | $ | 9.75 | | | $ | 9.83 | | | $ | 9.95 | | | $ | 10.14 | | | $ | 11.38 | | | $ | 11.01 | |
Income from Investment Operations | | | | | | | | | | | | | | | | | | | | | | | | |
Net investment income/(loss)a | | | 0.23 | e | | | 0.22 | | | | 0.23 | | | | 0.23 | | | | 0.30 | | | | 0.26 | |
Net realized and unrealized gains/(losses) on investments | | | — | * | | | 0.19 | | | | 0.20 | | | | 0.61 | | | | (0.08 | ) | | | 0.96 | |
Total from investment operations | | | 0.23 | | | | 0.41 | | | | 0.43 | | | | 0.84 | | | | 0.22 | | | | 1.22 | |
Less Distributions | | | | | | | | | | | | | | | | | | | | | | | | |
Dividends from net investment income | | | (0.26 | ) | | | (0.28 | ) | | | (0.38 | ) | | | (0.31 | ) | | | (0.51 | ) | | | (0.31 | ) |
Distributions from net realized capital gains1 | | | (0.25 | ) | | | (0.21 | ) | | | (0.17 | ) | | | (0.72 | ) | | | (0.95 | ) | | | (0.54 | ) |
Total distributions | | | (0.51 | ) | | | (0.49 | ) | | | (0.55 | ) | | | (1.03 | ) | | | (1.46 | ) | | | (0.85 | ) |
Net asset value end of period | | | 9.47 | | | | 9.75 | | | | 9.83 | | | | 9.95 | | | | 10.14 | | | | 11.38 | |
Net assets end of period (000s) | | $ | 17,075 | | | $ | 17,410 | | | $ | 15,510 | | | $ | 16,383 | | | $ | 15,920 | | | $ | 16,097 | |
Ratios and Supplemental Data (%) | | | | | | | | | | | | | | | | | | | | | | | | |
Total returnb | | | 2.53 | %c | | | 4.32 | % | | | 4.49 | % | | | 9.23 | % | | | 2.44 | % | | | 11.72 | % |
Ratio of total expenses to average net assets2 | | | — | | | | — | | | | — | | | | — | | | | — | | | | — | |
Ratio of net expenses to average net assetsa,2 | | | — | | | | — | | | | — | | | | — | | | | — | | | | — | |
Ratio of net investment income to average net assetsa,2 | | | 4.94 | d | | | 2.14 | | | | 2.36 | | | | 2.26 | | | | 2.51 | | | | 2.30 | |
Portfolio turnover3 | | | 15 | c | | | 20 | | | | 28 | | | | 21 | | | | 42 | | | | 37 | |
| | | | | | | | | | | | | | | | | | | | | | | | |
HARBOR TARGET RETIREMENT 2015 FUND | |
| | | Institutional Class | |
| | | 6-Month
Period Ended
April 30, 2015 | | | Year Ended October 31, | |
| | | | 2014 | | | 2013 | | | 2012 | | | 2011 | | | 2010 | |
| | | (Unaudited) | | | | | | | | | | | | | | | | |
Net asset value beginning of period | | $ | 11.68 | | | $ | 11.87 | | | $ | 11.52 | | | $ | 11.47 | | | $ | 12.26 | | | $ | 11.56 | |
Income from Investment Operations | | | | | | | | | | | | | | | | | | | | | | | | |
Net investment income/(loss)a | | | 0.24 | e | | | 0.24 | | | | 0.28 | | | | 0.29 | | | | 0.31 | | | | 0.28 | |
Net realized and unrealized gains/(losses) on investments | | | 0.04 | | | | 0.29 | | | | 0.60 | | | | 0.69 | | | | — | * | | | 1.24 | |
Total from investment operations | | | 0.28 | | | | 0.53 | | | | 0.88 | | | | 0.98 | | | | 0.31 | | | | 1.52 | |
Less Distributions | | | | | | | | | | | | | | | | | | | | | | | | |
Dividends from net investment income | | | (0.39 | ) | | | (0.31 | ) | | | (0.44 | ) | | | (0.36 | ) | | | (0.47 | ) | | | (0.32 | ) |
Distributions from net realized capital gains1 | | | (0.53 | ) | | | (0.41 | ) | | | (0.09 | ) | | | (0.57 | ) | | | (0.63 | ) | | | (0.50 | ) |
Total distributions | | | (0.92 | ) | | | (0.72 | ) | | | (0.53 | ) | | | (0.93 | ) | | | (1.10 | ) | | | (0.82 | ) |
Net asset value end of period | | | 11.04 | | | | 11.68 | | | | 11.87 | | | | 11.52 | | | | 11.47 | | | | 12.26 | |
Net assets end of period (000s) | | $ | 10,600 | | | $ | 11,200 | | | $ | 10,654 | | | $ | 10,832 | | | $ | 10,576 | | | $ | 6,645 | |
Ratios and Supplemental Data (%) | | | | | | | | | | | | | | | | | | | | | | | | |
Total returnb | | | 2.64 | %c | | | 4.73 | % | | | 7.89 | % | | | 9.49 | % | | | 2.76 | % | | | 13.86 | % |
Ratio of total expenses to average net assets2 | | | — | | | | — | | | | — | | | | — | | | | — | | | | — | |
Ratio of net expenses to average net assetsa,2 | | | — | | | | — | | | | — | | | | — | | | | — | | | | — | |
Ratio of net investment income to average net assetsa,2 | | | 4.42 | d | | | 2.08 | | | | 2.43 | | | | 2.14 | | | | 2.77 | | | | 2.47 | |
Portfolio turnover3 | | | 16 | c | | | 38 | | | | 48 | | | | 50 | | | | 57 | | | | 74 | |
See page 69 for notes the Financial Highlights.
The accompanying notes are an integral part of the Financial Statements.
61
| | | | | | | | | | | | | | | | | | | | | | | | | | | | | | | | | | | | | | | | | | | | | | |
| | |
| Administrative Class | | | Investor Class | |
6-Month
Period Ended
April 30, 2015 | | | Year Ended October 31, | | | 6-Month
Period Ended
April 30, 2015 | | | Year Ended October 31, | |
| | 2014 | | | 2013 | | | 2012 | | | 2011 | | | 2010 | | | | 2014 | | | 2013 | | | 2012 | | | 2011 | | | 2010 | |
| (Unaudited) | | | | | | | | | | | | | | | | | | (Unaudited) | | | | | | | | | | | | | | | | |
| $ | 9.75 | | | $ | 9.83 | | | $ | 9.95 | | | $ | 10.13 | | | $ | 11.37 | | | $ | 11.01 | | | $ | 9.75 | | | $ | 9.83 | | | $ | 9.95 | | | $ | 10.13 | | | $ | 11.37 | | | $ | 11.01 | |
| | | | | | | | | | | | | | | | | | | | | | | | | | | | | | | | | | | | | | | | | | | | | | |
| | 0.23 | e | | | 0.21 | | | | 0.24 | | | | 0.23 | | | | 0.30 | | | | 0.26 | | | | 0.23 | e | | | 0.21 | | | | 0.24 | | | | 0.23 | | | | 0.30 | | | | 0.26 | |
| | (0.01 | ) | | | 0.20 | | | | 0.19 | | | | 0.62 | | | | (0.08 | ) | | | 0.95 | | | | (0.01 | ) | | | 0.20 | | | | 0.19 | | | | 0.62 | | | | (0.08 | ) | | | 0.95 | |
| | 0.22 | | | | 0.41 | | | | 0.43 | | | | 0.85 | | | | 0.22 | | | | 1.21 | | | | 0.22 | | | | 0.41 | | | | 0.43 | | | | 0.85 | | | | 0.22 | | | | 1.21 | |
| | | | | | | | | | | | | | | | | | | | | | | | | | | | | | | | | | | | | | | | | | | | | | |
| | (0.26 | ) | | | (0.28 | ) | | | (0.38 | ) | | | (0.31 | ) | | | (0.51 | ) | | | (0.31 | ) | | | (0.26 | ) | | | (0.28 | ) | | | (0.38 | ) | | | (0.31 | ) | | | (0.51 | ) | | | (0.31 | ) |
| | (0.25 | ) | | | (0.21 | ) | | | (0.17 | ) | | | (0.72 | ) | | | (0.95 | ) | | | (0.54 | ) | | | (0.25 | ) | | | (0.21 | ) | | | (0.17 | ) | | | (0.72 | ) | | | (0.95 | ) | | | (0.54 | ) |
| | (0.51 | ) | | | (0.49 | ) | | | (0.55 | ) | | | (1.03 | ) | | | (1.46 | ) | | | (0.85 | ) | | | (0.51 | ) | | | (0.49 | ) | | | (0.55 | ) | | | (1.03 | ) | | | (1.46 | ) | | | (0.85 | ) |
| | 9.46 | | | | 9.75 | | | | 9.83 | | | | 9.95 | | | | 10.13 | | | | 11.37 | | | | 9.46 | | | | 9.75 | | | | 9.83 | | | | 9.95 | | | | 10.13 | | | | 11.37 | |
| $ | 15 | | | $ | 15 | | | $ | 14 | | | $ | 14 | | | $ | 13 | | | $ | 12 | | | $ | 16 | | | $ | 15 | | | $ | 15 | | | $ | 14 | | | $ | 13 | | | $ | 12 | |
| | | | | | | | | | | | | | | | | | | | | | | | | | | | | | | | | | | | | | | | | | | | | | |
| | 2.42 | %c | | | 4.32 | % | | | 4.49 | % | | | 9.34 | % | | | 2.43 | % | | | 11.62 | % | | | 2.42 | %c | | | 4.32 | % | | | 4.49 | % | | | 9.34 | % | | | 2.42 | % | | | 11.62 | % |
| | 0.25 | d | | | 0.25 | | | | 0.25 | | | | 0.25 | | | | 0.25 | | | | 0.25 | | | | 0.37 | d | | | 0.37 | | | | 0.37 | | | | 0.37 | | | �� | 0.37 | | | | 0.37 | |
| | — | | | | — | | | | — | | | | — | | | | — | | | | — | | | | — | | | | — | | | | — | | | | — | | | | — | | | | — | |
| | 4.87 | d | | | 2.12 | | | | 2.35 | | | | 2.24 | | | | 2.50 | | | | 2.29 | | | | 4.87 | d | | | 2.12 | | | | 2.35 | | | | 2.24 | | | | 2.50 | | | | 2.29 | |
| | 15 | c | | | 20 | | | | 28 | | | | 21 | | | | 42 | | | | 37 | | | | 15 | c | | | 20 | | | | 28 | | | | 21 | | | | 42 | | | | 37 | |
| | | | | | | | | | | | | | | | | | | | | | | | | | | | | | | | | | | | | | | | | | | | | | |
| | |
| Administrative Class | | | Investor Class | |
6-Month
Period Ended
April 30, 2015 | | | Year Ended October 31, | | | 6-Month
Period Ended
April 30, 2015 | | | Year Ended October 31, | |
| | 2014 | | | 2013 | | | 2012 | | | 2011 | | | 2010 | | | | 2014 | | | 2013 | | | 2012 | | | 2011 | | | 2010 | |
| (Unaudited) | | | | | | | | | | | | | | | | | | (Unaudited) | | | | | | | | | | | | | | | | |
| $ | 11.68 | | | $ | 11.87 | | | $ | 11.52 | | | $ | 11.47 | | | $ | 12.26 | | | $ | 11.56 | | | $ | 11.68 | | | $ | 11.87 | | | $ | 11.52 | | | $ | 11.47 | | | $ | 12.26 | | | $ | 11.56 | |
| | | | | | | | | | | | | | | | | | | | | | | | | | | | | | | | | | | | | | | | | | | | | | |
| | 0.24 | e | | | 0.23 | | | | 0.27 | | | | 0.24 | | | | 0.32 | | | | 0.30 | | | | 0.24 | e | | | 0.23 | | | | 0.27 | | | | 0.24 | | | | 0.32 | | | | 0.30 | |
| | 0.03 | | | | 0.30 | | | | 0.61 | | | | 0.74 | | | | (0.01 | ) | | | 1.22 | | | | 0.04 | | | | 0.30 | | | | 0.61 | | | | 0.74 | | | | (0.01 | ) | | | 1.22 | |
| | 0.27 | | | | 0.53 | | | | 0.88 | | | | 0.98 | | | | 0.31 | | | | 1.52 | | | | 0.28 | | | | 0.53 | | | | 0.88 | | | | 0.98 | | | | 0.31 | | | | 1.52 | |
| | | | | | | | | | | | | | | | | | | | | | | | | | | | | | | | | | | | | | | | | | | | | | |
| | (0.39 | ) | | | (0.31 | ) | | | (0.44 | ) | | | (0.36 | ) | | | (0.47 | ) | | | (0.32 | ) | | | (0.39 | ) | | | (0.31 | ) | | | (0.44 | ) | | | (0.36 | ) | | | (0.47 | ) | | | (0.32 | ) |
| | (0.53 | ) | | | (0.41 | ) | | | (0.09 | ) | | | (0.57 | ) | | | (0.63 | ) | | | (0.50 | ) | | | (0.53 | ) | | | (0.41 | ) | | | (0.09 | ) | | | (0.57 | ) | | | (0.63 | ) | | | (0.50 | ) |
| | (0.92 | ) | | | (0.72 | ) | | | (0.53 | ) | | | (0.93 | ) | | | (1.10 | ) | | | (0.82 | ) | | | (0.92 | ) | | | (0.72 | ) | | | (0.53 | ) | | | (0.93 | ) | | | (1.10 | ) | | | (0.82 | ) |
| | 11.03 | | | | 11.68 | | | | 11.87 | | | | 11.52 | | | | 11.47 | | | | 12.26 | | | | 11.04 | | | | 11.68 | | | | 11.87 | | | | 11.52 | | | | 11.47 | | | | 12.26 | |
| $ | 17 | | | $ | 17 | | | $ | 16 | | | $ | 15 | | | $ | 14 | | | $ | 13 | | | $ | 17 | | | $ | 17 | | | $ | 16 | | | $ | 15 | | | $ | 14 | | | $ | 13 | |
| | | | | | | | | | | | | | | | | | | | | | | | | | | | | | | | | | | | | | | | | | | | | | |
| | 2.56 | %c | | | 4.73 | % | | | 7.89 | % | | | 9.49 | % | | | 2.76 | % | | | 13.86 | % | | | 2.64 | %c | | | 4.73 | % | | | 7.89 | % | | | 9.49 | % | | | 2.76 | % | | | 13.86 | % |
| | 0.25 | d | | | 0.25 | | | | 0.25 | | | | 0.25 | | | | 0.25 | | | | 0.25 | | | | 0.37 | d | | | 0.37 | | | | 0.37 | | | | 0.37 | | | | 0.37 | | | | 0.37 | |
| | — | | | | — | | | | — | | | | — | | | | — | | | | — | | | | — | | | | — | | | | — | | | | — | | | | — | | | | — | |
| | 4.31 | d | | | 2.06 | | | | 2.40 | | | | 2.21 | | | | 2.70 | | | | 2.49 | | | | 4.31 | d | | | 2.06 | | | | 2.40 | | | | 2.21 | | | | 2.70 | | | | 2.49 | |
| | 16 | c | | | 38 | | | | 48 | | | | 50 | | | | 57 | | | | 74 | | | | 16 | c | | | 38 | | | | 48 | | | | 50 | | | | 57 | | | | 74 | |
62
Harbor Target Retirement Funds Financial Highlights—Continued
SELECTED DATA FOR A SHARE OUTSTANDING FOR THE PERIODS PRESENTED
| | | | | | | | | | | | | | | | | | | | | | | | |
HARBOR TARGET RETIREMENT 2020 FUND | |
| | | Institutional Class | |
| | | 6-Month
Period Ended
April 30, 2015 | | | Year Ended October 31, | |
| | | | 2014 | | | 2013 | | | 2012 | | | 2011 | | | 2010 | |
| | | (Unaudited) | | | | | | | | | | | | | | | | |
Net asset value beginning of period | | $ | 10.63 | | | $ | 10.78 | | | $ | 10.43 | | | $ | 10.92 | | | $ | 12.15 | | | $ | 11.68 | |
Income from Investment Operations | | | | | | | | | | | | | | | | | | | | | | | | |
Net investment income/(loss)a | | | 0.22 | e | | | 0.23 | | | | 0.26 | | | | 0.25 | | | | 0.34 | | | | 0.31 | |
Net realized and unrealized gains/(losses) on investments | | | 0.09 | | | | 0.29 | | | | 0.68 | | | | 0.64 | | | | (0.02 | ) | | | 1.28 | |
Total from investment operations | | | 0.31 | | | | 0.52 | | | | 0.94 | | | | 0.89 | | | | 0.32 | | | | 1.59 | |
Less Distributions | | | | | | | | | | | | | | | | | | | | | | | | |
Dividends from net investment income | | | (0.34 | ) | | | (0.30 | ) | | | (0.40 | ) | | | (0.32 | ) | | | (0.50 | ) | | | (0.37 | ) |
Distributions from net realized capital gains1 | | | (0.37 | ) | | | (0.37 | ) | | | (0.19 | ) | | | (1.06 | ) | | | (1.05 | ) | | | (0.75 | ) |
Total distributions | | | (0.71 | ) | | | (0.67 | ) | | | (0.59 | ) | | | (1.38 | ) | | | (1.55 | ) | | | (1.12 | ) |
Net asset value end of period | | | 10.23 | | | | 10.63 | | | | 10.78 | | | | 10.43 | | | | 10.92 | | | | 12.15 | |
Net assets end of period (000s) | | $ | 28,592 | | | $ | 31,124 | | | $ | 27,397 | | | $ | 28,353 | | | $ | 25,646 | | | $ | 23,929 | |
Ratios and Supplemental Data (%) | | | | | | | | | | | | | | | | | | | | | | | | |
Total returnb | | | 3.22 | %c | | | 5.06 | % | | | 9.43 | % | | | 9.71 | % | | | 2.91 | % | | | 14.64 | % |
Ratio of total expenses to average net assets2 | | | — | | | | — | | | | — | | | | — | | | | — | | | | — | |
Ratio of net expenses to average net assetsa,2 | | | — | | | | — | | | | — | | | | — | | | | — | | | | — | |
Ratio of net investment income to average net assetsa,2 | | | 4.39 | d | | | 2.18 | | | | 2.56 | | | | 2.25 | | | | 2.76 | | | | 2.53 | |
Portfolio turnover3 | | | 17 | c | | | 19 | | | | 36 | | | | 22 | | | | 48 | | | | 44 | |
| | | | | | | | | | | | | | | | | | | | | | | | |
HARBOR TARGET RETIREMENT 2025 FUND | |
| | | Institutional Class | |
| | | 6-Month
Period Ended
April 30, 2015 | | | Year Ended October 31, | |
| | | | 2014 | | | 2013 | | | 2012 | | | 2011 | | | 2010 | |
| | | (Unaudited) | | | | | | | | | | | | | | | | |
Net asset value beginning of period | | $ | 13.48 | | | $ | 13.44 | | | $ | 12.69 | | | $ | 12.50 | | | $ | 13.10 | | | $ | 11.81 | |
Income from Investment Operations | | | | | | | | | | | | | | | | | | | | | | | | |
Net investment income/(loss)a | | | 0.25 | e | | | 0.29 | | | | 0.34 | | | | 0.27 | | | | 0.36 | | | | 0.32 | |
Net realized and unrealized gains/(losses) on investments | | | 0.16 | | | | 0.40 | | | | 1.04 | | | | 0.81 | | | | (0.02 | ) | | | 1.48 | |
Total from investment operations | | | 0.41 | | | | 0.69 | | | | 1.38 | | | | 1.08 | | | | 0.34 | | | | 1.80 | |
Less Distributions | | | | | | | | | | | | | | | | | | | | | | | | |
Dividends from net investment income | | | (0.41 | ) | | | (0.36 | ) | | | (0.45 | ) | | | (0.32 | ) | | | (0.47 | ) | | | (0.33 | ) |
Distributions from net realized capital gains1 | | | (0.76 | ) | | | (0.29 | ) | | | (0.18 | ) | | | (0.57 | ) | | | (0.47 | ) | | | (0.18 | ) |
Total distributions | | | (1.17 | ) | | | (0.65 | ) | | | (0.63 | ) | | | (0.89 | ) | | | (0.94 | ) | | | (0.51 | ) |
Net asset value end of period | | | 12.72 | | | | 13.48 | | | | 13.44 | | | | 12.69 | | | | 12.50 | | | | 13.10 | |
Net assets end of period (000s) | | $ | 11,325 | | | $ | 10,612 | | | $ | 8,728 | | | $ | 7,204 | | | $ | 5,683 | | | $ | 3,782 | |
Ratios and Supplemental Data (%) | | | | | | | | | | | | | | | | | | | | | | | | |
Total returnb | | | 3.36 | %c | | | 5.37 | % | | | 11.33 | % | | | 9.62 | % | | | 2.69 | % | | | 15.67 | % |
Ratio of total expenses to average net assets2 | | | — | | | | — | | | | — | | | | — | | | | — | | | | — | |
Ratio of net expenses to average net assetsa,2 | | | — | | | | — | | | | — | | | | — | | | | — | | | | — | |
Ratio of net investment income to average net assetsa,2 | | | 4.03 | d | | | 2.06 | | | | 2.44 | | | | 2.18 | | | | 2.59 | | | | 2.32 | |
Portfolio turnover3 | | | 15 | c | | | 33 | | | | 32 | | | | 30 | | | | 41 | | | | 35 | |
See page 69 for notes the Financial Highlights.
The accompanying notes are an integral part of the Financial Statements.
63
| | | | | | | | | | | | | | | | | | | | | | | | | | | | | | | | | | | | | | | | | | | | | | |
| | |
| Administrative Class | | | Investor Class | |
6-Month
Period Ended
April 30, 2015 | | | Year Ended October 31, | | | 6-Month
Period Ended
April 30, 2015 | | | Year Ended October 31, | |
| | 2014 | | | 2013 | | | 2012 | | | 2011 | | | 2010 | | | | 2014 | | | 2013 | | | 2012 | | | 2011 | | | 2010 | |
| (Unaudited) | | | | | | | | | | | | | | | | | | (Unaudited) | | | | | | | | | | | | | | | | |
| $ | 10.63 | | | $ | 10.77 | | | $ | 10.42 | | | $ | 10.91 | | | $ | 12.15 | | | $ | 11.68 | | | $ | 10.63 | | | $ | 10.77 | | | $ | 10.43 | | | $ | 10.92 | | | $ | 12.15 | | | $ | 11.68 | |
| | | | | | | | | | | | | | | | | | | | | | | | | | | | | | | | | | | | | | | | | | | | | | |
| | 0.22 | e | | | 0.23 | | | | 0.26 | | | | 0.23 | | | | 0.33 | | | | 0.31 | | | | 0.22 | e | | | 0.23 | | | | 0.26 | | | | 0.23 | | | | 0.33 | | | | 0.31 | |
| | 0.09 | | | | 0.30 | | | | 0.68 | | | | 0.66 | | | | (0.02 | ) | | | 1.28 | | | | 0.09 | | | | 0.30 | | | | 0.67 | | | | 0.66 | | | | (0.01 | ) | | | 1.28 | |
| | 0.31 | | | | 0.53 | | | | 0.94 | | | | 0.89 | | | | 0.31 | | | | 1.59 | | | | 0.31 | | | | 0.53 | | | | 0.93 | | | | 0.89 | | | | 0.32 | | | | 1.59 | |
| | | | | | | | | | | | | | | | | | | | | | | | | | | | | | | | | | | | | | | | | | | | | | |
| | (0.34 | ) | | | (0.30 | ) | | | (0.40 | ) | | | (0.32 | ) | | | (0.50 | ) | | | (0.37 | ) | | | (0.34 | ) | | | (0.30 | ) | | | (0.40 | ) | | | (0.32 | ) | | | (0.50 | ) | | | (0.37 | ) |
| | (0.37 | ) | | | (0.37 | ) | | | (0.19 | ) | | | (1.06 | ) | | | (1.05 | ) | | | (0.75 | ) | | | (0.37 | ) | | | (0.37 | ) | | | (0.19 | ) | | | (1.06 | ) | | | (1.05 | ) | | | (0.75 | ) |
| | (0.71 | ) | | | (0.67 | ) | | | (0.59 | ) | | | (1.38 | ) | | | (1.55 | ) | | | (1.12 | ) | | | (0.71 | ) | | | (0.67 | ) | | | (0.59 | ) | | | (1.38 | ) | | | (1.55 | ) | | | (1.12 | ) |
| | 10.23 | | | | 10.63 | | | | 10.77 | | | | 10.42 | | | | 10.91 | | | | 12.15 | | | | 10.23 | | | | 10.63 | | | | 10.77 | | | | 10.43 | | | | 10.92 | | | | 12.15 | |
| $ | 18 | | | $ | 17 | | | $ | 16 | | | $ | 15 | | | $ | 14 | | | $ | 13 | | | $ | 18 | | | $ | 18 | | | $ | 17 | | | $ | 15 | | | $ | 14 | | | $ | 13 | |
| | | | | | | | | | | | | | | | | | | | | | | | | | | | | | | | | | | | | | | | | | | | | | |
| | 3.22 | %c | | | 5.16 | % | | | 9.44 | % | | | 9.72 | % | | | 2.82 | % | | | 14.65 | % | | | 3.22 | %c | | | 5.16 | % | | | 9.34 | % | | | 9.71 | % | | | 2.91 | % | | | 14.65 | % |
| | 0.25 | d | | | 0.25 | | | | 0.25 | | | | 0.25 | | | | 0.25 | | | | 0.25 | | | | 0.37 | d | | | 0.37 | | | | 0.37 | | | | 0.37 | | | | 0.37 | | | | 0.37 | |
| | — | | | | — | | | | — | | | | — | | | | — | | | | — | | | | — | | | | — | | | | — | | | | — | | | | — | | | | — | |
| | 4.30 | d | | | 2.17 | | | | 2.50 | | | | 2.25 | | | | 2.75 | | | | 2.58 | | | | 4.30 | d | | | 2.17 | | | | 2.50 | | | | 2.25 | | | | 2.75 | | | | 2.58 | |
| | 17 | c | | | 19 | | | | 36 | | | | 22 | | | | 48 | | | | 44 | | | | 17 | c | | | 19 | | | | 36 | | | | 22 | | | | 48 | | | | 44 | |
| | | | | | | | | | | | | | | | | | | | | | | | | | | | | | | | | | | | | | | | | | | | | | |
| | |
| Administrative Class | | | Investor Class | |
6-Month
Period Ended
April 30, 2015 | | | Year Ended October 31, | | | 6-Month
Period Ended
April 30, 2015 | | | Year Ended October 31, | |
| | 2014 | | | 2013 | | | 2012 | | | 2011 | | | 2010 | | | | 2014 | | | 2013 | | | 2012 | | | 2011 | | | 2010 | |
| (Unaudited) | | | | | | | | | | | | | | | | | | (Unaudited) | | | | | | | | | | | | | | | | |
| $ | 13.48 | | | $ | 13.44 | | | $ | 12.69 | | | $ | 12.50 | | | $ | 13.10 | | | $ | 11.81 | | | $ | 13.48 | | | $ | 13.44 | | | $ | 12.69 | | | $ | 12.50 | | | $ | 13.10 | | | $ | 11.81 | |
| | | | | | | | | | | | | | | | | | | | | | | | | | | | | | | | | | | | | | | | | | | | | | |
| | 0.26 | e | | | 0.28 | | | | 0.32 | | | | 0.26 | | | | 0.34 | | | | 0.32 | | | | 0.26 | e | | | 0.28 | | | | 0.32 | | | | 0.26 | | | | 0.34 | | | | 0.32 | |
| | 0.15 | | | | 0.41 | | | | 1.06 | | | | 0.82 | | | | — | * | | | 1.48 | | | | 0.15 | | | | 0.41 | | | | 1.06 | | | | 0.82 | | | | — | * | | | 1.48 | |
| | 0.41 | | | | 0.69 | | | | 1.38 | | | | 1.08 | | | | 0.34 | | | | 1.80 | | | | 0.41 | | | | 0.69 | | | | 1.38 | | | | 1.08 | | | | 0.34 | | | | 1.80 | |
| | | | | | | | | | | | | | | | | | | | | | | | | | | | | | | | | | | | | | | | | | | | | | |
| | (0.41 | ) | | | (0.36 | ) | | | (0.45 | ) | | | (0.32 | ) | | | (0.47 | ) | | | (0.33 | ) | | | (0.41 | ) | | | (0.36 | ) | | | (0.45 | ) | | | (0.32 | ) | | | (0.47 | ) | | | (0.33 | ) |
| | (0.76 | ) | | | (0.29 | ) | | | (0.18 | ) | | | (0.57 | ) | | | (0.47 | ) | | | (0.18 | ) | | | (0.76 | ) | | | (0.29 | ) | | | (0.18 | ) | | | (0.57 | ) | | | (0.47 | ) | | | (0.18 | ) |
| | (1.17 | ) | | | (0.65 | ) | | | (0.63 | ) | | | (0.89 | ) | | | (0.94 | ) | | | (0.51 | ) | | | (1.17 | ) | | | (0.65 | ) | | | (0.63 | ) | | | (0.89 | ) | | | (0.94 | ) | | | (0.51 | ) |
| | 12.72 | | | | 13.48 | | | | 13.44 | | | | 12.69 | | | | 12.50 | | | | 13.10 | | | | 12.72 | | | | 13.48 | | | | 13.44 | | | | 12.69 | | | | 12.50 | | | | 13.10 | |
| $ | 19 | | | $ | 18 | | | $ | 17 | | | $ | 16 | | | $ | 14 | | | $ | 14 | | | $ | 18 | | | $ | 18 | | | $ | 17 | | | $ | 15 | | | $ | 14 | | | $ | 14 | |
| | | | | | | | | | | | | | | | | | | | | | | | | | | | | | | | | | | | | | | | | | | | | | |
| | 3.37 | %c | | | 5.37 | % | | | 11.33 | % | | | 9.62 | % | | | 2.69 | % | | | 15.67 | % | | | 3.37 | %c | | | 5.37 | % | | | 11.33 | % | | | 9.62 | % | | | 2.69 | % | | | 15.67 | % |
| | 0.25 | d | | | 0.25 | | | | 0.25 | | | | 0.25 | | | | 0.25 | | | | 0.25 | | | | 0.37 | d | | | 0.37 | | | | 0.37 | | | | 0.37 | | | | 0.37 | | | | 0.37 | |
| | — | | | | — | | | | — | | | | — | | | | — | | | | — | | | | — | | | | — | | | | — | | | | — | | | | — | | | | — | |
| | 4.05 | d | | | 2.13 | | | | 2.50 | | | | 2.14 | | | | 2.61 | | | | 2.58 | | | | 4.05 | d | | | 2.13 | | | | 2.50 | | | | 2.14 | | | | 2.61 | | | | 2.58 | |
| | 15 | c | | | 33 | | | | 32 | | | | 30 | | | | 41 | | | | 35 | | | | 15 | c | | | 33 | | | | 32 | | | | 30 | | | | 41 | | | | 35 | |
64
Harbor Target Retirement Funds Financial Highlights—Continued
SELECTED DATA FOR A SHARE OUTSTANDING FOR THE PERIODS PRESENTED
| | | | | | | | | | | | | | | | | | | | | | | | |
HARBOR TARGET RETIREMENT 2030 FUND | |
| | | Institutional Class | |
| | | 6-Month
Period Ended
April 30, 2015 | | | Year Ended October 31, | |
| | | | 2014 | | | 2013 | | | 2012 | | | 2011 | | | 2010 | |
| | | (Unaudited) | | | | | | | | | | | | | | | | |
Net asset value beginning of period | | $ | 10.04 | | | $ | 10.22 | | | $ | 9.56 | | | $ | 10.59 | | | $ | 12.34 | | | $ | 11.92 | |
Income from Investment Operations | | | | | | | | | | | | | | | | | | | | | | | | |
Net investment income/(loss)a | | | 0.17 | e | | | 0.21 | | | | 0.25 | | | | 0.21 | | | | 0.30 | | | | 0.30 | |
Net realized and unrealized gains/(losses) on investments | | | 0.16 | | | | 0.35 | | | | 1.04 | | | | 0.56 | | | | 0.03 | | | | 1.50 | |
Total from investment operations | | | 0.33 | | | | 0.56 | | | | 1.29 | | | | 0.77 | | | | 0.33 | | | | 1.80 | |
Less Distributions | | | | | | | | | | | | | | | | | | | | | | | | |
Dividends from net investment income | | | (0.28 | ) | | | (0.27 | ) | | | (0.33 | ) | | | (0.26 | ) | | | (0.44 | ) | | | (0.35 | ) |
Distributions from net realized capital gains1 | | | (0.58 | ) | | | (0.47 | ) | | | (0.30 | ) | | | (1.54 | ) | | | (1.64 | ) | | | (1.03 | ) |
Total distributions | | | (0.86 | ) | | | (0.74 | ) | | | (0.63 | ) | | | (1.80 | ) | | | (2.08 | ) | | | (1.38 | ) |
Net asset value end of period | | | 9.51 | | | | 10.04 | | | | 10.22 | | | | 9.56 | | | | 10.59 | | | | 12.34 | |
Net assets end of period (000s) | | $ | 26,940 | | | $ | 24,727 | | | $ | 23,994 | | | $ | 22,862 | | | $ | 22,478 | | | $ | 26,393 | |
Ratios and Supplemental Data (%) | | | | | | | | | | | | | | | | | | | | | | | | |
Total returnb | | | 3.61 | %c | | | 5.79 | % | | | 14.19 | % | | | 9.64 | % | | | 2.75 | % | | | 16.35 | % |
Ratio of total expenses to average net assets2 | | | — | | | | — | | | | — | | | | — | | | | — | | | | — | |
Ratio of net expenses to average net assetsa,2 | | | — | | | | — | | | | — | | | | — | | | | — | | | | — | |
Ratio of net investment income to average net assetsa,2 | | | 3.52 | d | | | 1.99 | | | | 2.42 | | | | 2.03 | | | | 2.55 | | | | 2.37 | |
Portfolio turnover3 | | | 13 | c | | | 22 | | | | 31 | | | | 27 | | | | 39 | | | | 44 | |
| | | | | | | | | | | | | | | | | | | | | | | | |
HARBOR TARGET RETIREMENT 2035 FUND | |
| | | Institutional Class | |
| | | 6-Month
Period Ended
April 30, 2015 | | | Year Ended October 31, | |
| | | | 2014 | | | 2013 | | | 2012 | | | 2011 | | | 2010 | |
| | | (Unaudited) | | | | | | | | | | | | | | | | |
Net asset value beginning of period | | $ | 14.92 | | | $ | 14.52 | | | $ | 13.01 | | | $ | 12.99 | | | $ | 13.55 | | | $ | 11.94 | |
Income from Investment Operations | | | | | | | | | | | | | | | | | | | | | | | | |
Net investment income/(loss)a | | | 0.21 | e | | | 0.29 | | | | 0.33 | | | | 0.24 | | | | 0.34 | | | | 0.26 | |
Net realized and unrealized gains/(losses) on investments | | | 0.33 | | | | 0.58 | | | | 1.85 | | | | 0.87 | | | | 0.02 | | | | 1.71 | |
Total from investment operations | | | 0.54 | | | | 0.87 | | | | 2.18 | | | | 1.11 | | | | 0.36 | | | | 1.97 | |
Less Distributions | | | | | | | | | | | | | | | | | | | | | | | | |
Dividends from net investment income | | | (0.36 | ) | | | (0.33 | ) | | | (0.40 | ) | | | (0.25 | ) | | | (0.41 | ) | | | (0.27 | ) |
Distributions from net realized capital gains1 | | | (1.04 | ) | | | (0.14 | ) | | | (0.27 | ) | | | (0.84 | ) | | | (0.51 | ) | | | (0.09 | ) |
Total distributions | | | (1.40 | ) | | | (0.47 | ) | | | (0.67 | ) | | | (1.09 | ) | | | (0.92 | ) | | | (0.36 | ) |
Net asset value end of period | | | 14.06 | | | | 14.92 | | | | 14.52 | | | | 13.01 | | | | 12.99 | | | | 13.55 | |
Net assets end of period (000s) | | $ | 9,158 | | | $ | 7,708 | | | $ | 5,397 | | | $ | 2,794 | | | $ | 2,235 | | | $ | 1,300 | |
Ratios and Supplemental Data (%) | | | | | | | | | | | | | | | | | | | | | | | | |
Total returnb | | | 4.04 | %c | | | 6.19 | % | | | 17.43 | % | | | 9.86 | % | | | 2.58 | % | | | 16.76 | % |
Ratio of total expenses to average net assets2 | | | — | | | | — | | | | — | | | | — | | | | — | | | | — | |
Ratio of net expenses to average net assetsa,2 | | | — | | | | — | | | | — | | | | — | | | | — | | | | — | |
Ratio of net investment income to average net assetsa,2 | | | 3.06 | d | | | 1.64 | | | | 2.08 | | | | 1.79 | | | | 2.04 | | | | 1.82 | |
Portfolio turnover3 | | | 6 | c | | | 39 | | | | 12 | | | | 41 | | | | 45 | | | | 20 | |
See page 69 for notes the Financial Highlights.
The accompanying notes are an integral part of the Financial Statements.
65
| | | | | | | | | | | | | | | | | | | | | | | | | | | | | | | | | | | | | | | | | | | | | | |
| | |
| Administrative Class | | | Investor Class | |
6-Month
Period Ended
April 30, 2015 | | | Year Ended October 31, | | | 6-Month
Period Ended
April 30, 2015 | | | Year Ended October 31, | |
| | 2014 | | | 2013 | | | 2012 | | | 2011 | | | 2010 | | | | 2014 | | | 2013 | | | 2012 | | | 2011 | | | 2010 | |
| (Unaudited) | | | | | | | | | | | | | | | | | | (Unaudited) | | | | | | | | | | | | | | | | |
| $ | 10.03 | | | $ | 10.22 | | | $ | 9.56 | | | $ | 10.58 | | | $ | 12.34 | | | $ | 11.91 | | | $ | 10.03 | | | $ | 10.22 | | | $ | 9.56 | | | $ | 10.58 | | | $ | 12.34 | | | $ | 11.91 | |
| | | | | | | | | | | | | | | | | | | | | | | | | | | | | | | | | | | | | | | | | | | | | | |
| | 0.17 | e | | | 0.20 | | | | 0.24 | | | | 0.20 | | | | 0.30 | | | | 0.30 | | | | 0.17 | e | | | 0.20 | | | | 0.24 | | | | 0.20 | | | | 0.30 | | | | 0.30 | |
| | 0.17 | | | | 0.35 | | | | 1.05 | | | | 0.58 | | | | 0.02 | | | | 1.51 | | | | 0.17 | | | | 0.35 | | | | 1.05 | | | | 0.58 | | | | 0.02 | | | | 1.51 | |
| | 0.34 | | | | 0.55 | | | | 1.29 | | | | 0.78 | | | | 0.32 | | | | 1.81 | | | | 0.34 | | | | 0.55 | | | | 1.29 | | | | 0.78 | | | | 0.32 | | | | 1.81 | |
| | | | | | | | | | | | | | | | | | | | | | | | | | | | | | | | | | | | | | | | | | | | | | |
| | (0.28 | ) | | | (0.27 | ) | | | (0.33 | ) | | | (0.26 | ) | | | (0.44 | ) | | | (0.35 | ) | | | (0.28 | ) | | | (0.27 | ) | | | (0.33 | ) | | | (0.26 | ) | | | (0.44 | ) | | | (0.35 | ) |
| | (0.58 | ) | | | (0.47 | ) | | | (0.30 | ) | | | (1.54 | ) | | | (1.64 | ) | | | (1.03 | ) | | | (0.58 | ) | | | (0.47 | ) | | | (0.30 | ) | | | (1.54 | ) | | | (1.64 | ) | | | (1.03 | ) |
| | (0.86 | ) | | | (0.74 | ) | | | (0.63 | ) | | | (1.80 | ) | | | (2.08 | ) | | | (1.38 | ) | | | (0.86 | ) | | | (0.74 | ) | | | (0.63 | ) | | | (1.80 | ) | | | (2.08 | ) | | | (1.38 | ) |
| | 9.51 | | | | 10.03 | | | | 10.22 | | | | 9.56 | | | | 10.58 | | | | 12.34 | | | | 9.51 | | | | 10.03 | | | | 10.22 | | | | 9.56 | | | | 10.58 | | | | 12.34 | |
| $ | 19 | | | $ | 19 | | | $ | 18 | | | $ | 16 | | | $ | 14 | | | $ | 14 | | | $ | 20 | | | $ | 19 | | | $ | 18 | | | $ | 16 | | | $ | 14 | | | $ | 14 | |
| | | | | | | | | | | | | | | | | | | | | | | | | | | | | | | | | | | | | | | | | | | | | | |
| | 3.73 | %c | | | 5.70 | % | | | 14.20 | % | | | 9.74 | % | | | 2.65 | % | | | 16.45 | % | | | 3.73 | %c | | | 5.70 | % | | | 14.20 | % | | | 9.74 | % | | | 2.65 | % | | | 16.45 | % |
| | 0.25 | d | | | 0.25 | | | | 0.25 | | | | 0.25 | | | | 0.25 | | | | 0.25 | | | | 0.37 | d | | | 0.37 | | | | 0.37 | | | | 0.37 | | | | 0.37 | | | | 0.37 | |
| | — | | | | — | | | | — | | | | — | | | | — | | | | — | | | | — | | | | — | | | | — | | | | — | | | | — | | | | — | |
| | 3.58 | d | | | 1.97 | | | | 2.40 | | | | 2.02 | | | | 2.45 | | | | 2.40 | | | | 3.58 | d | | | 1.97 | | | | 2.40 | | | | 2.02 | | | | 2.45 | | | | 2.40 | |
| | 13 | c | | | 22 | | | | 31 | | | | 27 | | | | 39 | | | | 44 | | | | 13 | c | | | 22 | | | | 31 | | | | 27 | | | | 39 | | | | 44 | |
| | | | | | | | | | | | | | | | | | | | | | | | | | | | | | | | | | | | | | | | | | | | | | |
| | |
| Administrative Class | | | Investor Class | |
6-Month
Period Ended
April 30, 2015 | | | Year Ended October 31, | | | 6-Month
Period Ended
April 30, 2015 | | | Year Ended October 31, | |
| | 2014 | | | 2013 | | | 2012 | | | 2011 | | | 2010 | | | | 2014 | | | 2013 | | | 2012 | | | 2011 | | | 2010 | |
| (Unaudited) | | | | | | | | | | | | | | | | | | (Unaudited) | | | | | | | | | | | | | | | | |
| $ | 14.91 | | | $ | 14.51 | | | $ | 13.01 | | | $ | 12.99 | | | $ | 13.54 | | | $ | 11.93 | | | $ | 14.91 | | | $ | 14.51 | | | $ | 13.01 | | | $ | 12.99 | | | $ | 13.54 | | | $ | 11.93 | |
| | | | | | | | | | | | | | | | | | | | | | | | | | | | | | | | | | | | | | | | | | | | | | |
| | 0.22 | e | | | 0.27 | | | | 0.32 | | | | 0.25 | | | | 0.30 | | | | 0.27 | | | | 0.22 | e | | | 0.27 | | | | 0.32 | | | | 0.25 | | | | 0.30 | | | | 0.27 | |
| | 0.32 | | | | 0.60 | | | | 1.85 | | | | 0.86 | | | | 0.07 | | | | 1.70 | | | | 0.32 | | | | 0.60 | | | | 1.85 | | | | 0.86 | | | | 0.07 | | | | 1.70 | |
| | 0.54 | | | | 0.87 | | | | 2.17 | | | | 1.11 | | | | 0.37 | | | | 1.97 | | | | 0.54 | | | | 0.87 | | | | 2.17 | | | | 1.11 | | | | 0.37 | | | | 1.97 | |
| | | | | | | | | | | | | | | | | | | | | | | | | | | | | | | | | | | | | | | | | | | | | | |
| | (0.36 | ) | | | (0.33 | ) | | | (0.40 | ) | | | (0.25 | ) | | | (0.41 | ) | | | (0.27 | ) | | | (0.36 | ) | | | (0.33 | ) | | | (0.40 | ) | | | (0.25 | ) | | | (0.41 | ) | | | (0.27 | ) |
| | (1.04 | ) | | | (0.14 | ) | | | (0.27 | ) | | | (0.84 | ) | | | (0.51 | ) | | | (0.09 | ) | | | (1.04 | ) | | | (0.14 | ) | | | (0.27 | ) | | | (0.84 | ) | | | (0.51 | ) | | | (0.09 | ) |
| | (1.40 | ) | | | (0.47 | ) | | | (0.67 | ) | | | (1.09 | ) | | | (0.92 | ) | | | (0.36 | ) | | | (1.40 | ) | | | (0.47 | ) | | | (0.67 | ) | | | (1.09 | ) | | | (0.92 | ) | | | (0.36 | ) |
| | 14.05 | | | | 14.91 | | | | 14.51 | | | | 13.01 | | | | 12.99 | | | | 13.54 | | | | 14.05 | | | | 14.91 | | | | 14.51 | | | | 13.01 | | | | 12.99 | | | | 13.54 | |
| $ | 20 | | | $ | 20 | | | $ | 19 | | | $ | 16 | | | $ | 14 | | | $ | 14 | | | $ | 20 | | | $ | 19 | | | $ | 18 | | | $ | 16 | | | $ | 14 | | | $ | 14 | |
| | | | | | | | | | | | | | | | | | | | | | | | | | | | | | | | | | | | | | | | | | | | | | |
| | 4.04 | %c | | | 6.19 | % | | | 17.36 | % | | | 9.87 | % | | | 2.65 | % | | | 16.77 | % | | | 4.04 | %c | | | 6.19 | % | | | 17.36 | % | | | 9.87 | % | | | 2.65 | % | | | 16.77 | % |
| | 0.25 | d | | | 0.25 | | | | 0.25 | | | | 0.25 | | | | 0.25 | | | | 0.25 | | | | 0.37 | d | | | 0.37 | | | | 0.37 | | | | 0.37 | | | | 0.37 | | | | 0.37 | |
| | — | | | | — | | | | — | | | | — | | | | — | | | | — | | | | — | | | | — | | | | — | | | | — | | | | — | | | | — | |
| | 3.16 | d | | | 1.80 | | | | 2.30 | | | | 1.93 | | | | 2.13 | | | | 2.11 | | | | 3.16 | d | | | 1.80 | | | | 2.30 | | | | 1.93 | | | | 2.13 | | | | 2.11 | |
| | 6 | c | | | 39 | | | | 12 | | | | 41 | | | | 45 | | | | 20 | | | | 6 | c | | | 39 | | | | 12 | | | | 41 | | | | 45 | | | | 20 | |
66
Harbor Target Retirement Funds Financial Highlights—Continued
SELECTED DATA FOR A SHARE OUTSTANDING FOR THE PERIODS PRESENTED
| | | | | | | | | | | | | | | | | | | | | | | | |
HARBOR TARGET RETIREMENT 2040 FUND | |
| | | Institutional Class | |
| | | 6-Month
Period Ended
April 30, 2015 | | | Year Ended October 31, | |
| | | | 2014 | | | 2013 | | | 2012 | | | 2011 | | | 2010 | |
| | | (Unaudited) | | | | | | | | | | | | | | | | |
Net asset value beginning of period | | $ | 9.84 | | | $ | 10.01 | | | $ | 9.19 | | | $ | 10.85 | | | $ | 11.95 | | | $ | 11.94 | |
Income from Investment Operations | | | | | | | | | | | | | | | | | | | | | | | | |
Net investment income/(loss)a | | | 0.13 | e | | | 0.17 | | | | 0.22 | | | | 0.18 | | | | 0.24 | | | | 0.22 | |
Net realized and unrealized gains/(losses) on investments | | | 0.29 | | | | 0.46 | | | | 1.52 | | | | 0.50 | | | | 0.04 | | | | 1.64 | |
Total from investment operations | | | 0.42 | | | | 0.63 | | | | 1.74 | | | | 0.68 | | | | 0.28 | | | | 1.86 | |
Less Distributions | | | | | | | | | | | | | | | | | | | | | | | | |
Dividends from net investment income | | | (0.22 | ) | | | (0.23 | ) | | | (0.26 | ) | | | (0.20 | ) | | | (0.30 | ) | | | (0.25 | ) |
Distributions from net realized capital gains1 | | | (0.65 | ) | | | (0.57 | ) | | | (0.66 | ) | | | (2.14 | ) | | | (1.08 | ) | | | (1.60 | ) |
Total distributions | | | (0.87 | ) | | | (0.80 | ) | | | (0.92 | ) | | | (2.34 | ) | | | (1.38 | ) | | | (1.85 | ) |
Net asset value end of period | | | 9.39 | | | | 9.84 | | | | 10.01 | | | | 9.19 | | | | 10.85 | | | | 11.95 | |
Net assets end of period (000s) | | $ | 20,039 | | | $ | 18,933 | | | $ | 17,963 | | | $ | 15,554 | | | $ | 14,927 | | | $ | 16,379 | |
Ratios and Supplemental Data (%) | | | | | | | | | | | | | | | | | | | | | | | | |
Total returnb | | | 4.73 | %c | | | 6.77 | % | | | 20.63 | % | | | 9.76 | % | | | 2.16 | % | | | 17.23 | % |
Ratio of total expenses to average net assets2 | | | — | | | | — | | | | — | | | | — | | | | — | | | | — | |
Ratio of net expenses to average net assetsa,2 | | | — | | | | — | | | | — | | | | — | | | | — | | | | — | |
Ratio of net investment income to average net assetsa,2 | | | 2.85 | d | | | 1.59 | | | | 2.24 | | | | 1.71 | | | | 1.96 | | | | 1.81 | |
Portfolio turnover3 | | | 11 | c | | | 22 | | | | 22 | | | | 27 | | | | 45 | | | | 28 | |
| | | | | | | | | | | | | | | | | | | | | | | | |
HARBOR TARGET RETIREMENT 2045 FUND | |
| | | Institutional Class | |
| | | 6-Month
Period Ended
April 30, 2015 | | | Year Ended October 31, | |
| | | | 2014 | | | 2013 | | | 2012 | | | 2011 | | | 2010 | |
| | | (Unaudited) | | | | | | | | | | | | | | | | |
Net asset value beginning of period | | $ | 15.17 | | | $ | 14.85 | | | $ | 12.42 | | | $ | 12.85 | | | $ | 13.67 | | | $ | 11.91 | |
Income from Investment Operations | | | | | | | | | | | | | | | | | | | | | | | | |
Net investment income/(loss)a | | | 0.18 | e | | | 0.23 | | | | 0.29 | | | | 0.19 | | | | 0.25 | | | | 0.18 | |
Net realized and unrealized gains/(losses) on investments | | | 0.55 | | | | 0.80 | | | | 2.58 | | | | 0.81 | | | | 0.05 | | | | 1.86 | |
Total from investment operations | | | 0.73 | | | | 1.03 | | | | 2.87 | | | | 1.00 | | | | 0.30 | | | | 2.04 | |
Less Distributions | | | | | | | | | | | | | | | | | | | | | | | | |
Dividends from net investment income | | | (0.29 | ) | | | (0.31 | ) | | | (0.31 | ) | | | (0.19 | ) | | | (0.29 | ) | | | (0.18 | ) |
Distributions from net realized capital gains1 | | | (0.80 | ) | | | (0.40 | ) | | | (0.13 | ) | | | (1.24 | ) | | | (0.83 | ) | | | (0.10 | ) |
Total distributions | | | (1.09 | ) | | | (0.71 | ) | | | (0.44 | ) | | | (1.43 | ) | | | (1.12 | ) | | | (0.28 | ) |
Net asset value end of period | | | 14.81 | | | | 15.17 | | | | 14.85 | | | | 12.42 | | | | 12.85 | | | | 13.67 | |
Net assets end of period (000s) | | $ | 4,902 | | | $ | 4,239 | | | $ | 3,340 | | | $ | 1,911 | | | $ | 1,209 | | | $ | 880 | |
Ratios and Supplemental Data (%) | | | | | | | | | | | | | | | | | | | | | | | | |
Total returnb | | | 5.20 | %c | | | 7.17 | % | | | 23.75 | % | | | 9.62 | % | | | 1.97 | % | | | 17.38 | % |
Ratio of total expenses to average net assets2 | | | — | | | | — | | | | — | | | | — | | | | — | | | | — | |
Ratio of net expenses to average net assetsa,2 | | | — | | | | — | | | | — | | | | — | | | | — | | | | — | |
Ratio of net investment income to average net assetsa,2 | | | 2.45 | d | | | 1.37 | | | | 1.82 | | | | 1.40 | | | | 1.50 | | | | 1.27 | |
Portfolio turnover3 | | | 9 | c | | | 21 | | | | 20 | | | | 16 | | | | 59 | | | | 32 | |
See page 69 for notes the Financial Highlights.
The accompanying notes are an integral part of the Financial Statements.
67
| | | | | | | | | | | | | | | | | | | | | | | | | | | | | | | | | | | | | | | | | | | | | | |
| | |
| Administrative Class | | | Investor Class | |
6-Month
Period Ended
April 30, 2015 | | | Year Ended October 31, | | | 6-Month
Period Ended
April 30, 2015 | | | Year Ended October 31, | |
| | 2014 | | | 2013 | | | 2012 | | | 2011 | | | 2010 | | | | 2014 | | | 2013 | | | 2012 | | | 2011 | | | 2010 | |
| (Unaudited) | | | | | | | | | | | | | | | | | | (Unaudited) | | | | | | | | | | | | | | | | |
| $ | 9.85 | | | $ | 10.02 | | | $ | 9.20 | | | $ | 10.86 | | | $ | 11.96 | | | $ | 11.95 | | | $ | 9.85 | | | $ | 10.02 | | | $ | 9.20 | | | $ | 10.86 | | | $ | 11.96 | | | $ | 11.95 | |
| | | | | | | | | | | | | | | | | | | | | | | | | | | | | | | | | | | | | | | | | | | | | | |
| | 0.13 | e | | | 0.16 | | | | 0.21 | | | | 0.17 | | | | 0.23 | | | | 0.22 | | | | 0.13 | e | | | 0.16 | | | | 0.21 | | | | 0.17 | | | | 0.23 | | | | 0.22 | |
| | 0.29 | | | | 0.47 | | | | 1.53 | | | | 0.51 | | | | 0.05 | | | | 1.64 | | | | 0.29 | | | | 0.47 | | | | 1.53 | | | | 0.51 | | | | 0.05 | | | | 1.64 | |
| | 0.42 | | | | 0.63 | | | | 1.74 | | | | 0.68 | | | | 0.28 | | | | 1.86 | | | | 0.42 | | | | 0.63 | | | | 1.74 | | | | 0.68 | | | | 0.28 | | | | 1.86 | |
| | | | | | | | | | | | | | | | | | | | | | | | | | | | | | | | | | | | | | | | | | | | | | |
| | (0.22 | ) | | | (0.23 | ) | | | (0.26 | ) | | | (0.20 | ) | | | (0.30 | ) | | | (0.25 | ) | | | (0.22 | ) | | | (0.23 | ) | | | (0.26 | ) | | | (0.20 | ) | | | (0.30 | ) | | | (0.25 | ) |
| | (0.65 | ) | | | (0.57 | ) | | | (0.66 | ) | | | (2.14 | ) | | | (1.08 | ) | | | (1.60 | ) | | | (0.65 | ) | | | (0.57 | ) | | | (0.66 | ) | | | (2.14 | ) | | | (1.08 | ) | | | (1.60 | ) |
| | (0.87 | ) | | | (0.80 | ) | | | (0.92 | ) | | | (2.34 | ) | | | (1.38 | ) | | | (1.85 | ) | | | (0.87 | ) | | | (0.80 | ) | | | (0.92 | ) | | | (2.34 | ) | | | (1.38 | ) | | | (1.85 | ) |
| | 9.40 | | | | 9.85 | | | | 10.02 | | | | 9.20 | | | | 10.86 | | | | 11.96 | | | | 9.40 | | | | 9.85 | | | | 10.02 | | | | 9.20 | | | | 10.86 | | | | 11.96 | |
| $ | 21 | | | $ | 20 | | | $ | 19 | | | $ | 16 | | | $ | 14 | | | $ | 14 | | | $ | 21 | | | $ | 20 | | | $ | 19 | | | $ | 16 | | | $ | 14 | | | $ | 14 | |
| | | | | | | | | | | | | | | | | | | | | | | | | | | | | | | | | | | | | | | | | | | | | | |
| | 4.72 | %c | | | 6.76 | % | | | 20.62 | % | | | 9.78 | % | | | 2.16 | % | | | 17.22 | % | | | 4.72 | %c | | | 6.76 | % | | | 20.62 | % | | | 9.78 | % | | | 2.16 | % | | | 17.22 | % |
| | 0.25 | d | | | 0.25 | | | | 0.25 | | | | 0.25 | | | | 0.25 | | | | 0.25 | | | | 0.37 | d | | | 0.37 | | | | 0.37 | | | | 0.37 | | | | 0.37 | | | | 0.37 | |
| | — | | | | — | | | | — | | | | — | | | | — | | | | — | | | | — | | | | — | | | | — | | | | — | | | | — | | | | — | |
| | 2.86 | d | | | 1.60 | | | | 2.20 | | | | 1.71 | | | | 1.93 | | | | 1.82 | | | | 2.86 | d | | | 1.60 | | | | 2.20 | | | | 1.71 | | | | 1.93 | | | | 1.82 | |
| | 11 | c | | | 22 | | | | 22 | | | | 27 | | | | 45 | | | | 28 | | | | 11 | c | | | 22 | | | | 22 | | | | 27 | | | | 45 | | | | 28 | |
| | | | | | | | | | | | | | | | | | | | | | | | | | | | | | | | | | | | | | | | | | | | | | |
| | |
| Administrative Class | | | Investor Class | |
6-Month
Period Ended
April 30, 2015 | | | Year Ended October 31, | | | 6-Month
Period Ended
April 30, 2015 | | | Year Ended October 31, | |
| | 2014 | | | 2013 | | | 2012 | | | 2011 | | | 2010 | | | | 2014 | | | 2013 | | | 2012 | | | 2011 | | | 2010 | |
| (Unaudited) | | | | | | | | | | | | | | | | | | (Unaudited) | | | | | | | | | | | | | | | | |
| $ | 15.17 | | | $ | 14.84 | | | $ | 12.42 | | | $ | 12.85 | | | $ | 13.67 | | | $ | 11.91 | | | $ | 15.17 | | | $ | 14.84 | | | $ | 12.42 | | | $ | 12.85 | | | $ | 13.67 | | | $ | 11.91 | |
| | | | | | | | | | | | | | | | | | | | | | | | | | | | | | | | | | | | | | | | | | | | | | |
| | 0.18 | e | | | 0.22 | | | | 0.28 | | | | 0.20 | | | | 0.22 | | | | 0.19 | | | | 0.18 | e | | | 0.22 | | | | 0.28 | | | | 0.20 | | | | 0.22 | | | | 0.19 | |
| | 0.55 | | | | 0.82 | | | | 2.58 | | | | 0.80 | | | | 0.08 | | | | 1.85 | | | | 0.55 | | | | 0.82 | | | | 2.58 | | | | 0.80 | | | | 0.08 | | | | 1.85 | |
| | 0.73 | | | | 1.04 | | | | 2.86 | | | | 1.00 | | | | 0.30 | | | | 2.04 | | | | 0.73 | | | | 1.04 | | | | 2.86 | | | | 1.00 | | | | 0.30 | | | | 2.04 | |
| | | | | | | | | | | | | | | | | | | | | | | | | | | | | | | | | | | | | | | | | | | | | | |
| | (0.29 | ) | | | (0.31 | ) | | | (0.31 | ) | | | (0.19 | ) | | | (0.29 | ) | | | (0.18 | ) | | | (0.29 | ) | | | (0.31 | ) | | | (0.31 | ) | | | (0.19 | ) | | | (0.29 | ) | | | (0.18 | ) |
| | (0.80 | ) | | | (0.40 | ) | | | (0.13 | ) | | | (1.24 | ) | | | (0.83 | ) | | | (0.10 | ) | | | (0.80 | ) | | | (0.40 | ) | | | (0.13 | ) | | | (1.24 | ) | | | (0.83 | ) | | | (0.10 | ) |
| | (1.09 | ) | | | (0.71 | ) | | | (0.44 | ) | | | (1.43 | ) | | | (1.12 | ) | | | (0.28 | ) | | | (1.09 | ) | | | (0.71 | ) | | | (0.44 | ) | | | (1.43 | ) | | | (1.12 | ) | | | (0.28 | ) |
| | 14.81 | | | | 15.17 | | | | 14.84 | | | | 12.42 | | | | 12.85 | | | | 13.67 | | | | 14.81 | | | | 15.17 | | | | 14.84 | | | | 12.42 | | | | 12.85 | | | | 13.67 | |
| $ | 22 | | | $ | 21 | | | $ | 20 | | | $ | 16 | | | $ | 14 | | | $ | 14 | | | $ | 22 | | | $ | 21 | | | $ | 19 | | | $ | 15 | | | $ | 14 | | | $ | 14 | |
| | | | | | | | | | | | | | | | | | | | | | | | | | | | | | | | | | | | | | | | | | | | | | |
| | 5.21 | %c | | | 7.24 | % | | | 23.66 | % | | | 9.62 | % | | | 1.97 | % | | | 17.37 | % | | | 5.21 | %c | | | 7.24 | % | | | 23.66 | % | | | 9.62 | % | | | 1.97 | % | | | 17.37 | % |
| | 0.25 | d | | | 0.25 | | | | 0.25 | | | | 0.25 | | | | 0.25 | | | | 0.25 | | | | 0.37 | d | | | 0.37 | | | | 0.37 | | | | 0.37 | | | | 0.37 | | | | 0.37 | |
| | — | | | | — | | | | — | | | | — | | | | — | | | | — | | | | — | | | | — | | | | — | | | | — | | | | — | | | | — | |
| | 2.49 | d | | | 1.40 | | | | 2.06 | | | | 1.50 | | | | 1.50 | | | | 1.43 | | | | 2.49 | d | | | 1.40 | | | | 2.06 | | | | 1.50 | | | | 1.50 | | | | 1.43 | |
| | 9 | c | | | 21 | | | | 20 | | | | 16 | | | | 59 | | | | 32 | | | | 9 | c | | | 21 | | | | 20 | | | | 16 | | | | 59 | | | | 32 | |
68
Harbor Target Retirement Funds Financial Highlights—Continued
SELECTED DATA FOR A SHARE OUTSTANDING FOR THE PERIODS PRESENTED
| | | | | | | | | | | | | | | | | | | | | | | | |
HARBOR TARGET RETIREMENT 2050 FUND | |
| | | Institutional Class | |
| | | 6-Month
Period Ended
April 30, 2015 | | | Year Ended October 31, | |
| | | | 2014 | | | 2013 | | | 2012 | | | 2011 | | | 2010 | |
| | | (Unaudited) | | | | | | | | | | | | | | | | |
Net asset value beginning of period | | $ | 11.40 | | | $ | 11.46 | | | $ | 10.17 | | | $ | 11.75 | | | $ | 13.06 | | | $ | 11.91 | |
Income from Investment Operations | | | | | | | | | | | | | | | | | | | | | | | | |
Net investment income/(loss)a | | | 0.12 | e | | | 0.15 | | | | 0.22 | | | | 0.16 | | | | 0.20 | | | | 0.18 | |
Net realized and unrealized gains/(losses) on investments | | | 0.49 | | | | 0.67 | | | | 2.20 | | | | 0.58 | | | | 0.06 | | | | 1.80 | |
Total from investment operations | | | 0.61 | | | | 0.82 | | | | 2.42 | | | | 0.74 | | | | 0.26 | | | | 1.98 | |
Less Distributions | | | | | | | | | | | | | | | | | | | | | | | | |
Dividends from net investment income | | | (0.19 | ) | | | (0.23 | ) | | | (0.24 | ) | | | (0.17 | ) | | | (0.24 | ) | | | (0.19 | ) |
Distributions from net realized capital gains1 | | | (1.01 | ) | | | (0.65 | ) | | | (0.89 | ) | | | (2.15 | ) | | | (1.33 | ) | | | (0.64 | ) |
Total distributions | | | (1.20 | ) | | | (0.88 | ) | | | (1.13 | ) | | | (2.32 | ) | | | (1.57 | ) | | | (0.83 | ) |
Net asset value end of period | | | 10.81 | | | | 11.40 | | | | 11.46 | | | | 10.17 | | | | 11.75 | | | | 13.06 | |
Net assets end of period (000s) | | $ | 20,965 | | | $ | 20,434 | | | $ | 19,170 | | | $ | 14,516 | | | $ | 14,620 | | | $ | 15,950 | |
Ratios and Supplemental Data (%) | | | | | | | | | | | | | | | | | | | | | | | | |
Total returnb | | | 5.95 | %c | | | 7.61 | % | | | 26.12 | % | | | 9.66 | % | | | 1.64 | % | | | 17.29 | % |
Ratio of total expenses to average net assets2 | | | — | | | | — | | | | — | | | | — | | | | — | | | | — | |
Ratio of net expenses to average net assetsa,2 | | | — | | | | — | | | | — | | | | — | | | | — | | | | — | |
Ratio of net investment income to average net assetsa,2 | | | 2.22 | d | | | 1.17 | | | | 1.88 | | | | 1.41 | | | | 1.47 | | | | 1.38 | |
Portfolio turnover3 | | | 13 | c | | | 23 | | | | 17 | | | | 21 | | | | 34 | | | | 28 | |
| | | | | | | | | | | | | | | | | | | | | | | | |
| | | | | | | | | | | | | | |
HARBOR TARGET RETIREMENT 2055 FUND | |
| | | | | Institutional Class | | | Administrative Class | | | Investor Class | |
| | | | | 2015 | | | 2015 | | | 2015 | |
| | | | | (Unaudited) | | | (Unaudited) | | | (Unaudited) | |
Net asset value beginning of period | | | | $ | 10.00 | | | $ | 10.00 | | | $ | 10.00 | |
Income from Investment Operations | | | | | | | | | | | | | | |
Net investment income/(loss)a | | | | | 0.05 | e | | | 0.11 | e | | | 0.11 | e |
Net realized and unrealized gains/(losses) on investments | | | | | 0.59 | | | | 0.52 | | | | 0.52 | |
Total from investment operations | | | | | 0.64 | | | | 0.63 | | | | 0.63 | |
Less Distributions | | | | | | | | | | | | | | |
Dividends from net investment income | | | | | (0.15 | ) | | | (0.15 | ) | | | (0.15 | ) |
Distributions from net realized capital gains1 | | | | | — | | | | — | | | | — | |
Total distributions | | | | | (0.15 | ) | | | (0.15 | ) | | | (0.15 | ) |
Net asset value end of period | | | | | 10.49 | | | | 10.48 | | | | 10.48 | |
Net assets end of period (000s) | | | | $ | 413 | | | $ | 11 | | | $ | 11 | |
Ratios and Supplemental Data (%) | | | | | | | | | | | | | | |
Total returnb | | | | | 6.45 | %c | | | 6.34 | %c | | | 6.34 | %c |
Ratio of total expenses to average net assets2 | | | | | — | | | | 0.25 | d | | | 0.37 | d |
Ratio of net expenses to average net assetsa,2 | | | | | — | | | | — | | | | — | |
Ratio of net investment income to average net assetsa,2 | | | | | 0.92 | d | | | 2.21 | d | | | 2.21 | d |
Portfolio turnover3 | | | | | 6 | c | | | 6 | c | | | 6 | c |
| 1 | Includes both short-term and long-term capital gains. |
| 2 | Ratios of income and expenses to average net assets represents the expenses paid by the Fund but does not include the acquired fund fees and expenses from underlying funds. |
| 3 | Amounts do not include the activity of the underlying funds. |
| a | Reflects the Distributor’s and Transfer Agent’s waiver, if any, or its 12b-1 and transfer agency fees, respectively. |
| b | The total returns would have been lower had certain expenses not been waived during the periods shown. |
| e | Amounts are allocated based upon average shares outstanding during the period. |
The accompanying notes are an integral part of the Financial Statements.
69
| | | | | | | | | | | | | | | | | | | | | | | | | | | | | | | | | | | | | | | | | | | | | | |
| | |
| Administrative Class | | | Investor Class | |
6-Month
Period Ended
April 30, 2015 | | | Year Ended October 31, | | | 6-Month
Period Ended
April 30, 2015 | | | Year Ended October 31, | |
| | 2014 | | | 2013 | | | 2012 | | | 2011 | | | 2010 | | | | 2014 | | | 2013 | | | 2012 | | | 2011 | | | 2010 | |
| (Unaudited) | | | | | | | | | | | | | | | | | | (Unaudited) | | | | | | | | | | | | | | | | |
| $ | 11.41 | | | $ | 11.47 | | | $ | 10.18 | | | $ | 11.75 | | | $ | 13.06 | | | $ | 11.91 | | | $ | 11.41 | | | $ | 11.47 | | | $ | 10.18 | | | $ | 11.75 | | | $ | 13.06 | | | $ | 11.91 | |
| | | | | | | | | | | | | | | | | | | | | | | | | | | | | | | | | | | | | | | | | | | | | | |
| | 0.12 | e | | | 0.15 | | | | 0.22 | | | | 0.16 | | | | 0.19 | | | | 0.18 | | | | 0.12 | e | | | 0.15 | | | | 0.22 | | | | 0.16 | | | | 0.19 | | | | 0.18 | |
| | 0.49 | | | | 0.67 | | | | 2.20 | | | | 0.59 | | | | 0.07 | | | | 1.80 | | | | 0.49 | | | | 0.67 | | | | 2.20 | | | | 0.59 | | | | 0.07 | | | | 1.80 | |
| | 0.61 | | | | 0.82 | | | | 2.42 | | | | 0.75 | | | | 0.26 | | | | 1.98 | | | | 0.61 | | | | 0.82 | | | | 2.42 | | | | 0.75 | | | | 0.26 | | | | 1.98 | |
| | | | | | | | | | | | | | | | | | | | | | | | | | | | | | | | | | | | | | | | | | | | | | |
| | (0.19 | ) | | | (0.23 | ) | | | (0.24 | ) | | | (0.17 | ) | | | (0.24 | ) | | | (0.19 | ) | | | (0.19 | ) | | | (0.23 | ) | | | (0.24 | ) | | | (0.17 | ) | | | (0.24 | ) | | | (0.19 | ) |
| | (1.01 | ) | | | (0.65 | ) | | | (0.89 | ) | | | (2.15 | ) | | | (1.33 | ) | | | (0.64 | ) | | | (1.01 | ) | | | (0.65 | ) | | | (0.89 | ) | | | (2.15 | ) | | | (1.33 | ) | | | (0.64 | ) |
| | (1.20 | ) | | | (0.88 | ) | | | (1.13 | ) | | | (2.32 | ) | | | (1.57 | ) | | | (0.83 | ) | | | (1.20 | ) | | | (0.88 | ) | | | (1.13 | ) | | | (2.32 | ) | | | (1.57 | ) | | | (0.83 | ) |
| | 10.82 | | | | 11.41 | | | | 11.47 | | | | 10.18 | | | | 11.75 | | | | 13.06 | | | | 10.82 | | | | 11.41 | | | | 11.47 | | | | 10.18 | | | | 11.75 | | | | 13.06 | |
| $ | 22 | | | $ | 21 | | | $ | 19 | | | $ | 15 | | | $ | 14 | | | $ | 14 | | | $ | 23 | | | $ | 21 | | | $ | 20 | | | $ | 16 | | | $ | 14 | | | $ | 14 | |
| | | | | | | | | | | | | | | | | | | | | | | | | | | | | | | | | | | | | | | | | | | | | | |
| | 5.94 | %c | | | 7.61 | % | | | 26.09 | % | | | 9.74 | % | | | 1.64 | % | | | 17.29 | % | | | 5.94 | %c | | | 7.61 | % | | | 26.09 | % | | | 9.74 | % | | | 1.64 | % | | | 17.29 | % |
| | 0.25 | d | | | 0.25 | | | | 0.25 | | | | 0.25 | | | | 0.25 | | | | 0.25 | | | | 0.37 | d | | | 0.37 | | | | 0.37 | | | | 0.37 | | | | 0.37 | | | | 0.37 | |
| | — | | | | — | | | | — | | | | — | | | | — | | | | — | | | | — | | | | — | | | | — | | | | — | | | | — | | | | — | |
| | 2.19 | d | | | 1.17 | | | | 1.91 | | | | 1.35 | | | | 1.43 | | | | 1.38 | | | | 2.19 | d | | | 1.17 | | | | 1.91 | | | | 1.35 | | | | 1.43 | | | | 1.38 | |
| | 13 | c | | | 23 | | | | 17 | | | | 21 | | | | 34 | | | | 28 | | | | 13 | c | | | 23 | | | | 17 | | | | 21 | | | | 34 | | | | 28 | |
70
Harbor Target Retirement Funds
NOTES TO FINANCIAL STATEMENTS—April 30, 2015 (Unaudited)
(Currency in thousands)
NOTE 1—ORGANIZATIONAL MATTERS
Harbor Funds (the “Trust”) is registered under the Investment Company Act of 1940, as amended (the “Investment Company Act”), as an open-end management investment company. The Trust consists of 28 separate portfolios. The portfolios covered by this report include: Harbor Target Retirement Income Fund, Harbor Target Retirement 2015 Fund, Harbor Target Retirement 2020 Fund, Harbor Target Retirement 2025 Fund, Harbor Target Retirement 2030 Fund, Harbor Target Retirement 2035 Fund, Harbor Target Retirement 2040 Fund, Harbor Target Retirement 2045 Fund, Harbor Target Retirement 2050 Fund and Harbor Target Retirement 2055 Fund (individually referred to as a “Fund” and collectively referred to as the “Funds” or the “Target Retirement Funds”). The Funds invest in a combination of other affiliated funds of the Trust (the “Underlying Funds”). Harbor Capital Advisors, Inc. (the “Adviser” or “Harbor Capital”) is the investment adviser for the Funds and the Underlying Funds. The Underlying Funds are managed by subadvisers, none of which is affiliated with the Adviser.
The Funds may offer up to three classes of shares, designated as Institutional Class, Administrative Class and Investor Class. The shares of each class represent an interest in the same portfolio of investments of the respective Fund and have equal rights to voting, redemptions, dividends, and liquidations, except that: (i) certain expenses, subject to the approval of the Trust’s Board of Trustees (the “Board of Trustees”), may be applied differently to each class of shares in accordance with current regulations of the Securities and Exchange Commission and the Internal Revenue Service; and (ii) shareholders of a class that bears distribution and service expenses under terms of a distribution plan have exclusive voting rights as to that distribution plan.
NOTE 2—SIGNIFICANT ACCOUNTING POLICIES
The following is a summary of significant accounting policies followed by the Trust in the preparation of its financial statements. Each Fund follows the investment company reporting requirements under U.S. Generally Accepted Accounting Principles (“U.S. GAAP”). The preparation of financial statements in accordance with U.S. GAAP requires management to make estimates and assumptions that affect the reported amounts and disclosures in the financial statements. Actual results may differ from those estimates.
Security Valuation
The holdings of each Target Retirement Fund consist entirely of Institutional Class shares of the Underlying Funds, which are valued at their respective net asset values each business day and are categorized as Level 1 in the fair value hierarchy. For more information on the fair value hierarchy, please refer to the following Fair Value Measurements and Disclosures section.
Fair Value Measurements and Disclosures
Various inputs may be used to determine the value of each Fund’s investments, which are summarized in three broad categories defined as Level 1, Level 2 and Level 3. The inputs or methodologies used for valuing securities are not necessarily an indication of the risk associated with investing in those securities. The assignment of an investment to Level 1, 2 or 3 is based on the lowest level of significant inputs used to determine its fair value.
| | |
| Level 1— | | Quoted prices in active markets for identical securities. |
| Level 2— | | Other significant observable inputs (including quoted prices for similar securities, interest rates, prepayment speeds, credit risk, etc.). |
| Level 3— | | Significant unobservable inputs are used in situations where quoted prices or other observable inputs are not available or are deemed unreliable. Significant unobservable inputs may include the Funds’ own assumptions. |
Transfers between Levels, if any, are recognized as of the last day in the fiscal quarter of the period in which the event or change in circumstances that caused the reclassification occurred. For fair valuations using significant unobservable inputs, a reconciliation of the beginning to ending balances for reported fair values is provided that presents changes attributable to realized and unrealized gains and losses and purchases, sales, and transfers in/out of the Level 3 category during the
71
Harbor Target Retirement Funds
NOTES TO FINANCIAL STATEMENTS—Continued
(Currency in thousands)
NOTE 2—SIGNIFICANT ACCOUNTING POLICIES—Continued
period. A table that includes a categorization of investments into Level 1, Level 2 or Level 3, transfers between Levels, if any, and a Level 3 reconciliation, including details of significant unobservable inputs used, when applicable, can be found at the end of each Fund’s Portfolio of Investments schedule.
The Funds used observable inputs in their valuation methodologies whenever they were available and deemed reliable.
Description of the Underlying Funds
In pursuing its investment objectives and strategies, each of the Underlying Funds is permitted to engage in a wide range of investment practices. Further information about the Underlying Funds is contained in the statement of additional information, as well as the prospectuses of each of the Underlying Funds. The accounting policies of each of the Underlying Funds are disclosed in each Underlying Fund’s respective shareholder report. Because each Fund invests in the Underlying Funds, shareholders of each Fund will be affected by the investment practices of the Underlying Funds in direct proportion to the amount of assets each Fund allocates to the Underlying Funds.
Investment Transactions and Income
Securities transactions are accounted for on the trade date (the day the order to buy or sell is executed). Income and capital gain distributions received from the Underlying Funds are recorded on the ex-dividend date. Gains and losses on securities sold are determined on the basis of identified cost.
Distribution to Shareholders
Distributions on Fund shares are recorded on the ex-dividend date.
Expenses
Expenses incurred by the Trust are charged directly to the Fund that incurred such expense whenever possible. With respect to expenses incurred by any two or more Harbor Funds where amounts cannot be identified on a fund by fund basis, such expenses are generally allocated in proportion to the average net assets or the number of shareholders of each fund. Expenses included in the accompanying financial statements reflect the expenses of each Target Retirement Fund and do not include any expenses associated with the Underlying Funds.
Class Allocations
Income and realized and unrealized gains/(losses) are determined at the Fund level and allocated daily to each class of shares based on the applicable net assets of the respective classes. The 12b-1 and transfer agent fees, if any, are calculated daily at the class level based on the applicable net assets of each class and the specific expense rates applicable to each class.
Taxes
Each Fund is treated as a separate entity for federal tax purposes. Each Fund’s policy is to meet the requirements of Subchapter M of the Internal Revenue Code applicable to regulated investment companies and to distribute to its shareholders all of its taxable income within the prescribed time. It is also the intention of each Fund to distribute an amount sufficient to avoid imposition of any excise tax under Section 4982 of the Internal Revenue Code. Therefore, no provision has been made for federal taxes on income, capital gains or unrealized appreciation of securities held or excise tax on income and capital gains.
All investment transactions for the Funds are in affiliated Underlying Funds. The Underlying Funds may be subject to taxes imposed by countries in which they invest. Such taxes are generally based on income and/or capital gains earned or repatriated. Taxes are accrued and applied to net investment income, net realized gains and unrealized appreciation as such income and/or gains are earned.
72
Harbor Target Retirement Funds
NOTES TO FINANCIAL STATEMENTS—Continued
(Currency in thousands)
NOTE 2—SIGNIFICANT ACCOUNTING POLICIES—Continued
Management has analyzed each Fund’s tax positions taken on federal income tax returns for all open tax years (in particular, the tax years ended October 31, 2011-2013), including all positions expected to be taken upon filing the 2014 tax return and has concluded that no provision for income tax is required in any Fund’s financial statements. The Funds will recognize interest and penalties, if any, related to unrecognized tax benefits as income tax expense in the Statement of Operations.
Related Parties
The Funds do not invest in the Underlying Funds for the purpose of exercising management or control; however, investments by the Funds may represent a significant portion of an Underlying Fund’s net assets. At April 30, 2015, each Fund held 10% or fewer of the outstanding shares of any Underlying Fund. In aggregate, the Funds held 21% of Harbor Unconstrained Bond Fund.
New Accounting Pronouncement
In May 2015, Financial Accounting Standards Board (“FASB”) issued Accounting Standards Update (“ASU”) 2015-07, Disclosures for Investments in Certain Entities That Calculate Net Asset Value per Share (or Its Equivalent) (“ASU 2015-07”) which removes the requirement to make certain fair value disclosures for investments that are eligible to be measured at fair value using the net asset value per share. ASU 2015-07 becomes effective for interim or annual periods beginning after December 15, 2015. Management is evaluating the implications of this pronouncement and the impact it will have on the financial statement disclosures.
NOTE 3—INVESTMENT PORTFOLIO TRANSACTIONS
Purchases and sales of investments for each Fund for the six-month period ended April 30, 2015 are as follows:
| | | | | | | | | | | | | | | | | | | | |
| | | | | | | | | | | | Net Realized Gain/(Loss) | |
| Harbor Target Retirement Income Fund | | Purchases | | | Sales | | | Investment
income from
affiliated
funds | | | Distributions
received from
affiliated funds | | | Sale of
affiliated
funds | |
Underlying Funds | | | | | | | | | | | | | | | | | | | | |
Harbor Capital Appreciation Fund | | $ | 61 | | | $ | 89 | | | $ | — | | | $ | 27 | | | $ | 33 | |
Harbor Mid Cap Growth Fund | | | 52 | | | | 43 | | | | — | | | | 37 | | | | 8 | |
Harbor Small Cap Growth Fund | | | 43 | | | | 47 | | | | — | | | | 30 | | | | 10 | |
Harbor Large Cap Value Fund | | | 82 | | | | 100 | | | | 4 | | | | 33 | | | | 42 | |
Harbor Mid Cap Value Fund | | | 31 | | | | 58 | | | | 3 | | | | 2 | | | | 28 | |
Harbor Small Cap Value Fund | | | 32 | | | | 47 | | | | 1 | | | | 8 | | | | 12 | |
Harbor International Fund | | | 81 | | | | 226 | | | | 18 | | | | — | | | | 44 | |
Harbor International Growth Fund | | | 107 | | | | 85 | | | | 7 | | | | — | | | | 16 | |
Harbor Global Growth Fund | | | 32 | | | | 28 | | | | — | | | | 20 | | | | 9 | |
Harbor Unconstrained Bond Fund | | | 116 | | | | 388 | | | | 56 | | | | — | | | | (7 | ) |
Harbor High-Yield Bond Fund | | | 216 | | | | 719 | | | | 57 | | | | 52 | | | | (47 | ) |
Harbor Bond Fund | | | 438 | | | | 513 | | | | 100 | | | | 55 | | | | (23 | ) |
Harbor Real Return Fund | | | 339 | | | | 200 | | | | 174 | | | | — | | | | (17 | ) |
Harbor Money Market Fund | | | 925 | | | | 76 | | | | — | | | | — | | | | — | |
| | | | | | | | | | | | | | | | | | | | |
Total | | $ | 2,555 | | | $ | 2,619 | | | $ | 420 | | | $ | 264 | | | $ | 108 | |
| | | | | | | | | | | | | | | | | | | | |
73
Harbor Target Retirement Funds
NOTES TO FINANCIAL STATEMENTS—Continued
(Currency in thousands)
NOTE 3—INVESTMENT PORTFOLIO TRANSACTIONS—Continued
| | | | | | | | | | | | | | | | | | | | |
| | | | | | | | | | | | Net Realized Gain/(Loss) | |
| Harbor Target Retirement 2015 Fund | | Purchases | | | Sales | | | Investment
income from
affiliated
funds | | | Distributions
received from
affiliated funds | | | Sale of
affiliated
funds | |
Underlying Funds | | | | | | | | | | | | | | | | | | | | |
Harbor Capital Appreciation Fund | | $ | 63 | | | $ | 133 | | | $ | — | | | $ | 26 | | | $ | 30 | |
Harbor Mid Cap Growth Fund | | | 52 | | | | 67 | | | | — | | | | 35 | | | | — | |
Harbor Small Cap Growth Fund | | | 46 | | | | 73 | | | | — | | | | 29 | | | | (1 | ) |
Harbor Large Cap Value Fund | | | 87 | | | | 156 | | | | 3 | | | | 32 | | | | 41 | |
Harbor Mid Cap Value Fund | | | 32 | | | | 97 | | | | 3 | | | | 2 | | | | 37 | |
Harbor Small Cap Value Fund | | | 31 | | | | 78 | | | | 1 | | | | 8 | | | | 8 | |
Harbor International Fund | | | 92 | | | | 290 | | | | 17 | | | | — | | | | 23 | |
Harbor International Growth Fund | | | 78 | | | | 103 | | | | 7 | | | | — | | | | 9 | |
Harbor Global Growth Fund | | | 31 | | | | 46 | | | | — | | | | 20 | | | | 8 | |
Harbor Commodity Real Return Strategy Fund | | | 63 | | | | 70 | | | | 8 | | | | — | | | | (40 | ) |
Harbor Unconstrained Bond Fund | | | 69 | | | | 134 | | | | 31 | | | | — | | | | (2 | ) |
Harbor High-Yield Bond Fund | | | 159 | | | | 360 | | | | 39 | | | | 33 | | | | (31 | ) |
Harbor Bond Fund | | | 353 | | | | 381 | | | | 56 | | | | 31 | | | | (20 | ) |
Harbor Real Return Fund | | | 282 | | | | 136 | | | | 76 | | | | — | | | | (23 | ) |
Harbor Money Market Fund | | | 331 | | | | 72 | | | | — | | | | — | | | | — | |
| | | | | | | | | | | | | | | | | | | | |
Total | | $ | 1,769 | | | $ | 2,196 | | | $ | 241 | | | $ | 216 | | | $ | 39 | |
| | | | | | | | | | | | | | | | | | | | |
| | | | | | | | | | | | | | | | | | | | |
| | | | | | | | | | | | Net Realized Gain/(Loss) | |
| Harbor Target Retirement 2020 Fund | | Purchases | | | Sales | | | Investment
income from
affiliated
funds | | | Distributions
received from
affiliated funds | | | Sale of
affiliated
funds | |
Underlying Funds | | | | | | | | | | | | | | | | | | | | |
Harbor Capital Appreciation Fund | | $ | 145 | | | $ | 363 | | | $ | 1 | | | $ | 81 | | | $ | 147 | |
Harbor Mid Cap Growth Fund | | | 145 | | | | 191 | | | | — | | | | 110 | | | | 37 | |
Harbor Small Cap Growth Fund | | | 121 | | | | 205 | | | | — | | | | 91 | | | | 47 | |
Harbor Large Cap Value Fund | | | 204 | | | | 404 | | | | 10 | | | | 101 | | | | 158 | |
Harbor Mid Cap Value Fund | | | 59 | | | | 249 | | | | 10 | | | | 6 | | | | 130 | |
Harbor Small Cap Value Fund | | | 78 | | | | 211 | | | | 2 | | | | 25 | | | | 55 | |
Harbor International Fund | | | 205 | | | | 807 | | | | 54 | | | | — | | | | 164 | |
Harbor International Growth Fund | | | 284 | | | | 342 | | | | 21 | | | | — | | | | 66 | |
Harbor Global Growth Fund | | | 83 | | | | 127 | | | | 1 | | | | 61 | | | | 44 | |
Harbor Commodity Real Return Strategy Fund | | | 219 | | | | 161 | | | | 34 | | | | — | | | | (81 | ) |
Harbor Unconstrained Bond Fund | | | 185 | | | | 238 | | | | 76 | | | | — | | | | (1 | ) |
Harbor Convertible Securities Fund | | | 1,208 | | | | 112 | | | | 4 | | | | — | | | | 2 | |
Harbor High-Yield Bond Fund | | | 465 | | | | 843 | | | | 120 | | | | 100 | | | | (58 | ) |
Harbor Bond Fund | | | 699 | | | | 2,489 | | | | 147 | | | | 82 | | | | 13 | |
Harbor Real Return Fund | | | 489 | | | | 397 | | | | 168 | | | | — | | | | (49 | ) |
Harbor Money Market Fund | | | 430 | | | | 26 | | | | — | | | | — | | | | — | |
| | | | | | | | | | | | | | | | | | | | |
Total | | $ | 5,019 | | | $ | 7,165 | | | $ | 648 | | | $ | 657 | | | $ | 674 | |
| | | | | | | | | | | | | | | | | | | | |
74
Harbor Target Retirement Funds
NOTES TO FINANCIAL STATEMENTS—Continued
(Currency in thousands)
NOTE 3—INVESTMENT PORTFOLIO TRANSACTIONS—Continued
| | | | | | | | | | | | | | | | | | | | |
| | | | | | | | | | | | Net Realized Gain/(Loss) | |
| Harbor Target Retirement 2025 Fund | | Purchases | | | Sales | | | Investment
income from
affiliated
funds | | | Distributions
received from
affiliated funds | | | Sale of
affiliated
funds | |
Underlying Funds | | | | | | | | | | | | | | | | | | | | |
Harbor Capital Appreciation Fund | | $ | 82 | | | $ | 77 | | | $ | — | | | $ | 33 | | | $ | 25 | |
Harbor Mid Cap Growth Fund | | | 66 | | | | 38 | | | | — | | | | 45 | | | | 6 | |
Harbor Small Cap Growth Fund | | | 58 | | | | 54 | | | | — | | | | 37 | | | | 12 | |
Harbor Large Cap Value Fund | | | 113 | | | | 91 | | | | 4 | | | | 41 | | | | 34 | |
Harbor Mid Cap Value Fund | | | 45 | | | | 60 | | | | 4 | | | | 3 | | | | 26 | |
Harbor Small Cap Value Fund | | | 44 | | | | 53 | | | | 1 | | | | 10 | | | | 12 | |
Harbor International Fund | | | 108 | | | | 200 | | | | 22 | | | | — | | | | 33 | |
Harbor International Growth Fund | | | 133 | | | | 57 | | | | 9 | | | | — | | | | 9 | |
Harbor Global Growth Fund | | | 46 | | | | 26 | | | | — | | | | 25 | | | | 6 | |
Harbor Commodity Real Return Strategy Fund | | | 152 | | | | 51 | | | | 16 | | | | — | | | | (26 | ) |
Harbor Unconstrained Bond Fund | | | 127 | | | | 43 | | | | 25 | | | | — | | | | — | |
Harbor Convertible Securities Fund | | | 516 | | | | 14 | | | | 2 | | | | — | | | | — | |
Harbor High-Yield Bond Fund | | | 294 | | | | 122 | | | | 46 | | | | 36 | | | | (6 | ) |
Harbor Bond Fund | | | 461 | | | | 680 | | | | 47 | | | | 26 | | | | (25 | ) |
Harbor Real Return Fund | | | 210 | | | | 61 | | | | 43 | | | | — | | | | (10 | ) |
| | | | | | | | | | | | | | | | | | | | |
Total | | $ | 2,455 | | | $ | 1,627 | | | $ | 219 | | | $ | 256 | | | $ | 96 | |
| | | | | | | | | | | | | | | | | | | | |
| | | | | | | | | | | | | | | | | | | | |
| | | | | | | | | | | | Net Realized Gain/(Loss) | |
| Harbor Target Retirement 2030 Fund | | Purchases | | | Sales | | | Investment
income from
affiliated
funds | | | Distributions
received from
affiliated funds | | | Sale of
affiliated
funds | |
Underlying Funds | | | | | | | | | | | | | | | | | | | | |
Harbor Capital Appreciation Fund | | $ | 215 | | | $ | 206 | | | $ | 1 | | | $ | 96 | | | $ | 80 | |
Harbor Mid Cap Growth Fund | | | 200 | | | | 113 | | | | — | | | | 130 | | | | 29 | |
Harbor Small Cap Growth Fund | | | 157 | | | | 131 | | | | — | | | | 108 | | | | 32 | |
Harbor Large Cap Value Fund | | | 302 | | | | 234 | | | | 12 | | | | 119 | | | | 108 | |
Harbor Mid Cap Value Fund | | | 116 | | | | 146 | | | | 11 | | | | 8 | | | | 71 | |
Harbor Small Cap Value Fund | | | 95 | | | | 107 | | | | 2 | | | | 30 | | | | 28 | |
Harbor International Fund | | | 403 | | | | 708 | | | | 64 | | | | — | | | | 79 | |
Harbor International Growth Fund | | | 411 | | | | 205 | | | | 25 | | | | — | | | | 14 | |
Harbor Global Growth Fund | | | 133 | | | | 70 | | | | 1 | | | | 72 | | | | 15 | |
Harbor Commodity Real Return Strategy Fund | | | 429 | | | | 96 | | | | 47 | | | | — | | | | (71 | ) |
Harbor Unconstrained Bond Fund | | | 266 | | | | 41 | | | | 46 | | | | — | | | | — | |
Harbor Convertible Securities Fund | | | 1,007 | | | | 19 | | | | 3 | | | | — | | | | 1 | |
Harbor High-Yield Bond Fund | | | 664 | | | | 109 | | | | 97 | | | | 73 | | | | (7 | ) |
Harbor Bond Fund | | | 897 | | | | 1,036 | | | | 90 | | | | 50 | | | | 10 | |
Harbor Real Return Fund | | | 350 | | | | 45 | | | | 53 | | | | — | | | | (7 | ) |
| | | | | | | | | | | | | | | | | | | | |
Total | | $ | 5,645 | | | $ | 3,266 | | | $ | 452 | | | $ | 686 | | | $ | 382 | |
| | | | | | | | | | | | | | | | | | | | |
75
Harbor Target Retirement Funds
NOTES TO FINANCIAL STATEMENTS—Continued
(Currency in thousands)
NOTE 3—INVESTMENT PORTFOLIO TRANSACTIONS—Continued
| | | | | | | | | | | | | | | | | | | | |
| | | | | | | | | | | | Net Realized Gain/(Loss) | |
| Harbor Target Retirement 2035 Fund | | Purchases | | | Sales | | | Investment
income from
affiliated
funds | | | Distributions
received from
affiliated funds | | | Sale of
affiliated
funds | |
Underlying Funds | | | | | | | | | | | | | | | | | | | | |
Harbor Capital Appreciation Fund | | $ | 109 | | | $ | 39 | | | $ | — | | | $ | 36 | | | $ | 11 | |
Harbor Mid Cap Growth Fund | | | 82 | | | | 16 | | | | — | | | | 49 | | | | 1 | |
Harbor Small Cap Growth Fund | | | 67 | | | | 27 | | | | — | | | | 42 | | | | 1 | |
Harbor Large Cap Value Fund | | | 158 | | | | 57 | | | | 5 | | | | 45 | | | | 19 | |
Harbor Mid Cap Value Fund | | | 73 | | | | 37 | | | | 4 | | | | 3 | | | | 16 | |
Harbor Small Cap Value Fund | | | 57 | | | | 27 | | | | 1 | | | | 11 | | | | 3 | |
Harbor International Fund | | | 202 | | | | 205 | | | | 24 | | | | — | | | | 22 | |
Harbor International Growth Fund | | | 188 | | | | 31 | | | | 9 | | | | — | | | | 4 | |
Harbor Global Growth Fund | | | 64 | | | | 14 | | | | — | | | | 28 | | | | 3 | |
Harbor Commodity Real Return Strategy Fund | | | 176 | | | | 17 | | | | 15 | | | | — | | | | (10 | ) |
Harbor Unconstrained Bond Fund | | | 85 | | | | 2 | | | | 11 | | | | — | | | | — | |
Harbor Convertible Securities Fund | | | 64 | | | | — | | | | — | | | | — | | | | — | |
Harbor High-Yield Bond Fund | | | 257 | | | | 7 | | | | 28 | | | | 20 | | | | — | |
Harbor Bond Fund | | | 319 | | | | 19 | | | | 23 | | | | 12 | | | | — | |
Harbor Real Return Fund | | | 64 | | | | 1 | | | | 7 | | | | — | | | | — | |
| | | | | | | | | | | | | | | | | | | | |
Total | | $ | 1,965 | | | $ | 499 | | | $ | 127 | | | $ | 246 | | | $ | 70 | |
| | | | | | | | | | | | | | | | | | | | |
| | | | | | | | | | | | | | | | | | | | |
| | | | | | | | | | | | Net Realized Gain/(Loss) | |
| Harbor Target Retirement 2040 Fund | | Purchases | | | Sales | | | Investment
income from
affiliated
funds | | | Distributions
received from
affiliated funds | | | Sale of
affiliated
funds | |
Underlying Funds | | | | | | | | | | | | | | | | | | | | |
Harbor Capital Appreciation Fund | | $ | 194 | | | $ | 202 | | | $ | 1 | | | $ | 102 | | | $ | 101 | |
Harbor Mid Cap Growth Fund | | | 179 | | | | 107 | | | | — | | | | 138 | | | | 30 | |
Harbor Small Cap Growth Fund | | | 156 | | | | 148 | | | | — | | | | 114 | | | | 34 | |
Harbor Large Cap Value Fund | | | 276 | | | | 234 | | | | 12 | | | | 126 | | | | 97 | |
Harbor Mid Cap Value Fund | | | 102 | | | | 154 | | | | 12 | | | | 8 | | | | 75 | |
Harbor Small Cap Value Fund | | | 89 | | | | 129 | | | | 2 | | | | 32 | | | | 34 | |
Harbor International Fund | | | 325 | | | | 648 | | | | 68 | | | | — | | | | 97 | |
Harbor International Growth Fund | | | 358 | | | | 142 | | | | 27 | | | | — | | | | 25 | |
Harbor Global Growth Fund | | | 119 | | | | 68 | | | | 1 | | | | 77 | | | | 12 | |
Harbor Commodity Real Return Strategy Fund | | | 291 | | | | 29 | | | | 29 | | | | — | | | | (21 | ) |
Harbor Unconstrained Bond Fund | | | 123 | | | | 19 | | | | 20 | | | | — | | | | — | |
Harbor High-Yield Bond Fund | | | 405 | | | | 80 | | | | 48 | | | | 36 | | | | (2 | ) |
Harbor Bond Fund | | | 586 | | | | 153 | | | | 40 | | | | 22 | | | | 2 | |
Harbor Real Return Fund | | | 56 | | | | 10 | | | | 14 | | | | — | | | | (2 | ) |
| | | | | | | | | | | | | | | | | | | | |
Total | | $ | 3,259 | | | $ | 2,123 | | | $ | 274 | | | $ | 655 | | | $ | 482 | |
| | | | | | | | | | | | | | | | | | | | |
76
Harbor Target Retirement Funds
NOTES TO FINANCIAL STATEMENTS—Continued
(Currency in thousands)
NOTE 3—INVESTMENT PORTFOLIO TRANSACTIONS—Continued
| | | | | | | | | | | | | | | | | | | | |
| | | | | | | | | | | | Net Realized Gain/(Loss) | |
| Harbor Target Retirement 2045 Fund | | Purchases | | | Sales | | | Investment
income from
affiliated
funds | | | Distributions
received from
affiliated funds | | | Sale of
affiliated
funds | |
Underlying Funds | | | | | | | | | | | | | | | | | | | | |
Harbor Capital Appreciation Fund | | $ | 75 | | | $ | 35 | | | $ | — | | | $ | 27 | | | $ | 13 | |
Harbor Mid Cap Growth Fund | | | 58 | | | | 17 | | | | — | | | | 37 | | | | 3 | |
Harbor Small Cap Growth Fund | | | 48 | | | | 26 | | | | — | | | | 30 | | | | 4 | |
Harbor Large Cap Value Fund | | | 108 | | | | 42 | | | | 3 | | | | 33 | | | | 13 | |
Harbor Mid Cap Value Fund | | | 48 | | | | 27 | | | | 3 | | | | 2 | | | | 12 | |
Harbor Small Cap Value Fund | | | 35 | | | | 20 | | | | 1 | | | | 9 | | | | 4 | |
Harbor International Fund | | | 140 | | | | 140 | | | | 18 | | | | — | | | | 18 | |
Harbor International Growth Fund | | | 132 | | | | 23 | | | | 7 | | | | — | | | | 2 | |
Harbor Global Growth Fund | | | 46 | | | | 12 | | | | — | | | | 20 | | | | 4 | |
Harbor Commodity Real Return Strategy Fund | | | 81 | | | | 13 | | | | 7 | | | | — | | | | (8 | ) |
Harbor Unconstrained Bond Fund | | | 31 | | | | 5 | | | | 3 | | | | — | | | | — | |
Harbor High-Yield Bond Fund | | | 101 | | | | 18 | | | | 8 | | | | 6 | | | | (1 | ) |
Harbor Bond Fund | | | 147 | | | | 33 | | | | 5 | | | | 3 | | | | (1 | ) |
Harbor Real Return Fund | | | 11 | | | | — | | | | — | | | | — | | | | — | |
| | | | | | | | | | | | | | | | | | | | |
Total | | $ | 1,061 | | | $ | 411 | | | $ | 55 | | | $ | 167 | | | $ | 63 | |
| | | | | | | | | | | | | | | | | | | | |
| | | | | | | | | | | | | | | | | | | | |
| | | | | | | | | | | | Net Realized Gain/(Loss) | |
| Harbor Target Retirement 2050 Fund | | Purchases | | | Sales | | | Investment
income from
affiliated
funds | | | Distributions
received from
affiliated funds | | | Sale of
affiliated
funds | |
Underlying Funds | | | | | | | | | | | | | | | | | | | | |
Harbor Capital Appreciation Fund | | $ | 202 | | | $ | 220 | | | $ | 2 | | | $ | 141 | | | $ | 100 | |
Harbor Mid Cap Growth Fund | | | 226 | | | | 120 | | | | — | | | | 191 | | | | 33 | |
Harbor Small Cap Growth Fund | | | 196 | | | | 177 | | | | — | | | | 157 | | | | 37 | |
Harbor Large Cap Value Fund | | | 301 | | | | 277 | | | | 17 | | | | 174 | | | | 113 | |
Harbor Mid Cap Value Fund | | | 116 | | | | 207 | | | | 17 | | | | 11 | | | | 110 | |
Harbor Small Cap Value Fund | | | 103 | | | | 144 | | | | 3 | | | | 43 | | | | 38 | |
Harbor International Fund | | | 411 | | | | 939 | | | | 94 | | | | — | | | | 182 | |
Harbor International Growth Fund | | | 557 | | | | 284 | | | | 36 | | | | — | | | | 40 | |
Harbor Global Growth Fund | | | 156 | | | | 96 | | | | 1 | | | | 105 | | | | 16 | |
Harbor Commodity Real Return Strategy Fund | | | 231 | | | | 39 | | | | 23 | | | | — | | | | (20 | ) |
Harbor Unconstrained Bond Fund | | | 66 | | | | 19 | | | | 6 | | | | — | | | | — | |
Harbor High-Yield Bond Fund | | | 249 | | | | 65 | | | | 17 | | | | 12 | | | | (1 | ) |
Harbor Bond Fund | | | 329 | | | | 120 | | | | 11 | | | | 6 | | | | (4 | ) |
| | | | | | | | | | | | | | | | | | | | |
Total | | $ | 3,143 | | | $ | 2,707 | | | $ | 227 | | | $ | 840 | | | $ | 644 | |
| | | | | | | | | | | | | | | | | | | | |
77
Harbor Target Retirement Funds
NOTES TO FINANCIAL STATEMENTS—Continued
(Currency in thousands)
NOTE 3—INVESTMENT PORTFOLIO TRANSACTIONS—Continued
| | | | | | | | | | | | | | | | | | | | |
| | | | | | | | | | | | Net Realized Gain/(Loss) | |
| Harbor Target Retirement 2055 Fund | | Purchases | | | Sales | | | Investment
income from
affiliated
funds | | | Distributions
received from
affiliated funds | | | Sale of
affiliated
funds | |
Underlying Funds | | | | | | | | | | | | | | | | | | | | |
Harbor Capital Appreciation Fund | | $ | 49 | | | $ | 1 | | | $ | — | | | $ | — | | | $ | — | |
Harbor Mid Cap Growth Fund | | | 25 | | | | — | | | | — | | | | 1 | | | | — | |
Harbor Small Cap Growth Fund | | | 23 | | | | 1 | | | | — | | | | 1 | | | | — | |
Harbor Large Cap Value Fund | | | 58 | | | | 1 | | | | — | | | | 1 | | | | — | |
Harbor Mid Cap Value Fund | | | 38 | | | | 1 | | | | — | | | | — | | | | — | |
Harbor Small Cap Value Fund | | | 28 | | | | — | | | | — | | | | — | | | | — | |
Harbor International Fund | | | 87 | | | | 5 | | | | 1 | | | | — | | | | — | |
Harbor International Growth Fund | | | 58 | | | | 2 | | | | — | | | | — | | | | — | |
Harbor Global Growth Fund | | | 21 | | | | — | | | | — | | | | 1 | | | | — | |
Harbor Commodity Real Return Strategy Fund | | | 14 | | | | — | | | | — | | | | — | | | | — | |
Harbor Unconstrained Bond Fund | | | 3 | | | | — | | | | — | | | | — | | | | — | |
Harbor High-Yield Bond Fund | | | 12 | | | | — | | | | — | | | | — | | | | — | |
Harbor Bond Fund | | | 16 | | | | — | | | | — | | | | — | | | | — | |
| | | | | | | | | | | | | | | | | | | | |
Total | | $ | 432 | | | $ | 11 | | | $ | 1 | | | $ | 4 | | | $ | — | |
| | | | | | | | | | | | | | | | | | | | |
NOTE 4—FEES AND OTHER TRANSACTIONS WITH AFFILIATES
Investment Adviser
Harbor Capital is an indirect, wholly-owned subsidiary of Robeco Groep N.V. (“Robeco”). Robeco is majority owned by ORIX Corporation (“ORIX”). Harbor Capital is the Trust’s investment adviser and is also responsible for administrative and other services. The Funds do not pay any fees for the services of Harbor Capital.
Each Fund has a separate advisory agreement with Harbor Capital. Pursuant to this agreement, Harbor Capital pays all expenses of each Fund, excluding: (i) the amount of the acquired funds’ fees and expenses; (ii) compensation of the Independent Trustees; (iii) certain other expenses such as extraordinary items; and (iv) (a) for the Administrative and Investor Classes, distribution and service (12b-1) fees and (b) for the Investor Class, certain transfer agent fees.
Distributor
Harbor Funds Distributors, Inc. (“Harbor Funds Distributors” or the “Distributor”), a wholly-owned subsidiary of Harbor Capital, is the distributor for Harbor Funds shares. Under the Trust’s current distribution plans pursuant to Rule 12b-1 under the Investment Company Act with respect to each Fund’s Administrative and Investor Class shares (collectively, the “12b-1 Plans”), as applicable, each Fund pays the Distributor compensation at the annual rate of 0.25% of the average daily net assets of its Administrative and Investor Class shares. The 12b-1 Plans compensate the Distributor for the purpose of financing any activity that is primarily intended to result in the sale of Administrative and Investor Class shares of the Funds or for recordkeeping services or the servicing of shareholder accounts in the Administrative and Investor Class shares of the Funds. Such activities include, but are not limited to: printing of prospectuses and statements of additional information and reports for prospective shareholders (i.e., other than existing shareholders); preparation and distribution of advertising material and sales literature; expenses of organizing and conducting sales seminars; supplemental payments to dealers or other institutions such as asset-based sales charges, payments of recordkeeping fees under recordkeeping arrangements, or payments of service fees under shareholder service arrangements; and costs of administering the 12b-1 Plans.
Amounts payable by a Fund under the 12b-1 Plans need not be directly related to the expenses actually incurred by the Distributor on behalf of each Fund. The 12b-1 Plans do not obligate the Funds to reimburse the Distributor for the actual
78
Harbor Target Retirement Funds
NOTES TO FINANCIAL STATEMENTS—Continued
(Currency in thousands)
NOTE 4—FEES AND OTHER TRANSACTIONS WITH AFFILIATES—Continued
expenses the Distributor may incur in fulfilling its obligations under the 12b-1 Plans. Thus, even if the Distributor’s actual expenses exceed the fee payable to the Distributor at any given time, the Funds will not be obligated to pay more than that fee. If the Distributor’s expenses are less than the fee it receives, the Distributor will retain the difference.
Harbor Funds Distributors voluntarily waived its 12b-1 fees for the Target Retirement Funds during the period ended April 30, 2015. Fees incurred and the related waiver for these services are shown on each Fund’s Statement of Operations. The voluntary waiver may be discontinued at any time.
Transfer Agent
Harbor Services Group, Inc. (“Harbor Services Group”), a wholly-owned subsidiary of Harbor Capital, is the transfer and shareholder servicing agent for the Funds. The transfer agency and service agreement is reviewed and approved annually by the Board of Trustees and provides currently for compensation up to the following amounts per class of each Fund:
| | |
Share Class | | Transfer Agent Fees |
Institutional | | 0.00% of the average daily net assets of all Institutional Class shares |
Administrative | | 0.00% of the average daily net assets of all Administrative Class shares |
Investor | | 0.12% of the average daily net assets of all Investor Class shares |
Harbor Services Group voluntarily waived its transfer agent fees for the Target Retirement Funds during the six-month period ended April 30, 2015. Fees incurred and the related waiver for these transfer agent services are shown on each Fund’s Statement of Operations. The voluntary waiver may be discontinued at any time.
Shareholders
On April 30, 2015, Harbor Capital, Harbor Funds Distributors, and Harbor Services Group, collectively held the following shares of beneficial interest in the Funds:
| | | | | | | | | | | | | | | | | | | | |
| | | Number of Shares Owned by
Harbor Capital,
Harbor Funds Distributors, and
Harbor Services Group | | | Percentage of
Outstanding Shares | |
| | | Institutional
Class | | | Administrative
Class | | | Investor
Class | | | Total | | |
Harbor Target Retirement Income Fund | | | 8,218 | | | | 1,644 | | | | 1,644 | | | | 11,506 | | | | 0.6 | % |
Harbor Target Retirement 2015 Fund | | | 7,780 | | | | 1,556 | | | | 1,556 | | | | 10,892 | | | | 1.1 | % |
Harbor Target Retirement 2020 Fund | | | 20,902 | | | | 1,754 | | | | 1,754 | | | | 24,410 | | | | 0.9 | % |
Harbor Target Retirement 2025 Fund | | | 18,260 | | | | 1,466 | | | | 1,466 | | | | 21,192 | | | | 2.4 | % |
Harbor Target Retirement 2030 Fund | | | 49,429 | | | | 2,057 | | | | 2,057 | | | | 53,543 | | | | 1.9 | % |
Harbor Target Retirement 2035 Fund | | | 22,563 | | | | 1,450 | | | | 1,450 | | | | 25,463 | | | | 3.9 | % |
Harbor Target Retirement 2040 Fund | | | 11,273 | | | | 2,254 | | | | 2,254 | | | | 15,781 | | | | 0.7 | % |
Harbor Target Retirement 2045 Fund | | | 41,113 | | | | 1,472 | | | | 1,472 | | | | 44,057 | | | | 13.2 | % |
Harbor Target Retirement 2050 Fund | | | 19,577 | | | | 2,070 | | | | 2,070 | | | | 23,717 | | | | 1.2 | % |
Harbor Target Retirement 2055 Fund | | | 7,653 | | | | 1,015 | | | | 1,015 | | | | 9,683 | | | | 23.4 | % |
Independent Trustees
The Independent Trustees received no remuneration from the Target Retirement Funds for the six-month period ended April 30, 2015.
Indemnification
Under the Trust’s organizational documents, its officers and Trustees are indemnified against certain liabilities arising out of the performance of their duties to the Trust. In addition, in the normal course of business the Trust enters into contracts
79
Harbor Target Retirement Funds
NOTES TO FINANCIAL STATEMENTS—Continued
(Currency in thousands)
NOTE 4—FEES AND OTHER TRANSACTIONS WITH AFFILIATES—Continued
that provide general indemnities to other parties. The Trust’s maximum exposure under these arrangements is unknown as this would involve future claims that may be made against the Trust that have not yet occurred. The risk of material loss as a result of such indemnification claims is considered remote.
NOTE 5—TAX INFORMATION
The identified cost for federal income tax purposes of investments owned by each Fund and their respective gross unrealized appreciation and depreciation at April 30, 2015 are as follows:
| | | | | | | | | | | | | | | | |
| | | Identified Cost | | | Gross Unrealized | | | Net Unrealized
Appreciation/
(Depreciation) | |
| | | Appreciation | | | (Depreciation) | | |
Harbor Target Retirement Income Fund | | $ | 17,054 | | | $ | 446 | | | $ | (394 | ) | | $ | 52 | |
Harbor Target Retirement 2015 Fund | | | 10,656 | | | | 201 | | | | (223 | ) | | | (22 | ) |
Harbor Target Retirement 2020 Fund | | | 27,948 | | | | 1,425 | | | | (745 | ) | | | 680 | |
Harbor Target Retirement 2025 Fund | | | 11,097 | | | | 488 | | | | (223 | ) | | | 265 | |
Harbor Target Retirement 2030 Fund | | | 25,233 | | | | 2,405 | | | | (659 | ) | | | 1,746 | |
Harbor Target Retirement 2035 Fund | | | 8,983 | | | | 375 | | | | (160 | ) | | | 215 | |
Harbor Target Retirement 2040 Fund | | | 17,803 | | | | 2,627 | | | | (349 | ) | | | 2,278 | |
Harbor Target Retirement 2045 Fund | | | 4,555 | | | | 448 | | | | (57 | ) | | | 391 | |
Harbor Target Retirement 2050 Fund | | | 17,921 | | | | 3,294 | | | | (205 | ) | | | 3,089 | |
Harbor Target Retirement 2055 Fund | | | 422 | | | | 13 | | | | — | | | | 13 | |
NOTE 6—SUBSEQUENT EVENTS
Through the date the financial statements were issued, no subsequent events or transactions had occurred that would have materially impacted the financial statements or related disclosures as presented herein.
80
Harbor Target Retirement Funds
FEES AND EXPENSE EXAMPLE (Unaudited)
Example
As a shareholder of a Fund, you incur two types of costs: (1) transaction costs, including redemption fees (if any) and (2) ongoing costs, including management fees, distribution and service (12b-1) fees, and other Fund expenses. This example is intended to help you understand your ongoing costs (in dollars) of investing in a Fund and to compare these costs with the ongoing costs of investing in other mutual funds.
The example is based on an investment of $1,000 invested at the beginning of the period and held for the entire period November 1, 2014 through April 30, 2015.
Actual Expenses
The first line of the table below provides information about actual account values and actual expenses for each share class. You may use the information in the respective class line, together with the amount you invested, to estimate the expenses that you paid over the period. Simply divide your account value by $1,000 (for example, an $8,600 account value divided by $1,000 = 8.6), then multiply the result by the number in the first line of the respective class under the heading entitled “Expenses Paid During Period” to estimate the expenses you paid on your account during this period. Each Fund, as a shareholder in the Underlying Funds, will indirectly bear its pro rata share of the fees and expenses incurred by the Underlying Funds. These fees and expenses are not included in each Fund’s annualized expense ratio used to calculate the expense estimates in the table below.
Hypothetical Example for Comparison Purposes
The second line of the table for each share class below provides information about hypothetical account values and hypothetical expenses based on the respective Fund’s actual expense ratio and an assumed rate of return of 5% per year before expenses, which is not the respective Fund’s actual return. The hypothetical account values and expenses may not be used to estimate the actual ending account balance or expenses you paid for the period. You may use this information to compare the ongoing costs of investing in a Fund to other funds. To do so, compare this 5% hypothetical example with the 5% hypothetical examples that appear in the shareholder reports of the other funds. Each Fund, as a shareholder in the Underlying Funds, will indirectly bear its pro rata share of the fees and expenses incurred by the Underlying Funds. These fees and expenses are not included in each Fund’s annualized expense ratio used to calculate the expense estimates in the table below.
Please note that the expenses shown in the table are meant to highlight your ongoing costs only and do not reflect any transactional costs, such as redemption fees. Therefore, the second line of the table is useful in comparing ongoing costs only, and will not help you determine the relative total costs of owning different funds. In addition, if these transactional costs were included, your costs would have been higher.
| | | | | | | | | | | | | | | | |
| | | Annualized
Expense Ratio | | | Expenses Paid
During Period* | | | Beginning Account
Value
(November 1, 2014) | | | Ending Account
Value
(April 30, 2015) | |
Harbor Target Retirement Income | | | | | | | | | |
Institutional Class | | | 0.00 | % | | | | | | | | | | | | |
Actual | | | | | | $ | 0.00 | | | $ | 1,000 | | | $ | 1,025.30 | |
Hypothetical (5% return) | | | | | | | 0.00 | | | | 1,000 | | | | 1,024.86 | |
Administrative Class | | | 0.00 | % | | | | | | | | | | | | |
Actual | | | | | | $ | 0.00 | ** | | $ | 1,000 | | | $ | 1,024.20 | |
Hypothetical (5% return) | | | | | | | 0.00 | | | | 1,000 | | | | 1,024.86 | |
Investor Class | | | 0.00 | % | | | | | | | | | | | | |
Actual | | | | | | $ | 0.00 | ** | | $ | 1,000 | | | $ | 1,024.20 | |
Hypothetical (5% return) | | | | | | | 0.00 | | | | 1,000 | | | | 1,024.86 | |
81
Harbor Target Retirement Funds
FEES AND EXPENSE EXAMPLE—Continued
| | | | | | | | | | | | | | | | |
| | | Annualized
Expense Ratio | | | Expenses Paid
During Period* | | | Beginning Account
Value
(November 1, 2014) | | | Ending Account
Value
(April 30, 2015) | |
Harbor Target Retirement 2015 | | | | | | | | | |
Institutional Class | | | 0.00 | % | | | | | | | | | | | | |
Actual | | | | | | $ | 0.00 | | | $ | 1,000 | | | $ | 1,026.40 | |
Hypothetical (5% return) | | | | | | | 0.00 | | | | 1,000 | | | | 1,024.86 | |
Administrative Class | | | 0.00 | % | | | | | | | | | | | | |
Actual | | | | | | $ | 0.00 | ** | | $ | 1,000 | | | $ | 1,025.60 | |
Hypothetical (5% return) | | | | | | | 0.00 | | | | 1,000 | | | | 1,024.86 | |
Investor Class | | | 0.00 | % | | | | | | | | | | | | |
Actual | | | | | | $ | 0.00 | ** | | $ | 1,000 | | | $ | 1,026.40 | |
Hypothetical (5% return) | | | | | | | 0.00 | | | | 1,000 | | | | 1,024.86 | |
Harbor Target Retirement 2020 | | | | | | | | | |
Institutional Class | | | 0.00 | % | | | | | | | | | | | | |
Actual | | | | | | $ | 0.00 | | | $ | 1,000 | | | $ | 1,032.20 | |
Hypothetical (5% return) | | | | | | | 0.00 | | | | 1,000 | | | | 1,024.86 | |
Administrative Class | | | 0.00 | % | | | | | | | | | | | | |
Actual | | | | | | $ | 0.00 | ** | | $ | 1,000 | | | $ | 1,032.20 | |
Hypothetical (5% return) | | | | | | | 0.00 | | | | 1,000 | | | | 1,024.86 | |
Investor Class | | | 0.00 | % | | | | | | | | | | | | |
Actual | | | | | | $ | 0.00 | ** | | $ | 1,000 | | | $ | 1,032.20 | |
Hypothetical (5% return) | | | | | | | 0.00 | | | | 1,000 | | | | 1,024.86 | |
Harbor Target Retirement 2025 | | | | | | | | | |
Institutional Class | | | 0.00 | % | | | | | | | | | | | | |
Actual | | | | | | $ | 0.00 | | | $ | 1,000 | | | $ | 1,033.60 | |
Hypothetical (5% return) | | | | | | | 0.00 | | | | 1,000 | | | | 1,024.86 | |
Administrative Class | | | 0.00 | % | | | | | | | | | | | | |
Actual | | | | | | $ | 0.00 | ** | | $ | 1,000 | | | $ | 1,033.70 | |
Hypothetical (5% return) | | | | | | | 0.00 | | | | 1,000 | | | | 1,024.86 | |
Investor Class | | | 0.00 | % | | | | | | | | | | | | |
Actual | | | | | | $ | 0.00 | ** | | $ | 1,000 | | | $ | 1,033.70 | |
Hypothetical (5% return) | | | | | | | 0.00 | | | | 1,000 | | | | 1,024.86 | |
Harbor Target Retirement 2030 | | | | | | | | | |
Institutional Class | | | 0.00 | % | | | | | | | | | | | | |
Actual | | | | | | $ | 0.00 | | | $ | 1,000 | | | $ | 1,036.10 | |
Hypothetical (5% return) | | | | | | | 0.00 | | | | 1,000 | | | | 1,024.86 | |
Administrative Class | | | 0.00 | % | | | | | | | | | | | | |
Actual | | | | | | $ | 0.00 | ** | | $ | 1,000 | | | $ | 1,037.30 | |
Hypothetical (5% return) | | | | | | | 0.00 | | | | 1,000 | | | | 1,024.86 | |
Investor Class | | | 0.00 | % | | | | | | | | | | | | |
Actual | | | | | | $ | 0.00 | ** | | $ | 1,000 | | | $ | 1,037.30 | |
Hypothetical (5% return) | | | | | | | 0.00 | | | | 1,000 | | | | 1,024.86 | |
Harbor Target Retirement 2035 | | | | | | | | | |
Institutional Class | | | 0.00 | % | | | | | | | | | | | | |
Actual | | | | | | $ | 0.00 | | | $ | 1,000 | | | $ | 1,040.40 | |
Hypothetical (5% return) | | | | | | | 0.00 | | | | 1,000 | | | | 1,024.86 | |
Administrative Class | | | 0.00 | % | | | | | | | | | | | | |
Actual | | | | | | $ | 0.00 | ** | | $ | 1,000 | | | $ | 1,040.40 | |
Hypothetical (5% return) | | | | | | | 0.00 | | | | 1,000 | | | | 1,024.86 | |
Investor Class | | | 0.00 | % | | | | | | | | | | | | |
Actual | | | | | | $ | 0.00 | ** | | $ | 1,000 | | | $ | 1,040.40 | |
Hypothetical (5% return) | | | | | | | 0.00 | | | | 1,000 | | | | 1,024.86 | |
82
Harbor Target Retirement Funds
FEES AND EXPENSE EXAMPLE—Continued
| | | | | | | | | | | | | | | | |
| | | Annualized
Expense Ratio | | | Expenses Paid
During Period* | | | Beginning Account
Value
(November 1, 2014) | | | Ending Account
Value
(April 30, 2015) | |
Harbor Target Retirement 2040 | | | | | | | | | |
Institutional Class | | | 0.00 | % | | | | | | | | | | | | |
Actual | | | | | | $ | 0.00 | | | $ | 1,000 | | | $ | 1,047.30 | |
Hypothetical (5% return) | | | | | | | 0.00 | | | | 1,000 | | | | 1,024.86 | |
Administrative Class | | | 0.00 | % | | | | | | | | | | | | |
Actual | | | | | | $ | 0.00 | ** | | $ | 1,000 | | | $ | 1,047.20 | |
Hypothetical (5% return) | | | | | | | 0.00 | | | | 1,000 | | | | 1,024.86 | |
Investor Class | | | 0.00 | % | | | | | | | | | | | | |
Actual | | | | | | $ | 0.00 | ** | | $ | 1,000 | | | $ | 1,047.20 | |
Hypothetical (5% return) | | | | | | | 0.00 | | | | 1,000 | | | | 1,024.86 | |
Harbor Target Retirement 2045 | | | | | | | | | |
Institutional Class | | | 0.00 | % | | | | | | | | | | | | |
Actual | | | | | | $ | 0.00 | | | $ | 1,000 | | | $ | 1,052.00 | |
Hypothetical (5% return) | | | | | | | 0.00 | | | | 1,000 | | | | 1,024.86 | |
Administrative Class | | | 0.00 | % | | | | | | | | | | | | |
Actual | | | | | | $ | 0.00 | ** | | $ | 1,000 | | | $ | 1,052.10 | |
Hypothetical (5% return) | | | | | | | 0.00 | | | | 1,000 | | | | 1,024.86 | |
Investor Class | | | 0.00 | % | | | | | | | | | | | | |
Actual | | | | | | $ | 0.00 | ** | | $ | 1,000 | | | $ | 1,052.10 | |
Hypothetical (5% return) | | | | | | | 0.00 | | | | 1,000 | | | | 1,024.86 | |
Harbor Target Retirement 2050 | | | | | | | | | |
Institutional Class | | | 0.00 | % | | | | | | | | | | | | |
Actual | | | | | | $ | 0.00 | | | $ | 1,000 | | | $ | 1,059.50 | |
Hypothetical (5% return) | | | | | | | 0.00 | | | | 1,000 | | | | 1,024.86 | |
Administrative Class | | | 0.00 | % | | | | | | | | | | | | |
Actual | | | | | | $ | 0.00 | ** | | $ | 1,000 | | | $ | 1,059.40 | |
Hypothetical (5% return) | | | | | | | 0.00 | | | | 1,000 | | | | 1,024.86 | |
Investor Class | | | 0.00 | % | | | | | | | | | | | | |
Actual | | | | | | $ | 0.00 | ** | | $ | 1,000 | | | $ | 1,059.40 | |
Hypothetical (5% return) | | | | | | | 0.00 | | | | 1,000 | | | | 1,024.86 | |
Harbor Target Retirement 2055 | | | | | | | | | |
Institutional Class | | | 0.00 | % | | | | | | | | | | | | |
Actual | | | | | | $ | 0.00 | | | $ | 1,000 | | | $ | 1,064.50 | |
Hypothetical (5% return) | | | | | | | 0.00 | | | | 1,000 | | | | 1,024.86 | |
Administrative Class | | | 0.00 | % | | | | | | | | | | | | |
Actual | | | | | | $ | 0.00 | ** | | $ | 1,000 | | | $ | 1,063.40 | |
Hypothetical (5% return) | | | | | | | 0.00 | | | | 1,000 | | | | 1,024.86 | |
Investor Class | | | 0.00 | % | | | | | | | | | | | | |
Actual | | | | | | $ | 0.00 | ** | | $ | 1,000 | | | $ | 1,063.40 | |
Hypothetical (5% return) | | | | | | | 0.00 | | | | 1,000 | | | | 1,024.86 | |
| * | Expenses are equal to the Fund’s annualized net expense ratio, multiplied by the average account value over the period, multiplied by 181/365 (to reflect the one-half year period). |
| ** | Transfer agent fees and 12b-1 fees have been waived for the reporting period. |
83
Harbor Target Retirement Funds
ADDITIONAL INFORMATION (Unaudited)
PROXY VOTING
The Funds have adopted Proxy Voting Policies and Procedures under which the Funds vote proxies relating to securities held by the Funds. In addition, the Funds file Form N-PX, with its complete proxy voting record for the 12 months ended June 30th, no later than August 31st of each year. A description of the Funds’ Proxy Voting Policies and Procedures and the Funds’ proxy voting record (Form N-PX) is available (i) without charge, upon request, by calling Harbor Funds toll-free at 800-422-1050; (ii) on the Funds’ website at harborfunds.com; and (iii) on the SEC’s website at www.sec.gov.
HOUSEHOLDING
Harbor Funds has adopted a policy that allows it to send only one copy of a Fund’s prospectus, proxy material, annual report and semi-annual report to certain shareholders residing at the same household. This reduces Fund expenses, which benefits you and other shareholders. If you need additional copies or do not want your mailings to be “householded,” please call the Shareholder Servicing Agent at 800-422-1050. Individual copies will be sent within thirty (30) days after the Shareholder Servicing Agent receives your instructions. Your consent to householding is considered valid until revoked.
QUARTERLY PORTFOLIO DISCLOSURES
Each Fund files a complete portfolio of investments with the Securities and Exchange Commission for the first and third quarters of each fiscal year on Form N-Q. The Funds’ Form N-Q is available (i) without charge, upon request, by calling Harbor Funds toll-free at 800-422-1050, (ii) on the Funds’ website at harborfunds.com, and (iii) on the SEC’s web site at www.sec.gov. The form may also be viewed and copied at the Commission’s Public Reference Room in Washington, D.C. Information regarding the operations of the Public Reference Room may also be obtained by calling 800-SEC-0330.
ADVISORY AGREEMENT APPROVALS
FACTORS CONSIDERED BY THE TRUSTEES IN APPROVING THE INVESTMENT ADVISORY AGREEMENTS OF THE TARGET RETIREMENT FUNDS
The Investment Company Act of 1940, as amended, requires that the Investment Advisory Agreement of each Fund be approved initially, and following an initial two-year term, at least annually, by the Harbor Funds Board of Trustees, including a majority of the Independent Trustees voting separately.
At an in-person meeting of the Board of Trustees held on February 8, 9, and 10, 2015 (the “Meeting”), the Board, including the Independent Trustees voting separately, considered and approved the continuation of an Investment Advisory Agreement with Harbor Capital Advisors, Inc., (the “Adviser”), with respect to Harbor Target Retirement Income Fund, Harbor Target Retirement 2015 Fund, Harbor Target Retirement 2020 Fund, Harbor Target Retirement 2025 Fund, Harbor Target Retirement 2030 Fund, Harbor Target Retirement 2035 Fund, Harbor Target Retirement 2040 Fund, Harbor Target Retirement 2045 Fund and Harbor Target Retirement 2050 Fund (each, a “Target Retirement Fund” and collectively, the “Target Retirement Funds”), each a series of the Harbor Funds.
In evaluating the Target Retirement Funds’ Investment Advisory Agreement, the Trustees reviewed materials furnished by the Adviser, including information about its affiliates, personnel, and operations and also relied upon their knowledge of the Adviser resulting from their quarterly meetings, periodic telephonic meetings and other prior communications. At the Meeting, which had been called for the purpose of considering the continuation of the Investment Advisory Agreement, and at prior meetings, the Trustees, including the Independent Trustees, requested and received materials and presentations relating to Fund performance and the services rendered by the Adviser.
At the Meeting, the Trustees, including all of the Independent Trustees voting separately, determined that the terms of the Investment Advisory Agreement were fair and reasonable and approved the continuation for a one-year period of the Investment Advisory Agreement as being in the best interests of the respective Fund and its shareholders.
In their deliberations, the Independent Trustees had the opportunity to meet privately without representatives of the Adviser present and were represented throughout the process by legal counsel to the Independent Trustees and the Funds.
In considering the approval of the Target Retirement Funds’ Investment Advisory Agreement, the Board, including the Independent Trustees, evaluated a number of factors it considered relevant to its determination. The Board did not identify any single factor as all-important or controlling, and individual Trustees did not necessarily attribute the same weight or importance to each factor.
84
Harbor Target Retirement Funds
ADDITIONAL INFORMATION—Continued
Among the factors considered by the Trustees in approving the Investment Advisory Agreement were the following:
| | • | | the nature, extent, and quality of the services provided by the Adviser, including the background, education, expertise and experience of the investment professionals of the Adviser who provide services to the Target Retirement Funds; |
| | • | | the favorable history, reputation, qualifications and background of the Adviser, as well as the qualifications of its personnel; |
| | • | | the profitability of the Adviser with respect to each Target Retirement Fund, including the effect of revenues of Harbor Services Group, Inc. (“Harbor Services Group”), the Target Retirement Funds’ transfer agent, and Harbor Funds Distributors, Inc. (“Harbor Funds Distributors”), the Target Retirement Funds’ principal underwriter, on such profitability; |
| | • | | while no fees were proposed to be charged by the Adviser for investment advisory services, the Adviser would benefit from assets invested in the Target Retirement Funds in the form of increased advisory fees from the underlying Harbor Funds attributable to assets invested in such Funds by the Target Retirement Funds; |
| | • | | the fees and expense ratios of each Target Retirement Fund relative to the quality of services provided and the fees and expense ratios of similar investment companies; |
| | • | | the investment performance of each Target Retirement Fund in comparison to peer funds and the impact of the Target Retirement Funds’ glidepaths on relative performance; |
| | • | | the compensation received by Harbor Services Group and Harbor Funds Distributors in consideration of the services each provides to the Target Retirement Funds, and any other “fall out” benefits that inure to the Adviser and its affiliates as a result of their relationship with the Target Retirement Funds; |
| | • | | information received at regular meetings throughout the year related to Target Retirement Funds’ performance and services rendered by the Adviser; and |
| | • | | information contained in materials provided by the Adviser and compiled by Lipper, Inc. (“Lipper”) as to the investment returns, advisory fees and total expense ratios of each share class of each Target Retirement Fund (and, in certain cases, total expense ratios of certain other classes) relative to those of other investment companies with similar objectives and strategies managed by other investment advisers, consisting both of a peer group of funds as well as a broader universe of funds compiled by Lipper. |
Nature, Scope and Extent of Services
The Board evaluated the nature, scope and extent of the Adviser’s services in light of the Board’s extensive experience with the Adviser, as well as materials provided by the Adviser as part of its comprehensive written response to the 15(c) request letter prepared by legal counsel to the Independent Trustees in consultation with the Independent Trustees concerning the financial and other resources devoted by the Adviser to Harbor Funds, including the breadth and depth of experience and expertise of the investment, administrative, legal and compliance professionals dedicated to the Funds’ operations. The Trustees noted that the Adviser had a favorable long-term record of identifying mutual fund products that proved to be attractive to investors.
Investment Performance and Expense Ratios
In considering each Target Retirement Fund’s performance and expense ratio, the Trustees requested and received from the Adviser data compiled by Lipper. The Trustees also received information explaining the methodology for compilation of certain of this information and what it was intended to demonstrate.
Harbor Target Retirement Funds. In consideration of the Investment Advisory Agreement for each Target Retirement Fund (inception date of January 2, 2009 for each Target Retirement Fund), the Trustees noted that Lipper had selected 14 peer complexes’ target date funds as peers for the Harbor Target Retirement Funds that Lipper believes are the most comparable to the Target Retirement Funds. These 14 peer complexes are: AllianzGI Retirement Funds, BlackRock LifePath Active Portfolios, Fidelity Advisor Freedom Funds, Franklin LifeSmart Retirement Target Funds, John Hancock Retirement Living Portfolios, JPMorgan SmartRetirement Funds, MainStay Retirement Funds, MFS Lifetime Funds,
85
Harbor Target Retirement Funds
ADDITIONAL INFORMATION—Continued
Principal LifeTime Portfolios, Schwab Target Funds, T. Rowe Price Retirement Funds, USAA Target Retirement Funds, Vantagepoint Milestone Funds and Voya Retirement Solutions Funds. The Trustees further noted that the performance analysis conducted by Lipper included these 14 selected peers, as applicable, as the performance group and all target date funds as the performance universe.
The Trustees considered the expertise of Harbor Capital in managing assets generally and in the target retirement asset class specifically, noting that Harbor Capital had maintained risk-based asset allocation options for retirement plans sponsored by Owens-Illinois and other clients for more than 15 years prior to the 2009 launch of these funds. The Trustees noted that the Target Retirement Funds totaled $145.95 million in assets, out of a firm-wide total of approximately $81.28 billion in assets under management as of December 31, 2014.
The Trustees considered that the glidepaths for the Target Retirement Funds are generally more conservative compared to the peer funds in that the equity exposure for the Target Retirement Funds declines more steeply than it does in other target date fund families. The Trustees considered how strong equity market performance would, thus, negatively impact the performance of the Target Retirement Funds relative to their more aggressively positioned peer funds. The Trustees also considered the fact that Harbor Capital charged no management fee to the Funds and that Harbor Capital was voluntarily waiving its fees and/or reimbursing each of the Target Retirement Fund’s expenses, acknowledging that the waivers/reimbursements could be discontinued at any time. The Trustees noted that Harbor Capital’s profitability in managing the Target Retirement Funds was negative.
The Trustees analyzed the Institutional Class performance and expenses of each Target Retirement Fund (after giving effect to waivers and/or reimbursements, if applicable, that reduced the expenses of the Fund or its peer funds), as well as Lipper comparisons of underlying fund expenses, and made certain observations and findings as to each Fund as noted below.
Harbor Target Retirement Income Fund. The Trustees noted the Fund’s Institutional Class outperformance relative to its universe median for the four-year period ended December 31, 2014 and the Fund’s underperformance relative to its universe median for the one-, two-, three- and five-year periods ended December 31, 2014 according to Lipper. The Trustees also considered the Lipper comparison of underlying fund expenses showing that the Fund’s underlying fund expenses were above the peer group median. They also noted that the Fund’s underlying fund expenses caused the Fund to rank in the bottom third of its peer group. The actual total expense ratio of the Fund’s Institutional Class was above both the peer group and universe medians.
Harbor Target Retirement 2015 Fund. The Trustees noted the Fund’s Institutional Class underperformance relative to its universe medians for the one-, two-, three-, four- and five-year periods ended December 31, 2014 according to Lipper. The Trustees also considered the Lipper comparison of underlying fund expenses showing that the Fund’s underlying fund expenses were above the peer group median. They also noted that the Fund’s underlying fund expenses caused the Fund to rank in the third quarter of its peer group. The actual total expense ratio of the Fund’s Institutional Class was below the peer group and universe medians.
Harbor Target Retirement 2020 Fund. The Trustees noted the Fund’s Institutional Class underperformance relative to its universe medians for the one-, two-, three-, four- and five-year periods ended December 31, 2014 according to Lipper. The Trustees also considered the Lipper comparison of underlying fund expenses showing that the Fund’s underlying fund expenses were above the peer group median. They also noted that the Fund’s underlying fund expenses were in the bottom quintile of its peer group. The actual total expense ratio of the Fund’s Institutional Class was below both the peer group and universe medians.
Harbor Target Retirement 2025 Fund. The Trustees noted the Fund’s Institutional Class underperformance relative to its universe medians for the one-, two-, three-, four- and five-year periods ended December 31, 2014 according to Lipper. The Trustees also considered the Lipper comparison of underlying fund expenses showing that the Fund’s underlying fund expenses were slightly above the peer group median. They also noted that the Fund’s underlying fund expenses were in the bottom half of its peer group. The actual total expense ratio of the Fund’s Institutional Class was below both the peer group and universe medians.
Harbor Target Retirement 2030 Fund. The Trustees noted the Fund’s Institutional Class underperformance relative to its universe medians for the one-, two-, three-, four- and five-year periods ended December 31, 2014 according to Lipper. The Trustees also considered the Lipper comparison of underlying fund expenses showing that the Fund’s underlying fund expenses were at the peer group median. They also noted that the Fund’s underlying fund expenses were in the middle of its peer group. The actual total expense ratio of the Fund’s Institutional Class was below both the peer group and universe medians.
86
Harbor Target Retirement Funds
ADDITIONAL INFORMATION—Continued
Harbor Target Retirement 2035 Fund. The Trustees noted the Fund’s Institutional Class underperformance relative to its universe medians for the one-, two-, three-, four- and five-year periods ended December 31, 2014 according to Lipper. The Trustees also considered the Lipper comparison of underlying fund expenses showing that the Fund’s underlying fund expenses were at the peer group median. They also noted that the Fund’s underlying fund expenses were in the middle of its peer group. The actual total expense ratio of the Fund’s Institutional Class was below both the peer group and universe medians.
Harbor Target Retirement 2040 Fund. The Trustees noted the Fund’s Institutional Class underperformance relative to its universe medians for the one-, two-, three-, four- and five-year periods ended December 31, 2014 according to Lipper. The Trustees also considered the Lipper comparison of underlying fund expenses showing that the Fund’s underlying fund expenses were at the peer group median. They also noted that the Fund’s underlying fund expenses were in the middle of its peer group. The actual total expense ratio of the Fund’s Institutional Class was below both the peer group and universe medians.
Harbor Target Retirement 2045 Fund. The Trustees noted the Fund’s Institutional Class underperformance relative to its universe medians for the one-, two-, three-, four- and five-year periods ended December 31, 2014 according to Lipper. The Fund’s performance was at its Lipper universe median for the one-year period ended December 31, 2013. The Trustees also considered the Lipper comparison of underlying fund expenses showing that the Fund’s underlying fund expenses were slightly above the peer group median. They also noted that the Fund’s underlying fund expenses caused the Fund to rank in the bottom half of its peer group. The actual total expense ratio of the Fund’s Institutional Class was below both the peer group and universe medians.
Harbor Target Retirement 2050 Fund. The Trustees noted the Fund’s Institutional Class outperformance relative to its universe median for the three-year period ended December 31, 2014, its underperformance for the one-, two- and five-year periods ended December 31, 2014, and its performance at the universe median for the four-year period ended December 31, 2014. The Trustees also considered the Lipper comparison of underlying fund expenses showing that the Fund’s underlying fund expenses were slightly above the peer group median. They also noted that the Fund’s underlying fund expenses caused the Fund to rank in the bottom half of its peer group. The actual total expense ratio of the Fund’s Institutional Class was below both the peer group and universe medians.
* * *
Advisory Fees and Profitability
The Trustees noted that the Adviser receives no fee from any of the Target Retirement Funds for the Adviser’s services in allocating the Target Retirement Funds’ assets among shares of the other Harbor Funds. They also noted that the Adviser benefits indirectly from assets invested in the Target Retirement Funds in the form of increased advisory fees from the underlying Harbor Funds attributable to assets invested in such funds by the Target Retirement Funds and that the Board considers the issue of the Adviser’s profitability in operating these underlying funds at least annually as part of its annual investment advisory contract review process with respect to all of the Harbor Funds. The Board also noted that the Adviser was waiving fees and/or reimbursing a portion of each of the Target Retirement Fund’s expenses and that the Adviser was incurring a loss in operating the Target Retirement Funds.
Economies of Scale
As the Adviser does not receive a fee from any of the Target Retirement Funds for the Adviser’s services, the Trustees determined that it was unnecessary to consider economies of scale in this context. However, given that the Adviser benefits from assets invested in the Target Retirement Funds in the form of increased advisory fees from the underlying Harbor Funds, the Board noted that it considers the issue of breakpoints in the Harbor Funds’ fee schedules at least annually as part of its annual investment contract review process for all of the underlying Harbor Funds.
FACTORS CONSIDERED BY THE TRUSTEES IN APPROVING THE INVESTMENT ADVISORY AGREEMENT OF HARBOR TARGET RETIREMENT 2055 FUND
The Investment Company Act of 1940, as amended, requires that the Investment Advisory Agreement of each Fund be approved initially, and following an initial two-year term, at least annually, by the Harbor Funds Board of Trustees, including a majority of the Independent Trustees voting separately.
87
Harbor Target Retirement Funds
ADDITIONAL INFORMATION—Continued
At an in-person meeting of the Board of Trustees held on May 18 and 19, 2014 (the “Meeting”), the Board, including the Independent Trustees voting separately, considered and approved an Investment Advisory Agreement with Harbor Capital Advisors, Inc., the adviser to the Harbor Funds (the “Adviser”), with respect to the Harbor Target Retirement 2055 Fund (the “2055 Fund”), a newly formed series of the Harbor Funds.
In evaluating the Investment Advisory Agreement, the Trustees reviewed materials furnished by the Adviser, including information about its affiliates, personnel, and operations and also relied upon their knowledge of the Adviser resulting from their quarterly meetings, periodic telephonic meetings and other prior communications. At the Meeting, which had been called for the purpose of considering the Investment Advisory Agreement, the Trustees, including the Independent Trustees, requested and received materials and presentations relating to the existing Target Retirement Funds’ performance and the services to be rendered by the Adviser.
At the Meeting, the Trustees, including all of the Independent Trustees voting separately, determined that the terms of the Investment Advisory Agreement were fair and reasonable and approved the Investment Advisory Agreement for an initial two-year term as being in the best interests of the 2055 Fund and its future shareholders.
In their deliberations, the Independent Trustees had the opportunity to meet privately without representatives of the Adviser present and were represented throughout the process by legal counsel to the Independent Trustees and the Harbor Funds.
In considering the approval of the 2055 Fund’s proposed Investment Advisory Agreement, the Board, including the Independent Trustees, evaluated a number of factors it considered relevant to its determination. The Board did not identify any single factor as all-important or controlling, and individual Trustees did not necessarily attribute the same weight or importance to each factor.
Among the factors considered by the Trustees in approving the new Investment Advisory Agreement were the following:
| | • | | the nature, extent, and quality of the services expected to be provided by the Adviser, including the background, education, expertise and experience of the investment professionals of the Adviser who provide services to the 2055 Fund; |
| | • | | the favorable history, reputation, qualifications and background of the Adviser, as well as the qualifications of its personnel; |
| | • | | while no fees were proposed to be charged by the Adviser for investment advisory services, the Adviser would benefit from assets invested in the 2055 Fund in the form of increased advisory fees from the underlying Harbor Funds attributable to assets invested in such Funds by the 2055 Fund; |
| | • | | the proposed expense ratio of the 2055 Fund, including its expense ratio taking into account expenses of the underlying Harbor Funds relative to the fees and expense ratios of similar investment companies; |
| | • | | the investment performance of each existing Target Retirement Fund in comparison to peer funds and the impact of the existing Target Retirement Funds’ glidepaths on relative performance; |
| | • | | the compensation to be received by Harbor Services Group, the 2055 Fund’s transfer agent, and Harbor Funds Distributors, the 2055 Fund’s principal underwriter, in consideration of the services each will provide to the 2055 Fund, and any other “fall out” benefits that inure to the Adviser and its affiliates as a result of their relationship with the 2055 Fund; |
| | • | | information received at regular meetings throughout the year related to the existing Target Retirement Funds’ performance and services rendered by the Adviser; |
| | • | | information contained in materials provided by the Adviser and compiled by Lipper, Inc. (“Lipper”) as to the investment returns, advisory fees and total expense ratios of the Harbor Target Retirement 2050 Fund, an existing Target Retirement Fund with similar objectives and strategies, relative to those of other investment companies with similar objectives and strategies managed by other investment advisers, consisting both of a peer group of funds as well as a broader universe of funds compiled by Lipper; and |
| | • | | information contained in materials compiled by Morningstar, Inc. (“Morningstar”) as to the investment returns of the Institutional Class of each Fund relative to those of other investment companies with similar objectives and strategies managed by other investment advisers. |
88
Harbor Target Retirement Funds
ADDITIONAL INFORMATION—Continued
Nature, Scope and Extent of Services
The Board evaluated the nature, scope and extent of the services to be provided by the Adviser in light of the Board’s actual experience with the Adviser, as well as materials provided by the Adviser as part of its comprehensive written response to the 15(c) request letter prepared by legal counsel to the Independent Trustees in consultation with the Independent Trustees concerning the financial and other resources devoted by the Adviser to Harbor Funds, including the breadth and depth of experience and expertise of the investment, administrative, legal and compliance professionals dedicated to the Funds’ operations. The Trustees noted that the Adviser had a favorable long-term record of identifying mutual fund products that proved to be attractive to investors.
Investment Performance and Expense Ratios
In considering the 2055 Fund’s potential performance and proposed expense ratio, the Trustees requested and received from the Adviser data compiled by Lipper and Morningstar concerning comparative performance, fees and expense ratios with respect to the Harbor Target Retirement 2050 Fund. The Trustees also received information explaining the methodology for compilation of certain of this information and what it was intended to demonstrate.
Advisory Fees and Profitability
The Trustees noted that the Adviser would not receive a fee from the 2055 Fund for the Adviser’s services in allocating the 2055 Fund’s assets among shares of the other Harbor Funds. They also noted that the Adviser could benefit indirectly from assets invested in the 2055 Fund in the form of increased advisory fees from the underlying Harbor Funds attributable to assets invested in such funds by the 2055 Fund and that the Board considers the issue of the Adviser’s profitability in operating these underlying funds at least annually as part of its annual investment advisory contract review process with respect to all of the Harbor Funds. The Board also noted that the Adviser would waive fees and/or reimburse a portion of the 2055 Fund’s expenses and that the Adviser would expect to incur a loss in operating the 2055 Fund.
Economies of Scale
As the Adviser would not receive a fee from the 2055 Fund for the Adviser’s services, the Trustees determined that it was unnecessary to consider economies of scale in this context. However, given that the Adviser would potentially benefit from assets invested in the 2055 Fund in the form of increased advisory fees from the underlying Harbor Funds, the Board noted that it considers the issue of breakpoints in the Harbor Funds’ fee schedules at least annually as part of its annual investment contract review process for all of the underlying Harbor Funds.
89
Harbor Target Retirement Funds
ADDITIONAL INFORMATION—Continued
TRUSTEES AND OFFICERS
(As of June 2015)
The business and affairs of the Trust shall be managed by or under the direction of the Trustees, and they shall have all powers necessary or desirable to carry out that responsibility. The Trustees shall have full power and authority to take or refrain from taking any action and to execute any contracts and instruments that they may consider necessary or desirable in the management of the Trust. Any determination made by the Trustees in good faith as to what is in the interests of the Trust shall be conclusive. Information pertaining to the Trustees and Officers of Harbor Funds is set forth below. The address of each Trustee and Officer is: [Name of Trustee or Officer] c/o Harbor Funds, 111 South Wacker Drive, 34th Floor, Chicago, IL 60606-4302.
The Harbor Funds’ Statement of Additional Information includes additional information about the Trust’s Trustees and is available without charge by calling 800-422-1050 or at the Trust’s website at harborfunds.com.
| | | | | | | | |
Name (Age) Position(s) with Fund Address | | Term of Office and Length of Time Served1 | | Principal Occupation(s) During Past Five Years | | Number of Portfolios in
Fund Complex Overseen by
Trustee | | Other Directorships
of Public
Companies and
Other Registered
Investment
Companies
Held by Trustee
During Past Five
Years |
| INDEPENDENT TRUSTEES |
Scott M. Amero (51) Trustee | | Since 2014 | | Trustee, Rare (conservation non-profit) (2011-Present); Trustee, Berkshire School (2014-Present); BlackRock, Inc., (publicly traded investment management firm) Vice Chairman and Global Chief Investment Officer, Fixed Income (2010), Vice Chairman and Global Chief Investment Officer, Fixed Income, and Co-Head, Fixed Income Portfolio Management (2007-2010). | | 28 | | Director, Anthracite Capital, Inc. (2005-2010). |
| | | | |
Raymond J. Ball (70) Trustee | | Since 2006 | | Sidney Davidson Distinguished Service Professor of Accounting, University of Chicago Booth School of Business (2000-Present); Academic Affiliate, Analysis Group (litigation consulting firm) (2000-Present); Financial Reporting Faculty Advisory Group of the Institute of Chartered Accountants in England and Wales (2008-Present); and Advisory Board of the Center for Accounting Research & Education at University of Notre Dame (2006-Present). | | 28 | | None |
| | | | |
Donna J. Dean (63) Trustee | | Since 2010 | | Chief Investment Officer of the Rockefeller Foundation (a private foundation) (1995-Present); and Trustee of Queens University of Charlotte, North Carolina (2000-2014). | | 28 | | None |
| | | | |
Randall A. Hack (68) Trustee | | Since 2010 | | Founder and Senior Managing Director of Capstone Capital LLC (a private investment firm) (2003-Present); Director of Tower Development Corporation (cell tower developer) (2009-Present); and Advisory Director of Berkshire Partners (a private equity firm) (2002-2013). | | 28 | | Director of FiberTower Corporation (2002-2011). |
| | | | |
Robert Kasdin (57) Trustee | | Since 2014 | | Senior Vice President and Chief Operating Officer, Johns Hopkins Medicine (2015-Present); Senior Executive Vice President, Columbia University (2002-2015); Trustee, National September 11 Memorial & Museum at the World Trade Center (2005-Present); Trustee, The Metropolitan Museum of Art (2014-Present); Trustee (2004-2014) and President of the Board of Trustees (2006-2011), The Dalton School; Trustee, ARTstor Digital Library (a nonprofit digital images resource) (2013-Present); Director, Apollo Commercial Real Estate Finance, Inc. (2014-Present); and Director, Noranda Aluminum Holdings Corp. (2007-2014). | | 28 | | Director of Noranda Aluminum Holdings Corp. (2007-2014); and Director of Apollo Commercial Real Estate Finance, Inc. (2014-Present). |
| | | | |
Rodger F. Smith (74) Trustee | | Since 1987 | | Managing Director, Greenwich Associates (a research based consulting firm) (1976-Present); and Chair of Trust Advisory Committee of Tau Beta Pi Association (engineering honor society) (1985-Present). | | 28 | | None |
| | | | |
Ann M. Spruill (61) Trustee | | Since 2014 | | Partner (1993-2008), Member of Executive Committee (1996-2008), Member Board of Directors (2000-2008), Grantham, Mayo, Van Otterloo & Co. LLC (private investment management firm) (with the firm since 1990); Member Investment Committee and Chair of Global Equities, Museum of Fine Arts, Boston (2000-Present); and Trustee, Financial Accounting Foundation (2014-Present). | | 28 | | None |
90
Harbor Target Retirement Funds
ADDITIONAL INFORMATION—Continued
| | | | | | | | |
Name (Age) Position(s) with Fund Address | | Term of Office and Length of Time Served1 | | Principal Occupation(s) During Past Five Years | | Number of Portfolios in
Fund Complex Overseen by
Trustee | | Other Directorships
of Public
Companies and
Other Registered
Investment
Companies
Held by Trustee
During Past Five
Years |
| INTERESTED TRUSTEE |
David G. Van Hooser (68)* Chairman, Trustee and President | | Since 2000 | | President (2002-Present), Director and Chairman of the Board (2000-Present), Harbor Capital Advisors, Inc.; Chief Executive Officer (2007-Present), Chief Financial Officer (2012-Present), Treasurer (2007-2012) and Director (2000-Present), Harbor Funds Distributors, Inc.; and Director (2000-Present), Harbor Services Group, Inc. | | 28 | | None |
| FUND OFFICERS NOT LISTED ABOVE** |
Charles F. McCain (45) Chief Compliance Officer | | Since 2004 | | Executive Vice President and General Counsel (2004-Present) and Chief Compliance Officer (2004-2014), Harbor Capital Advisors, Inc.; Director (2007-Present) and Chief Compliance Officer (2004-Present), Harbor Services Group, Inc.; and Director, Executive Vice President and Chief Compliance Officer (2007-Present), Harbor Funds Distributors, Inc. |
| | |
Anmarie S. Kolinski (43) Treasurer | | Since 2007 | | Executive Vice President and Chief Financial Officer (2007-Present), Harbor Capital Advisors, Inc.; Chief Financial Officer (2007-Present), Harbor Services Group, Inc.; and Treasurer (2012-Present), Harbor Funds Distributors, Inc. |
| | |
Erik D. Ojala (40) Vice President and Secretary; AML Compliance Officer | | Since 2007;
Since 2010 | | Senior Vice President and Associate General Counsel (2007-Present) and Secretary (2010-Present), Harbor Capital Advisors, Inc.; and Assistant Secretary (2014-Present), Harbor Services Group, Inc. |
| | |
Brian L. Collins (46) Vice President | | Since 2005 | | Executive Vice President and Chief Investment Officer (2004-Present), Harbor Capital Advisors, Inc. |
| | |
Charles P. Ragusa (56) Vice President | | Since 2007 | | Executive Vice President (2007-Present), Harbor Capital Advisors, Inc.; President (2007-Present), Harbor Services Group, Inc.; and Executive Vice President and AML Compliance Officer (2007-Present), Harbor Funds Distributors, Inc. |
| | |
Jodie L. Crotteau (43) Assistant Secretary | | Since 2014 | | Senior Vice President and Chief Compliance Officer, Harbor Capital Advisors, Inc. (2014-Present); Vice President and Chief Compliance Officer, Grosvenor Registered Funds (2011-2014); Vice President, Grosvenor Capital Management, L.P. (2010-2014); Assistant Secretary (2005-2010) and AML Compliance Officer (2007-2010), Harbor Funds; Vice President, Secretary and Compliance Director (2007-2010), Harbor Capital Advisors, Inc.; Assistant Secretary (2005-2010), Harbor Services Group, Inc.; and Assistant Secretary (2007-2010), Harbor Funds Distributors, Inc. |
| | |
Susan A. DeRoche (62) Assistant Secretary | | Since 2006 | | Senior Vice President and Compliance Director (2007-Present) and Assistant Secretary (2006-Present), Harbor Capital Advisors, Inc.; Senior Vice President (2011–Present) and Secretary (2007-Present), Harbor Funds Distributors, Inc.; and Secretary (2014-Present) and Assistant Secretary (2012-2013), Harbor Services Group, Inc. |
| | |
John M. Paral (46) Assistant Treasurer | | Since 2013 | | Vice President (2012-Present) and Financial Reporting Manager (2007-2012), Harbor Capital Advisors, Inc. |
| 1 | Each Trustee serves for an indefinite term, until his successor is elected. Each Officer is elected annually. |
| * | Mr. Van Hooser is deemed an “Interested Trustee” due to his affiliation with the Adviser and Distributor of Harbor Funds. |
| ** | Officers of the Funds are “interested persons” as defined in the Investment Company Act. |
91
THIS PRIVACY STATEMENT IS NOT PART OF THIS REPORT
Harbor’s Privacy Statement
The following privacy statement is issued by Harbor Funds and each series of Harbor Funds and its affiliates, Harbor Capital Advisors, Inc., Harbor Services Group, Inc. and Harbor Funds Distributors, Inc. These measures reflect our commitment to maintaining the privacy of your confidential information. We appreciate the confidence you have shown by entrusting us with your assets.
Personal Information | It is our policy to respect the privacy of current and former shareholders and to protect personal information entrusted to us. We do not sell your personal information to anyone. |
| | In the course of providing products and services, we collect non-public personal information about you from the following sources: applications, forms, our website (including any information captured through our use of “cookies”), through mobile applications, by telephone and in correspondence and transactions with us, our affiliates or other parties. |
| | The non-public personal information collected may include name, address, e-mail address, telephone/fax numbers, account number, social security or taxpayer identification number, investment activity, and bank account information. |
| | When you visit us through our website or a mobile application, we may collect technical and navigational information, such as computer browser type, Internet protocol address, pages visited and average time spent on our website. We may use this information to alert you to software compatibility issues, or to improve our web design and functionality. We use “cookies” and similar files that may be placed on your hard drive for security purposes, to facilitate site navigation and to personalize the appearance of our site. |
Information Sharing | We occasionally disclose non-public personal information about our current or former shareholders with affiliated and non-affiliated parties, as permitted or required by law or regulation. In the normal course of servicing our shareholders, information we collect may be shared with non-affiliated companies that perform support services on our behalf or to other firms that assist us in providing you with products and services, such as custodians, transfer agents, broker-dealers and marketing service firms, as well as with other financial institutions. These companies may not use the information for any other purpose and we require them to keep the information they handle confidential. We may also share information with affiliates that are engaged in a variety of financial services in order to better service your account(s). |
| | When information is shared with third parties, they are not permitted to use the information for any purpose other than to assist our servicing of your account(s) or as permitted by law. |
| | If you close your account(s) or if we lose contact with you, we will continue to share information in accordance with our current privacy policy and practices. |
Access to Information | Access to non-public personal information is limited to employees, agents or other parties who need to know that information to perform their jobs, such as servicing your account(s), resolving problems or informing you of new products or services. |
Security | We maintain physical, electronic and procedural safeguards that comply with industry standards to protect your non-public personal information. |
| | For shareholders accessing information through our website or a mobile application, various forms of Internet security, such as data encryption firewall barriers, user names and passwords, and other tools are used. For additional information regarding our security measures, visit the terms and conditions of use on our website at harborfunds.com. If you have any questions or concerns about how we maintain the privacy of your non-public personal information, please contact us at 800-422-1050 Monday through Friday, between the hours of 8:00 a.m. and 6:00 p.m. Eastern time. |
We recommend that you read and retain this notice for your personal files
Eff. November 2013
92
Glossary
12b-1 Fee—A mutual fund fee, named for the SEC rule that permits it, used to pay for broker-dealer compensation and other distribution costs. If a fund has a 12b-1 fee, it will be disclosed in the fee table of a fund’s prospectus.
ADR—ADR after the name of a foreign holding stands for American Depositary Receipts representing ownership of foreign securities. ADRs are issued by U.S. banking institutions.
Average Market Capitalization—The average market capitalization of a fund’s equity portfolio gives you a measure of the size of the companies in which the fund invests. Market capitalization is calculated by multiplying the number of a company’s shares outstanding by its price per share.
Average Weighted Coupon—A calculation from a fund’s portfolio by weighting the coupon of each bond by its relative size in the portfolio.
Barclays U.S. Aggregate Bond Index—The Barclays U.S. Aggregate Bond Index is an unmanaged index of investment-grade fixed-rate debt issues with maturities of at least one year. This unmanaged index does not reflect fees and expenses and is not available for direct investment.
Barclays U.S. TIPS Index—The Barclays U.S. TIPS Index is an unmanaged market index comprised of all U.S. Treasury Inflation Protected Securities rated investment grade (Baa3 or better), have at least one year to final maturity, and at least $250 million par amount outstanding. This unmanaged index does not reflect fees and expenses and is not available for direct investment.
Beta—A measure of market-related risk. The beta of every index is 1.00, no matter how volatile the index is. A beta less than one means the portfolio is less volatile than the index. A beta higher than one indicates more volatility than the index.
Bloomberg Commodity Index Total ReturnSM—The Bloomberg Commodity Index Total ReturnSM is a broadly diversified index that tracks the commodities markets through commodity futures contracts. This unmanaged index does not reflect fees and expenses and is not available for direct investment.
BofA Merrill Lynch All U.S. Convertibles Ex Mandatory Index—The BofA Merrill Lynch All U.S. Convertibles Ex Mandatory Index is broadly representative of the U.S. convertible securities market, consisting of publicly traded issues, denominated in U.S. dollars, of all credit qualities, and excluding mandatory (equity-linked) convertibles. This unmanaged index does not reflect fees and expenses and is not available for direct investment.
BofA Merrill Lynch U.S. Dollar 3-Month LIBOR Constant Maturity Index—The BofA Merrill Lynch U.S. Dollar 3-Month LIBOR Constant Maturity Index tracks the performance of a synthetic asset paying Libor to a stated maturity. The index is based on the assumed purchase at par of a synthetic instrument having exactly its stated maturity and with a coupon equal to that day’s fixing rate. That issue is assumed to be sold the following business day (priced at a yield equal to the current day fixing rate) and rolled into a new instrument. This unmanaged index does not reflect fees and expenses and is not available for direct investment.
BofA Merrill Lynch 3-Month U.S. Treasury Bill Index—The BofA Merrill Lynch 3-Month U.S. Treasury Bill Index is comprised of a single U.S. Treasury Bill issue purchased at the beginning of each month and held for a full month, at which time that issue is sold and rolled into a newly selected issue. The issue selected each month is that having a maturity date closest to, but not beyond 90 days from the rebalance date.
BofA Merrill Lynch U.S. High Yield Index—The BofA Merrill Lynch U.S. High Yield Index is an unmanaged index that tracks the performance of below investment grade U.S. dollar-denominated corporate bonds publicly issued in the U.S. domestic market. All bonds are U.S. dollar denominated and rated Split BBB and below. This unmanaged index does not reflect fees and expenses and is not available for direct investment.
BofA Merrill Lynch U.S. Non-Distressed High Yield Index—The BofA Merrill Lynch U.S. Non-Distressed High Yield Index is a subset of the BofA Merrill Lynch U.S. High Yield Index including all securities with an option-adjusted spread less than 1,000 basis points. The unmanaged index does not reflect fees and expenses and is not available for direct investment.
Bottom-Up Equity Management Style—A management style that de-emphasizes the significance of economic and market cycles, focusing instead on the analysis of individual stocks.
Capital Gains Distribution—Profits distributed to shareholders resulting from the sale of securities held in the fund’s portfolio.
93
Glossary—Continued
Credit Risk—The possibility that a bond issuer may not be able to pay interest and repay its debt.
CUSIP Number—Identification number assigned to every stock, corporate bond and municipal bond by the Committee on Uniform Securities Identification Procedures (CUSIP), which is established by the American Bankers Association.
Diversification—The practice of investing broadly across securities of a number of issuers to reduce risk.
Duration—A common gauge of the price sensitivity of a fixed income asset or portfolio to a change in interest rates.
Emerging Markets—Emerging markets are countries with relatively young stock and bond markets. Examples include Brazil and Thailand. Typically, emerging-markets investments have the potential for losses and gains larger than those of developed-market investments.
Expense Ratio—The Fund’s total annual operating expenses (including management fees, distribution (12b-1) fees and other expenses) expressed as a percentage of average net assets.
Family of Funds—A group of mutual funds, each typically with its own investment objective, managed and distributed by the same company.
GDR—GDR after the name of a holding stands for Global Depositary Receipt representing ownership of foreign securities. GDRs are issued by either U.S. or non-U.S. banking organizations.
Inception Date—The date on which the Fund commenced operations.
Investment Objective—The goal that an investor and mutual fund pursue together (e.g., current income, long-term capital growth, etc.)
Median Market Cap—An indicator of the size of companies in which a fund invests; the midpoint of market capitalization (market price x shares outstanding) of a fund’s stocks, weighted by the proportion of the fund’s assets invested in each stock. Stocks representing half of the fund’s assets have market capitalizations above the median, and the rest are below it.
MSCI All Country World Index—The MSCI All Country World Index is a free float-adjusted market capitalization weighted index that is designed to measure the equity market performance of developed and emerging markets. This unmanaged index does not reflect fees and expenses and is not available for direct investment.
MSCI All Country World Ex. U.S. (ND) Index—The MSCI All Country World Ex. U.S.is a free float-adjusted market capitalization weighted index that is designed to measure equity market performance in the global developed and emerging markets, excluding the United States. This unmanaged index does not reflect fees and expenses and is not available for direct investment.
MSCI EAFE (ND) Index—The MSCI EAFE (ND) Index is an unmanaged index generally representative of major overseas stock markets. This unmanaged index does not reflect fees and expenses and is not available for direct investment.
MSCI Emerging Markets (ND) Index—The MSCI Emerging Markets (ND) Index is a market capitalization weighted index of equity securities in more than 20 emerging market economies. This unmanaged index does not reflect fees and expenses and is not available for direct investment.
MSCI World (ND) Index—The MSCI World (ND) Index is a free float-adjusted market capitalization index that is designed to measure global developed market equity performance. This unmanaged index does not reflect fees and expenses and is not available for direct investment.
Net Asset Value (NAV)—The per share value of a mutual fund, determined by subtracting the fund’s liabilities from its assets and dividing by the number of shares outstanding. Mutual funds calculate their NAVs at least once each business day.
No-Load Fund—A mutual fund whose shares are sold without a sales commission and without a 12b-1 fee of more than 0.25% per year. Harbor funds are no-load.
Open-End Investment Company—The legal name for a mutual fund, indicating that it stands ready to redeem (buy back) its shares from investors on any business day. Harbor Funds is an open-end investment company.
Operating Expenses—Business costs paid from a fund’s assets before earnings are distributed to shareholders. These include management fees and 12b-1 fees and other expenses.
Portfolio Manager—A specialist employed by a mutual fund’s adviser or subadviser to invest the fund’s assets in accordance with predetermined investment objectives.
94
Glossary—Continued
Portfolio Turnover—A measure of the trading activity in a fund’s investment portfolio (how often securities are bought and sold by a fund). Funds with high turnover rates incur higher transaction costs and may be more likely to distribute capital gains (which may be taxable to investors).
Price to Book Ratio (P/B)—A ratio used to compare a stock’s market value to its book value. It is calculated by dividing the current closing price of the stock by the latest quarter’s book value. For a fund, the weighted average price/book ratio of the stocks it holds.
Price to Earnings Ratio (P/E)—The ratio of a stock’s current price to its per-share earnings over the past year. For a fund, the weighted average P/E of the stocks it holds. P/E is an indicator of market expectations about corporate prospects; the higher the P/E, the greater the market expectations are for a company’s future growth.
Prospectus—The official document that describes a mutual fund to prospective investors. The prospectus contains information required by the SEC, such as investment objectives and policies, risks, services and fees.
Record Date—The date on which a shareholder must officially own shares in order to be entitled to a dividend.
Redemption Fee—Fee charged to shareholders by a mutual fund when they sell shares within a specified period after purchase. The time limit and size of fee vary among funds. The fee is paid to the fund, not the fund’s investment adviser. Its purpose is to protect long-term investors from the impact of short-term traders.
REITs (Real Estate Investment Trust)—REITs invest in real estate or loans secured by real estate and issue shares in such investments. A REIT is similar to a closed-end mutual fund.
Repurchase Agreement (Repo)—A form of short-term borrowing for dealers in government securities. The dealer sells the government securities to investors, usually on an overnight basis, and buys them back the following day. For the party selling the security (and agreeing to repurchase it in the future), it is a repo. For the party on the other end of the transaction (buying the security and agreeing to sell back in the future), it is a reverse repurchase agreement.
Risk/Reward (or Return)—The relationship between the degree of risk associated with an investment and its return potential. Typically, the higher the potential return of an investment, the greater the risk.
Russell 1000® Growth Index—The Russell 1000® Growth Index is an unmanaged index generally representative of the U.S. market for larger capitalization growth stocks. This unmanaged index does not reflect fees and expenses and is not available for direct investment. The Russell 1000® Growth Index and Russell® are trademarks of Russell Investments.
Russell 1000® Value Index—The Russell 1000® Value Index is an unmanaged index generally representative of the U.S. market for larger capitalization value stocks. This unmanaged index does not reflect fees and expenses and is not available for direct investment. The Russell 1000® Value Index and Russell® are trademarks of Russell Investments.
Russell 2000® Index—The Russell 2000® Index measures the performance of the small-cap segment of the U.S. equity universe. The Russell 2000® Index is a subset of the Russell 3000® Index representing approximately 10% of the total market capitalization of that index. It includes approximately 2,000 of the smallest securities based on a combination of their market cap and current index membership. The Russell 2000® Index is constructed to provide a comprehensive and unbiased small-cap barometer and is completely reconstituted annually to ensure larger stocks do not distort the performance and characteristics of the true small-cap opportunity set. This unmanaged index does not reflect fees and expenses and is not available for direct investment. The Russell 3000® Index and Russell® are trademarks of Russell Investments.
Russell 2000® Growth Index—The Russell 2000® Growth Index is an unmanaged index representing the smallest 2,000 stocks with the highest price-to-book ratio and future earnings. This unmanaged index does not reflect fees and expenses and is not available for direct investment. The Russell 2000® Growth Index and Russell® are trademarks of Russell Investments.
Russell 2000® Value Index—The Russell 2000® Value Index is an unmanaged index representing the smallest 2,000 stocks with the lowest price-to-book ratio and future earnings. This unmanaged index does not reflect fees and expenses and is not available for direct investment. The Russell 2000® Value Index and Russell® are trademarks of Russell Investments.
Russell 3000® Index—The Russell 3000® Index measures the performance of the largest 3,000 U.S. companies representing approximately 98% of the investable U.S. equity market. The Russell 3000® Index is constructed to provide a comprehensive, unbiased and stable barometer of the broad market and is completely reconstituted annually to ensure new and growing equities are reflected. This unmanaged index does not reflect fees and expenses and is not available for direct investment. The Russell 3000® Index and Russell® are trademarks of Russell Investments.
95
Glossary—Continued
Russell 3000® Growth Index—The Russell 3000® Growth Index measures the performance of the broad growth segment of the U.S. equity universe. It includes those Russell 3000 companies with higher price-to-book ratios and higher forecasted growth values. The Russell 3000® Growth Index is constructed to provide a comprehensive, unbiased, and stable barometer of the broad growth market. The index is completely reconstituted annually to ensure new and growing equities are included and that the represented companies continue to reflect growth characteristics. This unmanaged index does not reflect fees and expenses and is not available for direct investment. The Russell 3000® Growth Index and Russell® are trademarks of Russell Investments.
Russell 3000® Value Index—The Russell 3000® Value Index measures the performance of the broad value segment of U.S. equity value universe. It includes those Russell 3000 companies with lower price-to-book ratios and lower forecasted growth values. The Russell 3000® Value Index is constructed to provide a comprehensive, unbiased, and stable barometer of the broad value market. The index is completely reconstituted annually to ensure new and growing equities are included and that the represented companies continue to reflect value characteristics. This unmanaged index does not reflect fees and expenses and is not available for direct investment. The Russell 3000® Value Index and Russell® are trademarks of Russell Investments.
Russell Midcap® Growth Index—The Russell Midcap® Growth Index is an unmanaged index generally representative of the U.S. market for medium capitalization growth stocks. This unmanaged index does not reflect fees and expenses and is not available for direct investment. The Russell Midcap® Growth Index and Russell® are trademarks of Russell Investments.
Russell Midcap® Value Index—The Russell Midcap® Value Index is an unmanaged index generally representative of the U.S. market for medium capitalization value stocks. This unmanaged index does not reflect fees and expenses and is not available for direct investment. The Russell Midcap® Value Index and Russell® are trademarks of Russell Investments.
S&P 500 Index—The S&P 500 Index is an unmanaged index generally representative of the U.S. stock market. This unmanaged index does not reflect fees and expenses and is not available for direct investment.
Statement of Additional Information (SAI)—The supplementary document to a prospectus that contains more detailed information about a mutual fund; also known as “Part B” of a fund’s registration statement.
TBAs—A term used to describe a forward mortgage-backed securities trade. Pass-through securities issued by Freddie Mac, Fannie Mae and Ginnie Mae trade in the TBA market. The term TBA is derived from the fact that the actual mortgage- backed security that will be delivered to fulfill a TBA trade is not designated at the time the trade is made. The securities are “to be announced” 48 hours prior to the established trade settlement date.
Treasury Inflation-Protected Securities (TIPS)—TIPS are securities in which the principal amount is adjusted for inflation and interest payments are applied to the inflation-adjusted principal.
Top-Down Equity Management Style—Investment style that begins with an assessment of the overall economic environment and makes a general asset allocation decision regarding various sectors of the financial markets and various industries.
Total Return—Return on an investment over a specified period, including price appreciation (or depreciation) plus any income, expressed as an average annual compound of return.
Weighted Average Duration—Duration is a time measure of a bond’s interest-rate sensitivity, based on the weighted average of the time periods over which a bond’s cash flows accrue to the bondholder. Time periods are weighted by multiplying by the present value of its cash flow divided by the bond’s price. (A bond’s cash flows consist of coupon payments and repayment of capital.) A bond’s duration will almost always be shorter than its maturity, with the exception of zero-coupon bonds, for which maturity and duration are equal.
Weighted Average Maturity—The average length of time until principal must be repaid for all bonds in a mutual fund portfolio on a dollar weighted basis.
Yield—A measure of net income (dividends and interest) earned by the securities in the fund’s portfolio less fund expenses during a specified period. A fund’s yield is expressed as a percentage of the maximum offering price per share on a specified date.
Yield to Maturity—The term used to describe the rate of return an investor will receive if a long-term, interest-bearing security, such as a bond, is held to its maturity date. Yield to maturity is greater than the coupon rate if the bond is selling at a discount and less than the coupon rate if it is selling at a premium.
96
| | | | | | |
| 111 South Wacker Drive, 34th Floor | | Chicago, IL 60606-4302 | | 800-422-1050 | | harborfunds.com |
Trustees & Officers
David G. Van Hooser
Chairman, President & Trustee
Scott M. Amero
Trustee
Raymond J. Ball
Trustee
Donna J. Dean
Trustee
Randall A. Hack
Trustee
Robert Kasdin
Trustee
Rodger F. Smith
Trustee
Ann M. Spruill
Trustee
Charles F. McCain
Chief Compliance Officer
Anmarie S. Kolinski
Treasurer
Erik D. Ojala
Vice President, Secretary & AML Compliance Officer
Brian L. Collins
Vice President
Charles P. Ragusa
Vice President
Jodie L. Crotteau
Assistant Secretary
Susan A. DeRoche
Assistant Secretary
John M. Paral
Assistant Treasurer
Investment Adviser
Harbor Capital Advisors, Inc.
111 South Wacker Drive
34th Floor
Chicago, IL 60606-4302
312-443-4400
Distributor & Principal Underwriter
Harbor Funds Distributors, Inc.
111 South Wacker Drive
34th Floor
Chicago, IL 60606-4302
312-443-4600
Shareholder Servicing Agent
Harbor Services Group, Inc.
P.O. Box 804660
Chicago, IL 60680-4108
800-422-1050
Custodian
State Street Bank & Trust Company
State Street Financial Center
1 Lincoln Street
Boston, MA 02111-2900
ITEM 2 – CODE OF ETHICS
Not applicable.
ITEM 3 – AUDIT COMMITTEE FINANCIAL EXPERT
Not applicable.
ITEM 4 – PRINCIPAL ACCOUNTANT FEES AND SERVICES
Not applicable.
ITEM 5 – AUDIT COMMITTEE OF LISTED REGISTRANTS
Not applicable.
ITEM 6 – INVESTMENTS
| (a) | The Registrant has elected to include the schedule of investments in securities of unaffiliated issuers as part of the report to shareholders filed under Item 1 of this report on Form N-CSR. |
ITEM 7 – DISCLOSURE OF PROXY VOTING POLICIES AND PROCEDURES FOR CLOSED-END MANAGEMENT INVESTMENT COMPANIES
Not applicable.
ITEM 8 – PORTFOLIO MANAGERS OF CLOSED-END MANAGEMENT INVESTMENT COMPANIES
Not applicable.
ITEM 9 – PURCHASES OF EQUITY SECURITIES BY CLOSED-END MANAGEMENT INVESTMENT COMPANY AND AFFILIATED PURCHASERS
Not applicable.
ITEM 10 – SUBMISSION OF MATTERS TO A VOTE OF SECURITY HOLDERS
There were no material changes to the procedures by which shareholders may recommend nominees to the Registrant’s Board of Trustees since the date of the Registrant’s prior report on Form N-CSR.
ITEM 11 – CONTROLS AND PROCEDURES
| (a) | The Registrant’s Principal Executive and Principal Financial Officers concluded that the Registrant’s disclosure controls and procedures (as defined in Rule 30a-3(c) under the 1940 Act) are effective, based on the evaluation of these disclosure controls and procedures as of a date within 90 days of the filing of this report. |
| (b) | There was no change in the Registrant’s internal control over financial reporting (as defined in Rule 30a-3(d) under the 1940 Act) that occurred during the second fiscal quarter of the period covered by this report that has materially affected, or is reasonably likely to materially affect, the Registrant’s internal control over financial reporting. |
ITEM 12 – EXHIBITS
| (a) | A separate certification for each principal executive officer and principal financial officer of the Registrant as required by Rule 30a-2(a) under the 1940 Act (17 CFR 270.30a-2(a)) is attached hereto. |
| (b) | Certification as required by Section 1350 of Chapter 63 of Title 18 of the United States Code (18 U.S.C. 1350) is attached hereto. |
SIGNATURES
Pursuant to the requirements of the Securities Exchange Act of 1934 and the Investment Company Act of 1940, the Registrant has duly caused this report to be signed this 24th day of June, 2015 on its behalf by the undersigned, thereunto duly authorized.
| | |
| HARBOR FUNDS |
| |
| By: | | /s/ David G. Van Hooser |
| David G. Van Hooser |
| Chairman, President and Trustee |
| (Principal Executive Officer) |
Pursuant to the requirements of the Securities Exchange Act of 1934 and the Investment Company Act of 1940, this report has been signed below by the following persons on behalf of the Registrant and in the capacities and on the dates indicated.
| | | | | | |
| By: | | /s/ David G. Van Hooser | | Chairman, President and Trustee | | June 24, 2015 |
| | David G. Van Hooser | | (Principal Executive Officer) | | |
| | | |
| By: | | /s/ Anmarie S. Kolinski | | Treasurer (Principal Financial | | June 24, 2015 |
| | Anmarie S. Kolinski | | and Accounting Officer) | | |
| | |
| | | Exhibit Index |
| |
Number | | Description |
| |
| 99.CERT1 | | Certification for each principal executive officer and principal financial officer of the Registrant as required by Rule 30a-2(a) under the 1940 Act (17 CFR 270.30a-2(a)). |
| |
| 99.CERT2 | | Certification for each principal executive officer and principal financial officer of the Registrant as required by Rule 30a-2(a) under the 1940 Act (17 CFR 270.30a-2(a)). |
| |
| 99.906CERT | | Certification as required by Section 1350 of Chapter 63 of Title 18 of the United States Code (18 U.S.C. 1350). |