Table of Contents
UNITED STATES
SECURITIES AND EXCHANGE COMMISSION
Washington, D.C. 20549
Form N-CSR
CERTIFIED SHAREHOLDER REPORT OF
REGISTERED MANAGEMENT INVESTMENT COMPANIES
Investment Company Act file number: 811-4676
Harbor Funds
(Exact name of Registrant as specified in charter)
111 South Wacker Drive, 34th Floor
Chicago, Illinois 60606-4302
(Address of principal executive offices) (Zip code)
Charles F. McCain, Esq. HARBOR FUNDS 111 South Wacker Drive, 34th Floor Chicago, Illinois 60606-4302 | Christopher P. Harvey, Esq. DECHERT LLP One International Place – 40th Floor 100 Oliver Street Boston, MA 02110-2605 |
(Name and address of agent for service)
Registrant’s telephone number, including area code: (312) 443-4400
Date of fiscal year end: October 31
Date of reporting period: April 30, 2019
ITEM 1 – REPORTS TO STOCKHOLDERS
The following are copies of reports transmitted to shareholders pursuant to Rule 30e-1 under the Investment Company Act of 1940, as amended (the “1940 Act”) (17 CFR 270.30e-1):
Table of Contents
Semi-Annual Report
April 30, 2019
Domestic Equity Funds
Retirement Class | Institutional Class | Administrative Class | Investor Class | |
GROWTH FUNDS | ||||
Harbor Capital Appreciation Fund | HNACX | HACAX | HRCAX | HCAIX |
Harbor Strategic Growth Fund | HNGSX | MVSGX | HSRGX | HISWX |
Harbor Mid Cap Growth Fund | HNMGX | HAMGX | HRMGX | HIMGX |
Harbor Small Cap Growth Fund | HNSGX | HASGX | HRSGX | HISGX |
Harbor Small Cap Growth Opportunities Fund | HNSOX | HASOX | HRSOX | HISOX |
VALUE FUNDS | ||||
Harbor Large Cap Value Fund | HNLVX | HAVLX | HRLVX | HILVX |
Harbor Mid Cap Value Fund | HNMVX | HAMVX | HRMVX | HIMVX |
Harbor Small Cap Value Fund | HNVRX | HASCX | HSVRX | HISVX |
Harbor Small Cap Value Opportunities Fund | HSRVX | HSOVX | HSAVX | HSIVX |
Beginning on January 1, 2021, as permitted by regulations adopted by the Securities and Exchange Commission, paper copies of the Funds’ annual and semi-annual shareholder reports will no longer be sent by mail, unless you specifically request paper copies of the reports. Instead, the reports will be made available on the Funds’ website (harborfunds.com), and you will be notified by mail each time a report is posted and provided with a website link to access the report.
If you already elected to receive shareholder reports electronically, you will not be affected by this change and you need not take any action. You may elect to receive shareholder reports and other communications from a Fund electronically anytime by contacting your financial intermediary (such as a broker-dealer or bank) or, if you invest directly with Harbor Funds, by calling 800-422-1050.
You may elect to receive all future reports in paper free of charge. If you invest through a financial intermediary (such as a broker-dealer or bank), you can contact your financial intermediary to request that you continue to receive paper copies of the Funds’ shareholder reports. If you invest directly, you can call 800-422-1050 to request that you continue to receive paper copies of the Funds’ shareholder reports. Your election to receive reports in paper will apply to all Harbor Funds held in your account.
Table of Contents
This document must be preceded or accompanied by a Prospectus.
Letter from the Chairman
Charles F. McCain Chairman |
Dear Fellow Shareholder:
U.S. equities generally had positive returns in the fiscal half year ended April 30, 2019. However, the period saw a marked reversal in stock performance, with major declines in the closing months of 2018 followed by a robust rally in the first few months of 2019.
In the beginning of the six-month period, an equity market selloff reflected investor concerns about a range of issues, including the pace of global growth, the potential for more U.S. Federal Reserve (Fed) interest rate hikes, and a potential trade war between the U.S. and China.
Global equity markets rebounded in the first quarter of 2019, led by a strong advance by U.S. equities. The Fed signaled a pause on increases in the federal funds rate, and worries about a trade conflict with China abated. Each of the eleven broad S&P 500 sectors posted gains for the first quarter of 2019, led by Information Technology, Real Estate, and Industrials. The equity markets’ positive performance continued through April, buoyed by better-than-expected economic and earnings numbers.
The Russell 3000® Index, a measure of the broad U.S. stock market, had a return of 9.71% for the fiscal half year ended April 30, 2019. Growth stocks outperformed value stocks by a significant margin during the period. Mid cap stocks were the best performers from a capitalization perspective for the six-month period. Large cap stocks performed in line with the market, while small caps underperformed.
Comments by the portfolio managers of each Harbor domestic equity fund can be found in the pages preceding each Fund’s portfolio of investments. As always, we recommend that shareholders maintain a long-term perspective in evaluating all of their investments, including Harbor Funds.
Returns For Periods Ended April 30, 2019 | ||||||||||
Unannualized | Annualized | |||||||||
Domestic Equities | 6 Months | 1 Year | 5 Years | 10 Years | 30 Years | |||||
Russell 3000® (entire U.S. stock market) | 9.71% | 12.68% | 11.20% | 15.30% | 10.17% | |||||
S&P 500 (large cap stocks) | 9.76 | 13.49 | 11.63 | 15.32 | 10.15 | |||||
Russell Midcap® (mid cap stocks) | 11.65 | 10.69 | 9.75 | 15.65 | 11.41 | |||||
Russell 2000® (small cap stocks) | 6.06 | 4.61 | 8.63 | 14.10 | 9.41 | |||||
Russell 3000® Growth (growth stocks) | 11.81 | 16.61 | 14.17 | 16.83 | 10.05 | |||||
Russell 3000® Value (value stocks) | 7.61 | 8.58 | 8.17 | 13.69 | 9.91 | |||||
International & Global | ||||||||||
MSCI EAFE (ND)(foreign stocks) | 7.45% | -3.22% | 2.60% | 7.95% | 4.58% | |||||
MSCI EAFE Small Cap (ND)(foreign small cap stocks) | 5.89 | -7.88 | 5.27 | 11.49 | N/A | |||||
MSCI World (ND)(global stocks) | 8.83 | 6.48 | 7.31 | 11.58 | 6.82 | |||||
MSCI All Country World Ex. U.S. (ND)(foreign stocks) | 9.12 | -3.23 | 2.83 | 7.75 | N/A | |||||
MSCI Emerging Markets (ND)(emerging market stocks) | 13.76 | -5.04 | 4.04 | 7.50 | N/A | |||||
Fixed Income | ||||||||||
ICE BofAML U.S. Non-Distressed High Yield (domestic high-yield bonds) | 5.89% | 7.03% | 5.03% | 8.74% | N/A | |||||
Bloomberg Barclays U.S. Aggregate Bond (domestic bonds) | 5.49 | 5.29 | 2.57 | 3.72 | 6.09% | |||||
Bloomberg Barclays U.S. TIPS (domestic inflation-linked bonds) | 4.60 | 3.10 | 1.74 | 3.64 | N/A | |||||
ICE BofAML U.S. 3-Month Treasury Bill (proxy for money market returns) | 1.18 | 2.18 | 0.78 | 0.45 | 3.08 |
1
Change in market’s direction showed value of resilence
In the fourth calendar quarter of 2018, U.S. equities endured their worst quarterly performance in more than seven years, as concerns about interest rate increases, continuing trade tensions, and slowing global growth dampened investor sentiment. Some commentators speculated that the nearly 10-year-long bull market had reached its end.
But in the first quarter of 2019, such talk proved premature, as equities rebounded in the U.S. and globally. Anyone who pulled their money out of equities in December 2018, hoping to avoid further losses, may have missed out on the robust gains of early 2019.
Reacting emotionally to market movements, or trying to time when the market will rise or fall, can have a negative impact on the success of a long-term investment strategy. While past performance is never a guarantee of future results, many investors have historically achieved their financial objectives by making a long-term plan and staying true to it through market ups and downs.
Harbor Funds offers a variety of equity and fixed income funds that can serve as the foundation of a diversified portfolio.
Thank you for investing with Harbor Funds.
June 28, 2019
Charles F. McCain |
Chairman |
2
Harbor Capital Appreciation Fund
Manager’s Commentary (Unaudited)
Subadviser
Jennison Associates LLC
466 Lexington Avenue
New York, NY 10017
New York, NY 10017
Portfolio Managers
Spiros “Sig” Segalas
Since 1990
Since 1990
Kathleen A. McCarragher
Since 2013
Since 2013
Blair A. Boyer
Since 2019
Since 2019
Natasha Kuhlkin, CFA
Since 2019
Since 2019
Jennison has subadvised the Fund since 1990.
Investment Objective
The Fund seeks long-term growth of capital.
Spiros “Sig” Segalas
Kathleen A. McCarragher
Blair A. Boyer
Natasha Kuhlkin, CFA
Management’s Discussion of
Fund Performance
Fund Performance
MARKET REVIEW
A sell-off in 2018’s final quarter reflected mounting investor concerns about the rising risk of a major trade war with China, decelerating expansion in non-U.S. economies, the pace of U.S. growth, U.S. interest rate increases and their effect on U.S. economic growth, the state of U.S. trade alliances with other major trading partners, and discord and uncertainty about domestic policy. U.S. equity markets rebounded in the early months of 2019, as the U.S. Federal Reserve (Fed) signaled a pause in federal funds rate hikes, corporate earnings reports generally indicated continued strength, and sentiment grew that trade friction would be resolved.
PERFORMANCE
Harbor Capital Appreciation Fund advanced 13.49% (Retirement Class), 13.44% (Institutional Class), 13.31% (Administrative Class), and 13.24% (Investor Class) in the six-month period ended April 30, 2019, outperforming the Russell 1000® Growth benchmark, which rose 12.09%.
Among the Russell 1000® Growth Index’s major sectors, Consumer Discretionary, Information Technology, Communication Services, and Industrials posted double-digit gains. Health Care’s advance was nominal. The small Energy sector declined.
Information Technology positions were strong contributors to Fund absolute performance and performance relative-relative to the Fund’s benchmark index. Digital transformation of the enterprise has become a strategic imperative across many industries and companies. Holdings Microsoft, Salesforce.com, Workday, and Adobe offer mission-critical cloud applications and services that are fundamentally changing the way businesses operate.
Payments companies continue to benefit from the long-term shift from cash to electronic transactions. MasterCard and Visa have, in our view, strong market positions with high barriers to entry, pricing power, and solid operating leverage potential. PayPal offers innovative low-cost, high-security, easy-to-use digital payment options, especially for mobile and online transactions.
Apple declined on disappointing iPhone sales. More recently, the stock has turned around on expectations that demand will improve. After strong performance through much of 2017 and 2018, Nvidia fell in 2018’s final quarter, reflecting gaming graphics microchip inventory issues and a slowdown in the cryptocurrency mining boom. The stock has begun to recover on signs that the inventory issues are being resolved.
In Consumer Discretionary, Amazon continues to be a substantial holding. We believe that the company continues to strengthen its competitive edge through reinvestment in its business. The Amazon Web Services business is a driver of revenue and profit. The various business segments of Alibaba, one of the world’s largest e-commerce companies, have provided revenue growth. With an improving macroeconomic environment in China, we believe its sales growth looks poised to reaccelerate. Tesla’s decline was tied to renewed controversy surrounding CEO Elon Musk and concerns about electric vehicle production volume.
In Communication Services, Tencent’s growth is being driven by the company’s dominant position in China’s online gaming and instant messaging markets and its growing advertising and payment service efforts. Netflix continues to raise its competitive barriers with investments in content, resulting in strong subscriber growth and increased pricing and operating leverage.
3
Harbor Capital Appreciation Fund
Manager’s Commentary—Continued
TOTAL RETURNS
For the periods ended 04/30/2019
Unannualized | 1 Year | Annualized | |||||||||
6 Months | 5 Years | 10 Years | |||||||||
Harbor Capital Appreciation Fund | |||||||||||
Retirement Class1 | 13.49% | 14.45% | 15.40% | 16.64% | |||||||
Institutional Class | 13.44 | 14.37 | 15.36 | 16.62 | |||||||
Administrative Class | 13.31 | 14.08 | 15.07 | 16.32 | |||||||
Investor Class | 13.24 | 13.96 | 14.93 | 16.19 | |||||||
Comparative Indices | |||||||||||
Russell 1000® Growth | 12.09% | 17.43% | 14.50% | 16.96% | |||||||
S&P 500 | 9.76 | 13.49 | 11.63 | 15.32 |
As stated in the Fund’s prospectus dated March 1, 2019, the expense ratios were 0.58% (Net) and 0.63% (Gross) (Retirement Class); 0.66% (Net) and 0.71% (Gross) (Institutional Class); 0.91% (Net) and 0.96% (Gross) (Administrative Class); and 1.03% (Net) and 1.08% (Gross) (Investor Class). The net expense ratios reflect a contractual management fee waiver effective through 02/29/2020. The expense ratios in the prospectus may differ from the actual expense ratios for the period disclosed within this report. The expense ratios shown in the prospectus are based on the prior fiscal year, adjusted to reflect changes, if any, in contractual arrangements that occurred prior to the date of the prospectus (or supplement thereto, if applicable).
Performance data shown represents past performance and is no guarantee of future results. Past performance is net of management fees and expenses and reflects reinvested dividends and distributions but does not reflect the deduction of taxes that a shareholder would pay on Fund distributions or upon the redemption of Fund shares. Past performance reflects the beneficial effect of any expense waivers or reimbursements, without which returns would have been lower. Investment returns and principal value will fluctuate so that Fund shares, when redeemed, may be worth more or less than their original cost. Returns for periods less than one year are not annualized. Current performance may be higher or lower and is available through the most recent month end atharborfunds.com or by calling 800-422-1050.
Despite ongoing concern about data privacy, we believe Facebook is showing resilience, with solid engagement metrics and strong revenue growth, as advertisers continue to seek the reach and targeting Facebook provides. Video game publisher Activision Blizzard was hurt by signs of slowing growth momentum.
Materials and Energy positions detracted from absolute and relative return. Albemarle has the top global share and lowest cost structure in the lithium market but production issues and soft commodities pricing cloud its earnings outlook. Oil producer Concho Resources has been hurt by logistics constraints that are causing weak pricing in a portion of its production.
The Fund’s positions in Activision, Albemarle, and Concho were eliminated during the period.
OUTLOOK & STRATEGY
As a fundamental investor, we examine company and industry prospects over the short and long term, working to understand and anticipate how industries and businesses will change over time. Investing in companies with well-above-average long-term growth rates and unique, market-leading products and services remains our focus.
Market fears of a near-term recession have abated, while monetary policymakers have turned more dovish in light of slower growth expectations both in the U.S. and abroad. Bond yields have fallen since the Fed’s policy pivot.
Expectations of global growth depend in large part on a U.S.-China trade resolution that removes the threat and chilling impact of substantially higher tariff levels. U.S. trade issues extend beyond China as the fate of the proposed U.S.-Mexico-Canada Agreement, which would replace the North American Free Trade Agreement, remains unresolved, as does a dispute with the European Union over automobile tariffs.
Valuations of Fund holdings appear reasonable in absolute terms and relative to the S&P 500 and the Russell 1000® Growth indexes. Although we believe the Fund holds fundamentally strong companies with solid long-term growth prospects, we remain alert not only to the challenges posed by slowing economic growth and trade friction, but also by the headwinds created by data privacy issues, emerging regulatory views on the scope and scale of large technology platforms, and health care policy reform proposals leading into the 2020 U.S. election cycle.
1 | Retirement Class shares commenced operations on March 1, 2016. The performance attributed to the Retirement Class shares prior to that date is that of the Institutional Class shares. Performance prior to March 1, 2016 has not been adjusted to reflect the lower expenses of Retirement Class shares. During this period, Retirement Class shares would have had returns similar to, but potentially higher than, Institutional Class shares due to the fact that Retirement Class shares represent interests in the same portfolio as Institutional Class shares but are subject to lower expenses. |
This report contains the current opinions of Jennison Associates LLC as of the date of this report and should not be considered as investment advice or a recommendation of any particular security, strategy or investment product. Such opinions are subject to change without notice and securities described herein may no longer be included in, or may at any time be removed from, the Fund’s portfolio. This report is distributed for informational purposes only. Information contained herein has been obtained from sources believed reliable, but not guaranteed.
Equity securities, such as common stocks, are affected by company specific events and by movements in the overall stock markets in which those securities principally trade, among other factors. An adverse company specific event, or downturn in those stock markets, can depress the value of a particular company’s equity securities. For information on the different share classes and the risks associated with an investment in the Fund, please refer to the current prospectus.
4
Harbor Capital Appreciation Fund
Fund Summary—April 30, 2019 (Unaudited)
TOP Holdings(% of net assets)
❶ | Alphabet Inc. | 6.0% |
❷ | Amazon.com Inc. | 5.7% |
❸ | Microsoft Corp. | 4.9% |
❹ | Mastercard Inc. | 4.2% |
❺ | salesforce.com Inc. | 3.8% |
❻ | Netflix Inc. | 3.7% |
❼ | Visa Inc. | 3.7% |
❽ | Facebook Inc. | 3.5% |
❾ | Tencent Holdings Ltd. | 3.5% |
❿ | Adobe Inc. | 3.1% |
Sector Allocation(% of investments)
5
Harbor Capital Appreciation Fund
Portfolio of Investments—April 30, 2019 (Unaudited)
Value, Cost, and Principal Amounts in Thousands
COMMON STOCKS—99.8% | |||
Shares | Value | ||
AEROSPACE & DEFENSE—4.9% | |||
1,821,829 | Airbus SE (France) | $249,463 | |
2,308,145 | Boeing Co. | 871,763 | |
2,948,679 | Safran SA (France) | 429,803 | |
1,551,029 | |||
AUTOMOBILES—1.0% | |||
1,375,712 | Tesla Inc.* | 328,369 | |
BANKS—1.1% | |||
2,864,983 | JPMorgan Chase & Co. | 332,481 | |
BEVERAGES—1.1% | |||
1,562,751 | Constellation Brands Inc. | 330,787 | |
BIOTECHNOLOGY—4.3% | |||
3,592,768 | Alexion Pharmaceuticals Inc.* | 489,084 | |
3,748,996 | BioMarin Pharmaceutical Inc.* | 320,652 | |
910,243 | Sage Therapeutics Inc.* | 153,130 | |
2,259,672 | Vertex Pharmaceuticals Inc.* | 381,839 | |
1,344,705 | |||
CAPITAL MARKETS—1.2% | |||
1,724,319 | S&P Global Inc. | 380,488 | |
ENTERTAINMENT—3.7% | |||
3,153,400 | Netflix Inc.* | 1,168,461 | |
EQUITY REAL ESTATE INVESTMENT TRUSTS (REITs)—1.7% | |||
1,162,395 | American Tower Corp. | 227,016 | |
2,382,002 | Crown Castle International Corp. | 299,608 | |
526,624 | |||
FOOD & STAPLES RETAILING—2.0% | |||
2,498,952 | Costco Wholesale Corp. | 613,568 | |
HEALTH CARE EQUIPMENT & SUPPLIES—3.2% | |||
1,877,102 | Danaher Corp. | 248,603 | |
1,759,277 | Edwards Lifesciences Corp.* | 309,756 | |
856,532 | Intuitive Surgical Inc.* | 437,371 | |
995,730 | |||
HEALTH CARE PROVIDERS & SERVICES—0.8% | |||
167,765 | Guardant Health Inc.* | 10,990 | |
983,937 | UnitedHealth Group Inc. | 229,326 | |
240,316 | |||
HOTELS, RESTAURANTS & LEISURE—2.1% | |||
434,423 | Chipotle Mexican Grill Inc.* | 298,900 | |
2,762,195 | Marriott International Inc. | 376,819 | |
675,719 | |||
INTERACTIVE MEDIA & SERVICES—13.0% | |||
786,280 | Alphabet Inc. Class A* | 942,718 | |
791,767 | Alphabet Inc. Class C* | 940,999 | |
5,743,057 | Facebook Inc.* | 1,110,707 | |
22,112,306 | Tencent Holdings Ltd. (China) | 1,089,864 | |
4,084,288 | |||
INTERNET & DIRECT MARKETING RETAIL—8.8% | |||
5,214,543 | Alibaba Group Holding Ltd. ADR (China)*,1 | 967,663 | |
935,926 | Amazon.com Inc.* | 1,803,080 | |
2,770,743 |
COMMON STOCKS—Continued | |||
Shares | Value | ||
IT SERVICES—12.8% | |||
495,722 | Adyen NV (Netherlands)*,2 | $404,012 | |
1,593,785 | FleetCor Technologies Inc.* | 415,898 | |
5,125,845 | Mastercard Inc. | 1,303,195 | |
4,312,936 | PayPal Holdings Inc.* | 486,370 | |
3,520,505 | Square Inc.* | 256,363 | |
7,103,501 | Visa Inc. | 1,168,029 | |
4,033,867 | |||
LIFE SCIENCES TOOLS & SERVICES—1.9% | |||
1,947,560 | Illumina Inc.* | 607,639 | |
PERSONAL PRODUCTS—1.7% | |||
3,117,204 | Estée Lauder Companies Inc. | 535,567 | |
PHARMACEUTICALS—1.5% | |||
12,774,650 | AstraZeneca plc ADR (United Kingdom)1 | 481,093 | |
ROAD & RAIL—1.6% | |||
2,791,645 | Union Pacific Corp. | 494,233 | |
SEMICONDUCTORS & SEMICONDUCTOR EQUIPMENT—5.1% | |||
1,193,280 | Broadcom Inc. | 379,940 | |
3,456,927 | NVIDIA Corp. | 625,704 | |
4,343,254 | QUALCOMM Inc. | 374,085 | |
4,837,313 | Taiwan Semiconductor Manufacturing Co. Ltd. ADR (Taiwan)1 | 211,971 | |
1,591,700 | |||
SOFTWARE—16.3% | |||
3,416,490 | Adobe Inc.* | 988,219 | |
11,887,374 | Microsoft Corp. | 1,552,491 | |
432,936 | Red Hat Inc.* | 79,024 | |
7,271,539 | salesforce.com Inc.* | 1,202,349 | |
1,234,691 | ServiceNow Inc.* | 335,231 | |
2,811,656 | Splunk Inc.* | 388,121 | |
2,771,138 | Workday Inc.* | 569,829 | |
46,404 | Zoom Video Communications Inc.* | 3,363 | |
5,118,627 | |||
SPECIALTY RETAIL—2.2% | |||
1,945,478 | Home Depot Inc. | 396,294 | |
2,694,828 | Lowe's Companies Inc. | 304,893 | |
701,187 | |||
TECHNOLOGY HARDWARE, STORAGE & PERIPHERALS—2.8% | |||
4,413,431 | Apple Inc. | 885,643 | |
TEXTILES, APPAREL & LUXURY GOODS—5.0% | |||
745,961 | Kering SA (France) | 441,426 | |
2,758,517 | Lululemon Athletica Inc. (Canada)* | 486,464 | |
7,309,514 | NIKE Inc. | 641,995 | |
1,569,885 | |||
TOTAL COMMON STOCKS | |||
(Cost $17,212,238) | 31,362,749 | ||
TOTAL INVESTMENTS—99.8% | |||
(Cost $17,212,238) | 31,362,749 | ||
CASH AND OTHER ASSETS, LESS LIABILITIES—0.2% | 47,430 | ||
TOTAL NET ASSETS—100.0% | $31,410,179 |
6
Harbor Capital Appreciation Fund
Portfolio of Investments—Continued
FAIR VALUE MEASUREMENTS
The following table summarizes the Fund’s investments as of April 30, 2019 based on the inputs used to value them.
Asset Category | Quoted Prices Level 1 (000s) | Other Significant Observable Inputs Level 2 (000s) | Significant Unobservable Inputs Level 3 (000s) | Total (000s) | ||||
Common Stocks | ||||||||
Aerospace & Defense | $871,763 | $679,266 | $— | $1,551,029 | ||||
Automobiles | 328,369 | — | — | 328,369 | ||||
Banks | 332,481 | — | — | 332,481 | ||||
Beverages | 330,787 | — | — | 330,787 | ||||
Biotechnology | 1,344,705 | — | — | 1,344,705 | ||||
Capital Markets | 380,488 | — | — | 380,488 | ||||
Entertainment | 1,168,461 | — | — | 1,168,461 | ||||
Equity Real Estate Investment Trusts (REITs) | 526,624 | — | — | 526,624 | ||||
Food & Staples Retailing | 613,568 | — | — | 613,568 | ||||
Health Care Equipment & Supplies | 995,730 | — | — | 995,730 | ||||
Health Care Providers & Services | 240,316 | — | — | 240,316 | ||||
Hotels, Restaurants & Leisure | 675,719 | — | — | 675,719 | ||||
Interactive Media & Services | 2,994,424 | 1,089,864 | — | 4,084,288 | ||||
Internet & Direct Marketing Retail | 2,770,743 | — | — | 2,770,743 | ||||
IT Services | 3,629,855 | 404,012 | — | 4,033,867 | ||||
Life Sciences Tools & Services | 607,639 | — | — | 607,639 | ||||
Personal Products | 535,567 | — | — | 535,567 | ||||
Pharmaceuticals | 481,093 | — | — | 481,093 | ||||
Road & Rail | 494,233 | — | — | 494,233 | ||||
Semiconductors & Semiconductor Equipment | 1,591,700 | — | — | 1,591,700 | ||||
Software | 5,118,627 | — | — | 5,118,627 | ||||
Specialty Retail | 701,187 | — | — | 701,187 | ||||
Technology Hardware, Storage & Peripherals | 885,643 | — | — | 885,643 | ||||
Textiles, Apparel & Luxury Goods | 1,128,459 | 441,426 | — | 1,569,885 | ||||
Total Investments in Securities | $28,748,181 | $2,614,568 | $— | $31,362,749 |
There were no Level 3 investments at April 30, 2019 or October 31, 2018.
For more information on valuation inputs and their aggregation into the levels used in the table above, please refer to the Fair Value Measurements and Disclosures in Note 2 of the accompanying Notes to Financial Statements.
* | Non-income producing security |
1 | ADR after the name of a security stands for American Depositary Receipts representing ownership of foreign securities. ADRs are issued by U.S. banking institutions. |
2 | Securities purchased in a transaction exempt from registration under Rule 144A of the Securities Act of 1933. These securities may be resold in transactions exempt from registration, normally to qualified institutional buyers. The Fund has no right to demand registration of these securities. At April 30, 2019, the aggregate value of these securities was $404,012 or 1% of net assets. |
The accompanying notes are an integral part of the Financial Statements.
7
Harbor Strategic Growth Fund
Manager’s Commentary (Unaudited)
Subadviser
Mar Vista Investment Partners, LLC
11150 Santa Monica Boulevard, Suite 320
Los Angeles, CA 90025
Portfolio Managers
Silas A. Myers, CFA
Since 2017
Since 2017
Brian L. Massey, CFA
Since 2017
Since 2017
Joshua J. Honeycutt, CFA
Since 2017
Jeffrey B. Prestine
Since 2017
Since 2017
Mar Vista has subadvised the Fund since 2017.*
Investment Objective
The Fund seeks long-term growth of capital.
Silas A. Myers, CFA
Brian L. Massey, CFA
Joshua J. Honeycutt, CFA
Jeffrey B. Prestine
Management’s Discussion of
Fund Performance
Fund Performance
MARKET REVIEW
For the six-month period ended April 30, 2019, the Russell 1000® Growth Index was up 12.09%, equities recorded their best start in almost three decades as major market indices recouped all of the losses suffered in the final months of 2018. Asset price appreciation was broad based, with all eleven S&P 500 sectors ending higher for the first four months of 2019. A sharp reversal in the U.S. Federal Reserve’s (Fed) hawkish interest rate policy and U.S.-China trade optimism fueled the stock rally with economically sensitive businesses outperforming those with less cyclicality. A pause in central bankers’ tightening interest rate policies helped equity valuations expand, propelling the Russell 1000® Growth Index. In contrast to the stock market’s fast start, the U.S. bond market’s yield curve inverted for the first time since 2007, suggesting bond investors are worried about the unraveling of synchronized global growth. We expect this equity and bond market tug of war to continue until uncertainties surrounding global trade and corporate profits are resolved.
PERFORMANCE
For the six-month period ended April 30, 2019, Harbor Strategic Growth Fund returned 12.64% (Retirement Class), 12.56% (Institutional Class), 12.50% (Administrative Class), and 10.94% (Investor Class). Stock selection within the Health Care, Consumer Staples and Real Estate sectors drove the Fund’s performance. The Fund’s sector underweight in Health Care also added to outperformance.
Positive contributors to performance included Microchip Technology, TransDigm Group, American Tower and Moody’s Corporation. Microchip Technology’s stock has rebounded as the company works through excess inventory in its distribution channel. We believe this is a transitory cyclical issue and the secular drivers for Microchip Technology Inc.'s business remain intact. The firm continues to benefit from the electrification and automation of its primary end markets, automotive and industrial equipment. We believe it will compound shareholder value over our investment horizon, thus offering a compelling risk reward profile. TransDigm Group, the aviation electrical and mechanical components supplier, is up significantly over the last six months after surpassing earnings and revenues estimates as well as raising guidance for the upcoming fiscal year. In addition to its strong execution, its acquisition of Esterline, an aerospace and defense company, is expected to close before the end of the fiscal year, which should further boost revenue and profits. American Tower’s scale and geographic diversity provides broad exposure to accelerating wireless infrastructure investments from 3G in developing markets to 5G in the U.S. Concerns over a slowing global economy and the precipitous drop in the U.S. 10 Year Treasury to 2.4% helped push up the valuations for acyclical, long-duration assets like American Tower. Speculation that Sprint and T-Mobile’s merger would not be approved further helped drive the company’s stock price. Moody’s Corporation, the credit rating and analytics company, stock rebounded in the first quarter as global debt issuance recovered after a stagnant fourth quarter 2018 and concerns about an overly hawkish Fed subsided.
The largest detractors from performance for the six-month period ending April 30, 2019, included XPO Logistics, Markel Corporation, Berkshire Hathaway and Schlumberger. Over the past six months, XPO Logistics stock price experienced a sharp decline for two primary
* | On March 6, 2017, the Fund acquired all of the assets and substantially all of the liabilities of the Mar Vista Strategic Growth Fund (the “Predecessor Fund”). For the period November 1, 2011 (inception of the Predecessor Fund) to January 20, 2015, Mar Vista served as the Predecessor Fund’s subadviser and for the period January 20, 2015 to March 6, 2017, Mar Vista served as investment adviser to the Predecessor Fund. |
8
Harbor Strategic Growth Fund
Manager’s Commentary—Continued
TOTAL RETURNS
For the periods ended 04/30/2019
Unannualized | 1 Year | Annualized | |||||||||
6 Months | 5 Years | Life of Class | |||||||||
Harbor Strategic Growth Fund | |||||||||||
Retirement Class1 | 12.64% | 14.56% | N/A | 14.87% | |||||||
Institutional Class2 | 12.56 | 14.42 | 11.79 | 14.47 | |||||||
Administrative Class1 | 12.50 | 14.19 | N/A | 14.50 | |||||||
Investor Class1 | 10.94 | 12.55 | N/A | 13.65 | |||||||
Comparative Index | |||||||||||
Russell 1000® Growth2 | 12.09% | 17.43% | 14.50% | 16.05% |
As stated in the Fund’s prospectus dated March 1, 2019, the expense ratios were 0.63% (Net) and 0.77% (Gross) (Retirement Class); 0.71% (Net) and 0.85% (Gross) (Institutional Class); 0.96% (Net) and 1.10% (Gross) (Administrative Class); and 1.08% (Net) and 1.22% (Gross) (Investor Class). The net expense ratios reflect an expense limitation agreement (excluding interest expense, if any) effective through 02/29/2020. The expense ratios in the prospectus may differ from the actual expense ratios for the period disclosed within this report. The expense ratios shown in the prospectus are based on the prior fiscal year, adjusted to reflect changes, if any, in contractual arrangements that occurred prior to the date of the prospectus (or supplement thereto, if applicable).
Performance data shown represents past performance and is no guarantee of future results. Past performance is net of management fees and expenses and reflects reinvested dividends and distributions but does not reflect the deduction of taxes that a shareholder would pay on Fund distributions or upon the redemption of Fund shares. Past performance reflects the beneficial effect of any expense waivers or reimbursements, without which returns would have been lower. Investment returns and principal value will fluctuate so that Fund shares, when redeemed, may be worth more or less than their original cost. Returns for periods less than one year are not annualized. Current performance may be higher or lower and is available through the most recent month end atharborfunds.com or by calling 800-422-1050.
reasons. First, the company lowered its 2019 profit outlook due to slowing global economic activity. Second, XPO was the subject of a hedge fund’s short report that questioned the company’s accounting practices. Although most of the short report’s accusations were refuted by the company, our research process uncovered additional areas of concern. At Mar Vista, we attempt to invest in trustworthy capital allocators that demonstrate high integrity and financial transparency. More recently, XPO Logistics underwhelming operational performance and misguided investor communication lowered our conviction in management’s capabilities. For these reasons, we decided to exit our investment in XPO Logistics.
In 2018, the insurance industry endured the second year in a row of large catastrophe losses, mostly occurring during the fourth quarter. Markel Corporation was not immune to the material claims as its insurance business reported $100 million in losses. At the same time, Markel’s other key driver of value, its equity portfolio which accounts for 65% of book value, declined by mid-teens along with the rest of the stock market. As a result, reported book value for the fourth quarter declined 7% compared to the prior quarter. Similar to Markel, Berkshire Hathaway’s large catastrophe losses and a declining stock market, particularly its investments in Apple and Kraft, pressured the firm’s fourth quarter 2018 book value. With regard to Schlumberger, oil supply has proven to be more resilient than we expected despite an approximate 40% reduction in exploration and production cost from industry peaks in 2014. This resulted in a lower for longer price environment for the oil patch and the oil service industry in particular. We believe this backdrop will limit Schlumberger’s ability to grow shareholder value above market rates over our investment horizon. Therefore, we divested our position at the end of April 2019.
OUTLOOK & STRATEGY
We believe that elevated volatility may continue as economic activity moderates. While it may be unnerving to some investors, market volatility provides opportunities to increase the portfolio’s return potential while lowering risk. Our focus on owning compounding business models is well suited for turbulent times. We will continue to allocate capital to these competitively advantaged businesses when they trade below our estimates of intrinsic value.
Our investment team claims no special skill in predicting the market’s direction but, in the fullness of time, we believe a patient, high-conviction fund comprised of competitively advantaged serial compounders with stock prices that represent an appropriate margin of safety will generate excess risk-adjusted returns. In an environment with growing optimism, our investment team will remain diligent, conservative and patient as we deploy capital within our wide-moat universe.
1 | The “Life of Class” return as shown reflects the period 03/06/2017 through 04/30/2019. |
2 | The “Life of Class” return as shown reflects the period 11/01/2011 through 04/30/2019. |
This report contains the current opinions of Mar Vista Investment Partners, LLC as of the date of this report and should not be considered as investment advice or a recommendation of any particular security, strategy or investment product. Such opinions are subject to change without notice and securities described herein may no longer be included in, or may at any time be removed from, the Fund’s portfolio. This report is distributed for informational purposes only. Information contained herein has been obtained from sources believed reliable, but not guaranteed.
Equity securities, such as common stocks, are affected by company specific events and by movements in the overall stock markets in which those securities principally trade, among other factors. An adverse company specific event, or downturn in those stock markets, can depress the value of a particular company’s equity securities. For information on the different share classes and the risks associated with an investment in the Fund, please refer to the current prospectus.
9
Harbor Strategic Growth Fund
Fund Summary—April 30, 2019 (Unaudited)
TOP Holdings(% of net assets)
❶ | American Tower Corp. | 5.7% |
❷ | Alphabet Inc. Class C | 5.0% |
❸ | Berkshire Hathaway Inc. Class B | 4.9% |
❹ | Markel Corp. | 4.8% |
❺ | Honeywell International Inc. | 4.0% |
❻ | Intuit Inc. | 3.9% |
❼ | Ecolab Inc. | 3.4% |
❽ | Microchip Technology Inc. | 3.4% |
❾ | Oracle Corp. | 3.4% |
❿ | Roper Technologies Inc. | 3.4% |
Sector Allocation(% of investments)
10
Harbor Strategic Growth Fund
Portfolio of Investments—April 30, 2019 (Unaudited)
Value, Cost, and Principal Amounts in Thousands
COMMON STOCKS—95.1% | |||
Shares | Value | ||
AEROSPACE & DEFENSE—2.9% | |||
6,555 | TransDigm Group Inc.* | $3,163 | |
BANKS—5.0% | |||
27,352 | First Republic Bank | 2,889 | |
47,421 | U.S. Bancorp. | 2,528 | |
5,417 | |||
BEVERAGES—2.2% | |||
19,043 | PepsiCo Inc. | 2,438 | |
CAPITAL MARKETS—2.8% | |||
15,502 | Moody's Corp. | 3,048 | |
CHEMICALS—5.2% | |||
20,295 | Ecolab Inc. | 3,736 | |
10,639 | Linde plc (Ireland) | 1,918 | |
5,654 | |||
DIVERSIFIED FINANCIAL SERVICES—4.9% | |||
24,588 | Berkshire Hathaway Inc. Class B* | 5,328 | |
ELECTRICAL EQUIPMENT—2.5% | |||
54,447 | Sensata Technologies Holding plc (United Kingdom)* | 2,719 | |
ENERGY EQUIPMENT & SERVICES—0.2% | |||
2,928 | Core Laboratories NV (Netherlands) | 186 | |
EQUITY REAL ESTATE INVESTMENT TRUSTS (REITs)—5.7% | |||
31,837 | American Tower Corp. | 6,218 | |
HEALTH CARE EQUIPMENT & SUPPLIES—3.3% | |||
12,467 | Teleflex Inc. | 3,568 | |
INDUSTRIAL CONGLOMERATES—7.4% | |||
25,164 | Honeywell International Inc. | 4,369 | |
10,313 | Roper Technologies Inc. | 3,710 | |
8,079 | |||
INSURANCE—4.8% | |||
4,852 | Markel Corp.* | 5,199 | |
INTERACTIVE MEDIA & SERVICES—8.2% | |||
4,574 | Alphabet Inc. Class C* | 5,436 | |
17,675 | Facebook Inc.* | 3,418 | |
8,854 | |||
INTERNET & DIRECT MARKETING RETAIL—4.9% | |||
1,574 | Amazon.com Inc.* | 3,033 | |
1,246 | Booking Holdings Inc.* | 2,311 | |
5,344 |
COMMON STOCKS—Continued | |||
Shares | Value | ||
IT SERVICES—3.0% | |||
19,902 | Visa Inc. | $3,273 | |
LIFE SCIENCES TOOLS & SERVICES—2.1% | |||
3,013 | Mettler-Toledo International Inc.* | 2,245 | |
MACHINERY—2.3% | |||
28,367 | Fortive Corp. | 2,449 | |
PERSONAL PRODUCTS—3.1% | |||
55,023 | Unilever NV (Netherlands) | 3,329 | |
PHARMACEUTICALS—4.0% | |||
6,517 | Allergan plc (Ireland) | 958 | |
23,731 | Johnson & Johnson | 3,351 | |
4,309 | |||
SEMICONDUCTORS & SEMICONDUCTOR EQUIPMENT—3.4% | |||
37,388 | Microchip Technology Inc. | 3,735 | |
SOFTWARE—10.5% | |||
12,104 | Adobe Inc.* | 3,501 | |
17,071 | Intuit Inc. | 4,286 | |
65,738 | Oracle Corp. | 3,637 | |
11,424 | |||
SPECIALTY RETAIL—3.5% | |||
28,663 | CarMax Inc.* | 2,232 | |
4,281 | O'Reilly Automotive Inc.* | 1,620 | |
3,852 | |||
TECHNOLOGY HARDWARE, STORAGE & PERIPHERALS—3.2% | |||
17,141 | Apple Inc. | 3,440 | |
TOTAL COMMON STOCKS | |||
(Cost $79,560) | 103,271 | ||
TOTAL INVESTMENTS—95.1% | |||
(Cost $79,560) | 103,271 | ||
CASH AND OTHER ASSETS, LESS LIABILITIES—4.9% | 5,329 | ||
TOTAL NET ASSETS—100.0% | $108,600 |
FAIR VALUE MEASUREMENTS
All investments at April 30, 2019 (as disclosed in the preceding Portfolio of Investments) were classified as Level 1. There were no Level 3 investments at April 30, 2019 or October 31, 2018.
For more information on valuation inputs and their aggregation into the levels identified above, please refer to the Fair Value Measurements and Disclosures in Note 2 of the accompanying Notes to Financial Statements.
* | Non-income producing security |
The accompanying notes are an integral part of the Financial Statements.
11
Harbor Mid Cap Growth Fund
Manager’s Commentary (Unaudited)
Subadviser
Wellington Management Company LLP
280 Congress Street
Boston, MA 02210
Boston, MA 02210
Portfolio Managers
Stephen C. Mortimer
Since 2010
Since 2010
Michael T. Carmen, CFA, CPA
Since 2005
Mario E. Abularach, CFA, CMT
Since 2006
Since 2006
Wellington Management has subadvised the Fund since 2005.
Investment Objective
The Fund seeks long-term growth of capital.
Stephen C. Mortimer
Michael T. Carmen,
CFA, CPA
CFA, CPA
Mario E. Abularach,
CFA, CMT
CFA, CMT
Management’s Discussion of
Fund Performance
Fund Performance
MARKET REVIEW
U.S. equities suffered a sharp decline towards the end of 2018 but rebounded significantly at the beginning of 2019. The large fall in December occurred as markets contended with a confluence of moderating growth, tighter liquidity and monetary policy, trade uncertainty, swelling fiscal deficits, and political turmoil. As expected, the U.S. Federal Reserve (Fed) raised short-term interest rates by 0.25% as Fed Chair Jerome Powell highlighted the sustained level of economic growth and robust labor market.
Entering 2019, U.S. equities rallied to their largest quarterly gain since 2009 and continued this trend in April. A dovish shift in Fed policy and guidance, optimism for a U.S.-China trade deal, relatively strong fourth-quarter earnings, and corporate buybacks contributed to the positive market sentiment of the start of 2019. The Fed left the benchmark interest rate unchanged during the first quarter, signaling a more patient approach toward future policy-rate adjustments and announced that balance-sheet normalization will begin to slow in May and conclude in September. Fourth-quarter earnings and forward guidance from U.S. companies were encouraging relative to the market’s subdued expectations. Corporate buybacks represented the largest source of demand for U.S. stocks, as U.S. companies continued to purchase record quantities of their own shares on the back of solid U.S. economic growth and last year’s tax cuts.
Performance
For the six-month period ended April 30, 2019, Harbor Mid Cap Growth Fund outperformed the Russell Midcap® Growth Index. The Fund returned 21.82% (Retirement Class), 21.76% (Institutional Class), 21.63% (Administrative Class), and 21.56% (Investor Class) for the period, while the index finished up 16.55%.
Relative outperformance was driven by positive security selection, most notably within the Health Care, Consumer Discretionary, and Information Technology sectors. Unfavorable security selection within Communication Services and Consumer Staples partially offset positive returns. Sector allocation, a residual of the bottom-up stock selection process, detracted from the results; overweight allocations to Health Care and Communication Services, as well as an underweight to Information Technology, detracted most from performance.
Workday, a software-as-a-service (SaaS) provider for finance and human resources, was the Fund’s top relative contributor. Workday delivered strong fourth quarter and full fiscal year 2019 results at the end of February, reporting upside to all of its major metrics. The company displayed accelerated new business signings across its product platform, strong growth in its international and financials segments, and a significant increase in subscription revenue. This remains a high conviction name in the Fund, with a management team that continues to impress us. We trimmed our position in Workday, as well as a handful of other strong performing SaaS companies, and used the proceeds to initiate positions in other software names. Other notable contributors during the period were online home furnishings provider Wayfair, retail hard surface flooring provider Floor & Décor, and oral medical devices provider Align Technology.
Haemonetics, a provider of hematology (blood) products and solutions, was the Fund’s most significant detractor during the period. The company’s share price dropped after it reported a slight revenue miss in its fourth quarter results. This was caused by a faster decline in its blood business and slowing growth in its TEG hemostasis management system. However, its plasma business, which is a key growth driver and important to our overarching investment
12
Harbor Mid Cap Growth Fund
Manager’s Commentary—Continued
TOTAL RETURNS
For the periods ended 04/30/2019
Unannualized | 1 Year | Annualized | |||||||||
6 Months | 5 Years | 10 Years | |||||||||
Harbor Mid Cap Growth Fund | |||||||||||
Retirement Class1 | 21.82% | 23.41% | 13.50% | 16.22% | |||||||
Institutional Class | 21.76 | 23.35 | 13.45 | 16.19 | |||||||
Administrative Class | 21.63 | 23.05 | 13.17 | 15.90 | |||||||
Investor Class | 21.56 | 22.90 | 13.03 | 15.76 | |||||||
Comparative Index | |||||||||||
Russell Midcap® Growth | 16.55% | 17.64% | 12.20% | 16.56% |
As stated in the Fund’s prospectus dated March 1, 2019, the expense ratios were 0.81% (Retirement Class); 0.89% (Institutional Class); 1.14% (Administrative Class); and 1.26% (Investor Class). The expense ratios in the prospectus may differ from the actual expense ratios for the period disclosed within this report. The expense ratios shown in the prospectus are based on the prior fiscal year, adjusted to reflect changes, if any, in contractual arrangements that occurred prior to the date of the prospectus (or supplement thereto, if applicable).
Performance data shown represents past performance and is no guarantee of future results. Past performance is net of management fees and expenses and reflects reinvested dividends and distributions but does not reflect the deduction of taxes that a shareholder would pay on Fund distributions or upon the redemption of Fund shares. Past performance reflects the beneficial effect of any expense waivers or reimbursements, without which returns would have been lower. Investment returns and principal value will fluctuate so that Fund shares, when redeemed, may be worth more or less than their original cost. Returns for periods less than one year are not annualized. Current performance may be higher or lower and is available through the most recent month end atharborfunds.com or by calling 800-422-1050.
thesis, performed well. We continue to favor this name and took advantage of the recent weakness to add to our position. Other notable detractors during the period were streaming music provider Spotify, food processing company Lamb Weston, and video game developer Take-Two Interactive.
OUTLOOK & STRATEGY
Coming off of a volatile end to 2018, we welcomed a strong start to the year. In general, we have become more optimistic in our outlook for equity markets going forward. However, we used the first quarter rally as an opportunity to realize profits in winners whose valuations were starting to look weaker and add to high conviction names that have lagged the recent strength. We have identified opportunities where we are waiting for a pullback before we initiate a position. We are looking for opportunities where we hold a differentiated view that presents an attractive risk-reward ratio using our fundamental investment process.
Our investment philosophy is based on four key underlying premises. We believe that changes in earnings expectations drive security prices and opportunities arise where our expectations differ significantly from consensus. In addition, we believe that human nature has an anchoring bias that can often miss transformational change, and early identification of this change can lead to excess returns. We view being flexible as a key tenet of our philosophy and recognize that growth exists in unexpected places across sectors of the market. Finally, we believe that our valuation discipline helps control portfolio risk by seeking to balance downside risk with potential upside reward.
We employ this philosophy, together with a bottom-up fundamental analysis and opportunistic investment approach, in managing the Fund. We consider a very broad universe of available stocks within the mid cap market, typically focusing on companies that in our view, are characterized by accelerating earnings growth combined with a differentiated view relative to consensus.
Bottom-up investment decisions resulted in increased exposure to the Consumer Discretionary sector. This resulted in Consumer Discretionary becoming the Fund’s second largest overweight by the end of the period, with Health Care remaining the largest overweight. As of the end of the period, the Fund’s largest underweight allocations were to the Industrials, Financials, and Materials sectors.
1 | Retirement Class shares commenced operations on March 1, 2016. The performance attributed to the Retirement Class shares prior to that date is that of the Institutional Class shares. Performance prior to March 1, 2016 has not been adjusted to reflect the lower expenses of Retirement Class shares. During this period, Retirement Class shares would have had returns similar to, but potentially higher than, Institutional Class shares due to the fact that Retirement Class shares represent interests in the same portfolio as Institutional Class shares but are subject to lower expenses. |
This report contains the current opinions of Wellington Management Company LLP as of the date of this report and should not be considered as investment advice or a recommendation of any particular security, strategy or investment product. Such opinions are subject to change without notice and securities described herein may no longer be included in, or may at any time be removed from, the Fund’s portfolio. This report is distributed for informational purposes only. Information contained herein has been obtained from sources believed reliable, but not guaranteed.
Stocks of mid cap companies pose special risks, including possible illiquidity and greater price volatility than stocks of larger, more established companies. Equity securities, such as common stocks, are affected by company specific events and by movements in the overall stock markets in which those securities principally trade, among other factors. An adverse company specific event, or downturn in those stock markets, can depress the value of a particular company’s equity securities. For information on the different share classes and the risks associated with an investment in the Fund, please refer to the current prospectus.
13
Harbor Mid Cap Growth Fund
Fund Summary—April 30, 2019 (Unaudited)
TOP Holdings(% of net assets)
❶ | Align Technology Inc. | 4.1% |
❷ | Exact Sciences Corp. | 3.9% |
❸ | ServiceNow Inc. | 3.7% |
❹ | Workday Inc. | 3.7% |
❺ | CoStar Group Inc. | 3.1% |
❻ | Monster Beverage Corp. | 2.8% |
❼ | Advanced Micro Devices Inc. | 2.7% |
❽ | Spotify Technology SA | 2.6% |
❾ | Haemonetics Corp. | 2.5% |
Sector Allocation(% of investments)
(Excludes short-term investments)
14
Harbor Mid Cap Growth Fund
Portfolio of Investments—April 30, 2019 (Unaudited)
Value, Cost, and Principal Amounts in Thousands
COMMON STOCKS—93.6% | |||
Shares | Value | ||
AEROSPACE & DEFENSE—2.3% | |||
34,172 | Harris Corp. | $5,758 | |
BEVERAGES—2.8% | |||
118,967 | Monster Beverage Corp.* | 7,090 | |
BIOTECHNOLOGY—8.8% | |||
4,218 | Bluebird Bio Inc.* | 598 | |
34,752 | Caredx Inc.* | 946 | |
98,151 | Exact Sciences Corp.* | 9,687 | |
20,431 | Galapagos NV (Belgium)* | 2,338 | |
2,791 | Galapagos NV ADR (Belgium)*,1 | 321 | |
48,752 | Ionis Pharmaceuticals Inc.* | 3,624 | |
17,927 | Sage Therapeutics Inc.* | 3,016 | |
22,283 | Seattle Genetics Inc.* | 1,510 | |
22,040 | |||
COMMERCIAL SERVICES & SUPPLIES—1.6% | |||
49,611 | Brink's Co. | 3,965 | |
DIVERSIFIED CONSUMER SERVICES—1.5% | |||
33,447 | Grand Canyon Education Inc.* | 3,876 | |
ELECTRONIC EQUIPMENT, INSTRUMENTS & COMPONENTS—2.2% | |||
25,523 | Zebra Technologies Corp.* | 5,389 | |
ENTERTAINMENT—3.3% | |||
47,222 | Spotify Technology SA (Sweden)* | 6,411 | |
18,007 | Take-Two Interactive Software Inc.* | 1,744 | |
8,155 | |||
FOOD PRODUCTS—1.6% | |||
56,967 | Lamb Weston Holdings Inc. | 3,991 | |
HEALTH CARE EQUIPMENT & SUPPLIES—12.2% | |||
31,746 | Align Technology Inc.* | 10,308 | |
18,244 | DexCom Inc.* | 2,209 | |
70,430 | Haemonetics Corp.* | 6,147 | |
51,873 | Insulet Corp.* | 4,474 | |
37,407 | Penumbra Inc.* | 5,031 | |
38,906 | Tandem Diabetes Care Inc.* | 2,389 | |
30,558 | |||
HEALTH CARE TECHNOLOGY—1.4% | |||
24,845 | Veeva Systems Inc.* | 3,475 | |
HOTELS, RESTAURANTS & LEISURE—10.8% | |||
8,467 | Chipotle Mexican Grill Inc.* | 5,826 | |
67,108 | Hilton Grand Vacations Inc.* | 2,150 | |
35,623 | Marriott Vacations Worldwide Corp. | 3,763 | |
72,752 | Norwegian Cruise Line Holdings Ltd. (Bermuda)* | 4,102 | |
53,371 | Planet Fitness Inc.* | 4,040 | |
19,272 | Vail Resorts Inc. | 4,410 | |
18,467 | Wynn Resorts Ltd. | 2,668 | |
26,959 | |||
HOUSEHOLD DURABLES—1.2% | |||
55,547 | Lennar Corp. | 2,890 | |
INTERACTIVE MEDIA & SERVICES—4.1% | |||
174,615 | Pinterest Inc.* | 5,410 | |
45,342 | TripAdvisor Inc.* | 2,413 | |
72,580 | Zillow Group Inc. Class C* | 2,424 | |
10,247 |
COMMON STOCKS—Continued | |||
Shares | Value | ||
INTERNET & DIRECT MARKETING RETAIL—1.3% | |||
20,145 | Wayfair Inc.* | $3,267 | |
IT SERVICES—4.1% | |||
45,294 | GoDaddy Inc.* | 3,691 | |
15,027 | Shopify Inc. Class A (Canada)* | 3,660 | |
38,845 | Square Inc.* | 2,829 | |
10,180 | |||
MACHINERY—1.3% | |||
21,594 | IDEX Corp. | 3,383 | |
OIL, GAS & CONSUMABLE FUELS—1.2% | |||
9,415 | Diamondback Energy Inc. | 1,002 | |
150,992 | WPX Energy Inc.* | 2,097 | |
3,099 | |||
PHARMACEUTICALS—0.1% | |||
4,535 | Elanco Animal Health Inc.* | 143 | |
PROFESSIONAL SERVICES—3.1% | |||
15,856 | CoStar Group Inc.* | 7,869 | |
SEMICONDUCTORS & SEMICONDUCTOR EQUIPMENT—4.5% | |||
247,444 | Advanced Micro Devices Inc.* | 6,837 | |
122,600 | Marvell Technology Group Ltd. (Bermuda) | 3,067 | |
9,211 | Universal Display Corp. | 1,470 | |
11,374 | |||
SOFTWARE—19.3% | |||
54,647 | 2U Inc.* | 3,306 | |
14,034 | Fair Isaac Corp.* | 3,926 | |
79,571 | Guidewire Software Inc.* | 8,474 | |
196,720 | Pivotal Software Inc.* | 4,269 | |
34,329 | ServiceNow Inc.* | 9,321 | |
44,303 | Splunk Inc.* | 6,116 | |
44,590 | Workday Inc.* | 9,169 | |
42,749 | Zendesk Inc.* | 3,752 | |
48,333 | |||
SPECIALTY RETAIL—3.5% | |||
20,809 | Burlington Stores Inc.* | 3,515 | |
108,647 | Floor & Decor Holdings Inc.* | 5,217 | |
8,732 | |||
TEXTILES, APPAREL & LUXURY GOODS—1.4% | |||
30,427 | Under Armour Inc. Class A* | 702 | |
130,014 | Under Armour Inc. Class C* | 2,694 | |
3,396 | |||
TOTAL COMMON STOCKS | |||
(Cost $167,038) | 234,169 | ||
15
Harbor Mid Cap Growth Fund
Portfolio of Investments—Continued
Value, Cost, and Principal Amounts in Thousands
SHORT-TERM INVESTMENTS—5.8% | |||
(Cost $14,549) | |||
Principal Amount | Value | ||
EQUITY—5.8% | |||
Repurchase agreement with Bank of America dated April 30, 2019 due May 01, 2019 at 2.690% collateralized by U.S. Treasury Notes (value $15,009) | |||
$ | 14,549 | $14,549 | |
TOTAL INVESTMENTS—99.4% | |||
(Cost $181,587) | 248,718 | ||
CASH AND OTHER ASSETS, LESS LIABILITIES—0.6% | 1,490 | ||
TOTAL NET ASSETS—100.0% | $250,208 |
FAIR VALUE MEASUREMENTS
At April 30, 2019, the repurchase agreement (as disclosed in the preceding Portfolio of Investments) was classified as Level 2 and all other investments were classified as Level 1. There were no Level 3 investments at April 30, 2019 or October 31, 2018.
For more information on valuation inputs and their aggregation into the levels identified above, please refer to the Fair Value Measurements and Disclosures in Note 2 of the accompanying Notes to Financial Statements.
* | Non-income producing security |
1 | ADR after the name of a security stands for American Depositary Receipts representing ownership of foreign securities. ADRs are issued by U.S. banking institutions. |
The accompanying notes are an integral part of the Financial Statements.
16
Harbor Small Cap Growth Fund
Manager’s Commentary (Unaudited)
Subadviser
Westfield Capital Management Company, L.P.
One Financial Center
23rd Floor
23rd Floor
Boston, MA 02111
Portfolio Managers
William A. Muggia
Lead Portfolio Manager
Since 2000
Since 2000
Richard D. Lee, CFA
Since 2018
Since 2018
Ethan J. Meyers, CFA
Since 2000
Since 2000
John M. Montgomery
Since 2011
Since 2011
Westfield has subadvised the Fund since 2000.
Investment Objective
The Fund seeks long-term growth of capital.
William A. Muggia
Richard D. Lee, CFA
Ethan J. Meyers, CFA
John M. Montgomery
Management’s Discussion of
Fund Performance
Fund Performance
Market Review
The trailing six-month period was a tale of two markets, driven in large part by actions and commentary from the U.S. Federal Reserve (Fed). The fourth quarter of 2018 marked the largest quarterly decline in most of the Russell® Growth Indices in a decade and dragged the 2018 full year market returns into negative territory. In a dramatic shift, the first quarter of 2019 bore witness to a stock market advance of historical significance, as equities posted their largest quarterly gains since the stock market bottomed ten years ago in the strongest start to a year since 1998. While in isolation these gains would appear emblematic of economic acceleration, the true narrative includes the reversal of steep declines and sentiment extremes experienced at year-end, aided by the Fed’s communication around a “pause” of further rate hikes this year. Pockets of slowing growth were also evident in the U.S. in manufacturing, housing, and retails sales, but early indications suggest stabilization is already taking place. Our fundamental, bottom-up approach was rewarded in this environment, and stock selection was the primary driver of outperformance for both the first quarter of the calendar year and the trailing six-month period.
Performance
Harbor Small Cap Growth Fund returned 13.40% (Retirement Class), 13.44% (Institutional Class), 13.26% (Administrative Class), and 13.24% (Investor Class) for the six months ending April 30, 2019, outperforming the Russell 2000® Growth Index, which gained 8.27%. The outperformance was broad based with seven sectors adding to relative returns. Notable strength in Health Care and Information Technology offset relative weakness in Energy.
Health Care – the largest absolute weight in the Fund – was the top contributor to relative performance, adding 2.15% to relative outperformance. We continue to find opportunities within the Health Care sector but are also always cognizant of managing any outsized risk exposure to the binary outcomes that often come with concentrated pipelines. Given that back drop, we are broadly diversified across industries to gain exposure to the different sources of innovation within the sector. Stock selection accounted for the relative outperformance within the sector. The outperformance was well balanced with notable strength in biotechnology, health care equipment & supplies and pharmaceuticals. Ascendis Pharma, a development-stage orphan drug company, was the sector’s and Fund’s best relative performer. In March, the company reported success in a key Phase 3 trial for a children’s human growth hormone treatment. The trial demonstrated that their offering was comparable in experience to the current market offering but resulted in a superior outcome. We continue to maintain high conviction in this name, as the company generates impressive cash flow, offers lower-risk exposure to the space following their last trial success, and can either continue to grow organically or find an attractive merger and acquisition target.
Information Technology was also a source of relative strength during the period, adding 1.88% to relative outperformance. A combination of both stock selection and our overweight to this market-leading sector contributed positively to relative results. The outperformance was broad based with notable contribution from the portfolio’s software, communications equipment and IT services holdings. Within communications equipment, Acacia Communications, Inc., a developer and manufacturer of high-speed coherent optical interconnect products, was the Fund’s strongest relative performer. The stock moved higher on strong quarterly earnings results. We decided to sell our position following the advance given that the stock was near
17
Harbor Small Cap Growth Fund
Manager’s Commentary—Continued
TOTAL RETURNS
For the periods ended 04/30/2019
Unannualized | 1 Year | Annualized | |||||||||
6 Months | 5 Years | 10 Years | |||||||||
Harbor Small Cap Growth Fund | |||||||||||
Retirement Class1 | 13.40% | 9.01% | 10.46% | 16.17% | |||||||
Institutional Class | 13.44 | 8.96 | 10.41 | 16.15 | |||||||
Administrative Class | 13.26 | 8.71 | 10.06 | 15.83 | |||||||
Investor Class | 13.24 | 8.57 | 10.00 | 15.72 | |||||||
Comparative Index | |||||||||||
Russell 2000® Growth | 8.27% | 6.91% | 10.22% | 15.24% |
As stated in the Fund’s prospectus dated March 1, 2019, the expense ratios were 0.80% (Retirement Class); 0.88% (Institutional Class); 1.13% (Administrative Class); and 1.25% (Investor Class). The expense ratios in the prospectus may differ from the actual expense ratios for the period disclosed within this report. The expense ratios shown in the prospectus are based on the prior fiscal year, adjusted to reflect changes, if any, in contractual arrangements that occurred prior to the date of the prospectus (or supplement thereto, if applicable).
Performance data shown represents past performance and is no guarantee of future results. Past performance is net of management fees and expenses and reflects reinvested dividends and distributions but does not reflect the deduction of taxes that a shareholder would pay on Fund distributions or upon the redemption of Fund shares. Past performance reflects the beneficial effect of any expense waivers or reimbursements, without which returns would have been lower. Investment returns and principal value will fluctuate so that Fund shares, when redeemed, may be worth more or less than their original cost. Returns for periods less than one year are not annualized. Current performance may be higher or lower and is available through the most recent month end atharborfunds.com or by calling 800-422-1050.
our internal price target and valuation was extended. Within software, we have been focused on identifying businesses that are at the forefront of companies’ digital transformations. We believe these business evolutions create secular growth regardless of the state of the economy because the cost of maintaining the status quo in a changing environment around you is often seen as too great to bear. One such company is Fair Isaac Corporation. This data analytics software provider reported promising growth in both its traditional and new data analytics/Software as a Service (SaaS) business lines. We continue to maintain conviction in the stock believing that this high-quality, competitively-advantaged franchise has a visible runway to strong top- and bottom-line growth. The Fund also benefited from exposure to Ultimate Software Group, Inc. after the company announced that it planned to go private. Shares of this cloud payroll and human capital management provider rose on the deal, and we exited the position during the period.
Energy was the largest source of relative weakness within the Fund, costing 1.25% of relative returns. During the period, there was a marked dispersion between the performance of the sector and its constituents and the price of crude oil, particularly among companies focused on refining & marketing. Concerns around slowing global growth also served as a headwind for the sector, and the market strayed from rewarding fundamentals. This was notable among exploration & production companies, which were not compensated for strategic reinvestment for growth, but rather for returning capital to shareholders. With this macroeconomic backdrop, the Fund’s overweight position to the sector, combined with weak stock selection drove the underperformance. Specifically, an overweight position to exploration & production companies Centennial Resource Development, Inc., WPX Energy, Inc. and PBF Energy, Inc. detracted from relative results during the period. Despite the troubled performance during the period, we believe the Fund is well positioned in the sector.
Outlook & Strategy
Over the balance of the year, we expect to see an acceleration in U.S. and global growth after the recent soft patch. While it remains too early to say with certainty that a slowdown is behind us, leading indicators of recovery are emerging. The Fed’s more dovish tone, a marked departure from the monetary policy of mid-December, was well received by equity markets and should continue to support growth in the U.S. economy. Global growth may also see a boost as the Chinese government announced a stimulus package to shore up their economy against further slowing. Additionally, survey data suggests that a bottoming process is underway for growth in both countries. With the Fed on hold and the U.S. Dollar weakening, we could see small caps and cyclicals perform better into accelerating growth trends. We also maintain our preference for quality businesses with clean balance sheets and believe that our Growth at a Reasonable Price philosophy should be rewarded in this environment.
1 | Retirement Class shares commenced operations on March 1, 2016. The performance attributed to the Retirement Class shares prior to that date is that of the Institutional Class shares. Performance prior to March 1, 2016 has not been adjusted to reflect the lower expenses of Retirement Class shares. During this period, Retirement Class shares would have had returns similar to, but potentially higher than, Institutional Class shares due to the fact that Retirement Class shares represent interests in the same portfolio as Institutional Class shares but are subject to lower expenses. |
This report contains the current opinions of Westfield Capital Management Company, L.P. as of the date of this report and should not be considered as investment advice or a recommendation of any particular security, strategy or investment product. Such opinions are subject to change without notice and securities described herein may no longer be included in, or may at any time be removed from, the Fund’s portfolio. This report is distributed for informational purposes only. Information contained herein has been obtained from sources believed reliable, but not guaranteed.
Stocks of small cap companies pose special risks, including possible illiquidity and greater price volatility than stocks of larger, more established companies. Equity securities, such as common stocks, are affected by company specific events and by movements in the overall stock markets in which those securities principally trade, among other factors. An adverse company specific event, or downturn in those stock markets, can depress the value of a particular company’s equity securities. For information on the different share classes and the risks associated with an investment in the Fund, please refer to the current prospectus.
18
Harbor Small Cap Growth Fund
Fund Summary—April 30, 2019 (Unaudited)
TOP Holdings(% of net assets)
❶ | BIO-RAD Laboratories Inc. | 2.4% |
❷ | HEICO Corp. | 2.4% |
❸ | ICON plc | 2.3% |
❹ | Berry Global Group Inc. | 2.2% |
❺ | Kemper Corp. | 2.1% |
❻ | Teledyne Technologies Inc. | 2.1% |
❼ | Topbuild Corp. | 2.1% |
❽ | Ascendis Pharma A/S ADR | 1.9% |
❾ | Five Below Inc. | 1.9% |
❿ | Integra LifeSciences Holdings Corp. | 1.9% |
Sector Allocation(% of investments)
19
Harbor Small Cap Growth Fund
Portfolio of Investments—April 30, 2019 (Unaudited)
Value, Cost, and Principal Amounts in Thousands
COMMON STOCKS—97.3% | |||
Shares | Value | ||
AEROSPACE & DEFENSE—4.5% | |||
199,745 | HEICO Corp. | $17,863 | |
61,401 | Teledyne Technologies Inc.* | 15,259 | |
33,122 | |||
BANKS—2.5% | |||
227,720 | Bank of NT Butterfield & Son Ltd. (Bermuda) | ���9,114 | |
335,310 | First Hawaiian Inc. | 9,271 | |
18,385 | |||
BIOTECHNOLOGY—8.5% | |||
216,162 | Acceleron Pharma Inc.* | 8,804 | |
288,951 | Apellis Pharmaceuticals Inc.* | 5,724 | |
126,770 | Ascendis Pharma A/S ADR (Denmark)*,1 | 14,120 | |
104,926 | Blueprint Medicines Corp.* | 7,934 | |
343,230 | Fate Therapeutics Inc.* | 5,766 | |
742,069 | Ironwood Pharmaceuticals Inc.* | 8,823 | |
516,000 | Momenta Pharmaceuticals Inc.* | 7,219 | |
238,150 | Orchard Therapeutics plc ADR (United Kingdom)*,1 | 4,303 | |
62,693 | |||
BUILDING PRODUCTS—1.5% | |||
163,840 | Trex Co. Inc.* | 11,349 | |
CAPITAL MARKETS—2.3% | |||
150,263 | Hamilton Lane Inc. | 7,342 | |
130,412 | LPL Financial Holdings Inc. | 9,662 | |
17,004 | |||
CHEMICALS—1.8% | |||
118,490 | Ingevity Corp.* | 13,627 | |
COMMERCIAL SERVICES & SUPPLIES—1.8% | |||
119,150 | MSA Safety Inc. | 13,096 | |
COMMUNICATIONS EQUIPMENT—2.0% | |||
80,407 | Acacia Communications Inc.* | 4,654 | |
751,335 | Viavi Solutions Inc.* | 9,993 | |
14,647 | |||
CONSTRUCTION MATERIALS—1.3% | |||
541,821 | Summit Materials Inc.* | 9,493 | |
CONSUMER FINANCE—1.3% | |||
146,630 | Green Dot Corp.* | 9,351 | |
CONTAINERS & PACKAGING—2.1% | |||
270,080 | Berry Global Group Inc.* | 15,881 | |
DIVERSIFIED CONSUMER SERVICES—2.5% | |||
70,670 | Bright Horizons Family Solutions Inc.* | 9,056 | |
63,880 | Strategic Education Inc. | 9,157 | |
18,213 | |||
ELECTRONIC EQUIPMENT, INSTRUMENTS & COMPONENTS—1.6% | |||
242,940 | Avnet Inc. | 11,809 | |
ENTERTAINMENT—1.7% | |||
41,308 | Madison Square Garden Co.* | 12,906 | |
EQUITY REAL ESTATE INVESTMENT TRUSTS (REITs)—2.5% | |||
169,460 | CyrusOne Inc. | 9,437 | |
227,720 | Spirit Realty Capital Inc. | 9,214 | |
18,651 |
COMMON STOCKS—Continued | |||
Shares | Value | ||
HEALTH CARE EQUIPMENT & SUPPLIES—5.5% | |||
114,355 | Haemonetics Corp.* | $9,981 | |
270,740 | Integra LifeSciences Holdings Corp.* | 14,130 | |
78,771 | Masimo Corp.* | 10,252 | |
205,510 | Wright Medical Group NV (Netherlands)* | 6,077 | |
40,440 | |||
HEALTH CARE TECHNOLOGY—1.3% | |||
274,720 | Evolent Health Inc.* | 3,722 | |
109,890 | Teladoc Health Inc.* | 6,251 | |
9,973 | |||
HOTELS, RESTAURANTS & LEISURE—1.5% | |||
223,642 | Eldorado Resorts Inc.* | 11,041 | |
HOUSEHOLD DURABLES—2.1% | |||
215,800 | Topbuild Corp.* | 15,371 | |
INSURANCE—2.1% | |||
175,757 | Kemper Corp. | 15,797 | |
IT SERVICES—4.4% | |||
160,530 | InterXion Holding NV (Netherlands)* | 11,107 | |
57,422 | WEX Inc.* | 12,076 | |
167,805 | WNS Holdings Ltd. ADR (Jersey)*,1 | 9,590 | |
32,773 | |||
LIFE SCIENCES TOOLS & SERVICES—4.7% | |||
58,420 | BIO-RAD Laboratories Inc.* | 17,580 | |
126,934 | ICON plc (Ireland)* | 17,337 | |
34,917 | |||
MACHINERY—3.9% | |||
203,550 | Flowserve Corp. | 9,980 | |
150,200 | Lincoln Electric Holdings Inc. | 13,108 | |
115,510 | Timken Co. | 5,539 | |
28,627 | |||
MARINE—0.5% | |||
98,960 | Matson Inc. | 3,920 | |
MEDIA—0.9% | |||
59,244 | Nexstar Media Group Inc. | 6,934 | |
OIL, GAS & CONSUMABLE FUELS—3.5% | |||
327,670 | Centennial Resource Development Inc.* | 3,450 | |
279,350 | PBF Energy Inc. | 9,381 | |
929,070 | WPX Energy Inc.* | 12,905 | |
25,736 | |||
PHARMACEUTICALS—5.2% | |||
180,391 | Catalent Inc.* | 8,085 | |
1,903,819 | Correvio Pharma Corp. (Canada)* | 4,569 | |
363,750 | Cymabay Therapeutics Inc.* | 4,660 | |
250,225 | Intersect ENT Inc.* | 8,130 | |
405,450 | Medicines Co.* | 12,954 | |
38,398 | |||
ROAD & RAIL—1.5% | |||
179,390 | Ryder System Inc. | 11,301 | |
SEMICONDUCTORS & SEMICONDUCTOR EQUIPMENT—1.8% | |||
50,510 | Cabot Microelectronics Corp. | 6,377 | |
156,220 | Inphi Corp.* | 7,133 | |
13,510 |
20
Harbor Small Cap Growth Fund
Portfolio of Investments—Continued
Value, Cost, and Principal Amounts in Thousands
COMMON STOCKS—Continued | |||
Shares | Value | ||
SOFTWARE—12.8% | |||
556,050 | 8x8 Inc.* | $13,301 | |
83,407 | Alarm.com Holdings Inc.* | 5,912 | |
39,475 | Fair Isaac Corp.* | 11,043 | |
48,990 | MicroStrategy Inc.* | 7,334 | |
83,900 | NICE Ltd. ADR (Israel)*,1 | 11,566 | |
590,810 | Nuance Communications Inc.* | 9,943 | |
60,899 | Paylocity Holding Corp.* | 5,880 | |
107,404 | Proofpoint Inc.* | 13,471 | |
90,363 | Smartsheet Inc.* | 3,825 | |
105,254 | Tableau Software Inc.* | 12,821 | |
95,096 | |||
SPECIALTY RETAIL—3.3% | |||
459,070 | American Eagle Outfitters Inc. | 10,917 | |
94,990 | Five Below Inc.* | 13,905 | |
24,822 |
COMMON STOCKS—Continued | |||
Shares | Value | ||
TEXTILES, APPAREL & LUXURY GOODS—1.6% | |||
329,330 | Wolverine World Wide Inc. | $12,123 | |
THRIFTS & MORTGAGE FINANCE—1.0% | |||
163,170 | Essent Group Ltd. (Bermuda)* | 7,742 | |
TRADING COMPANIES & DISTRIBUTORS—1.8% | |||
313,106 | Rush Enterprises Inc. | 13,279 | |
TOTAL COMMON STOCKS | |||
(Cost $612,251) | 722,027 | ||
TOTAL INVESTMENTS—97.3% | |||
(Cost $612,251) | 722,027 | ||
CASH AND OTHER ASSETS, LESS LIABILITIES—2.7% | 20,069 | ||
TOTAL NET ASSETS—100.0% | $742,096 |
FAIR VALUE MEASUREMENTS
All investments at April 30, 2019 (as disclosed in the preceding Portfolio of Investments) were classified as Level 1. There were no Level 3 investments at April 30, 2019 or October 31, 2018.
For more information on valuation inputs and their aggregation into the levels identified above, please refer to the Fair Value Measurements and Disclosures in Note 2 of the accompanying Notes to Financial Statements.
AFFILIATED TRANSACTIONS
Certain of the Fund’s investments are in companies that are considered to be affiliated companies of the Fund because the Fund owned more than 5% of the outstanding voting securities of the company during the period November 1, 2018 through April 30, 2019. Transactions during the period in securities of these companies were as follows:
Security Name | Beginning Balance as of 11/01/2018 (000s) | Purchases (000s) | Sales (000s) | Net Realized Gain/(Loss) (000s) | Change in Unrealized Appreciation/ (Depreciation) (000s) | Net Dividend Income (000s) | Ending Balance as of 04/30/2019 (000s) | |||||||
Correvio Pharma Corp. (Canada) | $6,237 | $395 | $(201) | $(446) | $(1,416) | $— | $4,569 |
* | Non-income producing security |
1 | ADR after the name of a security stands for American Depositary Receipts representing ownership of foreign securities. ADRs are issued by U.S. banking institutions. |
The accompanying notes are an integral part of the Financial Statements.
21
Harbor Small Cap Growth Opportunities Fund
Manager’s Commentary (Unaudited)
Subadviser
Elk Creek Partners, LLC
44 Cook Street
Suite 705
Suite 705
Denver, CO 80206
Portfolio Managers
Cam Philpott, CFA
Since 2014
Since 2014
David Hand, CFA
Since 2014
Since 2014
Hiren Patel, Ph.D.
Since 2014
Since 2014
Sean McGinnis, CFA
Since 2014
Since 2014
Elk Creek has subadvised the Fund since 2014.
Investment Objective
The Fund seeks long-term growth of capital.
Cam Philpott, CFA
David Hand, CFA
Hiren Patel, Ph.D.
Sean McGinnis, CFA
Management’s Discussion of
Fund Performance
Fund Performance
Market REVIEW
After a sharp drop in October, the market had a brief reprieve during the month of November, and generally speaking, corporate earnings were consistent with expectations. However, we believe the October sell-off had more to do with forward looking economic concerns than forward looking company-specific concerns. Market participants sold aggressively in December, as global recession fears were sparked by slowing Chinese economic data, rising concerns regarding trade negotiations with China, and increasing conviction that the U.S. Federal Reserve (Fed) would continue to hike short-term rates into a weakening global economy, thereby contributing to the recessionary conditions.
Equities started 2019 with a powerful rally out of the gate that surprised many of the market’s participants. With favorable domestic macroeconomic data, stock prices regained much of the ground that they lost in the fourth quarter of 2018. Additionally, sentiment regarding a trade deal with China improved, and as optimism on that issue gained traction, fears over a trade-induced global slowdown faded. The Fed signaled a pause and lowered expectations for future potential rate increases. Between domestic data and improving sentiment over global trade, investors’ concerns about a monetary policy mistake waned, and that change contributed to rising equity prices.
Global economic concerns did reappear late in the first quarter as some European data, especially in Germany, disappointed investors and renewed anxiousness regarding slowing economic growth. Domestically, the yield curve inverted early in the year, and this phenomenon became more pronounced in March. Despite rising concerns at the end of the first quarter, domestic equity markets performed well in April. Both macroeconomic data and corporate earnings results have contributed to the rally.
Performance
For the six-month period ended April 30, 2019, Harbor Small Cap Growth Opportunities Fund returned 4.73% (Retirement Class), 4.64% (Institutional Class), 4.49% (Administrative Class), and 4.45% (Investor Class) underperforming its benchmark, the Russell 2000® Growth Index, which was up 8.27% for the same period.
Small cap stocks have underperformed large cap stocks over the period, as represented by the Russell 1000® Index return of 10.00% and the Russell 2000® Index return of 6.06%. Within small cap stocks, growth has outperformed value with the Russell 2000® Growth posting a return of 8.27% vs. the Russell 2000® Value return of 3.77%, in the same period.
Performance of the Fund has been driven primarily by stock selection, which is consistent with our team’s investment process and reflected in our longer-term track record. The sector in which stock selection most helped the Fund was Health Care. Stock selection in the Information Technology and Consumer Discretionary sectors detracted from performance. Sector allocation is not a primary focus of our investment strategy.
MaxLinear, Inc., a communications semiconductor company, was a strong contributor driven by the company reporting better than expected results in both the fiscal third and fourth quarters. Previously, investors had over-estimated the impact of the company’s business exposure in China, but more recent results confirmed our fundamental view, and rewarded our patience.
22
Harbor Small Cap Growth Opportunities Fund
Manager’s Commentary—Continued
TOTAL RETURNS
For the periods ended 04/30/2019
Unannualized | 1 Year | Annualized | |||||||||
6 Months | 5 Years | Life of Fund | |||||||||
Harbor Small Cap Growth Opportunities Fund | |||||||||||
Retirement Class1,2 | 4.73% | 7.34% | 8.23% | 8.28% | |||||||
Institutional Class1 | 4.64 | 7.26 | 8.18 | 8.23 | |||||||
Administrative Class1 | 4.49 | 6.95 | 8.03 | 8.07 | |||||||
Investor Class1 | 4.45 | 6.78 | 7.77 | 7.82 | |||||||
Comparative Index | |||||||||||
Russell 2000® Growth1 | 8.27% | 6.91% | 10.22% | 9.09% |
As stated in the Fund’s prospectus dated March 1, 2019, the expense ratios were 0.81% (Retirement Class); 0.89% (Institutional Class); 1.14% (Administrative Class); and 1.26% (Investor Class). The expense ratios in the prospectus may differ from the actual expense ratios for the period disclosed within this report. The expense ratios shown in the prospectus are based on the prior fiscal year, adjusted to reflect changes, if any, in contractual arrangements that occurred prior to the date of the prospectus (or supplement thereto, if applicable).
Performance data shown represents past performance and is no guarantee of future results. Past performance is net of management fees and expenses and reflects reinvested dividends and distributions but does not reflect the deduction of taxes that a shareholder would pay on Fund distributions or upon the redemption of Fund shares. Past performance reflects the beneficial effect of any expense waivers or reimbursements, without which returns would have been lower. Investment returns and principal value will fluctuate so that Fund shares, when redeemed, may be worth more or less than their original cost. Returns for periods less than one year are not annualized. Current performance may be higher or lower and is available through the most recent month end atharborfunds.com or by calling 800-422-1050.
Genetic therapy company, Spark Therapeutics, Inc., was another positive contributor, initially from solid performance from the company’s sales of Luxturna, the only approved therapy for inherited retinal disease. More significant outperformance was then driven by Roche’s acquisition of the company at a substantial premium.
Tesaro, Inc., a biopharmaceutical company focused on oncology, was a good stock for the Fund. The company’s lead drug, Zejula, performed slightly better than expectations, and we believe that it can continue to take share in treating ovarian cancer. Additionally, in December the company agreed to merge with Glaxo SmithKline.
Evolent Health, Inc., a leading provider of health solutions to hospitals and health systems, was a weak stock for the Fund primarily because investors became concerned about one of the company’s larger clients. We believe that investors have overstated the magnitude of the company’s exposure to this client. Additionally, we believe Evolent’s new business wins and recent acquisition bode well for the company’s growth prospects.
Integrated satellite manufacturer and service provider, Maxar Technologies, Inc., was also a weak stock as one of the company’s reconnaissance satellites failed. The company will receive insurance proceeds for the loss, and with its other satellites, Maxar should be able to recover roughly 10-15% of this satellite’s revenues. New satellites are currently under construction, with deployment scheduled in the 2020/2021 timeframe. While certainly disappointing news, the rest of the business is growing, and operating cost reduction programs should result in margin expansion this year.
Quotient Technology, Inc., the leading digital coupon company for grocery and retail stores, was another weak stock when fourth quarter results missed expectations. Given the market turmoil and economic concerns last quarter, one of the company’s larger customers reduced spending. Digital budgets are more readily adjusted than print spending, due to the longer lead times for print. Quotient retains its leading position, and this customer’s decision does not alter the growth opportunities for the market more broadly as digital coupons continue to grow, while print coupons shrink.
Outlook & StRategy
The market recovery is encouraging, and sentiment has distinctly improved from the dismal levels seen during the fourth quarter of 2018. Yet, in our view there seems to be some fragility to investor confidence despite the recent lift in stock prices. Our longstanding investment style and process remains the same, and over time, we have found that volatility presents opportunities for our process. We continue to believe that stock prices will ultimately reflect the fundamental performance of the underlying businesses, and market behavior over the short term generally tends to be technical in nature, rather than fundamental. Our expectation is that the change in investor sentiment will be a broadly positive event for the equity markets, and we believe that the recent narrow market will broaden to reward more stocks and sectors.
1 | The “Life of Fund” return as shown reflects the period 02/01/2014 through 04/30/2019. |
2 | Retirement Class shares commenced operations on March 1, 2016. The performance attributed to the Retirement Class shares prior to that date is that of the Institutional Class shares. Performance prior to March 1, 2016 has not been adjusted to reflect the lower expenses of Retirement Class shares. During this period, Retirement Class shares would have had returns similar to, but potentially higher than, Institutional Class shares due to the fact that Retirement Class shares represent interests in the same portfolio as Institutional Class shares but are subject to lower expenses. |
This report contains the current opinions of Elk Creek Partners, LLC as of the date of this report and should not be considered as investment advice or a recommendation of any particular security, strategy or investment product. Such opinions are subject to change without notice and securities described herein may no longer be included in, or may at any time be removed from, the Fund’s portfolio. This report is distributed for informational purposes only. Information contained herein has been obtained from sources believed reliable, but not guaranteed.
Stocks of small cap companies pose special risks, including possible illiquidity and greater price volatility than stocks of larger, more established companies. Equity securities, such as common stocks, are affected by company specific events and by movements in the overall stock markets in which those securities principally trade, among other factors. An adverse company specific event, or downturn in those stock markets, can depress the value of a particular company’s equity securities. For information on the different share classes and the risks associated with an investment in the Fund, please refer to the current prospectus.
23
Harbor Small Cap Growth Opportunities Fund
Fund Summary—April 30, 2019 (Unaudited)
TOP Holdings(% of net assets)
❶ | InterXion Holding NV | 3.1% |
❷ | Quotient Technology Inc. | 2.7% |
❸ | Cerus Corp. | 2.4% |
❹ | WageWorks Inc. | 1.9% |
❺ | Ligand Pharmaceuticals Inc. | 1.8% |
❻ | Evolent Health Inc. | 1.7% |
❼ | MaxLinear Inc. | 1.7% |
❽ | Medicines Co. | 1.7% |
❾ | Electronics for Imaging Inc. | 1.6% |
❿ | Invacare Corp. | 1.6% |
Sector Allocation(% of investments)
24
Harbor Small Cap Growth Opportunities Fund
Portfolio of Investments—April 30, 2019 (Unaudited)
Value, Cost, and Principal Amounts in Thousands
COMMON STOCKS—98.1% | |||
Shares | Value | ||
AEROSPACE & DEFENSE—1.3% | |||
46,850 | Aerojet Rocketdyne Holdings Inc.* | $1,586 | |
254,706 | Maxar Technologies Inc. | 1,256 | |
2,842 | |||
AIR FREIGHT & LOGISTICS—1.3% | |||
28,226 | Atlas Air Worldwide Holdings Inc.* | 1,363 | |
64,687 | Echo Global Logistics Inc.* | 1,484 | |
2,847 | |||
BANKS—2.1% | |||
41,203 | Chemical Financial Corp. | 1,810 | |
43,696 | FB Financial Corp. | 1,605 | |
59,548 | TriState Capital Holdings Inc.* | 1,385 | |
4,800 | |||
BEVERAGES—1.0% | |||
151,469 | Primo Water Corp.* | 2,386 | |
BIOTECHNOLOGY—7.9% | |||
102,288 | Amarin Corp. plc ADR (United Kingdom)*,1 | 1,913 | |
106,754 | Amicus Therapeutics Inc.* | 1,424 | |
100,527 | Clovis Oncology Inc.* | 1,837 | |
122,293 | Halozyme Therapeutics Inc.* | 1,972 | |
32,196 | Ligand Pharmaceuticals Inc.* | 4,052 | |
66,341 | Natera Inc.* | 1,268 | |
62,548 | Portola Pharmaceuticals Inc.* | 2,208 | |
86,024 | PTC Therapeutics Inc.* | 3,219 | |
17,893 | |||
COMMERCIAL SERVICES & SUPPLIES—2.9% | |||
101,463 | Advanced Disposal Services Inc.* | 3,281 | |
95,117 | Healthcare Services Group Inc. | 3,220 | |
6,501 | |||
COMMUNICATIONS EQUIPMENT—3.8% | |||
275,861 | Casa Systems Inc.* | 2,646 | |
553,403 | Infinera Corp.* | 2,402 | |
25,020 | Lumentum Holdings Inc.* | 1,550 | |
83,332 | Quantenna Communications Inc.* | 2,029 | |
8,627 | |||
CONSTRUCTION & ENGINEERING—1.4% | |||
62,062 | MasTec Inc.* | 3,143 | |
CONSUMER FINANCE—1.0% | |||
34,747 | Green Dot Corp.* | 2,216 | |
DIVERSIFIED CONSUMER SERVICES—1.3% | |||
60,806 | Adtalem Global Education Inc.* | 2,999 | |
DIVERSIFIED TELECOMMUNICATION SERVICES—1.3% | |||
103,965 | Iridium Communications Inc.* | 2,855 | |
ELECTRICAL EQUIPMENT—1.6% | |||
18,202 | EnerSys | 1,259 | |
100,322 | Power Solutions International Inc.* | 953 | |
45,441 | TPI Composites Inc.* | 1,407 | |
3,619 | |||
ELECTRONIC EQUIPMENT, INSTRUMENTS & COMPONENTS—1.4% | |||
48,401 | Methode Electronics Inc. | 1,428 | |
33,385 | MTS Systems Corp. | 1,836 | |
3,264 |
COMMON STOCKS—Continued | |||
Shares | Value | ||
ENTERTAINMENT—0.9% | |||
25,380 | World Wrestling Entertainment Inc. | $2,128 | |
FOOD & STAPLES RETAILING—0.3% | |||
18,707 | Chefs' Warehouse Inc.* | 611 | |
FOOD PRODUCTS—0.8% | |||
39,110 | Freshpet Inc.* | 1,747 | |
HEALTH CARE EQUIPMENT & SUPPLIES—7.0% | |||
892,906 | Cerus Corp.* | 5,473 | |
68,992 | CryoLife Inc.* | 2,115 | |
501,707 | Invacare Corp. | 3,713 | |
262,954 | ViewRay Inc.* | 1,830 | |
93,227 | Wright Medical Group NV (Netherlands)* | 2,757 | |
15,888 | |||
HEALTH CARE PROVIDERS & SERVICES—4.8% | |||
50,025 | Acadia Healthcare Co. Inc.* | 1,602 | |
275,599 | R1 RCM Inc.* | 2,885 | |
299,429 | Surgery Partners Inc.* | 3,243 | |
146,286 | Tivity Health Inc.* | 3,163 | |
10,893 | |||
HEALTH CARE TECHNOLOGY—4.6% | |||
284,772 | Evolent Health Inc.* | 3,858 | |
140,180 | NextGen Healthcare Inc.* | 2,634 | |
38,110 | Teladoc Health Inc.* | 2,168 | |
54,911 | Vocera Communications Inc.* | 1,749 | |
10,409 | |||
HOTELS, RESTAURANTS & LEISURE—4.9% | |||
26,802 | Churchill Downs Inc. | 2,703 | |
41,847 | Dave & Buster's Entertainment Inc. | 2,379 | |
24,614 | Eldorado Resorts Inc.* | 1,215 | |
204,017 | Noodles & Co.* | 1,459 | |
258,292 | Playa Hotels & Resorts NV (Netherlands)* | 2,066 | |
40,192 | Red Robin Gourmet Burgers Inc.* | 1,287 | |
11,109 | |||
INSURANCE—2.4% | |||
33,924 | Kinsale Capital Group Inc. | 2,463 | |
118,299 | National General Holdings Corp. | 2,916 | |
5,379 | |||
INTERNET & DIRECT MARKETING RETAIL—3.5% | |||
667,643 | Quotient Technology Inc.* | 6,203 | |
21,564 | Stamps.com Inc.* | 1,850 | |
8,053 | |||
IT SERVICES—7.5% | |||
91,439 | Carbonite Inc.* | 2,243 | |
41,942 | Cardtronics plc (United Kingdom)* | 1,500 | |
62,837 | EVO Payments Inc.* | 1,867 | |
62,585 | GTT Communications Inc.* | 2,625 | |
101,154 | InterXion Holding NV (Netherlands)* | 6,999 | |
30,917 | WNS Holdings Ltd. ADR (India)*,1 | 1,767 | |
17,001 | |||
LIFE SCIENCES TOOLS & SERVICES—0.8% | |||
76,482 | Luminex Corp. | 1,745 | |
MACHINERY—5.2% | |||
73,584 | Actuant Corp. | 1,882 |
25
Harbor Small Cap Growth Opportunities Fund
Portfolio of Investments—Continued
Value, Cost, and Principal Amounts in Thousands
COMMON STOCKS—Continued | |||
Shares | Value | ||
MACHINERY—Continued | |||
44,627 | CIRCOR International Inc.* | $1,505 | |
83,696 | Meritor Inc.* | 2,031 | |
236,360 | NN Inc. | 2,137 | |
124,269 | REV Group Inc. | 1,577 | |
89,698 | Rexnord Corp.* | 2,565 | |
11,697 | |||
OIL, GAS & CONSUMABLE FUELS—2.2% | |||
224,322 | Callon Petroleum Co.* | 1,685 | |
62,525 | Carrizo Oil & Gas Inc.* | 801 | |
73,767 | Matador Resources Co.* | 1,452 | |
179,130 | SRC Energy Inc.* | 1,102 | |
5,040 | |||
PERSONAL PRODUCTS—0.7% | |||
11,220 | Medifast Inc. | 1,646 | |
PHARMACEUTICALS—3.4% | |||
120,582 | Medicines Co.* | 3,852 | |
79,249 | Pacira Pharmaceuticals Inc.* | 3,156 | |
754,826 | Teligent Inc.* | 740 | |
7,748 | |||
PROFESSIONAL SERVICES—1.9% | |||
87,494 | WageWorks Inc.* | 4,269 | |
ROAD & RAIL—1.2% | |||
226,852 | Daseke Inc.* | 1,171 | |
24,088 | Saia Inc.* | 1,551 | |
2,722 | |||
SEMICONDUCTORS & SEMICONDUCTOR EQUIPMENT—3.7% | |||
129,672 | Aquantia Corp.* | 1,233 | |
75,028 | Inphi Corp.* | 3,426 | |
142,045 | MaxLinear Inc.* | 3,822 | |
8,481 | |||
SOFTWARE—2.9% | |||
178,822 | OneSpan Inc.* | 3,315 | |
614,952 | Synchronoss Technologies Inc.* | 3,309 | |
6,624 |
COMMON STOCKS—Continued | |||
Shares | Value | ||
SPECIALTY RETAIL—3.5% | |||
37,664 | At Home Group Inc.* | $885 | |
52,249 | Boot Barn Holdings Inc.* | 1,504 | |
10,520 | Children's Place Inc. | 1,187 | |
77,785 | Guess? Inc. | 1,584 | |
57,873 | National Vision Holdings Inc.* | 1,563 | |
185,841 | Party City Holdco Inc.* | 1,245 | |
7,968 | |||
TECHNOLOGY HARDWARE, STORAGE & PERIPHERALS—1.6% | |||
98,581 | Electronics for Imaging Inc.* | 3,666 | |
TEXTILES, APPAREL & LUXURY GOODS—1.1% | |||
58,152 | G-III Apparel Group Ltd.* | 2,509 | |
THRIFTS & MORTGAGE FINANCE—1.8% | |||
51,886 | Essent Group Ltd. (Bermuda)* | 2,462 | |
62,276 | Meta Financial Group Inc. | 1,604 | |
4,066 | |||
TRADING COMPANIES & DISTRIBUTORS—0.7% | |||
42,702 | Beacon Roofing Supply Inc.* | 1,608 | |
WATER UTILITIES—1.0% | |||
119,341 | AquaVenture Holdings Ltd. (Virgin Islands)* | 2,321 | |
WIRELESS TELECOMMUNICATION SERVICES—1.4% | |||
583,829 | Gogo Inc.* | 3,071 | |
TOTAL COMMON STOCKS | |||
(Cost $212,748) | 222,391 | ||
TOTAL INVESTMENTS—98.1% | |||
(Cost $212,748) | 222,391 | ||
CASH AND OTHER ASSETS, LESS LIABILITIES—1.9% | 4,249 | ||
TOTAL NET ASSETS—100.0% | $226,640 |
FAIR VALUE MEASUREMENTS
All investments at April 30, 2019 (as disclosed in the preceding Portfolio of Investments) were classified as Level 1. There were no Level 3 investments at April 30, 2019 or October 31, 2018.
For more information on valuation inputs and their aggregation into the levels identified above, please refer to the Fair Value Measurements and Disclosures in Note 2 of the accompanying Notes to Financial Statements.
* | Non-income producing security |
1 | ADR after the name of a security stands for American Depositary Receipts representing ownership of foreign securities. ADRs are issued by U.S. banking institutions. |
The accompanying notes are an integral part of the Financial Statements.
26
Harbor Large Cap Value Fund
Manager’s Commentary (Unaudited)
Subadviser
Aristotle Capital Management, LLC
11100 Santa
Monica Boulevard
Suite 1700
Suite 1700
Los Angeles, CA 90025
Portfolio Manager
Howard Gleicher, CFA
Since 2012
Since 2012
Gregory D. Padilla, CFA
Since 2018
Aristotle has subadvised the Fund since 2012.
Investment Objective
The Fund seeks long-term total return.
Howard Gleicher, CFA
Gregory D. Padilla, CFA
Management’s Discussion of
Fund Performance
Fund Performance
Markets Review
A number of macroeconomic headwinds late in the year sent the S&P 500 Index into a correction and, briefly, into bear market territory, down 20% from its September 21st high to its December 24th low. The CBOE Volatility Index (“VIX”) finished 2018 with its biggest increase on record, up over 130%. Concerns over the pace of interest rate increases, continuing trade tensions and slowing global growth weighed heavily on investor sentiment and tested the strength of the nearly ten-year-old U.S. bull market. Sentiment improved, however, during the first quarter amid the U.S. Federal Reserve’s (Fed) pivot on interest rates and optimism that a trade deal could be worked out between the United States and China. The S&P 500 Index gained 13.65% during the first three months of the year—its best quarter in seven years. Gains were broad-based, with all eleven sectors in the Index gaining at least 6% and eight of those eleven earning 10% or more. The rally in the stock market continued into April, with several indexes hitting record highs on, among other things, a strong start to earnings season and better-than-expected first quarter U.S. GDP growth.
Performance
Harbor Large Cap Value Fund outperformed the benchmark Russell 1000® Value Index during the six-month period ended April 30, 2019. The Fund returned 11.80% (Retirement Class), 11.75% (Institutional Class), 11.67% (Administrative Class), and 11.52% (Investor Class) while the Russell 1000® Value Index rose 7.90%.
Stock selection was strongest in Information Technology, Materials and Health Care. Within each of these sectors, Microchip Technology, Martin Marietta and Danaher, respectively, were the top contributors to relative return. An overweight in Information Technology also added to relative return. Relative performance was hurt by stock selection in Consumer Staples, Energy and Financials, and within each sector, Walgreens Boots Alliance, Halliburton and Mitsubishi UFJ, respectively, were the main detractors. An underweight in Utilities also detracted from relative return. Relative weights are the result of bottom-up security selection decisions.
Diversified healthcare-oriented company Danaher was one of the largest contributors to relative return during the period. The company announced that it plans to acquire GE Biopharma, a leading provider of instruments, consumables, and software involved in the development and manufacturing workflows of biopharmaceutical drugs. Danaher expects the transaction to close at the end of 2019 and to be accretive in the first full year post acquisition. Since spinning off Fortive in 2016, and with the anticipated spinoff of its dental unit later this year, we believe Danaher has transformed itself into a major player in the life science and diagnostic market, also with a meaningful position in water filtration. For years, we have particularly admired the firm’s ability to acquire businesses, integrate them and take them to new heights. Capital allocation decisions, coupled with The Danaher Business System (DBS), which aims to improve operating performance, remain, in our opinion, key sources of sustainable competitive advantages for years to come.
Walgreens Boots Alliance, the largest retail pharmacy destination across the United States and Europe, was one of the main detractors to relative return. Walgreens has over 9,000 stores and processes over 20% of all prescription drugs in the United States. Despite this scale, shares declined, as the pharmacy industry is encountering headwinds. While prices that pharmacies like Walgreens pay for generic drugs have been falling, the rates at which insurers reimburse have been falling faster. These headwinds have caused profit margins to decline in the near term. Although some readers may have had a different experience, the United States has been through a weak cough, cold and flu season, which also hurt near-term
27
Harbor Large Cap Value Fund
Manager’s Commentary—Continued
TOTAL RETURNS
For the periods ended 04/30/2019
Unannualized | 1 Year | Annualized | |||||||||
6 Months | 5 Years | 10 Years | |||||||||
Harbor Large Cap Value Fund | |||||||||||
Retirement Class1 | 11.80% | 8.86% | 11.26% | 14.34% | |||||||
Institutional Class | 11.75 | 8.78 | 11.22 | 14.32 | |||||||
Administrative Class | 11.67 | 8.56 | 10.93 | 14.01 | |||||||
Investor Class | 11.52 | 8.36 | 10.79 | 13.89 | |||||||
Comparative Index | |||||||||||
Russell 1000® Value | 7.90% | 9.06% | 8.27% | 13.76% |
As stated in the Fund’s prospectus dated March 1, 2019, the expense ratios were 0.61% (Net) and 0.65% (Gross) (Retirement Class); 0.69% (Net) and 0.73% (Gross) (Institutional Class); 0.94% (Net) and 0.98% (Gross) (Administrative Class); and 1.06% (Net) and 1.10% (Gross) (Investor Class). The net expense ratios reflect an expense limitation agreement (excluding interest expense, if any) effective through 02/29/2020. The expense ratios in the prospectus may differ from the actual expense ratios for the period disclosed within this report. The expense ratios shown in the prospectus are based on the prior fiscal year, adjusted to reflect changes, if any, in contractual arrangements that occurred prior to the date of the prospectus (or supplement thereto, if applicable).
Performance data shown represents past performance and is no guarantee of future results. Past performance is net of management fees and expenses and reflects reinvested dividends and distributions but does not reflect the deduction of taxes that a shareholder would pay on Fund distributions or upon the redemption of Fund shares. Past performance reflects the beneficial effect of any expense waivers or reimbursements, without which returns would have been lower. Investment returns and principal value will fluctuate so that Fund shares, when redeemed, may be worth more or less than their original cost. Returns for periods less than one year are not annualized. Current performance may be higher or lower and is available through the most recent month end atharborfunds.com or by calling 800-422-1050.
results. Walgreens’ strategy of cultivating strategic partnerships (e.g., AmerisourceBergen, LabCorp, FedEx and Microsoft, to name a few) rather than a vertical integration approach, we believe, uniquely positions the company to thrive over the long term in the shifting health care value chain.
During the period, we invested in Ohio-based Parker Hannifin. Founded over 100 years ago, Parker is a leading manufacturer of motion and control technologies and systems. The company manufactures highly engineered components and systems that facilitate motion and the controlled flow of liquids and gasses for a wide variety of global markets helping to increase their customers’ productivity and profitability. Parker products can be found on and around almost everything that moves. Today, Parker maintains a global footprint with operations in 50 countries, generating over $14 billion in annual revenue. Over the years, Parker has embarked on years of acquisitions. Under the relatively newly appointed CEO, Tom Williams, we believe Parker is now beginning to see the benefits of a renewed focus on business processes. Furthermore, the 2017 acquisition of industrial filtration company Clarcor, we believe, will have a beneficial long-term impact on Parker’s business mix.
We sold our position in AbbVie, a research-based global pharmaceutical company. We had originally invested in AbbVie in early 2013, after it split from Abbott Laboratories. Since then, many catalysts were realized and shares of AbbVie performed well. We continue to believe Humira is an outstanding franchise, and AbbVie has demonstrated it can make progress with new drugs to offset bio-similar competition for Humira. However, the company’s penchant for large acquisitions, together with greater uncertainty regarding Humira’s ex-U.S. franchise, leave us wanting to learn more. As such, we decided to sell our investment in this company.
Outlook & Strategy
The goal of our investment team is to understand and uncover what we believe to be high-quality businesses by emphasizing detailed research on individual companies, while maintaining a long-term focus. Although broad economic factors are taken into consideration as part of our analysis, we spend the vast majority of our efforts focusing on individual companies, seeking to identify businesses that, in our opinion, possess a combination of qualities that are both sustainable and difficult to reproduce.
1 | Retirement Class shares commenced operations on March 1, 2016. The performance attributed to the Retirement Class shares prior to that date is that of the Institutional Class shares. Performance prior to March 1, 2016 has not been adjusted to reflect the lower expenses of Retirement Class shares. During this period, Retirement Class shares would have had returns similar to, but potentially higher than, Institutional Class shares due to the fact that Retirement Class shares represent interests in the same portfolio as Institutional Class shares but are subject to lower expenses. |
This report contains the current opinions of Aristotle Capital Management, LLC as of the date of this report and should not be considered as investment advice or a recommendation of any particular security, strategy or investment product. Such opinions are subject to change without notice and securities described herein may no longer be included in, or may at any time be removed from, the Fund’s portfolio. This report is distributed for informational purposes only. Information contained herein has been obtained from sources believed reliable, but not guaranteed.
Equity securities, such as common stocks, are affected by company specific events and by movements in the overall stock markets in which those securities principally trade, among other factors. An adverse company specific event, or downturn in those stock markets, can depress the value of a particular company’s equity securities. For information on the different share classes and the risks associated with an investment in the Fund, please refer to the current prospectus.
28
Harbor Large Cap Value Fund
Fund Summary—April 30, 2019 (Unaudited)
TOP Holdings(% of net assets)
❶ | Adobe Inc. | 4.9% |
❷ | Microsoft Corp. | 4.3% |
❸ | Danaher Corp. | 3.5% |
❹ | Bank of America Corp. | 3.2% |
❺ | Microchip Technology Inc. | 3.1% |
❻ | PayPal Holdings Inc. | 3.1% |
❼ | ANSYS Inc. | 2.9% |
❽ | Coca-Cola Co. | 2.7% |
❾ | Amgen Inc. | 2.6% |
❿ | Oshkosh Corp. | 2.6% |
Sector Allocation(% of investments)
29
Harbor Large Cap Value Fund
Portfolio of Investments—April 30, 2019 (Unaudited)
Value, Cost, and Principal Amounts in Thousands
COMMON STOCKS—95.5% | |||
Shares | Value | ||
AEROSPACE & DEFENSE—2.2% | |||
141,000 | General Dynamics Corp. | $25,200 | |
BANKS—13.0% | |||
3,050,000 | Banco Bilbao Vizcaya Argentaria SA ADR (Spain)1 | 18,574 | |
1,200,000 | Bank of America Corp. | 36,696 | |
190,000 | BOK Financial Corp. | 16,557 | |
54,975 | Commerce Bancshares Inc. | 3,322 | |
155,000 | Cullen/Frost Bankers Inc. | 15,762 | |
370,000 | East West Bancorp Inc. | 19,048 | |
200,000 | JPMorgan Chase & Co. | 23,210 | |
2,720,000 | Mitsubishi UFJ Financial Group Inc. ADR (Japan)1 | 13,491 | |
146,660 | |||
BEVERAGES—2.7% | |||
620,000 | Coca-Cola Co. | 30,417 | |
BIOTECHNOLOGY—2.5% | |||
160,000 | Amgen Inc. | 28,691 | |
BUILDING PRODUCTS—3.4% | |||
144,260 | Allegion plc (Ireland) | 14,315 | |
655,000 | Johnson Controls International plc | 24,562 | |
38,877 | |||
CAPITAL MARKETS—2.4% | |||
185,000 | Ameriprise Financial Inc. | 27,152 | |
CHEMICALS—2.4% | |||
230,000 | PPG Industries Inc. | 27,025 | |
CONSTRUCTION MATERIALS—2.4% | |||
120,500 | Martin Marietta Materials Inc. | 26,739 | |
CONSUMER FINANCE—2.3% | |||
275,000 | Capital One Financial Corp. | 25,528 | |
ENERGY EQUIPMENT & SERVICES—1.4% | |||
560,000 | Halliburton Co. | 15,865 | |
EQUITY REAL ESTATE INVESTMENT TRUSTS (REITs)—3.0% | |||
145,000 | Equity Lifestyle Properties Inc. | 16,922 | |
140,000 | Sun Communities Inc. | 17,231 | |
34,153 | |||
FOOD & STAPLES RETAILING—2.4% | |||
326,354 | Kroger Co. | 8,413 | |
340,000 | Walgreens Boots Alliance Inc. | 18,214 | |
26,627 | |||
FOOD PRODUCTS—1.1% | |||
166,122 | Tyson Foods Inc. | 12,461 | |
GAS UTILITIES—1.6% | |||
303,654 | National Fuel Gas Co. | 17,979 | |
HEALTH CARE EQUIPMENT & SUPPLIES—8.0% | |||
376,688 | Alcon Inc. (Switzerland)* | 21,923 | |
300,000 | Danaher Corp. | 39,732 | |
319,000 | Medtronic plc (Ireland) | 28,331 | |
89,986 |
COMMON STOCKS—Continued | |||
Shares | Value | ||
HEALTH CARE PROVIDERS & SERVICES—1.4% | |||
478,000 | Acadia Healthcare Co. Inc.* | $15,306 | |
HOUSEHOLD DURABLES—4.6% | |||
457,000 | Lennar Corp. Class A | 23,778 | |
7,120 | Lennar Corp. Class B | 297 | |
550,000 | Sony Corp. ADR (Japan)1 | 27,703 | |
51,778 | |||
INSURANCE—2.0% | |||
155,000 | Chubb Ltd. (Switzerland) | 22,506 | |
INTERACTIVE MEDIA & SERVICES—2.5% | |||
705,000 | Twitter Inc.* | 28,137 | |
IT SERVICES—3.2% | |||
315,000 | PayPal Holdings Inc.* | 35,523 | |
MACHINERY—4.9% | |||
355,000 | Oshkosh Corp. | 29,319 | |
145,000 | Parker-Hannifin Corp. | 26,257 | |
55,576 | |||
OIL, GAS & CONSUMABLE FUELS—4.0% | |||
280,000 | Phillips 66 | 26,395 | |
115,000 | Pioneer Natural Resources Co. | 19,143 | |
45,538 | |||
PERSONAL PRODUCTS—2.3% | |||
425,000 | Unilever NV (United Kingdom) | 25,717 | |
PHARMACEUTICALS—2.2% | |||
300,000 | Novartis AG ADR (Switzerland)1 | 24,669 | |
SEMICONDUCTORS & SEMICONDUCTOR EQUIPMENT—3.1% | |||
350,000 | Microchip Technology Inc. | 34,961 | |
SOFTWARE—12.0% | |||
190,000 | Adobe Inc.* | 54,958 | |
165,000 | ANSYS Inc.* | 32,307 | |
369,000 | Microsoft Corp. | 48,191 | |
135,456 | |||
SPECIALTY RETAIL—2.5% | |||
137,000 | Home Depot Inc. | 27,907 | |
TOTAL COMMON STOCKS | |||
(Cost $863,106) | 1,076,434 | ||
TOTAL INVESTMENTS—95.5% | |||
(Cost $863,106) | 1,076,434 | ||
CASH AND OTHER ASSETS, LESS LIABILITIES—4.5% | 50,961 | ||
TOTAL NET ASSETS—100.0% | $1,127,395 |
30
Harbor Large Cap Value Fund
Portfolio of Investments—Continued
FAIR VALUE MEASUREMENTS
All investments at April 30, 2019 (as disclosed in the preceding Portfolio of Investments) were classified as Level 1. There were no Level 3 investments at April 30, 2019 or October 31, 2018.
For more information on valuation inputs and their aggregation into the levels identified above, please refer to the Fair Value Measurements and Disclosures in Note 2 of the accompanying Notes to Financial Statements.
* | Non-income producing security |
1 | ADR after the name of a security stands for American Depositary Receipts representing ownership of foreign securities. ADRs are issued by U.S. banking institutions. |
The accompanying notes are an integral part of the Financial Statements.
31
Harbor Mid Cap Value Fund
Manager’s Commentary (Unaudited)
Subadviser
LSV Asset Management
155 North Wacker Dr.
Suite 4600
Suite 4600
Chicago, IL 60606
Portfolio Managers
Josef Lakonishok, Ph.D.
Since 2004
Since 2004
Menno Vermeulen, CFA
Since 2004
Since 2004
Puneet Mansharamani, CFA
Since 2006
Greg Sleight
Since 2014
Since 2014
Guy Lakonishok, CFA
Since 2014
Since 2014
LSV has subadvised the Fund since 2004.
Investment Objective
The Fund seeks long-term total return.
Josef Lakonishok, Ph.D.
Menno Vermeulen, CFA
Puneet Mansharamani, CFA
Greg Sleight
Guy Lakonishok, CFA
Management’s Discussion of
Fund Performance
Fund Performance
Market Review
U.S. equities posted gains over the six-month period ended April 30, 2019. The S&P 500 Index returned 9.76% while mid cap stocks as measured by the Russell Midcap® Index advanced 11.65%. While equity markets sold off at the end of calendar year 2018, markets rebounded strongly over the first four months of 2019. The rebound was driven by accommodative central bank policies, expectations of a resolution to the U.S.-China trade dispute and continued strong growth in the U.S. The Federal Reserve (Fed) took a more dovish stance in comments in 2019 and held rates steady with a target range for the federal funds rate at 2.25% to 2.50%. The Fed indicated that it expects no additional interest rate increases in 2019. This reversed comments in December when the Fed signaled two additional interest rate hikes in 2019. On the trade front, expectations rose that the U.S. and China would come to some agreement on the trade dispute. While earnings growth is expected to slow in the U.S., corporate earnings are still expected to grow at high single digits. In addition, the overall U.S. economy continues to grow at a healthy pace, particularly compared to other developed markets. First quarter GDP came in above expectations at 3.2% growth.
Over the trailing six months, Information Technology led all sectors in the Russell Midcap® Value Index, advancing nearly 18%. Industrial stocks also did well particularly during the market recovery in 2019. Interest rate sensitive sectors including Real Estate and Utilities also outperformed the overall market, posting double digit returns. Energy and Communication Services lagged and were the only two sectors to post negative returns. Value trailed significantly among mid cap stocks over the period as the Russell Midcap® Value Index was up 8.28% while the Russell Midcap® Growth Index returned 16.55%.
Performance
Harbor Mid Cap Value Fund returned 6.45% (Retirement Class), 6.39% (Institutional Class), 6.29% (Administrative Class), and 6.19% (Investor Class) compared to 8.28% for the Russell Midcap® Value Index, for the six-month period ending April 30, 2019. While expectations that the Fed would hold interest rates at low levels provided a boost to the overall market, the impact was not positive for value stocks. The relatively weak performance of deeper value stocks had a negative impact on results as cheaper stocks that we favor based on measures of cash flow, earnings and book value underperformed considerably. While the Fund’s sector exposures added value in the period this was offset by poor stock selection among Consumer Discretionary, Industrials and Real Estate stocks. The Fund’s overweight to Information Technology and underweight to Energy had a positive impact on performance. This was partially offset by the Fund’s underweight to defensive sectors of the market, in particular Utilities and Real Estate.
Even though the Fund’s underweight to Energy had a positive impact on results, stock selection within Energy detracted as the Fund’s exposure to refining stocks including PBF Energy, Marathon Petroleum and HollyFrontier negatively impacted results. Within the Industrials sector, our aerospace and defense holdings Spirit Aerosystems and Huntington Ingalls lagged. In the Consumer Discretionary sector, retailers Macy’s and Kohl’s Corp struggled as did Cooper Standard and Tenneco Inc. Other stocks that contributed to the underperformance included long-term holding Kroger in the Consumer Staples sector, which posted disappointing fourth quarter earnings and Jazz Pharmaceuticals which declined nearly 20% in the period. Top
32
Harbor Mid Cap Value Fund
Manager’s Commentary—Continued
TOTAL RETURNS
For the periods ended 04/30/2019
Unannualized | 1 Year | Annualized | |||||||||
6 Months | 5 Years | 10 Years | |||||||||
Harbor Mid Cap Value Fund | |||||||||||
Retirement Class1 | 6.45% | -0.09% | 5.84% | 14.40% | |||||||
Institutional Class | 6.39 | -0.19 | 5.80 | 14.37 | |||||||
Administrative Class | 6.29 | -0.42 | 5.54 | 14.09 | |||||||
Investor Class | 6.19 | -0.57 | 5.41 | 13.96 | |||||||
Comparative Index | |||||||||||
Russell Midcap® Value | 8.28% | 5.76% | 7.83% | 14.98% |
As stated in the Fund’s prospectus dated March 1, 2019, the expense ratios were 0.76% (Net) and 0.80% (Gross) (Retirement Class); 0.84% (Net) and 0.88% (Gross) (Institutional Class); 1.09% (Net) and 1.13% (Gross) (Administrative Class); and 1.21% (Net) and 1.25% (Gross) (Investor Class). The net expense ratios reflect a contractual management fee waiver effective through 02/29/2020. The expense ratios in the prospectus may differ from the actual expense ratios for the period disclosed within this report. The expense ratios shown in the prospectus are based on the prior fiscal year, adjusted to reflect changes, if any, in contractual arrangements that occurred prior to the date of the prospectus (or supplement thereto, if applicable).
Performance data shown represents past performance and is no guarantee of future results. Past performance is net of management fees and expenses and reflects reinvested dividends and distributions but does not reflect the deduction of taxes that a shareholder would pay on Fund distributions or upon the redemption of Fund shares. Past performance reflects the beneficial effect of any expense waivers or reimbursements, without which returns would have been lower. Investment returns and principal value will fluctuate so that Fund shares, when redeemed, may be worth more or less than their original cost. Returns for periods less than one year are not annualized. Current performance may be higher or lower and is available through the most recent month end atharborfunds.com or by calling 800-422-1050.
contributors included semiconductor and semiconductor equipment holdings LAM Research and ON Semiconductor, which recovered after struggling in 2018, Industrial holdings Cummins and Oshkosh Corp and Group 1 Automotive and Whirlpool in the Consumer Discretionary sector.
Outlook & Strategy
Our portfolio decision making process is strictly quantitative and driven by a proprietary model which ranks securities on fundamental measures of value and indicators of near-term appreciation potential and a portfolio construction process that controls for risk while maximizing the expected return of the portfolio. The objective of the model is to pick undervalued stocks with high near-term appreciation potential. The process is bottom-up with no emphasis placed on macro-economic inputs.
Sector weightings are a residual of our bottom-up stock selection process subject to minimum and maximum exposures to sectors and industries. The Fund’s most significant sector exposures on an absolute basis were to the Financials, Industrial, and Consumer Discretionary sectors. Relative to the value benchmark, the Fund was overweight the Consumer Discretionary, Financials and Technology sectors while underweight Energy, Health Care, Utilities and Real Estate Investment Trusts.
Changes in the Fund tend to be gradual given the Fund’s low turnover and our three to five year investment horizon. Over the last six months we reduced the weight to Financials and Health Care. Within Financials, we reduced the Fund’s exposure to insurance stocks selling Assurant, Axis Capital Holdings and Everest Re Group. We reduced the weight to Health Care, selling Davita and Magellan Health and trimming HCA Healthcare, which did well and has become less attractive given current valuations. We increased the weight to Materials and Industrials in the period. We initiated several new positions in the Materials sector including International Paper and Silgan Holdings. In the Industrials sector, we initiated positions in Regal Beloit and Textron and added to Huntington Ingalls.
Despite the recent rally in equity markets, the Fund continues to trade at attractive multiples. The valuation discounts for the Fund relative to the value benchmark are as wide as we have seen in many years. We believe that companies held in the Fund continue to generate strong cash flow and earnings, in our view, and there has been little deterioration in the fundamentals of the individual Fund holdings.
1 | Retirement Class shares commenced operations on March 1, 2016. The performance attributed to the Retirement Class shares prior to that date is that of the Institutional Class shares. Performance prior to March 1, 2016 has not been adjusted to reflect the lower expenses of Retirement Class shares. During this period, Retirement Class shares would have had returns similar to, but potentially higher than, Institutional Class shares due to the fact that Retirement Class shares represent interests in the same portfolio as Institutional Class shares but are subject to lower expenses. |
This report contains the current opinions of LSV Asset Management as of the date of this report and should not be considered as investment advice or a recommendation of any particular security, strategy or investment product. Such opinions are subject to change without notice and securities described herein may no longer be included in, or may at any time be removed from, the Fund’s portfolio. This report is distributed for informational purposes only. Information contained herein has been obtained from sources believed reliable, but not guaranteed.
Stocks of mid cap companies pose special risks, including possible illiquidity and greater price volatility than stocks of larger, more established companies. Equity securities, such as common stocks, are affected by company specific events and by movements in the overall stock markets in which those securities principally trade, among other factors. An adverse company specific event, or downturn in those stock markets, can depress the value of a particular company’s equity securities. For information on the different share classes and the risks associated with an investment in the Fund, please refer to the current prospectus.
33
Harbor Mid Cap Value Fund
Fund Summary—April 30, 2019 (Unaudited)
TOP Holdings(% of net assets)
❶ | Entergy Corp. | 1.7% |
❷ | Cummins Inc. | 1.4% |
❸ | Lincoln National Corp. | 1.4% |
❹ | Discover Financial Services | 1.3% |
❺ | Lam Research Corp. | 1.3% |
❻ | SunTrust Banks Inc. | 1.3% |
❼ | United Continental Holdings Inc. | 1.3% |
❽ | Eastman Chemical Co. | 1.2% |
❾ | National Fuel Gas Co. | 1.2% |
❿ | Tyson Foods Inc. | 1.2% |
Sector Allocation(% of investments)
34
Harbor Mid Cap Value Fund
Portfolio of Investments—April 30, 2019 (Unaudited)
Value, Cost, and Principal Amounts in Thousands
COMMON STOCKS—99.1% | |||
Shares | Value | ||
AEROSPACE & DEFENSE—2.8% | |||
40,460 | Huntington Ingalls Industries Inc. | $9,006 | |
107,400 | Spirit AeroSystems Holdings Inc. | 9,333 | |
114,800 | Textron Inc. | 6,084 | |
24,423 | |||
AIR FREIGHT & LOGISTICS—0.4% | |||
74,217 | Atlas Air Worldwide Holdings Inc.* | 3,584 | |
AIRLINES—3.1% | |||
54,800 | Alaska Air Group Inc. | 3,392 | |
175,700 | American Airlines Group Inc. | 6,006 | |
375,200 | JetBlue Airways Corp.* | 6,960 | |
124,400 | United Continental Holdings Inc.* | 11,054 | |
27,412 | |||
AUTO COMPONENTS—2.2% | |||
118,200 | American Axle & Manufacturing Holdings Inc.* | 1,743 | |
76,500 | BorgWarner Inc. | 3,195 | |
32,900 | Cooper-Standard Holdings Inc.* | 1,667 | |
231,338 | Goodyear Tire & Rubber Co. | 4,444 | |
46,300 | Lear Corp. | 6,621 | |
68,500 | Tenneco Inc. | 1,502 | |
19,172 | |||
AUTOMOBILES—0.4% | |||
91,600 | Harley-Davidson Inc. | 3,410 | |
BANKS—6.5% | |||
134,800 | CIT Group Inc. | 7,181 | |
267,800 | Citizens Financial Group Inc. | 9,694 | |
297,500 | Fifth Third Bancorp | 8,574 | |
343,400 | KeyCorp | 6,027 | |
437,800 | Regions Financial Corp. | 6,799 | |
175,800 | SunTrust Banks Inc. | 11,511 | |
164,900 | Zions Bancorporation | 8,135 | |
57,921 | |||
BEVERAGES—0.8% | |||
110,500 | Molson Coors Brewing Co. | 7,093 | |
BUILDING PRODUCTS—0.4% | |||
76,600 | Owens Corning | 3,927 | |
CAPITAL MARKETS—2.4% | |||
57,200 | Ameriprise Financial Inc. | 8,395 | |
108,400 | Lazard Ltd. (Bermuda) | 4,215 | |
96,200 | Legg Mason Inc. | 3,218 | |
329,374 | Prospect Capital Corp. | 2,223 | |
33,900 | Raymond James Financial Inc. | 3,104 | |
21,155 | |||
CHEMICALS—4.2% | |||
9,746 | A. Schulman Inc. (Contingent Value Rights)* | 4x | |
69,000 | Cabot Corp. | 3,131 | |
97,900 | Celanese Corp. | 10,562 | |
112,122 | Chemours Co. | 4,038 | |
139,500 | Eastman Chemical Co. | 11,004 | |
226,000 | Huntsman Corp. | 5,026 | |
70,400 | Trinseo SA (Luxembourg) | 3,165 | |
36,930 |
COMMON STOCKS—Continued | |||
Shares | Value | ||
COMMERCIAL SERVICES & SUPPLIES—0.3% | |||
304,900 | Pitney Bowes Inc. | $2,168 | |
55,233 | RR Donnelley & Sons Co. | 255 | |
2,423 | |||
COMMUNICATIONS EQUIPMENT—0.9% | |||
302,700 | Juniper Networks Inc. | 8,406 | |
CONSUMER FINANCE—2.4% | |||
136,700 | Ally Financial Inc. | 4,061 | |
137,500 | Discover Financial Services | 11,205 | |
225,200 | Navient Corp. | 3,043 | |
58,455 | Nelnet Inc. | 3,393 | |
21,702 | |||
CONTAINERS & PACKAGING—2.0% | |||
96,100 | International Paper Co. | 4,498 | |
260,946 | Owens-Illinois Inc. | 5,156 | |
156,300 | Silgan Holdings Inc. | 4,680 | |
95,900 | WestRock Co. | 3,681 | |
18,015 | |||
DIVERSIFIED FINANCIAL SERVICES—0.9% | |||
79,987 | Banco Latinoamericano de Comercio Exterior SA (Panama) | 1,730 | |
120,200 | Voya Financial Inc. | 6,598 | |
8,328 | |||
ELECTRIC UTILITIES—4.6% | |||
82,400 | Edison International | 5,255 | |
154,400 | Entergy Corp. | 14,961 | |
253,500 | FirstEnergy Corp. | 10,654 | |
317,200 | PPL Corp. | 9,900 | |
40,770 | |||
ELECTRICAL EQUIPMENT—0.5% | |||
50,600 | Regal Beloit Corp. | 4,305 | |
ELECTRONIC EQUIPMENT, INSTRUMENTS & COMPONENTS—2.6% | |||
76,400 | Avnet Inc. | 3,714 | |
162,600 | Corning Inc. | 5,179 | |
79,185 | Methode Electronics Inc. | 2,337 | |
13,988 | SYNNEX Corp. | 1,509 | |
41,800 | Tech Data Corp.* | 4,456 | |
196,236 | TTM Technologies Inc.* | 2,598 | |
154,200 | Vishay Intertechnology Inc. | 3,055 | |
22,848 | |||
ENERGY EQUIPMENT & SERVICES—0.2% | |||
209,866 | McDermott International Inc. (Panama)* | 1,698 | |
ENTERTAINMENT—0.4% | |||
108,800 | Viacom Inc. | 3,145 | |
EQUITY REAL ESTATE INVESTMENT TRUSTS (REITs)—11.0% | |||
205,100 | Brixmor Property Group Inc. | 3,667 | |
507,836 | Franklin Street Properties Corp. | 3,992 | |
134,100 | Gaming and Leisure Properties Inc. | 5,415 | |
188,700 | Hersha Hospitality Trust | 3,504 | |
167,069 | Hospitality Properties Trust | 4,344 | |
371,000 | Host Hotels & Resorts Inc. | 7,138 | |
733,500 | Lexington Realty Trust | 6,653 | |
122,800 | Mack-Cali Realty Corp. | 2,859 | |
480,796 | Medical Properties Trust Inc. | 8,395 | |
8,604 | National Health Investors Inc. | 649 |
35
Harbor Mid Cap Value Fund
Portfolio of Investments—Continued
Value, Cost, and Principal Amounts in Thousands
COMMON STOCKS—Continued | |||
Shares | Value | ||
EQUITY REAL ESTATE INVESTMENT TRUSTS (REITs)—Continued | |||
52,750 | Office Properties Income Trust | $1,432 | |
207,500 | Omega Healthcare Investors Inc. | 7,343 | |
166,038 | Outfront Media Inc. | 3,957 | |
395,500 | Piedmont Office Realty Trust Inc. | 8,234 | |
29,388 | Retail Value Inc. | 985 | |
170,300 | Sabra Health Care REIT Inc. | 3,331 | |
411,114 | Senior Housing Properties Trust | 3,301 | |
286,200 | SITE Centers Corp. | 3,789 | |
110,060 | Spirit Realty Capital Inc. | 4,453 | |
277,300 | Summit Hotel Properties Inc. | 3,219 | |
761,700 | VEREIT Inc. | 6,292 | |
206,197 | Xenia Hotels & Resorts Inc. | 4,464 | |
97,416 | |||
FOOD & STAPLES RETAILING—1.4% | |||
62,200 | Ingles Markets Inc. | 1,708 | |
408,500 | Kroger Co. | 10,531 | |
12,239 | |||
FOOD PRODUCTS—3.3% | |||
68,100 | General Mills Inc. | 3,505 | |
54,200 | Ingredion Inc. | 5,136 | |
81,500 | JM Smucker Co. | 9,994 | |
143,800 | Tyson Foods Inc. | 10,786 | |
29,421 | |||
GAS UTILITIES—1.2% | |||
180,541 | National Fuel Gas Co. | 10,690 | |
HEALTH CARE PROVIDERS & SERVICES—1.8% | |||
94,600 | Cardinal Health Inc. | 4,608 | |
60,600 | HCA Healthcare Inc. | 7,710 | |
27,300 | Universal Health Services Inc. | 3,464 | |
15,782 | |||
HOTELS, RESTAURANTS & LEISURE—0.6% | |||
100,200 | Brinker International Inc. | 4,286 | |
15,250 | Wyndham Destinations Inc. | 664 | |
4,950 | |||
HOUSEHOLD DURABLES—2.8% | |||
101,478 | Ethan Allen Interiors Inc. | 2,243 | |
65,200 | Meritage Homes Corp.* | 3,335 | |
183,453 | PulteGroup Inc. | 5,771 | |
133,500 | Toll Brothers Inc. | 5,086 | |
59,600 | Whirlpool Corp. | 8,274 | |
24,709 | |||
INSURANCE—6.2% | |||
103,700 | Aflac Inc. | 5,224 | |
70,800 | Allstate Corp. | 7,014 | |
27,500 | American Financial Group Inc. | 2,847 | |
88,400 | Assured Guaranty Ltd. (Bermuda) | 4,217 | |
150,800 | Hartford Financial Services Group Inc. | 7,888 | |
179,800 | Lincoln National Corp. | 11,996 | |
101,693 | Maiden Holdings Ltd. (Bermuda) | 67 | |
148,900 | Old Republic International Corp. | 3,329 | |
79,000 | Principal Financial Group Inc. | 4,516 | |
75,200 | Universal Insurance Holdings Inc. | 2,240 | |
139,000 | Unum Group | 5,132 | |
54,470 |
COMMON STOCKS—Continued | |||
Shares | Value | ||
IT SERVICES—1.2% | |||
98,200 | DXC Technology Co. | $6,456 | |
228,100 | Western Union Co. | 4,434 | |
10,890 | |||
LEISURE PRODUCTS—0.4% | |||
65,300 | Brunswick Corp. | 3,344 | |
MACHINERY—4.8% | |||
42,500 | AGCO Corp. | 3,008 | |
100,600 | Allison Transmission Holdings Inc. | 4,714 | |
170,200 | Briggs & Stratton Corp. | 2,076 | |
72,600 | Cummins Inc. | 12,073 | |
161,900 | Meritor Inc.* | 3,928 | |
47,700 | Oshkosh Corp. | 3,939 | |
29,300 | Snap-on Inc. | 4,931 | |
64,700 | Timken Co. | 3,102 | |
313,300 | Wabash National Corp. | 4,725 | |
42,496 | |||
MEDIA—1.3% | |||
115,600 | AMC Networks Inc.* | 6,752 | |
290,841 | Gannett Co. Inc. | 2,714 | |
144,100 | TEGNA Inc. | 2,294 | |
11,760 | |||
METALS & MINING—0.8% | |||
78,500 | Reliance Steel & Aluminum Co. | 7,219 | |
MORTGAGE REAL ESTATE INVESTMENT TRUSTS (REITs)—1.9% | |||
479,058 | Annaly Capital Management Inc. | 4,834 | |
29,955 | Granite Point Mortgage Trust Inc. | 576 | |
171,000 | Invesco Mortgage Capital Inc. | 2,791 | |
298,300 | MFA Financial Inc. | 2,240 | |
191,300 | PennyMac Mortgage Investment Trust | 4,017 | |
158,050 | Two Harbors Investment Corp. | 2,191 | |
16,649 | |||
MULTILINE RETAIL—2.2% | |||
91,600 | Big Lots Inc. | 3,404 | |
50,800 | Dillard's Inc. | 3,477 | |
122,200 | Kohl's Corp. | 8,689 | |
150,600 | Macy's Inc. | 3,545 | |
19,115 | |||
MULTI-UTILITIES—0.7% | |||
108,700 | Public Service Enterprise Group Inc. | 6,484 | |
OIL, GAS & CONSUMABLE FUELS—3.8% | |||
240,100 | Carrizo Oil & Gas Inc.* | 3,078 | |
2,978 | Encana Corp. (Canada) | 21 | |
355,616 | Gulfport Energy Corp.* | 2,329 | |
99,000 | HollyFrontier Corp. | 4,725 | |
357,559 | Laredo Petroleum Inc.* | 1,080 | |
71,900 | Marathon Petroleum Corp. | 4,377 | |
163,700 | PBF Energy Inc. | 5,497 | |
474,000 | SRC Energy Inc.* | 2,915 | |
108,100 | Valero Energy Corp. | 9,800 | |
33,822 | |||
PAPER & FOREST PRODUCTS—0.5% | |||
86,900 | Domtar Corp. | 4,249 |
36
Harbor Mid Cap Value Fund
Portfolio of Investments—Continued
Value, Cost, and Principal Amounts in Thousands
COMMON STOCKS—Continued | |||
Shares | Value | ||
PHARMACEUTICALS—1.1% | |||
49,900 | Jazz Pharmaceuticals plc (Ireland)* | $6,476 | |
110,150 | Lannett Co. Inc.* | 847 | |
93,493 | Mylan NV (Netherlands)* | 2,523 | |
9,846 | |||
PROFESSIONAL SERVICES—0.8% | |||
71,100 | ManpowerGroup Inc. | 6,828 | |
ROAD & RAIL—0.4% | |||
62,800 | Ryder System Inc. | 3,956 | |
SEMICONDUCTORS & SEMICONDUCTOR EQUIPMENT—3.8% | |||
475,000 | Amkor Technology Inc.* | 4,303 | |
95,900 | Applied Materials Inc. | 4,226 | |
84,900 | Cirrus Logic Inc.* | 4,040 | |
56,600 | Lam Research Corp. | 11,741 | |
409,900 | ON Semiconductor Corp.* | 9,452 | |
33,762 | |||
SPECIALTY RETAIL—4.0% | |||
92,800 | Bed Bath & Beyond Inc. | 1,550 | |
100,700 | Best Buy Co. Inc. | 7,493 | |
116,700 | Dick's Sporting Goods Inc. | 4,318 | |
111,200 | Foot Locker Inc. | 6,362 | |
89,100 | GameStop Corp. | 771 | |
166,100 | Gap Inc. | 4,332 | |
64,100 | Group 1 Automotive Inc. | 5,019 | |
677,800 | Office Depot Inc. | 1,627 | |
76,700 | Penske Automotive Group Inc. | 3,522 | |
34,994 |
COMMON STOCKS—Continued | |||
Shares | Value | ||
TECHNOLOGY HARDWARE, STORAGE & PERIPHERALS—3.3% | |||
242,314 | HP Inc. | $4,834 | |
133,400 | NCR Corp.* | 3,862 | |
45,600 | NetApp Inc. | 3,322 | |
143,800 | Seagate Technology plc (Ireland) | 6,949 | |
78,900 | Western Digital Corp. | 4,033 | |
189,900 | Xerox Corp. | 6,335 | |
29,335 | |||
TEXTILES, APPAREL & LUXURY GOODS—0.3% | |||
60,900 | Capri Holdings Ltd. (Virgin Islands)* | 2,684 | |
THRIFTS & MORTGAGE FINANCE—1.0% | |||
306,700 | MGIC Investment Corp.* | 4,490 | |
185,900 | Radian Group Inc. | 4,354 | |
8,844 | |||
TRADING COMPANIES & DISTRIBUTORS—0.5% | |||
113,600 | Aircastle Ltd. (Bermuda) | 2,263 | |
65,642 | Triton International Ltd. (Bermuda) | 2,163 | |
4,426 | |||
TOTAL COMMON STOCKS | |||
(Cost $823,855) | 877,047 | ||
TOTAL INVESTMENTS—99.1% | |||
(Cost $823,855) | 877,047 | ||
CASH AND OTHER ASSETS, LESS LIABILITIES—0.9% | 7,813 | ||
TOTAL NET ASSETS—100.0% | $884,860 |
FAIR VALUE MEASUREMENTS
At April 30, 2019, the investments in A. Schulman Inc. (Contingent Value Rights) (as disclosed in the preceding Portfolio of Investments) were classified as Level 3 and all other investments were classified as Level 1.
For more information on valuation inputs and their aggregation into the levels identified above, please refer to the Fair Value Measurements and Disclosures in Note 2 of the accompanying Notes to Financial Statements.
The following is a rollforward of the Fund’s Level 3 investments during the period ended April 30, 2019.
Valuation Description | Beginning Balance Beginning as of 11/01/2018 (000s) | Purchases (000s) | Sales (000s) | Discount/ (Premium) (000s) | Total Realized Gain/(Loss)w (000s) | Change in Unrealized Appreciation/ (Depreciation)w (000s) | Transfers In Level 3 (000s) | Transfers Out of Level 3 (000s) | Ending Balance as of 04/30/2019w (000s) | |||||||||
Common Stocks | ||||||||||||||||||
Chemicals | $19 | $— | $(15) | $— | $— | $— | $— | $— | $4 |
The following is a summary of significant unobservable inputs used in the fair valuations of assets and liabilities categorized within Level 3 of the fair value hierarchy.
Valuation Descriptions | Ending Balance as of 04/30/2019 (000s) | Valuation Technique | Unobservable Inputs | Input Value(s) | ||||
Investments in Securities | ||||||||
Common Stocks | ||||||||
Chemicals | ||||||||
A. Schulman Inc. (Contingent Value Rights)* | $4 | Market Approach | Estimated Recovery Value | $ 0.43 |
37
Harbor Mid Cap Value Fund
Portfolio of Investments—Continued
* | Non-income producing security | ||
w | Amounts in this category are included in the “Realized and Change in Unrealized Gain/(Loss) on Investment Transactions” section of the Statement of Operations. The net unrealized appreciation/(depreciation) per investment type is as below: | ||
Valuation Description | Unrealized Gain/(Loss) as of 04/30/2019 (000s) | ||
Common Stocks | $– | ||
x | Fair valued in accordance with Harbor Funds Valuation Procedures. |
The accompanying notes are an integral part of the Financial Statements.
38
Harbor Small Cap Value Fund
Manager’s Commentary (Unaudited)
Subadviser
EARNEST Partners LLC
1180 Peachtree St. NE
Suite 2300
Suite 2300
Atlanta, GA 30309
Portfolio Manager
Paul Viera
Since 2001
Since 2001
EARNEST Partners has subadvised the Fund since 2001.
Investment Objective
The Fund seeks long-term total return.
Paul Viera
Management’s Discussion of
Fund Performance
Fund Performance
Market Review
During the six months ending April 30, 2019, the U.S. small cap value market ended in positive territory with the Russell 2000 Value® Index rising 3.77%. This period includes the end of 2018, which saw a sharp drop in equity prices, only to be followed by a market rally, which boosted most U.S. equity indexes to all-time highs. The two major developments that gave investors confidence in the beginning of 2019 were easing monetary policy and promising trade developments.
During the latter half of the period, the U.S. Federal Reserve (Fed) abruptly changed the near-term outlook for interest rates. In response to a slowing global economy, it signaled early in the quarter that it would pause its recent string of interest rate increases. In March, the Fed followed through and unanimously voted to maintain the federal funds rate in the range of 2.25% to 2.50% and noted that it would be “patient” as it considers future rate changes. Further, the Fed stated that it would reduce the pace at which it sells off its Treasury holdings, also helping to keep interest rates from rising too quickly. Whereas the Fed was projected in December last year to raise interest rates twice in 2019, it signaled that there would likely be no rate hikes for the rest of 2019, and the market took it a step further by pricing in at least one rate cut in 2019 in response to slowing economic indicators. Fed officials continued to maintain a generally optimistic stance on the U.S. economy, but cautioned that growth may be slowing, and noted that they expect U.S. GDP to expand by 2.3% this year, and 2.0% next year. Additionally, the Fed is calling for unemployment to fall to 3.7% this year, just above its December estimate of 3.5%.
International trade policy continued to be a major focus of equity markets as investors analyzed the impact of both pending and potential tariffs between the U.S. and its trade partners. Trade discussions between the U.S. and China progressed over the course of the period as tensions de-escalated and previously-planned further tariff increases of up to 25% on $200 billion of Chinese goods were postponed. In 2018 U.S. imposed 25% tariffs on approximately $50 billion of Chinese imports. In 2018, the U.S. imported about $540 billion of goods from China while China imported about $120 billion of goods from the U.S., highlighting concerns that the trade deficit with China will grow larger.
Performance
Harbor Small Cap Value Fund rose 10.15% (Retirement Class), 10.12% (Institutional Class), 9.96% (Administrative Class), and 9.90% (Investor Class) for the six months ended April 30, 2019, strongly outperforming the broader small cap value market, as represented by Russell 2000® Value, which returned 3.77%.
Contributing to performance, Sanmina Corporation is a global electronics manufacturing services provider that serves Original Equipment Manufacturers (OEMs) in technology-driven industries, including communication networks and computer hardware and storage. With nearly 80 manufacturing facilities, Sanmina is one of the largest independent manufacturers of printed circuit boards and backplanes. During the period, investors rewarded Sanmina Corporation for delivering robust results across several of its business segments. Compared to this time last year, the company reported a 25% increase in revenue to $2.19 billion for the period, exceeding the high end of market expectations. Sanmina’s continued efforts to improve component lead times and meet consumer demand drove shares up 34%.
Detracting from performance, Eaton Vance is one of the oldest investment management firms headquartered in the U.S. and has been providing financial and advisory services for over 90 years. With offices worldwide and $440 billion in AUM, Eaton manages a broad array of investment strategies and wealth management solutions to both high-net-worth individuals
39
Harbor Small Cap Value Fund
Manager’s Commentary—Continued
TOTAL RETURNS
For the periods ended 04/30/2019
Unannualized | 1 Year | Annualized | |||||||||
6 Months | 5 Years | 10 Years | |||||||||
Harbor Small Cap Value Fund | |||||||||||
Retirement Class1 | 10.15% | 3.96% | 9.93% | 14.67% | |||||||
Institutional Class | 10.12 | 3.90 | 9.87 | 14.64 | |||||||
Administrative Class | 9.96 | 3.63 | 9.60 | 14.35 | |||||||
Investor Class | 9.90 | 3.50 | 9.47 | 14.21 | |||||||
Comparative Index | |||||||||||
Russell 2000® Value | 3.77% | 2.19% | 6.94% | 12.87% |
As stated in the Fund’s prospectus dated March 1, 2019, the expense ratios were 0.80% (Retirement Class); 0.88% (Institutional Class); 1.13% (Administrative Class); and 1.25% (Investor Class). The expense ratios in the prospectus may differ from the actual expense ratios for the period disclosed within this report. The expense ratios shown in the prospectus are based on the prior fiscal year, adjusted to reflect changes, if any, in contractual arrangements that occurred prior to the date of the prospectus (or supplement thereto, if applicable).
Performance data shown represents past performance and is no guarantee of future results. Past performance is net of management fees and expenses and reflects reinvested dividends and distributions but does not reflect the deduction of taxes that a shareholder would pay on Fund distributions or upon the redemption of Fund shares. Past performance reflects the beneficial effect of any expense waivers or reimbursements, without which returns would have been lower. Investment returns and principal value will fluctuate so that Fund shares, when redeemed, may be worth more or less than their original cost. Returns for periods less than one year are not annualized. Current performance may be higher or lower and is available through the most recent month end atharborfunds.com or by calling 800-422-1050.
and institutional clients. During the quarter, disappointing news in bank regulatory reform caused headwinds for the Financials sector as a whole, triggering a broad decline for financial companies’ stocks. The stock was down 6% for the period.
Outlook & Strategy
As of April 30, 2019, the Fund was overweight in the Industrials, Energy, Health Care, Information Technology, Materials, and Telecommunications sectors and was underweight in Financials, Utilities, Consumer Staples, and Consumer Discretionary. These weightings are an outgrowth of our fundamental, bottom-up stock selection process.
In managing the Fund, we seek companies with share prices that we believe do not fully reflect their earnings growth outlook. Going forward, we will continue to employ our three-step investment methodology: screen the broad universe to identify stocks that we believe are best positioned to outperform; measure and manage downside risk to the benchmark; and perform in-depth, thorough, fundamental research to find what we believe are the best stocks to include in the Fund.
1 | Retirement Class shares commenced operations on March 1, 2016. The performance attributed to the Retirement Class shares prior to that date is that of the Institutional Class shares. Performance prior to March 1, 2016 has not been adjusted to reflect the lower expenses of Retirement Class shares. During this period, Retirement Class shares would have had returns similar to, but potentially higher than, Institutional Class shares due to the fact that Retirement Class shares represent interests in the same portfolio as Institutional Class shares but are subject to lower expenses. |
This report contains the current opinions of EARNEST Partners LLC as of the date of this report and should not be considered as investment advice or a recommendation of any particular security, strategy or investment product. Such opinions are subject to change without notice and securities described herein may no longer be included in, or may at any time be removed from, the Fund’s portfolio. This report is distributed for informational purposes only. Information contained herein has been obtained from sources believed reliable, but not guaranteed.
Stocks of small cap companies pose special risks, including possible illiquidity and greater price volatility than stocks of larger, more established companies. Equity securities, such as common stocks, are affected by company specific events and by movements in the overall stock markets in which those securities principally trade, among other factors. An adverse company specific event, or downturn in those stock markets, can depress the value of a particular company’s equity securities. For information on the different share classes and the risks associated with an investment in the Fund, please refer to the current prospectus.
40
Harbor Small Cap Value Fund
Fund Summary—April 30, 2019 (Unaudited)
TOP Holdings(% of net assets)
❶ | Hexcel Corp. | 3.4% |
❷ | FirstCash Inc. | 3.1% |
❸ | Teledyne Technologies Inc. | 3.0% |
❹ | Cabot Microelectronics Corp. | 2.8% |
❺ | Catalent Inc. | 2.4% |
❻ | Monolithic Power Systems Inc. | 2.4% |
❼ | Reinsurance Group of America Inc. | 2.3% |
❽ | Darling Ingredients Inc. | 2.2% |
❾ | Entegris Inc. | 2.2% |
❿ | Littelfuse Inc. | 2.2% |
Sector Allocation(% of investments)
41
Harbor Small Cap Value Fund
Portfolio of Investments—April 30, 2019 (Unaudited)
Value, Cost, and Principal Amounts in Thousands
COMMON STOCKS—95.5% | |||
Shares | Value | ||
AEROSPACE & DEFENSE—9.3% | |||
750,567 | Hexcel Corp. | $53,073 | |
246,971 | Moog Inc. | 23,126 | |
188,493 | Teledyne Technologies Inc.* | 46,842 | |
956,661 | Triumph Group Inc. | 22,702 | |
145,743 | |||
BANKS—9.9% | |||
1,099,735 | Cadence Bancorp | 25,019 | |
353,488 | Enterprise Financial Services Corp. | 15,037 | |
422,975 | Heartland Financial USA Inc. | 18,992 | |
329,863 | South State Corp. | 24,957 | |
679,031 | Trustmark Corp. | 24,418 | |
634,178 | United Bankshares Inc. | 24,885 | |
524,470 | WesBanco Inc. | 21,147 | |
154,455 | |||
BIOTECHNOLOGY—1.5% | |||
448,407 | Emergent BioSolutions Inc.* | 23,174 | |
CAPITAL MARKETS—3.9% | |||
281,037 | Eaton Vance Corp. | 11,683 | |
310,076 | Raymond James Financial Inc. | 28,393 | |
339,515 | Stifel Financial Corp. | 20,259 | |
60,335 | |||
CHEMICALS—2.9% | |||
448,014 | Cabot Corp. | 20,331 | |
294,095 | Scotts Miracle-Gro Co. | 25,004 | |
45,335 | |||
COMMERCIAL SERVICES & SUPPLIES—3.0% | |||
740,348 | Casella Waste Systems Inc.* | 27,630 | |
1,126,364 | Steelcase Inc. | 19,475 | |
47,105 | |||
CONSUMER FINANCE—3.1% | |||
501,324 | FirstCash Inc. | 48,969 | |
ELECTRICAL EQUIPMENT—1.9% | |||
436,601 | EnerSys | 30,208 | |
ELECTRONIC EQUIPMENT, INSTRUMENTS & COMPONENTS—10.8% | |||
283,875 | Anixter International Inc.* | 17,847 | |
148,750 | Coherent Inc.* | 22,017 | |
546,744 | FLIR Systems Inc. | 28,945 | |
168,054 | Littelfuse Inc. | 33,787 | |
374,148 | OSI Systems Inc.* | 33,722 | |
931,112 | Sanmina Corp.* | 31,583 | |
167,901 | |||
ENERGY EQUIPMENT & SERVICES—2.2% | |||
325,321 | Core Laboratories NV (Netherlands) | 20,622 | |
955 | DMC Global Inc. | 66 | |
667,676 | Oil States International Inc.* | 12,900 | |
33,588 | |||
EQUITY REAL ESTATE INVESTMENT TRUSTS (REITs)—3.6% | |||
285,011 | EastGroup Properties Inc. | 32,585 | |
713,096 | Pebblebrook Hotel Trust | 23,219 | |
55,804 |
COMMON STOCKS—Continued | |||
Shares | Value | ||
FOOD PRODUCTS—2.2% | |||
1,556,207 | Darling Ingredients Inc.* | $33,941 | |
GAS UTILITIES—1.2% | |||
583,183 | South Jersey Industries Inc. | 18,732 | |
HEALTH CARE PROVIDERS & SERVICES—1.6% | |||
195,306 | Molina Healthcare Inc.* | 25,317 | |
HOUSEHOLD DURABLES—2.0% | |||
614,307 | Meritage Homes Corp.* | 31,422 | |
INSURANCE—6.4% | |||
686,979 | American Equity Investment Life Holding Co. | 20,204 | |
405,374 | Horace Mann Educators Corp. | 15,639 | |
235,049 | Reinsurance Group of America Inc. | 35,612 | |
235,009 | State Auto Financial Corp. | 7,903 | |
450,227 | United Fire Group Inc. | 19,635 | |
98,993 | |||
IT SERVICES—1.8% | |||
458,175 | ManTech International Corp. | 28,402 | |
MACHINERY—10.1% | |||
451,362 | Albany International Corp. | 33,387 | |
605,223 | Altra Industrial Motion Corp. | 22,690 | |
660,295 | Franklin Electric Co. Inc. | 32,262 | |
2,310,990 | Mueller Water Products Inc. | 24,797 | |
581,377 | Timken Co. | 27,877 | |
999,810 | Welbilt Inc.* | 16,827 | |
157,840 | |||
OIL, GAS & CONSUMABLE FUELS—2.0% | |||
447,991 | PDC Energy Inc.* | 19,483 | |
397,426 | Whiting Petroleum Corp.* | 10,886 | |
30,369 | |||
PHARMACEUTICALS—2.4% | |||
830,620 | Catalent Inc.* | 37,228 | |
SEMICONDUCTORS & SEMICONDUCTOR EQUIPMENT—10.1% | |||
265,707 | Advanced Energy Industries Inc.* | 15,347 | |
341,218 | Cabot Microelectronics Corp. | 43,079 | |
848,788 | Entegris Inc. | 34,682 | |
1,454,579 | FormFactor Inc.* | 27,564 | |
240,158 | Monolithic Power Systems Inc. | 37,395 | |
158,067 | |||
TEXTILES, APPAREL & LUXURY GOODS—1.8% | |||
765,329 | Wolverine World Wide Inc. | 28,172 | |
TRADING COMPANIES & DISTRIBUTORS—1.8% | |||
368,470 | GATX Corp. | 28,420 | |
TOTAL COMMON STOCKS | |||
(Cost $1,088,071) | 1,489,520 | ||
TOTAL INVESTMENTS—95.5% | |||
(Cost $1,088,071) | 1,489,520 | ||
CASH AND OTHER ASSETS, LESS LIABILITIES—4.5% | 70,684 | ||
TOTAL NET ASSETS—100.0% | $1,560,204 |
42
Harbor Small Cap Value Fund
Portfolio of Investments—Continued
FAIR VALUE MEASUREMENTS
All investments at April 30, 2019 (as disclosed in the preceding Portfolio of Investments) were classified as Level 1. There were no Level 3 investments at April 30, 2019 or October 31, 2018.
For more information on valuation inputs and their aggregation into the levels identified above, please refer to the Fair Value Measurements and Disclosures in Note 2 of the accompanying Notes to Financial Statements.
* | Non-income producing security |
The accompanying notes are an integral part of the Financial Statements.
43
Harbor Small Cap Value Opportunities Fund
Manager’s Commentary (Unaudited)
Subadviser
Sapience Investments, LLC
520 Newport Center Dr.
Suite 650
Suite 650
Newport Beach, CA
92660
92660
Portfolio Manager
Samir Sikka
Since 2017
Since 2017
Sapience Investments, LLC has subadvised the Fund since 2017.
Investment Objective
The Fund seeks long-term total return.
Samir Sikka
Management’s Discussion of
Fund Performance
Fund Performance
Market Review
The worst December S&P 500 performance since 1931 preceded the best January performance since 1987. In our view, the reasons for the turnaround were clear, positive fundamental surprises. The U.S. Federal Reserve (Fed) moved from decidedly hawkish, or seeking rate hikes, in December to dovish in January. During the first quarter of 2019, government bond rates declined and credit spreads narrowed, making equities more attractive on a relative basis. A positive resolution of U.S. trade talks with China began to look likely. U.S. corporate earnings were strong, and oil prices surged. Investor sentiment briefly soured in March as the yield curve inverted (the U.S. 10-year Treasury rate fell below the three-month rate), which has historically been a lead indicator of a recession.
Though we are not narrowly focused Fed watchers, this change in monetary policy demands consideration. Six weeks after raising the federal funds rate and signaling at least three more rate hikes in 2019, the Fed announced a pause in rate hikes. In our view, this was a major shift. Investor sentiment shifted toward a mindset that economic and credit cycles would be extended. Educated interpreters suggested that the shift was driven by a number of possibilities, including the appointment of the historically dovish Richard Clarida as Fed Vice Chairman, new data showing that inflation had stopped rising toward the Fed’s 2% target, President Trump’s efforts to influence the Fed, and concerns over trade talks and slowing growth in Europe, China, and Japan.
Performance
For the six-months ended April 30, 2019, Harbor Small Cap Value Opportunities Fund outperformed its benchmark, the Russell 2000® Value Index. The Fund returned 5.05% (Retirement Class), 5.06% (Institutional Class), 4.94% (Administrative Class), and 4.90% (Investor Class) while the Russell 2000® Value Index rose 3.77%.
Compared with the Russell 2000® Value Index, stock selection was strongest in the Information Technology, Financials, Consumer Staples, and Industrials sectors, and within each sector, Diebold Nixdorf, Inc., Sterling Bancorp, TreeHouse Foods, Inc., and Beacon Roofing Supply, Inc., respectively, were the top contributors to relative performance. On the negative side, security selection in the Consumer Discretionary and Energy sectors subtracted from relative performance, and within each sector, Ascena Retail Group, Inc. and Weatherford International plc were the primary detractors. An overweight in the worst performing Energy sector also subtracted from relative performance.
Within Information Technology, Diebold continued its margin recovery trend that started in the third quarter of 2018. In February, Diebold reported better than expected operating profits, riding on the back of an improved services margin and better than expected fourth quarter revenues. To that end, during the earnings call, management provided guidance for 2021 margin expectations and the initial steps to be taken towards this goal. Management forecasts better profitability for 2019, which should help address the stressed leverage condition that prevailed for most of 2018. These are the early days of Diebold’s cost savings program under the firm’s new management, and we believe that the continued appreciation in Diebold’s stock price is predicated on improving operating performance, reduction of leverage, and refinancing of expensive debt over time.
In Consumer Discretionary, Ascena is a leading national specialty apparel retailer for women. Ascena has undertaken a major turnaround to reduce its cost structure and become more responsive to its customer base. In the past year, management has made demonstrable progress in their Premium and Kids segments. The performance in the Value and Plus segments—Lane Bryant specifically—has been abysmal. The stock price dropped during the period, as the company announced weaker than expected performance at Lane Bryant and Justice for the fiscal second quarter and bleak guidance for the fiscal third quarter. Investors have been
44
Harbor Small Cap Value Opportunities Fund
Manager’s Commentary—Continued
TOTAL RETURNS
For the periods ended 04/30/2019
Unannualized | 1 Year | 5 Years | Annualized | ||||||||
6 Months | Life of Fund | ||||||||||
Harbor Small Cap Value Opportunities Fund | |||||||||||
Retirement Class1 | 5.05% | 3.19% | N/A | 3.17% | |||||||
Institutional Class1 | 5.06 | 3.10 | N/A | 3.09 | |||||||
Administrative Class1 | 4.94 | 2.88 | N/A | 2.85 | |||||||
Investor Class1 | 4.90 | 2.73 | N/A | 2.74 | |||||||
Comparative Index | |||||||||||
Russell 2000® Value1 | 3.77% | 2.19% | N/A | 4.44% |
As stated in the Fund’s prospectus dated March 1, 2019, the expense ratios were 0.81% (Net) and 0.97% (Gross) (Retirement Class); 0.89% (Net) and 1.05% (Gross) (Institutional Class); 1.14% (Net) and 1.30% (Gross) (Administrative Class); and 1.26% (Net) and 1.42% (Gross) (Investor Class). The net expense ratios reflect an expense limitation agreement effective through 02/29/2020. The expense ratios in the prospectus may differ from the actual expense ratios for the period disclosed within this report. The expense ratios shown in the prospectus are based on the prior fiscal year, adjusted to reflect changes, if any, in contractual arrangements that occurred prior to the date of the prospectus (or supplement thereto, if applicable).
Performance data shown represents past performance and is no guarantee of future results. Past performance is net of management fees and expenses and reflects reinvested dividends and distributions but does not reflect the deduction of taxes that a shareholder would pay on Fund distributions or upon the redemption of Fund shares. Past performance reflects the beneficial effect of any expense waivers or reimbursements, without which returns would have been lower. Investment returns and principal value will fluctuate so that Fund shares, when redeemed, may be worth more or less than their original cost. Returns for periods less than one year are not annualized. Current performance may be higher or lower and is available through the most recent month end atharborfunds.com or by calling 800-422-1050.
disappointed with the inconsistent performance over the last two years, but we feel that improvements delivered in both the Premium and Kids segments have been under-recognized. In late March, management announced the company sold a 50% interest in Maurices to a private equity firm and will use the proceeds to reduce debt.
Outlook & Strategy
Much of the fear, doubt, and uncertainty that weighed upon investors in late 2018 appears to have dissipated, at least temporarily. While macroeconomic factors and projections are not a major part of our process, we care about achieving a clear perspective when the potential for significant economic change becomes likely. Each company we follow has an idiosyncratic sensitivity to the economy, which we factor into our bottom-up estimates and valuations. While we are currently cautious about a potential slowdown, we are not bearish on the economy. A big part of our strategy, especially in the fourth quarter of 2018, has been to increase positions of holdings that have fallen in price. While many are pointing to the inverted yield curve as a strong indicator of an upcoming recession, we do not believe that U.S. monetary policy is restrictive enough to induce a recession. We believe that the inversion has more to do with the state of overseas markets than what is occurring in the U.S. Our intensive, bottom-up research, which includes detailed discussions with corporate managers, suggests that the economic environment is moderating rather than spiraling towards a recession.
We value businesses on a forward-looking fundamental basis and seek to own above-average to high quality companies when market prices are below the investors’ estimate of intrinsic value. In our view, excess returns will likely come to those investors who are best able to carefully navigate between the “news” and the “noise,” selecting stocks with a disciplined process that identifies companies with overlooked return potential. We are optimistic about the Fund’s investments at this time, as we believe that the quality value relationship within equity markets has become more rational over the past several months.
1 | The “Life of Fund” return as shown reflects the period 08/01/2017 through 04/30/2019. |
This report contains the current opinions of Sapience Investments, LLC as of the date of this report and should not be considered as investment advice or a recommendation of any particular security, strategy or investment product. Such opinions are subject to change without notice and securities described herein may no longer be included in, or may at any time be removed from, the Fund’s portfolio. This report is distributed for informational purposes only. Information contained herein has been obtained from sources believed reliable, but not guaranteed.
Stocks of small cap companies pose special risks, including possible illiquidity and greater price volatility than stocks of larger, more established companies. Equity securities, such as common stocks, are affected by company specific events and by movements in the overall stock markets in which those securities principally trade, among other factors. An adverse company specific event, or downturn in those stock markets, can depress the value of a particular company’s equity securities. For information on the different share classes and the risks associated with an investment in the Fund, please refer to the current prospectus.
45
Harbor Small Cap Value Opportunities Fund
Fund Summary—April 30, 2019 (Unaudited)
TOP Holdings(% of net assets)
❶ | Cars.com Inc. | 3.9% |
❷ | KAR Auction Services Inc. | 3.9% |
❸ | Diebold Nixdorf Inc. | 3.7% |
❹ | Beacon Roofing Supply Inc. | 3.0% |
❺ | Sterling Bancorp | 2.6% |
❻ | Dave & Buster’s Entertainment Inc. | 2.4% |
❼ | Bank of NT Butterfield & Son Ltd. | 2.3% |
❽ | Stericycle Inc. | 2.3% |
❾ | Syneos Health Inc. | 2.3% |
❿ | Wintrust Financial Corp. | 2.3% |
Sector Allocation(% of investments)
46
Harbor Small Cap Value Opportunities Fund
Portfolio of Investments—April 30, 2019 (Unaudited)
Value, Cost, and Principal Amounts in Thousands
COMMON STOCKS—96.8% | |||
Shares | Value | ||
AUTO COMPONENTS—0.9% | |||
13,400 | Adient plc (Ireland) | $310 | |
BANKS—16.0% | |||
19,870 | Bank of NT Butterfield & Son Ltd. (Bermuda) | 795 | |
13,300 | Bank OZK | 434 | |
27,900 | Cadence Bancorp | 635 | |
8,200 | Cathay General Bancorp | 302 | |
24,200 | First Hawaiian Inc. | 669 | |
7,300 | Glacier Bancorp Inc. | 311 | |
7,750 | Hancock Whitney Corp. | 339 | |
5,800 | Popular Inc. (Puerto Rico) | 335 | |
42,400 | Sterling Bancorp | 908 | |
10,560 | Wintrust Financial Corp. | 804 | |
5,532 | |||
BUILDING PRODUCTS—1.1% | |||
14,900 | Continental Building Products Inc.* | 382 | |
CAPITAL MARKETS—1.4% | |||
16,480 | Artisan Partners Asset Management Inc. | 467 | |
CHEMICALS—1.1% | |||
21,350 | Valvoline Inc. | 395 | |
COMMERCIAL SERVICES & SUPPLIES—7.5% | |||
24,080 | KAR Auction Services Inc. | 1,360 | |
13,050 | Ritchie Bros Auctioneers Inc. (Canada) | 454 | |
13,300 | Stericycle Inc.* | 777 | |
2,591 | |||
CONSUMER FINANCE—1.1% | |||
28,250 | Navient Corp. | 382 | |
CONTAINERS & PACKAGING—1.3% | |||
14,400 | Silgan Holdings Inc. | 431 | |
DIVERSIFIED FINANCIAL SERVICES—1.5% | |||
59,100 | FGL Holdings (Cayman Islands) | 504 | |
ENERGY EQUIPMENT & SERVICES—4.4% | |||
118,650 | Forum Energy Technologies Inc.* | 709 | |
54,150 | Hunting plc ADR (United Kingdom)1 | 416 | |
20,200 | Oceaneering International Inc.* | 388 | |
1,513 | |||
EQUITY REAL ESTATE INVESTMENT TRUSTS (REITs)—6.0% | |||
18,250 | CoreCivic Inc. | 380 | |
26,050 | Outfront Media Inc. | 621 | |
31,700 | Physicians Realty Trust | 572 | |
10,850 | QTS Realty Trust Inc. | 492 | |
2,065 | |||
FOOD PRODUCTS—1.8% | |||
3,090 | Post Holdings Inc.* | 349 | |
3,990 | TreeHouse Foods Inc.* | 267 | |
616 | |||
HEALTH CARE EQUIPMENT & SUPPLIES—2.5% | |||
8,500 | Integra LifeSciences Holdings Corp.* | 443 | |
15,500 | Natus Medical Inc.* | 415 | |
858 |
COMMON STOCKS—Continued | |||
Shares | Value | ||
HEALTH CARE PROVIDERS & SERVICES—2.9% | |||
13,482 | Acadia Healthcare Co. Inc.* | $431 | |
20,050 | MEDNAX Inc.* | 561 | |
992 | |||
HOTELS, RESTAURANTS & LEISURE—2.8% | |||
14,340 | Dave & Buster's Entertainment Inc. | 815 | |
11,608 | El Pollo Loco Holdings Inc.* | 148 | |
963 | |||
INSURANCE—3.0% | |||
8,410 | Argo Group International Holdings Ltd. (Bermuda) | 657 | |
8,250 | Assured Guaranty Ltd. (Bermuda) | 393 | |
1,050 | |||
INTERACTIVE MEDIA & SERVICES—3.9% | |||
65,400 | Cars.com Inc.* | 1,361 | |
INTERNET & DIRECT MARKETING RETAIL—1.6% | |||
38,600 | Despegar.com Corp. (Virgin Islands)* | 563 | |
LIFE SCIENCES TOOLS & SERVICES—2.3% | |||
16,933 | Syneos Health Inc.* | 795 | |
MACHINERY—3.0% | |||
15,040 | Altra Industrial Motion Corp. | 564 | |
6,230 | EnPro Industries Inc. | 463 | |
1,027 | |||
MEDIA—1.0% | |||
16,390 | Liberty Latin America Ltd. (Bermuda)* | 343 | |
MORTGAGE REAL ESTATE INVESTMENT TRUSTS (REITs)—1.8% | |||
38,300 | Redwood Trust Inc. | 627 | |
MULTI-UTILITIES—1.4% | |||
6,650 | NorthWestern Corp. | 465 | |
OIL, GAS & CONSUMABLE FUELS—4.0% | |||
56,500 | Oasis Petroleum Inc.* | 345 | |
12,550 | Whiting Petroleum Corp.* | 344 | |
50,295 | WPX Energy Inc.* | 698 | |
1,387 | |||
PERSONAL PRODUCTS—1.6% | |||
42,411 | e.l.f. Beauty Inc.* | 542 | |
PROFESSIONAL SERVICES—1.1% | |||
23,513 | Resources Connection Inc. | 378 | |
ROAD & RAIL—1.5% | |||
5,920 | Genesee & Wyoming Inc.* | 525 | |
SPECIALTY RETAIL—7.0% | |||
511,990 | Ascena Retail Group Inc.* | 609 | |
67,630 | Michaels Companies Inc.* | 760 | |
40,200 | Party City Holdco Inc.* | 270 | |
13,253 | Signet Jewelers Ltd. (Bermuda) | 307 | |
15,710 | Urban Outfitters Inc.* | 467 | |
2,413 | |||
TECHNOLOGY HARDWARE, STORAGE & PERIPHERALS—3.7% | |||
127,189 | Diebold Nixdorf Inc.* | 1,283 | |
TEXTILES, APPAREL & LUXURY GOODS—1.5% | |||
36,400 | Samsonite International SA ADR (Luxembourg)1 | 521 |
47
Harbor Small Cap Value Opportunities Fund
Portfolio of Investments—Continued
Value, Cost, and Principal Amounts in Thousands
COMMON STOCKS—Continued | |||
Shares | Value | ||
THRIFTS & MORTGAGE FINANCE—1.4% | |||
10,350 | Essent Group Ltd. (Bermuda)* | $491 | |
TRADING COMPANIES & DISTRIBUTORS—4.7% | |||
15,490 | Air Lease Corp. | 597 | |
27,100 | Beacon Roofing Supply Inc.* | 1,021 | |
1,618 | |||
TOTAL COMMON STOCKS | |||
(Cost $31,973) | 33,390 | ||
MASTER LIMITED PARTNERSHIPS—1.5% | |||
(Cost $443) | |||
Shares | Value | ||
OIL, GAS & CONSUMABLE FUELS—1.5% | |||
15,750 | Viper Energy Partners LP | $529 | |
TOTAL INVESTMENTS—98.3% | |||
(Cost $32,416) | 33,919 | ||
CASH AND OTHER ASSETS, LESS LIABILITIES—1.7% | 590 | ||
TOTAL NET ASSETS—100.0% | $34,509 |
FAIR VALUE MEASUREMENTS
All investments at April 30, 2019 (as disclosed in the preceding Portfolio of Investments) were classified as Level 1. There were no Level 3 investments at April 30, 2019 or October 31, 2018.
For more information on valuation inputs and their aggregation into the levels identified above, please refer to the Fair Value Measurements and Disclosures in Note 2 of the accompanying Notes to Financial Statements.
* | Non-income producing security |
1 | ADR after the name of a security stands for American Depositary Receipts representing ownership of foreign securities. ADRs are issued by U.S. banking institutions. |
The accompanying notes are an integral part of the Financial Statements.
48
Harbor Domestic Equity Funds
StatementS of Assets and Liabilities—April 30, 2019 (Unaudited)
(All amounts in thousands, except per share amounts)
Harbor Capital Appreciation Fund | Harbor Strategic Growth Fund | Harbor Mid Cap Growth Fund | Harbor Small Cap Growth Fund | Harbor Small Cap Growth Opportunities Fund | Harbor Large Cap Value Fund | Harbor Mid Cap Value Fund | Harbor Small Cap Value Fund | Harbor Small Cap Value Opportunities Fund | ||||||||||
ASSETS | ||||||||||||||||||
Investments, at identified cost | $17,212,238 | $79,560 | $181,587* | $612,251 | $212,748 | $863,106 | $823,855 | $1,088,071 | $32,416 | |||||||||
Investments, at value | $31,362,749 | $103,271 | $234,169 | $722,027 | $222,391 | $1,076,434 | $877,047 | $1,489,520 | $33,919 | |||||||||
Repurchase agreements | — | — | 14,549 | — | — | — | — | — | — | |||||||||
Cash | 59,589 | 3,279 | — | 12,175 | 4,282 | 50,964 | 8,235 | 75,989 | 815 | |||||||||
Receivables for: | ||||||||||||||||||
Investments sold | 96,975 | 2,075 | 1,553 | 8,455 | 532 | 95 | 51 | 5,266 | 91 | |||||||||
Capital shares sold | 12,071 | 2 | 380 | 654 | 204 | 1,364 | 797 | 1,849 | — | |||||||||
Dividends | 4,873 | 8 | 2 | 35 | 18 | 264 | 868 | 412 | 3 | |||||||||
Interest | 3 | — | 1 | 1 | — | 3 | — | 4 | — | |||||||||
Withholding tax | 1,737 | 1 | 11 | — | — | 309 | — | — | — | |||||||||
Prepaid registration fees | 46 | 34 | 33 | 46 | 37 | 33 | 38 | 41 | 4 | |||||||||
Prepaid fund insurance | 119 | 1 | 2 | 3 | 1 | 4 | 4 | 6 | — | |||||||||
Other assets | 2,478 | 13 | 62 | 70 | 15 | 124 | 59 | 112 | 17 | |||||||||
Total Assets | 31,540,640 | 108,684 | 250,762 | 743,466 | 227,480 | 1,129,594 | 887,099 | 1,573,199 | 34,849 | |||||||||
LIABILITIES | ||||||||||||||||||
Payables for: | ||||||||||||||||||
Investments purchased | 80,483 | — | 212 | 557 | 347 | 99 | — | 9,877 | 307 | |||||||||
Capital shares reacquired | 28,856 | 13 | 81 | 207 | 306 | 1,342 | 1,448 | 1,733 | — | |||||||||
Accrued expenses: | ||||||||||||||||||
Management fees | 14,032 | 52 | 150 | 451 | 138 | 537 | 525 | 939 | 21 | |||||||||
12b-1 fees | 348 | — | 5 | 2 | 1 | 12 | 21 | 14 | — | |||||||||
Transfer agent fees | 2,204 | 6 | 20 | 39 | 15 | 69 | 71 | 115 | 3 | |||||||||
Trustees' fees and expenses | 2,808 | 3 | 64 | 79 | 18 | 64 | 69 | 128 | 1 | |||||||||
Other | 1,730 | 10 | 22 | 35 | 15 | 76 | 105 | 189 | 8 | |||||||||
Total Liabilities | 130,461 | 84 | 554 | 1,370 | 840 | 2,199 | 2,239 | 12,995 | 340 | |||||||||
NET ASSETS | $31,410,179 | $108,600 | $250,208 | $742,096 | $226,640 | $1,127,395 | $884,860 | $1,560,204 | $34,509 | |||||||||
Net Assets Consist of: | ||||||||||||||||||
Paid-in capital | $16,103,776 | $86,509 | $143,448 | $638,070 | $224,702 | $908,037 | $822,635 | $1,154,669 | $34,828 | |||||||||
Total distributable earnings/(loss) | 15,306,403 | 22,091 | 106,760 | 104,026 | 1,938 | 219,358 | 62,225 | 405,535 | (319) | |||||||||
$31,410,179 | $108,600 | $250,208 | $742,096 | $226,640 | $1,127,395 | $884,860 | $1,560,204 | $34,509 | ||||||||||
NET ASSET VALUE PER SHARE BY CLASS | ||||||||||||||||||
Retirement Class | ||||||||||||||||||
Net assets | $6,361,271 | $5,043 | $31,276 | $304,144 | $43,644 | $359,880 | $121,487 | $207,709 | $7,941 | |||||||||
Shares of beneficial interest1 | 84,107 | 235 | 2,857 | 23,644 | 4,119 | 22,923 | 5,785 | 6,238 | 817 | |||||||||
Net asset value per share2 | $75.63 | $21.47 | $10.95 | $12.86 | $10.60 | $15.70 | $21.00 | $33.30 | $9.72 | |||||||||
Institutional Class | ||||||||||||||||||
Net assets | $23,354,957 | $103,124 | $194,857 | $429,819 | $180,643 | $708,472 | $664,879 | $1,282,362 | $26,016 | |||||||||
Shares of beneficial interest1 | 308,707 | 4,807 | 17,847 | 33,525 | 17,092 | 45,127 | 31,655 | 38,521 | 2,676 | |||||||||
Net asset value per share2 | $75.65 | $21.45 | $10.92 | $12.82 | $10.57 | $15.70 | $21.00 | $33.29 | $9.72 | |||||||||
Administrative Class | ||||||||||||||||||
Net assets | $416,926 | $17 | $2,808 | $856 | $1,717 | $16,475 | $24,174 | $6,862 | $263 | |||||||||
Shares of beneficial interest1 | 5,625 | 1 | 273 | 73 | 164 | 1,050 | 1,140 | 207 | 27 | |||||||||
Net asset value per share2 | $74.12 | $21.44 | $10.31 | $11.71 | $10.46 | $15.70 | $21.20 | $33.11 | $9.72 | |||||||||
Investor Class | ||||||||||||||||||
Net assets | $1,277,025 | $416 | $21,267 | $7,277 | $636 | $42,568 | $74,320 | $63,271 | $289 | |||||||||
Shares of beneficial interest1 | 17,615 | 20 | 2,141 | 660 | 62 | 2,687 | 3,539 | 1,954 | 30 | |||||||||
Net asset value per share2 | $72.50 | $21.10 | $9.94 | $11.03 | $10.29 | $15.84 | $21.00 | $32.39 | $9.72 |
* | Including repurchase agreements |
1 | Par value $0.01 (unlimited authorizations) |
2 | Per share amounts can be recalculated to the amounts disclosed herein when total net assets and shares of beneficial interest are not rounded to thousands. |
The accompanying notes are an integral part of the Financial Statements.
49
Harbor Domestic Equity Funds
StatementS of Operations—Six Months Ended April 30, 2019 (Unaudited)
(All amounts in thousands)
Harbor Capital Appreciation Fund | Harbor Strategic Growth Fund | Harbor Mid Cap Growth Fund | Harbor Small Cap Growth Fund | Harbor Small Cap Growth Opportunities Fund | Harbor Large Cap Value Fund | Harbor Mid Cap Value Fund | Harbor Small Cap Value Fund | Harbor Small Cap Value Opportunities Fund | |
Investment Income | |||||||||
Dividends | $120,768 | $391 | $549 | $2,110 | $404 | $9,510 | $14,405 | $9,779 | $288 |
Interest | 1,265 | 41 | 174 | 157 | 57 | 432 | 68 | 424 | 13 |
Net securities lending income | 80 | — | — | — | — | — | — | — | — |
Foreign taxes withheld | (947) | (7) | — | — | (9) | (278) | (4) | (43) | (1) |
Total Investment Income | 121,166 | 425 | 723 | 2,267 | 452 | 9,664 | 14,469 | 10,160 | 300 |
Operating Expenses | |||||||||
Management fees | 86,996 | 236 | 1,252 | 2,617 | 858 | 2,967 | 3,353 | 5,142 | 117 |
12b-1 fees: | |||||||||
Administrative Class | 525 | — | 13 | 1 | 2 | 19 | 45 | 8 | — |
Investor Class | 1,557 | 1 | 22 | 8 | 1 | 53 | 91 | 79 | — |
Shareholder communications | 481 | 1 | 6 | 7 | 2 | 37 | 45 | 73 | 1 |
Custodian fees | 708 | 5 | 20 | 27 | 23 | 17 | 26 | 27 | 8 |
Transfer agent fees: | |||||||||
Retirement Class | 383 | — | 8 | 20 | 3 | 22 | 7 | 12 | — |
Institutional Class | 10,160 | 35 | 80 | 183 | 87 | 283 | 317 | 531 | 11 |
Administrative Class | 196 | — | 5 | — | 1 | 7 | 17 | 3 | — |
Investor Class | 1,329 | — | 19 | 7 | 1 | 45 | 78 | 67 | — |
Professional fees | 711 | 2 | 16 | 17 | 6 | 23 | 24 | 32 | 1 |
Trustees' fees and expenses | 688 | 2 | 7 | 17 | 6 | 23 | 22 | 32 | 1 |
Registration fees | 115 | 25 | 27 | 26 | 26 | 41 | 33 | 48 | 27 |
Miscellaneous | 185 | 4 | 6 | 9 | 6 | 10 | 10 | 13 | 4 |
Total expenses | 104,034 | 311 | 1,481 | 2,939 | 1,022 | 3,547 | 4,068 | 6,067 | 170 |
Management fees waived | (7,174) | — | — | — | — | — | (137) | — | — |
Transfer agent fees waived | (388) | (1) | (4) | (8) | (4) | (12) | (13) | (19) | (1) |
Other expenses reimbursed | — | (34) | — | — | — | (187) | — | — | (34) |
Custodian fees reduction | (35) | — | (1) | (1) | (1) | (2) | (1) | (4) | — |
Net expenses | 96,437 | 276 | 1,476 | 2,930 | 1,017 | 3,346 | 3,917 | 6,044 | 135 |
Net Investment Income/(Loss) | 24,729 | 149 | (753) | (663) | (565) | 6,318 | 10,552 | 4,116 | 165 |
Realized and Change in Net Unrealized Gain/(Loss) on Investment Transactions | |||||||||
Net realized gain/(loss) on: | |||||||||
Investments | 1,212,366 | (1,378) | 43,127 | (1,788) | 950 | 4,462 | (2,818) | 1,907 | (1,933) |
Foreign currency transactions | (121) | — | — | — | (1) | — | — | — | — |
Change in net unrealized appreciation/(depreciation) on: | |||||||||
Investments | 2,484,830 | 12,030 | 24,205 | 91,759 | 3,511 | 101,958 | 45,468 | 132,711 | 3,454 |
Translations of assets and liabilities in foreign currencies | (7) | — | (1) | — | — | — | — | — | — |
Net gain/(loss) on investment transactions | 3,697,068 | 10,652 | 67,331 | 89,971 | 4,460 | 106,420 | 42,650 | 134,618 | 1,521 |
Net Increase/(Decrease) in Net Assets Resulting from Operations | $3,721,797 | $10,801 | $66,578 | $89,308 | $3,895 | $112,738 | $53,202 | $138,734 | $1,686 |
The accompanying notes are an integral part of the Financial Statements.
50
Harbor Domestic Equity Funds
Statements of Changes In Net Assets
(All amounts in thousands)
Harbor Capital Appreciation Fund | Harbor Strategic Growth Fund | Harbor Mid Cap Growth Fund | ||||||
November 1, 2018 through April 30, 2019 | November 1, 2017 through October 31, 2018 | November 1, 2018 through April 30, 2019 | November 1, 2017 through October 31, 2018 | November 1, 2018 through April 30, 2019 | November 1, 2017 through October 31, 2018 | |||
INCREASE/(DECREASE) IN NET ASSETS | (Unaudited) | (Unaudited) | (Unaudited) | |||||
Operations: | ||||||||
Net investment income/(loss) | $24,729 | $68,671 | $149 | $195 | $(753) | $(1,347) | ||
Net realized gain/(loss) on investments | 1,212,245 | 3,389,399 | (1,378) | 1,922 | 43,127 | 72,227 | ||
Change in net unrealized appreciation/(depreciation) of investments | 2,484,823 | (743,393) | 12,030 | 1,689 | 24,204 | (44,332) | ||
Net increase/(decrease) in assets resulting from operations | 3,721,797 | 2,714,677 | 10,801 | 3,806 | 66,578 | 26,548 | ||
Distributions to Shareholders | ||||||||
Retirement Class | (502,294) | (396,568) | (104) | (13) | (25,016) | (14,153) | ||
Institutional Class | (2,034,651) | (2,446,657) | (1,821) | (1,185) | (26,702) | (15,890) | ||
Administrative Class | (41,111) | (51,883) | — | — | (2,327) | (3,120) | ||
Investor Class | (121,067) | (153,082) | (9) | (1) | (2,988) | (2,301) | ||
Total distributions to shareholders | (2,699,123) | (3,048,190) | (1,934) | (1,199) | (57,033) | (35,464) | ||
Net Increase/(Decrease) Derived from Capital Share Transactions | 851,585 | 1,054,440 | 29,614 | 10,964 | (106,019) | (47,997) | ||
Net increase/(decrease) in net assets | 1,874,259 | 720,927 | 38,481 | 13,571 | (96,474) | (56,913) | ||
Net Assets | ||||||||
Beginning of period | 29,535,920 | 28,814,993 | 70,119 | 56,548 | 346,682 | 403,595 | ||
End of period | $31,410,179 | $29,535,920 | $108,600 | $70,119 | $250,208 | $346,682 |
The accompanying notes are an integral part of the Financial Statements.
51
Harbor Small Cap Growth Fund | Harbor Small Cap Growth Opportunities Fund | Harbor Large Cap Value Fund | Harbor Mid Cap Value Fund | Harbor Small Cap Value Fund | Harbor Small Cap Value Opportunities Fund | |||||||||||
November 1, 2018 through April 30, 2019 | November 1, 2017 through October 31, 2018 | November 1, 2018 through April 30, 2019 | November 1, 2017 through October 31, 2018 | November 1, 2018 through April 30, 2019 | November 1, 2017 through October 31, 2018 | November 1, 2018 through April 30, 2019 | November 1, 2017 through October 31, 2018 | November 1, 2018 through April 30, 2019 | November 1, 2017 through October 31, 2018 | November 1, 2018 through April 30, 2019 | November 1, 2017 through October 31, 2018 | |||||
(Unaudited) | (Unaudited) | (Unaudited) | (Unaudited) | (Unaudited) | (Unaudited) | |||||||||||
$(663) | $(2,842) | $(565) | $(1,894) | $6,318 | $9,602 | $10,552 | $21,996 | $4,116 | $5,481 | $165 | $171 | |||||
(1,788) | 163,740 | 949 | 57,856 | 4,462 | 18,268 | (2,818) | 56,222 | 1,907 | 154,899 | (1,933) | 1,824 | |||||
91,759 | (131,098) | 3,511 | (23,665) | 101,958 | (39,265) | 45,468 | (125,443) | 132,711 | (248,143) | 3,454 | (2,001) | |||||
89,308 | 29,800 | 3,895 | 32,297 | 112,738 | (11,395) | 53,202 | (47,225) | 138,734 | (87,763) | 1,686 | (6) | |||||
(58,115) | (18,209) | (7,894) | (3,505) | (6,946) | (7,627) | (6,960) | (3,555) | (11,612) | (2,150) | (412) | (1) | |||||
(76,800) | (48,249) | (43,632) | (13,477) | (12,960) | (18,431) | (49,843) | (28,481) | (99,888) | (21,038) | (1,567) | (147) | |||||
(157) | (71) | (357) | (71) | (305) | (421) | (2,796) | (1,726) | (639) | (105) | (16) | (1) | |||||
(1,469) | (834) | (142) | (71) | (818) | (2,316) | (5,150) | (3,658) | (5,985) | (963) | (16) | (1) | |||||
(136,541) | (67,363) | (52,025) | (17,124) | (21,029) | (28,795) | (64,749) | (37,420) | (118,124) | (24,256) | (2,011) | (150) | |||||
75,069 | 43,786 | (10,992) | (34,380) | 55,917 | 253,253 | (46,550) | 39,635 | 156,629 | 314,366 | 3,308 | 6,491 | |||||
27,836 | 6,223 | (59,122) | (19,207) | 147,626 | 213,063 | (58,097) | (45,010) | 177,239 | 202,347 | 2,983 | 6,335 | |||||
714,260 | 708,037 | 285,762 | 304,969 | 979,769 | 766,706 | 942,957 | 987,967 | 1,382,965 | 1,180,618 | 31,526 | 25,191 | |||||
$742,096 | $714,260 | $226,640 | $285,762 | $1,127,395 | $979,769 | $884,860 | $942,957 | $1,560,204 | $1,382,965 | $34,509 | $31,526 |
52
Harbor Domestic Equity Funds
Statements of Changes in Net Assets—Capital Stock Activity
(All amounts in thousands)
Harbor Capital Appreciation Fund | Harbor Strategic Growth Fund | Harbor Mid Cap Growth Fund | ||||||
November 1, 2018 through April 30, 2019 | November 1, 2017 through October 31, 2018 | November 1, 2018 through April 30, 2019 | November 1, 2017 through October 31, 2018 | November 1, 2018 through April 30, 2019 | November 1, 2017 through October 31, 2018 | |||
(Unaudited) | (Unaudited) | (Unaudited) | ||||||
AMOUNT ($) | ||||||||
Retirement Class | ||||||||
Net proceeds from sale of shares | $770,961 | $3,554,254 | $1,069 | $3,374 | $29,809 | $46,562 | ||
Reinvested distributions | 474,878 | 378,865 | 103 | 12 | 25,016 | 14,153 | ||
Cost of shares reacquired | (531,827) | (1,359,223) | (180) | (182) | (168,449) | (40,095) | ||
Net increase/(decrease) in net assets | $714,012 | $2,573,896 | $992 | $3,204 | $(113,624) | $20,620 | ||
Institutional Class | ||||||||
Net proceeds from sale of shares | $1,590,065 | $3,646,684 | $30,957 | $17,159 | $36,826 | $49,030 | ||
Reinvested distributions | 1,856,429 | 2,226,227 | 1,758 | 1,183 | 19,729 | 11,273 | ||
Cost of shares reacquired | (3,186,997) | (6,874,710) | (4,153) | (10,834) | (29,298) | (42,659) | ||
Cost of shares reacquired through redemption in-kind | — | (291,425) | — | — | — | — | ||
Net increase/(decrease) in net assets | $259,497 | $(1,293,224) | $28,562 | $7,508 | $27,257 | $17,644 | ||
Administrative Class | ||||||||
Net proceeds from sale of shares | $50,746 | $90,994 | $— | $3 | $604 | $9,158 | ||
Reinvested distributions | 39,641 | 50,177 | — | — | 2,320 | 3,116 | ||
Cost of shares reacquired | (130,513) | (180,144) | — | — | (26,455) | (95,899) | ||
Net increase/(decrease) in net assets | $(40,126) | $(38,973) | $— | $3 | $(23,531) | $(83,625) | ||
Investor Class | ||||||||
Net proceeds from sale of shares | $77,949 | $340,918 | $62 | $337 | $4,790 | $9,964 | ||
Reinvested distributions | 119,520 | 151,394 | 8 | 1 | 2,958 | 2,285 | ||
Cost of shares reacquired | (279,267) | (679,571) | (10) | (89) | (3,869) | (14,885) | ||
Net increase/(decrease) in net assets | $(81,798) | $(187,259) | $60 | $249 | $3,879 | $(2,636) |
The accompanying notes are an integral part of the Financial Statements.
53
Harbor Small Cap Growth Fund | Harbor Small Cap Growth Opportunities Fund | Harbor Large Cap Value Fund | Harbor Mid Cap Value Fund | Harbor Small Cap Value Fund | Harbor Small Cap Value Opportunities Fund | |||||||||||
November 1, 2018 through April 30, 2019 | November 1, 2017 through October 31, 2018 | November 1, 2018 through April 30, 2019 | November 1, 2017 through October 31, 2018 | November 1, 2018 through April 30, 2019 | November 1, 2017 through October 31, 2018 | November 1, 2018 through April 30, 2019 | November 1, 2017 through October 31, 2018 | November 1, 2018 through April 30, 2019 | November 1, 2017 through October 31, 2018 | November 1, 2018 through April 30, 2019 | November 1, 2017 through October 31, 2018 | |||||
(Unaudited) | (Unaudited) | (Unaudited) | (Unaudited) | (Unaudited) | (Unaudited) | |||||||||||
$22,743 | $158,138 | $4,734 | $19,490 | $36,762 | $200,477 | $25,347 | $36,005 | $92,733 | $143,113 | $1,224 | $6,231 | |||||
56,734 | 17,919 | 7,893 | 3,505 | 6,647 | 7,588 | 6,960 | 3,555 | 6,761 | 1,153 | 412 | 1 | |||||
(62,482) | (40,086) | (2,172) | (35,883) | (28,250) | (23,708) | (14,621) | (16,551) | (53,435) | (33,113) | (1) | (3) | |||||
$16,995 | $135,971 | $10,455 | $(12,888) | $15,159 | $184,357 | $17,686 | $23,009 | $46,059 | $111,153 | $1,635 | $6,229 | |||||
$32,011 | $65,821 | $28,209 | $81,888 | $168,607 | $288,719 | $82,012 | $263,531 | $277,030 | $478,010 | $99 | $106 | |||||
73,911 | 47,317 | 43,627 | 13,012 | 11,922 | 17,031 | 47,820 | 27,819 | 86,451 | 18,030 | 1,567 | 147 | |||||
(48,840) | (204,931) | (93,544) | (116,301) | (132,659) | (174,554) | (169,381) | (252,177) | (245,600) | (335,507) | (37) | (3) | |||||
— | — | — | — | — | — | — | — | — | — | — | — | |||||
$57,082 | $(91,793) | $(21,708) | $(21,401) | $47,870 | $131,196 | $(39,549) | $39,173 | $117,881 | $160,533 | $1,629 | $250 | |||||
$71 | $703 | $518 | $988 | $340 | $3,946 | $4,637 | $10,291 | $1,021 | $5,226 | $— | $— | |||||
156 | 71 | 357 | 71 | 305 | 421 | 2,759 | 1,722 | 620 | 101 | 15 | 1 | |||||
(80) | (684) | (683) | (612) | (1,067) | (41,507) | (25,057) | (14,356) | (1,998) | (1,926) | — | — | |||||
$147 | $90 | $192 | $447 | $(422) | $(37,140) | $(17,661) | $(2,343) | $(357) | $3,401 | $15 | $1 | |||||
$846 | $1,819 | $48 | $479 | $3,112 | $25,671 | $11,253 | $18,261 | $7,646 | $71,109 | $15 | $10 | |||||
1,447 | 832 | 142 | 71 | 810 | 2,305 | 4,997 | 3,543 | 5,903 | 948 | 16 | 1 | |||||
(1,448) | (3,133) | (121) | (1,088) | (10,612) | (53,136) | (23,276) | (42,008) | (20,503) | (32,778) | (2) | — | |||||
$845 | $(482) | $69 | $(538) | $(6,690) | $(25,160) | $(7,026) | $(20,204) | $(6,954) | $39,279 | $29 | $11 |
54
Harbor Domestic Equity Funds
Statements of Changes in Net Assets—Capital Stock Activity—Continued
(All amounts in thousands)
Harbor Capital Appreciation Fund | Harbor Strategic Growth Fund | Harbor Mid Cap Growth Fund | ||||||
November 1, 2018 through April 30, 2019 | November 1, 2017 through October 31, 2018 | November 1, 2018 through April 30, 2019 | November 1, 2017 through October 31, 2018 | November 1, 2018 through April 30, 2019 | November 1, 2017 through October 31, 2018 | |||
(Unaudited) | (Unaudited) | (Unaudited) | ||||||
SHARES | ||||||||
Retirement Class | ||||||||
Shares sold | 11,249 | 46,871 | 55 | 168 | 2,915 | 4,092 | ||
Shares issued due to reinvestment of distributions | 7,633 | 5,399 | 6 | 1 | 2,954 | 1,361 | ||
Shares reacquired | (7,678) | (17,760) | (9) | (9) | (16,258) | (3,535) | ||
Net increase/(decrease) in shares outstanding | $11,204 | $34,510 | $52 | $160 | $(10,389) | $1,918 | ||
Institutional Class | ||||||||
Shares sold | 23,017 | 48,030 | 1,552 | 876 | 3,844 | 4,324 | ||
Shares issued due to reinvestment of distributions | 29,827 | 31,713 | 99 | 62 | 2,335 | 1,086 | ||
Shares reacquired | (46,517) | (90,775) | (217) | (537) | (2,947) | (3,780) | ||
Shares reacquired through redemption in-kind | — | (3,847) | — | — | — | — | ||
Net increase/(decrease) in shares outstanding | $6,327 | $(14,879) | $1,434 | $401 | $3,232 | $1,630 | ||
Administrative Class | ||||||||
Shares sold | 755 | 1,216 | — | — | 65 | 834 | ||
Shares issued due to reinvestment of distributions | 650 | 727 | — | — | 291 | 314 | ||
Shares reacquired | (1,959) | (2,431) | — | — | (2,682) | (8,734) | ||
Net increase/(decrease) in shares outstanding | $(554) | $(488) | $— | $— | $(2,326) | $(7,586) | ||
Investor Class | ||||||||
Shares sold | 1,172 | 4,662 | 3 | 17 | 517 | 938 | ||
Shares issued due to reinvestment of distributions | 2,001 | 2,235 | 1 | — | 384 | 237 | ||
Shares reacquired | (4,221) | (9,252) | — | (5) | (442) | (1,402) | ||
Net increase/(decrease) in shares outstanding | $(1,048) | $(2,355) | $4 | $12 | $459 | $(227) |
The accompanying notes are an integral part of the Financial Statements.
55
Harbor Small Cap Growth Fund | Harbor Small Cap Growth Opportunities Fund | Harbor Large Cap Value Fund | Harbor Mid Cap Value Fund | Harbor Small Cap Value Fund | Harbor Small Cap Value Opportunities Fund | |||||||||||
November 1, 2018 through April 30, 2019 | November 1, 2017 through October 31, 2018 | November 1, 2018 through April 30, 2019 | November 1, 2017 through October 31, 2018 | November 1, 2018 through April 30, 2019 | November 1, 2017 through October 31, 2018 | November 1, 2018 through April 30, 2019 | November 1, 2017 through October 31, 2018 | November 1, 2018 through April 30, 2019 | November 1, 2017 through October 31, 2018 | November 1, 2018 through April 30, 2019 | November 1, 2017 through October 31, 2018 | |||||
(Unaudited) | (Unaudited) | (Unaudited) | (Unaudited) | (Unaudited) | (Unaudited) | |||||||||||
1,945 | 10,053 | 477 | 1,517 | 2,560 | 13,207 | 1,266 | 1,544 | 3,058 | 3,898 | 132 | 631 | |||||
5,519 | 1,249 | 881 | 286 | 495 | 509 | 385 | 151 | 243 | 31 | 51 | — | |||||
(5,092) | (2,596) | (217) | (2,598) | (1,967) | (1,562) | (707) | (708) | (1,677) | (897) | — | — | |||||
$2,372 | $8,706 | $1,141 | $(795) | $1,088 | $12,154 | $944 | $987 | $1,624 | $3,032 | $183 | $631 | |||||
2,653 | 4,304 | 2,778 | 6,310 | 11,562 | 18,999 | 4,125 | 11,325 | 9,052 | 12,954 | 12 | 10 | |||||
7,211 | 3,302 | 4,880 | 1,061 | 887 | 1,143 | 2,644 | 1,178 | 3,109 | 496 | 195 | 15 | |||||
(4,234) | (13,569) | (9,172) | (9,007) | (9,433) | (11,540) | (8,517) | (10,785) | (7,890) | (9,126) | (5) | — | |||||
— | — | — | — | — | — | — | — | — | — | — | — | |||||
$5,630 | $(5,963) | $(1,514) | $(1,636) | $3,016 | $8,602 | $(1,748) | $1,718 | $4,271 | $4,324 | $202 | $25 | |||||
6 | 50 | 54 | 74 | 24 | 262 | 230 | 432 | 32 | 143 | — | — | |||||
17 | 6 | 40 | 6 | 23 | 28 | 151 | 72 | 23 | 3 | 2 | — | |||||
(7) | (49) | (67) | (47) | (73) | (2,787) | (1,218) | (606) | (65) | (53) | — | — | |||||
$16 | $7 | $27 | $33 | $(26) | $(2,497) | $(837) | $(102) | $(10) | $93 | $2 | $— | |||||
94 | 131 | 5 | 34 | 217 | 1,673 | 571 | 779 | 257 | 1,993 | 2 | 1 | |||||
164 | 65 | 16 | 6 | 60 | 153 | 277 | 150 | 218 | 27 | 2 | — | |||||
(151) | (224) | (13) | (80) | (734) | (3,444) | (1,182) | (1,795) | (688) | (917) | — | — | |||||
$107 | $(28) | $8 | $(40) | $(457) | $(1,618) | $(334) | $(866) | $(213) | $1,103 | $4 | $1 |
56
Harbor Domestic Equity Funds Financial Highlights
Selected Data for a Share Outstanding for the Periods Presented
HARBOR CAPITAL APPRECIATION FUND | ||||
Retirement Class | ||||
6-Month Period Ended April 30, 2019 | Year Ended October 31, | |||
2018 | 2017 | 2016f | ||
(Unaudited) | ||||
Net asset value beginning of period | $73.98 | $75.34 | $60.37 | $55.79 |
Income from Investment Operations | ||||
Net investment income/(loss)a | 0.09e | 0.23e | 0.16e | 0.05e |
Net realized and unrealized gains/(losses) on investments | 8.42 | 6.50 | 18.40 | 4.53 |
Total from investment operations | 8.51 | 6.73 | 18.56 | 4.58 |
Less Distributions | ||||
Dividends from net investment income | (0.21) | (0.17) | (0.10) | — |
Distributions from net realized capital gains | (6.65) | (7.92) | (3.49) | — |
Total distributions | (6.86) | (8.09) | (3.59) | — |
Net asset value end of period | 75.63 | 73.98 | 75.34 | 60.37 |
Net assets end of period (000s) | $6,361,271 | $5,393,675 | $2,892,484 | $1,022,839 |
Ratios and Supplemental Data (%) | ||||
Total returnb | 13.49%c | 9.50% | 32.62% | 8.21%c |
Ratio of total expenses to average net assets^ | 0.63d | 0.62 | 0.63 | 0.65d |
Ratio of net expenses to average net assetsa | 0.58d | 0.57 | 0.59 | 0.59d |
Ratio of net investment income to average net assetsa | 0.25d | 0.30 | 0.23 | 0.13d |
Portfolio turnover | 20c | 40 | 52 | 34c |
Administrative Class | ||||||
6-Month Period Ended April 30, 2019 | Year Ended October 31, | |||||
2018 | 2017 | 2016 | 2015 | 2014 | ||
(Unaudited) | ||||||
Net asset value beginning of period | $72.54 | $74.08 | $59.50 | $64.51 | $61.39 | $54.29 |
Income from Investment Operations | ||||||
Net investment income/(loss)a | (0.02)e | (0.01)e | (0.04)e | (0.06)e | (0.08)e | (0.11) |
Net realized and unrealized gains/(losses) on investments | 8.25 | 6.39 | 18.11 | (0.84) | 6.97 | 8.94 |
Total from investment operations | 8.23 | 6.38 | 18.07 | (0.90) | 6.89 | 8.83 |
Less Distributions | ||||||
Dividends from net investment income | — | — | — | — | — | — |
Distributions from net realized capital gains | (6.65) | (7.92) | (3.49) | (4.11) | (3.77) | (1.73) |
Total distributions | (6.65) | (7.92) | (3.49) | (4.11) | (3.77) | (1.73) |
Net asset value end of period | 74.12 | 72.54 | 74.08 | 59.50 | 64.51 | 61.39 |
Net assets end of period (000s) | $416,926 | $448,241 | $493,860 | $555,665 | $620,910 | $582,430 |
Ratios and Supplemental Data (%) | ||||||
Total returnb | 13.31%c | 9.16% | 32.20% | (1.48)% | 11.88% | 16.69% |
Ratio of total expenses to average net assets^ | 0.96d | 0.95 | 0.96 | 0.94 | 0.93 | 0.92 |
Ratio of net expenses to average net assetsa | 0.91d | 0.90 | 0.90 | 0.89 | 0.89 | 0.90 |
Ratio of net investment income to average net assetsa | (0.07)d | (0.01) | (0.06) | (0.11) | (0.13) | (0.14) |
Portfolio turnover | 20c | 40 | 52 | 34 | 37 | 34 |
See page 73 for notes to the Financial Highlights.
The accompanying notes are an integral part of the Financial Statements.
57
Institutional Class | |||||
6-Month Period Ended April 30, 2019 | Year Ended October 31, | ||||
2018 | 2017 | 2016 | 2015 | 2014 | |
(Unaudited) | |||||
$73.97 | $75.32 | $60.36 | $65.27 | $61.97 | $54.71 |
0.06e | 0.18e | 0.13e | 0.09e | 0.07e | 0.06 |
8.42 | 6.50 | 18.38 | (0.84) | 7.05 | 8.98 |
8.48 | 6.68 | 18.51 | (0.75) | 7.12 | 9.04 |
(0.15) | (0.11) | (0.06) | (0.05) | (0.05) | (0.05) |
(6.65) | (7.92) | (3.49) | (4.11) | (3.77) | (1.73) |
(6.80) | (8.03) | (3.55) | (4.16) | (3.82) | (1.78) |
75.65 | 73.97 | 75.32 | 60.36 | 65.27 | 61.97 |
$23,354,957 | $22,366,214 | $23,896,840 | $21,608,221 | $24,669,740 | $22,531,379 |
13.44%c | 9.44% | 32.52% | (1.23)% | 12.16% | 16.95% |
0.71d | 0.70 | 0.71 | 0.69 | 0.68 | 0.67 |
0.66d | 0.65 | 0.65 | 0.64 | 0.64 | 0.65 |
0.18d | 0.23 | 0.20 | 0.15 | 0.12 | 0.11 |
20c | 40 | 52 | 34 | 37 | 34 |
Investor Class | |||||
6-Month Period Ended April 30, 2019 | Year Ended October 31, | ||||
2018 | 2017 | 2016 | 2015 | 2014 | |
(Unaudited) | |||||
$71.15 | $72.88 | $58.66 | $63.73 | $60.76 | $53.82 |
(0.06)e | (0.10)e | (0.11)e | (0.13)e | (0.16)e | (0.17) |
8.06 | 6.29 | 17.82 | (0.83) | 6.90 | 8.84 |
8.00 | 6.19 | 17.71 | (0.96) | 6.74 | 8.67 |
— | — | — | — | — | — |
(6.65) | (7.92) | (3.49) | (4.11) | (3.77) | (1.73) |
(6.65) | (7.92) | (3.49) | (4.11) | (3.77) | (1.73) |
72.50 | 71.15 | 72.88 | 58.66 | 63.73 | 60.76 |
$1,277,025 | $1,327,790 | $1,531,809 | $1,540,557 | $2,214,518 | $1,910,930 |
13.24%c | 9.03% | 32.04% | (1.60)% | 11.75% | 16.53% |
1.08d | 1.07 | 1.08 | 1.06 | 1.05 | 1.04 |
1.03d | 1.02 | 1.02 | 1.01 | 1.01 | 1.02 |
(0.19)d | (0.13) | (0.17) | (0.22) | (0.25) | (0.26) |
20c | 40 | 52 | 34 | 37 | 34 |
58
Harbor Domestic Equity Funds Financial Highlights—Continued
Selected Data for a Share Outstanding for the Periods Presented
HARBOR STRATEGIC GROWTH FUND | ||||
Retirement Class | ||||
6-Month Period Ended April 30, 2019 | Year Ended October 31 | Year Ended June 30, 2017h | ||
2018 | 2017i | |||
(Unaudited) | ||||
Net asset value beginning of period | $19.65 | $18.86 | $17.67 | $16.76 |
Income from Investment Operations | ||||
Net investment income/(loss)a | 0.05e | 0.07e | 0.05e | 0.03e |
Net realized and unrealized gains/(losses) on investments | 2.33 | 1.11 | 1.14 | 0.88 |
Total from investment operations | 2.38 | 1.18 | 1.19 | 0.91 |
Less Distributions | ||||
Dividends from net investment income | (0.08) | (0.04) | — | — |
Distributions from net realized capital gains | (0.48) | (0.35) | — | — |
Total distributions | (0.56) | (0.39) | — | — |
Proceeds from redemption fees | N/A | N/A | N/A | N/A |
Net asset value end of period | 21.47 | 19.65 | 18.86 | 17.67 |
Net assets end of period (000s) | $5,043 | $3,584 | $435 | $316 |
Ratios and Supplemental Data (%) | ||||
Total returnb | 12.64%c | 6.34% | 6.73%c | 5.43%c |
Ratio of total expenses to average net assets^ | 0.71d | 0.76 | 1.10d | 1.52d |
Ratio of net expenses to average net assetsa | 0.62d | 0.62 | 0.62d | 0.62d |
Ratio of net investment income to average net assetsa | 0.48d | 0.33 | 0.42d | 0.58d |
Portfolio turnover | 8c | 15 | 9c | 21c |
Administrative Class | ||||
6-Month Period Ended April 30, 2019 | Year Ended October 31, | Year Ended June 30, 2017h | ||
2018 | 2017i | |||
(Unaudited) | ||||
Net asset value beginning of period | $19.58 | $18.82 | $17.65 | $16.76 |
Income from Investment Operations | ||||
Net investment income/(loss)a | 0.02e | 0.01e | 0.01e | 0.01e |
Net realized and unrealized gains/(losses) on investments | 2.33 | 1.10 | 1.16 | 0.88 |
Total from investment operations | 2.35 | 1.11 | 1.17 | 0.89 |
Less Distributions | ||||
Dividends from net investment income | (0.01) | — | — | — |
Distributions from net realized capital gains | (0.48) | (0.35) | — | — |
Total distributions | (0.49) | (0.35) | — | — |
Net asset value end of period | 21.44 | 19.58 | 18.82 | 17.65 |
Net assets end of period (000s) | $17 | $16 | $12 | $11 |
Ratios and Supplemental Data (%) | ||||
Total returnb | 12.50%c | 5.96% | 6.63%c | 5.31%c |
Ratio of total expenses to average net assets^ | 1.04d | 1.09 | 1.43d | 1.93d |
Ratio of net expenses to average net assetsa | 0.95d | 0.95 | 0.95d | 0.95d |
Ratio of net investment income to average net assetsa | 0.16d | 0.03 | 0.10d | 0.19d |
Portfolio turnover | 8c | 15 | 9c | 21c |
See page 73 for notes to the Financial Highlights.
The accompanying notes are an integral part of the Financial Statements.
59
Institutional Class | |||||||
6-Month Period Ended April 30, 2019 | Year Ended October 31, | Year Ended June 30, | |||||
2018 | 2017i | 2017 | 2016 | 2015 | 2014 | ||
(Unaudited) | |||||||
$19.63 | $18.85 | $17.66 | $15.54 | $15.39 | $15.41 | $12.80 | |
0.04e | 0.06e | 0.03e | 0.12e | 0.03e | 0.04e | 0.08e | |
2.32 | 1.11 | 1.16 | 2.22 | 0.63 | 1.11 | 3.35 | |
2.36 | 1.17 | 1.19 | 2.34 | 0.66 | 1.15 | 3.43 | |
(0.06) | (0.04) | — | (0.11) | (0.01) | (0.06) | (0.15) | |
(0.48) | (0.35) | — | (0.11) | (0.50) | (1.11) | (0.67) | |
(0.54) | (0.39) | — | (0.22) | (0.51) | (1.17) | (0.82) | |
N/A | N/A | N/A | —* | —* | —* | —* | |
21.45 | 19.63 | 18.85 | 17.66 | 15.54 | 15.39 | 15.41 | |
$103,124 | $66,197 | $56,026 | $31,866 | $25,388 | $20,540 | $13,678 | |
12.56%c | 6.26% | 6.74%c | 15.21% | 4.44% | 7.67% | 27.71% | |
0.79d | 0.84 | 1.18d | 1.48 | 1.74 | 2.23 | 2.79 | |
0.70d | 0.70 | 0.70d | 0.83 | 0.90 | 0.90 | 0.90 | |
0.38d | 0.28 | 0.29d | 0.71 | 0.19 | 0.18 | 0.58 | |
8c | 15 | 9c | 21 | 40 | 33 | 31 |
Investor Class | |||
6-Month Period Ended April 30, 2019 | Year Ended October 31, | Year Ended June 30, 2017h | |
2018 | 2017i | ||
(Unaudited) | |||
$19.54 | $18.81 | $17.64 | $16.76 |
—e | (0.02)e | 0.02e | 0.01e |
2.05 | 1.10 | 1.15 | 0.87 |
2.05 | 1.08 | 1.17 | 0.88 |
(0.01) | — | — | — |
(0.48) | (0.35) | — | — |
(0.49) | (0.35) | — | — |
21.10 | 19.54 | 18.81 | 17.64 |
$416 | $322 | $75 | $22 |
10.94%c | 5.80% | 6.63%c | 5.25%c |
1.16d | 1.21 | 1.55d | 2.03d |
1.07d | 1.07 | 1.07d | 1.07d |
0.03d | (0.11) | 0.05d | 0.13d |
8c | 15 | 9c | 21c |
60
Harbor Domestic Equity Funds Financial Highlights—Continued
Selected Data for a Share Outstanding for the Periods Presented
HARBOR MID CAP GROWTH FUND | ||||
Retirement Class | ||||
6-Month Period Ended April 30, 2019 | Year Ended October 31, | |||
2018 | 2017 | 2016f | ||
(Unaudited) | ||||
Net asset value beginning of period | $10.88 | $11.25 | $8.58 | $7.76 |
Income from Investment Operations | ||||
Net investment income/(loss)a | (0.02)e | (0.03)e | 0.01e | (0.03)e |
Net realized and unrealized gains/(losses) on investments | 1.87 | 0.88 | 2.66 | 0.85 |
Total from investment operations | 1.85 | 0.85 | 2.67 | 0.82 |
Less Distributions | ||||
Dividends from net investment income | — | — | — | — |
Distributions from net realized capital gains | (1.78) | (1.22) | — | — |
Total distributions | (1.78) | (1.22) | — | — |
Net asset value end of period | 10.95 | 10.88 | 11.25 | 8.58 |
Net assets end of period (000s) | $31,276 | $144,137 | $127,446 | $2,718 |
Ratios and Supplemental Data (%) | ||||
Total returnb | 21.82%c | 8.02% | 31.12% | 10.57%c |
Ratio of total expenses to average net assets^ | 0.81d | 0.80 | 0.81 | 0.81d |
Ratio of net expenses to average net assetsa | 0.81d | 0.80 | 0.81 | 0.80d |
Ratio of net investment income to average net assetsa | (0.35)d | (0.28) | 0.07 | (0.45)d |
Portfolio turnover | 30c | 85 | 87 | 84c |
Administrative Class | ||||||
6-Month Period Ended April 30, 2019 | Year Ended October 31, | |||||
2018 | 2017 | 2016 | 2015 | 2014 | ||
(Unaudited) | ||||||
Net asset value beginning of period | $10.37 | $10.81 | $8.27 | $9.45 | $11.15 | $11.54 |
Income from Investment Operations | ||||||
Net investment income/(loss)a | (0.03)e | (0.06)e | (0.04)e | (0.05)e | (0.06)e | (0.07) |
Net realized and unrealized gains/(losses) on investments | 1.75 | 0.84 | 2.58 | (0.03) | 0.19 | 1.52 |
Total from investment operations | 1.72 | 0.78 | 2.54 | (0.08) | 0.13 | 1.45 |
Less Distributions | ||||||
Dividends from net investment income | — | — | — | (0.04) | — | — |
Distributions from net realized capital gains | (1.78) | (1.22) | — | (1.06) | (1.83) | (1.84) |
Total distributions | (1.78) | (1.22) | — | (1.10) | (1.83) | (1.84) |
Net asset value end of period | 10.31 | 10.37 | 10.81 | 8.27 | 9.45 | 11.15 |
Net assets end of period (000s) | $2,808 | $26,936 | $110,114 | $175,211 | $366,121 | $384,511 |
Ratios and Supplemental Data (%) | ||||||
Total returnb | 21.63%c | 7.68% | 30.71% | (0.91)% | 1.29% | 14.16% |
Ratio of total expenses to average net assets^ | 1.14d | 1.13 | 1.13 | 1.10 | 1.09 | 1.09 |
Ratio of net expenses to average net assetsa | 1.14d | 1.12 | 1.12 | 1.10 | 1.09 | 1.08 |
Ratio of net investment income to average net assetsa | (0.63)d | (0.55) | (0.45) | (0.57) | (0.58) | (0.59) |
Portfolio turnover | 30c | 85 | 87 | 84 | 82 | 95 |
See page 73 for notes to the Financial Highlights.
The accompanying notes are an integral part of the Financial Statements.
61
Institutional Class | |||||
6-Month Period Ended April 30, 2019 | Year Ended October 31, | ||||
2018 | 2017 | 2016 | 2015 | 2014 | |
(Unaudited) | |||||
$10.86 | $11.24 | $8.58 | $9.76 | $11.43 | $11.76 |
(0.02)e | (0.04)e | (0.01)e | (0.03)e | (0.04)e | (0.04) |
1.86 | 0.88 | 2.67 | (0.03) | 0.20 | 1.55 |
1.84 | 0.84 | 2.66 | (0.06) | 0.16 | 1.51 |
— | — | — | (0.06) | — | — |
(1.78) | (1.22) | — | (1.06) | (1.83) | (1.84) |
(1.78) | (1.22) | — | (1.12) | (1.83) | (1.84) |
10.92 | 10.86 | 11.24 | 8.58 | 9.76 | 11.43 |
$194,857 | $158,680 | $145,914 | $303,802 | $194,308 | $306,371 |
21.76%c | 7.94% | 31.00% | (0.60)% | 1.55% | 14.45% |
0.89d | 0.88 | 0.88 | 0.86 | 0.84 | 0.84 |
0.89d | 0.87 | 0.87 | 0.85 | 0.84 | 0.83 |
(0.48)d | (0.36) | (0.14) | (0.31) | (0.35) | (0.34) |
30c | 85 | 87 | 84 | 82 | 95 |
Investor Class | |||||
6-Month Period Ended April 30, 2019 | Year Ended October 31, | ||||
2018 | 2017 | 2016 | 2015 | 2014 | |
(Unaudited) | |||||
$10.07 | $10.54 | $8.07 | $9.24 | $10.95 | $11.37 |
(0.04)e | (0.08)e | (0.04)e | (0.05)e | (0.07)e | (0.05) |
1.69 | 0.83 | 2.51 | (0.04) | 0.19 | 1.47 |
1.65 | 0.75 | 2.47 | (0.09) | 0.12 | 1.42 |
— | — | — | (0.02) | — | — |
(1.78) | (1.22) | — | (1.06) | (1.83) | (1.84) |
(1.78) | (1.22) | — | (1.08) | (1.83) | (1.84) |
9.94 | 10.07 | 10.54 | 8.07 | 9.24 | 10.95 |
$21,267 | $16,929 | $20,121 | $17,167 | $24,647 | $37,887 |
21.56%c | 7.57% | 30.61% | (1.05)% | 1.21% | 14.09% |
1.26d | 1.25 | 1.25 | 1.22 | 1.21 | 1.21 |
1.26d | 1.24 | 1.24 | 1.22 | 1.21 | 1.20 |
(0.85)d | (0.72) | (0.48) | (0.68) | (0.71) | (0.71) |
30c | 85 | 87 | 84 | 82 | 95 |
62
Harbor Domestic Equity Funds Financial Highlights—Continued
Selected Data for a Share Outstanding for the Periods Presented
HARBOR SMALL CAP GROWTH FUND | ||||
Retirement Class | ||||
6-Month Period Ended April 30, 2019 | Year Ended October 31, | |||
2018 | 2017 | 2016f | ||
(Unaudited) | ||||
Net asset value beginning of period | $14.39 | $15.08 | $11.95 | $10.72 |
Income from Investment Operations | ||||
Net investment income/(loss)a | (0.01)e | (0.05)e | (0.04)e | (0.02)e |
Net realized and unrealized gains/(losses) on investments | 1.24 | 0.82 | 3.23 | 1.25 |
Total from investment operations | 1.23 | 0.77 | 3.19 | 1.23 |
Less Distributions | ||||
Dividends from net investment income | — | — | — | — |
Distributions from net realized capital gains | (2.76) | (1.46) | (0.06) | — |
Total distributions | (2.76) | (1.46) | (0.06) | — |
Net asset value end of period | 12.86 | 14.39 | 15.08 | 11.95 |
Net assets end of period (000s) | $304,144 | $306,026 | $189,516 | $54,634 |
Ratios and Supplemental Data (%) | ||||
Total returnb | 13.40%c | 5.11% | 26.78% | 11.47%c |
Ratio of total expenses to average net assets^ | 0.79d | 0.79 | 0.79 | 0.81d |
Ratio of net expenses to average net assetsa | 0.79d | 0.79 | 0.79 | 0.80d |
Ratio of net investment income to average net assetsa | (0.14)d | (0.33) | (0.26) | (0.27)d |
Portfolio turnover | 38c | 99 | 83 | 89c |
Administrative Class | ||||||
6-Month Period Ended April 30, 2019 | Year Ended October 31, | |||||
2018 | 2017 | 2016 | 2015 | 2014 | ||
(Unaudited) | ||||||
Net asset value beginning of period | $13.39 | $14.17 | $11.30 | $13.04 | $14.89 | $15.26 |
Income from Investment Operations | ||||||
Net investment income/(loss)a | (0.03)e | (0.09)e | (0.07)e | (0.05)e | (0.07)e | 0.54k |
Net realized and unrealized gains/(losses) on investments | 1.11 | 0.77 | 3.00 | (0.11) | 0.54 | 1.22 |
Total from investment operations | 1.08 | 0.68 | 2.93 | (0.16) | 0.47 | 1.76 |
Less Distributions | ||||||
Dividends from net investment income | — | — | — | — | — | — |
Distributions from net realized capital gains | (2.76) | (1.46) | (0.06) | (1.58) | (2.32) | (2.13) |
Total distributions | (2.76) | (1.46) | (0.06) | (1.58) | (2.32) | (2.13) |
Net asset value end of period | 11.71 | 13.39 | 14.17 | 11.30 | 13.04 | 14.89 |
Net assets end of period (000s) | $856 | $769 | $719 | $686 | $877 | $650 |
Ratios and Supplemental Data (%) | ||||||
Total returnb | 13.26%c | 4.76% | 26.02% | (1.29)% | 3.12% | 12.65% |
Ratio of total expenses to average net assets^ | 1.12d | 1.12 | 1.11 | 1.10 | 1.09 | 1.08 |
Ratio of net expenses to average net assetsa | 1.12d | 1.11 | 1.10 | 1.10 | 1.08 | 1.08 |
Ratio of net investment income to average net assetsa | (0.48)d | (0.65) | (0.56) | (0.46) | (0.47) | (0.54) |
Portfolio turnover | 38c | 99 | 83 | 89 | 78 | 76 |
See page 73 for notes to the Financial Highlights.
The accompanying notes are an integral part of the Financial Statements.
63
Institutional Class | |||||
6-Month Period Ended April 30, 2019 | Year Ended October 31, | ||||
2018 | 2017 | 2016 | 2015 | 2014 | |
(Unaudited) | |||||
$14.35 | $15.06 | $11.94 | $13.65 | $15.45 | $15.72 |
(0.01)e | (0.06)e | (0.04)e | (0.02)e | (0.03)e | (0.05) |
1.24 | 0.81 | 3.22 | (0.11) | 0.55 | 1.91 |
1.23 | 0.75 | 3.18 | (0.13) | 0.52 | 1.86 |
— | — | — | — | — | — |
(2.76) | (1.46) | (0.06) | (1.58) | (2.32) | (2.13) |
(2.76) | (1.46) | (0.06) | (1.58) | (2.32) | (2.13) |
12.82 | 14.35 | 15.06 | 11.94 | 13.65 | 15.45 |
$429,819 | $400,389 | $509,889 | $523,888 | $587,761 | $603,476 |
13.44%c | 4.97% | 26.72% | (0.99)% | 3.35% | 12.94% |
0.87d | 0.87 | 0.86 | 0.85 | 0.84 | 0.83 |
0.87d | 0.86 | 0.85 | 0.85 | 0.83 | 0.83 |
(0.22)d | (0.40) | (0.30) | (0.21) | (0.22) | (0.29) |
38c | 99 | 83 | 89 | 78 | 76 |
Investor Class | |||||
6-Month Period Ended April 30, 2019 | Year Ended October 31, | ||||
2018 | 2017 | 2016 | 2015 | 2014 | |
(Unaudited) | |||||
$12.79 | $13.62 | $10.84 | $12.59 | $14.47 | $14.90 |
(0.03)e | (0.11)e | (0.08)e | (0.06)e | (0.08)e | (0.51) |
1.03 | 0.74 | 2.92 | (0.11) | 0.52 | 2.21 |
1.00 | 0.63 | 2.84 | (0.17) | 0.44 | 1.70 |
— | — | — | — | — | — |
(2.76) | (1.46) | (0.06) | (1.58) | (2.32) | (2.13) |
(2.76) | (1.46) | (0.06) | (1.58) | (2.32) | (2.13) |
11.03 | 12.79 | 13.62 | 10.84 | 12.59 | 14.47 |
$7,277 | $7,076 | $7,913 | $8,401 | $11,660 | $14,266 |
13.24%c | 4.58% | 26.29% | (1.44)% | 2.98% | 12.53% |
1.24d | 1.24 | 1.23 | 1.22 | 1.21 | 1.20 |
1.24d | 1.23 | 1.22 | 1.22 | 1.20 | 1.20 |
(0.60)d | (0.77) | (0.67) | (0.58) | (0.59) | (0.66) |
38c | 99 | 83 | 89 | 78 | 76 |
64
Harbor Domestic Equity Funds Financial Highlights—Continued
Selected Data for a Share Outstanding for the Periods Presented
HARBOR SMALL CAP GROWTH OPPORTUNITIES FUND | ||||
Retirement Class | ||||
6-Month Period Ended April 30, 2019 | Year Ended October 31, | |||
2018 | 2017 | 2016f | ||
(Unaudited) | ||||
Net asset value beginning of period | $13.14 | $12.61 | $10.24 | $9.04 |
Income from Investment Operations | ||||
Net investment income/(loss)a | (0.02)e | (0.07)e | (0.07)e | (0.04)e |
Net realized and unrealized gains/(losses) on investments | 0.15 | 1.35 | 2.44 | 1.24 |
Total from investment operations | 0.13 | 1.28 | 2.37 | 1.20 |
Less Distributions | ||||
Dividends from net investment income | — | — | — | — |
Distributions from net realized capital gains | (2.67) | (0.75) | — | — |
Total distributions | (2.67) | (0.75) | — | — |
Net asset value end of period | 10.60 | 13.14 | 12.61 | 10.24 |
Net assets end of period (000s) | $43,644 | $39,139 | $47,569 | $20,230 |
Ratios and Supplemental Data (%) | ||||
Total returnb | 4.73%c | 10.53% | 23.14% | 13.27%c |
Ratio of total expenses to average net assets^ | 0.82d | 0.80 | 0.81 | 0.85d |
Ratio of net expenses to average net assetsa | 0.82d | 0.80 | 0.81 | 0.84d |
Ratio of net investment income to average net assetsa | (0.45)d | (0.55) | (0.57) | (0.60)d |
Portfolio turnover | 40c | 71 | 67 | 85c |
Administrative Class | ||||||
6-Month Period Ended April 30, 2019 | Year Ended October 31, | |||||
2018 | 2017 | 2016 | 2015 | 2014g | ||
(Unaudited) | ||||||
Net asset value beginning of period | $13.03 | $12.54 | $10.22 | $10.27 | $10.75 | $10.00 |
Income from Investment Operations | ||||||
Net investment income/(loss)a | (0.04)e | (0.11)e | (0.12)e | (0.07)e | (0.09)e | (0.09) |
Net realized and unrealized gains/(losses) on investments | 0.14 | 1.35 | 2.44 | 0.37 | (0.34) | 0.84 |
Total from investment operations | 0.10 | 1.24 | 2.32 | 0.30 | (0.43) | 0.75 |
Less Distributions | ||||||
Dividends from net investment income | — | — | — | — | — | — |
Distributions from net realized capital gains | (2.67) | (0.75) | — | (0.35) | (0.05) | — |
Total distributions | (2.67) | (0.75) | — | (0.35) | (0.05) | — |
Net asset value end of period | 10.46 | 13.03 | 12.54 | 10.22 | 10.27 | 10.75 |
Net assets end of period (000s) | $1,717 | $1,792 | $1,308 | $143 | $3,006 | $269 |
Ratios and Supplemental Data (%) | ||||||
Total returnb | 4.49%c | 10.26% | 22.70% | 2.94% | (3.98)% | 7.50%c |
Ratio of total expenses to average net assets^ | 1.15d | 1.12 | 1.13 | 1.14 | 1.15 | 1.85d |
Ratio of net expenses to average net assetsa | 1.15d | 1.11 | 1.13 | 1.13 | 1.15 | 1.15d |
Ratio of net investment income to average net assetsa | (0.77)d | (0.86) | (0.96) | (0.69) | (0.80) | (0.90)d |
Portfolio turnover | 40c | 71 | 67 | 85 | 103 | 55c |
See page 73 for notes to the Financial Highlights.
The accompanying notes are an integral part of the Financial Statements.
65
Institutional Class | |||||
6-Month Period Ended April 30, 2019 | Year Ended October 31, | ||||
2018 | 2017 | 2016 | 2015 | 2014g | |
(Unaudited) | |||||
$13.12 | $12.59 | $10.23 | $10.31 | $10.77 | $10.00 |
(0.03)e | (0.08)e | (0.07)e | (0.05)e | (0.06)e | (0.02) |
0.15 | 1.36 | 2.43 | 0.32 | (0.35) | 0.79 |
0.12 | 1.28 | 2.36 | 0.27 | (0.41) | 0.77 |
— | — | — | — | — | — |
(2.67) | (0.75) | — | (0.35) | (0.05) | — |
(2.67) | (0.75) | — | (0.35) | (0.05) | — |
10.57 | 13.12 | 12.59 | 10.23 | 10.31 | 10.77 |
$180,643 | $244,140 | $254,925 | $169,718 | $205,007 | $57,779 |
4.64%c | 10.55% | 23.07% | 2.62% | (3.78)% | 7.70%c |
0.90d | 0.88 | 0.88 | 0.89 | 0.90 | 1.60d |
0.90d | 0.87 | 0.88 | 0.89 | 0.90 | 0.90d |
(0.50)d | (0.62) | (0.61) | (0.48) | (0.55) | (0.67)d |
40c | 71 | 67 | 85 | 103 | 55c |
Investor Class | |||||
6-Month Period Ended April 30, 2019 | Year Ended October 31, | ||||
2018 | 2017 | 2016 | 2015 | 2014g | |
(Unaudited) | |||||
$12.87 | $12.41 | $10.12 | $10.24 | $10.74 | $10.00 |
(0.04)e | (0.13)e | (0.11)e | (0.09)e | (0.09)e | (0.05) |
0.13 | 1.34 | 2.40 | 0.32 | (0.36) | 0.79 |
0.09 | 1.21 | 2.29 | 0.23 | (0.45) | 0.74 |
— | — | — | — | — | — |
(2.67) | (0.75) | — | (0.35) | (0.05) | — |
(2.67) | (0.75) | — | (0.35) | (0.05) | — |
10.29 | 12.87 | 12.41 | 10.12 | 10.24 | 10.74 |
$636 | $691 | $1,167 | $871 | $599 | $1,809 |
4.45%c | 10.12% | 22.63% | 2.24% | (4.17)% | 7.40%c |
1.27d | 1.25 | 1.25 | 1.26 | 1.27 | 1.97d |
1.27d | 1.24 | 1.25 | 1.26 | 1.27 | 1.27d |
(0.88)d | (0.99) | (0.99) | (0.87) | (0.86) | (1.03)d |
40c | 71 | 67 | 85 | 103 | 55c |
66
Harbor Domestic Equity Funds Financial Highlights—Continued
Selected Data for a Share Outstanding for the Periods Presented
HARBOR LARGE CAP VALUE FUND | ||||
Retirement Class | ||||
6-Month Period Ended April 30, 2019 | Year Ended October 31, | |||
2018 | 2017 | 2016f | ||
(Unaudited) | ||||
Net asset value beginning of period | $14.37 | $14.87 | $12.32 | $10.94 |
Income from Investment Operations | ||||
Net investment income/(loss)a | 0.10e | 0.17e | 0.12e | 0.12e |
Net realized and unrealized gains/(losses) on investments | 1.54 | (0.13) | 3.00 | 1.33 |
Total from investment operations | 1.64 | 0.04 | 3.12 | 1.45 |
Less Distributions | ||||
Dividends from net investment income | (0.08) | (0.13) | (0.14) | (0.07) |
Distributions from net realized capital gains | (0.23) | (0.41) | (0.43) | — |
Total distributions | (0.31) | (0.54) | (0.57) | (0.07) |
Net asset value end of period | 15.70 | 14.37 | 14.87 | 12.32 |
Net assets end of period (000s) | $359,880 | $313,721 | $143,966 | $3,822 |
Ratios and Supplemental Data (%) | ||||
Total returnb | 11.80%c | 0.18% | 26.08% | 13.24%c |
Ratio of total expenses to average net assets^ | 0.64d | 0.64 | 0.64 | 0.67d |
Ratio of net expenses to average net assetsa | 0.60d | 0.60 | 0.60 | 0.63d |
Ratio of net investment income to average net assetsa | 1.36d | 1.12 | 0.83 | 1.46d |
Portfolio turnover | 8c | 15 | 16 | 34c |
Administrative Class | ||||||
6-Month Period Ended April 30, 2019 | Year Ended October 31, | |||||
2018 | 2017 | 2016 | 2015 | 2014 | ||
(Unaudited) | ||||||
Net asset value beginning of period | $14.36 | $14.84 | $12.30 | $12.15 | $12.23 | $10.85 |
Income from Investment Operations | ||||||
Net investment income/(loss)a | 0.07e | 0.13e | 0.10e | 0.13e | 0.12e | 0.15 |
Net realized and unrealized gains/(losses) on investments | 1.55 | (0.15) | 2.99 | 0.63 | 0.70 | 1.34 |
Total from investment operations | 1.62 | (0.02) | 3.09 | 0.76 | 0.82 | 1.49 |
Less Distributions | ||||||
Dividends from net investment income | (0.05) | (0.05) | (0.12) | (0.10) | (0.11) | (0.11) |
Distributions from net realized capital gains | (0.23) | (0.41) | (0.43) | (0.51) | (0.79) | — |
Total distributions | (0.28) | (0.46) | (0.55) | (0.61) | (0.90) | (0.11) |
Net asset value end of period | 15.70 | 14.36 | 14.84 | 12.30 | 12.15 | 12.23 |
Net assets end of period (000s) | $16,475 | $15,460 | $53,006 | $9,361 | $24,690 | $20,927 |
Ratios and Supplemental Data (%) | ||||||
Total returnb | 11.67%c | (0.23)% | 25.77% | 6.77% | 7.02% | 13.78% |
Ratio of total expenses to average net assets^ | 0.97d | 0.97 | 0.97 | 0.96 | 0.95 | 0.95 |
Ratio of net expenses to average net assetsa | 0.93d | 0.93 | 0.93 | 0.93 | 0.93 | 0.93 |
Ratio of net investment income to average net assetsa | 1.03d | 0.84 | 0.70 | 1.09 | 1.00 | 1.02 |
Portfolio turnover | 8c | 15 | 16 | 34 | 24 | 32 |
See page 73 for notes to the Financial Highlights.
The accompanying notes are an integral part of the Financial Statements.
67
Institutional Class | |||||
6-Month Period Ended April 30, 2019 | Year Ended October 31, | ||||
2018 | 2017 | 2016 | 2015 | 2014 | |
(Unaudited) | |||||
$14.37 | $14.87 | $12.32 | $12.16 | $12.24 | $10.85 |
0.09e | 0.16e | 0.15e | 0.16e | 0.15e | 0.15 |
1.54 | (0.13) | 2.97 | 0.64 | 0.70 | 1.37 |
1.63 | 0.03 | 3.12 | 0.80 | 0.85 | 1.52 |
(0.07) | (0.12) | (0.14) | (0.13) | (0.14) | (0.13) |
(0.23) | (0.41) | (0.43) | (0.51) | (0.79) | — |
(0.30) | (0.53) | (0.57) | (0.64) | (0.93) | (0.13) |
15.70 | 14.37 | 14.87 | 12.32 | 12.16 | 12.24 |
$708,472 | $605,040 | $498,360 | $310,127 | $231,033 | $202,596 |
11.75%c | 0.11% | 26.00% | 7.14% | 7.29% | 14.13% |
0.72d | 0.72 | 0.72 | 0.72 | 0.70 | 0.70 |
0.68d | 0.68 | 0.68 | 0.68 | 0.68 | 0.68 |
1.27d | 1.05 | 1.10 | 1.32 | 1.25 | 1.26 |
8c | 15 | 16 | 34 | 24 | 32 |
Investor Class | |||||
6-Month Period Ended April 30, 2019 | Year Ended October 31, | ||||
2018 | 2017 | 2016 | 2015 | 2014 | |
(Unaudited) | |||||
$14.49 | $14.99 | $12.42 | $12.25 | $12.33 | $10.94 |
0.07e | 0.11e | 0.10e | 0.11e | 0.11e | 0.13 |
1.55 | (0.14) | 2.99 | 0.66 | 0.70 | 1.35 |
1.62 | (0.03) | 3.09 | 0.77 | 0.81 | 1.48 |
(0.04) | (0.06) | (0.09) | (0.09) | (0.10) | (0.09) |
(0.23) | (0.41) | (0.43) | (0.51) | (0.79) | — |
(0.27) | (0.47) | (0.52) | (0.60) | (0.89) | (0.09) |
15.84 | 14.49 | 14.99 | 12.42 | 12.25 | 12.33 |
$42,568 | $45,548 | $71,374 | $57,716 | $29,745 | $20,189 |
11.52%c | (0.27)% | 25.52% | 6.80% | 6.87% | 13.62% |
1.09d | 1.09 | 1.09 | 1.09 | 1.07 | 1.07 |
1.05d | 1.05 | 1.05 | 1.05 | 1.05 | 1.05 |
0.91d | 0.70 | 0.75 | 0.94 | 0.89 | 0.88 |
8c | 15 | 16 | 34 | 24 | 32 |
68
Harbor Domestic Equity Funds Financial Highlights—Continued
Selected Data for a Share Outstanding for the Periods Presented
HARBOR MID CAP VALUE FUND | ||||
Retirement Class | ||||
6-Month Period Ended April 30, 2019 | Year Ended October 31, | |||
2018 | 2017 | 2016f | ||
(Unaudited) | ||||
Net asset value beginning of period | $21.39 | $23.33 | $20.17 | $18.36 |
Income from Investment Operations | ||||
Net investment income/(loss)a | 0.25e | 0.50e | 0.40e | 0.28e |
Net realized and unrealized gains/(losses) on investments | 0.88 | (1.52) | 3.43 | 1.53 |
Total from investment operations | 1.13 | (1.02) | 3.83 | 1.81 |
Less Distributions | ||||
Dividends from net investment income | (0.37) | (0.33) | (0.36) | — |
Distributions from net realized capital gains | (1.15) | (0.59) | (0.31) | — |
Total distributions | (1.52) | (0.92) | (0.67) | — |
Net asset value end of period | 21.00 | 21.39 | 23.33 | 20.17 |
Net assets end of period (000s) | $121,487 | $103,552 | $89,942 | $14,999 |
Ratios and Supplemental Data (%) | ||||
Total returnb | 6.45%c | (4.75)% | 19.22% | 9.86%c |
Ratio of total expenses to average net assets^ | 0.80d | 0.79 | 0.80 | 0.82d |
Ratio of net expenses to average net assetsa | 0.77d | 0.76 | 0.77 | 0.79d |
Ratio of net investment income to average net assetsa | 2.44d | 2.15 | 1.79 | 2.11d |
Portfolio turnover | 6c | 24 | 22 | 18c |
Administrative Class | ||||||
6-Month Period Ended April 30, 2019 | Year Ended October 31, | |||||
2018 | 2017 | 2016 | 2015 | 2014 | ||
(Unaudited) | ||||||
Net asset value beginning of period | $21.52 | $23.47 | $20.30 | $20.40 | $20.47 | $17.64 |
Income from Investment Operations | ||||||
Net investment income/(loss)a | 0.21e | 0.43e | 0.34e | 0.40e | 0.29e | 0.25 |
Net realized and unrealized gains/(losses) on investments | 0.91 | (1.54) | 3.45 | 0.07 | (0.07) | 2.75 |
Total from investment operations | 1.12 | (1.11) | 3.79 | 0.47 | 0.22 | 3.00 |
Less Distributions | ||||||
Dividends from net investment income | (0.29) | (0.25) | (0.31) | (0.22) | (0.16) | (0.17) |
Distributions from net realized capital gains | (1.15) | (0.59) | (0.31) | (0.35) | (0.13) | — |
Total distributions | (1.44) | (0.84) | (0.62) | (0.57) | (0.29) | (0.17) |
Net asset value end of period | 21.20 | 21.52 | 23.47 | 20.30 | 20.40 | 20.47 |
Net assets end of period (000s) | $24,174 | $42,557 | $48,809 | $40,992 | $28,929 | $14,775 |
Ratios and Supplemental Data (%) | ||||||
Total returnb | 6.29%c | (5.06)% | 18.84% | 2.54% | 1.05% | 17.15% |
Ratio of total expenses to average net assets^ | 1.13d | 1.12 | 1.12 | 1.11 | 1.11 | 1.14 |
Ratio of net expenses to average net assetsa | 1.09d | 1.08 | 1.09 | 1.09 | 1.11 | 1.14 |
Ratio of net investment income to average net assetsa | 2.12d | 1.83 | 1.51 | 2.03 | 1.41 | 1.13 |
Portfolio turnover | 6c | 24 | 22 | 18 | 12 | 13 |
See page 73 for notes to the Financial Highlights.
The accompanying notes are an integral part of the Financial Statements.
69
Institutional Class | |||||
6-Month Period Ended April 30, 2019 | Year Ended October 31, | ||||
2018 | 2017 | 2016 | 2015 | 2014 | |
(Unaudited) | |||||
$21.38 | $23.33 | $20.17 | $20.27 | $20.32 | $17.50 |
0.24e | 0.49e | 0.39e | 0.44e | 0.34e | 0.18 |
0.88 | (1.54) | 3.43 | 0.08 | (0.07) | 2.84 |
1.12 | (1.05) | 3.82 | 0.52 | 0.27 | 3.02 |
(0.35) | (0.31) | (0.35) | (0.27) | (0.19) | (0.20) |
(1.15) | (0.59) | (0.31) | (0.35) | (0.13) | — |
(1.50) | (0.90) | (0.66) | (0.62) | (0.32) | (0.20) |
21.00 | 21.38 | 23.33 | 20.17 | 20.27 | 20.32 |
$664,879 | $714,309 | $739,122 | $600,800 | $484,078 | $195,247 |
6.39%c | (4.85)% | 19.16% | 2.81% | 1.32% | 17.39% |
0.88d | 0.87 | 0.87 | 0.86 | 0.86 | 0.89 |
0.84d | 0.83 | 0.84 | 0.84 | 0.86 | 0.89 |
2.40d | 2.09 | 1.76 | 2.28 | 1.66 | 1.40 |
6c | 24 | 22 | 18 | 12 | 13 |
Investor Class | |||||
6-Month Period Ended April 30, 2019 | Year Ended October 31, | ||||
2018 | 2017 | 2016 | 2015 | 2014 | |
(Unaudited) | |||||
$21.31 | $23.23 | $20.09 | $20.19 | $20.27 | $17.49 |
0.20e | 0.40e | 0.31e | 0.37e | 0.27e | 0.17 |
0.89 | (1.53) | 3.41 | 0.08 | (0.08) | 2.78 |
1.09 | (1.13) | 3.72 | 0.45 | 0.19 | 2.95 |
(0.25) | (0.20) | (0.27) | (0.20) | (0.14) | (0.17) |
(1.15) | (0.59) | (0.31) | (0.35) | (0.13) | — |
(1.40) | (0.79) | (0.58) | (0.55) | (0.27) | (0.17) |
21.00 | 21.31 | 23.23 | 20.09 | 20.19 | 20.27 |
$74,320 | $82,539 | $110,094 | $152,358 | $165,642 | $91,724 |
6.19%c | (5.20)% | 18.71% | 2.45% | 0.93% | 16.97% |
1.25d | 1.24 | 1.24 | 1.23 | 1.23 | 1.26 |
1.21d | 1.20 | 1.21 | 1.21 | 1.23 | 1.26 |
2.01d | 1.71 | 1.40 | 1.92 | 1.29 | 1.01 |
6c | 24 | 22 | 18 | 12 | 13 |
70
Harbor Domestic Equity Funds Financial Highlights—Continued
Selected Data for a Share Outstanding for the Periods Presented
HARBOR SMALL CAP VALUE FUND | ||||
Retirement Class | ||||
6-Month Period Ended April 30, 2019 | Year Ended October 31, | |||
2018 | 2017 | 2016f | ||
(Unaudited) | ||||
Net asset value beginning of period | $33.60 | $36.16 | $27.29 | $23.91 |
Income from Investment Operations | ||||
Net investment income/(loss)a | 0.10e | 0.17e | 0.06e | 0.05e |
Net realized and unrealized gains/(losses) on investments | 2.70 | (1.98) | 8.94 | 3.33 |
Total from investment operations | 2.80 | (1.81) | 9.00 | 3.38 |
Less Distributions | ||||
Dividends from net investment income | (0.15) | (0.06) | (0.13) | — |
Distributions from net realized capital gains | (2.95) | (0.69) | — | — |
Total distributions | (3.10) | (0.75) | (0.13) | — |
Net asset value end of period | 33.30 | 33.60 | 36.16 | 27.29 |
Net assets end of period (000s) | $207,709 | $155,036 | $57,196 | $2,529 |
Ratios and Supplemental Data (%) | ||||
Total returnb | 10.15%c | (5.18)% | 33.06% | 14.14%c |
Ratio of total expenses to average net assets^ | 0.80d | 0.79 | 0.81 | 0.82d |
Ratio of net expenses to average net assetsa | 0.79d | 0.79 | 0.81 | 0.81d |
Ratio of net investment income to average net assetsa | 0.67d | 0.45 | 0.17 | 0.27d |
Portfolio turnover | 14c | 22 | 8 | 10c |
Administrative Class | ||||||
6-Month Period Ended April 30, 2019 | Year Ended October 31, | |||||
2018 | 2017 | 2016 | 2015 | 2014 | ||
(Unaudited) | ||||||
Net asset value beginning of period | $33.36 | $35.97 | $27.16 | $26.07 | $27.05 | $28.80 |
Income from Investment Operations | ||||||
Net investment income/(loss)a | 0.06e | 0.06e | (0.02)e | 0.05e | 0.06e | (0.12) |
Net realized and unrealized gains/(losses) on investments | 2.68 | (1.98) | 8.88 | 1.93 | (0.13) | 2.78 |
Total from investment operations | 2.74 | (1.92) | 8.86 | 1.98 | (0.07) | 2.66 |
Less Distributions | ||||||
Dividends from net investment income | (0.04) | — | (0.05) | — | — | — |
Distributions from net realized capital gains | (2.95) | (0.69) | — | (0.89) | (0.91) | (4.41) |
Total distributions | (2.99) | (0.69) | (0.05) | (0.89) | (0.91) | (4.41) |
Net asset value end of period | 33.11 | 33.36 | 35.97 | 27.16 | 26.07 | 27.05 |
Net assets end of period (000s) | $6,862 | $7,253 | $4,462 | $1,360 | $1,144 | $5,690 |
Ratios and Supplemental Data (%) | ||||||
Total returnb | 9.96%c | (5.50)% | 32.67% | 7.93% | (0.28)% | 10.74% |
Ratio of total expenses to average net assets^ | 1.13d | 1.12 | 1.13 | 1.11 | 1.10 | 1.09 |
Ratio of net expenses to average net assetsa | 1.12d | 1.11 | 1.12 | 1.11 | 1.10 | 1.09 |
Ratio of net investment income to average net assetsa | 0.37d | 0.16 | (0.05) | 0.21 | 0.21 | 0.10 |
Portfolio turnover | 14c | 22 | 8 | 10 | 17 | 13 |
See page 73 for notes to the Financial Highlights.
The accompanying notes are an integral part of the Financial Statements.
71
Institutional Class | |||||
6-Month Period Ended April 30, 2019 | Year Ended October 31, | ||||
2018 | 2017 | 2016 | 2015 | 2014 | |
(Unaudited) | |||||
$33.57 | $36.14 | $27.27 | $26.21 | $27.17 | $28.89 |
0.10e | 0.15e | 0.08e | 0.12e | 0.10e | 0.06 |
2.69 | (2.00) | 8.90 | 1.92 | (0.09) | 2.68 |
2.79 | (1.85) | 8.98 | 2.04 | 0.01 | 2.74 |
(0.12) | (0.03) | (0.11) | (0.09) | (0.06) | (0.05) |
(2.95) | (0.69) | — | (0.89) | (0.91) | (4.41) |
(3.07) | (0.72) | (0.11) | (0.98) | (0.97) | (4.46) |
33.29 | 33.57 | 36.14 | 27.27 | 26.21 | 27.17 |
$1,282,362 | $1,149,857 | $1,081,412 | $738,705 | $827,423 | $709,251 |
10.12%c | (5.28)% | 33.00% | 8.18% | 0.01% | 11.03% |
0.88d | 0.87 | 0.88 | 0.86 | 0.85 | 0.84 |
0.87d | 0.86 | 0.87 | 0.86 | 0.85 | 0.84 |
0.61d | 0.40 | 0.24 | 0.48 | 0.38 | 0.33 |
14c | 22 | 8 | 10 | 17 | 13 |
Investor Class | |||||
6-Month Period Ended April 30, 2019 | Year Ended October 31, | ||||
2018 | 2017 | 2016 | 2015 | 2014 | |
(Unaudited) | |||||
$32.68 | $35.29 | $26.65 | $25.63 | $26.63 | $28.45 |
0.04e | 0.01e | (0.05)e | 0.03e | 0.01e | 0.09 |
2.62 | (1.93) | 8.71 | 1.88 | (0.10) | 2.50 |
2.66 | (1.92) | 8.66 | 1.91 | (0.09) | 2.59 |
— | — | (0.02) | — | — | — |
(2.95) | (0.69) | — | (0.89) | (0.91) | (4.41) |
(2.95) | (0.69) | (0.02) | (0.89) | (0.91) | (4.41) |
32.39 | 32.68 | 35.29 | 26.65 | 25.63 | 26.63 |
$63,271 | $70,819 | $37,548 | $17,775 | $16,797 | $17,265 |
9.90%c | (5.60)% | 32.49% | 7.79% | (0.37)% | 10.61% |
1.25d | 1.24 | 1.25 | 1.23 | 1.22 | 1.21 |
1.24d | 1.23 | 1.24 | 1.23 | 1.22 | 1.21 |
0.26d | 0.03 | (0.16) | 0.10 | 0.02 | (0.04) |
14c | 22 | 8 | 10 | 17 | 13 |
72
Harbor Domestic Equity Funds Financial Highlights—Continued
Selected Data for a Share Outstanding for the Periods Presented
HARBOR SMALL CAP VALUE OPPORTUNITIES FUND | |||||||||
Retirement Class | Institutional Class | ||||||||
6-Month Period Ended April 30, 2019 | Year Ended October 31, | 6-Month Period Ended April 30, 2019 | Year Ended October 31, | ||||||
2018 | 2017j | 2018 | 2017j | ||||||
(Unaudited) | (Unaudited) | ||||||||
Net asset value beginning of period | $9.99 | $10.07 | $10.00 | $9.98 | $10.07 | $10.00 | |||
Income from Investment Operations | |||||||||
Net investment income/(loss)a | 0.05e | 0.06e | 0.01e | 0.05e | 0.06e | 0.02e | |||
Net realized and unrealized gains/(losses) on investments | 0.32 | (0.08) | 0.06 | 0.33 | (0.09) | 0.05 | |||
Total from investment operations | 0.37 | (0.02) | 0.07 | 0.38 | (0.03) | 0.07 | |||
Less Distributions | |||||||||
Dividends from net investment income | (0.06) | (0.03) | — | (0.06) | (0.03) | — | |||
Distributions from net realized capital gains | (0.58) | (0.03) | — | (0.58) | (0.03) | — | |||
Total distributions | (0.64) | (0.06) | — | (0.64) | (0.06) | — | |||
Net asset value end of period | 9.72 | 9.99 | 10.07 | 9.72 | 9.98 | 10.07 | |||
Net assets end of period (000s) | $7,941 | $6,329 | $30 | $26,016 | $24,685 | $24,655 | |||
Ratios and Supplemental Data (%) | |||||||||
Total returnb | 5.05%c | (0.18)% | 0.70%c | 5.06%c | (0.31)% | 0.70%c | |||
Ratio of total expenses to average net assets^ | 1.03d | 0.96 | 3.33d | 1.11d | 1.04 | 3.41d | |||
Ratio of net expenses to average net assetsa | 0.80d | 0.80 | 0.80d | 0.88d | 0.88 | 0.88d | |||
Ratio of net investment income to average net assetsa | 1.11d | 0.56 | 0.48d | 1.05d | 0.56 | 0.60d | |||
Portfolio turnover | 35c | 73 | 9c | 35c | 73 | 9c |
* | Less than $0.01 |
^ | Percentage does not reflect reduction for credit balance arrangements (see the “Custodian” section Note 2 of the accompanying Notes to Financial Statements) |
a | Reflects the Adviser’s waiver, if any, of its management fees and/or other operating expenses |
b | The total returns would have been lower had certain expenses not been waived during the periods shown. |
c | Unannualized |
d | Annualized |
e | Amounts are based on daily average shares outstanding during the period. |
f | For the period March 1, 2016 (inception) through October 31, 2016 |
g | For the period February 1, 2014 (inception) through October 31, 2014 |
h | For the period March 6, 2017 (commencement of operations) through June 30, 2017 |
i | For the period July 1, 2017 through October 31, 2017 |
j | For the period August 1, 2017 (inception) through October 31, 2017 |
k | The amount shown for a share outstanding does not correspond with the aggregate net investment income (loss) for the period due to the timing of sales and purchases in relation to fluctuating market values of the investments of the Fund. |
The accompanying notes are an integral part of the Financial Statements.
73
Administrative Class | Investor Class | |||||
6-Month Period Ended April 30, 2019 | Year Ended October 31, | 6-Month Period Ended April 30, 2019 | Year Ended October 31, | |||
2018 | 2017j | 2018 | 2017j | |||
(Unaudited) | (Unaudited) | |||||
$9.96 | $10.06 | $10.00 | $9.95 | $10.06 | $10.00 | |
0.04e | 0.03e | 0.01e | 0.03e | 0.02e | 0.01e | |
0.33 | (0.08) | 0.05 | 0.34 | (0.09) | 0.05 | |
0.37 | (0.05) | 0.06 | 0.37 | (0.07) | 0.06 | |
(0.03) | (0.02) | — | (0.02) | (0.01) | — | |
(0.58) | (0.03) | — | (0.58) | (0.03) | — | |
(0.61) | (0.05) | — | (0.60) | (0.04) | — | |
9.72 | 9.96 | 10.06 | 9.72 | 9.95 | 10.06 | |
$263 | $250 | $252 | $289 | $262 | $254 | |
4.94%c | (0.51)% | 0.60%c | 4.90%c | (0.66)% | 0.60%c | |
1.36d | 1.29 | 3.66d | 1.48d | 1.41 | 3.78d | |
1.13d | 1.13 | 1.13d | 1.25d | 1.25 | 1.25d | |
0.80d | 0.31 | 0.35d | 0.68d | 0.19 | 0.23d | |
35c | 73 | 9c | 35c | 73 | 9c |
74
Harbor Domestic Equity Funds
Notes to Financial Statements—April 30, 2019 (Unaudited)
Note 1—Organizational Matters
Harbor Funds (the “Trust”) is registered under the Investment Company Act of 1940, as amended (the “Investment Company Act”), as an open-end management investment company. As of April 30, 2019, the Trust consists of 33 separate portfolios. The portfolios covered by this report are: Harbor Capital Appreciation Fund, Harbor Strategic Growth Fund, Harbor Mid Cap Growth Fund, Harbor Small Cap Growth Fund, Harbor Small Cap Growth Opportunities Fund, Harbor Large Cap Value Fund, Harbor Mid Cap Value Fund, Harbor Small Cap Value Fund and Harbor Small Cap Value Opportunities Fund (individually or collectively referred to as a “Fund” or the “Funds," respectively). Harbor Capital Advisors, Inc. (the “Adviser” or “Harbor Capital”) is the investment adviser for the Funds.
The Funds currently offer four classes of shares, designated as Retirement Class, Institutional Class, Administrative Class and Investor Class. The shares of each class represent an interest in the same portfolio of investments of the Funds and have equal rights with respect to voting, redemptions, dividends, and liquidations, except that: (i) certain expenses, subject to the approval of the Trust’s Board of Trustees (the “Board of Trustees”), may be applied differently to each class of shares in accordance with current regulations of the Securities and Exchange Commission (“SEC”) and the Internal Revenue Service; and (ii) shareholders of a class that bears distribution and service expenses under terms of a distribution plan have exclusive voting rights as to that distribution plan.
Note 2—Significant Accounting Policies
The following is a summary of significant accounting policies followed by the Trust in the preparation of its financial statements. Each Fund follows the investment company reporting requirements under U.S. Generally Accepted Accounting Principles (“U.S. GAAP”), which includes the accounting and reporting guidelines under Accounting Standards Codification (“ASC”) Topic 946,Financial Services-Investment Companies. The preparation of financial statements in accordance with U.S. GAAP requires management to make estimates and assumptions that affect the reported amounts and disclosures in the financial statements. Actual results may differ from those estimates.
Security Valuation
The Trust’s valuation procedures permit the Funds to use a variety of valuation methodologies, consider a number of subjective factors, analyze applicable facts and circumstances and, in general, exercise judgment, when valuing Fund investments. The methodology used for a specific type of investment may vary based on the circumstances and relevant considerations, including available market data.
Equity securities (including common stock, preferred stock, convertible preferred stock, and master limited partnerships), exchange-traded notes and financial derivative instruments (such as futures contracts, options contracts, including rights and warrants and centrally cleared swap agreements) that are traded or cleared on a national securities exchange or system (except securities listed on the National Association of Securities Dealers Automated Quotation (“NASDAQ”) system and United Kingdom securities) are valued at the last sale price on a national exchange or system on which they are principally traded or cleared as of the valuation date. Securities listed on the NASDAQ system or a United Kingdom exchange are valued at the official closing price of those securities. In the case of securities for which there are no sales on the valuation day, (i) securities traded principally on a U.S. exchange, including NASDAQ, are valued at the mean between the closing bid and ask price; and (ii) securities traded principally on a foreign exchange, including United Kingdom securities, are valued at the official bid price determined as of the close of the primary exchange. Securities of open-end registered investment companies that are held by a Fund are valued at net asset value. To the extent these securities are actively traded and fair valuation adjustments are not applied, they are normally categorized as Level 1 in the fair value hierarchy. Equity securities traded on inactive markets or valued by reference to similar instruments are normally categorized as Level 2 in the fair value hierarchy. For more information on the fair value hierarchy, please refer to the Fair Value Measurements and Disclosures section.
Short-term securities with a remaining maturity of less than 60 days at the time of acquisition that are held by a Fund are valued at amortized cost to the extent amortized cost represents fair value. Such securities are normally categorized as Level 2 in the fair value hierarchy.
When reliable market quotations or evaluated prices supplied by a pricing vendor are not readily available or are not believed to accurately reflect fair value, securities are priced at their fair value as determined by the Trust’s Valuation Committee (the “Valuation Committee”) pursuant to procedures adopted, and subject to oversight, by the Board of Trustees. The Valuation
75
Harbor Domestic Equity Funds
Notes to Financial Statements—Continued
Note 2—Significant Accounting Policies—Continued
Committee is comprised of a trustee and officers of the Trust and employees of Harbor Capital with relevant experience or responsibilities. Each security for which the Valuation Committee determines a fair value, including the basis for the fair value decision, is reviewed by the Board of Trustees at its regularly scheduled board meetings.
When a fair valuation method is applied by the Valuation Committee or a Fund’s subadviser, securities will be priced by a method that the Valuation Committee or subadviser believes accurately reflects fair value. Securities valued using fair valuation methods that incorporate significant unobservable inputs are normally categorized as Level 3 in the fair value hierarchy. Examples of possible fair valuation methodologies used in determining the fair value of securities categorized as Level 3 in the fair value hierarchy include, but are not limited to, benchmark pricing and indicative market quotations.
When benchmark pricing is used, the base price of a debt security is set and then subsequently adjusted in proportion to the market value changes of an index or similar security (the “benchmark security”) that trades in an active market or for which other observable inputs are available. The base price may be a broker-dealer quote, transaction price, or an internal value as derived by analysis of market data. The base price of the security may be reset on a periodic basis based on the availability of market data and procedures approved by a Fund’s subadviser. If the benchmark security is categorized as Level 2 in the fair value hierarchy due to the lack of an active market for that security, any security adjusted in proportion to the fair value of the benchmark security may be categorized as Level 3 in the fair value hierarchy. Significant changes in the unobservable inputs of the benchmark pricing process (i.e., the base price) would result in direct and proportional changes in the fair value of the security. The reasonability of the fair value is reviewed by the subadviser on a periodic basis and may be amended as the availability of market data indicates a material change.
If evaluated pricing through a third-party pricing vendor is not available or deemed not to be indicative of fair value, a Fund’s subadviser may elect to obtain indicative market quotations (“broker quotes”) directly from a broker-dealer or passed through from a third-party pricing vendor. Indicative market quotations are typically received from established market participants. In the event that the source of fair value is from a single-sourced broker quote, but the subadviser does not have the transparency to view the underlying inputs that support the market quotation, these securities are categorized as Level 3 in the fair value hierarchy. Significant changes in the broker quote would have direct and proportional changes in the fair value of the security.
A Fund may also use fair value pricing if the value of some or all of the Fund’s securities have been materially affected by events occurring before the Fund’s pricing time but after the close of the primary markets or exchanges on which the security is traded. This most commonly occurs with foreign securities, but may occur with other securities as well. In such cases, the Fund may apply a fair value factor supplied by the pricing vendor to a foreign security’s market close value to reflect changes in value that may have occurred between the close of the primary market or exchange on which the security is traded and the Fund’s pricing time. That factor may be derived using observable inputs such as a comparison of the trading patterns of a foreign security to intraday trading in the U.S. markets that are highly correlated to the foreign security or other information that becomes available after the close of the foreign market on which the security principally traded. When fair value pricing is employed, the prices of securities used by a Fund to calculate its net asset value may differ from market quotations, official closing prices or evaluated prices for the same securities, which means that the Fund may value those securities higher or lower than another given fund that uses market quotations, official closing prices or evaluated prices supplied by a pricing vendor in its calculation of net asset value. Securities valued using observable inputs, such as those described above, are normally categorized as Level 2 of the fair value hierarchy.
Fair Value Measurements and Disclosures
Various inputs may be used to determine the value of each Fund’s investments, which are summarized in three broad categories defined as Level 1, Level 2, and Level 3. The inputs or methodologies used for valuing securities are not necessarily indicative of the risk associated with investing in those securities. The assignment of an investment to Levels 1, 2, or 3 is based on the lowest level of significant inputs used to determine its fair value.
Level 1– | Quoted prices in active markets for identical securities. |
Level 2– | Other significant observable inputs (including quoted prices for similar securities, interest rates, prepayment speeds, credit risk, etc.). |
Level 3– | Significant unobservable inputs are used in situations where quoted prices or other observable inputs are not available or are deemed unreliable. Significant unobservable inputs may include each Fund’s own assumptions. |
76
Harbor Domestic Equity Funds
Notes to Financial Statements—Continued
Note 2—Significant Accounting Policies—Continued
A table that includes a categorization of investments into Levels 1, 2, or 3, and a summary of significant unobservable inputs used for Level 3 investments, when applicable, can be found at the end of each Fund’s Portfolio of Investments schedule. For fair valuations using significant unobservable inputs, if any, a reconciliation of the beginning to ending balances for reported fair values is provided at the end of each Fund’s Portfolio of Investments schedule that presents changes attributable to realized and unrealized gains and losses and purchases, sales, and transfers in/out of the Level 3 category during the period.
Each Fund used observable inputs in its valuation methodologies whenever they were available and deemed reliable.
Repurchase Agreements
In a repurchase agreement, a Fund buys a security at one price and simultaneously agrees to sell it back at a higher price. Such agreements must be adequately collateralized to cover the counterparty’s obligation to a Fund to close out the repurchase agreement. Each repurchase agreement counterparty must meet the minimum credit quality requirements applicable to the respective Fund and any other appropriate counterparty criteria as determined by a Fund’s subadviser. The minimum credit quality requirements are those applicable to a Fund’s purchase of securities such that if a Fund is permitted to only purchase securities that are rated investment-grade (or the equivalent if unrated), a Fund could only enter into repurchase agreements with counterparties that have debt outstanding that is rated investment-grade (or the equivalent if unrated). The securities are regularly monitored to ensure that the collateral is adequate. A Fund seeks to further mitigate its counterparty risk by entering into master repurchase agreements with its counterparties. The master repurchase agreements provide that, in the event of a counterparty’s default, including bankruptcy, a Fund may terminate any repurchase agreements with that counterparty, determine the net amount owned, and sell or retain the collateral up to the net amount owed to a Fund. A counterparty’s default may cause a Fund to suffer losses, including loss of interest on or principal of the securities and costs associated with delay and enforcement of the terms of the master repurchase agreement.
During the period, Harbor Mid Cap Growth Fund entered into repurchase agreements with domestic or foreign banks or with a member firm of the Financial Industry Regulatory Authority, Inc., or an affiliate of a member firm that is a primary dealer in U.S. government securities.
Foreign Currency Spot Contracts
A foreign currency spot contract is an agreement between two parties to buy and sell currencies at the current market rate for settlement within two business days.
The foreign currency spot contract is marked-to-market daily for settlements beyond one day, and any change in fair value is recorded as an unrealized gain or loss. When the contract is closed, the Fund records a realized gain or loss equal to the difference between the value on the open and close date. Risk of losses may arise from changes in the value of the foreign currency or if the counterparties do not perform under the contract’s terms. The maximum potential loss from such contracts is the aggregate face value in U.S. dollars at the time the contract was opened.
During the period, Harbor Capital Appreciation Fund, Harbor Mid Cap Growth Fund, and Harbor Small Cap Growth Opportunities Fund used foreign currency spot contracts to facilitate transactions in foreign securities or to convert foreign currency receipts into U.S. dollars.
Foreign Currency Translations
Purchases and sales of securities are translated into U.S. dollars at the current exchange rate on the respective dates of the transactions. Income and withholding taxes are translated at the prevailing exchange rate when accrued or incurred. The accounting records of the Funds are maintained in U.S. dollars. Investment securities and other assets and liabilities denominated in a foreign currency, when applicable, are translated into U.S. dollars based on the current exchange rates at period end.
77
Harbor Domestic Equity Funds
Notes to Financial Statements—Continued
Note 2—Significant Accounting Policies—Continued
Reported net realized gains and losses on foreign currency transactions, when applicable, represent net gains and losses from sales and maturities of foreign currency contracts, disposition of foreign currencies, currency gains and losses realized between the trade and settlement dates on securities transactions, and the difference between the amount of investment income accrued and tax reclaims receivable and the U.S. dollar amount actually received. The effects of changes in foreign currency exchange rates on investments in securities, when applicable, are included in the net realized and unrealized gain or loss on investments in the Statements of Operations.
Master Limited Partnerships
Master Limited Partnerships (“MLP”) are limited partnerships whose limited partnership units are available to investors and are traded on public exchanges. MLPs issue common units that represent an equity ownership interest in a partnership and provide limited voting rights. By providing capital to an MLP, a Fund is generally entitled to periodic cash distributions, which usually represent return of capital.
During the period, Harbor Small Cap Value Opportunities Fund invested in a MLP.
Investment Income
Dividends declared on portfolio securities are accrued on the ex-dividend date. For foreign securities, certain dividends are recorded after the ex-dividend date, but as soon as the respective Fund is notified of such dividends. Interest income is accrued daily as earned. Discounts and premiums on fixed income securities are amortized over the life of the respective securities using the effective yield method. Distributions from real estate investment trust securities and master limited partnerships are recorded as dividend income, and maybe reclassified as capital gains and/or return of capital, based on the information reported by the issuer, when available.
Distribution to Shareholders
Distributions on Fund shares are recorded on the ex-dividend date.
Securities Transactions
Securities transactions are accounted for on the trade date (the date the order to buy or sell is executed). Realized gains or losses on security transactions are determined on the basis of identified cost.
Proceeds from Litigation
Each Fund may receive proceeds from shareholder litigation settlements involving current and/or previously held portfolio holdings. Any proceeds received from litigation involving portfolio holdings are reflected in the Statements of Operations in realized gain/(loss) if the security has been disposed of by a Fund, or in unrealized gain/(loss) if the security is still held by a Fund.
Expenses
Expenses incurred by the Trust are charged directly to the Fund that incurred such expense whenever possible. With respect to expenses incurred by any two or more Harbor Funds where amounts cannot be identified on a fund by fund basis, such expenses are generally allocated in proportion to the average net assets or the number of shareholders of each Fund.
Custodian
Each Fund has credit balance arrangements with its custodian whereby positive balances in demand deposit accounts used by the transfer and shareholder servicing agent for clearing shareholder transactions in the Fund generate credits that are applied against gross custody expenses. Such custodial expense reductions, if any, are reflected on the respective Fund’s accompanying Statement of Operations.
78
Harbor Domestic Equity Funds
Notes to Financial Statements—Continued
Note 2—Significant Accounting Policies—Continued
Class Allocations
Income, common expenses and realized and unrealized gains/(losses) are determined at the Fund level and allocated daily to each class of shares based on the applicable net assets of the respective classes. Distribution and service fees, if any, and transfer agent fees are calculated daily at the class level based on the applicable net assets of each class and the expense rate(s) applicable to each class.
Taxes
Each Fund is treated as a separate entity for federal tax purposes. Each Fund’s policy is to meet the requirements of Subchapter M of the Internal Revenue Code applicable to regulated investment companies and to distribute to its shareholders all of its taxable income within the prescribed time. It is also the intention of each Fund to distribute an amount sufficient to avoid imposition of any excise tax under Section 4982 of the Internal Revenue Code. Therefore, no provision has been made for federal taxes on income, capital gains or unrealized appreciation of securities held or excise taxes on income and capital gains.
Each Fund may be subject to taxes imposed by countries in which they invest. Such taxes are generally based on income and/or capital gains earned or repatriated. Taxes are accrued and applied to net investment income, net realized gains and unrealized appreciation as such income and/or gains are earned.
Management has analyzed each Fund’s tax positions for all open tax years (in particular, U.S. federal income tax returns for the tax years ended October 31, 2015–2017), including all positions expected to be taken upon filing the 2018 tax return, in all material jurisdictions where each Fund operates, and has concluded that no provision for income tax is required in the Funds’ financial statements. Each Fund will recognize interest and penalties, if any, related to unrecognized tax benefits as income tax expense in the Statement of Operations.
Note 3—Investment Portfolio Transactions
Investment Portfolio Transactions
Purchases and sales of investments, other than short-term securities, for each Fund for the six-month period ended April 30, 2019 are as follows:
Purchases (000s) | Sales (000s) | ||
GROWTH FUNDS | |||
Harbor Capital Appreciation Fund | $5,925,249 | $7,584,307 | |
Harbor Strategic Growth Fund | 33,174 | 5,899 | |
Harbor Mid Cap Growth Fund | 93,822 | 251,673 | |
Harbor Small Cap Growth Fund | 263,057 | 327,828 | |
Harbor Small Cap Growth Opportunities Fund | 91,964 | 152,614 | |
VALUE FUNDS | |||
Harbor Large Cap Value Fund | $110,776 | $80,808 | |
Harbor Mid Cap Value Fund | 52,360 | 158,208 | |
Harbor Small Cap Value Fund | 189,837 | 194,605 | |
Harbor Small Cap Value Opportunities Fund | 14,062 | 10,738 |
In-Kind Redemption Transactions
In accordance with the Trust’s prospectus, the Funds may distribute portfolio securities rather than cash as payment for a redemption of Fund shares. For financial reporting purposes, the Fund recognizes a gain or loss on the securities distributed related to the in-kind redemption. Such gains and losses on in-kind redemptions are not taxable to shareholders. For the six-month period ended April 30, 2019, there were no in-kind redemptions from the Funds. For the year ended October 31, 2018, Harbor Capital Appreciation Fund realized gains of $174,277,000 upon the disposition of portfolio securities in connection with an in-kind redemption of Fund shares.
79
Harbor Domestic Equity Funds
Notes to Financial Statements—Continued
Note 3—Investment Portfolio Transactions—Continued
Securities Lending
Each Fund may engage in securities lending, whereby a Fund lends its securities to financial institutions in order to increase its income. The Trust has engaged State Street Bank and Trust Company to act as its agent (the “Lending Agent”) with respect to the lending of portfolio securities of the Funds, pursuant to the terms and conditions of a Securities Lending Authorization Agreement (the “SLA Agreement”). Securities loans are required to be secured at all times during the term of the loan by collateral that is at least equal to the value of the loaned securities determined at the close of each business day. Collateral may consist of cash and/or securities issued by the U.S. Treasury or the Government National Mortgage Association. During the period, all such collateral consisted of cash. Any additional collateral that may be required to secure a loan is delivered to the Fund on the next business day. This collateral is recognized as the gross liability for securities loaned in the Statements of Assets and Liabilities. Cash collateral is invested in the State Street Navigator Securities Lending Government Money Market Portfolio (the “Navigator Portfolio”), a money market mutual fund that seeks to provide income while maintaining a stable net asset value of $1.00. There is no assurance that the Navigator Portfolio will maintain a stable net asset value and the Funds are subject to the risk of loss on the cash collateral invested. A portion of the earnings generated by the investment of the cash collateral is rebated to the borrower for the use of the cash collateral and these earnings (less any rebate) are then divided between the Fund and the Lending Agent, as a fee for its services, according to agreed-upon rates. The Lending Agent and a Fund will share in any shortfall in the rebate due to the borrower, according to agreed-upon rates. In addition to receiving a fee from the borrower based on the demand for securities loaned and earning income on the investment of the cash collateral, a Fund receives substitute interest, dividends, or other amounts on the loaned securities, during the term of a loan. Net securities lending income is disclosed as such in the Statements of Operations.
Loans may be terminated at the option of the borrower or the Funds. Upon termination of the loan, the borrower will return to the Fund securities that are identical to the loaned securities. The Funds bear the risk of delay in recovery of, or loss of rights in, the securities loaned and the risk that the value of the collateral falls below the value of the securities on loan. Each Fund seeks to mitigate this risk through the SLA Agreement, which provides that in the event of default, the Lending Agent may apply the proceeds of the cash collateral from the loaned securities toward the purchase of replacement securities. If such proceeds are insufficient or the collateral is unavailable, the Lending Agent will purchase replacement securities at its sole expense, or if unable to do so, the Lending Agent may credit to the Fund’s account an amount equal to the fair value of the unreturned loaned securities. As the securities loans are subject to termination by the Fund or the borrower at any time, the remaining contractual maturities of each securities lending transaction is considered to be overnight and continuous.
During the period, Harbor Capital Appreciation Fund engaged in securities lending. As of April 30, 2019, Harbor Capital Appreciation Fund had no securities out on loan.
Note 4—FEES AND OTHER Transactions with Affiliates
Investment Adviser
Harbor Capital is a wholly-owned subsidiary of ORIX Corporation (“ORIX”). Harbor Capital is the Funds’ investment adviser and is also responsible for administrative and other services.
80
Harbor Domestic Equity Funds
Notes to Financial Statements—Continued
Note 4—FEES AND OTHER Transactions with Affiliates—Continued
Each Fund has a separate advisory agreement with Harbor Capital. The agreements provide for management fees based on an annual percentage rate of average daily net assets as follows:
Contractual Rate | Actual Rate | ||
Growth Funds | |||
Harbor Capital Appreciation Fund | 0.60%a | 0.55% | |
Harbor Strategic Growth Fund | 0.60 | 0.60 | |
Harbor Mid Cap Growth Fund | 0.75 | 0.75 | |
Harbor Small Cap Growth Fund | 0.75 | 0.75 | |
Harbor Small Cap Growth Opportunities Fund | 0.75 | 0.75 | |
Value Funds | |||
Harbor Large Cap Value Fund | 0.60% | 0.60% | |
Harbor Mid Cap Value Fund | 0.75b | 0.72 | |
Harbor Small Cap Value Fund | 0.75 | 0.75 | |
Harbor Small Cap Value Opportunities Fund | 0.75 | 0.75 |
a | The Adviser has contractually agreed to reduce the management fee to 0.56% on assets between $5 billion and $10 billion, 0.54% on assets between $10 billion and $20 billion and 0.53% on assets over $20 billion through February 29, 2020. |
b | The Adviser has contractually agreed to reduce the management fee to 0.70% on assets between $350 million and $1 billion and 0.65% on assets over $1 billion through February 29, 2020. |
Harbor Capital has from time to time voluntarily or contractually agreed not to impose a portion of its management fees and/or to bear a portion of the expenses incurred in the operation of certain Funds in order to limit Fund expenses. Such waivers, if any, are reflected on the accompanying Statements of Operations. Interest expense, if any, is excluded from contractual limitations. During the six-month period, the following expense limitation agreements were in effect:
Retirement Class | Institutional Class | Administrative Class | Investor Class | Expense Limitation Agreement Expiration Date | |||||
Harbor Strategic Growth Fund1 | 0.63% | 0.71% | 0.96% | 1.08% | 02/29/2020 | ||||
Harbor Large Cap Value Fund2 | 0.61 | 0.69 | 0.94 | 1.06 | 02/29/2020 | ||||
Harbor Small Cap Value Opportunities Fund3 | 0.81 | 0.89 | 1.14 | 1.26 | 02/29/2020 |
1 | For the period November 1, 2018 through February 28, 2019, Harbor Capital contractually agreed to limit the operating expenses, excluding interest expense (if any), to 0.62%, 0.70%, 0.95%, and 1.07% for the Retirement Class, Institutional Class, Administrative Class, and Investor Class, respectively. |
2 | For the period November 1, 2018 through February 28, 2019, Harbor Capital contractually agreed to limit the operating expenses, excluding interest expense (if any), to 0.60%, 0.68%, 0.93%, and 1.05% for the Retirement Class, Institutional Class, Administrative Class, and Investor Class, respectively. |
3 | For the period November 1, 2018 through February 28, 2019, Harbor Capital contractually agreed to limit the operating expenses, excluding interest expense (if any), to 0.80%, 0.88%, 1.13%, and 1.25% for the Retirement Class, Institutional Class, Administrative Class, and Investor Class, respectively. |
All expense limitation agreements include the transfer agent fee waiver discussed in the Transfer Agent note.
Distributor
Harbor Funds Distributors, Inc. (the “Distributor”), a wholly-owned subsidiary of Harbor Capital, is the distributor for Harbor Funds’ shares. Under the Trust’s current distribution plan pursuant to Rule 12b-1 under the Investment Company Act with respect to each Fund’s Administrative and Investor Class shares (the “12b-1 Plan”) as applicable, each Fund pays the Distributor compensation at the annual rate of 0.25% of the average daily net assets of its Administrative and Investor Class shares. Pursuant to the 12b-1 Plan, the Distributor is compensated for financing any activity that is primarily intended to result in the sale of Administrative and Investor Class shares of each Fund or for recordkeeping services or the servicing of shareholder accounts in the Administrative and Investor Class shares of each Fund. Such activities include, but are not limited to: printing of prospectuses and statements of additional information and reports for prospective shareholders (i.e., other than existing shareholders); preparation and distribution of advertising material and sales literature; expenses of organizing and conducting sales seminars; supplemental payments to dealers or other institutions such as asset-based sales charges, payments of recordkeeping fees under recordkeeping arrangements, or payments of service fees under shareholder service arrangements; and costs of administering the 12b-1 Plan.
81
Harbor Domestic Equity Funds
Notes to Financial Statements—Continued
Note 4—FEES AND OTHER Transactions with Affiliates—Continued
Amounts payable by a Fund under the 12b-1 Plan need not be directly related to the expenses actually incurred by the Distributor on behalf of each Fund. The 12b-1 Plan does not obligate each Fund to reimburse the Distributor for the actual expenses the Distributor may incur in fulfilling its obligations under the 12b-1 Plan. Thus, even if the Distributor’s actual expenses exceed the fee payable to the Distributor at any given time, each Fund will not be obligated to pay more than that fee. If the Distributor’s expenses are less than the fee it receives, the Distributor will retain the difference.
The fees attributable to each Fund’s respective class are shown on the accompanying Statements of Operations.
Transfer Agent
Harbor Services Group, Inc. (“Harbor Services Group”), a wholly-owned subsidiary of Harbor Capital, is the transfer and shareholder servicing agent for the Funds. The transfer agency and service agreement is reviewed and approved annually by the Board of Trustees and provides currently for compensation up to the following amounts per class of each Fund:
Transfer Agent Fees1 | |
Retirement Class | 0.02% of the average daily net assets of all Retirement Class shares |
Institutional Class | 0.10% of the average daily net assets of all Institutional Class shares |
Administrative Class | 0.10% of the average daily net assets of all Administrative Class shares |
Investor Class | 0.22% of the average daily net assets of all Investor Class shares |
1 | For the period November 1, 2018 through February 28, 2019, Harbor Services Group received compensation up to 0.01%, 0.09%, 0.09%, and 0.21% for the Retirement Class, Institutional Class, Administrative Class, and Investor Class, respectively. |
Harbor Services Group has voluntarily waived a portion of its transfer agent fees during the six-month period ended April 30, 2019. Fees incurred for these transfer agent services are shown on each Fund’s Statement of Operations. The voluntary waiver may be discontinued at any time.
Affiliated Transactions
The Investment Company Act permits purchase and sale transactions among affiliated investment companies subject to an exemptive rule. Harbor Funds has adopted policies and procedures pursuant to such rule. During the six-month period, the Funds did not enter into any transactions with any other Harbor fund.
Shareholders
On April 30, 2019, Harbor Capital, and its wholly owned subsidiaries, collectively held the following shares of beneficial interest in each of the following Funds:
Number of Shares Owned by Harbor Capital and Subsidiaries | Percentage of Outstanding Shares | ||||||||||
Retirement Class | Institutional Class | Administrative Class | Investor Class | Total | |||||||
GROWTH FUNDS | |||||||||||
Harbor Capital Appreciation Fund | 38,737 | — | — | — | 38,737 | 0.0% | |||||
Harbor Strategic Growth Fund | 42,459 | 1,155,820 | 631 | 630 | 1,199,540 | 23.7 | |||||
Harbor Mid Cap Growth Fund | 152,495 | — | — | — | 152,495 | 0.7 | |||||
Harbor Small Cap Growth Fund | 86,690 | — | — | — | 86,690 | 0.1 | |||||
Harbor Small Cap Growth Opportunities Fund | 29,130 | — | — | — | 29,130 | 0.1 | |||||
VALUE FUNDS | |||||||||||
Harbor Large Cap Value Fund | 110,860 | — | — | — | 110,860 | 0.2% | |||||
Harbor Mid Cap Value Fund | 62,361 | — | — | — | 62,361 | 0.1 | |||||
Harbor Small Cap Value Fund | 35,551 | — | — | — | 35,551 | 0.1 | |||||
Harbor Small Cap Value Opportunities Fund | 11,273 | 2,657,389 | 27,015 | 26,965 | 2,722,642 | 76.7 |
82
Harbor Domestic Equity Funds
Notes to Financial Statements—Continued
Note 4—FEES AND OTHER Transactions with Affiliates—Continued
Independent Trustees
The fees and expenses of the Independent Trustees are included in “Trustees’ fees and expenses” on each Fund’s Statement of Operations.
The Board of Trustees has adopted a Deferred Compensation Plan for Independent Trustees (the “Plan”), which enables Trustees to elect to defer receipt of all or a portion of the annual compensation they are entitled to receive from the Trust. For purposes of determining the amount owed to a Trustee under the Plan, deferred amounts are treated as though they had been invested in shares of the Fund(s) selected by the Trustee. While not required to do so, each Fund makes an investment equal to the Trustee’s investment election. The deferred compensation liability and the offsetting deferred compensation investment asset are included as a component of “Accrued expenses – Trustees’ fees and expenses” and “Other assets”, respectively, in the Statements of Assets and Liabilities. Such amounts fluctuate with changes in the market value of the selected securities. The deferred compensation and related mark-to-market impact liability and an offsetting investment asset will remain on each Fund’s Statement of Assets and Liabilities until distributed in accordance with the Plan.
Indemnification
Under the Trust’s organizational documents, its officers and Trustees are indemnified against certain liabilities arising out of the performance of their duties to the Trust. In addition, in the normal course of business the Trust enters into contracts that provide general indemnities to other parties. The Trust’s maximum exposure under these arrangements is unknown as this would involve future claims that may be made against the Trust that have not yet occurred. The risk of material loss as a result of such indemnification claims is considered remote.
NOTE 5—TAX INFORMATION
The identified cost for federal income tax purposes of investments owned by each Fund and its respective gross unrealized appreciation and depreciation at April 30, 2019 are as follows:
Identified Cost (000s) | Gross Unrealized | Net Unrealized Appreciation/ (Depreciation) (000s) | |||||
Appreciation (000s) | (Depreciation) (000s) | ||||||
GROWTH FUNDS | |||||||
Harbor Capital Appreciation Fund | $17,212,255 | $14,219,520 | $(68,992) | $14,150,528 | |||
Harbor Strategic Growth Fund | 79,560 | 24,107 | (396) | 23,711 | |||
Harbor Mid Cap Growth Fund | 181,587 | 70,750 | (3,620) | 67,130 | |||
Harbor Small Cap Growth Fund | 612,251 | 140,738 | (30,961) | 109,776 | |||
Harbor Small Cap Growth Opportunities Fund | 212,748 | 35,545 | (25,902) | 9,643 | |||
VALUE FUNDS | |||||||
Harbor Large Cap Value Fund | $863,106 | $238,126 | $(24,798) | $213,328 | |||
Harbor Mid Cap Value Fund | 823,855 | 146,120 | (92,928) | 53,192 | |||
Harbor Small Cap Value Fund | 1,088,071 | 438,713 | (37,264) | 401,449 | |||
Harbor Small Cap Value Opportunities Fund | 32,416 | 3,714 | (2,211) | 1,503 |
Note 6—Legal Proceedings
Tribune Company
Harbor Mid Cap Value Fund has been named as a defendant and/or as a putative member of a proposed defendant class in Kirschner v. FitzSimons (In re Tribune Co.), No. 12-2652 (S.D.N.Y.) (the “FitzSimons action”); Deutsche Bank v. Ohlson Enterprises, No. 12-0064 (S.D.N.Y.) (the “Deutsche Bank action”); and Niese v. ABN AMRO Clearing Chicago LLC, No. 12-0555 (S.D.N.Y.) (the “Niese action”), as a result of its ownership of shares in the Tribune Company (“Tribune”) in 2007, when Tribune effected a leveraged buyout transaction (“LBO”) by which Tribune converted to a privately-held company. The plaintiffs in these lawsuits have asserted claims for fraudulent conveyance against Harbor Mid Cap Value Fund and other former Tribune shareholders.
83
Harbor Domestic Equity Funds
Notes to Financial Statements—Continued
Note 6—Legal Proceedings—Continued
All three lawsuits have been consolidated with the majority of the other Tribune-related lawsuits in the multidistrict litigation proceeding In re Tribune Co. Fraudulent Conveyance Litig., No. 11-2296 (S.D.N.Y.) (the “MDL Proceeding”).
On September 23, 2013, the District Court granted the defendants’ omnibus motion to dismiss the Deutsche Bank and Niese actions, on the basis that the plaintiffs lacked standing. The plaintiffs appealed. On March 29, 2016, the U.S. Court of Appeals for the Second Circuit issued its opinion on the appeal, affirming the district court’s dismissal of those lawsuits. The appeals court held that while the plaintiffs have standing under the U.S. Bankruptcy Code, their claims were preempted by Section 546(e) of the Bankruptcy Code—the statutory safe harbor for settlement payments. Plaintiffs sought rehearing en banc, which the Second Circuit denied. On September 9, 2016, the plaintiffs filed a petition for writ of certiorari in the U.S. Supreme Court challenging the Second Circuit’s decision, which the shareholder defendants opposed. On April 3, 2018, Justice Kennedy and Justice Thomas issued a “Statement” related to the petition for certiorari suggesting that the Second Circuit and/or District Court may want to take steps to reexamine the application of the Section 546(e) safe harbor to the previously dismissed state law constructive fraudulent transfer claims based on the Supreme Court’s decision in Merit Management Group LP v. FTI Consulting, Inc. On April 10, 2018, plaintiffs filed in the Second Circuit a motion for that court to recall its mandate, vacate its prior decision, and remand to the district court for further proceedings consistent with Merit Management. On April 20, 2018, the shareholder defendants filed a response to plaintiffs’ motion to recall the mandate. On May 15, 2018, the Second Circuit issued an order recalling the mandate “in anticipation of further panel review.”
On May 23, 2014, the defendants filed motions to dismiss the FitzSimons action, including a global motion to dismiss Count I, which is the claim brought against former Tribune shareholders for intentional fraudulent conveyance under U.S. federal law. On January 6, 2017, the United States District Court for the Southern District of New York granted the shareholder defendants’ motion to dismiss and denied plaintiff’s request to amend the complaint. The Court’s order is not immediately appealable, but the Court issued an order stating that it intends to permit an interlocutory appeal of the dismissal order, but will wait to do so until it has resolved outstanding motions to dismiss filed by other defendants. Accordingly, the timing of the appeal is uncertain. On July 18, 2017, the plaintiff submitted a letter to the District Court seeking leave to amend its complaint to add a constructive fraudulent transfer claim. The Court denied the plaintiff’s request without prejudice to renewal of the request in the event of an intervening change in the law. On March 8, 2018, plaintiff renewed his request for leave to file a motion to amend the complaint to assert a constructive fraudulent transfer claim based on the Supreme Court’s ruling in Merit Management. The shareholder defendants opposed that request. On June 18, 2018, the District Court ordered that the request would be stayed from pending further action by the Second Circuit in the still pending appeal, discussed above. On December 18, 2018, plaintiff filed a letter with the District Court requesting that the stay be dissolved in order to permit briefing on the motion to amend the complaint and indicating plaintiff’s intention to file another motion to amend the complaint to reinstate claims for intentional fraudulent transfer. The shareholder defendants opposed that request. On January 14, 2019, the court held a case management conference, during which the court stated that it would allow the plaintiff to file a motion to amend to try to reinstate its intentional fraudulent transfer claim. On January 23, 2019, the court ordered the parties still facing pending claims to participate in a mediation within the following two months. On April 9, 2019, the plaintiff filed a motion to amend the complaint to add constructive fraudulent conveyance claims under federal law against certain shareholder defendants. Briefing on the motion is complete, and the court has not yet issued a ruling.
None of these lawsuits alleges any wrongdoing on the part of Harbor Mid Cap Value Fund. Harbor Mid Cap Value Fund held shares of Tribune and tendered these shares as part of Tribune’s LBO. The value of the proceeds received by Harbor Mid Cap Value Fund was approximately $299,000. Harbor Mid Cap Value Fund’s cost basis in the shares of Tribune was approximately $262,000. At this stage of the proceedings, Harbor Mid Cap Value Fund is not able to make a reliable prediction as to the outcome of these lawsuits or the effect, if any, on the Fund’s net asset value.
Note 7—Subsequent Events
Through the date the financial statements were issued, there were no subsequent events or transactions that would have materially impacted the financial statements or related disclosures as presented herein.
84
Harbor Domestic Equity Funds
Fees and Expenses Example (Unaudited)
Example
As a shareholder of a Fund, you incur two types of costs: (1) transaction costs, including redemption fees (if any) and (2) ongoing costs, including management fees, distribution and service (12b-1) fees (if any), and other Fund expenses. This example is intended to help you understand your ongoing costs (in dollars) of investing in a Fund and to compare these costs with the ongoing costs of investing in other mutual funds.
The example is based on an investment of $1,000 invested at the beginning of the period and held for the entire period November 1, 2018 through April 30, 2019.
Actual Expenses
The first line of the table below provides information about actual account values and actual expenses for each share class. You may use the information in the respective class line, together with the amount you invested, to estimate the expenses that you paid over the period. Simply divide your account value by $1,000 (for example, an $8,600 account value divided by $1,000 = 8.6), then multiply the result by the number in the first line of the respective class under the heading entitled “Expenses Paid During Period” to estimate the expenses you paid on your account during this period.
Hypothetical Example for Comparison Purposes
The second line of the table for each share class below provides information about hypothetical account values and hypothetical expenses based on the respective Fund/Class’s actual expense ratio and an assumed rate of return of 5% per year before expenses, which is not the respective Fund/Class’s actual return. The hypothetical account values and expenses may not be used to estimate the actual ending account balance or expenses you paid for the period. You may use this information to compare the ongoing costs of investing in a Fund to other funds. To do so, compare this 5% hypothetical example with the 5% hypothetical examples that appear in the shareholder reports of the other funds.
Please note that the expenses shown in the table are meant to highlight your ongoing costs only and do not reflect any transactional costs, such as redemption fees. Therefore, the second line of the table is useful in comparing ongoing costs only, and will not help you determine the relative total costs of owning different funds. In addition, if these transactional costs were included, your costs would have been higher.
Annualized Expense Ratios* | Expenses Paid During Period** | Beginning Account Value November 1, 2018 | Ending Account Value April 30, 2019 | |||||
Harbor Capital Appreciation Fund | ||||||||
Retirement Class | 0.58% | |||||||
Actual | $3.07 | $1,000 | $1,134.90 | |||||
Hypothetical (5% return) | 2.91 | 1,000 | 1,021.85 | |||||
Institutional Class | 0.66% | |||||||
Actual | $3.49 | $1,000 | $1,134.40 | |||||
Hypothetical (5% return) | 3.31 | 1,000 | 1,021.44 | |||||
Administrative Class | 0.91% | |||||||
Actual | $4.81 | $1,000 | $1,133.10 | |||||
Hypothetical (5% return) | 4.56 | 1,000 | 1,020.17 | |||||
Investor Class | 1.03% | |||||||
Actual | $5.45 | $1,000 | $1,132.40 | |||||
Hypothetical (5% return) | 5.16 | 1,000 | 1,019.56 |
85
Harbor Domestic Equity Funds
Fees and Expenses Example—Continued
Annualized Expense Ratios* | Expenses Paid During Period** | Beginning Account Value November 1, 2018 | Ending Account Value April 30, 2019 | |||||
Harbor Strategic Growth Fund | ||||||||
Retirement Class | 0.62% | |||||||
Actual | $3.26 | $1,000 | $1,126.40 | |||||
Hypothetical (5% return) | 3.11 | 1,000 | 1,021.64 | |||||
Institutional Class | 0.70% | |||||||
Actual | $3.69 | $1,000 | $1,125.60 | |||||
Hypothetical (5% return) | 3.51 | 1,000 | 1,021.24 | |||||
Administrative Class | 0.95% | |||||||
Actual | $5.00 | $1,000 | $1,124.50 | |||||
Hypothetical (5% return) | 4.76 | 1,000 | 1,019.97 | |||||
Investor Class | 1.07% | |||||||
Actual | $5.60 | $1,000 | $1,109.40 | |||||
Hypothetical (5% return) | 5.36 | 1,000 | 1,019.36 | |||||
Harbor Mid Cap Growth Fund | ||||||||
Retirement Class | 0.81% | |||||||
Actual | $4.46 | $1,000 | $1,218.20 | |||||
Hypothetical (5% return) | 4.06 | 1,000 | 1,020.68 | |||||
Institutional Class | 0.89% | |||||||
Actual | $4.89 | $1,000 | $1,217.60 | |||||
Hypothetical (5% return) | 4.46 | 1,000 | 1,020.27 | |||||
Administrative Class | 1.14% | |||||||
Actual | $6.26 | $1,000 | $1,216.30 | |||||
Hypothetical (5% return) | 5.71 | 1,000 | 1,019.00 | |||||
Investor Class | 1.26% | |||||||
Actual | $6.92 | $1,000 | $1,215.60 | |||||
Hypothetical (5% return) | 6.31 | 1,000 | 1,018.39 | |||||
Harbor Small Cap Growth Fund | ||||||||
Retirement Class | 0.79% | |||||||
Actual | $4.18 | $1,000 | $1,134.00 | |||||
Hypothetical (5% return) | 3.96 | 1,000 | 1,020.78 | |||||
Institutional Class | 0.87% | |||||||
Actual | $4.60 | $1,000 | $1,134.40 | |||||
Hypothetical (5% return) | 4.36 | 1,000 | 1,020.37 | |||||
Administrative Class | 1.12% | |||||||
Actual | $5.92 | $1,000 | $1,132.60 | |||||
Hypothetical (5% return) | 5.61 | 1,000 | 1,019.10 | |||||
Investor Class | 1.24% | |||||||
Actual | $6.56 | $1,000 | $1,132.40 | |||||
Hypothetical (5% return) | 6.21 | 1,000 | 1,018.49 |
86
Harbor Domestic Equity Funds
Fees and Expenses Example—Continued
Annualized Expense Ratios* | Expenses Paid During Period** | Beginning Account Value November 1, 2018 | Ending Account Value April 30, 2019 | |||||
Harbor Small Cap Growth Opportunities Fund | ||||||||
Retirement Class | 0.82% | |||||||
Actual | $4.17 | $1,000 | $1,047.30 | |||||
Hypothetical (5% return) | 4.11 | 1,000 | 1,020.63 | |||||
Institutional Class | 0.90% | |||||||
Actual | $4.56 | $1,000 | $1,046.40 | |||||
Hypothetical (5% return) | 4.51 | 1,000 | 1,020.22 | |||||
Administrative Class | 1.15% | |||||||
Actual | $5.83 | $1,000 | $1,044.90 | |||||
Hypothetical (5% return) | 5.76 | 1,000 | 1,018.95 | |||||
Investor Class | 1.27% | |||||||
Actual | $6.44 | $1,000 | $1,044.50 | |||||
Hypothetical (5% return) | 6.36 | 1,000 | 1,018.34 | |||||
Harbor Large Cap Value Fund | ||||||||
Retirement Class | 0.60% | |||||||
Actual | $3.16 | $1,000 | $1,118.00 | |||||
Hypothetical (5% return) | 3.01 | 1,000 | 1,021.75 | |||||
Institutional Class | 0.68% | |||||||
Actual | $3.57 | $1,000 | $1,117.50 | |||||
Hypothetical (5% return) | 3.41 | 1,000 | 1,021.34 | |||||
Administrative Class | 0.93% | |||||||
Actual | $4.88 | $1,000 | $1,116.70 | |||||
Hypothetical (5% return) | 4.66 | 1,000 | 1,020.07 | |||||
Investor Class | 1.05% | |||||||
Actual | $5.51 | $1,000 | $1,115.20 | |||||
Hypothetical (5% return) | 5.26 | 1,000 | 1,019.46 | |||||
Harbor Mid Cap Value Fund | ||||||||
Retirement Class | 0.77% | |||||||
Actual | $3.94 | $1,000 | $1,064.50 | |||||
Hypothetical (5% return) | 3.86 | 1,000 | 1,020.88 | |||||
Institutional Class | 0.84% | |||||||
Actual | $4.30 | $1,000 | $1,063.90 | |||||
Hypothetical (5% return) | 4.21 | 1,000 | 1,020.53 | |||||
Administrative Class | 1.09% | |||||||
Actual | $5.58 | $1,000 | $1,062.90 | |||||
Hypothetical (5% return) | 5.46 | 1,000 | 1,019.26 | |||||
Investor Class | 1.21% | |||||||
Actual | $6.19 | $1,000 | $1,061.90 | |||||
Hypothetical (5% return) | 6.06 | 1,000 | 1,018.65 |
87
Harbor Domestic Equity Funds
Fees and Expenses Example—Continued
Annualized Expense Ratios* | Expenses Paid During Period** | Beginning Account Value November 1, 2018 | Ending Account Value April 30, 2019 | |||||
Harbor Small Cap Value Fund | ||||||||
Retirement Class | 0.79% | |||||||
Actual | $4.12 | $1,000 | $1,101.50 | |||||
Hypothetical (5% return) | 3.96 | 1,000 | 1,020.78 | |||||
Institutional Class | 0.87% | |||||||
Actual | $4.53 | $1,000 | $1,101.20 | |||||
Hypothetical (5% return) | 4.36 | 1,000 | 1,020.37 | |||||
Administrative Class | 1.12% | |||||||
Actual | $5.83 | $1,000 | $1,099.60 | |||||
Hypothetical (5% return) | 5.61 | 1,000 | 1,019.10 | |||||
Investor Class | 1.24% | |||||||
Actual | $6.45 | $1,000 | $1,099.00 | |||||
Hypothetical (5% return) | 6.21 | 1,000 | 1,018.49 | |||||
Harbor Small Cap Value Opportunities Fund | ||||||||
Retirement Class | 0.80% | |||||||
Actual | $4.07 | $1,000 | $1,050.50 | |||||
Hypothetical (5% return) | 4.01 | 1,000 | 1,020.73 | |||||
Institutional Class | 0.88% | |||||||
Actual | $4.47 | $1,000 | $1,050.60 | |||||
Hypothetical (5% return) | 4.41 | 1,000 | 1,020.32 | |||||
Administrative Class | 1.13% | |||||||
Actual | $5.74 | $1,000 | $1,049.40 | |||||
Hypothetical (5% return) | 5.66 | 1,000 | 1,019.05 | |||||
Investor Class | 1.25% | |||||||
Actual | $6.35 | $1,000 | $1,049.00 | |||||
Hypothetical (5% return) | 6.26 | 1,000 | 1,018.44 |
* | Reflective of all fee waivers and expense reimbursements |
** | Expenses are equal to the Fund’s annualized expense ratio, multiplied by the average account value over the period, multiplied by 181/365 (to reflect the one-half year period). |
88
Harbor Domestic Equity Funds
Additional Information (Unaudited)
Proxy Voting
Harbor Funds has adopted Proxy Voting Policies and Procedures under which proxies relating to securities held by the Harbor funds are voted. In addition, Harbor Funds files Form N-PX, with its complete proxy voting record for the 12 months ended June 30th, no later than August 31st of each year. A description of Harbor Funds’ Proxy Voting Policies and Procedures and the proxy voting records (Form N-PX) are available (i) without charge, upon request, by calling Harbor Funds toll-free at 800-422-1050; (ii) on Harbor Funds’ website atharborfunds.com; and (iii) on the SEC’s website at sec.gov.
Householding
Harbor Funds has adopted a policy that allows it to send only one copy of a Fund’s prospectus, proxy materials, annual report and semi-annual report to certain shareholders residing at the same household. This reduces Fund expenses, which benefits you and other shareholders. If you need additional copies or do not want your mailings to be “householded,” please call the Shareholder Servicing Agent at 800-422-1050. Individual copies will be sent within thirty (30) days after the Shareholder Servicing Agent receives your instructions. Your consent to householding is considered valid until revoked.
Quarterly Portfolio Disclosures
Harbor Funds files a complete portfolio of investments with the SEC for the first and third quarters of each fiscal year. In 2019, the Funds filed a complete portfolio of investments for the first fiscal quarter on Form N-Q. Beginning with the third fiscal quarter of 2019, the Funds will file a complete portfolio of investments with the SEC on Form N-PORT. The Funds’ Forms N-Q and N-PORT are available (i) without charge, upon request, by calling Harbor Funds toll-free at 800-422-1050, (ii) on Harbor Funds’ website atharborfunds.com, and (iii) on the SEC’s website at sec.gov.
ADVISORY AGREEMENT APPROVALS
FACTORS CONSIDERED BY THE TRUSTEES IN APPROVING THE INVESTMENT ADVISORY AGREEMENTS AND SUBADVISORY AGREEMENTS OF THE DOMESTIC EQUITY FUNDS
The Investment Company Act requires that the Investment Advisory and Subadvisory Agreement of each Fund be approved initially, and following an initial two-year term, at least annually, by the Trust’s Board of Trustees (the “Board” or the “Trustees”), including a majority of the Independent Trustees voting separately.
At an in-person meeting of the Board held on February 15 and 16, 2019 (the “Meeting”), the Board, including all of the Independent Trustees voting separately, considered and approved the continuation of each Investment Advisory Agreement with Harbor Capital, the adviser to each Fund, and each Subadvisory Agreement with each Fund’s subadviser (each, a “Subadviser”) with respect to Harbor Capital Appreciation Fund, Harbor Strategic Growth Fund, Harbor Mid Cap Growth Fund, Harbor Small Cap Growth Fund, Harbor Small Cap Growth Opportunities Fund, Harbor Large Cap Value Fund, Harbor Mid Cap Value Fund, Harbor Small Cap Value Fund, and Harbor Small Cap Value Opportunities Fund.
In evaluating each Investment Advisory Agreement and each Subadvisory Agreement, the Trustees reviewed materials furnished by the Adviser and each Subadviser, including information about their respective affiliates, personnel, and operations, and also relied upon their knowledge of the Adviser and Subadvisers resulting from their quarterly meetings, periodic telephonic meetings and other prior communications. In connection with the Meeting, which had been called for the purpose of considering the continuation of the Investment Advisory Agreements and Subadvisory Agreements, and at prior meetings, the Trustees, including the Independent Trustees, requested and received materials and presentations relating to Fund performance and the services rendered by the Adviser and each Subadviser. The Trustees also discussed with representatives of the Adviser, at the Meeting and at prior meetings, Harbor Funds’ operations and the Adviser’s ability, consistent with the “manager of managers” structure of Harbor Funds, to (i) identify and recommend to the Trustees a subadviser for each Fund, (ii) monitor and oversee the performance and investment capabilities of each Subadviser, and (iii) recommend the replacement of a subadviser where appropriate. The Trustees specifically considered the Adviser’s history as a manager-of-managers, including its history of replacing subadvisers for particular Funds in circumstances in which the Board and the Adviser had determined that a change in subadviser was in the best interests of a Fund and its shareholders, whether as a result of (i) long-term underperformance not explained by market conditions or market cycles relative to the subadviser’s investment style, (ii) prolonged style inconsistency, (iii) material adverse changes in management or personnel, or (iv) other factors, such as if the Adviser were to identify another subadviser believed to better serve the shareholders than the existing subadviser.
89
Harbor Domestic Equity Funds
Additional Information—Continued
ADVISORY AGREEMENT APPROVALS—Continued
At the Meeting, the Trustees, including all of the Independent Trustees voting separately, determined, in the exercise of their business judgment, that the terms of each Investment Advisory Agreement and each Subadvisory Agreement were fair and reasonable and approved the continuation for a one-year period of each such Investment Advisory Agreement and Subadvisory Agreement as being in the best interests of each Fund and its shareholders.
In their deliberations, the Independent Trustees had the opportunity to meet privately without representatives of the Adviser or any Subadviser present and were represented throughout the process by legal counsel to the Independent Trustees and the Funds.
In considering the approval of each Fund’s Investment Advisory Agreement and Subadvisory Agreement, the Board, including the Independent Trustees, evaluated a number of factors it considered relevant to its determination. The Board did not identify any single factor as all-important or controlling, and individual Trustees did not necessarily attribute the same weight or importance to each factor.
Among the factors considered by the Trustees in approving the Investment Advisory Agreements and Subadvisory Agreements were the following:
• | the nature, extent, and quality of the services provided by the Adviser and each Subadviser, including the background, education, expertise and experience of the investment professionals of the Adviser and each Subadviser providing services to the Funds; |
• | the favorable history, reputation, qualifications and background of the Adviser and each Subadviser, as well as the qualifications of their respective personnel; |
• | the profitability of the Adviser with respect to each Fund, including the effect of revenues of Harbor Services Group, Inc. (“Harbor Services Group”), the Funds’ transfer agent, and Harbor Funds Distributors, Inc. (“Harbor Funds Distributors”), the Funds’ principal underwriter, on such profitability; |
• | the fees charged by the Adviser and Subadvisers for investment advisory and subadvisory services, respectively, including, in each case, the portion of the fee to be retained by the Adviser, after payment of the Subadviser’s fee, for the investment advisory and related services, including investment, business, legal, compliance, financial and administrative services, that the Adviser provides; |
• | the extent to which economies of scale might be realized as each Fund grows, and the extent to which each Fund’s advisory fee level reflects any economies of scale for the benefit of Fund investors; |
• | the fees and expense ratios of each Fund relative to the quality of services provided and the fees and expense ratios of similar investment companies; |
• | the short- and long-term investment performance of each Fund in comparison to peer groups and certain relevant benchmark indices and the Adviser’s efforts to address circumstances of underperformance where applicable; |
• | the compensation received by Harbor Services Group and Harbor Funds Distributors in consideration of the services each provides to the Funds; |
• | any “fall out” benefits that might inure to the Adviser and its affiliates as a result of their relationship with the Funds; |
• | information received at regular meetings throughout the year related to Fund performance and services rendered by the Adviser, as well as each of the Subadvisers, and research arrangements with brokers who execute transactions on behalf of each Subadviser; |
• | information contained in materials provided by the Adviser and compiled by Broadridge as to the investment returns, advisory fees and total expense ratios of the Institutional Class of each Fund (and, in certain cases, total expense ratios of the Investor Class) relative to those of other investment companies with similar objectives and strategies managed by other investment advisers, consisting both of a peer group of funds as well as a broader universe of funds compiled by Broadridge; and |
• | information contained in materials compiled by Morningstar as to the investment returns of the Institutional Class of each Fund relative to those of other investment companies with similar objectives and strategies managed by other investment advisers. |
90
Harbor Domestic Equity Funds
Additional Information—Continued
ADVISORY AGREEMENT APPROVALS—Continued
Nature, Extent, and Quality of Services
The Trustees separately considered the nature, extent, and quality of the services provided by the Adviser and each Subadviser. In their deliberations as to the approval of each Fund’s Investment Advisory Agreement and Subadvisory Agreement, the Trustees were mindful of the fact that, by choosing to invest in a Fund, the shareholders had entrusted the Adviser with the responsibility, subject to the approval of the Trustees, for selecting each Fund’s Subadviser, overseeing and monitoring that Subadviser’s performance and replacing the Subadviser if necessary. The Trustees also considered as relevant to their determination the favorable history, reputation, qualifications and background of the Adviser and each Subadviser, as well as the qualifications of their respective personnel.
The Adviser’s Services. The Board evaluated the nature, extent, and quality of the Adviser’s services in light of the Board’s experience with the Adviser, as well as materials provided by the Adviser as part of its comprehensive written response to the 15(c) request letter prepared by legal counsel to the Independent Trustees in consultation with the Independent Trustees concerning the financial and other resources devoted by the Adviser to Harbor Funds, including the breadth and depth of experience and expertise of the investment, accounting, administrative, legal and compliance professionals dedicated to Harbor Funds’ operations. The Trustees determined that the Adviser had the expertise and resources to identify, select, oversee and monitor each Subadviser and to operate effectively as the “manager of managers” for the Funds.
The Subadvisers’ Services. The Trustees’ consideration of the services provided by the Subadvisers included a review of each Subadviser’s portfolio managers, investment philosophy, style and processes and record of consistency therewith, the volatility of its results, its approach to controlling risk, and the quality and extent of its investment capabilities and resources, including the nature and extent of research it receives from broker-dealers (to the extent applicable) and other sources. In their deliberations with respect to each Fund, the Trustees considered the history of Harbor Funds’ relationship with each Subadviser and Harbor Funds’ experience with each Subadviser in this capacity.
The Trustees also considered each Subadviser’s breadth and depth of experience and investment results in managing other accounts similar to the respective Fund. The Trustees received a presentation at the Meeting by investment professionals from the Subadviser for Harbor Capital Appreciation Fund. The Trustees had received presentations by investment professionals from the Subadvisers for Harbor Strategic Growth Fund, Harbor Mid Cap Growth Fund, Harbor Small Cap Growth Fund, Harbor Small Cap Growth Opportunities Fund, Harbor Large Cap Value Fund, Harbor Mid Cap Value Fund, Harbor Small Cap Value Fund, and Harbor Small Cap Value Opportunities Fund at meetings of the Board of Trustees held in 2018. The Trustees reviewed information concerning each Subadviser’s historical investment results in managing accounts and/or funds, as applicable, in a manner substantially similar to the relevant Fund.
Investment Performance, Advisory Fees and Expense Ratios
In considering each Fund’s performance, advisory fees and expense ratio, the Trustees requested and received from the Adviser data compiled by Broadridge and Morningstar. The Trustees also received information explaining the methodology for compilation of certain of this information and what it was intended to demonstrate. The Trustees analyzed the Institutional Class performance of each Fund, the advisory fees of each Fund, and the Institutional Class expenses of each Fund (after giving effect to waivers and/or reimbursements, if applicable, that reduced the fees or expenses of the Fund or its peer funds) and made certain observations and findings as to each Fund as noted below. The Trustees also reviewed certain Investor Class comparative fee and expense information they considered relevant to their deliberations. In evaluating performance, the Trustees recognized that the performance data reflects a snapshot of a period as of a particular date and that selecting a different performance period could produce significantly different results.
Harbor Capital Appreciation Fund. The Trustees considered Harbor Capital Appreciation Fund (inception date December 29, 1987) and its Institutional Class performance in relation to its Broadridge universe and group for the one-, three- and five-year periods ended December 31, 2018, noting that according to the Broadridge data, Harbor Capital Appreciation Fund had underperformed its group median for the one-, three- and five-year periods and its universe median for the one-year period, ended December 31, 2018. The Fund had outperformed its universe median for the three- and five-year periods ended December 31, 2018. The Fund’s one-, three- and five-year rolling returns as of December 31, 2018 ranked in the second, second and first quartiles, respectively, according to Morningstar. The Trustees also considered that the Fund had outperformed its primary benchmark, the Russell 1000® Growth Index, for the one-year period and underperformed its benchmark index for the three- and five-year periods, ended December 31, 2018.
91
Harbor Domestic Equity Funds
Additional Information—Continued
ADVISORY AGREEMENT APPROVALS—Continued
The Trustees considered the expertise of Jennison Associates LLC (“Jennison”) in managing assets generally and specifically with respect to the Fund’s asset class, noting that Jennison managed approximately $52.8 billion in assets in this asset class, out of a firm-wide total of approximately $160.7 billion in assets under management. The Trustees also noted the experience of the Fund’s portfolio managers in this asset class, noting that one was a founding member of Jennison, as well as the addition of two portfolio managers to the Fund’s portfolio management team.
The Trustees observed that the Broadridge comparison of contractual management fees for the Fund’s expense group, assuming an asset level of $29.55 billion, showed that the Fund’s contractual management fee was above the group median for the Institutional Class. The actual total expense ratio for the Institutional Class of the Fund, however, was below both the group and universe medians. The Trustees also considered that Harbor Capital had agreed to continue the Fund’s existing contractual fee waiver arrangement until at least February 29, 2020. The Trustees noted that Harbor Capital’s profitability in operating the Fund was not excessive.
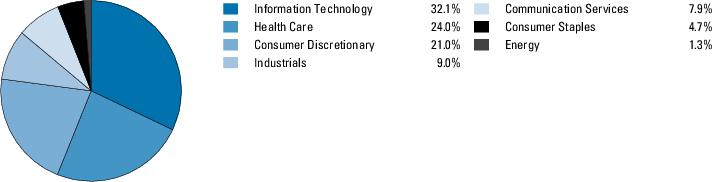
Harbor Strategic Growth Fund. The Trustees considered Harbor Strategic Growth Fund (inception date March 1, 2017) and its Institutional Class performance (including predecessor fund performance) in relation to its Broadridge universe and group for the one-, three- and five-year periods ended December 31, 2018, noting that according to the Broadridge data, Harbor Strategic Growth Fund had underperformed its group median for the one- and three-year periods and its universe median for the one-, three- and five-year periods ended December 31, 2018. The Fund had outperformed its group median for the five-year period ended December 31, 2018. The Fund’s one-, three- and five-year rolling returns as of December 31, 2018 each ranked in the third quartile, according to Morningstar. The Trustees also considered that the Fund had underperformed its benchmark, the Russell 1000® Growth Index, for the one-, three- and five-year periods ended December 31, 2018.
The Trustees considered the expertise of Mar Vista Investment Partners, LLC (“Mar Vista”) in managing assets generally and specifically with respect to the Fund’s asset class, noting that Mar Vista had approximately $4.2 billion in assets under advisement in this asset class, out of a firm-wide total of approximately $5.0 billion in assets under advisement. The Trustees also noted the experience of the Fund’s portfolio managers in this asset class, noting that Mar Vista had also managed the predecessor fund since 2011, prior to its reorganization into Harbor Strategic Growth Fund.
The Trustees observed that the Broadridge comparison of contractual management fees for the Fund’s expense group, assuming an asset level of $75 million, showed that the Fund’s contractual management fee was below the group median for the Institutional Class. The actual total expense ratio for the Institutional Class of the Fund was also below both the group and universe medians. The Trustees also considered that Harbor Capital had agreed to a contractual fee waiver/expense reimbursement arrangement with respect to the Fund that will be effective until at least February 29, 2020. The Trustees noted that Harbor Capital’s profitability in operating the Fund was not excessive.
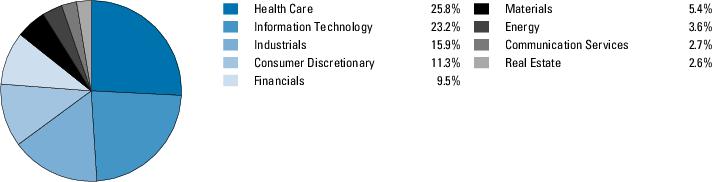
Harbor Mid Cap Growth Fund. The Trustees considered Harbor Mid Cap Growth Fund (inception date November 1, 2000), noting that, according to the Broadridge report, the Fund’s Institutional Class had outperformed its Broadridge group and universe medians for the one-, three - and five-year periods ended December 31, 2018. The Trustees considered the fact that, in comparison to its universe of other mid cap growth funds, as identified by Morningstar, the Fund’s one-, three- and five-year rolling returns ranked in the first, second and second quartiles, respectively, as of December 31, 2018. The Trustees also considered that the Fund had outperformed its benchmark, the Russell Midcap® Growth Index, for the one- and three-year periods ended December 31, 2018, while underperforming its benchmark index for the five- year period ended December 31, 2018.
The Trustees considered the expertise of Wellington Management Company LLP (“Wellington”) in managing assets generally and in the mid cap growth asset class specifically, noting that Wellington managed approximately $2.5 billion in assets in this asset class, out of a firm-wide total of approximately $1.0 trillion in assets under management. The Trustees noted the experience of the Fund’s portfolio managers in this asset class.
The Trustees observed that the Broadridge comparison of contractual management fees for the Fund’s expense group, assuming an asset level of $350 million, showed that the Fund’s contractual management fee was below the group median for the Institutional Class. The Broadridge data also showed that the actual total expense ratio for the Fund’s Institutional Class was below both the group and universe medians. The Trustees noted that Harbor Capital’s profitability in managing the Fund was not excessive.
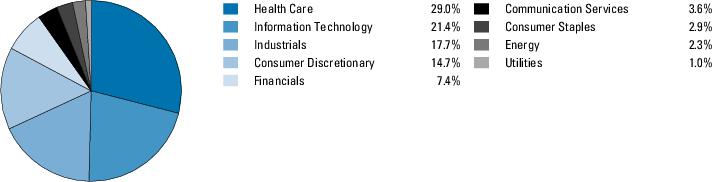
Harbor Small Cap Growth Fund. The Trustees considered Harbor Small Cap Growth Fund (inception date November 1, 2000), noting that according to the Broadridge report, the Fund’s Institutional Class underperformed its group median for the one- and three-year periods and its universe median for the one-, three- and five-year periods ended December 31, 2018. The Fund slightly outperformed its group median for the five-year period ended December 31, 2018. The Morningstar data presented ranked the Fund’s one-, three- and five-year rolling returns as of December 31, 2018 in the fourth, fourth and third quartiles, respectively. The Trustees also considered the fact that Harbor Small Cap Growth Fund had underperformed its benchmark, the Russell 2000® Growth Index, for the one-, three- and five-year periods ended December 31, 2018.
92
Harbor Domestic Equity Funds
Additional Information—Continued
ADVISORY AGREEMENT APPROVALS—Continued
The Trustees considered the expertise of Westfield Capital Management Company, L.P. (“Westfield”) in managing assets generally and in the small cap growth asset class specifically, noting that Westfield managed approximately $1.53 billion in assets in this asset class, out of a firm-wide total of approximately $11.86 billion in assets under management. The Trustees also noted the experience of the Fund’s portfolio managers in this asset class.
The Trustees observed that the Broadridge comparison of contractual management fees for the Fund’s expense group, assuming an asset level of $725 million, showed the Fund’s contractual management fee was below the group median for the Institutional Class. The Trustees also noted that the Fund’s actual total expense ratio for the Institutional Class was below the Broadridge group and universe median expense ratios. The Trustees noted that Harbor Capital’s profitability in operating the Fund was not excessive.
Harbor Small Cap Growth Opportunities Fund. The Trustees considered Harbor Small Cap Growth Opportunities Fund (inception date February 1, 2014), noting that according to the Broadridge report, the Fund’s Institutional Class underperformed both its group and universe medians for the one- and three-year and since inception periods ended December 31, 2018. The Morningstar data presented ranked the Fund’s one- and three-year and since inception rolling returns as of December 31, 2018 in the third, fourth and fourth quartiles, respectively. The Trustees also considered the fact that Harbor Small Cap Growth Opportunities Fund had outperformed its benchmark, the Russell 2000® Growth Index, for the one-year period and underperformed its benchmark for the three-year and since inception periods ended December 31, 2018.
The Trustees considered the expertise of the Fund’s subadviser, Elk Creek Partners, LLC (“Elk Creek”), in managing assets generally and in the small cap growth asset class specifically, noting that Elk Creek managed approximately $923.4 million in assets in this asset class, out of a firm-wide total of approximately $1.25 billion in assets under management. The Trustees also noted the experience of the Fund��s portfolio managers in this asset class.
The Trustees observed that the Broadridge comparison of contractual management fees for the Fund’s expense group, assuming an asset level of $300 million, showed the Fund’s contractual management fee was below the group median for the Institutional Class. The Trustees also noted that the Fund’s actual total expense ratio for the Institutional Class was also below the Broadridge group and universe median expense ratios. The Trustees noted that Harbor Capital’s profitability in operating the Fund was not excessive.
Harbor Large Cap Value Fund. The Trustees considered Harbor Large Cap Value Fund (inception date December 29, 1987), noting the Fund’s Institutional Class outperformance relative to both its group and universe medians for the three- and five-year periods ended December 31, 2018. The Trustees also noted the Fund’s outperformance relative to its group median and underperformance relative to its universe median for the one-year period ended December 31, 2018. The Morningstar data presented showed that the Fund’s one-, three- and five-year rolling returns ranked in the third, first and first quartiles, respectively, for the period ended December 31, 2018. The Trustees also noted that the Fund had outperformed its benchmark, the Russell 1000® Value Index, for the three- and five-year periods, and underperformed its benchmark for the one-year period, ended December 31, 2018.
The Trustees considered the expertise of Aristotle Capital Management, LLC (“Aristotle”) in managing assets generally and in the large cap value asset class specifically, noting that Aristotle managed approximately $13.98 billion in assets in the value equity strategy used by the Fund, out of a firm-wide total of approximately $15.55 billion in assets under management. The Trustees also noted the experience of the Fund’s portfolio managers in this asset class.
The Trustees noted that the Broadridge comparison of contractual management fees for the Fund’s expense group, assuming an asset level of $1.0 billion, showed the Fund’s management fee was below the group median for the Institutional Class, and the actual total expense ratio for the Fund’s Institutional Class was below its group and universe median expense ratios. The Trustees also considered that Harbor Capital had agreed to a contractual fee waiver/expense reimbursement arrangement with respect to the Fund that will be effective until at least February 29, 2020. The Trustees noted that the Adviser’s profitability in managing the Fund was not excessive.
Harbor Mid Cap Value Fund. The Trustees considered Harbor Mid Cap Value Fund (inception date March 1, 2002), noting the Fund’s Institutional Class performance was above its Broadridge group median for the one- and five-year periods ended December 31, 2018 and below the group median for the three-year period ended December 31, 2018. The Fund’s performance was below its Broadridge universe median for the one-, three- and five-year periods ended December 31, 2018. The Morningstar data presented showed that the Fund’s one-, three-, and five-year rolling returns ranked in the fourth, fourth and third quartiles, respectively, for the periods ended December 31, 2018. The Trustees considered the fact that the Fund had underperformed its benchmark, the Russell Midcap® Value Index, for the one-, three- and five-year periods ended December 31, 2018.
93
Harbor Domestic Equity Funds
Additional Information—Continued
ADVISORY AGREEMENT APPROVALS—Continued
The Trustees considered the expertise of LSV Asset Management (“LSV”) in managing assets generally and in the mid cap value asset class specifically, noting that LSV managed approximately $2.54 billion in assets in this asset class, out of a firm-wide total of approximately $105.84 billion in assets under management. The Trustees also noted the experience of the Fund’s portfolio managers in this asset class, noting that one of the portfolio managers was a founding partner of LSV.
The Trustees noted that the Broadridge comparison of contractual management fees for the Fund’s expense group, assuming an asset level of $950 million, showed the Fund’s management fee was above the group median for the Institutional Class. The actual total expense ratio for the Fund’s Institutional Class, however, was below its group and universe median expense ratios. The Trustees also considered that Harbor Capital had agreed to continue the Fund’s existing contractual fee waiver arrangement until at least February 29, 2020. The Trustees noted that the Adviser’s profitability in managing the Fund was not excessive.
Harbor Small Cap Value Fund. The Trustees considered Harbor Small Cap Value Fund (inception date December 14, 2001), noting the Fund’s outperformance relative to its Broadridge group median for the one-, three- and five-year periods and outperformance relative to its Broadridge universe median for the three- and five-year periods ended December 31, 2018. The Trustees noted that the Fund underperformed its Broadridge group universe for the one-year period ended December 31, 2018. According to the Morningstar data presented, the Fund’s one-, three- and five-year rolling returns ranked in the third, first and first quartiles, respectively, for the periods ended December 31, 2018. The Trustees also considered the fact that the Fund outperformed its benchmark, the Russell 2000® Value Index, for the three- and five-year periods ended December 31, 2018 and underperformed its benchmark for the one-year period ended December 31, 2018.
The Trustees considered the expertise of EARNEST Partners LLC (“EARNEST”) in managing assets generally and in the small cap value asset class specifically, noting that EARNEST managed approximately $3.6 billion in assets in this asset class, out of a firm-wide total of approximately $19.99 billion in assets under management. The Trustees also noted the experience of the Fund’s portfolio manager in this asset class, noting that he is the founder of EARNEST.
They observed that the Broadridge comparison of contractual management fees for the Fund’s expense group, assuming an asset level of $1.4 billion, showed the Fund’s management fee was below the group median for the Institutional Class. The actual total expense ratio for the Fund’s Institutional Class was below the group and universe median expense ratios. The Trustees noted that Harbor Capital’s profitability in operating the Fund was not excessive.
Harbor Small Cap Value Opportunities Fund. The Trustees considered Harbor Small Cap Value Opportunities Fund (inception date August 1, 2017), noting the Fund’s underperformance relative to each of its Broadridge group and universe medians for the one-year and since inception periods ended December 31, 2018. According to the Morningstar data presented, the Fund’s one-year and since inception returns each ranked in the fourth quartile for the periods ended December 31, 2018. The Trustees also considered the fact that the Fund underperformed its benchmark, the Russell 2000® Value Index, for the one-year and since inception periods ended December 31, 2018. The Trustees noted that the short time period since the Fund’s inception did not support drawing any significant conclusions about the Fund’s performance.
The Trustees considered the expertise of Sapience Investments, LLC (“Sapience”) in managing assets generally and in the small cap value asset class specifically, noting that Sapience managed approximately $513.3 million in assets in this asset class, out of a firm-wide total of approximately $647.7 in assets under management. The Trustees also noted the experience of the Fund’s portfolio manager in this asset class, noting that he is the founder of Sapience.
They observed that the Broadridge comparison of contractual management fees for the Fund’s expense group, assuming an asset level of $50 million, showed the Fund’s management fee was below the group median for the Institutional Class. The actual total expense ratio for the Fund’s Institutional Class was also below the group and universe median expense ratios. The Trustees also considered that Harbor Capital had agreed to a contractual fee waiver/expense reimbursement arrangement with respect to the Fund that will be effective until at least February 29, 2020. The Trustees noted that Harbor Capital’s profitability in operating the Fund was not excessive.
The Trustees also separately considered the allocation between the Adviser and each Subadviser of the relevant Fund’s investment advisory fee (i.e., the amount of the advisory fee retained by the Adviser relative to that paid to the relevant Subadviser as a subadvisory fee). They determined in each case that the allocation was reasonable and the product of arm’s length negotiation between the Adviser and Subadviser.
Profitability
The Trustees also considered the Adviser’s profitability in operating each of the Funds (as well as on a fund complex-wide basis) as presented by the Adviser, and the allocation methodology used by the Adviser to compute such profitability. The Trustees concluded that the methodology was reasonable and that a reasonable level of profitability was important to provide
94
Harbor Domestic Equity Funds
Additional Information—Continued
ADVISORY AGREEMENT APPROVALS—Continued
suitable incentives for the Adviser to continue to attract and maintain high-quality personnel and to invest in infrastructure and other resources to support and enhance the Funds’ operations. In considering the Adviser’s profitability generally, the Trustees also reviewed the compensation received by Harbor Services Group and Harbor Funds Distributors in consideration of the transfer agency and distribution services, respectively, that are provided to Harbor Funds and any other benefits enjoyed by the Adviser and its affiliates as a result of their relationship with Harbor Funds.
The Trustees also considered that profitability calculations with respect to advisory, transfer agency and distribution operations vary significantly depending on whether revenues on which the calculation is based are taken gross or net of amounts paid to third parties, such as subadvisory fee expenses and certain transfer agency expenses, and noted that subadvisory fee expenses are a direct expense of the Adviser. The Trustees also noted that the Adviser was, in certain cases, waiving a portion of its advisory fee and/or paying or reimbursing a portion of Fund expenses. The Trustees determined that the Adviser’s profitability in operating each Fund was not excessive.
Economies of Scale
The Trustees also considered the extent to which economies of scale might be realized as each Fund grows, and the extent to which each Fund’s advisory fee level reflects these economies of scale for the benefit of Fund investors. The Trustees specifically considered whether any advisory fee reduction “breakpoints” should be added to the advisory fee payable by any Fund. As noted above, the Trustees concluded that the Adviser’s profitability in each case was not excessive. They concluded that the Funds’ fee structures reflected economies of scale to date and that breakpoints in these fee structures were not required at the present time. The Trustees noted they intend to monitor each Fund’s asset growth in connection with future reviews of each Fund’s Investment Advisory Agreement to determine whether breakpoints may be appropriate at such time.
95
Benchmark Descriptions
Bloomberg Barclays U.S. Aggregate Bond Index—The Bloomberg Barclays U.S. Aggregate Bond Index is an unmanaged index of investment-grade fixed-rate debt issues with maturities of at least one year. This unmanaged index does not reflect fees and expenses and is not available for direct investment.
Bloomberg Barclays U.S. TIPS Index—The Bloomberg Barclays U.S. TIPS Index is an unmanaged market index comprised of all U.S. Treasury Inflation Protected Securities rated investment grade (Baa3 or better), have at least one year to final maturity, and at least $250 million par amount outstanding. This unmanaged index does not reflect fees and expenses and is not available for direct investment.
ICE BofAML U.S. Convertible Ex Mandatory Index—The ICE BofAML U.S. Convertible Ex Mandatory Index is broadly representative of the U.S. convertible securities market, consisting of publicly traded issues, denominated in U.S. dollars, of all credit qualities, and excluding mandatory (equity-linked) convertibles. This unmanaged index does not reflect fees and expenses and is not available for direct investment.
ICE BofAML U.S. 3-Month Treasury Bill Index—The ICE BofAML U.S. 3-Month Treasury Bill Index is comprised of a single U.S. Treasury Bill issue purchased at the beginning of each month and held for a full month, at which time that issue is sold and rolled into a newly selected issue. The issue selected each month is that having a maturity date closest to, but not beyond 90 days from the rebalance date.
ICE BofAML U.S. High Yield Index (H0A0)—The ICE BofAML U.S. High Yield Index (H0A0) is an unmanaged index that tracks the performance of below investment grade U.S. dollar-denominated corporate bonds publicly issued in the U.S. domestic market. All bonds are U.S. dollar denominated and rated Split BBB and below. This unmanaged index does not reflect fees and expenses and is not available for direct investment.
ICE BofAML U.S. Non-Distressed High Yield Index—The ICE BofAML U.S. Non-Distressed High Yield Index is a subset of the ICE BofAML U.S. High Yield Index (H0A0) including all securities with an option-adjusted spread less than 1,000 basis points. The unmanaged index does not reflect fees and expenses and is not available for direct investment.
MSCI All Country World (ND) Index—The MSCI All Country World (ND) Index is a free float-adjusted market capitalization weighted index that is designed to measure the equity market performance of global developed and emerging markets. This unmanaged index does not reflect fees and expenses and is not available for direct investment.
MSCI All Country World Ex. U.S. (ND) Index—The MSCI All Country World Ex. U.S. (ND) Index is a free float-adjusted market capitalization weighted index that is designed to measure equity market performance in the global developed and emerging markets, excluding the United States. This unmanaged index does not reflect fees and expenses and is not available for direct investment.
MSCI EAFE (ND) Index—The MSCI EAFE (ND) Index is an unmanaged index generally representative of major developed markets, excluding the U.S. and Canada. This unmanaged index does not reflect fees and expenses and is not available for direct investment.
MSCI EAFE Small Cap (ND) Index—The MSCI EAFE Small Cap (ND) Index is an equity index which captures small cap representation across developed market countries around the world, excluding the U.S. and Canada. This unmanaged index does not reflect fees and expenses and is not available for direct investment.
MSCI Emerging Markets (ND) Index—The MSCI Emerging Markets (ND) Index is a market capitalization weighted index of equity securities in more than 20 emerging market economies. This unmanaged index does not reflect fees and expenses and is not available for direct investment.
MSCI World (ND) Index—The MSCI World (ND) Index is a free float-adjusted market capitalization index that is designed to measure global developed market equity performance. This unmanaged index does not reflect fees and expenses and is not available for direct investment.
Russell 1000® Growth Index—The Russell 1000® Growth Index is an unmanaged index generally representative of the U.S. market for larger capitalization growth stocks. This unmanaged index does not reflect fees and expenses and is not available for direct investment. The Russell 1000® Growth Index and Russell® are trademarks of Frank Russell Company.
Russell 1000® Value Index—The Russell 1000® Value Index is an unmanaged index generally representative of the U.S. market for larger capitalization value stocks. This unmanaged index does not reflect fees and expenses and is not available for direct investment. The Russell 1000® Value Index and Russell® are trademarks of Frank Russell Company.
Russell 2000® Index—The Russell 2000® Index measures the performance of the small-cap segment of the U.S. equity universe. The Russell 2000® Index is a subset of the Russell 3000® Index representing approximately 10% of the total market capitalization of that index. It includes approximately 2,000 of the smallest securities based on a combination of their market cap and current
96
Benchmark Descriptions—Continued
index membership. The Russell 2000® Index is constructed to provide a comprehensive and unbiased small-cap barometer and is completely reconstituted annually to ensure larger stocks do not distort the performance and characteristics of the true small-cap opportunity set. This unmanaged index does not reflect fees and expenses and is not available for direct investment. The Russell 3000® Index and Russell® are trademarks of Frank Russell Company.
Russell 2000® Growth Index—The Russell 2000® Growth Index is an unmanaged index representing the smallest 2,000 stocks with the highest price-to-book ratio and future earnings. This unmanaged index does not reflect fees and expenses and is not available for direct investment. The Russell 2000® Growth Index and Russell® are trademarks of Frank Russell Company.
Russell 2000® Value Index—The Russell 2000® Value Index is an unmanaged index representing the smallest 2,000 stocks with the lowest price-to-book ratio and future earnings. This unmanaged index does not reflect fees and expenses and is not available for direct investment. The Russell 2000® Value Index and Russell® are trademarks of Frank Russell Company.
Russell 3000® Index—The Russell 3000® Index measures the performance of the largest 3,000 U.S. companies representing approximately 98% of the investable U.S. equity market. The Russell 3000® Index is constructed to provide a comprehensive, unbiased and stable barometer of the broad market and is completely reconstituted annually to ensure new and growing equities are reflected. This unmanaged index does not reflect fees and expenses and is not available for direct investment. The Russell 3000® Index and Russell® are trademarks of Frank Russell Company.
Russell 3000® Growth Index—The Russell 3000® Growth Index measures the performance of the broad growth segment of the U.S. equity universe. It includes those Russell 3000® companies with higher price-to-book ratios and higher forecasted growth values. The Russell 3000® Growth Index is constructed to provide a comprehensive, unbiased, and stable barometer of the broad growth market. The index is completely reconstituted annually to ensure new and growing equities are included and that the represented companies continue to reflect growth characteristics. This unmanaged index does not reflect fees and expenses and is not available for direct investment. The Russell 3000® Growth Index and Russell® are trademarks of Frank Russell Company.
Russell 3000® Value Index—The Russell 3000® Value Index measures the performance of the broad value segment of U.S. equity value universe. It includes those Russell 3000® companies with lower price-to-book ratios and lower forecasted growth values. The Russell 3000® Value Index is constructed to provide a comprehensive, unbiased, and stable barometer of the broad value market. The index is completely reconstituted annually to ensure new and growing equities are included and that the represented companies continue to reflect value characteristics. This unmanaged index does not reflect fees and expenses and is not available for direct investment. The Russell 3000® Value Index and Russell® are trademarks of Frank Russell Company.
Russell Midcap® Index—The Russell Midcap® Index is an unmanaged index generally representative of the U.S. market for medium capitalization stocks. This unmanaged index does not reflect fees and expenses and is not available for direct investment. The Russell Midcap® Index and Russell® are trademarks of Frank Russell Company.
Russell Midcap® Growth Index—The Russell Midcap® Growth Index is an unmanaged index generally representative of the U.S. market for medium capitalization growth stocks. This unmanaged index does not reflect fees and expenses and is not available for direct investment. The Russell Midcap® Growth Index and Russell® are trademarks of Frank Russell Company.
Russell Midcap® Value Index—The Russell Midcap® Value Index is an unmanaged index generally representative of the U.S. market for medium capitalization value stocks. This unmanaged index does not reflect fees and expenses and is not available for direct investment. The Russell Midcap® Value Index and Russell® are trademarks of Frank Russell Company.
S&P 500 Index—The S&P 500 Index is an unmanaged index generally representative of the U.S. stock market. This unmanaged index does not reflect fees and expenses and is not available for direct investment.
97
[THIS PAGE INTENTIONALLY LEFT BLANK]
98
[THIS PAGE INTENTIONALLY LEFT BLANK]
99
111 South Wacker Drive, 34th Floor | Chicago, IL 60606-4302 | 800-422-1050 | harborfunds.com |
Trustees & Officers
Charles F. McCain
Chairman, President & Trustee
Scott M. Amero
Trustee
Trustee
Raymond J. Ball
Trustee
Trustee
Donna J. Dean
Trustee
Trustee
Joseph L. Dowling, III
Trustee
Trustee
Randall A. Hack
Trustee
Trustee
Robert Kasdin
Trustee
Trustee
Kathryn L. Quirk
Trustee
Trustee
Ann M. Spruill
Trustee
Trustee
Erik D. Ojala
Chief Compliance Officer
Anmarie S. Kolinski
Treasurer
Treasurer
Brian L. Collins
Vice President
Vice President
Kristof M. Gleich
Vice President
Vice President
Charles P. Ragusa
Vice President
Vice President
Diana R. Podgorny
Secretary
Secretary
Jodie L. Crotteau
Assistant Secretary
Assistant Secretary
Lana M. Lewandowski
AML Compliance Officer
& Assistant Secretary
AML Compliance Officer
& Assistant Secretary
Lora A. Kmieciak
Assistant Treasurer
Assistant Treasurer
John M. Paral
Assistant Treasurer
Assistant Treasurer
Investment Adviser
Harbor Capital Advisors, Inc.
111 South Wacker Drive, 34th Floor
Chicago, IL 60606-4302
312-443-4400
111 South Wacker Drive, 34th Floor
Chicago, IL 60606-4302
312-443-4400
Distributor
Harbor Funds Distributors, Inc.
111 South Wacker Drive, 34th Floor
Chicago, IL 60606-4302
312-443-4600
111 South Wacker Drive, 34th Floor
Chicago, IL 60606-4302
312-443-4600
Shareholder Services
Harbor Services Group, Inc.
P.O. Box 804660
Chicago, IL 60680-4108
800-422-1050
P.O. Box 804660
Chicago, IL 60680-4108
800-422-1050
FD.SAR.DE.0419
Table of Contents
Semi-Annual Report
April 30, 2019
International & Global Funds
Retirement Class | Institutional Class | Administrative Class | Investor Class | |
Harbor International Fund | HNINX | HAINX | HRINX | HIINX |
Harbor Diversified International All Cap Fund | HNIDX | HAIDX | HRIDX | HIIDX |
Harbor Overseas Fund | HAORX | HAOSX | HAOAX | HAONX |
Harbor International Growth Fund | HNGFX | HAIGX | HRIGX | HIIGX |
Harbor International Small Cap Fund | HNISX | HAISX | HRISX | HIISX |
Harbor Global Leaders Fund | HNGIX | HGGAX | HRGAX | HGGIX |
Harbor Emerging Markets Equity Fund | HNEMX | HAEMX | HREMX | HIEEX |
Beginning on January 1, 2021, as permitted by regulations adopted by the Securities and Exchange Commission, paper copies of the Funds’ annual and semi-annual shareholder reports will no longer be sent by mail, unless you specifically request paper copies of the reports. Instead, the reports will be made available on the Funds’ website (harborfunds.com), and you will be notified by mail each time a report is posted and provided with a website link to access the report.
If you already elected to receive shareholder reports electronically, you will not be affected by this change and you need not take any action. You may elect to receive shareholder reports and other communications from a Fund electronically anytime by contacting your financial intermediary (such as a broker-dealer or bank) or, if you invest directly with Harbor Funds, by calling 800-422-1050.
You may elect to receive all future reports in paper free of charge. If you invest through a financial intermediary (such as a broker-dealer or bank), you can contact your financial intermediary to request that you continue to receive paper copies of the Funds’ shareholder reports. If you invest directly, you can call 800-422-1050 to request that you continue to receive paper copies of the Funds’ shareholder reports. Your election to receive reports in paper will apply to all Harbor Funds held in your account.
Table of Contents
This document must be preceded or accompanied by a Prospectus.
Letter from the Chairman
Charles F. McCain Chairman |
Dear Fellow Shareholder:
International equities in the aggregate posted positive returns in the fiscal half year ended April 30, 2019. The MSCI All Country World Ex U.S. (ND) Index, a measure of the equity markets outside the U.S., had a return of 9.12%. All international and global returns are in U.S. dollars.
Toward the end of 2018, equity markets struggled in the face of developments such as the U.K.’s lack of a viable Brexit plan, uncertainty over U.S.–China trade talks, and the U.S. Federal Reserve’s interest rate policy, which combined to negatively affect a wide range of asset classes. In the first few months of 2019, however, positive developments on these fronts eased market sentiment and resulted in global equity markets rallying sharply. The MSCI World (ND) Index, a measure of the global equity markets, posted a gain of 8.83% for the fiscal half year.
Emerging markets significantly outpaced developed markets for the six-month period, as the MSCI Emerging Markets (ND) Index gained 13.76%.
Comments by the portfolio managers of each Harbor international and global equity fund can be found in the pages preceding each Fund’s portfolio of investments. As always, we recommend that shareholders maintain a long-term perspective in evaluating all of their investments, including Harbor Funds.
Returns For Periods Ended April 30, 2019 | ||||||||||
Unannualized | Annualized | |||||||||
International & Global | 6 Months | 1 Year | 5 Years | 10 Years | 30 Years | |||||
MSCI EAFE (ND)(foreign stocks) | 7.45% | -3.22% | 2.60% | 7.95% | 4.58% | |||||
MSCI EAFE Small Cap (ND)(foreign small cap stocks) | 5.89 | -7.88 | 5.27 | 11.49 | N/A | |||||
MSCI World (ND)(global stocks) | 8.83 | 6.48 | 7.31 | 11.58 | 6.82 | |||||
MSCI All Country World Ex. U.S. (ND)(foreign stocks) | 9.12 | -3.23 | 2.83 | 7.75 | N/A | |||||
MSCI Emerging Markets (ND)(emerging market stocks) | 13.76 | -5.04 | 4.04 | 7.50 | N/A | |||||
Domestic Equities | ||||||||||
Russell 3000® (entire U.S. stock market) | 9.71% | 12.68% | 11.20% | 15.30% | 10.17% | |||||
S&P 500 (large cap stocks) | 9.76 | 13.49 | 11.63 | 15.32 | 10.15 | |||||
Russell Midcap® (mid cap stocks) | 11.65 | 10.69 | 9.75 | 15.65 | 11.41 | |||||
Russell 2000® (small cap stocks) | 6.06 | 4.61 | 8.63 | 14.10 | 9.41 | |||||
Russell 3000® Growth (growth stocks) | 11.81 | 16.61 | 14.17 | 16.83 | 10.05 | |||||
Russell 3000® Value (value stocks) | 7.61 | 8.58 | 8.17 | 13.69 | 9.91 | |||||
Fixed Income | ||||||||||
ICE BofAML U.S. Non-Distressed High Yield (domestic high-yield bonds) | 5.89% | 7.03% | 5.03% | 8.74% | N/A | |||||
Bloomberg Barclays U.S. Aggregate Bond (domestic bonds) | 5.49 | 5.29 | 2.57 | 3.72 | 6.09% | |||||
Bloomberg Barclays U.S. TIPS (domestic inflation-linked bonds) | 4.60 | 3.10 | 1.74 | 3.64 | N/A | |||||
ICE BofAML U.S. 3-Month Treasury Bill (proxy for money market returns) | 1.18 | 2.18 | 0.78 | 0.45 | 3.08 |
1
Change in market’s direction showed value of resilience
In the fourth calendar quarter of 2018, U.S. equities endured their worst quarterly performance in more than seven years, as concerns about interest rate increases, continuing trade tensions, and slowing global growth dampened investor sentiment. Some commentators speculated that the nearly 10-year-long bull market had reached its end.
But in the first quarter of 2019, such talk proved premature, as equities rebounded in the U.S. and globally. Anyone who pulled their money out of equities in December 2018, hoping to avoid further losses, may have missed out on the robust gains of early 2019.
Reacting emotionally to market movements, or trying to time when the market will rise or fall, can have a negative impact on the success of a long-term investment strategy. While past performance is never a guarantee of future results, many investors have historically achieved their financial objectives by making a long-term plan and staying true to it through market ups and downs.
Harbor Funds offers a variety of equity and fixed income funds that can serve as the foundation of a diversified portfolio.
Thank you for investing with Harbor Funds.
June 28, 2019
Charles F. McCain |
Chairman |
2
Harbor International Fund
Manager’s Commentary (Unaudited)
Subadviser
Marathon Asset Management LLP
Orion House
5 Upper St. Martin’s Lane
London, WC2H 9EA
England
London, WC2H 9EA
England
Portfolio Managers
Neil M. Ostrer
Since 2018
Since 2018
Charles Carter
Since 2018
Since 2018
Nick Longhurst
Since 2018
Since 2018
William J. Arah
Since 2018
Since 2018
Simon Somerville
Since 2018
Since 2018
Michael Nickson, CFA
Since 2018
Since 2018
Michael Godfrey, CFA
Since 2018
Since 2018
David Cull, CFA
Since 2018
Since 2018
Marathon Asset Management LLP (operating as Marathon-London in the U.S.) has subadvised the Fund since 2018.
Investment Objective
The Fund seeks long-term total return, principally from growth of capital.
Management’s Discussion of
Fund Performance
Fund Performance
MARKET REVIEW
Non-U.S. developed equity markets completed a swift V-shaped decline and recovery over the six-month period ending April 30, 2019, with the MSCI EAFE (ND) Index ultimately returning 7.45% over the entire period after seeing the Index experience a 14.19% decline during the final quarter of 2018. All international and global returns are in U.S. Dollars.
On a regional basis, the developed Asian ex-Japan markets collectively (Australia, Hong Kong, Singapore and New Zealand), which constituted 12.41% of the Index on average over the period, led the broad developed international equity market recovery over the reporting period returning 15.18% in USD within the MSCI EAFE (ND) Index during the period. European markets followed behind returning 8.48% in USD and averaging 62.71% of the MSCI EAFE (ND) Index over the period. The Japanese market exposure within the MSCI EAFE (ND) Index was relatively flat over the reporting period, returning 1.32% and averaging 24.32% of the MSCI EAFE (ND) Index over the period.
Following many central bank efforts to “normalize” monetary policy by raising rates in the latter part of 2018, the U.S. Federal Reserve (Fed) expressed what was widely interpreted as a more ‘dovish’ position and more or less committed to no further interest rate hikes during the first half of 2019. This guidance was quickly emulated by the European Central Bank. Further, government officials noted that trade negotiations between the U.S. and China appeared to be moving closer to culmination and U.S. tariff hikes on China were suspended. Finally, after an initial delay, the deadline for Britain’s exit from the European Union (“Brexit”) was deferred to October 31, 2019, which in turn ruled out the imminent possibility of a hard, or “no deal,” Brexit. Taken collectively, the subadviser believes these developments seemed to have eased the worries that sparked the selloff in the last quarter of 2018 and resulted in global equity markets rallying sharply over the start of 2019.
PERFORMANCE
The Fund transitioned to a new subadviser on August 22, 2018 which, in turn, prompted the transition of the underlying portfolio holdings from the legacy portfolio to a largely new portfolio of underlying holdings in order to reflect the new subadviser’s investment convictions. This transition from the legacy portfolio to the new portfolio was completed on April 10, 2019. Therefore, it is important to note that the performance narrative for the reporting period encompasses the relative return of the Fund versus the MSCI EAFE (ND) Index during this transition and may reference Fund exposures that should not be assumed to be supported by the new subadviser.
The Fund’s Retirement Class slightly outperformed the benchmark MSCI EAFE (ND) Index over the six-month period, returning 7.46% (Retirement Class), while the remaining classes underperformed, posting 7.42% (Institutional Class), 7.30% (Administrative Class), and 7.24% (Investor Class) as compared with the MSCI EAFE (ND) return of 7.45%. A positive contribution from currency and regional allocation exposure was offset by the negative influence due to stock selection. More specifically, the overweight exposure to the stronger British pound sterling (corresponding to the overweight exposure to that equity market) was one of the strongest positive contributing factors to relative performance of the Fund over the period. The Fund’s limited out-of-benchmark exposure to emerging markets, averaging 7.49% of the Fund over the reporting period, and stock specific exposure to those markets also contributed positively to the relative return of the Fund versus the MSCI EAFE (ND) Index. Conversely, stock selection within the developed Asia ex-Japan region (Hong Kong, in particular) and the Fund’s underweight exposure to that region weighed on the relative return of the Fund. Stock specific exposure within Europe, particularly France and Germany, also contributed negatively to the relative performance of the Fund.
From a sector standpoint, the Fund’s aggregate overweight exposure to the Industrials sector, which outperformed the overall MSCI EAFE (ND) Index return over the period, and stock selection within that sector were the largest positive contributors to relative returns of the
3
Harbor International Fund
Manager’s Commentary—Continued
TOTAL RETURNS
For the periods ended 04/30/2019
Unannualized | 1 Year | Annualized | |||||||||
6 Months | 5 Years | 10 Years | |||||||||
Harbor International Fund | |||||||||||
Retirement Class1 | 7.46% | -7.36% | -0.14% | 7.62% | |||||||
Institutional Class | 7.42 | -7.44 | -0.18 | 7.60 | |||||||
Administrative Class | 7.30 | -7.66 | -0.43 | 7.33 | |||||||
Investor Class | 7.24 | -7.78 | -0.55 | 7.20 | |||||||
Comparative Index | |||||||||||
MSCI EAFE (ND) | 7.45% | -3.22% | 2.60% | 7.95% |
As stated in the Fund’s prospectus dated March 1, 2019, the expense ratios were 0.69% (Net) and 0.81% (Gross) (Retirement Class); 0.77% (Net) and 0.89% (Gross) (Institutional Class); 1.02% (Net) and 1.14% (Gross) (Administrative Class); and 1.14% (Net) and 1.26% (Gross) (Investor Class). The net expense ratios reflect a contractual management fee waiver effective through 02/29/2020. The expense ratios in the prospectus may differ from the actual expense ratios for the period disclosed within this report. The expense ratios shown in the prospectus are based on the prior fiscal year, adjusted to reflect changes, if any, in contractual arrangements that occurred prior to the date of the prospectus (or supplement thereto, if applicable).
Performance data shown represents past performance and is no guarantee of future results. Past performance is net of management fees and expenses and reflects reinvested dividends and distributions but does not reflect the deduction of taxes that a shareholder would pay on Fund distributions or upon the redemption of Fund shares. Past performance reflects the beneficial effect of any expense waivers or reimbursements, without which returns would have been lower. Investment returns and principal value will fluctuate so that Fund shares, when redeemed, may be worth more or less than their original cost. Returns for periods less than one year are not annualized. Current performance may be higher or lower and is available through the most recent month end atharborfunds.com or by calling 800-422-1050.
Fund. Stock selection within the Health Care sector was also a positive contributor to relative performance of the Fund. Conversely, the Fund’s stock specific exposure within the Financials sectors weighed on relative returns of the Fund.
Within the context of the above performance attribution highlights over the six-month period, and taken collectively with the subadviser’s noted broad-based observations relating to the market’s V-shaped direction over the reporting period, it is important to emphasize that the transition of the Fund’s stock specific exposure was anchored around the long-term supply-side, bottom-up orientation of the investment philosophy and process employed by the new subadviser and that the new subadviser did not attempt to reposition the Fund based on broader market movements, geopolitical events or macroeconomic factors during the reporting period.
OUTLOOK & STRATEGY
Rather than attempt to predict macro geopolitical and economic forces and their influence on market conditions going forward, the subadviser remains focused on bottom-up stock selection with an aim to invest in businesses where, in its opinion, the supply-side capital cycle dynamics and capital allocation decisions by management remain favorable or are improving.
1 | Retirement Class shares commenced operations on March 1, 2016. The performance attributed to the Retirement Class shares prior to that date is that of the Institutional Class shares. Performance prior to March 1, 2016 has not been adjusted to reflect the lower expenses of Retirement Class shares. During this period, Retirement Class shares would have had returns similar to, but potentially higher than, Institutional Class shares due to the fact that Retirement Class shares represent interests in the same portfolio as Institutional Class shares but are subject to lower expenses. |
This report contains the current opinions of Marathon Asset Management LLP as of the date of this report and should not be considered as investment advice or a recommendation of any particular security, strategy or investment product. Such opinions are subject to change without notice and securities described herein may no longer be included in, or may at any time be removed from, the Fund’s portfolio. This report is distributed for informational purposes only. Information contained herein has been obtained from sources believed reliable, but not guaranteed.
Investing in international and emerging markets poses special risks, including potentially greater price volatility due to social, political and economic factors, as well as currency exchange rate fluctuations. These risks are more severe for securities of issuers in emerging market regions. For information on the different share classes and the risks associated with an investment in the Fund, please refer to the current prospectus.
4
Harbor International Fund
Fund Summary—April 30, 2019 (Unaudited)
TOP Holdings(% of net assets)
❶ | Intertek Group plc | 1.4% |
❷ | Coloplast AS | 1.2% |
❸ | Rightmove plc | 1.2% |
❹ | Vestas Wind Systems AS | 1.2% |
❺ | Compass Group plc | 1.1% |
❻ | Roche Holding AG | 1.1% |
❼ | Assa Abloy AB Class B | 1.0% |
❽ | BP plc | 1.0% |
❾ | GN Store Nord AS | 1.0% |
❿ | Toyota Motor Corp. | 1.0% |
Sector Allocation(% of investments)
(Excludes short-term investments)
REGION BREAKDOWN(% of investments)
(Excludes short-term investments)
5
Harbor International Fund
Portfolio of Investments—April 30, 2019 (Unaudited)
Value, Cost, and Principal Amounts in Thousands
COMMON STOCKS—97.2% | |||
Shares | Value | ||
AEROSPACE & DEFENSE—1.9% | |||
390,260 | Airbus SE (France) | $53,438 | |
4,362,698 | BAE Systems plc (United Kingdom) | 28,040 | |
3,076,425 | Rolls-Royce Holdings plc (United Kingdom)* | 36,842 | |
194,896 | Thales SA (France) | 23,286 | |
141,606 | |||
AIR FREIGHT & LOGISTICS—0.3% | |||
324,483 | Oesterreichische Post AG (Austria) | 12,636 | |
313,800 | Yamato Holdings Co. Ltd. (Japan) | 6,817 | |
19,453 | |||
AIRLINES—0.2% | |||
1,090,435 | EasyJet plc (United Kingdom) | 16,522 | |
AUTO COMPONENTS—1.0% | |||
562,400 | Bridgestone Corp. (Japan) | 22,311 | |
2,482,448 | Gestamp Automocion SA ADR (Spain)1,2 | 15,850 | |
931,650 | GUD Holdings Ltd. (Australia) | 7,763 | |
175,862 | Hankook Tire Co. Ltd. (South Korea) | 5,984 | |
174,200 | Koito Manufacturing Co. Ltd. (Japan) | 10,431 | |
541,100 | Sumitomo Electric Industries Ltd. (Japan) | 7,200 | |
101,000 | Toyota Industries Corp. (Japan) | 5,725 | |
75,264 | |||
AUTOMOBILES—1.7% | |||
5,567,764 | Baic Motor Corp. Ltd. (China)2 | 3,908 | |
387,921 | Bayerische Motoren Werke AG (Germany) | 33,093 | |
85,343 | Hyundai Motor Co. (South Korea) | 10,130 | |
177,500 | Subaru Corp. (Japan) | 4,350 | |
1,216,200 | Toyota Motor Corp. (Japan) | 75,296 | |
126,777 | |||
BANKS—7.3% | |||
1,989,903 | Axis Bank Ltd. (India) | 21,883 | |
849,462 | Banco Santander SA (Spain) | 4,306 | |
2,183,600 | Bangkok Bank PCL (Thailand) | 13,893 | |
4,367,625 | Bank of Ireland Group plc (Ireland)* | 27,920 | |
6,828,129 | Bankia SA (Spain) | 18,912 | |
14,904,231 | Barclays plc (United Kingdom) | 31,984 | |
��� 674,453 | BNP Paribas SA (France) | 35,903 | |
519,700 | Chiba Bank Ltd. (Japan) | 2,730 | |
674,200 | Concordia Financial Group Ltd. (Japan) | 2,632 | |
288,680 | Danske Bank AS (Denmark) | 5,131 | |
863,412 | DNB ASA (Norway) | 16,603 | |
272,500 | Fukuoka Financial Group Inc. (Japan) | 6,361 | |
244,824 | Hana Financial Group Inc. (South Korea) | 7,722 | |
3,231,471 | HSBC Holdings plc (Hong Kong) | 28,064 | |
3,496,746 | Intesa Sanpaolo SpA (Italy) | 9,161 | |
1,470,600 | Kasikornbank PCL (Thailand) | 8,805 | |
33,260,633 | Lloyds Banking Group plc (United Kingdom) | 27,202 | |
1,223,800 | Mitsubishi UFJ Financial Group Inc. (Japan) | 6,072 | |
12,587,700 | Mizuho Financial Group Inc. (Japan) | 19,658 | |
2,368,400 | Nordea Bank ABP (Sweden) | 18,633 | |
7,576,600 | Resona Holdings Inc. (Japan) | 32,164 | |
733,690 | Shinhan Financial Group Co. Ltd. (South Korea) | 27,730 | |
2,869,587 | Standard Chartered plc (United Kingdom) | 26,237 | |
1,349,000 | Sumitomo Mitsui Financial Group Inc. (Japan) | 49,031 | |
264,000 | Sumitomo Mitsui Trust Holdings Inc. (Japan) | 9,211 | |
3,186,153 | Svenska Handelsbanken AB (Sweden) | 34,803 | |
2,352,775 | UniCredit SpA (Italy) | 32,572 | |
543,100 | United Overseas Bank Ltd. (Singapore) | 11,122 | |
536,445 |
COMMON STOCKS—Continued | |||
Shares | Value | ||
BEVERAGES—4.2% | |||
446,328 | Anheuser-Busch InBev SA (Belgium) | $39,682 | |
170,700 | Asahi Group Holdings Ltd. (Japan) | 7,443 | |
227,685 | Carlsberg AS (Denmark) | 29,440 | |
2,518,174 | Coca-Cola Amatil Ltd. (Australia) | 15,621 | |
1,707,297 | Davide Campari-Milano SpA (Italy) | 17,223 | |
1,524,122 | Diageo plc (United Kingdom) | 64,254 | |
593,292 | Heineken NV (Netherlands) | 64,139 | |
2,065,900 | Kirin Holdings Co. Ltd. (Japan) | 46,996 | |
270,300 | Suntory Beverage & Food Ltd. (Japan) | 11,952 | |
1,634,000 | Tsingtao Brewery Co. Ltd. (China) | 10,423 | |
307,173 | |||
BUILDING PRODUCTS—2.1% | |||
3,540,593 | Assa Abloy AB Class B (Sweden) | 75,689 | |
149,286 | Geberit AG (Switzerland) | 62,597 | |
1,519,118 | GWA Group Ltd. (Australia) | 3,608 | |
736,800 | LIXIL Group Corp. (Japan) | 9,626 | |
151,520 | |||
CAPITAL MARKETS—2.3% | |||
4,220,213 | 3i Group plc (United Kingdom) | 59,051 | |
396,053 | Close Brothers Group plc (United Kingdom) | 8,030 | |
2,242,362 | IG Group Holdings plc (United Kingdom) | 14,917 | |
34,300 | JAFCO Co. Ltd. (Japan) | 1,298 | |
344,500 | Japan Exchange Group Inc. (Japan) | 5,626 | |
2,818,855 | Jupiter Fund Management plc (United Kingdom) | 13,833 | |
3,660,100 | Nomura Holdings Inc. (Japan) | 13,858 | |
165,198 | Rathbone Brothers plc (United Kingdom) | 5,435 | |
1,152,756 | St. James's Place plc (United Kingdom) | 16,917 | |
2,074,358 | UBS Group AG (Switzerland)* | 27,816 | |
166,781 | |||
CHEMICALS—2.3% | |||
396,344 | Akzo Nobel N.V. (Netherlands) | 33,676 | |
522,878 | BASF SE (Germany) | 42,688 | |
1,000,596 | DuluxGroup Ltd. (Australia) | 6,879 | |
227,700 | Nissan Chemical Industries Ltd. (Japan) | 10,144 | |
100,600 | Nitto Denko Corp. (Japan) | 5,439 | |
1,361,945 | Orica Ltd. (Australia) | 17,857 | |
128,700 | Shin-Etsu Chemical Co. Ltd. (Japan) | 12,191 | |
242,889 | Symrise AG (Germany) | 23,379 | |
2,200 | Tokyo Ohka Kogyo Co. Ltd. (Japan) | 70 | |
2,291,800 | Toray Industries Inc. (Japan) | 15,683 | |
168,006 | |||
COMMERCIAL SERVICES & SUPPLIES—3.4% | |||
89,700 | AEON Delight Co. Ltd. (Japan)* | 3,020 | |
2,162,342 | Brambles Ltd. (Australia) | 18,375 | |
17,882,683 | Cleanaway Waste Management Ltd. (Australia) | 28,398 | |
972,670 | Edenred (France) | 45,859 | |
584,269 | Elis SA (France) | 10,427 | |
10,785,397 | G4S plc (United Kingdom) | 30,483 | |
4,329,376 | HomeServe plc (United Kingdom) | 61,361 | |
72,713 | S-1 Corp. (South Korea) | 6,103 | |
184,300 | Secom Co. Ltd. (Japan) | 15,505 | |
14,321,630 | Serco Group plc (United Kingdom)* | 23,295 | |
152,900 | Sohgo Security Services Co. Ltd. (Japan) | 6,832 | |
249,658 | |||
CONSTRUCTION & ENGINEERING—1.0% | |||
637,686 | Boskalis Westminster NV (Netherlands) | 17,501 | |
268,960 | Ferrovial SA (Spain) | 6,632 | |
949,400 | Maeda Corp. (Japan) | 9,455 |
6
Harbor International Fund
Portfolio of Investments—Continued
Value, Cost, and Principal Amounts in Thousands
COMMON STOCKS—Continued | |||
Shares | Value | ||
CONSTRUCTION & ENGINEERING—Continued | |||
2,174,900 | Obayashi Corp. (Japan) | $21,381 | |
1,697,800 | Shimizu Corp. (Japan) | 14,542 | |
64,400 | SHO-BOND Holdings Co. Ltd. (Japan) | 4,426 | |
73,937 | |||
CONSTRUCTION MATERIALS—0.6% | |||
212,776 | CRH plc (Ireland) | 7,143 | |
69,807 | Imerys SA (France) | 3,720 | |
116,620 | Vicat SA (France) | 6,167 | |
1,046,216 | Wienerberger AG (Austria) | 24,043 | |
41,073 | |||
CONSUMER FINANCE—0.6% | |||
481,300 | AEON Financial Service Co. Ltd. (Japan) | 9,992 | |
4,366,600 | International Personal Finance plc (United Kingdom) | 10,403 | |
5,984,227 | Non-Standard Finance plc (United Kingdom)2 | 4,139 | |
2,256,800 | Provident Financial plc (United Kingdom)* | 15,668 | |
268,423 | Shriram Transport Finance Co. Ltd. (India) | 4,284 | |
44,486 | |||
CONTAINERS & PACKAGING—0.4% | |||
4,647,545 | DS Smith plc (United Kingdom) | 21,707 | |
536,900 | Toyo Seikan Group Holdings Ltd. (Japan) | 10,766 | |
32,473 | |||
DISTRIBUTORS—0.2% | |||
2,209,928 | Inchcape plc (United Kingdom) | 17,742 | |
DIVERSIFIED FINANCIAL SERVICES—0.1% | |||
10,448,000 | First Pacific Co. Ltd. (Hong Kong) | 4,333 | |
DIVERSIFIED TELECOMMUNICATION SERVICES—1.7% | |||
1,898,254 | Deutsche Telekom AG (Germany) | 31,805 | |
8,685,006 | Koninklijke KPN NV (Netherlands) | 26,692 | |
974,422 | KT Corp. ADR (South Korea)1 | 11,723 | |
1,268,500 | Nippon Telegraph & Telephone Corp. (Japan) | 52,780 | |
1,780,556 | Spark New Zealand Ltd. (New Zealand) | 4,369 | |
127,369 | |||
ELECTRIC UTILITIES—0.2% | |||
483,000 | Kansai Electric Power Co. (Japan) | 5,844 | |
778,000 | Tohoku Electric Power Co. Inc. (Japan) | 8,906 | |
14,750 | |||
ELECTRICAL EQUIPMENT—2.4% | |||
852,472 | Legrand SA (France) | 62,702 | |
93,500 | Mabuchi Motor Co. Ltd. (Japan) | 3,468 | |
15,168,000 | TECO Electric and Machinery Co. Ltd. (Taiwan) | 11,366 | |
407,700 | Ushio Inc. (Japan) | 4,956 | |
995,702 | Vestas Wind Systems AS (Denmark) | 90,095 | |
172,587 | |||
ELECTRONIC EQUIPMENT, INSTRUMENTS & COMPONENTS—2.8% | |||
355,400 | Azbil Corp. (Japan) | 8,554 | |
2,837,000 | Chroma ATE Inc. (Taiwan) | 13,591 | |
2,949,000 | Delta Electronics Inc. (Taiwan) | 15,565 | |
42,900 | Hirose Electric Co. Ltd. (Japan) | 4,972 | |
189,800 | Hitachi High-Technologies Corp. (Japan) | 8,460 | |
1,812,100 | Hitachi Ltd. (Japan) | 60,267 | |
3,500 | Keyence Corp. (Japan) | 2,187 | |
606,200 | Kyocera Corp. (Japan) | 39,393 | |
186,100 | Omron Corp. (Japan) | 9,996 | |
160,600 | Shimadzu Corp. (Japan) | 4,308 |
COMMON STOCKS—Continued | |||
Shares | Value | ||
ELECTRONIC EQUIPMENT, INSTRUMENTS & COMPONENTS—Continued | |||
725,382 | Spectris plc (United Kingdom) | $26,064 | |
131,700 | TDK Corp. (Japan) | 11,539 | |
204,896 | |||
ENERGY EQUIPMENT & SERVICES—0.8% | |||
1,671,249 | John Wood Group plc (United Kingdom) | 10,246 | |
592,809 | Petrofac Ltd. (United Kingdom) | 3,422 | |
7,773,701 | Saipem SpA (Italy)* | 39,432 | |
230,143 | TechnipFMC plc (France) | 5,684 | |
58,784 | |||
ENTERTAINMENT—0.4% | |||
342,861 | CTS Eventim AG & Co. KGaA (Germany) | 17,609 | |
477,394 | Modern Times Group Mortgage AB Class B (Sweden)* | 6,168 | |
117,600 | Toho Co. Ltd. (Japan) | 4,939 | |
28,716 | |||
FOOD & STAPLES RETAILING—1.5% | |||
541,900 | Dairy Farm International Holdings Ltd. (Hong Kong) | 4,245 | |
1,416,642 | Koninklijke Ahold Delhaize NV (Netherlands) | 34,143 | |
45,900 | Lawson Inc. (Japan) | 2,143 | |
176,900 | Matsumotokiyoshi Holdings Co. Ltd. (Japan) | 5,857 | |
3,559,813 | Metcash Ltd. (Australia) | 7,203 | |
1,031,700 | Seven & I Holdings Co. Ltd. (Japan) | 35,705 | |
136,000 | Sundrug Co. Ltd. (Japan) | 3,646 | |
4,986,111 | Tesco plc (United Kingdom) | 16,268 | |
109,210 | |||
FOOD PRODUCTS—1.5% | |||
4,453,000 | China Mengniu Dairy Co. Ltd. (China)* | 16,451 | |
2,762,875 | Devro plc (United Kingdom) | 7,166 | |
87,800 | Meiji Holdings Co. Ltd. (Japan) | 6,921 | |
933,200 | Nippon Suisan Kaisha Ltd. (Japan) | 6,548 | |
7,336,000 | Tingyi Cayman Islands Holding Corp. (China) | 12,080 | |
570,700 | Toyo Suisan Kaisha Ltd. (Japan) | 21,792 | |
393,195 | Viscofan SA (Spain) | 23,655 | |
17,518,000 | Want Want China Holdings Ltd. (China) | 13,908 | |
108,521 | |||
GAS UTILITIES—0.1% | |||
289,400 | Tokyo Gas Co. Ltd. (Japan) | 7,363 | |
HEALTH CARE EQUIPMENT & SUPPLIES—4.4% | |||
119,748 | Alcon Inc. (Switzerland)* | 6,896 | |
847,650 | Coloplast AS (Denmark) | 91,564 | |
10,827,125 | ConvaTec Group plc (United Kingdom)2 | 19,610 | |
1,469,622 | GN Store Nord AS (Denmark) | 75,326 | |
206,800 | Hoya Corp. (Japan) | 14,606 | |
845,048 | Koninklijke Philips NV (Netherlands) | 36,290 | |
532,400 | Olympus Corp. (Japan) | 5,975 | |
531,609 | Smith & Nephew plc (United Kingdom) | 10,277 | |
105,682 | Sonova Holding AG (Switzerland) | 21,346 | |
1,379,359 | William Demant Holding AS (Denmark)* | 43,583 | |
325,473 | |||
HEALTH CARE PROVIDERS & SERVICES—1.3% | |||
752,500 | Alfresa Holdings Corp. (Japan) | 20,998 | |
773,512 | Fresenius Medical Care AG & Co. KGaA (Germany) | 65,194 | |
301,900 | MediPAL Holdings Corp. (Japan) | 6,789 | |
92,981 |
7
Harbor International Fund
Portfolio of Investments—Continued
Value, Cost, and Principal Amounts in Thousands
COMMON STOCKS—Continued | |||
Shares | Value | ||
HOTELS, RESTAURANTS & LEISURE—4.3% | |||
6,245,000 | Ajisen China Holdings Ltd. (China) | $2,657 | |
482,055 | Carnival plc (United Kingdom) | 25,556 | |
3,539,578 | Compass Group plc (United Kingdom) | 80,539 | |
3,578,400 | Genting Singapore Ltd. (Singapore) | 2,595 | |
51,200 | GL Ltd. (Singapore) | 30 | |
1,924,922 | GVC Holdings plc (United Kingdom) | 16,426 | |
1,290,500 | Hongkong & Shanghai Hotels Ltd. (Hong Kong) | 1,890 | |
10,515,352 | Merlin Entertainments plc (United Kingdom)2 | 50,285 | |
471,558 | Paddy Power Betfair plc (United Kingdom) | 39,913 | |
974,672 | Playtech plc (United Kingdom) | 5,573 | |
4,476,848 | SSP Group plc (United Kingdom) | 40,692 | |
22,018,458 | Thomas Cook Group plc (United Kingdom)* | 7,676 | |
2,180,638 | TUI AG (Germany) | 24,369 | |
335,140 | Yum China Holdings Inc. (China) | 15,933 | |
314,134 | |||
HOUSEHOLD DURABLES—0.7% | |||
1,159,382 | Barratt Developments plc (United Kingdom) | 9,121 | |
966,900 | Casio Computer Co. Ltd. (Japan) | 12,179 | |
2,354,988 | McCarthy & Stone plc (United Kingdom)2 | 3,931 | |
85,300 | Rinnai Corp. (Japan) | 5,755 | |
666,400 | Sekisui Chemical Co. Ltd. (Japan) | 10,698 | |
245,800 | Sony Corp. (Japan) | 12,380 | |
54,064 | |||
HOUSEHOLD PRODUCTS—1.0% | |||
266,500 | Lion Corp. (Japan) | 5,486 | |
819,579 | Reckitt Benckiser Group plc (United Kingdom) | 66,309 | |
71,795 | |||
INDEPENDENT POWER & RENEWABLE ELECTRICITY PRODUCERS—0.0% | |||
12,862,800 | Lopez Holdings Corp. (Philippines) | 1,189 | |
INDUSTRIAL CONGLOMERATES—1.5% | |||
2,750,500 | CK Hutchison Holdings Ltd. (Hong Kong) | 28,919 | |
445,944 | DCC plc (United Kingdom) | 39,917 | |
516,700 | Jardine Matheson Holdings Ltd. (Hong Kong) | 34,014 | |
167,263 | LG Corp. (South Korea) | 10,459 | |
113,309 | |||
INSURANCE—4.8% | |||
1,137,128 | Admiral Group plc (United Kingdom) | 32,754 | |
870,576 | AXA SA (France)3 | 23,215 | |
2,302,000 | Dai-ichi Life Holdings Inc. (Japan) | 33,229 | |
252,400 | Great Eastern Holdings Ltd. (Singapore) | 4,818 | |
74,988 | Hannover Rueck SE (Germany) | 11,324 | |
13,393 | Helvetia Holding AG (Switzerland) | 8,511 | |
2,942,800 | Japan Post Holdings Co. Ltd. (Japan) | 32,958 | |
1,081,800 | MS&AD Insurance Group Holdings Inc. (Japan) | 33,626 | |
1,930,601 | QBE Insurance Group Ltd. (Australia) | 17,609 | |
1,490,518 | Sampo OYJ (Finland)3 | 68,248 | |
71,862 | Samsung Fire & Marine Insurance Co. Ltd. (South Korea) | 18,708 | |
678,900 | Sompo Holdings Inc. (Japan) | 25,624 | |
279,000 | Sony Financial Holdings Inc. (Japan) | 5,737 | |
467,400 | T&D Holdings Inc. (Japan) | 5,062 | |
594,600 | Tokio Marine Holdings Inc. (Japan) | 30,126 | |
351,549 | |||
INTERACTIVE MEDIA & SERVICES—2.2% | |||
337,307 | Adevinta ASA A (Norway)* | 3,402 | |
284,557 | Adevinta ASA B (Norway)* | 2,800 | |
3,159,820 | Auto Trader Group plc (United Kingdom)2 | 23,358 |
COMMON STOCKS—Continued | |||
Shares | Value | ||
INTERACTIVE MEDIA & SERVICES—Continued | |||
148,432 | Baidu Inc. ADR (China)*,1 | $24,674 | |
1,510,022 | Carsales.com Ltd. (Australia) | 14,345 | |
2,399,007 | Domain Holdings Australia Ltd. (Australia) | 4,573 | |
12,012,416 | Rightmove plc (United Kingdom) | 84,941 | |
158,093 | |||
INTERNET & DIRECT MARKETING RETAIL—0.6% | |||
125,088 | Ctrip.com International Ltd. ADR (China)*,1 | 5,510 | |
24,224 | GS Home Shopping Inc. (South Korea) | 3,554 | |
2,353,717 | Just Eat plc (United Kingdom)* | 21,518 | |
551,732 | MoneySuperMarket.com Group plc (United Kingdom) | 2,621 | |
1,401,000 | PChome Online Inc. (Taiwan)* | 5,963 | |
33,106 | Takeaway.com NV (Netherlands)*,2 | 2,853 | |
22,044 | Zooplus AG (Germany)* | 2,397 | |
44,416 | |||
IT SERVICES—1.2% | |||
201,304 | Alten SA (France) | 21,985 | |
195,500 | ITOCHU Techno-Solutions Corp. (Japan) | 4,804 | |
75,100 | Nomura Research Institute Ltd. (Japan) | 3,676 | |
2,468,900 | NTT Data Corp. (Japan) | 28,790 | |
94,300 | OBIC Co. Ltd. (Japan) | 10,948 | |
103,600 | Otsuka Corp. (Japan) | 4,075 | |
218,900 | SCSK Corp. (Japan)* | 10,402 | |
84,680 | |||
LEISURE PRODUCTS—0.9% | |||
789,500 | Bandai Namco Holdings Inc. (Japan) | 37,849 | |
1,497,000 | Giant Manufacturing Co. Ltd. (Taiwan) | 11,417 | |
4,442,000 | Goodbaby International Holdings Ltd. (Hong Kong)* | 1,261 | |
922,000 | Sega Sammy Holdings Inc. (Japan) | 11,679 | |
29,900 | Shimano Inc. (Japan) | 4,395 | |
66,601 | |||
LIFE SCIENCES TOOLS & SERVICES—0.6% | |||
75,017 | Eurofins Scientific SE (France) | 34,352 | |
96,702 | Gerresheimer AG (Germany) | 7,286 | |
41,638 | |||
MACHINERY—2.6% | |||
199,378 | Andritz AG (Austria) | 9,522 | |
4,942,677 | CNH Industrial NV (Italy) | 53,736 | |
153,900 | Daifuku Co. Ltd. (Japan) | 9,468 | |
192,128 | GEA Group AG (Germany) | 5,383 | |
5,800 | Hirata Corp. (Japan) | 400 | |
115,700 | Hoshizaki Corp. (Japan)* | 7,501 | |
420,812 | IMI plc (United Kingdom) | 5,779 | |
181,200 | Makita Corp. (Japan) | 6,611 | |
1,726,730 | Rotork plc (United Kingdom) | 7,043 | |
2,069,413 | Sandvik AB (Sweden)3 | 38,322 | |
��5,800 | SMC Corp. (Japan) | 2,423 | |
406,193 | Stabilus SA (Germany) | 22,667 | |
835,373 | Wartsila OYJ Abp (Finland) | 13,376 | |
5,509,000 | Yungtay Engineering Co. Ltd. (Taiwan)* | 11,500 | |
193,731 | |||
MARINE—0.3% | |||
2,735,290 | Irish Continental Group plc (Ireland) | 15,443 | |
7,952,829 | Wan HAI Lines Ltd. (Taiwan) | 4,197 | |
19,640 |
8
Harbor International Fund
Portfolio of Investments—Continued
Value, Cost, and Principal Amounts in Thousands
COMMON STOCKS—Continued | |||
Shares | Value | ||
MEDIA—3.1% | |||
435,753 | Axel Springer SE (Germany) | $24,681 | |
6,213,900 | BEC World PCL (Thailand)* | 1,753 | |
628,075 | Daily Mail & General Trust plc (United Kingdom) | 5,388 | |
233,614 | Euromoney Institutional Investor plc (United Kingdom) | 3,746 | |
1,252,800 | Fuji Media Holdings Inc. (Japan) | 16,860 | |
2,708,589 | Informa plc (United Kingdom) | 27,541 | |
18,154,720 | ITV plc (United Kingdom) | 32,418 | |
447,376 | JCDecaux SA (France) | 14,665 | |
69,416,800 | Media Nusantara Citra TBK PT (Indonesia) | 4,583 | |
543,021 | MediaSet Espana Comunicacion SA (Spain) | 4,211 | |
5,852,168 | Nine Entertainment Co. Holdings Ltd. (Australia) | 7,214 | |
1,220,700 | Nippon Television Holdings Inc. (Japan) | 17,868 | |
479,613 | Nordic Entertainment Group AB (Sweden)* | 12,221 | |
337,307 | Schibsted ASA Class A (Norway) | 8,861 | |
288,107 | Schibsted ASA Class B (Norway) | 6,892 | |
2,263,947 | Sky Network Television Ltd. (New Zealand) | 1,847 | |
2,972,100 | Television Broadcasts Ltd. (Hong Kong) | 5,839 | |
2,205,997 | WPP plc (United Kingdom) | 27,526 | |
224,114 | |||
METALS & MINING—2.3% | |||
1,184,341 | Acerinox SA (Spain) | 12,336 | |
5,821,774 | Alumina Ltd. (Australia) | 9,212 | |
724,443 | ArcelorMittal SA (France) | 15,761 | |
401,832 | BHP Billiton Ltd. (Australia) | 10,633 | |
826,610 | BHP Group plc (United Kingdom) | 19,512 | |
976,584 | BlueScope Steel Ltd. (Australia) | 9,280 | |
10,605,384 | Glencore plc (United Kingdom)* | 42,078 | |
813,699 | Newcrest Mining Ltd. (Australia) | 14,374 | |
544,411 | Rio Tinto plc (United Kingdom) | 31,760 | |
164,946 | |||
MULTILINE RETAIL—0.3% | |||
849,500 | Isetan Mitsukoshi Holdings Ltd. (Japan) | 8,098 | |
548,100 | Marui Group Co. Ltd. (Japan) | 11,149 | |
25,000 | Ryohin Keikaku Co. Ltd. (Japan) | 4,768 | |
24,015 | |||
MULTI-UTILITIES—0.1% | |||
864,497 | National Grid plc (United Kingdom) | 9,471 | |
OIL, GAS & CONSUMABLE FUELS—2.7% | |||
9,945,810 | BP plc (United Kingdom) | 72,323 | |
247,568 | Caltex Australia Ltd. (Australia) | 4,747 | |
992,136 | Equinor ASA (Norway) | 22,116 | |
2,696,600 | INPEX Corp. (Japan) | 26,235 | |
1,818,334 | Royal Dutch Shell plc (United Kingdom) | 58,248 | |
289,637 | Total SA (France) | 16,101 | |
199,770 | |||
PERSONAL PRODUCTS—1.8% | |||
5,864,018 | Asaleo Care Ltd. (Australia)* | 3,804 | |
597,800 | Kao Corp. (Japan) | 46,149 | |
42,500 | Kose Corp. (Japan) | 7,961 | |
143,000 | Mandom Corp. (Japan) | 3,702 | |
1,135,113 | Unilever plc (United Kingdom) | 68,805 | |
130,421 | |||
PHARMACEUTICALS—3.1% | |||
360,200 | Astellas Pharma Inc. (Japan) | 4,878 | |
429,500 | Haw Par Corp. Ltd. (Singapore) | 4,580 | |
598,745 | Novartis AG (Switzerland) | 49,061 |
COMMON STOCKS—Continued | |||
Shares | Value | ||
PHARMACEUTICALS—Continued | |||
1,168,449 | Novo Nordisk AS (Denmark) | $57,248 | |
433,100 | Otsuka Holdings Co. Ltd. (Japan) | 15,483 | |
323,302 | Roche Holding AG (Switzerland) | 85,308 | |
88,500 | Sawai Pharmaceutical Co. Ltd. (Japan) | 4,755 | |
142,600 | Takeda Pharmaceutical Co. Ltd. (Japan) | 5,262 | |
226,575 | |||
PROFESSIONAL SERVICES—5.1% | |||
786,840 | Adecco Group AG (Switzerland) | 45,206 | |
2,704,918 | ALS Ltd. (Australia) | 15,163 | |
9,268,797 | Capita plc (United Kingdom)* | 15,452 | |
65,041 | DKSH Holding AG (Switzerland) | 3,994 | |
1,596,237 | Experian plc (United Kingdom) | 46,465 | |
11,965,423 | Hays plc (United Kingdom) | 23,721 | |
1,430,839 | Intertek Group plc (United Kingdom) | 100,078 | |
1,588,706 | IPH Ltd. (Australia) | 7,993 | |
276,300 | Nomura Co. Ltd. (Japan) | 7,729 | |
1,326,021 | PageGroup plc (United Kingdom) | 9,322 | |
479,700 | Persol Holdings Co. Ltd. (Japan) | 9,042 | |
142,240 | Randstad Holding NV (Netherlands) | 8,135 | |
2,386,851 | RELX plc (United Kingdom) | 54,840 | |
114,300 | TechnoPro Holdings Inc. (Japan) | 6,877 | |
97,026 | Teleperformance SE (France) | 18,652 | |
372,669 | |||
REAL ESTATE MANAGEMENT & DEVELOPMENT—0.6% | |||
335,000 | Daiwa House Industry Co. Ltd. (Japan) | 9,390 | |
1,862,500 | Mitsubishi Estate Co. Ltd. (Japan) | 31,495 | |
40,885 | |||
ROAD & RAIL—1.2% | |||
375,100 | East Japan Railway Co. (Japan) | 35,350 | |
1,312,808 | National Express Group plc (United Kingdom) | 7,039 | |
597,600 | Senko Co. Ltd. (Japan) | 4,807 | |
581,900 | West Japan Railway Co. (Japan) | 43,278 | |
90,474 | |||
SEMICONDUCTORS & SEMICONDUCTOR EQUIPMENT—1.0% | |||
71,691 | ASML Holding NV (Netherlands) | 14,970 | |
2,598,500 | Renesas Electronics Corp. (Japan)* | 13,917 | |
176,432 | SK Hynix Inc. (South Korea) | 11,939 | |
2,989,000 | Taiwan Semiconductor Manufacturing Co. Ltd. (Taiwan) | 25,096 | |
25,500 | Tokyo Electron Ltd. (Japan) | 4,047 | |
69,969 | |||
SOFTWARE—0.1% | |||
53,800 | Oracle Corp. Japan (Japan) | 3,689 | |
SPECIALTY RETAIL—0.7% | |||
67,000 | ABC-Mart Inc. (Japan) | 4,164 | |
1,607,500 | Esprit Holdings Ltd. (Hong Kong)* | 326 | |
1,155,500 | L'Occitane International SA (Hong Kong) | 2,076 | |
3,121,572 | Pets at Home Group plc (United Kingdom) | 6,179 | |
379,600 | USS Co. Ltd. (Japan) | 7,287 | |
971,525 | WH Smith plc (United Kingdom) | 25,992 | |
1,591,200 | Yamada Denki Co. Ltd. (Japan) | 7,543 | |
53,567 | |||
TECHNOLOGY HARDWARE, STORAGE & PERIPHERALS—1.6% | |||
144,500 | Canon Inc. (Japan) | 4,010 | |
371,500 | FUJIFILM Holdings Corp. (Japan) | 17,355 | |
806,613 | Logitech International SA (Switzerland) | 31,608 |
9
Harbor International Fund
Portfolio of Investments—Continued
Value, Cost, and Principal Amounts in Thousands
COMMON STOCKS—Continued | |||
Shares | Value | ||
TECHNOLOGY HARDWARE, STORAGE & PERIPHERALS—Continued | |||
524,600 | NEC Corp. (Japan) | $17,717 | |
248,688 | Neopost SA (France) | 6,100 | |
994,906 | Samsung Electronics Co. Ltd. (South Korea) | 39,117 | |
115,907 | |||
TEXTILES, APPAREL & LUXURY GOODS—2.6% | |||
200,111 | adidas AG (Germany) | 51,546 | |
213,300 | ASICS Corp. (Japan) | 2,628 | |
552,469 | Cie Financiere Richemont SA (Switzerland) | 40,387 | |
863,091 | Cie Financiere Richemont SA ADR (South Africa)1 | 6,331 | |
422,405 | EssilorLuxottica SA (France) | 51,465 | |
12,314,000 | Li Ning Co. Ltd. (China)* | 22,371 | |
657,800 | Onward Holdings Co. Ltd. (Japan) | 3,629 | |
592,315 | Shenzhou International Group Holdings Ltd. (China) | 7,961 | |
3,642,500 | Stella International Holdings Ltd. (Hong Kong) | 6,464 | |
192,782 | |||
TOBACCO—0.5% | |||
188,097 | British American Tobacco plc (United Kingdom) | 7,364 | |
615,900 | Japan Tobacco Inc. (Japan) | 14,232 | |
341,958 | Swedish Match AB (Sweden) | 16,673 | |
38,269 | |||
TRADING COMPANIES & DISTRIBUTORS—1.7% | |||
668,608 | Brenntag AG (Germany) | 36,080 | |
1,871,013 | Bunzl plc (United Kingdom) | 56,432 | |
512,300 | ITOCHU Corp. (Japan) | 9,243 | |
927,400 | Mitsubishi Corp. (Japan) | 25,548 | |
127,303 | |||
TRANSPORTATION INFRASTRUCTURE—0.5% | |||
1,578,000 | China Merchants Port Holdings Co. Ltd. (China) | 3,192 | |
1,471,573 | Getlink SE (France) | 23,686 | |
243,000 | Mitsubishi Logistics Corp. (Japan) | 6,504 | |
33,382 | |||
WIRELESS TELECOMMUNICATION SERVICES—0.8% | |||
1,228,571 | Bharti Airtel Ltd. (India)* | 5,648 |
COMMON STOCKS—Continued | |||
Shares | Value | ||
WIRELESS TELECOMMUNICATION SERVICES—Continued | |||
983,900 | KDDI Corp. (Japan) | $22,676 | |
605,500 | NTT DoCoMo Inc. (Japan) | 13,149 | |
4,233,183 | Vodafone Group plc (United Kingdom) | 7,852 | |
70,775,266 | Vodafone Idea Ltd. (India)* | 15,618 | |
64,943 | |||
TOTAL COMMON STOCKS | |||
(Cost $7,089,023) | 7,121,889 | ||
PREFERRED STOCKS—0.5% | |||
AEROSPACE & DEFENSE—0.0% | |||
218,426,175 | Rolls-Royce Holdings plc (United Kingdom)* | 285x | |
AUTOMOBILES—0.5% | |||
192,734 | Volkswagen AG (Germany) | 33,652 | |
TOTAL PREFERRED STOCKS | |||
(Cost $32,112) | 33,937 | ||
SHORT-TERM INVESTMENTS—0.8% | |||
(Cost $61,600) | |||
Principal Amount | |||
$ | 61,600 | State Street Navigator Securities Lending Government Money Market Portfolio (1 day yield of 2.510%) | 61,600 |
TOTAL INVESTMENTS—98.5% | |||
(Cost $7,182,735) | 7,217,426 | ||
CASH AND OTHER ASSETS, LESS LIABILITIES—1.5% | 111,832 | ||
TOTAL NET ASSETS—100.0% | $7,329,258 |
WARRANTS/RIGHTS OPEN
Description | No. of Contracts | Strike Price | Expiration Date | Cost (000s) | Value (000s) | |||||
Bharti Airtel Ltd. | 358,209 | INR 220.00 | 5/17/2019 | $ — | $514 |
FAIR VALUE MEASUREMENTS
The following table summarizes the Fund’s investments as of April 30, 2019 based on the inputs used to value them.
Asset Category | Quoted Prices Level 1 (000s) | Other Significant Observable Inputs Level 2 (000s) | Significant Unobservable Inputs Level 3 (000s) | Total (000s) | ||||
Investments in Securities | ||||||||
Common Stocks | ||||||||
Africa | $— | $6,331 | $— | $6,331 | ||||
Europe | 25,319 | 4,530,707 | — | 4,556,026 | ||||
Middle East/Central Asia | — | 47,433 | — | 47,433 | ||||
Pacific Basin | 57,840 | 2,454,259 | — | 2,512,099 |
10
Harbor International Fund
Portfolio of Investments—Continued
FAIR VALUE MEASUREMENTS—Continued
Asset Category | Quoted Prices Level 1 (000s) | Other Significant Observable Inputs Level 2 (000s) | Significant Unobservable Inputs Level 3 (000s) | Total (000s) | ||||
Preferred Stocks | ||||||||
Europe | $— | $33,652 | $285 | $33,937 | ||||
Short-Term Investments | ||||||||
Investment Company-Securities Lending Investment Fund | 61,600 | — | — | 61,600 | ||||
Total Investments in Securities | $144,759 | $7,072,382 | $285 | $7,217,426 | ||||
Financial Derivative Instruments - Assets | ||||||||
Warrants/Rights | $— | $514 | $— | $514 | ||||
Total Investments | $144,759 | $7,072,896 | $285 | $7,217,940 |
For more information on valuation inputs and their aggregation into the levels used in the table above, please refer to the Fair Value Measurements and Disclosures in Note 2 of the accompanying Notes to Financial Statements.
The following is a rollforward of the Fund’s Level 3 investments during the period ended April 30, 2019.
Valuation Description | Beginning Balance Beginning as of 11/01/2018 (000s) | Purchases (000s) | Sales (000s) | Discount/ (Premium) (000s) | Total Realized Gain/(Loss)w (000s) | Change in Unrealized Appreciation/ (Depreciation)w (000s) | Transfers In Level 3 (000s) | Transfers Out of Level 3 (000s) | Ending Balance as of 04/30/2019w (000s) | |||||||||
Preferred Stocks | $677 | $282 | $(675) | $— | $(7) | $8 | $— | $— | $285 |
The following is a summary of significant unobservable inputs used in the fair valuations of assets and liabilities categorized within Level 3 of the fair value hierarchy.
Valuation Descriptions | Ending Balance as of 04/30/2019 (000s) | Valuation Technique | Unobservable Inputs | Input Value(s) | ||||
Investments in Securities | ||||||||
Preferred Stocks | ||||||||
Rolls-Royce Holdings plc C Shares (United Kingdom)* | $285 | Market Approach | Pre-Traded Price | GBP 0.001 |
AFFILIATED TRANSACTIONS
Certain of the Fund’s investments are in companies that are considered to be affiliated companies of the Fund because the Fund owned more than 5% of the outstanding voting securities of the company during the period November 1, 2018 through April 30, 2019. Transactions during the period in securities of these companies were as follows:
Security Name | Beginning Balance as of 11/01/2018 (000s) | Purchases (000s) | Sales (000s) | Net Realized Gain/(Loss) (000s) | Change in Unrealized Appreciation/ (Depreciation) (000s) | Net Dividend Income (000s) | Ending Balance as of 04/30/2019 (000s) | |||||||
Cementos Argos SA (Colombia) | $171,185 | $— | $(196,000) | $(69,131) | $93,946 | $1,265 | $— |
11
Harbor International Fund
Portfolio of Investments—Continued
* | Non-income producing security | ||
1 | ADR after the name of a security stands for American Depositary Receipts representing ownership of foreign securities. ADRs are issued by U.S. banking institutions. | ||
2 | Securities purchased in a transaction exempt from registration under Rule 144A of the Securities Act of 1933. These securities may be resold in transactions exempt from registration, normally to qualified institutional buyers. The Fund has no right to demand registration of these securities. At April 30, 2019, the aggregate value of these securities was $123,934 or 2% of net assets. | ||
3 | All or a portion of this security was out on loan as of April 30, 2019. | ||
w | Amounts in this category are included in the “Realized and Change in Unrealized Gain/(Loss) on Investment Transactions” section of the Statement of Operations. The net unrealized appreciation/(depreciation) per investment type is below: | ||
Valuation Description | Unrealized Gain/(Loss) as of 04/30/2019 (000s) | ||
Preferred Stocks | $3 | ||
x | Fair valued in accordance with Harbor Funds Valuation Procedures. | ||
GBP | British Pound | ||
INR | Indian Rupee |
The accompanying notes are an integral part of the Financial Statements.
12
Harbor Diversified International All Cap Fund
Manager’s Commentary (Unaudited)
Subadviser
Marathon Asset Management LLP
Orion House
5 Upper St. Martin’s Lane
London, WC2H 9EA
England
London, WC2H 9EA
England
Portfolio Managers
Neil M. Ostrer
Since 2015
Since 2015
Charles Carter
Since 2015
Since 2015
Nick Longhurst
Since 2015
Since 2015
William J. Arah
Since 2015
Since 2015
Simon Somerville
Since 2016
Since 2016
Michael Nickson, CFA
Since 2018
Since 2018
Michael Godfrey, CFA
Since 2015
Since 2015
David Cull, CFA
Since 2015
Since 2015
Robert Anstey, CFA
Since 2015
Since 2015
Marathon Asset Management LLP (operating as Marathon-London in the U.S.) has subadvised the Fund since 2015.
Investment Objective
The Fund seeks long-term growth of capital.
Management’s Discussion of
Fund Performance
Fund Performance
Market Review
Non-U.S. equity markets completed a swift V-shaped decline and recovery over the six-month period ending April 30, 2019, with the MSCI All Country World Ex-U.S. (ND) Index ultimately returning 9.12% over the entire period after seeing the Index experience a 12.97% decline during the final quarter of 2018. All international and global returns are in U.S. Dollars.
On a regional basis, the developed Asian ex-Japan markets (Australia, Hong Kong, Singapore and New Zealand), which constituted 8.37% of the Index on average over the period, led the broad international equity market rally, returning 15.18% within the MSCI All Country World ex-U.S. (ND) Index during the period. Emerging markets, in large part led by China, following closely behind returning 13.76% and averaging 25.84% of the MSCI All Country World Ex-U.S. (ND) Index over the period.
Following many central bank efforts to “normalize” monetary policy by raising rates in the latter part of 2018, the U.S. Federal Reserve (Fed) expressed what was widely interpreted as a more “dovish” position and more or less committed to no further interest rate hikes during the first half of 2019. This guidance was quickly emulated by the European Central Bank. Further, government officials noted that trade negotiations between the U.S. and China appeared to be moving closer to culmination and U.S. tariff hikes on China were suspended. Finally, after an initial delay, the deadline for Britain’s exit from the European Union (“Brexit”) was deferred to October 31, 2019, which in turn ruled out the imminent possibility of a hard, or “no deal,” Brexit. Taken collectively, the subadviser believes these developments seemed to have eased the worries that sparked the sell-off in the last quarter of 2018 and resulted in global equity markets rallying sharply over the start of 2019.
Performance
The Fund performed in line with the MSCI All Country World Ex-U.S. (ND) Index over the six-month period, returning 9.28% (Retirement Class), 9.20% (Institutional Class), 9.07% (Administrative Class), and 9.02% (Investor Class) versus a 9.12% return for the MSCI All Country World Ex-U.S. (ND) Index. A positive contribution from stock selection and currency effect was largely offset by the negative influence due to regional exposure. More specifically, stock selection within the emerging markets were the largest positive contributing factor to relative performance of the Fund over the period, with stock specific exposure in the Canadian market also contributing positively to relative returns. Conversely, stock selection within the Pacific ex-Japan region (Hong Kong, in particular) weighed on the relative returns of the Fund.
From a sector standpoint, stock selection within the Health Care and Consumer Staples sectors was the primary positive contributor to relative returns of the Fund over the reporting period. Conversely, the Fund’s stock specific exposure within both the Communication Services and Financials sectors weighed on relative returns of the Fund.
Within the context of the above performance attribution highlights over the six-month period, and taken collectively with our noted broad-based observations relating to the market’s V-shaped direction over the reporting period, it is important to emphasize that the Fund’s turnover remained low over the period (with an implied average holding period of over 7 years) and the Fund’s stock specific exposure remained grounded in the long-term supply-side, bottom-up orientation of the investment philosophy and process employed by the subadviser.
13
Harbor Diversified International All Cap Fund
Manager’s Commentary—Continued
TOTAL RETURNS
For the periods ended 04/30/2019
Unannualized | 1 Year | 5 Years | Annualized | ||||||||
6 Months | Life of Fund | ||||||||||
Harbor Diversified International All Cap Fund | |||||||||||
Retirement Class1,2 | 9.28% | -2.10% | N/A | 5.24% | |||||||
Institutional Class1 | 9.20 | -2.26 | N/A | 5.18 | |||||||
Administrative Class1 | 9.07 | -2.39 | N/A | 4.93 | |||||||
Investor Class1 | 9.02 | -2.58 | N/A | 4.80 | |||||||
Comparative Index | |||||||||||
MSCI All Country World Ex. U.S. (ND)1 | 9.12% | -3.23% | N/A | 6.37% |
As stated in the Fund’s prospectus dated March 1, 2019, the expense ratios were 0.72% (Net) and 0.91% (Gross) (Retirement Class); 0.80% (Net) and 0.99% (Gross) (Institutional Class); 1.05% (Net) and 1.24% (Gross) (Administrative Class); 1.17% (Net) and 1.36% (Gross) (Investor Class). The net expense ratios reflect an expense limitation agreement (excluding interest expense, if any) effective through 02/29/2020. The expense ratios in the prospectus may differ from the actual expense ratios for the period disclosed within this report. The expense ratios shown in the prospectus are based on the prior fiscal year, adjusted to reflect changes, if any, in contractual arrangements that occurred prior to the date of the prospectus (or supplement thereto, if applicable).
Performance data shown represents past performance and is no guarantee of future results. Past performance is net of management fees and expenses and reflects reinvested dividends and distributions but does not reflect the deduction of taxes that a shareholder would pay on Fund distributions or upon the redemption of Fund shares. Past performance reflects the beneficial effect of any expense waivers or reimbursements, without which returns would have been lower. Investment returns and principal value will fluctuate so that Fund shares, when redeemed, may be worth more or less than their original cost. Returns for periods less than one year are not annualized. Current performance may be higher or lower and is available through the most recent month end atharborfunds.com or by calling 800-422-1050.
Outlook & Strategy
Rather than attempt to predict macro geopolitical and economic forces and their influence on market conditions going forward, the subadviser remains focused on bottom-up stock selection with an aim to invest in businesses where, in its opinion, the supply-side capital cycle dynamics and capital allocation decisions by management remain favorable or are improving.
1 | The “Life of Fund” return as shown reflects the period 11/02/2015 through 04/30/2019. |
2 | Retirement Class shares commenced operations on March 1, 2016. The performance attributed to the Retirement Class shares prior to that date is that of the Institutional Class shares. Performance prior to March 1, 2016 has not been adjusted to reflect the lower expenses of Retirement Class shares. During this period, Retirement Class shares would have had returns similar to, but potentially higher than, Institutional Class shares due to the fact that Retirement Class shares represent interests in the same portfolio as Institutional Class shares but are subject to lower expenses. |
This report contains the current opinions of Marathon Asset Management LLP as of the date of this report and should not be considered as investment advice or a recommendation of any particular security, strategy or investment product. Such opinions are subject to change without notice and securities described herein may no longer be included in, or may at any time be removed from, the Fund’s portfolio. This report is distributed for informational purposes only. Information contained herein has been obtained from sources believed reliable, but not guaranteed.
Investing in international and emerging markets poses special risks, including potentially greater price volatility due to social, political and economic factors, as well as currency exchange rate fluctuations. These risks are more severe for securities of issuers in emerging market regions. For information on the different share classes and the risks associated with an investment in the Fund, please refer to the current prospectus.
14
Harbor Diversified International All Cap Fund
Fund Summary—April 30, 2019 (Unaudited)
TOP Holdings(% of net assets)
❶ | Samsung Electronics Co. Ltd. | 1.2% |
❷ | Taiwan Semiconductor Manufacturing Co. Ltd. | 1.2% |
❸ | Fairfax Financial Holdings Ltd. | 1.0% |
❹ | Coloplast AS | 0.9% |
❺ | Intertek Group plc | 0.9% |
❻ | Vestas Wind Systems AS | 0.9% |
❼ | Brookfield Asset Management Inc. | 0.8% |
❽ | Compass Group plc | 0.8% |
❾ | Rightmove plc | 0.8% |
❿ | Roche Holding AG | 0.8% |
Sector Allocation(% of investments)
(Excludes short-term investments)
15
Harbor Diversified International All Cap Fund
Fund Summary—April 30, 2019 (Unaudited)—Continued
REGION BREAKDOWN(% of investments)
(Excludes short-term investments)
16
Harbor Diversified International All Cap Fund
Portfolio of Investments—April 30, 2019 (Unaudited)
Value, Cost, and Principal Amounts in Thousands
COMMON STOCKS—97.0% | |||
Shares | Value | ||
AEROSPACE & DEFENSE—1.4% | |||
28,457 | Airbus SE (France) | $3,897 | |
325,292 | BAE Systems plc (United Kingdom) | 2,091 | |
125,731 | Embraer SA (Brazil)* | 630 | |
232,670 | Rolls-Royce Holdings plc (United Kingdom)* | 2,786 | |
14,892 | Thales SA (France) | 1,779 | |
11,183 | |||
AIR FREIGHT & LOGISTICS—0.2% | |||
25,411 | Oesterreichische Post AG (Austria) | 989 | |
22,400 | Yamato Holdings Co. Ltd. (Japan) | 487 | |
1,476 | |||
AIRLINES—0.2% | |||
83,796 | EasyJet plc (United Kingdom) | 1,270 | |
AUTO COMPONENTS—1.3% | |||
40,100 | Bridgestone Corp. (Japan) | 1,591 | |
199,108 | Gestamp Automocion SA ADR (Spain)1,2 | 1,271 | |
150,075 | GUD Holdings Ltd. (Australia) | 1,251 | |
35,959 | Hankook Tire Co. Ltd. (South Korea) | 1,224 | |
12,300 | Koito Manufacturing Co. Ltd. (Japan) | 737 | |
31,663 | Magna International Inc. (Canada) | 1,762 | |
2,370,796 | Nemak SAB de CV (Mexico)2 | 1,303 | |
2,848 | Nokian Renkaat OYJ (Finland)3 | 95 | |
38,500 | Sumitomo Electric Industries Ltd. (Japan) | 512 | |
7,200 | Toyota Industries Corp. (Japan) | 408 | |
10,154 | |||
AUTOMOBILES—1.4% | |||
1,341,847 | Baic Motor Corp. Ltd. (China)2 | 942 | |
29,060 | Bayerische Motoren Werke AG (Germany) | 2,479 | |
16,036 | Hyundai Motor Co. (South Korea) | 1,904 | |
12,600 | Subaru Corp. (Japan) | 309 | |
87,100 | Toyota Motor Corp. (Japan) | 5,392 | |
11,026 | |||
BANKS—8.3% | |||
429,906 | Axis Bank Ltd. (India) | 4,728 | |
66,108 | Banco Santander SA (Spain) | 335 | |
55,710 | Bancolombia SA ADR (Colombia)1 | 2,826 | |
269,000 | Bangkok Bank PCL (Thailand) | 1,712 | |
327,169 | Bank of Ireland Group plc (Ireland)* | 2,091 | |
522,424 | Bankia SA (Spain) | 1,447 | |
1,112,987 | Barclays plc (United Kingdom) | 2,389 | |
50,553 | BNP Paribas SA (France) | 2,691 | |
37,600 | Chiba Bank Ltd. (Japan) | 198 | |
47,700 | Concordia Financial Group Ltd. (Japan) | 186 | |
22,474 | Danske Bank AS (Denmark) | 399 | |
40,517 | DBS Group Holdings Ltd. (Singapore) | 843 | |
63,300 | DNB ASA (Norway) | 1,217 | |
19,200 | Fukuoka Financial Group Inc. (Japan) | 448 | |
820,583 | Grupo Financiero Inbursa SAB de CV (Mexico) | 1,254 | |
50,320 | Hana Financial Group Inc. (South Korea) | 1,587 | |
442,361 | HSBC Holdings plc (Hong Kong) | 3,842 | |
271,852 | Intesa Sanpaolo SpA (Italy) | 712 | |
255,600 | Kasikornbank PCL (Thailand) | 1,530 | |
34,629 | Komercni Banka AS (Czech Republic) | 1,314 | |
2,475,368 | Lloyds Banking Group plc (United Kingdom) | 2,024 | |
87,200 | Mitsubishi UFJ Financial Group Inc. (Japan) | 433 | |
896,100 | Mizuho Financial Group Inc. (Japan) | 1,400 | |
182,310 | Nordea Bank ABP (Sweden) | 1,434 | |
535,000 | Resona Holdings Inc. (Japan) | 2,271 | |
27,004 | Royal Bank of Canada (Canada) | 2,152 |
COMMON STOCKS—Continued | |||
Shares | Value | ||
BANKS—Continued | |||
46,511 | Sberbank of Russia PJSC ADR (Russia)1 | $672 | |
127,302 | Shinhan Financial Group Co. Ltd. (South Korea) | 4,811 | |
348,460 | Standard Chartered plc (United Kingdom) | 3,186 | |
94,800 | Sumitomo Mitsui Financial Group Inc. (Japan) | 3,446 | |
18,600 | Sumitomo Mitsui Trust Holdings Inc. (Japan) | 649 | |
236,581 | Svenska Handelsbanken AB (Sweden) | 2,584 | |
39,007 | Toronto-Dominion Bank (Canada) | 2,225 | |
1,285,055 | Turkiye Garanti Bankasi AS (Turkey)* | 1,764 | |
174,402 | UniCredit SpA (Italy) | 2,414 | |
85,682 | United Overseas Bank Ltd. (Singapore) | 1,755 | |
64,969 | |||
BEVERAGES—3.7% | |||
33,163 | Anheuser-Busch InBev SA (Belgium) | 2,948 | |
12,000 | Asahi Group Holdings Ltd. (Japan) | 523 | |
18,963 | Carlsberg AS (Denmark) | 2,452 | |
155,227 | Cia Cervecerias Unidas SA (Chile) | 2,145 | |
335,012 | Coca-Cola Amatil Ltd. (Australia) | 2,078 | |
132,918 | Davide Campari-Milano SpA (Italy) | 1,341 | |
113,469 | Diageo plc (United Kingdom) | 4,784 | |
675,234 | East African Breweries Ltd. (Kenya) | 1,504 | |
44,534 | Heineken NV (Netherlands)3 | 4,815 | |
147,000 | Kirin Holdings Co. Ltd. (Japan) | 3,344 | |
19,100 | Suntory Beverage & Food Ltd. (Japan) | 845 | |
312,000 | Tsingtao Brewery Co. Ltd. (China) | 1,990 | |
28,769 | |||
BUILDING PRODUCTS—1.5% | |||
264,846 | Assa Abloy AB Class B (Sweden) | 5,662 | |
11,116 | Geberit AG (Switzerland) | 4,661 | |
267,167 | GWA Group Ltd. (Australia) | 634 | |
46,200 | LIXIL Group Corp. (Japan) | 604 | |
11,561 | |||
CAPITAL MARKETS—2.5% | |||
326,263 | 3i Group plc (United Kingdom) | 4,565 | |
128,823 | Brookfield Asset Management Inc. (Canada) | 6,211 | |
30,834 | Close Brothers Group plc (United Kingdom) | 625 | |
50,584 | Georgia Capital plc (United Kingdom)* | 667 | |
163,295 | IG Group Holdings plc (United Kingdom) | 1,086 | |
2,300 | JAFCO Co. Ltd. (Japan) | 87 | |
24,300 | Japan Exchange Group Inc. (Japan) | 397 | |
221,916 | Jupiter Fund Management plc (United Kingdom) | 1,089 | |
257,100 | Nomura Holdings Inc. (Japan) | 974 | |
13,107 | Rathbone Brothers plc (United Kingdom) | 431 | |
84,416 | St. James's Place plc (United Kingdom) | 1,239 | |
155,148 | UBS Group AG (Switzerland)* | 2,081 | |
19,452 | |||
CHEMICALS—2.4% | |||
28,896 | Akzo Nobel N.V. (Netherlands) | 2,455 | |
38,988 | BASF SE (Germany) | 3,183 | |
222,394 | DuluxGroup Ltd. (Australia) | 1,529 | |
62,200 | Enaex SA (Chile) | 725 | |
16,200 | Nissan Chemical Industries Ltd. (Japan) | 722 | |
7,100 | Nitto Denko Corp. (Japan) | 384 | |
207,195 | Orica Ltd. (Australia) | 2,717 | |
143,630 | PhosAgro PJSC GDR (Russia)4 | 1,808 | |
9,000 | Shin-Etsu Chemical Co. Ltd. (Japan) | 853 | |
18,116 | Symrise AG (Germany) | 1,744 | |
92,644 | Tikkurila OYJ (Finland)3 | 1,553 |
17
Harbor Diversified International All Cap Fund
Portfolio of Investments—Continued
Value, Cost, and Principal Amounts in Thousands
COMMON STOCKS—Continued | |||
Shares | Value | ||
CHEMICALS—Continued | |||
100 | Tokyo Ohka Kogyo Co. Ltd. (Japan) | $3 | |
152,500 | Toray Industries Inc. (Japan) | 1,044 | |
18,720 | |||
COMMERCIAL SERVICES & SUPPLIES—3.2% | |||
6,300 | AEON Delight Co. Ltd. (Japan)* | 212 | |
334,928 | Brambles Ltd. (Australia) | 2,846 | |
2,244,032 | Cleanaway Waste Management Ltd. (Australia) | 3,563 | |
76,262 | Edenred (France) | 3,596 | |
44,249 | Elis SA (France) | 790 | |
797,215 | G4S plc (United Kingdom) | 2,253 | |
327,720 | HomeServe plc (United Kingdom) | 4,645 | |
72,705 | Ritchie Bros Auctioneers Inc. (Canada) | 2,530 | |
14,284 | S-1 Corp. (South Korea) | 1,199 | |
13,000 | Secom Co. Ltd. (Japan) | 1,094 | |
1,082,696 | Serco Group plc (United Kingdom)* | 1,761 | |
10,800 | Sohgo Security Services Co. Ltd. (Japan) | 482 | |
24,971 | |||
CONSTRUCTION & ENGINEERING—0.8% | |||
47,675 | Boskalis Westminster NV (Netherlands) | 1,308 | |
20,929 | Ferrovial SA (Spain) | 516 | |
67,000 | Maeda Corp. (Japan) | 667 | |
155,300 | Obayashi Corp. (Japan) | 1,527 | |
765,107 | Raubex Group Ltd. (South Africa) | 1,164 | |
120,800 | Shimizu Corp. (Japan) | 1,035 | |
4,600 | SHO-BOND Holdings Co. Ltd. (Japan) | 316 | |
6,533 | |||
CONSTRUCTION MATERIALS—0.4% | |||
16,566 | CRH plc (Ireland) | 556 | |
5,435 | Imerys SA (France) | 290 | |
9,001 | Vicat SA (France) | 476 | |
86,112 | Wienerberger AG (Austria) | 1,979 | |
3,301 | |||
CONSUMER FINANCE—0.8% | |||
34,100 | AEON Financial Service Co. Ltd. (Japan) | 708 | |
3,063,353 | Gentera SAB de CV (Mexico)* | 2,800 | |
318,307 | International Personal Finance plc (United Kingdom) | 759 | |
322,935 | Non-Standard Finance plc (United Kingdom)2 | 223 | |
153,348 | Provident Financial plc (United Kingdom)* | 1,065 | |
63,743 | Shriram Transport Finance Co. Ltd. (India) | 1,017 | |
6,572 | |||
CONTAINERS & PACKAGING—0.3% | |||
292,386 | DS Smith plc (United Kingdom) | 1,366 | |
38,500 | Toyo Seikan Group Holdings Ltd. (Japan) | 772 | |
2,138 | |||
DISTRIBUTORS—0.2% | |||
162,817 | Inchcape plc (United Kingdom) | 1,307 | |
DIVERSIFIED FINANCIAL SERVICES—0.1% | |||
1,290,000 | First Pacific Co. Ltd. (Hong Kong) | 535 | |
DIVERSIFIED TELECOMMUNICATION SERVICES—2.1% | |||
43,582 | BCE Inc. (Canada) | 1,950 | |
138,417 | Deutsche Telekom AG (Germany) | 2,319 | |
648,777 | Koninklijke KPN NV (Netherlands) | 1,994 | |
184,248 | KT Corp. ADR (South Korea)1 | 2,217 | |
89,200 | Nippon Telegraph & Telephone Corp. (Japan) | 3,711 |
COMMON STOCKS—Continued | |||
Shares | Value | ||
DIVERSIFIED TELECOMMUNICATION SERVICES—Continued | |||
281,971 | Spark New Zealand Ltd. (New Zealand) | $692 | |
646,860 | Telkom SA SOC Ltd. (South Africa) | 3,850 | |
16,733 | |||
ELECTRIC UTILITIES—0.1% | |||
34,500 | Kansai Electric Power Co. (Japan) | 418 | |
59,600 | Tohoku Electric Power Co. Inc. (Japan) | 682 | |
1,100 | |||
ELECTRICAL EQUIPMENT—1.8% | |||
63,226 | Legrand SA (France) | 4,650 | |
6,600 | Mabuchi Motor Co. Ltd. (Japan) | 245 | |
3,048,850 | TECO Electric and Machinery Co. Ltd. (Taiwan) | 2,284 | |
28,600 | Ushio Inc. (Japan) | 348 | |
74,884 | Vestas Wind Systems AS (Denmark) | 6,776 | |
14,303 | |||
ELECTRONIC EQUIPMENT, INSTRUMENTS & COMPONENTS—2.1% | |||
25,900 | Azbil Corp. (Japan) | 623 | |
278,000 | Chroma ATE Inc. (Taiwan) | 1,332 | |
545,735 | Delta Electronics Inc. (Taiwan) | 2,880 | |
3,015 | Hirose Electric Co. Ltd. (Japan) | 350 | |
13,500 | Hitachi High-Technologies Corp. (Japan) | 602 | |
126,700 | Hitachi Ltd. (Japan) | 4,214 | |
200 | Keyence Corp. (Japan) | 125 | |
42,100 | Kyocera Corp. (Japan) | 2,736 | |
13,200 | Omron Corp. (Japan) | 709 | |
11,300 | Shimadzu Corp. (Japan) | 303 | |
54,447 | Spectris plc (United Kingdom) | 1,956 | |
9,500 | TDK Corp. (Japan) | 832 | |
16,662 | |||
ENERGY EQUIPMENT & SERVICES—0.6% | |||
129,913 | John Wood Group plc (United Kingdom) | 796 | |
45,902 | Petrofac Ltd. (United Kingdom) | 265 | |
581,233 | Saipem SpA (Italy)* | 2,948 | |
17,918 | TechnipFMC plc (France) | 443 | |
4,452 | |||
ENTERTAINMENT—0.3% | |||
25,001 | CTS Eventim AG & Co. KGaA (Germany) | 1,284 | |
37,377 | Modern Times Group Mortgage AB Class B (Sweden)* | 483 | |
8,300 | Toho Co. Ltd. (Japan) | 348 | |
2,115 | |||
EQUITY REAL ESTATE INVESTMENT TRUSTS (REITs)—0.7% | |||
438,987 | Grivalia Properties REIC AE (Greece)* | 5,612 | |
FOOD & STAPLES RETAILING—2.3% | |||
59,260 | Alimentation Couche-Tard Inc. (Canada) | 3,494 | |
54,300 | Dairy Farm International Holdings Ltd. (Hong Kong) | 425 | |
175,394 | Eurocash SA (Poland) | 998 | |
106,379 | Koninklijke Ahold Delhaize NV (Netherlands)3 | 2,564 | |
3,200 | Lawson Inc. (Japan) | 150 | |
70,922 | Loblaw Cos. Ltd. (Canada) | 3,474 | |
19,445 | Magnit PJSC (Russia) | 1,117 | |
12,600 | Matsumotokiyoshi Holdings Co. Ltd. (Japan) | 417 | |
379,607 | Metcash Ltd. (Australia) | 768 | |
15,770 | PriceSmart Inc. (United States) | 943 | |
72,600 | Seven & I Holdings Co. Ltd. (Japan) | 2,513 |
18
Harbor Diversified International All Cap Fund
Portfolio of Investments—Continued
Value, Cost, and Principal Amounts in Thousands
COMMON STOCKS—Continued | |||
Shares | Value | ||
FOOD & STAPLES RETAILING—Continued | |||
9,800 | Sundrug Co. Ltd. (Japan) | $263 | |
370,224 | Tesco plc (United Kingdom) | 1,208 | |
18,334 | |||
FOOD PRODUCTS—2.8% | |||
688,000 | China Mengniu Dairy Co. Ltd. (China)* | 2,542 | |
2,122,100 | Delfi Ltd. (Singapore) | 2,110 | |
205,211 | Devro plc (United Kingdom) | 532 | |
1,548,469 | Grupo Lala SAB de CV (Mexico) | 2,070 | |
181,508 | Industrias Bachoco SAB de CV (Mexico) | 742 | |
6,300 | Meiji Holdings Co. Ltd. (Japan) | 497 | |
66,900 | Nippon Suisan Kaisha Ltd. (Japan) | 469 | |
47,093 | Oceana Group Ltd. (South Africa) | 230 | |
182,045 | Tiger Brands Ltd. (South Africa) | 3,167 | |
1,524,255 | Tingyi Cayman Islands Holding Corp. (China) | 2,510 | |
40,600 | Toyo Suisan Kaisha Ltd. (Japan) | 1,550 | |
244,435 | Ulker Biskuvi Sanayi AS (Turkey) | 779 | |
29,600 | Viscofan SA (Spain) | 1,781 | |
3,830,000 | Want Want China Holdings Ltd. (China) | 3,041 | |
22,020 | |||
GAS UTILITIES—0.1% | |||
20,500 | Tokyo Gas Co. Ltd. (Japan) | 521 | |
HEALTH CARE EQUIPMENT & SUPPLIES—3.2% | |||
8,895 | Alcon Inc. (Switzerland)* | 512 | |
63,621 | Coloplast AS (Denmark) | 6,872 | |
1,182,658 | ConvaTec Group plc (United Kingdom)2 | 2,142 | |
112,026 | GN Store Nord AS (Denmark) | 5,742 | |
14,800 | Hoya Corp. (Japan) | 1,045 | |
61,586 | Koninklijke Philips NV (Netherlands) | 2,645 | |
38,200 | Olympus Corp. (Japan) | 429 | |
41,330 | Smith & Nephew plc (United Kingdom) | 799 | |
7,707 | Sonova Holding AG (Switzerland) | 1,557 | |
102,410 | William Demant Holding AS (Denmark)* | 3,236 | |
24,979 | |||
HEALTH CARE PROVIDERS & SERVICES—0.9% | |||
54,600 | Alfresa Holdings Corp. (Japan) | 1,523 | |
57,768 | Fresenius Medical Care AG & Co. KGaA (Germany) | 4,869 | |
21,400 | MediPAL Holdings Corp. (Japan) | 481 | |
472,452 | Sigma Healthcare Ltd. (Australia) | 175 | |
7,048 | |||
HOTELS, RESTAURANTS & LEISURE—3.5% | |||
1,511,000 | Ajisen China Holdings Ltd. (China) | 643 | |
36,000 | Carnival plc (United Kingdom) | 1,909 | |
264,577 | Compass Group plc (United Kingdom) | 6,020 | |
150,703 | GVC Holdings plc (United Kingdom) | 1,286 | |
608,641 | Hongkong & Shanghai Hotels Ltd. (Hong Kong) | 891 | |
785,494 | Merlin Entertainments plc (United Kingdom)2 | 3,756 | |
36,083 | Paddy Power Betfair plc (United Kingdom) | 3,054 | |
74,061 | Playtech plc (United Kingdom) | 424 | |
332,494 | SSP Group plc (United Kingdom) | 3,022 | |
1,624,555 | Thomas Cook Group plc (United Kingdom)* | 566 | |
371,978 | Tsogo Sun Holdings Ltd. (South Africa) | 560 | |
165,130 | TUI AG (Germany) | 1,845 | |
66,680 | Yum China Holdings Inc. (China) | 3,170 | |
27,146 | |||
HOUSEHOLD DURABLES—0.8% | |||
90,021 | Barratt Developments plc (United Kingdom) | 708 | |
68,500 | Casio Computer Co. Ltd. (Japan) | 863 |
COMMON STOCKS—Continued | |||
Shares | Value | ||
HOUSEHOLD DURABLES—Continued | |||
199,486 | McCarthy & Stone plc (United Kingdom)2 | $333 | |
587,900 | MRV Engenharia e Participacoes SA (Brazil) | 2,175 | |
6,000 | Rinnai Corp. (Japan) | 405 | |
47,500 | Sekisui Chemical Co. Ltd. (Japan) | 763 | |
17,300 | Sony Corp. (Japan) | 871 | |
6,118 | |||
HOUSEHOLD PRODUCTS—0.7% | |||
18,800 | Lion Corp. (Japan) | 387 | |
61,364 | Reckitt Benckiser Group plc (United Kingdom) | 4,965 | |
5,352 | |||
INDEPENDENT POWER & RENEWABLE ELECTRICITY PRODUCERS—0.0% | |||
2,783,600 | Lopez Holdings Corp. (Philippines) | 257 | |
INDUSTRIAL CONGLOMERATES—2.2% | |||
407,000 | CK Hutchison Holdings Ltd. (Hong Kong) | 4,279 | |
34,252 | DCC plc (United Kingdom) | 3,066 | |
75,900 | Jardine Matheson Holdings Ltd. (Hong Kong) | 4,997 | |
38,177 | LG Corp. (South Korea) | 2,387 | |
941,661 | Quinenco SA (Chile) | 2,537 | |
17,266 | |||
INSURANCE—5.4% | |||
85,552 | Admiral Group plc (United Kingdom) | 2,464 | |
64,653 | AXA SA (France)3 | 1,724 | |
160,500 | Dai-ichi Life Holdings Inc. (Japan) | 2,317 | |
16,196 | Fairfax Financial Holdings Ltd. (Canada) | 7,724 | |
120,300 | Great Eastern Holdings Ltd. (Singapore) | 2,296 | |
5,831 | Hannover Rueck SE (Germany) | 881 | |
1,660 | Helvetia Holding AG (Switzerland) | 677 | |
210,100 | Japan Post Holdings Co. Ltd. (Japan) | 2,353 | |
76,800 | MS&AD Insurance Group Holdings Inc. (Japan) | 2,387 | |
360,561 | Old Mutual Ltd. (South Africa)3 | 580 | |
217,264 | Porto Seguro SA (Brazil) | 2,999 | |
260,310 | QBE Insurance Group Ltd. (Australia) | 2,374 | |
111,262 | Sampo OYJ (Finland) | 5,095 | |
14,915 | Samsung Fire & Marine Insurance Co. Ltd. (South Korea) | 3,883 | |
48,800 | Sompo Holdings Inc. (Japan) | 1,842 | |
19,700 | Sony Financial Holdings Inc. (Japan) | 405 | |
32,900 | T&D Holdings Inc. (Japan) | 356 | |
42,400 | Tokio Marine Holdings Inc. (Japan) | 2,148 | |
42,505 | |||
INTERACTIVE MEDIA & SERVICES—2.3% | |||
24,330 | Adevinta ASA A (Norway)* | 245 | |
20,562 | Adevinta ASA B (Norway)* | 202 | |
245,926 | Auto Trader Group plc (United Kingdom)2 | 1,818 | |
30,143 | Baidu Inc. ADR (China)*,1 | 5,011 | |
170,420 | Carsales.com Ltd. (Australia) | 1,619 | |
321,842 | Domain Holdings Australia Ltd. (Australia) | 614 | |
899,002 | Rightmove plc (United Kingdom) | 6,357 | |
53,007 | Yandex NV (Russia)* | 1,984 | |
17,850 | |||
INTERNET & DIRECT MARKETING RETAIL—0.7% | |||
27,141 | Ctrip.com International Ltd. ADR (China)*,1 | 1,196 | |
4,611 | GS Home Shopping Inc. (South Korea) | 676 | |
183,081 | Just Eat plc (United Kingdom)* | 1,674 | |
43,964 | MoneySuperMarket.com Group plc (United Kingdom) | 209 | |
345,520 | PChome Online Inc. (Taiwan)* | 1,471 |
19
Harbor Diversified International All Cap Fund
Portfolio of Investments—Continued
Value, Cost, and Principal Amounts in Thousands
COMMON STOCKS—Continued | |||
Shares | Value | ||
INTERNET & DIRECT MARKETING RETAIL—Continued | |||
2,637 | Takeaway.com NV (Netherlands)*,2 | $227 | |
1,686 | Zooplus AG (Germany)* | 183 | |
5,636 | |||
IT SERVICES—0.8% | |||
15,255 | Alten SA (France) | 1,666 | |
12,778 | Genpact Ltd. (United States) | 464 | |
13,900 | ITOCHU Techno-Solutions Corp. (Japan) | 342 | |
5,400 | Nomura Research Institute Ltd. (Japan) | 264 | |
175,700 | NTT Data Corp. (Japan) | 2,049 | |
6,600 | OBIC Co. Ltd. (Japan) | 766 | |
7,700 | Otsuka Corp. (Japan) | 303 | |
15,500 | SCSK Corp. (Japan)* | 736 | |
6,590 | |||
LEISURE PRODUCTS—1.1% | |||
55,900 | Bandai Namco Holdings Inc. (Japan) | 2,680 | |
301,386 | Giant Manufacturing Co. Ltd. (Taiwan) | 2,298 | |
831,000 | Goodbaby International Holdings Ltd. (Hong Kong)* | 236 | |
165,710 | Merida Industry Co. Ltd. (Taiwan) | 966 | |
59,700 | Sega Sammy Holdings Inc. (Japan) | 756 | |
2,100 | Shimano Inc. (Japan) | 309 | |
32,675 | Spin Master Corp. (Canada)*,2 | 1,086 | |
8,331 | |||
LIFE SCIENCES TOOLS & SERVICES—0.4% | |||
5,731 | Eurofins Scientific SE (France)3 | 2,625 | |
7,529 | Gerresheimer AG (Germany) | 567 | |
3,192 | |||
MACHINERY—2.1% | |||
15,885 | Andritz AG (Austria) | 759 | |
378,542 | CNH Industrial NV (Italy) | 4,115 | |
11,000 | Daifuku Co. Ltd. (Japan) | 677 | |
15,368 | GEA Group AG (Germany) | 430 | |
400 | Hirata Corp. (Japan) | 28 | |
8,300 | Hoshizaki Corp. (Japan)* | 538 | |
32,761 | IMI plc (United Kingdom) | 450 | |
12,800 | Makita Corp. (Japan) | 467 | |
134,431 | Rotork plc (United Kingdom) | 548 | |
153,900 | Sandvik AB (Sweden)3 | 2,850 | |
400 | SMC Corp. (Japan) | 167 | |
29,316 | Stabilus SA (Germany) | 1,636 | |
63,826 | Wartsila OYJ Abp (Finland) | 1,022 | |
1,545,000 | Yungtay Engineering Co. Ltd. (Taiwan)* | 3,225 | |
16,912 | |||
MARINE—0.3% | |||
39,204,971 | Cia Sud Americana de Vapores SA (Chile)* | 1,252 | |
221,259 | Irish Continental Group plc (Ireland) | 1,249 | |
2,501 | |||
MEDIA—2.5% | |||
32,901 | Axel Springer SE (Germany) | 1,863 | |
1,446,100 | BEC World PCL (Thailand)* | 408 | |
47,453 | Daily Mail & General Trust plc (United Kingdom) | 407 | |
17,650 | Euromoney Institutional Investor plc (United Kingdom) | 283 | |
85,900 | Fuji Media Holdings Inc. (Japan) | 1,156 | |
116,457 | Grupo Televisa SAB ADR (Mexico)1 | 1,181 | |
212,492 | Informa plc (United Kingdom) | 2,161 | |
1,382,601 | ITV plc (United Kingdom) | 2,469 | |
33,686 | JCDecaux SA (France) | 1,104 | |
14,582,221 | Media Nusantara Citra TBK PT (Indonesia) | 963 |
COMMON STOCKS—Continued | |||
Shares | Value | ||
MEDIA—Continued | |||
42,495 | MediaSet Espana Comunicacion SA (Spain) | $330 | |
804,054 | Nine Entertainment Co. Holdings Ltd. (Australia) | 991 | |
86,220 | Nippon Television Holdings Inc. (Japan) | 1,262 | |
37,377 | Nordic Entertainment Group AB (Sweden)* | 952 | |
24,330 | Schibsted ASA Class A (Norway) | 639 | |
20,562 | Schibsted ASA Class B (Norway) | 492 | |
352,649 | Sky Network Television Ltd. (New Zealand) | 288 | |
341,900 | Television Broadcasts Ltd. (Hong Kong) | 672 | |
162,888 | WPP plc (United Kingdom) | 2,032 | |
19,653 | |||
METALS & MINING—3.6% | |||
87,084 | Acerinox SA (Spain) | 907 | |
1,073,412 | Alumina Ltd. (Australia) | 1,699 | |
75,718 | Anglo American Platinum Ltd. (South Africa)* | 3,830 | |
66,840 | Anglo American plc (South Africa) | 1,723 | |
131,146 | Antofagasta plc (United Kingdom) | 1,559 | |
54,175 | ArcelorMittal SA (France) | 1,179 | |
210,530 | Barrick Gold Corp. (Canada) | 2,676 | |
51,861 | BHP Billiton Ltd. (Australia) | 1,372 | |
60,275 | BHP Group plc (United Kingdom) | 1,423 | |
195,753 | BlueScope Steel Ltd. (Australia) | 1,860 | |
76,406 | Cia de Minas Buenaventura SAA ADR (Peru)1 | 1,239 | |
21,469 | Franco-Nevada Corp. (Canada) | 1,538 | |
789,677 | Glencore plc (United Kingdom)* | 3,133 | |
120,819 | Newcrest Mining Ltd. (Australia) | 2,134 | |
40,466 | Rio Tinto plc (United Kingdom) | 2,361 | |
28,633 | |||
MULTILINE RETAIL—0.2% | |||
53,800 | Isetan Mitsukoshi Holdings Ltd. (Japan) | 513 | |
38,700 | Marui Group Co. Ltd. (Japan) | 787 | |
1,800 | Ryohin Keikaku Co. Ltd. (Japan) | 343 | |
1,643 | |||
MULTI-UTILITIES—0.1% | |||
63,672 | National Grid plc (United Kingdom) | 698 | |
OIL, GAS & CONSUMABLE FUELS—3.1% | |||
742,989 | BP plc (United Kingdom) | 5,403 | |
37,501 | Caltex Australia Ltd. (Australia) | 719 | |
166,609 | Canadian Natural Resources Ltd. (Canada) | 5,002 | |
73,296 | Equinor ASA (Norway) | 1,634 | |
188,600 | INPEX Corp. (Japan) | 1,835 | |
85,611 | Inter Pipeline Ltd. (Canada) | 1,394 | |
15,050 | Lukoil PJSC ADR (Russia)1 | 1,287 | |
98,545 | PrairieSky Royalty Ltd. (Canada) | 1,420 | |
135,574 | Royal Dutch Shell plc (United Kingdom) | 4,343 | |
22,125 | Total SA (France) | 1,230 | |
24,267 | |||
PERSONAL PRODUCTS—1.7% | |||
694,891 | Asaleo Care Ltd. (Australia)* | 451 | |
42,400 | Kao Corp. (Japan) | 3,273 | |
2,900 | Kose Corp. (Japan) | 543 | |
10,100 | Mandom Corp. (Japan) | 262 | |
254,968 | Natura Cosmeticos SA (Brazil) | 3,397 | |
84,319 | Unilever plc (United Kingdom) | 5,111 | |
13,037 | |||
PHARMACEUTICALS—2.6% | |||
25,400 | Astellas Pharma Inc. (Japan) | 344 | |
4,285,110 | Genomma Lab Internacional SAB de CV (Mexico)* | 3,431 |
20
Harbor Diversified International All Cap Fund
Portfolio of Investments—Continued
Value, Cost, and Principal Amounts in Thousands
COMMON STOCKS—Continued | |||
Shares | Value | ||
PHARMACEUTICALS—Continued | |||
83,807 | Haw Par Corp. Ltd. (Singapore) | $894 | |
44,479 | Novartis AG (Switzerland) | 3,645 | |
88,814 | Novo Nordisk AS (Denmark) | 4,351 | |
30,700 | Otsuka Holdings Co. Ltd. (Japan) | 1,097 | |
24,049 | Roche Holding AG (Switzerland) | 6,346 | |
6,200 | Sawai Pharmaceutical Co. Ltd. (Japan) | 333 | |
10,100 | Takeda Pharmaceutical Co. Ltd. (Japan) | 373 | |
20,814 | |||
PROFESSIONAL SERVICES—3.7% | |||
58,098 | Adecco Group AG (Switzerland) | 3,338 | |
338,012 | ALS Ltd. (Australia) | 1,895 | |
691,769 | Capita plc (United Kingdom)* | 1,153 | |
11,811 | DKSH Holding AG (Switzerland) | 725 | |
116,396 | Experian plc (United Kingdom) | 3,388 | |
877,086 | Hays plc (United Kingdom) | 1,739 | |
106,837 | Intertek Group plc (United Kingdom) | 7,473 | |
142,826 | IPH Ltd. (Australia) | 718 | |
19,400 | Nomura Co. Ltd. (Japan) | 543 | |
105,648 | PageGroup plc (United Kingdom) | 743 | |
34,000 | Persol Holdings Co. Ltd. (Japan) | 641 | |
11,058 | Randstad Holding NV (Netherlands) | 632 | |
176,921 | RELX plc (United Kingdom) | 4,065 | |
8,200 | TechnoPro Holdings Inc. (Japan) | 493 | |
7,075 | Teleperformance (France) | 1,360 | |
28,906 | |||
REAL ESTATE MANAGEMENT & DEVELOPMENT—0.5% | |||
23,500 | Daiwa House Industry Co. Ltd. (Japan) | 659 | |
15,487 | LOG Commercial Properties e Participacoes SA (Brazil) | 69 | |
374,715 | LPS Brasil Consultoria de Imoveis SA (Brazil)* | 447 | |
130,900 | Mitsubishi Estate Co. Ltd. (Japan) | 2,214 | |
63,419 | New World Development Co. Ltd. (Hong Kong) | 105 | |
87,376 | United Industrial Corp. Ltd. (Singapore) | 203 | |
3,697 | |||
ROAD & RAIL—1.4% | |||
15,919 | Canadian Pacific Railway Ltd. (Canada) | 3,567 | |
27,200 | East Japan Railway Co. (Japan) | 2,563 | |
91,099 | Globaltrans Investment plc GDR (Russia)4 | 881 | |
104,599 | National Express Group plc (United Kingdom) | 561 | |
42,000 | Senko Co. Ltd. (Japan) | 338 | |
40,700 | West Japan Railway Co. (Japan) | 3,027 | |
10,937 | |||
SEMICONDUCTORS & SEMICONDUCTOR EQUIPMENT—1.8% | |||
5,573 | ASML Holding NV (Netherlands)3 | 1,164 | |
191,300 | Renesas Electronics Corp. (Japan)* | 1,024 | |
33,443 | SK Hynix Inc. (South Korea) | 2,263 | |
1,100,000 | Taiwan Semiconductor Manufacturing Co. Ltd. (Taiwan) | 9,236 | |
1,800 | Tokyo Electron Ltd. (Japan) | 286 | |
13,973 | |||
SOFTWARE—1.2% | |||
4,604 | Constellation Software Inc. (Canada) | 4,062 | |
3,900 | Oracle Corp. Japan (Japan) | 268 | |
424,000 | TOTVS SA (Brazil)* | 4,817 | |
9,147 | |||
SPECIALTY RETAIL—1.0% | |||
4,800 | ABC-Mart Inc. (Japan) | 299 | |
4,429,400 | Esprit Holdings Ltd. (Hong Kong)* | 899 | |
172,929 | Fourlis Holdings SA (Greece)* | 1,044 |
COMMON STOCKS—Continued | |||
Shares | Value | ||
SPECIALTY RETAIL—Continued | |||
95,735 | JUMBO SA (Greece) | $1,747 | |
328,459 | L'Occitane International SA (Hong Kong) | 590 | |
230,625 | Pets at Home Group plc (United Kingdom) | 457 | |
27,000 | USS Co. Ltd. (Japan) | 518 | |
71,134 | WH Smith plc (United Kingdom) | 1,903 | |
112,500 | Yamada Denki Co. Ltd. (Japan) | 533 | |
7,990 | |||
TECHNOLOGY HARDWARE, STORAGE & PERIPHERALS—1.9% | |||
10,400 | Canon Inc. (Japan) | 289 | |
26,200 | FUJIFILM Holdings Corp. (Japan) | 1,224 | |
58,816 | Logitech International SA (Switzerland) | 2,305 | |
37,400 | NEC Corp. (Japan) | 1,263 | |
19,546 | Neopost SA (France) | 479 | |
234,838 | Samsung Electronics Co. Ltd. (South Korea) | 9,233 | |
14,793 | |||
TEXTILES, APPAREL & LUXURY GOODS—2.3% | |||
15,089 | adidas AG (Germany) | 3,887 | |
15,300 | ASICS Corp. (Japan) | 189 | |
41,425 | Cie Financiere Richemont SA (Switzerland)3 | 3,028 | |
176,025 | Cie Financiere Richemont SA ADR (South Africa)1 | 1,291 | |
31,084 | EssilorLuxottica SA (France) | 3,787 | |
33,280 | Gildan Activewear Inc. (Canada) | 1,227 | |
1,106,000 | Li Ning Co. Ltd. (China)* | 2,009 | |
44,600 | Onward Holdings Co. Ltd. (Japan) | 246 | |
1,320,746 | Stella International Holdings Ltd. (Hong Kong) | 2,344 | |
110,000 | Texwinca Holdings Ltd. (Hong Kong) | 44 | |
18,052 | |||
TOBACCO—0.4% | |||
14,649 | British American Tobacco plc (United Kingdom) | 573 | |
43,400 | Japan Tobacco Inc. (Japan) | 1,003 | |
26,127 | Swedish Match AB (Sweden) | 1,274 | |
2,850 | |||
TRADING COMPANIES & DISTRIBUTORS—1.2% | |||
50,209 | Brenntag AG (Germany) | 2,709 | |
138,522 | Bunzl plc (United Kingdom) | 4,178 | |
36,900 | ITOCHU Corp. (Japan) | 666 | |
64,900 | Mitsubishi Corp. (Japan) | 1,788 | |
9,341 | |||
TRANSPORTATION INFRASTRUCTURE—0.5% | |||
107,303 | Getlink SE (France) | 1,727 | |
514,337 | Global Ports Investments plc GDR (Russia)*,4 | 1,245 | |
1,681,447 | Grindrod Ltd. (South Africa)* | 901 | |
17,200 | Mitsubishi Logistics Corp. (Japan) | 460 | |
4,333 | |||
WIRELESS TELECOMMUNICATION SERVICES—1.3% | |||
316,863 | Bharti Airtel Ltd. (India)* | 1,457 | |
69,200 | KDDI Corp. (Japan) | 1,595 | |
15,900 | Millicom International Cellular SA SDR (Sweden)4 | 930 | |
42,600 | NTT DoCoMo Inc. (Japan) | 925 | |
28,964 | Rogers Communications Inc. (Canada) | 1,458 | |
183,748 | SmarTone Telecommunications Holdings Ltd. (Hong Kong) | 191 |
21
Harbor Diversified International All Cap Fund
Portfolio of Investments—Continued
Value, Cost, and Principal Amounts in Thousands
COMMON STOCKS—Continued | |||
Shares | Value | ||
WIRELESS TELECOMMUNICATION SERVICES—Continued | |||
311,371 | Vodafone Group plc (United Kingdom) | $578 | |
14,904,240 | Vodafone Idea Ltd. (India)* | 3,289 | |
10,423 | |||
TOTAL COMMON STOCKS | |||
(Cost $754,196) | 760,659 | ||
PREFERRED STOCKS—1.4% | |||
AEROSPACE & DEFENSE—0.0% | |||
16,423,152 | Rolls-Royce Holdings plc (United Kingdom)* | 21x | |
AUTOMOBILES—0.3% | |||
15,119 | Volkswagen AG (Germany) | 2,640 | |
BANKS—0.5% | |||
186,849 | Banco Bradesco SA (Brazil)* | 1,695 | |
1,878,866 | Grupo Aval Acciones y Valores SA (Colombia) | 724 | |
472,342 | Itausa - Investimentos Itau SA (Brazil) | 1,435 | |
3,854 |
PREFERRED STOCKS—Continued | |||
Shares | Value | ||
TEXTILES, APPAREL & LUXURY GOODS—0.6% | |||
1,056,368 | Alpargatas SA (Brazil)* | $4,216 | |
TOTAL PREFERRED STOCKS | |||
(Cost $9,455) | 10,731 | ||
SHORT-TERM INVESTMENTS—1.8% | |||
(Cost $14,480) | |||
Principal Amount | |||
$ | 14,480 | State Street Navigator Securities Lending Government Money Market Portfolio (1 day yield of 2.510%) | 14,480 |
TOTAL INVESTMENTS—100.2% | |||
(Cost $778,131) | 785,870 | ||
CASH AND OTHER ASSETS, LESS LIABILITIES—(0.2)% | (1,469) | ||
TOTAL NET ASSETS—100.0% | $784,401 |
WARRANTS/RIGHTS OPEN
Description | No. of Contracts | Strike Price | Expiration Date | Cost (000s) | Value (000s) | |||||
Bharti Airtel Ltd. | 88,455 | INR 220.00 | 5/17/2019 | $ — | $127 |
FORWARD CURRENCY CONTRACTS OPEN
Counterparty | Amount to be Delivered (000s) | Amount to be Received (000s) | Settlement Date | Unrealized Appreciation/ (Depreciation) (000s) | ||||
State Street Bank London | $ 1,451 | JPY 161,713 | 05/09/2019 | $ 2 |
FAIR VALUE MEASUREMENTS
The following table summarizes the Fund’s investments as of April 30, 2019 based on the inputs used to value them.
Asset Category | Quoted Prices Level 1 (000s) | Other Significant Observable Inputs Level 2 (000s) | Significant Unobservable Inputs Level 3 (000s) | Total (000s) | ||||
Investments in Securities | ||||||||
Common Stocks | ||||||||
Africa | $— | $18,800 | $— | $18,800 | ||||
Europe | 10,905 | 360,409 | — | 371,314 | ||||
Latin America | 38,039 | 4,279 | — | 42,318 | ||||
Middle East/Central Asia | — | 10,491 | — | 10,491 | ||||
North America | 56,359 | — | — | 56,359 | ||||
Pacific Basin | 11,594 | 249,783 | — | 261,377 | ||||
Preferred Stocks | ||||||||
Europe | — | 2,640 | 21 | 2,661 | ||||
Latin America | 8,070 | — | — | 8,070 | ||||
Short-Term Investments | ||||||||
Investment Company-Securities Lending Investment Fund | 14,480 | — | — | 14,480 | ||||
Total Investments in Securities | $139,447 | $646,402 | $21 | $785,870 | ||||
Financial Derivative Instruments - Assets | ||||||||
Forward Currency Contracts | $— | $2 | $— | $2 |
22
Harbor Diversified International All Cap Fund
Portfolio of Investments—Continued
FAIR VALUE MEASUREMENTS—Continued
Asset Category | Quoted Prices Level 1 (000s) | Other Significant Observable Inputs Level 2 (000s) | Significant Unobservable Inputs Level 3 (000s) | Total (000s) | ||||
Warrants/Rights | $— | $127 | $— | $127 | ||||
Total Financial Derivative Instruments - Assets | $— | $129 | $— | $129 | ||||
Total Investments | $139,447 | $646,531 | $21 | $785,999 |
For more information on valuation inputs and their aggregation into the levels used in the table above, please refer to the Fair Value Measurements and Disclosures in Note 2 of the accompanying Notes to Financial Statements.
The following is a rollforward of the Fund’s Level 3 investments during the period ended April 30, 2019.
Valuation Description | Beginning Balance Beginning as of 11/01/2018 (000s) | Purchases (000s) | Sales (000s) | Discount/ (Premium) (000s) | Total Realized Gain/(Loss)w (000s) | Change in Unrealized Appreciation/ (Depreciation)w (000s) | Transfers In Level 3 (000s) | Transfers Out of Level 3 (000s) | Ending Balance as of 04/30/2019w (000s) | |||||||||
Preferred Stocks | $13 | $21 | $(13) | $— | $— | $— | $— | $— | $21 |
The following is a summary of significant unobservable inputs used in the fair valuations of assets and liabilities categorized within Level 3 of the fair value hierarchy.
Valuation Descriptions | Ending Balance as of 04/30/2019 (000s) | Valuation Technique | Unobservable Inputs | Input Value(s) | ||||
Investments in Securities | ||||||||
Preferred Stocks | ||||||||
Rolls-Royce Holdings plc C Shares (United Kingdom)* | $21 | Market Approach | Pre-Traded Price | GBP 0.001 |
* | Non-income producing security | ||
1 | ADR after the name of a security stands for American Depositary Receipts representing ownership of foreign securities. ADRs are issued by U.S. banking institutions. | ||
2 | Securities purchased in a transaction exempt from registration under Rule 144A of the Securities Act of 1933. These securities may be resold in transactions exempt from registration, normally to qualified institutional buyers. The Fund has no right to demand registration of these securities. At April 30, 2019, the aggregate value of these securities was $13,101 or 2% of net assets. | ||
3 | All or a portion of this security was out on loan as of April 30, 2019. | ||
4 | GDR after the name of a security stands for Global Depositary Receipts representing ownership of foreign securities. GDRs are issued by either U.S. or non-U.S. banking institutions. Country specific examples of this type of depositary receipt, if any, are denoted using different abbreviations. SDR after the name of a security stands for Swedish Depository Receipts representing ownership of foreign securities in Sweden. | ||
w | Amounts in this category are included in the “Realized and Change in Unrealized Gain/(Loss) on Investment Transactions” section of the Statement of Operations. The net unrealized appreciation/(depreciation) per investment type is below: | ||
Valuation Description | Unrealized Gain/(Loss) as of 04/30/2019 (000s) | ||
Preferred Stocks | $– | ||
x | Fair valued in accordance with Harbor Funds Valuation Procedures. | ||
GBP | British Pound | ||
JPY | Japanese Yen | ||
INR | Indian Rupee |
The accompanying notes are an integral part of the Financial Statements.
23
Harbor Overseas Fund
Manager’s Commentary (Unaudited)
Subadviser
Acadian Asset Management LLC
260 Franklin Street
Boston, MA 02110
Boston, MA 02110
Portfolio Managers
Brendan O. Bradley, Ph.D.
Since 2019
Harry Gakidis, Ph.D.
Since 2019
Since 2019
Ryan D. Taliaferro, Ph.D.
Since 2019
Acadian has subadvised the Fund since 2019.
Investment Objective
The Fund seeks long-term growth of capital.
Management’s Discussion of
Fund Performance
Fund Performance
MARKET REVIEW
Global equity markets delivered stellar gains over the first quarter of 2019, up 12.6%, recapturing some of 2018’s losses in spite of a dimming outlook for global economic growth. Investors were encouraged by progress in the U.S.-China trade talks and hopeful that the yearlong trade dispute that has rattled global markets and upended corporate investment may be finally nearing resolution. Central banks, most notably the U.S. Federal Reserve (Fed), reacted to the signs of a global slowdown by shifting tack and adopting a more accommodative tone, a move welcomed by many market participants. Still, optimism was tempered by narratives of U.S. political dysfunction, the prospect of a chaotic, no-deal Brexit, and broader global trade malaise. Momentum relented somewhat as the quarter progressed as investors measured signals of supportive monetary policy against economic uncertainty and rounds of uneven data.
Despite gains in equities, the eurozone’s economy stumbled amid political tensions at home and sluggish demand from abroad. The bite of weak demand and uncertainty contributed to manufacturing’s descent into contraction. Still, domestic demand remained resilient, supported by a strengthening labor market and minor improvements in some of the region’s political uncertainties. Over the quarter, Japan’s equity markets continued to fluctuate on trade-related headline risk. Stocks staggered on setbacks in the U.S.-China trade talks and rebounded on any news of progress. Global growth concerns continued to preoccupy investors, particularly as exports, an engine of the Japanese economy, sputtered as the economic slowdown in China, and around the globe, took hold. During the quarter, Japan’s House of Representatives approved a record ¥101.46 trillion 2019 budget in an attempt to shore up weak domestic demand to offset losses in exports.
With the steadying economic situation in China, the Fed’s dovish tilt, and encouraging trade talks between the U.S. and China, investors appear to have been quick to forget the headwinds that hobbled emerging markets last year. While a final resolution has yet to be made and core issues remain unresolved, China has agreed to make additional purchases of U.S. goods and services and further open its capital markets to the United States. Markets remained buoyant as new evidence rolled in to suggest that Beijing’s support measures have gained traction. Policymakers’ tax cuts and infrastructure investment seem to have effectively countered some of the downward pressures on the economy.
In Latin America, equities rose 7.5% over the first quarter. Brazil, up 8.6%, beat the regional index, with markets encouraged by President Bolsonaro’s proposal to overhaul the country’s insolvent pension system, yet concerned with his ability to get the plan approved by the Brazilian Congress. We believe that much of the country’s economic viability is contingent on Bolsonaro’s ability to implement this vital pension-system reform; a series of political missteps may compromise his ability to bring his plan to fruition. Mexico posted a more tempered gain of 3.9% for the quarter with investors disheartened by a downgrade in the economy’s 2019 growth forecast, President Trump’s tensions with several independent regulators that serve as a check on his executive power, and the new NAFTA agreement’s in-limbo status.
PERFORMANCE
Harbor Overseas Fund underperformed its benchmark for the period ending April 30, 2019, with a return of 2.00% (Retirement Class), 2.00% (Institutional Class), and 1.90% (Investor Class) versus 3.46% for the MSCI EAFE (ND) Index.
Negative active return from stock selection was further reduced by value lost from country allocations. With regard to stock selection, the Fund did not benefit from positions in France and Japan, owing primarily to holdings in French drugmaker Ipsen and Japanese pharmaceutical company Mochinda. Stock selection in Australia and Israel provided some positive offset, led by investments in Australian iron ore producer Fortescue Metals and Israeli information
24
Harbor Overseas Fund
Manager’s Commentary—Continued
TOTAL RETURNS
For the periods ended 04/30/2019
1 Year | 5 Years | Unannualized | |||||||||
6 Months | Life of Fund | ||||||||||
Harbor Overseas Fund | |||||||||||
Retirement Class1 | N/A | N/A | N/A | 2.00% | |||||||
Institutional Class1 | N/A | N/A | N/A | 2.00 | |||||||
Investor Class1 | N/A | N/A | N/A | 1.90 | |||||||
Comparative Index | |||||||||||
MSCI EAFE (ND)1 | 7.45% | N/A | N/A | 3.46% |
As stated in the Fund’s prospectus dated March 1, 2019, the expense ratios were 0.77% (Net) and 2.16% (Gross) (Retirement Class); 0.85% (Net) and 2.24% (Gross) (Institutional Class); 1.10% (Net) and 2.49% (Gross) (Administrative Class); 1.22% (Net) and 2.61% (Gross) (Investor Class). The net expense ratios reflect an expense limitation agreement (excluding interest expense, if any) effective through 02/29/2020. The expense ratios in the prospectus may differ from the actual expense ratios for the period disclosed within this report. The expense ratios shown in the prospectus are based on the prior fiscal year, adjusted to reflect changes, if any, in contractual arrangements that occurred prior to the date of the prospectus (or supplement thereto, if applicable).
Performance data shown represents past performance and is no guarantee of future results. Past performance is net of management fees and expenses and reflects reinvested dividends and distributions but does not reflect the deduction of taxes that a shareholder would pay on Fund distributions or upon the redemption of Fund shares. Past performance reflects the beneficial effect of any expense waivers or reimbursements, without which returns would have been lower. Investment returns and principal value will fluctuate so that Fund shares, when redeemed, may be worth more or less than their original cost. Returns for periods less than one year are not annualized. Current performance may be higher or lower and is available through the most recent month end atharborfunds.com or by calling 800-422-1050.
security company CyberArk. From a country allocation perspective, opportunistic exposures to China and Canada saw the weakest results. An underweight position in the Netherlands and an opportunistic exposure to Brazil were more successful.
Active sector allocations yielded negative results, which were joined by unsuccessful stock selection. With respect to sector allocations, an underweight position in Consumer Staples and an overweight position in Financials detracted most from return. An overweight position in Information Technology saw more favorable results. At the stock level, selections in Industrials, Information Technology, Financials, and Consumer Discretionary drove underperformance. Stock selection in utilities provided some positive offset.
As of April 30, 2019, the Fund’s emphasis is on the Netherlands, Israel, and Italy. Additionally, it maintains a sizeable opportunistic exposure to Canada. The Fund is underweight the U.K., France, and Japan relative to the Index. At the sector level, the portfolio is focused on financials, information technology, and communication services. It is underweight, meanwhile, in industrials, consumer staples, and consumer discretionary.
OUTLOOK & STRATEGY
While fourth quarter 2018 U.S. Gross Domestic Product (GDP) generally was stronger than expected, projections for first quarter 2019 GDP growth have continued to soften, with the lengthy U.S. government shutdown and continued trade disputes weighing on growth. The Atlanta Fed’s most recent tracking estimate of Q1 GDP growth was only marginally positive at 0.1%, indicating the potential for a material, if somewhat temporary (due to the shutdown) slowing in the U.S. economy. Underpinning expectations for slowing growth are newfound weakness in the manufacturing sector, as well a soft February jobs report which may prove anomalous but adds credence to the slowdown story that is emerging from other areas of the economy (e.g. real estate). The Fed has also acknowledged a potential shift in the economic climate, opting to leave rates unchanged at their most recent meeting and shifting toward a projection of steady rates through the rest of 2019, especially in light of stable and below-target inflation, The Fed no longer appears to see a threat of accelerating growth stoking higher-than-targeted inflation rates.
The road ahead for the European economies appears quite uncertain. The European Central Bank (ECB) has acknowledged growth challenges, pushing any potential rate increase out an additional year, into 2020, and extending stimulus in the form of bank lending, in order to keep loans flowing. The ECB has also ratcheted down growth expectations for this year to 1.1% from its previous 1.7% projection. A no-deal Brexit remains very much in play and is widely considered a worst-case scenario for all parties. In addition, uncertain trade policy with the U.S. and other global partners continues to further dampen growth with the contracting German auto sector being a prime example of trade-related headwinds.
For Japan, the U.S.-China trade war and the global economic slowdown that has emerged in recent months has also hindered domestic growth. Falling exports, industrial production, and sharply declining manufacturing Purchasing Managers Indices are indications that Japan is not immune from global economic malaise. With the Bank of Japan already holding rates at ultra-accommodative levels, there is little ammunition left in Japan’s monetary policy toolkit to further stimulate the economy. Rather, Japan seems to be at the whims of its major trading partners to settle trade disputes and re-open the flow of goods.
Many emerging markets also saw their economic growth forecasts fall for 2019 as momentum softens. GDP growth is projected at 4.5% in 2019, down from 2018 (4.6%). While the risk appetite for emerging market assets increased over the first quarter, policy uncertainty and the accumulation of downside risks including weak global trade, a build-up of financial vulnerabilities, and political dysfunction, continue to impede growth prospects. We believe that U.S.-China trade tensions remain the greatest threat to emerging markets in the aggregate, and the tariff threat will likely remain until the U.S. is satisfied with sufficient structural reform on the part of China to remedy the deeper issues of intellectual property theft and technology transfer. On the upside, lower oil prices have reduced near-term risks and inflationary pressures for most emerging markets, with the caveat that energy-exporting economies are feeling the pinch from the drop in oil prices. While the U.S. and China are making headway towards resolving their trade differences, it may only provide an incremental step toward full resolution.
25
Harbor Overseas Fund
Manager’s Commentary—Continued
Economic growth in China is expected to continue to decelerate modestly in 2019 to 6.2%. The attenuating growth is the result of the combined influences of China’s efforts to rein in its burgeoning debt and the continuing trade dispute with the U.S. Chinese officials have pulled monetary and fiscal levers to moderate the downturn, however growth may still fall short of expectations, particularly if trade tensions fail to ease. China’s overall debt burden, which has grown sharply since the Great Financial Crisis, remains a critical concern with insufficient and inconsistent deleveraging efforts from the government, e.g. injecting liquidity through cuts in bank reserve requirements.
The projected slowdown in Europe, the Middle East and Africa (EMEA) is primarily due to the weak growth prospects in Turkey, where a contraction is projected for 2019. Turkey’s beleaguered economy officially sank into a recession in the fourth quarter of 2018, and discontent with the economic downturn may be reflected in upcoming local elections. While financial markets have stabilized somewhat since the abrupt currency crisis last year, deficiencies in bank-supplied liquidity are undermining economic recovery. While external competitiveness has improved, growth remains weak due to lack of confidence and soft external demand from slowing euro area markets.
Slowdowns in Latin America are also projected with softer than expected economic activity in Brazil and a continuing slowdown in Argentina. In Brazil, GDP growth expectations were revised down by Banco Central, and political risk associated with corruption and pension reform continues to add uncertainty to the outlook. In Argentina, growth is projected to contract through the first half of 2019 although at a lower rate than last year, which bodes well for a potential return to future growth in the second half of the year.
1 | The “Life of Fund” return as shown reflects the period 03/01/2019 through 04/30/2019. |
This report contains the current opinions of Acadian Asset Management LLC as of the date of this report and should not be considered as investment advice or a recommendation of any particular security, strategy or investment product. Such opinions are subject to change without notice and securities described herein may no longer be included in, or may at any time be removed from, the Fund’s portfolio. This report is distributed for informational purposes only. Information contained herein has been obtained from sources believed reliable, but not guaranteed.
Investing in international and emerging markets poses special risks, including potentially greater price volatility due to social, political and economic factors, as well as currency exchange rate fluctuations. These risks are more severe for securities of issuers in emerging market regions. For information on the different share classes and the risks associated with an investment in the Fund, please refer to the current prospectus.
26
Harbor Overseas Fund
Fund Summary—April 30, 2019 (Unaudited)
TOP Holdings(% of net assets)
❶ | Roche Holding AG | 2.7% |
❷ | Unilever NV | 2.2% |
❸ | Mitsubishi UFJ Financial Group Inc. | 1.8% |
❹ | Sumitomo Mitsui Financial Group Inc. | 1.8% |
❺ | Vodafone Group plc | 1.8% |
❻ | Assicurazioni Generali SpA | 1.7% |
❼ | Koninklijke Philips NV | 1.7% |
❽ | Telefonica SA | 1.7% |
❾ | Vivendi SA | 1.7% |
❿ | Wolters Kluwer NV | 1.7% |
Sector Allocation(% of investments)
REGION BREAKDOWN(% of investments)
27
Harbor Overseas Fund
Portfolio of Investments—April 30, 2019 (Unaudited)
Value, Cost, and Principal Amounts in Thousands
COMMON STOCKS—98.1% | |||
Shares | Value | ||
AIRLINES—0.1% | |||
1,369 | Deutsche Lufthansa AG (Germany) | $33 | |
AUTO COMPONENTS—0.3% | |||
5,200 | Showa Corp. (Japan) | 76 | |
AUTOMOBILES—1.2% | |||
11,450 | Peugeot SA (France) | 300 | |
2,400 | Tan Chong Motor Holdings BHD (Malaysia) | 1 | |
301 | |||
BANKS—15.1% | |||
245 | Bank Hapoalim Bm ADR (Israel)1 | 9 | |
4,900 | Bank of Montreal (Canada) | 387 | |
800 | Bank of Nova Scotia (Canada) | 44 | |
400 | DBS Group Holdings Ltd. (Singapore) | 8 | |
5,401 | Erste Group Bank AG (Austria) | 216 | |
7,699 | Faisal Islamic Bank of Egypt (Egypt) | 8 | |
37 | Grupo Bolivar SA (Colombia) | 1 | |
12,800 | Gunma Bank Ltd. (Japan) | 51 | |
49,490 | Israel Discount Bank Ltd. (Israel)* | 193 | |
319 | Israel Discount Bank Ltd. ADR (Israel)1 | 12 | |
34,200 | Japan Post Bank Co. Ltd. (Japan) | 377 | |
95,100 | Mitsubishi UFJ Financial Group Inc. (Japan) | 472 | |
281,500 | Mizuho Financial Group Inc. (Japan) | 440 | |
5,000 | Royal Bank of Canada (Canada) | 399 | |
29,755 | Royal Bank of Scotland Group plc (United Kingdom)* | 93 | |
16,600 | Shinsei Bank Ltd. (Japan) | 232 | |
593 | Sparebanken Sor (Norway) | 6 | |
12,500 | Sumitomo Mitsui Financial Group Inc. (Japan) | 454 | |
9,900 | Sumitomo Mitsui Trust Holdings Inc. (Japan) | 345 | |
2,800 | Toronto-Dominion Bank (Canada) | 160 | |
3,907 | |||
BEVERAGES—0.7% | |||
1,354 | Carlsberg AS (Denmark) | 175 | |
BIOTECHNOLOGY—0.1% | |||
3,171 | Kamada Ltd. (Israel)* | 19 | |
BUILDING PRODUCTS—1.3% | |||
24,485 | Nibe Industrier AB (Sweden) | 329 | |
CAPITAL MARKETS—4.1% | |||
8,871 | 3i Group plc (United Kingdom) | 124 | |
8,452 | Banca Generali SpA (Italy) | 239 | |
2,495 | Fiducian Group Ltd. (Australia) | 9 | |
5,553 | London Stock Exchange Group plc (United Kingdom) | 364 | |
60,800 | Singapore Exchange Ltd. (Singapore) | 330 | |
1,066 | |||
CHEMICALS—0.2% | |||
48,836 | Alpek SAB de CV (Mexico)* | 60 | |
COMMERCIAL SERVICES & SUPPLIES—0.2% | |||
2,920 | Atento SA (Luxembourg)* | 11 | |
412 | Catering International Services (France) | 5 | |
32,000 | China Boqi Environmental Holding Co. Ltd. (Cayman Islands)* | 7 | |
599 | Fursys Inc. (South Korea) | 19 | |
42 | |||
COMMUNICATIONS EQUIPMENT—0.0% | |||
1,220 | Telefonaktiebolaget LM Ericsson (Sweden) | 12 |
COMMON STOCKS—Continued | |||
Shares | Value | ||
CONSTRUCTION & ENGINEERING—0.7% | |||
6,000 | China Railway Group Ltd. (China) | $5 | |
4,718 | CIMIC Group Ltd. (Australia) | 168 | |
19,277 | Johns Lyng Group Ltd. (Australia)* | 20 | |
193 | |||
CONTAINERS & PACKAGING—0.0% | |||
64,100 | Hanwell Holdings Ltd. (Singapore) | 12 | |
DISTRIBUTORS—1.1% | |||
10,800 | Jardine Cycle & Carriage Ltd. (Singapore) | 282 | |
DIVERSIFIED CONSUMER SERVICES—0.1% | |||
42,161 | China Beststudy Education Group (Cayman Islands)* | 17 | |
DIVERSIFIED FINANCIAL SERVICES—1.0% | |||
3,847 | Exor NV (Netherlands) | 256 | |
15,000 | Mulpha International BHD (Malaysia)* | 9 | |
265 | |||
DIVERSIFIED TELECOMMUNICATION SERVICES—3.5% | |||
145,911 | BT Group plc (United Kingdom) | 435 | |
1,254 | Macquarie Telecom Group Ltd. (Australia) | 18 | |
604 | Magyar Telekom Telecommunications plc ADR (Hungary)1 | 5 | |
53,100 | Telefonica SA (Spain) | 443 | |
901 | |||
ELECTRIC UTILITIES—1.1% | |||
1,657 | Cia Paranaense de Energia ADR (Brazil)*,1 | 17 | |
12,240 | ENEL Americas SA ADR (Chile)1 | 107 | |
1,926 | Enel SpA (Italy) | 12 | |
16,707 | Iberdrola SA (Spain) | 152 | |
23,158 | OPG Power Ventures plc (Isle Of Man)* | 6 | |
294 | |||
ELECTRICAL EQUIPMENT—0.1% | |||
250,000 | Jiangnan Group Ltd. (Cayman Islands)* | 13 | |
ELECTRONIC EQUIPMENT, INSTRUMENTS & COMPONENTS—1.3% | |||
190 | Barco NV (Belgium) | 34 | |
98,377 | Datatec Ltd. (South Africa)* | 225 | |
13,314 | Hon Hai Precision Industry Co. Ltd. GDR (Taiwan)*,2 | 76 | |
335 | |||
ENERGY EQUIPMENT & SERVICES—0.8% | |||
69,085 | CGG SA (France)* | 125 | |
2,800 | MODEC Inc. (Japan) | 86 | |
211 | |||
ENTERTAINMENT—1.8% | |||
807 | AFC Ajax NV (Netherlands)* | 18 | |
1,029 | Ol Groupe SA (France)* | 3 | |
15,418 | Vivendi SA (France) | 448 | |
469 | |||
FOOD & STAPLES RETAILING—1.6% | |||
16,858 | Koninklijke Ahold Delhaize NV (Netherlands) | 406 | |
HEALTH CARE EQUIPMENT & SUPPLIES—3.0% | |||
28,686 | Fisher & Paykel Healthcare Corp. Ltd. (New Zealand) | 303 | |
372 | GN Store Nord AS (Denmark) | 19 | |
10,379 | Koninklijke Philips NV (Netherlands) | 446 | |
768 |
28
Harbor Overseas Fund
Portfolio of Investments—Continued
Value, Cost, and Principal Amounts in Thousands
COMMON STOCKS—Continued | |||
Shares | Value | ||
HEALTH CARE PROVIDERS & SERVICES—0.9% | |||
10,400 | MediPAL Holdings Corp. (Japan) | $234 | |
HEALTH CARE TECHNOLOGY—0.4% | |||
1,468 | CompuGroup Medical SE (Germany) | 97 | |
HOTELS, RESTAURANTS & LEISURE—0.7% | |||
522,000 | China Energy Development Holdings Ltd. (China)* | 12 | |
4,217 | Jumbo Interactive Ltd. (Australia) | 51 | |
88,000 | NagaCorp Ltd. (Hong Kong) | 113 | |
176 | |||
HOUSEHOLD DURABLES—4.0% | |||
477 | Amica SA (Poland) | 16 | |
35,688 | Barratt Developments plc (United Kingdom) | 281 | |
2,956 | Berkeley Group Holdings plc (United Kingdom) | 145 | |
15,700 | Haseko Corp. (Japan) | 190 | |
3,986 | Persimmon plc (United Kingdom) | 116 | |
117,956 | Taylor Wimpey plc (United Kingdom) | 280 | |
1,028 | |||
INSURANCE—5.8% | |||
22,970 | Assicurazioni Generali SpA (Italy) | 446 | |
2,200 | iA Financial Corp. Inc. (Canada) | 87 | |
33,600 | Japan Post Holdings Co. Ltd. (Japan) | 376 | |
26,492 | QBE Insurance Group Ltd. (Australia) | 242 | |
3,100 | Tokio Marine Holdings Inc. (Japan) | 157 | |
66,066 | Unipolsai Assicurazioni SpA (Italy) | 181 | |
1,489 | |||
INTERNET & DIRECT MARKETING RETAIL—0.2% | |||
1,871 | lastminute.com NV (Netherlands)* | 39 | |
IT SERVICES—1.8% | |||
670 | Comarch SA (Poland) | 33 | |
2,900 | Fujitsu Ltd. (Japan) | 213 | |
3,715 | Kainos Group plc (United Kingdom) | 26 | |
345 | Know It AB (Sweden) | 8 | |
4,900 | Otsuka Corp. (Japan) | 193 | |
413 | Techedge SpA (Italy)* | 2 | |
475 | |||
LIFE SCIENCES TOOLS & SERVICES—3.2% | |||
10,127 | Qiagen NV (Netherlands)* | 395 | |
1,657 | Sartorius Stedim Biotech (France) | 225 | |
559 | Siegfried Holding AG (Switzerland)* | 212 | |
832 | |||
MACHINERY—2.5% | |||
21,286 | Deutz AG (Germany) | 210 | |
600 | Makino Milling Machine Co. Ltd. (Japan) | 25 | |
700 | Mitsubishi Heavy Industries Ltd. (Japan) | 29 | |
1,400 | Mitsubishi Logisnext Co. Ltd. (Japan) | 16 | |
1,200 | Mitsuboshi Belting Ltd. (Japan) | 23 | |
1,941 | Sandvik AB (Sweden) | 36 | |
3,400 | Takuma Co. Ltd. (Japan) | 41 | |
5,687 | Valmet OYJ (Finland) | 157 | |
173,000 | Zoomlion Heavy Industry Science And Technology Co. Ltd. (China) | 102 | |
639 | |||
MEDIA—2.0% | |||
300 | Cogeco Inc. (Canada) | 18 | |
964 | Corus Entertainment Inc. (Canada) | 5 |
COMMON STOCKS—Continued | |||
Shares | Value | ||
MEDIA—Continued | |||
1,283 | Highco SA (France) | $8 | |
3,663 | Ilkka-Yhtyma OYJ (Finland) | 16 | |
1,950 | North Media As (Denmark)* | 11 | |
34,186 | Nos SGPS SA (Portugal) | 230 | |
3,753 | Publicis Groupe SA (France) | 223 | |
511 | |||
METALS & MINING—8.0% | |||
29,100 | Amerigo Resources Ltd. (Canada)* | 18 | |
52,356 | Arcelormittal South Africa Ltd. (South Africa)* | 11 | |
8,669 | BHP Billiton Ltd. (Australia) | 229 | |
19,990 | BlueScope Steel Ltd. (Australia) | 190 | |
20,044 | Champion Iron Ltd. (Australia)* | 32 | |
54,333 | Cia Siderurgica Nacional SA ADR (Brazil)*,1 | 198 | |
59,033 | Fortescue Metals Group Ltd. (Australia) | 298 | |
29,831 | Iluka Resources Ltd. (Australia) | 182 | |
14,997 | MMC Norilsk Nickel PJSC ADR (Russia)1 | 334 | |
671 | Nexa Resources SA (Luxembourg) | 8 | |
91,030 | Red 5 Ltd. (Australia)* | 7 | |
1,790 | Rio Tinto Ltd. (Australia) | 121 | |
7,200 | Rio Tinto plc (United Kingdom) | 420 | |
1,769 | Tribune Resources Ltd. (Australia)* | 5 | |
2,053 | |||
MULTI-UTILITIES—0.6% | |||
46,370 | Hera SpA (Italy) | 165 | |
OIL, GAS & CONSUMABLE FUELS—3.0% | |||
17,354 | Eni SpA (Italy) | 296 | |
17,958 | New Hope Corp. Ltd. (Australia) | 34 | |
525 | OMV AG ADR (Austria)1 | 28 | |
24,299 | Repsol SA (Spain) | 412 | |
29,450 | Universal Coal plc (United Kingdom) | 8 | |
778 | |||
PAPER & FOREST PRODUCTS—0.0% | |||
1,311 | Midway Ltd. (Australia) | 3 | |
PERSONAL PRODUCTS—2.2% | |||
9,437 | Unilever NV (Netherlands) | 571 | |
PHARMACEUTICALS—5.4% | |||
1,666 | Ipsen SA (France) | 195 | |
70,289 | Mayne Pharma Group Ltd. (Australia)* | 35 | |
1,940 | Merck KGAA (Germany) | 207 | |
4,800 | Mochida Pharmaceutical Co. Ltd. (Japan) | 223 | |
2,632 | Roche Holding AG (Switzerland) | 694 | |
562 | Vetoquinol SA (France) | 35 | |
1,389 | |||
PROFESSIONAL SERVICES—1.7% | |||
4,498 | People Infrastructure Ltd. (Australia)* | 8 | |
6,315 | Wolters Kluwer NV (Netherlands) | 441 | |
449 | |||
REAL ESTATE MANAGEMENT & DEVELOPMENT—1.9% | |||
83,000 | China Overseas Grand Oceans Group Ltd. (Hong Kong) | 44 | |
45,500 | CK Asset Holdings Ltd. (Cayman Islands) | 366 | |
120,899 | K Wah International Holdings Ltd. (Bermuda) | 76 | |
1,235 | LSR Group PJSC GDR (Russia)2 | 3 | |
10 | Plazza AG (Switzerland) | 2 | |
7,000 | Vanke Property Overseas Ltd. (Cayman Islands) | 5 | |
496 |
29
Harbor Overseas Fund
Portfolio of Investments—Continued
Value, Cost, and Principal Amounts in Thousands
COMMON STOCKS—Continued | |||
Shares | Value | ||
SEMICONDUCTORS & SEMICONDUCTOR EQUIPMENT—2.5% | |||
3,700 | Advantest Corp. (Japan) | $105 | |
1,072 | Canadian Solar Inc. (Canada)* | 21 | |
400 | Nuflare Technology Inc. (Japan) | 25 | |
2,915 | NXP Semiconductors NV (Netherlands) | 308 | |
9,846 | Tower Semiconductor Ltd. (Israel)* | 177 | |
636 | |||
SOFTWARE—5.6% | |||
2,219 | Atlassian Corp. plc (United Kingdom)* | 245 | |
3,389 | Check Point Software Technologies Ltd. (Israel)* | 409 | |
200 | Constellation Software Inc. (Canada) | 177 | |
1,405 | Cyberark Software Ltd. (Israel)* | 181 | |
3,315 | IVU Traffic Technologies AG (Germany)* | 30 | |
293 | Linedata Services (France) | 9 | |
2,762 | MiX Telematics Ltd. ADR (South Africa)1 | 50 | |
1,852 | NICE Ltd. ADR (Israel)*,1 | 255 | |
1,100 | OBIC Business Consultants Co. Ltd. (Japan) | 44 | |
3,383 | Sopheon plc (United Kingdom)* | 50 | |
1,450 | |||
TECHNOLOGY HARDWARE, STORAGE & PERIPHERALS—0.8% | |||
216,000 | Lenovo Group Ltd. (China) | 200 | |
TEXTILES, APPAREL & LUXURY GOODS—0.1% | |||
4,864 | Piquadro SpA (Italy) | 11 | |
600 | Rhythm Watch Co. Ltd. (Japan) | 7 | |
344 | Samyang Tongsang Co. Ltd. (South Korea) | 18 | |
36 |
COMMON STOCKS—Continued | |||
Shares | Value | ||
TOBACCO—1.2% | |||
6,137 | Swedish Match AB (Sweden) | $299 | |
TRANSPORTATION INFRASTRUCTURE—0.1% | |||
343 | Societe Marseillaise DU Tunnel Prado-Carenage SA (France)* | 8 | |
23,631 | Stalexport Autostrady SA (Poland) | 21 | |
29 | |||
WATER UTILITIES—0.9% | |||
19,621 | Cia de Saneamento Basico Do Estado de Sao Paulo ADR (Brazil)*,1 | 235 | |
WIRELESS TELECOMMUNICATION SERVICES—3.2% | |||
3,300 | SoftBank Group Corp. (Japan) | 350 | |
252,511 | Vodafone Group plc (United Kingdom) | 468 | |
818 | |||
TOTAL COMMON STOCKS | |||
(Cost $24,894) | 25,313 | ||
TOTAL INVESTMENTS—98.1% | |||
(Cost $24,894) | 25,313 | ||
CASH AND OTHER ASSETS, LESS LIABILITIES—1.9% | 487 | ||
TOTAL NET ASSETS—100.0% | $25,800 |
FAIR VALUE MEASUREMENTS
The following table summarizes the Fund’s investments as of April 30, 2019 based on the inputs used to value them.
Asset Category | Quoted Prices Level 1 (000s) | Other Significant Observable Inputs Level 2 (000s) | Significant Unobservable Inputs Level 3 (000s) | Total (000s) | ||||
Common Stocks | ||||||||
Africa | $50 | $244 | $— | $294 | ||||
Europe | 1,000 | 12,452 | — | 13,452 | ||||
Latin America | 618 | 408 | — | 1,026 | ||||
Middle East/Central Asia | 1,043 | 212 | — | 1,255 | ||||
North America | 1,316 | — | — | 1,316 | ||||
Pacific Basin | — | 7,970 | — | 7,970 | ||||
Total Investments in Securities | $4,027 | $21,286 | $— | $25,313 |
There were no Level 3 investments at April 30, 2019 or March 1, 2019 (inception).
For more information on valuation inputs and their aggregation into the levels used in the table above, please refer to the Fair Value Measurements and Disclosures in Note 2 of the accompanying Notes to Financial Statements.
* | Non-income producing security |
1 | ADR after the name of a security stands for American Depositary Receipts representing ownership of foreign securities. ADRs are issued by U.S. banking institutions. |
2 | GDR after the name of a security stands for Global Depositary Receipts representing ownership of foreign securities. GDRs are issued by either U.S. or non-U.S. banking institutions. Country specific examples of this type of depositary receipt, if any, are denoted using different abbreviations. |
The accompanying notes are an integral part of the Financial Statements.
30
Harbor International Growth Fund
Manager’s Commentary (Unaudited)
Subadviser
Baillie Gifford Overseas Limited
Calton Square
1 Greenside Row
Edinburgh, Scotland
United Kingdom
EH1 3AN
United Kingdom
EH1 3AN
Portfolio Managers
Gerard Callahan
Since 2013
Since 2013
Iain Campbell
Since 2013
Since 2013
Joseph M. Faraday, CFA
Since 2013
Moritz Sitte, CFA
Since 2014
Since 2014
Sophie Earnshaw, CFA
Since 2014
Since 2014
Baillie Gifford Overseas Limited has subadvised the Fund since 2013.
Investment Objective
The Fund seeks long-term growth of capital.
Gerard Callahan
Iain Campbell
Joseph M. Faraday, CFA
Moritz Sitte, CFA
Sophie Earnshaw, CFA
Management’s Discussion of
Fund Performance
Fund Performance
Market Review
We believe that to be a successful long-term investor, one must endure short-term periods of volatility in order to give company fundamentals a chance to manifest themselves in share prices. Along with any periods of more pronounced volatility in share prices, there is sometimes an increase in news flow surrounding political and/or economic events, as well as news on individual companies. To some, at least in the U.K., Brexit has been the piece of news at the top of the watchlist. British Prime Minister Theresa May was unable to progress her preferred deal in the U.K parliament, so the U.K. did not leave the European Union as planned, with an extension to the negotiating period to October 31, 2019. Our investment approach is resolutely bottom-up. We are focused on finding high quality individual businesses that we believe will flourish in the long term, rather than viewing macroeconomic events as the ultimate driver of share prices. That being the case, the make-up of the Fund has not been changed to take advantage of a particular outcome of Brexit or any other issue in world politics.
Performance
Through the six-month period ended of April 30, 2019, the Fund performed strongly, with a return of 15.65% (Retirement Class), 15.56% (Institutional Class), 15.44% (Administrative Class), and 15.40% (Investor Class) as compared to the MSCI All Country World Ex. U.S. (ND) Index return of 9.12%.
The performance of the Fund over the last six months was mostly driven by bottom-up stock-picking. Broadly speaking however, the Fund’s Japanese, Healthcare and Information Technology holdings collectively added value to performance, with Indian holdings and a lack of Real Estate exposure detracting from performance.
Turning to the companies that contributed to the Fund’s outperformance of the benchmark, there were two which stood out, namely Naspers, the South African tech-focused holding company, and Shopify, a Canadian company that facilitates the establishment of ecommerce functions for other businesses. Naspers is perhaps best known as the largest shareholder of Chinese tech giant Tencent, which is typically a major driver of its performance. We believe that Naspers trades at a meaningful discount to its assets and this discount has expanded in recent years. After a weak 2018, Naspers (and Tencent) performed strongly through April 2019. This upturn seems to be primarily a rebound after previous share price weakness, rather than being driven by any significant piece of company news. We still have much optimism about the long-term growth potential of Naspers, and the caliber of its management team.
Shopify has also performed well in share-price terms over the last six months. Founded by its current CEO, Tobias Lütke, the company has disrupted the area of e-commerce, by allowing businesses to set up quality online stores to sell their goods, and has supported their advertising and social media efforts, all for a fraction of the typical cost of doing so in the past. We believe there is still a huge amount of room for Shopify to grow in its market, and with its visionary CEO, that it has the tools at its disposal to do so.
At the other end of the spectrum, ASOS fared less well. The U.K. online clothing retailer had an especially difficult 2018, with the month of October being notably challenging. As investors in the Fund may be aware, some operational errors and unseasonably warm weather in Europe last year caused a wobble to the share price. This drop in value is still seen in the
31
Harbor International Growth Fund
Manager’s Commentary—Continued
TOTAL RETURNS
For the periods ended 04/30/2019
Unannualized | 1 Year | Annualized | |||||||||
6 Months | 5 Years | 10 Years | |||||||||
Harbor International Growth Fund | |||||||||||
Retirement Class1 | 15.65% | 0.85% | 4.76% | 8.20% | |||||||
Institutional Class | 15.56 | 0.77 | 4.70 | 8.17 | |||||||
Administrative Class | 15.44 | 0.50 | 4.42 | 7.89 | |||||||
Investor Class | 15.40 | 0.40 | 4.32 | 7.76 | |||||||
Comparative Index | |||||||||||
MSCI All Country World Ex. U.S. (ND) | 9.12% | -3.23% | 2.83% | 7.75% |
As stated in the Fund’s prospectus dated March 1, 2019, the expense ratios were 0.77% (Net) and 0.82% (Gross) (Retirement Class); 0.85% (Net) and 0.90% (Gross) (Institutional Class); 1.10% (Net) and 1.15% (Gross) (Administrative Class); and 1.22% (Net) and 1.27% (Gross) (Investor Class). The net expense ratios reflect an expense limitation agreement (excluding interest expense, if any) effective through 02/29/2020. The expense ratios in the prospectus may differ from the actual expense ratios for the period disclosed within this report. The expense ratios shown in the prospectus are based on the prior fiscal year, adjusted to reflect changes, if any, in contractual arrangements that occurred prior to the date of the prospectus (or supplement thereto, if applicable).
Performance data shown represents past performance and is no guarantee of future results. Past performance is net of management fees and expenses and reflects reinvested dividends and distributions but does not reflect the deduction of taxes that a shareholder would pay on Fund distributions or upon the redemption of Fund shares. Past performance reflects the beneficial effect of any expense waivers or reimbursements, without which returns would have been lower. Investment returns and principal value will fluctuate so that Fund shares, when redeemed, may be worth more or less than their original cost. Returns for periods less than one year are not annualized. Current performance may be higher or lower and is available through the most recent month end atharborfunds.com or by calling 800-422-1050.
six-months-through-April figures, however these hide the fact that the shares have performed well since the beginning of 2019. That said, these situations will often cause holdings to be put under the microscope and we must keep a close eye on developments. We still believe ASOS to be a quality business with characteristics which should allow it to endure in this aggressively competitive market.
Another business that detracted from the Fund’s performance for the period was Mahindra & Mahindra, an Indian manufacturer of tractors and utility vehicles. The business had a difficult fourth quarter 2018, which was exacerbated by its report of flat earnings in Q1, 2019, driven by a decline in margins in its tractor and automotive business. Autos is a particularly competitive market segment, and Mahindra has thus far failed to demonstrate a meaningful edge in the area, which has failed to live up to the market’s expectations. That said, it continues to invest for future growth..
Outlook & Strategy
As always, we wish to reiterate to investors that a period as short as six months may not be reflective of the long-term outlook. We are focused on the long-term potential for the businesses in the Fund.
1 | Retirement Class shares commenced operations on March 1, 2016. The performance attributed to the Retirement Class shares prior to that date is that of the Institutional Class shares. Performance prior to March 1, 2016 has not been adjusted to reflect the lower expenses of Retirement Class shares. During this period, Retirement Class shares would have had returns similar to, but potentially higher than, Institutional Class shares due to the fact that Retirement Class shares represent interests in the same portfolio as Institutional Class shares but are subject to lower expenses. |
This report contains the current opinions of Baillie Gifford Overseas Limited as of the date of this report and should not be considered as investment advice or a recommendation of any particular security, strategy or investment product. Such opinions are subject to change without notice and securities described herein may no longer be included in, or may at any time be removed from, the Fund’s portfolio. This report is distributed for informational purposes only. Information contained herein has been obtained from sources believed reliable, but not guaranteed.
Investing in international and emerging markets poses special risks, including potentially greater price volatility due to social, political and economic factors, as well as currency exchange rate fluctuations. These risks are more severe for securities of issuers in emerging market regions. For information on the different share classes and the risks associated with an investment in the Fund, please refer to the current prospectus.
32
Harbor International Growth Fund
Fund Summary—April 30, 2019 (Unaudited)
TOP Holdings(% of net assets)
❶ | Naspers Ltd. | 3.0% |
❷ | Hargreaves Lansdown plc | 2.8% |
❸ | Alibaba Group Holding Ltd. ADR | 2.7% |
❹ | Taiwan Semiconductor Manufacturing Co. Ltd. ADR | 2.5% |
❺ | Shiseido Co. Ltd. | 2.4% |
❻ | AIA Group Ltd. | 2.2% |
❼ | Cochlear Ltd. | 2.1% |
❽ | Rightmove plc | 2.0% |
❾ | adidas AG | 1.9% |
❿ | Shopify Inc. Class A | 1.9% |
Sector Allocation(% of investments)
(Excludes short-term investments)
REGION BREAKDOWN(% of investments)
(Excludes short-term investments)
33
Harbor International Growth Fund
Portfolio of Investments—April 30, 2019 (Unaudited)
Value, Cost, and Principal Amounts in Thousands
COMMON STOCKS—96.7% | |||
Shares | Value | ||
AUTO COMPONENTS—0.7% | |||
93,600 | Denso Corp. (Japan) | $4,090 | |
AUTOMOBILES—0.8% | |||
524,653 | Mahindra & Mahindra Ltd. GDR (India)1 | 4,806 | |
BANKS—4.0% | |||
974,200 | Public Bank BHD (Malaysia) | 5,303 | |
630,006 | Svenska Handelsbanken AB (Sweden)2 | 6,882 | |
532,127 | United Overseas Bank Ltd. (Singapore) | 10,897 | |
23,082 | |||
BEVERAGES—4.1% | |||
4,911,900 | Thai Beverage PCL (Thailand) | 3,034 | |
549,166 | Treasury Wine Estates Ltd. (Australia) | 6,661 | |
1,518,000 | Tsingtao Brewery Co. Ltd. (China) | 9,684 | |
465,064 | United Spirits Ltd. (India)* | 3,752 | |
23,131 | |||
BUILDING PRODUCTS—1.4% | |||
149,228 | Kingspan Group plc (Ireland) | 7,845 | |
CAPITAL MARKETS—3.5% | |||
539,668 | Hargreaves Lansdown plc (United Kingdom) | 15,941 | |
805,845 | Jupiter Fund Management plc (United Kingdom) | 3,955 | |
19,896 | |||
CHEMICALS—4.5% | |||
428,601 | Asian Paints Ltd. (India) | 9,021 | |
161,160 | Johnson Matthey plc (United Kingdom) | 7,031 | |
210,641 | Novozymes AS (Denmark) | 9,832 | |
25,884 | |||
COMMERCIAL SERVICES & SUPPLIES—0.9% | |||
374,212 | HomeServe plc (United Kingdom) | 5,304 | |
DIVERSIFIED FINANCIAL SERVICES—1.4% | |||
169,145 | Investor AB Class B (Sweden) | 8,067 | |
ELECTRICAL EQUIPMENT—3.0% | |||
111,619 | Legrand SA (France) | 8,210 | |
62,000 | Nidec Corp. (Japan) | 8,856 | |
17,066 | |||
ELECTRONIC EQUIPMENT, INSTRUMENTS & COMPONENTS—2.6% | |||
673,342 | Hon Hai Precision Industry Co. Ltd. GDR (Taiwan)*,1 | 3,826 | |
9,900 | Keyence Corp. (Japan) | 6,186 | |
95,700 | Murata Manufacturing Co. Ltd. (Japan) | 4,805 | |
14,817 | |||
ENERGY EQUIPMENT & SERVICES—0.7% | |||
612,893 | John Wood Group plc (United Kingdom) | 3,757 | |
ENTERTAINMENT—1.1% | |||
44,445 | Spotify Technology SA (Sweden)* | 6,034 | |
FOOD & STAPLES RETAILING—4.3% | |||
351,845 | Clicks Group Ltd. (South Africa) | 4,815 | |
432,660 | Jeronimo Martins SGPS SA (Portugal) | 7,052 | |
359,000 | Raia Drogasil SA (Brazil)* | 6,330 | |
56,900 | Sugi Holdings Co. Ltd. (Japan) | 2,878 | |
1,254,600 | Wal-Mart de Mexico SAB de CV (Mexico)* | 3,686 | |
24,761 |
COMMON STOCKS—Continued | |||
Shares | Value | ||
HEALTH CARE EQUIPMENT & SUPPLIES—4.3% | |||
88,543 | Cochlear Ltd. (Australia) | $11,704 | |
659,200 | Olympus Corp. (Japan) | 7,399 | |
91,900 | Sysmex Corp. (Japan) | 5,266 | |
24,369 | |||
HOUSEHOLD PRODUCTS—1.0% | |||
135,700 | Pigeon Corp. (Japan) | 5,810 | |
INDUSTRIAL CONGLOMERATES—1.6% | |||
55,600 | Jardine Matheson Holdings Ltd. (Singapore) | 3,660 | |
138,100 | Jardine Strategic Holdings Ltd. (Singapore) | 5,224 | |
8,884 | |||
INSURANCE—4.9% | |||
1,194,000 | AIA Group Ltd. (Hong Kong) | 12,226 | |
11,088 | Fairfax Financial Holdings Ltd. (Canada) | 5,287 | |
335,700 | MS&AD Insurance Group Holdings Inc. (Japan) | 10,435 | |
27,948 | |||
INTERACTIVE MEDIA & SERVICES—6.4% | |||
1,344,124 | Auto Trader Group plc (United Kingdom)3 | 9,936 | |
39,214 | Baidu Inc. ADR (China)*,4 | 6,518 | |
278,200 | Kakaku.com Inc. (Japan) | 5,732 | |
24,555 | Naver Corp. (South Korea) | 2,515 | |
1,643,452 | Rightmove plc (United Kingdom) | 11,621 | |
36,322 | |||
INTERNET & DIRECT MARKETING RETAIL—8.0% | |||
83,675 | Alibaba Group Holding Ltd. ADR (China)*,4 | 15,528 | |
78,260 | ASOS plc (United Kingdom)* | 4,013 | |
141,905 | Ctrip.com International Ltd. ADR (China)*,4 | 6,251 | |
245,416 | JD.com Inc. ADR (China)*,4 | 7,429 | |
100,996 | MakeMyTrip Ltd. (India)* | 2,546 | |
215,443 | Zalando SE (Germany)*,3 | 10,153 | |
45,920 | |||
IT SERVICES—3.1% | |||
65,653 | Bechtle AG (Germany) | 6,759 | |
44,911 | Shopify Inc. Class A (Canada)* | 10,937 | |
17,696 | |||
LEISURE PRODUCTS—1.2% | |||
44,700 | Shimano Inc. (Japan) | 6,570 | |
LIFE SCIENCES TOOLS & SERVICES—1.7% | |||
13,397 | Mettler-Toledo International Inc. (Switzerland)* | 9,984 | |
MACHINERY—7.8% | |||
162,695 | Atlas Copco AB Class A (Sweden)2 | 5,078 | |
156,158 | Atlas Copco AB Class B (Sweden)2 | 4,448 | |
151,787 | Epiroc AB Class A (Sweden)* | 1,569 | |
425,397 | Epiroc AB Class B (Sweden)* | 4,210 | |
124,204 | Kone OYJ (Finland) | 6,825 | |
37,843 | Schindler Holding AG (Switzerland) | 8,179 | |
23,600 | SMC Corp. (Japan) | 9,857 | |
203,837 | Weir Group plc (United Kingdom) | 4,430 | |
44,596 | |||
MEDIA—2.9% | |||
65,278 | Naspers Ltd. (South Africa) | 16,793 |
34
Harbor International Growth Fund
Portfolio of Investments—Continued
Value, Cost, and Principal Amounts in Thousands
COMMON STOCKS—Continued | |||
Shares | Value | ||
PERSONAL PRODUCTS—3.5% | |||
78,000 | Kao Corp. (Japan) | $6,021 | |
174,300 | Shiseido Co. Ltd. (Japan) | 13,710 | |
19,731 | |||
PROFESSIONAL SERVICES—2.2% | |||
101,829 | Intertek Group plc (United Kingdom) | 7,122 | |
415,070 | SEEK Ltd. (Australia) | 5,331 | |
12,453 | |||
SEMICONDUCTORS & SEMICONDUCTOR EQUIPMENT—5.7% | |||
42,940 | ASML Holding NV (Netherlands) | 8,966 | |
341,228 | Infineon Technologies AG (Germany) | 8,089 | |
329,421 | Taiwan Semiconductor Manufacturing Co. Ltd. ADR (Taiwan)4 | 14,435 | |
14,113 | U-Blox Holding AG (Switzerland)*,2 | 1,185 | |
32,675 | |||
SPECIALTY RETAIL—1.8% | |||
333,721 | Industria de Diseno Textil SA (Spain)2 | 10,105 | |
TEXTILES, APPAREL & LUXURY GOODS—4.5% | |||
42,826 | adidas AG (Germany) | 11,032 | |
230,036 | Burberry Group plc (United Kingdom) | 6,063 | |
119,164 | Cie Financiere Richemont SA (Switzerland) | 8,711 | |
25,806 | |||
THRIFTS & MORTGAGE FINANCE—1.9% | |||
373,600 | Housing Development Finance Corp. Ltd. (India) | 10,721 |
COMMON STOCKS—Continued | |||
Shares | Value | ||
WIRELESS TELECOMMUNICATION SERVICES—1.2% | |||
63,300 | SoftBank Group Corp. (Japan) | $6,712 | |
TOTAL COMMON STOCKS | |||
(Cost $484,232) | 551,635 | ||
PREFERRED STOCKS—1.8% | |||
(Cost $7,277) | |||
HEALTH CARE EQUIPMENT & SUPPLIES—1.8% | |||
54,706 | Sartorius AG (Germany) | 10,044 | |
SHORT-TERM INVESTMENTS—3.7% | |||
(Cost $21,349) | |||
Principal Amount | |||
$ | 21,349 | State Street Navigator Securities Lending Government Money Market Portfolio (1 day yield of 2.510%) | 21,349 |
TOTAL INVESTMENTS—102.2% | |||
(Cost $512,858) | 583,028 | ||
CASH AND OTHER ASSETS, LESS LIABILITIES—(2.2)% | (12,573) | ||
TOTAL NET ASSETS—100.0% | $570,455 |
FAIR VALUE MEASUREMENTS
The following table summarizes the Fund’s investments as of April 30, 2019 based on the inputs used to value them.
Asset Category | Quoted Prices Level 1 (000s) | Other Significant Observable Inputs Level 2 (000s) | Significant Unobservable Inputs Level 3 (000s) | Total (000s) | ||||
Common Stocks | ||||||||
Africa | $— | $21,608 | $— | $21,608 | ||||
Europe | 16,018 | 222,370 | — | 238,388 | ||||
Latin America | 10,016 | — | — | 10,016 | ||||
Middle East/Central Asia | 2,546 | 28,300 | — | 30,846 | ||||
North America | 16,224 | — | — | 16,224 | ||||
Pacific Basin | 50,161 | 184,392 | — | 234,553 | ||||
Preferred Stocks | ||||||||
Europe | — | 10,044 | — | 10,044 | ||||
Short-Term Investments | ||||||||
Investment Company-Securities Lending Investment Fund | 21,349 | — | — | 21,349 | ||||
Total Investments in Securities | $116,314 | $466,714 | $— | $583,028 |
There were no Level 3 investments at April 30, 2019 or October 31, 2018.
For more information on valuation inputs and their aggregation into the levels used in the table above, please refer to the Fair Value Measurements and Disclosures in Note 2 of the accompanying Notes to Financial Statements.
35
Harbor International Growth Fund
Portfolio of Investments—Continued
* | Non-income producing security |
1 | GDR after the name of a security stands for Global Depositary Receipts representing ownership of foreign securities. GDRs are issued by either U.S. or non-U.S. banking institutions. Country specific examples of this type of depositary receipt, if any, are denoted using different abbreviations. |
2 | All or a portion of this security was out on loan as of April 30, 2019. |
3 | Securities purchased in a transaction exempt from registration under Rule 144A of the Securities Act of 1933. These securities may be resold in transactions exempt from registration, normally to qualified institutional buyers. The Fund has no right to demand registration of these securities. At April 30, 2019, the aggregate value of these securities was $20,089 or 4% of net assets. |
4 | ADR after the name of a security stands for American Depositary Receipts representing ownership of foreign securities. ADRs are issued by U.S. banking institutions. |
The accompanying notes are an integral part of the Financial Statements.
36
Harbor International Small Cap Fund
Manager’s Commentary (Unaudited)
Subadviser
Baring International Investment Limited
20 Old Bailey
London, EC4M 7BF
United Kingdom
United Kingdom
Portfolio Managers
Nicholas M. Williams
Since 2016
Since 2016
Colin C. Riddles
Since 2016
Since 2016
Rosemary C. Simmonds, CFA
Since 2016
Since 2016
Barings has subadvised the Fund since 2016.*
Investment Objective
The Fund seeks long-term growth of capital.
Nicholas M. Williams
Colin C. Riddles
Rosemary C. Simmonds, CFA
Management’s Discussion of
Fund Performance
Fund Performance
Market Review
Over the six-month period to April 30, 2019, the international small cap market has proved volatile. From the beginning of November 2018 to the end of April 2019, the MSCI EAFE Small Cap (ND) Index has risen 5.89%. All returns are in U.S. Dollars.
During the first two months of the period, November and December 2018, international small cap, and equity markets worldwide, fell sharply, impacted by deteriorating confidence in global economic growth prospects and fears that the geopolitical background was deteriorating. By the end of 2018, however, share prices had fallen back so sharply that valuation levels had become more attractive, while concerns about geopolitical risks abated somewhat. Forecasts for global trade growth in 2019 were boosted by strong data from the United States, and hopes of stimulus programs in China, while globally central banks highlighted their willingness to maintain their overall stimulatory monetary policy stances. As a result, despite the volatility in benchmark indices over the period, the Fund’s return over the period was positive, reflecting a strong rebound in the MSCI EAFE Small Cap (ND) Index after the new year began.
Performance
Harbor International Small Cap Fund returned 5.66% (Retirement Class), 5.67% (Institutional Class), 5.49% (Administrative Class), and 5.37% (Investor Class) over the period. This return is slightly below that of the MSCI EAFE Small Cap (ND) Index over the period.
During the period the leading sectors in the MSCI EAFE Small Cap (ND) Index in terms of share price performances were the Information Technology and Consumer Discretionary sectors. The Fund’s allocation to these sectors is less than that of the Index; however, strong stock selection decisions in these sectors mitigated the impact of the lower exposure. In other sectors, stock selection decisions also boosted the relative return of the portfolio, while allocation to these other sectors had limited effect on the Fund’s relative returns.
From a geographic perspective, the most significant contributors to Index returns during the period were the Pacific ex-Japan region and the U.K. The Fund has a limited exposure to the Pacific ex-Japan region, however, investments in small cap companies exposed to China, which are considered Emerging Market companies, performed very strongly over the period, mitigating the impact on relative return of the limited exposure to Australian and Hong Kong small cap companies. The Fund holdings in U.K. small cap companies performed strongly over the period, boosted by generally strong stock selection as evidenced by encouraging corporate news flow from a number of the Fund’s holdings. Over the period as a whole the Fund’s European and Japanese holdings performed relatively strong, compared to their regional peers.
Over the period the Fund’s worst performing individual holding was Cosmos Pharmaceutical, the Japanese drug store chain, which released results for the first nine months of their financial year that disappointed expectations. While Cosmos Pharmaceutical has a strong range of proprietary nutrition, cosmetics and beauty products, the dull Japanese environment for retail sales and weakening trends in inbound tourism from Asian travelers impacted the company’s growth prospects. TGS-Nopec, the Norwegian oil services company which is a world-leader in the provision of seismic survey data for oil exploration, also performed weakly, in large part reflecting general uncertainties among investors about the longer-term outlook for oil prices.
* | Effective May 23, 2019, the Board of Trustees of Harbor Funds appointed Cedar Street Asset Management LLC (“Cedar Street”) to serve as the subadviser to Harbor International Small Cap Fund. Cedar Street replaced Baring International Investment Limited as subadviser to the Fund. |
37
Harbor International Small Cap Fund
Manager’s Commentary—Continued
TOTAL RETURNS
For the periods ended 04/30/2019
Unannualized | 1 Year | 5 Years | Annualized | ||||||||
6 Months | Life of Fund | ||||||||||
Harbor International Small Cap Fund | |||||||||||
Retirement Class1 | 5.66% | -7.95% | N/A | 9.51% | |||||||
Institutional Class1 | 5.67 | -8.01 | N/A | 9.45 | |||||||
Administrative Class1 | 5.49 | -8.27 | N/A | 9.15 | |||||||
Investor Class1 | 5.37 | -8.36 | N/A | 9.04 | |||||||
Comparative Index | |||||||||||
MSCI EAFE Small Cap (ND)1 | 5.89% | -7.88% | N/A | 10.46% |
As stated in the Fund’s prospectus dated March 1, 2019, the expense ratios were 0.88% (Net) and 1.08% (Gross) (Retirement Class); 0.96% (Net) and 1.16% (Gross) (Institutional Class); 1.21% (Net) and 1.41% (Gross) (Administrative Class); and 1.33% (Net) and 1.53% (Gross) (Investor Class). The net expense ratios reflect an expense limitation agreement (excluding interest expense, if any) effective through 02/29/2020. The expense ratios in the prospectus may differ from the actual expense ratios for the period disclosed within this report. The expense ratios shown in the prospectus are based on the prior fiscal year, adjusted to reflect changes, if any, in contractual arrangements that occurred prior to the date of the prospectus (or supplement thereto, if applicable).
Performance data shown represents past performance and is no guarantee of future results. Past performance is net of management fees and expenses and reflects reinvested dividends and distributions but does not reflect the deduction of taxes that a shareholder would pay on Fund distributions or upon the redemption of Fund shares. Past performance reflects the beneficial effect of any expense waivers or reimbursements, without which returns would have been lower. Investment returns and principal value will fluctuate so that Fund shares, when redeemed, may be worth more or less than their original cost. Returns for periods less than one year are not annualized. Current performance may be higher or lower and is available through the most recent month end atharborfunds.com or by calling 800-422-1050.
U.K. and European small cap companies were among the best performing individual holdings over the period, including athleisure footwear group JD Sports, which is enjoying strong sales growth and expanding internationally; and imaging technology specialist Barco, the Belgian company that is the global leader in next generation digital cinema projectors. The Fund also benefited from a take-over offer for DNA, the Finnish mobile phone service provider, from their Scandinavian peer Telenor.
Outlook & Strategy
Our outlook for the Fund remains positive with regard to the long-term potential for the asset class, and more importantly, the stock selection opportunities within this diverse and entrepreneurial group of companies.
Following the positive returns generated during the last six months, rebounding from the losses made in the previous period, the valuation of the asset class has increased, while forecasts for profits growth in 2019 continue to be subjected to downwards revision. Therefore, in the very short term, we believe that companies in the Fund’s benchmark range are less clearly over-sold than they were at the beginning of the year, and are valued, as an average across the MSCI EAFE Small Cap (ND) Index, closer to the higher end of their historic range on a number of valuation measures, implying that indices might find further progress more hard-won over the coming months. Furthermore, macro-level and political challenges identified at the beginning of the year remain unresolved amid persistent pressures on corporate profitability from tariffs, input costs and demand.
In the U.K., Brexit discussions continue to dominate headlines, with no greater certainty on Britain’s future trading relationship with the E.U. We believe that the most likely development at present seems to be that deadlines will be postponed, with the grudging acquiescence of the E.U. For the U.K. domestic economy, the uncertainties are having a negative impact: investment decisions are being postponed, and property prices and consumer spending are stagnating. The Brexit negotiations to some extent have distracted from domestic economic developments elsewhere in the E.U. Most European economies experienced a marked slow-down in the second half of 2018, with business confidence declining although unemployment and consumer spending trends are still improving.
Business confidence in Japan also deteriorated over recent months, in part due to concerns about the Chinese economy, but also reflecting fears that inbound tourism numbers are falling. Domestic enthusiasm for Prime Minister Abe’s leadership has declined and tax increases are due this year. More positively, however, Japanese companies continue to increase their focus on efficiency gains and on shareholder returns while construction trends and 5G spending are very strong. Australian business confidence is similarly affected by developments in China, although the recent general election results have been more favorable for investor sentiment than had been forecast.
In summary, economic growth was widely anticipated to slow in 2019, and so far this year the more cautious forecasters have seen their caution confirmed. Nevertheless, economic growth and global trade growth remain positive, despite continuing delays to the resolution of the U.S.-China tariff disputes. We believe it is likely that equity markets will prove more volatile over the coming months, however, we believe that investors in the Fund may benefit from a wide range of stock selection possibilities. It is our view that while for the MSCI EAFE Small Cap (ND) Index as a whole profit growth forecasts are continuing to be revised down, selected individual companies with exposure to growth opportunities should continue to perform strongly.
1 | The “Life of Fund” return as shown reflects the period 02/01/2016 through 04/30/2019. |
This report contains the current opinions of Baring International Investment Limited as of the date of this report and should not be considered as investment advice or a recommendation of any particular security, strategy or investment product. Such opinions are subject to change without notice and securities described herein may no longer be included in, or may at any time be removed from, the Fund’s portfolio. This report is distributed for informational purposes only. Information contained herein has been obtained from sources believed reliable, but not guaranteed.
Investing in international and emerging markets poses special risks, including potentially greater price volatility due to social, political and economic factors, as well as currency exchange rate fluctuations. These risks are more severe for securities of issuers in emerging market regions. For information on the different share classes and the risks associated with an investment in the Fund, please refer to the current prospectus.
Stocks of small cap companies pose special risks, including possible illiquidity and greater price volatility than stocks of larger, more established companies. Equity securities, such as common stocks, are affected by company specific events and by movements in the overall stock markets in which those securities principally trade, among other factors. An adverse company specific event, or downturn in those stock markets, can depress the value of a particular company’s equity securities. For information on the different share classes and the risks associated with an investment in the Fund, please refer to the current prospectus.
38
Harbor International Small Cap Fund
Fund Summary—April 30, 2019 (Unaudited)
TOP Holdings(% of net assets)
❶ | JD Sports Fashion plc | 1.3% |
❷ | B&M European Value Retail SA | 1.2% |
❸ | Barco NV | 1.2% |
❹ | CompuGroup Medical SE | 1.2% |
❺ | Cranswick plc | 1.2% |
❻ | HomeServe plc | 1.2% |
❼ | Intermediate Capital Group plc | 1.2% |
❽ | Marshalls plc | 1.2% |
❾ | Relo Group Inc. | 1.2% |
❿ | Cosmos Pharmaceutical Corp. | 1.1% |
Sector Allocation(% of investments)
(Excludes short-term investments)
REGION BREAKDOWN(% of investments)
(Excludes short-term investments)
39
Harbor International Small Cap Fund
Portfolio of Investments—April 30, 2019 (Unaudited)
Value, Cost, and Principal Amounts in Thousands
COMMON STOCKS—95.8% | |||
Shares | Value | ||
AEROSPACE & DEFENSE—1.0% | |||
300,042 | Senior plc (United Kingdom) | $908 | |
AUTO COMPONENTS—1.9% | |||
30,055 | Cie Plastic Omnium SA (France)1 | 911 | |
30,200 | Nifco Inc. (Japan) | 852 | |
1,763 | |||
BANKS—3.2% | |||
17,619 | Bawag Group AG (Austria)2 | 857 | |
165,300 | Chiba Bank Ltd. (Japan) | 868 | |
34,400 | Fukuoka Financial Group Inc. (Japan) | 803 | |
353,740 | Unicaja Banco SA (Spain)2 | 408 | |
2,936 | |||
BUILDING PRODUCTS—0.7% | |||
56,500 | Sanwa Holdings Corp. (Japan) | 680 | |
CAPITAL MARKETS—4.3% | |||
46,285 | Close Brothers Group plc (United Kingdom) | 938 | |
13,494 | Euronext NV (Netherlands)2 | 938 | |
71,808 | Intermediate Capital Group plc (United Kingdom) | 1,110 | |
23,600 | JAFCO Co. Ltd. (Japan) | 893 | |
3,879 | |||
CHEMICALS—3.8% | |||
97,363 | Hexpol AB (Sweden) | 761 | |
273,423 | Incitec Pivot Ltd. (Australia) | 650 | |
26,900 | NOF Corp. (Japan) | 959 | |
14,600 | Okamoto Industries Inc. (Japan) | 756 | |
65,804 | Synthomer plc (United Kingdom) | 360 | |
3,486 | |||
COMMERCIAL SERVICES & SUPPLIES—5.9% | |||
26,800 | AEON Delight Co. Ltd. (Japan)* | 902 | |
14,750 | Befesa SA (Luxembourg)*,2 | 647 | |
144,304 | Biffa plc (United Kingdom)2 | 447 | |
572,351 | Cleanaway Waste Management Ltd. (Australia) | 909 | |
80,126 | HomeServe plc (United Kingdom) | 1,136 | |
49,124 | Securitas AB (Sweden) | 859 | |
24,562 | SPIE SA (France) | 474 | |
5,374 | |||
CONSTRUCTION & ENGINEERING—4.2% | |||
33,100 | COMSYS Holdings Corp. (Japan) | 871 | |
34,800 | Kyowa Exeo Corp. (Japan) | 952 | |
65,724 | Maire Tecnimont SpA (Italy) | 235 | |
13,400 | SHO-BOND Holdings Co. Ltd. (Japan) | 921 | |
45,600 | Toshiba Plant Systems & Services Corp. (Japan) | 819 | |
3,798 | |||
CONSTRUCTION MATERIALS—1.2% | |||
133,144 | Marshalls plc (United Kingdom) | 1,121 | |
CONSUMER FINANCE—1.0% | |||
9,675 | Cembra Money Bank AG (Switzerland)* | 899 | |
CONTAINERS & PACKAGING—2.7% | |||
210,084 | DS Smith plc (United Kingdom) | 981 | |
389,810 | Orora Ltd. (Australia) | 833 | |
63,395 | RPC Group plc (United Kingdom) | 654 | |
2,468 |
COMMON STOCKS—Continued | |||
Shares | Value | ||
DISTRIBUTORS—1.0% | |||
16,500 | Paltac Corp. (Japan) | $911 | |
DIVERSIFIED CONSUMER SERVICES—0.9% | |||
929,000 | Fu Shou Yuan International Group Ltd. (Cayman Islands) | 797 | |
DIVERSIFIED FINANCIAL SERVICES—1.4% | |||
11,061 | Eurazeo SE (France) | 868 | |
8,872 | KBC Ancora CVA (Belgium) | 453 | |
1,321 | |||
DIVERSIFIED TELECOMMUNICATION SERVICES—2.1% | |||
41,607 | DNA OYJ (Finland) | 991 | |
107,683 | Infrastrutture Wireless Italiane SpA (Italy)2 | 893 | |
1,884 | |||
ELECTRONIC EQUIPMENT, INSTRUMENTS & COMPONENTS—2.3% | |||
5,981 | Barco NV (Belgium) | 1,064 | |
27,952 | Spectris plc (United Kingdom) | 1,004 | |
2,068 | |||
ENERGY EQUIPMENT & SERVICES—1.8% | |||
115,131 | Hunting plc (United Kingdom) | 885 | |
27,784 | TGS-NOPEC Geophysical Co. (Norway) | 726 | |
1,611 | |||
ENTERTAINMENT—0.9% | |||
14,400 | Kinepolis Group NV (Belgium) | 857 | |
FOOD & STAPLES RETAILING—1.9% | |||
6,400 | Cosmos Pharmaceutical Corp. (Japan) | 1,023 | |
29,879 | MARR SpA (Italy) | 726 | |
1,749 | |||
FOOD PRODUCTS—6.5% | |||
61,163 | AAK AB (Sweden) | 994 | |
9,407 | Bakkafrost P/F (Faeroe Islands) | 483 | |
159,455 | Costa Group Holdings Ltd. (Australia) | 638 | |
29,291 | Cranswick plc (United Kingdom) | 1,109 | |
20,400 | Morinaga & Co. Ltd./Japan (Japan) | 852 | |
36,300 | Nichirei Corp. (Japan) | 841 | |
96,590 | Tate & Lyle plc (United Kingdom) | 968 | |
5,885 | |||
HEALTH CARE EQUIPMENT & SUPPLIES—1.6% | |||
4,440 | Diasorin SpA (Italy) | 434 | |
51,600 | Nakanishi Inc. (Japan) | 994 | |
1,428 | |||
HEALTH CARE PROVIDERS & SERVICES—3.5% | |||
48,734 | Amplifon SpA (Italy) | 938 | |
33,811 | Fagron NV (Belgium) | 672 | |
7,864 | Orpea SA (France) | 959 | |
70,764 | UDG Healthcare plc (Ireland) | 607 | |
3,176 | |||
HEALTH CARE TECHNOLOGY—1.2% | |||
16,087 | CompuGroup Medical SE (Germany) | 1,067 | |
HOTELS, RESTAURANTS & LEISURE—2.5% | |||
147,866 | Dalata Hotel Group plc (Ireland) | 977 | |
50,930 | Scandic Hotels Group AB (Sweden)2 | 474 | |
90,312 | SSP Group plc (United Kingdom) | 821 | |
2,272 |
40
Harbor International Small Cap Fund
Portfolio of Investments—Continued
Value, Cost, and Principal Amounts in Thousands
COMMON STOCKS—Continued | |||
Shares | Value | ||
HOUSEHOLD PRODUCTS—1.1% | |||
22,800 | Pigeon Corp. (Japan) | $976 | |
INSURANCE—3.2% | |||
21,506 | ASR Nederland NV (Netherlands) | 957 | |
131,949 | Beazley plc (United Kingdom) | 994 | |
18,406 | Topdanmark AS (Denmark) | 993 | |
2,944 | |||
IT SERVICES—4.1% | |||
838,000 | Chinasoft International Ltd. (Cayman Islands)* | 479 | |
71,968 | Indra Sistemas SA (Spain)* | 849 | |
155,261 | Link Administration Holdings Ltd. (Australia) | 833 | |
26,000 | NET One Systems Co. Ltd. (Japan) | 675 | |
19,400 | SCSK Corp. (Japan)* | 922 | |
3,758 | |||
LEISURE PRODUCTS—1.0% | |||
74,881 | Technogym SpA (Italy)2 | 919 | |
LIFE SCIENCES TOOLS & SERVICES—2.2% | |||
13,432 | Gerresheimer AG (Germany) | 1,012 | |
4,389 | Tecan Group AG (Switzerland) | 991 | |
2,003 | |||
MACHINERY—5.2% | |||
2,148 | Bucher Industries AG (Switzerland) | 729 | |
436,000 | CIMC Enric Holdings Ltd. (China) | 425 | |
60,300 | Fuji Corp./Aichi (Japan) | 911 | |
45,800 | OSG Corp. (Japan) | 922 | |
30,200 | THK Co. Ltd. (Japan) | 799 | |
43,353 | Weir Group plc (United Kingdom) | 942 | |
4,728 | |||
MEDIA—1.0% | |||
14,036 | Stroeer SE & Co. KGAA (Germany) | 951 | |
MULTILINE RETAIL—2.1% | |||
211,988 | B&M European Value Retail SA (United Kingdom) | 1,093 | |
38,700 | Marui Group Co. Ltd. (Japan) | 787 | |
1,880 | |||
MULTI-UTILITIES—1.1% | |||
280,404 | Hera SpA (Italy) | 998 | |
OIL, GAS & CONSUMABLE FUELS—2.0% | |||
10,222 | Gaztransport Et Technigaz SA (France) | 925 | |
20,158 | Koninklijke Vopak NV (Netherlands) | 900 | |
1,825 | |||
PROFESSIONAL SERVICES—4.3% | |||
35,633 | AF Poyry AB (Sweden) | 665 |
COMMON STOCKS—Continued | |||
Shares | Value | ||
PROFESSIONAL SERVICES—Continued | |||
70,534 | Applus Services SA (Spain) | $886 | |
396,316 | Hays plc (United Kingdom) | 786 | |
6,800 | Insource Co. Ltd. (Japan) | 143 | |
34,300 | Nihon M&A Center Inc. (Japan) | 979 | |
7,800 | TechnoPro Holdings Inc. (Japan) | 469 | |
3,928 | |||
REAL ESTATE MANAGEMENT & DEVELOPMENT—3.9% | |||
590,000 | China Jinmao Holdings Group Ltd. (Hong Kong) | 382 | |
91,600 | Hulic Co. Ltd. (Japan) | 790 | |
22,800 | Katitas Co. Ltd. (Japan) | 760 | |
10,653 | Nexity SA (France) | 498 | |
40,300 | Relo Group Inc. (Japan) | 1,101 | |
3,531 | |||
SPECIALTY RETAIL—3.9% | |||
15,000 | ABC-Mart Inc. (Japan) | 932 | |
52,600 | BIC Camera Inc. (Japan) | 564 | |
42,197 | Grandvision NV (Netherlands)2 | 950 | |
139,772 | JD Sports Fashion plc (United Kingdom) | 1,149 | |
3,595 | |||
TEXTILES, APPAREL & LUXURY GOODS—1.0% | |||
495,000 | Li Ning Co. Ltd. (China)* | 899 | |
THRIFTS & MORTGAGE FINANCE—1.1% | |||
168,237 | Paragon Banking Group plc (United Kingdom) | 1,008 | |
TRADING COMPANIES & DISTRIBUTORS—1.1% | |||
12,374 | IMCD Group NV (Netherlands) | 1,000 | |
TOTAL COMMON STOCKS | |||
(Cost $84,128) | 87,281 | ||
SHORT-TERM INVESTMENTS—0.7% | |||
(Cost $663) | |||
Principal Amount | |||
$ | 663 | State Street Navigator Securities Lending Government Money Market Portfolio (1 day yield of 2.510%) | 663 |
TOTAL INVESTMENTS—96.5% | |||
(Cost $84,791) | 87,944 | ||
CASH AND OTHER ASSETS, LESS LIABILITIES—3.5% | 3,167 | ||
TOTAL NET ASSETS—100.0% | $91,111 |
FORWARD CURRENCY CONTRACTS OPEN
Counterparty | Amount to be Delivered (000s) | Amount to be Received (000s) | Settlement Date | Unrealized Appreciation/ (Depreciation) (000s) | ||||
State Street Bank London | $ 171 | JPY 198,464 | 05/07/2019 | $ 6 | ||||
State Street Bank London | JPY 41,878 | $ 375 | 05/07/2019 | (1) | ||||
Total Forward Currency Contracts | $5 |
41
Harbor International Small Cap Fund
Portfolio of Investments—Continued
FAIR VALUE MEASUREMENTS
The following table summarizes the Fund’s investments as of April 30, 2019 based on the inputs used to value them.
Asset Category | Quoted Prices Level 1 (000s) | Other Significant Observable Inputs Level 2 (000s) | Significant Unobservable Inputs Level 3 (000s) | Total (000s) | ||||
Investments in Securities | ||||||||
Common Stocks | ||||||||
Europe | $— | $53,809 | $— | $53,809 | ||||
Latin America | — | 1,701 | — | 1,701 | ||||
Pacific Basin | — | 31,771 | — | 31,771 | ||||
Short-Term Investments | ||||||||
Investment Company-Securities Lending Investment Fund | 663 | — | — | 663 | ||||
Total Investments in Securities | $663 | $87,281 | $— | $87,944 | ||||
Financial Derivative Instruments - Assets | ||||||||
Forward Currency Contracts | $— | $6 | $— | $6 | ||||
Total Financial Derivative Instruments - Assets | $— | $6 | $— | $6 | ||||
Liability Category | ||||||||
Financial Derivative Instruments - Liabilities | ||||||||
Forward Currency Contracts | $— | $(1) | $— | $(1) | ||||
Total Financial Derivative Instruments-Liabilities | $— | $(1) | $— | $(1) | ||||
Total Investments | $663 | $87,286 | $— | $87,949 |
There were no Level 3 investments at April 30, 2019 or October 31, 2018.
For more information on valuation inputs and their aggregation into the levels used in the table above, please refer to the Fair Value Measurements and Disclosures in Note 2 of the accompanying Notes to Financial Statements.
* | Non-income producing security |
1 | All or a portion of this security was out on loan as of April 30, 2019. |
2 | Securities purchased in a transaction exempt from registration under Rule 144A of the Securities Act of 1933. These securities may be resold in transactions exempt from registration, normally to qualified institutional buyers. The Fund has no right to demand registration of these securities. At April 30, 2019, the aggregate value of these securities was $6,533 or 7% of net assets. |
JPY | Japanese Yen |
The accompanying notes are an integral part of the Financial Statements.
42
Harbor Global Leaders Fund
Manager’s Commentary (Unaudited)
Subadviser
Sands Capital Management, LLC
1000 Wilson Boulevard
Suite 3000
Suite 3000
Arlington, VA 22209
Portfolio Managers
Sunil H. Thakor, CFA
Since 2017
Since 2017
Michael F. Raab, CFA
Since 2019
Since 2019
Sands Capital has subadvised the Fund since 2017.
Investment Objective
The Fund seeks long-term growth of capital.
Sunil H. Thakor, CFA
Michael F. Raab, CFA
Management’s Discussion of
Fund Performance
Fund Performance
Market Review
Global equities, as measured by the MSCI All Country World (ND) Index, rose during the six-month period ending April 30, 2019. The strength was broad-based, with merely four constituent countries posting a negative return. Of the 44 countries that advanced during the period, 18 rose by double digits.
The path wasn’t smooth. Calendar year 2018 finished as the worst year for the MSCI All Country World Index since 2008, and December saw a decline of more than 7%. However, the turning of the calendar turned the tide, resulting in a 16% year-to-date gain. Last year’s concerns about a global growth slowdown persist, but stocks broadly rerated on resilient U.S. economic data, better-than-feared corporate earnings, and easing U.S.-China trade tensions. Worldwide monetary easing—in a reversal from 2018 policy—provided an additional boost to global markets.
The U.S. contributed most to global equity returns, as the country’s equity markets hit all-time highs. China was another bright spot, as trade deal optimism, an announced government stimulus, oversold conditions, and the news that MSCI plans to include more mainland Chinese shares in its benchmark indexes all contributed to equity market gains. All sectors made a positive contribution during the period, led by the faster-growing Information Technology and Consumer Discretionary sectors.
Performance
Over the six-month period ending April 30, 2019, Harbor Global Leaders Fund returned 16.85% (Retirement Class), 16.79% (Institutional Class), 16.68% (Administrative Class), and 16.60% (Investor Class) versus the 9.37% return for the MSCI All Country World (ND) Index. Security selection was the main driver of relative results for the period and the Fund also benefitted from a supportive market environment.
U.S.-Canada businesses contributed most to relative investment results, especially in the Industrials and Information Technology sectors. The Mid-East & Africa was the sole regional detractor, as the Fund had a zero percent weighting to the region, which posted a double-digit rise.
The largest absolute contributors to investment results were TransDigm, HDFC Bank, Alimentation Couche-Tard, Alibaba, and Visa.
HDFC Bank continues to track our long-term investment case. In the most recent quarter, the business reported 24% year-over-year loan growth, which translated to a 23% increase in net income. The key operating metrics—margins, cost-to-income, and cost of credit—were all in line with our estimates. While retail growth of 19% was slower than expected, we believe this reflected a cyclical slowdown in some products, such as auto loans. The Fund’s outlook remains unchanged, and importantly, the absolute level of growth was still strong. HDFC Bank made the strategic decision over a decade ago to be a retail-oriented bank, focused on financing the needs of India’s growing middle class. This decision has enabled it to largely avoid the capital exependiture- and infrastructure-driven bad-asset cycles that have plagued the Indian banking sector over the past decade. Over our investment horizon, we expect HDFC Bank to continue to take market share from public-sector banks, building on its existing market leadership (which includes 25% share of non-mortgage retail loans, and leading positions in credit card issuance and wealth management product distribution). We believe that the company’s key drivers of growth include 1) monetization of its large existing client base, 2) partnerships with leading platforms to expand geographic reach and channel diversity, and 3) continued product digitalization and customer experience improvements.
43
Harbor Global Leaders Fund
Manager’s Commentary—Continued
TOTAL RETURNS
For the periods ended 04/30/2019
Unannualized | 1 Year | Annualized | |||||||||
6 Months | 5 Years | 10 Years | |||||||||
Harbor Global Leaders Fund | |||||||||||
Retirement Class1 | 16.85% | 18.76% | 11.23% | 15.71% | |||||||
Institutional Class | 16.79 | 18.65 | 11.18 | 15.68 | |||||||
Administrative Class | 16.68 | 18.38 | 10.91 | 15.39 | |||||||
Investor Class | 16.60 | 18.27 | 10.78 | 15.25 | |||||||
Comparative Index | |||||||||||
MSCI All Country World (ND) | 9.37% | 5.06% | 6.96% | 11.11% |
As stated in the Fund’s prospectus dated March 1, 2019, the expense ratios were 0.83% (Net) and 0.97% (Gross) (Retirement Class); 0.91% (Net) and 1.05% (Institutional Class); 1.16% (Net) and 1.30% (Gross) (Administrative Class); and 1.28% (Net) and 1.42% (Gross) (Investor Class). The net expense ratios reflect an expense limitation agreement (excluding interest expense, if any) effective through 02/29/2020. The expense ratios in the prospectus may differ from the actual expense ratios for the period disclosed within this report. The expense ratios shown in the prospectus are based on the prior fiscal year, adjusted to reflect changes, if any, in contractual arrangements that occurred prior to the date of the prospectus (or supplement thereto, if applicable).
Performance data shown represents past performance and is no guarantee of future results. Past performance is net of management fees and expenses and reflects reinvested dividends and distributions but does not reflect the deduction of taxes that a shareholder would pay on Fund distributions or upon the redemption of Fund shares. Past performance reflects the beneficial effect of any expense waivers or reimbursements, without which returns would have been lower. Investment returns and principal value will fluctuate so that Fund shares, when redeemed, may be worth more or less than their original cost. Returns for periods less than one year are not annualized. Current performance may be higher or lower and is available through the most recent month end atharborfunds.com or by calling 800-422-1050.
The largest absolute detractors from investment results were EssilorLuxottica, Fresenius Medical Care, UnitedHealth, Booking, and Ross Stores.
Shares of Fresenius Medical Care sold off sharply in December 2018. We believe the company’s new investor relations team struggled to communicate a confluence of business changes, including International Financial Reporting Standards revenue-recognition practices, foreign-exchange headwinds, and business restructuring. The unexpectedly weak pre-announced third-quarter 2018 results, along with lowered fiscal-year 2018 guidance, exacerbated the business’s challenges. Fresenius misexecuted on its commercially insured dialysis business, which is a major contributor to profitability, given the higher margins than Medicare patients. While Fresenius continues to be a leader in the oligopolistic kidney dialysis market, the business’s growth profile is maturing, and we believe it will take several quarters to work through its issues. The Fund sold its position in December 2018.
The Fund initiated positions in Boston Scientific, Equinix, Roper Technologies, and Texas Instruments during the period. It exited Booking, Fomento Economico Mexicano, Fresenius Medical Care, and Sands China. There were no material changes to the Fund’s regional or sector positioning.
Outlook & Strategy
Our investment philosophy is rooted in the belief that over time, common stock price appreciation follows the earnings power and growth of underlying businesses. We seek to invest in businesses that are dominators, disruptors, and scale leaders. These types of businesses either drive or benefit from change. In our view, sustainable growth derives from the combination of leadership and competitive advantage, and these types of businesses are best positioned for future earnings growth.
1 | Retirement Class shares commenced operations on March 1, 2016. The performance attributed to the Retirement Class shares prior to that date is that of the Institutional Class shares. Performance prior to March 1, 2016 has not been adjusted to reflect the lower expenses of Retirement Class shares. During this period, Retirement Class shares would have had returns similar to, but potentially higher than, Institutional Class shares due to the fact that Retirement Class shares represent interests in the same portfolio as Institutional Class shares but are subject to lower expenses. |
This report contains the current opinions of Sands Capital Management, LLC as of the date of this report and should not be considered as investment advice or a recommendation of any particular security, strategy or investment product. Such opinions are subject to change without notice and securities described herein may no longer be included in, or may at any time be removed from, the Fund’s portfolio. This report is distributed for informational purposes only. Information contained herein has been obtained from sources believed reliable, but not guaranteed.
Investing in international and emerging markets poses special risks, including potentially greater price volatility due to social, political and economic factors, as well as currency exchange rate fluctuations. These risks are more severe for securities of issuers in emerging market regions. For information on the different share classes and the risks associated with an investment in the Fund, please refer to the current prospectus.
44
Harbor Global Leaders Fund
Fund Summary—April 30, 2019 (Unaudited)
TOP Holdings(% of net assets)
❶ | Visa Inc. | 5.0% |
❷ | Safran SA | 4.5% |
❸ | TransDigm Group Inc. | 4.4% |
❹ | Alimentation Couche-Tard Inc. | 4.1% |
❺ | Adobe Inc. | 4.0% |
❻ | Recruit Holdings Co. Ltd. | 3.9% |
❼ | HDFC Bank Ltd. ADR | 3.7% |
❽ | Keyence Corp. | 3.6% |
❾ | salesforce.com Inc. | 3.6% |
❿ | Zoetis Inc. | 3.6% |
Sector Allocation(% of investments)
(Excludes short-term investments)
REGION BREAKDOWN(% of investments)
(Excludes short-term investments)
45
Harbor Global Leaders Fund
Portfolio of Investments—April 30, 2019 (Unaudited)
Value, Cost, and Principal Amounts in Thousands
COMMON STOCKS—99.1% | |||
Shares | Value | ||
AEROSPACE & DEFENSE—8.9% | |||
23,915 | Safran SA (France) | $3,486 | |
7,095 | TransDigm Group Inc. (United States)* | 3,423 | |
6,909 | |||
AUTO COMPONENTS—2.6% | |||
23,875 | Aptiv plc (United States) | 2,046 | |
BANKS—3.8% | |||
25,350 | HDFC Bank Ltd. ADR (India)1 | 2,906 | |
BIOTECHNOLOGY—1.3% | |||
7,425 | CSL Ltd. (Australia) | 1,042 | |
CAPITAL MARKETS—4.0% | |||
24,350 | Intercontinental Exchange Inc. (United States) | 1,981 | |
5,500 | Moody's Corp. (United States) | 1,081 | |
3,062 | |||
ELECTRONIC EQUIPMENT, INSTRUMENTS & COMPONENTS—3.6% | |||
4,430 | Keyence Corp. (Japan) | 2,768 | |
ENTERTAINMENT—1.5% | |||
17,350 | Live Nation Entertainment Inc. (United States)* | 1,134 | |
EQUITY REAL ESTATE INVESTMENT TRUSTS (REITs)—2.0% | |||
3,440 | Equinix Inc. (United States) | 1,564 | |
FOOD & STAPLES RETAILING—4.1% | |||
54,075 | Alimentation Couche-Tard Inc. (Canada) | 3,188 | |
HEALTH CARE EQUIPMENT & SUPPLIES—1.8% | |||
37,500 | Boston Scientific Corp. (United States)* | 1,392 | |
HEALTH CARE PROVIDERS & SERVICES—2.1% | |||
6,975 | UnitedHealth Group Inc. (United States) | 1,626 | |
HOTELS, RESTAURANTS & LEISURE—2.3% | |||
23,145 | Starbucks Corp. (United States) | 1,798 | |
INDUSTRIAL CONGLOMERATES—2.1% | |||
4,450 | Roper Technologies Inc. (United States) | 1,601 | |
INSURANCE—2.2% | |||
169,600 | AIA Group Ltd. (Hong Kong) | 1,737 | |
INTERACTIVE MEDIA & SERVICES—4.1% | |||
1,780 | Alphabet Inc. Class A (United States)* | 2,134 | |
151,700 | Rightmove plc (United Kingdom) | 1,073 | |
3,207 | |||
INTERNET & DIRECT MARKETING RETAIL—3.3% | |||
13,650 | Alibaba Group Holding Ltd. ADR (China)*,1 | 2,533 | |
IT SERVICES—5.0% | |||
23,639 | Visa Inc. (United States) | 3,887 | |
MULTILINE RETAIL—4.1% | |||
16,650 | Dollar General Corp. (United States) | 2,099 | |
16,550 | Pan Pacific International Holdings Corp. (Japan) | 1,067 | |
3,166 |
COMMON STOCKS—Continued | |||
Shares | Value | ||
PHARMACEUTICALS—3.6% | |||
27,250 | Zoetis Inc. (United States) | $2,775 | |
PROFESSIONAL SERVICES—6.5% | |||
100,850 | Recruit Holdings Co. Ltd. (Japan) | 3,037 | |
14,435 | Verisk Analytics Inc. (United States) | 2,037 | |
5,074 | |||
ROAD & RAIL—1.6% | |||
6,915 | Union Pacific Corp. (United States) | 1,224 | |
SEMICONDUCTORS & SEMICONDUCTOR EQUIPMENT—5.4% | |||
51,000 | Taiwan Semiconductor Manufacturing Co. Ltd. ADR (Taiwan)1 | 2,235 | |
16,550 | Texas Instruments Inc. (United States) | 1,950 | |
4,185 | |||
SOFTWARE—15.1% | |||
10,550 | Adobe Inc. (United States)* | 3,051 | |
8,795 | Dassault Systemes SE (France) | 1,393 | |
9,575 | Intuit Inc. (United States) | 2,404 | |
16,900 | salesforce.com Inc. (United States)* | 2,794 | |
12,225 | Temenos Group AG (Switzerland)* | 2,034 | |
11,676 | |||
SPECIALTY RETAIL—3.9% | |||
51,125 | Industria de Diseno Textil SA (Spain)2 | 1,548 | |
14,900 | Ross Stores Inc. (United States) | 1,455 | |
3,003 | |||
TEXTILES, APPAREL & LUXURY GOODS—4.2% | |||
10,825 | EssilorLuxottica SA (France) | 1,319 | |
21,825 | NIKE Inc. (United States) | 1,917 | |
3,236 | |||
TOTAL COMMON STOCKS | |||
(Cost $58,403) | 76,739 | ||
SHORT-TERM INVESTMENTS—1.8% | |||
(Cost $1,428) | |||
Principal Amount | |||
$ | 1,428 | State Street Navigator Securities Lending Government Money Market Portfolio (1 day yield of 2.510%) | 1,428 |
TOTAL INVESTMENTS—100.9% | |||
(Cost $59,831) | 78,167 | ||
CASH AND OTHER ASSETS, LESS LIABILITIES—(0.9)% | (663) | ||
TOTAL NET ASSETS—100.0% | $77,504 |
46
Harbor Global Leaders Fund
Portfolio of Investments—Continued
FORWARD CURRENCY CONTRACTS OPEN
Counterparty | Amount to be Delivered (000s) | Amount to be Received (000s) | Settlement Date | Unrealized Appreciation/ (Depreciation) (000s) | ||||
State Street Bank and Trust Co. | $ 6 | JPY 2,703 | 05/09/2019 | $ — |
FAIR VALUE MEASUREMENTS
The following table summarizes the Fund’s investments as of April 30, 2019 based on the inputs used to value them.
Asset Category | Quoted Prices Level 1 (000s) | Other Significant Observable Inputs Level 2 (000s) | Significant Unobservable Inputs Level 3 (000s) | Total (000s) | ||||
Investments in Securities | ||||||||
Common Stocks | ||||||||
Europe | $— | $10,853 | $— | $10,853 | ||||
Middle East/Central Asia | 2,906 | — | — | 2,906 | ||||
North America | 48,561 | — | — | 48,561 | ||||
Pacific Basin | 4,768 | 9,651 | — | 14,419 | ||||
Short-Term Investments | ||||||||
Investment Company-Securities Lending Investment Fund | 1,428 | — | — | 1,428 | ||||
Total Investments in Securities | $57,663 | $20,504 | $— | $78,167 | ||||
Financial Derivative Instruments - Assets | ||||||||
Forward Currency Contracts | $— | $— | $— | $— | ||||
Total Financial Derivative Instruments - Assets | $— | $— | $— | $— | ||||
Total Investments | $57,663 | $20,504 | $— | $78,167 |
There were no Level 3 investments at April 30, 2019 or October 31,2018.
For more information on valuation inputs and their aggregation into the levels used in the table above, please refer to the Fair Value Measurements and Disclosures in Note 2 of the accompanying Notes to Financial Statements.
* | Non-income producing security |
1 | ADR after the name of a security stands for American Depositary Receipts representing ownership of foreign securities. ADRs are issued by U.S. banking institutions. |
2 | All or a portion of this security was out on loan as of April 30, 2019. |
JPY | Japanese Yen |
The accompanying notes are an integral part of the Financial Statements.
47
Harbor Emerging Markets Equity Fund
Manager’s Commentary (Unaudited)
Subadviser
Oaktree Capital Management, L.P.
333 South Grand Avenue
28th Floor
28th Floor
Los Angeles, CA 90071
Portfolio Managers
Frank J. Carroll
Since 2013
Since 2013
Timothy D. Jensen
Since 2013
Since 2013
Oaktree has subadvised the Fund since 2013.
Investment Objective
The Fund seeks long-term growth of capital.
Frank J. Carroll
Timothy D. Jensen
Management’s Discussion of
Fund Performance
Fund Performance
Market Review
Emerging markets equities performed well during the six-months ended April 30, 2019. The asset class outperformed developed markets during the global sell-off that occurred in the fourth quarter of 2018. Following this sell-off, financial markets enjoyed a strong start to 2019 largely due to policy shifts in the United States and China. The U.S. Federal Reserve (Fed) backed away from its monetary tightening stance in response to economic slowness and weak equity and credit market performance in the fourth quarter of 2018. The Fed articulated a timetable to end its quantitative tightening program and eliminated 2019 rate hikes from its dot plot. Although a U.S.-China trade agreement has not been struck, the market has been reassured via multiple tweets and White House announcements that negotiations are progressing and an agreement is ever closer. China has implemented an array of stimulus measures, including faster credit growth, cuts in personal and value-added taxes, increased infrastructure spending and other targeted policies. By the end of March, the purchasing managers index strengthened, property sales bounced, and consensus growth expectations firmed.
Performance
Harbor Emerging Markets Equity Fund returned 15.05% (Retirement Class), 14.97% (Institutional Class), 16.25% (Administrative Class), and 14.72% (Investor Class) for the six months ended April 30, 2019, compared to the 13.76% return of the MSCI Emerging Markets (ND) Index.
Although the MSCI Emerging Markets (ND) Index return was strong, the rally was not uniform. China was by far the strongest large market, and due to its heavy index weight it supported the Index. However, most countries trailed the benchmark return. Consistent with our bottom-up process, the bulk of the Fund’s outperformance was driven by individual stock selection. Stock selection in Indonesia, China and Russia drove relative performance, along with our overweight allocation to China. Stock selection in Brazil detracted from relative performance. By sector, stock selection among Consumer Staples, Communication Services, Financials, Materials and Health Care contributed to relative performance, while stock selection among Information Technology detracted. Our overweight exposure to Energy and underweight exposures to Communication Services and Consumer Discretionary had a negative effect. Finally, growth stocks outperformed value during the period, creating a headwind for the Fund given our value bias.
Outlook & Strategy
Entering 2019, our bull case for emerging markets was summarized:
• | Emerging markets equities are cheap relative to developed markets and their own historical trading multiples, as well as in absolute terms. The index ended 2018 at multiples of less than 1.5 times book and less than 12 times trailing earnings. The Fund trades at discounts to the market on both of these measures. |
• | The Fed turned more dovish late in 2018. As we near the end of the tightening cycle, the headwinds facing emerging markets will ease. |
• | The U.S. Dollar has been appreciating against the Trade Weighted Broad Dollar Index since 2011 (despite a down year in 2017). Most emerging markets currencies are in our view undervalued or deeply undervalued on purchasing power parity measures. Weakness in the U.S. Dollar would be positive for international stocks. |
48
Harbor Emerging Markets Equity Fund
Manager’s Commentary—Continued
TOTAL RETURNS
For the periods ended 04/30/2019
Unannualized | 1 Year | Annualized | |||||||||
6 Months | 5 Years | Life of Fund | |||||||||
Harbor Emerging Markets Equity Fund | |||||||||||
Retirement Class1,2 | 15.05% | -2.57% | 3.30% | 2.47% | |||||||
Institutional Class1 | 14.97 | -2.72 | 3.26 | 2.43 | |||||||
Administrative Class1 | 16.25 | -1.67 | 3.28 | 2.41 | |||||||
Investor Class1 | 14.72 | -3.08 | 2.88 | 2.05 | |||||||
Comparative Index | |||||||||||
MSCI Emerging Markets (ND)1 | 13.76% | -5.04% | 4.04% | 3.10% |
As stated in the Fund’s prospectus dated March 1, 2019, the expense ratios were 1.08% (Net) and 1.27% (Gross) (Retirement Class); 1.16% (Net) and 1.35% (Gross) (Institutional Class); 1.41% (Net) and 1.60% (Gross) (Administrative Class); and 1.53% (Net) and 1.72% (Gross) (Investor Class). The net expense ratios reflect an expense limitation agreement (excluding interest expense, if any) effective through 02/29/2020. The expense ratios in the prospectus may differ from the actual expense ratios for the period disclosed within this report. The expense ratios shown in the prospectus are based on the prior fiscal year, adjusted to reflect changes, if any, in contractual arrangements that occurred prior to the date of the prospectus (or supplement thereto, if applicable).
Performance data shown represents past performance and is no guarantee of future results. Past performance is net of management fees and expenses and reflects reinvested dividends and distributions but does not reflect the deduction of taxes that a shareholder would pay on Fund distributions or upon the redemption of Fund shares. Past performance reflects the beneficial effect of any expense waivers or reimbursements, without which returns would have been lower. Investment returns and principal value will fluctuate so that Fund shares, when redeemed, may be worth more or less than their original cost. Returns for periods less than one year are not annualized. Current performance may be higher or lower and is available through the most recent month end atharborfunds.com or by calling 800-422-1050.
• | The Trump administration softened China trade rhetoric late in 2018. A trade deal that stops short of ending globalization would reduce uncertainty and allow companies to plan and to invest again. |
• | The Chinese government ended 2018 in easing mode and will ease more in 2019. |
During the first few months of 2019, the U.S. Dollar was stable in a tight range, but otherwise the emerging markets equity asset class, particularly Chinese equities, benefited from favorable developments in these areas. However, as highlighted above, the asset class also experienced significant performance dispersion by country, sector, and within countries and sectors, and the rally was China-centric.
The markets rose ahead of clear improvements in fundamentals, as markets often do. Recent market research shows the ratio of estimates of upgrades to earnings downgrades troughed in January, at about the same weak level reached at the end of 2015; the only materially weaker period for this earnings revision ratio was during the global financial crisis. Barring a recession, we believe that the worst periods of earnings estimate downgrades may have already occurred. Our job will be to identify stocks priced for excessive pessimism that have the highest upside potential. As mentioned above, there is also a heavy political calendar this year. We believe significant dispersion, beaten-down expectations and macro events create a fertile opportunity for active managers in a diverse asset class like emerging markets.
The Fund is overweight China, and retains smaller overweight exposures to Russia, Indonesia and Brazil. We believe a resolution of the trade war would be taken very well by Chinese and Asian markets. We remain underweight Taiwan, and have no exposure to Turkey, Malaysia and Argentina. By sector, the Fund is overweight Financials and Energy and underweight Consumer Discretionary. As always, our main focus is to follow our bottom-up process to find what we believe to be good quality names, no matter the country or sector, which we believe will perform well over the long-term.
1 | The “Life of Fund” return as shown reflects the period 11/01/2013 through 04/30/2019. |
2 | Retirement Class shares commenced operations on March 1, 2016. The performance attributed to the Retirement Class shares prior to that date is that of the Institutional Class shares. Performance prior to March 1, 2016 has not been adjusted to reflect the lower expenses of Retirement Class shares. During this period, Retirement Class shares would have had returns similar to, but potentially higher than, Institutional Class shares due to the fact that Retirement Class shares represent interests in the same portfolio as Institutional Class shares but are subject to lower expenses. |
This report contains the current opinions of Oaktree Capital Management, L.P. as of the date of this report and should not be considered as investment advice or a recommendation of any particular security, strategy or investment product. Such opinions are subject to change without notice and securities described herein may no longer be included in, or may at any time be removed from, the Fund’s portfolio. This report is distributed for informational purposes only. Information contained herein has been obtained from sources believed reliable, but not guaranteed.
Investing in international and emerging markets poses special risks, including potentially greater price volatility due to social, political and economic factors, as well as currency exchange rate fluctuations. These risks are more severe for securities of issuers in emerging market regions. For information on the different share classes and the risks associated with an investment in the Fund, please refer to the current prospectus.
49
Harbor Emerging Markets Equity Fund
Fund Summary—April 30, 2019 (Unaudited)
TOP Holdings(% of net assets)
❶ | Tencent Holdings Ltd. | 6.9% |
❷ | Samsung Electronics Co. Ltd. | 4.8% |
❸ | Taiwan Semiconductor Manufacturing Co. Ltd. ADR | 3.9% |
❹ | China Construction Bank Corp. | 3.8% |
❺ | ICICI Bank Ltd. ADR | 3.3% |
❻ | Ping An Insurance Group Co. of China Ltd. | 3.1% |
❼ | Lukoil PJSC ADR | 2.8% |
❽ | Sberbank of Russia PJSC ADR | 2.8% |
❾ | Itau Unibanco Holding SA ADR | 2.4% |
❿ | Petroleo Brasileiro SA ADR | 2.3% |
Sector Allocation(% of investments)
REGION BREAKDOWN(% of investments)
50
Harbor Emerging Markets Equity Fund
Portfolio of Investments—April 30, 2019 (Unaudited)
Value, Cost, and Principal Amounts in Thousands
COMMON STOCKS—96.7% | |||
Shares | Value | ||
AIRLINES—1.4% | |||
43,328 | Azul SA ADR (Brazil)*,1 | $1,125 | |
AUTOMOBILES—0.7% | |||
270,000 | Geely Automobile Holdings Ltd. (China) | 544 | |
BANKS—24.5% | |||
574,078 | Alpha Bank AE (Greece)* | 894 | |
5,907,300 | Bank Rakyat Indonesia Persero Tbk PT (Indonesia)* | 1,816 | |
3,586,000 | China Construction Bank Corp. (China) | 3,161 | |
187,500 | China Merchants Bank Co. Ltd. (China) | 928 | |
186,437 | Grupo Financiero Banorte SAB de CV (Mexico)* | 1,181 | |
47,029 | Hana Financial Group Inc. (South Korea) | 1,483 | |
240,525 | ICICI Bank Ltd. ADR (India)1 | 2,754 | |
2,396,000 | Industrial & Commercial Bank of China Ltd. (China) | 1,802 | |
224,142 | Itau Unibanco Holding SA ADR (Brazil)1 | 1,939 | |
21,636 | OTP Bank plc (Hungary) | 962 | |
396,000 | Ping An Bank Co. Ltd. (China) | 816 | |
157,798 | Sberbank of Russia PJSC ADR (Russia)1 | 2,262 | |
189,700 | United Bank Ltd. (Pakistan) | 201 | |
20,199 | |||
BEVERAGES—1.2% | |||
62,700 | Wuliangye Yibin Co. Ltd. (China) | 952 | |
BIOTECHNOLOGY—0.3% | |||
187,774 | Ascletis Pharma Inc. (China)*,2 | 161 | |
700 | BeiGene Ltd. ADR (China)*,1 | 87 | |
248 | |||
CHEMICALS—0.0% | |||
2,684,000 | Tianhe Chemicals Group Ltd. (China)*,2 | —x | |
CONSTRUCTION & ENGINEERING—0.8% | |||
874,000 | China Railway Group Ltd. (China) | 689 | |
CONSTRUCTION MATERIALS—4.8% | |||
161,500 | Anhui Conch Cement Co. Ltd. (China) | 986 | |
169,205 | Cemex SAB de CV ADR (Mexico)*,1 | 778 | |
1,141,100 | Semen Indonesia Persero TBK PT (Indonesia) | 1,083 | |
16,832 | UltraTech Cement Ltd. (India) | 1,118 | |
3,965 | |||
ENERGY EQUIPMENT & SERVICES—1.5% | |||
1,136,000 | China Oilfield Services Ltd. (China) | 1,217 | |
ENTERTAINMENT—0.4% | |||
14,800 | HUYA Inc. ADR (China)*,1 | 354 | |
FOOD & STAPLES RETAILING—1.1% | |||
77,066 | Shoprite Holdings Ltd. (South Africa) | 930 | |
FOOD PRODUCTS—4.4% | |||
148,619 | BRF SA ADR (Brazil)*,1 | 1,164 | |
1,554,700 | Charoen Pokphand Foods PCL (Thailand) | 1,327 | |
1,455,000 | Want Want China Holdings Ltd. (China) | 1,155 | |
3,646 | |||
HOTELS, RESTAURANTS & LEISURE—3.9% | |||
105,475 | China International Travel Service Corp. Ltd. (China) | 1,215 | |
143,000 | Galaxy Entertainment Group Ltd. (China)* | 1,071 | |
20,438 | Yum China Holdings Inc. (China) | 972 | |
3,258 | |||
HOUSEHOLD DURABLES—0.5% | |||
125,200 | Suofeiya Home Collection Co. Ltd. (China) | 414 |
COMMON STOCKS—Continued | |||
Shares | Value | ||
INDEPENDENT POWER & RENEWABLE ELECTRICITY PRODUCERS—0.7% | |||
888,100 | China Longyuan Power Group Corp. Ltd. (China) | $612 | |
INSURANCE—3.9% | |||
124,800 | China Pacific Insurance Group Co. Ltd. (China) | 512 | |
25,279 | ICICI Prudential Life Insurance Co. Ltd. (India)2 | 134 | |
213,000 | Ping An Insurance Group Co. of China Ltd. (China) | 2,578 | |
3,224 | |||
INTERACTIVE MEDIA & SERVICES—8.7% | |||
115,000 | Tencent Holdings Ltd. (China) | 5,668 | |
14,000 | Weibo Corp. ADR (China)*,1 | 959 | |
15,403 | Yandex NV (Russia)* | 577 | |
7,204 | |||
IT SERVICES—1.4% | |||
94,393 | Infosys Ltd. ADR (India)1 | 1,016 | |
19,059 | Network International Holdings plc (United Arab Emirates)*,2 | 129 | |
1,145 | |||
LIFE SCIENCES TOOLS & SERVICES—1.1% | |||
30,900 | Hangzhou Tigermed Consulting Co. Ltd. (China)* | 305 | |
48,247 | WuXi AppTec Co. Ltd. (China)*,2 | 593 | |
898 | |||
MACHINERY—1.0% | |||
114,213 | Samsung Heavy Industries Co. Ltd. (South Korea)* | 806 | |
METALS & MINING—3.6% | |||
83,087 | AngloGold Ashanti Ltd. ADR (South Africa)1 | 980 | |
252,314 | Ganfeng Lithium Co. Ltd. (China)*,2 | 434 | |
1,504,800 | MMG Ltd. (China)* | 652 | |
386,608 | Petra Diamonds Ltd. (South Africa)* | 102 | |
3,486 | POSCO (South Korea) | 763 | |
2,931 | |||
OIL, GAS & CONSUMABLE FUELS—11.4% | |||
266,300 | China Shenhua Energy Co. Ltd. (China) | 589 | |
9,409 | CNOOC Ltd. ADR (China)1 | 1,709 | |
27,773 | Lukoil PJSC ADR (Russia)1 | 2,358 | |
138,537 | Petroleo Brasileiro SA ADR (Brazil)*,1 | 1,912 | |
72,823 | Reliance Industries Ltd. (India) | 1,459 | |
4,126 | S-Oil Corp. (South Korea) | 325 | |
186,900 | Thai Oil PCL (Thailand) | 406 | |
114,700 | Ultrapar Participacoes SA (Brazil) | 614 | |
9,372 | |||
PERSONAL PRODUCTS—1.4% | |||
6,334 | AmorePacific Corp. (South Korea) | 1,128 | |
PHARMACEUTICALS—0.9% | |||
24,327 | Glenmark Pharmaceuticals Ltd. (India) | 222 | |
54,400 | Jiangsu Hengrui Medicine Co. Ltd. (China) | 531 | |
753 | |||
REAL ESTATE MANAGEMENT & DEVELOPMENT—2.2% | |||
546,000 | Guangzhou R&F Properties Co. Ltd. (China) | 1,086 | |
235,000 | Shimao Property Holdings Ltd. (China) | 717 | |
1,803 | |||
SEMICONDUCTORS & SEMICONDUCTOR EQUIPMENT—6.6% | |||
118,000 | MediaTek Inc. (Taiwan)* | 1,131 |
51
Harbor Emerging Markets Equity Fund
Portfolio of Investments—Continued
Value, Cost, and Principal Amounts in Thousands
COMMON STOCKS—Continued | |||
Shares | Value | ||
SEMICONDUCTORS & SEMICONDUCTOR EQUIPMENT—Continued | |||
15,376 | SK Hynix Inc. (South Korea) | $1,040 | |
74,208 | Taiwan Semiconductor Manufacturing Co. Ltd. ADR (Taiwan)1 | 3,252 | |
5,423 | |||
SPECIALTY RETAIL—1.6% | |||
72,447 | Foschini Group Ltd. (South Africa) | 939 | |
64,574 | Truworths International Ltd. (South Africa) | 342 | |
1,281 | |||
TECHNOLOGY HARDWARE, STORAGE & PERIPHERALS—4.8% | |||
101,417 | Samsung Electronics Co. Ltd. (South Korea) | 3,988 | |
THRIFTS & MORTGAGE FINANCE—0.7% | |||
61,091 | Indiabulls Housing Finance Ltd. (India) | 607 | |
WIRELESS TELECOMMUNICATION SERVICES—1.2% | |||
141,306 | MTN Group Ltd. (South Africa) | 1,024 | |
TOTAL COMMON STOCKS | |||
(Cost $70,435) | 79,740 | ||
PARTICIPATION (EQUITY LINKED) NOTES—0.1% | |||
(Cost $71) | |||
Principal Amount | Value | ||
BANKS—0.1% | |||
United Bank Ltd. (Pakistan)*,2 | |||
$ | 43,645 | $0.01–06/19/2019 | $46 |
TOTAL INVESTMENTS—96.8% | |||
(Cost $70,506) | 79,786 | ||
CASH AND OTHER ASSETS, LESS LIABILITIES—3.2% | 2,646 | ||
TOTAL NET ASSETS—100.0% | $82,432 |
FAIR VALUE MEASUREMENTS
The following table summarizes the Fund’s investments as of April 30, 2019 based on the inputs used to value them.
Asset Category | Quoted Prices Level 1 (000s) | Other Significant Observable Inputs Level 2 (000s) | Significant Unobservable Inputs Level 3 (000s) | Total (000s) | ||||
Common Stocks | ||||||||
Africa | $980 | $3,337 | $— | $4,317 | ||||
Europe | 577 | 6,476 | — | 7,053 | ||||
Latin America | 8,713 | — | — | 8,713 | ||||
Middle East/Central Asia | 3,899 | 3,741 | — | 7,640 | ||||
Pacific Basin | 7,333 | 44,684 | — | 52,017 | ||||
Participation (Equity Linked) Notes | ||||||||
Middle East/Central Asia | — | 46 | — | 46 | ||||
Total Investments in Securities | $21,502 | $58,284 | $— | $79,786 |
For more information on valuation inputs and their aggregation into the levels used in the table above, please refer to the Fair Value Measurements and Disclosures in Note 2 of the accompanying Notes to Financial Statements.
52
Harbor Emerging Markets Equity Fund
Portfolio of Investments—Continued
FAIR VALUE MEASUREMENTS—Continued
The following is a rollforward of the Fund’s Level 3 investments during the period ended April 30, 2019.
Valuation Description | Beginning Balance Beginning as of 11/01/2018 (000s) | Purchases (000s) | Sales (000s) | Discount/ (Premium) (000s) | Total Realized Gain/(Loss)w (000s) | Change in Unrealized Appreciation/ (Depreciation)w (000s) | Transfers In Level 3 (000s) | Transfers Out of Level 3 (000s) | Ending Balance as of 04/30/2019w (000s) | |||||||||
Common Stocks | $— | $— | $— | $— | $— | $— | $— | $— | $— |
The following is a summary of significant unobservable inputs used in the fair valuations of assets and liabilities categorized within Level 3 of the fair value hierarchy.
Valuation Descriptions | Ending Balance as of 04/30/2019 (000s) | Valuation Technique | Unobservable Input | Input Value(s) | ||||
Investments in Securities | ||||||||
Common Stocks | ||||||||
Tianhe Chemicals Group Ltd. (China)*,2 | $— | Market Approach | Estimated Recovery Value | HKD 0.00 |
* | Non-income producing security | ||
1 | ADR after the name of a security stands for American Depositary Receipts representing ownership of foreign securities. ADRs are issued by U.S. banking institutions. | ||
2 | Securities purchased in a transaction exempt from registration under Rule 144A of the Securities Act of 1933. These securities may be resold in transactions exempt from registration, normally to qualified institutional buyers. The Fund has no right to demand registration of these securities. At April 30, 2019, the aggregate value of these securities was $1,497 or 2% of net assets. | ||
w | Amounts in this category are included in the “Realized and Change in Unrealized Gain/(Loss) on Investment Transactions” section of the Statement of Operations. The net unrealized appreciation/(depreciation) per investment type is below: | ||
Valuation Description | Unrealized Gain/(Loss) as of 04/30/2019 (000s) | ||
Common Stocks | $(512) | ||
x | Fair valued in accordance with Harbor Funds Valuation Procedures. | ||
HKD | Hong Kong Dollar |
The accompanying notes are an integral part of the Financial Statements.
53
[THIS PAGE INTENTIONALLY LEFT BLANK]
54
Harbor International & Global Funds
StatementS of Assets and Liabilities—April 30, 2019 (Unaudited)
(All amounts in thousands, except per share amounts)
Harbor International Fund | Harbor Diversified International All Cap Fund | Harbor Overseas Fund | Harbor International Growth Fund | Harbor International Small Cap Fund | Harbor Global Leaders Fund | Harbor Emerging Markets Equity Fund | |
ASSETS | |||||||
Investments, at identified cost | $7,182,735 | $778,131 | $24,894 | $512,858 | $84,791 | $59,831 | $70,506 |
Investments, at value(Including securities loaned of $58,160, $13,828, $0, $20,452, $620, $1,387 and $0) | $7,217,426 | $785,870 | $25,313 | $583,028 | $87,944 | $78,167 | $79,786 |
Cash | 97,765 | 9,728 | 23 | 7,491 | 5,286 | 1,004 | 3,940 |
Foreign currency, at value (cost: $21,268, $2,240, $292, $37, $5, $0 and $38) | 21,248 | 2,248 | 293 | 37 | 5 | — | 38 |
Receivables for: | |||||||
Investments sold | 12,239 | 1,724 | 115 | — | 522 | — | 1 |
Foreign currency spot contracts | 7,806 | 572 | — | 130 | 433 | 18 | 1,058 |
Capital shares sold | 2,189 | 314 | — | 585 | 29 | 121 | — |
Dividends | 41,186 | 3,533 | 107 | 1,329 | 256 | 47 | 95 |
Interest | 7 | 1 | — | — | — | — | — |
Securities lending income | 318 | 41 | — | 14 | — | — | — |
Unrealized appreciation on open forward currency contracts | — | 2 | — | — | 6 | — | — |
Purchased options, at value (cost: $0,$0,$0,$0,$0,$0 and $0) | 514 | 127 | — | — | — | — | — |
Withholding tax | 41,275 | 425 | 12 | 368 | 38 | 13 | — |
Prepaid registration fees | 52 | 42 | 50 | 32 | 40 | 34 | 30 |
Prepaid fund insurance | 52 | 3 | — | 3 | — | — | — |
Other assets | 5,213 | 201 | — | 133 | 24 | 13 | 26 |
Total Assets | 7,447,290 | 804,831 | 25,913 | 593,150 | 94,583 | 79,417 | 84,974 |
LIABILITIES | |||||||
Payables for: | |||||||
Investments purchased | 24,315 | 3,991 | 45 | 257 | 2,064 | 381 | 1,314 |
Foreign currency spot contracts | 7,808 | 573 | — | 130 | 433 | 18 | 1,059 |
Capital shares reacquired | 9,974 | 221 | — | 168 | 200 | 1 | — |
Collateral for securities loaned | 61,600 | 14,480 | — | 21,349 | 663 | 1,428 | — |
Unrealized depreciation on open forward currency contracts | — | — | — | — | 1 | — | — |
Accrued expenses: | |||||||
Management fees | 4,555 | 452 | 16 | 346 | 60 | 50 | 64 |
12b-1 fees | 141 | 3 | — | 7 | — | 3 | — |
Transfer agent fees | 506 | 31 | 1 | 40 | 5 | 7 | 5 |
Trustees' fees and expenses | 3,839 | 28 | — | 81 | 3 | 4 | 5 |
Other | 5,294 | 651 | 51 | 317 | 43 | 21 | 95 |
Total Liabilities | 118,032 | 20,430 | 113 | 22,695 | 3,472 | 1,913 | 2,542 |
NET ASSETS | $7,329,258 | $784,401 | $25,800 | $570,455 | $91,111 | $77,504 | $82,432 |
Net Assets Consist of: | |||||||
Paid-in capital | $6,586,916 | $788,250 | $25,302 | $508,857 | $88,526 | $56,509 | $75,538 |
Total distributable earnings/(loss) | 742,342 | (3,849) | 498 | 61,598 | 2,585 | 20,995 | 6,894 |
$7,329,258 | $784,401 | $25,800 | $570,455 | $91,111 | $77,504 | $82,432 | |
The accompanying notes are an integral part of the Financial Statements.
55
Harbor International Fund | Harbor Diversified International All Cap Fund | Harbor Overseas Fund | Harbor International Growth Fund | Harbor International Small Cap Fund | Harbor Global Leaders Fund | Harbor Emerging Markets Equity Fund | ||||||||
NET ASSET VALUE PER SHARE BY CLASS | ||||||||||||||
Retirement Class | ||||||||||||||
Net assets | $2,223,447 | $499,202 | $12,736 | $136,602 | $23,916 | $9,770 | $25,100 | |||||||
Shares of beneficial interest1 | 58,505 | 45,800 | 1,249 | 8,696 | 1,907 | 336 | 2,303 | |||||||
Net asset value per share2 | $38.00 | $10.90 | $10.20 | $15.71 | $12.54 | $29.10 | $10.90 | |||||||
Institutional Class | ||||||||||||||
Net assets | $4,428,279 | $270,408 | $13,033 | $400,371 | $66,222 | $51,008 | $56,765 | |||||||
Shares of beneficial interest1 | 116,105 | 24,797 | 1,278 | 25,502 | 5,282 | 1,756 | 5,209 | |||||||
Net asset value per share2 | $38.14 | $10.90 | $10.20 | $15.70 | $12.54 | $29.05 | $10.90 | |||||||
Administrative Class | ||||||||||||||
Net assets | $73,888 | $6,263 | N/A | $422 | $331 | $1,359 | $35 | |||||||
Shares of beneficial interest1 | 1,928 | 575 | N/A | 27 | 26 | 48 | 3 | |||||||
Net asset value per share2 | $38.32 | $10.89 | N/A | $15.69 | $12.53 | $28.52 | $11.04 | |||||||
Investor Class | ||||||||||||||
Net assets | $603,644 | $8,528 | $31 | $33,060 | $642 | $15,367 | $532 | |||||||
Shares of beneficial interest1 | 15,990 | 787 | 3 | 2,118 | 51 | 546 | 49 | |||||||
Net asset value per share2 | $37.75 | $10.84 | $10.19 | $15.61 | $12.53 | $28.15 | $10.88 |
1 | Par value $0.01 (unlimited authorizations) |
2 | Per share amounts can be recalculated to the amounts disclosed herein when total net assets and shares of beneficial interest are not rounded to thousands. |
56
Harbor International & Global Funds
StatementS of Operations—Six Months Ended April 30, 2019 (Unaudited)
(All amounts in thousands)
Harbor International Fund | Harbor Diversified International All Cap Fund | Harbor Overseas Funda | Harbor International Growth Fund | Harbor International Small Cap Fund | Harbor Global Leaders Fund | Harbor Emerging Markets Equity Fund | |
Investment Income | |||||||
Dividends | $130,269 | $12,615 | $276 | $4,063 | $709 | $215 | $507 |
Interest | 2,219 | 113 | 2 | 73 | 36 | 14 | 23 |
Net securities lending income | 334 | 70 | — | 46 | — | — | — |
Foreign taxes withheld | (10,182) | (1,027) | (24) | (400) | (64) | (7) | (64) |
Total Investment Income | 122,640 | 11,771 | 254 | 3,782 | 681 | 222 | 466 |
Operating Expenses | |||||||
Management fees | 31,595 | 2,640 | 32 | 1,930 | 284 | 246 | 380 |
12b-1 fees: | |||||||
Administrative Class | 99 | 7 | N/A | 1 | — | 1 | — |
Investor Class | 878 | 9 | — | 38 | 1 | 17 | 1 |
Shareholder communications | 263 | 15 | 2 | 10 | 2 | 2 | 2 |
Custodian fees | 954 | 292 | 15 | 72 | 27 | 13 | 55 |
Transfer agent fees: | |||||||
Retirement Class | 151 | 30 | — | 7 | 1 | — | 1 |
Institutional Class | 2,493 | 117 | 2 | 179 | 26 | 21 | 28 |
Administrative Class | 37 | 3 | N/A | — | — | 1 | — |
Investor Class | 748 | 7 | — | 33 | 1 | 14 | 1 |
Professional fees | 342 | 43 | 24 | 34 | 3 | 4 | 17 |
Trustees' fees and expenses | 186 | 17 | — | 12 | 1 | 1 | 2 |
Registration fees | 69 | 33 | 15 | 26 | 25 | 25 | 26 |
Miscellaneous | 72 | 9 | 2 | 8 | 4 | 5 | 5 |
Total expenses | 37,887 | 3,222 | 92 | 2,350 | 375 | 350 | 518 |
Management fees waived | (4,836) | (725) | — | — | — | — | — |
Transfer agent fees waived | (121) | (7) | — | (7) | (1) | (1) | (1) |
Other expenses reimbursed | (1,447) | — | (58) | (137) | (59) | (29) | (62) |
Custodian fees reduction | (39) | (1) | — | (1) | — | — | — |
Net expenses | 31,444 | 2,489 | 34 | 2,205 | 315 | 320 | 455 |
Net Investment Income/(Loss) | 91,196 | 9,282 | 220 | 1,577 | 366 | (98) | 11 |
Realized and Change in Net Unrealized Gain/(Loss) on Investment Transactions | |||||||
Net realized gain/(loss) on: | |||||||
Investments(net of foreign capital gains tax: $258, $155, $–, $12, $–, $– and $9) | (584,963) | (7,583) | (111) | (637) | (879) | 2,889 | (71) |
Foreign currency transactions | (3,565) | (63) | (31) | (87) | (16) | 5 | (32) |
Purchased options | (11,002) | 1 | — | — | 63 | — | — |
Change in net unrealized appreciation/(depreciation) on: | |||||||
Investments(net of foreign capital gains tax accrual: $434, $87, $–, $146, $–, $– and $51) | 928,108 | 61,136 | 419 | 76,116 | 4,936 | 8,127 | 11,235 |
Forward currency contracts | — | 2 | — | — | 5 | — | — |
Purchased options | 11,379 | 126 | — | — | — | — | — |
Translations of assets and liabilities in foreign currencies | (426) | (8) | 1 | (2) | (10) | (1) | 1 |
Net gain/(loss) on investment transactions | 339,531 | 53,611 | 278 | 75,390 | 4,099 | 11,020 | 11,133 |
Net Increase/(Decrease) in Net Assets Resulting from Operations | $430,727 | $62,893 | $498 | $76,967 | $4,465 | $10,922 | $11,144 |
a | For the period March 1, 2019 (inception) through April 30, 2019 |
The accompanying notes are an integral part of the Financial Statements.
57
[THIS PAGE INTENTIONALLY LEFT BLANK]
58
Harbor International & Global Funds
Statements of Changes In Net Assets
(All amounts in thousands)
Harbor International Fund | Harbor Diversified International All Cap Fund | Harbor Overseas Fund | |||||
November 1, 2018 through April 30, 2019 | November 1, 2017 through October 31, 2018 | November 1, 2018 through April 30, 2019 | November 1, 2017 through October 31, 2018 | March 1, 2019a through April 30, 2019 | |||
INCREASE/(DECREASE) IN NET ASSETS | (Unaudited) | (Unaudited) | (Unaudited) | ||||
Operations: | |||||||
Net investment income/(loss) | $91,196 | $394,632 | $9,282 | $9,622 | $220 | ||
Net realized gain/(loss) on investments | (599,530) | 8,189,741 | (7,645) | 15,238 | (142) | ||
Change in net unrealized appreciation/(depreciation) of investments | 939,061 | (10,168,963) | 61,256 | (89,192) | 420 | ||
Net increase/(decrease) in assets resulting from operations | 430,727 | (1,584,590) | 62,893 | (64,332) | 498 | ||
Distributions to Shareholders | |||||||
Retirement Class | (886,406) | (301,911) | (18,266) | (7,408) | — | ||
Institutional Class | (2,278,752) | (1,460,339) | (9,595) | (7,178) | — | ||
Administrative Class | (33,262) | (18,715) | (228) | (10) | N/A | ||
Investor Class | (286,043) | (97,976) | (196) | (170) | — | ||
Total distributions to shareholders | (3,484,463) | (1,878,941) | (28,285) | (14,766) | — | ||
Net Increase/(Decrease) Derived from Capital Share Transactions | (1,883,233) | (16,526,349) | 80,077 | 425,394 | 25,302 | ||
Net increase/(decrease) in net assets | (4,936,969) | (19,989,880) | 114,685 | 346,296 | 25,800 | ||
Net Assets | |||||||
Beginning of period | 12,266,227 | 32,256,107 | 669,716 | 323,420 | — | ||
End of period | $7,329,258 | $12,266,227 | $784,401 | $669,716 | $25,800 |
a | Inception |
The accompanying notes are an integral part of the Financial Statements.
59
Harbor International Growth Fund | Harbor International Small Cap Fund | Harbor Global Leaders Fund | Harbor Emerging Markets Equity Fund | |||||||
November 1, 2018 through April 30, 2019 | November 1, 2017 through October 31, 2018 | November 1, 2018 through April 30, 2019 | November 1, 2017 through October 31, 2018 | November 1, 2018 through April 30, 2019 | November 1, 2017 through October 31, 2018 | November 1, 2018 through April 30, 2019 | November 1, 2017 through October 31, 2018 | |||
(Unaudited) | (Unaudited) | (Unaudited) | (Unaudited) | |||||||
$1,577 | $4,561 | $366 | $631 | $(98) | $(32) | $11 | $806 | |||
(724) | (7,547) | (832) | 2,179 | 2,894 | 1,452 | (103) | 4,471 | |||
76,114 | (72,951) | 4,931 | (9,302) | 8,126 | 2,965 | 11,236 | (13,287) | |||
76,967 | (75,937) | 4,465 | (6,492) | 10,922 | 4,385 | 11,144 | (8,010) | |||
(755) | (483) | (325) | (169) | (165) | (395) | (149) | (46) | |||
(2,750) | (3,975) | (1,897) | (536) | (820) | (2,548) | (585) | (499) | |||
(2) | (4) | (11) | (4) | (26) | (102) | (1) | (2) | |||
(118) | (105) | (20) | (6) | (307) | (1,035) | (3) | (4) | |||
(3,625) | (4,567) | (2,253) | (715) | (1,318) | (4,080) | (738) | (551) | |||
(29,168) | 204,499 | 29,400 | 19,306 | 13,953 | 7,664 | 746 | 22,785 | |||
44,174 | 123,995 | 31,612 | 12,099 | 23,557 | 7,969 | 11,152 | 14,224 | |||
526,281 | 402,286 | 59,499 | 47,400 | 53,947 | 45,978 | 71,280 | 57,056 | |||
$570,455 | $526,281 | $91,111 | $59,499 | $77,504 | $53,947 | $82,432 | $71,280 |
60
Harbor International & Global Funds
Statements of Changes in Net Assets—Capital Stock Activity
(All amounts in thousands)
Harbor International Fund | Harbor Diversified International All Cap Fund | Harbor Overseas Fund | Harbor International Growth Fund | |||||||
November 1, 2018 through April 30, 2019 | November 1, 2017 through October 31, 2018 | November 1, 2018 through April 30, 2019 | November 1, 2017 through October 31, 2018 | March 1, 2019a through April 30, 2019 | November 1, 2018 through April 30, 2019 | November 1, 2017 through October 31, 2018 | ||||
(Unaudited) | (Unaudited) | (Unaudited) | (Unaudited) | |||||||
AMOUNT ($) | ||||||||||
Retirement Class | ||||||||||
Net proceeds from sale of shares | $144,058 | $3,779,787 | $106,838 | $442,635 | $12,489 | $33,949 | $91,332 | |||
Reinvested distributions | 850,774 | 289,406 | 17,966 | 7,256 | — | 754 | 483 | |||
Cost of shares reacquired | (739,847) | (3,327,599) | (66,588) | (73,305) | — | (6,534) | (8,663) | |||
Net increase/(decrease) in net assets | $254,985 | $741,594 | $58,216 | $376,586 | $12,489 | $28,169 | $83,152 | |||
Institutional Class | ||||||||||
Net proceeds from sale of shares | $371,162 | $1,638,830 | $31,797 | $204,761 | $12,783 | $46,329 | $163,918 | |||
Reinvested distributions | 2,078,309 | 1,264,571 | 9,578 | 7,160 | — | 2,429 | 3,876 | |||
Cost of shares reacquired | (4,554,369) | (19,210,292) | (22,292) | (170,087) | — | (102,676) | (69,370) | |||
Net increase/(decrease) in net assets | $(2,104,898) | $(16,306,891) | $19,083 | $41,834 | $12,783 | $(53,918) | $98,424 | |||
Administrative Class | ||||||||||
Net proceeds from sale of shares | $11,132 | $80,793 | $535 | $6,598 | N/A | $88 | $117 | |||
Reinvested distributions | 32,597 | 18,354 | 227 | 10 | N/A | 2 | 4 | |||
Cost of shares reacquired | (31,434) | (368,808) | (522) | (592) | N/A | (49) | (205) | |||
Net increase/(decrease) in net assets | $12,295 | $(269,661) | $240 | $6,016 | N/A | $41 | $(84) | |||
Investor Class | ||||||||||
Net proceeds from sale of shares | $30,927 | $125,886 | $3,293 | $1,632 | $31 | $2,093 | $31,908 | |||
Reinvested distributions | 282,826 | 96,300 | 196 | 169 | — | 117 | 103 | |||
Cost of shares reacquired | (359,368) | (913,577) | (951) | (843) | (1) | (5,670) | (9,004) | |||
Net increase/(decrease) in net assets | $(45,615) | $(691,391) | $2,538 | $958 | $30 | $(3,460) | $23,007 |
a | Inception |
The accompanying notes are an integral part of the Financial Statements.
61
Harbor International Small Cap Fund | Harbor Global Leaders Fund | Harbor Emerging Markets Equity Fund | |||||
November 1, 2018 through April 30, 2019 | November 1, 2017 through October 31, 2018 | November 1, 2018 through April 30, 2019 | November 1, 2017 through October 31, 2018 | November 1, 2018 through April 30, 2019 | November 1, 2017 through October 31, 2018 | ||
(Unaudited) | (Unaudited) | (Unaudited) | |||||
$15,414 | $7,003 | $1,785 | $2,712 | $10,607 | $9,727 | ||
325 | 169 | 165 | 395 | 149 | 46 | ||
(420) | (5,596) | (111) | (670) | (410) | (641) | ||
$15,319 | $1,576 | $1,839 | $2,437 | $10,346 | $9,132 | ||
$13,547 | $19,220 | $23,076 | $5,826 | $13,545 | $22,433 | ||
1,876 | 536 | 773 | 2,455 | 580 | 498 | ||
(1,368) | (2,166) | (12,970) | (4,003) | (23,319) | (9,292) | ||
$14,055 | $17,590 | $10,879 | $4,278 | $(9,194) | $13,639 | ||
$5 | $— | $67 | $105 | $30 | $404 | ||
11 | 4 | 26 | 102 | 1 | 2 | ||
— | (29) | (7) | (312) | (272) | (378) | ||
$16 | $(25) | $86 | $(105) | $(241) | $28 | ||
$7 | $309 | $2,154 | $2,754 | $104 | $733 | ||
20 | 6 | 307 | 1,035 | 3 | 4 | ||
(17) | (150) | (1,312) | (2,735) | (272) | (751) | ||
$10 | $165 | $1,149 | $1,054 | $(165) | $(14) |
62
Harbor International & Global Funds
Statements of Changes in Net Assets—Capital Stock Activity—Continued
(All amounts in thousands)
Harbor International Fund | Harbor Diversified International All Cap Fund | Harbor Overseas Fund | Harbor International Growth Fund | |||||||
November 1, 2018 through April 30, 2019 | November 1, 2017 through October 31, 2018 | November 1, 2018 through April 30, 2019 | November 1, 2017 through October 31, 2018 | March 1, 2019a through April 30, 2019 | November 1, 2018 through April 30, 2019 | November 1, 2017 through October 31, 2018 | ||||
(Unaudited) | (Unaudited) | (Unaudited) | (Unaudited) | |||||||
SHARES | ||||||||||
Retirement Class | ||||||||||
Shares sold | 3,753 | 54,607 | 10,338 | 38,235 | 1,249 | 2,236 | 5,787 | |||
Shares issued due to reinvestment of distributions | 25,283 | 4,314 | 1,875 | 635 | — | 58 | 31 | |||
Shares reacquired | (16,895) | (50,569) | (6,766) | (6,359) | — | (446) | (553) | |||
Net increase/(decrease) in net assets | $12,141 | $8,352 | $5,447 | $32,511 | $1,249 | $1,848 | $5,265 | |||
Institutional Class | ||||||||||
Shares sold | 8,692 | 24,128 | 3,124 | 17,970 | 1,278 | 3,349 | 10,292 | |||
Shares issued due to reinvestment of distributions | 61,525 | 18,841 | 999 | 626 | — | 188 | 248 | |||
Shares reacquired | (101,220) | (287,896) | (2,232) | (14,819) | — | (7,255) | (4,389) | |||
Net increase/(decrease) in net assets | $(31,003) | $(244,927) | $1,891 | $3,777 | $1,278 | $(3,718) | $6,151 | |||
Administrative Class | ||||||||||
Shares sold | 237 | 1,212 | 52 | 576 | N/A | 7 | 7 | |||
Shares issued due to reinvestment of distributions | 959 | 274 | 24 | 1 | N/A | — | — | |||
Shares reacquired | (818) | (5,665) | (53) | (51) | N/A | (4) | (13) | |||
Net increase/(decrease) in net assets | $378 | $(4,179) | $23 | $526 | N/A | $3 | $(6) | |||
Investor Class | ||||||||||
Shares sold | 775 | 1,886 | 335 | 143 | 3 | 149 | 1,982 | |||
Shares issued due to reinvestment of distributions | 8,447 | 1,446 | 21 | 15 | — | 9 | 7 | |||
Shares reacquired | (8,766) | (13,807) | (97) | (74) | — | (413) | (574) | |||
Net increase/(decrease) in net assets | $456 | $(10,475) | $259 | $84 | $3 | $(255) | $1,415 |
a | Inception |
The accompanying notes are an integral part of the Financial Statements.
63
Harbor International Small Cap Fund | Harbor Global Leaders Fund | Harbor Emerging Markets Equity Fund | |||||
November 1, 2018 through April 30, 2019 | November 1, 2017 through October 31, 2018 | November 1, 2018 through April 30, 2019 | November 1, 2017 through October 31, 2018 | November 1, 2018 through April 30, 2019 | November 1, 2017 through October 31, 2018 | ||
(Unaudited) | (Unaudited) | (Unaudited) | |||||
1,249 | 502 | 65 | 105 | 1,059 | 934 | ||
30 | 12 | 7 | 16 | 16 | 4 | ||
(35) | (403) | (4) | (26) | (41) | (60) | ||
$1,244 | $111 | $68 | $95 | $1,034 | $878 | ||
1,155 | 1,394 | 867 | 223 | 1,332 | 2,127 | ||
171 | 38 | 32 | 101 | 62 | 47 | ||
(113) | (156) | (460) | (154) | (2,272) | (875) | ||
$1,213 | $1,276 | $439 | $170 | $(878) | $1,299 | ||
— | — | 3 | 4 | 3 | 35 | ||
1 | — | 1 | 4 | — | — | ||
— | (2) | — | (12) | (26) | (34) | ||
$1 | $(2) | $4 | $(4) | $(23) | $1 | ||
— | 22 | 83 | 109 | 10 | 65 | ||
2 | — | 13 | 44 | 1 | — | ||
(1) | (11) | (52) | (111) | (26) | (66) | ||
$1 | $11 | $44 | $42 | $(15) | $(1) |
64
Harbor International & Global Funds Financial Highlights
Selected Data for a Share Outstanding for the Periods Presented
HARBOR INTERNATIONAL FUND | ||||
Retirement Class | ||||
6-Month Period Ended April 30, 2019 | Year Ended October 31, | |||
2018l | 2017 | 2016f | ||
(Unaudited) | ||||
Net asset value beginning of period | $58.31 | $69.91 | $60.32 | $57.14 |
Income from Investment Operations | ||||
Net investment income/(loss)a | 0.48e | 1.21e | 0.94e | 0.68e |
Net realized and unrealized gains/(losses) on investments | 1.05 | (8.51) | 9.85 | 2.50 |
Total from investment operations | 1.53 | (7.30) | 10.79 | 3.18 |
Less Distributions | ||||
Dividends from net investment income | (0.97) | (1.30) | (1.20) | — |
Distributions from net realized capital gains | (20.87) | (3.00) | — | — |
Total distributions | (21.84) | (4.30) | (1.20) | — |
Net asset value end of period | 38.00 | 58.31 | 69.91 | 60.32 |
Net assets end of period (000s) | $2,223,447 | $2,703,360 | $2,657,442 | $739,842 |
Ratios and Supplemental Data (%) | ||||
Total returnb | 7.46%c | (11.24)% | 18.30% | 5.57%c |
Ratio of total expenses to average net assets^ | 0.81d | 0.74 | 0.74 | 0.75d |
Ratio of net expenses to average net assetsa | 0.66d | 0.64 | 0.73 | 0.72d |
Ratio of net investment income to average net assetsa | 2.43d | 1.80 | 1.42 | 1.68d |
Portfolio turnover | 4c | 64 | 13 | 14c |
Administrative Class | ||||||
6-Month Period Ended April 30, 2019 | Year Ended October 31, | |||||
2018l | 2017 | 2016 | 2015 | 2014 | ||
(Unaudited) | ||||||
Net asset value beginning of period | $58.08 | $69.57 | $59.99 | $65.32 | $67.48 | $70.18 |
Income from Investment Operations | ||||||
Net investment income/(loss)a | 0.40e | 0.88e | 0.79e | 0.79e | 1.04e | 1.91j |
Net realized and unrealized gains/(losses) on investments | 1.12 | (8.37) | 9.77 | (3.44) | (2.20) | (3.27) |
Total from investment operations | 1.52 | (7.49) | 10.56 | (2.65) | (1.16) | (1.36) |
Less Distributions | ||||||
Dividends from net investment income | (0.41) | (1.00) | (0.98) | (0.91) | (1.00) | (1.34) |
Distributions from net realized capital gains | (20.87) | (3.00) | — | (1.77) | — | — |
Total distributions | (21.28) | (4.00) | (0.98) | (2.68) | (1.00) | (1.34) |
Net asset value end of period | 38.32 | 58.08 | 69.57 | 59.99 | 65.32 | 67.48 |
Net assets end of period (000s) | $73,888 | $90,009 | $398,584 | $510,575 | $831,967 | $961,478 |
Ratios and Supplemental Data (%) | ||||||
Total returnb | 7.30%c | (11.53)% | 17.93% | (3.97)% | (1.73)% | (1.93)% |
Ratio of total expenses to average net assets^ | 1.14d | 1.07 | 1.06 | 1.04 | 1.01 | 1.01 |
Ratio of net expenses to average net assetsa | 0.99d | 0.97 | 1.05 | 1.02 | 0.99 | 0.98 |
Ratio of net investment income to average net assetsa | 2.01d | 1.30 | 1.22 | 1.33 | 1.54 | 1.85 |
Portfolio turnover | 4c | 64 | 13 | 14 | 25 | 11 |
See page 79 for notes to the Financial Highlights.
The accompanying notes are an integral part of the Financial Statements.
65
Institutional Class | |||||
6-Month Period Ended April 30, 2019 | Year Ended October 31, | ||||
2018l | 2017 | 2016 | 2015 | 2014 | |
(Unaudited) | |||||
$58.31 | $69.90 | $60.30 | $65.67 | $68.09 | $70.79 |
0.43e | 1.04e | 0.97e | 0.99e | 1.22e | 1.25 |
1.10 | (8.39) | 9.79 | (3.51) | (2.22) | (2.45) |
1.53 | (7.35) | 10.76 | (2.52) | (1.00) | (1.20) |
(0.83) | (1.24) | (1.16) | (1.08) | (1.42) | (1.50) |
(20.87) | (3.00) | — | (1.77) | — | — |
(21.70) | (4.24) | (1.16) | (2.85) | (1.42) | (1.50) |
38.14 | 58.31 | 69.90 | 60.30 | 65.67 | 68.09 |
$4,428,279 | $8,577,147 | $27,401,853 | $33,201,899 | $41,195,827 | $43,385,100 |
7.42%c | (11.31)% | 18.24% | (3.74)% | (1.48)% | (1.69)% |
0.89d | 0.82 | 0.81 | 0.79 | 0.76 | 0.76 |
0.73d | 0.72 | 0.80 | 0.77 | 0.74 | 0.73 |
2.09d | 1.53 | 1.51 | 1.66 | 1.80 | 1.78 |
4c | 64 | 13 | 14 | 25 | 11 |
Investor Class | |||||
6-Month Period Ended April 30, 2019 | Year Ended October 31, | ||||
2018l | 2017 | 2016 | 2015 | 2014 | |
(Unaudited) | |||||
$57.66 | $69.14 | $59.61 | $64.86 | $67.23 | $69.92 |
0.37e | 0.81e | 0.72e | 0.73e | 0.96e | 1.07 |
1.08 | (8.33) | 9.71 | (3.43) | (2.19) | (2.51) |
1.45 | (7.52) | 10.43 | (2.70) | (1.23) | (1.44) |
(0.49) | (0.96) | (0.90) | (0.78) | (1.14) | (1.25) |
(20.87) | (3.00) | — | (1.77) | — | — |
(21.36) | (3.96) | (0.90) | (2.55) | (1.14) | (1.25) |
37.75 | 57.66 | 69.14 | 59.61 | 64.86 | 67.23 |
$603,644 | $895,711 | $1,798,228 | $2,188,360 | $3,756,852 | $4,786,270 |
7.24%c | (11.65)% | 17.79% | (4.09)% | (1.84)% | (2.05)% |
1.26d | 1.19 | 1.18 | 1.16 | 1.13 | 1.13 |
1.11d | 1.09 | 1.17 | 1.14 | 1.11 | 1.10 |
1.84d | 1.21 | 1.13 | 1.23 | 1.43 | 1.46 |
4c | 64 | 13 | 14 | 25 | 11 |
66
Harbor International & Global Funds Financial Highlights—Continued
Selected Data for a Share Outstanding for the Periods Presented
HARBOR DIVERSIFIED INTERNATIONAL ALL CAP FUND | ||||
Retirement Class | ||||
6-Month Period Ended April 30, 2019 | Year Ended October 31, | |||
2018 | 2017 | 2016f | ||
(Unaudited) | ||||
Net asset value beginning of period | $10.41 | $11.79 | $9.77 | $9.21 |
Income from Investment Operations | ||||
Net investment income/(loss)a | 0.14e | 0.21e | 0.14e | 0.06e |
Net realized and unrealized gains/(losses) on investments | 0.77 | (1.19) | 2.01 | 0.50 |
Total from investment operations | 0.91 | (0.98) | 2.15 | 0.56 |
Less Distributions | ||||
Dividends from net investment income | (0.13) | (0.12) | (0.13) | — |
Distributions from net realized capital gains | (0.29) | (0.28) | — | — |
Total distributions | (0.42) | (0.40) | (0.13) | — |
Net asset value end of period | 10.90 | 10.41 | 11.79 | 9.77 |
Net assets end of period (000s) | $499,202 | $420,056 | $92,442 | $1,786 |
Ratios and Supplemental Data (%) | ||||
Total returnb | 9.28%c | (8.55)% | 22.35% | 6.08%c |
Ratio of total expenses to average net assets^ | 0.88d | 0.90 | 0.99 | 1.17d |
Ratio of net expenses to average net assetsa | 0.67d | 0.74 | 0.77 | 0.80d |
Ratio of net investment income to average net assetsa | 2.64d | 1.87 | 1.27 | 0.97d |
Portfolio turnover | 9c | 42 | 46 | 68c |
Administrative Class | ||||
6-Month Period Ended April 30, 2019 | Year Ended October 31, | |||
2018 | 2017 | 2016g | ||
(Unaudited) | ||||
Net asset value beginning of period | $10.39 | $11.76 | $9.75 | $10.00 |
Income from Investment Operations | ||||
Net investment income/(loss)a | 0.12e | 0.22e | 0.14e | 0.13e |
Net realized and unrealized gains/(losses) on investments | 0.77 | (1.22) | 1.97 | (0.38) |
Total from investment operations | 0.89 | (1.00) | 2.11 | (0.25) |
Less Distributions | ||||
Dividends from net investment income | (0.10) | (0.09) | (0.10) | —* |
Distributions from net realized capital gains | (0.29) | (0.28) | — | — |
Total distributions | (0.39) | (0.37) | (0.10) | —* |
Net asset value end of period | 10.89 | 10.39 | 11.76 | 9.75 |
Net assets end of period (000s) | $6,263 | $5,734 | $310 | $246 |
Ratios and Supplemental Data (%) | ||||
Total returnb | 9.07%c | (8.76)% | 21.91% | (2.49)%c |
Ratio of total expenses to average net assets^ | 1.21d | 1.23 | 1.32 | 1.46d |
Ratio of net expenses to average net assetsa | 1.00d | 1.06 | 1.10 | 1.10d |
Ratio of net investment income to average net assetsa | 2.26d | 1.96 | 1.29 | 1.39d |
Portfolio turnover | 9c | 42 | 46 | 68c |
See page 79 for notes to the Financial Highlights.
The accompanying notes are an integral part of the Financial Statements.
67
Institutional Class | |||
6-Month Period Ended April 30, 2019 | Year Ended October 31, | ||
2018 | 2017 | 2016g | |
(Unaudited) | |||
$10.41 | $11.79 | $9.77 | $10.00 |
0.13e | 0.20e | 0.17e | 0.20e |
0.77 | (1.18) | 1.98 | (0.42) |
0.90 | (0.98) | 2.15 | (0.22) |
(0.12) | (0.12) | (0.13) | (0.01) |
(0.29) | (0.28) | — | — |
(0.41) | (0.40) | (0.13) | (0.01) |
10.90 | 10.41 | 11.79 | 9.77 |
$270,408 | $238,470 | $225,473 | $150,263 |
9.20%c | (8.62)% | 22.29% | (2.25)%c |
0.96d | 0.98 | 1.07 | 1.22d |
0.75d | 0.82 | 0.85 | 0.85d |
2.53d | 1.72 | 1.59 | 2.13d |
9c | 42 | 46 | 68c |
Investor Class | |||
6-Month Period Ended April 30, 2019 | Year Ended October 31, | ||
2018 | 2017 | 2016g | |
(Unaudited) | |||
$10.33 | $11.71 | $9.74 | $10.00 |
0.12e | 0.15e | 0.14e | 0.12e |
0.76 | (1.17) | 1.96 | (0.38) |
0.88 | (1.02) | 2.10 | (0.26) |
(0.08) | (0.08) | (0.13) | — |
(0.29) | (0.28) | — | — |
(0.37) | (0.36) | (0.13) | — |
10.84 | 10.33 | 11.71 | 9.74 |
$8,528 | $5,456 | $5,195 | $329 |
9.02%c | (8.93)% | 21.82% | (2.60)%c |
1.33d | 1.35 | 1.44 | 1.59d |
1.12d | 1.19 | 1.22 | 1.22d |
2.28d | 1.34 | 1.31 | 1.28d |
9c | 42 | 46 | 68c |
68
Harbor International & Global Funds Financial Highlights—Continued
Selected Data for a Share Outstanding for the Periods Presented
HARBOR OVERSEAS FUND | |||||
Retirement Class | Institutional Class | Investor Class | |||
6-Month Period Ended April 30, 2019h | 6-Month Period Ended April 30, 2019h | 6-Month Period Ended April 30, 2019h | |||
(Unaudited) | (Unaudited) | (Unaudited) | |||
Net asset value beginning of period | $10.00 | $10.00 | $10.00 | ||
Income from Investment Operations | |||||
Net investment income/(loss)a | 0.09e | 0.09e | 0.08e | ||
Net realized and unrealized gains/(losses) on investments | 0.11 | 0.11 | 0.11 | ||
Total from investment operations | 0.20 | 0.20 | 0.19 | ||
Less Distributions | |||||
Dividends from net investment income | — | — | — | ||
Distributions from net realized capital gains | — | — | — | ||
Total distributions | — | — | — | ||
Net asset value end of period | 10.20 | 10.20 | 10.19 | ||
Net assets end of period (000s) | $12,736 | $13,033 | $31 | ||
Ratios and Supplemental Data (%) | |||||
Total returnb | 2.00%c | 2.00%c | 1.90%c | ||
Ratio of total expenses to average net assets^ | 2.13d | 2.21d | 2.58d | ||
Ratio of net expenses to average net assetsa | 0.77d | 0.85d | 1.22d | ||
Ratio of net investment income to average net assetsa | 5.21d | 5.13d | 4.76d | ||
Portfolio turnover | 22c | 22c | 22c |
See page 79 for notes to the Financial Highlights.
The accompanying notes are an integral part of the Financial Statements.
69
[THIS PAGE INTENTIONALLY LEFT BLANK]
70
Harbor International & Global Funds Financial Highlights—Continued
Selected Data for a Share Outstanding for the Periods Presented
HARBOR INTERNATIONAL GROWTH FUND | ||||
Retirement Class | ||||
6-Month Period Ended April 30, 2019 | Year Ended October 31, | |||
2018 | 2017 | 2016f | ||
(Unaudited) | ||||
Net asset value beginning of period | $13.70 | $15.71 | $12.90 | $11.76 |
Income from Investment Operations | ||||
Net investment income/(loss)a | 0.05e | 0.17e | 0.17e | 0.09e |
Net realized and unrealized gains/(losses) on investments | 2.07 | (1.99) | 2.81 | 1.05 |
Total from investment operations | 2.12 | (1.82) | 2.98 | 1.14 |
Less Distributions | ||||
Dividends from net investment income | (0.11) | (0.19) | (0.17) | — |
Distributions from net realized capital gains | — | — | — | — |
Total distributions | (0.11) | (0.19) | (0.17) | — |
Net asset value end of period | 15.71 | 13.70 | 15.71 | 12.90 |
Net assets end of period (000s) | $136,602 | $93,815 | $24,872 | $2,360 |
Ratios and Supplemental Data (%) | ||||
Total returnb | 15.65%c | (11.74)% | 23.52% | 9.69%c |
Ratio of total expenses to average net assets^ | 0.83d | 0.81 | 0.84 | 0.86d |
Ratio of net expenses to average net assetsa | 0.77d | 0.77 | 0.77 | 0.80d |
Ratio of net investment income to average net assetsa | 0.73d | 1.07 | 1.19 | 1.06d |
Portfolio turnover | 6c | 17 | 13 | 19c |
Administrative Class | ||||||
6-Month Period Ended April 30, 2019 | Year Ended October 31, | |||||
2018 | 2017 | 2016 | 2015 | 2014 | ||
(Unaudited) | ||||||
Net asset value beginning of period | $13.66 | $15.67 | $12.87 | $12.63 | $12.66 | $12.93 |
Income from Investment Operations | ||||||
Net investment income/(loss)a | 0.03e | 0.08e | 0.09e | 0.16e | 0.15e | (0.08) |
Net realized and unrealized gains/(losses) on investments | 2.06 | (1.95) | 2.84 | 0.12 | (0.03) | (0.03) |
Total from investment operations | 2.09 | (1.87) | 2.93 | 0.28 | 0.12 | (0.11) |
Less Distributions | ||||||
Dividends from net investment income | (0.06) | (0.14) | (0.13) | (0.04) | (0.15) | (0.16) |
Distributions from net realized capital gains | — | — | — | — | — | — |
Total distributions | (0.06) | (0.14) | (0.13) | (0.04) | (0.15) | (0.16) |
Net asset value end of period | 15.69 | 13.66 | 15.67 | 12.87 | 12.63 | 12.66 |
Net assets end of period (000s) | $422 | $330 | $466 | $333 | $329 | $675 |
Ratios and Supplemental Data (%) | ||||||
Total returnb | 15.44%c | (12.03)% | 23.08% | 2.21% | 0.96% | (0.83)% |
Ratio of total expenses to average net assets^ | 1.16d | 1.14 | 1.16 | 1.15 | 1.14 | 1.13 |
Ratio of net expenses to average net assetsa | 1.10d | 1.10 | 1.10 | 1.10 | 1.10 | 1.10 |
Ratio of net investment income to average net assetsa | 0.36d | 0.51 | 0.66 | 1.25 | 1.20 | 1.08 |
Portfolio turnover | 6c | 17 | 13 | 19 | 20 | 30 |
See page 79 for notes to the Financial Highlights.
The accompanying notes are an integral part of the Financial Statements.
71
Institutional Class | |||||
6-Month Period Ended April 30, 2019 | Year Ended October 31, | ||||
2018 | 2017 | 2016 | 2015 | 2014 | |
(Unaudited) | |||||
$13.69 | $15.69 | $12.89 | $12.71 | $12.75 | $13.01 |
0.04e | 0.13e | 0.13e | 0.17e | 0.15e | 0.16 |
2.07 | (1.95) | 2.84 | 0.14 | —* | (0.23) |
2.11 | (1.82) | 2.97 | 0.31 | 0.15 | (0.07) |
(0.10) | (0.18) | (0.17) | (0.13) | (0.19) | (0.19) |
— | — | — | — | — | — |
(0.10) | (0.18) | (0.17) | (0.13) | (0.19) | (0.19) |
15.70 | 13.69 | 15.69 | 12.89 | 12.71 | 12.75 |
$400,371 | $399,911 | $362,035 | $277,638 | $254,461 | $196,062 |
15.56%c | (11.75)% | 23.38% | 2.46% | 1.22% | (0.54)% |
0.91d | 0.89 | 0.91 | 0.90 | 0.89 | 0.88 |
0.85d | 0.85 | 0.85 | 0.85 | 0.85 | 0.85 |
0.61d | 0.84 | 0.92 | 1.36 | 1.19 | 1.23 |
6c | 17 | 13 | 19 | 20 | 30 |
Investor Class | |||||
6-Month Period Ended April 30, 2019 | Year Ended October 31, | ||||
2018 | 2017 | 2016 | 2015 | 2014 | |
(Unaudited) | |||||
$13.58 | $15.57 | $12.79 | $12.60 | $12.64 | $12.89 |
0.02e | 0.11e | 0.07e | 0.12e | 0.10e | —* |
2.06 | (1.98) | 2.82 | 0.15 | —* | (0.11) |
2.08 | (1.87) | 2.89 | 0.27 | 0.10 | (0.11) |
(0.05) | (0.12) | (0.11) | (0.08) | (0.14) | (0.14) |
— | — | — | — | — | — |
(0.05) | (0.12) | (0.11) | (0.08) | (0.14) | (0.14) |
15.61 | 13.58 | 15.57 | 12.79 | 12.60 | 12.64 |
$33,060 | $32,225 | $14,913 | $13,466 | $15,978 | $17,429 |
15.40%c | (12.12)% | 22.89% | 2.15% | 0.81% | (0.85)% |
1.28d | 1.26 | 1.28 | 1.27 | 1.26 | 1.25 |
1.22d | 1.22 | 1.22 | 1.22 | 1.22 | 1.22 |
0.22d | 0.69 | 0.54 | 0.99 | 0.79 | 0.87 |
6c | 17 | 13 | 19 | 20 | 30 |
72
Harbor International & Global Funds Financial Highlights—Continued
Selected Data for a Share Outstanding for the Periods Presented
HARBOR INTERNATIONAL SMALL CAP FUND | ||||
Retirement Class | ||||
6-Month Period Ended April 30, 2019 | Year Ended October 31, | |||
2018 | 2017 | 2016i | ||
(Unaudited) | ||||
Net asset value beginning of period | $12.38 | $13.90 | $10.77 | $10.00 |
Income from Investment Operations | ||||
Net investment income/(loss)a | 0.09e | 0.17e | 0.08e | 0.06e |
Net realized and unrealized gains/(losses) on investments | 0.55 | (1.50) | 3.18 | 0.71 |
Total from investment operations | 0.64 | (1.33) | 3.26 | 0.77 |
Less Distributions | ||||
Dividends from net investment income | (0.10) | (0.09) | (0.13) | — |
Distributions from net realized capital gains | (0.38) | (0.10) | — | — |
Total distributions | (0.48) | (0.19) | (0.13) | — |
Net asset value end of period | 12.54 | 12.38 | 13.90 | 10.77 |
Net assets end of period (000s) | $23,916 | $8,213 | $7,671 | $629 |
Ratios and Supplemental Data (%) | ||||
Total returnb | 5.66%c | (9.71)% | 30.67% | 7.70%c |
Ratio of total expenses to average net assets^ | 1.05d | 1.07 | 1.35 | 2.50d |
Ratio of net expenses to average net assetsa | 0.87d | 0.87 | 0.87 | 0.90d |
Ratio of net investment income to average net assetsa | 1.43d | 1.19 | 0.60 | 0.73d |
Portfolio turnover | 18c | 53 | 44 | 35c |
Administrative Class | ||||
6-Month Period Ended April 30, 2019 | Year Ended October 31, | |||
2018 | 2017 | 2016i | ||
(Unaudited) | ||||
Net asset value beginning of period | $12.34 | $13.87 | $10.75 | $10.00 |
Income from Investment Operations | ||||
Net investment income/(loss)a | 0.04e | 0.11e | 0.07e | 0.09e |
Net realized and unrealized gains/(losses) on investments | 0.58 | (1.49) | 3.15 | 0.66 |
Total from investment operations | 0.62 | (1.38) | 3.22 | 0.75 |
Less Distributions | ||||
Dividends from net investment income | (0.05) | (0.05) | (0.10) | — |
Distributions from net realized capital gains | (0.38) | (0.10) | — | — |
Total distributions | (0.43) | (0.15) | (0.10) | — |
Net asset value end of period | 12.53 | 12.34 | 13.87 | 10.75 |
Net assets end of period (000s) | $331 | $309 | $371 | $263 |
Ratios and Supplemental Data (%) | ||||
Total returnb | 5.49%c | (10.06)% | 30.25% | 7.50%c |
Ratio of total expenses to average net assets^ | 1.38d | 1.40 | 1.67 | 2.80d |
Ratio of net expenses to average net assetsa | 1.20d | 1.20 | 1.20 | 1.20d |
Ratio of net investment income to average net assetsa | 0.71d | 0.76 | 0.59 | 1.16d |
Portfolio turnover | 18c | 53 | 44 | 35c |
See page 79 for notes to the Financial Highlights.
The accompanying notes are an integral part of the Financial Statements.
73
Institutional Class | |||
6-Month Period Ended April 30, 2019 | Year Ended October 31, | ||
2018 | 2017 | 2016i | |
(Unaudited) | |||
$12.37 | $13.90 | $10.77 | $10.00 |
0.06e | 0.15e | 0.10e | 0.11e |
0.58 | (1.50) | 3.15 | 0.66 |
0.64 | (1.35) | 3.25 | 0.77 |
(0.09) | (0.08) | (0.12) | — |
(0.38) | (0.10) | — | — |
(0.47) | (0.18) | (0.12) | — |
12.54 | 12.37 | 13.90 | 10.77 |
$66,222 | $50,358 | $38,818 | $17,509 |
5.67%c | (9.83)% | 30.59% | 7.70%c |
1.13d | 1.15 | 1.42 | 2.55d |
0.95d | 0.95 | 0.95 | 0.95d |
1.04d | 1.05 | 0.81 | 1.40d |
18c | 53 | 44 | 35c |
Investor Class | |||
6-Month Period Ended April 30, 2019 | Year Ended October 31, | ||
2018 | 2017 | 2016i | |
(Unaudited) | |||
$12.34 | $13.86 | $10.74 | $10.00 |
0.03e | 0.10e | 0.06e | 0.10e |
0.58 | (1.48) | 3.14 | 0.64 |
0.61 | (1.38) | 3.20 | 0.74 |
(0.04) | (0.04) | (0.08) | — |
(0.38) | (0.10) | — | — |
(0.42) | (0.14) | (0.08) | — |
12.53 | 12.34 | 13.86 | 10.74 |
$642 | $619 | $540 | $287 |
5.37%c | (10.08)% | 30.10% | 7.40%c |
1.50d | 1.52 | 1.79 | 2.92d |
1.32d | 1.32 | 1.32 | 1.32d |
0.58d | 0.73 | 0.53 | 1.33d |
18c | 53 | 44 | 35c |
74
Harbor International & Global Funds Financial Highlights—Continued
Selected Data for a Share Outstanding for the Periods Presented
HARBOR GLOBAL LEADERS FUND | ||||
Retirement Class | ||||
6-Month Period Ended April 30, 2019 | Year Ended October 31, | |||
2018 | 2017k | 2016f | ||
(Unaudited) | ||||
Net asset value beginning of period | $25.52 | $25.33 | $20.29 | $19.79 |
Income from Investment Operations | ||||
Net investment income/(loss)a | (0.02)e | 0.02e | 0.08e | (0.03)e |
Net realized and unrealized gains/(losses) on investments | 4.20 | 2.40 | 4.96 | 0.53 |
Total from investment operations | 4.18 | 2.42 | 5.04 | 0.50 |
Less Distributions | ||||
Dividends from net investment income | — | (0.03) | — | — |
Distributions from net realized capital gains | (0.60) | (2.20) | — | — |
Total distributions | (0.60) | (2.23) | — | — |
Net asset value end of period | 29.10 | 25.52 | 25.33 | 20.29 |
Net assets end of period (000s) | $9,770 | $6,846 | $4,376 | $1,713 |
Ratios and Supplemental Data (%) | ||||
Total returnb | 16.85%c | 10.01% | 24.84% | 2.53%c |
Ratio of total expenses to average net assets^ | 0.92d | 0.96 | 1.13 | 1.00d |
Ratio of net expenses to average net assetsa | 0.82d | 0.82 | 0.83 | 0.85d |
Ratio of net investment income to average net assetsa | (0.15)d | 0.09 | 0.32 | (0.18)d |
Portfolio turnover | 28c | 20 | 123 | 76c |
Administrative Class | ||||||
6-Month Period Ended April 30, 2019 | Year Ended October 31, | |||||
2018 | 2017k | 2016 | 2015 | 2014 | ||
(Unaudited) | ||||||
Net asset value beginning of period | $25.06 | $24.97 | $20.06 | $21.65 | $23.63 | $23.65 |
Income from Investment Operations | ||||||
Net investment income/(loss)a | (0.06)e | (0.05)e | (0.04)e | (0.05)e | (0.07)e | 0.01 |
Net realized and unrealized gains/(losses) on investments | 4.12 | 2.34 | 4.95 | (0.82) | 0.66 | 2.14 |
Total from investment operations | 4.06 | 2.29 | 4.91 | (0.87) | 0.59 | 2.15 |
Less Distributions | ||||||
Dividends from net investment income | — | — | — | — | — | (0.02) |
Distributions from net realized capital gains | (0.60) | (2.20) | — | (0.72) | (2.57) | (2.15) |
Total distributions | (0.60) | (2.20) | — | (0.72) | (2.57) | (2.17) |
Net asset value end of period | 28.52 | 25.06 | 24.97 | 20.06 | 21.65 | 23.63 |
Net assets end of period (000s) | $1,359 | $1,111 | $1,204 | $1,253 | $1,198 | $802 |
Ratios and Supplemental Data (%) | ||||||
Total returnb | 16.68%c | 9.61% | 24.48% | (4.17)% | 2.74% | 9.77% |
Ratio of total expenses to average net assets^ | 1.25d | 1.29 | 1.46 | 1.29 | 1.26 | 1.33 |
Ratio of net expenses to average net assetsa | 1.15d | 1.15 | 1.15 | 1.15 | 1.15 | 1.15 |
Ratio of net investment income to average net assetsa | (0.49)d | (0.21) | (0.13) | (0.23) | (0.31) | (0.01) |
Portfolio turnover | 28c | 20 | 123 | 76 | 106 | 141 |
See page 79 for notes to the Financial Highlights.
The accompanying notes are an integral part of the Financial Statements.
75
Institutional Class | |||||
6-Month Period Ended April 30, 2019 | Year Ended October 31, | ||||
2018 | 2017k | 2016 | 2015 | 2014 | |
(Unaudited) | |||||
$25.49 | $25.31 | $20.29 | $21.83 | $23.79 | $23.78 |
(0.03)e | 0.01e | 0.03e | 0.01e | (0.01)e | 0.05 |
4.19 | 2.38 | 4.99 | (0.83) | 0.65 | 2.18 |
4.16 | 2.39 | 5.02 | (0.82) | 0.64 | 2.23 |
— | (0.01) | — | — | (0.03) | (0.07) |
(0.60) | (2.20) | — | (0.72) | (2.57) | (2.15) |
(0.60) | (2.21) | — | (0.72) | (2.60) | (2.22) |
29.05 | 25.49 | 25.31 | 20.29 | 21.83 | 23.79 |
$51,008 | $33,574 | $29,034 | $25,471 | $34,402 | $26,601 |
16.79%c | 9.90% | 24.74% | (3.90)% | 2.97% | 10.08% |
1.00d | 1.04 | 1.21 | 1.04 | 1.01 | 1.08 |
0.90d | 0.90 | 0.90 | 0.90 | 0.90 | 0.90 |
(0.23)d | 0.03 | 0.14 | 0.04 | (0.06) | 0.22 |
28c | 20 | 123 | 76 | 106 | 141 |
Investor Class | |||||
6-Month Period Ended April 30, 2019 | Year Ended October 31, | ||||
2018 | 2017k | 2016 | 2015 | 2014 | |
(Unaudited) | |||||
$24.76 | $24.72 | $19.89 | $21.49 | $23.51 | $23.54 |
(0.08)e | (0.09)e | (0.06)e | (0.07)e | (0.10)e | (0.03) |
4.07 | 2.33 | 4.89 | (0.81) | 0.65 | 2.15 |
3.99 | 2.24 | 4.83 | (0.88) | 0.55 | 2.12 |
— | — | — | — | — | —* |
(0.60) | (2.20) | — | (0.72) | (2.57) | (2.15) |
(0.60) | (2.20) | — | (0.72) | (2.57) | (2.15) |
28.15 | 24.76 | 24.72 | 19.89 | 21.49 | 23.51 |
$15,367 | $12,416 | $11,364 | $10,659 | $13,693 | $8,584 |
16.60%c | 9.50% | 24.28% | (4.25)% | 2.57% | 9.68% |
1.37d | 1.41 | 1.58 | 1.41 | 1.38 | 1.45 |
1.27d | 1.27 | 1.27 | 1.27 | 1.27 | 1.27 |
(0.61)d | (0.35) | (0.25) | (0.35) | (0.44) | (0.17) |
28c | 20 | 123 | 76 | 106 | 141 |
76
Harbor International & Global Funds Financial Highlights—Continued
Selected Data for a Share Outstanding for the Periods Presented
HARBOR EMERGING MARKETS EQUITY FUND | ||||
Retirement Class | ||||
6-Month Period Ended April 30, 2019 | Year Ended October 31, | |||
2018 | 2017 | 2016f | ||
(Unaudited) | ||||
Net asset value beginning of period | $9.57 | $10.83 | $8.59 | $6.90 |
Income from Investment Operations | ||||
Net investment income/(loss)a | —*e | 0.12e | 0.13e | 0.05e |
Net realized and unrealized gains/(losses) on investments | 1.42 | (1.27) | 2.21 | 1.64 |
Total from investment operations | 1.42 | (1.15) | 2.34 | 1.69 |
Less Distributions | ||||
Dividends from net investment income | (0.09) | (0.11) | (0.10) | — |
Distributions from net realized capital gains | — | — | — | — |
Total distributions | (0.09) | (0.11) | (0.10) | — |
Net asset value end of period | 10.90 | 9.57 | 10.83 | 8.59 |
Net assets end of period (000s) | $25,100 | $12,146 | $4,232 | $1,335 |
Ratios and Supplemental Data (%) | ||||
Total returnb | 15.05%c | (10.71)% | 27.62% | 24.49%c |
Ratio of total expenses to average net assets^ | 1.23d | 1.26 | 1.35 | 1.45d |
Ratio of net expenses to average net assetsa | 1.07d | 1.07 | 1.08 | 1.10d |
Ratio of net investment income to average net assetsa | 0.06d | 1.16 | 1.32 | 0.95d |
Portfolio turnover | 35c | 56 | 59 | 49c |
Administrative Class | ||||||
6-Month Period Ended April 30, 2019 | Year Ended October 31, | |||||
2018 | 2017 | 2016 | 2015 | 2014 | ||
(Unaudited) | ||||||
Net asset value beginning of period | $9.55 | $10.80 | $8.58 | $7.87 | $10.03 | $10.00 |
Income from Investment Operations | ||||||
Net investment income/(loss)a | —*e | 0.08e | 0.08e | 0.05e | 0.04e | 0.05 |
Net realized and unrealized gains/(losses) on investments | 1.54 | (1.25) | 2.22 | 0.71 | (2.18) | (0.02) |
Total from investment operations | 1.54 | (1.17) | 2.30 | 0.76 | (2.14) | 0.03 |
Less Distributions | ||||||
Dividends from net investment income | (0.05) | (0.08) | (0.08) | (0.05) | (0.02) | — |
Distributions from net realized capital gains | — | — | — | — | — | — |
Total distributions | (0.05) | (0.08) | (0.08) | (0.05) | (0.02) | — |
Net asset value end of period | 11.04 | 9.55 | 10.80 | 8.58 | 7.87 | 10.03 |
Net assets end of period (000s) | $35 | $249 | $275 | $217 | $197 | $250 |
Ratios and Supplemental Data (%) | ||||||
Total returnb | 16.25%c | (10.91)% | 27.04% | 9.81% | (21.36)% | 0.30% |
Ratio of total expenses to average net assets^ | 1.56d | 1.59 | 1.68 | 1.74 | 1.72 | 2.59 |
Ratio of net expenses to average net assetsa | 1.40d | 1.40 | 1.40 | 1.40 | 1.43 | 1.50 |
Ratio of net investment income to average net assetsa | (0.07)d | 0.77 | 0.85 | 0.69 | 0.49 | 0.47 |
Portfolio turnover | 35c | 56 | 59 | 49 | 58 | 50 |
See page 79 for notes to the Financial Highlights.
The accompanying notes are an integral part of the Financial Statements.
77
Institutional Class | |||||
6-Month Period Ended April 30, 2019 | Year Ended October 31, | ||||
2018 | 2017 | 2016 | 2015 | 2014 | |
(Unaudited) | |||||
$9.57 | $10.83 | $8.59 | $7.89 | $10.05 | $10.00 |
—*e | 0.14e | 0.11e | 0.07e | 0.08e | 0.05 |
1.42 | (1.30) | 2.22 | 0.71 | (2.19) | —* |
1.42 | (1.16) | 2.33 | 0.78 | (2.11) | 0.05 |
(0.09) | (0.10) | (0.09) | (0.08) | (0.05) | — |
— | — | — | — | — | — |
(0.09) | (0.10) | (0.09) | (0.08) | (0.05) | — |
10.90 | 9.57 | 10.83 | 8.59 | 7.89 | 10.05 |
$56,765 | $58,271 | $51,849 | $36,390 | $41,927 | $27,294 |
14.97%c | (10.77)% | 27.54% | 9.99% | (21.10)% | 0.50% |
1.31d | 1.34 | 1.43 | 1.49 | 1.47 | 2.34 |
1.15d | 1.15 | 1.15 | 1.15 | 1.17 | 1.25 |
(0.01)d | 1.28 | 1.13 | 0.93 | 0.90 | 0.78 |
35c | 56 | 59 | 49 | 58 | 50 |
Investor Class | |||||
6-Month Period Ended April 30, 2019 | Year Ended October 31, | ||||
2018 | 2017 | 2016 | 2015 | 2014 | |
(Unaudited) | |||||
$9.53 | $10.78 | $8.56 | $7.85 | $10.01 | $10.00 |
(0.02)e | 0.09e | 0.07e | 0.05e | 0.04e | 0.03 |
1.42 | (1.27) | 2.22 | 0.70 | (2.18) | (0.02) |
1.40 | (1.18) | 2.29 | 0.75 | (2.14) | 0.01 |
(0.05) | (0.07) | (0.07) | (0.04) | (0.02) | — |
— | — | — | — | — | — |
(0.05) | (0.07) | (0.07) | (0.04) | (0.02) | — |
10.88 | 9.53 | 10.78 | 8.56 | 7.85 | 10.01 |
$532 | $614 | $700 | $482 | $406 | $454 |
14.72%c | (11.03)% | 27.00% | 9.69% | (21.45)% | 0.10% |
1.68d | 1.71 | 1.80 | 1.86 | 1.84 | 2.71 |
1.52d | 1.52 | 1.52 | 1.52 | 1.55 | 1.62 |
(0.34)d | 0.82 | 0.75 | 0.69 | 0.40 | 0.45 |
35c | 56 | 59 | 49 | 58 | 50 |
78
Harbor International & Global Funds Financial Highlights—Continued
Selected Data for a Share Outstanding for the Periods Presented
* | Less than $0.01 |
^ | Percentage does not reflect reduction for credit balance arrangements (see the “Custodian” section in Note 2 of the accompanying Notes to Financial Statements) |
a | Reflects the Adviser’s waiver, if any, of its management fees and/or other operating expenses |
b | The total returns would have been lower had certain expenses not been waived during the periods shown. |
c | Unannualized |
d | Annualized |
e | Amounts are based on daily shares outstanding during the period. |
f | For the period March 1, 2016 (inception) through October 31, 2016 |
g | For the period November 2, 2015 (inception) through October 31, 2016 |
h | For the period March 1, 2019 (inception) through April 30, 2019 |
i | For the period February 1, 2016 (inception) through October 31, 2016 |
j | The amount shown for a share outstanding does not correspond with the aggregate net investment income/(loss) for the period due to the timing of sales and purchases of shares in relation to fluctuating market values of the investments of the Fund. |
k | Effective March 1, 2017, the Board of Trustees appointed Sands Capital Management, LLC as subadviser to Harbor Global Leaders Fund. |
l | Effective August 22, 2018, the Board of Trustees appointed Marathon Asset Management LLP as subadviser to Harbor International Fund. |
The accompanying notes are an integral part of the Financial Statements.
79
Harbor International & Global Funds
Notes to Financial Statements—April 30, 2019 (Unaudited)
Note 1—Organizational Matters
Harbor Funds (the “Trust”) is registered under the Investment Company Act of 1940, as amended (the “Investment Company Act”), as an open-end management investment company. As of April 30, 2019, the Trust consists of 33 separate portfolios. The portfolios covered by this report are: Harbor International Fund, Harbor Diversified International All Cap Fund, Harbor Overseas Fund, Harbor International Growth Fund, Harbor International Small Cap Fund, Harbor Global Leaders Fund and Harbor Emerging Markets Equity Fund (individually or collectively referred to as a “Fund” or the “Funds," respectively). Harbor Capital Advisors, Inc. (the “Adviser” or “Harbor Capital”) is the investment adviser for the Funds.
The Funds currently offer four classes of shares, designated as Retirement Class, Institutional Class, Administrative Class and Investor Class. The shares of each class represent an interest in the same portfolio of investments of the Funds and have equal rights with respect to voting, redemptions, dividends, and liquidations, except that: (i) certain expenses, subject to the approval of the Trust’s Board of Trustees (the “Board of Trustees”), may be applied differently to each class of shares in accordance with current regulations of the Securities and Exchange Commission (“SEC”) and the Internal Revenue Service; and (ii) shareholders of a class that bears distribution and service expenses under terms of a distribution plan have exclusive voting rights as to that distribution plan.
Note 2—Significant Accounting Policies
The following is a summary of significant accounting policies followed by the Trust in the preparation of its financial statements. Each Fund follows the investment company reporting requirements under U.S. Generally Accepted Accounting Principles (“U.S. GAAP”), which includes the accounting and reporting guidelines under Accounting Standards Codification (“ASC”) Topic 946,Financial Services-Investment Companies. The preparation of financial statements in accordance with U.S. GAAP requires management to make estimates and assumptions that affect the reported amounts and disclosures in the financial statements. Actual results may differ from those estimates.
Security Valuation
The Trust’s valuation procedures permit the Funds to use a variety of valuation methodologies, consider a number of subjective factors, analyze applicable facts and circumstances and, in general, exercise judgment, when valuing Fund investments. The methodology used for a specific type of investment may vary based on the circumstances and relevant considerations, including available market data.
Equity securities (including common stock, preferred stock, convertible preferred stock, and master limited partnerships), exchange-traded notes and financial derivative instruments (such as futures contracts, options contracts, including rights and warrants and centrally cleared swap agreements) that are traded or cleared on a national securities exchange or system (except securities listed on the National Association of Securities Dealers Automated Quotation (“NASDAQ”) system and United Kingdom securities) are valued at the last sale price on a national exchange or system on which they are principally traded or cleared as of the valuation date. Securities listed on the NASDAQ system or a United Kingdom exchange are valued at the official closing price of those securities. In the case of securities for which there are no sales on the valuation day, (i) securities traded principally on a U.S. exchange, including NASDAQ, are valued at the mean between the closing bid and ask price; and (ii) securities traded principally on a foreign exchange, including United Kingdom securities, are valued at the official bid price determined as of the close of the primary exchange. Securities of open-end registered investment companies that are held by a Fund are valued at net asset value. To the extent these securities are actively traded and fair valuation adjustments are not applied, they are normally categorized as Level 1 in the fair value hierarchy. Equity securities traded on inactive markets or valued by reference to similar instruments are normally categorized as Level 2 in the fair value hierarchy. For more information on the fair value hierarchy, please refer to the Fair Value Measurements and Disclosures section.
Participatory notes are valued at the last sale price of the underlying local shares on the national exchange on which they trade. Such securities are normally categorized as Level 2 in the fair value hierarchy.
Short-term securities with a remaining maturity of less than 60 days at the time of acquisition that are held by a Fund are valued at amortized cost to the extent amortized cost represents fair value. Such securities are normally categorized as Level 2 in the fair value hierarchy.
80
Harbor International & Global Funds
Notes to Financial Statements—Continued
Note 2—Significant Accounting Policies—Continued
Over-the-counter financial derivative instruments, such as forward currency contracts, options contracts, and swap agreements, derive their value from underlying asset prices, indices, reference rates and other inputs, or a combination of these factors. These instruments are valued using evaluated prices furnished by a pricing vendor selected by the Board of Trustees. In certain cases, when a valuation is not readily available from a pricing vendor, the Fund’s subadviser provides a valuation, typically using its own proprietary models. Depending on the instrument and the terms of the transaction, the value of the derivative instrument can be determined by a pricing vendor or subadviser using a series of techniques, including simulation pricing models. The pricing models use inputs, such as issuer details, indices, spreads, interest rates, yield curves, dividends and exchange rates, that are observed from actively quoted markets. Derivative instruments that use valuation techniques and inputs similar to those described above are normally categorized as Level 2 in the fair value hierarchy.
When reliable market quotations or evaluated prices supplied by a pricing vendor are not readily available or are not believed to accurately reflect fair value, securities are priced at their fair value as determined by the Trust’s Valuation Committee (the “Valuation Committee”) pursuant to procedures adopted, and subject to oversight, by the Board of Trustees. The Valuation Committee is comprised of a trustee and officers of the Trust and employees of Harbor Capital with relevant experience or responsibilities. Each security for which the Valuation Committee determines a fair value, including the basis for the fair value decision, is reviewed by the Board of Trustees at its regularly scheduled board meetings.
When a fair valuation method is applied by the Valuation Committee or a Fund’s subadviser, securities will be priced by a method that the Valuation Committee or subadviser believes accurately reflects fair value. Securities valued using fair valuation methods that incorporate significant unobservable inputs are normally categorized as Level 3 in the fair value hierarchy. Examples of possible fair valuation methodologies used in determining the fair value of securities categorized as Level 3 in the fair value hierarchy include, but are not limited to, benchmark pricing and indicative market quotations.
When benchmark pricing is used, the base price of a debt security is set and then subsequently adjusted in proportion to the market value changes of an index or similar security (the “benchmark security”) that trades in an active market or for which other observable inputs are available. The base price may be a broker-dealer quote, transaction price, or an internal value as derived by analysis of market data. The base price of the security may be reset on a periodic basis based on the availability of market data and procedures approved by a Fund’s subadviser. If the benchmark security is categorized as Level 2 in the fair value hierarchy due to the lack of an active market for that security, any security adjusted in proportion to the fair value of the benchmark security may be categorized as Level 3 in the fair value hierarchy. Significant changes in the unobservable inputs of the benchmark pricing process (i.e., the base price) would result in direct and proportional changes in the fair value of the security. The reasonability of the fair value is reviewed by the subadviser on a periodic basis and may be amended as the availability of market data indicates a material change.
If evaluated pricing through a third-party pricing vendor is not available or deemed not to be indicative of fair value, a Fund’s subadviser may elect to obtain indicative market quotations (“broker quotes”) directly from a broker-dealer or passed through from a third-party pricing vendor. Indicative market quotations are typically received from established market participants. In the event that the source of fair value is from a single-sourced broker quote, but the subadviser does not have the transparency to view the underlying inputs that support the market quotation, these securities are categorized as Level 3 in the fair value hierarchy. Significant changes in the broker quote would have direct and proportional changes in the fair value of the security.
A Fund may also use fair value pricing if the value of some or all of the Fund’s securities have been materially affected by events occurring before the Fund’s pricing time but after the close of the primary markets or exchanges on which the security is traded. This most commonly occurs with foreign securities, but may occur with other securities as well. In such cases, the Fund may apply a fair value factor supplied by the pricing vendor to a foreign security’s market close value to reflect changes in value that may have occurred between the close of the primary market or exchange on which the security is traded and the Fund’s pricing time. That factor may be derived using observable inputs such as a comparison of the trading patterns of a foreign security to intraday trading in the U.S. markets that are highly correlated to the foreign security or other information that becomes available after the close of the foreign market on which the security principally traded. When fair value pricing is employed, the prices of securities used by a Fund to calculate its net asset value may differ from market quotations, official closing prices or evaluated prices for the same securities, which means that the Fund may value those securities higher or lower than another given fund that uses market quotations, official closing prices or evaluated prices supplied by a pricing vendor in its calculation of net asset value. Securities valued using observable inputs, such as those described above, are normally categorized as Level 2 of the fair value hierarchy.
81
Harbor International & Global Funds
Notes to Financial Statements—Continued
Note 2—Significant Accounting Policies—Continued
Fair Value Measurements and Disclosures
Various inputs may be used to determine the value of each Fund’s investments, which are summarized in three broad categories defined as Level 1, Level 2, and Level 3. The inputs or methodologies used for valuing securities are not necessarily indicative of the risk associated with investing in those securities. The assignment of an investment to Levels 1, 2, or 3 is based on the lowest level of significant inputs used to determine its fair value.
Level 1– | Quoted prices in active markets for identical securities. |
Level 2– | Other significant observable inputs (including quoted prices for similar securities, interest rates, prepayment speeds, credit risk, etc.). |
Level 3– | Significant unobservable inputs are used in situations where quoted prices or other observable inputs are not available or are deemed unreliable. Significant unobservable inputs may include each Fund’s own assumptions. |
A table that includes a categorization of investments into Levels 1, 2, or 3, and a summary of significant unobservable inputs used for Level 3 investments, when applicable, can be found at the end of each Fund’s Portfolio of Investments schedule. For fair valuations using significant unobservable inputs, if any, a reconciliation of the beginning to ending balances for reported fair values is provided at the end of each Fund’s Portfolio of Investments schedule that presents changes attributable to realized and unrealized gains and losses and purchases, sales, and transfers in/out of the Level 3 category during the period.
Each Fund used observable inputs in its valuation methodologies whenever they were available and deemed reliable.
Participatory Notes
Participatory notes are equity-linked securities which can be used to gain exposure to emerging markets. These instruments represent interests in securities listed on certain foreign exchanges and thus present similar risks to investing directly in such equity securities. These instruments are issued by a broker-dealer evidencing ownership of shares listed on a foreign stock exchange. Accordingly, the participatory notes also expose investors to counterparty risk which is the risk that the entity issuing the note may not be able to honor its financial commitments. A Fund’s participatory notes are not subject to any master netting agreements. Participatory notes may be more volatile and less liquid than holding the underlying security directly. A participatory note is intended to reflect the performance of the underlying equity securities on a one-to-one basis. A Fund is entitled to receive dividends or other distributions paid on the underlying securities from the broker-dealer. A Fund however is not entitled to the same rights as an owner of the underlying securities, such as voting rights.
During the period, Harbor Emerging Markets Equity Fund invested in participatory notes to gain exposure to certain foreign markets.
Warrants and Rights
Warrants are contracts that generally give the holder the right, but not the obligation, to buy a stated number of shares of common stock at a specified price at any time during the life of the warrant. Rights represent a privilege offered to holders of record of issued securities to subscribe (usually on a pro rata basis) for additional securities of the same class, of a different class or of a different issuer. Warrants and rights are typically written by the issuer of the security underlying the warrant or right. Although some warrants and rights may be non-transferable, others may be traded over-the-counter or on an exchange.
A Fund may acquire warrants or rights in order to gain exposure to the underlying security without owning the security, including, for example, cases where the Fund hopes to lock in the price today of a security it may wish to purchase in the future. In order for a warrant to be profitable, the market price of the underlying security must rise sufficiently above the exercise price to cover any premium and transaction costs. The value of a warrant or right may not necessarily change with the value of the underlying securities. When a Fund acquires warrants or rights, it runs the risk that it will lose its entire investment in the warrants or rights, unless the Fund exercises the warrant or right, acquires the underlying securities, or enters into a closing transaction before expiration. Warrants and rights cease to have value if they are not exercised prior to their expiration date. If the price of the underlying security does not rise to an extent sufficient to cover any premium and transaction costs, the Fund will lose part or all of its investment. Any premiums or purchase price paid for warrants or other rights that expire are treated as realized losses. If a Fund enters into a closing sale transaction, it realizes a gain or loss, depending on whether the proceeds from the sale are greater or less than the cost of the warrants or rights.
82
Harbor International & Global Funds
Notes to Financial Statements—Continued
Note 2—Significant Accounting Policies—Continued
Warrants or rights outstanding at the end of the period, if any, are disclosed at the end of each applicable Fund’s Portfolio of Investments and are included in “Purchased options” in the Statements of Assets and Liabilities. Realized gain/(loss) and unrealized appreciation/(depreciation) recognized during the period are included in “Purchased options” in the Statements of Operations.
During the period, Harbor International Fund, Harbor Diversified International All Cap Fund, and Harbor International Small Cap Fund held warrants/rights as a result of their investments in underlying securities.
Forward Currency Contracts
A forward currency contract is an agreement between two parties to buy and sell currencies at a set price on a future date.
The forward currency contract is marked-to-market daily and the change in fair value is recorded as an unrealized gain or loss. When the contract is closed, the Fund records a realized gain or loss equal to the difference between the value on the open and close date. Risk of losses may arise from changes in the value of the foreign currency, or if the counterparties do not perform under the contract’s terms. The maximum potential loss from such contracts is the aggregate face value in U.S. dollars at the time the contract was opened.
During the period, Harbor Diversified International All Cap Fund, Harbor International Small Cap Fund, and Harbor Global Leaders Fund used forward currency contracts to manage their exposure to changes in exchange rates or as a hedge against foreign exchange risk related to specific transactions or portfolio positions.
Foreign Currency Spot Contracts
A foreign currency spot contract is an agreement between two parties to buy and sell currencies at the current market rate for settlement within two business days.
The foreign currency spot contract is marked-to-market daily for settlements beyond one day, and any change in fair value is recorded as an unrealized gain or loss. When the contract is closed, the Fund records a realized gain or loss equal to the difference between the value on the open and close date. Risk of losses may arise from changes in the value of the foreign currency or if the counterparties do not perform under the contract’s terms. The maximum potential loss from such contracts is the aggregate face value in U.S. dollars at the time the contract was opened.
During the period, each Fund used foreign currency spot contracts to facilitate transactions in foreign securities or to convert foreign currency receipts into U.S. dollars.
Foreign Currency Translations
Purchases and sales of securities are translated into U.S. dollars at the current exchange rate on the respective dates of the transactions. Income and withholding taxes are translated at the prevailing exchange rate when accrued or incurred. The accounting records of the Funds are maintained in U.S. dollars. Investment securities and other assets and liabilities denominated in a foreign currency, when applicable, are translated into U.S. dollars based on the current exchange rates at period end.
Reported net realized gains and losses on foreign currency transactions, when applicable, represent net gains and losses from sales and maturities of foreign currency contracts, disposition of foreign currencies, currency gains and losses realized between the trade and settlement dates on securities transactions, and the difference between the amount of investment income accrued and tax reclaims receivable and the U.S. dollar amount actually received. The effects of changes in foreign currency exchange rates on investments in securities, when applicable, are included in the net realized and unrealized gain or loss on investments in the Statements of Operations.
83
Harbor International & Global Funds
Notes to Financial Statements—Continued
Note 2—Significant Accounting Policies—Continued
Investment Income
Dividends declared on portfolio securities are accrued on the ex-dividend date. For foreign securities, certain dividends are recorded after the ex-dividend date, but as soon as the respective Fund is notified of such dividends. Interest income is accrued daily as earned. Discounts and premiums on fixed income securities are amortized over the life of the respective securities using the effective yield method. Distributions from real estate investment trust securities are recorded as dividend income, and maybe reclassified as capital gains and/or return of capital, based on the information reported by the issuer, when available.
Distribution to Shareholders
Distributions on Fund shares are recorded on the ex-dividend date.
Securities Transactions
Securities transactions are accounted for on the trade date (the date the order to buy or sell is executed). Realized gains or losses on security transactions are determined on the basis of identified cost.
Proceeds from Litigation
Each Fund may receive proceeds from shareholder litigation settlements involving current and/or previously held portfolio holdings. Any proceeds received from litigation involving portfolio holdings are reflected in the Statements of Operations in realized gain/(loss) if the security has been disposed of by a Fund, or in unrealized gain/(loss) if the security is still held by a Fund.
Expenses
Expenses incurred by the Trust are charged directly to the Fund that incurred such expense whenever possible. With respect to expenses incurred by any two or more Harbor Funds where amounts cannot be identified on a fund by fund basis, such expenses are generally allocated in proportion to the average net assets or the number of shareholders of each Fund.
Custodian
Each Fund has credit balance arrangements with its custodian whereby positive balances in demand deposit accounts used by the transfer and shareholder servicing agent for clearing shareholder transactions in the Fund generate credits that are applied against gross custody expenses. Such custodial expense reductions, if any, are reflected on the respective Fund’s accompanying Statement of Operations.
Class Allocations
Income, common expenses and realized and unrealized gains/(losses) are determined at the Fund level and allocated daily to each class of shares based on the applicable net assets of the respective classes. Distribution and service fees, if any, and transfer agent fees are calculated daily at the class level based on the applicable net assets of each class and the expense rate(s) applicable to each class.
Taxes
Each Fund is treated as a separate entity for federal tax purposes. Each Fund’s policy is to meet the requirements of Subchapter M of the Internal Revenue Code applicable to regulated investment companies and to distribute to its shareholders all of its taxable income within the prescribed time. It is also the intention of each Fund to distribute an amount sufficient to avoid imposition of any excise tax under Section 4982 of the Internal Revenue Code. Therefore, no provision has been made for federal taxes on income, capital gains or unrealized appreciation of securities held or excise taxes on income and capital gains.
Each Fund may be subject to taxes imposed by countries in which they invest. Such taxes are generally based on income and/or capital gains earned or repatriated. Taxes are accrued and applied to net investment income, net realized gains and unrealized appreciation as such income and/or gains are earned.
84
Harbor International & Global Funds
Notes to Financial Statements—Continued
Note 2—Significant Accounting Policies—Continued
Management has analyzed each Fund’s tax positions for all open tax years (in particular, U.S. federal income tax returns for the tax years ended October 31, 2015–2017), including all positions expected to be taken upon filing the 2018 tax return, in all material jurisdictions where each Fund operates, and has concluded that no provision for income tax is required in the Funds’ financial statements. Each Fund will recognize interest and penalties, if any, related to unrecognized tax benefits as income tax expense in the Statement of Operations.
Note 3—Investment Portfolio Transactions
Investment Portfolio Transactions
Purchases and sales of investments, other than short-term securities, for each Fund for the six-month period ended April 30, 2019 are as follows:
Purchases (000s) | Sales (000s) | ||
Harbor International Fund | $346,230 | $5,122,668 | |
Harbor Diversified International All Cap Fund | 125,667 | 64,522 | |
Harbor Overseas Fund | 30,672 | 5,626 | |
Harbor International Growth Fund | 31,599 | 60,820 | |
Harbor International Small Cap Fund | 38,731 | 11,812 | |
Harbor Global Leaders Fund | 30,328 | 18,116 | |
Harbor Emerging Markets Equity Fund | 27,367 | 27,958 |
Securities Lending
Each Fund may engage in securities lending, whereby a Fund lends its securities to financial institutions in order to increase its income. The Trust has engaged State Street Bank and Trust Company to act as its agent (the “Lending Agent”) with respect to the lending of portfolio securities of the Funds, pursuant to the terms and conditions of a Securities Lending Authorization Agreement (the “SLA Agreement”). Securities loans are required to be secured at all times during the term of the loan by collateral that is at least equal to the value of the loaned securities determined at the close of each business day. Collateral may consist of cash and/or securities issued by the U.S. Treasury or the Government National Mortgage Association. During the period, all such collateral consisted of cash. Any additional collateral that may be required to secure a loan is delivered to the Fund on the next business day. This collateral is recognized as the gross liability for securities loaned in the Statements of Assets and Liabilities. Cash collateral is invested in the State Street Navigator Securities Lending Government Money Market Portfolio (the “Navigator Portfolio”), a money market mutual fund that seeks to provide income while maintaining a stable net asset value of $1.00. There is no assurance that the Navigator Portfolio will maintain a stable net asset value and the Funds are subject to the risk of loss on the cash collateral invested. A portion of the earnings generated by the investment of the cash collateral is rebated to the borrower for the use of the cash collateral and these earnings (less any rebate) are then divided between the Fund and the Lending Agent, as a fee for its services, according to agreed-upon rates. The Lending Agent and a Fund will share in any shortfall in the rebate due to the borrower, according to agreed-upon rates. In addition to receiving a fee from the borrower based on the demand for securities loaned and earning income on the investment of the cash collateral, a Fund receives substitute interest, dividends, or other amounts on the loaned securities, during the term of a loan. Net securities lending income is disclosed as such in the Statements of Operations.
Loans may be terminated at the option of the borrower or the Funds. Upon termination of the loan, the borrower will return to the Fund securities that are identical to the loaned securities. The Funds bear the risk of delay in recovery of, or loss of rights in, the securities loaned and the risk that the value of the collateral falls below the value of the securities on loan. Each Fund seeks to mitigate this risk through the SLA Agreement, which provides that in the event of default, the Lending Agent may apply the proceeds of the cash collateral from the loaned securities toward the purchase of replacement securities. If such proceeds are insufficient or the collateral is unavailable, the Lending Agent will purchase replacement securities at its sole expense, or if unable to do so, the Lending Agent may credit to the Fund’s account an amount equal to the fair value of the unreturned loaned securities. As the securities loaned are subject to termination by the Fund or the borrower at any time, the remaining contractual maturities of each securities lending transaction is considered to be overnight and continuous.
85
Harbor International & Global Funds
Notes to Financial Statements—Continued
Note 3—Investment Portfolio Transactions—Continued
The following table shows the Harbor funds that engaged in securities lending during the period and summarizes the value of equity securities loaned and related cash collateral at April 30, 2019.
Market Value of Securities on Loan (000s) | Cash Collateral (000s) | ||
Harbor International Fund | $58,160 | $61,600 | |
Harbor Diversified International All Cap Fund | 13,828 | 14,480 | |
Harbor International Growth Fund | 20,452 | 21,349 | |
Harbor International Small Cap Fund | 620 | 663 | |
Harbor Global Leaders Fund | 1,387 | 1,428 |
Note 4—FEES AND OTHER Transactions with Affiliates
Investment Adviser
Harbor Capital is a wholly-owned subsidiary of ORIX Corporation (“ORIX”). Harbor Capital is the Funds’ investment adviser and is also responsible for administrative and other services.
Each Fund has a separate advisory agreement with Harbor Capital. The agreements provide for management fees based on an annual percentage rate of average daily net assets as follows:
Contractual Rate | Actual Rate | ||
Harbor International Fund | 0.75%, 0.65%a | 0.64% | |
Harbor Diversified International All Cap Fund | 0.75b | 0.54 | |
Harbor Overseas Fund | 0.75 | 0.75 | |
Harbor International Growth Fund | 0.75 | 0.75 | |
Harbor International Small Cap Fund | 0.85 | 0.85 | |
Harbor Global Leaders Fund | 0.75 | 0.75 | |
Harbor Emerging Markets Equity Fund | 0.95 | 0.95 |
a | The management fee rate is 0.75% on assets up to $12 billion and 0.65% on assets in excess of $12 billion. |
b | For the period November 1, 2018 to April 30, 2019, Harbor Capital voluntarily waived a portion of its management fee. |
Harbor Capital has from time to time voluntarily or contractually agreed not to impose a portion of its management fees and/or to bear a portion of the expenses incurred in the operation of certain Funds in order to limit Fund expenses. Such waivers, if any, are reflected on the accompanying Statements of Operations. Interest expense, if any, is excluded from contractual limitations. During the six-month period, the following expense limitation agreements were in effect:
Retirement Class | Institutional Class | Administrative Class | Investor Class | Expense Limitation Agreement Expiration Date | |||||
Harbor International Fund1 | 0.69% | 0.77% | 1.02% | 1.14% | 02/29/2020 | ||||
Harbor Diversified International All Cap Fund | 0.72 | 0.80 | 1.05 | 1.17 | 02/29/2020 | ||||
Harbor Overseas Fund | 0.77 | 0.85 | 1.10 | 1.22 | 02/29/2020 | ||||
Harbor International Growth Fund | 0.77 | 0.85 | 1.10 | 1.22 | 02/29/2020 | ||||
Harbor International Small Cap Fund2 | 0.88 | 0.96 | 1.21 | 1.33 | 02/29/2020 | ||||
Harbor Global Leaders Fund3 | 0.83 | 0.91 | 1.16 | 1.28 | 02/29/2020 | ||||
Harbor Emerging Markets Equity Fund4 | 1.08 | 1.16 | 1.41 | 1.53 | 02/29/2020 |
1 | For the period November 1, 2018 through February 28, 2019, Harbor Capital contractually agreed to further waive a portion of its management fee to limit the Fund’s operating expenses, excluding interest expense (if any), to 0.64%, 0.72%, 0.97%, and 1.09% for the Retirement Class, Institutional Class, Administrative Class, and Investor Class, respectively. |
2 | For the period November 1, 2018 through February 28, 2019, Harbor Capital contractually agreed to limit the operating expenses, excluding interest expense (if any), to 0.87%, 0.95%, 1.20%, and 1.32% for the Retirement Class, Institutional Class, Administrative Class, and Investor Class, respectively. |
3 | For the period November 1, 2018 through February 28, 2019, Harbor Capital contractually agreed to limit the operating expenses, excluding interest expense (if any), to 0.82%, 0.90%, 1.15%, and 1.27% for the Retirement Class, Institutional Class, Administrative Class, and Investor Class, respectively. |
4 | For the period November 1, 2018 through February 28, 2019, Harbor Capital contractually agreed to limit the operating expenses, excluding interest expense (if any), to 1.07%, 1.15%, 1.40%, and 1.52% for the Retirement Class, Institutional Class, Administrative Class, and Investor Class, respectively. |
86
Harbor International & Global Funds
Notes to Financial Statements—Continued
Note 4—FEES AND OTHER Transactions with Affiliates—Continued
All expense limitation agreements include the transfer agent fee waiver discussed in the Transfer Agent note.
Distributor
Harbor Funds Distributors, Inc. (the “Distributor”), a wholly-owned subsidiary of Harbor Capital, is the distributor for Harbor Funds’ shares. Under the Trust’s current distribution plan pursuant to Rule 12b-1 under the Investment Company Act with respect to each Fund’s Administrative and Investor Class shares (the “12b-1 Plan”) as applicable, each Fund pays the Distributor compensation at the annual rate of 0.25% of the average daily net assets of its Administrative and Investor Class shares. Pursuant to the 12b-1 Plan, the Distributor is compensated for financing any activity that is primarily intended to result in the sale of Administrative and Investor Class shares of each Fund or for recordkeeping services or the servicing of shareholder accounts in the Administrative and Investor Class shares of each Fund. Such activities include, but are not limited to: printing of prospectuses and statements of additional information and reports for prospective shareholders (i.e., other than existing shareholders); preparation and distribution of advertising material and sales literature; expenses of organizing and conducting sales seminars; supplemental payments to dealers or other institutions such as asset-based sales charges, payments of recordkeeping fees under recordkeeping arrangements, or payments of service fees under shareholder service arrangements; and costs of administering the 12b-1 Plan.
Amounts payable by a Fund under the 12b-1 Plan need not be directly related to the expenses actually incurred by the Distributor on behalf of each Fund. The 12b-1 Plan does not obligate each Fund to reimburse the Distributor for the actual expenses the Distributor may incur in fulfilling its obligations under the 12b-1 Plan. Thus, even if the Distributor’s actual expenses exceed the fee payable to the Distributor at any given time, each Fund will not be obligated to pay more than that fee. If the Distributor’s expenses are less than the fee it receives, the Distributor will retain the difference.
The fees attributable to each Fund’s respective class are shown on the accompanying Statements of Operations.
Transfer Agent
Harbor Services Group, Inc. (“Harbor Services Group”), a wholly-owned subsidiary of Harbor Capital, is the transfer and shareholder servicing agent for the Funds. The transfer agency and service agreement is reviewed and approved annually by the Board of Trustees and provides currently for compensation up to the following amounts per class of each Fund:
Transfer Agent Fees1 | |
Retirement Class | 0.02% of the average daily net assets of all Retirement Class shares |
Institutional Class | 0.10% of the average daily net assets of all Institutional Class shares |
Administrative Class | 0.10% of the average daily net assets of all Administrative Class shares |
Investor Class | 0.22% of the average daily net assets of all Investor Class shares |
1 | For the period November 1, 2018 through February 28, 2019, Harbor Services Group received compensation up to 0.01%, 0.09%, 0.09%, and 0.21% for the Retirement Class, Institutional Class, Administrative Class, and Investor Class, respectively. |
Harbor Services Group has voluntarily waived a portion of its transfer agent fees during the six-month period ended April 30, 2019. Fees incurred for these transfer agent services are shown on each Fund’s Statement of Operations. The voluntary waiver may be discontinued at any time.
Affiliated Transactions
The Investment Company Act permits purchase and sale transactions among affiliated investment companies subject to an exemptive rule. Harbor Funds has adopted policies and procedures pursuant to such rule. During the six-month period, the Funds did not enter into any transactions with any other Harbor fund.
87
Harbor International & Global Funds
Notes to Financial Statements—Continued
Note 4—FEES AND OTHER Transactions with Affiliates—Continued
Shareholders
On April 30, 2019, Harbor Capital, and its wholly owned subsidiaries, collectively held the following shares of beneficial interest in each of the following Funds:
Number of Shares Owned by Harbor Capital and Subsidiaries | Percentage of Outstanding Shares | ||||||||||
Retirement Class | Institutional Class | Administrative Class | Investor Class | Total | |||||||
Harbor International Fund | 23,640 | — | — | — | 23,640 | 0.0% | |||||
Harbor Diversified International All Cap Fund | 99,943 | — | — | — | 99,943 | 0.1 | |||||
Harbor Overseas Fund | 1,248,500 | 1,248,500 | — | 3,000 | 2,500,000 | 98.8 | |||||
Harbor International Growth Fund | 80,068 | — | — | — | 80,068 | 0.2 | |||||
Harbor International Small Cap Fund | 54,130 | 1,549,670 | 25,976 | 25,888 | 1,655,664 | 22.8 | |||||
Harbor Global Leaders Fund | 38,791 | 479,463 | 26,458 | 26,478 | 571,190 | 21.3 | |||||
Harbor Emerging Markets Equity Fund | 80,433 | — | — | — | 80,433 | 1.1 |
Independent Trustees
The fees and expenses of the Independent Trustees are included in “Trustees’ fees and expenses” on each Fund’s Statement of Operations.
The Board of Trustees has adopted a Deferred Compensation Plan for Independent Trustees (the “Plan”), which enables Trustees to elect to defer receipt of all or a portion of the annual compensation they are entitled to receive from the Trust. For purposes of determining the amount owed to a Trustee under the Plan, deferred amounts are treated as though they had been invested in shares of the Fund(s) selected by the Trustee. While not required to do so, each Fund makes an investment equal to the Trustee’s investment election. The deferred compensation liability and the offsetting deferred compensation investment asset are included as a component of “Accrued expenses – Trustees’ fees and expenses” and “Other assets”, respectively, in the Statements of Assets and Liabilities. Such amounts fluctuate with changes in the market value of the selected securities. The deferred compensation and related mark-to-market impact liability and an offsetting investment asset will remain on each Fund’s Statement of Assets and Liabilities until distributed in accordance with the Plan.
Indemnification
Under the Trust’s organizational documents, its officers and Trustees are indemnified against certain liabilities arising out of the performance of their duties to the Trust. In addition, in the normal course of business the Trust enters into contracts that provide general indemnities to other parties. The Trust’s maximum exposure under these arrangements is unknown as this would involve future claims that may be made against the Trust that have not yet occurred. The risk of material loss as a result of such indemnification claims is considered remote.
88
Harbor International & Global Funds
Notes to Financial Statements—Continued
NOTE 5—TAX INFORMATION
The identified cost for federal income tax purposes of investments owned by each Fund and its respective gross unrealized appreciation and depreciation at April 30, 2019 are as follows:
Identified Cost (000s) | Gross Unrealized | Net Unrealized Appreciation/ (Depreciation) (000s) | |||||
Appreciation (000s) | (Depreciation) (000s) | ||||||
Harbor International Fund | $7,204,003 | $544,787 | $(510,922) | $33,865 | |||
Harbor Diversified International All Cap Fund | 780,372 | 55,900 | (48,143) | 7,757 | |||
Harbor Overseas Fund | 25,186 | 902 | (482) | 420 | |||
Harbor International Growth Fund* | 512,895 | 94,593 | (24,580) | 70,013 | |||
Harbor International Small Cap Fund | 84,795 | 6,644 | (3,498) | 3,146 | |||
Harbor Global Leaders Fund | 59,831 | 18,477 | (142) | 18,335 | |||
Harbor Emerging Markets Equity Fund* | 70,544 | 12,786 | (3,558) | 9,228 |
* | Capital loss carryforwards are available, which may reduce taxable income from future net realized gain on investments. |
Note 6—Derivatives
Each Fund’s derivative holdings do not qualify for hedge accounting treatment and as such are recorded at current fair value. For a discussion of risks related to these investments please refer to the descriptions of each type of derivative instrument in Note 2— Significant Accounting Policies.
Each Fund’s derivative instruments outstanding as of the six-month period ended April 30, 2019, if any, as disclosed in the Portfolios of Investments, and the related amounts of realized and changes in unrealized gains and losses on derivative instruments during the period as disclosed in the Statements of Operations, are indicators of the volume of derivative activity for each Fund.
Derivative Instruments
At April 30, 2019, the fair values of derivatives, by primary risk exposure, were reflected in the Statement of Assets and Liabilities as follows:
HARBOR INTERNATIONAL FUND
Statement of Assets and Liabilities Caption | Equity Contracts (000s) | Foreign Exchange Contracts (000s) | ||
Purchased options (warrants/rights) | $514 | $— |
HARBOR DIVERSIFIED INTERNATIONAL ALL CAP FUND
Statement of Assets and Liabilities Caption | Equity Contracts (000s) | Foreign Exchange Contracts (000s) | ||
Purchased options (warrants/rights) | $127 | $— | ||
Unrealized appreciation on open forward currency contracts | — | 2 |
89
Harbor International & Global Funds
Notes to Financial Statements—Continued
Note 6—Derivatives—Continued
HARBOR INTERNATIONAL SMALL CAP FUND
Statement of Assets and Liabilities Caption | Equity Contracts (000s) | Foreign Exchange Contracts (000s) | ||
Unrealized appreciation on open forward currency contracts | $— | $6 | ||
Unrealized depreciation on open forward currency contracts | — | (1) |
HARBOR GLOBAL LEADERS FUND
Statement of Assets and Liabilities Caption | Equity Contracts (000s) | Foreign Exchange Contracts (000s) | ||
Unrealized appreciation on open forward currency contracts | $— | $— |
The change in net unrealized appreciation/(depreciation) and net realized gain/(loss) on derivatives, by primary risk exposure, for the six-month period ended April 30, 2019, were:
HARBOR INTERNATIONAL FUND
Net realized gain/(loss) on derivatives | Equity Contracts (000s) | Foreign Exchange Contracts (000s) | ||
Purchased options (warrants/rights) | $(11,002) | $— | ||
Forward currency contracts | — | — | ||
Net realized gain/(loss) on derivatives | $(11,002) | $— |
Change in net unrealized appreciation/(depreciation) on derivatives | Equity Contracts (000s) | Foreign Exchange Contracts (000s) | ||
Purchased options (warrants/rights) | $11,379 | $— | ||
Forward currency contracts | — | — | ||
Change in net unrealized appreciation/(depreciation) on derivatives | $11,379 | $— |
HARBOR DIVERSIFIED INTERNATIONAL ALL CAP FUND
Net realized gain/(loss) on derivatives | Equity Contracts (000s) | Foreign Exchange Contracts (000s) | ||
Purchased options (warrants/rights) | $1 | $— | ||
Forward Currency Contracts | — | — | ||
Net realized gain/(loss) on derivatives | $1 | $— |
Change in net unrealized appreciation/(depreciation) on derivatives | Equity Contracts (000s) | Foreign Exchange Contracts (000s) | ||
Purchased options (warrants/rights) | $126 | $— | ||
Forward currency contracts | — | 2 | ||
Change in net unrealized appreciation/(depreciation) on derivatives | $126 | $2 |
90
Harbor International & Global Funds
Notes to Financial Statements—Continued
Note 6—Derivatives—Continued
HARBOR INTERNATIONAL SMALL CAP FUND
Net realized gain/(loss) on derivatives | Equity Contracts (000s) | Foreign Exchange Contracts (000s) | ||
Purchased options (warrants/rights) | $63 | $— | ||
Forward currency contracts | — | — | ||
Net realized gain/(loss) on derivatives | $63 | $— |
Change in net unrealized appreciation/(depreciation) on derivatives | Equity Contracts (000s) | Foreign Exchange Contracts (000s) | ||
Purchased options (warrants/rights) | $— | $— | ||
Forward currency contracts | — | 5 | ||
Change in net unrealized appreciation/(depreciation) on derivatives | $— | $5 |
Note 7—Subsequent Events
Effective May 23, 2019, the Board of Trustees of Harbor Funds appointed Cedar Street Asset Management LLC (“Cedar Street”) to serve as the subadviser to Harbor International Small Cap Fund. Cedar Street replaced Baring International Investment Limited as subadviser to the Fund. There were no other subsequent events or transactions that would have materially impacted the financial statements or related disclosures as presented herein.
91
Harbor International & Global Funds
Fees and Expenses Example (Unaudited)
Example
As a shareholder of a Fund, you incur two types of costs: (1) transaction costs, including redemption fees (if any) and (2) ongoing costs, including management fees, distribution and service (12b-1) fees (if any), and other Fund expenses. This example is intended to help you understand your ongoing costs (in dollars) of investing in a Fund and to compare these costs with the ongoing costs of investing in other mutual funds.
The example is based on an investment of $1,000 invested at the beginning of the period and held for the entire period November 1, 2018 through April 30, 2019.
Actual Expenses
The first line of the table below provides information about actual account values and actual expenses for each share class. You may use the information in the respective class line, together with the amount you invested, to estimate the expenses that you paid over the period. Simply divide your account value by $1,000 (for example, an $8,600 account value divided by $1,000 = 8.6), then multiply the result by the number in the first line of the respective class under the heading entitled “Expenses Paid During Period” to estimate the expenses you paid on your account during this period.
Hypothetical Example for Comparison Purposes
The second line of the table for each share class below provides information about hypothetical account values and hypothetical expenses based on the respective Fund/Class’s actual expense ratio and an assumed rate of return of 5% per year before expenses, which is not the respective Fund/Class’s actual return. The hypothetical account values and expenses may not be used to estimate the actual ending account balance or expenses you paid for the period. You may use this information to compare the ongoing costs of investing in a Fund to other funds. To do so, compare this 5% hypothetical example with the 5% hypothetical examples that appear in the shareholder reports of the other funds.
Please note that the expenses shown in the table are meant to highlight your ongoing costs only and do not reflect any transactional costs, such as redemption fees. Therefore, the second line of the table is useful in comparing ongoing costs only, and will not help you determine the relative total costs of owning different funds. In addition, if these transactional costs were included, your costs would have been higher.
Annualized Expense Ratios* | Expenses Paid During Period** | Beginning Account Value November 1, 2018 | Ending Account Value April 30, 2019 | |||||
Harbor International Fund | ||||||||
Retirement Class | 0.66% | |||||||
Actual | $3.39 | $1,000 | $1,074.60 | |||||
Hypothetical (5% return) | 3.31 | 1,000 | 1,021.44 | |||||
Institutional Class | 0.73% | |||||||
Actual | $3.75 | $1,000 | $1,074.20 | |||||
Hypothetical (5% return) | 3.66 | 1,000 | 1,021.08 | |||||
Administrative Class | 0.99% | |||||||
Actual | $5.09 | $1,000 | $1,073.00 | |||||
Hypothetical (5% return) | 4.96 | 1,000 | 1,019.76 | |||||
Investor Class | 1.11% | |||||||
Actual | $5.70 | $1,000 | $1,072.40 | |||||
Hypothetical (5% return) | 5.56 | 1,000 | 1,019.15 |
92
Harbor International & Global Funds
Fees and Expenses Example—Continued
Annualized Expense Ratios* | Expenses Paid During Period** | Beginning Account Value November 1, 2018 | Ending Account Value April 30, 2019 | |||||
Harbor Diversified International All Cap Fund | ||||||||
Retirement Class | 0.67% | |||||||
Actual | $3.47 | $1,000 | $1,092.80 | |||||
Hypothetical (5% return) | 3.36 | 1,000 | 1,021.39 | |||||
Institutional Class | 0.75% | |||||||
Actual | $3.89 | $1,000 | $1,092.00 | |||||
Hypothetical (5% return) | 3.76 | 1,000 | 1,020.98 | |||||
Administrative Class | 1.00% | |||||||
Actual | $5.18 | $1,000 | $1,090.70 | |||||
Hypothetical (5% return) | 5.01 | 1,000 | 1,019.71 | |||||
Investor Class | 1.12% | |||||||
Actual | $5.80 | $1,000 | $1,090.20 | |||||
Hypothetical (5% return) | 5.61 | 1,000 | 1,019.10 | |||||
Harbor Overseas Fund | ||||||||
Retirement Class | 0.77% | |||||||
Actual*** | $1.30 | $1,000 | $1,020.00 | |||||
Hypothetical (5% return) | 1.29 | 1,000 | 1,007.06 | |||||
Institutional Class | 0.85% | |||||||
Actual*** | $1.43 | $1,000 | $1,020.00 | |||||
Hypothetical (5% return) | 1.43 | 1,000 | 1,006.92 | |||||
Investor Class | 1.22% | |||||||
Actual*** | $2.06 | $1,000 | $1,019.00 | |||||
Hypothetical (5% return) | 2.05 | 1,000 | 1,006.30 | |||||
Harbor International Growth Fund | ||||||||
Retirement Class | 0.77% | |||||||
Actual | $4.12 | $1,000 | $1,156.50 | |||||
Hypothetical (5% return) | 3.86 | 1,000 | 1,020.88 | |||||
Institutional Class | 0.85% | |||||||
Actual | $4.55 | $1,000 | $1,155.60 | |||||
Hypothetical (5% return) | 4.26 | 1,000 | 1,020.47 | |||||
Administrative Class | 1.10% | |||||||
Actual | $5.87 | $1,000 | $1,154.40 | |||||
Hypothetical (5% return) | 5.51 | 1,000 | 1,019.20 | |||||
Investor Class | 1.22% | |||||||
Actual | $6.52 | $1,000 | $1,154.00 | |||||
Hypothetical (5% return) | 6.11 | 1,000 | 1,018.59 | |||||
Harbor International Small Cap Fund | ||||||||
Retirement Class | 0.87% | |||||||
Actual | $4.43 | $1,000 | $1,056.60 | |||||
Hypothetical (5% return) | 4.36 | 1,000 | 1,020.37 | |||||
Institutional Class | 0.95% | |||||||
Actual | $4.84 | $1,000 | $1,056.70 | |||||
Hypothetical (5% return) | 4.76 | 1,000 | 1,019.97 | |||||
Administrative Class | 1.20% | |||||||
Actual | $6.11 | $1,000 | $1,054.90 | |||||
Hypothetical (5% return) | 6.01 | 1,000 | 1,018.70 | |||||
Investor Class | 1.32% | |||||||
Actual | $6.73 | $1,000 | $1,053.70 | |||||
Hypothetical (5% return) | 6.60 | 1,000 | 1,018.09 |
93
Harbor International & Global Funds
Fees and Expenses Example—Continued
Annualized Expense Ratios* | Expenses Paid During Period** | Beginning Account Value November 1, 2018 | Ending Account Value April 30, 2019 | |||||
Harbor Global Leaders Fund | ||||||||
Retirement Class | 0.82% | |||||||
Actual | $4.41 | $1,000 | $1,168.50 | |||||
Hypothetical (5% return) | 4.11 | 1,000 | 1,020.63 | |||||
Institutional Class | 0.90% | |||||||
Actual | $4.83 | $1,000 | $1,167.90 | |||||
Hypothetical (5% return) | 4.51 | 1,000 | 1,020.22 | |||||
Administrative Class | 1.15% | |||||||
Actual | $6.18 | $1,000 | $1,166.80 | |||||
Hypothetical (5% return) | 5.76 | 1,000 | 1,018.95 | |||||
Investor Class | 1.27% | |||||||
Actual | $6.82 | $1,000 | $1,166.00 | |||||
Hypothetical (5% return) | 6.36 | 1,000 | 1,018.34 | |||||
Harbor Emerging Markets Equity Fund | ||||||||
Retirement Class | 1.07% | |||||||
Actual | $5.71 | $1,000 | $1,150.50 | |||||
Hypothetical (5% return) | 5.36 | 1,000 | 1,019.36 | |||||
Institutional Class | 1.15% | |||||||
Actual | $6.13 | $1,000 | $1,149.70 | |||||
Hypothetical (5% return) | 5.76 | 1,000 | 1,018.95 | |||||
Administrative Class | 1.40% | |||||||
Actual | $7.50 | $1,000 | $1,162.50 | |||||
Hypothetical (5% return) | 7.00 | 1,000 | 1,017.68 | |||||
Investor Class | 1.52% | |||||||
Actual | $8.09 | $1,000 | $1,147.20 | |||||
Hypothetical (5% return) | 7.60 | 1,000 | 1,017.07 |
* | Reflective of all fee waivers and expense reimbursements |
** | Expenses are equal to the Fund’s annualized expense ratio, multiplied by the average account value over the period, multiplied by 181/365 (to reflect the one-half year period). |
*** | Fund has less than six months of operating history. Expenses are equal to the Class' annualized net expense ratio, multiplied by the average account value over the period, multiplied by 61/365 (to reflect the period since the commencement of operations). The expense amounts reported under Hypothetical (5% return) are not comparable to the amounts reported using actual fund return. |
94
Harbor International & Global Funds
Additional Information (Unaudited)
Proxy Voting
Harbor Funds has adopted Proxy Voting Policies and Procedures under which proxies relating to securities held by the Harbor funds are voted. In addition, Harbor Funds files Form N-PX, with its complete proxy voting record for the 12 months ended June 30th, no later than August 31st of each year. A description of Harbor Funds’ Proxy Voting Policies and Procedures and the proxy voting records (Form N-PX) are available (i) without charge, upon request, by calling Harbor Funds toll-free at 800-422-1050; (ii) on Harbor Funds’ website atharborfunds.com; and (iii) on the SEC’s website at sec.gov.
Householding
Harbor Funds has adopted a policy that allows it to send only one copy of a Fund’s prospectus, proxy materials, annual report and semi-annual report to certain shareholders residing at the same household. This reduces Fund expenses, which benefits you and other shareholders. If you need additional copies or do not want your mailings to be “householded,” please call the Shareholder Servicing Agent at 800-422-1050. Individual copies will be sent within thirty (30) days after the Shareholder Servicing Agent receives your instructions. Your consent to householding is considered valid until revoked.
Quarterly Portfolio Disclosures
Harbor Funds files a complete portfolio of investments with the SEC for the first and third quarters of each fiscal year. In 2019, the Funds filed a complete portfolio of investments for the first fiscal quarter on Form N-Q. Beginning with the third fiscal quarter of 2019, the Funds will file a complete portfolio of investments with the SEC on Form N-PORT. The Funds’ Forms N-Q and N-PORT are available (i) without charge, upon request, by calling Harbor Funds toll-free at 800-422-1050, (ii) on Harbor Funds’ website atharborfunds.com, and (iii) on the SEC’s website at sec.gov.
ADVISORY AGREEMENT APPROVALS
FACTORS CONSIDERED BY THE TRUSTEES IN APPROVING THE INVESTMENT ADVISORY AGREEMENTS AND SUBADVISORY AGREEMENTS OF THE international & Global FUNDS
The Investment Company Act of 1940, as amended, requires that the Investment Advisory and Subadvisory Agreement of each Fund be approved initially, and following an initial two-year term, at least annually, by the Harbor Funds Board of Trustees (the “Board” or the “Trustees”), including a majority of the Independent Trustees voting separately.
At an in-person meeting of the Board held on February 15 and 16, 2019 (the “Meeting”), the Board, including all of the Independent Trustees voting separately, considered and approved the continuation of each Investment Advisory Agreement with Harbor Capital Advisors, Inc., the adviser to each Fund (the “Adviser” or “Harbor Capital”), and each Subadvisory Agreement with each Fund’s subadviser (each, a “Subadviser”) with respect to Harbor International Fund (Investment Advisory Agreement only), Harbor Diversified International All Cap Fund, Harbor International Growth Fund, Harbor International Small Cap Fund, Harbor Global Leaders Fund, and Harbor Emerging Markets Equity Fund. The Board noted that the Subadvisory Agreement with Marathon Asset Management LLP (“Marathon-London”) with respect to Harbor International Fund was approved for an initial two-year term by the Board at an in-person meeting held on August 14 and 15, 2018 and will remain in effect until August 22, 2020.
In evaluating each Investment Advisory Agreement and each Subadvisory Agreement, the Trustees reviewed materials furnished by the Adviser and each Subadviser, including information about their respective affiliates, personnel, and operations, and also relied upon their knowledge of the Adviser and Subadvisers resulting from their quarterly meetings, periodic telephonic meetings and other prior communications. In connection with the Meeting, which had been called for the purpose of considering the continuation of the Investment Advisory Agreements and Subadvisory Agreements, and at prior meetings, the Trustees, including the Independent Trustees, requested and received materials and presentations relating to Fund performance and the services rendered by the Adviser and each Subadviser. The Trustees also discussed with representatives of the Adviser, at the Meeting and at prior meetings, Harbor Funds’ operations and the Adviser’s ability, consistent with the “manager of managers” structure of Harbor Funds, to (i) identify and recommend to the Trustees a subadviser for each Fund, (ii) monitor and oversee the performance and investment capabilities of each Subadviser, and (iii) recommend the replacement of a subadviser where appropriate. The Trustees specifically considered the Adviser’s history as a manager-of-managers, including its history of replacing subadvisers for particular Funds in circumstances in which the Board and the Adviser had determined that a change in subadviser was in the best interests of a Fund and its shareholders, whether as a result of (i) long-term underperformance not explained
95
Harbor International & Global Funds
Additional Information—Continued
ADVISORY AGREEMENT APPROVALS—Continued
by market conditions or market cycles relative to the subadviser’s investment style, (ii) prolonged style inconsistency, (iii) material adverse changes in management or personnel, or (iv) other factors, such as if the Adviser were to identify another subadviser believed to better serve the shareholders than the existing subadviser.
At the Meeting, the Trustees, including all of the Independent Trustees voting separately, determined, in the exercise of their business judgment, that the terms of each Investment Advisory Agreement and each Subadvisory Agreement were fair and reasonable and approved the continuation for a one-year period of each such Investment Advisory Agreement and Subadvisory Agreement as being in the best interests of each Fund and its shareholders.
In their deliberations, the Independent Trustees had the opportunity to meet privately without representatives of the Adviser or any Subadviser present and were represented throughout the process by legal counsel to the Independent Trustees and the Funds.
In considering the approval of each Fund’s Investment Advisory Agreement and Subadvisory Agreement, as applicable, the Board, including the Independent Trustees, evaluated a number of factors it considered relevant to its determination. The Board did not identify any single factor as all-important or controlling, and individual Trustees did not necessarily attribute the same weight or importance to each factor.
Among the factors considered by the Trustees in approving the Investment Advisory Agreements and Subadvisory Agreements were the following:
• | the nature, extent, and quality of the services provided by the Adviser and each Subadviser, including the background, education, expertise and experience of the investment professionals of the Adviser and each Subadviser providing services to the Funds; |
• | the favorable history, reputation, qualifications and background of the Adviser and each Subadviser, as well as the qualifications of their respective personnel; |
• | the profitability of the Adviser with respect to each Fund, including the effect of revenues of Harbor Services Group, Inc. (“Harbor Services Group”), the Funds’ transfer agent, and Harbor Funds Distributors, Inc. (“Harbor Funds Distributors”), the Funds’ principal underwriter, on such profitability; |
• | the fees charged by the Adviser and Subadvisers for investment advisory and subadvisory services, respectively, including, in each case, the portion of the fee to be retained by the Adviser, after payment of the Subadviser’s fee, for the investment advisory and related services, including investment, business, legal, compliance, financial and administrative services, that the Adviser provides; |
• | the extent to which economies of scale might be realized as each Fund grows, and the extent to which each Fund’s advisory fee level reflects any economies of scale for the benefit of Fund investors; |
• | the fees and expense ratios of each Fund relative to the quality of services provided and the fees and expense ratios of similar investment companies; |
• | the short- and long-term investment performance of each Fund in comparison to peer groups and certain relevant benchmark indices and the Adviser’s efforts to address circumstances of underperformance where applicable; |
• | the compensation received by Harbor Services Group and Harbor Funds Distributors in consideration of the services each provides to the Funds; |
• | any “fall out” benefits that might inure to the Adviser and its affiliates as a result of their relationship with the Funds; |
• | information received at regular meetings throughout the year related to Fund performance and services rendered by the Adviser, as well as each of the Subadvisers, and research arrangements with brokers who execute transactions on behalf of each Subadviser; |
• | information contained in materials provided by the Adviser and compiled by Broadridge as to the investment returns, advisory fees and total expense ratios of the Institutional Class of each Fund (and, in certain cases, total expense ratios of the Investor Class) relative to those of other investment companies with similar objectives and strategies managed by other investment advisers, consisting both of a peer group of funds as well as a broader universe of funds compiled by Broadridge; and |
• | information contained in materials compiled by Morningstar as to the investment returns of the Institutional Class of each Fund relative to those of other investment companies with similar objectives and strategies managed by other investment advisers. |
96
Harbor International & Global Funds
Additional Information—Continued
ADVISORY AGREEMENT APPROVALS—Continued
Nature, Extent, and Quality of Services
The Trustees separately considered the nature, extent, and quality of the services provided by the Adviser and each Subadviser. In their deliberations as to the approval of each Fund’s Investment Advisory Agreement and Subadvisory Agreement, the Trustees were mindful of the fact that, by choosing to invest in a Fund, the shareholders had entrusted the Adviser with the responsibility, subject to the approval of the Trustees, for selecting each Fund’s Subadviser, overseeing and monitoring that Subadviser’s performance and replacing the Subadviser if necessary. The Trustees also considered as relevant to their determination the favorable history, reputation, qualifications and background of the Adviser and each Subadviser, as well as the qualifications of their respective personnel.
The Adviser’s Services. The Board evaluated the nature, extent, and quality of the Adviser’s services in light of the Board’s experience with the Adviser, as well as materials provided by the Adviser as part of its comprehensive written response to the 15(c) request letter prepared by legal counsel to the Independent Trustees in consultation with the Independent Trustees concerning the financial and other resources devoted by the Adviser to Harbor Funds, including the breadth and depth of experience and expertise of the investment, accounting, administrative, legal and compliance professionals dedicated to Harbor Funds’ operations. The Trustees determined that the Adviser had the expertise and resources to identify, select, oversee and monitor each Subadviser and to operate effectively as the “manager of managers” for the Funds.
The Subadvisers’ Services. The Trustees’ consideration of the services provided by the Subadvisers included a review of each Subadviser’s portfolio managers, investment philosophy, style and processes and record of consistency therewith, the volatility of its results, its approach to controlling risk, and the quality and extent of its investment capabilities and resources, including the nature and extent of research it receives from broker-dealers (to the extent applicable) and other sources. In their deliberations with respect to each Fund, the Trustees considered the history of Harbor Funds’ relationship with each Subadviser and Harbor Funds’ experience with each Subadviser in this capacity.
The Trustees also considered each Subadviser’s breadth and depth of experience and investment results in managing other accounts similar to the respective Fund. The Trustees had received presentations by investment professionals from the Subadvisers for Harbor International Fund, Harbor Diversified International All Cap Fund, Harbor International Growth Fund, Harbor International Small Cap Fund, Harbor Global Leaders Fund, and Harbor Emerging Markets Equity Fund at meetings of the Board of Trustees held in 2018. The Trustees reviewed information concerning each Subadviser’s historical investment results in managing accounts and/or funds, as applicable, in a manner substantially similar to the relevant Fund.
Investment Performance, Advisory Fees and Expense Ratios
In considering each Fund’s performance, advisory fees and expense ratio, the Trustees requested and received from the Adviser data compiled by Broadridge and Morningstar. The Trustees also received information explaining the methodology for compilation of certain of this information and what it was intended to demonstrate. The Trustees analyzed the Institutional Class performance of each Fund, the advisory fees of each Fund, and the Institutional Class expenses of each Fund (after giving effect to waivers and/or reimbursements, if applicable, that reduced the fees or expenses of the Fund or its peer funds) and made certain observations and findings as to each Fund as noted below. The Trustees also reviewed certain Investor Class fee and expense information they considered relevant to their deliberations. In evaluating performance, the Trustees recognized that the performance data reflects a snapshot of a period as of a particular date and that selecting a different performance period could produce significantly different results.
Harbor International Fund. The Trustees considered Harbor International Fund (inception date December 29, 1987), noting its underperformance relative to each of its Broadridge group and universe medians for the one-, three- and five-year periods ended December 31, 2018. The Morningstar data presented showed that the Fund’s one-, three- and five-year rolling returns as of December 31, 2018 each ranked in the fourth quartile. The Trustees also considered that the Fund had underperformed its benchmark, the MSCI EAFE® (ND) Index, for the one-, three- and five-year periods ended December 31, 2018. The Trustees noted the fact that Marathon-London had recently been appointed as the Fund’s subadviser and that the current subadvisory agreement for the Fund was considered and approved for an initial two-year term by the Trustees at an in-person meeting held on August 14-15, 2018.
The Trustees considered the expertise of Marathon-London in managing assets generally and in the strategy used with respect to the Fund specifically, noting that Marathon-London managed approximately $34.1 billion in this asset class, out of a firm-wide total of approximately $60.6 billion in assets under management. The Trustees also noted the experience of the Fund’s portfolio managers in this asset class and recent departures from the portfolio management team.
97
Harbor International & Global Funds
Additional Information—Continued
ADVISORY AGREEMENT APPROVALS—Continued
The Trustees noted that the Broadridge comparison of contractual management fees for the Fund’s expense group, assuming an asset level of $12.28 billion, showed the Fund’s management fee was below the group median for the Institutional Class. The actual total expense ratio for the Institutional Class was also below the group and universe median expense ratios. The Trustees observed that the advisory fee schedule included a contractual breakpoint reducing the fee rate from 75 basis points to 65 basis points on assets over $12 billion. The Trustees also considered that Harbor Capital had agreed to a contractual fee waiver/expense reimbursement arrangement with respect to the Fund that will be effective until at least February 29, 2020. The Trustees noted that Harbor Capital’s profitability in operating the Fund was not excessive.
Harbor Diversified International All Cap Fund. The Trustees considered Harbor Diversified International All Cap Fund (inception date November 2, 2015), noting that its Institutional Class performance was below its Broadridge group and universe medians for the one- and three-year periods ended December 31, 2018. The Trustees noted that the Fund’s Institutional Class performance was equal to its Broadridge group median and below its universe median for the since inception period ended December 31, 2018. The Morningstar data presented showed that the Fund’s one- and three-year and since inception rolling returns as of December 31, 2018 ranked in the first, third and second quartiles, respectively. The Trustees noted that the Fund had outperformed its benchmark, the MSCI ACWI ex. U.S. (ND) Index, for the one-year period and underperformed its benchmark index for the three-year and since inception periods ended December 31, 2018.
The Trustees considered the expertise of Marathon-London in managing assets generally and in the strategy used with respect to the Fund specifically, noting that Marathon-London managed approximately $5.25 billion in assets in this strategy, out of a firm-wide total of approximately $60.6 billion in assets under management. The Trustees also noted the experience of the Fund’s portfolio managers in this asset class and recent departures from the portfolio management team.
The Trustees noted that the Broadridge comparison of contractual management fees for the Fund’s expense group, assuming an asset level of $675 million, showed the Fund’s management fee was at the group median for the Institutional Class. The actual total expense ratio for the Fund’s Institutional Class was below the group and universe median expense ratios. The Trustees also considered that the Fund’s existing contractual fee waiver/expense reimbursement arrangement will continue until at least February 29, 2020. The Trustees noted that Harbor Capital’s profitability in operating the Fund was not excessive.
Harbor International Growth Fund. The Trustees considered Harbor International Growth Fund (inception date November 1, 1993), and observed that its Institutional Class performance exceeded its Broadridge group median for the one-, three- and five-year periods ended December 31, 2018. The Fund outperformed its Broadridge universe median for the three- and five-year periods ended December 31, 2018 and underperformed its universe median for the one-year period ended December 31, 2018. The Morningstar data presented showed that the Fund’s one-, three- and five-year rolling returns as of December 31, 2018 ranked in the fourth, third and third quartiles, respectively. The Trustees noted that the Fund had outperformed its benchmark, the MSCI ACWI ex. U.S. (ND) Index, for the five-year period ended December 31, 2018 and underperformed its benchmark index for the one- and three-year periods ended December 31, 2018.
The Trustees considered the expertise of Baillie Gifford Overseas Limited (“Baillie Gifford”) in managing assets generally and in the ACWI ex-US Focus strategy specifically, noting that Baillie Gifford managed approximately $9.6 billion in assets in this strategy, out of a firm-wide total of approximately $220.7 billion in assets under management. The Trustees also noted the experience of the Fund’s portfolio managers in this asset class.
The Trustees noted that the Broadridge comparison of contractual management fees for the Fund’s expense group, assuming an asset level of $550 million, showed the Fund’s management fee was below the group median for the Institutional Class. The actual total expense ratio for the Fund’s Institutional Class was also below the group and universe median expense ratios. The Trustees also considered that Harbor Capital had agreed to continue the Fund’s existing contractual fee waiver/expense reimbursement arrangement until at least February 29, 2020. The Trustees noted that the Adviser’s profitability in managing the Fund was not excessive.
Harbor International Small Cap Fund. The Trustees considered Harbor International Small Cap Fund (inception date February 1, 2016), and observed that its Institutional Class performance was above its Broadridge group and universe medians for the since inception period ended December 31, 2018. The Fund’s performance was below its Broadridge group median and at its universe median for the one-year period ended December 31, 2018. The Morningstar data presented ranked the Fund’s one-year and since inception rolling returns as of December 31, 2018 in the third and second quartiles, respectively. The Trustees noted that the Fund had underperformed its benchmark, the MSCI EAFE Small Cap (NR) Index, for the one-year and since inception periods ended December 31, 2018. The Trustees noted that the short time period since the Fund’s inception did not support making any significant conclusions about the Fund’s performance.
98
Harbor International & Global Funds
Additional Information—Continued
ADVISORY AGREEMENT APPROVALS—Continued
The Trustees considered the expertise of Baring International Investment Limited (“BIIL”) in managing assets generally and in the international small cap asset class specifically, noting that BIIL managed approximately $579 million in assets in this strategy (including assets across the combined Barings group), out of a firm-wide total of approximately $303.9 billion in assets under management. The Trustees also noted the experience of the Fund’s portfolio managers in this asset class.
The Trustees noted that the Broadridge comparison of contractual management fees for the Fund’s expense group, assuming an asset level of $75 million, showed the Fund’s management fee was below the group median for the Institutional Class. The actual total expense ratio for the Fund’s Institutional Class was also below the group and universe median expense ratios. The Trustees also considered that Harbor Capital had agreed to a contractual fee waiver/expense reimbursement arrangement with respect to the Fund that will be effective until at least February 29, 2020. The Trustees noted that Harbor Capital’s profitability in operating the Fund was negative.
Harbor Global Leaders Fund. The Trustees considered Harbor Global Leaders Fund (inception date March 1, 2009) and observed that its Institutional Class performance was above its Broadridge group and universe medians for the one-, three- and five-year periods ended December 31, 2018. The Morningstar data presented showed that the Fund’s one-, three- and five-year rolling returns each ranked in the first quartile for the periods ended December 31, 2018. The Trustees noted that the Fund had outperformed its benchmark, the MSCI ACWI (ND) Index, for the one-, three- and five-year periods ended December 31, 2018.
The Trustees considered the expertise of Sands Capital Management, LLC (“Sands Capital”) in managing assets generally and in the international equity asset class specifically, noting that Sands Capital managed approximately $352 million in assets in this asset class, out of a firm-wide total of approximately $35.39 billion in assets under management. The Trustees also noted the experience of the Fund’s portfolio manager in this asset class.
The Trustees noted that the Broadridge comparison of contractual management fees for the Fund’s expense group, assuming an asset level of $75 million, showed the Fund’s management fee was below the group median for the Institutional Class. The actual total expense ratio for the Fund’s Institutional Class was also below the group and universe median expense ratios. The Trustees also considered that Harbor Capital had agreed to a contractual fee waiver/expense reimbursement arrangement with respect to the Fund that will be effective until at least February 29, 2020. They noted that the Adviser’s profitability in managing the Fund was not excessive.
Harbor Emerging Markets Equity Fund. The Trustees considered Harbor Emerging Markets Equity Fund (inception date November 1, 2013), noting that according to the Broadridge report, the Fund’s Institutional Class performance was above the group and universe medians for the one- and three-year periods ended December 31, 2018 and below the group and universe medians for the five-year period ended December 31, 2018. The Morningstar data presented ranked the Fund’s one-, three- and five-year rolling returns as of December 31, 2018 in the first, first and third quartiles, respectively. The Trustees also considered the fact that Harbor Emerging Markets Equity Fund had outperformed its benchmark, the MSCI Emerging Markets Index, for the one- and three-year periods and underperformed its benchmark for the five-year period ended December 31, 2018.
The Trustees considered the expertise of the Fund’s subadviser, Oaktree Capital Management, L.P. (“Oaktree Capital”), in managing assets generally and in the emerging markets equity asset class specifically, noting that Oaktree Capital managed approximately $4.05 billion in assets in this asset class, out of a firm-wide total of approximately $123.5 billion in assets under management as of September 30, 2018. The Trustees also noted the experience of the Fund’s portfolio managers in this asset class.
The Trustees observed that the Broadridge comparison of contractual management fees for the Fund’s expense group, assuming an asset level of $75 million, showed the Fund’s contractual management fee was below the group median for the Institutional Class. The Trustees also noted that the Fund’s actual total expense ratio for the Institutional Class was also below the Broadridge group and universe median expense ratios. The Trustees also considered that Harbor Capital had agreed to a contractual fee waiver/expense reimbursement arrangement with respect to the Fund that will be effective until at least February 29, 2020. The Trustees noted that Harbor Capital’s profitability in operating the Fund was not excessive.
The Trustees also separately considered the allocation between the Adviser and each Subadviser of the relevant Fund’s investment advisory fee (i.e., the amount of the advisory fee retained by the Adviser relative to that paid to the relevant Subadviser as a subadvisory fee). They determined in each case that the allocation was reasonable and the product of arm’s length negotiation between the Adviser and Subadviser.
99
Harbor International & Global Funds
Additional Information—Continued
ADVISORY AGREEMENT APPROVALS—Continued
Profitability
The Trustees also considered the Adviser’s profitability in operating each of the Funds (as well as on a fund complex-wide basis) as presented by the Adviser, and the allocation methodology used by the Adviser to compute such profitability. The Trustees concluded that the methodology was reasonable and that a reasonable level of profitability was important to provide suitable incentives for the Adviser to continue to attract and maintain high-quality personnel and to invest in infrastructure and other resources to support and enhance the Funds’ operations. In considering the Adviser’s profitability generally, the Trustees also reviewed the compensation received by Harbor Services Group and Harbor Funds Distributors in consideration of the transfer agency and distribution services, respectively, that are provided to Harbor Funds and any other benefits enjoyed by the Adviser and its affiliates as a result of their relationship with Harbor Funds.
The Trustees also considered that profitability calculations with respect to advisory, transfer agency and distribution operations vary significantly depending on whether revenues on which the calculation is based are taken gross or net of amounts paid to third parties, such as subadvisory fee expenses and certain transfer agency expenses, and noted that subadvisory fee expenses are a direct expense of the Adviser. The Trustees also noted that the Adviser was, in all cases, waiving a portion of its advisory fee and/or paying or reimbursing a portion of Fund expenses. The Trustees determined that the Adviser’s profitability in operating each Fund was not excessive.
Economies of Scale
The Trustees also considered the extent to which economies of scale might be realized as each Fund grows, and the extent to which each Fund’s advisory fee level reflects these economies of scale for the benefit of Fund investors. The Trustees specifically considered whether any advisory fee reduction “breakpoints” should be added to the advisory fee payable by any Fund. As noted above, the Trustees concluded that the Adviser’s profitability in each case was not excessive. They concluded that the Funds’ fee structures reflected economies of scale to date and that breakpoints in these fee structures were not required at the present time. The Trustees noted they intend to monitor each Fund’s asset growth in connection with future reviews of each Fund’s Investment Advisory Agreement to determine whether breakpoints may be appropriate at such time.
FACTORS CONSIDERED BY THE TRUSTEES IN APPROVING THE INVESTMENT ADVISORY AGREEMENT AND SUBADVISORY AGREEMENT OF HARBOR OVERSEAS FUND
The Investment Company Act of 1940, as amended, requires that the Investment Advisory and Subadvisory Agreement of each Fund be approved initially, and following an initial two-year term, at least annually, by the Harbor Funds Board of Trustees (the “Board” or the “Trustees”), including a majority of the Independent Trustees voting separately.
At an in-person meeting of the Board of Trustees held on November 18 and 19, 2018 (the “Meeting”), the Board, including all of the Independent Trustees voting separately, considered and approved an Investment Advisory Agreement with Harbor Capital Advisors, Inc., the adviser to the series of Harbor Funds (the “Adviser” or “Harbor Capital”), and a Subadvisory Agreement with Acadian Asset Management LLC (“Acadian” or the “Subadviser”) with respect to Harbor Overseas Fund (the “Fund”), a newly formed series of Harbor Funds.
In evaluating the Investment Advisory Agreement and the Subadvisory Agreement, the Trustees reviewed materials furnished by the Adviser and the Subadviser, including information about their respective affiliates, personnel, and operations, and also relied upon their knowledge of the Adviser resulting from their quarterly meetings, periodic telephonic meetings and other prior communications. In connection with the Meeting, which had been called for the purpose of considering the Investment Advisory Agreement and Subadvisory Agreement, the Trustees, including the Independent Trustees, requested and received materials and presentations relating to the services to be rendered by the Adviser and Subadviser. The Trustees also discussed with representatives of the Adviser, at the Meeting and at prior meetings, Harbor Funds’ operations and the Adviser’s ability, consistent with the “manager of managers” structure of Harbor Funds, to (i) identify and recommend to the Trustees a subadviser for the Fund, (ii) monitor and oversee the performance and investment capabilities of the Subadviser, and (iii) recommend the replacement of a subadviser where appropriate.
At the Meeting, the Trustees, including all of the Independent Trustees voting separately, determined, in the exercise of their business judgment, that the terms of the Investment Advisory Agreement and the Subadvisory Agreement with respect to Harbor Overseas Fund were fair and reasonable and approved the Investment Advisory Agreement and the Subadvisory Agreement for an initial two-year term as being in the best interests of the Fund and its future shareholders.
In their deliberations, the Independent Trustees had the opportunity to meet privately without representatives of the Adviser or the Subadviser present and were represented throughout the process by legal counsel to the Independent Trustees and the Harbor Funds.
100
Harbor International & Global Funds
Additional Information—Continued
ADVISORY AGREEMENT APPROVALS—Continued
In considering the approval of the Fund’s proposed Investment Advisory Agreement and Subadvisory Agreement, the Board, including the Independent Trustees, evaluated a number of factors it considered relevant to its determination. The Board did not identify any single factor as all-important or controlling, and individual Trustees did not necessarily attribute the same weight or importance to each factor.
Among the factors considered by the Trustees in approving the new Investment Advisory Agreement and Subadvisory Agreement were the following:
• | the nature, extent, and quality of the services expected to be provided by the Adviser and Acadian, including the background, education, expertise and experience of the investment professionals of the Adviser and Acadian to provide services to the Fund; |
• | the favorable history, reputation, qualifications and background of the Adviser and Acadian, as well as the qualifications of their personnel; |
• | the fees proposed to be charged by the Adviser and Acadian for investment advisory and subadvisory services, respectively, including the portion of the fee to be retained by the Adviser, after payment of Acadian’s fee, for investment advisory and related services including investment, business, legal, compliance, financial and administrative services, that the Adviser would provide; |
• | the proposed fees and expense ratios of the Fund relative to the fees and expense ratios of similar investment companies; |
• | the investment performance of Acadian in managing other accounts in a style similar to the style to be utilized in managing the Fund relative to the performance of a benchmark index; |
• | information received at regular meetings throughout the year related to services rendered by the Adviser; |
• | the compensation to be received by Harbor Services Group Inc. (“Harbor Services Group”), the Fund’s transfer agent, and Harbor Funds Distributors, Inc. (“Harbor Funds Distributors”), the Fund’s principal underwriter, in consideration of the services each would provide to the Fund; |
• | any “fall out” benefits that might inure to the Adviser and its affiliates or Acadian and its affiliates as a result of their relationship with the Fund; |
• | information received at regular meetings throughout the year related to the Adviser’s profitability; |
• | the expected profitability of the Adviser with respect to the Fund, including the effect of revenues of Harbor Services Group and Harbor Funds Distributors on such profitability; and |
• | the extent to which economies of scale might be realized as the Fund grows, and the extent to which the Fund’s proposed advisory fee level reflects any economies of scale for the benefit of Fund investors. |
Nature, Extent, and Quality of Services
In evaluating the nature, extent, and quality of the services to be provided by the Adviser, the reasonableness of the overall compensation provided under the proposed Investment Advisory Agreement and other considerations, the Trustees considered the Adviser’s ability, consistent with the manager-of-managers structure of Harbor Funds, to identify and recommend to the Trustees quality subadvisers for the Funds, to monitor and oversee the performance and investment capabilities of each subadviser, and to recommend the replacement of a subadviser when appropriate. The Trustees specifically considered the Adviser’s history as a manager-of-managers, including its history of replacing subadvisers for particular Funds in circumstances in which the Board and the Adviser had determined that a change in subadviser was in the best interests of a Fund and its shareholders, whether as a result of (i) long-term underperformance not explained by market conditions or market cycles relative to the subadviser’s investment style, (ii) prolonged style inconsistency, (iii) material adverse changes in management or personnel, or (iv) other factors, such as if the Adviser were to identify another subadviser believed to better serve the shareholders than the existing subadviser.
The Board evaluated the nature, extent, and quality of the Adviser’s proposed services in light of the Board’s actual experience with the Adviser, as well as materials provided by the Adviser concerning the financial and other resources devoted by the Adviser to the Funds generally, including the breadth and depth of experience and expertise of the investment, administrative, legal and compliance professionals dedicated to the Funds’ operations. The Trustees determined that the Adviser has the expertise and resources to identify, select, oversee and monitor subadvisers and to operate effectively as the manager-of-managers for the Fund.
101
Harbor International & Global Funds
Additional Information—Continued
ADVISORY AGREEMENT APPROVALS—Continued
In evaluating the nature and quality of the services to be provided by Acadian, the Trustees considered the collective expertise and experience of the professionals at Acadian and the favorable record they had generated in the international equity asset class. The Trustees also noted the experience of the proposed portfolio managers of the Fund in this asset class and the favorable record generated by them at Acadian. In considering Acadian’s performance, the Trustees noted that Acadian’s record in its non-U.S. equity strategy was favorable compared to its benchmark and peers.
Advisory Fees and Expense Ratios
The Trustees observed that the data available concerning comparative fees and expense ratios showed that the Fund’s proposed advisory fee was slightly above the median and above the average management fees of the peer group of funds presented to the Board for comparison purposes using Morningstar data. The Trustees also reviewed and determined to be reasonable, in relation to the services provided by each party, the split between the advisory fee paid to Harbor Capital and the subadvisory fee paid to Acadian and specifically the net advisory fee retained by the Adviser at various asset levels.
It was further noted that the Fund’s proposed Institutional Class net expense ratio was below the average and median expense ratios and the Retirement Class net expense ratio was slightly above the average and slightly below the median expense ratios of the peer group of funds presented to the Board for comparison purposes using Morningstar data. The Trustees observed that the incremental expenses of the Administrative Class and Investor Class relative to the Institutional Class data they considered would be comprised solely of Rule 12b-1 and/or transfer agent service fees, which the Board reviews separately.
Profitability
The Trustees also noted that the Adviser expected to operate the Fund initially at a loss (and had agreed to reduce or waive a portion of its advisory fee and/or absorb fund expenses while paying Acadian its fee and/or paying or reimbursing fund expenses).
Economies of Scale
The Trustees also concluded that breakpoints in the Fund’s advisory fee were not necessary at the present time in light of, among other things, the Adviser’s forward-looking approach to setting the contractual advisory fee, its absorbing fund expenses during the initial period of the Fund’s operations while paying Acadian its full subadvisory fee and the uncertainty surrounding the aspects of the Fund’s future asset growth. It was agreed, however, that the Board would consider the issue of breakpoints in the Fund’s advisory fee schedule at least annually after the initial two-year contract term as part of its annual investment contract review process for all of the Funds.
102
Benchmark Descriptions
Bloomberg Barclays U.S. Aggregate Bond Index—The Bloomberg Barclays U.S. Aggregate Bond Index is an unmanaged index of investment-grade fixed-rate debt issues with maturities of at least one year. This unmanaged index does not reflect fees and expenses and is not available for direct investment.
Bloomberg Barclays U.S. TIPS Index—The Bloomberg Barclays U.S. TIPS Index is an unmanaged market index comprised of all U.S. Treasury Inflation Protected Securities rated investment grade (Baa3 or better), have at least one year to final maturity, and at least $250 million par amount outstanding. This unmanaged index does not reflect fees and expenses and is not available for direct investment.
ICE BofAML U.S. Convertible Ex Mandatory Index—The ICE BofAML U.S. Convertible Ex Mandatory Index is broadly representative of the U.S. convertible securities market, consisting of publicly traded issues, denominated in U.S. dollars, of all credit qualities, and excluding mandatory (equity-linked) convertibles. This unmanaged index does not reflect fees and expenses and is not available for direct investment.
ICE BofAML U.S. 3-Month Treasury Bill Index—The ICE BofAML U.S. 3-Month Treasury Bill Index is comprised of a single U.S. Treasury Bill issue purchased at the beginning of each month and held for a full month, at which time that issue is sold and rolled into a newly selected issue. The issue selected each month is that having a maturity date closest to, but not beyond 90 days from the rebalance date.
ICE BofAML U.S. High Yield Index (H0A0)—The ICE BofAML U.S. High Yield Index (H0A0) is an unmanaged index that tracks the performance of below investment grade U.S. dollar-denominated corporate bonds publicly issued in the U.S. domestic market. All bonds are U.S. dollar denominated and rated Split BBB and below. This unmanaged index does not reflect fees and expenses and is not available for direct investment.
ICE BofAML U.S. Non-Distressed High Yield Index—The ICE BofAML U.S. Non-Distressed High Yield Index is a subset of the ICE BofAML U.S. High Yield Index (H0A0) including all securities with an option-adjusted spread less than 1,000 basis points. The unmanaged index does not reflect fees and expenses and is not available for direct investment.
MSCI All Country World (ND) Index—The MSCI All Country World (ND) Index is a free float-adjusted market capitalization weighted index that is designed to measure the equity market performance of global developed and emerging markets. This unmanaged index does not reflect fees and expenses and is not available for direct investment.
MSCI All Country World Ex. U.S. (ND) Index—The MSCI All Country World Ex. U.S. (ND) Index is a free float-adjusted market capitalization weighted index that is designed to measure equity market performance in the global developed and emerging markets, excluding the United States. This unmanaged index does not reflect fees and expenses and is not available for direct investment.
MSCI EAFE (ND) Index—The MSCI EAFE (ND) Index is an unmanaged index generally representative of major developed markets, excluding the U.S. and Canada. This unmanaged index does not reflect fees and expenses and is not available for direct investment.
MSCI EAFE Small Cap (ND) Index—The MSCI EAFE Small Cap (ND) Index is an equity index which captures small cap representation across developed market countries around the world, excluding the U.S. and Canada. This unmanaged index does not reflect fees and expenses and is not available for direct investment.
MSCI Emerging Markets (ND) Index—The MSCI Emerging Markets (ND) Index is a market capitalization weighted index of equity securities in more than 20 emerging market economies. This unmanaged index does not reflect fees and expenses and is not available for direct investment.
MSCI World (ND) Index—The MSCI World (ND) Index is a free float-adjusted market capitalization index that is designed to measure global developed market equity performance. This unmanaged index does not reflect fees and expenses and is not available for direct investment.
Russell 1000® Growth Index—The Russell 1000® Growth Index is an unmanaged index generally representative of the U.S. market for larger capitalization growth stocks. This unmanaged index does not reflect fees and expenses and is not available for direct investment. The Russell 1000® Growth Index and Russell® are trademarks of Frank Russell Company.
Russell 1000® Value Index—The Russell 1000® Value Index is an unmanaged index generally representative of the U.S. market for larger capitalization value stocks. This unmanaged index does not reflect fees and expenses and is not available for direct investment. The Russell 1000® Value Index and Russell® are trademarks of Frank Russell Company.
Russell 2000® Index—The Russell 2000® Index measures the performance of the small-cap segment of the U.S. equity universe. The Russell 2000® Index is a subset of the Russell 3000® Index representing approximately 10% of the total market capitalization of that index. It includes approximately 2,000 of the smallest securities based on a combination of their market cap and current
103
Benchmark Descriptions—Continued
index membership. The Russell 2000® Index is constructed to provide a comprehensive and unbiased small-cap barometer and is completely reconstituted annually to ensure larger stocks do not distort the performance and characteristics of the true small-cap opportunity set. This unmanaged index does not reflect fees and expenses and is not available for direct investment. The Russell 3000® Index and Russell® are trademarks of Frank Russell Company.
Russell 2000® Growth Index—The Russell 2000® Growth Index is an unmanaged index representing the smallest 2,000 stocks with the highest price-to-book ratio and future earnings. This unmanaged index does not reflect fees and expenses and is not available for direct investment. The Russell 2000® Growth Index and Russell® are trademarks of Frank Russell Company.
Russell 2000® Value Index—The Russell 2000® Value Index is an unmanaged index representing the smallest 2,000 stocks with the lowest price-to-book ratio and future earnings. This unmanaged index does not reflect fees and expenses and is not available for direct investment. The Russell 2000® Value Index and Russell® are trademarks of Frank Russell Company.
Russell 3000® Index—The Russell 3000® Index measures the performance of the largest 3,000 U.S. companies representing approximately 98% of the investable U.S. equity market. The Russell 3000® Index is constructed to provide a comprehensive, unbiased and stable barometer of the broad market and is completely reconstituted annually to ensure new and growing equities are reflected. This unmanaged index does not reflect fees and expenses and is not available for direct investment. The Russell 3000® Index and Russell® are trademarks of Frank Russell Company.
Russell 3000® Growth Index—The Russell 3000® Growth Index measures the performance of the broad growth segment of the U.S. equity universe. It includes those Russell 3000® companies with higher price-to-book ratios and higher forecasted growth values. The Russell 3000® Growth Index is constructed to provide a comprehensive, unbiased, and stable barometer of the broad growth market. The index is completely reconstituted annually to ensure new and growing equities are included and that the represented companies continue to reflect growth characteristics. This unmanaged index does not reflect fees and expenses and is not available for direct investment. The Russell 3000® Growth Index and Russell® are trademarks of Frank Russell Company.
Russell 3000® Value Index—The Russell 3000® Value Index measures the performance of the broad value segment of U.S. equity value universe. It includes those Russell 3000® companies with lower price-to-book ratios and lower forecasted growth values. The Russell 3000® Value Index is constructed to provide a comprehensive, unbiased, and stable barometer of the broad value market. The index is completely reconstituted annually to ensure new and growing equities are included and that the represented companies continue to reflect value characteristics. This unmanaged index does not reflect fees and expenses and is not available for direct investment. The Russell 3000® Value Index and Russell® are trademarks of Frank Russell Company.
Russell Midcap® Index—The Russell Midcap® Index is an unmanaged index generally representative of the U.S. market for medium capitalization stocks. This unmanaged index does not reflect fees and expenses and is not available for direct investment. The Russell Midcap® Index and Russell® are trademarks of Frank Russell Company.
Russell Midcap® Growth Index—The Russell Midcap® Growth Index is an unmanaged index generally representative of the U.S. market for medium capitalization growth stocks. This unmanaged index does not reflect fees and expenses and is not available for direct investment. The Russell Midcap® Growth Index and Russell® are trademarks of Frank Russell Company.
Russell Midcap® Value Index—The Russell Midcap® Value Index is an unmanaged index generally representative of the U.S. market for medium capitalization value stocks. This unmanaged index does not reflect fees and expenses and is not available for direct investment. The Russell Midcap® Value Index and Russell® are trademarks of Frank Russell Company.
S&P 500 Index—The S&P 500 Index is an unmanaged index generally representative of the U.S. stock market. This unmanaged index does not reflect fees and expenses and is not available for direct investment.
104
111 South Wacker Drive, 34th Floor | Chicago, IL 60606-4302 | 800-422-1050 | harborfunds.com |
Trustees & Officers
Charles F. McCain
Chairman, President & Trustee
Scott M. Amero
Trustee
Trustee
Raymond J. Ball
Trustee
Trustee
Donna J. Dean
Trustee
Trustee
Joseph L. Dowling, III
Trustee
Trustee
Randall A. Hack
Trustee
Trustee
Robert Kasdin
Trustee
Trustee
Kathryn L. Quirk
Trustee
Trustee
Ann M. Spruill
Trustee
Trustee
Erik D. Ojala
Chief Compliance Officer
Anmarie S. Kolinski
Treasurer
Treasurer
Brian L. Collins
Vice President
Vice President
Kristof M. Gleich
Vice President
Vice President
Charles P. Ragusa
Vice President
Vice President
Diana R. Podgorny
Secretary
Secretary
Jodie L. Crotteau
Assistant Secretary
Assistant Secretary
Lana M. Lewandowski
AML Compliance Officer
& Assistant Secretary
AML Compliance Officer
& Assistant Secretary
Lora A. Kmieciak
Assistant Treasurer
Assistant Treasurer
John M. Paral
Assistant Treasurer
Assistant Treasurer
Investment Adviser
Harbor Capital Advisors, Inc.
111 South Wacker Drive, 34th Floor
Chicago, IL 60606-4302
312-443-4400
111 South Wacker Drive, 34th Floor
Chicago, IL 60606-4302
312-443-4400
Distributor
Harbor Funds Distributors, Inc.
111 South Wacker Drive, 34th Floor
Chicago, IL 60606-4302
312-443-4600
111 South Wacker Drive, 34th Floor
Chicago, IL 60606-4302
312-443-4600
Shareholder Services
Harbor Services Group, Inc.
P.O. Box 804660
Chicago, IL 60680-4108
800-422-1050
P.O. Box 804660
Chicago, IL 60680-4108
800-422-1050
FD.SAR.IG.0419
Table of Contents
Semi-Annual Report
April 30, 2019
Fixed Income Funds
Retirement Class | Institutional Class | Administrative Class | Investor Class | |
Harbor Convertible Securities Fund | HNCVX | HACSX | HRCSX | HICSX |
Harbor High-Yield Bond Fund | HNHYX | HYFAX | HYFRX | HYFIX |
Harbor High-Yield Opportunities Fund | HHYRX | HHYNX | HHYAX | HHYVX |
Harbor Core Bond Fund | HCBRX | HACBX | – | – |
Harbor Bond Fund | HBFRX | HABDX | HRBDX | – |
Harbor Real Return Fund | HRRNX | HARRX | HRRRX | – |
Harbor Money Market Fund | – | HARXX | HRMXX | – |
Beginning on January 1, 2021, as permitted by regulations adopted by the Securities and Exchange Commission, paper copies of the Funds’ annual and semi-annual shareholder reports will no longer be sent by mail, unless you specifically request paper copies of the reports. Instead, the reports will be made available on the Funds’ website (harborfunds.com), and you will be notified by mail each time a report is posted and provided with a website link to access the report.
If you already elected to receive shareholder reports electronically, you will not be affected by this change and you need not take any action. You may elect to receive shareholder reports and other communications from a Fund electronically anytime by contacting your financial intermediary (such as a broker-dealer or bank) or, if you invest directly with Harbor Funds, by calling 800-422-1050.
You may elect to receive all future reports in paper free of charge. If you invest through a financial intermediary (such as a broker-dealer or bank), you can contact your financial intermediary to request that you continue to receive paper copies of the Funds’ shareholder reports. If you invest directly, you can call 800-422-1050 to request that you continue to receive paper copies of the Funds’ shareholder reports. Your election to receive reports in paper will apply to all Harbor Funds held in your account.
Table of Contents
1 | |
Fixed Income Funds | |
Harbor Convertible Securities Fund | |
3 | |
5 | |
6 | |
Harbor High-Yield Bond Fund | |
10 | |
12 | |
13 | |
Harbor High-Yield Opportunities Fund | |
23 | |
25 | |
26 | |
Harbor Core Bond Fund | |
32 | |
34 | |
35 | |
Harbor Bond Fund | |
39 | |
42 | |
43 | |
Harbor Real Return Fund | |
61 | |
63 | |
64 | |
Harbor Money Market Fund | |
76 | |
78 | |
79 | |
Financial Statements | |
81 | |
83 | |
85 | |
91 | |
93 | |
107 | |
126 | |
Additional Information | |
129 | |
129 | |
129 | |
129 | |
135 |
This document must be preceded or accompanied by a Prospectus.
Letter from the Chairman
Charles F. McCain Chairman |
Dear Fellow Shareholder:
Domestic long-term fixed income markets were generally up for the fiscal half year ended April 30, 2019. The Bloomberg Barclays U.S. Aggregate Bond Index, a diversified benchmark of investment-grade bonds, generated a return of 5.49% for the six-month period.
At the beginning of the period, expectations for higher inflation, increased Treasury debt supply, and more Federal Reserve (Fed) interest rate hikes had all contributed to rising U.S. interest rates. As 2019 began and the Fed adopted a more accommodative stance – even signaling the possibility of an interest rate cut – Treasury yields tumbled, driving strong performance in the U.S. fixed income market.
U.S. Treasury Inflation Protected Securities (TIPS) returned 4.60% for the fiscal half year, as measured by the Bloomberg Barclays U.S. TIPS Index, substantially outperforming conventional U.S. Treasury bonds.
High yield bonds outgained other fixed income market segments for the six-month period, as the ICE BofAML U.S. Non-Distressed High Yield Index returned 5.89%. Following a steep decline at the end of 2018, the high yield market rebounded strongly in the first few months of 2019, propelled by higher oil prices and the rallying stock market.
Comments by the portfolio managers of each Harbor fixed income fund can be found in the pages preceding each Fund’s portfolio of investments. As always, we recommend that shareholders maintain a long-term perspective in evaluating all of their investments, including Harbor Funds.
Returns For Periods Ended April 30, 2019 | ||||||||||
Unannualized | Annualized | |||||||||
Fixed Income | 6 Months | 1 Year | 5 Years | 10 Years | 30 Years | |||||
ICE BofAML U.S. Non-Distressed High Yield (domestic high-yield bonds) | 5.89% | 7.03% | 5.03% | 8.74% | N/A | |||||
Bloomberg Barclays U.S. Aggregate Bond (domestic bonds) | 5.49 | 5.29 | 2.57 | 3.72 | 6.09% | |||||
Bloomberg Barclays U.S. TIPS (domestic inflation-linked bonds) | 4.60 | 3.10 | 1.74 | 3.64 | N/A | |||||
ICE BofAML U.S. 3-Month Treasury Bill (proxy for money market returns) | 1.18 | 2.18 | 0.78 | 0.45 | 3.08 | |||||
Domestic Equities | ||||||||||
Russell 3000® (entire U.S. stock market) | 9.71% | 12.68% | 11.20% | 15.30% | 10.17% | |||||
S&P 500 (large cap stocks) | 9.76 | 13.49 | 11.63 | 15.32 | 10.15 | |||||
Russell Midcap® (mid cap stocks) | 11.65 | 10.69 | 9.75 | 15.65 | 11.41 | |||||
Russell 2000® (small cap stocks) | 6.06 | 4.61 | 8.63 | 14.10 | 9.41 | |||||
Russell 3000® Growth (growth stocks) | 11.81 | 16.61 | 14.17 | 16.83 | 10.05 | |||||
Russell 3000® Value (value stocks) | 7.61 | 8.58 | 8.17 | 13.69 | 9.91 | |||||
International & Global | ||||||||||
MSCI EAFE (ND)(foreign stocks) | 7.45% | -3.22% | 2.60% | 7.95% | 4.58% | |||||
MSCI EAFE Small Cap (ND)(foreign small cap stocks) | 5.89 | -7.88 | 5.27 | 11.49 | N/A | |||||
MSCI World (ND)(global stocks) | 8.83 | 6.48 | 7.31 | 11.58 | 6.82 | |||||
MSCI All Country World Ex. U.S. (ND)(foreign stocks) | 9.12 | -3.23 | 2.83 | 7.75 | N/A | |||||
MSCI Emerging Markets (ND)(emerging market stocks) | 13.76 | -5.04 | 4.04 | 7.50 | N/A |
1
Change in market’s direction showed value of resilience
In the fourth calendar quarter of 2018, U.S. equities endured their worst quarterly performance in more than seven years, as concerns about interest rate increases, continuing trade tensions, and slowing global growth dampened investor sentiment. At its December 2018 meeting, the Fed further raised the federal funds rate target by 0.25%. Investment-grade spreads widened during the fourth quarter and some commentators speculated that the nearly 10-year-long bull market had reached its end.
But in the first quarter of 2019, such talk proved premature, as equities rebounded in the U.S. and globally. Market sentiment recovered, investment-grade spreads tightened, and the Fed held rates steady. Anyone who pulled their money out of equities in December 2018, hoping to avoid further losses, may have missed out on the robust gains of early 2019. In fixed income, U.S. Treasury yields fell and buoyed the investment-grade debt market while the high-yield market led the fixed income asset class for the calendar year through April 2019.
Reacting emotionally to market movements, or trying to time when the market will rise or fall, can have a negative impact on the success of a long-term investment strategy. While past performance is never a guarantee of future results, many investors have historically achieved their financial objectives by making a long-term plan and staying true to it through market ups and downs.
Harbor Funds offers a variety of equity and fixed income funds that can serve as the foundation of a diversified portfolio. Thank you for investing with Harbor Funds.
June 28, 2019
Charles F. McCain |
Chairman |
2
Harbor Convertible Securities Fund
Manager’s Commentary (Unaudited)
Subadviser
Shenkman Capital Management, Inc.
461 Fifth Avenue
22nd Floor
22nd Floor
New York, NY 10017
Portfolio Managers
Mark R. Shenkman
Since 2011
Since 2011
Justin W. Slatky
Since 2017
Since 2017
Raymond F. Condon
Since 2011
Since 2011
Jordan N. Barrow, CFA
Since 2016
Since 2016
Thomas Whitley, CFA
Since 2019
Since 2019
Shenkman Capital has subadvised the Fund since 2011.
Investment Objective
The Fund seeks to maximize total returns (i.e., current income and capital appreciation).
Mark R. Shenkman
Justin W. Slatky
Raymond F. Condon
Jordan N. Barrow, CFA
Thomas Whitley, CFA
Management’s Discussion of
Fund Performance
Fund Performance
Market Review
With most major indices rallying strongly in 2019, the equity markets recorded their best initial start to a year since 1987. For the year to date through April 2019, the S&P 500 equity index rose 18.25%, but came on the heels of a 7.19% decline during November through December. This bifurcation of performance is also evidenced by the CBOE Volatility Index (“VIX”). While it averaged 18 points during the six-month period ending April 30, 2019, in line with the ten-year average, more than 80% of trading days during November-January were above that level. Conversely the VIX did not close above 17 points on any day during the February-April period. The Fund’s benchmark, the ICE BofAML U.S. Convertible Ex Mandatory Index, returned 9.44% for the first six months of the fiscal year ending April 30, 2019 while underlying equities had an approximate weighted average return of 11% for the same period based on the issuer weightings of the benchmark. The convertible market showed similar bifurcation as the equity markets through the period, and we believe exhibited its traditional characteristics of downside protection while maintaining strong upside equity participation. The Index returned 46.9% of the S&P 500’s November-December decline, but returned 72.6% of the S&P’s January-April increase.
Given the V-shape of returns during the first half of the fiscal year, convertible new issuance got off to a slow start in 2019, as opportunistic issuers sat on the sidelines while equities recovered. $15.2 billion of new issuance priced from November to April, versus $21.7 billion during the six-month period ending April 30, 2018, per Bank of America Merrill Lynch. Despite the decline, which came after the largest new issuance period since 2007, we see a few signs of returning strength. First, while January had very little issuance, February and March saw a fairly strong resurgence around earnings season, and in aggregate grew year-over-year. Second, approximately 10% of recent new deals have been from investment grade issuers. While currently a small portion, it is encouraging to see more investment grade companies view the convertible market as a viable avenue for raising capital.
Performance
Harbor Convertible Securities Fund returned 8.97% (Retirement Class), 9.02% (Institutional Class), 8.88% (Administrative Class), and 8.84% (Investor Class) for the six-month period ended April 30, 2019, compared with the 9.44% return of the benchmark. As has been common in recent years, the Index derived a large amount of its contribution (29%) from convertibles trading over 100% above their bond floors, while the Fund derived approximately 4% from that segment. As is endemic of the Fund’s investment style, the Fund continues to underweight that portion of the market.
Software and semiconductors were the largest industry contributors to the Fund’s performance for the first six months of the fiscal year. In software, the Fund benefitted from positions in Workday and Zendesk. Workday provides cloud services for human resources and financial management, while Zendesk provides software for help desks and customer support. In semiconductors, the Fund’s holding in Microchip Technology, a chip supplier to the automotive and industrial industries, was the top contributor.
The largest detractors to the Fund’s performance from an industry point of view were automobiles and energy equipment. In automobiles, Tesla, a leading manufacturer of high performance electric vehicles, had disappointing fourth quarter earnings and the equity remains volatile. We continue to believe the underlying credit is sound and view the company’s recent $2.5+ billion capital raise as a positive. In energy equipment, negative contribution was broad-based by issuer, as the Energy sector as a whole posted losses during the period. The Fund maintains
3
Harbor Convertible Securities Fund
Manager’s Commentary—Continued
TOTAL RETURNS
For the periods ended 04/30/2019
Unannualized | 1 Year | Annualized | |||||||||
6 Months | 5 Years | Life of Fund | |||||||||
Harbor Convertible Securities Fund | |||||||||||
Retirement Class1,2 | 8.97% | 9.75% | 4.84% | 5.54% | |||||||
Institutional Class1 | 9.02 | 9.87 | 4.83 | 5.54 | |||||||
Administrative Class1 | 8.88 | 9.27 | 4.51 | 5.23 | |||||||
Investor Class1 | 8.84 | 9.38 | 4.43 | 5.13 | |||||||
Comparative Index | |||||||||||
ICE BofAML U.S. Convertible Ex Mandatory1 | 9.44% | 11.27% | 8.49% | 9.15% |
As stated in the Fund’s prospectus dated March 1, 2019, the expense ratios were 0.70% (Net) and 0.75% (Gross) (Retirement Class), 0.78% (Net) and 0.83% (Gross) (Institutional Class), 1.03% (Net) and 1.08% (Gross) (Administrative Class), and 1.15% (Net) and 1.20% (Gross) (Investor Class). The net expense ratios reflect a contractual management fee waiver effective through 02/29/2020. The expense ratios in the prospectus may differ from the actual expense ratios for the period disclosed within this report. The expense ratios shown in the prospectus are based on the prior fiscal year, adjusted to reflect changes, if any, in contractual arrangements that occurred prior to the date of the prospectus (or supplement thereto, if applicable).
Performance data shown represents past performance and is no guarantee of future results. Past performance is net of management fees and expenses and reflects reinvested dividends and distributions but does not reflect the deduction of taxes that a shareholder would pay on Fund distributions or upon the redemption of Fund shares. Past performance reflects the beneficial effect of any expense waivers or reimbursements, without which returns would have been lower. Investment returns and principal value will fluctuate so that Fund shares, when redeemed, may be worth more or less than their original cost. Returns for periods less than one year are not annualized. Current performance may be higher or lower and is available through the most recent month end atharborfunds.com or by calling 800-422-1050. The Fund charges a redemption fee of 1% on redemption of Fund shares that are held for less than 90 days.
a small weighting among the highest credit-quality convertibles in the space, which we believe should provide downside protection during periods of equity weakness as well as upside optionality in the event of any future sector rally.
Outlook & Strategy
Looking forward, we believe that the overall prospects for convertibles remain positive. The prospects include: a growth-oriented equity environment; positive overall credit conditions; and potential new issue activity combined with a historical non-correlation to rising Treasury rates.
Also, the resurgence of the convertible new issue calendar in recent years has begun to present many new opportunities. Recently issued convertibles have included both new convertible issuers as well as existing issuers. This development has allowed the Fund to diversify its positions into new businesses that meet its credit criteria, as well as maintain exposure to repeat issuers by purchasing new issues closer to their bond floors. We believe this trend favors the Fund’s investment style, as we focus first on investment credit worthiness, with an emphasis on positive risk/reward characteristics.
As we experience a period of interest rate uncertainty, with associated intermittent periods of volatility, we expect that the market may favor more balanced convertible securities with a positive credit profile, which we believe is consistent with the Fund’s investment approach.
1 | The “Life of Fund” return as shown reflects the period 05/01/2011 through 04/30/2019. |
2 | Retirement Class shares commenced operations on March 1, 2016. The performance attributed to the Retirement Class shares prior to that date is that of the Institutional Class shares. Performance prior to March 1, 2016 has not been adjusted to reflect the lower expenses of Retirement Class shares. During this period, Retirement Class shares would have had returns similar to, but potentially higher than, Institutional Class shares due to the fact that Retirement Class shares represent interests in the same portfolio as Institutional Class shares but are subject to lower expenses. |
This report contains the current opinions of Shenkman Capital Management, Inc. as of the date of this report and should not be considered as investment advice or a recommendation of any particular security, strategy or investment product. Such opinions are subject to change without notice and securities described herein may no longer be included in, or may at any time be removed from, the Fund’s portfolio. This report is distributed for informational purposes only. Information contained herein has been obtained from sources believed reliable, but not guaranteed.
Convertible securities tend to be of lower credit quality, and the value of a convertible security generally increases and decreases with the value of the underlying common stock, but may also be sensitive to changes in interest rates. A rise in interest rates will likely cause a decrease in the value of convertible securities. Such an event would likely have an adverse effect on the Harbor Convertible Securities Fund. High-yield investing poses additional credit risk related to lower-rated bonds. For information on the different share classes and the risks associated with an investment in the Fund, please refer to the current prospectus.
4
Harbor Convertible Securities Fund
Fund Summary—April 30, 2019 (Unaudited)
TOP Issuers(% of net assets)
❶ | Live Nation Entertainment Inc. | 2.3% |
❷ | Liberty Media Corp. | 2.2% |
❸ | Splunk Inc. | 2.1% |
❹ | Blackstone Mortgage Trust Inc. | 2.0% |
❺ | Meritor Inc. | 2.0% |
❻ | Ares Capital Corp. | 1.9% |
❼ | Ctrip.com International Ltd. | 1.9% |
❽ | Akamai Technologies Inc. | 1.8% |
❾ | Liberty Expedia Holdings Inc. | 1.7% |
❿ | Marriott Vacations Worldwide Corp. | 1.7% |
Sector Allocation(% of investments)
Maturity Profile(% of investments)
5
Harbor Convertible Securities Fund
Portfolio of Investments—April 30, 2019 (Unaudited)
Value, Cost, and Principal Amounts in Thousands
CONVERTIBLE BONDS—96.6% | |||
Principal Amount | Value | ||
AEROSPACE & DEFENSE—0.5% | |||
Arconic Inc. | |||
$ | 671 | 1.625%—10/15/2019 | $669 |
AUTO COMPONENTS—1.4% | |||
CIE Generale des Etablissements Michelin SCA | |||
600 | 0.000%—01/10/20221 | 612 | |
Valeo SA MTN2 | |||
1,200 | 0.000%—06/16/20211 | 1,131 | |
1,743 | |||
AUTOMOBILES—1.4% | |||
Tesla Inc. | |||
1,246 | 1.250%—03/01/2021 | 1,225 | |
572 | 2.375%—03/15/2022 | 589 | |
1,814 | |||
BANKS—0.5% | |||
BofA Finance LLC MTN2 | |||
604 | 0.250%—05/01/2023 | 600 | |
BIOTECHNOLOGY—4.5% | |||
BioMarin Pharmaceutical Inc. | |||
2,010 | 0.599%—08/01/2024 | 2,071 | |
Exact Sciences Corp. | |||
1,246 | 0.375%—03/15/2027 | 1,406 | |
222 | 1.000%—01/15/2025 | 335 | |
1,741 | |||
Ionis Pharmaceuticals Inc. | |||
449 | 1.000%—11/15/2021 | 578 | |
Ligand Pharmaceuticals Inc. | |||
936 | 0.750%—05/15/20233 | 816 | |
Neurocrine Biosciences Inc. | |||
403 | 2.250%—05/15/2024 | 488 | |
5,694 | |||
CAPITAL MARKETS—1.8% | |||
Ares Capital Corp. | |||
1,618 | 3.750%—02/01/2022 | 1,629 | |
726 | 4.625%—03/01/2024 | 732 | |
2,361 | |||
COMMUNICATIONS EQUIPMENT—2.0% | |||
Lumentum Holdings Inc. | |||
602 | 0.250%—03/15/2024 | 751 | |
Palo Alto Networks Inc. | |||
1,618 | 0.750%—07/01/20233 | 1,842 | |
2,593 | |||
CONSTRUCTION & ENGINEERING—3.9% | |||
Dycom Industries Inc. | |||
1,307 | 0.750%—09/15/2021 | 1,240 | |
KBR Inc. | |||
610 | 2.500%—11/01/20233 | 667 | |
Tutor Perini Corp. | |||
1,557 | 2.875%—06/15/2021 | 1,537 | |
Vinci SA | |||
1,400 | 0.375%—02/16/2022 | 1,593 | |
5,037 |
CONVERTIBLE BONDS—Continued | |||
Principal Amount | Value | ||
DIVERSIFIED CONSUMER SERVICES—0.8% | |||
Chegg Inc. | |||
$ | 884 | 0.125%—03/15/20253 | $850 |
99 | 0.250%—05/15/2023 | 142 | |
992 | |||
DIVERSIFIED TELECOMMUNICATION SERVICES—2.9% | |||
Inmarsat plc | |||
600 | 3.875%—09/09/2023 | 898 | |
Liberty Media Corp. | |||
540 | 1.000%—01/30/2023 | 647 | |
242 | 1.375%—10/15/2023 | 284 | |
1,820 | 2.125%—03/31/20483 | 1,772 | |
547 | 2.250%—09/30/2046 | 281 | |
2,984 | |||
3,882 | |||
ELECTRONIC EQUIPMENT, INSTRUMENTS & COMPONENTS—0.5% | |||
OSI Systems Inc. | |||
665 | 1.250%—09/01/2022 | 692 | |
ENERGY EQUIPMENT & SERVICES—1.4% | |||
Ensco Jersey Finance Ltd. | |||
245 | 3.000%—01/31/2024 | 208 | |
Nabors Industries Inc. | |||
792 | 0.750%—01/15/2024 | 574 | |
Oil States International Inc. | |||
591 | 1.500%—02/15/2023 | 532 | |
Transocean Inc. | |||
478 | 0.500%—01/30/2023 | 513 | |
1,827 | |||
ENTERTAINMENT—3.5% | |||
iQIYI Inc. | |||
1,599 | 2.000%—04/01/20253 | 1,629 | |
Live Nation Entertainment Inc. | |||
2,454 | 2.500%—03/15/2023 | 2,891 | |
4,520 | |||
EQUITY REAL ESTATE INVESTMENT TRUSTS (REITs)—4.1% | |||
Empire State Realty OP LP | |||
340 | 2.625%—08/15/20193 | 340 | |
Extra Space Storage LP | |||
1,561 | 3.125%—10/01/20353 | 1,826 | |
IH Merger Sub LLC | |||
1,077 | 3.500%—01/15/2022 | 1,252 | |
National Health Investors Inc. | |||
519 | 3.250%—04/01/2021 | 582 | |
Spirit Realty Capital Inc. | |||
1,255 | 3.750%—05/15/2021 | 1,267 | |
5,267 | |||
HEALTH CARE EQUIPMENT & SUPPLIES—4.7% | |||
Conmed Corp. | |||
480 | 2.625%—02/01/20243 | 526 | |
Dexcom Inc. | |||
77 | 0.750%—05/15/2022 | 105 | |
1,665 | 0.750%—12/01/20233 | 1,738 | |
1,843 | |||
Insulet Corp. | |||
942 | 1.375%—11/15/20243 | 1,076 | |
Nuvasive Inc. | |||
1,011 | 2.250%—03/15/2021 | 1,164 |
6
Harbor Convertible Securities Fund
Portfolio of Investments—Continued
Value, Cost, and Principal Amounts in Thousands
CONVERTIBLE BONDS—Continued | |||
Principal Amount | Value | ||
HEALTH CARE EQUIPMENT & SUPPLIES—Continued | |||
Wright Medical Group Inc. | |||
$ | 1,223 | 1.625%—06/15/20233 | $1,333 |
5,942 | |||
HEALTH CARE PROVIDERS & SERVICES—0.4% | |||
Molina Healthcare Inc. | |||
168 | 1.125%—01/15/2020 | 536 | |
HEALTH CARE TECHNOLOGY—2.2% | |||
Allscripts Healthcare Solutions Inc. | |||
2,085 | 1.250%—07/01/2020 | 2,058 | |
Evolent Health Inc. | |||
390 | 1.500%—10/15/20253 | 322 | |
Tabula Rasa Healthcare Inc. | |||
353 | 1.750%—02/15/20263 | 368 | |
2,748 | |||
HOTELS, RESTAURANTS & LEISURE—2.4% | |||
Caesars Entertainment Corp. | |||
190 | 5.000%—10/01/2024 | 282 | |
Huazhu Group Ltd. | |||
548 | 0.375%—11/01/2022 | 637 | |
Marriott Vacations Worldwide Corp. | |||
2,221 | 1.500%—09/15/2022 | 2,185 | |
3,104 | |||
INDEPENDENT POWER & RENEWABLE ELECTRICITY PRODUCERS—0.9% | |||
Nextera Energy Partners LP | |||
1,203 | 1.500%—09/15/20203 | 1,199 | |
INDUSTRIAL CONGLOMERATES—0.4% | |||
Siemens Financieringsmaatschappij NV | |||
500 | 1.650%—08/16/2019 | 547 | |
INTERACTIVE MEDIA & SERVICES—3.9% | |||
IAC Financeco Inc. | |||
657 | 0.875%—10/01/20223 | 1,022 | |
Twitter Inc. | |||
1,125 | 0.250%—06/15/20243 | 1,139 | |
Weibo Corp. | |||
1,240 | 1.250%—11/15/2022 | 1,181 | |
Zillow Group Inc. | |||
1,068 | 1.500%—07/01/2023 | 979 | |
604 | 2.000%—12/01/2021 | 613 | |
1,592 | |||
4,934 | |||
INTERNET & DIRECT MARKETING RETAIL—5.4% | |||
Booking Holdings Inc. | |||
782 | 0.350%—06/15/2020 | 1,120 | |
Ctrip.com International Ltd. | |||
2,165 | 1.990%—07/01/2025 | 2,434 | |
Liberty Expedia Holdings Inc. | |||
2,179 | 1.000%—06/30/20473 | 2,184 | |
Mercadolibre Inc. | |||
322 | 2.000%—08/15/20283 | 416 | |
Wayfair Inc. | |||
489 | 1.125%—11/01/20243 | 763 | |
6,917 | |||
IT SERVICES—4.0% | |||
Akamai Technologies Inc. | |||
2,222 | 0.125%—05/01/20253 | 2,358 |
CONVERTIBLE BONDS—Continued | |||
Principal Amount | Value | ||
IT SERVICES—Continued | |||
Okta Inc. | |||
$ | 120 | 0.250%—02/15/2023 | $266 |
Square Inc. | |||
695 | 0.500%—05/15/20233 | 831 | |
Twilio Inc. | |||
135 | 0.250%—06/01/20233 | 271 | |
Wix.com Ltd. | |||
1,126 | 0.000%—07/01/20231,3 | 1,327 | |
5,053 | |||
LIFE SCIENCES TOOLS & SERVICES—2.2% | |||
Illumina Inc. | |||
1,205 | 0.000%—08/15/20231,3 | 1,305 | |
219 | 0.500%—06/15/2021 | 301 | |
1,606 | |||
Qiagen NV | |||
200 | 0.875%—03/19/2021 | 284 | |
800 | 1.000%—11/13/2024 | 866 | |
1,150 | |||
2,756 | |||
MACHINERY—3.7% | |||
Chart Industries Inc. | |||
382 | 1.000%—11/15/20243 | 612 | |
Fortive Corp. | |||
740 | 0.875%—02/15/20223 | 782 | |
Greenbrier Cos. Inc. | |||
861 | 2.875%—02/01/2024 | 869 | |
Meritor Inc. | |||
2,427 | 3.250%—10/15/2037 | 2,508 | |
4,771 | |||
MEDIA—2.8% | |||
Dish Network Corp. | |||
2,269 | 3.375%—08/15/2026 | 2,087 | |
Liberty Interactive LLC | |||
756 | 1.750%—09/30/20463 | 910 | |
Pandora Media Inc. | |||
548 | 1.750%—12/01/2023 | 617 | |
3,614 | |||
MORTGAGE REAL ESTATE INVESTMENT TRUSTS (REITs)—3.7% | |||
Blackstone Mortgage Trust Inc. | |||
2,468 | 4.750%—03/15/2023 | 2,527 | |
Starwood Property Trust Inc. | |||
1,134 | 4.375%—04/01/2023 | 1,141 | |
Two Harbors Investment Corp. | |||
1,098 | 6.250%—01/15/2022 | 1,116 | |
4,784 | |||
OIL, GAS & CONSUMABLE FUELS—2.9% | |||
Chesapeake Energy Corp. | |||
1,199 | 5.500%—09/15/2026 | 1,090 | |
Oasis Petroleum Inc. | |||
541 | 2.625%—09/15/2023 | 519 | |
PDC Energy Inc. | |||
337 | 1.125%—09/15/2021 | 322 | |
SM Energy Co. | |||
309 | 1.500%—07/01/2021 | 287 |
7
Harbor Convertible Securities Fund
Portfolio of Investments—Continued
Value, Cost, and Principal Amounts in Thousands
CONVERTIBLE BONDS—Continued | |||
Principal Amount | Value | ||
OIL, GAS & CONSUMABLE FUELS—Continued | |||
Total SA MTN2 | |||
$ | 1,400 | 0.500%—12/02/2022 | $1,491 |
3,709 | |||
PERSONAL PRODUCTS—0.5% | |||
Herbalife Nutrition Ltd. | |||
567 | 2.625%—03/15/2024 | 596 | |
PHARMACEUTICALS—2.0% | |||
Jazz Investments I Ltd. | |||
1,293 | 1.500%—08/15/2024 | 1,233 | |
614 | 1.875%—08/15/2021 | 611 | |
1,844 | |||
Supernus Pharmaceuticals Inc. | |||
654 | 0.625%—04/01/2023 | 663 | |
2,507 | |||
PROFESSIONAL SERVICES—0.5% | |||
FTI Consulting Inc. | |||
601 | 2.000%—08/15/20233 | 646 | |
SEMICONDUCTORS & SEMICONDUCTOR EQUIPMENT—8.0% | |||
Advanced Micro Devices Inc. | |||
113 | 2.125%—09/01/2026 | 399 | |
Cypress Semiconductor Corp. | |||
518 | 2.000%—02/01/2023 | 564 | |
Intel Corp. | |||
502 | 3.250%—08/01/2039 | 1,255 | |
Microchip Technology Inc. | |||
1,642 | 1.625%—02/15/2027 | 2,134 | |
NXP Semiconductors NV | |||
1,044 | 1.000%—12/01/2019 | 1,157 | |
ON Semiconductor Corp. | |||
1,122 | 1.000%—12/01/2020 | 1,502 | |
Silicon Laboratories Inc. | |||
1,231 | 1.375%—03/01/2022 | 1,571 | |
STMicroelectronics NV | |||
1,000 | 0.250%—07/03/2024 | 1,148 | |
Teradyne Inc. | |||
340 | 1.250%—12/15/2023 | 558 | |
10,288 | |||
SOFTWARE—13.8% | |||
Atlassian Inc. | |||
403 | 0.625%—05/01/20233 | 597 | |
DocuSign Inc. | |||
1,001 | 0.500%—09/15/20233 | 1,083 | |
Envestnet Inc. | |||
1,306 | 1.750%—06/01/20233 | 1,578 | |
FireEye Inc. | |||
1,243 | 0.875%—06/01/20243 | 1,252 | |
Five9 Inc. | |||
247 | 0.125%—05/01/20233 | 351 | |
HubSpot Inc. | |||
103 | 0.250%—06/01/2022 | 206 | |
New Relic Inc. | |||
1,022 | 0.500%—05/01/20233 | 1,197 |
CONVERTIBLE BONDS—Continued | |||
Principal Amount | Value | ||
SOFTWARE—Continued | |||
Nice Systems Inc. | |||
$ | 311 | 1.250%—01/15/2024 | $531 |
Nuance Communications Inc. | |||
320 | 1.000%—12/15/2035 | 299 | |
1,239 | 1.250%—04/01/2025 | 1,233 | |
1,532 | |||
Nutanix Inc. | |||
345 | 0.000%—01/15/20231 | 395 | |
Q2 Holdings Inc. | |||
121 | 0.750%—02/15/2023 | 170 | |
Rapid7 Inc. | |||
331 | 1.250%—08/01/20233 | 480 | |
RingCentral Inc. | |||
490 | 0.000%—03/15/20231 | 743 | |
ServiceNow Inc. | |||
314 | 0.000%—06/01/20221 | 636 | |
Splunk Inc. | |||
1,788 | 0.500%—09/15/20233 | 2,041 | |
596 | 1.125%—09/15/20253 | 696 | |
2,737 | |||
Verint Systems Inc. | |||
1,432 | 1.500%—06/01/2021 | 1,610 | |
Workday Inc. | |||
981 | 0.250%—10/01/2022 | 1,461 | |
Zendesk Inc. | |||
718 | 0.250%—03/15/2023 | 1,083 | |
17,642 | |||
SPECIALTY RETAIL—1.3% | |||
Guess? Inc. | |||
625 | 2.000%—04/15/20243 | 652 | |
RH | |||
259 | 0.000%—06/15/20191 | 258 | |
807 | 0.000%—06/15/20231,3 | 703 | |
961 | |||
1,613 | |||
TECHNOLOGY HARDWARE, STORAGE & PERIPHERALS—1.7% | |||
Pure Storage Inc. | |||
847 | 0.125%—04/15/2023 | 940 | |
Western Digital Corp. | |||
1,317 | 1.500%—02/01/20243 | 1,178 | |
2,118 | |||
TOTAL CONVERTIBLE BONDS | |||
(Cost $118,274) | 123,715 | ||
TOTAL INVESTMENTS—96.6% | |||
(Cost $118,274) | 123,715 | ||
CASH AND OTHER ASSETS, LESS LIABILITIES—3.4% | 4,325 | ||
TOTAL NET ASSETS—100.0% | $128,040 |
8
Harbor Convertible Securities Fund
Portfolio of Investments—Continued
FAIR VALUE MEASUREMENTS
All investments at April 30, 2019 (as disclosed in the preceding Portfolio of Investments) were classified as Level 2. There were no Level 3 investments at April 30, 2019 or October 31, 2018.
For more information on valuation inputs and their aggregation into the levels identified above, please refer to the Fair Value Measurements and Disclosures in Note 2 of the accompanying Notes to Financial Statements.
1 | Zero coupon bond |
2 | MTN after the name of a security stands for Medium Term Note. |
3 | Securities purchased in a transaction exempt from registration under Rule 144A of the Securities Act of 1933. These securities may be resold in transactions exempt from registration, normally to qualified institutional buyers. The Fund has no right to demand registration of these securities. At April 30, 2019, the aggregate value of these securities was $42,678 or 34% of net assets. |
The accompanying notes are an integral part of the Financial Statements.
9
Harbor High-Yield Bond Fund
Manager’s Commentary (Unaudited)
Subadviser
Shenkman Capital Management, Inc.
461 Fifth Avenue
22nd Floor
22nd Floor
New York, NY 10017
Portfolio Managers
Mark R. Shenkman
Since 2002
Since 2002
Justin W. Slatky
Since 2012
Since 2012
Eric Dobbin
Since 2012
Since 2012
Robert S. Kricheff
Since 2015
Since 2015
Neil Wechsler, CFA
Since 2017
Since 2017
Shenkman Capital has subadvised the Fund since 2002.
Investment Objective
The Fund seeks total returns (i.e., current income and capital appreciation).
Mark R. Shenkman
Justin W. Slatky
Eric Dobbin
Steven N. Schweitzer
Robert S. Kricheff
Neil Wechsler, CFA
Management’s Discussion of
Fund Performance
Fund Performance
Market review
After a negative year of returns for high yield in 2018 and a challenging fourth quarter in particular, the leveraged finance asset classes rebounded dramatically in early 2019. This occurred after a rapid change in the U.S. Federal Reserve (Fed) Chair’s tone and positive inflows helped technical indicators. The ICE BofAML U.S. Non-Distressed High Yield Index returned 5.89% for the six-month period ended April 30th, 2019, and 4.6% in January alone. After starting November 2018 with a yield to-worst of 6.44% and an option adjusted spread (OAS) of 3.36%, by the end of April these measures were at 5.63% and 3.18%, respectively.
Concerns over global growth, political instability, and U.S./China trade negotiations all still loom over markets, but the Chinese economy has appeared to improve after stimulus while its stock market has rallied. The most dramatic news during the period was from the U.S. as the Fed reversed its outlook for rate hikes. This trigger increased returns in longer duration issues in the Index, as bonds with an option adjusted duration (“OAD”) of 2-4 years returned 5.17%, while those with a 6-8 year OAD returned 9.24%. For the period, returns by rating category favored higher quality segments as BB rated bonds in the Index returned 6.76%, while single Bs posted 5.45%. The small CCC segment lagged with a gain of 3.28%.
New issuance continued in both the high-yield bond and leveraged loan markets during the first quarter of 2019, though at a slower pace than seen in the prior two years. New issuance in the high-yield bond market during the quarter was $65.4 billion, and leveraged loan volume was $67.4 billion, according to JPMorgan. One trend seen in 2019 has been a rise in issuance of senior secured bonds in place of loans. Use of proceeds for new high-yield bonds has primarily been for refinancing; however, there was one large leveraged buyout (“LBO”) for Power Solutions. Large M&A news in the quarter that may impact future supply includes a proposed LBO of Inmarsat, ZF International’s plans to acquire Wabco, and Centene’s plans to acquire Wellcare.
performance
Harbor High-Yield Bond Fund returned 4.81% (Retirement Class), 4.88% (Institutional Class), 4.80% (Administrative Class), and 4.65% (Investor Class) for the six months ending April 30, 2019, while the ICE BofAML U.S. Non-Distressed High Yield Index returned 5.89% and the ICE BofAML U.S. High Yield (H0A0) returned 5.55%. Detracting from performance was negative selection in oil and gas and media - cable. The Fund’s relative performance benefitted from strong selection and an overweight in the environmental sector, as well as positive selection in telecom - satellites. The Fund ended the period invested in 290 different issuers across 37 industries, had a yield-to-worst of 4.99%, a weighted average credit rating of B1/BB-, and a duration-to-worst of 2.85 years.
The Fund remained active during the period, taking profits and reducing exposure in healthcare, media-cable and oil and gas, while meaningfully increasing our investments and focus in the technology, financial services and media-broadcast industries. We continued to migrate the overall credit quality in the Fund higher as the market rally took lower rated securities to full valuations. We have also become more selective in new issuance with our participation rate lower than it has historically been in past years.
10
Harbor High-Yield Bond Fund
Manager’s Commentary—Continued
TOTAL RETURNS
For the periods ended 04/30/2019
Unannualized | 1 Year | Annualized | |||||||||
6 Months | 5 Years | 10 Years | |||||||||
Harbor High-Yield Bond Fund | |||||||||||
Retirement Class1 | 4.81% | 5.73% | 3.79% | 7.39% | |||||||
Institutional Class | 4.88 | 5.65 | 3.74 | 7.37 | |||||||
Administrative Class | 4.80 | 5.42 | 3.48 | 7.11 | |||||||
Investor Class | 4.65 | 5.33 | 3.36 | 6.97 | |||||||
Comparative Indices | |||||||||||
ICE BofAML U.S. Non-Distressed High Yield | 5.89% | 7.03% | 5.02% | 8.74% | |||||||
ICE BofAML U.S. High Yield (H0A0) | 5.55 | 6.71 | 4.84 | 10.19 |
As stated in the Fund’s prospectus dated March 1, 2019, the expense ratios were 0.53% (Net) and 0.62% (Gross) (Retirement Class); 0.61% (Net) and 0.70% (Gross) (Institutional Class); 0.86% (Net) and 0.95% (Gross) (Administrative Class); and 0.98% (Net) and 1.07% (Gross) (Investor Class). The net expense ratios reflect a contractual management fee waiver effective through 02/29/2020. The expense ratios in the prospectus may differ from the actual expense ratios for the period disclosed within this report. The expense ratios shown in the prospectus are based on the prior fiscal year, adjusted to reflect changes, if any, in contractual arrangements that occurred prior to the date of the prospectus (or supplement thereto, if applicable).
Performance data shown represents past performance and is no guarantee of future results. Past performance is net of management fees and expenses and reflects reinvested dividends and distributions but does not reflect the deduction of taxes that a shareholder would pay on Fund distributions or upon the redemption of Fund shares. Past performance reflects the beneficial effect of any expense waivers or reimbursements, without which returns would have been lower. Investment returns and principal value will fluctuate so that Fund shares, when redeemed, may be worth more or less than their original cost. Returns for periods less than one year are not annualized. Current performance may be higher or lower and is available through the most recent month end atharborfunds.com or by calling 800-422-1050. The Fund charges a redemption fee of 1% on redemption of Fund shares that are held for less than 90 days.
Outlook & Strategy
Better-than-expected economic data has driven investor confidence. Consensus thinking has typically been a dangerous investment philosophy as latent risks can suddenly erupt. When winning is easy, complacency sets in! The U.S./China trade negotiations are a good example. Both countries would benefit from trade reforms and the markets have been anticipating an agreement. However, given the protracted negotiations, it may be a bumpy road ahead. The J.E.T. fuel for the markets (jobs, earnings, and trade) has made for a smooth ride for the first four months of 2019. Nevertheless, we anticipate increased volatility as the year progresses. Risk-taking has returned with inordinate demand for private debt and equity, which may not be appropriately marked-to- market. Moreover, with limited dealer capital to support secondary trading, the shock absorbers, which historically soften some of the volatility in a correction, have been greatly reduced. A significant force in the credit markets has been the $10 trillion of negative yielding assets, pushing investors to seek more attractive returns. In our view, the longest expansion in U.S. history should not end anytime soon in light of current economic momentum and benign interest rates. Moreover, the U.S. economy does not appear overheated, despite tight labor conditions. In sum, economic data has been beyond expectations. Despite favorable fundamentals and market technical indicators, corrections often occur when least expected. Hence, a cautious and defensive strategy may be warranted.
1 | Retirement Class shares commenced operations on March 1, 2016. The performance attributed to the Retirement Class shares prior to that date is that of the Institutional Class shares. Performance prior to March 1, 2016 has not been adjusted to reflect the lower expenses of Retirement Class shares. During this period, Retirement Class shares would have had returns similar to, but potentially higher than, Institutional Class shares due to the fact that Retirement Class shares represent interests in the same portfolio as Institutional Class shares but are subject to lower expenses. |
This report contains the current opinions of Shenkman Capital Management, Inc. as of the date of this report and should not be considered as investment advice or a recommendation of any particular security, strategy or investment product. Such opinions are subject to change without notice and securities described herein may no longer be included in, or may at any time be removed from, the Fund’s portfolio. This report is distributed for informational purposes only. Information contained herein has been obtained from sources believed reliable, but not guaranteed.
Fixed income investments are affected by interest rate changes and the creditworthiness of the issues held by the Fund. A rise in interest rates will cause a decrease in the value of fixed income securities. Such an event would have an adverse effect on the Fund. High-yield investing poses additional credit risk related to lower-rated bonds. For information on the different share classes and the risks associated with an investment in the Fund, please refer to the current prospectus.
11
Harbor High-Yield Bond Fund
Fund Summary—April 30, 2019 (Unaudited)
TOP Issuers(% of net assets)
❶ | CSC Holdings LLC | 1.5% |
❷ | CCO Holdings LLC | 1.4% |
❸ | T-Mobile USA Inc. | 1.2% |
❹ | Bausch Health Cos. Inc. | 1.1% |
❺ | Dell International LLC / EMC Corp. | 1.1% |
❻ | Tenet Healthcare Corp. | 1.0% |
❼ | Bombardier Inc. | 0.9% |
❽ | Sirius XM Radio Inc. | 0.9% |
❾ | Hughes Satellite Systems Corp. | 0.8% |
❿ | Navient Corp. | 0.8% |
Sector Allocation(% of investments)
Maturity Profile(% of investments)
12
Harbor High-Yield Bond Fund
Portfolio of Investments—April 30, 2019 (Unaudited)
Value, Cost, and Principal Amounts in Thousands
BANK LOAN OBLIGATIONS—2.5% | |||
Principal Amount | Value | ||
CHEMICALS—0.2% | |||
Solenis International LP | |||
Term Loan | |||
$ | 910 | 6.629% (3 Month USD Libor + 2.629) 06/26/20251 | $911 |
COMMERCIAL SERVICES & SUPPLIES—0.3% | |||
Granite Acquisition Inc. | |||
Term Loan B | |||
1,678 | 6.092% (3 Month USD Libor + 3.500) 12/17/20211 | 1,684 | |
HEALTH CARE PROVIDERS & SERVICES—0.3% | |||
AHP Health Partners Inc. | |||
Term Loan B | |||
1,221 | 6.983% (1 Month USD Libor + 2.483) 06/30/20251 | 1,227 | |
Envision Healthcare Corp. | |||
Term Loan | |||
543 | 6.233% (1 Month USD Libor + 2.483) 10/10/20251 | 525 | |
1,752 | |||
HEALTH CARE TECHNOLOGY—0.1% | |||
Change Healthcare Holdings LLC | |||
Term Loan B | |||
633 | 5.233% (1 Month USD Libor + 2.483) 03/01/20241 | 634 | |
HOTELS, RESTAURANTS & LEISURE—0.2% | |||
Stars Group Holdings BV | |||
Term Loan B | |||
822 | 6.101% (3 Month USD Libor + 2.601) 07/10/20251 | 827 | |
INTERACTIVE MEDIA & SERVICES—0.2% | |||
Ancestry.com Inc. | |||
Term Loan B | |||
1,148 | 5.740% (1 Month USD Libor + 3.250) 10/19/20231 | 1,152 | |
MACHINERY—0.1% | |||
Navistar Inc. | |||
Term Loan B | |||
593 | 5.990% (1 Month USD Libor + 2.490) 11/06/20241 | 594 | |
MEDIA—0.2% | |||
Liberty Cablevision of Puerto Rico LLC | |||
First-Lien Term Loan | |||
460 | 5.973% (1 Month USD Libor + 2.473) 01/07/20221 | 460 | |
Univision Communications Inc. | |||
Term Loan | |||
692 | 5.233% (1 Month USD Libor + 2.483) 03/15/20241 | 667 | |
1,127 | |||
SOFTWARE—0.4% | |||
Carbonite Inc. | |||
Term Loan B | |||
480 | 5.806% (1 Month USD Libor + 2.556) 03/21/20261 | 484 | |
Project Alpha Intermediate Holding Inc. | |||
Term Loan B | |||
756 | 6.733% (1 Month USD Libor + 2.483) 04/26/20241 | 759 | |
Ultimate Software Group Inc. | |||
Term Loan B | |||
770 | 6.233% (1 Month USD Libor + 2.483) 04/08/20261 | 777 | |
2,020 | |||
SPECIALTY RETAIL—0.5% | |||
Ascena Retail Group Inc. | |||
Term Loan B | |||
1,289 | 7.000% (1 Month USD Libor + 4.500) 08/21/20221 | 1,113 |
BANK LOAN OBLIGATIONS—Continued | |||
Principal Amount | Value | ||
SPECIALTY RETAIL—Continued | |||
Bass Pro Group LLC | |||
Term Loan B | |||
$ | 1,221 | 7.483% (1 Month USD Libor + 5.000) 09/25/20241 | $1,222 |
2,335 | |||
TOTAL BANK LOAN OBLIGATIONS | |||
(Cost $13,026) | 13,036 | ||
CORPORATE BONDS & NOTES—94.3% | |||
AEROSPACE & DEFENSE—2.2% | |||
Arconic Inc. | |||
1,500 | 5.400%—04/15/2021 | 1,547 | |
272 | 5.900%—02/01/2027 | 288 | |
1,835 | |||
Bombardier Inc. | |||
600 | 6.000%—10/15/20222 | 603 | |
1,835 | 7.875%—04/15/20272 | 1,849 | |
2,000 | 8.750%—12/01/20212 | 2,220 | |
4,672 | |||
TransDigm Inc. | |||
1,000 | 6.250%—03/15/20262 | 1,044 | |
1,045 | 6.500%—07/15/2024 | 1,063 | |
1,500 | 7.500%—03/15/20272 | 1,550 | |
3,657 | |||
TransDigm UK Holdings plc | |||
1,090 | 6.875%—05/15/20262 | 1,098 | |
11,262 | |||
AIR FREIGHT & LOGISTICS—0.9% | |||
XPO Logistics Inc. | |||
1,260 | 6.125%—09/01/20232 | 1,291 | |
2,045 | 6.500%—06/15/20222 | 2,099 | |
1,000 | 6.750%—08/15/20242 | 1,035 | |
4,425 | |||
AUTO COMPONENTS—0.9% | |||
Adient Global Holdings Ltd. | |||
1,120 | 4.875%—08/15/20262 | 916 | |
Adient US LLC | |||
670 | 7.000%—05/15/20262 | 687 | |
American Axle & Manufacturing Inc. | |||
1,250 | 6.625%—10/15/2022 | 1,283 | |
Delphi Jersey Holdings plc | |||
730 | 5.000%—10/01/20252 | 672 | |
Tenneco Inc. | |||
1,350 | 5.000%—07/15/2026 | 1,110 | |
4,668 | |||
AUTOMOBILES—0.4% | |||
Jaguar Land Rover Automotive plc | |||
1,150 | 4.500%—10/01/20272 | 955 | |
Tesla Inc. | |||
1,500 | 5.300%—08/15/20252 | 1,288 | |
2,243 |
13
Harbor High-Yield Bond Fund
Portfolio of Investments—Continued
Value, Cost, and Principal Amounts in Thousands
CORPORATE BONDS & NOTES—Continued | |||
Principal Amount | Value | ||
BANKS—0.3% | |||
CIT Group Inc. | |||
$ | 1,155 | 5.250%—03/07/2025 | $1,232 |
509 | 6.125%—03/09/2028 | 568 | |
1,800 | |||
BEVERAGES—0.4% | |||
Cott Holdings Inc. | |||
2,000 | 5.500%—04/01/20252 | 2,032 | |
BIOTECHNOLOGY—0.3% | |||
Avantor Inc. | |||
1,500 | 6.000%—10/01/20242 | 1,569 | |
BUILDING PRODUCTS—1.4% | |||
Griffon Corp. | |||
1,850 | 5.250%—03/01/2022 | 1,857 | |
New Enterprise Stone & Lime Co. Inc. | |||
1,500 | 6.250%—03/15/20262 | 1,525 | |
Standard Industries Inc. | |||
500 | 4.750%—01/15/20282 | 481 | |
1,500 | 5.500%—02/15/20232 | 1,526 | |
2,007 | |||
Summit Materials LLC / Summit Materials Finance Corp. | |||
1,400 | 6.125%—07/15/2023 | 1,431 | |
300 | 6.500%—03/15/20272 | 311 | |
1,742 | |||
7,131 | |||
CAPITAL MARKETS—0.4% | |||
Deutsche Bank AG | |||
1,150 | 4.875%—12/01/2032 | 984 | |
Refinitiv US Holdings Inc. | |||
1,000 | 6.250%—05/15/20262 | 1,029 | |
2,013 | |||
CHEMICALS—1.6% | |||
Blue Cube Spinco LLC | |||
975 | 9.750%—10/15/2023 | 1,092 | |
387 | 10.000%—10/15/2025 | 442 | |
1,534 | |||
GCP Applied Technologies Inc. | |||
750 | 5.500%—04/15/20262 | 764 | |
NOVA Chemicals Corp. | |||
750 | 4.875%—06/01/20242 | 736 | |
1,000 | 5.250%—08/01/20232 | 1,011 | |
1,747 | |||
OCI NV | |||
600 | 6.625%—04/15/20232 | 628 | |
PQ Corp. | |||
1,500 | 6.750%—11/15/20222 | 1,558 | |
Trinseo LLC | |||
1,000 | 5.375%—09/01/20252 | 978 | |
Tronox Inc. | |||
1,250 | 6.500%—04/15/20262 | 1,266 | |
8,475 | |||
COMMERCIAL SERVICES & SUPPLIES—2.7% | |||
Advanced Disposal Services Inc. | |||
500 | 5.625%—11/15/20242 | 527 |
CORPORATE BONDS & NOTES—Continued | |||
Principal Amount | Value | ||
COMMERCIAL SERVICES & SUPPLIES—Continued | |||
Brink's Co. | |||
$ | 928 | 4.625%—10/15/20272 | $898 |
Covanta Holding Corp. | |||
1,000 | 5.875%—07/01/2025 | 1,029 | |
Exela Intermediate LLC / Exela Finance Inc. | |||
1,237 | 10.000%—07/15/20232 | 1,252 | |
GFL Environmental Inc. | |||
750 | 7.000%—06/01/20262 | 733 | |
2,325 | 8.500%—05/01/20272 | 2,427 | |
3,160 | |||
GW Honos Security Corp. | |||
1,321 | 8.750%—05/15/20252 | 1,252 | |
Matthews International Corp. | |||
345 | 5.250%—12/01/20252 | 338 | |
NuStar Logistics LP | |||
2,000 | 6.750%—02/01/2021 | 2,090 | |
RR Donnelley & Sons Co. | |||
740 | 6.000%—04/01/2024 | 747 | |
Waste Pro USA Inc. | |||
1,000 | 5.500%—02/15/20262 | 1,000 | |
Williams Scotsman International Inc. | |||
1,435 | 7.875%—12/15/20222 | 1,507 | |
13,800 | |||
COMMUNICATIONS EQUIPMENT—2.2% | |||
CommScope Inc. | |||
1,250 | 5.000%—06/15/20212 | 1,255 | |
700 | 6.000%—03/01/20262 | 743 | |
400 | 8.250%—03/01/20272 | 433 | |
2,431 | |||
Hughes Satellite Systems Corp. | |||
874 | 6.625%—08/01/2026 | 886 | |
3,000 | 7.625%—06/15/2021 | 3,210 | |
4,096 | |||
Telesat Canada | |||
1,500 | 8.875%—11/15/20242 | 1,629 | |
Viasat Inc. | |||
3,300 | 5.625%—09/15/2025-04/15/20272 | 3,312 | |
11,468 | |||
CONSUMER FINANCE—1.9% | |||
Ally Financial Inc. | |||
74 | 4.125%—03/30/2020 | 74 | |
605 | 5.750%—11/20/2025 | 658 | |
875 | 8.000%—11/01/2031 | 1,123 | |
1,855 | |||
Navient Corp. | |||
1,000 | 5.000%—10/26/2020 | 1,016 | |
Navient Corp. MTN3 | |||
1,100 | 5.500%—01/25/2023 | 1,124 | |
2,000 | 7.250%—01/25/2022 | 2,150 | |
3,274 | |||
Springleaf Finance Corp. | |||
500 | 5.625%—03/15/2023 | 520 | |
780 | 6.125%—03/15/2024 | 825 | |
650 | 6.875%—03/15/2025 | 699 | |
1,675 | 7.750%—10/01/2021 | 1,826 | |
3,870 | |||
10,015 |
14
Harbor High-Yield Bond Fund
Portfolio of Investments—Continued
Value, Cost, and Principal Amounts in Thousands
CORPORATE BONDS & NOTES—Continued | |||
Principal Amount | Value | ||
CONTAINERS & PACKAGING—2.3% | |||
ARD Finance SA | |||
$ | 1,250 | 7.125%—09/15/2023 | $1,255 |
Ardagh Packaging Finance plc | |||
300 | 4.625%—05/15/20232 | 304 | |
800 | 6.000%—02/15/20252 | 808 | |
1,112 | |||
Berry Global Inc. | |||
1,000 | 6.000%—10/15/2022 | 1,032 | |
BWAY Holding Co. | |||
980 | 5.500%—04/15/20242 | 977 | |
500 | 7.250%—04/15/20252 | 489 | |
1,466 | |||
Cascades Inc. | |||
1,400 | 5.500%—07/15/20222 | 1,417 | |
Crown Americas LLC / Crown Americas Capital Corp. VI | |||
1,000 | 4.750%—02/01/2026 | 1,019 | |
Flex Acquisition Co. Inc. | |||
750 | 6.875%—01/15/20252 | 709 | |
OI European Group BV | |||
925 | 4.000%—03/15/20232 | 916 | |
Reynolds Group Issuer Inc. | |||
750 | 5.125%—07/15/20232 | 762 | |
2,180 | 5.750%—10/15/2020 | 2,189 | |
2,951 | |||
11,877 | |||
DISTRIBUTORS—0.1% | |||
LKQ Corp. | |||
750 | 4.750%—05/15/2023 | 759 | |
DIVERSIFIED CONSUMER SERVICES—0.2% | |||
Frontdoor Inc. | |||
960 | 6.750%—08/15/20262 | 1,009 | |
DIVERSIFIED FINANCIAL SERVICES—1.8% | |||
Avolon Holdings Funding Ltd. | |||
1,615 | 5.125%—10/01/20232 | 1,682 | |
500 | 5.250%—05/15/20242 | 524 | |
2,206 | |||
Compass Group Diversified Holdings LLC | |||
750 | 8.000%—05/01/20262 | 793 | |
DAE Funding LLC | |||
470 | 4.000%—08/01/20202 | 473 | |
1,000 | 5.000%—08/01/20242 | 1,032 | |
1,000 | 5.750%—11/15/20232 | 1,050 | |
2,555 | |||
Fidelity & Guaranty Life Holdings Inc. | |||
1,200 | 5.500%—05/01/20252 | 1,218 | |
Park Aerospace Holdings Ltd. | |||
615 | 5.250%—08/15/20222 | 642 | |
Virtu Financial Inc. | |||
2,000 | 6.750%—06/15/20222 | 2,072 | |
9,486 | |||
DIVERSIFIED TELECOMMUNICATION SERVICES—4.6% | |||
Altice Financing SA | |||
1,500 | 7.500%—05/15/20262 | 1,526 |
CORPORATE BONDS & NOTES—Continued | |||
Principal Amount | Value | ||
DIVERSIFIED TELECOMMUNICATION SERVICES—Continued | |||
Altice Luxembourg SA | |||
$ | 200 | 7.625%—02/15/20252 | $188 |
1,500 | 7.750%—05/15/20222 | 1,532 | |
1,720 | |||
CenturyLink Inc. | |||
2,150 | 5.800%—03/15/2022 | 2,220 | |
1,000 | 6.450%—06/15/2021 | 1,045 | |
100 | 6.750%—12/01/2023 | 106 | |
1,197 | 7.500%—04/01/2024 | 1,289 | |
4,660 | |||
Frontier Communications Corp. | |||
835 | 7.125%—01/15/2023 | 524 | |
210 | 7.625%—04/15/2024 | 117 | |
352 | 8.750%—04/15/2022 | 246 | |
500 | 11.000%—09/15/2025 | 326 | |
1,213 | |||
GCI Inc. | |||
3,000 | 6.750%—06/01/2021 | 3,009 | |
Inmarsat Finance plc | |||
2,000 | 4.875%—05/15/20222 | 2,030 | |
Intelsat Connect Finance SA | |||
800 | 9.500%—02/15/20232 | 746 | |
Intelsat Jackson Holdings SA | |||
750 | 5.500%—08/01/2023 | 680 | |
1,750 | 8.500%—10/15/20242 | 1,736 | |
2,416 | |||
Level 3 Communications Inc. | |||
1,925 | 5.750%—12/01/2022 | 1,946 | |
Level 3 Financing Inc. | |||
500 | 5.375%—08/15/2022 | 503 | |
Telecom Italia Capital SA | |||
625 | 6.000%—09/30/2034 | 581 | |
545 | 6.375%—11/15/2033 | 533 | |
1,114 | |||
Wind Tre SpA | |||
1,035 | 5.000%—01/20/20262 | 951 | |
Zayo Group LLC | |||
1,250 | 5.750%—01/15/20272 | 1,272 | |
530 | 6.375%—05/15/2025 | 541 | |
1,813 | |||
23,647 | |||
ELECTRIC UTILITIES—0.4% | |||
Talen Energy Supply LLC | |||
660 | 6.500%—06/01/2025 | 582 | |
Vistra Energy Corp. | |||
587 | 7.375%—11/01/2022 | 609 | |
Vistra Operations Co. LLC | |||
1,000 | 5.625%—02/15/20272 | 1,030 | |
2,221 | |||
ELECTRONIC EQUIPMENT, INSTRUMENTS & COMPONENTS—0.2% | |||
Anixter Inc. | |||
1,075 | 5.500%—03/01/2023 | 1,134 |
15
Harbor High-Yield Bond Fund
Portfolio of Investments—Continued
Value, Cost, and Principal Amounts in Thousands
CORPORATE BONDS & NOTES—Continued | |||
Principal Amount | Value | ||
ENERGY EQUIPMENT & SERVICES—2.2% | |||
Archrock Partners LP / Archrock Partners Finance Corp. | |||
$ | 500 | 6.000%—10/01/2022 | $506 |
760 | 6.875%—04/01/20272 | 794 | |
1,300 | |||
Ensco plc | |||
400 | 7.750%—02/01/2026 | 347 | |
Ensign Drilling Inc. | |||
1,235 | 9.250%—04/15/20242 | 1,240 | |
Nabors Industries Inc. | |||
1,860 | 5.750%—02/01/2025 | 1,702 | |
Pride International LLC | |||
1,000 | 7.875%—08/15/2040 | 795 | |
Transocean Guardian Ltd. | |||
33 | 5.875%—01/15/20242 | 34 | |
Transocean Inc. | |||
500 | 6.800%—03/15/2038 | 397 | |
1,160 | 7.250%—11/01/20252 | 1,153 | |
588 | 7.500%—01/15/20262 | 582 | |
2,132 | |||
Transocean Poseidon Ltd. | |||
500 | 6.875%—02/01/20272 | 534 | |
Unit Corp. | |||
1,285 | 6.625%—05/15/2021 | 1,266 | |
USA Compression Partners LP / USA Compression Finance Corp. | |||
680 | 6.875%—09/01/20272 | 719 | |
Weatherford International Ltd. | |||
1,075 | 6.750%—09/15/2040 | 688 | |
553 | 8.250%—06/15/2023 | 384 | |
1,072 | |||
11,141 | |||
ENTERTAINMENT—2.0% | |||
AMC Entertainment Holdings Inc. | |||
1,125 | 5.750%—06/15/2025 | 1,089 | |
277 | 5.875%—11/15/2026 | 258 | |
1,347 | |||
Cinemark USA Inc. | |||
1,840 | 5.125%—12/15/2022 | 1,874 | |
Lions Gate Capital Holdings LLC | |||
2,129 | 6.375%—02/01/20242 | 2,233 | |
Meredith Corp. | |||
1,500 | 6.875%—02/01/2026 | 1,568 | |
NetFlix Inc. | |||
475 | 5.375%—11/15/20292 | 482 | |
350 | 5.500%—02/15/2022 | 369 | |
600 | 6.375%—05/15/20292 | 657 | |
1,508 | |||
WMG Acquisition Corp. | |||
1,518 | 5.625%—04/15/20222 | 1,546 | |
10,076 | |||
EQUITY REAL ESTATE INVESTMENT TRUSTS (REITs)—4.9% | |||
Brookfield Property REIT Inc. | |||
745 | 5.750%—05/15/20262 | 761 | |
CoreCivic Inc. | |||
1,500 | 4.750%—10/15/2027 | 1,299 | |
CyrusOne LP | |||
1,000 | 5.000%—03/15/2024 | 1,025 |
CORPORATE BONDS & NOTES—Continued | |||
Principal Amount | Value | ||
EQUITY REAL ESTATE INVESTMENT TRUSTS (REITs)—Continued | |||
Equinix Inc. | |||
$ | 2,000 | 5.375%—01/01/2022-05/15/2027 | $2,089 |
FelCor Lodging LP | |||
1,000 | 6.000%—06/01/2025 | 1,046 | |
GEO Group Inc. | |||
1,400 | 5.875%—01/15/2022 | 1,386 | |
GLP Capital LP | |||
850 | 5.750%—06/01/2028 | 916 | |
Iron Mountain Inc. | |||
850 | 4.875%—09/15/20272 | 829 | |
750 | 5.250%—03/15/20282 | 742 | |
500 | 5.750%—08/15/2024 | 505 | |
1,750 | 6.000%—08/15/2023 | 1,799 | |
3,875 | |||
Kennedy-Wilson Inc. | |||
1,500 | 5.875%—04/01/2024 | 1,519 | |
Ladder Capital Finance Corp. | |||
850 | 5.250%—10/01/20252 | 849 | |
460 | 5.875%—08/01/20212 | 470 | |
1,319 | |||
MPT Operating Partnership LP | |||
2,500 | 6.375%—03/01/2024 | 2,636 | |
QualityTech LP | |||
314 | 4.750%—11/15/20252 | 308 | |
RHP Hotel Properties LP | |||
2,500 | 5.000%—04/15/2021-04/15/2023 | 2,524 | |
Sabra Health Care LP | |||
2,500 | 5.500%—02/01/2021 | 2,523 | |
SBA Communications Corp. | |||
1,745 | 4.000%—10/01/2022 | 1,762 | |
24,988 | |||
FOOD & STAPLES RETAILING—0.6% | |||
Albertsons Companies LLC | |||
680 | 5.750%—03/15/2025 | 678 | |
1,070 | 6.625%—06/15/2024 | 1,109 | |
630 | 7.500%—03/15/20262 | 671 | |
2,458 | |||
Rite Aid Corp. | |||
1,000 | 6.125%—04/01/20232 | 856 | |
3,314 | |||
FOOD PRODUCTS—1.2% | |||
B&G Foods Inc. | |||
2,000 | 5.250%—04/01/2025 | 1,970 | |
Darling Ingredients Inc. | |||
1,290 | 5.250%—04/15/20272 | 1,316 | |
Dean Foods Co. | |||
775 | 6.500%—03/15/20232 | 407 | |
Post Holdings Inc. | |||
1,750 | 5.500%—03/01/20252 | 1,798 | |
370 | 5.750%—03/01/20272 | 381 | |
2,179 | |||
TreeHouse Foods Inc. | |||
434 | 4.875%—03/15/2022 | 439 | |
6,311 | |||
GAS UTILITIES—0.7% | |||
AmeriGas Partners LP | |||
500 | 5.750%—05/20/2027 | 519 |
16
Harbor High-Yield Bond Fund
Portfolio of Investments—Continued
Value, Cost, and Principal Amounts in Thousands
CORPORATE BONDS & NOTES—Continued | |||
Principal Amount | Value | ||
GAS UTILITIES—Continued | |||
DCP Midstream Operating LP | |||
$ | 500 | 6.750%—09/15/20372 | $524 |
Ferrellgas LP | |||
1,175 | 6.500%—05/01/2021 | 1,054 | |
Suburban Propane Partners LP | |||
1,600 | 5.875%—03/01/2027 | 1,564 | |
3,661 | |||
HEALTH CARE EQUIPMENT & SUPPLIES—0.4% | |||
Hologic Inc. | |||
1,000 | 4.375%—10/15/20252 | 995 | |
Teleflex Inc. | |||
1,000 | 4.625%—11/15/2027 | 999 | |
1,994 | |||
HEALTH CARE PROVIDERS & SERVICES—5.8% | |||
Acadia Healthcare Co. Inc. | |||
794 | 5.125%—07/01/2022 | 801 | |
815 | 5.625%—02/15/2023 | 827 | |
1,628 | |||
AHP Health Partners Co. | |||
1,061 | 9.750%—07/15/20261,2 | 1,155 | |
Air Medical Merger Sub Corp. | |||
1,150 | 6.375%—05/15/20232 | 1,061 | |
Centene Corp. | |||
2,000 | 5.625%—02/15/2021 | 2,035 | |
1,254 | 6.125%—02/15/2024 | 1,315 | |
3,350 | |||
DaVita Inc. | |||
1,500 | 5.750%—08/15/2022 | 1,528 | |
Envision Healthcare Corp. | |||
900 | 8.750% (1 Month USD Libor + 3.750) 10/15/20261,2 | 851 | |
HCA Healthcare Inc. | |||
2,500 | 6.250%—02/15/2021 | 2,628 | |
HCA Inc. | |||
950 | 5.375%—02/01/2025-09/01/2026 | 1,004 | |
500 | 5.625%—09/01/2028 | 534 | |
1,250 | 5.875%—02/15/2026-02/01/2029 | 1,346 | |
2,884 | |||
Molina Healthcare Inc. | |||
181 | 4.875%—06/15/20252 | 181 | |
2,000 | 5.375%—11/15/2022 | 2,092 | |
2,273 | |||
MPH Acquisition Holdings LLC | |||
3,218 | 7.125%—06/01/20242 | 3,243 | |
RegionalCare Hospital Partners Holdings Inc. | |||
1,000 | 8.250%—05/01/20232 | 1,064 | |
RegionalCare Hospital Partners Holdings Inc. / LifePoint Health Inc. | |||
600 | 9.750%—12/01/20262 | 628 | |
Team Health Holdings Inc. | |||
765 | 6.375%—02/01/20252 | 654 | |
Tenet Healthcare Corp. | |||
2,722 | 4.375%—10/01/2021 | 2,766 | |
861 | 4.500%—04/01/2021 | 877 | |
1,561 | 6.000%—10/01/2020 | 1,620 | |
5,263 | |||
Vizient Inc. | |||
370 | 6.250%—05/15/20272 | 384 |
CORPORATE BONDS & NOTES—Continued | |||
Principal Amount | Value | ||
HEALTH CARE PROVIDERS & SERVICES—Continued | |||
West Street Merger Sub Inc. | |||
$ | 1,060 | 6.375%—09/01/20252 | $1,031 |
29,625 | |||
HEALTH CARE TECHNOLOGY—0.2% | |||
Change Healthcare Holdings LLC | |||
1,000 | 5.750%—03/01/20252 | 995 | |
HOTELS, RESTAURANTS & LEISURE—3.6% | |||
Brinker International Inc. | |||
1,500 | 3.875%—05/15/2023 | 1,464 | |
ESH Hospitality Inc. | |||
1,500 | 5.250%—05/01/20252 | 1,509 | |
Hilton Domestic Operating Co. Inc. | |||
884 | 5.125%—05/01/20262 | 907 | |
International Game Technology plc | |||
1,000 | 6.250%—02/15/20222 | 1,048 | |
IRB Holding Corp. | |||
1,600 | 6.750%—02/15/20262 | 1,592 | |
Landry's Inc. | |||
575 | 6.750%—10/15/20242 | 589 | |
Marriott Ownership Resorts Inc. | |||
1,475 | 6.500%—09/15/20262 | 1,554 | |
MGM Resorts International | |||
1,000 | 5.500%—04/15/2027 | 1,034 | |
1,500 | 7.750%—03/15/2022 | 1,663 | |
2,697 | |||
New Red Finance Inc. | |||
1,375 | 4.625%—01/15/20222 | 1,383 | |
1,000 | 5.000%—10/15/20252 | 994 | |
2,377 | |||
Scientific Games International Inc. | |||
600 | 8.250%—03/15/20262 | 623 | |
Stars Group Holdings BV / Stars Group US Co.-Borrower LLC | |||
750 | 7.000%—07/15/20262 | 789 | |
VICI Properties Inc. | |||
2,100 | 8.000%—10/15/2023 | 2,310 | |
Viking Cruises Ltd. | |||
500 | 5.875%—09/15/20272 | 499 | |
VOC Escrow Ltd. | |||
450 | 5.000%—02/15/20282 | 449 | |
18,407 | |||
HOUSEHOLD DURABLES—0.9% | |||
Lennar Corp. | |||
1,345 | 4.750%—04/01/2021-11/29/2027 | 1,376 | |
1,000 | 4.875%—12/15/2023 | 1,037 | |
475 | 5.250%—06/01/2026 | 495 | |
2,908 | |||
M/I Homes Inc. | |||
800 | 5.625%—08/01/2025 | 789 | |
Toll Brothers Finance Corp. | |||
355 | 4.350%—02/15/2028 | 341 | |
Tri Pointe Group Inc. | |||
650 | 4.875%—07/01/2021 | 661 | |
4,699 | |||
HOUSEHOLD PRODUCTS—1.4% | |||
Energizer Holdings Inc. | |||
1,605 | 5.500%—06/15/20252 | 1,626 |
17
Harbor High-Yield Bond Fund
Portfolio of Investments—Continued
Value, Cost, and Principal Amounts in Thousands
CORPORATE BONDS & NOTES—Continued | |||
Principal Amount | Value | ||
HOUSEHOLD PRODUCTS—Continued | |||
First Quality Finance Co. Inc. | |||
$ | 2,500 | 4.625%—05/15/20212 | $2,506 |
Prestige Brands Inc. | |||
1,750 | 5.375%—12/15/20212 | 1,768 | |
400 | 6.375%—03/01/20242 | 415 | |
2,183 | |||
Spectrum Brands Inc. | |||
878 | 6.625%—11/15/2022 | 900 | |
7,215 | |||
INDEPENDENT POWER & RENEWABLE ELECTRICITY PRODUCERS—1.7% | |||
AES Corp. | |||
1,065 | 4.000%—03/15/2021 | 1,078 | |
585 | 4.500%—03/15/2023 | 596 | |
1,000 | 5.500%—04/15/2025 | 1,041 | |
300 | 6.000%—05/15/2026 | 319 | |
3,034 | |||
Calpine Corp. | |||
505 | 5.250%—06/01/20262 | 508 | |
500 | 5.500%—02/01/2024 | 498 | |
600 | 5.750%—01/15/2025 | 595 | |
1,601 | |||
NRG Energy Inc. | |||
2,850 | 6.250%—05/01/2024 | 2,947 | |
Terraform Power Operating LLC | |||
583 | 4.250%—01/31/20232 | 579 | |
600 | 5.000%—01/31/20282 | 594 | |
1,173 | |||
8,755 | |||
INDUSTRIAL CONGLOMERATES—0.2% | |||
Gates Global LLC | |||
800 | 6.000%—07/15/20222 | 803 | |
INSURANCE—0.2% | |||
Acrisure Finance Inc. | |||
500 | 7.000%—11/15/20252 | 455 | |
Hub International Ltd. | |||
750 | 7.000%—05/01/20262 | 758 | |
1,213 | |||
INTERACTIVE MEDIA & SERVICES—0.4% | |||
Match Group Inc. | |||
700 | 5.625%—02/15/20292 | 718 | |
1,200 | 6.375%—06/01/2024 | 1,265 | |
1,983 | |||
IT SERVICES—1.4% | |||
First Data Corp. | |||
2,515 | 5.375%—08/15/20232 | 2,578 | |
1,371 | 5.750%—01/15/20242 | 1,418 | |
3,996 | |||
WEX Inc. | |||
3,000 | 4.750%—02/01/20232 | 3,018 | |
7,014 | |||
LEISURE PRODUCTS—0.3% | |||
NCL Corp. Ltd. | |||
500 | 4.750%—12/15/20212 | 507 |
CORPORATE BONDS & NOTES—Continued | |||
Principal Amount | Value | ||
LEISURE PRODUCTS—Continued | |||
Wyndham Destinations Inc. | |||
$ | 305 | 3.900%—03/01/2023 | $302 |
390 | 5.400%—04/01/2024 | 403 | |
500 | 5.750%—04/01/2027 | 504 | |
1,209 | |||
1,716 | |||
LIFE SCIENCES TOOLS & SERVICES—0.9% | |||
inVentiv Group Holdings Inc. | |||
1,086 | 7.500%—10/01/20242 | 1,143 | |
IQVIA Inc. | |||
1,250 | 4.875%—05/15/20232 | 1,277 | |
Jaguar Holding Co. II | |||
2,000 | 6.375%—08/01/20232 | 2,045 | |
4,465 | |||
MACHINERY—0.6% | |||
Allison Transmission Inc. | |||
715 | 4.750%—10/01/20272 | 704 | |
366 | 5.875%—06/01/20292 | 378 | |
1,082 | |||
Colfax Corp. | |||
275 | 6.000%—02/15/20242 | 287 | |
410 | 6.375%—02/15/20262 | 434 | |
721 | |||
EnPro Industries Inc. | |||
1,000 | 5.750%—10/15/20262 | 1,030 | |
2,833 | |||
MEDIA—12.2% | |||
Altice France SA | |||
700 | 6.250%—05/15/20242 | 720 | |
1,326 | 7.375%—05/01/20262 | 1,347 | |
2,067 | |||
AMC Networks Inc. | |||
930 | 4.750%—08/01/2025 | 927 | |
Block Communications Inc. | |||
2,050 | 6.875%—02/15/20252 | 2,137 | |
C&W Senior Financing Designated Activity Company | |||
1,170 | 7.500%—10/15/20262 | 1,217 | |
Cable One Inc. | |||
1,480 | 5.750%—06/15/20222 | 1,508 | |
CBS Radio Inc. | |||
1,408 | 7.250%—11/01/20242 | 1,461 | |
CCO Holdings LLC | |||
650 | 5.000%—02/01/20282 | 651 | |
5,000 | 5.250%—03/15/2021-09/30/2022 | 5,084 | |
1,500 | 5.875%—04/01/20242 | 1,571 | |
7,306 | |||
CSC Holdings LLC | |||
2,000 | 5.125%—12/15/20212 | 2,010 | |
1,000 | 5.375%—02/01/20282 | 1,019 | |
1,000 | 7.750%—07/15/20252 | 1,077 | |
3,000 | 10.875%—10/15/20252 | 3,457 | |
7,563 | |||
DISH DBS Corp. | |||
400 | 5.875%—11/15/2024 | 346 | |
3,250 | 7.750%—07/01/2026 | 2,917 | |
3,263 |
18
Harbor High-Yield Bond Fund
Portfolio of Investments—Continued
Value, Cost, and Principal Amounts in Thousands
CORPORATE BONDS & NOTES—Continued | |||
Principal Amount | Value | ||
MEDIA—Continued | |||
Entercom Media Corp. | |||
$ | 835 | 6.500%—05/01/20272 | $854 |
EW Scripps Co. | |||
1,850 | 5.125%—05/15/20252 | 1,762 | |
Graham Holdings Co. | |||
945 | 5.750%—06/01/20262 | 992 | |
Gray Television Inc. | |||
1,245 | 7.000%—05/15/20272 | 1,347 | |
Lamar Media Corp. | |||
500 | 5.000%—05/01/2023 | 509 | |
725 | 5.750%—02/01/20262 | 764 | |
1,273 | |||
Mediacom Broadband LLC | |||
150 | 5.500%—04/15/2021 | 151 | |
Midcontinent Finance Corp. | |||
2,000 | 6.875%—08/15/20232 | 2,095 | |
Nexstar Broadcasting Inc. | |||
550 | 5.875%—11/15/2022 | 564 | |
Outfront Media Capital LLC | |||
1,400 | 5.875%—03/15/2025 | 1,451 | |
Quebecor Media Inc. | |||
600 | 5.750%—01/15/2023 | 628 | |
Radiate HoldCo LLC | |||
1,260 | 6.625%—02/15/20252 | 1,244 | |
310 | 6.875%—02/15/20232 | 312 | |
1,556 | |||
Sable International Finance Ltd. | |||
840 | 5.750%—09/07/20272 | 835 | |
200 | 6.875%—08/01/20222 | 209 | |
1,044 | |||
Sinclair Television Group Inc. | |||
2,000 | 6.125%—10/01/2022 | 2,042 | |
Sirius XM Radio Inc. | |||
1,000 | 5.000%—08/01/20272 | 1,012 | |
3,500 | 6.000%—07/15/20242 | 3,627 | |
4,639 | |||
TEGNA Inc. | |||
2,525 | 6.375%—10/15/2023 | 2,615 | |
Telenet Finance Luxembourg Notes Sarl | |||
1,000 | 5.500%—03/01/20282 | 994 | |
Townsquare Media Inc. | |||
500 | 6.500%—04/01/20232 | 490 | |
Tribune Media Co. | |||
3,000 | 5.875%—07/15/2022 | 3,057 | |
Univision Communications Inc. | |||
1,370 | 5.125%—02/15/20252 | 1,293 | |
4 | 6.750%—09/15/20222 | 4 | |
1,297 | |||
UPCB Finance IV Ltd. | |||
1,800 | 5.375%—01/15/20252 | 1,844 | |
Virgin Media Finance plc | |||
500 | 5.750%—01/15/20252 | 513 | |
800 | 6.000%—10/15/20242 | 831 | |
1,344 | |||
Virgin Media Secured Finance plc | |||
880 | 5.250%—01/15/2021 | 910 |
CORPORATE BONDS & NOTES—Continued | |||
Principal Amount | Value | ||
MEDIA—Continued | |||
Ziggo Bond Finance BV | |||
$ | 1,000 | 5.875%—01/15/20252 | $1,005 |
1,000 | 6.000%—01/15/20272 | 985 | |
1,990 | |||
62,388 | |||
METALS & MINING—2.8% | |||
AK Steel Corp. | |||
500 | 7.000%—03/15/2027 | 426 | |
Alcoa Nederland Holding BV | |||
1,740 | 6.125%—05/15/20282 | 1,814 | |
Alliance Resource Operating Partners | |||
500 | 7.500%—05/01/20252 | 526 | |
Commercial Metals Co. | |||
1,000 | 5.375%—07/15/2027 | 987 | |
Constellium NV | |||
400 | 5.750%—05/15/20242 | 411 | |
1,100 | 6.625%—03/01/20252 | 1,147 | |
1,558 | |||
FMG Resources August 2006 Pty Ltd. | |||
1,365 | 4.750%—05/15/20222 | 1,387 | |
600 | 5.125%—03/15/20232 | 615 | |
2,002 | |||
Freeport-McMoRan Inc. | |||
880 | 3.550%—03/01/2022 | 875 | |
513 | 5.400%—11/14/2034 | 484 | |
885 | 5.450%—03/15/2043 | 803 | |
234 | 6.875%—02/15/2023 | 248 | |
2,410 | |||
Grinding Media Inc. | |||
1,000 | 7.375%—12/15/20232 | 982 | |
Novelis Corp. | |||
155 | 5.875%—09/30/20262 | 158 | |
1,300 | 6.250%—08/15/20242 | 1,357 | |
1,515 | |||
Steel Dynamics Inc. | |||
1,800 | 5.125%—10/01/2021 | 1,814 | |
Teck Resources Ltd. | |||
550 | 8.500%—06/01/20242 | 589 | |
14,623 | |||
MORTGAGE REAL ESTATE INVESTMENT TRUSTS (REITs)—0.6% | |||
Starwood Property Trust Inc. | |||
900 | 3.625%—02/01/2021 | 898 | |
2,000 | 5.000%—12/15/2021 | 2,047 | |
2,945 | |||
OIL, GAS & CONSUMABLE FUELS—9.7% | |||
Antero Midstream Partners LP / Antero Midstream Finance Corp. | |||
780 | 5.750%—03/01/20272 | 800 | |
Ascent Resources Utica Holdings LLC / Aru Finance Corp. | |||
325 | 7.000%—11/01/20262 | 319 | |
975 | 10.000%—04/01/20222 | 1,072 | |
1,391 | |||
Baytex Energy Corp. | |||
1,200 | 5.625%—06/01/20242 | 1,143 |
19
Harbor High-Yield Bond Fund
Portfolio of Investments—Continued
Value, Cost, and Principal Amounts in Thousands
CORPORATE BONDS & NOTES—Continued | |||
Principal Amount | Value | ||
OIL, GAS & CONSUMABLE FUELS—Continued | |||
Berry Petroleum Co. LLC | |||
$ | 408 | 7.000%—02/15/20262 | $403 |
Blue Racer Midstream LLC | |||
800 | 6.125%—11/15/20222 | 813 | |
Callon Petroleum Co. | |||
1,080 | 6.375%—07/01/2026 | 1,110 | |
Centennial Resource Production LLC | |||
132 | 5.375%—01/15/20262 | 130 | |
562 | 6.875%—04/01/20272 | 584 | |
714 | |||
Cheniere Energy Partners LP | |||
1,000 | 5.250%—10/01/2025 | 1,024 | |
750 | 5.625%—10/01/20262 | 776 | |
1,800 | |||
Chesapeake Energy Corp. | |||
1,500 | 8.000%—06/15/2027 | 1,474 | |
CNX Midstream Partners LP | |||
1,190 | 6.500%—03/15/20262 | 1,156 | |
Crestwood Midstream Partners LP | |||
870 | 5.625%—05/01/20272 | 868 | |
Crownrock Finance Inc. | |||
1,405 | 5.625%—10/15/20252 | 1,393 | |
Energy Transfer Operating LP | |||
146 | 5.875%—01/15/2024 | 160 | |
EnLink Midstream LLC | |||
545 | 5.375%—06/01/2029 | 548 | |
Extraction Oil & Gas Inc. | |||
185 | 5.625%—02/01/20262 | 153 | |
1,085 | 7.375%—05/15/20242 | 982 | |
1,135 | |||
Genesis Energy LP | |||
713 | 5.625%—06/15/2024 | 712 | |
255 | 6.000%—05/15/2023 | 258 | |
1,750 | 6.750%—08/01/2022 | 1,782 | |
2,752 | |||
Global Partners LP | |||
1,450 | 7.000%—06/15/2023 | 1,455 | |
Great Western Petroleum LLC | |||
1,000 | 9.000%—09/30/20212 | 818 | |
Gulfport Energy Corp. | |||
920 | 6.000%—10/15/2024 | 811 | |
750 | 6.375%—01/15/2026 | 651 | |
1,462 | |||
Indigo Natural Resources LLC | |||
1,500 | 6.875%—02/15/20262 | 1,399 | |
Jagged Peak Energy LLC | |||
790 | 5.875%—05/01/2026 | 797 | |
Magnolia Oil & Gas Operating LLC / Magnolia Oil & Gas Finance Corp. | |||
1,635 | 6.000%—08/01/20262 | 1,676 | |
Matador Resources Co. | |||
1,100 | 5.875%—09/15/2026 | 1,114 | |
Murphy Oil Corp. | |||
1,900 | 5.875%—12/01/2042 | 1,701 | |
870 | 7.050%—05/01/2029 | 950 | |
2,651 | |||
NGL Energy Partners LP | |||
1,600 | 7.500%—11/01/2023 | 1,672 |
CORPORATE BONDS & NOTES—Continued | |||
Principal Amount | Value | ||
OIL, GAS & CONSUMABLE FUELS—Continued | |||
NGPL Pipeco LLC | |||
$ | 555 | 4.375%—08/15/20222 | $572 |
750 | 4.875%—08/15/20272 | 777 | |
1,349 | |||
Oasis Petroleum Inc. | |||
1,925 | 6.875%—01/15/2023 | 1,944 | |
Parkland Fuel Corp. | |||
1,300 | 6.000%—04/01/20262 | 1,329 | |
Parsley Energy LLC / Parsley Finance Corp. | |||
935 | 5.625%—10/15/20272 | 961 | |
140 | 6.250%—06/01/20242 | 145 | |
1,106 | |||
PDC Energy Inc. | |||
1,250 | 5.750%—05/15/2026 | 1,254 | |
500 | 6.125%—09/15/2024 | 509 | |
1,763 | |||
QEP Resources Inc. | |||
800 | 5.625%—03/01/2026 | 751 | |
Rockies Express Pipeline LLC | |||
1,455 | 6.875%—04/15/20402 | 1,590 | |
Rose Rock Midstream LP | |||
1,006 | 5.625%—07/15/2022-11/15/2023 | 982 | |
Sanchez Energy Corp. | |||
3,000 | 7.750%—06/15/2021 | 420 | |
SM Energy Co. | |||
262 | 6.125%—11/15/2022 | 266 | |
SRC Energy Inc. | |||
1,085 | 6.250%—12/01/2025 | 1,036 | |
Summit Midstream Holdings LLC | |||
780 | 5.750%—04/15/2025 | 723 | |
Sunoco LP / Sunoco Finance Corp. | |||
1,000 | 4.875%—01/15/2023 | 1,019 | |
1,000 | 6.000%—04/15/20272 | 1,040 | |
2,059 | |||
Tallgrass Energy Finance Corp. | |||
785 | 4.750%—10/01/20232 | 796 | |
Targa Resources Partners LP / Targa Resources Partners Finance Corp. | |||
406 | 6.750%—03/15/2024 | 425 | |
384 | 6.875%—01/15/20292 | 416 | |
841 | |||
Wildhorse Resource Development Corp. | |||
2,175 | 6.875%—02/01/2025 | 2,194 | |
49,853 | |||
PHARMACEUTICALS—2.4% | |||
Bausch Health Cos. Inc. | |||
1,000 | 5.500%—03/01/20232 | 1,007 | |
700 | 5.750%—08/15/20272 | 731 | |
400 | 6.125%—04/15/20252 | 406 | |
1,950 | 7.000%—03/15/20242 | 2,060 | |
1,250 | 8.500%—01/31/20272 | 1,365 | |
5,569 | |||
Catalent Pharma Solutions Inc. | |||
317 | 4.875%—01/15/20262 | 319 | |
Mallinckrodt International Finance SA | |||
725 | 4.750%—04/15/2023 | 529 | |
PAR Pharmaceutical Inc. | |||
1,000 | 7.500%—04/01/20272 | 1,040 |
20
Harbor High-Yield Bond Fund
Portfolio of Investments—Continued
Value, Cost, and Principal Amounts in Thousands
CORPORATE BONDS & NOTES—Continued | |||
Principal Amount | Value | ||
PHARMACEUTICALS—Continued | |||
Teva Pharmaceutical Finance Netherlands III BV | |||
$ | 1,600 | 2.200%—07/21/2021 | $1,538 |
1,000 | 6.000%—04/15/2024 | 1,018 | |
2,556 | |||
Valeant Pharmaceuticals International Inc. | |||
2,000 | 6.500%—03/15/20222 | 2,073 | |
12,086 | |||
PROFESSIONAL SERVICES—1.0% | |||
Nielsen Finance LLC. | |||
1,000 | 4.500%—10/01/2020 | 1,003 | |
2,725 | 5.000%—04/15/20222 | 2,725 | |
3,728 | |||
Tempo Acquisition LLC | |||
1,420 | 6.750%—06/01/20252 | 1,457 | |
5,185 | |||
REAL ESTATE MANAGEMENT & DEVELOPMENT—0.8% | |||
Greystar Real Estate Partners LLC | |||
1,158 | 5.750%—12/01/20252 | 1,167 | |
Newmark Group Inc. | |||
850 | 6.125%—11/15/2023 | 892 | |
Realogy Group LLC | |||
1,000 | 5.250%—12/01/20212 | 1,009 | |
900 | 9.375%—04/01/20272 | 937 | |
1,946 | |||
4,005 | |||
ROAD & RAIL—0.5% | |||
Avis Budget Car Rental LLC | |||
1,000 | 5.500%—04/01/2023 | 1,021 | |
Herc Rentals Inc. | |||
1,448 | 7.500%—06/01/20222 | 1,510 | |
2,531 | |||
SEMICONDUCTORS & SEMICONDUCTOR EQUIPMENT—0.4% | |||
Advanced Micro Devices Inc. | |||
1,250 | 7.000%—07/01/2024 | 1,301 | |
Entegris Inc. | |||
800 | 4.625%—02/10/20262 | 804 | |
2,105 | |||
SOFTWARE—2.2% | |||
ACI Worldwide Inc. | |||
1,086 | 5.750%—08/15/20262 | 1,127 | |
CDK Global Inc. | |||
1,575 | 4.875%—06/01/2027 | 1,598 | |
570 | 5.000%—10/15/2024 | 592 | |
2,190 | |||
Infor Software Parent LLC | |||
1,917 | 7.125%—05/01/20212 | 1,929 | |
Informatica LLC | |||
1,500 | 7.125%—07/15/20232 | 1,541 | |
Nuance Communications Inc. | |||
1,800 | 6.000%—07/01/2024 | 1,850 | |
Open Text Corp. | |||
830 | 5.625%—01/15/20232 | 855 | |
Symantec Corp. | |||
1,550 | 5.000%—04/15/20252 | 1,582 | |
11,074 |
CORPORATE BONDS & NOTES—Continued | |||
Principal Amount | Value | ||
SPECIALTY RETAIL—0.9% | |||
L Brands Inc. | |||
$ | 500 | 5.625%—02/15/2022 | $520 |
915 | 6.875%—11/01/2035 | 817 | |
1,337 | |||
Party City Holdings Inc. | |||
1,000 | 6.625%—08/01/20262 | 994 | |
Penske Automotive Group Inc. | |||
1,000 | 5.750%—10/01/2022 | 1,021 | |
PetSmart Inc. | |||
1,200 | 5.875%—06/01/20252 | 1,094 | |
4,446 | |||
TECHNOLOGY HARDWARE, STORAGE & PERIPHERALS—1.7% | |||
Dell International LLC / EMC Corp. | |||
1,025 | 5.300%—10/01/20292 | 1,056 | |
2,000 | 5.875%—06/15/20212 | 2,038 | |
2,225 | 7.125%—06/15/20242 | 2,354 | |
5,448 | |||
EMC Corp. | |||
345 | 2.650%—06/01/2020 | 343 | |
NCR Corp. | |||
2,820 | 5.875%—12/15/2021 | 2,852 | |
8,643 | |||
TEXTILES, APPAREL & LUXURY GOODS—0.2% | |||
William Carter Co. | |||
925 | 5.625%—03/15/20272 | 960 | |
THRIFTS & MORTGAGE FINANCE—1.4% | |||
Nationstar Mortgage LLC | |||
3,750 | 6.500%—07/01/2021 | 3,764 | |
Quicken Loans Inc. | |||
2,500 | 5.250%—01/15/20282 | 2,434 | |
750 | 5.750%—05/01/20252 | 765 | |
3,199 | |||
6,963 | |||
TRADING COMPANIES & DISTRIBUTORS—0.2% | |||
United Rentals North America Inc. | |||
750 | 6.500%—12/15/2026 | 804 | |
WIRELESS TELECOMMUNICATION SERVICES—2.5% | |||
Sprint Capital Corp. | |||
3,000 | 8.750%—03/15/2032 | 3,157 | |
Sprint Communications Inc. | |||
2,400 | 6.000%—11/15/2022 | 2,421 | |
Sprint Corp. | |||
70 | 7.125%—06/15/2024 | 70 | |
810 | 7.250%—09/15/2021 | 851 | |
700 | 7.875%—09/15/2023 | 730 | |
1,651 | |||
T-Mobile USA Inc. | |||
600 | 4.000%—04/15/2022 | 608 | |
1,380 | 4.750%—02/01/2028 | 1,397 | |
850 | 5.125%—04/15/2025 | 879 |
21
Harbor High-Yield Bond Fund
Portfolio of Investments—Continued
Value, Cost, and Principal Amounts in Thousands
CORPORATE BONDS & NOTES—Continued | |||
Principal Amount | Value | ||
WIRELESS TELECOMMUNICATION SERVICES—Continued | |||
$ | 1,050 | 6.000%—03/01/2023-04/15/2024 | $1,087 |
1,750 | 6.500%—01/15/2024-01/15/2026 | 1,850 | |
5,821 | |||
13,050 | |||
TOTAL CORPORATE BONDS & NOTES | |||
(Cost $481,428) | 483,903 | ||
TOTAL INVESTMENTS—96.8% | |||
(Cost $494,454) | 496,939 | ||
CASH AND OTHER ASSETS, LESS LIABILITIES—3.2% | 16,347 | ||
TOTAL NET ASSETS—100.0% | $513,286 |
FAIR VALUE MEASUREMENTS
All investments at April 30, 2019 (as disclosed in the preceding Portfolio of Investments) were classified as Level 2. There were no Level 3 investments at April 30, 2019 or October 31, 2018.
For more information on valuation inputs and their aggregation into the levels identified above, please refer to the Fair Value Measurements and Disclosures in Note 2 of the accompanying Notes to Financial Statements.
1 | Variable rate security; the stated rate represents the rate in effect at April 30, 2019. |
2 | Securities purchased in a transaction exempt from registration under Rule 144A of the Securities Act of 1933. These securities may be resold in transactions exempt from registration, normally to qualified institutional buyers. The Fund has no right to demand registration of these securities. At April 30, 2019, the aggregate value of these securities was $257,151 or 50% of net assets. |
3 | MTN after the name of a security stands for Medium Term Note. |
The accompanying notes are an integral part of the Financial Statements.
22
Harbor High-Yield Opportunities Fund
Manager’s Commentary (Unaudited)
Subadviser
Crescent Capital Group LP
11100 Santa Monica Blvd
Suite 2000
Los Angeles, CA 90025
Portfolio Managers
John A. Fekete
Since2017
Since2017
Conrad E. Chen
Since 2017
Since 2017
Ross M. Slusser
Since 2017
Since 2017
Scott K. Fukumoto
Since 2017
Since 2017
Crescent Capital has subadvised the Fund since 2017.
Investment Objective
The Fund seeks total return.
John A. Fekete
Conrad E. Chen
Ross M. Slusser
Scott K. Fukumoto
Management’s Discussion of
Fund Performance
Fund Performance
MARKET REVIEW
The U.S. High-Yield market generated a positive return for the six months ended April 30, 2019, up 5.55% as measured by the ICE BofAML U.S. High Yield (H0A0) Index. Other credit benchmarks were also up: U.S. Corporates returned 7.09%, European high-yield returned 3.24% and U.S. Bank Loans returned 2.09%. The semi‐annual period covered in this review is denoted by two distinct periods for the U.S. high-yield market; a deep market sell-off during November and December of 2018, followed by a strong market rally that produced the best first quarter performance in over 25 years and the strongest start to a calendar year (through April) since 2009.
At the December 2018 meeting, the Federal Open Market Committee (FOMC) raised the Fed Funds rate by 0.25%, triggering a wide market sell-off and a spike in volatility. The S&P 500 was down 13.5% during fourth quarter 2018. West Texas Intermediate (WTI) Oil prices sharply declined and ended the year at $45/barrel as OPEC production cuts failed to bring stability to the market. The last few months of the year proved to be a challenging period for risk assets as the market remained under pressure amid persistent uncertainties surrounding the unresolved trade issues between the U.S. and China, geopolitical risks surrounding Saudi Arabia, Italy’s budget concerns, Brexit and softening growth in Europe and emerging markets. The fourth quarter also saw heavy withdrawals from the U.S. high-yield asset class; specifically, high-yield mutual funds and ETFs reported outflows of $20.2 billion in Q4 and $45.1 billion for 2018, according to Lipper. In response to the broad market sell off, risk assets suffered losses across the board and gave up most of the 2018 year-to-date gains.
After a disappointing end to 2018, the market rallied in the first four months of 2019 supported by a shift in the U.S. Federal Reserve (Fed) policy to a dovish tone easing recession fears, stronger than expected Q1 earnings, and rapid improvement in oil and equity prices. WTI oil was up 41% since the start of the year, ending at $63/ barrel at the end of April while the S&P 500 gained 18%. The market was pricing in a Fed rate cut instead of additional hikes in 2019, following similar action by other central banks around the globe adjusting policy to an accommodative mode. Fund flows reversed trend and stand at $13.3 billion in inflows at the end of April according to Lipper. U.S. Treasury yields were lower since the start of the year, the 10-year yield decreased by 18.25% and the 5-year yield decreased by 0.24% to end at 2.50% and 2.27%, respectively at the end of April. The U.S. high-yield market benefited from the improved tone and generated the strongest start to a year since 2009 with a return of 8.90% at the end of April, outperforming all other fixed income asset classes.
PERFORMANCE
Harbor High-Yield Opportunities Fund returned 4.29% (Retirement Class), 4.25% (Institutional Class), 4.12% (Administrative Class), and 3.95% (Investor Class) underperforming the Index for the six-month period ended April 30, 2019. The Fund benefitted from strong security selection in several sectors. Additionally, an overweight to Financials was accretive to relative performance. Conversely, approximately 70% of the relative underperformance is attributable to weak security selection in Energy lead by EP Energy (-0.22% relative contribution to return), Jones Energy (‐0.19% relative contribution to return) and Sanchez Energy (‐0.14% contribution to return). Additionally, the Fund held an average cash position of approximately 3%, which also detracted 0.10% basis points from relative performance.
23
Harbor High-Yield Opportunities Fund
Manager’s Commentary—Continued
TOTAL RETURNS
For the periods ended 04/30/2019
Unannualized | 1 Year | 5 Years | Annualized | ||||||||
6 Months | Life of Fund | ||||||||||
Harbor High-Yield Opportunities Fund | |||||||||||
Retirement Class1 | 4.29% | 4.81% | N/A | 2.49% | |||||||
Institutional Class1 | 4.25 | 4.73 | N/A | 2.42 | |||||||
Administrative Class1 | 4.12 | 4.47 | N/A | 2.17 | |||||||
Investor Class1 | 3.95 | 4.25 | N/A | 1.99 | |||||||
Comparative Index | |||||||||||
ICE BofAML U.S. High Yield (H0A0)1 | 5.55% | 6.71% | N/A | 4.27% |
As stated in the Fund’s prospectus dated March 1, 2019, the expense ratios were 0.65% (Net) and 0.93% (Gross) (Retirement Class); 0.73% (Net) and 1.01% (Gross) (Institutional Class); 0.98% (Net) and 1.26% (Gross) (Administrative Class); and 1.10% (Net) and 1.38% (Gross) (Investor Class). The net expense ratios reflect an expense limitation agreement (excluding interest expense, if any) effective through 02/29/2020. The expense ratios in the prospectus may differ from the actual expense ratios for the period disclosed within this report. The expense ratios shown in the prospectus are based on the prior fiscal year, adjusted to reflect changes, if any, in contractual arrangements that occurred prior to the date of the prospectus (or supplement thereto, if applicable).
Performance data shown represents past performance and is no guarantee of future results. Past performance is net of management fees and expenses and reflects reinvested dividends and distributions but does not reflect the deduction of taxes that a shareholder would pay on Fund distributions or upon the redemption of Fund shares. Past performance reflects the beneficial effect of any expense waivers or reimbursements, without which returns would have been lower. Investment returns and principal value will fluctuate so that Fund shares, when redeemed, may be worth more or less than their original cost. Returns for periods less than one year are not annualized. Current performance may be higher or lower and is available through the most recent month end atharborfunds.com or by calling 800-422-1050. The Fund charges a redemption fee of 1% on redemption of Fund shares that are held for less than 90 days.
From a ratings standpoint, the Fund exhibited strong security selection in the BB-rated credit tier; however, this benefit was offset by the Fund’s slight underweight to the BB-rated credit tier as higher quality bonds outperformed all other credit tiers during the review period. Lastly, weak security selection in the B-rated and CCC-rated credit tiers were also detractors from relative performance.
OUTLOOK & STRATEGY
We maintain a constructive outlook on below investment grade corporate credit. In our view rate concerns have subsided with a dovish pivot in the monetary policy from the Fed, a positive development for credit assets. Fundamentals in the U.S. high-yield space remain stable with minor shifts in the fourth quarter; leverage levels were unchanged with a modest decline in interest coverage ratios. Continued strength in technical factors is also supportive of U.S high-yield as fund flows have reversed trend since last year and now stand at $13.3 billion year to date through April. Following the deep fourth quarter 2018 sell-off, valuation for the asset class looks more compelling. Many sell side analysts are forecasting a mid-to-high single digit return in 2019 for U.S. high-yield and some have revised their forecasts higher, noting the improved return profile offered by U.S. high-yield after the year-end spread widening. Major rating agencies project defaults to come in below 3.0% in 2019, well below the historical average of 4.6%.
We do not foresee any major fundamental concerns for the asset class. Risks to our view include FOMC rate actions, a potential peak in corporate earnings growth, oil price volatility, and rising risks of a global trade war. At present, a continuation of the status quo for the U.S. economy seems, in our view, most likely. With GDP growth of 2.0 to 3.0% per annum, we believe there is neither concern for recession nor overheating in the near-term.
1 | The “Life of Fund” return as shown reflects the period 11/01/2017 through 04/30/2019. |
This report contains the current opinions of Crescent Capital Group LP as of the date of this report and should not be considered as investment advice or a recommendation of any particular security, strategy or investment product. Such opinions are subject to change without notice and securities described herein may no longer be included in, or may at any time be removed from, the Fund’s portfolio. This report is distributed for informational purposes only. Information contained herein has been obtained from sources believed reliable, but not guaranteed.
Fixed income investments are affected by interest rate changes and the creditworthiness of the issues held by the Fund. A rise in interest rates will cause a decrease in the value of fixed income securities. Such an event would have an adverse effect on the Fund. High-yield investing poses additional credit risk related to lower-rated bonds. For information on the different share classes and the risks associated with an investment in the Fund, please refer to the current prospectus.
24
Harbor High-Yield Opportunities Fund
Fund Summary—April 30, 2019 (Unaudited)
TOP Issuers(% of net assets)
❶ | CCO Holdings LLC | 1.9% |
❷ | Bausch Health Cos. Inc. | 1.8% |
❸ | Sprint Corp. | 1.6% |
❹ | Tenet Healthcare Corp. | 1.3% |
❺ | CSC Holdings LLC | 1.2% |
❻ | HCA Inc. | 1.1% |
❼ | Block Communications Inc. | 1.0% |
❽ | Sirius XM Radio Inc. | 1.0% |
❾ | T-Mobile USA Inc. | 1.0% |
❿ | Vistra Operations Co. LLC | 1.0% |
Sector Allocation(% of investments)
Maturity Profile(% of investments)
25
Harbor High-Yield Opportunities Fund
Portfolio of Investments—April 30, 2019 (Unaudited)
Value, Cost, and Principal Amounts in Thousands
ASSET-BACKED SECURITIES—0.2% | |||
(Cost $117) | |||
Principal Amount | Value | ||
AIRLINES—0.2% | |||
US Airways 2012-2 Class B Pass-Through Trust | |||
Series 2012-2 Cl. B | |||
$ | 108 | 6.750%—06/03/2021 | $114 |
CORPORATE BONDS & NOTES—96.9% | |||
AEROSPACE & DEFENSE—2.8% | |||
Arconic Inc. | |||
250 | 5.125%—10/01/2024 | 258 | |
100 | 5.900%—02/01/2027 | 106 | |
364 | |||
BBA US Holdings Inc. | |||
500 | 5.375%—05/01/20261 | 514 | |
Bombardier Inc. | |||
300 | 6.000%—10/15/20221 | 301 | |
300 | 7.500%—12/01/20241 | 306 | |
607 | |||
TransDigm Inc. | |||
100 | 6.250%—03/15/20261 | 104 | |
550 | 6.375%—06/15/2026 | 554 | |
658 | |||
2,143 | |||
AIR FREIGHT & LOGISTICS—0.3% | |||
XPO Logistics Inc. | |||
250 | 6.125%—09/01/20231 | 256 | |
AUTO COMPONENTS—0.8% | |||
KGA Escrow LLC | |||
450 | 7.500%—08/15/20231 | 466 | |
Panther BF Aggregator 2 LP / Panther Finance Co. Inc. | |||
125 | 6.250%—05/15/20261 | 131 | |
597 | |||
AUTOMOBILES—0.7% | |||
Fiat Chrysler Automobiles NV | |||
175 | 5.250%—04/15/2023 | 183 | |
Jaguar Land Rover Automotive plc | |||
100 | 4.500%—10/01/20271 | 83 | |
McLaren Finance plc | |||
250 | 5.750%—08/01/20221 | 247 | |
513 | |||
BANKS—1.2% | |||
CIT Group Inc. | |||
200 | 5.250%—03/07/2025 | 213 | |
Intesa Sanpaolo SpA MTN2 | |||
200 | 5.017%—06/26/20241 | 193 | |
Oxford Finance LLC | |||
500 | 6.375%—12/15/20221 | 518 | |
924 | |||
BEVERAGES—0.7% | |||
Cott Holdings Inc. | |||
500 | 5.500%—04/01/20251 | 508 | |
BUILDING PRODUCTS—0.3% | |||
Standard Industries Inc. | |||
250 | 5.375%—11/15/20241 | 256 |
CORPORATE BONDS & NOTES—Continued | |||
Principal Amount | Value | ||
CAPITAL MARKETS—1.8% | |||
Icahn Enterprises LP / Icahn Enterprises Finance Corp. | |||
$ | 350 | 6.250%—02/01/2022 | $361 |
200 | 6.375%—12/15/2025 | 209 | |
570 | |||
Jefferies Finance LLC / JFIN Co.-Issuer Corp. | |||
200 | 6.875%—04/15/20221 | 204 | |
LPL Holdings Inc. | |||
400 | 5.750%—09/15/20251 | 408 | |
Refinitiv US Holdings Inc. | |||
200 | 6.250%—05/15/20261 | 206 | |
1,388 | |||
CHEMICALS—1.5% | |||
Avantor Inc. | |||
250 | 6.000%—10/01/20241 | 262 | |
CF Industries Inc. | |||
350 | 5.150%—03/15/2034 | 340 | |
INEOS Group Holdings SA | |||
250 | 5.625%—08/01/20241 | 253 | |
NOVA Chemicals Corp. | |||
125 | 4.875%—06/01/20241 | 123 | |
Olin Corp. | |||
150 | 5.125%—09/15/2027 | 153 | |
1,131 | |||
COMMERCIAL SERVICES & SUPPLIES—0.8% | |||
ADT Security Corp. | |||
50 | 4.125%—06/15/2023 | 49 | |
100 | 4.875%—07/15/20321 | 83 | |
132 | |||
Prime Security Services Borrower LLC / Prime Finance Inc. | |||
100 | 5.750%—04/15/20261 | 101 | |
89 | 9.250%—05/15/20231 | 94 | |
195 | |||
Williams Scotsman International Inc. | |||
250 | 7.875%—12/15/20221 | 263 | |
590 | |||
COMMUNICATIONS EQUIPMENT—0.5% | |||
Plantronics Inc. | |||
400 | 5.500%—05/31/20231 | 405 | |
CONSTRUCTION MATERIALS—0.5% | |||
Cemex SAB de CV | |||
325 | 7.750%—04/16/20261 | 356 | |
CONSUMER FINANCE—3.9% | |||
Ally Financial Inc. | |||
300 | 5.125%—09/30/2024 | 318 | |
150 | 5.750%—11/20/2025 | 163 | |
481 | |||
Credit Acceptance Corp. | |||
550 | 6.625%—03/15/20261 | 579 | |
Goeasy Ltd. | |||
550 | 7.875%—11/01/20221 | 580 | |
Navient Corp. MTN2 | |||
600 | 6.125%—03/25/2024 | 617 |
26
Harbor High-Yield Opportunities Fund
Portfolio of Investments—Continued
Value, Cost, and Principal Amounts in Thousands
CORPORATE BONDS & NOTES—Continued | |||
Principal Amount | Value | ||
CONSUMER FINANCE—Continued | |||
Springleaf Finance Corp. | |||
$ | 150 | 6.875%—03/15/2025 | $161 |
500 | 7.125%—03/15/2026 | 538 | |
699 | |||
2,956 | |||
CONTAINERS & PACKAGING—2.6% | |||
ARD Securities Finance SARL | |||
157 | 8.750%—01/31/20231 | 155 | |
Ardagh Packaging Finance plc | |||
425 | 7.250%—05/15/20241 | 449 | |
Ball Corp. | |||
100 | 4.875%—03/15/2026 | 104 | |
200 | 5.250%—07/01/2025 | 213 | |
317 | |||
BWAY Holding Co. | |||
250 | 5.500%—04/15/20241 | 249 | |
100 | 7.250%—04/15/20251 | 98 | |
347 | |||
Cascades Inc. | |||
250 | 5.750%—07/15/20231 | 255 | |
Reynolds Group Issuer Inc. | |||
400 | 5.125%—07/15/20231 | 406 | |
1,929 | |||
DIVERSIFIED CONSUMER SERVICES—0.4% | |||
Laureate Education Inc. | |||
200 | 8.250%—05/01/20251 | 217 | |
Midas Intermediate Holdco II LLC / Midas Intermediate Holdco II Finance Inc. | |||
100 | 7.875%—10/01/20221 | 93 | |
310 | |||
DIVERSIFIED FINANCIAL SERVICES—2.1% | |||
Clearway Energy Operating LLC | |||
200 | 5.375%—08/15/2024 | 204 | |
CommScope Inc. | |||
225 | 6.000%—03/01/20261 | 239 | |
Crownrock Finance Inc. | |||
225 | 5.625%—10/15/20251 | 223 | |
New Red Finance Inc. | |||
400 | 5.000%—10/15/20251 | 398 | |
UPCB Finance IV Ltd. | |||
500 | 5.375%—01/15/20251 | 512 | |
1,576 | |||
DIVERSIFIED TELECOMMUNICATION SERVICES—6.7% | |||
Altice Financing SA | |||
250 | 6.625%—02/15/20231 | 257 | |
Altice France SA | |||
100 | 6.250%—05/15/20241 | 103 | |
375 | 7.375%—05/01/20261 | 381 | |
484 | |||
Altice Luxembourg SA | |||
150 | 7.625%—02/15/20251 | 141 | |
225 | 7.750%—05/15/20221 | 230 | |
371 | |||
CenturyLink Inc. | |||
200 | 7.500%—04/01/2024 | 215 |
CORPORATE BONDS & NOTES—Continued | |||
Principal Amount | Value | ||
DIVERSIFIED TELECOMMUNICATION SERVICES—Continued | |||
Frontier Communications Corp. | |||
$ | 150 | 8.000%—04/01/20271 | $156 |
250 | 8.500%—04/01/20261 | 236 | |
400 | 11.000%—09/15/2025 | 261 | |
653 | |||
Hughes Satellite Systems Corp. | |||
550 | 5.250%—08/01/2026 | 555 | |
Level 3 Financing Inc. | |||
525 | 5.375%—01/15/2024 | 533 | |
Qwest Corp. | |||
325 | 6.875%—09/15/2033 | 325 | |
Sable International Finance Ltd. | |||
200 | 6.875%—08/01/20221 | 209 | |
Telecom Italia SpA | |||
300 | 5.303%—05/30/20241 | 300 | |
Videotron Ltd. | |||
350 | 5.125%—04/15/20271 | 359 | |
Virgin Media Secured Finance plc | |||
500 | 5.500%—08/15/20261 | 514 | |
Zayo Group LLC | |||
275 | 5.750%—01/15/20271 | 280 | |
5,055 | |||
ELECTRIC UTILITIES—1.0% | |||
Vistra Operations Co. LLC | |||
750 | 5.625%—02/15/20271 | 773 | |
ELECTRONIC EQUIPMENT, INSTRUMENTS & COMPONENTS—0.5% | |||
Ingram Micro Inc. | |||
400 | 5.450%—12/15/2024 | 399 | |
ENERGY EQUIPMENT & SERVICES—1.3% | |||
Archrock Partners LP / Archrock Partners Finance Corp. | |||
250 | 6.875%—04/01/20271 | 261 | |
Diamond Offshore Drilling Inc. | |||
250 | 4.875%—11/01/2043 | 162 | |
Ensco plc | |||
175 | 5.750%—10/01/2044 | 116 | |
Oceaneering International Inc. | |||
175 | 4.650%—11/15/2024 | 167 | |
USA Compression Partners LP / USA Compression Finance Corp. | |||
150 | 6.875%—04/01/2026 | 158 | |
100 | 6.875%—09/01/20271 | 106 | |
264 | |||
970 | |||
ENTERTAINMENT—0.9% | |||
AMC Entertainment Holdings Inc. | |||
150 | 5.750%—06/15/2025 | 145 | |
NetFlix Inc. | |||
25 | 5.375%—11/15/20291 | 26 | |
475 | 5.875%—11/15/2028 | 502 | |
528 | |||
673 | |||
EQUITY REAL ESTATE INVESTMENT TRUSTS (REITs)—1.7% | |||
Equinix Inc. | |||
300 | 5.375%—05/15/2027 | 319 | |
75 | 5.875%—01/15/2026 | 79 | |
398 |
27
Harbor High-Yield Opportunities Fund
Portfolio of Investments—Continued
Value, Cost, and Principal Amounts in Thousands
CORPORATE BONDS & NOTES—Continued | |||
Principal Amount | Value | ||
EQUITY REAL ESTATE INVESTMENT TRUSTS (REITs)—Continued | |||
MGM Growth Properties Operating Partnership LP / MGP Finance Co.-Issuer Inc. | |||
$ | 200 | 5.750%—02/01/20271 | $211 |
MPT Operating Partnership LP | |||
250 | 5.000%—10/15/2027 | 251 | |
100 | 5.250%—08/01/2026 | 102 | |
353 | |||
SBA Communications Corp. | |||
300 | 4.875%—09/01/2024 | 306 | |
1,268 | |||
FOOD & STAPLES RETAILING—0.3% | |||
Albertsons Companies LLC | |||
200 | 5.750%—03/15/2025 | 200 | |
FOOD PRODUCTS—1.3% | |||
JBS USA Holdings Inc. | |||
300 | 6.500%—04/15/20291 | 319 | |
Pilgrim's Pride Corp. | |||
200 | 5.875%—09/30/20271 | 207 | |
Post Holdings Inc. | |||
300 | 5.000%—08/15/20261 | 300 | |
150 | 5.750%—03/01/20271 | 154 | |
454 | |||
980 | |||
HEALTH CARE EQUIPMENT & SUPPLIES—0.1% | |||
Avantor Inc. | |||
100 | 9.000%—10/01/20251 | 109 | |
HEALTH CARE PROVIDERS & SERVICES—7.1% | |||
Centene Corp. | |||
600 | 4.750%—01/15/2025 | 610 | |
Community Health Systems Inc. | |||
275 | 5.125%—08/01/2021 | 272 | |
100 | 6.250%—03/31/2023 | 98 | |
125 | 6.875%—02/01/2022 | 83 | |
175 | 8.000%—11/15/2019 | 174 | |
75 | 8.625%—01/15/20241 | 76 | |
703 | |||
DaVita Inc. | |||
250 | 5.125%—07/15/2024 | 251 | |
Encompass Health Group | |||
700 | 5.750%—11/01/2024 | 712 | |
HCA Inc. | |||
775 | 5.375%—02/01/2025-09/01/2026 | 819 | |
RegionalCare Hospital Partners Holdings Inc. | |||
250 | 8.250%—05/01/20231 | 266 | |
RegionalCare Hospital Partners Holdings Inc. / LifePoint Health Inc. | |||
150 | 9.750%—12/01/20261 | 157 | |
Select Medical Corp. | |||
400 | 6.375%—06/01/2021 | 401 | |
Tenet Healthcare Corp. | |||
200 | 4.625%—07/15/2024 | 201 | |
75 | 6.250%—02/01/20271 | 78 | |
325 | 6.750%—06/15/2023 | 333 | |
275 | 7.000%—08/01/2025 | 279 | |
50 | 8.125%—04/01/2022 | 54 | |
945 |
CORPORATE BONDS & NOTES—Continued | |||
Principal Amount | Value | ||
HEALTH CARE PROVIDERS & SERVICES—Continued | |||
Universal Health Services Inc. | |||
$ | 250 | 5.000%—06/01/20261 | $257 |
Wellcare Health Plans Inc. | |||
250 | 5.375%—08/15/20261 | 263 | |
5,384 | |||
HOTELS, RESTAURANTS & LEISURE—5.8% | |||
Aramark Services Inc. | |||
250 | 5.000%—02/01/20281 | 255 | |
Churchill Downs Inc. | |||
225 | 5.500%—04/01/20271 | 231 | |
Everi Payments Inc. | |||
250 | 7.500%—12/15/20251 | 261 | |
International Game Technology plc | |||
350 | 6.500%—02/15/20251 | 374 | |
KFC Holding Co./Pizza Hut Holdings LLC/Taco Bell of America LLC | |||
200 | 5.250%—06/01/20261 | 207 | |
Melco Resorts Finance Ltd. | |||
300 | 4.875%—06/06/20251 | 301 | |
MGM Resorts International | |||
300 | 5.500%—04/15/2027 | 310 | |
275 | 5.750%—06/15/2025 | 292 | |
602 | |||
Sabre GLBL Inc. | |||
350 | 5.375%—04/15/20231 | 360 | |
Scientific Games International Inc. | |||
225 | 8.250%—03/15/20261 | 233 | |
245 | 10.000%—12/01/2022 | 259 | |
492 | |||
Silversea Cruise Finance Ltd. | |||
500 | 7.250%—02/01/20251 | 541 | |
Viking Cruises Ltd. | |||
250 | 5.875%—09/15/20271 | 249 | |
100 | 6.250%—05/15/20251 | 104 | |
353 | |||
Wynn Las Vegas LLC / Wynn Las Vegas Capital Corp. | |||
125 | 5.250%—05/15/20271 | 122 | |
275 | 5.500%—03/01/20251 | 279 | |
401 | |||
4,378 | |||
HOUSEHOLD DURABLES—1.5% | |||
M/I Homes Inc. | |||
150 | 5.625%—08/01/2025 | 148 | |
PulteGroup Inc. | |||
250 | 5.500%—03/01/2026 | 265 | |
Taylor Morrison Communities Inc. | |||
200 | 6.625%—05/15/2022 | 207 | |
Tempur Sealy International Inc. | |||
500 | 5.625%—10/15/2023 | 507 | |
1,127 | |||
HOUSEHOLD PRODUCTS—0.7% | |||
Energizer Holdings Inc. | |||
200 | 6.375%—07/15/20261 | 207 | |
Kronos Acquisition Holdings Inc. | |||
400 | 9.000%—08/15/20231 | 358 | |
565 |
28
Harbor High-Yield Opportunities Fund
Portfolio of Investments—Continued
Value, Cost, and Principal Amounts in Thousands
CORPORATE BONDS & NOTES—Continued | |||
Principal Amount | Value | ||
INDEPENDENT POWER & RENEWABLE ELECTRICITY PRODUCERS—2.4% | |||
AES Corp. | |||
$ | 200 | 5.125%—09/01/2027 | $208 |
Calpine Corp. | |||
350 | 5.250%—06/01/20261 | 352 | |
125 | 5.875%—01/15/20241 | 128 | |
480 | |||
NRG Energy Inc. | |||
350 | 7.250%—05/15/2026 | 382 | |
Talen Energy Supply LLC | |||
650 | 9.500%—07/15/20221 | 712 | |
1,782 | |||
INSURANCE—0.4% | |||
Acrisure LLC / Acrisure Finance Inc. | |||
300 | 8.125%—02/15/20241 | 314 | |
INTERACTIVE MEDIA & SERVICES—0.6% | |||
Match Group Inc. | |||
450 | 5.625%—02/15/20291 | 462 | |
INTERNET & DIRECT MARKETING RETAIL—0.5% | |||
Travelport Corporate Finance plc | |||
375 | 6.000%—03/15/20261 | 404 | |
INTERNET SERVICES & INFRASTRUCTURE—1.1% | |||
EIG Investors Corp. | |||
300 | 10.875%—02/01/2024 | 322 | |
J2 Cloud Services LLC | |||
475 | 6.000%—07/15/20251 | 498 | |
820 | |||
IT SERVICES—1.5% | |||
CommScope Technologies Finance LLC | |||
300 | 6.000%—06/15/20251 | 306 | |
First Data Corp. | |||
350 | 5.000%—01/15/20241 | 359 | |
250 | 5.750%—01/15/20241 | 258 | |
617 | |||
Rackspace Hosting Inc. | |||
200 | 8.625%—11/15/20241 | 187 | |
1,110 | |||
MACHINERY—0.2% | |||
Allison Transmission Inc. | |||
175 | 5.875%—06/01/20291 | 180 | |
MEDIA—10.7% | |||
AMC Networks Inc. | |||
500 | 5.000%—04/01/2024 | 508 | |
Block Communications Inc. | |||
750 | 6.875%—02/15/20251 | 782 | |
Cablevision Systems Corp. | |||
175 | 5.875%—09/15/2022 | 182 | |
CCO Holdings LLC | |||
200 | 5.000%—02/01/20281 | 200 | |
150 | 5.375%—05/01/20251 | 156 | |
775 | 5.500%—05/01/20261 | 802 | |
200 | 5.875%—04/01/20241 | 209 | |
1,367 | |||
Clear Channel Worldwide Holdings Inc. | |||
350 | 6.500%—11/15/2022 | 360 |
CORPORATE BONDS & NOTES—Continued | |||
Principal Amount | Value | ||
MEDIA—Continued | |||
CSC Holdings LLC | |||
$ | 200 | 5.375%—02/01/20281 | $204 |
675 | 5.500%—04/15/20271 | 697 | |
901 | |||
DISH DBS Corp. | |||
175 | 5.000%—03/15/2023 | 161 | |
300 | 5.875%—11/15/2024 | 260 | |
200 | 7.750%—07/01/2026 | 179 | |
600 | |||
Intelsat Jackson Holdings SA | |||
550 | 8.500%—10/15/20241 | 545 | |
125 | 9.750%—07/15/20251 | 129 | |
674 | |||
Lamar Media Corp. | |||
400 | 5.750%—02/01/2026 | 422 | |
Nexstar Escrow Corp. | |||
350 | 5.625%—08/01/20241 | 356 | |
Salem Media Group Inc. | |||
525 | 6.750%—06/01/20241 | 475 | |
Sinclair Television Group Inc. | |||
400 | 5.625%—08/01/20241 | 405 | |
Sirius XM Radio Inc. | |||
775 | 5.000%—08/01/20271 | 784 | |
Tegna Inc. | |||
250 | 5.500%—09/15/20241 | 258 | |
8,074 | |||
METALS & MINING—1.9% | |||
Alcoa Nederland Holding BV | |||
200 | 6.750%—09/30/20241 | 212 | |
100 | 7.000%—09/30/20261 | 108 | |
320 | |||
Cleveland-Cliffs Inc. | |||
225 | 5.875%—06/01/20271 | 218 | |
Freeport-McMoRan Inc. | |||
600 | 4.550%—11/14/2024 | 598 | |
Teck Resources Ltd. | |||
275 | 6.250%—07/15/2041 | 298 | |
1,434 | |||
OIL, GAS & CONSUMABLE FUELS—9.7% | |||
Ascent Resources Utica Holdings LLC / ARU Finance Corp. | |||
225 | 7.000%—11/01/20261 | 221 | |
125 | 10.000%—04/01/20221 | 137 | |
358 | |||
Berry Petroleum Co. LLC | |||
175 | 7.000%—02/15/20261 | 173 | |
Calfrac Holdings LP | |||
100 | 8.500%—06/15/20261 | 84 | |
California Resources Corp. | |||
250 | 8.000%—12/15/20221 | 192 | |
Cheniere Corpus Christi Holdings LLC | |||
275 | 5.125%—06/30/2027 | 287 | |
Cheniere Energy Partners LP | |||
250 | 5.250%—10/01/2025 | 256 | |
Chesapeake Energy Corp. | |||
300 | 8.000%—01/15/2025-06/15/2027 | 300 | |
CITGO Holding Inc. | |||
150 | 10.750%—02/15/20201 | 155 |
29
Harbor High-Yield Opportunities Fund
Portfolio of Investments—Continued
Value, Cost, and Principal Amounts in Thousands
CORPORATE BONDS & NOTES—Continued | |||
Principal Amount | Value | ||
OIL, GAS & CONSUMABLE FUELS—Continued | |||
Crestwood Midstream Partners LP | |||
$ | 250 | 6.250%—04/01/2023 | $258 |
DCP Midstream Operating LP | |||
300 | 5.375%—07/15/2025 | 316 | |
Denbury Resources Inc. | |||
150 | 9.000%—05/15/20211 | 153 | |
Energy Transfer Operating LP | |||
175 | 5.875%—01/15/2024 | 191 | |
EnLink Midstream Partners LP | |||
200 | 4.150%—06/01/2025 | 193 | |
Hilcorp Finance Co. | |||
250 | 5.000%—12/01/20241 | 249 | |
Jones Energy Holdings LLC | |||
300 | 0.000%—04/01/2022* | 6 | |
Murphy Oil Corp. | |||
500 | 6.875%—08/15/2024 | 524 | |
Murphy Oil USA Inc. | |||
350 | 5.625%—05/01/2027 | 366 | |
350 | 6.000%—08/15/2023 | 359 | |
725 | |||
Nabors Industries Inc. | |||
150 | 5.500%—01/15/2023 | 144 | |
Newfield Exploration Co. | |||
300 | 5.375%—01/01/2026 | 324 | |
Noble Holding International Ltd. | |||
86 | 7.750%—01/15/2024 | 78 | |
Oasis Petroleum Inc. | |||
100 | 6.250%—05/01/20261 | 97 | |
Parsley Energy LLC / Parsley Finance Corp. | |||
125 | 5.625%—10/15/20271 | 129 | |
QEP Resources Inc. | |||
125 | 5.625%—03/01/2026 | 117 | |
Rose Rock Midstream LP | |||
400 | 5.625%—07/15/2022-11/15/2023 | 390 | |
Sunoco LP / Sunoco Finance Corp. | |||
600 | 6.000%—04/15/20271 | 624 | |
Targa Resources Partners LP / Targa Resources Partners Finance Corp. | |||
150 | 6.500%—07/15/20271 | 161 | |
225 | 6.750%—03/15/2024 | 236 | |
397 | |||
Transocean Inc. | |||
448 | 7.500%—01/15/20261 | 444 | |
Whiting Petroleum Corp. | |||
200 | 6.625%—01/15/2026 | 200 | |
7,364 | |||
PERSONAL PRODUCTS—0.5% | |||
HLF Financing SaRL LLC / Herbalife International Inc. | |||
350 | 7.250%—08/15/20261 | 357 | |
PHARMACEUTICALS—3.3% | |||
Bausch Health Cos. Inc. | |||
600 | 5.750%—08/15/20271 | 627 | |
175 | 6.125%—04/15/20251 | 178 | |
175 | 8.500%—01/31/20271 | 191 | |
325 | 9.250%—04/01/20261 | 362 | |
1,358 | |||
Endo Finance LLC | |||
325 | 5.875%—10/15/20241 | 324 |
CORPORATE BONDS & NOTES—Continued | |||
Principal Amount | Value | ||
PHARMACEUTICALS—Continued | |||
Horizon Pharma Inc. | |||
$ | 142 | 6.625%—05/01/2023 | $146 |
Mallinckrodt International Finance SA | |||
275 | 5.625%—10/15/20231 | 216 | |
PAR Pharmaceutical Inc. | |||
50 | 7.500%—04/01/20271 | 52 | |
Prestige Brands Inc. | |||
300 | 6.375%—03/01/20241 | 311 | |
Teva Pharmaceutical Finance Netherlands III BV | |||
150 | 3.150%—10/01/2026 | 126 | |
2,533 | |||
PROFESSIONAL SERVICES—0.5% | |||
Nielsen Finance LLC. | |||
375 | 5.000%—04/15/20221 | 375 | |
REAL ESTATE MANAGEMENT & DEVELOPMENT—0.7% | |||
Newmark Group Inc. | |||
250 | 6.125%—11/15/2023 | 263 | |
Realogy Group LLC | |||
250 | 9.375%—04/01/20271 | 260 | |
523 | |||
ROAD & RAIL—1.0% | |||
Hertz Corp. | |||
375 | 5.875%—10/15/2020 | 375 | |
375 | 7.625%—06/01/20221 | 388 | |
763 | |||
SEMICONDUCTORS & SEMICONDUCTOR EQUIPMENT—0.5% | |||
Advanced Micro Devices Inc. | |||
325 | 7.000%—07/01/2024 | 338 | |
SOFTWARE—2.0% | |||
Infor Software Parent LLC | |||
400 | 7.125%—05/01/20211 | 402 | |
Open Text Corp. | |||
400 | 5.875%—06/01/20261 | 420 | |
Solera LLC | |||
500 | 10.500%—03/01/20241 | 545 | |
SS&C Technologies Inc. | |||
175 | 5.500%—09/30/20271 | 180 | |
1,547 | |||
SPECIALTY RETAIL—0.8% | |||
Asbury Automotive Group Inc. | |||
100 | 6.000%—12/15/2024 | 104 | |
Penske Automotive Group Inc. | |||
175 | 5.500%—05/15/2026 | 175 | |
PetSmart Inc. | |||
100 | 5.875%—06/01/20251 | 91 | |
100 | 7.125%—03/15/20231 | 89 | |
180 | |||
Staples Inc. | |||
150 | 7.500%—04/15/20261 | 151 | |
610 | |||
TECHNOLOGY HARDWARE, STORAGE & PERIPHERALS—1.7% | |||
Dell International LLC / EMC Corp. | |||
250 | 7.125%—06/15/20241 | 264 | |
EMC Corp. | |||
400 | 3.375%—06/01/2023 | 390 |
30
Harbor High-Yield Opportunities Fund
Portfolio of Investments—Continued
Value, Cost, and Principal Amounts in Thousands
CORPORATE BONDS & NOTES—Continued | |||
Principal Amount | Value | ||
TECHNOLOGY HARDWARE, STORAGE & PERIPHERALS—Continued | |||
Seagate HDD Cayman | |||
$ | 400 | 4.750%—01/01/2025 | $391 |
Xerox Corp. | |||
275 | 4.125%—03/15/2023 | 276 | |
1,321 | |||
TEXTILES, APPAREL & LUXURY GOODS—0.3% | |||
Hanesbrands Inc. | |||
200 | 4.625%—05/15/20241 | 203 | |
50 | 4.875%—05/15/20261 | 50 | |
253 | |||
TOBACCO—0.5% | |||
Vector Group Ltd. | |||
375 | 6.125%—02/01/20251 | 338 | |
TRADING COMPANIES & DISTRIBUTORS—2.3% | |||
Ashtead Capital Inc. | |||
300 | 5.250%—08/01/20261 | 313 | |
Fly Leasing Ltd. | |||
300 | 6.375%—10/15/2021 | 305 | |
Fortress Transportation & Infrastructure Investors LLC | |||
350 | 6.500%—10/01/20251 | 360 | |
United Rentals North America Inc. | |||
225 | 5.250%—01/15/2030 | 227 | |
500 | 5.750%—11/15/2024 | 515 | |
742 | |||
1,720 | |||
TRANSPORTATION INFRASTRUCTURE—0.6% | |||
DAE Funding LLC | |||
425 | 5.000%—08/01/20241 | 439 |
CORPORATE BONDS & NOTES—Continued | |||
Principal Amount | Value | ||
WIRELESS TELECOMMUNICATION SERVICES—3.4% | |||
C&W Senior Financing Designated Activity Company | |||
$ | 200 | 6.875%—09/15/20271 | $201 |
200 | 7.500%—10/15/20261 | 208 | |
409 | |||
Level 3 Financing Inc. | |||
125 | 5.250%—03/15/2026 | 127 | |
Sprint Capital Corp. | |||
100 | 6.875%—11/15/2028 | 96 | |
Sprint Corp. | |||
725 | 7.125%—06/15/2024 | 728 | |
400 | 7.875%—09/15/2023 | 417 | |
1,145 | |||
T-Mobile USA Inc. | |||
625 | 4.750%—02/01/2028 | 633 | |
175 | 5.375%—04/15/2027 | 185 | |
818 | |||
2,595 | |||
TOTAL CORPORATE BONDS & NOTES | |||
(Cost $72,784) | 73,375 | ||
TOTAL INVESTMENTS—97.1% | |||
(Cost $72,901) | 73,489 | ||
CASH AND OTHER ASSETS, LESS LIABILITIES—2.9% | 2,233 | ||
TOTAL NET ASSETS—100.0% | $75,722 |
FAIR VALUE MEASUREMENTS
All investments at April 30, 2019 (as disclosed in the preceding Portfolio of Investments) were classified as Level 2. There were no Level 3 investments at April 30, 2019 or October 31, 2018.
For more information on valuation inputs and their aggregation into the levels identified above, please refer to the Fair Value Measurements and Disclosures in Note 2 of the accompanying Notes to Financial Statements.
* | Security in Default |
1 | Securities purchased in a transaction exempt from registration under Rule 144A of the Securities Act of 1933. These securities may be resold in transactions exempt from registration, normally to qualified institutional buyers. The Fund has no right to demand registration of these securities. At April 30, 2019, the aggregate value of these securities was $43,319 or 57% of net assets. |
2 | MTN after the name of a security stands for Medium Term Note. |
The accompanying notes are an integral part of the Financial Statements.
31
Harbor Core Bond Fund
Manager’s Commentary (Unaudited)
Subadviser
Income Research + Management
100 Federal Street
30th Floor
30th Floor
Boston, MA 02110
Portfolio Managers
William A. O’Malley, CFA
Since 2018
James E. Gubitosi, CFA
Since 2018
Since 2018
Sarah Kilpatrick
Since 2018
Since 2018
IR+M has subadvised the Fund since 2018.
Investment Objective
The Fund seeks total return.
William A. O’Malley, CFA
James E. Gubitosi, CFA
Sarah Kilpatrick
Management’s Discussion of
Fund Performance
Fund Performance
Market Review
It was the tale of two markets during the semi-annual period ending April 30, 2019. In late 2018, geopolitical concerns, falling oil prices, and a continuation of tightening monetary policy pushed market volatility higher. At the December meeting, the U.S. Federal Reserve (Fed), as expected, raised the federal funds target range by another 0.25% to 2.25 to 2.50%. This marked the fourth rate increase in 2018 and ninth since December 2015. The Treasury curve flattened as the rate hike put upward pressure on shorter maturities. The policy-sensitive 2-year yield reached as high as 2.97%, surpassing the 5-year yield for the first curve inversion of 2018. As a result, the 10-year breakeven inflation rate fell to 1.71%. This weaker credit sentiment pushed investment-grade spreads wider to close out 2018 at 1.53%. Market sentiment then rebounded during the first four months of 2019. The Fed not only held rates steady, but signaled that rates could be held lower for longer – an unexpectedly dovish tone. The dovish Fed, low inflation, and slowing global growth caused investors to price in the potential for a rate cut in 2019. The market-implied probability of a rate cut rose above 75% as a result, and Treasury yields fell across the curve, pushing the 10-year yield below the 3-month bill for the first time since 2007. In the corporate market, a healthy appetite for risk, despite lower Treasury yields, supported investment-grade bonds. Strong demand helped tighten spreads from 1.53% at the beginning of the year to 1.11% at the end of April 2019.
Performance
During the reporting period, Harbor Core Bond Fund had strong absolute performance, returning 5.35% (Retirement Class) and 5.31% (Institutional Class). However, for the period the Retirement Class trailed the Bloomberg Barclays U.S. Aggregate Bond Index by 0.14% on a relative basis, with the Index posting positive absolute returns of 5.49%. Detractors from relative performance included the Fund’s out of benchmark allocation to small business loans and underweight to non-corporates, while the contributors to relative performance included the Fund’s underweight to Treasuries and security selection within corporates; namely Industrials and Utilities. Holdings that drove positive performance in the Fund included Anadarko Petroleum, Charter Communications and Exelon Corporation, while detractors included Ferguson Finance PLC, United Airlines and Nissan Motors.
Allocation shifts were made on the margin over the reporting period, as we took advantage of spread tightening and monetized tighter trading corporate bonds by reallocating the proceeds to more attractive opportunities within the sector. Over the course of the period we also broadly brought down our Treasury allocation and took the opportunity to increase our securitized exposure. Compared to the Bloomberg Barclays U.S. Aggregate Index, the Fund holds an 18% underweight to Treasuries and an overweight to spread sectors, with a 5% credit overweight and a 12% securitized overweight at the end of the reporting period.
32
Harbor Core Bond Fund
Manager’s Commentary—Continued
TOTAL RETURNS
For the periods ended 04/30/2019
Unannualized | 1 Year | 5 Years | Unannualized | ||||||||
6 Months | Life of Fund | ||||||||||
Harbor Core Bond Fund | |||||||||||
Retirement Class1 | 5.35% | N/A | N/A | 4.58% | |||||||
Institutional Class1 | 5.31 | N/A | N/A | 4.51 | |||||||
Comparative Index | |||||||||||
Bloomberg Barclays U.S. Aggregate Bond1 | 5.49% | N/A | N/A | 4.54% |
As stated in the Fund’s prospectus dated March 1, 2019, the expense ratios were 0.37% (Net) and 0.46% (Gross) (Retirement Class) and 0.45% (Net) and 0.54% (Gross) (Institutional Class). The net expense ratios reflect a contractual management fee waiver effective through 02/29/2020. The expense ratios in the prospectus may differ from the actual expense ratios for the period disclosed within this report. The expense ratios shown in the prospectus are based on estimates for the current fiscal year.
Performance data shown represents past performance and is no guarantee of future results. Past performance is net of management fees and expenses and reflects reinvested dividends and distributions but does not reflect the deduction of taxes that a shareholder would pay on Fund distributions or upon the redemption of Fund shares. Past performance reflects the beneficial effect of any expense waivers or reimbursements, without which returns would have been lower. Investment returns and principal value will fluctuate so that Fund shares, when redeemed, may be worth more or less than their original cost. Returns for periods less than one year are not annualized. Current performance may be higher or lower and is available through the most recent month end atharborfunds.com or by calling 800-422-1050.
Outlook & Strategy
We remain optimistic on corporate fundamentals. We believe that investment-grade corporate fundamentals remain healthy, and therefore we are flat to slightly overweight credit versus the benchmark. However, we are concerned about geopolitical tensions, long credit spreads and non-corporates. To take advantage of any broad market weakness as the result of slowing global growth or setbacks in trade talks, we currently have a slight spread duration overweight to high-quality securitized bonds. By doing so, we feel that we have ample liquidity to shift allocations as opportunities present themselves. Also, based on our current positioning, if long end spreads tighten significantly or if non-corporates outperform, the Fund may underperform. However, we are positioned with a yield advantage that would mitigate some of the impact.
The subadviser’s investment philosophy is consistent across all of its broad market strategies and is based on the belief that careful security selection and active portfolio risk management will lead to superior returns over the long-term (e.g. a market cycle). Portfolios are constructed to meet client objectives by using a disciplined, bottom-up approach to a variety of investment grade fixed income sectors. We believe that predicting the timing, direction, and magnitude of future interest rate changes is very difficult to consistently get right; as such, we keep duration and yield curve exposure neutral to the benchmark. This philosophy has remained consistent since the inception of IR+M. We do not maintain an outlook on rates and did not change our view as a result of events that took place over the reporting period. We remain committed to our disciplined, bottom-up approach while keeping our portfolios duration-neutral to their respective benchmarks and actively managing portfolio risks.
Going forward, questions remain on the health of the global economy. Central banks across Europe and China are bracing for slowing growth, and messaged that they plan to keep yields low to help spur expansion. As a result, the 10-year German government bond fell into negative territory for the first time since 2016. However, domestic economic data suggests that the U.S. is still on solid footing even with muted inflation. Despite this, investors are becoming increasingly wary and point towards the temporary yield curve inversion as proof of overly tight financial conditions. At IR+M, we continue to believe that it is time to leverage our years of experience and security selection skills. Periods of uncertainty can lead to volatility, and we stand ready to opportunistically deploy capital as volatility picks up. We are continuing to monitor credit fundamentals for broad signs of weakness, which we have yet to see. We will remain surgical in our bottom-up approach, while being mindful of potential risks.
1 | The “Life of Fund” return as shown reflects the period 06/01/2018 through 04/30/2019. |
This report contains the current opinions of Income Research + Management as of the date of this report and should not be considered as investment advice or a recommendation of any particular security, strategy or investment product. Such opinions are subject to change without notice and securities described herein may no longer be included in, or may at any time be removed from, the Fund’s portfolio. This report is distributed for informational purposes only. Information contained herein has been obtained from sources believed reliable, but not guaranteed.
Fixed income investments are affected by interest rate changes and the creditworthiness of the issues held by the Fund. A rise in interest rates will cause a decrease in the value of fixed income securities. Such an event would have an adverse effect on the Fund. There may be a greater risk that the Fund could lose money due to prepayment and extension risks because the Fund invests heavily at times in mortgage-related securities. The Fund may engage in active and frequent trading to achieve its principal investment strategies. References to securities that are backed by the full faith and credit of the U.S. Government do not apply to the shares of the Fund. For information on the different share classes and the risks associated with an investment in the Fund, please refer to the current prospectus.
33
Harbor Core Bond Fund
Fund Summary—April 30, 2019 (Unaudited)
TOP Issuers(% of net assets)
❶ | U.S. Treasury | 17.2% |
❷ | Federal National Mortgage Association | 14.8% |
❸ | Federal Home Loan Mortgage Corp. | 6.6% |
❹ | U.S. Small Business Administration | 4.6% |
❺ | Government National Mortgage Association | 4.3% |
❻ | World Omni Auto Receivables Trust | 1.8% |
❼ | JPMorgan Mortgage Trust | 1.5% |
❽ | GMF Floorplan Owner Revolving Trust | 1.4% |
❾ | AT&T Inc. | 1.2% |
❿ | Morgan Stanley | 1.1% |
Total Investments(% of investments)
Maturity Profile(% of investments)
34
Harbor Core Bond Fund
Portfolio of Investments—April 30, 2019 (Unaudited)
Value, Cost and Principal Amounts in Thousands
ASSET-BACKED SECURITIES—10.7% | |||
Principal Amount | Value | ||
Air Canada Pass-Through Trust | |||
Series 2015-1 Cl. A | |||
$ | 336 | 3.600%—09/15/20281 | $336 |
American Airlines Pass-Through Trust | |||
Series 2015-1 Cl. A | |||
596 | 3.375%—11/01/2028 | 590 | |
102 | 4.950%—07/15/2024 | 106 | |
696 | |||
CNH Equipment Trust | |||
Series 2018-A Cl. A3 | |||
590 | 3.120%—07/17/2023 | 595 | |
Series 2018-B Cl. A3 | |||
271 | 3.190%—11/15/2023 | 274 | |
869 | |||
DB Master Finance LLC | |||
Series 2017-1A Cl. A2I | |||
247 | 3.629%—11/20/20471 | 248 | |
254 | 3.787%—05/20/20491 | 257 | |
505 | |||
Delta Air Lines Pass-Through Trust | |||
Series 2015-1 Cl. AA | |||
306 | 3.625%—01/30/2029 | 313 | |
DLL Securitization Trust | |||
Series 2017-A Cl. A3 | |||
253 | 2.140%—12/15/20211 | 252 | |
Domino's Pizza Master Issuer LLC | |||
Series 2017-1A Cl. A2I | |||
246 | 4.021% (3 Month USD Libor + 1.250) 04/25/20221,2 | 246 | |
Ford Credit Floorplan Master Owner Trust | |||
Series 2016-5 Cl. A1 | |||
492 | 1.950%—11/15/2021 | 490 | |
GM Financial Automobile Leasing Trust | |||
Series 2019-1 Cl. A3 | |||
437 | 2.980%—12/20/2021 | 440 | |
GMF Floorplan Owner Revolving Trust | |||
Series 2017-1 Cl. A1 | |||
1,194 | 2.220%—01/18/20221 | 1,190 | |
MMAF Equipment Finance LLC | |||
Series 2019-A Cl. A3 | |||
334 | 2.840%—11/13/20231 | 336 | |
Store Master Funding I-VII | |||
205 | 3.960%—10/20/20481 | 212 | |
United Airlines Pass-Through Trust | |||
Series 2014-1 Cl. A | |||
844 | 4.000%—10/11/2027 | 866 | |
Verizon Owner Trust | |||
Series 2018-A Cl. A1A | |||
501 | 3.230%—04/20/2023 | 508 | |
Wheels SPV LLC | |||
Series 2017-1A Cl. A2 | |||
200 | 3.060%—04/20/20271 | 201 | |
World Omni Auto Receivables Trust | |||
Series 2017-B Cl. A3 | |||
500 | 1.950%—02/15/2023 | 496 | |
Series 2019-A Cl. A3 | |||
273 | 3.040%—05/15/2024 | 276 |
ASSET-BACKED SECURITIES—Continued | |||
Principal Amount | Value | ||
Series 2018-D Cl. A3 | |||
$ | 750 | 3.330%—04/15/2024 | $764 |
1,536 | |||
TOTAL ASSET-BACKED SECURITIES | |||
(Cost $8,895) | 8,996 | ||
COLLATERALIZED MORTGAGE OBLIGATIONS—8.6% | |||
BANK 2019-BNK16 | |||
Series 2019-BN16 Cl. ASB | |||
651 | 3.898%—02/15/2052 | 686 | |
Citigroup Commercial Mortgage Trust | |||
Series 2014-GC21 Cl. A2 | |||
505 | 3.575%—05/10/2047 | 518 | |
Commercial Mortgage Pass-Through Certificates | |||
Series 2014-CR14 Cl. A2 | |||
224 | 3.147%—02/10/2047 | 224 | |
Series 2014-CR21 Cl. A3 | |||
262 | 3.528%—12/10/2047 | 269 | |
493 | |||
DBGS Mortgage Trust | |||
Series 2018-C1 Cl. A4 | |||
274 | 4.466%—10/15/2051 | 301 | |
Flagstar Mortgage Trust | |||
Series 2018-1 Cl. A5 | |||
219 | 3.500%—03/25/20481,2 | 219 | |
GS Mortgage Securities Trust | |||
Series 2012-GCJ7 Cl. A4 | |||
423 | 3.377%—05/10/2045 | 428 | |
Invitation Homes Trust | |||
Series 2018-SFR1 Cl. A | |||
120 | 3.174%—03/17/20371,3 | 119 | |
JPMBB Commercial Mortgage Securities Trust | |||
Series 2015-C32 Cl. A2 | |||
741 | 2.816%—11/15/2048 | 741 | |
Series 2013-C14 Cl. A2 | |||
175 | 3.019%—08/15/2046 | 175 | |
916 | |||
JPMorgan Chase Commercial Mortgage Securities Trust | |||
Series 2012-CBX Cl. A4 | |||
316 | 3.483%—06/15/2045 | 321 | |
JPMorgan Mortgage Trust | |||
Series 2016-4 Cl. A5 | |||
222 | 3.500%—10/25/20461,2 | 223 | |
Series 2018-4 Cl. A5 | |||
389 | 3.500%—10/25/20481,2 | 391 | |
Series 2018-6 Cl. 1A4 | |||
335 | 3.500%—12/25/2048 | 336 | |
Series 2019-1 Cl. A6 | |||
275 | 4.000%—05/25/20491,2 | 279 | |
1,229 | |||
Morgan Stanley Capital I Trust | |||
Series 2012-C4 Cl. A4 | |||
319 | 3.244%—03/15/2045 | 323 | |
Progress Residential Trust | |||
Series 2018-SFR3 Cl. A | |||
433 | 3.880%—10/17/20351 | 445 | |
UBS Commercial Mortgage Trust | |||
Series 2018-C10 Cl. A4 | |||
543 | 4.313%—05/15/2051 | 586 |
35
Harbor Core Bond Fund
Portfolio of Investments—Continued
Value, Cost and Principal Amounts in Thousands
COLLATERALIZED MORTGAGE OBLIGATIONS—Continued | |||
Principal Amount | Value | ||
WF RBS Commercial Mortgage Trust | |||
Series 2012-C10 Cl. A3 | |||
$ | 244 | 2.875%—12/15/2045 | $245 |
Series 2011-C4 Cl. A4 | |||
400 | 4.902%—06/15/20441,2 | 414 | |
659 | |||
TOTAL COLLATERALIZED MORTGAGE OBLIGATIONS | |||
(Cost $7,140) | 7,243 | ||
CORPORATE BONDS & NOTES—30.0% | |||
AEROSPACE & DEFENSE—0.7% | |||
BAE Systems Holdings Inc. | |||
300 | 3.800%—10/07/20241 | 306 | |
Lockheed Martin Corp. | |||
225 | 4.700%—05/15/2046 | 253 | |
559 | |||
AIR FREIGHT & LOGISTICS—0.3% | |||
FedEx Corp. | |||
270 | 4.050%—02/15/2048 | 242 | |
AUTOMOBILES—0.7% | |||
Daimler Finance North America LLC | |||
300 | 2.200%—05/05/20201 | 298 | |
Volkswagen Group of America Finance LLC | |||
240 | 4.625%—11/13/20251 | 253 | |
551 | |||
BANKS—2.7% | |||
Bank of America Corp. MTN4 | |||
200 | 3.500%—04/19/2026 | 202 | |
206 | 4.330%—03/15/20502 | 213 | |
415 | |||
Citigroup Inc. | |||
826 | 3.400%—05/01/2026 | 826 | |
JPMorgan Chase & Co. | |||
300 | 3.200%—01/25/2023 | 303 | |
476 | 4.203%—07/23/20292 | 497 | |
800 | |||
PNC Bank NA | |||
250 | 3.500%—06/08/2023 | 257 | |
2,298 | |||
BEVERAGES—0.7% | |||
Anheuser-Busch Cos. LLC / Anheuser-Busch InBev Worldwide Inc. | |||
589 | 4.900%—02/01/20461 | 598 | |
BIOTECHNOLOGY—0.9% | |||
AbbVie Inc. | |||
400 | 2.500%—05/14/2020 | 399 | |
Celgene Corp. | |||
400 | 2.875%—08/15/2020 | 400 | |
799 | |||
CAPITAL MARKETS—4.0% | |||
Apollo Management Holdings LP | |||
250 | 4.000%—05/30/20241 | 252 | |
Goldman Sachs Group Inc. | |||
420 | 5.750%—01/24/2022 | 451 |
CORPORATE BONDS & NOTES—Continued | |||
Principal Amount | Value | ||
CAPITAL MARKETS—Continued | |||
KKR Group Finance Co. II LLC | |||
$ | 456 | 5.500%—02/01/20431 | $493 |
Macquarie Group Ltd. | |||
165 | 3.189%—11/28/20231,2 | 164 | |
Macquarie Group Ltd. MTN4 | |||
250 | 4.150%—03/27/20241,2 | 256 | |
Moody's Corp. | |||
407 | 3.250%—06/07/2021 | 411 | |
Morgan Stanley MTN4 | |||
553 | 3.125%—07/27/2026 | 539 | |
450 | 3.875%—01/27/2026 | 461 | |
1,000 | |||
UBS Group Funding Switzerland AG | |||
300 | 4.125%—04/15/20261 | 311 | |
3,338 | |||
CONSUMER FINANCE—2.9% | |||
American Express Co. | |||
250 | 3.375%—05/17/2021 | 253 | |
150 | 3.400%—02/27/2023 | 153 | |
406 | |||
Capital One Financial Corp. | |||
410 | 3.200%—01/30/2023 | 412 | |
GE Capital International Funding Co. Unlimited Co. | |||
415 | 2.342%—11/15/2020 | 411 | |
375 | 4.418%—11/15/2035 | 350 | |
761 | |||
General Motors Financial Co. Inc. | |||
444 | 4.150%—06/19/2023 | 453 | |
Nissan Motor Acceptance Corp. MTN4 | |||
400 | 2.150%—09/28/20201 | 395 | |
2,427 | |||
DIVERSIFIED FINANCIAL SERVICES—1.1% | |||
Cooperatieve Rabobank U.A. | |||
400 | 3.875%—09/26/20231 | 413 | |
Siemens Financieringsmaatschappij NV | |||
300 | 2.150%—05/27/20201 | 298 | |
Voya Financial Inc. | |||
200 | 3.125%—07/15/2024 | 198 | |
909 | |||
DIVERSIFIED TELECOMMUNICATION SERVICES—1.5% | |||
AT&T Inc. | |||
305 | 3.400%—05/15/2025 | 307 | |
664 | 3.777% (3 Month USD Libor + 1.180) 06/12/20242 | 667 | |
974 | |||
Verizon Communications Inc. | |||
247 | 4.522%—09/15/2048 | 257 | |
1,231 | |||
ELECTRIC UTILITIES—2.8% | |||
Berkshire Hathaway Energy Co. | |||
525 | 6.125%—04/01/2036 | 667 | |
Duke Energy Corp. | |||
475 | 3.750%—04/15/2024 | 490 | |
Eversource Energy | |||
260 | 2.750%—03/15/2022 | 260 | |
Exelon Corp. | |||
223 | 5.100%—06/15/2045 | 253 |
36
Harbor Core Bond Fund
Portfolio of Investments—Continued
Value, Cost and Principal Amounts in Thousands
CORPORATE BONDS & NOTES—Continued | |||
Principal Amount | Value | ||
ELECTRIC UTILITIES—Continued | |||
Southern Co. | |||
$ | 430 | 3.250%—07/01/2026 | $425 |
Virginia Electric & Power Co. | |||
305 | 3.150%—01/15/2026 | 305 | |
2,400 | |||
EQUITY REAL ESTATE INVESTMENT TRUSTS (REITs)—2.4% | |||
Boston Properties LP | |||
468 | 4.500%—12/01/2028 | 501 | |
Digital Realty Trust LP | |||
500 | 3.700%—08/15/2027 | 499 | |
HCP Inc. | |||
400 | 4.250%—11/15/2023 | 418 | |
Ventas Realty LP | |||
250 | 4.125%—01/15/2026 | 258 | |
WEA Finance LLC / Westfield UK & Europe Finance plc | |||
350 | 2.700%—09/17/20191 | 350 | |
2,026 | |||
FOOD & STAPLES RETAILING—0.3% | |||
Kroger Co. | |||
250 | 4.000%—02/01/2024 | 258 | |
HEALTH CARE PROVIDERS & SERVICES—1.5% | |||
CVS Pass-Through Trust | |||
138 | 5.880%—01/10/2028 | 149 | |
542 | 8.353%—07/10/20311 | 663 | |
812 | |||
Express Scripts Holding Co. | |||
495 | 3.400%—03/01/2027 | 482 | |
1,294 | |||
INDUSTRIAL CONGLOMERATES—0.2% | |||
General Electric Co. MTN4 | |||
172 | 4.625%—01/07/2021 | 176 | |
INSURANCE—0.9% | |||
American International Group Inc. | |||
465 | 4.125%—02/15/2024 | 486 | |
Five Corners Funding Trust | |||
250 | 4.419%—11/15/20231 | 264 | |
750 | |||
MEDIA—2.1% | |||
Charter Communications Operating LLC / Charter Communications Operating Capital | |||
525 | 6.384%—10/23/2035 | 594 | |
Comcast Cable Communications Holdings Inc. | |||
200 | 9.455%—11/15/2022 | 245 | |
Comcast Corp. | |||
470 | 3.000%—02/01/2024 | 473 | |
COX Communications Inc. | |||
300 | 2.950%—06/30/20231 | 298 | |
200 | 3.250%—12/15/20221 | 201 | |
499 | |||
1,811 | |||
OIL, GAS & CONSUMABLE FUELS—1.6% | |||
Anadarko Petroleum Corp. | |||
1,000 | 0.000%—10/10/20365 | 502 | |
Concho Resources Inc. | |||
155 | 4.300%—08/15/2028 | 162 |
CORPORATE BONDS & NOTES—Continued | |||
Principal Amount | Value | ||
OIL, GAS & CONSUMABLE FUELS—Continued | |||
Phillips 66 Partners LP | |||
$ | 250 | 3.605%—02/15/2025 | $252 |
Sunoco Logistics Partners Operations LP | |||
428 | 3.900%—07/15/2026 | 426 | |
1,342 | |||
ROAD & RAIL—1.0% | |||
Norfolk Southern Corp. | |||
310 | 4.837%—10/01/2041 | 340 | |
Penske Truck Leasing Co. LP / PTL Finance Corp. | |||
500 | 3.900%—02/01/20241 | 512 | |
852 | |||
SEMICONDUCTORS & SEMICONDUCTOR EQUIPMENT—0.3% | |||
Broadcom Inc. | |||
257 | 3.625%—10/15/20241 | 254 | |
TRADING COMPANIES & DISTRIBUTORS—1.3% | |||
AerCap Ireland Capital DAC / AerCap Global Aviation Trust | |||
272 | 4.125%—07/03/2023 | 278 | |
Air Lease Corp. | |||
374 | 3.875%—07/03/2023 | 382 | |
Ferguson Finance plc | |||
466 | 4.500%—10/24/20281 | 474 | |
1,134 | |||
WATER UTILITIES—0.1% | |||
Aquarion Co. | |||
117 | 4.000%—08/15/20241 | 120 | |
TOTAL CORPORATE BONDS & NOTES | |||
(Cost $24,636) | 25,369 | ||
MORTGAGE PASS-THROUGH—25.7% | |||
Federal Home Loan Mortgage Corp. | |||
2,564 | 3.000%—11/01/2043-02/01/2047 | 2,550 | |
888 | 3.500%—07/01/2046 | 906 | |
1,810 | 4.000%—02/01/2046-03/01/2048 | 1,871 | |
242 | 5.000%—06/01/2041 | 261 | |
5,588 | |||
Federal National Mortgage Association | |||
3,250 | 3.500%—10/01/2037-09/01/2046 | 3,313 | |
2,885 | 4.000%—04/01/2045-09/01/2047 | 2,991 | |
1,866 | 4.500%—05/01/2046-11/01/2047 | 1,963 | |
3,977 | 5.000%—09/01/2033-04/01/2049 | 4,268 | |
12,535 | |||
Government National Mortgage Association | |||
768 | 4.000%—09/20/2041-09/15/2046 | 796 | |
2,686 | 4.500%—01/15/2042-08/20/2047 | 2,811 | |
3,607 | |||
TOTAL MORTGAGE PASS-THROUGH | |||
(Cost $21,542) | 21,730 | ||
MUNICIPAL BONDS—1.8% | |||
Metropolitan Transportation Authority | |||
195 | 5.871%—11/15/2039 | 239 |
37
Harbor Core Bond Fund
Portfolio of Investments—Continued
Value, Cost and Principal Amounts in Thousands
MUNICIPAL BONDS—Continued | |||
Principal Amount | Value | ||
MUNICIPAL BONDS—Continued | |||
Metropolitan Water Reclamation District of Greater Chicago | |||
$ | 145 | 5.720%—12/01/2038 | $180 |
New York State Urban Development Corp. | |||
555 | 5.770%—03/15/2039 | 658 | |
State of California | |||
300 | 7.500%—04/01/2034 | 432 | |
TOTAL MUNICIPAL BONDS | |||
(Cost $1,475) | 1,509 | ||
U.S. GOVERNMENT OBLIGATIONS—22.0% | |||
U.S. Small Business Administration | |||
Series 2012-20C Cl. 1 | |||
193 | 2.510%—03/01/2032 | 191 | |
Series 2017-20H Cl. 1 | |||
177 | 2.750%—08/01/2037 | 175 | |
Series 2016-20L Cl. 1 | |||
1,268 | 2.810%—12/01/2036 | 1,261 | |
Series 2015-20H Cl. 1 | |||
460 | 2.820%—08/01/2035 | 458 | |
Series 2017-20J Cl. 1 | |||
292 | 2.850%—10/01/2037 | 291 | |
Series 2018-20B Cl. 1 | |||
331 | 3.220%—02/01/2038 | 338 |
U.S. GOVERNMENT OBLIGATIONS—Continued | |||
Principal Amount | Value | ||
U.S. GOVERNMENT OBLIGATIONS—Continued | |||
Series 2018-20G Cl. 1 | |||
$ | 505 | 3.540%—07/01/2038 | $524 |
Series 2018-20F Cl. 1 | |||
747 | 3.600%—06/01/2038 | 778 | |
4,016 | |||
U.S. Treasury Bonds | |||
4,143 | 3.000%—02/15/2048-08/15/2048 | 4,194 | |
3,410 | 4.500%—05/15/2038 | 4,317 | |
8,511 | |||
U.S. Treasury Notes | |||
466 | 2.375%—02/29/2024 | 468 | |
4,472 | 2.750%—09/15/2021 | 4,525 | |
1,011 | 2.875%—10/31/2023 | 1,037 | |
6,030 | |||
TOTAL U.S. GOVERNMENT OBLIGATIONS | |||
(Cost $18,165) | 18,557 | ||
TOTAL INVESTMENTS—98.8% | |||
(Cost $81,853) | 83,404 | ||
CASH AND OTHER ASSETS, LESS LIABILITIES—1.2% | 1,016 | ||
TOTAL NET ASSETS—100.0% | $84,420 |
FAIR VALUE MEASUREMENTS
All investments at April 30, 2019 (as disclosed in the preceding Portfolio of Investments) were classified as Level 2. There were no Level 3 investments at April 30, 2019 or October 31, 2018.
For more information on valuation inputs and their aggregation into the levels identified above, please refer to the Fair Value Measurements and Disclosures in Note 2 of the accompanying Notes to Financial Statements.
1 | Securities purchased in a transaction exempt from registration under Rule 144A of the Securities Act of 1933. These securities may be resold in transactions exempt from registration, normally to qualified institutional buyers. The Fund has no right to demand registration of these securities. At April 30, 2019, the aggregate value of these securities was $12,541 or 15% of net assets. |
2 | Variable rate security; the stated rate represents the rate in effect at April 30, 2019. |
3 | Floating rate security; the stated rate represents the rate in effect at April 30, 2019. |
4 | MTN after the name of a security stands for Medium Term Note. |
5 | Zero coupon bond |
The accompanying notes are an integral part of the Financial Statements.
38
Harbor Bond Fund
Manager’s Commentary (Unaudited)
Subadviser
Pacific Investment Management Company LLC (PIMCO)
650 Newport Center Dr.
Newport Beach, CA
92660
Newport Beach, CA
92660
Portfolio Managers
Scott A. Mather
Since 2014
Since 2014
Mark R. Kiesel
Since 2014
Since 2014
Mihir P. Worah, Ph.D.
Since 2014
Since 2014
PIMCO has subadvised the Fund since 1987.
Investment Objective
The Fund seeks total return.
Scott A. Mather
Mark R. Kiesel
Mihir P. Worah, Ph.D.
Management’s Discussion of
Fund Performance
Fund Performance
MARKET REVIEW
Elevated volatility headlined much of the end of 2018 as concerns about slowing global growth and rising geopolitical uncertainty weighed on risk sentiment. U.S. stocks reversed their gains from earlier in 2018 and fell sharply over December alongside a broader global risk asset sell-off.
Most risk assets experienced challenging performance as risk sentiment waned. Equities globally ended 2018 lower and credit spreads widened while developed market yields fell. Commodities, particularly oil prices, experienced a sharp decline due to heightened concerns over an influx of supply and softening demand.
Central banks remained on course for diminished monetary support as the fundamental backdrop remained solid overall. The U.S. Federal Reserve (Fed) hiked rates for the fourth time in 2018, as expected, but lowered its expectations for rate increases in 2019. The European Central Bank (ECB) announced the end of its asset purchase program and reiterated its intention to leave rates unchanged through the summer of 2019. Other geopolitical developments – midterm elections and a government shutdown in the U.S., ongoing Brexit negotiations, and political as well as budgetary turmoil in the Eurozone – contributed to diminished investor appetites.
Following December’s steep sell-off, risk assets bounced back as dovish pivots from global central banks helped ease financial conditions and optimism over U.S.-China trade negotiations bolstered investor sentiment. Still, economic data continued to signal decelerating global growth.
Robust risk appetites reverberated across most risk assets – global equities surged higher, developed market yields fell, credit spreads tightened, and oil prices climbed – though not all retraced the extent of late 2018’s drawdowns.
Even as risk sentiment improved, fundamental data continued to indicate a slowdown in global growth. The Eurozone saw downside surprises in growth metrics as external demand weakened, driven in part by the persistent slowdown in China (this in turn spurred stimulus measures from Chinese policymakers). Economic data in the U.S. were mixed, particularly with a temporary government shutdown, but labor and housing markets remained broadly robust.
Geopolitical developments were mixed: headlines highlighted continued political uncertainty surrounding Brexit, but also progress on a potential U.S.-China trade deal, though a full agreement remained elusive.
Global central banks signaled more accommodative stances as evidence grew of a deceleration in global economies. The Fed established a “patient” approach to policy – lowering both growth expectations and its rate hike outlook for 2019. The ECB, Bank of England (BOE), Reserve Bank of Australia (RBA), and others likewise struck more cautionary tones in the first quarter of 2019, further contributing to the broad-based rally in both risk assets as well as sovereign yields.
PERFORMANCE
Harbor Bond Fund underperformed the Bloomberg Barclays U.S. Aggregate Bond Index for the six months ended April 30, 2019. The Fund returned 4.80% (Retirement Class), 4.76% (Institutional Class), and 4.63% (Administrative Class) for the six months ended April 30, 2019, compared with the benchmark’s return of 5.49%.
39
Harbor Bond Fund
Manager’s Commentary—Continued
TOTAL RETURNS
For the periods ended 04/30/2019
Unannualized | 1 Year | Annualized | |||||||||
6 Months | 5 Years | 10 Years | |||||||||
Harbor Bond Fund | |||||||||||
Retirement Class1 | 4.80% | 5.18% | 2.79% | 4.56% | |||||||
Institutional Class | 4.76 | 5.19 | 2.79 | 4.56 | |||||||
Administrative Class | 4.63 | 4.93 | 2.54 | 4.30 | |||||||
Comparative Index | |||||||||||
Bloomberg Barclays U.S. Aggregate Bond | 5.49% | 5.29% | 2.57% | 3.72% |
As stated in the Fund’s prospectus dated March 1, 2019, the expense ratios were 0.72% (Net) and 0.83% (Gross) (Retirement Class); 0.80% (Net) and 0.91% (Gross) (Institutional Class); and 1.05% (Net) and 1.16% (Gross) (Administrative Class). The net expense ratios reflect a contractual management fee waiver and an expense limitation agreement (excluding interest expense) effective through 02/29/2020. The expense ratios in the prospectus may differ from the actual expense ratios for the period disclosed within this report. The expense ratios shown in the prospectus are based on the prior fiscal year, adjusted to reflect changes, if any, in contractual arrangements that occurred prior to the date of the prospectus (or supplement thereto, if applicable).
Performance data shown represents past performance and is no guarantee of future results. Past performance is net of management fees and expenses and reflects reinvested dividends and distributions but does not reflect the deduction of taxes that a shareholder would pay on Fund distributions or upon the redemption of Fund shares. Past performance reflects the beneficial effect of any expense waivers or reimbursements, without which returns would have been lower. Investment returns and principal value will fluctuate so that Fund shares, when redeemed, may be worth more or less than their original cost. Returns for periods less than one year are not annualized. Current performance may be higher or lower and is available through the most recent month end atharborfunds.com or by calling 800-422-1050.
The following strategies helped returns for the six months ended April 30, 2019:
• | U.S. interest rate strategies, including duration and yield curve positioning, particularly an overweight to the intermediate portion of the U.S. Treasury curve as rates fell over the period. |
• | An overweight to the Banking and Financials sector over the period which performed well as corporate spreads narrowed over the period. |
• | Holdings of agency mortgage positions, as they outperformed like duration Treasuries. |
• | A tactical allocation to U.S. Treasury Inflation-Protected Securities (TIPS), as U.S. inflation expectations sharply rebounded from weakness in the beginning of the period. |
The following strategies were negative or neutral for returns:
• | Interest rate strategies that benefit from rising rates in the Italy, U.K, Australia, and Japan detracted as rates in these regions fell over the period. |
• | Tactical exposure to non-agency mortgage-backed securities, which underperformed. |
OUTLOOK & STRATEGY
We would expect world GDP growth to slow to 2.5%‒3% this year from 3.3% in 2018. However, with China increasing stimulus and a trade deal between the U.S. and China in the making, we think there is a good chance that global growth will stabilize or even pick up moderately later this year. We expect inflation globally to fall to 1.5%−2% from 2.2% in 2018 due to continued below-target inflation in the U.S., Europe and Japan.
In the U.S., we continue to expect growth to slow to 2%–2.5% in 2019 from nearly 3% last year. Factors contributing to the deceleration include fading fiscal stimulus, the lagged effect of tighter monetary policy over the past few years, and headwinds from the China/global slowdown. We estimate that China’s easing will not filter through to U.S. growth until late 2019 or early 2020. Headline inflation looks set to drop to 1.5%−2% this year, while core Consumer Price Index (CPI) moves sideways. With growth slowing and inflation remaining below target, we believe the Fed is likely to keep rates unchanged in 2019.
For the Eurozone, we expect growth to slow to a trend-like pace of 0.75%–1.25% in 2019 from close to 2% in 2018, as weak global trade exerts significant downward pressure on the economy and Italy is in recession. An improvement in global trade conditions through this year should contribute to a gradual reacceleration. Reflecting firmer wage growth, we expect a moderate pickup in core inflation, which has been stuck at 1% for some time. In line with the ECB’s forward guidance, we expect policy rates to remain unchanged this year.
In the U.K., we expect real growth in the range of 1%–1.5% in 2019, modestly below trend, and we continue to think that a chaotic no-deal Brexit is a low-probability event. We see core CPI inflation stable at or close to the 2% target as import price pressures have faded and domestic price pressures remain subdued. In the event of a soft Brexit by mid-year, a rate hike by the BOE in the second half of the year would appear likely.
Japan’s GDP growth is expected to be modest at 0.5%–1% in 2019, broadly unchanged from 0.7% in 2018. With core CPI inflation expected to dip into negative territory (due to temporary factors) around the middle of the year, we expect the Bank of Japan to keep its targets for short rates and the 10-year yield unchanged this year.
In China, we see growth slowing in 2019 to the middle of a 5.5%‒6.5% range from 6.6% in 2018, but stabilizing in the second half of the year as fiscal and monetary stimulus find some traction and a likely trade deal between the U.S. and China supports confidence.
1 | Retirement Class shares commenced operations on June 1, 2018. The performance attributed to the Retirement Class shares prior to that date is that of the Institutional Class shares. Performance prior to June 1, 2018 has not been adjusted to reflect the lower expenses of Retirement Class shares. During this period, Retirement Class shares would have had returns similar to, but potentially higher than, Institutional Class shares due to the fact that Retirement Class shares represent interests in the same portfolio as Institutional Class shares but are subject to lower expenses. |
40
Harbor Bond Fund
Manager’s Commentary—Continued
We expect fiscal stimulus of 1.5% to 2% of GDP. Inflation remains benign at 1.5%-2.5% in our forecast, and we are looking for another rate cut by the People’s Bank of China in addition to more reductions in banks’ reserve requirement ratios. Yuan stability is well-anchored with a patient Fed and the understanding that this needs to be a component of the U.S.-China trade deal.
With respect to portfolio strategy for the Fund:
• | We still have a preference for U.S. duration against rate exposure in other developed regions, including the U.K. and Japan. We prefer the intermediate portion of the curve, anchored by the new neutral thesis and the weight of lower global yields. |
• | We are overweight U.S. duration with a focus on intermediate rates and an underweight to the long end of the curve. |
• | We remain underweight international and global corporates in favor of more diversified credit exposures in other sectors. We would look to add opportunistically again amid market dislocations as we do not see any imminent downturn in the business cycle. |
• | We remain tactical with currency positioning, particularly given less conviction in the overall direction of the U.S. dollar. We continue to seek attractive risk/reward opportunities. |
This report contains the current opinions of Pacific Investment Management Company LLC (PIMCO) as of the date of this report and should not be considered as investment advice or a recommendation of any particular security, strategy or investment product. Such opinions are subject to change without notice and securities described herein may no longer be included in, or may at any time be removed from, the Fund’s portfolio. This report is distributed for informational purposes only. Information contained herein has been obtained from sources believed reliable, but not guaranteed.
Fixed income investments are affected by interest rate changes and the creditworthiness of the issues held by the Fund. A rise in interest rates will cause a decrease in the value of fixed income securities. Such an event would have an adverse effect on the Fund. The use of derivative instruments may add additional risk. There may be a greater risk that the Fund could lose money due to prepayment and extension risks because the Fund invests heavily at times in mortgage-related securities. The Fund may engage in active and frequent trading to achieve its principal investment strategies. References to securities that are backed by the full faith and credit of the U.S. Government do not apply to the shares of the Fund. For information on the different share classes and the risks associated with an investment in the Fund, please refer to the current prospectus.
41
Harbor Bond Fund
Fund Summary—April 30, 2019 (Unaudited)
TOP Issuers(% of net assets)
❶ | Federal National Mortgage Association TBA | 47.1% |
❷ | U.S. Treasury | 27.7% |
❸ | Japan Treasury Discount Bill | 10.1% |
❹ | Federal National Mortgage Association REMIC | 4.1% |
❺ | Government National Mortgage Association TBA | 3.7% |
❻ | Federal National Mortgage Association | 2.4% |
❼ | Brazil Letras Do Tesouro Nacional | 1.6% |
❽ | Federal Home Loan Mortgage Corp. TBA | 1.4% |
❾ | Barclays plc | 1.2% |
❿ | Ford Motor Credit Co. LLC | 1.2% |
Total Investments(% of net assets)
(Excludes net cash and derivative positions of -70.5%)
Maturity Profile(% of investments)
42
Harbor Bond Fund
Portfolio of Investments—April 30, 2019 (Unaudited)
Value, Cost, Notional and Principal Amounts in Thousands
ASSET-BACKED SECURITIES—10.0% | |||
Principal Amount | Value | ||
Allegro CLO I Ltd.1 | |||
Series 2013 Cl. 1A | |||
$ | 2,322 | 3.740% (3 Month USD Libor + 1.220) 01/30/20262,3 | $2,324 |
Ally Auto Receivables Trust | |||
Series 2018-3 Cl. A2 | |||
4,605 | 2.720%—05/17/2021 | 4,606 | |
AmeriCredit Automobile Receivables Trust | |||
Series 2018-1 Cl. A2B | |||
1,849 | 2.517% (1 Month USD Libor) 07/19/20212 | 1,849 | |
Arbor Realty Commercial Real Estate Notes Ltd. | |||
Series 2017-FL1 Cl. A | |||
6,800 | 3.580% (1 Month USD Libor + 1.300) 04/15/20272,3 | 6,822 | |
Argent Securities Inc. | |||
Series 2006-W4 Cl. A2C | |||
6,444 | 2.441% (1 Month USD Libor + 0.160) 05/25/20362 | 2,407 | |
Series 2005-W2 Cl. A2C | |||
1,744 | 2.641% (1 Month USD Libor + 0.360) 10/25/20352 | 1,751 | |
Series 2004-W11 Cl. M3 | |||
939 | 3.406% (1 Month USD Libor + 0.750) 11/25/20342 | 942 | |
5,100 | |||
Asset Backed Securities Corp. Home Equity Loan Trust | |||
Series 2003-HE4 Cl. M1 | |||
5,146 | 3.729% (1 Month USD Libor + 0.830) 08/15/20332 | 5,157 | |
Atlas Senior Loan Fund IV Ltd. | |||
Series 2013-2A Cl. A1RR | |||
1,772 | 2.994% (3 Month USD Libor + 0.680) 02/17/20262,3 | 1,767 | |
Capital One Multi-Asset Execution Trust | |||
Series 2014-A4 Cl. A4 | |||
6,400 | 2.640% (1 Month USD Libor + 0.360) 06/15/20222 | 6,405 | |
Cent CLO Ltd.1 | |||
Series 2015-24A Cl. A1R | |||
5,200 | 3.506% (3 Month USD Libor + 1.070) 10/15/20262,3 | 5,178 | |
Countrywide Asset-Backed Certificates | |||
Series 2006-21 Cl. 2A3 | |||
1,560 | 2.431% (1 Month USD Libor + 0.150) 05/25/20372 | 1,546 | |
Series 2006-ABC1 Cl. A3 | |||
4,564 | 2.521% (1 Month USD Libor + 0.240) 05/25/20362 | 3,302 | |
Series 2006-2 Cl. M1 | |||
1,200 | 2.681% (1 Month USD Libor + 0.400) 06/25/20362 | 1,185 | |
6,033 | |||
Credit Acceptance Auto Loan Trust | |||
Series 2018-2A Cl. A | |||
6,300 | 3.470%—05/17/20273 | 6,361 | |
Crown Point CLO Ltd.1 | |||
Series 2018-5A Cl. A | |||
5,700 | 3.389% (3 Month USD Libor + 0.940) 07/17/20282,3 | 5,654 |
ASSET-BACKED SECURITIES—Continued | |||
Principal Amount | Value | ||
Dryden XXV Senior Loan Fund | |||
Series 2012-25A Cl. APR | |||
$ | 5,500 | 3.336% (3 Month USD Libor + 0.900) 10/15/20272,3 | $5,494 |
First Franklin Mortgage Loan Trust | |||
Series 2006-FF10 Cl. A4 | |||
222 | 2.431% (1 Month USD Libor + 0.150) 07/25/20362 | 222 | |
Flagship VII Ltd. | |||
Series 2013 Cl. 7A | |||
899 | 3.881% (3 Month USD Libor + 1.120) 01/20/20262,3 | 900 | |
GSAA Trust | |||
Series 2006-20 Cl. 1A2 | |||
4,480 | 2.461% (1 Month USD Libor + 0.180) 12/25/20462 | 2,311 | |
Series 2007-9 Cl. A1A | |||
1,441 | 6.000%—08/25/2047 | 1,373 | |
3,684 | |||
GSAMP Trust | |||
Series 2007-FM1 Cl. 2A2 | |||
115 | 2.351% (1 Month USD Libor + 0.070) 12/25/20362 | 66 | |
Home Equity Asset Trust | |||
Series 2005-2 Cl. M4 | |||
217 | 3.266% (1 Month USD Libor + 0.700) 07/25/20352 | 218 | |
HSI Asset Securitization Corp. Trust | |||
Series 2006-HE2 Cl. 2A3 | |||
5,111 | 2.451% (1 Month USD Libor + 0.170) 12/25/20362 | 1,993 | |
IXIS Real Estate Capital Trust | |||
Series 2005-HE1 Cl. M4 | |||
2,354 | 3.331% (1 Month USD Libor + 1.050) 06/25/20352 | 2,283 | |
JPMorgan Mortgage Acquisition Corp. | |||
Series 2006-HE1 Cl.A4 | |||
2,651 | 2.861% (1 Month USD Libor + 0.290) 01/25/20362 | 2,631 | |
JPMorgan Mortgage Acquisition Trust | |||
Series 2007-HE1 Cl. AF3 | |||
910 | 4.199%—05/25/20354 | 693 | |
LoanCore Ltd. | |||
Series 2018-CRE1 Cl. A | |||
5,200 | 3.410% (1 Month USD Libor + 1.130) 05/15/20282,3 | 5,206 | |
MASTR Asset Backed Securities Trust | |||
Series 2006-HE2 Cl. A4 | |||
5,665 | 2.521% (1 Month USD Libor + 0.240) 06/25/20362 | 3,186 | |
Mid-State Trust | |||
Series 2004-1 Cl. A | |||
1,068 | 6.005%—08/15/2037 | 1,153 | |
Monarch Grove CLO1 | |||
Series 2018-1A Cl. A1 | |||
4,300 | 3.370% (3 Month USD Libor + 0.880) 01/25/20282,3 | 4,266 | |
Morgan Stanley ABS Capital I Inc. Trust | |||
Series 2007-HE1 Cl. A2C | |||
2,191 | 2.431% (1 Month USD Libor + 0.150) 11/25/20362 | 1,510 | |
Morgan Stanley Dean Witter Capital I | |||
Series 2002-HE1 Cl. M1 | |||
584 | 3.181% (1 Month USD Libor + 0.600) 07/25/20322 | 588 |
43
Harbor Bond Fund
Portfolio of Investments—Continued
Value, Cost, Notional and Principal Amounts in Thousands
ASSET-BACKED SECURITIES—Continued | |||
Principal Amount | Value | ||
Mountain View CLO Ltd.1 | |||
Series 2014-1A Cl. ARR | |||
$ | 5,793 | 3.236% (3 Month USD Libor + 0.800) 10/15/20262,3 | $5,771 |
Navient Student Loan Trust | |||
Series 2017-3A Cl. A1 | |||
1,468 | 2.581% (1 Month USD Libor + 0.300) 07/26/20662,3 | 1,468 | |
Nissan Master Owner Trust Receivables | |||
Series 2016-A Cl. A1 | |||
6,500 | 2.920% (1 Month USD Libor + 0.640) 06/15/20212 | 6,504 | |
OneMain Financial Issuance Trust | |||
Series 2017-1A Cl. A1 | |||
5,500 | 2.370%—09/14/20323 | 5,464 | |
Option One Mortgage Loan Trust | |||
Series 2007-6 Cl. 2A4 | |||
4,561 | 2.531% (1 Month USD Libor + 0.250) 07/25/20372 | 3,366 | |
Park Place Securities Inc. | |||
Series 2005-WCW3 Cl. M1 | |||
5,838 | 2.761% (1 Month USD Libor + 0.480) 08/25/20352 | 5,862 | |
People's Financial Realty Mortgage Securities Trust | |||
Series 2006-1 Cl. 1A2 | |||
4,722 | 2.411% (1 Month USD Libor + 0.130) 09/25/20362 | 1,358 | |
RAMP Trust | |||
Series 2004-RS8 Cl. MII1 | |||
401 | 3.386% (1 Month USD Libor + 0.600) 08/25/20342 | 403 | |
Securitized Asset Backed Receivables LLC Trust | |||
Series 2005-FR5 Cl. M1 | |||
9,031 | 2.941% (1 Month USD Libor + 0.440) 08/25/20352 | 6,137 | |
Small Business Administration Participation Certificates | |||
Series 2003-20I Cl. 1 | |||
41 | 5.130%—09/01/2023 | 43 | |
Series 2009-20A Cl. 1 | |||
1,967 | 5.720%—01/01/2029 | 2,102 | |
Series 2008-20H Cl. 1 | |||
3,876 | 6.020%—08/01/2028 | 4,124 | |
Series 2001-20A Cl. 1 | |||
38 | 6.290%—01/01/2021 | 39 | |
6,308 | |||
SoFi Professional Loan Program Trust | |||
Series 2018-A1FX Cl. B | |||
4,050 | 2.640%—08/25/20473 | 4,047 | |
Soundview Home Loan Trust | |||
Series 2006-WF2 Cl. A1 | |||
362 | 2.411% (1 Month USD Libor + 0.130) 12/25/20362 | 362 | |
Specialty Underwriting & Residential Finance Trust | |||
Series 2006-BC4 Cl. A2B | |||
3,064 | 2.391% (1 Month USD Libor + 0.110) 09/25/20372 | 1,463 | |
Structured Asset Securities Co. | |||
Series 2007-MN1A Cl. A1 | |||
21,530 | 2.511% (1 Month USD Libor + 0.230) 01/25/20372,3 | 15,658 |
ASSET-BACKED SECURITIES—Continued | |||
Principal Amount | Value | ||
Student Loan Marketing Association | |||
Series 2013-B Cl. A2A | |||
$ | 1,311 | 1.850%—06/17/20303 | $1,308 |
Telos CLO Ltd.1 | |||
Series 2014 Cl. 6A | |||
6,817 | 3.719% (3 Month USD Libor + 1.270) 01/17/20272,3 | 6,821 | |
Tralee CLO V Ltd.1 | |||
Series 2018-5A Cl. A1 | |||
5,900 | 3.869% (3 Month USD Libor + 1.110) 10/20/20282,3 | 5,879 | |
Trillium Credit Card Trust II | |||
Series 2018-1A Cl. A | |||
8,100 | 2.544% (1 Month USD Libor) 02/27/20232,3,4 | 8,103 | |
Venture XVI CLO Ltd.1 | |||
Series 2014-16A Cl. ARR | |||
5,400 | 3.286% (3 Month USD Libor + 0.850) 01/15/20282,3 | 5,368 | |
Westlake Automobile Receivables Trust | |||
Series 2018-A2A Cl. 3A | |||
6,644 | 2.980%—01/18/20223 | 6,655 | |
TOTAL ASSET-BACKED SECURITIES | |||
(Cost $186,168) | 189,654 | ||
BANK LOAN OBLIGATIONS—0.3% | |||
(Cost $5,178) | |||
CONSUMER FINANCE—0.3% | |||
Toyota Motor Credit Corp. | |||
Revolver Term Out Loan | |||
5,200 | 3.390% (3 Month USD Libor + 0.580) 09/28/20202 | 5,192x | |
COLLATERALIZED MORTGAGE OBLIGATIONS—6.2% | |||
Adjustable Rate Mortgage Trust | |||
Series 2006-3 Cl. 4A2 | |||
2,890 | 2.401% (1 Month USD Libor + 0.120) 08/25/20362 | 1,651 | |
Alba plc | |||
Series 2007-1 Cl. A3 | |||
GBP | 2,663 | 0.967% (3 Month GBP Libor + 0.170) 03/17/20392 | 3,277 |
Banc of America Funding Corp. | |||
Series 2007-C Cl. 7A5 | |||
$ | 946 | 2.580% (1 Month USD Libor + 0.300) 05/20/20472 | ��� 900 |
BCAP LLC Trust | |||
Series 2007-AA2 Cl. 12A1 | |||
6,715 | 2.491% (1 Month USD Libor + 0.210) 05/25/20472 | 6,197 | |
Series 2011-RR5 Cl. 12A1 | |||
517 | 4.917%—03/26/20373,4 | 520 | |
Series 2011-RR4 Cl. 8A1 | |||
2,198 | 5.250%—02/26/20362,3 | 1,658 | |
Series 2011-RR5 Cl. 5A1 | |||
1,931 | 5.250%—08/26/20372,3 | 1,965 | |
10,340 | |||
Bear Stearns Adjustable Rate Mortgage Trust | |||
Series 2000-2 Cl. A1 | |||
17 | 2.781% (Cost of Funds for the 11th District of San Francisco) 11/25/20302 | 16 |
44
Harbor Bond Fund
Portfolio of Investments—Continued
Value, Cost, Notional and Principal Amounts in Thousands
COLLATERALIZED MORTGAGE OBLIGATIONS—Continued | |||
Principal Amount | Value | ||
Series 2004-10 Cl. 12A3 | |||
$ | 29 | 4.208%—01/25/20352 | $29 |
Series 2004-1 Cl. 12A5 | |||
308 | 4.663%—04/25/20345 | 312 | |
Series 2006-4 Cl. 1A1 | |||
351 | 4.717%—10/25/20362 | 344 | |
701 | |||
Bear Stearns Alt-A Trust | |||
Series 2005-4 Cl. 1A1 | |||
134 | 2.721% (1 Month USD Libor + 0.220) 07/25/20352 | 134 | |
BX Trust | |||
Series 2017 Cl. A | |||
2,150 | 3.200% (1 Month USD Libor) 07/15/20342,3 | 2,150 | |
Chase Mortgage Finance Corp. | |||
Series 2006-A1 Cl. 4A1 | |||
1,663 | 4.222%—09/25/20362 | 1,561 | |
Countrywide Alternative Loan Trust | |||
Series 2006-6BC Cl. 1A2 | |||
3,426 | 2.886% (1 Month USD Libor + 0.400) 05/25/20362 | 2,945 | |
Series 2005-84 Cl. 1A1 | |||
2,787 | 3.412%—02/25/20362 | 2,415 | |
Series 2005-20CB Cl. 2A5 | |||
2,247 | 5.500%—07/25/2035 | 2,033 | |
Series 2006-36T2 Cl. 1A4 | |||
1,245 | 5.750%—12/25/2036 | 864 | |
8,257 | |||
Countrywide Home Loan Mortgage Pass Through Trust | |||
Series 2007-HY5 Cl. 1A1 | |||
860 | 4.510%—09/25/20472 | 841 | |
Credit Suisse First Boston Mortgage Securities Corp. | |||
Series 2006-C2 Cl. A3 | |||
343 | 6.000%—11/25/2035 | 284 | |
Deutsche Alt-A Securities Inc. Mortgage Loan Trust | |||
Series 2007-AR2 Cl. A1 | |||
5,015 | 2.431% (1 Month USD Libor + 0.150) 03/25/20372 | 4,659 | |
DSLA Mortgage Loan Trust | |||
Series 2006-AR1 Cl. 1A1A | |||
2,272 | 3.317% (Fed 12 Month Treasury Average Constant Maturity Treasury + 0.920) 03/19/20462 | 2,100 | |
Eurohome UK Mortgages plc | |||
Series 2007-1 Cl. A | |||
GBP | 2,230 | 0.947% (3 Month GBP Libor + 0.150) 06/15/20442 | 2,801 |
First Horizon Asset Securities Inc. | |||
Series 2005-AR6 Cl. 4A1 | |||
$ | 1,110 | 3.717%—02/25/20362 | 1,057 |
First Nationwide Trust | |||
Series 2001-3 Cl. 1A1 | |||
— | 6.750%—08/21/2031 | 1 | |
GPT Mortgage Trust | |||
Series 2018-GPP Cl. A | |||
3,005 | 3.292% (1 Month USD Libor + 1.013) 06/15/20352,3 | 2,995 | |
GS Mortgage Securities Corp. Trust | |||
Series 2016-RENT Cl. A | |||
6,900 | 3.203%—02/10/20293 | 6,933 |
COLLATERALIZED MORTGAGE OBLIGATIONS—Continued | |||
Principal Amount | Value | ||
GSMPS Mortgage Loan Trust | |||
Series 2006-RP2 Cl. 1AF1 | |||
$ | 5,179 | 2.886% (1 Month USD Libor + 0.400) 04/25/20362,3 | $4,489 |
GSR Mortgage Loan Trust | |||
Series 2005-AR3 Cl. 3A1 | |||
543 | 4.258%—05/25/20352 | 515 | |
Series 2005-AR7 Cl. 6A1 | |||
269 | 4.466%—11/25/20352 | 274 | |
789 | |||
HarborView Mortgage Loan Trust | |||
Series 2004-8 Cl. 2A3 | |||
723 | 3.102% (1 Month USD Libor + 0.410) 11/19/20342 | ��� 672 | |
HomeBanc Mortgage Trust | |||
Series 2006-H2 Cl. A2 | |||
3,498 | 2.461% (1 Month USD Libor + 0.180) 12/25/20362 | 3,443 | |
IndyMac ARM Trust | |||
Series 2001-H2 Cl. A2 | |||
4 | 3.502%—01/25/20322 | 4 | |
IndyMac IMSC Mortgage Loan Trust | |||
Series 2007-F2 Cl. 2A1 | |||
2,969 | 6.500%—07/25/2037 | 1,743 | |
IndyMac INDX Mortgage Loan Trust | |||
Series 2007-AR13 Cl. 4A1 | |||
14,103 | 3.510%—07/25/20372 | 11,809 | |
Series 2005-AR31 Cl. 1A1 | |||
1,125 | 3.949%—01/25/20362 | 1,029 | |
12,838 | |||
JP Morgan Mortgage Trust | |||
Series 2006-A6 Cl. 1A4L | |||
2,460 | 4.240%—10/25/20362 | 2,229 | |
Series 2006-S1 Cl. 3A1 | |||
661 | 5.500%—04/25/2036 | 676 | |
2,905 | |||
JP Morgan Re-REMIC6 | |||
Series 2009-7 Cl. 11A1 | |||
39 | 4.056%—09/27/20362,3 | 40 | |
Mansard Mortgages plc | |||
Series 2007-2X Cl. A1 | |||
GBP | 1,071 | 1.447% (3 Month GBP Libor + 0.650) 12/15/20492 | 1,365 |
Merrill Lynch Alternative Note Asset Trust | |||
Series 2007-F1 Cl. 2A6 | |||
$ | 605 | 6.000%—03/25/2037 | 440 |
Merrill Lynch Mortgage Investors Inc. | |||
Series 2005-3 Cl. 4A | |||
28 | 2.736% (1 Month USD Libor + 0.250) 11/25/20352 | 28 | |
Morgan Stanley Bank of America Merrill Lynch Trust | |||
Series 2015-C22 Cl. ASB | |||
6,000 | 3.040%—04/15/2048 | 6,058 | |
Provident Funding Mortgage Loan Trust | |||
Series 2005-2 Cl. 3A | |||
2,253 | 4.405%—10/25/20352 | 2,284 | |
Residential Accredit Loans Inc. | |||
Series 2007-QS4 Cl. 3A9 | |||
2,039 | 6.000%—03/25/2037 | 1,887 | |
Residential Asset Securitization Trust | |||
Series 2007-A8 Cl. 2A1 | |||
17,857 | 6.250%—08/25/2037 | 7,256 |
45
Harbor Bond Fund
Portfolio of Investments—Continued
Value, Cost, Notional and Principal Amounts in Thousands
COLLATERALIZED MORTGAGE OBLIGATIONS—Continued | |||
Principal Amount | Value | ||
Residential Funding Mortgage Securities I | |||
Series 2007-SA1 Cl. 2A2 | |||
$ | 268 | 4.667%—02/25/20372 | $219 |
Series 2006-SA1 Cl. 2A1 | |||
308 | 4.796%—02/25/20362 | 284 | |
503 | |||
RMAC Securities plc | |||
Series 2006-NS4X Cl. A3A | |||
GBP | 1,737 | 0.971% (3 Month GBP Libor + 0.170) 06/12/20442 | 2,144 |
Structured Adjustable Rate Mortgage Loan Trust | |||
Series 2007-1 Cl. 1A1 | |||
$ | 2,125 | 2.431% (1 Month USD Libor + 0.150) 02/25/20372 | 2,046 |
Series 2005-21A Cl. 3A1 | |||
497 | 4.512%—04/25/20352 | 495 | |
2,541 | |||
Structured Asset Mortgage Investments Inc. | |||
Series 2005-AR5 Cl. A2 | |||
411 | 2.732% (1 Month USD Libor + 0.250) 07/19/20352 | 410 | |
Suntrust Adjustable Rate Mortgage Loan Trust | |||
Series 2007-S1 Cl. 1A | |||
634 | 4.611%—01/25/20372 | 596 | |
Towd Point Mortgage Funding | |||
Series 2019-GR4A Cl. A1 | |||
GBP | 7,500 | 1.855% (3 Month GBP Libor + 1.025) 10/20/20512,3 | 9,776 |
Washington Mutual Mortgage Pass Through Certificates Trust | |||
Series 2005-AR13 Cl. A1A1 | |||
$ | 212 | 2.571% (1 Month USD Libor + 0.290) 10/25/20452 | 210 |
Series 2005-AR6 Cl. 2A1A | |||
431 | 2.741% (1 Month USD Libor + 0.230) 04/25/20452 | 429 | |
Series 2006-AR11 Cl. 3A1A | |||
2,067 | 3.317% (Fed 12 Month Treasury Average Constant Maturity Treasury + 0.920) 09/25/20462 | 1,955 | |
2,594 | |||
Wells Fargo Mortgage Backed Securities Trust | |||
Series 2006-AR10 Cl. 1A1 | |||
2,553 | 4.704%—07/25/20362 | 2,588 | |
TOTAL COLLATERALIZED MORTGAGE OBLIGATIONS | |||
(Cost $112,398) | 118,035 | ||
CORPORATE BONDS & NOTES—50.6% | |||
AEROSPACE & DEFENSE—0.3% | |||
Rockwell Collins Inc. | |||
5,500 | 2.800%—03/15/2022 | 5,489 | |
AIRLINES—0.2% | |||
Delta Air Lines Inc. | |||
3,000 | 3.400%—04/19/2021 | 3,017 | |
700 | 3.625%—03/15/2022 | 706 | |
3,723 |
CORPORATE BONDS & NOTES—Continued | |||
Principal Amount | Value | ||
AUTO COMPONENTS—0.3% | |||
ZF North America Capital Inc. | |||
$ | 5,800 | 4.500%—04/29/20223 | $5,938 |
AUTOMOBILES—3.1% | |||
Ford Motor Credit Co. LLC | |||
5,400 | 2.343%—11/02/2020 | 5,331 | |
3,400 | 2.425%—06/12/2020 | 3,371 | |
1,300 | 2.459%—03/27/2020 | 1,292 | |
1,550 | 3.200%—01/15/2021 | 1,540 | |
10,050 | 8.125%—01/15/2020 | 10,395 | |
21,929 | |||
General Motors Financial Co. Inc. | |||
6,600 | 2.450%—11/06/2020 | 6,542 | |
2,800 | 3.150%—01/15/2020 | 2,805 | |
2,600 | 3.200%—07/13/2020 | 2,609 | |
7,700 | 3.274% (3 Month USD Libor + 0.540) 11/06/20202 | 7,662 | |
19,618 | |||
Nissan Motor Acceptance Corp. | |||
2,600 | 2.550%—03/08/20213 | 2,567 | |
Volkswagen Group of America Finance LLC | |||
4,800 | 3.458% (3 Month USD Libor + 0.770) 11/13/20202,3 | 4,818 | |
4,800 | 4.250%—11/13/20233 | 4,966 | |
4,800 | 4.750%—11/13/20283 | 4,995 | |
14,779 | |||
58,893 | |||
BANKS—14.7% | |||
Australia & New Zealand Banking Group Ltd. | |||
5,100 | 2.772% (3 Month USD Libor + 0.460) 05/17/20212,3 | 5,113 | |
5,200 | 3.300%—05/17/2021 | 5,257 | |
10,370 | |||
Banco Bilbao Vizcaya Argentaria SA | |||
EUR | 4,000 | 6.750% (EUR 5 Year Swap Curve + 6.604) 02/18/20202,7 | 4,644 |
Banco Do Nordeste Do Brasil SA | |||
$ | 3,300 | 4.375%—05/03/2019 | 3,300 |
Banco Espirito Santo SA MTN8 | |||
EUR | 3,500 | 0.000%—01/15/2049* | 1,122 |
Bank of America Corp. MTN8 | |||
$ | 1,300 | 2.151%—11/09/2020 | 1,290 |
4,960 | 3.106% (3 Month USD Libor + 0.790) 03/05/20242 | 4,965 | |
6,255 | |||
Banque Federative du Credit Mutuel SA | |||
6,300 | 3.750%—07/20/20233 | 6,472 | |
Barclays Bank plc | |||
3,700 | 4.610% (3 Month USD Libor + 1.400) 02/15/20232 | 3,794 | |
GBP | 3,800 | 14.000% (3 Month GBP Libor + 13.400) 06/15/20192,7 | 5,031 |
8,825 | |||
Barclays MTN8 | |||
4,000 | 3.250%—02/12/2027 | 5,285 | |
Barclays plc | |||
$ | 5,200 | 3.684%—01/10/2023 | 5,205 |
6,300 | 4.451% (3 Month USD Libor + 2.110) 08/10/20212 | 6,459 |
46
Harbor Bond Fund
Portfolio of Investments—Continued
Value, Cost, Notional and Principal Amounts in Thousands
CORPORATE BONDS & NOTES—Continued | |||
Principal Amount | Value | ||
BANKS—Continued | |||
EUR | 4,100 | 6.500% (EUR 5 Year Swap Curve + 5.875) 09/15/20192,7 | $4,683 |
GBP | 2,400 | 7.000% (GBP Swap 5 Year + 5.084) 09/15/20192,7 | 3,173 |
EUR | 2,000 | 8.000% (EUR 5 Year Swap Curve + 6.750) 12/15/20202,7 | 2,442 |
21,962 | |||
BBVA Bancomer SA/Texas | |||
$ | 1,200 | 6.500%—03/10/2021 | 1,259 |
Citibank NA | |||
5,400 | 3.400%—07/23/2021 | 5,481 | |
Citigroup Inc. | |||
3,000 | 2.350%—08/02/2021 | 2,973 | |
6,800 | 2.750%—04/25/2022 | 6,768 | |
3,900 | 2.876% (3 Month USD Libor + 0.950) 07/24/20232 | 3,878 | |
4,000 | 3.751% (3 Month USD Libor + 1.430) 09/01/20232 | 4,082 | |
17,701 | |||
Deutsche Bank AG/New York | |||
5,500 | 2.700%—07/13/2020 | 5,448 | |
3,800 | 3.950%—02/27/2023 | 3,740 | |
3,200 | 4.250%—10/14/2021 | 3,205 | |
12,393 | |||
HSBC Bank plc | |||
4,300 | 4.125%—08/12/20203 | 4,376 | |
ING Bank NV | |||
5,600 | 2.450%—03/16/20203 | 5,590 | |
JPMorgan Chase & Co. | |||
5,500 | 2.400%—06/07/2021 | 5,466 | |
5,000 | 2.750%—06/23/2020 | 5,005 | |
5,700 | 3.514% (3 Month USD Libor + 0.610) 06/18/20222 | 5,781 | |
16,252 | |||
JPMorgan Chase Bank NA | |||
10,000 | 2.848% (3 Month USD Libor + 0.340) 04/26/20212 | 10,013 | |
4,500 | 3.086% (3 Month USD Libor + 0.350) 04/26/20212 | 4,512 | |
14,525 | |||
Lloyds Bank plc | |||
4,900 | 3.300%—05/07/2021 | 4,947 | |
5,700 | 12.000% (3 Month USD Libor + 11.756) 12/16/20242,3,7 | 6,875 | |
11,822 | |||
Lloyds Banking Group plc | |||
5,300 | 4.450%—05/08/2025 | 5,521 | |
GBP | 4,200 | 7.000% (GBP Swap 5 Year + 5.060) 06/27/20192,7 | 5,523 |
11,044 | |||
Mitsubishi UFJ Financial Group Inc. | |||
$ | 3,900 | 3.455%—03/02/2023 | 3,964 |
Nordea Bank Abp | |||
2,500 | 3.750%—08/30/20233 | 2,532 | |
Oversea-Chinese Banking Corp. Ltd. | |||
4,200 | 2.762% (3 Month USD Libor + 0.450) 05/17/20212,3 | 4,194 | |
Royal Bank of Canada | |||
4,300 | 2.300%—03/22/2021 | 4,280 |
CORPORATE BONDS & NOTES—Continued | |||
Principal Amount | Value | ||
BANKS—Continued | |||
Royal Bank of Scotland Group plc | |||
$ | 700 | 3.784% (3 Month USD Libor + 1.470) 05/15/20232 | $703 |
4,200 | 4.892% (3 Month USD Libor + 1.754) 05/18/20292 | 4,389 | |
1,500 | 8.625% (USD Swap Semi 30/360 5Y + 7.598) 08/15/20212,7 | 1,616 | |
6,708 | |||
Royal Bank of Scotland Group plc MTN8 | |||
EUR | 1,200 | 2.000% (3 Month EUR Libor + 1.737) 03/04/20252 | 1,402 |
Skandinaviska Enskilda Banken AB | |||
$ | 5,300 | 2.742% (3 Month USD Libor + 0.430) 05/17/20212,3 | 5,312 |
5,300 | 3.250%—05/17/20213 | 5,354 | |
10,666 | |||
Societe Generale SA MTN8 | |||
4,900 | 4.250%—09/14/20233 | 5,050 | |
Standard Chartered plc | |||
5,000 | 4.247% (3 Month USD Libor + 1.150) 01/20/20232,3 | 5,096 | |
Sumitomo Mitsui Financial Group Inc. | |||
6,900 | 4.007% (3 Month USD Libor + 1.680) 03/09/20212 | 7,061 | |
Svenska Handelsbanken AB MTN8 | |||
5,500 | 3.350%—05/24/2021 | 5,565 | |
Synchrony Bank | |||
5,500 | 3.650%—05/24/2021 | 5,570 | |
Toronto-Dominion Bank | |||
5,900 | 3.350%—10/22/20213 | 6,009 | |
UBS AG/London | |||
3,400 | 2.450%—12/01/20203 | 3,384 | |
2,700 | 2.801% (3 Month USD Libor + 0.480) 12/01/20202,3 | 2,707 | |
6,091 | |||
Unicredit SpA MTN8 | |||
10,600 | 7.830%—12/04/20233 | 11,906 | |
US Bank NA | |||
6,300 | 3.150%—04/26/2021 | 6,365 | |
Volkswagen Bank GmbH MTN8 | |||
EUR | 2,000 | 0.101% (3 Month EUR Libor + 1.550) 06/15/20212 | 2,238 |
Wells Fargo & Co. | |||
$ | 3,100 | 3.757% (3 Month USD Libor + 1.230) 10/31/20232 | 3,162 |
8,200 | 6.104% (3 Month USD Libor + 3.770) 06/15/20192,7 | 8,251 | |
11,413 | |||
Wells Fargo Bank NA | |||
5,900 | 3.625%—10/22/2021 | 6,011 | |
280,799 | |||
BEVERAGES—0.5% | |||
Bacardi Ltd. | |||
4,700 | 4.450%—05/15/20253 | 4,842 | |
Pernod Ricard SA | |||
4,200 | 4.450%—01/15/20223 | 4,354 | |
9,196 |
47
Harbor Bond Fund
Portfolio of Investments—Continued
Value, Cost, Notional and Principal Amounts in Thousands
CORPORATE BONDS & NOTES—Continued | |||
Principal Amount | Value | ||
BIOTECHNOLOGY—0.1% | |||
Baxalta Inc. | |||
$ | 1,548 | 2.875%—06/23/2020 | $1,547 |
BUILDING PRODUCTS—0.3% | |||
CRH America Finance Inc. | |||
3,200 | 3.950%—04/04/20283 | 3,185 | |
3,200 | 4.500%—04/04/20483 | 3,036 | |
6,221 | |||
Owens Corning | |||
300 | 4.200%—12/01/2024 | 305 | |
6,526 | |||
CAPITAL MARKETS—6.5% | |||
BGC Partners Inc. | |||
6,300 | 5.375%—07/24/2023 | 6,531 | |
Blackstone CQP Holdco LP | |||
4,000 | 6.000%—08/18/20213 | 4,000 | |
8,000 | 6.500%—03/20/20213 | 8,040 | |
12,040 | |||
BM & FBovespa SA | |||
1,300 | 5.500%—07/16/2020 | 1,337 | |
Credit Agricole SA/London MTN8 | |||
5,400 | 3.750%—04/24/20233 | 5,488 | |
Credit Suisse Group AG | |||
5,100 | 2.997% (3 Month USD Libor + 1.200) 12/14/20232,3 | 5,039 | |
Credit Suisse Group Funding Guernsey Ltd. | |||
8,900 | 3.750%—03/26/2025 | 9,019 | |
4,845 | 3.800%—09/15/2022 | 4,949 | |
13,968 | |||
Deutsche Bank AG MTN8 | |||
13,700 | 2.850%—05/10/2019 | 13,700 | |
Deutsche Bank AG/New York | |||
6,000 | 3.150%—01/22/2021 | 5,918 | |
3,500 | 3.406% (3 Month USD Libor + 0.970) 07/13/20202 | 3,494 | |
9,412 | |||
E*Trade Financial Corp. | |||
5,100 | 2.950%—08/24/2022 | 5,095 | |
Goldman Sachs Group Inc. | |||
5,500 | 3.200%—02/23/2023 | 5,507 | |
7,700 | 3.307% (3 Month USD Libor + 0.780) 10/31/20222 | 7,707 | |
800 | 5.750%—01/24/2022 | 859 | |
14,073 | |||
Goldman Sachs Group Inc. MTN8 | |||
5,000 | 4.000%—03/03/2024 | 5,174 | |
Moody's Corp. | |||
300 | 2.625%—01/15/2023 | 298 | |
462 | 4.500%—09/01/2022 | 485 | |
783 | |||
Morgan Stanley | |||
5,200 | 3.649% (3 Month USD Libor + 1.180) 01/20/20222 | 5,258 | |
Morgan Stanley MTN8 | |||
4,508 | 5.625%—09/23/2019 | 4,557 | |
Platin 1426 GmbH | |||
EUR | 2,700 | 6.875%—06/15/20233 | 3,006 |
CORPORATE BONDS & NOTES—Continued | |||
Principal Amount | Value | ||
CAPITAL MARKETS—Continued | |||
UBS AG | |||
$ | 8,000 | 2.907% (3 Month USD Libor + 0.580) 06/08/20202,3 | $8,037 |
UBS AG MTN8 | |||
1,800 | 3.171% (3 Month USD Libor + 0.850) 06/01/20202 | 1,815 | |
UBS Group Funding Jersey Ltd. | |||
8,500 | 3.000%—04/15/20213 | 8,517 | |
123,830 | |||
CHEMICALS—0.2% | |||
Sasol Financing USA LLC | |||
3,900 | 5.875%—03/27/2024 | 4,150 | |
CONSUMER FINANCE—2.6% | |||
Ally Financial Inc. | |||
200 | 4.125%—03/30/2020 | 201 | |
200 | 7.500%—09/15/2020 | 211 | |
412 | |||
American Express Co. | |||
5,200 | 3.375%—05/17/2021 | 5,265 | |
6,400 | 3.400%—02/27/2023 | 6,515 | |
5,200 | 3.700%—08/03/2023 | 5,349 | |
17,129 | |||
Capital One Financial Corp. | |||
5,400 | 2.400%—10/30/2020 | 5,374 | |
5,500 | 3.201% (3 Month USD Libor + 0.450) 10/30/20202 | 5,504 | |
10,878 | |||
Daimler Finance North America LLC | |||
5,300 | 3.350%—05/04/20213 | 5,340 | |
5,300 | 3.700%—05/04/20233 | 5,423 | |
10,763 | |||
Harley-Davidson Financial Services Inc. | |||
5,300 | 3.550%—05/21/20213 | 5,334 | |
Navient Corp. MTN8 | |||
100 | 8.000%—03/25/2020 | 104 | |
Springleaf Finance Corp. | |||
2,800 | 6.875%—03/15/2025 | 3,010 | |
Toyota Motor Credit Corp. MTN8 | |||
2,600 | 2.712% (3 Month USD Libor + 0.400) 05/17/20222 | 2,607 | |
50,237 | |||
DIVERSIFIED FINANCIAL SERVICES—3.2% | |||
AXA Equitable Holdings Inc. | |||
3,200 | 3.900%—04/20/2023 | 3,291 | |
BAT Capital Corp. | |||
5,060 | 2.764%—08/15/2022 | 4,992 | |
1,500 | 3.283% (3 Month USD Libor + 0.590) 08/14/20202 | 1,498 | |
4,640 | 3.564% (3 Month USD Libor + 0.880) 08/15/20222 | 4,619 | |
11,109 | |||
Cantor Fitzgerald LP | |||
5,400 | 6.500%—06/17/20223 | 5,775 | |
Depository Trust & Clearing Corp. | |||
3,000 | 4.875% (3 Month USD Libor + 3.167) 06/15/20202,3,7 | 3,016 |
48
Harbor Bond Fund
Portfolio of Investments—Continued
Value, Cost, Notional and Principal Amounts in Thousands
CORPORATE BONDS & NOTES—Continued | |||
Principal Amount | Value | ||
DIVERSIFIED FINANCIAL SERVICES—Continued | |||
GE Capital UK Funding Unlimited Co. MTN8 | |||
GBP | 2,830 | 5.875%—11/04/2020 | $3,922 |
Guardian Life Global Funding | |||
$ | 4,000 | 3.400%—04/25/20233 | 4,081 |
HSBC Holdings plc | |||
5,100 | 3.322% (3 Month USD Libor + 1.000) 05/18/20242 | 5,099 | |
GBP | 3,000 | 5.875% (GBP Swap 5 Year + 4.276) 09/28/20262,7 | 4,105 |
9,204 | |||
Imperial Brands Finance plc | |||
$ | 2,100 | 3.750%—07/21/20223 | 2,130 |
Reckitt Benckiser Treasury Services plc | |||
3,400 | 2.375%—06/24/20223 | 3,346 | |
Rio Oil Finance Trust | |||
1,539 | 9.250%—07/06/20243 | 1,662 | |
6,149 | 9.750%—01/06/20273 | 6,841 | |
8,503 | |||
Syngenta Finance NV | |||
4,500 | 3.933%—04/23/20213 | 4,541 | |
Volkswagen International Finance NV | |||
EUR | 2,000 | 1.242% (3 Month EUR Libor + 1.550) 11/16/20242 | 2,294 |
61,212 | |||
DIVERSIFIED TELECOMMUNICATION SERVICES—2.5% | |||
Altice Financing SA | |||
$ | 2,200 | 6.625%—02/15/20233 | 2,260 |
Altice France SA | |||
1,000 | 7.375%—05/01/20263 | 1,016 | |
AT&T Inc. | |||
5,000 | 3.000%—06/30/2022 | 5,019 | |
6,200 | 3.071% (3 Month USD Libor + 0.750) 06/01/20212 | 6,243 | |
5,200 | 3.086% (3 Month USD Libor + 0.650) 01/15/20202 | 5,219 | |
5,000 | 3.514% (3 Month USD Libor + 1.180) 06/12/20242 | 5,025 | |
21,506 | |||
British Telecommunications plc | |||
1,300 | 4.500%—12/04/2023 | 1,365 | |
Deutsche Telekom International Finance BV | |||
6,080 | 2.820%—01/19/20223 | 6,069 | |
Telefonica Emisiones SAU | |||
1,800 | 5.134%—04/27/2020 | 1,840 | |
Verizon Communications Inc. | |||
12,695 | 3.376%—02/15/2025 | 12,893 | |
46,949 | |||
ELECTRIC UTILITIES—1.1% | |||
American Electric Power Co. Inc. | |||
1,000 | 2.150%—11/13/2020 | 992 | |
Duke Energy Corp. | |||
5,300 | 2.819% (3 Month USD Libor + 0.500) 05/14/20212,3 | 5,300 | |
4,536 | 3.750%—04/15/2024 | 4,681 | |
9,981 | |||
FirstEnergy Corp. | |||
1,100 | 2.850%—07/15/2022 | 1,093 |
CORPORATE BONDS & NOTES—Continued | |||
Principal Amount | Value | ||
ELECTRIC UTILITIES—Continued | |||
Nextera Energy Capital Holdings Inc. | |||
$ | 8,600 | 2.636% (3 Month USD Libor + 0.315) 09/03/20192 | $8,600 |
20,666 | |||
ELECTRONIC EQUIPMENT, INSTRUMENTS & COMPONENTS—0.2% | |||
Arrow Electronics Inc. | |||
2,100 | 3.500%—04/01/2022 | 2,124 | |
Tech Data Corp. | |||
1,700 | 3.700%—02/15/2022 | 1,709 | |
3,833 | |||
EQUITY REAL ESTATE INVESTMENT TRUSTS (REITs)—1.9% | |||
American Tower Corp. | |||
2,099 | 3.300%—02/15/2021 | 2,115 | |
AvalonBay Communities Inc. MTN8 | |||
3,000 | 3.450%—06/01/2025 | 3,076 | |
CBL & Associates LP | |||
2,700 | 4.600%—10/15/2024 | 1,795 | |
6,600 | 5.950%—12/15/2026 | 4,670 | |
6,465 | |||
Crown Castle International Corp. | |||
5,500 | 3.700%—06/15/2026 | 5,525 | |
Digital Realty Trust LP | |||
5,500 | 4.450%—07/15/2028 | 5,750 | |
EPR Properties | |||
3,400 | 4.500%—06/01/2027 | 3,442 | |
600 | 4.950%—04/15/2028 | 626 | |
4,068 | |||
OMEGA Healthcare Investors Inc. | |||
3,800 | 4.375%—08/01/2023 | 3,875 | |
Washington Prime Group LP | |||
5,800 | 5.950%—08/15/2024 | 5,384 | |
36,258 | |||
FOOD & STAPLES RETAILING—0.1% | |||
CVS Pass-Through Trust | |||
537 | 6.943%—01/10/2030 | 613 | |
Viterra Inc. | |||
200 | 5.950%—08/01/20203 | 207 | |
Walgreens Boots Alliance Inc. | |||
1,600 | 3.300%—11/18/2021 | 1,614 | |
2,434 | |||
FOOD PRODUCTS—0.7% | |||
Kraft Heinz Foods Co. | |||
400 | 3.267% (3 Month USD Libor + 0.570) 02/10/20212 | 400 | |
2,800 | 5.375%—02/10/2020 | 2,852 | |
3,252 | |||
McCormick & Co. Inc. | |||
4,400 | 2.700%—08/15/2022 | 4,376 | |
Mondelez International Inc. | |||
5,000 | 3.000%—05/07/2020 | 5,010 | |
Tyson Foods Inc. | |||
1,100 | 2.250%—08/23/2021 | 1,088 | |
13,726 | |||
HEALTH CARE EQUIPMENT & SUPPLIES—0.3% | |||
Zimmer Biomet Holdings Inc. | |||
4,900 | 2.700%—04/01/2020 | 4,891 |
49
Harbor Bond Fund
Portfolio of Investments—Continued
Value, Cost, Notional and Principal Amounts in Thousands
CORPORATE BONDS & NOTES—Continued | |||
Principal Amount | Value | ||
HEALTH CARE PROVIDERS & SERVICES—0.6% | |||
Centene Corp. | |||
$ | 500 | 5.375%—06/01/20263 | $523 |
CVS Health Corp. | |||
1,073 | 2.800%—07/20/2020 | 1,072 | |
5,800 | 3.700%—03/09/2023 | 5,882 | |
6,954 | |||
HCA Inc. | |||
4,000 | 5.375%—09/01/2026 | 4,230 | |
100 | 5.875%—02/01/2029 | 108 | |
200 | 6.500%—02/15/2020 | 205 | |
4,543 | |||
12,020 | |||
HOTELS, RESTAURANTS & LEISURE—0.6% | |||
Wynn Las Vegas LLC / Wynn Las Vegas Capital Corp. | |||
5,200 | 4.250%—05/30/20233 | 5,184 | |
5,300 | 5.500%—03/01/20253 | 5,365 | |
10,549 | |||
INDEPENDENT POWER & RENEWABLE ELECTRICITY PRODUCERS—0.3% | |||
Nextera Energy Capital Holdings Inc. | |||
4,800 | 3.200%—02/25/2022 | 4,840 | |
INSURANCE—1.0% | |||
AIA Group Ltd. | |||
5,900 | 2.858% (3 Month USD Libor + 0.520) 09/20/20212,3 | 5,896 | |
AIG Global Funding | |||
6,400 | 3.350%—06/25/20213 | 6,464 | |
Ambac LSNI LLC | |||
895 | 7.396% (3 Month USD Libor + 5.000) 02/12/20232,3 | 907 | |
Jackson National Life Global Funding | |||
6,300 | 3.300%—06/11/20213 | 6,374 | |
19,641 | |||
LIFE SCIENCES TOOLS & SERVICES—0.3% | |||
Thermo Fisher Scientific Inc. | |||
5,300 | 3.300%—02/15/2022 | 5,374 | |
MACHINERY—0.4% | |||
CNH Industrial Capital LLC | |||
500 | 3.875%—10/15/2021 | 508 | |
2,200 | 4.375%—11/06/2020 | 2,241 | |
2,749 | |||
John Deere Capital Corp. MTN8 | |||
5,600 | 2.867% (3 Month USD Libor + 0.550) 06/07/20232 | 5,600 | |
8,349 | |||
MEDIA—1.1% | |||
Charter Communications Operating LLC / Charter Communications Operating Capital | |||
1,800 | 3.579%—07/23/2020 | 1,813 | |
4,800 | 4.464%—07/23/2022 | 4,983 | |
6,796 | |||
COX Communications Inc. | |||
4,700 | 3.250%—12/15/20223 | 4,735 | |
Discovery Communications LLC | |||
4,000 | 2.200%—09/20/2019 | 3,989 |
CORPORATE BONDS & NOTES—Continued | |||
Principal Amount | Value | ||
MEDIA—Continued | |||
Virgin Media Receivables Financing Notes I DAC | |||
GBP | 4,130 | 5.500%—09/15/2024 | $5,571 |
21,091 | |||
MORTGAGE REAL ESTATE INVESTMENT TRUSTS (REITs)—0.5% | |||
ERP Operating LP | |||
$ | 4,100 | 3.375%—06/01/2025 | 4,187 |
Simon Property Group LP | |||
6,000 | 2.500%—09/01/2020 | 6,002 | |
10,189 | |||
MULTI-UTILITIES—0.3% | |||
Sempra Energy | |||
5,200 | 2.784% (3 Month USD Libor + 0.450) 03/15/20212 | 5,172 | |
OIL, GAS & CONSUMABLE FUELS—0.9% | |||
Enbridge Inc. | |||
2,900 | 2.814% (3 Month USD Libor + 0.400) 01/10/20202 | 2,901 | |
Energy Transfer Partners LP | |||
1,100 | 4.150%—10/01/2020 | 1,117 | |
Equities Midstream Partners LP | |||
1,550 | 4.750%—07/15/2023 | 1,582 | |
MPLX LP | |||
3,300 | 4.900%—04/15/2058 | 3,136 | |
Odebrecht Drilling Norbe VIII/IX Ltd. | |||
1,418 | 6.350%—12/01/20213 | 1,376 | |
3,285 | 7.350%—12/01/20263 | 2,032 | |
3,408 | |||
Odebrecht Offshore Drilling Finance Ltd. | |||
834 | 6.720%—12/01/20223 | 801 | |
3,253 | 7.720%—12/01/20263 | 831 | |
1,632 | |||
Odebrecht Oil & Gas Finance Ltd. | |||
2,183 | 0.000%—05/10/20193,7,9 | 28 | |
Rio Oil Finance Trust | |||
2,343 | 9.250%—07/06/2024 | 2,531 | |
Southern California Gas Co. | |||
900 | 3.200%—06/15/2025 | 902 | |
17,237 | |||
PHARMACEUTICALS—1.7% | |||
Abbvie Inc. | |||
1,000 | 3.200%—11/06/2022 | 1,009 | |
Allergan Funding SCS | |||
6,700 | 3.000%—03/12/2020 | 6,704 | |
2,700 | 3.450%—03/15/2022 | 2,715 | |
9,419 | |||
Bayer US Finance II LLC | |||
6,300 | 3.875%—12/15/20233 | 6,358 | |
2,800 | 4.250%—12/15/20253 | 2,841 | |
9,199 | |||
Mylan NV | |||
EUR | 5,100 | 2.250%—11/22/2024 | 5,911 |
Takeda Pharmaceutical Co. Ltd. | |||
$ | 3,900 | 4.400%—11/26/20233 | 4,102 |
50
Harbor Bond Fund
Portfolio of Investments—Continued
Value, Cost, Notional and Principal Amounts in Thousands
CORPORATE BONDS & NOTES—Continued | |||
Principal Amount | Value | ||
PHARMACEUTICALS—Continued | |||
Teva Pharmaceutical Finance Netherlands III BV | |||
$ | 3,000 | 6.750%—03/01/2028 | $3,093 |
32,733 | |||
REAL ESTATE MANAGEMENT & DEVELOPMENT—0.2% | |||
Tesco Property Finance 5 plc | |||
GBP | 2,260 | 5.661%—10/13/2041 | 3,562 |
ROAD & RAIL—0.4% | |||
ERAC USA Finance LLC | |||
$ | 2,600 | 3.300%—10/15/20223 | 2,621 |
Penske Truck Leasing Co. LP / PTL Finance Corp. | |||
3,800 | 2.700%—03/14/20233 | 3,721 | |
TTX Co. MTN8 | |||
250 | 2.600%—06/15/20203 | 250 | |
6,592 | |||
SEMICONDUCTORS & SEMICONDUCTOR EQUIPMENT—0.8% | |||
Broadcom Corp. / Broadcom Cayman Finance Ltd. | |||
3,800 | 3.000%—01/15/2022 | 3,780 | |
3,800 | 3.875%—01/15/2027 | 3,637 | |
7,417 | |||
Broadcom Inc. | |||
4,900 | 3.125%—10/15/20223 | 4,870 | |
NXP BV / NXP Funding LLC | |||
700 | 4.125%—06/01/20213 | 715 | |
1,800 | 4.625%—06/15/20223 | 1,874 | |
2,589 | |||
14,876 | |||
TECHNOLOGY HARDWARE, STORAGE & PERIPHERALS—0.7% | |||
Dell International LLC / EMC Corp. | |||
4,000 | 5.450%—06/15/20233 | 4,270 | |
EMC Corp. | |||
3,600 | 2.650%—06/01/2020 | 3,582 | |
Hewlett Packard Enterprise Co. | |||
5,900 | 3.515% (3 Month USD Libor + 0.720) 10/05/20212 | 5,902 | |
13,754 | |||
THRIFTS & MORTGAGE FINANCE—0.3% | |||
Nationwide Building Society | |||
5,300 | 4.363% (3 Month USD Libor + 1.392) 08/01/20242,3 | 5,445 | |
TOBACCO—0.0% | |||
Japan Tobacco Inc. MTN8 | |||
800 | 2.000%—04/13/2021 | 786 | |
TRADING COMPANIES & DISTRIBUTORS—1.4% | |||
AerCap Ireland Capital DAC / Aercap Global Aviation Trust | |||
2,000 | 3.500%—05/26/2022 | 2,004 | |
5,500 | 4.875%—01/16/2024 | 5,780 | |
7,784 | |||
Air Lease Corp. | |||
2,500 | 3.875%—04/01/2021 | 2,542 | |
Air Lease Corp. MTN8 | |||
3,600 | 4.250%—02/01/2024 | 3,699 |
CORPORATE BONDS & NOTES—Continued | |||
Principal Amount | Value | ||
TRADING COMPANIES & DISTRIBUTORS—Continued | |||
Aviation Capital Group LLC | |||
$ | 5,300 | 3.875%—05/01/20233 | $5,344 |
6,300 | 4.125%—08/01/20253 | 6,397 | |
11,741 | |||
International Lease Finance Corp. | |||
837 | 8.250%—12/15/2020 | 903 | |
Mitsubishi Corp. MTN8 | |||
400 | 2.625%—07/14/2022 | 396 | |
27,065 | |||
WIRELESS TELECOMMUNICATION SERVICES—0.3% | |||
Sprint Capital Corp. | |||
3,500 | 6.900%—05/01/2019 | 3,500 | |
Sprint Communications Inc. | |||
1,400 | 7.000%—08/15/2020 | 1,456 | |
4,956 | |||
TOTAL CORPORATE BONDS & NOTES | |||
(Cost $959,412) | 964,528 | ||
ESCROW—0.0% | |||
(Cost $15) | |||
Shares | |||
AUTOMOBILES—0.0% | |||
36,000 | General Motors Co. Escrow | —x | |
FOREIGN GOVERNMENT OBLIGATIONS—13.6% | |||
Principal Amount | |||
Brazil Letras Do Tesouro Nacional | |||
BRL | 120,800 | 0.000%—10/01/2019-01/01/20209 | 29,735 |
Japan Finance Organization For Municipalities MTN8 | |||
$ | 6,800 | 2.625%—04/20/20223 | 6,792 |
Japan International Cooperation Agency | |||
6,900 | 2.750%—04/27/2027 | 6,800 | |
Japan Treasury Discount Bill | |||
JPY | 21,450,000 | 0.000%—05/09/2019-06/03/20199 | 192,581 |
Province of Ontario Canada | |||
CAD | 5,600 | 3.150%—06/02/2022 | 4,343 |
Province of Quebec Canada | |||
3,800 | 3.500%—12/01/2022 | 2,998 | |
13,900 | 4.250%—12/01/2021 | 11,025 | |
14,023 | |||
Qatar Government International Bond | |||
$ | 5,500 | 3.375%—03/14/20243 | 5,584 |
TOTAL FOREIGN GOVERNMENT OBLIGATIONS | |||
(Cost $269,602) | 259,858 | ||
51
Harbor Bond Fund
Portfolio of Investments—Continued
Value, Cost, Notional and Principal Amounts in Thousands
MORTGAGE PASS-THROUGH—61.9% | |||
Principal Amount | Value | ||
Bancorp Commercial Mortgage Trust | |||
Series 2018-CRE4 Cl. A | |||
$ | 4,644 | 3.180% (1 Month USD Libor + 0.900) 09/15/20352,3 | $4,639 |
Federal Home Loan Mortgage Corp. | |||
31 | 4.436% (US Treasury Yield Curve Rate T Note 1 Year Constant Maturity Treasury + 2.250) 08/01/20352 | 32 | |
324 | 4.500%—12/01/2040-09/01/2041 | 344 | |
5 | 4.623% (US Treasury Yield Curve Rate T Note 1 Year Constant Maturity Treasury + 2.209) 06/01/20242 | 5 | |
946 | 5.500%—02/01/2038-07/01/2038 | 1,040 | |
3,446 | 6.000%—01/01/2029-05/01/2040 | 3,831 | |
5,252 | |||
Federal Home Loan Mortgage Corp. Multifamily Structured Pass Through Certificates | |||
18,406 | 1.262%—08/25/20222 | 641 | |
Federal Home Loan Mortgage Corp. REMIC6 | |||
5,229 | 2.884% (1 Month USD Libor + 0.400) 06/15/20412 | 5,230 | |
18 | 2.934% (1 Month USD Libor + 0.450) 11/15/20302 | 18 | |
36 | 8.000%—08/15/2022 | 38 | |
2 | 9.000%—12/15/2020 | 2 | |
5,288 | |||
Federal Home Loan Mortgage Corp. Structured Pass Through Securities | |||
Series T-63 Cl. 1A1 | |||
98 | 3.364% (Fed 12 Month Treasury Average Constant Maturity Treasury + 1.200) 02/25/20452 | 98 | |
Series E3 Cl. A | |||
40 | 3.797%—08/15/20325 | 41 | |
139 | |||
Federal Home Loan Mortgage Corp. TBA10 | |||
23,000 | 3.000%—06/13/2049 | 22,725 | |
3,500 | 3.500%—05/14/2048 | 3,535 | |
26,260 | |||
Federal Housing Authority Project | |||
— | 7.400%—02/01/2021 | —x | |
Federal National Mortgage Association | |||
5,300 | 2.310%—08/01/2022 | 5,266 | |
6,000 | 2.870%—09/01/2027 | 5,954 | |
516 | 3.000%—02/01/2021-11/01/2025 | 520 | |
430 | 3.330%—11/01/2021 | 436 | |
116 | 3.500%—03/01/2026-05/01/2027 | 118 | |
211 | 3.797% (Fed 12 Month Treasury Average Constant Maturity Treasury + 1.400) 10/01/20402 | 210 | |
5,746 | 4.000%—09/01/2023-10/01/2048 | 5,929 | |
56 | 4.303% (12 Month USD Libor + 1.674) 05/01/20352 | 58 | |
789 | 4.414% (12 Month USD Libor + 1.715) 06/01/20352 | 827 | |
531 | 4.430% (12 Month USD Libor + 1.693) 08/01/20352 | 554 | |
7,494 | 4.500%—06/01/2019-10/01/2042 | 7,774 | |
4,325 | 5.000%—12/01/2023-06/01/2044 | 4,589 | |
25,890 | 5.500%—01/01/2025-09/01/2041 | 28,314 | |
8,073 | 6.000%—07/01/2023-06/01/2040 | 8,942 | |
69,491 |
MORTGAGE PASS-THROUGH—Continued | |||
Principal Amount | Value | ||
Federal National Mortgage Association REMIC6 | |||
Series 2015-38 Cl. DF | |||
$ | 4,930 | 2.819% (1 Month USD Libor + 0.310) 06/25/20552 | $4,904 |
Series 2011-98 Cl. ZL | |||
72,752 | 3.500%—10/25/2041 | 73,087 | |
Series 2006-5 Cl. 3A2 | |||
63 | 4.393%—05/25/20355 | 66 | |
Series 2003-25 Cl. KP | |||
494 | 5.000%—04/25/2033 | 533 | |
Series 2003-W1 Cl. 1A1 | |||
166 | 5.363%—12/25/20422 | 176 | |
78,766 | |||
Federal National Mortgage Association TBA10 | |||
155,000 | 3.000%—06/13/2049 | 153,066 | |
285,500 | 3.500%—06/19/2032-06/13/2048 | 288,055 | |
376,200 | 4.000%—5/16/2028-06/13/2049 | 385,876 | |
68,000 | 4.500%—06/13/2047-05/13/2049 | 70,727 | |
1,000 | 5.500%—6/12/2045 | 1,067 | |
898,791 | |||
Government National Mortgage Association | |||
11,619 | 5.000%—08/15/2033-05/20/2049 | 12,251 | |
Government National Mortgage Association II | |||
276 | 3.375% (US Treasury Yield Curve Rate T Note 1 Year Constant Maturity Treasury + 3.000) 01/20/2025-02/20/20322 | 287 | |
22 | 3.625% (US Treasury Yield Curve Rate T Note 1 Year Constant Maturity Treasury + 1.500) 05/20/20242 | 22 | |
70 | 3.750% (US Treasury Yield Curve Rate T Note 1 Year Constant Maturity Treasury + 6.000) 08/20/2022-09/20/20242 | 71 | |
37 | 3.750% (US Treasury Yield Curve Rate T Note 1 Year Constant Maturity Treasury + 1.500) 07/20/20272 | 38 | |
19 | 4.125% (US Treasury Yield Curve Rate T Note 1 Year Constant Maturity Treasury + 1.500) 12/20/20242 | 19 | |
90 | 4.125% (US Treasury Yield Curve Rate T Note 1 Year Constant Maturity Treasury + 7.500) 10/20/2025-11/20/20292 | 92 | |
529 | |||
Government National Mortgage Association II TBA10 | |||
9,000 | 3.500%—05/21/2048 | 9,150 | |
Government National Mortgage Association TBA10 | |||
2,000 | 3.000%—05/21/2048 | 1,995 | |
21,000 | 4.000%—05/21/2048 | 21,633 | |
43,500 | 5.000%—05/21/2048-06/20/2049 | 45,344 | |
68,972 | |||
TOTAL MORTGAGE PASS-THROUGH | |||
(Cost $1,178,079) | 1,180,169 | ||
MUNICIPAL BONDS—0.3% | |||
Chicago Transit Authority | |||
220 | 6.300%—12/01/2021 | 231 | |
City of Chicago, IL | |||
816 | 7.750%—01/01/2042 | 906 |
52
Harbor Bond Fund
Portfolio of Investments—Continued
Value, Cost, Notional and Principal Amounts in Thousands
MUNICIPAL BONDS—Continued | |||
Principal Amount | Value | ||
Clark County, NV | |||
$ | 4,000 | 6.350%—07/01/2029 | $4,023 |
TOTAL MUNICIPAL BONDS | |||
(Cost $5,014) | 5,160 | ||
U.S. GOVERNMENT OBLIGATIONS—27.6% | |||
U.S. Treasury Bonds | |||
14,000 | 2.250%—08/15/2046 | 12,207 | |
32,500 | 2.500%—02/15/204511 | 30,029 | |
1,700 | 2.500%—02/15/2046 | 1,565 | |
16,800 | 2.875%—05/15/204311 | 16,728 | |
13,000 | 3.000%—05/15/2042-02/15/2048 | 13,180 | |
17,100 | 3.125%—02/15/2042-02/15/2043 | 17,820 | |
52,700 | 3.125%—08/15/204411 | 54,703 | |
459 | 3.375%—11/15/204811 | 499 | |
1,800 | 3.625%—02/15/2044 | 2,029 | |
4,200 | 4.250%—05/15/203911 | 5,167 | |
10,500 | 4.375%—05/15/2040 | 13,138 | |
12,000 | 4.625%—02/15/204011 | 15,497 | |
182,562 | |||
U.S. Treasury Inflation Indexed Bonds12 | |||
11,985 | 0.375%—07/15/2027 | 11,874 |
U.S. GOVERNMENT OBLIGATIONS—Continued | |||
Principal Amount | Value | ||
$ | 8,616 | 0.625%—01/15/2026 | $8,697 |
28,494 | 0.750%—07/15/202811 | 29,098 | |
859 | 0.750%—02/15/2045 | 819 | |
31,029 | 0.875%—01/15/2029 | 31,974 | |
10,643 | 1.000%—02/15/2048-02/15/2049 | 10,778 | |
93,240 | |||
U.S. Treasury Notes | |||
16,800 | 1.375%—03/31/2020 | 16,644 | |
21,000 | 1.750%—09/30/202211 | 20,661 | |
25,100 | 1.875%—07/31/202211 | 24,814 | |
94,000 | 2.000%—08/31/2021-12/31/202111 | 93,463 | |
68,200 | 2.250%—11/15/2024-08/15/202711 | 67,356 | |
27,900 | 2.625%—02/15/2029 | 28,191 | |
251,129 | |||
TOTAL U.S. GOVERNMENT OBLIGATIONS | |||
(Cost $532,885) | 526,931 | ||
TOTAL INVESTMENTS—172.2% | |||
(Cost $3,248,751) | 3,249,527 | ||
CASH AND OTHER ASSETS, LESS LIABILITIES—(72.2)% | (1,343,978) | ||
TOTAL NET ASSETS—100.0% | $1,905,549 |
FUTURES CONTRACTS
Description | Number of Contracts | Expiration Date | Current Notional Value (000s) | Unrealized Appreciation/ (Depreciation) (000s) | ||||
Australian Government Bond Futures 3 year (Short) | 93 | 06/17/2019 | AUD 10,595 | $ (2) | ||||
Australian Government Bond Futures 10 year (Short) | 828 | 06/17/2019 | 114,496 | (1,299) | ||||
Canadian Government Bond Futures 10 year (Short) | 189 | 06/19/2019 | CAD 26,116 | (278) | ||||
Euro-BTP Futures (Short) | 1,032 | 06/06/2019 | EUR 134,635 | (4,525) | ||||
Euro-Bund Futures (Long) | 591 | 06/06/2019 | 97,698 | 679 | ||||
Euro-BUXL Bond Futures 30 year (Short) | 125 | 06/06/2019 | 23,593 | (911) | ||||
Euro-Oat Futures (Short) | 704 | 06/06/2019 | 114,048 | (3,018) | ||||
United Kingdom GILT Futures 90 day (Short) | 119 | 06/26/2019 | GBP 15,151 | (8) | ||||
Eurodollar Futures-CME 90 day (Short) | 805 | 06/15/2020 | $ 196,742 | (831) | ||||
Eurodollar Futures-CME 90 day (Short) | 475 | 09/14/2020 | 116,173 | (594) | ||||
Eurodollar Futures-CME 90 day (Short) | 286 | 12/14/2020 | 69,956 | (518) | ||||
U.S. Treasury Bond Futures 30 year (Short) | 935 | 06/19/2019 | 137,883 | (1,523) | ||||
U.S. Treasury Note Futures 5 year (Long) | 4,015 | 06/28/2019 | 464,297 | 3,624 | ||||
U.S. Treasury Note Futures 10 year (Long) | 611 | 06/19/2019 | 75,564 | 72 | ||||
Total Futures Contracts | $(9,132) |
PURCHASED OPTIONS
PURCHASED OPTIONS THAT REQUIRE PERIODIC SETTLEMENT OF VARIATION MARGIN
Description | Exchange | Strike Price | Expiration Date | Number of Contracts/ Notional | Premiums Paid (000s) | Value (000s) | ||||||
Euro-BTP Futures Option (Call) | Eurex | EUR 159.00 | 05/24/2019 | 656 | $8 | $7 | ||||||
Euro-Bund Futures Option (Put) | Eurex | 145.00 | 05/24/2019 | 505 | 6 | 6 | ||||||
Euro-OAT Futures Option (Call) | Eurex | 175.00 | 05/24/2019 | 767 | 9 | 9 | ||||||
Total Purchased Options that Require Periodic Settlement of Variation Margin | $23 | $22 |
53
Harbor Bond Fund
Portfolio of Investments—Continued
PURCHASED OPTIONS—Continued
PURCHASED OPTIONS NOT SETTLED THROUGH VARIATION MARGIN
Description | Counterparty/Exchange | Strike Price | Expiration Date | Number of Contracts/ Notional | Premiums Paid (000s) | Value (000s) | ||||||
Federal National Mortgage Association Future 30 year (Put) | Goldman Sachs & Co. LLC | $ 78.00 | 05/06/2019 | 30,000,000 | $2 | $— | ||||||
Federal National Mortgage Association Future 30 year (Put) | JP Morgan Chase Bank NA | 69.00 | 05/06/2019 | 64,000,000 | 2 | — | ||||||
Federal National Mortgage Association Future 30 year (Put) | JP Morgan Chase Bank NA | 70.00 | 05/06/2019 | 168,000,000 | 7 | — | ||||||
Federal National Mortgage Association Future 30 year (Put) | JP Morgan Chase Bank NA | 72.00 | 05/06/2019 | 1,000,000 | — | — | ||||||
U.S. Treasury Bond Option 30 year (Call) | Chicago Board of Trade | 189.00 | 05/24/2019 | 18 | — | — | ||||||
U.S. Treasury Bond Option 30 year (Call) | Chicago Board of Trade | 190.00 | 05/24/2019 | 417 | 4 | — | ||||||
U.S. Treasury Bond Option 30 year (Call) | Chicago Board of Trade | 191.00 | 05/24/2019 | 492 | 4 | 1 | ||||||
U.S. Treasury Note Option 5 year (Put) | Chicago Board of Trade | 107.00 | 05/24/2019 | 31 | — | — | ||||||
U.S. Treasury Note Option 5 year (Put) | Chicago Board of Trade | 108.25 | 05/24/2019 | 2,414 | 21 | 2 | ||||||
U.S. Treasury Note Option 5 year (Put) | Chicago Board of Trade | 108.50 | 05/24/2019 | 1,275 | 11 | 1 | ||||||
U.S. Treasury Note Option 5 year (Put) | Chicago Board of Trade | 108.75 | 05/24/2019 | 121 | 1 | — | ||||||
U.S. Treasury Note Option 10 year (Call) | Chicago Board of Trade | 138.00 | 05/24/2019 | 668 | 6 | 1 | ||||||
U.S. Treasury Note Option 10 year (Call) | Chicago Board of Trade | 140.50 | 05/24/2019 | 1 | — | — | ||||||
U.S. Treasury Note Option 10 year (Call) | Chicago Board of Trade | 141.00 | 05/24/2019 | 7 | — | — | ||||||
U.S. Treasury Note Option 10 year (Put) | Chicago Board of Trade | 112.00 | 06/21/2019 | 173 | 2 | — | ||||||
U.S. Treasury Note Option 10 year (Put) | Chicago Board of Trade | 114.00 | 06/21/2019 | 89 | 1 | — | ||||||
Total Purchased Options Not Settled Through Variation Margin | $61 | $5 |
PURCHASED SWAP OPTIONS NOT SETTLED THROUGH VARIATION MARGIN
Description | Counterparty | Floating Rate Index | Pay/Receive Floating Rate | Strike Rate | Expiration Date | Number of Contracts/ Notional | Premiums Paid (000s) | Value (000s) | ||||||||
Interest Rate Swap Option 30 year (Put) | Goldman Sachs Bank USA | 3-Month USD-LIBOR | Receive | 2.94% | 12/12/2019 | 1,800,000 | $86 | $26 | ||||||||
Total Purchased Options | $170 | $53 |
WRITTEN OPTIONS
WRITTEN OPTIONS NOT SETTLED THROUGH VARIATION MARGIN
Description | Counterparty | Strike Index/Price | Expiration Date | Number of Contracts/ Notional | Premiums Received (000s) | Value (000s) | ||||||
Consumer Price All Urban Non-Seasonally Adjusted Index - Floor (Put) | Citibank NA | 215.949j | 03/12/2020 | 13,400,000 | $114 | $— | ||||||
Consumer Price All Urban Non-Seasonally Adjusted Index - Floor (Put) | Citibank NA | 216.687j | 04/07/2020 | 32,600,000 | 291 | — | ||||||
Consumer Price All Urban Non-Seasonally Adjusted Index - Floor (Put) | Citibank NA | 217.965j | 09/29/2020 | 14,800,000 | 191 | — | ||||||
Consumer Price All Urban Non-Seasonally Adjusted Index - Floor (Put) | Deutsche Bank AG | 215.949j | 03/10/2020 | 5,100,000 | 38 | — | ||||||
Consumer Price All Urban Non-Seasonally Adjusted Index - Floor (Put) | Deutsche Bank AG | 218.011j | 10/13/2020 | 15,600,000 | 153 | — | ||||||
Currency Option U.S. Dollar vs. Mexican Peso (Call) | Goldman Sachs Bank USA | $ 19.90 | 06/27/2019 | 8,100,000 | 75 | (34) | ||||||
Currency Option U.S. Dollar vs. Mexican Peso (Call) | Goldman Sachs Bank USA | 19.93 | 06/11/2019 | 18,000,000 | 162 | (43) | ||||||
Currency Option U.S. Dollar vs. Mexican Peso (Call) | HSBC Bank USA NA | 19.65 | 06/06/2019 | 5,600,000 | 37 | (19) | ||||||
Total Written Options Not Settled Through Variation Margin | $1,061 | $(96) |
WRITTEN SWAP OPTIONS NOT SETTLED THROUGH VARIATION MARGIN
Description | Counterparty | Floating Rate Index | Buy/Sell Credit Protection Pay/Receive Floating Rate | Strike Rate | Expiration Date | Number of Contracts/ Notional | Premiums Received (000s) | Value (000s) | ||||||||
Credit Default Swap Option 5 year (Put) | Goldman Sachs International | Markit CDX North America Investment Grade | Sell | 2.400% | 09/18/2019 | 4,400,000 | $7 | $— |
54
Harbor Bond Fund
Portfolio of Investments—Continued
WRITTEN OPTIONS—Continued
WRITTEN SWAP OPTIONS NOT SETTLED THROUGH VARIATION MARGIN—Continued
Description | Counterparty | Floating Rate Index | Buy/Sell Credit Protection Pay/Receive Floating Rate | Strike Rate | Expiration Date | Number of Contracts/ Notional | Premiums Received (000s) | Value (000s) | ||||||||
Interest Rate Swap Option 5 year (Put) | Goldman Sachs Bank USA | 3-Month USD-LIBOR | Pay | 2.750% | 12/12/2019 | 7,800,000 | $85 | $(15) | ||||||||
Total Written Swap Options Not Settled Through Variation Margin | $92 | $(15) | ||||||||||||||
Total Written Options | $1,153 | $(111) |
FORWARD CURRENCY CONTRACTS
Counterparty | Amount to be Delivered (000s) | Amount to be Received (000s) | Settlement Date | Unrealized Appreciation/ (Depreciation) (000s) | ||||
BNP Paribas SA | $ 24 | ARS 1,053 | 05/14/2019 | $ (1) | ||||
Goldman Sachs Bank USA | $ 1,035 | AUD 1,448 | 05/03/2019 | (14) | ||||
Goldman Sachs Bank USA | $ 3,024 | AUD 4,297 | 05/03/2019 | 5 | ||||
Citibank NA | AUD 2,601 | $ 1,853 | 05/03/2019 | 19 | ||||
JP Morgan Chase Bank NA | AUD 859 | $ 610 | 05/03/2019 | 4 | ||||
BNP Paribas SA | BRL 34,500 | $ 9,076 | 10/02/2019 | 390 | ||||
BNP Paribas SA | BRL 67,500 | $ 17,611 | 01/03/2020 | 739 | ||||
JP Morgan Chase Bank | BRL 18,800 | $ 4,944 | 10/02/2019 | 211 | ||||
Barclays Bank plc | $ 16,922 | GBP 12,827 | 05/15/2019 | (182) | ||||
Citibank NA | $ 7,925 | GBP 14,854 | 05/15/2019 | (234) | ||||
Goldman Sachs Bank USA | $ 25,287 | GBP 19,237 | 05/15/2019 | (181) | ||||
JP Morgan Chase Bank NA | $ 5,183 | GBP 3,959 | 05/15/2019 | (16) | ||||
Barclays Bank plc | GBP 23,508 | $ 31,432 | 05/15/2019 | 752 | ||||
BNP Paribas SA | GBP 6,489 | $ 8,521 | 05/15/2019 | 52 | ||||
JP Morgan Chase Bank NA | GBP 4,258 | $ 5,611 | 05/15/2019 | 54 | ||||
UBS AG | GBP 10,162 | $ 13,163 | 05/15/2019 | (99) | ||||
Barclays Bank plc | $ 17,078 | CAD 23,024 | 05/03/2019 | 109 | ||||
Citibank NA | CAD 2,179 | $ 1,634 | 05/03/2019 | 7 | ||||
HSBC Bank USA | CAD 10,777 | $ 8,080 | 05/03/2019 | 35 | ||||
JP Morgan Chase Bank NA | CAD 12,689 | $ 9,539 | 05/03/2019 | 67 | ||||
Barclays Bank plc | $ 4,146 | EUR 6,533 | 05/15/2019 | (78) | ||||
Citibank NA | $ 4,507 | EUR 12,066 | 05/15/2019 | (120) | ||||
Goldman Sachs Bank USA | $ 1,730 | EUR 1,541 | 05/15/2019 | 1 | ||||
JP Morgan Chase Bank NA | $ 9,560 | EUR 8,492 | 05/03/2019 | (33) | ||||
JP Morgan Chase Bank NA | $ 1,339 | EUR 1,178 | 05/15/2019 | (16) | ||||
Barclays Bank plc | EUR 1,547 | $ 8,697 | 05/15/2019 | 101 | ||||
BNP Paribas SA | EUR 1,101 | $ 1,245 | 05/15/2019 | 9 | ||||
Citibank NA | EUR 1,319 | $ 10,533 | 05/15/2019 | 158 | ||||
Citibank NA | EUR 1,737 | $ 1,942 | 05/15/2019 | (9) | ||||
JP Morgan Chase Bank NA | EUR 998 | $ 39,152 | 05/15/2019 | 452 | ||||
BNP Paribas SA | $ 139 | INR 10,029 | 06/19/2019 | 4 | ||||
Barclays Bank plc | $ 14,342 | JPY 1,594,500 | 05/15/2019 | (10) | ||||
Citibank NA | $ 5,453 | JPY 605,100 | 05/15/2019 | (14) | ||||
Goldman Sachs Bank USA | $ 16,274 | JPY 1,787,300 | 05/15/2019 | (208) | ||||
JP Morgan Chase Bank NA | $ 24,960 | JPY 2,773,400 | 05/15/2019 | (31) | ||||
Barclays Bank plc | JPY 1,870,000 | $ 17,181 | 05/20/2019 | 365 | ||||
BNP Paribas SA | JPY 6,080,000 | $ 56,332 | 05/13/2019 | 1,691 | ||||
BNP Paribas SA | JPY 2,332,000 | $ 21,422 | 05/20/2019 | 452 | ||||
Goldman Sachs Bank USA | JPY 1,248,000 | $ 11,459 | 05/20/2019 | 236 | ||||
JP Morgan Chase Bank NA | JPY 400,000 | $ 3,645 | 05/15/2019 | 50 | ||||
UBS AG | JPY 3,460,000 | $ 31,809 | 05/09/2019 | 725 | ||||
UBS AG | JPY 6,460,000 | $ 58,774 | 06/03/2019 | 616 | ||||
Citibank NA | $ 6,629 | MXN 129,070 | 06/26/2019 | 116 | ||||
Citibank NA | $ 6,143 | MXN 120,738 | 08/14/2019 | 116 | ||||
Citibank NA | MXN 109,109 | $ 5,528 | 06/26/2019 | (174) | ||||
HSBC Bank USA | MXN 19,961 | $ 1,011 | 06/26/2019 | (32) | ||||
HSBC Bank USA | MXN 10,768 | $ 575 | 08/14/2019 | (5) | ||||
NatWest Markets Plc | MXN 109,555 | $ 5,512 | 08/14/2019 | (168) | ||||
BNP Paribas SA | $ 129 | RUB 8,441 | 08/15/2019 | (1) | ||||
Société Générale | $ 127 | RUB 8,441 | 05/15/2019 | 3 | ||||
BNP Paribas SA | RUB 8,441 | $ 131 | 05/15/2019 | 1 |
55
Harbor Bond Fund
Portfolio of Investments—Continued
FORWARD CURRENCY CONTRACTS—Continued
Counterparty | Amount to be Delivered (000s) | Amount to be Received (000s) | Settlement Date | Unrealized Appreciation/ (Depreciation) (000s) | ||||
HSBC Bank USA | TRY 752 | $ 127 | 05/15/2019 | $2 | ||||
Total Forward Currency Contracts | $5,916 |
INTEREST RATE SWAP AGREEMENTS
CENTRALLY CLEARED SWAP AGREEMENTS
INTEREST RATE SWAPS
Counterparty | Floating Rate Index | Pay/ Receive Floating Rate | Fixed Rate | Payment Frequency | Expiration Date | Notional Amount (000s) | Value (000s) | Upfront Premiums (Received)/ Paid (000s) | Unrealized Appreciation/ (Depreciation) (000s) | |||||||||
CME Group | Canada Bankers Acceptances-CDOR 3-Month | Receive | 1.750% | Semi-annual | 12/16/2046 | CAD 1,900 | $222 | $(25) | $247 | |||||||||
LCH Group | EUR-EURIBOR-Act/ 360-Bloomberg 6-Month | Pay | 1.000 | Annual | 06/19/2029 | EUR 30,200 | 1,573 | 95 | 1,478 | |||||||||
LCH Group | EUR-EURIBOR-Act/ 360-Bloomberg 6-Month | Pay | 0.750 | Annual | 09/18/2029 | 91,900 | 1,824 | 807 | 1,017 | |||||||||
LCH Group | EUR-EURIBOR-Act/ 360-Bloomberg 6-Month | Pay | 1.501 | Annual | 07/04/2042 | 19,600 | 2,315 | 1 | 2,314 | |||||||||
LCH Group | EUR-EURIBOR-Act/ 360-Bloomberg 6-Month | Pay | 1.250 | Annual | 09/18/2049 | 7,200 | 282 | 54 | 228 | |||||||||
LCH Group | British Bankers' Association LIBOR GBP 6-Month | Receive | 1.250 | Semi-annual | 09/18/2024 | GBP 39,300 | (41) | 106 | (147) | |||||||||
LCH Group | British Bankers' Association LIBOR GBP 6-Month | Receive | 1.500 | Semi-annual | 06/19/2029 | 7,800 | (129) | (61) | (68) | |||||||||
LCH Group | British Bankers' Association LIBOR GBP 6-Month | Receive | 1.500 | Semi-annual | 09/18/2029 | 7,700 | (107) | (55) | (52) | |||||||||
LCH Group | British Bankers' Association LIBOR GBP 6-Month | Receive | 1.750 | Semi-annual | 06/19/2049 | 9,500 | (783) | (660) | (123) | |||||||||
LCH Group | British Bankers' Association LIBOR GBP 6-Month | Receive | 1.500 | Semi-annual | 09/18/2049 | 10,500 | 18 | 169 | (151) | |||||||||
CME Group | British Bankers' Association LIBOR JPY 6-Month | Receive | 0.300 | Semi-annual | 03/18/2026 | JPY 11,580,000 | (1,981) | (643) | (1,338) | |||||||||
LCH Group | British Bankers' Association LIBOR JPY 6-Month | Receive | 0.300 | Semi-annual | 03/18/2026 | 7,800,000 | (1,343) | (485) | (858) | |||||||||
LCH Group | British Bankers' Association LIBOR JPY 6-Month | Receive | 0.300 | Semi-annual | 09/20/2027 | 2,180,000 | (380) | (113) | (267) | |||||||||
LCH Group | British Bankers' Association LIBOR JPY 6-Month | Receive | 0.300 | Semi-annual | 03/20/2028 | 1,020,000 | (175) | 73 | (248) | |||||||||
LCH Group | British Bankers' Association LIBOR JPY 6-Month | Pay | 0.380 | Semi-annual | 06/18/2028 | 5,480,000 | 1,339 | 209 | 1,130 | |||||||||
LCH Group | British Bankers' Association LIBOR JPY 6-Month | Receive | 0.399 | Semi-annual | 06/18/2028 | 770,000 | (201) | — | (201) | |||||||||
LCH Group | British Bankers' Association LIBOR JPY 6-Month | Receive | 0.450 | Semi-annual | 03/20/2029 | 670,000 | (199) | (50) | (149) | |||||||||
LCH Group | British Bankers' Association LIBOR JPY 6-Month | Receive | 0.750 | Semi-annual | 03/20/2038 | 2,120,000 | (1,189) | 44 | (1,233) | |||||||||
LCH Group | British Bankers' Association LIBOR JPY 6-Month | Receive | 0.800 | Semi-annual | 10/22/2038 | 220,000 | (140) | — | (140) | |||||||||
LCH Group | British Bankers' Association LIBOR JPY 6-Month | Receive | 0.705 | Semi-annual | 10/31/2038 | 640,000 | (302) | 41 | (343) | |||||||||
LCH Group | British Bankers' Association LIBOR JPY 6-Month | Receive | 0.785 | Semi-annual | 11/12/2038 | 320,000 | (206) | 1 | (207) | |||||||||
LCH Group | British Bankers' Association LIBOR JPY 6-Month | Receive | 0.750 | Semi-annual | 12/20/2038 | 2,785,000 | (1,580) | 168 | (1,748) | |||||||||
LCH Group | British Bankers' Association LIBOR JPY 6-Month | Receive | 1.000 | Semi-annual | 03/21/2048 | 240,000 | (253) | (8) | (245) | |||||||||
CME Group | British Bankers' Association LIBOR USD 3-Month | Pay | 2.800 | Semi-annual | 08/22/2023 | $ 122,400 | 2,467 | (2,780) | 5,247 | |||||||||
CME Group | British Bankers' Association LIBOR USD 3-Month | Receive | 2.905 | Semi-annual | 08/22/2048 | 16,600 | (609) | 1,638 | (2,247) |
56
Harbor Bond Fund
Portfolio of Investments—Continued
INTEREST RATE SWAP AGREEMENTS—Continued
CENTRALLY CLEARED SWAP AGREEMENTS—Continued
INTEREST RATE SWAPS—Continued
Counterparty | Floating Rate Index | Pay/ Receive Floating Rate | Fixed Rate | Payment Frequency | Expiration Date | Notional Amount (000s) | Value (000s) | Upfront Premiums (Received)/ Paid (000s) | Unrealized Appreciation/ (Depreciation) (000s) | |||||||||
CME Group | British Bankers' Association LIBOR USD 3-Month | Receive | 2.930% | Semi-annual | 08/22/2048 | $ 6,000 | $(252) | $637 | $(889) | |||||||||
CME Group | British Bankers' Association LIBOR USD 3-Month | Receive | 2.940 | Semi-annual | 08/22/2048 | 5,300 | (234) | 518 | (752) | |||||||||
LCH Group | British Bankers' Association LIBOR USD 3-Month | Receive | 2.250 | Semi-annual | 06/20/2028 | 51,400 | 649 | 2,891 | (2,242) | |||||||||
Centrally Cleared Interest Rate Swaps | (1,987) | |||||||||||||||||
Interest Rate Swaps | $(1,987) |
CREDIT DEFAULT SWAP AGREEMENTS
CENTRALLY CLEARED SWAP AGREEMENTS
CREDIT DEFAULT SWAPS
Counterparty | Reference Entity | Buy/ Sellb,c | Pay/ Receive Fixed Rate | Expiration Date | Implied Credit Spreadd | Payment Frequency | Notional Amount (000s)e | Value (000s)f | Upfront Premiums (Received)/ Paid (000s) | Unrealized Appreciation/ (Depreciation) (000s) | ||||||||||
ICE Group | iTraxx Europe Series 29 Version 1 0.001% | Buy | 1.000% | 06/20/2023 | 0.440% | Quarterly | EUR 60,400 | $(1,660) | $(1,070) | $(590) | ||||||||||
ICE Group | TESCO PLC 6.000% due 12/14/2029 | Sell | 1.000 | 06/20/2022 | 0.530 | Quarterly | 5,000 | 91 | (244) | 335 | ||||||||||
ICE Group | Markit CDX North America Investment Grade Index Series 32 0.001% | Sell | 1.000 | 06/20/2024 | 0.580 | Quarterly | $ 4,700 | 100 | 89 | 11 | ||||||||||
ICE Group | Ford Motor Company 4.346% due 12/08/2026 | Sell | 5.000 | 06/20/2023 | 1.400 | Quarterly | 2,100 | 304 | 313 | (9) | ||||||||||
ICE Group | General Electric Company 2.700% due 10/09/2022 | Sell | 1.000 | 12/20/2023 | 0.820 | Quarterly | 2,700 | 27 | (119) | 146 | ||||||||||
ICE Group | General Electric Company 2.700% due 10/09/2022 | Sell | 1.000 | 06/20/2024 | 0.940 | Quarterly | 1,900 | 8 | (6) | 14 | ||||||||||
ICE Group | MBIA Inc. 6.625% due 10/01/2028 | Sell | 5.000 | 12/20/2019 | 0.490 | Quarterly | 7,000 | 244 | (238) | 482 | ||||||||||
ICE Group | MetLife, Inc. 4.750% due 02/08/2021 | Sell | 1.000 | 12/20/2021 | 0.290 | Quarterly | 6,900 | 139 | 2 | 137 | ||||||||||
ICE Group | The Goldman Sachs Group, Inc. 5.950% due 01/18/2018 | Sell | 1.000 | 09/20/2020 | 0.310 | Quarterly | 8,000 | 85 | 128 | (43) | ||||||||||
Centrally Cleared Credit Default Swaps | $483 |
OVER-THE-COUNTER (OTC) SWAP AGREEMENTS
CREDIT DEFAULT SWAPS
Counterparty | Reference Entity | Buy/ Sellb,c | Pay/ Receive Fixed Rate | Expiration Date | Implied Credit Spreadd | Payment Frequency | Notional Amount (000s)e | Value (000s)f | Upfront Premiums (Received)/ Paid (000s) | Unrealized Appreciation/ (Depreciation) (000s) | ||||||||||
Citibank NA | Axa Equitable Holdings Inc. 3.900% due 04/20/2023 | Sell | 1.000% | 06/20/2023 | 1.080% | Quarterly | $ 4,200 | $(8) | $(114) | $106 | ||||||||||
Goldman Sachs International | Petroleo Brasileiro SA Petrobras 8.375% due 12/10/2018 | Sell | 1.000 | 12/20/2019 | 0.330 | Quarterly | 400 | 2 | (42) | 44 | ||||||||||
HSBC Bank USA NA | Petroleo Brasileiro SA Petrobras 8.375% due 12/10/2018 | Sell | 1.000 | 03/20/2020 | 0.420 | Quarterly | 200 | 1 | (37) | 38 |
57
Harbor Bond Fund
Portfolio of Investments—Continued
CREDIT DEFAULT SWAP AGREEMENTS—Continued
OVER-THE-COUNTER (OTC) SWAP AGREEMENTS—Continued
CREDIT DEFAULT SWAPS—Continued
Counterparty | Reference Entity | Buy/ Sellb,c | Pay/ Receive Fixed Rate | Expiration Date | Implied Credit Spreadd | Payment Frequency | Notional Amount (000s)e | Value (000s)f | Upfront Premiums (Received)/ Paid (000s) | Unrealized Appreciation/ (Depreciation) (000s) | ||||||||||
JP Morgan Chase Bank NA | Petroleo Brasileiro SA Petrobras 8.375% due 12/10/2018 | Sell | 1.000% | 12/20/2019 | 0.330% | Quarterly | $ 2,100 | $12 | $(237) | $249 | ||||||||||
Over-the-Counter Credit Default Swaps | 437 | |||||||||||||||||||
Credit Default Swaps | $920 | |||||||||||||||||||
Total Swaps | $(1,067) |
FIXED INCOME INVESTMENTS SOLD SHORT — (0.5)%
Principal Amount (000s) | Security | Proceeds (000s) | Value (000s) | |||
$ 9,000 | Federal National Mortgage Association TBA10 6.000%—06/13/2049 | $9,719 | $(9,731) |
REVERSE REPURCHASE AGREEMENTS — (12.3)%
Counterparty | Borrowing Rate | Borrowing Date | Maturity Date | Proceeds (000s) | Value (000s) | |||||
Bank of America | 2.630% | 04/29/2019 | 05/03/2019 | $507 | $(507) | |||||
Bank of Montreal | 2.570% | 04/08/2019 | 05/08/2019 | 10,900 | (10,900) | |||||
Bank of Nova Scotia | 2.540 - 2.550% | 04/03/2019 - 04/08/2019 | 07/02/2019 - 07/09/2019 | 91,425 | (91,425) | |||||
JP Morgan Chase | 2.630% | 02/04/2019 | 05/06/2019 | 82,412 | (82,412) | |||||
Royal Bank of Canada | 2.600 - 2.640% | 03/04/2019 - 04/16/2019 | 06/05/2019 - 07/22/2019 | 49,968 | (49,968) | |||||
Total Reverse Repurchase Agreements | $235,212 | $(235,212) |
SALE-BUYBACK TRANSACTIONS — (6.3)%
Counterparty | Borrowing Rate | Borrowing Date | Maturity Date | Proceeds (000s) | Value (000s) | |||||
Barclays Capital Inc. | 1.000 - 2.625% | 04/29/2019 - 04/30/2019 | 05/01/2019 | $29,743 | $(29,811) | |||||
Morgan Stanley | 2.250 - 4.375% | 04/04/2019 - 04/16/2019 | 05/06/2019 - 07/12/2019 | 26,465 | (26,947) | |||||
UBS Securities LLC | 1.375 - 2.250% | 04/22/2019 - 04/29/2019 | 07/09/2019 - 07/30/2019 | 62,444 | (63,509) | |||||
Total Sale-Buyback Transactions | $ 118,652 | $(120,267) |
FAIR VALUE MEASUREMENTS
The following table summarizes the Fund’s investments as of April 30, 2019 based on the inputs used to value them.
Asset Category | Quoted Prices Level 1 (000s) | Other Significant Observable Inputs Level 2 (000s) | Significant Unobservable Inputs Level 3 (000s) | Total (000s) | ||||
Investments in Securities | ||||||||
Asset-Backed Securities | $— | $189,654 | $— | $189,654 | ||||
Bank Loan Obligations | — | — | 5,192 | 5,192 | ||||
Collateralized Mortgage Obligations | — | 118,035 | — | 118,035 | ||||
Corporate Bonds & Notes | — | 964,528 | — | 964,528 | ||||
Escrow | — | — | — | — | ||||
Foreign Government Obligations | — | 259,858 | — | 259,858 | ||||
Mortgage Pass-Through | — | 1,180,169 | — | 1,180,169 | ||||
Municipal Bonds | — | 5,160 | — | 5,160 | ||||
U.S. Government Obligations | — | 526,931 | — | 526,931 | ||||
Total Investments in Securities | $— | $3,244,335 | $5,192 | $3,249,527 | ||||
Financial Derivative Instruments - Assets | ||||||||
Forward Currency Contracts | $— | $7,542 | $— | $7,542 | ||||
Futures Contracts | 4,375 | — | — | 4,375 | ||||
Purchased Options | 27 | 26 | — | 53 |
58
Harbor Bond Fund
Portfolio of Investments—Continued
FAIR VALUE MEASUREMENTS—Continued
Asset Category | Quoted Prices Level 1 (000s) | Other Significant Observable Inputs Level 2 (000s) | Significant Unobservable Inputs Level 3 (000s) | Total (000s) | ||||
Swap Agreements | $— | $13,223 | $— | $13,223 | ||||
Total Financial Derivative Instruments - Assets | $4,402 | $20,791 | $— | $25,193 | ||||
Liability Category | ||||||||
Fixed Income Investments Sold Short | $— | $(9,731) | $— | $(9,731) | ||||
Reverse Repurchase Agreements | — | (235,212) | — | (235,212) | ||||
Sale-Buyback Transactions | — | (120,267) | — | (120,267) | ||||
Total Investments Sold Short and Secured Borrowings | $— | $(365,210) | $— | $(365,210) | ||||
Financial Derivative Instruments - Liabilities | ||||||||
Forward Currency Contracts | $— | $(1,626) | $— | $(1,626) | ||||
Futures Contracts | (13,507) | — | — | (13,507) | ||||
Swap Agreements | — | (14,290) | — | (14,290) | ||||
Written Options | — | (111) | — | (111) | ||||
Total Financial Derivative Instruments - Liabilities | $(13,507) | $(16,027) | $— | $(29,534) | ||||
Total Investments | $(9,105) | $2,883,889 | $5,192 | $2,879,976 |
For more information on valuation inputs and their aggregation into the levels used in the table above, please refer to the Fair Value Measurements and Disclosures in Note 2 of the accompanying Notes to Financial Statements.
The following is a rollforward of the Fund’s Level 3 investments during the period ended April 30, 2019.
Valuation Description | Beginning Balance as of 11/01/2018 (000s) | Purchases (000s) | Sales (000s) | Discount/ (Premium) (000s) | Total Realized Gain/(Loss) (000s) | Change in Unrealized Appreciation/ (Depreciation) (000s) | Transfers In Level 3 (000s) | Transfers Out of Level 3 (000s) | Ending Balance as of 04/30/2019w (000s) | |||||||||
Bank Loan Obligations | $5,185 | $— | $— | $— | $— | $7 | $— | $— | $5,192 | |||||||||
Escrow | — | — | — | — | — | — | — | — | — | |||||||||
Mortgage Pass-Through | 1 | — | — | — | — | (1) | — | — | — | |||||||||
$5,186 | $— | $— | $— | $— | $6 | $— | $— | $5,192 |
The following is a summary of significant unobservable inputs used in the fair valuations of assets and liabilities categorized within Level 3 of the fair value hierarchy.
Valuation Descriptions | Ending Balance as of 04/30/2019 (000s) | Valuation Technique | Unobservable Inputs | Input Value(s) | ||||
Investments in Securities | ||||||||
Bank Loan Obligations | ||||||||
Toyota Motor Credit Corp. | ||||||||
Revolver Term Out Loan | $ 5,192 | Benchmark Pricing | Base Price Plus Spread | $ 99.85 | ||||
Escrow | ||||||||
General Motors Co. Escrow | — | Cash Available in Relation to Claims | Estimated Recovery Value | $ 0.00 | ||||
Mortgage Pass-Through | ||||||||
Federal Housing Authority Project | — | Benchmark Pricing | Base Price | $ 100.10 | ||||
$5,192 |
REMAINING CONTRACTUAL MATURITY OF TRANSFERS ACCOUNTED FOR AS SECURED BORROWINGS
The following is a summary of the remaining contractual maturities of transfers accounted for as secured borrowings, by collateral type, as of April 30, 2019.
Overnight and Continuous (000s) | Up to 30 Days (000s) | 31-90 Days (000s) | Greater Than 90 Days (000s) | Total (000s) | |||||
Reverse Repurchase Agreements | |||||||||
U.S. Treasury Obligations | $— | $93,819 | $141,393 | $— | $235,212 | ||||
Sale-Buyback Transactions | |||||||||
U.S. Treasury Obligations | $29,811 | $3,316 | $67,530 | $19,610 | $120,267 | ||||
Total Secured Borrowings | $29,811 | $97,135 | $208,923 | $19,610 | $355,479 |
59
Harbor Bond Fund
Portfolio of Investments—Continued
* | Security in Default | ||
1 | CLO after the name of a security stands for Collateralized Loan Obligation. | ||
2 | Variable rate security; the stated rate represents the rate in effect at April 30, 2019. | ||
3 | Securities purchased in a transaction exempt from registration under Rule 144A of the Securities Act of 1933. These securities may be resold in transactions exempt from registration, normally to qualified institutional buyers. The Fund has no right to demand registration of these securities. At April 30, 2019, the aggregate value of these securities was $470,518 or 25% of net assets. | ||
4 | Step coupon security; the stated rate represents the rate in effect at April 30, 2019. | ||
5 | Floating rate security; the stated rate represents the rate in effect at April 30, 2019. | ||
6 | REMICs are CMOs which can hold mortgages secured by any type of real property and issue multiple-class securities backed by those mortgages. | ||
7 | Perpetuity bond; the maturity date represents the next callable date. | ||
8 | MTN after the name of a security stands for Medium Term Note. | ||
9 | Zero coupon bond | ||
10 | TBAs are mortgage-backed securities traded under delayed delivery commitments, settling after April 30, 2019. Although the unit price for the trades has been established, the principal value has not been finalized. However, the amount of the commitments will not fluctuate more than 2% from the principal amount. Income on TBAs is not earned until settlement date (see Note 2 of the accompanying Notes to Financial Statements). | ||
11 | At April 30, 2019, a portion of securities held by the Fund were pledged as collateral for exchange traded and centrally cleared derivatives, over-the-counter (OTC) derivatives, forward commitments, or secured borrowings (see Note 2 of the accompanying Notes to Financial Statements). The securities pledged had an aggregate value of $258,523 or 14% of net assets. | ||
12 | Inflation-protected securities (“IPS”) are securities in which the principal amount is adjusted for inflation and interest payments are applied to the inflation-adjusted principal. | ||
b | If the Fund is a buyer of protection and a credit event occurs, as defined under the terms of that particular swap agreement, the Fund will either (i) receive from the seller of protection an amount equal to the notional amount of the swap and deliver the referenced obligation or underlying securities comprising the referenced index or (ii) receive a net settlement amount in the form of cash or securities equal to the notional amount of the swap less the recovery value of the referenced obligation or underlying securities comprising the referenced index. | ||
c | If the Fund is a seller of protection and a credit event occurs, as defined under the terms of that particular swap agreement, the Fund will either (i) pay to the buyer of protection an amount equal to the notional amount of the swap and take delivery of the referenced obligation or underlying securities comprising the referenced index or (ii) pay a net settlement amount in the form of cash or securities equal to the notional amount of the swap less the recovery value of the referenced obligation or underlying securities comprising the referenced index. | ||
d | Implied credit spreads, represented in absolute terms, utilized in determining the value of credit default swap agreements on corporate issues or sovereign issues of an emerging country as of period end serve as an indicator of the current status of the payment/performance risk and represent the likelihood or risk of default for the credit derivative. The implied credit spread of a particular referenced entity reflects the cost of buying/selling protection and may include upfront payments required to be made to enter into the agreement. Wider credit spreads represent a deterioration of the referenced entity’s credit soundness and a greater likelihood or risk of default or other credit event occurring as defined under the terms of the agreement. A credit spread identified as “Defaulted” indicates a credit event has occurred for the referenced entity or obligation. | ||
e | The maximum potential amount the Fund could be required to make as a seller of credit protection or receive as a buyer of credit protection if a credit event occurs as defined under the terms of that particular swap agreement. | ||
f | The quoted market prices and resulting values for credit default swap agreements on asset-backed securities and credit indices serve as an indicator of the current status of the payment/performance risk and represent the likelihood of an expected liability (or profit) for the credit derivative should the notional amount of the swap agreement be closed/sold as of the period end. Increasing values, in absolute terms when compared to the notional amount of the swap, represent a deterioration of the referenced entity’s credit soundness and a greater likelihood or risk of default or other credit event occurring as defined under the terms of the agreement. | ||
j | Amount represents index value | ||
w | Amounts in this category are included in the “Realized and Change in Unrealized Gain/(Loss) on Investment Transactions” section of the Statement of Operations. The net unrealized appreciation/(depreciation) per investment type is below: | ||
Valuation Description | Unrealized Gain/(Loss) as of 04/30/2019 (000s) | ||
Bank Loan Obligations | $14 | ||
Escrow | (15) | ||
Mortgage Pass-Through | – | ||
$(1) | |||
x | Fair valued in accordance with Harbor Funds Valuation Procedures. | ||
ARS | Argentine Peso | ||
AUD | Australian Dollar | ||
BRL | Brazilian Real | ||
GBP | British Pound | ||
CAD | Canadian Dollar | ||
EUR | Euro | ||
INR | Indian Rupee | ||
JPY | Japanese Yen | ||
MXN | Mexican Peso | ||
RUB | Russian Ruble | ||
TRY | Turkish Lira |
The accompanying notes are an integral part of the Financial Statements.
60
Harbor Real Return Fund
Manager’s Commentary (Unaudited)
Subadviser
Pacific Investment Management Company LLC (PIMCO)
650 Newport Center Dr.
Newport Beach, CA
92660
Newport Beach, CA
92660
Portfolio Managers
Mihir P. Worah, Ph.D.
Since 2007
Since 2007
Stephen A. Rodosky
Since 2019
Since 2019
PIMCO has subadvised the Fund since 2005.
Investment Objective
The Fund seeks maximum real return, consistent with preservation of real capital.
Mihir P. Worah, Ph.D.
Stephen A. Rodosky
Management’s Discussion of
Fund Performance
Fund Performance
MARKET REVIEW
Elevated volatility headlined much of the end of 2018 as concerns about slowing global growth and rising geopolitical uncertainty weighed on risk sentiment. U.S. stocks reversed their gains from earlier in 2018 and fell sharply over December alongside a broader global risk asset sell-off.
Most risk assets experienced challenging performance as risk sentiment waned. Equities globally ended 2018 lower and credit spreads widened while developed market yields fell. Commodities, particularly oil prices, experienced a sharp decline due to heightened concerns over an influx of supply and softening demand.
Central banks remained on course for diminished monetary support as the fundamental backdrop remained solid overall. The U.S. Federal Reserve (Fed) hiked for the fourth time in 2018, as expected, but lowered its expectations for rate increases in 2019. The European Central Bank (ECB) announced the end of its asset purchase program and reiterated its intention to leave rates unchanged through the summer of 2019. Other geopolitical developments – midterm elections and a government shutdown in the U.S., ongoing Brexit negotiations, and political as well as budgetary turmoil in the Eurozone – contributed to diminished investor appetites.
Following December’s steep sell-off, risk assets bounced back as dovish pivots from global central banks helped ease financial conditions and optimism over U.S.-China trade negotiations bolstered investor sentiment. Still, economic data continued to signal decelerating global growth.
Robust risk appetites reverberated across most risk assets – global equities surged higher, developed market yields fell, credit spreads tightened, and oil prices climbed – though not all retraced the extent of late 2018’s drawdowns.
Even as risk sentiment improved, fundamental data continued to indicate a slowdown in global growth. The Eurozone saw downside surprises in growth metrics as external demand weakened, driven in part by the persistent slowdown in China (this in turn spurred stimulus measures from Chinese policymakers). Economic data in the U.S. were mixed, particularly with a temporary government shutdown, but labor and housing markets remained broadly robust.
Geopolitical developments were mixed: headlines highlighted continued political uncertainty surrounding Brexit, but also progress on a potential U.S.-China trade deal, though a full agreement remained elusive.
Global central banks signaled more accommodative stances as evidence grew of a deceleration in global economies. The Fed established a “patient” approach to policy – lowering both growth expectations and its rate hike outlook for 2019. Other central banks around the globe likewise struck more cautionary tones in the first quarter of 2019, further contributing to the broad-based rally in both risk assets as well as sovereign yields.
PEFORMANCE
Harbor Real Return Fund returned 4.65% (Retirement Class), 4.52% (Institutional Class), and 4.45% (Administrative Class) for the six months ended April 30, 2019, compared with the 4.60% return of the Bloomberg Barclays U.S. TIPS Index.
The following strategies helped returns over the six months ended April 30, 2019:
• | Long U.S. versus U.K. & Eurozone breakeven inflation (BEI) expectations, as U.S. inflation expectations sharply rebounded from weakness in the beginning of the period. |
• | Select holdings in residential mortgage-backed securities |
• | A tactical allocation to investment grade corporate credit particularly Banking and Financials |
61
Harbor Real Return Fund
Manager’s Commentary—Continued
TOTAL RETURNS
For the periods ended 04/30/2019
Unannualized | 1 Year | Annualized | |||||||||
6 Months | 5 Years | 10 Years | |||||||||
Harbor Real Return Fund | |||||||||||
Retirement Class1 | 4.65% | 2.83% | 1.42% | 3.56% | |||||||
Institutional Class | 4.52 | 2.75 | 1.41 | 3.56 | |||||||
Administrative Class | 4.45 | 2.56 | 1.15 | 3.30 | |||||||
Comparative Index | |||||||||||
Bloomberg Barclays U.S. TIPS | 4.60% | 3.10% | 1.74% | 3.64% |
As stated in the Fund’s prospectus dated March 1, 2019, the expense ratios were 1.07% (Net) and 1.29% (Gross) (Retirement Class); 1.15% (Net) and 1.37% (Gross) (Institutional Class); and 1.40% (Net) and 1.62% (Gross) (Administrative Class). The net expense ratios reflect an expense limitation agreement (excluding interest expense) effective through 02/29/2020. The expense ratios in the prospectus may differ from the actual expense ratios for the period disclosed within this report. The expense ratios shown in the prospectus are based on the prior fiscal year, adjusted to reflect changes, if any, in contractual arrangements that occurred prior to the date of the prospectus (or supplement thereto, if applicable).
Performance data shown represents past performance and is no guarantee of future results. Past performance is net of management fees and expenses and reflects reinvested dividends and distributions but does not reflect the deduction of taxes that a shareholder would pay on Fund distributions or upon the redemption of Fund shares. Past performance reflects the beneficial effect of any expense waivers or reimbursements, without which returns would have been lower. Investment returns and principal value will fluctuate so that Fund shares, when redeemed, may be worth more or less than their original cost. Returns for periods less than one year are not annualized. Current performance may be higher or lower and is available through the most recent month end atharborfunds.com or by calling 800-422-1050.
The following strategies were negative or neutral for returns:
• | An underweight to nominal duration position overall on the back of a synchronized move lower in global interest rates. |
OUTLOOK & STRATEGY
We would expect world GDP growth to slow to 2.5%‒3% this year from 3.3% in 2018. However, with China increasing stimulus and a trade deal between the U.S. and China in the making, we think there is a good chance that global growth will stabilize or even pick up moderately later this year. We expect inflation globally to fall to 1.5%−2% from 2.2% in 2018 due to continued below-target inflation in the U.S., Europe and Japan.
In the U.S., we continue to expect growth to slow to 2%–2.5% in 2019 from nearly 3% last year. Factors contributing to the deceleration include fading fiscal stimulus, the lagged effect of tighter monetary policy over the past few years, and headwinds from the China/global slowdown. We estimate that China’s easing will not filter through to U.S. growth until late 2019 or early 2020. Headline inflation looks set to drop to 1.5%−2% this year, while core Consumer Price Index (CPI) moves sideways. With growth slowing and inflation remaining below target, we believe the Fed is likely to keep rates unchanged in 2019.
For the Eurozone, we expect growth to slow to a trend-like pace of 0.75%–1.25% in 2019 from close to 2% in 2018, as weak global trade exerts significant downward pressure on the economy and Italy is in recession. An improvement in global trade conditions through this year should contribute to a gradual reacceleration. Reflecting firmer wage growth, we expect a moderate pickup in core inflation, which has been stuck at 1% for some time. In line with the ECB’s forward guidance, we expect policy rates to remain unchanged this year.
In the U.K., we expect real growth in the range of 1%–1.5% in 2019, modestly below trend, and we continue to think that a chaotic no-deal Brexit is a low-probability event. We see core Consumer Price Index (CPI) inflation stable at or close to the 2% target as import price pressures have faded and domestic price pressures remain subdued. In the event of a soft Brexit by midyear, a rate hike by the Bank of England in the second half of the year would appear likely.
Japan’s GDP growth is expected to be modest at 0.5%–1% in 2019, broadly unchanged from 0.7% in 2018. With core CPI inflation expected to dip into negative territory (due to temporary factors) around the middle of the year, we expect the Bank of Japan to keep its targets for short rates and the 10-year yield unchanged this year.
In China, we see growth slowing in 2019 to the middle of a 5.5%‒6.5% range from 6.6% in 2018, but stabilizing in the second half of the year as fiscal and monetary stimulus find some traction and a likely trade deal between the U.S. and China supports confidence.
With respect to portfolio strategy for the Fund:
• | We maintain an underweight position overall, primarily sourced in developed market countries with rich valuations such as the U.K., Japan, and select European countries. |
• | We remain long U.S. versus U.K. & Eurozone breakeven inflation (BEI) expectations, given still attractive valuations in the U.S. and richness in U.K. and European markets. |
• | Our spread sector exposures include positions in agency and non-agency mortgage-backed securities. We remain tactical in foreign currency markets with emphasis on select emerging markets currencies that offer attractive |
1 | Retirement Class shares commenced operations on June 1, 2018. The performance attributed to the Retirement Class shares prior to that date is that of the Institutional Class shares. Performance prior to June 1, 2018 has not been adjusted to reflect the lower expenses of Retirement Class shares. During this period, Retirement Class shares would have had returns similar to, but potentially higher than, Institutional Class shares due to the fact that Retirement Class shares represent interests in the same portfolio as Institutional Class shares but are subject to lower expenses. |
This report contains the current opinions of Pacific Investment Management Company LLC (PIMCO) as of the date of this report and should not be considered as investment advice or a recommendation of any particular security, strategy or investment product. Such opinions are subject to change without notice and securities described herein may no longer be included in, or may at any time be removed from, the Fund’s portfolio. This report is distributed for informational purposes only. Information contained herein has been obtained from sources believed reliable, but not guaranteed.
Fixed income securities are affected by interest rate changes and the creditworthiness of the issues held by the Fund. A rise in interest rates will cause a decrease in the value of fixed income securities. Such an event would have an adverse effect on the Fund. The use of derivative instruments may add additional risk. For information on the different share classes and the risks associated with an investment in the Fund, please refer to the current prospectus.
62
Harbor Real Return Fund
Fund Summary—April 30, 2019 (Unaudited)
TOP Issuers(% of net assets)
❶ | U.S. Treasury | 98.2% |
❷ | Federal National Mortgage Association TBA | 15.2% |
❸ | U.K. Gilt Inflation Linked | 2.1% |
❹ | France Government Bond OAT | 1.7% |
❺ | New Zealand Government Bond | 1.5% |
❻ | French Republic Government Bond Oat | 1.1% |
❼ | Lavender Trust | 1.1% |
❽ | Navient Corp. | 0.9% |
❾ | Australia Government Bond | 0.8% |
❿ | Long Beach Mortgage Loan Trust | 0.7% |
Total Investments(% of net assets)
(Excludes net cash, short-term investments and derivative positions of -38.6%)
Maturity Profile(% of investments)
63
Harbor Real Return Fund
Portfolio of Investments—April 30, 2019 (Unaudited)
Value, Cost, Notional and Principal Amounts in Thousands
ASSET-BACKED SECURITIES—5.1% | |||
Principal Amount | Value | ||
Countrywide Asset-Backed Certificates | |||
Series 2007-1A Cl. 1 | |||
$ | 49 | 2.421% (1 Month USD Libor + 0.140) 07/25/20371 | $44 |
Series 2006-19 Cl. 2A3 | |||
100 | 2.531% (1 Month USD Libor + 0.250) 03/25/20371 | 95 | |
Series 2007-8 Cl. 1A1 | |||
226 | 2.667% (1 Month USD Libor + 0.190) 11/25/20371 | 217 | |
356 | |||
Credit-Based Asset Servicing & Securitization LLC | |||
Series 2007-CB6 Cl. A3 | |||
169 | 2.697% (1 Month USD Libor + 0.220) 07/25/20371,2 | 113 | |
Crown Point CLO Ltd.3 | |||
Series 2018-5A Cl. A | |||
300 | 3.389% (3 Month USD Libor + 0.940) 07/17/20281,2 | 298 | |
Evans Grove CLO Ltd.3 | |||
Series 2018-1A Cl. A1 | |||
200 | 3.231% (3 Month USD Libor + 0.920) 05/28/20281,2 | 199 | |
Figueroa CLO Ltd.3 | |||
Series 2013-2A Cl. A1RR | |||
100 | 3.188% (3 Month USD Libor + 0.850) 06/20/20271,2 | 100 | |
Fremont Home Loan Trust | |||
Series 2006-C Cl. 1A1 | |||
23 | 2.416% (1 Month USD Libor + 0.135) 10/25/20361 | 22 | |
GSAMP Trust | |||
Series 2004-WF Cl. M2 | |||
75 | 3.931% (1 Month USD Libor + 1.100) 10/25/20341 | 73 | |
Home Equity Mortgage Loan Asset-Backed Trust | |||
Series 2007-A Cl. 1A | |||
31 | 2.501% (1 Month USD Libor + 0.220) 04/25/20371 | 24 | |
JMP Credit Advisors CLO IIIR Ltd.3 | |||
Series 2014-1RA Cl. A | |||
250 | 3.286% (3 Month USD Libor + 0.850) 01/17/20281,2 | 248 | |
Legacy Mortgage Asset Trust | |||
Series 2019-GS3 Cl. 1 | |||
100 | 3.750%—04/25/20592,4 | 100x | |
Long Beach Mortgage Loan Trust | |||
Series 2006-WL3 Cl. 2A4 | |||
265 | 2.581% (1 Month USD Libor + 0.300) 01/25/20361 | 247 | |
Series 2006-7 Cl. 2A2 | |||
29 | 2.597% (1 Month USD Libor + 0.120) 08/25/20361 | 15 | |
Series 2005-WL2 Cl. M2 | |||
333 | 3.016% (1 Month USD Libor + 0.490) 08/25/20351 | 335 | |
597 | |||
MASTR Asset Backed Securities Trust | |||
Series 2006-HE2 Cl. A4 | |||
178 | 2.521% (1 Month USD Libor + 0.240) 06/25/20361 | 100 | |
Morgan Stanley ABS Capital I Inc. Trust | |||
Series 2006-HE8 Cl. A2FP | |||
96 | 2.351% (1 Month USD Libor + 0.070) 10/25/20361 | 59 | |
Morgan Stanley Mortgage Loan Trust | |||
Series 2006-15XS Cl. A6A | |||
108 | 5.910%—11/25/20364 | 47 | |
Mountain View CLO X Ltd.3 | |||
Series 2015-10A Cl. AR | |||
200 | 3.256% (3 Month USD Libor + 0.820) 10/13/20271,2 | 199 | |
Navient Student Loan Trust | |||
Series 2016-7A Cl. A | |||
144 | 3.437% (1 Month USD Libor + 1.150) 03/25/20661,2 | 145 | |
Octagon Investment Partners XXIII Ltd. | |||
Series 2015-A1R Cl. 1A | |||
260 | 3.286% (3 Month USD Libor + 0.855) 07/15/20271,2 | 259 |
ASSET-BACKED SECURITIES—Continued | |||
Principal Amount | Value | ||
Saxon Asset Securities Trust | |||
Series 2007-3 Cl. 1A | |||
$ | 52 | 2.787% (1 Month USD Libor + 0.310) 09/25/20471 | $50 |
Series 2003-1 Cl. AF7 | |||
56 | 4.034%—06/25/20334 | 57 | |
107 | |||
Soundview Home Loan Trust | |||
Series 2006-OPT2 Cl. A4 | |||
200 | 2.561% (1 Month USD Libor + 0.280) 05/25/20361 | 195 | |
Series 2007-OPT1 Cl. 1A1 | |||
38 | 2.677% (1 Month USD Libor + 0.200) 06/25/20371 | 29 | |
224 | |||
TICP CLO III-2 Ltd.3 | |||
Series 2018-3R Cl. A | |||
250 | 3.309% (3 Month USD Libor + 0.840) 04/20/20281,2 | 248 | |
Venture XII CLO Ltd.3 | |||
Series 2012-12A Cl. ARP | |||
250 | 3.111% (3 Month USD Libor + 0.800) 02/28/20261,2 | 249 | |
Venture XVI CLO Ltd.3 | |||
Series 2014-16A Cl. ARR | |||
400 | 3.286% (3 Month USD Libor + 0.850) 01/15/20281,2 | 398 | |
Volt LXII LLC | |||
Series 2017-NPL9 Cl. A1 | |||
61 | 3.125%—09/25/20472,4 | 60 | |
TOTAL ASSET-BACKED SECURITIES | |||
(Cost $4,067) | 4,225 | ||
COLLATERALIZED MORTGAGE OBLIGATIONS—2.3% | |||
Alliance Bancorp Trust | |||
Series 2007 Cl. OA1 | |||
63 | 2.521% (1 Month USD Libor + 0.240) 07/25/20371 | 56 | |
Bear Stearns Adjustable Rate Mortgage Trust | |||
Series 2006-2 Cl. 3A2 | |||
17 | 4.144%—07/25/20361 | 16 | |
Series 2005-12 Cl. 23A1 | |||
36 | 4.170%—02/25/20361 | 34 | |
50 | |||
Citigroup Mortgage Loan Trust Inc. | |||
Series 2005-12 Cl. 2A1 | |||
265 | 3.016% (1 Month USD Libor + 0.800) 08/25/20351,2 | 250 | |
Series 2007-AR4 Cl. 1A1A | |||
128 | 4.641%—03/25/20371 | 126 | |
376 | |||
Countrywide Home Loan Mortgage Pass Through Trust | |||
Series 2004-HYB5 Cl. 2A1 | |||
12 | 4.307%—04/20/20351 | 12 | |
First Horizon Alternative Mortgage Securities Trust | |||
Series 2006-FA8 Cl. 1A7 | |||
10 | 6.000%—02/25/2037 | 8 | |
Lavender Trust | |||
Series 2010-RR2A Cl. A4 | |||
1,088 | 6.250%—10/26/20362 | 863 | |
Morgan Stanley Mortgage Loan Trust | |||
Series 2006-8AR Cl. 6A1 | |||
80 | 4.235%—06/25/20361 | 82 | |
Residential Asset Securitization Trust | |||
Series 2006-R1 Cl. A2 | |||
47 | 2.681% (1 Month USD Libor + 0.400) 01/25/20461 | 23 |
64
Harbor Real Return Fund
Portfolio of Investments—Continued
Value, Cost, Notional and Principal Amounts in Thousands
COLLATERALIZED MORTGAGE OBLIGATIONS—Continued | |||
Principal Amount | Value | ||
Towd Point Mortgage Funding | |||
Series 2019-GR4A Cl. A1 | |||
GBP | 300 | 1.855% (3 Month GBP Libor + 1.025) 10/20/20511,2 | $391 |
Washington Mutual Mortgage Pass Through Certificates Trust | |||
Series 2003-AR9 Cl. 2A | |||
$ | 12 | 4.409%—09/25/20331 | 13 |
TOTAL COLLATERALIZED MORTGAGE OBLIGATIONS | |||
(Cost $1,753) | 1,874 | ||
CORPORATE BONDS & NOTES—8.1% | |||
AUTOMOBILES—0.5% | |||
Ford Motor Credit Co. LLC MTN5 | |||
EUR | 400 | 0.122% (3 Month EUR Libor + 0.430) 05/14/20211 | 442 |
BANKS—1.7% | |||
Bank of America Corp. | |||
$ | 60 | 5.875% (3 Month USD Libor + 2.931) 03/15/20281,6 | 62 |
Deutsche Bank AG/New York | |||
500 | 4.250%—10/14/2021 | 501 | |
ING Bank NV MTN5 | |||
100 | 2.625%—12/05/20222 | 100 | |
Toronto Dominion Bank | |||
200 | 2.250%—03/15/20212 | 199 | |
Unicredit SpA MTN5 | |||
500 | 7.830%—12/04/20232 | 561 | |
1,423 | |||
CAPITAL MARKETS—1.0% | |||
Goldman Sachs Group Inc. | |||
500 | 3.534% (3 Month USD Libor + 1.200) 09/15/20201 | 506 | |
UBS AG | |||
300 | 2.907% (3 Month USD Libor + 0.580) 06/08/20201,2 | 301 | |
807 | |||
CONSUMER FINANCE—1.2% | |||
FCE Bank plc MTN5 | |||
EUR | 200 | 1.875%—06/24/2021 | 230 |
Navient Corp. MTN5 | |||
$ | 740 | 4.949% (US CPI Urban Consumers + 2.250) 05/03/20191,7 | 759 |
989 | |||
DIVERSIFIED FINANCIAL SERVICES—0.1% | |||
BAT Capital Corp. | |||
100 | 3.283% (3 Month USD Libor + 0.590) 08/14/20201 | 100 | |
DIVERSIFIED TELECOMMUNICATION SERVICES—0.3% | |||
AT&T Inc. | |||
100 | 3.071% (3 Month USD Libor + 0.750) 06/01/20211 | 101 | |
100 | 5.150%—02/15/2050 | 105 | |
206 | |||
ELECTRIC UTILITIES—0.2% | |||
Nextera Energy Capital Holdings Inc. | |||
160 | 2.636% (3 Month USD Libor + 0.315) 09/03/20191 | 160 | |
GAS UTILITIES—0.1% | |||
Sempra Energy | |||
100 | 2.784% (3 Month USD Libor + 0.450) 03/15/20211 | 99 |
CORPORATE BONDS & NOTES—Continued | |||
Principal Amount | Value | ||
INDEPENDENT POWER PRODUCERS & ENERGY TRADERS—0.3% | |||
Emera US Finance LP | |||
$ | 200 | 2.700%—06/15/2021 | $199 |
INTERACTIVE MEDIA & SERVICES—0.1% | |||
eBay Inc. | |||
100 | 2.750%—01/30/2023 | 99 | |
OIL, GAS & CONSUMABLE FUELS—0.9% | |||
Dominion Energy Gas Holdings LLC | |||
100 | 2.934% (3 Month USD Libor + 0.600) 06/15/20211 | 100 | |
Enbridge Inc. | |||
100 | 2.814% (3 Month USD Libor + 0.400) 01/10/20201 | 100 | |
Petrobras Global Finance BV | |||
325 | 5.299%—01/27/2025 | 335 | |
200 | 7.375%—01/17/2027 | 223 | |
558 | |||
758 | |||
THRIFTS & MORTGAGE FINANCE—0.3% | |||
Nationwide Building Society MTN5 | |||
GBP | 200 | 6.875% (GBP Swap 5 Year + 4.880) 6/20/20191,6 | 263 |
TRADING COMPANIES & DISTRIBUTORS—1.0% | |||
AerCap Ireland Capital Ltd. | |||
$ | 300 | 4.625%—10/30/2020 | 307 |
Aircastle Ltd. | |||
500 | 5.125%—03/15/2021 | 517 | |
824 | |||
WIRELESS TELECOMMUNICATION SERVICES—0.4% | |||
Sprint Corp. | |||
300 | 7.250%—09/15/2021 | 315 | |
TOTAL CORPORATE BONDS & NOTES | |||
(Cost $6,580) | 6,684 | ||
FOREIGN GOVERNMENT OBLIGATIONS—8.9% | |||
Argentina Bonar Bonds | |||
ARS | 418 | 37.717% (Argentina Deposit Rates Badlar Private Banks ARS 30 to 35 Days + 2.000) 04/03/20221 | 8 |
Argentina Pom Politica Monetaria | |||
3,724 | 42.819% (Argentina Blended Historical Policy Rate) 06/21/20201 | 91 | |
Argentine Republic Government International Bond | |||
$ | 80 | 5.875%—01/11/2028 | 56 |
210 | 6.875%—01/26/2027 | 151 | |
207 | |||
Australia Government Bond | |||
AUD | 400 | 1.250%—02/21/20227 | 332 |
360 | 3.000%—09/20/20257 | 368 | |
700 | |||
Canadian Government Real Return Bond | |||
CAD | 306 | 4.250%—12/01/20267 | 301 |
France Government Bond OAT | |||
EUR | 110 | 1.850%—07/25/20277 | 155 |
1,004 | 2.250%—07/25/20207 | 1,193 | |
1,348 | |||
French Republic Government Bond OAT | |||
677 | 2.100%—07/25/20237 | 876 |
65
Harbor Real Return Fund
Portfolio of Investments—Continued
Value, Cost, Notional and Principal Amounts in Thousands
FOREIGN GOVERNMENT OBLIGATIONS—Continued | |||
Principal Amount | Value | ||
Italy Buoni Poliennali del Tesoro | |||
EUR | 165 | 2.350%—09/15/20242,7 | $200 |
Japanese Government CPI Linked Bond7 | |||
JPY | 40,225 | 0.100%—03/10/2028 | 375 |
Mexican Bonos | |||
MXN | 2,386 | 7.750%—05/29/2031 | 121 |
New Zealand Government Bond | |||
NZD | 1,600 | 2.000%—09/20/20257 | 1,247 |
Peruvian Government International Bond | |||
PEN | 200 | 5.940%—02/12/20292 | 64 |
U.K. Gilt Inflation Linked7 | |||
GBP | 956 | 0.125%—03/22/2026-11/22/2065 | 1,628 |
41 | 0.750%—11/22/2047 | 104 | |
1,732 | |||
TOTAL FOREIGN GOVERNMENT OBLIGATIONS | |||
(Cost $7,621) | 7,270 | ||
MORTGAGE PASS-THROUGH—16.2% | |||
Federal Home Loan Mortgage Corp. REMIC8 | |||
$ | 134 | 2.880% (1 Month USD Libor + 0.600) 12/15/20371 | 135 |
Federal National Mortgage Association REMIC8 | |||
31 | 2.631% (1 Month USD Libor + 0.350) 07/25/20371 | 31 | |
51 | 2.661% (1 Month USD Libor + 0.380) 07/25/20371 | 51 | |
23 | 2.721% (1 Month USD Libor + 0.440) 05/25/20361 | 23 | |
105 | |||
Federal National Mortgage Association TBA9 | |||
4,520 | 3.500%—06/13/2049 | 4,558 | |
7,700 | 4.000%—07/12/2042-06/13/2048 | 7,896 | |
12,454 | |||
Government National Mortgage Association | |||
398 | 2.881% (1 Month USD Libor + 0.400) 02/20/20491 | 397 | |
202 | 3.030% (12 Month USD Libor + 0.150) 08/20/20681 | 199 | |
596 | |||
TOTAL MORTGAGE PASS-THROUGH | |||
(Cost $13,295) | 13,290 | ||
U.S. GOVERNMENT OBLIGATIONS—98.0% | |||
Principal Amount | |||
U.S. Treasury Inflation Indexed Bonds7 | |||
$ | 3,423 | 0.125%—04/15/2021-07/15/2026 | 3,390 |
U.S. GOVERNMENT OBLIGATIONS—Continued | |||
Principal Amount | Value | ||
$ | 12,389 | 0.375%—07/15/2023-07/15/2027 | $12,361 |
1,023 | 0.500%—01/15/2028 | 1,019 | |
11,225 | 0.625%—07/15/2021-02/15/2043 | 11,319 | |
2,359 | 0.750%—07/15/2028-02/15/2045 | 2,291 | |
5,360 | 0.875%—01/15/2029-02/15/2047 | 5,446 | |
505 | 1.000%—02/15/2046-02/15/2048 | 512 | |
6,800 | 1.375%—02/15/2044 | 7,461 | |
150 | 1.750%—01/15/2028 | 165 | |
1,150 | 2.000%—01/15/2026 | 1,265 | |
834 | 2.125%—02/15/2040-02/15/2041 | 1,040 | |
23,867 | 2.375%—01/15/202510 | 26,473 | |
3,183 | 2.375%—01/15/2027 | 3,629 | |
2,265 | 2.500%—01/15/2029 | 2,678 | |
397 | 3.375%—04/15/2032 | 534 | |
494 | 3.875%—04/15/2029 | 650 | |
80,233 | |||
U.S. Treasury Notes | |||
300 | 2.750%—02/15/202410 | 306 | |
TOTAL U.S. GOVERNMENT OBLIGATIONS | |||
(Cost $80,349) | 80,539 | ||
SHORT-TERM INVESTMENTS—2.0% | |||
BANKER'S ACCEPTANCE—0.3% | |||
Bank of Montreal | |||
CAD | 100 | 0.000%—06/03/201911 | 74 |
Royal Bank of Canada | |||
100 | 0.000%—05/31/201911 | 75 | |
Toronto Dominion Bank | |||
100 | 0.000%—05/31/201911 | 75 | |
224 | |||
REPURCHASE AGREEMENT—1.7% | |||
$ | 1,400 | Repurchase Agreement with Credit Suisse dated April 30, 2019 due May 01, 2019 at 2.780% collateralized by U.S. Treasury Notes (value $1,416) | 1,400 |
TOTAL SHORT-TERM INVESTMENTS | |||
(Cost $1,624) | 1,624 | ||
TOTAL INVESTMENTS—140.6% | |||
(Cost $115,289) | 115,506 | ||
CASH AND OTHER ASSETS, LESS LIABILITIES—(40.6)% | (33,365) | ||
TOTAL NET ASSETS—100.0% | $82,141 |
FUTURES CONTRACTS
Description | Number of Contracts | Expiration Date | Current Notional Value (000s) | Unrealized Appreciation/ (Depreciation) (000s) | ||||
Australian Government Bond Futures 3 year (Short) | 5 | 06/17/2019 | AUD 569 | $ (3) | ||||
Australian Government Bond Futures 10 year (Short) | 2 | 06/17/2019 | 276 | (4) | ||||
Euro-BOBL Futures (Long) | 29 | 06/06/2019 | EUR 3,855 | 30 | ||||
Euro-BTP Futures (Short) | 15 | 06/06/2019 | 1,957 | (52) | ||||
Euro-Bund Futures (Long) | 56 | 06/06/2019 | 9,257 | 110 | ||||
Euro-BUXL Bond Futures 30 year (Short) | 11 | 06/06/2019 | 2,076 | (80) | ||||
Euro-Oat Futures (Short) | 30 | 06/06/2019 | 4,860 | (78) | ||||
Euro-Schatz Futures (Short) | 103 | 06/06/2019 | 11,528 | (20) | ||||
United Kingdom GILT Futures 90 day (Short) | 12 | 06/26/2019 | GBP 1,528 | (1) |
66
Harbor Real Return Fund
Portfolio of Investments—Continued
FUTURES CONTRACTS—Continued
Description | Number of Contracts | Expiration Date | Current Notional Value (000s) | Unrealized Appreciation/ (Depreciation) (000s) | ||||
Japanese Government Bond Futures 10 year (Long) | 1 | 06/13/2019 | JPY 152,730 | $3 | ||||
U.S. Treasury Bond Futures 30 year (Short) | 11 | 06/19/2019 | $ 1,622 | (25) | ||||
U.S. Treasury Note Futures 2 year (Long) | 16 | 06/28/2019 | 3,408 | 9 | ||||
U.S. Treasury Note Futures 5 year (Short) | 13 | 06/28/2019 | 1,503 | (10) | ||||
U.S. Treasury Note Futures 10 year (Short) | 16 | 06/19/2019 | 1,979 | (3) | ||||
Ultra U.S. Treasury Bond Futures 10 year (Short) | 32 | 06/19/2019 | 4,217 | (49) | ||||
Ultra U.S. Treasury Bond Futures 30 year (Long) | 8 | 06/19/2019 | 1,314 | 3 | ||||
Total Futures Contracts | $(170) |
PURCHASED OPTIONS
PURCHASED OPTIONS THAT REQUIRE PERIODIC SETTLEMENT OF VARIATION MARGIN
Description | Exchange | Strike Price | Expiration Date | Number of Contracts/ Notional | Premiums Paid (000s) | Value (000s) | ||||||
Euro-BOBL Futures Option (Put) | Eurex | EUR 128.00 | 05/24/2019 | 40 | $— | $— | ||||||
Euro-BTP Futures Option (Call) | Eurex | 159.00 | 05/24/2019 | 19 | — | — | ||||||
Euro-Bund Futures Option (Put) | Eurex | 144.00 | 05/24/2019 | 24 | — | — | ||||||
Euro-OAT Futures Option (Call) | Eurex | 175.00 | 05/24/2019 | 12 | — | — | ||||||
Euro-Schatz Futures Option (Call) | Eurex | 114.00 | 05/24/2019 | 97 | 2 | 1 | ||||||
Total Purchased Options that Require Periodic Settlement of Variation Margin | $2 | $1 |
PURCHASED OPTIONS NOT SETTLED THROUGH VARIATION MARGIN
Description | Exchange | Strike Price | Expiration Date | Number of Contracts/ Notional | Premiums Paid (000s) | Value (000s) | ||||||
U.S. Treasury Bond Option 30 year (Call) | Chicago Board of Trade | $ 192.00 | 05/24/2019 | 13 | $— | $— | ||||||
U.S. Treasury Note Option 2 year (Put) | Chicago Board of Trade | 105.00 | 05/24/2019 | 6 | — | — | ||||||
U.S. Treasury Note Option 5 year (Call) | Chicago Board of Trade | 124.25 | �� | 05/24/2019 | 36 | — | — | |||||
U.S. Treasury Note Option 10 year (Call) | Chicago Board of Trade | 136.00 | 05/24/2019 | 8 | — | — | ||||||
U.S. Treasury Note Option 10 year (Call) | Chicago Board of Trade | 140.00 | 05/24/2019 | 2 | — | — | ||||||
U.S. Treasury Note Option 10 year (Put) | Chicago Board of Trade | 112.00 | 05/24/2019 | 1 | — | — | ||||||
U.S. Treasury Note Option 10 year (Put) | Chicago Board of Trade | 113.50 | 05/24/2019 | 11 | — | — | ||||||
U.S. Ultra Treasury Bond Futures 30 year (Put) | Chicago Board of Trade | 114.00 | 05/24/2019 | 3 | — | — | ||||||
Total Purchased Options Not Settled Through Variation Margin | $— | $— |
PURCHASED SWAP OPTIONS NOT SETTLED THROUGH VARIATION MARGIN
Description | Counterparty | Floating Rate Index | Pay/Receive Floating Rate | Strike Rate | Expiration Date | Number of Contracts/ Notional | Premiums Paid (000s) | Value (000s) | ||||||||
Interest Rate Swap Option 2 year (Call) | Morgan Stanley Capital Services LLC | 3-Month USD-LIBOR | Pay | 2.250% | 03/26/2020 | 8,200,000 | $49 | $39 | ||||||||
Interest Rate Swap Option 2 year (Call) | Morgan Stanley Capital Services LLC | 3-Month USD-LIBOR | Pay | 2.250 | 03/27/2020 | 2,900,000 | 20 | 14 | ||||||||
Interest Rate Swap Option 2 year (Call) | Morgan Stanley Capital Services LLC | 3-Month USD-LIBOR | Pay | 2.500 | 02/20/2020 | 5,500,000 | 24 | 39 | ||||||||
Interest Rate Swap Option 2 year (Call) | Morgan Stanley Capital Services LLC | 3-Month USD-LIBOR | Pay | 2.500 | 02/21/2020 | 5,500,000 | 22 | 39 | ||||||||
Total Purchased Swap Options Not Settled Through Variation Margin | $115 | $131 | ||||||||||||||
Total Purchased Options | $117 | $132 |
67
Harbor Real Return Fund
Portfolio of Investments—Continued
WRITTEN OPTIONS
WRITTEN OPTIONS THAT REQUIRE PERIODIC SETTLEMENT OF VARIATION MARGIN
Description | Exchange | Strike Price | Expiration Date | Number of Contracts/ Notional | Premiums Received (000s) | Value (000s) | ||||||
Euro-BOBL Futures Option (Call) | Eurex | EUR 132.75 | 05/24/2019 | 12 | $3 | $(4) | ||||||
Euro-BOBL Futures Option (Put) | Eurex | 132.75 | 05/24/2019 | 12 | 3 | (1) | ||||||
Euro-Bund Futures Option (Call) | Eurex | 166.00 | 05/24/2019 | 5 | 3 | (2) | ||||||
Euro-Bund Futures Option (Call) | Eurex | 167.00 | 05/24/2019 | 8 | 4 | (1) | ||||||
Euro-Bund Futures Option (Put) | Eurex | 162.50 | 05/24/2019 | 5 | 2 | (1) | ||||||
Euro-Bund Futures Option (Put) | Eurex | 164.00 | 05/24/2019 | 5 | 2 | — | ||||||
Total Written Options that Require Periodic Settlement of Variation Margin | $17 | $(9) |
WRITTEN OPTIONS NOT SETTLED THROUGH VARIATION MARGIN
Description | Counterparty/Exchange | Strike Index/Price | Expiration Date | Number of Contracts/ Notional | Premiums Received (000s) | Value (000s) | ||||||
Consumer Price All Urban Non-Seasonally Adjusted Index - Cap (Call) | JP Morgan Chase Bank NA | 243.273j | 04/22/2024 | 4,000,000 | $29 | $— | ||||||
Consumer Price All Urban Non-Seasonally Adjusted Index - Cap (Call) | JP Morgan Chase Bank NA | 244.172j | 05/16/2024 | 300,000 | 2 | — | ||||||
Consumer Price All Urban Non-Seasonally Adjusted Index - Floor (Put) | Citibank NA | 216.687j | 04/07/2020 | 3,500,000 | 31 | — | ||||||
Consumer Price All Urban Non-Seasonally Adjusted Index - Floor (Put) | Citibank NA | 217.965j | 09/29/2020 | 500,000 | 7 | — | ||||||
Consumer Price All Urban Non-Seasonally Adjusted Index - Floor (Put) | JP Morgan Chase Bank NA | 234.812j | 03/24/2020 | 1,700,000 | 19 | — | ||||||
Consumer Price All Urban Non-Seasonally Adjusted Index - Floor (Put) | JP Morgan Chase Bank NA | 238.643j | 10/02/2020 | 1,000,000 | 19 | (1) | ||||||
Eurozone HICP Ex. Tobacco Index - Cap (Call) | Goldman Sachs Bank USA | 120.716j | 06/22/2035 | 400,000 | 18 | (1) | ||||||
USD ICE Swap Rate Index 30 year - Floor (Call) | Morgan Stanley Capital Services LLC | 1.000j | 01/02/2020 | 5,500,000 | 5 | (1) | ||||||
Federal National Mortgage Association Future 30 year (Call) | JP Morgan Chase Bank NA | $ 99.88 | 06/06/2019 | 1,000,000 | 1 | (1) | ||||||
Federal National Mortgage Association Future 30 year (Put) | JP Morgan Chase Bank NA | 97.88 | 06/06/2019 | 1,000,000 | 1 | (1) | ||||||
Total Written Options Not Settled Through Variation Margin | $132 | $(5) |
WRITTEN SWAP OPTIONS NOT SETTLED THROUGH VARIATION MARGIN
Description | Counterparty | Floating Rate Index | Buy/Sell Credit Protection Pay/Receive Floating Rate | Strike Rate | Expiration Date | Number of Contracts/ Notional | Premiums Received (000s) | Value (000s) | ||||||||
Credit Default Swap Option 5 year (Put) | Citibank NA | Markit CDX North America Investment Grade | Sell | 1.100% | 05/15/2019 | 200,000 | $— | $— | ||||||||
Credit Default Swap Option 5 year (Put) | Goldman Sachs International | Markit iTraxx Europe | Sell | 2.400 | 09/18/2019 | 100,000 | — | — | ||||||||
Credit Default Swap Option 5 year (Put) | Goldman Sachs International | Markit CDX North America Investment Grade | Sell | 2.400 | 09/18/2019 | 200,000 | — | — | ||||||||
Interest Rate Swap Option 5 year (Call) | Morgan Stanley Capital Services LLC | 3-Month USD-LIBOR | Receive | 2.338 | 03/26/2020 | 1,700,000 | 23 | (18) | ||||||||
Interest Rate Swap Option 5 year (Call) | Morgan Stanley Capital Services LLC | 3-Month USD-LIBOR | Receive | 2.344 | 03/26/2020 | 1,700,000 | 26 | (18) | ||||||||
Interest Rate Swap Option 5 year (Call) | Morgan Stanley Capital Services LLC | 3-Month USD-LIBOR | Receive | 2.361 | 03/27/2020 | 1,100,000 | 18 | (12) | ||||||||
Interest Rate Swap Option 5 year (Call) | Morgan Stanley Capital Services LLC | 3-Month USD-LIBOR | Receive | 2.521 | 02/20/2020 | 2,400,000 | 25 | (36) |
68
Harbor Real Return Fund
Portfolio of Investments—Continued
WRITTEN OPTIONS—Continued
WRITTEN SWAP OPTIONS NOT SETTLED THROUGH VARIATION MARGIN—Continued
Description | Counterparty | Floating Rate Index | Buy/Sell Credit Protection Pay/Receive Floating Rate | Strike Rate | Expiration Date | Number of Contracts/ Notional | Premiums Received (000s) | Value (000s) | ||||||||
Interest Rate Swap Option 5 year (Call) | Morgan Stanley Capital Services LLC | 3-Month USD-LIBOR | Receive | 2.527% | 02/21/2020 | 2,300,000 | $22 | $(35) | ||||||||
Total Written Swap Options Not Settled Through Variation Margin | $114 | $(119) | ||||||||||||||
Total Written Options | $263 | $(133) |
FORWARD CURRENCY CONTRACTS
Counterparty | Amount to be Delivered (000s) | Amount to be Received (000s) | Settlement Date | Unrealized Appreciation/ (Depreciation) (000s) | ||||
HSBC Bank USA | $ 707 | AUD 1,003 | 05/03/2019 | $ — | ||||
Goldman Sachs Bank USA | AUD 996 | $ 706 | 05/03/2019 | 4 | ||||
HSBC Bank USA | AUD 1,003 | $ 708 | 06/04/2019 | — | ||||
JP Morgan Chase Bank NA | AUD 7 | $ 5 | 05/03/2019 | — | ||||
Citibank NA | $ 2,380 | GBP 1,843 | 05/03/2019 | 25 | ||||
BNP Paribas SA | GBP 1,596 | $ 2,103 | 05/03/2019 | 22 | ||||
Citibank NA | GBP 1,843 | $ 2,384 | 06/04/2019 | (24) | ||||
JP Morgan Chase Bank NA | GBP 247 | $ 324 | 05/03/2019 | 2 | ||||
Citibank NA | $ 634 | CAD 853 | 05/03/2019 | 3 | ||||
BNP Paribas SA | CAD 100 | $ 75 | 06/03/2019 | — | ||||
Citibank NA | CAD 853 | $ 635 | 06/04/2019 | (3) | ||||
JP Morgan Chase Bank NA | CAD 200 | $ 149 | 05/31/2019 | — | ||||
UBS AG | CAD 853 | $ 636 | 05/03/2019 | (1) | ||||
BNP Paribas SA | $ 116 | COP 362,743 | 06/11/2019 | (4) | ||||
Citibank NA | $ 235 | COP 733,417 | 06/11/2019 | (9) | ||||
Goldman Sachs Bank USA | $ 329 | EUR 292 | 05/03/2019 | (1) | ||||
UBS AG | $ 3,266 | EUR 2,930 | 05/03/2019 | 21 | ||||
JP Morgan Chase Bank NA | EUR 3,222 | $ 3,627 | 05/03/2019 | 13 | ||||
UBS AG | EUR 2,930 | $ 3,275 | 06/04/2019 | (22) | ||||
BNP Paribas SA | $ 413 | IDR 5,914,172 | 06/19/2019 | — | ||||
Citibank NA | $ 139 | JPY 15,300 | 05/08/2019 | (2) | ||||
HSBC Bank USA | $ 137 | JPY 15,300 | 06/04/2019 | 1 | ||||
HSBC Bank USA | JPY 15,300 | $ 137 | 05/08/2019 | (1) | ||||
Société Générale | JPY 59,400 | $ 533 | 06/04/2019 | (2) | ||||
Citibank NA | MXN 1,146 | $ 58 | 06/26/2019 | (2) | ||||
Goldman Sachs Bank USA | MXN 1,412 | $ 75 | 05/15/2019 | — | ||||
BNP Paribas SA | $ 1,254 | NZD 1,885 | 05/03/2019 | 5 | ||||
BNP Paribas SA | NZD 1,885 | $ 1,254 | 06/04/2019 | (5) | ||||
Citibank NA | NZD 1,701 | $ 1,159 | 05/03/2019 | 23 | ||||
Goldman Sachs Bank USA | NZD 184 | $ 124 | 05/03/2019 | 1 | ||||
Barclays Bank plc | $ 447 | RUB 29,634 | 05/15/2019 | 11 | ||||
BNP Paribas SA | $ 376 | RUB 24,594 | 08/15/2019 | (2) | ||||
BNP Paribas SA | RUB 24,594 | $ 382 | 05/15/2019 | 2 | ||||
Société Générale | RUB 5,040 | $ 76 | 05/15/2019 | (2) | ||||
Barclays Bank plc | SGD 123 | $ 91 | 06/19/2019 | — | ||||
JP Morgan Chase Bank NA | SGD 158 | $ 117 | 06/19/2019 | 1 | ||||
Goldman Sachs Bank USA | $ 207 | ZAR 2,937 | 05/09/2019 | (2) | ||||
Goldman Sachs Bank USA | KRW 424,810 | $ 379 | 06/19/2019 | 14 | ||||
BNP Paribas SA | TWD 12,861 | $ 418 | 06/19/2019 | 2 | ||||
Total Forward Currency Contracts | $68 |
69
Harbor Real Return Fund
Portfolio of Investments—Continued
INTEREST RATE SWAP AGREEMENTS
CENTRALLY CLEARED SWAP AGREEMENTS
INTEREST RATE SWAPS
Counterparty | Floating Rate Index | Pay/Receive Floating Rate | Fixed Rate | Payment Frequency | Expiration Date | Notional Amount (000s) | Value (000s) | Upfront Premiums (Received)/ Paid (000s) | Unrealized Appreciation/ (Depreciation) (000s) | |||||||||
LCH Group | Eurostat Eurozone HICP Ex Tobacco NSA | Pay | 1.066% | At maturity | 02/15/2024 | EUR 170 | $1 | $— | $1 | |||||||||
LCH Group | Eurostat Eurozone HICP Ex Tobacco NSA | Pay | 1.168 | At maturity | 03/15/2024 | 700 | 4 | 1 | 3 | |||||||||
LCH Group | Eurostat Eurozone HICP Ex Tobacco NSA | Pay | 1.620 | At maturity | 05/15/2028 | 350 | 16 | — | 16 | |||||||||
LCH Group | Eurostat Eurozone HICP Ex Tobacco NSA | Pay | 1.796 | At maturity | 11/15/2038 | 130 | 11 | — | 11 | |||||||||
LCH Group | Eurostat Eurozone HICP Ex Tobacco NSA | Pay | 1.808 | At maturity | 11/15/2038 | 100 | 9 | — | 9 | |||||||||
LCH Group | Eurostat Eurozone HICP Ex Tobacco NSA | Pay | 1.945 | At maturity | 11/15/2048 | 60 | 8 | — | 8 | |||||||||
LCH Group | Eurostat Eurozone HICP Ex Tobacco NSA | Pay | 1.950 | At maturity | 11/15/2048 | 70 | 9 | — | 9 | |||||||||
LCH Group | French Consumer Price Index Ex Tobacco Index | Receive | 1.160 | At maturity | 08/15/2020 | 20 | — | — | — | |||||||||
LCH Group | French Consumer Price Index Ex Tobacco Index | Receive | 1.345 | At maturity | 06/15/2021 | 200 | (2) | — | (2) | |||||||||
LCH Group | French Consumer Price Index Ex Tobacco Index | Receive | 1.000 | At maturity | 03/15/2024 | 700 | — | — | — | |||||||||
LCH Group | British Bankers' Association LIBOR GBP 6-Month | Receive | 1.500 | Semi-annual | 09/18/2049 | GBP 350 | 1 | 6 | (5) | |||||||||
LCH Group | UK Retail Prices Index All Items NSA | Pay | 3.100 | At maturity | 06/15/2031 | 150 | (16) | (18) | 2 | |||||||||
LCH Group | UK Retail Prices Index All Items NSA | Pay | 3.470 | At maturity | 09/15/2032 | 1,290 | (12) | 1 | (13) | |||||||||
LCH Group | UK Retail Prices Index All Items NSA | Pay | 3.500 | At maturity | 09/15/2033 | 40 | — | — | — | |||||||||
LCH Group | UK Retail Prices Index All Items NSA | Pay | 3.579 | At maturity | 10/15/2033 | 20 | — | — | — | |||||||||
LCH Group | UK Retail Prices Index All Items NSA | Pay | 3.358 | At maturity | 04/15/2035 | 200 | (4) | (5) | 1 | |||||||||
LCH Group | British Bankers' Association LIBOR JPY 6-Month | Receive | 0.450 | Semi-annual | 03/20/2029 | JPY 148,670 | (44) | (8) | (36) | |||||||||
CME Group | New Zeland 90 Day Bank Bill Futures Rate Agreement | Receive | 3.250 | Semi-annual | 03/21/2028 | NZD 600 | (36) | 2 | (38) | |||||||||
CME Group | British Bankers' Association LIBOR USD 3-Month | Pay | 2.250 | Semi-annual | 12/20/2022 | $ 1,400 | 4 | 2 | 2 | |||||||||
CME Group | British Bankers' Association LIBOR USD 3-Month | Pay | 2.678 | Semi-annual | 10/25/2023 | 1,000 | 15 | — | 15 | |||||||||
CME Group | British Bankers' Association LIBOR USD 3-Month | Pay | 2.670 | Semi-annual | 11/19/2023 | 1,000 | 22 | — | 22 | |||||||||
CME Group | British Bankers' Association LIBOR USD 3-Month | Pay | 2.681 | Semi-annual | 12/12/2023 | 1,000 | 22 | — | 22 | |||||||||
CME Group | British Bankers' Association LIBOR USD 3-Month | Pay | 2.500 | Semi-annual | 12/19/2023 | 800 | 11 | (7) | 18 | |||||||||
CME Group | British Bankers' Association LIBOR USD 3-Month | Receive | 2.400 | Semi-annual | 03/16/2026 | 700 | — | — | — | |||||||||
CME Group | British Bankers' Association LIBOR USD 3-Month | Receive | 2.300 | Semi-annual | 04/21/2026 | 1,700 | 8 | (9) | 17 | |||||||||
CME Group | British Bankers' Association LIBOR USD 3-Month | Receive | 2.300 | Semi-annual | 04/27/2026 | 2,000 | 9 | (8) | 17 | |||||||||
CME Group | British Bankers' Association LIBOR USD 3-Month | Receive | 1.850 | Semi-annual | 07/27/2026 | 600 | 16 | (1) | 17 | |||||||||
CME Group | British Bankers' Association LIBOR USD 3-Month | Receive | 2.000 | Semi-annual | 07/27/2026 | 3,500 | 67 | 54 | 13 | |||||||||
CME Group | British Bankers' Association LIBOR USD 3-Month | Receive | 2.400 | Semi-annual | 12/07/2026 | 100 | — | 1 | (1) | |||||||||
CME Group | British Bankers' Association LIBOR USD 3-Month | Receive | 3.100 | Semi-annual | 04/17/2028 | 2,010 | (42) | (6) | (36) | |||||||||
CME Group | British Bankers' Association LIBOR USD 3-Month | Receive | 2.765 | Semi-annual | 07/18/2028 | 500 | (15) | 6 | (21) |
70
Harbor Real Return Fund
Portfolio of Investments—Continued
INTEREST RATE SWAP AGREEMENTS—Continued
CENTRALLY CLEARED SWAP AGREEMENTS—Continued
INTEREST RATE SWAPS—Continued
Counterparty | Floating Rate Index | Pay/Receive Floating Rate | Fixed Rate | Payment Frequency | Expiration Date | Notional Amount (000s) | Value (000s) | Upfront Premiums (Received)/ Paid (000s) | Unrealized Appreciation/ (Depreciation) (000s) | |||||||||
CME Group | British Bankers' Association LIBOR USD 3-Month | Receive | 3.134% | Semi-annual | 09/13/2028 | $ 1,900 | $(39) | $— | $(39) | |||||||||
CME Group | British Bankers' Association LIBOR USD 3-Month | Receive | 2.750 | Semi-annual | 12/20/2047 | 70 | (1) | 3 | (4) | |||||||||
CME Group | British Bankers' Association LIBOR USD 3-Month | Receive | 2.500 | Semi-annual | 06/20/2048 | 90 | 4 | 11 | (7) | |||||||||
CME Group | British Bankers' Association LIBOR USD 3-Month | Receive | 2.951 | Semi-annual | 11/19/2048 | 100 | (5) | — | (5) | |||||||||
CME Group | British Bankers' Association LIBOR USD 3-Month | Receive | 3.000 | Semi-annual | 12/19/2048 | 400 | (26) | 24 | (50) | |||||||||
LCH Group | British Bankers' Association LIBOR USD 3-Month | Receive | 2.250 | Semi-annual | 06/20/2028 | 1,330 | 17 | 74 | (57) | |||||||||
LCH Group | Federal Funds Effective Rate US | Receive | 2.000 | Annual | 12/15/2047 | 300 | 27 | (1) | 28 | |||||||||
LCH Group | Federal Funds Effective Rate US | Receive | 2.428 | Annual | 12/20/2047 | 100 | — | — | — | |||||||||
LCH Group | Federal Funds Effective Rate US | Receive | 2.478 | Annual | 12/20/2047 | 223 | (2) | — | (2) | |||||||||
LCH Group | Federal Funds Effective Rate US | Receive | 2.499 | Annual | 12/20/2047 | 60 | (1) | — | (1) | |||||||||
LCH Group | US Consumer Price Index Urban Consumers NSA | Receive | 2.027 | At maturity | 11/23/2020 | 500 | — | — | — | |||||||||
LCH Group | US Consumer Price Index Urban Consumers NSA | Receive | 2.021 | At maturity | 11/25/2020 | 400 | — | — | — | |||||||||
LCH Group | US Consumer Price Index Urban Consumers NSA | Receive | 1.550 | At maturity | 07/26/2021 | 300 | 7 | 10 | (3) | |||||||||
LCH Group | US Consumer Price Index Urban Consumers NSA | Receive | 1.603 | At maturity | 09/12/2021 | 310 | 6 | 9 | (3) | |||||||||
LCH Group | US Consumer Price Index Urban Consumers NSA | Pay | 1.730 | At maturity | 07/26/2026 | 300 | (10) | (16) | 6 | |||||||||
LCH Group | US Consumer Price Index Urban Consumers NSA | Pay | 1.801 | At maturity | 09/12/2026 | 310 | (8) | (14) | 6 | |||||||||
LCH Group | US Consumer Price Index Urban Consumers NSA | Pay | 1.780 | At maturity | 09/15/2026 | 200 | (6) | (10) | 4 | |||||||||
LCH Group | US Consumer Price Index Urban Consumers NSA | Pay | 2.180 | At maturity | 09/20/2027 | 170 | 1 | — | 1 | |||||||||
LCH Group | US Consumer Price Index Urban Consumers NSA | Pay | 2.150 | At maturity | 09/25/2027 | 200 | — | — | — | |||||||||
LCH Group | US Consumer Price Index Urban Consumers NSA | Pay | 2.156 | At maturity | 10/17/2027 | 400 | 1 | — | 1 | |||||||||
LCH Group | US Consumers Price Index Urban Consumers NSA | Receive | 1.000 | At maturity | 03/20/2020 | 6,400 | 9 | — | 9 | |||||||||
LCH Group | US Consumers Price Index Urban Consumers NSA | Receive | 1.000 | At maturity | 03/14/2021 | 1,600 | 3 | — | 3 | |||||||||
LCH Group | US Consumers Price Index Urban Consumers NSA | Receive | 2.069 | At maturity | 07/15/2022 | 200 | — | — | — | |||||||||
LCH Group | US Consumers Price Index Urban Consumers NSA | Receive | 2.210 | At maturity | 02/05/2023 | 950 | (11) | — | (11) | |||||||||
LCH Group | US Consumers Price Index Urban Consumers NSA | Receive | 2.263 | At maturity | 04/27/2023 | 270 | (5) | — | (5) | |||||||||
LCH Group | US Consumers Price Index Urban Consumers NSA | Receive | 2.263 | At maturity | 05/09/2023 | 140 | (2) | — | (2) | |||||||||
LCH Group | US Consumers Price Index Urban Consumers NSA | Receive | 2.281 | At maturity | 05/10/2023 | 220 | (5) | — | (5) | |||||||||
LCH Group | US Consumers Price Index Urban Consumers NSA | Pay | 2.335 | At maturity | 02/05/2028 | 480 | 12 | 1 | 11 | |||||||||
LCH Group | US Consumers Price Index Urban Consumers NSA | Pay | 2.353 | At maturity | 05/09/2028 | 140 | 4 | — | 4 | |||||||||
LCH Group | US Consumers Price Index Urban Consumers NSA | Pay | 2.360 | At maturity | 05/09/2028 | 210 | 6 | — | 6 | |||||||||
LCH Group | US Consumers Price Index Urban Consumers NSA | Pay | 2.364 | At maturity | 05/10/2028 | 220 | 6 | — | 6 |
71
Harbor Real Return Fund
Portfolio of Investments—Continued
INTEREST RATE SWAP AGREEMENTS—Continued
CENTRALLY CLEARED SWAP AGREEMENTS—Continued
INTEREST RATE SWAPS—Continued
Counterparty | Floating Rate Index | Pay/Receive Floating Rate | Fixed Rate | Payment Frequency | Expiration Date | Notional Amount (000s) | Value (000s) | Upfront Premiums (Received)/ Paid (000s) | Unrealized Appreciation/ (Depreciation) (000s) | |||||||||
LCH Group | US Consumers Price Index Urban Consumers NSA | Pay | 2.370% | At maturity | 06/06/2028 | $ 200 | $6 | $— | $6 | |||||||||
LCH Group | US Consumers Price Index Urban Consumers NSA | Pay | 2.165 | At maturity | 04/16/2029 | 300 | — | — | — | |||||||||
Centrally Cleared Interest Rate Swaps | $(52) |
OVER-THE-COUNTER (OTC) SWAP AGREEMENTS
INTEREST RATE SWAPS
Counterparty | Floating Rate Index | Pay/Receive Floating Rate | Fixed Rate | Payment Frequency | Expiration Date | Notional Amount (000s) | Value (000s) | Upfront Premiums (Received)/ Paid (000s) | Unrealized Appreciation/ (Depreciation) (000s) | |||||||||
Deutsche Bank AG | US Consumer Price Index Urban Consumers NSA | Receive | 2.500% | At maturity | 07/15/2022 | $ 300 | $(29) | $7 | $(36) | |||||||||
Morgan Stanley Capital Services LLC | US Consumer Price Index Urban Consumers NSA | Pay | 1.788 | At maturity | 07/18/2026 | 1,100 | (32) | — | (32) | |||||||||
Morgan Stanley Capital Services LLC | US Consumer Price Index Urban Consumers NSA | Pay | 1.800 | At maturity | 07/20/2026 | 1,200 | (34) | — | (34) | |||||||||
Morgan Stanley Capital Services LLC | US Consumer Price Index Urban Consumers NSA | Pay | 1.805 | At maturity | 09/20/2026 | 100 | (3) | — | (3) | |||||||||
Over-the-Counter Interest Rate Swaps | (105) | |||||||||||||||||
Interest Rate Swaps | $(157) |
CREDIT DEFAULT SWAP AGREEMENTS
CENTRALLY CLEARED SWAP AGREEMENTS
CREDIT DEFAULT SWAPS
Counterparty | Reference Entity | Buy/ Sellb,c | Pay/Receive Fixed Rate | Expiration Date | Implied Credit Spreadd | Payment Frequency | Notional Amount (000s)e | Value (000s)f | Upfront Premiums (Received)/ Paid (000s) | Unrealized Appreciation/ (Depreciation) (000s) | ||||||||||
ICE Group | Daimler AG 0.625% due 03/05/2020 | Sell | 1.000% | 12/20/2020 | 0.240% | Quarterly | EUR 30 | $— | $— | $— | ||||||||||
ICE Group | Markit CDX North America High Yield Index Series 31 0.001% | Buy | 5.000 | 12/20/2023 | 2.920 | Quarterly | $ 1,067 | (96) | (61) | (35) | ||||||||||
Centrally Cleared Credit Default Swaps | $(35) |
OVER-THE-COUNTER (OTC) SWAP AGREEMENTS
CREDIT DEFAULT SWAPS
Counterparty | Reference Entity | Buy/ Sellb,c | Pay/Receive Fixed Rate | Expiration Date | Implied Credit Spreadd | Payment Frequency | Notional Amount (000s)e | Value (000s)f | Upfront Premiums (Received)/ Paid (000s) | Unrealized Appreciation/ (Depreciation) (000s) | ||||||||||
Goldman Sachs International | Markit CMBX North America AAA Indices 0.001% | Sell | 0.500% | 10/17/2057 | 0.270% | Monthly | $ 100 | $1 | $(5) | $6 | ||||||||||
Goldman Sachs International | Markit CMBX North America AAA Indices 0.001% | Sell | 0.500 | 09/17/2058 | 0.330 | Monthly | 100 | 1 | (6) | 7 |
72
Harbor Real Return Fund
Portfolio of Investments—Continued
CREDIT DEFAULT SWAP AGREEMENTS—Continued
OVER-THE-COUNTER (OTC) SWAP AGREEMENTS—Continued
CREDIT DEFAULT SWAPS—Continued
Counterparty | Reference Entity | Buy/ Sellb,c | Pay/Receive Fixed Rate | Expiration Date | Implied Credit Spreadd | Payment Frequency | Notional Amount (000s)e | Value (000s)f | Upfront Premiums (Received)/ Paid (000s) | Unrealized Appreciation/ (Depreciation) (000s) | ||||||||||
Barclays Bank plc | United Mexican States 4.150% due 03/28/2027 | Buy | 1.000% | 12/20/2023 | 1.020% | Quarterly | $ 600 | $— | $6 | $(6) | ||||||||||
HSBC Bank USA NA | United Mexican States 4.150% due 03/28/2027 | Buy | 1.000 | 12/20/2023 | 1.020 | Quarterly | 200 | — | 2 | (2) | ||||||||||
Over-the-Counter Credit Default Swaps | 5 | |||||||||||||||||||
Credit Default Swaps | $(30) | |||||||||||||||||||
Total Swaps | $(187) |
FIXED INCOME INVESTMENTS SOLD SHORT — (2.4)%
Principal Amount (000s) | Security | Proceeds (000s) | Value (000s) | |||
$ 2,000 | Federal National Mortgage Association TBA9 3.000%—06/13/2049 | $1,969 | $(1,975) |
REVERSE REPURCHASE AGREEMENTS — (24.7)%
Counterparty | Borrowing Rate | Borrowing Date | Maturity Date | Proceeds (000s) | Value (000s) | |||||
Royal Bank of Canada | 2.640% | 03/04/2019 | 06/05/2019 | $12,767 | $(12,767) | |||||
Royal Bank of Scotland | 2.590% | 04/26/2019 | 05/02/2019 | 7,484 | (7,484) | |||||
Total Reverse Repurchase Agreements | $20,251 | $(20,251) |
SALE-BUYBACK TRANSACTIONS — (3.0)%
Counterparty | Borrowing Rate | Borrowing Date | Maturity Date | Proceeds (000s) | Value (000s) | |||||
Morgan Stanley | 0.375% | 04/16/2019 | 07/12/2019 | $2,376 | $(2,459) | |||||
Total Sale-Buyback Transactions | $2,376 | $(2,459) |
FAIR VALUE MEASUREMENTS
The following table summarizes the Fund’s investments as of April 30, 2019 based on the inputs used to value them.
Asset Category | Quoted Prices Level 1 (000s) | Other Significant Observable Inputs Level 2 (000s) | Significant Unobservable Inputs Level 3 (000s) | Total (000s) | ||||
Investments in Securities | ||||||||
Asset-Backed Securities | $— | $4,125 | $100 | $4,225 | ||||
Collateralized Mortgage Obligations | — | 1,874 | — | 1,874 | ||||
Corporate Bonds & Notes | — | 6,684 | — | 6,684 | ||||
Foreign Government Obligations | — | 7,270 | — | 7,270 | ||||
Mortgage Pass-Through | — | 13,290 | — | 13,290 | ||||
U.S. Government Obligations | — | 80,539 | — | 80,539 | ||||
Short-Term Investments | ||||||||
Banker’s Acceptance | — | 224 | — | 224 | ||||
Repurchase Agreement | — | 1,400 | — | 1,400 | ||||
Total Investments in Securities | $— | $115,406 | $100 | $115,506 | ||||
Financial Derivative Instruments - Assets | ||||||||
Forward Currency Contracts | $— | $150 | $— | $150 | ||||
Futures Contracts | 155 | — | — | 155 | ||||
Purchased Options | 1 | 131 | — | 132 | ||||
Swap Agreements | — | 307 | — | 307 | ||||
Total Financial Derivative Instruments - Assets | $156 | $588 | $— | $744 |
73
Harbor Real Return Fund
Portfolio of Investments—Continued
FAIR VALUE MEASUREMENTS—Continued
Liability Category | Quoted Prices Level 1 (000s) | Other Significant Observable Inputs Level 2 (000s) | Significant Unobservable Inputs Level 3 (000s) | Total (000s) | ||||
Fixed Income Investments Sold Short | $— | $(1,975) | $— | $(1,975) | ||||
Reverse Repurchase Agreements | — | (20,251) | — | (20,251) | ||||
Sale-Buyback Transactions | — | (2,459) | — | (2,459) | ||||
Total Investments Sold Short and Secured Borrowings | $— | $(24,685) | $— | $(24,685) | ||||
Financial Derivative Instruments - Liabilities | ||||||||
Forward Currency Contracts | $— | $(82) | $— | $(82) | ||||
Futures Contracts | (325) | — | — | (325) | ||||
Swap Agreements | — | (494) | — | (494) | ||||
Written Options | (9) | (124) | — | (133) | ||||
Total Financial Derivative Instruments - Liabilities | $(334) | $(700) | $— | $(1,034) | ||||
Total Investments | $(178) | $90,609 | 100 | $90,531 |
For more information on valuation inputs and their aggregation into the levels used in the table above, please refer to the Fair Value Measurements and Disclosures in Note 2 of the accompanying Notes to Financial Statements.
The following is a rollforward of the Fund’s Level 3 investments during the period ended April 30, 2019.
Valuation Description | Beginning Balance as of 11/01/2018 (000s) | Purchases (000s) | Sales (000s) | Discount/ (Premium) (000s) | Total Realized Gain/(Loss) (000s) | Change in Unrealized Appreciation/ (Depreciation) (000s) | Transfers In Level 3 (000s) | Transfers Out of Level 3 (000s) | Ending Balance as of 04/30/2019w (000s) | |||||||||
Asset-Backed Securities | $— | $100 | $— | $— | $— | $— | $— | $— | $100 |
The following is a summary of significant unobservable inputs used in the fair valuations of assets and liabilities categorized within Level 3 of the fair value hierarchy.
Valuation Descriptions | Ending Balance as of 04/30/2019 (000s) | Valuation Technique | Unobservable Inputs | Input Value(s) | ||||
Investments in Securities | ||||||||
Asset-Backed Securities | ||||||||
Legacy Mortgage Asset Trust | ||||||||
Series 2019-GS3 Cl. 1 | $100 | Market Approach | Last Traded Price | $ 100.07 |
REMAINING CONTRACTUAL MATURITY OF TRANSFERS ACCOUNTED FOR AS SECURED BORROWINGS
The following is a summary of the remaining contractual maturities of transfers accounted for as secured borrowings, by collateral type, as of April 30, 2019.
Overnight and Continuous (000s) | Up to 30 days (000s) | 31-90 days (000s) | Greater Than 90 days (000s) | Total (000s) | |||||
Reverse Repurchase Agreements | |||||||||
U.S. Treasury Obligations | $— | $7,484 | $12,767 | $— | $20,251 | ||||
Sale-Buyback Transactions | |||||||||
U.S. Treasury Obligations | $— | $— | $2,459 | $— | $2,459 | ||||
Total Secured Borrowings | $— | $7,484 | $15,226 | $— | $22,710 |
74
Harbor Real Return Fund
Portfolio of Investments—Continued
1 | Variable rate security; the stated rate represents the rate in effect at April 30, 2019. | ||
2 | Securities purchased in a transaction exempt from registration under Rule 144A of the Securities Act of 1933. These securities may be resold in transactions exempt from registration, normally to qualified institutional buyers. The Fund has no right to demand registration of these securities. At April 30, 2019, the aggregate value of these securities was $5,545 or 7% of net assets. | ||
3 | CLO after the name of a security stands for Collateralized Loan Obligation. | ||
4 | Step coupon security; the stated rate represents the rate in effect at April 30, 2019. | ||
5 | MTN after the name of a security stands for Medium Term Note. | ||
6 | Perpetuity bond; the maturity date represents the next callable date. | ||
7 | Inflation-protected securities (“IPS”) are securities in which the principal amount is adjusted for inflation and interest payments are applied to the inflation-adjusted principal. | ||
8 | REMICs are CMOs which can hold mortgages secured by any type of real property and issue multiple-class securities backed by those mortgages. | ||
9 | TBAs are mortgage-backed securities traded under delayed delivery commitments, settling after April 30, 2019. Although the unit price for the trades has been established, the principal value has not been finalized. However, the amount of the commitments will not fluctuate more than 2% from the principal amount. Income on TBAs is not earned until settlement date (see Note 2 of the accompanying Notes to Financial Statements). | ||
10 | At April 30, 2019, a portion of securities held by the Fund were pledged as collateral for exchange traded and centrally cleared derivatives, over-the-counter (OTC) derivatives, forward commitments, or secured borrowings (see Note 2 of the accompanying Notes to Financial Statements). The securities pledged had an aggregate value of $20,385 or 25% of net assets. | ||
11 | Zero coupon bond | ||
b | If the Fund is a buyer of protection and a credit event occurs, as defined under the terms of that particular swap agreement, the Fund will either (i) receive from the seller of protection an amount equal to the notional amount of the swap and deliver the referenced obligation or underlying securities comprising the referenced index or (ii) receive a net settlement amount in the form of cash or securities equal to the notional amount of the swap less the recovery value of the referenced obligation or underlying securities comprising the referenced index. | ||
c | If the Fund is a seller of protection and a credit event occurs, as defined under the terms of that particular swap agreement, the Fund will either (i) pay to the buyer of protection an amount equal to the notional amount of the swap and take delivery of the referenced obligation or underlying securities comprising the referenced index or (ii) pay a net settlement amount in the form of cash or securities equal to the notional amount of the swap less the recovery value of the referenced obligation or underlying securities comprising the referenced index. | ||
d | Implied credit spreads, represented in absolute terms, utilized in determining the value of credit default swap agreements on corporate issues or sovereign issues of an emerging country as of period end serve as an indicator of the current status of the payment/performance risk and represent the likelihood or risk of default for the credit derivative. The implied credit spread of a particular referenced entity reflects the cost of buying/selling protection and may include upfront payments required to be made to enter into the agreement. Wider credit spreads represent a deterioration of the referenced entity’s credit soundness and a greater likelihood or risk of default or other credit event occurring as defined under the terms of the agreement. A credit spread identified as “Defaulted” indicates a credit event has occurred for the referenced entity or obligation. | ||
e | The maximum potential amount the Fund could be required to make as a seller of credit protection or receive as a buyer of credit protection if a credit event occurs as defined under the terms of that particular swap agreement. | ||
f | The quoted market prices and resulting values for credit default swap agreements on asset-backed securities and credit indices serve as an indicator of the current status of the payment/performance risk and represent the likelihood of an expected liability (or profit) for the credit derivative should the notional amount of the swap agreement be closed/sold as of the period end. Increasing values, in absolute terms when compared to the notional amount of the swap, represent a deterioration of the referenced entity’s credit soundness and a greater likelihood or risk of default or other credit event occurring as defined under the terms of the agreement. | ||
j | Amount represents index value | ||
w | Amounts in this category are included in the “Realized and Change in Unrealized Gain/(Loss) on Investment Transactions” section of the Statement of Operations. The net unrealized appreciation/(depreciation) per investment type is below: | ||
Valuation Description | Unrealized Gain/(Loss) as of 04/30/2019 (000s) | ||
Asset-Backed Securities | $– | ||
x | Fair valued in accordance with Harbor Funds Valuation Procedures. | ||
ARS | Argentine Peso | ||
AUD | Australian Dollar | ||
GBP | British Pound | ||
CAD | Canadian Dollar | ||
COP | Colombian Peso | ||
EUR | Euro | ||
IDR | Indonesian Rupiah | ||
JPY | Japanese Yen | ||
KRW | South Korean Won | ||
MXN | Mexican Peso | ||
NZD | New Zealand Dollar | ||
PEN | Peruvian Nuevosol | ||
RUB | Russian Ruble | ||
SGD | Singapore Dollar | ||
TWD | Taiwan Dollar | ||
ZAR | South African Rand |
The accompanying notes are an integral part of the Financial Statements.
75
Harbor Money Market Fund
Manager’s Commentary (Unaudited)
Subadviser
BNP Paribas Asset Management USA, Inc.
200 Park Avenue
New York, NY 10166
Portfolio Manager
Kenneth J. O’Donnell, CFA
Since 2003
Since 2003
BNP has subadvised the Fund since 1987.
Investment Objective
The Fund seeks to provide current income while maintaining liquidity and a stable share price of $1.
Kenneth J. O’Donnell, CFA
Management’s Discussion of
Fund Performance
Fund Performance
Market Review
Global economic growth decelerated in the six months ending April 30, 2019 with evidence of a slowdown in both emerging and advanced economies. The U.S. economy continued to expand at an above trend pace, though the economies of Europe and Japan slowed considerably. This pattern of a slowing global growth trend was an unwelcome sign for many central banks as they look to unwind post crisis-era stimulus measures. We believe that the stimulus burden will shift from monetary to fiscal policy across advanced economies as the impact of non-traditional central bank policy measures wanes.
In late 2018, the U.S. Federal Reserve (Fed) tightened monetary policy for the ninth time in the cycle. Volatility increased as markets began pricing the end to the tightening cycle. The persistent rally in risk assets stalled in the fourth quarter of 2018 with equity markets correcting and credit spreads widening across most sectors. Renegotiation of the U.S.-China trade policy by the Trump administration and global growth concerns contributed to the uncertainty in markets. Federal Reserve Chair Jerome Powell declared a formal pause in the tightening cycle as short term interest rates reached the low end of the estimated neutral range for monetary policy. In sharp contrast to previous expectations for further tightening, markets are currently forecasting a reduction in short term interest rates in late 2019.
Short-term U.S. Treasury Note yields declined from their peak during the six-month period as market sentiment abruptly shifted and investors began discounting an end to the policy normalization cycle. Intermediate yields declined more aggressively inverting the slope of the yield curve. Money market yields closely tracked monetary policy rates with yields hovering around 2.40% over the past six months. The steady increase in money market yields has been welcomed by investors who have endured low interest rates for nearly a decade. We believe that money market yields will stabilize at current levels through year end as Fed policy remains on hold.
PerformancE
For the six months ending April 30, 2019, the Harbor Money Market Fund returned 1.04% (Institutional Class) and 0.92% (Administrative Class), underperforming the return of the Fund’s benchmark, the ICE BofAML U.S. 3-Month Treasury Bill Index, which returned 1.18%. The duration of the portfolio, a measure of its sensitivity to changes in interest rates, was managed tactically throughout the period between approximately 45 days and 30 days as expectations for monetary policy shifted dramatically.
76
Harbor Money Market Fund
Manager’s Commentary—Continued
TOTAL RETURNS
For the periods ended 04/30/2019
Unannualized | 1 Year | Annualized | |||||||||
6 Months | 5 Years | 10 Years | |||||||||
Harbor Money Market Fund | |||||||||||
Institutional Class | 1.04% | 1.88% | 0.72% | 0.42% | |||||||
Administrative Class | 0.92 | 1.69 | 0.68 | 0.40 | |||||||
Comparative Index | |||||||||||
ICE BofAML U.S. 3-Month Treasury Bill | 1.18% | 2.18% | 0.78% | 0.45% |
Current 7-day subsidizeda SEC yield for period ended 04/30/2019: | Institutional Class: 2.14% | Administrative Class: 1.89% |
Current 7-day unsubsidizedb SEC yield for period ended 04/30/2019: | Institutional Class: 2.07% | Administrative Class: 1.82% |
Performance data shown represents past performance and is no guarantee of future results. Past performance is net of management fees and expenses and reflects reinvested dividends and distributions but does not reflect the deduction of taxes that a shareholder would pay on Fund distributions or upon the redemption of Fund shares. Past performance reflects the beneficial effect of any expense waivers or reimbursements, without which returns would have been lower. Investment returns and principal value will fluctuate so that Fund shares, when redeemed, may be worth more or less than their original cost. Returns for periods less than one year are not annualized. Current performance may be higher or lower and is available through the most recent month end atharborfunds.com or by calling 800-422-1050. Voluntary waivers and reimbursements may be discontinued at any time without notice. Current yield excludes gains and losses as defined by the Securities and Exchange Commission. The current yield more closely reflects the current earnings of the Fund than the total return.
Outlook & Strategy
Looking ahead, we expect monetary policy to remain stable throughout 2019 as the Fed assesses the evolution of the economic cycle. We expect that real, or inflation-adjusted, economic growth in the U.S. will average approximately 2.25% and that wage pressures will build throughout the year as incremental gains in the labor sector push the economy well through estimates of full employment. We also believe that personal consumption and business investment will continue to drive domestic growth.
The Fed may become challenged in defending its policy stance if inflation data falters. While by most measures, the Fed has achieved both of its dual mandate goals, short term yields are peaking well below previous cycles. We expect that the next tightening may occur in 2020 if the global growth trends resume but acknowledge that the cycle has reached the late stages. Rising growth rates and improving inflation data have supported asset valuations despite recent market volatility. We do not expect any changes in the tools used to manage short-term interest rates, i.e. interest paid on banking reserves and the overnight fixed-rate reserve purchase agreement program, or reverse repo facility, though we do expect the Fed to end balance sheet reduction in late 2019, earlier than previously expected. We believe that the Fund will continue to benefit from tighter monetary policy, while the transparency of the Federal Open Market Committee will provide opportunities to tactically adjust the Fund’s duration profile as conditions evolve.
a | Reflects reimbursement or waivers currently in effect |
b | Does not reflect reimbursements or waivers currently in effect |
This report contains the current opinions of BNP Paribas Asset Management USA, Inc. as of the date of this report and should not be considered as investment advice or a recommendation of any particular security, strategy or investment product. Such opinions are subject to change without notice and securities described herein may no longer be included in, or may at any time be removed from, the Fund’s portfolio. This report is distributed for informational purposes only. Information contained herein has been obtained from sources believed reliable, but not guaranteed.
You could lose money by investing in Harbor Money Market Fund. Although the Fund seeks to preserve the value of your investment at $1.00 per share, it cannot guarantee it will do so. An investment in the Fund is not insured or guaranteed by the FDIC or any other government agency. The Fund’s sponsor has no legal obligation to provide financial support to the Fund and you should not expect the sponsor to provide financial support to the Fund at any time. For information on the different share classes and the risks associated with an investment in the Fund, please refer to the current prospectus.
77
Harbor Money Market Fund
Fund Summary—April 30, 2019 (Unaudited)
TOP Issuers(% of net assets)
❶ | U.S. Treasury | 68.3% |
❷ | Federal Home Loan Bank | 22.3% |
❸ | Federal Home Loan Mortgage Corp. | 4.7% |
❹ | Federal National Mortgage Association | 4.6% |
Total Investments(% of net assets)
(Excludes net cash of 0.1%)
78
Harbor Money Market Fund
Portfolio of Investments—April 30, 2019 (Unaudited)
Value, Cost, and Principal Amounts in Thousands
GOVERNMENT AGENCY DEBT—31.6%† | |||
Principal Amount | Value | ||
Federal Home Loan Bank Discount Notes | |||
$ | 1,810 | 2.360%—05/01/2019 | $1,810 |
5,500 | 2.383%—05/13/2019 | 5,496 | |
2,800 | 2.390%—05/24/2019 | 2,796 | |
6,750 | 2.395%—05/29/2019 | 6,737 | |
16,200 | 2.400%—05/03/2019-05/22/2019 | 16,192 | |
33,031 | |||
Federal Home Loan Mortgage Corp. Discount Notes | |||
7,000 | 2.400%—05/13/2019 | 6,994 | |
Federal National Mortgage Association Discount Notes | |||
6,800 | 2.390%—05/15/2019 | 6,794 | |
TOTAL GOVERNMENT AGENCY DEBT | |||
(Cost $46,819) | 46,819 | ||
TREASURY DEBT—68.3%† | |||
U.S. Treasury Bills | |||
10,100 | 2.357%—06/27/2019 | 10,062 |
TREASURY DEBT—Continued | |||
Principal Amount | Value | ||
$ | 10,250 | 2.358%—06/13/2019 | $10,221 |
7,700 | 2.360%—06/20/2019 | 7,675 | |
10,000 | 2.363%—05/16/2019 | 9,990 | |
14,150 | 2.364%—06/04/2019-07/11/2019 | 14,103 | |
3,500 | 2.367%—05/07/2019 | 3,499 | |
8,700 | 2.370%—05/28/2019 | 8,685 | |
11,250 | 2.376%—07/05/2019 | 11,202 | |
5,500 | 2.382%—05/09/2019 | 5,497 | |
10,900 | 2.384%—05/23/2019 | 10,884 | |
9,400 | 2.389%—06/06/2019 | 9,378 | |
TOTAL TREASURY DEBT | |||
(Cost $101,196) | 101,196 | ||
TOTAL INVESTMENTS—99.9% | |||
(Cost $148,015) | 148,015 | ||
CASH AND OTHER ASSETS, LESS LIABILITIES—0.1% | 186 | ||
TOTAL NET ASSETS—100.0% | $148,201 |
FAIR VALUE MEASUREMENTS
All investments at April 30, 2019 (as disclosed in the preceding Portfolio of Investments) were classified as Level 2. There were no Level 3 investments at April 30, 2019 or October 31, 2018.
For more information on valuation inputs and their aggregation into the levels identified above, please refer to the Fair Value Measurements and Disclosures in Note 2 of the accompanying Notes to Financial Statements.
† | Coupon represents yield to maturity |
The accompanying notes are an integral part of the Financial Statements.
79
[THIS PAGE INTENTIONALLY LEFT BLANK]
80
Harbor Fixed Income Funds
StatementS of Assets and Liabilities—April 30, 2019 (Unaudited)
(All amounts in thousands, except per share amounts)
Harbor Convertible Securities Fund | Harbor High-Yield Bond Fund | Harbor High-Yield Opportunities Fund | Harbor Core Bond Fund | Harbor Bond Fund | Harbor Real Return Fund | Harbor Money Market Fund | |
ASSETS | |||||||
Investments, at identified cost | $118,274 | $494,454 | $72,901 | $81,853 | $3,248,751 | $115,289* | $148,015 |
Investments, at value | $123,715 | $496,939 | $73,489 | $83,404 | $3,249,527 | $114,106 | $148,015 |
Repurchase agreements | — | — | — | — | — | 1,400 | — |
Due from broker | — | — | — | — | 3,043 | 782 | — |
Cash | 3,701 | 8,447 | 1,698 | 1,743 | 1,329 | 541 | 209 |
Foreign currency, at value (cost: $0,$0,$0,$0,$7,030,$342 and $0) | — | — | — | — | 6,882 | 336 | — |
Receivables for: | |||||||
Investments sold | 167 | 4,743 | 655 | — | 1,170,712 | 18,672 | — |
Capital shares sold | 132 | 427 | — | 1 | 626 | 5 | 139 |
Interest | 398 | 7,507 | 1,155 | 527 | 14,807 | 425 | — |
Unrealized appreciation on open forward currency contracts | — | — | — | — | 7,542 | 150 | — |
Unrealized appreciation on OTC swap agreements | — | — | — | — | 437 | 13 | — |
Swap premiums paid on OTC swap agreements | — | — | — | — | — | 3 | — |
Variation margin on options and futures contracts | — | — | — | — | 10,839 | 172 | — |
Variation margin on centrally cleared swap agreements | — | — | — | — | 1,125 | 13 | — |
Purchased options not settled through variation margin, at value (cost: $0,$0,$0,$0,$147,$115 and $0) | — | — | — | — | 31 | 131 | — |
Options sold | — | — | — | — | — | 23 | — |
Withholding tax | — | — | 2 | — | — | — | — |
Prepaid registration fees | 33 | 42 | 34 | 11 | 34 | 22 | 16 |
Prepaid fund insurance | 1 | 4 | — | 1 | 9 | 1 | 1 |
Other assets | 21 | 151 | 10 | 18 | 667 | 44 | 25 |
Total Assets | 128,168 | 518,260 | 77,043 | 85,705 | 4,467,610 | 136,839 | 148,405 |
LIABILITIES | |||||||
Payables for: | |||||||
Due to broker | — | — | — | — | 15,155 | 43 | — |
Investments purchased | 9 | 4,261 | 1,272 | 1,246 | 2,166,715 | 29,355 | — |
Capital shares reacquired | 13 | 244 | — | — | 1,040 | 3 | 131 |
Dividends to shareholders | — | — | — | — | — | — | 1 |
Interest on reverse repurchase agreements | — | — | — | — | 830 | 55 | — |
Investments sold short, at value (proceeds: $0,$0,$0,$0,$9,719,$1,969 and $0) | — | — | — | — | 9,731 | 1,975 | — |
Written options not settled through variation margin, at value (premiums received: $0,$0,$0,$0,$1,153,$246 and $0) | — | — | — | — | 111 | 124 | — |
Swap premiums received on OTC swap agreements | — | — | — | — | 430 | — | — |
Unrealized depreciation on OTC swap agreements | — | — | — | — | — | 113 | — |
Reverse repurchase agreements | — | — | — | — | 235,212 | 20,251 | — |
Sale-buyback financing transactions | — | — | — | — | 120,267 | 2,459 | — |
Variation margin on options and futures contracts | — | — | — | — | 9,357 | 165 | — |
Unrealized depreciation on open forward currency contracts | — | — | — | — | 1,626 | 82 | — |
Accrued expenses: | |||||||
Management fees | 62 | 216 | 37 | 24 | 713 | 33 | 22 |
12b-1 fees | — | 4 | — | — | 7 | — | 1 |
Transfer agent fees | 9 | 37 | 6 | 6 | 152 | 7 | 12 |
Trustees' fees and expenses | 22 | 158 | 3 | 2 | 494 | 22 | 14 |
Other | 13 | 54 | 3 | 7 | 221 | 11 | 23 |
Total Liabilities | 128 | 4,974 | 1,321 | 1,285 | 2,562,061 | 54,698 | 204 |
NET ASSETS | $128,040 | $513,286 | $75,722 | $84,420 | $1,905,549 | $82,141 | $148,201 |
Net Assets Consist of: | |||||||
Paid-in capital | $120,218 | $592,672 | $78,168 | $82,740 | $1,983,455 | $115,346 | $148,167 |
Total distributable earnings/(loss) | 7,822 | (79,386) | (2,446) | 1,680 | (77,906) | (33,205) | 34 |
$128,040 | $513,286 | $75,722 | $84,420 | $1,905,549 | $82,141 | $148,201 | |
The accompanying notes are an integral part of the Financial Statements.
81
Harbor Convertible Securities Fund | Harbor High-Yield Bond Fund | Harbor High-Yield Opportunities Fund | Harbor Core Bond Fund | Harbor Bond Fund | Harbor Real Return Fund | Harbor Money Market Fund | ||||||||
NET ASSET VALUE PER SHARE BY CLASS | ||||||||||||||
Retirement Class | ||||||||||||||
Net assets | $24,540 | $93,671 | $261 | $5,820 | $11,533 | $258 | N/A | |||||||
Shares of beneficial interest1 | 2,286 | 9,525 | 27 | 570 | 1,010 | 28 | N/A | |||||||
Net asset value per share2 | $10.72 | $9.83 | $9.64 | $10.21 | $11.42 | $9.14 | N/A | |||||||
Institutional Class | ||||||||||||||
Net assets | $101,473 | $399,882 | $75,354 | $78,600 | $1,860,176 | $81,186 | $145,644 | |||||||
Shares of beneficial interest1 | 9,447 | 40,670 | 7,820 | 7,700 | 162,712 | 8,876 | 145,644 | |||||||
Net asset value per share2 | $10.74 | $9.83 | $9.64 | $10.21 | $11.43 | $9.15 | $1.00 | |||||||
Administrative Class | ||||||||||||||
Net assets | $58 | $869 | $51 | N/A | $33,840 | $697 | $2,557 | |||||||
Shares of beneficial interest1 | 5 | 88 | 5 | N/A | 2,957 | 76 | 2,557 | |||||||
Net asset value per share2 | $10.71 | $9.87 | $9.64 | N/A | $11.44 | $9.15 | $1.00 | |||||||
Investor Class | ||||||||||||||
Net assets | $1,969 | $18,864 | $56 | N/A | N/A | N/A | N/A | |||||||
Shares of beneficial interest1 | 184 | 1,913 | 6 | N/A | N/A | N/A | N/A | |||||||
Net asset value per share2 | $10.71 | $9.86 | $9.63 | N/A | N/A | N/A | N/A |
* | Including repurchase agreements |
1 | Par value $0.01 (unlimited authorizations) |
2 | Per share amounts can be recalculated to the amounts disclosed herein when total net assets and shares of beneficial interest are not rounded to thousands. |
82
Harbor Fixed Income Funds
StatementS of Operations—Six Months Ended April 30, 2019 (Unaudited)
(All amounts in thousands)
Harbor Convertible Securities Fund | Harbor High-Yield Bond Fund | Harbor High-Yield Opportunities Fund | Harbor Core Bond Fund | Harbor Bond Fund | Harbor Real Return Fund | Harbor Money Market Fund | |
Investment Income | |||||||
Interest | $1,046 | $19,721 | $2,288 | $1,208 | $41,555 | $870 | $1,960 |
Consent fee income | 2 | 14 | 3 | — | — | — | — |
Total Investment Income | 1,048 | 19,735 | 2,291 | 1,208 | 41,555 | 870 | 1,960 |
Operating Expenses | |||||||
Management fees | 392 | 1,911 | 216 | 118 | 4,548 | 199 | 165 |
12b-1 fees: | |||||||
Administrative Class | — | 1 | — | N/A | 40 | 1 | 10 |
Investor Class | 2 | 28 | — | N/A | N/A | N/A | N/A |
Shareholder communications | — | 18 | — | — | 90 | 5 | 1 |
Custodian fees | 7 | 22 | 3 | 6 | 149 | 29 | 13 |
Transfer agent fees: | |||||||
Retirement Class | 2 | 12 | — | — | 1 | — | N/A |
Institutional Class | 44 | 192 | 33 | 30 | 865 | 38 | 73 |
Administrative Class | — | 1 | — | N/A | 15 | — | 4 |
Investor Class | 2 | 24 | — | N/A | N/A | N/A | N/A |
Professional fees | 3 | 17 | 2 | 4 | 46 | 4 | 4 |
Trustees' fees and expenses | 3 | 17 | 2 | 2 | 46 | 2 | 3 |
Registration fees | 25 | 26 | 21 | 22 | 31 | 22 | 16 |
Miscellaneous | 5 | 9 | 4 | 3 | 15 | 4 | 4 |
Expenses before interest expense | 485 | 2,278 | 281 | 185 | 5,846 | 304 | 293 |
Interest expense | — | — | — | — | 5,579 | 397 | — |
Total expenses | 485 | 2,278 | 281 | 185 | 11,425 | 701 | 293 |
Management fees waived | (30) | (293) | — | — | (226) | — | (17) |
Transfer agent fees waived | (2) | (8) | (1) | (1) | (28) | (1) | (2) |
Other expenses reimbursed | — | — | (17) | (31) | (722) | (86) | (31) |
Custodian fees reduction | — | (2) | — | — | (2) | — | (2) |
Net expenses | 453 | 1,975 | 263 | 153 | 10,447 | 614 | 241 |
Net Investment Income/(Loss) | 595 | 17,760 | 2,028 | 1,055 | 31,108 | 256 | 1,719 |
Realized and Change in Net Unrealized Gain/(Loss) on Investment Transactions | |||||||
Net realized gain/(loss) on: | |||||||
Investments | 2,872 | (15,259) | (2,222) | 135 | 32,952 | (856) | — |
Foreign currency transactions | — | — | — | — | 362 | 144 | — |
Investments sold short | — | — | — | — | (541) | (77) | — |
Swap agreements | — | — | — | — | 4,849 | (41) | — |
Futures contracts | — | — | — | — | (19,598) | (287) | — |
Purchased options | — | — | — | — | (167) | (1) | — |
Written options | — | — | — | — | 1,995 | 37 | — |
Change in net unrealized appreciation/(depreciation) on: | |||||||
Investments | 7,000 | 23,208 | 3,204 | 2,383 | 57,962 | 5,338 | — |
Forwards currency contracts | — | — | — | — | (2,306) | (86) | — |
Investments sold short | — | — | — | — | (12) | (12) | — |
Swap agreements | — | — | — | — | (5,086) | (424) | — |
Futures contracts | — | — | — | — | (11,764) | (346) | — |
Purchased options | — | — | — | — | (145) | 15 | — |
Written options | — | — | — | — | 92 | 7 | — |
Translations of assets and liabilities in foreign currencies | — | — | — | — | (104) | 1 | — |
Net gain/(loss) on investment transactions | 9,872 | 7,949 | 982 | 2,518 | 58,489 | 3,412 | — |
Net Increase/(Decrease) in Net Assets Resulting from Operations | $10,467 | $25,709 | $3,010 | $3,573 | $89,597 | $3,668 | $1,719 |
The accompanying notes are an integral part of the Financial Statements.
83
[THIS PAGE INTENTIONALLY LEFT BLANK]
84
Harbor Fixed Income Funds
Statements of Changes In Net Assets
(All amounts in thousands)
Harbor Convertible Securities Fund | Harbor High-Yield Bond Fund | Harbor High-Yield Opportunities Fund | ||||||
November 1, 2018 through April 30, 2019 | November 1, 2017 through October 31, 2018 | November 1, 2018 through April 30, 2019 | November 1, 2017 through October 31, 2018 | November 1, 2018 through April 30, 2019 | November 1, 2017a through October 31, 2018 | |||
INCREASE/(DECREASE) IN NET ASSETS | (Unaudited) | (Unaudited) | (Unaudited) | |||||
Operations: | ||||||||
Net investment income/(loss) | $595 | $1,044 | $17,760 | $57,979 | $2,028 | $3,506 | ||
Net realized gain/(loss) on investments | 2,872 | 7,491 | (15,259) | 7,393 | (2,222) | (1,192) | ||
Change in net unrealized appreciation/(depreciation) of investments | 7,000 | (5,744) | 23,208 | (61,944) | 3,204 | (2,616) | ||
Net increase/(decrease) in assets resulting from operations | 10,467 | 2,791 | 25,709 | 3,428 | 3,010 | (302) | ||
Distributions to Shareholders | ||||||||
Retirement Class | (1,504) | (2,467) | (6,621) | (11,614) | (7) | (9) | ||
Institutional Class | (5,534) | (8,137) | (13,175) | (47,842) | (2,159) | (2,970) | ||
Administrative Class | (3) | (37) | (27) | (86) | (1) | (2) | ||
Investor Class | (106) | (187) | (703) | (1,869) | (2) | (2) | ||
Total distributions to shareholders | (7,147) | (10,828) | (20,526) | (61,411) | (2,169) | (2,983) | ||
Net Increase/(Decrease) Derived from Capital Share Transactions | 3,970 | 14,401 | (298,651) | (608,957) | 3,167 | 74,999 | ||
Net increase/(decrease) in net assets | 7,290 | 6,364 | (293,468) | (666,940) | 4,008 | 71,714 | ||
Net Assets | ||||||||
Beginning of period | 120,750 | 114,386 | 806,754 | 1,473,694 | 71,714 | — | ||
End of period | $128,040 | $120,750 | $513,286 | $806,754 | $75,722 | $71,714 |
a | Inception |
The accompanying notes are an integral part of the Financial Statements.
85
Harbor Core Bond Fund | Harbor Bond Fund | Harbor Real Return Fund | Harbor Money Market Fund | |||||||
November 1, 2018 through April 30, 2019 | June 1, 2018a through October 31, 2018 | November 1, 2018 through April 30, 2019 | November 1, 2017 through October 31, 2018 | November 1, 2018 through April 30, 2019 | November 1, 2017 through October 31, 2018 | November 1, 2018 through April 30, 2019 | November 1, 2017 through October 31, 2018 | |||
(Unaudited) | (Unaudited) | (Unaudited) | (Unaudited) | |||||||
$1,055 | $646 | $31,108 | $61,306 | $256 | $2,888 | $1,719 | $2,029 | |||
135 | (228) | 19,852 | (35,461) | (1,081) | 311 | — | — | |||
2,383 | (832) | 38,637 | (60,429) | 4,493 | (4,561) | — | — | |||
3,573 | (414) | 89,597 | (34,584) | 3,668 | (1,362) | 1,719 | 2,029 | |||
(73) | (18) | (146) | (69) | (5) | (9) | N/A | N/A | |||
(937) | (445) | (32,167) | (71,173) | (1,163) | (4,024) | (1,644) | (1,999) | |||
N/A | N/A | (510) | (953) | (9) | (47) | (75) | (30) | |||
N/A | N/A | N/A | N/A | N/A | N/A | N/A | N/A | |||
(1,010) | (463) | (32,823) | (72,195) | (1,177) | (4,080) | (1,719) | (2,029) | |||
26,547 | 56,187 | (88,937) | (145,275) | (6,676) | (9,622) | 16,289 | (39,270) | |||
29,110 | 55,310 | (32,163) | (252,054) | (4,185) | (15,064) | 16,289 | (39,270) | |||
55,310 | — | 1,937,712 | 2,189,766 | 86,326 | 101,390 | 131,912 | 171,182 | |||
$84,420 | $55,310 | $1,905,549 | $1,937,712 | $82,141 | $86,326 | $148,201 | $131,912 |
86
Harbor Fixed Income Funds
Statements of Changes in Net Assets—Capital Stock Activity
(All amounts in thousands)
Harbor Convertible Securities Fund | Harbor High-Yield Bond Fund | Harbor High-Yield Opportunities Fund | ||||||
November 1, 2018 through April 30, 2019 | November 1, 2017 through October 31, 2018 | November 1, 2018 through April 30, 2019 | November 1, 2017 through October 31, 2018 | November 1, 2018 through April 30, 2019 | November 1, 2017a through October 31, 2018 | |||
(Unaudited) | (Unaudited) | (Unaudited) | ||||||
AMOUNT ($) | ||||||||
Retirement Class | ||||||||
Net proceeds from sale of shares | $86 | $1,150 | $9,697 | $389,532 | $62 | $253 | ||
Net proceeds from redemption fees | — | — | 4 | 12 | — | — | ||
Reinvested distributions | 1,504 | 2,467 | 6,527 | 10,972 | 7 | 9 | ||
Cost of shares reacquired | (3,134) | (1,044) | (226,114) | (128,042) | (61) | (3) | ||
Net increase/(decrease) in net assets | $(1,544) | $2,573 | $(209,886) | $272,474 | $8 | $259 | ||
Institutional Class | ||||||||
Net proceeds from sale of shares | $17,076 | $32,066 | $27,529 | $106,617 | $2,416 | $73,824 | ||
Net proceeds from redemption fees | — | 1 | 7 | 293 | — | — | ||
Reinvested distributions | 5,461 | 7,984 | 12,931 | 38,689 | 2,159 | 2,970 | ||
Cost of shares reacquired | (17,079) | (27,880) | (115,939) | (1,017,400) | (1,419) | (2,162) | ||
Net increase/(decrease) in net assets | $5,458 | $12,171 | $(75,472) | $(871,801) | $3,156 | $74,632 | ||
Administrative Class | ||||||||
Net proceeds from sale of shares | $— | $— | $34 | $173 | $— | $50 | ||
Net proceeds from redemption fees | — | — | — | 1 | — | — | ||
Reinvested distributions | 3 | 37 | 25 | 73 | 1 | 2 | ||
Cost of shares reacquired | — | (358) | (572) | (542) | — | — | ||
Net increase/(decrease) in net assets | $3 | $(321) | $(513) | $(295) | $1 | $52 | ||
Investor Class | ||||||||
Net proceeds from sale of shares | $272 | $768 | $2,713 | $7,271 | $— | $54 | ||
Net proceeds from redemption fees | — | — | 1 | 9 | — | — | ||
Reinvested distributions | 106 | 187 | 694 | 1,847 | 2 | 2 | ||
Cost of shares reacquired | (325) | (977) | (16,188) | (18,462) | — | — | ||
Net increase/(decrease) in net assets | $53 | $(22) | $(12,780) | $(9,335) | $2 | $56 |
a | Inception |
The accompanying notes are an integral part of the Financial Statements.
87
Harbor Core Bond Fund | Harbor Bond Fund | Harbor Real Return Fund | Harbor Money Market Fund | |||||||
November 1, 2018 through April 30, 2019 | June 1, 2018a through October 31, 2018 | November 1, 2018 through April 30, 2019 | November 1, 2017 through October 31, 2018 | November 1, 2018 through April 30, 2019 | November 1, 2017 through October 31, 2018 | November 1, 2018 through April 30, 2019 | November 1, 2017 through October 31, 2018 | |||
(Unaudited) | (Unaudited) | (Unaudited) | (Unaudited) | |||||||
$2,705 | $3,069 | $5,814 | $7,107 | $92 | $397 | N/A | N/A | |||
— | — | — | — | — | — | N/A | N/A | |||
56 | 18 | 145 | 69 | 5 | 8 | N/A | N/A | |||
(192) | — | (1,677) | (185) | (168) | (68) | N/A | N/A | |||
$2,569 | $3,087 | $4,282 | $6,991 | $(71) | $337 | N/A | N/A | |||
$25,557 | $54,477 | $127,072 | $305,904 | $6,842 | $9,213 | $196,873 | $550,663 | |||
— | — | — | — | — | — | — | — | |||
937 | 445 | 30,510 | 67,995 | 1,113 | 3,895 | 1,628 | 1,988 | |||
(2,516) | (1,822) | (252,594) | (528,432) | (14,548) | (22,355) | (182,683) | (592,462) | |||
$23,978 | $53,100 | $(95,012) | $(154,533) | $(6,593) | $(9,247) | $15,818 | $(39,811) | |||
N/A | N/A | $4,488 | $9,690 | $6 | $275 | $19,517 | $2,601 | |||
N/A | N/A | — | — | — | — | — | — | |||
N/A | N/A | 510 | 952 | 9 | 47 | 74 | 30 | |||
N/A | N/A | (3,205) | (8,375) | (27) | (1,034) | (19,120) | (2,090) | |||
N/A | N/A | $1,793 | $2,267 | $(12) | $(712) | $471 | $541 | |||
N/A | N/A | N/A | N/A | N/A | N/A | N/A | N/A | |||
N/A | N/A | N/A | N/A | N/A | N/A | N/A | N/A |
88
Harbor Fixed Income Funds
Statements of Changes in Net Assets—Capital Stock Activity—Continued
(All amounts in thousands)
Harbor Convertible Securities Fund | Harbor High-Yield Bond Fund | Harbor High-Yield Opportunities Fund | ||||||
November 1, 2018 through April 30, 2019 | November 1, 2017 through October 31, 2018 | November 1, 2018 through April 30, 2019 | November 1, 2017 through October 31, 2018 | November 1, 2018 through April 30, 2019 | November 1, 2017a through October 31, 2018 | |||
(Unaudited) | (Unaudited) | (Unaudited) | ||||||
SHARES | ||||||||
Retirement Class | ||||||||
Shares sold | 9 | 103 | 1,006 | 39,085 | 7 | 25 | ||
Shares issued due to reinvestment of distributions | 156 | 239 | 687 | 1,119 | 1 | 1 | ||
Shares reacquired | (306) | (97) | (23,514) | (12,964) | (7) | — | ||
Net increase/(decrease) in shares outstanding | $(141) | $245 | $(21,821) | $27,240 | $1 | $26 | ||
Institutional Class | ||||||||
Shares sold | 1,664 | 3,011 | 2,867 | 10,670 | 255 | 7,401 | ||
Shares issued due to reinvestment of distributions | 565 | 773 | 1,355 | 3,920 | 231 | 306 | ||
Shares reacquired | (1,701) | (2,619) | (12,110) | (101,838) | (151) | (222) | ||
Net increase/(decrease) in shares outstanding | $528 | $1,165 | $(7,888) | $(87,248) | $335 | $7,485 | ||
Administrative Class | ||||||||
Shares sold | — | — | 3 | 17 | — | 5 | ||
Shares issued due to reinvestment of distributions | — | 4 | 3 | 7 | — | — | ||
Shares reacquired | — | (34) | (59) | (54) | — | — | ||
Net increase/(decrease) in shares outstanding | $— | $(30) | $(53) | $(30) | $— | $5 | ||
Investor Class | ||||||||
Shares sold | 27 | 73 | 280 | 725 | — | 6 | ||
Shares issued due to reinvestment of distributions | 11 | 18 | 73 | 186 | — | — | ||
Shares reacquired | (32) | (92) | (1,690) | (1,836) | — | — | ||
Net increase/(decrease) in shares outstanding | $6 | $(1) | $(1,337) | $(925) | $— | $6 |
a | Inception |
The accompanying notes are an integral part of the Financial Statements.
89
Harbor Core Bond Fund | Harbor Bond Fund | Harbor Real Return Fund | Harbor Money Market Fund | |||||||
November 1, 2018 through April 30, 2019 | June 1, 2018a through October 31, 2018 | November 1, 2018 through April 30, 2019 | November 1, 2017 through October 31, 2018 | November 1, 2018 through April 30, 2019 | November 1, 2017 through October 31, 2018 | November 1, 2018 through April 30, 2019 | November 1, 2017 through October 31, 2018 | |||
(Unaudited) | (Unaudited) | (Unaudited) | (Unaudited) | |||||||
272 | 309 | 523 | 635 | 10 | 43 | N/A | N/A | |||
6 | 2 | 13 | 6 | 1 | 1 | N/A | N/A | |||
(19) | — | (150) | (17) | (19) | (8) | N/A | N/A | |||
$259 | $311 | $386 | $624 | $(8) | $36 | N/A | N/A | |||
2,548 | 5,447 | 11,303 | 26,978 | 768 | 1,000 | 196,873 | 550,663 | |||
93 | 45 | 2,736 | 6,008 | 127 | 424 | 1,628 | 1,988 | |||
(250) | (183) | (22,516) | (46,739) | (1,630) | (2,425) | (182,683) | (592,462) | |||
$2,391 | $5,309 | $(8,477) | $(13,753) | $(735) | $(1,001) | $15,818 | $(39,811) | |||
N/A | N/A | 397 | 857 | 1 | 30 | 19,517 | 2,601 | |||
N/A | N/A | 45 | 84 | 1 | 5 | 74 | 30 | |||
N/A | N/A | (286) | (739) | (3) | (113) | (19,120) | (2,090) | |||
N/A | N/A | $156 | $202 | $(1) | $(78) | $471 | $541 | |||
N/A | N/A | N/A | N/A | N/A | N/A | N/A | N/A | |||
N/A | N/A | N/A | N/A | N/A | N/A | N/A | N/A |
90
Harbor Fixed Income Funds
Statement of Cash Flows— Six Months Ended April 30, 2019 (Unaudited)
(All amounts in thousands)
Harbor Real Return Fund | |
Cash flows from operating activities: | |
Net increase in net assets resulting from operations | $ 3,668 |
Adjustments to reconcile net increase in net assets from operations to net cash from operating activities: | |
Purchases of long-term securities | (144,738) |
Proceeds from sales of long-term securities | 163,679 |
Purchases of short-term portfolio investments, net | (825) |
Decrease in receivable for investments sold | 19,437 |
Decrease in interest receivable | 83 |
Increase in swap premiums paid on OTC swap agreements | (3) |
Increase in variation margin on options and futures contracts | 76 |
Decrease in variation margin on swap agreements | 104 |
Decrease in due to broker | (4,456) |
Increase in due from broker | (262) |
Increase in prepaid registration fees | (2) |
Increase in prepaid fund insurance | (1) |
Increase in other assets | (42) |
Decrease in payable for investments purchased | (17,468) |
Decrease in interest on reverse repurchase agreements | (24) |
Decrease in investments sold short | (1,827) |
Increase in premiums from written options not settled through variation margin | 100 |
Decrease in swap premiums received | (4) |
Decrease in management fees payable | (3) |
Increase in transfer agent fees payable | 1 |
Increase in Trustees' fees and expenses payable | 2 |
Decrease in other liabilities | (5) |
Net change in unrealized appreciation/(depreciation) on investments | (5,327) |
Net change in unrealized appreciation/(depreciation) on forwards | 86 |
Net change in unrealized appreciation/(depreciation) on OTC swaps | (23) |
Net change in unrealized appreciation/(depreciation) on purchased options not settled through variation margin | (16) |
Net realized loss on investments | 789 |
Net realized loss on purchased options | 1 |
Net amortization and earned inflation component .. | 293 |
Net cash provided by operating activities | 13,293 |
Cash flows from financing activities: | |
Proceeds from shares sold | 6,944 |
Payment on shares redeemed | (14,793) |
Cash dividends paid | (50) |
Proceeds from reverse repurchase agreement transactions | 182,875 |
Payments on reverse repurchase agreement transactions . . .. | (185,798) |
Proceeds from sale-buyback financing transactions | 24,032 |
Payments on sale-buyback financing transactions | (26,484) |
Net cash used for financing activities | (13,274) |
Net increase in cash and foreign currency | 19 |
Cash and foreign currency: | |
Beginning of period | $ 858 |
End of period | 877 |
Reinvestment of dividends | $ 1,127 |
Supplemental disclosure of cash flow information: | |
Interest paid during the period | $ 421 |
The accompanying notes are an integral part of the Financial Statements.
91
[THIS PAGE INTENTIONALLY LEFT BLANK]
92
Harbor Fixed Income Funds Financial Highlights
Selected Data for a Share Outstanding for the Periods Presented
HARBOR CONVERTIBLE SECURITIES FUND | ||||
Retirement Class | ||||
6-Month Period Ended April 30, 2019 | Year Ended October 31, | |||
2018 | 2017 | 2016f | ||
(Unaudited) | ||||
Net asset value beginning of period | $10.47 | $11.27 | $10.53 | $9.78 |
Income from Investment Operations | ||||
Net investment income/(loss)a | 0.05e | 0.10e | 0.14e | 0.08e |
Net realized and unrealized gains/(losses) on investments | 0.82 | 0.19 | 0.78 | 0.75 |
Total from investment operations | 0.87 | 0.29 | 0.92 | 0.83 |
Less Distributions | ||||
Dividends from net investment income | (0.13) | (0.09) | (0.18) | (0.08) |
Distributions from net realized capital gains | (0.49) | (1.00) | — | — |
Total distributions | (0.62) | (1.09) | (0.18) | (0.08) |
Proceeds from redemption fees | —* | —* | —* | — |
Net asset value end of period | 10.72 | 10.47 | 11.27 | 10.53 |
Net assets end of period (000s) | $24,540 | $25,412 | $24,585 | $2,215 |
Ratios and Supplemental Data (%) | ||||
Total returnb | 8.97%c | 2.80% | 8.81% | 8.51%c |
Ratio of total expenses to average net assets^ | 0.72d | 0.74 | 0.72 | 0.73d |
Ratio of net expenses to average net assetsa | 0.67d | 0.69 | 0.67 | 0.71d |
Ratio of net investment income to average net assetsa | 1.05d | 0.95 | 1.24 | 1.13d |
Portfolio turnover | 23c | 94 | 102 | 102c |
Administrative Class | ||||||
6-Month Period Ended April 30, 2019 | Year Ended October 31, | |||||
2018 | 2017 | 2016 | 2015 | 2014 | ||
(Unaudited) | ||||||
Net asset value beginning of period | $10.44 | $11.26 | $10.53 | $10.62 | $11.19 | $10.94 |
Income from Investment Operations | ||||||
Net investment income/(loss)a | 0.04e | 0.07e | 0.10e | 0.09e | 0.12e | 0.13 |
Net realized and unrealized gains/(losses) on investments | 0.82 | 0.17 | 0.77 | 0.20 | (0.08) | 0.41 |
Total from investment operations | 0.86 | 0.24 | 0.87 | 0.29 | 0.04 | 0.54 |
Less Distributions | ||||||
Dividends from net investment income | (0.10) | (0.06) | (0.14) | (0.19) | (0.19) | (0.18) |
Distributions from net realized capital gains | (0.49) | (1.00) | — | (0.19) | (0.42) | (0.11) |
Total distributions | (0.59) | (1.06) | (0.14) | (0.38) | (0.61) | (0.29) |
Proceeds from redemption fees | —* | —* | —* | —* | —* | —* |
Net asset value end of period | 10.71 | 10.44 | 11.26 | 10.53 | 10.62 | 11.19 |
Net assets end of period (000s) | $58 | $53 | $395 | $392 | $376 | $306 |
Ratios and Supplemental Data (%) | ||||||
Total returnb | 8.88%c | 2.27% | 8.37% | 2.96% | 0.47% | 4.97% |
Ratio of total expenses to average net assets^ | 1.05d | 1.07 | 1.04 | 1.02 | 1.00 | 0.99 |
Ratio of net expenses to average net assetsa | 1.00d | 1.01 | 1.00 | 1.01 | 1.00 | 0.99 |
Ratio of net investment income to average net assetsa | 0.72d | 0.63 | 0.93 | 0.90 | 1.11 | 1.35 |
Portfolio turnover | 23c | 94 | 102 | 102 | 81 | 54 |
See page 105 for notes to the Financial Highlights.
The accompanying notes are an integral part of the Financial Statements.
93
Institutional Class | |||||
6-Month Period Ended April 30, 2019 | Year Ended October 31, | ||||
2018 | 2017 | 2016 | 2015 | 2014 | |
(Unaudited) | |||||
$10.48 | $11.27 | $10.53 | $10.63 | $11.20 | $10.95 |
0.05e | 0.09e | 0.13e | 0.12e | 0.15e | 0.19 |
0.82 | 0.20 | 0.78 | 0.19 | (0.08) | 0.38 |
0.87 | 0.29 | 0.91 | 0.31 | 0.07 | 0.57 |
(0.12) | (0.08) | (0.17) | (0.22) | (0.22) | (0.21) |
(0.49) | (1.00) | — | (0.19) | (0.42) | (0.11) |
(0.61) | (1.08) | (0.17) | (0.41) | (0.64) | (0.32) |
—* | —* | —* | —* | —* | —* |
10.74 | 10.48 | 11.27 | 10.53 | 10.63 | 11.20 |
$101,473 | $93,424 | $87,391 | $421,671 | $373,421 | $353,370 |
9.02%c | 2.82% | 8.74% | 3.12% | 0.72% | 5.23% |
0.80d | 0.82 | 0.79 | 0.77 | 0.75 | 0.74 |
0.75d | 0.76 | 0.76 | 0.76 | 0.75 | 0.74 |
0.97d | 0.88 | 1.18 | 1.15 | 1.37 | 1.58 |
23c | 94 | 102 | 102 | 81 | 54 |
Investor Class | |||||
6-Month Period Ended April 30, 2019 | Year Ended October 31, | ||||
2018 | 2017 | 2016 | 2015 | 2014 | |
(Unaudited) | |||||
$10.45 | $11.25 | $10.52 | $10.61 | $11.18 | $10.94 |
0.03e | 0.05e | 0.09e | 0.08e | 0.11e | 0.11 |
0.82 | 0.19 | 0.77 | 0.20 | (0.08) | 0.40 |
0.85 | 0.24 | 0.86 | 0.28 | 0.03 | 0.51 |
(0.10) | (0.04) | (0.13) | (0.18) | (0.18) | (0.16) |
(0.49) | (1.00) | — | (0.19) | (0.42) | (0.11) |
(0.59) | (1.04) | (0.13) | (0.37) | (0.60) | (0.27) |
—* | —* | —* | —* | —* | —* |
10.71 | 10.45 | 11.25 | 10.52 | 10.61 | 11.18 |
$1,969 | $1,861 | $2,015 | $2,039 | $1,861 | $1,941 |
8.84%c | 2.35% | 8.26% | 2.85% | 0.35% | 4.76% |
1.17d | 1.19 | 1.16 | 1.14 | 1.12 | 1.11 |
1.12d | 1.13 | 1.12 | 1.13 | 1.12 | 1.11 |
0.60d | 0.51 | 0.81 | 0.77 | 1.00 | 1.24 |
23c | 94 | 102 | 102 | 81 | 54 |
94
Harbor Fixed Income Funds Financial Highlights—Continued
Selected Data for a Share Outstanding for the Periods Presented
HARBOR HIGH-YIELD BOND FUND | ||||
Retirement Class | ||||
6-Month Period Ended April 30, 2019 | Year Ended October 31, | |||
2018 | 2017 | 2016f | ||
(Unaudited) | ||||
Net asset value beginning of period | $9.69 | $10.22 | $10.00 | $9.40 |
Income from Investment Operations | ||||
Net investment income/(loss)a | 0.27e | 0.54e | 0.55e | 0.36e |
Net realized and unrealized gains/(losses) on investments | 0.18 | (0.49) | 0.25 | 0.61 |
Total from investment operations | 0.45 | 0.05 | 0.80 | 0.97 |
Less Distributions | ||||
Dividends from net investment income | (0.31) | (0.58) | (0.58) | (0.37) |
Distributions from net realized capital gains | — | — | — | — |
Total distributions | (0.31) | (0.58) | (0.58) | (0.37) |
Proceeds from redemption fees | —* | —* | —* | —* |
Net asset value end of period | 9.83 | 9.69 | 10.22 | 10.00 |
Net assets end of period (000s) | $93,671 | $303,627 | $41,975 | $1,828 |
Ratios and Supplemental Data (%) | ||||
Total returnb | 4.81%c | 0.54% | 8.23% | 10.49%c |
Ratio of total expenses to average net assets^ | 0.65d | 0.61 | 0.65 | 0.66d |
Ratio of net expenses to average net assetsa | 0.55d | 0.53 | 0.61 | 0.61d |
Ratio of net investment income to average net assetsa | 5.66d | 5.50 | 5.44 | 5.38d |
Portfolio turnover | 32c | 53 | 56 | 58c |
Administrative Class | ||||||
6-Month Period Ended April 30, 2019 | Year Ended October 31, | |||||
2018 | 2017 | 2016 | 2015 | 2014 | ||
(Unaudited) | ||||||
Net asset value beginning of period | $9.71 | $10.25 | $10.01 | $10.02 | $10.87 | $11.21 |
Income from Investment Operations | ||||||
Net investment income/(loss)a | 0.25e | 0.52e | 0.53e | 0.51e | 0.55e | 0.60 |
Net realized and unrealized gains/(losses) on investments | 0.20 | (0.51) | 0.25 | (0.02) | (0.67) | (0.08) |
Total from investment operations | 0.45 | 0.01 | 0.78 | 0.49 | (0.12) | 0.52 |
Less Distributions | ||||||
Dividends from net investment income | (0.29) | (0.55) | (0.54) | (0.50) | (0.51) | (0.59) |
Distributions from net realized capital gains | — | — | — | — | (0.22) | (0.27) |
Total distributions | (0.29) | (0.55) | (0.54) | (0.50) | (0.73) | (0.86) |
Proceeds from redemption fees | —* | —* | —* | —* | —* | —* |
Net asset value end of period | 9.87 | 9.71 | 10.25 | 10.01 | 10.02 | 10.87 |
Net assets end of period (000s) | $869 | $1,374 | $1,753 | $4,631 | $4,314 | $4,773 |
Ratios and Supplemental Data (%) | ||||||
Total returnb | 4.80%c | 0.10% | 7.98% | 5.18% | (1.03)% | 4.82% |
Ratio of total expenses to average net assets^ | 0.98d | 0.94 | 0.97 | 0.95 | 0.94 | 0.93 |
Ratio of net expenses to average net assetsa | 0.88d | 0.86 | 0.92 | 0.91 | 0.90 | 0.89 |
Ratio of net investment income to average net assetsa | 5.31d | 5.18 | 5.20 | 5.20 | 5.26 | 5.18 |
Portfolio turnover | 32c | 53 | 56 | 58 | 49 | 48 |
See page 105 for notes to the Financial Highlights.
The accompanying notes are an integral part of the Financial Statements.
95
Institutional Class | |||||
6-Month Period Ended April 30, 2019 | Year Ended October 31, | ||||
2018 | 2017 | 2016 | 2015 | 2014 | |
(Unaudited) | |||||
$9.68 | $10.21 | $9.99 | $10.00 | $10.85 | $11.19 |
0.27e | 0.54e | 0.55e | 0.53e | 0.57e | 0.60 |
0.19 | (0.51) | 0.24 | (0.02) | (0.66) | (0.05) |
0.46 | 0.03 | 0.79 | 0.51 | (0.09) | 0.55 |
(0.31) | (0.57) | (0.57) | (0.52) | (0.54) | (0.62) |
— | — | — | — | (0.22) | (0.27) |
(0.31) | (0.57) | (0.57) | (0.52) | (0.76) | (0.89) |
—* | 0.01 | —* | —* | —* | —* |
9.83 | 9.68 | 10.21 | 9.99 | 10.00 | 10.85 |
$399,882 | $470,204 | $1,387,213 | $1,817,902 | $1,460,808 | $1,707,788 |
4.88%c | 0.45% | 8.16% | 5.46% | (0.79)% | 5.10% |
0.73d | 0.69 | 0.72 | 0.70 | 0.69 | 0.68 |
0.63d | 0.62 | 0.67 | 0.66 | 0.65 | 0.64 |
5.55d | 5.40 | 5.43 | 5.43 | 5.51 | 5.43 |
32c | 53 | 56 | 58 | 49 | 48 |
Investor Class | |||||
6-Month Period Ended April 30, 2019 | Year Ended October 31, | ||||
2018 | 2017 | 2016 | 2015 | 2014 | |
(Unaudited) | |||||
$9.71 | $10.24 | $10.01 | $10.02 | $10.87 | $11.21 |
0.25e | 0.50e | 0.52e | 0.49e | 0.53e | 0.59 |
0.19 | (0.49) | 0.24 | (0.02) | (0.66) | (0.08) |
0.44 | 0.01 | 0.76 | 0.47 | (0.13) | 0.51 |
(0.29) | (0.54) | (0.53) | (0.48) | (0.50) | (0.58) |
— | — | — | — | (0.22) | (0.27) |
(0.29) | (0.54) | (0.53) | (0.48) | (0.72) | (0.85) |
—* | —* | —* | —* | —* | —* |
9.86 | 9.71 | 10.24 | 10.01 | 10.02 | 10.87 |
$18,864 | $31,549 | $42,753 | $87,155 | $96,957 | $100,194 |
4.65%c | 0.08% | 7.79% | 5.02% | (1.15)% | 4.70% |
1.10d | 1.06 | 1.09 | 1.07 | 1.06 | 1.05 |
1.00d | 0.98 | 1.04 | 1.03 | 1.02 | 1.01 |
5.19d | 5.05 | 5.08 | 5.09 | 5.14 | 5.06 |
32c | 53 | 56 | 58 | 49 | 48 |
96
Harbor Fixed Income Funds Financial Highlights—Continued
Selected Data for a Share Outstanding for the Periods Presented
HARBOR HIGH-YIELD OPPORTUNITIES FUND | |||||
Retirement Class | Institutional Class | ||||
6-Month Period Ended April 30, 2019 | Year Ended October 31, 2018h | 6-Month Period Ended April 30, 2019 | Year Ended October 31, 2018h | ||
(Unaudited) | (Unaudited) | ||||
Net asset value beginning of period | $9.53 | $10.00 | $9.53 | $10.00 | |
Income from Investment Operations | |||||
Net investment income/(loss)a | 0.27e | 0.52e | 0.26e | 0.50e | |
Net realized and unrealized gains/(losses) on investments | 0.13 | (0.57) | 0.13 | (0.56) | |
Total from investment operations | 0.40 | (0.05) | 0.39 | (0.06) | |
Less Distributions | |||||
Dividends from net investment income | (0.29) | (0.42) | (0.28) | (0.41) | |
Distributions from net realized capital gains | — | — | — | — | |
Total distributions | (0.29) | (0.42) | (0.28) | (0.41) | |
Proceeds from redemption fees | — | —* | — | —* | |
Net asset value end of period | 9.64 | 9.53 | 9.64 | 9.53 | |
Net assets end of period (000s) | $261 | $250 | $75,354 | $71,361 | |
Ratios and Supplemental Data (%) | |||||
Total returnb | 4.29%c | (0.53)% | 4.25%c | (0.59)% | |
Ratio of total expenses to average net assets^ | 0.70d | 0.92 | 0.78d | 1.00 | |
Ratio of net expenses to average net assetsa | 0.65d | 0.65 | 0.73d | 0.73 | |
Ratio of net investment income to average net assetsa | 5.73d | 5.29 | 5.64d | 5.12 | |
Portfolio turnover | 47c | 56 | 47c | 56 |
See page 105 for notes to the Financial Highlights.
The accompanying notes are an integral part of the Financial Statements.
97
Administrative Class | Investor Class | |||
6-Month Period Ended April 30, 2019 | Year Ended October 31, 2018h | 6-Month Period Ended April 30, 2019 | Year Ended October 31, 2018h | |
(Unaudited) | (Unaudited) | |||
$9.53 | $10.00 | $9.53 | $10.00 | |
0.25e | 0.47e | 0.25e | 0.46e | |
0.13 | (0.55) | 0.12 | (0.55) | |
0.38 | (0.08) | 0.37 | (0.09) | |
(0.27) | (0.39) | (0.27) | (0.38) | |
— | — | — | — | |
(0.27) | (0.39) | (0.27) | (0.38) | |
— | —* | — | —* | |
9.64 | 9.53 | 9.63 | 9.53 | |
$51 | $50 | $56 | $53 | |
4.12%c | (0.82)% | 3.95%c | (0.92)% | |
1.03d | 1.25 | 1.15d | 1.37 | |
0.98d | 0.98 | 1.10d | 1.10 | |
5.39d | 4.84 | 5.27d | 4.73 | |
47c | 56 | 47c | 56 |
98
Harbor Fixed Income Funds Financial Highlights—Continued
Selected Data for a Share Outstanding for the Periods Presented
HARBOR CORE BOND FUND | ||
Retirement Class | ||
6-Month Period Ended April 30, 2019 | Year Ended October 31, 2018g | |
(Unaudited) | ||
Net asset value beginning of period | $9.84 | $10.00 |
Income from Investment Operations | ||
Net investment income/(loss)a | 0.16e | 0.12e |
Net realized and unrealized gains/(losses) on investments | 0.36 | (0.19) |
Total from investment operations | 0.52 | (0.07) |
Less Distributions | ||
Dividends from net investment income | (0.15) | (0.09) |
Distributions from net realized capital gains | — | — |
Total distributions | (0.15) | (0.09) |
Net asset value end of period | 10.21 | 9.84 |
Net assets end of period (000s) | $5,820 | $3,061 |
Ratios and Supplemental Data (%) | ||
Total returnb | 5.35%c | (0.73)%c |
Ratio of total expenses to average net assets^ | 0.46d | 0.77d |
Ratio of net expenses to average net assetsa | 0.37d | 0.37d |
Ratio of net investment income to average net assetsa | 3.12d | 2.98d |
Portfolio turnover | 34c | 97c |
See page 105 for notes to the Financial Highlights.
The accompanying notes are an integral part of the Financial Statements.
99
Institutional Class | |
6-Month Period Ended April 30, 2019 | Year Ended October 31, 2018g |
(Unaudited) | |
$9.84 | $10.00 |
0.15e | 0.12e |
0.37 | (0.19) |
0.52 | (0.07) |
(0.15) | (0.09) |
— | — |
(0.15) | (0.09) |
10.21 | 9.84 |
$78,600 | $52,249 |
5.31%c | (0.75)%c |
0.54d | 0.85d |
0.45d | 0.45d |
3.04d | 2.86d |
34c | 97c |
100
Harbor Fixed Income Funds Financial Highlights—Continued
Selected Data for a Share Outstanding for the Periods Presented
HARBOR BOND FUND | ||
Retirement Class | ||
6-Month Period Ended April 30, 2019 | Year Ended October 31, 2018g | |
(Unaudited) | ||
Net asset value beginning of period | $11.09 | $11.28 |
Income from Investment Operations | ||
Net investment income/(loss)a | 0.19e | 0.16e |
Net realized and unrealized gains/(losses) on investments | 0.34 | (0.16) |
Total from investment operations | 0.53 | —* |
Less Distributions | ||
Dividends from net investment income | (0.20) | (0.19) |
Distributions from net realized capital gains | — | — |
Total distributions | (0.20) | (0.19) |
Net asset value end of period | 11.42 | 11.09 |
Net assets end of period (000s) | $11,533 | $6,921 |
Ratios and Supplemental Data (%) | ||
Total returnb | 4.80%c | 0.01%c |
Ratio of total expenses to average net assets^ | 1.04d | 1.16d |
Ratio of net expenses to average net assetsa | 0.94d | 1.06d |
Ratio of net expenses excluding interest expense to average net assetsa | 0.43d | 0.43d |
Ratio of net investment income to average net assetsa | 3.37d | 3.44d |
Portfolio turnover | 329c | 674c |
Administrative Class | ||||||
6-Month Period Ended April 30, 2019 | Year Ended October 31, | |||||
2018 | 2017 | 2016 | 2015 | 2014 | ||
(Unaudited) | ||||||
Net asset value beginning of period | $11.11 | $11.69 | $11.89 | $11.93 | $12.28 | $12.23 |
Income from Investment Operations | ||||||
Net investment income/(loss)a | 0.17e | 0.31e | 0.34e | 0.34e | 0.30e | 0.22 |
Net realized and unrealized gains/(losses) on investments | 0.34 | (0.53) | (0.05) | 0.16 | (0.16) | 0.15 |
Total from investment operations | 0.51 | (0.22) | 0.29 | 0.50 | 0.14 | 0.37 |
Less Distributions | ||||||
Dividends from net investment income | (0.18) | (0.36) | (0.32) | (0.45) | (0.38) | (0.32) |
Distributions from net realized capital gains | — | — | (0.17) | (0.09) | (0.11) | — |
Total distributions | (0.18) | (0.36) | (0.49) | (0.54) | (0.49) | (0.32) |
Net asset value end of period | 11.44 | 11.11 | 11.69 | 11.89 | 11.93 | 12.28 |
Net assets end of period (000s) | $33,840 | $31,111 | $30,376 | $37,887 | $57,874 | $102,591 |
Ratios and Supplemental Data (%) | ||||||
Total returnb | 4.63%c | (1.88)% | 2.56% | 4.42% | 1.13% | 3.05% |
Ratio of total expenses to average net assets^ | 1.41d | 1.16 | 0.88 | 0.85 | 0.83 | 0.81 |
Ratio of net expenses to average net assetsa | 1.31d | 1.06 | 0.79 | 0.78 | 0.77 | 0.79 |
Ratio of net expenses excluding interest expense to average net assetsa | 0.76d | 0.76 | 0.76 | 0.76 | 0.77 | 0.79 |
Ratio of net investment income to average net assetsa | 3.04d | 2.69 | 2.90 | 2.89 | 2.47 | 1.66 |
Portfolio turnover | 329c | 674 | 654 | 592 | 586 | 439 |
See page 105 for notes to the Financial Highlights.
The accompanying notes are an integral part of the Financial Statements.
101
Institutional Class | |||||
6-Month Period Ended April 30, 2019 | Year Ended October 31, | ||||
2018 | 2017 | 2016 | 2015 | 2014 | |
(Unaudited) | |||||
$11.10 | $11.68 | $11.88 | $11.92 | $12.28 | $12.22 |
0.18e | 0.33e | 0.36e | 0.37e | 0.34e | 0.25 |
0.34 | (0.52) | (0.04) | 0.16 | (0.18) | 0.16 |
0.52 | (0.19) | 0.32 | 0.53 | 0.16 | 0.41 |
(0.19) | (0.39) | (0.35) | (0.48) | (0.41) | (0.35) |
— | — | (0.17) | (0.09) | (0.11) | — |
(0.19) | (0.39) | (0.52) | (0.57) | (0.52) | (0.35) |
11.43 | 11.10 | 11.68 | 11.88 | 11.92 | 12.28 |
$1,860,176 | $1,899,680 | $2,159,390 | $2,438,815 | $2,874,705 | $4,125,889 |
4.76%c | (1.63)% | 2.82% | 4.70% | 1.32% | 3.40% |
1.18d | 0.90 | 0.63 | 0.60 | 0.58 | 0.56 |
1.08d | 0.80 | 0.54 | 0.53 | 0.52 | 0.54 |
0.51d | 0.51 | 0.51 | 0.51 | 0.52 | 0.54 |
3.29d | 2.93 | 3.15 | 3.16 | 2.80 | 1.90 |
329c | 674 | 654 | 592 | 586 | 439 |
102
Harbor Fixed Income Funds Financial Highlights—Continued
Selected Data for a Share Outstanding for the Periods Presented
HARBOR REAL RETURN FUND | ||
Retirement Class | ||
6-Month Period Ended April 30, 2019 | Year Ended October 31, 2018g | |
(Unaudited) | ||
Net asset value beginning of period | $8.87 | $9.23 |
Income from Investment Operations | ||
Net investment income/(loss)a | 0.02e | 0.13e |
Net realized and unrealized gains/(losses) on investments | 0.38 | (0.28) |
Total from investment operations | 0.40 | (0.15) |
Less Distributions | ||
Dividends from net investment income | (0.13) | (0.21) |
Distributions from net realized capital gains | — | — |
Total distributions | (0.13) | (0.21) |
Net asset value end of period | 9.14 | 8.87 |
Net assets end of period (000s) | $258 | $322 |
Ratios and Supplemental Data (%) | ||
Total returnb | 4.65%c | (1.64)%c |
Ratio of total expenses to average net assets^ | 1.62d | 1.16d |
Ratio of net expenses to average net assetsa | 1.41d | 0.96d |
Ratio of net expenses excluding interest expense to average net assetsa | 0.44d | 0.44d |
Ratio of net investment income to average net assetsa | 0.48d | 3.45d |
Portfolio turnover | 144c | 519c |
Administrative Class | ||||||
6-Month Period Ended April 30, 2019 | Year Ended October 31, | |||||
2018 | 2017 | 2016 | 2015 | 2014 | ||
(Unaudited) | ||||||
Net asset value beginning of period | $8.88 | $9.42 | $9.46 | $9.15 | $10.17 | $10.41 |
Income from Investment Operations | ||||||
Net investment income/(loss)a | 0.02e | 0.25e | 0.21e | 0.13e | 0.08e | 0.21 |
Net realized and unrealized gains/(losses) on investments | 0.37 | (0.42) | (0.15) | 0.34 | (0.42) | (0.03) |
Total from investment operations | 0.39 | (0.17) | 0.06 | 0.47 | (0.34) | 0.18 |
Less Distributions | ||||||
Dividends from net investment income | (0.12) | (0.37) | (0.10) | (0.16) | (0.68) | (0.02) |
Distributions from net realized capital gains | — | — | — | — | — | (0.40) |
Total distributions | (0.12) | (0.37) | (0.10) | (0.16) | (0.68) | (0.42) |
Net asset value end of period | 9.15 | 8.88 | 9.42 | 9.46 | 9.15 | 10.17 |
Net assets end of period (000s) | $697 | $688 | $1,461 | $2,492 | $3,174 | $3,481 |
Ratios and Supplemental Data (%) | ||||||
Total returnb | 4.45%c | (1.86)% | 0.62% | 5.26% | (3.47)% | 1.81% |
Ratio of total expenses to average net assets^ | 1.94d | 1.56 | 1.26 | 1.12 | 1.02 | 0.88 |
Ratio of net expenses to average net assetsa | 1.73d | 1.37 | 1.10 | 0.98 | 0.93 | 0.87 |
Ratio of net expenses excluding interest expense to average net assetsa | 0.77d | 0.78 | 0.77 | 0.80 | 0.83 | 0.85 |
Ratio of net investment income to average net assetsa | 0.36d | 2.73 | 2.19 | 1.38 | 0.90 | 2.08 |
Portfolio turnover | 144c | 519 | 758 | 611 | 531 | 427 |
See page 105 for notes to the Financial Highlights.
The accompanying notes are an integral part of the Financial Statements.
103
Institutional Class | |||||
6-Month Period Ended April 30, 2019 | Year Ended October 31, | ||||
2018 | 2017 | 2016 | 2015 | 2014 | |
(Unaudited) | |||||
$8.88 | $9.42 | $9.48 | $9.15 | $10.18 | $10.41 |
0.03e | 0.28e | 0.23e | 0.15e | 0.10e | 0.40 |
0.37 | (0.42) | (0.14) | 0.35 | (0.43) | (0.20) |
0.40 | (0.14) | 0.09 | 0.50 | (0.33) | 0.20 |
(0.13) | (0.40) | (0.15) | (0.17) | (0.70) | (0.03) |
— | — | — | — | — | (0.40) |
(0.13) | (0.40) | (0.15) | (0.17) | (0.70) | (0.43) |
9.15 | 8.88 | 9.42 | 9.48 | 9.15 | 10.18 |
$81,186 | $85,316 | $99,929 | $108,890 | $130,467 | $169,969 |
4.52%c | (1.57)% | 0.92% | 5.55% | (3.32)% | 2.07% |
1.69d | 1.36 | 1.03 | 0.87 | 0.77 | 0.63 |
1.48d | 1.16 | 0.87 | 0.73 | 0.68 | 0.62 |
0.52d | 0.53 | 0.54 | 0.55 | 0.58 | 0.60 |
0.62d | 3.07 | 2.42 | 1.63 | 1.06 | 1.91 |
144c | 519 | 758 | 611 | 531 | 427 |
104
Harbor Fixed Income Funds Financial Highlights—Continued
Selected Data for a Share Outstanding for the Periods Presented
HARBOR MONEY MARKET FUND | ||||||
Institutional Class | ||||||
6-Month Period Ended April 30, 2019 | Year Ended October 31, | |||||
2018 | 2017 | 2016 | 2015 | 2014 | ||
(Unaudited) | ||||||
Net asset value beginning of period | $1.00 | $1.00 | $1.00 | $1.00 | $1.00 | $1.00 |
Income from Investment Operations | ||||||
Net investment income/(loss)a | 0.01e | 0.01e | 0.01e | —*,e | —*,e | —* |
Net realized and unrealized gains/(losses) on investments | — | — | — | — | — | — |
Total from investment operations | 0.01 | 0.01 | 0.01 | —* | —* | —* |
Less Distributions | ||||||
Dividends from net investment income | (0.01) | (0.01) | (0.01) | —* | —* | —* |
Net asset value end of period | 1.00 | 1.00 | 1.00 | 1.00 | 1.00 | 1.00 |
Net assets end of period (000s) | $145,644 | $129,826 | $169,637 | $136,986 | $176,781 | $157,801 |
Ratios and Supplemental Data (%) | ||||||
Total returnb | 1.04%c | 1.44% | 0.73% | 0.30% | 0.08% | 0.06% |
Ratio of total expenses to average net assets^ | 0.34d | 0.35 | 0.35 | 0.36 | 0.32 | 0.30 |
Ratio of net expenses to average net assetsa | 0.28d | 0.20 | — | — | — | — |
Ratio of net investment income to average net assetsa | 2.09d | 1.42 | 0.72 | 0.27 | 0.08 | 0.06 |
* | Less than $0.01 |
^ | Percentage does not reflect reduction for credit balance arrangements (see the “Custodian” section in Note 2 of the accompanying Notes to Financial Statements) |
a | Reflects the Adviser’s waiver, if any, of its management fees and/or other operating expenses |
b | The total returns would have been lower had certain expenses not been waived during the periods shown. |
c | Unannualized |
d | Annualized |
e | Amounts are based on daily shares outstanding during the period. |
f | For the period March 1, 2016 (inception) through October 31, 2016 |
g | For the period June 1, 2018 (inception) through October 31, 2018 |
h | For the period November 1, 2017 (inception) through October 31, 2018 |
The accompanying notes are an integral part of the Financial Statements.
105
Administrative Class | |||||
6-Month Period Ended April 30, 2019 | Year Ended October 31, | ||||
2018 | 2017 | 2016 | 2015 | 2014 | |
(Unaudited) | |||||
$1.00 | $1.00 | $1.00 | $1.00 | $1.00 | $1.00 |
0.01e | 0.01e | 0.01e | —*,e | —*,e | —* |
— | — | — | — | — | — |
0.01 | 0.01 | 0.01 | —* | —* | —* |
(0.01) | (0.01) | (0.01) | —* | —* | —* |
1.00 | 1.00 | 1.00 | 1.00 | 1.00 | 1.00 |
$2,557 | $2,086 | $1,545 | $2,267 | $1,727 | $2,177 |
0.92%c | 1.36% | 0.73% | 0.30% | 0.08% | 0.06% |
0.59d | 0.60 | 0.60 | 0.61 | 0.57 | 0.55 |
0.53d | 0.29 | — | — | — | — |
1.84d | 1.36 | 0.70 | 0.28 | 0.07 | 0.06 |
106
Harbor Fixed Income Funds
Notes to Financial Statements—April 30, 2019 (Unaudited)
Note 1—Organizational Matters
Harbor Funds (the “Trust”) is registered under the Investment Company Act of 1940, as amended (the “Investment Company Act”), as an open-end management investment company. As of April 30, 2019, the Trust consists of 33 separate portfolios. The portfolios covered by this report are: Harbor Convertible Securities Fund, Harbor High-Yield Bond Fund, Harbor High-Yield Opportunities Fund, Harbor Core Bond Fund, Harbor Bond Fund, Harbor Real Return Fund, and Harbor Money Market Fund (individually or collectively referred to as a “Fund” or the “Funds," respectively). Harbor Capital Advisors, Inc. (the “Adviser” or “Harbor Capital”) is the investment adviser for the Funds.
The Funds currently offer up to four classes of shares, designated as Retirement Class, Institutional Class, Administrative Class and Investor Class. The shares of each class represent an interest in the same portfolio of investments of the Funds and have equal rights with respect to voting, redemptions, dividends, and liquidations, except that: (i) certain expenses, subject to the approval of the Trust’s Board of Trustees (the “Board of Trustees”), may be applied differently to each class of shares in accordance with current regulations of the Securities and Exchange Commission (“SEC”) and the Internal Revenue Service; and (ii) shareholders of a class that bears distribution and service expenses under terms of a distribution plan have exclusive voting rights as to that distribution plan.
Note 2—Significant Accounting Policies
The following is a summary of significant accounting policies followed by the Trust in the preparation of its financial statements. Each Fund follows the investment company reporting requirements under U.S. Generally Accepted Accounting Principles (“U.S. GAAP”), which includes the accounting and reporting guidelines under Accounting Standards Codification (“ASC”) Topic 946,Financial Services-Investment Companies. The preparation of financial statements in accordance with U.S. GAAP requires management to make estimates and assumptions that affect the reported amounts and disclosures in the financial statements. Actual results may differ from those estimates.
Security Valuation
The Trust’s valuation procedures permit the Funds to use a variety of valuation methodologies, consider a number of subjective factors, analyze applicable facts and circumstances and, in general, exercise judgment, when valuing Fund investments. The methodology used for a specific type of investment may vary based on the circumstances and relevant considerations, including available market data.
Equity securities (including common stock, preferred stock, convertible preferred stock, and master limited partnerships), exchange-traded notes and financial derivative instruments (such as futures contracts, options contracts, including rights and warrants and centrally cleared swap agreements) that are traded or cleared on a national securities exchange or system (except securities listed on the National Association of Securities Dealers Automated Quotation (“NASDAQ”) system and United Kingdom securities) are valued at the last sale price on a national exchange or system on which they are principally traded or cleared as of the valuation date. Securities listed on the NASDAQ system or a United Kingdom exchange are valued at the official closing price of those securities. In the case of securities for which there are no sales on the valuation day, (i) securities traded principally on a U.S. exchange, including NASDAQ, are valued at the mean between the closing bid and ask price; and (ii) securities traded principally on a foreign exchange, including United Kingdom securities, are valued at the official bid price determined as of the close of the primary exchange. Securities of open-end registered investment companies that are held by a Fund are valued at net asset value. To the extent these securities are actively traded and fair valuation adjustments are not applied, they are normally categorized as Level 1 in the fair value hierarchy. Equity securities traded on inactive markets or valued by reference to similar instruments are normally categorized as Level 2 in the fair value hierarchy. For more information on the fair value hierarchy, please refer to the Fair Value Measurements and Disclosures section.
Debt securities (including corporate bonds, municipal bonds and notes, U.S. government agencies, U.S. treasury obligations, mortgage-backed and asset-backed securities, foreign government obligations, bank loans, and convertible securities other than short-term securities with a remaining maturity of less than 60 days at the time of acquisition), are valued using evaluated prices furnished by a pricing vendor selected by the Board of Trustees. An evaluated price represents an assessment by the pricing vendor using various market inputs of what the pricing vendor believes is the fair value of a security at a particular point in time. The pricing vendor determines evaluated prices for debt securities that would be transacted at institutional-size quantities using inputs including, but not limited to, (i) recent transaction prices and dealer quotes, (ii) transaction prices for what the pricing vendor believes are securities with similar characteristics, (iii) the pricing vendor’s assessment of the risk
107
Harbor Fixed Income Funds
Notes to Financial Statements—Continued
Note 2—Significant Accounting Policies—Continued
inherent in the security taking into account criteria such as credit quality, payment history, liquidity and market conditions, and (iv) various correlations and relationships between security price movements and other factors, such as interest rate changes, which are recognized by institutional traders. In the case of mortgage-backed and asset-backed securities, the inputs used by the pricing vendor may also include information about cash flows, prepayment rates, default rates, delinquency and loss assumption, collateral characteristics, credit enhancements and other specific information about the particular offering. Because many debt securities trade infrequently, the pricing vendor will often not have current transaction price information available as an input in determining an evaluated price for a particular security. When current transaction price information is available, it is one input into the pricing vendor’s evaluation process, which means that the evaluated price supplied by the pricing vendor will frequently differ from that transaction price. Securities held by Harbor Money Market Fund are valued at amortized cost, which the Adviser has determined, pursuant to the Board of Trustees’ authorization, approximates fair value. Under this method, investments purchased at a discount or premium are valued by accreting or amortizing the difference between the original purchase price and the maturity value of the issue over the period to effective maturity. Securities that use similar valuation techniques and inputs as described above are normally categorized as Level 2 in the fair value hierarchy.
Short-term securities with a remaining maturity of less than 60 days at the time of acquisition that are held by a Fund are valued at amortized cost to the extent amortized cost represents fair value. Such securities are normally categorized as Level 2 in the fair value hierarchy.
Over-the-counter financial derivative instruments, such as forward currency contracts, options contracts, and swap agreements, derive their value from underlying asset prices, indices, reference rates and other inputs, or a combination of these factors. These instruments are valued using evaluated prices furnished by a pricing vendor selected by the Board of Trustees. In certain cases, when a valuation is not readily available from a pricing vendor, the Fund’s subadviser provides a valuation, typically using its own proprietary models. Depending on the instrument and the terms of the transaction, the value of the derivative instrument can be determined by a pricing vendor or subadviser using a series of techniques, including simulation pricing models. The pricing models use inputs, such as issuer details, indices, spreads, interest rates, yield curves, dividends and exchange rates, that are observed from actively quoted markets. Derivative instruments that use valuation techniques and inputs similar to those described above are normally categorized as Level 2 in the fair value hierarchy.
When reliable market quotations or evaluated prices supplied by a pricing vendor are not readily available or are not believed to accurately reflect fair value, securities are priced at their fair value as determined by the Trust’s Valuation Committee (the “Valuation Committee”) pursuant to procedures adopted, and subject to oversight, by the Board of Trustees. The Valuation Committee is comprised of a trustee and officers of the Trust and employees of Harbor Capital with relevant experience or responsibilities. Each security for which the Valuation Committee determines a fair value, including the basis for the fair value decision, is reviewed by the Board of Trustees at its regularly scheduled board meetings.
When a fair valuation method is applied by the Valuation Committee or a Fund’s subadviser, securities will be priced by a method that the Valuation Committee or subadviser believes accurately reflects fair value. Securities valued using fair valuation methods that incorporate significant unobservable inputs are normally categorized as Level 3 in the fair value hierarchy. Examples of possible fair valuation methodologies used in determining the fair value of securities categorized as Level 3 in the fair value hierarchy include, but are not limited to, benchmark pricing and indicative market quotations.
When benchmark pricing is used, the base price of a debt security is set and then subsequently adjusted in proportion to the market value changes of an index or similar security (the “benchmark security”) that trades in an active market or for which other observable inputs are available. The base price may be a broker-dealer quote, transaction price, or an internal value as derived by analysis of market data. The base price of the security may be reset on a periodic basis based on the availability of market data and procedures approved by a Fund’s subadviser. If the benchmark security is categorized as Level 2 in the fair value hierarchy due to the lack of an active market for that security, any security adjusted in proportion to the fair value of the benchmark security may be categorized as Level 3 in the fair value hierarchy. Significant changes in the unobservable inputs of the benchmark pricing process (i.e., the base price) would result in direct and proportional changes in the fair value of the security. The reasonability of the fair value is reviewed by the subadviser on a periodic basis and may be amended as the availability of market data indicates a material change.
If evaluated pricing through a third-party pricing vendor is not available or deemed not to be indicative of fair value, a Fund’s subadviser may elect to obtain indicative market quotations (“broker quotes”) directly from a broker-dealer or passed through from a third-party pricing vendor. Indicative market quotations are typically received from established market participants.
108
Harbor Fixed Income Funds
Notes to Financial Statements—Continued
Note 2—Significant Accounting Policies—Continued
In the event that the source of fair value is from a single-sourced broker quote, but the subadviser does not have the transparency to view the underlying inputs that support the market quotation, these securities are categorized as Level 3 in the fair value hierarchy. Significant changes in the broker quote would have direct and proportional changes in the fair value of the security.
A Fund may also use fair value pricing if the value of some or all of the Fund’s securities have been materially affected by events occurring before the Fund’s pricing time but after the close of the primary markets or exchanges on which the security is traded. This most commonly occurs with foreign securities, but may occur with other securities as well. In such cases, the Fund may apply a fair value factor supplied by the pricing vendor to a foreign security’s market close value to reflect changes in value that may have occurred between the close of the primary market or exchange on which the security is traded and the Fund’s pricing time. That factor may be derived using observable inputs such as a comparison of the trading patterns of a foreign security to intraday trading in the U.S. markets that are highly correlated to the foreign security or other information that becomes available after the close of the foreign market on which the security principally traded. When fair value pricing is employed, the prices of securities used by a Fund to calculate its net asset value may differ from market quotations, official closing prices or evaluated prices for the same securities, which means that the Fund may value those securities higher or lower than another given fund that uses market quotations, official closing prices or evaluated prices supplied by a pricing vendor in its calculation of net asset value. Securities valued using observable inputs, such as those described above, are normally categorized as Level 2 of the fair value hierarchy.
Fair Value Measurements and Disclosures
Various inputs may be used to determine the value of each Fund’s investments, which are summarized in three broad categories defined as Level 1, Level 2, and Level 3. The inputs or methodologies used for valuing securities are not necessarily indicative of the risk associated with investing in those securities. The assignment of an investment to Levels 1, 2, or 3 is based on the lowest level of significant inputs used to determine its fair value.
Level 1– | Quoted prices in active markets for identical securities. |
Level 2– | Other significant observable inputs (including quoted prices for similar securities, interest rates, prepayment speeds, credit risk, etc.). |
Level 3– | Significant unobservable inputs are used in situations where quoted prices or other observable inputs are not available or are deemed unreliable. Significant unobservable inputs may include each Fund’s own assumptions. |
A table that includes a categorization of investments into Levels 1, 2, or 3, and a summary of significant unobservable inputs used for Level 3 investments, when applicable, can be found at the end of each Fund’s Portfolio of Investments schedule. For fair valuations using significant unobservable inputs, if any, a reconciliation of the beginning to ending balances for reported fair values is provided at the end of each Fund’s Portfolio of Investments schedule that presents changes attributable to realized and unrealized gains and losses and purchases, sales, and transfers in/out of the Level 3 category during the period.
Each Fund used observable inputs in its valuation methodologies whenever they were available and deemed reliable.
Loan Participations and Assignments
Loan participations and loan assignments are direct debt instruments, which are interests in amounts owed by corporate, governmental, or other borrowers to lenders or lending syndicates. A Fund’s investments in loans may be in the form of participation in loans or assignments of all or a portion of loans from third parties. A loan is often administered by a bank or other financial institution (the “agent”) that acts as agent for all holders. The agent administers the terms of the loan, as specified in the loan agreement. When investing in a loan participation, the Fund has the right to receive payments of principal, interest and any fees to which it is entitled, only from the agent selling the loan agreement and only upon receipt by the agent of payments from the borrower. As a result, the Fund may be subject to the credit risk of both the borrower and the agent that is selling the loan agreement. When the Fund purchases assignments from the agent, it acquires direct rights against the borrower on the loan.
During the period, Harbor High-Yield Bond Fund and Harbor Bond Fund invested in loan participations and assignments.
109
Harbor Fixed Income Funds
Notes to Financial Statements—Continued
Note 2—Significant Accounting Policies—Continued
Harbor High-Yield Bond Fund entered into unfunded loan commitments during the period, which are contractual obligations for future funding. Unfunded loan commitments may include revolving credit facilities, which may obligate the Fund to supply additional cash to the borrower on demand. Unfunded loan commitments represent a future obligation in full, even though a percentage of the notional loan amounts will never be utilized by the borrower. The funded portion of these credit agreements are presented on the Portfolio of Investments. Unfunded loan commitments are marked to market daily and any unrealized appreciation or depreciation is included in the Statement of Assets and Liabilities and the Statement of Operations.
Harbor High-Yield Bond Fund may receive a commitment fee based on the undrawn portion of the underlying line of credit portion of an unfunded loan commitment. In certain circumstances, a Fund that has entered into an unfunded loan commitment may receive a prepayment penalty fee upon the prepayment of a loan by a borrower. Fees earned are recorded as a component of interest income on the Statement of Operations.
As of April 30, 2019, Harbor High-Yield Bond Fund did not have unfunded loan commitments outstanding.
Inflation-Indexed Bonds
Inflation-indexed bonds are fixed-income securities whose principal value is periodically adjusted based on the rate of inflation. The interest rate on these bonds is generally fixed at issuance at a rate lower than typical bonds. Over the life of an inflation-indexed bond, however, interest will be paid based on a principal value that is adjusted for inflation. Any increase in the principal amount of an inflation-indexed bond will be included as interest income even though investors do not receive the principal until maturity.
During the period, Harbor Bond Fund and Harbor Real Return Fund invested in inflation-indexed bonds.
Mortgage-Related and Other Asset-Backed Securities
Mortgage-backed or asset-backed securities include mortgage pass-through securities, collateralized mortgage obligations (“CMOs”), commercial mortgage-backed securities, CMO residuals, stripped mortgage-backed securities (“SMBSs”) and other securities that directly or indirectly represent a participation in, or are secured by and payable from, mortgage loans on real property. The value of some mortgage- or asset-backed securities may be particularly sensitive to changes in prevailing interest rates. Early repayment of principal on some mortgage-related securities may expose a Fund to a lower rate of return upon reinvestment of principal. The value of these securities may fluctuate in response to the market’s perception of the creditworthiness of the issuers. Additionally, although mortgages and mortgage-related securities are generally supported by some form of government or private guarantee and/or insurance, there is no assurance that private guarantors or insurers will meet their obligations.
During the period, Harbor High-Yield Opportunities Fund, Harbor Core Bond Fund, Harbor Bond Fund, and Harbor Real Return Fund invested in mortgage-related or other asset-backed securities.
U.S. Government Securities
U.S. government securities include securities issued by U.S. government agencies or government-sponsored enterprises that may not be guaranteed by the U.S. Treasury. The Government National Mortgage Association (“GNMA”), a wholly owned U.S. government corporation, is authorized to guarantee, with the full faith and credit of the U.S. government, the timely payment of principal and interest on securities issued by institutions approved by GNMA and backed by pools of mortgages insured by the Federal Housing Administration or guaranteed by the Department of Veterans Affairs. Government-related guarantors are not backed by the full faith and credit of the U.S. government and include the Federal National Mortgage Association and the Federal Home Loan Mortgage Corporation.
During the period, Harbor Core Bond Fund, Harbor Bond Fund, Harbor Real Return Fund, and Harbor Money Market Fund invested in U.S. government securities.
110
Harbor Fixed Income Funds
Notes to Financial Statements—Continued
Note 2—Significant Accounting Policies—Continued
Forward Commitments and When-Issued Securities
Purchasing securities on a when-issued or forward commitment basis involves a risk of loss if the value of the security to be purchased declines prior to the settlement date. Although a Fund would generally purchase securities on a when-issued or forward commitment basis with the intention of acquiring securities for its portfolio, a Fund may dispose of a when-issued security or forward commitment prior to settlement if a subadviser deems it appropriate to do so. Each Fund may enter into a forward commitment sale to hedge its portfolio positions or to sell securities it owned under a delayed delivery arrangement. These transactions involve a commitment by a Fund to purchase or sell securities at a future date (ordinarily one or two months later). The price of the underlying securities (usually expressed in terms of yield) and the date when the securities will be delivered and paid for (the settlement date) are fixed at the time the transaction is negotiated. When-issued purchase and forward commitment transactions are negotiated directly with the other party, and such commitments are not traded on exchanges.
The value of securities purchased on a when-issued or forward commitment basis and any subsequent fluctuations in their value are reflected in the computation of a Fund’s net asset value starting on the date of the agreement to purchase the securities. A Fund does not earn interest on the securities it has committed to purchase until they are paid for and delivered on the settlement date. When a Fund makes a forward commitment to sell securities it owns, the proceeds to be received upon settlement are included in the Fund’s assets. Fluctuations in the fair value of the underlying securities are not reflected in a Fund’s net asset value as long as the commitment to sell remains in effect. Settlement of when-issued purchase and forward commitment transactions generally takes place within two months after the date of the transaction, but a Fund may agree to a longer settlement period.
A Fund will purchase securities on a when-issued basis, or purchase or sell securities on a forward commitment basis, only with the intention of completing the transaction and actually purchasing or selling the securities. If deemed advisable as a matter of investment strategy, however, a Fund may dispose of or renegotiate a commitment after it is entered into. A Fund also may sell securities it has committed to purchase before those securities are delivered to a Fund on the settlement date. A Fund may realize a capital gain or loss in connection with these transactions. When a Fund purchases securities on a when-issued or forward commitment basis, the Fund will maintain in a segregated account with the Fund’s custodian, or set aside or restrict in the subadviser’s records or systems relating to the Fund, cash or liquid assets having a value (determined daily) at least equal to the amount of the Fund’s purchase commitments. In the case of a forward commitment to sell portfolio securities, portfolio holdings will be held in a segregated account with the Fund’s custodian, or set aside or restricted on the subadviser’s records or systems relating to the Fund, while the commitment is outstanding.
During the period, Harbor Bond Fund and Harbor Real Return Fund purchased and sold securities on a forward commitment basis, including “TBA” (to be announced) purchase and sale commitments.
Repurchase Agreements
In a repurchase agreement, a Fund buys a security at one price and simultaneously agrees to sell it back at a higher price. Such agreements must be adequately collateralized to cover the counterparty’s obligation to a Fund to close out the repurchase agreement. Each repurchase agreement counterparty must meet the minimum credit quality requirements applicable to the respective Fund and any other appropriate counterparty criteria as determined by a Fund’s subadviser. The minimum credit quality requirements are those applicable to a Fund’s purchase of securities such that if a Fund is permitted to only purchase securities that are rated investment-grade (or the equivalent if unrated), a Fund could only enter into repurchase agreements with counterparties that have debt outstanding that is rated investment-grade (or the equivalent if unrated). The securities are regularly monitored to ensure that the collateral is adequate. A Fund seeks to further mitigate its counterparty risk by entering into master repurchase agreements with its counterparties. The master repurchase agreements provide that, in the event of a counterparty’s default, including bankruptcy, a Fund may terminate any repurchase agreements with that counterparty, determine the net amount owned, and sell or retain the collateral up to the net amount owed to a Fund. A counterparty’s default may cause a Fund to suffer losses, including loss of interest on or principal of the securities and costs associated with delay and enforcement of the terms of the master repurchase agreement.
During the period, Harbor Bond Fund and Harbor Real Return Fund entered into repurchase agreements with domestic or foreign banks or with a member firm of the Financial Industry Regulatory Authority, Inc., or an affiliate of a member firm that is a primary dealer in U.S. government securities.
111
Harbor Fixed Income Funds
Notes to Financial Statements—Continued
Note 2—Significant Accounting Policies—Continued
Reverse Repurchase Agreements
A reverse repurchase agreement involves the delivery of a portfolio security in exchange for cash by a Fund, coupled with an agreement to repurchase the same or substantially the same security at a specified time and price. Until the security is repurchased, a Fund is obligated to pay interest, based upon market rates of the time of issuance, on the value of the repurchase agreement. While a reverse repurchase agreement is outstanding, a Fund continues to receive principal and interest payments on the underlying security. Cash received in exchange for securities delivered plus accrued interest payments to be made by the Fund to counterparties is reflected as a liability on the Statements of Assets and Liabilities. Interest payments based upon the reverse repurchase agreement term made by the Fund to counterparties are recorded as a component of interest expense on the Statements of Operations. To cover its obligations under reverse repurchase agreements, a Fund will segregate cash or liquid securities, which are marked-to-market daily, with the Fund’s custodian, or set aside or restrict assets in the subadviser’s records or systems relating to a Fund, in an amount not less than the repurchase price, including accrued interest, of the underlying security. Reverse repurchase agreements involve the risk that the fair value of the securities sold by a Fund may decline below the repurchase price of the securities and, if the proceeds from the reverse repurchase agreement are invested in securities, that the fair value of the securities purchased may decline below the repurchase price of the securities sold. In periods of increased demand for the security, a Fund may receive a fee for use of the security by the counterparty, which may result in interest income to a Fund.
During the six-month period, Harbor Bond Fund and Harbor Real Return Fund entered into reverse repurchase agreements. The average amount of borrowings outstanding during the six-month period ended April 30, 2019 was $206,245,000 at a weighted average interest rate of 2.500% for the Harbor Bond Fund and $19,210,000 at a weighted average interest rate of 2.538% for the Harbor Real Return Fund. Average debt outstanding and average interest rate during the period is calculated based on calendar days.
A table that includes the remaining maturity period for outstanding reverse repurchase agreements and the type of investment collateral pledged, if any, can be found subsequent to each Fund’s Portfolio of Investments schedule.
Sale-Buybacks
A “sale-buyback” financing transaction consists of a sale of a portfolio security by a Fund to a financial institution (the counterparty) with a simultaneous agreement to repurchase the same or substantially the same security at an agreed-upon price and date. A Fund is not entitled to receive principal and interest payments, if any, made on the security sold to the counterparty during the term of the agreement.
The agreed-upon proceeds for securities to be repurchased by a Fund are reflected as a liability on the Statement of Assets and Liabilities. A Fund will recognize net income represented by the price differential between the price received for the transferred security and the agreed-upon repurchase price. This is commonly referred to as the “price drop.” A price drop consists of two components: (i) the foregone interest and inflationary income adjustments, if any, a Fund would have otherwise received had the security not been sold, and (ii) the negotiated financing terms between a Fund and counterparty. Foregone interest and inflationary income adjustments, if any, are recorded as components of interest income on the Statements of Operations. Interest payments based upon negotiated financing terms made by a Fund to counterparties are recorded as a component of interest expense on the Statements of Operations. To cover its obligations under sale-buyback transactions, a Fund will segregate cash or liquid securities, which are marked-to-market daily, with the Fund’s custodian, or set aside or restrict assets in the subadviser’s records or systems relating to a Fund, in an amount not less than the repurchase price, including accrued interest, of the underlying security. Sale-buyback transactions involve the risk that the fair value of the securities sold by a Fund may decline below the repurchase price of the securities and, if the proceeds from the sale-buyback transactions are invested in securities, that the fair value of the securities purchased may decline below the repurchase price of the securities sold. In periods of increased demand for a security, a Fund may receive a fee for use of the security by the counterparty, which may result in additional interest income to a Fund.
During the period, Harbor Bond Fund and Harbor Real Return Fund entered into sale-buyback transactions. The average amount of borrowings outstanding during the six-month period ended April 30, 2019 was $56,666,000 at a weighted average interest rate of 2.542% for Harbor Bond Fund and $564,000 at a weighted average interest rate of 2.491% for Harbor Real Return Fund. Average debt outstanding and average interest rate during the period is calculated based on calendar days.
112
Harbor Fixed Income Funds
Notes to Financial Statements—Continued
Note 2—Significant Accounting Policies—Continued
A table that includes the remaining maturity period for outstanding sale-buyback transactions and the type of investment collateral pledged, if any, can be found subsequent to each Fund’s Portfolio of Investments schedule.
Short Sales
Short-selling obligates a Fund to replace a borrowed security by purchasing it at the market price at the time of replacement. Until the security is replaced, such Fund is required to pay any accrued interest or dividends to the lender and also may be required to pay a premium. A Fund would realize a gain if the security declines in price between the date of the short sale and the date on which such Fund replaces the borrowed security. A Fund would incur a loss as a result of the short sale if the price of the security increases between those dates. Until a Fund replaces the borrowed security, subject to pre-arranged exposure levels, it will maintain cash or liquid securities sufficient to cover its short position in a segregated account with the Fund’s custodian or set aside or restricted in the subadviser’s records or systems relating to the Fund. Short sales involve the risk of an unlimited increase in the market price of the borrowed security.
During the period, Harbor Bond Fund and Harbor Real Return Fund engaged in short-selling.
Futures Contracts
A futures contract is an agreement between two parties to buy or sell a specified financial instrument at a set price on a future date. Futures contracts tend to increase or decrease a Fund’s exposure to the underlying instrument or can be used to hedge other Fund investments.
Upon entering into a futures contract, a Fund is required to pledge to the broker an amount of cash, U.S. government securities or other liquid securities equal to the minimum “initial margin” requirements of the exchange. Pursuant to the contract, a Fund agrees to receive from or pay to the broker an amount of cash equal to the daily fluctuation in value of the contract referred to as “variation margin.” Such receipts or payments are recorded by a Fund as unrealized gains or losses. When the contract is closed or expires, a Fund records a realized gain or loss equal to the difference between the value of the contract at the time it was opened and the value at the time it was closed. A Fund may suffer losses if it is unable to close out its position because of an illiquid secondary market. There is no assurance that a Fund will be able to close out its position when the Fund considers it appropriate or desirable to do so. In the event of adverse price movements, a Fund may be required to continue making daily cash payments to maintain its required margin. If a Fund has insufficient cash, it may have to sell portfolio securities to meet daily margin requirements at a time when the Fund would not otherwise elect to do so. In addition, a Fund may be required to deliver or take delivery of instruments. The maximum potential loss on a long futures contract is the U.S. dollar value of the notional amount at the time the contract is opened. The potential loss on a short futures contract is unlimited. There is minimal counterparty risk with futures contracts as they are traded on an exchange and the exchange’s clearinghouse, as counterparty to all exchange-traded futures, guarantees the futures contracts against default.
During the period, Harbor Bond Fund and Harbor Real Return Fund used futures contracts to gain exposure to the fixed income asset class with greater efficiency and lower cost than was possible through direct investment, to add value when these securities were attractively priced, or to adjust the portfolio’s sensitivity to changes in interest rates or currency exchange rates.
Options
An option, including rights and warrants, is a contract that offers the buyer the right, but not the obligation, to buy (call) or sell (put) a security or other financial asset at an agreed-upon price (the strike price) during a certain period of time or on a specific date (exercise date). Purchased call options tend to increase a Fund’s exposure to the underlying instrument. Purchased put options tend to decrease a Fund’s exposure to the underlying instrument.
When a Fund purchases an option, it pays a premium. If a purchased option expires, a Fund realizes a loss in the amount of the premium. If a Fund enters into a closing sale transaction, it realizes a gain or loss, depending on whether the proceeds from the sale are greater or less than the cost of the option. If a call option is exercised by a Fund, the cost of the securities acquired by exercising the call is increased by the premium paid to buy the call. If a put option is exercised by a Fund, it
113
Harbor Fixed Income Funds
Notes to Financial Statements—Continued
Note 2—Significant Accounting Policies—Continued
realizes a gain or loss from the sale of the underlying security and the proceeds from such sale are decreased by the premium originally paid. The risk associated with purchasing options is limited to the premium paid. A Fund’s maximum risk of loss from counterparty credit risk is also limited to the premium paid for the contract.
When a Fund writes an option, it receives a premium. If a written option expires on its stipulated expiration date, or if a Fund enters into a closing purchase transaction, the Fund realizes a gain (or loss, if the cost of a closing purchase transaction exceeds the premium received when the option was written) without regard to any unrealized gain or loss on the underlying security, and the liability related to such option is extinguished. If a written call option is exercised, a Fund realizes a gain or loss from the sale of the underlying security, and the proceeds of the sale are increased by the premium originally received. If a written put option is exercised, the amount of the premium originally received reduces the cost of the security that a Fund purchases upon exercise of the option.
The risk in writing a call option is that a Fund relinquishes the opportunity to profit if the fair value of the underlying security increases and the option is exercised. In writing a put option, a Fund assumes the risk of incurring a loss if the fair value of the underlying security decreases and the option is exercised. In addition, there is a risk that a Fund may not be able to enter into a closing transaction because of an illiquid secondary market or if the counterparty does not perform under the contract’s terms.
Options on exchange-traded futures contracts are an option contract in which the underlying instrument is a single futures contract. A Fund may write or purchase options on exchange-traded futures contracts in which a Fund agrees to receive from or pay to the broker an amount of cash equal to the daily fluctuation in value of the contract referred to as “variation margin.” Such receipts or payments are recorded by a Fund as unrealized gains or losses. When the contract is closed or expires, a Fund records a realized gain or loss equal to the difference between the value of the contract at the time it was opened and the value at the time it was closed.
During the period, Harbor Bond Fund and Harbor Real Return Fund purchased and wrote (sold) option contracts to manage their respective exposure to the bond markets and to fluctuations in interest rates and currency values.
Swap Agreements
A swap is a contract between two parties to exchange future cash flows at specified intervals (payment dates) based upon a notional principal amount during the agreed-upon life of the contract. Swaps are marked-to-market daily and changes in value are recorded as unrealized appreciation or depreciation.
Upon entering a swap agreement, any payments received or made at the beginning of the measurement period are reflected as such on the Statements of Assets and Liabilities and represent a reconciling value to compensate for differences between the stated terms of the swap agreement and prevailing market conditions (such as credit spreads, currency exchange rates, interest rates, and other relevant factors). These upfront payments are recorded as realized gains or losses on the Statements of Operations upon termination or maturity of the swap. If a liquidation payment is received or made at the termination of the swap, it is recorded as realized gain or loss on the Statements of Operations. Net periodic payments received or paid by a Fund are included as part of realized gains or losses on the Statements of Operations. A Fund will only enter into swap agreements with counterparties that meet the minimum credit quality requirements applicable to a Fund and any other appropriate counterparty criteria as determined by a Fund’s subadviser. The minimum credit quality requirements are similar to those applicable to a Fund’s purchase of securities, such that if a Fund is permitted to only purchase securities that are rated investment-grade (or the equivalent if unrated), a Fund could only enter into one of the below referenced transactions with counterparties that have debt outstanding that is rated investment-grade (or the equivalent if unrated). Entering into swap agreements involves, to varying degrees, elements of credit risk, market risk and interest rate risk in excess of the amount recognized in the Statements of Assets and Liabilities. Such risks include the possibility that there is not a liquid market for these agreements, that the counterparty to the agreements may default on its obligation to perform, or that there may be unfavorable changes in market conditions or interest rates. A Fund’s maximum risk of loss from counterparty credit risk is the discounted value of the net cash flows to be received from the counterparty over the contract’s remaining life or the value of the contract. This risk is typically mitigated by entering into swap agreements with highly-rated counterparties, the existence of a master netting arrangement between a Fund and the counterparty, and the posting of collateral by the counterparty.
114
Harbor Fixed Income Funds
Notes to Financial Statements—Continued
Note 2—Significant Accounting Policies—Continued
Interest Rate Swaps are agreements between counterparties to exchange cash flows or an exchange of commitments to pay or receive interest with respect to the notional amount of principal. Changes in interest rates can have an effect on the value of bond holdings, the amount of interest income earned and the value of the interest rate swaps held.
During the period, Harbor Bond Fund and Harbor Real Return Fund used interest rate swap agreements to manage their respective exposure to interest rate changes.
Credit Default Swaps are agreements between counterparties to buy or sell protection on a debt security, a basket of securities, or an index of obligations against a defined credit event. Under the terms of a credit default swap, the buyer of protection receives credit protection in exchange for making periodic payments to the seller of protection based on a given percentage applied to a notional principal amount. In return for these payments, the seller acts as the guarantor of the creditworthiness of a reference entity, obligation or index. An issuer may represent either a single issuer, a “basket” of issuers, or a credit index. A credit index is a basket of credit instruments or exposures designed to be representative of some part of the credit market as a whole.
The buyer in a credit default contract is obligated to pay the seller a periodic stream of payments over the term of the contract provided that no credit event occurs. Credit events may include bankruptcy, failure to pay principal, maturity extension, rating downgrade, or write-down. As a seller, if an underlying credit event occurs, a Fund will either pay the buyer an amount equal to the notional amount of the swap and take delivery of the reference obligation (or underlying securities comprising an index), or pay a net settlement amount of cash equal to the notional amount of the swap less the recovery value of the reference obligation (or underlying securities comprising an index). As a buyer, if an underlying credit event occurs, a Fund will either receive from the seller an amount equal to the notional amount of the swap and deliver the reference obligation (or underlying securities comprising an index) or receive a net settlement.
During the period, Harbor Bond Fund and Harbor Real Return Fund used credit default swap agreements as a seller to gain credit exposure to an issuer or to simulate investments in long bond positions that were either unavailable or less attractively priced in the bond market; the Funds used credit default swap agreements as a buyer to provide a measure of protection against defaults of an issuer. The maximum exposure to loss of the notional value as the seller of credit default swaps outstanding at April 30, 2019 for Harbor Bond Fund and Harbor Real Return Fund was $45,808,000 and $234,000, respectively.
Forward Currency Contracts
A forward currency contract is an agreement between two parties to buy and sell currencies at a set price on a future date.
The forward currency contract is marked-to-market daily and the change in fair value is recorded as an unrealized gain or loss. When the contract is closed, the Fund records a realized gain or loss equal to the difference between the value on the open and close date. Risk of losses may arise from changes in the value of the foreign currency, or if the counterparties do not perform under the contract’s terms. The maximum potential loss from such contracts is the aggregate face value in U.S. dollars at the time the contract was opened.
During the period, Harbor Bond Fund and Harbor Real Return Fund used forward currency contracts to manage their respective exposure to changes in exchange rates or as a hedge against foreign exchange risk related to specific transactions or portfolio positions. Each Fund entered into collateral agreements with certain counterparties to mitigate counterparty risk associated with forward currency contracts.
Foreign Currency Spot Contracts
A foreign currency spot contract is an agreement between two parties to buy and sell currencies at the current market rate for settlement within two business days.
The foreign currency spot contract is marked-to-market daily for settlements beyond one day, and any change in fair value is recorded as an unrealized gain or loss. When the contract is closed, the Fund records a realized gain or loss equal to the difference between the value on the open and close date. Risk of losses may arise from changes in the value of the foreign currency or if the counterparties do not perform under the contract’s terms. The maximum potential loss from such contracts is the aggregate face value in U.S. dollars at the time the contract was opened.
115
Harbor Fixed Income Funds
Notes to Financial Statements—Continued
Note 2—Significant Accounting Policies—Continued
During the period, Harbor Bond Fund and Harbor Real Return Fund used foreign currency spot contracts to facilitate transactions in foreign securities or to convert foreign currency receipts into U.S. dollars.
Foreign Currency Translations
Purchases and sales of securities are translated into U.S. dollars at the current exchange rate on the respective dates of the transactions. Income and withholding taxes are translated at the prevailing exchange rate when accrued or incurred. The accounting records of the Funds are maintained in U.S. dollars. Investment securities and other assets and liabilities denominated in a foreign currency, when applicable, are translated into U.S. dollars based on the current exchange rates at period end.
Reported net realized gains and losses on foreign currency transactions, when applicable, represent net gains and losses from sales and maturities of foreign currency contracts, disposition of foreign currencies, currency gains and losses realized between the trade and settlement dates on securities transactions, and the difference between the amount of investment income accrued and tax reclaims receivable and the U.S. dollar amount actually received. The effects of changes in foreign currency exchange rates on investments in securities, when applicable, are included in the net realized and unrealized gain or loss on investments in the Statements of Operations.
Investment Income
Dividends declared on portfolio securities are accrued on the ex-dividend date. For foreign securities held, certain dividends are recorded after the ex-dividend date, but as soon as the respective Fund is notified of such dividends. Interest income is accrued daily as earned. Discounts and premiums on fixed income securities purchased are amortized over the life of the respective securities using the effective yield method. Paydown gains and losses on mortgage-backed and asset-backed securities are recognized as a component of interest income. Consent fees relating to corporate actions from investments held are recorded as income upon receipt.
Distribution to Shareholders
Distributions on Fund shares are recorded on the ex-dividend date.
Securities Transactions
Securities transactions are accounted for on the trade date (the date the order to buy or sell is executed). Realized gains or losses on security transactions are determined on the basis of identified cost.
Proceeds from Litigation
Each Fund may receive proceeds from shareholder litigation settlements involving current and/or previously held portfolio holdings. Any proceeds received from litigation involving portfolio holdings are reflected in the Statements of Operations in realized gain/(loss) if the security has been disposed of by a Fund, or in unrealized gain/(loss) if the security is still held by a Fund.
Expenses
Expenses incurred by the Trust are charged directly to the Fund that incurred such expense whenever possible. With respect to expenses incurred by any two or more Harbor Funds where amounts cannot be identified on a fund by fund basis, such expenses are generally allocated in proportion to the average net assets or the number of shareholders of each Fund.
Custodian
Each Fund has credit balance arrangements with its custodian whereby positive balances in demand deposit accounts used by the transfer and shareholder servicing agent for clearing shareholder transactions in the Fund generate credits that are applied against gross custody expenses. Such custodial expense reductions, if any, are reflected on the respective Fund’s accompanying Statement of Operations.
116
Harbor Fixed Income Funds
Notes to Financial Statements—Continued
Note 2—Significant Accounting Policies—Continued
Class Allocations
Income, common expenses and realized and unrealized gains/(losses) are determined at the Fund level and allocated daily to each class of shares based on the applicable net assets of the respective classes. Distribution and service fees, if any, and transfer agent fees are calculated daily at the class level based on the applicable net assets of each class and the expense rate(s) applicable to each class.
Taxes
Each Fund is treated as a separate entity for federal tax purposes. Each Fund’s policy is to meet the requirements of Subchapter M of the Internal Revenue Code applicable to regulated investment companies and to distribute to its shareholders all of its taxable income within the prescribed time. It is also the intention of each Fund to distribute an amount sufficient to avoid imposition of any excise tax under Section 4982 of the Internal Revenue Code. Therefore, no provision has been made for federal taxes on income, capital gains or unrealized appreciation of securities held or excise taxes on income and capital gains.
Each Fund may be subject to taxes imposed by countries in which they invest. Such taxes are generally based on income and/or capital gains earned or repatriated. Taxes are accrued and applied to net investment income, net realized gains and unrealized appreciation as such income and/or gains are earned.
Management has analyzed each Fund’s tax positions for all open tax years (in particular, U.S. federal income tax returns for the tax years ended October 31, 2015–2017), including all positions expected to be taken upon filing the 2018 tax return, in all material jurisdictions where each Fund operates, and has concluded that no provision for income tax is required in the Funds’ financial statements. Each Fund will recognize interest and penalties, if any, related to unrecognized tax benefits as income tax expense in the Statement of Operations.
Statement of Cash Flows
U.S. GAAP requires entities providing financial statements that report both a statement of assets and liabilities and a statement of operations to also provide a statement of cash flows for each period for which results of operations are provided. Investment companies that meet certain conditions are exempted from this requirement. One of the conditions that must be satisfied is that the fund have little or no debt outstanding during the period.
Harbor Bond Fund and Harbor Real Return Fund entered into secured financing transactions which resulted in debt being recorded on each Fund’s Statement of Assets and Liabilities. Management has determined that the average level of debt outstanding during the period for Harbor Real Return Fund requires the Fund to present a Statement of Cash Flows.
New Accounting Pronouncements
In March 2017, the FASB issued ASU 2017-08,Premium Amortization on Purchased Callable Debt Securities, which provides guidance related to the amortization period for certain purchased callable debt securities held at a premium. This ASU is effective for annual periods beginning after December 15, 2018, and interim periods within those annual periods, however, early adoption is permitted. The amendments in this ASU should be applied on a modified retrospective basis through a cumulative-effect adjustment directly to retained earnings as of the beginning of the period of adoption. At this time, management is evaluating the implications of these changes on the financial statements.
117
Harbor Fixed Income Funds
Notes to Financial Statements—Continued
Note 3—Investment Portfolio Transactions
Investment Portfolio Transactions
Purchases and sales of investments, other than short-term securities, for each Fund for the six-month period ended April 30, 2019 are as follows:
Purchases (000s) | Sales (000s) | ||||||
U.S. Government | Other | U.S. Government | Other | ||||
Harbor Covertible Securities Fund | $— | $27,517 | $— | $31,247 | |||
Harbor High-Yield Bond Fund | — | 201,752 | — | 501,398 | |||
Harbor High-Yield Opportunities Fund | — | 41,737 | — | 38,139 | |||
Harbor Core Bond Fund | 34,774 | 17,385 | 21,792 | 2,475 | |||
Harbor Bond Fund | 10,159,346 | 293,501 | 10,187,658 | 404,630 | |||
Harbor Real Return Fund | 138,658 | 6,080 | 161,739 | 1,940 |
Note 4—FEES AND OTHER Transactions with Affiliates
Investment Adviser
Harbor Capital is a wholly-owned subsidiary of ORIX Corporation (“ORIX”). Harbor Capital is the Funds’ investment adviser and is also responsible for administrative and other services.
Each Fund has a separate advisory agreement with Harbor Capital. The agreements provide for management fees based on an annual percentage rate of average daily net assets as follows:
Contractual Rate | Actual Rate | ||
Harbor Convertible Securities Fund | 0.65%a | 0.60% | |
Harbor High-Yield Bond Fund | 0.60b | 0.51 | |
Harbor High-Yield Opportunities Fund | 0.60 | 0.60 | |
Harbor Core Bond Fund | 0.34 | 0.34 | |
Harbor Bond Fund | 0.48c | 0.46 | |
Harbor Real Return Fund | 0.48 | 0.48 | |
Harbor Money Market Fund | 0.20d | 0.18 |
a | The Adviser has contractually agreed to reduce the management fee to 0.60% through February 29, 2020. |
b | The Adviser has contractually agreed to reduce the management fee to 0.508% through February 29, 2020. |
c | The Adviser has contractually agreed to reduce the management fee to 0.43% on assets between $1 billion and $3 billion and to 0.405% on assets over $3 billion through February 29, 2020. |
d | The Adviser has contractually agreed to reduce the management fee to 0.18% through February 29, 2020. |
Harbor Capital has from time to time voluntarily or contractually agreed not to impose a portion of its management fees and/or to bear a portion of the expenses incurred in the operation of certain Funds in order to limit Fund expenses. Such waivers, if any, are reflected on the accompanying Statements of Operations. Interest expense, if any, is excluded from contractual limitations. During the six-month period, the following expense limitation agreements were in effect:
Retirement Class | Institutional Class | Administrative Class | Investor Class | Expense Limitation Agreement Expiration Date | |||||
Harbor High-Yield Opportunities Fund | 0.65% | 0.73% | 0.98% | 1.10% | 02/29/2020 | ||||
Harbor Core Bond Fund | 0.37 | 0.45 | N/A | N/A | 02/29/2020 | ||||
Harbor Bond Fund | 0.43 | 0.51 | 0.76 | N/A | 02/29/2020 | ||||
Harbor Real Return Fund | 0.44 | 0.52 | 0.77 | N/A | 02/29/2020 | ||||
Harbor Money Market Fund | N/A | 0.28 | 0.53 | N/A | 02/29/2020 |
All expense limitation agreements include the transfer agent fee waiver discussed in the Transfer Agent note.
118
Harbor Fixed Income Funds
Notes to Financial Statements—Continued
Note 4—FEES AND OTHER Transactions with Affiliates—Continued
Distributor
Harbor Funds Distributors, Inc. (the “Distributor”), a wholly-owned subsidiary of Harbor Capital, is the distributor for Harbor Funds’ shares. Under the Trust’s current distribution plan pursuant to Rule 12b-1 under the Investment Company Act with respect to each Fund’s Administrative and Investor Class shares (the “12b-1 Plan”) as applicable, each Fund pays the Distributor compensation at the annual rate of 0.25% of the average daily net assets of its Administrative and Investor Class shares. Pursuant to the 12b-1 Plan, the Distributor is compensated for financing any activity that is primarily intended to result in the sale of Administrative and Investor Class shares of each Fund or for recordkeeping services or the servicing of shareholder accounts in the Administrative and Investor Class shares of each Fund. Such activities include, but are not limited to: printing of prospectuses and statements of additional information and reports for prospective shareholders (i.e., other than existing shareholders); preparation and distribution of advertising material and sales literature; expenses of organizing and conducting sales seminars; supplemental payments to dealers or other institutions such as asset-based sales charges, payments of recordkeeping fees under recordkeeping arrangements, or payments of service fees under shareholder service arrangements; and costs of administering the 12b-1 Plan.
Amounts payable by a Fund under the 12b-1 Plan need not be directly related to the expenses actually incurred by the Distributor on behalf of each Fund. The 12b-1 Plan does not obligate each Fund to reimburse the Distributor for the actual expenses the Distributor may incur in fulfilling its obligations under the 12b-1 Plan. Thus, even if the Distributor’s actual expenses exceed the fee payable to the Distributor at any given time, each Fund will not be obligated to pay more than that fee. If the Distributor’s expenses are less than the fee it receives, the Distributor will retain the difference.
The fees attributable to each Fund’s respective class are shown on the accompanying Statements of Operations.
Transfer Agent
Harbor Services Group, Inc. (“Harbor Services Group”), a wholly-owned subsidiary of Harbor Capital, is the transfer and shareholder servicing agent for the Funds. The transfer agency and service agreement is reviewed and approved annually by the Board of Trustees and provides currently for compensation up to the following amounts per class of each Fund:
Transfer Agent Fees1 | |
Retirement Class | 0.02% of the average daily net assets of all Retirement Class shares |
Institutional Class | 0.10% of the average daily net assets of all Institutional Class shares |
Administrative Class | 0.10% of the average daily net assets of all Administrative Class shares |
Investor Class | 0.22% of the average daily net assets of all Investor Class shares |
1 | For the period November 1, 2018 through February 28, 2019, Harbor Services Group received compensation up to 0.01%, 0.09%, 0.09%, and 0.21% for the Retirement Class, Institutional Class, Administrative Class, and Investor Class, respectively. |
Harbor Services Group has voluntarily waived a portion of its transfer agent fees during the six-month period ended April 30, 2019. Fees incurred for these transfer agent services are shown on each Fund’s Statement of Operations. The voluntary waiver may be discontinued at any time.
Affiliated Transactions
The Investment Company Act permits purchase and sale transactions among affiliated investment companies subject to an exemptive rule. Harbor Funds has adopted policies and procedures pursuant to such rule. During the six-month period, the Funds did not enter into any transactions with any other Harbor fund.
119
Harbor Fixed Income Funds
Notes to Financial Statements—Continued
Note 4—FEES AND OTHER Transactions with Affiliates—Continued
Shareholders
On April 30, 2019, Harbor Capital, and its wholly owned subsidiaries, collectively held the following shares of beneficial interest in each of the following Funds:
Number of Shares Owned by Harbor Capital and Subsidiaries | Percentage of Outstanding Shares | ||||||||||
Retirement Class | Institutional Class | Administrative Class | Investor Class | Total | |||||||
Harbor Convertible Securities Fund | 39,248 | — | — | — | 39,248 | 0.3% | |||||
Harbor High-Yield Bond Fund | 54,175 | — | — | — | 54,175 | 0.1 | |||||
Harbor High-Yield Opportunities Fund | 10,147 | 5,363,689 | 5,356 | 5,348 | 5,384,540 | 68.5 | |||||
Harbor Core Bond Fund | 115,699 | 5,015,879 | — | — | 5,131,578 | 62.0 | |||||
Harbor Bond Fund | 45,997 | — | — | — | 45,997 | 0.0 | |||||
Harbor Real Return Fund | 6,578 | — | — | — | 6,578 | 0.1 | |||||
Harbor Money Market Fund | — | 65,272,581 | 26,024 | — | 65,298,605 | 44.1 |
Independent Trustees
The fees and expenses of the Independent Trustees are included in “Trustees’ fees and expenses” on each Fund’s Statement of Operations.
The Board of Trustees has adopted a Deferred Compensation Plan for Independent Trustees (the “Plan”), which enables Trustees to elect to defer receipt of all or a portion of the annual compensation they are entitled to receive from the Trust. For purposes of determining the amount owed to a Trustee under the Plan, deferred amounts are treated as though they had been invested in shares of the Fund(s) selected by the Trustee. While not required to do so, each Fund makes an investment equal to the Trustee’s investment election. The deferred compensation liability and the offsetting deferred compensation investment asset are included as a component of “Accrued expenses – Trustees’ fees and expenses” and “Other assets”, respectively, in the Statements of Assets and Liabilities. Such amounts fluctuate with changes in the market value of the selected securities. The deferred compensation and related mark-to-market impact liability and an offsetting investment asset will remain on each Fund’s Statement of Assets and Liabilities until distributed in accordance with the Plan.
Indemnification
Under the Trust’s organizational documents, its officers and Trustees are indemnified against certain liabilities arising out of the performance of their duties to the Trust. In addition, in the normal course of business the Trust enters into contracts that provide general indemnities to other parties. The Trust’s maximum exposure under these arrangements is unknown as this would involve future claims that may be made against the Trust that have not yet occurred. The risk of material loss as a result of such indemnification claims is considered remote.
Redemption Fee
A 1% redemption fee is charged on shares of Harbor Convertible Securities Fund, Harbor High-Yield Bond Fund, and Harbor High-Yield Opportunities Fund that are redeemed within 90 days from their date of purchase. All redemption fees are recorded by the Fund as paid-in capital. For the six-month period ended April 30, 2019 redemption fee proceeds are as follows:
Amount (000s) | |
Harbor Convertible Securities Fund | $— |
Harbor High-Yield Bond Fund | 12 |
Harbor High-Yield Opportunities Fund | — |
120
Harbor Fixed Income Funds
Notes to Financial Statements—Continued
NOTE 5—TAX INFORMATION
The identified cost for federal income tax purposes of investments owned by each Fund and its respective gross unrealized appreciation and depreciation at April 30, 2019 are as follows:
Identified Cost (000s) | Gross Unrealized | Net Unrealized Appreciation/ (Depreciation) (000s) | |||||
Appreciation (000s) | (Depreciation) (000s) | ||||||
Harbor Convertible Securities Fund | $118,274 | $8,335 | $(2,894) | $5,441 | |||
Harbor High-Yield Bond Fund* | 494,454 | 10,229 | (7,735) | 2,494 | |||
Harbor High-Yield Opportunities Fund* | 72,901 | 1,400 | (812) | 588 | |||
Harbor Core Bond Fund* | 81,853 | 1,575 | (24) | 1,551 | |||
Harbor Bond Fund* | 3,263,935 | 74,905 | (78,528) | (3,623) | |||
Harbor Real Return Fund* | 115,968 | 2,576 | (2,515) | 61 | |||
Harbor Money Market Fund | 148,015 | — | — | — |
* | Capital loss carryforwards are available, which may reduce taxable income from future net realized gain on investments. |
Note 6—Derivatives
Each Fund’s derivative holdings do not qualify for hedge accounting treatment and as such are recorded at current fair value. For a discussion of risks related to these investments please refer to the descriptions of each type of derivative instrument in Note 2— Significant Accounting Policies.
Each Fund’s derivative instruments outstanding as of the six-month period ended April 30, 2019, if any, as disclosed in the Portfolios of Investments, and the related amounts of realized and changes in unrealized gains and losses on derivative instruments during the period as disclosed in the Statements of Operations, are indicators of the volume of derivative activity for each Fund.
Derivative Instruments
At April 30, 2019, the fair values of derivatives, by primary risk exposure, were reflected in the Statement of Assets and Liabilities as follows:
HARBOR BOND FUND
Statement of Assets and Liabilities Caption | Interest Rate Contracts (000s) | Foreign Exchange Contracts (000s) | Credit Contracts (000s) | Total (000s) | ||||||||
Assets | ||||||||||||
Unrealized appreciation on open forward currency contracts | $— | $7,542 | $— | $7,542 | ||||||||
Unrealized appreciation on OTC swap agreementsb | — | — | 437 | 437 | ||||||||
Variation margin on centrally cleared swap agreementsa,b | 11,661 | — | 1,125 | 12,786 | ||||||||
Variation margin on options and futures contracts (futures)a | 4,375 | — | — | 4,375 | ||||||||
Variation margin on options and futures contracts (options)a | 22 | — | — | 22 | ||||||||
Purchased options, at value | 31 | — | — | 31 | ||||||||
Liabilities | ||||||||||||
Unrealized depreciation on open forward currency contracts | $— | $(1,626) | $— | $(1,626) | ||||||||
Variation margin on centrally cleared swap agreementsa,b | (13,648) | — | (642) | (14,290) | ||||||||
Variation margin on options and futures contracts (futures)a | (13,507) | — | — | (13,507) | ||||||||
Written options, at value | (15) | (96) | — | (111) |
121
Harbor Fixed Income Funds
Notes to Financial Statements—Continued
Note 6—Derivatives—Continued
HARBOR REAL RETURN FUND
Statement of Assets and Liabilities Caption | Interest Rate Contracts (000s) | Foreign Exchange Contracts (000s) | Credit Contracts (000s) | Total (000s) | ||||||||
Assets | ||||||||||||
Unrealized appreciation on open forward currency contracts | $— | $150 | $— | $150 | ||||||||
Unrealized appreciation on OTC swap agreementsb | — | — | 13 | 13 | ||||||||
Variation margin on centrally cleared swap agreementsa,b | 294 | — | — | 294 | ||||||||
Variation margin on options and futures contracts (futures)a | 155 | — | — | 155 | ||||||||
Variation margin on options and futures contracts (options)a | 1 | — | — | 1 | ||||||||
Purchased options, at value | 131 | — | — | 131 | ||||||||
Liabilities | ||||||||||||
Unrealized depreciation on open forward currency contracts | $— | $(82) | $— | $(82) | ||||||||
Unrealized depreciation on OTC swap agreementsb | (105) | — | (8) | (113) | ||||||||
Variation margin on centrally cleared swap agreementsa,b | (346) | — | (35) | (381) | ||||||||
Variation margin on options and futures contracts (futures)a | (325) | — | — | (325) | ||||||||
Variation margin on options and futures contracts (options)a | (9) | — | — | (9) | ||||||||
Written options, at value | (124) | — | — | (124) |
a | Includes cumulative appreciation/depreciation of contracts as reported in the Portfolio of Investments. Only current day’s variation margin is reported within the Statement of Assets and Liabilities |
b | Net of premiums received of $430,000 for Harbor Bond Fund and net of premiums paid of $3,000 for Harbor Real Return Fund |
Realized net gain/(loss) and the change in net unrealized appreciation/(depreciation) on derivatives, by primary risk exposure, for the six-month period ended April 30, 2019, were:
HARBOR BOND FUND
Net realized gain/(loss) on derivatives | Interest Rate Contracts (000s) | Foreign Exchange Contracts (000s) | Credit Contracts (000s) | Total (000s) | ||||
Forward currency contracts | $— | $3,270 | $— | $3,270 | ||||
Futures contracts | (19,598) | — | — | (19,598) | ||||
Purchased options | (158) | (9) | — | (167) | ||||
Written options | 374 | 1,621 | — | 1,995 | ||||
Swaps agreements | 4,074 | 775 | 4,849 | |||||
Net realized gain/(loss) on derivatives | $(15,308) | $4,882 | $775 | $(9,651) |
Change in net unrealized appreciation/(depreciation) on derivatives | Interest Rate Contracts (000s) | Foreign Exchange Contracts (000s) | Credit Contracts (000s) | Total (000s) | ||||
Forward currency contracts | $— | $(2,306) | $— | $(2,306) | ||||
Futures contracts | (11,764) | — | — | (11,764) | ||||
Purchased options | (145) | — | — | (145) | ||||
Written options | 115 | (30) | 7 | 92 | ||||
Swaps agreements | (4,557) | — | (529) | (5,086) | ||||
Change in net unrealized appreciation/(depreciation) on derivatives | $(16,351) | $(2,336) | $(522) | $(19,209) |
122
Harbor Fixed Income Funds
Notes to Financial Statements—Continued
Note 6—Derivatives—Continued
HARBOR REAL RETURN FUND
Net realized gain/(loss) on derivatives | Interest Rate Contracts (000s) | Foreign Exchange Contracts (000s) | Credit Contracts (000s) | Total (000s) | ||||
Forward currency contracts | $— | $209 | $— | $209 | ||||
Futures contracts | (287) | — | — | (287) | ||||
Purchased options | (1) | — | — | (1) | ||||
Written options | 35 | 2 | — | 37 | ||||
Swaps agreements | (26) | — | (15) | (41) | ||||
Net realized gain/(loss) on derivatives | $(279) | $211 | $(15) | $(83) |
Change in net unrealized appreciation/(depreciation) on derivatives | Interest Rate Contracts (000s) | Foreign Exchange Contracts (000s) | Credit Contracts (000s) | Total (000s) | ||||
Forward currency contracts | $— | $(86) | $— | $(86) | ||||
Futures contracts | (346) | — | — | (346) | ||||
Purchased options | 15 | — | — | 15 | ||||
Written options | 7 | — | — | 7 | ||||
Swaps agreements | (377) | — | (47) | (424) | ||||
Change in net unrealized appreciation/(depreciation) on derivatives | $(701) | $(86) | $(47) | $(834) |
Note 7—OFFSETTING ASSETS AND LIABILITIES
Master Netting Arrangements
As described in further detail below, each Fund may enter into Master Netting Arrangements that govern the terms of certain transactions. Master Netting Arrangements are designed to reduce the counterparty risk associated with relevant transactions by establishing credit protection mechanisms and providing standardization as a means of improving legal certainty. As Master Netting Arrangements are specific to the unique operations of different asset types, they allow a Fund to close out and net its total exposure to a counterparty in the event of a default with respect to all of the transactions governed under a single agreement with that counterparty. Master Netting Arrangements can also help reduce counterparty risk by specifying collateral posting requirements at pre-arranged exposure levels. Securities and cash pledged as collateral are reflected as assets in the Statements of Assets and Liabilities as either a component of investments at value (securities) or due from broker. Cash collateral received is not typically held in a segregated account and, as such, is reflected as a liability in the Statements of Assets and Liabilities as due to broker. The fair value of any securities received as collateral is not reflected as a component of net asset value.
For the six-month period ended April 30, 2019, the following Master Netting Arrangements have been entered into by one or more of the Funds:
Master Repurchase Agreements and Global Master Repurchase Agreements, which govern repurchase and reverse repurchase transactions between the Fund and select counterparties. As of April 30, 2019, Harbor Bond Fund and Harbor Real Return Fund had investment exposures subject to the terms of these agreements.
Master Securities Forward Transaction Agreements, which govern the considerations and factors surrounding the settlement of certain forward settling transactions, such as delayed-delivery or sale-buyback transactions by and between the Fund and select counterparties. As of April 30, 2019, Harbor Bond Fund and Harbor Real Return Fund had investment exposures subject to the terms of these agreements.
International Swaps and Derivatives Association, Inc. Master Agreements and Credit Support Annexes, which govern over-the-counter market traded financial derivative transactions entered into by the Fund and select counterparties. As of April 30, 2019, Harbor Bond Fund and Harbor Real Return Fund had investment exposures subject to the terms of these agreements.
123
Harbor Fixed Income Funds
Notes to Financial Statements—Continued
Note 7—OFFSETTING ASSETS AND LIABILITIES—Continued
The following is a summary by counterparty of the gross value of material Borrowings and Other Financing Transactions and collateral (received)/pledged as of April 30, 2019:
HARBOR BOND FUND
Counterparty | Payable for Reverse Repurchase Agreements (000s) | Payable for Sale-Buyback Transactions (000s) | Payable for Short Sale (000s) | Total Borrowings and Other Financing Transactions (000s) | Collateral (Received)/ Pledged (000s) | Net Exposure (000s) | ||||||||||||
Global/Master Repurchase Agreement | ||||||||||||||||||
Bank of America | $(507) | $— | $— | $(507) | $507 | $— | ||||||||||||
Bank of Montreal | (10,900) | — | — | (10,900) | 10,900 | — | ||||||||||||
Bank of Nova Scotia | (91,425) | — | — | (91,425) | 91,425 | — | ||||||||||||
JP Morgan Chase | (82,412) | — | — | (82,412) | 82,412 | — | ||||||||||||
Royal Bank of Canada | (49,968) | — | — | (49,968) | 49,968 | — | ||||||||||||
Master Securities Forward Transactions Agreements | ||||||||||||||||||
Barclays Capital Inc. | — | (29,811) | — | (29,811) | — | (29,811) | ||||||||||||
JP Morgan Securities LLC | — | — | (9,731) | (9,731) | 1,000 | (8,731) | ||||||||||||
Morgan Stanley | — | (63,509) | — | (63,509) | — | (63,509) | ||||||||||||
UBS Securities LLC | — | (26,947) | — | (26,947) | 30 | (26,917) | ||||||||||||
Total Borrowings and Other Financing Transactions | $(235,212) | $(120,267) | $(9,731) |
HARBOR REAL RETURN FUND
Counterparty | Payable for Reverse Repurchase Agreements (000s) | Payable for Sale-Buyback Transactions (000s) | Payable for Short Sale (000s) | Total Borrowings and Other Financing Transactions (000s) | Collateral (Received)/ Pledged (000s) | Net Exposure (000s) | ||||||||||||
Global/Master Repurchase Agreement | ||||||||||||||||||
Royal Bank of Canada | $(12,767) | $— | $— | $(12,767) | $12,767 | $— | ||||||||||||
Royal Bank of Scotland | (7,484) | — | — | (7,484) | 7,484 | — | ||||||||||||
Master Securities Forward Transactions Agreements | ||||||||||||||||||
Morgan Stanley Co Incorporated | — | (2,459) | (1,975) | (4,434) | — | (4,434) | ||||||||||||
Total Borrowings and Other Financing Transactions | $(20,251) | $(2,459) | $(1,975) |
The following is a summary by counterparty of the value of OTC financial derivative instruments and collateral (received)/pledged as governed by International Swaps and Derivatives Association, Inc. master agreements as of April 30, 2019.
HARBOR BOND FUND
Financial Derivative Assets | Financial Derivative Liabilities | Net Value of OTC Derivatives (000s) | Collateral (Received)/ Pledged* (000s) | Net Exposure (000s) | ||||||||||||||||||
Counterparty | Forward Currency Contracts (000s) | Purchased Options (000s) | Swap Agreements (000s) | Total Over-the- Counter (000s) | Forward Currency Contracts (000s) | Written Options (000s) | Swap Agreements (000s) | Total Over-the- Counter (000s) | ||||||||||||||
Barclays Bank plc | $1,327 | $— | $— | $1,327 | $(270) | $— | $— | $(270) | $1,057 | $(870) | $187 | |||||||||||
BNP Paribas SA | 3,338 | — | — | 3,338 | (2) | — | — | (2) | 3,336 | (3,336) | — | |||||||||||
Citibank NA | 416 | — | 106 | 522 | (551) | — | — | (551) | (29) | 29 | — | |||||||||||
Goldman Sachs Bank USA | 242 | 26 | — | 268 | (403) | (92) | — | (495) | (227) | 227 | — | |||||||||||
Goldman Sachs International | — | — | 44 | 44 | — | — | — | — | 44 | — | 44 | |||||||||||
HSBC Bank USA | 37 | — | — | 37 | (37) | — | — | (37) | — | — | — | |||||||||||
HSBC Bank USA NA | — | — | 38 | 38 | — | (19) | — | (19) | 19 | (19) | — | |||||||||||
JP Morgan Chase Bank | 211 | — | — | 211 | — | — | — | — | 211 | — | 211 | |||||||||||
JP Morgan Chase Bank NA | 627 | — | 249 | 876 | (96) | — | — | (96) | 780 | (780) | — | |||||||||||
NatWest Markets Plc | — | — | — | — | (168) | — | — | (168) | (168) | — | (168) | |||||||||||
Société Générale | 3 | — | — | 3 | — | — | — | — | 3 | — | 3 |
124
Harbor Fixed Income Funds
Notes to Financial Statements—Continued
Note 7—OFFSETTING ASSETS AND LIABILITIES—Continued
HARBOR BOND FUND—Continued
Financial Derivative Assets | Financial Derivative Liabilities | Net Value of OTC Derivatives (000s) | Collateral (Received)/ Pledged* (000s) | Net Exposure (000s) | ||||||||||||||||||
Counterparty | Forward Currency Contracts (000s) | Purchased Options (000s) | Swap Agreements (000s) | Total Over-the- Counter (000s) | Forward Currency Contracts (000s) | Written Options (000s) | Swap Agreements (000s) | Total Over-the- Counter (000s) | ||||||||||||||
UBS AG | $1,341 | $— | $— | $1,341 | $(99) | $— | $— | $(99) | $1,242 | $— | $1,242 | |||||||||||
Total Over-the-Counter Exposure | $7,542 | $26 | $437 | $8,005 | $(1,626) | $(111) | $— | $(1,737) |
* | Of the total collateral received and/or pledged listed in the table above, no cash has been received as collateral. |
HARBOR REAL RETURN FUND
Financial Derivative Assets | Financial Derivative Liabilities | Net Value of OTC Derivatives (000s) | Collateral (Received)/ Pledged* (000s) | Net Exposure (000s) | ||||||||||||||||||
Counterparty | Forward Currency Contracts (000s) | Purchased Options (000s) | Swap Agreements (000s) | Total Over-the- Counter (000s) | Forward Currency Contracts (000s) | Written Options (000s) | Swap Agreements (000s) | Total Over-the- Counter (000s) | ||||||||||||||
Barclays Bank plc | $11 | $— | $— | $11 | $— | $— | $(6) | $(6) | $5 | $— | $5 | |||||||||||
BNP Paribas SA | 31 | — | — | 31 | (11) | — | — | (11) | 20 | — | 20 | |||||||||||
Citibank NA | 51 | — | — | 51 | (40) | — | — | (40) | 11 | — | 11 | |||||||||||
Deutsche Bank AG | — | — | — | — | — | — | (36) | (36) | (36) | — | (36) | |||||||||||
Goldman Sachs Bank USA | 19 | — | — | 19 | (3) | (1) | — | (4) | 15 | — | 15 | |||||||||||
Goldman Sachs International | — | — | 13 | 13 | — | — | — | — | 13 | — | 13 | |||||||||||
HSBC Bank USA | 1 | — | — | 1 | (1) | — | — | (1) | — | — | — | |||||||||||
HSBC Bank USA NA | — | — | — | — | — | — | (2) | (2) | (2) | (2) | ||||||||||||
JP Morgan Chase Bank NA | 16 | — | — | 16 | — | (3) | — | (3) | 13 | — | 13 | |||||||||||
Morgan Stanley Capital Services LLC | — | 131 | — | 131 | — | (120) | (69) | (189) | (58) | — | (58) | |||||||||||
Société Générale | — | — | — | — | (4) | — | — | (4) | (4) | — | (4) | |||||||||||
UBS AG | 21 | — | — | 21 | (23) | — | — | (23) | (2) | — | (2) | |||||||||||
Total Over-the-Counter Exposure | $150 | $131 | $13 | $294 | $(82) | $(124) | $(113) | $(319) |
* | Of the total collateral received and/or pledged listed in the table above, no cash has been received as collateral. |
Exchange traded and centrally cleared derivatives are not subject to master netting or similar arrangements.
Note 8—Subsequent Events
Through the date the financial statements were issued, there were no subsequent events or transactions that would have materially impacted the financial statements or related disclosures as presented herein.
125
Harbor Fixed Income Funds
Fees and Expenses Example (Unaudited)
Example
As a shareholder of a Fund, you incur two types of costs: (1) transaction costs, including redemption fees (if any) and (2) ongoing costs, including management fees, distribution and service (12b-1) fees (if any), and other Fund expenses. This example is intended to help you understand your ongoing costs (in dollars) of investing in a Fund and to compare these costs with the ongoing costs of investing in other mutual funds.
The example is based on an investment of $1,000 invested at the beginning of the period and held for the entire period November 1, 2018 through April 30, 2019.
Actual Expenses
The first line of the table below provides information about actual account values and actual expenses for each share class. You may use the information in the respective class line, together with the amount you invested, to estimate the expenses that you paid over the period. Simply divide your account value by $1,000 (for example, an $8,600 account value divided by $1,000 = 8.6), then multiply the result by the number in the first line of the respective class under the heading entitled “Expenses Paid During Period” to estimate the expenses you paid on your account during this period.
Hypothetical Example for Comparison Purposes
The second line of the table for each share class below provides information about hypothetical account values and hypothetical expenses based on the respective Fund/Class’s actual expense ratio and an assumed rate of return of 5% per year before expenses, which is not the respective Fund/Class’s actual return. The hypothetical account values and expenses may not be used to estimate the actual ending account balance or expenses you paid for the period. You may use this information to compare the ongoing costs of investing in a Fund to other funds. To do so, compare this 5% hypothetical example with the 5% hypothetical examples that appear in the shareholder reports of the other funds.
Please note that the expenses shown in the table are meant to highlight your ongoing costs only and do not reflect any transactional costs, such as redemption fees. Therefore, the second line of the table is useful in comparing ongoing costs only, and will not help you determine the relative total costs of owning different funds. In addition, if these transactional costs were included, your costs would have been higher.
Annualized Expense Ratios* | Expenses Paid During Period** | Beginning Account Value November 1, 2018 | Ending Account Value April 30, 2019 | |||||
Harbor Convertible Securities Fund | ||||||||
Retirement Class | 0.67% | |||||||
Actual | $3.47 | $1,000 | $1,089.70 | |||||
Hypothetical (5% return) | 3.36 | 1,000 | 1,021.39 | |||||
Institutional Class | 0.75% | |||||||
Actual | $3.89 | $1,000 | $1,090.23 | |||||
Hypothetical (5% return) | 3.76 | 1,000 | 1,020.98 | |||||
Administrative Class | 1.00% | |||||||
Actual | $5.18 | $1,000 | $1,088.80 | |||||
Hypothetical (5% return) | 5.01 | 1,000 | 1,019.71 | |||||
Investor Class | 1.12% | |||||||
Actual | $5.80 | $1,000 | $1,088.40 | |||||
Hypothetical (5% return) | 5.61 | 1,000 | 1,019.10 |
126
Harbor Fixed Income Funds
Fees and Expenses Example—Continued
Annualized Expense Ratios* | Expenses Paid During Period** | Beginning Account Value November 1, 2018 | Ending Account Value April 30, 2019 | |||||
Harbor High-Yield Bond Fund | ||||||||
Retirement Class | 0.55% | |||||||
Actual | $2.80 | $1,000 | $1,048.10 | |||||
Hypothetical (5% return) | 2.76 | 1,000 | 1,022.00 | |||||
Institutional Class | 0.63% | |||||||
Actual | $3.20 | $1,000 | $1,048.80 | |||||
Hypothetical (5% return) | 3.16 | 1,000 | 1,021.59 | |||||
Administrative Class | 0.88% | |||||||
Actual | $4.46 | $1,000 | $1,048.00 | |||||
Hypothetical (5% return) | 4.41 | 1,000 | 1,020.32 | |||||
Investor Class | 1.00% | |||||||
Actual | $5.08 | $1,000 | $1,046.50 | |||||
Hypothetical (5% return) | 5.01 | 1,000 | 1,019.71 | |||||
Harbor High-Yield Opportunities Fund | ||||||||
Retirement Class | 0.65% | |||||||
Actual | $3.29 | $1,000 | $1,042.90 | |||||
Hypothetical (5% return) | 3.26 | 1,000 | 1,021.49 | |||||
Institutional Class | 0.73% | |||||||
Actual | $3.70 | $1,000 | $1,042.50 | |||||
Hypothetical (5% return) | 3.66 | 1,000 | 1,021.08 | |||||
Administrative Class | 0.98% | |||||||
Actual | $4.96 | $1,000 | $1,041.20 | |||||
Hypothetical (5% return) | 4.91 | 1,000 | 1,019.81 | |||||
Investor Class | 1.10% | |||||||
Actual | $5.56 | $1,000 | $1,039.50 | |||||
Hypothetical (5% return) | 5.51 | 1,000 | 1,019.20 | |||||
Harbor Core Bond Fund | ||||||||
Retirement Class | 0.37% | |||||||
Actual | $1.59 | $1,000 | $1,053.50 | |||||
Hypothetical (5% return) | 1.86 | 1,000 | 1,022.91 | |||||
Institutional Class | 0.45% | |||||||
Actual | $1.94 | $1,000 | $1,053.10 | |||||
Hypothetical (5% return) | 2.26 | 1,000 | 1,022.51 | |||||
Harbor Bond Fund | ||||||||
Retirement Class | 0.94% | |||||||
Actual | $4.03 | $1,000 | $1,048.00 | |||||
Hypothetical (5% return) | 4.71 | 1,000 | 1,015.31 | |||||
Institutional Class | 1.08% | |||||||
Actual | $5.49 | $1,000 | $1,047.60 | |||||
Hypothetical (5% return) | 5.41 | 1,000 | 1,019.31 | |||||
Administrative Class | 1.31% | |||||||
Actual | $6.65 | $1,000 | $1,046.30 | |||||
Hypothetical (5% return) | 6.56 | 1,000 | 1,018.14 |
127
Harbor Fixed Income Funds
Fees and Expenses Example—Continued
Annualized Expense Ratios* | Expenses Paid During Period** | Beginning Account Value November 1, 2018 | Ending Account Value April 30, 2019 | |||||
Harbor Real Return Fund | ||||||||
Retirement Class | 1.41% | |||||||
Actual | $6.05 | $1,000 | $1,046.50 | |||||
Hypothetical (5% return) | 7.05 | 1,000 | 1,010.58 | |||||
Institutional Class | 1.48% | |||||||
Actual | $7.51 | $1,000 | $1,045.20 | |||||
Hypothetical (5% return) | 7.40 | 1,000 | 1,017.27 | |||||
Administrative Class | 1.73% | |||||||
Actual | $8.77 | $1,000 | $1,044.50 | |||||
Hypothetical (5% return) | 8.65 | 1,000 | 1,016.00 | |||||
Harbor Money Market Fund | ||||||||
Institutional Class | 0.28% | |||||||
Actual | $1.40 | $1,000 | $1,010.40 | |||||
Hypothetical (5% return) | 1.40 | 1,000 | 1,023.37 | |||||
Administrative Class | 0.53% | |||||||
Actual | $2.64 | $1,000 | $1,009.20 | |||||
Hypothetical (5% return) | 2.66 | 1,000 | 1,022.10 |
* | Reflective of all fee waivers and expense reimbursements |
** | Expenses are equal to the Fund’s annualized expense ratio, multiplied by the average account value over the period, multiplied by 181/365 (to reflect the one-half year period). |
128
Harbor Fixed Income Funds
Additional Information (Unaudited)
Proxy Voting
Harbor Funds has adopted Proxy Voting Policies and Procedures under which proxies relating to securities held by the Harbor funds are voted. In addition, Harbor Funds files Form N-PX, with its complete proxy voting record for the 12 months ended June 30th, no later than August 31st of each year. A description of Harbor Funds’ Proxy Voting Policies and Procedures and the proxy voting records (Form N-PX) are available (i) without charge, upon request, by calling Harbor Funds toll-free at 800-422-1050; (ii) on Harbor Funds’ website atharborfunds.com; and (iii) on the SEC’s website at sec.gov.
Householding
Harbor Funds has adopted a policy that allows it to send only one copy of a Fund’s prospectus, proxy materials, annual report and semi-annual report to certain shareholders residing at the same household. This reduces Fund expenses, which benefits you and other shareholders. If you need additional copies or do not want your mailings to be “householded,” please call the Shareholder Servicing Agent at 800-422-1050. Individual copies will be sent within thirty (30) days after the Shareholder Servicing Agent receives your instructions. Your consent to householding is considered valid until revoked.
Quarterly Portfolio Disclosures
Harbor Funds files a complete portfolio of investments with the SEC for the first and third quarters of each fiscal year. In 2019, the Funds filed a complete portfolio of investments for the first fiscal quarter on Form N-Q. Beginning with the third fiscal quarter of 2019, the Funds will file a complete portfolio of investments with the SEC on Form N-PORT. The Funds’ Forms N-Q and N-PORT are available (i) without charge, upon request, by calling Harbor Funds toll-free at 800-422-1050, (ii) on Harbor Funds’ website atharborfunds.com, and (iii) on the SEC’s website at sec.gov.
ADVISORY AGREEMENT APPROVALS
FACTORS CONSIDERED BY THE TRUSTEES IN APPROVING THE INVESTMENT ADVISORY AGREEMENTS AND SUBADVISORY AGREEMENTS OF the fixed income FUNDS
The Investment Company Act of 1940, as amended, requires that the Investment Advisory and Subadvisory Agreement of each Fund be approved initially, and following an initial two-year term, at least annually, by the Harbor Funds Board of Trustees (the “Board” or the “Trustees”), including a majority of the Independent Trustees voting separately.
At an in-person meeting of the Board held on February 15 and16, 2019 (the “Meeting”), the Board, including all of the Independent Trustees voting separately, considered and approved the continuation of each Investment Advisory Agreement with Harbor Capital Advisors, Inc., the adviser to each Fund (the “Adviser” or “Harbor Capital”), and each Subadvisory Agreement with each Fund’s subadviser (each, a “Subadviser”) with respect to Harbor Convertible Securities Fund, Harbor High-Yield Bond Fund, Harbor High-Yield Opportunities Fund, Harbor Bond Fund, Harbor Real Return Fund and Harbor Money Market Fund.
In evaluating each Investment Advisory Agreement and each Subadvisory Agreement, the Trustees reviewed materials furnished by the Adviser and each Subadviser, including information about their respective affiliates, personnel, and operations, and also relied upon their knowledge of the Adviser and Subadvisers resulting from their quarterly meetings, periodic telephonic meetings and other prior communications. In connection with the Meeting, which had been called for the purpose of considering the continuation of the Investment Advisory Agreements and Subadvisory Agreements, and at prior meetings, the Trustees, including the Independent Trustees, requested and received materials and presentations relating to Fund performance and the services rendered by the Adviser and each Subadviser. The Trustees also discussed with representatives of the Adviser, at the Meeting and at prior meetings, Harbor Funds’ operations and the Adviser’s ability, consistent with the “manager of managers” structure of Harbor Funds, to (i) identify and recommend to the Trustees a subadviser for each Fund, (ii) monitor and oversee the performance and investment capabilities of each Subadviser, and (iii) recommend the replacement of a subadviser where appropriate. The Trustees specifically considered the Adviser’s history as a manager-of-managers, including its history of replacing subadvisers for particular Funds in circumstances in which the Board and the Adviser had determined that a change in subadviser was in the best interests of a Fund and its shareholders, whether as a result of (i) long-term underperformance not explained by market conditions or market cycles relative to the subadviser’s investment style, (ii) prolonged style inconsistency, (iii) material adverse changes in management or personnel, or (iv) other factors, such as if the Adviser were to identify another subadviser believed to better serve the shareholders than the existing subadviser.
129
Harbor Fixed Income Funds
Additional Information—Continued
ADVISORY AGREEMENT APPROVALS—Continued
At the Meeting, the Trustees, including all of the Independent Trustees voting separately, determined, in the exercise of their business judgment, that the terms of each Investment Advisory Agreement and each Subadvisory Agreement were fair and reasonable and approved the continuation for a one-year period of each such Investment Advisory Agreement and Subadvisory Agreement as being in the best interests of each Fund and its shareholders.
In their deliberations, the Independent Trustees had the opportunity to meet privately without representatives of the Adviser or any Subadviser present and were represented throughout the process by legal counsel to the Independent Trustees and the Funds.
In considering the approval of each Fund’s Investment Advisory Agreement and Subadvisory Agreement, the Board, including the Independent Trustees, evaluated a number of factors it considered relevant to its determination. The Board did not identify any single factor as all-important or controlling, and individual Trustees did not necessarily attribute the same weight or importance to each factor.
Among the factors considered by the Trustees in approving the Investment Advisory Agreements and Subadvisory Agreements were the following:
• | the nature, extent, and quality of the services provided by the Adviser and each Subadviser, including the background, education, expertise and experience of the investment professionals of the Adviser and each Subadviser providing services to the Funds; |
• | the favorable history, reputation, qualifications and background of the Adviser and each Subadviser, as well as the qualifications of their respective personnel; |
• | the profitability of the Adviser with respect to each Fund, including the effect of revenues of Harbor Services Group, Inc. (“Harbor Services Group”), the Funds’ transfer agent, and Harbor Funds Distributors, Inc. (“Harbor Funds Distributors”), the Funds’ principal underwriter, on such profitability; |
• | the fees charged by the Adviser and Subadvisers for investment advisory and subadvisory services, respectively, including, in each case, the portion of the fee to be retained by the Adviser, after payment of the Subadviser’s fee, for the investment advisory and related services, including investment, business, legal, compliance, financial and administrative services, that the Adviser provides; |
• | the extent to which economies of scale might be realized as each Fund grows, and the extent to which each Fund’s advisory fee level reflects any economies of scale for the benefit of Fund investors; |
• | the fees and expense ratios of each Fund relative to the quality of services provided and the fees and expense ratios of similar investment companies; |
• | the short- and long-term investment performance of each Fund in comparison to peer groups and certain relevant benchmark indices and the Adviser’s efforts to address circumstances of underperformance where applicable; |
• | the compensation received by Harbor Services Group and Harbor Funds Distributors in consideration of the services each provides to the Funds; |
• | any “fall out” benefits that might inure to the Adviser and its affiliates as a result of their relationship with the Funds; |
• | information received at regular meetings throughout the year related to Fund performance and services rendered by the Adviser, as well as each of the Subadvisers, and research arrangements with brokers who execute transactions on behalf of each Subadviser; |
• | information contained in materials provided by the Adviser and compiled by Broadridge as to the investment returns, advisory fees and total expense ratios of the Institutional Class of each Fund (and, in certain cases, total expense ratios of the Investor Class) relative to those of other investment companies with similar objectives and strategies managed by other investment advisers, consisting both of a peer group of funds as well as a broader universe of funds compiled by Broadridge; and |
• | information contained in materials compiled by Morningstar as to the investment returns of the Institutional Class of each Fund relative to those of other investment companies with similar objectives and strategies managed by other investment advisers. |
130
Harbor Fixed Income Funds
Additional Information—Continued
ADVISORY AGREEMENT APPROVALS—Continued
Nature, Extent, and Quality of Services
The Trustees separately considered the nature, extent, and quality of the services provided by the Adviser and each Subadviser. In their deliberations as to the approval of each Fund’s Investment Advisory Agreement and Subadvisory Agreement, the Trustees were mindful of the fact that, by choosing to invest in a Fund, the shareholders had entrusted the Adviser with the responsibility, subject to the approval of the Trustees, for selecting each Fund’s Subadviser, overseeing and monitoring that Subadviser’s performance and replacing the Subadviser if necessary. The Trustees also considered as relevant to their determination the favorable history, reputation, qualifications and background of the Adviser and each Subadviser, as well as the qualifications of their respective personnel.
The Adviser’s Services. The Board evaluated the nature, extent, and quality of the Adviser’s services in light of the Board’s experience with the Adviser, as well as materials provided by the Adviser as part of its comprehensive written response to the 15(c) request letter prepared by legal counsel to the Independent Trustees in consultation with the Independent Trustees concerning the financial and other resources devoted by the Adviser to Harbor Funds, including the breadth and depth of experience and expertise of the investment, accounting, administrative, legal and compliance professionals dedicated to Harbor Funds’ operations. The Trustees determined that the Adviser had the expertise and resources to identify, select, oversee and monitor each Subadviser and to operate effectively as the “manager of managers” for the Funds.
The Subadvisers’ Services. The Trustees’ consideration of the services provided by the Subadvisers included a review of each Subadviser’s portfolio managers, investment philosophy, style and processes and record of consistency therewith, the volatility of its results, its approach to controlling risk, and the quality and extent of its investment capabilities and resources, including the nature and extent of research it receives from broker-dealers (to the extent applicable) and other sources. In their deliberations with respect to each Fund, the Trustees considered the history of Harbor Funds’ relationship with each Subadviser and Harbor Funds’ experience with each Subadviser in this capacity.
The Trustees also considered each Subadviser’s breadth and depth of experience and investment results in managing other accounts similar to the respective Fund. The Trustees received a presentation at the Meeting by investment professionals from the Subadvisers for Harbor Convertible Securities Fund and Harbor High-Yield Bond Fund. The Trustees had received a presentation by investment professionals from the Subadviser for Harbor High-Yield Opportunities Fund, Harbor Bond Fund, Harbor Real Return Fund, and Harbor Money Market Fund at meetings of the Board of Trustees held in 2018. The Trustees reviewed information concerning each Subadviser’s historical investment results in managing accounts and/or funds, as applicable, in a manner substantially similar to the relevant Fund.
Investment Performance, Advisory Fees and Expense Ratios
In considering each Fund’s performance, advisory fees and expense ratio, the Trustees requested and received from the Adviser data compiled by Broadridge and Morningstar. The Trustees also received information explaining the methodology for compilation of certain of this information and what it was intended to demonstrate. The Trustees analyzed the Institutional Class performance of each Fund, the advisory fees of each Fund, and the Institutional Class expenses of each Fund (after giving effect to waivers and/or reimbursements, if applicable, that reduced the fees or expenses of the Fund or its peer funds) and made certain observations and findings as to each Fund as noted below. The Trustees also reviewed certain Investor Class fee and expense information they considered relevant to their deliberations. In evaluating performance, the Trustees recognized that the performance data reflects a snapshot of a period as of a particular date and that selecting a different performance period could produce significantly different results.
Harbor Convertible Securities Fund. The Trustees considered Harbor Convertible Securities Fund (inception date May 1, 2011), noting its underperformance relative to its Broadridge group and universe medians for the three- and five-year periods ended December 31, 2018 and its outperformance relative to its Broadridge group and universe medians for the one-year period ended December 31, 2018. The Fund’s one-, three- and five-year rolling returns as of December 31, 2018 ranked in the first, fourth and fourth quartiles, respectively, according to Morningstar data. The Trustees also considered the fact that the Fund had underperformed its benchmark, the ICE Bank of America (“ICE BofA”) Merrill Lynch All US Convertibles Ex Mandatory Index, for the one-, three-, and five-year periods ended December 31, 2018.
The Trustees considered the expertise of Shenkman Capital Management, Inc. (“Shenkman Capital”) in managing assets generally and in the convertible securities asset class specifically, noting that Shenkman Capital managed approximately $617 million in assets in this asset class, out of a firm-wide total of approximately $25.3 billion in assets under management. The Trustees also noted the experience of the Fund’s portfolio managers in this asset class.
131
Harbor Fixed Income Funds
Additional Information—Continued
ADVISORY AGREEMENT APPROVALS—Continued
The Trustees observed that the Broadridge comparison of contractual management fees for the Fund’s expense group, assuming an asset level of $125 million, showed the Fund’s management fee was below the group median for the Institutional Class. The actual total expense ratio of the Fund’s Institutional Class was also below the group and universe medians. The Trustees also considered that the Fund’s existing contractual fee waiver arrangement will continue until at least February 29, 2020. The Trustees noted that Harbor Capital’s profitability in operating the Fund was not excessive.
Harbor High-Yield Bond Fund. The Trustees considered Harbor High-Yield Bond Fund (inception date December 1, 2002), noting its underperformance relative to its Broadridge group and universe medians for each of the three- and five-year periods ended December 31, 2018 and its outperformance relative to its Broadridge group and universe medians for the one-year period ended December 31, 2018. The Fund’s one-, three- and five-year rolling returns as of December 31, 2018 ranked in the second, third and third quartiles, respectively, according to Morningstar data. The Trustees also considered the fact that the Fund had outperformed its primary benchmark, the ICE BofA Merrill Lynch U.S. Non-Distressed High Yield Index, for the one-year period and underperformed its benchmark indices for the three- and five-year periods ended December 31, 2018. The Trustees considered that the Fund’s subadviser, Shenkman Capital, utilizes a more conservative high yield bond investment strategy that often underperforms in periods when high-yield bonds are generally performing well.
The Trustees considered the expertise of Shenkman Capital in managing assets generally and in the high-yield asset class specifically, noting that Shenkman Capital managed approximately $5 billion in assets in this asset class, out of a firm-wide total of approximately $25.3 billion in assets under management. The Trustees also noted the experience of the Fund’s portfolio managers, one of whom is the founder of the firm, in this asset class.
The Trustees observed that the Broadridge comparison of contractual management fees for the Fund’s expense group, assuming an asset level of $825 million, showed the Fund’s management fee was above the group median for the Institutional Class. The actual total expense ratio of the Fund’s Institutional Class, however, was below the group and universe medians. The Trustees also considered that the Fund’s existing contractual fee waiver arrangement will continue until at least February 29, 2020. The Trustees noted that Harbor Capital’s profitability in operating the Fund was not excessive.
Harbor High-Yield Opportunities Fund. The Trustees considered Harbor High-Yield Opportunities Fund (inception date November 1, 2017), noting its underperformance relative to its Broadridge group and universe medians for each of the one-year and since inception periods ended December 31, 2018. The Fund’s one-year and since inception rolling returns as of December 31, 2018 each ranked in the fourth quartile, according to Morningstar data. The Trustees also considered the fact that the Fund had underperformed its benchmark, the ICE BofA Merrill Lynch U.S. High Yield Index, for the one-year and since inception periods ended December 31, 2018. The Trustees noted that the short time period since the Fund’s inception did not support drawing any significant conclusions about the Fund’s performance.
The Trustees considered the expertise of Crescent Capital Group LP (“Crescent Capital”) in managing assets generally and in the high-yield asset class specifically, noting that Crescent Capital managed approximately $2.7 billion in assets in this asset class, out of a firm-wide total of approximately $24.7 billion in assets under management. The Trustees also noted the experience of the Fund’s portfolio managers in this asset class.
The Trustees observed that the Broadridge comparison of contractual management fees for the Fund’s expense group, assuming an asset level of $75 million, showed the Fund’s management fee was equal to the group median for the Institutional Class. The actual total expense ratio of the Fund’s Institutional Class was above the group and universe medians. The Trustees also considered that the Fund’s existing contractual fee waiver/expense reimbursement arrangement will continue until at least February 29, 2020. The Trustees noted that Harbor Capital’s profitability in operating the Fund was not excessive.
Harbor Bond Fund. The Trustees considered Harbor Bond Fund (inception date December 29, 1987), noting the Fund’s underperformance relative to its Broadridge group and universe medians for the three- and five-year periods ended December 31, 2018 and its outperformance relative to the Broadridge group and universe medians for the one-year period ended December 31, 2018. The Fund’s one-, three- and five-year rolling returns as of December 31, 2018 each ranked in the second quartile, according to Morningstar data. The Trustees also considered the fact that Harbor Bond Fund had outperformed its benchmark, the Bloomberg Barclays U.S. Aggregate Bond Index, for the three- and five-year periods ended December 31, 2018 and underperformed its benchmark index for the one-year period ended December 31, 2018.
The Trustees considered the expertise of Pacific Investment Management Company LLC (“PIMCO”) in managing assets generally and in the bond asset class specifically, noting that PIMCO managed approximately $140.7 billion in “total return” assets, out of a firm-wide total of approximately $1.66 trillion in assets under management. The Trustees also noted the experience of the Fund’s portfolio managers in this asset class.
132
Harbor Fixed Income Funds
Additional Information—Continued
ADVISORY AGREEMENT APPROVALS—Continued
The Trustees observed that the Broadridge comparison of contractual management fees for the Fund’s expense group, assuming an asset level of $1.95 billion, showed the Fund’s management fee was above the group median for the Institutional Class. The actual total expense ratio of the Fund’s Institutional Class was below the Broadridge group median and above the universe median. The Trustees also considered that the Fund’s existing contractual fee waiver and expense reimbursement arrangements will continue until at least February 29, 2020. The Trustees noted that Harbor Capital’s profitability in operating the Fund was not excessive.
Harbor Real Return Fund. The Trustees considered Harbor Real Return Fund (inception date December 1, 2005), noting its underperformance relative to its Broadridge group median for the one-, three- and five-year periods ended December 31, 2018. The Fund outperformed its Broadridge universe median for the three- and five-year periods ended December 31, 2018 and underperformed its universe median for the one-year period ended December 31, 2018. According to the Morningstar data presented, the Fund’s one-, three- and five-year rolling returns as of December 31, 2018 were ranked in the fourth, second and second quartiles, respectively. The Trustees also considered the fact that the Fund outperformed its benchmark, the Bloomberg Barclays U.S. TIPS Index, for the three-year period ended December 31, 2018 and the Fund underperformed its benchmark for the one- and five-year periods ended December 31, 2018.
The Trustees considered the expertise of PIMCO in managing assets generally and in the inflation-protection asset class specifically, noting that PIMCO managed approximately $42.9 billion in “real return” assets, out of a firm-wide total of approximately $1.66 trillion in assets under management. The Trustees also noted the experience of the Fund’s portfolio managers in this asset class, as well as the recent departure of one of the Fund’s portfolio managers and the addition of a portfolio manager to the Fund.
The Trustees observed that the Broadridge comparison of contractual management fees for the Fund’s expense group, assuming an asset level of $100 million, showed the Fund’s management fee was below the group median for the Institutional Class. The actual total expense ratio of the Fund’s Institutional Class was also below the Broadridge universe and group medians. The Trustees also considered that the Fund’s existing contractual expense reimbursement arrangement will continue until at least February 29, 2020. The Trustees noted that Harbor Capital’s profitability in operating this Fund was negative.
Harbor Money Market Fund. The Trustees considered Harbor Money Market Fund (inception date December 29, 1987), noting the Fund’s outperformance relative to its group and universe medians for each of the one-, three- and five-year periods ended December 31, 2018, according to Broadridge. According to the Morningstar data presented, the Fund’s one-, three- and five-year rolling returns as of December 31, 2018 were ranked in the third, first and first quartiles, respectively. The Trustees considered the Fund’s performance record relative to its benchmark, the ICE BofA Merrill Lynch US 3-Month U.S. Treasury Bill Index, noting that the Fund had underperformed the benchmark for the one-, three- and five-year periods ended December 31, 2018. The Trustees noted that the Fund operates as a “government money market fund,” as defined in Rule 2a-7 under the Investment Company Act.
The Trustees considered the expertise of BNP Paribas Asset Management USA, Inc. (“BNPP AM US”) in managing assets generally and in the short duration fixed income asset class specifically, noting that BNPP AM US managed approximately $11.95 billion of short duration assets, out of a firm-wide total of approximately $646.3 billion in assets under management (reflecting the assets of BNP Paribas Asset Management), as of September 31, 2018. The Trustees also noted the experience of the Fund’s portfolio manager in this asset class.
The Trustees considered that the Broadridge comparison of contractual management fees for the Fund’s expense group, assuming an asset level of $150 million, showed that the Fund’s management fee was below the group median for the Institutional Class. The actual total expense ratio of the Fund’s Institutional Class was below the group and universe medians. The Trustees also considered that the Fund’s existing contractual fee waiver and expense reimbursement arrangements will continue until at least February 29, 2020. The Trustees noted that Harbor Capital’s profitability in managing the Fund was negative.
The Trustees also separately considered the allocation between the Adviser and each Subadviser of the relevant Fund’s investment advisory fee (i.e., the amount of the advisory fee retained by the Adviser relative to that paid to the relevant Subadviser as a subadvisory fee). They determined in each case that the allocation was reasonable and the product of arm’s length negotiation between the Adviser and Subadviser.
Profitability
The Trustees also considered the Adviser’s profitability in operating each of the Funds (as well as on a fund complex-wide basis) as presented by the Adviser, and the allocation methodology used by the Adviser to compute such profitability. The Trustees concluded that the methodology was reasonable and that a reasonable level of profitability was important to provide suitable incentives for the Adviser to continue to attract and maintain high-quality personnel and to invest in infrastructure and other resources to support and enhance the Funds’ operations. In considering the Adviser’s profitability generally, the
133
Harbor Fixed Income Funds
Additional Information—Continued
ADVISORY AGREEMENT APPROVALS—Continued
Trustees also reviewed the compensation received by Harbor Services Group and Harbor Funds Distributors in consideration of the transfer agency and distribution services, respectively, that are provided to Harbor Funds and any other benefits enjoyed by the Adviser and its affiliates as a result of their relationship with Harbor Funds.
The Trustees also considered that profitability calculations with respect to advisory, transfer agency and distribution operations vary significantly depending on whether revenues on which the calculation is based are taken gross or net of amounts paid to third parties, such as subadvisory fee expenses and certain transfer agency expenses, and noted that subadvisory fee expenses are a direct expense of the Adviser. The Trustees also noted that the Adviser was, in all cases, waiving a portion of its advisory fee and/or paying or reimbursing a portion of Fund expenses. The Trustees determined that the Adviser’s profitability in operating each Fund was not excessive.
Economies of Scale
The Trustees also considered the extent to which economies of scale might be realized as each Fund grows, and the extent to which each Fund’s advisory fee level reflects these economies of scale for the benefit of Fund investors. The Trustees specifically considered whether any advisory fee reduction “breakpoints” should be added to the advisory fee payable by any Fund. As noted above, the Trustees concluded that the Adviser’s profitability in each case was not excessive. They concluded that the Funds’ fee structures reflected economies of scale to date and that breakpoints in these fee structures were not required at the present time. The Trustees noted they intend to monitor each Fund’s asset growth in connection with future reviews of each Fund’s Investment Advisory Agreement to determine whether breakpoints may be appropriate at such time.
134
Benchmark Descriptions
Bloomberg Barclays U.S. Aggregate Bond Index—The Bloomberg Barclays U.S. Aggregate Bond Index is an unmanaged index of investment-grade fixed-rate debt issues with maturities of at least one year. This unmanaged index does not reflect fees and expenses and is not available for direct investment.
Bloomberg Barclays U.S. TIPS Index—The Bloomberg Barclays U.S. TIPS Index is an unmanaged market index comprised of all U.S. Treasury Inflation Protected Securities rated investment grade (Baa3 or better), have at least one year to final maturity, and at least $250 million par amount outstanding. This unmanaged index does not reflect fees and expenses and is not available for direct investment.
ICE BofAML U.S. Convertible Ex Mandatory Index—The ICE BofAML U.S. Convertible Ex Mandatory Index is broadly representative of the U.S. convertible securities market, consisting of publicly traded issues, denominated in U.S. dollars, of all credit qualities, and excluding mandatory (equity-linked) convertibles. This unmanaged index does not reflect fees and expenses and is not available for direct investment.
ICE BofAML U.S. 3-Month Treasury Bill Index—The ICE BofAML U.S. 3-Month Treasury Bill Index is comprised of a single U.S. Treasury Bill issue purchased at the beginning of each month and held for a full month, at which time that issue is sold and rolled into a newly selected issue. The issue selected each month is that having a maturity date closest to, but not beyond 90 days from the rebalance date.
ICE BofAML U.S. High Yield Index (H0A0)—The ICE BofAML U.S. High Yield Index (H0A0) is an unmanaged index that tracks the performance of below investment grade U.S. dollar-denominated corporate bonds publicly issued in the U.S. domestic market. All bonds are U.S. dollar denominated and rated Split BBB and below. This unmanaged index does not reflect fees and expenses and is not available for direct investment.
ICE BofAML U.S. Non-Distressed High Yield Index—The ICE BofAML U.S. Non-Distressed High Yield Index is a subset of the ICE BofAML U.S. High Yield Index (H0A0) including all securities with an option-adjusted spread less than 1,000 basis points. The unmanaged index does not reflect fees and expenses and is not available for direct investment.
MSCI All Country World (ND) Index—The MSCI All Country World (ND) Index is a free float-adjusted market capitalization weighted index that is designed to measure the equity market performance of global developed and emerging markets. This unmanaged index does not reflect fees and expenses and is not available for direct investment.
MSCI All Country World Ex. U.S. (ND) Index—The MSCI All Country World Ex. U.S. (ND) Index is a free float-adjusted market capitalization weighted index that is designed to measure equity market performance in the global developed and emerging markets, excluding the United States. This unmanaged index does not reflect fees and expenses and is not available for direct investment.
MSCI EAFE (ND) Index—The MSCI EAFE (ND) Index is an unmanaged index generally representative of major developed markets, excluding the U.S. and Canada. This unmanaged index does not reflect fees and expenses and is not available for direct investment.
MSCI EAFE Small Cap (ND) Index—The MSCI EAFE Small Cap (ND) Index is an equity index which captures small cap representation across developed market countries around the world, excluding the U.S. and Canada. This unmanaged index does not reflect fees and expenses and is not available for direct investment.
MSCI Emerging Markets (ND) Index—The MSCI Emerging Markets (ND) Index is a market capitalization weighted index of equity securities in more than 20 emerging market economies. This unmanaged index does not reflect fees and expenses and is not available for direct investment.
MSCI World (ND) Index—The MSCI World (ND) Index is a free float-adjusted market capitalization index that is designed to measure global developed market equity performance. This unmanaged index does not reflect fees and expenses and is not available for direct investment.
Russell 1000® Growth Index—The Russell 1000® Growth Index is an unmanaged index generally representative of the U.S. market for larger capitalization growth stocks. This unmanaged index does not reflect fees and expenses and is not available for direct investment. The Russell 1000® Growth Index and Russell® are trademarks of Frank Russell Company.
Russell 1000® Value Index—The Russell 1000® Value Index is an unmanaged index generally representative of the U.S. market for larger capitalization value stocks. This unmanaged index does not reflect fees and expenses and is not available for direct investment. The Russell 1000® Value Index and Russell® are trademarks of Frank Russell Company.
Russell 2000® Index—The Russell 2000® Index measures the performance of the small-cap segment of the U.S. equity universe. The Russell 2000® Index is a subset of the Russell 3000® Index representing approximately 10% of the total market capitalization of that index. It includes approximately 2,000 of the smallest securities based on a combination of their market cap and current
135
Benchmark Descriptions—Continued
index membership. The Russell 2000® Index is constructed to provide a comprehensive and unbiased small-cap barometer and is completely reconstituted annually to ensure larger stocks do not distort the performance and characteristics of the true small-cap opportunity set. This unmanaged index does not reflect fees and expenses and is not available for direct investment. The Russell 3000® Index and Russell® are trademarks of Frank Russell Company.
Russell 2000® Growth Index—The Russell 2000® Growth Index is an unmanaged index representing the smallest 2,000 stocks with the highest price-to-book ratio and future earnings. This unmanaged index does not reflect fees and expenses and is not available for direct investment. The Russell 2000® Growth Index and Russell® are trademarks of Frank Russell Company.
Russell 2000® Value Index—The Russell 2000® Value Index is an unmanaged index representing the smallest 2,000 stocks with the lowest price-to-book ratio and future earnings. This unmanaged index does not reflect fees and expenses and is not available for direct investment. The Russell 2000® Value Index and Russell® are trademarks of Frank Russell Company.
Russell 3000® Index—The Russell 3000® Index measures the performance of the largest 3,000 U.S. companies representing approximately 98% of the investable U.S. equity market. The Russell 3000® Index is constructed to provide a comprehensive, unbiased and stable barometer of the broad market and is completely reconstituted annually to ensure new and growing equities are reflected. This unmanaged index does not reflect fees and expenses and is not available for direct investment. The Russell 3000® Index and Russell® are trademarks of Frank Russell Company.
Russell 3000® Growth Index—The Russell 3000® Growth Index measures the performance of the broad growth segment of the U.S. equity universe. It includes those Russell 3000® companies with higher price-to-book ratios and higher forecasted growth values. The Russell 3000® Growth Index is constructed to provide a comprehensive, unbiased, and stable barometer of the broad growth market. The index is completely reconstituted annually to ensure new and growing equities are included and that the represented companies continue to reflect growth characteristics. This unmanaged index does not reflect fees and expenses and is not available for direct investment. The Russell 3000® Growth Index and Russell® are trademarks of Frank Russell Company.
Russell 3000® Value Index—The Russell 3000® Value Index measures the performance of the broad value segment of U.S. equity value universe. It includes those Russell 3000® companies with lower price-to-book ratios and lower forecasted growth values. The Russell 3000® Value Index is constructed to provide a comprehensive, unbiased, and stable barometer of the broad value market. The index is completely reconstituted annually to ensure new and growing equities are included and that the represented companies continue to reflect value characteristics. This unmanaged index does not reflect fees and expenses and is not available for direct investment. The Russell 3000® Value Index and Russell® are trademarks of Frank Russell Company.
Russell Midcap® Index—The Russell Midcap® Index is an unmanaged index generally representative of the U.S. market for medium capitalization stocks. This unmanaged index does not reflect fees and expenses and is not available for direct investment. The Russell Midcap® Index and Russell® are trademarks of Frank Russell Company.
Russell Midcap® Growth Index—The Russell Midcap® Growth Index is an unmanaged index generally representative of the U.S. market for medium capitalization growth stocks. This unmanaged index does not reflect fees and expenses and is not available for direct investment. The Russell Midcap® Growth Index and Russell® are trademarks of Frank Russell Company.
Russell Midcap® Value Index—The Russell Midcap® Value Index is an unmanaged index generally representative of the U.S. market for medium capitalization value stocks. This unmanaged index does not reflect fees and expenses and is not available for direct investment. The Russell Midcap® Value Index and Russell® are trademarks of Frank Russell Company.
S&P 500 Index—The S&P 500 Index is an unmanaged index generally representative of the U.S. stock market. This unmanaged index does not reflect fees and expenses and is not available for direct investment.
136
111 South Wacker Drive, 34th Floor | Chicago, IL 60606-4302 | 800-422-1050 | harborfunds.com |
Trustees & Officers
Charles F. McCain
Chairman, President & Trustee
Scott M. Amero
Trustee
Trustee
Raymond J. Ball
Trustee
Trustee
Donna J. Dean
Trustee
Trustee
Joseph L. Dowling, III
Trustee
Trustee
Randall A. Hack
Trustee
Trustee
Robert Kasdin
Trustee
Trustee
Kathryn L. Quirk
Trustee
Trustee
Ann M. Spruill
Trustee
Trustee
Erik D. Ojala
Chief Compliance Officer
Anmarie S. Kolinski
Treasurer
Treasurer
Brian L. Collins
Vice President
Vice President
Kristof M. Gleich
Vice President
Vice President
Charles P. Ragusa
Vice President
Vice President
Diana R. Podgorny
Secretary
Secretary
Jodie L. Crotteau
Assistant Secretary
Assistant Secretary
Lana M. Lewandowski
AML Compliance Officer
& Assistant Secretary
AML Compliance Officer
& Assistant Secretary
Lora A. Kmieciak
Assistant Treasurer
Assistant Treasurer
John M. Paral
Assistant Treasurer
Assistant Treasurer
Investment Adviser
Harbor Capital Advisors, Inc.
111 South Wacker Drive, 34th Floor
Chicago, IL 60606-4302
312-443-4400
111 South Wacker Drive, 34th Floor
Chicago, IL 60606-4302
312-443-4400
Distributor
Harbor Funds Distributors, Inc.
111 South Wacker Drive, 34th Floor
Chicago, IL 60606-4302
312-443-4600
111 South Wacker Drive, 34th Floor
Chicago, IL 60606-4302
312-443-4600
Shareholder Services
Harbor Services Group, Inc.
P.O. Box 804660
Chicago, IL 60680-4108
800-422-1050
P.O. Box 804660
Chicago, IL 60680-4108
800-422-1050
FD.SAR.FI.0419
Table of Contents
Semi-Annual Report
April 30, 2019
Target Retirement Funds
Institutional Class | |
Harbor Target Retirement Income Fund | HARAX |
Harbor Target Retirement 2015 Fund | HARGX |
Harbor Target Retirement 2020 Fund | HARJX |
Harbor Target Retirement 2025 Fund | HARMX |
Harbor Target Retirement 2030 Fund | HARPX |
Harbor Target Retirement 2035 Fund | HARUX |
Harbor Target Retirement 2040 Fund | HARYX |
Harbor Target Retirement 2045 Fund | HACCX |
Harbor Target Retirement 2050 Fund | HAFFX |
Harbor Target Retirement 2055 Fund | HATRX |
Beginning on January 1, 2021, as permitted by regulations adopted by the Securities and Exchange Commission, paper copies of the Funds’ annual and semi-annual shareholder reports will no longer be sent by mail, unless you specifically request paper copies of the reports. Instead, the reports will be made available on the Funds’ website (harborfunds.com), and you will be notified by mail each time a report is posted and provided with a website link to access the report.
If you already elected to receive shareholder reports electronically, you will not be affected by this change and you need not take any action. You may elect to receive shareholder reports and other communications from a Fund electronically anytime by contacting your financial intermediary (such as a broker-dealer or bank) or, if you invest directly with Harbor Funds, by calling 800-422-1050.
You may elect to receive all future reports in paper free of charge. If you invest through a financial intermediary (such as a broker-dealer or bank), you can contact your financial intermediary to request that you continue to receive paper copies of the Funds’ shareholder reports. If you invest directly, you can call 800-422-1050 to request that you continue to receive paper copies of the Funds’ shareholder reports. Your election to receive reports in paper will apply to all Harbor Funds held in your account.
Table of Contents
This document must be preceded or accompanied by a Prospectus.
Letter from the Chairman
Charles F. McCain Chairman |
Dear Fellow Shareholder:
The Harbor Target Retirement Funds invest in a diversified portfolio of Harbor equity and fixed income funds. In the fiscal half year ended April 30, 2019, most underlying Harbor funds posted positive returns.
In the closing months of 2018, investor concerns about a range of issues, including slowing growth and trade tensions between the U.S. and China, drove stocks markedly lower. U.S. equities rebounded strongly in the first quarter of 2019, in part due to the U.S. Federal Reserve (Fed) adopting a more accommodative stance. Better-than-expected economic and earnings numbers buoyed equities through the end of the period. The Russell 3000® Index, a measure of the broad U.S. stock market, had a return of 9.71% for the fiscal half year.
International stock markets also rebounded in early 2019 from late-2018 losses, as investor concerns over Brexit, U.S.–China trade talks, and the Fed’s interest rate policy eased. The MSCI World (ND) Index, a measure of the global equity markets, posted a gain of 8.83% for the fiscal half year.
Domestic long-term fixed income markets were generally up for the fiscal half year ended April 30, 2019. The Bloomberg Barclays U.S. Aggregate Bond Index, a diversified benchmark of investment-grade bonds, generated a return of 5.49% for the six-month period. High yield bonds outgained other fixed income market segments, as the ICE BofAML U.S. Non-Distressed High Yield Index returned 5.89%.
Comments by the portfolio managers of the Harbor Target Retirement Funds can be found in the pages preceding each Fund’s portfolio of investments. As always, we recommend that shareholders maintain a long-term perspective in evaluating all of their investments, including Harbor Funds.
Returns For Periods Ended April 30, 2019 | ||||||||||
Unannualized | Annualized | |||||||||
Domestic Equities | 6 Months | 1 Year | 5 Years | 10 Years | 30 Years | |||||
Russell 3000® (entire U.S. stock market) | 9.71% | 12.68% | 11.20% | 15.30% | 10.17% | |||||
S&P 500 (large cap stocks) | 9.76 | 13.49 | 11.63 | 15.32 | 10.15 | |||||
Russell Midcap® (mid cap stocks) | 11.65 | 10.69 | 9.75 | 15.65 | 11.41 | |||||
Russell 2000® (small cap stocks) | 6.06 | 4.61 | 8.63 | 14.10 | 9.41 | |||||
Russell 3000® Growth (growth stocks) | 11.81 | 16.61 | 14.17 | 16.83 | 10.05 | |||||
Russell 3000® Value (value stocks) | 7.61 | 8.58 | 8.17 | 13.69 | 9.91 | |||||
International & Global | ||||||||||
MSCI EAFE (ND)(foreign stocks) | 7.45% | -3.22% | 2.60% | 7.95% | 4.58% | |||||
MSCI EAFE Small Cap (ND)(foreign small cap stocks) | 5.89 | -7.88 | 5.27 | 11.49 | N/A | |||||
MSCI World (ND)(global stocks) | 8.83 | 6.48 | 7.31 | 11.58 | 6.82 | |||||
MSCI All Country World Ex. U.S. (ND)(foreign stocks) | 9.12 | -3.23 | 2.83 | 7.75 | N/A | |||||
MSCI Emerging Markets (ND)(emerging market stocks) | 13.76 | -5.04 | 4.04 | 7.50 | N/A | |||||
Fixed Income | ||||||||||
ICE BofAML U.S. Non-Distressed High Yield (domestic high-yield bonds) | 5.89% | 7.03% | 5.03% | 8.74% | N/A | |||||
Bloomberg Barclays U.S. Aggregate Bond (domestic bonds) | 5.49 | 5.29 | 2.57 | 3.72 | 6.09% | |||||
Bloomberg Barclays U.S. TIPS (domestic inflation-linked bonds) | 4.60 | 3.10 | 1.74 | 3.64 | N/A | |||||
ICE BofAML U.S. 3-Month Treasury Bill (proxy for money market returns) | 1.18 | 2.18 | 0.78 | 0.45 | 3.08 |
1
Change in market’s direction showed value of resilience
In the fourth calendar quarter of 2018, U.S. equities endured their worst quarterly performance in more than seven years, as concerns about interest rate increases, continuing trade tensions, and slowing global growth dampened investor sentiment. Some commentators speculated that the nearly 10-year-long bull market had reached its end.
But in the first quarter of 2019, such talk proved premature, as equities rebounded in the U.S. and globally. Anyone who pulled their money out of equities in December 2018, hoping to avoid further losses, may have missed out on the robust gains of early 2019.
Reacting emotionally to market movements, or trying to time when the market will rise or fall, can have a negative impact on the success of a long-term investment strategy. While past performance is never a guarantee of future results, many investors have historically achieved their financial objectives by making a long-term plan and staying true to it through market ups and downs.
Harbor Funds offers a variety of equity and fixed income funds that can serve as the foundation of a diversified portfolio.
Thank you for investing with Harbor Funds.
June 28, 2019
Charles F. McCain |
Chairman |
2
Harbor Target Retirement Funds
Manager’s Commentary (Unaudited)
Adviser
Harbor Capital Advisors, Inc.
111 South Wacker Dr. 34th Floor
Chicago, IL 60606
Portfolio Managers
Brian L. Collins, CFA
Since Inception
Since Inception
Paul C. Herbert, CFA, CAIA
Since Inception
Linda M. Molenda
Since Inception
Since Inception
Harbor Capital has managed the Funds since inception.
Market Review
The 2019 fiscal half year period began amid volatile market conditions due to angst over slowing economic growth and an uncertain political and monetary policy backdrop. Stock markets in the U.S. and abroad slowed in December before reversing and rallying to start the new year fueled by a general tone of optimism, with supportive central bank communication a frequently cited catalyst for the rebound. By April 30, 2019, indexes across equities and fixed income markets were solidly in the green, led by growth benchmarks, as well as by emerging markets stocks.
The Russell 3000® Index, representing U.S. large-, mid-, and small-cap stocks, posted a solid 9.71% gain for the period. Mid-cap stocks led large caps, with the stocks of small companies posting lower, but positive returns. As mentioned, growth again led value, and again by large margins. The S&P 500 Index of large cap stocks gained 9.76%, nearly matching the Russell 3000®. Despite a rebound in oil prices before the period’s end, Energy stocks were underwater for the six months ended April 30, 2019. Nevertheless, every other GICS sector gained ground. Real Estate led the pack, gaining nearly 14%.
Developed non-U.S. stocks shared in the rally, though they didn’t enjoy all of the upside, with the MSCI EAFE (ND) Index of developed market stocks advancing by 7.45%. All of the index’s sectors gained ground, as did its major countries. Information Technology was the leading sector, paced by East Asian hardware stocks. Turning to developed regions and countries, Europe led and Japan trailed. Emerging Markets stocks shined, with the MSCI Emerging Markets Index gaining 13.76%
Fixed income markets also registered solid gains. High yield bonds, as measured by the BofAML U.S. High Yield Index, rose by 5.55% and investment-grade bonds nearly kept up, with the Bloomberg Barclays U.S. Aggregate Bond Index rising by 5.49%. Treasury Inflation Protected Securities, as represented by the Bloomberg Barclays U.S. TIPS Index, were not left out, gaining 4.60%.
Performance
In this environment, each of the Harbor Target Retirement Funds delivered positive absolute performance. Consistent with their larger holdings in stock funds, the later-dated Target Funds posted higher returns than the earlier-dated Target Funds. See the table within this section for each of the Funds’ total returns. Each Fund also outperformed its Composite Index during the period. Returns for these indexes are included in a separate table in this section.
Several of the underlying equity funds delivered strong outperformance compared to their individual benchmarks during the period, driving the Target Funds’ excess returns versus the composite indexes. For instance, Harbor International Growth Fund gained 15.56%, outperforming its benchmark, the MSCI All-Country World Ex.-US (ND) Index, by 6.44% (the returns presented in this section are for the Institutional Class of each underlying Fund). International Growth’s showing was helped by strong performance from Naspers, a South African holding company, and Shopify, a Canadian e-commerce firm. Harbor Large Cap Value Fund was another meaningful contributor to performance, gaining 11.75% while its benchmark, the Russell 1000® Value Index, rose by 7.90%. Harbor Large Cap Value Fund’s results benefitted from strong performance from Microchip, a semiconductor maker, and Danaher, a diversified healthcare-oriented company.
While they also had positive returns, the underlying fixed income funds’ excess returns were negative for the period. Harbor Bond Fund gained 4.76%, which trailed the Bloomberg Barclays U.S. Aggregate Bond Index’s 5.49% return. The Fund was held back by certain interest rate strategies and exposure to non-agency mortgage backed securities. Harbor High-Yield Opportunities Fund’s Retirement Class lagged its benchmark, ICE BofAML U.S. High Yield Index by 1.26%. Weak selection in the Energy sector was the primary culprit.
3
Harbor Target Retirement Funds
Manager’s Commentary—Continued
Outlook
The rebound from the deep market declines in 2018’s fourth quarter was welcome. However, as the second half of the Funds’ fiscal year has begun, concerns over the unresolved U.S.-China trade picture’s impact on global growth have gripped markets, sending them lower again. It can be tempting to try to handicap how certain events may play out, and to adjust positioning accordingly. In our view a successful investment plan is built on maintaining a long-term perspective and constructing diversified portfolios. We believe that these elements, when effectively combined with the capabilities of the investment teams at the subadvisers of the underlying funds, may have the potential to tilt the odds of long-term success in the Funds’ favor.
HARBOR TARGET RETIREMENT FUNDS | Unannualized Total Return 6 Months Ended April 30, 2019 |
Harbor Target Retirement Income Fund | 6.00% |
Harbor Target Retirement 2015 Fund | 5.93 |
Harbor Target Retirement 2020 Fund | 6.90 |
Harbor Target Retirement 2025 Fund | 8.01 |
Harbor Target Retirement 2030 Fund | 8.31 |
Harbor Target Retirement 2035 Fund | 9.21 |
Harbor Target Retirement 2040 Fund | 9.83 |
Harbor Target Retirement 2045 Fund | 10.18 |
Harbor Target Retirement 2050 Fund | 10.90 |
Harbor Target Retirement 2055 Fund | 11.46 |
COMMONLY USED MARKET INDICES | Unannualized Total Return 6 Months Ended April 30, 2019 |
Bloomberg Barclays U.S. Aggregate Bond (domestic bonds) | 5.49% |
MSCI EAFE (ND) (foreign stocks) | 7.45 |
Russell 3000® (entire U.S. stock market) | 9.71 |
HARBOR TARGET RETIREMENT FUND COMPOSITE INDICES | Unannualized Total Return 6 Months Ended April 30, 2019 |
Composite Index Income | 5.75% |
Composite Index 2015 | 5.70 |
Composite Index 2020 | 6.38 |
Composite Index 2025 | 7.14 |
Composite Index 2030 | 7.47 |
Composite Index 2035 | 7.85 |
Composite Index 2040 | 8.24 |
Composite Index 2045 | 8.32 |
Composite Index 2050 | 8.66 |
Composite Index 2055 | 9.01 |
4
Harbor Target Retirement Funds
Manager’s Commentary—Continued
Underlying Harbor Funds Performance (Institutional Class Shares)
Total Return for the Period Ended April 30, 2019 | |||||||||||||||||||
EQUITY | 6 Monthsb | One Year | Five Yearsa | Ten Yearsa | Since Inceptiona | Current 7-Day SEC Yield | Inception Date | Expense Ratios*,a | |||||||||||
Subsidizedc | Unsubsidizedd | Net | Gross | ||||||||||||||||
Harbor Capital Appreciation Fund | 13.44% | 14.37% | 15.36% | 16.62% | 11.91% | N/A | N/A | 12/29/1987 | 0.66%e | 0.71% | |||||||||
Harbor Strategic Growth Fund | 12.56 | 14.42 | 11.79 | N/A | 14.47 | N/A | N/A | 11/01/2011f | 0.71g | 0.85 | |||||||||
Harbor Mid Cap Growth Fund | 21.76 | 23.35 | 13.45 | 16.19 | 5.78 | N/A | N/A | 11/01/2000 | 0.89 | 0.89 | |||||||||
Harbor Small Cap Growth Fund | 13.44 | 8.96 | 10.41 | 16.15 | 8.99 | N/A | N/A | 11/01/2000 | 0.88 | 0.88 | |||||||||
Harbor Large Cap Value Fund | 11.75 | 8.78 | 11.22 | 14.32 | 10.10 | N/A | N/A | 12/29/1987 | 0.69g | 0.73 | |||||||||
Harbor Mid Cap Value Fund | 6.39 | -0.19 | 5.80 | 14.37 | 7.67 | N/A | N/A | 03/01/2002 | 0.84e | 0.88 | |||||||||
Harbor Small Cap Value Fund | 10.12 | 3.90 | 9.87 | 14.64 | 10.38 | N/A | N/A | 12/14/2001 | 0.88 | 0.88 | |||||||||
Harbor International Fund | 7.42 | -7.44 | -0.18 | 7.60 | 10.06 | N/A | N/A | 12/29/1987 | 0.77e,g | 0.89 | |||||||||
Harbor Diversified International All Cap Fund | 9.20 | -2.26 | N/A | N/A | 5.18 | N/A | N/A | 11/02/2015 | 0.80e,g | 0.99 | |||||||||
Harbor International Growth Fund | 15.56 | 0.77 | 4.70 | 8.17 | 3.86 | N/A | N/A | 11/01/1993 | 0.85g | 0.90 | |||||||||
Harbor Global Leaders Fund | 16.79 | 18.65 | 11.18 | 15.68 | 17.51 | N/A | N/A | 03/01/2009 | 0.91g | 1.05 | |||||||||
FIXED INCOME | |||||||||||||||||||
Harbor High-Yield Bond Fund | 4.88% | 5.65% | 3.74% | 7.37% | 6.81% | N/A | N/A | 12/01/2002 | 0.61%e | 0.70% | |||||||||
Harbor High-Yield Opportunities Fund | 4.25 | 4.73 | N/A | N/A | 2.42 | N/A | N/A | 11/01/2017 | 0.73g | 1.01 | |||||||||
Harbor Core Bond Fund | 5.31 | N/A | N/A | N/A | 4.51 | N/A | N/A | 06/01/2018 | 0.45g | 0.54 | |||||||||
Harbor Bond Fund | 4.76 | 5.19 | 2.79 | 4.56 | 6.84 | N/A | N/A | 12/29/1987 | 0.80e,g | 0.91 | |||||||||
Harbor Real Return Fund | 4.52 | 2.75 | 1.41 | 3.56 | 3.65 | N/A | N/A | 12/01/2005 | 1.15g | 1.37 | |||||||||
SHORT-TERM | |||||||||||||||||||
Harbor Money Market Fund | 1.04% | 1.88% | 0.72% | 0.42% | 3.13% | 2.14% | 2.07% | 12/29/1987 | 0.28%e,g | 0.36% |
This report contains the current opinions of Harbor Capital Advisors, Inc. as of the date of this report and should not be considered as investment advice or a recommendation of any particular security, strategy or investment product. Such opinions are subject to change without notice and securities described herein may no longer be included in, or may at any time be removed from, the Fund’s portfolio. This report is distributed for informational purposes only. Information contained herein has been obtained from sources believed reliable, but not guaranteed.
Performance data shown represents past performance and is no guarantee of future results. Past performance is net of management fees and expenses and reflects reinvested dividends and distributions, but does not reflect the deduction of taxes that a shareholder would pay on Fund distributions or on the redemption of Fund shares. Past performance reflects the beneficial effect of any expense waivers or reimbursements, without which returns would have been lower. Investment returns and principal value will fluctuate and when redeemed may be worth more or less than their original cost. Returns for periods less than one year are not annualized. Current performance may be higher or lower and is available through the most recent month end atharborfunds.com or by calling 800-422-1050.
The Funds invest in a variety of underlying Harbor funds that are subject to risks associated with their particular investment strategies. By investing in several underlying funds, the Funds have partial exposure to the risks of many different areas of the market. Investments in the Funds are not guaranteed. An investor may experience losses. There is no guarantee that the Funds will provide adequate income through retirement. For information on the different share classes and the risks associated with an investment in the Funds, please refer to the current prospectus.
* | All mutual funds have expense ratios which represent what shareholders pay for operating expenses and management fees. Expense ratios are expressed as an annualized percentage of a fund’s average net assets paid out in expenses. Net expense ratios reflect adjustments due to voluntary or contractual fee waivers or expense reimbursements. Expense ratio information is as of the fund’s current prospectus, as revised and supplemented to date. |
a | Annualized |
b | Unannualized |
c | Reflects reimbursements or waivers in effect during the period |
d | Does not reflect reimbursements or waivers currently in effect |
e | Reflects a contractual management fee waiver effective through February 29, 2020 |
f | For the period November 1, 2011 (inception of the Predecessor Fund) to January 20, 2015, Mar Vista Investment Partners, LLC served as the Predecessor Fund’s subadviser and for the period January 20, 2015 to March 6, 2017, Mar Vista Investment Partners, LLC served as investment adviser to the Predecessor Fund. |
g | Reflects an expense limitation agreement (excluding interest expense, if any) effective through February 29, 2020 |
5
Harbor Target Retirement Funds
Asset Allocation Framework (Unaudited)
Target Asset Allocation (glide path)
Harbor Target Retirement Funds - Target Asset Allocation
Over time, the allocation to asset classes and underlying Harbor funds will change in a predetermined manner as shown in the glide path above. The glide path shows the shifting of the asset allocations over time and illustrates how each Target Retirement Fund’s (except Harbor Target Retirement Income Fund) asset mix becomes more conservative as time elapses.
The principal value of the Funds is not guaranteed at any time, including the target retirement date.
Investment Styles
The Harbor Target Retirement Funds are constructed based on Harbor Capital Advisors’ investment experience that, over the long term, stocks generally provide greater growth opportunities and greater risk than bonds, and bonds generally provide more income and lower volatility than stocks. The year in the Fund name refers to the approximate year (the target date) when an investor in the Fund would leave the work force and enter retirement and likely stop making new investments in the Fund. The Harbor Target Retirement Income Fund is designed for investors currently in retirement. The year-specific Target Retirement Funds strive to produce more income and lower volatility as the target year approaches.
Harbor Capital Advisors allocates each Fund’s assets among the underlying Harbor funds based on the Fund’s investment objectives and policies. The asset allocation for each Fund (other than the Harbor Target Retirement Income Fund) will change over time as the target date indicated in the Fund’s name draws closer.
HARBOR TARGET RETIREMENT FUNDS - ACTUAL ALLOCATION AS OF April 30, 2019 | |||||||||||||||||||
2055 Fund | 2050 Fund | 2045 Fund | 2040 Fund | 2035 Fund | 2030 Fund | 2025 Fund | 2020 Fund | 2015 Fund | Income Fund | ||||||||||
Equity | |||||||||||||||||||
Harbor Capital Appreciation Fund | 8% | 7% | 6% | 6% | 5% | 4% | 3% | 2% | 1% | 1% | |||||||||
Harbor Strategic Growth Fund | 4 | 4 | 3 | 3 | 2 | 2 | 3 | 2 | 1 | 1 | |||||||||
Harbor Mid Cap Growth Fund | 6 | 6 | 5 | 5 | 4 | 4 | 3 | 2 | 1 | 1 | |||||||||
Harbor Small Cap Growth Fund | 5 | 5 | 5 | 4 | 4 | 3 | 3 | 2 | 1 | 1 | |||||||||
Harbor Large Cap Value Fund | 14 | 12 | 11 | 10 | 9 | 7 | 6 | 5 | 3 | 3 | |||||||||
Harbor Mid Cap Value Fund | 9 | 8 | 7 | 7 | 6 | 5 | 4 | 3 | 2 | 2 | |||||||||
Harbor Small Cap Value Fund | 7 | 6 | 6 | 5 | 4 | 4 | 3 | 2 | 1 | 1 | |||||||||
Harbor International Fund | 12 | 11 | 9 | 9 | 8 | 6 | 5 | 4 | 3 | 3 | |||||||||
Harbor Diversified International All Cap Fund | 11 | 10 | 9 | 9 | 7 | 6 | 5 | 4 | 3 | 3 | |||||||||
Harbor International Growth Fund | 12 | 11 | 9 | 9 | 8 | 6 | 6 | 4 | 3 | 3 | |||||||||
Harbor Global Leaders Fund | 5 | 4 | 4 | 3 | 3 | 3 | 2 | 2 | 1 | 1 | |||||||||
Total Equity | 93 | 84 | 74 | 70 | 60 | 50 | 43 | 32 | 20 | 20 | |||||||||
Fixed Income | |||||||||||||||||||
Harbor High-Yield Bond Fund | 0% | 0% | 7% | 7% | 9% | 11% | 10% | 9% | 8% | 8% | |||||||||
Harbor High-Yield Opportunities Fund | 3 | 7 | 4 | 5 | 6 | 7 | 7 | 6 | 5 | 5 | |||||||||
Harbor Core Bond Fund | 0 | 3 | 5 | 9 | 10 | 12 | 20 | 23 | 26 | 26 | |||||||||
Harbor Bond Fund | 4 | 6 | 10 | 9 | 10 | 13 | 10 | 11 | 13 | 13 | |||||||||
Harbor Real Return Fund | 0 | 0 | 0 | 0 | 5 | 7 | 10 | 12 | 18 | 18 | |||||||||
Total Fixed Income | 7 | 16 | 26 | 30 | 40 | 50 | 57 | 61 | 70 | 70 | |||||||||
Short-Term | |||||||||||||||||||
Harbor Money Market Fund | 0% | 0% | 0% | 0% | 0% | 0% | 0% | 7% | 10% | 10% | |||||||||
100% | 100% | 100% | 100% | 100% | 100% | 100% | 100% | 100% | 100% |
6
Harbor Target Retirement Income Fund
Fund Summary —April 30, 2019 (Unaudited)
Asset Allocation(% of investments)
FUND PERFORMANCE
TOTAL RETURNS For the periods ended 04/30/2019 | Unannualized | 1 Year | Annualized | Inception Date | ||||||||||
6 Months | 5 Years | 10 Years | ||||||||||||
Harbor Target Retirement Income Fund | ||||||||||||||
Institutional Class | 6.00% | 4.72% | 3.59% | 5.77% | 01/02/2009 | |||||||||
Comparative Indices | ||||||||||||||
Bloomberg Barclays U.S. Aggregate Bond | 5.49% | 5.29% | 2.57% | 3.72% | — | |||||||||
MSCI EAFE (ND) | 7.45 | -3.22 | 2.60 | 7.95 | — | |||||||||
Russell 3000® | 9.71 | 12.68 | 11.20 | 15.29 | — | |||||||||
Composite Index Income | 5.75 | 4.86 | 3.57 | 5.55 | — |
As stated in the Fund’s prospectus dated March 1, 2019, the expense ratio was 0.70%. The Adviser has contractually agreed to limit the Fund’s operating expenses to: (i) the amount of the acquired funds’ fees and expenses; (ii) compensation of the Independent Trustees; and (iii) certain other expenses such as extraordinary items. The expense ratio in the prospectus may differ from the actual expense ratio for the period disclosed within this report. The expense ratio shown in the prospectus is based on the prior fiscal year, adjusted to reflect changes, if any, in contractual arrangements that occurred prior to the date of the prospectus (or supplement thereto, if applicable).
Performance data shown represents past performance and is no guarantee of future results. Past performance is net of management fees and expenses and reflects reinvested dividends and distributions but does not reflect the deduction of taxes that a shareholder would pay on Fund distributions or upon the redemption of Fund shares. Past performance reflects the beneficial effect of any expense waivers or reimbursements, without which returns would have been lower. Investment returns and principal value will fluctuate so that Fund shares, when redeemed, may be worth more or less than their original cost. Returns for periods less than one year are not annualized. Current performance may be higher or lower and is available through the most recent month end atharborfunds.com or by calling 800-422-1050. See the Benchmark Descriptions at the end of this report for a description of the Composite Index.
7
Harbor Target Retirement Income Fund
Portfolio of Investments—April 30, 2019 (Unaudited)
Value and Cost in Thousands
EQUITY FUNDS—20.0% | ||||
Shares | Value | |||
2,258 | Harbor Capital Appreciation Fund | $171 | ||
8,001 | Harbor Strategic Growth Fund | 172 | ||
16,036 | Harbor Mid Cap Growth Fund | 175 | ||
12,251 | Harbor Small Cap Growth Fund | 157 | ||
25,940 | Harbor Large Cap Value Fund | 407 | ||
12,566 | Harbor Mid Cap Value Fund | 264 | ||
5,810 | Harbor Small Cap Value Fund | 193 | ||
8,910 | Harbor International Fund | 340 | ||
31,157 | Harbor Diversified International All Cap Fund | 340 | ||
21,679 | Harbor International Growth Fund | 340 | ||
4,992 | Harbor Global Leaders Fund | 145 | ||
TOTAL EQUITY FUNDS | ||||
(Cost $2,596) | 2,704 | |||
FIXED INCOME FUNDS—70.0% | |||
| Shares | Value | |
107,726 | Harbor High-Yield Bond Fund | $1,059 | |
73,314 | Harbor High-Yield Opportunities Fund | 707 | |
347,530 | Harbor Core Bond Fund | 3,548 | |
155,192 | Harbor Bond Fund | 1,774 | |
260,150 | Harbor Real Return Fund | 2,380 | |
TOTAL FIXED INCOME FUNDS | |||
(Cost $9,445) | 9,468 | ||
SHORT-TERM INVESTMENTS—10.0% | |||
(Cost $1,351) | |||
1,350,697 | Harbor Money Market Fund | 1,351 | |
TOTAL INVESTMENTS—100.0% | |||
(Cost $13,392) | 13,523 | ||
CASH AND OTHER ASSETS, LESS LIABILITIES—0.0% | 2 | ||
TOTAL NET ASSETS—100.0% | $13,525 |
AFFILIATED TRANSACTIONS
The Underlying Funds are considered to be affiliated with the Fund. The following table shows investment transactions and earnings from investments in the affiliated Funds during the period November 1, 2018 through April 30, 2019.
Underlying Funds | Beginning Balance as of 11/01/2018 (000s) | Purchases of Affiliated Funds (000s) | Sales of Affiliated Funds (000s) | Change in Net Unrealized Gain/(Loss) from Affiliated Funds (000s) | Net Realized Gain/(Loss) | Investment Income from Affiliated Funds (000s) | ||||||||
Sale of Affiliated Funds (000s) | Distributions Received from Affiliated Funds (000s) | |||||||||||||
Harbor Capital Appreciation Fund | $164 | $58 | $(57) | $(2) | $8 | $15 | $— | |||||||
Harbor Strategic Growth Fund | 162 | 37 | (43) | 15 | 1 | 4 | 1 | |||||||
Harbor Mid Cap Growth Fund | 169 | 73 | (75) | (7) | 15 | 27 | — | |||||||
Harbor Small Cap Growth Fund | 148 | 73 | (55) | (14) | 5 | 29 | — | |||||||
Harbor Large Cap Value Fund | 385 | 93 | (108) | 13 | 24 | 6 | 2 | |||||||
Harbor Mid Cap Value Fund | 251 | 85 | (71) | (6) | 5 | 13 | 4 | |||||||
Harbor Small Cap Value Fund | 183 | 68 | (61) | (12) | 15 | 16 | 1 | |||||||
Harbor International Fund | 319 | 174 | (56) | (70) | (27) | 116 | 4 | |||||||
Harbor Diversified International All Cap Fund | 319 | 62 | (58) | 15 | 2 | 9 | 4 | |||||||
Harbor International Growth Fund | 323 | 62 | (91) | 29 | 17 | — | 2 | |||||||
Harbor Global Leaders Fund | 137 | 28 | (39) | 9 | 10 | 3 | — | |||||||
Harbor High-Yield Bond Fund | 983 | 196 | (134) | 11 | 3 | — | 33 | |||||||
Harbor High-Yield Opportunities Fund | 655 | 133 | (88) | 12 | (5) | — | 20 | |||||||
Harbor Core Bond Fund | — | 3,672 | (188) | 61 | 3 | — | 22 | |||||||
Harbor Bond Fund | 4,913 | 578 | (3,804) | 334 | (247) | — | 69 | |||||||
Harbor Real Return Fund | 2,194 | 468 | (351) | 119 | (50) | — | 31 | |||||||
Harbor Money Market Fund | 1,256 | 267 | (172) | — | — | — | 13 | |||||||
Total | $12,561 | $6,127 | $(5,451) | $507 | $(221) | $238 | $206 |
8
Harbor Target Retirement 2015 Fund
Fund Summary —April 30, 2019 (Unaudited)
Asset Allocation(% of investments)
FUND PERFORMANCE
TOTAL RETURNS For the periods ended 04/30/2019 | Unannualized | 1 Year | Annualized | Inception Date | ||||||||||
6 Months | 5 Years | 10 Years | ||||||||||||
Harbor Target Retirement 2015 Fund | ||||||||||||||
Institutional Class | 5.93% | 4.54% | 3.64% | 6.89% | 01/02/2009 | |||||||||
Comparative Indices | ||||||||||||||
Bloomberg Barclays U.S. Aggregate Bond | 5.49% | 5.29% | 2.57% | 3.72% | — | |||||||||
MSCI EAFE (ND) | 7.45 | -3.22 | 2.60 | 7.95 | — | |||||||||
Russell 3000® | 9.71 | 12.68 | 11.20 | 15.29 | — | |||||||||
Composite Index 2015 | 5.70 | 4.74 | 3.67 | 6.69 | — |
As stated in the Fund’s prospectus dated March 1, 2019, the expense ratio was 0.70%. The Adviser has contractually agreed to limit the Fund’s operating expenses to: (i) the amount of the acquired funds’ fees and expenses; (ii) compensation of the Independent Trustees; and (iii) certain other expenses such as extraordinary items. The expense ratio in the prospectus may differ from the actual expense ratio for the period disclosed within this report. The expense ratio shown in the prospectus is based on the prior fiscal year, adjusted to reflect changes, if any, in contractual arrangements that occurred prior to the date of the prospectus (or supplement thereto, if applicable).
Performance data shown represents past performance and is no guarantee of future results. Past performance is net of management fees and expenses and reflects reinvested dividends and distributions but does not reflect the deduction of taxes that a shareholder would pay on Fund distributions or upon the redemption of Fund shares. Past performance reflects the beneficial effect of any expense waivers or reimbursements, without which returns would have been lower. Investment returns and principal value will fluctuate so that Fund shares, when redeemed, may be worth more or less than their original cost. Returns for periods less than one year are not annualized. Current performance may be higher or lower and is available through the most recent month end atharborfunds.com or by calling 800-422-1050. See the Benchmark Descriptions at the end of this report for a description of the Composite Index.
9
Harbor Target Retirement 2015 Fund
Portfolio of Investments—April 30, 2019 (Unaudited)
Value and Cost in Thousands
EQUITY FUNDS—20.0% | ||||
Shares | Value | |||
704 | Harbor Capital Appreciation Fund | $53 | ||
2,495 | Harbor Strategic Growth Fund | 54 | ||
5,000 | Harbor Mid Cap Growth Fund | 55 | ||
3,820 | Harbor Small Cap Growth Fund | 49 | ||
8,087 | Harbor Large Cap Value Fund | 127 | ||
3,918 | Harbor Mid Cap Value Fund | 82 | ||
1,812 | Harbor Small Cap Value Fund | 60 | ||
2,778 | Harbor International Fund | 106 | ||
9,715 | Harbor Diversified International All Cap Fund | 106 | ||
6,759 | Harbor International Growth Fund | 106 | ||
1,557 | Harbor Global Leaders Fund | 45 | ||
TOTAL EQUITY FUNDS | ||||
(Cost $814) | 843 | |||
FIXED INCOME FUNDS—70.0% | |||
| Shares | Value | |
33,589 | Harbor High-Yield Bond Fund | $330 | |
22,859 | Harbor High-Yield Opportunities Fund | 221 | |
108,357 | Harbor Core Bond Fund | 1,106 | |
48,388 | Harbor Bond Fund | 553 | |
81,115 | Harbor Real Return Fund | 742 | |
TOTAL FIXED INCOME FUNDS | |||
(Cost $2,937) | 2,952 | ||
SHORT-TERM INVESTMENTS—10.0% | |||
(Cost $421) | |||
421,149 | Harbor Money Market Fund | 421 | |
TOTAL INVESTMENTS—100.0% | |||
(Cost $4,172) | 4,216 | ||
CASH AND OTHER ASSETS, LESS LIABILITIES—0.0% | 1 | ||
TOTAL NET ASSETS—100.0% | $4,217 |
AFFILIATED TRANSACTIONS
The Underlying Funds are considered to be affiliated with the Fund. The following table shows investment transactions and earnings from investments in the affiliated Funds during the period November 1, 2018 through April 30, 2019.
Underlying Funds | Beginning Balance as of 11/01/2018 (000s) | Purchases of Affiliated Funds (000s) | Sales of Affiliated Funds (000s) | Change in Net Unrealized Gain/(Loss) from Affiliated Funds (000s) | Net Realized Gain/(Loss) | Investment Income from Affiliated Funds (000s) | ||||||||
Sale of Affiliated Funds (000s) | Distributions Received from Affiliated Funds (000s) | |||||||||||||
Harbor Capital Appreciation Fund | $70 | $21 | $(41) | $1 | $2 | $6 | $— | |||||||
Harbor Strategic Growth Fund | 69 | 13 | (34) | 5 | 1 | 2 | — | |||||||
Harbor Mid Cap Growth Fund | 72 | 26 | (46) | — | 3 | 12 | — | |||||||
Harbor Small Cap Growth Fund | 64 | 28 | (38) | (3) | (2) | 13 | — | |||||||
Harbor Large Cap Value Fund | 164 | 31 | (82) | (5) | 19 | 2 | 1 | |||||||
Harbor Mid Cap Value Fund | 107 | 31 | (55) | (2) | 1 | 6 | 2 | |||||||
Harbor Small Cap Value Fund | 79 | 25 | (45) | (7) | 8 | 7 | — | |||||||
Harbor International Fund | 136 | 69 | (57) | (8) | (34) | 49 | 2 | |||||||
Harbor Diversified International All Cap Fund | 136 | 22 | (59) | 4 | 3 | 4 | — | |||||||
Harbor International Growth Fund | 138 | 21 | (70) | 6 | 11 | — | 1 | |||||||
Harbor Global Leaders Fund | 57 | 10 | (30) | — | 8 | 1 | — | |||||||
Harbor High-Yield Bond Fund | 384 | 52 | (112) | 6 | — | — | 12 | |||||||
Harbor High-Yield Opportunities Fund | 257 | 35 | (74) | 6 | (3) | — | 8 | |||||||
Harbor Core Bond Fund | — | 1,378 | (295) | 19 | 4 | — | 8 | |||||||
Harbor Bond Fund | 1,821 | 190 | (1,491) | 103 | (70) | — | 26 | |||||||
Harbor Real Return Fund | 789 | 171 | (243) | 26 | (1) | — | 11 | |||||||
Harbor Money Market Fund | 449 | 100 | (128) | — | — | — | 5 | |||||||
Total | $4,792 | $2,223 | $(2,900) | $151 | $(50) | $102 | $76 |
10
Harbor Target Retirement 2020 Fund
Fund Summary —April 30, 2019 (Unaudited)
Asset Allocation(% of investments)
FUND PERFORMANCE
TOTAL RETURNS For the periods ended 04/30/2019 | Unannualized | 1 Year | Annualized | Inception Date | ||||||||||
6 Months | 5 Years | 10 Years | ||||||||||||
Harbor Target Retirement 2020 Fund | ||||||||||||||
Institutional Class | 6.90% | 4.81% | 4.23% | 7.66% | 01/02/2009 | |||||||||
Comparative Indices | ||||||||||||||
Bloomberg Barclays U.S. Aggregate Bond | 5.49% | 5.29% | 2.57% | 3.72% | — | |||||||||
MSCI EAFE (ND) | 7.45 | -3.22 | 2.60 | 7.95 | — | |||||||||
Russell 3000® | 9.71 | 12.68 | 11.20 | 15.29 | — | |||||||||
Composite Index 2020 | 6.38 | 5.03 | 4.27 | 7.45 | — |
As stated in the Fund’s prospectus dated March 1, 2019, the expense ratio was 0.71%. The Adviser has contractually agreed to limit the Fund’s operating expenses to: (i) the amount of the acquired funds’ fees and expenses; (ii) compensation of the Independent Trustees; and (iii) certain other expenses such as extraordinary items. The expense ratio in the prospectus may differ from the actual expense ratio for the period disclosed within this report. The expense ratio shown in the prospectus is based on the prior fiscal year, adjusted to reflect changes, if any, in contractual arrangements that occurred prior to the date of the prospectus (or supplement thereto, if applicable).
Performance data shown represents past performance and is no guarantee of future results. Past performance is net of management fees and expenses and reflects reinvested dividends and distributions but does not reflect the deduction of taxes that a shareholder would pay on Fund distributions or upon the redemption of Fund shares. Past performance reflects the beneficial effect of any expense waivers or reimbursements, without which returns would have been lower. Investment returns and principal value will fluctuate so that Fund shares, when redeemed, may be worth more or less than their original cost. Returns for periods less than one year are not annualized. Current performance may be higher or lower and is available through the most recent month end atharborfunds.com or by calling 800-422-1050. See the Benchmark Descriptions at the end of this report for a description of the Composite Index.
11
Harbor Target Retirement 2020 Fund
Portfolio of Investments—April 30, 2019 (Unaudited)
Value and Cost in Thousands
EQUITY FUNDS—32.1% | ||||
Shares | Value | |||
6,676 | Harbor Capital Appreciation Fund | $505 | ||
23,646 | Harbor Strategic Growth Fund | 507 | ||
49,795 | Harbor Mid Cap Growth Fund | 544 | ||
38,522 | Harbor Small Cap Growth Fund | 494 | ||
76,314 | Harbor Large Cap Value Fund | 1,198 | ||
37,681 | Harbor Mid Cap Value Fund | 791 | ||
17,920 | Harbor Small Cap Value Fund | 597 | ||
26,831 | Harbor International Fund | 1,023 | ||
93,584 | Harbor Diversified International All Cap Fund | 1,020 | ||
65,272 | Harbor International Growth Fund | 1,025 | ||
13,975 | Harbor Global Leaders Fund | 406 | ||
TOTAL EQUITY FUNDS | ||||
(Cost $7,818) | 8,110 | |||
FIXED INCOME FUNDS—60.9% | |||
| Shares | Value | |
227,858 | Harbor High-Yield Bond Fund | $2,240 | |
154,913 | Harbor High-Yield Opportunities Fund | 1,493 | |
556,826 | Harbor Core Bond Fund | 5,685 | |
248,699 | Harbor Bond Fund | 2,843 | |
342,947 | Harbor Real Return Fund | 3,138 | |
TOTAL FIXED INCOME FUNDS | |||
(Cost $15,342) | 15,399 | ||
SHORT-TERM INVESTMENTS—7.0% | |||
(Cost $1,767) | |||
1,766,591 | Harbor Money Market Fund | 1,767 | |
TOTAL INVESTMENTS—100.0% | |||
(Cost $24,927) | 25,276 | ||
CASH AND OTHER ASSETS, LESS LIABILITIES—0.0% | 3 | ||
TOTAL NET ASSETS—100.0% | $25,279 |
AFFILIATED TRANSACTIONS
The Underlying Funds are considered to be affiliated with the Fund. The following table shows investment transactions and earnings from investments in the affiliated Funds during the period November 1, 2018 through April 30, 2019.
Underlying Funds | Beginning Balance as of 11/01/2018 (000s) | Purchases of Affiliated Funds (000s) | Sales of Affiliated Funds (000s) | Change in Net Unrealized Gain/(Loss) from Affiliated Funds (000s) | Net Realized Gain/(Loss) | Investment Income from Affiliated Funds (000s) | ||||||||
Sale of Affiliated Funds (000s) | Distributions Received from Affiliated Funds (000s) | |||||||||||||
Harbor Capital Appreciation Fund | $543 | $154 | $(210) | $(6) | $24 | $49 | $1 | |||||||
Harbor Strategic Growth Fund | 537 | 90 | (166) | 44 | 2 | 13 | 2 | |||||||
Harbor Mid Cap Growth Fund | 584 | 223 | (283) | (26) | 46 | 94 | — | |||||||
Harbor Small Cap Growth Fund | 523 | 216 | (207) | (43) | 5 | 104 | — | |||||||
Harbor Large Cap Value Fund | 1,274 | 214 | (401) | 30 | 81 | 20 | 6 | |||||||
Harbor Mid Cap Value Fund | 843 | 202 | (246) | (17) | 9 | 46 | 14 | |||||||
Harbor Small Cap Value Fund | 638 | 176 | (220) | (42) | 45 | 56 | 2 | |||||||
Harbor International Fund | 1,079 | 472 | (197) | (228) | (103) | 390 | 16 | |||||||
Harbor Diversified International All Cap Fund | 1,079 | 105 | (213) | 44 | 5 | 30 | 13 | |||||||
Harbor International Growth Fund | 1,091 | 102 | (312) | 91 | 53 | — | 8 | |||||||
Harbor Global Leaders Fund | 431 | 66 | (147) | 20 | 36 | 10 | — | |||||||
Harbor High-Yield Bond Fund | 2,417 | 243 | (453) | 35 | (2) | — | 74 | |||||||
Harbor High-Yield Opportunities Fund | 1,611 | 161 | (294) | 29 | (14) | — | 46 | |||||||
Harbor Core Bond Fund | — | 5,927 | (349) | 103 | 4 | — | 35 | |||||||
Harbor Bond Fund | 8,426 | 821 | (6,551) | 473 | (326) | — | 117 | |||||||
Harbor Real Return Fund | 3,052 | 519 | (528) | 126 | (31) | — | 43 | |||||||
Harbor Money Market Fund | 1,426 | 565 | (224) | — | — | — | 17 | |||||||
Total | $25,554 | $10,256 | $(11,001) | $633 | $(166) | $812 | $394 |
12
Harbor Target Retirement 2025 Fund
Fund Summary —April 30, 2019 (Unaudited)
Asset Allocation(% of investments)
FUND PERFORMANCE
TOTAL RETURNS For the periods ended 04/30/2019 | Unannualized | 1 Year | Annualized | Inception Date | ||||||||||
6 Months | 5 Years | 10 Years | ||||||||||||
Harbor Target Retirement 2025 Fund | ||||||||||||||
Institutional Class | 8.01% | 5.33% | 4.57% | 8.32% | 01/02/2009 | |||||||||
Comparative Indices | ||||||||||||||
Bloomberg Barclays U.S. Aggregate Bond | 5.49% | 5.29% | 2.57% | 3.72% | — | |||||||||
MSCI EAFE (ND) | 7.45 | -3.22 | 2.60 | 7.95 | — | |||||||||
Russell 3000® | 9.71 | 12.68 | 11.20 | 15.29 | — | |||||||||
Composite Index 2025 | 7.14 | 5.35 | 4.63 | 8.19 | — |
As stated in the Fund’s prospectus dated March 1, 2019, the expense ratio was 0.74%. The Adviser has contractually agreed to limit the Fund’s operating expenses to: (i) the amount of the acquired funds’ fees and expenses; (ii) compensation of the Independent Trustees; and (iii) certain other expenses such as extraordinary items. The expense ratio in the prospectus may differ from the actual expense ratio for the period disclosed within this report. The expense ratio shown in the prospectus is based on the prior fiscal year, adjusted to reflect changes, if any, in contractual arrangements that occurred prior to the date of the prospectus (or supplement thereto, if applicable).
Performance data shown represents past performance and is no guarantee of future results. Past performance is net of management fees and expenses and reflects reinvested dividends and distributions but does not reflect the deduction of taxes that a shareholder would pay on Fund distributions or upon the redemption of Fund shares. Past performance reflects the beneficial effect of any expense waivers or reimbursements, without which returns would have been lower. Investment returns and principal value will fluctuate so that Fund shares, when redeemed, may be worth more or less than their original cost. Returns for periods less than one year are not annualized. Current performance may be higher or lower and is available through the most recent month end atharborfunds.com or by calling 800-422-1050. See the Benchmark Descriptions at the end of this report for a description of the Composite Index.
13
Harbor Target Retirement 2025 Fund
Portfolio of Investments—April 30, 2019 (Unaudited)
Value and Cost in Thousands
EQUITY FUNDS—42.7% | |||
Shares | Value | ||
7,112 | Harbor Capital Appreciation Fund | $538 | |
25,048 | Harbor Strategic Growth Fund | 537 | |
54,462 | Harbor Mid Cap Growth Fund | 595 | |
41,735 | Harbor Small Cap Growth Fund | 535 | |
80,822 | Harbor Large Cap Value Fund | 1,269 | |
39,763 | Harbor Mid Cap Value Fund | 835 | |
19,087 | Harbor Small Cap Value Fund | 635 | |
28,165 | Harbor International Fund | 1,074 | |
98,269 | Harbor Diversified International All Cap Fund | 1,071 | |
68,756 | Harbor International Growth Fund | 1,080 | |
14,621 | Harbor Global Leaders Fund | 425 | |
TOTAL EQUITY FUNDS | |||
(Cost $8,418) | 8,594 | ||
FIXED INCOME FUNDS—57.3% | |||
| Shares | Value | |
219,173 | Harbor High-Yield Bond Fund | $2,154 | |
149,060 | Harbor High-Yield Opportunities Fund | 1,437 | |
389,770 | Harbor Core Bond Fund | 3,980 | |
174,231 | Harbor Bond Fund | 1,991 | |
213,505 | Harbor Real Return Fund | 1,954 | |
TOTAL FIXED INCOME FUNDS | |||
(Cost $11,505) | 11,516 | ||
TOTAL INVESTMENTS—100.0% | |||
(Cost $19,923) | 20,110 | ||
CASH AND OTHER ASSETS, LESS LIABILITIES—0.0% | —a | ||
TOTAL NET ASSETS—100.0% | $20,110 |
AFFILIATED TRANSACTIONS
The Underlying Funds are considered to be affiliated with the Fund. The following table shows investment transactions and earnings from investments in the affiliated Funds during the period November 1, 2018 through April 30, 2019.
Underlying Funds | Beginning Balance as of 11/01/2018 (000s) | Purchases of Affiliated Funds (000s) | Sales of Affiliated Funds (000s) | Change in Net Unrealized Gain/(Loss) from Affiliated Funds (000s) | Net Realized Gain/(Loss) | Investment Income from Affiliated Funds (000s) | ||||||||
Sale of Affiliated Funds (000s) | Distributions Received from Affiliated Funds (000s) | |||||||||||||
Harbor Capital Appreciation Fund | $471 | $153 | $(110) | $15 | $9 | $42 | $1 | |||||||
Harbor Strategic Growth Fund | 464 | 93 | (70) | 48 | 2 | 11 | 1 | |||||||
Harbor Mid Cap Growth Fund | 511 | 214 | (161) | 11 | 20 | 82 | — | |||||||
Harbor Small Cap Growth Fund | 458 | 206 | (106) | (21) | (2) | 91 | — | |||||||
Harbor Large Cap Value Fund | 1,100 | 243 | (189) | 71 | 44 | 18 | 6 | |||||||
Harbor Mid Cap Value Fund | 732 | 220 | (119) | (4) | 6 | 40 | 12 | |||||||
Harbor Small Cap Value Fund | 556 | 195 | (128) | (6) | 18 | 49 | 2 | |||||||
Harbor International Fund | 935 | 505 | (84) | (240) | (42) | 341 | 14 | |||||||
Harbor Diversified International All Cap Fund | 935 | 177 | (92) | 48 | 3 | 26 | 11 | |||||||
Harbor International Growth Fund | 947 | 157 | (167) | 115 | 28 | — | 7 | |||||||
Harbor Global Leaders Fund | 367 | 73 | (69) | 36 | 18 | 9 | — | |||||||
Harbor High-Yield Bond Fund | 2,040 | 419 | (335) | 48 | (18) | — | 66 | |||||||
Harbor High-Yield Opportunities Fund | 1,359 | 278 | (214) | 25 | (11) | — | 41 | |||||||
Harbor Core Bond Fund | — | 4,010 | (101) | 70 | 1 | — | 24 | |||||||
Harbor Bond Fund | 5,090 | 729 | (3,921) | 233 | (140) | — | 72 | |||||||
Harbor Real Return Fund | 1,686 | 425 | (213) | 63 | (7) | — | 24 | |||||||
Total | $17,651 | $8,097 | $(6,079) | $512 | $(71) | $709 | $281 |
a | Rounds to less than $1,000 |
The accompanying notes are an integral part of the Financial Statements.
14
Harbor Target Retirement 2030 Fund
Fund Summary —April 30, 2019 (Unaudited)
Asset Allocation(% of investments)
FUND PERFORMANCE
TOTAL RETURNS For the periods ended 04/30/2019 | Unannualized | 1 Year | Annualized | Inception Date | ||||||||||
6 Months | 5 Years | 10 Years | ||||||||||||
Harbor Target Retirement 2030 Fund | ||||||||||||||
Institutional Class | 8.31% | 5.21% | 4.88% | 9.06% | 01/02/2009 | |||||||||
Comparative Indices | ||||||||||||||
Bloomberg Barclays U.S. Aggregate Bond | 5.49% | 5.29% | 2.57% | 3.72% | — | |||||||||
MSCI EAFE (ND) | 7.45 | -3.22 | 2.60 | 7.95 | — | |||||||||
Russell 3000® | 9.71 | 12.68 | 11.20 | 15.29 | — | |||||||||
Composite Index 2030 | 7.47 | 5.41 | 4.90 | 8.94 | — |
As stated in the Fund’s prospectus dated March 1, 2019, the expense ratio was 0.75%. The Adviser has contractually agreed to limit the Fund’s operating expenses to: (i) the amount of the acquired funds’ fees and expenses; (ii) compensation of the Independent Trustees; and (iii) certain other expenses such as extraordinary items. The expense ratio in the prospectus may differ from the actual expense ratio for the period disclosed within this report. The expense ratio shown in the prospectus is based on the prior fiscal year, adjusted to reflect changes, if any, in contractual arrangements that occurred prior to the date of the prospectus (or supplement thereto, if applicable).
Performance data shown represents past performance and is no guarantee of future results. Past performance is net of management fees and expenses and reflects reinvested dividends and distributions but does not reflect the deduction of taxes that a shareholder would pay on Fund distributions or upon the redemption of Fund shares. Past performance reflects the beneficial effect of any expense waivers or reimbursements, without which returns would have been lower. Investment returns and principal value will fluctuate so that Fund shares, when redeemed, may be worth more or less than their original cost. Returns for periods less than one year are not annualized. Current performance may be higher or lower and is available through the most recent month end atharborfunds.com or by calling 800-422-1050. See the Benchmark Descriptions at the end of this report for a description of the Composite Index.
15
Harbor Target Retirement 2030 Fund
Portfolio of Investments—April 30, 2019 (Unaudited)
Value and Cost in Thousands
EQUITY FUNDS—49.9% | |||
Shares | Value | ||
16,702 | Harbor Capital Appreciation Fund | $1,263 | |
33,615 | Harbor Strategic Growth Fund | 721 | |
100,210 | Harbor Mid Cap Growth Fund | 1,094 | |
77,452 | Harbor Small Cap Growth Fund | 993 | |
149,391 | Harbor Large Cap Value Fund | 2,345 | |
74,324 | Harbor Mid Cap Value Fund | 1,561 | |
35,702 | Harbor Small Cap Value Fund | 1,188 | |
52,597 | Harbor International Fund | 2,006 | |
183,373 | Harbor Diversified International All Cap Fund | 1,999 | |
128,643 | Harbor International Growth Fund | 2,020 | |
26,802 | Harbor Global Leaders Fund | 779 | |
TOTAL EQUITY FUNDS | |||
(Cost $15,126) | 15,969 | ||
FIXED INCOME FUNDS—50.1% | |||
| Shares | Value | |
350,016 | Harbor High-Yield Bond Fund | $3,441 | |
238,204 | Harbor High-Yield Opportunities Fund | 2,296 | |
390,542 | Harbor Core Bond Fund | 3,987 | |
349,036 | Harbor Bond Fund | 3,990 | |
252,115 | Harbor Real Return Fund | 2,307 | |
TOTAL FIXED INCOME FUNDS | |||
(Cost $16,050) | 16,021 | ||
TOTAL INVESTMENTS—100.0% | |||
(Cost $31,176) | 31,990 | ||
CASH AND OTHER ASSETS, LESS LIABILITIES—0.0% | —a | ||
TOTAL NET ASSETS—100.0% | $31,990 |
AFFILIATED TRANSACTIONS
The Underlying Funds are considered to be affiliated with the Fund. The following table shows investment transactions and earnings from investments in the affiliated Funds during the period November 1, 2018 through April 30, 2019.
Underlying Funds | Beginning Balance as of 11/01/2018 (000s) | Purchases of Affiliated Funds (000s) | Sales of Affiliated Funds (000s) | Change in Net Unrealized Gain/(Loss) from Affiliated Funds (000s) | Net Realized Gain/(Loss) | Investment Income from Affiliated Funds (000s) | ||||||||
Sale of Affiliated Funds (000s) | Distributions Received from Affiliated Funds (000s) | |||||||||||||
Harbor Capital Appreciation Fund | $1,150 | $334 | $(264) | $5 | $38 | $104 | $2 | |||||||
Harbor Strategic Growth Fund | 568 | 179 | (90) | 64 | — | 14 | 2 | |||||||
Harbor Mid Cap Growth Fund | 942 | 347 | (239) | 5 | 39 | 152 | — | |||||||
Harbor Small Cap Growth Fund | 847 | 379 | (180) | (47) | (6) | 170 | — | |||||||
Harbor Large Cap Value Fund | 2,008 | 462 | (326) | 145 | 56 | 32 | 10 | |||||||
Harbor Mid Cap Value Fund | 1,342 | 443 | (220) | 3 | (7) | 74 | 23 | |||||||
Harbor Small Cap Value Fund | 1,021 | 364 | (211) | (16) | 30 | 91 | 4 | |||||||
Harbor International Fund | 1,726 | 991 | (178) | (403) | (130) | 637 | 25 | |||||||
Harbor Diversified International All Cap Fund | 1,725 | 379 | (193) | 88 | — | 49 | 21 | |||||||
Harbor International Growth Fund | 1,745 | 272 | (252) | 232 | 23 | — | 13 | |||||||
Harbor Global Leaders Fund | 669 | 130 | (115) | 76 | 19 | 15 | — | |||||||
Harbor High-Yield Bond Fund | 3,116 | 655 | (375) | 53 | (8) | — | 103 | |||||||
Harbor High-Yield Opportunities Fund | 2,076 | 438 | (238) | 34 | (14) | — | 64 | |||||||
Harbor Core Bond Fund | — | 4,000 | (83) | 68 | 2 | — | 23 | |||||||
Harbor Bond Fund | 7,081 | 975 | (4,211) | 373 | (228) | — | 105 | |||||||
Harbor Real Return Fund | 1,957 | 504 | (218) | 70 | (6) | — | 27 | |||||||
Total | $27,973 | $10,852 | $(7,393) | $750 | $(192) | $1,338 | $422 |
a | Rounds to less than $1,000 |
The accompanying notes are an integral part of the Financial Statements.
16
Harbor Target Retirement 2035 Fund
Fund Summary —April 30, 2019 (Unaudited)
Asset Allocation(% of investments)
FUND PERFORMANCE
TOTAL RETURNS For the periods ended 04/30/2019 | Unannualized | 1 Year | Annualized | Inception Date | ||||||||||
6 Months | 5 Years | 10 Years | ||||||||||||
Harbor Target Retirement 2035 Fund | ||||||||||||||
Institutional Class | 9.21% | 5.33% | 5.39% | 9.82% | 01/02/2009 | |||||||||
Comparative Indices | ||||||||||||||
Bloomberg Barclays U.S. Aggregate Bond | 5.49% | 5.29% | 2.57% | 3.72% | — | |||||||||
MSCI EAFE (ND) | 7.45 | -3.22 | 2.60 | 7.95 | — | |||||||||
Russell 3000® | 9.71 | 12.68 | 11.20 | 15.29 | — | |||||||||
Composite Index 2035 | 7.85 | 5.34 | 5.28 | 9.67 | — |
As stated in the Fund’s prospectus dated March 1, 2019, the expense ratio was 0.76%. The Adviser has contractually agreed to limit the Fund’s operating expenses to: (i) the amount of the acquired funds’ fees and expenses; (ii) compensation of the Independent Trustees; and (iii) certain other expenses such as extraordinary items. The expense ratio in the prospectus may differ from the actual expense ratio for the period disclosed within this report. The expense ratio shown in the prospectus is based on the prior fiscal year, adjusted to reflect changes, if any, in contractual arrangements that occurred prior to the date of the prospectus (or supplement thereto, if applicable).
Performance data shown represents past performance and is no guarantee of future results. Past performance is net of management fees and expenses and reflects reinvested dividends and distributions but does not reflect the deduction of taxes that a shareholder would pay on Fund distributions or upon the redemption of Fund shares. Past performance reflects the beneficial effect of any expense waivers or reimbursements, without which returns would have been lower. Investment returns and principal value will fluctuate so that Fund shares, when redeemed, may be worth more or less than their original cost. Returns for periods less than one year are not annualized. Current performance may be higher or lower and is available through the most recent month end atharborfunds.com or by calling 800-422-1050. See the Benchmark Descriptions at the end of this report for a description of the Composite Index.
17
Harbor Target Retirement 2035 Fund
Portfolio of Investments—April 30, 2019 (Unaudited)
Value and Cost in Thousands
EQUITY FUNDS—59.8% | |||
Shares | Value | ||
12,437 | Harbor Capital Appreciation Fund | $941 | |
22,000 | Harbor Strategic Growth Fund | 472 | |
70,720 | Harbor Mid Cap Growth Fund | 772 | |
54,827 | Harbor Small Cap Growth Fund | 703 | |
106,029 | Harbor Large Cap Value Fund | 1,665 | |
53,010 | Harbor Mid Cap Value Fund | 1,113 | |
25,335 | Harbor Small Cap Value Fund | 844 | |
37,711 | Harbor International Fund | 1,438 | |
131,869 | Harbor Diversified International All Cap Fund | 1,437 | |
91,760 | Harbor International Growth Fund | 1,441 | |
19,147 | Harbor Global Leaders Fund | 556 | |
TOTAL EQUITY FUNDS | |||
(Cost $10,811) | 11,382 | ||
FIXED INCOME FUNDS—40.2% | |||
| Shares | Value | |
177,302 | Harbor High-Yield Bond Fund | $1,743 | |
120,667 | Harbor High-Yield Opportunities Fund | 1,163 | |
191,128 | Harbor Core Bond Fund | 1,951 | |
170,692 | Harbor Bond Fund | 1,951 | |
90,981 | Harbor Real Return Fund | 833 | |
TOTAL FIXED INCOME FUNDS | |||
(Cost $7,640) | 7,641 | ||
TOTAL INVESTMENTS—100.0% | |||
(Cost $18,451) | 19,023 | ||
CASH AND OTHER ASSETS, LESS LIABILITIES—0.0% | —a | ||
TOTAL NET ASSETS—100.0% | $19,023 |
AFFILIATED TRANSACTIONS
The Underlying Funds are considered to be affiliated with the Fund. The following table shows investment transactions and earnings from investments in the affiliated Funds during the period November 1, 2018 through April 30, 2019.
Underlying Funds | Beginning Balance as of 11/01/2018 (000s) | Purchases of Affiliated Funds (000s) | Sales of Affiliated Funds (000s) | Change in Net Unrealized Gain/(Loss) from Affiliated Funds (000s) | Net Realized Gain/(Loss) | Investment Income from Affiliated Funds (000s) | ||||||||
Sale of Affiliated Funds (000s) | Distributions Received from Affiliated Funds (000s) | |||||||||||||
Harbor Capital Appreciation Fund | $758 | $260 | $(119) | $24 | $18 | $70 | $1 | |||||||
Harbor Strategic Growth Fund | 376 | 92 | (39) | 41 | 2 | 9 | 1 | |||||||
Harbor Mid Cap Growth Fund | 626 | 266 | (159) | 8 | 31 | 102 | — | |||||||
Harbor Small Cap Growth Fund | 553 | 291 | (114) | (31) | 4 | 114 | — | |||||||
Harbor Large Cap Value Fund | 1,326 | 335 | (144) | 117 | 31 | 22 | 7 | |||||||
Harbor Mid Cap Value Fund | 889 | 330 | (111) | 10 | (5) | 50 | 15 | |||||||
Harbor Small Cap Value Fund | 668 | 270 | (112) | — | 18 | 61 | 3 | |||||||
Harbor International Fund | 1,139 | 740 | (89) | (299) | (53) | 428 | 17 | |||||||
Harbor Diversified International All Cap Fund | 1,140 | 322 | (89) | 64 | — | 33 | 14 | |||||||
Harbor International Growth Fund | 1,150 | 226 | (117) | 174 | 8 | — | 9 | |||||||
Harbor Global Leaders Fund | 444 | 91 | (47) | 59 | 9 | 10 | — | |||||||
Harbor High-Yield Bond Fund | 1,403 | 463 | (148) | 30 | (5) | — | 49 | |||||||
Harbor High-Yield Opportunities Fund | 936 | 306 | (91) | 17 | (5) | — | 31 | |||||||
Harbor Core Bond Fund | — | 1,958 | (40) | 33 | — | — | 11 | |||||||
Harbor Bond Fund | 3,113 | 771 | (2,003) | 145 | (75) | — | 48 | |||||||
Harbor Real Return Fund | 603 | 274 | (67) | 25 | (2) | — | 9 | |||||||
Total | $15,124 | $6,995 | $(3,489) | $417 | $(24) | $899 | $215 |
a | Rounds to less than $1,000 |
The accompanying notes are an integral part of the Financial Statements.
18
Harbor Target Retirement 2040 Fund
Fund Summary —April 30, 2019 (Unaudited)
Asset Allocation(% of investments)
FUND PERFORMANCE
TOTAL RETURNS For the periods ended 04/30/2019 | Unannualized | 1 Year | Annualized | Inception Date | ||||||||||
6 Months | 5 Years | 10 Years | ||||||||||||
Harbor Target Retirement 2040 Fund | ||||||||||||||
Institutional Class | 9.83% | 5.31% | 5.95% | 10.55% | 01/02/2009 | |||||||||
Comparative Indices | ||||||||||||||
Bloomberg Barclays U.S. Aggregate Bond | 5.49% | 5.29% | 2.57% | 3.72% | — | |||||||||
MSCI EAFE (ND) | 7.45 | -3.22 | 2.60 | 7.95 | — | |||||||||
Russell 3000® | 9.71 | 12.68 | 11.20 | 15.29 | — | |||||||||
Composite Index 2040 | 8.24 | 5.34 | 5.74 | 10.42 | — |
As stated in the Fund’s prospectus dated March 1, 2019, the expense ratio was 0.75%. The Adviser has contractually agreed to limit the Fund’s operating expenses to: (i) the amount of the acquired funds’ fees and expenses; (ii) compensation of the Independent Trustees; and (iii) certain other expenses such as extraordinary items. The expense ratio in the prospectus may differ from the actual expense ratio for the period disclosed within this report. The expense ratio shown in the prospectus is based on the prior fiscal year, adjusted to reflect changes, if any, in contractual arrangements that occurred prior to the date of the prospectus (or supplement thereto, if applicable).
Performance data shown represents past performance and is no guarantee of future results. Past performance is net of management fees and expenses and reflects reinvested dividends and distributions but does not reflect the deduction of taxes that a shareholder would pay on Fund distributions or upon the redemption of Fund shares. Past performance reflects the beneficial effect of any expense waivers or reimbursements, without which returns would have been lower. Investment returns and principal value will fluctuate so that Fund shares, when redeemed, may be worth more or less than their original cost. Returns for periods less than one year are not annualized. Current performance may be higher or lower and is available through the most recent month end atharborfunds.com or by calling 800-422-1050. See the Benchmark Descriptions at the end of this report for a description of the Composite Index.
19
Harbor Target Retirement 2040 Fund
Portfolio of Investments—April 30, 2019 (Unaudited)
Value and Cost in Thousands
EQUITY FUNDS—69.9% | |||
Shares | Value | ||
21,651 | Harbor Capital Appreciation Fund | $1,638 | |
38,289 | Harbor Strategic Growth Fund | 821 | |
122,263 | Harbor Mid Cap Growth Fund | 1,335 | |
94,395 | Harbor Small Cap Growth Fund | 1,210 | |
185,052 | Harbor Large Cap Value Fund | 2,905 | |
91,774 | Harbor Mid Cap Value Fund | 1,927 | |
43,738 | Harbor Small Cap Value Fund | 1,456 | |
65,153 | Harbor International Fund | 2,485 | |
227,437 | Harbor Diversified International All Cap Fund | 2,479 | |
158,966 | Harbor International Growth Fund | 2,496 | |
33,712 | Harbor Global Leaders Fund | 980 | |
TOTAL EQUITY FUNDS | |||
(Cost $18,438) | 19,732 | ||
FIXED INCOME FUNDS—30.1% | |||
| Shares | Value | |
210,483 | Harbor High-Yield Bond Fund | $2,069 | |
142,309 | Harbor High-Yield Opportunities Fund | 1,372 | |
247,000 | Harbor Core Bond Fund | 2,522 | |
220,793 | Harbor Bond Fund | 2,524 | |
TOTAL FIXED INCOME FUNDS | |||
(Cost $8,470) | 8,487 | ||
TOTAL INVESTMENTS—100.0% | |||
(Cost $26,908) | 28,219 | ||
CASH AND OTHER ASSETS, LESS LIABILITIES—0.0% | —a | ||
TOTAL NET ASSETS—100.0% | $28,219 |
AFFILIATED TRANSACTIONS
The Underlying Funds are considered to be affiliated with the Fund. The following table shows investment transactions and earnings from investments in the affiliated Funds during the period November 1, 2018 through April 30, 2019.
Underlying Funds | Beginning Balance as of 11/01/2018 (000s) | Purchases of Affiliated Funds (000s) | Sales of Affiliated Funds (000s) | Change in Net Unrealized Gain/(Loss) from Affiliated Funds (000s) | Net Realized Gain/(Loss) | Investment Income from Affiliated Funds (000s) | ||||||||
Sale of Affiliated Funds (000s) | Distributions Received from Affiliated Funds (000s) | |||||||||||||
Harbor Capital Appreciation Fund | $1,422 | $341 | $(198) | $31 | $42 | $128 | $3 | |||||||
Harbor Strategic Growth Fund | 699 | 94 | (46) | 73 | 1 | 17 | 2 | |||||||
Harbor Mid Cap Growth Fund | 1,159 | 364 | (259) | 38 | 33 | 185 | — | |||||||
Harbor Small Cap Growth Fund | 1,030 | 383 | (151) | (33) | (19) | 204 | — | |||||||
Harbor Large Cap Value Fund | 2,459 | 361 | (172) | 176 | 81 | 40 | 12 | |||||||
Harbor Mid Cap Value Fund | 1,633 | 406 | (114) | (42) | 44 | 90 | 28 | |||||||
Harbor Small Cap Value Fund | 1,234 | 336 | (140) | (5) | 31 | 110 | 5 | |||||||
Harbor International Fund | 2,098 | 1,116 | (83) | (592) | (54) | 780 | 31 | |||||||
Harbor Diversified International All Cap Fund | 2,100 | 354 | (89) | 113 | 1 | 59 | 26 | |||||||
Harbor International Growth Fund | 2,134 | 191 | (154) | 309 | 16 | — | 15 | |||||||
Harbor Global Leaders Fund | 842 | 94 | (80) | 110 | 14 | 19 | — | |||||||
Harbor High-Yield Bond Fund | 1,799 | 423 | (184) | 32 | (1) | — | 61 | |||||||
Harbor High-Yield Opportunities Fund | 1,191 | 282 | (115) | 21 | (7) | — | 38 | |||||||
Harbor Core Bond Fund | — | 2,507 | (30) | 44 | 1 | — | 15 | |||||||
Harbor Bond Fund | 4,250 | 716 | (2,534) | 187 | (95) | — | 66 | |||||||
Total | $24,050 | $7,968 | $(4,349) | $462 | $88 | $1,632 | $302 |
a | Rounds to less than $1,000 |
The accompanying notes are an integral part of the Financial Statements.
20
Harbor Target Retirement 2045 Fund
Fund Summary —April 30, 2019 (Unaudited)
Asset Allocation(% of investments)
FUND PERFORMANCE
TOTAL RETURNS For the periods ended 04/30/2019 | Unannualized | 1 Year | Annualized | Inception Date | ||||||||||
6 Months | 5 Years | 10 Years | ||||||||||||
Harbor Target Retirement 2045 Fund | ||||||||||||||
Institutional Class | 10.18% | 5.23% | 6.37% | 11.14% | 01/02/2009 | |||||||||
Comparative Indices | ||||||||||||||
Bloomberg Barclays U.S. Aggregate Bond | 5.49% | 5.29% | 2.57% | 3.72% | — | |||||||||
MSCI EAFE (ND) | 7.45 | -3.22 | 2.60 | 7.95 | — | |||||||||
Russell 3000® | 9.71 | 12.68 | 11.20 | 15.29 | — | |||||||||
Composite Index 2045 | 8.32 | 5.19 | 6.09 | 11.06 | — |
As stated in the Fund’s prospectus dated March 1, 2019, the expense ratio was 0.76%. The Adviser has contractually agreed to limit the Fund’s operating expenses to: (i) the amount of the acquired funds’ fees and expenses; (ii) compensation of the Independent Trustees; and (iii) certain other expenses such as extraordinary items. The expense ratio in the prospectus may differ from the actual expense ratio for the period disclosed within this report. The expense ratio shown in the prospectus is based on the prior fiscal year, adjusted to reflect changes, if any, in contractual arrangements that occurred prior to the date of the prospectus (or supplement thereto, if applicable).
Performance data shown represents past performance and is no guarantee of future results. Past performance is net of management fees and expenses and reflects reinvested dividends and distributions but does not reflect the deduction of taxes that a shareholder would pay on Fund distributions or upon the redemption of Fund shares. Past performance reflects the beneficial effect of any expense waivers or reimbursements, without which returns would have been lower. Investment returns and principal value will fluctuate so that Fund shares, when redeemed, may be worth more or less than their original cost. Returns for periods less than one year are not annualized. Current performance may be higher or lower and is available through the most recent month end atharborfunds.com or by calling 800-422-1050. See the Benchmark Descriptions at the end of this report for a description of the Composite Index.
21
Harbor Target Retirement 2045 Fund
Portfolio of Investments—April 30, 2019 (Unaudited)
Value and Cost in Thousands
EQUITY FUNDS—74.1% | |||
Shares | Value | ||
11,894 | Harbor Capital Appreciation Fund | $900 | |
21,041 | Harbor Strategic Growth Fund | 451 | |
66,758 | Harbor Mid Cap Growth Fund | 729 | |
51,050 | Harbor Small Cap Growth Fund | 654 | |
102,018 | Harbor Large Cap Value Fund | 1,602 | |
50,264 | Harbor Mid Cap Value Fund | 1,055 | |
23,812 | Harbor Small Cap Value Fund | 793 | |
35,736 | Harbor International Fund | 1,363 | |
124,914 | Harbor Diversified International All Cap Fund | 1,362 | |
86,960 | Harbor International Growth Fund | 1,365 | |
18,837 | Harbor Global Leaders Fund | 547 | |
TOTAL EQUITY FUNDS | |||
(Cost $10,504) | 10,821 | ||
FIXED INCOME FUNDS—25.9% | |||
| Shares | Value | |
95,977 | Harbor High-Yield Bond Fund | $943 | |
64,789 | Harbor High-Yield Opportunities Fund | 625 | |
72,602 | Harbor Core Bond Fund | 741 | |
129,707 | Harbor Bond Fund | 1,483 | |
TOTAL FIXED INCOME FUNDS | |||
(Cost $3,785) | 3,792 | ||
TOTAL INVESTMENTS—100.0% | |||
(Cost $14,289) | 14,613 | ||
CASH AND OTHER ASSETS, LESS LIABILITIES—0.0% | —a | ||
TOTAL NET ASSETS—100.0% | $14,613 |
AFFILIATED TRANSACTIONS
The Underlying Funds are considered to be affiliated with the Fund. The following table shows investment transactions and earnings from investments in the affiliated Funds during the period November 1, 2018 through April 30, 2019.
Underlying Funds | Beginning Balance as of 11/01/2018 (000s) | Purchases of Affiliated Funds (000s) | Sales of Affiliated Funds (000s) | Change in Net Unrealized Gain/(Loss) from Affiliated Funds (000s) | Net Realized Gain/(Loss) | Investment Income from Affiliated Funds (000s) | ||||||||
Sale of Affiliated Funds (000s) | Distributions Received from Affiliated Funds (000s) | |||||||||||||
Harbor Capital Appreciation Fund | $793 | $198 | $(126) | $16 | $19 | $74 | $2 | |||||||
Harbor Strategic Growth Fund | 394 | 79 | (63) | 42 | (1) | 10 | 1 | |||||||
Harbor Mid Cap Growth Fund | 631 | 211 | (147) | 8 | 26 | 105 | — | |||||||
Harbor Small Cap Growth Fund | 556 | 242 | (112) | (35) | 3 | 115 | — | |||||||
Harbor Large Cap Value Fund | 1,392 | 270 | (203) | 105 | 38 | 23 | 7 | |||||||
Harbor Mid Cap Value Fund | 918 | 294 | (156) | (2) | 1 | 52 | 16 | |||||||
Harbor Small Cap Value Fund | 681 | 233 | (135) | (11) | 25 | 62 | 2 | |||||||
Harbor International Fund | 1,178 | 717 | (159) | (276) | (97) | 447 | 18 | |||||||
Harbor Diversified International All Cap Fund | 1,182 | 282 | (164) | 57 | 5 | 34 | 15 | |||||||
Harbor International Growth Fund | 1,188 | 173 | (175) | 151 | 28 | — | 9 | |||||||
Harbor Global Leaders Fund | 482 | 73 | (78) | 55 | 15 | 11 | — | |||||||
Harbor High-Yield Bond Fund | 755 | 312 | (139) | 20 | (5) | — | 27 | |||||||
Harbor High-Yield Opportunities Fund | 499 | 208 | (90) | 12 | (4) | — | 16 | |||||||
Harbor Core Bond Fund | — | 809 | (81) | 13 | — | — | 4 | |||||||
Harbor Bond Fund | 1,761 | 455 | (778) | 74 | (29) | — | 29 | |||||||
Total | $12,410 | $4,556 | $(2,606) | $229 | $24 | $933 | $146 |
a | Rounds to less than $1,000 |
The accompanying notes are an integral part of the Financial Statements.
22
Harbor Target Retirement 2050 Fund
Fund Summary —April 30, 2019 (Unaudited)
Asset Allocation(% of investments)
FUND PERFORMANCE
TOTAL RETURNS For the periods ended 04/30/2019 | Unannualized | 1 Year | Annualized | Inception Date | ||||||||||
6 Months | 5 Years | 10 Years | ||||||||||||
Harbor Target Retirement 2050 Fund | ||||||||||||||
Institutional Class | 10.90% | 5.21% | 6.90% | 11.62% | 01/02/2009 | |||||||||
Comparative Indices | ||||||||||||||
Bloomberg Barclays U.S. Aggregate Bond | 5.49% | 5.29% | 2.57% | 3.72% | — | |||||||||
MSCI EAFE (ND) | 7.45 | -3.22 | 2.60 | 7.95 | — | |||||||||
Russell 3000® | 9.71 | 12.68 | 11.20 | 15.29 | — | |||||||||
Composite Index 2050 | 8.66 | 5.06 | 6.55 | 11.50 | — |
As stated in the Fund’s prospectus dated March 1, 2019, the expense ratio was 0.78%. The Adviser has contractually agreed to limit the Fund’s operating expenses to: (i) the amount of the acquired funds’ fees and expenses; (ii) compensation of the Independent Trustees; and (iii) certain other expenses such as extraordinary items. The expense ratio in the prospectus may differ from the actual expense ratio for the period disclosed within this report. The expense ratio shown in the prospectus is based on the prior fiscal year, adjusted to reflect changes, if any, in contractual arrangements that occurred prior to the date of the prospectus (or supplement thereto, if applicable).
Performance data shown represents past performance and is no guarantee of future results. Past performance is net of management fees and expenses and reflects reinvested dividends and distributions but does not reflect the deduction of taxes that a shareholder would pay on Fund distributions or upon the redemption of Fund shares. Past performance reflects the beneficial effect of any expense waivers or reimbursements, without which returns would have been lower. Investment returns and principal value will fluctuate so that Fund shares, when redeemed, may be worth more or less than their original cost. Returns for periods less than one year are not annualized. Current performance may be higher or lower and is available through the most recent month end atharborfunds.com or by calling 800-422-1050. See the Benchmark Descriptions at the end of this report for a description of the Composite Index.
23
Harbor Target Retirement 2050 Fund
Portfolio of Investments—April 30, 2019 (Unaudited)
Value and Cost in Thousands
EQUITY FUNDS—84.1% | |||
Shares | Value | ||
24,308 | Harbor Capital Appreciation Fund | $1,839 | |
42,848 | Harbor Strategic Growth Fund | 919 | |
134,944 | Harbor Mid Cap Growth Fund | 1,474 | |
103,598 | Harbor Small Cap Growth Fund | 1,328 | |
207,984 | Harbor Large Cap Value Fund | 3,265 | |
101,588 | Harbor Mid Cap Value Fund | 2,133 | |
48,225 | Harbor Small Cap Value Fund | 1,605 | |
72,044 | Harbor International Fund | 2,748 | |
251,331 | Harbor Diversified International All Cap Fund | 2,740 | |
176,025 | Harbor International Growth Fund | 2,764 | |
38,570 | Harbor Global Leaders Fund | 1,120 | |
TOTAL EQUITY FUNDS | |||
(Cost $20,341) | 21,935 | ||
FIXED INCOME FUNDS—15.9% | |||
| Shares | Value | |
193,402 | Harbor High-Yield Opportunities Fund | $1,864 | |
74,405 | Harbor Core Bond Fund | 760 | |
133,054 | Harbor Bond Fund | 1,521 | |
TOTAL FIXED INCOME FUNDS | |||
(Cost $4,145) | 4,145 | ||
TOTAL INVESTMENTS—100.0% | |||
(Cost $24,486) | 26,080 | ||
CASH AND OTHER ASSETS, LESS LIABILITIES—0.0% | —a | ||
TOTAL NET ASSETS—100.0% | $26,080 |
AFFILIATED TRANSACTIONS
The Underlying Funds are considered to be affiliated with the Fund. The following table shows investment transactions and earnings from investments in the affiliated Funds during the period November 1, 2018 through April 30, 2019.
Underlying Funds | Beginning Balance as of 11/01/2018 (000s) | Purchases of Affiliated Funds (000s) | Sales of Affiliated Funds (000s) | Change in Net Unrealized Gain/(Loss) from Affiliated Funds (000s) | Net Realized Gain/(Loss) | Investment Income from Affiliated Funds (000s) | ||||||||
Sale of Affiliated Funds (000s) | Distributions Received from Affiliated Funds (000s) | |||||||||||||
Harbor Capital Appreciation Fund | $1,703 | $258 | $(190) | $46 | $22 | $152 | $3 | |||||||
Harbor Strategic Growth Fund | 845 | 77 | (86) | 84 | (1) | 20 | 3 | |||||||
Harbor Mid Cap Growth Fund | 1,341 | 328 | (259) | 58 | 6 | 214 | — | |||||||
Harbor Small Cap Growth Fund | 1,173 | 392 | (169) | (35) | (33) | 233 | — | |||||||
Harbor Large Cap Value Fund | 2,973 | 286 | (283) | 168 | 121 | 47 | 15 | |||||||
Harbor Mid Cap Value Fund | 1,944 | 409 | (218) | (76) | 74 | 104 | 32 | |||||||
Harbor Small Cap Value Fund | 1,435 | 354 | (211) | (18) | 45 | 125 | 5 | |||||||
Harbor International Fund | 2,509 | 1,262 | (265) | (562) | (196) | 905 | 36 | |||||||
Harbor Diversified International All Cap Fund | 2,524 | 352 | (260) | 124 | — | 69 | 30 | |||||||
Harbor International Growth Fund | 2,529 | 135 | (260) | 344 | 16 | — | 18 | |||||||
Harbor Global Leaders Fund | 1,044 | 52 | (117) | 124 | 17 | 23 | — | |||||||
Harbor High-Yield Opportunities Fund | 1,511 | 524 | (192) | 34 | (13) | — | 48 | |||||||
Harbor Core Bond Fund | — | 758 | (12) | 13 | 1 | — | 4 | |||||||
Harbor Bond Fund | 1,860 | 387 | (773) | 75 | (28) | — | 29 | |||||||
Total | $23,391 | $5,574 | $(3,295) | $379 | $31 | $1,892 | $223 |
a | Rounds to less than $1,000 |
The accompanying notes are an integral part of the Financial Statements.
24
Harbor Target Retirement 2055 Fund
Fund Summary —April 30, 2019 (Unaudited)
Asset Allocation(% of investments)
FUND PERFORMANCE
TOTAL RETURNS For the periods ended 04/30/2019 | Unannualized | 1 Year | 5 Years | Annualized | Inception Date | |||||||||
6 Months | Life of Fund | |||||||||||||
Harbor Target Retirement 2055 Fund | ||||||||||||||
Institutional Class | 11.46% | 5.18% | N/A | 7.65% | 11/01/2014 | |||||||||
Comparative Indices | ||||||||||||||
Bloomberg Barclays U.S. Aggregate Bond | 5.49% | 5.29% | N/A | 2.34% | — | |||||||||
MSCI EAFE (ND) | 7.45 | -3.22 | N/A | 4.04 | — | |||||||||
Russell 3000® | 9.71 | 12.68 | N/A | 10.70 | — | |||||||||
Composite Index 2055 | 9.01 | 5.06 | N/A | 7.10 | — |
As stated in the Fund’s prospectus dated March 1, 2019, the expense ratio was 0.79%. The Adviser has contractually agreed to limit the Fund’s operating expenses to: (i) the amount of the acquired funds’ fees and expenses; (ii) compensation of the Independent Trustees; and (iii) certain other expenses such as extraordinary items. The expense ratio in the prospectus may differ from the actual expense ratio for the period disclosed within this report. The expense ratio shown in the prospectus is based on the prior fiscal year, adjusted to reflect changes, if any, in contractual arrangements that occurred prior to the date of the prospectus (or supplement thereto, if applicable).
Performance data shown represents past performance and is no guarantee of future results. Past performance is net of management fees and expenses and reflects reinvested dividends and distributions but does not reflect the deduction of taxes that a shareholder would pay on Fund distributions or upon the redemption of Fund shares. Past performance reflects the beneficial effect of any expense waivers or reimbursements, without which returns would have been lower. Investment returns and principal value will fluctuate so that Fund shares, when redeemed, may be worth more or less than their original cost. Returns for periods less than one year are not annualized. Current performance may be higher or lower and is available through the most recent month end atharborfunds.com or by calling 800-422-1050. See the Benchmark Descriptions at the end of this report for a description of the Composite Index.
25
Harbor Target Retirement 2055 Fund
Portfolio of Investments—April 30, 2019 (Unaudited)
Value and Cost in Thousands
EQUITY FUNDS—93.0% | |||
Shares | Value | ||
5,419 | Harbor Capital Appreciation Fund | $410 | |
9,568 | Harbor Strategic Growth Fund | 205 | |
30,034 | Harbor Mid Cap Growth Fund | 328 | |
22,824 | Harbor Small Cap Growth Fund | 293 | |
46,681 | Harbor Large Cap Value Fund | 733 | |
22,720 | Harbor Mid Cap Value Fund | 477 | |
10,692 | Harbor Small Cap Value Fund | 356 | |
16,128 | Harbor International Fund | 615 | |
56,341 | Harbor Diversified International All Cap Fund | 614 | |
39,278 | Harbor International Growth Fund | 617 | |
8,720 | Harbor Global Leaders Fund | 253 | |
TOTAL EQUITY FUNDS | |||
(Cost $4,896) | 4,901 | ||
FIXED INCOME FUNDS—7.0% | |||
| Shares | Value | |
17,134 | Harbor High-Yield Opportunities Fund | $165 | |
17,662 | Harbor Bond Fund | 202 | |
TOTAL FIXED INCOME FUNDS | |||
(Cost $366) | 367 | ||
TOTAL INVESTMENTS—100.0% | |||
(Cost $5,262) | 5,268 | ||
CASH AND OTHER ASSETS, LESS LIABILITIES—0.0% | — | ||
TOTAL NET ASSETS—100.0% | $5,268 |
AFFILIATED TRANSACTIONS
The Underlying Funds are considered to be affiliated with the Fund. The following table shows investment transactions and earnings from investments in the affiliated Funds during the period November 1, 2018 through April 30, 2019.
Underlying Funds | Beginning Balance as of 11/01/2018 (000s) | Purchases of Affiliated Funds (000s) | Sales of Affiliated Funds (000s) | Change in Net Unrealized Gain/(Loss) from Affiliated Funds (000s) | Net Realized Gain/(Loss) | Investment Income from Affiliated Funds (000s) | ||||||||
Sale of Affiliated Funds (000s) | Distributions Received from Affiliated Funds (000s) | |||||||||||||
Harbor Capital Appreciation Fund | $296 | $121 | $(25) | $16 | $2 | $28 | $1 | |||||||
Harbor Strategic Growth Fund | 147 | 52 | (11) | 17 | — | 4 | — | |||||||
Harbor Mid Cap Growth Fund | 233 | 101 | (21) | 13 | 2 | 40 | — | |||||||
Harbor Small Cap Growth Fund | 209 | 109 | (14) | (10) | (1) | 44 | — | |||||||
Harbor Large Cap Value Fund | 518 | 186 | (31) | 55 | 5 | 9 | 3 | |||||||
Harbor Mid Cap Value Fund | 338 | 161 | (23) | 1 | — | 20 | 6 | |||||||
Harbor Small Cap Value Fund | 252 | 117 | (19) | 4 | 2 | 24 | 1 | |||||||
Harbor International Fund | 439 | 359 | (44) | (114) | (25) | 169 | 7 | |||||||
Harbor Diversified International All Cap Fund | 438 | 195 | (45) | 27 | (1) | 13 | 5 | |||||||
Harbor International Growth Fund | 442 | 147 | (47) | 72 | 3 | — | 3 | |||||||
Harbor Global Leaders Fund | 182 | 56 | (14) | 26 | 3 | 4 | — | |||||||
Harbor High-Yield Opportunities Fund | 117 | 68 | (22) | 3 | (1) | — | 4 | |||||||
Harbor Bond Fund | 145 | 89 | (37) | 6 | (1) | — | 3 | |||||||
Total | $3,756 | $1,761 | $(353) | $116 | $(12) | $355 | $33 |
26
Harbor Target Retirement Funds
StatementS of Assets and Liabilities—April 30, 2019 (Unaudited)
(All amounts in thousands, except per share amounts)
Harbor Target Retirement Income Fund | Harbor Target Retirement 2015 Fund | Harbor Target Retirement 2020 Fund | Harbor Target Retirement 2025 Fund | Harbor Target Retirement 2030 Fund | Harbor Target Retirement 2035 Fund | Harbor Target Retirement 2040 Fund | Harbor Target Retirement 2045 Fund | Harbor Target Retirement 2050 Fund | Harbor Target Retirement 2055 Fund | |||||||||||
ASSETS | ||||||||||||||||||||
Investments, at identified cost | $13,392 | $4,172 | $24,927 | $19,923 | $31,176 | $18,451 | $26,908 | $14,289 | $24,486 | $5,262 | ||||||||||
Investments in affiliated funds, at value | $13,523 | $4,216 | $25,276 | $20,110 | $31,990 | $19,023 | $28,219 | $14,613 | $26,080 | $5,268 | ||||||||||
Receivables for: | ||||||||||||||||||||
Investments in affiliated funds sold | — | — | — | — | — | — | 1 | — | 29 | — | ||||||||||
Capital shares sold | — | — | — | — | — | 1 | — | — | — | — | ||||||||||
Distributions from affiliated funds | 2 | 1 | 3 | — | — | — | — | — | — | — | ||||||||||
Total Assets | 13,525 | 4,217 | 25,279 | 20,110 | 31,990 | 19,024 | 28,220 | 14,613 | 26,109 | 5,268 | ||||||||||
LIABILITIES | ||||||||||||||||||||
Payables for: | ||||||||||||||||||||
Investments in affiliated funds purchased | — | — | — | — | — | 1 | — | — | — | — | ||||||||||
Capital shares reacquired | — | — | — | — | — | — | 1 | — | 29 | — | ||||||||||
Total Liabilities | — | — | — | — | — | 1 | 1 | — | 29 | — | ||||||||||
NET ASSETS | $13,525 | $4,217 | $25,279 | $20,110 | $31,990 | $19,023 | $28,219 | $14,613 | $26,080 | $5,268 | ||||||||||
Net Assets Consist of: | ||||||||||||||||||||
Paid-in capital | $13,947 | $4,402 | $25,233 | $19,586 | $30,523 | $17,828 | $25,463 | $13,445 | $22,767 | $4,952 | ||||||||||
Total distributable earnings/(loss) | (422) | (185) | 46 | 524 | 1,467 | 1,195 | 2,756 | 1,168 | 3,313 | 316 | ||||||||||
$13,525 | $4,217 | $25,279 | $20,110 | $31,990 | $19,023 | $28,219 | $14,613 | $26,080 | $5,268 | |||||||||||
NET ASSET VALUE PER SHARE BY CLASS | ||||||||||||||||||||
Institutional Class | ||||||||||||||||||||
Net assets | $13,525 | $4,217 | $25,279 | $20,110 | $31,990 | $19,023 | $28,219 | $14,613 | $26,080 | $5,268 | ||||||||||
Shares of beneficial interest1 | 1,507 | 393 | 2,646 | 1,654 | 3,598 | 1,343 | 3,183 | 974 | 2,635 | 452 | ||||||||||
Net asset value per share2 | $8.98 | $10.72 | $9.55 | $12.16 | $8.89 | $14.17 | $8.86 | $15.01 | $9.90 | $11.65 |
1 | Par value $0.01 (unlimited authorizations) |
2 | Per share amounts can be recalculated to the amounts disclosed herein when total net assets and shares of beneficial interest are not rounded to thousands. |
The accompanying notes are an integral part of the Financial Statements.
27
Harbor Target Retirement Funds
StatementS of Operations—Six Months Ended April 30, 2019 (Unaudited)
(All amounts in thousands)
Harbor Target Retirement Income Fund | Harbor Target Retirement 2015 Fund | Harbor Target Retirement 2020 Fund | Harbor Target Retirement 2025 Fund | Harbor Target Retirement 2030 Fund | Harbor Target Retirement 2035 Fund | Harbor Target Retirement 2040 Fund | Harbor Target Retirement 2045 Fund | Harbor Target Retirement 2050 Fund | Harbor Target Retirement 2055 Fund | |
Investment Income | ||||||||||
Dividends from affiliated funds | $206 | $76 | $394 | $281 | $422 | $215 | $302 | $146 | $223 | $33 |
Total Investment Income | 206 | 76 | 394 | 281 | 422 | 215 | 302 | 146 | 223 | 33 |
Net Investment Income/(Loss) | 206 | 76 | 394 | 281 | 422 | 215 | 302 | 146 | 223 | 33 |
Realized and Change in Net Unrealized Gain/(Loss) on Investment Transactions | ||||||||||
Net realized gain/(loss) on: | ||||||||||
Sale of affiliated funds | (221) | (50) | (166) | (71) | (192) | (24) | 88 | 24 | 31 | (12) |
Distributions received from affiliated funds | 238 | 102 | 812 | 709 | 1,338 | 899 | 1,632 | 933 | 1,892 | 355 |
Change in net unrealized appreciation/(depreciation) on: | ||||||||||
Affiliated funds | 507 | 151 | 633 | 512 | 750 | 417 | 462 | 229 | 379 | 116 |
Net gain/(loss) on investment transactions | 524 | 203 | 1,279 | 1,150 | 1,896 | 1,292 | 2,182 | 1,186 | 2,302 | 459 |
Net Increase/(Decrease) in Net Assets Resulting from Operations | $730 | $279 | $1,673 | $1,431 | $2,318 | $1,507 | $2,484 | $1,332 | $2,525 | $492 |
The accompanying notes are an integral part of the Financial Statements.
28
Harbor Target Retirement Funds
Statements of Changes In Net Assets
(All amounts in thousands)
Harbor Target Retirement Income Fund | Harbor Target Retirement 2015 Fund | Harbor Target Retirement 2020 Fund | Harbor Target Retirement 2025 Fund | ||||||||
November 1, 2018 through April 30, 2019 | November 1, 2017 through October 31, 2018 | November 1, 2018 through April 30, 2019 | November 1, 2017 through October 31, 2018 | November 1, 2018 through April 30, 2019 | November 1, 2017 through October 31, 2018 | November 1, 2018 through April 30, 2019 | November 1, 2017 through October 31, 2018 | ||||
INCREASE/(DECREASE) IN NET ASSETS | (Unaudited) | (Unaudited) | (Unaudited) | (Unaudited) | |||||||
Operations: | |||||||||||
Net investment income/(loss) | $206 | $417 | $76 | $167 | $394 | $780 | $281 | $588 | |||
Net realized gain/(loss) on sale of affiliated funds | (221) | 17 | (50) | 124 | (166) | 327 | (71) | 472 | |||
Realized gain distributions received from affiliated funds | 238 | 127 | 102 | 70 | 812 | 444 | 709 | 402 | |||
Change in net unrealized appreciation/(depreciation) on affiliated funds | 507 | (687) | 151 | (398) | 633 | (1,869) | 512 | (1,699) | |||
Net increase/(decrease) in assets resulting from operations | 730 | (126) | 279 | (37) | 1,673 | (318) | 1,431 | (237) | |||
Distributions to Shareholders | |||||||||||
Institutional Class | (467) | (512) | (205) | (178) | (1,481) | (775) | (1,339) | (585) | |||
Total distributions to shareholders | (467) | (512) | (205) | (178) | (1,481) | (775) | (1,339) | (585) | |||
Net Increase/(Decrease) Derived from Capital Share Transactions | 701 | (547) | (649) | (1,281) | (467) | (1,095) | 2,367 | (2,745) | |||
Net increase/(decrease) in net assets | 964 | (1,185) | (575) | (1,496) | (275) | (2,188) | 2,459 | (3,567) | |||
Net Assets | |||||||||||
Beginning of period | 12,561 | 13,746 | 4,792 | 6,288 | 25,554 | 27,742 | 17,651 | 21,218 | |||
End of period | $13,525 | $12,561 | $4,217 | $4,792 | $25,279 | $25,554 | $20,110 | $17,651 |
The accompanying notes are an integral part of the Financial Statements.
29
Harbor Target Retirement 2030 Fund | Harbor Target Retirement 2035 Fund | Harbor Target Retirement 2040 Fund | Harbor Target Retirement 2045 Fund | Harbor Target Retirement 2050 Fund | Harbor Target Retirement 2055 Fund | |||||||||||
November 1, 2018 through April 30, 2019 | November 1, 2017 through October 31, 2018 | November 1, 2018 through April 30, 2019 | November 1, 2017 through October 31, 2018 | November 1, 2018 through April 30, 2019 | November 1, 2017 through October 31, 2018 | November 1, 2018 through April 30, 2019 | November 1, 2017 through October 31, 2018 | November 1, 2018 through April 30, 2019 | November 1, 2017 through October 31, 2018 | November 1, 2018 through April 30, 2019 | November 1, 2017 through October 31, 2018 | |||||
(Unaudited) | (Unaudited) | (Unaudited) | (Unaudited) | (Unaudited) | (Unaudited) | |||||||||||
$422 | $770 | $215 | $356 | $302 | $494 | $146 | $181 | $223 | $294 | $33 | $31 | |||||
(192) | 525 | (24) | 276 | 88 | 779 | 24 | 313 | 31 | 752 | (12) | 161 | |||||
1,338 | 647 | 899 | 418 | 1,632 | 803 | 933 | 368 | 1,892 | 946 | 355 | 124 | |||||
750 | (2,378) | 417 | (1,357) | 462 | (2,502) | 229 | (1,180) | 379 | (2,530) | 116 | (459) | |||||
2,318 | (436) | 1,507 | (307) | 2,484 | (426) | 1,332 | (318) | 2,525 | (538) | 492 | (143) | |||||
(1,950) | (844) | (956) | (350) | (2,080) | (780) | (895) | (311) | (1,977) | (913) | (311) | (76) | |||||
(1,950) | (844) | (956) | (350) | (2,080) | (780) | (895) | (311) | (1,977) | (913) | (311) | (76) | |||||
3,649 | 635 | 3,348 | 776 | 3,765 | 316 | 1,766 | 3,176 | 2,141 | 2,021 | 1,331 | 1,247 | |||||
4,017 | (645) | 3,899 | 119 | 4,169 | (890) | 2,203 | 2,547 | 2,689 | 570 | 1,512 | 1,028 | |||||
27,973 | 28,618 | 15,124 | 15,005 | 24,050 | 24,940 | 12,410 | 9,863 | 23,391 | 22,821 | 3,756 | 2,728 | |||||
$31,990 | $27,973 | $19,023 | $15,124 | $28,219 | $24,050 | $14,613 | $12,410 | $26,080 | $23,391 | $5,268 | $3,756 |
30
Harbor Target Retirement Funds
Statements of Changes in Net Assets—Capital Stock Activity
(All amounts in thousands)
Harbor Target Retirement Income Fund | Harbor Target Retirement 2015 Fund | Harbor Target Retirement 2020 Fund | Harbor Target Retirement 2025 Fund | ||||||||
November 1, 2018 through April 30, 2019 | November 1, 2017 through October 31, 2018 | November 1, 2018 through April 30, 2019 | November 1, 2017 through October 31, 2018 | November 1, 2018 through April 30, 2019 | November 1, 2017 through October 31, 2018 | November 1, 2018 through April 30, 2019 | November 1, 2017 through October 31, 2018 | ||||
(Unaudited) | (Unaudited) | (Unaudited) | (Unaudited) | ||||||||
AMOUNT ($) | |||||||||||
Institutional Class | |||||||||||
Net proceeds from sale of shares | $1,960 | $1,484 | $444 | $512 | $1,626 | $3,554 | $2,580 | $3,363 | |||
Reinvested distributions | 467 | 512 | 205 | 178 | 1,481 | 775 | 1,339 | 585 | |||
Cost of shares reacquired | (1,726) | (2,543) | (1,298) | (1,971) | (3,574) | (5,424) | (1,552) | (6,693) | |||
Net increase/(decrease) in net assets | $701 | $(547) | $(649) | $(1,281) | $(467) | $(1,095) | $2,367 | $(2,745) | |||
SHARES | |||||||||||
Institutional Class | |||||||||||
Shares sold | 223 | 164 | 43 | 47 | 175 | 361 | 218 | 265 | |||
Shares issued due to reinvestment of distributions | 55 | 56 | 20 | 17 | 168 | 80 | 122 | 47 | |||
Shares reacquired | (198) | (279) | (123) | (182) | (386) | (554) | (132) | (529) | |||
Net increase/(decrease) in shares outstanding | $80 | $(59) | $(60) | $(118) | $(43) | $(113) | $208 | $(217) |
The accompanying notes are an integral part of the Financial Statements.
31
Harbor Target Retirement 2030 Fund | Harbor Target Retirement 2035 Fund | Harbor Target Retirement 2040 Fund | Harbor Target Retirement 2045 Fund | Harbor Target Retirement 2050 Fund | Harbor Target Retirement 2055 Fund | |||||||||||
November 1, 2018 through April 30, 2019 | November 1, 2017 through October 31, 2018 | November 1, 2018 through April 30, 2019 | November 1, 2017 through October 31, 2018 | November 1, 2018 through April 30, 2019 | November 1, 2017 through October 31, 2018 | November 1, 2018 through April 30, 2019 | November 1, 2017 through October 31, 2018 | November 1, 2018 through April 30, 2019 | November 1, 2017 through October 31, 2018 | November 1, 2018 through April 30, 2019 | November 1, 2017 through October 31, 2018 | |||||
(Unaudited) | (Unaudited) | (Unaudited) | (Unaudited) | (Unaudited) | (Unaudited) | |||||||||||
$4,902 | $4,732 | $3,667 | $3,194 | $3,319 | $4,380 | $2,530 | $4,685 | $1,934 | $4,395 | $1,379 | $2,096 | |||||
1,950 | 844 | 956 | 350 | 2,080 | 780 | 895 | 311 | 1,977 | 913 | 311 | 75 | |||||
(3,203) | (4,941) | (1,275) | (2,768) | (1,634) | (4,844) | (1,659) | (1,820) | (1,770) | (3,287) | (359) | (924) | |||||
$3,649 | $635 | $3,348 | $776 | $3,765 | $316 | $1,766 | $3,176 | $2,141 | $2,021 | $1,331 | $1,247 | |||||
570 | 515 | 270 | 220 | 390 | 468 | 176 | 301 | 204 | 418 | 125 | 171 | |||||
245 | 93 | 76 | 24 | 268 | 85 | 69 | 21 | 232 | 89 | 31 | 6 | |||||
(383) | (535) | (94) | (192) | (192) | (517) | (116) | (116) | (186) | (313) | (34) | (75) | |||||
$432 | $73 | $252 | $52 | $466 | $36 | $129 | $206 | $250 | $194 | $122 | $102 |
32
Harbor Target Retirement Funds Financial Highlights
Selected Data for a Share Outstanding for the Periods Presented
HARBOR TARGET RETIREMENT INCOME FUND
Institutional Class | ||||||
6-Month Period Ended April 30, 2019 | Year Ended October 31, | |||||
2018 | 2017 | 2016 | 2015 | 2014 | ||
(Unaudited) | ||||||
Net asset value beginning of period | $8.80 | $9.25 | $8.93 | $9.19 | $9.75 | $9.83 |
Income from Investment Operations | ||||||
Net investment income/(loss) | 0.14a | 0.28a | 0.22a | 0.25a | 0.34a | 0.22 |
Net realized and unrealized gains/(losses) on investments | 0.36 | (0.38) | 0.40 | 0.08 | (0.30) | 0.19 |
Total from investment operations | 0.50 | (0.10) | 0.62 | 0.33 | 0.04 | 0.41 |
Less Distributions | ||||||
Dividends from net investment income | (0.16) | (0.29) | (0.27) | (0.29) | (0.35) | (0.28) |
Distributions from net realized capital gains | (0.16) | (0.06) | (0.03) | (0.30) | (0.25) | (0.21) |
Total distributions | (0.32) | (0.35) | (0.30) | (0.59) | (0.60) | (0.49) |
Net asset value end of period | 8.98 | 8.80 | 9.25 | 8.93 | 9.19 | 9.75 |
Net assets end of period (000s) | $13,525 | $12,561 | $13,746 | $13,805 | $15,124 | $17,410 |
Ratios and Supplemental Data (%) | ||||||
Total return | 6.00%d | (1.14)% | 7.17% | 3.91% | 0.46% | 4.32% |
Ratio of total expenses to average net assetsb | — | — | — | — | — | — |
Ratio of net investment income to average net assetsb | 3.26e | 3.13 | 2.46 | 2.87 | 3.57 | 2.14 |
Portfolio turnoverc | 43d | 28 | 16 | 26 | 24 | 20 |
HARBOR TARGET RETIREMENT 2015 FUND
Institutional Class | ||||||
6-Month Period Ended April 30, 2019 | Year Ended October 31, | |||||
2018 | 2017 | 2016 | 2015 | 2014 | ||
(Unaudited) | ||||||
Net asset value beginning of period | $10.58 | $11.02 | $10.45 | $10.77 | $11.68 | $11.87 |
Income from Investment Operations | ||||||
Net investment income/(loss) | 0.17a | 0.33a | 0.26a | 0.29a | 0.36a | 0.24 |
Net realized and unrealized gains/(losses) on investments | 0.43 | (0.45) | 0.60 | 0.05 | (0.35) | 0.29 |
Total from investment operations | 0.60 | (0.12) | 0.86 | 0.34 | 0.01 | 0.53 |
Less Distributions | ||||||
Dividends from net investment income | (0.33) | (0.32) | (0.29) | (0.36) | (0.39) | (0.31) |
Distributions from net realized capital gains | (0.13) | — | — | (0.30) | (0.53) | (0.41) |
Total distributions | (0.46) | (0.32) | (0.29) | (0.66) | (0.92) | (0.72) |
Net asset value end of period | 10.72 | 10.58 | 11.02 | 10.45 | 10.77 | 11.68 |
Net assets end of period (000s) | $4,217 | $4,792 | $6,288 | $6,574 | $7,778 | $11,200 |
Ratios and Supplemental Data (%) | ||||||
Total return | 5.93%d | (1.10)% | 8.43% | 3.59% | 0.13% | 4.73% |
Ratio of total expenses to average net assetsb | — | — | — | — | — | — |
Ratio of net investment income to average net assetsb | 3.21e | 3.07 | 2.43 | 2.82 | 3.26 | 2.08 |
Portfolio turnoverc | 23d | 29 | 22 | 32 | 26 | 38 |
See page 37 for notes to the Financial Highlights.
The accompanying notes are an integral part of the Financial Statements.
33
HARBOR TARGET RETIREMENT 2020 FUND
Institutional Class | ||||||
6-Month Period Ended April 30, 2019 | Year Ended October 31, | |||||
2018 | 2017 | 2016 | 2015 | 2014 | ||
(Unaudited) | ||||||
Net asset value beginning of period | $9.50 | $9.90 | $9.29 | $9.94 | $10.63 | $10.78 |
Income from Investment Operations | ||||||
Net investment income/(loss) | 0.14a | 0.28a | 0.23a | 0.26a | 0.32a | 0.23 |
Net realized and unrealized gains/(losses) on investments | 0.47 | (0.40) | 0.73 | 0.04 | (0.30) | 0.29 |
Total from investment operations | 0.61 | (0.12) | 0.96 | 0.30 | 0.02 | 0.52 |
Less Distributions | ||||||
Dividends from net investment income | (0.28) | (0.28) | (0.24) | (0.32) | (0.34) | (0.30) |
Distributions from net realized capital gains | (0.28) | — | (0.11) | (0.63) | (0.37) | (0.37) |
Total distributions | (0.56) | (0.28) | (0.35) | (0.95) | (0.71) | (0.67) |
Net asset value end of period | 9.55 | 9.50 | 9.90 | 9.29 | 9.94 | 10.63 |
Net assets end of period (000s) | $25,279 | $25,554 | $27,742 | $25,419 | $27,290 | $31,124 |
Ratios and Supplemental Data (%) | ||||||
Total return | 6.90%d | (1.29)% | 10.77% | 3.56% | 0.30% | 5.06% |
Ratio of total expenses to average net assetsb | — | — | — | — | — | — |
Ratio of net investment income to average net assetsb | 3.15e | 2.89 | 2.44 | 2.83 | 3.19 | 2.18 |
Portfolio turnoverc | 21d | 31 | 29 | 33 | 28 | 19 |
HARBOR TARGET RETIREMENT 2025 FUND
Institutional Class | ||||||
6-Month Period Ended April 30, 2019 | Year Ended October 31, | |||||
2018 | 2017 | 2016 | 2015 | 2014 | ||
(Unaudited) | ||||||
Net asset value beginning of period | $12.21 | $12.76 | $11.78 | $12.32 | $13.48 | $13.44 |
Income from Investment Operations | ||||||
Net investment income/(loss) | 0.18a | 0.37a | 0.29a | 0.31a | 0.37a | 0.29 |
Net realized and unrealized gains/(losses) on investments | 0.70 | (0.57) | 1.12 | 0.05 | (0.36) | 0.40 |
Total from investment operations | 0.88 | (0.20) | 1.41 | 0.36 | 0.01 | 0.69 |
Less Distributions | ||||||
Dividends from net investment income | (0.38) | (0.35) | (0.28) | (0.37) | (0.41) | (0.36) |
Distributions from net realized capital gains | (0.55) | — | (0.15) | (0.53) | (0.76) | (0.29) |
Total distributions | (0.93) | (0.35) | (0.43) | (0.90) | (1.17) | (0.65) |
Net asset value end of period | 12.16 | 12.21 | 12.76 | 11.78 | 12.32 | 13.48 |
Net assets end of period (000s) | $20,110 | $17,651 | $21,218 | $14,293 | $11,487 | $10,612 |
Ratios and Supplemental Data (%) | ||||||
Total return | 8.01%d | (1.63)% | 12.38% | 3.39% | 0.11% | 5.37% |
Ratio of total expenses to average net assetsb | — | — | — | — | — | — |
Ratio of net investment income to average net assetsb | 3.10e | 2.92 | 2.42 | 2.69 | 2.91 | 2.06 |
Portfolio turnoverc | 33d | 36 | 24 | 25 | 25 | 33 |
The accompanying notes are an integral part of the Financial Statements.
34
Harbor Target Retirement Funds Financial Highlights—Continued
Selected Data for a Share Outstanding for the Periods Presented
HARBOR TARGET RETIREMENT 2030 FUND
Institutional Class | ||||||
6-Month Period Ended April 30, 2019 | Year Ended October 31, | |||||
2018 | 2017 | 2016 | 2015 | 2014 | ||
(Unaudited) | ||||||
Net asset value beginning of period | $8.84 | $9.25 | $8.60 | $9.19 | $10.04 | $10.22 |
Income from Investment Operations | ||||||
Net investment income/(loss) | 0.13a | 0.24a | 0.20a | 0.21a | 0.24a | 0.21 |
Net realized and unrealized gains/(losses) on investments | 0.53 | (0.38) | 0.96 | 0.01 | (0.23) | 0.35 |
Total from investment operations | 0.66 | (0.14) | 1.16 | 0.22 | 0.01 | 0.56 |
Less Distributions | ||||||
Dividends from net investment income | (0.25) | (0.25) | (0.21) | (0.26) | (0.28) | (0.27) |
Distributions from net realized capital gains | (0.36) | (0.02) | (0.30) | (0.55) | (0.58) | (0.47) |
Total distributions | (0.61) | (0.27) | (0.51) | (0.81) | (0.86) | (0.74) |
Net asset value end of period | 8.89 | 8.84 | 9.25 | 8.60 | 9.19 | 10.04 |
Net assets end of period (000s) | $31,990 | $27,973 | $28,618 | $24,634 | $25,084 | $24,727 |
Ratios and Supplemental Data (%) | ||||||
Total return | 8.31%d | (1.57)% | 14.18% | 2.96% | 0.13% | 5.79% |
Ratio of total expenses to average net assetsb | — | — | — | — | — | — |
Ratio of net investment income to average net assetsb | 2.99e | 2.62 | 2.30 | 2.54 | 2.55 | 1.99 |
Portfolio turnoverc | 26d | 31 | 29 | 31 | 24 | 22 |
HARBOR TARGET RETIREMENT 2035 FUND
Institutional Class | ||||||
6-Month Period Ended April 30, 2019 | Year Ended October 31, | |||||
2018 | 2017 | 2016 | 2015 | 2014 | ||
(Unaudited) | ||||||
Net asset value beginning of period | $13.86 | $14.44 | $12.93 | $13.56 | $14.92 | $14.52 |
Income from Investment Operations | ||||||
Net investment income/(loss) | 0.18a | 0.33a | 0.28a | 0.27a | 0.3a | 0.29 |
Net realized and unrealized gains/(losses) on investments | 0.99 | (0.58) | 1.75 | 0.04 | (0.26) | 0.58 |
Total from investment operations | 1.17 | (0.25) | 2.03 | 0.31 | 0.04 | 0.87 |
Less Distributions | ||||||
Dividends from net investment income | (0.35) | (0.33) | (0.28) | (0.35) | (0.36) | (0.33) |
Distributions from net realized capital gains | (0.51) | — | (0.24) | (0.59) | (1.04) | (0.14) |
Total distributions | (0.86) | (0.33) | (0.52) | (0.94) | (1.40) | (0.47) |
Net asset value end of period | 14.17 | 13.86 | 14.44 | 12.93 | 13.56 | 14.92 |
Net assets end of period (000s) | $19,023 | $15,124 | $15,005 | $11,496 | $9,007 | $7,708 |
Ratios and Supplemental Data (%) | ||||||
Total return | 9.21%d | (1.79)% | 16.31% | 2.70% | 0.34% | 6.19% |
Ratio of total expenses to average net assetsb | — | — | — | — | — | — |
Ratio of net investment income to average net assetsb | 2.65e | 2.26 | 2.06 | 2.17 | 2.17 | 1.64 |
Portfolio turnoverc | 21d | 29 | 26 | 26 | 22 | 39 |
See page 37 for notes to the Financial Highlights.
The accompanying notes are an integral part of the Financial Statements.
35
HARBOR TARGET RETIREMENT 2040 FUND
Institutional Class | ||||||
6-Month Period Ended April 30, 2019 | Year Ended October 31, | |||||
2018 | 2017 | 2016 | 2015 | 2014 | ||
(Unaudited) | ||||||
Net asset value beginning of period | $8.85 | $9.30 | $8.42 | $9.05 | $9.84 | $10.01 |
Income from Investment Operations | ||||||
Net investment income/(loss) | 0.10a | 0.18a | 0.15a | 0.17a | 0.18a | 0.17 |
Net realized and unrealized gains/(losses) on investments | 0.66 | (0.34) | 1.30 | (0.01) | (0.10) | 0.46 |
Total from investment operations | 0.76 | (0.16) | 1.45 | 0.16 | 0.08 | 0.63 |
Less Distributions | ||||||
Dividends from net investment income | (0.20) | (0.19) | (0.17) | (0.20) | (0.22) | (0.23) |
Distributions from net realized capital gains | (0.55) | (0.10) | (0.40) | (0.59) | (0.65) | (0.57) |
Total distributions | (0.75) | (0.29) | (0.57) | (0.79) | (0.87) | (0.80) |
Net asset value end of period | 8.86 | 8.85 | 9.30 | 8.42 | 9.05 | 9.84 |
Net assets end of period (000s) | $28,219 | $24,050 | $24,940 | $19,448 | $19,805 | $18,933 |
Ratios and Supplemental Data (%) | ||||||
Total return | 9.83%d | (1.84)% | 18.26% | 2.36% | 0.94% | 6.77% |
Ratio of total expenses to average net assetsb | — | — | — | — | — | — |
Ratio of net investment income to average net assetsb | 2.39e | 1.90 | 1.78 | 2.03 | 1.96 | 1.59 |
Portfolio turnoverc | 17d | 30 | 21 | 30 | 18 | 22 |
HARBOR TARGET RETIREMENT 2045 FUND
Institutional Class | ||||||
6-Month Period Ended April 30, 2019 | Year Ended October 31, | |||||
2018 | 2017 | 2016 | 2015 | 2014 | ||
(Unaudited) | ||||||
Net asset value beginning of period | $14.69 | $15.43 | $13.51 | $14.25 | $15.17 | $14.85 |
Income from Investment Operations | ||||||
Net investment income/(loss) | 0.16a | 0.23a | 0.21a | 0.21a | 0.23a | 0.23 |
Net realized and unrealized gains/(losses) on investments | 1.19 | (0.49) | 2.42 | 0.01 | (0.06) | 0.80 |
Total from investment operations | 1.35 | (0.26) | 2.63 | 0.22 | 0.17 | 1.03 |
Less Distributions | ||||||
Dividends from net investment income | (0.29) | (0.28) | (0.22) | (0.27) | (0.29) | (0.31) |
Distributions from net realized capital gains | (0.74) | (0.20) | (0.49) | (0.69) | (0.80) | (0.40) |
Total distributions | (1.03) | (0.48) | (0.71) | (0.96) | (1.09) | (0.71) |
Net asset value end of period | 15.01 | 14.69 | 15.43 | 13.51 | 14.25 | 15.17 |
Net assets end of period (000s) | $14,613 | $12,410 | $9,863 | $7,211 | $5,523 | $4,239 |
Ratios and Supplemental Data (%) | ||||||
Total return | 10.18%d | (1.83)% | 20.37% | 1.91% | 1.23% | 7.17% |
Ratio of total expenses to average net assetsb | — | — | — | — | — | — |
Ratio of net investment income to average net assetsb | 2.22e | 1.49 | 1.50 | 1.58 | 1.56 | 1.37 |
Portfolio turnoverc | 19d | 22 | 32 | 24 | 15 | 21 |
The accompanying notes are an integral part of the Financial Statements.
36
Harbor Target Retirement Funds Financial Highlights—Continued
Selected Data for a Share Outstanding for the Periods Presented
HARBOR TARGET RETIREMENT 2050 FUND
Institutional Class | ||||||
6-Month Period Ended April 30, 2019 | Year Ended October 31, | |||||
2018 | 2017 | 2016 | 2015 | 2014 | ||
(Unaudited) | ||||||
Net asset value beginning of period | $9.81 | $10.42 | $9.23 | $10.39 | $11.40 | $11.46 |
Income from Investment Operations | ||||||
Net investment income/(loss) | 0.09a | 0.13a | 0.12a | 0.12a | 0.14a | 0.15 |
Net realized and unrealized gains/(losses) on investments | 0.84 | (0.33) | 1.81 | (0.03) | 0.05 | 0.67 |
Total from investment operations | 0.93 | (0.20) | 1.93 | 0.09 | 0.19 | 0.82 |
Less Distributions | ||||||
Dividends from net investment income | (0.17) | (0.16) | (0.13) | (0.17) | (0.19) | (0.23) |
Distributions from net realized capital gains | (0.67) | (0.25) | (0.61) | (1.08) | (1.01) | (0.65) |
Total distributions | (0.84) | (0.41) | (0.74) | (1.25) | (1.20) | (0.88) |
Net asset value end of period | 9.90 | 9.81 | 10.42 | 9.23 | 10.39 | 11.40 |
Net assets end of period (000s) | $26,080 | $23,391 | $22,821 | $18,728 | $19,221 | $20,434 |
Ratios and Supplemental Data (%) | ||||||
Total return | 10.90%d | (2.06)% | 22.40% | 1.51% | 1.83% | 7.61% |
Ratio of total expenses to average net assetsb | — | — | — | — | — | — |
Ratio of net investment income to average net assetsb | 1.89e | 1.20 | 1.27 | 1.34 | 1.35 | 1.17 |
Portfolio turnoverc | 14d | 22 | 33 | 24 | 24 | 23 |
HARBOR TARGET RETIREMENT 2055 FUND
Institutional Class | |||||
6-Month Period Ended April 30, 2019 | Year Ended October 31, | ||||
2018 | 2017 | 2016 | 2015f | ||
(Unaudited) | |||||
Net asset value beginning of period | $11.39 | $11.97 | $10.02 | $10.08 | $10.00 |
Income from Investment Operations | |||||
Net investment income/(loss) | 0.09a | 0.11a | 0.10a | 0.11a | 0.05a |
Net realized and unrealized gains/(losses) on investments | 1.06 | (0.37) | 2.17 | 0.01 | 0.18 |
Total from investment operations | 1.15 | (0.26) | 2.27 | 0.12 | 0.23 |
Less Distributions | |||||
Dividends from net investment income | (0.16) | (0.16) | (0.12) | (0.14) | (0.15) |
Distributions from net realized capital gains | (0.73) | (0.16) | (0.20) | (0.04) | — |
Total distributions | (0.89) | (0.32) | (0.32) | (0.18) | (0.15) |
Net asset value end of period | 11.65 | 11.39 | 11.97 | 10.02 | 10.08 |
Net assets end of period (000s) | $5,268 | $3,756 | $2,728 | $1,240 | $762 |
Ratios and Supplemental Data (%) | |||||
Total return | 11.46%d | (2.31)% | 23.34% | 1.38% | 2.28% |
Ratio of total expenses to average net assetsb | — | — | — | — | — |
Ratio of net investment income to average net assetsb | 1.57e | 0.91 | 0.95 | 1.13 | 0.52 |
Portfolio turnoverc | 8d | 29 | 32 | 33 | 15 |
a | Amounts are based on average daily shares outstanding during the period. |
b | Ratios of income and expenses to average net assets represents the expenses paid by the Fund but does not include the acquired fund fees and expenses from underlying funds. |
c | Amounts do not include the activity of the underlying funds. |
d | Unannualized |
e | Annualized |
f | Fund Inception was November 1, 2014. |
The accompanying notes are an integral part of the Financial Statements.
37
Harbor Target Retirement Funds
Notes to Financial Statements—April 30, 2019 (Unaudited)
Note 1—Organizational Matters
Harbor Funds (the “Trust”) is registered under the Investment Company Act of 1940, as amended (the “Investment Company Act”), as an open-end management investment company. As of April 30, 2019, the Trust consists of 33 separate portfolios. The portfolios covered by this report are: Harbor Target Retirement Income Fund, Harbor Target Retirement 2015 Fund, Harbor Target Retirement 2020 Fund, Harbor Target Retirement 2025 Fund, Harbor Target Retirement 2030 Fund, Harbor Target Retirement 2035 Fund, Harbor Target Retirement 2040 Fund, Harbor Target Retirement 2045 Fund, Harbor Target Retirement 2050 Fund and Harbor Target Retirement 2055 Fund (individually referred to as a “Fund” and collectively referred to as the “Funds” or “Target Retirement Funds”). The Funds invest in a combination of other funds of the Trust (the “Underlying Funds”). Harbor Capital Advisors, Inc. (the “Adviser” or “Harbor Capital”) is the investment adviser for the Funds and the Underlying Funds. The Underlying Funds are managed by subadvisers, none of which is affiliated with the Adviser.
The Funds currently offer one class of shares, designated as Institutional Class.
Note 2—Significant Accounting Policies
The following is a summary of significant accounting policies followed by the Trust in the preparation of its financial statements. Each Fund follows the investment company reporting requirements under U.S. Generally Accepted Accounting Principles (“U.S. GAAP”), which includes the accounting and reporting guidelines under Accounting Standards Codification (“ASC”) Topic 946,Financial Services-Investment Companies. The preparation of financial statements in accordance with U.S. GAAP requires management to make estimates and assumptions that affect the reported amounts and disclosures in the financial statements. Actual results may differ from those estimates.
Security Valuation
The holdings of each Target Retirement Fund consist entirely of Institutional Class shares of the Underlying Funds, which are valued at their respective net asset values each business day.
Fair Value Measurements and Disclosures
Various inputs may be used to determine the value of each Fund’s investments, which are summarized in three broad categories defined as Level 1, Level 2, and Level 3. The inputs or methodologies used for valuing securities are not necessarily indicative of the risk associated with investing in those securities. The assignment of an investment to Levels 1, 2, or 3 is based on the lowest level of significant inputs used to determine its fair value.
Level 1– | Quoted prices in active markets for identical securities. |
Level 2– | Other significant observable inputs (including quoted prices for similar securities, interest rates, prepayment speeds, credit risk, etc.). |
Level 3– | Significant unobservable inputs are used in situations where quoted prices or other observable inputs are not available or are deemed unreliable. Significant unobservable inputs may include each Fund’s own assumptions. |
Each Fund used observable inputs in its valuation methodologies whenever they were available and deemed reliable. At April 30, 2019, all investments held by each Fund (as disclosed in the Portfolio of Investments) were classified as Level 1. There were no Level 3 investments at April 30, 2019 or October 31, 2018.
Description of the Underlying Funds
In pursuing its investment objectives and strategies, each of the Underlying Funds is permitted to engage in a wide range of investment practices. Further information about the Underlying Funds is contained in the Target Retirement Funds’ prospectus and statement of additional information, as well as the prospectus of each of the Underlying Funds. The accounting policies of each of the Underlying Funds are disclosed in each Underlying Fund’s respective shareholder report. Because each Fund invests in the Underlying Funds, shareholders of each Fund will be affected by the investment practices of the Underlying Funds in direct proportion to the amount of assets each Fund allocates to the Underlying Funds.
38
Harbor Target Retirement Funds
Notes to Financial Statements—Continued
Note 2—Significant Accounting Policies—Continued
Investment Transactions and Income
Securities transactions are accounted for on the trade date (the date the order to buy or sell is executed). Income and capital gain distributions received from the Underlying Funds are recorded on the ex-dividend date. Gains and losses on securities sold are determined on the basis of identified cost.
Distribution to Shareholders
Distributions on Fund shares are recorded on the ex-dividend date.
Expenses
Expenses incurred by the Trust are charged directly to the Fund that incurred such expense whenever possible. With respect to expenses incurred by any two or more Harbor Funds where amounts cannot be identified on a fund by fund basis, such expenses are generally allocated in proportion to the average net assets or the number of shareholders of each Fund.
Taxes
Each Fund is treated as a separate entity for federal tax purposes. Each Fund’s policy is to meet the requirements of Subchapter M of the Internal Revenue Code applicable to regulated investment companies and to distribute to its shareholders all of its taxable income within the prescribed time. It is also the intention of each Fund to distribute an amount sufficient to avoid imposition of any excise tax under Section 4982 of the Internal Revenue Code. Therefore, no provision has been made for federal taxes on income, capital gains or unrealized appreciation of securities held or excise taxes on income and capital gains.
Management has analyzed each Fund’s tax positions for all open tax years (in particular, U.S. federal income tax returns for the tax years ended October 31, 2015–2017), including all positions expected to be taken upon filing the 2018 tax return, in all material jurisdictions where the Funds operate, and has concluded that no provision for income tax is required in any Fund’s financial statements. The Funds will recognize interest and penalties, if any, related to unrecognized tax benefits as income tax expense in the Statements of Operations.
Related Parties
The Funds do not invest in the Underlying Funds for the purpose of exercising management or control; however, investments by the Funds may represent a significant portion of an Underlying Fund’s net assets. At April 30, 2019, each Fund held less than 25% of the outstanding shares of any Underlying Fund. In aggregate, the Funds held 29% of Harbor Core Bond Fund.
Note 3—FEES AND OTHER Transactions with Affiliates
Investment Adviser
Harbor Capital is a wholly-owned subsidiary of ORIX Corporation (“ORIX”). Harbor Capital is the Funds’ investment adviser and is also responsible for administrative and other services. The Funds do not pay any fees for the services of Harbor Capital.
Each Fund has a separate advisory agreement with Harbor Capital. Pursuant to this agreement, Harbor Capital pays all expenses of each Fund, excluding: (i) the amount of acquired funds’ fees and expenses; (ii) compensation of the Independent Trustees; and (iii) certain other expenses such as extraordinary items.
Distributor
Harbor Funds Distributors, Inc. (the “Distributor”), a wholly-owned subsidiary of Harbor Capital, is the distributor for Harbor Funds’ shares. The Funds do not pay any fees for the services of the Distributor.
Transfer Agent
Harbor Services Group, Inc. (“Harbor Services Group”), a wholly-owned subsidiary of Harbor Capital, is the transfer and shareholder servicing agent for the Funds. The Funds do not pay any fees for the services of Harbor Services Group.
39
Harbor Target Retirement Funds
Notes to Financial Statements—Continued
Note 3—FEES AND OTHER Transactions with Affiliates—Continued
Shareholders
On April 30, 2019, Harbor Capital, and its wholly owned subsidiaries, collectively held the following shares of beneficial interest in each of the following Funds:
Number of Shares Owned by Harbor Capital and Subsidiaries | Percentage of Outstanding Shares | ||
Institutional Class | |||
Harbor Target Retirement 2025 Fund | 2,758 | 0.2% | |
Harbor Target Retirement 2030 Fund | 145,452 | 4.0 | |
Harbor Target Retirement 2035 Fund | 24,877 | 1.9 | |
Harbor Target Retirement 2040 Fund | 2,047 | 0.1 | |
Harbor Target Retirement 2045 Fund | 9,740 | 1.0 | |
Harbor Target Retirement 2050 Fund | 13,059 | 0.5 | |
Harbor Target Retirement 2055 Fund | 7,124 | 1.6 |
Independent Trustees
The Independent Trustees’ received no remuneration from the Target Retirement Funds for the six-month period ended April 30, 2019.
Indemnification
Under the Trust’s organizational documents, its officers and Trustees are indemnified against certain liabilities arising out of the performance of their duties to the Trust. In addition, in the normal course of business the Trust enters into contracts that provide general indemnities to other parties. The Trust’s maximum exposure under these arrangements is unknown as this would involve future claims that may be made against the Trust that have not yet occurred. The risk of material loss as a result of such indemnification claims is considered remote.
NOTE 4—TAX INFORMATION
The identified cost for federal income tax purposes of investments owned by each Fund and its respective gross unrealized appreciation and depreciation at April 30, 2019 are as follows:
Identified Cost (000s) | Gross Unrealized | Net Unrealized Appreciation/ (Depreciation) (000s) | |||||
Appreciation (000s) | (Depreciation) (000s) | ||||||
Harbor Target Retirement Income Fund | $13,392 | $267 | $(136) | $131 | |||
Harbor Target Retirement 2015 Fund | 4,172 | 75 | (31) | 44 | |||
Harbor Target Retirement 2020 Fund | 24,927 | 710 | (361) | 349 | |||
Harbor Target Retirement 2025 Fund | 19,923 | 622 | (435) | 187 | |||
Harbor Target Retirement 2030 Fund | 31,176 | 1,431 | (617) | 814 | |||
Harbor Target Retirement 2035 Fund | 18,451 | 991 | (419) | 572 | |||
Harbor Target Retirement 2040 Fund | 26,908 | 2,123 | (812) | 1,311 | |||
Harbor Target Retirement 2045 Fund | 14,289 | 736 | (412) | 324 | |||
Harbor Target Retirement 2050 Fund | 24,486 | 2,401 | (807) | 1,594 | |||
Harbor Target Retirement 2055 Fund | 5,262 | 204 | (198) | 6 |
Note 5—Subsequent Events
Through the date the financial statements were issued, there were no subsequent events or transactions that would have materially impacted the financial statements or related disclosures as presented herein.
40
Harbor Target Retirement Funds
Fees and Expenses Example (Unaudited)
Example
As a shareholder of a Fund, you incur two types of costs: (1) transaction costs, including redemption fees (if any) and (2) ongoing costs, including management fees, distribution and service (12b-1) fees (if any), and other Fund expenses. This example is intended to help you understand your ongoing costs (in dollars) of investing in a Fund and to compare these costs with the ongoing costs of investing in other mutual funds. The expense ratios reflected below do not include the acquired fund fees and expenses from Underlying Funds.
The example is based on an investment of $1,000 invested at the beginning of the period and held for the entire period November 1, 2018 through April 30, 2019.
Actual Expenses
The first line of the table below provides information about actual account values and actual expenses for each share class. You may use the information in the respective class line, together with the amount you invested, to estimate the expenses that you paid over the period. Simply divide your account value by $1,000 (for example, an $8,600 account value divided by $1,000 = 8.6), then multiply the result by the number in the first line of the respective class under the heading entitled “Expenses Paid During Period” to estimate the expenses you paid on your account during this period.
Hypothetical Example for Comparison Purposes
The second line of the table for each share class below provides information about hypothetical account values and hypothetical expenses based on the respective Fund/Class’s actual expense ratio and an assumed rate of return of 5% per year before expenses, which is not the respective Fund/Class’s actual return. The hypothetical account values and expenses may not be used to estimate the actual ending account balance or expenses you paid for the period. You may use this information to compare the ongoing costs of investing in a Fund to other funds. To do so, compare this 5% hypothetical example with the 5% hypothetical examples that appear in the shareholder reports of the other funds.
Please note that the expenses shown in the table are meant to highlight your ongoing costs only and do not reflect any transactional costs, such as redemption fees. Therefore, the second line of the table is useful in comparing ongoing costs only, and will not help you determine the relative total costs of owning different funds. In addition, if these transactional costs were included, your costs would have been higher.
Annualized Expense Ratios | Expenses Paid During Period* | Beginning Account Value November 1, 2018 | Ending Account Value April 30, 2019 | |||||
Harbor Target Retirement Income Fund | ||||||||
Institutional Class | 0.00% | |||||||
Actual | $0.00 | $1,000 | $1,060.00 | |||||
Hypothetical (5% return) | 0.00 | 1,000 | 1,024.79 | |||||
Harbor Target Retirement 2015 Fund | ||||||||
Institutional Class | 0.00% | |||||||
Actual | $0.00 | $1,000 | $1,059.30 | |||||
Hypothetical (5% return) | 0.00 | 1,000 | 1,024.79 | |||||
Harbor Target Retirement 2020 Fund | ||||||||
Institutional Class | 0.00% | |||||||
Actual | $0.00 | $1,000 | $1,069.00 | |||||
Hypothetical (5% return) | 0.00 | 1,000 | 1,024.79 | |||||
Harbor Target Retirement 2025 Fund | ||||||||
Institutional Class | 0.00% | |||||||
Actual | $0.00 | $1,000 | $1,080.10 | |||||
Hypothetical (5% return) | 0.00 | 1,000 | 1,024.79 | |||||
Harbor Target Retirement 2030 Fund | ||||||||
Institutional Class | 0.00% | |||||||
Actual | $0.00 | $1,000 | $1,083.10 | |||||
Hypothetical (5% return) | 0.00 | 1,000 | 1,024.79 |
41
Harbor Target Retirement Funds
Fees and Expenses Example—Continued
Annualized Expense Ratios | Expenses Paid During Period* | Beginning Account Value November 1, 2018 | Ending Account Value April 30, 2019 | |||||
Harbor Target Retirement 2035 Fund | ||||||||
Institutional Class | 0.00% | |||||||
Actual | $0.00 | $1,000 | $1,092.10 | |||||
Hypothetical (5% return) | 0.00 | 1,000 | 1,024.79 | |||||
Harbor Target Retirement 2040 Fund | ||||||||
Institutional Class | 0.00% | |||||||
Actual | $0.00 | $1,000 | $1,098.30 | |||||
Hypothetical (5% return) | 0.00 | 1,000 | 1,024.79 | |||||
Harbor Target Retirement 2045 Fund | ||||||||
Institutional Class | 0.00% | |||||||
Actual | $0.00 | $1,000 | $1,101.80 | |||||
Hypothetical (5% return) | 0.00 | 1,000 | 1,024.79 | |||||
Harbor Target Retirement 2050 Fund | ||||||||
Institutional Class | 0.00% | |||||||
Actual | $0.00 | $1,000 | $1,109.00 | |||||
Hypothetical (5% return) | 0.00 | 1,000 | 1,024.79 | |||||
Harbor Target Retirement 2055 Fund | ||||||||
Institutional Class | 0.00% | |||||||
Actual | $0.00 | $1,000 | $1,114.60 | |||||
Hypothetical (5% return) | 0.00 | 1,000 | 1,024.79 |
* | Expenses are equal to the Fund’s annualized expense ratio, multiplied by the average account value over the period, multiplied by 181/365 (to reflect the one-half year period). |
42
Harbor Target Retirement Funds
Additional Information (Unaudited)
Proxy Voting
Harbor Funds has adopted Proxy Voting Policies and Procedures under which proxies relating to securities held by the Harbor funds are voted. In addition, Harbor Funds files Form N-PX, with its complete proxy voting record for the 12 months ended June 30th, no later than August 31st of each year. A description of Harbor Funds’ Proxy Voting Policies and Procedures and the proxy voting records (Form N-PX) are available (i) without charge, upon request, by calling Harbor Funds toll-free at 800-422-1050; (ii) on Harbor Funds’ website atharborfunds.com; and (iii) on the SEC’s website at sec.gov.
Householding
Harbor Funds has adopted a policy that allows it to send only one copy of a Fund’s prospectus, proxy materials, annual report and semi-annual report to certain shareholders residing at the same household. This reduces Fund expenses, which benefits you and other shareholders. If you need additional copies or do not want your mailings to be “householded,” please call the Shareholder Servicing Agent at 800-422-1050. Individual copies will be sent within thirty (30) days after the Shareholder Servicing Agent receives your instructions. Your consent to householding is considered valid until revoked.
Quarterly Portfolio Disclosures
Harbor Funds files a complete portfolio of investments with the SEC for the first and third quarters of each fiscal year. In 2019, the Funds filed a complete portfolio of investments for the first fiscal quarter on Form N-Q. Beginning with the third fiscal quarter of 2019, the Funds will file a complete portfolio of investments with the SEC on Form N-PORT. The Funds’ Forms N-Q and N-PORT are available (i) without charge, upon request, by calling Harbor Funds toll-free at 800-422-1050, (ii) on Harbor Funds’ website atharborfunds.com, and (iii) on the SEC’s website at sec.gov.
ADVISORY AGREEMENT APPROVALS
FACTORS CONSIDERED BY THE TRUSTEES IN APPROVING THE INVESTMENT ADVISORY AGREEMENTS OF THE TARGET RETIREMENT FUNDS
The Investment Company Act requires that the Investment Advisory Agreement of each Fund be approved initially, and following an initial two-year term, at least annually, by the Trust’s Board of Trustees (the “Board” or the “Trustees”), including a majority of the Independent Trustees voting separately.
At an in-person meeting of the Board held on February 15-16, 2019 (the “Meeting”), the Board, including all of the Independent Trustees voting separately, considered and approved the continuation of an Investment Advisory Agreement with Harbor Capital, the adviser to each Fund (the “Adviser” or “Harbor Capital”), with respect to Harbor Target Retirement Income Fund, Harbor Target Retirement 2015 Fund, Harbor Target Retirement 2020 Fund, Harbor Target Retirement 2025 Fund, Harbor Target Retirement 2030 Fund, Harbor Target Retirement 2035 Fund, Harbor Target Retirement 2040 Fund, Harbor Target Retirement 2045 Fund, Harbor Target Retirement 2050 Fund, and Harbor Target Retirement 2055 Fund (each, a “Target Retirement Fund” and collectively, the “Target Retirement Funds”), each a series of the Harbor Funds.
In evaluating the Target Retirement Funds’ Investment Advisory Agreement, the Trustees reviewed materials furnished by the Adviser, including information about its affiliates, personnel, and operations, and also relied upon their knowledge of the Adviser resulting from their quarterly meetings, periodic telephonic meetings and other prior communications. In connection with the Meeting, which had been called for the purpose of considering the continuation of the Investment Advisory Agreement, and at prior meetings, the Trustees, including the Independent Trustees, requested and received materials and presentations relating to Fund performance and the services rendered by the Adviser.
At the Meeting, the Trustees, including the Independent Trustees voting separately, determined, in the exercise of their business judgment, that the terms of the Investment Advisory Agreement were fair and reasonable and approved the continuation for a one-year period of the Investment Advisory Agreement as being in the best interests of each Target Retirement Fund and its shareholders.
In their deliberations, the Independent Trustees had the opportunity to meet privately without representatives of the Adviser present and were represented throughout the process by legal counsel to the Independent Trustees and the Funds.
43
Harbor Target Retirement Funds
Additional Information—Continued
ADVISORY AGREEMENT APPROVALS—Continued
In considering the approval of the Target Retirement Funds’ Investment Advisory Agreement, the Board, including the Independent Trustees, evaluated a number of factors it considered relevant to its determination. The Board did not identify any single factor as all-important or controlling, and individual Trustees did not necessarily attribute the same weight or importance to each factor.
Among the factors considered by the Trustees in approving the Investment Advisory Agreement were the following:
• | the nature, extent, and quality of the services provided by the Adviser, including the background, education, expertise and experience of the investment professionals of the Adviser providing services to the Target Retirement Funds; |
• | the favorable history, reputation, qualifications and background of the Adviser, as well as the qualifications of its personnel; |
• | the profitability of the Adviser with respect to each Target Retirement Fund; |
• | while no fees were proposed to be charged by the Adviser for investment advisory services, the Adviser would benefit from assets invested in the Target Retirement Funds in the form of increased advisory fees from the underlying Harbor Funds attributable to assets invested in such Funds by the Target Retirement Funds; |
• | the fees and expense ratios of each Target Retirement Fund relative to the quality of services provided and the fees and expense ratios of similar investment companies; |
• | the short- and long-term investment performance of each Target Retirement Fund in comparison to peer funds and the impact of the Target Retirement Funds’ glidepaths on relative performance; |
• | any “fall out” benefits that might inure to the Adviser and its affiliates as a result of their relationship with the Target Retirement Funds; |
• | information received at regular meetings throughout the year related to Target Retirement Funds’ performance and services rendered by the Adviser; and |
• | information contained in materials provided by the Adviser and compiled by Broadridge, as to the investment returns, advisory fees and total expense ratios of the Institutional Class of each Target Retirement Fund relative to those of other investment companies with similar objectives and strategies managed by other investment advisers, consisting both of a peer group of funds as well as a broader universe of funds compiled by Broadridge. |
Nature, Extent, and Quality of Services
The Board evaluated the nature, extent, and quality of the Adviser’s services in light of the Board’s experience with the Adviser, as well as materials provided by the Adviser as part of its comprehensive written response to the 15(c) request letter prepared by legal counsel to the Independent Trustees in consultation with the Independent Trustees concerning the financial and other resources devoted by the Adviser to Harbor Funds, including the breadth and depth of experience and expertise of the investment, accounting, administrative, legal and compliance professionals dedicated to Harbor Funds’ operations. The Trustees determined that the Adviser has the expertise and resources to manage and operate effectively each Target Retirement Fund.
Investment Performance, Advisory Fees, and Expense Ratios
In considering each Target Retirement Fund’s performance, advisory fees and expense ratio, the Trustees requested and received from the Adviser data compiled by Broadridge. The Trustees also received information explaining the methodology for compilation of certain of this information and what it was intended to demonstrate. In evaluating performance, the Trustees recognized that the performance data reflects a snapshot of a period as of a particular date and that selecting a different performance period could produce significantly different results.
Harbor Target Retirement Funds. In consideration of the Investment Advisory Agreement for each Target Retirement Fund (inception date of January 2, 2009 for each Target Retirement Fund except the Target Retirement 2055 Fund which had an inception date of November 1, 2014), the Trustees noted that Broadridge had selected 14 peer complexes’ target date funds as peers for the Harbor Target Retirement Funds that Broadridge believes are the most comparable to the Target Retirement Funds. These 14 peer complexes are: American Century One Choice Portfolios, Fidelity Advisor Freedom Funds, Franklin LifeSmart Retirement Target Funds, Invesco Balanced-Risk Retirement Funds, JPMorgan SmartRetirement Funds, KP Retirement Path Funds, MassMutual RetireSMART Funds, MFS Lifetime Funds, PIMCO RealPath Funds, Principal Lifetime Portfolios, Putnam RetirementReady Portfolios, T. Rowe Price Retirement Funds, TIAA-CREF Lifecycle Portfolios and USAA Target Retirement Funds. The Trustees further noted that the performance analysis conducted by Broadridge included these 14 selected peers, as applicable, as the performance group and all target date funds as the performance universe.
44
Harbor Target Retirement Funds
Additional Information—Continued
ADVISORY AGREEMENT APPROVALS—Continued
The Trustees considered the expertise of Harbor Capital in managing assets generally and in the target retirement asset class specifically, noting that Harbor Capital had maintained risk-based asset allocation options for retirement plans sponsored by Owens-Illinois, Inc. and other clients for more than 15 years prior to the 2009 launch of these funds. The Trustees noted that the Target Retirement Funds totaled $161.95 million in assets, out of a firm-wide total of approximately $44.45 billion in assets under management as of December 31, 2018.
The Trustees considered the fact that the Target Retirement Funds had been in operation for a shorter period than many of their peers. They also noted that the glidepaths for the Target Retirement Funds are generally more conservative compared to the peer funds in that the equity exposure for the Target Retirement Funds declines more steeply than it does in other target date fund families. The Trustees noted that Harbor Capital had recently made changes to the target allocations for Harbor Target Retirement 2025-2040 Funds to increase the Funds’ equity exposure, although the Funds continue to be relatively conservative in their positioning. The Trustees considered how periods of strong equity market performance would negatively impact the performance of the Target Retirement Funds relative to their more aggressively positioned peer funds. The Trustees also considered the fact that Harbor Capital charged no management fee to the Funds and that Harbor Capital pays the expenses of each Target Retirement Fund with limited exceptions. The Trustees noted that Harbor Capital’s profitability in managing the Target Retirement Funds was negative.
Harbor Target Retirement Income Fund. The Trustees noted the Fund’s outperformance relative to its universe medians for the one-, three- and five-year periods ended December 31, 2018, according to Broadridge. The actual total expense ratio of the Fund’s Institutional Class (including acquired fund fees and expenses) was below the peer group median and above the peer universe median.
Harbor Target Retirement 2015 Fund. The Trustees noted the Fund’s outperformance for the one-year period and underperformance for the three- and five-year periods ended December 31, 2018 relative to its universe medians, according to Broadridge. The actual total expense ratio of the Fund’s Institutional Class (including acquired fund fees and expenses) was equal to the peer group median and above the peer universe median.
Harbor Target Retirement 2020 Fund. The Trustees noted the Fund’s outperformance for the one-year period and underperformance for the three- and five-year periods ended December 31, 2018 relative to its universe medians, according to Broadridge. The actual total expense ratio of the Fund’s Institutional Class (including acquired fund fees and expenses) was equal to the peer group median and above the peer universe median.
Harbor Target Retirement 2025 Fund. The Trustees noted the Fund’s underperformance relative to its universe medians for each of the one-, three- and five-year periods ended December 31, 2018, according to Broadridge. The actual total expense ratio of the Fund’s Institutional Class (including acquired fund fees and expenses) was above the peer group and peer universe medians.
Harbor Target Retirement 2030 Fund. The Trustees noted the Fund’s outperformance relative to its universe median for the one-year period and underperformance relative to its universe medians for the three- and five-year periods ended December 31, 2018, according to Broadridge. The actual total expense ratio of the Fund’s Institutional Class (including acquired fund fees and expenses) was above the peer group and peer universe medians.
Harbor Target Retirement 2035 Fund. The Trustees noted the Fund’s outperformance relative to its universe median for the one-year period and underperformance relative to its universe medians for the three- and five-year periods ended December 31, 2018, according to Broadridge. The actual total expense ratio of the Fund’s Institutional Class (including acquired fund fees and expenses) was above the peer group and peer universe medians.
Harbor Target Retirement 2040 Fund. The Trustees noted the Fund’s underperformance relative to its universe medians for the one-, three- and five-year periods ended December 31, 2018, according to Broadridge. The actual total expense ratio of the Fund’s Institutional Class (including acquired fund fees and expenses) was above the peer group and peer universe medians.
Harbor Target Retirement 2045 Fund. The Trustees noted the Fund’s underperformance relative to its universe medians for the one-, three- and five-year periods ended December 31, 2018, according to Broadridge. The actual total expense ratio of the Fund’s Institutional Class (including acquired fund fees and expenses) was above the peer group and peer universe medians.
Harbor Target Retirement 2050 Fund. The Trustees noted the Fund’s underperformance relative to its universe medians for the one-, three- and five-year periods ended December 31, 2018, according to Broadridge. The actual total expense ratio of the Fund’s Institutional Class (including acquired fund fees and expenses) was above the peer group and peer universe medians.
Harbor Target Retirement 2055 Fund. The Trustees noted the Fund’s underperformance relative to its universe medians for the one-, three- and five-year periods ended December 31, 2018, according to Broadridge. The actual total expense ratio of the Fund’s Institutional Class (including acquired fund fees and expenses) was above the peer group and peer universe medians.
45
Harbor Target Retirement Funds
Additional Information—Continued
ADVISORY AGREEMENT APPROVALS—Continued
Adviser Fees and Profitability
The Trustees noted that the Adviser receives no fee from any of the Target Retirement Funds for the Adviser’s services in allocating the Target Retirement Funds’ assets among shares of the other Harbor Funds. They also noted that the Adviser benefits indirectly from assets invested in the Target Retirement Funds in the form of increased advisory and other fees from the underlying Harbor Funds attributable to assets invested in such funds by the Target Retirement Funds and that the Board considers the issue of the Adviser’s profitability in operating these underlying funds at least annually as part of its annual investment advisory contract review process with respect to all of the Harbor Funds. The Board also noted that the Adviser pays the expenses of each Target Retirement Fund with limited exceptions and that the Adviser was incurring a loss in operating the Target Retirement Funds.
Economies of Scale
As the Adviser does not receive a fee from any of the Target Retirement Funds for the Adviser’s services, the Trustees determined that it was unnecessary to consider economies of scale in this context. However, given that the Adviser benefits from assets invested in the Target Retirement Funds in the form of increased advisory fees from the underlying Harbor Funds, the Board noted that it considers the issue of breakpoints in the Harbor Funds’ fee schedules at least annually as part of its annual investment contract review process for all of the underlying Harbor Funds.
46
Benchmark Descriptions
Composite Index Income—The Composite Index Income is derived by applying the Harbor Target Retirement Fund’s (the “Income Fund”) target asset allocation to the results of the underlying funds’ benchmarks: Russell 1000® Growth Index, Russell Midcap® Growth Index, Russell 2000® Growth Index, Russell 1000® Value Index, Russell Midcap® Value Index, Russell 2000® Value Index, MSCI EAFE (ND) Index, MSCI All Country World Ex. U.S. (ND) Index (with respect to Harbor International Growth Fund weightings, prior to May 28, 2013, the MSCI EAFE Growth (ND) Index), MSCI All Country World (ND) Index, ICE BofAML U.S. High Yield Index (H0A0), ICE BofAML U.S. Non-Distressed High Yield Index (with respect to the Harbor High-Yield Bond Fund; prior to March 31, 2015, the ICE BofAML U.S. High Yield Index (H0A0) was this fund’s benchmark and a component of the Composite Index), Bloomberg Barclays U.S. Aggregate Bond Index, Bloomberg Barclays U.S. TIPS Index, ICE BofAML U.S. 3-Month Treasury Bill Index. The weights of the Composite Index Income match the Income Fund’s historical target asset allocation and are adjusted as changes are made to this asset allocation. Refer to the Target Retirement Funds Prospectus for the Income Fund’s target asset allocation. This unmanaged index does not reflect fees and expenses and is not available for direct investment.
Composite Index 2015—The Composite Index 2015 is derived by applying the Harbor Target Retirement 2015 Fund’s (the “2015 Fund”) target asset allocation to the results of the underlying funds’ benchmarks: Russell 1000® Growth Index, Russell Midcap® Growth Index, Russell 2000® Growth Index, Russell 1000® Value Index, Russell Midcap® Value Index, Russell 2000® Value Index, MSCI EAFE (ND) Index, MSCI All Country World Ex. U.S. (ND) Index (with respect to Harbor International Growth Fund weightings, prior to May 28, 2013, the MSCI EAFE Growth (ND) Index), MSCI All Country World (ND) Index, ICE BofAML U.S. High Yield Index (H0A0), ICE BofAML U.S. Non-Distressed High Yield Index (with respect to the Harbor High-Yield Bond Fund; prior to March 31, 2015, the ICE BofAML U.S. High Yield Index (H0A0) was this fund’s benchmark and a component of the Composite Index), Bloomberg Barclays U.S. Aggregate Bond Index, Bloomberg Barclays U.S. TIPS Index, ICE BofAML U.S. 3-Month Treasury Bill Index. The weights of the Composite Index 2015 match the 2015 Fund’s historical target asset allocation and are adjusted as changes are made to this asset allocation. Refer to the Target Retirement Funds Prospectus for the 2015 Fund’s target asset allocation. This unmanaged index does not reflect fees and expenses and is not available for direct investment.
Composite Index 2020—The Composite Index 2020 is derived by applying the Harbor Target Retirement 2020 Fund’s (the “2020 Fund”) target asset allocation to the results of the underlying funds’ benchmarks: Russell 1000® Growth Index, Russell Midcap® Growth Index, Russell 2000® Growth Index, Russell 1000® Value Index, Russell Midcap® Value Index, Russell 2000® Value Index, MSCI EAFE (ND) Index, MSCI All Country World Ex. U.S. (ND) Index (with respect to Harbor International Growth Fund weightings, prior to May 28, 2013, the MSCI EAFE Growth (ND) Index), MSCI All Country World (ND) Index, ICE BofAML U.S. High Yield Index (H0A0), ICE BofAML U.S. Non-Distressed High Yield Index (with respect to the Harbor High-Yield Bond Fund; prior to March 31, 2015, the ICE BofAML U.S. High Yield Index (H0A0) was this fund’s benchmark and a component of the Composite Index), Bloomberg Barclays U.S. Aggregate Bond Index, Bloomberg Barclays U.S. TIPS Index, ICE BofAML U.S. 3-Month Treasury Bill Index. The weights of the Composite Index 2020 match the 2020 Fund’s historical target asset allocation and are adjusted as changes are made to this asset allocation. Refer to the Target Retirement Funds Prospectus for the 2020 Fund’s target asset allocation. This unmanaged index does not reflect fees and expenses and is not available for direct investment.
Composite Index 2025—The Composite Index 2025 is derived by applying the Harbor Target Retirement 2025 Fund’s (the “2025 Fund”) target asset allocation to the results of the underlying funds’ benchmarks: Russell 1000® Growth Index, Russell Midcap® Growth Index, Russell 2000® Growth Index, Russell 1000® Value Index, Russell Midcap® Value Index, Russell 2000® Value Index, MSCI EAFE (ND) Index, MSCI All Country World Ex. U.S. (ND) Index (with respect to Harbor International Growth Fund weightings, prior to May 28, 2013, the MSCI EAFE Growth (ND) Index), MSCI All Country World (ND) Index, ICE BofAML U.S. High Yield Index (H0A0), ICE BofAML U.S. Non-Distressed High Yield Index (with respect to the Harbor High-Yield Bond Fund; prior to March 31, 2015, the ICE BofAML U.S. High Yield Index (H0A0) was this fund’s benchmark and a component of the Composite Index), Bloomberg Barclays U.S. Aggregate Bond Index, Bloomberg Barclays U.S. TIPS Index. The weights of the Composite Index 2025 match the 2025 Fund’s historical target asset allocation and are adjusted as changes are made to this asset allocation. Refer to the Target Retirement Funds Prospectus for the 2025 Fund’s target asset allocation. This unmanaged index does not reflect fees and expenses and is not available for direct investment.
Composite Index 2030—The Composite Index 2030 is derived by applying the Harbor Target Retirement 2030 Fund’s (the “2030 Fund”) target asset allocation to the results of the underlying funds’ benchmarks: Russell 1000® Growth Index, Russell Midcap® Growth Index, Russell 2000® Growth Index, Russell 1000® Value Index, Russell Midcap® Value Index, Russell 2000® Value Index, MSCI EAFE (ND) Index, MSCI All Country World Ex. U.S. (ND) Index (with respect to Harbor International Growth Fund weightings, prior to May 28, 2013, the MSCI EAFE Growth (ND) Index), MSCI All Country World (ND) Index, ICE BofAML U.S. High Yield Index (H0A0), ICE BofAML U.S. Non-Distressed High Yield Index (with respect to the Harbor High-Yield Bond Fund; prior to March 31, 2015, the ICE BofAML U.S. High Yield Index (H0A0) was this fund’s benchmark and a component of the Composite Index), Bloomberg Barclays U.S. Aggregate Bond Index, Bloomberg Barclays U.S. TIPS
47
Benchmark Descriptions—Continued
Index. The weights of the Composite Index 2030 match the 2030 Fund’s historical target asset allocation and are adjusted as changes are made to this asset allocation. Refer to the Target Retirement Funds Prospectus for the 2030 Fund’s target asset allocation. This unmanaged index does not reflect fees and expenses and is not available for direct investment.
Composite Index 2035—The Composite Index 2035 is derived by applying the Harbor Target Retirement 2035 Fund’s (the “2035 Fund”) target asset allocation to the results of the underlying funds’ benchmarks: Russell 1000® Growth Index, Russell Midcap® Growth Index, Russell 2000® Growth Index, Russell 1000® Value Index, Russell Midcap® Value Index, Russell 2000® Value Index, MSCI EAFE (ND) Index, MSCI All Country World Ex. U.S. (ND) Index (with respect to Harbor International Growth Fund weightings, prior to May 28, 2013, the MSCI EAFE Growth (ND) Index), MSCI All Country World (ND) Index, ICE BofAML U.S. High Yield Index (H0A0), ICE BofAML U.S. Non-Distressed High Yield Index (with respect to the Harbor High-Yield Bond Fund; prior to March 31, 2015, the ICE BofAML U.S. High Yield Index (H0A0) was this fund’s benchmark and a component of the Composite Index), Bloomberg Barclays U.S. Aggregate Bond Index, Bloomberg Barclays U.S. TIPS Index. The weights of the Composite Index 2035 match the 2035 Fund’s historical target asset allocation and are adjusted as changes are made to this asset allocation. Refer to the Target Retirement Funds Prospectus for the 2035 Fund’s target asset allocation. This unmanaged index does not reflect fees and expenses and is not available for direct investment.
Composite Index 2040—The Composite Index 2040 is derived by applying the Harbor Target Retirement 2040 Fund’s (the “2040 Fund”) target asset allocation to the results of the underlying funds’ benchmarks: Russell 1000® Growth Index, Russell Midcap® Growth Index, Russell 2000® Growth Index, Russell 1000® Value Index, Russell Midcap® Value Index, Russell 2000® Value Index, MSCI EAFE (ND) Index, MSCI All Country World Ex. U.S. (ND) Index (with respect to Harbor International Growth Fund weightings, prior to May 28, 2013, the MSCI EAFE Growth (ND) Index), MSCI All Country World (ND) Index, ICE BofAML U.S. High Yield Index (H0A0), ICE BofAML U.S. Non-Distressed High Yield Index (with respect to the Harbor High-Yield Bond Fund; prior to March 31, 2015, the ICE BofAML U.S. High Yield Index (H0A0) was this fund’s benchmark and a component of the Composite Index), Bloomberg Barclays U.S. Aggregate Bond Index. The weights of the Composite Index 2040 match the 2040 Fund’s historical target asset allocation and are adjusted as changes are made to this asset allocation. Refer to the Target Retirement Funds Prospectus for the 2040 Fund’s target asset allocation. This unmanaged index does not reflect fees and expenses and is not available for direct investment.
Composite Index 2045—The Composite Index 2045 is derived by applying the Harbor Target Retirement 2045 Fund’s (the “2045 Fund”) target asset allocation to the results of the underlying funds’ benchmarks: Russell 1000® Growth Index, Russell Midcap® Growth Index, Russell 2000® Growth Index, Russell 1000® Value Index, Russell Midcap® Value Index, Russell 2000® Value Index, MSCI EAFE (ND) Index, MSCI All Country World Ex. U.S. (ND) Index (with respect to Harbor International Growth Fund weightings, prior to May 28, 2013, the MSCI EAFE Growth (ND) Index), MSCI All Country World (ND) Index, ICE BofAML U.S. High Yield Index (H0A0), ICE BofAML U.S. Non-Distressed High Yield Index (with respect to the Harbor High-Yield Bond Fund; prior to March 31, 2015, the ICE BofAML U.S. High Yield Index (H0A0) was this fund’s benchmark and a component of the Composite Index), Bloomberg Barclays U.S. Aggregate Bond Index. The weights of the Composite Index 2045 match the 2045 Fund’s historical target asset allocation and are adjusted as changes are made to this asset allocation. Refer to the Target Retirement Funds Prospectus for the 2045 Fund’s target asset allocation. This unmanaged index does not reflect fees and expenses and is not available for direct investment.
Composite Index 2050—The Composite Index 2050 is derived by applying the Harbor Target Retirement 2050 Fund’s (the “2050 Fund”) target asset allocation to the results of the underlying funds’ benchmarks: Russell 1000® Growth Index, Russell Midcap® Growth Index, Russell 2000® Growth Index, Russell 1000® Value Index, Russell Midcap® Value Index, Russell 2000® Value Index, MSCI EAFE (ND) Index, MSCI All Country World Ex. U.S. (ND) Index (with respect to Harbor International Growth Fund weightings, prior to May 28, 2013, the MSCI EAFE Growth (ND) Index), MSCI All Country World (ND) Index, ICE BofAML U.S. High Yield Index (H0A0), Bloomberg Barclays U.S. Aggregate Bond Index. The weights of the Composite Index 2050 match the 2050 Fund’s historical target asset allocation and are adjusted as changes are made to this asset allocation. Refer to the Target Retirement Funds Prospectus for the 2050 Fund’s target asset allocation. This unmanaged index does not reflect fees and expenses and is not available for direct investment.
Composite Index 2055—The Composite Index 2055 is derived by applying the Harbor Target Retirement 2055 Fund’s (the “2055 Fund”) target asset allocation to the results of the underlying funds’ benchmarks: Russell 1000® Growth Index, Russell Midcap® Growth Index, Russell 2000® Growth Index, Russell 1000® Value Index, Russell Midcap® Value Index, Russell 2000® Value Index, MSCI EAFE (ND) Index, MSCI All Country World Ex. U.S. (ND) Index (with respect to Harbor International Growth Fund weightings, prior to May 28, 2013, the MSCI EAFE Growth (ND) Index), MSCI All Country World (ND) Index, ICE BofAML U.S. High Yield Index (H0A0), Bloomberg Barclays U.S. Aggregate Bond Index. The weights of the Composite Index 2055 match the 2055 Fund’s historical target asset allocation and are adjusted as changes are made to this asset allocation. Refer to the Target Retirement Funds Prospectus for the 2055 Fund’s target asset allocation. This unmanaged index does not reflect fees and expenses and is not available for direct investment.
48
Benchmark Descriptions—Continued
Bloomberg Barclays U.S. Aggregate Bond Index—The Bloomberg Barclays U.S. Aggregate Bond Index is an unmanaged index of investment-grade fixed-rate debt issues with maturities of at least one year. This unmanaged index does not reflect fees and expenses and is not available for direct investment.
Bloomberg Barclays U.S. TIPS Index—The Bloomberg Barclays U.S. TIPS Index is an unmanaged market index comprised of all U.S. Treasury Inflation Protected Securities rated investment grade (Baa3 or better), have at least one year to final maturity, and at least $250 million par amount outstanding. This unmanaged index does not reflect fees and expenses and is not available for direct investment.
ICE BofAML U.S. Convertible Ex Mandatory Index—The ICE BofAML U.S. Convertible Ex Mandatory Index is broadly representative of the U.S. convertible securities market, consisting of publicly traded issues, denominated in U.S. dollars, of all credit qualities, and excluding mandatory (equity-linked) convertibles. This unmanaged index does not reflect fees and expenses and is not available for direct investment.
ICE BofAML U.S. 3-Month Treasury Bill Index—The ICE BofAML U.S. 3-Month Treasury Bill Index is comprised of a single U.S. Treasury Bill issue purchased at the beginning of each month and held for a full month, at which time that issue is sold and rolled into a newly selected issue. The issue selected each month is that having a maturity date closest to, but not beyond 90 days from the rebalance date.
ICE BofAML U.S. High Yield Index (H0A0)—The ICE BofAML U.S. High Yield Index (H0A0) is an unmanaged index that tracks the performance of below investment grade U.S. dollar-denominated corporate bonds publicly issued in the U.S. domestic market. All bonds are U.S. dollar denominated and rated Split BBB and below. This unmanaged index does not reflect fees and expenses and is not available for direct investment.
ICE BofAML U.S. Non-Distressed High Yield Index—The ICE BofAML U.S. Non-Distressed High Yield Index is a subset of the ICE BofAML U.S. High Yield Index (H0A0) including all securities with an option-adjusted spread less than 1,000 basis points. The unmanaged index does not reflect fees and expenses and is not available for direct investment.
MSCI All Country World (ND) Index—The MSCI All Country World (ND) Index is a free float-adjusted market capitalization weighted index that is designed to measure the equity market performance of global developed and emerging markets. This unmanaged index does not reflect fees and expenses and is not available for direct investment.
MSCI All Country World Ex. U.S. (ND) Index—The MSCI All Country World Ex. U.S. (ND) Index is a free float-adjusted market capitalization weighted index that is designed to measure equity market performance in the global developed and emerging markets, excluding the United States. This unmanaged index does not reflect fees and expenses and is not available for direct investment.
MSCI EAFE (ND) Index—The MSCI EAFE (ND) Index is an unmanaged index generally representative of major developed markets, excluding the U.S. and Canada. This unmanaged index does not reflect fees and expenses and is not available for direct investment.
MSCI EAFE Small Cap (ND) Index—The MSCI EAFE Small Cap (ND) Index is an equity index which captures small cap representation across developed market countries around the world, excluding the U.S. and Canada. This unmanaged index does not reflect fees and expenses and is not available for direct investment.
MSCI Emerging Markets (ND) Index—The MSCI Emerging Markets (ND) Index is a market capitalization weighted index of equity securities in more than 20 emerging market economies. This unmanaged index does not reflect fees and expenses and is not available for direct investment.
MSCI World (ND) Index—The MSCI World (ND) Index is a free float-adjusted market capitalization index that is designed to measure global developed market equity performance. This unmanaged index does not reflect fees and expenses and is not available for direct investment.
Russell 1000® Growth Index—The Russell 1000® Growth Index is an unmanaged index generally representative of the U.S. market for larger capitalization growth stocks. This unmanaged index does not reflect fees and expenses and is not available for direct investment. The Russell 1000® Growth Index and Russell® are trademarks of Frank Russell Company.
Russell 1000® Value Index—The Russell 1000® Value Index is an unmanaged index generally representative of the U.S. market for larger capitalization value stocks. This unmanaged index does not reflect fees and expenses and is not available for direct investment. The Russell 1000® Value Index and Russell® are trademarks of Frank Russell Company.
Russell 2000® Index—The Russell 2000® Index measures the performance of the small-cap segment of the U.S. equity universe. The Russell 2000® Index is a subset of the Russell 3000® Index representing approximately 10% of the total market capitalization of that index. It includes approximately 2,000 of the smallest securities based on a combination of their market cap and current
49
Benchmark Descriptions—Continued
index membership. The Russell 2000® Index is constructed to provide a comprehensive and unbiased small-cap barometer and is completely reconstituted annually to ensure larger stocks do not distort the performance and characteristics of the true small-cap opportunity set. This unmanaged index does not reflect fees and expenses and is not available for direct investment. The Russell 3000® Index and Russell® are trademarks of Frank Russell Company.
Russell 2000® Growth Index—The Russell 2000® Growth Index is an unmanaged index representing the smallest 2,000 stocks with the highest price-to-book ratio and future earnings. This unmanaged index does not reflect fees and expenses and is not available for direct investment. The Russell 2000® Growth Index and Russell® are trademarks of Frank Russell Company.
Russell 2000® Value Index—The Russell 2000® Value Index is an unmanaged index representing the smallest 2,000 stocks with the lowest price-to-book ratio and future earnings. This unmanaged index does not reflect fees and expenses and is not available for direct investment. The Russell 2000® Value Index and Russell® are trademarks of Frank Russell Company.
Russell 3000® Index—The Russell 3000® Index measures the performance of the largest 3,000 U.S. companies representing approximately 98% of the investable U.S. equity market. The Russell 3000® Index is constructed to provide a comprehensive, unbiased and stable barometer of the broad market and is completely reconstituted annually to ensure new and growing equities are reflected. This unmanaged index does not reflect fees and expenses and is not available for direct investment. The Russell 3000® Index and Russell® are trademarks of Frank Russell Company.
Russell 3000® Growth Index—The Russell 3000® Growth Index measures the performance of the broad growth segment of the U.S. equity universe. It includes those Russell 3000® companies with higher price-to-book ratios and higher forecasted growth values. The Russell 3000® Growth Index is constructed to provide a comprehensive, unbiased, and stable barometer of the broad growth market. The index is completely reconstituted annually to ensure new and growing equities are included and that the represented companies continue to reflect growth characteristics. This unmanaged index does not reflect fees and expenses and is not available for direct investment. The Russell 3000® Growth Index and Russell® are trademarks of Frank Russell Company.
Russell 3000® Value Index—The Russell 3000® Value Index measures the performance of the broad value segment of U.S. equity value universe. It includes those Russell 3000® companies with lower price-to-book ratios and lower forecasted growth values. The Russell 3000® Value Index is constructed to provide a comprehensive, unbiased, and stable barometer of the broad value market. The index is completely reconstituted annually to ensure new and growing equities are included and that the represented companies continue to reflect value characteristics. This unmanaged index does not reflect fees and expenses and is not available for direct investment. The Russell 3000® Value Index and Russell® are trademarks of Frank Russell Company.
Russell Midcap® Index—The Russell Midcap® Index is an unmanaged index generally representative of the U.S. market for medium capitalization stocks. This unmanaged index does not reflect fees and expenses and is not available for direct investment. The Russell Midcap® Index and Russell® are trademarks of Frank Russell Company.
Russell Midcap® Growth Index—The Russell Midcap® Growth Index is an unmanaged index generally representative of the U.S. market for medium capitalization growth stocks. This unmanaged index does not reflect fees and expenses and is not available for direct investment. The Russell Midcap® Growth Index and Russell® are trademarks of Frank Russell Company.
Russell Midcap® Value Index—The Russell Midcap® Value Index is an unmanaged index generally representative of the U.S. market for medium capitalization value stocks. This unmanaged index does not reflect fees and expenses and is not available for direct investment. The Russell Midcap® Value Index and Russell® are trademarks of Frank Russell Company.
S&P 500 Index—The S&P 500 Index is an unmanaged index generally representative of the U.S. stock market. This unmanaged index does not reflect fees and expenses and is not available for direct investment.
50
[THIS PAGE INTENTIONALLY LEFT BLANK]
51
111 South Wacker Drive, 34th Floor | Chicago, IL 60606-4302 | 800-422-1050 | harborfunds.com |
Trustees & Officers
Charles F. McCain
Chairman, President & Trustee
Scott M. Amero
Trustee
Trustee
Raymond J. Ball
Trustee
Trustee
Donna J. Dean
Trustee
Trustee
Joseph L. Dowling, III
Trustee
Trustee
Randall A. Hack
Trustee
Trustee
Robert Kasdin
Trustee
Trustee
Kathryn L. Quirk
Trustee
Trustee
Ann M. Spruill
Trustee
Trustee
Erik D. Ojala
Chief Compliance Officer
Anmarie S. Kolinski
Treasurer
Treasurer
Brian L. Collins
Vice President
Vice President
Kristof M. Gleich
Vice President
Vice President
Charles P. Ragusa
Vice President
Vice President
Diana R. Podgorny
Secretary
Secretary
Jodie L. Crotteau
Assistant Secretary
Assistant Secretary
Lana M. Lewandowski
AML Compliance Officer
& Assistant Secretary
AML Compliance Officer
& Assistant Secretary
Lora A. Kmieciak
Assistant Treasurer
Assistant Treasurer
John M. Paral
Assistant Treasurer
Assistant Treasurer
Investment Adviser
Harbor Capital Advisors, Inc.
111 South Wacker Drive, 34th Floor
Chicago, IL 60606-4302
312-443-4400
111 South Wacker Drive, 34th Floor
Chicago, IL 60606-4302
312-443-4400
Distributor
Harbor Funds Distributors, Inc.
111 South Wacker Drive, 34th Floor
Chicago, IL 60606-4302
312-443-4600
111 South Wacker Drive, 34th Floor
Chicago, IL 60606-4302
312-443-4600
Shareholder Services
Harbor Services Group, Inc.
P.O. Box 804660
Chicago, IL 60680-4108
800-422-1050
P.O. Box 804660
Chicago, IL 60680-4108
800-422-1050
FD.SAR.TR.0419
Table of Contents
ITEM 2 – CODE OF ETHICS
Not applicable.
ITEM 3 – AUDIT COMMITTEE FINANCIAL EXPERT
Not applicable.
ITEM 4 – PRINCIPAL ACCOUNTANT FEES AND SERVICES
Not applicable.
ITEM 5 – AUDIT COMMITTEE OF LISTED REGISTRANTS
Not applicable.
ITEM 6 – INVESTMENTS
(a) | The Registrant has elected to include the schedule of investments in securities of unaffiliated issuers as part of the report to shareholders filed under Item 1 of this report on Form N-CSR. |
(b) | Not applicable. |
ITEM 7 – DISCLOSURE OF PROXY VOTING POLICIES AND PROCEDURES FOR CLOSED-END MANAGEMENT INVESTMENT COMPANIES
Not applicable.
ITEM 8 – PORTFOLIO MANAGERS OF CLOSED-END MANAGEMENT INVESTMENT COMPANIES
Not applicable.
ITEM 9 – PURCHASES OF EQUITY SECURITIES BY CLOSED-END MANAGEMENT INVESTMENT COMPANY AND AFFILIATED PURCHASERS
Not applicable.
ITEM 10 – SUBMISSION OF MATTERS TO A VOTE OF SECURITY HOLDERS
There were no material changes to the procedures by which shareholders may recommend nominees to the Registrant’s Board of Trustees since the date of the Registrant’s prior report on Form N-CSR.
ITEM 11 – CONTROLS AND PROCEDURES
(a) | The Registrant’s Principal Executive and Principal Financial Officers concluded that the Registrant’s disclosure controls and procedures (as defined in Rule 30a-3(c) under the 1940 Act) are effective, based on the evaluation of these disclosure controls and procedures as of a date within 90 days of the filing of this report. |
(b) | There was no change in the Registrant’s internal control over financial reporting (as defined in Rule 30a-3(d) under the 1940 Act) that occurred during the second fiscal quarter of the period covered by this report that has materially affected, or is reasonably likely to materially affect, the Registrant’s internal control over financial reporting. |
ITEM 12 – EXHIBITS
(a) | A separate certification for each principal executive officer and principal financial officer of the Registrant as required by Rule 30a-2(a) under the 1940 Act (17 CFR 270.30a-2(a)) is attached hereto. |
(b) | Certification as required by Section 1350 of Chapter 63 of Title 18 of the United States Code (18 U.S.C. 1350) is attached hereto. |
SIGNATURES
Pursuant to the requirements of the Securities Exchange Act of 1934 and the Investment Company Act of 1940, the Registrant has duly caused this report to be signed June 28, 2019 on its behalf by the undersigned, thereunto duly authorized.
HARBOR FUNDS
By: /s/ Charles F. McCain
Charles F. McCain
Chairman, President and Trustee
(Principal Executive Officer)
Chairman, President and Trustee
(Principal Executive Officer)
Pursuant to the requirements of the Securities Exchange Act of 1934 and the Investment Company Act of 1940, this report has been signed below by the following persons on behalf of the Registrant and in the capacities and on the dates indicated.
By: | /s/ Charles F. McCain Charles F. McCain | Chairman, President and Trustee (Principal Executive Officer) | June 28, 2019 |
By: | /s/ Anmarie S. Kolinski Anmarie S. Kolinski | Treasurer (Principal Financial and Accounting Officer) | June 28, 2019 |
Exhibit Index
Number | Description | |
99.CERT1 | Certification for each principal executive officer and principal financial officer of the Registrant as required by Rule 30a-2(a) under the 1940 Act (17 CFR 270.30a-2(a)). | |
99.CERT2 | Certification for each principal executive officer and principal financial officer of the Registrant as required by Rule 30a-2(a) under the 1940 Act (17 CFR 270.30a-2(a)). | |
99.906CERT | Certification as required by Section 1350 of Chapter 63 of Title 18 of the United States Code (18 U.S.C. 1350). |