UNITED STATES
SECURITIES AND EXCHANGE COMMISSION
Washington, D.C. 20549
FORM N-CSR
CERTIFIED SHAREHOLDER REPORT
OF
REGISTERED MANAGEMENT COMPANY
| Investment Company Act file number: | 811-4681 |
| Name of Registrant: | Vanguard Bond Index Funds |
| Address of Registrant: | P.O. Box 2600 Valley Forge, PA 19482 |
| Name and address of agent for service: | Heidi Stam, Esquire P.O. Box 876 Valley Forge, PA 19482 |
Registrant’s telephone number, including area code: (610) 669-1000
| Date of fiscal year end: | December 31 |
| Date of reporting period: | January 1, 2006 - December 31, 2006 |
| Item 1: | Reports to Shareholders |
|
|
Vanguard® Bond Index Funds |
|
|
> Annual Report |
|
|
|
|
|
December 31, 2006 |
|
|
|
|

|
Vanguard Total Bond Market Index Fund |
|
Vanguard Short-Term Bond Index Fund |
|
Vanguard Intermediate-Term Bond Index Fund |
|
Vanguard Long-Term Bond Index Fund |
|
|
|
|
|
|
|
|
|
> | Over the past 12 months, the Vanguard Bond Index Funds provided |
| returns ranging from 2.7% to 4.3% for the Investor Shares. |
|
|
|
|
> | The funds’ returns were in line with those of their market segments, |
| as measured by their target indexes. |
|
|
|
|
> | Although the fixed-income markets featured a number of unusual |
| developments, returns were typical of (if a bit below) long-term |
| averages. |
Contents |
|
|
|
Your Fund’s Total Returns | 1 |
Chairman’s Letter | 2 |
Total Bond Market Index Fund | 8 |
Short-Term Bond Index Fund | 25 |
Intermediate-Term Bond Index Fund | 39 |
Long-Term Bond Index Fund | 54 |
About Your Fund’s Expenses | 70 |
Glossary | 72 |
Please note: The opinions expressed in this report are just that—informed opinions. They should not be considered promises or advice. Also, please keep in mind that the information and opinions cover the period through the date on the cover of this report. Of course, the risks of investing in your fund are spelled out in the prospectus.
Your Fund’s Total Returns
Fiscal Year Ended December 31, 2006 |
|
| Total |
| Returns |
Vanguard Total Bond Market Index Fund |
|
Investor Shares | 4.3% |
Admiral™ Shares1 | 4.4 |
Signal Shares2 | 2.23 |
Institutional Shares4 | 4.4 |
Lehman Aggregate Bond Index | 4.3 |
Average Intermediate-Term Investment Grade Debt Fund5 | 4.1 |
|
|
|
|
Vanguard Short-Term Bond Index Fund |
|
Investor Shares | 4.1% |
Admiral Shares1 | 4.2 |
Lehman 1–5 Year Government/Credit Index | 4.2 |
Average 1–5 Year Investment Grade Debt Fund5 | 4.0 |
|
|
|
|
Vanguard Intermediate-Term Bond Index Fund |
|
Investor Shares | 3.9% |
Admiral Shares1 | 4.0 |
Institutional Shares4 | 4.46 |
Lehman 5–10 Year Government/Credit Index | 3.8 |
Average Intermediate-Term Investment Grade Debt Fund5 | 4.1 |
|
|
|
|
Vanguard Long-Term Bond Index Fund |
|
Investor Shares | 2.7% |
Institutional Shares4 | 3.97 |
Lehman Long Government/Credit Index | 2.7 |
Average Corporate A-Rated Debt Fund5 | 3.9 |
1 | A lower-cost class of shares available to many longtime shareholders and to those with significant investments in the fund. |
2 | Signal Shares also carry lower costs and are available to certain institutional shareholders who meet specific administrative, service, and account-size criteria. |
3 | Since inception: September 1, 2006. |
4 | This class of shares also carries low expenses and is available for a minimum investment of $5 million for the Total Bond Market Index Fund or $25 million for the Intermediate- and Long-Term Bond Index Funds. |
5 | Derived from data provided by Lipper Inc. |
6 | Since inception: January 26, 2006. |
7 | Since inception: February 2, 2006. |
1

Chairman’s Letter
Dear Shareholder,
The returns of the Vanguard Bond Index Funds’ Investor Shares fell within a narrow range for the 12-month period, from the Long-Term Bond Index Fund’s 2.7% return to the 4.3% return of the Total Bond Market Index Fund. (After the start of the year, we introduced Institutional Shares for the Intermediate- and Long-Term Bond Index Funds and Signal Shares for the Total Bond Market Index Fund.) The funds’ returns were in line with those of their target indexes.
Yields moved higher in an unusual interest rate environment. The funds’ year-end yields, as well as the components of their 2006 total returns, appear on page 4.
Bond market featured unusual developments
During the first half of 2006, interest rates, particularly short-term interest rates, climbed rapidly as the Federal Reserve Board extended its rate-boosting campaign. The Fed raised its target for the federal funds rate four times, to 5.25%. The Fed then paused, and during the second half of the year, short-term rates stabilized. As inflation fears eased, however, long-term yields drifted below the yield of the 3-month U.S. Treasury bill—an inversion of the usual relationship.
In addition to unusual interest rate dynamics, the bond market also featured shrinking risk premiums. Strong corporate fundamentals and a ready supply of cash-rich lenders helped compress the difference
2
between the yields of virtually risk-free U.S. Treasury bonds and the rates paid by corporate borrowers. In fact, the riskiest bonds generated the best returns, as investors bid up prices (depressing yields) in a market that exacted few penalties for risk-taking.
Over the full 12 months, the broad taxable bond market returned 4.3%, with corporate bonds outperforming government bonds.
Strong second half pushed stocks to new high
Beginning in mid-July, stocks climbed steadily through the remainder of the year, with the Dow Jones Industrial Average setting a record high on December 27. For the year, the broad
U.S. stock market gained 15.9%. Despite a soft housing sector and ongoing troubles within the U.S. auto industry, the economy continued to grow and corporate profits remained strong.
As expected, fund performance reflected market dynamics
During the past 12 months, the performance of the Vanguard Bond Index Funds largely reflected surprising shifts in interest rates. Despite the tortuous back and forth of bond yields and prices, the funds’ 12-month returns were consistent with, if a bit below, the bond market’s historical averages.
During the first half of 2006, the sharp rise in interest rates depressed the share prices of all four bond portfolios. Although
Market Barometer |
|
|
| |
|
| Average Annual Total Returns | ||
| Periods Ended December 31, 2006 | |||
| One Year | Three Years | Five Years | |
Bonds |
|
|
| |
Lehman Aggregate Bond Index (Broad taxable market) | 4.3% | 3.7% | 5.1% | |
Lehman Municipal Bond Index | 4.8 | 4.3 | 5.5 | |
Citigroup 3-Month Treasury Bill Index | 4.8 | 3.0 | 2.3 | |
|
|
|
| |
|
|
|
| |
Stocks |
|
|
| |
Russell 1000 Index (Large-caps) | 15.5% | 11.0% | 6.8% | |
Russell 2000 Index (Small-caps) | 18.4 | 13.6 | 11.4 | |
Dow Jones Wilshire 5000 Index (Entire market) | 15.9 | 11.5 | 7.6 | |
MSCI All Country World Index ex USA (International) | 27.2 | 21.8 | 16.9 | |
|
|
|
| |
|
|
|
| |
CPI |
|
|
| |
Consumer Price Index | 2.5% | 3.1% | 2.7% | |
3
prices recovered somewhat in the second half, all four funds produced modestly negative capital returns for the full 12 months. The longer-term, more interest rate-sensitive funds experienced the sharpest declines. The Long-Term Bond Index Fund, for example, posted a capital return of –2.6%, compared with –0.3% for the Short-Term Bond Index Fund. Interest income more than offset the negative capital returns, producing 12-month total returns for the Investor Shares that ranged from a high of 4.3% for the Total Bond Market Index Fund to a low of 2.7% for the Long-Term Bond Index Fund.
Although they have similar interest rate sensitivity, the Total Bond Market Index Fund returned a bit more than the Intermediate-Term Bond Index Fund. The difference largely reflected the Total Bond Market Index Fund’s 35% allocation to strongly performing mortgage-backed securities, which aren’t held by the intermediate-term fund.
Compared with all-Treasury portfolios, shrinking risk premiums modestly boosted the performance of the Vanguard Bond Index Funds, which hold both government and corporate securities. For example, the Short-Term Bond Index Fund returned 4.1%, compared with the 3.8% return of the all-Treasury Lehman 1–5 Year Treasury Index (which also has no expenses). The remaining three funds also outperformed all-Treasury indexes of similar maturities.
Your portfolio’s advisor, Vanguard Fixed Income Group, captured the market’s return in all four funds, a tribute to its disciplined portfolio construction and
Yields and Returns |
|
|
|
|
| ||
|
|
| Components of Total Returns | ||||
| Yields at Year-End | Year Ended December 31, 2006 | |||||
Index Fund (Investor Shares) | 2005 | 2006 |
| Capital | Income | Total | |
Total Bond Market | 4.75% | 4.96% | –0.7% | 5.0% | 4.3% | ||
Short-Term Bond | 4.55 | 4.76 | –0.3 | 4.4 | 4.1 | ||
Intermediate-Term Bond | 4.88 | 4.96 | –1.1 | 5.0 | 3.9 | ||
Long-Term Bond | 5.06 | 5.31 | –2.6 | 5.3 | 2.7 | ||
4
execution methodologies. This market-tracking performance also reflects the funds’ low costs, which leave more of their returns to compound in your account
Long-term performance is built on enduring strengths
These same characteristics—disciplined management and low costs—have also produced excellent long-term performance. For the most recent ten-year period, the funds’ annualized results have come within 0.2 percentage point of their benchmark results. Returns have ranged from an annualized 7.7% for the Long-Term Bond Index Fund to 5.1% for the Short-Term Bond Index Fund.
The funds have also outperformed the average returns of their peer groups for the 10-year period. The funds won’t beat their peer groups every year, of course. Indeed, in 2006, the returns of the Intermediate- and Long-Term Bond Index Funds were a bit below their peer-group averages. But over time we expect the Vanguard Bond Index Funds’ broad diversification, disciplined management, and low costs to make them a tough bogey for even the most talented fixed income managers to reach.
On its 20th anniversary, bond indexing is going strong
On December 11, 2006, Vanguard Total Bond Market Index Fund, the world’s first bond index mutual fund, celebrated its 20th anniversary. Less than a decade after the fund’s inception, Vanguard created the Short-, Intermediate-, and Long-Term Bond Index Funds. All four portfolios have delivered distinguished performance,
Total Returns |
|
|
|
Ten Years Ended December 31, 2006 |
|
|
|
|
| Average |
|
| Vanguard | Comparable | Target |
Index Fund (Investor Shares) | Fund | Fund1 | Index |
Total Bond Market | 6.0% | 5.4% | 6.2% |
Short-Term Bond | 5.1 | 4.5 | 5.3 |
Intermediate-Term Bond | 6.5 | 5.4 | 6.7 |
Long-Term Bond | 7.7 | 5.4 | 7.7 |
The figures shown represent past performance, which is not a guarantee of future results. (Current performance may be lower or higher than the performance data cited. For performance data current to the most recent month-end, visit our website at www.vanguard.com.) Note, too, that both investment returns and principal value can fluctuate widely, so an investor’s shares, when sold, could be worth more or less than their original cost.
1 | Derived from data provided by Lipper Inc. |
5
benefiting from the same strengths that have made Vanguard a leader in stock indexing: talented teams, disciplined portfolio management, and low costs.
Vanguard’s broad range of bond and stock index funds is more than an example of our indexing expertise. The variety of funds also underscores one of our core investment beliefs: the need for balance among the different asset classes and diversification within them. Selecting a mix of stock and bond funds—index, active, or some combination of the two—appropriate for your circumstances is a key to successful long-term investing.
Over time, a balanced and diversified approach gives you the opportunity to participate in the stock market’s long-term growth potential, while tempering its episodic volatility with a fixed income anchor.
Thank you for investing with Vanguard.
Sincerely,

John J. Brennan
Chairman and Chief Executive Officer
January 16, 2007
Expense Ratios1 |
|
|
|
|
|
Your fund compared with its peer group |
|
|
|
| |
| Investor | Admiral | Signal | Institutional | Peer |
Index Fund | Shares | Shares | Shares | Shares | Group |
Total Bond Market | 0.20% | 0.11% | 0.11%2 | 0.07% | 0.99% |
Short-Term Bond | 0.18 | 0.11 | — | — | 0.96 |
Intermediate-Term Bond | 0.18 | 0.11 | — | 0.082 | 0.99 |
Long-Term Bond | 0.18 | — | — | 0.082 | 1.13 |
1 | Fund expense ratios reflect the 12 months ended December 31, 2006. Peer groups are: for the Total Bond Market Index Fund and Intermediate-Term Bond Index Fund, the Average Intermediate-Term Investment Grade Debt Fund; for the Short-Term Bond Index Fund, the Average 1–5 Year Investment Grade Debt Fund; and for the Long-Term Bond Index Fund, the Average Corporate A-Rated Debt Fund. Peer-group expense ratios are derived from data provided by Lipper Inc. and capture information through year-end 2005. |
2 | Annualized. Inception dates for Total Bond Market Index Fund Signal Shares, September 1, 2006; for Intermediate-Term Bond Index Fund Institutional Shares, January 26, 2006; for Long-Term Bond Index Fund Institutional Shares, February 2, 2006. |
6
Your Fund’s Performance at a Glance |
|
|
|
|
|
December 31, 2005–December 31, 2006 |
|
|
|
|
|
|
|
|
|
|
|
|
|
| Distributions Per Share |
| |
| Starting | Ending |
|
|
|
| Share | Share | Income | Capital | SEC |
Index Fund | Price | Price | Dividends | Gains | Yield |
Total Bond Market |
|
|
|
|
|
Investor Shares | $10.06 | $9.99 | $0.485 | $0.000 | 4.96% |
Admiral Shares | 10.06 | 9.99 | 0.494 | 0.000 | 5.05 |
Signal Shares | 9.941 | 9.99 | 0.166 | 0.000 | 5.04 |
Institutional Shares | 10.06 | 9.99 | 0.498 | 0.000 | 5.09 |
Short-Term Bond |
|
|
|
|
|
Investor Shares | $9.92 | $9.89 | $0.426 | $0.000 | 4.76% |
Admiral Shares | 9.92 | 9.89 | 0.433 | 0.000 | 4.83 |
Intermediate-Term Bond |
|
|
|
|
|
Investor Shares | $10.36 | $10.25 | $0.499 | $0.000 | 4.96% |
Admiral Shares | 10.36 | 10.25 | 0.506 | 0.000 | 5.03 |
Institutional Shares | 10.292 | 10.25 | 0.473 | 0.000 | 5.06 |
Long-Term Bond |
|
|
|
|
|
Investor Shares | $11.84 | $11.53 | $0.603 | $0.000 | 5.31% |
Institutional Shares | 11.663 | 11.53 | 0.559 | 0.000 | 5.41 |
1 | Share price at inception; September 1, 2006. |
2 | Share price at inception; January 26, 2006. |
3 | Share price at inception; February 2, 2006. |
7
Total Bond Market Index Fund
Fund Profile
As of December 31, 2006
Financial Attributes |
|
|
|
| Target |
| Fund | Index1 |
Number of Issues | 2,801 | 7,134 |
Yield |
| — |
Investor Shares | 5.0% |
|
Admiral Shares | 5.1% |
|
Signal Shares | 5.0% |
|
Institutional Shares | 5.1% |
|
Yield to Maturity | 5.3%2 | 5.4% |
Average Coupon | 5.5% | 5.4% |
Average Effective Maturity | 6.9 years | 7.0 years |
Average Quality3 | Aa1 | Aa1 |
Average Duration | 4.5 years | 4.5 years |
Expense Ratio |
| — |
Investor Shares | 0.20% |
|
Admiral Shares | 0.11% |
|
Signal Shares | 0.11%4 |
|
Institutional Shares | 0.07% |
|
Short-Term Reserves | 0% | — |
Sector Diversification5 (% of portfolio) |
|
|
|
Asset-Backed/Commercial Mortgage-Backed | 6% |
Finance | 9 |
Foreign | 3 |
Government Mortgage-Backed | 35 |
Industrial | 9 |
Treasury/Agency | 36 |
Utilities | 2 |
Volatility Measures6 |
|
| Fund versus |
| Target Index1 |
R-Squared | 1.00 |
Beta | 1.01 |
Distribution by Maturity (% of portfolio) |
|
|
|
Under 1 Year | 1% |
1–5 Years | 44 |
5–10 Years | 41 |
10–20 Years | 8 |
20–30 Years | 6 |
Distribution by Credit Quality3(% of portfolio) |
|
|
|
Aaa | 80% |
Aa | 5 |
A | 8 |
Baa | 7 |
Investment Focus

1 | Lehman Aggregate Bond Index. |
2 | Before expenses. |
3 | Moody’s Investors Service. |
4 | Annualized. |
5 | The agency and mortgage-backed securities sectors may include issues from government-sponsored enterprises; such issues are not backed by the full faith and credit of the U.S. government. |
6 | For an explanation of R-squared, beta, and other terms used here, see the Glossary on page 72. |
8
Total Bond Market Index Fund
Performance Summary
All of the returns in this report represent past performance, which is not a guarantee of future results that may be achieved by the fund. (Current performance may be lower or higher than the performance data cited. For performance data current to the most recent month-end, visit our website at www.vanguard.com.) Note, too, that both investment returns and principal value can fluctuate widely, so an investor’s shares, when sold, could be worth more or less than their original cost. The returns shown do not reflect taxes that a shareholder would pay on fund distributions or on the sale of fund shares.
Cumulative Performance: December 31, 1996–December 31, 2006
Initial Investment of $10,000

|
|
|
| |
|
|
| ||
| Average Annual Total Returns | Final Value | ||
| Periods Ended December 31, 2006 | of a $10,000 | ||
| One Year | Five Years | Ten Years | Investment |
Total Bond Market Index Fund |
|
|
|
|
Investor Shares1 | 4.27% | 4.61% | 5.96% | $17,843 |
Lehman Aggregate Bond Index | 4.33 | 5.06 | 6.24 | 18,312 |
Average Intermediate-Term Investment Grade |
|
|
|
|
Debt Fund2 | 4.06 | 4.46 | 5.35 | 16,836 |
|
|
|
| Final Value |
|
|
| Since | of a $100,000 |
| One Year | Five Years | Inception3 | Investment |
Total Bond Market Index Fund Admiral Shares | 4.36% | 4.69% | 4.16% | $123,247 |
Lehman Aggregate Bond Index | 4.33 | 5.06 | 4.50 | 125,372 |
|
| Final Value of |
| Since | a $10,000,000 |
| Inception3 | Investment |
Total Bond Market Index Fund Signal Shares | 2.18% | $10,218,346 |
Lehman Aggregate Bond Index | 2.06 | 10,205,784 |
1 | Total return figures do not reflect the $10 annual account maintenance fee applied on balances under $10,000. |
2 | Derived from data provided by Lipper Inc.; based on the Average Intermediate-Term U.S. Government Fund through December 31, 2001, and the Average Intermediate-Term Investment Grade Debt Fund thereafter. |
3 | Inception dates are November 12, 2001, for the Admiral Shares and September 1, 2006, for the Signal Shares. |
9
Total Bond Market Index Fund
|
|
|
| Final Value of |
|
|
|
| a $5,000,000 |
| One Year | Five Years | Ten Years | Investment |
Total Bond Market Index Fund Institutional Shares | 4.40% | 4.74% | 6.08% | $9,025,613 |
Lehman Aggregate Bond Index | 4.33 | 5.06 | 6.24 | 9,156,229 |
Fiscal-Year Total Returns (%): December 31, 1996–December 31, 2006 |
|
| |||
|
|
| Investor Shares |
| |
|
|
| Lehman1 | ||
Fiscal | Capital | Income | Total | Total | |
Year | Return | Return | Return | Return | |
1997 | 2.5% | 6.9% | 9.4% | 9.7% | |
1998 | 2.2 | 6.4 | 8.6 | 8.7 | |
1999 | –6.8 | 6.0 | –0.8 | –0.8 | |
2000 | 4.2 | 7.2 | 11.4 | 11.6 | |
2001 | 1.9 | 6.5 | 8.4 | 8.4 | |
2002 | 2.4 | 5.9 | 8.3 | 10.3 | |
2003 | –0.7 | 4.7 | 4.0 | 4.1 | |
2004 | –0.2 | 4.4 | 4.2 | 4.3 | |
2005 | –2.0 | 4.4 | 2.4 | 2.4 | |
2006 | –0.7 | 5.0 | 4.3 | 4.3 | |
1 | Lehman Aggregate Bond Index. |
Note: See Financial Highlights tables on pages 17 through 20 for dividend and capital gains information.
10
Total Bond Market Index Fund
Financial Statements
Statement of Net Assets—Investments Summary
As of December 31, 2006
This Statement summarizes the fund’s holdings by bond type (U.S. government and agency issues, corporate bonds, sovereign bonds, etc.); corporate bonds are further classified by industry sector. Details are reported for each of the fund’s 50 largest individual holdings and for investments that, in total for any issuer, represent more than 1% of the fund’s net assets. The total value of smaller holdings is reported as a single amount within each category.
The fund provides a complete list of its holdings four times in each fiscal year, at the quarter-ends. For the second and fourth fiscal quarters, the complete listing of the fund’s holdings is available electronically on Vanguard.com® and on the Securities and Exchange Comission’s website (www.sec.gov), or you can have it mailed to you without charge by calling 800-662-7447. For the first and third fiscal quarters, the fund files the lists with the SEC on Form N-Q. Shareholders can look up the fund’s Forms N-Q on the SEC’s website. Forms N-Q may also be reviewed and copied at the SEC’s Public Reference Room (see the back cover of this report for further information).
|
|
| Face | Market | Percentage | |
|
| Maturity | Amount | Value• | of Net | |
| Coupon | Date | ($000) | ($000) | Assets | |
U.S. Government and Agency Obligations |
|
|
|
| ||
U.S. Government Securities |
|
|
|
|
| |
U.S. Treasury Bond | 8.750% | 5/15/17 | 252,360 | 333,904 | 0.8% | |
U.S. Treasury Bond | 8.500% | 2/15/20 | 222,140 | 300,028 | 0.7% | |
U.S. Treasury Bond | 8.875% | 8/15/17 | 205,790 | 275,340 | 0.7% | |
U.S. Treasury Bond | 7.625% | 2/15/25 | 186,125 | 246,352 | 0.6% | |
U.S. Treasury Bond | 6.125% | 8/15/29 | 208,490 | 243,803 | 0.6% | |
U.S. Treasury Bond | 8.750% | 8/15/20 | 173,950 | 240,513 | 0.6% | |
U.S. Treasury Bond | 6.750% | 8/15/26 | 175,530 | 215,955 | 0.5% | |
U.S. Treasury Bond | 8.125% | 8/15/19 | 161,395 | 210,923 | 0.5% | |
U.S. Treasury Bond | 10.625% | 8/15/15 | 147,450 | 208,595 | 0.5% | |
U.S. Treasury Bond | 7.250% | 5/15/16 | 137,100 | 163,000 | 0.4% | |
U.S. Treasury Bond | 11.250% | 2/15/15 | 112,225 | 161,236 | 0.4% | |
U.S. Treasury Bond | 12.000% | 8/15/13 | 131,800 | 146,339 | 0.4% | |
U.S. Treasury Bond | 7.625% | 11/15/22 | 110,305 | 143,206 | 0.4% | |
U.S. Treasury Bond | 7.875% | 2/15/21 | 107,107 | 139,506 | 0.3% | |
U.S. Treasury Bond | 8.125% | 8/15/21 | 93,600 | 124,955 | 0.3% | |
U.S. Treasury Bond | 3.625%–13.250% | 11/15/12–2/15/36 | 343,919 | 441,291 | 1.1% | |
U.S. Treasury Note | 4.625% | 2/29/08 | 587,825 | 585,255 | 1.4% | |
U.S. Treasury Note | 4.375% | 1/31/08 | 530,950 | 527,381 | 1.3% | |
U.S. Treasury Note | 4.250% | 8/15/14 | 485,150 | 470,973 | 1.2% | |
U.S. Treasury Note | 4.250% | 1/15/11 | 315,210 | 309,989 | 0.8% | |
U.S. Treasury Note | 6.500% | 2/15/10 | 247,380 | 259,864 | 0.6% | |
U.S. Treasury Note | 4.625% | 9/30/08 | 231,375 | 230,469 | 0.6% | |
U.S. Treasury Note | 3.375% | 10/15/09 | 230,495 | 222,390 | 0.5% | |
U.S. Treasury Note | 4.875% | 4/30/11 | 218,800 | 220,202 | 0.5% | |
U.S. Treasury Note | 4.000% | 2/15/14 | 226,295 | 216,606 | 0.5% | |
U.S. Treasury Note | 4.875% | 8/31/08 | 214,850 | 214,815 | 0.5% | |
U.S. Treasury Note | 4.500% | 2/15/09 | 194,460 | 193,275 | 0.5% | |
U.S. Treasury Note | 3.125% | 4/15/09 | 191,345 | 184,557 | 0.5% | |
U.S. Treasury Note | 6.000% | 8/15/09 | 171,875 | 177,058 | 0.4% | |
U.S. Treasury Note | 4.625% | 3/31/08 | 167,500 | 166,792 | 0.4% | |
11
Total Bond Market Index Fund
|
|
|
| Face | Market | Percentage | |
|
|
| Maturity | Amount | Value• | of Net | |
|
| Coupon | Date | ($000) | ($000) | Assets | |
| U.S. Treasury Note | 4.875% | 8/15/09 | 159,600 | 160,073 | 0.4% | |
| U.S. Treasury Note | 3.500% | 2/15/10 | 161,275 | 155,604 | 0.4% | |
| U.S. Treasury Note | 4.875% | 5/31/08 | 153,450 | 153,354 | 0.4% | |
| U.S. Treasury Note | 4.750% | 5/15/14 | 150,525 | 150,924 | 0.4% | |
| U.S. Treasury Note | 4.000% | 3/15/10 | 140,225 | 137,267 | 0.3% | |
| U.S. Treasury Note | 3.625% | 1/15/10 | 133,960 | 129,814 | 0.3% | |
| U.S. Treasury Note | 4.500% | 9/30/11 | 130,275 | 129,134 | 0.3% | |
| U.S. Treasury Note | 2.625%–5.625% | 5/15/07–8/15/16 | 1,841,873 | 1,811,133 | 4.6% | |
|
|
|
|
| 10,401,875 | 25.6% | |
Agency Bonds and Notes |
|
|
|
|
| ||
1 | Federal Home Loan Bank | 5.125% | 8/14/13 | 122,750 | 123,693 | 0.3% | |
1 | Federal Home Loan Bank | 3.875%–7.625% | 2/6/08–7/15/36 | 909,645 | 913,876 | 2.3% | |
1 | Federal Home Loan |
|
|
|
|
| |
| Mortgage Corp. | 5.750% | 4/15/08 | 250,680 | 252,461 | 0.6% | |
1 | Federal Home Loan |
|
|
|
|
| |
| Mortgage Corp. | 3.875% | 6/15/08 | 145,400 | 142,923 | 0.4% | |
1 | Federal Home Loan |
|
|
|
|
| |
| Mortgage Corp. | 4.125% | 7/12/10 | 127,947 | 124,562 | 0.3% | |
1 | Federal Home Loan |
|
|
|
|
| |
| Mortgage Corp. | 0.000%–7.000% | 2/21/08–3/15/31 | 847,194 | 869,610 | 2.1% | |
1 | Federal National |
|
|
|
|
| |
| Mortgage Assn. | 6.000% | 5/15/08 | 174,035 | 176,011 | 0.4% | |
1 | Federal National |
|
|
|
|
| |
| Mortgage Assn. | 3.875% | 7/15/08 | 138,200 | 135,717 | 0.3% | |
1 | Federal National |
|
|
|
|
| |
| Mortgage Assn. | 6.625% | 9/15/09 | 124,315 | 129,411 | 0.3% | |
1 | Federal National |
|
|
|
|
| |
| Mortgage Assn. | 3.250%–8.250% | 1/2/07–11/15/30 | 926,938 | 964,874 | 2.4% | |
† | Other—Agency Bonds and Notes |
|
| 231,056 | 0.6% | ||
|
|
|
|
| 4,064,194 | 10.0% | |
Mortgage-Backed Securities |
|
|
|
|
| ||
| Conventional Mortgage-Backed Securities |
|
|
|
| ||
1, 2 Federal Home Loan |
|
|
|
|
| ||
| Mortgage Corp. | 4.000%–10.500% | 1/1/07–1/1/37 | 5,077,910 | 5,001,078 | 12.3% | |
1, 2 Federal National |
|
|
|
|
| ||
| Mortgage Assn. | 6.000% | 1/1/37 | 120,700 | 121,492 | 0.3% | |
1, 2 Federal National |
|
|
|
|
| ||
| Mortgage Assn. | 4.000%–11.000% | 3/1/07–1/1/37 | 7,340,536 | 7,250,195 | 17.9% | |
| 2 Government National |
|
|
|
|
| |
| Mortgage Assn. | 4.000%–11.500% | 8/15/07–1/1/37 | 1,481,729 | 1,481,352 | 3.7% | |
| Nonconventional Mortgage-Backed Securities |
|
|
| |||
| 2 Government National |
|
|
|
|
| |
| Mortgage Assn. | 5.375%–7.900% | 2/15/21–6/20/29 | 1,059 | 1,069 | 0.0% | |
|
|
|
|
| 13,855,186 | 34.2% | |
Total U.S. Government and Agency Obligations (Cost $28,378,925) |
| 28,321,255 | 69.8% | ||||
Corporate Bonds |
|
|
|
|
| ||
Asset-Backed/Commercial Mortgage-Backed Securities |
|
|
| ||||
2, 3 Bank One Issuance Trust | 5.460% | 2/15/11 | 200,000 | 200,452 | 0.5% | ||
2, 3 Chase Issuance Trust | 5.360% | 12/15/10 | 216,826 | 216,926 | 0.5% | ||
2, 3 DaimlerChrysler Master |
|
|
|
|
| ||
| Owner Trust | 5.360% | 8/17/09 | 231,500 | 231,532 | 0.6% | |
2, 3 Discover Card Master Trust I | 5.370% | 5/15/10 | 146,000 | 146,074 | 0.4% | ||
12
Total Bond Market Index Fund
|
|
|
| Face | Market | Percentage |
|
|
| Maturity | Amount | Value• | of Net |
|
| Coupon | Date | ($000) | ($000) | Assets |
2, 3 MBNA Credit Card Master |
|
|
|
|
| |
| Note Trust | 5.480% | 2/15/11 | 131,900 | 132,308 | 0.3% |
2, 3 MBNA Credit Card Master |
|
|
|
|
| |
| Note Trust | 5.350% | 12/15/10 | 117,500 | 117,582 | 0.3% |
† | Other—Asset-Backed/Commercial |
|
|
|
|
|
| Mortgage-Backed Securities |
|
|
| 2,301,145 | 5.6% |
|
|
|
|
| 3,346,019 | 8.2% |
Finance |
|
|
|
|
| |
† | Banking |
|
|
| 1,403,907 | 3.5% |
† | Brokerage |
|
|
| 580,134 | 1.4% |
† | Finance Companies |
|
|
| 753,622 | 1.9% |
† | Insurance |
|
|
| 412,219 | 1.0% |
† | Real Estate Investment Trusts |
|
|
| 170,431 | 0.4% |
† | Finance—Other |
|
|
| 2,704 | 0.0% |
|
|
|
|
| 3,323,017 | 8.2% |
Industrial |
|
|
|
|
| |
† | Basic Industry |
|
|
| 216,099 | 0.5% |
† | Capital Goods |
|
|
| 442,417 | 1.1% |
† | Communication |
|
|
| 976,986 | 2.4% |
† | Consumer Cyclical |
|
|
| 593,856 | 1.5% |
† | Consumer Noncyclical |
|
|
| 648,614 | 1.6% |
† | Energy |
|
|
| 335,013 | 0.8% |
† | Technology |
|
|
| 161,023 | 0.4% |
† | Transportation |
|
|
| 185,789 | 0.5% |
† | Industrial—Other |
|
|
| 15,306 | 0.0% |
|
|
|
|
| 3,575,103 | 8.8% |
Utilities |
|
|
|
|
| |
† | Electric |
|
|
| 568,404 | 1.4% |
† | Natural Gas |
|
|
| 190,202 | 0.5% |
|
|
|
|
| 758,606 | 1.9% |
Total Corporate Bonds (Cost $11,017,885) |
|
| 11,002,745 | 27.1% | ||
† | Sovereign Bonds (U.S. Dollar-Denominated) (Cost $1,026,940) | 1,031,272 | 2.5% | |||
† | Taxable Municipal Bonds (Cost $68,943) |
|
| 70,780 | 0.2% | |
|
|
|
| Shares |
|
|
Temporary Cash Investments |
|
|
|
|
| |
4 | Vanguard Market Liquidity Fund, 5.294% |
| 256,076,537 | 256,077 | 0.7% | |
4 | Vanguard Market Liquidity Fund, 5.294%—Note E |
| 5,840,000 | 5,840 | 0.0% | |
Total Temporary Cash Investments (Cost $261,917) |
|
| 261,917 | 0.7% | ||
5 | Total Investments (Cost $40,754,610) |
|
| 40,687,969 | 100.3% | |
Other Assets and Liabilities |
|
|
|
|
| |
Other Assets—Note B |
|
|
| 746,995 | 1.8% | |
Liabilities—Note E |
|
|
| (876,744) | (2.1%) | |
|
|
|
|
| (129,749) | (0.3%) |
Net Assets |
|
|
| 40,558,220 | 100.0% | |
13
Total Bond Market Index Fund
At December 31, 2006, net assets consisted of:6 |
|
| Amount |
| ($000) |
Paid-in Capital | 40,877,760 |
Undistributed Net Investment Income | 125 |
Accumulated Net Realized Losses | (259,086) |
Unrealized Appreciation (Depreciation) |
|
Investment Securities | (66,641) |
Swap Contracts | 6,062 |
Net Assets | 40,558,220 |
|
|
|
|
Investor Shares—Net Assets |
|
Applicable to 2,379,705,839 outstanding $.001 par value shares |
|
of beneficial interest (unlimited authorization) | 23,769,364 |
Net Asset Value Per Share—Investor Shares | $9.99 |
|
|
|
|
Admiral Shares—Net Assets |
|
Applicable to 790,903,755 outstanding $.001 par value shares |
|
of beneficial interest (unlimited authorization) | 7,899,825 |
Net Asset Value Per Share—Admiral Shares | $9.99 |
|
|
|
|
Signal Shares—Net Assets |
|
Applicable to 63,323,681 outstanding $.001 par value shares |
|
of beneficial interest (unlimited authorization) | 632,498 |
Net Asset Value Per Share—Signal Shares | $9.99 |
|
|
|
|
Institutional Shares—Net Assets |
|
Applicable to 826,615,847 outstanding $.001 par value shares |
|
of beneficial interest (unlimited authorization) | 8,256,533 |
Net Asset Value Per Share—Institutional Shares | $9.99 |
• | See Note A in Notes to Financial Statements. |
† | Represents the aggregate value, by category, of securities that are not among the 50 largest holdings and, in total for any issuer, represent 1% or less of net assets. |
1 | The issuer operates under a congressional charter; its securities are neither issued nor guaranteed by the U.S. government. If needed, access to additional funding from the U.S. Treasury (beyond the issuer’s line of credit) would require congressional action. |
2 | The average or expected maturity is shorter than the final maturity shown because of the possibility of interim principal payments and prepayments or the possibility of the issue being called. |
3 | Adjustable-rate note. |
4 | Affiliated money market fund available only to Vanguard funds and certain trusts and accounts managed by Vanguard. Rate shown is the 7-day yield. |
5 | Certain of the fund’s securities are exempt from registration under Rule 144A of the Securities Act of 1933. Such securities may be sold in transactions exempt from registration, normally to qualified institutional buyers. At December 31, 2006, the aggregate value of these securities was $145,595,000, representing 0.36% of net assets. |
6 | See Note C in Notes to Financial Statements for the tax-basis components of net assets. |
14
Total Bond Market Index Fund
Statement of Operations
| Year Ended |
| December 31, 2006 |
| ($000) |
Investment Income |
|
Income |
|
Interest1 | 1,816,647 |
Security Lending | 101 |
Total Income | 1,816,748 |
Expenses |
|
The Vanguard Group—Note B |
|
Investment Advisory Services | 2,925 |
Management and Administrative |
|
Investor Shares | 35,255 |
Admiral Shares | 4,293 |
Signal Shares | 147 |
Institutional Shares | 2,165 |
Marketing and Distribution |
|
Investor Shares | 5,725 |
Admiral Shares | 1,154 |
Signal Shares | 11 |
Institutional Shares | 2,201 |
Custodian Fees | 448 |
Auditing Fees | 41 |
Shareholders’ Reports |
|
Investor Shares | 488 |
Admiral Shares | 17 |
Signal Shares | 4 |
Institutional Shares | 57 |
Trustees’ Fees and Expenses | 35 |
Total Expenses | 54,966 |
Net Investment Income | 1,761,782 |
Realized Net Gain (Loss) |
|
Investment Securities Sold | (132,030) |
Swap Contracts | (7,996) |
Realized Net Gain (Loss) | (140,026) |
Change in Unrealized Appreciation (Depreciation) |
|
Investment Securities | (89,082) |
Swap Contracts | 10,296 |
Change in Unrealized Appreciation (Depreciation) | (78,786) |
Net Increase (Decrease) in Net Assets Resulting from Operations | 1,542,970 |
1 | Interest income from an affiliated company of the fund was $15,396,000. |
15
Total Bond Market Index Fund
Statement of Changes in Net Assets
| Year Ended December 31, | |
| 2006 | 2005 |
| ($000) | ($000) |
Increase (Decrease) in Net Assets |
|
|
Operations |
|
|
Net Investment Income | 1,761,782 | 1,421,206 |
Realized Net Gain (Loss) | (140,026) | (112,286) |
Change in Unrealized Appreciation (Depreciation) | (78,786) | (569,764) |
Net Increase (Decrease) in Net Assets Resulting from Operations | 1,542,970 | 739,156 |
Distributions |
|
|
Net Investment Income |
|
|
Investor Shares | (1,082,915) | (912,434) |
Admiral Shares | (285,074) | (153,117) |
Signal Shares | (7,558) | — |
Institutional Shares | (388,213) | (363,606) |
Realized Capital Gain |
|
|
Investor Shares | — | (3,964) |
Admiral Shares | — | (520) |
Signal Shares | — | — |
Institutional Shares | — | (1,529) |
Total Distributions | (1,763,760) | (1,435,170) |
Capital Share Transactions—Note F |
|
|
Investor Shares | 2,289,948 | 2,597,037 |
Admiral Shares | 3,377,281 | 2,106,495 |
Signal Shares | 631,124 | — |
Institutional Shares | 983,478 | 64,580 |
Net Increase (Decrease) from Capital Share Transactions | 7,281,831 | 4,768,112 |
Total Increase (Decrease) | 7,061,041 | 4,072,098 |
Net Assets |
|
|
Beginning of Period | 33,497,179 | 29,425,081 |
End of Period1 | 40,558,220 | 33,497,179 |
1 | Net Assets—End of Period includes undistributed net investment income of $125,000 and $0. |
16
Total Bond Market Index Fund
Financial Highlights
Investor Shares |
|
|
|
|
| |
|
|
| Year Ended December 31, | |||
For a Share Outstanding Throughout Each Period | 2006 | 2005 | 2004 | 2003 | 2002 | |
Net Asset Value, Beginning of Period | $10.06 | $10.27 | $10.31 | $10.38 | $10.15 | |
Investment Operations |
|
|
|
|
| |
Net Investment Income | .485 | .446 | .441 | .465 | .572 | |
Net Realized and Unrealized Gain (Loss) |
|
|
|
|
| |
on Investments | (.070) | (.205) | (.014) | (.060) | .239 | |
Total from Investment Operations | .415 | .241 | .427 | .405 | .811 | |
Distributions |
|
|
|
|
| |
Dividends from Net Investment Income | (.485) | (.449) | (.446) | (.475) | (.570) | |
Distributions from Realized Capital Gains | — | (.002) | (.021) | — | (.011) | |
Total Distributions | (.485) | (.451) | (.467) | (.475) | (.581) | |
Net Asset Value, End of Period | $9.99 | $10.06 | $10.27 | $10.31 | $10.38 | |
|
|
|
|
|
| |
Total Return1 | 4.27% | 2.40% | 4.24% | 3.97% | 8.26% | |
|
|
|
|
|
| |
Ratios/Supplemental Data |
|
|
|
|
| |
Net Assets, End of Period (Millions) | $23,769 | $21,643 | $19,479 | $17,032 | $16,676 | |
Ratio of Total Expenses to |
|
|
|
|
| |
Average Net Assets | 0.20% | 0.20% | 0.20% | 0.22% | 0.22% | |
Ratio of Net Investment Income to |
|
|
|
|
| |
Average Net Assets | 4.88% | 4.40% | 4.29% | 4.46% | 5.63% | |
Portfolio Turnover Rate2 | 63% | 59% | 59% | 89% | 90% | |
1 | Total returns do not reflect the $10 annual account maintenance fee applied on balances under $10,000. |
2 | Excludes the value of portfolio securities received or delivered as a result of in-kind purchases or redemptions of the fund’s capital shares. |
17
Total Bond Market Index Fund
Admiral Shares |
|
|
|
|
|
|
|
| Year Ended December 31, | ||
For a Share Outstanding Throughout Each Period | 2006 | 2005 | 2004 | 2003 | 2002 |
Net Asset Value, Beginning of Period | $10.06 | $10.27 | $10.31 | $10.38 | $10.15 |
Investment Operations |
|
|
|
|
|
Net Investment Income | .494 | .455 | .450 | .472 | .578 |
Net Realized and Unrealized Gain (Loss) |
|
|
|
|
|
on Investments | (.070) | (.205) | (.014) | (.060) | .239 |
Total from Investment Operations | .424 | .250 | .436 | .412 | .817 |
Distributions |
|
|
|
|
|
Dividends from Net Investment Income | (.494) | (.458) | (.455) | (.482) | (.576) |
Distributions from Realized Capital Gains | — | (.002) | (.021) | — | (.011) |
Total Distributions | (.494) | (.460) | (.476) | (.482) | (.587) |
Net Asset Value, End of Period | $9.99 | $10.06 | $10.27 | $10.31 | $10.38 |
|
|
|
|
|
|
|
|
|
|
|
|
Total Return | 4.36% | 2.49% | 4.33% | 4.04% | 8.32% |
|
|
|
|
|
|
|
|
|
|
|
|
Ratios/Supplemental Data |
|
|
|
|
|
Net Assets, End of Period (Millions) | $7,900 | $4,529 | $2,502 | $2,092 | $1,805 |
Ratio of Total Expenses to |
|
|
|
|
|
Average Net Assets | 0.11% | 0.11% | 0.11% | 0.15% | 0.17% |
Ratio of Net Investment Income to |
|
|
|
|
|
Average Net Assets | 4.97% | 4.49% | 4.38% | 4.52% | 5.66% |
Portfolio Turnover Rate1 | 63% | 59% | 59% | 89% | 90% |
1 | Excludes the value of portfolio securities received or delivered as a result of in-kind purchases or redemptions of the fund’s capital shares. |
18
Total Bond Market Index Fund
Signal Shares |
|
| Sept. 11 to |
| Dec. 31, |
For a Share Outstanding Throughout the Period | 2006 |
Net Asset Value, Beginning of Period | $9.94 |
Investment Operations |
|
Net Investment Income | .166 |
Net Realized and Unrealized Gain (Loss) on Investments | .050 |
Total from Investment Operations | .216 |
Distributions |
|
Dividends from Net Investment Income | (.166) |
Distributions from Realized Capital Gains | — |
Total Distributions | (.166) |
Net Asset Value, End of Period | $9.99 |
|
|
Total Return | 2.18% |
|
|
Ratios/Supplemental Data |
|
Net Assets, End of Period (Millions) | $632 |
Ratio of Total Expenses to Average Net Assets | 0.11%* |
Ratio of Net Investment Income to Average Net Assets | 4.97%* |
Portfolio Turnover Rate2 | 63% |
1 | Inception. |
2 | Excludes the value of portfolio securities received or delivered as a result of in-kind purchases or redemptions of the fund’s capital shares. |
* | Annualized. |
19
Total Bond Market Index Fund
Institutional Shares |
|
|
|
|
| ||
|
|
| Year Ended December 31, | ||||
For a Share Outstanding Throughout Each Period | 2006 | 2005 | 2004 | 2003 | 2002 | ||
Net Asset Value, Beginning of Period | $10.06 | $10.27 | $10.31 | $10.38 | $10.15 | ||
Investment Operations |
|
|
|
|
| ||
Net Investment Income | .498 | .459 | .453 | .477 | .585 | ||
Net Realized and Unrealized Gain (Loss) |
|
|
|
|
| ||
on Investments | (.070) | (.205) | (.014) | (.060) | .239 | ||
Total from Investment Operations | .428 | .254 | .439 | .417 | .824 | ||
Distributions |
|
|
|
|
| ||
Dividends from Net Investment Income | (.498) | (.462) | (.458) | (.487) | (.583) | ||
Distributions from Realized Capital Gains | — | (.002) | (.021) | — | (.011) | ||
Total Distributions | (.498) | (.464) | (.479) | (.487) | (.594) | ||
Net Asset Value, End of Period | $9.99 | $10.06 | $10.27 | $10.31 | $10.38 | ||
|
|
|
|
|
| ||
Total Return | 4.40% | 2.53% | 4.36% | 4.10% | 8.39% | ||
|
|
|
|
|
| ||
Ratios/Supplemental Data |
|
|
|
|
| ||
Net Assets, End of Period (Millions) | $8,257 | $7,325 | $7,444 | $6,593 | $6,525 | ||
Ratio of Total Expenses to |
|
|
|
|
| ||
Average Net Assets | 0.07% | 0.07% | 0.08% | 0.10% | 0.10% | ||
Ratio of Net Investment Income to |
|
|
|
|
| ||
Average Net Assets | 5.01% | 4.53% | 4.41% | 4.60% | 5.77% | ||
Portfolio Turnover Rate1 | 63% | 59% | 59% | 89% | 90% | ||
1 | Excludes the value of portfolio securities received or delivered as a result of in-kind purchases or redemptions of the fund’s capital shares. See accompanying Notes, which are an integral part of the Financial Statements. |
20
Total Bond Market Index Fund
Notes to Financial Statements
Vanguard Total Bond Market Index Fund is registered under the Investment Company Act of 1940 as an open-end investment company, or mutual fund. Certain of the fund’s investments are in corporate debt instruments; the issuers’ abilities to meet their obligations may be affected by economic developments in their respective industries. The fund offers four classes of shares: Investor Shares, Admiral Shares, Signal Shares, and Institutional Shares. Investor Shares are available to any investor who meets the fund’s minimum purchase requirements. Admiral Shares are designed for investors who meet certain administrative, service, tenure, and account-size criteria. Signal Shares are designed for institutional investors who meet certain administrative, service, and account-size criteria. Signal Shares were first issued on September 1, 2006. Institutional Shares are designed for investors who meet certain administrative and service criteria and invest a minimum of $5 million.
A. The following significant accounting policies conform to generally accepted accounting principles for U.S. mutual funds. The fund consistently follows such policies in preparing its financial statements.
1. Security Valuation: Bonds, and temporary cash investments acquired over 60 days to maturity, are valued using the latest bid prices or using valuations based on a matrix system (which considers such factors as security prices, yields, maturities, and ratings), both as furnished by independent pricing services. Investments in Vanguard Market Liquidity Fund are valued at that fund’s net asset value. Other temporary cash investments are valued at amortized cost, which approximates market value. Securities for which market quotations are not readily available, or whose values have been materially affected by events occurring before the fund’s pricing time but after the close of the securities’ primary markets, are valued by methods deemed by the board of trustees to represent fair value.
2. Mortgage Dollar Rolls: The fund has entered into mortgage-dollar-roll transactions, in which the fund sells mortgage-backed securities to a dealer and simultaneously agrees to purchase similar securities in the future at a predetermined price. The proceeds of the securities sold in mortgage-dollar-roll transactions are invested in high-quality short-term fixed income securities. The fund forgoes principal and interest paid on the securities, and is compensated by interest earned on the proceeds of the initial sale and by a lower price on the securities to be repurchased. The fund accounts for mortgage-dollar-roll transactions as purchases and sales; as such, these transactions may increase the fund’s portfolio turnover rate. Amounts to be received or paid in connection with open mortgage dollar rolls are included in Receivables for Investment Securities Sold or Payables for Investment Securities Purchased in the Statement of Net Assets. The primary risk associated with mortgage dollar rolls is that a counterparty will default on its obligations to deliver purchased securities.
3. Swap Contracts: The fund has entered into swap transactions to earn the total return on a specified security or index of fixed income securities. Under the terms of the swaps, the fund receives the total return (either receiving the increase or paying the decrease) on a reference security or index, applied to a notional principal amount. In return, the fund agrees to pay the counterparty a floating rate, which is reset periodically based on short-term interest rates, applied to the same notional amount. At the same time, the fund invests an amount equal to the notional amount of the swaps in high-quality floating-rate securities.
The notional amounts of swap contracts are not recorded in the Statement of Net Assets. Swaps are valued daily, and the change in value is recorded as unrealized appreciation (depreciation) until the termination of the swap, at which time realized gain (loss) is recorded. The primary risk associated with total return swaps is that a counterparty will default on its obligation to pay net amounts due to the fund.
21
Total Bond Market Index Fund
4. Federal Income Taxes: The fund intends to continue to qualify as a regulated investment company and distribute all of its taxable income. Accordingly, no provision for federal income taxes is required in the financial statements.
5. Distributions: Distributions from net investment income are declared daily and paid on the first business day of the following month. Annual distributions from realized capital gains, if any, are recorded on the ex-dividend date.
6. Security Lending: The fund may lend its securities to qualified institutional borrowers to earn additional income. Security loans are required to be secured at all times by collateral at least equal to the market value of securities loaned. The fund invests cash collateral received in Vanguard Market Liquidity Fund, and records a liability for the return of the collateral, during the period the securities are on loan. Security lending income represents the income earned on investing cash collateral, less expenses associated with the loan.
7. Other: Interest income includes income distributions received from Vanguard Market Liquidity Fund and is accrued daily. Premiums and discounts on debt securities purchased are amortized and accreted, respectively, to interest income over the lives of the respective securities. Security transactions are accounted for on the date securities are bought or sold. Costs used to determine realized gains (losses) on the sale of investment securities are those of the specific securities sold.
B. The Vanguard Group furnishes at cost investment advisory, corporate management, administrative, marketing, and distribution services. The costs of such services are allocated to the fund under methods approved by the board of trustees. The fund has committed to provide up to 0.40% of its net assets in capital contributions to Vanguard. At December 31, 2006, the fund had contributed capital of $3,913,000 to Vanguard (included in Other Assets), representing 0.01% of the fund’s net assets and 3.91% of Vanguard’s capitalization. The fund’s trustees and officers are also directors and officers of Vanguard.
C. Capital gain distributions are determined on a tax basis and may differ from realized capital gains for financial reporting purposes. Differences may be permanent or temporary. Permanent differences are reclassified among capital accounts in the financial statements to reflect their tax character. Temporary differences arise when gains or losses are recognized in different periods for financial statement and tax purposes; these differences will reverse at some time in the future.
During the year ended December 31, 2006, the fund realized $5,347,000 of net capital losses resulting from in-kind redemptions—in which shareholders exchanged fund shares for securities held by the fund rather than for cash. Because such losses are not taxable to the fund, and are not distributed to shareholders, they have been reclassified from accumulated net realized losses to paid-in capital.
Realized and unrealized gains (losses) on certain of the fund’s swap contracts are treated as ordinary income (loss) for tax purposes; the effect on the fund’s income dividends to shareholders is offset by a change in principal return. Realized gains of $2,103,000 on swap contracts have been reclassified from accumulated net realized losses to undistributed net investment income. Taxable income on swap contracts is accumulated monthly and included in income dividends paid to shareholders in the following month. At December 31, 2006, the fund had $125,000 of net swap gains available to distribute to shareholders as ordinary income dividends.
At December 31, 2006, the fund had available realized losses of $257,496,000 to offset future net capital gains of $77,012,000 through December 31, 2013, and $180,484,000 through December 31, 2014.
22
Total Bond Market Index Fund
At December 31, 2006, the cost of investment securities for tax purposes was $40,755,287,000. Net unrealized depreciation of investment securities for tax purposes was $67,318,000, consisting of unrealized gains of $367,326,000 on securities that had risen in value since their purchase and $434,644,000 in unrealized losses on securities that had fallen in value since their purchase.
At December 31, 2006, the fund had the following open swap contracts:
Total Return Swaps
|
|
|
| Unrealized |
|
| Notional | Floating | Appreciation |
|
| Amount | Interest | (Depreciation) |
Reference Entity/Termination Date | Dealer1 | ($000) | Rate Paid2 | ($000) |
Commercial Mortgage-Backed Securities Index |
|
|
|
|
1/31/07 | BA | 75,000 | 5.352% | 1,518 |
1/31/07 | BA | 75,000 | 5.272 | 203 |
2/28/07 | BA | 90,000 | 5.322 | 1,718 |
2/28/07 | BA | 60,000 | 5.262 | 163 |
3/31/07 | BA | 80,000 | 5.352 | 1,511 |
3/31/07 | LEH | 70,000 | 5.276 | 189 |
4/30/07 | LEH | 75,000 | 5.326 | 1,347 |
4/30/07 | LEH | 75,000 | 5.276 | 203 |
5/31/07 | LEH | 75,000 | 5.256 | 1,083 |
5/31/07 | LEH | 45,000 | 5.276 | 122 |
6/30/07 | BA | 75,000 | 5.262 | (1,061) |
6/30/07 | LEH | 75,000 | 5.256 | 1,083 |
7/31/07 | BA | 100,000 | 5.252 | 520 |
7/31/07 | LEH | 25,000 | 5.271 | (354) |
7/31/07 | LEH | 25,000 | 5.271 | (354) |
8/31/07 | BA | 100,000 | 5.312 | (606) |
8/31/07 | LEH | 50,000 | 5.276 | (708) |
9/30/07 | BA | 80,000 | 5.312 | (485) |
10/31/07 | BA | 25,000 | 5.272 | 67 |
10/31/07 | UBS | 75,000 | 5.276 | 203 |
Federal Home Loan Mortgage Corp., 5.500% 30-Year |
|
|
|
|
1/31/07 | UBS | 185,000 | 5.046 | 15 |
Federal Home Loan Mortgage Corp., 6.000% 30-Year |
|
|
|
|
1/31/07 | UBS | 213,000 | 5.146 | (216) |
Federal National Mortgage Assn., 5.000% 15-Year |
|
|
|
|
1/31/07 | UBS | 59,000 | 5.216 | (99) |
|
|
|
| 6,062 |
1 | BA—Bank of America. |
LEH—Lehman Brothers
UBS—UBS Warburg.
2 | Based on one-month London InterBank Offered Rate (LIBOR) as of the most recent payment date. |
23
Total Bond Market Index Fund
D. During the year ended December 31, 2006, the fund purchased $3,662,929,000 of investment securities and sold $2,993,586,000 of investment securities other than U.S. government securities and temporary cash investments. Purchases and sales of U.S. government securities were $23,848,642,000 and $18,997,528,000, respectively.
E. The market value of securities on loan to broker-dealers at December 31, 2006, was $5,695,000, for which the fund received cash collateral of $5,840,000.
F. Capital share transactions for each class of shares were:
|
| Year Ended December 31, | |||
|
| 2006 |
| 2005 | |
| Amount | Shares |
| Amount | Shares |
| ($000) | (000) | ($000) | (000) | |
Investor Shares |
|
|
|
| |
Issued | 6,561,424 | 660,130 | 6,688,301 | 658,061 | |
Issued in Lieu of Cash Distributions | 1,046,965 | 105,570 | 872,818 | 85,904 | |
Redeemed | (5,318,441) | (537,965) | (4,964,082) | (488,126) | |
Net Increase (Decrease)—Investor Shares | 2,289,948 | 227,735 | 2,597,037 | 255,839 | |
Admiral Shares |
|
|
|
| |
Issued | 4,291,475 | 432,780 | 3,015,972 | 296,415 | |
Issued in Lieu of Cash Distributions | 242,937 | 24,472 | 127,332 | 12,554 | |
Redeemed | (1,157,131) | (116,719) | (1,036,809) | (102,186) | |
Net Increase (Decrease)—Admiral Shares | 3,377,281 | 340,533 | 2,106,495 | 206,783 | |
Signal Shares |
|
|
|
| |
Issued | 633,727 | 63,588 | — | — | |
Issued in Lieu of Cash Distributions | 7,557 | 755 | — | — | |
Redeemed | (10,160) | (1,019) | — | — | |
Net Increase (Decrease)—Signal Shares | 631,124 | 63,324 | — | — | |
Institutional Shares |
|
|
|
| |
Issued | 2,785,682 | 280,111 | 2,661,556 | 261,588 | |
Issued in Lieu of Cash Distributions | 352,988 | 35,593 | 329,651 | 32,437 | |
Redeemed | (2,155,192) | (217,434) | (2,926,627) | (290,291) | |
Net Increase (Decrease)—Institutional Shares | 983,478 | 98,270 | 64,580 | 3,734 | |
G. In June 2006, the Financial Accounting Standards Board issued Interpretation No. 48 (“FIN 48”), “Accounting for Uncertainty in Income Taxes.” FIN 48 establishes the minimum threshold for recognizing, and a system for measuring, the benefits of tax-return positions in financial statements. FIN 48 will be effective for the fund’s fiscal year ending December 31, 2007. Management is in the process of analyzing the fund’s tax positions for purposes of implementing FIN 48; based on the analysis completed to date, management does not believe the adoption of FIN 48 will result in any material impact to the fund’s financial statements.
24
Short-Term Bond Index Fund
Fund Profile
As of December 31, 2006
Financial Attributes |
|
|
|
|
| Target | Broad |
| Fund | Index1 | Index2 |
Number of Issues | 717 | 1,779 | 7,134 |
Yield |
| — | — |
Investor Shares | 4.8% |
|
|
Admiral Shares | 4.8% |
|
|
Yield to Maturity | 5.0%3 | 5.0% | 5.4% |
Average Coupon | 4.9% | 4.8% | 5.4% |
Average Effective |
|
|
|
Maturity | 2.7 years | 2.7 years | 7.0 years |
Average Quality4 | Aa1 | Aa1 | Aa1 |
Average Duration | 2.4 years | 2.4 years | 4.5 years |
Expense Ratio |
| — | — |
Investor Shares | 0.18% |
|
|
Admiral Shares | 0.11% |
|
|
Short-Term Reserves | 0% | — | — |
Sector Diversification5 (% of portfolio) |
|
|
|
Asset-Backed/Commercial Mortgage-Backed | 1% |
Finance | 13 |
Foreign | 5 |
Government Mortgage-Backed | 0 |
Industrial | 10 |
Treasury/Agency | 69 |
Utilities | 2 |
Volatility Measures6 |
| |
| Fund Versus | Fund Versus |
| Target Index1 | Broad Index2 |
R-Squared | 0.99 | 0.89 |
Beta | 1.01 | 0.56 |
Distribution by Maturity (% of portfolio) |
|
|
|
Under 1 Year | 3% |
1–3 Years | 56 |
3–5 Years | 38 |
Over 5 Years | 3 |
Distribution by Credit Quality4 (% of portfolio) |
|
|
|
Aaa | 74% |
Aa | 8 |
A | 11 |
Baa | 7 |
Investment Focus

1 | Lehman 1–5 Year Government/Credit Index. |
2 | Lehman Aggregate Bond Index. |
3 | Before expenses. |
4 | Moody’s Investors Service. |
5 | The agency sector may include issues from government-sponsored enterprises; such issues are not backed by the full faith and credit of the U.S. government. |
6 | For an explanation of R-squared, beta, and other terms used here, see the Glossary on page 72. |
25
Short-Term Bond Index Fund
Performance Summary
All of the returns in this report represent past performance, which is not a guarantee of future results that may be achieved by the fund. (Current performance may be lower or higher than the performance data cited. For performance data current to the most recent month-end, visit our website at www.vanguard.com.) Note, too, that both investment returns and principal value can fluctuate widely, so an investor’s shares, when sold, could be worth more or less than their original cost. The returns shown do not reflect taxes that a shareholder would pay on fund distributions or on the sale of fund shares.
Cumulative Performance: December 31, 1996–December 31, 2006
Initial Investment of $10,000

|
|
|
| |
|
|
| ||
| Average Annual Total Returns | Final Value | ||
| Periods Ended December 31, 2006 | of a $10,000 | ||
| One Year | Five Years | Ten Years | Investment |
Short-Term Bond Index Fund |
|
|
|
|
Investor Shares1 | 4.09% | 3.30% | 5.07% | $16,391 |
Lehman Aggregate Bond Index | 4.33 | 5.06 | 6.24 | 18,312 |
Lehman 1–5 Year Government/Credit Index | 4.22 | 3.77 | 5.34 | 16,818 |
Average 1–5 Year Investment Grade |
|
|
|
|
Debt Fund2 | 4.00 | 3.10 | 4.47 | 15,489 |
|
|
|
| Final Value |
|
|
| Since | of a $100,000 |
| One Year | Five Years | Inception3 | Investment |
Short-Term Bond Index Fund Admiral Shares | 4.16% | 3.36% | 3.06% | $116,718 |
Lehman Aggregate Bond Index | 4.33 | 5.06 | 4.50 | 125,372 |
Lehman 1–5 Year Government/Credit Index | 4.22 | 3.77 | 3.48 | 119,209 |
1 | Total return figures do not reflect the $10 annual account maintenance fee applied on balances under $10,000. |
2 | Derived from data provided by Lipper Inc.; based on the Average 1–5 Year U.S. Government Fund through December 31, 2001, and the Average 1–5 Year Investment Grade Debt Fund thereafter. |
3 | November 12, 2001. |
26
Short-Term Bond Index Fund
Fiscal-Year Total Returns (%): December 31, 1996–December 31, 2006 |
|
| ||
|
|
| Investor Shares |
|
|
|
|
| Lehman1 |
Fiscal | Capital | Income | Total | Total |
Year | Return | Return | Return | Return |
1997 | 0.8% | 6.2% | 7.0% | 7.1% |
1998 | 1.7 | 5.9 | 7.6 | 7.6 |
1999 | –3.3 | 5.4 | 2.1 | 2.1 |
2000 | 2.4 | 6.4 | 8.8 | 8.9 |
2001 | 3.0 | 5.9 | 8.9 | 9.0 |
2002 | 1.5 | 4.6 | 6.1 | 8.1 |
2003 | 0.1 | 3.3 | 3.4 | 3.4 |
2004 | –1.3 | 3.0 | 1.7 | 1.8 |
2005 | –2.2 | 3.5 | 1.3 | 1.4 |
2006 | –0.3 | 4.4 | 4.1 | 4.2 |
1 | Lehman 1–5 Year Government/Credit Index. |
Note: See Financial Highlights tables on pages 34 and 35 for dividend and capital gains information.
27
Short-Term Bond Index Fund
Financial Statements
Statement of Net Assets—Investments Summary
As of December 31, 2006
This Statement summarizes the fund’s holdings by bond type (U.S. government and agency issues, corporate bonds, sovereign bonds, etc.); corporate bonds are further classified by industry sector. Details are reported for each of the fund’s 50 largest individual holdings and for investments that, in total for any issuer, represent more than 1% of the fund’s net assets. The total value of smaller holdings is reported as a single amount within each category.
The fund provides a complete list of its holdings four times in each fiscal year, at the quarter-ends. For the second and fourth fiscal quarters, the complete listing of the fund’s holdings is available electronically on Vanguard.com® and on the Securities and Exchange Comission’s website (www.sec.gov), or you can have it mailed to you without charge by calling 800-662-7447. For the first and third fiscal quarters, the fund files the lists with the SEC on Form N-Q. Shareholders can look up the fund’s Forms N-Q on the SEC’s website. Forms N-Q may also be reviewed and copied at the SEC’s Public Reference Room (see the back cover of this report for further information).
|
|
| Face | Market | Percentage |
|
| Maturity | Amount | Value• | of Net |
| Coupon | Date | ($000) | ($000) | Assets |
U.S. Government and Agency Obligations |
|
|
|
| |
U.S. Government Securities |
|
|
|
|
|
U.S. Treasury Bond | 13.250% | 5/15/14 | 35,000 | 41,585 | 0.8% |
U.S. Treasury Note | 4.875% | 4/30/11 | 140,900 | 141,803 | 2.7% |
U.S. Treasury Note | 4.250% | 10/15/10 | 141,575 | 139,385 | 2.7% |
U.S. Treasury Note | 4.500% | 2/15/09 | 139,725 | 138,874 | 2.6% |
U.S. Treasury Note | 4.375% | 12/31/07 | 127,225 | 126,450 | 2.4% |
U.S. Treasury Note | 4.875% | 8/31/08 | 103,075 | 103,059 | 2.0% |
U.S. Treasury Note | 4.125% | 8/15/10 | 91,825 | 90,075 | 1.7% |
U.S. Treasury Note | 4.000% | 11/15/12 | 88,500 | 85,444 | 1.6% |
U.S. Treasury Note | 2.625% | 5/15/08 | 87,075 | 84,477 | 1.6% |
U.S. Treasury Note | 3.375% | 2/15/08 | 84,000 | 82,530 | 1.6% |
U.S. Treasury Note | 3.500% | 2/15/10 | 81,850 | 78,972 | 1.5% |
U.S. Treasury Note | 3.000% | 2/15/08 | 80,325 | 78,593 | 1.5% |
U.S. Treasury Note | 4.875% | 5/31/08 | 77,925 | 77,877 | 1.5% |
U.S. Treasury Note | 4.750% | 3/31/11 | 77,250 | 77,371 | 1.5% |
U.S. Treasury Note | 5.625% | 5/15/08 | 65,700 | 66,295 | 1.3% |
U.S. Treasury Note | 4.250% | 1/15/11 | 57,675 | 56,720 | 1.1% |
U.S. Treasury Note | 4.000% | 3/15/10 | 57,500 | 56,287 | 1.1% |
U.S. Treasury Note | 4.625% | 2/29/08 | 53,925 | 53,689 | 1.0% |
U.S. Treasury Note | 5.125% | 6/30/08 | 53,150 | 53,308 | 1.0% |
U.S. Treasury Note | 3.375% | 10/15/09 | 54,915 | 52,984 | 1.0% |
U.S. Treasury Note | 6.500% | 2/15/10 | 49,575 | 52,077 | 1.0% |
U.S. Treasury Note | 4.500% | 2/28/11 | 50,875 | 50,493 | 0.9% |
U.S. Treasury Note | 4.375% | 1/31/08 | 50,100 | 49,763 | 0.9% |
U.S. Treasury Note | 6.000% | 8/15/09 | 35,525 | 36,596 | 0.7% |
U.S. Treasury Note | 4.000% | 4/15/10 | 33,175 | 32,460 | 0.6% |
U.S. Treasury Note | 4.625% | 10/31/11 | 32,000 | 31,880 | 0.6% |
U.S. Treasury Note | 4.625% | 9/30/08 | 27,275 | 27,168 | 0.5% |
U.S. Treasury Note | 5.125% | 6/30/11 | 26,275 | 26,719 | 0.5% |
U.S. Treasury Note | 3.000%–5.000% | 3/31/08–8/15/12 | 305,308 | 300,961 | 5.7% |
|
|
|
| 2,293,895 | 43.6% |
28
Short-Term Bond Index Fund
|
|
|
| Face | Market | Percentage | |||
|
|
| Maturity | Amount | Value• | of Net | |||
|
| Coupon | Date | ($000) | ($000) | Assets | |||
Agency Bonds and Notes |
|
|
|
|
| ||||
1 | Federal Home Loan Bank | 4.850% | 2/6/08 | 54,500 | 54,300 | 1.0% | |||
1 | Federal Home Loan Bank | 4.625% | 1/18/08 | 53,600 | 53,303 | 1.0% | |||
1 | Federal Home Loan Bank | 5.375% | 7/17/09 | 41,650 | 42,017 | 0.8% | |||
1 | Federal Home Loan Bank | 2.625% | 7/15/08 | 35,000 | 33,743 | 0.6% | |||
1 | Federal Home Loan Bank | 5.125% | 6/18/08 | 30,925 | 30,933 | 0.6% | |||
1 | Federal Home Loan Bank | 4.875% | 11/18/11 | 29,600 | 29,456 | 0.6% | |||
1 | Federal Home Loan Bank | 3.000%–5.800% | 2/8/08–8/19/11 | 187,800 | 186,397 | 3.5% | |||
1 | Federal Home Loan |
|
|
|
|
| |||
| Mortgage Corp. | 5.250% | 5/21/09 | 49,500 | 49,767 | 0.9% | |||
1 | Federal Home Loan |
|
|
|
|
| |||
| Mortgage Corp. | 5.000% | 9/16/08 | 42,050 | 42,016 | 0.8% | |||
1 | Federal Home Loan |
|
|
|
|
| |||
| Mortgage Corp. | 4.125% | 7/12/10 | 42,000 | 40,889 | 0.8% | |||
1 | Federal Home Loan |
|
|
|
|
| |||
| Mortgage Corp. | 4.875% | 2/17/09 | 40,000 | 39,902 | 0.8% | |||
1 | Federal Home Loan |
|
|
|
|
| |||
| Mortgage Corp. | 3.875% | 6/15/08 | 38,500 | 37,844 | 0.7% | |||
1 | Federal Home Loan |
|
|
|
|
| |||
| Mortgage Corp. | 5.125% | 10/15/08 | 37,450 | 37,492 | 0.7% | |||
1 | Federal Home Loan |
|
|
|
|
| |||
| Mortgage Corp. | 6.625% | 9/15/09 | 30,000 | 31,223 | 0.6% | |||
1 | Federal Home Loan |
|
|
|
|
| |||
| Mortgage Corp. | 5.750% | 4/15/08 | 25,500 | 25,681 | 0.5% | |||
1 | Federal Home Loan |
|
|
|
|
| |||
| Mortgage Corp. | 4.250%–6.000% | 12/19/08–7/18/11 | 77,000 | 77,280 | 1.5% | |||
1 | Federal National |
|
|
|
|
| |||
| Mortgage Assn. | 4.875% | 4/10/08 | 64,100 | 63,846 | 1.2% | |||
1 | Federal National |
|
|
|
|
| |||
| Mortgage Assn. | 6.000% | 5/15/08 | 58,075 | 58,735 | 1.1% | |||
1 | Federal National |
|
|
|
|
| |||
| Mortgage Assn. | 6.625% | 9/15/09 | 56,000 | 58,296 | 1.1% | |||
1 | Federal National |
|
|
|
|
| |||
| Mortgage Assn. | 7.250% | 1/15/10 | 52,000 | 55,270 | 1.1% | |||
1 | Federal National |
|
|
|
|
| |||
| Mortgage Assn. | 4.500% | 10/15/08 | 33,725 | 33,413 | 0.6% | |||
1 | Federal National |
|
|
|
|
| |||
| Mortgage Assn. | 6.625% | 11/15/10 | 31,000 | 32,794 | 0.6% | |||
1 | Federal National |
|
|
|
|
| |||
| Mortgage Assn. | 6.375% | 6/15/09 | 28,500 | 29,466 | 0.6% | |||
1 | Federal National |
|
|
|
|
| |||
| Mortgage Assn. | 5.250% | 1/15/09 | 25,375 | 25,494 | 0.5% | |||
1 | Federal National |
|
|
|
|
| |||
| Mortgage Assn. | 3.250%–6.000% | 2/15/08–5/15/11 | 83,450 | 83,084 | 1.6% | |||
† | Other—Agency Bonds and Notes |
|
| 51,338 | 1.0% | ||||
|
|
|
|
| 1,303,979 | 24.8% | |||
Total U.S. Government and Agency Obligations (Cost $3,615,284) |
| 3,597,874 | 68.4% | ||||||
Corporate Bonds |
|
|
|
|
| ||||
† | Asset-Backed/Commercial Mortgage-Backed Securities |
| 30,602 | 0.6% | |||||
|
|
|
|
|
|
| |||
Finance |
|
|
|
|
| ||||
† | Banking |
|
|
| 300,000 | 5.7% | |||
† | Brokerage |
|
|
| 113,592 | 2.2% | |||
29
Short-Term Bond Index Fund
|
|
|
| Face | Market | Percentage | ||
|
|
| Maturity | Amount | Value• | of Net | ||
|
| Coupon | Date | ($000) | ($000) | Assets | ||
| Finance Companies |
|
|
|
|
| ||
| General Electric |
|
|
|
|
| ||
| Capital Corp. | 3.125%–7.375% | 1/15/08–11/21/11 | 50,825 | 50,948 | 1.0% | ||
| Heller Financial, Inc. | 7.375% | 11/1/09 | 3,200 | 3,384 | 0.0% | ||
† | Other—Finance Companies |
|
| 136,914 | 2.6% | |||
† | Insurance |
|
|
| 55,656 | 1.0% | ||
† | Real Estate Investment Trusts |
|
| 19,552 | 0.4% | |||
|
|
|
|
| 680,046 | 12.9% | ||
Industrial |
|
|
|
|
| |||
† | Basic Industry |
|
|
| 26,028 | 0.5% | ||
† | Capital Goods |
|
|
| 70,308 | 1.3% | ||
† | Communication |
|
|
| 148,121 | 2.8% | ||
† | Consumer Cyclical |
|
|
| 109,840 | 2.1% | ||
† | Consumer Noncyclical |
|
|
| 89,010 | 1.7% | ||
† | Energy |
|
|
| 31,908 | 0.6% | ||
† | Technology |
|
|
| 29,486 | 0.6% | ||
† | Transportation |
|
|
| 27,858 | 0.5% | ||
† | Industrial—Other |
|
|
| 1,051 | 0.0% | ||
|
|
|
|
| 533,610 | 10.1% | ||
Utilities |
|
|
|
|
| |||
† | Electric |
|
|
| 55,629 | 1.1% | ||
† | Natural Gas |
|
|
| 21,960 | 0.4% | ||
|
|
|
|
| 77,589 | 1.5% | ||
Total Corporate Bonds (Cost $1,339,098) |
|
| 1,321,847 | 25.1% | ||||
† | Sovereign Bonds (U.S. Dollar-Denominated) (Cost $274,721) | 272,034 | 5.2% | |||||
|
|
|
| Shares |
|
| ||
Temporary Cash Investment |
|
|
|
|
| |||
2 | Vanguard Market Liquidity Fund, 5.294% (Cost $20,274) | 20,273,696 | 20,274 | 0.4% | ||||
3 | Total Investments (Cost $5,249,377) |
|
| 5,212,029 | 99.1% | |||
Other Assets and Liabilities |
|
|
|
|
| |||
Other Assets—Note B |
|
|
| 147,961 | 2.8% | |||
Liabilities |
|
|
| (100,307) | (1.9%) | |||
|
|
|
|
| 47,654 | 0.9% | ||
Net Assets |
|
|
| 5,259,683 | 100.0% | |||
30
Short-Term Bond Index Fund
At December 31, 2006, net assets consisted of:4 |
|
| Amount |
| ($000) |
Paid-in Capital | 5,411,227 |
Undistributed Net Investment Income | — |
Accumulated Net Realized Losses | (114,196) |
Unrealized Depreciation | (37,348) |
Net Assets | 5,259,683 |
|
|
|
|
Investor Shares—Net Assets |
|
Applicable to 276,032,102 outstanding $.001 |
|
par value shares of beneficial interest (unlimited authorization) | 2,731,188 |
Net Asset Value Per Share—Investor Shares | $9.89 |
|
|
|
|
Admiral Shares—Net Assets |
|
Applicable to 255,546,771 outstanding $.001 |
|
par value shares of beneficial interest (unlimited authorization) | 2,528,495 |
Net Asset Value Per Share—Admiral Shares | $9.89 |
• | See Note A in Notes to Financial Statements. |
† | Represents the aggregate value, by category, of securities that are not among the 50 largest holdings and, in total for any issuer, represent 1% or less of net assets. |
1 | The issuer operates under a congressional charter; its securities are neither issued nor guaranteed by the U.S. government. If needed, access to additional funding from the U.S. Treasury (beyond the issuer’s line of credit) would require congressional action. |
2 | Affiliated money market fund available only to Vanguard funds and certain trusts and accounts managed by Vanguard. Rate shown is the 7-day yield. |
3 | Certain of the fund’s securities are exempt from registration under Rule 144A of the Securities Act of 1933. Such securities may be sold in transactions exempt from registration, normally to qualified institutional buyers. At December 31, 2006, the aggregate value of these securities was $9,126,000, representing 0.2% of net assets. |
4 | See Note D in Notes to Financial Statements for the tax-basis components of net assets. |
31
Short-Term Bond Index Fund
Statement of Operations
| Year Ended |
| December 31, 2006 |
| ($000) |
Investment Income |
|
Income |
|
Interest1 | 235,026 |
Security Lending | 21 |
Total Income | 235,047 |
Expenses |
|
The Vanguard Group—Note B |
|
Investment Advisory Services | 441 |
Management and Administrative |
|
Investor Shares | 3,808 |
Admiral Shares | 1,714 |
Marketing and Distribution |
|
Investor Shares | 780 |
Admiral Shares | 650 |
Custodian Fees | 49 |
Auditing Fees | 37 |
Shareholders’ Reports |
|
Investor Shares | 73 |
Admiral Shares | 6 |
Trustees’ Fees and Expenses | 5 |
Total Expenses | 7,563 |
Expenses Paid Indirectly—Note C | (14) |
Net Expenses | 7,549 |
Net Investment Income | 227,498 |
Realized Net Gain (Loss) on Investment Securities Sold | (59,610) |
Change in Unrealized Appreciation (Depreciation) of Investment Securities | 45,311 |
Net Increase (Decrease) in Net Assets Resulting from Operations | 213,199 |
1 | Interest income from an affiliated company of the fund was $985,000. |
32
Short-Term Bond Index Fund
Statement of Changes in Net Assets
| Year Ended December 31, | |
| 2006 | 2005 |
| ($000) | ($000) |
Increase (Decrease) in Net Assets |
|
|
Operations |
|
|
Net Investment Income | 227,498 | 187,210 |
Realized Net Gain (Loss) | (59,610) | (52,432) |
Change in Unrealized Appreciation (Depreciation) | 45,311 | (65,846) |
Net Increase (Decrease) in Net Assets Resulting from Operations | 213,199 | 68,932 |
Distributions |
|
|
Net Investment Income |
|
|
Investor Shares | (120,319) | (121,131) |
Admiral Shares | (107,179) | (66,079) |
Realized Capital Gain |
|
|
Investor Shares | — | — |
Admiral Shares | — | — |
Total Distributions | (227,498) | (187,210) |
Capital Share Transactions—Note F |
|
|
Investor Shares | (211,192) | (767,371) |
Admiral Shares | 208,694 | 897,866 |
Net Increase (Decrease) from Capital Share Transactions | (2,498) | 130,495 |
Total Increase (Decrease) | (16,797) | 12,217 |
Net Assets |
|
|
Beginning of Period | 5,276,480 | 5,264,263 |
End of Period | 5,259,683 | 5,276,480 |
33
Short-Term Bond Index Fund
Financial Highlights
Investor Shares |
|
|
|
|
|
|
|
| Year Ended December 31, | ||
For a Share Outstanding Throughout Each Period | 2006 | 2005 | 2004 | 2003 | 2002 |
Net Asset Value, Beginning of Period | $9.92 | $10.14 | $10.28 | $10.32 | $10.19 |
Investment Operations |
|
|
|
|
|
Net Investment Income | .426 | .350 | .303 | .329 | .452 |
Net Realized and Unrealized Gain (Loss) |
|
|
|
|
|
on Investments | (.030) | (.220) | (.131) | .015 | .152 |
Total from Investment Operations | .396 | .130 | .172 | .344 | .604 |
Distributions |
|
|
|
|
|
Dividends from Net Investment Income | (.426) | (.350) | (.303) | (.329) | (.452) |
Distributions from Realized Capital Gains | — | — | (.009) | (.055) | (.022) |
Total Distributions | (.426) | (.350) | (.312) | (.384) | (.474) |
Net Asset Value, End of Period | $9.89 | $9.92 | $10.14 | $10.28 | $10.32 |
|
|
|
|
|
|
Total Return1 | 4.09% | 1.31% | 1.70% | 3.37% | 6.10% |
|
|
|
|
|
|
Ratios/Supplemental Data |
|
|
|
|
|
Net Assets, End of Period (Millions) | $2,731 | $2,951 | $3,795 | $3,041 | $2,553 |
Ratio of Total Expenses to |
|
|
|
|
|
Average Net Assets | 0.18% | 0.18% | 0.18% | 0.20% | 0.21% |
Ratio of Net Investment Income to |
|
|
|
|
|
Average Net Assets | 4.32% | 3.50% | 2.97% | 3.17% | 4.37% |
Portfolio Turnover Rate | 106% | 106% | 92% | 111% | 139% |
1 | Total returns do not reflect the $10 annual account maintenance fee applied on balances under $10,000. |
34
Short-Term Bond Index Fund
Admiral Shares |
|
|
|
|
| |
|
|
| Year Ended December 31, | |||
For a Share Outstanding Throughout Each Period | 2006 | 2005 | 2004 | 2003 | 2002 | |
Net Asset Value, Beginning of Period | $9.92 | $10.14 | $10.28 | $10.32 | $10.19 | |
Investment Operations |
|
|
|
|
| |
Net Investment Income | .433 | .357 | .310 | .334 | .457 | |
Net Realized and Unrealized Gain (Loss) |
|
|
|
|
| |
on Investments | (.030) | (.220) | (.131) | .015 | .152 | |
Total from Investment Operations | .403 | .137 | .179 | .349 | .609 | |
Distributions |
|
|
|
|
| |
Dividends from Net Investment Income | (.433) | (.357) | (.310) | (.334) | (.457) | |
Distributions from Realized Capital Gains | — | — | (.009) | (.055) | (.022) | |
Total Distributions | (.433) | (.357) | (.319) | (.389) | (.479) | |
Net Asset Value, End of Period | $9.89 | $9.92 | $10.14 | $10.28 | $10.32 | |
|
|
|
|
|
| |
Total Return | 4.16% | 1.38% | 1.77% | 3.43% | 6.15% | |
|
|
|
|
|
| |
Ratios/Supplemental Data |
|
|
|
|
| |
Net Assets, End of Period (Millions) | $2,528 | $2,326 | $1,469 | $1,177 | $773 | |
Ratio of Total Expenses to |
|
|
|
|
| |
Average Net Assets | 0.11% | 0.11% | 0.10% | 0.15% | 0.16% | |
Ratio of Net Investment Income to |
|
|
|
|
| |
Average Net Assets | 4.39% | 3.57% | 3.05% | 3.21% | 4.37% | |
Portfolio Turnover Rate | 106% | 106% | 92% | 111% | 139% | |
See accompanying Notes, which are an integral part of the Financial Statements.
35
Short-Term Bond Index Fund
Notes to Financial Statements
Vanguard Short-Term Bond Index Fund is registered under the Investment Company Act of 1940 as an open-end investment company, or mutual fund. Certain of the fund’s investments are in corporate debt instruments; the issuers’ abilities to meet their obligations may be affected by economic developments in their respective industries. The fund offers two classes of shares: Investor Shares and Admiral Shares. Investor Shares are available to any investor who meets the fund’s minimum purchase requirements. Admiral Shares are designed for investors who meet certain administrative, service, tenure, and account-size criteria.
A. The following significant accounting policies conform to generally accepted accounting principles for U.S. mutual funds. The fund consistently follows such policies in preparing its financial statements.
1. Security Valuation: Bonds, and temporary cash investments acquired over 60 days to maturity, are valued using the latest bid prices or using valuations based on a matrix system (which considers such factors as security prices, yields, maturities, and ratings), both as furnished by independent pricing services. Investments in Vanguard Market Liquidity Fund are valued at that fund’s net asset value. Other temporary cash investments are valued at amortized cost, which approximates market value. Securities for which market quotations are not readily available, or whose values have been materially affected by events occurring before the fund’s pricing time but after the close of the securities’ primary markets, are valued by methods deemed by the board of trustees to represent fair value.
2. Federal Income Taxes: The fund intends to continue to qualify as a regulated investment company and distribute all of its taxable income. Accordingly, no provision for federal income taxes is required in the financial statements.
3. Distributions: Distributions from net investment income are declared daily and paid on the first business day of the following month. Annual distributions from realized capital gains, if any, are recorded on the ex-dividend date.
4. Security Lending: The fund may lend its securities to qualified institutional borrowers to earn additional income. Security loans are required to be secured at all times by collateral at least equal to the market value of securities loaned. The fund invests cash collateral received in Vanguard Market Liquidity Fund, and records a liability for the return of the collateral, during the period the securities are on loan. Security lending income represents the income earned on investing cash collateral, less expenses associated with the loan.
5. Other: Interest income includes income distributions received from Vanguard Market Liquidity Fund and is accrued daily. Premiums and discounts on debt securities purchased are amortized and accreted, respectively, to interest income over the lives of the respective securities. Security transactions are accounted for on the date securities are bought or sold. Costs used to determine realized gains (losses) on the sale of investment securities are those of the specific securities sold.
Each class of shares has equal rights as to assets and earnings, except that each class separately bears certain class-specific expenses related to maintenance of shareholder accounts (included in Management and Administrative expenses) and shareholder reporting. Marketing and distribution expenses are allocated to each class of shares based on a method approved by the board of trustees. Income, other non-class-specific expenses, and gains and losses on investments are allocated to each class of shares based on its relative net assets.
36
Short-Term Bond Index Fund
B. The Vanguard Group furnishes at cost investment advisory, corporate management, administrative, marketing, and distribution services. The costs of such services are allocated to the fund under methods approved by the board of trustees. The fund has committed to provide up to 0.40% of its net assets in capital contributions to Vanguard. At December 31, 2006, the fund had contributed capital of $519,000 to Vanguard (included in Other Assets), representing 0.01% of the fund’s net assets and 0.52% of Vanguard’s capitalization. The fund’s trustees and officers are also directors and officers of Vanguard.
C. The fund’s custodian bank has agreed to reduce its fees when the fund maintains cash on deposit in the non-interest-bearing custody account. For the year ended December 31, 2006, custodian fee offset arrangements reduced the fund’s expenses by $14,000.
D. Capital gain distributions are determined on a tax basis and may differ from realized capital gains for financial reporting purposes. Differences may be permanent or temporary. Permanent differences are reclassified among capital accounts in the financial statements to reflect their tax character. Temporary differences arise when gains or losses are recognized in different periods for financial statement and tax purposes; these differences will reverse at some time in the future.
For tax purposes, at December 31, 2006, the fund had available realized losses of $114,120,000 to offset future net capital gains of $39,101,000 through December 31, 2013, $72,661,000 through December 31, 2014, and $2,358,000 through December 31, 2015.
At December 31, 2006, the cost of investment securities for tax purposes was $5,249,403,000. Net unrealized depreciation of investment securities for tax purposes was $37,374,000, consisting of unrealized gains of $8,543,000 on securities that had risen in value since their purchase and $45,917,000 in unrealized losses on securities that had fallen in value since their purchase.
E. During the year ended December 31, 2006, the fund purchased $665,936,000 of investment securities and sold $663,066,000 of investment securities other than U.S. government securities and temporary cash investments. Purchases and sales of U.S. government securities were $4,774,556,000 and $4,784,841,000, respectively.
F. Capital share transactions for each class of shares were:
|
| Year Ended December 31, | |||
|
| 2006 |
| 2005 | |
| Amount | Shares |
| Amount | Shares |
| ($000) | (000) | ($000) | (000) | |
Investor Shares |
|
|
|
| |
Issued | 868,531 | 88,075 | 1,082,749 | 108,084 | |
Issued in Lieu of Cash Distributions | 107,294 | 10,880 | 106,931 | 10,687 | |
Redeemed | (1,187,017) | (120,354) | (1,957,051) | (195,557) | |
Net Increase (Decrease)—Investor Shares | (211,192) | (21,399) | (767,371) | (76,786) | |
Admiral Shares |
|
|
|
| |
Issued | 933,150 | 94,611 | 1,512,599 | 151,137 | |
Issued in Lieu of Cash Distributions | 90,446 | 9,171 | 54,236 | 5,429 | |
Redeemed | (814,902) | (82,674) | (668,969) | (66,961) | |
Net Increase (Decrease)—Admiral Shares | 208,694 | 21,108 | 897,866 | 89,605 | |
37
Short-Term Bond Index Fund
G. In June 2006, the Financial Accounting Standards Board issued Interpretation No. 48 (“FIN 48”), “Accounting for Uncertainty in Income Taxes.” FIN 48 establishes the minimum threshold for recognizing, and a system for measuring, the benefits of tax-return positions in financial statements. FIN 48 will be effective for the fund’s fiscal year ending December 31, 2007. Management is in the process of analyzing the fund’s tax positions for purposes of implementing FIN 48; based on the analysis completed to date, management does not believe the adoption of FIN 48 will result in any material impact to the fund’s financial statements.
38
Intermediate-Term Bond Index Fund
Fund Profile
As of December 31, 2006
Financial Attributes |
|
|
|
|
| Target | Broad |
| Fund | Index1 | Index2 |
Number of Issues | 849 | 1,268 | 7,134 |
Yield |
| — | — |
Investor Shares | 5.0% |
|
|
Admiral Shares | 5.0% |
|
|
Institutional Shares | 5.1% |
|
|
Yield to Maturity | 5.2%3 | 5.3% | 5.4% |
Average Coupon | 5.8% | 5.4% | 5.4% |
Average Effective Maturity | 7.5 years | 7.6 years | 7.0 years |
Average Quality4 | Aa2 | Aa2 | Aa1 |
Average Duration | 5.9 years | 5.9 years | 4.5 years |
Expense Ratio |
| — | — |
Investor Shares | 0.18% |
|
|
Admiral Shares | 0.11% |
|
|
Institutional Shares | 0.08%5 |
|
|
Short-Term Reserves | 1% | — | — |
Sector Diversification6 (% of portfolio) |
|
|
|
Asset-Backed/Commercial Mortgage-Backed | 0% |
Finance | 20 |
Foreign | 6 |
Government Mortgage-Backed | 0 |
Industrial | 19 |
Treasury/Agency | 50 |
Utilities | 4 |
Short-Term Reserves | 1% |
Volatility Measures7 |
| |
| Fund Versus | Fund Versus |
| Target Index1 | Broad Index2 |
R-Squared | 1.00 | 0.99 |
Beta | 1.00 | 1.37 |
Distribution by Maturity (% of portfolio) |
|
|
|
Under 1 Year | 2% |
1–5 Years | 1 |
5–10 Years | 91 |
10–20 Years | 6 |
Distribution by Credit Quality4 (% of portfolio) |
|
|
|
Aaa | 54% |
Aa | 10 |
A | 19 |
Baa | 17 |
Investment Focus
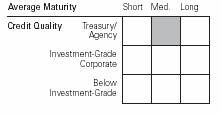
1 | Lehman 5–10 Year Government/Credit Index. |
2 | Lehman Aggregate Bond Index. |
3 | Before expenses. |
4 | Moody’s Investors Service. |
5 | Annualized. |
6 | The agency sector may include issues from government-sponsored enterprises; such issues are not backed by the full faith and credit of the U.S. government. |
7 | For an explanation of R-squared, beta, and other terms used here, see the Glossary on page 72. |
39
Intermediate-Term Bond Index Fund
Performance Summary
All of the returns in this report represent past performance, which is not a guarantee of future results that may be achieved by the fund. (Current performance may be lower or higher than the performance data cited. For performance data current to the most recent month-end, visit our website at www.vanguard.com.) Note, too, that both investment returns and principal value can fluctuate widely, so an investor’s shares, when sold, could be worth more or less than their original cost. The returns shown do not reflect taxes that a shareholder would pay on fund distributions or on the sale of fund shares.
Cumulative Performance: December 31, 1996–December 31, 2006
Initial Investment of $10,000

|
|
|
| ||
|
|
| |||
| Average Annual Total Returns | Final Value | |||
| Periods Ended December 31, 2006 | of a $10,000 | |||
| One Year | Five Years | Ten Years | Investment | |
Intermediate-Term Bond Index Fund |
|
|
|
| |
Investor Shares1 | 3.91% | 5.43% | 6.49% | $18,760 | |
Lehman Aggregate Bond Index | 4.33 | 5.06 | 6.24 | 18,312 | |
Lehman 5–10 Year Government/Credit Index | 3.81 | 5.92 | 6.68 | 19,094 | |
Average Intermediate-Term Investment Grade |
|
|
|
| |
Debt Fund2 | 4.06 | 4.46 | 5.35 | 16,836 | |
|
|
|
| Final Value |
|
|
| Since | of a $100,000 |
| One Year | Five Years | Inception3 | Investment |
Intermediate-Term Bond Index Fund Admiral Shares | 3.98% | 5.50% | 4.80% | $127,196 |
Lehman Aggregate Bond Index | 4.33 | 5.06 | 4.50 | 125,372 |
Lehman 5–10 Year Government/Credit Index | 3.81 | 5.92 | 5.16 | 129,447 |
|
| Final Value of |
| Since | a $25,000,000 |
| Inception3 | Investment |
Intermediate-Term Bond Index Fund Institutional Shares | 4.36% | $26,089,158 |
Lehman Aggregate Bond Index | 4.40 | 26,099,330 |
Lehman 5–10 Year Government/Credit Index | 4.13 | 26,032,670 |
1 | Total return figures do not reflect the $10 annual account maintenance fee applied on balances under $10,000. |
2 | Derived from data provided by Lipper Inc.; based on the Average Intermediate-Term U.S. Government Fund through December 31, 2001, and the Average Intermediate-Term Investment Grade Debt Fund thereafter. |
3 | Inception dates are November 12, 2001, for the Admiral Shares and January 26, 2006, for the Institutional Shares. |
40
Intermediate-Term Bond Index Fund
Fiscal-Year Total Returns (%): December 31, 1996–December 31, 2006 |
|
| |||
|
| Investor Shares |
| ||
|
|
|
| Lehman1 | |
Fiscal | Capital | Income | Total | Total | |
Year | Return | Return | Return | Return | |
1997 | 2.4% | 7.0% | 9.4% | 9.4% | |
1998 | 3.5 | 6.6 | 10.1 | 10.1 | |
1999 | –9.0 | 6.0 | –3.0 | –2.9 | |
2000 | 5.4 | 7.4 | 12.8 | 12.4 | |
2001 | 2.6 | 6.7 | 9.3 | 8.8 | |
2002 | 4.7 | 6.2 | 10.9 | 13.0 | |
2003 | 0.6 | 5.0 | 5.6 | 6.0 | |
2004 | 0.4 | 4.8 | 5.2 | 5.3 | |
2005 | –2.9 | 4.7 | 1.8 | 1.8 | |
2006 | –1.1 | 5.0 | 3.9 | 3.8 | |
1 | Lehman 5–10 Year Government/Credit Index. |
Note: See Financial Highlights tables on pages 48 through 50 for dividend and capital gains information.
41
Intermediate-Term Bond Index Fund
Financial Statements
Statement of Net Assets—Investments Summary
As of December 31, 2006
This Statement summarizes the fund’s holdings by bond type (U.S. government and agency issues, corporate bonds, sovereign bonds, etc.); corporate bonds are further classified by industry sector. Details are reported for each of the fund’s 50 largest individual holdings and for investments that, in total for any issuer, represent more than 1% of the fund’s net assets. The total value of smaller holdings is reported as a single amount within each category.
The fund provides a complete list of its holdings four times in each fiscal year, at the quarter-ends. For the second and fourth fiscal quarters, the complete listing of the fund’s holdings is available electronically on Vanguard.com® and on the Securities and Exchange Comission’s website (www.sec.gov), or you can have it mailed to you without charge by calling 800-662-7447. For the first and third fiscal quarters, the fund files the lists with the SEC on Form N-Q. Shareholders can look up the fund’s Forms N-Q on the SEC’s website. Forms N-Q may also be reviewed and copied at the SEC’s Public Reference Room (see the back cover of this report for further information).
|
|
|
| Face | Market | Percentage | |
|
|
| Maturity | Amount | Value• | of Net | |
|
| Coupon | Date | ($000) | ($000) | Assets | |
U.S. Government and Agency Obligations |
|
|
|
| |||
U.S. Government Securities |
|
|
|
|
| ||
| U.S. Treasury Bond | 7.250% | 5/15/16 | 191,150 | 227,260 | 3.6% | |
| U.S. Treasury Bond | 9.875% | 11/15/15 | 146,775 | 201,151 | 3.2% | |
| U.S. Treasury Bond | 8.750% | 5/15/17 | 140,125 | 185,404 | 3.0% | |
| U.S. Treasury Bond | 11.250% | 2/15/15 | 108,735 | 156,222 | 2.5% | |
| U.S. Treasury Bond | 9.250% | 2/15/16 | 114,525 | 152,586 | 2.5% | |
| U.S. Treasury Bond | 9.125% | 5/15/18 | 93,500 | 128,635 | 2.0% | |
| U.S. Treasury Bond | 10.625% | 8/15/15 | 59,030 | 83,509 | 1.3% | |
| U.S. Treasury Bond | 4.000% | 2/15/15 | 82,425 | 78,523 | 1.2% | |
| U.S. Treasury Bond | 7.500% | 11/15/16 | 28,525 | 34,671 | 0.6% | |
| U.S. Treasury Bond | 3.625%–10.375% | 11/15/12–2/15/19 | 28,150 | 30,104 | 0.5% | |
| U.S. Treasury Note | 4.000% | 2/15/14 | 260,710 | 249,549 | 4.0% | |
| U.S. Treasury Note | 4.250% | 11/15/14 | 134,845 | 130,821 | 2.1% | |
| U.S. Treasury Note | 4.750% | 5/15/14 | 103,775 | 104,051 | 1.7% | |
| U.S. Treasury Note | 4.250% | 11/15/13 | 80,325 | 78,204 | 1.3% | |
| U.S. Treasury Note | 3.875% | 2/15/13 | 76,675 | 73,393 | 1.2% | |
| U.S. Treasury Note | 4.000% | 11/15/12 | 68,175 | 65,821 | 1.1% | |
| U.S. Treasury Note | 4.375% | 12/31/07 | 63,500 | 63,113 | 1.0% | |
| U.S. Treasury Note | 4.625% | 9/30/08 | 34,725 | 34,589 | 0.6% | |
| U.S. Treasury Note | 4.250% | 8/15/13 | 27,925 | 27,227 | 0.4% | |
| U.S. Treasury Note | 4.250% | 8/15/14 | 24,925 | 24,197 | 0.4% | |
| U.S. Treasury Note | 4.125%–5.125% | 10/31/07–8/15/16 | 25,010 | 24,792 | 0.4% | |
|
|
|
|
| 2,153,822 | 34.6% | |
Agency Bonds and Notes |
|
|
|
|
| ||
1 | Federal Home Loan Bank | 4.500% | 9/16/13 | 38,400 | 37,322 | 0.6% | |
1 | Federal Home Loan Bank | 5.125% | 8/14/13 | 34,300 | 34,564 | 0.5% | |
1 | Federal Home Loan Bank | 4.500% | 11/15/12 | 24,175 | 23,642 | 0.4% | |
1 | Federal Home Loan Bank | 5.375% | 5/18/16 | 21,350 | 21,942 | 0.4% | |
1 | Federal Home Loan Bank | 5.250% | 6/18/14 | 20,325 | 20,713 | 0.3% | |
1 | Federal Home Loan Bank | 4.750% | 12/16/16 | 19,650 | 19,252 | 0.3% | |
42
Intermediate-Term Bond Index Fund
|
|
|
| Face | Market | Percentage | ||
|
|
| Maturity | Amount | Value• | of Net | ||
|
| Coupon | Date | ($000) | ($000) | Assets | ||
1 | Federal Home Loan Bank | 3.875%–5.750% | 5/15/12–6/13/16 | 23,300 | 23,431 | 0.4% | ||
1 | Federal Home Loan |
|
|
|
|
| ||
| Mortgage Corp. | 4.875% | 11/15/13 | 60,250 | 59,998 | 1.0% | ||
1 | Federal Home Loan |
|
|
|
|
| ||
| Mortgage Corp. | 5.125% | 7/15/12 | 59,000 | 59,447 | 1.0% | ||
1 | Federal Home Loan |
|
|
|
|
| ||
| Mortgage Corp. | 5.000% | 7/15/14 | 51,100 | 51,321 | 0.8% | ||
1 | Federal Home Loan |
|
|
|
|
| ||
| Mortgage Corp. | 4.500% | 1/15/13 | 50,850 | 49,625 | 0.8% | ||
1 | Federal Home Loan |
|
|
|
|
| ||
| Mortgage Corp. | 5.750% | 1/15/12 | 46,875 | 48,493 | 0.8% | ||
1 | Federal Home Loan |
|
|
|
|
| ||
| Mortgage Corp. | 4.500% | 7/15/13 | 44,975 | 43,791 | 0.7% | ||
1 | Federal Home Loan |
|
|
|
|
| ||
| Mortgage Corp. | 5.250% | 4/18/16 | 26,500 | 27,005 | 0.4% | ||
1 | Federal Home Loan |
|
|
|
|
| ||
| Mortgage Corp. | 5.500% | 7/18/16 | 15,000 | 15,586 | 0.3% | ||
1 | Federal Home Loan |
|
|
|
|
| ||
| Mortgage Corp. | 4.500%–5.125% | 1/15/14–10/18/16 | 20,000 | 19,632 | 0.3% | ||
1 | Federal National |
|
|
|
|
| ||
| Mortgage Assn. | 6.125% | 3/15/12 | 72,235 | 76,024 | 1.2% | ||
1 | Federal National |
|
|
|
|
| ||
| Mortgage Assn. | 4.625% | 10/15/13 | 56,500 | 55,364 | 0.9% | ||
1 | Federal National |
|
|
|
|
| ||
| Mortgage Assn. | 5.250% | 9/15/16 | 32,925 | 33,498 | 0.5% | ||
1 | Federal National |
|
|
|
|
| ||
| Mortgage Assn. | 4.625% | 10/15/14 | 31,625 | 30,965 | 0.5% | ||
1 | Federal National |
|
|
|
|
| ||
| Mortgage Assn. | 4.375% | 9/15/12 | 30,675 | 29,781 | 0.5% | ||
1 | Federal National |
|
|
|
|
| ||
| Mortgage Assn. | 4.875% | 12/15/16 | 29,900 | 29,608 | 0.5% | ||
1 | Federal National |
|
|
|
|
| ||
| Mortgage Assn. | 5.000% | 3/15/16 | 21,025 | 21,054 | 0.3% | ||
1 | Federal National |
|
|
|
|
| ||
| Mortgage Assn. | 4.375%–5.250% | 8/1/12–1/2/14 | 33,050 | 32,429 | 0.5% | ||
† | Other—Agency Bonds and Notes |
|
| 50,419 | 0.8% | |||
|
|
|
|
| 914,906 | 14.7% | ||
Total U.S. Government and Agency Obligations (Cost $3,071,576) |
| 3,068,728 | 49.3% | |||||
Corporate Bonds |
|
|
|
|
| |||
† | Asset-Backed/Commercial Mortgage-Backed Securities |
| 5,408 | 0.1% | ||||
|
|
|
|
|
|
| ||
Finance |
|
|
|
|
| |||
| Banking |
|
|
|
|
| ||
| Citigroup, Inc. | 5.000% | 9/15/14 | 25,344 | 24,726 | 0.4% | ||
| HSBC Bank USA | 4.625% | 4/1/14 | 8,275 | 7,937 | 0.1% | ||
| HSBC Holdings PLC | 5.250% | 12/12/12 | 5,225 | 5,217 | 0.1% | ||
| UFJ Finance Aruba AEC | 6.750% | 7/15/13 | 15,350 | 16,451 | 0.3% | ||
† | Other—Banking |
|
|
| 405,091 | 6.5% | ||
| Brokerage |
|
|
|
|
| ||
| Goldman Sachs Group, Inc. | 5.250% | 4/1/13 | 18,250 | 18,210 | 0.3% | ||
| Goldman Sachs Group, Inc. | 4.750%–6.600% | 1/15/12–10/1/16 | 68,875 | 68,322 | 1.1% | ||
| Morgan Stanley Dean Witter | 5.300% | 3/1/13 | 31,500 | 31,523 | 0.5% | ||
| Morgan Stanley Dean Witter | 4.750%–6.600% | 1/9/12–10/18/16 | 34,665 | 34,671 | 0.5% | ||
† | Other—Brokerage |
|
|
| 74,927 | 1.2% | ||
43
Intermediate-Term Bond Index Fund
|
|
|
| Face | Market | Percentage | |||||
|
|
| Maturity | Amount | Value• | of Net | |||||
|
| Coupon | Date | ($000) | ($000) | Assets | |||||
| Finance Companies |
|
|
|
|
| |||||
| General Electric |
|
|
|
|
| |||||
| Capital Corp. | 5.875% | 2/15/12 | 29,550 | 30,401 | 0.5% | |||||
| General Electric |
|
|
|
|
| |||||
| Capital Corp. | 4.250%–8.125% | 5/15/12–10/20/16 | 50,763 | 51,776 | 0.8% | |||||
2 | HSBC Finance |
|
|
|
|
| |||||
| Capital Trust IX | 5.911% | 11/30/35 | 5,700 | 5,739 | 0.1% | |||||
| HSBC Finance Corp. | 4.750%–7.000% | 5/15/12–1/19/16 | 45,975 | 46,119 | 0.7% | |||||
† | Other—Finance Companies |
|
|
| 137,290 | 2.2% | |||||
| Insurance |
|
|
|
|
| |||||
| GE Global Insurance |
|
|
|
|
| |||||
| Holdings Corp. | 7.750% | 6/15/30 | 250 | 303 | 0.0% | |||||
† | Other—Insurance |
|
|
| 165,858 | 2.7% | |||||
† | Real Estate Investment Trusts |
|
|
| 103,495 | 1.7% | |||||
|
|
|
|
| 1,228,056 | 19.7% | |||||
Industrial |
|
|
|
|
| ||||||
† | Basic Industry |
|
|
| 98,565 | 1.6% | |||||
| Capital Goods |
|
|
|
|
| |||||
| General Electric Co. | 5.000% | 2/1/13 | 17,975 | 17,780 | 0.3% | |||||
† | Other—Capital Goods |
|
|
| 127,035 | 2.0% | |||||
† | Communication |
|
|
| 291,800 | 4.7% | |||||
† | Consumer Cyclical |
|
|
| 186,239 | 3.0% | |||||
† | Consumer Noncyclical |
|
|
| 249,117 | 4.0% | |||||
† | Energy |
|
|
| 95,674 | 1.5% | |||||
† | Technology |
|
|
| 64,106 | 1.0% | |||||
† | Transportation |
|
|
| 30,998 | 0.5% | |||||
† | Industrial—Other |
|
|
| 6,516 | 0.1% | |||||
|
|
|
|
| 1,167,830 | 18.7% | |||||
Utilities |
|
|
|
|
| ||||||
† | Electric |
|
|
| 191,345 | 3.1% | |||||
† | Natural Gas |
|
|
| 62,566 | 1.0% | |||||
|
|
|
|
| 253,911 | 4.1% | |||||
Total Corporate Bonds (Cost $2,672,358) |
|
| 2,655,205 | 42.6% | |||||||
Sovereign Bonds (U.S. Dollar-Denominated) |
|
|
|
| |||||||
| Kreditanstalt fur Wiederaufbau | 5.125% | 3/14/16 | 15,800 | 15,931 | 0.3% | |||||
| Province of Ontario | 4.750% | 1/19/16 | 16,725 | 16,281 | 0.3% | |||||
| Republic of Italy | 5.250% | 9/20/16 | 24,500 | 24,632 | 0.4% | |||||
| Republic of Italy | 5.625% | 6/15/12 | 21,625 | 22,068 | 0.3% | |||||
† | Other—Sovereign Bonds |
|
|
| 299,911 | 4.8% | |||||
Total Sovereign Bonds (Cost $381,411) |
|
| 378,823 | 6.1% | |||||||
† | Taxable Municipal Bonds (Cost $1,347) |
|
| 1,323 | 0.0% | ||||||
|
|
|
| Shares |
|
| |||||
Temporary Cash Investment |
|
|
|
|
| ||||||
3 | Vanguard Market Liquidity Fund, 5.294% (Cost $104,078) | 104,078,428 | 104,078 | 1.7% | |||||||
4 | Total Investments (Cost $6,230,770) |
|
| 6,208,157 | 99.7% | ||||||
Other Assets and Liabilities |
|
|
|
|
| ||||||
| Other Assets—Note B |
|
|
| 125,427 | 2.0% | |||||
| Liabilities |
|
|
| (105,756) | (1.7%) | |||||
|
|
|
|
| 19,671 | 0.3% | |||||
Net Assets |
|
|
| 6,227,828 | 100.0% | ||||||
44
Intermediate-Term Bond Index Fund
At December 31, 2006, net assets consisted of:5 |
|
| Amount |
| ($000) |
Paid-in Capital | 6,335,876 |
Undistributed Net Investment Income | — |
Accumulated Net Realized Losses | (85,435) |
Unrealized Depreciation | (22,613) |
Net Assets | 6,227,828 |
|
|
|
|
Investor Shares—Net Assets |
|
Applicable to 285,835,336 outstanding $.001 par value shares |
|
of beneficial interest (unlimited authorization) | 2,928,867 |
Net Asset Value Per Share—Investor Shares | $10.25 |
|
|
|
|
Admiral Shares—Net Assets |
|
Applicable to 304,315,376 outstanding $.001 par value shares |
|
of beneficial interest (unlimited authorization) | 3,118,226 |
Net Asset Value Per Share—Admiral Shares | $10.25 |
|
|
|
|
Institutional Shares—Net Assets |
|
Applicable to 17,638,325 outstanding $.001 par value shares |
|
of beneficial interest (unlimited authorization) | 180,735 |
Net Asset Value Per Share—Institutional Shares | $10.25 |
• | See Note A in Notes to Financial Statements. |
† | Represents the aggregate value, by category, of securities that are not among the 50 largest holdings and, in total for any issuer, represent 1% or less of net assets. |
1 | The issuer operates under a congressional charter; its securities are neither issued nor guaranteed by the U.S. government. If needed, access to additional funding from the U.S. Treasury (beyond the issuer’s line of credit) would require congressional action. |
2 | The average or expected maturity is shorter than the final maturity shown because of the possibility of interim principal payments and prepayments or the possibility of the issue being called. |
3 | Affiliated money market fund available only to Vanguard funds and certain trusts and accounts managed by Vanguard. Rate shown is the 7-day yield. |
4 | Certain of the fund’s securities are exempt from registration under Rule 144A of the Securities Act of 1933. Such securities may be sold in transactions exempt from registration, normally to qualified institutional buyers. At December 31, 2006, the aggregate value of these securities was $17,191,000, representing 0.3% of net assets. |
5 | See Note D in Notes to Financial Statements for the tax-basis components of net assets. |
45
Intermediate-Term Bond Index Fund
Statement of Operations
| Year Ended |
| December 31, 2006 |
| ($000) |
Investment Income |
|
Income |
|
Interest1 | 311,378 |
Security Lending | 25 |
Total Income | 311,403 |
Expenses |
|
The Vanguard Group—Note B |
|
Investment Advisory Services | 511 |
Management and Administrative |
|
Investor Shares | 4,105 |
Admiral Shares | 2,224 |
Institutional Shares | 79 |
Marketing and Distribution |
|
Investor Shares | 789 |
Admiral Shares | 729 |
Institutional Shares | 12 |
Custodian Fees | 29 |
Auditing Fees | 37 |
Shareholders’ Reports |
|
Investor Shares | 79 |
Admiral Shares | 10 |
Institutional Shares | — |
Trustees’ Fees and Expenses | 6 |
Total Expenses | 8,610 |
Expenses Paid Indirectly—Note C | (23) |
Net Expenses | 8,587 |
Net Investment Income | 302,816 |
Realized Net Gain (Loss) on Investment Securities Sold | (65,369) |
Change in Unrealized Appreciation (Depreciation) of Investment Securities | 3,463 |
Net Increase (Decrease) in Net Assets Resulting from Operations | 240,910 |
1 | Interest income from an affiliated company of the fund was $3,228,000. |
46
Intermediate-Term Bond Index Fund
Statement of Changes in Net Assets
| Year Ended December 31, | |
| 2006 | 2005 |
| ($000) | ($000) |
Increase (Decrease) in Net Assets |
|
|
Operations |
|
|
Net Investment Income | 302,816 | 251,557 |
Realized Net Gain (Loss) | (65,369) | (18,070) |
Change in Unrealized Appreciation (Depreciation) | 3,463 | (139,902) |
Net Increase (Decrease) in Net Assets Resulting from Operations | 240,910 | 93,585 |
Distributions |
|
|
Net Investment Income |
|
|
Investor Shares | (145,591) | (160,529) |
Admiral Shares | (150,746) | (91,028) |
Institutional Shares | (6,479) | — |
Realized Capital Gain1 |
|
|
Investor Shares | — | (3,866) |
Admiral Shares | — | (1,338) |
Institutional Shares | — | — |
Total Distributions | (302,816) | (256,761) |
Capital Share Transactions—Note F |
|
|
Investor Shares | (47,249) | (392,735) |
Admiral Shares | 199,316 | 1,885,701 |
Institutional Shares | 179,910 | — |
Net Increase (Decrease) from Capital Share Transactions | 331,977 | 1,492,966 |
Total Increase (Decrease) | 270,071 | 1,329,790 |
Net Assets |
|
|
Beginning of Period | 5,957,757 | 4,627,967 |
End of Period | 6,227,828 | 5,957,757 |
1.Includes fiscal 2005 short-term gain distributions totaling $1,892,000. Short-term gain distributions are treated as ordinary income dividends for tax purposes.
47
Intermediate-Term Bond Index Fund
Financial Highlights
Investor Shares |
|
|
|
|
|
|
|
| Year Ended December 31, | ||
For a Share Outstanding Throughout Each Period | 2006 | 2005 | 2004 | 2003 | 2002 |
Net Asset Value, Beginning of Period | $10.36 | $10.68 | $10.69 | $10.75 | $10.28 |
Investment Operations |
|
|
|
|
|
Net Investment Income | .499 | .492 | .506 | .532 | .597 |
Net Realized and Unrealized Gain (Loss) |
|
|
|
|
|
on Investments | (.110) | (.309) | .038 | .064 | .478 |
Total from Investment Operations | .389 | .183 | .544 | .596 | 1.075 |
Distributions |
|
|
|
|
|
Dividends from Net Investment Income | (.499) | (.492) | (.506) | (.532) | (.597) |
Distributions from Realized Capital Gains | — | (.011) | (.048) | (.124) | (.008) |
Total Distributions | (.499) | (.503) | (.554) | (.656) | (.605) |
Net Asset Value, End of Period | $10.25 | $10.36 | $10.68 | $10.69 | $10.75 |
|
|
|
|
|
|
Total Return1 | 3.91% | 1.75% | 5.22% | 5.65% | 10.85% |
|
|
|
|
|
|
Ratios/Supplemental Data |
|
|
|
|
|
Net Assets, End of Period (Millions) | $2,929 | $3,009 | $3,501 | $2,749 | $2,415 |
Ratio of Total Expenses to |
|
|
|
|
|
Average Net Assets | 0.18% | 0.18% | 0.18% | 0.20% | 0.21% |
Ratio of Net Investment Income to |
|
|
|
|
|
Average Net Assets | 4.91% | 4.68% | 4.75% | 4.91% | 5.75% |
Portfolio Turnover Rate | 86% | 76% | 84% | 98% | 141% |
1 | Total returns do not reflect the $10 annual account maintenance fee applied on balances under $10,000. |
48
Intermediate-Term Bond Index Fund
Admiral Shares |
|
|
|
|
| |
|
|
| Year Ended December 31, | |||
For a Share Outstanding Throughout Each Period | 2006 | 2005 | 2004 | 2003 | 2002 | |
Net Asset Value, Beginning of Period | $10.36 | $10.68 | $10.69 | $10.75 | $10.28 | |
Investment Operations |
|
|
|
|
| |
Net Investment Income | .506 | .499 | .514 | .538 | .602 | |
Net Realized and Unrealized Gain (Loss) |
|
|
|
|
| |
on Investments | (.110) | (.309) | .038 | .064 | .478 | |
Total from Investment Operations | .396 | .190 | .552 | .602 | 1.080 | |
Distributions |
|
|
|
|
| |
Dividends from Net Investment Income | (.506) | (.499) | (.514) | (.538) | (.602) | |
Distributions from Realized Capital Gains | — | (.011) | (.048) | (.124) | (.008) | |
Total Distributions | (.506) | (.510) | (.562) | (.662) | (.610) | |
Net Asset Value, End of Period | $10.25 | $10.36 | $10.68 | $10.69 | $10.75 | |
|
|
|
|
|
| |
Total Return | 3.98% | 1.82% | 5.30% | 5.70% | 10.91% | |
|
|
|
|
|
| |
Ratios/Supplemental Data |
|
|
|
|
| |
Net Assets, End of Period (Millions) | $3,118 | $2,949 | $1,127 | $756 | $662 | |
Ratio of Total Expenses to |
|
|
|
|
| |
Average Net Assets | 0.11% | 0.11% | 0.11% | 0.15% | 0.16% | |
Ratio of Net Investment Income to |
|
|
|
|
| |
Average Net Assets | 4.98% | 4.75% | 4.82% | 4.96% | 5.78% | |
Portfolio Turnover Rate | 86% | 76% | 84% | 98% | 141% | |
49
Intermediate-Term Bond Index Fund
Institutional Shares |
|
| Jan. 261 to |
| Dec. 31, |
For a Share Outstanding Throughout the Period | 2006 |
Net Asset Value, Beginning of Period | $10.29 |
Investment Operations |
|
Net Investment Income | .473 |
Net Realized and Unrealized Gain (Loss) on Investments | (.040) |
Total from Investment Operations | .433 |
Distributions |
|
Dividends from Net Investment Income | (.473) |
Distributions from Realized Capital Gains | — |
Total Distributions | (.473) |
Net Asset Value, End of Period | $10.25 |
|
|
Total Return | 4.36% |
|
|
Ratios/Supplemental Data |
|
Net Assets, End of Period (Millions) | $181 |
Ratio of Total Expenses to Average Net Assets | 0.08%* |
Ratio of Net Investment Income to Average Net Assets | 5.01%* |
Portfolio Turnover Rate | 86% |
1 | Inception. |
* Annualized.
See accompanying Notes, which are an integral part of the Financial Statements.
50
Intermediate-Term Bond Index Fund
Notes to Financial Statements
Vanguard Intermediate-Term Bond Index Fund is registered under the Investment Company Act of 1940 as an open-end investment company, or mutual fund. Certain of the fund’s investments are in corporate debt instruments; the issuers’ abilities to meet their obligations may be affected by economic developments in their respective industries. The fund offers three classes of shares: Investor Shares, Admiral Shares, and Institutional Shares. Investor Shares are available to any investor who meets the fund’s minimum purchase requirements. Admiral Shares are designed for investors who meet certain administrative, service, tenure, and account-size criteria. Institutional Shares were first issued on January 26, 2006, and are designed for investors who meet certain administrative and service criteria and invest a minimum of $25 million.
A. The following significant accounting policies conform to generally accepted accounting principles for U.S. mutual funds. The fund consistently follows such policies in preparing its financial statements.
1. Security Valuation: Bonds, and temporary cash investments acquired over 60 days to maturity, are valued using the latest bid prices or using valuations based on a matrix system (which considers such factors as security prices, yields, maturities, and ratings), both as furnished by independent pricing services. Investments in Vanguard Market Liquidity Fund are valued at that fund’s net asset value. Other temporary cash investments are valued at amortized cost, which approximates market value. Securities for which market quotations are not readily available, or whose values have been materially affected by events occurring before the fund’s pricing time but after the close of the securities’ primary markets, are valued by methods deemed by the board of trustees to represent fair value.
2. Federal Income Taxes: The fund intends to continue to qualify as a regulated investment company and distribute all of its taxable income. Accordingly, no provision for federal income taxes is required in the financial statements.
3. Distributions: Distributions from net investment income are declared daily and paid on the first business day of the following month. Annual distributions from realized capital gains, if any, are recorded on the ex-dividend date.
4. Security Lending: The fund may lend its securities to qualified institutional borrowers to earn additional income. Security loans are required to be secured at all times by collateral at least equal to the market value of securities loaned. The fund invests cash collateral received in Vanguard Market Liquidity Fund, and records a liability for the return of the collateral, during the period the securities are on loan. Security lending income represents the income earned on investing cash collateral, less expenses associated with the loan.
5. Other: Interest income includes income distributions received from Vanguard Market Liquidity Fund and is accrued daily. Premiums and discounts on debt securities purchased are amortized and accreted, respectively, to interest income over the lives of the respective securities. Security transactions are accounted for on the date securities are bought or sold. Costs used to determine realized gains (losses) on the sale of investment securities are those of the specific securities sold.
Each class of shares has equal rights as to assets and earnings, except that each class separately bears certain class-specific expenses related to maintenance of shareholder accounts (included in Management and Administrative expenses) and shareholder reporting. Marketing and distribution expenses are allocated to each class of shares based on a method approved by the board of trustees. Income, other non-class-specific expenses, and gains and losses on investments are allocated to each class of shares based on its relative net assets.
51
Intermediate-Term Bond Index Fund
B. The Vanguard Group furnishes at cost investment advisory, corporate management, administrative, marketing, and distribution services. The costs of such services are allocated to the fund under methods approved by the board of trustees. The fund has committed to provide up to 0.40% of its net assets in capital contributions to Vanguard. At December 31, 2006, the fund had contributed capital of $618,000 to Vanguard (included in Other Assets), representing 0.01% of the fund’s net assets and 0.62% of Vanguard’s capitalization. The fund’s trustees and officers are also directors and officers of Vanguard.
C. The fund’s custodian bank has agreed to reduce its fees when the fund maintains cash on deposit in the non-interest-bearing custody account. For the year ended December 31, 2006, custodian fee offset arrangements reduced the fund’s expenses by $23,000.
D. Capital gain distributions are determined on a tax basis and may differ from realized capital gains for financial reporting purposes. Differences may be permanent or temporary. Permanent differences are reclassified among capital accounts in the financial statements to reflect their tax character. Temporary differences arise when gains or losses are recognized in different periods for financial statement and tax purposes; these differences will reverse at some time in the future.
For tax purposes, at December 31, 2006, the fund had available realized losses of $85,082,000 to offset future net capital gains of $866,000 through December 31, 2013, $80,479,000 through December 31, 2014, and $3,737,000 through December 31, 2015.
At December 31, 2006, the cost of investment securities for tax purposes was $6,230,988,000. Net unrealized depreciation of investment securities for tax purposes was $22,831,000, consisting of unrealized gains of $36,409,000 on securities that had risen in value since their purchase and $59,240,000 in unrealized losses on securities that had fallen in value since their purchase.
E. During the year ended December 31, 2006, the fund purchased $1,347,838,000 of investment securities and sold $1,331,853,000 of investment securities other than U.S. government securities and temporary cash investments. Purchases and sales of U.S. government securities were $3,983,039,000 and $3,692,243,000, respectively.
F. Capital share transactions for each class of shares were:
|
|
| Year Ended December 31, | ||
|
| 2006 |
| 2005 | |
| Amount | Shares |
| Amount | Shares |
| ($000) | (000) | ($000) | (000) | |
Investor Shares |
|
|
|
| |
Issued | 836,823 | 82,313 | 1,407,063 | 133,636 | |
Issued in Lieu of Cash Distributions | 127,802 | 12,585 | 142,246 | 13,528 | |
Redeemed | (1,011,874) | (99,568) | (1,942,044) | (184,581) | |
Net Increase (Decrease)—Investor Shares | (47,249) | (4,670) | (392,735) | (37,417) | |
Admiral Shares |
|
|
|
| |
Issued | 1,100,803 | 108,299 | 2,183,549 | 207,568 | |
Issued in Lieu of Cash Distributions | 122,022 | 12,016 | 72,355 | 6,909 | |
Redeemed | (1,023,509) | (100,768) | (370,203) | (35,263) | |
Net Increase (Decrease)—Admiral Shares | 199,316 | 19,547 | 1,885,701 | 179,214 | |
52
Intermediate-Term Bond Index Fund
|
| Year Ended December 31, | |||
|
| 2006 |
| 2005 | |
| Amount | Shares |
| Amount | Shares |
| ($000) | (000) | ($000) | (000) | |
Institutional Shares |
|
|
|
| |
Issued | 187,743 | 18,420 | — | — | |
Issued in Lieu of Cash Distributions | 4,554 | 448 | — | — | |
Redeemed | (12,387) | (1,230) | — | — | |
Net Increase (Decrease)—Institutional Shares | 179,910 | 17,638 | — | — | |
G. In June 2006, the Financial Accounting Standards Board issued Interpretation No. 48 (“FIN 48”), “Accounting for Uncertainty in Income Taxes.” FIN 48 establishes the minimum threshold for recognizing, and a system for measuring, the benefits of tax-return positions in financial statements. FIN 48 will be effective for the fund’s fiscal year ending December 31, 2007. Management is in the process of analyzing the fund’s tax positions for purposes of implementing FIN 48; based on the analysis completed to date, management does not believe the adoption of FIN 48 will result in any material impact to the fund’s financial statements.
53
Long-Term Bond Index Fund
Fund Profile
As of December 31, 2006
Financial Attributes |
|
|
|
|
| Target | Broad |
| Fund | Index1 | Index2 |
Number of Issues | 679 | 988 | 7,134 |
Yield |
| — | — |
Investor Shares | 5.3% |
|
|
Institutional Shares | 5.4% |
|
|
Yield to Maturity | 5.5%3 | 5.5% | 5.4% |
Average Coupon | 6.9% | 6.7% | 5.4% |
Average Effective |
|
|
|
Maturity | 20.1 years | 20.8 years | 7.0 years |
Average Quality4 | Aa2 | Aa2 | Aa1 |
Average Duration | 10.9 years | 10.9 years | 4.5 years |
Expense Ratio |
| — | — |
Investor Shares | 0.18% |
|
|
Institutional Shares | 0.08%5 |
|
|
Short-Term Reserves | 0% | — | — |
Sector Diversification6 (% of portfolio) |
|
|
|
Asset-Backed/Commercial Mortgage-Backed | 0% |
Finance | 11 |
Foreign | 6 |
Government Mortgage-Backed | 0 |
Industrial | 25 |
Treasury/Agency | 53 |
Utilities | 5 |
Volatility Measures7 |
| |
| Fund Versus | Fund Versus |
| Target Index1 | Broad Index2 |
R-Squared | 1.00 | 0.94 |
Beta | 1.01 | 2.25 |
Distribution by Maturity (% of portfolio) |
|
|
|
Under 1 Year | 1% |
1–5 Years | 0 |
5–10 Years | 1 |
10–20 Years | 44 |
20–30 Years | 53 |
Over 30 Years | 1 |
Distribution by Credit Quality4(% of portfolio) |
|
|
|
Aaa | 55% |
Aa | 7 |
A | 18 |
Baa | 20 |
Investment Focus

1 | Lehman Long Government/Credit Index. |
2 | Lehman Aggregate Bond Index. |
3 | Before expenses. |
4 | Moody’s Investors Service. |
5 | Annualized. |
6 | The agency sector may include issues from government-sponsored enterprises; such issues are not backed by the full faith and credit of the U.S. government. |
7 | For an explanation of R-squared, beta, and other terms used here, see the Glossary on page 72. |
54
Long-Term Bond Index Fund
Performance Summary
All of the returns in this report represent past performance, which is not a guarantee of future results that may be achieved by the fund. (Current performance may be lower or higher than the performance data cited. For performance data current to the most recent month-end, visit our website at www.vanguard.com.) Note, too, that both investment returns and principal value can fluctuate widely, so an investor’s shares, when sold, could be worth more or less than their original cost. The returns shown do not reflect taxes that a shareholder would pay on fund distributions or on the sale of fund shares.
Cumulative Performance: December 31, 1996–December 31, 2006
Initial Investment of $10,000

|
|
|
| |
|
|
| ||
| Average Annual Total Returns | Final Value | ||
| Periods Ended December 31, 2006 | of a $10,000 | ||
| One Year | Five Years | Ten Years | Investment |
Long-Term Bond Index Fund |
|
|
|
|
Investor Shares1 | 2.67% | 7.18% | 7.72% | $21,043 |
Lehman Aggregate Bond Index | 4.33 | 5.06 | 6.24 | 18,312 |
Lehman Long Government/Credit Index | 2.71 | 7.38 | 7.72 | 21,030 |
Average Corporate A-Rated Debt Fund2 | 3.86 | 4.64 | 5.44 | 16,981 |
|
| Final Value of |
| Since | a $25,000,000 |
| Inception3 | Investment |
Long-Term Bond Index Fund Institutional Shares | 3.86% | $25,966,067 |
Lehman Aggregate Bond Index | 4.48 | 26,121,093 |
Lehman Long Government/Credit Index | 3.76 | 25,940,836 |
1 | Total return figures do not reflect the $10 annual account maintenance fee applied on balances under $10,000. |
2 | Derived from data provided by Lipper Inc.; based on the Average General U.S. Government Fund through December 31, 2001, and the Average Corporate A-Rated Debt Fund thereafter. |
3 | February 2, 2006. |
55
Long-Term Bond Index Fund
Fiscal-Year Total Returns (%): December 31, 1996–December 31, 2006 |
|
| |||
|
| Investor Shares |
| ||
|
|
|
| Lehman1 | |
Fiscal | Capital | Income | Total | Total | |
Year | Return | Return | Return | Return | |
1997 | 6.9% | 7.4% | 14.3% | 14.5% | |
1998 | 5.5 | 6.5 | 12.0 | 11.8 | |
1999 | –13.5 | 5.6 | –7.9 | –7.7 | |
2000 | 9.1 | 7.5 | 16.6 | 16.2 | |
2001 | 1.6 | 6.6 | 8.2 | 7.3 | |
2002 | 7.8 | 6.6 | 14.4 | 14.8 | |
2003 | 0.0 | 5.5 | 5.5 | 5.9 | |
2004 | 2.8 | 5.6 | 8.4 | 8.6 | |
2005 | 0.2 | 5.1 | 5.3 | 5.3 | |
2006 | –2.6 | 5.3 | 2.7 | 2.7 | |
1 | Lehman Long Government/Credit Index. |
Note: See Financial Highlights tables on pages 63 and 64 for dividend and capital gains information.
56
Long-Term Bond Index Fund
Financial Statements
Statement of Net Assets—Investments Summmary
As of December 31, 2006
This Statement summarizes the fund’s holdings by bond type (U.S. government and agency issues, corporate bonds, sovereign bonds, etc.); corporate bonds are further classified by industry sector. Details are reported for each of the fund’s 50 largest individual holdings and for investments that, in total for any issuer, represent more than 1% of the fund’s net assets. The total value of smaller holdings is reported as a single amount within each category.
The fund provides a complete list of its holdings four times in each fiscal year, at the quarter-ends. For the second and fourth fiscal quarters, the complete listing of the fund’s holdings is available electronically on Vanguard.com® and on the Securities and Exchange Comission’s website (www.sec.gov), or you can have it mailed to you without charge by calling 800-662-7447. For the first and third fiscal quarters, the fund files the lists with the SEC on Form N-Q. Shareholders can look up the fund’s Forms N-Q on the SEC’s website. Forms N-Q may also be reviewed and copied at the SEC’s Public Reference Room (see the back cover of this report for further information).
|
|
|
| Face | Market | Percentage |
|
|
| Maturity | Amount | Value• | of Net |
|
| Coupon | Date | ($000) | ($000) | Assets |
U.S. Government and Agency Obligations |
|
|
|
| ||
U.S. Government Securities |
|
|
|
|
| |
| U.S. Treasury Bond | 6.250% | 5/15/30 | 103,855 | 123,783 | 5.6% |
| U.S. Treasury Bond | 8.750% | 8/15/20 | 61,325 | 84,792 | 3.8% |
| U.S. Treasury Bond | 7.625% | 2/15/25 | 63,400 | 83,916 | 3.8% |
| U.S. Treasury Bond | 8.125% | 8/15/21 | 57,720 | 77,056 | 3.5% |
| U.S. Treasury Bond | 6.375% | 8/15/27 | 62,660 | 74,595 | 3.4% |
| U.S. Treasury Bond | 8.875% | 2/15/19 | 53,025 | 72,537 | 3.3% |
| U.S. Treasury Bond | 6.750% | 8/15/26 | 48,615 | 59,812 | 2.7% |
| U.S. Treasury Bond | 6.125% | 8/15/29 | 45,080 | 52,716 | 2.4% |
| U.S. Treasury Bond | 8.500% | 2/15/20 | 38,075 | 51,425 | 2.3% |
| U.S. Treasury Bond | 8.875% | 8/15/17 | 35,975 | 48,133 | 2.2% |
| U.S. Treasury Bond | 7.625% | 11/15/22 | 34,045 | 44,200 | 2.0% |
| U.S. Treasury Bond | 5.500% | 8/15/28 | 31,525 | 34,081 | 1.6% |
| U.S. Treasury Bond | 8.000% | 11/15/21 | 25,195 | 33,407 | 1.5% |
| U.S. Treasury Bond | 7.875% | 2/15/21 | 22,780 | 29,671 | 1.3% |
| U.S. Treasury Bond | 5.375% | 2/15/31 | 26,750 | 28,669 | 1.3% |
| U.S. Treasury Bond | 8.750% | 5/15/20 | 20,700 | 28,553 | 1.3% |
| U.S. Treasury Bond | 8.125% | 8/15/19 | 21,645 | 28,287 | 1.3% |
| U.S. Treasury Bond | 6.625% | 2/15/27 | 18,190 | 22,169 | 1.0% |
| U.S. Treasury Bond | 9.000% | 11/15/18 | 5,330 | 7,332 | 0.3% |
| U.S. Treasury Bond | 4.500%–11.250% | 2/15/15–2/15/36 | 10,135 | 12,094 | 0.5% |
| U.S. Treasury Note | 3.375%–4.500% | 2/28/07–11/15/13 | 10,150 | 10,038 | 0.5% |
|
|
|
|
| 1,007,266 | 45.6% |
Agency Bonds and Notes |
|
|
|
|
| |
1 | Federal Home Loan Bank | 5.375% | 5/15/19 | 7,250 | 7,397 | 0.3% |
1 | Federal Home Loan |
|
|
|
|
|
| Mortgage Corp. | 6.750% | 3/15/31 | 14,100 | 17,104 | 0.8% |
1 | Federal Home Loan |
|
|
|
|
|
| Mortgage Corp. | 6.750% | 9/15/29 | 7,700 | 9,287 | 0.4% |
1 | Federal Home Loan |
|
|
|
|
|
| Mortgage Corp. | 5.000% | 12/14/18 | 7,150 | 6,974 | 0.3% |
57
Long-Term Bond Index Fund
|
|
|
| Face | Market | Percentage | ||
|
|
| Maturity | Amount | Value• | of Net | ||
|
| Coupon | Date | ($000) | ($000) | Assets | ||
1 | Federal Home Loan |
|
|
|
|
| ||
| Mortgage Corp. | 6.250% | 7/15/32 | 3,175 | 3,662 | 0.2% | ||
1 | Federal National |
|
|
|
|
| ||
| Mortgage Assn. | 7.250% | 5/15/30 | 11,935 | 15,236 | 0.7% | ||
1 | Federal National |
|
|
|
|
| ||
| Mortgage Assn. | 6.625% | 11/15/30 | 12,100 | 14,474 | 0.7% | ||
1 | Federal National |
|
|
|
|
| ||
| Mortgage Assn. | 7.125% | 1/15/30 | 10,475 | 13,176 | 0.6% | ||
1 | Federal National |
|
|
|
|
| ||
| Mortgage Assn. | 6.250% | 5/15/29 | 5,350 | 6,093 | 0.3% | ||
1 | Federal National |
|
|
|
|
| ||
| Mortgage Assn. | 0.000%–6.210% | 6/1/17–8/6/38 | 15,625 | 9,012 | 0.4% | ||
| State of Israel (U.S. |
|
|
|
|
| ||
| Government Guaranteed) | 5.500% | 12/4/23 | 5,325 | 5,428 | 0.2% | ||
1 | Tennessee Valley Auth. | 6.750% | 11/1/25 | 4,500 | 5,361 | 0.2% | ||
† | Other—Agency Bonds and Notes |
|
| 28,410 | 1.3% | |||
|
|
|
|
| 141,614 | 6.4% | ||
Total U.S. Government and Agency Obligations (Cost $1,120,783) | 1,148,880 | 52.0% | ||||||
Corporate Bonds |
|
|
|
|
| |||
† | Asset-Backed Securities |
|
|
| 3,324 | 0.1% | ||
|
|
|
|
|
|
| ||
Finance |
|
|
|
|
| |||
† | Banking |
|
|
| 117,362 | 5.3% | ||
| Brokerage |
|
|
|
|
| ||
| Goldman Sachs Group, Inc. | 6.125% | 2/15/33 | 5,450 | 5,581 | 0.3% | ||
† | Other—Brokerage |
|
|
| 28,368 | 1.3% | ||
| Finance Companies |
|
|
|
|
| ||
| General Electric Capital Corp. | 6.750% | 3/15/32 | 11,775 | 13,586 | 0.6% | ||
† | Other—Finance Companies |
|
|
| 5,965 | 0.3% | ||
† | Insurance |
|
|
| 56,529 | 2.6% | ||
† | Real Estate Investment Trusts |
|
| 2,813 | 0.1% | |||
† | Finance—Other |
|
|
| 751 | 0.0% | ||
|
|
|
|
| 230,955 | 10.5% | ||
Industrial |
|
|
|
|
| |||
† | Basic Industry |
|
|
| 39,858 | 1.8% | ||
| Capital Goods |
|
|
|
|
| ||
| Northrop Grumman Corp. | 7.750% | 2/15/31 | 4,300 | 5,340 | 0.2% | ||
† | Other—Capital Goods |
|
|
| 45,722 | 2.1% | ||
| Communication |
|
|
|
|
| ||
| AT&T Corp. | 8.000% | 11/15/31 | 4,425 | 5,505 | 0.2% | ||
| British Telecommunications PLC | 9.125% | 12/15/30 | 5,975 | 8,178 | 0.4% | ||
| Deutsche Telekom |
|
|
|
|
| ||
| International Finance | 8.250% | 6/15/30 | 8,125 | 10,003 | 0.5% | ||
| France Telecom | 8.500% | 3/1/31 | 5,500 | 7,256 | 0.3% | ||
| New Cingular Wireless Services | 8.750% | 3/1/31 | 4,600 | 5,980 | 0.3% | ||
| Sprint Capital Corp. | 6.875% | 11/15/28 | 6,200 | 6,187 | 0.3% | ||
| Time Warner Entertainment | 8.375% | 3/15/23–7/15/33 | 4,375 | 5,193 | 0.2% | ||
| Verizon Global Funding Corp. | 7.750% | 12/1/30 | 7,350 | 8,624 | 0.4% | ||
† | Other—Communication |
|
|
| 109,239 | 4.9% | ||
| Consumer Cyclical |
|
|
|
|
| ||
| Time Warner, Inc. | 7.625% | 4/15/31 | 5,835 | 6,498 | 0.3% | ||
| Time Warner, Inc. | 6.625% | 5/15/29 | 5,275 | 5,313 | 0.3% | ||
| Time Warner, Inc. | 6.500%–9.150% | 2/1/23–11/15/36 | 6,220 | 7,002 | 0.3% | ||
† | Other—Consumer Cyclical |
|
|
| 48,501 | 2.2% | ||
† | Consumer Noncyclical |
|
|
| 87,441 | 4.0% | ||
58
Long-Term Bond Index Fund
|
|
|
| Face | Market | Percentage | ||
|
|
| Maturity | Amount | Value• | of Net | ||
|
| Coupon | Date | ($000) | ($000) | Assets | ||
| Energy |
|
|
|
|
| ||
| Tosco Corp. | 8.125% | 2/15/30 | 7,500 | 9,553 | 0.4% | ||
† | Other—Energy |
|
|
| 61,735 | 2.8% | ||
† | Technology |
|
|
| 17,567 | 0.8% | ||
† | Transportation |
|
|
| 33,878 | 1.6% | ||
† | Industrial—Other |
|
|
| 662 | 0.0% | ||
|
|
|
|
| 535,235 | 24.3% | ||
Utilities |
|
|
|
|
| |||
| Electric |
|
|
|
|
| ||
| FirstEnergy Corp. | 7.375% | 11/15/31 | 5,050 | 5,781 | 0.3% | ||
| Pacific Gas & Electric Co. | 6.050% | 3/1/34 | 6,650 | 6,727 | 0.3% | ||
† | Other—Electric |
|
|
| 77,527 | 3.5% | ||
† | Natural Gas |
|
|
| 25,563 | 1.1% | ||
|
|
|
|
| 115,598 | 5.2% | ||
Total Corporate Bonds (Cost $878,776) |
|
| 885,112 | 40.1% | ||||
Sovereign Bonds (U.S. Dollar-Denominated) |
|
|
|
| ||||
| Quebec Hydro Electric | 8.050% | 7/7/24 | 5,000 | 6,493 | 0.3% | ||
| Republic of Italy | 6.875% | 9/27/23 | 6,600 | 7,662 | 0.4% | ||
| United Mexican States | 8.125% | 12/30/19 | 7,250 | 8,863 | 0.4% | ||
| United Mexican States | 5.625% | 1/15/17 | 5,425 | 5,436 | 0.2% | ||
| United Mexican States | 8.000% | 9/24/22 | 4,300 | 5,263 | 0.2% | ||
| United Mexican States | 6.750%–8.300% | 8/15/31–9/27/34 | 10,850 | 12,718 | 0.6% | ||
† | Other—Sovereign Bonds |
|
|
| 48,652 | 2.2% | ||
Total Sovereign Bonds (Cost $91,603) |
|
| 95,087 | 4.3% | ||||
Taxable Municipal Bonds |
|
|
|
|
| |||
| Illinois (Taxable Pension) GO | 5.100% | 6/1/33 | 18,150 | 17,374 | 0.8% | ||
† | Other—Taxable Muncipal Bonds |
|
| 10,481 | 0.5% | |||
Total Taxable Municipal Bonds (Cost $27,442) |
|
| 27,855 | 1.3% | ||||
|
|
|
| Shares |
|
| ||
Temporary Cash Investment |
|
|
|
|
| |||
2 | Vanguard Market Liquidity Fund, 5.294% (Cost $10,884) | 10,884,295 | 10,884 | 0.5% | ||||
3 | Total Investments (Cost $2,129,488) |
|
| 2,167,818 | 98.2% | |||
Other Assets and Liabilities |
|
|
|
|
| |||
| Receivables for Capital Shares Issued |
|
| 53,026 | 2.4% | |||
| Other Assets—Note B |
|
|
| 55,175 | 2.5% | ||
| Payables for Investment Securities Purchased |
| (61,522) | (2.8%) | ||||
| Other Liabilities |
|
|
| (7,675) | (0.3%) | ||
|
|
|
|
| 39,004 | 1.8% | ||
Net Assets (100%) |
|
|
| 2,206,822 | 100.0% | |||
59
Long-Term Bond Index Fund
At December 31, 2006, net assets consisted of:4 |
|
| Amount |
| ($000) |
Paid-in Capital | 2,188,232 |
Undistributed Net Investment Income | — |
Accumulated Net Realized Losses | (19,740) |
Unrealized Appreciation | 38,330 |
Net Assets | 2,206,822 |
|
|
|
|
Investor Shares—Net Assets |
|
Applicable to 164,683,081 outstanding $.001 par value shares |
|
of beneficial interest (unlimited authorization) | 1,898,104 |
Net Asset Value Per Share—Investor Shares | $11.53 |
|
|
|
|
Institutional Shares—Net Assets |
|
Applicable to 26,782,090 outstanding $.001 par value shares |
|
of beneficial interest (unlimited authorization) | 308,718 |
Net Asset Value Per Share—Institutional Shares | $11.53 |
• | See Note A in Notes to Financial Statements. |
† | Represents the aggregate value, by category, of securities that are not among the 50 largest holdings and, in total for any issuer, represent 1% or less of net assets. |
1 | The issuer operates under a congressional charter; its securities are neither issued nor guaranteed by the U.S. government. If needed, access to additional funding from the U.S. Treasury (beyond the issuer’s line of credit) would require congressional action. |
2 | Affiliated money market fund available only to Vanguard funds and certain trusts and accounts managed by Vanguard. Rate shown is the 7-day yield. |
3 | Certain of the fund’s securities are exempt from registration under Rule 144A of the Securities Act of 1933. Such securities may be sold in transactions exempt from registration, normally to qualified institutional buyers. At December 31, 2006, the aggregate value of these securities was $11,120,000, representing 0.5% of net assets. |
4 | See Note D in Notes to Financial Statements for the tax-basis components of net assets. GO—General Obligation Bond. |
60
Long-Term Bond Index Fund
Statement of Operations
| Year Ended |
| December 31, 2006 |
| ($000) |
Investment Income |
|
Income |
|
Interest1 | 110,748 |
Security Lending | 4 |
Total Income | 110,752 |
Expenses |
|
The Vanguard Group—Note B |
|
Investment Advisory Services | 167 |
Management and Administrative |
|
Investor Shares | 2,587 |
Institutional Shares | 90 |
Marketing and Distribution |
|
Investor Shares | 461 |
Institutional Shares | 28 |
Custodian Fees | 13 |
Auditing Fees | 36 |
Shareholders’ Reports |
|
Investor Shares | 51 |
Institutional Shares | — |
Trustees’ Fees and Expenses | 2 |
Total Expenses | 3,435 |
Expenses Paid Indirectly—Note C | (8) |
Net Expenses | 3,427 |
Net Investment Income | 107,325 |
Realized Net Gain (Loss) on Investment Securities Sold | (12,647) |
Change in Unrealized Appreciation (Depreciation) of Investment Securities | (37,520) |
Net Increase (Decrease) in Net Assets Resulting from Operations | 57,158 |
1 | Interest income from an affiliated company of the fund was $931,000. |
61
Long-Term Bond Index Fund
Statement of Changes in Net Assets
| Year Ended December 31, | |
| 2006 | 2005 |
| ($000) | ($000) |
Increase (Decrease) in Net Assets |
|
|
Operations |
|
|
Net Investment Income | 107,325 | 82,570 |
Realized Net Gain (Loss) | (12,647) | (3,641) |
Change in Unrealized Appreciation (Depreciation) | (37,520) | (1,431) |
Net Increase (Decrease) in Net Assets Resulting from Operations | 57,158 | 77,498 |
Distributions |
|
|
Net Investment Income |
|
|
Investor Shares | (98,659) | (82,570) |
Institutional Shares | (8,666) | — |
Realized Capital Gain |
|
|
Investor Shares | — | — |
Institutional Shares | — | — |
Total Distributions | (107,325) | (82,570) |
Capital Share Transactions—Note F |
|
|
Investor Shares | 57,219 | 588,386 |
Institutional Shares | 306,723 | — |
Net Increase (Decrease) from Capital Share Transactions | 363,942 | 588,386 |
Total Increase (Decrease) | 313,775 | 583,314 |
Net Assets |
|
|
Beginning of Period | 1,893,047 | 1,309,733 |
End of Period | 2,206,822 | 1,893,047 |
62
Long-Term Bond Index Fund
Financial Highlights
Investor Shares |
|
|
|
|
|
|
|
| Year Ended December 31, | ||
For a Share Outstanding Throughout Each Period | 2006 | 2005 | 2004 | 2003 | 2002 |
Net Asset Value, Beginning of Period | $11.84 | $11.82 | $11.50 | $11.67 | $10.83 |
Investment Operations |
|
|
|
|
|
Net Investment Income | .603 | .601 | .617 | .627 | .658 |
Net Realized and Unrealized Gain (Loss) |
|
|
|
|
|
on Investments | (.310) | .020 | .320 | .004 | .840 |
Total from Investment Operations | .293 | .621 | .937 | .631 | 1.498 |
Distributions |
|
|
|
|
|
Dividends from Net Investment Income | (.603) | (.601) | (.617) | (.627) | (.658) |
Distributions from Realized Capital Gains | — | — | — | (.174) | — |
Total Distributions | (.603) | (.601) | (.617) | (.801) | (.658) |
Net Asset Value, End of Period | $11.53 | $11.84 | $11.82 | $11.50 | $11.67 |
|
|
|
|
|
|
|
|
|
|
|
|
Total Return1 | 2.67% | 5.32% | 8.40% | 5.50% | 14.35% |
|
|
|
|
|
|
|
|
|
|
|
|
Ratios/Supplemental Data |
|
|
|
|
|
Net Assets, End of Period (Millions) | $1,898 | $1,893 | $1,310 | $951 | $794 |
Ratio of Total Expenses to |
|
|
|
|
|
Average Net Assets | 0.18% | 0.18% | 0.18% | 0.20% | 0.21% |
Ratio of Net Investment Income to |
|
|
|
|
|
Average Net Assets | 5.30% | 5.03% | 5.34% | 5.34% | 5.92% |
Portfolio Turnover Rate | 55% | 52% | 62% | 76% | 141% |
1 | Total returns do not reflect the $10 annual account maintenance fee applied on balances under $10,000. |
63
Long-Term Bond Index Fund
Institutional Shares |
|
| Feb. 21 to |
| Dec. 31, |
For a Share Outstanding Throughout the Period | 2006 |
Net Asset Value, Beginning of Period | $11.66 |
Investment Operations |
|
Net Investment Income | .559 |
Net Realized and Unrealized Gain (Loss) on Investments | (.130) |
Total from Investment Operations | .429 |
Distributions |
|
Dividends from Net Investment Income | (.559) |
Distributions from Realized Capital Gains | — |
Total Distributions | (.559) |
Net Asset Value, End of Period | $11.53 |
|
|
Total Return | 3.86% |
|
|
Ratios/Supplemental Data |
|
Net Assets, End of Period (Millions) | $309 |
Ratio of Total Expenses to Average Net Assets | 0.08%* |
Ratio of Net Investment Income to Average Net Assets | 5.40%* |
Portfolio Turnover Rate | 55% |
1 | Inception. |
* Annualized.
See accompanying Notes, which are an integral part of the Financial Statements.
64
Long-Term Bond Index Fund
Notes to Financial Statements
Vanguard Long-Term Bond Index Fund is registered under the Investment Company Act of 1940 as an open-end investment company, or mutual fund. Certain of the fund’s investments are in corporate debt instruments; the issuers’ abilities to meet their obligations may be affected by economic developments in their respective industries. The fund offers two classes of shares: Investor Shares and Institutional Shares. Investor Shares are available to any investor who meets the fund’s minimum purchase requirements. Institutional Shares were first issued on February 2, 2006, and are designed for investors who meet certain administrative and service criteria and invest a minimum of $25 million.
A. The following significant accounting policies conform to generally accepted accounting principles for U.S. mutual funds. The fund consistently follows such policies in preparing its financial statements.
1. Security Valuation: Bonds, and temporary cash investments acquired over 60 days to maturity, are valued using the latest bid prices or using valuations based on a matrix system (which considers such factors as security prices, yields, maturities, and ratings), both as furnished by independent pricing services. Investments in Vanguard Market Liquidity Fund are valued at that fund’s net asset value. Other temporary cash investments are valued at amortized cost, which approximates market value. Securities for which market quotations are not readily available, or whose values have been materially affected by events occurring before the fund’s pricing time but after the close of the securities’ primary markets, are valued by methods deemed by the board of trustees to represent fair value.
2. Federal Income Taxes: The fund intends to continue to qualify as a regulated investment company and distribute all of its taxable income. Accordingly, no provision for federal income taxes is required in the financial statements.
3. Distributions: Distributions from net investment income are declared daily and paid on the first business day of the following month. Annual distributions from realized capital gains, if any, are recorded on the ex-dividend date.
4. Security Lending: The fund may lend its securities to qualified institutional borrowers to earn additional income. Security loans are required to be secured at all times by collateral at least equal to the market value of securities loaned. The fund invests cash collateral received in Vanguard Market Liquidity Fund, and records a liability for the return of the collateral, during the period the securities are on loan. Security lending income represents the income earned on investing cash collateral, less expenses associated with the loan.
5. Other: Interest income includes income distributions received from Vanguard Market Liquidity Fund and is accrued daily. Premiums and discounts on debt securities purchased are amortized and accreted, respectively, to interest income over the lives of the respective securities. Security transactions are accounted for on the date securities are bought or sold. Costs used to determine realized gains (losses) on the sale of investment securities are those of the specific securities sold.
Each class of shares has equal rights as to assets and earnings, except that each class separately bears certain class-specific expenses related to maintenance of shareholder accounts (included in Management and Administrative expenses) and shareholder reporting. Marketing and distribution expenses are allocated to each class of shares based on a method approved by the board of trustees. Income, other non-class-specific expenses, and gains and losses on investments are allocated to each class of shares based on its relative net assets.
65
Long-Term Bond Index Fund
B. The Vanguard Group furnishes at cost investment advisory, corporate management, administrative, marketing, and distribution services. The costs of such services are allocated to the fund under methods approved by the board of trustees. The fund has committed to provide up to 0.40% of its net assets in capital contributions to Vanguard. At December 31, 2006, the fund had contributed capital of $214,000 to Vanguard (included in Other Assets), representing 0.01% of the fund’s net assets and 0.21% of Vanguard’s capitalization. The fund’s trustees and officers are also directors and officers of Vanguard.
C. The fund’s custodian bank has agreed to reduce its fees when the fund maintains cash on deposit in the non-interest-bearing custody account. For the year ended December 31, 2006, custodian fee offset arrangements reduced the fund’s expenses by $8,000.
D. Capital gain distributions are determined on a tax basis and may differ from realized capital gains for financial reporting purposes. Differences may be permanent or temporary. Permanent differences are reclassified among capital accounts in the financial statements to reflect their tax character. Temporary differences arise when gains or losses are recognized in different periods for financial statement and tax purposes; these differences will reverse at some time in the future.
For tax purposes, at December 31, 2006, the fund had available realized losses of $19,016,000 to offset future net capital gains of $3,199,000 through December 31, 2012, $1,583,000 through December 31, 2013, and $14,234,000 through December 31, 2014.
At December 31, 2006, the cost of investment securities for tax purposes was $2,130,213,000. Net unrealized appreciation of investment securities for tax purposes was $37,605,000, consisting of unrealized gains of $56,100,000 on securities that had risen in value since their purchase and $18,495,000 in unrealized losses on securities that had fallen in value since their purchase.
E. During the year ended December 31, 2006, the fund purchased $414,879,000 of investment securities and sold $194,569,000 of investment securities other than U.S. government securities and temporary cash investments. Purchases and sales of U.S. government securities were $1,004,937,000 and $875,350,000, respectively.
F. Capital share transactions for each class of shares were:
|
| Year Ended December 31, | |||
|
| 2006 |
| 2005 | |
| Amount | Shares |
| Amount | Shares |
| ($000) | (000) | ($000) | (000) | |
Investor Shares |
|
|
|
| |
Issued | 529,255 | 46,386 | 786,307 | 65,739 | |
Issued in Lieu of Cash Distributions | 87,690 | 7,706 | 73,461 | 6,148 | |
Redeemed | (559,726) | (49,299) | (271,382) | (22,831) | |
Net Increase (Decrease)—Investor Shares | 57,219 | 4,793 | 588,386 | 49,056 | |
Institutional Shares |
|
|
|
| |
Issued | 303,081 | 26,463 | — | — | |
Issued in Lieu of Cash Distributions | 7,397 | 651 | — | — | |
Redeemed | (3,755) | (332) | — | — | |
Net Increase (Decrease)—Institutional Shares | 306,723 | 26,782 | — | — | |
66
Long-Term Bond Index Fund
G. In June 2006, the Financial Accounting Standards Board issued Interpretation No. 48 (“FIN 48”), “Accounting for Uncertainty in Income Taxes.” FIN 48 establishes the minimum threshold for recognizing, and a system for measuring, the benefits of tax-return positions in financial statements. FIN 48 will be effective for the fund’s fiscal year ending December 31, 2007. Management is in the process of analyzing the fund’s tax positions for purposes of implementing FIN 48; based on the analysis completed to date, management does not believe the adoption of FIN 48 will result in any material impact to the fund’s financial statements.
67
Report of Independent Registered Public Accounting Firm
To the Trustees of Vanguard Bond Index Funds and Shareholders of Vanguard Total Bond Market Index Fund, Vanguard Short-Term Bond Index Fund, Vanguard Intermediate-Term Bond Index Fund and Vanguard Long-Term Bond Index Fund:
In our opinion, the accompanying statements of net assets–investments summary, and the related statements of operations and of changes in net assets and the financial highlights present fairly, in all material respects, the financial position of Vanguard Total Bond Market Index Fund, Vanguard Short-Term Bond Index Fund, Vanguard Intermediate-Term Bond Index Fund, and Vanguard Long-Term Bond Index Fund (separate funds of Vanguard Bond Index Funds, hereafter referred to as the “Funds”) at December 31, 2006, the results of each of their operations for the year then ended, the changes in each of their net assets for each of the two years in the period then ended and the financial highlights for each of the periods indicated, in conformity with accounting principles generally accepted in the United States of America. These financial statements and financial highlights (hereafter referred to as “financial statements”) are the responsibility of the Funds’ management; our responsibility is to express an opinion on these financial statements based on our audits. We conducted our audits of these financial statements in accordance with the standards of the Public Company Accounting Oversight Board (United States). Those standards require that we plan and perform the audit to obtain reasonable assurance about whether the financial statements are free of material misstatement. An audit includes examining, on a test basis, evidence supporting the amounts and disclosures in the financial statements, assessing the accounting principles used and significant estimates made by management, and evaluating the overall financial statement presentation. We believe that our audits, which included confirmation of securities at December 31, 2006 by correspondence with the custodian and brokers and by agreement to the underlying ownership records for Vanguard Market Liquidity Fund, provide a reasonable basis for our opinion.
PricewaterhouseCoopers LLP
Philadelphia, Pennsylvania
February 9, 2007
68
Special 2006 tax information (unaudited) for Vanguard Total Bond Market Index Fund
This information for the fiscal year ended December 31, 2006, is included pursuant to provisions of the Internal Revenue Code.
For nonresident alien shareholders, 70.7% of income dividends qualifies as interest-related dividends.
Special 2006 tax information (unaudited) for Vanguard Short-Term Bond Index Fund
This information for the fiscal year ended December 31, 2006, is included pursuant to provisions of the Internal Revenue Code.
For nonresident alien shareholders, 69.0% of income dividends qualifies as interest-related dividends.
Special 2006 tax information (unaudited) for Vanguard Intermediate-Term Bond Index Fund
This information for the fiscal year ended December 31, 2006, is included pursuant to provisions of the Internal Revenue Code.
For nonresident alien shareholders, 66.5% of income dividends qualifies as interest-related dividends.
Special 2006 tax information (unaudited) for Vanguard Long-Term Bond Index Fund
This information for the fiscal year ended December 31, 2006, is included pursuant to provisions of the Internal Revenue Code.
For nonresident alien shareholders, 66.0% of income dividends qualifies as interest-related dividends.
69
About Your Fund’s Expenses
As a shareholder of the fund, you incur ongoing costs, which include costs for portfolio management, administrative services, and shareholder reports (like this one), among others. Operating expenses, which are deducted from a fund’s gross income, directly reduce the investment return of the fund.
A fund’s expenses are expressed as a percentage of its average net assets. This figure is known as the expense ratio. The following examples are intended to help you understand the ongoing costs (in dollars) of investing in your fund and to compare these costs with those of other mutual funds. The examples are based on an investment of $1,000 made at the beginning of the period shown and held for the entire period.
The table on page 71 illustrates your fund’s costs in two ways:
• Based on actual fund return. This section helps you to estimate the actual expenses that you paid over the period. The “Ending Account Value” shown is derived from the fund’s actual return, and the third column shows the dollar amount that would have been paid by an investor who started with $1,000 in the fund. You may use the information here, together with the amount you invested, to estimate the expenses that you paid over the period.
To do so, simply divide your account value by $1,000 (for example, an $8,600 account value divided by $1,000 = 8.6), then multiply the result by the number given for your fund under the heading “Expenses Paid During Period.”
• Based on hypothetical 5% yearly return. This section is intended to help you compare your fund’s costs with those of other mutual funds. It assumes that the fund had a yearly return of 5% before expenses, but that the expense ratio is unchanged. In this case—because the return used is not the fund’s actual return—the results do not apply to your investment. The example is useful in making comparisons because the Securities and Exchange Commission requires all mutual funds to calculate expenses based on a 5% return. You can assess your fund’s costs by comparing this hypothetical example with the hypothetical examples that appear in shareholder reports of other funds.
Note that the expenses shown in the table are meant to highlight and help you compare ongoing costs only and do not reflect any transactional costs or account maintenance fees. They do not include your fund’s low-balance fee, which is described in the prospectus. If this fee were applied to your account, your costs would be higher. Your fund does not charge transaction fees, such as purchase or redemption fees, nor does it carry a “sales load.”
The calculations assume no shares were bought or sold during the period. Your actual costs may have been higher or lower, depending on the amount of your investment and the timing of any purchases or redemptions.
You can find more information about the fund’s expenses, including annual expense ratios, in the Financial Statements section of this report. For additional information on operating expenses and other shareholder costs, please refer to the appropriate fund prospectus.
70
Six Months Ended December 31, 20061 |
|
|
|
| Beginning | Ending | Expenses |
| Account Value | Account Value | Paid During |
Index Fund | 6/30/2006 | 12/31/2006 | Period2 |
Based on Actual Fund Return |
|
|
|
Total Bond Market |
|
|
|
Investor | $1,000.00 | $1,052.49 | $0.98 |
Admiral | 1,000.00 | 1,052.96 | 0.52 |
Institutional | 1,000.00 | 1,053.17 | 0.31 |
Short-Term Bond |
|
|
|
Investor | $1,000.00 | $1,035.33 | $0.87 |
Admiral | 1,000.00 | 1,035.69 | 0.51 |
Intermediate-Term Bond |
|
|
|
Investor | $1,000.00 | $1,059.16 | $0.88 |
Admiral | 1,000.00 | 1,059.53 | 0.52 |
Institutional | 1,000.00 | 1,059.68 | 0.42 |
Long-Term Bond |
|
|
|
Investor | $1,000.00 | $1,081.21 | $0.89 |
Institutional | 1,000.00 | 1,081.71 | 0.42 |
Based on Hypothetical 5% Yearly Return |
|
|
|
Total Bond Market |
|
|
|
Investor | $1,000.00 | $1,024.25 | $0.97 |
Admiral | 1,000.00 | 1,024.70 | 0.51 |
Institutional | 1,000.00 | 1,024.90 | 0.31 |
Short-Term Bond |
|
|
|
Investor | $1,000.00 | $1,024.35 | $0.87 |
Admiral | 1,000.00 | 1,024.70 | 0.51 |
Intermediate-Term Bond |
|
|
|
Investor | $1,000.00 | $1,024.35 | $0.87 |
Admiral | 1,000.00 | 1,024.70 | 0.51 |
Institutional | 1,000.00 | 1,024.80 | 0.41 |
Long-Term Bond |
|
|
|
Investor | $1,000.00 | $1,024.35 | $0.87 |
Institutional | 1,000.00 | 1,024.80 | 0.41 |
1 | This table does not include data for funds or share classes of funds with fewer than six months of history. |
2 | These calculations are based on expenses incurred in the most recent six-month period. The funds’ annualized six-month expense ratios for that period are: for the Total Bond Market Index Fund, 0.19% for Investor Shares, 0.10% for Admiral Shares, 0.06% for Institutional Shares; for the Short-Term Bond Index Fund, 0.17% for Investor Shares, 0.10% for Admiral Shares; for the Intermediate-Term Bond Index Fund, 0.17% for Investor Shares, 0.10% for Admiral Shares, 0.08% for Institutional Shares; and for the Long-Term Bond Index Fund, 0.17% for Investor Shares, 0.08% for Institutional Shares. The dollar amounts shown as “Expenses Paid” are equal to the annualized expense ratio multiplied by the average account value over the period, multiplied by the number of days in the most recent six-month period, then divided by the number of days in the most recent 12-month period. |
71
Glossary
Average Coupon. The average interest rate paid on the fixed income securities held by a fund. It is expressed as a percentage of face value.
Average Duration. An estimate of how much the value of the bonds held by a fund will fluctuate in response to a change in interest rates. To see how the value could change, multiply the average duration by the change in rates. If interest rates rise by 1 percentage point, the value of the bonds in a fund with an average duration of five years would decline by about 5%. If rates decrease by a percentage point, the value would rise by 5%.
Average Effective Maturity. The average length of time until fixed income securities held by a fund reach maturity and are repaid, taking into consideration the possibility that the issuer may call the bond before its maturity date. The figure reflects the proportion of fund assets represented by each security; it also reflects any futures contracts held. In general, the longer the average effective maturity, the more a fund’s share price will fluctuate in response to changes in market interest rates.
Average Quality. An indicator of credit risk, this figure is the average of the ratings assigned to a fund’s fixed income holdings by credit-rating agencies. The agencies make their judgment after appraising an issuer’s ability to meet its obligations. Quality is graded on a scale, with Aaa or AAA indicating the most creditworthy bond issuers. U.S. Treasury securities are considered to have the highest credit quality.
Beta. A measure of the magnitude of a fund’s past share-price fluctuations in relation to the ups and downs of a given market index. The index is assigned a beta of 1.00. Compared with a given index, a fund with a beta of 1.20 typically would have seen its share price rise or fall by 12% when the index rose or fell by 10%. A fund’s beta should be reviewed in conjunction with its R-squared (see definition below). The lower the R-squared, the less correlation there is between the fund and the index, and the less reliable beta is as an indicator of volatility.
Expense Ratio. The percentage of a fund’s average net assets used to pay its annual administrative and advisory expenses. These expenses directly reduce returns to investors.
Inception Date. The date on which the assets of a fund (or one of its share classes) are first invested in accordance with the fund’s investment objective. For funds with a subscription period, the inception date is the day after that period ends. Investment performance is measured from the inception date.
R-Squared. A measure of how much of a fund’s past returns can be explained by the returns from the market in general, as measured by a given index. If a fund’s total returns were precisely synchronized with an index’s returns, its R-squared would be 1.00. If the fund’s returns bore no relationship to the index’s returns, its R-squared would be 0.
Short-Term Reserves. The percentage of a fund invested in highly liquid, short-term securities that can be readily converted to cash.
Yield. A snapshot of a fund’s interest income. The yield, expressed as a percentage of the fund’s net asset value, is based on income earned over the past 30 days (7 days for money market funds) and is annualized, or projected forward for the coming year.
Yield to Maturity. The rate of return an investor would receive if the fixed income securities held by a fund were held to their maturity dates.
72
This page intentionally left blank.
This page intentionally left blank.
This page intentionally left blank.
The People Who Govern Your Fund
The trustees of your mutual fund are there to see that the fund is operated and managed in your best interests since, as a shareholder, you are a part owner of the fund. Your fund’s trustees also serve on the board of directors of The Vanguard Group, Inc., which is owned by the Vanguard funds and provides services to them on an at-cost basis.
A majority of Vanguard’s board members are independent, meaning that they have no affiliation with Vanguard or the funds they oversee, apart from the sizable personal investments they have made as private individuals.
Our independent board members bring distinguished backgrounds in business, academia, and public service to their task of working with Vanguard officers to establish the policies and oversee the activities of the funds. Among board members’ responsibilities are selecting investment advisors for the funds; monitoring fund operations, performance, and costs; reviewing contracts; nominating and selecting new trustees/directors; and electing Vanguard officers.
Each trustee serves a fund until its termination; or until the trustee’s retirement, resignation, or death; or otherwise as specified in the fund’s organizational documents. Any trustee may be removed at a shareholders’ meeting by a vote representing two-thirds of the net asset value of all shares of the fund together with shares of other Vanguard funds organized within the same trust. The table on these two pages shows information for each trustee and executive officer of the fund. The mailing address of the trustees and officers is P.O. Box 876, Valley Forge, PA 19482.
Chairman of the Board, Chief Executive Officer, and Trustee | |
|
|
John J. Brennan1 |
|
Born 1954 | Principal Occupation(s) During the Past Five Years: Chairman of the Board, Chief |
Trustee since May 1987; | Executive Officer, and Director/Trustee of The Vanguard Group, Inc., and of each |
Chairman of the Board and | of the investment companies served by The Vanguard Group. |
Chief Executive Officer |
|
145 Vanguard Funds Overseen | |
|
|
Independent Trustees |
|
|
|
Charles D. Ellis |
|
Born 1937 | Principal Occupation(s) During the Past Five Years: Applecore Partners (pro bono ventures |
Trustee since January 2001 | in education); Senior Advisor to Greenwich Associates (international business strategy |
145 Vanguard Funds Overseen | consulting); Successor Trustee of Yale University; Overseer of the Stern School of Business |
| at New York University; Trustee of the Whitehead Institute for Biomedical Research. |
|
|
Rajiv L. Gupta |
|
Born 1945 | Principal Occupation(s) During the Past Five Years: Chairman and Chief Executive Officer |
Trustee since December 20012 | of Rohm and Haas Co. (chemicals); Board Member of the American Chemistry Council; |
145 Vanguard Funds Overseen | Director of Tyco International, Ltd. (diversified manufacturing and services) (since 2005); |
| Trustee of Drexel University and of the Chemical Heritage Foundation. |
|
|
Amy Gutmann |
|
Born 1949 | Principal Occupation(s) During the Past Five Years: President of the University of |
Trustee since June 2006 | Pennsylvania since 2004; Professor in the School of Arts and Sciences, Annenberg School |
145 Vanguard Funds Overseen | for Communication, and Graduate School of Education of the University of Pennsylvania |
| since 2004; Provost (2001–2004) and Laurance S. Rockefeller Professor of Politics and the |
| University Center for Human Values (1990–2004), Princeton University; Director of Carnegie |
| Corporation of New York and of Philadelphia 2016 (since 2005) and of Schuylkill River |
| Development Corporation and Greater Philadelphia Chamber of Commerce (since 2004). |
JoAnn Heffernan Heisen |
| |
Born 1950 | Principal Occupation(s) During the Past Five Years: Corporate Vice President and Chief | |
Trustee since July 1998 | Global Diversity Officer (since January 2006), Vice President and Chief Information | |
145 Vanguard Funds Overseen | Officer (1997–2005), and Member of the Executive Committee of Johnson & Johnson | |
| (pharmaceuticals/consumer products); Director of the University Medical Center at | |
| Princeton and Women’s Research and Education Institute. | |
|
| |
André F. Perold |
| |
Born 1952 | Principal Occupation(s) During the Past Five Years: George Gund Professor of Finance and | |
Trustee since December 2004 | Banking, Harvard Business School (since 2000); Senior Associate Dean, Director of Faculty | |
145 Vanguard Funds Overseen | Recruiting, and Chair of Finance Faculty, Harvard Business School; Director and Chairman | |
| of UNX, Inc. (equities trading firm) (since 2003); Director of registered investment | |
| companies advised by Merrill Lynch Investment Managers and affiliates (1985–2004), | |
| Genbel Securities Limited (South African financial services firm) (1999–2003), Gensec | |
| Bank (1999–2003), Sanlam, Ltd. (South African insurance company) (2001–2003), and | |
| Stockback, Inc. (credit card firm) (2000–2002). | |
|
| |
Alfred M. Rankin, Jr. |
| |
Born 1941 | Principal Occupation(s) During the Past Five Years: Chairman, President, Chief Executive | |
Trustee since January 1993 | Officer, and Director of NACCO Industries, Inc. (forklift trucks/housewares/ lignite); | |
145 Vanguard Funds Overseen | Director of Goodrich Corporation (industrial products/aircraft systems and services). | |
|
| |
J. Lawrence Wilson |
| |
Born 1936 | Principal Occupation(s) During the Past Five Years: Retired Chairman and Chief Executive | |
Trustee since April 1985 | Officer of Rohm and Haas Co. (chemicals); Director of Cummins Inc. (diesel engines), | |
145 Vanguard Funds Overseen | MeadWestvaco Corp. (packaging products), and AmerisourceBergen Corp. (pharmaceutical | |
| distribution); Trustee of Vanderbilt University and of Culver Educational Foundation. | |
|
| |
Executive Officers1 |
| |
|
| |
Heidi Stam |
| |
Born 1956 | Principal Occupation(s) During the Past Five Years: Managing Director of The Vanguard | |
Secretary since July 2005 | Group, Inc., since 2006; General Counsel of The Vanguard Group since 2005; Secretary | |
145 Vanguard Funds Overseen | of The Vanguard Group, and each of the investment companies served by The Vanguard | |
| Group, since 2005; Principal of The Vanguard Group (1997-2006). | |
|
| |
Thomas J. Higgins |
| |
Born 1957 | Principal Occupation(s) During the Past Five Years: Principal of The Vanguard Group, Inc.; | |
Treasurer since July 1998 | Treasurer of each of the investment companies served by The Vanguard Group. | |
145 Vanguard Funds Overseen |
| |
|
| |
Vanguard Senior Management Team | ||
|
| |
R. Gregory Barton | Kathleen C. Gubanich | Michael S. Miller |
Mortimer J. Buckley | Paul A. Heller | Ralph K. Packard |
James H. Gately | F. William McNabb, III | George U. Sauter |
|
| |
Founder |
| |
|
| |
John C. Bogle |
| |
Chairman and Chief Executive Officer, 1974–1996 | ||
1 Officers of the funds are “interested persons” as defined in the Investment Company Act of 1940.
2 December 2002 for Vanguard Equity Income Fund, Vanguard Growth Equity Fund, the Vanguard Municipal Bond Funds, and the Vanguard State Tax-Exempt Funds.
More information about the trustees is in the Statement of Additional Information, available from The Vanguard Group.
|
|
| P.O. Box 2600 |
| Valley Forge, PA 19482-2600 |

Connect with Vanguard™ > www.vanguard.com
Fund Information > 800-662-7447 | Vanguard, Vanguard.com, Admiral, Signal, Connect with Vanguard, |
| and the ship logo are trademarks of The Vanguard Group, |
Direct Investor Account Services > 800-662-2739 | Inc. |
|
|
Institutional Investor Services > 800-523-1036 | All other marks are the exclusive property of their |
| respective owners. |
Text Telephone for the |
|
| All comparative mutual fund data are from Lipper Inc. |
| or Morningstar, Inc., unless otherwise noted. |
|
|
|
|
|
|
This material may be used in conjunction | You can obtain a free copy of Vanguard’s proxy voting |
with the offering of shares of any Vanguard | guidelines by visiting our website, www.vanguard.com, |
fund only if preceded or accompanied by | and searching for “proxy voting guidelines,” or by calling |
the fund’s current prospectus. | Vanguard at 800-662-2739. They are also available from |
| the SEC’s website, www.sec.gov. In addition, you may |
| obtain a free report on how your fund voted the proxies for |
| securities it owned during the 12 months ended June 30. |
| To get the report, visit either www.vanguard.com |
| or www.sec.gov. |
|
|
| You can review and copy information about your fund |
| at the SEC’s Public Reference Room in Washington, D.C. |
| To find out more about this public service, call the SEC |
| at 202-551-8090. Information about your fund is also |
| available on the SEC’s website, and you can receive |
| copies of this information, for a fee, by sending a |
| request in either of two ways: via e-mail addressed to |
| publicinfo@sec.gov or via regular mail addressed to the |
| Public Reference Section, Securities and Exchange |
| Commission, Washington, DC 20549-0102. |
|
|
|
|
|
|
|
|
| © 2007 The Vanguard Group, Inc. |
| All rights reserved. |
| Vanguard Marketing Corporation, Distributor. |
|
|
| Q840 022007 |
Vanguard Total Bond Market Index Fund
Schedule of Investments
December 31, 2006
| Coupon | Maturity Date | Face Amount ($000) | Market Value ($000) | |
|---|---|---|---|---|
| U.S. Government and Agency Obligations (69.8%) | ||||
| U.S. Government Securities (25.6%) | ||||
| U.S. Treasury Bond | 10.375% | 11/15/12 | 4,375 | 4,570 |
| U.S. Treasury Bond | 3.625% | 5/15/13 | 4,950 | 4,665 |
| U.S. Treasury Bond | 12.000% | 8/15/13 | 131,800 | 146,339 |
| U.S. Treasury Bond | 13.250% | 5/15/14 | 7,000 | 8,317 |
| U.S. Treasury Bond | 11.250% | 2/15/15 | 112,225 | 161,236 |
| U.S. Treasury Bond | 10.625% | 8/15/15 | 147,450 | 208,595 |
| U.S. Treasury Bond | 9.875% | 11/15/15 | 5,950 | 8,154 |
| U.S. Treasury Bond | 9.250% | 2/15/16 | 175 | 233 |
| U.S. Treasury Bond | 7.250% | 5/15/16 | 137,100 | 163,000 |
| U.S. Treasury Bond | 7.500% | 11/15/16 | 14,694 | 17,860 |
| U.S. Treasury Bond | 8.750% | 5/15/17 | 252,360 | 333,904 |
| U.S. Treasury Bond | 8.875% | 8/15/17 | 205,790 | 275,340 |
| U.S. Treasury Bond | 9.125% | 5/15/18 | 17,500 | 24,076 |
| U.S. Treasury Bond | 9.000% | 11/15/18 | 9,175 | 12,621 |
| U.S. Treasury Bond | 8.875% | 2/15/19 | 52,675 | 72,058 |
| U.S. Treasury Bond | 8.125% | 8/15/19 | 161,395 | 210,923 |
| U.S. Treasury Bond | 8.500% | 2/15/20 | 222,140 | 300,028 |
| U.S. Treasury Bond | 8.750% | 5/15/20 | 40,575 | 55,968 |
| U.S. Treasury Bond | 8.750% | 8/15/20 | 173,950 | 240,513 |
| U.S. Treasury Bond | 7.875% | 2/15/21 | 107,107 | 139,506 |
| U.S. Treasury Bond | 8.125% | 5/15/21 | 4,525 | 6,026 |
| U.S. Treasury Bond | 8.125% | 8/15/21 | 93,600 | 124,955 |
| U.S. Treasury Bond | 8.000% | 11/15/21 | 86,120 | 114,190 |
| U.S. Treasury Bond | 7.625% | 11/15/22 | 110,305 | 143,206 |
| U.S. Treasury Bond | 7.125% | 2/15/23 | 2,575 | 3,205 |
| U.S. Treasury Bond | 7.625% | 2/15/25 | 186,125 | 246,352 |
| U.S. Treasury Bond | 6.875% | 8/15/25 | 5,325 | 6,593 |
| U.S. Treasury Bond | 6.750% | 8/15/26 | 175,530 | 215,955 |
| U.S. Treasury Bond | 6.500% | 11/15/26 | 775 | 931 |
| U.S. Treasury Bond | 6.625% | 2/15/27 | 17,125 | 20,871 |
| U.S. Treasury Bond | 6.375% | 8/15/27 | 10,240 | 12,190 |
| U.S. Treasury Bond | 6.125% | 11/15/27 | 5,975 | 6,936 |
| U.S. Treasury Bond | 5.250% | 11/15/28 | 3,710 | 3,893 |
| U.S. Treasury Bond | 5.250% | 2/15/29 | 11,100 | 11,648 |
| U.S. Treasury Bond | 6.125% | 8/15/29 | 208,490 | 243,803 |
| U.S. Treasury Bond | 6.250% | 5/15/30 | 35,000 | 41,716 |
| U.S. Treasury Bond | 5.375% | 2/15/31 | 3,350 | 3,590 |
| U.S. Treasury Bond | 4.500% | 2/15/36 | 1,030 | 980 |
| U.S. Treasury Note | 3.125% | 5/15/07 | 4,900 | 4,866 |
| U.S. Treasury Note | 3.250% | 8/15/07 | 11,975 | 11,844 |
| U.S. Treasury Note | 4.375% | 12/31/07 | 47,300 | 47,012 |
| U.S. Treasury Note | 4.375% | 1/31/08 | 530,950 | 527,381 |
| U.S. Treasury Note | 4.625% | 2/29/08 | 587,825 | 585,255 |
| U.S. Treasury Note | 4.625% | 3/31/08 | 167,500 | 166,792 |
| U.S. Treasury Note | 4.875% | 4/30/08 | 79,500 | 79,425 |
| U.S. Treasury Note | 2.625% | 5/15/08 | 115,975 | 112,514 |
| U.S. Treasury Note | 3.750% | 5/15/08 | 46,325 | 45,616 |
| U.S. Treasury Note | 5.625% | 5/15/08 | 25,970 | 26,205 |
| U.S. Treasury Note | 4.875% | 5/31/08 | 153,450 | 153,354 |
| U.S. Treasury Note | 5.125% | 6/30/08 | 82,225 | 82,469 |
| U.S. Treasury Note | 5.000% | 7/31/08 | 25,000 | 25,039 |
| U.S. Treasury Note | 4.875% | 8/31/08 | 214,850 | 214,815 |
| U.S. Treasury Note | 3.125% | 9/15/08 | 2,200 | 2,139 |
| U.S. Treasury Note | 4.625% | 9/30/08 | 231,375 | 230,469 |
| U.S. Treasury Note | 3.125% | 10/15/08 | 5,125 | 4,977 |
| U.S. Treasury Note | 4.875% | 10/31/08 | 52,725 | 52,750 |
| U.S. Treasury Note | 3.375% | 11/15/08 | 32,725 | 31,887 |
| U.S. Treasury Note | 4.375% | 11/15/08 | 101,950 | 101,122 |
| U.S. Treasury Note | 4.750% | 11/15/08 | 5,300 | 5,293 |
| U.S. Treasury Note | 3.250% | 1/15/09 | 59,200 | 57,442 |
| U.S. Treasury Note | 3.000% | 2/15/09 | 83,540 | 80,538 |
| U.S. Treasury Note | 4.500% | 2/15/09 | 194,460 | 193,275 |
| U.S. Treasury Note | 3.125% | 4/15/09 | 191,345 | 184,557 |
| U.S. Treasury Note | 3.875% | 5/15/09 | 11,175 | 10,955 |
| U.S. Treasury Note | 4.875% | 5/15/09 | 9,675 | 9,696 |
| U.S. Treasury Note | 4.000% | 6/15/09 | 7,730 | 7,596 |
| U.S. Treasury Note | 3.625% | 7/15/09 | 90,355 | 87,969 |
| U.S. Treasury Note | 3.500% | 8/15/09 | 97,325 | 94,375 |
| U.S. Treasury Note | 4.875% | 8/15/09 | 159,600 | 160,073 |
| U.S. Treasury Note | 6.000% | 8/15/09 | 171,875 | 177,058 |
| U.S. Treasury Note | 3.375% | 10/15/09 | 230,495 | 222,390 |
| U.S. Treasury Note | 4.625% | 11/15/09 | 71,025 | 70,803 |
| U.S. Treasury Note | 3.500% | 12/15/09 | 28,825 | 27,861 |
| U.S. Treasury Note | 3.625% | 1/15/10 | 133,960 | 129,814 |
| U.S. Treasury Note | 3.500% | 2/15/10 | 161,275 | 155,604 |
| U.S. Treasury Note | 6.500% | 2/15/10 | 247,380 | 259,864 |
| U.S. Treasury Note | 4.000% | 3/15/10 | 140,225 | 137,267 |
| U.S. Treasury Note | 4.000% | 4/15/10 | 46,475 | 45,473 |
| U.S. Treasury Note | 3.875% | 5/15/10 | 2,200 | 2,144 |
| U.S. Treasury Note | 3.625% | 6/15/10 | 22,000 | 21,251 |
| U.S. Treasury Note | 4.125% | 8/15/10 | 115,471 | 113,269 |
| U.S. Treasury Note | 3.875% | 9/15/10 | 42,100 | 40,922 |
| U.S. Treasury Note | 4.250% | 10/15/10 | 2,675 | 2,634 |
| U.S. Treasury Note | 4.500% | 11/15/10 | 4,400 | 4,368 |
| U.S. Treasury Note | 4.375% | 12/15/10 | 42,910 | 42,414 |
| U.S. Treasury Note | 4.250% | 1/15/11 | 315,210 | 309,989 |
| U.S. Treasury Note | 4.500% | 2/28/11 | 36,215 | 35,943 |
| U.S. Treasury Note | 4.750% | 3/31/11 | 30,000 | 30,047 |
| U.S. Treasury Note | 4.875% | 4/30/11 | 218,800 | 220,202 |
| U.S. Treasury Note | 4.875% | 5/31/11 | 25,000 | 25,172 |
| U.S. Treasury Note | 5.125% | 6/30/11 | 20,950 | 21,304 |
| U.S. Treasury Note | 4.875% | 7/31/11 | 81,200 | 81,771 |
| U.S. Treasury Note | 4.500% | 9/30/11 | 130,275 | 129,134 |
| U.S. Treasury Note | 4.625% | 10/31/11 | 32,590 | 32,468 |
| U.S. Treasury Note | 4.875% | 2/15/12 | 1,990 | 2,008 |
| U.S. Treasury Note | 4.375% | 8/15/12 | 105 | 103 |
| U.S. Treasury Note | 4.000% | 11/15/12 | 2,250 | 2,172 |
| U.S. Treasury Note | 3.875% | 2/15/13 | 95,430 | 91,345 |
| U.S. Treasury Note | 4.250% | 8/15/13 | 27,227 | 26,546 |
| U.S. Treasury Note | 4.250% | 11/15/13 | 22,340 | 21,750 |
| U.S. Treasury Note | 4.000% | 2/15/14 | 226,295 | 216,606 |
| U.S. Treasury Note | 4.750% | 5/15/14 | 150,525 | 150,924 |
| U.S. Treasury Note | 4.250% | 8/15/14 | 485,150 | 470,973 |
| U.S. Treasury Note | 4.250% | 11/15/14 | 89,575 | 86,902 |
| U.S. Treasury Note | 4.875% | 8/15/16 | 725 | 734 |
| 10,401,875 | ||||
| Agency Bonds and Notes (10.0%) | ||||
| Arab Republic of Egypt | ||||
| (U.S. Government Guaranteed) | 4.450% | 9/15/15 | 15,150 | 14,611 |
| 1Federal Farm Credit Bank | 3.000% | 12/17/07 | 11,275 | 11,043 |
| 1Federal Farm Credit Bank | 3.375% | 7/15/08 | 8,800 | 8,570 |
| 1Federal Farm Credit Bank | 3.750% | 1/15/09 | 9,775 | 9,516 |
| 1Federal Farm Credit Bank | 4.125% | 4/15/09 | 9,150 | 8,968 |
| 1Federal Farm Credit Bank | 4.125% | 7/17/09 | 3,000 | 2,941 |
| 1Federal Farm Credit Bank | 5.000% | 10/23/09 | 5,000 | 5,002 |
| 1Federal Farm Credit Bank | 5.375% | 7/18/11 | 28,750 | 29,233 |
| 1Federal Farm Credit Bank | 4.875% | 12/16/15 | 1,575 | 1,554 |
| 1Federal Farm Credit Bank | 5.125% | 8/25/16 | 5,550 | 5,589 |
| 1Federal Home Loan Bank | 4.850% | 2/6/08 | 63,600 | 63,367 |
| 1Federal Home Loan Bank | 5.125% | 4/16/08 | 4,075 | 4,074 |
| 1Federal Home Loan Bank | 4.125% | 4/18/08 | 20,925 | 20,660 |
| 1Federal Home Loan Bank | 5.125% | 6/13/08 | 47,850 | 47,869 |
| 1Federal Home Loan Bank | 5.125% | 6/18/08 | 101,725 | 101,751 |
| 1Federal Home Loan Bank | 5.125% | 8/8/08 | 50,000 | 50,013 |
| 1Federal Home Loan Bank | 3.875% | 8/22/08 | 100,000 | 98,085 |
| 1Federal Home Loan Bank | 5.800% | 9/2/08 | 44,000 | 44,493 |
| 1Federal Home Loan Bank | 5.865% | 9/2/08 | 42,820 | 43,290 |
| 1Federal Home Loan Bank | 5.790% | 4/27/09 | 900 | 913 |
| 1Federal Home Loan Bank | 5.375% | 7/17/09 | 13,875 | 13,997 |
| 1Federal Home Loan Bank | 5.000% | 12/11/09 | 4,200 | 4,200 |
| 1Federal Home Loan Bank | 3.875% | 1/15/10 | 12,200 | 11,847 |
| 1Federal Home Loan Bank | 4.375% | 3/17/10 | 20,000 | 19,649 |
| 1Federal Home Loan Bank | 7.625% | 5/14/10 | 71,925 | 77,701 |
| 1Federal Home Loan Bank | 5.375% | 8/19/11 | 41,425 | 42,115 |
| 1Federal Home Loan Bank | 4.875% | 11/18/11 | 13,750 | 13,683 |
| 1Federal Home Loan Bank | 5.750% | 5/15/12 | 25,400 | 26,363 |
| 1Federal Home Loan Bank | 4.500% | 11/15/12 | 32,050 | 31,343 |
| 1Federal Home Loan Bank | 5.375% | 6/14/13 | 15,000 | 15,260 |
| 1Federal Home Loan Bank | 5.125% | 8/14/13 | 122,750 | 123,693 |
| 1Federal Home Loan Bank | 4.500% | 9/16/13 | 60,800 | 59,094 |
| 1Federal Home Loan Bank | 5.250% | 6/18/14 | 35,925 | 36,612 |
| 1Federal Home Loan Bank | 5.375% | 5/18/16 | 26,350 | 27,080 |
| 1Federal Home Loan Bank | 5.625% | 6/13/16 | 2,950 | 3,049 |
| 1Federal Home Loan Bank | 4.750% | 12/16/16 | 42,675 | 41,812 |
| 1Federal Home Loan Bank | 5.250% | 12/11/20 | 9,225 | 9,288 |
| 1Federal Home Loan Bank | 5.500% | 7/15/36 | 6,000 | 6,268 |
| 1Federal Home Loan Mortgage Corp. | 4.625% | 2/21/08 | 80,000 | 79,482 |
| 1Federal Home Loan Mortgage Corp. | 2.750% | 3/15/08 | 25 | 24 |
| 1Federal Home Loan Mortgage Corp. | 5.750% | 4/15/08 | 250,680 | 252,461 |
| 1Federal Home Loan Mortgage Corp. | 3.875% | 6/15/08 | 145,400 | 142,923 |
| 1Federal Home Loan Mortgage Corp. | 5.000% | 9/16/08 | 7,950 | 7,944 |
| 1Federal Home Loan Mortgage Corp. | 5.125% | 10/15/08 | 7,050 | 7,058 |
| 1Federal Home Loan Mortgage Corp. | 3.750% | 5/12/09 | 3,130 | 3,037 |
| 1Federal Home Loan Mortgage Corp. | 5.250% | 5/21/09 | 73,400 | 73,796 |
| 1Federal Home Loan Mortgage Corp. | 6.625% | 9/15/09 | 36,065 | 37,535 |
| 1Federal Home Loan Mortgage Corp. | 7.000% | 3/15/10 | 71,925 | 76,212 |
| 1Federal Home Loan Mortgage Corp. | 4.125% | 7/12/10 | 127,947 | 124,562 |
| 1Federal Home Loan Mortgage Corp. | 6.875% | 9/15/10 | 38,683 | 41,183 |
| 1Federal Home Loan Mortgage Corp. | 4.750% | 1/18/11 | 5,800 | 5,756 |
| 1Federal Home Loan Mortgage Corp. | 6.000% | 6/15/11 | 8,800 | 9,159 |
| 1Federal Home Loan Mortgage Corp. | 5.250% | 7/18/11 | 25,000 | 25,285 |
| 1Federal Home Loan Mortgage Corp. | 5.750% | 1/15/12 | 85,000 | 87,933 |
| 1Federal Home Loan Mortgage Corp. | 5.125% | 7/15/12 | 40,145 | 40,449 |
| 1Federal Home Loan Mortgage Corp. | 4.500% | 1/15/13 | 31,325 | 30,570 |
| 1Federal Home Loan Mortgage Corp. | 4.500% | 7/15/13 | 9,550 | 9,299 |
| 1Federal Home Loan Mortgage Corp. | 4.875% | 11/15/13 | 114,925 | 114,444 |
| 1Federal Home Loan Mortgage Corp. | 5.000% | 7/15/14 | 96,650 | 97,068 |
| 1Federal Home Loan Mortgage Corp. | 0.000% | 11/24/14 | 9,500 | 6,428 |
| 1Federal Home Loan Mortgage Corp. | 5.000% | 12/14/18 | 29,521 | 28,794 |
| 1Federal Home Loan Mortgage Corp. | 6.750% | 9/15/29 | 14,000 | 16,886 |
| 1Federal Home Loan Mortgage Corp. | 6.750% | 3/15/31 | 58,750 | 71,268 |
| 1Federal National Mortgage Assn | 4.750% | 1/2/07 | 305 | 305 |
| 1Federal National Mortgage Assn | 3.250% | 11/15/07 | 20 | 20 |
| 1Federal National Mortgage Assn | 6.000% | 5/15/08 | 174,035 | 176,011 |
| 1Federal National Mortgage Assn | 3.875% | 7/15/08 | 138,200 | 135,717 |
| 1Federal National Mortgage Assn | 3.250% | 8/15/08 | 150 | 146 |
| 1Federal National Mortgage Assn | 4.500% | 10/15/08 | 15,525 | 15,381 |
| 1Federal National Mortgage Assn | 3.375% | 12/15/08 | 28,950 | 28,066 |
| 1Federal National Mortgage Assn | 5.250% | 1/15/09 | 45,050 | 45,260 |
| 1Federal National Mortgage Assn | 3.250% | 2/15/09 | 10 | 10 |
| 1Federal National Mortgage Assn | 4.875% | 4/15/09 | 25,000 | 24,934 |
| 1Federal National Mortgage Assn | 4.250% | 5/15/09 | 28,300 | 27,839 |
| 1Federal National Mortgage Assn | 6.375% | 6/15/09 | 49,412 | 51,086 |
| 1Federal National Mortgage Assn | 6.625% | 9/15/09 | 124,315 | 129,411 |
| 1Federal National Mortgage Assn | 7.250% | 1/15/10 | 83,390 | 88,634 |
| 1Federal National Mortgage Assn | 4.125% | 5/15/10 | 20,000 | 19,492 |
| 1Federal National Mortgage Assn | 7.125% | 6/15/10 | 25 | 27 |
| 1Federal National Mortgage Assn | 6.250% | 2/1/11 | 16,665 | 17,358 |
| 1Federal National Mortgage Assn | 5.125% | 4/15/11 | 24,000 | 24,143 |
| 1Federal National Mortgage Assn | 6.000% | 5/15/11 | 42,500 | 44,186 |
| 1Federal National Mortgage Assn | 5.000% | 10/15/11 | 86,925 | 87,115 |
| 1Federal National Mortgage Assn | 6.125% | 3/15/12 | 97,705 | 102,830 |
| 1Federal National Mortgage Assn | 4.375% | 9/15/12 | 36,125 | 35,073 |
| 1Federal National Mortgage Assn | 4.750% | 2/21/13 | 5,000 | 4,920 |
| 1Federal National Mortgage Assn | 4.375% | 3/15/13 | 24,990 | 24,221 |
| 1Federal National Mortgage Assn | 4.625% | 5/1/13 | 15,850 | 15,382 |
| 1Federal National Mortgage Assn | 4.625% | 10/15/13 | 90,625 | 88,803 |
| 1Federal National Mortgage Assn | 5.125% | 1/2/14 | 3,925 | 3,918 |
| 1Federal National Mortgage Assn | 5.000% | 4/15/15 | 20,000 | 20,065 |
| 1Federal National Mortgage Assn | 8.200% | 3/10/16 | 50 | 61 |
| 1Federal National Mortgage Assn | 5.000% | 3/15/16 | 9,150 | 9,163 |
| 1Federal National Mortgage Assn | 5.250% | 9/15/16 | 40,475 | 41,179 |
| 1Federal National Mortgage Assn | 4.875% | 12/15/16 | 6,475 | 6,412 |
| 1Federal National Mortgage Assn | 6.250% | 5/15/29 | 1,375 | 1,566 |
| 1Federal National Mortgage Assn | 7.125% | 1/15/30 | 805 | 1,013 |
| 1Federal National Mortgage Assn | 7.250% | 5/15/30 | 85,701 | 109,400 |
| 1Federal National Mortgage Assn | 6.625% | 11/15/30 | 22,460 | 26,866 |
| Private Export Funding Corp. | 7.200% | 1/15/10 | 31,825 | 33,770 |
| Resolution Funding Corp. | ||||
| (U.S. Government Guaranteed) | 8.125% | 10/15/19 | 550 | 703 |
| Resolution Funding Corp. | ||||
| (U.S. Government Guaranteed) | 8.875% | 7/15/20 | 280 | 381 |
| Resolution Funding Corp. | ||||
| (U.S. Government Guaranteed) | 8.625% | 1/15/30 | 110 | 159 |
| Small Business Administration Variable Rate | ||||
| Interest Only Custodial Receipts (U.S. Government Guaranteed) | 2.719% | 7/15/17 | 4,449 | 222 |
| State of Israel (U.S. Government Guaranteed) | 5.500% | 9/18/23 | 5,525 | 5,643 |
| State of Israel (U.S. Government Guaranteed) | 5.500% | 12/4/23 | 3,900 | 3,975 |
| State of Israel (U.S. Government Guaranteed) | 5.500% | 4/26/24 | 3,000 | 3,012 |
| 1Tennessee Valley Auth | 5.375% | 11/13/08 | 31,925 | 32,097 |
| 1Tennessee Valley Auth | 7.125% | 5/1/30 | 33,925 | 42,729 |
| 1Tennessee Valley Auth | 4.650% | 6/15/35 | 4,400 | 4,035 |
| 1Tennessee Valley Auth | 5.375% | 4/1/56 | 7,150 | 7,303 |
| 4,064,194 | ||||
| Mortgage-Backed Securities (34.2%) | ||||
| Conventional Mortgage-Backed Securities (34.2%) | ||||
| 1, 2 Federal Home Loan Mortgage Corp. | 4.000% | 3/1/08-2/1/21 | 209,243 | 198,433 |
| 1, 2 Federal Home Loan Mortgage Corp. | 4.500% | 1/1/08-9/1/35 | 625,922 | 600,729 |
| 1, 2 Federal Home Loan Mortgage Corp. | 5.000% | 6/1/07-1/1/37 | 1,560,667 | 1,515,861 |
| 1, 2 Federal Home Loan Mortgage Corp. | 5.500% | 1/1/07-1/1/37 | 1,526,024 | 1,514,348 |
| 1, 2 Federal Home Loan Mortgage Corp. | 6.000% | 7/1/08-12/1/36 | 785,919 | 792,973 |
| 1, 2 Federal Home Loan Mortgage Corp. | 6.500% | 12/1/07-10/1/36 | 259,583 | 264,816 |
| 1, 2 Federal Home Loan Mortgage Corp. | 7.000% | 4/1/07-10/1/36 | 80,209 | 82,350 |
| 1, 2 Federal Home Loan Mortgage Corp. | 7.500% | 2/1/07-2/1/32 | 15,583 | 16,078 |
| 1, 2 Federal Home Loan Mortgage Corp. | 8.000% | 2/1/07-1/1/32 | 11,130 | 11,627 |
| 1, 2 Federal Home Loan Mortgage Corp. | 8.500% | 4/1/07-7/1/31 | 1,854 | 1,962 |
| 1, 2 Federal Home Loan Mortgage Corp. | 9.000% | 7/1/16-3/1/31 | 1,378 | 1,477 |
| 1, 2 Federal Home Loan Mortgage Corp. | 9.500% | 4/1/16-6/1/25 | 309 | 328 |
| 1, 2 Federal Home Loan Mortgage Corp. | 10.000% | 7/1/09-4/1/25 | 88 | 95 |
| 1, 2 Federal Home Loan Mortgage Corp. | 10.500% | 12/1/15 | 1 | 1 |
| 1, 2 Federal National Mortgage Assn | 4.000% | 9/1/10-6/1/19 | 121,607 | 115,410 |
| 1, 2 Federal National Mortgage Assn | 4.500% | 2/1/10-11/1/35 | 739,249 | 709,472 |
| 1, 2 Federal National Mortgage Assn | 5.000% | 9/1/09-1/1/37 | 2,193,703 | 2,131,595 |
| 1, 2 Federal National Mortgage Assn | 5.500% | 11/1/08-1/1/37 | 2,281,082 | 2,262,475 |
| 1, 2 Federal National Mortgage Assn | 6.000% | 7/1/08-1/1/37 | 1,370,062 | 1,380,840 |
| 1, 2 Federal National Mortgage Assn | 6.500% | 3/1/08-1/1/37 | 576,479 | 587,591 |
| 1, 2 Federal National Mortgage Assn | 7.000% | 10/1/07-1/1/37 | 148,180 | 152,237 |
| 1, 2 Federal National Mortgage Assn | 7.500% | 9/1/07-12/1/32 | 20,845 | 21,532 |
| 1, 2 Federal National Mortgage Assn | 8.000% | 3/1/07-9/1/31 | 6,293 | 6,573 |
| 1, 2 Federal National Mortgage Assn | 8.500% | 4/1/07-5/1/32 | 2,256 | 2,384 |
| 1, 2 Federal National Mortgage Assn | 9.000% | 5/1/08-8/1/30 | 591 | 627 |
| 1, 2 Federal National Mortgage Assn | 9.500% | 7/1/10-11/1/25 | 686 | 736 |
| 1, 2 Federal National Mortgage Assn | 10.000% | 10/1/14-11/1/19 | 171 | 181 |
| 1, 2 Federal National Mortgage Assn | 10.500% | 5/1/10-8/1/20 | 20 | 21 |
| 1, 2 Federal National Mortgage Assn | 11.000% | 9/1/19 | 12 | 13 |
| 2 Government National Mortgage Assn | 4.000% | 8/15/18-9/15/18 | 2,313 | 2,193 |
| 2 Government National Mortgage Assn | 4.500% | 6/15/18-3/15/36 | 42,979 | 41,065 |
| 2 Government National Mortgage Assn | 5.000% | 11/15/17-1/1/37 | 324,560 | 316,351 |
| 2 Government National Mortgage Assn | 5.500% | 3/15/15-12/20/36 | 520,098 | 517,852 |
| 2 Government National Mortgage Assn | 6.000% | 3/15/09-1/1/37 | 362,243 | 367,196 |
| 2 Government National Mortgage Assn | 6.500% | 10/15/07-1/1/37 | 154,293 | 158,431 |
| 2 Government National Mortgage Assn | 7.000% | 11/15/07-9/15/36 | 43,354 | 44,794 |
| 2 Government National Mortgage Assn | 7.250% | 9/15/25 | 55 | 57 |
| 2 Government National Mortgage Assn | 7.500% | 9/15/07-6/15/32 | 13,974 | 14,508 |
| 2 Government National Mortgage Assn | 7.750% | 2/15/30 | 10 | 11 |
| 2 Government National Mortgage Assn | 8.000% | 8/15/07-12/15/30 | 9,554 | 10,031 |
| 2 Government National Mortgage Assn | 8.500% | 5/15/10-3/15/31 | 2,022 | 2,138 |
| 2 Government National Mortgage Assn | 9.000% | 10/15/08-3/15/31 | 4,538 | 4,849 |
| 2 Government National Mortgage Assn | 9.500% | 5/15/16-9/15/25 | 968 | 1,038 |
| 2 Government National Mortgage Assn | 10.000% | 2/15/18-2/15/25 | 391 | 425 |
| 2 Government National Mortgage Assn | 10.500% | 7/15/15-4/15/25 | 267 | 296 |
| 2 Government National Mortgage Assn | 11.000% | 1/15/10-12/15/15 | 61 | 66 |
| 2 Government National Mortgage Assn | 11.500% | 3/15/10-4/15/16 | 49 | 51 |
| Nonconventional Mortgage-Backed Secties (0.0%) | ||||
| 2 Government National Mortgage Assn | 7.900% | 2/15/21 | 8 | 8 |
| 2 Government National Mortgage Assn | 5.375% | 6/20/29 | 1,051 | 1,061 |
| 13,855,186 | ||||
| Total U.S. Government and Agency Obligations (Cost $28,378,925) | 28,321,255 | |||
| Corporate Bonds (27.1%) | ||||
| Asset-Backed/Commercial Mortgage-Backed Securities (8.2%) | ||||
| 2, 3 American Express Credit Account Mas | 5.490% | 3/15/10 | 6,000 | 6,006 |
| 2, 3 American Express Credit Account Mas | 5.460% | 10/15/10 | 66,200 | 66,315 |
| 2, 3 American Express Credit Account Mas | 5.530% | 11/15/10 | 3,000 | 3,010 |
| 2, 3 American Express Credit Account Mas | 5.350% | 3/15/11 | 1,500 | 1,501 |
| 2 Banc of America Commercial Mortgage | 5.787% | 5/11/35 | 19,521 | 19,793 |
| 2 Banc of America Commercial Mortgage | 6.503% | 4/15/36 | 8,564 | 8,842 |
| 2 Banc of America Commercial Mortgage | 5.118% | 7/11/43 | 2,690 | 2,672 |
| 2, 3 Bank One Issuance Trust | 5.460% | 1/15/10 | 10,000 | 10,002 |
| 2 Bank One Issuance Trust | 3.590% | 5/17/10 | 2,150 | 2,126 |
| 2, 3 Bank One Issuance Trust | 5.470% | 6/15/10 | 78,950 | 79,041 |
| 2, 3 Bank One Issuance Trust | 5.460% | 12/15/10 | 23,450 | 23,507 |
| 2, 3 Bank One Issuance Trust | 5.460% | 2/15/11 | 200,000 | 200,452 |
| 2 Bear Stearns Commercial Mortgage Se | 5.610% | 11/15/33 | 9,900 | 10,004 |
| 2 Bear Stearns Commercial Mortgage Se | 5.466% | 4/12/38 | 20,000 | 20,353 |
| 2 Bear Stearns Commercial Mortgage Se | 4.830% | 8/15/38 | 20,000 | 19,469 |
| 2 Bear Stearns Commercial Mortgage Se | 5.457% | 3/11/39 | 42,000 | 42,428 |
| 2 Bear Stearns Commercial Mortgage Se | 4.680% | 8/13/39 | 10,000 | 9,627 |
| 2 Bear Stearns Commercial Mortgage Se | 4.740% | 3/13/40 | 9,000 | 8,689 |
| 2 CIT Group Home Equity Loan Trust | 6.200% | 2/25/30 | 1,656 | 1,647 |
| 2 COMED Transitional Funding Trust | 5.630% | 6/25/09 | 114 | 114 |
| 2, 3 Capital One Master Trust | 5.540% | 10/15/10 | 10,000 | 10,012 |
| 2, 3 Capital One Master Trust | 5.540% | 6/15/11 | 14,000 | 14,062 |
| 2, 3 Capital One Multi-Asset Execution T | 5.530% | 9/15/11 | 75,630 | 75,956 |
| 2 Chase Commercial Mortgage Securitie | 6.390% | 11/18/30 | 17,766 | 17,971 |
| 2, 3 Chase Credit Card Master Trust | 5.390% | 9/15/09 | 39,400 | 39,398 |
| 2, 3 Chase Credit Card Master Trust | 5.450% | 10/15/09 | 14,200 | 14,206 |
| 2, 3 Chase Credit Card Master Trust | 5.470% | 2/15/10 | 53,510 | 53,570 |
| 2, 3 Chase Credit Card Master Trust | 5.470% | 1/17/11 | 35,000 | 35,125 |
| 2, 3 Chase Issuance Trust | 5.360% | 12/15/10 | 216,826 | 216,926 |
| 2 Chase Issuance Trust | 4.650% | 12/17/12 | 39,225 | 38,782 |
| 2 Chase Manhattan Auto Owner Trust | 2.570% | 2/16/10 | 5,770 | 5,724 |
| 2 Citibank Credit Card Issuance Trust | 4.950% | 2/9/09 | 43,650 | 43,633 |
| 2 Citibank Credit Card Issuance Trust | 6.875% | 11/16/09 | 750 | 760 |
| 2 Citibank Credit Card Master Trust | 5.875% | 3/10/11 | 1,250 | 1,270 |
| 2, 4 Citicorp Lease Pass-Through Trust | 8.040% | 12/15/19 | 18,025 | 21,301 |
| 2, 4 Commercial Mortgage Lease-Backed Ce | 6.746% | 6/20/31 | 13,486 | 14,026 |
| 2 Countrywide Home Loans | 4.046% | 5/25/33 | 12,557 | 12,351 |
| 2 Credit Suisse First Boston Mortgage | 5.100% | 8/15/38 | 36,000 | 35,332 |
| 2 Credit Suisse First Boston Mortgage | 7.290% | 9/15/41 | 19,247 | 19,934 |
| 2 Credit Suisse Mortgage Capital Cert | 5.556% | 2/15/39 | 35,100 | 35,497 |
| 2 DLJ Commercial Mortgage Corp. | 6.410% | 2/18/31 | 14,395 | 14,455 |
| 2 DaimlerChrysler Auto Trust | 5.330% | 8/8/10 | 32,400 | 32,453 |
| 2, 3 DaimlerChrysler Master Owner Trust | 5.360% | 8/17/09 | 231,500 | 231,532 |
| 2 Detroit Edison Securitization Fundi | 5.875% | 3/1/10 | 479 | 480 |
| 2, 3 Discover Card Master Trust I | 5.460% | 11/17/09 | 14,300 | 14,303 |
| 2, 3 Discover Card Master Trust I | 5.380% | 4/16/10 | 29,450 | 29,470 |
| 2, 3 Discover Card Master Trust I | 5.370% | 5/15/10 | 146,000 | 146,074 |
| 2, 3 Discover Card Master Trust I | 5.480% | 8/15/10 | 105,000 | 105,258 |
| 2, 3 Discover Card Master Trust I | 5.370% | 5/15/11 | 31,625 | 31,687 |
| 2 Federal Housing Administration | 7.430% | 10/1/20 | 13 | 14 |
| 2 First Union National Bank Commercia | 6.223% | 12/12/33 | 12,550 | 13,029 |
| 2, 3 Fleet Credit Card Master Trust II | 5.490% | 4/15/10 | 12,500 | 12,516 |
| 2 Ford Credit Auto Owner Trust | 4.300% | 8/15/09 | 14,600 | 14,486 |
| 2 GE Capital Commercial Mortgage Corp | 6.531% | 5/15/33 | 17,000 | 17,768 |
| 2 GE Capital Commercial Mortgage Corp | 6.290% | 8/11/33 | 3,000 | 3,103 |
| 2 GE Capital Commercial Mortgage Corp | 5.994% | 12/10/35 | 2,557 | 2,584 |
| 2 GE Capital Commercial Mortgage Corp | 6.269% | 12/10/35 | 12,200 | 12,663 |
| 2 GE Capital Commercial Mortgage Corp | 5.145% | 7/10/37 | 1,340 | 1,326 |
| 2 GE Capital Commercial Mortgage Corp | 4.996% | 12/10/37 | 20,000 | 19,804 |
| 2, 3 GE Capital Credit Card Master Note | 5.400% | 6/15/10 | 18,500 | 18,503 |
| 2, 3 GE Capital Credit Card Master Note | 5.360% | 6/15/11 | 44,000 | 44,062 |
| 2 GE Capital Credit Card Master Note | 5.080% | 9/15/12 | 19,100 | 19,142 |
| 2 GMAC Commercial Mortgage Securities | 6.175% | 5/15/33 | 18,921 | 19,098 |
| 2 GMAC Commercial Mortgage Securities | 7.455% | 8/16/33 | 11,265 | 11,900 |
| 2 GMAC Commercial Mortgage Securities | 6.465% | 4/15/34 | 14,085 | 14,663 |
| 2 GMAC Commercial Mortgage Securities | 6.700% | 4/15/34 | 16,500 | 17,362 |
| 2 GMAC Commercial Mortgage Securities | 6.420% | 5/15/35 | 9,228 | 9,323 |
| 2 GS Mortgage Securities Corp. II | 4.608% | 1/10/40 | 20,000 | 19,257 |
| 2, 3 Gracechurch Card Funding PLC | 5.470% | 10/15/09 | 46,000 | 46,052 |
| 2, 3 Gracechurch Card Funding PLC | 5.370% | 11/16/09 | 100,000 | 100,068 |
| 2, 3 Gracechurch Card Funding PLC | 5.460% | 3/15/10 | 20,500 | 20,545 |
| 2, 3 Gracechurch Card Funding PLC | 5.360% | 6/15/10 | 109,700 | 109,854 |
| 2, 3 Gracechurch Card Funding PLC | 5.360% | 9/15/10 | 77,000 | 77,099 |
| 2 Honda Auto Receivables Owner Trust | 2.910% | 10/20/08 | 9,097 | 9,016 |
| 2 Honda Auto Receivables Owner Trust | 2.770% | 11/21/08 | 832 | 831 |
| 2 Honda Auto Receivables Owner Trust | 4.610% | 8/17/09 | 42,500 | 42,270 |
| 2 Honda Auto Receivables Owner Trust | 5.300% | 7/21/10 | 12,150 | 12,260 |
| 2 JPMorgan Chase Commercial Mortgage | 6.260% | 3/15/33 | 19,935 | 20,541 |
| 2 JPMorgan Chase Commercial Mortgage | 5.050% | 12/12/34 | 11,000 | 10,879 |
| 2 JPMorgan Chase Commercial Mortgage | 4.985% | 1/12/37 | 15,000 | 14,692 |
| 2 JPMorgan Chase Commercial Mortgage | 5.255% | 7/12/37 | 1,790 | 1,783 |
| 2 JPMorgan Chase Commercial Mortgage | 5.376% | 7/12/37 | 12,180 | 12,155 |
| 2 LB Commerical Conduit Mortgage Trus | 6.780% | 6/15/31 | 26,148 | 26,751 |
| 2 LB-UBS Commercial Mortgage Trust | 7.370% | 8/15/26 | 20,000 | 21,133 |
| 2 LB-UBS Commercial Mortgage Trust | 5.197% | 11/15/30 | 20,925 | 20,716 |
| 2 LB-UBS Commercial Mortgage Trust | 6.133% | 12/15/30 | 8,190 | 8,497 |
| 2 MBNA Credit Card Master Note Trust | 4.950% | 6/15/09 | 45,800 | 45,796 |
| 2, 3 MBNA Credit Card Master Note Trust | 5.490% | 2/16/10 | 51,000 | 51,061 |
| 2, 3 MBNA Credit Card Master Note Trust | 5.350% | 12/15/10 | 117,500 | 117,582 |
| 2 MBNA Credit Card Master Note Trust | 4.300% | 2/15/11 | 21,775 | 21,501 |
| 2, 3 MBNA Credit Card Master Note Trust | 5.480% | 2/15/11 | 131,900 | 132,308 |
| 2 MBNA Master Credit Card Trust | 7.000% | 2/15/12 | 17,459 | 18,297 |
| 2 Morgan Stanley Capital I | 6.520% | 3/15/30 | 1,160 | 1,164 |
| 2 Morgan Stanley Capital I | 6.480% | 11/15/30 | 2,317 | 2,333 |
| 2 Morgan Stanley Capital I | 5.230% | 9/15/42 | 21,650 | 21,423 |
| 2 Morgan Stanley Dean Witter Capital | 6.660% | 2/15/33 | 5,000 | 5,201 |
| 2 Morgan Stanley Dean Witter Capital | 6.390% | 7/15/33 | 5,000 | 5,191 |
| 2 Morgan Stanley Dean Witter Capital | 4.920% | 3/12/35 | 20,000 | 19,588 |
| 2 Morgan Stanley Dean Witter Capital | 6.390% | 10/15/35 | 5,000 | 5,204 |
| 2 Morgan Stanley Dean Witter Capital | 4.740% | 11/13/36 | 1,340 | 1,301 |
| 2 Nissan Auto Receivables Owner Trust | 4.190% | 7/15/09 | 19,900 | 19,725 |
| 2 Oncor Electric Delivery Transition | 4.030% | 2/15/12 | 3,000 | 2,941 |
| 2 PECO Energy Transition Trust | 6.130% | 3/1/09 | 450 | 454 |
| 2 PG&E Energy Recovery Funding LLC | 4.140% | 9/25/12 | 8,625 | 8,412 |
| 2 PG&E Energy Recovery Funding LLC | 5.030% | 3/25/14 | 13,650 | 13,656 |
| 2 PP&L Transition Bond Co. LLC | 7.150% | 6/25/09 | 850 | 871 |
| 2 PSE&G Transition Funding LLC | 6.890% | 12/15/17 | 19,800 | 22,113 |
| 2 Prudential Securities Secured Finan | 7.193% | 6/16/31 | 4,575 | 4,705 |
| 2 Public Service New Hampshire Fundin | 5.730% | 11/1/10 | 404 | 406 |
| 2 Residential Asset Securities Corp. | 6.489% | 10/25/30 | 580 | 578 |
| 2 Salomon Brothers Mortgage Securitie | 4.117% | 9/25/33 | 32,609 | 32,378 |
| 2 USAA Auto Owner Trust | 4.550% | 2/16/10 | 33,200 | 32,964 |
| 2 USAA Auto Owner Trust | 5.360% | 2/15/11 | 22,250 | 22,349 |
| 2 Volkswagen Auto Loan Enhanced Trust | 4.800% | 7/20/09 | 37,200 | 37,083 |
| 2 Wachovia Bank Commercial Mortgage T | 4.440% | 11/15/34 | 3,000 | 2,917 |
| 2 Wachovia Bank Commercial Mortgage T | 4.980% | 11/15/34 | 900 | 880 |
| 2 Wachovia Bank Commercial Mortgage T | 4.867% | 2/15/35 | 900 | 874 |
| 2 World Omni Auto Receivables Trust | 3.540% | 6/12/09 | 22,037 | 21,872 |
| 3,346,019 | ||||
| Finance (8.2%) | ||||
| Banking (3.5%) | ||||
| Abbey National PLC | 7.950% | 10/26/29 | 11,965 | 15,172 |
| AmSouth Bank NA | 5.200% | 4/1/15 | 6,200 | 6,081 |
| Associates Corp. of North America | 6.950% | 11/1/18 | 350 | 393 |
| BAC Capital Trust XI | 6.625% | 5/23/36 | 2,725 | 2,942 |
| BB&T Corp. | 6.500% | 8/1/11 | 2,990 | 3,143 |
| BB&T Corp. | 4.750% | 10/1/12 | 3,900 | 3,796 |
| BB&T Corp. | 5.200% | 12/23/15 | 5,275 | 5,186 |
| BB&T Corp. | 5.625% | 9/15/16 | 6,450 | 6,553 |
| BB&T Corp. | 4.900% | 6/30/17 | 625 | 596 |
| BB&T Corp. | 5.250% | 11/1/19 | 5,450 | 5,306 |
| BB&T Corp. | 6.750% | 6/7/36 | 8,775 | 9,611 |
| Bank One Corp. | 6.000% | 8/1/08 | 900 | 912 |
| Bank One Corp. | 6.000% | 2/17/09 | 110 | 112 |
| Bank One Corp. | 7.875% | 8/1/10 | 21,180 | 22,981 |
| Bank One Corp. | 5.900% | 11/15/11 | 4,725 | 4,856 |
| Banc One Corp. | 7.625% | 10/15/26 | 1,475 | 1,775 |
| Bank One Texas | 6.250% | 2/15/08 | 2,100 | 2,123 |
| Bank of America Corp. | 3.250% | 8/15/08 | 14,600 | 14,168 |
| Bank of America Corp. | 3.375% | 2/17/09 | 2,800 | 2,707 |
| Bank of America Corp. | 4.250% | 10/1/10 | 7,400 | 7,185 |
| Bank of America Corp. | 4.375% | 12/1/10 | 3,500 | 3,408 |
| Bank of America Corp. | 5.375% | 8/15/11 | 7,925 | 7,989 |
| Bank of America Corp. | 6.250% | 4/15/12 | 600 | 627 |
| Bank of America Corp. | 4.875% | 1/15/13 | 1,340 | 1,319 |
| Bank of America Corp. | 4.750% | 8/15/13 | 810 | 784 |
| Bank of America Corp. | 5.375% | 6/15/14 | 10,150 | 10,221 |
| Bank of America Corp. | 5.125% | 11/15/14 | 14,250 | 14,108 |
| Bank of America Corp. | 5.250% | 12/1/15 | 12,100 | 11,947 |
| Bank of America Corp. | 5.750% | 8/15/16 | 13,925 | 14,275 |
| Bank of America Corp. | 5.625% | 10/14/16 | 15,300 | 15,593 |
| 4Bank of America Corp. | 5.420% | 3/15/17 | 19,900 | 19,625 |
| Bank of America Corp. | 5.625% | 3/8/35 | 6,375 | 5,975 |
| Bank of America Corp. | 6.000% | 10/15/36 | 5,350 | 5,529 |
| Bank of New York Co., Inc. | 3.750% | 2/15/08 | 9,970 | 9,816 |
| Bank of New York Co., Inc. | 4.950% | 1/14/11 | 3,275 | 3,249 |
| Bank of New York Co., Inc. | 4.950% | 3/15/15 | 7,225 | 7,035 |
| Bank of Tokyo-Mitsubishi | 8.400% | 4/15/10 | 8,525 | 9,306 |
| BankAmerica Capital II | 8.000% | 12/15/26 | 100 | 103 |
| BankAmerica Corp. | 5.875% | 2/15/09 | 3,025 | 3,074 |
| BankBoston NA | 6.375% | 4/15/08 | 9,200 | 9,332 |
| Barclays Bank PLC | 6.278% | 12/29/49 | 3,295 | 3,237 |
| Charter One Bank N.A | 5.500% | 4/26/11 | 13,150 | 13,287 |
| Citicorp | 6.375% | 11/15/08 | 100 | 102 |
| Citicorp Capital II | 8.015% | 2/15/27 | 1,225 | 1,276 |
| Citigroup Capital II | 7.750% | 12/1/36 | 5,000 | 5,137 |
| Citigroup, Inc. | 3.500% | 2/1/08 | 150 | 147 |
| Citigroup, Inc. | 6.500% | 2/15/08 | 7,000 | 7,091 |
| Citigroup, Inc. | 3.625% | 2/9/09 | 2,375 | 2,307 |
| Citigroup, Inc. | 6.200% | 3/15/09 | 140 | 143 |
| Citigroup, Inc. | 4.250% | 7/29/09 | 11,105 | 10,877 |
| Citigroup, Inc. | 4.625% | 8/3/10 | 11,950 | 11,760 |
| Citigroup, Inc. | 6.500% | 1/18/11 | 10,795 | 11,310 |
| Citigroup, Inc. | 5.100% | 9/29/11 | 39,620 | 39,494 |
| Citigroup, Inc. | 6.000% | 2/21/12 | 7,450 | 7,723 |
| Citigroup, Inc. | 5.625% | 8/27/12 | 7,465 | 7,602 |
| Citigroup, Inc. | 5.125% | 5/5/14 | 3,750 | 3,724 |
| Citigroup, Inc. | 5.000% | 9/15/14 | 13,608 | 13,276 |
| Citigroup, Inc. | 4.700% | 5/29/15 | 4,075 | 3,913 |
| Citigroup, Inc. | 5.300% | 1/7/16 | 18,900 | 18,833 |
| Citigroup, Inc. | 5.850% | 8/2/16 | 5,450 | 5,660 |
| Citigroup, Inc. | 6.625% | 6/15/32 | 1,250 | 1,397 |
| Citigroup, Inc. | 5.875% | 2/22/33 | 4,300 | 4,359 |
| Citigroup, Inc. | 6.000% | 10/31/33 | 3,650 | 3,782 |
| Citigroup, Inc. | 5.850% | 12/11/34 | 2,000 | 2,049 |
| Citigroup, Inc. | 6.125% | 8/25/36 | 7,025 | 7,384 |
| Colonial Bank NA | 6.375% | 12/1/15 | 1,425 | 1,467 |
| Comerica Bank | 5.200% | 8/22/17 | 3,725 | 3,555 |
| Compass Bank | 5.900% | 4/1/26 | 2,400 | 2,391 |
| Credit Suisse First Boston USA, Inc. | 4.625% | 1/15/08 | 1,910 | 1,898 |
| Credit Suisse First Boston USA, Inc. | 3.875% | 1/15/09 | 7,750 | 7,573 |
| Credit Suisse First Boston USA, Inc. | 4.700% | 6/1/09 | 1,600 | 1,589 |
| Credit Suisse First Boston USA, Inc. | 4.875% | 8/15/10 | 24,600 | 24,383 |
| Credit Suisse First Boston USA, Inc. | 5.250% | 3/2/11 | 9,175 | 9,200 |
| Credit Suisse First Boston USA, Inc. | 5.500% | 8/16/11 | 2,000 | 2,025 |
| Credit Suisse First Boston USA, Inc. | 6.125% | 11/15/11 | 10,650 | 11,066 |
| Credit Suisse First Boston USA, Inc. | 6.500% | 1/15/12 | 2,950 | 3,113 |
| Credit Suisse First Boston USA, Inc. | 5.500% | 8/15/13 | 5,350 | 5,427 |
| Credit Suisse First Boston USA, Inc. | 5.125% | 1/15/14 | 1,935 | 1,919 |
| Credit Suisse First Boston USA, Inc. | 4.875% | 1/15/15 | 18,750 | 18,222 |
| Credit Suisse First Boston USA, Inc. | 5.125% | 8/15/15 | 3,190 | 3,143 |
| Credit Suisse First Boston USA, Inc. | 7.125% | 7/15/32 | 4,025 | 4,821 |
| Deutsche Bank Financial LLC | 5.375% | 3/2/15 | 6,050 | 6,059 |
| Fifth Third Bank | 4.200% | 2/23/10 | 3,975 | 3,868 |
| Fifth Third Bank | 4.750% | 2/1/15 | 11,625 | 11,113 |
| Fifth Third Bank | 4.500% | 6/1/18 | 2,250 | 2,054 |
| First Tennessee Bank | 5.050% | 1/15/15 | 1,825 | 1,770 |
| First Union Institutional Capital I | 8.040% | 12/1/26 | 1,825 | 1,888 |
| FirstStar Bank | 7.125% | 12/1/09 | 2,685 | 2,829 |
| Fleet Boston Financial Corp. | 3.850% | 2/15/08 | 3,550 | 3,496 |
| Fleet Capital Trust II | 7.920% | 12/11/26 | 2,315 | 2,393 |
| Golden West Financial Corp. | 4.750% | 10/1/12 | 340 | 331 |
| GreenPoint Financial Corp. | 3.200% | 6/6/08 | 340 | 330 |
| HSBC Bank PLC | 6.950% | 3/15/11 | 11,350 | 12,048 |
| HSBC Bank USA | 4.625% | 4/1/14 | 1,625 | 1,559 |
| HSBC Bank USA | 5.875% | 11/1/34 | 3,025 | 3,063 |
| HSBC Bank USA | 5.625% | 8/15/35 | 4,625 | 4,498 |
| HSBC Holdings PLC | 7.500% | 7/15/09 | 2,040 | 2,152 |
| HSBC Holdings PLC | 5.250% | 12/12/12 | 2,265 | 2,261 |
| HSBC Holdings PLC | 7.625% | 5/17/32 | 1,250 | 1,522 |
| HSBC Holdings PLC | 7.350% | 11/27/32 | 2,515 | 2,976 |
| HSBC Holdings PLC | 6.500% | 5/2/36 | 17,350 | 18,760 |
| J.P. Morgan, Inc. | 6.000% | 1/15/09 | 7,475 | 7,600 |
| JPM Capital Trust | 6.550% | 9/29/36 | 8,725 | 8,953 |
| JPM Capital Trust II | 7.950% | 2/1/27 | 975 | 1,015 |
| JPMorgan Capital Trust | 5.875% | 3/15/35 | 3,975 | 3,869 |
| JPMorgan Chase&Co. | 3.700% | 1/15/08 | 11,890 | 11,711 |
| JPMorgan Chase&Co. | 4.000% | 2/1/08 | 6,625 | 6,543 |
| JPMorgan Chase&Co. | 3.625% | 5/1/08 | 5,925 | 5,806 |
| JPMorgan Chase&Co. | 3.500% | 3/15/09 | 8,475 | 8,196 |
| JPMorgan Chase&Co. | 6.750% | 2/1/11 | 9,362 | 9,873 |
| JPMorgan Chase&Co. | 5.600% | 6/1/11 | 17,925 | 18,242 |
| JPMorgan Chase&Co. | 4.500% | 1/15/12 | 12,350 | 11,959 |
| JPMorgan Chase&Co. | 6.625% | 3/15/12 | 3,225 | 3,416 |
| JPMorgan Chase&Co. | 5.750% | 1/2/13 | 3,600 | 3,677 |
| JPMorgan Chase&Co. | 4.875% | 3/15/14 | 9,540 | 9,266 |
| JPMorgan Chase&Co. | 5.125% | 9/15/14 | 12,650 | 12,471 |
| JPMorgan Chase&Co. | 4.750% | 3/1/15 | 4,700 | 4,530 |
| JPMorgan Chase&Co. | 5.250% | 5/1/15 | 2,150 | 2,130 |
| JPMorgan Chase&Co. | 5.150% | 10/1/15 | 6,175 | 6,068 |
| JPMorgan Chase&Co. | 5.875% | 6/13/16 | 4,075 | 4,189 |
| JPMorgan Chase&Co. | 5.850% | 8/1/35 | 1,375 | 1,341 |
| Key Bank NA | 4.412% | 3/18/08 | 4,725 | 4,681 |
| Key Bank NA | 7.000% | 2/1/11 | 725 | 771 |
| Key Bank NA | 5.800% | 7/1/14 | 1,175 | 1,197 |
| Key Bank NA | 4.950% | 9/15/15 | 7,175 | 6,895 |
| Key Bank NA | 5.450% | 3/3/16 | 7,075 | 7,049 |
| MBNA America Bank NA | 5.375% | 1/15/08 | 5,040 | 5,046 |
| MBNA America Bank NA | 4.625% | 8/3/09 | 3,450 | 3,409 |
| MBNA America Bank NA | 6.625% | 6/15/12 | 765 | 809 |
| MBNA Corp. | 7.500% | 3/15/12 | 3,970 | 4,371 |
| MBNA Corp. | 6.125% | 3/1/13 | 2,200 | 2,296 |
| MBNA Corp. | 5.000% | 6/15/15 | 950 | 932 |
| Marshall&Ilsley Bank | 4.500% | 8/25/08 | 1,300 | 1,285 |
| Marshall&Ilsley Bank | 4.850% | 6/16/15 | 700 | 675 |
| Marshall&Ilsley Corp. | 4.375% | 8/1/09 | 2,675 | 2,627 |
| Mellon Bank NA | 4.750% | 12/15/14 | 3,650 | 3,510 |
| Mellon Capital II | 7.995% | 1/15/27 | 5,525 | 5,753 |
| Mellon Funding Corp. | 3.250% | 4/1/09 | 2,775 | 2,666 |
| Mellon Funding Corp. | 6.400% | 5/14/11 | 450 | 471 |
| Mellon Funding Corp. | 5.000% | 12/1/14 | 1,100 | 1,077 |
| NB Capital Trust II | 7.830% | 12/15/26 | 5,000 | 5,168 |
| NB Capital Trust IV | 8.250% | 4/15/27 | 3,400 | 3,550 |
| National City Bank | 4.150% | 8/1/09 | 6,675 | 6,514 |
| National City Bank | 4.500% | 3/15/10 | 7,525 | 7,368 |
| National City Bank | 6.250% | 3/15/11 | 1,500 | 1,555 |
| National City Bank | 4.625% | 5/1/13 | 1,000 | 959 |
| National City Corp. | 3.200% | 4/1/08 | 3,775 | 3,681 |
| National City Corp. | 6.875% | 5/15/19 | 850 | 941 |
| National Westminster Bank PLC | 7.375% | 10/1/09 | 450 | 474 |
| NationsBank Corp. | 6.800% | 3/15/28 | 725 | 814 |
| North Fork Bancorp., Inc. | 5.875% | 8/15/12 | 250 | 255 |
| PNC Bank NA | 4.875% | 9/21/17 | 11,500 | 10,941 |
| PNC Funding Corp. | 5.250% | 11/15/15 | 5,950 | 5,908 |
| Popular North America, Inc. | 4.250% | 4/1/08 | 1,000 | 986 |
| Regions Financial Corp. | 4.500% | 8/8/08 | 1,100 | 1,091 |
| Regions Financial Corp. | 4.375% | 12/1/10 | 1,000 | 970 |
| Regions Financial Corp. | 7.000% | 3/1/11 | 5,250 | 5,578 |
| Regions Financial Corp. | 7.750% | 3/1/11 | 7,525 | 8,212 |
| Regions Financial Corp. | 6.375% | 5/15/12 | 9,975 | 10,472 |
| Republic New York Corp. | 7.750% | 5/15/09 | 4,300 | 4,541 |
| Royal Bank of Canada | 4.125% | 1/26/10 | 10,300 | 10,021 |
| Royal Bank of Canada | 5.650% | 7/20/11 | 2,325 | 2,373 |
| Royal Bank of Scotland Group PLC | 6.375% | 2/1/11 | 1,675 | 1,746 |
| Royal Bank of Scotland Group PLC | 5.000% | 11/12/13 | 12,150 | 11,908 |
| Royal Bank of Scotland Group PLC | 5.050% | 1/8/15 | 6,675 | 6,516 |
| Royal Bank of Scotland Group PLC | 7.648% | 8/29/49 | 15,395 | 18,055 |
| Santander Central Hispano Issuances | 7.625% | 9/14/10 | 13,400 | 14,453 |
| Santander Finance Issuances | 6.375% | 2/15/11 | 1,400 | 1,444 |
| Sanwa Bank Ltd. | 8.350% | 7/15/09 | 5,600 | 5,974 |
| Sanwa Bank Ltd. | 7.400% | 6/15/11 | 13,625 | 14,734 |
| Southtrust Corp. | 5.800% | 6/15/14 | 3,075 | 3,129 |
| 4Sovereign Bancorp, Inc. | 4.800% | 9/1/10 | 8,275 | 8,087 |
| Sovereign Bank | 5.125% | 3/15/13 | 900 | 882 |
| State Street Capital Trust | 5.300% | 1/15/16 | 3,425 | 3,425 |
| Sumitomo Bank International Finance NV | 8.500% | 6/15/09 | 6,475 | 6,931 |
| Sumitomo Mitsui Banking Corp. | 8.000% | 6/15/12 | 8,515 | 9,484 |
| SunTrust Banks, Inc. | 6.375% | 4/1/11 | 8,455 | 8,827 |
| SunTrust Banks, Inc. | 5.000% | 9/1/15 | 350 | 341 |
| SunTrust Banks, Inc. | 6.000% | 2/15/26 | 3,925 | 4,036 |
| SunTrust Capital II | 7.900% | 6/15/27 | 2,085 | 2,181 |
| Suntrust Capital | 6.100% | 12/15/36 | 1,875 | 1,834 |
| Swiss Bank Corp. | 7.000% | 10/15/15 | 2,825 | 3,152 |
| Swiss Bank Corp. | 7.375% | 6/15/17 | 4,175 | 4,885 |
| Synovus Financial Corp. | 5.125% | 6/15/17 | 4,925 | 4,757 |
| The Chase Manhattan Corp. | 6.375% | 4/1/08 | 75 | 76 |
| The Chase Manhattan Corp. | 7.875% | 6/15/10 | 450 | 487 |
| UFJ Finance Aruba AEC | 6.750% | 7/15/13 | 11,850 | 12,700 |
| US Bancorp | 3.125% | 3/15/08 | 3,275 | 3,198 |
| US Bank NA | 6.500% | 2/1/08 | 3,500 | 3,546 |
| US Bank NA | 4.125% | 3/17/08 | 7,375 | 7,284 |
| US Bank NA | 4.400% | 8/15/08 | 4,200 | 4,155 |
| US Bank NA | 6.375% | 8/1/11 | 6,875 | 7,201 |
| US Bank NA | 6.300% | 2/4/14 | 9,150 | 9,695 |
| US Bank NA | 4.950% | 10/30/14 | 6,575 | 6,420 |
| Union Bank of California NA | 5.950% | 5/11/16 | 4,700 | 4,839 |
| UnionBanCal Corp. | 5.250% | 12/16/13 | 1,475 | 1,454 |
| Wachovia Bank NA | 4.375% | 8/15/08 | 1,625 | 1,602 |
| Wachovia Bank NA | 4.800% | 11/1/14 | 4,250 | 4,076 |
| Wachovia Bank NA | 4.875% | 2/1/15 | 16,550 | 15,997 |
| Wachovia Bank NA | 5.000% | 8/15/15 | 1,110 | 1,077 |
| Wachovia Corp. | 6.250% | 8/4/08 | 850 | 863 |
| Wachovia Corp. | 3.625% | 2/17/09 | 750 | 728 |
| Wachovia Corp. | 7.875% | 2/15/10 | 5,550 | 5,976 |
| Wachovia Corp. | 4.375% | 6/1/10 | 10,200 | 9,973 |
| Wachovia Corp. | 7.800% | 8/18/10 | 13,130 | 14,245 |
| Wachovia Corp. | 5.300% | 10/15/11 | 13,450 | 13,486 |
| Wachovia Corp. | 4.875% | 2/15/14 | 2,575 | 2,488 |
| Wachovia Corp. | 5.250% | 8/1/14 | 3,575 | 3,531 |
| Wachovia Corp. | 5.625% | 10/15/16 | 4,900 | 4,924 |
| Wachovia Corp. | 6.605% | 10/1/25 | 275 | 300 |
| 4Wachovia Corp. | 8.000% | 12/15/26 | 5,125 | 5,295 |
| Wachovia Corp. | 7.500% | 4/15/35 | 1,100 | 1,340 |
| Wachovia Corp. | 5.500% | 8/1/35 | 1,450 | 1,385 |
| Wachovia Corp. | 6.550% | 10/15/35 | 775 | 843 |
| Washington Mutual Bank | 6.875% | 6/15/11 | 19,145 | 20,252 |
| Washington Mutual Bank | 5.500% | 1/15/13 | 5,075 | 5,077 |
| Washington Mutual Bank | 5.650% | 8/15/14 | 6,800 | 6,816 |
| Washington Mutual Bank | 5.125% | 1/15/15 | 5,925 | 5,756 |
| Washington Mutual Capital I | 8.375% | 6/1/27 | 1,750 | 1,836 |
| Washington Mutual, Inc. | 4.375% | 1/15/08 | 750 | 743 |
| Washington Mutual, Inc. | 4.000% | 1/15/09 | 2,500 | 2,442 |
| Washington Mutual, Inc. | 4.200% | 1/15/10 | 1,900 | 1,845 |
| Washington Mutual, Inc. | 5.000% | 3/22/12 | 4,875 | 4,802 |
| Washington Mutual, Inc. | 5.250% | 9/15/17 | 3,950 | 3,827 |
| Wells Fargo&Co. | 4.125% | 3/10/08 | 20,095 | 19,860 |
| Wells Fargo&Co. | 3.125% | 4/1/09 | 5,025 | 4,828 |
| Wells Fargo&Co. | 4.200% | 1/15/10 | 15,750 | 15,330 |
| Wells Fargo&Co. | 4.625% | 8/9/10 | 7,400 | 7,284 |
| Wells Fargo&Co. | 4.875% | 1/12/11 | 7,675 | 7,601 |
| Wells Fargo&Co. | 6.375% | 8/1/11 | 2,000 | 2,093 |
| Wells Fargo&Co. | 5.300% | 8/26/11 | 4,800 | 4,834 |
| Wells Fargo&Co. | 5.125% | 9/1/12 | 4,000 | 3,980 |
| Wells Fargo&Co. | 4.950% | 10/16/13 | 14,800 | 14,490 |
| Wells Fargo&Co. | 4.625% | 4/15/14 | 275 | 263 |
| Wells Fargo&Co. | 5.000% | 11/15/14 | 675 | 659 |
| Wells Fargo&Co. | 5.375% | 2/7/35 | 4,425 | 4,259 |
| Wells Fargo Bank NA | 6.450% | 2/1/11 | 8,200 | 8,583 |
| Wells Fargo Bank NA | 4.750% | 2/9/15 | 4,075 | 3,921 |
| Wells Fargo Bank NA | 5.750% | 5/16/16 | 4,700 | 4,837 |
| Wells Fargo Bank NA | 5.950% | 8/26/36 | 5,600 | 5,780 |
| Wells Fargo Capital X | 5.950% | 12/15/36 | 2,875 | 2,809 |
| Wells Fargo Financial | 5.500% | 8/1/12 | 3,975 | 4,036 |
| World Savings Bank, FSB | 4.125% | 3/10/08 | 6,175 | 6,097 |
| World Savings Bank, FSB | 4.125% | 12/15/09 | 6,000 | 5,837 |
| Zions Bancorp | 5.500% | 11/16/15 | 6,950 | 6,873 |
| Brokerage (1.4%) | ||||
| Ameriprise Financial Inc. | 5.350% | 11/15/10 | 6,650 | 6,674 |
| Ameriprise Financial Inc. | 5.650% | 11/15/15 | 4,925 | 4,966 |
| Bear Stearns Co., Inc. | 4.000% | 1/31/08 | 18,200 | 17,949 |
| Bear Stearns Co., Inc. | 2.875% | 7/2/08 | 1,900 | 1,838 |
| Bear Stearns Co., Inc. | 3.250% | 3/25/09 | 600 | 577 |
| Bear Stearns Co., Inc. | 4.550% | 6/23/10 | 750 | 735 |
| Bear Stearns Co., Inc. | 5.500% | 8/15/11 | 900 | 911 |
| Bear Stearns Co., Inc. | 5.700% | 11/15/14 | 18,240 | 18,597 |
| Bear Stearns Co., Inc. | 5.300% | 10/30/15 | 2,715 | 2,690 |
| Bear Stearns Co., Inc. | 5.550% | 1/22/17 | 4,250 | 4,247 |
| Dean Witter, Discover&Co. | 6.750% | 10/15/13 | 800 | 861 |
| 4Fidelity Investments | 7.490% | 6/15/19 | 1,000 | 1,162 |
| Goldman Sachs Group, Inc. | 4.125% | 1/15/08 | 5,090 | 5,025 |
| Goldman Sachs Group, Inc. | 3.875% | 1/15/09 | 16,670 | 16,287 |
| Goldman Sachs Group, Inc. | 6.650% | 5/15/09 | 18,290 | 18,912 |
| Goldman Sachs Group, Inc. | 4.500% | 6/15/10 | 23,450 | 22,977 |
| Goldman Sachs Group, Inc. | 5.000% | 1/15/11 | 200 | 199 |
| Goldman Sachs Group, Inc. | 6.600% | 1/15/12 | 3,075 | 3,250 |
| Goldman Sachs Group, Inc. | 5.700% | 9/1/12 | 4,000 | 4,083 |
| Goldman Sachs Group, Inc. | 5.250% | 4/1/13 | 10,490 | 10,467 |
| Goldman Sachs Group, Inc. | 4.750% | 7/15/13 | 2,225 | 2,151 |
| Goldman Sachs Group, Inc. | 5.150% | 1/15/14 | 3,015 | 2,970 |
| Goldman Sachs Group, Inc. | 5.000% | 10/1/14 | 17,675 | 17,187 |
| Goldman Sachs Group, Inc. | 5.500% | 11/15/14 | 7,650 | 7,664 |
| Goldman Sachs Group, Inc. | 5.125% | 1/15/15 | 2,060 | 2,018 |
| Goldman Sachs Group, Inc. | 5.350% | 1/15/16 | 17,250 | 17,103 |
| Goldman Sachs Group, Inc. | 5.750% | 10/1/16 | 4,975 | 5,063 |
| Goldman Sachs Group, Inc. | 5.950% | 1/15/27 | 9,150 | 9,049 |
| Goldman Sachs Group, Inc. | 6.125% | 2/15/33 | 11,825 | 12,108 |
| Goldman Sachs Group, Inc. | 6.345% | 2/15/34 | 13,975 | 14,160 |
| Goldman Sachs Group, Inc. | 6.450% | 5/1/36 | 11,275 | 11,821 |
| Janus Capital Group | 5.875% | 9/15/11 | 3,375 | 3,400 |
| Jefferies Group Inc. | 6.250% | 1/15/36 | 7,700 | 7,477 |
| Lehman Brothers Holdings, Inc. | 4.000% | 1/22/08 | 6,900 | 6,816 |
| Lehman Brothers Holdings, Inc. | 7.000% | 2/1/08 | 4,925 | 5,010 |
| Lehman Brothers Holdings, Inc. | 3.500% | 8/7/08 | 2,990 | 2,915 |
| Lehman Brothers Holdings, Inc. | 3.950% | 11/10/09 | 6,925 | 6,714 |
| Lehman Brothers Holdings, Inc. | 4.250% | 1/27/10 | 1,475 | 1,439 |
| Lehman Brothers Holdings, Inc. | 4.500% | 7/26/10 | 8,150 | 7,978 |
| Lehman Brothers Holdings, Inc. | 7.875% | 8/15/10 | 7,000 | 7,618 |
| Lehman Brothers Holdings, Inc. | 4.375% | 11/30/10 | 4,400 | 4,277 |
| Lehman Brothers Holdings, Inc. | 5.000% | 1/14/11 | 8,400 | 8,351 |
| Lehman Brothers Holdings, Inc. | 6.625% | 1/18/12 | 3,300 | 3,498 |
| Lehman Brothers Holdings, Inc. | 5.750% | 5/17/13 | 14,525 | 14,870 |
| Lehman Brothers Holdings, Inc. | 5.500% | 4/4/16 | 13,850 | 13,898 |
| Lehman Brothers Holdings, Inc. | 5.750% | 1/3/17 | 2,400 | 2,433 |
| Lehman Brothers Holdings, Inc. | 5.875% | 11/15/17 | 250 | 256 |
| Merrill Lynch&Co., Inc. | 3.700% | 4/21/08 | 4,750 | 4,660 |
| Merrill Lynch&Co., Inc. | 3.125% | 7/15/08 | 10,675 | 10,361 |
| Merrill Lynch&Co., Inc. | 6.375% | 10/15/08 | 2,000 | 2,040 |
| Merrill Lynch&Co., Inc. | 4.125% | 1/15/09 | 11,425 | 11,219 |
| Merrill Lynch&Co., Inc. | 6.000% | 2/17/09 | 6,686 | 6,802 |
| Merrill Lynch&Co., Inc. | 4.250% | 2/8/10 | 6,425 | 6,259 |
| Merrill Lynch&Co., Inc. | 4.790% | 8/4/10 | 2,575 | 2,546 |
| Merrill Lynch&Co., Inc. | 5.770% | 7/25/11 | 12,775 | 13,054 |
| Merrill Lynch&Co., Inc. | 5.000% | 2/3/14 | 6,675 | 6,558 |
| Merrill Lynch&Co., Inc. | 5.450% | 7/15/14 | 600 | 603 |
| Merrill Lynch&Co., Inc. | 5.000% | 1/15/15 | 13,075 | 12,787 |
| Merrill Lynch&Co., Inc. | 6.050% | 5/16/16 | 7,675 | 7,952 |
| Merrill Lynch&Co., Inc. | 6.500% | 7/15/18 | 425 | 461 |
| Merrill Lynch&Co., Inc. | 6.875% | 11/15/18 | 3,625 | 4,065 |
| Merrill Lynch&Co., Inc. | 6.220% | 9/15/26 | 10,625 | 11,039 |
| Morgan Stanley Dean Witter | 3.625% | 4/1/08 | 1,570 | 1,541 |
| Morgan Stanley Dean Witter | 3.875% | 1/15/09 | 14,400 | 14,058 |
| Morgan Stanley Dean Witter | 4.000% | 1/15/10 | 21,875 | 21,175 |
| Morgan Stanley Dean Witter | 4.250% | 5/15/10 | 22,105 | 21,494 |
| Morgan Stanley Dean Witter | 5.050% | 1/21/11 | 1,725 | 1,717 |
| Morgan Stanley Dean Witter | 6.750% | 4/15/11 | 10,035 | 10,618 |
| Morgan Stanley Dean Witter | 5.625% | 1/9/12 | 2,500 | 2,545 |
| Morgan Stanley Dean Witter | 6.600% | 4/1/12 | 7,420 | 7,875 |
| Morgan Stanley Dean Witter | 5.300% | 3/1/13 | 400 | 400 |
| Morgan Stanley Dean Witter | 4.750% | 4/1/14 | 16,225 | 15,561 |
| Morgan Stanley Dean Witter | 5.375% | 10/15/15 | 7,100 | 7,058 |
| Morgan Stanley Dean Witter | 5.750% | 10/18/16 | 14,825 | 15,090 |
| Morgan Stanley Dean Witter | 6.250% | 8/9/26 | 8,300 | 8,751 |
| Morgan Stanley Dean Witter | 7.250% | 4/1/32 | 9,415 | 11,194 |
| Finance Companies (1.9%) | ||||
| Allied Capital Corp. | 6.000% | 4/1/12 | 3,125 | 3,090 |
| American Express Centurion Bank | 4.375% | 7/30/09 | 2,300 | 2,257 |
| American Express Co. | 4.750% | 6/17/09 | 3,100 | 3,071 |
| American Express Co. | 5.250% | 9/12/11 | 4,000 | 4,006 |
| American Express Co. | 4.875% | 7/15/13 | 1,500 | 1,463 |
| American Express Co. | 5.500% | 9/12/16 | 3,600 | 3,626 |
| American Express Co. | 6.800% | 9/1/66 | 3,475 | 3,705 |
| American Express Credit Corp. | 3.000% | 5/16/08 | 3,400 | 3,307 |
| American Express Credit Corp. | 5.000% | 12/2/10 | 4,725 | 4,701 |
| American General Finance Corp. | 3.875% | 10/1/09 | 4,000 | 3,862 |
| American General Finance Corp. | 4.875% | 5/15/10 | 5,100 | 5,048 |
| American General Finance Corp. | 5.625% | 8/17/11 | 7,625 | 7,702 |
| American General Finance Corp. | 4.875% | 7/15/12 | 725 | 708 |
| American General Finance Corp. | 5.850% | 6/1/13 | 13,570 | 13,881 |
| American General Finance Corp. | 5.750% | 9/15/16 | 7,225 | 7,315 |
| CIT Group Co. of Canada | 4.650% | 7/1/10 | 7,550 | 7,382 |
| CIT Group Co. of Canada | 5.600% | 11/2/11 | 2,300 | 2,322 |
| CIT Group Co. of Canada | 5.200% | 6/1/15 | 8,575 | 8,336 |
| CIT Group, Inc. | 5.000% | 11/24/08 | 7,725 | 7,692 |
| CIT Group, Inc. | 4.250% | 2/1/10 | 3,475 | 3,375 |
| CIT Group, Inc. | 5.200% | 11/3/10 | 4,800 | 4,779 |
| CIT Group, Inc. | 4.750% | 12/15/10 | 2,250 | 2,203 |
| CIT Group, Inc. | 5.600% | 4/27/11 | 5,050 | 5,077 |
| CIT Group, Inc. | 7.750% | 4/2/12 | 6,400 | 7,062 |
| CIT Group, Inc. | 5.400% | 3/7/13 | 2,550 | 2,529 |
| CIT Group, Inc. | 5.000% | 2/13/14 | 125 | 121 |
| CIT Group, Inc. | 5.125% | 9/30/14 | 6,875 | 6,667 |
| CIT Group, Inc. | 5.000% | 2/1/15 | 4,175 | 4,009 |
| CIT Group, Inc. | 5.400% | 1/30/16 | 2,600 | 2,558 |
| CIT Group, Inc. | 5.850% | 9/15/16 | 6,450 | 6,535 |
| CIT Group, Inc. | 6.000% | 4/1/36 | 2,150 | 2,129 |
| Capital One Bank | 4.875% | 5/15/08 | 3,600 | 3,582 |
| Capital One Bank | 4.250% | 12/1/08 | 1,850 | 1,817 |
| Capital One Bank | 5.000% | 6/15/09 | 4,075 | 4,054 |
| Capital One Bank | 5.750% | 9/15/10 | 1,975 | 2,009 |
| Capital One Bank | 6.500% | 6/13/13 | 1,725 | 1,822 |
| Capital One Bank | 5.125% | 2/15/14 | 1,750 | 1,725 |
| Capital One Capital III | 7.686% | 8/15/36 | 7,100 | 8,033 |
| Capital One Financial | 5.700% | 9/15/11 | 3,925 | 3,985 |
| Capital One Financial | 4.800% | 2/21/12 | 2,125 | 2,070 |
| Capital One Financial | 5.500% | 6/1/15 | 6,075 | 6,075 |
| Capital One Financial | 6.150% | 9/1/16 | 1,925 | 1,994 |
| Capital One Financial | 5.250% | 2/21/17 | 1,775 | 1,718 |
| Countrywide Financial Corp. | 6.250% | 5/15/16 | 3,500 | 3,569 |
| Countrywide Home Loan | 4.250% | 12/19/07 | 250 | 247 |
| Countrywide Home Loan | 3.250% | 5/21/08 | 13,225 | 12,868 |
| Countrywide Home Loan | 6.250% | 4/15/09 | 1,500 | 1,529 |
| Countrywide Home Loan | 5.625% | 7/15/09 | 340 | 343 |
| Countrywide Home Loan | 4.125% | 9/15/09 | 13,525 | 13,139 |
| Countrywide Home Loan | 4.000% | 3/22/11 | 4,400 | 4,177 |
| General Electric Capital Corp. | 4.250% | 1/15/08 | 13,325 | 13,189 |
| General Electric Capital Corp. | 3.500% | 5/1/08 | 20,770 | 20,299 |
| General Electric Capital Corp. | 3.600% | 10/15/08 | 11,840 | 11,515 |
| General Electric Capital Corp. | 3.125% | 4/1/09 | 2,325 | 2,227 |
| General Electric Capital Corp. | 3.250% | 6/15/09 | 3,325 | 3,184 |
| General Electric Capital Corp. | 4.125% | 9/1/09 | 10,150 | 9,899 |
| General Electric Capital Corp. | 4.625% | 9/15/09 | 5,525 | 5,451 |
| General Electric Capital Corp. | 8.300% | 9/20/09 | 275 | 296 |
| General Electric Capital Corp. | 5.250% | 10/27/09 | 9,725 | 9,764 |
| General Electric Capital Corp. | 4.875% | 10/21/10 | 7,600 | 7,532 |
| General Electric Capital Corp. | 6.125% | 2/22/11 | 20,425 | 21,145 |
| General Electric Capital Corp. | 5.500% | 4/28/11 | 15,300 | 15,489 |
| General Electric Capital Corp. | 5.875% | 2/15/12 | 2,915 | 2,999 |
| General Electric Capital Corp. | 4.375% | 3/3/12 | 11,200 | 10,783 |
| General Electric Capital Corp. | 4.250% | 6/15/12 | 8,975 | 8,569 |
| General Electric Capital Corp. | 6.000% | 6/15/12 | 950 | 984 |
| General Electric Capital Corp. | 5.450% | 1/15/13 | 1,020 | 1,031 |
| General Electric Capital Corp. | 5.650% | 6/9/14 | 13,575 | 13,855 |
| General Electric Capital Corp. | 4.875% | 3/4/15 | 900 | 876 |
| General Electric Capital Corp. | 5.000% | 1/8/16 | 13,000 | 12,714 |
| General Electric Capital Corp. | 5.375% | 10/20/16 | 15,700 | 15,728 |
| General Electric Capital Corp. | 6.750% | 3/15/32 | 31,935 | 36,846 |
| HSBC Finance Capital Trust IX | 5.911% | 11/30/35 | 2,700 | 2,719 |
| HSBC Finance Corp. | 4.625% | 1/15/08 | 6,070 | 6,028 |
| HSBC Finance Corp. | 4.125% | 3/11/08 | 5,920 | 5,846 |
| HSBC Finance Corp. | 6.400% | 6/17/08 | 6,250 | 6,350 |
| HSBC Finance Corp. | 4.125% | 12/15/08 | 21,850 | 21,416 |
| HSBC Finance Corp. | 5.875% | 2/1/09 | 920 | 933 |
| HSBC Finance Corp. | 4.750% | 5/15/09 | 21,175 | 20,983 |
| HSBC Finance Corp. | 4.125% | 11/16/09 | 3,550 | 3,455 |
| HSBC Finance Corp. | 4.625% | 9/15/10 | 8,400 | 8,251 |
| HSBC Finance Corp. | 5.250% | 1/14/11 | 13,600 | 13,598 |
| HSBC Finance Corp. | 5.700% | 6/1/11 | 12,300 | 12,513 |
| HSBC Finance Corp. | 6.375% | 10/15/11 | 15,900 | 16,636 |
| HSBC Finance Corp. | 7.000% | 5/15/12 | 10,375 | 11,181 |
| HSBC Finance Corp. | 6.375% | 11/27/12 | 2,590 | 2,727 |
| HSBC Finance Corp. | 4.750% | 7/15/13 | 1,750 | 1,694 |
| HSBC Finance Corp. | 5.250% | 1/15/14 | 3,325 | 3,303 |
| HSBC Finance Corp. | 5.250% | 4/15/15 | 2,525 | 2,496 |
| HSBC Finance Corp. | 5.000% | 6/30/15 | 6,900 | 6,700 |
| HSBC Finance Corp. | 5.500% | 1/19/16 | 5,250 | 5,279 |
| Heller Financial, Inc. | 7.375% | 11/1/09 | 4,500 | 4,758 |
| International Lease Finance Corp. | 4.500% | 5/1/08 | 1,425 | 1,410 |
| International Lease Finance Corp. | 6.375% | 3/15/09 | 700 | 716 |
| International Lease Finance Corp. | 5.125% | 11/1/10 | 5,800 | 5,760 |
| International Lease Finance Corp. | 5.450% | 3/24/11 | 3,050 | 3,067 |
| International Lease Finance Corp. | 5.750% | 6/15/11 | 14,375 | 14,603 |
| International Lease Finance Corp. | 5.400% | 2/15/12 | 2,250 | 2,256 |
| International Lease Finance Corp. | 5.000% | 9/15/12 | 5,250 | 5,155 |
| International Lease Finance Corp. | 5.625% | 9/20/13 | 10,500 | 10,607 |
| Residential Capital Corp. | 6.125% | 11/21/08 | 7,850 | 7,858 |
| Residential Capital Corp. | 6.375% | 6/30/10 | 9,850 | 9,979 |
| Residential Capital Corp. | 6.000% | 2/22/11 | 9,975 | 9,969 |
| Residential Capital Corp. | 6.500% | 4/17/13 | 17,275 | 17,539 |
| SLM Corp. | 3.625% | 3/17/08 | 12,010 | 11,768 |
| SLM Corp. | 4.000% | 1/15/09 | 1,590 | 1,549 |
| SLM Corp. | 4.500% | 7/26/10 | 3,175 | 3,084 |
| SLM Corp. | 5.400% | 10/25/11 | 22,850 | 22,861 |
| SLM Corp. | 5.000% | 10/1/13 | 500 | 487 |
| SLM Corp. | 5.050% | 11/14/14 | 2,400 | 2,323 |
| SLM Corp. | 5.625% | 8/1/33 | 6,200 | 5,970 |
| iStar Financial Inc. | 5.800% | 3/15/11 | 4,425 | 4,447 |
| iStar Financial Inc. | 5.650% | 9/15/11 | 5,750 | 5,753 |
| iStar Financial Inc. | 5.150% | 3/1/12 | 5,275 | 5,139 |
| 4iStar Financial Inc. | 5.950% | 10/15/13 | 1,100 | 1,105 |
| iStar Financial Inc. | 5.875% | 3/15/16 | 3,725 | 3,702 |
| Insurance (1.0%) | ||||
| ACE Capital Trust II | 9.700% | 4/1/30 | 2,200 | 3,023 |
| AEGON Funding Corp. | 5.750% | 12/15/20 | 1,350 | 1,365 |
| AEGON NV | 4.750% | 6/1/13 | 2,900 | 2,805 |
| AXA Financial, Inc. | 6.500% | 4/1/08 | 115 | 117 |
| AXA Financial, Inc. | 7.750% | 8/1/10 | 1,075 | 1,160 |
| AXA SA | 8.600% | 12/15/30 | 7,750 | 10,016 |
| Aetna, Inc. | 7.875% | 3/1/11 | 2,600 | 2,832 |
| Aetna, Inc. | 5.750% | 6/15/11 | 1,400 | 1,421 |
| Aetna, Inc. | 6.000% | 6/15/16 | 7,950 | 8,198 |
| Aetna, Inc. | 6.625% | 6/15/36 | 6,425 | 6,890 |
| Allstate Corp. | 7.200% | 12/1/09 | 8,740 | 9,215 |
| Allstate Corp. | 5.000% | 8/15/14 | 3,200 | 3,127 |
| Allstate Corp. | 6.125% | 12/15/32 | 2,850 | 2,934 |
| Allstate Corp. | 5.350% | 6/1/33 | 520 | 488 |
| Allstate Corp. | 5.550% | 5/9/35 | 1,525 | 1,470 |
| Allstate Life Global Funding | 4.500% | 5/29/09 | 1,350 | 1,330 |
| Ambac, Inc. | 5.950% | 12/5/35 | 8,750 | 8,722 |
| American General Capital II | 8.500% | 7/1/30 | 8,590 | 11,001 |
| American International Group, Inc. | 2.875% | 5/15/08 | 3,325 | 3,221 |
| American International Group, Inc. | 4.700% | 10/1/10 | 1,450 | 1,425 |
| American International Group, Inc. | 5.375% | 10/18/11 | 4,200 | 4,204 |
| American International Group, Inc. | 5.050% | 10/1/15 | 3,625 | 3,535 |
| American International Group, Inc. | 5.600% | 10/18/16 | 3,225 | 3,271 |
| American International Group, Inc. | 6.250% | 5/1/36 | 11,450 | 12,234 |
| Aon Capital Trust | 8.205% | 1/1/27 | 1,200 | 1,384 |
| Arch Capital Group Ltd. | 7.350% | 5/1/34 | 3,775 | 4,150 |
| Aspen Insurance Holdings Ltd. | 6.000% | 8/15/14 | 3,300 | 3,200 |
| Assurant, Inc. | 5.625% | 2/15/14 | 1,850 | 1,848 |
| Assurant, Inc. | 6.750% | 2/15/34 | 3,200 | 3,446 |
| Axis Capital Holdings | 5.750% | 12/1/14 | 2,700 | 2,683 |
| Berkshire Hathaway Finance Corp. | 3.375% | 10/15/08 | 2,965 | 2,875 |
| Berkshire Hathaway Finance Corp. | 4.125% | 1/15/10 | 8,100 | 7,880 |
| Berkshire Hathaway Finance Corp. | 4.200% | 12/15/10 | 4,150 | 4,019 |
| Berkshire Hathaway Finance Corp. | 4.625% | 10/15/13 | 4,475 | 4,337 |
| Berkshire Hathaway Finance Corp. | 5.100% | 7/15/14 | 550 | 546 |
| Berkshire Hathaway Finance Corp. | 4.850% | 1/15/15 | 10,375 | 10,059 |
| CIGNA Corp. | 7.875% | 5/15/27 | 1,300 | 1,524 |
| CIGNA Corp. | 6.150% | 11/15/36 | 3,500 | 3,465 |
| CNA Financial Corp. | 6.000% | 8/15/11 | 3,225 | 3,279 |
| CNA Financial Corp. | 5.850% | 12/15/14 | 4,725 | 4,740 |
| CNA Financial Corp. | 6.500% | 8/15/16 | 6,950 | 7,231 |
| Cincinnati Financial Corp. | 6.920% | 5/15/28 | 550 | 610 |
| Cincinnati Financial Corp. | 6.125% | 11/1/34 | 4,300 | 4,394 |
| Commerce Group, Inc. | 5.950% | 12/9/13 | 1,750 | 1,752 |
| Fidelity National Financial, Inc. | 7.300% | 8/15/11 | 4,850 | 5,088 |
| Fund American Cos., Inc. | 5.875% | 5/15/13 | 1,925 | 1,917 |
| GE Global Insurance Holdings Corp. | 6.450% | 3/1/19 | 2,000 | 2,125 |
| GE Global Insurance Holdings Corp. | 7.000% | 2/15/26 | 4,200 | 4,682 |
| GE Global Insurance Holdings Corp. | 7.750% | 6/15/30 | 1,650 | 2,003 |
| Genworth Financial, Inc. | 4.750% | 6/15/09 | 2,625 | 2,598 |
| Genworth Financial, Inc. | 5.750% | 6/15/14 | 1,025 | 1,049 |
| Genworth Financial, Inc. | 4.950% | 10/1/15 | 1,225 | 1,182 |
| Genworth Financial, Inc. | 6.500% | 6/15/34 | 3,775 | 4,096 |
| Genworth Financial, Inc. | 6.150% | 11/15/66 | 1,800 | 1,804 |
| Hartford Financial Services Group, Inc. | 5.250% | 10/15/11 | 4,675 | 4,670 |
| Hartford Financial Services Group, Inc. | 4.625% | 7/15/13 | 2,100 | 2,015 |
| Hartford Financial Services Group, Inc. | 5.500% | 10/15/16 | 2,550 | 2,550 |
| Hartford Financial Services Group, Inc. | 5.950% | 10/15/36 | 3,500 | 3,547 |
| Hartford Financial Services Group, Inc. | 6.100% | 10/1/41 | 4,850 | 4,947 |
| Humana Inc. | 6.450% | 6/1/16 | 5,825 | 5,986 |
| Humana Inc. | 6.300% | 8/1/18 | 250 | 252 |
| ING Capital Funding Trust III | 5.775% | 12/8/49 | 4,775 | 4,762 |
| ING USA Global | 4.500% | 10/1/10 | 12,950 | 12,643 |
| John Hancock Financial Services | 5.625% | 12/1/08 | 500 | 503 |
| Lincoln National Corp. | 6.200% | 12/15/11 | 575 | 596 |
| Lincoln National Corp. | 6.150% | 4/7/36 | 7,325 | 7,586 |
| Loews Corp. | 5.250% | 3/15/16 | 1,500 | 1,464 |
| Loews Corp. | 6.000% | 2/1/35 | 650 | 640 |
| Marsh&McLennan Cos., Inc. | 5.150% | 9/15/10 | 3,075 | 3,025 |
| Marsh&McLennan Cos., Inc. | 6.250% | 3/15/12 | 6,225 | 6,336 |
| Marsh&McLennan Cos., Inc. | 5.750% | 9/15/15 | 9,475 | 9,347 |
| MetLife, Inc. | 6.125% | 12/1/11 | 850 | 881 |
| MetLife, Inc. | 5.375% | 12/15/12 | 2,450 | 2,455 |
| MetLife, Inc. | 5.000% | 11/24/13 | 4,900 | 4,791 |
| MetLife, Inc. | 5.500% | 6/15/14 | 650 | 653 |
| MetLife, Inc. | 5.000% | 6/15/15 | 3,400 | 3,302 |
| MetLife, Inc. | 6.500% | 12/15/32 | 2,975 | 3,230 |
| MetLife, Inc. | 6.375% | 6/15/34 | 2,775 | 2,968 |
| MetLife, Inc. | 5.700% | 6/15/35 | 975 | 954 |
| Principal Financial Group, Inc. | 6.050% | 10/15/36 | 3,000 | 3,078 |
| 4Principal Life Global | 3.625% | 4/30/08 | 770 | 754 |
| Principal Life Income Funding | 5.125% | 3/1/11 | 4,675 | 4,649 |
| Principal Life Income Funding | 5.100% | 4/15/14 | 4,825 | 4,738 |
| Progressive Corp. | 6.625% | 3/1/29 | 5,175 | 5,729 |
| Progressive Corp. | 6.250% | 12/1/32 | 325 | 347 |
| Protective Life Secured Trust | 3.700% | 11/24/08 | 7,025 | 6,834 |
| Protective Life Secured Trust | 4.850% | 8/16/10 | 1,425 | 1,407 |
| Prudential Financial, Inc. | 3.750% | 5/1/08 | 500 | 490 |
| Prudential Financial, Inc. | 5.100% | 12/14/11 | 450 | 447 |
| Prudential Financial, Inc. | 4.500% | 7/15/13 | 3,225 | 3,065 |
| Prudential Financial, Inc. | 4.750% | 4/1/14 | 2,525 | 2,414 |
| Prudential Financial, Inc. | 5.100% | 9/20/14 | 2,975 | 2,914 |
| Prudential Financial, Inc. | 5.500% | 3/15/16 | 2,375 | 2,378 |
| Prudential Financial, Inc. | 5.750% | 7/15/33 | 1,800 | 1,778 |
| Prudential Financial, Inc. | 5.400% | 6/13/35 | 2,300 | 2,153 |
| Prudential Financial, Inc. | 5.900% | 3/17/36 | 4,400 | 4,416 |
| Prudential Financial, Inc. | 5.700% | 12/14/36 | 6,275 | 6,088 |
| St. Paul Travelers Cos., Inc. | 5.500% | 12/1/15 | 1,700 | 1,703 |
| St. Paul Travelers Cos., Inc. | 6.250% | 6/20/16 | 3,475 | 3,660 |
| Torchmark Corp. | 6.375% | 6/15/16 | 4,225 | 4,415 |
| Travelers Property Casualty Corp. | 3.750% | 3/15/08 | 4,525 | 4,435 |
| Travelers Property Casualty Corp. | 6.375% | 3/15/33 | 350 | 368 |
| UnitedHealth Group, Inc. | 4.125% | 8/15/09 | 6,775 | 6,584 |
| UnitedHealth Group, Inc. | 5.000% | 8/15/14 | 4,225 | 4,097 |
| UnitedHealth Group, Inc. | 4.875% | 3/15/15 | 2,500 | 2,396 |
| UnitedHealth Group, Inc. | 5.800% | 3/15/36 | 2,175 | 2,144 |
| WellPoint Inc. | 3.750% | 12/14/07 | 2,325 | 2,289 |
| WellPoint Inc. | 4.250% | 12/15/09 | 1,750 | 1,701 |
| WellPoint Inc. | 5.000% | 1/15/11 | 4,050 | 3,999 |
| WellPoint Inc. | 6.375% | 1/15/12 | 3,815 | 3,976 |
| WellPoint Inc. | 6.800% | 8/1/12 | 360 | 383 |
| WellPoint Inc. | 5.000% | 12/15/14 | 5,400 | 5,228 |
| WellPoint Inc. | 5.250% | 1/15/16 | 750 | 735 |
| WellPoint Inc. | 5.950% | 12/15/34 | 3,275 | 3,225 |
| WellPoint Inc. | 5.850% | 1/15/36 | 1,650 | 1,607 |
| Willis North America Inc. | 5.125% | 7/15/10 | 1,100 | 1,070 |
| Willis North America Inc. | 5.625% | 7/15/15 | 4,550 | 4,355 |
| XL Capital Ltd. | 5.250% | 9/15/14 | 5,600 | 5,499 |
| XL Capital Ltd. | 6.375% | 11/15/24 | 575 | 598 |
| Real Estate Investment Trusts (0.4%) | ||||
| Archstone-Smith Operating Trust | 5.250% | 5/1/15 | 4,600 | 4,518 |
| Arden Realty LP | 5.250% | 3/1/15 | 1,075 | 1,062 |
| AvalonBay Communities, Inc. | 5.500% | 1/15/12 | 2,450 | 2,459 |
| AvalonBay Communities, Inc. | 5.750% | 9/15/16 | 975 | 986 |
| Boston Properties, Inc. | 6.250% | 1/15/13 | 1,790 | 1,866 |
| Boston Properties, Inc. | 5.625% | 4/15/15 | 5,250 | 5,282 |
| Brandywine Operating Partnership | 4.500% | 11/1/09 | 4,475 | 4,360 |
| Brandywine Operating Partnership | 5.625% | 12/15/10 | 3,375 | 3,393 |
| Brandywine Operating Partnership | 5.400% | 11/1/14 | 1,175 | 1,154 |
| Colonial Realty LP | 5.500% | 10/1/15 | 2,675 | 2,613 |
| Developers Diversified Realty Corp. | 5.250% | 4/15/11 | 500 | 495 |
| Developers Diversified Realty Corp. | 5.375% | 10/15/12 | 6,200 | 6,145 |
| Duke Realty LP | 5.625% | 8/15/11 | 2,000 | 2,009 |
| Duke Realty LP | 5.950% | 2/15/17 | 1,750 | 1,783 |
| EOP Operating LP | 6.750% | 2/15/08 | 2,850 | 2,896 |
| EOP Operating LP | 8.100% | 8/1/10 | 1,000 | 1,102 |
| EOP Operating LP | 4.650% | 10/1/10 | 2,575 | 2,557 |
| EOP Operating LP | 7.000% | 7/15/11 | 1,250 | 1,353 |
| EOP Operating LP | 6.750% | 2/15/12 | 1,960 | 2,120 |
| EOP Operating LP | 5.875% | 1/15/13 | 1,690 | 1,772 |
| EOP Operating LP | 4.750% | 3/15/14 | 1,900 | 1,881 |
| EOP Operating LP | 7.875% | 7/15/31 | 1,850 | 2,195 |
| ERP Operating LP | 6.625% | 3/15/12 | 8,395 | 8,834 |
| ERP Operating LP | 5.250% | 9/15/14 | 725 | 714 |
| ERP Operating LP | 5.125% | 3/15/16 | 3,200 | 3,101 |
| ERP Operating LP | 5.375% | 8/1/16 | 3,725 | 3,671 |
| HRPT Properties Trust | 6.250% | 8/15/16 | 1,750 | 1,807 |
| Health Care Property Investors, Inc. | 6.450% | 6/25/12 | 1,375 | 1,412 |
| Health Care Property Investors, Inc. | 5.650% | 12/15/13 | 11,000 | 10,844 |
| Health Care Property Investors, Inc. | 5.625% | 5/1/17 | 100 | 96 |
| Health Care REIT, Inc. | 6.000% | 11/15/13 | 250 | 251 |
| Health Care REIT, Inc. | 6.200% | 6/1/16 | 6,875 | 6,923 |
| Hospitality Properties | 5.125% | 2/15/15 | 2,200 | 2,088 |
| Kimco Realty Corp. | 5.783% | 3/15/16 | 1,350 | 1,367 |
| Liberty Property LP | 5.125% | 3/2/15 | 10,350 | 9,959 |
| Liberty Property LP | 5.500% | 12/15/16 | 1,675 | 1,654 |
| ProLogis | 5.250% | 11/15/10 | 2,475 | 2,457 |
| ProLogis | 5.500% | 3/1/13 | 2,575 | 2,563 |
| ProLogis | 5.625% | 11/15/15 | 3,525 | 3,516 |
| ProLogis | 5.750% | 4/1/16 | 3,225 | 3,231 |
| ProLogis | 5.625% | 11/15/16 | 2,425 | 2,409 |
| Reckson Operating Partnership | 6.000% | 3/31/16 | 2,850 | 2,769 |
| Regency Centers LP | 6.750% | 1/15/12 | 7,225 | 7,599 |
| Regency Centers LP | 5.250% | 8/1/15 | 2,800 | 2,732 |
| Simon Property Group Inc. | 4.875% | 8/15/10 | 3,625 | 3,572 |
| Simon Property Group Inc. | 5.600% | 9/1/11 | 3,250 | 3,282 |
| Simon Property Group Inc. | 5.000% | 3/1/12 | 3,975 | 3,909 |
| Simon Property Group Inc. | 6.350% | 8/28/12 | 55 | 57 |
| Simon Property Group Inc. | 5.625% | 8/15/14 | 150 | 151 |
| Simon Property Group Inc. | 5.750% | 12/1/15 | 3,125 | 3,173 |
| Simon Property Group Inc. | 5.250% | 12/1/16 | 9,975 | 9,719 |
| Simon Property Group Inc. | 5.875% | 3/1/17 | 3,675 | 3,752 |
| Tanger Factory Outlet Centers, Inc. | 6.150% | 11/15/15 | 4,250 | 4,299 |
| Vornado Realty | 5.600% | 2/15/11 | 4,525 | 4,519 |
| Other (0.0%) | ||||
| J. Paul Getty Trust | 5.875% | 10/1/33 | 2,700 | 2,704 |
| 3,323,017 | ||||
| Industrial (8.8%) | ||||
| Basic Industry (0.5%) | ||||
| Alcoa, Inc. | 6.500% | 6/1/11 | 4,275 | 4,463 |
| Alcan, Inc. | 4.875% | 9/15/12 | 1,050 | 1,019 |
| Alcan, Inc. | 4.500% | 5/15/13 | 5,175 | 4,876 |
| Alcan, Inc. | 5.200% | 1/15/14 | 875 | 854 |
| Alcan, Inc. | 5.000% | 6/1/15 | 1,050 | 1,001 |
| Alcan, Inc. | 6.125% | 12/15/33 | 2,400 | 2,369 |
| BHP Billiton Finance | 4.800% | 4/15/13 | 13,365 | 12,935 |
| BHP Billiton Finance | 5.250% | 12/15/15 | 4,450 | 4,415 |
| Barrick Gold Finance Inc. | 4.875% | 11/15/14 | 3,325 | 3,147 |
| Celulosa Arauco Constitution SA | 8.625% | 8/15/10 | 7,425 | 8,205 |
| Celulosa Arauco Constitution SA | 5.625% | 4/20/15 | 2,625 | 2,599 |
| Dow Chemical Co. | 6.125% | 2/1/11 | 12,000 | 12,334 |
| Dow Chemical Co. | 6.000% | 10/1/12 | 875 | 900 |
| Dow Chemical Co. | 7.375% | 11/1/29 | 5,150 | 5,944 |
| E.I. du Pont de Nemours&Co. | 6.875% | 10/15/09 | 6,200 | 6,483 |
| E.I. du Pont de Nemours&Co. | 4.125% | 4/30/10 | 1,525 | 1,478 |
| E.I. du Pont de Nemours&Co. | 4.750% | 11/15/12 | 2,520 | 2,445 |
| E.I. du Pont de Nemours&Co. | 5.250% | 12/15/16 | 150 | 147 |
| E.I. du Pont de Nemours&Co. | 6.500% | 1/15/28 | 1,425 | 1,539 |
| Eastman Chemical Co. | 7.250% | 1/15/24 | 600 | 631 |
| Eastman Chemical Co. | 7.600% | 2/1/27 | 2,563 | 2,779 |
| Falconbridge Ltd. | 7.350% | 6/5/12 | 775 | 836 |
| Falconbridge Ltd. | 5.375% | 6/1/15 | 450 | 436 |
| ICI Wilmington | 4.375% | 12/1/08 | 3,750 | 3,665 |
| ICI Wilmington | 5.625% | 12/1/13 | 900 | 894 |
| Inco Ltd. | 7.750% | 5/15/12 | 60 | 66 |
| Inco Ltd. | 5.700% | 10/15/15 | 4,300 | 4,195 |
| Inco Ltd. | 7.200% | 9/15/32 | 1,500 | 1,604 |
| International Paper Co. | 4.250% | 1/15/09 | 3,250 | 3,178 |
| International Paper Co. | 5.850% | 10/30/12 | 2,005 | 2,038 |
| International Paper Co. | 5.300% | 4/1/15 | 5,650 | 5,438 |
| Lubrizol Corp. | 5.500% | 10/1/14 | 400 | 390 |
| Lubrizol Corp. | 6.500% | 10/1/34 | 725 | 728 |
| MeadWestvaco Corp. | 6.850% | 4/1/12 | 1,515 | 1,583 |
| Newmont Mining | 5.875% | 4/1/35 | 3,125 | 2,918 |
| Noranda, Inc. | 7.250% | 7/15/12 | 2,925 | 3,159 |
| Noranda, Inc. | 6.000% | 10/15/15 | 1,450 | 1,471 |
| Noranda, Inc. | 5.500% | 6/15/17 | 6,125 | 5,912 |
| Placer Dome, Inc. | 6.450% | 10/15/35 | 2,875 | 2,915 |
| Plum Creek Timber Co. | 5.875% | 11/15/15 | 4,275 | 4,198 |
| Potash Corp. of Saskatchewan | 7.750% | 5/31/11 | 10,875 | 11,849 |
| Potash Corp. of Saskatchewan | 4.875% | 3/1/13 | 1,500 | 1,447 |
| Potash Corp. of Saskatchewan | 5.875% | 12/1/36 | 125 | 121 |
| Praxair, Inc. | 2.750% | 6/15/08 | 1,950 | 1,882 |
| Praxair, Inc. | 3.950% | 6/1/13 | 600 | 554 |
| 4 Reliance Steel&Aluminum | 6.200% | 11/15/16 | 350 | 348 |
| 4 Reliance Steel&Aluminum | 6.850% | 11/15/36 | 650 | 638 |
| Rio Tinto Finance USA Ltd. | 2.625% | 9/30/08 | 3,675 | 3,515 |
| 2 Rohm&Haas Co. | 9.800% | 4/15/20 | 2,678 | 3,299 |
| Rohm&Haas Co. | 7.850% | 7/15/29 | 2,950 | 3,581 |
| Southern Copper Corp. | 7.500% | 7/27/35 | 6,450 | 7,087 |
| Teck Cominco Ltd. | 6.125% | 10/1/35 | 6,525 | 6,279 |
| Temple Inland Inc. | 7.875% | 5/1/12 | 900 | 976 |
| Vale Overseas Ltd. | 6.250% | 1/11/16 | 875 | 888 |
| Vale Overseas Ltd. | 6.250% | 1/23/17 | 7,850 | 7,958 |
| Vale Overseas Ltd. | 8.250% | 1/17/34 | 7,125 | 8,532 |
| Vale Overseas Ltd. | 6.875% | 11/21/36 | 8,675 | 8,881 |
| Westvaco Corp. | 8.200% | 1/15/30 | 1,050 | 1,172 |
| Weyerhaeuser Co. | 5.950% | 11/1/08 | 925 | 933 |
| Weyerhaeuser Co. | 6.750% | 3/15/12 | 9,820 | 10,298 |
| Weyerhaeuser Co. | 7.375% | 3/15/32 | 9,280 | 9,674 |
| Capital Goods (1.1%) | ||||
| 3M Co. | 5.125% | 11/6/09 | 1,650 | 1,654 |
| 2, 4 BAE Systems Asset Trust | 7.156% | 12/15/11 | 2,705 | 2,826 |
| Bemis Co. Inc. | 4.875% | 4/1/12 | 1,500 | 1,461 |
| Boeing Capital Corp. | 7.375% | 9/27/10 | 3,250 | 3,488 |
| Boeing Capital Corp. | 6.500% | 2/15/12 | 12,925 | 13,650 |
| Boeing Capital Corp. | 5.800% | 1/15/13 | 3,215 | 3,303 |
| Boeing Co. | 5.125% | 2/15/13 | 200 | 199 |
| Boeing Co. | 8.750% | 8/15/21 | 1,450 | 1,908 |
| Boeing Co. | 7.250% | 6/15/25 | 3,150 | 3,742 |
| Boeing Co. | 8.750% | 9/15/31 | 975 | 1,374 |
| Boeing Co. | 6.125% | 2/15/33 | 200 | 216 |
| Boeing Co. | 6.625% | 2/15/38 | 5,045 | 5,759 |
| CRH America Inc. | 5.625% | 9/30/11 | 4,375 | 4,402 |
| CRH America Inc. | 6.950% | 3/15/12 | 6,660 | 7,037 |
| CRH America Inc. | 5.300% | 10/15/13 | 875 | 851 |
| CRH America Inc. | 6.000% | 9/30/16 | 3,700 | 3,735 |
| CRH America Inc. | 6.400% | 10/15/33 | 2,670 | 2,659 |
| Caterpillar Financial Services Corp. | 2.700% | 7/15/08 | 1,850 | 1,780 |
| Caterpillar Financial Services Corp. | 4.500% | 9/1/08 | 1,550 | 1,530 |
| Caterpillar Financial Services Corp. | 4.150% | 1/15/10 | 11,925 | 11,574 |
| Caterpillar Financial Services Corp. | 4.300% | 6/1/10 | 7,600 | 7,388 |
| Caterpillar Financial Services Corp. | 4.750% | 2/17/15 | 5,425 | 5,158 |
| Caterpillar Financial Services Corp. | 4.625% | 6/1/15 | 3,125 | 2,941 |
| Caterpillar, Inc. | 5.700% | 8/15/16 | 350 | 355 |
| Caterpillar, Inc. | 6.625% | 7/15/28 | 600 | 667 |
| Caterpillar, Inc. | 7.300% | 5/1/31 | 1,375 | 1,635 |
| Caterpillar, Inc. | 6.050% | 8/15/36 | 900 | 927 |
| Caterpillar, Inc. | 6.950% | 5/1/42 | 1,275 | 1,491 |
| Caterpillar, Inc. | 7.375% | 3/1/97 | 6,150 | 7,237 |
| Deere&Co. | 6.950% | 4/25/14 | 6,595 | 7,180 |
| Deere&Co. | 8.100% | 5/15/30 | 3,755 | 4,868 |
| 4 Embraer Overseas Ltd. | 6.375% | 1/24/17 | 5,775 | 5,724 |
| Emerson Electric Co. | 7.125% | 8/15/10 | 4,275 | 4,548 |
| Emerson Electric Co. | 4.625% | 10/15/12 | 5,050 | 4,884 |
| Emerson Electric Co. | 4.500% | 5/1/13 | 4,900 | 4,689 |
| General Dynamics Corp. | 3.000% | 5/15/08 | 6,300 | 6,111 |
| General Dynamics Corp. | 4.500% | 8/15/10 | 25 | 24 |
| General Dynamics Corp. | 4.250% | 5/15/13 | 7,015 | 6,632 |
| General Electric Co. | 5.000% | 2/1/13 | 27,615 | 27,315 |
| Hanson PLC | 7.875% | 9/27/10 | 1,425 | 1,536 |
| Hanson PLC | 5.250% | 3/15/13 | 1,525 | 1,485 |
| Honeywell International, Inc. | 7.500% | 3/1/10 | 1,500 | 1,599 |
| Honeywell International, Inc. | 6.125% | 11/1/11 | 2,350 | 2,440 |
| Honeywell International, Inc. | 5.400% | 3/15/16 | 200 | 201 |
| Honeywell International, Inc. | 5.700% | 3/15/36 | 1,250 | 1,235 |
| John Deere Capital Corp. | 4.875% | 3/16/09 | 11,525 | 11,433 |
| John Deere Capital Corp. | 5.400% | 10/17/11 | 6,350 | 6,367 |
| John Deere Capital Corp. | 7.000% | 3/15/12 | 7,730 | 8,296 |
| 4 Joy Global, Inc. | 6.000% | 11/15/16 | 2,175 | 2,170 |
| Lafarge SA | 6.150% | 7/15/11 | 675 | 692 |
| Lafarge SA | 6.500% | 7/15/16 | 7,325 | 7,631 |
| Lafarge SA | 7.125% | 7/15/36 | 14,000 | 15,254 |
| Lockheed Martin Corp. | 7.650% | 5/1/16 | 5,325 | 6,147 |
| Lockheed Martin Corp. | 7.750% | 5/1/26 | 600 | 735 |
| Lockheed Martin Corp. | 6.150% | 9/1/36 | 7,525 | 7,936 |
| Masco Corp. | 5.875% | 7/15/12 | 1,135 | 1,138 |
| Masco Corp. | 4.800% | 6/15/15 | 8,800 | 8,042 |
| Masco Corp. | 6.125% | 10/3/16 | 100 | 101 |
| Masco Corp. | 7.750% | 8/1/29 | 450 | 486 |
| Masco Corp. | 6.500% | 8/15/32 | 1,700 | 1,612 |
| Minnesota Mining&Manufacturing Corp. | 6.375% | 2/15/28 | 4,325 | 4,741 |
| Mohawk Industries Inc. | 5.750% | 1/15/11 | 7,275 | 7,279 |
| Mohawk Industries Inc. | 6.125% | 1/15/16 | 13,975 | 13,855 |
| Northrop Grumman Corp. | 7.125% | 2/15/11 | 10,850 | 11,562 |
| Northrop Grumman Corp. | 7.750% | 3/1/16 | 100 | 116 |
| Northrop Grumman Corp. | 7.875% | 3/1/26 | 2,600 | 3,187 |
| Northrop Grumman Corp. | 7.750% | 2/15/31 | 4,215 | 5,235 |
| 4 Owens Corning, Inc. | 6.500% | 12/1/16 | 1,100 | 1,099 |
| 4 Owens Corning, Inc. | 7.000% | 12/1/36 | 1,875 | 1,848 |
| Raytheon Co. | 6.150% | 11/1/08 | 1,186 | 1,202 |
| Raytheon Co. | 8.300% | 3/1/10 | 2,160 | 2,343 |
| Raytheon Co. | 6.550% | 3/15/10 | 4,000 | 4,148 |
| Raytheon Co. | 4.850% | 1/15/11 | 250 | 246 |
| Raytheon Co. | 5.500% | 11/15/12 | 1,350 | 1,361 |
| Raytheon Co. | 5.375% | 4/1/13 | 3,665 | 3,658 |
| Raytheon Co. | 6.400% | 12/15/18 | 500 | 536 |
| Raytheon Co. | 7.200% | 8/15/27 | 1,150 | 1,336 |
| Republic Services, Inc. | 6.750% | 8/15/11 | 2,225 | 2,331 |
| Republic Services, Inc. | 6.086% | 3/15/35 | 2,850 | 2,821 |
| TRW, Inc. | 7.750% | 6/1/29 | 2,650 | 3,246 |
| Textron Financial Corp. | 4.125% | 3/3/08 | 5,950 | 5,869 |
| Textron Financial Corp. | 4.600% | 5/3/10 | 5,050 | 4,940 |
| Textron, Inc. | 6.500% | 6/1/12 | 8,775 | 9,201 |
| Tyco International Group SA | 6.125% | 11/1/08 | 1,100 | 1,114 |
| Tyco International Group SA | 6.750% | 2/15/11 | 11,125 | 11,728 |
| Tyco International Group SA | 6.375% | 10/15/11 | 12,325 | 12,869 |
| Tyco International Group SA | 6.000% | 11/15/13 | 5,850 | 6,069 |
| Tyco International Group SA | 7.000% | 6/15/28 | 2,350 | 2,715 |
| USA Waste Services, Inc. | 7.000% | 7/15/28 | 1,425 | 1,531 |
| United Technologies Corp. | 4.375% | 5/1/10 | 1,525 | 1,488 |
| United Technologies Corp. | 7.125% | 11/15/10 | 250 | 266 |
| United Technologies Corp. | 6.350% | 3/1/11 | 4,150 | 4,313 |
| United Technologies Corp. | 4.875% | 5/1/15 | 5,975 | 5,778 |
| United Technologies Corp. | 8.875% | 11/15/19 | 4,000 | 5,189 |
| United Technologies Corp. | 6.700% | 8/1/28 | 1,642 | 1,853 |
| United Technologies Corp. | 7.500% | 9/15/29 | 2,800 | 3,436 |
| United Technologies Corp. | 5.400% | 5/1/35 | 3,450 | 3,351 |
| United Technologies Corp. | 6.050% | 6/1/36 | 5,900 | 6,225 |
| WMX Technologies Inc. | 7.100% | 8/1/26 | 1,375 | 1,483 |
| Waste Management, Inc. | 6.500% | 11/15/08 | 11,475 | 11,699 |
| Waste Management, Inc. | 6.875% | 5/15/09 | 3,570 | 3,685 |
| Waste Management, Inc. | 7.375% | 8/1/10 | 875 | 931 |
| Waste Management, Inc. | 5.000% | 3/15/14 | 1,325 | 1,278 |
| Waste Management, Inc. | 7.750% | 5/15/32 | 3,225 | 3,798 |
| Communication (2.4%) | ||||
| AT&T Corp. | 6.000% | 3/15/09 | 10,875 | 11,021 |
| AT&T Corp. | 7.300% | 11/15/11 | 3,700 | 4,007 |
| AT&T Corp. | 8.000% | 11/15/31 | 10,205 | 12,695 |
| AT&T Corp. | 6.800% | 5/15/36 | 400 | 425 |
| AT&T Inc. | 4.125% | 9/15/09 | 9,225 | 8,971 |
| AT&T Inc. | 5.300% | 11/15/10 | 4,550 | 4,554 |
| AT&T Inc. | 6.250% | 3/15/11 | 14,890 | 15,380 |
| AT&T Inc. | 5.875% | 2/1/12 | 5,780 | 5,905 |
| AT&T Inc. | 5.875% | 8/15/12 | 4,995 | 5,108 |
| AT&T Inc. | 5.100% | 9/15/14 | 12,075 | 11,752 |
| AT&T Inc. | 5.625% | 6/15/16 | 3,400 | 3,379 |
| AT&T Inc. | 6.450% | 6/15/34 | 3,900 | 3,985 |
| AT&T Inc. | 6.150% | 9/15/34 | 2,750 | 2,716 |
| Alltel Corp. | 7.000% | 7/1/12 | 5,575 | 5,801 |
| Alltel Corp. | 7.875% | 7/1/32 | 525 | 550 |
| America Movil SA de C.V | 4.125% | 3/1/09 | 5,350 | 5,223 |
| America Movil SA de C.V | 5.500% | 3/1/14 | 2,575 | 2,520 |
| America Movil SA de C.V | 5.750% | 1/15/15 | 3,725 | 3,697 |
| America Movil SA de C.V | 6.375% | 3/1/35 | 4,425 | 4,348 |
| BellSouth Capital Funding | 7.875% | 2/15/30 | 9,525 | 10,975 |
| BellSouth Corp. | 4.200% | 9/15/09 | 3,525 | 3,431 |
| BellSouth Corp. | 4.750% | 11/15/12 | 5,870 | 5,680 |
| BellSouth Corp. | 5.200% | 9/15/14 | 3,200 | 3,132 |
| BellSouth Corp. | 6.550% | 6/15/34 | 6,400 | 6,554 |
| BellSouth Corp. | 6.000% | 11/15/34 | 3,835 | 3,673 |
| BellSouth Telecommunications | 6.375% | 6/1/28 | 8,365 | 8,464 |
| Belo Corp. | 7.250% | 9/15/27 | 340 | 332 |
| British Sky Broadcasting Corp. | 6.875% | 2/23/09 | 5,050 | 5,190 |
| British Sky Broadcasting Corp. | 8.200% | 7/15/09 | 1,675 | 1,783 |
| British Telecommunications PLC | 8.625% | 12/15/10 | 20,735 | 23,165 |
| British Telecommunications PLC | 9.125% | 12/15/30 | 12,085 | 16,542 |
| CBS Corp. | 7.700% | 7/30/10 | 5,375 | 5,749 |
| CBS Corp. | 6.625% | 5/15/11 | 2,260 | 2,333 |
| CBS Corp. | 5.625% | 8/15/12 | 3,650 | 3,595 |
| CBS Corp. | 4.625% | 5/15/18 | 500 | 431 |
| CBS Corp. | 5.500% | 5/15/33 | 675 | 562 |
| CenturyTel Enterprises | 6.875% | 1/15/28 | 925 | 899 |
| CenturyTel, Inc. | 7.875% | 8/15/12 | 2,375 | 2,574 |
| Cingular Wireless LLC | 7.125% | 12/15/31 | 12,370 | 13,724 |
| Comcast Cable Communications Holdings Inc. | 8.375% | 3/15/13 | 4,365 | 4,972 |
| Comcast Cable Communications Holdings Inc. | 9.455% | 11/15/22 | 8,361 | 10,859 |
| Comcast Cable Communications, Inc. | 6.200% | 11/15/08 | 4,000 | 4,059 |
| Comcast Cable Communications, Inc. | 6.875% | 6/15/09 | 1,400 | 1,449 |
| Comcast Cable Communications, Inc. | 6.750% | 1/30/11 | 9,990 | 10,471 |
| Comcast Cable Communications, Inc. | 6.500% | 1/15/17 | 425 | 443 |
| Comcast Cable Communications, Inc. | 8.875% | 5/1/17 | 2,825 | 3,428 |
| Comcast Corp. | 5.850% | 1/15/10 | 1,925 | 1,951 |
| Comcast Corp. | 5.500% | 3/15/11 | 1,925 | 1,934 |
| Comcast Corp. | 5.300% | 1/15/14 | 2,250 | 2,202 |
| Comcast Corp. | 6.500% | 1/15/15 | 5,640 | 5,887 |
| Comcast Corp. | 5.850% | 11/15/15 | 200 | 201 |
| Comcast Corp. | 5.900% | 3/15/16 | 4,350 | 4,365 |
| Comcast Corp. | 4.950% | 6/15/16 | 3,000 | 2,800 |
| Comcast Corp. | 5.875% | 2/15/18 | 6,200 | 6,133 |
| Comcast Corp. | 7.050% | 3/15/33 | 1,690 | 1,814 |
| Comcast Corp. | 6.500% | 11/15/35 | 7,100 | 7,143 |
| Comcast Corp. | 6.450% | 3/15/37 | 4,775 | 4,798 |
| Cox Communications, Inc. | 4.625% | 1/15/10 | 1,050 | 1,028 |
| Cox Communications, Inc. | 6.750% | 3/15/11 | 21,500 | 22,481 |
| Cox Communications, Inc. | 7.125% | 10/1/12 | 5,550 | 5,924 |
| Cox Communications, Inc. | 5.450% | 12/15/14 | 11,375 | 11,074 |
| Cox Communications, Inc. | 5.500% | 10/1/15 | 725 | 704 |
| Deutsche Telekom International Finance | 3.875% | 7/22/08 | 3,950 | 3,867 |
| Deutsche Telekom International Finance | 8.000% | 6/15/10 | 17,135 | 18,574 |
| Deutsche Telekom International Finance | 5.250% | 7/22/13 | 1,025 | 1,003 |
| Deutsche Telekom International Finance | 5.750% | 3/23/16 | 900 | 890 |
| Deutsche Telekom International Finance | 8.250% | 6/15/30 | 20,780 | 25,582 |
| Embarq Corp. | 7.082% | 6/1/16 | 9,100 | 9,282 |
| Embarq Corp. | 7.995% | 6/1/36 | 2,875 | 2,986 |
| France Telecom | 7.750% | 3/1/11 | 10,900 | 11,882 |
| France Telecom | 8.500% | 3/1/31 | 20,500 | 27,047 |
| GTE Corp. | 8.750% | 11/1/21 | 3,760 | 4,473 |
| GTE Corp. | 6.940% | 4/15/28 | 4,620 | 4,791 |
| Gannett Co., Inc. | 6.375% | 4/1/12 | 4,975 | 5,131 |
| Grupo Televisa SA | 6.625% | 3/18/25 | 4,125 | 4,326 |
| Grupo Televisa SA | 8.500% | 3/11/32 | 750 | 933 |
| IAC/InteractiveCorp | 7.000% | 1/15/13 | 3,850 | 3,991 |
| Knight Ridder, Inc. | 5.750% | 9/1/17 | 75 | 70 |
| Knight Ridder, Inc. | 6.875% | 3/15/29 | 750 | 713 |
| Koninklijke KPN NV | 8.000% | 10/1/10 | 715 | 772 |
| Koninklijke KPN NV | 8.375% | 10/1/30 | 4,165 | 4,821 |
| New Cingular Wireless Services | 7.875% | 3/1/11 | 22,205 | 24,276 |
| New Cingular Wireless Services | 8.125% | 5/1/12 | 11,555 | 12,993 |
| New Cingular Wireless Services | 8.750% | 3/1/31 | 3,880 | 5,044 |
| New England Telephone&Telegraph Co. | 7.875% | 11/15/29 | 2,125 | 2,306 |
| News America Holdings, Inc. | 9.250% | 2/1/13 | 2,841 | 3,335 |
| News America Holdings, Inc. | 8.000% | 10/17/16 | 4,425 | 5,072 |
| News America Holdings, Inc. | 7.700% | 10/30/25 | 900 | 1,009 |
| News America Holdings, Inc. | 8.150% | 10/17/36 | 2,625 | 3,108 |
| News America Holdings, Inc. | 7.750% | 12/1/45 | 1,775 | 2,014 |
| News America Inc. | 5.300% | 12/15/14 | 2,075 | 2,038 |
| News America Inc. | 7.250% | 5/18/18 | 150 | 164 |
| News America Inc. | 6.550% | 3/15/33 | 275 | 275 |
| News America Inc. | 6.200% | 12/15/34 | 4,150 | 4,025 |
| News America Inc. | 6.400% | 12/15/35 | 5,135 | 5,120 |
| Nextel Communications | 6.875% | 10/31/13 | 7,100 | 7,178 |
| Nextel Communications | 5.950% | 3/15/14 | 5,730 | 5,618 |
| Nextel Communications | 7.375% | 8/1/15 | 9,695 | 9,957 |
| Omnicom Group Inc. | 5.900% | 4/15/16 | 925 | 936 |
| Pacific Bell | 7.125% | 3/15/26 | 1,700 | 1,844 |
| R.R. Donnelley&Sons Co. | 3.750% | 4/1/09 | 2,200 | 2,118 |
| R.R. Donnelley&Sons Co. | 4.950% | 5/15/10 | 3,150 | 3,088 |
| R.R. Donnelley&Sons Co. | 4.950% | 4/1/14 | 1,275 | 1,173 |
| R.R. Donnelley&Sons Co. | 5.500% | 5/15/15 | 1,585 | 1,494 |
| Reed Elsevier Capital | 4.625% | 6/15/12 | 1,375 | 1,315 |
| Sprint Capital Corp. | 6.125% | 11/15/08 | 14,925 | 15,125 |
| Sprint Capital Corp. | 6.375% | 5/1/09 | 12,275 | 12,545 |
| Sprint Capital Corp. | 7.625% | 1/30/11 | 7,725 | 8,269 |
| Sprint Capital Corp. | 8.375% | 3/15/12 | 1,365 | 1,519 |
| Sprint Capital Corp. | 6.900% | 5/1/19 | 775 | 800 |
| Sprint Capital Corp. | 6.875% | 11/15/28 | 2,850 | 2,844 |
| Sprint Capital Corp. | 8.750% | 3/15/32 | 13,725 | 16,487 |
| Sprint Nextel Corp. | 6.000% | 12/1/16 | 4,350 | 4,242 |
| TCI Communications, Inc. | 8.750% | 8/1/15 | 16,995 | 20,041 |
| TCI Communications, Inc. | 7.875% | 2/15/26 | 425 | 486 |
| Tele-Communications, Inc. | 7.875% | 8/1/13 | 14,425 | 15,991 |
| Telecom Italia Capital | 4.000% | 11/15/08 | 5,140 | 5,007 |
| Telecom Italia Capital | 4.000% | 1/15/10 | 5,400 | 5,172 |
| Telecom Italia Capital | 4.875% | 10/1/10 | 3,400 | 3,306 |
| Telecom Italia Capital | 6.200% | 7/18/11 | 9,600 | 9,746 |
| Telecom Italia Capital | 5.250% | 11/15/13 | 3,585 | 3,429 |
| Telecom Italia Capital | 4.950% | 9/30/14 | 4,000 | 3,705 |
| Telecom Italia Capital | 5.250% | 10/1/15 | 9,175 | 8,563 |
| Telecom Italia Capital | 6.375% | 11/15/33 | 3,720 | 3,529 |
| Telecom Italia Capital | 7.200% | 7/18/36 | 3,285 | 3,433 |
| Telecomunicaciones de Puerto Rico | 6.800% | 5/15/09 | 4,250 | 4,338 |
| Telefonica Emisiones SAU | 5.984% | 6/20/11 | 11,475 | 11,694 |
| Telefonica Emisiones SAU | 6.421% | 6/20/16 | 8,125 | 8,392 |
| Telefonica Emisiones SAU | 7.045% | 6/20/36 | 12,850 | 13,741 |
| Telefonica Europe BV | 7.750% | 9/15/10 | 12,775 | 13,739 |
| Telefonica Europe BV | 8.250% | 9/15/30 | 5,775 | 6,906 |
| Telefonos de Mexico SA | 4.750% | 1/27/10 | 2,550 | 2,502 |
| Telefonos de Mexico SA | 5.500% | 1/27/15 | 13,425 | 12,989 |
| Telus Corp. | 8.000% | 6/1/11 | 9,250 | 10,139 |
| Thomson Corp. | 5.750% | 2/1/08 | 8,050 | 8,077 |
| Thomson Corp. | 6.200% | 1/5/12 | 675 | 696 |
| Thomson Corp. | 5.500% | 8/15/35 | 1,150 | 1,045 |
| Time Warner Entertainment | 7.250% | 9/1/08 | 925 | 950 |
| Time Warner Entertainment | 10.150% | 5/1/12 | 1,400 | 1,657 |
| Time Warner Entertainment | 8.375% | 3/15/23 | 2,815 | 3,294 |
| Time Warner Entertainment | 8.375% | 7/15/33 | 8,735 | 10,548 |
| US Cellular | 6.700% | 12/15/33 | 3,800 | 3,591 |
| Verizon Communications Corp. | 5.350% | 2/15/11 | 7,750 | 7,769 |
| Verizon Communications Corp. | 5.550% | 2/15/16 | 5,650 | 5,650 |
| Verizon Global Funding Corp. | 4.000% | 1/15/08 | 1,500 | 1,480 |
| Verizon Global Funding Corp. | 6.875% | 6/15/12 | 17,400 | 18,612 |
| Verizon Global Funding Corp. | 7.375% | 9/1/12 | 7,975 | 8,729 |
| Verizon Global Funding Corp. | 4.375% | 6/1/13 | 560 | 529 |
| Verizon Global Funding Corp. | 7.750% | 12/1/30 | 2,890 | 3,391 |
| Verizon Global Funding Corp. | 5.850% | 9/15/35 | 5,000 | 4,810 |
| Verizon Maryland, Inc. | 6.125% | 3/1/12 | 500 | 512 |
| Verizon Maryland, Inc. | 5.125% | 6/15/33 | 450 | 371 |
| Verizon New England, Inc. | 6.500% | 9/15/11 | 3,970 | 4,087 |
| Verizon New Jersey, Inc. | 5.875% | 1/17/12 | 7,815 | 7,921 |
| Verizon New York, Inc. | 6.875% | 4/1/12 | 2,850 | 2,963 |
| Verizon New York, Inc. | 7.375% | 4/1/32 | 2,625 | 2,705 |
| Verizon Pennsylvania, Inc. | 5.650% | 11/15/11 | 11,125 | 11,175 |
| Verizon Virginia, Inc. | 4.625% | 3/15/13 | 6,625 | 6,240 |
| Vodafone AirTouch PLC | 7.750% | 2/15/10 | 1,955 | 2,083 |
| Vodafone AirTouch PLC | 7.875% | 2/15/30 | 4,900 | 5,744 |
| Vodafone Group PLC | 3.950% | 1/30/08 | 7,875 | 7,758 |
| Vodafone Group PLC | 5.000% | 12/16/13 | 1,900 | 1,837 |
| Vodafone Group PLC | 5.375% | 1/30/15 | 4,450 | 4,354 |
| Vodafone Group PLC | 5.000% | 9/15/15 | 9,125 | 8,685 |
| Vodafone Group PLC | 5.750% | 3/15/16 | 4,350 | 4,362 |
| Vodafone Group PLC | 6.250% | 11/30/32 | 9,225 | 9,209 |
| WPP Finance USA Corp. | 5.875% | 6/15/14 | 3,875 | 3,894 |
| Consumer Cyclical (1.5%) | ||||
| Brinker International | 5.750% | 6/1/14 | 1,925 | 1,868 |
| CVS Corp. | 4.000% | 9/15/09 | 1,075 | 1,039 |
| CVS Corp. | 5.750% | 8/15/11 | 1,525 | 1,545 |
| CVS Corp. | 4.875% | 9/15/14 | 2,750 | 2,633 |
| Centex Corp. | 4.750% | 1/15/08 | 340 | 337 |
| Centex Corp. | 7.875% | 2/1/11 | 290 | 313 |
| Centex Corp. | 5.450% | 8/15/12 | 1,600 | 1,570 |
| Centex Corp. | 5.125% | 10/1/13 | 3,690 | 3,534 |
| Centex Corp. | 6.500% | 5/1/16 | 2,875 | 2,939 |
| Chrysler Corp. | 7.450% | 3/1/27 | 4,300 | 4,583 |
| D.R. Horton, Inc. | 4.875% | 1/15/10 | 2,775 | 2,709 |
| D.R. Horton, Inc. | 6.000% | 4/15/11 | 6,575 | 6,603 |
| D.R. Horton, Inc. | 5.375% | 6/15/12 | 500 | 484 |
| D.R. Horton, Inc. | 5.250% | 2/15/15 | 5,050 | 4,720 |
| D.R. Horton, Inc. | 5.625% | 1/15/16 | 250 | 238 |
| D.R. Horton, Inc. | 6.500% | 4/15/16 | 6,425 | 6,460 |
| DaimlerChrysler North America Holding Corp. | 4.750% | 1/15/08 | 20,550 | 20,383 |
| DaimlerChrysler North America Holding Corp. | 4.050% | 6/4/08 | 13,300 | 13,017 |
| DaimlerChrysler North America Holding Corp. | 7.200% | 9/1/09 | 75 | 78 |
| DaimlerChrysler North America Holding Corp. | 4.875% | 6/15/10 | 1,700 | 1,659 |
| DaimlerChrysler North America Holding Corp. | 5.875% | 3/15/11 | 27,400 | 27,519 |
| DaimlerChrysler North America Holding Corp. | 5.750% | 9/8/11 | 15,250 | 15,227 |
| DaimlerChrysler North America Holding Corp. | 7.300% | 1/15/12 | 14,345 | 15,237 |
| DaimlerChrysler North America Holding Corp. | 6.500% | 11/15/13 | 400 | 411 |
| DaimlerChrysler North America Holding Corp. | 8.500% | 1/18/31 | 7,605 | 9,061 |
| Federated Department Stores, Inc. | 6.300% | 4/1/09 | 4,743 | 4,829 |
| Federated Department Stores, Inc. | 6.625% | 4/1/11 | 3,225 | 3,330 |
| Federated Department Stores, Inc. | 6.790% | 7/15/27 | 2,805 | 2,783 |
| Federated Department Stores, Inc. | 7.000% | 2/15/28 | 1,625 | 1,653 |
| Federated Department Stores, Inc. | 6.900% | 4/1/29 | 2,175 | 2,196 |
| Federated Retail Holding | 5.900% | 12/1/16 | 525 | 526 |
| Home Depot Inc. | 3.750% | 9/15/09 | 6,150 | 5,935 |
| Home Depot Inc. | 4.625% | 8/15/10 | 6,150 | 6,012 |
| Home Depot Inc. | 5.200% | 3/1/11 | 1,675 | 1,665 |
| Home Depot Inc. | 5.250% | 12/16/13 | 4,475 | 4,449 |
| Home Depot Inc. | 5.400% | 3/1/16 | 4,750 | 4,652 |
| Home Depot Inc. | 5.875% | 12/16/36 | 9,325 | 9,160 |
| ITT Corp. | 7.375% | 11/15/15 | 3,750 | 3,844 |
| J.C. Penney Co., Inc. | 8.000% | 3/1/10 | 6,550 | 6,983 |
| J.C. Penney Co., Inc. | 7.950% | 4/1/17 | 4,700 | 5,331 |
| J.C. Penney Co., Inc. | 7.400% | 4/1/37 | 3,275 | 3,560 |
| Johnson Controls, Inc. | 5.250% | 1/15/11 | 3,475 | 3,446 |
| Johnson Controls, Inc. | 6.000% | 1/15/36 | 325 | 312 |
| Kohl's Corp. | 6.000% | 1/15/33 | 825 | 799 |
| Lennar Corp. | 5.125% | 10/1/10 | 1,050 | 1,030 |
| Lennar Corp. | 5.950% | 10/17/11 | 11,000 | 11,080 |
| Lennar Corp. | 5.950% | 3/1/13 | 610 | 610 |
| Lennar Corp. | 5.600% | 5/31/15 | 8,950 | 8,618 |
| Lowe's Cos., Inc. | 8.250% | 6/1/10 | 1,000 | 1,094 |
| Lowe's Cos., Inc. | 5.000% | 10/15/15 | 3,800 | 3,651 |
| Lowe's Cos., Inc. | 5.400% | 10/15/16 | 9,800 | 9,638 |
| Lowe's Cos., Inc. | 6.875% | 2/15/28 | 60 | 68 |
| Lowe's Cos., Inc. | 6.500% | 3/15/29 | 4,726 | 5,006 |
| Lowe's Cos., Inc. | 5.500% | 10/15/35 | 200 | 187 |
| Lowe's Cos., Inc. | 5.800% | 10/15/36 | 5,100 | 4,950 |
| Marriott International | 4.625% | 6/15/12 | 3,925 | 3,713 |
| Marriott International | 6.200% | 6/15/16 | 1,650 | 1,668 |
| May Department Stores Co. | 5.750% | 7/15/14 | 4,325 | 4,227 |
| May Department Stores Co. | 6.650% | 7/15/24 | 2,600 | 2,591 |
| May Department Stores Co. | 6.700% | 7/15/34 | 4,900 | 4,838 |
| McDonald's Corp. | 6.000% | 4/15/11 | 3,385 | 3,476 |
| Nordstrom, Inc. | 6.950% | 3/15/28 | 1,325 | 1,424 |
| Pulte Homes, Inc. | 4.875% | 7/15/09 | 2,375 | 2,345 |
| Pulte Homes, Inc. | 6.250% | 2/15/13 | 450 | 459 |
| Pulte Homes, Inc. | 5.250% | 1/15/14 | 1,650 | 1,585 |
| Pulte Homes, Inc. | 5.200% | 2/15/15 | 1,000 | 952 |
| Pulte Homes, Inc. | 7.875% | 6/15/32 | 2,200 | 2,418 |
| Pulte Homes, Inc. | 6.000% | 2/15/35 | 1,350 | 1,237 |
| Target Corp. | 3.375% | 3/1/08 | 17,650 | 17,276 |
| Target Corp. | 7.500% | 8/15/10 | 1,700 | 1,826 |
| Target Corp. | 6.350% | 1/15/11 | 1,620 | 1,687 |
| Target Corp. | 5.875% | 3/1/12 | 595 | 612 |
| Target Corp. | 5.875% | 7/15/16 | 10,050 | 10,364 |
| Target Corp. | 7.000% | 7/15/31 | 4,210 | 4,853 |
| Target Corp. | 6.350% | 11/1/32 | 7,525 | 8,083 |
| The Walt Disney Co. | 5.700% | 7/15/11 | 15,975 | 16,245 |
| The Walt Disney Co. | 6.375% | 3/1/12 | 2,100 | 2,203 |
| The Walt Disney Co. | 5.625% | 9/15/16 | 5,975 | 6,021 |
| Time Warner, Inc. | 6.750% | 4/15/11 | 4,525 | 4,728 |
| Time Warner, Inc. | 5.500% | 11/15/11 | 6,675 | 6,656 |
| Time Warner, Inc. | 6.875% | 5/1/12 | 3,950 | 4,173 |
| Time Warner, Inc. | 9.125% | 1/15/13 | 1,500 | 1,750 |
| Time Warner, Inc. | 5.875% | 11/15/16 | 4,975 | 4,954 |
| Time Warner, Inc. | 9.150% | 2/1/23 | 11,825 | 14,686 |
| Time Warner, Inc. | 7.570% | 2/1/24 | 1,500 | 1,639 |
| Time Warner, Inc. | 6.625% | 5/15/29 | 5,725 | 5,766 |
| Time Warner, Inc. | 7.625% | 4/15/31 | 14,175 | 15,785 |
| Time Warner, Inc. | 7.700% | 5/1/32 | 4,745 | 5,355 |
| Time Warner, Inc. | 6.500% | 11/15/36 | 6,500 | 6,480 |
| Toll Brothers, Inc. | 5.150% | 5/15/15 | 3,900 | 3,581 |
| Toyota Motor Credit Corp. | 2.875% | 8/1/08 | 3,560 | 3,439 |
| Toyota Motor Credit Corp. | 4.250% | 3/15/10 | 20,075 | 19,592 |
| Toyota Motor Credit Corp. | 4.350% | 12/15/10 | 2,675 | 2,604 |
| Toyota Motor Credit Corp. | 5.450% | 5/18/11 | 3,375 | 3,421 |
| Viacom Inc. | 5.750% | 4/30/11 | 6,225 | 6,226 |
| Viacom Inc. | 6.250% | 4/30/16 | 6,575 | 6,524 |
| Viacom Inc. | 6.875% | 4/30/36 | 6,750 | 6,659 |
| Wal-Mart Stores, Inc. | 3.375% | 10/1/08 | 13,725 | 13,319 |
| Wal-Mart Stores, Inc. | 6.875% | 8/10/09 | 13,395 | 13,966 |
| Wal-Mart Stores, Inc. | 4.000% | 1/15/10 | 15,000 | 14,540 |
| Wal-Mart Stores, Inc. | 4.125% | 7/1/10 | 9,440 | 9,137 |
| Wal-Mart Stores, Inc. | 4.750% | 8/15/10 | 2,660 | 2,626 |
| Wal-Mart Stores, Inc. | 4.125% | 2/15/11 | 4,500 | 4,332 |
| Wal-Mart Stores, Inc. | 4.550% | 5/1/13 | 800 | 770 |
| Wal-Mart Stores, Inc. | 4.500% | 7/1/15 | 3,500 | 3,292 |
| Wal-Mart Stores, Inc. | 7.550% | 2/15/30 | 16,095 | 19,531 |
| 4 Western Union Co. | 5.400% | 11/17/11 | 5,600 | 5,516 |
| 4 Western Union Co. | 6.200% | 11/17/36 | 3,375 | 3,165 |
| Yum! Brands, Inc. | 8.875% | 4/15/11 | 8,250 | 9,203 |
| Yum! Brands, Inc. | 7.700% | 7/1/12 | 1,425 | 1,555 |
| Yum! Brands, Inc. | 6.250% | 4/15/16 | 7,100 | 7,219 |
| Consumer Noncyclical (1.6%) | ||||
| Abbott Laboratories | 3.500% | 2/17/09 | 1,500 | 1,451 |
| Abbott Laboratories | 5.375% | 5/15/09 | 6,225 | 6,264 |
| Abbott Laboratories | 3.750% | 3/15/11 | 3,500 | 3,305 |
| Abbott Laboratories | 5.600% | 5/15/11 | 10,000 | 10,148 |
| Abbott Laboratories | 4.350% | 3/15/14 | 925 | 868 |
| Abbott Laboratories | 5.875% | 5/15/16 | 11,050 | 11,398 |
| Allergan Inc. | 5.750% | 4/1/16 | 1,375 | 1,395 |
| Altria Group, Inc. | 5.625% | 11/4/08 | 5,375 | 5,393 |
| Altria Group, Inc. | 7.000% | 11/4/13 | 125 | 136 |
| AmerisourceBergen Corp. | 5.625% | 9/15/12 | 525 | 518 |
| AmerisourceBergen Corp. | 5.875% | 9/15/15 | 7,300 | 7,103 |
| Amgen Inc. | 4.000% | 11/18/09 | 6,800 | 6,602 |
| Amgen Inc. | 4.850% | 11/18/14 | 5,750 | 5,574 |
| Anheuser-Busch Cos., Inc. | 6.000% | 4/15/11 | 1,500 | 1,541 |
| Anheuser-Busch Cos., Inc. | 4.375% | 1/15/13 | 3,675 | 3,474 |
| Anheuser-Busch Cos., Inc. | 7.125% | 7/1/17 | 3,350 | 3,416 |
| Anheuser-Busch Cos., Inc. | 6.800% | 8/20/32 | 2,600 | 2,866 |
| Anheuser-Busch Cos., Inc. | 5.750% | 4/1/36 | 4,550 | 4,356 |
| Archer-Daniels-Midland Co. | 8.125% | 6/1/12 | 3,950 | 4,450 |
| Archer-Daniels-Midland Co. | 7.500% | 3/15/27 | 1,450 | 1,736 |
| Archer-Daniels-Midland Co. | 7.000% | 2/1/31 | 2,450 | 2,821 |
| Archer-Daniels-Midland Co. | 5.375% | 9/15/35 | 7,750 | 7,340 |
| AstraZeneca PLC | 5.400% | 6/1/14 | 3,750 | 3,763 |
| Baxter Finco, BV | 4.750% | 10/15/10 | 6,875 | 6,762 |
| Baxter International, Inc. | 5.900% | 9/1/16 | 3,325 | 3,423 |
| Boston Scientific | 6.000% | 6/15/11 | 5,175 | 5,228 |
| Boston Scientific | 5.450% | 6/15/14 | 2,975 | 2,857 |
| Boston Scientific | 6.400% | 6/15/16 | 3,000 | 3,029 |
| Boston Scientific | 6.250% | 11/15/35 | 5,050 | 5,029 |
| Bottling Group LLC | 4.625% | 11/15/12 | 15,785 | 15,245 |
| Bottling Group LLC | 5.000% | 11/15/13 | 2,525 | 2,466 |
| Bottling Group LLC | 5.500% | 4/1/16 | 5,900 | 5,899 |
| Bristol-Myers Squibb Co. | 4.000% | 8/15/08 | 5,125 | 5,021 |
| Bristol-Myers Squibb Co. | 7.150% | 6/15/23 | 750 | 845 |
| Bristol-Myers Squibb Co. | 5.875% | 11/15/36 | 18,825 | 18,621 |
| Bristol-Myers Squibb Co. | 6.875% | 8/1/97 | 1,125 | 1,200 |
| Bunge Ltd. Finance Corp. | 4.375% | 12/15/08 | 1,325 | 1,299 |
| Bunge Ltd. Finance Corp. | 5.100% | 7/15/15 | 1,950 | 1,833 |
| C.R. Bard, Inc. | 6.700% | 12/1/26 | 6,300 | 6,707 |
| Campbell Soup Co. | 6.750% | 2/15/11 | 7,200 | 7,566 |
| Cardinal Health, Inc. | 6.750% | 2/15/11 | 425 | 445 |
| Cardinal Health, Inc. | 4.000% | 6/15/15 | 650 | 575 |
| 4 Cardinal Health, Inc. | 5.800% | 10/15/16 | 9,575 | 9,531 |
| Cardinal Health, Inc. | 5.850% | 12/15/17 | 2,150 | 2,140 |
| Cia. Brasil de Bebidas AmBev | 10.500% | 12/15/11 | 2,455 | 2,977 |
| Cia. Brasil de Bebidas AmBev | 8.750% | 9/15/13 | 3,375 | 3,953 |
| Clorox Co. | 4.200% | 1/15/10 | 10,525 | 10,196 |
| Clorox Co. | 5.000% | 1/15/15 | 3,075 | 2,982 |
| Coca-Cola Enterprises Inc. | 5.750% | 11/1/08 | 1,925 | 1,943 |
| Coca-Cola Enterprises Inc. | 4.250% | 9/15/10 | 340 | 329 |
| Coca-Cola Enterprises Inc. | 6.125% | 8/15/11 | 4,400 | 4,558 |
| Coca-Cola Enterprises Inc. | 8.500% | 2/1/22 | 3,675 | 4,628 |
| Coca-Cola Enterprises Inc. | 8.000% | 9/15/22 | 1,550 | 1,883 |
| Coca-Cola Enterprises Inc. | 7.000% | 10/1/26 | 1,325 | 1,488 |
| Coca-Cola Enterprises Inc. | 6.950% | 11/15/26 | 1,070 | 1,203 |
| Coca-Cola HBC Finance | 5.125% | 9/17/13 | 670 | 658 |
| ConAgra Foods, Inc. | 7.875% | 9/15/10 | 5,950 | 6,440 |
| ConAgra Foods, Inc. | 6.750% | 9/15/11 | 145 | 153 |
| 4 ConAgra Foods, Inc. | 5.819% | 6/15/17 | 851 | 845 |
| ConAgra Foods, Inc. | 9.750% | 3/1/21 | 129 | 164 |
| ConAgra Foods, Inc. | 7.125% | 10/1/26 | 1,275 | 1,398 |
| ConAgra Foods, Inc. | 7.000% | 10/1/28 | 875 | 944 |
| ConAgra Foods, Inc. | 8.250% | 9/15/30 | 1,420 | 1,737 |
| Coors Brewing Co. | 6.375% | 5/15/12 | 900 | 931 |
| Diageo Capital PLC | 3.375% | 3/20/08 | 13,500 | 13,201 |
| Diageo Capital PLC | 7.250% | 11/1/09 | 450 | 473 |
| Diageo Capital PLC | 4.375% | 5/3/10 | 1,000 | 974 |
| Diageo Capital PLC | 5.875% | 9/30/36 | 475 | 468 |
| Eli Lilly&Co. | 6.000% | 3/15/12 | 2,475 | 2,576 |
| Fortune Brands Inc. | 5.125% | 1/15/11 | 12,000 | 11,795 |
| Fortune Brands Inc. | 5.375% | 1/15/16 | 13,675 | 12,966 |
| Fortune Brands Inc. | 5.875% | 1/15/36 | 3,475 | 3,175 |
| Genentech Inc. | 4.400% | 7/15/10 | 1,350 | 1,320 |
| Genentech Inc. | 4.750% | 7/15/15 | 1,225 | 1,173 |
| Genentech Inc. | 5.250% | 7/15/35 | 3,550 | 3,320 |
| General Mills, Inc. | 6.000% | 2/15/12 | 5,164 | 5,286 |
| Gillette Co. | 3.800% | 9/15/09 | 1,400 | 1,355 |
| GlaxoSmithKline Capital Inc. | 4.375% | 4/15/14 | 3,200 | 3,015 |
| GlaxoSmithKline Capital Inc. | 5.375% | 4/15/34 | 3,850 | 3,738 |
| Grand Metropolitan Investment Corp. | 9.000% | 8/15/11 | 500 | 572 |
| Grand Metropolitan Investment Corp. | 7.450% | 4/15/35 | 500 | 595 |
| H.J. Heinz Co. | 6.625% | 7/15/11 | 3,200 | 3,334 |
| H.J. Heinz Co. | 6.750% | 3/15/32 | 4,100 | 4,153 |
| Health Management Associates Inc. | 6.125% | 4/15/16 | 3,150 | 2,984 |
| Hershey Foods Corp. | 5.300% | 9/1/11 | 2,500 | 2,505 |
| Hershey Foods Corp. | 5.450% | 9/1/16 | 1,550 | 1,556 |
| Hospira, Inc. | 4.950% | 6/15/09 | 1,075 | 1,056 |
| Hospira, Inc. | 5.900% | 6/15/14 | 1,925 | 1,864 |
| Imperial Tobacco | 7.125% | 4/1/09 | 1,000 | 1,036 |
| Johnson&Johnson | 3.800% | 5/15/13 | 3,940 | 3,679 |
| Johnson&Johnson | 6.950% | 9/1/29 | 1,625 | 1,949 |
| Johnson&Johnson | 4.950% | 5/15/33 | 1,750 | 1,642 |
| Kellogg Co. | 2.875% | 6/1/08 | 2,175 | 2,102 |
| Kellogg Co. | 6.600% | 4/1/11 | 8,525 | 8,935 |
| Kellogg Co. | 7.450% | 4/1/31 | 7,415 | 8,808 |
| Kimberly-Clark Corp. | 5.625% | 2/15/12 | 2,575 | 2,620 |
| Kimberly-Clark Corp. | 4.875% | 8/15/15 | 6,250 | 5,951 |
| Kimberly-Clark Corp. | 6.250% | 7/15/18 | 175 | 185 |
| Kraft Foods, Inc. | 4.125% | 11/12/09 | 6,400 | 6,208 |
| Kraft Foods, Inc. | 5.625% | 11/1/11 | 15,425 | 15,586 |
| Kraft Foods, Inc. | 6.250% | 6/1/12 | 5,715 | 5,934 |
| Kraft Foods, Inc. | 5.250% | 10/1/13 | 25 | 25 |
| Kraft Foods, Inc. | 6.500% | 11/1/31 | 10,650 | 11,443 |
| Kroger Co. | 7.250% | 6/1/09 | 4,225 | 4,392 |
| Kroger Co. | 6.800% | 4/1/11 | 2,600 | 2,715 |
| Kroger Co. | 6.750% | 4/15/12 | 2,200 | 2,309 |
| Kroger Co. | 6.200% | 6/15/12 | 3,500 | 3,588 |
| Kroger Co. | 5.500% | 2/1/13 | 1,725 | 1,705 |
| Kroger Co. | 4.950% | 1/15/15 | 3,675 | 3,465 |
| Kroger Co. | 6.800% | 12/15/18 | 4,025 | 4,219 |
| Kroger Co. | 7.700% | 6/1/29 | 9,900 | 11,048 |
| Kroger Co. | 8.000% | 9/15/29 | 1,250 | 1,431 |
| Kroger Co. | 7.500% | 4/1/31 | 520 | 583 |
| Laboratory Corp. of America | 5.500% | 2/1/13 | 340 | 333 |
| Laboratory Corp. of America | 5.625% | 12/15/15 | 2,975 | 2,904 |
| McKesson Corp. | 7.750% | 2/1/12 | 375 | 410 |
| Medtronic Inc. | 4.375% | 9/15/10 | 2,775 | 2,698 |
| Medtronic Inc. | 4.750% | 9/15/15 | 5,375 | 5,099 |
| Merck&Co. | 4.375% | 2/15/13 | 2,850 | 2,708 |
| Merck&Co. | 4.750% | 3/1/15 | 2,425 | 2,313 |
| Merck&Co. | 6.400% | 3/1/28 | 4,080 | 4,354 |
| Merck&Co. | 5.950% | 12/1/28 | 2,375 | 2,397 |
| Molson Coors Capital Finance | 4.850% | 9/22/10 | 1,975 | 1,937 |
| Newell Rubbermaid, Inc. | 4.000% | 5/1/10 | 3,225 | 3,090 |
| Pepsi Bottling Group, Inc. | 7.000% | 3/1/29 | 2,200 | 2,514 |
| PepsiAmericas Inc. | 4.875% | 1/15/15 | 375 | 358 |
| PepsiAmericas Inc. | 5.000% | 5/15/17 | 4,600 | 4,371 |
| Pfizer, Inc. | 4.500% | 2/15/14 | 9,350 | 9,013 |
| Pharmacia Corp. | 6.600% | 12/1/28 | 1,500 | 1,698 |
| Philip Morris Cos., Inc. | 7.650% | 7/1/08 | 3,325 | 3,428 |
| Philip Morris Cos., Inc. | 7.750% | 1/15/27 | 3,645 | 4,415 |
| Procter&Gamble Co. | 6.875% | 9/15/09 | 8,700 | 9,077 |
| Procter&Gamble Co. | 4.950% | 8/15/14 | 2,225 | 2,181 |
| Procter&Gamble Co. | 6.450% | 1/15/26 | 3,675 | 4,018 |
| Procter&Gamble Co. | 5.500% | 2/1/34 | 100 | 98 |
| Procter&Gamble Co. | 5.800% | 8/15/34 | 3,375 | 3,468 |
| 2 Procter&Gamble Co. ESOP | 9.360% | 1/1/21 | 15,286 | 19,238 |
| Quest Diagnostic, Inc. | 5.450% | 11/1/15 | 8,550 | 8,214 |
| Safeway, Inc. | 4.950% | 8/16/10 | 3,775 | 3,708 |
| Safeway, Inc. | 6.500% | 3/1/11 | 4,200 | 4,341 |
| Safeway, Inc. | 5.800% | 8/15/12 | 1,200 | 1,208 |
| Safeway, Inc. | 7.250% | 2/1/31 | 1,950 | 2,121 |
| Schering-Plough Corp. | 5.550% | 12/1/13 | 5,225 | 5,231 |
| Schering-Plough Corp. | 6.750% | 12/1/33 | 4,350 | 4,750 |
| Sysco Corp. | 5.375% | 9/21/35 | 4,725 | 4,475 |
| Teva Pharmaceutical Finance LLC | 6.150% | 2/1/36 | 6,650 | 6,472 |
| Unilever Capital Corp. | 7.125% | 11/1/10 | 11,700 | 12,423 |
| Unilever Capital Corp. | 5.900% | 11/15/32 | 3,425 | 3,460 |
| Universal Health Services, Inc. | 7.125% | 6/30/16 | 1,325 | 1,385 |
| WM Wrigley Jr. Co. | 4.300% | 7/15/10 | 5,725 | 5,551 |
| WM Wrigley Jr. Co. | 4.650% | 7/15/15 | 5,550 | 5,265 |
| 4 Western Union Co. | 5.930% | 10/1/16 | 1,000 | 988 |
| Wyeth | 4.375% | 3/1/08 | 8,320 | 8,228 |
| Wyeth | 6.950% | 3/15/11 | 1,875 | 1,991 |
| Wyeth | 5.500% | 3/15/13 | 11,200 | 11,328 |
| Wyeth | 5.500% | 2/1/14 | 7,425 | 7,455 |
| Wyeth | 6.450% | 2/1/24 | 1,850 | 1,985 |
| Wyeth | 6.500% | 2/1/34 | 3,375 | 3,680 |
| Wyeth | 6.000% | 2/15/36 | 6,025 | 6,174 |
| Energy (0.8%) | ||||
| Alberta Energy Co. Ltd. | 7.375% | 11/1/31 | 975 | 1,101 |
| Amerada Hess Corp. | 6.650% | 8/15/11 | 7,450 | 7,781 |
| Amerada Hess Corp. | 7.875% | 10/1/29 | 7,450 | 8,674 |
| Amerada Hess Corp. | 7.125% | 3/15/33 | 3,325 | 3,632 |
| Anadarko Finance Co. | 6.750% | 5/1/11 | 3,550 | 3,716 |
| Anadarko Petroleum Corp. | 3.250% | 5/1/08 | 1,850 | 1,795 |
| Anadarko Petroleum Corp. | 5.950% | 9/15/16 | 11,200 | 11,207 |
| Anadarko Petroleum Corp. | 6.450% | 9/15/36 | 12,700 | 12,846 |
| Apache Corp. | 6.250% | 4/15/12 | 1,025 | 1,077 |
| Apache Finance Canada | 7.750% | 12/15/29 | 1,350 | 1,642 |
| Atlantic Richfield Co. | 5.900% | 4/15/09 | 3,484 | 3,543 |
| Baker Hughes, Inc. | 6.250% | 1/15/09 | 500 | 509 |
| Baker Hughes, Inc. | 6.875% | 1/15/29 | 825 | 911 |
| Burlington Resources, Inc. | 6.680% | 2/15/11 | 3,800 | 3,992 |
| Burlington Resources, Inc. | 7.200% | 8/15/31 | 850 | 993 |
| Burlington Resources, Inc. | 7.400% | 12/1/31 | 7,050 | 8,428 |
| Canadian Natural Resources | 5.450% | 10/1/12 | 1,650 | 1,638 |
| Canadian Natural Resources | 4.900% | 12/1/14 | 5,575 | 5,257 |
| Canadian Natural Resources | 6.000% | 8/15/16 | 5,375 | 5,421 |
| Canadian Natural Resources | 7.200% | 1/15/32 | 6,050 | 6,640 |
| Canadian Natural Resources | 6.450% | 6/30/33 | 4,265 | 4,242 |
| Canadian Natural Resources | 6.500% | 2/15/37 | 9,975 | 9,984 |
| ChevronTexaco Capital Co. | 3.375% | 2/15/08 | 8,000 | 7,841 |
| Conoco Funding Co. | 6.350% | 10/15/11 | 12,085 | 12,632 |
| Conoco Funding Co. | 7.250% | 10/15/31 | 350 | 411 |
| ConocoPhillips Canada | 5.300% | 4/15/12 | 4,525 | 4,520 |
| ConocoPhillips Canada | 5.625% | 10/15/16 | 13,800 | 13,886 |
| ConocoPhillips Canada | 5.950% | 10/15/36 | 3,225 | 3,282 |
| Devon Financing Corp. | 6.875% | 9/30/11 | 10,235 | 10,821 |
| Devon Financing Corp. | 7.875% | 9/30/31 | 4,325 | 5,202 |
| Diamond Offshore Drilling | 4.875% | 7/1/15 | 775 | 728 |
| Encana Corp. | 4.600% | 8/15/09 | 1,225 | 1,202 |
| Encana Corp. | 6.500% | 8/15/34 | 2,100 | 2,159 |
| Encana Holdings Finance Corp. | 5.800% | 5/1/14 | 2,100 | 2,112 |
| Halliburton Co. | 5.500% | 10/15/10 | 4,100 | 4,092 |
| Husky Energy Inc. | 6.250% | 6/15/12 | 2,000 | 2,060 |
| Husky Energy Inc. | 6.150% | 6/15/19 | 1,000 | 1,008 |
| Kerr McGee Corp. | 6.875% | 9/15/11 | 6,850 | 7,219 |
| Kerr McGee Corp. | 6.950% | 7/1/24 | 11,250 | 12,015 |
| Kerr McGee Corp. | 7.875% | 9/15/31 | 1,700 | 2,044 |
| Lasmo Inc. | 7.300% | 11/15/27 | 400 | 472 |
| Marathon Oil Corp. | 6.125% | 3/15/12 | 5,620 | 5,773 |
| Marathon Oil Corp. | 6.800% | 3/15/32 | 575 | 633 |
| Nexen, Inc. | 5.050% | 11/20/13 | 3,700 | 3,558 |
| Nexen, Inc. | 7.875% | 3/15/32 | 1,100 | 1,307 |
| Nexen, Inc. | 5.875% | 3/10/35 | 400 | 377 |
| Noble Energy Inc. | 8.000% | 4/1/27 | 175 | 206 |
| Norsk Hydro | 6.360% | 1/15/09 | 2,725 | 2,785 |
| Norsk Hydro | 7.250% | 9/23/27 | 4,300 | 5,015 |
| Norsk Hydro | 7.150% | 1/15/29 | 3,475 | 4,029 |
| Occidental Petroleum | 6.750% | 1/15/12 | 2,975 | 3,163 |
| Occidental Petroleum | 7.200% | 4/1/28 | 5,200 | 5,962 |
| Occidental Petroleum | 8.450% | 2/15/29 | 700 | 919 |
| PanCanadian Energy Corp. | 7.200% | 11/1/31 | 7,050 | 7,781 |
| Petro-Canada | 4.000% | 7/15/13 | 1,675 | 1,522 |
| Petro-Canada | 7.875% | 6/15/26 | 1,675 | 1,964 |
| Petro-Canada | 7.000% | 11/15/28 | 1,375 | 1,478 |
| Petro-Canada | 5.350% | 7/15/33 | 5,975 | 5,218 |
| Petro-Canada | 5.950% | 5/15/35 | 5,975 | 5,698 |
| Petro-Canada Financial Partnership | 5.000% | 11/15/14 | 2,375 | 2,271 |
| Phillips Petroleum Co. | 8.750% | 5/25/10 | 1,250 | 1,384 |
| Questar Market Resources | 6.050% | 9/1/16 | 3,575 | 3,651 |
| Shell International Finance | 5.625% | 6/27/11 | 850 | 868 |
| Suncor Energy, Inc. | 7.150% | 2/1/32 | 1,700 | 1,976 |
| Suncor Energy, Inc. | 5.950% | 12/1/34 | 150 | 151 |
| Sunoco, Inc. | 4.875% | 10/15/14 | 1,700 | 1,591 |
| Sunoco, Inc. | 5.750% | 1/15/17 | 2,300 | 2,253 |
| Talisman Energy, Inc. | 5.125% | 5/15/15 | 1,400 | 1,328 |
| Talisman Energy, Inc. | 7.250% | 10/15/27 | 1,050 | 1,150 |
| Talisman Energy, Inc. | 5.850% | 2/1/37 | 5,700 | 5,232 |
| Tosco Corp. | 8.125% | 2/15/30 | 18,775 | 23,915 |
| Transocean Sedco Forex, Inc. | 7.500% | 4/15/31 | 2,150 | 2,424 |
| Valero Energy Corp. | 6.875% | 4/15/12 | 12,800 | 13,536 |
| Valero Energy Corp. | 4.750% | 6/15/13 | 340 | 323 |
| Valero Energy Corp. | 7.500% | 4/15/32 | 790 | 902 |
| Weatherford International Inc. | 6.500% | 8/1/36 | 7,075 | 7,119 |
| XTO Energy, Inc. | 6.250% | 4/15/13 | 4,800 | 4,950 |
| XTO Energy, Inc. | 4.900% | 2/1/14 | 325 | 310 |
| XTO Energy, Inc. | 5.000% | 1/31/15 | 1,725 | 1,642 |
| XTO Energy, Inc. | 5.300% | 6/30/15 | 1,475 | 1,428 |
| XTO Energy, Inc. | 6.100% | 4/1/36 | 500 | 486 |
| Technology (0.4%) | ||||
| Cisco Systems Inc. | 5.250% | 2/22/11 | 18,300 | 18,356 |
| Cisco Systems Inc. | 5.500% | 2/22/16 | 9,400 | 9,426 |
| Computer Sciences Corp. | 3.500% | 4/15/08 | 825 | 804 |
| Computer Sciences Corp. | 5.000% | 2/15/13 | 1,900 | 1,825 |
| Corning Inc. | 7.250% | 8/15/36 | 400 | 428 |
| Electronic Data Systems | 7.125% | 10/15/09 | 2,425 | 2,530 |
| Electronic Data Systems | 6.500% | 8/1/13 | 1,375 | 1,389 |
| Electronic Data Systems | 7.450% | 10/15/29 | 1,500 | 1,641 |
| First Data Corp. | 3.375% | 8/1/08 | 4,000 | 3,883 |
| First Data Corp. | 4.950% | 6/15/15 | 2,500 | 2,382 |
| Harris Corp. | 5.000% | 10/1/15 | 4,400 | 4,121 |
| Hewlett-Packard Co. | 3.625% | 3/15/08 | 11,825 | 11,595 |
| Hewlett-Packard Co. | 6.500% | 7/1/12 | 560 | 593 |
| International Business Machines Corp. | 3.800% | 2/1/08 | 7,325 | 7,210 |
| International Business Machines Corp. | 5.375% | 2/1/09 | 3,975 | 3,998 |
| International Business Machines Corp. | 4.750% | 11/29/12 | 235 | 230 |
| International Business Machines Corp. | 7.500% | 6/15/13 | 3,575 | 3,985 |
| International Business Machines Corp. | 7.000% | 10/30/25 | 720 | 819 |
| International Business Machines Corp. | 6.220% | 8/1/27 | 6,250 | 6,576 |
| International Business Machines Corp. | 6.500% | 1/15/28 | 700 | 764 |
| International Business Machines Corp. | 7.125% | 12/1/96 | 6,735 | 7,744 |
| Motorola, Inc. | 7.625% | 11/15/10 | 1,219 | 1,314 |
| Motorola, Inc. | 8.000% | 11/1/11 | 1,525 | 1,689 |
| Motorola, Inc. | 7.500% | 5/15/25 | 4,850 | 5,621 |
| Motorola, Inc. | 6.500% | 9/1/25 | 2,675 | 2,817 |
| Motorola, Inc. | 6.500% | 11/15/28 | 1,200 | 1,271 |
| Oracle Corp. | 5.000% | 1/15/11 | 6,025 | 5,966 |
| Oracle Corp. | 5.250% | 1/15/16 | 10,875 | 10,638 |
| Pitney Bowes Credit Corp. | 5.750% | 8/15/08 | 5,075 | 5,117 |
| Pitney Bowes, Inc. | 4.875% | 8/15/14 | 2,925 | 2,812 |
| Pitney Bowes, Inc. | 4.750% | 1/15/16 | 10,800 | 10,192 |
| Science Applications International Corp. | 6.250% | 7/1/12 | 1,275 | 1,311 |
| Science Applications International Corp. | 5.500% | 7/1/33 | 1,775 | 1,578 |
| Xerox Corp. | 9.750% | 1/15/09 | 2,725 | 2,933 |
| Xerox Corp. | 7.125% | 6/15/10 | 4,100 | 4,274 |
| Xerox Corp. | 6.875% | 8/15/11 | 2,425 | 2,528 |
| Xerox Corp. | 7.625% | 6/15/13 | 2,400 | 2,514 |
| Xerox Corp. | 6.400% | 3/15/16 | 4,225 | 4,310 |
| Xerox Corp. | 6.750% | 2/1/17 | 3,700 | 3,839 |
| Transportation (0.5%) | ||||
| 2 American Airlines, Inc. | 6.855% | 4/15/09 | 3,256 | 3,308 |
| American Airlines, Inc. | 7.024% | 10/15/09 | 8,625 | 8,959 |
| American Airlines, Inc. | 7.858% | 10/1/11 | 1,675 | 1,830 |
| Burlington Northern Santa Fe Corp. | 7.125% | 12/15/10 | 500 | 532 |
| Burlington Northern Santa Fe Corp. | 6.750% | 7/15/11 | 3,720 | 3,924 |
| Burlington Northern Santa Fe Corp. | 7.000% | 12/15/25 | 6,400 | 7,202 |
| Burlington Northern Santa Fe Corp. | 6.200% | 8/15/36 | 7,250 | 7,436 |
| CNF, Inc. | 6.700% | 5/1/34 | 3,600 | 3,442 |
| CSX Corp. | 6.250% | 10/15/08 | 875 | 888 |
| CSX Corp. | 6.750% | 3/15/11 | 3,300 | 3,461 |
| CSX Corp. | 6.300% | 3/15/12 | 5,150 | 5,338 |
| CSX Corp. | 7.950% | 5/1/27 | 325 | 398 |
| CSX Corp. | 6.000% | 10/1/36 | 9,375 | 9,396 |
| Canadian National Railway Co. | 6.375% | 10/15/11 | 1,075 | 1,122 |
| Canadian National Railway Co. | 4.400% | 3/15/13 | 1,175 | 1,117 |
| Canadian National Railway Co. | 5.800% | 6/1/16 | 950 | 978 |
| Canadian National Railway Co. | 6.800% | 7/15/18 | 10,750 | 11,892 |
| Canadian National Railway Co. | 6.250% | 8/1/34 | 1,525 | 1,625 |
| Canadian National Railway Co. | 6.200% | 6/1/36 | 3,450 | 3,642 |
| Canadian Pacific Rail | 6.250% | 10/15/11 | 11,350 | 11,750 |
| Canadian Pacific Rail | 7.125% | 10/15/31 | 550 | 642 |
| Continental Airlines, Inc. | 6.563% | 2/15/12 | 3,000 | 3,128 |
| 2 Continental Airlines, Inc. | 6.648% | 9/15/17 | 11,041 | 11,483 |
| 2 Continental Airlines, Inc. | 6.900% | 1/2/18 | 179 | 187 |
| 2 Continental Airlines, Inc. | 6.545% | 2/2/19 | 557 | 576 |
| 4 ERAC USA Finance Co. | 7.350% | 6/15/08 | 4,925 | 5,037 |
| FedEx Corp. | 3.500% | 4/1/09 | 1,900 | 1,830 |
| FedEx Corp. | 5.500% | 8/15/09 | 4,075 | 4,097 |
| Mass Transit Railway Corp. | 7.500% | 11/8/10 | 425 | 457 |
| Norfolk Southern Corp. | 7.350% | 5/15/07 | 9 | 9 |
| Norfolk Southern Corp. | 6.200% | 4/15/09 | 3,200 | 3,259 |
| Norfolk Southern Corp. | 6.750% | 2/15/11 | 6,850 | 7,201 |
| Norfolk Southern Corp. | 5.257% | 9/17/14 | 45 | 44 |
| Norfolk Southern Corp. | 7.700% | 5/15/17 | 6,375 | 7,389 |
| Norfolk Southern Corp. | 9.750% | 6/15/20 | 1,696 | 2,289 |
| Norfolk Southern Corp. | 5.590% | 5/17/25 | 634 | 617 |
| Norfolk Southern Corp. | 7.800% | 5/15/27 | 1,945 | 2,373 |
| Norfolk Southern Corp. | 5.640% | 5/17/29 | 1,155 | 1,116 |
| Norfolk Southern Corp. | 7.250% | 2/15/31 | 691 | 809 |
| Norfolk Southern Corp. | 7.050% | 5/1/37 | 9,500 | 10,954 |
| Norfolk Southern Corp. | 7.900% | 5/15/97 | 2,075 | 2,562 |
| Ryder System Inc. | 5.950% | 5/2/11 | 3,375 | 3,414 |
| Ryder System Inc. | 5.850% | 11/1/16 | 1,100 | 1,082 |
| Southwest Airlines Co. | 6.500% | 3/1/12 | 8,175 | 8,522 |
| Southwest Airlines Co. | 5.250% | 10/1/14 | 275 | 266 |
| Southwest Airlines Co. | 5.750% | 12/15/16 | 3,950 | 3,871 |
| Southwest Airlines Co. | 5.125% | 3/1/17 | 850 | 793 |
| Union Pacific Corp. | 7.250% | 11/1/08 | 3,875 | 3,996 |
| Union Pacific Corp. | 3.625% | 6/1/10 | 2,040 | 1,927 |
| Union Pacific Corp. | 6.650% | 1/15/11 | 3,005 | 3,142 |
| Union Pacific Corp. | 6.125% | 1/15/12 | 525 | 542 |
| Union Pacific Corp. | 6.500% | 4/15/12 | 1,332 | 1,398 |
| Union Pacific Corp. | 7.000% | 2/1/16 | 450 | 494 |
| Union Pacific Corp. | 6.625% | 2/1/29 | 1,875 | 2,043 |
| Other (0.0%) | ||||
| Black&Decker Corp. | 7.125% | 6/1/11 | 500 | 526 |
| Black&Decker Corp. | 4.750% | 11/1/14 | 3,800 | 3,486 |
| Black&Decker Corp. | 5.750% | 11/15/16 | 2,950 | 2,932 |
| Cooper Industries, Inc. | 5.250% | 11/15/12 | 4,425 | 4,376 |
| Dover Corp. | 4.875% | 10/15/15 | 2,050 | 1,966 |
| Dover Corp. | 5.375% | 10/15/35 | 650 | 617 |
| Rockwell International Corp. | 6.700% | 1/15/28 | 1,275 | 1,403 |
| 3,575,103 | ||||
| Utilities (1.9%) | ||||
| Electric (1.4%) | ||||
| AEP Texas Central Co. | 6.650% | 2/15/33 | 2,775 | 2,949 |
| Alabama Power Co. | 5.500% | 10/15/17 | 4,500 | 4,496 |
| American Electric Power Co., Inc. | 5.375% | 3/15/10 | 1,250 | 1,251 |
| American Electric Power Co., Inc. | 5.250% | 6/1/15 | 875 | 855 |
| Arizona Public Service Co. | 6.375% | 10/15/11 | 800 | 821 |
| Arizona Public Service Co. | 5.800% | 6/30/14 | 725 | 722 |
| Arizona Public Service Co. | 4.650% | 5/15/15 | 925 | 849 |
| Arizona Public Service Co. | 5.500% | 9/1/35 | 1,300 | 1,159 |
| 4 Baltimore Gas&Electric Co. | 5.900% | 10/1/16 | 3,750 | 3,774 |
| 4 Baltimore Gas&Electric Co. | 6.350% | 10/1/36 | 600 | 617 |
| Boston Edison Co. | 4.875% | 4/15/14 | 2,200 | 2,136 |
| Carolina Power&Light Co. | 6.500% | 7/15/12 | 750 | 787 |
| Carolina Power&Light Co. | 5.125% | 9/15/13 | 405 | 399 |
| CenterPoint Energy Houston | 5.700% | 3/15/13 | 13,635 | 13,732 |
| CenterPoint Energy Houston | 5.750% | 1/15/14 | 500 | 503 |
| CenterPoint Energy Houston | 6.950% | 3/15/33 | 400 | 443 |
| Cincinnati Gas&Electric Co. | 5.700% | 9/15/12 | 3,425 | 3,448 |
| Cleveland Electric Illumination Co. | 7.880% | 11/1/17 | 1,375 | 1,613 |
| Columbus Southern Power | 5.850% | 10/1/35 | 8,300 | 8,115 |
| Commonwealth Edison Co. | 3.700% | 2/1/08 | 1,150 | 1,128 |
| Commonwealth Edison Co. | 6.150% | 3/15/12 | 1,300 | 1,329 |
| Commonwealth Edison Co. | 5.875% | 2/1/33 | 590 | 572 |
| Commonwealth Edison Co. | 5.900% | 3/15/36 | 500 | 486 |
| Connecticut Light&Power Co. | 6.350% | 6/1/36 | 7,500 | 7,998 |
| Consolidated Edison Co. of New York | 5.625% | 7/1/12 | 375 | 381 |
| Consolidated Edison Co. of New York | 4.875% | 2/1/13 | 340 | 331 |
| Consolidated Edison Co. of New York | 5.375% | 12/15/15 | 1,600 | 1,590 |
| Consolidated Edison Co. of New York | 5.500% | 9/15/16 | 6,900 | 6,894 |
| Consolidated Edison Co. of New York | 5.300% | 3/1/35 | 1,200 | 1,107 |
| Consolidated Edison Co. of New York | 5.850% | 3/15/36 | 3,250 | 3,244 |
| Consolidated Edison Co. of New York | 6.200% | 6/15/36 | 3,575 | 3,743 |
| Constellation Energy Group, Inc. | 6.125% | 9/1/09 | 875 | 893 |
| Constellation Energy Group, Inc. | 7.000% | 4/1/12 | 1,275 | 1,369 |
| Constellation Energy Group, Inc. | 4.550% | 6/15/15 | 18,775 | 17,450 |
| Constellation Energy Group, Inc. | 7.600% | 4/1/32 | 2,390 | 2,809 |
| Consumers Energy Co. | 4.250% | 4/15/08 | 3,785 | 3,725 |
| Consumers Energy Co. | 4.800% | 2/17/09 | 5,650 | 5,578 |
| Consumers Energy Co. | 5.000% | 2/15/12 | 750 | 731 |
| Consumers Energy Co. | 5.375% | 4/15/13 | 3,575 | 3,559 |
| Consumers Energy Co. | 5.650% | 4/15/20 | 1,000 | 982 |
| DTE Energy Co. | 7.050% | 6/1/11 | 1,150 | 1,220 |
| Detroit Edison Co. | 6.125% | 10/1/10 | 2,730 | 2,788 |
| Detroit Edison Co. | 5.700% | 10/1/37 | 1,000 | 974 |
| Dominion Resources, Inc. | 4.125% | 2/15/08 | 450 | 444 |
| Dominion Resources, Inc. | 6.250% | 6/30/12 | 4,650 | 4,831 |
| Dominion Resources, Inc. | 5.150% | 7/15/15 | 14,750 | 14,343 |
| Dominion Resources, Inc. | 5.250% | 8/1/33 | 3,225 | 3,160 |
| Dominion Resources, Inc. | 6.300% | 3/15/33 | 1,675 | 1,722 |
| Dominion Resources, Inc. | 5.950% | 6/15/35 | 10,650 | 10,545 |
| Dominion Resources, Inc. | 6.300% | 9/30/66 | 2,750 | 2,760 |
| Duke Capital Corp. | 7.500% | 10/1/09 | 500 | 526 |
| Duke Capital Corp. | 6.250% | 2/15/13 | 50 | 51 |
| Duke Capital Corp. | 5.500% | 3/1/14 | 4,450 | 4,395 |
| Duke Capital Corp. | 6.750% | 2/15/32 | 2,700 | 2,879 |
| Duke Energy Corp. | 3.750% | 3/5/08 | 3,350 | 3,289 |
| Duke Energy Corp. | 6.250% | 1/15/12 | 8,750 | 9,108 |
| Duke Energy Corp. | 6.000% | 12/1/28 | 1,900 | 1,920 |
| Duke Energy Corp. | 6.450% | 10/15/32 | 2,400 | 2,569 |
| El Paso Electric Co. | 6.000% | 5/15/35 | 1,875 | 1,810 |
| Empresa Nacional Electric | 8.350% | 8/1/13 | 775 | 884 |
| Energy East Corp. | 6.750% | 6/15/12 | 6,050 | 6,358 |
| Energy East Corp. | 6.750% | 7/15/36 | 4,275 | 4,536 |
| Entergy Gulf States, Inc. | 3.600% | 6/1/08 | 3,125 | 3,047 |
| Exelon Corp. | 4.900% | 6/15/15 | 5,200 | 4,904 |
| Exelon Corp. | 5.625% | 6/15/35 | 300 | 284 |
| FPL Group Capital, Inc. | 7.375% | 6/1/09 | 2,675 | 2,802 |
| FPL Group Capital, Inc. | 5.625% | 9/1/11 | 3,875 | 3,924 |
| FPL Group Capital, Inc. | 6.350% | 10/1/16 | 2,600 | 2,641 |
| FirstEnergy Corp. | 6.450% | 11/15/11 | 14,650 | 15,356 |
| FirstEnergy Corp. | 7.375% | 11/15/31 | 9,700 | 11,104 |
| Florida Power&Light Co. | 5.950% | 10/1/33 | 50 | 51 |
| Florida Power&Light Co. | 5.625% | 4/1/34 | 4,450 | 4,354 |
| Florida Power&Light Co. | 4.950% | 6/1/35 | 4,425 | 3,914 |
| Florida Power&Light Co. | 5.400% | 9/1/35 | 1,725 | 1,633 |
| Florida Power&Light Co. | 6.200% | 6/1/36 | 5,300 | 5,611 |
| Florida Power&Light Co. | 5.650% | 2/1/37 | 4,375 | 4,292 |
| Florida Power Corp. | 4.500% | 6/1/10 | 3,825 | 3,728 |
| Florida Power Corp. | 4.800% | 3/1/13 | 9,175 | 8,898 |
| Indiana Michigan Power Co. | 6.050% | 3/15/37 | 100 | 98 |
| Jersey Central Power&Light | 5.625% | 5/1/16 | 3,575 | 3,561 |
| Kansas City Power&Light | 6.050% | 11/15/35 | 2,075 | 2,057 |
| MidAmerican Energy Co. | 5.125% | 1/15/13 | 6,025 | 5,934 |
| MidAmerican Energy Co. | 6.750% | 12/30/31 | 4,750 | 5,279 |
| MidAmerican Energy Co. | 5.750% | 11/1/35 | 1,700 | 1,662 |
| MidAmerican Energy Holdings Co. | 5.875% | 10/1/12 | 4,020 | 4,100 |
| MidAmerican Energy Holdings Co. | 5.000% | 2/15/14 | 1,425 | 1,377 |
| MidAmerican Energy Holdings Co. | 8.480% | 9/15/28 | 700 | 888 |
| MidAmerican Energy Holdings Co. | 6.125% | 4/1/36 | 25,425 | 25,778 |
| National Rural Utilities Cooperative Finance Corp. | 7.250% | 3/1/12 | 16,400 | 17,822 |
| National Rural Utilities Cooperative Finance Corp. | 4.750% | 3/1/14 | 2,125 | 2,050 |
| National Rural Utilities Cooperative Finance Corp. | 8.000% | 3/1/32 | 3,175 | 4,062 |
| NiSource Finance Corp. | 7.875% | 11/15/10 | 6,660 | 7,186 |
| NiSource Finance Corp. | 5.400% | 7/15/14 | 1,350 | 1,313 |
| NiSource Finance Corp. | 5.250% | 9/15/17 | 1,525 | 1,434 |
| NiSource Finance Corp. | 5.450% | 9/15/20 | 1,675 | 1,572 |
| Niagara Mohawk Power Corp. | 7.750% | 10/1/08 | 2,700 | 2,801 |
| Northern States Power Co. | 5.250% | 7/15/35 | 425 | 395 |
| Northern States Power Co. | 6.250% | 6/1/36 | 3,075 | 3,290 |
| Ohio Edison | 6.400% | 7/15/16 | 3,650 | 3,819 |
| Ohio Power Co. | 6.000% | 6/1/16 | 2,975 | 3,057 |
| Oncor Electric Delivery Co. | 6.375% | 5/1/12 | 2,600 | 2,672 |
| Oncor Electric Delivery Co. | 6.375% | 1/15/15 | 3,425 | 3,519 |
| Oncor Electric Delivery Co. | 7.000% | 9/1/22 | 100 | 107 |
| Oncor Electric Delivery Co. | 7.250% | 1/15/33 | 4,475 | 5,032 |
| PPL Energy Supply LLC | 6.400% | 11/1/11 | 12,350 | 12,803 |
| PPL Energy Supply LLC | 5.400% | 8/15/14 | 1,000 | 983 |
| PPL Energy Supply LLC | 6.200% | 5/15/16 | 3,750 | 3,868 |
| PPL Energy Supply LLC | 6.000% | 12/15/36 | 2,500 | 2,395 |
| PSE&G Power LLC | 7.750% | 4/15/11 | 575 | 623 |
| PSE&G Power LLC | 6.950% | 6/1/12 | 6,050 | 6,408 |
| PSE&G Power LLC | 5.500% | 12/1/15 | 400 | 392 |
| PSE&G Power LLC | 8.625% | 4/15/31 | 650 | 840 |
| PSI Energy Inc. | 5.000% | 9/15/13 | 200 | 193 |
| PSI Energy Inc. | 6.050% | 6/15/16 | 425 | 438 |
| PSI Energy Inc. | 6.120% | 10/15/35 | 1,400 | 1,405 |
| PacifiCorp | 6.900% | 11/15/11 | 7,600 | 8,094 |
| PacifiCorp | 7.700% | 11/15/31 | 1,250 | 1,552 |
| PacifiCorp | 5.250% | 6/15/35 | 50 | 46 |
| Pacific Gas&Electric Co. | 3.600% | 3/1/09 | 4,800 | 4,639 |
| Pacific Gas&Electric Co. | 4.200% | 3/1/11 | 4,400 | 4,212 |
| Pacific Gas&Electric Co. | 4.800% | 3/1/14 | 5,900 | 5,671 |
| Pacific Gas&Electric Co. | 6.050% | 3/1/34 | 14,850 | 15,022 |
| Pepco Holdings, Inc. | 6.450% | 8/15/12 | 6,800 | 7,038 |
| Pepco Holdings, Inc. | 7.450% | 8/15/32 | 1,475 | 1,699 |
| Progress Energy, Inc. | 7.100% | 3/1/11 | 6,686 | 7,126 |
| Progress Energy, Inc. | 6.850% | 4/15/12 | 2,200 | 2,340 |
| Progress Energy, Inc. | 7.750% | 3/1/31 | 1,800 | 2,177 |
| Progress Energy, Inc. | 7.000% | 10/30/31 | 2,950 | 3,310 |
| Public Service Co. of Colorado | 4.375% | 10/1/08 | 8,625 | 8,493 |
| Public Service Co. of Colorado | 7.875% | 10/1/12 | 8,425 | 9,468 |
| Public Service Co. of Colorado | 5.500% | 4/1/14 | 65 | 65 |
| Puget Sound Energy Inc. | 5.483% | 6/1/35 | 950 | 864 |
| Puget Sound Energy Inc. | 6.274% | 3/15/37 | 5,275 | 5,376 |
| Reliant Energy Resources | 7.750% | 2/15/11 | 500 | 540 |
| SCANA Corp. | 6.875% | 5/15/11 | 7,825 | 8,264 |
| South Carolina Electric&Gas Co. | 6.625% | 2/1/32 | 2,750 | 3,062 |
| South Carolina Electric&Gas Co. | 5.300% | 5/15/33 | 745 | 699 |
| Southern California Edison Co. | 5.000% | 1/15/14 | 3,450 | 3,358 |
| Southern California Edison Co. | 4.650% | 4/1/15 | 1,500 | 1,420 |
| Southern California Edison Co. | 5.000% | 1/15/16 | 3,050 | 2,953 |
| Southern California Edison Co. | 6.000% | 1/15/34 | 3,025 | 3,085 |
| Southern California Edison Co. | 5.750% | 4/1/35 | 1,025 | 1,010 |
| Southern California Edison Co. | 5.350% | 7/15/35 | 3,825 | 3,560 |
| Southern California Edison Co. | 5.625% | 2/1/36 | 8,550 | 8,279 |
| Southern California Edison Co. | 5.550% | 1/15/37 | 9,875 | 9,453 |
| Southern Power Co. | 6.250% | 7/15/12 | 475 | 492 |
| Southern Power Co. | 4.875% | 7/15/15 | 275 | 262 |
| TXU Energy Co. | 7.000% | 3/15/13 | 1,900 | 1,996 |
| Tampa Electric Co. | 6.550% | 5/15/36 | 3,675 | 3,898 |
| Toledo Edison Co. | 6.150% | 5/15/37 | 400 | 394 |
| Union Electric Co. | 5.400% | 2/1/16 | 3,950 | 3,853 |
| Virginia Electric&Power Co. | 5.400% | 1/15/16 | 350 | 345 |
| Virginia Electric&Power Co. | 6.000% | 1/15/36 | 5,175 | 5,166 |
| Wisconsin Electric Power Co. | 5.625% | 5/15/33 | 1,175 | 1,159 |
| Xcel Energy, Inc. | 7.000% | 12/1/10 | 700 | 739 |
| Xcel Energy, Inc. | 6.500% | 7/1/36 | 3,600 | 3,789 |
| Natural Gas (0.5%) | ||||
| AGL Capital Corp. | 7.125% | 1/14/11 | 2,350 | 2,481 |
| AGL Capital Corp. | 6.000% | 10/1/34 | 150 | 145 |
| Atmos Energy Corp. | 4.000% | 10/15/09 | 5,175 | 4,979 |
| Atmos Energy Corp. | 4.950% | 10/15/14 | 2,075 | 1,971 |
| Boardwalk Pipelines LLC | 5.500% | 2/1/17 | 1,750 | 1,690 |
| CenterPoint Energy Resources | 7.875% | 4/1/13 | 1,000 | 1,107 |
| CenterPoint Energy Resources | 6.150% | 5/1/16 | 1,750 | 1,787 |
| Consolidated Natural Gas | 6.250% | 11/1/11 | 9,225 | 9,549 |
| Consolidated Natural Gas | 5.000% | 12/1/14 | 5,075 | 4,876 |
| Consolidated Natural Gas | 6.800% | 12/15/27 | 2,000 | 2,171 |
| Duke Energy Field Services | 7.875% | 8/16/10 | 4,600 | 4,947 |
| Duke Energy Field Services | 8.125% | 8/16/30 | 225 | 277 |
| Energy Transfer Partners LP | 5.650% | 8/1/12 | 4,550 | 4,567 |
| Energy Transfer Partners LP | 5.950% | 2/1/15 | 3,175 | 3,195 |
| Energy Transfer Partners LP | 6.125% | 2/15/17 | 1,425 | 1,444 |
| Energy Transfer Partners LP | 6.625% | 10/15/36 | 1,875 | 1,930 |
| * Enron Corp. | 7.625% | 9/10/04 | 2,000 | 665 |
| * Enron Corp. | 6.625% | 11/15/05 | 1,375 | 457 |
| * Enron Corp. | 7.125% | 5/15/07 | 8,646 | 2,875 |
| * Enron Corp. | 6.875% | 10/15/07 | 8,500 | 2,826 |
| * Enron Corp. | 6.750% | 8/1/09 | 6,445 | 2,143 |
| Enterprise Products Operating LP | 4.625% | 10/15/09 | 500 | 490 |
| Enterprise Products Operating LP | 4.950% | 6/1/10 | 4,850 | 4,769 |
| Enterprise Products Operating LP | 5.600% | 10/15/14 | 3,950 | 3,874 |
| Enterprise Products Operating LP | 6.875% | 3/1/33 | 1,775 | 1,864 |
| Enterprise Products Operating LP | 6.650% | 10/15/34 | 150 | 154 |
| * HNG Internorth | 9.625% | 3/15/06 | 4,680 | 1,556 |
| KN Energy, Inc. | 7.250% | 3/1/28 | 1,975 | 1,910 |
| KeySpan Corp. | 7.625% | 11/15/10 | 1,400 | 1,508 |
| Kinder Morgan Energy Partners LP | 6.750% | 3/15/11 | 900 | 938 |
| Kinder Morgan Energy Partners LP | 7.125% | 3/15/12 | 5,925 | 6,269 |
| Kinder Morgan Energy Partners LP | 5.000% | 12/15/13 | 4,450 | 4,232 |
| Kinder Morgan Energy Partners LP | 5.125% | 11/15/14 | 1,950 | 1,862 |
| Kinder Morgan Energy Partners LP | 7.300% | 8/15/33 | 250 | 270 |
| Kinder Morgan, Inc. | 5.350% | 1/5/11 | 225 | 220 |
| Kinder Morgan, Inc. | 6.500% | 9/1/12 | 13,250 | 13,328 |
| Kinder Morgan, Inc. | 5.700% | 1/5/16 | 725 | 669 |
| Kinder Morgan, Inc. | 6.400% | 1/5/36 | 3,775 | 3,392 |
| Magellan Midstream Partners, LP | 5.650% | 10/15/16 | 1,025 | 999 |
| National Grid PLC | 6.300% | 8/1/16 | 9,150 | 9,495 |
| ONEOK Inc. | 5.200% | 6/15/15 | 3,500 | 3,292 |
| ONEOK Inc. | 6.000% | 6/15/35 | 2,800 | 2,555 |
| ONEOK Partners, LP | 5.900% | 4/1/12 | 4,175 | 4,223 |
| ONEOK Partners, LP | 6.150% | 10/1/16 | 5,350 | 5,424 |
| ONEOK Partners, LP | 6.650% | 10/1/36 | 14,600 | 14,977 |
| Panhandle Eastern Pipeline | 4.800% | 8/15/08 | 450 | 444 |
| 4 Plains All American Pipeline LP | 6.650% | 1/15/37 | 600 | 610 |
| San Diego Gas&Electric | 5.300% | 11/15/15 | 2,525 | 2,488 |
| San Diego Gas&Electric | 5.350% | 5/15/35 | 950 | 904 |
| Sempra Energy | 7.950% | 3/1/10 | 1,075 | 1,155 |
| Southern California Gas Co. | 5.750% | 11/15/35 | 1,000 | 1,002 |
| Southern Union Co. | 7.600% | 2/1/24 | 1,000 | 1,038 |
| Texas Eastern Transmission | 7.000% | 7/15/32 | 300 | 334 |
| Texas Gas Transmission | 4.600% | 6/1/15 | 3,650 | 3,359 |
| Trans-Canada Pipelines | 4.000% | 6/15/13 | 3,725 | 3,427 |
| Trans-Canada Pipelines | 5.600% | 3/31/34 | 4,255 | 4,025 |
| Trans-Canada Pipelines | 5.850% | 3/15/36 | 3,150 | 3,063 |
| * 4 Yosemite Security Trust | 8.250% | 11/15/04 | 31,685 | 24,001 |
| 758,606 | ||||
| Total Corporate Bonds (Cost $11,017,885) | 11,002,745 | |||
| Sovereign Bonds (U.S. Dollar-Denominated) (2.5%) | ||||
| African Development Bank | 3.250% | 8/1/08 | 7,050 | 6,871 |
| Asian Development Bank | 4.125% | 9/15/10 | 500 | 487 |
| Asian Development Bank | 5.593% | 7/16/18 | 2,100 | 2,167 |
| Bayerische Landesbank | 2.875% | 10/15/08 | 5,100 | 4,897 |
| Canadian Government | 5.250% | 11/5/08 | 2,175 | 2,189 |
| Canadian Mortgage&Housing | 2.950% | 6/2/08 | 1,000 | 973 |
| Canadian Mortgage&Housing | 4.800% | 10/1/10 | 1,400 | 1,390 |
| China Development Bank | 4.750% | 10/8/14 | 4,425 | 4,244 |
| China Development Bank | 5.000% | 10/15/15 | 1,800 | 1,745 |
| Corp. Andina de Fomento | 5.200% | 5/21/13 | 4,575 | 4,496 |
| Development Bank of Japan | 4.250% | 6/9/15 | 2,500 | 2,359 |
| Eksportfinans | 4.750% | 12/15/08 | 12,875 | 12,790 |
| Eksportfinans | 5.500% | 5/25/16 | 18,150 | 18,699 |
| European Investment Bank | 3.500% | 3/14/08 | 19,450 | 19,126 |
| European Investment Bank | 3.875% | 8/15/08 | 24,375 | 23,994 |
| European Investment Bank | 4.000% | 3/3/10 | 3,725 | 3,618 |
| European Investment Bank | 4.125% | 9/15/10 | 1,650 | 1,602 |
| European Investment Bank | 5.250% | 6/15/11 | 17,750 | 17,928 |
| European Investment Bank | 4.625% | 5/15/14 | 42,900 | 41,813 |
| European Investment Bank | 4.875% | 2/16/16 | 625 | 616 |
| Export-Import Bank of Korea | 4.500% | 8/12/09 | 3,900 | 3,820 |
| Export-Import Bank of Korea | 4.625% | 3/16/10 | 1,950 | 1,906 |
| Export-Import Bank of Korea | 5.125% | 3/16/15 | 1,075 | 1,044 |
| Federation of Malaysia | 8.750% | 6/1/09 | 6,500 | 7,012 |
| Federation of Malaysia | 7.500% | 7/15/11 | 11,725 | 12,736 |
| Financement Quebec | 5.000% | 10/25/12 | 4,450 | 4,415 |
| Hellenic Republic | 6.950% | 3/4/08 | 5,600 | 5,712 |
| Instituto de Credito Oficial | 6.000% | 5/19/08 | 5,725 | 5,810 |
| Inter-American Development Bank | 5.750% | 2/26/08 | 11,250 | 11,338 |
| Inter-American Development Bank | 5.375% | 11/18/08 | 5,800 | 5,863 |
| Inter-American Development Bank | 5.625% | 4/16/09 | 19,100 | 19,372 |
| Inter-American Development Bank | 8.500% | 3/15/11 | 2,240 | 2,524 |
| Inter-American Development Bank | 4.375% | 9/20/12 | 3,840 | 3,709 |
| Inter-American Development Bank | 4.250% | 9/14/15 | 1,900 | 1,794 |
| Inter-American Development Bank | 5.125% | 9/13/16 | 300 | 301 |
| Inter-American Development Bank | 7.000% | 6/15/25 | 3,625 | 4,339 |
| International Bank for Reconstruction&Development | 4.125% | 6/24/09 | 1,725 | 1,694 |
| International Bank for Reconstruction&Development | 4.125% | 8/12/09 | 600 | 589 |
| International Bank for Reconstruction&Development | 5.000% | 4/1/16 | 625 | 620 |
| International Bank for Reconstruction&Development | 7.625% | 1/19/23 | 4,200 | 5,266 |
| International Bank for Reconstruction&Development | 8.875% | 3/1/26 | 1,050 | 1,493 |
| International Bank for Reconstruction&Development | 4.750% | 2/15/35 | 775 | 723 |
| International Finance Corp. | 3.000% | 4/15/08 | 10,475 | 10,210 |
| Japan Bank International | 4.750% | 5/25/11 | 1,775 | 1,750 |
| Japan Finance Corp. | 5.875% | 3/14/11 | 1,025 | 1,055 |
| Japan Finance Corp. | 4.625% | 4/21/15 | 8,400 | 8,190 |
| KFW International Finance Inc. | 4.875% | 10/19/09 | 11,000 | 10,963 |
| Korea Development Bank | 3.875% | 3/2/09 | 1,975 | 1,920 |
| Korea Development Bank | 4.750% | 7/20/09 | 9,375 | 9,262 |
| Korea Development Bank | 4.625% | 9/16/10 | 2,675 | 2,610 |
| Korea Development Bank | 5.750% | 9/10/13 | 9,815 | 9,999 |
| Korea Electric Power | 7.750% | 4/1/13 | 7,500 | 8,444 |
| Kreditanstalt fur Wiederaufbau | 3.750% | 1/24/08 | 8,400 | 8,285 |
| Kreditanstalt fur Wiederaufbau | 4.625% | 11/17/08 | 25,600 | 25,429 |
| Kreditanstalt fur Wiederaufbau | 5.250% | 5/19/09 | 25,500 | 25,639 |
| Kreditanstalt fur Wiederaufbau | 4.250% | 6/15/10 | 11,800 | 11,525 |
| Kreditanstalt fur Wiederaufbau | 4.125% | 10/15/14 | 1,725 | 1,627 |
| Kreditanstalt fur Wiederaufbau | 5.125% | 3/14/16 | 6,760 | 6,816 |
| Landeskreditbank Baden-Wuerttemberg - Foerderbank | 4.250% | 9/15/10 | 1,925 | 1,876 |
| Landwirtschaftliche Rentenbank | 3.250% | 6/16/08 | 4,675 | 4,556 |
| Landwirtschaftliche Rentenbank | 4.125% | 7/15/08 | 850 | 837 |
| Landwirtschaftliche Rentenbank | 3.875% | 9/4/08 | 8,325 | 8,157 |
| Landwirtschaftliche Rentenbank | 3.875% | 3/15/10 | 750 | 725 |
| Landwirtschaftliche Rentenbank | 5.250% | 7/15/11 | 2,925 | 2,944 |
| Landwirtschaftliche Rentenbank | 4.875% | 11/16/15 | 3,125 | 3,062 |
| Nordic Investment Bank | 3.125% | 4/24/08 | 5,275 | 5,147 |
| Nordic Investment Bank | 2.875% | 6/15/09 | 850 | 797 |
| Nordic Investment Bank | 3.875% | 6/15/10 | 500 | 482 |
| Oesterreichische Kontrollbank | 2.375% | 6/16/08 | 800 | 770 |
| Oesterreichische Kontrollbank | 4.250% | 10/6/10 | 400 | 391 |
| Ontario Hydro Electric | 6.100% | 1/30/08 | 650 | 657 |
| Ontario Hydro Electric | 7.450% | 3/31/13 | 3,400 | 3,819 |
| Pemex Project Funding Master Trust | 8.500% | 2/15/08 | 3,900 | 4,025 |
| Pemex Project Funding Master Trust | 6.125% | 8/15/08 | 5,650 | 5,704 |
| Pemex Project Funding Master Trust | 7.875% | 2/1/09 | 19,780 | 20,710 |
| Pemex Project Funding Master Trust | 9.125% | 10/13/10 | 1,845 | 2,073 |
| Pemex Project Funding Master Trust | 8.000% | 11/15/11 | 7,525 | 8,308 |
| Pemex Project Funding Master Trust | 7.375% | 12/15/14 | 385 | 425 |
| Pemex Project Funding Master Trust | 5.750% | 12/15/15 | 7,675 | 7,648 |
| Pemex Project Funding Master Trust | 8.625% | 2/1/22 | 8,355 | 10,331 |
| Pemex Project Funding Master Trust | 6.625% | 6/15/35 | 7,650 | 7,834 |
| People's Republic of China | 7.300% | 12/15/08 | 2,325 | 2,412 |
| People's Republic of China | 4.750% | 10/29/13 | 2,125 | 2,085 |
| Petrobras International Finance | 9.750% | 7/6/11 | 1,575 | 1,860 |
| Province of British Columbia | 5.375% | 10/29/08 | 5,900 | 5,942 |
| Province of Manitoba | 7.500% | 2/22/10 | 5,075 | 5,424 |
| Province of Nova Scotia | 5.750% | 2/27/12 | 1,975 | 2,027 |
| Province of Ontario | 5.500% | 10/1/08 | 30,575 | 30,788 |
| ^Province of Ontario | 3.625% | 10/21/09 | 2,000 | 1,927 |
| Province of Ontario | 5.000% | 10/18/11 | 12,900 | 12,855 |
| Province of Ontario | 4.750% | 1/19/16 | 2,650 | 2,580 |
| Province of Ontario | 5.450% | 4/27/16 | 4,100 | 4,199 |
| Province of Quebec | 5.000% | 7/17/09 | 23,945 | 23,854 |
| Province of Quebec | 6.125% | 1/22/11 | 6,760 | 6,995 |
| Province of Quebec | 4.600% | 5/26/15 | 3,575 | 3,419 |
| Province of Quebec | 5.125% | 11/14/16 | 7,250 | 7,180 |
| Province of Quebec | 7.125% | 2/9/24 | 1,230 | 1,461 |
| Province of Quebec | 7.500% | 9/15/29 | 7,305 | 9,227 |
| Province of Saskatchewan | 7.375% | 7/15/13 | 1,600 | 1,796 |
| Quebec Hydro Electric | 6.300% | 5/11/11 | 16,350 | 16,874 |
| Quebec Hydro Electric | 8.000% | 2/1/13 | 5,200 | 5,931 |
| Quebec Hydro Electric | 7.500% | 4/1/16 | 1,825 | 2,102 |
| Quebec Hydro Electric | 8.400% | 1/15/22 | 950 | 1,242 |
| Quebec Hydro Electric | 8.050% | 7/7/24 | 3,100 | 4,026 |
| Quebec Hydro Electric | 8.500% | 12/1/29 | 500 | 695 |
| Region of Lombardy, Italy | 5.804% | 10/25/32 | 3,275 | 3,315 |
| Republic of Chile | 7.125% | 1/11/12 | 2,675 | 2,904 |
| Republic of Chile | 5.500% | 1/15/13 | 1,865 | 1,894 |
| Republic of Hungary | 4.750% | 2/3/15 | 10,950 | 10,378 |
| Republic of Italy | 3.750% | 12/14/07 | 7,950 | 7,862 |
| Republic of Italy | 4.000% | 6/16/08 | 1,850 | 1,824 |
| Republic of Italy | 3.250% | 5/15/09 | 6,625 | 6,371 |
| Republic of Italy | 6.000% | 2/22/11 | 14,025 | 14,461 |
| Republic of Italy | 5.625% | 6/15/12 | 32,425 | 33,089 |
| Republic of Italy | 4.500% | 1/21/15 | 9,500 | 9,251 |
| Republic of Italy | 4.750% | 1/25/16 | 4,250 | 4,119 |
| Republic of Italy | 5.250% | 9/20/16 | 5,550 | 5,580 |
| Republic of Italy | 6.875% | 9/27/23 | 8,850 | 10,274 |
| Republic of Italy | 5.375% | 6/15/33 | 15,275 | 14,985 |
| Republic of Korea | 8.875% | 4/15/08 | 11,000 | 11,456 |
| ^Republic of Korea | 4.250% | 6/1/13 | 14,275 | 13,436 |
| Republic of Korea | 5.625% | 11/3/25 | 1,750 | 1,748 |
| Republic of Poland | 6.250% | 7/3/12 | 5,550 | 5,814 |
| Republic of Poland | 5.250% | 1/15/14 | 770 | 774 |
| Republic of Poland | 5.000% | 10/19/15 | 3,625 | 3,555 |
| Republic of South Africa | 7.375% | 4/25/12 | 14,575 | 15,723 |
| Republic of South Africa | 6.500% | 6/2/14 | 1,025 | 1,075 |
| Republic of South Africa | 8.500% | 6/23/17 | 850 | 1,030 |
| State of Israel | 4.625% | 6/15/13 | 1,700 | 1,625 |
| State of Israel | 5.500% | 11/9/16 | 9,000 | 8,993 |
| Swedish Export Credit Corp. | 4.125% | 10/15/08 | 7,800 | 7,683 |
| Swedish Export Credit Corp. | 4.000% | 6/15/10 | 2,775 | 2,681 |
| 4Tenaga Nasional | 7.500% | 1/15/96 | 5,000 | 5,503 |
| United Mexican States | 10.375% | 2/17/09 | 8,315 | 9,171 |
| United Mexican States | 9.875% | 2/1/10 | 3,055 | 3,460 |
| United Mexican States | 8.375% | 1/14/11 | 10,142 | 11,293 |
| United Mexican States | 7.500% | 1/14/12 | 5,597 | 6,143 |
| United Mexican States | 6.375% | 1/16/13 | 5,231 | 5,511 |
| United Mexican States | 5.875% | 1/15/14 | 8,075 | 8,277 |
| United Mexican States | 6.625% | 3/3/15 | 2,711 | 2,914 |
| United Mexican States | 11.375% | 9/15/16 | 6,000 | 8,640 |
| United Mexican States | 5.625% | 1/15/17 | 36,125 | 36,197 |
| United Mexican States | 8.125% | 12/30/19 | 12,150 | 14,853 |
| United Mexican States | 8.000% | 9/24/22 | 800 | 979 |
| United Mexican States | 8.300% | 8/15/31 | 18,780 | 24,170 |
| United Mexican States | 7.500% | 4/8/33 | 3,375 | 3,986 |
| United Mexican States | 6.750% | 9/27/34 | 11,325 | 12,288 |
| Total Sovereign Bonds (Cost $1,026,940) | 1,031,272 | |||
| Taxable Municipal Bonds (0.2%) | ||||
| Illinois (Taxable Pension) GO | 4.950% | 6/1/23 | 4,600 | 4,400 |
| Illinois (Taxable Pension) GO | 5.100% | 6/1/33 | 37,750 | 36,135 |
| Kansas Dev. Finance Auth. Rev. (Public Employee Retirement System) | 5.501% | 5/1/34 | 5,500 | 5,514 |
| New Jersey Econ. Dev. Auth. State Pension Rev | 7.425% | 2/15/29 | 4,150 | 5,122 |
| New Jersey Turnpike Auth. Rev | 4.252% | 1/1/16 | 190 | 178 |
| New Jersey Turnpike Auth. Rev | 4.252% | 1/1/16 | 3,485 | 3,287 |
| Oregon (Taxable Pension) GO | 5.762% | 6/1/23 | 2,375 | 2,475 |
| Oregon (Taxable Pension) GO | 5.892% | 6/1/27 | 3,250 | 3,403 |
| Oregon School Board Assn | 4.759% | 6/30/28 | 2,475 | 2,274 |
| Oregon School Board Assn | 5.528% | 6/30/28 | 1,475 | 1,482 |
| Wisconsin Public Service Rev | 4.800% | 5/1/13 | 3,025 | 2,965 |
| Wisconsin Public Service Rev | 5.700% | 5/1/26 | 3,425 | 3,545 |
| Total Taxable Municipal Bonds (Cost $68,943) | 70,780 | |||
| Shares | ||||
|---|---|---|---|---|
| Temporary Cash Investments (0.7%) | ||||
| 5Vanguard Market Liquidity Fund, 5.294% | 256,076,537 | 256,077 | ||
| 5Vanguard Market Liquidity Fund, 5.294% | 5,840,000 | 5,840 | ||
| Total Temporary Cash Investments (Cost $261,917) | 261,917 | |||
| Total Investments (100.3%) | ||||
| (Cost $40,754,610) | 40,687,969 | |||
| Other Assets and Liabilities—Net (-0.3%) | (129,749) | |||
| Net Assets (100%) | 40,558,220 | |||
* Non-income-producing ecurity--security in default.
^ Part of security position is on loan to broker-dealers.
1 The issuer operates under a congressional charter; its securities are neither issued nor guaranteed by the U.S. government. If needed, access to additional funding from the U.S. Treasury (beyond the issuer's line of credit) would require congressional action.
2 The average or expected maturity is shorter than the final maturity shown due to the possibility of interim principal payments and prepayments or the possibility of the issue being called.
3 Adjustable-rate note.
4 Security exempt from registration under Rule 144A of the Securities Act of 1933. Such securities may be sold in transactions exempt from registration, normally to qualified institutional buyers. At December 31, 2006, the aggregate value of these securities was $145,595,000, representing 0.36% of net assets.
5 Affiliated money market fund available only to Vanguard funds and certain trusts and accounts managed by Vanguard. Rate shown is the 7-day yield.
GO - General Obligation Bond.
Vanguard Short-Term Bond Index Fund
Schedule of Investments
December 31, 2006
| Coupon | Maturity Date | Face Amount ($000) | Market Value ($000) | |
|---|---|---|---|---|
| U.S. Government and Agency Obligations (68.4%) | ||||
| U.S. Government Securities (43.6%) | ||||
| U.S. Treasury Bond | 13.250% | 5/15/14 | 35,000 | 41,585 |
| U.S. Treasury Note | 4.375% | 12/31/07 | 127,225 | 126,450 |
| U.S. Treasury Note | 4.375% | 1/31/08 | 50,100 | 49,763 |
| U.S. Treasury Note | 3.000% | 2/15/08 | 80,325 | 78,593 |
| U.S. Treasury Note | 3.375% | 2/15/08 | 84,000 | 82,530 |
| U.S. Treasury Note | 4.625% | 2/29/08 | 53,925 | 53,689 |
| U.S. Treasury Note | 4.625% | 3/31/08 | 8,500 | 8,464 |
| U.S. Treasury Note | 4.875% | 4/30/08 | 24,175 | 24,152 |
| U.S. Treasury Note | 2.625% | 5/15/08 | 87,075 | 84,477 |
| U.S. Treasury Note | 3.750% | 5/15/08 | 2,875 | 2,831 |
| U.S. Treasury Note | 5.625% | 5/15/08 | 65,700 | 66,295 |
| U.S. Treasury Note | 4.875% | 5/31/08 | 77,925 | 77,877 |
| U.S. Treasury Note | 5.125% | 6/30/08 | 53,150 | 53,308 |
| U.S. Treasury Note | 5.000% | 7/31/08 | 16,000 | 16,025 |
| U.S. Treasury Note | 4.875% | 8/31/08 | 103,075 | 103,059 |
| U.S. Treasury Note | 3.125% | 9/15/08 | 1,000 | 972 |
| U.S. Treasury Note | 4.625% | 9/30/08 | 27,275 | 27,168 |
| U.S. Treasury Note | 3.125% | 10/15/08 | 9,275 | 9,007 |
| U.S. Treasury Note | 4.875% | 10/31/08 | 21,700 | 21,710 |
| U.S. Treasury Note | 3.375% | 11/15/08 | 22,750 | 22,167 |
| U.S. Treasury Note | 4.375% | 11/15/08 | 7,250 | 7,191 |
| U.S. Treasury Note | 3.000% | 2/15/09 | 16,725 | 16,124 |
| U.S. Treasury Note | 4.500% | 2/15/09 | 139,725 | 138,874 |
| U.S. Treasury Note | 3.125% | 4/15/09 | 18,725 | 18,061 |
| U.S. Treasury Note | 3.875% | 5/15/09 | 19,103 | 18,727 |
| U.S. Treasury Note | 4.875% | 5/15/09 | 14,325 | 14,356 |
| U.S. Treasury Note | 4.000% | 6/15/09 | 2,675 | 2,629 |
| U.S. Treasury Note | 3.625% | 7/15/09 | 8,375 | 8,154 |
| U.S. Treasury Note | 3.500% | 8/15/09 | 3,775 | 3,661 |
| U.S. Treasury Note | 4.875% | 8/15/09 | 7,925 | 7,949 |
| U.S. Treasury Note | 6.000% | 8/15/09 | 35,525 | 36,596 |
| U.S. Treasury Note | 3.375% | 10/15/09 | 54,915 | 52,984 |
| U.S. Treasury Note | 3.500% | 11/15/09 | 1,325 | 1,281 |
| U.S. Treasury Note | 3.625% | 1/15/10 | 3,525 | 3,416 |
| U.S. Treasury Note | 3.500% | 2/15/10 | 81,850 | 78,972 |
| U.S. Treasury Note | 6.500% | 2/15/10 | 49,575 | 52,077 |
| U.S. Treasury Note | 4.000% | 3/15/10 | 57,500 | 56,287 |
| U.S. Treasury Note | 4.000% | 4/15/10 | 33,175 | 32,460 |
| U.S. Treasury Note | 3.875% | 5/15/10 | 26,125 | 25,456 |
| U.S. Treasury Note | 4.125% | 8/15/10 | 91,825 | 90,075 |
| U.S. Treasury Note | 3.875% | 9/15/10 | 5,700 | 5,541 |
| U.S. Treasury Note | 4.250% | 10/15/10 | 141,575 | 139,385 |
| U.S. Treasury Note | 4.500% | 11/15/10 | 300 | 298 |
| U.S. Treasury Note | 4.375% | 12/15/10 | 9,730 | 9,618 |
| U.S. Treasury Note | 4.250% | 1/15/11 | 57,675 | 56,720 |
| U.S. Treasury Note | 4.500% | 2/28/11 | 50,875 | 50,493 |
| U.S. Treasury Note | 4.750% | 3/31/11 | 77,250 | 77,371 |
| U.S. Treasury Note | 4.875% | 4/30/11 | 140,900 | 141,803 |
| U.S. Treasury Note | 4.875% | 5/31/11 | 125 | 126 |
| U.S. Treasury Note | 5.125% | 6/30/11 | 26,275 | 26,719 |
| U.S. Treasury Note | 4.875% | 7/31/11 | 19,925 | 20,065 |
| U.S. Treasury Note | 4.500% | 9/30/11 | 9,900 | 9,813 |
| U.S. Treasury Note | 4.625% | 10/31/11 | 32,000 | 31,880 |
| U.S. Treasury Note | 4.875% | 2/15/12 | 200 | 202 |
| U.S. Treasury Note | 4.375% | 8/15/12 | 23,300 | 22,965 |
| U.S. Treasury Note | 4.000% | 11/15/12 | 88,500 | 85,444 |
| 2,293,895 | ||||
| Agency Bonds and Notes (24.8%) | ||||
| 1Federal Farm Credit Bank | 3.000% | 12/17/07 | 13,825 | 13,540 |
| 1Federal Farm Credit Bank | 3.000% | 4/15/08 | 5,000 | 4,864 |
| 1Federal Farm Credit Bank | 3.375% | 7/15/08 | 4,475 | 4,358 |
| 1Federal Farm Credit Bank | 4.125% | 4/15/09 | 2,625 | 2,573 |
| 1Federal Farm Credit Bank | 4.125% | 7/17/09 | 10,000 | 9,805 |
| 1Federal Farm Credit Bank | 5.000% | 10/23/09 | 3,000 | 3,001 |
| 1Federal Farm Credit Bank | 5.375% | 7/18/11 | 2,100 | 2,135 |
| 1Federal Home Loan Bank | 4.625% | 1/18/08 | 53,600 | 53,303 |
| 1Federal Home Loan Bank | 4.850% | 2/6/08 | 54,500 | 54,300 |
| 1Federal Home Loan Bank | 4.625% | 2/8/08 | 7,500 | 7,450 |
| 1Federal Home Loan Bank | 3.375% | 2/15/08 | 7,500 | 7,352 |
| 1Federal Home Loan Bank | 4.750% | 3/14/08 | 23,000 | 22,886 |
| 1Federal Home Loan Bank | 5.125% | 4/16/08 | 3,275 | 3,274 |
| 1Federal Home Loan Bank | 4.125% | 4/18/08 | 16,725 | 16,513 |
| 1Federal Home Loan Bank | 5.125% | 6/13/08 | 22,775 | 22,784 |
| 1Federal Home Loan Bank | 5.125% | 6/18/08 | 30,925 | 30,933 |
| 1Federal Home Loan Bank | 2.625% | 7/15/08 | 35,000 | 33,743 |
| 1Federal Home Loan Bank | 5.800% | 9/2/08 | 16,000 | 16,179 |
| 1Federal Home Loan Bank | 3.000% | 4/15/09 | 10,000 | 9,579 |
| 1Federal Home Loan Bank | 5.375% | 7/17/09 | 41,650 | 42,017 |
| 1Federal Home Loan Bank | 5.000% | 9/18/09 | 10,000 | 10,009 |
| 1Federal Home Loan Bank | 5.000% | 12/11/09 | 4,625 | 4,625 |
| 1Federal Home Loan Bank | 3.875% | 1/15/10 | 13,375 | 12,988 |
| 1Federal Home Loan Bank | 4.375% | 3/17/10 | 22,025 | 21,639 |
| 1Federal Home Loan Bank | 5.250% | 6/11/10 | 5,000 | 5,033 |
| 1Federal Home Loan Bank | 4.500% | 6/22/10 | 10,000 | 9,820 |
| 1Federal Home Loan Bank | 5.375% | 8/19/11 | 16,000 | 16,266 |
| 1Federal Home Loan Bank | 4.875% | 11/18/11 | 29,600 | 29,456 |
| 1Federal Home Loan Mortgage Corp. | 5.750% | 4/15/08 | 25,500 | 25,681 |
| 1Federal Home Loan Mortgage Corp. | 3.875% | 6/15/08 | 38,500 | 37,844 |
| 1Federal Home Loan Mortgage Corp. | 5.000% | 9/16/08 | 42,050 | 42,016 |
| 1Federal Home Loan Mortgage Corp. | 5.125% | 10/15/08 | 37,450 | 37,492 |
| 1Federal Home Loan Mortgage Corp. | 4.625% | 12/19/08 | 5,000 | 4,963 |
| 1Federal Home Loan Mortgage Corp. | 4.875% | 2/17/09 | 40,000 | 39,902 |
| 1Federal Home Loan Mortgage Corp. | 5.250% | 5/21/09 | 49,500 | 49,767 |
| 1Federal Home Loan Mortgage Corp. | 4.250% | 7/15/09 | 24,000 | 23,592 |
| 1Federal Home Loan Mortgage Corp. | 6.625% | 9/15/09 | 30,000 | 31,223 |
| 1Federal Home Loan Mortgage Corp. | 4.125% | 7/12/10 | 42,000 | 40,889 |
| 1Federal Home Loan Mortgage Corp. | 4.750% | 1/18/11 | 12,000 | 11,910 |
| 1Federal Home Loan Mortgage Corp. | 5.625% | 3/15/11 | 5,000 | 5,125 |
| 1Federal Home Loan Mortgage Corp. | 5.125% | 4/18/11 | 6,000 | 6,038 |
| 1Federal Home Loan Mortgage Corp. | 6.000% | 6/15/11 | 12,500 | 13,010 |
| 1Federal Home Loan Mortgage Corp. | 5.250% | 7/18/11 | 12,500 | 12,642 |
| 1Federal National Mortgage Assn | 5.750% | 2/15/08 | 10,625 | 10,691 |
| 1Federal National Mortgage Assn | 4.875% | 4/10/08 | 64,100 | 63,846 |
| 1Federal National Mortgage Assn | 6.000% | 5/15/08 | 58,075 | 58,735 |
| 1Federal National Mortgage Assn | 3.875% | 7/15/08 | 10,000 | 9,820 |
| 1Federal National Mortgage Assn | 4.500% | 10/15/08 | 33,725 | 33,413 |
| 1Federal National Mortgage Assn | 3.375% | 12/15/08 | 16,325 | 15,827 |
| 1Federal National Mortgage Assn | 5.250% | 1/15/09 | 25,375 | 25,494 |
| 1Federal National Mortgage Assn | 3.250% | 2/15/09 | 7,500 | 7,235 |
| 1Federal National Mortgage Assn | 4.875% | 4/15/09 | 3,000 | 2,992 |
| 1Federal National Mortgage Assn | 6.375% | 6/15/09 | 28,500 | 29,466 |
| 1Federal National Mortgage Assn | 6.625% | 9/15/09 | 56,000 | 58,296 |
| 1Federal National Mortgage Assn | 7.250% | 1/15/10 | 52,000 | 55,270 |
| 1Federal National Mortgage Assn | 6.625% | 11/15/10 | 31,000 | 32,794 |
| 1Federal National Mortgage Assn | 4.500% | 2/15/11 | 12,500 | 12,289 |
| 1Federal National Mortgage Assn | 5.125% | 4/15/11 | 6,000 | 6,036 |
| 1Federal National Mortgage Assn | 6.000% | 5/15/11 | 17,500 | 18,194 |
| 1Tennessee Valley Auth | 5.375% | 11/13/08 | 11,003 | 11,062 |
| 1,303,979 | ||||
| Total U.S. Government and Agency Obligations | ||||
| (Cost $3,615,284) | 3,597,874 | |||
| Corporate Bonds (25.1%) | ||||
| Asset-Backed/Commercial Mortgage-Backed Securities (0.6%) | ||||
| 2 Countrywide Home Loans | 4.046% | 5/25/33 | 693 | 682 |
| 2 DaimlerChrysler Auto Trust | 5.330% | 8/8/10 | 5,400 | 5,409 |
| 2 Honda Auto Receivables Owner Trust | 5.300% | 7/21/10 | 7,850 | 7,921 |
| 2 Salomon Brothers Mortgage Securities VII | 4.117% | 9/25/33 | 4,355 | 4,324 |
| 2 USAA Auto Owner Trust | 5.360% | 2/15/11 | 7,850 | 7,885 |
| 2 Wachovia Auto Owner Trust | 4.790% | 4/20/10 | 4,400 | 4,381 |
| 30,602 | ||||
| Finance (12.9%) | ||||
| Banking (5.7%) | ||||
| Associates Corp. of North America | 6.250% | 11/1/08 | 8,000 | 8,142 |
| Bank of America Corp. | 3.375% | 2/17/09 | 500 | 483 |
| Bank of America Corp. | 4.250% | 10/1/10 | 1,550 | 1,505 |
| Bank of America Corp. | 4.375% | 12/1/10 | 8,625 | 8,398 |
| Bank of America Corp. | 5.375% | 8/15/11 | 1,850 | 1,865 |
| Bank of New York Co., Inc. | 3.750% | 2/15/08 | 3,250 | 3,200 |
| Bank of New York Co., Inc. | 4.950% | 1/14/11 | 2,825 | 2,802 |
| Bank of Tokyo-Mitsubishi | 8.400% | 4/15/10 | 5,250 | 5,731 |
| Bank One Corp. | 2.625% | 6/30/08 | 3,600 | 3,470 |
| Bank One Corp. | 6.000% | 8/1/08 | 1,500 | 1,519 |
| Bank One Corp. | 6.000% | 2/17/09 | 5,000 | 5,082 |
| Bank One Corp. | 5.900% | 11/15/11 | 1,500 | 1,542 |
| BankAmerica Corp. | 5.875% | 2/15/09 | 3,500 | 3,556 |
| BankBoston NA | 6.375% | 3/25/08 | 2,500 | 2,530 |
| BB&T Corp. | 6.500% | 8/1/11 | 1,250 | 1,314 |
| Charter One Bank N.A | 5.500% | 4/26/11 | 1,850 | 1,869 |
| Citicorp | 6.375% | 11/15/08 | 4,475 | 4,568 |
| Citigroup, Inc. | 6.500% | 2/15/08 | 6,300 | 6,382 |
| Citigroup, Inc. | 3.625% | 2/9/09 | 6,325 | 6,145 |
| Citigroup, Inc. | 4.250% | 7/29/09 | 6,245 | 6,117 |
| Citigroup, Inc. | 4.625% | 8/3/10 | 1,900 | 1,870 |
| Citigroup, Inc. | 6.500% | 1/18/11 | 3,000 | 3,143 |
| Citigroup, Inc. | 5.100% | 9/29/11 | 5,405 | 5,388 |
| Credit Suisse First Boston USA, Inc. | 4.625% | 1/15/08 | 6,125 | 6,088 |
| Credit Suisse First Boston USA, Inc. | 3.875% | 1/15/09 | 3,500 | 3,420 |
| Credit Suisse First Boston USA, Inc. | 4.700% | 6/1/09 | 5,500 | 5,463 |
| Credit Suisse First Boston USA, Inc. | 4.875% | 8/15/10 | 925 | 917 |
| Credit Suisse First Boston USA, Inc. | 5.250% | 3/2/11 | 1,000 | 1,003 |
| Credit Suisse First Boston USA, Inc. | 6.125% | 11/15/11 | 4,500 | 4,676 |
| Depfa Bank | 3.625% | 10/29/08 | 2,000 | 1,940 |
| Deutsche Bank Financial, Inc. | 7.500% | 4/25/09 | 1,500 | 1,577 |
| Fifth Third Bank | 3.375% | 8/15/08 | 3,100 | 3,012 |
| Fifth Third Bank | 4.200% | 2/23/10 | 1,000 | 973 |
| FirstStar Bank | 7.125% | 12/1/09 | 2,000 | 2,107 |
| Fleet Boston Financial Corp. | 3.850% | 2/15/08 | 3,700 | 3,643 |
| HSBC Bank USA | 3.875% | 9/15/09 | 6,000 | 5,818 |
| J.P. Morgan, Inc. | 6.000% | 1/15/09 | 1,625 | 1,652 |
| JPMorgan Chase&Co. | 3.700% | 1/15/08 | 1,000 | 985 |
| JPMorgan Chase&Co. | 4.000% | 2/1/08 | 1,770 | 1,748 |
| JPMorgan Chase&Co. | 3.625% | 5/1/08 | 3,000 | 2,940 |
| JPMorgan Chase&Co. | 3.500% | 3/15/09 | 10,250 | 9,912 |
| JPMorgan Chase&Co. | 6.750% | 2/1/11 | 4,950 | 5,220 |
| Key Bank NA | 7.000% | 2/1/11 | 975 | 1,037 |
| KeyCorp | 4.700% | 5/21/09 | 2,000 | 1,980 |
| Marshall&Ilsley Bank | 4.500% | 8/25/08 | 500 | 494 |
| Marshall&Ilsley Corp. | 4.375% | 8/1/09 | 1,350 | 1,326 |
| MBNA America Bank NA | 5.375% | 1/15/08 | 3,750 | 3,755 |
| MBNA America Bank NA | 4.625% | 8/3/09 | 2,250 | 2,223 |
| Mellon Financial Co. | 6.375% | 2/15/10 | 1,000 | 1,034 |
| Mellon Funding Corp. | 6.700% | 3/1/08 | 1,000 | 1,016 |
| Mellon Funding Corp. | 3.250% | 4/1/09 | 3,000 | 2,882 |
| National Australia Bank | 8.600% | 5/19/10 | 2,000 | 2,206 |
| National City Bank | 4.150% | 8/1/09 | 2,550 | 2,488 |
| National City Bank | 4.500% | 3/15/10 | 600 | 587 |
| National City Corp. | 3.200% | 4/1/08 | 500 | 488 |
| National Westminster Bank PLC | 7.375% | 10/1/09 | 4,000 | 4,217 |
| PNC Funding Corp. | 4.200% | 3/10/08 | 1,250 | 1,235 |
| PNC Funding Corp. | 7.500% | 11/1/09 | 1,875 | 1,989 |
| Popular North America, Inc. | 4.250% | 4/1/08 | 2,000 | 1,972 |
| Regions Financial Corp. | 4.500% | 8/8/08 | 3,400 | 3,372 |
| Regions Financial Corp. | 7.000% | 3/1/11 | 1,500 | 1,594 |
| Republic New York Corp. | 7.750% | 5/15/09 | 2,400 | 2,535 |
| Royal Bank of Canada | 4.125% | 1/26/10 | 4,200 | 4,086 |
| Royal Bank of Canada | 5.650% | 7/20/11 | 750 | 766 |
| Royal Bank of Scotland Group PLC | 6.375% | 2/1/11 | 1,500 | 1,564 |
| Santander Central Hispano Issuances | 7.625% | 11/3/09 | 5,000 | 5,311 |
| Santander Central Hispano Issuances | 7.625% | 9/14/10 | 1,650 | 1,780 |
| Sanwa Bank Ltd. | 8.350% | 7/15/09 | 3,000 | 3,200 |
| Sanwa Bank Ltd. | 7.400% | 6/15/11 | 2,350 | 2,541 |
| 3Sovereign Bancorp, Inc. | 4.800% | 9/1/10 | 2,600 | 2,541 |
| Sumitomo Bank International Finance NV | 8.500% | 6/15/09 | 6,025 | 6,449 |
| SunTrust Banks, Inc. | 6.250% | 6/1/08 | 2,250 | 2,282 |
| SunTrust Banks, Inc. | 6.375% | 4/1/11 | 4,500 | 4,698 |
| The Chase Manhattan Corp. | 6.375% | 4/1/08 | 1,950 | 1,975 |
| US Bancorp | 3.125% | 3/15/08 | 1,325 | 1,294 |
| US Bank NA | 4.125% | 3/17/08 | 3,000 | 2,963 |
| US Bank NA | 4.400% | 8/15/08 | 450 | 445 |
| US Bank NA | 6.375% | 8/1/11 | 6,300 | 6,599 |
| Wachovia Bank NA | 4.375% | 8/15/08 | 750 | 739 |
| Wachovia Corp. | 3.500% | 8/15/08 | 2,000 | 1,949 |
| Wachovia Corp. | 3.625% | 2/17/09 | 10,175 | 9,876 |
| Wachovia Corp. | 4.375% | 6/1/10 | 2,625 | 2,566 |
| Wachovia Corp. | 7.800% | 8/18/10 | 2,000 | 2,170 |
| Wachovia Corp. | 5.300% | 10/15/11 | 1,125 | 1,128 |
| Washington Mutual Bank | 6.875% | 6/15/11 | 1,975 | 2,089 |
| Washington Mutual, Inc. | 4.000% | 1/15/09 | 6,000 | 5,861 |
| Washington Mutual, Inc. | 4.200% | 1/15/10 | 400 | 388 |
| Washington Mutual, Inc. | 8.250% | 4/1/10 | 1,500 | 1,619 |
| Wells Fargo&Co. | 5.250% | 12/1/07 | 2,000 | 1,993 |
| Wells Fargo&Co. | 4.125% | 3/10/08 | 11,550 | 11,415 |
| Wells Fargo&Co. | 3.125% | 4/1/09 | 2,220 | 2,133 |
| Wells Fargo&Co. | 4.200% | 1/15/10 | 7,680 | 7,475 |
| Wells Fargo&Co. | 4.625% | 8/9/10 | 2,100 | 2,067 |
| Wells Fargo&Co. | 4.875% | 1/12/11 | 2,225 | 2,203 |
| Wells Fargo&Co. | 6.375% | 8/1/11 | 1,500 | 1,570 |
| Wells Fargo&Co. | 5.300% | 8/26/11 | 2,625 | 2,644 |
| World Savings Bank, FSB | 4.125% | 3/10/08 | 1,550 | 1,530 |
| World Savings Bank, FSB | 4.125% | 12/15/09 | 2,000 | 1,946 |
| Brokerage (2.2%) | ||||
| Ameriprise Financial Inc. | 5.350% | 11/15/10 | 2,150 | 2,158 |
| Bear Stearns Co., Inc. | 4.000% | 1/31/08 | 1,750 | 1,726 |
| Bear Stearns Co., Inc. | 2.875% | 7/2/08 | 3,000 | 2,901 |
| Bear Stearns Co., Inc. | 7.625% | 12/7/09 | 1,000 | 1,066 |
| Bear Stearns Co., Inc. | 4.550% | 6/23/10 | 1,650 | 1,617 |
| Bear Stearns Co., Inc. | 4.500% | 10/28/10 | 900 | 880 |
| Bear Stearns Co., Inc. | 5.500% | 8/15/11 | 3,500 | 3,542 |
| Goldman Sachs Group, Inc. | 4.125% | 1/15/08 | 1,750 | 1,728 |
| Goldman Sachs Group, Inc. | 3.875% | 1/15/09 | 3,325 | 3,249 |
| Goldman Sachs Group, Inc. | 6.650% | 5/15/09 | 5,300 | 5,480 |
| Goldman Sachs Group, Inc. | 7.350% | 10/1/09 | 1,500 | 1,584 |
| Goldman Sachs Group, Inc. | 4.500% | 6/15/10 | 13,440 | 13,169 |
| Goldman Sachs Group, Inc. | 5.000% | 1/15/11 | 800 | 796 |
| Janus Capital Group | 5.875% | 9/15/11 | 850 | 856 |
| Lehman Brothers Holdings, Inc. | 4.000% | 1/22/08 | 2,500 | 2,470 |
| Lehman Brothers Holdings, Inc. | 7.000% | 2/1/08 | 2,500 | 2,543 |
| Lehman Brothers Holdings, Inc. | 3.500% | 8/7/08 | 5,175 | 5,045 |
| Lehman Brothers Holdings, Inc. | 3.600% | 3/13/09 | 2,200 | 2,131 |
| Lehman Brothers Holdings, Inc. | 3.950% | 11/10/09 | 5,200 | 5,042 |
| Lehman Brothers Holdings, Inc. | 4.250% | 1/27/10 | 725 | 707 |
| Lehman Brothers Holdings, Inc. | 4.500% | 7/26/10 | 1,450 | 1,419 |
| Lehman Brothers Holdings, Inc. | 7.875% | 8/15/10 | 2,000 | 2,176 |
| Lehman Brothers Holdings, Inc. | 5.000% | 1/14/11 | 3,150 | 3,132 |
| Merrill Lynch&Co., Inc. | 3.700% | 4/21/08 | 1,000 | 981 |
| Merrill Lynch&Co., Inc. | 3.125% | 7/15/08 | 2,650 | 2,572 |
| Merrill Lynch&Co., Inc. | 4.831% | 10/27/08 | 1,000 | 992 |
| Merrill Lynch&Co., Inc. | 4.125% | 1/15/09 | 2,875 | 2,823 |
| Merrill Lynch&Co., Inc. | 6.000% | 2/17/09 | 5,500 | 5,596 |
| Merrill Lynch&Co., Inc. | 4.250% | 2/8/10 | 1,000 | 974 |
| Merrill Lynch&Co., Inc. | 4.790% | 8/4/10 | 2,105 | 2,081 |
| Merrill Lynch&Co., Inc. | 4.500% | 11/4/10 | 5,500 | 5,378 |
| Merrill Lynch&Co., Inc. | 5.770% | 7/25/11 | 1,500 | 1,533 |
| Morgan Stanley Dean Witter | 3.625% | 4/1/08 | 5,200 | 5,103 |
| Morgan Stanley Dean Witter | 3.875% | 1/15/09 | 5,025 | 4,906 |
| Morgan Stanley Dean Witter | 4.250% | 5/15/10 | 4,875 | 4,740 |
| Morgan Stanley Dean Witter | 5.050% | 1/21/11 | 4,750 | 4,729 |
| Morgan Stanley Dean Witter | 6.750% | 4/15/11 | 5,450 | 5,767 |
| Finance Companies (3.6%) | ||||
| American Express Centurion Bank | 4.375% | 7/30/09 | 1,625 | 1,595 |
| American Express Co. | 4.750% | 6/17/09 | 1,525 | 1,511 |
| American Express Credit Corp. | 3.000% | 5/16/08 | 3,300 | 3,210 |
| American General Finance Corp. | 3.875% | 10/1/09 | 6,550 | 6,324 |
| American General Finance Corp. | 4.625% | 9/1/10 | 1,000 | 978 |
| American General Finance Corp. | 5.625% | 8/17/11 | 2,100 | 2,121 |
| American General Finance Corp. | 5.850% | 6/1/13 | 2,325 | 2,378 |
| Capital One Bank | 4.875% | 5/15/08 | 1,750 | 1,741 |
| Capital One Bank | 4.250% | 12/1/08 | 2,500 | 2,456 |
| Capital One Bank | 5.000% | 6/15/09 | 925 | 920 |
| Capital One Bank | 5.750% | 9/15/10 | 1,000 | 1,017 |
| Capital One Financial | 5.700% | 9/15/11 | 1,200 | 1,218 |
| CIT Group Co. of Canada | 4.650% | 7/1/10 | 2,350 | 2,298 |
| CIT Group Co. of Canada | 5.600% | 11/2/11 | 775 | 782 |
| CIT Group, Inc. | 5.000% | 11/24/08 | 1,775 | 1,767 |
| CIT Group, Inc. | 4.250% | 2/1/10 | 2,925 | 2,841 |
| CIT Group, Inc. | 5.200% | 11/3/10 | 5,500 | 5,476 |
| CIT Group, Inc. | 4.750% | 12/15/10 | 1,500 | 1,469 |
| CIT Group, Inc. | 5.600% | 4/27/11 | 1,150 | 1,156 |
| Countrywide Home Loan | 3.250% | 5/21/08 | 4,500 | 4,379 |
| Countrywide Home Loan | 6.250% | 4/15/09 | 3,500 | 3,568 |
| Countrywide Home Loan | 4.125% | 9/15/09 | 1,925 | 1,870 |
| Countrywide Home Loan | 4.000% | 3/22/11 | 3,350 | 3,181 |
| General Electric Capital Corp. | 4.250% | 1/15/08 | 8,275 | 8,190 |
| General Electric Capital Corp. | 3.500% | 5/1/08 | 13,900 | 13,585 |
| General Electric Capital Corp. | 3.600% | 10/15/08 | 2,050 | 1,994 |
| General Electric Capital Corp. | 3.125% | 4/1/09 | 1,200 | 1,150 |
| General Electric Capital Corp. | 3.250% | 6/15/09 | 1,075 | 1,030 |
| General Electric Capital Corp. | 4.125% | 9/1/09 | 2,450 | 2,389 |
| General Electric Capital Corp. | 5.250% | 10/27/09 | 2,625 | 2,636 |
| General Electric Capital Corp. | 7.375% | 1/19/10 | 10,525 | 11,167 |
| General Electric Capital Corp. | 4.875% | 10/21/10 | 650 | 644 |
| General Electric Capital Corp. | 6.125% | 2/22/11 | 4,200 | 4,348 |
| General Electric Capital Corp. | 5.500% | 4/28/11 | 1,550 | 1,569 |
| General Electric Capital Corp. | 4.375% | 11/21/11 | 2,325 | 2,246 |
| Heller Financial, Inc. | 7.375% | 11/1/09 | 3,200 | 3,384 |
| HSBC Finance Corp. | 4.625% | 1/15/08 | 1,375 | 1,365 |
| HSBC Finance Corp. | 4.125% | 3/11/08 | 12,175 | 12,022 |
| HSBC Finance Corp. | 6.400% | 6/17/08 | 3,600 | 3,658 |
| HSBC Finance Corp. | 4.125% | 12/15/08 | 6,225 | 6,101 |
| HSBC Finance Corp. | 5.875% | 2/1/09 | 2,000 | 2,027 |
| HSBC Finance Corp. | 4.750% | 5/15/09 | 5,275 | 5,227 |
| HSBC Finance Corp. | 4.125% | 11/16/09 | 1,225 | 1,192 |
| HSBC Finance Corp. | 4.625% | 9/15/10 | 2,600 | 2,554 |
| HSBC Finance Corp. | 5.250% | 1/14/11 | 1,725 | 1,725 |
| HSBC Finance Corp. | 5.700% | 6/1/11 | 2,075 | 2,111 |
| HSBC Finance Corp. | 6.375% | 10/15/11 | 3,000 | 3,139 |
| International Lease Finance Corp. | 4.500% | 5/1/08 | 1,000 | 990 |
| International Lease Finance Corp. | 6.375% | 3/15/09 | 500 | 512 |
| International Lease Finance Corp. | 3.500% | 4/1/09 | 2,025 | 1,950 |
| International Lease Finance Corp. | 5.125% | 11/1/10 | 3,300 | 3,277 |
| International Lease Finance Corp. | 5.450% | 3/24/11 | 975 | 981 |
| International Lease Finance Corp. | 5.750% | 6/15/11 | 6,250 | 6,349 |
| iStar Financial Inc. | 4.875% | 1/15/09 | 1,000 | 989 |
| iStar Financial Inc. | 6.000% | 12/15/10 | 1,500 | 1,524 |
| iStar Financial Inc. | 5.800% | 3/15/11 | 525 | 528 |
| iStar Financial Inc. | 5.650% | 9/15/11 | 2,175 | 2,176 |
| Residential Capital Corp. | 6.125% | 11/21/08 | 2,125 | 2,127 |
| Residential Capital Corp. | 6.375% | 6/30/10 | 5,300 | 5,369 |
| Residential Capital Corp. | 6.000% | 2/22/11 | 3,500 | 3,498 |
| SLM Corp. | 3.625% | 3/17/08 | 4,500 | 4,409 |
| SLM Corp. | 4.000% | 1/15/09 | 2,500 | 2,436 |
| SLM Corp. | 4.500% | 7/26/10 | 1,050 | 1,020 |
| SLM Corp. | 5.400% | 10/25/11 | 3,400 | 3,402 |
| Insurance (1.0%) | ||||
| Aetna, Inc. | 7.875% | 3/1/11 | 1,675 | 1,825 |
| Aetna, Inc. | 5.750% | 6/15/11 | 1,575 | 1,598 |
| Allstate Corp. | 7.200% | 12/1/09 | 2,500 | 2,636 |
| Allstate Life Global Funding | 4.500% | 5/29/09 | 100 | 98 |
| American International Group, Inc. | 2.875% | 5/15/08 | 1,000 | 969 |
| American International Group, Inc. | 4.700% | 10/1/10 | 2,100 | 2,064 |
| American International Group, Inc. | 5.375% | 10/18/11 | 800 | 801 |
| AXA Financial, Inc. | 6.500% | 4/1/08 | 2,000 | 2,026 |
| Berkshire Hathaway Finance Corp. | 3.375% | 10/15/08 | 3,000 | 2,909 |
| Berkshire Hathaway Finance Corp. | 4.125% | 1/15/10 | 4,300 | 4,184 |
| Berkshire Hathaway Finance Corp. | 4.200% | 12/15/10 | 1,000 | 968 |
| CNA Financial Corp. | 6.000% | 8/15/11 | 2,150 | 2,186 |
| Genworth Financial, Inc. | 4.750% | 6/15/09 | 1,625 | 1,608 |
| Hartford Financial Services Group, Inc. | 5.250% | 10/15/11 | 4,025 | 4,020 |
| ING USA Global | 4.500% | 10/1/10 | 4,200 | 4,100 |
| John Hancock Financial Services | 5.625% | 12/1/08 | 850 | 855 |
| Marsh&McLennan Cos., Inc. | 3.625% | 2/15/08 | 3,000 | 2,938 |
| Marsh&McLennan Cos., Inc. | 5.150% | 9/15/10 | 50 | 49 |
| Principal Life Income Funding | 3.200% | 4/1/09 | 1,500 | 1,436 |
| Principal Life Income Funding | 5.125% | 3/1/11 | 775 | 771 |
| Protective Life Secured Trust | 3.700% | 11/24/08 | 1,275 | 1,240 |
| Protective Life Secured Trust | 4.850% | 8/16/10 | 1,700 | 1,678 |
| Prudential Financial, Inc. | 3.750% | 5/1/08 | 1,000 | 980 |
| Prudential Financial, Inc. | 5.100% | 12/14/11 | 1,200 | 1,193 |
| Safeco Corp. | 4.875% | 2/1/10 | 2,500 | 2,463 |
| Travelers Property Casualty Corp. | 3.750% | 3/15/08 | 2,525 | 2,475 |
| UnitedHealth Group, Inc. | 4.125% | 8/15/09 | 1,425 | 1,385 |
| UnitedHealth Group, Inc. | 5.250% | 3/15/11 | 1,850 | 1,841 |
| WellPoint Inc. | 3.750% | 12/14/07 | 2,050 | 2,018 |
| WellPoint Inc. | 4.250% | 12/15/09 | 900 | 875 |
| WellPoint Inc. | 5.000% | 1/15/11 | 600 | 592 |
| Willis North America Inc. | 5.125% | 7/15/10 | 900 | 875 |
| Real Estate Investment Trusts (0.4%) | ||||
| Archstone-Smith Operating Trust | 3.000% | 6/15/08 | 2,000 | 1,935 |
| Brandywine Operating Partnership | 4.500% | 11/1/09 | 1,500 | 1,461 |
| Brandywine Operating Partnership | 5.625% | 12/15/10 | 550 | 553 |
| Developers Diversified Realty Corp. | 5.250% | 4/15/11 | 1,500 | 1,485 |
| Duke Realty LP | 5.625% | 8/15/11 | 575 | 578 |
| EOP Operating LP | 6.750% | 2/15/08 | 1,325 | 1,346 |
| EOP Operating LP | 8.100% | 8/1/10 | 500 | 551 |
| EOP Operating LP | 4.650% | 10/1/10 | 1,000 | 993 |
| Health Care Property Investors, Inc. | 5.950% | 9/15/11 | 1,625 | 1,631 |
| ProLogis | 5.250% | 11/15/10 | 2,475 | 2,457 |
| Simon Property Group Inc. | 3.750% | 1/30/09 | 2,300 | 2,230 |
| Simon Property Group Inc. | 4.875% | 8/15/10 | 2,000 | 1,971 |
| Simon Property Group Inc. | 5.600% | 9/1/11 | 1,250 | 1,262 |
| Vornado Realty | 5.600% | 2/15/11 | 1,100 | 1,099 |
| 680,046 | ||||
| Industrial (10.1%) | ||||
| Basic Industry (0.5%) | ||||
| Alcoa, Inc. | 7.375% | 8/1/10 | 2,075 | 2,214 |
| Alcoa, Inc. | 6.500% | 6/1/11 | 1,000 | 1,044 |
| BHP Billiton Finance | 5.000% | 12/15/10 | 1,000 | 993 |
| Dow Chemical Co. | 6.125% | 2/1/11 | 2,525 | 2,595 |
| E.I. du Pont de Nemours&Co. | 6.875% | 10/15/09 | 3,500 | 3,660 |
| ICI Wilmington | 4.375% | 12/1/08 | 2,200 | 2,150 |
| International Paper Co. | 4.250% | 1/15/09 | 1,000 | 978 |
| International Paper Co. | 4.000% | 4/1/10 | 2,000 | 1,917 |
| Monsanto Co. | 4.000% | 5/15/08 | 2,000 | 1,962 |
| Potash Corp. of Saskatchewan | 7.750% | 5/31/11 | 2,400 | 2,615 |
| Praxair, Inc. | 2.750% | 6/15/08 | 3,000 | 2,895 |
| Rio Tinto Finance USA Ltd. | 2.625% | 9/30/08 | 2,000 | 1,913 |
| Weyerhaeuser Co. | 5.950% | 11/1/08 | 1,082 | 1,092 |
| Capital Goods (1.3%) | ||||
| 3M Co. | 5.125% | 11/6/09 | 575 | 577 |
| Boeing Capital Corp. | 6.100% | 3/1/11 | 4,850 | 5,010 |
| Caterpillar Financial Services Corp. | 2.700% | 7/15/08 | 1,500 | 1,444 |
| Caterpillar Financial Services Corp. | 4.500% | 9/1/08 | 35 | 35 |
| Caterpillar Financial Services Corp. | 4.150% | 1/15/10 | 2,900 | 2,815 |
| Caterpillar Financial Services Corp. | 4.300% | 6/1/10 | 6,975 | 6,780 |
| CRH America Inc. | 5.625% | 9/30/11 | 1,500 | 1,509 |
| Emerson Electric Co. | 7.125% | 8/15/10 | 500 | 532 |
| General Dynamics Corp. | 3.000% | 5/15/08 | 2,525 | 2,449 |
| General Dynamics Corp. | 4.500% | 8/15/10 | 875 | 856 |
| Hanson PLC | 7.875% | 9/27/10 | 2,000 | 2,155 |
| Honeywell International, Inc. | 7.500% | 3/1/10 | 3,000 | 3,197 |
| John Deere Capital Corp | 4.400% | 7/15/09 | 2,500 | 2,450 |
| John Deere Capital Corp. | 4.875% | 3/16/09 | 5,525 | 5,481 |
| John Deere Capital Corp. | 5.400% | 10/17/11 | 1,325 | 1,329 |
| Lafarge SA | 6.150% | 7/15/11 | 3,175 | 3,254 |
| Mohawk Industries Inc. | 5.750% | 1/15/11 | 3,000 | 3,002 |
| Northrop Grumman Corp. | 7.125% | 2/15/11 | 3,550 | 3,783 |
| Raytheon Co. | 8.300% | 3/1/10 | 500 | 542 |
| Raytheon Co. | 4.850% | 1/15/11 | 1,500 | 1,474 |
| Republic Services, Inc. | 6.750% | 8/15/11 | 1,000 | 1,048 |
| Textron Financial Corp. | 4.125% | 3/3/08 | 1,925 | 1,899 |
| Textron Financial Corp. | 6.000% | 11/20/09 | 800 | 816 |
| Textron Financial Corp. | 4.600% | 5/3/10 | 2,300 | 2,250 |
| Tyco International Group SA | 6.125% | 11/1/08 | 1,100 | 1,114 |
| Tyco International Group SA | 6.125% | 1/15/09 | 2,500 | 2,534 |
| Tyco International Group SA | 6.750% | 2/15/11 | 1,950 | 2,056 |
| Tyco International Group SA | 6.375% | 10/15/11 | 2,000 | 2,088 |
| United Technologies Corp. | 4.375% | 5/1/10 | 2,125 | 2,073 |
| United Technologies Corp. | 7.125% | 11/15/10 | 2,000 | 2,127 |
| United Technologies Corp. | 6.350% | 3/1/11 | 500 | 520 |
| Waste Management, Inc. | 6.500% | 11/15/08 | 1,025 | 1,045 |
| Waste Management, Inc. | 6.875% | 5/15/09 | 2,000 | 2,064 |
| Communication (2.8%) | ||||
| America Movil SA de C.V | 4.125% | 3/1/09 | 1,550 | 1,513 |
| Ameritech Capital Funding | 6.150% | 1/15/08 | 3,000 | 3,021 |
| AT&T Corp. | 6.000% | 3/15/09 | 1,800 | 1,824 |
| AT&T Corp. | 7.300% | 11/15/11 | 2,900 | 3,140 |
| AT&T Inc. | 4.125% | 9/15/09 | 2,750 | 2,674 |
| AT&T Inc. | 5.300% | 11/15/10 | 2,300 | 2,302 |
| AT&T Inc. | 6.250% | 3/15/11 | 1,525 | 1,575 |
| BellSouth Corp. | 4.200% | 9/15/09 | 6,300 | 6,132 |
| British Sky Broadcasting Corp. | 6.875% | 2/23/09 | 775 | 796 |
| British Sky Broadcasting Corp. | 8.200% | 7/15/09 | 2,750 | 2,928 |
| British Telecommunications PLC | 8.625% | 12/15/10 | 7,325 | 8,183 |
| CBS Corp. | 7.700% | 7/30/10 | 2,475 | 2,647 |
| Comcast Cable Communications, Inc. | 6.200% | 11/15/08 | 5,000 | 5,074 |
| Comcast Cable Communications, Inc. | 6.875% | 6/15/09 | 3,300 | 3,415 |
| Comcast Cable Communications, Inc. | 6.750% | 1/30/11 | 1,500 | 1,572 |
| Comcast Corp. | 5.850% | 1/15/10 | 75 | 76 |
| Comcast Corp. | 5.500% | 3/15/11 | 1,050 | 1,055 |
| Cox Communications, Inc. | 7.875% | 8/15/09 | 1,500 | 1,587 |
| Cox Communications, Inc. | 4.625% | 1/15/10 | 4,225 | 4,138 |
| Cox Communications, Inc. | 6.750% | 3/15/11 | 2,175 | 2,274 |
| Deutsche Telekom International Finance | 3.875% | 7/22/08 | 3,075 | 3,010 |
| Deutsche Telekom International Finance | 8.000% | 6/15/10 | 7,000 | 7,588 |
| France Telecom | 7.750% | 3/1/11 | 8,100 | 8,830 |
| Gannett Co., Inc. | 6.375% | 4/1/12 | 200 | 206 |
| Koninklijke KPN NV | 8.000% | 10/1/10 | 2,000 | 2,160 |
| New Cingular Wireless Services | 7.875% | 3/1/11 | 7,125 | 7,789 |
| News America Inc. | 6.625% | 1/9/08 | 500 | 506 |
| R.R. Donnelley&Sons Co. | 3.750% | 4/1/09 | 850 | 818 |
| R.R. Donnelley&Sons Co. | 4.950% | 5/15/10 | 900 | 882 |
| Sprint Capital Corp. | 6.125% | 11/15/08 | 5,350 | 5,422 |
| Sprint Capital Corp. | 6.375% | 5/1/09 | 2,975 | 3,041 |
| Sprint Capital Corp. | 7.625% | 1/30/11 | 475 | 508 |
| Telecom Italia Capital | 4.000% | 11/15/08 | 2,045 | 1,992 |
| Telecom Italia Capital | 4.000% | 1/15/10 | 3,605 | 3,453 |
| Telecom Italia Capital | 4.875% | 10/1/10 | 1,000 | 972 |
| Telecom Italia Capital | 6.200% | 7/18/11 | 700 | 711 |
| Telefonica Emisiones SAU | 5.984% | 6/20/11 | 4,850 | 4,943 |
| Telefonica Europe BV | 7.750% | 9/15/10 | 4,500 | 4,840 |
| Telefonos de Mexico SA | 4.500% | 11/19/08 | 1,600 | 1,576 |
| Telefonos de Mexico SA | 4.750% | 1/27/10 | 3,150 | 3,091 |
| Telus Corp. | 8.000% | 6/1/11 | 5,000 | 5,481 |
| Thomson Corp. | 5.750% | 2/1/08 | 250 | 251 |
| Time Warner Entertainment | 7.250% | 9/1/08 | 1,500 | 1,541 |
| Verizon Global Funding Corp. | 4.000% | 1/15/08 | 6,400 | 6,315 |
| Verizon Global Funding Corp. | 7.250% | 12/1/10 | 3,000 | 3,204 |
| Verizon New England, Inc. | 6.500% | 9/15/11 | 2,500 | 2,574 |
| Verizon Pennsylvania, Inc. | 5.650% | 11/15/11 | 2,000 | 2,009 |
| Vodafone AirTouch PLC | 7.750% | 2/15/10 | 6,235 | 6,644 |
| Vodafone Group PLC | 3.950% | 1/30/08 | 1,000 | 985 |
| Vodafone Group PLC | 5.500% | 6/15/11 | 850 | 853 |
| Consumer Cyclical (2.1%) | ||||
| Centex Corp. | 4.750% | 1/15/08 | 1,000 | 992 |
| CVS Corp. | 4.000% | 9/15/09 | 1,750 | 1,692 |
| CVS Corp. | 5.750% | 8/15/11 | 225 | 228 |
| D.R. Horton, Inc. | 4.875% | 1/15/10 | 1,175 | 1,147 |
| D.R. Horton, Inc. | 6.000% | 4/15/11 | 2,750 | 2,762 |
| DaimlerChrysler North America Holding Corp. | 4.750% | 1/15/08 | 5,700 | 5,654 |
| DaimlerChrysler North America Holding Corp. | 4.050% | 6/4/08 | 5,000 | 4,894 |
| DaimlerChrysler North America Holding Corp. | 7.200% | 9/1/09 | 6,100 | 6,333 |
| DaimlerChrysler North America Holding Corp. | 4.875% | 6/15/10 | 1,950 | 1,903 |
| DaimlerChrysler North America Holding Corp. | 8.000% | 6/15/10 | 1,000 | 1,071 |
| DaimlerChrysler North America Holding Corp. | 5.875% | 3/15/11 | 5,200 | 5,223 |
| DaimlerChrysler North America Holding Corp. | 5.750% | 9/8/11 | 3,700 | 3,694 |
| Federated Department Stores, Inc. | 6.625% | 9/1/08 | 1,000 | 1,017 |
| Federated Department Stores, Inc. | 6.300% | 4/1/09 | 2,500 | 2,546 |
| Home Depot Inc. | 3.750% | 9/15/09 | 1,125 | 1,086 |
| Home Depot Inc. | 4.625% | 8/15/10 | 2,075 | 2,028 |
| Home Depot Inc. | 5.200% | 3/1/11 | 1,325 | 1,317 |
| J.C. Penney Co., Inc. | 8.000% | 3/1/10 | 3,000 | 3,198 |
| Johnson Controls, Inc. | 5.250% | 1/15/11 | 875 | 868 |
| Lennar Corp. | 5.125% | 10/1/10 | 1,700 | 1,667 |
| Lennar Corp. | 5.950% | 10/17/11 | 1,575 | 1,586 |
| Lowe's Cos., Inc. | 8.250% | 6/1/10 | 2,000 | 2,187 |
| May Department Stores Co. | 4.800% | 7/15/09 | 1,500 | 1,477 |
| Pulte Homes, Inc. | 4.875% | 7/15/09 | 450 | 444 |
| Pulte Homes, Inc. | 7.875% | 8/1/11 | 1,000 | 1,083 |
| Target Corp. | 3.375% | 3/1/08 | 6,000 | 5,873 |
| Target Corp. | 5.400% | 10/1/08 | 1,500 | 1,507 |
| Target Corp. | 7.500% | 8/15/10 | 1,000 | 1,074 |
| Target Corp. | 6.350% | 1/15/11 | 1,000 | 1,042 |
| The Walt Disney Co. | 5.700% | 7/15/11 | 1,900 | 1,932 |
| Time Warner, Inc. | 6.750% | 4/15/11 | 75 | 78 |
| Time Warner, Inc. | 5.500% | 11/15/11 | 4,000 | 3,989 |
| Toyota Motor Credit Corp. | 2.875% | 8/1/08 | 3,050 | 2,946 |
| Toyota Motor Credit Corp. | 5.500% | 12/15/08 | 2,500 | 2,515 |
| Toyota Motor Credit Corp. | 4.250% | 3/15/10 | 2,050 | 2,001 |
| Toyota Motor Credit Corp. | 4.350% | 12/15/10 | 2,000 | 1,947 |
| Toyota Motor Credit Corp. | 5.450% | 5/18/11 | 500 | 507 |
| Viacom Inc. | 5.750% | 4/30/11 | 2,925 | 2,925 |
| Wal-Mart Stores, Inc. | 3.375% | 10/1/08 | 675 | 655 |
| Wal-Mart Stores, Inc. | 6.875% | 8/10/09 | 10,100 | 10,530 |
| Wal-Mart Stores, Inc. | 4.000% | 1/15/10 | 2,500 | 2,423 |
| Wal-Mart Stores, Inc. | 4.125% | 7/1/10 | 4,320 | 4,181 |
| Wal-Mart Stores, Inc. | 4.750% | 8/15/10 | 880 | 869 |
| Wal-Mart Stores, Inc. | 4.125% | 2/15/11 | 1,275 | 1,227 |
| 3Western Union Co. | 5.400% | 11/17/11 | 1,925 | 1,896 |
| Yum! Brands, Inc. | 8.875% | 4/15/11 | 3,250 | 3,626 |
| Consumer Noncyclical (1.7%) | ||||
| Abbott Laboratories | 3.500% | 2/17/09 | 2,000 | 1,935 |
| Abbott Laboratories | 5.375% | 5/15/09 | 350 | 352 |
| Abbott Laboratories | 3.750% | 3/15/11 | 1,250 | 1,180 |
| Abbott Laboratories | 5.600% | 5/15/11 | 3,325 | 3,374 |
| Altria Group, Inc. | 5.625% | 11/4/08 | 1,000 | 1,003 |
| Amgen Inc. | 4.000% | 11/18/09 | 3,150 | 3,058 |
| Anheuser-Busch Cos., Inc. | 6.000% | 4/15/11 | 800 | 822 |
| Baxter Finco, BV | 4.750% | 10/15/10 | 500 | 492 |
| Boston Scientific | 6.000% | 6/15/11 | 2,500 | 2,526 |
| Bristol-Myers Squibb Co. | 4.000% | 8/15/08 | 1,000 | 980 |
| Bunge Ltd. Finance Corp. | 4.375% | 12/15/08 | 450 | 441 |
| Campbell Soup Co. | 6.750% | 2/15/11 | 1,000 | 1,051 |
| Cardinal Health, Inc. | 6.750% | 2/15/11 | 1,000 | 1,047 |
| Clorox Co. | 4.200% | 1/15/10 | 2,650 | 2,567 |
| Coca-Cola Enterprises Inc. | 5.750% | 11/1/08 | 1,350 | 1,362 |
| Coca-Cola Enterprises Inc. | 4.375% | 9/15/09 | 1,500 | 1,472 |
| ConAgra Foods, Inc. | 7.875% | 9/15/10 | 1,000 | 1,082 |
| ConAgra Foods, Inc. | 6.750% | 9/15/11 | 387 | 408 |
| 3ConAgra Foods, Inc. | 5.819% | 6/15/17 | 613 | 609 |
| Diageo Capital PLC | 3.375% | 3/20/08 | 4,650 | 4,547 |
| Diageo Capital PLC | 4.375% | 5/3/10 | 500 | 487 |
| Fortune Brands Inc. | 5.125% | 1/15/11 | 2,650 | 2,605 |
| Genentech Inc. | 4.400% | 7/15/10 | 850 | 831 |
| Gillette Co. | 3.800% | 9/15/09 | 2,000 | 1,936 |
| H.J. Heinz Co. | 6.625% | 7/15/11 | 2,500 | 2,605 |
| Hershey Foods Corp. | 5.300% | 9/1/11 | 550 | 551 |
| Hospira, Inc. | 4.950% | 6/15/09 | 575 | 565 |
| Imperial Tobacco | 7.125% | 4/1/09 | 1,775 | 1,838 |
| Kellogg Co. | 2.875% | 6/1/08 | 2,000 | 1,933 |
| Kellogg Co. | 6.600% | 4/1/11 | 3,000 | 3,144 |
| Kraft Foods, Inc. | 4.000% | 10/1/08 | 1,000 | 979 |
| Kraft Foods, Inc. | 4.125% | 11/12/09 | 1,775 | 1,722 |
| Kraft Foods, Inc. | 5.625% | 11/1/11 | 4,750 | 4,800 |
| Kroger Co. | 7.450% | 3/1/08 | 2,000 | 2,043 |
| Kroger Co. | 7.250% | 6/1/09 | 1,500 | 1,559 |
| Kroger Co. | 8.050% | 2/1/10 | 1,700 | 1,819 |
| Kroger Co. | 6.800% | 4/1/11 | 1,000 | 1,044 |
| Medtronic Inc. | 4.375% | 9/15/10 | 1,625 | 1,580 |
| Molson Coors Capital Finance | 4.850% | 9/22/10 | 300 | 294 |
| Newell Rubbermaid, Inc. | 4.000% | 5/1/10 | 1,000 | 958 |
| Philip Morris Cos., Inc. | 7.650% | 7/1/08 | 175 | 180 |
| Procter&Gamble Co. | 6.875% | 9/15/09 | 4,825 | 5,034 |
| Quest Diagnostic, Inc. | 5.125% | 11/1/10 | 2,000 | 1,972 |
| Safeway, Inc. | 6.500% | 11/15/08 | 3,800 | 3,863 |
| Safeway, Inc. | 4.950% | 8/16/10 | 875 | 860 |
| Unilever Capital Corp. | 7.125% | 11/1/10 | 4,000 | 4,247 |
| WM Wrigley Jr. Co. | 4.300% | 7/15/10 | 2,425 | 2,351 |
| Wyeth | 6.950% | 3/15/11 | 6,500 | 6,902 |
| Energy (0.6%) | ||||
| Amerada Hess Corp. | 6.650% | 8/15/11 | 1,500 | 1,567 |
| Anadarko Petroleum Corp. | 3.250% | 5/1/08 | 2,250 | 2,183 |
| Burlington Resources, Inc. | 6.680% | 2/15/11 | 2,000 | 2,101 |
| Canadian Natural Resources | 6.700% | 7/15/11 | 2,500 | 2,608 |
| Conoco Funding Co. | 6.350% | 10/15/11 | 3,500 | 3,658 |
| Devon Financing Corp. | 6.875% | 9/30/11 | 3,500 | 3,700 |
| Encana Corp. | 4.600% | 8/15/09 | 1,250 | 1,227 |
| Halliburton Co. | 5.500% | 10/15/10 | 1,500 | 1,497 |
| Kerr McGee Corp. | 6.875% | 9/15/11 | 3,475 | 3,662 |
| Norsk Hydro | 6.360% | 1/15/09 | 1,500 | 1,533 |
| Occidental Petroleum | 4.250% | 3/15/10 | 2,560 | 2,486 |
| Phillips Petroleum Co. | 8.750% | 5/25/10 | 3,800 | 4,206 |
| Shell International Finance | 5.625% | 6/27/11 | 1,450 | 1,480 |
| Technology (0.6%) | ||||
| Cisco Systems Inc. | 5.250% | 2/22/11 | 6,500 | 6,520 |
| Computer Sciences Corp. | 3.500% | 4/15/08 | 500 | 487 |
| Electronic Data Systems | 7.125% | 10/15/09 | 975 | 1,017 |
| First Data Corp. | 3.375% | 8/1/08 | 2,300 | 2,233 |
| Hewlett-Packard Co. | 3.625% | 3/15/08 | 400 | 392 |
| International Business Machines Corp. | 5.375% | 2/1/09 | 2,000 | 2,011 |
| International Business Machines Corp. | 4.375% | 6/1/09 | 3,100 | 3,049 |
| Motorola, Inc. | 7.625% | 11/15/10 | 1,040 | 1,121 |
| Motorola, Inc. | 8.000% | 11/1/11 | 1,900 | 2,104 |
| Oracle Corp. | 5.000% | 1/15/11 | 4,650 | 4,604 |
| Pitney Bowes Credit Corp. | 5.750% | 8/15/08 | 1,750 | 1,765 |
| Xerox Corp. | 9.750% | 1/15/09 | 1,125 | 1,211 |
| Xerox Corp. | 7.125% | 6/15/10 | 1,825 | 1,903 |
| Xerox Corp. | 6.875% | 8/15/11 | 1,025 | 1,069 |
| Transportation (0.5%) | ||||
| American Airlines, Inc. | 7.024% | 10/15/09 | 3,775 | 3,921 |
| Burlington Northern Santa Fe Corp. | 6.750% | 7/15/11 | 2,500 | 2,637 |
| Canadian National Railway Co. | 4.250% | 8/1/09 | 2,700 | 2,632 |
| Canadian Pacific Rail | 6.250% | 10/15/11 | 1,550 | 1,605 |
| CSX Corp. | 6.250% | 10/15/08 | 1,500 | 1,522 |
| 3ERAC USA Finance Co. | 7.350% | 6/15/08 | 1,600 | 1,637 |
| FedEx Corp. | 3.500% | 4/1/09 | 2,075 | 1,999 |
| Mass Transit Railway Corp. | 7.500% | 2/4/09 | 1,500 | 1,564 |
| Mass Transit Railway Corp. | 7.500% | 11/8/10 | 1,500 | 1,614 |
| Norfolk Southern Corp. | 7.350% | 5/15/07 | 305 | 307 |
| Norfolk Southern Corp. | 6.200% | 4/15/09 | 2,250 | 2,291 |
| Norfolk Southern Corp. | 6.750% | 2/15/11 | 1,425 | 1,498 |
| Ryder System Inc. | 5.950% | 5/2/11 | 850 | 860 |
| Union Pacific Corp. | 6.625% | 2/1/08 | 1,750 | 1,771 |
| Union Pacific Corp. | 7.250% | 11/1/08 | 1,000 | 1,031 |
| Union Pacific Corp. | 3.875% | 2/15/09 | 1,000 | 969 |
| Other (0.0%) | ||||
| Black&Decker Corp. | 7.125% | 6/1/11 | 1,000 | 1,051 |
| 533,610 | ||||
| Utilities (1.5%) | ||||
| Electric (1.1%) | ||||
| American Electric Power Co., Inc. | 5.375% | 3/15/10 | 2,700 | 2,702 |
| Commonwealth Edison Co. | 3.700% | 2/1/08 | 100 | 98 |
| Constellation Energy Group, Inc. | 6.125% | 9/1/09 | 875 | 893 |
| Consumers Energy Co. | 4.250% | 4/15/08 | 2,000 | 1,968 |
| Consumers Energy Co. | 4.800% | 2/17/09 | 1,000 | 987 |
| Detroit Edison Co. | 6.125% | 10/1/10 | 1,000 | 1,021 |
| Dominion Resources, Inc. | 4.125% | 2/15/08 | 2,250 | 2,221 |
| 2 Dominion Resources, Inc. | 6.300% | 9/30/66 | 1,750 | 1,756 |
| Duke Energy Corp. | 3.750% | 3/5/08 | 3,000 | 2,946 |
| Entergy Gulf States, Inc. | 3.600% | 6/1/08 | 1,250 | 1,219 |
| Exelon Generation Co. LLC | 6.950% | 6/15/11 | 1,500 | 1,579 |
| FirstEnergy Corp. | 6.450% | 11/15/11 | 3,525 | 3,695 |
| Florida Power Corp. | 4.500% | 6/1/10 | 1,150 | 1,121 |
| FPL Group Capital, Inc. | 7.375% | 6/1/09 | 2,075 | 2,174 |
| FPL Group Capital, Inc. | 5.625% | 9/1/11 | 1,250 | 1,266 |
| Illinois Power | 7.500% | 6/15/09 | 1,000 | 1,043 |
| MidAmerican Energy Holdings Co. | 3.500% | 5/15/08 | 250 | 244 |
| National Rural Utilities Cooperative Finance Corp. | 3.875% | 2/15/08 | 700 | 689 |
| National Rural Utilities Cooperative Finance Corp. | 4.375% | 10/1/10 | 3,350 | 3,254 |
| Niagara Mohawk Power Corp. | 7.750% | 10/1/08 | 1,000 | 1,038 |
| NiSource Finance Corp. | 7.875% | 11/15/10 | 2,300 | 2,482 |
| Pacific Gas&Electric Co. | 3.600% | 3/1/09 | 2,450 | 2,368 |
| Pacific Gas&Electric Co. | 4.200% | 3/1/11 | 1,100 | 1,053 |
| PacifiCorp | 6.900% | 11/15/11 | 3,650 | 3,887 |
| PPL Electric Utilities Corp. | 6.250% | 8/15/09 | 2,000 | 2,045 |
| PPL Energy Supply LLC | 6.400% | 11/1/11 | 500 | 518 |
| Progress Energy, Inc. | 7.100% | 3/1/11 | 1,843 | 1,964 |
| PSE&G Power LLC | 7.750% | 4/15/11 | 450 | 487 |
| Public Service Co. of Colorado | 4.375% | 10/1/08 | 1,600 | 1,575 |
| Public Service Co. of New Mexico | 4.400% | 9/15/08 | 500 | 492 |
| Public Service Electric&Gas | 4.000% | 11/1/08 | 1,000 | 977 |
| Reliant Energy Resources | 7.750% | 2/15/11 | 2,500 | 2,699 |
| SCANA Corp. | 6.875% | 5/15/11 | 1,500 | 1,584 |
| Xcel Energy, Inc. | 7.000% | 12/1/10 | 1,500 | 1,584 |
| Natural Gas (0.4%) | ||||
| AGL Capital Corp. | 7.125% | 1/14/11 | 500 | 528 |
| Atmos Energy Corp. | 4.000% | 10/15/09 | 1,300 | 1,251 |
| Consolidated Natural Gas | 6.850% | 4/15/11 | 2,050 | 2,161 |
| Consolidated Natural Gas | 6.250% | 11/1/11 | 1,000 | 1,035 |
| Duke Energy Field Services | 7.875% | 8/16/10 | 1,750 | 1,882 |
| * Enron Corp. | 9.125% | 4/1/03 | 2,000 | 665 |
| * Enron Corp. | 7.625% | 9/10/04 | 1,000 | 333 |
| Enterprise Products Operating LP | 4.625% | 10/15/09 | 400 | 392 |
| Enterprise Products Operating LP | 4.950% | 6/1/10 | 2,450 | 2,409 |
| * HNG Internorth | 9.625% | 3/15/06 | 1,500 | 499 |
| KeySpan Corp. | 7.625% | 11/15/10 | 1,500 | 1,615 |
| Kinder Morgan Energy Partners LP | 6.750% | 3/15/11 | 1,900 | 1,980 |
| Kinder Morgan, Inc. | 5.350% | 1/5/11 | 1,675 | 1,638 |
| KN Energy, Inc. | 6.800% | 3/1/08 | 1,500 | 1,518 |
| Sempra Energy | 7.950% | 3/1/10 | 1,500 | 1,611 |
| * 3Yosemite Security Trust | 8.250% | 11/15/04 | 3,225 | 2,443 |
| 77,589 | ||||
| Total Corporate Bonds | ||||
| (Cost $1,339,098) | 1,321,847 | |||
| Sovereign Bonds (U.S. Dollar-Denominated) (5.2%) | ||||
| African Development Bank | 3.250% | 8/1/08 | 1,500 | 1,462 |
| Bayerische Landesbank | 2.875% | 10/15/08 | 1,800 | 1,728 |
| Canadian Government | 5.250% | 11/5/08 | 4,200 | 4,228 |
| Canadian Mortgage&Housing | 2.950% | 6/2/08 | 2,000 | 1,945 |
| Canadian Mortgage&Housing | 4.800% | 10/1/10 | 1,250 | 1,241 |
| Eksportfinans | 4.750% | 12/15/08 | 6,025 | 5,985 |
| European Investment Bank | 3.500% | 3/14/08 | 6,175 | 6,072 |
| European Investment Bank | 3.875% | 8/15/08 | 9,725 | 9,573 |
| European Investment Bank | 4.500% | 2/17/09 | 3,825 | 3,787 |
| European Investment Bank | 4.000% | 3/3/10 | 2,925 | 2,841 |
| European Investment Bank | 4.125% | 9/15/10 | 9,750 | 9,466 |
| European Investment Bank | 5.250% | 6/15/11 | 11,250 | 11,363 |
| Export-Import Bank of Korea | 4.500% | 8/12/09 | 3,500 | 3,428 |
| Export-Import Bank of Korea | 4.625% | 3/16/10 | 500 | 489 |
| Federation of Malaysia | 8.750% | 6/1/09 | 4,350 | 4,693 |
| Federation of Malaysia | 7.500% | 7/15/11 | 2,875 | 3,123 |
| Hellenic Republic | 6.950% | 3/4/08 | 3,075 | 3,136 |
| Instituto de Credito Oficial | 6.000% | 5/19/08 | 5,000 | 5,074 |
| Inter-American Development Bank | 5.750% | 2/26/08 | 7,500 | 7,559 |
| Inter-American Development Bank | 5.375% | 11/18/08 | 1,250 | 1,264 |
| Inter-American Development Bank | 5.625% | 4/16/09 | 4,275 | 4,336 |
| Inter-American Development Bank | 7.375% | 1/15/10 | 800 | 853 |
| International Bank for Reconstruction&Development | 4.125% | 6/24/09 | 1,000 | 982 |
| International Bank for Reconstruction&Development | 4.125% | 8/12/09 | 975 | 958 |
| International Finance Corp. | 3.000% | 4/15/08 | 1,650 | 1,608 |
| International Finance Corp. | 4.000% | 6/15/10 | 1,250 | 1,207 |
| International Finance Corp. | 5.125% | 5/2/11 | 1,500 | 1,507 |
| Japan Bank International | 4.750% | 5/25/11 | 2,150 | 2,119 |
| Japan Finance Corp. | 5.875% | 3/14/11 | 2,000 | 2,059 |
| KFW International Finance Inc. | 4.875% | 10/19/09 | 3,650 | 3,638 |
| Korea Development Bank | 3.875% | 3/2/09 | 2,375 | 2,309 |
| Korea Development Bank | 4.750% | 7/20/09 | 4,575 | 4,520 |
| Kreditanstalt fur Wiederaufbau | 4.625% | 11/17/08 | 2,475 | 2,458 |
| Kreditanstalt fur Wiederaufbau | 5.250% | 5/19/09 | 20,475 | 20,587 |
| Kreditanstalt fur Wiederaufbau | 4.250% | 6/15/10 | 14,875 | 14,528 |
| Landeskreditbank Baden-Wuerttemberg - Foerderbank | 4.250% | 9/15/10 | 3,500 | 3,412 |
| Landwirtschaftliche Rentenbank | 3.250% | 6/16/08 | 1,700 | 1,657 |
| Landwirtschaftliche Rentenbank | 3.875% | 9/4/08 | 3,500 | 3,429 |
| Landwirtschaftliche Rentenbank | 3.625% | 10/20/09 | 7,225 | 6,962 |
| Landwirtschaftliche Rentenbank | 3.875% | 3/15/10 | 3,500 | 3,383 |
| Nordic Investment Bank | 3.125% | 4/24/08 | 3,350 | 3,269 |
| Nordic Investment Bank | 3.875% | 6/15/10 | 3,750 | 3,617 |
| Oesterreichische Kontrollbank | 4.250% | 10/6/10 | 3,375 | 3,295 |
| Ontario Hydro Electric | 6.100% | 1/30/08 | 2,000 | 2,021 |
| Pemex Project Funding Master Trust | 8.500% | 2/15/08 | 5,325 | 5,495 |
| Pemex Project Funding Master Trust | 6.125% | 8/15/08 | 1,325 | 1,338 |
| Pemex Project Funding Master Trust | 7.875% | 2/1/09 | 4,725 | 4,947 |
| People's Republic of China | 7.300% | 12/15/08 | 2,000 | 2,075 |
| Petrobras International Finance | 9.750% | 7/6/11 | 975 | 1,152 |
| Province of British Columbia | 5.375% | 10/29/08 | 2,375 | 2,392 |
| Province of Ontario | 5.500% | 10/1/08 | 6,500 | 6,545 |
| Province of Ontario | 3.625% | 10/21/09 | 2,025 | 1,951 |
| Province of Ontario | 5.000% | 10/18/11 | 3,450 | 3,438 |
| Province of Quebec | 5.750% | 2/15/09 | 6,200 | 6,277 |
| Province of Quebec | 5.000% | 7/17/09 | 1,500 | 1,494 |
| Quebec Hydro Electric | 6.300% | 5/11/11 | 2,500 | 2,580 |
| Republic of Italy | 3.750% | 12/14/07 | 6,200 | 6,131 |
| Republic of Italy | 4.000% | 6/16/08 | 7,500 | 7,393 |
| Republic of Italy | 6.000% | 2/22/11 | 3,500 | 3,609 |
| Republic of Korea | 8.875% | 4/15/08 | 7,000 | 7,290 |
| Republic of South Africa | 9.125% | 5/19/09 | 3,000 | 3,236 |
| Swedish Export Credit Corp. | 4.125% | 10/15/08 | 4,925 | 4,851 |
| Swedish Export Credit Corp. | 4.000% | 6/15/10 | 2,175 | 2,101 |
| United Mexican States | 9.875% | 2/1/10 | 475 | 538 |
| United Mexican States | 8.375% | 1/14/11 | 12,600 | 14,030 |
| Total Sovereign Bonds | ||||
| (Cost $274,721) | 272,034 | |||
| Temporary Cash Investment (0.4%) | Shares | |||
| 4 Vanguard Market Liquidity Fund, 5.294% | ||||
| (Cost $20,274) | 20,273,696 | 20,274 | ||
| Total Investments (99.1%) | ||||
| (Cost $5,249,377) | 5,212,029 | |||
| Other Assets and Liabilities - Net (0.9%) | 47,654 | |||
| Net Assets (100%) | 5,259,683 | |||
* Non-income-producing security--security in default.
1 The issuer operates under a congressional charter; its securities are neither issued nor guaranteed by the U.S. government. If needed, access to additional funding from the U.S. Treasury (beyond the issuer's line of credit) would require congressional action.
2 The average or expected maturity is shorter than the final maturity shown because of the possibility of interim principal payments and prepayments or the possibility of the issue being called.
3 Security exempt from registration under Rule 144A of the Securities Act of 1933. Such securities may be sold in transactions exempt from registration, normally to qualified institutional buyers. At December 31, 2006, the aggregate value of these securities was $9,126,000, representing 0.2% of net assets.
4 Affiliated money market fund available only to Vanguard funds and certain trusts and accounts managed by Vanguard. Rate shown is the 7-day yield.
Vanguard Long-Term Bond Index Fund
Schedule of Investments
December 31, 2006
| Coupon | Maturity Date | Face Amount ($000) | Market Value ($000) | |
|---|---|---|---|---|
| U.S. Government and Agency Obligations (52.0%) | ||||
| U.S. Government Securities (45.6%) | ||||
| U.S. Treasury Bond | 11.250% | 2/15/15 | 115 | 165 |
| U.S. Treasury Bond | 7.250% | 5/15/16 | 550 | 654 |
| U.S. Treasury Bond | 7.500% | 11/15/16 | 20 | 24 |
| U.S. Treasury Bond | 8.750% | 5/15/17 | 365 | 483 |
| U.S. Treasury Bond | 8.875% | 8/15/17 | 35,975 | 48,133 |
| U.S. Treasury Bond | 9.000% | 11/15/18 | 5,330 | 7,332 |
| U.S. Treasury Bond | 8.875% | 2/15/19 | 53,025 | 72,537 |
| U.S. Treasury Bond | 8.125% | 8/15/19 | 21,645 | 28,287 |
| U.S. Treasury Bond | 8.500% | 2/15/20 | 38,075 | 51,425 |
| U.S. Treasury Bond | 8.750% | 5/15/20 | 20,700 | 28,553 |
| U.S. Treasury Bond | 8.750% | 8/15/20 | 61,325 | 84,792 |
| U.S. Treasury Bond | 7.875% | 2/15/21 | 22,780 | 29,671 |
| U.S. Treasury Bond | 8.125% | 5/15/21 | 1,365 | 1,818 |
| U.S. Treasury Bond | 8.125% | 8/15/21 | 57,720 | 77,056 |
| U.S. Treasury Bond | 8.000% | 11/15/21 | 25,195 | 33,407 |
| U.S. Treasury Bond | 7.250% | 8/15/22 | 550 | 690 |
| U.S. Treasury Bond | 7.625% | 11/15/22 | 34,045 | 44,200 |
| U.S. Treasury Bond | 7.125% | 2/15/23 | 225 | 280 |
| U.S. Treasury Bond | 6.250% | 8/15/23 | 50 | 58 |
| U.S. Treasury Bond | 7.500% | 11/15/24 | 300 | 392 |
| U.S. Treasury Bond | 7.625% | 2/15/25 | 63,400 | 83,916 |
| U.S. Treasury Bond | 6.875% | 8/15/25 | 825 | 1,021 |
| U.S. Treasury Bond | 6.000% | 2/15/26 | 375 | 425 |
| U.S. Treasury Bond | 6.750% | 8/15/26 | 48,615 | 59,812 |
| U.S. Treasury Bond | 6.500% | 11/15/26 | 800 | 961 |
| U.S. Treasury Bond | 6.625% | 2/15/27 | 18,190 | 22,169 |
| U.S. Treasury Bond | 6.375% | 8/15/27 | 62,660 | 74,595 |
| U.S. Treasury Bond | 6.125% | 11/15/27 | 2,975 | 3,453 |
| U.S. Treasury Bond | 5.500% | 8/15/28 | 31,525 | 34,081 |
| U.S. Treasury Bond | 5.250% | 11/15/28 | 670 | 703 |
| U.S. Treasury Bond | 5.250% | 2/15/29 | 650 | 682 |
| U.S. Treasury Bond | 6.125% | 8/15/29 | 45,080 | 52,716 |
| U.S. Treasury Bond | 6.250% | 5/15/30 | 103,855 | 123,783 |
| U.S. Treasury Bond | 5.375% | 2/15/31 | 26,750 | 28,669 |
| U.S. Treasury Bond | 4.500% | 2/15/36 | 300 | 285 |
| U.S. Treasury Note | 3.375% | 2/28/07 | 3,150 | 3,142 |
| U.S. Treasury Note | 3.750% | 3/31/07 | 1,650 | 1,645 |
| U.S. Treasury Note | 4.375% | 12/31/07 | 1,725 | 1,714 |
| U.S. Treasury Note | 4.500% | 2/15/09 | 1,525 | 1,516 |
| U.S. Treasury Note | 3.875% | 2/15/13 | 1,450 | 1,388 |
| U.S. Treasury Note | 4.250% | 11/15/13 | 650 | 633 |
| 1,007,266 | ||||
| Agency Bonds and Notes (6.4%) | ||||
| 1 Federal Home Loan Bank | 5.375% | 5/15/19 | 7,250 | 7,397 |
| 1 Federal Home Loan Bank | 5.125% | 8/15/19 | 500 | 499 |
| 1 Federal Home Loan Bank | 5.250% | 12/11/20 | 2,500 | 2,517 |
| 1 Federal Home Loan Bank | 5.625% | 6/11/21 | 2,500 | 2,620 |
| 1 Federal Home Loan Bank | 5.625% | 3/14/36 | 1,000 | 1,055 |
| 1 Federal Home Loan Bank | 5.500% | 7/15/36 | 2,000 | 2,089 |
| 1 Federal Home Loan Mortgage Corp. | 5.000% | 12/14/18 | 7,150 | 6,974 |
| 1 Federal Home Loan Mortgage Corp. | 6.750% | 9/15/29 | 7,700 | 9,287 |
| 1 Federal Home Loan Mortgage Corp. | 6.750% | 3/15/31 | 14,100 | 17,104 |
| 1 Federal Home Loan Mortgage Corp. | 6.250% | 7/15/32 | 3,175 | 3,662 |
| 1 Federal National Mortgage Assn | 0.000% | 6/1/17 | 6,325 | 3,721 |
| 1 Federal National Mortgage Assn | 0.000% | 10/9/19 | 8,300 | 4,146 |
| 1 Federal National Mortgage Assn | 6.250% | 5/15/29 | 5,350 | 6,093 |
| 1 Federal National Mortgage Assn | 7.125% | 1/15/30 | 10,475 | 13,176 |
| 1 Federal National Mortgage Assn | 7.250% | 5/15/30 | 11,935 | 15,236 |
| 1 Federal National Mortgage Assn | 6.625% | 11/15/30 | 12,100 | 14,474 |
| 1 Federal National Mortgage Assn | 6.210% | 8/6/38 | 1,000 | 1,145 |
| State of Israel (U.S. Government Guaranteed) | 5.500% | 9/18/23 | 1,375 | 1,404 |
| State of Israel (U.S. Government Guaranteed) | 5.500% | 12/4/23 | 5,325 | 5,428 |
| State of Israel (U.S. Government Guaranteed) | 5.500% | 4/26/24 | 2,900 | 2,911 |
| 1 Tennessee Valley Auth | 6.250% | 12/15/17 | 2,600 | 2,864 |
| 1 Tennessee Valley Auth | 6.750% | 11/1/25 | 4,500 | 5,361 |
| 1 Tennessee Valley Auth | 7.125% | 5/1/30 | 3,250 | 4,093 |
| 1 Tennessee Valley Auth | 4.650% | 6/15/35 | 2,825 | 2,591 |
| 1 Tennessee Valley Auth | 5.880% | 4/1/36 | 1,000 | 1,096 |
| 1 Tennessee Valley Auth | 6.150% | 1/15/38 | 2,450 | 2,781 |
| 1 Tennessee Valley Auth | 5.375% | 4/1/56 | 1,850 | 1,890 |
| 141,614 | ||||
| Total U.S. Government and Agency Obligations | ||||
| (Cost $1,120,783) | 1,148,880 | |||
| Corporate Bonds (40.1%) | ||||
| Asset-Backed Securities (0.1%) | ||||
| 23Citicorp Lease Pass-Through Trust | 8.040% | 12/15/19 | 450 | 532 |
| 2 PSE&G Transition Funding LLC | 6.890% | 12/15/17 | 2,500 | 2,792 |
| 3,324 | ||||
| Finance (10.5%) | ||||
| Banking (5.3%) | ||||
| Abbey National PLC | 7.950% | 10/26/29 | 3,925 | 4,977 |
| ABN AMRO Bank NV | 4.650% | 6/4/18 | 2,250 | 2,081 |
| Associates Corp. of North America | 6.950% | 11/1/18 | 1,150 | 1,290 |
| BAC Capital Trust XI | 6.625% | 5/23/36 | 1,575 | 1,700 |
| Banc One Corp. | 7.750% | 7/15/25 | 2,000 | 2,418 |
| Banc One Corp. | 7.625% | 10/15/26 | 4,350 | 5,234 |
| Bank of America Corp. | 5.375% | 8/15/11 | 2,225 | 2,243 |
| Bank of America Corp. | 5.375% | 6/15/14 | 1,000 | 1,007 |
| Bank of America Corp. | 5.625% | 3/8/35 | 4,775 | 4,476 |
| Bank of America Corp. | 6.000% | 10/15/36 | 2,300 | 2,377 |
| Barclays Bank PLC | 6.278% | 12/29/49 | 750 | 737 |
| BB&T Corp. | 4.900% | 6/30/17 | 3,225 | 3,075 |
| BB&T Corp. | 5.250% | 11/1/19 | 1,000 | 974 |
| BB&T Corp. | 6.750% | 6/7/36 | 925 | 1,013 |
| Citicorp Capital II | 8.015% | 2/15/27 | 450 | 469 |
| Citigroup, Inc. | 3.500% | 2/1/08 | 1,000 | 982 |
| Citigroup, Inc. | 6.625% | 6/15/32 | 2,000 | 2,234 |
| Citigroup, Inc. | 5.875% | 2/22/33 | 4,250 | 4,308 |
| Citigroup, Inc. | 6.000% | 10/31/33 | 2,200 | 2,280 |
| Citigroup, Inc. | 5.850% | 12/11/34 | 2,300 | 2,357 |
| Citigroup, Inc. | 6.125% | 8/25/36 | 2,925 | 3,075 |
| Comerica Bank | 5.200% | 8/22/17 | 1,450 | 1,384 |
| Compass Bank | 5.900% | 4/1/26 | 1,075 | 1,071 |
| Credit Suisse First Boston USA, Inc. | 7.125% | 7/15/32 | 2,100 | 2,515 |
| Fifth Third Bank | 4.500% | 6/1/18 | 1,550 | 1,415 |
| First Union Institutional Capital I | 8.040% | 12/1/26 | 500 | 517 |
| Fleet Capital Trust II | 7.920% | 12/11/26 | 1,150 | 1,189 |
| Fleet Financial Group, Inc. | 6.875% | 1/15/28 | 400 | 455 |
| HSBC Bank USA | 5.875% | 11/1/34 | 3,675 | 3,721 |
| HSBC Bank USA | 5.625% | 8/15/35 | 3,700 | 3,598 |
| HSBC Holdings PLC | 7.625% | 5/17/32 | 1,050 | 1,278 |
| HSBC Holdings PLC | 7.350% | 11/27/32 | 200 | 237 |
| HSBC Holdings PLC | 6.500% | 5/2/36 | 1,575 | 1,703 |
| JPM Capital Trust | 6.550% | 9/29/36 | 2,900 | 2,976 |
| JPM Capital Trust II | 7.950% | 2/1/27 | 500 | 520 |
| JPMorgan Capital Trust | 5.875% | 3/15/35 | 2,350 | 2,287 |
| JPMorgan Chase & Co. | 3.625% | 5/1/08 | 2,000 | 1,960 |
| JPMorgan Chase & Co. | 5.850% | 8/1/35 | 425 | 414 |
| Key Bank NA | 6.950% | 2/1/28 | 1,693 | 1,896 |
| Marshall & Ilsley Bank | 5.000% | 1/17/17 | 1,000 | 964 |
| Mellon Capital II | 7.995% | 1/15/27 | 2,100 | 2,187 |
| National City Corp. | 6.875% | 5/15/19 | 1,700 | 1,882 |
| NationsBank Corp. | 6.800% | 3/15/28 | 375 | 421 |
| NB Capital Trust IV | 8.250% | 4/15/27 | 400 | 418 |
| PNC Bank NA | 4.875% | 9/21/17 | 2,750 | 2,616 |
| 2 Royal Bank of Scotland Group PLC | 7.648% | 8/29/49 | 4,375 | 5,131 |
| State Street Capital Trust | 5.250% | 10/15/18 | 1,000 | 984 |
| SunTrust Banks, Inc. | 5.200% | 1/17/17 | 1,000 | 980 |
| SunTrust Banks, Inc. | 5.450% | 12/1/17 | 1,350 | 1,348 |
| Suntrust Capital | 6.100% | 12/15/36 | 1,650 | 1,614 |
| SunTrust Capital II | 7.900% | 6/15/27 | 750 | 784 |
| Swiss Bank Corp. | 7.000% | 10/15/15 | 1,000 | 1,116 |
| Swiss Bank Corp. | 7.375% | 6/15/17 | 550 | 644 |
| Synovus Financial Corp. | 5.125% | 6/15/17 | 750 | 724 |
| Wachovia Corp. | 6.605% | 10/1/25 | 725 | 790 |
| 3 Wachovia Corp. | 8.000% | 12/15/26 | 2,300 | 2,376 |
| Wachovia Corp. | 7.500% | 4/15/35 | 150 | 183 |
| Wachovia Corp. | 5.500% | 8/1/35 | 3,550 | 3,391 |
| Wachovia Corp. | 6.550% | 10/15/35 | 125 | 136 |
| Washington Mutual Bank | 6.750% | 5/20/36 | 100 | 108 |
| Washington Mutual Capital I | 8.375% | 6/1/27 | 1,250 | 1,311 |
| Washington Mutual, Inc. | 5.250% | 9/15/17 | 3,025 | 2,931 |
| Wells Fargo & Co. | 5.375% | 2/7/35 | 2,450 | 2,358 |
| Wells Fargo Bank NA | 5.950% | 8/26/36 | 1,850 | 1,910 |
| Wells Fargo Capital X | 5.950% | 12/15/36 | 1,650 | 1,612 |
| Brokerage (1.6%) | ||||
| Bear Stearns Co., Inc. | 5.550% | 1/22/17 | 1,725 | 1,724 |
| Bear Stearns Co., Inc. | 4.650% | 7/2/18 | 1,075 | 996 |
| Goldman Sachs Group, Inc. | 5.950% | 1/15/27 | 4,075 | 4,030 |
| Goldman Sachs Group, Inc. | 6.125% | 2/15/33 | 5,450 | 5,581 |
| Goldman Sachs Group, Inc. | 6.345% | 2/15/34 | 5,175 | 5,243 |
| Jefferies Group Inc. | 6.250% | 1/15/36 | 1,400 | 1,359 |
| Lehman Brothers Holdings, Inc. | 5.750% | 1/3/17 | 2,300 | 2,331 |
| Lehman Brothers Holdings, Inc. | 5.875% | 11/15/17 | 750 | 767 |
| Merrill Lynch & Co., Inc. | 6.500% | 7/15/18 | 625 | 677 |
| Merrill Lynch & Co., Inc. | 6.875% | 11/15/18 | 4,075 | 4,569 |
| Merrill Lynch & Co., Inc. | 6.220% | 9/15/26 | 2,100 | 2,182 |
| Morgan Stanley Dean Witter | 6.250% | 8/9/26 | 1,975 | 2,082 |
| Morgan Stanley Dean Witter | 7.250% | 4/1/32 | 2,025 | 2,408 |
| Finance Companies (0.9%) | ||||
| Capital One Capital III | 7.686% | 8/15/36 | 775 | 877 |
| Capital One Financial | 5.250% | 2/21/17 | 1,475 | 1,428 |
| CIT Group, Inc. | 6.000% | 4/1/36 | 1,800 | 1,782 |
| General Electric Capital Corp. | 6.750% | 3/15/32 | 11,775 | 13,586 |
| SLM Corp. | 5.625% | 8/1/33 | 1,950 | 1,878 |
| Insurance (2.6%) | ||||
| ACE Capital Trust II | 9.700% | 4/1/30 | 850 | 1,168 |
| AEGON Funding Corp. | 5.750% | 12/15/20 | 1,000 | 1,011 |
| Aetna, Inc. | 6.625% | 6/15/36 | 1,950 | 2,091 |
| Allstate Corp. | 6.125% | 12/15/32 | 1,250 | 1,287 |
| Allstate Corp. | 5.350% | 6/1/33 | 1,950 | 1,829 |
| Allstate Corp. | 5.550% | 5/9/35 | 1,000 | 964 |
| Allstate Corp. | 5.950% | 4/1/36 | 925 | 943 |
| Ambac, Inc. | 5.950% | 12/5/35 | 1,050 | 1,047 |
| American General Capital II | 8.500% | 7/1/30 | 850 | 1,089 |
| American International Group, Inc. | 6.250% | 5/1/36 | 3,075 | 3,286 |
| Aon Capital Trust | 8.205% | 1/1/27 | 1,075 | 1,240 |
| Arch Capital Group Ltd. | 7.350% | 5/1/34 | 625 | 687 |
| Assurant, Inc. | 6.750% | 2/15/34 | 1,200 | 1,292 |
| AXA SA | 8.600% | 12/15/30 | 2,700 | 3,490 |
| CIGNA Corp. | 7.875% | 5/15/27 | 500 | 586 |
| CIGNA Corp. | 6.150% | 11/15/36 | 550 | 545 |
| Cincinnati Financial Corp. | 6.920% | 5/15/28 | 1,000 | 1,108 |
| Cincinnati Financial Corp. | 6.125% | 11/1/34 | 850 | 869 |
| Endurance Specialty Holdings | 7.000% | 7/15/34 | 700 | 724 |
| GE Global Insurance Holdings Corp. | 6.450% | 3/1/19 | 400 | 425 |
| GE Global Insurance Holdings Corp. | 7.000% | 2/15/26 | 1,350 | 1,505 |
| GE Global Insurance Holdings Corp. | 7.750% | 6/15/30 | 400 | 486 |
| Genworth Financial, Inc. | 6.500% | 6/15/34 | 625 | 678 |
| Hartford Financial Services Group, Inc. | 5.950% | 10/15/36 | 650 | 659 |
| Hartford Financial Services Group, Inc. | 6.100% | 10/1/41 | 1,200 | 1,224 |
| Humana Inc. | 6.300% | 8/1/18 | 750 | 757 |
| Lincoln National Corp. | 6.150% | 4/7/36 | 1,150 | 1,191 |
| Loews Corp. | 6.000% | 2/1/35 | 800 | 788 |
| Marsh & McLennan Cos., Inc. | 5.875% | 8/1/33 | 900 | 833 |
| MBIA, Inc. | 5.700% | 12/1/34 | 1,000 | 967 |
| MetLife, Inc. | 6.500% | 12/15/32 | 2,725 | 2,959 |
| MetLife, Inc. | 6.375% | 6/15/34 | 1,725 | 1,845 |
| MetLife, Inc. | 6.400% | 12/15/36 | 1,950 | 1,966 |
| Principal Financial Group, Inc. | 6.050% | 10/15/36 | 1,100 | 1,129 |
| Progressive Corp. | 6.625% | 3/1/29 | 1,625 | 1,799 |
| Prudential Financial, Inc. | 5.750% | 7/15/33 | 1,000 | 988 |
| Prudential Financial, Inc. | 5.400% | 6/13/35 | 350 | 328 |
| Prudential Financial, Inc. | 5.900% | 3/17/36 | 1,500 | 1,506 |
| Prudential Financial, Inc. | 5.700% | 12/14/36 | 950 | 922 |
| St. Paul Travelers Cos., Inc. | 6.750% | 6/20/36 | 1,000 | 1,110 |
| Travelers Property Casualty Corp. | 6.375% | 3/15/33 | 1,500 | 1,577 |
| UnitedHealth Group, Inc. | 5.800% | 3/15/36 | 1,300 | 1,281 |
| WellPoint Inc. | 5.950% | 12/15/34 | 1,250 | 1,231 |
| WellPoint Inc. | 5.850% | 1/15/36 | 1,975 | 1,923 |
| XL Capital Ltd. | 6.375% | 11/15/24 | 1,150 | 1,196 |
| Real Estate Investment Trusts (0.1%) | ||||
| Duke Realty LP | 5.950% | 2/15/17 | 750 | 764 |
| EOP Operating LP | 7.875% | 7/15/31 | 650 | 771 |
| Health Care Property Investors, Inc. | 5.625% | 5/1/17 | 375 | 359 |
| Simon Property Group Inc. | 5.875% | 3/1/17 | 900 | 919 |
| Other (0.0%) | ||||
| J. Paul Getty Trust | 5.875% | 10/1/33 | 750 | 751 |
| 230,955 | ||||
| Industrial (24.3%) | ||||
| Basic Industry (1.8%) | ||||
| Alcan, Inc. | 7.250% | 3/15/31 | 1,250 | 1,404 |
| Alcan, Inc. | 6.125% | 12/15/33 | 1,075 | 1,061 |
| Aluminum Co. of America | 6.750% | 1/15/28 | 600 | 667 |
| BHP Finance USA Ltd. | 6.420% | 3/1/26 | 1,500 | 1,604 |
| Dow Chemical Co. | 7.375% | 11/1/29 | 2,025 | 2,337 |
| E.I. du Pont de Nemours & Co. | 6.500% | 1/15/28 | 800 | 864 |
| Eastman Chemical Co. | 7.250% | 1/15/24 | 900 | 947 |
| Eastman Chemical Co. | 7.600% | 2/1/27 | 300 | 325 |
| Inco Ltd. | 7.200% | 9/15/32 | 1,050 | 1,123 |
| Lubrizol Corp. | 6.500% | 10/1/34 | 200 | 201 |
| Monsanto Co. | 5.500% | 8/15/25 | 1,350 | 1,292 |
| Newmont Mining | 5.875% | 4/1/35 | 1,100 | 1,027 |
| Noranda, Inc. | 5.500% | 6/15/17 | 1,250 | 1,207 |
| Placer Dome, Inc. | 6.450% | 10/15/35 | 700 | 710 |
| Potash Corp. of Saskatchewan | 5.875% | 12/1/36 | 850 | 821 |
| 3 Reliance Steel & Aluminum | 6.850% | 11/15/36 | 350 | 344 |
| 2 Rohm & Haas Co. | 9.800% | 4/15/20 | 371 | 457 |
| Rohm & Haas Co. | 7.850% | 7/15/29 | 1,950 | 2,367 |
| Southern Copper Corp. | 7.500% | 7/27/35 | 1,975 | 2,170 |
| Teck Cominco Ltd. | 6.125% | 10/1/35 | 1,800 | 1,732 |
| Vale Overseas Ltd. | 6.250% | 1/23/17 | 3,375 | 3,421 |
| Vale Overseas Ltd. | 8.250% | 1/17/34 | 1,725 | 2,066 |
| Vale Overseas Ltd. | 6.875% | 11/21/36 | 4,175 | 4,274 |
| Westvaco Corp. | 8.200% | 1/15/30 | 575 | 642 |
| Westvaco Corp. | 7.950% | 2/15/31 | 400 | 437 |
| Weyerhaeuser Co. | 6.950% | 8/1/17 | 350 | 364 |
| Weyerhaeuser Co. | 8.500% | 1/15/25 | 600 | 684 |
| Weyerhaeuser Co. | 7.950% | 3/15/25 | 500 | 544 |
| Weyerhaeuser Co. | 7.375% | 3/15/32 | 3,550 | 3,701 |
| Willamette Ind | 7.850% | 7/1/26 | 1,000 | 1,065 |
| Capital Goods (2.3%) | ||||
| Boeing Co. | 8.750% | 8/15/21 | 300 | 395 |
| Boeing Co. | 8.750% | 9/15/31 | 850 | 1,198 |
| Boeing Co. | 6.125% | 2/15/33 | 925 | 1,000 |
| Boeing Co. | 6.625% | 2/15/38 | 1,050 | 1,199 |
| Caterpillar, Inc. | 6.625% | 7/15/28 | 825 | 916 |
| Caterpillar, Inc. | 7.300% | 5/1/31 | 1,200 | 1,427 |
| Caterpillar, Inc. | 6.050% | 8/15/36 | 1,000 | 1,030 |
| Caterpillar, Inc. | 6.950% | 5/1/42 | 1,425 | 1,667 |
| CRH America Inc. | 6.400% | 10/15/33 | 750 | 747 |
| Deere & Co. | 8.100% | 5/15/30 | 1,000 | 1,296 |
| Deere & Co. | 7.125% | 3/3/31 | 425 | 504 |
| 3 Embraer Overseas Ltd. | 6.375% | 1/24/17 | 700 | 694 |
| Emerson Electric Co. | 4.500% | 5/1/13 | 600 | 574 |
| Emerson Electric Co. | 6.000% | 8/15/32 | 400 | 415 |
| Goodrich Corp. | 6.800% | 7/1/36 | 1,000 | 1,063 |
| Honeywell International, Inc. | 5.700% | 3/15/36 | 1,625 | 1,606 |
| Lafarge SA | 7.125% | 7/15/36 | 1,800 | 1,961 |
| Lockheed Martin Corp. | 7.750% | 5/1/26 | 150 | 184 |
| Lockheed Martin Corp. | 6.150% | 9/1/36 | 4,600 | 4,851 |
| Masco Corp. | 7.750% | 8/1/29 | 550 | 594 |
| Masco Corp. | 6.500% | 8/15/32 | 1,275 | 1,209 |
| Minnesota Mining & Manufacturing Corp. | 6.375% | 2/15/28 | 500 | 548 |
| Northrop Grumman Corp. | 7.750% | 2/15/31 | 4,300 | 5,340 |
| 3 Owens Corning, Inc. | 6.500% | 12/1/16 | 1,275 | 1,274 |
| 3 Owens Corning, Inc. | 7.000% | 12/1/36 | 700 | 690 |
| PACTIV Corp. | 7.950% | 12/15/25 | 1,000 | 1,109 |
| Raytheon Co. | 6.400% | 12/15/18 | 500 | 536 |
| Raytheon Co. | 7.200% | 8/15/27 | 1,150 | 1,336 |
| Raytheon Co. | 7.000% | 11/1/28 | 1,000 | 1,147 |
| Republic Services, Inc. | 6.086% | 3/15/35 | 225 | 223 |
| TRW, Inc. | 7.750% | 6/1/29 | 250 | 306 |
| Tyco International Group SA | 7.000% | 6/15/28�� | 2,675 | 3,090 |
| United Technologies Corp. | 8.875% | 11/15/19 | 545 | 707 |
| United Technologies Corp. | 6.700% | 8/1/28 | 250 | 282 |
| United Technologies Corp. | 7.500% | 9/15/29 | 1,875 | 2,301 |
| United Technologies Corp. | 5.400% | 5/1/35 | 2,100 | 2,040 |
| United Technologies Corp. | 6.050% | 6/1/36 | 1,150 | 1,213 |
| USA Waste Services, Inc. | 7.000% | 7/15/28 | 2,050 | 2,202 |
| Waste Management, Inc. | 7.750% | 5/15/32 | 1,125 | 1,325 |
| WMX Technologies Inc. | 7.100% | 8/1/26 | 800 | 863 |
| Communication (7.5%) | ||||
| Alltel Corp. | 7.875% | 7/1/32 | 1,375 | 1,439 |
| America Movil SA de C.V | 6.375% | 3/1/35 | 2,075 | 2,039 |
| Ameritech Capital Funding | 6.550% | 1/15/28 | 1,000 | 991 |
| AT&T Corp. | 8.000% | 11/15/31 | 4,425 | 5,505 |
| AT&T Corp. | 6.800% | 5/15/36 | 1,275 | 1,354 |
| AT&T Inc. | 6.450% | 6/15/34 | 3,975 | 4,061 |
| AT&T Inc. | 6.150% | 9/15/34 | 3,000 | 2,963 |
| BellSouth Capital Funding | 7.875% | 2/15/30 | 3,425 | 3,947 |
| BellSouth Corp. | 5.200% | 12/15/16 | 350 | 337 |
| BellSouth Corp. | 6.550% | 6/15/34 | 2,475 | 2,535 |
| BellSouth Corp. | 6.000% | 11/15/34 | 1,480 | 1,418 |
| BellSouth Telecommunications | 6.375% | 6/1/28 | 4,140 | 4,189 |
| British Telecommunications PLC | 9.125% | 12/15/30 | 5,975 | 8,178 |
| CBS Corp. | 4.625% | 5/15/18 | 150 | 129 |
| CBS Corp. | 7.875% | 7/30/30 | 2,640 | 2,778 |
| CBS Corp. | 5.500% | 5/15/33 | 525 | 437 |
| CenturyTel Enterprises | 6.875% | 1/15/28 | 550 | 535 |
| Cingular Wireless LLC | 7.125% | 12/15/31 | 2,425 | 2,690 |
| Comcast Cable Communications Holdings Inc. | 9.455% | 11/15/22 | 2,698 | 3,504 |
| Comcast Cable Communications, Inc. | 6.500% | 1/15/17 | 1,575 | 1,642 |
| Comcast Cable Communications, Inc. | 8.875% | 5/1/17 | 2,200 | 2,670 |
| Comcast Corp. | 5.875% | 2/15/18 | 1,400 | 1,385 |
| Comcast Corp. | 7.050% | 3/15/33 | 1,375 | 1,476 |
| Comcast Corp. | 5.650% | 6/15/35 | 1,000 | 908 |
| Comcast Corp. | 6.500% | 11/15/35 | 3,375 | 3,395 |
| Comcast Corp. | 6.450% | 3/15/37 | 2,050 | 2,060 |
| Deutsche Telekom International Finance | 8.250% | 6/15/30 | 8,125 | 10,003 |
| Embarq Corp. | 7.995% | 6/1/36 | 2,500 | 2,596 |
| France Telecom | 8.500% | 3/1/31 | 5,500 | 7,256 |
| Grupo Televisa SA | 6.625% | 3/18/25 | 1,600 | 1,678 |
| Grupo Televisa SA | 8.500% | 3/11/32 | 250 | 311 |
| GTE Corp. | 6.840% | 4/15/18 | 1,000 | 1,061 |
| GTE Corp. | 8.750% | 11/1/21 | 900 | 1,071 |
| GTE Corp. | 6.940% | 4/15/28 | 2,275 | 2,359 |
| Knight Ridder, Inc. | 5.750% | 9/1/17 | 1,075 | 1,003 |
| Knight Ridder, Inc. | 6.875% | 3/15/29 | 200 | 190 |
| Koninklijke KPN NV | 8.375% | 10/1/30 | 1,525 | 1,765 |
| Michigan Bell Telephone Co. | 7.850% | 1/15/22 | 1,522 | 1,660 |
| New Cingular Wireless Services | 8.750% | 3/1/31 | 4,600 | 5,980 |
| New England Telephone & Telegraph Co. | 7.875% | 11/15/29 | 400 | 434 |
| News America Holdings, Inc. | 8.150% | 10/17/36 | 1,225 | 1,450 |
| News America Holdings, Inc. | 7.750% | 12/1/45 | 1,225 | 1,390 |
| News America Inc. | 7.250% | 5/18/18 | 350 | 382 |
| News America Inc. | 6.550% | 3/15/33 | 225 | 225 |
| News America Inc. | 6.200% | 12/15/34 | 4,075 | 3,953 |
| News America Inc. | 6.400% | 12/15/35 | 2,125 | 2,119 |
| Pacific Bell | 7.125% | 3/15/26 | 550 | 597 |
| Sprint Capital Corp. | 6.900% | 5/1/19 | 2,925 | 3,020 |
| Sprint Capital Corp. | 6.875% | 11/15/28 | 6,200 | 6,187 |
| Sprint Capital Corp. | 8.750% | 3/15/32 | 3,125 | 3,754 |
| Sprint Nextel Corp. | 6.000% | 12/1/16 | 4,750 | 4,632 |
| TCI Communications, Inc. | 7.875% | 2/15/26 | 2,200 | 2,514 |
| Telecom Italia Capital | 6.375% | 11/15/33 | 3,975 | 3,771 |
| Telecom Italia Capital | 6.000% | 9/30/34 | 500 | 451 |
| Telecom Italia Capital | 7.200% | 7/18/36 | 1,625 | 1,698 |
| Telefonica Emisiones SAU | 7.045% | 6/20/36 | 4,725 | 5,053 |
| Telefonica Europe BV | 8.250% | 9/15/30 | 2,500 | 2,990 |
| Thomson Corp. | 5.500% | 8/15/35 | 650 | 591 |
| Time Warner Entertainment | 8.375% | 3/15/23 | 2,425 | 2,838 |
| Time Warner Entertainment | 8.375% | 7/15/33 | 1,950 | 2,355 |
| US Cellular | 6.700% | 12/15/33 | 950 | 898 |
| Verizon Global Funding Corp. | 7.750% | 12/1/30 | 7,350 | 8,624 |
| Verizon Global Funding Corp. | 5.850% | 9/15/35 | 1,375 | 1,323 |
| Verizon Maryland, Inc. | 5.125% | 6/15/33 | 500 | 412 |
| Verizon New York, Inc. | 7.375% | 4/1/32 | 650 | 670 |
| Vodafone AirTouch PLC | 7.875% | 2/15/30 | 2,000 | 2,344 |
| Vodafone Group PLC | 4.625% | 7/15/18 | 2,000 | 1,792 |
| Vodafone Group PLC | 6.250% | 11/30/32 | 200 | 200 |
| Consumer Cyclical (3.1%) | ||||
| Chrysler Corp. | 7.450% | 3/1/27 | 2,400 | 2,558 |
| Chrysler Corp. | 7.450% | 2/1/97 | 829 | 839 |
| Chrysler Corp. | 7.400% | 8/1/97 | 1,000 | 1,005 |
| DaimlerChrysler North America Holding Corp. | 8.500% | 1/18/31 | 2,875 | 3,425 |
| Federated Department Stores, Inc. | 6.790% | 7/15/27 | 800 | 794 |
| Federated Department Stores, Inc. | 7.000% | 2/15/28 | 1,100 | 1,119 |
| Federated Department Stores, Inc. | 6.900% | 4/1/29 | 150 | 152 |
| Federated Retail Holding | 5.900% | 12/1/16 | 975 | 976 |
| Home Depot Inc. | 5.875% | 12/16/36 | 5,325 | 5,231 |
| J.C. Penney Co., Inc. | 7.950% | 4/1/17 | 900 | 1,021 |
| J.C. Penney Co., Inc. | 7.125% | 11/15/23 | 1,000 | 1,097 |
| J.C. Penney Co., Inc. | 7.400% | 4/1/37 | 750 | 815 |
| Johnson Controls, Inc. | 6.000% | 1/15/36 | 425 | 408 |
| Kohl's Corp. | 6.000% | 1/15/33 | 400 | 388 |
| Limited Brands Inc. | 6.950% | 3/1/33 | 250 | 251 |
| Lowe's Cos., Inc. | 6.875% | 2/15/28 | 550 | 623 |
| Lowe's Cos., Inc. | 6.500% | 3/15/29 | 1,800 | 1,907 |
| Lowe's Cos., Inc. | 5.500% | 10/15/35 | 800 | 747 |
| Lowe's Cos., Inc. | 5.800% | 10/15/36 | 800 | 776 |
| May Department Stores Co. | 6.650% | 7/15/24 | 1,450 | 1,445 |
| May Department Stores Co. | 6.700% | 7/15/34 | 2,350 | 2,320 |
| Nordstrom, Inc. | 6.950% | 3/15/28 | 300 | 323 |
| Pulte Homes, Inc. | 7.875% | 6/15/32 | 1,000 | 1,099 |
| Pulte Homes, Inc. | 6.375% | 5/15/33 | 600 | 565 |
| Pulte Homes, Inc. | 6.000% | 2/15/35 | 150 | 137 |
| Target Corp. | 7.000% | 7/15/31 | 550 | 634 |
| Target Corp. | 6.350% | 11/1/32 | 2,475 | 2,658 |
| The Walt Disney Co. | 7.000% | 3/1/32 | 2,500 | 2,882 |
| Time Warner, Inc. | 9.150% | 2/1/23 | 1,980 | 2,459 |
| Time Warner, Inc. | 7.570% | 2/1/24 | 500 | 546 |
| Time Warner, Inc. | 6.625% | 5/15/29 | 5,275 | 5,313 |
| Time Warner, Inc. | 7.625% | 4/15/31 | 5,835 | 6,498 |
| Time Warner, Inc. | 7.700% | 5/1/32 | 2,040 | 2,302 |
| Time Warner, Inc. | 6.500% | 11/15/36 | 1,700 | 1,695 |
| Viacom Inc. | 6.875% | 4/30/36 | 3,075 | 3,034 |
| Wal-Mart Stores, Inc. | 7.550% | 2/15/30 | 3,500 | 4,247 |
| Wal-Mart Stores, Inc. | 5.250% | 9/1/35 | 3,675 | 3,373 |
| 3 Western Union Co. | 6.200% | 11/17/36 | 850 | 797 |
| 3 Wyndham Worldwide | 6.000% | 12/1/16 | 875 | 855 |
| Consumer Noncyclical (4.0%) | ||||
| Anheuser-Busch Cos., Inc. | 7.125% | 7/1/17 | 600 | 612 |
| Anheuser-Busch Cos., Inc. | 6.800% | 8/20/32 | 3,125 | 3,444 |
| Anheuser-Busch Cos., Inc. | 5.950% | 1/15/33 | 650 | 645 |
| Anheuser-Busch Cos., Inc. | 5.750% | 4/1/36 | 400 | 383 |
| Archer-Daniels-Midland Co. | 8.375% | 4/15/17 | 1,000 | 1,208 |
| Archer-Daniels-Midland Co. | 7.500% | 3/15/27 | 350 | 419 |
| Archer-Daniels-Midland Co. | 6.625% | 5/1/29 | 250 | 275 |
| Archer-Daniels-Midland Co. | 7.000% | 2/1/31 | 2,625 | 3,022 |
| Archer-Daniels-Midland Co. | 5.935% | 10/1/32 | 255 | 259 |
| Archer-Daniels-Midland Co. | 5.375% | 9/15/35 | 1,325 | 1,255 |
| Boston Scientific | 6.250% | 11/15/35 | 1,450 | 1,444 |
| Bristol-Myers Squibb Co. | 7.150% | 6/15/23 | 1,950 | 2,197 |
| Bristol-Myers Squibb Co. | 6.800% | 11/15/26 | 239 | 262 |
| Bristol-Myers Squibb Co. | 5.875% | 11/15/36 | 2,700 | 2,671 |
| Bristol-Myers Squibb Co. | 6.875% | 8/1/97 | 200 | 213 |
| C.R. Bard, Inc. | 6.700% | 12/1/26 | 500 | 532 |
| Cardinal Health, Inc. | 5.850% | 12/15/17 | 1,975 | 1,965 |
| Coca-Cola Enterprises Inc. | 8.500% | 2/1/22 | 2,000 | 2,518 |
| Coca-Cola Enterprises Inc. | 8.000% | 9/15/22 | 500 | 607 |
| Coca-Cola Enterprises Inc. | 7.000% | 10/1/26 | 1,175 | 1,320 |
| Coca-Cola Enterprises Inc. | 6.950% | 11/15/26 | 3,850 | 4,327 |
| 3 ConAgra Foods, Inc. | 5.819% | 6/15/17 | 621 | 617 |
| ConAgra Foods, Inc. | 9.750% | 3/1/21 | 129 | 164 |
| ConAgra Foods, Inc. | 7.125% | 10/1/26 | 1,150 | 1,261 |
| ConAgra Foods, Inc. | 7.000% | 10/1/28 | 175 | 189 |
| ConAgra Foods, Inc. | 8.250% | 9/15/30 | 950 | 1,162 |
| Diageo Capital PLC | 5.875% | 9/30/36 | 500 | 493 |
| Eli Lilly & Co. | 7.125% | 6/1/25 | 1,000 | 1,168 |
| Fortune Brands Inc. | 5.875% | 1/15/36 | 1,475 | 1,348 |
| Genentech Inc. | 5.250% | 7/15/35 | 1,025 | 959 |
| GlaxoSmithKline Capital Inc. | 5.375% | 4/15/34 | 1,350 | 1,311 |
| Grand Metropolitan Investment Corp. | 7.450% | 4/15/35 | 1,325 | 1,576 |
| H.J. Heinz Co. | 6.750% | 3/15/32 | 1,600 | 1,621 |
| Johnson & Johnson | 6.950% | 9/1/29 | 1,125 | 1,349 |
| Johnson & Johnson | 4.950% | 5/15/33 | 1,125 | 1,055 |
| Kellogg Co. | 7.450% | 4/1/31 | 2,600 | 3,088 |
| Kimberly-Clark Corp. | 6.250% | 7/15/18 | 675 | 712 |
| Kraft Foods, Inc. | 6.500% | 11/1/31 | 2,150 | 2,310 |
| Kroger Co. | 7.700% | 6/1/29 | 375 | 418 |
| Kroger Co. | 8.000% | 9/15/29 | 1,925 | 2,204 |
| Kroger Co. | 7.500% | 4/1/31 | 850 | 954 |
| Merck & Co. | 6.300% | 1/1/26 | 500 | 524 |
| Merck & Co. | 6.400% | 3/1/28 | 1,750 | 1,867 |
| Merck & Co. | 5.950% | 12/1/28 | 1,050 | 1,060 |
| Pepsi Bottling Group, Inc. | 7.000% | 3/1/29 | 2,575 | 2,942 |
| PepsiAmericas Inc. | 5.000% | 5/15/17 | 750 | 713 |
| Pharmacia Corp. | 6.500% | 12/1/18 | 750 | 818 |
| Pharmacia Corp. | 6.600% | 12/1/28 | 2,000 | 2,263 |
| Philip Morris Cos., Inc. | 7.750% | 1/15/27 | 1,800 | 2,180 |
| Procter & Gamble Co. | 6.450% | 1/15/26 | 1,600 | 1,749 |
| Procter & Gamble Co. | 5.500% | 2/1/34 | 850 | 837 |
| Procter & Gamble Co. | 5.800% | 8/15/34 | 600 | 616 |
| 2 Procter & Gamble Co. ESOP | 9.360% | 1/1/21 | 2,466 | 3,104 |
| Safeway, Inc. | 7.250% | 2/1/31 | 856 | 931 |
| Schering-Plough Corp. | 6.750% | 12/1/33 | 1,950 | 2,129 |
| Sysco Corp. | 5.375% | 9/21/35 | 1,000 | 947 |
| Teva Pharmaceutical Finance LLC | 6.150% | 2/1/36 | 2,400 | 2,336 |
| Unilever Capital Corp. | 5.900% | 11/15/32 | 3,925 | 3,965 |
| Wyeth | 6.450% | 2/1/24 | 1,225 | 1,314 |
| Wyeth | 6.500% | 2/1/34 | 1,125 | 1,227 |
| Wyeth | 6.000% | 2/15/36 | 2,325 | 2,382 |
| Energy (3.2%) | ||||
| Alberta Energy Co. Ltd. | 7.375% | 11/1/31 | 1,000 | 1,129 |
| Amerada Hess Corp. | 7.875% | 10/1/29 | 3,500 | 4,075 |
| Amerada Hess Corp. | 7.125% | 3/15/33 | 575 | 628 |
| Anadarko Finance Co. | 7.500% | 5/1/31 | 1,500 | 1,703 |
| Anadarko Petroleum Corp. | 6.450% | 9/15/36 | 4,550 | 4,602 |
| Apache Finance Canada | 7.750% | 12/15/29 | 650 | 791 |
| Baker Hughes, Inc. | 6.875% | 1/15/29 | 1,000 | 1,105 |
| Burlington Resources, Inc. | 7.200% | 8/15/31 | 650 | 760 |
| Burlington Resources, Inc. | 7.400% | 12/1/31 | 1,675 | 2,003 |
| Canadian Natural Resources | 7.200% | 1/15/32 | 1,400 | 1,536 |
| Canadian Natural Resources | 6.450% | 6/30/33 | 675 | 671 |
| Canadian Natural Resources | 6.500% | 2/15/37 | 2,150 | 2,152 |
| ChevronTexaco Corp. | 9.750% | 3/15/20 | 500 | 691 |
| Conoco Funding Co. | 7.250% | 10/15/31 | 400 | 470 |
| ConocoPhillips Canada | 5.950% | 10/15/36 | 1,750 | 1,781 |
| Devon Energy Corp. | 7.950% | 4/15/32 | 250 | 306 |
| Devon Financing Corp. | 7.875% | 9/30/31 | 4,100 | 4,931 |
| Encana Corp. | 6.500% | 8/15/34 | 3,125 | 3,213 |
| Global Marine, Inc. | 7.000% | 6/1/28 | 800 | 873 |
| Husky Energy Inc. | 6.150% | 6/15/19 | 510 | 514 |
| Kerr McGee Corp. | 6.950% | 7/1/24 | 2,000 | 2,136 |
| Kerr McGee Corp. | 7.875% | 9/15/31 | 500 | 601 |
| Lasmo Inc. | 7.300% | 11/15/27 | 600 | 708 |
| Marathon Oil Corp. | 6.800% | 3/15/32 | 1,000 | 1,101 |
| Nexen, Inc. | 7.875% | 3/15/32 | 550 | 654 |
| Nexen, Inc. | 5.875% | 3/10/35 | 1,850 | 1,744 |
| Noble Energy Inc. | 8.000% | 4/1/27 | 775 | 910 |
| Norsk Hydro | 7.250% | 9/23/27 | 2,175 | 2,537 |
| Norsk Hydro | 7.150% | 1/15/29 | 1,000 | 1,159 |
| Occidental Petroleum | 7.200% | 4/1/28 | 1,400 | 1,605 |
| Occidental Petroleum | 8.450% | 2/15/29 | 200 | 262 |
| Petro-Canada | 7.875% | 6/15/26 | 150 | 176 |
| Petro-Canada | 7.000% | 11/15/28 | 250 | 269 |
| Petro-Canada | 5.350% | 7/15/33 | 1,650 | 1,441 |
| Petro-Canada | 5.950% | 5/15/35 | 2,000 | 1,907 |
| Suncor Energy, Inc. | 7.150% | 2/1/32 | 800 | 930 |
| Suncor Energy, Inc. | 5.950% | 12/1/34 | 875 | 881 |
| Sunoco, Inc. | 5.750% | 1/15/17 | 875 | 857 |
| Talisman Energy, Inc. | 7.250% | 10/15/27 | 450 | 493 |
| Talisman Energy, Inc. | 5.850% | 2/1/37 | 2,500 | 2,295 |
| Tosco Corp. | 8.125% | 2/15/30 | 7,500 | 9,553 |
| Transocean Sedco Forex, Inc. | 7.500% | 4/15/31 | 1,275 | 1,437 |
| Valero Energy Corp. | 7.500% | 4/15/32 | 1,800 | 2,055 |
| Weatherford International Inc. | 6.500% | 8/1/36 | 1,150 | 1,157 |
| XTO Energy, Inc. | 6.100% | 4/1/36 | 500 | 486 |
| Technology (0.8%) | ||||
| Corning Inc. | 7.250% | 8/15/36 | 600 | 642 |
| Dell Inc. | 7.100% | 4/15/28 | 500 | 540 |
| Electronic Data Systems | 7.450% | 10/15/29 | 375 | 410 |
| International Business Machines Corp. | 7.000% | 10/30/25 | 1,050 | 1,194 |
| International Business Machines Corp. | 6.220% | 8/1/27 | 4,600 | 4,840 |
| International Business Machines Corp. | 6.500% | 1/15/28 | 2,800 | 3,057 |
| International Business Machines Corp. | 7.125% | 12/1/96 | 400 | 460 |
| Motorola, Inc. | 7.500% | 5/15/25 | 900 | 1,043 |
| Motorola, Inc. | 6.500% | 9/1/25 | 1,475 | 1,553 |
| Motorola, Inc. | 6.500% | 11/15/28 | 1,000 | 1,059 |
| Pitney Bowes, Inc. | 4.750% | 5/15/18 | 1,000 | 923 |
| Science Applications International Corp. | 5.500% | 7/1/33 | 500 | 445 |
| Xerox Corp. | 6.750% | 2/1/17 | 1,350 | 1,401 |
| Transportation (1.6%) | ||||
| Burlington Northern Santa Fe Corp. | 7.000% | 12/15/25 | 700 | 788 |
| Burlington Northern Santa Fe Corp. | 7.950% | 8/15/30 | 1,300 | 1,612 |
| Burlington Northern Santa Fe Corp. | 6.200% | 8/15/36 | 1,425 | 1,462 |
| Canadian National Railway Co. | 6.800% | 7/15/18 | 1,025 | 1,134 |
| Canadian National Railway Co. | 6.250% | 8/1/34 | 1,850 | 1,971 |
| Canadian National Railway Co. | 6.200% | 6/1/36 | 1,325 | 1,399 |
| Canadian Pacific Rail | 7.125% | 10/15/31 | 2,075 | 2,424 |
| CNF, Inc. | 6.700% | 5/1/34 | 700 | 669 |
| 2 Continental Airlines, Inc. | 6.648% | 9/15/17 | 2,659 | 2,766 |
| 2 Continental Airlines, Inc. | 6.900% | 1/2/18 | 965 | 1,008 |
| 2 Continental Airlines, Inc. | 6.545% | 2/2/19 | 1,025 | 1,059 |
| CSX Corp. | 7.900% | 5/1/17 | 1,000 | 1,166 |
| CSX Corp. | 7.950% | 5/1/27 | 675 | 827 |
| CSX Corp. | 6.000% | 10/1/36 | 750 | 752 |
| Federal Express Corp. | 7.600% | 7/1/97 | 1,000 | 1,161 |
| Norfolk Southern Corp. | 7.700% | 5/15/17 | 2,400 | 2,782 |
| Norfolk Southern Corp. | 9.750% | 6/15/20 | 411 | 555 |
| Norfolk Southern Corp. | 5.590% | 5/17/25 | 716 | 697 |
| Norfolk Southern Corp. | 7.800% | 5/15/27 | 2,802 | 3,419 |
| Norfolk Southern Corp. | 5.640% | 5/17/29 | 698 | 674 |
| Norfolk Southern Corp. | 7.250% | 2/15/31 | 1,009 | 1,181 |
| Norfolk Southern Corp. | 7.900% | 5/15/97 | 450 | 556 |
| Southwest Airlines Co. | 5.125% | 3/1/17 | 650 | 607 |
| Union Pacific Corp. | 7.125% | 2/1/28 | 600 | 685 |
| Union Pacific Corp. | 6.625% | 2/1/29 | 1,125 | 1,226 |
| United Parcel Service of America | 8.375% | 4/1/20 | 500 | 634 |
| United Parcel Service of America | 8.375% | 4/1/30 | 500 | 664 |
| Other (0.0%) | ||||
| Dover Corp. | 5.375% | 10/15/35 | 350 | 332 |
| Rockwell International Corp. | 6.700% | 1/15/28 | 300 | 330 |
| 535,235 | ||||
| Utilities (5.2%) | ||||
| Electric (4.1%) | ||||
| AEP Texas Central Co. | 6.650% | 2/15/33 | 1,950 | 2,072 |
| Alabama Power Co. | 5.500% | 10/15/17 | 1,425 | 1,424 |
| AmerenEnergy Generating | 7.950% | 6/1/32 | 1,750 | 2,090 |
| Appalachian Power Co. | 5.800% | 10/1/35 | 350 | 333 |
| Arizona Public Service Co. | 5.500% | 9/1/35 | 300 | 268 |
| 3 Baltimore Gas & Electric Co. | 6.350% | 10/1/36 | 1,000 | 1,028 |
| CenterPoint Energy Houston | 6.950% | 3/15/33 | 925 | 1,025 |
| Cleveland Electric Illumination Co. | 7.880% | 11/1/17 | 250 | 293 |
| Cleveland Electric Illumination Co. | 5.950% | 12/15/36 | 1,000 | 951 |
| Columbus Southern Power | 5.850% | 10/1/35 | 800 | 782 |
| Commonwealth Edison Co. | 5.875% | 2/1/33 | 250 | 242 |
| Commonwealth Edison Co. | 5.900% | 3/15/36 | 500 | 486 |
| Connecticut Light & Power Co. | 6.350% | 6/1/36 | 750 | 800 |
| Consolidated Edison Co. of New York | 5.300% | 3/1/35 | 775 | 715 |
| Consolidated Edison Co. of New York | 5.850% | 3/15/36 | 2,225 | 2,221 |
| Consolidated Edison Co. of New York | 6.200% | 6/15/36 | 550 | 576 |
| Constellation Energy Group, Inc. | 7.600% | 4/1/32 | 1,800 | 2,116 |
| Consumers Energy Co. | 5.650% | 4/15/20 | 1,250 | 1,228 |
| Detroit Edison Co. | 5.700% | 10/1/37 | 500 | 487 |
| Dominion Resources, Inc. | 6.750% | 12/15/32 | 1,000 | 1,086 |
| Dominion Resources, Inc. | 6.300% | 3/15/33 | 1,150 | 1,182 |
| Dominion Resources, Inc. | 5.950% | 6/15/35 | 1,925 | 1,906 |
| DTE Energy Co. | 6.375% | 4/15/33 | 1,000 | 1,027 |
| Duke Capital Corp. | 8.000% | 10/1/19 | 425 | 495 |
| Duke Capital Corp. | 6.750% | 2/15/32 | 575 | 613 |
| Duke Energy Corp. | 6.000% | 12/1/28 | 1,000 | 1,011 |
| Duke Energy Corp. | 6.450% | 10/15/32 | 1,050 | 1,124 |
| El Paso Electric Co. | 6.000% | 5/15/35 | 725 | 700 |
| Energy East Corp. | 6.750% | 7/15/36 | 1,425 | 1,512 |
| Exelon Corp. | 5.625% | 6/15/35 | 475 | 450 |
| FirstEnergy Corp. | 7.375% | 11/15/31 | 5,050 | 5,781 |
| Florida Power & Light Co. | 5.950% | 10/1/33 | 350 | 358 |
| Florida Power & Light Co. | 5.625% | 4/1/34 | 1,174 | 1,149 |
| Florida Power & Light Co. | 4.950% | 6/1/35 | 775 | 686 |
| Florida Power & Light Co. | 5.400% | 9/1/35 | 1,625 | 1,538 |
| Florida Power & Light Co. | 6.200% | 6/1/36 | 350 | 371 |
| Florida Power & Light Co. | 5.650% | 2/1/37 | 750 | 736 |
| Indiana Michigan Power Co. | 6.050% | 3/15/37 | 725 | 711 |
| Kansas City Power & Light | 6.050% | 11/15/35 | 500 | 496 |
| MidAmerican Energy Co. | 6.750% | 12/30/31 | 1,800 | 2,001 |
| MidAmerican Energy Co. | 5.750% | 11/1/35 | 850 | 831 |
| MidAmerican Energy Co. | 5.800% | 10/15/36 | 875 | 855 |
| MidAmerican Energy Holdings Co. | 8.480% | 9/15/28 | 300 | 380 |
| MidAmerican Energy Holdings Co. | 6.125% | 4/1/36 | 4,425 | 4,486 |
| National Rural Utilities Cooperative Finance Corp. | 8.000% | 3/1/32 | 1,900 | 2,431 |
| NiSource Finance Corp. | 5.250% | 9/15/17 | 2,025 | 1,905 |
| NiSource Finance Corp. | 5.450% | 9/15/20 | 725 | 680 |
| Northern States Power Co. | 5.250% | 7/15/35 | 1,175 | 1,093 |
| Northern States Power Co. | 6.250% | 6/1/36 | 725 | 776 |
| Ohio Power Co. | 6.600% | 2/15/33 | 400 | 424 |
| Oncor Electric Delivery Co. | 7.000% | 9/1/22 | 1,425 | 1,529 |
| Oncor Electric Delivery Co. | 7.000% | 5/1/32 | 1,150 | 1,255 |
| Oncor Electric Delivery Co. | 7.250% | 1/15/33 | 325 | 366 |
| Pacific Gas & Electric Co. | 6.050% | 3/1/34 | 6,650 | 6,727 |
| PacifiCorp | 7.700% | 11/15/31 | 400 | 497 |
| PacifiCorp | 5.250% | 6/15/35 | 1,150 | 1,057 |
| Pepco Holdings, Inc. | 7.450% | 8/15/32 | 300 | 346 |
| PPL Energy Supply LLC | 6.000% | 12/15/36 | 1,350 | 1,293 |
| Progress Energy, Inc. | 7.750% | 3/1/31 | 1,725 | 2,086 |
| Progress Energy, Inc. | 7.000% | 10/30/31 | 925 | 1,038 |
| PSE&G Power LLC | 8.625% | 4/15/31 | 1,000 | 1,293 |
| PSI Energy Inc. | 6.120% | 10/15/35 | 600 | 602 |
| Puget Sound Energy Inc. | 5.483% | 6/1/35 | 825 | 750 |
| Puget Sound Energy Inc. | 6.274% | 3/15/37 | 1,425 | 1,452 |
| South Carolina Electric & Gas Co. | 6.625% | 2/1/32 | 500 | 557 |
| South Carolina Electric & Gas Co. | 5.300% | 5/15/33 | 950 | 891 |
| Southern California Edison Co. | 6.650% | 4/1/29 | 700 | 750 |
| Southern California Edison Co. | 6.000% | 1/15/34 | 1,125 | 1,147 |
| Southern California Edison Co. | 5.750% | 4/1/35 | 400 | 394 |
| Southern California Edison Co. | 5.350% | 7/15/35 | 2,250 | 2,094 |
| Southern California Edison Co. | 5.625% | 2/1/36 | 1,000 | 968 |
| Southern California Edison Co. | 5.550% | 1/15/37 | 600 | 574 |
| Tampa Electric Co. | 6.550% | 5/15/36 | 450 | 477 |
| Toledo Edison Co. | 6.150% | 5/15/37 | 600 | 591 |
| United Utilities PLC | 5.375% | 2/1/19 | 1,000 | 949 |
| United Utilities PLC | 6.875% | 8/15/28 | 375 | 395 |
| Virginia Electric & Power Co. | 6.000% | 1/15/36 | 900 | 898 |
| Wisconsin Electric Power Co. | 5.625% | 5/15/33 | 450 | 444 |
| Xcel Energy, Inc. | 6.500% | 7/1/36 | 650 | 684 |
| Natural Gas (1.1%) | ||||
| AGL Capital Corp. | 6.000% | 10/1/34 | 850 | 821 |
| Boardwalk Pipelines LLC | 5.500% | 2/1/17 | 825 | 797 |
| Consolidated Natural Gas | 6.800% | 12/15/27 | 1,500 | 1,628 |
| Duke Energy Field Services | 8.125% | 8/16/30 | 500 | 615 |
| Energy Transfer Partners LP | 6.125% | 2/15/17 | 850 | 861 |
| Energy Transfer Partners LP | 6.625% | 10/15/36 | 725 | 746 |
| Enterprise Products Operating LP | 6.875% | 3/1/33 | 875 | 919 |
| Enterprise Products Operating LP | 6.650% | 10/15/34 | 900 | 925 |
| KeySpan Corp. | 8.000% | 11/15/30 | 1,175 | 1,443 |
| Kinder Morgan Energy Partners LP | 7.750% | 3/15/32 | 500 | 567 |
| Kinder Morgan Energy Partners LP | 7.300% | 8/15/33 | 1,000 | 1,081 |
| Kinder Morgan Energy Partners LP | 5.800% | 3/15/35 | 1,550 | 1,384 |
| Kinder Morgan, Inc. | 6.400% | 1/5/36 | 550 | 494 |
| KN Energy, Inc. | 7.250% | 3/1/28 | 1,550 | 1,499 |
| ONEOK Inc. | 6.000% | 6/15/35 | 975 | 890 |
| ONEOK Partners, LP | 6.650% | 10/1/36 | 1,850 | 1,898 |
| 3 Plains All American Pipeline LP | 6.125% | 1/15/17 | 1,500 | 1,506 |
| 3 Plains All American Pipeline LP | 6.650% | 1/15/37 | 400 | 407 |
| San Diego Gas & Electric | 5.350% | 5/15/35 | 1,275 | 1,214 |
| Southern California Gas Co. | 5.750% | 11/15/35 | 75 | 75 |
| Southern Union Co. | 7.600% | 2/1/24 | 500 | 519 |
| Southern Union Co. | 8.250% | 11/15/29 | 1,000 | 1,136 |
| Texas Eastern Transmission | 7.000% | 7/15/32 | 700 | 780 |
| Trans-Canada Pipelines | 5.600% | 3/31/34 | 1,725 | 1,632 |
| Trans-Canada Pipelines | 5.850% | 3/15/36 | 1,775 | 1,726 |
| 115,598 | ||||
| Total Corporate Bonds | ||||
| (Cost $878,776) | 885,112 | |||
| Sovereign Bonds (U.S. Dollar-Denominated) (4.3%) | ||||
| Asian Development Bank | 5.593% | 7/16/18 | 2,200 | 2,270 |
| European Investment Bank | 4.875% | 2/15/36 | 1,000 | 928 |
| Inter-American Development Bank | 7.000% | 6/15/25 | 750 | 898 |
| International Bank for Reconstruction & Development | 7.625% | 1/19/23 | 1,807 | 2,266 |
| International Bank for Reconstruction & Development | 8.875% | 3/1/26 | 1,000 | 1,422 |
| International Bank for Reconstruction & Development | 4.750% | 2/15/35 | 2,225 | 2,077 |
| Korea Electric Power | 7.000% | 2/1/27 | 750 | 857 |
| Kreditanstalt fur Wiederaufbau | 0.000% | 4/18/36 | 3,700 | 820 |
| Pemex Project Funding Master Trust | 8.625% | 2/1/22 | 2,750 | 3,400 |
| Pemex Project Funding Master Trust | 6.625% | 6/15/35 | 4,900 | 5,018 |
| Province of British Columbia | 6.500% | 1/15/26 | 1,500 | 1,719 |
| Province of Manitoba | 9.250% | 4/1/20 | 1,500 | 2,055 |
| Province of Nova Scotia | 9.125% | 5/1/21 | 1,280 | 1,742 |
| Province of Quebec | 4.875% | 5/5/14 | 500 | 491 |
| Province of Quebec | 7.500% | 7/15/23 | 600 | 735 |
| Province of Quebec | 7.125% | 2/9/24 | 3,800 | 4,515 |
| Province of Quebec | 7.500% | 9/15/29 | 2,950 | 3,726 |
| Province of Saskatchewan | 7.375% | 7/15/13 | 600 | 674 |
| Quebec Hydro Electric | 9.400% | 2/1/21 | 1,480 | 2,069 |
| Quebec Hydro Electric | 8.400% | 1/15/22 | 775 | 1,013 |
| Quebec Hydro Electric | 8.050% | 7/7/24 | 5,000 | 6,493 |
| Quebec Hydro Electric | 8.500% | 12/1/29 | 500 | 695 |
| Region of Lombardy, Italy | 5.804% | 10/25/32 | 2,375 | 2,404 |
| Republic of Finland | 6.950% | 2/15/26 | 195 | 234 |
| Republic of Italy | 6.875% | 9/27/23 | 6,600 | 7,662 |
| Republic of Italy | 5.375% | 6/15/33 | 4,725 | 4,635 |
| Republic of Korea | 5.625% | 11/3/25 | 900 | 899 |
| Republic of South Africa | 8.500% | 6/23/17 | 900 | 1,090 |
| United Mexican States | 5.625% | 1/15/17 | 5,425 | 5,436 |
| United Mexican States | 8.125% | 12/30/19 | 7,250 | 8,863 |
| United Mexican States | 8.000% | 9/24/22 | 4,300 | 5,263 |
| United Mexican States | 8.300% | 8/15/31 | 2,825 | 3,636 |
| United Mexican States | 7.500% | 4/8/33 | 3,900 | 4,606 |
| United Mexican States | 6.750% | 9/27/34 | 4,125 | 4,476 |
| Total Sovereign Bonds | ||||
| (Cost $91,603) | 95,087 | |||
| Taxable Municipal Bonds (1.3%) | ||||
| Illinois (Taxable Pension) GO | 4.950% | 6/1/23 | 1,225 | 1,172 |
| Illinois (Taxable Pension) GO | 5.100% | 6/1/33 | 18,150 | 17,374 |
| Kansas Dev. Finance Auth. Rev. (Public Employee Retirement System) | 5.501% | 5/1/34 | 500 | 501 |
| New Jersey Econ. Dev. Auth. State Pension Rev | 7.425% | 2/15/29 | 1,250 | 1,543 |
| New Jersey Turnpike Auth. Rev | 4.252% | 1/1/16 | 30 | 28 |
| New Jersey Turnpike Auth. Rev | 4.252% | 1/1/16 | 570 | 538 |
| Oregon (Taxable Pension) GO | 5.762% | 6/1/23 | 600 | 625 |
| Oregon (Taxable Pension) GO | 5.892% | 6/1/27 | 1,850 | 1,937 |
| Oregon School Board Assn | 4.759% | 6/30/28 | 1,850 | 1,699 |
| Oregon School Board Assn | 5.528% | 6/30/28 | 1,500 | 1,507 |
| Wisconsin Public Service Rev | 5.700% | 5/1/26 | 900 | 931 |
| Total Taxable Municipal Bonds | ||||
| (Cost $27,442) | 27,855 | |||
| Temporary Cash Investment (0.5%) | Shares | |||
| 4 Vanguard Market Liquidity Fund, 5.294% | ||||
| (Cost $10,884) | 10,884,295 | 10,884 | ||
| Total Investments (98.2%) | ||||
| (Cost $2,129,488) | 2,167,818 | |||
| Other Assets and Liabilities - Net (1.8%) | 39,004 | |||
| Net Assets (100%) | 2,206,822 | |||
| 1 | The issuer operates under a congressional charter; its securities are neither issued nor guaranteed by the U.S. government. If needed, access to additional funding from the U.S. Treasury (beyond the issuer's line of credit) would require congressional action. |
| 2 | The average or expected maturity is shorter than the final maturity shown because of the possibility of interim principal payments and prepayments or the possibility of the issue being called. |
| 3 | Security exempt from registration under Rule 144A of the Securities Act of 1933. Such securities may be sold in transactions exempt from registration, normally to qualified institutional buyers. At December 31, 2006, the aggregate value of these securities was $11,120,000, representing 0.5% of net assets. |
| 4 | Affiliated money market fund available only to Vanguard funds and certain trusts and accounts managed by Vanguard. Rate shown is the 7-day yield. GO - General Obligation Bond. |
| Vanguard Intermediate-Term Bond Index Fund Schedule of Investments December 31, 2006 | ||||
|---|---|---|---|---|
| Coupon | Maturity Date | Face Amount ($000) | Market Value ($000) | |
| U.S. Government and Agency Obligations (49.3%) | ||||
| U.S. Government Securities (34.6%) | ||||
| U.S. Treasury Bond | 10.375% | 11/15/12 | 12,075 | 12,613 |
| U.S. Treasury Bond | 3.625% | 5/15/13 | 10,225 | 9,635 |
| U.S. Treasury Bond | 4.000% | 2/15/15 | 82,425 | 78,523 |
| U.S. Treasury Bond | 11.250% | 2/15/15 | 108,735 | 156,222 |
| U.S. Treasury Bond | 10.625% | 8/15/15 | 59,030 | 83,509 |
| U.S. Treasury Bond | 9.875% | 11/15/15 | 146,775 | 201,151 |
| U.S. Treasury Bond | 9.250% | 2/15/16 | 114,525 | 152,586 |
| U.S. Treasury Bond | 7.250% | 5/15/16 | 191,150 | 227,260 |
| U.S. Treasury Bond | 7.500% | 11/15/16 | 28,525 | 34,671 |
| U.S. Treasury Bond | 8.750% | 5/15/17 | 140,125 | 185,404 |
| U.S. Treasury Bond | 8.875% | 8/15/17 | 4,900 | 6,556 |
| U.S. Treasury Bond | 9.125% | 5/15/18 | 93,500 | 128,635 |
| U.S. Treasury Bond | 8.875% | 2/15/19 | 950 | 1,300 |
| U.S. Treasury Note | 4.250% | 10/31/07 | 5,125 | 5,091 |
| U.S. Treasury Note | 4.375% | 12/31/07 | 63,500 | 63,113 |
| U.S. Treasury Note | 4.375% | 1/31/08 | 8,525 | 8,468 |
| U.S. Treasury Note | 4.625% | 9/30/08 | 34,725 | 34,589 |
| U.S. Treasury Note | 4.750% | 11/15/08 | 3,100 | 3,096 |
| U.S. Treasury Note | 4.875% | 2/15/12 | 500 | 505 |
| U.S. Treasury Note | 4.375% | 8/15/12 | 5,960 | 5,874 |
| U.S. Treasury Note | 4.000% | 11/15/12 | 68,175 | 65,821 |
| U.S. Treasury Note | 3.875% | 2/15/13 | 76,675 | 73,393 |
| U.S. Treasury Note | 4.250% | 8/15/13 | 27,925 | 27,227 |
| U.S. Treasury Note | 4.250% | 11/15/13 | 80,325 | 78,204 |
| U.S. Treasury Note | 4.000% | 2/15/14 | 260,710 | 249,549 |
| U.S. Treasury Note | 4.750% | 5/15/14 | 103,775 | 104,051 |
| U.S. Treasury Note | 4.250% | 8/15/14 | 24,925 | 24,197 |
| U.S. Treasury Note | 4.250% | 11/15/14 | 134,845 | 130,821 |
| U.S. Treasury Note | 4.125% | 5/15/15 | 1,325 | 1,272 |
| U.S. Treasury Note | 5.125% | 5/15/16 | 250 | 258 |
| U.S. Treasury Note | 4.875% | 8/15/16 | 225 | 228 |
| 2,153,822 | ||||
| Agency Bonds and Notes (14.7%) | ||||
| Arab Republic of Egypt (U.S. Government Guaranteed) | 4.450% | 9/15/15 | 6,825 | 6,582 |
| 1 Federal Farm Credit Bank | 4.875% | 12/16/15 | 7,450 | 7,351 |
| 1 Federal Farm Credit Bank | 5.125% | 8/25/16 | 7,200 | 7,251 |
| 1 Federal Home Loan Bank | 5.750% | 5/15/12 | 7,475 | 7,758 |
| 1 Federal Home Loan Bank | 4.500% | 11/15/12 | 24,175 | 23,642 |
| 1 Federal Home Loan Bank | 3.875% | 6/14/13 | 6,500 | 6,116 |
| 1 Federal Home Loan Bank | 5.375% | 6/14/13 | 5,000 | 5,087 |
| 1 Federal Home Loan Bank | 5.125% | 8/14/13 | 34,300 | 34,564 |
| 1 Federal Home Loan Bank | 4.500% | 9/16/13 | 38,400 | 37,322 |
| 1 Federal Home Loan Bank | 5.250% | 6/18/14 | 20,325 | 20,713 |
| 1 Federal Home Loan Bank | 5.375% | 5/18/16 | 21,350 | 21,942 |
| 1 Federal Home Loan Bank | 5.625% | 6/13/16 | 4,325 | 4,470 |
| 1 Federal Home Loan Bank | 4.750% | 12/16/16 | 19,650 | 19,252 |
| 1 Federal Home Loan Mortgage Corp. | 5.750% | 1/15/12 | 46,875 | 48,493 |
| 1 Federal Home Loan Mortgage Corp. | 5.125% | 7/15/12 | 59,000 | 59,447 |
| 1 Federal Home Loan Mortgage Corp. | 4.500% | 1/15/13 | 50,850 | 49,625 |
| 1 Federal Home Loan Mortgage Corp. | 4.500% | 7/15/13 | 44,975 | 43,791 |
| 1 Federal Home Loan Mortgage Corp. | 4.875% | 11/15/13 | 60,250 | 59,998 |
| 1 Federal Home Loan Mortgage Corp. | 4.500% | 1/15/14 | 15,000 | 14,588 |
| 1 Federal Home Loan Mortgage Corp. | 5.000% | 7/15/14 | 51,100 | 51,321 |
| 1 Federal Home Loan Mortgage Corp. | 5.250% | 4/18/16 | 26,500 | 27,005 |
| 1 Federal Home Loan Mortgage Corp. | 5.500% | 7/18/16 | 15,000 | 15,586 |
| 1 Federal Home Loan Mortgage Corp. | 5.125% | 10/18/16 | 5,000 | 5,044 |
| 1 Federal National Mortgage Assn | 6.125% | 3/15/12 | 72,235 | 76,024 |
| 1 Federal National Mortgage Assn | 5.250% | 8/1/12 | 3,500 | 3,504 |
| 1 Federal National Mortgage Assn | 4.375% | 9/15/12 | 30,675 | 29,781 |
| 1 Federal National Mortgage Assn | 4.375% | 3/15/13 | 13,400 | 12,987 |
| 1 Federal National Mortgage Assn | 4.625% | 5/1/13 | 6,600 | 6,405 |
| 1 Federal National Mortgage Assn | 4.625% | 10/15/13 | 56,500 | 55,364 |
| 1 Federal National Mortgage Assn | 5.125% | 1/2/14 | 9,550 | 9,533 |
| 1 Federal National Mortgage Assn | 4.625% | 10/15/14 | 31,625 | 30,965 |
| 1 Federal National Mortgage Assn | 5.000% | 3/15/16 | 21,025 | 21,054 |
| 1 Federal National Mortgage Assn | 5.250% | 9/15/16 | 32,925 | 33,498 |
| 1 Federal National Mortgage Assn | 4.875% | 12/15/16 | 29,900 | 29,608 |
| Private Export Funding Corp. | 7.200% | 1/15/10 | 6,500 | 6,897 |
| 1 Tennessee Valley Auth | 6.790% | 5/23/12 | 5,000 | 5,412 |
| 1 Tennessee Valley Auth | 6.000% | 3/15/13 | 6,000 | 6,298 |
| 1 Tennessee Valley Auth | 4.750% | 8/1/13 | 4,000 | 3,932 |
| 1 Tennessee Valley Auth | 4.375% | 6/15/15 | 7,000 | 6,696 |
| 914,906 | ||||
| Total U.S. Government and Agency Obligations | ||||
| (Cost $3,071,576) | 3,068,728 | |||
| Corporate Bonds (42.6%) | ||||
| Asset-Backed/Commercial Mortgage-Backed Securities (0.1%) | ||||
| 2 Bear Stearns Commercial Mortgage Securities, Inc. | 5.610% | 11/15/33 | 2,500 | 2,526 |
| 2,3 Citicorp Lease Pass-Through Trust | 8.040% | 12/15/19 | 2,100 | 2,482 |
| 2,3 Commercial Mortgage Lease-Backed Certificate | 6.746% | 6/20/31 | 384 | 400 |
| 5,408 | ||||
| Finance (19.7%) | ||||
| Banking (7.4%) | ||||
| AmSouth Bank NA | 4.850% | 4/1/13 | 1,500 | 1,459 |
| AmSouth Bank NA | 5.200% | 4/1/15 | 2,000 | 1,962 |
| Banco Bradesco SA | 8.750% | 10/24/13 | 1,500 | 1,703 |
| Bank of America Corp. | 6.250% | 4/15/12 | 14,150 | 14,797 |
| Bank of America Corp. | 4.875% | 9/15/12 | 3,000 | 2,953 |
| Bank of America Corp. | 4.875% | 1/15/13 | 1,000 | 984 |
| Bank of America Corp. | 5.375% | 6/15/14 | 2,775 | 2,794 |
| Bank of America Corp. | 5.125% | 11/15/14 | 2,100 | 2,079 |
| Bank of America Corp. | 5.250% | 12/1/15 | 5,000 | 4,937 |
| Bank of America Corp. | 5.750% | 8/15/16 | 3,900 | 3,998 |
| Bank of America Corp. | 5.625% | 10/14/16 | 12,875 | 13,121 |
| Bank of New York Co., Inc. | 6.375% | 4/1/12 | 1,500 | 1,577 |
| Bank of New York Co., Inc. | 4.950% | 3/15/15 | 2,300 | 2,239 |
| Bank One Corp. | 5.250% | 1/30/13 | 925 | 921 |
| BB&T Corp. | 4.750% | 10/1/12 | 5,500 | 5,353 |
| BB&T Corp. | 5.200% | 12/23/15 | 5,425 | 5,333 |
| BB&T Corp. | 5.625% | 9/15/16 | 1,150 | 1,168 |
| Citigroup, Inc. | 6.000% | 2/21/12 | 5,050 | 5,235 |
| Citigroup, Inc. | 5.625% | 8/27/12 | 8,050 | 8,197 |
| Citigroup, Inc. | 5.125% | 5/5/14 | 3,125 | 3,103 |
| Citigroup, Inc. | 5.000% | 9/15/14 | 25,344 | 24,726 |
| Citigroup, Inc. | 4.875% | 5/7/15 | 3,600 | 3,472 |
| Citigroup, Inc. | 4.700% | 5/29/15 | 2,600 | 2,497 |
| Citigroup, Inc. | 5.300% | 1/7/16 | 4,900 | 4,883 |
| Citigroup, Inc. | 5.850% | 8/2/16 | 6,400 | 6,647 |
| Colonial Bank NA | 6.375% | 12/1/15 | 1,250 | 1,287 |
| Comerica Bank | 5.750% | 11/21/16 | 1,300 | 1,310 |
| Comerica Inc. | 4.800% | 5/1/15 | 1,500 | 1,418 |
| Credit Suisse First Boston USA, Inc. | 6.500% | 1/15/12 | 11,290 | 11,915 |
| Credit Suisse First Boston USA, Inc. | 5.500% | 8/15/13 | 12,975 | 13,161 |
| Credit Suisse First Boston USA, Inc. | 5.125% | 1/15/14 | 2,000 | 1,983 |
| Credit Suisse First Boston USA, Inc. | 4.875% | 1/15/15 | 5,050 | 4,908 |
| Credit Suisse First Boston USA, Inc. | 5.125% | 8/15/15 | 7,725 | 7,611 |
| Credit Suisse First Boston USA, Inc. | 5.375% | 3/2/16 | 3,225 | 3,235 |
| Deutsche Bank Financial LLC | 5.375% | 3/2/15 | 4,050 | 4,056 |
| Fifth Third Bank | 4.750% | 2/1/15 | 2,800 | 2,677 |
| First Tennessee Bank | 5.050% | 1/15/15 | 2,800 | 2,715 |
| Golden West Financial Corp. | 4.750% | 10/1/12 | 2,500 | 2,437 |
| HSBC Bank USA | 4.625% | 4/1/14 | 8,275 | 7,937 |
| HSBC Holdings PLC | 5.250% | 12/12/12 | 5,225 | 5,217 |
| JPMorgan Chase & Co. | 4.500% | 1/15/12 | 1,875 | 1,816 |
| JPMorgan Chase & Co. | 5.750% | 1/2/13 | 9,650 | 9,855 |
| JPMorgan Chase & Co. | 4.875% | 3/15/14 | 6,950 | 6,750 |
| JPMorgan Chase & Co. | 5.125% | 9/15/14 | 8,965 | 8,838 |
| JPMorgan Chase & Co. | 4.750% | 3/1/15 | 5,000 | 4,819 |
| JPMorgan Chase & Co. | 5.250% | 5/1/15 | 150 | 149 |
| JPMorgan Chase & Co. | 5.150% | 10/1/15 | 15,250 | 14,986 |
| JPMorgan Chase & Co. | 5.875% | 6/13/16 | 975 | 1,002 |
| Key Bank NA | 5.800% | 7/1/14 | 3,800 | 3,871 |
| Key Bank NA | 4.950% | 9/15/15 | 1,000 | 961 |
| Key Bank NA | 5.450% | 3/3/16 | 3,025 | 3,014 |
| Marshall & Ilsley Bank | 5.250% | 9/4/12 | 3,000 | 2,985 |
| Marshall & Ilsley Bank | 4.850% | 6/16/15 | 700 | 675 |
| MBNA America Bank NA | 6.625% | 6/15/12 | 4,800 | 5,079 |
| MBNA Corp. | 7.500% | 3/15/12 | 2,400 | 2,643 |
| MBNA Corp. | 6.125% | 3/1/13 | 3,375 | 3,523 |
| Mellon Bank NA | 4.750% | 12/15/14 | 3,800 | 3,654 |
| National City Bank | 4.625% | 5/1/13 | 4,500 | 4,317 |
| NationsBank Corp. | 7.750% | 8/15/15 | 1,000 | 1,153 |
| North Fork Bancorp., Inc. | 5.875% | 8/15/12 | 2,000 | 2,040 |
| PaineWebber | 7.625% | 12/1/09 | 3,000 | 3,205 |
| Paribas NY | 6.950% | 7/22/13 | 2,000 | 2,178 |
| PNC Funding Corp. | 5.250% | 11/15/15 | 3,275 | 3,252 |
| Regions Financial Corp. | 6.375% | 5/15/12 | 3,925 | 4,121 |
| Royal Bank of Scotland Group PLC | 5.000% | 11/12/13 | 11,425 | 11,197 |
| Royal Bank of Scotland Group PLC | 5.000% | 10/1/14 | 3,500 | 3,419 |
| Royal Bank of Scotland Group PLC | 5.050% | 1/8/15 | 8,050 | 7,858 |
| 2 Royal Bank of Scotland Group PLC | 5.512% | 12/31/49 | 50 | 50 |
| Southtrust Corp. | 5.800% | 6/15/14 | 1,350 | 1,374 |
| Sovereign Bank | 5.125% | 3/15/13 | 5,600 | 5,490 |
| State Street Capital Trust | 5.300% | 1/15/16 | 1,000 | 1,000 |
| Sumitomo Mitsui Banking Corp. | 8.000% | 6/15/12 | 4,910 | 5,469 |
| SunTrust Banks, Inc. | 5.000% | 9/1/15 | 3,550 | 3,462 |
| Synovus Financial Corp. | 4.875% | 2/15/13 | 2,000 | 1,935 |
| UFJ Finance Aruba AEC | 6.750% | 7/15/13 | 15,350 | 16,451 |
| Union Bank of California NA | 5.950% | 5/11/16 | 4,100 | 4,221 |
| UnionBanCal Corp. | 5.250% | 12/16/13 | 1,200 | 1,183 |
| US Bank NA | 6.300% | 2/4/14 | 2,600 | 2,755 |
| US Bank NA | 4.950% | 10/30/14 | 7,725 | 7,543 |
| US Bank NA | 4.800% | 4/15/15 | 1,000 | 965 |
| Wachovia Bank NA | 4.800% | 11/1/14 | 2,750 | 2,637 |
| Wachovia Bank NA | 4.875% | 2/1/15 | 4,475 | 4,325 |
| Wachovia Corp. | 4.875% | 2/15/14 | 8,900 | 8,601 |
| Wachovia Corp. | 5.250% | 8/1/14 | 9,300 | 9,185 |
| Wachovia Corp. | 5.625% | 10/15/16 | 9,850 | 9,899 |
| Washington Mutual Bank | 5.500% | 1/15/13 | 4,200 | 4,202 |
| Washington Mutual Bank | 5.650% | 8/15/14 | 3,375 | 3,383 |
| Washington Mutual Bank | 5.125% | 1/15/15 | 6,600 | 6,412 |
| Washington Mutual, Inc. | 5.000% | 3/22/12 | 1,800 | 1,773 |
| Washington Mutual, Inc. | 4.625% | 4/1/14 | 2,000 | 1,875 |
| Wells Fargo & Co. | 5.125% | 9/1/12 | 350 | 348 |
| Wells Fargo & Co. | 4.950% | 10/16/13 | 5,225 | 5,116 |
| Wells Fargo & Co. | 4.625% | 4/15/14 | 6,650 | 6,354 |
| Wells Fargo & Co. | 5.000% | 11/15/14 | 8,475 | 8,275 |
| Wells Fargo Bank NA | 4.750% | 2/9/15 | 6,975 | 6,711 |
| Wells Fargo Bank NA | 5.750% | 5/16/16 | 4,600 | 4,734 |
| Wells Fargo Financial | 5.500% | 8/1/12 | 350 | 355 |
| Zions Bancorp | 5.650% | 5/15/14 | 1,200 | 1,200 |
| Zions Bancorp | 5.500% | 11/16/15 | 6,850 | 6,774 |
| Brokerage (3.6%) | ||||
| Ameriprise Financial Inc. | 5.650% | 11/15/15 | 3,450 | 3,478 |
| Amvescap PLC | 5.375% | 2/27/13 | 975 | 965 |
| Bear Stearns Co., Inc. | 5.700% | 11/15/14 | 11,150 | 11,368 |
| Bear Stearns Co., Inc. | 5.300% | 10/30/15 | 1,100 | 1,090 |
| Goldman Sachs Group, Inc. | 6.600% | 1/15/12 | 5,625 | 5,945 |
| Goldman Sachs Group, Inc. | 5.700% | 9/1/12 | 4,925 | 5,027 |
| Goldman Sachs Group, Inc. | 5.250% | 4/1/13 | 18,250 | 18,210 |
| Goldman Sachs Group, Inc. | 4.750% | 7/15/13 | 13,975 | 13,510 |
| Goldman Sachs Group, Inc. | 5.150% | 1/15/14 | 10,725 | 10,563 |
| Goldman Sachs Group, Inc. | 5.000% | 10/1/14 | 10,700 | 10,405 |
| Goldman Sachs Group, Inc. | 5.500% | 11/15/14 | 5,425 | 5,435 |
| Goldman Sachs Group, Inc. | 5.125% | 1/15/15 | 2,500 | 2,449 |
| Goldman Sachs Group, Inc. | 5.350% | 1/15/16 | 10,600 | 10,510 |
| Goldman Sachs Group, Inc. | 5.750% | 10/1/16 | 4,400 | 4,478 |
| Jefferies Group Inc. | 5.500% | 3/15/16 | 2,000 | 1,959 |
| Lehman Brothers Holdings, Inc. | 6.625% | 1/18/12 | 7,250 | 7,685 |
| Lehman Brothers Holdings, Inc. | 5.750% | 5/17/13 | 4,350 | 4,453 |
| Lehman Brothers Holdings, Inc. | 8.800% | 3/1/15 | 1,000 | 1,209 |
| Lehman Brothers Holdings, Inc. | 5.500% | 4/4/16 | 8,425 | 8,454 |
| Merrill Lynch & Co., Inc. | 5.000% | 2/3/14 | 8,650 | 8,498 |
| Merrill Lynch & Co., Inc. | 5.450% | 7/15/14 | 750 | 754 |
| Merrill Lynch & Co., Inc. | 5.000% | 1/15/15 | 15,925 | 15,575 |
| Merrill Lynch & Co., Inc. | 5.300% | 9/30/15 | 2,775 | 2,757 |
| Merrill Lynch & Co., Inc. | 6.050% | 5/16/16 | 6,450 | 6,682 |
| Morgan Stanley Dean Witter | 5.625% | 1/9/12 | 6,500 | 6,616 |
| Morgan Stanley Dean Witter | 6.600% | 4/1/12 | 6,115 | 6,490 |
| Morgan Stanley Dean Witter | 5.300% | 3/1/13 | 31,500 | 31,523 |
| Morgan Stanley Dean Witter | 4.750% | 4/1/14 | 13,500 | 12,947 |
| Morgan Stanley Dean Witter | 5.375% | 10/15/15 | 3,550 | 3,529 |
| Morgan Stanley Dean Witter | 5.750% | 10/18/16 | 5,000 | 5,089 |
| Finance Companies (4.3%) | ||||
| Allied Capital Corp. | 6.000% | 4/1/12 | 1,150 | 1,137 |
| American Express Co. | 4.875% | 7/15/13 | 5,500 | 5,363 |
| American Express Co. | 5.500% | 9/12/16 | 1,400 | 1,410 |
| 2 American Express Co. | 6.800% | 9/1/66 | 2,025 | 2,159 |
| American Express Credit Corp. | 5.300% | 12/2/15 | 2,000 | 1,997 |
| American General Finance Corp. | 4.875% | 7/15/12 | 2,050 | 2,002 |
| American General Finance Corp. | 5.850% | 6/1/13 | 7,450 | 7,621 |
| American General Finance Corp. | 5.750% | 9/15/16 | 7,375 | 7,467 |
| Capital One Bank | 6.500% | 6/13/13 | 3,775 | 3,988 |
| Capital One Bank | 5.125% | 2/15/14 | 3,150 | 3,105 |
| Capital One Financial | 4.800% | 2/21/12 | 50 | 49 |
| Capital One Financial | 5.500% | 6/1/15 | 3,750 | 3,750 |
| Capital One Financial | 6.150% | 9/1/16 | 4,325 | 4,481 |
| CIT Group Co. of Canada | 5.200% | 6/1/15 | 5,775 | 5,614 |
| CIT Group, Inc. | 7.750% | 4/2/12 | 5,250 | 5,793 |
| CIT Group, Inc. | 5.400% | 3/7/13 | 2,150 | 2,132 |
| CIT Group, Inc. | 5.000% | 2/13/14 | 875 | 845 |
| CIT Group, Inc. | 5.125% | 9/30/14 | 4,525 | 4,388 |
| CIT Group, Inc. | 5.000% | 2/1/15 | 4,550 | 4,369 |
| CIT Group, Inc. | 5.400% | 1/30/16 | 2,250 | 2,213 |
| CIT Group, Inc. | 5.850% | 9/15/16 | 2,150 | 2,178 |
| Countrywide Financial Corp. | 6.250% | 5/15/16 | 4,875 | 4,971 |
| General Electric Capital Corp. | 5.875% | 2/15/12 | 29,550 | 30,401 |
| General Electric Capital Corp. | 8.125% | 5/15/12 | 5,638 | 6,383 |
| General Electric Capital Corp. | 4.250% | 6/15/12 | 4,950 | 4,726 |
| General Electric Capital Corp. | 6.000% | 6/15/12 | 13,925 | 14,424 |
| General Electric Capital Corp. | 5.450% | 1/15/13 | 4,000 | 4,043 |
| General Electric Capital Corp. | 5.650% | 6/9/14 | 9,075 | 9,262 |
| General Electric Capital Corp. | 4.875% | 3/4/15 | 5,000 | 4,867 |
| General Electric Capital Corp. | 5.000% | 1/8/16 | 5,000 | 4,890 |
| General Electric Capital Corp. | 5.375% | 10/20/16 | 3,175 | 3,181 |
| 2 HSBC Finance Capital Trust IX | 5.911% | 11/30/35 | 5,700 | 5,739 |
| HSBC Finance Corp. | 7.000% | 5/15/12 | 4,400 | 4,742 |
| HSBC Finance Corp. | 6.375% | 11/27/12 | 7,150 | 7,529 |
| HSBC Finance Corp. | 4.750% | 7/15/13 | 10,075 | 9,751 |
| HSBC Finance Corp. | 5.250% | 1/15/14 | 2,150 | 2,136 |
| HSBC Finance Corp. | 5.250% | 4/15/15 | 4,425 | 4,375 |
| HSBC Finance Corp. | 5.000% | 6/30/15 | 8,350 | 8,108 |
| HSBC Finance Corp. | 5.500% | 1/19/16 | 9,425 | 9,478 |
| International Lease Finance Corp. | 4.750% | 1/13/12 | 1,500 | 1,462 |
| International Lease Finance Corp. | 5.400% | 2/15/12 | 3,450 | 3,459 |
| International Lease Finance Corp. | 5.000% | 9/15/12 | 8,725 | 8,568 |
| International Lease Finance Corp. | 5.625% | 9/20/13 | 1,400 | 1,414 |
| iStar Financial Inc. | 5.150% | 3/1/12 | 5,500 | 5,358 |
| 3 iStar Financial Inc. | 5.950% | 10/15/13 | 1,625 | 1,633 |
| iStar Financial Inc. | 5.875% | 3/15/16 | 2,475 | 2,460 |
| PHH Corp. | 7.125% | 3/1/13 | 2,050 | 2,136 |
| Residential Capital Corp. | 6.500% | 4/17/13 | 12,625 | 12,818 |
| SLM Corp. | 5.375% | 1/15/13 | 10,500 | 10,504 |
| SLM Corp. | 5.000% | 10/1/13 | 4,500 | 4,380 |
| SLM Corp. | 5.375% | 5/15/14 | 4,750 | 4,711 |
| SLM Corp. | 5.050% | 11/14/14 | 1,400 | 1,355 |
| Insurance (2.7%) | ||||
| ACE INA Holdings, Inc. | 5.875% | 6/15/14 | 2,000 | 2,040 |
| AEGON NV | 4.750% | 6/1/13 | 3,475 | 3,361 |
| Aetna, Inc. | 6.000% | 6/15/16 | 3,850 | 3,970 |
| Allstate Corp. | 6.125% | 2/15/12 | 3,000 | 3,095 |
| Allstate Corp. | 5.000% | 8/15/14 | 1,325 | 1,295 |
| American International Group, Inc. | 4.250% | 5/15/13 | 5,000 | 4,709 |
| American International Group, Inc. | 5.050% | 10/1/15 | 5,775 | 5,631 |
| American International Group, Inc. | 5.600% | 10/18/16 | 2,025 | 2,054 |
| Aspen Insurance Holdings Ltd. | 6.000% | 8/15/14 | 1,100 | 1,067 |
| Assurant, Inc. | 5.625% | 2/15/14 | 2,825 | 2,822 |
| AXA Financial, Inc. | 7.750% | 8/1/10 | 1,500 | 1,618 |
| Axis Capital Holdings | 5.750% | 12/1/14 | 1,800 | 1,789 |
| Berkshire Hathaway Finance Corp. | 4.750% | 5/15/12 | 1,525 | 1,498 |
| Berkshire Hathaway Finance Corp. | 4.625% | 10/15/13 | 4,450 | 4,312 |
| Berkshire Hathaway Finance Corp. | 5.100% | 7/15/14 | 1,850 | 1,837 |
| Berkshire Hathaway Finance Corp. | 4.850% | 1/15/15 | 6,600 | 6,399 |
| CNA Financial Corp. | 5.850% | 12/15/14 | 4,100 | 4,113 |
| CNA Financial Corp. | 6.500% | 8/15/16 | 3,400 | 3,538 |
| Commerce Group, Inc. | 5.950% | 12/9/13 | 900 | 901 |
| Fund American Cos., Inc. | 5.875% | 5/15/13 | 2,100 | 2,092 |
| GE Global Insurance Holdings Corp. | 7.750% | 6/15/30 | 250 | 303 |
| Genworth Financial, Inc. | 5.750% | 6/15/14 | 4,250 | 4,348 |
| Genworth Financial, Inc. | 4.950% | 10/1/15 | 1,450 | 1,399 |
| 2 Genworth Financial, Inc. | 6.150% | 11/15/66 | 1,700 | 1,704 |
| Hartford Financial Services Group, Inc. | 4.625% | 7/15/13 | 1,200 | 1,151 |
| Hartford Financial Services Group, Inc. | 5.500% | 10/15/16 | 1,975 | 1,975 |
| Humana Inc. | 6.450% | 6/1/16 | 2,625 | 2,697 |
| 2 ING Capital Funding Trust III | 5.775% | 12/8/49 | 3,800 | 3,790 |
| Jefferson Pilot Corp. | 4.750% | 1/30/14 | 4,000 | 3,824 |
| Lincoln National Corp. | 6.200% | 12/15/11 | 1,650 | 1,709 |
| Loews Corp. | 5.250% | 3/15/16 | 500 | 488 |
| Marsh & McLennan Cos., Inc. | 6.250% | 3/15/12 | 1,900 | 1,934 |
| Marsh & McLennan Cos., Inc. | 4.850% | 2/15/13 | 2,000 | 1,882 |
| Marsh & McLennan Cos., Inc. | 5.750% | 9/15/15 | 5,550 | 5,475 |
| MetLife, Inc. | 6.125% | 12/1/11 | 1,500 | 1,554 |
| MetLife, Inc. | 5.375% | 12/15/12 | 3,000 | 3,006 |
| MetLife, Inc. | 5.000% | 11/24/13 | 2,325 | 2,273 |
| MetLife, Inc. | 5.500% | 6/15/14 | 1,075 | 1,079 |
| MetLife, Inc. | 5.000% | 6/15/15 | 4,050 | 3,933 |
| Nationwide Financial Services | 5.900% | 7/1/12 | 2,650 | 2,708 |
| Principal Life Income Funding | 5.100% | 4/15/14 | 4,250 | 4,174 |
| Progressive Corp. | 6.375% | 1/15/12 | 2,500 | 2,611 |
| Prudential Financial, Inc. | 4.500% | 7/15/13 | 4,500 | 4,277 |
| Prudential Financial, Inc. | 4.750% | 4/1/14 | 3,200 | 3,060 |
| Prudential Financial, Inc. | 5.100% | 9/20/14 | 1,625 | 1,591 |
| Prudential Financial, Inc. | 5.500% | 3/15/16 | 1,950 | 1,953 |
| St. Paul Travelers Cos., Inc. | 5.500% | 12/1/15 | 1,350 | 1,353 |
| St. Paul Travelers Cos., Inc. | 6.250% | 6/20/16 | 2,025 | 2,133 |
| Torchmark Corp. | 6.375% | 6/15/16 | 1,750 | 1,829 |
| Transatlantic Holdings | 5.750% | 12/14/15 | 4,000 | 3,975 |
| Travelers Property Casualty Corp. | 5.000% | 3/15/13 | 2,500 | 2,446 |
| UnitedHealth Group, Inc. | 5.000% | 8/15/14 | 5,400 | 5,237 |
| UnitedHealth Group, Inc. | 4.875% | 3/15/15 | 1,950 | 1,869 |
| UnitedHealth Group, Inc. | 5.375% | 3/15/16 | 1,875 | 1,857 |
| WellPoint Inc. | 6.375% | 1/15/12 | 1,650 | 1,720 |
| WellPoint Inc. | 6.800% | 8/1/12 | 3,500 | 3,724 |
| WellPoint Inc. | 5.000% | 12/15/14 | 4,375 | 4,235 |
| WellPoint Inc. | 5.250% | 1/15/16 | 3,700 | 3,627 |
| Willis North America Inc. | 5.625% | 7/15/15 | 2,750 | 2,632 |
| XL Capital Ltd. | 6.500% | 1/15/12 | 75 | 78 |
| XL Capital Ltd. | 5.250% | 9/15/14 | 6,525 | 6,407 |
| Real Estate Investment Trusts (1.7%) | ||||
| Archstone-Smith Operating Trust | 5.625% | 8/15/14 | 1,500 | 1,510 |
| Archstone-Smith Operating Trust | 5.250% | 5/1/15 | 4,925 | 4,837 |
| Arden Realty LP | 5.250% | 3/1/15 | 1,250 | 1,234 |
| AvalonBay Communities, Inc. | 5.500% | 1/15/12 | 2,000 | 2,007 |
| AvalonBay Communities, Inc. | 6.125% | 11/1/12 | 1,000 | 1,035 |
| AvalonBay Communities, Inc. | 5.750% | 9/15/16 | 1,750 | 1,769 |
| Boston Properties, Inc. | 6.250% | 1/15/13 | 5,225 | 5,445 |
| Boston Properties, Inc. | 5.625% | 4/15/15 | 1,700 | 1,710 |
| Brandywine Operating Partnership | 5.400% | 11/1/14 | 2,250 | 2,209 |
| Colonial Realty LP | 5.500% | 10/1/15 | 1,800 | 1,758 |
| Developers Diversified Realty Corp. | 5.375% | 10/15/12 | 1,875 | 1,858 |
| EOP Operating LP | 6.750% | 2/15/12 | 2,200 | 2,380 |
| EOP Operating LP | 4.750% | 3/15/14 | 4,150 | 4,109 |
| ERP Operating LP | 6.625% | 3/15/12 | 4,500 | 4,735 |
| ERP Operating LP | 5.200% | 4/1/13 | 1,000 | 983 |
| ERP Operating LP | 5.250% | 9/15/14 | 4,025 | 3,965 |
| ERP Operating LP | 5.125% | 3/15/16 | 1,000 | 969 |
| ERP Operating LP | 5.375% | 8/1/16 | 475 | 468 |
| Health Care Property Investors, Inc. | 6.450% | 6/25/12 | 1,075 | 1,104 |
| Health Care Property Investors, Inc. | 5.650% | 12/15/13 | 4,400 | 4,338 |
| Health Care REIT, Inc. | 6.000% | 11/15/13 | 4,725 | 4,748 |
| Health Care REIT, Inc. | 6.200% | 6/1/16 | 925 | 931 |
| HealthCare Realty Trust | 5.125% | 4/1/14 | 2,925 | 2,789 |
| Hospitality Properties | 5.125% | 2/15/15 | 2,200 | 2,088 |
| HRPT Properties Trust | 6.250% | 8/15/16 | 5,150 | 5,318 |
| Kimco Realty Corp. | 5.783% | 3/15/16 | 1,350 | 1,367 |
| Liberty Property LP | 5.125% | 3/2/15 | 4,450 | 4,282 |
| ProLogis | 5.500% | 3/1/13 | 2,000 | 1,991 |
| ProLogis | 5.625% | 11/15/15 | 2,800 | 2,793 |
| ProLogis | 5.750% | 4/1/16 | 3,000 | 3,006 |
| ProLogis | 5.625% | 11/15/16 | 1,925 | 1,913 |
| Reckson Operating Partnership | 6.000% | 3/31/16 | 1,525 | 1,482 |
| Regency Centers LP | 6.750% | 1/15/12 | 2,600 | 2,735 |
| Regency Centers LP | 5.250% | 8/1/15 | 1,000 | 976 |
| Simon Property Group Inc. | 5.000% | 3/1/12 | 400 | 393 |
| Simon Property Group Inc. | 6.350% | 8/28/12 | 2,500 | 2,610 |
| Simon Property Group Inc. | 5.625% | 8/15/14 | 2,350 | 2,371 |
| Simon Property Group Inc. | 5.100% | 6/15/15 | 1,500 | 1,460 |
| Simon Property Group Inc. | 5.750% | 12/1/15 | 4,600 | 4,670 |
| Simon Property Group Inc. | 6.100% | 5/1/16 | 1,800 | 1,872 |
| Simon Property Group Inc. | 5.250% | 12/1/16 | 3,625 | 3,532 |
| Tanger Factory Outlet Centers, Inc. | 6.150% | 11/15/15 | 1,725 | 1,745 |
| 1,228,056 | ||||
| Industrial (18.7%) | ||||
| Basic Industry (1.6%) | ||||
| Alcan, Inc. | 4.875% | 9/15/12 | 1,000 | 970 |
| Alcan, Inc. | 4.500% | 5/15/13 | 2,825 | 2,662 |
| Alcan, Inc. | 5.200% | 1/15/14 | 1,500 | 1,464 |
| Alcan, Inc. | 5.000% | 6/1/15 | 1,575 | 1,501 |
| Alcoa, Inc. | 6.000% | 1/15/12 | 3,000 | 3,076 |
| Alcoa, Inc. | 5.375% | 1/15/13 | 3,000 | 2,991 |
| Barrick Gold Finance Inc. | 4.875% | 11/15/14 | 2,050 | 1,940 |
| BHP Billiton Finance | 4.800% | 4/15/13 | 10,000 | 9,678 |
| BHP Billiton Finance | 5.250% | 12/15/15 | 2,725 | 2,704 |
| Celulosa Arauco Constitution SA | 5.125% | 7/9/13 | 1,500 | 1,455 |
| Celulosa Arauco Constitution SA | 5.625% | 4/20/15 | 5,150 | 5,098 |
| Dow Chemical Co. | 6.000% | 10/1/12 | 3,575 | 3,676 |
| E.I. du Pont de Nemours & Co. | 4.750% | 11/15/12 | 2,500 | 2,425 |
| E.I. du Pont de Nemours & Co. | 4.125% | 3/6/13 | 1,500 | 1,404 |
| E.I. du Pont de Nemours & Co. | 5.250% | 12/15/16 | 2,175 | 2,131 |
| Falconbridge Ltd. | 7.350% | 6/5/12 | 1,500 | 1,618 |
| ICI Wilmington | 5.625% | 12/1/13 | 1,600 | 1,589 |
| Inco Ltd. | 7.750% | 5/15/12 | 2,550 | 2,786 |
| Inco Ltd. | 5.700% | 10/15/15 | 1,675 | 1,634 |
| International Paper Co. | 5.850% | 10/30/12 | 888 | 903 |
| International Paper Co. | 5.300% | 4/1/15 | 4,175 | 4,018 |
| International Paper Co. | 5.250% | 4/1/16 | 2,950 | 2,800 |
| Lubrizol Corp. | 5.500% | 10/1/14 | 675 | 658 |
| MeadWestvaco Corp. | 6.850% | 4/1/12 | 1,500 | 1,568 |
| Monsanto Co. | 7.375% | 8/15/12 | 2,575 | 2,812 |
| Noranda, Inc. | 7.250% | 7/15/12 | 2,325 | 2,511 |
| Noranda, Inc. | 6.000% | 10/15/15 | 2,025 | 2,054 |
| Plum Creek Timber Co. | 5.875% | 11/15/15 | 1,650 | 1,620 |
| Potash Corp. of Saskatchewan | 4.875% | 3/1/13 | 1,500 | 1,447 |
| Praxair, Inc. | 6.375% | 4/1/12 | 2,000 | 2,090 |
| Praxair, Inc. | 3.950% | 6/1/13 | 2,500 | 2,308 |
| 3 Reliance Steel & Aluminum | 6.200% | 11/15/16 | 650 | 646 |
| Temple Inland Inc. | 7.875% | 5/1/12 | 1,500 | 1,626 |
| Temple Inland Inc. | 6.375% | 1/15/16 | 1,500 | 1,524 |
| Vale Overseas Ltd. | 6.250% | 1/11/16 | 5,825 | 5,912 |
| Weyerhaeuser Co. | 6.750% | 3/15/12 | 10,775 | 11,299 |
| WMC Finance USA | 5.125% | 5/15/13 | 2,000 | 1,967 |
| Capital Goods (2.3%) | ||||
| 2,3 BAE Systems Asset Trust | 7.156% | 12/15/11 | 531 | 555 |
| Bemis Co. Inc. | 4.875% | 4/1/12 | 2,050 | 1,996 |
| Boeing Capital Corp. | 5.800% | 1/15/13 | 6,500 | 6,678 |
| Boeing Co. | 5.125% | 2/15/13 | 4,575 | 4,543 |
| Brascan Corp. | 7.125% | 6/15/12 | 1,000 | 1,066 |
| Caterpillar Financial Services Corp. | 4.750% | 2/17/15 | 5,125 | 4,872 |
| Caterpillar Financial Services Corp. | 4.625% | 6/1/15 | 1,200 | 1,129 |
| Caterpillar, Inc. | 5.700% | 8/15/16 | 3,500 | 3,546 |
| CRH America Inc. | 6.950% | 3/15/12 | 4,575 | 4,834 |
| CRH America Inc. | 5.300% | 10/15/13 | 2,075 | 2,017 |
| CRH America Inc. | 6.000% | 9/30/16 | 5,250 | 5,299 |
| Deere & Co. | 6.950% | 4/25/14 | 3,080 | 3,353 |
| Emerson Electric Co. | 4.625% | 10/15/12 | 7,000 | 6,770 |
| General Dynamics Corp. | 4.250% | 5/15/13 | 6,850 | 6,476 |
| General Electric Co. | 5.000% | 2/1/13 | 17,975 | 17,780 |
| Hanson PLC | 5.250% | 3/15/13 | 3,775 | 3,675 |
| Hanson PLC | 6.125% | 8/15/16 | 1,000 | 1,016 |
| Honeywell International, Inc. | 5.400% | 3/15/16 | 5,200 | 5,214 |
| John Deere Capital Corp. | 7.000% | 3/15/12 | 8,340 | 8,951 |
| 3 Joy Global, Inc. | 6.000% | 11/15/16 | 1,275 | 1,272 |
| Lafarge SA | 6.500% | 7/15/16 | 5,800 | 6,042 |
| Lockheed Martin Corp. | 7.650% | 5/1/16 | 3,000 | 3,463 |
| Masco Corp. | 5.875% | 7/15/12 | 1,600 | 1,604 |
| Masco Corp. | 4.800% | 6/15/15 | 4,875 | 4,455 |
| Masco Corp. | 6.125% | 10/3/16 | 1,850 | 1,860 |
| Mohawk Industries Inc. | 6.125% | 1/15/16 | 9,075 | 8,997 |
| Northrop Grumman Corp. | 7.750% | 3/1/16 | 2,900 | 3,364 |
| 3 Owens Corning, Inc. | 6.500% | 12/1/16 | 1,325 | 1,324 |
| Raytheon Co. | 5.500% | 11/15/12 | 1,250 | 1,260 |
| Raytheon Co. | 5.375% | 4/1/13 | 725 | 724 |
| Textron, Inc. | 6.500% | 6/1/12 | 2,450 | 2,569 |
| Tyco International Group SA | 6.000% | 11/15/13 | 4,800 | 4,980 |
| United Technologies Corp. | 6.100% | 5/15/12 | 1,500 | 1,560 |
| United Technologies Corp. | 4.875% | 5/1/15 | 6,425 | 6,213 |
| Waste Management, Inc. | 6.375% | 11/15/12 | 1,250 | 1,308 |
| Waste Management, Inc. | 5.000% | 3/15/14 | 4,200 | 4,050 |
| Communication (4.7%) | ||||
| Alltel Corp. | 7.000% | 7/1/12 | 3,225 | 3,356 |
| America Movil SA de C.V | 5.500% | 3/1/14 | 5,650 | 5,530 |
| America Movil SA de C.V | 5.750% | 1/15/15 | 1,525 | 1,514 |
| AT&T Inc. | 5.875% | 2/1/12 | 4,050 | 4,138 |
| AT&T Inc. | 5.875% | 8/15/12 | 1,450 | 1,483 |
| AT&T Inc. | 5.100% | 9/15/14 | 15,500 | 15,085 |
| AT&T Inc. | 5.625% | 6/15/16 | 1,725 | 1,714 |
| BellSouth Corp. | 4.750% | 11/15/12 | 5,450 | 5,273 |
| BellSouth Corp. | 5.200% | 9/15/14 | 3,100 | 3,034 |
| CBS Corp. | 5.625% | 8/15/12 | 650 | 640 |
| CenturyTel, Inc. | 7.875% | 8/15/12 | 1,650 | 1,788 |
| CenturyTel, Inc. | 5.000% | 2/15/15 | 1,000 | 915 |
| Cingular Wireless LLC | 6.500% | 12/15/11 | 6,500 | 6,826 |
| Comcast Cable Communications Holdings Inc. | 8.375% | 3/15/13 | 10,235 | 11,658 |
| Comcast Corp. | 5.300% | 1/15/14 | 8,515 | 8,334 |
| Comcast Corp. | 6.500% | 1/15/15 | 3,825 | 3,992 |
| Comcast Corp. | 5.850% | 11/15/15 | 3,800 | 3,810 |
| Comcast Corp. | 5.900% | 3/15/16 | 3,650 | 3,662 |
| Comcast Corp. | 4.950% | 6/15/16 | 2,175 | 2,030 |
| Cox Communications, Inc. | 7.125% | 10/1/12 | 2,000 | 2,135 |
| Cox Communications, Inc. | 4.625% | 6/1/13 | 4,000 | 3,765 |
| Cox Communications, Inc. | 5.450% | 12/15/14 | 10,225 | 9,955 |
| Cox Communications, Inc. | 5.500% | 10/1/15 | 1,250 | 1,214 |
| Deutsche Telekom International Finance | 5.250% | 7/22/13 | 7,600 | 7,435 |
| Deutsche Telekom International Finance | 5.750% | 3/23/16 | 2,725 | 2,696 |
| Embarq Corp. | 7.082% | 6/1/16 | 12,675 | 12,928 |
| Gannett Co., Inc. | 6.375% | 4/1/12 | 975 | 1,005 |
| IAC/InteractiveCorp | 7.000% | 1/15/13 | 2,175 | 2,255 |
| New Cingular Wireless Services | 8.125% | 5/1/12 | 7,125 | 8,012 |
| News America Holdings, Inc. | 9.250% | 2/1/13 | 1,325 | 1,555 |
| News America Inc. | 5.300% | 12/15/14 | 4,450 | 4,371 |
| Nextel Communications | 6.875% | 10/31/13 | 6,000 | 6,066 |
| Nextel Communications | 5.950% | 3/15/14 | 6,300 | 6,177 |
| Nextel Communications | 7.375% | 8/1/15 | 9,400 | 9,654 |
| Omnicom Group Inc. | 5.900% | 4/15/16 | 6,400 | 6,477 |
| R.R. Donnelley & Sons Co. | 4.950% | 4/1/14 | 2,550 | 2,345 |
| R.R. Donnelley & Sons Co. | 5.500% | 5/15/15 | 2,365 | 2,229 |
| Reed Elsevier Capital | 4.625% | 6/15/12 | 1,700 | 1,626 |
| Sprint Capital Corp. | 8.375% | 3/15/12 | 8,050 | 8,956 |
| TCI Communications, Inc. | 8.750% | 8/1/15 | 3,895 | 4,593 |
| Telecom Italia Capital | 5.250% | 11/15/13 | 5,075 | 4,855 |
| Telecom Italia Capital | 4.950% | 9/30/14 | 13,225 | 12,250 |
| Telecom Italia Capital | 5.250% | 10/1/15 | 2,850 | 2,660 |
| Tele-Communications, Inc. | 9.800% | 2/1/12 | 1,000 | 1,180 |
| Tele-Communications, Inc. | 7.875% | 8/1/13 | 5,401 | 5,987 |
| Telefonica Emisiones SAU | 6.421% | 6/20/16 | 9,000 | 9,296 |
| Telefonos de Mexico SA | 5.500% | 1/27/15 | 4,500 | 4,354 |
| Telstra Corp. Ltd. | 6.375% | 4/1/12 | 2,500 | 2,582 |
| Thomson Corp. | 6.200% | 1/5/12 | 3,075 | 3,173 |
| Time Warner Entertainment | 10.150% | 5/1/12 | 400 | 474 |
| Time Warner Entertainment | 8.875% | 10/1/12 | 2,500 | 2,830 |
| Verizon Communications Corp. | 5.550% | 2/15/16 | 8,325 | 8,324 |
| Verizon Florida, Inc. | 6.125% | 1/15/13 | 1,500 | 1,531 |
| Verizon Global Funding Corp. | 6.875% | 6/15/12 | 3,975 | 4,252 |
| Verizon Global Funding Corp. | 7.375% | 9/1/12 | 2,800 | 3,065 |
| Verizon Global Funding Corp. | 4.900% | 9/15/15 | 2,000 | 1,906 |
| Verizon Maryland, Inc. | 6.125% | 3/1/12 | 2,125 | 2,174 |
| Verizon New Jersey, Inc. | 5.875% | 1/17/12 | 5,225 | 5,296 |
| Verizon New York, Inc. | 6.875% | 4/1/12 | 3,425 | 3,561 |
| Verizon Virginia, Inc. | 4.625% | 3/15/13 | 4,300 | 4,050 |
| Vodafone Group PLC | 5.000% | 12/16/13 | 3,050 | 2,949 |
| Vodafone Group PLC | 5.375% | 1/30/15 | 6,325 | 6,189 |
| Vodafone Group PLC | 5.000% | 9/15/15 | 2,900 | 2,760 |
| Vodafone Group PLC | 5.750% | 3/15/16 | 3,700 | 3,710 |
| WPP Finance USA Corp. | 5.875% | 6/15/14 | 2,150 | 2,161 |
| Consumer Cyclical (3.0%) | ||||
| Brinker International | 5.750% | 6/1/14 | 1,700 | 1,650 |
| Centex Corp. | 7.500% | 1/15/12 | 2,000 | 2,140 |
| Centex Corp. | 5.450% | 8/15/12 | 1,125 | 1,104 |
| Centex Corp. | 5.125% | 10/1/13 | 3,300 | 3,161 |
| Centex Corp. | 5.700% | 5/15/14 | 1,000 | 983 |
| Centex Corp. | 6.500% | 5/1/16 | 2,900 | 2,965 |
| CVS Corp. | 4.875% | 9/15/14 | 1,675 | 1,604 |
| CVS Corp. | 6.125% | 8/15/16 | 2,500 | 2,574 |
| D.R. Horton, Inc. | 5.375% | 6/15/12 | 300 | 291 |
| D.R. Horton, Inc. | 5.625% | 9/15/14 | 1,000 | 965 |
| D.R. Horton, Inc. | 5.250% | 2/15/15 | 6,500 | 6,075 |
| D.R. Horton, Inc. | 5.625% | 1/15/16 | 750 | 713 |
| D.R. Horton, Inc. | 6.500% | 4/15/16 | 2,925 | 2,941 |
| DaimlerChrysler North America Holding Corp. | 7.300% | 1/15/12 | 11,875 | 12,613 |
| DaimlerChrysler North America Holding Corp. | 6.500% | 11/15/13 | 6,375 | 6,555 |
| Home Depot Inc. | 5.250% | 12/16/13 | 4,450 | 4,424 |
| Home Depot Inc. | 5.400% | 3/1/16 | 11,775 | 11,533 |
| Johnson Controls, Inc. | 4.875% | 9/15/13 | 1,000 | 962 |
| Johnson Controls, Inc. | 5.500% | 1/15/16 | 3,000 | 2,939 |
| Lennar Corp. | 5.950% | 3/1/13 | 3,100 | 3,098 |
| Lennar Corp. | 5.600% | 5/31/15 | 3,375 | 3,250 |
| Limited Brands Inc. | 5.250% | 11/1/14 | 3,100 | 2,947 |
| Lowe's Cos., Inc. | 5.000% | 10/15/15 | 4,275 | 4,107 |
| Lowe's Cos., Inc. | 5.400% | 10/15/16 | 2,000 | 1,967 |
| Marriott International | 4.625% | 6/15/12 | 1,175 | 1,112 |
| Marriott International | 6.200% | 6/15/16 | 1,750 | 1,769 |
| May Department Stores Co. | 5.750% | 7/15/14 | 3,600 | 3,518 |
| McDonald's Corp. | 5.750% | 3/1/12 | 1,800 | 1,841 |
| MDC Holdings Inc. | 5.500% | 5/15/13 | 3,625 | 3,465 |
| Pulte Homes, Inc. | 6.250% | 2/15/13 | 1,000 | 1,019 |
| Pulte Homes, Inc. | 5.250% | 1/15/14 | 2,750 | 2,642 |
| Pulte Homes, Inc. | 5.200% | 2/15/15 | 550 | 523 |
| Staples Inc. | 7.375% | 10/1/12 | 2,000 | 2,170 |
| Starwood Hotel Resorts | 7.875% | 5/1/12 | 7,000 | 7,385 |
| Target Corp. | 5.875% | 3/1/12 | 8,225 | 8,454 |
| Target Corp. | 4.000% | 6/15/13 | 550 | 511 |
| Target Corp. | 5.875% | 7/15/16 | 1,800 | 1,856 |
| The Walt Disney Co. | 6.375% | 3/1/12 | 9,514 | 9,982 |
| The Walt Disney Co. | 5.625% | 9/15/16 | 2,450 | 2,469 |
| Time Warner, Inc. | 6.750% | 4/15/11 | 8,600 | 8,986 |
| Time Warner, Inc. | 6.875% | 5/1/12 | 6,100 | 6,445 |
| Time Warner, Inc. | 9.125% | 1/15/13 | 1,500 | 1,750 |
| Time Warner, Inc. | 5.875% | 11/15/16 | 4,150 | 4,133 |
| Toll Brothers, Inc. | 6.875% | 11/15/12 | 1,500 | 1,547 |
| Toll Brothers, Inc. | 5.950% | 9/15/13 | 1,000 | 982 |
| Toll Brothers, Inc. | 5.150% | 5/15/15 | 2,150 | 1,974 |
| Viacom Inc. | 6.250% | 4/30/16 | 6,800 | 6,747 |
| Wal-Mart Stores, Inc. | 4.550% | 5/1/13 | 3,450 | 3,321 |
| Wal-Mart Stores, Inc. | 4.500% | 7/1/15 | 9,325 | 8,771 |
| 3 Western Union Co. | 5.930% | 10/1/16 | 3,800 | 3,755 |
| Westinghouse Electric | 8.625% | 8/1/12 | 1,000 | 1,119 |
| 3 Wyndham Worldwide | 6.000% | 12/1/16 | 125 | 122 |
| Yum! Brands, Inc. | 7.700% | 7/1/12 | 1,100 | 1,201 |
| Yum! Brands, Inc. | 6.250% | 4/15/16 | 5,025 | 5,109 |
| Consumer Noncyclical (4.0%) | ||||
| Abbott Laboratories | 4.350% | 3/15/14 | 4,350 | 4,083 |
| Abbott Laboratories | 5.875% | 5/15/16 | 8,500 | 8,768 |
| Allergan Inc. | 5.750% | 4/1/16 | 3,300 | 3,347 |
| Altria Group, Inc. | 7.000% | 11/4/13 | 4,750 | 5,176 |
| AmerisourceBergen Corp. | 5.625% | 9/15/12 | 1,475 | 1,456 |
| AmerisourceBergen Corp. | 5.875% | 9/15/15 | 4,425 | 4,306 |
| Amgen Inc. | 4.850% | 11/18/14 | 5,700 | 5,525 |
| Anheuser Busch Cos., Inc. | 4.700% | 4/15/12 | 1,500 | 1,454 |
| Anheuser-Busch Cos., Inc. | 4.375% | 1/15/13 | 3,275 | 3,096 |
| Archer-Daniels-Midland Co. | 8.125% | 6/1/12 | 4,000 | 4,506 |
| AstraZeneca PLC | 5.400% | 6/1/14 | 3,050 | 3,061 |
| Baxter International, Inc. | 4.625% | 3/15/15 | 3,150 | 2,968 |
| Baxter International, Inc. | 5.900% | 9/1/16 | 2,600 | 2,677 |
| Boston Scientific | 5.450% | 6/15/14 | 4,200 | 4,033 |
| Boston Scientific | 5.500% | 11/15/15 | 2,000 | 2,004 |
| Boston Scientific | 6.400% | 6/15/16 | 2,375 | 2,398 |
| Bottling Group LLC | 4.625% | 11/15/12 | 6,000 | 5,795 |
| Bottling Group LLC | 5.000% | 11/15/13 | 1,500 | 1,465 |
| Bottling Group LLC | 5.500% | 4/1/16 | 4,525 | 4,524 |
| Bunge Ltd. Finance Corp. | 5.350% | 4/15/14 | 2,900 | 2,793 |
| Bunge Ltd. Finance Corp. | 5.100% | 7/15/15 | 1,925 | 1,809 |
| Cardinal Health, Inc. | 4.000% | 6/15/15 | 2,200 | 1,948 |
| 3 Cardinal Health, Inc. | 5.800% | 10/15/16 | 2,750 | 2,737 |
| Cia. Brasil de Bebidas AmBev | 10.500% | 12/15/11 | 2,900 | 3,516 |
| Cia. Brasil de Bebidas AmBev | 8.750% | 9/15/13 | 2,800 | 3,280 |
| Clorox Co. | 5.000% | 1/15/15 | 4,200 | 4,073 |
| Coca-Cola HBC Finance | 5.125% | 9/17/13 | 2,400 | 2,356 |
| Colgate-Palmolive Co. | 5.980% | 4/25/12 | 1,250 | 1,296 |
| Coors Brewing Co. | 6.375% | 5/15/12 | 2,000 | 2,069 |
| Diageo Capital PLC | 5.125% | 1/30/12 | 2,000 | 1,981 |
| Diageo Capital PLC | 5.500% | 9/30/16 | 3,000 | 2,973 |
| Diageo Finance BV | 5.300% | 10/28/15 | 2,675 | 2,630 |
| Eli Lilly & Co. | 6.000% | 3/15/12 | 3,000 | 3,122 |
| Fortune Brands Inc. | 5.375% | 1/15/16 | 9,050 | 8,581 |
| Genentech Inc. | 4.750% | 7/15/15 | 2,900 | 2,776 |
| General Mills, Inc. | 6.000% | 2/15/12 | 7,393 | 7,567 |
| GlaxoSmithKline Capital Inc. | 4.375% | 4/15/14 | 8,075 | 7,609 |
| H.J. Heinz Co. | 6.000% | 3/15/12 | 4,000 | 4,070 |
| �� Health Management Associates Inc. | 6.125% | 4/15/16 | 1,100 | 1,042 |
| Hershey Foods Corp. | 5.450% | 9/1/16 | 2,100 | 2,108 |
| Hospira, Inc. | 5.900% | 6/15/14 | 675 | 654 |
| Johnson & Johnson | 3.800% | 5/15/13 | 3,000 | 2,801 |
| Kimberly-Clark Corp. | 5.625% | 2/15/12 | 5,150 | 5,240 |
| Kimberly-Clark Corp. | 4.875% | 8/15/15 | 1,025 | 976 |
| Kraft Foods, Inc. | 6.250% | 6/1/12 | 4,825 | 5,010 |
| Kraft Foods, Inc. | 5.250% | 10/1/13 | 7,250 | 7,176 |
| Kroger Co. | 6.750% | 4/15/12 | 7,100 | 7,453 |
| Kroger Co. | 5.500% | 2/1/13 | 275 | 272 |
| Kroger Co. | 4.950% | 1/15/15 | 2,325 | 2,192 |
| Laboratory Corp. of America | 5.500% | 2/1/13 | 2,500 | 2,446 |
| Laboratory Corp. of America | 5.625% | 12/15/15 | 1,250 | 1,220 |
| McKesson Corp. | 7.750% | 2/1/12 | 2,000 | 2,185 |
| Medco Health Solutions | 7.250% | 8/15/13 | 3,500 | 3,759 |
| Medtronic Inc. | 4.750% | 9/15/15 | 3,200 | 3,036 |
| Merck & Co. | 4.375% | 2/15/13 | 2,975 | 2,827 |
| Merck & Co. | 4.750% | 3/1/15 | 3,400 | 3,242 |
| Panamerican Beverages, Inc. | 7.250% | 7/1/09 | 1,000 | 1,045 |
| PepsiAmericas Inc. | 4.875% | 1/15/15 | 2,875 | 2,747 |
| Pfizer, Inc. | 4.500% | 2/15/14 | 2,875 | 2,771 |
| Procter & Gamble Co. | 4.950% | 8/15/14 | 4,900 | 4,802 |
| Procter & Gamble Co. | 4.850% | 12/15/15 | 3,000 | 2,907 |
| Quest Diagnostic, Inc. | 5.450% | 11/1/15 | 2,400 | 2,306 |
| Safeway, Inc. | 5.800% | 8/15/12 | 3,500 | 3,525 |
| Schering-Plough Corp. | 5.550% | 12/1/13 | 5,750 | 5,756 |
| Teva Pharmaceutical Finance LLC | 5.550% | 2/1/16 | 2,225 | 2,181 |
| Tyson Foods, Inc. | 6.850% | 4/1/16 | 2,950 | 3,029 |
| Universal Health Services, Inc. | 7.125% | 6/30/16 | 1,375 | 1,437 |
| UST, Inc. | 6.625% | 7/15/12 | 1,000 | 1,055 |
| WM Wrigley Jr. Co. | 4.650% | 7/15/15 | 3,350 | 3,178 |
| Wyeth | 5.500% | 3/15/13 | 13,950 | 14,109 |
| Wyeth | 5.500% | 2/1/14 | 6,775 | 6,802 |
| Energy (1.5%) | ||||
| Anadarko Petroleum Corp. | 5.950% | 9/15/16 | 9,600 | 9,606 |
| Apache Corp. | 6.250% | 4/15/12 | 2,300 | 2,417 |
| BP Amoco PLC | 8.500% | 4/1/12 | 1,700 | 1,950 |
| Burlington Resources, Inc. | 6.500% | 12/1/11 | 4,025 | 4,218 |
| Canadian Natural Resources | 5.450% | 10/1/12 | 1,650 | 1,638 |
| Canadian Natural Resources | 4.900% | 12/1/14 | 2,950 | 2,781 |
| Canadian Natural Resources | 6.000% | 8/15/16 | 3,350 | 3,379 |
| ConocoPhillips Canada | 5.300% | 4/15/12 | 2,500 | 2,497 |
| ConocoPhillips Canada | 5.625% | 10/15/16 | 10,000 | 10,062 |
| Diamond Offshore Drilling | 4.875% | 7/1/15 | 2,050 | 1,927 |
| Encana Corp. | 4.750% | 10/15/13 | 1,125 | 1,070 |
| Encana Holdings Finance Corp. | 5.800% | 5/1/14 | 5,575 | 5,607 |
| Global Santa Fe | 5.000% | 2/15/13 | 1,000 | 942 |
| Husky Energy Inc. | 6.250% | 6/15/12 | 2,225 | 2,292 |
| Marathon Oil Corp. | 6.125% | 3/15/12 | 6,900 | 7,087 |
| Nexen, Inc. | 5.050% | 11/20/13 | 3,000 | 2,885 |
| Occidental Petroleum | 6.750% | 1/15/12 | 3,750 | 3,987 |
| Petro-Canada | 4.000% | 7/15/13 | 1,800 | 1,636 |
| Petro-Canada Financial Partnership | 5.000% | 11/15/14 | 3,375 | 3,227 |
| Questar Market Resources | 6.050% | 9/1/16 | 600 | 613 |
| Sunoco, Inc. | 4.875% | 10/15/14 | 950 | 889 |
| Sunoco, Inc. | 5.750% | 1/15/17 | 1,200 | 1,176 |
| Talisman Energy, Inc. | 5.125% | 5/15/15 | 2,150 | 2,040 |
| Valero Energy Corp. | 6.875% | 4/15/12 | 8,775 | 9,279 |
| Weatherford International Inc. | 5.500% | 2/15/16 | 3,000 | 2,910 |
| XTO Energy, Inc. | 7.500% | 4/15/12 | 1,000 | 1,086 |
| XTO Energy, Inc. | 6.250% | 4/15/13 | 3,775 | 3,893 |
| XTO Energy, Inc. | 4.900% | 2/1/14 | 2,750 | 2,626 |
| XTO Energy, Inc. | 5.000% | 1/31/15 | 400 | 381 |
| XTO Energy, Inc. | 5.300% | 6/30/15 | 1,625 | 1,573 |
| Technology (1.0%) | ||||
| Arrow Electronics, Inc. | 6.875% | 7/1/13 | 1,000 | 1,044 |
| Cisco Systems Inc. | 5.500% | 2/22/16 | 15,050 | 15,092 |
| Computer Sciences Corp. | 5.000% | 2/15/13 | 600 | 576 |
| Electronic Data Systems | 6.500% | 8/1/13 | 4,325 | 4,368 |
| First Data Corp. | 4.850% | 10/1/14 | 2,254 | 2,141 |
| First Data Corp. | 4.950% | 6/15/15 | 2,500 | 2,382 |
| Harris Corp. | 5.000% | 10/1/15 | 1,425 | 1,335 |
| Hewlett-Packard Co. | 6.500% | 7/1/12 | 2,500 | 2,648 |
| International Business Machines Corp. | 4.750% | 11/29/12 | 1,900 | 1,861 |
| International Business Machines Corp. | 7.500% | 6/15/13 | 6,600 | 7,357 |
| Oracle Corp. | 5.250% | 1/15/16 | 10,175 | 9,953 |
| Pitney Bowes, Inc. | 4.625% | 10/1/12 | 250 | 241 |
| Pitney Bowes, Inc. | 3.875% | 6/15/13 | 1,500 | 1,374 |
| Pitney Bowes, Inc. | 4.875% | 8/15/14 | 6,075 | 5,841 |
| Pitney Bowes, Inc. | 4.750% | 1/15/16 | 750 | 708 |
| Science Applications International Corp. | 6.250% | 7/1/12 | 1,000 | 1,028 |
| Xerox Corp. | 7.625% | 6/15/13 | 2,275 | 2,383 |
| Xerox Corp. | 6.400% | 3/15/16 | 3,700 | 3,774 |
| Transportation (0.5%) | ||||
| American Airlines, Inc. | 7.858% | 10/1/11 | 1,425 | 1,557 |
| Burlington Northern Santa Fe Corp. | 5.900% | 7/1/12 | 5,000 | 5,117 |
| Canadian National Railway Co. | 4.400% | 3/15/13 | 2,000 | 1,902 |
| Canadian National Railway Co. | 5.800% | 6/1/16 | 1,950 | 2,008 |
| Continental Airlines, Inc. | 6.563% | 2/15/12 | 500 | 521 |
| CSX Corp. | 6.300% | 3/15/12 | 4,625 | 4,794 |
| Norfolk Southern Corp. | 5.257% | 9/17/14 | 3,095 | 3,056 |
| Ryder System Inc. | 5.850% | 11/1/16 | 1,000 | 984 |
| Southwest Airlines Co. | 6.500% | 3/1/12 | 2,400 | 2,502 |
| Southwest Airlines Co. | 5.250% | 10/1/14 | 2,000 | 1,933 |
| Southwest Airlines Co. | 5.750% | 12/15/16 | 1,300 | 1,274 |
| Union Pacific Corp. | 6.125% | 1/15/12 | 100 | 103 |
| Union Pacific Corp. | 6.500% | 4/15/12 | 4,425 | 4,643 |
| Union Pacific Corp. | 7.000% | 2/1/16 | 550 | 604 |
| Other (0.1%) | ||||
| Black & Decker Corp. | 4.750% | 11/1/14 | 1,000 | 917 |
| Black & Decker Corp. | 5.750% | 11/15/16 | 1,925 | 1,913 |
| Cooper Industries, Inc. | 5.250% | 11/15/12 | 1,400 | 1,385 |
| Dover Corp. | 4.875% | 10/15/15 | 2,400 | 2,301 |
| 1,167,830 | ||||
| Utilities (4.1%) | ||||
| Electric (3.1%) | ||||
| American Electric Power Co., Inc. | 5.250% | 6/1/15 | 1,850 | 1,807 |
| Arizona Public Service Co. | 5.800% | 6/30/14 | 500 | 498 |
| Arizona Public Service Co. | 4.650% | 5/15/15 | 3,825 | 3,510 |
| 3 Baltimore Gas & Electric Co. | 5.900% | 10/1/16 | 2,250 | 2,265 |
| Boston Edison Co. | 4.875% | 10/15/12 | 1,925 | 1,883 |
| Boston Edison Co. | 4.875% | 4/15/14 | 2,350 | 2,282 |
| Carolina Power & Light Co. | 6.500% | 7/15/12 | 1,850 | 1,941 |
| Carolina Power & Light Co. | 5.125% | 9/15/13 | 8,220 | 8,107 |
| Carolina Power & Light Co. | 5.250% | 12/15/15 | 3,000 | 2,945 |
| CenterPoint Energy Houston | 5.700% | 3/15/13 | 4,000 | 4,029 |
| CenterPoint Energy Houston | 5.750% | 1/15/14 | 500 | 503 |
| Cincinnati Gas & Electric Co. | 5.700% | 9/15/12 | 3,900 | 3,926 |
| Cleveland Electric Illumination Co. | 5.650% | 12/15/13 | 500 | 499 |
| Commonwealth Edison Co. | 6.150% | 3/15/12 | 2,650 | 2,710 |
| Commonwealth Edison Co. | 4.700% | 4/15/15 | 700 | 652 |
| Consolidated Edison Co. of New York | 4.875% | 2/1/13 | 5,000 | 4,868 |
| Consolidated Edison Co. of New York | 5.500% | 9/15/16 | 1,850 | 1,848 |
| Constellation Energy Group, Inc. | 7.000% | 4/1/12 | 2,300 | 2,469 |
| Constellation Energy Group, Inc. | 4.550% | 6/15/15 | 6,250 | 5,809 |
| Consumers Energy Co. | 5.000% | 2/15/12 | 3,175 | 3,096 |
| Consumers Energy Co. | 5.375% | 4/15/13 | 2,500 | 2,489 |
| Consumers Energy Co. | 5.500% | 8/15/16 | 1,125 | 1,104 |
| Dayton Power & Light | 5.125% | 10/1/13 | 1,875 | 1,844 |
| Dominion Resources, Inc. | 6.250% | 6/30/12 | 4,000 | 4,156 |
| Dominion Resources, Inc. | 5.000% | 3/15/13 | 1,500 | 1,458 |
| Dominion Resources, Inc. | 5.150% | 7/15/15 | 6,525 | 6,345 |
| Duke Capital Corp. | 6.250% | 2/15/13 | 2,150 | 2,209 |
| Duke Capital Corp. | 5.500% | 3/1/14 | 1,000 | 988 |
| Duke Capital Corp. | 5.668% | 8/15/14 | 1,000 | 997 |
| Duke Energy Corp. | 6.250% | 1/15/12 | 4,450 | 4,632 |
| Duke Energy Corp. | 5.625% | 11/30/12 | 2,000 | 2,035 |
| Empresa Nacional Electric | 8.350% | 8/1/13 | 2,125 | 2,423 |
| Energy East Corp. | 6.750% | 6/15/12 | 1,750 | 1,839 |
| Exelon Corp. | 4.900% | 6/15/15 | 3,425 | 3,230 |
| Exelon Generation Co. LLC | 5.350% | 1/15/14 | 1,000 | 983 |
| Florida Power & Light Co. | 4.850% | 2/1/13 | 3,000 | 2,944 |
| Florida Power Corp. | 4.800% | 3/1/13 | 3,000 | 2,910 |
| FPL Group Capital, Inc. | 6.350% | 10/1/16 | 1,825 | 1,854 |
| Jersey Central Power & Light | 5.625% | 5/1/16 | 3,675 | 3,660 |
| Metropolitan Edison | 4.875% | 4/1/14 | 1,000 | 951 |
| MidAmerican Energy Co. | 5.125% | 1/15/13 | 4,000 | 3,940 |
| MidAmerican Energy Holdings Co. | 5.875% | 10/1/12 | 3,000 | 3,060 |
| MidAmerican Energy Holdings Co. | 5.000% | 2/15/14 | 600 | 580 |
| National Rural Utilities Cooperative Finance Corp. | 7.250% | 3/1/12 | 8,210 | 8,922 |
| National Rural Utilities Cooperative Finance Corp. | 4.750% | 3/1/14 | 2,000 | 1,929 |
| NiSource Finance Corp. | 6.150% | 3/1/13 | 2,500 | 2,543 |
| NiSource Finance Corp. | 5.400% | 7/15/14 | 3,250 | 3,162 |
| Northern States Power Co. | 8.000% | 8/28/12 | 2,500 | 2,812 |
| Ohio Edison | 6.400% | 7/15/16 | 200 | 209 |
| Ohio Power Co. | 5.500% | 2/15/13 | 2,000 | 1,996 |
| Ohio Power Co. | 6.000% | 6/1/16 | 425 | 437 |
| Oncor Electric Delivery Co. | 6.375% | 5/1/12 | 3,000 | 3,083 |
| Oncor Electric Delivery Co. | 6.375% | 1/15/15 | 175 | 180 |
| Pacific Gas & Electric Co. | 4.800% | 3/1/14 | 6,800 | 6,536 |
| Pepco Holdings, Inc. | 6.450% | 8/15/12 | 3,425 | 3,545 |
| PPL Energy Supply LLC | 6.200% | 5/15/16 | 500 | 516 |
| Progress Energy, Inc. | 6.850% | 4/15/12 | 775 | 824 |
| PSE&G Power LLC | 6.950% | 6/1/12 | 5,050 | 5,349 |
| PSI Energy Inc. | 5.000% | 9/15/13 | 1,125 | 1,087 |
| PSI Energy Inc. | 6.050% | 6/15/16 | 1,500 | 1,544 |
| Public Service Co. of Colorado | 7.875% | 10/1/12 | 4,775 | 5,366 |
| Public Service Co. of Colorado | 5.500% | 4/1/14 | 1,000 | 1,004 |
| Public Service Electric & Gas | 5.375% | 9/1/13 | 2,000 | 1,992 |
| Southern California Edison Co. | 5.000% | 1/15/14 | 4,200 | 4,088 |
| Southern California Edison Co. | 4.650% | 4/1/15 | 2,625 | 2,485 |
| Southern California Edison Co. | 5.000% | 1/15/16 | 925 | 896 |
| Southern Power Co. | 6.250% | 7/15/12 | 5,130 | 5,311 |
| Southern Power Co. | 4.875% | 7/15/15 | 1,125 | 1,070 |
| Tampa Electric Co. | 6.875% | 6/15/12 | 1,000 | 1,064 |
| Transalta Corp. | 6.750% | 7/15/12 | 125 | 130 |
| TXU Energy Co. | 7.000% | 3/15/13 | 6,000 | 6,303 |
| Union Electric Co. | 5.400% | 2/1/16 | 300 | 293 |
| Virginia Electric & Power Co. | 5.400% | 1/15/16 | 4,450 | 4,391 |
| Natural Gas (1.0%) | ||||
| Atmos Energy Corp. | 5.125% | 1/15/13 | 2,000 | 1,937 |
| Atmos Energy Corp. | 4.950% | 10/15/14 | 3,400 | 3,229 |
| CenterPoint Energy Resources | 7.875% | 4/1/13 | 4,250 | 4,703 |
| CenterPoint Energy Resources | 6.150% | 5/1/16 | 1,350 | 1,379 |
| Consolidated Natural Gas | 5.000% | 12/1/14 | 1,675 | 1,609 |
| Energy Transfer Partners LP | 5.650% | 8/1/12 | 1,950 | 1,957 |
| Energy Transfer Partners LP | 5.950% | 2/1/15 | 3,275 | 3,296 |
| Enterprise Products Operating LP | 5.600% | 10/15/14 | 4,750 | 4,659 |
| Kinder Morgan Energy Partners LP | 7.125% | 3/15/12 | 2,950 | 3,121 |
| Kinder Morgan Energy Partners LP | 5.000% | 12/15/13 | 2,200 | 2,092 |
| Kinder Morgan Energy Partners LP | 5.125% | 11/15/14 | 2,150 | 2,053 |
| Kinder Morgan, Inc. | 6.500% | 9/1/12 | 7,825 | 7,871 |
| Kinder Morgan, Inc. | 5.700% | 1/5/16 | 1,000 | 922 |
| Magellan Midstream Partners, LP | 5.650% | 10/15/16 | 650 | 633 |
| National Grid PLC | 6.300% | 8/1/16 | 3,775 | 3,918 |
| ONEOK Inc. | 5.200% | 6/15/15 | 3,100 | 2,916 |
| ONEOK Partners, LP | 5.900% | 4/1/12 | 3,400 | 3,439 |
| ONEOK Partners, LP | 6.150% | 10/1/16 | 3,125 | 3,168 |
| San Diego Gas & Electric | 5.300% | 11/15/15 | 300 | 296 |
| Sempra Energy | 6.000% | 2/1/13 | 1,925 | 1,976 |
| Teppco Partners, LP | 7.625% | 2/15/12 | 2,000 | 2,152 |
| Texas Gas Transmission | 4.600% | 6/1/15 | 500 | 460 |
| Trans-Canada Pipelines | 4.000% | 6/15/13 | 3,000 | 2,760 |
| Valero Logistics | 6.050% | 3/15/13 | 2,000 | 2,020 |
| 253,911 | ||||
| Total Corporate Bonds | ||||
| (Cost $2,672,358) | 2,655,205 | |||
| Sovereign Bonds (U.S. Dollar-Denominated) (6.1%) | ||||
| Asian Development Bank | 4.500% | 9/4/12 | 6,500 | 6,335 |
| Asian Development Bank | 6.640% | 5/27/14 | 521 | 571 |
| Asian Development Bank | 5.500% | 6/27/16 | 2,900 | 2,991 |
| China Development Bank | 4.750% | 10/8/14 | 2,700 | 2,590 |
| China Development Bank | 5.000% | 10/15/15 | 3,450 | 3,345 |
| Corp. Andina de Fomento | 6.875% | 3/15/12 | 2,300 | 2,441 |
| Corp. Andina de Fomento | 5.200% | 5/21/13 | 3,500 | 3,439 |
| Development Bank of Japan | 4.250% | 6/9/15 | 2,325 | 2,194 |
| Eksportfinans | 5.500% | 5/25/16 | 7,100 | 7,315 |
| European Bank for Reconstruction & Development | 5.000% | 5/19/14 | 3,400 | 3,394 |
| European Investment Bank | 4.625% | 5/15/14 | 12,350 | 12,037 |
| European Investment Bank | 4.875% | 2/16/16 | 9,250 | 9,119 |
| European Investment Bank | 5.125% | 9/13/16 | 9,850 | 9,890 |
| Export-Import Bank of Korea | 5.125% | 3/16/15 | 4,800 | 4,660 |
| Financement Quebec | 5.000% | 10/25/12 | 2,000 | 1,984 |
| Inter-American Development Bank | 4.375% | 9/20/12 | 6,500 | 6,278 |
| Inter-American Development Bank | 4.500% | 9/15/14 | 3,000 | 2,912 |
| Inter-American Development Bank | 4.250% | 9/14/15 | 9,420 | 8,894 |
| Inter-American Development Bank | 5.125% | 9/13/16 | 3,700 | 3,718 |
| International Bank for Reconstruction & Development | 3.625% | 5/21/13 | 2,500 | 2,319 |
| International Bank for Reconstruction & Development | 5.000% | 4/1/16 | 4,375 | 4,339 |
| Japan Finance Corp. | 4.625% | 4/21/15 | 5,600 | 5,460 |
| Korea Development Bank | 5.750% | 9/10/13 | 6,675 | 6,800 |
| Korea Electric Power | 7.750% | 4/1/13 | 2,300 | 2,589 |
| Kreditanstalt fur Wiederaufbau | 4.125% | 10/15/14 | 6,475 | 6,109 |
| Kreditanstalt fur Wiederaufbau | 5.125% | 3/14/16 | 15,800 | 15,931 |
| Landwirtschaftliche Rentenbank | 4.875% | 11/16/15 | 2,025 | 1,984 |
| Oesterreichische Kontrollbank | 4.500% | 3/9/15 | 2,600 | 2,510 |
| Oesterreichische Kontrollbank | 4.875% | 2/16/16 | 5,000 | 4,926 |
| Ontario Hydro Electric | 7.450% | 3/31/13 | 3,000 | 3,370 |
| 2 Pemex Finance Ltd. | 9.690% | 8/15/09 | 2,750 | 2,896 |
| Pemex Project Funding Master Trust | 7.375% | 12/15/14 | 4,825 | 5,324 |
| Pemex Project Funding Master Trust | 5.750% | 12/15/15 | 9,015 | 8,983 |
| People's Republic of China | 4.750% | 10/29/13 | 5,000 | 4,906 |
| Province of Manitoba | 7.500% | 2/22/10 | 1,000 | 1,069 |
| Province of Nova Scotia | 5.750% | 2/27/12 | 2,500 | 2,566 |
| Province of Ontario | 4.750% | 1/19/16 | 16,725 | 16,281 |
| Province of Ontario | 5.450% | 4/27/16 | 7,100 | 7,271 |
| Province of Quebec | 4.875% | 5/5/14 | 5,500 | 5,402 |
| Province of Quebec | 4.600% | 5/26/15 | 4,800 | 4,590 |
| Province of Quebec | 5.125% | 11/14/16 | 8,675 | 8,592 |
| Province of Saskatchewan | 7.375% | 7/15/13 | 1,000 | 1,123 |
| Quebec Hydro Electric | 7.500% | 4/1/16 | 2,500 | 2,880 |
| Republic of Chile | 7.125% | 1/11/12 | 4,000 | 4,342 |
| Republic of Chile | 5.500% | 1/15/13 | 4,450 | 4,519 |
| Republic of Hungary | 4.750% | 2/3/15 | 7,350 | 6,966 |
| Republic of Italy | 5.625% | 6/15/12 | 21,625 | 22,068 |
| Republic of Italy | 4.500% | 1/21/15 | 8,900 | 8,666 |
| Republic of Italy | 4.750% | 1/25/16 | 4,075 | 3,950 |
| Republic of Italy | 5.250% | 9/20/16 | 24,500 | 24,632 |
| Republic of Korea | 4.250% | 6/1/13 | 10,725 | 10,095 |
| Republic of Poland | 6.250% | 7/3/12 | 5,875 | 6,154 |
| Republic of Poland | 5.250% | 1/15/14 | 4,700 | 4,724 |
| Republic of Poland | 5.000% | 10/19/15 | 4,500 | 4,413 |
| Republic of South Africa | 7.375% | 4/25/12 | 7,150 | 7,713 |
| Republic of South Africa | 6.500% | 6/2/14 | 2,225 | 2,333 |
| State of Israel | 4.625% | 6/15/13 | 3,550 | 3,394 |
| State of Israel | 5.125% | 3/1/14 | 2,000 | 1,948 |
| State of Israel | 5.500% | 11/9/16 | 4,025 | 4,022 |
| United Mexican States | 6.375% | 1/16/13 | 6,574 | 6,926 |
| United Mexican States | 5.875% | 1/15/14 | 9,325 | 9,558 |
| United Mexican States | 6.625% | 3/3/15 | 14,200 | 15,265 |
| United Mexican States | 11.375% | 9/15/16 | 1,425 | 2,052 |
| United Mexican States | 5.625% | 1/15/17 | 2,750 | 2,756 |
| Total Sovereign Bonds | ||||
| (Cost $381,411) | 378,823 | |||
| Taxable Municipal Bonds (0.0%) | ||||
| Wisconsin Public Service Rev | 4.800% | 5/1/13 | 1,350 | 1,323 |
| (Cost $1,347) | ||||
| Temporary Cash Investment (1.7%) | Shares | |||
| 4 Vanguard Market Liquidity Fund, 5.294% | ||||
| (Cost $104,078) | 104,078,428 | 104,078 | ||
| Total Investments (99.7%) | ||||
| (Cost $6,230,770) | 6,208,157 | |||
| Other Assets and Liabilities - Net (0.3%) | 19,671 | |||
| Net Assets (100%) | 6,227,828 | |||
1 The issuer operates under a congressional charter; its securities are neither issued nor guaranteed by the U.S. government. If needed, access to additional funding from the U.S. Treasury (beyond the issuer's line of credit) would require congressional action.
2 The average or expected maturity is shorter than the final maturity shown because of the possibility of interim principal payments and prepayments or the possibility of the issue being called.
3 Security exempt from registration under Rule 144A of the Securities Act of 1933. Such securities may be sold in transactions exempt from registration, normally to qualified institutional buyers. At December 31, 2006, the aggregate value of these securities was $17,191,000, representing 0.3% of net assets.
4 Affiliated money market fund available only to Vanguard funds and certain trusts and accounts managed by Vanguard. Rate shown is the 7-day yield.
Item 2: Code of Ethics. The Registrant has adopted a code of ethics that applies to the Registrant's principal executive officer, principal financial officer, principal accounting officer or controller or persons performing similar functions. The Code of Ethics was amended during the reporting period covered by this report to make certain technical, non-material changes.
Item 3: Audit Committee Financial Expert. The following members of the Audit Committee have been determined by the Registrant’s Board of Trustees to be Audit Committee Financial Experts serving on its Audit Committee, and to be independent: Charles D. Ellis, Rajiv L. Gupta, JoAnn Heffernan Heisen, André F. Perold, Alfred M. Rankin, Jr., and J. Lawrence Wilson.
Item 4: Principal Accountant Fees and Services.
(a) Audit Fees.
Audit Fees of the Registrant
Fiscal Year Ended December 31, 2006: $151,000
Fiscal Year Ended December 31, 2005: $87,000
Aggregate Audit Fees of Registered Investment Companies in the Vanguard Group
Fiscal Year Ended December 31, 2006:$2,347,620
Fiscal Year Ended December 31, 2005:$2,152,740
(b) Audit-Related Fees.
Fiscal Year Ended December 31, 2006: $530,000
Fiscal Year Ended December 31, 2005: $382,200
Includes fees billed in connection with assurance and related services provided to the Registrant, The Vanguard Group, Inc., Vanguard Marketing Corporation, and other registered investment companies in the Vanguard Group.
(c) Tax Fees.
Fiscal Year Ended December 31, 2006: $101,300
Fiscal Year Ended December 31, 2005: $98,400
Includes fees billed in connection with tax compliance, planning and advice services provided to the Registrant, The Vanguard Group, Inc., Vanguard Marketing Corporation, and other registered investment companies in the Vanguard Group and related to income and excise taxes.
(d) All Other Fees.
Fiscal Year Ended December 31, 2006: $0
Fiscal Year Ended December 31, 2005: $0
Includes fees billed for services related to risk management and privacy matters. Services were provided to the Registrant, The Vanguard Group, Inc., Vanguard Marketing Corporation, and other registered investment companies in the Vanguard Group.
(e) (1) Pre-Approval Policies. The policy of the Registrant’s Audit Committee is to consider and, if appropriate, approve before the principal accountant is engaged for such services, all specific audit and non-audit services provided to: (1) the Registrant; (2) The Vanguard Group, Inc.; (3) other entities controlled by The Vanguard Group, Inc. that provide ongoing services to the Registrant; and (4) other registered investment companies in the Vanguard Group. In making a determination, the Audit Committee considers whether the services are consistent with maintaining the principal accountant’s independence.
In the event of a contingency situation in which the principal accountant is needed to provide services in between scheduled Audit Committee meetings, the Chairman of the Audit Committee would be called on to consider and, if appropriate, pre-approve audit or permitted non-audit services in an amount sufficient to complete services through the next Audit Committee meeting, and to determine if such services would be consistent with maintaining the accountant’s independence. At the next scheduled Audit Committee meeting, services and fees would be presented to the Audit Committee for formal consideration, and, if appropriate, approval by the entire Audit Committee. The Audit Committee would again consider whether such services and fees are consistent with maintaining the principal accountant’s independence.
The Registrant’s Audit Committee is informed at least annually of all audit and non-audit services provided by the principal accountant to the Vanguard complex, whether such services are provided to: (1) the Registrant; (2) The Vanguard Group, Inc.; (3) other entities controlled by The Vanguard Group, Inc. that provide ongoing services to the Registrant; or (4) other registered investment companies in the Vanguard Group.
(2) No percentage of the principal accountant’s fees or services were approved pursuant to the waiver provision of paragraph (c)(7)(i)(C) of Rule 2-01 of Regulation S-X.
(f) For the most recent fiscal year, over 50% of the hours worked under the principal accountant’s engagement were not performed by persons other than full-time, permanent employees of the principal accountant.
(g) Aggregate Non-Audit Fees.
Fiscal Year Ended December 31, 2006:$101,300
Fiscal Year Ended December 31, 2005: $98,400
Includes fees billed for non-audit services provided to the Registrant, The Vanguard Group, Inc., Vanguard Marketing Corporation, and other registered investment companies in the Vanguard Group.
(h) For the most recent fiscal year, the Audit Committee has determined that the provision of all non-audit services was consistent with maintaining the principal accountant’s independence.
Item 5: Not applicable.
Item 6: Not applicable.
Item 7: Not applicable.
Item 8: Not applicable.
Item 9: Not applicable.
Item 10: Not applicable
Item 11: Controls and Procedures.
(a) Disclosure Controls and Procedures. The Principal Executive and Financial Officers concluded that the Registrant’s Disclosure Controls and Procedures are effective based on their evaluation of the Disclosure Controls and Procedures as of a date within 90 days of the filing date of this report.
(b) Internal Control Over Financial Reporting. There were no significant changes in Registrant’s internal control over financial reporting or in other factors that could significantly affect this control subsequent to the date of the evaluation, including any corrective actions with regard to significant deficiencies and material weaknesses.
Item 12: Exhibits.
(a) Code of Ethics.
(b) Certifications.
Pursuant to the requirements of the Securities Exchange Act of 1934 and the Investment Company Act of 1940, the registrant has duly caused this report to be signed on its behalf by the undersigned, thereunto duly authorized.
| VANGUARD BOND INDEX FUNDS | |
| BY: | (signature) |
| (HEIDI STAM) JOHN J. BRENNAN* CHIEF EXECUTIVE OFFICER |
| Date: | February 14, 2007 |
Pursuant to the requirements of the Securities Exchange Act of 1934 and the Investment Company Act of 1940, this report has been signed below by the following persons on behalf of the registrant and in the capacities and on the dates indicated.
| VANGUARD BOND INDEX FUNDS | |
| BY: | (signature) |
| (HEIDI STAM) JOHN J. BRENNAN* CHIEF EXECUTIVE OFFICER |
| Date: | February 14, 2007 |
| VANGUARD BOND INDEX FUNDS | |
| BY: | (signature) |
| (HEIDI STAM) THOMAS J. HIGGINS* TREASURER |
| Date: | February 14, 2007 |
* By Power of Attorney. See File Number 002-65955-99, filed on July 27, 2006. Incorporated by Reference.