UNITED STATES SECURITIES AND EXCHANGE COMMISSION
Washington, D.C. 20549
FORM N-CSR
CERTIFIED SHAREHOLDER REPORT OF
REGISTERED MANAGEMENT INVESTMENT COMPANIES
| Investment Company Act file number: | 811-4681 |
| Name of Registrant: | Vanguard Bond Index Funds |
| Address of Registrant: | P.O. Box 2600 |
| Valley Forge, PA 19482 | |
| Name and address of agent for service: | Heidi Stam, Esquire |
| P.O. Box 876 | |
| Valley Forge, PA 19482 | |
| Registrant’s telephone number, including area code: | (610) 669-1000 |
| Date of fiscal year end: | December 31 |
| Date of reporting period: | January 1, 2009 – December 31, 2009 |
| Item 1: | Reports to Shareholders |
![]()
Vanguard Bond Index Funds Annual Report

Vanguard Total Bond Market Index Fund
Vanguard Short-Term Bond Index Fund
Vanguard Intermediate-Term Bond Index Fund
Vanguard Long-Term Bond Index Fund
- Investors began to embrace risk again in early 2009, helping to fuel a rally in the corporate bond market.
- For the fiscal year ended December 31, 2009, the Vanguard Bond Index Funds’ returns for Investor Shares ranged from 1.76% for the Long-Term Bond Index Fund to 6.79% for the Intermediate-Term Bond Index Fund. The returns of all four funds were in line with their target indexes.
- As lower-quality, riskier bonds became some of the year’s best performers, the funds’ results lagged the average returns of their peers.
| Contents | |
| Your Fund’s Total Returns.......................... | 1 |
| Chairman’s Letter....................................... | 4 |
| Results of Proxy Voting.............................. | 10 |
| Total Bond Market Index Fund................... | 12 |
| Short-Term Bond Index Fund.................... | 32 |
| Intermediate-Term Bond Index Fund......... | 49 |
| Long-Term Bond Index Fund..................... | 68 |
| About Your Fund’s Expenses...................... | 85 |
| Glossary..................................................... | 88 |
Please note: The opinions expressed in this report are just that—informed opinions. They should not be considered promises or advice. Also, please keep in mind that the information and opinions cover the period through the date on the front of this report. Of course, the risks of investing in your fund are spelled out in the prospectus.
Cover photograph: Veronica Coia.
| Your Fund’s Total Returns | |||
| Fiscal Year Ended December 31, 2009 | |||
| Ticker | Total | ||
| Symbol | Returns | ||
| Vanguard Total Bond Market Index Fund | |||
| Investor Shares | VBMFX | 5.93 | % |
| Admiral™ Shares1 | VBTLX | 6.04 | |
| Signal® Shares2 | VBTSX | 6.04 | |
| Institutional Shares3 | VBTIX | 6.09 | |
| ETF Shares4 | BND | ||
| Market Price | 3.46 | ||
| Net Asset Value | 6.03 | ||
| Barclays Capital U.S. Aggregate Bond Index | 5.93 | ||
| Intermediate-Term Investment Grade Debt Funds Average5 | 12.49 | ||
| Vanguard Short-Term Bond Index Fund | |||
| Investor Shares | VBISX | 4.28 | % |
| Admiral Shares1 | VBIRX | 4.38 | |
| Signal Shares2 | VBSSX | 4.38 | |
| ETF Shares4 | BSV | ||
| Market Price | 1.58 | ||
| Net Asset Value | 4.44 | ||
| Barclays Capital U.S. 1–5 Year Government/Credit Bond Index | 4.62 | ||
| 1–5 Year Investment Grade Debt Funds Average5 | 9.78 | ||
1 A lower-cost class of shares available to many longtime shareholders and to those with significant investments in the fund.
2 Signal Shares also carry lower costs and are available to certain institutional shareholders who meet specific administrative, service, and account-size criteria.
3 This class of shares also carries low expenses and is available for a minimum investment of $5 million.
4 These Vanguard ETF® Shares are traded on the NYSE Arca exchange and are available only through brokers. The table shows ETF returns based on both the NYSE Arca market price and the net asset value for a share. U.S. Pat. No. 6,879,964 B2; 7,337,138.
5 Derived from data provided by Lipper Inc.
1
| Your Fund’s Total Returns | |||
| Fiscal Year Ended December 31, 2009 | |||
| Ticker | Total | ||
| Symbol | Returns | ||
| Vanguard Intermediate-Term Bond Index Fund | |||
| Investor Shares | VBIIX | 6.79 | % |
| Admiral Shares1 | VBILX | 6.89 | |
| Signal Shares2 | VIBSX | 6.89 | |
| Institutional Shares3 | VBIMX | 6.95 | |
| ETF Shares4 | BIV | ||
| Market Price | 4.12 | ||
| Net Asset Value | 6.82 | ||
| Barclays Capital U.S. 5–10 Year Government/Credit Bond Index | 6.50 | ||
| Intermediate-Term Investment Grade Debt Funds Average5 | 12.49 | ||
| Vanguard Long-Term Bond Index Fund | |||
| Investor Shares | VBLTX | 1.76 | % |
| Institutional Shares3 | VBLLX | 1.91 | |
| ETF Shares4 | BLV | ||
| Market Price | 0.39 | ||
| Net Asset Value | 1.79 | ||
| Barclays Capital U.S. Long Government/Credit Bond Index | 1.92 | ||
| Corporate A-Rated Debt Funds Average5 | 14.69 | ||
1 A lower-cost class of shares available to many longtime shareholders and to those with significant investments in the fund.
2 Signal Shares also carry lower costs and are available to certain institutional shareholders who meet specific administrative, service, and account-size criteria.
3 This class of shares also carries low expenses and is available for a minimum investment of $25 million.
4 These Vanguard ETF Shares are traded on the NYSE Arca exchange and are available only through brokers. The table shows ETF returns based on both the NYSE Arca market price and the net asset value for a share. U.S. Pat. No. 6,879,964 B2; 7,337,138.
5 Derived from data provided by Lipper Inc.
2
| Your Fund’s Performance at a Glance | ||||||||||
| December 31, 2008–December 31, 2009 | ||||||||||
| Starting | Ending | Distributions Per Share | 30 | -Day | ||||||
| Share | Share | Income | Capital | SEC | ||||||
| Index Fund | Price | Price | Dividends | Gains | Yield | |||||
| Total Bond Market | ||||||||||
| Investor Shares | $ | 10.18 | $ | 10.35 | $ | 0.421 | $ | 0.000 | 3.33 | % |
| Admiral Shares | 10.18 | 10.35 | 0.432 | 0.000 | 3.45 | |||||
| Signal Shares | 10.18 | 10.35 | 0.432 | 0.000 | 3.46 | |||||
| Institutional Shares | 10.18 | 10.35 | 0.437 | 0.000 | 3.49 | |||||
| ETF Shares | 76.93 | 78.31 | 3.163 | 0.000 | 3.45 | |||||
| Short-Term Bond | ||||||||||
| Investor Shares | $ | 10.28 | $ | 10.42 | $ | 0.293 | $ | 0.001 | 1.45 | % |
| Admiral Shares | 10.28 | 10.42 | 0.303 | 0.001 | 1.58 | |||||
| Signal Shares | 10.28 | 10.42 | 0.303 | 0.001 | 1.58 | |||||
| ETF Shares | 78.13 | 79.35 | 2.196 | 0.008 | 1.57 | |||||
| Intermediate-Term Bond | ||||||||||
| Investor Shares | $ | 10.50 | $ | 10.72 | $ | 0.474 | $ | 0.000 | 3.85 | % |
| Admiral Shares | 10.50 | 10.72 | 0.485 | 0.000 | 3.99 | |||||
| Signal Shares | 10.50 | 10.72 | 0.485 | 0.000 | 3.98 | |||||
| Institutional Shares | 10.50 | 10.72 | 0.490 | 0.000 | 4.02 | |||||
| ETF Shares | 77.19 | 78.85 | 3.474 | 0.000 | 3.98 | |||||
| Long-Term Bond | ||||||||||
| Investor Shares | $ | 11.98 | $ | 11.56 | $ | 0.608 | $ | 0.000 | 5.21 | % |
| Institutional Shares | 11.98 | 11.56 | 0.625 | 0.000 | 5.37 | |||||
| ETF Shares | 78.66 | 75.91 | 4.005 | 0.000 | 5.32 | |||||
3

Chairman’s Letter
Dear Shareholder,
As credit markets stabilized and investors regained their appetite for risk, corporate bonds enjoyed a strong rally in 2009, partly at the expense of ultra-safe U.S. Treasury bonds. These broad bond market dynamics were muted within the four Vanguard Bond Index Funds, because their diversified portfolios have significant holdings in Treasuries.
The best performer was the Intermediate-Term Bond Index Fund, with a 6.79% return for Investor Shares, followed by 5.93% for the Total Bond Market Index Fund, 4.28% for the Short-Term Bond Index Fund, and 1.76% for the Long-Term Bond Index Fund. Each fund’s return was in line with that of its target index. Unlike in 2008, however, the funds’ focus on higher-quality securities held back performance compared with their peer groups.
Please note: For ETF Shares of the four funds, we calculate returns based on both the market price and the net asset value (NAV) of the shares. Historically, the two returns have been similar. However, in 2008, as we noted in last year’s annual report, the returns diverged—reflecting the extraordinary conditions in the fixed income markets. Because the market price of the ETF Shares was significantly higher than their NAVs at year-end 2008, market-price returns were notably higher than NAV returns. In 2009, with credit markets becoming more normal, the return
4
differentials reversed: Market-price returns were lower than NAV returns. At year-end 2009, although market price was above NAV, the premium was more in line with historical relationships. For more information on the history of ETF premiums and discounts, please visit Vanguard.com, select your ETF, and then select the Performance tab.
I would also like to call to your attention two changes effective after the close of the year. As of January 1, 2010, each fund adopted a new float-adjusted version of its former benchmark index. In announcing this change last autumn, we noted that float-adjusted indexes better represent the liquidity in the marketplace by including only those bonds that are actually available to investors. The Federal Reserve Board’s extraordinary efforts to stabilize the credit markets included plans to purchase more than $1 trillion in U.S. agency mortgage-backed securities, effectively removing these bonds from the investable universe. Barclays Capital updates its float-adjusted indexes as such bonds are taken out of the public supply, and then again when they are sold back.
Also, in early February, the previously announced merger of Vanguard Institutional Total Bond Market Index Fund into Vanguard Total Bond Market Index Fund was completed. As a result, the Total Bond Market Index Fund now offers investors six share classes, including new Institutional Plus Shares.
| Market Barometer | ||||||
| Average Annual Total Returns | ||||||
| Periods Ended December 31, 2009 | ||||||
| One Year | Three Years | Five Years | ||||
| Bonds | ||||||
| Barclays Capital U.S. Aggregate Bond Index (Broad taxable market) | 5.93 | % | 6.04 | % | 4.97 | % |
| Barclays Capital Municipal Bond Index | 12.91 | 4.41 | 4.32 | |||
| Citigroup 3-Month Treasury Bill Index | 0.16 | 2.22 | 2.88 | |||
| Stocks | ||||||
| Russell 1000 Index (Large-caps) | 28.43 | % | –5.36 | % | 0.79 | % |
| Russell 2000 Index (Small-caps) | 27.17 | –6.07 | 0.51 | |||
| Dow Jones U.S. Total Stock Market Index | 29.35 | –5.01 | 1.09 | |||
| MSCI All Country World Index ex USA (International) | 42.14 | –3.04 | 6.30 | |||
| CPI | ||||||
| Consumer Price Index | 2.72 | % | 2.28 | % | 2.56 | % |
5
Bond markets calmed down, money market funds endured
Compared with the final months of 2008, when credit markets seized up and investors fled to the safety of U.S. Treasuries, 2009 represented a return to normalcy for bonds. Investors’ appetite for risk returned, and the demand for corporate bonds increased, raising their prices and bringing down their yields. For the 12 months ended December 31, the broad taxable bond market returned about 6%, while municipal bonds returned about 13%.
Meanwhile, money market funds and other short-term savings vehicles did poorly in 2009. Interest rates at the shortest end of the maturity spectrum remained at historic lows, a casualty of the Federal Reserve Board’s efforts to revive the economy. The Fed kept its target for the federal funds rate between 0% and 0.25% for the entire year.
Impressive stock returns masked lingering uncertainties
For the 12 months, the broad U.S. stock market returned more than 29%, its highest calendar-year return since 2003. The year began with the market searching for a bottom, and it finally hit a low point in early March. From there, stocks mounted one of their strongest rallies ever in both magnitude and duration, resulting in a check mark-shaped stock chart for 2009.
The market’s outsized result came against a backdrop of economic uncertainty. The economy, which struggled to regain its
| Yields and Returns | ||||||||||
| Components of Total Returns | ||||||||||
| Yields at Year-End | Year Ended December 31, 2009 | |||||||||
| Index Fund (Investor Shares) | 2008 | 2009 | Capital | Income | Total | |||||
| Total Bond Market | 4.25 | % | 3.33 | % | 1.67 | % | 4.26 | % | 5.93 | % |
| Short-Term Bond | 2.60 | 1.45 | 1.37 | 2.91 | 4.28 | |||||
| Intermediate-Term Bond | 4.46 | 3.85 | 2.10 | 4.69 | 6.79 | |||||
| Long-Term Bond | 4.88 | 5.21 | –3.51 | 5.27 | 1.76 | |||||
6
footing as the financial crisis abated, began to show signs of growth in the second half of the year, even as unemployment climbed to levels not seen since 1983.
Stock markets outside the United States fared even better during 2009, especially many emerging markets, which weathered the financial crisis in relatively better fiscal and economic shape than their developed-market counterparts.
Corporate bonds rallied as confidence returned
Judging by the returns of the Total Bond Market Index Fund in 2008 and 2009, it might appear on the surface that not much happened in the bond markets. But nothing could be farther from the truth. Relatively similar returns for Investor shares—5.05% in 2008 and 5.93% in 2009—masked significant differences in performance across sectors, qualities, and maturities.
In 2009, corporate bonds stole the spotlight from Treasuries, which were the star performers in an otherwise dismal 2008. Instead of seeking safety and capital preservation, investors sought risk and rewards in the form of the higher yields offered by corporate bonds—the riskier the better, or so it seemed. After returning –4.94% in 2008, the worst annual return for this component of the Barclays Capital U.S. Aggregate Bond Index since 1974, corporate bonds enjoyed double-digit gains in 2009. In contrast, the Treasury
| Total Returns | ||||||
| Ten Years Ended December 31, 2009 | ||||||
| Comparable | ||||||
| Vanguard | Funds | Target | ||||
| Index Fund (Investor Shares) | Fund | Average1 | Index | |||
| Total Bond Market | 6.06 | % | 5.10 | % | 6.33 | % |
| Short-Term Bond | 5.09 | 3.90 | 5.36 | |||
| Intermediate-Term Bond | 6.83 | 5.10 | 6.98 | |||
| Long-Term Bond | 7.71 | 5.29 | 7.68 |
The figures shown represent past performance, which is not a guarantee of future results. (Current performance may be lower or higher than the performance data cited. For performance data current to the most recent month-end, visit our website at www.vanguard.com/performance.) Note, too, that both investment returns and principal value can fluctuate widely, so an investor’s shares, when sold, could be worth more or less than their original cost.
1 Derived from data provided by Lipper Inc.
7
component of this target index finished 2009 in negative territory. These dynamics played out in varying degrees in each fund.
Investors’ desire for higher returns than the rock-bottom rates offered by money market funds and some other short-term investments led them to favor intermediate-term bonds, bidding up their prices. As a result, the Intermediate-Term Bond Index Fund was the best performer of the four funds in this report. At the other end of the spectrum, the Long-Term Bond Index Fund had the lowest return in the group, as long-term bond yields rose (and prices fell), reflecting, in part, investors’ concerns about potential future inflation.
These relationships are apparent in the Yields and Returns table on page 6. While the year-end 30-day SEC yield of the Long-Term Bond Index Fund Investor Shares rose from 4.88% in 2008 to 5.21% in 2009, yields of the other three funds declined year-over-year. This translated into lower income returns for each fund (including the Long-Term Bond Index Fund), compared with this component in 2008. Capital returns were positive for all of the funds, however, except the Long-Term Bond Index Fund.
Diversification and indexing can help smooth the ride
For the ten years ended December 31, 2009, the Long-Term Bond Index Fund was the highest performer, with an average annual return of 7.71% for Investor Shares
| Expense Ratios1 | ||||||||||||
| Your Fund Compared With Its Peer Group | ||||||||||||
| Investor | Admiral | Signal | Institutional | ETF | Peer | |||||||
| Index Fund | Shares | Shares | Shares | Shares | Shares | Group2 | ||||||
| Total Bond Market | 0.22 | % | 0.14 | % | 0.14 | % | 0.08 | % | 0.14 | % | 0.94 | % |
| Short-Term Bond | 0.22 | 0.14 | 0.14 | — | 0.14 | 0.90 | ||||||
| Intermediate-Term Bond | 0.22 | 0.14 | 0.14 | 0.09 | 0.14 | 0.94 | ||||||
| Long-Term Bond | 0.22 | — | — | 0.09 | 0.14 | 1.10 | ||||||
1 The fund expense ratios shown are from the prospectuses dated April 24, 2009, and represent estimated costs for the current fiscal year based on the fund’s net assets as of the prospectus date. For the fiscal year ended December 31, 2009, the Total Bond Market Index Fund’s expense ratios were 0.22% for Investor Shares, 0.12% for Admiral Shares, 0.12% for Signal Shares, 0.07% for Institutional Shares, and 0.12% for ETF Shares. The Short-Term Bond Index Fund’s expense ratios were 0.22% for Investor Shares, 0.12% for Admiral Shares, 0.12% for Signal Shares, and 0.12% for ETF Shares. The Intermediate-Term Bond Index Fund’s expense ratios were 0.22% for Investor Shares, 0.12% for Admiral Shares, 0.12% for Signal Shares, 0.07% for Institutional Shares, and 0.12% for ETF Shares. The Long-Term Bond Index Fund’s expense ratios were 0.22% for Investor Shares, 0.07% for Institutional Shares, and 0. 12% for ETF Shares.
2 Peer groups are: for the Total Bond Market Index Fund and Intermediate-Term Bond Index Fund, the Intermediate-Term Investment Grade Debt Funds; for the Short-Term Bond Index Fund, the 1–5 Year Investment Grade Debt Funds; and for the Long-Term Bond Index Fund, the Corporate A-Rated Debt Funds. Peer-group expense ratios are derived from data provided by Lipper Inc. and capture information through year-end 2008.
8
(see the ten-year returns table on page 7). And even the Short-Term Bond Index Fund’s average annual return of 5.09% was well ahead of the loss sustained by the broad U.S. stock market in a disappointing decade.
The funds’ ability to track their respective benchmark indexes over time and to outperform the average results of their peer groups (shown also in the ten-year table) is a tribute to the skill and low costs of the fund’s advisor, Vanguard Fixed Income Group. The group’s seasoned team of portfolio managers, traders, risk managers, and credit analysts are supported by state-of-the-art technology. These resources are critical to the day-today management of the funds and to the effort to capture the key characteristics—such as credit quality, duration, and yield to maturity—and returns of a benchmark without owning all of the index’s bonds.
Most investors with stock and bond holdings have been taken on a roller-coaster ride over the last two years. In 2008, when virtually all asset classes except Treasuries experienced significant losses, having a balanced and diversified portfolio helped cushion some of the shock. And when both stocks and corporate bonds came roaring back in 2009, diversification admittedly trimmed some of the potential gains. History has taught us, however, that trying to anticipate any market’s ups and downs can be a costly, and futile, exercise.
Instead, we encourage investors to maintain a portfolio that is diversified both across and within asset classes. The importance of diversification is underscored by bonds’ considerable edge over stocks in the last decade. And by choosing a low-cost, well-managed index fund—such as those among the Vanguard Bond Index Funds—investors have the ability to earn returns consistent with those of the target benchmark.
On another matter, I would like to inform you that on January 1, 2010, we completed a leadership transition that began in March 2008. I succeeded Jack Brennan as chairman of Vanguard and each of the funds. Jack has agreed to serve as chairman emeritus and senior advisor. Under Jack’s leadership, Vanguard has grown to become a preeminent firm in the mutual fund industry. Jack’s energy, his relentless pursuit of perfection, and his unwavering focus on always doing the right thing for our clients are evident in every facet of Vanguard policy today.
Thank you for entrusting your assets to Vanguard.
F. William McNabb III
Chairman and Chief Executive Officer
February 8, 2010
9
Results of Proxy Voting
At a special meeting of shareholders on July 2, 2009, fund shareholders approved the following two proposals:
Proposal 1—Elect trustees for each fund.*
The individuals listed in the table below were elected as trustees for each fund. All trustees with the exception of Messrs. McNabb and Volanakis (both of whom already served as directors of The Vanguard Group, Inc.) served as trustees to the funds prior to the shareholder meeting.
Total Bond Market Index Fund, Short-Term Bond Index Fund, Intermediate-Term Bond Index Fund, Long-Term Bond Index Fund
| Percentage | ||||
| Trustee | For | Withheld | For | |
| John J. Brennan | 7,480,563,019 | 132,452,355 | 98.3 | % |
| Charles D. Ellis | 7,406,205,129 | 206,810,245 | 97.3 | % |
| Emerson U. Fullwood | 7,486,175,684 | 126,839,690 | 98.3 | % |
| Rajiv L. Gupta | 7,475,619,448 | 137,395,926 | 98.2 | % |
| Amy Gutmann | 7,494,805,274 | 118,210,101 | 98.4 | % |
| JoAnn Heffernan Heisen | 7,478,861,968 | 134,153,407 | 98.2 | % |
| F. William McNabb III | 7,490,714,832 | 122,300,542 | 98.4 | % |
| André F. Perold | 7,470,382,148 | 142,633,227 | 98.1 | % |
| Alfred M. Rankin, Jr. | 7,478,299,969 | 134,715,405 | 98.2 | % |
| Peter F. Volanakis | 7,496,308,685 | 116,706,689 | 98.5 | % |
| * Results are for all funds within the same trust. |
Proposal 2—Update and standardize the funds’ fundamental policies regarding:
| (a) | Purchasing and selling real estate. |
| (b) | Issuing senior securities. |
| (c) | Borrowing money. |
| (d) | Making loans. |
| (e) | Purchasing and selling commodities. |
| (f) | Concentrating investments in a particular industry or group of industries. |
| (g) | Eliminating outdated fundamental investment policies not required by law. |
The revised fundamental policies are clearly stated and simple, yet comprehensive, making oversight and compliance more efficient than under the former policies. The revised fundamental policies will allow the funds to respond more quickly to regulatory and market changes, while avoiding the costs and delays associated with successive shareholder meetings.
10
| Broker | Percentage | ||||||
| Vanguard Fund | For | Abstain | Against | Non-Votes | For | ||
| Total Bond Market Index Fund | |||||||
| 2a | 3,346,382,865 | 61,620,042 | 75,437,129 | 188,087,531 | 91.1 | % | |
| 2b | 3,337,161,663 | 68,364,463 | 77,913,910 | 188,087,531 | 90.9 | % | |
| 2c | 3,293,514,604 | 65,498,043 | 124,427,388 | 188,087,533 | 89.7 | % | |
| 2d | 3,327,171,353 | 65,799,525 | 90,469,156 | 188,087,533 | 90.6 | % | |
| 2e | 3,304,666,744 | 64,198,612 | 114,574,682 | 188,087,530 | 90.0 | % | |
| 2f | 3,325,859,928 | 72,046,430 | 85,533,679 | 188,087,531 | 90.6 | % | |
| 2g | 3,348,249,550 | 63,346,822 | 71,843,662 | 188,087,533 | 91.2 | % | |
| Short-Term Bond Index Fund | |||||||
| 2a | 496,826,289 | 6,859,206 | 13,045,093 | 77,279,948 | 83.6 | % | |
| 2b | 496,710,026 | 7,373,810 | 12,646,747 | 77,279,953 | 83.6 | % | |
| 2c | 490,972,136 | 7,505,032 | 18,253,408 | 77,279,960 | 82.7 | % | |
| 2d | 494,674,572 | 7,295,207 | 14,760,800 | 77,279,956 | 83.3 | % | |
| 2e | 493,671,090 | 7,257,175 | 15,802,315 | 77,279,956 | 83.1 | % | |
| 2f | 495,949,410 | 7,186,931 | 13,594,240 | 77,279,955 | 83.5 | % | |
| 2g | 490,453,131 | 7,533,637 | 18,743,822 | 77,279,946 | 82.6 | % | |
| Intermediate-Term Bond Index Fund | |||||||
| 2a | 500,535,808 | 5,635,451 | 15,078,945 | 51,044,265 | 87.5 | % | |
| 2b | 499,891,010 | 6,699,475 | 14,659,719 | 51,044,265 | 87.3 | % | |
| 2c | 501,242,163 | 6,330,949 | 13,677,089 | 51,044,268 | 87.6 | % | |
| 2d | 497,411,098 | 6,312,459 | 17,526,645 | 51,044,267 | 86.9 | % | |
| 2e | 495,200,473 | 6,320,518 | 19,729,211 | 51,044,267 | 86.5 | % | |
| 2f | 499,045,475 | 6,133,922 | 16,070,807 | 51,044,265 | 87.2 | % | |
| 2g | 503,389,279 | 6,653,607 | 11,207,317 | 51,044,266 | 88.0 | % | |
| Long-Term Bond Index Fund | |||||||
| 2a | 158,187,217 | 2,137,206 | 3,465,791 | 8,431,031 | 91.9 | % | |
| 2b | 157,944,559 | 2,533,747 | 3,311,906 | 8,431,033 | 91.7 | % | |
| 2c | 157,014,764 | 2,270,183 | 4,505,264 | 8,431,034 | 91.2 | % | |
| 2d | 154,013,905 | 2,275,979 | 7,500,328 | 8,431,032 | 89.4 | % | |
| 2e | 157,045,070 | 2,261,953 | 4,483,188 | 8,431,034 | 91.2 | % | |
| 2f | 154,340,610 | 5,795,947 | 3,653,655 | 8,431,032 | 89.6 | % | |
| 2g | 159,009,679 | 2,268,560 | 2,511,975 | 8,431,031 | 92.3 | % | |
11
Total Bond Market Index Fund
Fund Profile
As of December 31, 2009
| Financial Attributes | ||||
| Target | ||||
| Fund | Index1 | |||
| Number of Issues | 3,362 | 8,413 | ||
| Yield2 | 3.7 | % | ||
| Investor Shares | 3.3 | % | ||
| Admiral Shares | 3.5 | % | ||
| Signal Shares | 3.5 | % | ||
| Institutional Shares | 3.5 | % | ||
| ETF Shares | 3.5 | % | ||
| Yield to Maturity | 3.6 | %3 | 3.7 | % |
| Average Coupon | 4.9 | % | 4.7 | % |
| Average Effective Maturity | 6.7 years | 6.8 years | ||
| Average Quality4 | Aa1 | /Aa2 | Aa1 | /Aa2 |
| Average Duration | 4.5 years | 4.6 years | ||
| Expense Ratio5 | — | |||
| Investor Shares | 0.22 | % | ||
| Admiral Shares | 0.14 | % | ||
| Signal Shares | 0.14 | % | ||
| Institutional Shares | 0.08 | % | ||
| ETF Shares | 0.14 | % | ||
| Short-Term Reserves | 0.8 | % | — | |
| Sector Diversification6 (% of portfolio) | ||||
| Asset-Backed/Commercial Mortgage-Backed | 3.7 | % | ||
| Finance | 7.2 | |||
| Foreign | 4.1 | |||
| Government Mortgage-Backed | 33.2 | |||
| Industrial | 10.7 | |||
| Treasury/Agency | 38.0 | |||
| Utilities | 2.3 | |||
| Other | 0.8 | |||
Volatility Measures7
| Fund Versus | |
| Target Index1 | |
| R-Squared | 0.99 |
| Beta | 1.00 |
Distribution by Maturity (% of portfolio)
| Under 1 Year | 2.4 | % |
| 1–5 Years | 47.5 | |
| 5–10 Years | 37.8 | |
| 10–20 Years | 5.6 | |
| 20–30 Years | 6.6 | |
| Over 30 Years | 0.1 |
Distribution by Credit Quality4 (% of portfolio)
| Aaa | 76.9 | % |
| Aa | 4.0 | |
| A | 10.3 | |
| Baa | 8.8 |
Investment Focus

1 Barclays Capital U.S. Aggregate Bond Index.
2 30-day SEC yield for the fund; index yield assumes that all bonds are called or prepaid at the earliest possible dates. See the Glossary.
3 Before expenses.
4 Moody’s Investors Service.
5 The expense ratios shown are from the prospectuses dated April 24, 2009, and represent estimated costs for the current fiscal year based on the fund’s net assets as of the prospectus date. For the fiscal year ended December 31, 2009, the expense ratios for the Total Bond Market Index Fund were 0.22% for Investor Shares, 0.12% for Admiral Shares, 0.12% for Signal Shares, 0.07% for Institutional Shares, and 0.12% for ETF Shares.
6 The agency and mortgage-backed securities sectors may include issues from government-sponsored enterprises; such issues are not backed by the full faith and credit of the U.S. government.
7 For an explanation of R-squared, beta, and other terms used here, see the Glossary.
12
Total Bond Market Index Fund
Performance Summary
All of the returns in this report represent past performance, which is not a guarantee of future results that may be achieved by the fund. (Current performance may be lower or higher than the performance data cited. For performance data current to the most recent month-end, visit our website at www.vanguard.com/performance.) Note, too, that both investment returns and principal value can fluctuate widely, so an investor’s shares, when sold, could be worth more or less than their original cost. The returns shown do not reflect taxes that a shareholder would pay on fund distributions or on the sale of fund shares.
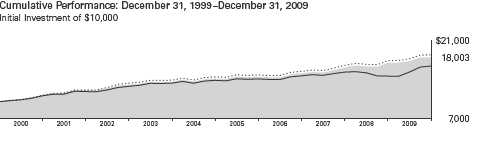
| Average Annual Total Returns | Final Value | |||||||
| Periods Ended December 31, 2009 | of a $10,000 | |||||||
| One Year | Five Years | Ten Years | Investment | |||||
| Total Bond Market Index Fund | ||||||||
| Investor Shares1 | 5.93 | % | 4.90 | % | 6.06 | % | $ | 18,003 |
| Barclays Capital U.S. Aggregate Bond Index | 5.93 | 4.97 | 6.33 | 18,475 | ||||
| Intermediate-Term Investment Grade | ||||||||
| Debt Funds Average2 | 12.49 | 3.48 | 5.10 | 16,450 | ||||
| Final Value | ||||||||
| Since | of a $100,000 | |||||||
| One Year | Five Years | Inception3 | Investment | |||||
| Total Bond Market Index Fund Admiral Shares | 6.04 | % | 5.00 | % | 4.86 | % | $ | 147,062 |
| Barclays Capital U.S. Aggregate Bond Index | 5.93 | 4.97 | 5.07 | 149,477 | ||||
| Final Value of | ||||||||
| Since | a $1,000,000 | |||||||
| One Year | Inception3 | Investment | ||||||
| Total Bond Market Index Fund Signal Shares | 6.04 | % | 6.13 | % | $ | 1,219,171 | ||
| Barclays Capital U.S. Aggregate Bond Index | 5.93 | 6.07 | 1,217,018 | |||||
1 Total return figures do not reflect the account service fee that may be applicable to certain accounts with balances below $10,000.
2 Derived from data provided by Lipper Inc.; based on average returns for Intermediate U.S. Government Funds through December 31, 2001, and average returns for Intermediate Investment Grade Debt Funds thereafter.
3 Performance for the fund and its comparative standards is calculated since the following inception dates: November 12, 2001, for the Admiral Shares, and September 1, 2006, for the Signal Shares.
See Financial Highlights for dividend and capital gains information.
13
| Total Bond Market Index Fund | |||||||||
| Final Value of | |||||||||
| a $5,000,000 | |||||||||
| One Year | Five Years | Ten Years | Investment | ||||||
| Total Bond Market Index Fund Institutional Shares | 6.09 | % | 5.04 | % | 6.19 | % | $ | 9,115,097 | |
| Barclays Capital U.S. Aggregate Bond Index | 5.93 | 4.97 | 6.33 | 9,237,386 | |||||
| Final Value | |||||||||
| Since | of a $10,000 | ||||||||
| One Year | Inception2 | Investment | |||||||
| Total Bond Market Index Fund | |||||||||
| ETF Shares Net Asset Value1 | 6.03 | % | 6.08 | % | $ | 11,760 | |||
| Barclays Capital U.S. Aggregate Bond Index | 5.93 | 6.05 | 11,750 | ||||||
| Cumulative Returns: ETF Shares, April 3, 2007—December 31, 2009 | |||||||||
| Since | |||||||||
| One Year | Inception2 | ||||||||
| Total Bond Market Index Fund ETF Shares | |||||||||
| Market Price | 3.46 | % | 17.87 | % | |||||
| Total Bond Market Index Fund ETF Shares | |||||||||
| Net Asset Value | 6.03 | 17.60 | |||||||
| Barclays Capital U.S. Aggregate Bond Index | 5.93 | 17.50 | |||||||
| Fiscal-Year Total Returns (%): December 31, 1999—December 31, 2009 | |||||||||
| Investor Shares | Barclays3 | ||||||||
| Fiscal | Capital | Income | Total | Total | |||||
| Year | Return | Return | Return | Return | |||||
| 2000 | 4.2 | % | 7.2 | % | 11.4 | % | 11.6 | % | |
| 2001 | 1.9 | 6.5 | 8.4 | 8.4 | |||||
| 2002 | 2.4 | 5.9 | 8.3 | 10.3 | |||||
| 2003 | –0.7 | 4.7 | 4.0 | 4.1 | |||||
| 2004 | –0.2 | 4.4 | 4.2 | 4.3 | |||||
| 2005 | –2.0 | 4.4 | 2.4 | 2.4 | |||||
| 2006 | –0.7 | 5.0 | 4.3 | 4.3 | |||||
| 2007 | 1.7 | 5.2 | 6.9 | 7.0 | |||||
| 2008 | 0.2 | 4.9 | 5.1 | 5.2 | |||||
| 2009 | 1.7 | 4.2 | 5.9 | 5.9 | |||||
1 For more information about how the ETF Shares’ market prices have compared with their net asset value, visit www.vanguard.com, select your ETF, and then select the Performance tab. The Premium/Discount table there shows the percentages of days on which the ETF Shares’ market price was above or below the NAV.
2 Performance for the fund and its comparative standards is calculated since the ETF Shares’ inception on April 3, 2007.
3 Barclays Capital U.S. Aggregate Bond Index.
14
Total Bond Market Index Fund
Financial Statements
Statement of Net Assets—Investments Summary
As of December 31, 2009
This Statement summarizes the fund’s holdings by asset type. Details are reported for each of the fund’s 50 largest individual holdings and for investments that, in total for any issuer, represent more than 1% of the fund’s net assets. The total value of smaller holdings is reported as a single amount within each category.
The fund reports a complete list of its holdings in regulatory filings four times in each fiscal year, at the quarter-ends. For the second and fourth fiscal quarters, the complete listing of the fund’s holdings is available electronically on Vanguard.com and on the Securities and Exchange Commission’s website (www.sec.gov), or you can have it mailed to you without charge by calling 800-662-7447. For the first and third fiscal quarters, the fund files the lists with the SEC on Form N-Q. Shareholders can look up the fund’s Forms N-Q on the SEC’s website. Forms N-Q may also be reviewed and copied at the SEC’s Public Reference Room (see the back cover of this report for further information).
| Face | Market | Percentage | |||||||||
| Maturity | Amount | Value• | of Net | ||||||||
| Coupon | Date | ($ | 000 | ) | ($ | 000 | ) | Assets | |||
| U.S. Government and Agency Obligations | |||||||||||
| U.S. Government Securities | |||||||||||
| United States Treasury Inflation | |||||||||||
| Indexed Bonds | 3.500 | % | 1/15/11 | 62,575 | 80,613 | 0.1 | % | ||||
| United States Treasury Note/Bond | 5.125 | % | 6/30/11 | 759,035 | 806,475 | 1.2 | % | ||||
| United States Treasury Note/Bond | 0.875 | % | 2/28/11 | 725,950 | 727,649 | 1.1 | % | ||||
| United States Treasury Note/Bond | 3.375 | % | 11/15/19 | 656,389 | 631,669 | 0.9 | % | ||||
| United States Treasury Note/Bond | 3.125 | % | 9/30/13 | 605,510 | 629,446 | 0.9 | % | ||||
| United States Treasury Note/Bond | 2.750 | % | 10/31/13 | 552,108 | 565,568 | 0.8 | % | ||||
| United States Treasury Note/Bond | 4.375 | % | 12/15/10 | 495,025 | 513,123 | 0.8 | % | ||||
| United States Treasury Note/Bond | 2.125 | % | 11/30/14 | 487,509 | 476,160 | 0.7 | % | ||||
| United States Treasury Note/Bond | 1.125 | % | 12/15/12 | 475,550 | 468,046 | 0.7 | % | ||||
| United States Treasury Note/Bond | 8.750 | % | 5/15/17 | 315,790 | 427,055 | 0.6 | % | ||||
| United States Treasury Note/Bond | 4.750 | % | 2/15/37 | 394,150 | 403,081 | 0.6 | % | ||||
| United States Treasury Note/Bond | 3.875 | % | 5/15/18 | 396,016 | 402,265 | 0.6 | % | ||||
| United States Treasury Note/Bond | 1.750 | % | 3/31/14 | 402,775 | 393,274 | 0.6 | % | ||||
| United States Treasury Note/Bond | 6.250 | % | 8/15/23 | 314,920 | 376,279 | 0.6 | % | ||||
| United States Treasury Note/Bond | 1.375 | % | 5/15/12 | 357,050 | 357,107 | 0.5 | % | ||||
| United States Treasury Note/Bond | 9.875 | % | 11/15/15 | 256,225 | 352,069 | 0.5 | % | ||||
| United States Treasury Note/Bond | 4.750 | % | 8/15/17 | 322,525 | 350,091 | 0.5 | % | ||||
| United States Treasury Note/Bond | 4.750 | % | 5/31/12 | 315,390 | 340,621 | 0.5 | % | ||||
| United States Treasury Note/Bond | 8.750 | % | 8/15/20 | 230,025 | 325,485 | 0.5 | % | ||||
| United States Treasury Note/Bond | 4.500 | % | 4/30/12 | 298,290 | 319,824 | 0.5 | % | ||||
| United States Treasury Note/Bond | 1.375 | % | 4/15/12 | 312,714 | 313,055 | 0.5 | % | ||||
| United States Treasury Note/Bond | 1.125 | % | 6/30/11 | 303,950 | 305,138 | 0.4 | % | ||||
| United States Treasury Note/Bond | 4.875 | % | 2/15/12 | 276,345 | 297,331 | 0.4 | % | ||||
| United States Treasury Note/Bond | 1.500 | % | 12/31/13 | 293,000 | 285,356 | 0.4 | % | ||||
| United States Treasury Note/Bond | 7.875 | % | 2/15/21 | 199,237 | 267,912 | 0.4 | % | ||||
| United States Treasury Note/Bond | 4.875 | % | 4/30/11 | 248,755 | 261,971 | 0.4 | % | ||||
| United States Treasury Note/Bond | 3.875 | % | 2/15/13 | 239,975 | 255,648 | 0.4 | % | ||||
| United States Treasury Note/Bond | 4.500 | % | 8/15/39 | 257,472 | 251,880 | 0.4 | % | ||||
| United States Treasury Note/Bond | 2.375 | % | 10/31/14 | 254,190 | 251,491 | 0.4 | % | ||||
15
| Total Bond Market Index Fund | |||||||||||||
| Face | Market | Percentage | |||||||||||
| Maturity | Amount | Value• | of Net | ||||||||||
| Coupon | Date | ($ | 000 | ) | ($ | 000 | ) | Assets | |||||
| United States Treasury Note/Bond | 3.250 | % | 6/30/16 | 247,645 | 248,420 | 0.4 | % | ||||||
| United States Treasury Note/Bond | 4.250 | % | 11/15/17 | 236,010 | 247,478 | 0.4 | % | ||||||
| United States Treasury Note/Bond | 8.875 | % | 2/15/19 | 171,900 | 240,177 | 0.3 | % | ||||||
| United States Treasury Note/Bond | 6.750 | % | 8/15/26 | 186,530 | 235,406 | 0.3 | % | ||||||
| United States Treasury Note/Bond | 5.125 | % | 5/15/16 | 208,385 | 232,414 | 0.3 | % | ||||||
| United States Treasury Note/Bond | 1.875 | % | 4/30/14 | 214,825 | 210,428 | 0.3 | % | ||||||
| United States Treasury Note/Bond | 1.000 | % | 7/31/11 | 204,150 | 204,438 | 0.3 | % | ||||||
| United States Treasury Note/Bond | 0.750 | % | 11/30/11 | 196,269 | 194,981 | 0.3 | % | ||||||
| United States Treasury Note/Bond | 4.875 | % | 6/30/12 | 178,365 | 193,471 | 0.3 | % | ||||||
| United States Treasury Note/Bond | 8.125 | % | 8/15/21 | 131,140 | 179,928 | 0.3 | % | ||||||
| United States Treasury Note/Bond | 2.625 | % | 2/29/16 | 182,250 | 177,353 | 0.3 | % | ||||||
| United States Treasury Note/Bond | 4.250 | % | 1/15/11 | 170,475 | 176,868 | 0.3 | % | ||||||
| United States Treasury Note/Bond | 2.625 | % | 7/31/14 | 171,745 | 172,657 | 0.3 | % | ||||||
| United States Treasury | |||||||||||||
| Note/Bond | 0.875%–11.250 | % | 2/28/10–5/15/39 | 5,865,846 | 6,188,461 | 9.0 | % | ||||||
| 20,338,162 | 30.0 | % | |||||||||||
| Agency Bonds and Notes | |||||||||||||
| 1 | Federal Home Loan Bank of Chicago | 5.625 | % | 6/13/16 | 3,555 | 3,588 | 0.0 | % | |||||
| 1,2 | Federal Home Loan Banks | 1.000%–5.625% | 3/16/11–7/15/36 | 968,910 | 1,016,875 | 1.5 | % | ||||||
| 1 | Federal Home Loan | ||||||||||||
| Mortgage Corp. | 0.000%–6.750% | 1/18/11–7/15/32 | 1,209,797 | 1,287,269 | 1.9 | % | |||||||
| 1 | Federal National | ||||||||||||
| Mortgage Assn. | 0.000%–8.200% | 2/1/11–7/15/37 | 1,412,491 | 1,500,431 | 2.2 | % | |||||||
| Agency Bonds and Notes—Other † | 1,249,052 | 1.9 | % | ||||||||||
| 5,057,215 | 7.5 | % | |||||||||||
| Conventional Mortgage-Backed Securities | |||||||||||||
| 1,2 | Fannie Mae Pool | 5.000 | % | 1/1/40 | 218,975 | 224,723 | 0.3 | % | |||||
| 1,2 | Fannie Mae Pool | 5.000 | % | 11/1/33 | 188,061 | 194,009 | 0.3 | % | |||||
| 1,2 | Fannie Mae Pool | 4.500 | % | 8/1/39 | 177,549 | 177,460 | 0.3 | % | |||||
| 1,2 | Fannie Mae Pool | 4.000%–11.000% | 2/1/10–1/1/40 | 9,933,664 | 10,406,468 | 15.3 | % | ||||||
| 1,2 | Freddie Mac Gold Pool | 5.500 | % | 1/1/40 | 257,125 | 269,338 | 0.4 | % | |||||
| 1,2 | Freddie Mac Gold Pool | 5.000 | % | 1/1/40 | 191,250 | 196,091 | 0.3 | % | |||||
| 1,2 | Freddie Mac Gold Pool | 4.000 | % | 1/1/25 | 173,175 | 174,257 | 0.3 | % | |||||
| 1,2 | Freddie Mac Gold Pool | 4.000%–10.000% | 1/1/10–1/1/40 | 6,285,374 | 6,571,179 | 9.6 | % | ||||||
| 1,2 | Freddie Mac Non Gold Pool | 8.000%–9.500% | 7/1/16–3/1/20 | 69 | 75 | 0.0 | % | ||||||
| 2 | Ginnie Mae I Pool | 5.000 | % | 1/1/40 | 511,300 | 525,841 | 0.8 | % | |||||
| 2 | Ginnie Mae I Pool | 4.500 | % | 1/1/40 | 391,800 | 392,047 | 0.6 | % | |||||
| 2 | Ginnie Mae I Pool | 5.500 | % | 1/1/40 | 312,325 | 327,257 | 0.5 | % | |||||
| 2 | Ginnie Mae I Pool | 4.000%–11.500% | 5/15/10–1/1/40 | 1,458,175 | 1,521,860 | 2.2 | % | ||||||
| 2 | Ginnie Mae II Pool | 4.500%–8.500% | 8/20/30–1/1/40 | 799,140 | 837,995 | 1.2 | % | ||||||
| 21,818,600 | 32.1 | % | |||||||||||
| Nonconventional Mortgage-Backed Securities | |||||||||||||
| 1,2 | Fannie Mae Pool | 2.701%–6.499% | 11/1/33–8/1/38 | 588,241 | 615,028 | 0.9 | % | ||||||
| 1,2 | Freddie Mac Non Gold Pool | 2.691%–6.480% | 9/1/34–7/1/38 | 456,264 | 477,912 | 0.7 | % | ||||||
| 2 | Ginnie Mae I Pool | 7.900 | % | 2/15/21 | 5 | 6 | 0.0 | % | |||||
| 2 | Ginnie Mae II Pool | 4.375 | % | 6/20/29 | 308 | 317 | 0.0 | % | |||||
| 1,093,263 | 1.6 | % | |||||||||||
| Total U.S. Government and Agency Obligations (Cost $47,396,630) | 48,307,240 | 71.2 | % | ||||||||||
| 3Asset-Backed/Commercial Mortgage-Backed Securities (Cost $ 2,546,454) † | 2,543,213 | 3.7 | % | ||||||||||
16
| Total Bond Market Index Fund | ||||||||||
| Market | Percentage | |||||||||
| Value• | of Net | |||||||||
| Coupon | ($ | 000 | ) | Assets | ||||||
| Corporate Bonds | ||||||||||
| Finance | ||||||||||
| 3 | Banking † | 3,286,836 | 4.9 | % | ||||||
| 3 | Brokerage † | 59,920 | 0.1 | % | ||||||
| Finance Companies † | 633,258 | 0.9 | % | |||||||
| 3 | Insurance † | 675,544 | 1.0 | % | ||||||
| Other Finance † | 28,836 | 0.0 | % | |||||||
| Real Estate Investment Trusts † | 218,149 | 0.3 | % | |||||||
| 4,902,543 | 7.2 | % | ||||||||
| Industrial | ||||||||||
| 3 | Basic Industry † | 654,706 | 1.0 | % | ||||||
| 3 | Capital Goods † | 679,618 | 1.0 | % | ||||||
| 3 | Communication † | 1,615,665 | 2.4 | % | ||||||
| Consumer Cyclical † | 700,321 | 1.0 | % | |||||||
| 3 | Consumer Noncyclical † | 1,705,744 | 2.5 | % | ||||||
| 3 | Energy † | 949,350 | 1.4 | % | ||||||
| Other Industrial † | 2,454 | 0.0 | % | |||||||
| Technology † | 526,133 | 0.8 | % | |||||||
| Transportation † | 264,568 | 0.4 | % | |||||||
| 7,098,559 | 10.5 | % | ||||||||
| Utilities | ||||||||||
| 3 | Electric † | 1,108,242 | 1.6 | % | ||||||
| 3 | Natural Gas † | 402,265 | 0.6 | % | ||||||
| Other Utility † | 136 | 0.0 | % | |||||||
| 1,510,643 | 2.2 | % | ||||||||
| Total Corporate Bonds (Cost $12,991,944) | 13,511,745 | 19.9 | % | |||||||
| 3Sovereign Bonds (U.S. Dollar-Denominated) (Cost $2,495,676) † | 2,550,497 | 3.8 | % | |||||||
| Taxable Municipal Bonds (Cost $285,733) † | 277,962 | 0.4 | % | |||||||
| Shares | ||||||||||
| Temporary Cash Investment | ||||||||||
| Money Market Fund | ||||||||||
| 4,5 | Vanguard Market Liquidity Fund | |||||||||
| (Cost $2,934,013) | 0.187 | % | 2,934,012,346 | 2,934,013 | 4.3 | % | ||||
| ^Total Investments (Cost $68,650,450) | 70,124,670 | 103.3 | % | |||||||
| Other Assets and Liabilities | ||||||||||
| Other Assets | 2,545,425 | 3.8 | % | |||||||
| Liabilities5 | (4,798,861 | ) | (7.1 | %) | ||||||
| (2,253,436 | ) | (3.3 | %) | |||||||
| Net Assets | 67,871,234 | 100.0 | % | |||||||
| At December 31, 2009, net assets consisted of: | ||||||||||
| Amount | ||||||||||
| ($ | 000 | ) | ||||||||
| Paid-in Capital | 66,506,510 | |||||||||
| Undistributed Net Investment Income | — | |||||||||
| Accumulated Net Realized Losses | (109,496 | ) | ||||||||
| Unrealized Appreciation (Depreciation) | 1,474,220 | |||||||||
| Net Assets | 67,871,234 | |||||||||
17
| Total Bond Market Index Fund | |||
| Amount | |||
| ($ | 000 | ) | |
| Investor Shares—Net Assets | |||
| Applicable to 1,888,935,947 outstanding $.001 par value shares of | |||
| beneficial interest (unlimited authorization) | 19,554,934 | ||
| Net Asset Value Per Share—Investor Shares | $ | 10.35 | |
| Admiral Shares—Net Assets | |||
| Applicable to 1,732,202,215 outstanding $.001 par value shares of | |||
| beneficial interest (unlimited authorization) | 17,932,187 | ||
| Net Asset Value Per Share—Admiral Shares | $ | 10.35 | |
| Signal Shares—Net Assets | |||
| Applicable to 816,261,876 outstanding $.001 par value shares of | |||
| beneficial interest (unlimited authorization) | 8,450,127 | ||
| Net Asset Value Per Share—Signal Shares | $ | 10.35 | |
| Institutional Shares—Net Assets | |||
| Applicable to 1,515,875,898 outstanding $.001 par value shares of | |||
| beneficial interest (unlimited authorization) | 15,692,469 | ||
| Net Asset Value Per Share—Institutional Shares | $ | 10.35 | |
| ETF Shares—Net Assets | |||
| Applicable to 79,700,000 outstanding $.001 par value shares of | |||
| beneficial interest (unlimited authorization) | 6,241,517 | ||
| Net Asset Value Per Share—ETF Shares | $ | 78.31 | |
18
| Total Bond Market Index Fund | |||
| As of December 31, 2009 | |||
| Market | |||
| Value• | |||
| ($ | 000 | ) | |
| Statement of Assets and Liabilities | |||
| Assets | |||
| Investments in Securities, at Value | 70,124,670 | ||
| Receivables for Investment Securities Sold | 1,618,510 | ||
| Receivables for Capital Shares Issued | 345,194 | ||
| Other Assets | 581,721 | ||
| Total Assets | 72,670,095 | ||
| Liabilities | |||
| Payables for Investment Securities Purchased | 4,355,115 | ||
| Payables for Capital Shares Redeemed | 242,247 | ||
| Other Liabilities | 201,499 | ||
| Total Liabilities | 4,798,861 | ||
| Net Assets | 67,871,234 | ||
• See Note A in Notes to Financial Statements.
^ The total value of securities on loan is $11,303,000.
† Represents the aggregate value, by category, of securities that are not among the 50 largest holdings and, in total for any issuer, represent 1% or less of net assets.
1 The issuer operates under a congressional charter; its securities are not backed by the full faith and credit of the U.S. government.
2 The average or expected maturity is shorter than the final maturity shown because of the possibility of interim principal payments and prepayments or the possibility of the issue being called.
3 Certain of the fund’s securities are exempt from registration under Rule 144A of the Securities Act of 1933. Such securities may be sold in transactions exempt from registration, normally to qualified institutional buyers. At December 31, 2009, the aggregate value of these securities was $363,669,000, representing 0.5% of net assets.
4 Affiliated money market fund available only to Vanguard funds and certain trusts and accounts managed by Vanguard. Rate shown is the 7-day yield.
5 Includes $11,372,000 of collateral received for securities on loan.
See accompanying Notes, which are an integral part of the Financial Statements.
19
| Total Bond Market Index Fund | |||
| Statement of Operations | |||
| Year Ended | |||
| December 31, 2009 | |||
| ($ | 000 | ) | |
| Investment Income | |||
| Income | |||
| Interest1 | 2,571,915 | ||
| Security Lending | 187 | ||
| Total Income | 2,572,102 | ||
| Expenses | |||
| The Vanguard Group—Note B | |||
| Investment Advisory Services | 5,291 | ||
| Management and Administrative—Investor Shares | 31,696 | ||
| Management and Administrative—Admiral Shares | 13,260 | ||
| Management and Administrative—Signal Shares | 6,076 | ||
| Management and Administrative—Institutional Shares | 3,561 | ||
| Management and Administrative—ETF Shares | 3,427 | ||
| Marketing and Distribution—Investor Shares | 6,552 | ||
| Marketing and Distribution—Admiral Shares | 2,913 | ||
| Marketing and Distribution—Signal Shares | 2,179 | ||
| Marketing and Distribution—Institutional Shares | 4,049 | ||
| Marketing and Distribution—ETF Shares | 1,257 | ||
| Custodian Fees | 642 | ||
| Auditing Fees | 37 | ||
| Shareholders’ Reports and Proxies—Investor Shares | 885 | ||
| Shareholders’ Reports and Proxies—Admiral Shares | 122 | ||
| Shareholders’ Reports and Proxies—Signal Shares | 99 | ||
| Shareholders’ Reports and Proxies—Institutional Shares | 160 | ||
| Shareholders’ Reports and Proxies—ETF Shares | 210 | ||
| Trustees’ Fees and Expenses | 105 | ||
| Total Expenses | 82,521 | ||
| Net Investment Income | 2,489,581 | ||
| Realized Net Gain (Loss) | |||
| Investment Securities Sold | 362,102 | ||
| Swap Contracts | (9,929 | ) | |
| Realized Net Gain (Loss) | 352,173 | ||
| Change in Unrealized Appreciation (Depreciation) | |||
| Investment Securities | 529,306 | ||
| Swap Contracts | 13,697 | ||
| Change in Unrealized Appreciation (Depreciation) | 543,003 | ||
| Net Increase (Decrease) in Net Assets Resulting from Operations | 3,384,757 | ||
| 1 | Interest income from an affiliated company of the fund was $6,439,000. |
| See accompanying Notes, which are an integral part of the Financial Statements. |
20
| Total Bond Market Index Fund | ||||||
| Statement of Changes in Net Assets | ||||||
| Year Ended December 31, | ||||||
| 2009 | 2008 | |||||
| ($ | 000 | ) | ($ | 000 | ) | |
| Increase (Decrease) in Net Assets | ||||||
| Operations | ||||||
| Net Investment Income | 2,489,581 | 2,965,075 | ||||
| Realized Net Gain (Loss) | 352,173 | (10,506 | ) | |||
| Change in Unrealized Appreciation (Depreciation) | 543,003 | 112,158 | ||||
| Net Increase (Decrease) in Net Assets Resulting from Operations | 3,384,757 | 3,066,727 | ||||
| Distributions | ||||||
| Net Investment Income | ||||||
| Investor Shares | (770,305 | ) | (1,452,546 | ) | ||
| Admiral Shares | (632,712 | ) | (571,976 | ) | ||
| Signal Shares | (327,633 | ) | (309,319 | ) | ||
| Institutional Shares | (572,912 | ) | (539,801 | ) | ||
| ETF Shares | (189,300 | ) | (92,422 | ) | ||
| Realized Capital Gain | ||||||
| Investor Shares | — | — | ||||
| Admiral Shares | — | — | ||||
| Signal Shares | — | — | ||||
| Institutional Shares | — | — | ||||
| ETF Shares | — | — | ||||
| Total Distributions | (2,492,862 | ) | (2,966,064 | ) | ||
| Capital Share Transactions | ||||||
| Investor Shares | (10,335,988 | ) | 172,304 | |||
| Admiral Shares | 4,698,656 | 2,713,715 | ||||
| Signal Shares | 946,785 | 1,929,964 | ||||
| Institutional Shares | 3,044,080 | 2,908,936 | ||||
| ETF Shares | 3,210,839 | 1,823,393 | ||||
| Net Increase (Decrease) from Capital Share Transactions | 1,564,372 | 9,548,312 | ||||
| Total Increase (Decrease) | 2,456,267 | 9,648,975 | ||||
| Net Assets | ||||||
| Beginning of Period | 65,414,967 | 55,765,992 | ||||
| End of Period | 67,871,234 | 65,414,967 | ||||
See accompanying Notes, which are an integral part of the Financial Statements.
21
| Total Bond Market Index Fund | |||||||||||||||
| Financial Highlights | |||||||||||||||
| Investor Shares | |||||||||||||||
| For a Share Outstanding | Year Ended December 31, | ||||||||||||||
| Throughout Each Period | 2009 | 2008 | 2007 | 2006 | 2005 | ||||||||||
| Net Asset Value, Beginning of Period | $ | 10.18 | $ | 10.16 | $ | 9.99 | $ | 10.06 | $ | 10.27 | |||||
| Investment Operations | |||||||||||||||
| Net Investment Income | .421 | .477 | .501 | .485 | .446 | ||||||||||
| Net Realized and Unrealized Gain (Loss) | |||||||||||||||
| on Investments | .170 | .020 | .170 | (.070 | ) | (.205 | ) | ||||||||
| Total from Investment Operations | .591 | .497 | .671 | .415 | .241 | ||||||||||
| Distributions | |||||||||||||||
| Dividends from Net Investment Income | (.421 | ) | (.477 | ) | (.501 | ) | (.485 | ) | (.449 | ) | |||||
| Distributions from Realized Capital Gains | — | — | — | — | (.002 | ) | |||||||||
| Total Distributions | (.421 | ) | (.477 | ) | (.501 | ) | (.485 | ) | (.451 | ) | |||||
| Net Asset Value, End of Period | $ | 10.35 | $ | 10.18 | $ | 10.16 | $ | 9.99 | $ | 10.06 | |||||
| Total Return1 | 5.93 | % | 5.05 | % | 6.92 | % | 4.27 | % | 2.40 | % | |||||
| Ratios/Supplemental Data | |||||||||||||||
| Net Assets, End of Period (Millions) | $ | 19,555 | $ | 29,687 | $ | 29,532 | $ | 23,769 | $ | 21,643 | |||||
| Ratio of Total Expenses to | |||||||||||||||
| Average Net Assets | 0.22 | % | 0.20 | % | 0.19 | % | 0.20 | % | 0.20 | % | |||||
| Ratio of Net Investment Income to | |||||||||||||||
| Average Net Assets | 4.09 | % | 4.73 | % | 5.02 | % | 4.88 | % | 4.40 | % | |||||
| Portfolio Turnover Rate2 | 80 | % | 61 | % | 54 | % | 63 | % | 59 | % | |||||
| 1 | Total returns do not include the account service fee that may be applicable to certain accounts with balances below $10,000. |
| 2 | Excludes the value of portfolio securities received or delivered as a result of in-kind purchases or redemptions of the fund’s capital shares, including ETF Creation Units. |
See accompanying Notes, which are an integral part of the Financial Statements.
22
| Total Bond Market Index Fund | |||||||||||||||
| Financial Highlights | |||||||||||||||
| Admiral Shares | |||||||||||||||
| For a Share Outstanding | Year Ended December 31, | ||||||||||||||
| Throughout Each Period | 2009 | 2008 | 2007 | 2006 | 2005 | ||||||||||
| Net Asset Value, Beginning of Period | $ | 10.18 | $ | 10.16 | $ | 9.99 | $ | 10.06 | $ | 10.27 | |||||
| Investment Operations | |||||||||||||||
| Net Investment Income | .432 | .486 | .510 | .494 | .455 | ||||||||||
| Net Realized and Unrealized Gain (Loss) | |||||||||||||||
| on Investments | .170 | .020 | .170 | (.070 | ) | (.205 | ) | ||||||||
| Total from Investment Operations | .602 | .506 | .680 | .424 | .250 | ||||||||||
| Distributions | |||||||||||||||
| Dividends from Net Investment Income | (.432 | ) | (.486 | ) | (.510 | ) | (.494 | ) | (.458 | ) | |||||
| Distributions from Realized Capital Gains | — | — | — | — | (.002 | ) | |||||||||
| Total Distributions | (.432 | ) | (.486 | ) | (.510 | ) | (.494 | ) | (.460 | ) | |||||
| Net Asset Value, End of Period | $ | 10.35 | $ | 10.18 | $ | 10.16 | $ | 9.99 | $ | 10.06 | |||||
| Total Return | 6.04 | % | 5.15 | % | 7.02 | % | 4.36 | % | 2.49 | % | |||||
| Ratios/Supplemental Data | |||||||||||||||
| Net Assets, End of Period (Millions) | $ | 17,932 | $ | 12,978 | $ | 10,232 | $ | 7,900 | $ | 4,529 | |||||
| Ratio of Total Expenses to | |||||||||||||||
| Average Net Assets | 0.12 | % | 0.11 | % | 0.10 | % | 0.11 | % | 0.11 | % | |||||
| Ratio of Net Investment Income to | |||||||||||||||
| Average Net Assets | 4.19 | % | 4.82 | % | 5.11 | % | 4.97 | % | 4.49 | % | |||||
| Portfolio Turnover Rate1 | 80 | % | 61 | % | 54 | % | 63 | % | 59 | % | |||||
| 1 | Excludes the value of portfolio securities received or delivered as a result of in-kind purchases or redemptions of the fund’s capital shares, including ETF Creation Units. |
See accompanying Notes, which are an integral part of the Financial Statements.
23
| Total Bond Market Index Fund | ||||||||||||
| Financial Highlights | ||||||||||||
| Signal Shares | ||||||||||||
| Sept. 1, | ||||||||||||
| 20061 to | ||||||||||||
| Year Ended December 31, | Dec. 31, | |||||||||||
| For a Share Outstanding Throughout Each Period | 2009 | 2008 | 2007 | 2006 | ||||||||
| Net Asset Value, Beginning of Period | $ | 10.18 | $ | 10.16 | $ | 9.99 | $ | 9.94 | ||||
| Investment Operations | ||||||||||||
| Net Investment Income | .432 | .486 | .510 | .166 | ||||||||
| Net Realized and Unrealized Gain (Loss) on Investments | .170 | .020 | .170 | .050 | ||||||||
| Total from Investment Operations | .602 | .506 | .680 | .216 | ||||||||
| Distributions | ||||||||||||
| Dividends from Net Investment Income | (.432 | ) | (.486 | ) | (.510 | ) | (.166 | ) | ||||
| Distributions from Realized Capital Gains | — | — | — | — | ||||||||
| Total Distributions | (.432 | ) | (.486 | ) | (.510 | ) | (.166 | ) | ||||
| Net Asset Value, End of Period | $ | 10.35 | $ | 10.18 | $ | 10.16 | $ | 9.99 | ||||
| Total Return | 6.04 | % | 5.15 | % | 7.02 | % | 2.18 | % | ||||
| Ratios/Supplemental Data | ||||||||||||
| Net Assets, End of Period (Millions) | $ | 8,450 | $ | 7,372 | $ | 5,414 | $ | 632 | ||||
| Ratio of Total Expenses to Average Net Assets | 0.12 | % | 0.11 | % | 0.10 | % | 0.11 | %2 | ||||
| Ratio of Net Investment Income to Average Net Assets | 4.19 | % | 4.82 | % | 5.11 | % | 4.97 | %2 | ||||
| Portfolio Turnover Rate3 | 80 | % | 61 | % | 54 | % | 63 | % | ||||
| 1 | Inception. |
| 2 | Annualized. |
| 3 | Excludes the value of portfolio securities received or delivered as a result of in-kind purchases or redemptions of the fund’s capital shares, including ETF Creation Units. |
See accompanying Notes, which are an integral part of the Financial Statements.
24
| Total Bond Market Index Fund | |||||||||||||||
| Financial Highlights | |||||||||||||||
| Institutional Shares | |||||||||||||||
| For a Share Outstanding | Year Ended December 31, | ||||||||||||||
| Throughout Each Period | 2009 | 2008 | 2007 | 2006 | 2005 | ||||||||||
| Net Asset Value, Beginning of Period | $ | 10.18 | $ | 10.16 | $ | 9.99 | $ | 10.06 | $ | 10.27 | |||||
| Investment Operations | |||||||||||||||
| Net Investment Income | .437 | .490 | .513 | .498 | .459 | ||||||||||
| Net Realized and Unrealized Gain (Loss) | |||||||||||||||
| on Investments | .170 | .020 | .170 | (.070 | ) | (.205 | ) | ||||||||
| Total from Investment Operations | .607 | .510 | .683 | .428 | .254 | ||||||||||
| Distributions | |||||||||||||||
| Dividends from Net Investment Income | (.437 | ) | (.490 | ) | (.513 | ) | (.498 | ) | (.462 | ) | |||||
| Distributions from Realized Capital Gains | — | — | — | — | (.002 | ) | |||||||||
| Total Distributions | (.437 | ) | (.490 | ) | (.513 | ) | (.498 | ) | (.464 | ) | |||||
| Net Asset Value, End of Period | $ | 10.35 | $ | 10.18 | $ | 10.16 | $ | 9.99 | $ | 10.06 | |||||
| Total Return | 6.09 | % | 5.19 | % | 7.05 | % | 4.40 | % | 2.53 | % | |||||
| Ratios/Supplemental Data | |||||||||||||||
| Net Assets, End of Period (Millions) | $ | 15,692 | $ | 12,431 | $ | 9,492 | $ | 8,257 | $ | 7,325 | |||||
| Ratio of Total Expenses to | |||||||||||||||
| Average Net Assets | 0.07 | % | 0.07 | % | 0.07 | % | 0.07 | % | 0.07 | % | |||||
| Ratio of Net Investment Income to | |||||||||||||||
| Average Net Assets | 4.24 | % | 4.86 | % | 5.14 | % | 5.01 | % | 4.53 | % | |||||
| Portfolio Turnover Rate1 | 80 | % | 61 | % | 54 | % | 63 | % | 59 | % | |||||
| 1 | Excludes the value of portfolio securities received or delivered as a result of in-kind purchases or redemptions of the fund’s capital shares, including ETF Creation Units. |
See accompanying Notes, which are an integral part of the Financial Statements.
25
| Total Bond Market Index Fund | |||||||||
| Financial Highlights | |||||||||
| ETF Shares | |||||||||
| April 3, | |||||||||
| Year Ended | 20071 to | ||||||||
| December 31, | Dec. 31, | ||||||||
| For a Share Outstanding Throughout Each Period | 2009 | 2008 | 2007 | ||||||
| Net Asset Value, Beginning of Period | $ | 76.93 | $ | 76.61 | $ | 74.95 | |||
| Investment Operations | |||||||||
| Net Investment Income | 3.163 | 3.525 | 2.351 | ||||||
| Net Realized and Unrealized Gain (Loss) on Investments | 1.380 | .320 | 1.660 | ||||||
| Total from Investment Operations | 4.543 | 3.845 | 4.011 | ||||||
| Distributions | |||||||||
| Dividends from Net Investment Income | (3.163 | ) | (3.525 | ) | (2.351 | ) | |||
| Distributions from Realized Capital Gains | — | — | — | ||||||
| Total Distributions | (3.163 | ) | (3.525 | ) | (2.351 | ) | |||
| Net Asset Value, End of Period | $ | 78.31 | $ | 76.93 | $ | 76.61 | |||
| Total Return | 6.03 | % | 5.18 | % | 5.45 | % | |||
| Ratios/Supplemental Data | |||||||||
| Net Assets, End of Period (Millions) | $ | 6,242 | $ | 2,946 | $ | 1,095 | |||
| Ratio of Total Expenses to Average Net Assets | 0.12 | % | 0.10 | % | 0.11 | %2 | |||
| Ratio of Net Investment Income to Average Net Assets | 4.19 | % | 4.83 | % | 5.10 | %2 | |||
| Portfolio Turnover Rate3 | 80 | % | 61 | % | 54 | % | |||
| 1 | Inception. |
| 2 | Annualized. |
| 3 | Excludes the value of portfolio securities received or delivered as a result of in-kind purchases or redemptions of the fund’s capital shares, including ETF Creation Units. |
See accompanying Notes, which are an integral part of the Financial Statements.
26
Total Bond Market Index Fund
Notes to Financial Statements
Vanguard Total Bond Market Index Fund is registered under the Investment Company Act of 1940 as an open-end investment company, or mutual fund. Certain of the fund’s investments are in corporate debt instruments; the issuers’ abilities to meet their obligations may be affected by economic developments in their respective industries. The fund offers five classes of shares: Investor Shares, Admiral Shares, Signal Shares, Institutional Shares, and ETF Shares. Investor Shares are available to any investor who meets the fund’s minimum purchase requirements. Admiral Shares are designed for investors who meet certain administrative, service, tenure, and account-size criteria. Signal Shares are designed for institutional investors who meet certain administrative, service, and account-size criteria. Institutional Shares are designed for investors who meet certain administrative and service criteria and invest a minim um of $5 million. ETF Shares are listed for trading on the NYSE Arca, Inc.; they can be purchased and sold through a broker.
A. The following significant accounting policies conform to generally accepted accounting principles for U.S. mutual funds. The fund consistently follows such policies in preparing its financial statements.
1. Security Valuation: Bonds, and temporary cash investments acquired over 60 days to maturity, are valued using the latest bid prices or using valuations based on a matrix system (which considers such factors as security prices, yields, maturities, and ratings), both as furnished by independent pricing services. Investments in Vanguard Market Liquidity Fund are valued at that fund’s net asset value. Other temporary cash investments are valued at amortized cost, which approximates market value. Securities for which market quotations are not readily available, or whose values have been affected by events occurring before the fund’s pricing time but after the close of the securities’ primary markets, are valued by methods deemed by the board of trustees to represent fair value.
2. Swap Contracts: The fund is subject to credit risk through its investment in swap transactions to earn the total return on the Commercial Mortgage-Backed Securities (CMBS) Index. Under the terms of the swaps, the fund receives the total return (either receiving the increase or paying the decrease) on the CMBS Index, applied to a notional principal amount. In return, the fund agrees to pay the counterparty a floating rate, which is reset periodically based on short-term interest rates, applied to the same notional amount. At the same time, the fund invests an amount equal to the notional amount of the swaps in high-quality floating-rate securities.
The notional amounts of swap contracts are not recorded in the Statement of Net Assets. Swaps are valued daily, and the change in value is recorded as unrealized appreciation (depreciation) until periodic payments are made, or the swap terminates, at which time realized gain (loss) is recorded. A primary risk for all types of swaps is that a counterparty will default on its obligation to pay net amounts due to the fund. The fund’s maximum risk of loss from counterparty credit risk is the amount of unrealized appreciation on the swap contract. This risk is mitigated by entering into swaps only with highly rated counterparties, by a master netting arrangement between the fund and the counterparty, and by the posting of collateral by the counterparty. The swap contracts contain provisions whereby a counterparty may terminate open contracts if the fund’s net assets decline below a certain level, triggering a payment by the fund if the fund is in a net liability position at the time of the termination. The payment amount would be reduced by any collateral the fund has posted. Any securities posted as collateral for open contracts are noted in the Statement of Net Assets.
3. Mortgage Dollar Rolls: The fund has entered into mortgage-dollar-roll transactions, in which the fund sells mortgage-backed securities to a dealer and simultaneously agrees to purchase similar securities in the future at a predetermined price. The proceeds of the securities sold in mortgage-dollar-roll
27
Total Bond Market Index Fund
transactions are invested in high-quality short-term fixed income securities. The fund forgoes principal and interest paid on the securities, and is compensated by interest earned on the proceeds of the initial sale and by a lower price on the securities to be repurchased. The fund accounts for mortgage-dollar-roll transactions as purchases and sales; as such, these transactions may increase the fund’s portfolio turnover rate. Amounts to be received or paid in connection with open mortgage dollar rolls are included in Receivables for Investment Securities Sold or Payables for Investment Securities Purchased in the Statement of Assets and Liabilities. The primary risk associated with mortgage dollar rolls is that a counterparty will default on its obligations to deliver purchased securities.
4. Federal Income Taxes: The fund intends to continue to qualify as a regulated investment company and distribute all of its taxable income. Management has analyzed the fund’s tax positions taken for all open federal income tax years (December 31, 2006–2009), and has concluded that no provision for federal income tax is required in the fund’s financial statements.
5. Distributions: Distributions from net investment income are declared daily by all share classes except ETF Shares, and paid on the first business day of the following month. Monthly income dividends from ETF Shares, and annual distributions from realized capital gains, if any, are recorded on the ex-dividend date.
6. Security Lending: The fund may lend its securities to qualified institutional borrowers to earn additional income. Security loans are required to be secured at all times by collateral at least equal to the market value of securities loaned. The fund invests cash collateral received in Vanguard Market Liquidity Fund, and records a liability for the return of the collateral, during the period the securities are on loan. Security lending income represents the income earned on investing cash collateral, less expenses associated with the loan.
7. Other: Interest income includes income distributions received from Vanguard Market Liquidity Fund and is accrued daily. Premiums and discounts on debt securities purchased are amortized and accreted, respectively, to interest income over the lives of the respective securities. Security transactions are accounted for on the date securities are bought or sold. Costs used to determine realized gains (losses) on the sale of investment securities are those of the specific securities sold.
Each class of shares has equal rights as to assets and earnings, except that each class separately bears certain class-specific expenses related to maintenance of shareholder accounts (included in Management and Administrative expenses), shareholder reporting, and proxies. Marketing and distribution expenses are allocated to each class of shares based on a method approved by the board of trustees. Income, other non-class-specific expenses, and gains and losses on investments are allocated to each class of shares based on its relative net assets.
B. The Vanguard Group furnishes at cost investment advisory, corporate management, administrative, marketing, and distribution services. The costs of such services are allocated to the fund under methods approved by the board of trustees. The fund has committed to provide up to 0.40% of its net assets in capital contributions to Vanguard. At December 31, 2009, the fund had contributed capital of $13,623,000 to Vanguard (included in Other Assets), representing 0.02% of the fund’s net assets and 5.45% of Vanguard’s capitalization. The fund’s trustees and officers are also directors and officers of Vanguard.
28
Total Bond Market Index Fund
C. Various inputs may be used to determine the value of the fund’s investments. These inputs are summarized in three broad levels for financial statement purposes. The inputs or methodologies used to value securities are not necessarily an indication of the risk associated with investing in those securities.
Level 1—Quoted prices in active markets for identical securities.
Level 2—Other significant observable inputs (including quoted prices for similar securities, interest rates, prepayment speeds, credit risk, etc.).
Level 3—Significant unobservable inputs (including the fund’s own assumptions used to determine the fair value of investments).
The following table summarizes the fund’s investments as of December 31, 2009, based on the inputs used to value them:
| Level 1 | Level 2 | Level 3 | |||||||
| Investments | ($ | 000 | ) | ($ | 000 | ) | ($ | 000 | ) |
| U.S. Government and Agency Obligations | — | 48,307,240 | — | ||||||
| Asset-Backed/Commercial Mortgage-Backed Securities | — | 2,543,213 | — | ||||||
| Corporate Bonds | — | 13,511,688 | 57 | ||||||
| Sovereign Bonds | — | 2,550,497 | — | ||||||
| Taxable Municipal Bonds | — | 277,962 | — | ||||||
| Temporary Cash Investments | 2,934,013 | — | — | ||||||
| Total | 2,934,013 | 67,190,600 | 57 |
The following table summarizes changes in investments valued based on Level 3 inputs during the year ended December 31, 2009:
| Investments in | |||
| Corporate Bonds | |||
| Amount Valued Based on Level 3 Inputs | ($ | 000 | ) |
| Balance as of December 31, 2008 | — | ||
| Transfers into Level 3 | 91 | ||
| Change in unrealized appreciation (depreciation) | (34 | ) | |
| Balance as of December 31, 2009 | 57 |
29
Total Bond Market Index Fund
D. Capital gain distributions are determined on a tax basis and may differ from realized capital gains for financial reporting purposes. Differences may be permanent or temporary. Permanent differences are reclassified among capital accounts in the financial statements to reflect their tax character. Temporary differences arise when gains or losses are recognized in different periods for financial statement and tax purposes; these differences will reverse at some time in the future.
During the year ended December 31, 2009, the fund realized $248,154,000 of net capital gains resulting from in-kind redemptions—in which shareholders exchanged fund shares for securities held by the fund rather than for cash. Because such gains are not taxable to the fund, and are not distributed to shareholders, they have been reclassified from accumulated net realized losses to paid-in capital.
For tax purposes, at December 31, 2009, the fund had available capital loss carryforwards totaling $95,769,000 to offset future net capital gains of $83,811,000 through December 31, 2014, and $11,958,000 through December 31, 2016.
Certain of the fund’s U.S. Treasury Inflation-Indexed securities experienced deflation adjustments that reduced interest income and the cost of investments for financial statement purposes by an amount greater than the reduction of taxable income; the additional income reduction was deferred for tax purposes until it was used to offset future inflation adjustments that increased taxable income. The difference became permanent when securities were sold. During the year ended December 31, 2009, the fund realized gains of $3,281,000 that were included in ordinary income for tax purposes as a result of deferred deflation adjustments; accordingly, such gains have been reclassified from accumulated net realized gains to undistributed net investment income.
At December 31, 2009, the cost of investment securities for tax purposes was $68,663,264,000. Net unrealized appreciation of investment securities for tax purposes was $1,461,406,000, consisting of unrealized gains of $1,952,730,000 on securities that had risen in value since their purchase and $491,324,000 in unrealized losses on securities that had fallen in value since their purchase.
E. During the year ended December 31, 2009, the fund purchased $6,510,753,000 of investment securities and sold $5,908,420,000 of investment securities, other than U.S. government securities and temporary cash investments. Purchases and sales of U.S. government securities were $55,867,591,000 and $54,986,418,000, respectively.
30
Total Bond Market Index Fund
| F. Capital share transactions for each class of shares were: | ||||||||||
| Year Ended December 31, | ||||||||||
| 2009 | 2008 | |||||||||
| Amount | Shares | Amount | Shares | |||||||
| ($ | 000 | ) | (000 | ) | ($ | 000 | ) | (000 | ) | |
| Investor Shares | ||||||||||
| Issued | 7,982,568 | 779,356 | 12,149,716 | 1,208,131 | ||||||
| Issued in Lieu of Cash Distributions | 687,168 | 67,060 | 1,412,821 | 140,609 | ||||||
| Redeemed | (19,005,724 | ) | (1,873,272 | ) | (13,390,233) (1,340,352) | |||||
| Net Increase (Decrease)—Investor Shares | (10,335,988 | ) | (1,026,856 | ) | 172,304 | 8,388 | ||||
| Admiral Shares | ||||||||||
| Issued | 6,429,050 | 626,833 | 4,380,267 | 434,463 | ||||||
| Issued in Lieu of Cash Distributions | 565,799 | 55,172 | 515,178 | 51,308 | ||||||
| Redeemed | (2,296,193 | ) | (224,500 | ) | (2,181,730 | ) | (218,412 | ) | ||
| Net Increase (Decrease)—Admiral Shares | 4,698,656 | 457,505 | 2,713,715 | 267,359 | ||||||
| Signal Shares | ||||||||||
| Issued | 3,291,701 | 321,384 | 3,626,167 | 360,870 | ||||||
| Issued in Lieu of Cash Distributions | 290,553 | 28,363 | 281,653 | 28,052 | ||||||
| Redeemed | (2,635,469 | ) | (257,541 | ) | (1,977,856 | ) | (197,842 | ) | ||
| Net Increase (Decrease)—Signal Shares | 946,785 | 92,206 | 1,929,964 | 191,080 | ||||||
| Institutional Shares | ||||||||||
| Issued | 6,850,147 | 668,591 | 6,316,289 | 627,668 | ||||||
| Issued in Lieu of Cash Distributions | 530,609 | 51,771 | 502,440 | 50,060 | ||||||
| Redeemed | (4,336,676 | ) | (425,444 | ) | (3,909,793 | ) | (391,276 | ) | ||
| Net Increase (Decrease)—Institutional Shares | 3,044,080 | 294,918 | 2,908,936 | 286,452 | ||||||
| ETF Shares | ||||||||||
| Issued | 3,210,839 | 41,400 | 1,854,223 | 24,400 | ||||||
| Issued in Lieu of Cash Distributions | — | — | — | — | ||||||
| Redeemed | — | — | (30,830 | ) | (400 | ) | ||||
| Net Increase (Decrease)—ETF Shares | 3,210,839 | 41,400 | 1,823,393 | 24,000 | ||||||
G. In preparing the financial statements as of December 31, 2009, management considered the impact of subsequent events occurring through February 12, 2010, for potential recognition or disclosure in these financial statements.
As of the close of business on February 5, 2010, the fund acquired all the net assets of Vanguard Institutional Total Bond Market Index Fund pursuant to a plan of reorganization approved by the funds’ board of trustees. The acquisition was accomplished by a tax-free exchange of 403,613,000 shares of the fund for 80,272,000 shares of Institutional Total Bond Market Index Fund outstanding as of the close of business on February 5, 2010. Shares of Institutional Total Bond Market Index Fund were exchanged for new Institutional Plus Shares of the fund. The Institutional Total Bond Market Index Fund’s net assets as of the close of business on February 5, 2010, of $4,235,240,000, including $134,921,000 of unrealized appreciation, were combined with the fund’s net assets. The net assets of the fund immediately before the acquisition were $70,363,886,000. The net assets of the fund immediately following the acquisiti on were $74,599,126,000.
31
Short-Term Bond Index Fund
Fund Profile
As of December 31, 2009
| Financial Attributes | ||||||
| Target | Broad | |||||
| Fund | Index1 | Index2 | ||||
| Number of Issues | 1,223 | 2,139 | 8,413 | |||
| Yield3 | 2.0 | % | 3.7 | % | ||
| Investor Shares | 1.5 | % | ||||
| Admiral Shares | 1.6 | % | ||||
| Signal Shares | 1.6 | % | ||||
| ETF Shares | 1.6 | % | ||||
| Yield to Maturity | 1.9 | %4 | 2.0 | % | 3.7 | % |
| Average Coupon | 3.5 | % | 3.3 | % | 4.7 | % |
| Average Effective | ||||||
| Maturity | 2.7 years | 2.8 years | 6.8 years | |||
| Average Quality5 | Aa1/Aa2 | Aa1/Aa2 | Aa1/Aa2 | |||
| Average Duration | 2.6 years | 2.6 years | 4.6 years | |||
| Expense Ratio6 | — | — | ||||
| Investor Shares | 0.22 | % | ||||
| Admiral Shares | 0.14 | % | ||||
| Signal Shares | 0.14 | % | ||||
| ETF Shares | 0.14 | % | ||||
| Short-Term Reserves | 0.5 | % | — | — | ||
| Sector Diversification7 (% of portfolio) | ||||||
| Finance | 9.5 | % | ||||
| Foreign | 6.6 | |||||
| Government Mortgage-Backed | 0.1 | |||||
| Industrial | 10.8 | |||||
| Treasury/Agency | 70.9 | |||||
| Utilities | 1.6 | |||||
| Other | 0.5 | |||||
| Volatility Measures8 | ||
| Fund Versus | Fund Versus | |
| Target Index1 | Broad Index2 | |
| R-Squared | 0.99 | 0.74 |
| Beta | 1.03 | 0.54 |
Distribution by Maturity (% of portfolio)
| Under 1 Year | 6.0 | % |
| 1–3 Years | 57.0 | |
| 3–5 Years | 36.8 | |
| Over 5 Years | 0.2 |
Distribution by Credit Quality5 (% of portfolio)
| Aaa | 76.0 | % |
| Aa | 5.7 | |
| A | 10.8 | |
| Baa | 7.5 |
Investment Focus

1 Barclays Capital U.S. 1–5 Year Government/Credit Bond Index.
2 Barclays Capital U.S. Aggregate Bond Index.
3 30-day SEC yield for the fund; index yield assumes that all bonds are called or prepaid at the earliest possible dates. See the Glossary.
4 Before expenses.
5 Moody’s Investors Service.
6 The expense ratios shown are from the prospectuses dated April 24, 2009, and represent estimated costs for the current fiscal year based on the fund’s net assets as of the prospectus date. For the fiscal year ended December 31, 2009, the expense ratios for the Short-Term Bond Index Fund were 0.22% for Investor Shares, 0.12% for Admiral Shares, 0.12% for Signal Shares, and 0.12% for ETF Shares.
7 The agency sector may include issues from government-sponsored enterprises; such issues are not backed by the full faith and credit of the U.S. government.
8 For an explanation of R-squared, beta, and other terms used here, see the Glossary.
32
Short-Term Bond Index Fund
Performance Summary
All of the returns in this report represent past performance, which is not a guarantee of future results that may be achieved by the fund. (Current performance may be lower or higher than the performance data cited. For performance data current to the most recent month-end, visit our website at www.vanguard.com/performance.) Note, too, that both investment returns and principal value can fluctuate widely, so an investor’s shares, when sold, could be worth more or less than their original cost. The returns shown do not reflect taxes that a shareholder would pay on fund distributions or on the sale of fund shares.

| Average Annual Total Returns | Final Value | ||||||||
| Periods Ended December 31, 2009 | of a $10,000 | ||||||||
| One Year | Five Years | Ten Years | Investment | ||||||
| Short-Term Bond Index Fund Investor Shares1 | 4.28 | % | 4.45 | % | 5.09 | % | $ | 16,430 | |
| Barclays Capital U.S. Aggregate Bond Index | 5.93 | 4.97 | 6.33 | 18,475 | |||||
| Barclays Capital U.S. 1–5 Year | |||||||||
| Government/Credit Bond Index | 4.62 | 4.52 | 5.36 | 16,854 | |||||
| 1–5 Year Investment Grade Debt Funds Average2 | 9.78 | 2.74 | 3.90 | 14,659 | |||||
| Final Value | ||||||||
| Since | of a $100,000 | |||||||
| One Year | Five Years | Inception3 | Investment | |||||
| Short-Term Bond Index Fund Admiral Shares | 4.38 | % | 4.53 | % | 4.03 | % | $ | 137,938 |
| Barclays Capital U.S. Aggregate Bond Index | 5.93 | 4.97 | 5.15 | 152,886 | ||||
| Barclays Capital U.S. 1–5 Year | ||||||||
| Government/Credit Bond Index | 4.62 | 4.52 | 4.27 | 140,477 | ||||
| Final Value of | ||||||||
| Since | a $1,000,000 | |||||||
| One Year | Inception3 | Investment | ||||||
| Short-Term Bond Index Fund Signal Shares | 4.38 | % | 5.66 | % | $ | 1,163,757 | ||
| Barclays Capital U.S. Aggregate Bond Index | 5.93 | 6.02 | 1,174,816 | |||||
| Barclays Capital U.S. 1–5 Year | ||||||||
| Government/Credit Bond Index | 4.62 | 5.59 | 1,161,675 | |||||
1 Total return figures do not reflect the account service fee that may be applicable to certain accounts with balances below $10,000.
2 Derived from data provided by Lipper Inc.; based on average returns for 1–5 Year U.S. Government Funds through December 31, 2001, and average returns for 1–5 Year Investment Grade Debt Funds thereafter.
3 Performance for the fund and its comparative standards is calculated since the following inception dates: November 12, 2001, for the Admiral Shares, and March 30, 2007, for the Signal Shares.
See Financial Highlights for dividend and capital gains information.
33
| Short-Term Bond Index Fund | ||||||||||
| Final Value | ||||||||||
| Since | of a $10,000 | |||||||||
| One Year | Inception2 | Investment | ||||||||
| Short-Term Bond Index Fund ETF Shares Net Asset Value1 | 4.44 | % | 5.69 | % | $ | 11,640 | ||||
| Barclays Capital U.S. Aggregate Bond Index | 5.93 | 6.05 | 11,750 | |||||||
| Barclays Capital U.S. 1–5 Year Government/Credit Bond Index | 4.62 | 5.62 | 11,621 | |||||||
| Cumulative Returns: ETF Shares, April 3, 2007—December 31, 2009 | ||||||||||
| Since | ||||||||||
| One Year | Inception2 | |||||||||
| Short-Term Bond Market Index Fund ETF Shares Market Price | 1.58 | % | 16.62 | % | ||||||
| Short-Term Bond Market Index Fund ETF Shares Net Asset Value | 4.44 | 16.40 | ||||||||
| Barclays Capital U.S. 1–5 Year Government/Credit Bond Index | 4.62 | 16.21 | ||||||||
| Fiscal-Year Total Returns (%): December 31, 1999—December 31, 2009 | ||||||||||
| Investor Shares | Barclays3 | |||||||||
| Fiscal | Capital | Income | Total | Total | ||||||
| Year | Return | Return | Return | Return | ||||||
| 2000 | 2.4 | % | 6.4 | % | 8.8 | % | 8.9 | % | ||
| 2001 | 3.0 | 5.9 | 8.9 | 9.0 | ||||||
| 2002 | 1.5 | 4.6 | 6.1 | 8.1 | ||||||
| 2003 | 0.1 | 3.3 | 3.4 | 3.4 | ||||||
| 2004 | –1.3 | 3.0 | 1.7 | 1.8 | ||||||
| 2005 | –2.2 | 3.5 | 1.3 | 1.4 | ||||||
| 2006 | –0.3 | 4.4 | 4.1 | 4.2 | ||||||
| 2007 | 2.4 | 4.8 | 7.2 | 7.3 | ||||||
| 2008 | 1.5 | 3.9 | 5.4 | 5.1 | ||||||
| 2009 | 1.4 | 2.9 | 4.3 | 4.6 | ||||||
1 For more information about how the ETF Shares’ market prices have compared with their net asset value, visit www.vanguard.com, select your ETF, and then select the Performance tab. The Premium/Discount table there shows the percentages of days on which the ETF Shares’ market price was above or below the NAV.
2 Performance for the fund and its comparative standards is calculated since the ETF Shares’ inception on April 3, 2007.
3 Barclays Capital U.S. 1–5 Year Government/Credit Bond Index.
34
Short-Term Bond Index Fund
Financial Statements
Statement of Net Assets—Investments Summary
As of December 31, 2009
This Statement summarizes the fund’s holdings by asset type. Details are reported for each of the fund’s 50 largest individual holdings and for investments that, in total for any issuer, represent more than 1% of the fund’s net assets. The total value of smaller holdings is reported as a single amount within each category.
The fund reports a complete list of its holdings in regulatory filings four times in each fiscal year, at the quarter-ends. For the second and fourth fiscal quarters, the complete listing of the fund’s holdings is available electronically on Vanguard.com and on the Securities and Exchange Commission’s website (www.sec.gov), or you can have it mailed to you without charge by calling 800-662-7447. For the first and third fiscal quarters, the fund files the lists with the SEC on Form N-Q. Shareholders can look up the fund’s Forms N-Q on the SEC’s website. Forms N-Q may also be reviewed and copied at the SEC’s Public Reference Room (see the back cover of this report for further information).
| Face | Market | Percentage | |||||||||
| Maturity | Amount | Value• | of Net | ||||||||
| Coupon | Date | ($ | 000 | ) | ($ | 000 | ) | Assets | |||
| U.S. Government and Agency Obligations | |||||||||||
| U.S. Government Securities | |||||||||||
| United States Treasury Inflation | |||||||||||
| Indexed Bonds | 3.500 | % | 1/15/11 | 9,125 | 11,755 | 0.1 | % | ||||
| United States Treasury Note/Bond | 0.875 | % | 2/28/11 | 300,325 | 301,028 | 1.9 | % | ||||
| United States Treasury Note/Bond | 1.125 | % | 12/15/12 | 274,725 | 270,390 | 1.7 | % | ||||
| United States Treasury Note/Bond | 1.750 | % | 8/15/12 | 245,745 | 247,357 | 1.5 | % | ||||
| United States Treasury Note/Bond | 0.875 | % | 12/31/10 | 237,160 | 238,011 | 1.5 | % | ||||
| United States Treasury Note/Bond | 1.125 | % | 1/15/12 | 234,695 | 234,474 | 1.5 | % | ||||
| United States Treasury Note/Bond | 2.625 | % | 7/31/14 | 232,160 | 233,393 | 1.5 | % | ||||
| United States Treasury Note/Bond | 2.750 | % | 10/31/13 | 221,900 | 227,310 | 1.4 | % | ||||
| United States Treasury Note/Bond | 3.125 | % | 9/30/13 | 216,375 | 224,928 | 1.4 | % | ||||
| United States Treasury Note/Bond | 2.625 | % | 6/30/14 | 213,730 | 215,333 | 1.3 | % | ||||
| United States Treasury Note/Bond | 1.875 | % | 4/30/14 | 219,600 | 215,105 | 1.3 | % | ||||
| United States Treasury Note/Bond | 1.375 | % | 5/15/12 | 209,750 | 209,784 | 1.3 | % | ||||
| United States Treasury Note/Bond | 1.250 | % | 11/30/10 | 207,175 | 208,665 | 1.3 | % | ||||
| United States Treasury Note/Bond | 4.375 | % | 12/15/10 | 191,530 | 198,532 | 1.2 | % | ||||
| United States Treasury Note/Bond | 2.125 | % | 11/30/14 | 202,055 | 197,351 | 1.2 | % | ||||
| United States Treasury Note/Bond | 2.250 | % | 5/31/14 | 188,835 | 187,566 | 1.2 | % | ||||
| United States Treasury Note/Bond | 1.000 | % | 12/31/11 | 186,000 | 185,477 | 1.2 | % | ||||
| United States Treasury Note/Bond | 1.875 | % | 2/28/14 | 187,085 | 184,045 | 1.1 | % | ||||
| United States Treasury Note/Bond | 4.500 | % | 9/30/11 | 168,490 | 178,599 | 1.1 | % | ||||
| United States Treasury Note/Bond | 5.125 | % | 6/30/11 | 167,480 | 177,948 | 1.1 | % | ||||
| United States Treasury Note/Bond | 1.375 | % | 11/15/12 | 177,917 | 176,695 | 1.1 | % | ||||
| United States Treasury Note/Bond | 3.500 | % | 5/31/13 | 146,110 | 154,009 | 1.0 | % | ||||
| United States Treasury Note/Bond | 1.875 | % | 6/15/12 | 149,925 | 151,565 | 0.9 | % | ||||
| United States Treasury Note/Bond | 2.375 | % | 10/31/14 | 145,485 | 143,940 | 0.9 | % | ||||
| United States Treasury Note/Bond | 4.500 | % | 3/31/12 | 132,385 | 141,693 | 0.9 | % | ||||
| United States Treasury Note/Bond | 4.875 | % | 4/30/11 | 133,885 | 140,998 | 0.9 | % | ||||
| United States Treasury Note/Bond | 1.125 | % | 6/30/11 | 138,750 | 139,293 | 0.9 | % | ||||
| United States Treasury Note/Bond | 4.625 | % | 10/31/11 | 127,550 | 135,820 | 0.8 | % | ||||
| United States Treasury Note/Bond | 2.625 | % | 12/31/14 | 136,000 | 135,309 | 0.8 | % | ||||
35
| Short-Term Bond Index Fund | |||||||||||||
| Face | Market | Percentage | |||||||||||
| Maturity | Amount | Value• | of Net | ||||||||||
| Coupon | Date | ($ | 000 | ) | ($ | 000 | ) | Assets | |||||
| United States Treasury Note/Bond | 1.750 | % | 1/31/14 | 128,645 | 126,233 | 0.8 | % | ||||||
| United States Treasury Note/Bond | 4.625 | % | 7/31/12 | 116,340 | 125,666 | 0.8 | % | ||||||
| United States Treasury Note/Bond | 1.750 | % | 3/31/14 | 127,915 | 124,898 | 0.8 | % | ||||||
| United States Treasury Note/Bond | 0.875 | % | 4/30/11 | 121,250 | 121,402 | 0.8 | % | ||||||
| United States Treasury Note/Bond | 4.875 | % | 6/30/12 | 111,070 | 120,477 | 0.8 | % | ||||||
| United States Treasury Note/Bond | 4.500 | % | 11/30/11 | 104,975 | 111,766 | 0.7 | % | ||||||
| United States Treasury Note/Bond | 4.750 | % | 5/31/12 | 102,840 | 111,067 | 0.7 | % | ||||||
| United States Treasury Note/Bond | 3.125 | % | 8/31/13 | 105,330 | 109,494 | 0.7 | % | ||||||
| United States Treasury Note/Bond | 4.500 | % | 2/28/11 | 95,410 | 99,584 | 0.6 | % | ||||||
| United States Treasury Note/Bond | 3.875 | % | 2/15/13 | 90,205 | 96,096 | 0.6 | % | ||||||
| United States Treasury Note/Bond | 4.500 | % | 4/30/12 | 82,335 | 88,279 | 0.6 | % | ||||||
| United States Treasury Note/Bond | 3.875 | % | 10/31/12 | 82,080 | 87,351 | 0.5 | % | ||||||
| United States Treasury Note/Bond | 1.000 | % | 10/31/11 | 85,180 | 85,100 | 0.5 | % | ||||||
| United States Treasury Note/Bond | 4.750 | % | 3/31/11 | 79,675 | 83,572 | 0.5 | % | ||||||
| United States Treasury Note/Bond | 2.000 | % | 11/30/13 | 82,815 | 82,388 | 0.5 | % | ||||||
| United States Treasury Note/Bond | 4.750 | % | 5/15/14 | 73,625 | 81,034 | 0.5 | % | ||||||
| United States Treasury Note/Bond | 4.625 | % | 8/31/11 | 73,975 | 78,436 | 0.5 | % | ||||||
| United States Treasury Note/Bond | 1.375 | % | 2/15/12 | 72,300 | 72,503 | 0.5 | % | ||||||
| United States Treasury Note/Bond | 1.500 | % | 12/31/13 | 70,950 | 69,099 | 0.4 | % | ||||||
| United States Treasury | |||||||||||||
| Note/Bond | 0.875%–5.750% | 2/15/10–9/30/14 | 1,070,019 | 1,102,182 | 6.9 | % | |||||||
| 8,443,000 | 52.7 | % | |||||||||||
| Agency Bonds and Notes | |||||||||||||
| 1 | Bank of America Corp. | 2.100%–3.125% | 4/30/12–6/22/12 | 71,975 | 73,838 | 0.5 | % | ||||||
| 1 | Bank of America NA | 1.700 | % | 12/23/10 | 7,500 | 7,575 | 0.0 | % | |||||
| 1 | Citibank NA | 1.250%–1.875% | 3/30/11–12/28/12 | 36,575 | 36,626 | 0.2 | % | ||||||
| 1 | Citigroup Funding Inc. | 1.375%–2.250% | 5/5/11–12/10/12 | 47,387 | 47,697 | 0.3 | % | ||||||
| 1 | Citigroup Inc. | 2.125%–2.875% | 12/9/11–4/30/12 | 59,345 | 60,463 | 0.4 | % | ||||||
| 2 | Federal Home Loan Banks | 1.625 | % | 7/27/11 | 79,875 | 80,643 | 0.5 | % | |||||
| 2,3 | Federal Home Loan Banks | 1.000%–5.500% | 3/11/11–8/13/14 | 587,595 | 610,399 | 3.8 | % | ||||||
| 2 | Federal Home Loan Mortgage Corp. | 4.500 | % | 7/15/13 | 69,000 | 74,444 | 0.5 | % | |||||
| 2,3 | Federal Home Loan | ||||||||||||
| Mortgage Corp. | 1.125%–6.000% | 1/18/11–7/28/14 | 584,395 | 605,748 | 3.8 | % | |||||||
| 2 | Federal National Mortgage Assn. | 6.000 | % | 5/15/11 | 94,275 | 100,799 | 0.6 | % | |||||
| 2 | Federal National | ||||||||||||
| Mortgage Assn. | 1.000%–5.500% | 2/15/11–11/20/14 | 657,925 | 681,905 | 4.3 | % | |||||||
| 1 | General Electric Capital Corp. | 1.625%–3.000% | 1/7/11–12/28/12 | 130,250 | 132,011 | 0.8 | % | ||||||
| 1 | JPMorgan Chase & Co. | 1.650%–3.125% | 2/23/11–12/26/12 | 70,325 | 71,772 | 0.5 | % | ||||||
| Agency Bonds and Notes—Other † | 310,361 | 1.9 | % | ||||||||||
| 2,894,281 | 18.1 | % | |||||||||||
| Total U.S. Government and Agency Obligations (Cost $11,251,896) | 11,337,281 | 70.8 | % | ||||||||||
| 4Asset-Backed/Commercial Mortgage-Backed Securities (Cost $ 8,575) † | 8,771 | 0.1 | % | ||||||||||
| Corporate Bonds | |||||||||||||
| Finance | |||||||||||||
| Banking | |||||||||||||
| Bank of America Corp. | 4.250%–7.375% | 10/1/10–11/15/14 | 57,600 | 60,975 | 0.4 | % | |||||||
| Bank One Corp. | 5.900 | % | 11/15/11 | 1,500 | 1,603 | 0.0 | % | ||||||
| Bear Stearns Cos. LLC | 4.500%–6.950% | 10/28/10–11/15/14 | 14,200 | 15,126 | 0.1 | % | |||||||
| Citigroup Inc. | 5.000%–6.500% | 1/18/11–1/15/15 | 121,150 | 124,830 | 0.8 | % | |||||||
| Countrywide Financial Corp. | 5.800 | % | 6/7/12 | 3,850 | 4,089 | 0.0 | % | ||||||
| Countrywide Home Loans Inc. | 4.000 | % | 3/22/11 | 1,925 | 1,976 | 0.0 | % | ||||||
36
| Short-Term Bond Index Fund | ||||||||||||
| Face | Market | Percentage | ||||||||||
| Maturity | Amount | Value• | of Net | |||||||||
| Coupon | Date | ($ | 000 | ) | ($ | 000 | ) | Assets | ||||
| FIA Card Services NA | 6.625 | % | 6/15/12 | 1,000 | 1,062 | 0.0 | % | |||||
| JPMorgan Chase & Co. | 4.650%–6.750% | 2/1/11–5/1/15 | 89,425 | 95,894 | 0.6 | % | ||||||
| MBNA Corp. | 6.125%–7.500% | 3/15/12–3/1/13 | 3,075 | 3,339 | 0.0 | % | ||||||
| Merrill Lynch & Co. Inc. | 5.000%–6.150% | 7/25/11–1/15/15 | 44,850 | 47,784 | 0.3 | % | ||||||
| 4 | Banking—Other † | 674,420 | 4.2 | % | ||||||||
| Brokerage † | 14,536 | 0.1 | % | |||||||||
| Finance Companies | ||||||||||||
| General Electric Capital Corp. | 3.500%–6.125% | 9/13/10–11/14/14 | 145,210 | 152,818 | 1.0 | % | ||||||
| Finance Companies—Other † | 98,176 | 0.6 | % | |||||||||
| 4 | Insurance † | 160,407 | 1.0 | % | ||||||||
| Other Finance † | 14,171 | 0.1 | % | |||||||||
| Real Estate Investment Trusts † | 49,607 | 0.3 | % | |||||||||
| 1,520,813 | 9.5 | % | ||||||||||
| Industrial | ||||||||||||
| 4 | Basic Industry † | 140,641 | 0.9 | % | ||||||||
| Capital Goods | ||||||||||||
| General Electric Co. | 5.000 | % | 2/1/13 | 18,500 | 19,593 | 0.1 | % | |||||
| Capital Goods—Other † | 158,376 | 1.0 | % | |||||||||
| 4 | Communication † | 401,829 | 2.5 | % | ||||||||
| Consumer Cyclical † | 189,029 | 1.2 | % | |||||||||
| 4 | Consumer Noncyclical † | 425,662 | 2.7 | % | ||||||||
| 4 | Energy † | 192,218 | 1.2 | % | ||||||||
| Other Industrial † | 1,818 | 0.0 | % | |||||||||
| Technology † | 156,687 | 1.0 | % | |||||||||
| Transportation † | 38,751 | 0.2 | % | |||||||||
| 1,724,604 | 10.8 | % | ||||||||||
| Utilities | ||||||||||||
| 4 | Electric † | 187,820 | 1.1 | % | ||||||||
| Natural Gas † | 60,204 | 0.4 | % | |||||||||
| 248,024 | 1.5 | % | ||||||||||
| Total Corporate Bonds (Cost $3,339,144) | 3,493,441 | 21.8 | % | |||||||||
| Sovereign Bonds (U.S. Dollar-Denominated) | ||||||||||||
| European Investment Bank | 1.750%–5.250% | 2/15/11–6/4/14 | 212,825 | 217,698 | 1.4 | % | ||||||
| Kreditanstalt | ||||||||||||
| fuer Wiederaufbau | 1.875%–4.750% | 11/15/10–10/21/14 | 176,450 | 180,506 | 1.1 | % | ||||||
| Landwirtschaftliche | ||||||||||||
| Rentenbank | 1.875%–5.250% | 2/14/11–3/15/13 | 44,675 | 45,767 | 0.3 | % | ||||||
| Sovereign Bonds (U.S. Dollar-Denominated)—Other † | 598,493 | 3.7 | % | |||||||||
| Total Sovereign Bonds (Cost $1,020,084) | 1,042,464 | 6.5 | % | |||||||||
| Taxable Municipal Bonds (Cost $ 6,764) † | 6,911 | 0.1 | % | |||||||||
| Shares | ||||||||||||
| Temporary Cash Investment | ||||||||||||
| Money Market Fund | ||||||||||||
| 5,6 | Vanguard Market Liquidity Fund | |||||||||||
| (Cost $191,629) | 0.187 | % | 191,629,464 | 191,629 | 1.2 | % | ||||||
| ^Total Investments (Cost $15,818,092) | 16,080,497 | 100.5 | % | |||||||||
| Other Assets and Liabilities | ||||||||||||
| Other Assets | 590,205 | 3.7 | % | |||||||||
| Liabilities6 | (665,135 | ) | (4.2 | %) | ||||||||
| (74,930 | ) | (0.5 | %) | |||||||||
| Net Assets | 16,005,567 | 100.0 | % | |||||||||
37
| Short-Term Bond Index Fund | |||
| At December 31, 2009, net assets consisted of: | |||
| Amount | |||
| ($ | 000 | ) | |
| Paid-in Capital | 15,732,474 | ||
| Undistributed Net Investment Income | — | ||
| Accumulated Net Realized Gains | 10,688 | ||
| Unrealized Appreciation (Depreciation) | 262,405 | ||
| Net Assets | 16,005,567 | ||
| Investor Shares—Net Assets | |||
| Applicable to 506,758,280 outstanding $.001 par value shares of | |||
| beneficial interest (unlimited authorization) | 5,282,855 | ||
| Net Asset Value Per Share—Investor Shares | $ | 10.42 | |
| Admiral Shares—Net Assets | |||
| Applicable to 188,088,166 outstanding $.001 par value shares of | |||
| beneficial interest (unlimited authorization) | 1,960,773 | ||
| Net Asset Value Per Share—Admiral Shares | $ | 10.42 | |
| Signal Shares—Net Assets | |||
| Applicable to 487,298,127 outstanding $.001 par value shares of | |||
| beneficial interest (unlimited authorization) | 5,079,987 | ||
| Net Asset Value Per Share—Signal Shares | $ | 10.42 | |
| ETF Shares—Net Assets | |||
| Applicable to 46,400,000 outstanding $.001 par value shares of | |||
| beneficial interest (unlimited authorization) | 3,681,952 | ||
| Net Asset Value Per Share—ETF Shares | $ | 79.35 | |
• See Note A in Notes to Financial Statements.
^ The total value of securities on loan is $925,000.
† Represents the aggregate value, by category, of securities that are not among the 50 largest holdings and, in total for any issuer, represent 1% or less of net assets.
1 Guaranteed by the Federal Deposit Insurance Corporation (FDIC) as part of the Temporary Liquidity Guarantee Program.
2 The issuer operates under a congressional charter; its securities are not backed by the full faith and credit of the U.S. government.
3 The average or expected maturity is shorter than the final maturity shown because of the possibility of interim principal payments and prepayments or the possibility of the issue being called.
4 Certain of the fund’s securities are exempt from registration under Rule 144A of the Securities Act of 1933. Such securities may be sold in transactions exempt from registration, normally to qualified institutional buyers. At December 31, 2009, the aggregate value of these securities was $67,126,000, representing 0.4% of net assets.
5 Affiliated money market fund available only to Vanguard funds and certain trusts and accounts managed by Vanguard. Rate shown is the 7-day yield.
6 Includes $990,000 of collateral received for securities on loan.
See accompanying Notes, which are an integral part of the Financial Statements.
38
| Short-Term Bond Index Fund | |||
| Statement of Operations | |||
| Year Ended | |||
| December 31, 2009 | |||
| ($ | 000 | ) | |
| Investment Income | |||
| Income | |||
| Interest1 | 363,907 | ||
| Security Lending | 114 | ||
| Total Income | 364,021 | ||
| Expenses | |||
| The Vanguard Group—Note B | |||
| Investment Advisory Services | 1,089 | ||
| Management and Administrative—Investor Shares | 7,620 | ||
| Management and Administrative—Admiral Shares | 1,473 | ||
| Management and Administrative—Signal Shares | 3,019 | ||
| Management and Administrative—ETF Shares | 1,556 | ||
| Marketing and Distribution—Investor Shares | 1,257 | ||
| Marketing and Distribution—Admiral Shares | 384 | ||
| Marketing and Distribution—Signal Shares | 1,156 | ||
| Marketing and Distribution—ETF Shares | 534 | ||
| Custodian Fees | 115 | ||
| Auditing Fees | 32 | ||
| Shareholders’ Reports and Proxies—Investor Shares | 226 | ||
| Shareholders’ Reports and Proxies—Admiral Shares | 18 | ||
| Shareholders’ Reports and Proxies—Signal Shares | 42 | ||
| Shareholders’ Reports and Proxies—ETF Shares | 83 | ||
| Trustees’ Fees and Expenses | 20 | ||
| Total Expenses | 18,624 | ||
| Net Investment Income | 345,397 | ||
| Realized Net Gain (Loss) on Investment Securities Sold | 75,989 | ||
| Change in Unrealized Appreciation (Depreciation) of Investment Securities | 84,295 | ||
| Net Increase (Decrease) in Net Assets Resulting from Operations | 505,681 | ||
| 1 Interest income from an affiliated company of the fund was $365,000. | |||
| See accompanying Notes, which are an integral part of the Financial Statements. | |||
39
| Short-Term Bond Index Fund | ||||||
| Statement of Changes in Net Assets | ||||||
| Year Ended December 31, | ||||||
| 2009 | 2008 | |||||
| ($ | 000 | ) | ($ | 000 | ) | |
| Increase (Decrease) in Net Assets | ||||||
| Operations | ||||||
| Net Investment Income | 345,397 | 308,519 | ||||
| Realized Net Gain (Loss) | 75,989 | 47,739 | ||||
| Change in Unrealized Appreciation (Depreciation) | 84,295 | 74,389 | ||||
| Net Increase (Decrease) in Net Assets Resulting from Operations | 505,681 | 430,647 | ||||
| Distributions | ||||||
| Net Investment Income | ||||||
| Investor Shares | (121,171 | ) | (122,056 | ) | ||
| Admiral Shares | (51,150 | ) | (61,985 | ) | ||
| Signal Shares | (113,924 | ) | (94,644 | ) | ||
| ETF Shares | (59,509 | ) | (29,834 | ) | ||
| Realized Capital Gain | ||||||
| Investor Shares | (504 | ) | — | |||
| Admiral Shares | (190 | ) | — | |||
| Signal Shares | (480 | ) | — | |||
| ETF Shares | (363 | ) | — | |||
| Total Distributions | (347,291 | ) | (308,519 | ) | ||
| Capital Share Transactions | ||||||
| Investor Shares | 1,545,538 | 858,062 | ||||
| Admiral Shares | 305,117 | 108,610 | ||||
| Signal Shares | 1,815,238 | 1,320,260 | ||||
| ETF Shares | 2,508,830 | 729,327 | ||||
| Net Increase (Decrease) from Capital Share Transactions | 6,174,723 | 3,016,259 | ||||
| Total Increase (Decrease) | 6,333,113 | 3,138,387 | ||||
| Net Assets | ||||||
| Beginning of Period | 9,672,454 | 6,534,067 | ||||
| End of Period | 16,005,567 | 9,672,454 | ||||
See accompanying Notes, which are an integral part of the Financial Statements.
40
| Short-Term Bond Index Fund | |||||||||||||||
| Financial Highlights | |||||||||||||||
| Investor Shares | |||||||||||||||
| For a Share Outstanding | Year Ended December 31, | ||||||||||||||
| Throughout Each Period | 2009 | 2008 | 2007 | 2006 | 2005 | ||||||||||
| Net Asset Value, Beginning of Period | $ | 10.28 | $ | 10.13 | $ | 9.89 | $ | 9.92 | $ | 10.14 | |||||
| Investment Operations | |||||||||||||||
| Net Investment Income | .293 | .389 | .456 | .426 | .350 | ||||||||||
| Net Realized and Unrealized Gain (Loss) | |||||||||||||||
| on Investments | .141 | .150 | .240 | (.030 | ) | (.220 | ) | ||||||||
| Total from Investment Operations | .434 | .539 | .696 | .396 | .130 | ||||||||||
| Distributions | |||||||||||||||
| Dividends from Net Investment Income | (.293 | ) | (.389 | ) | (.456 | ) | (.426 | ) | (.350 | ) | |||||
| Distributions from Realized Capital Gains | (.001 | ) | — | — | — | — | |||||||||
| Total Distributions | (.294 | ) | (.389 | ) | (.456 | ) | (.426 | ) | (.350 | ) | |||||
| Net Asset Value, End of Period | $ | 10.42 | $ | 10.28 | $ | 10.13 | $ | 9.89 | $ | 9.92 | |||||
| Total Return1 | 4.28 | % | 5.43 | % | 7.22 | % | 4.09 | % | 1.31 | % | |||||
| Ratios/Supplemental Data | |||||||||||||||
| Net Assets, End of Period (Millions) | $ | 5,283 | $ | 3,680 | $ | 2,773 | $ | 2,731 | $ | 2,951 | |||||
| Ratio of Total Expenses to | |||||||||||||||
| Average Net Assets | 0.22 | % | 0.19 | % | 0.18 | % | 0.18 | % | 0.18 | % | |||||
| Ratio of Net Investment Income to | |||||||||||||||
| Average Net Assets | 2.78 | % | 3.79 | % | 4.58 | % | 4.32 | % | 3.50 | % | |||||
| Portfolio Turnover Rate2 | 77 | % | 101 | % | 79 | % | 106 | % | 106 | % | |||||
| 1 | Total returns do not include the account service fee that may be applicable to certain accounts with balances below $10,000. |
| 2 | Excludes the value of portfolio securities received or delivered as a result of in-kind purchases or redemptions of the fund’s capital shares, including ETF Creation Units. |
See accompanying Notes, which are an integral part of the Financial Statements.
41
| Short-Term Bond Index Fund | |||||||||||||||
| Financial Highlights | |||||||||||||||
| Admiral Shares | |||||||||||||||
| For a Share Outstanding | Year Ended December 31, | ||||||||||||||
| Throughout Each Period | 2009 | 2008 | 2007 | 2006 | 2005 | ||||||||||
| Net Asset Value, Beginning of Period | $ | 10.28 | $ | 10.13 | $ | 9.89 | $ | 9.92 | $ | 10.14 | |||||
| Investment Operations | |||||||||||||||
| Net Investment Income | .303 | .397 | .464 | .433 | .357 | ||||||||||
| Net Realized and Unrealized Gain (Loss) | |||||||||||||||
| on Investments | .141 | .150 | .240 | (.030 | ) | (.220 | ) | ||||||||
| Total from Investment Operations | .444 | .547 | .704 | .403 | .137 | ||||||||||
| Distributions | |||||||||||||||
| Dividends from Net Investment Income | (.303 | ) | (.397 | ) | (.464 | ) | (.433 | ) | (.357 | ) | |||||
| Distributions from Realized Capital Gains | (.001 | ) | — | — | — | — | |||||||||
| Total Distributions | (.304 | ) | (.397 | ) | (.464 | ) | (.433 | ) | (.357 | ) | |||||
| Net Asset Value, End of Period | $ | 10.42 | $ | 10.28 | $ | 10.13 | $ | 9.89 | $ | 9.92 | |||||
| Total Return | 4.38 | % | 5.51 | % | 7.31 | % | 4.16 | % | 1.38 | % | |||||
| Ratios/Supplemental Data | |||||||||||||||
| Net Assets, End of Period (Millions) | $ | 1,961 | $ | 1,632 | $ | 1,502 | $ | 2,528 | $ | 2,326 | |||||
| Ratio of Total Expenses to | |||||||||||||||
| Average Net Assets | 0.12 | % | 0.11 | % | 0.10 | % | 0.11 | % | 0.11 | % | |||||
| Ratio of Net Investment Income to | |||||||||||||||
| Average Net Assets | 2.88 | % | 3.87 | % | 4.66 | % | 4.39 | % | 3.57 | % | |||||
| Portfolio Turnover Rate1 | 77 | % | 101 | % | 79 | % | 106 | % | 106 | % | |||||
| 1 | Excludes the value of portfolio securities received or delivered as a result of in-kind purchases or redemptions of the fund’s capital shares, including ETF Creation Units. |
See accompanying Notes, which are an integral part of the Financial Statements.
42
| Short-Term Bond Index Fund | |||||||||
| Financial Highlights | |||||||||
| Signal Shares | |||||||||
| Mar. 30, | |||||||||
| Year Ended | 20071 to | ||||||||
| December 31, | Dec. 31, | ||||||||
| For a Share Outstanding Throughout Each Period | 2009 | 2008 | 2007 | ||||||
| Net Asset Value, Beginning of Period | $ | 10.28 | $ | 10.13 | $ | 9.93 | |||
| Investment Operations | |||||||||
| Net Investment Income | .303 | .397 | .352 | ||||||
| Net Realized and Unrealized Gain (Loss) on Investments | .141 | .150 | .200 | ||||||
| Total from Investment Operations | .444 | .547 | .552 | ||||||
| Distributions | |||||||||
| Dividends from Net Investment Income | (.303 | ) | (.397 | ) | (.352 | ) | |||
| Distributions from Realized Capital Gains | (.001 | ) | — | — | |||||
| Total Distributions | (.304 | ) | (.397 | ) | (.352 | ) | |||
| Net Asset Value, End of Period | $ | 10.42 | $ | 10.28 | $ | 10.13 | |||
| Total Return | 4.38 | % | 5.51 | % | 5.67 | % | |||
| Ratios/Supplemental Data | |||||||||
| Net Assets, End of Period (Millions) | $ | 5,080 | $ | 3,212 | $ | 1,851 | |||
| Ratio of Total Expenses to Average Net Assets | 0.12 | % | 0.11 | % | 0.10 | %2 | |||
| Ratio of Net Investment Income to Average Net Assets | 2.88 | % | 3.87 | % | 4.66 | %2 | |||
| Portfolio Turnover Rate3 | 77 | % | 101 | % | 79 | % | |||
| 1 | Inception. |
| 2 | Annualized. |
| 3 | Excludes the value of portfolio securities received or delivered as a result of in-kind purchases or redemptions of the fund’s capital shares, including ETF Creation Units. |
See accompanying Notes, which are an integral part of the Financial Statements.
43
| Short-Term Bond Index Fund | |||||||||
| Financial Highlights | |||||||||
| ETF Shares | |||||||||
| Apr. 3, | |||||||||
| Year Ended | 20071 to | ||||||||
| December 31, | Dec. 31, | ||||||||
| For a Share Outstanding Throughout Each Period | 2009 | 2008 | 2007 | ||||||
| Net Asset Value, Beginning of Period | $ | 78.13 | $ | 76.88 | $ | 74.95 | |||
| Investment Operations | |||||||||
| Net Investment Income | 2.196 | 2.886 | 2.249 | ||||||
| Net Realized and Unrealized Gain (Loss) on Investments | 1.228 | 1.250 | 1.930 | ||||||
| Total from Investment Operations | 3.424 | 4.136 | 4.179 | ||||||
| Distributions | |||||||||
| Dividends from Net Investment Income | (2.196 | ) | (2.886 | ) | (2.249 | ) | |||
| Distributions from Realized Capital Gains | (.008 | ) | — | — | |||||
| Total Distributions | (2.204 | ) | (2.886 | ) | (2.249 | ) | |||
| Net Asset Value, End of Period | $ | 79.35 | $ | 78.13 | $ | 76.88 | |||
| Total Return | 4.44 | % | 5.48 | % | 5.67 | % | |||
| Ratios/Supplemental Data | |||||||||
| Net Assets, End of Period (Millions) | $ | 3,682 | $ | 1,149 | $ | 407 | |||
| Ratio of Total Expenses to Average Net Assets | 0.12 | % | 0.10 | % | 0.11 | %2 | |||
| Ratio of Net Investment Income to Average Net Assets | 2.88 | % | 3.88 | % | 4.65 | %2 | |||
| Portfolio Turnover Rate3 | 77 | % | 101 | % | 79 | % | |||
| 1 | Inception. |
| 2 | Annualized. |
| 3 | Excludes the value of portfolio securities received or delivered as a result of in-kind purchases or redemptions of the fund’s capital shares, including ETF Creation Units. |
See accompanying Notes, which are an integral part of the Financial Statements.
44
Short-Term Bond Index Fund
Notes to Financial Statements
Vanguard Short-Term Bond Index Fund is registered under the Investment Company Act of 1940 as an open-end investment company, or mutual fund. Certain of the fund’s investments are in corporate debt instruments; the issuers’ abilities to meet their obligations may be affected by economic developments in their respective industries. The fund offers four classes of shares: Investor Shares, Admiral Shares, Signal Shares, and ETF Shares. Investor Shares are available to any investor who meets the fund’s minimum purchase requirements. Admiral Shares are designed for investors who meet certain administrative, service, tenure, and account-size criteria. Signal Shares are designed for institutional investors who meet certain administrative, service, and account-size criteria. ETF Shares are listed for trading on the NYSE Arca, Inc.; they can be purchased and sold through a broker.
A. The following significant accounting policies conform to generally accepted accounting principles for U.S. mutual funds. The fund consistently follows such policies in preparing its financial statements.
1. Security Valuation: Bonds, and temporary cash investments acquired over 60 days to maturity, are valued using the latest bid prices or using valuations based on a matrix system (which considers such factors as security prices, yields, maturities, and ratings), both as furnished by independent pricing services. Investments in Vanguard Market Liquidity Fund are valued at that fund’s net asset value. Other temporary cash investments are valued at amortized cost, which approximates market value. Securities for which market quotations are not readily available, or whose values have been affected by events occurring before the fund’s pricing time but after the close of the securities’ primary markets, are valued by methods deemed by the board of trustees to represent fair value.
2. Federal Income Taxes: The fund intends to continue to qualify as a regulated investment company and distribute all of its taxable income. Management has analyzed the fund’s tax positions taken for all open federal income tax years (December 31, 2006–2009), and has concluded that no provision for federal income tax is required in the fund’s financial statements.
3. Distributions: Distributions from net investment income are declared daily by all share classes except ETF Shares, and paid on the first business day of the following month. Monthly income dividends from ETF Shares, and annual distributions from realized capital gains, if any, are recorded on the ex-dividend date.
4. Security Lending: The fund may lend its securities to qualified institutional borrowers to earn additional income. Security loans are required to be secured at all times by collateral at least equal to the market value of securities loaned. The fund invests cash collateral received in Vanguard Market Liquidity Fund, and records a liability for the return of the collateral, during the period the securities are on loan. Security lending income represents the income earned on investing cash collateral, less expenses associated with the loan.
5. Other: Interest income includes income distributions received from Vanguard Market Liquidity Fund and is accrued daily. Premiums and discounts on debt securities purchased are amortized and accreted, respectively, to interest income over the lives of the respective securities. Security transactions are accounted for on the date securities are bought or sold. Costs used to determine realized gains (losses) on the sale of investment securities are those of the specific securities sold.
Each class of shares has equal rights as to assets and earnings, except that each class separately bears certain class-specific expenses related to maintenance of shareholder accounts (included in Management and Administrative expenses), shareholder reporting, and proxies. Marketing and
45
Short-Term Bond Index Fund
distribution expenses are allocated to each class of shares based on a method approved by the board of trustees. Income, other non-class-specific expenses, and gains and losses on investments are allocated to each class of shares based on its relative net assets.
B. The Vanguard Group furnishes at cost investment advisory, corporate management, administrative, marketing, and distribution services. The costs of such services are allocated to the fund under methods approved by the board of trustees. The fund has committed to provide up to 0.40% of its net assets in capital contributions to Vanguard. At December 31, 2009, the fund had contributed capital of $3,122,000 to Vanguard (included in Other Assets), representing 0.02% of the fund’s net assets and 1.25% of Vanguard’s capitalization. The fund’s trustees and officers are also directors and officers of Vanguard.
C. Various inputs may be used to determine the value of the fund’s investments. These inputs are summarized in three broad levels for financial statement purposes. The inputs or methodologies used to value securities are not necessarily an indication of the risk associated with investing in those securities.
Level 1—Quoted prices in active markets for identical securities.
Level 2—Other significant observable inputs (including quoted prices for similar securities, interest rates, prepayment speeds, credit risk, etc.).
Level 3—Significant unobservable inputs (including the fund’s own assumptions used to determine the fair value of investments).
The following table summarizes the fund’s investments as of December 31, 2009, based on the inputs used to value them:
| Level 1 | Level 2 | Level 3 | |||||||
| Investments | ($ | 000 | ) | ($ | 000 | ) | ($ | 000 | ) |
| U.S. Government and Agency Obligations | — | 11,337,281 | — | ||||||
| Asset-Backed/Commercial Mortgage-Backed Securities | — | 8,771 | — | ||||||
| Corporate Bonds | — | 3,493,431 | 10 | ||||||
| Sovereign Bonds | — | 1,042,464 | — | ||||||
| Taxable Municipal Bonds | — | 6,911 | — | ||||||
| Temporary Cash Investments | 191,629 | — | — | ||||||
| Total | 191,629 | 15,888,858 | 10 |
46
Short-Term Bond Index Fund
The following table summarizes changes in investments valued based on Level 3 inputs during the year ended December 31, 2009:
| Investments in | |||
| Corporate Bonds | |||
| Amount Valued Based on Level 3 Inputs | ($ | 000 | ) |
| Balance as of December 31, 2008 | — | ||
| Transfers in and/or out of Level 3 | 16 | ||
| Change in unrealized appreciation (depreciation) | (6 | ) | |
| Balance as of December 31, 2009 | 10 |
D. Capital gain distributions are determined on a tax basis and may differ from realized capital gains for financial reporting purposes. Differences may be permanent or temporary. Permanent differences are reclassified among capital accounts in the financial statements to reflect their tax character. Temporary differences arise when gains or losses are recognized in different periods for financial statement and tax purposes; these differences will reverse at some time in the future.
The fund used a tax accounting practice to treat a portion of the price of capital shares redeemed during the year as distributions from realized capital gains. Accordingly, the fund has reclassified $849,000 from accumulated net realized gains to paid-in capital.
For tax purposes, at December 31, 2009, the fund had short-term and long-term capital gains of $5,112,000 and $6,213,000, respectively, available for distribution. Short-term gain distributions are treated as ordinary income dividends for tax purposes.
Certain of the fund’s U.S. Treasury Inflation-Indexed securities experienced deflation adjustments that reduced interest income and the cost of investments for financial statement purposes by an amount greater than the reduction of taxable income; the additional income reduction was deferred for tax purposes until it was used to offset future inflation adjustments that increase taxable income. The difference became permanent when the securities were sold. During the year ended December 31, 2009, the fund realized gains of $357,000 that were included in ordinary income for tax purposes as a result of deferred deflation adjustments; accordingly such gains have been reclassified from accumulated net realized gains to undistributed net investment income.
At December 31, 2009, the cost of investment securities for tax purposes was $15,818,583,000. Net unrealized appreciation of investment securities for tax purposes was $261,914,000, consisting of unrealized gains of $298,704,000 on securities that had risen in value since their purchase and $36,790,000 in unrealized losses on securities that had fallen in value since their purchase.
47
Short-Term Bond Index Fund
E. During the year ended December 31, 2009, the fund purchased $2,277,504,000 of investment securities and sold $921,652,000 of investment securities, other than U.S. government securities and temporary cash investments. Purchases and sales of U.S. government securities were $12,966,537,000 and $8,261,870,000, respectively.
| F. Capital share transactions for each class of shares were: | ||||||||||
| Year Ended December 31, | ||||||||||
| 2009 | 2008 | |||||||||
| Amount | Shares | Amount | Shares | |||||||
| ($ | 000 | ) | (000 | ) | ($ | 000 | ) | (000 | ) | |
| Investor Shares | ||||||||||
| Issued | 3,417,628 | 329,509 | 2,042,093 | 200,868 | ||||||
| Issued in Lieu of Cash Distributions | 104,748 | 10,107 | 110,107 | 10,827 | ||||||
| Redeemed | (1,976,838 | ) | (190,885 | ) | (1,294,138 | ) | (127,426 | ) | ||
| Net Increase (Decrease)—Investor Shares | 1,545,538 | 148,731 | 858,062 | 84,269 | ||||||
| Admiral Shares | ||||||||||
| Issued | 1,167,345 | 112,451 | 660,329 | 64,940 | ||||||
| Issued in Lieu of Cash Distributions | 44,207 | 4,267 | 54,719 | 5,378 | ||||||
| Redeemed | (906,435 | ) | (87,457 | ) | (606,438 | ) | (59,784 | ) | ||
| Net Increase (Decrease)—Admiral Shares | 305,117 | 29,261 | 108,610 | 10,534 | ||||||
| Signal Shares | ||||||||||
| Issued | 2,766,402 | 266,663 | 2,041,854 | 200,877 | ||||||
| Issued in Lieu of Cash Distributions | 101,450 | 9,784 | 86,207 | 8,482 | ||||||
| Redeemed | (1,052,614 | ) | (101,661 | ) | (807,801 | ) | (79,607 | ) | ||
| Net Increase (Decrease)—Signal Shares | 1,815,238 | 174,786 | 1,320,260 | 129,752 | ||||||
| ETF Shares | ||||||||||
| Issued | 2,508,830 | 31,700 | 790,243 | 10,200 | ||||||
| Issued in Lieu of Cash Distributions | — | — | — | — | ||||||
| Redeemed | — | — | (60,916 | ) | (800 | ) | ||||
| Net Increase (Decrease)—ETF Shares | 2,508,830 | 31,700 | 729,327 | 9,400 | ||||||
G. In preparing the financial statements as of December 31, 2009, management considered the impact of subsequent events occurring through February 12, 2010, for potential recognition or disclosure in these financial statements.
48
Intermediate-Term Bond Index Fund
| Fund Profile | |||||||
| As of December 31, 2009 | |||||||
| Financial Attributes | |||||||
| Target | Broad | ||||||
| Fund | Index1 | Index2 | |||||
| Number of Issues | 1,037 | 1,514 | 8,413 | ||||
| Yield3 | 4.2 | % | 3.7 | % | |||
| Investor Shares | 3.9 | % | |||||
| Admiral Shares | 4.0 | % | |||||
| Signal Shares | 4.0 | % | |||||
| Institutional Shares | 4.0 | % | |||||
| ETF Shares | 4.0 | % | |||||
| Yield to Maturity | 4.2 | %4 | 4.2 | % | 3.7 | % | |
| Average Coupon | 5.3 | % | 5.0 | % | 4.7 | % | |
| Average Effective | |||||||
| Maturity | 7.5 years | 7.6 years | 6.8 years | ||||
| Average Quality5 | Aa2/Aa3 | Aa2/Aa3 | Aa1/Aa2 | ||||
| Average Duration | 6.3 years | 6.3 years | 4.6 years | ||||
| Expense Ratio6 | — | — | |||||
| Investor Shares | 0.22 | % | |||||
| Admiral Shares | 0.14 | % | |||||
| Signal Shares | 0.14 | % | |||||
| Institutional Shares | 0.09 | % | |||||
| ETF Shares | 0.14 | % | |||||
| Short-Term Reserves | 0.0 | % | — | — | |||
| Sector Diversification7 (% of portfolio) | |||||||
| Finance | 15.9 | % | |||||
| Foreign | 6.5 | ||||||
| Government Mortgage-Backed | 0.1 | ||||||
| Industrial | 21.6 | ||||||
| Treasury/Agency | 51.5 | ||||||
| Utilities | 4.4 | ||||||
| Volatility Measures8 | ||
| Fund Versus | Fund Versus | |
| Target Index1 | Broad Index2 | |
| R-Squared | 0.99 | 0.97 |
| Beta | 1.02 | 1.64 |
Distribution by Maturity (% of portfolio)
| Under 1 Year | 0.1 | % |
| 1–5 Years | 0.6 | |
| 5–10 Years | 99.2 | |
| 10–20 Years | 0.1 |
Distribution by Credit Quality5 (% of portfolio)
| Aaa | 54.0 | % |
| Aa | 6.4 | |
| A | 20.7 | |
| Baa | 18.9 |
Investment Focus
1 Barclays Capital U.S. 5-10 Year Government/Credit Bond Index.
2 Barclays Capital U.S. Aggregate Bond Index.
3 30-day SEC yield for the fund; index yield assumes that all bonds are called or prepaid at the earliest possible dates. See the Glossary.
4 Before expenses.
5 Moody’s Investors Service.
6 The expense ratios shown are from the prospectuses dated April 24, 2009, and represent estimated costs for the current fiscal year based on the fund’s net assets as of the prospectus date. For the fiscal year ended December 31, 2009, the expense ratios for the Intermediate-Term Bond Index Fund were 0.22% for Investor Shares, 0.12% for Admiral Shares, 0.12% for Signal Shares, 0.07% for Institutional Shares, and 0.12% for ETF Shares.
7 The agency sector may include issues from government-sponsored enterprises; such issues are not backed by the full faith and credit of the U.S. government.
8 For an explanation of R-squared, beta, and other terms used here, see the Glossary.
49
Intermediate-Term Bond Index Fund
Performance Summary
All of the returns in this report represent past performance, which is not a guarantee of future results that may be achieved by the fund. (Current performance may be lower or higher than the performance data cited. For performance data current to the most recent month-end, visit our website at www.vanguard.com/performance.) Note, too, that both investment returns and principal value can fluctuate widely, so an investor’s shares, when sold, could be worth more or less than their original cost. The returns shown do not reflect taxes that a shareholder would pay on fund distributions or on the sale of fund shares.
Cumulative Performance: December 31, 1999—December 31, 2009
Initial Investment of $10,000

| Average Annual Total Returns | Final Value | |||||||
| Periods Ended December 31, 2009 | of a $10,000 | |||||||
| One Year | Five Years | Ten Years | Investment | |||||
| Intermediate-Term Bond Index Fund | ||||||||
| Investor Shares1 | 6.79 | % | 4.98 | % | 6.83 | % | $ | 19,362 |
| Barclays Capital U.S. Aggregate Bond Index | 5.93 | 4.97 | 6.33 | 18,475 | ||||
| Barclays Capital U.S. 5–10 Year | ||||||||
| Government/Credit Bond Index | 6.50 | 4.93 | 6.98 | 19,631 | ||||
| Intermediate Investment Grade | ||||||||
| Debt Funds Average2 | 12.49 | 3.48 | 5.10 | 16,450 | ||||
| Final Value | ||||||||
| Since | of a $100,000 | |||||||
| One Year | Five Years | Inception3 | Investment | |||||
| Intermediate-Term Bond Index Fund Admiral Shares | 6.89 | % | 5.06 | % | 5.43 | % | $ | 153,771 |
| Barclays Capital U.S. Aggregate Bond Index | 5.93 | 4.97 | 5.02 | 152,886 | ||||
| Barclays Capital U.S. 5–10 Year | ||||||||
| Government/Credit Bond Index | 6.50 | 4.93 | 5.60 | 155,784 |
1 Total return figures do not reflect the account service fee that may be applicable to certain accounts with balances below $10,000.
2 Derived from data provided by Lipper Inc.; based on average returns for Intermediate U.S. Government Funds through December 31, 2001, and average returns for Intermediate Investment Grade Debt Funds thereafter.
3 Performance for the fund’s Admiral Shares and comparative standards is calculated since the Admiral Shares’ inception on November 12, 2001.
See Financial Highlights for dividend and capital gains information.
50
| Intermediate-Term Bond Index Fund | |||||||
| Final Value of | |||||||
| Since | a $ | 1,000,000 | |||||
| One Year | Inception2 | Investment | |||||
| Intermediate-Term Bond Index Fund Signal Shares | 6.89 | % | 7.29 | % | $ | 1,198,644 | |
| Barclays Capital U.S. Aggregate Bond Index | 5.93 | 6.60 | 1,178,898 | ||||
| Barclays Capital U.S. 5–10 Year Government/Credit Bond Index | 6.50 | 7.10 | 1,193,138 | ||||
| Final Value of | |||||||
| Since | a $ | 25,000,000 | |||||
| One Year | Inception2 | Investment | |||||
| Intermediate-Term Bond Index Fund Institutional Shares | 6.95 | % | 6.13 | % | $ | 31,577,124 | |
| Barclays Capital U.S. Aggregate Bond Index | 5.93 | 5.73 | 31,122,903 | ||||
| Barclays Capital U.S. 5–10 Year Government/Credit Bond Index | 6.50 | 5.91 | 31,327,787 | ||||
| Final Value | |||||||
| Since | of a $ | 10,000 | |||||
| One Year | Inception2 | Investment | |||||
| Intermediate-Term Bond Index Fund ETF Shares Net Asset Value1 | 6.82 | % | 6.55 | % | $ | 11,904 | |
| Barclays Capital U.S. Aggregate Bond Index | 5.93 | 6.05 | 11,750 | ||||
| Barclays Capital U.S. 5–10 Year Government/Credit Bond Index | 6.50 | 6.37 | 11,848 | ||||
| Cumulative Returns: ETF Shares, April 3, 2007—December 31, 2009 | |||||||
| Since | |||||||
| One Year | Inception2 | ||||||
| Intermediate-Term Bond Market Index Fund ETF Shares | |||||||
| Market Price | 4.12 | % | 19.33 | % | |||
| Intermediate-Term Bond Market Index Fund ETF Shares | |||||||
| Net Asset Value | 6.82 | 19.04 | |||||
| Barclays Capital U.S. 5–10 Year Government/Credit Bond Index | 6.50 | 18.48 | |||||
1 For more information about how the ETF Shares’ market prices have compared with their net asset value, visit www.vanguard.com, select your ETF, and then select the Performance tab. The Premium/Discount table there shows the percentages of days on which the ETF Shares’ market price was above or below the NAV.
2 Performance for the fund and its comparative standards is calculated since the following inception dates: June 4, 2007, for the Signal Shares; January 26, 2006, for the Institutional Shares; and April 3, 2007, for the ETF Shares.
51
| Intermediate-Term Bond Index Fund | ||||||||
| Fiscal-Year Total Returns (%): December 31, 1999—December 31, 2009 | ||||||||
| Investor Shares | Barclays1 | |||||||
| Fiscal | Capital | Income | Total | Total | ||||
| Year | Return | Return | Return | Return | ||||
| 2000 | 5.4 | % | 7.4 | % | 12.8 | % | 12.4 | % |
| 2001 | 2.6 | 6.7 | 9.3 | 8.8 | ||||
| 2002 | 4.7 | 6.2 | 10.9 | 13.0 | ||||
| 2003 | 0.6 | 5.0 | 5.6 | 6.0 | ||||
| 2004 | 0.4 | 4.8 | 5.2 | 5.3 | ||||
| 2005 | –2.9 | 4.7 | 1.8 | 1.8 | ||||
| 2006 | –1.1 | 5.0 | 3.9 | 3.8 | ||||
| 2007 | 2.4 | 5.2 | 7.6 | 7.6 | ||||
| 2008 | 0.0 | 4.9 | 4.9 | 5.1 | ||||
| 2009 | 2.1 | 4.7 | 6.8 | 6.5 | ||||
1 Barclays Capital U.S. 5–10 Year Government/Credit Bond Index.
52
Intermediate-Term Bond Index Fund
Financial Statements
Statement of Net Assets—Investments Summary
As of December 31, 2009
This Statement summarizes the fund’s holdings by asset type. Details are reported for each of the fund’s 50 largest individual holdings and for investments that, in total for any issuer, represent more than 1% of the fund’s net assets. The total value of smaller holdings is reported as a single amount within each category.
The fund reports a complete list of its holdings in regulatory filings four times in each fiscal year, at the quarter-ends. For the second and fourth fiscal quarters, the complete listing of the fund’s holdings is available electronically on Vanguard.com and on the Securities and Exchange Commission’s website (www.sec.gov), or you can have it mailed to you without charge by calling 800-662-7447. For the first and third fiscal quarters, the fund files the lists with the SEC on Form N-Q. Shareholders can look up the fund’s Forms N-Q on the SEC’s website. Forms N-Q may also be reviewed and copied at the SEC’s Public Reference Room (see the back cover of this report for further information).
| Face | Market | Percentage | |||||||||
| Maturity | Amount | Value• | of Net | ||||||||
| Coupon | Date | ($ | 000 | ) | ($ | 000 | ) | Assets | |||
| U.S. Government and Agency Obligations | |||||||||||
| U.S. Government Securities | |||||||||||
| United States Treasury Note/Bond | 3.750 | % | 11/15/18 | 324,860 | 324,912 | 3.4 | % | ||||
| United States Treasury Note/Bond | 2.750 | % | 2/15/19 | 263,520 | 242,726 | 2.5 | % | ||||
| United States Treasury Note/Bond | 3.375 | % | 11/15/19 | 251,790 | 242,308 | 2.5 | % | ||||
| United States Treasury Note/Bond | 4.000 | % | 8/15/18 | 222,975 | 227,818 | 2.4 | % | ||||
| United States Treasury Note/Bond | 4.000 | % | 2/15/15 | 206,450 | 219,450 | 2.3 | % | ||||
| United States Treasury Note/Bond | 3.125 | % | 5/15/19 | 219,905 | 208,325 | 2.2 | % | ||||
| United States Treasury Note/Bond | 3.625 | % | 8/15/19 | 203,115 | 199,751 | 2.1 | % | ||||
| United States Treasury Note/Bond | 3.875 | % | 5/15/18 | 192,025 | 195,055 | 2.0 | % | ||||
| United States Treasury Note/Bond | 3.500 | % | 2/15/18 | 155,600 | 154,385 | 1.6 | % | ||||
| United States Treasury Note/Bond | 4.500 | % | 5/15/17 | 130,095 | 139,121 | 1.4 | % | ||||
| United States Treasury Note/Bond | 7.500 | % | 11/15/16 | 105,645 | 133,145 | 1.4 | % | ||||
| United States Treasury Note/Bond | 8.750 | % | 5/15/17 | 98,070 | 132,624 | 1.4 | % | ||||
| United States Treasury Note/Bond | 4.625 | % | 2/15/17 | 118,290 | 127,772 | 1.3 | % | ||||
| United States Treasury Note/Bond | 4.750 | % | 8/15/17 | 117,075 | 127,081 | 1.3 | % | ||||
| United States Treasury Note/Bond | 5.125 | % | 5/15/16 | 107,370 | 119,751 | 1.2 | % | ||||
| United States Treasury Note/Bond | 3.250 | % | 5/31/16 | 115,725 | 116,249 | 1.2 | % | ||||
| United States Treasury Note/Bond | 4.250 | % | 8/15/15 | 95,250 | 101,962 | 1.1 | % | ||||
| United States Treasury Note/Bond | 8.875 | % | 8/15/17 | 71,285 | 97,204 | 1.0 | % | ||||
| United States Treasury Note/Bond | 4.875 | % | 8/15/16 | 75,595 | 83,142 | 0.9 | % | ||||
| United States Treasury Note/Bond | 9.875 | % | 11/15/15 | 60,200 | 82,718 | 0.9 | % | ||||
| United States Treasury Note/Bond | 2.750 | % | 11/30/16 | 85,750 | 82,575 | 0.8 | % | ||||
| United States Treasury Note/Bond | 4.125 | % | 5/15/15 | 74,070 | 78,989 | 0.8 | % | ||||
| United States Treasury Note/Bond | 3.250 | % | 12/31/16 | 79,225 | 78,458 | 0.8 | % | ||||
| United States Treasury Note/Bond | 8.875 | % | 2/15/19 | 51,850 | 72,444 | 0.7 | % | ||||
| United States Treasury Note/Bond | 11.250 | % | 2/15/15 | 50,615 | 71,415 | 0.7 | % | ||||
| United States Treasury Note/Bond | 2.625 | % | 2/29/16 | 73,200 | 71,233 | 0.7 | % | ||||
| United States Treasury Note/Bond | 10.625 | % | 8/15/15 | 46,685 | 65,578 | 0.7 | % | ||||
| United States Treasury Note/Bond | 7.250 | % | 5/15/16 | 51,450 | 63,709 | 0.7 | % | ||||
| United States Treasury Note/Bond | 4.500 | % | 2/15/16 | 56,165 | 60,597 | 0.6 | % | ||||
| United States Treasury Note/Bond | 9.250 | % | 2/15/16 | 41,620 | 56,057 | 0.6 | % | ||||
53
| Intermediate-Term Bond Index Fund | ||||||||||||
| Face | Market | Percentage | ||||||||||
| Maturity | Amount | Value• | of Net | |||||||||
| Coupon | Date | ($ | 000 | ) | ($ | 000 | ) | Assets | ||||
| United States Treasury Note/Bond | 3.250 | % | 6/30/16 | 54,815 | 54,987 | 0.6 | % | |||||
| United States Treasury Note/Bond | 3.125 | % | 10/31/16 | 53,400 | 52,741 | 0.5 | % | |||||
| United States Treasury Note/Bond | 4.625 | % | 11/15/16 | 45,530 | 49,251 | 0.5 | % | |||||
| United States Treasury Note/Bond | 4.250 | % | 11/15/17 | 44,405 | 46,563 | 0.5 | % | |||||
| United States Treasury Note/Bond | 9.125 | % | 5/15/18 | 27,995 | 39,307 | 0.4 | % | |||||
| United States Treasury Note/Bond | 2.375 | % | 3/31/16 | 40,650 | 38,897 | 0.4 | % | |||||
| United States Treasury Note/Bond | 4.500 | % | 11/15/15 | 24,825 | 26,889 | 0.3 | % | |||||
| United States Treasury Note/Bond | 2.625 | % | 4/30/16 | 1,200 | 1,163 | 0.0 | % | |||||
| 4,286,352 | 44.4 | % | ||||||||||
| Agency Bonds and Notes | ||||||||||||
| 1 Federal Home Loan Bank of Chicago | 5.625 | % | 6/13/16 | 4,325 | 4,365 | 0.0 | % | |||||
| 1 Federal Home Loan Banks | 5.000 | % | 11/17/17 | 32,225 | 34,733 | 0.4 | % | |||||
| 1 Federal Home Loan Banks | 4.750 | % | 12/16/16 | 26,750 | 28,602 | 0.3 | % | |||||
| 1 Federal Home Loan Banks | 4.875 | % | 5/17/17 | 24,225 | 26,023 | 0.3 | % | |||||
| 1 Federal Home Loan Banks | 5.125%–5.375% | 6/18/14–8/15/19 | 25,895 | 28,197 | 0.3 | % | ||||||
| 1 Federal Home Loan Mortgage Corp. | 5.500 | % | 7/18/16 | 52,000 | 58,050 | 0.6 | % | |||||
| 1 Federal Home Loan Mortgage Corp. | 4.500 | % | 1/15/15 | 27,950 | 30,035 | 0.3 | % | |||||
| 1 Federal Home Loan Mortgage Corp. | 4.750 | % | 1/19/16 | 23,925 | 25,805 | 0.3 | % | |||||
| 1 Federal Home Loan | ||||||||||||
| Mortgage Corp. | 3.750%–5.250% | 1/26/15–3/27/19 | 68,150 | 71,700 | 0.7 | % | ||||||
| 1 Federal National Mortgage Assn. | 4.875 | % | 12/15/16 | 44,900 | 48,493 | 0.5 | % | |||||
| 1 Federal National Mortgage Assn. | 5.000 | % | 2/13/17 | 37,175 | 40,330 | 0.4 | % | |||||
| 1 Federal National Mortgage Assn. | 5.375 | % | 6/12/17 | 25,000 | 27,660 | 0.3 | % | |||||
| 1 Federal National Mortgage Assn. | 5.000 | % | 4/15/15 | 25,000 | 27,417 | 0.3 | % | |||||
| 1 Federal National | ||||||||||||
| Mortgage Assn. | 0.000%–5.250% | 10/15/15–10/9/19 | 63,400 | 63,250 | 0.7 | % | ||||||
| Agency Bonds and Notes—Other † | 99,614 | 1.0 | % | |||||||||
| 614,274 | 6.4 | % | ||||||||||
| Total U.S. Government and Agency Obligations (Cost $4,860,857) | 4,900,626 | 50.8 | % | |||||||||
| 2Asset-Backed/Commercial Mortgage-Backed Securities (Cost $ 2,788) † | 2,887 | 0.0 | % | |||||||||
| Corporate Bonds | ||||||||||||
| Finance | ||||||||||||
| Banking | ||||||||||||
| Bank of America Corp. | 5.250%–7.750% | 8/15/15–6/1/19 | 87,900 | 91,079 | 0.9 | % | ||||||
| Bank of America NA | 5.300%–6.100% | 3/15/17–6/15/17 | 16,050 | 15,706 | 0.2 | % | ||||||
| Bank One Corp. | 4.900 | % | 4/30/15 | 6,150 | 6,343 | 0.1 | % | |||||
| Bear Stearns Cos. LLC | 5.300%–7.250% | 10/30/15–2/1/18 | 44,150 | 48,149 | 0.5 | % | ||||||
| Countrywide Financial Corp. | 6.250 | % | 5/15/16 | 3,775 | 3,848 | 0.0 | % | |||||
| Goldman Sachs Group Inc. | 5.125%–7.500% | 1/15/15–2/15/19 | 98,700 | 105,096 | 1.1 | % | ||||||
| JPMorgan Chase & Co. | 4.750%–6.300% | 3/1/15–4/23/19 | 57,450 | 61,805 | 0.6 | % | ||||||
| JPMorgan Chase Bank NA | 5.875%–6.000% | 6/13/16–10/1/17 | 8,900 | 9,378 | 0.1 | % | ||||||
| MBNA Corp. | 5.000 | % | 6/15/15 | 1,300 | 1,297 | 0.0 | % | |||||
| Merrill Lynch & Co. Inc. | 6.875 | % | 4/25/18 | 34,850 | 37,604 | 0.4 | % | |||||
| Merrill Lynch & Co. Inc. | 5.000%–6.500% | 1/15/15–7/15/18 | 34,550 | 35,269 | 0.4 | % | ||||||
| Morgan Stanley | 5.375%–7.300% | 4/28/15–9/23/19 | 118,675 | 124,395 | 1.3 | % | ||||||
| 2 Banking—Other † | 505,883 | 5.2 | % | |||||||||
| Brokerage † | 26,538 | 0.3 | % | |||||||||
| Finance Companies | ||||||||||||
| General Electric Capital Corp. | 5.625 | % | 5/1/18 | 27,925 | 28,552 | 0.3 | % | |||||
| 3 General Electric Capital Corp. | 4.375%–6.375% | 9/21/15–11/15/67 | 48,850 | 47,546 | 0.5 | % | ||||||
| Finance Companies—Other † | 41,625 | 0.4 | % | |||||||||
| Insurance † | 236,723 | 2.5 | % | |||||||||
| Other Finance † | 1,625 | 0.0 | % | |||||||||
54
| Intermediate-Term Bond Index Fund | ||||||||||||
| Face | Market | Percentage | ||||||||||
| Maturity | Amount | Value• | of Net | |||||||||
| Coupon | Date | ($ | 000 | ) | ($ | 000 | ) | Assets | ||||
| Real Estate Investment Trusts | ||||||||||||
| Arden Realty LP | 5.250 | % | 3/1/15 | 1,250 | 1,287 | 0.0 | % | |||||
| Real Estate Investment Trusts—Other † | 99,328 | 1.0 | % | |||||||||
| 1,529,076 | 15.8 | % | ||||||||||
| Industrial | ||||||||||||
| 2 | Basic Industry † | 237,878 | 2.5 | % | ||||||||
| Capital Goods | ||||||||||||
| General Electric Co. | 5.250 | % | 12/6/17 | 20,475 | 20,890 | 0.2 | % | |||||
| 2 | Capital Goods—Other † | 200,315 | 2.1 | % | ||||||||
| 2 | Communication † | 376,508 | 3.9 | % | ||||||||
| Consumer Cyclical † | 164,217 | 1.7 | % | |||||||||
| 2 | Consumer Noncyclical † | 533,444 | 5.5 | % | ||||||||
| 2 | Energy † | 270,905 | 2.8 | % | ||||||||
| Other Industrial † | 1,387 | 0.0 | % | |||||||||
| Technology † | 174,297 | 1.8 | % | |||||||||
| Transportation † | 76,364 | 0.8 | % | |||||||||
| 2,056,205 | 21.3 | % | ||||||||||
| Utilities | ||||||||||||
| Electric † | 287,552 | 3.0 | % | |||||||||
| 2 | Natural Gas † | 131,655 | 1.4 | % | ||||||||
| Other Utility † | 3,704 | 0.0 | % | |||||||||
| 422,911 | 4.4 | % | ||||||||||
| Total Corporate Bonds (Cost $3,784,644) | 4,008,192 | 41.5 | % | |||||||||
| Sovereign Bonds (U.S. Dollar-Denominated) | ||||||||||||
| Italian Republic | 5.250 | % | 9/20/16 | 25,700 | 27,377 | 0.3 | % | |||||
| 2 | Sovereign Bonds (U.S. Dollar-Denominated)—Other † | 585,622 | 6.0 | % | ||||||||
| Total Sovereign Bonds (Cost $582,711) | 612,999 | 6.3 | % | |||||||||
| Taxable Municipal Bonds (Cost $15,949) † | 16,100 | 0.2 | % | |||||||||
| Shares | ||||||||||||
| Temporary Cash Investment | ||||||||||||
| Money Market Fund | ||||||||||||
| 4,5 | Vanguard Market | |||||||||||
| Liquidity Fund (Cost $56,243) | 0.187 | % | 56,242,980 | 56,243 | 0.6 | % | ||||||
| ^Total Investments (Cost $9,303,192) | 9,597,047 | 99.4 | % | |||||||||
| Other Assets and Liabilities | ||||||||||||
| Other Assets | 266,986 | 2.8 | % | |||||||||
| Liabilities5 | (207,797 | ) | (2.2 | %) | ||||||||
| 59,189 | 0.6 | % | ||||||||||
| Net Assets | 9,656,236 | 100.0 | % | |||||||||
55
| Intermediate-Term Bond Index Fund | |||
| At December 31, 2009, net assets consisted of: | |||
| Amount | |||
| ($ | 000 | ) | |
| Paid-in Capital | 9,430,649 | ||
| Undistributed Net Investment Income | — | ||
| Accumulated Net Realized Losses | (68,268 | ) | |
| Unrealized Appreciation (Depreciation) | 293,855 | ||
| Net Assets | 9,656,236 | ||
| Investor Shares—Net Assets | |||
| Applicable to 324,599,385 outstanding $.001 par value shares of | |||
| beneficial interest (unlimited authorization) | 3,478,806 | ||
| Net Asset Value Per Share—Investor Shares | $ | 10.72 | |
| Admiral Shares—Net Assets | |||
| Applicable to 234,049,217 outstanding $.001 par value shares of | |||
| beneficial interest (unlimited authorization) | 2,508,355 | ||
| Net Asset Value Per Share—Admiral Shares | $ | 10.72 | |
| Signal Shares—Net Assets | |||
| Applicable to 178,918,245 outstanding $.001 par value shares of | |||
| beneficial interest (unlimited authorization) | 1,917,503 | ||
| Net Asset Value Per Share—Signal Shares | $ | 10.72 | |
| Institutional Shares—Net Assets | |||
| Applicable to 48,667,867 outstanding $.001 par value shares of | |||
| beneficial interest (unlimited authorization) | 521,586 | ||
| Net Asset Value Per Share—Institutional Shares | $ | 10.72 | |
| ETF Shares—Net Assets | |||
| Applicable to 15,600,000 outstanding $.001 par value shares of | |||
| beneficial interest (unlimited authorization) | 1,229,986 | ||
| Net Asset Value Per Share—ETF Shares | $ | 78.85 | |
• See Note A in Notes to Financial Statements.
^ The total value of securities on loan is $2,386,000.
† Represents the aggregate value, by category, of securities that are not among the 50 largest holdings and, in total for any issuer, represent 1% or less of net assets.
1 The issuer operates under a congressional charter; its securities are not backed by the full faith and credit of the U.S. government.
2 Certain of the fund’s securities are exempt from registration under Rule 144A of the Securities Act of 1933. Such securities may be sold in transactions exempt from registration, normally to qualified institutional buyers. At December 31, 2009, the aggregate value of these securities was $72,647,000, representing 0.8% of net assets.
3 The average or expected maturity is shorter than the final maturity shown because of the possibility of interim principal payments and prepayments or the possibility of the issue being called.
4 Affiliated money market fund available only to Vanguard funds and certain trusts and accounts managed by Vanguard. Rate shown is the 7-day yield.
5 Includes $2,472,000 of collateral received for securities on loan.
See accompanying Notes, which are an integral part of the Financial Statements.
56
| Intermediate-Term Bond Index Fund | |||
| Statement of Operations | |||
| Year Ended | |||
| December 31, 2009 | |||
| ($ | 000 | ) | |
| Investment Income | |||
| Income | |||
| Interest1 | 421,323 | ||
| Security Lending | 177 | ||
| Total Income | 421,500 | ||
| Expenses | |||
| The Vanguard Group—Note B | |||
| Investment Advisory Services | 820 | ||
| Management and Administrative—Investor Shares | 5,901 | ||
| Management and Administrative—Admiral Shares | 2,032 | ||
| Management and Administrative—Signal Shares | 1,356 | ||
| Management and Administrative—Institutional Shares | 135 | ||
| Management and Administrative—ETF Shares | 637 | ||
| Marketing and Distribution—Investor Shares | 909 | ||
| Marketing and Distribution—Admiral Shares | 516 | ||
| Marketing and Distribution—Signal Shares | 517 | ||
| Marketing and Distribution—Institutional Shares | 148 | ||
| Marketing and Distribution—ETF Shares | 249 | ||
| Custodian Fees | 94 | ||
| Auditing Fees | 44 | ||
| Shareholders’ Reports and Proxies—Investor Shares | 206 | ||
| Shareholders’ Reports and Proxies—Admiral Shares | 26 | ||
| Shareholders’ Reports and Proxies—Signal Shares | 9 | ||
| Shareholders’ Reports and Proxies—Institutional Shares | — | ||
| Shareholders’ Reports and Proxies—ETF Shares | 52 | ||
| Trustees’ Fees and Expenses | 16 | ||
| Total Expenses | 13,667 | ||
| Net Investment Income | 407,833 | ||
| Realized Net Gain (Loss) on Investment Securities Sold | 35,773 | ||
| Change in Unrealized Appreciation (Depreciation) of Investment Securities | 136,972 | ||
| Net Increase (Decrease) in Net Assets Resulting from Operations | 580,578 | ||
| 1 Interest income from an affiliated company of the fund was $414,000. | |||
| See accompanying Notes, which are an integral part of the Financial Statements. | |||
57
| Intermediate-Term Bond Index Fund | ||||||
| Statement of Changes in Net Assets | ||||||
| Year Ended December 31, | ||||||
| 2009 | 2008 | |||||
| ($ | 000 | ) | ($ | 000 | ) | |
| Increase (Decrease) in Net Assets | ||||||
| Operations | ||||||
| Net Investment Income | 407,833 | 390,193 | ||||
| Realized Net Gain (Loss) | 35,773 | (3,055 | ) | |||
| Change in Unrealized Appreciation (Depreciation) | 136,972 | (1,555 | ) | |||
| Net Increase (Decrease) in Net Assets Resulting from Operations | 580,578 | 385,583 | ||||
| Distributions | ||||||
| Net Investment Income | ||||||
| Investor Shares | (150,877 | ) | (153,431 | ) | ||
| Admiral Shares | (111,757 | ) | (117,970 | ) | ||
| Signal Shares | (80,944 | ) | (78,791 | ) | ||
| Institutional Shares | (22,620 | ) | (21,395 | ) | ||
| ETF Shares | (41,635 | ) | (18,606 | ) | ||
| Realized Capital Gain | ||||||
| Investor Shares | — | — | ||||
| Admiral Shares | — | — | ||||
| Signal Shares | — | — | ||||
| Institutional Shares | — | — | ||||
| ETF Shares | — | — | ||||
| Total Distributions | (407,833 | ) | (390,193 | ) | ||
| Capital Share Transactions | ||||||
| Investor Shares | 93,898 | 300,687 | ||||
| Admiral Shares | 6,039 | 153,622 | ||||
| Signal Shares | 164,663 | 277,805 | ||||
| Institutional Shares | 5,641 | 238,476 | ||||
| ETF Shares | 591,961 | 444,484 | ||||
| Net Increase (Decrease) from Capital Share Transactions | 862,202 | 1,415,074 | ||||
| Total Increase (Decrease) | 1,034,947 | 1,410,464 | ||||
| Net Assets | ||||||
| Beginning of Period | 8,621,289 | 7,210,825 | ||||
| End of Period | 9,656,236 | 8,621,289 | ||||
See accompanying Notes, which are an integral part of the Financial Statements.
58
| Intermediate-Term Bond Index Fund | |||||||||||||||
| Financial Highlights | |||||||||||||||
| Investor Shares | |||||||||||||||
| For a Share Outstanding | Year Ended December 31, | ||||||||||||||
| Throughout Each Period | 2009 | 2008 | 2007 | 2006 | 2005 | ||||||||||
| Net Asset Value, Beginning of Period | $ | 10.50 | $ | 10.50 | $ | 10.25 | $ | 10.36 | $ | 10.68 | |||||
| Investment Operations | |||||||||||||||
| Net Investment Income | .474 | .498 | .507 | .499 | .492 | ||||||||||
| Net Realized and Unrealized Gain (Loss) | |||||||||||||||
| on Investments | .220 | — | .250 | (.110 | ) | (.309 | ) | ||||||||
| Total from Investment Operations | .694 | .498 | .757 | .389 | .183 | ||||||||||
| Distributions | |||||||||||||||
| Dividends from Net Investment Income | (.474 | ) | (.498 | ) | (.507 | ) | (.499 | ) | (.492 | ) | |||||
| Distributions from Realized Capital Gains | — | — | — | — | (.011 | ) | |||||||||
| Total Distributions | (.474 | ) | (.498 | ) | (.507 | ) | (.499 | ) | (.503 | ) | |||||
| Net Asset Value, End of Period | $ | 10.72 | $ | 10.50 | $ | 10.50 | $ | 10.25 | $ | 10.36 | |||||
| Total Return1 | 6.79 | % | 4.93 | % | 7.61 | % | 3.91 | % | 1.75 | % | |||||
| Ratios/Supplemental Data | |||||||||||||||
| Net Assets, End of Period (Millions) | $ | 3,479 | $ | 3,318 | $ | 3,020 | $ | 2,929 | $ | 3,009 | |||||
| Ratio of Total Expenses to | |||||||||||||||
| Average Net Assets | 0.22 | % | 0.19 | % | 0.18 | % | 0.18 | % | 0.18 | % | |||||
| Ratio of Net Investment Income to | |||||||||||||||
| Average Net Assets | 4.50 | % | 4.81 | % | 4.74 | % | 4.91 | % | 4.68 | % | |||||
| Portfolio Turnover Rate2 | 72 | % | 89 | % | 72 | % | 86 | % | 76 | % | |||||
| 1 | Total returns do not include the account service fee that may be applicable to certain accounts with balances below $10,000. |
| 2 | Excludes the value of portfolio securities received or delivered as a result of in-kind purchases or redemptions of the fund’s capital shares, including ETF Creation Units. |
See accompanying Notes, which are an integral part of the Financial Statements.
59
| Intermediate-Term Bond Index Fund | |||||||||||||||
| Financial Highlights | |||||||||||||||
| Admiral Shares | |||||||||||||||
| For a Share Outstanding | Year Ended December 31, | ||||||||||||||
| Throughout Each Period | 2009 | 2008 | 2007 | 2006 | 2005 | ||||||||||
| Net Asset Value, Beginning of Period | $ | 10.50 | $ | 10.50 | $ | 10.25 | $ | 10.36 | $ | 10.68 | |||||
| Investment Operations | |||||||||||||||
| Net Investment Income | .485 | .506 | .515 | .506 | .499 | ||||||||||
| Net Realized and Unrealized Gain (Loss) | |||||||||||||||
| on Investments | .220 | — | .250 | (.110 | ) | (.309 | ) | ||||||||
| Total from Investment Operations | .705 | .506 | .765 | .396 | .190 | ||||||||||
| Distributions | |||||||||||||||
| Dividends from Net Investment Income | (.485 | ) | (.506 | ) | (.515 | ) | (.506 | ) | (.499 | ) | |||||
| Distributions from Realized Capital Gains | — | — | — | — | (.011 | ) | |||||||||
| Total Distributions | (.485 | ) | (.506 | ) | (.515 | ) | (.506 | ) | (.510 | ) | |||||
| Net Asset Value, End of Period | $ | 10.72 | $ | 10.50 | $ | 10.50 | $ | 10.25 | $ | 10.36 | |||||
| Total Return | 6.89 | % | 5.01 | % | 7.70 | % | 3.98 | % | 1.82 | % | |||||
| Ratios/Supplemental Data | |||||||||||||||
| Net Assets, End of Period (Millions) | $ | 2,508 | $ | 2,458 | $ | 2,308 | $ | 3,118 | $ | 2,949 | |||||
| Ratio of Total Expenses to | |||||||||||||||
| Average Net Assets | 0.12 | % | 0.11 | % | 0.10 | % | 0.11 | % | 0.11 | % | |||||
| Ratio of Net Investment Income to | |||||||||||||||
| Average Net Assets | 4.60 | % | 4.89 | % | 4.82 | % | 4.98 | % | 4.75 | % | |||||
| Portfolio Turnover Rate1 | 72 | % | 89 | % | 72 | % | 86 | % | 76 | % | |||||
| 1 | Excludes the value of portfolio securities received or delivered as a result of in-kind purchases or redemptions of the fund’s capital shares, including ETF Creation Units. |
See accompanying Notes, which are an integral part of the Financial Statements.
60
| Intermediate-Term Bond Index Fund | |||||||||
| Financial Highlights | |||||||||
| Signal Shares | |||||||||
| June 4, | |||||||||
| Year Ended | 20071 to | ||||||||
| December 31, | Dec. 31, | ||||||||
| For a Share Outstanding Throughout Each Period | 2009 | 2008 | 2007 | ||||||
| Net Asset Value, Beginning of Period | $ | 10.50 | $ | 10.50 | $ | 10.12 | |||
| Investment Operations | |||||||||
| Net Investment Income | .485 | .506 | .297 | ||||||
| Net Realized and Unrealized Gain (Loss) on Investments | .220 | — | .380 | ||||||
| Total from Investment Operations | .705 | .506 | .677 | ||||||
| Distributions | |||||||||
| Dividends from Net Investment Income | (.485 | ) | (.506 | ) | (.297 | ) | |||
| Distributions from Realized Capital Gains | — | — | — | ||||||
| Total Distributions | (.485 | ) | (.506 | ) | (.297 | ) | |||
| Net Asset Value, End of Period | $ | 10.72 | $ | 10.50 | $ | 10.50 | |||
| Total Return | 6.89 | % | 5.01 | % | 6.77 | % | |||
| Ratios/Supplemental Data | |||||||||
| Net Assets, End of Period (Millions) | $ | 1,918 | $ | 1,720 | $ | 1,443 | |||
| Ratio of Total Expenses to Average Net Assets | 0.12 | % | 0.11 | % | 0.10 | %2 | |||
| Ratio of Net Investment Income to Average Net Assets | 4.60 | % | 4.89 | % | 4.82 | %2 | |||
| Portfolio Turnover Rate3 | 72 | % | 89 | % | 72 | % | |||
| 1 | Inception. |
| 2 | Annualized. |
| 3 | Excludes the value of portfolio securities received or delivered as a result of in-kind purchases or redemptions of the fund’s capital shares, including ETF Creation Units. |
See accompanying Notes, which are an integral part of the Financial Statements.
61
| Intermediate-Term Bond Index Fund | ||||||||||||
| Financial Highlights | ||||||||||||
| Institutional Shares | ||||||||||||
| Jan. 26, | ||||||||||||
| 20061 to | ||||||||||||
| Year Ended December 31, | Dec. 31, | |||||||||||
| For a Share Outstanding Throughout Each Period | 2009 | 2008 | 2007 | 2006 | ||||||||
| Net Asset Value, Beginning of Period | $ | 10.50 | $ | 10.50 | $ | 10.25 | $ | 10.29 | ||||
| Investment Operations | ||||||||||||
| Net Investment Income | .490 | .510 | .518 | .473 | ||||||||
| Net Realized and Unrealized Gain (Loss) on Investments | .220 | — | .250 | (.040 | ) | |||||||
| Total from Investment Operations | .710 | .510 | .768 | .433 | ||||||||
| Distributions | ||||||||||||
| Dividends from Net Investment Income | (.490 | ) | (.510 | ) | (.518 | ) | (.473 | ) | ||||
| Distributions from Realized Capital Gains | — | — | — | — | ||||||||
| Total Distributions | (.490 | ) | (.510 | ) | (.518 | ) | (.473 | ) | ||||
| Net Asset Value, End of Period | $ | 10.72 | $ | 10.50 | $ | 10.50 | $ | 10.25 | ||||
| Total Return | 6.95 | % | 5.05 | % | 7.73 | % | 4.36 | % | ||||
| Ratios/Supplemental Data | ||||||||||||
| Net Assets, End of Period (Millions) | $ | 522 | $ | 508 | $ | 271 | $ | 181 | ||||
| Ratio of Total Expenses to Average Net Assets | 0.07 | % | 0.07 | % | 0.07 | % | 0.08 | %2 | ||||
| Ratio of Net Investment Income to Average Net Assets | 4.65 | % | 4.93 | % | 4.85 | % | 5.01 | %2 | ||||
| Portfolio Turnover Rate3 | 72 | % | 89 | % | 72 | % | 86 | % | ||||
| 1 | Inception. |
| 2 | Annualized. |
| 3 | Excludes the value of portfolio securities received or delivered as a result of in-kind purchases or redemptions of the fund’s capital shares, including ETF Creation Units. |
See accompanying Notes, which are an integral part of the Financial Statements.
62
| Intermediate-Term Bond Index Fund | |||||||||
| Financial Highlights | |||||||||
| ETF Shares | |||||||||
| April 3, | |||||||||
| Year Ended | 20071 to | ||||||||
| December 31, | Dec. 31, | ||||||||
| For a Share Outstanding Throughout Each Period | 2009 | 2008 | 2007 | ||||||
| Net Asset Value, Beginning of Period | $ | 77.19 | $ | 76.96 | $ | 74.90 | |||
| Investment Operations | |||||||||
| Net Investment Income | 3.474 | 3.537 | 2.389 | ||||||
| Net Realized and Unrealized Gain (Loss) on Investments | 1.660 | .230 | 2.060 | ||||||
| Total from Investment Operations | 5.134 | 3.767 | 4.449 | ||||||
| Distributions | |||||||||
| Dividends from Net Investment Income | (3.474 | ) | (3.537 | ) | (2.389 | ) | |||
| Distributions from Realized Capital Gains | — | — | — | ||||||
| Total Distributions | (3.474 | ) | (3.537 | ) | (2.389 | ) | |||
| Net Asset Value, End of Period | $ | 78.85 | $ | 77.19 | $ | 76.96 | |||
| Total Return | 6.82 | % | 5.07 | % | 6.06 | % | |||
| Ratios/Supplemental Data | |||||||||
| Net Assets, End of Period (Millions) | $ | 1,230 | $ | 617 | $ | 169 | |||
| Ratio of Total Expenses to Average Net Assets | 0.12 | % | 0.10 | % | 0.11 | %2 | |||
| Ratio of Net Investment Income to Average Net Assets | 4.60 | % | 4.90 | % | 4.81 | %2 | |||
| Portfolio Turnover Rate3 | 72 | % | 89 | % | 72 | % | |||
| 1 | Inception. |
| 2 | Annualized. |
| 3 | Excludes the value of portfolio securities received or delivered as a result of in-kind purchases or redemptions of the fund’s capital shares, including ETF Creation Units. |
See accompanying Notes, which are an integral part of the Financial Statements.
63
Intermediate-Term Bond Index Fund
Notes to Financial Statements
Vanguard Intermediate-Term Bond Index Fund is registered under the Investment Company Act of
1940 as an open-end investment company, or mutual fund. Certain of the fund’s investments are in
corporate debt instruments; the issuers’ abilities to meet their obligations may be affected by
economic developments in their respective industries. The fund offers five classes of shares: Investor
Shares, Admiral Shares, Signal Shares, Institutional Shares, and ETF Shares. Investor Shares are
available to any investor who meets the fund’s minimum purchase requirements. Admiral Shares are
designed for investors who meet certain administrative, service, tenure, and account-size criteria.
Signal Shares are designed for institutional investors who meet certain administrative, service, and
account-size criteria. Institutional Shares are designed for investors who meet certain administrative
and service criteria and invest a minimum of $25 million. ETF Shares are listed for trading on the NYSE
Arca, Inc.; they can be purchased and sold through a broker.
A. The following significant accounting policies conform to generally accepted accounting principles for
U.S. mutual funds. The fund consistently follows such policies in preparing its financial statements.
1. Security Valuation: Bonds, and temporary cash investments acquired over 60 days to maturity, are
valued using the latest bid prices or using valuations based on a matrix system (which considers such
factors as security prices, yields, maturities, and ratings), both as furnished by independent pricing
services. Investments in Vanguard Market Liquidity Fund are valued at that fund’s net asset value.
Other temporary cash investments are valued at amortized cost, which approximates market value.
Securities for which market quotations are not readily available, or whose values have been affected by
events occurring before the fund’s pricing time but after the close of the securities’ primary markets,
are valued by methods deemed by the board of trustees to represent fair value.
2. Federal Income Taxes: The fund intends to continue to qualify as a regulated investment company
and distribute all of its taxable income. Management has analyzed the fund’s tax positions taken for all
open federal income tax years (December 31, 2006–2009), and has concluded that no provision for
federal income tax is required in the fund’s financial statements.
3. Distributions: Distributions from net investment income are declared daily by all share classes
except ETF Shares, and paid on the first business day of the following month. Monthly income
dividends from ETF Shares, and annual distributions from realized capital gains, if any, are recorded on
the ex-dividend date.
4. Security Lending: The fund may lend its securities to qualified institutional borrowers to earn
additional income. Security loans are required to be secured at all times by collateral at least equal to
the market value of securities loaned. The fund invests cash collateral received in Vanguard Market
Liquidity Fund, and records a liability for the return of the collateral, during the period the securities are
on loan. Security lending income represents the income earned on investing cash collateral, less
expenses associated with the loan.
64
Intermediate-Term Bond Index Fund
5. Other: Interest income includes income distributions received from Vanguard Market Liquidity Fund and is accrued daily. Premiums and discounts on debt securities purchased are amortized and accreted, respectively, to interest income over the lives of the respective securities. Security transactions are accounted for on the date securities are bought or sold. Costs used to determine realized gains (losses) on the sale of investment securities are those of the specific securities sold.
Each class of shares has equal rights as to assets and earnings, except that each class separately bears certain class-specific expenses related to maintenance of shareholder accounts (included in Management and Administrative expenses), shareholder reporting, and proxies. Marketing and distribution expenses are allocated to each class of shares based on a method approved by the board of trustees. Income, other non-class-specific expenses, and gains and losses on investments are allocated to each class of shares based on its relative net assets.
B. The Vanguard Group furnishes at cost investment advisory, corporate management, administrative, marketing, and distribution services. The costs of such services are allocated to the fund under methods approved by the board of trustees. The fund has committed to provide up to 0.40% of its net assets in capital contributions to Vanguard. At December 31, 2009, the fund had contributed capital of $1,989,000 to Vanguard (included in Other Assets), representing 0.02% of the fund’s net assets and 0.80% of Vanguard’s capitalization. The fund’s trustees and officers are also directors and officers of Vanguard.
C. Various inputs may be used to determine the value of the fund’s investments. These inputs are summarized in three broad levels for financial statement purposes. The inputs or methodologies used to value securities are not necessarily an indication of the risk associated with investing in those securities.
Level 1—Quoted prices in active markets for identical securities.
Level 2—Other significant observable inputs (including quoted prices for similar securities, interest rates, prepayment speeds, credit risk, etc.).
Level 3—Significant unobservable inputs (including the fund’s own assumptions used to determine the fair value of investments).
The following table summarizes the fund’s investments as of December 31, 2009, based on the inputs used to value them:
| Level 1 | Level 2 | Level 3 | |||||||
| Investments | ($ | 000 | ) | ($ | 000 | ) | ($ | 000 | ) |
| U.S. Government and Agency Obligations | — | 4,900,626 | — | ||||||
| Asset-Backed/Commercial Mortgage-Backed Securities | — | 2,887 | — | ||||||
| Corporate Bonds | — | 4,008,192 | — | ||||||
| Sovereign Bonds | — | 612,999 | — | ||||||
| Taxable Municipal Bonds | — | 16,100 | — | ||||||
| Temporary Cash Investments | 56,243 | — | — | ||||||
| Total | 56,243 | 9,540,804 | — |
65
Intermediate-Term Bond Index Fund
D. Capital gain distributions are determined on a tax basis and may differ from realized capital gains for financial reporting purposes. Differences may be permanent or temporary. Permanent differences are reclassified among capital accounts in the financial statements to reflect their tax character. Temporary differences arise when gains or losses are recognized in different periods for financial statement and tax purposes; these differences will reverse at some time in the future.
During the year ended December 31, 2009, the fund realized $3,608,000 of net capital gains resulting from in-kind redemptions—in which shareholders exchanged fund shares for securities held by the fund rather than for cash. Because such gains are not taxable to the fund, and are not distributed to shareholders, they have been reclassified from accumulated net realized losses to paid-in capital.
For tax purposes, at December 31, 2009, the fund had available realized losses of $66,039,000 to offset future net capital gains of $52,216,000 through December 31, 2014, and $13,823,000 through December 31, 2015.
At December 31, 2009, the cost of investment securities for tax purposes was $9,305,285,000. Net unrealized appreciation of investment securities for tax purposes was $291,762,000, consisting of unrealized gains of $391,855,000 on securities that had risen in value since their purchase and $100,093,000 in unrealized losses on securities that had fallen in value since their purchase.
E. During the year ended December 31, 2009, the fund purchased $1,664,523,000 of investment securities and sold $1,426,462,000 of investment securities, other than U.S. government securities and temporary cash investments. Purchases and sales of U.S. government securities were $5,663,764,000 and $4,896,005,000, respectively.
66
Intermediate-Term Bond Index Fund
| F. Capital share transactions for each class of shares were: | ||||||||||
| Year Ended December 31, | ||||||||||
| 2009 | 2008 | |||||||||
| Amount | Shares | Amount | Shares | |||||||
| ($ | 000 | ) | (000 | ) | ($ | 000 | ) | (000 | ) | |
| Investor Shares | ||||||||||
| Issued | 1,225,673 | 116,217 | 1,230,796 | 118,492 | ||||||
| Issued in Lieu of Cash Distributions | 133,436 | 12,655 | 136,232 | 13,198 | ||||||
| Redeemed | (1,265,211 | ) | (120,211 | ) | (1,066,341 | ) | (103,456 | ) | ||
| Net Increase (Decrease)—Investor Shares | 93,898 | 8,661 | 300,687 | 28,234 | ||||||
| Admiral Shares | ||||||||||
| Issued | 671,113 | 63,370 | 668,252 | 64,244 | ||||||
| Issued in Lieu of Cash Distributions | 93,288 | 8,851 | 101,648 | 9,843 | ||||||
| Redeemed | (758,362 | ) | (72,161 | ) | (616,278 | ) | (60,024 | ) | ||
| Net Increase (Decrease)—Admiral Shares | 6,039 | 60 | 153,622 | 14,063 | ||||||
| Signal Shares | ||||||||||
| Issued | 752,037 | 71,224 | 753,648 | 72,597 | ||||||
| Issued in Lieu of Cash Distributions | 58,442 | 5,540 | 56,772 | 5,502 | ||||||
| Redeemed | (645,816 | ) | (61,600 | ) | (532,615 | ) | (51,782 | ) | ||
| Net Increase (Decrease)—Signal Shares | 164,663 | 15,164 | 277,805 | 26,317 | ||||||
| Institutional Shares | ||||||||||
| Issued | 166,484 | 15,686 | 326,022 | 31,113 | ||||||
| Issued in Lieu of Cash Distributions | 18,218 | 1,729 | 18,455 | 1,795 | ||||||
| Redeemed | (179,061 | ) | (17,140 | ) | (106,001 | ) | (10,288 | ) | ||
| Net Increase (Decrease)—Institutional Shares | 5,641 | 275 | 238,476 | 22,620 | ||||||
| ETF Shares | ||||||||||
| Issued | 637,998 | 8,200 | 451,599 | 5,900 | ||||||
| Issued in Lieu of Cash Distributions | — | — | — | — | ||||||
| Redeemed | (46,037 | ) | (600 | ) | (7,115 | ) | (100 | ) | ||
| Net Increase (Decrease)—ETF Shares | 591,961 | 7,600 | 444,484 | 5,800 | ||||||
G. In preparing the financial statements as of December 31, 2009, management considered the impact of subsequent events occurring through February 12, 2010, for potential recognition or disclosure in these financial statements.
67
Long-Term Bond Index Fund
Fund Profile
As of December 31, 2009
| Financial Attributes | |||||||
| Target | Broad | ||||||
| Fund | Index1 | Index2 | |||||
| Number of Issues | 891 | 1,241 | 8,413 | ||||
| Yield3 | 5.5 | % | 3.7 | % | |||
| Investor Shares | 5.2 | % | |||||
| Institutional Shares | 5.4 | % | |||||
| ETF Shares | 5.3 | % | |||||
| Yield to Maturity | 5.4 | %4 | 5.5 | % | 3.7 | % | |
| Average Coupon | 6.2 | % | 6.2 | % | 4.7 | % | |
| Average Effective | |||||||
| Maturity | 22.2 years | 22.6 years | 6.8 years | ||||
| Average Quality5 | Aa3/A1 | Aa3 | /A1 | Aa1/Aa2 | |||
| Average Duration | 12.1 years | 12.1 years | 4.6 years | ||||
| Expense Ratio6 | — | — | |||||
| Investor Shares | 0.22 | % | |||||
| Institutional Shares | 0.09 | % | |||||
| ETF Shares | 0.14 | % | |||||
| Short-Term Reserves | 0.4 | % | — | — | |||
| Sector Diversification7 (% of portfolio) | |||||||
| Asset-Backed/Commercial Mortgage-Backed | 0.1 | % | |||||
| Finance | 10.2 | ||||||
| Foreign | 9.2 | ||||||
| Industrial | 28.7 | ||||||
| Treasury/Agency | 43.4 | ||||||
| Utilities | 8.0 | ||||||
| Other | 0.4 | ||||||
| Volatility Measures8 | ||
| Fund Versus | Fund Versus | |
| Target Index1 | Broad Index2 | |
| R-Squared | 1.00 | 0.88 |
| Beta | 1.01 | 2.68 |
Distribution by Maturity (% of portfolio)
| Under 1 Year | 0.4 | % |
| 1–5 Years | 0.2 | |
| 5–10 Years | 2.3 | |
| 10–20 Years | 34.4 | |
| 20–30 Years | 61.0 | |
| Over 30 Years | 1.7 |
Distribution by Credit Quality5 (% of portfolio)
| Aaa | 44.9 | % |
| Aa | 8.3 | |
| A | 22.9 | |
| Baa | 23.9 |
Investment Focus

1 Barclays Capital U.S. Long Government/Credit Bond Index.
2 Barclays Capital U.S. Aggregate Bond Index.
3 30-day SEC yield for the fund; index yield assumes that all bonds are called or prepaid at the earliest possible dates. See the Glossary.
4 Before expenses.
5 Moody’s Investors Service.
6 The expense ratios shown are from the prospectuses dated April 24, 2009, and represent estimated costs for the current fiscal year based on the fund’s net assets as of the prospectus date. For the fiscal year ended December 31, 2009, the expense ratios for the Long-Term Bond Index Fund were 0.22% for Investor Shares, 0.07% for Institutional Shares, and 0.12% for ETF Shares.
7 The agency sector may include issues from government-sponsored enterprises; such issues are not backed by the full faith and credit of the U.S. government.
8 For an explanation of R-squared, beta, and other terms used here, see the Glossary.
68
Long-Term Bond Index Fund
Performance Summary
All of the returns in this report represent past performance, which is not a guarantee of future results that may be achieved by the fund. (Current performance may be lower or higher than the performance data cited. For performance data current to the most recent month-end, visit our website at www.vanguard.com/performance.) Note, too, that both investment returns and principal value can fluctuate widely, so an investor’s shares, when sold, could be worth more or less than their original cost. The returns shown do not reflect taxes that a shareholder would pay on fund distributions or on the sale of fund shares.
| Average Annual Total Returns | Final Value | |||||||
| Periods Ended December 31, 2009 | of a $10,000 | |||||||
| One Year | Five Years | Ten Years | Investment | |||||
| Long-Term Bond Index Fund Investor Shares1 | 1.76 | % | 4.97 | % | 7.71 | % | $ | 21,024 |
| Barclays Capital U.S. Aggregate Bond Index | 5.93 | 4.97 | 6.33 | 18,475 | ||||
| Barclays Capital U.S. Long | ||||||||
| Government/Credit Bond Index | 1.92 | 4.97 | 7.68 | 20,960 | ||||
| Corporate A-Rated Debt Funds Average2 | 14.69 | 3.57 | 5.29 | 16,739 | ||||
| Final Value of | ||||||
| Since | a $25,000,000 | |||||
| One Year | Inception3 | Investment | ||||
| Long-Term Bond Index Fund Institutional Shares | 1.91 | % | 5.40 | % | $ | 30,712,364 |
| Barclays Capital U.S. Aggregate Bond Index | 5.93 | 5.79 | 31,148,853 | |||
| Barclays Capital U.S. Long | ||||||
| Government/Credit Bond Index | 1.92 | 5.27 | 30,560,906 |
1 Total return figures do not reflect the account service fee that may be applicable to certain accounts with balances below $10,000.
2 Derived from data provided by Lipper Inc.; based on average returns for General Government Funds through December 31,2001, and the average returns for Corporate A-Rated Debt Funds thereafter.
3 Performance for the fund’s Institutional Shares and its comparative standards is calculated since the Institutional Shares’ inception on February 2, 2006.
See Financial Highlights for dividend and capital gains information.
69
| Long-Term Bond Index Fund | ||||||||||
| Final Value | ||||||||||
| Since | of a $10,000 | |||||||||
| One Year | Inception2 | Investment | ||||||||
| Long-Term Bond Index Fund ETF Shares Net Asset Value1 | 1.79 | % | 5.90 | % | $ | 11,704 | ||||
| Barclays Capital U.S. Aggregate Bond Index | 5.93 | 6.05 | 11,750 | |||||||
| Barclays Capital U.S. Long Government/Credit Bond Index | 1.92 | 5.78 | 11,667 | |||||||
| Cumulative Returns: ETF Shares, April 3, 2007—December 31, 2009 | ||||||||||
| Since | ||||||||||
| One Year | Inception2 | |||||||||
| Long-Term Bond Market Index Fund ETF Shares Market Price | 0.39 | % | 17.19 | % | ||||||
| Long-Term Bond Market Index Fund ETF Shares Net Asset Value | 1.79 | 17.04 | ||||||||
| Barclays Capital U.S. Long Government/Credit Bond Index | 1.92 | 16.67 | ||||||||
| Fiscal-Year Total Returns (%): December 31, 1999—December 31, 2009 | ||||||||||
| Investor Shares | Barclays3 | |||||||||
| Fiscal | Capital | Income | Total | Total | ||||||
| Year | Return | Return | Return | Return | ||||||
| 2000 | 9.1 | % | 7.5 | % | 16.6 | % | 16.2 | % | ||
| 2001 | 1.6 | 6.6 | 8.2 | 7.3 | ||||||
| 2002 | 7.8 | 6.6 | 14.4 | 14.8 | ||||||
| 2003 | 0.0 | 5.5 | 5.5 | 5.9 | ||||||
| 2004 | 2.8 | 5.6 | 8.4 | 8.6 | ||||||
| 2005 | 0.2 | 5.1 | 5.3 | 5.3 | ||||||
| 2006 | –2.6 | 5.3 | 2.7 | 2.7 | ||||||
| 2007 | 1.0 | 5.6 | 6.6 | 6.6 | ||||||
| 2008 | 2.8 | 5.8 | 8.6 | 8.4 | ||||||
| 2009 | –3.5 | 5.3 | 1.8 | 1.9 | ||||||
1 For more information about how the ETF Shares’ market prices have compared with their net asset value, visit www.vanguard.com, select your ETF, and then select the Performance tab. The Premium/Discount table there shows the percentages of days on which the ETF Shares’ market price was above or below the NAV.
2 Performance for the fund’s ETF Shares and its comparative standards is calculated since the ETF Shares’ inception on April 3, 2007.
3 Barclays Capital U.S. Long Government/Credit Bond Index.
70
Long-Term Bond Index Fund
Financial Statements
Statement of Net Assets—Investments Summary
As of December 31, 2009
This Statement summarizes the fund’s holdings by asset type. Details are reported for each of the fund’s 50 largest individual holdings and for investments that, in total for any issuer, represent more than 1% of the fund’s net assets. The total value of smaller holdings is reported as a single amount within each category.
The fund reports a complete list of its holdings in regulatory filings four times in each fiscal year, at the quarter-ends. For the second and fourth fiscal quarters, the complete listing of the fund’s holdings is available electronically on Vanguard.com and on the Securities and Exchange Commission’s website (www.sec.gov), or you can have it mailed to you without charge by calling 800-662-7447. For the first and third fiscal quarters, the fund files the lists with the SEC on Form N-Q. Shareholders can look up the fund’s Forms N-Q on the SEC’s website. Forms N-Q may also be reviewed and copied at the SEC’s Public Reference Room (see the back cover of this report for further information).
| Face | Market | Percentage | |||||||||||
| Maturity | Amount | Value• | of Net | ||||||||||
| Coupon | Date | ($ | 000 | ) | ($ | 000 | ) | Assets | |||||
| U.S. Government and Agency Obligations | |||||||||||||
| U.S. Government Securities | |||||||||||||
| United States Treasury Note/Bond | 8.000 | % | 11/15/21 | 90,495 | 123,271 | 4.3 | % | ||||||
| United States Treasury Note/Bond | 6.250 | % | 8/15/23 | 81,805 | 97,744 | 3.4 | % | ||||||
| United States Treasury Note/Bond | 4.250 | % | 5/15/39 | 101,853 | 95,614 | 3.3 | % | ||||||
| United States Treasury Note/Bond | 4.500 | % | 8/15/39 | 87,821 | 85,914 | 3.0 | % | ||||||
| United States Treasury Note/Bond | 7.125 | % | 2/15/23 | 60,935 | 78,187 | 2.7 | % | ||||||
| United States Treasury Note/Bond | 4.500 | % | 5/15/38 | 69,685 | 68,302 | 2.4 | % | ||||||
| United States Treasury Note/Bond | 5.000 | % | 5/15/37 | 52,325 | 55,612 | 1.9 | % | ||||||
| United States Treasury Note/Bond | 3.500 | % | 2/15/39 | 65,783 | 53,942 | 1.9 | % | ||||||
| United States Treasury Note/Bond | 4.375 | % | 2/15/38 | 55,848 | 53,657 | 1.9 | % | ||||||
| United States Treasury Note/Bond | 5.375 | % | 2/15/31 | 47,370 | 52,374 | 1.8 | % | ||||||
| United States Treasury Note/Bond | 7.625 | % | 11/15/22 | 37,240 | 49,686 | 1.7 | % | ||||||
| United States Treasury Note/Bond | 6.375 | % | 8/15/27 | 39,085 | 47,739 | 1.7 | % | ||||||
| United States Treasury Note/Bond | 6.125 | % | 8/15/29 | 37,805 | 45,407 | 1.6 | % | ||||||
| United States Treasury Note/Bond | 6.625 | % | 2/15/27 | 31,355 | 39,169 | 1.4 | % | ||||||
| United States Treasury Note/Bond | 7.500 | % | 11/15/24 | 25,350 | 33,906 | 1.2 | % | ||||||
| United States Treasury Note/Bond | 3.375 | % | 11/15/19 | 23,236 | 22,361 | 0.8 | % | ||||||
| United States Treasury Note/Bond | 8.125 | % | 8/15/21 | 15,885 | 21,795 | 0.8 | % | ||||||
| United States Treasury Note/Bond | 5.500 | % | 8/15/28 | 12,755 | 14,220 | 0.5 | % | ||||||
| United States Treasury Note/Bond | 6.125 | % | 11/15/27 | 10,450 | 12,452 | 0.4 | % | ||||||
| United States Treasury Note/Bond | 8.750 | % | 8/15/20 | 7,205 | 10,195 | 0.3 | % | ||||||
| United States Treasury | |||||||||||||
| Note/Bond | 1.125%–8.500% | 2/15/10–11/15/39 | 23,985 | 26,172 | 0.9 | % | |||||||
| 1,087,719 | 37.9 | % | |||||||||||
| Agency Bonds and Notes | |||||||||||||
| 1 | Federal Home Loan Mortgage Corp. | 6.750 | % | 3/15/31 | 12,125 | 14,850 | 0.5 | % | |||||
| 1 | Federal Home Loan Mortgage Corp. | 6.750 | % | 9/15/29 | 7,700 | 9,250 | 0.3 | % | |||||
| 1 | Federal Home Loan Mortgage Corp. | 6.250 | % | 7/15/32 | 4,525 | 5,267 | 0.2 | % | |||||
| 1 | Federal National Mortgage Assn. | 7.125 | % | 1/15/30 | 12,075 | 15,271 | 0.5 | % | |||||
| 1 | Federal National Mortgage Assn. | 6.250 | % | 5/15/29 | 8,300 | 9,560 | 0.3 | % | |||||
| 1 | Federal National Mortgage Assn. | 7.250 | % | 5/15/30 | 6,635 | 8,503 | 0.3 | % | |||||
71
| Long-Term Bond Index Fund | ||||||||||||
| Face | Market | Percentage | ||||||||||
| Maturity | Amount | Value• | of Net | |||||||||
| Coupon | Date | ($ | 000 | ) | ($ | 000 | ) | Assets | ||||
| 1 Federal National Mortgage Assn. | 5.625 | % | 7/15/37 | 7,325 | 7,717 | 0.3 | % | |||||
| 1 Federal National | ||||||||||||
| Mortgage Assn. | 6.210%–6.625 | % | 11/15/30–8/6/38 | 4,300 | 5,097 | 0.2 | % | |||||
| Agency Bonds and Notes—Other † | 43,564 | 1.5 | % | |||||||||
| 119,079 | 4.1 | % | ||||||||||
| Total U.S. Government and Agency Obligations (Cost $1,221,654) | 1,206,798 | 42.0 | % | |||||||||
| Asset-Backed/Commercial Mortgage-Backed Securities (Cost $2,500) † | 2,905 | 0.1 | % | |||||||||
| Corporate Bonds | ||||||||||||
| Finance | ||||||||||||
| Banking | ||||||||||||
| Goldman Sachs Group Inc. | 6.750 | % | 10/1/37 | 11,025 | 11,255 | 0.4 | % | |||||
| 2 Banking—Other † | 162,738 | 5.7 | % | |||||||||
| Brokerage † | 2,371 | 0.1 | % | |||||||||
| Finance Companies | ||||||||||||
| General Electric Capital Corp. | 6.750 | % | 3/15/32 | 19,675 | 20,048 | 0.7 | % | |||||
| General Electric Capital Corp. | 5.875 | % | 1/14/38 | 9,925 | 9,207 | 0.3 | % | |||||
| General Electric Capital Corp. | 6.150%–6.875 | % | 8/7/37–1/10/39 | 11,125 | 11,006 | 0.3 | % | |||||
| Finance Companies—Other † | 1,483 | 0.1 | % | |||||||||
| Insurance † | 72,918 | 2.5 | % | |||||||||
| 291,026 | 10.1 | % | ||||||||||
| Industrial | ||||||||||||
| Basic Industry † | 54,221 | 1.9 | % | |||||||||
| 2 Capital Goods † | 57,832 | 2.0 | % | |||||||||
| Communication | ||||||||||||
| Alltel Corp. | 7.875 | % | 7/1/32 | 3,025 | 3,641 | 0.1 | % | |||||
| Ameritech Capital Funding Corp. | 6.550 | % | 1/15/28 | 1,000 | 971 | 0.0 | % | |||||
| AT&T Corp. | 8.000 | % | 11/15/31 | 4,350 | 5,319 | 0.2 | % | |||||
| AT&T Inc. | 6.450 | % | 6/15/34 | 7,750 | 7,957 | 0.3 | % | |||||
| AT&T Inc. | 6.550 | % | 2/15/39 | 6,600 | 6,969 | 0.2 | % | |||||
| AT&T Inc. | 6.300%–6.500% | 9/1/37–5/15/38 | 10,225 | 10,483 | 0.4 | % | ||||||
| AT&T Mobility LLC | 7.125 | % | 12/15/31 | 2,425 | 2,728 | 0.1 | % | |||||
| Bellsouth Capital Funding Corp. | 7.875 | % | 2/15/30 | 4,250 | 4,830 | 0.2 | % | |||||
| BellSouth Corp. | 6.000%–6.875 | % | 10/15/31–11/15/34 | 4,230 | 4,230 | 0.2 | % | |||||
| BellSouth Telecommunications Inc. | 6.375 | % | 6/1/28 | 4,140 | 4,113 | 0.1 | % | |||||
| Comcast Corp. | 6.500 | % | 11/15/35 | 7,025 | 7,262 | 0.3 | % | |||||
| Deutsche Telekom | ||||||||||||
| International Finance BV | 8.750 | % | 6/15/30 | 8,825 | 11,442 | 0.4 | % | |||||
| France Telecom SA | 8.500 | % | 3/1/31 | 5,550 | 7,374 | 0.3 | % | |||||
| GTE Corp. | 6.940%–8.750 | % | 11/1/21–4/15/28 | 3,175 | 3,477 | 0.1 | % | |||||
| New Cingular Wireless Services Inc. | 8.750 | % | 3/1/31 | 4,875 | 6,304 | 0.2 | % | |||||
| Pacific Bell Telephone Co. | 7.125 | % | 3/15/26 | 550 | 605 | 0.0 | % | |||||
| Verizon Communications Inc. | 5.850%–8.950 | % | 9/15/35–4/1/39 | 15,950 | 17,433 | 0.6 | % | |||||
| Verizon Global Funding Corp. | 7.750 | % | 12/1/30 | 6,825 | 8,068 | 0.3 | % | |||||
| Verizon Maryland Inc. | 5.125 | % | 6/15/33 | 500 | 390 | 0.0 | % | |||||
| Verizon New England Inc. | 7.875 | % | 11/15/29 | 400 | 436 | 0.0 | % | |||||
| Verizon New York Inc. | 7.375 | % | 4/1/32 | 650 | 686 | 0.0 | % | |||||
| 2 Communication—Other † | 108,781 | 3.8 | % | |||||||||
| Consumer Cyclical | ||||||||||||
| Historic TW Inc. | 6.625 | % | 5/15/29 | 6,975 | 7,318 | 0.2 | % | |||||
| Consumer Cyclical—Other † | 85,378 | 3.0 | % | |||||||||
| Consumer Noncyclical | ||||||||||||
| AstraZeneca PLC | 6.450 | % | 9/15/37 | 6,750 | 7,567 | 0.2 | % | |||||
| Pfizer Inc. | 7.200 | % | 3/15/39 | 6,275 | 7,725 | 0.3 | % | |||||
| 2 Consumer Noncyclical—Other † | 163,129 | 5.7 | % | |||||||||
72
| Long-Term Bond Index Fund | ||||||||||||
| Face | Market | Percentage | ||||||||||
| Maturity | Amount | Value• | of Net | |||||||||
| Coupon | Date | ($ | 000 | ) | ($ | 000 | ) | Assets | ||||
| Energy | ||||||||||||
| Tosco Corp. | 8.125 | % | 2/15/30 | 7,500 | 9,111 | 0.3 | % | |||||
| 2 Energy—Other † | 125,536 | 4.4 | % | |||||||||
| Technology † | 38,419 | 1.4 | % | |||||||||
| Transportation † | 40,549 | 1.4 | % | |||||||||
| 820,284 | 28.6 | % | ||||||||||
| Utilities | ||||||||||||
| Electric | ||||||||||||
| Midamerican Energy Holdings Co. | 6.125 | % | 4/1/36 | 7,475 | 7,612 | 0.3 | % | |||||
| Pacific Gas & Electric Co. | 6.050 | % | 3/1/34 | 7,875 | 8,249 | 0.3 | % | |||||
| 2 Electric—Other † | 153,678 | 5.3 | % | |||||||||
| Natural Gas † | 56,888 | 2.0 | % | |||||||||
| Other Utility † | 1,904 | 0.1 | % | |||||||||
| 228,331 | 8.0 | % | ||||||||||
| Total Corporate Bonds (Cost $1,305,019) | 1,339,641 | 46.7 | % | |||||||||
| Sovereign Bonds (U.S. Dollar-Denominated) | ||||||||||||
| Brazilian Government | ||||||||||||
| International Bond | 11.000 | % | 8/17/40 | 9,900 | 13,192 | 0.5 | % | |||||
| Brazilian Government | ||||||||||||
| International Bond | 8.750 | % | 2/4/25 | 8,500 | 10,965 | 0.4 | % | |||||
| Brazilian Government | ||||||||||||
| International Bond | 10.125 | % | 5/15/27 | 6,700 | 9,832 | 0.3 | % | |||||
| Brazilian Government | ||||||||||||
| International Bond | 7.125 | % | 1/20/37 | 6,850 | 7,842 | 0.3 | % | |||||
| Brazilian Government | ||||||||||||
| International Bond | 8.250 | % | 1/20/34 | 5,675 | 7,221 | 0.2 | % | |||||
| Brazilian Government | ||||||||||||
| International Bond | 5.625%–8.875 | % | 4/15/24–1/7/41 | 5,150 | 5,901 | 0.2 | % | |||||
| Italian Republic | 6.875 | % | 9/27/23 | 6,600 | 7,451 | 0.3 | % | |||||
| Mexico Government | ||||||||||||
| International Bond | 6.750 | % | 9/27/34 | 12,500 | 13,247 | 0.5 | % | |||||
| Mexico Government | ||||||||||||
| International Bond | 8.125 | % | 12/30/19 | 5,750 | 7,026 | 0.2 | % | |||||
| Mexico Government | ||||||||||||
| International Bond | 8.300 | % | 8/15/31 | 1,325 | 1,639 | 0.1 | % | |||||
| Pemex Project Funding Master Trust | 6.625 | % | 6/15/35–6/15/38 | 5,275 | 4,979 | 0.2 | % | |||||
| Petrobras International | ||||||||||||
| Finance Co. | 5.750%–6.875 | % | 1/20/20–1/20/40 | 8,425 | 8,540 | 0.3 | % | |||||
| United Mexican States | 6.050 | % | 1/11/40 | 4,400 | 4,230 | 0.1 | % | |||||
| Sovereign Bonds (U.S. Dollar-Denominated)—Other † | 63,455 | 2.2 | % | |||||||||
| Total Sovereign Bonds (Cost $165,505) | 165,520 | 5.8 | % | |||||||||
| Taxable Municipal Bonds | ||||||||||||
| Illinois GO | 5.100 | % | 6/1/33 | 18,125 | 15,150 | 0.5 | % | |||||
| Taxable Municipal Bonds—Other † | 94,119 | 3.3 | % | |||||||||
| Total Taxable Municipal Bonds (Cost $113,728) | 109,269 | 3.8 | % | |||||||||
73
| Long-Term Bond Index Fund | |||||||||
| Market | Percentage | ||||||||
| Value• | of Net | ||||||||
| Coupon | Shares | ($ | 000 | ) | Assets | ||||
| Temporary Cash Investment | |||||||||
| Money Market Fund | |||||||||
| 3 Vanguard Market | |||||||||
| Liquidity Fund (Cost $32,005) | 0.187 | % | 32,005,393 | 32,005 | 1.1 | % | |||
| Total Investments (Cost $2,840,411) | 2,856,138 | 99.5 | % | ||||||
| Other Assets and Liabilities | |||||||||
| Other Assets | 51,525 | 1.8 | % | ||||||
| Liabilities | (37,885 | ) | (1.3 | %) | |||||
| 13,640 | 0.5 | % | |||||||
| Net Assets | 2,869,778 | 100.0 | % | ||||||
| At December 31, 2009, net assets consisted of: | |||||||||
| Amount | |||||||||
| ($ | 000 | ) | |||||||
| Paid-in Capital | 2,860,566 | ||||||||
| Undistributed Net Investment Income | — | ||||||||
| Accumulated Net Realized Losses | (6,515 | ) | |||||||
| Unrealized Appreciation (Depreciation) | 15,727 | ||||||||
| Net Assets | 2,869,778 | ||||||||
| Investor Shares—Net Assets | |||||||||
| Applicable to 177,314,400 outstanding $.001 par value shares of | |||||||||
| beneficial interest (unlimited authorization) | 2,049,139 | ||||||||
| Net Asset Value Per Share—Investor Shares | $ | 11.56 | |||||||
| Institutional Shares—Net Assets | |||||||||
| Applicable to 44,080,814 outstanding $.001 par value shares of | |||||||||
| beneficial interest (unlimited authorization) | 509,421 | ||||||||
| Net Asset Value Per Share—Institutional Shares | $ | 11.56 | |||||||
| ETF Shares—Net Assets | |||||||||
| Applicable to 4,100,000 outstanding $.001 par value shares of | |||||||||
| beneficial interest (unlimited authorization) | 311,218 | ||||||||
| Net Asset Value Per Share—ETF Shares | $ | 75.91 | |||||||
• See Note A in Notes to Financial Statements.
† Represents the aggregate value, by category, of securities that are not among the 50 largest holdings and, in total for any issuer, represent 1% or less of net assets.
1 The issuer operates under a congressional charter; its securities are not backed by the full faith and credit of the U.S. government.
2 Certain of the fund's securities are exempt from registration under Rule 144A of the Securities Act of 1933. Such securities may be sold in transactions exempt from registration, normally to qualified institutional buyers. At December 31, 2009, the aggregate value of these securities was $18,926,000, representing 0.7% of net assets.
3 Affiliated money market fund available only to Vanguard funds and certain trusts and accounts managed by Vanguard. Rate shown is the 7-day yield.
GO—General Obligation Bond.
See accompanying Notes, which are an integral part of the Financial Statements.
74
| Long-Term Bond Index Fund | |||
| Statement of Operations | |||
| Year Ended | |||
| December 31, 2009 | |||
| ($ | 000 | ) | |
| Investment Income | |||
| Income | |||
| Interest1 | 154,697 | ||
| Security Lending | 4 | ||
| Total Income | 154,701 | ||
| Expenses | |||
| The Vanguard Group—Note B | |||
| Investment Advisory Services | 257 | ||
| Management and Administrative—Investor Shares | 3,814 | ||
| Management and Administrative—Institutional Shares | 128 | ||
| Management and Administrative—ETF Shares | 128 | ||
| Marketing and Distribution—Investor Shares | 566 | ||
| Marketing and Distribution—Institutional Shares | 113 | ||
| Marketing and Distribution—ETF Shares | 47 | ||
| Custodian Fees | 65 | ||
| Auditing Fees | 20 | ||
| Shareholders' Reports and Proxies—Investor Shares | 146 | ||
| Shareholders' Reports and Proxies—Institutional Shares | — | ||
| Shareholders' Reports and Proxies—ETF Shares | 14 | ||
| Trustees' Fees and Expenses | 5 | ||
| Total Expenses | 5,303 | ||
| Net Investment Income | 149,398 | ||
| Realized Net Gain (Loss) on Investment Securities Sold | 10,368 | ||
| Change in Unrealized Appreciation (Depreciation) of Investment Securities | (134,448 | ) | |
| Net Increase (Decrease) in Net Assets Resulting from Operations | 25,318 | ||
| 1 Interest income from an affiliated company of the fund was $123,000. | |||
| See accompanying Notes, which are an integral part of the Financial Statements. | |||
75
| Long-Term Bond Index Fund | ||||||
| Statement of Changes in Net Assets | ||||||
| Year Ended December 31, | ||||||
| 2009 | 2008 | |||||
| ($ | 000 | ) | ($ | 000 | ) | |
| Increase (Decrease) in Net Assets | ||||||
| Operations | ||||||
| Net Investment Income | 149,398 | 154,878 | ||||
| Realized Net Gain (Loss) | 10,368 | 911 | ||||
| Change in Unrealized Appreciation (Depreciation) | (134,448 | ) | 80,786 | |||
| Net Increase (Decrease) in Net Assets Resulting from Operations | 25,318 | 236,575 | ||||
| Distributions | ||||||
| Net Investment Income | ||||||
| Investor Shares | (116,480 | ) | (126,834 | ) | ||
| Institutional Shares | (23,007 | ) | (22,249 | ) | ||
| ETF Shares | (9,911 | ) | (5,795 | ) | ||
| Realized Capital Gain | ||||||
| Investor Shares | — | — | ||||
| Institutional Shares | — | — | ||||
| ETF Shares | — | — | ||||
| Total Distributions | (149,398 | ) | (154,878 | ) | ||
| Capital Share Transactions | ||||||
| Investor Shares | (368,882 | ) | 171,319 | |||
| Institutional Shares | 133,570 | (32,056 | ) | |||
| ETF Shares | 173,643 | 58,839 | ||||
| Net Increase (Decrease) from Capital Share Transactions | (61,669 | ) | 198,102 | |||
| Total Increase (Decrease) | (185,749 | ) | 279,799 | |||
| Net Assets | ||||||
| Beginning of Period | 3,055,527 | 2,775,728 | ||||
| End of Period | 2,869,778 | 3,055,527 | ||||
See accompanying Notes, which are an integral part of the Financial Statements.
76
| Long-Term Bond Index Fund | |||||||||||||||
| Financial Highlights | |||||||||||||||
| Investor Shares | |||||||||||||||
| For a Share Outstanding | Year Ended December 31, | ||||||||||||||
| Throughout Each Period | 2009 | 2008 | 2007 | 2006 | 2005 | ||||||||||
| Net Asset Value, Beginning of Period | $ | 11.98 | $ | 11.65 | $ | 11.53 | $ | 11.84 | $ | 11.82 | |||||
| Investment Operations | |||||||||||||||
| Net Investment Income | .608 | .618 | .613 | .603 | .601 | ||||||||||
| Net Realized and Unrealized Gain (Loss) | |||||||||||||||
| on Investments | (.420 | ) | .330 | .120 | (.310 | ) | .020 | ||||||||
| Total from Investment Operations | .188 | .948 | .733 | .293 | .621 | ||||||||||
| Distributions | |||||||||||||||
| Dividends from Net Investment Income | (.608 | ) | (.618 | ) | (.613 | ) | (.603 | ) | (.601 | ) | |||||
| Distributions from Realized Capital Gains | — | — | — | — | — | ||||||||||
| Total Distributions | (.608 | ) | (.618 | ) | (.613 | ) | (.603 | ) | (.601 | ) | |||||
| Net Asset Value, End of Period | $ | 11.56 | $ | 11.98 | $ | 11.65 | $ | 11.53 | $ | 11.84 | |||||
| Total Return1 | 1.76 | % | 8.64 | % | 6.59 | % | 2.67 | % | 5.32 | % | |||||
| Ratios/Supplemental Data | |||||||||||||||
| Net Assets, End of Period (Millions) | $ | 2,049 | $ | 2,518 | $ | 2,277 | $ | 1,898 | $ | 1,893 | |||||
| Ratio of Total Expenses | |||||||||||||||
| to Average Net Assets | 0.22 | % | 0.19 | % | 0.18 | % | 0.18 | % | 0.18 | % | |||||
| Ratio of Net Investment Income to | |||||||||||||||
| Average Net Assets | 5.33 | % | 5.49 | % | 5.34 | % | 5.30 | % | 5.03 | % | |||||
| Portfolio Turnover Rate2 | 69 | % | 67 | % | 62 | % | 55 | % | 52 | % | |||||
| 1 | Total returns do not include the account service fee that may be applicable to certain accounts with balances below $10,000. |
| 2 | Excludes the value of portfolio securities received or delivered as a result of in-kind purchases or redemptions of the fund’s capital shares, including ETF Creation Units. |
See accompanying Notes, which are an integral part of the Financial Statements.
77
| Long-Term Bond Index Fund | ||||||||||||
| Financial Highlights | ||||||||||||
| Institutional Shares | ||||||||||||
| Feb. 2, | ||||||||||||
| 20061 to | ||||||||||||
| Year Ended December 31, | Dec. 31, | |||||||||||
| For a Share Outstanding Throughout Each Period | 2009 | 2008 | 2007 | 2006 | ||||||||
| Net Asset Value, Beginning of Period | $ | 11.98 | $ | 11.65 | $ | 11.53 | $ | 11.66 | ||||
| Investment Operations | ||||||||||||
| Net Investment Income | .625 | .632 | .626 | .559 | ||||||||
| Net Realized and Unrealized Gain (Loss) on Investments | (.420 | ) | .330 | .120 | (.130 | ) | ||||||
| Total from Investment Operations | .205 | .962 | .746 | .429 | ||||||||
| Distributions | ||||||||||||
| Dividends from Net Investment Income | (.625 | ) | (.632 | ) | (.626 | ) | (.559 | ) | ||||
| Distributions from Realized Capital Gains | — | — | — | — | ||||||||
| Total Distributions | (.625 | ) | (.632 | ) | (.626 | ) | (.559 | ) | ||||
| Net Asset Value, End of Period | $ | 11.56 | $ | 11.98 | $ | 11.65 | $ | 11.53 | ||||
| Total Return | 1.91 | % | 8.77 | % | 6.71 | % | 3.86 | % | ||||
| Ratios/Supplemental Data | ||||||||||||
| Net Assets, End of Period (Millions) | $ | 509 | $ | 388 | $ | 415 | $ | 309 | ||||
| Ratio of Total Expenses to Average Net Assets | 0.07 | % | 0.07 | % | 0.07 | % | 0.08 | %2 | ||||
| Ratio of Net Investment Income to Average Net Assets | 5.48 | % | 5.61 | % | 5.45 | % | 5.40 | %2 | ||||
| Portfolio Turnover Rate3 | 69 | % | 67 | % | 62 | % | 55 | % | ||||
| 1 | Inception. |
| 2 | Annualized. |
| 3 | Excludes the value of portfolio securities received or delivered as a result of in-kind purchases or redemptions of the fund’s capital shares, including ETF Creation Units. |
See accompanying Notes, which are an integral part of the Financial Statements.
78
| Long-Term Bond Index Fund | |||||||||
| Financial Highlights | |||||||||
| ETF Shares | |||||||||
| April 3, | |||||||||
| Year Ended | 20071 to | ||||||||
| December 31, | Dec. 31, | ||||||||
| For a Share Outstanding Throughout Each Period | 2009 | 2008 | 2007 | ||||||
| Net Asset Value, Beginning of Period | $ | 78.66 | $ | 76.38 | $ | 74.90 | |||
| Investment Operations | |||||||||
| Net Investment Income | 4.005 | 4.004 | 2.740 | ||||||
| Net Realized and Unrealized Gain (Loss) on Investments | (2.750 | ) | 2.280 | 1.480 | |||||
| Total from Investment Operations | 1.255 | 6.284 | 4.220 | ||||||
| Distributions | |||||||||
| Dividends from Net Investment Income | (4.005 | ) | (4.004 | ) | (2.740 | ) | |||
| Distributions from Realized Capital Gains | — | — | — | ||||||
| Total Distributions | (4.005 | ) | (4.004 | ) | (2.740 | ) | |||
| Net Asset Value, End of Period | $ | 75.91 | $ | 78.66 | $ | 76.38 | |||
| Total Return | 1.79 | % | 8.70 | % | 5.77 | % | |||
| Ratios/Supplemental Data | |||||||||
| Net Assets, End of Period (Millions) | $ | 311 | $ | 149 | $ | 84 | |||
| Ratio of Total Expenses to Average Net Assets | 0.12 | % | 0.10 | % | 0.11 | %2 | |||
| Ratio of Net Investment Income to Average Net Assets | 5.43 | % | 5.58 | % | 5.41 | %2 | |||
| Portfolio Turnover Rate3 | 69 | % | 67 | % | 62 | % | |||
| 1 | Inception. |
| 2 | Annualized. |
| 3 | Excludes the value of portfolio securities received or delivered as a result of in-kind purchases or redemptions of the fund’s capital shares, including ETF Creation Units. |
See accompanying Notes, which are an integral part of the Financial Statements.
79
Long-Term Bond Index Fund
Notes to Financial Statements
Vanguard Long-Term Bond Index Fund is registered under the Investment Company Act of 1940 as an open-end investment company, or mutual fund. Certain of the fund’s investments are in corporate debt instruments; the issuers’ abilities to meet their obligations may be affected by economic developments in their respective industries. The fund offers three classes of shares: Investor Shares, Institutional Shares, and ETF Shares. Investor Shares are available to any investor who meets the fund’s minimum purchase requirements. Institutional Shares are designed for investors who meet certain administrative and service criteria and invest a minimum of $25 million. ETF Shares are listed for trading on the NYSE Arca, Inc.; they can be purchased and sold through a broker.
A. The following significant accounting policies conform to generally accepted accounting principles for U.S. mutual funds. The fund consistently follows such policies in preparing its financial statements.
1. Security Valuation: Bonds, and temporary cash investments acquired over 60 days to maturity, are valued using the latest bid prices or using valuations based on a matrix system (which considers such factors as security prices, yields, maturities, and ratings), both as furnished by independent pricing services. Investments in Vanguard Market Liquidity Fund are valued at that fund’s net asset value. Other temporary cash investments are valued at amortized cost, which approximates market value. Securities for which market quotations are not readily available, or whose values have been affected by events occurring before the fund’s pricing time but after the close of the securities’ primary markets, are valued by methods deemed by the board of trustees to represent fair value.
2. Federal Income Taxes: The fund intends to continue to qualify as a regulated investment company and distribute all of its taxable income. Management has analyzed the fund’s tax positions taken for all open federal income tax years (December 31, 2006–2009), and has concluded that no provision for federal income tax is required in the fund’s financial statements.
3. Distributions: Distributions from net investment income are declared daily by all share classes except ETF Shares, and paid on the first business day of the following month. Monthly income dividends from ETF Shares, and annual distributions from realized capital gains, if any, are recorded on the ex-dividend date.
4. Security Lending: The fund may lend its securities to qualified institutional borrowers to earn additional income. Security loans are required to be secured at all times by collateral at least equal to the market value of securities loaned. The fund invests cash collateral received in Vanguard Market Liquidity Fund, and records a liability for the return of the collateral, during the period the securities are on loan. Security lending income represents the income earned on investing cash collateral, less expenses associated with the loan.
5. Other: Interest income includes income distributions received from Vanguard Market Liquidity Fund and is accrued daily. Premiums and discounts on debt securities purchased are amortized and accreted, respectively, to interest income over the lives of the respective securities. Security transactions are accounted for on the date securities are bought or sold. Costs used to determine realized gains (losses) on the sale of investment securities are those of the specific securities sold.
Each class of shares has equal rights as to assets and earnings, except that each class separately bears certain class-specific expenses related to maintenance of shareholder accounts (included in Management and Administrative expenses), shareholder reporting, and proxies. Marketing and distribution expenses are allocated to each class of shares based on a method approved by the board of trustees. Income, other non-class-specific expenses, and gains and losses on investments are allocated to each class of shares based on its relative net assets.
80
Long-Term Bond Index Fund
B. The Vanguard Group furnishes at cost investment advisory, corporate management, administrative, marketing, and distribution services. The costs of such services are allocated to the fund under methods approved by the board of trustees. The fund has committed to provide up to 0.40% of its net assets in capital contributions to Vanguard. At December 31, 2009, the fund had contributed capital of $594,000 to Vanguard (included in Other Assets), representing 0.02% of the fund’s net assets and 0.24% of Vanguard’s capitalization. The fund’s trustees and officers are also directors and officers of Vanguard.
C. Various inputs may be used to determine the value of the fund’s investments. These inputs are summarized in three broad levels for financial statement purposes. The inputs or methodologies used to value securities are not necessarily an indication of the risk associated with investing in those securities.
Level 1—Quoted prices in active markets for identical securities.
Level 2—Other significant observable inputs (including quoted prices for similar securities, interest rates, prepayment speeds, credit risk, etc.).
Level 3—Significant unobservable inputs (including the fund’s own assumptions used to determine the fair value of investments).
The following table summarizes the fund’s investments as of December 31, 2009, based on the inputs used to value them:
| Level 1 | Level 2 | Level 3 | |||||||
| Investments | ($ | 000 | ) | ($ | 000 | ) | ($ | 000 | ) |
| U.S. Government and Agency Obligations | — | 1,206,798 | — | ||||||
| Asset-Backed/Commercial Mortgage-Backed Securities | — | 2,905 | — | ||||||
| Corporate Bonds | — | 1,339,641 | — | ||||||
| Sovereign Bonds | — | 165,520 | — | ||||||
| Taxable Municipal Bonds | — | 109,269 | — | ||||||
| Temporary Cash Investments | 32,005 | — | — | ||||||
| Total | 32,005 | 2,824,133 | — |
D. Capital gain distributions are determined on a tax basis and may differ from realized capital gains for financial reporting purposes. Differences may be permanent or temporary. Permanent differences are reclassified among capital accounts in the financial statements to reflect their tax character. Temporary differences arise when gains or losses are recognized in different periods for financial statement and tax purposes; these differences will reverse at some time in the future.
During the year ended December 31, 2009, the fund realized $3,913,000 of net capital gains resulting from in-kind redemptions—in which shareholders exchanged fund shares for securities held by the fund rather than for cash. Because such gains are not taxable to the fund, and are not distributed to shareholders, they have been reclassified from accumulated net realized losses to paid-in capital.
For tax purposes, at December 31, 2009, the fund had available capital loss carryforwards totaling $5,703,000 to offset future net capital gains through December 31, 2014.
81
Long-Term Bond Index Fund
At December 31, 2009, the cost of investment securities for tax purposes was $2,841,223,000. Net unrealized appreciation of investment securities for tax purposes was $14,915,000, consisting of unrealized gains of $93,157,000 on securities that had risen in value since their purchase and $78,242,000 in unrealized losses on securities that had fallen in value since their purchase.
E. During the year ended December 31, 2009, the fund purchased $588,540,000 of investment securities and sold $505,713,000 of investment securities, other than U.S. government securities and temporary cash investments. Purchases and sales of U.S. government securities were $1,476,290,000 and $1,581,974,000, respectively.
| F. Capital share transactions for each class of shares were: | ||||||||||
| Year Ended December 31, | ||||||||||
| 2009 | 2008 | |||||||||
| Amount | Shares | Amount | Shares | |||||||
| ($ | 000 | ) | (000 | ) | ($ | 000 | ) | (000 | ) | |
| Investor Shares | ||||||||||
| Issued | 472,981 | 41,195 | 695,857 | 61,565 | ||||||
| Issued in Lieu of Cash Distributions | 99,551 | 8,728 | 111,322 | 9,918 | ||||||
| Redeemed | (941,414 | ) | (82,720 | ) | (635,860 | ) | (56,733 | ) | ||
| Net Increase (Decrease)—Investor Shares | (368,882 | ) | (32,797 | ) | 171,319 | 14,750 | ||||
| Institutional Shares | ||||||||||
| Issued | 178,284 | 15,672 | 159,587 | 13,869 | ||||||
| Issued in Lieu of Cash Distributions | 18,631 | 1,625 | 20,843 | 1,854 | ||||||
| Redeemed | (63,345 | ) | (5,589 | ) | (212,486 | ) | (18,950 | ) | ||
| Net Increase (Decrease)—Institutional Shares | 133,570 | 11,708 | (32,056 | ) | (3,227 | ) | ||||
| ETF Shares | ||||||||||
| Issued | 203,678 | 2,600 | 58,839 | 800 | ||||||
| Issued in Lieu of Cash Distributions | — | — | — | — | ||||||
| Redeemed | (30,035 | ) | (400 | ) | — | — | ||||
| Net Increase (Decrease)—ETF Shares | 173,643 | 2,200 | 58,839 | 800 | ||||||
G. In preparing the financial statements as of December 31, 2009, management considered the impact of subsequent events occurring through February 12, 2010, for potential recognition or disclosure in these financial statements.
82
Report of Independent Registered Public Accounting Firm
To the Trustees of Vanguard Bond Index Funds and the Shareholders of Vanguard Total Bond Market Index Fund, Vanguard Short-Term Bond Index Fund, Vanguard Intermediate-Term Bond Index Fund and Vanguard Long-Term Bond Index Fund:
In our opinion, the accompanying statements of net assets–investments summary, and the related statements of operations and of changes in net assets and the financial highlights present fairly, in all material respects, the financial position of Vanguard Total Bond Market Index Fund, Vanguard Short-Term Bond Index Fund, Vanguard Intermediate-Term Bond Index Fund and Vanguard Long-Term Bond Index Fund (constituting separate portfolios of Vanguard Bond Index Funds, hereafter referred to as the “Funds”) at December 31, 2009, the results of each of their operations for the year then ended, the changes in each of their net assets for each of the two years for the period then ended and the financial highlights for each of the periods indicated, in conformity with accounting principles generally accepted in the United States of America. These financial statements and financial highlights (hereafter referred to as & #147;financial statements”) are the responsibility of the Funds’ management; our responsibility is to express an opinion on these financial statements based on our audits. We conducted our audits of these financial statements in accordance with the standards of the Public Company Accounting Oversight Board (United States). Those standards require that we plan and perform the audit to obtain reasonable assurance about whether the financial statements are free of material misstatement. An audit includes examining, on a test basis, evidence supporting the amounts and disclosures in the financial statements, assessing the accounting principles used and significant estimates made by management, and evaluating the overall financial statement presentation.
We believe that our audits, which included confirmation of securities at December 31, 2009 by correspondence with the custodian and brokers and by agreement to the underlying ownership records of Vanguard Market Liquidity Fund, provide a reasonable basis for our opinion.
PricewaterhouseCoopers LLP
Philadelphia, Pennsylvania
February 12, 2010
83
Special 2009 tax information (unaudited) for Vanguard Total Bond Market Index Fund
This information for the fiscal year ended December 31, 2009, is included pursuant to provisions of the Internal Revenue Code.
For nonresident alien shareholders, 92.0% of income dividends are interest-related dividends.
Special 2009 tax information (unaudited) for Vanguard Short-Term Bond Index Fund
This information for the fiscal year ended December 31, 2009, is included pursuant to provisions of the Internal Revenue Code.
The fund distributed $2,046,000 as capital gain dividends (from net long-term capital gains) to shareholders during the fiscal year.
For nonresident alien shareholders, 85.6% of income dividends are interest-related dividends.
Special 2009 tax information (unaudited) for Vanguard Intermediate-Term Bond Index Fund
This information for the fiscal year ended December 31, 2009, is included pursuant to provisions of the Internal Revenue Code.
For nonresident alien shareholders, 86.1% of income dividends are interest-related dividends.
Special 2009 tax information (unaudited) for Vanguard Long-Term Bond Index Fund
This information for the fiscal year ended December 31, 2009, is included pursuant to provisions of the Internal Revenue Code.
For nonresident alien shareholders, 81.7% of income dividends are interest-related dividends.
84
About Your Fund’s Expenses
As a shareholder of the fund, you incur ongoing costs, which include costs for portfolio management, administrative services, and shareholder reports (like this one), among others. Operating expenses, which are deducted from a fund’s gross income, directly reduce the investment return of the fund.
A fund’s expenses are expressed as a percentage of its average net assets. This figure is known as the expense ratio. The following examples are intended to help you understand the ongoing costs (in dollars) of investing in your fund and to compare these costs with those of other mutual funds. The examples are based on an investment of $1,000 made at the beginning of the period shown and held for the entire period.
The accompanying tables illustrate your fund’s costs in two ways:
• Based on actual fund return. This section helps you to estimate the actual expenses that you paid over the period. The “Ending Account Value” shown is derived from the fund’s actual return, and the third column shows the dollar amount that would have been paid by an investor who started with $1,000 in the fund. You may use the information here, together with the amount you invested, to estimate the expenses that you paid over the period.
To do so, simply divide your account value by $1,000 (for example, an $8,600 account value divided by $1,000 = 8.6), then multiply the result by the number given for your fund under the heading “Expenses Paid During Period.”
• Based on hypothetical 5% yearly return. This section is intended to help you compare your fund’s costs with those of other mutual funds. It assumes that the fund had a yearly return of 5% before expenses, but that the expense ratio is unchanged. In this case—because the return used is not the fund’s actual return—the results do not apply to your investment. The example is useful in making comparisons because the Securities and Exchange Commission requires all mutual funds to calculate expenses based on a 5% return. You can assess your fund’s costs by comparing this hypothetical example with the hypothetical examples that appear in shareholder reports of other funds.
Note that the expenses shown in the table are meant to highlight and help you compare ongoing costs only and do not reflect transaction costs incurred by the fund for buying and selling securities. Further, the expenses do not include the account service fee described in the prospectus. If such a fee were applied to your account, your costs would be higher. Your fund does not charge transaction fees, such as purchase or redemption fees, nor does it carry a “sales load.”
The calculations assume no shares were bought or sold during the period. Your actual costs may have been higher or lower, depending on the amount of your investment and the timing of any purchases or redemptions.
You can find more information about the fund’s expenses, including annual expense ratios, in the Financial Statements section of this report. For additional information on operating expenses and other shareholder costs, please refer to your fund’s current prospectus.
85
| Six Months Ended December 31, 2009 | ||||||
| Beginning | Ending | Expenses | ||||
| Account Value | Account Value | Paid During | ||||
| Index Fund | 6/30/2009 | 12/31/2009 | Period1 | |||
| Based on Actual Fund Return | ||||||
| Total Bond Market | ||||||
| Investor Shares | $ | 1,000.00 | $ | 1,037.48 | $ | 1.13 |
| Admiral Shares | 1,000.00 | 1,038.11 | 0.51 | |||
| Signal Shares | 1,000.00 | 1,038.13 | 0.46 | |||
| Institutional Shares | 1,000.00 | 1,038.33 | 0.26 | |||
| ETF Shares | 1,000.00 | 1,038.65 | 0.51 | |||
| Short-Term Bond | ||||||
| Investor Shares | $ | 1,000.00 | $ | 1,022.93 | $ | 1.12 |
| Admiral Shares | 1,000.00 | 1,023.57 | 0.46 | |||
| Signal Shares | 1,000.00 | 1,023.55 | 0.51 | |||
| ETF Shares | 1,000.00 | 1,023.67 | 0.51 | |||
| Intermediate-Term Bond | ||||||
| Investor Shares | $ | 1,000.00 | $ | 1,053.53 | $ | 1.14 |
| Admiral Shares | 1,000.00 | 1,054.20 | 0.47 | |||
| Signal Shares | 1,000.00 | 1,054.18 | 0.52 | |||
| Institutional Shares | 1,000.00 | 1,054.42 | 0.26 | |||
| ETF Shares | 1,000.00 | 1,053.64 | 0.52 | |||
| Long-Term Bond | ||||||
| Investor Shares | $ | 1,000.00 | $ | 1,054.33 | $ | 1.14 |
| Institutional Shares | 1,000.00 | 1,055.20 | 0.26 | |||
| ETF Shares | 1,000.00 | 1,054.66 | 0.52 |
1 These calculations are based on expenses incurred in the most recent six-month period. The funds’ annualized six-month expense ratios for that period are: for the Total Bond Market Index Fund, 0.22% for Investor Shares, 0.10% for Admiral Shares, 0.09% for Signal Shares, 0.05% for Institutional Shares, 0.10% for ETF Shares; for the Short-Term Bond Index Fund, 0.22% for Investor Shares, 0.09% for Admiral Shares, 0.10% for Signal Shares, 0.10% for ETF Shares; for the Intermediate-Term Bond Index Fund, 0.22% for Investor Shares, 0.09% for Admiral Shares, 0.10% for Signal Shares, 0.05% for Institutional Shares, 0.10% for ETF Shares; and for the Long-Term Bond Index Fund, 0.22% for Investor Shares, 0.05% for Institutional Shares, 0.10% for ETF Shares. The dollar amounts shown as “Expenses Paid” are equal to the annualized expense ratio multiplied by the average account value over the period, multiplied by the number of days in the most recent six-month period, then divided by the number of days in the most recent 12-month period.
86
| Six Months Ended December 31, 2009 | ||||||
| Beginning | Ending | Expenses | ||||
| Account Value | Account Value | Paid During | ||||
| Index Fund | 6/30/2009 | 12/31/2009 | Period1 | |||
| Based on Hypothetical 5% Yearly Return | ||||||
| Total Bond Market | ||||||
| Investor Shares | $ | 1,000.00 | $ | 1,024.10 | $ | 1.12 |
| Admiral Shares | 1,000.00 | 1,024.70 | 0.51 | |||
| Signal Shares | 1,000.00 | 1,024.75 | 0.46 | |||
| Institutional Shares | 1,000.00 | 1,024.95 | 0.26 | |||
| ETF Shares | 1,000.00 | 1,024.70 | 0.51 | |||
| Short-Term Bond | ||||||
| Investor Shares | $ | 1,000.00 | $ | 1,024.10 | $ | 1.12 |
| Admiral Shares | 1,000.00 | 1,024.75 | 0.46 | |||
| Signal Shares | 1,000.00 | 1,024.70 | 0.51 | |||
| ETF Shares | 1,000.00 | 1,024.70 | 0.51 | |||
| Intermediate-Term Bond | ||||||
| Investor Shares | $ | 1,000.00 | $ | 1,024.10 | $ | 1.12 |
| Admiral Shares | 1,000.00 | 1,024.75 | 0.46 | |||
| Signal Shares | 1,000.00 | 1,024.70 | 0.51 | |||
| Institutional Shares | 1,000.00 | 1,024.95 | 0.26 | |||
| ETF Shares | 1,000.00 | 1,024.70 | 0.51 | |||
| Long -Term Bond | ||||||
| Investor Shares | $ | 1,000.00 | $ | 1,024.10 | $ | 1.12 |
| Institutional Shares | 1,000.00 | 1,024.95 | 0.26 | |||
| ETF Shares | 1,000.00 | 1,024.70 | 0.51 |
1 These calculations are based on expenses incurred in the most recent six-month period. The funds’ annualized six-month expense ratios for that period are: for the Total Bond Market Index Fund, 0.22% for Investor Shares, 0.10% for Admiral Shares, 0.09% for Signal Shares, 0.05% for Institutional Shares, 0.10% for ETF Shares; for the Short-Term Bond Index Fund, 0.22% for Investor Shares, 0.09% for Admiral Shares, 0.10% for Signal Shares, 0.10% for ETF Shares; for the Intermediate-Term Bond Index Fund, 0.22% for Investor Shares, 0.09% for Admiral Shares, 0.10% for Signal Shares, 0.05% for Institutional Shares, 0.10% for ETF Shares; and for the Long-Term Bond Index Fund, 0.22% for Investor Shares, 0.05% for Institutional Shares, 0.10% for ETF Shares. The dollar amounts shown as “Expenses Paid” are equal to the annualized expense ratio multiplied by the average account value over the period, multiplied by the number of days in the most recent six-month period, then divided by the number of days in the most recent 12-month period.
87
Glossary
Average Coupon. The average interest rate paid on the fixed income securities held by a fund. It is expressed as a percentage of face value.
Average Duration. An estimate of how much the value of the bonds held by a fund will fluctuate in response to a change in interest rates. To see how the value could change, multiply the average duration by the change in rates. If interest rates rise by 1 percentage point, the value of the bonds in a fund with an average duration of five years would decline by about 5%. If rates decrease by a percentage point, the value would rise by 5%.
Average Effective Maturity. The average length of time until fixed income securities held by a fund reach maturity and are repaid, taking into consideration the possibility that the issuer may call the bond before its maturity date. The figure reflects the proportion of fund assets represented by each security; it also reflects any futures contracts held. In general, the longer the average effective maturity, the more a fund’s share price will fluctuate in response to changes in market interest rates.
Average Quality. An indicator of credit risk, this figure is the average of the ratings assigned to a fund’s fixed income holdings by credit-rating agencies. The agencies make their judgment after appraising an issuer’s ability to meet its obligations. Quality is graded on a scale, with Aaa or AAA indicating the most creditworthy bond issuers. U.S. Treasury securities are considered to have the highest credit quality.
Beta. A measure of the magnitude of a fund’s past share-price fluctuations in relation to the ups and downs of a given market index. The index is assigned a beta of 1.00. Compared with a given index, a fund with a beta of 1.20 typically would have seen its share price rise or fall by 12% when the index rose or fell by 10%. For this report, beta is based on returns over the past 36 months for both the fund and the index. Note that a fund’s beta should be reviewed in conjunction with its R-squared (see definition). The lower the R-squared, the less correlation there is between the fund and the index, and the less reliable beta is as an indicator of volatility.
Expense Ratio. The percentage of a fund’s average net assets used to pay its annual administrative and advisory expenses. These expenses directly reduce returns to investors.
Inception Date. The date on which the assets of a fund (or one of its share classes) are first invested in accordance with the fund’s investment objective. For funds with a subscription period, the inception date is the day after that period ends. Investment performance is measured from the inception date.
R-Squared. A measure of how much of a fund’s past returns can be explained by the returns from the market in general, as measured by a given index. If a fund’s total returns were precisely synchronized with an index’s returns, its R-squared would be 1.00. If the fund’s returns bore no relationship to the index’s returns, its R-squared would be 0. For this report, R-squared is based on returns over the past 36 months for both the fund and the index.
Short-Term Reserves. The percentage of a fund invested in highly liquid, short-term securities that can be readily converted to cash.
88
Yield. A fund’s 30-day SEC yield is derived using a formula specified by the U.S. Securities and Exchange Commission. Under the formula, data related to the fund’s security holdings in the previous 30 days are used to calculate the fund’s hypothetical net income for that period, which is then annualized and divided by the fund’s estimated average net assets over the calculation period. For the purposes of this calculation, a security’s income is based on its current market yield to maturity (in the case of bonds) or its projected dividend yield (for stocks). Because the SEC yield represents hypothetical annualized income, it will differ—at times significantly—from the fund’s actual experience. As a result, the fund’s income distributions may be higher or lower than implied by the SEC yield.
Yield to Maturity. The rate of return an investor would receive if the fixed income securities held by a fund were held to their maturity dates.
89
This page intentionally left blank.
This page intentionally left blank.
The People Who Govern Your Fund
The trustees of your mutual fund are there to see that the fund is operated and managed in your best interests since, as a shareholder, you are a part owner of the fund. Your fund’s trustees also serve on the board of directors of The Vanguard Group, Inc., which is owned by the Vanguard funds and provides services to them on an at-cost basis.
A majority of Vanguard’s board members are independent, meaning that they have no affiliation with Vanguard or the funds they oversee, apart from the sizable personal investments they have made as private individuals. The independent board members have distinguished backgrounds in business, academia, and public service. Each of the trustees and executive officers oversees 163 Vanguard funds.
The following table provides information for each trustee and executive officer of the fund. More information about the trustees is in the Statement of Additional Information, which can be obtained, without charge, by contacting Vanguard at 800-662-7447, or online at www.vanguard.com.
Interested Trustee1
F. William McNabb III
Born 1957. Trustee Since July 2009. Chairman of the Board. Principal Occupation(s) During the Past Five Years: Chairman of the Board of The Vanguard Group, Inc., and of each of the investment companies served by The Vanguard Group, since January 2010; Director of The Vanguard Group since 2008; Chief Executive Officer and President of The Vanguard Group and of each of the investment companies served by The Vanguard Group since 2008; Director of Vanguard Marketing Corporation; Managing Director of The Vanguard Group (1995–2008).
Independent Trustees
Emerson U. Fullwood
Born 1948. Trustee Since January 2008. Principal Occupation(s) During the Past Five Years: Executive Chief Staff and Marketing Officer for North America and Corporate Vice President (retired 2008) of Xerox Corporation (photocopiers and printers); Director of SPX Corporation (multi-industry manufacturing), the United Way of Rochester, the Boy Scouts of America, Amerigroup Corporation (direct health and medical insurance carriers), and Monroe Community College Foundation.
Rajiv L. Gupta
Born 1945. Trustee Since December 2001.2 Principal Occupation(s) During the Past Five Years: Chairman and Chief Executive Officer (retired 2009) and President (2006–2008) of Rohm and Haas Co. (chemicals); Board Member of American Chemistry Council; Director of Tyco International, Ltd. (diversified manufacturing and services) and Hewlett-Packard Co. (electronic computer manufacturing); Trustee of The Conference Board.
Amy Gutmann
Born 1949. Trustee Since June 2006. Principal Occupation(s) During the Past Five Years: President of the University of Pennsylvania; Christopher H. Browne Distinguished Professor of Political Science in the School of Arts and Sciences with secondary appointments at the Annenberg School for Communication and the Graduate School of Education of the University of Pennsylvania; Director of Carnegie Corporation of New York, Schuylkill River Development Corporation, and Greater Philadelphia Chamber of Commerce; Trustee of the National Constitution Center.
JoAnn Heffernan Heisen
Born 1950. Trustee Since July 1998. Principal Occupation(s) During the Past Five Years: Corporate Vice President and Chief Global Diversity Officer since 2006 (retired 2008) and Member of the Executive Committee (retired 2008) of Johnson & Johnson (pharmaceuticals/consumer products); Vice President and Chief Information Officer of Johnson & Johnson (1997–2005); Director of the University Medical Center at Princeton and Women’s Research and Education Institute; Member of the Advisory Board of the Maxwell School of Citizenship and Public Affairs at Syracuse University.
F. Joseph Loughrey
Born 1949. Trustee Since October 2009. Principal Occupation(s) During the Past Five Years: President and Chief Operating Officer since 2005 (retired 2009) and Vice Chairman of the Board (2008–2009) of Cummins Inc. (industrial machinery); Director of SKF AB (industrial machinery), Hillenbrand, Inc. (specialized consumer services), Sauer-Danfoss Inc. (machinery), the Lumina Foundation for Education, and the Columbus Community Education Coalition; Chairman of the Advisory Council for the College of Arts and Letters at the University of Notre Dame.
André F. Perold
Born 1952. Trustee Since December 2004. Principal Occupation(s) During the Past Five Years: George Gund Professor of Finance and Banking, Harvard Business School; Chair of the Investment Committee of HighVista Strategies LLC (private investment firm).
Alfred M. Rankin, Jr.
Born 1941. Trustee Since January 1993. Principal Occupation(s) During the Past Five Years: Chairman, President, and Chief Executive Officer of NACCO Industries, Inc. (forklift trucks/housewares/lignite); Director of Goodrich Corporation (industrial products/ aircraft systems and services); Deputy Chairman of the Federal Reserve Bank of Cleveland; Trustee of University Hospitals of Cleveland, The Cleveland Museum of Art, and Case Western Reserve University.
Peter F. Volanakis
Born 1955. Trustee Since July 2009. Principal Occupation(s) During the Past Five Years: President since 2007 and Chief Operating Officer since 2005 of Corning Incorporated (communications equipment); President of Corning Technologies (2001–2005); Director of Corning Incorporated and Dow Corning; Trustee of the Corning Incorporated Foundation and the Corning Museum of Glass; Overseer of the Amos Tuck School of Business Administration at Dartmouth College.
Executive Officers
Thomas J. Higgins
Born 1957. Chief Financial Officer Since September 2008. Principal Occupation(s) During the Past Five Years: Principal of The Vanguard Group, Inc.; Chief Financial Officer of each of the investment companies served by The Vanguard Group since 2008; Treasurer of each of the investment companies served by The Vanguard Group (1998–2008).
Kathryn J. Hyatt
Born 1955. Treasurer Since November 2008. Principal Occupation(s) During the Past Five Years: Principal of The Vanguard Group, Inc.; Treasurer of each of the investment companies served by The Vanguard Group since 2008; Assistant Treasurer of each of the investment companies served by The Vanguard Group (1988–2008).
Heidi Stam
Born 1956. Secretary Since July 2005. Principal Occupation(s) During the Past Five Years: Managing Director of The Vanguard Group, Inc., since 2006; General Counsel of The Vanguard Group since 2005; Secretary of The Vanguard Group and of each of the investment companies served by The Vanguard Group since 2005; Director and Senior Vice President of Vanguard Marketing Corporation since 2005; Principal of The Vanguard Group (1997–2006).
Vanguard Senior Management Team
R. Gregory Barton
Mortimer J. Buckley
Kathleen C. Gubanich
Paul A. Heller
Michael S. Miller
James M. Norris
Glenn W. Reed
George U. Sauter
Chairman Emeritus and Senior Advisor
John J. Brennan
Chairman, 1996–2009
Chief Executive Officer and President, 1996–2008
Founder
John C. Bogle
Chairman and Chief Executive Officer, 1974–1996
1 Mr. McNabb is considered an “interested person,” as defined in the Investment Company Act of 1940, because he is an officer of the Vanguard funds.
2 December 2002 for Vanguard Equity Income Fund, Vanguard Growth Equity Fund, the Vanguard Municipal Bond Funds, and the Vanguard State Tax-Exempt Funds.

P.O. Box 2600
Valley Forge, PA 19482-2600
Connect with Vanguard® > www.vanguard.com
Fund Information > 800-662-7447
Direct Investor Account Services > 800-662-2739
Institutional Investor Services > 800-523-1036
Text Telephone for People
With Hearing Impairment > 800-749-7273
This material may be used in conjunction with the offering of shares of any Vanguard fund only if preceded or accompanied by the fund’s current prospectus.
Vanguard ETFs® are not sponsored, endorsed, sold, or promoted by Barclays Capital. Barclays Capital makes no representation or warranty, express or implied, to the owners of Vanguard ETFs or any member of the public regarding the advisability of investing in securities generally or in Vanguard ETFs particularly or the ability of the Barclays Capital Index to track general bond market performance. Barclays Capital hereby expressly disclaims all warranties of merchantability and fitness for a particular purpose with respect to the Barclays Capital Index and any data included therein. Barclays Capital’s only relationship to Vanguard and Vanguard ETFs is the licensing of the Barclays Capital Index which is determined, composed, and calculated by Barc lays Capital without regard to Vanguard or the Vanguard ETFs. Barclays Capital is not responsible for, and has not participated in, the determination of the timing of, prices of, or quantities of Vanguard ETFs to be issued. Source of index data: Barclays Capital Global Family of Indices. Copyright 2009, Barclays Capital. All rights reserved.
All comparative mutual fund data are from Lipper Inc. or Morningstar, Inc., unless otherwise noted.
You can obtain a free copy of Vanguard’s proxy voting guidelines by visiting our website, www.vanguard.com, and searching for “proxy voting guidelines,” or by calling Vanguard at 800-662-2739. The guidelines are also available from the SEC’s website, www.sec.gov. In addition, you may obtain a free report on how your fund voted the proxies for securities it owned during the 12 months ended June 30. To get the report, visit either www.vanguard.com or www.sec.gov.
You can review and copy information about your fund at the SEC’s Public Reference Room in Washington, D.C. To find out more about this public service, call the SEC at 202-551-8090. Information about your fund is also available on the SEC’s website, and you can receive copies of this information, for a fee, by sending a request in either of two ways: via e-mail addressed to publicinfo@sec.gov or via regular mail addressed to the Public Reference Section, Securities and Exchange Commission, Washington, DC 20549-0102.
© 2010 The Vanguard Group, Inc. All rights reserved.
Vanguard Marketing Corporation, Distributor.
Q840 022010
| Vanguard® Total Bond Market Index Fund | |||||||||
| Schedule of Investments | |||||||||
| December 31, 2008 | |||||||||
| Face | Market | ||||||||
| Maturity | Amount | Value | |||||||
| Coupon | Date | ($ | 000 | ) | ($ | 000 | ) | ||
| U.S. Government and Agency Obligations (73.2%) | |||||||||
| U.S. Government Securities (25.6%) | |||||||||
| U.S. Treasury Bond | 13.250 | % | 5/15/14 | 7,000 | 7,317 | ||||
| U.S. Treasury Bond | 11.250 | % | 2/15/15 | 77,200 | 117,224 | ||||
| U.S. Treasury Bond | 10.625 | % | 8/15/15 | 7,350 | 11,127 | ||||
| U.S. Treasury Bond | 9.875 | % | 11/15/15 | 327,600 | 488,533 | ||||
| U.S. Treasury Bond | 9.250 | % | 2/15/16 | 8,525 | 12,448 | ||||
| U.S. Treasury Bond | 7.250 | % | 5/15/16 | 114,640 | 153,599 | ||||
| U.S. Treasury Bond | 7.500 | % | 11/15/16 | 112,144 | 153,304 | ||||
| U.S. Treasury Bond | 8.750 | % | 5/15/17 | 470,440 | 693,311 | ||||
| U.S. Treasury Bond | 8.875 | % | 8/15/17 | 33,135 | 49,413 | ||||
| U.S. Treasury Bond | 9.125 | % | 5/15/18 | 5,710 | 8,843 | ||||
| U.S. Treasury Bond | 8.875 | % | 2/15/19 | 219,875 | 338,572 | ||||
| U.S. Treasury Bond | 8.125 | % | 8/15/19 | 79,795 | 118,147 | ||||
| U.S. Treasury Bond | 8.500 | % | 2/15/20 | 2,165 | 3,304 | ||||
| U.S. Treasury Bond | 8.750 | % | 8/15/20 | 294,125 | 459,938 | ||||
| U.S. Treasury Bond | 7.875 | % | 2/15/21 | 269,607 | 401,294 | ||||
| U.S. Treasury Bond | 8.125 | % | 5/15/21 | 15,125 | 22,995 | ||||
| U.S. Treasury Bond | 8.125 | % | 8/15/21 | 192,215 | 292,978 | ||||
| U.S. Treasury Bond | 8.000 | % | 11/15/21 | 81,920 | 124,493 | ||||
| U.S. Treasury Bond | 7.250 | % | 8/15/22 | 435 | 634 | ||||
| U.S. Treasury Bond | 7.625 | % | 11/15/22 | 76,855 | 115,943 | ||||
| U.S. Treasury Bond | 7.125 | % | 2/15/23 | 93,785 | 136,325 | ||||
| U.S. Treasury Bond | 6.250 | % | 8/15/23 | 80,505 | 110,066 | ||||
| U.S. Treasury Bond | 6.875 | % | 8/15/25 | 650 | 988 | ||||
| U.S. Treasury Bond | 6.000 | % | 2/15/26 | 3,275 | 4,571 | ||||
| U.S. Treasury Bond | 6.750 | % | 8/15/26 | 379,255 | 572,914 | ||||
| U.S. Treasury Bond | 6.500 | % | 11/15/26 | 775 | 1,144 | ||||
| U.S. Treasury Bond | 6.625 | % | 2/15/27 | 17,835 | 26,711 | ||||
| U.S. Treasury Bond | 6.375 | % | 8/15/27 | 32,345 | 47,411 | ||||
| U.S. Treasury Bond | 6.125 | % | 11/15/27 | 4,635 | 6,656 | ||||
| U.S. Treasury Bond | 5.250 | % | 11/15/28 | 5,410 | 7,154 | ||||
| U.S. Treasury Bond | 5.250 | % | 2/15/29 | 139,990 | 185,880 | ||||
| U.S. Treasury Bond | 6.125 | % | 8/15/29 | 118,040 | 173,555 | ||||
| U.S. Treasury Bond | 6.250 | % | 5/15/30 | 73,885 | 111,289 | ||||
| U.S. Treasury Bond | 5.375 | % | 2/15/31 | 3,869 | 5,327 | ||||
| U.S. Treasury Bond | 4.500 | % | 2/15/36 | 145 | 193 | ||||
| U.S. Treasury Bond | 4.750 | % | 2/15/37 | 66,400 | 92,753 | ||||
| U.S. Treasury Bond | 5.000 | % | 5/15/37 | 75,857 | 110,206 | ||||
| U.S. Treasury Bond | 4.375 | % | 2/15/38 | 143,018 | 192,135 | ||||
| U.S. Treasury Bond | 4.500 | % | 5/15/38 | 223,310 | 305,517 | ||||
| U.S. Treasury Inflation-Indexed Note | 3.500 | % | 1/15/11 | 145,075 | 177,110 | ||||
| U.S. Treasury Inflation-Indexed Note | 2.375 | % | 4/15/11 | 113,675 | 121,242 | ||||
| U.S. Treasury Note | 4.750 | % | 2/28/09 | 840 | 846 | ||||
| U.S. Treasury Note | 4.625 | % | 7/31/09 | 2,805 | 2,874 | ||||
| U.S. Treasury Note | 6.000 | % | 8/15/09 | 37,330 | 38,619 | ||||
| U.S. Treasury Note | 4.000 | % | 8/31/09 | 1,135 | 1,162 | ||||
| U.S. Treasury Note | 4.625 | % | 11/15/09 | 49,585 | 51,382 | ||||
| U.S. Treasury Note | 3.250 | % | 12/31/09 | 387,800 | 398,829 | ||||
| U.S. Treasury Note | 2.125 | % | 1/31/10 | 118,575 | 120,743 | ||||
| U.S. Treasury Note | 3.500 | % | 2/15/10 | 29,270 | 30,304 | ||||
| U.S. Treasury Note | 4.750 | % | 2/15/10 | 468,875 | 491,222 | ||||
| U.S. Treasury Note | 6.500 | % | 2/15/10 | 828,815 | 883,981 | ||||
| U.S. Treasury Note | 2.000 | % | 2/28/10 | 18,500 | 18,832 | ||||
| U.S. Treasury Note | 1.750 | % | 3/31/10 | 366,360 | 372,372 | ||||
| U.S. Treasury Note | 4.000 | % | 4/15/10 | 1,290 | 1,352 | ||||
| U.S. Treasury Note | 2.625 | % | 5/31/10 | 263,565 | 271,514 | ||||
| U.S. Treasury Note | 2.875 | % | 6/30/10 | 671,575 | 695,503 | ||||
| U.S. Treasury Note | 3.875 | % | 7/15/10 | 6,395 | 6,745 | ||||
| U.S. Treasury Note | 2.750 | % | 7/31/10 | 309,700 | 320,831 | ||||
| U.S. Treasury Note | 4.125 | % | 8/15/10 | 11,841 | 12,542 | ||||
| U.S. Treasury Note | 5.750 | % | 8/15/10 | 45,350 | 49,240 | ||||
| U.S. Treasury Note | 2.375 | % | 8/31/10 | 388,675 | 400,456 | ||||
| U.S. Treasury Note | 2.000 | % | 9/30/10 | 23,625 | 24,223 | ||||
| U.S. Treasury Note | 1.500 | % | 10/31/10 | 71,450 | 72,510 | ||||
Page 1
| Vanguard® Total Bond Market Index Fund | |||||||||
| Schedule of Investments | |||||||||
| December 31, 2008 | |||||||||
| Face | Market | ||||||||
| Maturity | Amount | Value | |||||||
| Coupon | Date | ($ | 000 | ) | ($ | 000 | ) | ||
| U.S. Treasury Note | 1.250 | % | 11/30/10 | 493,650 | 498,972 | ||||
| U.S. Treasury Note | 0.875 | % | 12/31/10 | 140,460 | 140,768 | ||||
| U.S. Treasury Note | 5.000 | % | 2/15/11 | 66,950 | 73,195 | ||||
| U.S. Treasury Note | 4.500 | % | 2/28/11 | 47,615 | 51,491 | ||||
| U.S. Treasury Note | 4.750 | % | 3/31/11 | 1,000 | 1,089 | ||||
| U.S. Treasury Note | 4.875 | % | 4/30/11 | 1,950 | 2,138 | ||||
| U.S. Treasury Note | 4.625 | % | 8/31/11 | 4,600 | 5,056 | ||||
| U.S. Treasury Note | 4.500 | % | 9/30/11 | 1,845 | 2,024 | ||||
| U.S. Treasury Note | 1.750 | % | 11/15/11 | 4,000 | 4,089 | ||||
| U.S. Treasury Note | 4.500 | % | 11/30/11 | 68,855 | 75,816 | ||||
| U.S. Treasury Note | 4.625 | % | 12/31/11 | 200 | 221 | ||||
| U.S. Treasury Note | 4.625 | % | 2/29/12 | 49,080 | 54,502 | ||||
| U.S. Treasury Note | 4.500 | % | 3/31/12 | 29,050 | 32,114 | ||||
| U.S. Treasury Note | 4.500 | % | 4/30/12 | 203,210 | 225,151 | ||||
| U.S. Treasury Note | 4.750 | % | 5/31/12 | 742,605 | 831,599 | ||||
| U.S. Treasury Note | 4.875 | % | 6/30/12 | 265,525 | 298,509 | ||||
| U.S. Treasury Note | 4.625 | % | 7/31/12 | 432,850 | 485,264 | ||||
| U.S. Treasury Note | 4.125 | % | 8/31/12 | 3,471 | 3,839 | ||||
| U.S. Treasury Note | 4.250 | % | 9/30/12 | 2,735 | 3,054 | ||||
| U.S. Treasury Note | 3.875 | % | 10/31/12 | 9,925 | 10,986 | ||||
| U.S. Treasury Note | 3.375 | % | 11/30/12 | 1,725 | 1,880 | ||||
| U.S. Treasury Note | 2.750 | % | 2/28/13 | 8,820 | 9,425 | ||||
| U.S. Treasury Note | 3.500 | % | 5/31/13 | 256,980 | 281,473 | ||||
| U.S. Treasury Note | 3.375 | % | 6/30/13 | 10,150 | 11,065 | ||||
| U.S. Treasury Note | 3.375 | % | 7/31/13 | 12,675 | 13,843 | ||||
| U.S. Treasury Note | 3.125 | % | 8/31/13 | 132,470 | 142,799 | ||||
| U.S. Treasury Note | 3.125 | % | 9/30/13 | 484,710 | 522,881 | ||||
| U.S. Treasury Note | 2.750 | % | 10/31/13 | 730,183 | 776,279 | ||||
| U.S. Treasury Note | 4.250 | % | 11/15/13 | 6,265 | 7,149 | ||||
| U.S. Treasury Note | 2.000 | % | 11/30/13 | 296,550 | 304,287 | ||||
| U.S. Treasury Note | 1.500 | % | 12/31/13 | 399,425 | 398,426 | ||||
| U.S. Treasury Note | 4.750 | % | 5/15/14 | 9,675 | 11,383 | ||||
| U.S. Treasury Note | 4.250 | % | 8/15/14 | 900 | 1,035 | ||||
| U.S. Treasury Note | 4.000 | % | 2/15/15 | 136,275 | 155,269 | ||||
| U.S. Treasury Note | 4.125 | % | 5/15/15 | 36,395 | 41,741 | ||||
| U.S. Treasury Note | 4.250 | % | 8/15/15 | 19,925 | 23,153 | ||||
| U.S. Treasury Note | 4.500 | % | 11/15/15 | 9,710 | 11,521 | ||||
| U.S. Treasury Note | 4.500 | % | 2/15/16 | 1,925 | 2,267 | ||||
| U.S. Treasury Note | 5.125 | % | 5/15/16 | 265,300 | 321,345 | ||||
| U.S. Treasury Note | 4.875 | % | 8/15/16 | 71,080 | 84,941 | ||||
| U.S. Treasury Note | 4.625 | % | 11/15/16 | 4,051 | 4,788 | ||||
| U.S. Treasury Note | 4.625 | % | 2/15/17 | 225 | 267 | ||||
| U.S. Treasury Note | 4.500 | % | 5/15/17 | 5,050 | 5,936 | ||||
| U.S. Treasury Note�� | 4.750 | % | 8/15/17 | 248,750 | 297,955 | ||||
| U.S. Treasury Note | 4.250 | % | 11/15/17 | 615 | 718 | ||||
| U.S. Treasury Note | 3.500 | % | 2/15/18 | 600 | 666 | ||||
| U.S. Treasury Note | 3.875 | % | 5/15/18 | 3,416 | 3,903 | ||||
| U.S. Treasury Note | 4.000 | % | 8/15/18 | 100,035 | 115,759 | ||||
| U.S. Treasury Note | 3.750 | % | 11/15/18 | 126,600 | 143,592 | ||||
| 16,724,269 | |||||||||
| Agency Bonds and Notes (7.8%) | |||||||||
| Agency for International Development - Egypt | |||||||||
| (U.S. Government Guaranteed) | 4.450 | % | 9/15/15 | 15,150 | 16,579 | ||||
| 1 Federal Farm Credit Bank | 5.250 | % | 9/13/10 | 5,200 | 5,535 | ||||
| 1 Federal Farm Credit Bank | 3.750 | % | 12/6/10 | 14,625 | 15,272 | ||||
| 1 Federal Farm Credit Bank | 4.875 | % | 2/18/11 | 30,000 | 32,044 | ||||
| 1 Federal Farm Credit Bank | 2.625 | % | 4/21/11 | 14,750 | 15,089 | ||||
| 1 Federal Farm Credit Bank | 5.375 | % | 7/18/11 | 28,750 | 31,310 | ||||
| 1 Federal Farm Credit Bank | 3.875 | % | 8/25/11 | 15,200 | 15,927 | ||||
| 1 Federal Farm Credit Bank | 4.500 | % | 10/17/12 | 14,100 | 15,327 | ||||
| 1 Federal Farm Credit Bank | 3.875 | % | 10/7/13 | 9,600 | 10,144 | ||||
| 1 Federal Farm Credit Bank | 4.875 | % | 12/16/15 | 1,575 | 1,748 | ||||
| 1 Federal Farm Credit Bank | 5.125 | % | 8/25/16 | 10,325 | 11,718 | ||||
| 1 Federal Farm Credit Bank | 4.875 | % | 1/17/17 | 9,500 | 10,537 | ||||
| 1 Federal Farm Credit Bank | 5.150 | % | 11/15/19 | 20,000 | 23,203 |
Page 2
| Vanguard® Total Bond Market Index Fund | |||||||||
| Schedule of Investments | |||||||||
| December 31, 2008 | |||||||||
| Face | Market | ||||||||
| Maturity | Amount | Value | |||||||
| Coupon | Date | ($ | 000 | ) | ($ | 000 | ) | ||
| 1 Federal Home Loan Bank | 5.790 | % | 4/27/09 | 900 | 916 | ||||
| 1 Federal Home Loan Bank | 3.750 | % | 1/8/10 | 1,650 | 1,695 | ||||
| 1 Federal Home Loan Bank | 3.875 | % | 1/15/10 | 86,700 | 89,204 | ||||
| 1 Federal Home Loan Bank | 2.750 | % | 3/12/10 | 15,100 | 15,383 | ||||
| 1 Federal Home Loan Bank | 4.375 | % | 3/17/10 | 95,000 | 98,776 | ||||
| 1 Federal Home Loan Bank | 4.875 | % | 5/14/10 | 24,400 | 25,610 | ||||
| 1 Federal Home Loan Bank | 7.625 | % | 5/14/10 | 71,925 | 78,072 | ||||
| 1 Federal Home Loan Bank | 2.750 | % | 6/18/10 | 14,850 | 15,166 | ||||
| 1 Federal Home Loan Bank | 3.500 | % | 7/16/10 | 63,750 | 65,955 | ||||
| 1 Federal Home Loan Bank | 3.375 | % | 10/20/10 | 43,200 | 44,825 | ||||
| 1 Federal Home Loan Bank | 4.750 | % | 12/10/10 | 5,300 | 5,630 | ||||
| 1 Federal Home Loan Bank | 3.625 | % | 12/17/10 | 10,800 | 11,266 | ||||
| 1 Federal Home Loan Bank | 3.125 | % | 6/10/11 | 9,875 | 10,223 | ||||
| 1 Federal Home Loan Bank | 3.375 | % | 6/24/11 | 75,000 | 78,343 | ||||
| 1 Federal Home Loan Bank | 3.625 | % | 7/1/11 | 23,175 | 24,244 | ||||
| 1 Federal Home Loan Bank | 5.375 | % | 8/19/11 | 81,550 | 89,272 | ||||
| 1 Federal Home Loan Bank | 3.750 | % | 9/9/11 | 5,875 | 6,177 | ||||
| 1 Federal Home Loan Bank | 3.625 | % | 9/16/11 | 11,775 | 12,394 | ||||
| 1 Federal Home Loan Bank | 4.875 | % | 11/18/11 | 25,750 | 28,021 | ||||
| 1 Federal Home Loan Bank | 4.625 | % | 10/10/12 | 41,875 | 45,849 | ||||
| 1 Federal Home Loan Bank | 3.375 | % | 2/27/13 | 12,500 | 13,048 | ||||
| 1 Federal Home Loan Bank | 3.875 | % | 6/14/13 | 30,625 | 32,531 | ||||
| 1 Federal Home Loan Bank | 5.375 | % | 6/14/13 | 15,000 | 16,804 | ||||
| 1 Federal Home Loan Bank | 5.125 | % | 8/14/13 | 12,100 | 13,498 | ||||
| 1 Federal Home Loan Bank | 4.000 | % | 9/6/13 | 18,025 | 19,226 | ||||
| 1 Federal Home Loan Bank | 5.250 | % | 9/13/13 | 2,500 | 2,793 | ||||
| 1 Federal Home Loan Bank | 4.500 | % | 9/16/13 | 64,325 | 70,173 | ||||
| 1 Federal Home Loan Bank | 3.625 | % | 10/18/13 | 29,075 | 30,567 | ||||
| 1 Federal Home Loan Bank | 5.500 | % | 8/13/14 | 81,325 | 93,101 | ||||
| 1 Federal Home Loan Bank | 5.375 | % | 5/18/16 | 49,850 | 56,880 | ||||
| 1 Federal Home Loan Bank | 5.625 | % | 6/13/16 | 2,950 | 3,140 | ||||
| 1 Federal Home Loan Bank | 5.125 | % | 10/19/16 | 12,600 | 14,162 | ||||
| 1 Federal Home Loan Bank | 4.750 | % | 12/16/16 | 86,575 | 95,824 | ||||
| 1 Federal Home Loan Bank | 4.875 | % | 5/17/17 | 29,600 | 33,223 | ||||
| 1 Federal Home Loan Bank | 5.000 | % | 11/17/17 | 5,900 | 6,716 | ||||
| 1 Federal Home Loan Bank | 5.250 | % | 12/11/20 | 16,150 | 18,842 | ||||
| 1 Federal Home Loan Bank | 5.625 | % | 6/11/21 | 1,375 | 1,630 | ||||
| 1 Federal Home Loan Bank | 5.500 | % | 7/15/36 | 11,000 | 14,129 | ||||
| 1 Federal Home Loan Mortgage Corp. | 3.750 | % | 5/12/09 | 3,130 | 3,168 | ||||
| 1 Federal Home Loan Mortgage Corp. | 7.000 | % | 3/15/10 | 81,425 | 87,164 | ||||
| 1 Federal Home Loan Mortgage Corp. | 2.875 | % | 4/30/10 | 22,200 | 22,723 | ||||
| 1 Federal Home Loan Mortgage Corp. | 2.875 | % | 6/28/10 | 11,600 | 11,880 | ||||
| 1 Federal Home Loan Mortgage Corp. | 4.125 | % | 7/12/10 | 127,947 | 133,468 | ||||
| 1 Federal Home Loan Mortgage Corp. | 3.250 | % | 7/16/10 | 11,800 | 12,161 | ||||
| 1 Federal Home Loan Mortgage Corp. | 5.125 | % | 8/23/10 | 75,000 | 79,651 | ||||
| 1 Federal Home Loan Mortgage Corp. | 6.875 | % | 9/15/10 | 38,683 | 42,293 | ||||
| 1 Federal Home Loan Mortgage Corp. | 5.000 | % | 10/18/10 | 6,200 | 6,591 | ||||
| 1 Federal Home Loan Mortgage Corp. | 3.125 | % | 10/25/10 | 12,400 | 12,833 | ||||
| 1 Federal Home Loan Mortgage Corp. | 4.750 | % | 1/18/11 | 69,500 | 74,141 | ||||
| 1 Federal Home Loan Mortgage Corp. | 3.250 | % | 2/25/11 | 18,500 | 19,192 | ||||
| 1 Federal Home Loan Mortgage Corp. | 5.625 | % | 3/15/11 | 50,000 | 54,413 | ||||
| 1 Federal Home Loan Mortgage Corp. | 5.875 | % | 3/21/11 | 750 | 785 | ||||
| 1 Federal Home Loan Mortgage Corp. | 5.125 | % | 4/18/11 | 60,000 | 64,838 | ||||
| 1 Federal Home Loan Mortgage Corp. | 6.000 | % | 6/15/11 | 33,800 | 37,445 | ||||
| 1 Federal Home Loan Mortgage Corp. | 3.875 | % | 6/29/11 | 11,225 | 11,893 | ||||
| 1 Federal Home Loan Mortgage Corp. | 5.250 | % | 7/18/11 | 115,000 | 125,245 | ||||
| 1 Federal Home Loan Mortgage Corp. | 5.750 | % | 1/15/12 | 82,000 | 91,529 | ||||
| 1 Federal Home Loan Mortgage Corp. | 5.500 | % | 8/20/12 | 50,000 | 56,271 | ||||
| 1 Federal Home Loan Mortgage Corp. | 4.625 | % | 10/25/12 | 38,850 | 42,576 | ||||
| 1 Federal Home Loan Mortgage Corp. | 4.125 | % | 12/21/12 | 17,950 | 19,377 | ||||
| 1 Federal Home Loan Mortgage Corp. | 4.500 | % | 1/15/13 | 81,325 | 88,634 | ||||
| 1 Federal Home Loan Mortgage Corp. | 4.500 | % | 7/15/13 | 22,525 | 24,625 | ||||
| 1 Federal Home Loan Mortgage Corp. | 4.875 | % | 11/15/13 | 114,925 | 127,797 | ||||
| 1 Federal Home Loan Mortgage Corp. | 5.000 | % | 7/15/14 | 90,650 | 101,838 | ||||
| 1 Federal Home Loan Mortgage Corp. | 0.000 | % | 11/24/14 | 9,500 | 8,039 | ||||
| 1 Federal Home Loan Mortgage Corp. | 4.750 | % | 1/19/16 | 42,900 | 47,544 |
Page 3
| Vanguard® Total Bond Market Index Fund | |||||||||
| Schedule of Investments | |||||||||
| December 31, 2008 | |||||||||
| Face | Market | ||||||||
| Maturity | Amount | Value | |||||||
| Coupon | Date | ($ | 000 | ) | ($ | 000 | ) | ||
| 1 Federal Home Loan Mortgage Corp. | 5.250 | % | 4/18/16 | 97,500 | 111,072 | ||||
| 1 Federal Home Loan Mortgage Corp. | 5.000 | % | 2/16/17 | 30,000 | 34,071 | ||||
| 1 Federal Home Loan Mortgage Corp. | 5.000 | % | 4/18/17 | 10,000 | 11,374 | ||||
| 1 Federal Home Loan Mortgage Corp. | 5.500 | % | 8/23/17 | 40,000 | 47,170 | ||||
| 1 Federal Home Loan Mortgage Corp. | 4.875 | % | 6/13/18 | 24,050 | 27,592 | ||||
| 1 Federal Home Loan Mortgage Corp. | 5.000 | % | 12/14/18 | 29,521 | 28,871 | ||||
| 1 Federal Home Loan Mortgage Corp. | 6.750 | % | 9/15/29 | 14,000 | 20,058 | ||||
| 1 Federal Home Loan Mortgage Corp. | 6.750 | % | 3/15/31 | 46,750 | 68,384 | ||||
| 1 Federal National Mortgage Assn. | 7.250 | % | 1/15/10 | 89,090 | 94,629 | ||||
| 1 Federal National Mortgage Assn. | 3.250 | % | 2/10/10 | 21,800 | 22,332 | ||||
| 1 Federal National Mortgage Assn. | 3.875 | % | 2/15/10 | 40,100 | 41,405 | ||||
| 1 Federal National Mortgage Assn. | 4.750 | % | 3/12/10 | 34,350 | 35,832 | ||||
| 1 Federal National Mortgage Assn. | 4.125 | % | 5/15/10 | 38,400 | 39,929 | ||||
| 1 Federal National Mortgage Assn. | 7.125 | % | 6/15/10 | 25 | 27 | ||||
| 1 Federal National Mortgage Assn. | 3.000 | % | 7/12/10 | 61,000 | 62,672 | ||||
| 1 Federal National Mortgage Assn. | 2.875 | % | 10/12/10 | 17,450 | 17,958 | ||||
| 1 Federal National Mortgage Assn. | 6.625 | % | 11/15/10 | 57,175 | 62,786 | ||||
| 1 Federal National Mortgage Assn. | 4.750 | % | 12/15/10 | 91,100 | 96,914 | ||||
| 1 Federal National Mortgage Assn. | 6.250 | % | 2/1/11 | 16,665 | 17,582 | ||||
| 1 Federal National Mortgage Assn. | 5.125 | % | 4/15/11 | 37,900 | 40,954 | ||||
| 1 Federal National Mortgage Assn. | 6.000 | % | 5/15/11 | 44,580 | 49,150 | ||||
| 1 Federal National Mortgage Assn. | 3.375 | % | 5/19/11 | 50,000 | 52,167 | ||||
| 1 Federal National Mortgage Assn. | 5.000 | % | 10/15/11 | 86,925 | 94,623 | ||||
| 1 Federal National Mortgage Assn. | 5.000 | % | 2/16/12 | 50,000 | 54,837 | ||||
| 1 Federal National Mortgage Assn. | 6.125 | % | 3/15/12 | 87,705 | 99,399 | ||||
| 1 Federal National Mortgage Assn. | 4.875 | % | 5/18/12 | 36,450 | 39,969 | ||||
| 1 Federal National Mortgage Assn. | 5.250 | % | 8/1/12 | 9,100 | 9,335 | ||||
| 1 Federal National Mortgage Assn. | 4.375 | % | 9/15/12 | 49,325 | 53,541 | ||||
| 1 Federal National Mortgage Assn. | 3.625 | % | 2/12/13 | 22,225 | 23,506 | ||||
| 1 Federal National Mortgage Assn. | 4.750 | % | 2/21/13 | 5,000 | 5,445 | ||||
| 1 Federal National Mortgage Assn. | 4.375 | % | 3/15/13 | 15,240 | 16,543 | ||||
| 1 Federal National Mortgage Assn. | 4.625 | % | 5/1/13 | 27,969 | 28,498 | ||||
| 1 Federal National Mortgage Assn. | 4.625 | % | 10/15/13 | 60,850 | 66,987 | ||||
| 1 Federal National Mortgage Assn. | 2.875 | % | 12/11/13 | 11,700 | 11,978 | ||||
| 1 Federal National Mortgage Assn. | 5.125 | % | 1/2/14 | 3,925 | 3,972 | ||||
| 1 Federal National Mortgage Assn. | 4.125 | % | 4/15/14 | 37,500 | 40,514 | ||||
| 1 Federal National Mortgage Assn. | 4.625 | % | 10/15/14 | 50,000 | 55,257 | ||||
| 1 Federal National Mortgage Assn. | 5.000 | % | 4/15/15 | 20,000 | 22,529 | ||||
| 1 Federal National Mortgage Assn. | 4.375 | % | 10/15/15 | 20,000 | 21,815 | ||||
| 1 Federal National Mortgage Assn. | 8.200 | % | 3/10/16 | 50 | 66 | ||||
| 1 Federal National Mortgage Assn. | 5.375 | % | 7/15/16 | 20,000 | 23,041 | ||||
| 1 Federal National Mortgage Assn. | 5.250 | % | 9/15/16 | 54,975 | 62,947 | ||||
| 1 Federal National Mortgage Assn. | 4.875 | % | 12/15/16 | 6,475 | 7,262 | ||||
| 1 Federal National Mortgage Assn. | 5.000 | % | 2/13/17 | 93,425 | 106,020 | ||||
| 1 Federal National Mortgage Assn. | 5.000 | % | 5/11/17 | 50,000 | 56,957 | ||||
| 1 Federal National Mortgage Assn. | 0.000 | % | 10/9/19 | 3,000 | 1,752 | ||||
| 1 Federal National Mortgage Assn. | 6.250 | % | 5/15/29 | 1,375 | 1,873 | ||||
| 1 Federal National Mortgage Assn. | 7.125 | % | 1/15/30 | 30,805 | 46,010 | ||||
| 1 Federal National Mortgage Assn. | 7.250 | % | 5/15/30 | 54,601 | 83,365 | ||||
| 1 Federal National Mortgage Assn. | 6.625 | % | 11/15/30 | 17,460 | 25,168 | ||||
| 1 Federal National Mortgage Assn. | 5.625 | % | 7/15/37 | 5,650 | 7,214 | ||||
| 1 Financing Corp. | 9.800 | % | 4/6/18 | 1,650 | 2,515 | ||||
| 1 Financing Corp. | 9.700 | % | 4/5/19 | 2,000 | 3,099 | ||||
| Resolution Funding Corp. (U.S. Government Guaranteed) | 8.125 | % | 10/15/19 | 550 | 790 | ||||
| Resolution Funding Corp. (U.S. Government Guaranteed) | 8.875 | % | 7/15/20 | 280 | 426 | ||||
| Resolution Funding Corp. (U.S. Government Guaranteed) | 8.625 | % | 1/15/30 | 110 | 184 | ||||
| Small Business Administration Variable Rate Interest Only | |||||||||
| Custodial Receipts (U.S. Government Guaranteed) | 2.719 | % | 7/15/17 | 4,449 | 222 | ||||
| State of Israel (U.S. Government Guaranteed) | 5.500 | % | 9/18/23 | 5,525 | 6,729 | ||||
| State of Israel (U.S. Government Guaranteed) | 5.500 | % | 12/4/23 | 3,900 | 4,759 | ||||
| State of Israel (U.S. Government Guaranteed) | 5.500 | % | 4/26/24 | 14,575 | 17,850 | ||||
| 1 Tennessee Valley Auth. | 5.625 | % | 1/18/11 | 275 | 298 | ||||
| 1 Tennessee Valley Auth. | 5.500 | % | 7/18/17 | 19,800 | 22,977 | ||||
| 1 Tennessee Valley Auth. | 4.500 | % | 4/1/18 | 5,850 | 6,451 | ||||
| 1 Tennessee Valley Auth. | 6.750 | % | 11/1/25 | 2,125 | 2,942 | ||||
| 1 Tennessee Valley Auth. | 7.125 | % | 5/1/30 | 32,625 | 47,577 |
Page 4
| Vanguard® Total Bond Market Index Fund | ||||||||||
| Schedule of Investments | ||||||||||
| December 31, 2008 | ||||||||||
| Face | Market | |||||||||
| Maturity | Amount | Value | ||||||||
| Coupon | Date | ($ | 000 | ) | ($ | 000 | ) | |||
| 1 | Tennessee Valley Auth. | 4.650 | % | 6/15/35 | 4,400 | 4,871 | ||||
| 1 | Tennessee Valley Auth. | 5.500 | % | 6/15/38 | 3,025 | 3,799 | ||||
| 1 | Tennessee Valley Auth. | 4.875 | % | 1/15/48 | 8,600 | 10,060 | ||||
| 1 | Tennessee Valley Auth. | 5.375 | % | 4/1/56 | 7,150 | 9,190 | ||||
| 5,093,946 | ||||||||||
| Conventional Mortgage-Backed Securities (36.8%) | ||||||||||
| 1,2 | Federal Home Loan Mortgage Corp. | 4.000 | % | 1/1/09–2/1/21 | 150,257 | 152,930 | ||||
| 1,2 | Federal Home Loan Mortgage Corp. | 4.500 | % | 3/1/09–5/1/38 | 670,883 | 687,777 | ||||
| 1,2 | Federal Home Loan Mortgage Corp. | 5.000 | % | 7/1/09–7/1/38 | 2,211,952 | 2,265,028 | ||||
| 1,2 | Federal Home Loan Mortgage Corp. | 5.500 | % | 6/1/09–1/1/38 | 2,987,400 | 3,066,684 | ||||
| 1,2 | Federal Home Loan Mortgage Corp. | 6.000 | % | 1/1/09–7/1/38 | 1,864,237 | 1,924,834 | ||||
| 1,2 | Federal Home Loan Mortgage Corp. | 6.500 | % | 1/1/09–9/1/38 | 384,567 | 400,111 | ||||
| 1,2 | Federal Home Loan Mortgage Corp. | 7.000 | % | 1/1/09–1/1/37 | 45,881 | 48,061 | ||||
| 1,2 | Federal Home Loan Mortgage Corp. | 7.500 | % | 10/1/09–2/1/32 | 9,753 | 10,226 | ||||
| 1,2 | Federal Home Loan Mortgage Corp. | 8.000 | % | 11/1/09–1/1/32 | 7,335 | 7,815 | ||||
| 1,2 | Federal Home Loan Mortgage Corp. | 8.500 | % | 4/1/10–7/1/31 | 1,289 | 1,383 | ||||
| 1,2 | Federal Home Loan Mortgage Corp. | 9.000 | % | 7/1/16–3/1/31 | 843 | 907 | ||||
| 1,2 | Federal Home Loan Mortgage Corp. | 9.500 | % | 4/1/16–6/1/25 | 187 | 202 | ||||
| 1,2 | Federal Home Loan Mortgage Corp. | 10.000 | % | 7/1/09–4/1/25 | 60 | 62 | ||||
| 1,2 | Federal National Mortgage Assn. | 4.000 | % | 9/1/10–6/1/19 | 85,447 | 87,219 | ||||
| 1,2 | Federal National Mortgage Assn. | 4.500 | % | 2/1/10–9/1/38 | 973,939 | 999,948 | ||||
| 1,2 | Federal National Mortgage Assn. | 5.000 | % | 9/1/09–4/1/37 | 3,001,527 | 3,079,987 | ||||
| 1,2 | Federal National Mortgage Assn. | 5.500 | % | 3/1/09–9/1/38 | 4,072,142 | 4,187,815 | ||||
| 1,2 | Federal National Mortgage Assn. | 6.000 | % | 1/1/09–12/1/38 | 2,728,798 | 2,817,169 | ||||
| 1,2 | Federal National Mortgage Assn. | 6.500 | % | 1/1/09–7/1/38 | 994,026 | 1,034,477 | ||||
| 1,2 | Federal National Mortgage Assn. | 7.000 | % | 5/1/09–11/1/38 | 297,872 | 310,988 | ||||
| 1,2 | Federal National Mortgage Assn. | 7.500 | % | 5/1/10–12/1/32 | 13,749 | 14,491 | ||||
| 1,2 | Federal National Mortgage Assn. | 8.000 | % | 1/1/10–9/1/31 | 4,108 | 4,383 | ||||
| 1,2 | Federal National Mortgage Assn. | 8.500 | % | 7/1/10–5/1/32 | 1,586 | 1,703 | ||||
| 1,2 | Federal National Mortgage Assn. | 9.000 | % | 2/1/17–8/1/30 | 368 | 397 | ||||
| 1,2 | Federal National Mortgage Assn. | 9.500 | % | 7/1/10–11/1/25 | 487 | 526 | ||||
| 1,2 | Federal National Mortgage Assn. | 10.000 | % | 10/1/14–11/1/19 | 102 | 108 | ||||
| 1,2 | Federal National Mortgage Assn. | 10.500 | % | 3/1/11–8/1/20 | 5 | 5 | ||||
| 1,2 | Federal National Mortgage Assn. | 11.000 | % | 9/1/19 | 6 | 6 | ||||
| 2 | Government National Mortgage Assn. | 4.000 | % | 8/15/18–9/15/18 | 1,649 | 1,691 | ||||
| 2 | Government National Mortgage Assn. | 4.500 | % | 6/15/18–2/1/37 | 46,568 | 47,603 | ||||
| 2 | Government National Mortgage Assn. | 5.000 | % | 11/15/17–1/1/39 | 461,828 | 474,733 | ||||
| 2 | Government National Mortgage Assn. | 5.500 | % | 3/15/15–1/1/39 | 1,041,675 | 1,074,113 | ||||
| 2 | Government National Mortgage Assn. | 6.000 | % | 3/15/09–12/15/38 | 954,356 | 985,122 | ||||
| 2 | Government National Mortgage Assn. | 6.500 | % | 2/15/09–9/15/38 | 327,988 | 340,812 | ||||
| 2 | Government National Mortgage Assn. | 7.000 | % | 2/15/09–9/15/36 | 25,323 | 26,555 | ||||
| 2 | Government National Mortgage Assn. | 7.250 | % | 9/15/25 | 50 | 53 | ||||
| 2 | Government National Mortgage Assn. | 7.500 | % | 9/15/09–6/15/32 | 9,503 | 10,041 | ||||
| 2 | Government National Mortgage Assn. | 7.750 | % | 2/15/30 | 6 | 6 | ||||
| 2 | Government National Mortgage Assn. | 8.000 | % | 7/15/09–12/15/30 | 6,354 | 6,777 | ||||
| 2 | Government National Mortgage Assn. | 8.500 | % | 5/15/10–3/15/31 | 1,397 | 1,501 | ||||
| 2 | Government National Mortgage Assn. | 9.000 | % | 6/15/09–2/15/31 | 2,861 | 3,056 | ||||
| 2 | Government National Mortgage Assn. | 9.500 | % | 5/15/16–9/15/25 | 671 | 723 | ||||
| 2 | Government National Mortgage Assn. | 10.000 | % | 2/15/18–2/15/25 | 270 | 293 | ||||
| 2 | Government National Mortgage Assn. | 10.500 | % | 7/15/15–4/15/25 | 209 | 231 | ||||
| 2 | Government National Mortgage Assn. | 11.000 | % | 1/15/10–11/15/15 | 25 | 28 | ||||
| 2 | Government National Mortgage Assn. | 11.500 | % | 3/15/10–4/15/16 | 31 | 32 | ||||
| 24,078,612 | ||||||||||
| Nonconventional Mortgage-Backed Securities (3.0%) | ||||||||||
| 1,2 | Federal Home Loan Mortgage Corp. | 4.098 | % | 4/1/35 | 984 | 989 | ||||
| 1,2 | Federal Home Loan Mortgage Corp. | 4.379 | % | 1/1/35 | 1,014 | 1,025 | ||||
| 1,2 | Federal Home Loan Mortgage Corp. | 4.381 | % | 12/1/34 | 19,715 | 19,521 | ||||
| 1,2 | Federal Home Loan Mortgage Corp. | 4.580 | % | 9/1/34 | 10,041 | 9,885 | ||||
| 1,2 | Federal Home Loan Mortgage Corp. | 4.596 | % | 11/1/34 | 15,066 | 15,134 | ||||
| 1,2 | Federal Home Loan Mortgage Corp. | 4.599 | % | 4/1/35 | 10,475 | 10,517 | ||||
| 1,2 | Federal Home Loan Mortgage Corp. | 4.630 | % | 12/1/35 | 13,627 | 13,688 | ||||
| 1,2 | Federal Home Loan Mortgage Corp. | 4.653 | % | 7/1/35 | 13,339 | 13,403 | ||||
| 1,2 | Federal Home Loan Mortgage Corp. | 4.676 | % | 12/1/34 | 7,167 | 7,213 | ||||
| 1,2 | Federal Home Loan Mortgage Corp. | 4.796 | % | 7/1/35 | 24,979 | 25,173 | ||||
Page 5
| Vanguard® Total Bond Market Index Fund | ||||||||||
| Schedule of Investments | ||||||||||
| December 31, 2008 | ||||||||||
| Face | Market | |||||||||
| Maturity | Amount | Value | ||||||||
| Coupon | Date | ($ | 000 | ) | ($ | 000 | ) | |||
| 1,2 | Federal Home Loan Mortgage Corp. | 4.804 | % | 3/1/36 | 23,027 | 23,215 | ||||
| 1,2 | Federal Home Loan Mortgage Corp. | 4.999 | % | 5/1/35 | 17,006 | 17,197 | ||||
| 1,2 | Federal Home Loan Mortgage Corp. | 5.033 | % | 7/1/38 | 13,377 | 13,486 | ||||
| 1,2 | Federal Home Loan Mortgage Corp. | 5.239 | % | 3/1/37 | 12,409 | 12,558 | ||||
| 1,2 | Federal Home Loan Mortgage Corp. | 5.262 | % | 3/1/36 | 18,482 | 18,760 | ||||
| 1,2 | Federal Home Loan Mortgage Corp. | 5.276 | % | 12/1/36 | 11,678 | 11,774 | ||||
| 1,2 | Federal Home Loan Mortgage Corp. | 5.293 | % | 3/1/38 | 19,779 | 19,908 | ||||
| 1,2 | Federal Home Loan Mortgage Corp. | 5.327 | % | 12/1/35 | 11,332 | 11,535 | ||||
| 1,2 | Federal Home Loan Mortgage Corp. | 5.423 | % | 3/1/37 | 11,650 | 11,860 | ||||
| 1,2 | Federal Home Loan Mortgage Corp. | 5.431 | % | 4/1/37 | 22,200 | 22,602 | ||||
| 1,2 | Federal Home Loan Mortgage Corp. | 5.485 | % | 2/1/36 | 15,504 | 15,775 | ||||
| 1,2 | Federal Home Loan Mortgage Corp. | 5.549 | % | 7/1/36 | 13,715 | 13,965 | ||||
| 1,2 | Federal Home Loan Mortgage Corp. | 5.565 | % | 1/1/37 | 8,721 | 8,778 | ||||
| 1,2 | Federal Home Loan Mortgage Corp. | 5.568 | % | 6/1/37 | 8,411 | 8,546 | ||||
| 1,2 | Federal Home Loan Mortgage Corp. | 5.576 | % | 5/1/36 | 22,155 | 22,571 | ||||
| 1,2 | Federal Home Loan Mortgage Corp. | 5.599 | % | 4/1/37 | 16,624 | 16,973 | ||||
| 1,2 | Federal Home Loan Mortgage Corp. | 5.676 | % | 12/1/36 | 22,882 | 23,344 | ||||
| 1,2 | Federal Home Loan Mortgage Corp. | 5.689 | % | 3/1/37 | 30,264 | 30,892 | ||||
| 1,2 | Federal Home Loan Mortgage Corp. | 5.703 | % | 9/1/36 | 46,102 | 47,145 | ||||
| 1,2 | Federal Home Loan Mortgage Corp. | 5.716 | % | 11/1/36 | 9,933 | 10,165 | ||||
| 1,2 | Federal Home Loan Mortgage Corp. | 5.770 | % | 5/1/36 | 18,885 | 19,347 | ||||
| 1,2 | Federal Home Loan Mortgage Corp. | 5.777 | % | 4/1/37 | 169 | 172 | ||||
| 1,2 | Federal Home Loan Mortgage Corp. | 5.785 | % | 3/1/37 | 7,245 | 7,418 | ||||
| 1,2 | Federal Home Loan Mortgage Corp. | 5.820 | % | 10/1/37 | 30,471 | 31,226 | ||||
| 1,2 | Federal Home Loan Mortgage Corp. | 5.828 | % | 4/1/37 | 40,567 | 41,488 | ||||
| 1,2 | Federal Home Loan Mortgage Corp. | 5.830 | % | 6/1/37 | 12,282 | 12,589 | ||||
| 1,2 | Federal Home Loan Mortgage Corp. | 5.857 | % | 3/1/37 | 1,682 | 1,725 | ||||
| 1,2 | Federal Home Loan Mortgage Corp. | 5.864 | % | 6/1/37 | 18,619 | 19,101 | ||||
| 1,2 | Federal Home Loan Mortgage Corp. | 5.874 | % | 12/1/36 | 9,190 | 9,416 | ||||
| 1,2 | Federal Home Loan Mortgage Corp. | 5.881 | % | 5/1/37 | 27,062 | 27,683 | ||||
| 1,2 | Federal Home Loan Mortgage Corp. | 5.939 | % | 1/1/37 | 8,652 | 8,878 | ||||
| 1,2 | Federal Home Loan Mortgage Corp. | 5.967 | % | 10/1/37 | 4,695 | 4,826 | ||||
| 1,2 | Federal Home Loan Mortgage Corp. | 6.056 | % | 3/1/37 | 1,228 | 1,260 | ||||
| 1,2 | Federal Home Loan Mortgage Corp. | 6.061 | % | 3/1/37 | 932 | 957 | ||||
| 1,2 | Federal Home Loan Mortgage Corp. | 6.091 | % | 8/1/37 | 22,783 | 23,418 | ||||
| 1,2 | Federal Home Loan Mortgage Corp. | 6.109 | % | 12/1/36 | 18,614 | 19,188 | ||||
| 1,2 | Federal Home Loan Mortgage Corp. | 6.128 | % | 8/1/37 | 7,719 | 7,932 | ||||
| 1,2 | Federal Home Loan Mortgage Corp. | 6.390 | % | 6/1/37 | 18,839 | 19,467 | ||||
| 1,2 | Federal Home Loan Mortgage Corp. | 6.511 | % | 2/1/37 | 14,394 | 14,942 | ||||
| 1,2 | Federal National Mortgage Assn. | 4.008 | % | 7/1/35 | 11,199 | 11,102 | ||||
| 1,2 | Federal National Mortgage Assn. | 4.135 | % | 5/1/34 | 10,339 | 10,321 | ||||
| 1,2 | Federal National Mortgage Assn. | 4.417 | % | 8/1/35 | 30,387 | 30,465 | ||||
| 1,2 | Federal National Mortgage Assn. | 4.425 | % | 7/1/35 | 10,109 | 10,140 | ||||
| 1,2 | Federal National Mortgage Assn. | 4.574 | % | 1/1/35 | 11,911 | 11,914 | ||||
| 1,2 | Federal National Mortgage Assn. | 4.579 | % | 11/1/34 | 26,533 | 26,559 | ||||
| 1,2 | Federal National Mortgage Assn. | 4.582 | % | 12/1/34 | 16,283 | 16,149 | ||||
| 1,2 | Federal National Mortgage Assn. | 4.618 | % | 8/1/35 | 17,633 | 17,714 | ||||
| 1,2 | Federal National Mortgage Assn. | 4.621 | % | 10/1/36 | 8,630 | 8,680 | ||||
| 1,2 | Federal National Mortgage Assn. | 4.629 | % | 11/1/33 | 9,117 | 9,169 | ||||
| 1,2 | Federal National Mortgage Assn. | 4.633 | % | 9/1/34 | 7,104 | 7,142 | ||||
| 1,2 | Federal National Mortgage Assn. | 4.677 | % | 10/1/34 | 11,772 | 11,679 | ||||
| 1,2 | Federal National Mortgage Assn. | 4.691 | % | 11/1/34 | 14,354 | 14,170 | ||||
| 1,2 | Federal National Mortgage Assn. | 4.725 | % | 8/1/35 | 10,036 | 10,035 | ||||
| 1,2 | Federal National Mortgage Assn. | 4.740 | % | 9/1/34 | 5,040 | 5,067 | ||||
| 1,2 | Federal National Mortgage Assn. | 4.751 | % | 6/1/34 | 9,785 | 9,861 | ||||
| 1,2 | Federal National Mortgage Assn. | 4.756 | % | 10/1/34 | 16,766 | 16,698 | ||||
| 1,2 | Federal National Mortgage Assn. | 4.769 | % | 5/1/35 | 5,957 | 6,038 | ||||
| 1,2 | Federal National Mortgage Assn. | 4.771 | % | 4/1/36 | 33,090 | 33,694 | ||||
| 1,2 | Federal National Mortgage Assn. | 4.794 | % | 9/1/35 | 12,228 | 12,326 | ||||
| 1,2 | Federal National Mortgage Assn. | 4.818 | % | 12/1/35 | 23,379 | 23,570 | ||||
| 1,2 | Federal National Mortgage Assn. | 4.835 | % | 4/1/37 | 12,672 | 12,820 | ||||
| 1,2 | Federal National Mortgage Assn. | 4.850 | % | 11/1/35 | 35,652 | 35,961 | ||||
| 1,2 | Federal National Mortgage Assn. | 4.865 | % | 7/1/35 | 15,322 | 15,458 | ||||
| 1,2 | Federal National Mortgage Assn. | 4.937 | % | 7/1/35 | 7,083 | 7,154 | ||||
| 1,2 | Federal National Mortgage Assn. | 4.964 | % | 11/1/34 | 5,201 | 5,262 | ||||
| 1,2 | Federal National Mortgage Assn. | 4.965 | % | 11/1/33 | 4,761 | 4,812 | ||||
Page 6
| Vanguard® Total Bond Market Index Fund | |||||||||||
| Schedule of Investments | |||||||||||
| December 31, 2008 | |||||||||||
| Face | Market | ||||||||||
| Maturity | Amount | Value | |||||||||
| Coupon | Date | ($ | 000 | ) | ($ | 000 | ) | ||||
| 1,2 | Federal National Mortgage Assn. | 4.968 | % | 10/1/35 | 24,418 | 24,676 | |||||
| 1,2 | Federal National Mortgage Assn. | 4.981 | % | 5/1/37 | 26,718 | 27,026 | |||||
| 1,2 | Federal National Mortgage Assn. | 5.020 | % | 7/1/38 | 9,698 | 9,778 | |||||
| 1,2 | Federal National Mortgage Assn. | 5.026 | % | 12/1/33 | 6,197 | 6,270 | |||||
| 1,2 | Federal National Mortgage Assn. | 5.030 | % | 8/1/37 | 44,704 | 45,273 | |||||
| 1,2 | Federal National Mortgage Assn. | 5.049 | % | 11/1/35 | 24,458 | 24,747 | |||||
| 1,2 | Federal National Mortgage Assn. | 5.059 | % | 2/1/36 | 11,578 | 11,714 | |||||
| 1,2 | Federal National Mortgage Assn. | 5.074 | % | 12/1/35 | 28,691 | 29,039 | |||||
| 1,2 | Federal National Mortgage Assn. | 5.108 | % | 1/1/36 | 13,558 | 13,725 | |||||
| 1,2 | Federal National Mortgage Assn. | 5.129 | % | 12/1/35 | 29,842 | 30,223 | |||||
| 1,2 | Federal National Mortgage Assn. | 5.171 | % | 8/1/38 | 1,759 | 1,776 | |||||
| 1,2 | Federal National Mortgage Assn. | 5.178 | % | 3/1/38 | 18,863 | 18,935 | |||||
| 1,2 | Federal National Mortgage Assn. | 5.254 | % | 3/1/37 | 16,901 | 17,184 | |||||
| 1,2 | Federal National Mortgage Assn. | 5.317 | % | 7/1/38 | 1,675 | 1,698 | |||||
| 1,2 | Federal National Mortgage Assn. | 5.322 | % | 12/1/35 | 8,954 | 9,108 | |||||
| 1,2 | Federal National Mortgage Assn. | 5.382 | % | 2/1/36 | 16,673 | 16,932 | |||||
| 1,2 | Federal National Mortgage Assn. | 5.456 | % | 2/1/36 | 18,806 | 19,114 | |||||
| 1,2 | Federal National Mortgage Assn. | 5.470 | % | 5/1/37 | 6,989 | 7,104 | |||||
| 1,2 | Federal National Mortgage Assn. | 5.482 | % | 4/1/37 | 1,862 | 1,896 | |||||
| 1,2 | Federal National Mortgage Assn. | 5.575 | % | 1/1/37 | 15,336 | 15,634 | |||||
| 1,2 | Federal National Mortgage Assn. | 5.593 | % | 7/1/36 | 12,341 | 12,573 | |||||
| 1,2 | Federal National Mortgage Assn. | 5.621 | % | 5/1/36 | 6,875 | 7,010 | |||||
| 1,2 | Federal National Mortgage Assn. | 5.627 | % | 3/1/37 | 13,907 | 14,193 | |||||
| 1,2 | Federal National Mortgage Assn. | 5.658 | % | 6/1/36 | 16,288 | 16,594 | |||||
| 1,2 | Federal National Mortgage Assn. | 5.673 | % | 6/1/37 | 10,134 | 10,359 | |||||
| 1,2 | Federal National Mortgage Assn. | 5.676 | % | 3/1/37 | 43,894 | 44,831 | |||||
| 1,2 | Federal National Mortgage Assn. | 5.687 | % | 2/1/37 | 17,074 | 17,443 | |||||
| 1,2 | Federal National Mortgage Assn. | 5.695 | % | 2/1/37 | 32,728 | 33,409 | |||||
| 1,2 | Federal National Mortgage Assn. | 5.710 | % | 9/1/36 | 12,719 | 12,980 | |||||
| 1,2 | Federal National Mortgage Assn. | 5.728 | % | 3/1/37 | 32,358 | 33,063 | |||||
| 1,2 | Federal National Mortgage Assn. | 5.741 | % | 12/1/36 | 48,953 | 49,976 | |||||
| 1,2 | Federal National Mortgage Assn. | 5.754 | % | 12/1/37 | 33,919 | 34,514 | |||||
| 1,2 | Federal National Mortgage Assn. | 5.756 | % | 4/1/36 | 13,707 | 13,985 | |||||
| 1,2 | Federal National Mortgage Assn. | 5.777 | % | 1/1/36 | 7,526 | 7,626 | |||||
| 1,2 | Federal National Mortgage Assn. | 5.780 | % | 4/1/37 | 11,995 | 12,262 | |||||
| 1,2 | Federal National Mortgage Assn. | 5.799 | % | 4/1/37 | 20,969 | 21,414 | |||||
| 1,2 | Federal National Mortgage Assn. | 5.822 | % | 6/1/37 | 29,424 | 30,106 | |||||
| 1,2 | Federal National Mortgage Assn. | 5.888 | % | 9/1/36 | 15,033 | 15,369 | |||||
| 1,2 | Federal National Mortgage Assn. | 5.947 | % | 11/1/36 | 14,496 | 14,884 | |||||
| 1,2 | Federal National Mortgage Assn. | 6.007 | % | 10/1/37 | 23,748 | 24,303 | |||||
| 1,2 | Federal National Mortgage Assn. | 6.049 | % | 4/1/36 | 13,898 | 14,278 | |||||
| 1,2 | Federal National Mortgage Assn. | 6.055 | % | 8/1/37 | 18,987 | 19,531 | |||||
| 1,2 | Federal National Mortgage Assn. | 6.130 | % | 6/1/36 | 3,259 | 3,355 | |||||
| 1,2 | Federal National Mortgage Assn. | 6.611 | % | 9/1/37 | 25,913 | 26,825 | |||||
| 2 | Government National Mortgage Assn. | 5.375 | % | 6/20/29 | 482 | 485 | |||||
| 2 | Government National Mortgage Assn. | 7.900 | % | 2/15/21 | 6 | 7 | |||||
| 1,955,817 | |||||||||||
| Total U.S. Government and Agency Obligations (Cost $45,348,204) | 47,852,644 | ||||||||||
| Corporate Bonds (22.8%) | |||||||||||
| Asset-Backed/Commercial Mortgage-Backed Securities (4.7%) | |||||||||||
| 2,3,4 American Express Credit Account Master Trust | 1.185 | % | 8/15/11 | 17,350 | 17,332 | ||||||
| 2,4 | American Express Credit Account Master Trust | 1.275 | % | 9/15/11 | 40,000 | 39,779 | |||||
| 3 | BA Covered Bond Issuer | 5.500 | % | 6/14/12 | 22,700 | 23,311 | |||||
| 2 | Banc of America Commercial Mortgage, Inc. | 5.787 | % | 5/11/35 | 18,210 | 15,957 | |||||
| 2 | Banc of America Commercial Mortgage, Inc. | 6.503 | % | 4/15/36 | 7,391 | 6,792 | |||||
| 2 | Banc of America Commercial Mortgage, Inc. | 4.050 | % | 11/10/38 | 7,950 | 7,434 | |||||
| 2 | Banc of America Commercial Mortgage, Inc. | 4.153 | % | 11/10/38 | 5,000 | 4,325 | |||||
| 2,4 | Banc of America Commercial Mortgage, Inc. | 5.319 | % | 6/10/39 | 12,500 | 10,667 | |||||
| 2 | Banc of America Commercial Mortgage, Inc. | 4.877 | % | 7/10/42 | 33,400 | 26,480 | |||||
| 2 | Banc of America Commercial Mortgage, Inc. | 5.118 | % | 7/11/43 | 18,555 | 18,165 | |||||
| 2 | Banc of America Commercial Mortgage, Inc. | 5.372 | % | 9/10/45 | 21,855 | 16,657 | |||||
| 2 | Banc of America Commercial Mortgage, Inc. | 5.115 | % | 10/10/45 | 17,525 | 13,579 | |||||
| 2 | Banc of America Commercial Mortgage, Inc. | 5.634 | % | 7/10/46 | 23,375 | 18,224 | |||||
| 2 | Banc of America Commercial Mortgage, Inc. | 5.414 | % | 9/10/47 | 10,900 | 8,398 | |||||
Page 7
| Vanguard® Total Bond Market Index Fund | ||||||||||
| Schedule of Investments | ||||||||||
| December 31, 2008 | ||||||||||
| Face | Market | |||||||||
| Maturity | Amount | Value | ||||||||
| Coupon | Date | ($ | 000 | ) | ($ | 000 | ) | |||
| 2,4 | Banc of America Commercial Mortgage, Inc. | 6.158 | % | 2/10/51 | 32,900 | 24,590 | ||||
| 2,4 | Bank of America Credit Card Trust | 1.415 | % | 4/16/12 | 23,886 | 22,735 | ||||
| 2 | Bank of America Credit Card Trust | 4.720 | % | 5/15/13 | 10,600 | 9,955 | ||||
| 2 | Bear Stearns Commercial Mortgage Securities, Inc. | 5.610 | % | 11/15/33 | 9,900 | 8,803 | ||||
| 2 | Bear Stearns Commercial Mortgage Securities, Inc. | 5.463 | % | 4/12/38 | 26,000 | 20,030 | ||||
| 2,4 | Bear Stearns Commercial Mortgage Securities, Inc. | 5.464 | % | 4/12/38 | 1,525 | 1,436 | ||||
| 2,4 | Bear Stearns Commercial Mortgage Securities, Inc. | 5.464 | % | 4/12/38 | 4,025 | 2,145 | ||||
| 2 | Bear Stearns Commercial Mortgage Securities, Inc. | 4.830 | % | 8/15/38 | 20,000 | 17,637 | ||||
| 2 | Bear Stearns Commercial Mortgage Securities, Inc. | 5.456 | % | 3/11/39 | 48,250 | 37,115 | ||||
| 2 | Bear Stearns Commercial Mortgage Securities, Inc. | 4.680 | % | 8/13/39 | 10,800 | 8,756 | ||||
| 2 | Bear Stearns Commercial Mortgage Securities, Inc. | 4.740 | % | 3/13/40 | 9,000 | 7,411 | ||||
| 2 | Bear Stearns Commercial Mortgage Securities, Inc. | 5.660 | % | 6/11/40 | 32,425 | 25,101 | ||||
| 2 | Bear Stearns Commercial Mortgage Securities, Inc. | 5.405 | % | 12/11/40 | 1,168 | 919 | ||||
| 2 | Bear Stearns Commercial Mortgage Securities, Inc. | 4.521 | % | 11/11/41 | 4,950 | 4,154 | ||||
| 2 | Bear Stearns Commercial Mortgage Securities, Inc. | 5.742 | % | 9/11/42 | 16,125 | 11,132 | ||||
| 2 | Bear Stearns Commercial Mortgage Securities, Inc. | 5.793 | % | 9/11/42 | 6,525 | 5,307 | ||||
| 2 | Bear Stearns Commercial Mortgage Securities, Inc. | 5.127 | % | 10/12/42 | 12,250 | 11,518 | ||||
| 2 | Bear Stearns Commercial Mortgage Securities, Inc. | 5.613 | % | 6/11/50 | 11,750 | 8,673 | ||||
| 2 | Bear Stearns Commercial Mortgage Securities, Inc. | 5.694 | % | 6/11/50 | 55,550 | 38,298 | ||||
| 2 | Bear Stearns Commercial Mortgage Securities, Inc. | 5.700 | % | 6/11/50 | 9,915 | 6,806 | ||||
| 2,4 | Bear Stearns Commercial Mortgage Securities, Inc. | 5.915 | % | 6/11/50 | 8,118 | 3,450 | ||||
| 2,3,4 BMW Floorplan Master Owner Trust | 0.961 | % | 9/17/11 | 28,000 | 24,336 | |||||
| 2 | Capital Auto Receivables Asset Trust | 4.680 | % | 10/15/12 | 21,400 | 19,870 | ||||
| 2,4 | Capital One Multi-Asset Execution Trust | 1.285 | % | 1/17/12 | 50,000 | 49,638 | ||||
| 2 | Capital One Multi-Asset Execution Trust | 5.300 | % | 2/18/14 | 7,325 | 6,765 | ||||
| 2 | Capital One Multi-Asset Execution Trust | 5.050 | % | 12/17/18 | 43,450 | 32,892 | ||||
| 2 | Capital One Multi-Asset Execution Trust | 5.750 | % | 7/15/20 | 3,950 | 3,105 | ||||
| 2,4 | Capital One Prime Auto Receivables Trust | 1.215 | % | 4/15/11 | 16,575 | 16,126 | ||||
| 2 | CDC Commercial Mortgage Trust | 5.676 | % | 11/15/30 | 25,000 | 22,683 | ||||
| 2 | Chase Commercial Mortgage Securities Corp. | 7.757 | % | 4/15/32 | 1,893 | 1,821 | ||||
| 2,4 | Chase Credit Card Master Trust | 1.365 | % | 9/15/11 | 7,000 | 6,874 | ||||
| 2,4 | Chase Issuance Trust | 1.215 | % | 11/15/11 | 30,820 | 29,476 | ||||
| 2,4 | Chase Issuance Trust | 1.215 | % | 2/15/12 | 23,678 | 23,140 | ||||
| 2 | Chase Issuance Trust | 4.650 | % | 12/17/12 | 39,225 | 37,881 | ||||
| 2 | Chase Issuance Trust | 4.650 | % | 3/15/15 | 38,500 | 34,742 | ||||
| 2 | Chase Issuance Trust | 5.400 | % | 7/15/15 | 12,350 | 11,350 | ||||
| 2 | CIT Group Home Equity Loan Trust | 6.200 | % | 2/25/30 | 1,345 | 1,146 | ||||
| 2 | Citibank Credit Card Issuance Trust | 4.850 | % | 2/10/11 | 775 | 774 | ||||
| 2 | Citibank Credit Card Issuance Trust | 4.150 | % | 7/7/17 | 4,150 | 3,298 | ||||
| 2 | Citibank Credit Card Issuance Trust | 5.650 | % | 9/20/19 | 4,150 | 3,446 | ||||
| 2 | Citibank Credit Card Master Trust | 5.875 | % | 3/10/11 | 1,250 | 1,246 | ||||
| 2 | Citigroup Commercial Mortgage Trust | 4.623 | % | 10/15/41 | 4,100 | 2,792 | ||||
| 2,4 | Citigroup Commercial Mortgage Trust | 5.724 | % | 3/15/49 | 17,175 | 13,658 | ||||
| 2,4 | Citigroup Commercial Mortgage Trust | 5.700 | % | 12/10/49 | 12,825 | 8,961 | ||||
| 2,4 | Citigroup/Deutsche Bank Commercial Mortgage Trust | 5.225 | % | 7/15/44 | 8,300 | 4,782 | ||||
| 2 | Citigroup/Deutsche Bank Commercial Mortgage Trust | 5.225 | % | 7/15/44 | 38,051 | 29,832 | ||||
| 2 | Citigroup/Deutsche Bank Commercial Mortgage Trust | 5.886 | % | 11/15/44 | 22,000 | 15,365 | ||||
| 2 | Citigroup/Deutsche Bank Commercial Mortgage Trust | 5.205 | % | 12/11/49 | 40,075 | 30,318 | ||||
| 2 | Citigroup/Deutsche Bank Commercial Mortgage Trust | 5.322 | % | 12/11/49 | 23,825 | 16,359 | ||||
| 2,3 | Commercial Mortgage Lease-Backed Certificates | 6.746 | % | 6/20/31 | 13,627 | 14,275 | ||||
| 2 | Commercial Mortgage Pass Through Certificates | 4.084 | % | 6/10/38 | 8,500 | 6,745 | ||||
| 2 | Commercial Mortgage Pass Through Certificates | 5.116 | % | 6/10/44 | 30,550 | 23,781 | ||||
| 2 | Commercial Mortgage Pass-Through Certificates | 5.767 | % | 6/10/46 | 19,500 | 15,520 | ||||
| 2 | Commercial Mortgage Pass-Through Certificates | 5.248 | % | 12/10/46 | 4,023 | 3,638 | ||||
| 2,4 | Commercial Mortgage Pass-Through Certificates | 5.816 | % | 12/10/49 | 35,098 | 24,667 | ||||
| 2 | Countrywide Home Loans | 4.783 | % | 5/25/33 | 5,908 | 5,519 | ||||
| 2 | Credit Suisse First Boston Mortgage Securities Corp. | 6.380 | % | 12/18/35 | 4,416 | 4,058 | ||||
| 2,4 | Credit Suisse First Boston Mortgage Securities Corp. | 4.750 | % | 1/15/37 | 19,920 | 12,554 | ||||
| 2,4 | Credit Suisse First Boston Mortgage Securities Corp. | 5.014 | % | 2/15/38 | 17,300 | 13,701 | ||||
| 2 | Credit Suisse First Boston Mortgage Securities Corp. | 3.936 | % | 5/15/38 | 13,530 | 10,723 | ||||
| 2,4 | Credit Suisse First Boston Mortgage Securities Corp. | 5.100 | % | 8/15/38 | 725 | 438 | ||||
| 2 | Credit Suisse First Boston Mortgage Securities Corp. | 5.100 | % | 8/15/38 | 39,700 | 30,884 | ||||
| 2 | Credit Suisse First Boston Mortgage Securities Corp. | 7.290 | % | 9/15/41 | 10,882 | 10,668 | ||||
| 2 | Credit Suisse Mortgage Capital Certificates | 5.826 | % | 6/15/38 | 31,533 | 25,165 | ||||
| 2 | Credit Suisse Mortgage Capital Certificates | 5.551 | % | 2/15/39 | 55,600 | 42,838 | ||||
| 2,4 | Credit Suisse Mortgage Capital Certificates | 5.723 | % | 6/15/39 | 39,285 | 27,524 | ||||
Page 8
| Vanguard® Total Bond Market Index Fund | ||||||||||
| Schedule of Investments | ||||||||||
| December 31, 2008 | ||||||||||
| Face | Market | |||||||||
| Maturity | Amount | Value | ||||||||
| Coupon | Date | ($ | 000 | ) | ($ | 000 | ) | |||
| 2 | Credit Suisse Mortgage Capital Certificates | 5.311 | % | 12/15/39 | 34,760 | 26,255 | ||||
| 2 | Credit Suisse Mortgage Capital Certificates | 5.383 | % | 2/15/40 | 7,575 | 5,221 | ||||
| 2,4 | CWCapital Cobalt | 5.820 | % | 5/15/46 | 31,925 | 22,419 | ||||
| 2,4 | CWCapital Cobalt | 5.484 | % | 4/15/47 | 2,200 | 1,511 | ||||
| 2 | DaimlerChrysler Auto Trust | 4.200 | % | 7/8/10 | 3,672 | 3,660 | ||||
| 2 | DaimlerChrysler Auto Trust | 5.330 | % | 8/8/10 | 7,806 | 7,799 | ||||
| 2 | DaimlerChrysler Auto Trust | 3.700 | % | 6/8/12 | 9,500 | 8,281 | ||||
| 2 | Discover Card Master Trust | 5.100 | % | 10/15/13 | 1,200 | 1,103 | ||||
| 2 | Discover Card Master Trust | 5.650 | % | 12/15/15 | 27,800 | 23,773 | ||||
| 2 | Discover Card Master Trust | 5.650 | % | 3/16/20 | 3,850 | 2,866 | ||||
| 1,2 | Federal Housing Administration | 7.430 | % | 10/1/20 | 4 | 5 | ||||
| 2 | Fifth Third Auto Trust | 4.070 | % | 1/17/12 | 24,000 | 21,965 | ||||
| 2 | First Union National Bank Commercial Mortgage Trust | 6.223 | % | 12/12/33 | 12,550 | 11,286 | ||||
| 2,4 | First Union National Bank Commercial Mortgage Trust | 6.618 | % | 10/15/35 | 15,876 | 14,683 | ||||
| 2 | Ford Credit Auto Owner Trust | 4.370 | % | 10/15/12 | 18,800 | 13,213 | ||||
| 2 | GE Capital Commercial Mortgage Corp. | 6.531 | % | 5/15/33 | 17,000 | 15,722 | ||||
| 2 | GE Capital Commercial Mortgage Corp. | 6.290 | % | 8/11/33 | 3,000 | 2,738 | ||||
| 2 | GE Capital Commercial Mortgage Corp. | 5.994 | % | 12/10/35 | 1,576 | 1,498 | ||||
| 2 | GE Capital Commercial Mortgage Corp. | 6.269 | % | 12/10/35 | 14,200 | 12,886 | ||||
| 2 | GE Capital Commercial Mortgage Corp. | 5.145 | % | 7/10/37 | 1,340 | 1,110 | ||||
| 2 | GE Capital Commercial Mortgage Corp. | 4.996 | % | 12/10/37 | 20,000 | 16,977 | ||||
| 2,4 | GE Capital Commercial Mortgage Corp. | 5.338 | % | 3/10/44 | 38,290 | 29,201 | ||||
| 2 | GE Capital Credit Card Master Note Trust | 5.080 | % | 9/15/12 | 43,350 | 41,866 | ||||
| 2 | GMAC Commercial Mortgage Securities, Inc. | 7.455 | % | 8/16/33 | 13,352 | 12,676 | ||||
| 2 | GMAC Commercial Mortgage Securities, Inc. | 6.465 | % | 4/15/34 | 13,518 | 12,710 | ||||
| 2 | GMAC Commercial Mortgage Securities, Inc. | 6.700 | % | 4/15/34 | 17,050 | 15,723 | ||||
| 2 | GMAC Commercial Mortgage Securities, Inc. | 4.908 | % | 3/10/38 | 2,000 | 1,604 | ||||
| 2 | GMAC Commercial Mortgage Securities, Inc. | 4.646 | % | 4/10/40 | 4,900 | 4,372 | ||||
| 2 | GMAC Commercial Mortgage Securities, Inc. | 4.864 | % | 12/10/41 | 2,250 | 1,785 | ||||
| 2 | Greenwich Capital Commercial Funding Corp. | 4.948 | % | 1/11/35 | 8,250 | 6,995 | ||||
| 2 | Greenwich Capital Commercial Funding Corp. | 4.533 | % | 1/5/36 | 4,325 | 3,834 | ||||
| 2 | Greenwich Capital Commercial Funding Corp. | 4.915 | % | 1/5/36 | 15,250 | 12,337 | ||||
| 2 | Greenwich Capital Commercial Funding Corp. | 5.317 | % | 6/10/36 | 17,395 | 14,845 | ||||
| 2 | Greenwich Capital Commercial Funding Corp. | 5.117 | % | 4/10/37 | 7,471 | 7,005 | ||||
| 2 | Greenwich Capital Commercial Funding Corp. | 5.224 | % | 4/10/37 | 29,872 | 23,322 | ||||
| 2 | Greenwich Capital Commercial Funding Corp. | 4.799 | % | 8/10/42 | 23,080 | 17,714 | ||||
| 2 | GS Mortgage Securities Corp. II | 5.506 | % | 4/10/38 | 17,375 | 16,327 | ||||
| 2,4 | GS Mortgage Securities Corp. II | 5.553 | % | 4/10/38 | 11,900 | 9,170 | ||||
| 2 | GS Mortgage Securities Corp. II | 5.396 | % | 8/10/38 | 31,360 | 25,498 | ||||
| 2 | GS Mortgage Securities Corp. II | 4.608 | % | 1/10/40 | 20,000 | 16,468 | ||||
| 2 | GS Mortgage Securities Corp. II | 5.799 | % | 8/10/45 | 13,245 | 9,346 | ||||
| 2 | Honda Auto Receivables Owner Trust | 5.300 | % | 7/21/10 | 3,263 | 3,257 | ||||
| 2 | Honda Auto Receivables Owner Trust | 5.120 | % | 10/15/10 | 21,308 | 21,154 | ||||
| 2 | Honda Auto Receivables Owner Trust | 4.880 | % | 9/18/14 | 9,375 | 8,720 | ||||
| 2 | JPMorgan Chase Commercial Mortgage Securities | 6.260 | % | 3/15/33 | 18,974 | 18,017 | ||||
| 2 | JPMorgan Chase Commercial Mortgage Securities | 5.050 | % | 12/12/34 | 11,800 | 9,995 | ||||
| 2 | JPMorgan Chase Commercial Mortgage Securities | 4.985 | % | 1/12/37 | 15,000 | 12,561 | ||||
| 2 | JPMorgan Chase Commercial Mortgage Securities | 5.255 | % | 7/12/37 | 1,790 | 1,554 | ||||
| 2 | JPMorgan Chase Commercial Mortgage Securities | 5.376 | % | 7/12/37 | 12,780 | 11,159 | ||||
| 2 | JPMorgan Chase Commercial Mortgage Securities | 4.824 | % | 9/12/37 | 3,450 | 3,101 | ||||
| 2,4 | JPMorgan Chase Commercial Mortgage Securities | 4.948 | % | 9/12/37 | 975 | 588 | ||||
| 2 | JPMorgan Chase Commercial Mortgage Securities | 4.404 | % | 1/12/39 | 13,195 | 10,308 | ||||
| 2,4 | JPMorgan Chase Commercial Mortgage Securities | 5.371 | % | 6/12/41 | 20,050 | 16,405 | ||||
| 2 | JPMorgan Chase Commercial Mortgage Securities | 5.160 | % | 4/15/43 | 28,761 | 27,704 | ||||
| 2,4 | JPMorgan Chase Commercial Mortgage Securities | 5.475 | % | 4/15/43 | 4,252 | 3,309 | ||||
| 2 | JPMorgan Chase Commercial Mortgage Securities | 5.875 | % | 4/15/45 | 32,300 | 25,859 | ||||
| 2 | JPMorgan Chase Commercial Mortgage Securities | 5.447 | % | 5/15/45 | 7,075 | 5,936 | ||||
| 2 | JPMorgan Chase Commercial Mortgage Securities | 5.803 | % | 6/15/49 | 44,150 | 34,280 | ||||
| 2 | JPMorgan Chase Commercial Mortgage Securities | 5.818 | % | 6/15/49 | 21,630 | 15,250 | ||||
| 2 | JPMorgan Chase Commercial Mortgage Securities | 5.794 | % | 2/12/51 | 42,405 | 29,415 | ||||
| 2 | JPMorgan Chase Commercial Mortgage Securities | 5.855 | % | 2/12/51 | 10,650 | 7,934 | ||||
| 2 | JPMorgan Chase Commercial Mortgage Securities | 5.716 | % | 2/15/51 | 12,341 | 8,454 | ||||
| 2,4 | JPMorgan Chase Commercial Mortgage Securities | 5.882 | % | 2/15/51 | 26,620 | 18,625 | ||||
| 2 | LB Commerical Conduit Mortgage Trust | 6.780 | % | 6/15/31 | 18,811 | 18,635 | ||||
| 2 | LB-UBS Commercial Mortgage Trust | 5.386 | % | 6/15/26 | 3,500 | 3,267 | ||||
| 2 | LB-UBS Commercial Mortgage Trust | 7.370 | % | 8/15/26 | 21,168 | 20,159 | ||||
Page 9
| Vanguard® Total Bond Market Index Fund | ||||||||||
| Schedule of Investments | ||||||||||
| December 31, 2008 | ||||||||||
| Face | Market | |||||||||
| Maturity | Amount | Value | ||||||||
| Coupon | Date | ($ | 000 | ) | ($ | 000 | ) | |||
| 2 | LB-UBS Commercial Mortgage Trust | 4.786 | % | 10/15/29 | 16,155 | 12,607 | ||||
| 2 | LB-UBS Commercial Mortgage Trust | 4.742 | % | 2/15/30 | 9,345 | 7,160 | ||||
| 2 | LB-UBS Commercial Mortgage Trust | 4.553 | % | 7/15/30 | 1,584 | 1,504 | ||||
| 2 | LB-UBS Commercial Mortgage Trust | 5.197 | % | 11/15/30 | 21,475 | 16,843 | ||||
| 2 | LB-UBS Commercial Mortgage Trust | 6.133 | % | 12/15/30 | 8,190 | 7,327 | ||||
| 2 | LB-UBS Commercial Mortgage Trust | 4.853 | % | 9/15/31 | 20,575 | 17,465 | ||||
| 2 | LB-UBS Commercial Mortgage Trust | 4.166 | % | 5/15/32 | 6,600 | 5,251 | ||||
| 2 | LB-UBS Commercial Mortgage Trust | 4.931 | % | 9/15/35 | 27,000 | 22,134 | ||||
| 2,4 | LB-UBS Commercial Mortgage Trust | 5.661 | % | 3/15/39 | 29,421 | 22,766 | ||||
| 2 | LB-UBS Commercial Mortgage Trust | 5.424 | % | 2/15/40 | 600 | 413 | ||||
| 2 | LB-UBS Commercial Mortgage Trust | 5.430 | % | 2/15/40 | 18,200 | 12,495 | ||||
| 2,4 | LB-UBS Commercial Mortgage Trust | 6.149 | % | 4/15/41 | 30,150 | 22,404 | ||||
| 2 | LB-UBS Commercial Mortgage Trust | 5.866 | % | 9/15/45 | 41,900 | 29,169 | ||||
| 2 | LB-UBS Commerical Mortgage Trust | 4.960 | % | 12/15/31 | 4,500 | 3,768 | ||||
| 2,4 | LB-UBS Commerical Mortgage Trust | 5.936 | % | 7/15/44 | 8,275 | 3,593 | ||||
| 2,4 | MBNA Credit Card Master Note Trust | 4.969 | % | 12/15/11 | 4,500 | 4,377 | ||||
| 2,4 | MBNA Credit Card Master Note Trust | 1.275 | % | 3/15/12 | 50,000 | 48,141 | ||||
| 2 | MBNA Master Credit Card Trust | 7.000 | % | 2/15/12 | 62,983 | 62,454 | ||||
| 2 | MBNA Master Credit Card Trust | 7.800 | % | 10/15/12 | 1,000 | 995 | ||||
| 2 | Merrill Lynch Mortgage Trust | 5.236 | % | 11/12/35 | 7,375 | 6,005 | ||||
| 2 | Merrill Lynch Mortgage Trust | 5.657 | % | 5/12/39 | 12,200 | 9,676 | ||||
| 2,4 | Merrill Lynch Mortgage Trust | 5.291 | % | 1/12/44 | 25,650 | 19,966 | ||||
| 2,4 | Merrill Lynch Mortgage Trust | 5.829 | % | 6/12/50 | 34,618 | 24,358 | ||||
| 2 | Merrill Lynch Mortgage Trust | 5.425 | % | 2/12/51 | 4,200 | 3,104 | ||||
| 2 | Merrill Lynch Mortgage Trust | 5.690 | % | 2/12/51 | 15,670 | 11,186 | ||||
| 2 | Merrill Lynch/Countrywide Commercial Mortgage Trust | 5.700 | % | 9/12/17 | 35,300 | 24,356 | ||||
| 2 | Merrill Lynch/Countrywide Commercial Mortgage Trust | 5.909 | % | 6/12/46 | 41,100 | 32,957 | ||||
| 2 | Merrill Lynch/Countrywide Commercial Mortgage Trust | 5.378 | % | 8/12/48 | 23,995 | 16,455 | ||||
| 2 | Merrill Lynch/Countrywide Commercial Mortgage Trust | 5.590 | % | 9/12/49 | 12,350 | 9,367 | ||||
| 2,4 | Morgan Stanley Capital I | 5.110 | % | 6/15/40 | 19,000 | 15,217 | ||||
| 2 | Morgan Stanley Capital I | 5.030 | % | 6/13/41 | 1,822 | 1,360 | ||||
| 2 | Morgan Stanley Capital I | 5.270 | % | 6/13/41 | 2,800 | 2,260 | ||||
| 2 | Morgan Stanley Capital I | 5.328 | % | 11/12/41 | 4,250 | 3,226 | ||||
| 2 | Morgan Stanley Capital I | 4.970 | % | 12/15/41 | 10,800 | 6,981 | ||||
| 2 | Morgan Stanley Capital I | 5.168 | % | 1/14/42 | 4,650 | 3,653 | ||||
| 2,4 | Morgan Stanley Capital I | 5.650 | % | 6/13/42 | 17,900 | 12,434 | ||||
| 2 | Morgan Stanley Capital I | 4.989 | % | 8/13/42 | 28,000 | 21,766 | ||||
| 2 | Morgan Stanley Capital I | 5.230 | % | 9/15/42 | 28,650 | 22,494 | ||||
| 2 | Morgan Stanley Capital I | 5.771 | % | 10/15/42 | 9,775 | 7,644 | ||||
| 2,4 | Morgan Stanley Capital I | 5.208 | % | 11/14/42 | 19,850 | 15,547 | ||||
| 2 | Morgan Stanley Capital I | 6.280 | % | 1/11/43 | 20,150 | 15,061 | ||||
| 2 | Morgan Stanley Capital I | 5.332 | % | 12/15/43 | 6,300 | 4,751 | ||||
| 2,4 | Morgan Stanley Capital I | 5.387 | % | 3/12/44 | 36,666 | 28,183 | ||||
| 2,4 | Morgan Stanley Capital I | 5.691 | % | 4/15/49 | 375 | 160 | ||||
| 2,4 | Morgan Stanley Capital I | 5.881 | % | 6/11/49 | 4,000 | 1,717 | ||||
| 2 | Morgan Stanley Capital I | 5.809 | % | 12/12/49 | 18,800 | 13,032 | ||||
| 2 | Morgan Stanley Capital I | 5.090 | % | 10/12/52 | 9,300 | 8,707 | ||||
| 2 | Morgan Stanley Dean Witter Capital I | 6.660 | % | 2/15/33 | 4,675 | 4,433 | ||||
| 2 | Morgan Stanley Dean Witter Capital I | 6.390 | % | 7/15/33 | 4,747 | 4,216 | ||||
| 2 | Morgan Stanley Dean Witter Capital I | 4.920 | % | 3/12/35 | 20,000 | 16,630 | ||||
| 2 | Morgan Stanley Dean Witter Capital I | 6.390 | % | 10/15/35 | 5,340 | 4,823 | ||||
| 2 | Morgan Stanley Dean Witter Capital I | 4.740 | % | 11/13/36 | 26,900 | 22,466 | ||||
| 2 | Nissan Auto Receivables Owner Trust | 4.460 | % | 4/16/12 | 1,160 | 1,129 | ||||
| 2 | Nissan Auto Receivables Owner Trust | 5.050 | % | 11/17/14 | 7,875 | 7,385 | ||||
| 2 | Oncor Electric Delivery Transition Bond Co. | 4.030 | % | 2/15/12 | 1,318 | 1,319 | ||||
| 2 | PG&E Energy Recovery Funding LLC | 4.140 | % | 9/25/12 | 8,625 | 8,569 | ||||
| 2 | PG&E Energy Recovery Funding LLC | 5.030 | % | 3/25/14 | 13,650 | 13,465 | ||||
| 2 | PNC Mortgage Acceptance Corp. | 7.300 | % | 10/12/33 | 814 | 766 | ||||
| 2 | Prudential Securities Secured Financing | 7.193 | % | 6/16/31 | 1,830 | 1,811 | ||||
| 2 | PSE&G Transition Funding LLC | 6.890 | % | 12/15/17 | 19,800 | 19,967 | ||||
| 2 | Residential Asset Securities Corp. | 6.489 | % | 10/25/30 | 386 | 365 | ||||
| 2 | Salomon Brothers Mortgage Securities VII | 5.561 | % | 9/25/33 | 17,438 | 15,973 | ||||
| 2 | USAA Auto Owner Trust | 5.360 | % | 2/15/11 | 6,724 | 6,715 | ||||
| 2 | USAA Auto Owner Trust | 4.710 | % | 2/18/14 | 16,075 | 14,481 | ||||
| 2 | Wachovia Bank Commercial Mortgage Trust | 4.440 | % | 11/15/34 | 1,916 | 1,717 | ||||
| 2 | Wachovia Bank Commercial Mortgage Trust | 4.980 | % | 11/15/34 | 900 | 761 | ||||
Page 10
| Vanguard® Total Bond Market Index Fund | ||||||||||
| Schedule of Investments | ||||||||||
| December 31, 2008 | ||||||||||
| Face | Market | |||||||||
| Maturity | Amount | Value | ||||||||
| Coupon | Date | ($ | 000 | ) | ($ | 000 | ) | |||
| 2 | Wachovia Bank Commercial Mortgage Trust | 4.867 | % | 2/15/35 | 900 | 748 | ||||
| 2,4 | Wachovia Bank Commercial Mortgage Trust | 5.125 | % | 8/15/35 | 3,600 | 2,966 | ||||
| 2 | Wachovia Bank Commercial Mortgage Trust | 4.719 | % | 1/15/41 | 4,100 | 3,687 | ||||
| 2 | Wachovia Bank Commercial Mortgage Trust | 4.748 | % | 2/15/41 | 25,955 | 20,171 | ||||
| 2 | Wachovia Bank Commercial Mortgage Trust | 5.001 | % | 7/15/41 | 8,950 | 8,521 | ||||
| 2,4 | Wachovia Bank Commercial Mortgage Trust | 5.232 | % | 7/15/41 | 27,995 | 22,787 | ||||
| 2 | Wachovia Bank Commercial Mortgage Trust | 4.803 | % | 10/15/41 | 23,800 | 18,466 | ||||
| 2,4 | Wachovia Bank Commercial Mortgage Trust | 5.083 | % | 3/15/42 | 17,775 | 14,029 | ||||
| 2 | Wachovia Bank Commercial Mortgage Trust | 5.118 | % | 7/15/42 | 7,525 | 5,856 | ||||
| 2,4 | Wachovia Bank Commercial Mortgage Trust | 5.740 | % | 5/15/43 | 16,200 | 12,904 | ||||
| 2 | Wachovia Bank Commercial Mortgage Trust | 4.699 | % | 5/15/44 | 17,104 | 13,036 | ||||
| 2,4 | Wachovia Bank Commercial Mortgage Trust | 5.209 | % | 10/15/44 | 17,435 | 13,905 | ||||
| 2,4 | Wachovia Bank Commercial Mortgage Trust | 5.265 | % | 12/15/44 | 37,450 | 29,234 | ||||
| 2,4 | Wachovia Bank Commercial Mortgage Trust | 5.765 | % | 7/15/45 | 13,500 | 10,589 | ||||
| 2 | Wachovia Bank Commercial Mortgage Trust | 5.313 | % | 11/15/48 | 20,250 | 16,628 | ||||
| 2 | World Omni Auto Receivables Trust | 3.940 | % | 10/15/12 | 19,200 | 17,574 | ||||
| 3,062,441 | ||||||||||
| Finance (7.7%) | ||||||||||
| Banking (4.9%) | ||||||||||
| Abbey National PLC | 7.950 | % | 10/26/29 | 14,415 | 12,493 | |||||
| ABN AMRO Bank NV | 4.650 | % | 6/4/18 | 325 | 261 | |||||
| American Exoress Co. | 7.000 | % | 3/19/18 | 12,775 | 13,010 | |||||
| American Express Bank, FSB | 5.550 | % | 10/17/12 | 4,225 | 4,005 | |||||
| American Express Bank, FSB | 5.500 | % | 4/16/13 | 10,000 | 9,526 | |||||
| American Express Bank, FSB | 6.000 | % | 9/13/17 | 5,200 | 4,621 | |||||
| American Express Centurion Bank | 5.200 | % | 11/26/10 | 1,975 | 1,915 | |||||
| American Express Centurion Bank | 5.550 | % | 10/17/12 | 3,100 | 2,952 | |||||
| American Express Centurion Bank | 5.950 | % | 6/12/17 | 2,175 | 2,020 | |||||
| American Express Centurion Bank | 6.000 | % | 9/13/17 | 4,650 | 4,369 | |||||
| American Express Co. | 4.875 | % | 7/15/13 | 7,300 | 6,924 | |||||
| American Express Co. | 5.500 | % | 9/12/16 | 3,600 | 3,328 | |||||
| American Express Co. | 6.150 | % | 8/28/17 | 6,450 | 6,291 | |||||
| American Express Co. | 8.150 | % | 3/19/38 | 2,500 | 2,918 | |||||
| 2 | American Express Co. | 6.800 | % | 9/1/66 | 7,565 | 4,150 | ||||
| American Express Credit Corp. | 5.000 | % | 12/2/10 | 6,075 | 5,794 | |||||
| American Express Credit Corp. | 5.875 | % | 5/2/13 | 17,850 | 17,416 | |||||
| American Express Credit Corp. | 7.300 | % | 8/20/13 | 2,625 | 2,702 | |||||
| 3 | American Express Travel | 5.250 | % | 11/21/11 | 7,750 | 7,364 | ||||
| AmSouth Bank NA | 5.200 | % | 4/1/15 | 6,200 | 4,716 | |||||
| Associates Corp. of North America | 6.950 | % | 11/1/18 | 350 | 355 | |||||
| BAC Capital Trust XI | 6.625 | % | 5/23/36 | 1,675 | 1,595 | |||||
| Banc One Corp. | 7.625 | % | 10/15/26 | 1,475 | 1,645 | |||||
| 3 | Banco Bilbao Vizcaya ARG | 5.750 | % | 7/20/17 | 23,425 | 23,460 | ||||
| 2 | Bank of America Capital Trust XIV | 5.630 | % | 12/31/49 | 7,880 | 2,994 | ||||
| Bank of America Corp. | 4.500 | % | 8/1/10 | 9,850 | 9,921 | |||||
| Bank of America Corp. | 4.250 | % | 10/1/10 | 9,625 | 9,602 | |||||
| Bank of America Corp. | 4.375 | % | 12/1/10 | 2,500 | 2,501 | |||||
| 5 | Bank of America Corp. | 1.700 | % | 12/23/10 | 14,950 | 15,002 | ||||
| Bank of America Corp. | 5.375 | % | 8/15/11 | 3,100 | 3,175 | |||||
| Bank of America Corp. | 6.250 | % | 4/15/12 | 5,925 | 6,211 | |||||
| 5 | Bank of America Corp. | 3.125 | % | 6/15/12 | 35,325 | 37,003 | ||||
| Bank of America Corp. | 5.375 | % | 9/11/12 | 1,800 | 1,822 | |||||
| Bank of America Corp. | 4.875 | % | 9/15/12 | 4,525 | 4,459 | |||||
| Bank of America Corp. | 4.875 | % | 1/15/13 | 6,600 | 6,624 | |||||
| Bank of America Corp. | 4.900 | % | 5/1/13 | 24,890 | 25,069 | |||||
| Bank of America Corp. | 5.375 | % | 6/15/14 | 3,750 | 3,741 | |||||
| Bank of America Corp. | 5.125 | % | 11/15/14 | 24,500 | 23,631 | |||||
| Bank of America Corp. | 5.250 | % | 12/1/15 | 4,900 | 4,445 | |||||
| Bank of America Corp. | 5.750 | % | 8/15/16 | 13,925 | 13,148 | |||||
| Bank of America Corp. | 5.625 | % | 10/14/16 | 8,100 | 7,998 | |||||
| Bank of America Corp. | 5.300 | % | 3/15/17 | 30,225 | 29,025 | |||||
| Bank of America Corp. | 5.420 | % | 3/15/17 | 19,550 | 17,392 | |||||
| Bank of America Corp. | 6.100 | % | 6/15/17 | 6,650 | 6,638 | |||||
| Bank of America Corp. | 6.000 | % | 9/1/17 | 1,225 | 1,247 | |||||
| Bank of America Corp. | 5.750 | % | 12/1/17 | 5,100 | 5,175 | |||||
Page 11
| Vanguard® Total Bond Market Index Fund | ||||||||||
| Schedule of Investments | ||||||||||
| December 31, 2008 | ||||||||||
| Face | Market | |||||||||
| Maturity | Amount | Value | ||||||||
| Coupon | Date | ($ | 000 | ) | ($ | 000 | ) | |||
| Bank of America Corp. | 5.650 | % | 5/1/18 | 12,850 | 12,888 | |||||
| Bank of America Corp. | 5.625 | % | 3/8/35 | 12,350 | 10,297 | |||||
| Bank of America Corp. | 6.000 | % | 10/15/36 | 17,000 | 18,276 | |||||
| Bank of America Corp. | 6.500 | % | 9/15/37 | 2,950 | 3,015 | |||||
| Bank of New York Mellon | 4.950 | % | 1/14/11 | 2,550 | 2,575 | |||||
| Bank of New York Mellon | 6.375 | % | 4/1/12 | 400 | 421 | |||||
| Bank of New York Mellon | 4.950 | % | 11/1/12 | 23,400 | 23,935 | |||||
| Bank of New York Mellon | 4.500 | % | 4/1/13 | 2,650 | 2,668 | |||||
| Bank of New York Mellon | 5.125 | % | 8/27/13 | 4,475 | 4,624 | |||||
| Bank of New York Mellon | 4.950 | % | 3/15/15 | 7,400 | 7,216 | |||||
| Bank of Tokyo-Mitsubishi | 8.400 | % | 4/15/10 | 8,525 | 8,741 | |||||
| Bank One Corp. | 7.875 | % | 8/1/10 | 21,180 | 22,231 | |||||
| Bank One Corp. | 5.250 | % | 1/30/13 | 4,725 | 4,650 | |||||
| Bank One Corp. | 4.900 | % | 4/30/15 | 2,475 | 2,313 | |||||
| BankAmerica Capital II | 8.000 | % | 12/15/26 | 100 | 78 | |||||
| Barclays Bank PLC | 5.450 | % | 9/12/12 | 5,950 | 6,130 | |||||
| 2 | Barclays Bank PLC | 6.278 | % | 12/29/49 | 3,295 | 2,099 | ||||
| BB&T Capital Trust II | 6.750 | % | 6/7/36 | 9,475 | 7,187 | |||||
| 2 | BB&T Capital Trust IV | 6.820 | % | 6/12/57 | 4,825 | 2,935 | ||||
| BB&T Corp. | 6.500 | % | 8/1/11 | 3,030 | 3,086 | |||||
| BB&T Corp. | 4.750 | % | 10/1/12 | 7,025 | 6,795 | |||||
| BB&T Corp. | 5.200 | % | 12/23/15 | 5,550 | 5,292 | |||||
| BB&T Corp. | 5.625 | % | 9/15/16 | 6,950 | 7,035 | |||||
| BB&T Corp. | 4.900 | % | 6/30/17 | 625 | 571 | |||||
| BB&T Corp. | 5.250 | % | 11/1/19 | 3,175 | 2,841 | |||||
| Bear Stearns Co., Inc. | 4.550 | % | 6/23/10 | 7,850 | 7,794 | |||||
| Bear Stearns Co., Inc. | 4.500 | % | 10/28/10 | 3,120 | 3,104 | |||||
| Bear Stearns Co., Inc. | 5.350 | % | 2/1/12 | 28,975 | 28,698 | |||||
| Bear Stearns Co., Inc. | 6.950 | % | 8/10/12 | 10,000 | 10,459 | |||||
| Bear Stearns Co., Inc. | 5.700 | % | 11/15/14 | 18,240 | 17,930 | |||||
| Bear Stearns Co., Inc. | 5.300 | % | 10/30/15 | 7,715 | 7,548 | |||||
| Bear Stearns Co., Inc. | 5.550 | % | 1/22/17 | 5,150 | 4,839 | |||||
| Bear Stearns Co., Inc. | 6.400 | % | 10/2/17 | 4,975 | 5,171 | |||||
| Bear Stearns Co., Inc. | 7.250 | % | 2/1/18 | 13,450 | 14,753 | |||||
| Bear Stearns Co., Inc. | 4.650 | % | 7/2/18 | 2,075 | 1,915 | |||||
| Capital One Bank | 5.750 | % | 9/15/10 | 2,025 | 1,968 | |||||
| Capital One Bank | 6.500 | % | 6/13/13 | 5,500 | 4,933 | |||||
| Capital One Capital III | 7.686 | % | 8/15/36 | 7,650 | 3,213 | |||||
| Capital One Capital IV | 6.745 | % | 2/17/37 | 3,100 | 1,426 | |||||
| Capital One Financial Corp. | 5.700 | % | 9/15/11 | 4,025 | 3,747 | |||||
| Capital One Financial Corp. | 4.800 | % | 2/21/12 | 2,125 | 1,921 | |||||
| Capital One Financial Corp. | 5.500 | % | 6/1/15 | 6,075 | 5,128 | |||||
| Capital One Financial Corp. | 6.150 | % | 9/1/16 | 6,525 | 4,468 | |||||
| Capital One Financial Corp. | 5.250 | % | 2/21/17 | 1,775 | 1,556 | |||||
| Capital One Financial Corp. | 6.750 | % | 9/15/17 | 7,225 | 6,982 | |||||
| Charter One Bank N.A. | 5.500 | % | 4/26/11 | 13,150 | 12,482 | |||||
| 2,3 | Citicorp Lease Pass-Through Trust | 8.040 | % | 12/15/19 | 18,025 | 17,581 | ||||
| 2 | Citigroup Capital XXI | 8.300 | % | 12/21/57 | 19,325 | 14,899 | ||||
| Citigroup, Inc. | 4.125 | % | 2/22/10 | 4,175 | 4,083 | |||||
| Citigroup, Inc. | 4.625 | % | 8/3/10 | 7,900 | 7,747 | |||||
| Citigroup, Inc. | 6.500 | % | 1/18/11 | 15,895 | 16,021 | |||||
| Citigroup, Inc. | 5.125 | % | 2/14/11 | 4,475 | 4,391 | |||||
| Citigroup, Inc. | 5.100 | % | 9/29/11 | 39,500 | 38,565 | |||||
| 5 | Citigroup, Inc. | 2.875 | % | 12/9/11 | 22,225 | 23,013 | ||||
| Citigroup, Inc. | 6.000 | % | 2/21/12 | 9,075 | 8,955 | |||||
| Citigroup, Inc. | 5.250 | % | 2/27/12 | 12,475 | 12,126 | |||||
| Citigroup, Inc. | 5.500 | % | 8/27/12 | 2,925 | 2,889 | |||||
| Citigroup, Inc. | 5.625 | % | 8/27/12 | 8,140 | 7,650 | |||||
| Citigroup, Inc. | 5.300 | % | 10/17/12 | 27,300 | 26,642 | |||||
| Citigroup, Inc. | 5.500 | % | 4/11/13 | 32,890 | 32,164 | |||||
| Citigroup, Inc. | 6.500 | % | 8/19/13 | 25,425 | 25,682 | |||||
| Citigroup, Inc. | 5.125 | % | 5/5/14 | 1,675 | 1,587 | |||||
| Citigroup, Inc. | 5.000 | % | 9/15/14 | 21,368 | 18,575 | |||||
| Citigroup, Inc. | 4.700 | % | 5/29/15 | 4,075 | 3,517 | |||||
| Citigroup, Inc. | 5.300 | % | 1/7/16 | 24,600 | 23,321 | |||||
| Citigroup, Inc. | 5.500 | % | 2/15/17 | 4,000 | 3,604 | |||||
Page 12
| Vanguard® Total Bond Market Index Fund | |||||||||
| Schedule of Investments | |||||||||
| December 31, 2008 | |||||||||
| Face | Market | ||||||||
| Maturity | Amount | Value | |||||||
| Coupon | Date | ($ | 000 | ) | ($ | 000 | ) | ||
| Citigroup, Inc. | 6.000 | % | 8/15/17 | 15,150 | 15,082 | ||||
| Citigroup, Inc. | 6.125 | % | 11/21/17 | 12,975 | 13,051 | ||||
| Citigroup, Inc. | 6.625 | % | 6/15/32 | 1,525 | 1,482 | ||||
| Citigroup, Inc. | 5.875 | % | 2/22/33 | 15,300 | 13,117 | ||||
| Citigroup, Inc. | 6.000 | % | 10/31/33 | 2,575 | 2,254 | ||||
| Citigroup, Inc. | 5.850 | % | 12/11/34 | 2,000 | 1,953 | ||||
| Citigroup, Inc. | 6.125 | % | 8/25/36 | 9,575 | 8,773 | ||||
| Citigroup, Inc. | 5.875 | % | 5/29/37 | 7,050 | 7,103 | ||||
| Citigroup, Inc. | 6.875 | % | 3/5/38 | 20,000 | 23,097 | ||||
| Colonial Bank NA | 6.375 | % | 12/1/15 | 1,425 | 931 | ||||
| Comerica Bank | 5.750 | % | 11/21/16 | 12,700 | 9,521 | ||||
| Comerica Bank | 5.200 | % | 8/22/17 | 5,450 | 4,117 | ||||
| 2 Comerica Capital Trust II | 6.576 | % | 2/20/37 | 4,350 | 1,805 | ||||
| Compass Bank | 6.400 | % | 10/1/17 | 2,700 | 2,302 | ||||
| Compass Bank | 5.900 | % | 4/1/26 | 2,400 | 1,720 | ||||
| Countrywide Financial Corp. | 5.800 | % | 6/7/12 | 8,175 | 8,001 | ||||
| Countrywide Financial Corp. | 6.250 | % | 5/15/16 | 3,525 | 3,362 | ||||
| Countrywide Home Loan | 5.625 | % | 7/15/09 | 340 | 340 | ||||
| Countrywide Home Loan | 4.125 | % | 9/15/09 | 8,310 | 8,217 | ||||
| Countrywide Home Loan | 4.000 | % | 3/22/11 | 4,950 | 4,709 | ||||
| Credit Suisse First Boston USA, Inc. | 4.700 | % | 6/1/09 | 15 | 15 | ||||
| Credit Suisse First Boston USA, Inc. | 4.125 | % | 1/15/10 | 6,975 | 6,943 | ||||
| Credit Suisse First Boston USA, Inc. | 4.875 | % | 8/15/10 | 24,600 | 24,597 | ||||
| Credit Suisse First Boston USA, Inc. | 5.250 | % | 3/2/11 | 9,275 | 9,306 | ||||
| Credit Suisse First Boston USA, Inc. | 5.500 | % | 8/16/11 | 10,125 | 10,142 | ||||
| Credit Suisse First Boston USA, Inc. | 6.125 | % | 11/15/11 | 11,825 | 12,118 | ||||
| Credit Suisse First Boston USA, Inc. | 6.500 | % | 1/15/12 | 3,675 | 3,744 | ||||
| Credit Suisse First Boston USA, Inc. | 5.500 | % | 8/15/13 | 12,110 | 12,069 | ||||
| Credit Suisse First Boston USA, Inc. | 4.875 | % | 1/15/15 | 19,700 | 18,472 | ||||
| Credit Suisse First Boston USA, Inc. | 5.125 | % | 8/15/15 | 14,815 | 13,557 | ||||
| Credit Suisse First Boston USA, Inc. | 5.375 | % | 3/2/16 | 1,175 | 1,079 | ||||
| Credit Suisse First Boston USA, Inc. | 7.125 | % | 7/15/32 | 2,825 | 3,116 | ||||
| 2 Credit Suisse First Boston USA, Inc. | 5.860 | % | 5/15/49 | 9,250 | 4,623 | ||||
| Credit Suisse New York | 5.000 | % | 5/15/13 | 15,175 | 14,605 | ||||
| Credit Suisse New York | 6.000 | % | 2/15/18 | 5,200 | 5,118 | ||||
| Dean Witter, Discover & Co. | 6.750 | % | 10/15/13 | 800 | 716 | ||||
| Deutsche Bank AG London | 5.375 | % | 10/12/12 | 15,875 | 16,132 | ||||
| Deutsche Bank AG London | 4.875 | % | 5/20/13 | 13,200 | 13,374 | ||||
| Deutsche Bank AG London | 6.000 | % | 9/1/17 | 29,000 | 30,770 | ||||
| Deutsche Bank Financial LLC | 5.375 | % | 3/2/15 | 5,400 | 4,885 | ||||
| Fifth Third Bancorp. | 4.200 | % | 2/23/10 | 4,275 | 4,206 | ||||
| Fifth Third Bancorp. | 6.250 | % | 5/1/13 | 5,950 | 5,639 | ||||
| Fifth Third Bancorp. | 4.750 | % | 2/1/15 | 10,950 | 9,384 | ||||
| Fifth Third Bancorp. | 4.500 | % | 6/1/18 | 1,550 | 1,136 | ||||
| Fifth Third Bancorp. | 8.250 | % | 3/1/38 | 5,450 | 4,415 | ||||
| 2 Fifth Third Capital Trust IV | 6.500 | % | 4/15/67 | 4,350 | 2,219 | ||||
| First Tennessee Bank | 5.050 | % | 1/15/15 | 1,825 | 1,178 | ||||
| First Union Institutional Capital I | 8.040 | % | 12/1/26 | 1,825 | 1,519 | ||||
| Fleet Capital Trust II | 7.920 | % | 12/11/26 | 2,315 | 1,904 | ||||
| Golden West Financial Corp. | 4.750 | % | 10/1/12 | 3,315 | 3,147 | ||||
| 2 Goldman Sachs Capital II | 5.793 | % | 12/29/49 | 8,625 | 3,404 | ||||
| Goldman Sachs Group, Inc. | 4.500 | % | 6/15/10 | 5,945 | 5,869 | ||||
| Goldman Sachs Group, Inc. | 6.875 | % | 1/15/11 | 6,250 | 6,343 | ||||
| Goldman Sachs Group, Inc. | 6.600 | % | 1/15/12 | 33,200 | 32,831 | ||||
| 5 Goldman Sachs Group, Inc. | 3.250 | % | 6/15/12 | 37,350 | 39,088 | ||||
| Goldman Sachs Group, Inc. | 5.450 | % | 11/1/12 | 12,375 | 11,811 | ||||
| Goldman Sachs Group, Inc. | 5.250 | % | 4/1/13 | 12,415 | 11,675 | ||||
| Goldman Sachs Group, Inc. | 4.750 | % | 7/15/13 | 11,050 | 10,143 | ||||
| Goldman Sachs Group, Inc. | 5.250 | % | 10/15/13 | 16,550 | 15,268 | ||||
| Goldman Sachs Group, Inc. | 5.150 | % | 1/15/14 | 2,740 | 2,510 | ||||
| Goldman Sachs Group, Inc. | 5.000 | % | 10/1/14 | 15,550 | 13,453 | ||||
| Goldman Sachs Group, Inc. | 5.125 | % | 1/15/15 | 14,735 | 13,370 | ||||
| Goldman Sachs Group, Inc. | 5.350 | % | 1/15/16 | 18,900 | 17,146 | ||||
| Goldman Sachs Group, Inc. | 5.750 | % | 10/1/16 | 5,600 | 5,165 | ||||
| Goldman Sachs Group, Inc. | 5.625 | % | 1/15/17 | 14,750 | 12,298 | ||||
| Goldman Sachs Group, Inc. | 6.250 | % | 9/1/17 | 33,125 | 31,330 |
Page 13
| Vanguard® Total Bond Market Index Fund | |||||||||
| Schedule of Investments | |||||||||
| December 31, 2008 | |||||||||
| Face | Market | ||||||||
| Maturity | Amount | Value | |||||||
| Coupon | Date | ($ | 000 | ) | ($ | 000 | ) | ||
| Goldman Sachs Group, Inc. | 5.950 | % | 1/18/18 | 29,650 | 27,558 | ||||
| Goldman Sachs Group, Inc. | 6.150 | % | 4/1/18 | 12,175 | 11,700 | ||||
| Goldman Sachs Group, Inc. | 5.950 | % | 1/15/27 | 11,250 | 8,337 | ||||
| Goldman Sachs Group, Inc. | 6.125 | % | 2/15/33 | 10,650 | 9,897 | ||||
| Goldman Sachs Group, Inc. | 6.345 | % | 2/15/34 | 19,890 | 14,632 | ||||
| Goldman Sachs Group, Inc. | 6.450 | % | 5/1/36 | 3,200 | 2,442 | ||||
| Goldman Sachs Group, Inc. | 6.750 | % | 10/1/37 | 44,350 | 36,488 | ||||
| 3 HBOS Treasury Services PLC | 5.250 | % | 2/21/17 | 21,125 | 20,880 | ||||
| 3 HBOS Treasury Services PLC | 6.750 | % | 5/21/18 | 7,250 | 6,344 | ||||
| HSBC Bank PLC | 6.950 | % | 3/15/11 | 11,350 | 11,498 | ||||
| HSBC Bank USA | 4.625 | % | 4/1/14 | 125 | 119 | ||||
| HSBC Bank USA | 5.875 | % | 11/1/34 | 2,475 | 2,406 | ||||
| HSBC Bank USA | 5.625 | % | 8/15/35 | 4,825 | 4,483 | ||||
| HSBC Holdings PLC | 7.625 | % | 5/17/32 | 1,250 | 1,359 | ||||
| HSBC Holdings PLC | 7.350 | % | 11/27/32 | 2,515 | 2,655 | ||||
| HSBC Holdings PLC | 6.500 | % | 5/2/36 | 22,100 | 22,610 | ||||
| HSBC Holdings PLC | 6.500 | % | 9/15/37 | 16,575 | 17,488 | ||||
| HSBC Holdings PLC | 6.800 | % | 6/1/38 | 7,200 | 7,770 | ||||
| 3 ICICI Bank Ltd. | 6.625 | % | 10/3/12 | 6,425 | 5,076 | ||||
| JPM Capital Trust | 6.550 | % | 9/29/36 | 8,725 | 7,389 | ||||
| JPMorgan Capital Trust | 5.875 | % | 3/15/35 | 5,205 | 4,059 | ||||
| JPMorgan Chase & Co. | 7.875 | % | 6/15/10 | 450 | 468 | ||||
| JPMorgan Chase & Co. | 6.750 | % | 2/1/11 | 14,862 | 15,317 | ||||
| JPMorgan Chase & Co. | 5.600 | % | 6/1/11 | 35,250 | 36,219 | ||||
| JPMorgan Chase & Co. | 4.850 | % | 6/16/11 | 11,200 | 11,305 | ||||
| JPMorgan Chase & Co. | 3.125 | % | 12/1/11 | 21,500 | 22,459 | ||||
| JPMorgan Chase & Co. | 4.500 | % | 1/15/12 | 9,400 | 9,344 | ||||
| JPMorgan Chase & Co. | 6.625 | % | 3/15/12 | 12,575 | 12,875 | ||||
| JPMorgan Chase & Co. | 5.375 | % | 10/1/12 | 26,725 | 27,295 | ||||
| JPMorgan Chase & Co. | 5.750 | % | 1/2/13 | 7,150 | 7,202 | ||||
| JPMorgan Chase & Co. | 4.750 | % | 5/1/13 | 8,775 | 8,818 | ||||
| JPMorgan Chase & Co. | 5.375 | % | 1/15/14 | 1,825 | 1,817 | ||||
| JPMorgan Chase & Co. | 4.875 | % | 3/15/14 | 19,540 | 18,888 | ||||
| JPMorgan Chase & Co. | 5.125 | % | 9/15/14 | 13,085 | 12,678 | ||||
| JPMorgan Chase & Co. | 4.750 | % | 3/1/15 | 3,550 | 3,443 | ||||
| JPMorgan Chase & Co. | 5.250 | % | 5/1/15 | 9,725 | 9,278 | ||||
| JPMorgan Chase & Co. | 5.150 | % | 10/1/15 | 3,860 | 3,722 | ||||
| JPMorgan Chase & Co. | 5.875 | % | 6/13/16 | 5,075 | 5,098 | ||||
| JPMorgan Chase & Co. | 6.125 | % | 6/27/17 | 14,825 | 14,871 | ||||
| JPMorgan Chase & Co. | 6.000 | % | 10/1/17 | 2,950 | 2,944 | ||||
| JPMorgan Chase & Co. | 6.000 | % | 1/15/18 | 4,275 | 4,520 | ||||
| JPMorgan Chase & Co. | 5.850 | % | 8/1/35 | 825 | 671 | ||||
| JPMorgan Chase & Co. | 6.400 | % | 5/15/38 | 10,000 | 11,949 | ||||
| JPMorgan Chase Capital XXII | 6.450 | % | 2/2/37 | 12,275 | 9,850 | ||||
| JPMorgan Chase Capital XXV | 6.800 | % | 10/1/37 | 9,650 | 8,835 | ||||
| KeyBank NA | 7.000 | % | 2/1/11 | 725 | 716 | ||||
| KeyBank NA | 5.500 | % | 9/17/12 | 6,800 | 6,392 | ||||
| KeyBank NA | 5.800 | % | 7/1/14 | 3,675 | 3,289 | ||||
| KeyBank NA | 4.950 | % | 9/15/15 | 7,175 | 5,597 | ||||
| KeyBank NA | 5.450 | % | 3/3/16 | 7,175 | 5,812 | ||||
| KeyCorp | 6.500 | % | 5/14/13 | 6,750 | 6,261 | ||||
| Manufacturers & Traders Trust Co. | 6.625 | % | 12/4/17 | 8,350 | 7,764 | ||||
| 2 Manufacturers & Traders Trust Co. | 5.585 | % | 12/28/20 | 550 | 407 | ||||
| Marshall & Ilsley Bank | 5.250 | % | 9/4/12 | 1,150 | 1,012 | ||||
| Marshall & Ilsley Bank | 4.850 | % | 6/16/15 | 700 | 532 | ||||
| Marshall & Ilsley Bank | 5.000 | % | 1/17/17 | 250 | 194 | ||||
| MBNA America Bank NA | 6.625 | % | 6/15/12 | 3,465 | 3,494 | ||||
| MBNA Corp. | 7.500 | % | 3/15/12 | 3,245 | 3,336 | ||||
| MBNA Corp. | 6.125 | % | 3/1/13 | 4,900 | 4,797 | ||||
| MBNA Corp. | 5.000 | % | 6/15/15 | 4,375 | 4,004 | ||||
| Mellon Bank NA | 4.750 | % | 12/15/14 | 3,650 | 3,580 | ||||
| 2 Mellon Capital IV | 6.244 | % | 6/29/49 | 200 | 118 | ||||
| Mellon Funding Corp. | 6.400 | % | 5/14/11 | 450 | 470 | ||||
| Mellon Funding Corp. | 5.000 | % | 12/1/14 | 1,100 | 1,009 | ||||
| Morgan Stanley Dean Witter | 4.000 | % | 1/15/10 | 19,250 | 18,891 | ||||
| Morgan Stanley Dean Witter | 4.250 | % | 5/15/10 | 15,155 | 14,540 |
Page 14
| Vanguard® Total Bond Market Index Fund | ||||||||||
| Schedule of Investments | ||||||||||
| December 31, 2008 | ||||||||||
| Face | Market | |||||||||
| Maturity | Amount | Value | ||||||||
| Coupon | Date | ($ | 000 | ) | ($ | 000 | ) | |||
| 5 | Morgan Stanley Dean Witter | 2.900 | % | 12/1/10 | 13,650 | 14,010 | ||||
| Morgan Stanley Dean Witter | 5.050 | % | 1/21/11 | 2,700 | 2,624 | |||||
| Morgan Stanley Dean Witter | 6.750 | % | 4/15/11 | 21,140 | 20,635 | |||||
| 5 | Morgan Stanley Dean Witter | 3.250 | % | 12/1/11 | 14,600 | 15,286 | ||||
| Morgan Stanley Dean Witter | 5.625 | % | 1/9/12 | 6,525 | 6,083 | |||||
| Morgan Stanley Dean Witter | 6.600 | % | 4/1/12 | 14,510 | 13,815 | |||||
| Morgan Stanley Dean Witter | 5.750 | % | 8/31/12 | 9,400 | 8,745 | |||||
| Morgan Stanley Dean Witter | 5.300 | % | 3/1/13 | 21,950 | 19,908 | |||||
| Morgan Stanley Dean Witter | 4.750 | % | 4/1/14 | 26,882 | 21,183 | |||||
| Morgan Stanley Dean Witter | 6.000 | % | 4/28/15 | 15,575 | 13,682 | |||||
| Morgan Stanley Dean Witter | 5.375 | % | 10/15/15 | 7,100 | 5,965 | |||||
| Morgan Stanley Dean Witter | 5.750 | % | 10/18/16 | 18,500 | 15,432 | |||||
| Morgan Stanley Dean Witter | 5.450 | % | 1/9/17 | 11,125 | 9,327 | |||||
| Morgan Stanley Dean Witter | 5.550 | % | 4/27/17 | 3,725 | 3,113 | |||||
| Morgan Stanley Dean Witter | 5.950 | % | 12/28/17 | 20,575 | 17,513 | |||||
| Morgan Stanley Dean Witter | 6.625 | % | 4/1/18 | 20,650 | 18,572 | |||||
| Morgan Stanley Dean Witter | 6.250 | % | 8/9/26 | 18,625 | 15,497 | |||||
| Morgan Stanley Dean Witter | 7.250 | % | 4/1/32 | 9,415 | 8,194 | |||||
| National City Bank | 4.500 | % | 3/15/10 | 7,525 | 7,332 | |||||
| National City Bank | 6.250 | % | 3/15/11 | 575 | 544 | |||||
| National City Bank | 4.625 | % | 5/1/13 | 3,225 | 2,673 | |||||
| National City Corp. | 4.900 | % | 1/15/15 | 1,725 | 1,477 | |||||
| National City Corp. | 6.875 | % | 5/15/19 | 850 | 689 | |||||
| 2 | National City Preferred Capital Trust I | 12.000 | % | 12/31/49 | 7,025 | 6,603 | ||||
| NationsBank Corp. | 6.800 | % | 3/15/28 | 725 | 690 | |||||
| 3 | Nationwide Building Society | 5.500 | % | 7/18/12 | 24,775 | 23,482 | ||||
| NB Capital Trust II | 7.830 | % | 12/15/26 | 5,000 | 3,826 | |||||
| NB Capital Trust IV | 8.250 | % | 4/15/27 | 3,400 | 2,709 | |||||
| North Fork Bancorp., Inc. | 5.875 | % | 8/15/12 | 250 | 199 | |||||
| 3 | Northern Rock PLC | 5.625 | % | 6/22/17 | 47,600 | 46,652 | ||||
| Northern Trust Co. | 5.500 | % | 8/15/13 | 1,575 | 1,626 | |||||
| Northern Trust Co. | 6.500 | % | 8/15/18 | 1,400 | 1,504 | |||||
| Paribas NY | 6.950 | % | 7/22/13 | 1,225 | 1,287 | |||||
| PNC Bank NA | 4.875 | % | 9/21/17 | 9,750 | 8,972 | |||||
| PNC Bank NA | 6.000 | % | 12/7/17 | 1,425 | 1,418 | |||||
| PNC Bank NA | 6.875 | % | 4/1/18 | 175 | 184 | |||||
| PNC Funding Corp. | 4.500 | % | 3/10/10 | 500 | 499 | |||||
| PNC Funding Corp. | 5.125 | % | 12/14/10 | 5,750 | 5,828 | |||||
| PNC Funding Corp. | 5.250 | % | 11/15/15 | 10,275 | 9,787 | |||||
| PNC Funding Corp. | 5.625 | % | 2/1/17 | 1,075 | 1,034 | |||||
| Regions Bank | 7.500 | % | 5/15/18 | 1,400 | 1,250 | |||||
| Regions Financial Corp. | 4.375 | % | 12/1/10 | 1,000 | 933 | |||||
| Regions Financial Corp. | 6.375 | % | 5/15/12 | 15,925 | 14,811 | |||||
| Regions Financial Corp. | 7.375 | % | 12/10/37 | 4,950 | 3,878 | |||||
| 2 | Regions Financial Corp. | 6.625 | % | 5/15/47 | 5,075 | 2,779 | ||||
| Royal Bank of Canada | 4.125 | % | 1/26/10 | 13,450 | 13,405 | |||||
| Royal Bank of Scotland Group PLC | 6.375 | % | 2/1/11 | 1,675 | 1,687 | |||||
| Royal Bank of Scotland Group PLC | 5.000 | % | 11/12/13 | 13,125 | 11,713 | |||||
| Royal Bank of Scotland Group PLC | 5.050 | % | 1/8/15 | 8,225 | 7,006 | |||||
| 2 | Royal Bank of Scotland Group PLC | 7.640 | % | 3/31/49 | 4,975 | 1,990 | ||||
| 2 | Royal Bank of Scotland Group PLC | 7.648 | % | 8/29/49 | 23,895 | 11,885 | ||||
| 2 | Royal Bank of Scotland Group PLC | 5.512 | % | 9/29/49 | 6,774 | 2,894 | ||||
| Santander Central Hispano Issuances Ltd. | 7.625 | % | 9/14/10 | 12,500 | 12,487 | |||||
| Santander Financial Issuances | 6.375 | % | 2/15/11 | 1,400 | 1,329 | |||||
| Sanwa Bank Ltd. | 7.400 | % | 6/15/11 | 11,800 | 12,213 | |||||
| Southtrust Corp. | 5.800 | % | 6/15/14 | 3,075 | 2,846 | |||||
| Sovereign Bancorp, Inc. | 4.800 | % | 9/1/10 | 8,275 | 7,490 | |||||
| Sovereign Bancorp, Inc. | 8.750 | % | 5/30/18 | 1,650 | 1,510 | |||||
| Sovereign Bank | 5.125 | % | 3/15/13 | 2,900 | 2,429 | |||||
| 2,3 | Standard Chartered PLC | 6.409 | % | 12/31/49 | 7,100 | 2,969 | ||||
| State Street Capital Trust | 5.300 | % | 1/15/16 | 3,425 | 3,392 | |||||
| Sumitomo Mitsui Banking Corp. | 8.000 | % | 6/15/12 | 16,075 | 16,763 | |||||
| SunTrust Banks, Inc. | 6.375 | % | 4/1/11 | 8,455 | 8,520 | |||||
| SunTrust Banks, Inc. | 5.250 | % | 11/5/12 | 8,150 | 7,808 | |||||
| SunTrust Banks, Inc. | 5.000 | % | 9/1/15 | 350 | 329 | |||||
| SunTrust Banks, Inc. | 6.000 | % | 9/11/17 | 3,725 | 3,525 | |||||
Page 15
| Vanguard® Total Bond Market Index Fund | |||||||||
| Schedule of Investments | |||||||||
| December 31, 2008 | |||||||||
| Face | Market | ||||||||
| Maturity | Amount | Value | |||||||
| Coupon | Date | ($ | 000 | ) | ($ | 000 | ) | ||
| SunTrust Banks, Inc. | 5.450 | % | 12/1/17 | 500 | 470 | ||||
| SunTrust Banks, Inc. | 7.250 | % | 3/15/18 | 1,100 | 1,146 | ||||
| SunTrust Banks, Inc. | 6.000 | % | 2/15/26 | 3,925 | 3,389 | ||||
| SunTrust Capital VIII | 6.100 | % | 12/15/36 | 3,635 | 2,388 | ||||
| 2 SunTrust Preferred Capital I | 5.853 | % | 12/31/49 | 2,875 | 1,157 | ||||
| Swiss Bank Corp. | 7.000 | % | 10/15/15 | 2,825 | 2,825 | ||||
| Swiss Bank Corp. | 7.375 | % | 6/15/17 | 4,175 | 4,287 | ||||
| Synovus Financial Corp. | 4.875 | % | 2/15/13 | 1,000 | 850 | ||||
| Synovus Financial Corp. | 5.125 | % | 6/15/17 | 4,925 | 3,767 | ||||
| UBS AG | 5.875 | % | 7/15/16 | 2,800 | 2,595 | ||||
| UBS AG | 5.875 | % | 12/20/17 | 32,534 | 29,829 | ||||
| UBS AG | 5.750 | % | 4/25/18 | 10,975 | 10,000 | ||||
| UFJ Finance Aruba AEC | 6.750 | % | 7/15/13 | 27,325 | 27,306 | ||||
| Union Bank of California NA | 5.950 | % | 5/11/16 | 4,700 | 3,780 | ||||
| Union Planters Corp. | 7.750 | % | 3/1/11 | 7,525 | 7,197 | ||||
| UnionBanCal Corp. | 5.250 | % | 12/16/13 | 2,680 | 2,330 | ||||
| US Bank NA | 6.375 | % | 8/1/11 | 6,975 | 7,277 | ||||
| US Bank NA | 6.300 | % | 2/4/14 | 9,150 | 9,846 | ||||
| US Bank NA | 4.950 | % | 10/30/14 | 10,225 | 10,160 | ||||
| 2 USB Capital IX | 6.189 | % | 4/15/49 | 10,040 | 4,518 | ||||
| Wachovia Bank NA | 4.800 | % | 11/1/14 | 1,825 | 1,685 | ||||
| Wachovia Bank NA | 4.875 | % | 2/1/15 | 17,300 | 15,845 | ||||
| Wachovia Bank NA | 5.000 | % | 8/15/15 | 1,110 | 977 | ||||
| Wachovia Bank NA | 6.000 | % | 11/15/17 | 9,825 | 9,570 | ||||
| Wachovia Bank NA | 5.850 | % | 2/1/37 | 18,225 | 17,567 | ||||
| Wachovia Bank NA | 6.600 | % | 1/15/38 | 14,625 | 15,675 | ||||
| 2 Wachovia Capital Trust III | 5.800 | % | 3/15/11 | 12,925 | 7,690 | ||||
| Wachovia Corp. | 7.875 | % | 2/15/10 | 3,700 | 3,746 | ||||
| Wachovia Corp. | 4.375 | % | 6/1/10 | 6,875 | 6,842 | ||||
| Wachovia Corp. | 7.800 | % | 8/18/10 | 12,905 | 13,122 | ||||
| Wachovia Corp. | 5.300 | % | 10/15/11 | 17,775 | 17,438 | ||||
| Wachovia Corp. | 4.875 | % | 2/15/14 | 6,150 | 5,623 | ||||
| Wachovia Corp. | 5.250 | % | 8/1/14 | 1,120 | 1,036 | ||||
| Wachovia Corp. | 5.625 | % | 10/15/16 | 4,900 | 4,439 | ||||
| Wachovia Corp. | 5.750 | % | 6/15/17 | 31,175 | 30,811 | ||||
| Wachovia Corp. | 5.750 | % | 2/1/18 | 1,650 | 1,662 | ||||
| Wachovia Corp. | 6.605 | % | 10/1/25 | 275 | 256 | ||||
| 3 Wachovia Corp. | 8.000 | % | 12/15/26 | 5,125 | 4,049 | ||||
| Wachovia Corp. | 7.500 | % | 4/15/35 | 1,100 | 1,064 | ||||
| Wachovia Corp. | 5.500 | % | 8/1/35 | 3,600 | 2,919 | ||||
| Wachovia Corp. | 6.550 | % | 10/15/35 | 775 | 665 | ||||
| Wells Fargo & Co. | 4.200 | % | 1/15/10 | 28,879 | 29,320 | ||||
| Wells Fargo & Co. | 4.875 | % | 1/12/11 | 15,575 | 15,976 | ||||
| Wells Fargo & Co. | 6.375 | % | 8/1/11 | 2,000 | 2,085 | ||||
| Wells Fargo & Co. | 5.300 | % | 8/26/11 | 4,800 | 4,888 | ||||
| 5 Wells Fargo & Co. | 3.000 | % | 12/9/11 | 19,200 | 19,994 | ||||
| Wells Fargo & Co. | 5.125 | % | 9/1/12 | 4,000 | 4,023 | ||||
| Wells Fargo & Co. | 5.250 | % | 10/23/12 | 19,850 | 20,354 | ||||
| Wells Fargo & Co. | 4.375 | % | 1/31/13 | 9,175 | 9,043 | ||||
| Wells Fargo & Co. | 4.950 | % | 10/16/13 | 6,975 | 6,834 | ||||
| Wells Fargo & Co. | 4.625 | % | 4/15/14 | 275 | 267 | ||||
| Wells Fargo & Co. | 5.625 | % | 12/11/17 | 37,625 | 38,953 | ||||
| Wells Fargo & Co. | 5.375 | % | 2/7/35 | 5,625 | 5,400 | ||||
| Wells Fargo Bank NA | 6.450 | % | 2/1/11 | 15,800 | 16,472 | ||||
| Wells Fargo Bank NA | 4.750 | % | 2/9/15 | 12,875 | 12,427 | ||||
| Wells Fargo Bank NA | 5.750 | % | 5/16/16 | 7,925 | 8,126 | ||||
| Wells Fargo Bank NA | 5.950 | % | 8/26/36 | 10,275 | 10,673 | ||||
| Wells Fargo Capital X | 5.950 | % | 12/15/36 | 3,075 | 2,568 | ||||
| 2 Wells Fargo Capital XIII | 7.700 | % | 12/29/49 | 8,050 | 6,621 | ||||
| 2 Wells Fargo Capital XV | 9.750 | % | 12/29/49 | 5,925 | 6,043 | ||||
| Wells Fargo Financial | 5.500 | % | 8/1/12 | 3,975 | 4,050 | ||||
| Zions Bancorp. | 5.500 | % | 11/16/15 | 6,950 | 5,191 |
Page 16
| Vanguard® Total Bond Market Index Fund | |||||||||
| Schedule of Investments | |||||||||
| December 31, 2008 | |||||||||
| Face | Market | ||||||||
| Maturity | Amount | Value | |||||||
| Coupon | Date | ($ | 000 | ) | ($ | 000 | ) | ||
| Brokerage (0.4%) | |||||||||
| Ameriprise Financial Inc. | 5.350 | % | 11/15/10 | 5,900 | 5,291 | ||||
| Ameriprise Financial Inc. | 5.650 | % | 11/15/15 | 4,925 | 4,186 | ||||
| 2 Ameriprise Financial Inc. | 7.518 | % | 6/1/66 | 1,250 | 689 | ||||
| BlackRock, Inc. | 6.250 | % | 9/15/17 | 4,000 | 3,775 | ||||
| 3 Fidelity Investments | 7.490 | % | 6/15/19 | 1,000 | 983 | ||||
| Janus Capital Group | 5.875 | % | 9/15/11 | 3,375 | 2,459 | ||||
| Janus Capital Group | 6.700 | % | 6/15/17 | 2,575 | 1,286 | ||||
| Jefferies Group Inc. | 6.450 | % | 6/8/27 | 14,325 | 8,842 | ||||
| Jefferies Group Inc. | 6.250 | % | 1/15/36 | 8,425 | 5,039 | ||||
| Lazard Group | 6.850 | % | 6/15/17 | 7,775 | 4,918 | ||||
| Merrill Lynch & Co., Inc. | 4.125 | % | 9/10/09 | 7,750 | 7,670 | ||||
| Merrill Lynch & Co., Inc. | 4.250 | % | 2/8/10 | 12,880 | 12,624 | ||||
| Merrill Lynch & Co., Inc. | 5.770 | % | 7/25/11 | 4,325 | 4,385 | ||||
| Merrill Lynch & Co., Inc. | 6.050 | % | 8/15/12 | 12,850 | 12,869 | ||||
| Merrill Lynch & Co., Inc. | 5.450 | % | 2/5/13 | 18,650 | 17,961 | ||||
| Merrill Lynch & Co., Inc. | 6.150 | % | 4/25/13 | 25,800 | 25,422 | ||||
| Merrill Lynch & Co., Inc. | 5.000 | % | 2/3/14 | 7,100 | 6,756 | ||||
| Merrill Lynch & Co., Inc. | 5.450 | % | 7/15/14 | 2,875 | 2,768 | ||||
| Merrill Lynch & Co., Inc. | 5.000 | % | 1/15/15 | 19,150 | 18,261 | ||||
| Merrill Lynch & Co., Inc. | 6.050 | % | 5/16/16 | 3,550 | 3,274 | ||||
| Merrill Lynch & Co., Inc. | 5.700 | % | 5/2/17 | 20,600 | 18,454 | ||||
| Merrill Lynch & Co., Inc. | 6.400 | % | 8/28/17 | 13,750 | 13,842 | ||||
| Merrill Lynch & Co., Inc. | 6.875 | % | 4/25/18 | 15,350 | 16,153 | ||||
| Merrill Lynch & Co., Inc. | 6.500 | % | 7/15/18 | 425 | 425 | ||||
| Merrill Lynch & Co., Inc. | 6.875 | % | 11/15/18 | 19 | 20 | ||||
| Merrill Lynch & Co., Inc. | 6.220 | % | 9/15/26 | 19,050 | 17,661 | ||||
| Merrill Lynch & Co., Inc. | 6.110 | % | 1/29/37 | 5,625 | 5,076 | ||||
| Merrill Lynch & Co., Inc. | 7.750 | % | 5/14/38 | 13,510 | 14,727 | ||||
| 2 Schwab Capital Trust I | 7.500 | % | 11/15/37 | 2,150 | 1,118 | ||||
| Finance Companies (1.2%) | |||||||||
| Allied Capital Corp. | 6.000 | % | 4/1/12 | 3,125 | 2,148 | ||||
| American General Finance Corp. | 3.875 | % | 10/1/09 | 4,000 | 2,920 | ||||
| American General Finance Corp. | 4.875 | % | 5/15/10 | 5,100 | 3,009 | ||||
| American General Finance Corp. | 5.625 | % | 8/17/11 | 7,625 | 3,660 | ||||
| American General Finance Corp. | 4.875 | % | 7/15/12 | 1,650 | 710 | ||||
| American General Finance Corp. | 5.375 | % | 10/1/12 | 1,000 | 470 | ||||
| American General Finance Corp. | 5.850 | % | 6/1/13 | 19,820 | 8,225 | ||||
| American General Finance Corp. | 5.750 | % | 9/15/16 | 4,925 | 1,872 | ||||
| American General Finance Corp. | 6.900 | % | 12/15/17 | 13,800 | 5,520 | ||||
| Block Financial LLC | 7.875 | % | 1/15/13 | 2,000 | 1,878 | ||||
| Capmark Financial Group | 5.875 | % | 5/10/12 | 1,775 | 612 | ||||
| Capmark Financial Group | 6.300 | % | 5/10/17 | 3,625 | 1,015 | ||||
| CIT Group Funding Co. of Canada | 4.650 | % | 7/1/10 | 7,550 | 6,625 | ||||
| CIT Group Funding Co. of Canada | 5.600 | % | 11/2/11 | 5,300 | 4,134 | ||||
| CIT Group Funding Co. of Canada | 5.200 | % | 6/1/15 | 8,575 | 6,002 | ||||
| CIT Group, Inc. | 4.250 | % | 2/1/10 | 3,475 | 3,227 | ||||
| CIT Group, Inc. | 5.200 | % | 11/3/10 | 4,300 | 3,741 | ||||
| CIT Group, Inc. | 4.750 | % | 12/15/10 | 3,650 | 3,212 | ||||
| CIT Group, Inc. | 5.600 | % | 4/27/11 | 6,375 | 5,339 | ||||
| CIT Group, Inc. | 5.800 | % | 7/28/11 | 5,325 | 4,420 | ||||
| CIT Group, Inc. | 7.625 | % | 11/30/12 | 7,325 | 6,226 | ||||
| CIT Group, Inc. | 5.400 | % | 3/7/13 | 7,450 | 5,513 | ||||
| CIT Group, Inc. | 5.000 | % | 2/13/14 | 125 | 89 | ||||
| CIT Group, Inc. | 5.125 | % | 9/30/14 | 5,625 | 4,050 | ||||
| CIT Group, Inc. | 5.000 | % | 2/1/15 | 4,175 | 2,797 | ||||
| CIT Group, Inc. | 5.400 | % | 1/30/16 | 2,750 | 1,925 | ||||
| CIT Group, Inc. | 5.850 | % | 9/15/16 | 6,450 | 4,579 | ||||
| CIT Group, Inc. | 5.650 | % | 2/13/17 | 8,825 | 6,177 | ||||
| CIT Group, Inc. | 6.000 | % | 4/1/36 | 2,150 | 1,355 | ||||
| 2 CIT Group, Inc. | 6.100 | % | 3/15/67 | 225 | 68 | ||||
| Discover Financial Services | 6.450 | % | 6/12/17 | 1,250 | 864 | ||||
| General Electric Capital Corp. | 8.300 | % | 9/20/09 | 275 | 283 | ||||
| General Electric Capital Corp. | 4.250 | % | 9/13/10 | 5,250 | 5,247 | ||||
Page 17
| Vanguard® Total Bond Market Index Fund | |||||||||
| Schedule of Investments | |||||||||
| December 31, 2008 | |||||||||
| Face | Market | ||||||||
| Maturity | Amount | Value | |||||||
| Coupon | Date | ($ | 000 | ) | ($ | 000 | ) | ||
| General Electric Capital Corp. | 4.875 | % | 10/21/10 | 11,450 | 11,674 | ||||
| General Electric Capital Corp. | 5.000 | % | 12/1/10 | 2,650 | 2,704 | ||||
| General Electric Capital Corp. | 6.125 | % | 2/22/11 | 12,580 | 13,072 | ||||
| General Electric Capital Corp. | 5.500 | % | 4/28/11 | 11,475 | 11,792 | ||||
| 5 General Electric Capital Corp. | 3.000 | % | 12/9/11 | 20,800 | 21,563 | ||||
| General Electric Capital Corp. | 5.875 | % | 2/15/12 | 31,390 | 32,263 | ||||
| General Electric Capital Corp. | 4.375 | % | 3/3/12 | 11,200 | 11,030 | ||||
| General Electric Capital Corp. | 5.000 | % | 4/10/12 | 250 | 250 | ||||
| General Electric Capital Corp. | 6.000 | % | 6/15/12 | 20,175 | 20,794 | ||||
| General Electric Capital Corp. | 5.250 | % | 10/19/12 | 50,550 | 50,982 | ||||
| General Electric Capital Corp. | 5.450 | % | 1/15/13 | 10,475 | 10,589 | ||||
| General Electric Capital Corp. | 4.800 | % | 5/1/13 | 17,150 | 17,019 | ||||
| General Electric Capital Corp. | 5.500 | % | 6/4/14 | 15,725 | 15,763 | ||||
| General Electric Capital Corp. | 5.650 | % | 6/9/14 | 9,200 | 9,278 | ||||
| General Electric Capital Corp. | 5.375 | % | 10/20/16 | 4,450 | 4,366 | ||||
| General Electric Capital Corp. | 5.400 | % | 2/15/17 | 24,400 | 23,964 | ||||
| General Electric Capital Corp. | 5.625 | % | 9/15/17 | 8,500 | 8,418 | ||||
| General Electric Capital Corp. | 5.625 | % | 5/1/18 | 35,025 | 35,269 | ||||
| General Electric Capital Corp. | 6.750 | % | 3/15/32 | 38,685 | 41,926 | ||||
| General Electric Capital Corp. | 6.150 | % | 8/7/37 | 11,775 | 11,664 | ||||
| General Electric Capital Corp. | 5.875 | % | 1/14/38 | 42,975 | 42,704 | ||||
| 2 General Electric Capital Corp. | 6.375 | % | 11/15/67 | 12,800 | 8,138 | ||||
| 2 HSBC Finance Capital Trust IX | 5.911 | % | 11/30/35 | 2,700 | 1,548 | ||||
| HSBC Finance Corp. | 4.625 | % | 9/15/10 | 24,500 | 24,222 | ||||
| HSBC Finance Corp. | 5.250 | % | 1/14/11 | 15,425 | 15,314 | ||||
| HSBC Finance Corp. | 5.700 | % | 6/1/11 | 18,725 | 18,437 | ||||
| HSBC Finance Corp. | 6.375 | % | 10/15/11 | 8,000 | 8,035 | ||||
| HSBC Finance Corp. | 7.000 | % | 5/15/12 | 10,375 | 10,451 | ||||
| HSBC Finance Corp. | 5.900 | % | 6/19/12 | 3,650 | 3,690 | ||||
| HSBC Finance Corp. | 6.375 | % | 11/27/12 | 27,815 | 27,510 | ||||
| HSBC Finance Corp. | 4.750 | % | 7/15/13 | 1,850 | 1,715 | ||||
| HSBC Finance Corp. | 5.250 | % | 1/15/14 | 5,600 | 5,379 | ||||
| HSBC Finance Corp. | 5.000 | % | 6/30/15 | 33,350 | 30,363 | ||||
| HSBC Finance Corp. | 5.500 | % | 1/19/16 | 1,850 | 1,769 | ||||
| International Lease Finance Corp. | 4.875 | % | 9/1/10 | 1,625 | 1,300 | ||||
| International Lease Finance Corp. | 5.125 | % | 11/1/10 | 1,850 | 1,406 | ||||
| International Lease Finance Corp. | 4.950 | % | 2/1/11 | 13,350 | 9,812 | ||||
| International Lease Finance Corp. | 5.450 | % | 3/24/11 | 6,250 | 4,562 | ||||
| International Lease Finance Corp. | 5.750 | % | 6/15/11 | 20,900 | 15,257 | ||||
| International Lease Finance Corp. | 5.300 | % | 5/1/12 | 6,075 | 4,252 | ||||
| International Lease Finance Corp. | 5.000 | % | 9/15/12 | 9,350 | 6,451 | ||||
| International Lease Finance Corp. | 6.375 | % | 3/25/13 | 10,225 | 7,157 | ||||
| International Lease Finance Corp. | 5.625 | % | 9/20/13 | 14,345 | 9,504 | ||||
| International Lease Finance Corp. | 5.650 | % | 6/1/14 | 5,875 | 3,877 | ||||
| PHH Corp. | 7.125 | % | 3/1/13 | 1,150 | 541 | ||||
| SLM Corp. | 4.500 | % | 7/26/10 | 3,175 | 2,837 | ||||
| SLM Corp. | 5.400 | % | 10/25/11 | 21,550 | 17,381 | ||||
| SLM Corp. | 5.375 | % | 1/15/13 | 5,325 | 3,834 | ||||
| SLM Corp. | 5.000 | % | 10/1/13 | 5,350 | 3,878 | ||||
| SLM Corp. | 5.050 | % | 11/14/14 | 2,400 | 1,609 | ||||
| SLM Corp. | 8.450 | % | 6/15/18 | 22,875 | 18,218 | ||||
| SLM Corp. | 5.625 | % | 8/1/33 | 6,200 | 3,736 | ||||
| Insurance (0.9%) | |||||||||
| ACE Capital Trust II | 9.700 | % | 4/1/30 | 2,200 | 1,721 | ||||
| ACE INA Holdings, Inc. | 5.600 | % | 5/15/15 | 7,375 | 6,789 | ||||
| ACE INA Holdings, Inc. | 5.700 | % | 2/15/17 | 3,150 | 2,867 | ||||
| ACE INA Holdings, Inc. | 5.800 | % | 3/15/18 | 2,125 | 1,930 | ||||
| AEGON Funding Corp. | 5.750 | % | 12/15/20 | 1,350 | 1,168 | ||||
| AEGON NV | 4.750 | % | 6/1/13 | 2,225 | 1,867 | ||||
| Aetna, Inc. | 7.875 | % | 3/1/11 | 1,700 | 1,711 | ||||
| Aetna, Inc. | 5.750 | % | 6/15/11 | 1,400 | 1,384 | ||||
| Aetna, Inc. | 6.000 | % | 6/15/16 | 11,150 | 10,312 | ||||
| Aetna, Inc. | 6.500 | % | 9/15/18 | 2,425 | 2,352 | ||||
| Aetna, Inc. | 6.625 | % | 6/15/36 | 9,200 | 7,567 | ||||
Page 18
| Vanguard® Total Bond Market Index Fund | ||||||||||
| Schedule of Investments | ||||||||||
| December 31, 2008 | ||||||||||
| Face | Market | |||||||||
| Maturity | Amount | Value | ||||||||
| Coupon | Date | ($ | 000 | ) | ($ | 000 | ) | |||
| Aetna, Inc. | 6.750 | % | 12/15/37 | 225 | 190 | |||||
| Allied World Assurance | 7.500 | % | 8/1/16 | 6,100 | 5,383 | |||||
| Allstate Corp. | 7.200 | % | 12/1/09 | 8,740 | 9,006 | |||||
| Allstate Corp. | 6.125 | % | 2/15/12 | 2,990 | 2,902 | |||||
| Allstate Corp. | 5.000 | % | 8/15/14 | 2,600 | 2,439 | |||||
| Allstate Corp. | 6.125 | % | 12/15/32 | 2,850 | 2,618 | |||||
| Allstate Corp. | 5.350 | % | 6/1/33 | 1,120 | 925 | |||||
| Allstate Corp. | 5.550 | % | 5/9/35 | 1,625 | 1,374 | |||||
| 2 | Allstate Corp. | 6.125 | % | 5/15/37 | 2,700 | 1,737 | ||||
| 2 | Allstate Corp. | 6.500 | % | 5/15/57 | 6,525 | 3,700 | ||||
| Allstate Life Global Funding | 5.375 | % | 4/30/13 | 4,550 | 4,589 | |||||
| Ambac, Inc. | 5.950 | % | 12/5/35 | 9,000 | 2,768 | |||||
| American General Capital II | 8.500 | % | 7/1/30 | 8,590 | 3,694 | |||||
| American International Group, Inc. | 4.700 | % | 10/1/10 | 1,450 | 1,289 | |||||
| American International Group, Inc. | 5.375 | % | 10/18/11 | 4,200 | 3,412 | |||||
| American International Group, Inc. | 4.950 | % | 3/20/12 | 7,430 | 5,786 | |||||
| American International Group, Inc. | 4.250 | % | 5/15/13 | 825 | 593 | |||||
| American International Group, Inc. | 5.050 | % | 10/1/15 | 2,800 | 1,876 | |||||
| American International Group, Inc. | 5.600 | % | 10/18/16 | 1,875 | 1,252 | |||||
| American International Group, Inc. | 5.450 | % | 5/18/17 | 9,525 | 6,227 | |||||
| American International Group, Inc. | 5.850 | % | 1/16/18 | 14,900 | 9,964 | |||||
| American International Group, Inc. | 6.250 | % | 5/1/36 | 10,775 | 6,021 | |||||
| American International Group, Inc. | 6.250 | % | 3/15/37 | 935 | 351 | |||||
| 2,3 | American International Group, Inc. | 8.175 | % | 5/15/58 | 24,500 | 9,279 | ||||
| Aon Capital Trust | 8.205 | % | 1/1/27 | 1,200 | 665 | |||||
| Arch Capital Group Ltd. | 7.350 | % | 5/1/34 | 3,250 | 2,684 | |||||
| Aspen Insurance Holdings Ltd. | 6.000 | % | 8/15/14 | 3,300 | 2,225 | |||||
| Assurant, Inc. | 5.625 | % | 2/15/14 | 1,450 | 1,076 | |||||
| Assurant, Inc. | 6.750 | % | 2/15/34 | 4,100 | 2,526 | |||||
| AXA Financial, Inc. | 7.750 | % | 8/1/10 | 1,075 | 1,077 | |||||
| AXA SA | 8.600 | % | 12/15/30 | 10,550 | 7,534 | |||||
| Axis Capital Holdings Ltd. | 5.750 | % | 12/1/14 | 2,700 | 1,813 | |||||
| Berkshire Hathaway Finance Corp. | 4.125 | % | 1/15/10 | 5,250 | 5,322 | |||||
| Berkshire Hathaway Finance Corp. | 4.200 | % | 12/15/10 | 6,800 | 6,963 | |||||
| Berkshire Hathaway Finance Corp. | 4.600 | % | 5/15/13 | 11,350 | 11,689 | |||||
| Berkshire Hathaway Finance Corp. | 5.000 | % | 8/15/13 | 22,100 | 23,023 | |||||
| Berkshire Hathaway Finance Corp. | 5.100 | % | 7/15/14 | 550 | 580 | |||||
| Berkshire Hathaway Finance Corp. | 4.850 | % | 1/15/15 | 6,880 | 7,173 | |||||
| Berkshire Hathaway Finance Corp. | 5.400 | % | 5/15/18 | 9,975 | 10,325 | |||||
| Chubb Corp. | 5.200 | % | 4/1/13 | 2,000 | 1,985 | |||||
| Chubb Corp. | 5.750 | % | 5/15/18 | 2,450 | 2,410 | |||||
| Chubb Corp. | 6.000 | % | 5/11/37 | 8,600 | 7,769 | |||||
| Chubb Corp. | 6.500 | % | 5/15/38 | 3,150 | 3,003 | |||||
| 2 | Chubb Corp. | 6.375 | % | 3/29/67 | 7,000 | 4,386 | ||||
| CIGNA Corp. | 6.350 | % | 3/15/18 | 1,450 | 1,256 | |||||
| CIGNA Corp. | 7.875 | % | 5/15/27 | 1,300 | 1,152 | |||||
| CIGNA Corp. | 6.150 | % | 11/15/36 | 7,100 | 4,953 | |||||
| Cincinnati Financial Corp. | 6.920 | % | 5/15/28 | 550 | 476 | |||||
| Cincinnati Financial Corp. | 6.125 | % | 11/1/34 | 4,300 | 3,303 | |||||
| CNA Financial Corp. | 6.000 | % | 8/15/11 | 3,225 | 2,339 | |||||
| CNA Financial Corp. | 5.850 | % | 12/15/14 | 4,225 | 3,110 | |||||
| CNA Financial Corp. | 6.500 | % | 8/15/16 | 6,950 | 4,918 | |||||
| Commerce Group, Inc. | 5.950 | % | 12/9/13 | 1,750 | 1,498 | |||||
| Coventry Health Care Inc. | 6.300 | % | 8/15/14 | 4,995 | 3,185 | |||||
| 2 | Everest Reinsurance Holdings, Inc. | 6.600 | % | 5/15/37 | 2,775 | 1,158 | ||||
| Fidelity National Financial, Inc. | 7.300 | % | 8/15/11 | 4,850 | 4,822 | |||||
| Fund American Cos., Inc. | 5.875 | % | 5/15/13 | 2,200 | 1,614 | |||||
| GE Global Insurance Holdings Corp. | 6.450 | % | 3/1/19 | 1,425 | 1,327 | |||||
| GE Global Insurance Holdings Corp. | 7.000 | % | 2/15/26 | 4,200 | 3,859 | |||||
| GE Global Insurance Holdings Corp. | 7.750 | % | 6/15/30 | 1,650 | 1,588 | |||||
| Genworth Financial, Inc. | 5.125 | % | 3/15/11 | 750 | 525 | |||||
| Genworth Financial, Inc. | 5.650 | % | 6/15/12 | 5,000 | 2,081 | |||||
| Genworth Financial, Inc. | 5.750 | % | 6/15/14 | 1,025 | 379 | |||||
| Genworth Financial, Inc. | 4.950 | % | 10/1/15 | 1,225 | 459 | |||||
| Genworth Financial, Inc. | 6.500 | % | 6/15/34 | 3,975 | 1,193 | |||||
| 2 | Genworth Financial, Inc. | 6.150 | % | 11/15/66 | 3,505 | 351 | ||||
Page 19
| Vanguard® Total Bond Market Index Fund | |||||||||
| Schedule of Investments | |||||||||
| December 31, 2008 | |||||||||
| Face | Market | ||||||||
| Maturity | Amount | Value | |||||||
| Coupon | Date | ($ | 000 | ) | ($ | 000 | ) | ||
| Hartford Financial Services Group, Inc. | 5.250 | % | 10/15/11 | 4,675 | 4,102 | ||||
| Hartford Financial Services Group, Inc. | 4.625 | % | 7/15/13 | 3,000 | 2,292 | ||||
| Hartford Financial Services Group, Inc. | 5.500 | % | 10/15/16 | 3,250 | 2,449 | ||||
| Hartford Financial Services Group, Inc. | 5.375 | % | 3/15/17 | 3,200 | 2,261 | ||||
| Hartford Financial Services Group, Inc. | 6.300 | % | 3/15/18 | 350 | 257 | ||||
| Hartford Financial Services Group, Inc. | 6.000 | % | 1/15/19 | 1,550 | 1,114 | ||||
| Hartford Financial Services Group, Inc. | 5.950 | % | 10/15/36 | 3,600 | 2,291 | ||||
| 2 Hartford Financial Services Group, Inc. | 8.125 | % | 6/15/38 | 2,200 | 1,019 | ||||
| Hartford Financial Services Group, Inc. | 6.100 | % | 10/1/41 | 4,075 | 2,638 | ||||
| Humana Inc. | 6.450 | % | 6/1/16 | 6,025 | 4,809 | ||||
| Humana Inc. | 7.200 | % | 6/15/18 | 7,850 | 6,330 | ||||
| Humana Inc. | 6.300 | % | 8/1/18 | 250 | 187 | ||||
| Humana Inc. | 8.150 | % | 6/15/38 | 9,650 | 7,210 | ||||
| ING Capital Funding Trust III | 8.439 | % | 12/31/10 | 600 | 303 | ||||
| 2 ING Capital Funding Trust III | 5.775 | % | 12/8/49 | 12,700 | 5,700 | ||||
| ING USA Global | 4.500 | % | 10/1/10 | 13,000 | 12,644 | ||||
| Liberty Mutual Group | 4.875 | % | 2/1/10 | 1,250 | 1,197 | ||||
| Lincoln National Corp. | 6.200 | % | 12/15/11 | 1,225 | 1,116 | ||||
| Lincoln National Corp. | 5.650 | % | 8/27/12 | 3,975 | 3,252 | ||||
| Lincoln National Corp. | 6.150 | % | 4/7/36 | 7,250 | 4,530 | ||||
| 2 Lincoln National Corp. | 7.000 | % | 5/17/66 | 1,410 | 620 | ||||
| 2 Lincoln National Corp. | 6.050 | % | 4/20/67 | 7,150 | 2,574 | ||||
| Loews Corp. | 5.250 | % | 3/15/16 | 4,150 | 3,793 | ||||
| Loews Corp. | 6.000 | % | 2/1/35 | 650 | 488 | ||||
| Marsh & McLennan Cos., Inc. | 5.150 | % | 9/15/10 | 3,075 | 3,001 | ||||
| Marsh & McLennan Cos., Inc. | 6.250 | % | 3/15/12 | 6,225 | 5,832 | ||||
| Marsh & McLennan Cos., Inc. | 5.375 | % | 7/15/14 | 550 | 487 | ||||
| Marsh & McLennan Cos., Inc. | 5.750 | % | 9/15/15 | 8,850 | 7,779 | ||||
| Marsh & McLennan Cos., Inc. | 5.875 | % | 8/1/33 | 400 | 297 | ||||
| MetLife, Inc. | 6.125 | % | 12/1/11 | 850 | 843 | ||||
| MetLife, Inc. | 5.375 | % | 12/15/12 | 7,475 | 7,135 | ||||
| MetLife, Inc. | 5.000 | % | 11/24/13 | 5,175 | 4,733 | ||||
| MetLife, Inc. | 5.000 | % | 6/15/15 | 3,375 | 3,116 | ||||
| MetLife, Inc. | 6.500 | % | 12/15/32 | 3,450 | 2,927 | ||||
| MetLife, Inc. | 6.375 | % | 6/15/34 | 2,250 | 1,872 | ||||
| MetLife, Inc. | 5.700 | % | 6/15/35 | 975 | 782 | ||||
| MetLife, Inc. | 6.400 | % | 12/15/36 | 8,415 | 5,072 | ||||
| Nationwide Financial Services | 6.750 | % | 5/15/37 | 750 | 307 | ||||
| Principal Financial Group, Inc. | 6.050 | % | 10/15/36 | 3,000 | 2,054 | ||||
| Principal Life Income Funding | 5.125 | % | 3/1/11 | 4,675 | 4,529 | ||||
| Principal Life Income Funding | 5.300 | % | 12/14/12 | 6,675 | 6,390 | ||||
| Principal Life Income Funding | 5.300 | % | 4/24/13 | 6,750 | 6,438 | ||||
| Principal Life Income Funding | 5.100 | % | 4/15/14 | 4,825 | 4,440 | ||||
| Progressive Corp. | 6.375 | % | 1/15/12 | 1,950 | 1,946 | ||||
| Progressive Corp. | 6.625 | % | 3/1/29 | 5,175 | 4,773 | ||||
| Progressive Corp. | 6.250 | % | 12/1/32 | 325 | 281 | ||||
| 2 Progressive Corp. | 6.700 | % | 6/15/37 | 8,500 | 3,961 | ||||
| Protective Life Secured Trust | 4.850 | % | 8/16/10 | 2,225 | 1,956 | ||||
| Prudential Financial, Inc. | 5.100 | % | 12/14/11 | 450 | 390 | ||||
| Prudential Financial, Inc. | 5.800 | % | 6/15/12 | 2,400 | 2,084 | ||||
| Prudential Financial, Inc. | 5.150 | % | 1/15/13 | 2,325 | 1,928 | ||||
| Prudential Financial, Inc. | 4.500 | % | 7/15/13 | 7,825 | 6,180 | ||||
| Prudential Financial, Inc. | 4.750 | % | 4/1/14 | 2,125 | 1,662 | ||||
| Prudential Financial, Inc. | 5.100 | % | 9/20/14 | 8,675 | 6,692 | ||||
| Prudential Financial, Inc. | 5.500 | % | 3/15/16 | 725 | 527 | ||||
| Prudential Financial, Inc. | 6.100 | % | 6/15/17 | 1,200 | 875 | ||||
| Prudential Financial, Inc. | 6.000 | % | 12/1/17 | 4,475 | 3,587 | ||||
| Prudential Financial, Inc. | 5.750 | % | 7/15/33 | 1,800 | 1,160 | ||||
| Prudential Financial, Inc. | 5.400 | % | 6/13/35 | 2,300 | 1,390 | ||||
| Prudential Financial, Inc. | 5.900 | % | 3/17/36 | 4,400 | 2,859 | ||||
| Prudential Financial, Inc. | 5.700 | % | 12/14/36 | 23,700 | 14,895 | ||||
| Torchmark Corp. | 6.375 | % | 6/15/16 | 4,225 | 3,298 | ||||
| Travelers Cos. Inc. | 5.375 | % | 6/15/12 | 300 | 301 | ||||
| Travelers Cos. Inc. | 5.750 | % | 12/15/17 | 4,450 | 4,291 | ||||
| Travelers Cos. Inc. | 5.800 | % | 5/15/18 | 250 | 241 | ||||
| 2 Travelers Cos. Inc. | 6.250 | % | 3/15/37 | 2,975 | 1,873 |
Page 20
| Vanguard® Total Bond Market Index Fund | |||||||||
| Schedule of Investments | |||||||||
| December 31, 2008 | |||||||||
| Face | Market | ||||||||
| Maturity | Amount | Value | |||||||
| Coupon | Date | ($ | 000 | ) | ($ | 000 | ) | ||
| Travelers Cos. Inc. | 6.250 | % | 6/15/37 | 14,550 | 14,134 | ||||
| Travelers Cos., Inc. | 5.500 | % | 12/1/15 | 1,700 | 1,622 | ||||
| Travelers Cos., Inc. | 6.250 | % | 6/20/16 | 2,875 | 2,862 | ||||
| Travelers Property Casualty Corp. | 6.375 | % | 3/15/33 | 425 | 398 | ||||
| UnitedHealth Group, Inc. | 5.250 | % | 3/15/11 | 225 | 216 | ||||
| UnitedHealth Group, Inc. | 5.500 | % | 11/15/12 | 11,375 | 10,417 | ||||
| UnitedHealth Group, Inc. | 4.875 | % | 2/15/13 | 2,700 | 2,529 | ||||
| UnitedHealth Group, Inc. | 4.875 | % | 4/1/13 | 2,725 | 2,540 | ||||
| UnitedHealth Group, Inc. | 5.000 | % | 8/15/14 | 4,925 | 4,605 | ||||
| UnitedHealth Group, Inc. | 4.875 | % | 3/15/15 | 2,500 | 2,164 | ||||
| UnitedHealth Group, Inc. | 6.000 | % | 6/15/17 | 8,975 | 7,935 | ||||
| UnitedHealth Group, Inc. | 6.000 | % | 11/15/17 | 1,250 | 1,110 | ||||
| UnitedHealth Group, Inc. | 6.000 | % | 2/15/18 | 19,805 | 18,326 | ||||
| UnitedHealth Group, Inc. | 5.800 | % | 3/15/36 | 1,500 | 1,137 | ||||
| UnitedHealth Group, Inc. | 6.500 | % | 6/15/37 | 2,125 | 1,640 | ||||
| UnitedHealth Group, Inc. | 6.625 | % | 11/15/37 | 4,725 | 4,006 | ||||
| UnitedHealth Group, Inc. | 6.875 | % | 2/15/38 | 5,625 | 4,976 | ||||
| WellPoint Inc. | 5.000 | % | 1/15/11 | 5,700 | 5,554 | ||||
| WellPoint Inc. | 6.375 | % | 1/15/12 | 3,815 | 3,761 | ||||
| WellPoint Inc. | 6.800 | % | 8/1/12 | 2,710 | 2,672 | ||||
| WellPoint Inc. | 5.000 | % | 12/15/14 | 3,525 | 3,135 | ||||
| WellPoint Inc. | 5.250 | % | 1/15/16 | 750 | 658 | ||||
| WellPoint Inc. | 5.875 | % | 6/15/17 | 5,200 | 4,950 | ||||
| WellPoint Inc. | 5.950 | % | 12/15/34 | 7,000 | 5,822 | ||||
| WellPoint Inc. | 5.850 | % | 1/15/36 | 6,710 | 5,693 | ||||
| WellPoint Inc. | 6.375 | % | 6/15/37 | 1,355 | 1,188 | ||||
| Willis North America Inc. | 5.125 | % | 7/15/10 | 1,100 | 912 | ||||
| Willis North America Inc. | 5.625 | % | 7/15/15 | 4,550 | 3,258 | ||||
| Willis North America Inc. | 6.200 | % | 3/28/17 | 2,750 | 1,874 | ||||
| XL Capital Ltd. | 5.250 | % | 9/15/14 | 5,300 | 2,920 | ||||
| XL Capital Ltd. | 6.375 | % | 11/15/24 | 575 | 298 | ||||
| XL Capital Ltd. | 6.250 | % | 5/15/27 | 8,625 | 3,856 | ||||
| 2 XL Capital Ltd. | 6.500 | % | 12/15/49 | 5,150 | 1,127 | ||||
| Other Finance (0.0%) | |||||||||
| Chicago Mercantile Exchange Group Inc. | 5.400 | % | 8/1/13 | 10,175 | 10,137 | ||||
| Orix Corp. | 5.480 | % | 11/22/11 | 6,125 | 4,612 | ||||
| XTRA Finance Corp. | 5.150 | % | 4/1/17 | 15,400 | 15,178 | ||||
| Real Estate Investment Trusts (0.3%) | |||||||||
| AMB Property LP | 6.300 | % | 6/1/13 | 3,925 | 2,443 | ||||
| Arden Realty LP | 5.250 | % | 3/1/15 | 1,075 | 935 | ||||
| AvalonBay Communities, Inc. | 5.500 | % | 1/15/12 | 2,450 | 1,981 | ||||
| AvalonBay Communities, Inc. | 6.125 | % | 11/1/12 | 1,000 | 788 | ||||
| AvalonBay Communities, Inc. | 5.750 | % | 9/15/16 | 975 | 647 | ||||
| Boston Properties, Inc. | 6.250 | % | 1/15/13 | 4,890 | 3,698 | ||||
| Boston Properties, Inc. | 5.625 | % | 4/15/15 | 5,250 | 3,414 | ||||
| Brandywine Operating Partnership | 5.625 | % | 12/15/10 | 2,925 | 2,502 | ||||
| Brandywine Operating Partnership | 5.750 | % | 4/1/12 | 6,208 | 4,723 | ||||
| Brandywine Operating Partnership | 5.400 | % | 11/1/14 | 1,175 | 739 | ||||
| Brandywine Operating Partnership | 5.700 | % | 5/1/17 | 75 | 41 | ||||
| Camden Property Trust | 5.700 | % | 5/15/17 | 7,700 | 4,025 | ||||
| Colonial Realty LP | 5.500 | % | 10/1/15 | 5,465 | 3,160 | ||||
| Developers Diversified Realty Corp. | 5.250 | % | 4/15/11 | 500 | 282 | ||||
| Developers Diversified Realty Corp. | 5.375 | % | 10/15/12 | 4,675 | 1,897 | ||||
| Duke Realty LP | 5.625 | % | 8/15/11 | 2,000 | 1,564 | ||||
| Duke Realty LP | 5.950 | % | 2/15/17 | 5,250 | 2,734 | ||||
| ERP Operating LP | 6.625 | % | 3/15/12 | 5,020 | 4,119 | ||||
| ERP Operating LP | 5.500 | % | 10/1/12 | 3,500 | 2,691 | ||||
| ERP Operating LP | 5.250 | % | 9/15/14 | 725 | 499 | ||||
| ERP Operating LP | 5.125 | % | 3/15/16 | 3,200 | 2,253 | ||||
| ERP Operating LP | 5.375 | % | 8/1/16 | 3,725 | 2,686 | ||||
| ERP Operating LP | 5.750 | % | 6/15/17 | 1,375 | 986 | ||||
| HCP Inc. | 6.700 | % | 1/30/18 | 6,650 | 3,023 | ||||
| Health Care Property Investors, Inc. | 6.450 | % | 6/25/12 | 4,800 | 3,492 | ||||
Page 21
| Vanguard® Total Bond Market Index Fund | |||||||||
| Schedule of Investments | |||||||||
| December 31, 2008 | |||||||||
| Face | Market | ||||||||
| Maturity | Amount | Value | |||||||
| Coupon | Date | ($ | 000 | ) | ($ | 000 | ) | ||
| Health Care Property Investors, Inc. | 5.650 | % | 12/15/13 | 9,750 | 5,971 | ||||
| Health Care Property Investors, Inc. | 6.300 | % | 9/15/16 | 3,200 | 1,564 | ||||
| Health Care Property Investors, Inc. | 6.000 | % | 1/30/17 | 2,125 | 1,003 | ||||
| Health Care Property Investors, Inc. | 5.625 | % | 5/1/17 | 100 | 47 | ||||
| Health Care REIT, Inc. | 6.000 | % | 11/15/13 | 2,350 | 1,594 | ||||
| Health Care REIT, Inc. | 6.200 | % | 6/1/16 | 10,675 | 6,315 | ||||
| Hospitality Properties | 5.125 | % | 2/15/15 | 6,245 | 3,100 | ||||
| HRPT Properties Trust | 6.250 | % | 8/15/16 | 1,750 | 948 | ||||
| HRPT Properties Trust | 6.250 | % | 6/15/17 | 6,175 | 3,194 | ||||
| Kimco Realty Corp. | 5.783 | % | 3/15/16 | 1,350 | 865 | ||||
| Liberty Property LP | 5.125 | % | 3/2/15 | 9,625 | 6,409 | ||||
| Liberty Property LP | 5.500 | % | 12/15/16 | 2,425 | 1,520 | ||||
| National Retail Properties | 6.875 | % | 10/15/17 | 11,275 | 7,273 | ||||
| Nationwide Health Properties, Inc. | 6.250 | % | 2/1/13 | 4,900 | 3,886 | ||||
| ProLogis | 5.500 | % | 3/1/13 | 2,575 | 1,159 | ||||
| ProLogis | 5.625 | % | 11/15/15 | 3,525 | 1,798 | ||||
| ProLogis | 5.750 | % | 4/1/16 | 3,225 | 1,677 | ||||
| ProLogis | 5.625 | % | 11/15/16 | 3,925 | 1,884 | ||||
| Realty Income Corp. | 6.750 | % | 8/15/19 | 6,925 | 5,029 | ||||
| Regency Centers LP | 6.750 | % | 1/15/12 | 7,225 | 5,877 | ||||
| Regency Centers LP | 5.250 | % | 8/1/15 | 2,800 | 1,762 | ||||
| Simon Property Group Inc. | 4.875 | % | 8/15/10 | 7,850 | 6,941 | ||||
| Simon Property Group Inc. | 5.600 | % | 9/1/11 | 3,250 | 2,721 | ||||
| Simon Property Group Inc. | 5.000 | % | 3/1/12 | 3,975 | 2,904 | ||||
| Simon Property Group Inc. | 6.350 | % | 8/28/12 | 55 | 43 | ||||
| Simon Property Group Inc. | 5.300 | % | 5/30/13 | 2,725 | 1,961 | ||||
| Simon Property Group Inc. | 5.625 | % | 8/15/14 | 150 | 100 | ||||
| Simon Property Group Inc. | 5.750 | % | 12/1/15 | 16,025 | 10,542 | ||||
| Simon Property Group Inc. | 5.250 | % | 12/1/16 | 16,200 | 11,379 | ||||
| Simon Property Group Inc. | 5.875 | % | 3/1/17 | 3,675 | 2,405 | ||||
| Simon Property Group Inc. | 6.125 | % | 5/30/18 | 5,250 | 3,555 | ||||
| Tanger Factory Outlet Centers, Inc. | 6.150 | % | 11/15/15 | 4,250 | 3,073 | ||||
| Vornado Realty | 5.600 | % | 2/15/11 | 4,000 | 3,634 | ||||
| 5,040,152 | |||||||||
| Industrial (8.6%) | |||||||||
| Basic Industry (0.7%) | |||||||||
| Agrium Inc. | 6.750 | % | 1/15/19 | 16,475 | 15,797 | ||||
| Alcan, Inc. | 6.450 | % | 3/15/11 | 950 | 838 | ||||
| Alcan, Inc. | 4.875 | % | 9/15/12 | 1,050 | 791 | ||||
| Alcan, Inc. | 4.500 | % | 5/15/13 | 7,225 | 5,143 | ||||
| Alcan, Inc. | 5.200 | % | 1/15/14 | 875 | 636 | ||||
| Alcan, Inc. | 5.000 | % | 6/1/15 | 1,050 | 757 | ||||
| Alcan, Inc. | 6.125 | % | 12/15/33 | 8,000 | 4,846 | ||||
| Alcoa, Inc. | 6.000 | % | 1/15/12 | 4,225 | 3,960 | ||||
| Alcoa, Inc. | 5.375 | % | 1/15/13 | 5,160 | 4,621 | ||||
| Alcoa, Inc. | 6.000 | % | 7/15/13 | 14,025 | 12,733 | ||||
| Alcoa, Inc. | 6.750 | % | 7/15/18 | 300 | 251 | ||||
| Alcoa, Inc. | 5.720 | % | 2/23/19 | 5,773 | 4,363 | ||||
| Alcoa, Inc. | 5.870 | % | 2/23/22 | 1,577 | 1,135 | ||||
| Alcoa, Inc. | 5.900 | % | 2/1/27 | 6,200 | 4,301 | ||||
| Aluminum Co. of America | 6.750 | % | 1/15/28 | 750 | 569 | ||||
| ArcelorMittal | 5.375 | % | 6/1/13 | 13,650 | 10,684 | ||||
| ArcelorMittal | 6.125 | % | 6/1/18 | 11,600 | 7,854 | ||||
| Barrick Gold Finance Inc. | 6.125 | % | 9/15/13 | 9,650 | 9,122 | ||||
| Barrick Gold Finance Inc. | 4.875 | % | 11/15/14 | 3,325 | 2,996 | ||||
| Barrick North America Finance LLC | 6.800 | % | 9/15/18 | 6,475 | 6,154 | ||||
| Barrick North America Finance LLC | 7.500 | % | 9/15/38 | 7,875 | 7,690 | ||||
| BHP Billiton Finance Ltd. | 5.125 | % | 3/29/12 | 4,300 | 4,255 | ||||
| BHP Billiton Finance Ltd. | 5.400 | % | 3/29/17 | 940 | 873 | ||||
| BHP Finance USA | 5.250 | % | 12/15/15 | 5,150 | 4,667 | ||||
| BHP Finance USA Ltd. | 4.800 | % | 4/15/13 | 9,090 | 8,651 | ||||
| Celulosa Arauco Constitution SA | 8.625 | % | 8/15/10 | 7,825 | 8,079 | ||||
| Celulosa Arauco Constitution SA | 5.125 | % | 7/9/13 | 1,500 | 1,447 | ||||
| Celulosa Arauco Constitution SA | 5.625 | % | 4/20/15 | 2,625 | 2,481 | ||||
| Commercial Metals Co. | 6.500 | % | 7/15/17 | 2,750 | 2,136 |
Page 22
| Vanguard® Total Bond Market Index Fund | |||||||||
| Schedule of Investments | |||||||||
| December 31, 2008 | |||||||||
| Face | Market | ||||||||
| Maturity | Amount | Value | |||||||
| Coupon | Date | ($ | 000 | ) | ($ | 000 | ) | ||
| Commercial Metals Co. | 7.350 | % | 8/15/18 | 6,850 | 5,534 | ||||
| Dow Chemical Co. | 6.125 | % | 2/1/11 | 12,500 | 12,426 | ||||
| Dow Chemical Co. | 6.000 | % | 10/1/12 | 2,055 | 1,947 | ||||
| Dow Chemical Co. | 5.700 | % | 5/15/18 | 10,240 | 8,781 | ||||
| Dow Chemical Co. | 7.375 | % | 11/1/29 | 3,900 | 3,502 | ||||
| E.I. du Pont de Nemours & Co. | 4.125 | % | 4/30/10 | 5,350 | 5,449 | ||||
| E.I. du Pont de Nemours & Co. | 4.750 | % | 11/15/12 | 3,745 | 3,759 | ||||
| E.I. du Pont de Nemours & Co. | 5.000 | % | 1/15/13 | 4,725 | 4,778 | ||||
| E.I. du Pont de Nemours & Co. | 4.125 | % | 3/6/13 | 350 | 342 | ||||
| E.I. du Pont de Nemours & Co. | 5.000 | % | 7/15/13 | 7,850 | 7,947 | ||||
| E.I. du Pont de Nemours & Co. | 5.875 | % | 1/15/14 | 4,850 | 5,027 | ||||
| E.I. du Pont de Nemours & Co. | 5.250 | % | 12/15/16 | 800 | 798 | ||||
| E.I. du Pont de Nemours & Co. | 6.000 | % | 7/15/18 | 12,725 | 13,307 | ||||
| E.I. du Pont de Nemours & Co. | 6.500 | % | 1/15/28 | 2,050 | 2,125 | ||||
| Eastman Chemical Co. | 7.250 | % | 1/15/24 | 675 | 570 | ||||
| Eastman Chemical Co. | 7.600 | % | 2/1/27 | 2,563 | 2,315 | ||||
| Falconbridge Ltd. | 7.350 | % | 6/5/12 | 1,275 | 1,007 | ||||
| Falconbridge Ltd. | 5.375 | % | 6/1/15 | 450 | 287 | ||||
| Freeport-McMoRan Copper & Gold Inc. | 8.250 | % | 4/1/15 | 11,375 | 9,782 | ||||
| Freeport-McMoRan Copper & Gold Inc. | 8.375 | % | 4/1/17 | 16,950 | 13,941 | ||||
| ICI Wilmington | 5.625 | % | 12/1/13 | 900 | 880 | ||||
| Inco Ltd. | 7.750 | % | 5/15/12 | 60 | 59 | ||||
| Inco Ltd. | 5.700 | % | 10/15/15 | 4,300 | 3,615 | ||||
| Inco Ltd. | 7.200 | % | 9/15/32 | 1,500 | 1,152 | ||||
| International Paper Co. | 4.000 | % | 4/1/10 | 500 | 484 | ||||
| International Paper Co. | 5.850 | % | 10/30/12 | 2,893 | 2,499 | ||||
| International Paper Co. | 5.300 | % | 4/1/15 | 5,650 | 3,850 | ||||
| International Paper Co. | 7.950 | % | 6/15/18 | 14,950 | 11,561 | ||||
| Lubrizol Corp. | 5.500 | % | 10/1/14 | 9,650 | 8,730 | ||||
| Lubrizol Corp. | 6.500 | % | 10/1/34 | 4,835 | 3,780 | ||||
| Monsanto Co. | 7.375 | % | 8/15/12 | 1,025 | 1,157 | ||||
| Monsanto Co. | 5.125 | % | 4/15/18 | 3,950 | 4,164 | ||||
| 3 Mosaic Co. | 7.375 | % | 12/1/14 | 6,800 | 6,086 | ||||
| Newmont Mining | 5.875 | % | 4/1/35 | 3,125 | 1,783 | ||||
| Noranda, Inc. | 7.250 | % | 7/15/12 | 3,750 | 2,961 | ||||
| Noranda, Inc. | 6.000 | % | 10/15/15 | 1,450 | 1,021 | ||||
| Noranda, Inc. | 5.500 | % | 6/15/17 | 6,650 | 4,234 | ||||
| Nucor Corp. | 5.000 | % | 12/1/12 | 1,000 | 982 | ||||
| Nucor Corp. | 5.000 | % | 6/1/13 | 300 | 298 | ||||
| Nucor Corp. | 5.750 | % | 12/1/17 | 1,325 | 1,322 | ||||
| Nucor Corp. | 5.850 | % | 6/1/18 | 5,750 | 5,569 | ||||
| Nucor Corp. | 6.400 | % | 12/1/37 | 4,300 | 4,125 | ||||
| Placer Dome, Inc. | 6.450 | % | 10/15/35 | 2,275 | 1,801 | ||||
| Plum Creek Timber Co. | 5.875 | % | 11/15/15 | 4,275 | 3,511 | ||||
| Potash Corp. of Saskatchewan | 7.750 | % | 5/31/11 | 10,425 | 10,806 | ||||
| Potash Corp. of Saskatchewan | 4.875 | % | 3/1/13 | 5,000 | 4,755 | ||||
| Potash Corp. of Saskatchewan | 5.875 | % | 12/1/36 | 975 | 862 | ||||
| PPG Industries, Inc. | 5.750 | % | 3/15/13 | 4,900 | 4,836 | ||||
| PPG Industries, Inc. | 6.650 | % | 3/15/18 | 4,350 | 4,289 | ||||
| Praxair, Inc. | 6.375 | % | 4/1/12 | 2,250 | 2,372 | ||||
| Praxair, Inc. | 3.950 | % | 6/1/13 | 975 | 953 | ||||
| Praxair, Inc. | 5.250 | % | 11/15/14 | 7,200 | 7,405 | ||||
| Praxair, Inc. | 4.625 | % | 3/30/15 | 425 | 402 | ||||
| Praxair, Inc. | 5.200 | % | 3/15/17 | 1,400 | 1,357 | ||||
| Reliance Steel & Aluminum | 6.200 | % | 11/15/16 | 350 | 287 | ||||
| Reliance Steel & Aluminum | 6.850 | % | 11/15/36 | 650 | 526 | ||||
| Rio Tinto Finance USA Ltd. | 5.875 | % | 7/15/13 | 16,185 | 12,974 | ||||
| Rio Tinto Finance USA Ltd. | 6.500 | % | 7/15/18 | 11,650 | 8,342 | ||||
| Rio Tinto Finance USA Ltd. | 7.125 | % | 7/15/28 | 5,425 | 3,839 | ||||
| Rohm & Haas Co. | 5.600 | % | 3/15/13 | 150 | 147 | ||||
| Rohm & Haas Co. | 6.000 | % | 9/15/17 | 5,025 | 4,512 | ||||
| 2 Rohm & Haas Co. | 9.800 | % | 4/15/20 | 2,282 | 2,616 | ||||
| Rohm & Haas Co. | 7.850 | % | 7/15/29 | 2,425 | 2,372 | ||||
| Southern Copper Corp. | 7.500 | % | 7/27/35 | 9,050 | 6,923 | ||||
| US Steel Corp. | 6.050 | % | 6/1/17 | 4,775 | 2,796 | ||||
| US Steel Corp. | 7.000 | % | 2/1/18 | 2,900 | 1,965 |
Page 23
| Vanguard® Total Bond Market Index Fund | ||||||||||
| Schedule of Investments | ||||||||||
| December 31, 2008 | ||||||||||
| Face | Market | |||||||||
| Maturity | Amount | Value | ||||||||
| Coupon | Date | ($ | 000 | ) | ($ | 000 | ) | |||
| US Steel Corp. | 6.650 | % | 6/1/37 | 275 | 146 | |||||
| Vale Overseas Ltd. | 6.250 | % | 1/11/16 | 2,525 | 2,430 | |||||
| Vale Overseas Ltd. | 6.250 | % | 1/23/17 | 5,500 | 5,197 | |||||
| Vale Overseas Ltd. | 8.250 | % | 1/17/34 | 2,925 | 3,086 | |||||
| Vale Overseas Ltd. | 6.875 | % | 11/21/36 | 16,237 | 14,979 | |||||
| Weyerhaeuser Co. | 7.375 | % | 3/15/32 | 8,755 | 5,934 | |||||
| Capital Goods (0.9%) | ||||||||||
| 3M Co. | 5.125 | % | 11/6/09 | 1,650 | 1,684 | |||||
| 3M Co. | 5.700 | % | 3/15/37 | 3,650 | 4,004 | |||||
| 2,3 | BAE Systems Asset Trust | 7.156 | % | 12/15/11 | 1,865 | 1,927 | ||||
| 3 | BAE Systems Holdings Inc. | 5.200 | % | 8/15/15 | 700 | 654 | ||||
| Bemis Co. Inc. | 4.875 | % | 4/1/12 | 1,500 | 1,393 | |||||
| Black & Decker Corp. | 7.125 | % | 6/1/11 | 500 | 495 | |||||
| Black & Decker Corp. | 5.750 | % | 11/15/16 | 2,950 | 2,454 | |||||
| Boeing Capital Corp. | 7.375 | % | 9/27/10 | 3,250 | 3,457 | |||||
| Boeing Capital Corp. | 6.500 | % | 2/15/12 | 15,175 | 16,069 | |||||
| Boeing Capital Corp. | 5.800 | % | 1/15/13 | 6,540 | 6,814 | |||||
| Boeing Co. | 8.750 | % | 8/15/21 | 1,000 | 1,223 | |||||
| Boeing Co. | 7.250 | % | 6/15/25 | 2,275 | 2,590 | |||||
| Boeing Co. | 8.750 | % | 9/15/31 | 975 | 1,265 | |||||
| Boeing Co. | 6.125 | % | 2/15/33 | 950 | 1,000 | |||||
| Boeing Co. | 6.625 | % | 2/15/38 | 2,345 | 2,508 | |||||
| Caterpillar Financial Services Corp. | 4.150 | % | 1/15/10 | 10,000 | 9,902 | |||||
| Caterpillar Financial Services Corp. | 4.300 | % | 6/1/10 | 7,625 | 7,495 | |||||
| Caterpillar Financial Services Corp. | 5.125 | % | 10/12/11 | 700 | 700 | |||||
| Caterpillar Financial Services Corp. | 4.850 | % | 12/7/12 | 400 | 395 | |||||
| Caterpillar Financial Services Corp. | 4.250 | % | 2/8/13 | 4,725 | 4,553 | |||||
| Caterpillar Financial Services Corp. | 4.750 | % | 2/17/15 | 5,775 | 5,444 | |||||
| Caterpillar Financial Services Corp. | 4.625 | % | 6/1/15 | 3,125 | 2,918 | |||||
| Caterpillar, Inc. | 7.000 | % | 12/15/13 | 2,000 | 2,151 | |||||
| Caterpillar, Inc. | 6.625 | % | 7/15/28 | 850 | 855 | |||||
| Caterpillar, Inc. | 7.300 | % | 5/1/31 | 700 | 751 | |||||
| Caterpillar, Inc. | 6.050 | % | 8/15/36 | 19,300 | 19,638 | |||||
| Caterpillar, Inc. | 8.250 | % | 12/15/38 | 1,000 | 1,226 | |||||
| Caterpillar, Inc. | 6.950 | % | 5/1/42 | 1,275 | 1,280 | |||||
| Caterpillar, Inc. | 7.375 | % | 3/1/97 | 6,150 | 6,324 | |||||
| Cooper Industries, Inc. | 5.250 | % | 11/15/12 | 4,425 | 4,441 | |||||
| Cooper Industries, Inc. | 5.450 | % | 4/1/15 | 2,450 | 2,395 | |||||
| CRH America Inc. | 5.625 | % | 9/30/11 | 4,375 | 3,634 | |||||
| CRH America Inc. | 6.950 | % | 3/15/12 | 6,210 | 5,188 | |||||
| CRH America Inc. | 5.300 | % | 10/15/13 | 875 | 622 | |||||
| CRH America Inc. | 6.000 | % | 9/30/16 | 15,375 | 9,736 | |||||
| CRH America Inc. | 8.125 | % | 7/15/18 | 15,025 | 10,940 | |||||
| CRH America Inc. | 6.400 | % | 10/15/33 | 2,120 | 1,230 | |||||
| Danaher Corp. | 5.625 | % | 1/15/18 | 2,850 | 2,941 | |||||
| Deere & Co. | 6.950 | % | 4/25/14 | 6,595 | 6,973 | |||||
| Deere & Co. | 8.100 | % | 5/15/30 | 3,755 | 4,245 | |||||
| Deere & Co. | 7.125 | % | 3/3/31 | 725 | 755 | |||||
| Dover Corp. | 5.450 | % | 3/15/18 | 8,100 | 8,378 | |||||
| Dover Corp. | 5.375 | % | 10/15/35 | 650 | 624 | |||||
| Dover Corp. | 6.600 | % | 3/15/38 | 3,275 | 3,784 | |||||
| Eaton Corp. | 4.900 | % | 5/15/13 | 3,850 | 3,700 | |||||
| Eaton Corp. | 5.600 | % | 5/15/18 | 2,700 | 2,590 | |||||
| Embraer Overseas Ltd. | 6.375 | % | 1/24/17 | 5,775 | 4,158 | |||||
| Emerson Electric Co. | 7.125 | % | 8/15/10 | 3,600 | 3,780 | |||||
| Emerson Electric Co. | 4.625 | % | 10/15/12 | 8,425 | 8,492 | |||||
| Emerson Electric Co. | 4.500 | % | 5/1/13 | 4,900 | 4,901 | |||||
| Emerson Electric Co. | 5.250 | % | 10/15/18 | 7,925 | 8,089 | |||||
| General Dynamics Corp. | 4.500 | % | 8/15/10 | 25 | 25 | |||||
| General Dynamics Corp. | 4.250 | % | 5/15/13 | 8,615 | 8,533 | |||||
| General Dynamics Corp. | 5.250 | % | 2/1/14 | 3,650 | 3,757 | |||||
| General Electric Co. | 5.000 | % | 2/1/13 | 35,815 | 36,350 | |||||
| General Electric Co. | 5.250 | % | 12/6/17 | 8,275 | 8,345 | |||||
| Harsco Corp. | 5.750 | % | 5/15/18 | 6,125 | 6,222 | |||||
Page 24
| Vanguard® Total Bond Market Index Fund | |||||||||
| Schedule of Investments | |||||||||
| December 31, 2008 | |||||||||
| Face | Market | ||||||||
| Maturity | Amount | Value | |||||||
| Coupon | Date | ($ | 000 | ) | ($ | 000 | ) | ||
| Honeywell International, Inc. | 7.500 | % | 3/1/10 | 1,500 | 1,566 | ||||
| Honeywell International, Inc. | 6.125 | % | 11/1/11 | 3,125 | 3,296 | ||||
| Honeywell International, Inc. | 5.625 | % | 8/1/12 | 4,200 | 4,376 | ||||
| Honeywell International, Inc. | 4.250 | % | 3/1/13 | 1,400 | 1,393 | ||||
| Honeywell International, Inc. | 5.400 | % | 3/15/16 | 2,075 | 2,121 | ||||
| Honeywell International, Inc. | 5.300 | % | 3/15/17 | 6,475 | 6,569 | ||||
| Honeywell International, Inc. | 5.300 | % | 3/1/18 | 700 | 711 | ||||
| Honeywell International, Inc. | 5.700 | % | 3/15/36 | 2,775 | 2,786 | ||||
| Ingersoll-Rand GL Holding Company | 6.000 | % | 8/15/13 | 5,100 | 4,991 | ||||
| Ingersoll-Rand GL Holding Company | 6.875 | % | 8/15/18 | 7,200 | 6,811 | ||||
| John Deere Capital Corp | 4.950 | % | 12/17/12 | 4,350 | 4,366 | ||||
| John Deere Capital Corp. | 5.400 | % | 10/17/11 | 5,675 | 5,704 | ||||
| John Deere Capital Corp. | 5.350 | % | 1/17/12 | 4,400 | 4,480 | ||||
| John Deere Capital Corp. | 7.000 | % | 3/15/12 | 13,245 | 14,219 | ||||
| John Deere Capital Corp. | 4.900 | % | 9/9/13 | 10,450 | 10,386 | ||||
| John Deere Capital Corp. | 5.750 | % | 9/10/18 | 5,850 | 5,694 | ||||
| Joy Global, Inc. | 6.000 | % | 11/15/16 | 2,175 | 1,848 | ||||
| Lafarge SA | 6.150 | % | 7/15/11 | 675 | 579 | ||||
| Lafarge SA | 6.500 | % | 7/15/16 | 7,925 | 5,354 | ||||
| Lafarge SA | 7.125 | % | 7/15/36 | 14,925 | 8,497 | ||||
| Lockheed Martin Corp. | 4.121 | % | 3/14/13 | 2,875 | 2,824 | ||||
| Lockheed Martin Corp. | 7.650 | % | 5/1/16 | 5,325 | 6,108 | ||||
| Lockheed Martin Corp. | 7.750 | % | 5/1/26 | 600 | 743 | ||||
| Lockheed Martin Corp. | 6.150 | % | 9/1/36 | 11,950 | 13,045 | ||||
| Martin Marietta Material | 6.600 | % | 4/15/18 | 6,450 | 4,758 | ||||
| Masco Corp. | 5.875 | % | 7/15/12 | 3,185 | 2,598 | ||||
| Masco Corp. | 4.800 | % | 6/15/15 | 7,650 | 5,027 | ||||
| Masco Corp. | 6.125 | % | 10/3/16 | 2,600 | 1,786 | ||||
| Masco Corp. | 7.750 | % | 8/1/29 | 450 | 300 | ||||
| Masco Corp. | 6.500 | % | 8/15/32 | 2,450 | 1,279 | ||||
| Minnesota Mining & Manufacturing Corp. | 6.375 | % | 2/15/28 | 4,325 | 4,987 | ||||
| Mohawk Industries Inc. | 5.750 | % | 1/15/11 | 7,275 | 6,717 | ||||
| Mohawk Industries Inc. | 6.125 | % | 1/15/16 | 13,975 | 10,488 | ||||
| Northrop Grumman Corp. | 7.125 | % | 2/15/11 | 10,700 | 11,256 | ||||
| Northrop Grumman Corp. | 7.750 | % | 3/1/16 | 700 | 793 | ||||
| Northrop Grumman Corp. | 7.875 | % | 3/1/26 | 2,600 | 3,108 | ||||
| Parker-Hannifin Corp. | 5.500 | % | 5/15/18 | 1,600 | 1,557 | ||||
| Parker-Hannifin Corp. | 6.250 | % | 5/15/38 | 1,950 | 1,947 | ||||
| Raytheon Co. | 4.850 | % | 1/15/11 | 250 | 252 | ||||
| Raytheon Co. | 5.500 | % | 11/15/12 | 2,600 | 2,655 | ||||
| Raytheon Co. | 6.400 | % | 12/15/18 | 500 | 544 | ||||
| Raytheon Co. | 7.200 | % | 8/15/27 | 4,550 | 5,151 | ||||
| Republic Services, Inc. | 6.750 | % | 8/15/11 | 1,875 | 1,842 | ||||
| Republic Services, Inc. | 6.086 | % | 3/15/35 | 2,850 | 2,010 | ||||
| Rockwell Automation | 5.650 | % | 12/1/17 | 2,100 | 2,193 | ||||
| Rockwell Automation | 6.700 | % | 1/15/28 | 1,275 | 1,443 | ||||
| Rockwell Automation | 6.250 | % | 12/1/37 | 4,700 | 5,192 | ||||
| Roper Industries Inc. | 6.625 | % | 8/15/13 | 11,325 | 11,547 | ||||
| Textron Financial Corp. | 4.600 | % | 5/3/10 | 4,200 | 3,788 | ||||
| Textron Financial Corp. | 5.125 | % | 11/1/10 | 12,925 | 11,426 | ||||
| Textron Financial Corp. | 5.400 | % | 4/28/13 | 5,955 | 4,306 | ||||
| Textron, Inc. | 6.500 | % | 6/1/12 | 8,125 | 7,006 | ||||
| Textron, Inc. | 5.600 | % | 12/1/17 | 1,300 | 938 | ||||
| TRW, Inc. | 7.750 | % | 6/1/29 | 5,325 | 6,123 | ||||
| Tyco International Group SA | 6.750 | % | 2/15/11 | 9,850 | 9,441 | ||||
| Tyco International Group SA | 6.375 | % | 10/15/11 | 12,725 | 11,934 | ||||
| Tyco International Group SA | 6.000 | % | 11/15/13 | 5,850 | 5,182 | ||||
| Tyco International Group SA | 7.000 | % | 12/15/19 | 2,350 | 1,960 | ||||
| United Technologies Corp. | 4.375 | % | 5/1/10 | 1,275 | 1,286 | ||||
| United Technologies Corp. | 7.125 | % | 11/15/10 | 250 | 266 | ||||
| United Technologies Corp. | 6.350 | % | 3/1/11 | 8,175 | 8,538 | ||||
| United Technologies Corp. | 5.375 | % | 12/15/17 | 15,150 | 15,525 | ||||
| United Technologies Corp. | 8.875 | % | 11/15/19 | 3,150 | 4,093 | ||||
| United Technologies Corp. | 6.700 | % | 8/1/28 | 1,642 | 1,822 | ||||
| United Technologies Corp. | 7.500 | % | 9/15/29 | 2,800 | 3,388 | ||||
| United Technologies Corp. | 5.400 | % | 5/1/35 | 4,150 | 3,970 |
Page 25
| Vanguard® Total Bond Market Index Fund | |||||||||
| Schedule of Investments | |||||||||
| December 31, 2008 | |||||||||
| Face | Market | ||||||||
| Maturity | Amount | Value | |||||||
| Coupon | Date | ($ | 000 | ) | ($ | 000 | ) | ||
| United Technologies Corp. | 6.050 | % | 6/1/36 | 10,850 | 11,512 | ||||
| United Technologies Corp. | 6.125 | % | 7/15/38 | 2,750 | 2,991 | ||||
| Vulcan Materials Co. | 6.300 | % | 6/15/13 | 3,200 | 2,939 | ||||
| Vulcan Materials Co. | 7.000 | % | 6/15/18 | 5,550 | 4,283 | ||||
| Waste Management, Inc. | 7.375 | % | 8/1/10 | 875 | 887 | ||||
| Waste Management, Inc. | 6.375 | % | 11/15/12 | 800 | 761 | ||||
| Waste Management, Inc. | 5.000 | % | 3/15/14 | 500 | 435 | ||||
| Waste Management, Inc. | 7.750 | % | 5/15/32 | 525 | 465 | ||||
| WMX Technologies Inc. | 7.100 | % | 8/1/26 | 1,375 | 1,160 | ||||
| Communication (2.0%) | |||||||||
| America Movil SA de C.V. | 5.500 | % | 3/1/14 | 2,575 | 2,369 | ||||
| America Movil SA de C.V. | 5.750 | % | 1/15/15 | 2,625 | 2,418 | ||||
| America Movil SA de C.V. | 6.375 | % | 3/1/35 | 10,125 | 8,682 | ||||
| America Movil SA de C.V. | 6.125 | % | 11/15/37 | 5,125 | 4,177 | ||||
| AT&T Inc. | 5.300 | % | 11/15/10 | 4,550 | 4,619 | ||||
| AT&T Inc. | 6.250 | % | 3/15/11 | 14,990 | 15,357 | ||||
| AT&T Inc. | 7.300 | % | 11/15/11 | 6,275 | 6,690 | ||||
| AT&T Inc. | 5.875 | % | 2/1/12 | 6,730 | 6,906 | ||||
| AT&T Inc. | 5.875 | % | 8/15/12 | 5,495 | 5,662 | ||||
| AT&T Inc. | 4.950 | % | 1/15/13 | 9,000 | 9,068 | ||||
| AT&T Inc. | 6.700 | % | 11/15/13 | 1,450 | 1,549 | ||||
| AT&T Inc. | 5.100 | % | 9/15/14 | 11,525 | 11,500 | ||||
| AT&T Inc. | 5.625 | % | 6/15/16 | 42,175 | 42,270 | ||||
| AT&T Inc. | 5.500 | % | 2/1/18 | 4,865 | 4,855 | ||||
| AT&T Inc. | 5.600 | % | 5/15/18 | 5,100 | 5,258 | ||||
| AT&T Inc. | 8.000 | % | 11/15/31 | 23,755 | 30,793 | ||||
| AT&T Inc. | 6.450 | % | 6/15/34 | 6,675 | 7,419 | ||||
| AT&T Inc. | 6.800 | % | 5/15/36 | 1,675 | 1,949 | ||||
| AT&T Inc. | 6.500 | % | 9/1/37 | 21,125 | 23,546 | ||||
| AT&T Inc. | 6.300 | % | 1/15/38 | 11,900 | 13,050 | ||||
| AT&T Wireless | 7.875 | % | 3/1/11 | 15,200 | 16,007 | ||||
| AT&T Wireless | 8.125 | % | 5/1/12 | 14,155 | 15,181 | ||||
| AT&T Wireless | 8.750 | % | 3/1/31 | 4,855 | 5,949 | ||||
| BellSouth Capital Funding Corp. | 7.875 | % | 2/15/30 | 12,950 | 14,007 | ||||
| BellSouth Corp. | 4.750 | % | 11/15/12 | 2,065 | 2,026 | ||||
| BellSouth Corp. | 5.200 | % | 12/15/16 | 7,200 | 7,027 | ||||
| BellSouth Corp. | 6.875 | % | 10/15/31 | 6,275 | 6,461 | ||||
| BellSouth Corp. | 6.550 | % | 6/15/34 | 6,800 | 6,741 | ||||
| BellSouth Corp. | 6.000 | % | 11/15/34 | 3,835 | 3,412 | ||||
| BellSouth Telecommunications Inc. | 6.375 | % | 6/1/28 | 8,365 | 8,186 | ||||
| Belo Corp. | 7.250 | % | 9/15/27 | 340 | 161 | ||||
| British Telecommunications PLC | 8.625 | % | 12/15/10 | 8,735 | 9,033 | ||||
| British Telecommunications PLC | 5.150 | % | 1/15/13 | 2,000 | 1,836 | ||||
| British Telecommunications PLC | 5.950 | % | 1/15/18 | 7,100 | 6,084 | ||||
| British Telecommunications PLC | 9.125 | % | 12/15/30 | 13,135 | 14,025 | ||||
| CBS Corp. | 7.700 | % | 7/30/10 | 5,375 | 5,261 | ||||
| CBS Corp. | 6.625 | % | 5/15/11 | 2,760 | 2,437 | ||||
| CBS Corp. | 5.625 | % | 8/15/12 | 3,700 | 3,054 | ||||
| CBS Corp. | 4.625 | % | 5/15/18 | 500 | 318 | ||||
| CBS Corp. | 7.875 | % | 7/30/30 | 575 | 364 | ||||
| CBS Corp. | 5.500 | % | 5/15/33 | 675 | 350 | ||||
| CenturyTel Enterprises | 6.875 | % | 1/15/28 | 925 | 582 | ||||
| CenturyTel, Inc. | 7.875 | % | 8/15/12 | 2,375 | 2,082 | ||||
| CenturyTel, Inc. | 6.000 | % | 4/1/17 | 425 | 307 | ||||
| Cingular Wireless LLC | 6.500 | % | 12/15/11 | 2,850 | 2,911 | ||||
| Cingular Wireless LLC | 7.125 | % | 12/15/31 | 12,370 | 12,445 | ||||
| Comcast Cable Communications Holdings Inc. | 8.375 | % | 3/15/13 | 6,960 | 7,227 | ||||
| Comcast Cable Communications Holdings Inc. | 9.455 | % | 11/15/22 | 8,861 | 9,986 | ||||
| Comcast Cable Communications, Inc. | 6.750 | % | 1/30/11 | 15,865 | 16,037 | ||||
| Comcast Cable Communications, Inc. | 8.875 | % | 5/1/17 | 2,825 | 3,029 | ||||
| Comcast Corp. | 5.850 | % | 1/15/10 | 1,925 | 1,942 | ||||
| Comcast Corp. | 5.500 | % | 3/15/11 | 1,925 | 1,906 | ||||
| Comcast Corp. | 5.300 | % | 1/15/14 | 4,455 | 4,295 | ||||
| Comcast Corp. | 6.500 | % | 1/15/15 | 5,640 | 5,590 | ||||
Page 26
| Vanguard® Total Bond Market Index Fund | |||||||||
| Schedule of Investments | |||||||||
| December 31, 2008 | |||||||||
| Face | Market | ||||||||
| Maturity | Amount | Value | |||||||
| Coupon | Date | ($ | 000 | ) | ($ | 000 | ) | ||
| Comcast Corp. | 5.850 | % | 11/15/15 | 1,000 | 958 | ||||
| Comcast Corp. | 5.900 | % | 3/15/16 | 13,200 | 12,691 | ||||
| Comcast Corp. | 6.300 | % | 11/15/17 | 31,800 | 31,417 | ||||
| Comcast Corp. | 5.875 | % | 2/15/18 | 17,350 | 16,751 | ||||
| Comcast Corp. | 6.500 | % | 11/15/35 | 11,600 | 11,496 | ||||
| Comcast Corp. | 6.450 | % | 3/15/37 | 1,875 | 1,858 | ||||
| Comcast Corp. | 6.950 | % | 8/15/37 | 9,325 | 9,840 | ||||
| Comcast Corp. | 6.400 | % | 5/15/38 | 1,850 | 1,821 | ||||
| Cox Communications, Inc. | 4.625 | % | 1/15/10 | 1,300 | 1,257 | ||||
| Cox Communications, Inc. | 6.750 | % | 3/15/11 | 20,075 | 19,217 | ||||
| Cox Communications, Inc. | 7.125 | % | 10/1/12 | 5,800 | 5,479 | ||||
| Cox Communications, Inc. | 5.450 | % | 12/15/14 | 11,825 | 10,329 | ||||
| Cox Communications, Inc. | 5.500 | % | 10/1/15 | 725 | 643 | ||||
| Deutsche Telekom International Finance | 8.500 | % | 6/15/10 | 24,335 | 25,322 | ||||
| Deutsche Telekom International Finance | 5.875 | % | 8/20/13 | 450 | 452 | ||||
| Deutsche Telekom International Finance | 5.750 | % | 3/23/16 | 9,225 | 8,796 | ||||
| Deutsche Telekom International Finance | 6.750 | % | 8/20/18 | 425 | 432 | ||||
| Deutsche Telekom International Finance | 8.750 | % | 6/15/30 | 21,580 | 26,544 | ||||
| Embarq Corp. | 6.738 | % | 6/1/13 | 650 | 531 | ||||
| Embarq Corp. | 7.082 | % | 6/1/16 | 20,625 | 15,839 | ||||
| Embarq Corp. | 7.995 | % | 6/1/36 | 3,990 | 2,543 | ||||
| France Telecom | 7.750 | % | 3/1/11 | 15,475 | 16,284 | ||||
| France Telecom | 8.500 | % | 3/1/31 | 17,000 | 20,570 | ||||
| Gannett Co., Inc. | 6.375 | % | 4/1/12 | 5,025 | 3,280 | ||||
| Grupo Televisa SA | 6.625 | % | 3/18/25 | 4,125 | 3,527 | ||||
| Grupo Televisa SA | 8.500 | % | 3/11/32 | 750 | 686 | ||||
| GTE Corp. | 8.750 | % | 11/1/21 | 3,835 | 4,124 | ||||
| GTE Corp. | 6.940 | % | 4/15/28 | 4,620 | 4,394 | ||||
| Koninklijke KPN NV | 8.000 | % | 10/1/10 | 780 | 785 | ||||
| Koninklijke KPN NV | 8.375 | % | 10/1/30 | 5,615 | 5,876 | ||||
| McGraw-Hill Cos. Inc. | 5.375 | % | 11/15/12 | 1,550 | 1,387 | ||||
| McGraw-Hill Cos. Inc. | 5.900 | % | 11/15/17 | 5,975 | 5,041 | ||||
| McGraw-Hill Cos. Inc. | 6.550 | % | 11/15/37 | 7,125 | 5,105 | ||||
| New England Telephone & Telegraph Co. | 7.875 | % | 11/15/29 | 775 | 699 | ||||
| News America Holdings, Inc. | 9.250 | % | 2/1/13 | 151 | 163 | ||||
| News America Holdings, Inc. | 8.000 | % | 10/17/16 | 4,425 | 4,668 | ||||
| News America Holdings, Inc. | 7.700 | % | 10/30/25 | 900 | 926 | ||||
| News America Holdings, Inc. | 8.150 | % | 10/17/36 | 2,625 | 2,855 | ||||
| News America Holdings, Inc. | 7.750 | % | 12/1/45 | 1,775 | 1,692 | ||||
| News America Inc. | 5.300 | % | 12/15/14 | 1,300 | 1,184 | ||||
| News America Inc. | 7.250 | % | 5/18/18 | 150 | 152 | ||||
| News America Inc. | 6.550 | % | 3/15/33 | 275 | 246 | ||||
| News America Inc. | 6.200 | % | 12/15/34 | 17,435 | 15,380 | ||||
| News America Inc. | 6.400 | % | 12/15/35 | 16,210 | 15,722 | ||||
| News America Inc. | 6.650 | % | 11/15/37 | 1,050 | 1,016 | ||||
| Omnicom Group Inc. | 5.900 | % | 4/15/16 | 925 | 753 | ||||
| Pacific Bell | 7.125 | % | 3/15/26 | 1,700 | 1,778 | ||||
| Qwest Communications International Inc. | 7.875 | % | 9/1/11 | 5,250 | 4,673 | ||||
| Qwest Communications International Inc. | 8.875 | % | 3/15/12 | 5,800 | 5,336 | ||||
| Qwest Communications International Inc. | 7.500 | % | 10/1/14 | 10,125 | 8,277 | ||||
| Qwest Communications International Inc. | 6.500 | % | 6/1/17 | 3,875 | 2,868 | ||||
| R.R. Donnelley & Sons Co. | 4.950 | % | 5/15/10 | 3,400 | 3,150 | ||||
| R.R. Donnelley & Sons Co. | 5.625 | % | 1/15/12 | 1,850 | 1,648 | ||||
| R.R. Donnelley & Sons Co. | 4.950 | % | 4/1/14 | 1,275 | 1,025 | ||||
| R.R. Donnelley & Sons Co. | 5.500 | % | 5/15/15 | 1,585 | 1,110 | ||||
| R.R. Donnelley & Sons Co. | 6.125 | % | 1/15/17 | 225 | 155 | ||||
| Reed Elsevier Capital | 4.625 | % | 6/15/12 | 1,375 | 1,313 | ||||
| Rogers Communications Inc. | 7.250 | % | 12/15/12 | 3,940 | 3,846 | ||||
| Rogers Communications Inc. | 6.375 | % | 3/1/14 | 11,700 | 11,276 | ||||
| Rogers Communications Inc. | 5.500 | % | 3/15/14 | 750 | 699 | ||||
| Rogers Communications Inc. | 6.800 | % | 8/15/18 | 15,075 | 15,263 | ||||
| Rogers Communications Inc. | 7.500 | % | 8/15/38 | 600 | 660 | ||||
| TCI Communications, Inc. | 8.750 | % | 8/1/15 | 17,480 | 18,386 | ||||
| TCI Communications, Inc. | 7.875 | % | 2/15/26 | 425 | 425 | ||||
| Tele-Communications, Inc. | 7.875 | % | 8/1/13 | 19,826 | 20,266 | ||||
| Telecom Italia Capital | 4.000 | % | 1/15/10 | 4,300 | 4,047 |
Page 27
| Vanguard® Total Bond Market Index Fund | |||||||||
| Schedule of Investments | |||||||||
| December 31, 2008 | |||||||||
| Face | Market | ||||||||
| Maturity | Amount | Value | |||||||
| Coupon | Date | ($ | 000 | ) | ($ | 000 | ) | ||
| Telecom Italia Capital | 4.875 | % | 10/1/10 | 3,400 | 3,115 | ||||
| Telecom Italia Capital | 6.200 | % | 7/18/11 | 9,600 | 8,490 | ||||
| Telecom Italia Capital | 5.250 | % | 11/15/13 | 7,663 | 6,174 | ||||
| Telecom Italia Capital | 4.950 | % | 9/30/14 | 4,210 | 3,188 | ||||
| Telecom Italia Capital | 5.250 | % | 10/1/15 | 9,355 | 7,126 | ||||
| Telecom Italia Capital | 6.999 | % | 6/4/18 | 740 | 648 | ||||
| Telecom Italia Capital | 6.375 | % | 11/15/33 | 5,920 | 4,199 | ||||
| Telecom Italia Capital | 6.000 | % | 9/30/34 | 1,000 | 684 | ||||
| Telecom Italia Capital | 7.200 | % | 7/18/36 | 3,285 | 2,572 | ||||
| Telecom Italia Capital | 7.721 | % | 6/4/38 | 1,525 | 1,268 | ||||
| Telefonica Emisiones SAU | 5.984 | % | 6/20/11 | 9,825 | 9,776 | ||||
| Telefonica Emisiones SAU | 5.855 | % | 2/4/13 | 2,500 | 2,362 | ||||
| Telefonica Emisiones SAU | 6.421 | % | 6/20/16 | 17,275 | 17,228 | ||||
| Telefonica Emisiones SAU | 7.045 | % | 6/20/36 | 7,425 | 8,279 | ||||
| Telefonica Europe BV | 7.750 | % | 9/15/10 | 12,775 | 12,988 | ||||
| Telefonica Europe BV | 8.250 | % | 9/15/30 | 5,775 | 6,702 | ||||
| Telefonos de Mexico SA | 4.750 | % | 1/27/10 | 2,850 | 2,861 | ||||
| Telefonos de Mexico SA | 5.500 | % | 1/27/15 | 18,725 | 16,946 | ||||
| Telus Corp. | 8.000 | % | 6/1/11 | 10,000 | 9,910 | ||||
| Thomson Corp. | 6.200 | % | 1/5/12 | 5,725 | 5,522 | ||||
| Thomson Corp. | 5.700 | % | 10/1/14 | 10,025 | 9,010 | ||||
| Thomson Corp. | 6.500 | % | 7/15/18 | 775 | 720 | ||||
| Thomson Corp. | 5.500 | % | 8/15/35 | 6,400 | 4,770 | ||||
| Thomson Reuters Corp. | 5.950 | % | 7/15/13 | 2,325 | 2,165 | ||||
| Time Warner Cable Inc. | 5.400 | % | 7/2/12 | 7,050 | 6,667 | ||||
| Time Warner Cable Inc. | 6.200 | % | 7/1/13 | 8,225 | 7,900 | ||||
| Time Warner Cable Inc. | 8.250 | % | 2/14/14 | 4,675 | 4,773 | ||||
| Time Warner Cable Inc. | 5.850 | % | 5/1/17 | 21,620 | 19,592 | ||||
| Time Warner Cable Inc. | 6.750 | % | 7/1/18 | 15,350 | 14,752 | ||||
| Time Warner Cable Inc. | 8.750 | % | 2/14/19 | 7,300 | 7,871 | ||||
| Time Warner Cable Inc. | 6.550 | % | 5/1/37 | 2,900 | 2,767 | ||||
| Time Warner Cable Inc. | 7.300 | % | 7/1/38 | 4,470 | 4,688 | ||||
| Time Warner Entertainment | 10.150 | % | 5/1/12 | 1,075 | 1,098 | ||||
| Time Warner Entertainment | 8.875 | % | 10/1/12 | 850 | 846 | ||||
| Time Warner Entertainment | 8.375 | % | 3/15/23 | 2,815 | 2,823 | ||||
| Time Warner Entertainment | 8.375 | % | 7/15/33 | 8,735 | 8,766 | ||||
| US Cellular | 6.700 | % | 12/15/33 | 3,800 | 2,771 | ||||
| US West Communications Group | 7.500 | % | 6/15/23 | 4,575 | 3,180 | ||||
| US West Communications Group | 6.875 | % | 9/15/33 | 6,325 | 3,763 | ||||
| Verizon Communications Corp. | 5.350 | % | 2/15/11 | 7,950 | 8,101 | ||||
| Verizon Communications Corp. | 4.350 | % | 2/15/13 | 50 | 48 | ||||
| Verizon Communications Corp. | 5.250 | % | 4/15/13 | 5,525 | 5,443 | ||||
| Verizon Communications Corp. | 5.550 | % | 2/15/16 | 11,325 | 11,144 | ||||
| Verizon Communications Corp. | 5.500 | % | 2/15/18 | 21,650 | 21,379 | ||||
| Verizon Communications Corp. | 8.750 | % | 11/1/18 | 2,975 | 3,532 | ||||
| Verizon Communications Corp. | 6.250 | % | 4/1/37 | 2,575 | 2,654 | ||||
| Verizon Communications Corp. | 6.400 | % | 2/15/38 | 6,925 | 7,433 | ||||
| Verizon Communications Corp. | 6.900 | % | 4/15/38 | 7,375 | 8,430 | ||||
| Verizon Communications Corp. | 8.950 | % | 3/1/39 | 12,700 | 16,644 | ||||
| Verizon Global Funding Corp. | 7.250 | % | 12/1/10 | 8,050 | 8,573 | ||||
| Verizon Global Funding Corp. | 6.875 | % | 6/15/12 | 17,400 | 18,227 | ||||
| Verizon Global Funding Corp. | 7.375 | % | 9/1/12 | 7,975 | 8,506 | ||||
| Verizon Global Funding Corp. | 4.375 | % | 6/1/13 | 1,060 | 1,018 | ||||
| Verizon Global Funding Corp. | 7.750 | % | 12/1/30 | 7,340 | 8,154 | ||||
| Verizon Global Funding Corp. | 5.850 | % | 9/15/35 | 17,300 | 16,797 | ||||
| Verizon Maryland, Inc. | 6.125 | % | 3/1/12 | 500 | 486 | ||||
| Verizon Maryland, Inc. | 5.125 | % | 6/15/33 | 450 | 330 | ||||
| Verizon New England, Inc. | 6.500 | % | 9/15/11 | 4,670 | 4,722 | ||||
| Verizon New Jersey, Inc. | 5.875 | % | 1/17/12 | 7,815 | 7,694 | ||||
| Verizon New York, Inc. | 6.875 | % | 4/1/12 | 3,350 | 3,348 | ||||
| Verizon New York, Inc. | 7.375 | % | 4/1/32 | 2,625 | 2,196 | ||||
| Verizon Pennsylvania, Inc. | 5.650 | % | 11/15/11 | 11,125 | 10,729 | ||||
| Verizon Virginia, Inc. | 4.625 | % | 3/15/13 | 7,325 | 6,629 | ||||
| 3 Verizon Wireless Inc. | 7.375 | % | 11/15/13 | 7,025 | 7,398 | ||||
| 3 Verizon Wireless Inc. | 8.500 | % | 11/15/18 | 5,425 | 6,258 | ||||
| Vodafone AirTouch PLC | 7.750 | % | 2/15/10 | 1,955 | 1,997 |
Page 28
| Vanguard® Total Bond Market Index Fund | |||||||||
| Schedule of Investments | |||||||||
| December 31, 2008 | |||||||||
| Face | Market | ||||||||
| Maturity | Amount | Value | |||||||
| Coupon | Date | ($ | 000 | ) | ($ | 000 | ) | ||
| Vodafone AirTouch PLC | 7.875 | % | 2/15/30 | 4,900 | 5,415 | ||||
| Vodafone Group PLC | 5.350 | % | 2/27/12 | 1,575 | 1,560 | ||||
| Vodafone Group PLC | 5.000 | % | 12/16/13 | 1,475 | 1,425 | ||||
| Vodafone Group PLC | 5.375 | % | 1/30/15 | 4,675 | 4,484 | ||||
| Vodafone Group PLC | 5.000 | % | 9/15/15 | 2,025 | 1,894 | ||||
| Vodafone Group PLC | 5.750 | % | 3/15/16 | 7,025 | 6,676 | ||||
| Vodafone Group PLC | 5.625 | % | 2/27/17 | 16,275 | 15,655 | ||||
| Vodafone Group PLC | 6.250 | % | 11/30/32 | 9,225 | 8,732 | ||||
| Vodafone Group PLC | 6.150 | % | 2/27/37 | 4,275 | 4,291 | ||||
| WPP Finance USA Corp. | 5.875 | % | 6/15/14 | 3,875 | 3,481 | ||||
| Consumer Cyclical (1.1%) | |||||||||
| 3 Best Buy Co. | 6.750 | % | 7/15/13 | 12,100 | 11,151 | ||||
| Brinker International Inc. | 5.750 | % | 6/1/14 | 1,925 | 1,429 | ||||
| Costco Wholesale Corp. | 5.500 | % | 3/15/17 | 16,850 | 17,958 | ||||
| CVS Caremark Corp. | 5.750 | % | 8/15/11 | 2,025 | 2,006 | ||||
| CVS Caremark Corp. | 4.875 | % | 9/15/14 | 2,750 | 2,500 | ||||
| CVS Caremark Corp. | 5.750 | % | 6/1/17 | 2,555 | 2,407 | ||||
| CVS Caremark Corp. | 6.250 | % | 6/1/27 | 20,975 | 19,522 | ||||
| 2 CVS Caremark Corp. | 6.302 | % | 6/1/37 | 5,325 | 2,297 | ||||
| DaimlerChrysler North America Holding Corp. | 4.875 | % | 6/15/10 | 1,700 | 1,538 | ||||
| DaimlerChrysler North America Holding Corp. | 8.000 | % | 6/15/10 | 1,300 | 1,222 | ||||
| DaimlerChrysler North America Holding Corp. | 5.875 | % | 3/15/11 | 11,035 | 9,490 | ||||
| DaimlerChrysler North America Holding Corp. | 5.750 | % | 9/8/11 | 13,895 | 11,811 | ||||
| DaimlerChrysler North America Holding Corp. | 7.300 | % | 1/15/12 | 22,870 | 19,554 | ||||
| DaimlerChrysler North America Holding Corp. | 6.500 | % | 11/15/13 | 16,300 | 13,040 | ||||
| DaimlerChrysler North America Holding Corp. | 8.500 | % | 1/18/31 | 9,130 | 6,660 | ||||
| Darden Restaurants Inc. | 5.625 | % | 10/15/12 | 5,700 | 5,003 | ||||
| Darden Restaurants Inc. | 6.200 | % | 10/15/17 | 9,575 | 7,513 | ||||
| Darden Restaurants Inc. | 6.800 | % | 10/15/37 | 3,300 | 2,269 | ||||
| Federated Retail Holding | 5.350 | % | 3/15/12 | 3,850 | 2,882 | ||||
| Federated Retail Holding | 5.900 | % | 12/1/16 | 12,875 | 7,881 | ||||
| Federated Retail Holding | 6.375 | % | 3/15/37 | 2,775 | 1,581 | ||||
| Home Depot Inc. | 4.625 | % | 8/15/10 | 9,800 | 9,434 | ||||
| Home Depot Inc. | 5.200 | % | 3/1/11 | 1,675 | 1,637 | ||||
| Home Depot Inc. | 5.250 | % | 12/16/13 | 12,025 | 11,090 | ||||
| Home Depot Inc. | 5.400 | % | 3/1/16 | 3,950 | 3,511 | ||||
| Home Depot Inc. | 5.875 | % | 12/16/36 | 9,250 | 7,270 | ||||
| ITT Corp. | 7.375 | % | 11/15/15 | 12,800 | 8,135 | ||||
| J.C. Penney Co., Inc. | 8.000 | % | 3/1/10 | 6,625 | 6,211 | ||||
| J.C. Penney Co., Inc. | 7.950 | % | 4/1/17 | 4,950 | 3,721 | ||||
| J.C. Penney Co., Inc. | 5.750 | % | 2/15/18 | 700 | 471 | ||||
| J.C. Penney Co., Inc. | 6.375 | % | 10/15/36 | 7,850 | 4,837 | ||||
| J.C. Penney Co., Inc. | 7.400 | % | 4/1/37 | 3,275 | 2,220 | ||||
| Johnson Controls, Inc. | 5.250 | % | 1/15/11 | 3,875 | 3,501 | ||||
| Johnson Controls, Inc. | 6.000 | % | 1/15/36 | 1,025 | 649 | ||||
| Kohl’s Corp. | 6.250 | % | 12/15/17 | 2,775 | 2,243 | ||||
| Kohl’s Corp. | 6.000 | % | 1/15/33 | 825 | 528 | ||||
| Kohl’s Corp. | 6.875 | % | 12/15/37 | 2,450 | 1,743 | ||||
| Lowe’s Cos., Inc. | 8.250 | % | 6/1/10 | 1,000 | 1,055 | ||||
| Lowe’s Cos., Inc. | 5.600 | % | 9/15/12 | 3,500 | 3,527 | ||||
| Lowe’s Cos., Inc. | 5.400 | % | 10/15/16 | 13,325 | 12,755 | ||||
| Lowe’s Cos., Inc. | 6.100 | % | 9/15/17 | 2,675 | 2,586 | ||||
| Lowe’s Cos., Inc. | 6.875 | % | 2/15/28 | 460 | 452 | ||||
| Lowe’s Cos., Inc. | 6.500 | % | 3/15/29 | 4,726 | 4,362 | ||||
| Lowe’s Cos., Inc. | 5.500 | % | 10/15/35 | 200 | 162 | ||||
| Lowe’s Cos., Inc. | 5.800 | % | 10/15/36 | 7,825 | 6,540 | ||||
| Macy’s Retail Holdings Inc. | 5.750 | % | 7/15/14 | 4,325 | 2,744 | ||||
| Macy’s Retail Holdings Inc. | 6.650 | % | 7/15/24 | 2,600 | 1,431 | ||||
| Macy’s Retail Holdings Inc. | 6.790 | % | 7/15/27 | 2,805 | 1,480 | ||||
| Macy’s Retail Holdings Inc. | 7.000 | % | 2/15/28 | 1,625 | 875 | ||||
| Macys Retail Holdings Inc. | 6.625 | % | 4/1/11 | 3,225 | 2,740 | ||||
| Macys Retail Holdings Inc. | 6.900 | % | 4/1/29 | 7,200 | 3,878 | ||||
| Marriott International | 4.625 | % | 6/15/12 | 3,925 | 2,974 | ||||
| Marriott International | 5.625 | % | 2/15/13 | 2,825 | 2,139 | ||||
Page 29
| Vanguard® Total Bond Market Index Fund | |||||||||
| Schedule of Investments | |||||||||
| December 31, 2008 | |||||||||
| Face | Market | ||||||||
| Maturity | Amount | Value | |||||||
| Coupon | Date | ($ | 000 | ) | ($ | 000 | ) | ||
| Marriott International | 6.200 | % | 6/15/16 | 1,650 | 1,148 | ||||
| Marriott International | 6.375 | % | 6/15/17 | 2,000 | 1,383 | ||||
| McDonald’s Corp. | 6.000 | % | 4/15/11 | 3,385 | 3,592 | ||||
| McDonald’s Corp. | 5.300 | % | 3/15/17 | 1,000 | 1,028 | ||||
| McDonald’s Corp. | 5.800 | % | 10/15/17 | 6,725 | 7,173 | ||||
| McDonald’s Corp. | 5.350 | % | 3/1/18 | 6,275 | 6,520 | ||||
| McDonald’s Corp. | 6.300 | % | 10/15/37 | 2,475 | 2,691 | ||||
| McDonald’s Corp. | 6.300 | % | 3/1/38 | 1,975 | 2,178 | ||||
| MDC Holdings Inc. | 5.500 | % | 5/15/13 | 3,625 | 2,826 | ||||
| Nordstrom, Inc. | 6.250 | % | 1/15/18 | 1,825 | 1,284 | ||||
| Nordstrom, Inc. | 6.950 | % | 3/15/28 | 1,325 | 868 | ||||
| Nordstrom, Inc. | 7.000 | % | 1/15/38 | 1,250 | 761 | ||||
| Starwood Hotel Resorts | 7.875 | % | 5/1/12 | 3,875 | 2,985 | ||||
| Starwood Hotel Resorts | 6.250 | % | 2/15/13 | 4,300 | 2,969 | ||||
| Target Corp. | 7.500 | % | 8/15/10 | 1,700 | 1,772 | ||||
| Target Corp. | 6.350 | % | 1/15/11 | 2,645 | 2,729 | ||||
| Target Corp. | 5.875 | % | 3/1/12 | 6,200 | 6,397 | ||||
| Target Corp. | 5.125 | % | 1/15/13 | 7,100 | 7,064 | ||||
| Target Corp. | 4.000 | % | 6/15/13 | 1,945 | 1,848 | ||||
| Target Corp. | 5.875 | % | 7/15/16 | 20,100 | 19,739 | ||||
| Target Corp. | 5.375 | % | 5/1/17 | 4,950 | 4,679 | ||||
| Target Corp. | 6.000 | % | 1/15/18 | 12,400 | 12,083 | ||||
| Target Corp. | 7.000 | % | 7/15/31 | 3,035 | 2,788 | ||||
| Target Corp. | 6.350 | % | 11/1/32 | 7,425 | 6,294 | ||||
| Target Corp. | 6.500 | % | 10/15/37 | 7,550 | 6,647 | ||||
| Target Corp. | 7.000 | % | 1/15/38 | 5,475 | 5,122 | ||||
| The Walt Disney Co. | 5.700 | % | 7/15/11 | 17,375 | 18,322 | ||||
| The Walt Disney Co. | 6.375 | % | 3/1/12 | 1,250 | 1,329 | ||||
| The Walt Disney Co. | 4.700 | % | 12/1/12 | 675 | 693 | ||||
| The Walt Disney Co. | 4.500 | % | 12/15/13 | 8,825 | 8,888 | ||||
| The Walt Disney Co. | 5.625 | % | 9/15/16 | 7,500 | 7,763 | ||||
| The Walt Disney Co. | 5.875 | % | 12/15/17 | 6,325 | 6,642 | ||||
| The Walt Disney Co. | 7.000 | % | 3/1/32 | 1,350 | 1,582 | ||||
| Time Warner, Inc. | 6.750 | % | 4/15/11 | 9,100 | 8,943 | ||||
| Time Warner, Inc. | 5.500 | % | 11/15/11 | 6,825 | 6,363 | ||||
| Time Warner, Inc. | 6.875 | % | 5/1/12 | 6,975 | 6,773 | ||||
| Time Warner, Inc. | 9.125 | % | 1/15/13 | 825 | 829 | ||||
| Time Warner, Inc. | 5.875 | % | 11/15/16 | 11,125 | 10,054 | ||||
| Time Warner, Inc. | 9.150 | % | 2/1/23 | 11,825 | 13,079 | ||||
| Time Warner, Inc. | 7.570 | % | 2/1/24 | 1,500 | 1,435 | ||||
| Time Warner, Inc. | 6.625 | % | 5/15/29 | 9,400 | 8,255 | ||||
| Time Warner, Inc. | 7.625 | % | 4/15/31 | 10,675 | 10,543 | ||||
| Time Warner, Inc. | 7.700 | % | 5/1/32 | 4,745 | 4,708 | ||||
| Time Warner, Inc. | 6.500 | % | 11/15/36 | 8,650 | 7,717 | ||||
| Toll Brothers, Inc. | 6.875 | % | 11/15/12 | 750 | 640 | ||||
| Toll Brothers, Inc. | 5.150 | % | 5/15/15 | 3,900 | 2,808 | ||||
| Toyota Motor Credit Corp. | 4.250 | % | 3/15/10 | 16,875 | 16,971 | ||||
| Toyota Motor Credit Corp. | 4.350 | % | 12/15/10 | 5,475 | 5,553 | ||||
| Toyota Motor Credit Corp. | 5.450 | % | 5/18/11 | 3,675 | 3,807 | ||||
| VF Corp. | 5.950 | % | 11/1/17 | 3,125 | 2,787 | ||||
| VF Corp. | 6.450 | % | 11/1/37 | 2,850 | 2,328 | ||||
| Viacom Inc. | 5.750 | % | 4/30/11 | 2,175 | 1,962 | ||||
| Viacom Inc. | 6.250 | % | 4/30/16 | 7,275 | 6,068 | ||||
| Viacom Inc. | 6.125 | % | 10/5/17 | 2,300 | 1,882 | ||||
| Viacom Inc. | 6.875 | % | 4/30/36 | 590 | 474 | ||||
| Wal-Mart Stores, Inc. | 4.125 | % | 7/1/10 | 12,125 | 12,313 | ||||
| Wal-Mart Stores, Inc. | 4.750 | % | 8/15/10 | 6,575 | 6,837 | ||||
| Wal-Mart Stores, Inc. | 4.125 | % | 2/15/11 | 25,025 | 25,896 | ||||
| Wal-Mart Stores, Inc. | 4.250 | % | 4/15/13 | 1,950 | 2,019 | ||||
| Wal-Mart Stores, Inc. | 4.550 | % | 5/1/13 | 1,700 | 1,771 | ||||
| Wal-Mart Stores, Inc. | 7.250 | % | 6/1/13 | 800 | 914 | ||||
| Wal-Mart Stores, Inc. | 4.500 | % | 7/1/15 | 1,050 | 1,062 | ||||
| Wal-Mart Stores, Inc. | 5.375 | % | 4/5/17 | 2,450 | 2,625 | ||||
| Wal-Mart Stores, Inc. | 5.800 | % | 2/15/18 | 3,775 | 4,145 | ||||
| Wal-Mart Stores, Inc. | 5.875 | % | 4/5/27 | 21,675 | 23,197 | ||||
| Wal-Mart Stores, Inc. | 7.550 | % | 2/15/30 | 14,420 | 17,689 |
Page 30
| Vanguard® Total Bond Market Index Fund | |||||||||
| Schedule of Investments | |||||||||
| December 31, 2008 | |||||||||
| Face | Market | ||||||||
| Maturity | Amount | Value | |||||||
| Coupon | Date | ($ | 000 | ) | ($ | 000 | ) | ||
| Wal-Mart Stores, Inc. | 5.250 | % | 9/1/35 | 5,600 | 5,623 | ||||
| Wal-Mart Stores, Inc. | 6.500 | % | 8/15/37 | 14,125 | 16,913 | ||||
| Wal-Mart Stores, Inc. | 6.200 | % | 4/15/38 | 2,625 | 2,936 | ||||
| Walgreen Co. | 4.875 | % | 8/1/13 | 14,700 | 15,252 | ||||
| Western Union Co. | 5.400 | % | 11/17/11 | 4,925 | 4,706 | ||||
| Western Union Co. | 5.930 | % | 10/1/16 | 6,750 | 5,878 | ||||
| Western Union Co. | 6.200 | % | 11/17/36 | 3,375 | 2,636 | ||||
| Wyndham Worldwide | 6.000 | % | 12/1/16 | 7,895 | 3,197 | ||||
| Yum! Brands, Inc. | 8.875 | % | 4/15/11 | 3,475 | 3,498 | ||||
| Yum! Brands, Inc. | 7.700 | % | 7/1/12 | 3,050 | 3,011 | ||||
| Yum! Brands, Inc. | 6.250 | % | 4/15/16 | 4,525 | 3,869 | ||||
| Yum! Brands, Inc. | 6.250 | % | 3/15/18 | 3,400 | 2,960 | ||||
| Yum! Brands, Inc. | 6.875 | % | 11/15/37 | 10,075 | 8,123 | ||||
| Consumer Noncyclical (2.0%) | |||||||||
| Abbott Laboratories | 3.750 | % | 3/15/11 | 6,450 | 6,582 | ||||
| Abbott Laboratories | 5.600 | % | 5/15/11 | 9,000 | 9,541 | ||||
| Abbott Laboratories | 5.150 | % | 11/30/12 | 3,475 | 3,729 | ||||
| Abbott Laboratories | 4.350 | % | 3/15/14 | 925 | 943 | ||||
| Abbott Laboratories | 5.875 | % | 5/15/16 | 19,650 | 21,545 | ||||
| Abbott Laboratories | 5.600 | % | 11/30/17 | 4,500 | 4,849 | ||||
| Abbott Laboratories | 6.150 | % | 11/30/37 | 4,400 | 5,191 | ||||
| Allergan Inc. | 5.750 | % | 4/1/16 | 1,375 | 1,325 | ||||
| Altria Group, Inc. | 8.500 | % | 11/10/13 | 8,575 | 8,972 | ||||
| Altria Group, Inc. | 9.700 | % | 11/10/18 | 3,600 | 3,901 | ||||
| Altria Group, Inc. | 9.950 | % | 11/10/38 | 6,300 | 6,901 | ||||
| AmerisourceBergen Corp. | 5.625 | % | 9/15/12 | 1,275 | 1,184 | ||||
| AmerisourceBergen Corp. | 5.875 | % | 9/15/15 | 7,300 | 6,462 | ||||
| Amgen Inc. | 4.850 | % | 11/18/14 | 5,975 | 5,873 | ||||
| Amgen Inc. | 5.850 | % | 6/1/17 | 10,800 | 11,139 | ||||
| Amgen Inc. | 6.375 | % | 6/1/37 | 4,500 | 4,779 | ||||
| Amgen Inc. | 6.900 | % | 6/1/38 | 1,250 | 1,429 | ||||
| Anheuser-Busch Cos., Inc. | 6.000 | % | 4/15/11 | 1,500 | 1,514 | ||||
| Anheuser-Busch Cos., Inc. | 4.375 | % | 1/15/13 | 5,325 | 4,913 | ||||
| Anheuser-Busch Cos., Inc. | 5.600 | % | 3/1/17 | 6,375 | 5,928 | ||||
| Anheuser-Busch Cos., Inc. | 5.500 | % | 1/15/18 | 13,325 | 12,146 | ||||
| Anheuser-Busch Cos., Inc. | 6.800 | % | 8/20/32 | 2,600 | 2,408 | ||||
| Anheuser-Busch Cos., Inc. | 5.750 | % | 4/1/36 | 5,475 | 4,438 | ||||
| Archer-Daniels-Midland Co. | 8.375 | % | 4/15/17 | 625 | 730 | ||||
| Archer-Daniels-Midland Co. | 5.450 | % | 3/15/18 | 10,725 | 10,663 | ||||
| Archer-Daniels-Midland Co. | 7.000 | % | 2/1/31 | 3,900 | 4,070 | ||||
| Archer-Daniels-Midland Co. | 5.935 | % | 10/1/32 | 4,725 | 4,420 | ||||
| Archer-Daniels-Midland Co. | 5.375 | % | 9/15/35 | 7,775 | 6,743 | ||||
| Archer-Daniels-Midland Co. | 6.450 | % | 1/15/38 | 1,950 | 1,983 | ||||
| AstraZeneca PLC | 5.400 | % | 9/15/12 | 20,375 | 21,597 | ||||
| AstraZeneca PLC | 5.400 | % | 6/1/14 | 3,750 | 3,923 | ||||
| AstraZeneca PLC | 5.900 | % | 9/15/17 | 15,350 | 16,406 | ||||
| AstraZeneca PLC | 6.450 | % | 9/15/37 | 18,150 | 20,736 | ||||
| Baxter Finco, BV | 4.750 | % | 10/15/10 | 6,875 | 6,887 | ||||
| Baxter International, Inc. | 5.900 | % | 9/1/16 | 2,575 | 2,775 | ||||
| Baxter International, Inc. | 6.250 | % | 12/1/37 | 4,375 | 4,971 | ||||
| Biogen Idec Inc. | 6.000 | % | 3/1/13 | 9,775 | 9,902 | ||||
| Biogen Idec Inc. | 6.875 | % | 3/1/18 | 14,925 | 14,869 | ||||
| Bottling Group LLC | 4.625 | % | 11/15/12 | 16,685 | 16,879 | ||||
| Bottling Group LLC | 5.000 | % | 11/15/13 | 2,525 | 2,510 | ||||
| Bottling Group LLC | 5.500 | % | 4/1/16 | 7,325 | 7,333 | ||||
| Bristol-Myers Squibb Co. | 5.250 | % | 8/15/13 | 350 | 374 | ||||
| Bristol-Myers Squibb Co. | 5.450 | % | 5/1/18 | 2,725 | 2,819 | ||||
| Bristol-Myers Squibb Co. | 7.150 | % | 6/15/23 | 500 | 591 | ||||
| Bristol-Myers Squibb Co. | 6.800 | % | 11/15/26 | 250 | 288 | ||||
| Bristol-Myers Squibb Co. | 5.875 | % | 11/15/36 | 17,450 | 18,713 | ||||
| Bristol-Myers Squibb Co. | 6.125 | % | 5/1/38 | 2,925 | 3,249 | ||||
| Bristol-Myers Squibb Co. | 6.875 | % | 8/1/97 | 1,125 | 1,305 | ||||
| Bunge Ltd. Finance Corp. | 5.100 | % | 7/15/15 | 1,950 | 1,444 | ||||
| C.R. Bard, Inc. | 6.700 | % | 12/1/26 | 6,300 | 6,286 | ||||
Page 31
| Vanguard® Total Bond Market Index Fund | |||||||||
| Schedule of Investments | |||||||||
| December 31, 2008 | |||||||||
| Face | Market | ||||||||
| Maturity | Amount | Value | |||||||
| Coupon | Date | ($ | 000 | ) | ($ | 000 | ) | ||
| Campbell Soup Co. | 6.750 | % | 2/15/11 | 6,500 | 6,859 | ||||
| Cardinal Health, Inc. | 5.650 | % | 6/15/12 | 700 | 675 | ||||
| Cardinal Health, Inc. | 4.000 | % | 6/15/15 | 650 | 548 | ||||
| Cardinal Health, Inc. | 5.800 | % | 10/15/16 | 2,150 | 1,963 | ||||
| Cardinal Health, Inc. | 5.850 | % | 12/15/17 | 1,730 | 1,548 | ||||
| Cia. Brasil de Bebidas AmBev | 10.500 | % | 12/15/11 | 4,055 | 4,440 | ||||
| Cia. Brasil de Bebidas AmBev | 8.750 | % | 9/15/13 | 4,850 | 5,093 | ||||
| Clorox Co. | 4.200 | % | 1/15/10 | 2,050 | 2,028 | ||||
| Clorox Co. | 5.000 | % | 1/15/15 | 2,250 | 2,129 | ||||
| Coca-Cola Co. | 5.350 | % | 11/15/17 | 13,175 | 14,205 | ||||
| Coca-Cola Enterprises Inc. | 4.250 | % | 9/15/10 | 340 | 342 | ||||
| Coca-Cola Enterprises Inc. | 5.000 | % | 8/15/13 | 10,800 | 10,737 | ||||
| Coca-Cola Enterprises Inc. | 7.375 | % | 3/3/14 | 4,400 | 4,851 | ||||
| Coca-Cola Enterprises Inc. | 8.500 | % | 2/1/22 | 13,675 | 15,953 | ||||
| Coca-Cola Enterprises Inc. | 8.000 | % | 9/15/22 | 1,550 | 1,746 | ||||
| Coca-Cola Enterprises Inc. | 7.000 | % | 10/1/26 | 4,100 | 4,282 | ||||
| Coca-Cola Enterprises Inc. | 6.950 | % | 11/15/26 | 3,345 | 3,477 | ||||
| Coca-Cola Enterprises Inc. | 6.750 | % | 9/15/28 | 1,575 | 1,606 | ||||
| Coca-Cola HBC Finance BV | 5.125 | % | 9/17/13 | 1,270 | 1,253 | ||||
| ConAgra Foods, Inc. | 7.875 | % | 9/15/10 | 5,816 | 5,928 | ||||
| ConAgra Foods, Inc. | 6.750 | % | 9/15/11 | 895 | 900 | ||||
| ConAgra Foods, Inc. | 5.819 | % | 6/15/17 | 1,176 | 1,104 | ||||
| ConAgra Foods, Inc. | 9.750 | % | 3/1/21 | 129 | 153 | ||||
| ConAgra Foods, Inc. | 7.125 | % | 10/1/26 | 1,000 | 957 | ||||
| ConAgra Foods, Inc. | 7.000 | % | 10/1/28 | 875 | 837 | ||||
| ConAgra Foods, Inc. | 8.250 | % | 9/15/30 | 1,420 | 1,506 | ||||
| Covidien International | 5.450 | % | 10/15/12 | 3,325 | 3,249 | ||||
| Covidien International | 6.000 | % | 10/15/17 | 3,775 | 3,700 | ||||
| Covidien International | 6.550 | % | 10/15/37 | 5,125 | 5,046 | ||||
| Delhaize America Inc. | 9.000 | % | 4/15/31 | 2,800 | 2,834 | ||||
| Diageo Capital PLC | 7.250 | % | 11/1/09 | 450 | 457 | ||||
| Diageo Capital PLC | 4.375 | % | 5/3/10 | 1,530 | 1,537 | ||||
| Diageo Capital PLC | 5.200 | % | 1/30/13 | 10,350 | 10,351 | ||||
| Diageo Capital PLC | 5.500 | % | 9/30/16 | 1,700 | 1,605 | ||||
| Diageo Capital PLC | 5.750 | % | 10/23/17 | 8,525 | 8,280 | ||||
| Diageo Capital PLC | 5.875 | % | 9/30/36 | 1,075 | 1,015 | ||||
| Diageo Finance BV | 5.300 | % | 10/28/15 | 7,975 | 7,811 | ||||
| 3 Dr. Pepper Snapple Group | 6.120 | % | 5/1/13 | 2,100 | 2,051 | ||||
| 3 Dr. Pepper Snapple Group | 6.820 | % | 5/1/18 | 5,850 | 5,708 | ||||
| 3 Dr. Pepper Snapple Group | 7.450 | % | 5/1/38 | 1,225 | 1,215 | ||||
| Eli Lilly & Co. | 6.000 | % | 3/15/12 | 3,825 | 4,124 | ||||
| Eli Lilly & Co. | 5.200 | % | 3/15/17 | 11,900 | 12,154 | ||||
| Eli Lilly & Co. | 5.500 | % | 3/15/27 | 6,725 | 6,864 | ||||
| Eli Lilly & Co. | 5.550 | % | 3/15/37 | 1,050 | 1,085 | ||||
| Estee Lauder Ace Trust I | 6.000 | % | 5/15/37 | 925 | 869 | ||||
| Fortune Brands Inc. | 5.125 | % | 1/15/11 | 3,725 | 3,597 | ||||
| Fortune Brands Inc. | 5.375 | % | 1/15/16 | 13,950 | 11,824 | ||||
| Fortune Brands Inc. | 5.875 | % | 1/15/36 | 3,625 | 2,659 | ||||
| Genentech Inc. | 4.400 | % | 7/15/10 | 1,350 | 1,359 | ||||
| Genentech Inc. | 4.750 | % | 7/15/15 | 2,620 | 2,594 | ||||
| Genentech Inc. | 5.250 | % | 7/15/35 | 4,100 | 3,946 | ||||
| General Mills, Inc. | 6.000 | % | 2/15/12 | 10,907 | 11,203 | ||||
| General Mills, Inc. | 5.650 | % | 9/10/12 | 2,975 | 3,038 | ||||
| General Mills, Inc. | 5.250 | % | 8/15/13 | 4,675 | 4,705 | ||||
| General Mills, Inc. | 5.200 | % | 3/17/15 | 900 | 857 | ||||
| General Mills, Inc. | 5.700 | % | 2/15/17 | 15,375 | 15,296 | ||||
| GlaxoSmithKline Capital Inc. | 4.850 | % | 5/15/13 | 12,850 | 13,206 | ||||
| GlaxoSmithKline Capital Inc. | 4.375 | % | 4/15/14 | 3,750 | 3,749 | ||||
| GlaxoSmithKline Capital Inc. | 5.650 | % | 5/15/18 | 18,350 | 19,306 | ||||
| GlaxoSmithKline Capital Inc. | 5.375 | % | 4/15/34 | 4,450 | 4,422 | ||||
| GlaxoSmithKline Capital Inc. | 6.375 | % | 5/15/38 | 19,425 | 22,290 | ||||
| Grand Metropolitan Investment Corp. | 9.000 | % | 8/15/11 | 500 | 539 | ||||
| Grand Metropolitan Investment Corp. | 7.450 | % | 4/15/35 | 1,075 | 1,110 | ||||
| H.J. Heinz Co. | 6.625 | % | 7/15/11 | 7,200 | 7,415 | ||||
| H.J. Heinz Co. | 5.350 | % | 7/15/13 | 2,700 | 2,690 | ||||
| H.J. Heinz Co. | 6.750 | % | 3/15/32 | 3,800 | 3,415 |
Page 32
| Vanguard® Total Bond Market Index Fund | |||||||||
| Schedule of Investments | |||||||||
| December 31, 2008 | |||||||||
| Face | Market | ||||||||
| Maturity | Amount | Value | |||||||
| Coupon | Date | ($ | 000 | ) | ($ | 000 | ) | ||
| Hasbro Inc. | 6.300 | % | 9/15/17 | 7,025 | 6,544 | ||||
| Hershey Foods Corp. | 5.450 | % | 9/1/16 | 1,550 | 1,552 | ||||
| Hospira, Inc. | 5.900 | % | 6/15/14 | 1,925 | 1,659 | ||||
| Hospira, Inc. | 6.050 | % | 3/30/17 | 250 | 204 | ||||
| Johnson & Johnson | 5.150 | % | 8/15/12 | 10,250 | 11,206 | ||||
| Johnson & Johnson | 3.800 | % | 5/15/13 | 4,715 | 4,938 | ||||
| Johnson & Johnson | 5.550 | % | 8/15/17 | 6,025 | 6,850 | ||||
| Johnson & Johnson | 5.150 | % | 7/15/18 | 2,000 | 2,192 | ||||
| Johnson & Johnson | 6.950 | % | 9/1/29 | 5,625 | 7,268 | ||||
| Johnson & Johnson | 4.950 | % | 5/15/33 | 6,100 | 6,301 | ||||
| Johnson & Johnson | 5.950 | % | 8/15/37 | 6,500 | 7,923 | ||||
| Johnson & Johnson | 5.850 | % | 7/15/38 | 5,650 | 6,712 | ||||
| Kellogg Co. | 6.600 | % | 4/1/11 | 13,325 | 13,991 | ||||
| Kellogg Co. | 5.125 | % | 12/3/12 | 6,910 | 7,056 | ||||
| Kellogg Co. | 4.250 | % | 3/6/13 | 5,200 | 5,190 | ||||
| Kellogg Co. | 7.450 | % | 4/1/31 | 240 | 298 | ||||
| Kimberly-Clark Corp. | 5.625 | % | 2/15/12 | 3,150 | 3,274 | ||||
| Kimberly-Clark Corp. | 4.875 | % | 8/15/15 | 6,250 | 6,135 | ||||
| Kimberly-Clark Corp. | 6.125 | % | 8/1/17 | 10,450 | 11,084 | ||||
| Kimberly-Clark Corp. | 6.250 | % | 7/15/18 | 175 | 188 | ||||
| Kimberly-Clark Corp. | 6.625 | % | 8/1/37 | 1,050 | 1,193 | ||||
| Kraft Foods, Inc. | 5.625 | % | 11/1/11 | 46,725 | 47,570 | ||||
| Kraft Foods, Inc. | 6.250 | % | 6/1/12 | 5,540 | 5,695 | ||||
| Kraft Foods, Inc. | 5.250 | % | 10/1/13 | 275 | 267 | ||||
| Kraft Foods, Inc. | 6.500 | % | 8/11/17 | 15,725 | 15,604 | ||||
| Kraft Foods, Inc. | 6.125 | % | 2/1/18 | 400 | 392 | ||||
| Kraft Foods, Inc. | 6.125 | % | 8/23/18 | 8,475 | 8,435 | ||||
| Kraft Foods, Inc. | 6.500 | % | 11/1/31 | 9,575 | 9,275 | ||||
| Kraft Foods, Inc. | 7.000 | % | 8/11/37 | 13,700 | 13,816 | ||||
| Kraft Foods, Inc. | 6.875 | % | 1/26/39 | 3,225 | 3,297 | ||||
| Kroger Co. | 6.800 | % | 4/1/11 | 2,600 | 2,630 | ||||
| Kroger Co. | 6.750 | % | 4/15/12 | 10,575 | 10,845 | ||||
| Kroger Co. | 6.200 | % | 6/15/12 | 7,625 | 7,700 | ||||
| Kroger Co. | 5.500 | % | 2/1/13 | 2,075 | 2,060 | ||||
| Kroger Co. | 5.000 | % | 4/15/13 | 4,750 | 4,625 | ||||
| Kroger Co. | 4.950 | % | 1/15/15 | 3,675 | 3,371 | ||||
| Kroger Co. | 6.400 | % | 8/15/17 | 1,030 | 1,035 | ||||
| Kroger Co. | 6.800 | % | 12/15/18 | 4,025 | 4,179 | ||||
| Kroger Co. | 6.150 | % | 1/15/20 | 4,550 | 4,451 | ||||
| Kroger Co. | 7.700 | % | 6/1/29 | 9,200 | 9,987 | ||||
| Kroger Co. | 8.000 | % | 9/15/29 | 1,250 | 1,399 | ||||
| Kroger Co. | 7.500 | % | 4/1/31 | 3,020 | 3,319 | ||||
| Kroger Co. | 6.900 | % | 4/15/38 | 2,925 | 3,093 | ||||
| Laboratory Corp. of America | 5.500 | % | 2/1/13 | 1,965 | 1,890 | ||||
| Laboratory Corp. of America | 5.625 | % | 12/15/15 | 2,975 | 2,546 | ||||
| McKesson Corp. | 7.750 | % | 2/1/12 | 750 | 767 | ||||
| McKesson Corp. | 5.250 | % | 3/1/13 | 12,200 | 11,367 | ||||
| Medco Health Solutions | 6.125 | % | 3/15/13 | 550 | 513 | ||||
| Medco Health Solutions | 7.250 | % | 8/15/13 | 575 | 549 | ||||
| Medco Health Solutions | 7.125 | % | 3/15/18 | 10,325 | 9,414 | ||||
| Medtronic Inc. | 4.375 | % | 9/15/10 | 2,775 | 2,767 | ||||
| Medtronic Inc. | 4.750 | % | 9/15/15 | 4,750 | 4,561 | ||||
| Merck & Co. | 5.125 | % | 11/15/11 | 3,150 | 3,345 | ||||
| Merck & Co. | 4.375 | % | 2/15/13 | 4,725 | 5,129 | ||||
| Merck & Co. | 4.750 | % | 3/1/15 | 11,925 | 11,914 | ||||
| Merck & Co. | 6.400 | % | 3/1/28 | 4,005 | 4,373 | ||||
| Merck & Co. | 5.950 | % | 12/1/28 | 2,675 | 2,780 | ||||
| Merck & Co. | 5.750 | % | 11/15/36 | 1,300 | 1,346 | ||||
| Molson Coors Capital Finance | 4.850 | % | 9/22/10 | 1,975 | 1,944 | ||||
| Newell Rubbermaid, Inc. | 4.000 | % | 5/1/10 | 2,300 | 2,163 | ||||
| Pepsi Bottling Group, Inc. | 7.000 | % | 3/1/29 | 2,200 | 2,387 | ||||
| PepsiAmericas Inc. | 5.750 | % | 7/31/12 | 3,225 | 3,202 | ||||
| PepsiAmericas Inc. | 4.875 | % | 1/15/15 | 375 | 344 | ||||
| PepsiAmericas Inc. | 5.000 | % | 5/15/17 | 4,600 | 4,161 | ||||
| Pepsico, Inc. | 5.150 | % | 5/15/12 | 2,650 | 2,794 | ||||
| Pepsico, Inc. | 4.650 | % | 2/15/13 | 17,350 | 18,217 |
Page 33
| Vanguard® Total Bond Market Index Fund | |||||||||
| Schedule of Investments | |||||||||
| December 31, 2008 | |||||||||
| Face | Market | ||||||||
| Maturity | Amount | Value | |||||||
| Coupon | Date | ($ | 000 | ) | ($ | 000 | ) | ||
| Pepsico, Inc. | 5.000 | % | 6/1/18 | 11,525 | 11,814 | ||||
| Pharmacia Corp. | 6.500 | % | 12/1/18 | 750 | 881 | ||||
| Pharmacia Corp. | 6.600 | % | 12/1/28 | 775 | 867 | ||||
| Philip Morris International Inc | 5.650 | % | 5/16/18 | 12,100 | 12,041 | ||||
| Philip Morris International Inc. | 4.875 | % | 5/16/13 | 10,625 | 10,761 | ||||
| Philip Morris International Inc. | 6.875 | % | 3/17/14 | 8,325 | 8,730 | ||||
| Philip Morris International Inc. | 6.375 | % | 5/16/38 | 9,150 | 9,685 | ||||
| Philips Electronics NV | 4.625 | % | 3/11/13 | 4,750 | 4,505 | ||||
| Philips Electronics NV | 5.750 | % | 3/11/18 | 12,275 | 11,462 | ||||
| Philips Electronics NV | 6.875 | % | 3/11/38 | 5,900 | 5,618 | ||||
| Procter & Gamble Co. | 4.600 | % | 1/15/14 | 5,975 | 6,181 | ||||
| Procter & Gamble Co. | 4.950 | % | 8/15/14 | 1,600 | 1,653 | ||||
| Procter & Gamble Co. | 6.450 | % | 1/15/26 | 1,825 | 2,087 | ||||
| Procter & Gamble Co. | 5.550 | % | 3/5/37 | 13,475 | 15,115 | ||||
| 2 Procter & Gamble Co. ESOP | 9.360 | % | 1/1/21 | 12,790 | 15,328 | ||||
| Quest Diagnostic, Inc. | 5.450 | % | 11/1/15 | 8,175 | 7,205 | ||||
| Quest Diagnostic, Inc. | 6.400 | % | 7/1/17 | 675 | 620 | ||||
| Quest Diagnostic, Inc. | 6.950 | % | 7/1/37 | 2,950 | 2,540 | ||||
| Reynolds American Inc. | 6.500 | % | 7/15/10 | 2,525 | 2,449 | ||||
| Reynolds American Inc. | 7.250 | % | 6/1/12 | 4,075 | 3,775 | ||||
| Reynolds American Inc. | 7.250 | % | 6/1/13 | 7,350 | 6,578 | ||||
| Reynolds American Inc. | 7.625 | % | 6/1/16 | 4,000 | 3,295 | ||||
| Reynolds American Inc. | 6.750 | % | 6/15/17 | 5,800 | 4,365 | ||||
| Reynolds American Inc. | 7.250 | % | 6/15/37 | 4,700 | 3,337 | ||||
| Safeway, Inc. | 4.950 | % | 8/16/10 | 3,125 | 3,112 | ||||
| Safeway, Inc. | 6.500 | % | 3/1/11 | 7,575 | 7,600 | ||||
| Safeway, Inc. | 5.800 | % | 8/15/12 | 3,650 | 3,637 | ||||
| Safeway, Inc. | 6.250 | % | 3/15/14 | 600 | 607 | ||||
| Safeway, Inc. | 6.350 | % | 8/15/17 | 800 | 806 | ||||
| Safeway, Inc. | 7.250 | % | 2/1/31 | 5,700 | 6,572 | ||||
| Sara Lee Corp. | 6.125 | % | 11/1/32 | 375 | 311 | ||||
| Schering-Plough Corp. | 5.550 | % | 12/1/13 | 19,100 | 19,150 | ||||
| Schering-Plough Corp. | 6.000 | % | 9/15/17 | 1,025 | 1,003 | ||||
| Schering-Plough Corp. | 6.750 | % | 12/1/33 | 9,075 | 9,443 | ||||
| Schering-Plough Corp. | 6.550 | % | 9/15/37 | 2,350 | 2,389 | ||||
| Sysco Corp. | 4.200 | % | 2/12/13 | 2,225 | 2,235 | ||||
| Sysco Corp. | 5.250 | % | 2/12/18 | 1,800 | 1,830 | ||||
| Sysco Corp. | 5.375 | % | 9/21/35 | 4,725 | 4,502 | ||||
| Teva Pharmaceutical Finance LLC | 5.550 | % | 2/1/16 | 550 | 538 | ||||
| Teva Pharmaceutical Finance LLC | 6.150 | % | 2/1/36 | 11,100 | 10,730 | ||||
| Unilever Capital Corp. | 7.125 | % | 11/1/10 | 10,950 | 11,719 | ||||
| Unilever Capital Corp. | 5.900 | % | 11/15/32 | 25 | 25 | ||||
| UST, Inc. | 6.625 | % | 7/15/12 | 800 | 769 | ||||
| UST, Inc. | 5.750 | % | 3/1/18 | 3,200 | 2,661 | ||||
| Whirlpool Corp. | 5.500 | % | 3/1/13 | 14,250 | 11,371 | ||||
| Wyeth | 6.950 | % | 3/15/11 | 2,450 | 2,595 | ||||
| Wyeth | 5.500 | % | 3/15/13 | 20,150 | 20,588 | ||||
| Wyeth | 5.500 | % | 2/1/14 | 5,875 | 5,974 | ||||
| Wyeth | 5.500 | % | 2/15/16 | 5,750 | 5,893 | ||||
| Wyeth | 5.450 | % | 4/1/17 | 3,875 | 3,945 | ||||
| Wyeth | 6.450 | % | 2/1/24 | 1,850 | 2,085 | ||||
| Wyeth | 6.500 | % | 2/1/34 | 1,975 | 2,198 | ||||
| Wyeth | 6.000 | % | 2/15/36 | 6,125 | 6,644 | ||||
| Wyeth | 5.950 | % | 4/1/37 | 14,020 | 15,257 | ||||
| Energy (0.9%) | |||||||||
| Alberta Energy Co. Ltd. | 7.375 | % | 11/1/31 | 975 | 872 | ||||
| Amerada Hess Corp. | 6.650 | % | 8/15/11 | 7,450 | 7,355 | ||||
| Amerada Hess Corp. | 7.875 | % | 10/1/29 | 6,250 | 6,066 | ||||
| Amerada Hess Corp. | 7.125 | % | 3/15/33 | 6,050 | 5,386 | ||||
| Anadarko Finance Co. | 6.750 | % | 5/1/11 | 3,225 | 3,181 | ||||
| Anadarko Finance Co. | 7.500 | % | 5/1/31 | 985 | 872 | ||||
| Anadarko Petroleum Corp. | 5.950 | % | 9/15/16 | 6,700 | 5,876 | ||||
| Anadarko Petroleum Corp. | 6.450 | % | 9/15/36 | 9,670 | 7,636 | ||||
| Apache Corp. | 6.250 | % | 4/15/12 | 1,700 | 1,787 | ||||
Page 34
| Vanguard® Total Bond Market Index Fund | |||||||||
| Schedule of Investments | |||||||||
| December 31, 2008 | |||||||||
| Face | Market | ||||||||
| Maturity | Amount | Value | |||||||
| Coupon | Date | ($ | 000 | ) | ($ | 000 | ) | ||
| Apache Corp. | 5.250 | % | 4/15/13 | 1,000 | 1,023 | ||||
| Apache Corp. | 6.000 | % | 9/15/13 | 7,275 | 7,609 | ||||
| Apache Corp. | 5.625 | % | 1/15/17 | 1,050 | 1,053 | ||||
| Apache Corp. | 6.900 | % | 9/15/18 | 6,350 | 6,921 | ||||
| Apache Corp. | 6.000 | % | 1/15/37 | 6,500 | 6,228 | ||||
| Apache Finance Canada Corp. | 7.750 | % | 12/15/29 | 1,350 | 1,484 | ||||
| Baker Hughes, Inc. | 6.875 | % | 1/15/29 | 825 | 839 | ||||
| BJ Services Co. | 6.000 | % | 6/1/18 | 3,525 | 3,133 | ||||
| BP Capital Markets PLC | 5.250 | % | 11/7/13 | 14,925 | 15,705 | ||||
| Burlington Resources, Inc. | 6.680 | % | 2/15/11 | 4,300 | 4,428 | ||||
| Burlington Resources, Inc. | 6.500 | % | 12/1/11 | 3,975 | 4,072 | ||||
| Burlington Resources, Inc. | 7.200 | % | 8/15/31 | 850 | 862 | ||||
| Burlington Resources, Inc. | 7.400 | % | 12/1/31 | 4,575 | 4,755 | ||||
| Cameron International Corp. | 6.375 | % | 7/15/18 | 1,200 | 1,048 | ||||
| Cameron International Corp. | 7.000 | % | 7/15/38 | 625 | 498 | ||||
| Canadian Natural Resources | 5.450 | % | 10/1/12 | 5,425 | 5,110 | ||||
| Canadian Natural Resources | 5.150 | % | 2/1/13 | 1,875 | 1,720 | ||||
| Canadian Natural Resources | 4.900 | % | 12/1/14 | 5,575 | 4,779 | ||||
| Canadian Natural Resources | 6.000 | % | 8/15/16 | 5,375 | 4,777 | ||||
| Canadian Natural Resources | 7.200 | % | 1/15/32 | 5,375 | 4,787 | ||||
| Canadian Natural Resources | 6.450 | % | 6/30/33 | 6,915 | 5,602 | ||||
| Canadian Natural Resources | 6.500 | % | 2/15/37 | 9,175 | 7,513 | ||||
| Canadian Natural Resources | 6.250 | % | 3/15/38 | 1,825 | 1,437 | ||||
| Canadian Natural Resources | 6.750 | % | 2/1/39 | 1,125 | 936 | ||||
| Conoco Funding Co. | 6.350 | % | 10/15/11 | 16,085 | 16,898 | ||||
| Conoco Funding Co. | 7.250 | % | 10/15/31 | 350 | 374 | ||||
| Conoco, Inc. | 6.950 | % | 4/15/29 | 1,230 | 1,332 | ||||
| ConocoPhillips | 8.750 | % | 5/25/10 | 1,250 | 1,338 | ||||
| ConocoPhillips | 5.900 | % | 10/15/32 | 1,950 | 1,945 | ||||
| ConocoPhillips Canada | 5.300 | % | 4/15/12 | 5,025 | 5,072 | ||||
| ConocoPhillips Canada | 5.625 | % | 10/15/16 | 20,825 | 21,522 | ||||
| ConocoPhillips Canada | 5.950 | % | 10/15/36 | 3,475 | 3,373 | ||||
| Devon Energy Corp. | 7.950 | % | 4/15/32 | 5,975 | 6,643 | ||||
| Devon Financing Corp. | 6.875 | % | 9/30/11 | 10,185 | 10,291 | ||||
| Devon Financing Corp. | 7.875 | % | 9/30/31 | 8,725 | 9,564 | ||||
| Diamond Offshore Drilling | 4.875 | % | 7/1/15 | 775 | 722 | ||||
| Encana Corp. | 5.900 | % | 12/1/17 | 9,550 | 7,995 | ||||
| Encana Corp. | 6.500 | % | 8/15/34 | 10,150 | 8,114 | ||||
| Encana Corp. | 6.625 | % | 8/15/37 | 2,050 | 1,654 | ||||
| Encana Holdings Finance Corp. | 5.800 | % | 5/1/14 | 2,100 | 1,977 | ||||
| EOG Resources Inc. | 6.125 | % | 10/1/13 | 400 | 419 | ||||
| EOG Resources Inc. | 5.875 | % | 9/15/17 | 8,825 | 9,032 | ||||
| Global Marine, Inc. | 7.000 | % | 6/1/28 | 4,000 | 3,513 | ||||
| Halliburton Co. | 5.500 | % | 10/15/10 | 4,100 | 4,255 | ||||
| Halliburton Co. | 5.900 | % | 9/15/18 | 2,150 | 2,275 | ||||
| Halliburton Co. | 6.700 | % | 9/15/38 | 8,775 | 9,403 | ||||
| Husky Energy Inc. | 6.250 | % | 6/15/12 | 2,875 | 2,853 | ||||
| Husky Energy Inc. | 6.150 | % | 6/15/19 | 1,000 | 873 | ||||
| Husky Energy Inc. | 6.800 | % | 9/15/37 | 2,400 | 1,866 | ||||
| Kerr McGee Corp. | 6.875 | % | 9/15/11 | 6,850 | 6,774 | ||||
| Kerr McGee Corp. | 6.950 | % | 7/1/24 | 11,770 | 10,160 | ||||
| Kerr McGee Corp. | 7.875 | % | 9/15/31 | 1,700 | 1,563 | ||||
| Lasmo Inc. | 7.300 | % | 11/15/27 | 400 | 434 | ||||
| Marathon Oil Corp. | 6.125 | % | 3/15/12 | 9,470 | 9,223 | ||||
| Marathon Oil Corp. | 6.000 | % | 7/1/12 | 3,400 | 3,353 | ||||
| Marathon Oil Corp. | 6.000 | % | 10/1/17 | 17,225 | 15,070 | ||||
| Marathon Oil Corp. | 5.900 | % | 3/15/18 | 15,650 | 12,890 | ||||
| Marathon Oil Corp. | 6.600 | % | 10/1/37 | 10,315 | 7,666 | ||||
| Nabors Industries Inc. | 6.150 | % | 2/15/18 | 11,825 | 10,340 | ||||
| Nexen, Inc. | 5.050 | % | 11/20/13 | 6,700 | 6,184 | ||||
| Nexen, Inc. | 5.650 | % | 5/15/17 | 2,325 | 1,961 | ||||
| Nexen, Inc. | 7.875 | % | 3/15/32 | 1,100 | 1,044 | ||||
| Nexen, Inc. | 5.875 | % | 3/10/35 | 400 | 295 | ||||
| Nexen, Inc. | 6.400 | % | 5/15/37 | 12,950 | 10,152 | ||||
| Noble Energy Inc. | 8.000 | % | 4/1/27 | 175 | 171 | ||||
| Norsk Hydro | 7.250 | % | 9/23/27 | 2,125 | 2,355 |
Page 35
| Vanguard® Total Bond Market Index Fund | |||||||||
| Schedule of Investments | |||||||||
| December 31, 2008 | |||||||||
| Face | Market | ||||||||
| Maturity | Amount | Value | |||||||
| Coupon | Date | ($ | 000 | ) | ($ | 000 | ) | ||
| Norsk Hydro | 7.150 | % | 1/15/29 | 3,475 | 3,783 | ||||
| Occidental Petroleum | 6.750 | % | 1/15/12 | 6,725 | 7,085 | ||||
| PanCanadian Energy Corp. | 7.200 | % | 11/1/31 | 7,050 | 6,182 | ||||
| Petro-Canada | 4.000 | % | 7/15/13 | 5,475 | 4,714 | ||||
| Petro-Canada | 7.875 | % | 6/15/26 | 1,675 | 1,563 | ||||
| Petro-Canada | 7.000 | % | 11/15/28 | 1,375 | 1,165 | ||||
| Petro-Canada | 5.350 | % | 7/15/33 | 5,975 | 3,972 | ||||
| Petro-Canada | 5.950 | % | 5/15/35 | 8,475 | 5,846 | ||||
| Petro-Canada | 6.800 | % | 5/15/38 | 2,400 | 1,804 | ||||
| Petro-Canada Financial Partnership | 5.000 | % | 11/15/14 | 1,600 | 1,333 | ||||
| Petro-Canada Financial Partnership | 6.050 | % | 5/15/18 | 2,400 | 2,029 | ||||
| Questar Market Resources | 6.050 | % | 9/1/16 | 3,575 | 3,291 | ||||
| Shell International Finance BV | 5.625 | % | 6/27/11 | 1,000 | 1,053 | ||||
| Shell International Finance BV | 4.950 | % | 3/22/12 | 3,450 | 3,567 | ||||
| Shell International Finance BV | 5.200 | % | 3/22/17 | 3,525 | 3,664 | ||||
| Shell International Finance BV | 6.375 | % | 12/15/38 | 15,800 | 17,994 | ||||
| 3 Statoilhydro ASA | 6.500 | % | 12/1/28 | 1,200 | 1,231 | ||||
| Suncor Energy, Inc. | 6.100 | % | 6/1/18 | 3,800 | 3,277 | ||||
| Suncor Energy, Inc. | 7.150 | % | 2/1/32 | 1,700 | 1,444 | ||||
| Suncor Energy, Inc. | 5.950 | % | 12/1/34 | 150 | 108 | ||||
| Suncor Energy, Inc. | 6.500 | % | 6/15/38 | 9,875 | 7,514 | ||||
| Sunoco, Inc. | 4.875 | % | 10/15/14 | 1,700 | 1,419 | ||||
| Sunoco, Inc. | 5.750 | % | 1/15/17 | 2,300 | 1,939 | ||||
| Talisman Energy, Inc. | 5.125 | % | 5/15/15 | 1,400 | 1,242 | ||||
| Talisman Energy, Inc. | 7.250 | % | 10/15/27 | 1,050 | 794 | ||||
| Talisman Energy, Inc. | 5.850 | % | 2/1/37 | 5,500 | 3,812 | ||||
| Tosco Corp. | 8.125 | % | 2/15/30 | 18,775 | 22,080 | ||||
| Transocean Inc. | 5.250 | % | 3/15/13 | 4,200 | 3,895 | ||||
| Transocean Inc. | 6.000 | % | 3/15/18 | 6,325 | 5,715 | ||||
| Transocean Inc. | 7.500 | % | 4/15/31 | 2,650 | 2,370 | ||||
| Transocean Inc. | 6.800 | % | 3/15/38 | 6,050 | 5,325 | ||||
| Valero Energy Corp. | 6.875 | % | 4/15/12 | 17,725 | 17,886 | ||||
| Valero Energy Corp. | 4.750 | % | 6/15/13 | 340 | 317 | ||||
| Valero Energy Corp. | 7.500 | % | 4/15/32 | 5,265 | 4,193 | ||||
| Valero Energy Corp. | 6.625 | % | 6/15/37 | 5,715 | 4,207 | ||||
| Weatherford International Inc. | 5.950 | % | 6/15/12 | 750 | 699 | ||||
| Weatherford International Inc. | 5.150 | % | 3/15/13 | 1,550 | 1,365 | ||||
| Weatherford International Inc. | 6.350 | % | 6/15/17 | 5,350 | 4,659 | ||||
| Weatherford International Inc. | 6.000 | % | 3/15/18 | 2,250 | 1,892 | ||||
| Weatherford International Inc. | 6.500 | % | 8/1/36 | 10,125 | 7,464 | ||||
| Weatherford International Inc. | 6.800 | % | 6/15/37 | 1,875 | 1,415 | ||||
| Weatherford International Inc. | 7.000 | % | 3/15/38 | 2,125 | 1,650 | ||||
| XTO Energy, Inc. | 5.000 | % | 8/1/10 | 1,000 | 986 | ||||
| XTO Energy, Inc. | 5.900 | % | 8/1/12 | 6,025 | 5,940 | ||||
| XTO Energy, Inc. | 6.250 | % | 4/15/13 | 8,575 | 8,543 | ||||
| XTO Energy, Inc. | 5.750 | % | 12/15/13 | 5,875 | 5,682 | ||||
| XTO Energy, Inc. | 4.900 | % | 2/1/14 | 525 | 471 | ||||
| XTO Energy, Inc. | 5.000 | % | 1/31/15 | 1,725 | 1,523 | ||||
| XTO Energy, Inc. | 6.250 | % | 8/1/17 | 10,650 | 10,222 | ||||
| XTO Energy, Inc. | 6.500 | % | 12/15/18 | 7,675 | 7,506 | ||||
| XTO Energy, Inc. | 6.100 | % | 4/1/36 | 1,300 | 1,060 | ||||
| XTO Energy, Inc. | 6.750 | % | 8/1/37 | 8,725 | 8,181 | ||||
| XTO Energy, Inc. | 6.375 | % | 6/15/38 | 1,875 | 1,604 | ||||
| Other Industrial (0.0%) | |||||||||
| Cintas Corp. | 6.125 | % | 12/1/17 | 2,925 | 2,724 | ||||
| Technology (0.6%) | |||||||||
| Agilent Technologies Inc. | 6.500 | % | 11/1/17 | 9,300 | 6,393 | ||||
| Arrow Electronics, Inc. | 6.875 | % | 7/1/13 | 200 | 183 | ||||
| BMC Software Inc. | 7.250 | % | 6/1/18 | 2,775 | 2,599 | ||||
| Cisco Systems Inc. | 5.250 | % | 2/22/11 | 40,400 | 42,004 | ||||
| Cisco Systems Inc. | 5.500 | % | 2/22/16 | 3,915 | 4,132 | ||||
| Computer Sciences Corp. | 5.000 | % | 2/15/13 | 4,575 | 4,044 | ||||
| 3 Computer Sciences Corp. | 5.500 | % | 3/15/13 | 2,075 | 1,866 | ||||
Page 36
| Vanguard® Total Bond Market Index Fund | |||||||||
| Schedule of Investments | |||||||||
| December 31, 2008 | |||||||||
| Face | Market | ||||||||
| Maturity | Amount | Value | |||||||
| Coupon | Date | ($ | 000 | ) | ($ | 000 | ) | ||
| 3 Computer Sciences Corp. | 6.500 | % | 3/15/18 | 400 | 334 | ||||
| Corning Inc. | 7.250 | % | 8/15/36 | 400 | 300 | ||||
| Dell Inc. | 4.700 | % | 4/15/13 | 7,100 | 6,593 | ||||
| Dell Inc. | 5.650 | % | 4/15/18 | 3,875 | 3,359 | ||||
| Dell Inc. | 6.500 | % | 4/15/38 | 3,800 | 3,133 | ||||
| Dun & Bradstreet Corp. | 6.000 | % | 4/1/13 | 6,000 | 5,700 | ||||
| Electronic Data Systems | 6.000 | % | 8/1/13 | 6,275 | 6,491 | ||||
| Equifax Inc. | 6.300 | % | 7/1/17 | 1,300 | 930 | ||||
| Equifax Inc. | 7.000 | % | 7/1/37 | 1,900 | 1,206 | ||||
| Fiserv, Inc. | 6.125 | % | 11/20/12 | 11,075 | 10,379 | ||||
| Fiserv, Inc. | 6.800 | % | 11/20/17 | 7,075 | 6,067 | ||||
| Harris Corp. | 5.000 | % | 10/1/15 | 4,400 | 3,716 | ||||
| Harris Corp. | 5.950 | % | 12/1/17 | 225 | 194 | ||||
| Hewlett-Packard Co. | 6.500 | % | 7/1/12 | 1,835 | 1,990 | ||||
| Hewlett-Packard Co. | 4.500 | % | 3/1/13 | 15,825 | 16,129 | ||||
| Hewlett-Packard Co. | 5.400 | % | 3/1/17 | 2,035 | 2,071 | ||||
| Hewlett-Packard Co. | 5.500 | % | 3/1/18 | 4,275 | 4,373 | ||||
| IBM International Group Capital | 5.050 | % | 10/22/12 | 25,525 | 26,782 | ||||
| International Business Machines Corp. | 4.950 | % | 3/22/11 | 3,225 | 3,338 | ||||
| International Business Machines Corp. | 7.500 | % | 6/15/13 | 3,575 | 4,026 | ||||
| International Business Machines Corp. | 5.700 | % | 9/14/17 | 26,975 | 28,623 | ||||
| International Business Machines Corp. | 7.000 | % | 10/30/25 | 720 | 819 | ||||
| International Business Machines Corp. | 6.220 | % | 8/1/27 | 6,250 | 6,604 | ||||
| International Business Machines Corp. | 6.500 | % | 1/15/28 | 700 | 763 | ||||
| International Business Machines Corp. | 5.875 | % | 11/29/32 | 500 | 513 | ||||
| International Business Machines Corp. | 8.000 | % | 10/15/38 | 500 | 666 | ||||
| International Business Machines Corp. | 7.125 | % | 12/1/96 | 6,735 | 7,771 | ||||
| Intuit Inc. | 5.400 | % | 3/15/12 | 2,475 | 2,271 | ||||
| Intuit Inc. | 5.750 | % | 3/15/17 | 2,925 | 2,118 | ||||
| Lexmark International Inc. | 5.900 | % | 6/1/13 | 3,450 | 2,961 | ||||
| Lexmark International Inc. | 6.650 | % | 6/1/18 | 5,575 | 4,089 | ||||
| Motorola, Inc. | 7.625 | % | 11/15/10 | 619 | 546 | ||||
| Motorola, Inc. | 8.000 | % | 11/1/11 | 725 | 616 | ||||
| Motorola, Inc. | 5.375 | % | 11/15/12 | 6,125 | 4,573 | ||||
| Motorola, Inc. | 6.000 | % | 11/15/17 | 1,675 | 1,028 | ||||
| Motorola, Inc. | 7.500 | % | 5/15/25 | 1,000 | 538 | ||||
| Motorola, Inc. | 6.500 | % | 9/1/25 | 1,550 | 803 | ||||
| Motorola, Inc. | 6.500 | % | 11/15/28 | 500 | 259 | ||||
| Motorola, Inc. | 6.625 | % | 11/15/37 | 2,450 | 1,159 | ||||
| National Semiconductor | 6.150 | % | 6/15/12 | 750 | 591 | ||||
| National Semiconductor | 6.600 | % | 6/15/17 | 7,400 | 5,372 | ||||
| Oracle Corp. | 5.000 | % | 1/15/11 | 6,150 | 6,295 | ||||
| Oracle Corp. | 4.950 | % | 4/15/13 | 6,350 | 6,547 | ||||
| Oracle Corp. | 5.250 | % | 1/15/16 | 9,990 | 10,269 | ||||
| Oracle Corp. | 5.750 | % | 4/15/18 | 17,010 | 17,643 | ||||
| Oracle Corp. | 6.500 | % | 4/15/38 | 7,200 | 8,319 | ||||
| Pitney Bowes, Inc. | 4.625 | % | 10/1/12 | 4,050 | 3,979 | ||||
| Pitney Bowes, Inc. | 3.875 | % | 6/15/13 | 5,050 | 4,796 | ||||
| Pitney Bowes, Inc. | 4.875 | % | 8/15/14 | 350 | 337 | ||||
| Pitney Bowes, Inc. | 4.750 | % | 1/15/16 | 13,750 | 13,012 | ||||
| Pitney Bowes, Inc. | 5.750 | % | 9/15/17 | 4,450 | 4,388 | ||||
| Pitney Bowes, Inc. | 4.750 | % | 5/15/18 | 375 | 348 | ||||
| Pitney Bowes, Inc. | 5.250 | % | 1/15/37 | 550 | 508 | ||||
| Science Applications International Corp. | 6.250 | % | 7/1/12 | 1,275 | 1,306 | ||||
| Science Applications International Corp. | 5.500 | % | 7/1/33 | 1,775 | 1,330 | ||||
| Tyco Electronics Group | 6.000 | % | 10/1/12 | 2,450 | 1,982 | ||||
| Tyco Electronics Group | 6.550 | % | 10/1/17 | 9,325 | 7,843 | ||||
| Tyco Electronics Group | 7.125 | % | 10/1/37 | 750 | 560 | ||||
| Xerox Capital Trust I | 8.000 | % | 2/1/27 | 5,750 | 3,867 | ||||
| Xerox Corp. | 7.125 | % | 6/15/10 | 4,000 | 3,756 | ||||
| Xerox Corp. | 6.875 | % | 8/15/11 | 2,425 | 2,116 | ||||
| Xerox Corp. | 5.500 | % | 5/15/12 | 3,200 | 2,507 | ||||
| Xerox Corp. | 7.625 | % | 6/15/13 | 4,425 | 3,693 | ||||
| Xerox Corp. | 6.400 | % | 3/15/16 | 5,125 | 3,822 | ||||
| Xerox Corp. | 6.750 | % | 2/1/17 | 3,700 | 2,644 | ||||
| Xerox Corp. | 6.350 | % | 5/15/18 | 13,325 | 10,352 |
Page 37
| Vanguard® Total Bond Market Index Fund | |||||||||
| Schedule of Investments | |||||||||
| December 31, 2008 | |||||||||
| Face | Market | ||||||||
| Maturity | Amount | Value | |||||||
| Coupon | Date | ($ | 000 | ) | ($ | 000 | ) | ||
| Transportation (0.4%) | |||||||||
| Burlington Northern Santa Fe Corp. | 7.125 | % | 12/15/10 | 500 | 516 | ||||
| Burlington Northern Santa Fe Corp. | 6.750 | % | 7/15/11 | 3,720 | 3,820 | ||||
| Burlington Northern Santa Fe Corp. | 5.900 | % | 7/1/12 | 3,375 | 3,386 | ||||
| Burlington Northern Santa Fe Corp. | 5.650 | % | 5/1/17 | 3,025 | 2,950 | ||||
| Burlington Northern Santa Fe Corp. | 5.750 | % | 3/15/18 | 4,100 | 4,006 | ||||
| Burlington Northern Santa Fe Corp. | 7.000 | % | 12/15/25 | 6,400 | 6,418 | ||||
| Burlington Northern Santa Fe Corp. | 6.200 | % | 8/15/36 | 3,975 | 3,670 | ||||
| Burlington Northern Santa Fe Corp. | 6.150 | % | 5/1/37 | 75 | 70 | ||||
| Canadian National Railway Co. | 6.375 | % | 10/15/11 | 1,075 | 1,100 | ||||
| Canadian National Railway Co. | 4.400 | % | 3/15/13 | 3,175 | 3,129 | ||||
| Canadian National Railway Co. | 4.950 | % | 1/15/14 | 700 | 684 | ||||
| Canadian National Railway Co. | 5.800 | % | 6/1/16 | 950 | 963 | ||||
| Canadian National Railway Co. | 5.850 | % | 11/15/17 | 1,425 | 1,452 | ||||
| Canadian National Railway Co. | 6.800 | % | 7/15/18 | 11,025 | 12,011 | ||||
| Canadian National Railway Co. | 6.900 | % | 7/15/28 | 700 | 766 | ||||
| Canadian National Railway Co. | 6.250 | % | 8/1/34 | 1,925 | 1,944 | ||||
| Canadian National Railway Co. | 6.200 | % | 6/1/36 | 3,025 | 3,077 | ||||
| Canadian Pacific Railway Co. | 6.250 | % | 10/15/11 | 10,950 | 10,642 | ||||
| Canadian Pacific Railway Co. | 7.125 | % | 10/15/31 | 550 | 440 | ||||
| Canadian Pacific Railway Co. | 5.950 | % | 5/15/37 | 1,200 | 834 | ||||
| CNF, Inc. | 6.700 | % | 5/1/34 | 4,150 | 2,991 | ||||
| Continental Airlines, Inc. | 6.563 | % | 2/15/12 | 2,450 | 1,954 | ||||
| 2 Continental Airlines, Inc. | 6.648 | % | 9/15/17 | 8,362 | 6,376 | ||||
| 2 Continental Airlines, Inc. | 6.900 | % | 1/2/18 | 4,647 | 3,637 | ||||
| 2 Continental Airlines, Inc. | 6.545 | % | 2/2/19 | 519 | 413 | ||||
| 2 Continental Airlines, Inc. | 5.983 | % | 4/19/22 | 750 | 503 | ||||
| CSX Corp. | 6.750 | % | 3/15/11 | 2,450 | 2,451 | ||||
| CSX Corp. | 6.300 | % | 3/15/12 | 1,775 | 1,745 | ||||
| CSX Corp. | 5.750 | % | 3/15/13 | 125 | 119 | ||||
| CSX Corp. | 6.250 | % | 4/1/15 | 2,750 | 2,704 | ||||
| CSX Corp. | 5.600 | % | 5/1/17 | 1,875 | 1,681 | ||||
| CSX Corp. | 6.250 | % | 3/15/18 | 300 | 277 | ||||
| CSX Corp. | 7.950 | % | 5/1/27 | 325 | 331 | ||||
| CSX Corp. | 6.000 | % | 10/1/36 | 7,550 | 6,108 | ||||
| CSX Corp. | 6.150 | % | 5/1/37 | 2,875 | 2,372 | ||||
| CSX Corp. | 7.450 | % | 4/1/38 | 2,350 | 2,290 | ||||
| Delta Air Lines Enhanced Equipment Trust Certificates | 6.417 | % | 7/2/12 | 4,100 | 2,962 | ||||
| 2 Delta Air Lines Enhanced Equipment Trust Certificates | 6.718 | % | 1/2/23 | 3,814 | 2,446 | ||||
| Delta Air Lines, Inc. | 7.111 | % | 9/18/11 | 4,100 | 3,157 | ||||
| 2 Delta Air Lines, Inc. | 6.821 | % | 8/10/22 | 5,610 | 3,338 | ||||
| Norfolk Southern Corp. | 6.750 | % | 2/15/11 | 6,000 | 6,100 | ||||
| Norfolk Southern Corp. | 5.257 | % | 9/17/14 | 45 | 43 | ||||
| Norfolk Southern Corp. | 7.700 | % | 5/15/17 | 6,375 | 6,901 | ||||
| Norfolk Southern Corp. | 5.750 | % | 4/1/18 | 1,750 | 1,704 | ||||
| Norfolk Southern Corp. | 9.750 | % | 6/15/20 | 1,696 | 1,967 | ||||
| Norfolk Southern Corp. | 5.590 | % | 5/17/25 | 634 | 582 | ||||
| Norfolk Southern Corp. | 7.800 | % | 5/15/27 | 2,495 | 2,759 | ||||
| Norfolk Southern Corp. | 5.640 | % | 5/17/29 | 2,205 | 2,070 | ||||
| Norfolk Southern Corp. | 7.050 | % | 5/1/37 | 12,995 | 13,549 | ||||
| Norfolk Southern Corp. | 7.900 | % | 5/15/97 | 2,075 | 2,331 | ||||
| Ryder System Inc. | 5.950 | % | 5/2/11 | 3,375 | 3,028 | ||||
| Ryder System Inc. | 5.850 | % | 3/1/14 | 2,000 | 1,556 | ||||
| Ryder System Inc. | 7.200 | % | 9/1/15 | 4,375 | 3,259 | ||||
| Ryder System Inc. | 5.850 | % | 11/1/16 | 1,950 | 1,613 | ||||
| Southwest Airlines Co. | 6.500 | % | 3/1/12 | 7,950 | 7,487 | ||||
| Southwest Airlines Co. | 5.250 | % | 10/1/14 | 275 | 210 | ||||
| Southwest Airlines Co. | 5.750 | % | 12/15/16 | 3,950 | 2,703 | ||||
| Southwest Airlines Co. | 5.125 | % | 3/1/17 | 850 | 597 | ||||
| 2 Southwest Airlines Co. | 6.150 | % | 8/1/22 | 2,030 | 1,584 | ||||
| Union Pacific Corp. | 3.625 | % | 6/1/10 | 2,040 | 2,004 | ||||
| Union Pacific Corp. | 6.650 | % | 1/15/11 | 6,005 | 6,049 | ||||
| Union Pacific Corp. | 6.125 | % | 1/15/12 | 200 | 202 | ||||
| Union Pacific Corp. | 6.500 | % | 4/15/12 | 2,383 | 2,441 | ||||
| Union Pacific Corp. | 5.450 | % | 1/31/13 | 2,750 | 2,681 | ||||
| Union Pacific Corp. | 7.000 | % | 2/1/16 | 450 | 471 |
Page 38
| Vanguard® Total Bond Market Index Fund | |||||||||
| Schedule of Investments | |||||||||
| December 31, 2008 | |||||||||
| Face | Market | ||||||||
| Maturity | Amount | Value | |||||||
| Coupon | Date | ($ | 000 | ) | ($ | 000 | ) | ||
| Union Pacific Corp. | 5.650 | % | 5/1/17 | 5,200 | 4,958 | ||||
| Union Pacific Corp. | 5.750 | % | 11/15/17 | 8,525 | 8,150 | ||||
| Union Pacific Corp. | 5.700 | % | 8/15/18 | 8,650 | 8,384 | ||||
| Union Pacific Corp. | 6.625 | % | 2/1/29 | 1,950 | 1,847 | ||||
| 2 Union Pacific Railroad Co. | 6.176 | % | 1/2/31 | 1,562 | 1,531 | ||||
| United Parcel Service of America | 4.500 | % | 1/15/13 | 2,750 | 2,880 | ||||
| United Parcel Service of America | 5.500 | % | 1/15/18 | 4,185 | 4,452 | ||||
| United Parcel Service of America | 6.200 | % | 1/15/38 | 4,875 | 5,374 | ||||
| 5,610,658 | |||||||||
| Utilities (1.8%) | |||||||||
| Electric (1.4%) | |||||||||
| AEP Texas Central Co. | 6.650 | % | 2/15/33 | 2,775 | 2,536 | ||||
| Alabama Power Co. | 4.850 | % | 12/15/12 | 2,400 | 2,390 | ||||
| Alabama Power Co. | 5.500 | % | 10/15/17 | 3,975 | 3,927 | ||||
| American Electric Power Co., Inc. | 5.375 | % | 3/15/10 | 925 | 927 | ||||
| American Electric Power Co., Inc. | 5.250 | % | 6/1/15 | 875 | 798 | ||||
| American Water Capital Corp. | 6.085 | % | 10/15/17 | 8,800 | 7,692 | ||||
| American Water Capital Corp. | 6.593 | % | 10/15/37 | 6,300 | 4,814 | ||||
| Appalachian Power Co. | 7.000 | % | 4/1/38 | 6,900 | 6,594 | ||||
| Arizona Public Service Co. | 6.375 | % | 10/15/11 | 800 | 751 | ||||
| Arizona Public Service Co. | 5.800 | % | 6/30/14 | 725 | 602 | ||||
| Arizona Public Service Co. | 4.650 | % | 5/15/15 | 925 | 712 | ||||
| Arizona Public Service Co. | 5.500 | % | 9/1/35 | 700 | 402 | ||||
| Baltimore Gas & Electric Co. | 5.900 | % | 10/1/16 | 4,250 | 3,849 | ||||
| Baltimore Gas & Electric Co. | 6.350 | % | 10/1/36 | 625 | 501 | ||||
| Carolina Power & Light Co. | 6.500 | % | 7/15/12 | 1,250 | 1,274 | ||||
| Carolina Power & Light Co. | 5.125 | % | 9/15/13 | 6,400 | 6,528 | ||||
| Carolina Power & Light Co. | 6.300 | % | 4/1/38 | 2,750 | 2,995 | ||||
| CenterPoint Energy Houston | 5.700 | % | 3/15/13 | 16,860 | 15,702 | ||||
| CenterPoint Energy Houston | 5.750 | % | 1/15/14 | 500 | 476 | ||||
| CenterPoint Energy Houston | 6.950 | % | 3/15/33 | 400 | 368 | ||||
| Cincinnati Gas & Electric Co. | 5.700 | % | 9/15/12 | 4,925 | 4,842 | ||||
| Cleveland Electric Illumination Co. | 7.880 | % | 11/1/17 | 1,375 | 1,410 | ||||
| Columbus Southern Power | 5.850 | % | 10/1/35 | 6,700 | 5,867 | ||||
| Commonwealth Edison Co. | 6.150 | % | 3/15/12 | 2,025 | 1,997 | ||||
| Commonwealth Edison Co. | 5.950 | % | 8/15/16 | 10,855 | 10,204 | ||||
| Commonwealth Edison Co. | 6.150 | % | 9/15/17 | 15,025 | 14,130 | ||||
| Commonwealth Edison Co. | 5.800 | % | 3/15/18 | 3,675 | 3,304 | ||||
| Commonwealth Edison Co. | 5.875 | % | 2/1/33 | 590 | 503 | ||||
| Commonwealth Edison Co. | 5.900 | % | 3/15/36 | 800 | 665 | ||||
| Commonwealth Edison Co. | 6.450 | % | 1/15/38 | 3,875 | 3,536 | ||||
| Connecticut Light & Power Co. | 6.350 | % | 6/1/36 | 6,975 | 7,139 | ||||
| Consolidated Edison Co. of New York | 4.875 | % | 2/1/13 | 3,715 | 3,639 | ||||
| Consolidated Edison Co. of New York | 5.375 | % | 12/15/15 | 1,600 | 1,568 | ||||
| Consolidated Edison Co. of New York | 5.500 | % | 9/15/16 | 6,200 | 6,075 | ||||
| Consolidated Edison Co. of New York | 5.300 | % | 3/1/35 | 2,450 | 2,104 | ||||
| Consolidated Edison Co. of New York | 5.850 | % | 3/15/36 | 2,325 | 2,155 | ||||
| Consolidated Edison Co. of New York | 6.200 | % | 6/15/36 | 3,575 | 3,474 | ||||
| Consolidated Edison Co. of New York | 6.300 | % | 8/15/37 | 7,000 | 6,890 | ||||
| Consolidated Edison Co. of New York | 6.750 | % | 4/1/38 | 2,700 | 2,816 | ||||
| Constellation Energy Group, Inc. | 6.125 | % | 9/1/09 | 875 | 869 | ||||
| Constellation Energy Group, Inc. | 7.000 | % | 4/1/12 | 1,275 | 1,150 | ||||
| Constellation Energy Group, Inc. | 4.550 | % | 6/15/15 | 18,050 | 13,725 | ||||
| Constellation Energy Group, Inc. | 7.600 | % | 4/1/32 | 2,390 | 2,033 | ||||
| Consumers Energy Co. | 5.000 | % | 2/15/12 | 2,500 | 2,427 | ||||
| Consumers Energy Co. | 5.375 | % | 4/15/13 | 5,175 | 5,080 | ||||
| Consumers Energy Co. | 5.500 | % | 8/15/16 | 1,925 | 1,824 | ||||
| Consumers Energy Co. | 5.650 | % | 4/15/20 | 1,000 | 934 | ||||
| Detroit Edison Co. | 6.125 | % | 10/1/10 | 2,730 | 2,783 | ||||
| Detroit Edison Co. | 5.700 | % | 10/1/37 | 1,000 | 912 | ||||
| Dominion Resources, Inc. | 4.750 | % | 12/15/10 | 2,225 | 2,160 | ||||
| Dominion Resources, Inc. | 6.250 | % | 6/30/12 | 2,790 | 2,748 | ||||
| Dominion Resources, Inc. | 5.700 | % | 9/17/12 | 850 | 842 | ||||
| Dominion Resources, Inc. | 5.150 | % | 7/15/15 | 19,050 | 18,012 | ||||
| Dominion Resources, Inc. | 6.000 | % | 11/30/17 | 5,300 | 5,079 |
Page 39
| Vanguard® Total Bond Market Index Fund | |||||||||
| Schedule of Investments | |||||||||
| December 31, 2008 | |||||||||
| Face | Market | ||||||||
| Maturity | Amount | Value | |||||||
| Coupon | Date | ($ | 000 | ) | ($ | 000 | ) | ||
| Dominion Resources, Inc. | 6.300 | % | 3/15/33 | 1,675 | 1,424 | ||||
| Dominion Resources, Inc. | 5.250 | % | 8/1/33 | 3,225 | 2,919 | ||||
| Dominion Resources, Inc. | 5.950 | % | 6/15/35 | 9,825 | 8,675 | ||||
| Dominion Resources, Inc. | 7.000 | % | 6/15/38 | 1,275 | 1,233 | ||||
| 2 Dominion Resources, Inc. | 7.500 | % | 6/30/66 | 4,325 | 2,223 | ||||
| 2 Dominion Resources, Inc. | 6.300 | % | 9/30/66 | 2,750 | 1,278 | ||||
| DTE Energy Co. | 7.050 | % | 6/1/11 | 6,640 | 6,582 | ||||
| DTE Energy Co. | 6.375 | % | 4/15/33 | 275 | 217 | ||||
| 3 Duke Energy Carolinas LLC | 5.750 | % | 11/15/13 | 500 | 523 | ||||
| Duke Energy Carolinas LLC | 6.100 | % | 6/1/37 | 10,725 | 10,767 | ||||
| Duke Energy Carolinas LLC | 6.000 | % | 1/15/38 | 475 | 474 | ||||
| Duke Energy Carolinas LLC | 6.050 | % | 4/15/38 | 3,425 | 3,438 | ||||
| Duke Energy Corp. | 6.250 | % | 1/15/12 | 8,707 | 9,030 | ||||
| Duke Energy Corp. | 6.000 | % | 12/1/28 | 1,900 | 1,929 | ||||
| Duke Energy Corp. | 6.450 | % | 10/15/32 | 1,500 | 1,610 | ||||
| Duke Energy Indiana Inc. | 6.350 | % | 8/15/38 | 9,925 | 10,589 | ||||
| El Paso Electric Co. | 6.000 | % | 5/15/35 | 2,200 | 1,503 | ||||
| Empresa Nacional Electric | 8.350 | % | 8/1/13 | 2,900 | 3,125 | ||||
| Energy East Corp. | 6.750 | % | 6/15/12 | 6,050 | 6,051 | ||||
| Energy East Corp. | 6.750 | % | 7/15/36 | 4,275 | 3,614 | ||||
| 3 Entergy Gulf States, Inc. | 6.000 | % | 5/1/18 | 10,525 | 9,130 | ||||
| Entergy Louisiana LLC | 6.500 | % | 9/1/18 | 1,575 | 1,445 | ||||
| Exelon Corp. | 6.750 | % | 5/1/11 | 500 | 494 | ||||
| Exelon Corp. | 4.900 | % | 6/15/15 | 5,200 | 4,477 | ||||
| Exelon Corp. | 5.625 | % | 6/15/35 | 935 | 624 | ||||
| FirstEnergy Corp. | 6.450 | % | 11/15/11 | 52,330 | 51,074 | ||||
| FirstEnergy Corp. | 7.375 | % | 11/15/31 | 8,190 | 7,762 | ||||
| Florida Power & Light Co. | 4.850 | % | 2/1/13 | 3,000 | 3,006 | ||||
| Florida Power & Light Co. | 5.550 | % | 11/1/17 | 2,275 | 2,375 | ||||
| Florida Power & Light Co. | 5.950 | % | 10/1/33 | 50 | 54 | ||||
| Florida Power & Light Co. | 5.625 | % | 4/1/34 | 4,450 | 4,574 | ||||
| Florida Power & Light Co. | 5.400 | % | 9/1/35 | 2,075 | 2,069 | ||||
| Florida Power & Light Co. | 6.200 | % | 6/1/36 | 4,700 | 5,219 | ||||
| Florida Power & Light Co. | 5.650 | % | 2/1/37 | 4,725 | 4,908 | ||||
| Florida Power & Light Co. | 5.850 | % | 5/1/37 | 2,450 | 2,620 | ||||
| Florida Power & Light Co. | 5.950 | % | 2/1/38 | 9,975 | 10,820 | ||||
| Florida Power Corp. | 4.500 | % | 6/1/10 | 3,825 | 3,800 | ||||
| Florida Power Corp. | 4.800 | % | 3/1/13 | 12,175 | 11,777 | ||||
| Florida Power Corp. | 5.650 | % | 6/15/18 | 3,725 | 3,841 | ||||
| Florida Power Corp. | 6.350 | % | 9/15/37 | 5,300 | 5,847 | ||||
| Florida Power Corp. | 6.400 | % | 6/15/38 | 4,200 | 4,802 | ||||
| FPL Group Capital, Inc. | 5.625 | % | 9/1/11 | 3,975 | 4,115 | ||||
| FPL Group Capital, Inc. | 5.350 | % | 6/15/13 | 5,625 | 5,648 | ||||
| 2 FPL Group Capital, Inc. | 6.350 | % | 10/1/66 | 2,600 | 1,291 | ||||
| 2 FPL Group Capital, Inc. | 6.650 | % | 6/15/67 | 3,200 | 1,602 | ||||
| Georgia Power Co. | 5.700 | % | 6/1/17 | 2,340 | 2,367 | ||||
| Georgia Power Co. | 5.650 | % | 3/1/37 | 425 | 404 | ||||
| Illinois Power | 6.125 | % | 11/15/17 | 1,475 | 1,304 | ||||
| Illinois Power | 6.250 | % | 4/1/18 | 5,700 | 4,980 | ||||
| Indiana Michigan Power Co. | 6.050 | % | 3/15/37 | 7,475 | 6,084 | ||||
| 2 Integrys Energy Group | 6.110 | % | 12/1/66 | 5,150 | 2,557 | ||||
| Jersey Central Power & Light | 5.625 | % | 5/1/16 | 3,575 | 3,301 | ||||
| Jersey Central Power & Light | 5.650 | % | 6/1/17 | 2,250 | 2,076 | ||||
| Kansas City Power & Light | 6.050 | % | 11/15/35 | 2,075 | 1,655 | ||||
| MidAmerican Energy Co. | 5.650 | % | 7/15/12 | 3,200 | 3,206 | ||||
| MidAmerican Energy Co. | 5.125 | % | 1/15/13 | 7,875 | 7,730 | ||||
| MidAmerican Energy Co. | 5.950 | % | 7/15/17 | 1,675 | 1,746 | ||||
| MidAmerican Energy Co. | 5.300 | % | 3/15/18 | 550 | 543 | ||||
| MidAmerican Energy Co. | 6.750 | % | 12/30/31 | 5,475 | 5,526 | ||||
| MidAmerican Energy Co. | 5.750 | % | 11/1/35 | 1,700 | 1,506 | ||||
| MidAmerican Energy Holdings Co. | 5.875 | % | 10/1/12 | 7,020 | 6,957 | ||||
| MidAmerican Energy Holdings Co. | 5.000 | % | 2/15/14 | 1,425 | 1,360 | ||||
| MidAmerican Energy Holdings Co. | 5.750 | % | 4/1/18 | 5,925 | 5,892 | ||||
| MidAmerican Energy Holdings Co. | 8.480 | % | 9/15/28 | 700 | 742 | ||||
| MidAmerican Energy Holdings Co. | 6.125 | % | 4/1/36 | 22,975 | 21,273 | ||||
| MidAmerican Energy Holdings Co. | 5.950 | % | 5/15/37 | 8,625 | 7,837 |
Page 40
| Vanguard® Total Bond Market Index Fund | |||||||||
| Schedule of Investments | |||||||||
| December 31, 2008 | |||||||||
| Face | Market | ||||||||
| Maturity | Amount | Value | |||||||
| Coupon | Date | ($ | 000 | ) | ($ | 000 | ) | ||
| MidAmerican Energy Holdings Co. | 6.500 | % | 9/15/37 | 1,050 | 1,014 | ||||
| National Rural Utilities Cooperative Finance Corp. | 7.250 | % | 3/1/12 | 18,810 | 20,030 | ||||
| National Rural Utilities Cooperative Finance Corp. | 5.500 | % | 7/1/13 | 6,125 | 5,788 | ||||
| National Rural Utilities Cooperative Finance Corp. | 4.750 | % | 3/1/14 | 2,140 | 1,963 | ||||
| National Rural Utilities Cooperative Finance Corp. | 5.450 | % | 4/10/17 | 275 | 253 | ||||
| National Rural Utilities Cooperative Finance Corp. | 5.450 | % | 2/1/18 | 4,960 | 4,535 | ||||
| National Rural Utilities Cooperative Finance Corp. | 8.000 | % | 3/1/32 | 4,000 | 3,888 | ||||
| Nevada Power Co. | 6.750 | % | 7/1/37 | 1,500 | 1,341 | ||||
| NiSource Finance Corp. | 7.875 | % | 11/15/10 | 6,660 | 6,133 | ||||
| NiSource Finance Corp. | 6.150 | % | 3/1/13 | 525 | 396 | ||||
| NiSource Finance Corp. | 5.400 | % | 7/15/14 | 1,350 | 911 | ||||
| NiSource Finance Corp. | 5.250 | % | 9/15/17 | 1,525 | 1,034 | ||||
| NiSource Finance Corp. | 6.400 | % | 3/15/18 | 850 | 551 | ||||
| NiSource Finance Corp. | 6.800 | % | 1/15/19 | 150 | 103 | ||||
| NiSource Finance Corp. | 5.450 | % | 9/15/20 | 1,675 | 1,018 | ||||
| Northern States Power Co. | 5.250 | % | 3/1/18 | 2,325 | 2,346 | ||||
| Northern States Power Co. | 5.250 | % | 7/15/35 | 425 | 403 | ||||
| Northern States Power Co. | 6.250 | % | 6/1/36 | 1,975 | 2,148 | ||||
| Northern States Power Co. | 6.200 | % | 7/1/37 | 3,600 | 3,895 | ||||
| NStar Electric Co. | 4.875 | % | 4/15/14 | 2,200 | 2,114 | ||||
| NStar Electric Co. | 5.625 | % | 11/15/17 | 5,650 | 5,365 | ||||
| Ohio Edison | 6.400 | % | 7/15/16 | 4,650 | 4,050 | ||||
| Ohio Power Co. | 5.750 | % | 9/1/13 | 8,525 | 8,391 | ||||
| Ohio Power Co. | 6.000 | % | 6/1/16 | 3,975 | 3,910 | ||||
| Oncor Electric Delivery Co. | 6.375 | % | 5/1/12 | 3,650 | 3,619 | ||||
| Oncor Electric Delivery Co. | 6.375 | % | 1/15/15 | 7,175 | 6,797 | ||||
| Oncor Electric Delivery Co. | 7.000 | % | 9/1/22 | 600 | 559 | ||||
| Oncor Electric Delivery Co. | 7.000 | % | 5/1/32 | 2,125 | 1,918 | ||||
| Oncor Electric Delivery Co. | 7.250 | % | 1/15/33 | 4,475 | 4,088 | ||||
| Pacific Gas & Electric Co. | 4.200 | % | 3/1/11 | 29,075 | 28,558 | ||||
| Pacific Gas & Electric Co. | 4.800 | % | 3/1/14 | 5,125 | 4,990 | ||||
| Pacific Gas & Electric Co. | 5.625 | % | 11/30/17 | 4,250 | 4,354 | ||||
| Pacific Gas & Electric Co. | 6.050 | % | 3/1/34 | 5,855 | 6,070 | ||||
| Pacific Gas & Electric Co. | 5.800 | % | 3/1/37 | 8,300 | 8,509 | ||||
| PacifiCorp | 6.900 | % | 11/15/11 | 7,600 | 8,002 | ||||
| PacifiCorp | 7.700 | % | 11/15/31 | 1,250 | 1,500 | ||||
| PacifiCorp | 5.250 | % | 6/15/35 | 50 | 45 | ||||
| PacifiCorp | 6.250 | % | 10/15/37 | 800 | 830 | ||||
| PECO Energy Co. | 5.350 | % | 3/1/18 | 2,000 | 1,926 | ||||
| Pennsylvania Electric Co. | 6.050 | % | 9/1/17 | 2,775 | 2,477 | ||||
| Pepco Holdings, Inc. | 6.450 | % | 8/15/12 | 8,075 | 7,559 | ||||
| Pepco Holdings, Inc. | 7.450 | % | 8/15/32 | 1,475 | 1,219 | ||||
| Potomac Electric Power | 6.500 | % | 11/15/37 | 1,000 | 978 | ||||
| PPL Energy Supply LLC | 6.400 | % | 11/1/11 | 12,350 | 11,860 | ||||
| PPL Energy Supply LLC | 6.300 | % | 7/15/13 | 3,700 | 3,473 | ||||
| PPL Energy Supply LLC | 5.400 | % | 8/15/14 | 1,000 | 856 | ||||
| PPL Energy Supply LLC | 6.200 | % | 5/15/16 | 3,825 | 3,041 | ||||
| PPL Energy Supply LLC | 6.500 | % | 5/1/18 | 2,550 | 2,093 | ||||
| PPL Energy Supply LLC | 6.000 | % | 12/15/36 | 2,050 | 1,437 | ||||
| Progress Energy, Inc. | 7.100 | % | 3/1/11 | 6,686 | 6,701 | ||||
| Progress Energy, Inc. | 6.850 | % | 4/15/12 | 2,200 | 2,226 | ||||
| Progress Energy, Inc. | 5.625 | % | 1/15/16 | 1,375 | 1,270 | ||||
| Progress Energy, Inc. | 7.750 | % | 3/1/31 | 1,800 | 1,815 | ||||
| Progress Energy, Inc. | 7.000 | % | 10/30/31 | 5,650 | 5,244 | ||||
| PSE&G Power LLC | 7.750 | % | 4/15/11 | 1,075 | 1,073 | ||||
| PSE&G Power LLC | 6.950 | % | 6/1/12 | 17,025 | 16,745 | ||||
| PSE&G Power LLC | 5.000 | % | 4/1/14 | 2,800 | 2,474 | ||||
| PSE&G Power LLC | 5.500 | % | 12/1/15 | 3,275 | 2,858 | ||||
| PSE&G Power LLC | 8.625 | % | 4/15/31 | 400 | 418 | ||||
| PSI Energy Inc. | 5.000 | % | 9/15/13 | 200 | 190 | ||||
| PSI Energy Inc. | 6.050 | % | 6/15/16 | 425 | 404 | ||||
| PSI Energy Inc. | 6.120 | % | 10/15/35 | 1,400 | 1,313 | ||||
| Public Service Co. of Colorado | 7.875 | % | 10/1/12 | 9,800 | 10,408 | ||||
| Public Service Co. of Colorado | 5.500 | % | 4/1/14 | 65 | 64 | ||||
| Public Service Co. of Colorado | 5.800 | % | 8/1/18 | 1,900 | 1,945 | ||||
| Public Service Co. of Colorado | 6.250 | % | 9/1/37 | 1,850 | 1,907 |
Page 41
| Vanguard® Total Bond Market Index Fund | |||||||||
| Schedule of Investments | |||||||||
| December 31, 2008 | |||||||||
| Face | Market | ||||||||
| Maturity | Amount | Value | |||||||
| Coupon | Date | ($ | 000 | ) | ($ | 000 | ) | ||
| Public Service Co. of Colorado | 6.500 | % | 8/1/38 | 3,300 | 3,517 | ||||
| Public Service Co. of Oklahoma | 6.625 | % | 11/15/37 | 5,550 | 5,027 | ||||
| Public Service Electric & Gas | 5.250 | % | 7/1/35 | 325 | 282 | ||||
| Public Service Electric & Gas | 5.800 | % | 5/1/37 | 6,000 | 5,627 | ||||
| Puget Sound Energy Inc. | 5.483 | % | 6/1/35 | 950 | 761 | ||||
| Puget Sound Energy Inc. | 6.274 | % | 3/15/37 | 5,275 | 4,705 | ||||
| SCANA Corp. | 6.875 | % | 5/15/11 | 7,825 | 8,028 | ||||
| Sierra Pacific Power Co. | 6.000 | % | 5/15/16 | 2,925 | 2,754 | ||||
| Sierra Pacific Power Co. | 6.750 | % | 7/1/37 | 5,000 | 4,550 | ||||
| South Carolina Electric & Gas Co. | 6.500 | % | 11/1/18 | 1,900 | 2,099 | ||||
| South Carolina Electric & Gas Co. | 6.625 | % | 2/1/32 | 2,750 | 3,066 | ||||
| South Carolina Electric & Gas Co. | 5.300 | % | 5/15/33 | 220 | 208 | ||||
| South Carolina Electric & Gas Co. | 6.050 | % | 1/15/38 | 1,475 | 1,543 | ||||
| Southern California Edison Co. | 5.000 | % | 1/15/14 | 3,450 | 3,520 | ||||
| Southern California Edison Co. | 4.650 | % | 4/1/15 | 2,075 | 2,033 | ||||
| Southern California Edison Co. | 5.000 | % | 1/15/16 | 1,450 | 1,448 | ||||
| Southern California Edison Co. | 5.750 | % | 4/1/35 | 1,025 | 1,102 | ||||
| Southern California Edison Co. | 5.350 | % | 7/15/35 | 5,450 | 5,551 | ||||
| Southern California Edison Co. | 5.625 | % | 2/1/36 | 8,175 | 8,651 | ||||
| Southern California Edison Co. | 5.550 | % | 1/15/37 | 9,875 | 10,351 | ||||
| Southern California Edison Co. | 5.950 | % | 2/1/38 | 100 | 111 | ||||
| Southern Co. | 5.300 | % | 1/15/12 | 2,075 | 2,098 | ||||
| Southern Power Co. | 6.250 | % | 7/15/12 | 4,155 | 4,195 | ||||
| Southern Power Co. | 4.875 | % | 7/15/15 | 7,925 | 6,969 | ||||
| Southwestern Electric Power | 5.550 | % | 1/15/17 | 500 | 468 | ||||
| Southwestern Electric Power | 6.450 | % | 1/15/19 | 4,575 | 4,483 | ||||
| Tampa Electric Co. | 6.375 | % | 8/15/12 | 5,000 | 4,879 | ||||
| Tampa Electric Co. | 6.550 | % | 5/15/36 | 3,675 | 3,225 | ||||
| Toledo Edison Co. | 6.150 | % | 5/15/37 | 400 | 319 | ||||
| TransAlta Corp. | 6.650 | % | 5/15/18 | 1,550 | 1,391 | ||||
| Union Electric Co. | 5.400 | % | 2/1/16 | 3,950 | 3,427 | ||||
| Virginia Electric & Power Co. | 5.100 | % | 11/30/12 | 675 | 660 | ||||
| Virginia Electric & Power Co. | 5.400 | % | 1/15/16 | 1,100 | 1,079 | ||||
| Virginia Electric & Power Co. | 6.000 | % | 1/15/36 | 7,150 | 6,810 | ||||
| Virginia Electric & Power Co. | 6.000 | % | 5/15/37 | 3,125 | 3,054 | ||||
| Virginia Electric & Power Co. | 6.350 | % | 11/30/37 | 2,275 | 2,269 | ||||
| Virginia Electric & Power Co. | 8.875 | % | 11/15/38 | 275 | 349 | ||||
| Wisconsin Electric Power Co. | 6.000 | % | 4/1/14 | 475 | 510 | ||||
| Wisconsin Electric Power Co. | 5.625 | % | 5/15/33 | 1,175 | 1,123 | ||||
| Wisconsin Electric Power Co. | 5.700 | % | 12/1/36 | 1,025 | 988 | ||||
| Wisconsin Energy Corp. | 6.500 | % | 4/1/11 | 10,750 | 11,045 | ||||
| 2 Wisconsin Energy Corp. | 6.250 | % | 5/15/67 | 16,950 | 8,404 | ||||
| Wisconsin Power & Light Co. | 6.375 | % | 8/15/37 | 5,050 | 4,860 | ||||
| Xcel Energy, Inc. | 5.613 | % | 4/1/17 | 736 | 663 | ||||
| Xcel Energy, Inc. | 6.500 | % | 7/1/36 | 3,600 | 3,312 | ||||
| Natural Gas (0.4%) | |||||||||
| AGL Capital Corp. | 7.125 | % | 1/14/11 | 2,350 | 2,367 | ||||
| AGL Capital Corp. | 6.000 | % | 10/1/34 | 150 | 109 | ||||
| Atmos Energy Corp. | 4.000 | % | 10/15/09 | 5,175 | 5,024 | ||||
| Atmos Energy Corp. | 4.950 | % | 10/15/14 | 3,630 | 3,180 | ||||
| Boardwalk Pipelines LLC | 5.500 | % | 2/1/17 | 4,025 | 3,233 | ||||
| British Transco Finance | 6.625 | % | 6/1/18 | 2,050 | 1,869 | ||||
| Buckeye Partners LP | 6.050 | % | 1/15/18 | 450 | 390 | ||||
| CenterPoint Energy Resources | 7.875 | % | 4/1/13 | 4,030 | 3,998 | ||||
| CenterPoint Energy Resources | 6.150 | % | 5/1/16 | 1,375 | 1,196 | ||||
| Consolidated Natural Gas | 6.250 | % | 11/1/11 | 8,800 | 8,994 | ||||
| Consolidated Natural Gas | 5.000 | % | 12/1/14 | 5,625 | 5,218 | ||||
| Duke Capital Corp. | 6.250 | % | 2/15/13 | 1,375 | 1,334 | ||||
| Duke Capital Corp. | 5.500 | % | 3/1/14 | 3,825 | 3,406 | ||||
| Duke Capital Corp. | 5.668 | % | 8/15/14 | 250 | 223 | ||||
| Duke Capital Corp. | 6.750 | % | 2/15/32 | 2,800 | 2,154 | ||||
| Duke Energy Field Services | 7.875 | % | 8/16/10 | 4,600 | 4,609 | ||||
| Duke Energy Field Services | 8.125 | % | 8/16/30 | 225 | 203 | ||||
| El Paso Natural Gas Co. | 5.950 | % | 4/15/17 | 2,625 | 2,134 | ||||
Page 42
| Vanguard® Total Bond Market Index Fund | |||||||||
| Schedule of Investments | |||||||||
| December 31, 2008 | |||||||||
| Face | Market | ||||||||
| Maturity | Amount | Value | |||||||
| Coupon | Date | ($ | 000 | ) | ($ | 000 | ) | ||
| Enbridge Energy Partners | 6.500 | % | 4/15/18 | 2,850 | 2,372 | ||||
| Enbridge Energy Partners | 9.875 | % | 3/1/19 | 5,550 | 5,591 | ||||
| Enbridge Energy Partners | 7.500 | % | 4/15/38 | 6,625 | 5,403 | ||||
| Enbridge Inc. | 5.600 | % | 4/1/17 | 375 | 313 | ||||
| Energy Transfer Partners LP | 5.650 | % | 8/1/12 | 5,475 | 4,973 | ||||
| Energy Transfer Partners LP | 5.950 | % | 2/1/15 | 8,200 | 7,091 | ||||
| Energy Transfer Partners LP | 6.125 | % | 2/15/17 | 1,425 | 1,198 | ||||
| Energy Transfer Partners LP | 6.625 | % | 10/15/36 | 1,750 | 1,226 | ||||
| Energy Transfer Partners LP | 7.500 | % | 7/1/38 | 725 | 567 | ||||
| 6 Enron Corp. | 7.625 | % | 9/10/04 | 2,000 | 10 | ||||
| 6 Enron Corp. | 6.625 | % | 11/15/05 | 1,375 | 7 | ||||
| 6 Enron Corp. | 7.125 | % | 5/15/07 | 8,646 | 43 | ||||
| 6 Enron Corp. | 6.875 | % | 10/15/07 | 8,500 | 42 | ||||
| 6 Enron Corp. | 6.750 | % | 8/1/09 | 6,445 | 32 | ||||
| Enterprise Products Operating LP | 4.950 | % | 6/1/10 | 4,475 | 4,327 | ||||
| Enterprise Products Operating LP | 5.650 | % | 4/1/13 | 4,425 | 3,963 | ||||
| Enterprise Products Operating LP | 5.600 | % | 10/15/14 | 4,600 | 3,916 | ||||
| Enterprise Products Operating LP | 6.300 | % | 9/15/17 | 11,150 | 9,619 | ||||
| Enterprise Products Operating LP | 6.500 | % | 1/31/19 | 3,525 | 2,942 | ||||
| Enterprise Products Operating LP | 6.875 | % | 3/1/33 | 1,775 | 1,381 | ||||
| Enterprise Products Operating LP | 6.650 | % | 10/15/34 | 150 | 113 | ||||
| Equitable Resources Inc. | 6.500 | % | 4/1/18 | 14,650 | 13,252 | ||||
| 6 HNG Internorth | 9.625 | % | 3/15/06 | 4,680 | 23 | ||||
| KeySpan Corp. | 7.625 | % | 11/15/10 | 1,400 | 1,457 | ||||
| Kinder Morgan Energy Partners LP | 6.750 | % | 3/15/11 | 975 | 944 | ||||
| Kinder Morgan Energy Partners LP | 7.125 | % | 3/15/12 | 6,885 | 6,399 | ||||
| Kinder Morgan Energy Partners LP | 5.850 | % | 9/15/12 | 7,375 | 6,789 | ||||
| Kinder Morgan Energy Partners LP | 5.000 | % | 12/15/13 | 6,775 | 6,075 | ||||
| Kinder Morgan Energy Partners LP | 5.125 | % | 11/15/14 | 2,150 | 1,848 | ||||
| Kinder Morgan Energy Partners LP | 6.000 | % | 2/1/17 | 40 | 34 | ||||
| Kinder Morgan Energy Partners LP | 5.950 | % | 2/15/18 | 7,925 | 6,761 | ||||
| Kinder Morgan Energy Partners LP | 7.300 | % | 8/15/33 | 250 | 209 | ||||
| Kinder Morgan Energy Partners LP | 6.500 | % | 2/1/37 | 650 | 502 | ||||
| Kinder Morgan Energy Partners LP | 6.950 | % | 1/15/38 | 3,620 | 2,963 | ||||
| Magellan Midstream Partners, LP | 5.650 | % | 10/15/16 | 1,025 | 922 | ||||
| National Grid PLC | 6.300 | % | 8/1/16 | 9,800 | 8,428 | ||||
| NuStar Energy LP | 7.650 | % | 4/15/18 | 5,775 | 5,194 | ||||
| ONEOK Inc. | 5.200 | % | 6/15/15 | 3,500 | 2,901 | ||||
| ONEOK Inc. | 6.000 | % | 6/15/35 | 2,800 | 2,029 | ||||
| ONEOK Partners, LP | 5.900 | % | 4/1/12 | 3,325 | 3,134 | ||||
| ONEOK Partners, LP | 6.150 | % | 10/1/16 | 5,350 | 4,599 | ||||
| ONEOK Partners, LP | 6.650 | % | 10/1/36 | 14,700 | 11,661 | ||||
| ONEOK Partners, LP | 6.850 | % | 10/15/37 | 5,900 | 4,567 | ||||
| Panhandle Eastern Pipeline | 6.200 | % | 11/1/17 | 9,525 | 7,564 | ||||
| Panhandle Eastern Pipeline | 7.000 | % | 6/15/18 | 1,375 | 1,147 | ||||
| Plains All American Pipeline LP | 6.650 | % | 1/15/37 | 1,325 | 909 | ||||
| Reliant Energy Resources | 7.750 | % | 2/15/11 | 1,000 | 1,021 | ||||
| San Diego Gas & Electric | 5.300 | % | 11/15/15 | 2,525 | 2,528 | ||||
| San Diego Gas & Electric | 5.350 | % | 5/15/35 | 950 | 878 | ||||
| San Diego Gas & Electric | 6.125 | % | 9/15/37 | 325 | 334 | ||||
| Sempra Energy | 7.950 | % | 3/1/10 | 1,075 | 1,088 | ||||
| Sempra Energy | 6.000 | % | 2/1/13 | 900 | 867 | ||||
| Sempra Energy | 6.150 | % | 6/15/18 | 100 | 93 | ||||
| Southern California Gas Co. | 5.750 | % | 11/15/35 | 1,000 | 945 | ||||
| 3 Southern Natural Gas | 5.900 | % | 4/1/17 | 8,435 | 6,454 | ||||
| Southern Union Co. | 7.600 | % | 2/1/24 | 1,000 | 711 | ||||
| Spectra Energy Corp. | 6.200 | % | 4/15/18 | 1,250 | 1,099 | ||||
| Teppco Partners, LP | 5.900 | % | 4/15/13 | 2,800 | 2,512 | ||||
| Teppco Partners, LP | 6.650 | % | 4/15/18 | 2,825 | 2,423 | ||||
| Teppco Partners, LP | 7.550 | % | 4/15/38 | 1,800 | 1,365 | ||||
| Texas Eastern Transmission | 7.000 | % | 7/15/32 | 300 | 264 | ||||
| Texas Gas Transmission | 4.600 | % | 6/1/15 | 3,175 | 2,652 | ||||
| Trans-Canada Pipelines | 4.000 | % | 6/15/13 | 4,250 | 3,817 | ||||
| Trans-Canada Pipelines | 6.500 | % | 8/15/18 | 4,850 | 4,732 | ||||
| Trans-Canada Pipelines | 5.600 | % | 3/31/34 | 3,230 | 2,563 | ||||
| Trans-Canada Pipelines | 5.850 | % | 3/15/36 | 10,250 | 8,471 |
Page 43
| Vanguard® Total Bond Market Index Fund | |||||||||
| Schedule of Investments | |||||||||
| December 31, 2008 | |||||||||
| Face | Market | ||||||||
| Maturity | Amount | Value | |||||||
| Coupon | Date | ($ | 000 | ) | ($ | 000 | ) | ||
| Trans-Canada Pipelines | 6.200 | % | 10/15/37 | 3,450 | 3,082 | ||||
| 2 Trans-Canada Pipelines | 6.350 | % | 5/15/67 | 13,805 | 6,301 | ||||
| Transcontinental Gas Pipe Line Corp. | 7.000 | % | 8/15/11 | 4,375 | 4,319 | ||||
| Williams Cos., Inc. | 7.125 | % | 9/1/11 | 7,650 | 6,961 | ||||
| Williams Cos., Inc. | 8.125 | % | 3/15/12 | 2,600 | 2,418 | ||||
| Williams Cos., Inc. | 7.625 | % | 7/15/19 | 11,650 | 9,203 | ||||
| Williams Cos., Inc. | 7.500 | % | 1/15/31 | 11,575 | 7,871 | ||||
| Williams Cos., Inc. | 7.750 | % | 6/15/31 | 2,825 | 1,949 | ||||
| Other Utilities (0.0%) | |||||||||
| Veolia Environnement | 6.750 | % | 6/1/38 | 125 | 105 | ||||
| 1,225,372 | |||||||||
| Total Corporate Bonds (Cost $16,537,850) | 14,938,623 | ||||||||
| Sovereign Bonds (U.S. Dollar-Denominated) (2.9%) | |||||||||
| Asian Development Bank | 4.125 | % | 9/15/10 | 500 | 521 | ||||
| Asian Development Bank | 4.500 | % | 9/4/12 | 1,375 | 1,476 | ||||
| Asian Development Bank | 3.625 | % | 9/5/13 | 29,000 | 30,437 | ||||
| Asian Development Bank | 5.250 | % | 6/12/17 | 700 | 823 | ||||
| Asian Development Bank | 5.593 | % | 7/16/18 | 3,528 | 4,255 | ||||
| Canada Mortgage & Housing Corp. | 4.800 | % | 10/1/10 | 1,375 | 1,444 | ||||
| China Development Bank | 4.750 | % | 10/8/14 | 4,425 | 4,532 | ||||
| China Development Bank | 5.000 | % | 10/15/15 | 1,800 | 1,777 | ||||
| Corp. Andina de Fomento | 5.200 | % | 5/21/13 | 5,500 | 4,924 | ||||
| Corp. Andina de Fomento | 5.750 | % | 1/12/17 | 11,600 | 9,667 | ||||
| Development Bank of Japan | 4.250 | % | 6/9/15 | 2,500 | 2,610 | ||||
| Eksportfinans | 5.500 | % | 5/25/16 | 10,395 | 11,226 | ||||
| Eksportfinans | 5.500 | % | 6/26/17 | 7,975 | 8,691 | ||||
| European Investment Bank | 5.000 | % | 2/8/10 | 3,350 | 3,469 | ||||
| European Investment Bank | 4.000 | % | 3/3/10 | 25,925 | 26,544 | ||||
| European Investment Bank | 4.125 | % | 9/15/10 | 400 | 413 | ||||
| European Investment Bank | 4.625 | % | 9/15/10 | 10,975 | 11,473 | ||||
| European Investment Bank | 3.250 | % | 2/15/11 | 12,375 | 12,672 | ||||
| European Investment Bank | 2.625 | % | 5/16/11 | 6,000 | 6,075 | ||||
| European Investment Bank | 5.250 | % | 6/15/11 | 14,425 | 15,450 | ||||
| European Investment Bank | 3.125 | % | 7/15/11 | 4,225 | 4,317 | ||||
| European Investment Bank | 3.250 | % | 10/14/11 | 5,225 | 5,382 | ||||
| European Investment Bank | 2.625 | % | 11/15/11 | 4,225 | 4,297 | ||||
| European Investment Bank | 4.625 | % | 3/21/12 | 35,000 | 37,566 | ||||
| European Investment Bank | 2.875 | % | 3/15/13 | 9,600 | 9,669 | ||||
| European Investment Bank | 3.250 | % | 5/15/13 | 24,550 | 25,261 | ||||
| European Investment Bank | 4.250 | % | 7/15/13 | 39,700 | 42,439 | ||||
| European Investment Bank | 4.625 | % | 5/15/14 | 42,900 | 46,371 | ||||
| European Investment Bank | 4.875 | % | 2/16/16 | 625 | 692 | ||||
| European Investment Bank | 5.125 | % | 9/13/16 | 2,550 | 2,886 | ||||
| European Investment Bank | 4.875 | % | 1/17/17 | 24,625 | 28,088 | ||||
| European Investment Bank | 5.125 | % | 5/30/17 | 25,900 | 30,211 | ||||
| European Investment Bank | 4.875 | % | 2/15/36 | 400 | 490 | ||||
| Export Development Canada | 3.750 | % | 7/15/11 | 750 | 791 | ||||
| Export Development Canada | 2.625 | % | 11/15/11 | 6,550 | 6,722 | ||||
| Export-Import Bank of Korea | 4.625 | % | 3/16/10 | 2,450 | 2,325 | ||||
| Export-Import Bank of Korea | 5.125 | % | 2/14/11 | 11,900 | 11,164 | ||||
| Export-Import Bank of Korea | 5.500 | % | 10/17/12 | 9,725 | 9,049 | ||||
| Export-Import Bank of Korea | 5.125 | % | 3/16/15 | 1,075 | 871 | ||||
| Federation of Malaysia | 7.500 | % | 7/15/11 | 11,100 | 11,898 | ||||
| Federative Republic of Brazil | 9.250 | % | 10/22/10 | 4,700 | 5,135 | ||||
| Federative Republic of Brazil | 11.000 | % | 1/11/12 | 4,950 | 5,878 | ||||
| Federative Republic of Brazil | 7.875 | % | 3/7/15 | 8,100 | 9,173 | ||||
| Federative Republic of Brazil | 6.000 | % | 1/17/17 | 18,150 | 18,649 | ||||
| 2 Federative Republic of Brazil | 8.000 | % | 1/15/18 | 28,150 | 31,429 | ||||
| Federative Republic of Brazil | 8.875 | % | 4/15/24 | 5,475 | 6,734 | ||||
| Federative Republic of Brazil | 8.750 | % | 2/4/25 | 14,800 | 18,056 | ||||
| Federative Republic of Brazil | 10.125 | % | 5/15/27 | 14,700 | 20,235 | ||||
| Federative Republic of Brazil | 8.250 | % | 1/20/34 | 17,675 | 21,519 | ||||
| Federative Republic of Brazil | 7.125 | % | 1/20/37 | 9,825 | 11,004 | ||||
| Federative Republic of Brazil | 11.000 | % | 8/17/40 | 29,200 | 37,960 | ||||
Page 44
| Vanguard® Total Bond Market Index Fund | |||||||||
| Schedule of Investments | |||||||||
| December 31, 2008 | |||||||||
| Face | Market | ||||||||
| Maturity | Amount | Value | |||||||
| Coupon | Date | ($ | 000 | ) | ($ | 000 | ) | ||
| Financement Quebec | 5.000 | % | 10/25/12 | 4,450 | 4,811 | ||||
| Inter-American Development Bank | 8.500 | % | 3/15/11 | 2,240 | 2,541 | ||||
| Inter-American Development Bank | 4.750 | % | 10/19/12 | 4,900 | 5,297 | ||||
| Inter-American Development Bank | 3.500 | % | 3/15/13 | 12,000 | 12,431 | ||||
| Inter-American Development Bank | 4.250 | % | 9/14/15 | 1,900 | 2,077 | ||||
| Inter-American Development Bank | 5.125 | % | 9/13/16 | 300 | 345 | ||||
| Inter-American Development Bank | 4.250 | % | 9/10/18 | 27,725 | 30,544 | ||||
| Inter-American Development Bank | 7.000 | % | 6/15/25 | 3,175 | 4,423 | ||||
| International Bank for Reconstruction & Development | 3.125 | % | 11/15/11 | 700 | 723 | ||||
| International Bank for Reconstruction & Development | 5.000 | % | 4/1/16 | 18,625 | 21,556 | ||||
| International Bank for Reconstruction & Development | 7.625 | % | 1/19/23 | 4,200 | 6,150 | ||||
| International Bank for Reconstruction & Development | 8.875 | % | 3/1/26 | 1,050 | 1,704 | ||||
| International Bank for Reconstruction & Development | 4.750 | % | 2/15/35 | 775 | 915 | ||||
| Japan Bank International | 4.750 | % | 5/25/11 | 2,275 | 2,404 | ||||
| Japan Bank International | 4.375 | % | 11/26/12 | 6,400 | 6,720 | ||||
| Japan Bank International | 4.250 | % | 6/18/13 | 28,575 | 29,537 | ||||
| Japan Finance Corp. | 5.875 | % | 3/14/11 | 425 | 454 | ||||
| Japan Finance Corp. | 4.625 | % | 4/21/15 | 8,400 | 8,724 | ||||
| Japan Finance Corp. | 5.000 | % | 5/16/17 | 5,000 | 5,342 | ||||
| KFW International Finance Inc. | 3.250 | % | 10/14/11 | 16,700 | 17,205 | ||||
| Korea Development Bank | 4.625 | % | 9/16/10 | 2,675 | 2,512 | ||||
| Korea Development Bank | 5.300 | % | 1/17/13 | 2,675 | 2,467 | ||||
| Korea Development Bank | 5.750 | % | 9/10/13 | 12,015 | 10,251 | ||||
| Korea Electric Power | 7.750 | % | 4/1/13 | 6,950 | 6,803 | ||||
| Kreditanstalt fur Wiederaufbau | 5.000 | % | 6/1/10 | 11,750 | 12,238 | ||||
| Kreditanstalt fur Wiederaufbau | 4.250 | % | 6/15/10 | 13,350 | 13,791 | ||||
| Kreditanstalt fur Wiederaufbau | 3.250 | % | 2/15/11 | 25,925 | 26,579 | ||||
| Kreditanstalt fur Wiederaufbau | 3.750 | % | 6/27/11 | 26,450 | 27,484 | ||||
| Kreditanstalt fur Wiederaufbau | 4.750 | % | 5/15/12 | 16,000 | 17,266 | ||||
| Kreditanstalt fur Wiederaufbau | 3.250 | % | 3/15/13 | 70,350 | 72,330 | �� | |||
| Kreditanstalt fur Wiederaufbau | 3.500 | % | 5/16/13 | 14,625 | 15,172 | ||||
| Kreditanstalt fur Wiederaufbau | 4.000 | % | 10/15/13 | 29,200 | 30,906 | ||||
| Kreditanstalt fur Wiederaufbau | 4.125 | % | 10/15/14 | 1,725 | 1,825 | ||||
| Kreditanstalt fur Wiederaufbau | 5.125 | % | 3/14/16 | 26,635 | 30,220 | ||||
| Kreditanstalt fur Wiederaufbau | 4.375 | % | 3/15/18 | 2,175 | 2,409 | ||||
| Kreditanstalt fur Wiederaufbau | 4.500 | % | 7/16/18 | 17,400 | 19,431 | ||||
| Landeskreditbank Baden-Wuerttemberg - Foerderbank | 4.250 | % | 9/15/10 | 1,925 | 2,009 | ||||
| Landeskreditbank Baden-Wuerttemberg - Foerderbank | 4.875 | % | 1/13/12 | 12,000 | 13,051 | ||||
| Landwirtschaftliche Rentenbank | 3.875 | % | 3/15/10 | 750 | 775 | ||||
| Landwirtschaftliche Rentenbank | 5.250 | % | 7/2/12 | 5,225 | 5,703 | ||||
| Landwirtschaftliche Rentenbank | 3.250 | % | 3/15/13 | 25,050 | 25,795 | ||||
| Landwirtschaftliche Rentenbank | 4.875 | % | 11/16/15 | 3,925 | 4,307 | ||||
| Landwirtschaftliche Rentenbank | 5.125 | % | 2/1/17 | 8,975 | 10,142 | ||||
| Mass Transit Railway Corp. | 7.500 | % | 11/8/10 | 425 | 459 | ||||
| Nordic Investment Bank | 3.875 | % | 6/15/10 | 750 | 774 | ||||
| Nordic Investment Bank | 4.500 | % | 9/13/10 | 4,000 | 4,176 | ||||
| Nordic Investment Bank | 4.875 | % | 3/15/11 | 500 | 531 | ||||
| Nordic Investment Bank | 5.000 | % | 2/1/17 | 5,350 | 6,163 | ||||
| Oesterreichische Kontrollbank | 4.250 | % | 10/6/10 | 400 | 420 | ||||
| Oesterreichische Kontrollbank | 2.875 | % | 3/15/11 | 12,000 | 12,323 | ||||
| Oesterreichische Kontrollbank | 4.750 | % | 11/8/11 | 3,250 | 3,459 | ||||
| Oesterreichische Kontrollbank | 4.750 | % | 10/16/12 | 5,275 | 5,679 | ||||
| Oesterreichische Kontrollbank | 5.000 | % | 4/25/17 | 16,675 | 18,942 | ||||
| Ontario Hydro Electric | 7.450 | % | 3/31/13 | 4,700 | 5,692 | ||||
| Pemex Project Funding Master Trust | 9.125 | % | 10/13/10 | 395 | 415 | ||||
| 3 Pemex Project Funding Master Trust | 5.750 | % | 3/1/18 | 32,675 | 28,779 | ||||
| Pemex Project Funding Master Trust | 6.625 | % | 6/15/35 | 8,724 | 7,372 | ||||
| 3 Pemex Project Funding Master Trust | 6.625 | % | 6/15/35 | 5,475 | 4,626 | ||||
| 3 Pemex Project Funding Master Trust | 6.625 | % | 6/15/38 | 7,200 | 6,030 | ||||
| People’s Republic of China | 4.750 | % | 10/29/13 | 7,125 | 7,387 | ||||
| Petrobras International Finance | 6.125 | % | 10/6/16 | 16,325 | 15,823 | ||||
| Petrobras International Finance | 5.875 | % | 3/1/18 | 6,550 | 5,879 | ||||
| Petrobras International Finance | 8.375 | % | 12/10/18 | 4,000 | 4,105 | ||||
| Province of Manitoba | 7.500 | % | 2/22/10 | 5,075 | 5,386 | ||||
| Province of Nova Scotia | 5.750 | % | 2/27/12 | 1,975 | 2,128 | ||||
| Province of Ontario | 3.125 | % | 9/8/10 | 15,275 | 15,435 |
Page 45
| Vanguard® Total Bond Market Index Fund | |||||||||
| Schedule of Investments | |||||||||
| December 31, 2008 | |||||||||
| Face | Market | ||||||||
| Maturity | Amount | Value | |||||||
| Coupon | Date | ($ | 000 | ) | ($ | 000 | ) | ||
| Province of Ontario | 2.750 | % | 2/22/11 | 3,000 | 3,017 | ||||
| Province of Ontario | 3.375 | % | 5/20/11 | 925 | 943 | ||||
| Province of Ontario | 5.000 | % | 10/18/11 | 19,825 | 20,774 | ||||
| Province of Ontario | 3.500 | % | 7/15/13 | 9,800 | 9,887 | ||||
| Province of Ontario | 4.750 | % | 1/19/16 | 2,200 | 2,373 | ||||
| Province of Ontario | 5.450 | % | 4/27/16 | 37,500 | 42,108 | ||||
| Province of Quebec | 6.125 | % | 1/22/11 | 8,135 | 8,719 | ||||
| Province of Quebec | 4.875 | % | 5/5/14 | 750 | 804 | ||||
| Province of Quebec | 4.600 | % | 5/26/15 | 9,575 | 9,881 | ||||
| Province of Quebec | 5.125 | % | 11/14/16 | 26,875 | 28,844 | ||||
| Province of Quebec | 4.625 | % | 5/14/18 | 7,450 | 7,794 | ||||
| Province of Quebec | 7.125 | % | 2/9/24 | 1,230 | 1,585 | ||||
| Province of Quebec | 7.500 | % | 9/15/29 | 7,280 | 10,236 | ||||
| Province of Saskatchewan | 7.375 | % | 7/15/13 | 1,600 | 1,987 | ||||
| Quebec Hydro Electric | 6.300 | % | 5/11/11 | 16,350 | 17,487 | ||||
| Quebec Hydro Electric | 8.000 | % | 2/1/13 | 12,700 | 15,016 | ||||
| Quebec Hydro Electric | 7.500 | % | 4/1/16 | 1,825 | 2,258 | ||||
| Quebec Hydro Electric | 8.400 | % | 1/15/22 | 950 | 1,405 | ||||
| Quebec Hydro Electric | 8.050 | % | 7/7/24 | 3,000 | 4,276 | ||||
| Quebec Hydro Electric | 8.500 | % | 12/1/29 | 500 | 790 | ||||
| Region of Lombardy, Italy | 5.804 | % | 10/25/32 | 2,750 | 3,376 | ||||
| Republic of Chile | 7.125 | % | 1/11/12 | 4,075 | 4,581 | ||||
| Republic of Chile | 5.500 | % | 1/15/13 | 3,240 | 3,534 | ||||
| Republic of Hungary | 4.750 | % | 2/3/15 | 8,150 | 7,207 | ||||
| Republic of Italy | 6.000 | % | 2/22/11 | 12,325 | 13,161 | ||||
| Republic of Italy | 3.500 | % | 7/15/11 | 8,850 | 9,127 | ||||
| Republic of Italy | 5.625 | % | 6/15/12 | 19,450 | 21,197 | ||||
| Republic of Italy | 4.500 | % | 1/21/15 | 18,350 | 18,900 | ||||
| Republic of Italy | 4.750 | % | 1/25/16 | 26,075 | 27,551 | ||||
| Republic of Italy | 5.250 | % | 9/20/16 | 14,025 | 15,347 | ||||
| Republic of Italy | 6.875 | % | 9/27/23 | 12,950 | 16,365 | ||||
| Republic of Italy | 5.375 | % | 6/15/33 | 19,525 | 22,454 | ||||
| ^ Republic of Korea | 4.250 | % | 6/1/13 | 21,775 | 20,362 | ||||
| Republic of Korea | 5.625 | % | 11/3/25 | 1,750 | 1,508 | ||||
| Republic of Peru | 9.125 | % | 2/21/12 | 1,000 | 1,070 | ||||
| Republic of Peru | 9.875 | % | 2/6/15 | 7,150 | 8,187 | ||||
| Republic of Peru | 7.350 | % | 7/21/25 | 5,950 | 5,861 | ||||
| 2 Republic of Peru | 6.550 | % | 3/14/37 | 13,000 | 11,570 | ||||
| Republic of Poland | 6.250 | % | 7/3/12 | 7,725 | 8,007 | ||||
| Republic of Poland | 5.250 | % | 1/15/14 | 770 | 757 | ||||
| Republic of Poland | 5.000 | % | 10/19/15 | 3,625 | 3,493 | ||||
| Republic of South Africa | 7.375 | % | 4/25/12 | 9,450 | 9,332 | ||||
| Republic of South Africa | 5.875 | % | 5/30/22 | 4,100 | 3,444 | ||||
| State of Israel | 4.625 | % | 6/15/13 | 2,900 | 3,039 | ||||
| State of Israel | 5.500 | % | 11/9/16 | 8,875 | 9,491 | ||||
| Swedish Export Credit Corp. | 4.875 | % | 1/19/10 | 2,500 | 2,568 | ||||
| Swedish Export Credit Corp. | 4.000 | % | 6/15/10 | 2,775 | 2,856 | ||||
| Swedish Export Credit Corp. | 4.500 | % | 9/27/10 | 18,725 | 19,388 | ||||
| Swedish Export Credit Corp. | 5.125 | % | 3/1/17 | 1,500 | 1,657 | ||||
| United Mexican States | 9.875 | % | 2/1/10 | 3,055 | 3,276 | ||||
| United Mexican States | 8.375 | % | 1/14/11 | 12,267 | 13,248 | ||||
| United Mexican States | 7.500 | % | 1/14/12 | 5,597 | 6,017 | ||||
| United Mexican States | 6.375 | % | 1/16/13 | 5,605 | 5,843 | ||||
| United Mexican States | 5.875 | % | 1/15/14 | 8,075 | 8,257 | ||||
| United Mexican States | 6.625 | % | 3/3/15 | 2,711 | 2,874 | ||||
| United Mexican States | 11.375 | % | 9/15/16 | 6,000 | 8,100 | ||||
| United Mexican States | 5.625 | % | 1/15/17 | 36,300 | 36,391 | ||||
| United Mexican States | 5.950 | % | 3/19/19 | 12,500 | 12,562 | ||||
| United Mexican States | 8.300 | % | 8/15/31 | 11,375 | 13,735 | ||||
| United Mexican States | 6.750 | % | 9/27/34 | 34,838 | 36,406 | ||||
| United Mexican States | 6.050 | % | 1/11/40 | 6,200 | 6,029 | ||||
| Total Sovereign Bonds (Cost $1,873,091) | 1,922,404 | ||||||||
Page 46
| Vanguard® Total Bond Market Index Fund | |||||||||
| Schedule of Investments | |||||||||
| December 31, 2008 | |||||||||
| Face | Market | ||||||||
| Maturity | Amount | Value | |||||||
| Coupon | Date | ($ | 000 | ) | ($ | 000 | ) | ||
| Taxable Municipal Bonds (0.2%) | |||||||||
| Chicago IL Transit Auth. Rev. | 6.899 | % | 12/1/40 | 10,000 | 9,869 | ||||
| Connecticut GO | 5.850 | % | 3/15/32 | 9,900 | 9,476 | ||||
| Illinois (Taxable Pension) GO | 4.950 | % | 6/1/23 | 15,300 | 14,194 | ||||
| Illinois (Taxable Pension) GO | 5.100 | % | 6/1/33 | 47,850 | 41,916 | ||||
| Kansas Dev. Finance Auth. Rev. (Public Employee | |||||||||
| Retirement System) | 5.501 | % | 5/1/34 | 5,500 | 5,040 | ||||
| New Jersey Econ. Dev. Auth. State Pension Rev. | 7.425 | % | 2/15/29 | 11,775 | 11,909 | ||||
| New Jersey Turnpike Auth. Rev. | 4.252 | % | 1/1/16 | 190 | 186 | ||||
| New Jersey Turnpike Auth. Rev. | 4.252 | % | 1/1/16 | 3,485 | 3,347 | ||||
| Oregon (Taxable Pension) GO | 5.762 | % | 6/1/23 | 2,375 | 2,341 | ||||
| Oregon (Taxable Pension) GO | 5.892 | % | 6/1/27 | 3,250 | 3,135 | ||||
| Oregon School Board Assn. | 4.759 | % | 6/30/28 | 2,475 | 2,082 | ||||
| Oregon School Board Assn. | 5.528 | % | 6/30/28 | 1,475 | 1,372 | ||||
| Tobacco Settlement Finance Auth. Rev. | 7.467 | % | 6/1/47 | 5,050 | 3,163 | ||||
| Wisconsin Public Service Rev. | 4.800 | % | 5/1/13 | 3,025 | 3,026 | ||||
| Wisconsin Public Service Rev. | 5.700 | % | 5/1/26 | 3,425 | 3,116 | ||||
| Total Taxable Municipal Bonds (Cost $123,784) | 114,172 | ||||||||
| Shares | |||||||||
| Temporary Cash Investments (1.5%) | |||||||||
| 7,8 Vanguard Market Liquidity Fund (Cost $1,008,837) | 1.378 | % | 1,008,836,880 | 1,008,837 | |||||
| Total Investments (100.6%) (Cost $64,891,766) | 65,836,680 | ||||||||
| Other Assets and Liabilities—Net (–0.6%)8 | (421,713 | ) | |||||||
| Net Assets (100%) | 65,414,967 | ||||||||
^ Part of security position is on loan to broker-dealers. The total value of securities on loan is $2,816,000.
1 The issuer operates under a congressional charter; its securities are neither issued nor guaranteed by the U.S. government.
2 The average or expected maturity is shorter than the final maturity shown because of the possibility of interim principal payments and prepayments or the possibility of the issue being called.
3 Security exempt from registration under Rule 144A of the Securities Act of 1933. Such securities may be sold in transactions exempt from registration, normally to qualified institutional buyers. At December 31, 2008, the aggregate value of these securities was $348,794,000, representing 0.5% of net assets.
4 Adjustable-rate security.
5 Guaranteed by the Federal Deposit Insurance Corporation (FDIC) as part of the Temporary Liquidity Guarantee Program.
6 Non-income-producing security--security in default.
7 Affiliated money market fund available only to Vanguard funds and certain trusts and accounts managed by Vanguard. Rate shown is the 7-day yield.
8 Includes $2,910,000 of collateral received for securities on loan.
GO—General Obligation Bond.
REIT—Real Estate Investment Trust.
Page 47
| Vanguard® Short-Term Bond Index Fund | |||||||||
| Schedule of Investments | |||||||||
| December 31, 2008 | |||||||||
| Face | Market | ||||||||
| Maturity | Amount | Value | |||||||
| Coupon | Date | ($ | 000 | ) | ($ | 000 | ) | ||
| U.S. Government and Agency Obligations (68.3%) | |||||||||
| U.S. Government Securities (49.3%) | |||||||||
| U.S. Treasury Bond | 13.250 | % | 5/15/14 | 35,000 | 36,586 | ||||
| U.S. Treasury Inflation-Indexed Note | 3.500 | % | 1/15/11 | 17,575 | 21,456 | ||||
| U.S. Treasury Inflation-Indexed Note | 2.375 | % | 4/15/11 | 16,450 | 17,545 | ||||
| U.S. Treasury Note | 3.500 | % | 8/15/09 | 6,230 | 6,352 | ||||
| U.S. Treasury Note | 3.500 | % | 11/15/09 | 7,690 | 7,897 | ||||
| U.S. Treasury Note | 3.125 | % | 11/30/09 | 132,880 | 136,202 | ||||
| U.S. Treasury Note | 3.250 | % | 12/31/09 | 81,215 | 83,525 | ||||
| U.S. Treasury Note | 2.125 | % | 1/31/10 | 102,895 | 104,776 | ||||
| U.S. Treasury Note | 3.500 | % | 2/15/10 | 34,645 | 35,868 | ||||
| U.S. Treasury Note | 4.750 | % | 2/15/10 | 124,075 | 129,988 | ||||
| U.S. Treasury Note | 6.500 | % | 2/15/10 | 155,840 | 166,213 | ||||
| U.S. Treasury Note | 2.000 | % | 2/28/10 | 79,300 | 80,725 | ||||
| U.S. Treasury Note | 1.750 | % | 3/31/10 | 170,875 | 173,679 | ||||
| U.S. Treasury Note | 4.500 | % | 5/15/10 | 66,250 | 69,945 | ||||
| U.S. Treasury Note | 2.625 | % | 5/31/10 | 154,725 | 159,392 | ||||
| U.S. Treasury Note | 2.875 | % | 6/30/10 | 178,225 | 184,575 | ||||
| U.S. Treasury Note | 2.750 | % | 7/31/10 | 141,800 | 146,896 | ||||
| U.S. Treasury Note | 4.125 | % | 8/15/10 | 60,150 | 63,712 | ||||
| U.S. Treasury Note | 5.750 | % | 8/15/10 | 3,350 | 3,637 | ||||
| U.S. Treasury Note | 2.375 | % | 8/31/10 | 241,435 | 248,753 | ||||
| U.S. Treasury Note | 2.000 | % | 9/30/10 | 140,090 | 143,636 | ||||
| U.S. Treasury Note | 1.500 | % | 10/31/10 | 157,030 | 159,360 | ||||
| U.S. Treasury Note | 4.500 | % | 11/15/10 | 300 | 322 | ||||
| U.S. Treasury Note | 1.250 | % | 11/30/10 | 129,050 | 130,441 | ||||
| U.S. Treasury Note | 4.375 | % | 12/15/10 | 7,505 | 8,062 | ||||
| U.S. Treasury Note | 0.875 | % | 12/31/10 | 66,395 | 66,540 | ||||
| U.S. Treasury Note | 5.000 | % | 2/15/11 | 1,625 | 1,777 | ||||
| U.S. Treasury Note | 4.750 | % | 3/31/11 | 16,500 | 17,972 | ||||
| U.S. Treasury Note | 4.875 | % | 4/30/11 | 215 | 236 | ||||
| U.S. Treasury Note | 5.125 | % | 6/30/11 | 815 | 902 | ||||
| U.S. Treasury Note | 4.875 | % | 7/31/11 | 9,965 | 11,000 | ||||
| U.S. Treasury Note | 4.625 | % | 8/31/11 | 25,850 | 28,415 | ||||
| U.S. Treasury Note | 4.500 | % | 9/30/11 | 40,955 | 44,935 | ||||
| U.S. Treasury Note | 1.750 | % | 11/15/11 | 42,375 | 43,322 | ||||
| U.S. Treasury Note | 4.500 | % | 11/30/11 | 84,230 | 92,745 | ||||
| U.S. Treasury Note | 1.125 | % | 12/15/11 | 66,000 | 66,279 | ||||
| U.S. Treasury Note | 4.625 | % | 12/31/11 | 12,620 | 13,971 | ||||
| U.S. Treasury Note | 4.750 | % | 1/31/12 | 75,790 | 84,304 | ||||
| U.S. Treasury Note | 4.625 | % | 2/29/12 | 27,410 | 30,438 | ||||
| U.S. Treasury Note | 4.500 | % | 3/31/12 | 103,940 | 114,903 | ||||
| U.S. Treasury Note | 4.500 | % | 4/30/12 | 100,165 | 110,980 | ||||
| U.S. Treasury Note | 4.750 | % | 5/31/12 | 176,580 | 197,741 | ||||
| U.S. Treasury Note | 4.875 | % | 6/30/12 | 114,750 | 129,004 | ||||
| U.S. Treasury Note | 4.625 | % | 7/31/12 | 164,050 | 183,915 | ||||
| U.S. Treasury Note | 4.375 | % | 8/15/12 | 25 | 28 | ||||
| U.S. Treasury Note | 4.125 | % | 8/31/12 | 63,335 | 70,054 | ||||
| U.S. Treasury Note | 3.875 | % | 10/31/12 | 107,025 | 118,464 | ||||
| U.S. Treasury Note | 3.375 | % | 11/30/12 | 700 | 763 | ||||
| U.S. Treasury Note | 2.750 | % | 2/28/13 | 25,475 | 27,222 | ||||
| U.S. Treasury Note | 3.625 | % | 5/15/13 | 1,355 | 1,489 | ||||
| U.S. Treasury Note | 3.500 | % | 5/31/13 | 101,210 | 110,856 | ||||
| U.S. Treasury Note | 3.375 | % | 6/30/13 | 108,925 | 118,746 | ||||
| U.S. Treasury Note | 3.375 | % | 7/31/13 | 6,075 | 6,635 | ||||
| U.S. Treasury Note | 3.125 | % | 8/31/13 | 105,330 | 113,543 | ||||
| U.S. Treasury Note | 3.125 | % | 9/30/13 | 139,450 | 150,432 | ||||
| U.S. Treasury Note | 2.750 | % | 10/31/13 | 91,650 | 97,436 | ||||
| U.S. Treasury Note | 4.250 | % | 11/15/13 | 8,170 | 9,323 | ||||
| U.S. Treasury Note | 2.000 | % | 11/30/13 | 172,590 | 177,093 | ||||
| U.S. Treasury Note | 1.500 | % | 12/31/13 | 202,625 | 202,118 | ||||
| 4,763,124 | |||||||||
Page 48
| Vanguard® Short-Term Bond Index Fund | |||||||||
| Schedule of Investments | |||||||||
| December 31, 2008 | |||||||||
| Face | Market | ||||||||
| Maturity | Amount | Value | |||||||
| Coupon | Date | ($ | 000 | ) | ($ | 000 | ) | ||
| Agency Bonds and Notes (19.0%) | |||||||||
| 1 Federal Farm Credit Bank | 5.250 | % | 9/13/10 | 2,325 | 2,475 | ||||
| 1 Federal Farm Credit Bank | 3.750 | % | 12/6/10 | 24,200 | 25,271 | ||||
| 1 Federal Farm Credit Bank | 4.875 | % | 2/18/11 | 7,000 | 7,477 | ||||
| 1 Federal Farm Credit Bank | 2.625 | % | 4/21/11 | 6,750 | 6,905 | ||||
| 1 Federal Farm Credit Bank | 5.375 | % | 7/18/11 | 2,100 | 2,287 | ||||
| 1 Federal Farm Credit Bank | 3.875 | % | 8/25/11 | 6,300 | 6,601 | ||||
| 1 Federal Farm Credit Bank | 4.500 | % | 10/17/12 | 4,200 | 4,565 | ||||
| 1 Federal Farm Credit Bank | 3.875 | % | 10/7/13 | 2,500 | 2,642 | ||||
| 1 Federal Home Loan Bank | 3.875 | % | 1/15/10 | 46,375 | 47,714 | ||||
| 1 Federal Home Loan Bank | 2.750 | % | 3/12/10 | 6,575 | 6,698 | ||||
| 1 Federal Home Loan Bank | 4.375 | % | 3/17/10 | 22,025 | 22,901 | ||||
| 1 Federal Home Loan Bank | 4.875 | % | 5/14/10 | 43,950 | 46,129 | ||||
| 1 Federal Home Loan Bank | 5.250 | % | 6/11/10 | 5,450 | 5,757 | ||||
| 1 Federal Home Loan Bank | 2.750 | % | 6/18/10 | 46,650 | 47,643 | ||||
| 1 Federal Home Loan Bank | 4.500 | % | 6/22/10 | 10,000 | 10,466 | ||||
| 1 Federal Home Loan Bank | 3.500 | % | 7/16/10 | 17,800 | 18,416 | ||||
| 1 Federal Home Loan Bank | 3.375 | % | 8/13/10 | 11,750 | 12,137 | ||||
| 1 Federal Home Loan Bank | 4.125 | % | 8/13/10 | 9,050 | 9,444 | ||||
| 1 Federal Home Loan Bank | 3.375 | % | 10/20/10 | 33,500 | 34,760 | ||||
| 1 Federal Home Loan Bank | 4.750 | % | 12/10/10 | 2,325 | 2,470 | ||||
| 1 Federal Home Loan Bank | 3.625 | % | 12/17/10 | 19,700 | 20,550 | ||||
| 1 Federal Home Loan Bank | 3.250 | % | 3/11/11 | 5,000 | 5,176 | ||||
| 1 Federal Home Loan Bank | 3.125 | % | 6/10/11 | 900 | 932 | ||||
| 1 Federal Home Loan Bank | 3.375 | % | 6/24/11 | 30,000 | 31,337 | ||||
| 1 Federal Home Loan Bank | 3.625 | % | 7/1/11 | 10,300 | 10,775 | ||||
| 1 Federal Home Loan Bank | 5.375 | % | 8/19/11 | 37,350 | 40,887 | ||||
| 1 Federal Home Loan Bank | 3.750 | % | 9/9/11 | 2,800 | 2,944 | ||||
| 1 Federal Home Loan Bank | 3.625 | % | 9/16/11 | 5,575 | 5,868 | ||||
| 1 Federal Home Loan Bank | 4.875 | % | 11/18/11 | 31,950 | 34,768 | ||||
| 1 Federal Home Loan Bank | 5.750 | % | 5/15/12 | 14,000 | 15,688 | ||||
| 1 Federal Home Loan Bank | 4.625 | % | 10/10/12 | 40,000 | 43,796 | ||||
| 1 Federal Home Loan Bank | 4.500 | % | 11/15/12 | 30,000 | 32,838 | ||||
| 1 Federal Home Loan Bank | 4.000 | % | 9/6/13 | 20,000 | 21,332 | ||||
| 1 Federal Home Loan Bank | 4.500 | % | 9/16/13 | 7,800 | 8,509 | ||||
| 1 Federal Home Loan Bank | 3.625 | % | 10/18/13 | 19,675 | 20,685 | ||||
| 1 Federal Home Loan Mortgage Corp. | 5.000 | % | 6/11/09 | 30,000 | 30,608 | ||||
| 1 Federal Home Loan Mortgage Corp. | 4.875 | % | 2/9/10 | 40,000 | 41,621 | ||||
| 1 Federal Home Loan Mortgage Corp. | 2.875 | % | 4/30/10 | 31,000 | 31,730 | ||||
| 1 Federal Home Loan Mortgage Corp. | 2.875 | % | 6/28/10 | 14,875 | 15,234 | ||||
| 1 Federal Home Loan Mortgage Corp. | 4.125 | % | 7/12/10 | 45,600 | 47,568 | ||||
| 1 Federal Home Loan Mortgage Corp. | 3.250 | % | 7/16/10 | 15,125 | 15,588 | ||||
| 1 Federal Home Loan Mortgage Corp. | 5.125 | % | 8/23/10 | 50,000 | 53,101 | ||||
| 1 Federal Home Loan Mortgage Corp. | 6.875 | % | 9/15/10 | 25,000 | 27,333 | ||||
| 1 Federal Home Loan Mortgage Corp. | 5.000 | % | 10/18/10 | 2,000 | 2,126 | ||||
| 1 Federal Home Loan Mortgage Corp. | 3.125 | % | 10/25/10 | 4,000 | 4,140 | ||||
| 1 Federal Home Loan Mortgage Corp. | 4.750 | % | 1/18/11 | 12,000 | 12,801 | ||||
| 1 Federal Home Loan Mortgage Corp. | 3.250 | % | 2/25/11 | 28,500 | 29,565 | ||||
| 1 Federal Home Loan Mortgage Corp. | 5.625 | % | 3/15/11 | 20,000 | 21,765 | ||||
| 1 Federal Home Loan Mortgage Corp. | 5.875 | % | 3/21/11 | 4,000 | 4,185 | ||||
| 1 Federal Home Loan Mortgage Corp. | 5.125 | % | 4/18/11 | 26,000 | 28,096 | ||||
| 1 Federal Home Loan Mortgage Corp. | 6.000 | % | 6/15/11 | 12,500 | 13,848 | ||||
| 1 Federal Home Loan Mortgage Corp. | 3.875 | % | 6/29/11 | 4,475 | 4,741 | ||||
| 1 Federal Home Loan Mortgage Corp. | 5.250 | % | 7/18/11 | 22,500 | 24,505 | ||||
| 1 Federal Home Loan Mortgage Corp. | 4.500 | % | 11/15/11 | 9,000 | 9,682 | ||||
| 1 Federal Home Loan Mortgage Corp. | 4.750 | % | 3/5/12 | 13,000 | 14,166 | ||||
| 1 Federal Home Loan Mortgage Corp. | 5.125 | % | 7/15/12 | 10,000 | 11,087 | ||||
| 1 Federal Home Loan Mortgage Corp. | 5.500 | % | 8/20/12 | 20,000 | 22,509 | ||||
| 1 Federal Home Loan Mortgage Corp. | 4.625 | % | 10/25/12 | 36,300 | 39,782 | ||||
| 1 Federal Home Loan Mortgage Corp. | 4.125 | % | 12/21/12 | 22,850 | 24,667 | ||||
| 1 Federal Home Loan Mortgage Corp. | 4.500 | % | 7/15/13 | 36,200 | 39,575 | ||||
| 1 Federal Home Loan Mortgage Corp. | 4.125 | % | 9/27/13 | 10,000 | 10,804 | ||||
| 1 Federal Home Loan Mortgage Corp. | 4.500 | % | 1/15/14 | 15,000 | 16,477 | ||||
| 1 Federal Home Loan Mortgage Corp. | 5.000 | % | 1/30/14 | 9,000 | 9,997 | ||||
| 1 Federal National Mortgage Assn. | 7.250 | % | 1/15/10 | 60,250 | 63,996 | ||||
| 1 Federal National Mortgage Assn. | 3.250 | % | 2/10/10 | 9,275 | 9,501 |
Page 49
| Vanguard® Short-Term Bond Index Fund | |||||||||
| Schedule of Investments | |||||||||
| December 31, 2008 | |||||||||
| Face | Market | ||||||||
| Maturity | Amount | Value | |||||||
| Coupon | Date | ($ | 000 | ) | ($ | 000 | ) | ||
| 1 Federal National Mortgage Assn. | 3.875 | % | 2/15/10 | 31,975 | 33,016 | ||||
| 1 Federal National Mortgage Assn. | 4.750 | % | 3/12/10 | 35,575 | 37,109 | ||||
| 1 Federal National Mortgage Assn. | 2.500 | % | 4/9/10 | 50,000 | 50,864 | ||||
| 1 Federal National Mortgage Assn. | 3.000 | % | 7/12/10 | 6,675 | 6,858 | ||||
| 1 Federal National Mortgage Assn. | 4.375 | % | 9/13/10 | 25,000 | 26,267 | ||||
| 1 Federal National Mortgage Assn. | 2.875 | % | 10/12/10 | 8,500 | 8,747 | ||||
| 1 Federal National Mortgage Assn. | 6.625 | % | 11/15/10 | 16,850 | 18,503 | ||||
| 1 Federal National Mortgage Assn. | 4.750 | % | 12/15/10 | 10,750 | 11,436 | ||||
| 1 Federal National Mortgage Assn. | 4.500 | % | 2/15/11 | 14,300 | 15,206 | ||||
| 1 Federal National Mortgage Assn. | 5.500 | % | 3/15/11 | 5,000 | 5,429 | ||||
| 1 Federal National Mortgage Assn. | 5.125 | % | 4/15/11 | 25,250 | 27,284 | ||||
| 1 Federal National Mortgage Assn. | 6.000 | % | 5/15/11 | 74,100 | 81,697 | ||||
| 1 Federal National Mortgage Assn. | 3.375 | % | 5/19/11 | 20,000 | 20,867 | ||||
| 1 Federal National Mortgage Assn. | 5.000 | % | 10/15/11 | 25,000 | 27,214 | ||||
| 1 Federal National Mortgage Assn. | 4.875 | % | 5/18/12 | 27,200 | 29,826 | ||||
| 1 Federal National Mortgage Assn. | 5.250 | % | 8/1/12 | 4,300 | 4,411 | ||||
| 1 Federal National Mortgage Assn. | 4.750 | % | 11/19/12 | 15,000 | 16,556 | ||||
| 1 Federal National Mortgage Assn. | 3.625 | % | 2/12/13 | 40,350 | 42,675 | ||||
| 1 Federal National Mortgage Assn. | 4.750 | % | 2/21/13 | 7,000 | 7,623 | ||||
| 1 Federal National Mortgage Assn. | 4.625 | % | 5/1/13 | 10,550 | 10,750 | ||||
| 1 Federal National Mortgage Assn. | 3.875 | % | 7/12/13 | 24,325 | 25,961 | ||||
| 1 Federal National Mortgage Assn. | 4.625 | % | 10/15/13 | 15,000 | 16,513 | ||||
| 1 Federal National Mortgage Assn. | 2.875 | % | 12/11/13 | 5,800 | 5,938 | ||||
| 1 Federal National Mortgage Assn. | 4.125 | % | 4/15/14 | 10,000 | 10,804 | ||||
| 1,841,195 | |||||||||
| Total U.S. Government and Agency Obligations (Cost $6,348,479) | 6,604,319 | ||||||||
| Corporate Bonds (24.9%) | |||||||||
| Asset-Backed/Commercial Mortgage-Backed Securities (0.2%) | |||||||||
| 2 BA Covered Bond Issuer | 5.500 | % | 6/14/12 | 6,800 | 6,983 | ||||
| 3 Countrywide Home Loans | 4.783 | % | 5/25/33 | 326 | 305 | ||||
| 3 DaimlerChrysler Auto Trust | 5.330 | % | 8/8/10 | 1,301 | 1,300 | ||||
| 3 Honda Auto Receivables Owner Trust | 5.300 | % | 7/21/10 | 2,108 | 2,104 | ||||
| 3 Salomon Brothers Mortgage Securities VII | 5.561 | % | 9/25/33 | 2,329 | 2,133 | ||||
| 3 USAA Auto Owner Trust | 5.360 | % | 2/15/11 | 2,372 | 2,369 | ||||
| 15,194 | |||||||||
| Finance (12.0%) | |||||||||
| Banking (7.9%) | |||||||||
| American Express Bank, FSB | 5.550 | % | 10/17/12 | 12,650 | 11,991 | ||||
| American Express Bank, FSB | 5.500 | % | 4/16/13 | 2,000 | 1,905 | ||||
| American Express Centurion Bank | 5.200 | % | 11/26/10 | 2,150 | 2,085 | ||||
| American Express Centurion Bank | 5.550 | % | 10/17/12 | 550 | 524 | ||||
| American Express Credit Corp. | 5.875 | % | 5/2/13 | 7,300 | 7,122 | ||||
| American Express Credit Corp. | 7.300 | % | 8/20/13 | 3,475 | 3,578 | ||||
| 2 American Express Travel | 5.250 | % | 11/21/11 | 2,325 | 2,209 | ||||
| AmSouth Bank NA | 4.850 | % | 4/1/13 | 1,500 | 1,252 | ||||
| Banco Bradesco SA | 8.750 | % | 10/24/13 | 1,500 | 1,669 | ||||
| 3 Bank of America Capital Trust XIV | 5.630 | % | 12/31/49 | 2,150 | 817 | ||||
| Bank of America Corp. | 4.500 | % | 8/1/10 | 7,600 | 7,655 | ||||
| Bank of America Corp. | 4.250 | % | 10/1/10 | 10,500 | 10,475 | ||||
| Bank of America Corp. | 4.375 | % | 12/1/10 | 3,075 | 3,077 | ||||
| 4 Bank of America Corp. | 1.700 | % | 12/23/10 | 7,500 | 7,526 | ||||
| Bank of America Corp. | 5.375 | % | 8/15/11 | 6,950 | 7,118 | ||||
| Bank of America Corp. | 6.250 | % | 4/15/12 | 3,225 | 3,381 | ||||
| 4 Bank of America Corp. | 3.125 | % | 6/15/12 | 18,750 | 19,641 | ||||
| Bank of America Corp. | 5.375 | % | 9/11/12 | 2,175 | 2,201 | ||||
| Bank of America Corp. | 4.875 | % | 9/15/12 | 3,000 | 2,956 | ||||
| Bank of America Corp. | 4.875 | % | 1/15/13 | 2,025 | 2,033 | ||||
| Bank of America Corp. | 4.900 | % | 5/1/13 | 7,975 | 8,032 | ||||
| Bank of New York Mellon | 4.950 | % | 1/14/11 | 2,825 | 2,853 | ||||
| Bank of New York Mellon | 6.375 | % | 4/1/12 | 1,000 | 1,053 | ||||
| Bank of New York Mellon | 4.950 | % | 11/1/12 | 8,575 | 8,771 | ||||
| Bank of New York Mellon | 4.500 | % | 4/1/13 | 2,200 | 2,215 | ||||
Page 50
| Vanguard® Short-Term Bond Index Fund | |||||||||
| Schedule of Investments | |||||||||
| December 31, 2008 | |||||||||
| Face | Market | ||||||||
| Maturity | Amount | Value | |||||||
| Coupon | Date | ($ | 000 | ) | ($ | 000 | ) | ||
| Bank of New York Mellon | 5.125 | % | 8/27/13 | 400 | 413 | ||||
| Bank of Tokyo-Mitsubishi | 8.400 | % | 4/15/10 | 7,500 | 7,690 | ||||
| Bank One Corp. | 5.900 | % | 11/15/11 | 1,500 | 1,536 | ||||
| Barclays Bank PLC | 5.450 | % | 9/12/12 | 5,375 | 5,538 | ||||
| BB&T Corp. | 6.500 | % | 8/1/11 | 4,050 | 4,125 | ||||
| BB&T Corp. | 4.750 | % | 10/1/12 | 1,500 | 1,451 | ||||
| Bear Stearns Co., Inc. | 4.550 | % | 6/23/10 | 4,800 | 4,766 | ||||
| Bear Stearns Co., Inc. | 4.500 | % | 10/28/10 | 9,000 | 8,953 | ||||
| Bear Stearns Co., Inc. | 5.350 | % | 2/1/12 | 8,750 | 8,666 | ||||
| Bear Stearns Co., Inc. | 6.950 | % | 8/10/12 | 1,500 | 1,569 | ||||
| Capital One Bank | 5.750 | % | 9/15/10 | 1,975 | 1,919 | ||||
| Capital One Financial Corp. | 5.700 | % | 9/15/11 | 4,750 | 4,421 | ||||
| Capital One Financial Corp. | 4.800 | % | 2/21/12 | 50 | 45 | ||||
| Charter One Bank N.A. | 5.500 | % | 4/26/11 | 3,550 | 3,370 | ||||
| Citigroup, Inc. | 4.125 | % | 2/22/10 | 8,050 | 7,872 | ||||
| Citigroup, Inc. | 4.625 | % | 8/3/10 | 7,275 | 7,134 | ||||
| Citigroup, Inc. | 6.500 | % | 1/18/11 | 8,475 | 8,542 | ||||
| Citigroup, Inc. | 5.125 | % | 2/14/11 | 4,600 | 4,514 | ||||
| Citigroup, Inc. | 5.100 | % | 9/29/11 | 5,200 | 5,077 | ||||
| 4 Citigroup, Inc. | 2.875 | % | 12/9/11 | 10,900 | 11,287 | ||||
| Citigroup, Inc. | 6.000 | % | 2/21/12 | 5,700 | 5,624 | ||||
| Citigroup, Inc. | 5.250 | % | 2/27/12 | 8,800 | 8,554 | ||||
| Citigroup, Inc. | 5.625 | % | 8/27/12 | 3,500 | 3,289 | ||||
| Citigroup, Inc. | 5.300 | % | 10/17/12 | 7,050 | 6,880 | ||||
| Citigroup, Inc. | 5.500 | % | 4/11/13 | 11,625 | 11,368 | ||||
| Citigroup, Inc. | 6.500 | % | 8/19/13 | 8,225 | 8,308 | ||||
| Countrywide Financial Corp. | 5.800 | % | 6/7/12 | 3,850 | 3,768 | ||||
| Countrywide Home Loan | 4.125 | % | 9/15/09 | 4,625 | 4,573 | ||||
| Countrywide Home Loan | 4.000 | % | 3/22/11 | 1,600 | 1,522 | ||||
| Credit Suisse First Boston USA, Inc. | 4.125 | % | 1/15/10 | 2,025 | 2,016 | ||||
| Credit Suisse First Boston USA, Inc. | 4.875 | % | 8/15/10 | 925 | 925 | ||||
| Credit Suisse First Boston USA, Inc. | 5.250 | % | 3/2/11 | 4,150 | 4,164 | ||||
| Credit Suisse First Boston USA, Inc. | 6.125 | % | 11/15/11 | 8,400 | 8,608 | ||||
| Credit Suisse First Boston USA, Inc. | 6.500 | % | 1/15/12 | 21,050 | 21,446 | ||||
| Credit Suisse First Boston USA, Inc. | 5.500 | % | 8/15/13 | 1,700 | 1,694 | ||||
| Credit Suisse New York | 5.000 | % | 5/15/13 | 3,100 | 2,984 | ||||
| Deutsche Bank AG London | 5.375 | % | 10/12/12 | 16,150 | 16,411 | ||||
| Deutsche Bank AG London | 4.875 | % | 5/20/13 | 9,375 | 9,499 | ||||
| Fifth Third Bancorp. | 4.200 | % | 2/23/10 | 1,000 | 984 | ||||
| Fifth Third Bancorp. | 6.250 | % | 5/1/13 | 2,825 | 2,677 | ||||
| Golden West Financial Corp. | 4.750 | % | 10/1/12 | 3,575 | 3,394 | ||||
| 3 Goldman Sachs Capital II | 5.793 | % | 12/29/49 | 6,250 | 2,466 | ||||
| Goldman Sachs Group, Inc. | 4.500 | % | 6/15/10 | 5,915 | 5,839 | ||||
| Goldman Sachs Group, Inc. | 6.875 | % | 1/15/11 | 4,950 | 5,024 | ||||
| Goldman Sachs Group, Inc. | 6.600 | % | 1/15/12 | 22,450 | 22,201 | ||||
| Goldman Sachs Group, Inc. | 5.300 | % | 2/14/12 | 5,500 | 5,201 | ||||
| 4 Goldman Sachs Group, Inc. | 3.250 | % | 6/15/12 | 15,650 | 16,378 | ||||
| Goldman Sachs Group, Inc. | 5.450 | % | 11/1/12 | 3,050 | 2,911 | ||||
| Goldman Sachs Group, Inc. | 5.250 | % | 4/1/13 | 1,575 | 1,481 | ||||
| Goldman Sachs Group, Inc. | 4.750 | % | 7/15/13 | 9,525 | 8,743 | ||||
| Goldman Sachs Group, Inc. | 5.250 | % | 10/15/13 | 4,825 | 4,451 | ||||
| HSBC Holdings PLC | 5.250 | % | 12/12/12 | 6,500 | 6,523 | ||||
| 2 ICICI Bank Ltd. | 6.625 | % | 10/3/12 | 4,775 | 3,772 | ||||
| JPMorgan Chase & Co. | 6.750 | % | 2/1/11 | 8,850 | 9,121 | ||||
| JPMorgan Chase & Co. | 5.600 | % | 6/1/11 | 12,300 | 12,638 | ||||
| JPMorgan Chase & Co. | 4.850 | % | 6/16/11 | 2,925 | 2,952 | ||||
| 4 JPMorgan Chase & Co. | 3.125 | % | 12/1/11 | 13,500 | 14,102 | ||||
| JPMorgan Chase & Co. | 6.625 | % | 3/15/12 | 3,725 | 3,814 | ||||
| JPMorgan Chase & Co. | 5.375 | % | 10/1/12 | 13,325 | 13,609 | ||||
| JPMorgan Chase & Co. | 5.750 | % | 1/2/13 | 1,900 | 1,914 | ||||
| JPMorgan Chase & Co. | 4.750 | % | 5/1/13 | 5,325 | 5,351 | ||||
| JPMorgan Chase & Co. | 5.250 | % | 5/1/15 | 2,000 | 1,908 | ||||
| KeyBank NA | 7.000 | % | 2/1/11 | 975 | 963 | ||||
| KeyBank NA | 5.500 | % | 9/17/12 | 1,025 | 964 | ||||
| KeyCorp | 6.500 | % | 5/14/13 | 2,975 | 2,759 | ||||
| Marshall & Ilsley Bank | 6.375 | % | 9/1/11 | 1,500 | 1,344 |
Page 51
| Vanguard® Short-Term Bond Index Fund | ||||||||||
| Schedule of Investments | ||||||||||
| December 31, 2008 | ||||||||||
| Face | Market | |||||||||
| Maturity | Amount | Value | ||||||||
| Coupon | Date | ($ | 000 | ) | ($ | 000 | ) | |||
| Marshall & Ilsley Bank | 5.250 | % | 9/4/12 | 1,850 | 1,628 | |||||
| MBNA America Bank NA | 6.625 | % | 6/15/12 | 1,000 | 1,008 | |||||
| MBNA Corp. | 7.500 | % | 3/15/12 | 2,400 | 2,468 | |||||
| MBNA Corp. | 6.125 | % | 3/1/13 | 675 | 661 | |||||
| 3 | Mellon Capital IV | 6.244 | % | 6/29/49 | 1,750 | 1,033 | ||||
| Mellon Financial Co. | 6.375 | % | 2/15/10 | 1,000 | 1,026 | |||||
| Morgan Stanley Dean Witter | 4.000 | % | 1/15/10 | 1,850 | 1,816 | |||||
| Morgan Stanley Dean Witter | 4.250 | % | 5/15/10 | 7,550 | 7,244 | |||||
| 4 | Morgan Stanley Dean Witter | 2.900 | % | 12/1/10 | 6,500 | 6,671 | ||||
| Morgan Stanley Dean Witter | 5.050 | % | 1/21/11 | 1,350 | 1,312 | |||||
| Morgan Stanley Dean Witter | 6.750 | % | 4/15/11 | 8,150 | 7,955 | |||||
| 4 | Morgan Stanley Dean Witter | 3.250 | % | 12/1/11 | 7,250 | 7,590 | ||||
| Morgan Stanley Dean Witter | 5.625 | % | 1/9/12 | 5,675 | 5,291 | |||||
| Morgan Stanley Dean Witter | 6.600 | % | 4/1/12 | 6,415 | 6,108 | |||||
| Morgan Stanley Dean Witter | 5.750 | % | 8/31/12 | 5,800 | 5,396 | |||||
| Morgan Stanley Dean Witter | 5.250 | % | 11/2/12 | 11,925 | 10,846 | |||||
| Morgan Stanley Dean Witter | 5.300 | % | 3/1/13 | 7,800 | 7,074 | |||||
| National Australia Bank | 8.600 | % | 5/19/10 | 2,000 | 2,047 | |||||
| National City Bank | 4.500 | % | 3/15/10 | 600 | 585 | |||||
| National City Bank | 6.250 | % | 3/15/11 | 1,500 | 1,420 | |||||
| National City Bank | 4.625 | % | 5/1/13 | 2,275 | 1,885 | |||||
| 3 | National City Preferred Capital Trust I | 12.000 | % | 12/31/49 | 2,225 | 2,092 | ||||
| 2 | Nationwide Building Society | 5.500 | % | 7/18/12 | 2,700 | 2,559 | ||||
| North Fork Bancorp., Inc. | 5.875 | % | 8/15/12 | 600 | 479 | |||||
| Northern Trust Co. | 5.500 | % | 8/15/13 | 1,875 | 1,936 | |||||
| Paribas NY | 6.950 | % | 7/22/13 | 775 | 814 | |||||
| PNC Funding Corp. | 7.500 | % | 11/1/09 | 1,875 | 1,886 | |||||
| PNC Funding Corp. | 5.125 | % | 12/14/10 | 2,950 | 2,990 | |||||
| Regions Financial Corp. | 4.375 | % | 12/1/10 | 500 | 467 | |||||
| Regions Financial Corp. | 6.375 | % | 5/15/12 | 7,225 | 6,719 | |||||
| Royal Bank of Canada | 4.125 | % | 1/26/10 | 5,400 | 5,382 | |||||
| Royal Bank of Scotland Group PLC | 6.375 | % | 2/1/11 | 1,500 | 1,511 | |||||
| Royal Bank of Scotland Group PLC | 5.000 | % | 11/12/13 | 3,025 | 2,700 | |||||
| Santander Central Hispano Issuances Ltd. | 7.625 | % | 11/3/09 | 5,000 | 4,948 | |||||
| Santander Central Hispano Issuances Ltd. | 7.625 | % | 9/14/10 | 1,650 | 1,648 | |||||
| Sanwa Bank Ltd. | 7.400 | % | 6/15/11 | 3,825 | 3,959 | |||||
| Sovereign Bancorp, Inc. | 4.800 | % | 9/1/10 | 2,600 | 2,353 | |||||
| Sovereign Bank | 5.125 | % | 3/15/13 | 1,600 | 1,340 | |||||
| 3 | State Street Capital Trust | 8.250 | % | 12/29/49 | 2,500 | 1,919 | ||||
| Sumitomo Mitsui Banking Corp. | 8.000 | % | 6/15/12 | 3,300 | 3,441 | |||||
| SunTrust Banks, Inc. | 6.375 | % | 4/1/11 | 4,500 | 4,534 | |||||
| SunTrust Banks, Inc. | 5.250 | % | 11/5/12 | 2,750 | 2,635 | |||||
| 3 | SunTrust Preferred Capital I | 5.853 | % | 12/31/49 | 2,125 | 855 | ||||
| Synovus Financial Corp. | 4.875 | % | 2/15/13 | 1,000 | 850 | |||||
| UFJ Finance Aruba AEC | 6.750 | % | 7/15/13 | 5,550 | 5,546 | |||||
| 2,3 | Unicredit Luxembourg Finance | 5.584 | % | 1/13/12 | 500 | 455 | ||||
| US Bank NA | 6.375 | % | 8/1/11 | 8,700 | 9,076 | |||||
| 3 | USB Capital IX | 6.189 | % | 4/15/49 | 2,050 | 923 | ||||
| 3 | Wachovia Capital Trust III | 5.800 | % | 3/15/11 | 5,950 | 3,540 | ||||
| Wachovia Corp. | 4.375 | % | 6/1/10 | 6,825 | 6,792 | |||||
| Wachovia Corp. | 7.800 | % | 8/18/10 | 2,000 | 2,034 | |||||
| Wachovia Corp. | 5.300 | % | 10/15/11 | 8,975 | 8,805 | |||||
| Wachovia Corp. | 5.500 | % | 5/1/13 | 6,805 | 6,832 | |||||
| Wells Fargo & Co. | 4.200 | % | 1/15/10 | 19,050 | 19,341 | |||||
| Wells Fargo & Co. | 4.875 | % | 1/12/11 | 4,325 | 4,436 | |||||
| Wells Fargo & Co. | 6.375 | % | 8/1/11 | 1,500 | 1,564 | |||||
| Wells Fargo & Co. | 5.300 | % | 8/26/11 | 5,125 | 5,219 | |||||
| Wells Fargo & Co. | 5.250 | % | 10/23/12 | 10,975 | 11,254 | |||||
| Wells Fargo & Co. | 4.375 | % | 1/31/13 | 11,000 | 10,842 | |||||
| Wells Fargo & Co. | 4.950 | % | 10/16/13 | 7,350 | 7,202 | |||||
| 3 | Wells Fargo Capital XIII | 7.700 | % | 12/29/49 | 8,325 | 6,847 | ||||
| 3 | Wells Fargo Capital XV | 9.750 | % | 12/29/49 | 4,125 | 4,208 | ||||
Page 52
| Vanguard® Short-Term Bond Index Fund | |||||||||
| Schedule of Investments | |||||||||
| December 31, 2008 | |||||||||
| Face | Market | ||||||||
| Maturity | Amount | Value | |||||||
| Coupon | Date | ($ | 000 | ) | ($ | 000 | ) | ||
| Brokerage (0.4%) | |||||||||
| Ameriprise Financial Inc. | 5.350 | % | 11/15/10 | 2,675 | 2,399 | ||||
| Amvescap PLC | 5.375 | % | 2/27/13 | 975 | 888 | ||||
| Janus Capital Group | 5.875 | % | 9/15/11 | 850 | 619 | ||||
| Merrill Lynch & Co., Inc. | 4.125 | % | 9/10/09 | 2,700 | 2,672 | ||||
| Merrill Lynch & Co., Inc. | 4.250 | % | 2/8/10 | 7,750 | 7,596 | ||||
| Merrill Lynch & Co., Inc. | 4.500 | % | 11/4/10 | 3,500 | 3,406 | ||||
| Merrill Lynch & Co., Inc. | 5.770 | % | 7/25/11 | 1,175 | 1,191 | ||||
| Merrill Lynch & Co., Inc. | 6.050 | % | 8/15/12 | 8,175 | 8,187 | ||||
| Merrill Lynch & Co., Inc. | 5.450 | % | 2/5/13 | 4,225 | 4,069 | ||||
| Merrill Lynch & Co., Inc. | 6.150 | % | 4/25/13 | 5,350 | 5,272 | ||||
| Finance Companies (2.3%) | |||||||||
| Allied Capital Corp. | 6.000 | % | 4/1/12 | 1,150 | 791 | ||||
| American General Finance Corp. | 3.875 | % | 10/1/09 | 1,900 | 1,387 | ||||
| American General Finance Corp. | 4.625 | % | 9/1/10 | 1,000 | 520 | ||||
| American General Finance Corp. | 5.625 | % | 8/17/11 | 2,100 | 1,008 | ||||
| American General Finance Corp. | 4.875 | % | 7/15/12 | 1,125 | 484 | ||||
| American General Finance Corp. | 5.375 | % | 10/1/12 | 625 | 294 | ||||
| American General Finance Corp. | 5.850 | % | 6/1/13 | 5,325 | 2,210 | ||||
| Block Financial LLC | 7.875 | % | 1/15/13 | 800 | 751 | ||||
| Capmark Financial Group | 5.875 | % | 5/10/12 | 1,800 | 621 | ||||
| CIT Group Funding Co. of Canada | 4.650 | % | 7/1/10 | 3,150 | 2,764 | ||||
| CIT Group Funding Co. of Canada | 5.600 | % | 11/2/11 | 375 | 293 | ||||
| CIT Group, Inc. | 4.250 | % | 2/1/10 | 4,325 | 4,017 | ||||
| CIT Group, Inc. | 5.200 | % | 11/3/10 | 4,025 | 3,502 | ||||
| CIT Group, Inc. | 4.750 | % | 12/15/10 | 6,275 | 5,522 | ||||
| CIT Group, Inc. | 5.600 | % | 4/27/11 | 2,825 | 2,366 | ||||
| CIT Group, Inc. | 5.800 | % | 7/28/11 | 750 | 622 | ||||
| CIT Group, Inc. | 5.400 | % | 2/13/12 | 1,000 | 790 | ||||
| CIT Group, Inc. | 7.625 | % | 11/30/12 | 3,025 | 2,571 | ||||
| General Electric Capital Corp. | 4.250 | % | 9/13/10 | 4,575 | 4,572 | ||||
| General Electric Capital Corp. | 4.875 | % | 10/21/10 | 6,900 | 7,035 | ||||
| General Electric Capital Corp. | 5.000 | % | 12/1/10 | 2,275 | 2,321 | ||||
| General Electric Capital Corp. | 6.125 | % | 2/22/11 | 25,875 | 26,888 | ||||
| General Electric Capital Corp. | 5.500 | % | 4/28/11 | 1,150 | 1,182 | ||||
| General Electric Capital Corp. | 5.875 | % | 2/15/12 | 16,885 | 17,355 | ||||
| General Electric Capital Corp. | 4.375 | % | 3/3/12 | 2,325 | 2,290 | ||||
| General Electric Capital Corp. | 6.000 | % | 6/15/12 | 13,250 | 13,656 | ||||
| General Electric Capital Corp. | 5.250 | % | 10/19/12 | 18,750 | 18,910 | ||||
| General Electric Capital Corp. | 5.450 | % | 1/15/13 | 6,975 | 7,051 | ||||
| General Electric Capital Corp. | 4.800 | % | 5/1/13 | 11,000 | 10,916 | ||||
| HSBC Finance Corp. | 4.125 | % | 11/16/09 | 7,575 | 7,508 | ||||
| HSBC Finance Corp. | 4.625 | % | 9/15/10 | 6,150 | 6,080 | ||||
| HSBC Finance Corp. | 5.250 | % | 1/14/11 | 5,425 | 5,386 | ||||
| HSBC Finance Corp. | 5.700 | % | 6/1/11 | 12,425 | 12,234 | ||||
| HSBC Finance Corp. | 6.375 | % | 10/15/11 | 1,525 | 1,532 | ||||
| HSBC Finance Corp. | 7.000 | % | 5/15/12 | 4,400 | 4,432 | ||||
| HSBC Finance Corp. | 5.900 | % | 6/19/12 | 1,375 | 1,390 | ||||
| HSBC Finance Corp. | 6.375 | % | 11/27/12 | 3,650 | 3,610 | ||||
| HSBC Finance Corp. | 4.750 | % | 7/15/13 | 4,675 | 4,333 | ||||
| International Lease Finance Corp. | 4.875 | % | 9/1/10 | 1,200 | 960 | ||||
| International Lease Finance Corp. | 5.125 | % | 11/1/10 | 2,100 | 1,596 | ||||
| International Lease Finance Corp. | 4.950 | % | 2/1/11 | 2,300 | 1,690 | ||||
| International Lease Finance Corp. | 5.450 | % | 3/24/11 | 975 | 712 | ||||
| International Lease Finance Corp. | 5.750 | % | 6/15/11 | 7,450 | 5,438 | ||||
| International Lease Finance Corp. | 5.300 | % | 5/1/12 | 5,375 | 3,762 | ||||
| International Lease Finance Corp. | 5.000 | % | 9/15/12 | 4,665 | 3,219 | ||||
| International Lease Finance Corp. | 6.375 | % | 3/25/13 | 4,075 | 2,852 | ||||
| International Lease Finance Corp. | 5.625 | % | 9/20/13 | 3,900 | 2,584 | ||||
| PHH Corp. | 7.125 | % | 3/1/13 | 900 | 423 | ||||
| SLM Corp. | 4.500 | % | 7/26/10 | 3,550 | 3,172 | ||||
| SLM Corp. | 5.400 | % | 10/25/11 | 3,700 | 2,984 | ||||
Page 53
| Vanguard® Short-Term Bond Index Fund | |||||||||
| Schedule of Investments | |||||||||
| December 31, 2008 | |||||||||
| Face | Market | ||||||||
| Maturity | Amount | Value | |||||||
| Coupon | Date | ($ | 000 | ) | ($ | 000 | ) | ||
| SLM Corp. | 5.125 | % | 8/27/12 | 2,500 | 1,829 | ||||
| SLM Corp. | 5.375 | % | 1/15/13 | 2,400 | 1,728 | ||||
| SLM Corp. | 5.000 | % | 10/1/13 | 4,350 | 3,153 | ||||
| Insurance (1.1%) | |||||||||
| Aetna, Inc. | 7.875 | % | 3/1/11 | 1,675 | 1,686 | ||||
| Aetna, Inc. | 5.750 | % | 6/15/11 | 1,575 | 1,557 | ||||
| Allstate Corp. | 6.125 | % | 2/15/12 | 1,450 | 1,407 | ||||
| Allstate Life Global Funding | 5.375 | % | 4/30/13 | 7,775 | 7,842 | ||||
| American International Group, Inc. | 4.700 | % | 10/1/10 | 2,100 | 1,866 | ||||
| American International Group, Inc. | 5.375 | % | 10/18/11 | 800 | 650 | ||||
| American International Group, Inc. | 4.950 | % | 3/20/12 | 1,475 | 1,149 | ||||
| American International Group, Inc. | 4.250 | % | 5/15/13 | 3,600 | 2,588 | ||||
| AXA Financial, Inc. | 7.750 | % | 8/1/10 | 2,276 | 2,280 | ||||
| Berkshire Hathaway Finance Corp. | 4.125 | % | 1/15/10 | 5,150 | 5,221 | ||||
| Berkshire Hathaway Finance Corp. | 4.200 | % | 12/15/10 | 5,150 | 5,273 | ||||
| Berkshire Hathaway Finance Corp. | 4.750 | % | 5/15/12 | 4,300 | 4,448 | ||||
| Berkshire Hathaway Finance Corp. | 4.600 | % | 5/15/13 | 4,250 | 4,377 | ||||
| Berkshire Hathaway Finance Corp. | 5.000 | % | 8/15/13 | 2,275 | 2,370 | ||||
| Chubb Corp. | 5.200 | % | 4/1/13 | 3,000 | 2,978 | ||||
| CNA Financial Corp. | 6.000 | % | 8/15/11 | 2,450 | 1,777 | ||||
| Fund American Cos., Inc. | 5.875 | % | 5/15/13 | 1,825 | 1,338 | ||||
| Genworth Financial, Inc. | 5.125 | % | 3/15/11 | 1,600 | 1,120 | ||||
| Genworth Financial, Inc. | 5.650 | % | 6/15/12 | 2,500 | 1,041 | ||||
| Hartford Financial Services Group, Inc. | 5.250 | % | 10/15/11 | 4,200 | 3,685 | ||||
| ING Capital Funding Trust III | 8.439 | % | 12/31/10 | 4,000 | 2,018 | ||||
| ING USA Global | 4.500 | % | 10/1/10 | 3,600 | 3,502 | ||||
| Liberty Mutual Group | 4.875 | % | 2/1/10 | 2,500 | 2,393 | ||||
| Lincoln National Corp. | 6.200 | % | 12/15/11 | 1,550 | 1,412 | ||||
| Lincoln National Corp. | 5.650 | % | 8/27/12 | 225 | 184 | ||||
| Marsh & McLennan Cos., Inc. | 5.150 | % | 9/15/10 | 50 | 49 | ||||
| Marsh & McLennan Cos., Inc. | 6.250 | % | 3/15/12 | 2,175 | 2,038 | ||||
| MetLife, Inc. | 5.375 | % | 12/15/12 | 2,850 | 2,720 | ||||
| MetLife, Inc. | 5.000 | % | 11/24/13 | 2,050 | 1,875 | ||||
| Principal Life Income Funding | 5.125 | % | 3/1/11 | 1,300 | 1,260 | ||||
| Principal Life Income Funding | 5.300 | % | 12/14/12 | 1,900 | 1,819 | ||||
| Principal Life Income Funding | 5.300 | % | 4/24/13 | 2,350 | 2,241 | ||||
| Progressive Corp. | 6.375 | % | 1/15/12 | 850 | 848 | ||||
| Protective Life Secured Trust | 4.850 | % | 8/16/10 | 2,075 | 1,824 | ||||
| Protective Life Secured Trust | 5.450 | % | 9/28/12 | 1,290 | 1,127 | ||||
| Prudential Financial, Inc. | 5.100 | % | 12/14/11 | 1,200 | 1,041 | ||||
| Prudential Financial, Inc. | 5.800 | % | 6/15/12 | 1,700 | 1,476 | ||||
| Prudential Financial, Inc. | 5.150 | % | 1/15/13 | 2,150 | 1,783 | ||||
| Prudential Financial, Inc. | 4.500 | % | 7/15/13 | 450 | 355 | ||||
| Travelers Cos. Inc. | 5.375 | % | 6/15/12 | 700 | 702 | ||||
| Travelers Property Casualty Corp. | 5.000 | % | 3/15/13 | 2,500 | 2,369 | ||||
| UnitedHealth Group, Inc. | 5.250 | % | 3/15/11 | 4,525 | 4,338 | ||||
| UnitedHealth Group, Inc. | 5.500 | % | 11/15/12 | 575 | 527 | ||||
| UnitedHealth Group, Inc. | 4.875 | % | 2/15/13 | 1,625 | 1,522 | ||||
| UnitedHealth Group, Inc. | 4.875 | % | 4/1/13 | 1,625 | 1,515 | ||||
| WellPoint Inc. | 5.000 | % | 1/15/11 | 1,950 | 1,900 | ||||
| WellPoint Inc. | 6.375 | % | 1/15/12 | 1,650 | 1,627 | ||||
| WellPoint Inc. | 6.800 | % | 8/1/12 | 1,150 | 1,134 | ||||
| Willis North America Inc. | 5.125 | % | 7/15/10 | 900 | 746 | ||||
| XL Capital Ltd. | 6.500 | % | 1/15/12 | 2,575 | 1,606 | ||||
| Other Finance (0.0%) | |||||||||
| Chicago Mercantile Exchange Group Inc. | 5.400 | % | 8/1/13 | 2,400 | 2,391 | ||||
| Orix Corp. | 5.480 | % | 11/22/11 | 2,650 | 1,995 | ||||
| Real Estate Investment Trusts (0.3%) | |||||||||
| AMB Property LP | 6.300 | % | 6/1/13 | 475 | 296 | ||||
| AvalonBay Communities, Inc. | 5.500 | % | 1/15/12 | 2,000 | 1,617 | ||||
| Boston Properties, Inc. | 6.250 | % | 1/15/13 | 2,100 | 1,588 | ||||
| Brandywine Operating Partnership | 5.750 | % | 4/1/12 | 2,750 | 2,092 | ||||
Page 54
| Vanguard® Short-Term Bond Index Fund | |||||||||
| Schedule of Investments | |||||||||
| December 31, 2008 | |||||||||
| Face | Market | ||||||||
| Maturity | Amount | Value | |||||||
| Coupon | Date | ($ | 000 | ) | ($ | 000 | ) | ||
| Developers Diversified Realty Corp. | 5.250 | % | 4/15/11 | 1,500 | 845 | ||||
| Duke Realty LP | 5.625 | % | 8/15/11 | 575 | 450 | ||||
| ERP Operating LP | 6.625 | % | 3/15/12 | 1,350 | 1,108 | ||||
| ERP Operating LP | 5.500 | % | 10/1/12 | 2,000 | 1,538 | ||||
| ERP Operating LP | 5.200 | % | 4/1/13 | 1,000 | 742 | ||||
| Health Care Property Investors, Inc. | 5.950 | % | 9/15/11 | 625 | 474 | ||||
| Health Care Property Investors, Inc. | 6.450 | % | 6/25/12 | 750 | 546 | ||||
| Health Care REIT, Inc. | 6.000 | % | 11/15/13 | 2,775 | 1,883 | ||||
| Nationwide Health Properties, Inc. | 6.250 | % | 2/1/13 | 1,850 | 1,467 | ||||
| ProLogis | 5.500 | % | 4/1/12 | 965 | 496 | ||||
| ProLogis | 5.500 | % | 3/1/13 | 2,000 | 900 | ||||
| Regency Centers LP | 6.750 | % | 1/15/12 | 1,650 | 1,342 | ||||
| Simon Property Group Inc. | 4.600 | % | 6/15/10 | 175 | 154 | ||||
| Simon Property Group Inc. | 4.875 | % | 8/15/10 | 3,850 | 3,404 | ||||
| Simon Property Group Inc. | 5.600 | % | 9/1/11 | 1,250 | 1,047 | ||||
| Simon Property Group Inc. | 5.000 | % | 3/1/12 | 5,900 | 4,310 | ||||
| Simon Property Group Inc. | 5.300 | % | 5/30/13 | 2,925 | 2,105 | ||||
| Vornado Realty | 5.600 | % | 2/15/11 | 1,850 | 1,681 | ||||
| 1,158,811 | |||||||||
| Industrial (10.9%) | |||||||||
| Basic Industry (0.7%) | |||||||||
| Alcan, Inc. | 6.450 | % | 3/15/11 | 3,150 | 2,778 | ||||
| Alcan, Inc. | 4.500 | % | 5/15/13 | 775 | 552 | ||||
| Alcoa, Inc. | 6.000 | % | 1/15/12 | 4,275 | 4,006 | ||||
| Alcoa, Inc. | 5.375 | % | 1/15/13 | 650 | 582 | ||||
| Alcoa, Inc. | 6.000 | % | 7/15/13 | 3,725 | 3,382 | ||||
| ArcelorMittal | 5.375 | % | 6/1/13 | 5,050 | 3,953 | ||||
| Barrick Gold Finance Inc. | 6.125 | % | 9/15/13 | 3,100 | 2,930 | ||||
| BHP Billiton Finance Ltd. | 5.000 | % | 12/15/10 | 1,000 | 990 | ||||
| BHP Billiton Finance Ltd. | 5.125 | % | 3/29/12 | 475 | 470 | ||||
| BHP Finance USA Ltd. | 4.800 | % | 4/15/13 | 3,000 | 2,855 | ||||
| Celulosa Arauco Constitution SA | 8.625 | % | 8/15/10 | 3,500 | 3,614 | ||||
| Dow Chemical Co. | 6.125 | % | 2/1/11 | 2,725 | 2,709 | ||||
| Dow Chemical Co. | 6.000 | % | 10/1/12 | 3,000 | 2,842 | ||||
| E.I. du Pont de Nemours & Co. | 4.125 | % | 4/30/10 | 1,175 | 1,197 | ||||
| E.I. du Pont de Nemours & Co. | 5.000 | % | 1/15/13 | 6,100 | 6,168 | ||||
| E.I. du Pont de Nemours & Co. | 4.125 | % | 3/6/13 | 1,000 | 979 | ||||
| E.I. du Pont de Nemours & Co. | 5.000 | % | 7/15/13 | 4,100 | 4,151 | ||||
| Falconbridge Ltd. | 7.350 | % | 6/5/12 | 1,000 | 789 | ||||
| International Paper Co. | 4.000 | % | 4/1/10 | 2,000 | 1,937 | ||||
| Lubrizol Corp. | 5.500 | % | 10/1/14 | 1,850 | 1,674 | ||||
| Monsanto Co. | 7.375 | % | 8/15/12 | 1,200 | 1,354 | ||||
| Noranda, Inc. | 7.250 | % | 7/15/12 | 1,500 | 1,184 | ||||
| Nucor Corp. | 5.000 | % | 12/1/12 | 925 | 908 | ||||
| Nucor Corp. | 5.000 | % | 6/1/13 | 1,200 | 1,191 | ||||
| Potash Corp. of Saskatchewan | 7.750 | % | 5/31/11 | 3,325 | 3,447 | ||||
| PPG Industries, Inc. | 5.750 | % | 3/15/13 | 1,875 | 1,850 | ||||
| Praxair, Inc. | 6.375 | % | 4/1/12 | 1,250 | 1,318 | ||||
| Praxair, Inc. | 3.950 | % | 6/1/13 | 825 | 806 | ||||
| Rio Tinto Finance USA Ltd. | 5.875 | % | 7/15/13 | 5,450 | 4,369 | ||||
| US Steel Corp. | 5.650 | % | 6/1/13 | 800 | 570 | ||||
| Weyerhaeuser Co. | 6.750 | % | 3/15/12 | 4,600 | 4,062 | ||||
| WMC Finance USA | 5.125 | % | 5/15/13 | 1,600 | 1,524 | ||||
| Capital Goods (1.4%) | |||||||||
| 3M Co. | 5.125 | % | 11/6/09 | 575 | 587 | ||||
| 3M Co. | 4.375 | % | 8/15/13 | 2,000 | 2,114 | ||||
| Bemis Co. Inc. | 4.875 | % | 4/1/12 | 1,600 | 1,486 | ||||
| Black & Decker Corp. | 7.125 | % | 6/1/11 | 1,000 | 990 | ||||
| Boeing Capital Corp. | 6.100 | % | 3/1/11 | 4,850 | 5,050 | ||||
| Boeing Capital Corp. | 6.500 | % | 2/15/12 | 4,700 | 4,977 | ||||
| Boeing Capital Corp. | 5.800 | % | 1/15/13 | 2,750 | 2,865 | ||||
| Caterpillar Financial Services Corp. | 4.150 | % | 1/15/10 | 2,900 | 2,872 | ||||
| Caterpillar Financial Services Corp. | 4.300 | % | 6/1/10 | 8,975 | 8,822 | ||||
Page 55
| Vanguard® Short-Term Bond Index Fund | |||||||||
| Schedule of Investments | |||||||||
| December 31, 2008 | |||||||||
| Face | Market | ||||||||
| Maturity | Amount | Value | |||||||
| Coupon | Date | ($ | 000 | ) | ($ | 000 | ) | ||
| Caterpillar Financial Services Corp. | 4.250 | % | 2/8/13 | 700 | 675 | ||||
| Caterpillar Financial Services Corp. | 6.200 | % | 9/30/13 | 2,150 | 2,226 | ||||
| Cooper Industries, Inc. | 5.250 | % | 11/15/12 | 1,400 | 1,405 | ||||
| CRH America Inc. | 5.625 | % | 9/30/11 | 2,500 | 2,076 | ||||
| CRH America Inc. | 6.950 | % | 3/15/12 | 2,000 | 1,671 | ||||
| CRH America Inc. | 5.300 | % | 10/15/13 | 2,075 | 1,475 | ||||
| Eaton Corp. | 4.900 | % | 5/15/13 | 1,050 | 1,009 | ||||
| Emerson Electric Co. | 7.125 | % | 8/15/10 | 500 | 525 | ||||
| Emerson Electric Co. | 4.625 | % | 10/15/12 | 3,200 | 3,225 | ||||
| General Dynamics Corp. | 4.500 | % | 8/15/10 | 875 | 892 | ||||
| General Dynamics Corp. | 4.250 | % | 5/15/13 | 3,800 | 3,764 | ||||
| General Dynamics Corp. | 5.250 | % | 2/1/14 | 925 | 952 | ||||
| General Electric Co. | 5.000 | % | 2/1/13 | 16,000 | 16,239 | ||||
| Honeywell International, Inc. | 7.500 | % | 3/1/10 | 1,000 | 1,044 | ||||
| Honeywell International, Inc. | 6.125 | % | 11/1/11 | 2,000 | 2,110 | ||||
| Honeywell International, Inc. | 5.625 | % | 8/1/12 | 775 | 807 | ||||
| Honeywell International, Inc. | 4.250 | % | 3/1/13 | 2,050 | 2,040 | ||||
| Ingersoll-Rand GL Holding Company | 6.000 | % | 8/15/13 | 1,800 | 1,761 | ||||
| John Deere Capital Corp | 4.950 | % | 12/17/12 | 2,300 | 2,308 | ||||
| John Deere Capital Corp. | 5.400 | % | 10/17/11 | 1,325 | 1,332 | ||||
| John Deere Capital Corp. | 7.000 | % | 3/15/12 | 14,750 | 15,835 | ||||
| Lafarge SA | 6.150 | % | 7/15/11 | 3,175 | 2,722 | ||||
| Lockheed Martin Corp. | 4.121 | % | 3/14/13 | 2,000 | 1,965 | ||||
| Masco Corp. | 5.875 | % | 7/15/12 | 2,500 | 2,039 | ||||
| Mohawk Industries Inc. | 5.750 | % | 1/15/11 | 3,000 | 2,770 | ||||
| Northrop Grumman Corp. | 7.125 | % | 2/15/11 | 4,250 | 4,471 | ||||
| Raytheon Co. | 4.850 | % | 1/15/11 | 2,000 | 2,014 | ||||
| Republic Services, Inc. | 6.750 | % | 8/15/11 | 1,000 | 983 | ||||
| Roper Industries Inc. | 6.625 | % | 8/15/13 | 1,650 | 1,682 | ||||
| Textron Financial Corp. | 6.000 | % | 11/20/09 | 800 | 745 | ||||
| Textron Financial Corp. | 4.600 | % | 5/3/10 | 2,300 | 2,074 | ||||
| Textron Financial Corp. | 5.125 | % | 11/1/10 | 2,275 | 2,011 | ||||
| Textron Financial Corp. | 5.400 | % | 4/28/13 | 1,350 | 976 | ||||
| Textron, Inc. | 6.500 | % | 6/1/12 | 2,700 | 2,328 | ||||
| Tyco International Group SA | 6.125 | % | 1/15/09 | 2,500 | 2,500 | ||||
| Tyco International Group SA | 6.750 | % | 2/15/11 | 1,950 | 1,869 | ||||
| Tyco International Group SA | 6.375 | % | 10/15/11 | 2,000 | 1,876 | ||||
| United Technologies Corp. | 4.375 | % | 5/1/10 | 2,625 | 2,647 | ||||
| United Technologies Corp. | 7.125 | % | 11/15/10 | 2,000 | 2,129 | ||||
| United Technologies Corp. | 6.350 | % | 3/1/11 | 1,225 | 1,279 | ||||
| United Technologies Corp. | 6.100 | % | 5/15/12 | 1,000 | 1,056 | ||||
| Vulcan Materials Co. | 6.300 | % | 6/15/13 | 1,250 | 1,148 | ||||
| Communication (2.7%) | |||||||||
| AT&T Inc. | 5.300 | % | 11/15/10 | 2,400 | 2,436 | ||||
| AT&T Inc. | 6.250 | % | 3/15/11 | 13,675 | 14,010 | ||||
| AT&T Inc. | 7.300 | % | 11/15/11 | 8,925 | 9,515 | ||||
| AT&T Inc. | 5.875 | % | 2/1/12 | 4,725 | 4,849 | ||||
| AT&T Inc. | 5.875 | % | 8/15/12 | 1,825 | 1,881 | ||||
| AT&T Inc. | 4.950 | % | 1/15/13 | 3,075 | 3,098 | ||||
| AT&T Inc. | 6.700 | % | 11/15/13 | 2,225 | 2,377 | ||||
| AT&T Wireless | 7.875 | % | 3/1/11 | 12,250 | 12,901 | ||||
| AT&T Wireless | 8.125 | % | 5/1/12 | 3,900 | 4,183 | ||||
| British Telecommunications PLC | 8.625 | % | 12/15/10 | 7,325 | 7,575 | ||||
| British Telecommunications PLC | 5.150 | % | 1/15/13 | 2,000 | 1,836 | ||||
| CBS Corp. | 7.700 | % | 7/30/10 | 2,475 | 2,422 | ||||
| CBS Corp. | 6.625 | % | 5/15/11 | 2,000 | 1,766 | ||||
| CBS Corp. | 5.625 | % | 8/15/12 | 2,225 | 1,836 | ||||
| CenturyTel, Inc. | 7.875 | % | 8/15/12 | 1,000 | 877 | ||||
| Cingular Wireless LLC | 6.500 | % | 12/15/11 | 1,000 | 1,022 | ||||
| Comcast Cable Communications Holdings Inc. | 8.375 | % | 3/15/13 | 5,800 | 6,022 | ||||
| Comcast Cable Communications, Inc. | 6.750 | % | 1/30/11 | 17,350 | 17,538 | ||||
| Comcast Corp. | 5.850 | % | 1/15/10 | 75 | 76 | ||||
| Comcast Corp. | 5.500 | % | 3/15/11 | 2,575 | 2,550 | ||||
| Cox Communications, Inc. | 4.625 | % | 1/15/10 | 4,850 | 4,690 | ||||
Page 56
| Vanguard® Short-Term Bond Index Fund | |||||||||
| Schedule of Investments | |||||||||
| December 31, 2008 | |||||||||
| Face | Market | ||||||||
| Maturity | Amount | Value | |||||||
| Coupon | Date | ($ | 000 | ) | ($ | 000 | ) | ||
| Cox Communications, Inc. | 6.750 | % | 3/15/11 | 2,175 | 2,082 | ||||
| Cox Communications, Inc. | 7.125 | % | 10/1/12 | 2,950 | 2,787 | ||||
| Deutsche Telekom International Finance | 8.500 | % | 6/15/10 | 9,375 | 9,755 | ||||
| Deutsche Telekom International Finance | 5.250 | % | 7/22/13 | 3,215 | 3,078 | ||||
| Deutsche Telekom International Finance | 5.875 | % | 8/20/13 | 1,025 | 1,030 | ||||
| Embarq Corp. | 6.738 | % | 6/1/13 | 3,000 | 2,450 | ||||
| France Telecom | 7.750 | % | 3/1/11 | 13,925 | 14,653 | ||||
| Gannett Co., Inc. | 6.375 | % | 4/1/12 | 1,175 | 767 | ||||
| Koninklijke KPN NV | 8.000 | % | 10/1/10 | 2,000 | 2,012 | ||||
| McGraw-Hill Cos. Inc. | 5.375 | % | 11/15/12 | 2,475 | 2,215 | ||||
| News America Holdings, Inc. | 9.250 | % | 2/1/13 | 2,825 | 3,053 | ||||
| Qwest Communications International Inc. | 7.875 | % | 9/1/11 | 2,375 | 2,114 | ||||
| Qwest Communications International Inc. | 8.875 | % | 3/15/12 | 3,875 | 3,565 | ||||
| R.R. Donnelley & Sons Co. | 4.950 | % | 5/15/10 | 900 | 834 | ||||
| R.R. Donnelley & Sons Co. | 5.625 | % | 1/15/12 | 600 | 534 | ||||
| Rogers Communications Inc. | 7.250 | % | 12/15/12 | 3,500 | 3,417 | ||||
| Telecom Italia Capital | 4.000 | % | 1/15/10 | 3,605 | 3,393 | ||||
| Telecom Italia Capital | 4.875 | % | 10/1/10 | 1,000 | 916 | ||||
| Telecom Italia Capital | 6.200 | % | 7/18/11 | 700 | 619 | ||||
| Telecom Italia Capital | 5.250 | % | 11/15/13 | 2,875 | 2,316 | ||||
| Telefonica Emisiones SAU | 5.984 | % | 6/20/11 | 6,200 | 6,169 | ||||
| Telefonica Emisiones SAU | 5.855 | % | 2/4/13 | 3,000 | 2,834 | ||||
| Telefonica Europe BV | 7.750 | % | 9/15/10 | 5,000 | 5,083 | ||||
| Telefonos de Mexico SA | 4.750 | % | 1/27/10 | 4,650 | 4,667 | ||||
| Telus Corp. | 8.000 | % | 6/1/11 | 5,000 | 4,955 | ||||
| Thomson Corp. | 6.200 | % | 1/5/12 | 1,500 | 1,447 | ||||
| Thomson Reuters Corp. | 5.950 | % | 7/15/13 | 3,925 | 3,654 | ||||
| Time Warner Cable Inc. | 5.400 | % | 7/2/12 | 7,300 | 6,904 | ||||
| Time Warner Cable Inc. | 6.200 | % | 7/1/13 | 4,250 | 4,082 | ||||
| Time Warner Entertainment | 8.875 | % | 10/1/12 | 1,000 | 995 | ||||
| Verizon Communications Corp. | 5.350 | % | 2/15/11 | 3,800 | 3,872 | ||||
| Verizon Communications Corp. | 4.350 | % | 2/15/13 | 2,950 | 2,814 | ||||
| Verizon Communications Corp. | 5.250 | % | 4/15/13 | 2,875 | 2,832 | ||||
| Verizon Florida, Inc. | 6.125 | % | 1/15/13 | 1,500 | 1,486 | ||||
| Verizon Global Funding Corp. | 7.250 | % | 12/1/10 | 6,800 | 7,242 | ||||
| Verizon Global Funding Corp. | 6.875 | % | 6/15/12 | 2,500 | 2,619 | ||||
| Verizon Global Funding Corp. | 7.375 | % | 9/1/12 | 4,300 | 4,586 | ||||
| Verizon Global Funding Corp. | 4.375 | % | 6/1/13 | 250 | 240 | ||||
| Verizon New England, Inc. | 6.500 | % | 9/15/11 | 2,500 | 2,528 | ||||
| Verizon New Jersey, Inc. | 5.875 | % | 1/17/12 | 3,700 | 3,643 | ||||
| Verizon New York, Inc. | 6.875 | % | 4/1/12 | 2,000 | 1,999 | ||||
| Verizon Pennsylvania, Inc. | 5.650 | % | 11/15/11 | 2,000 | 1,929 | ||||
| Verizon Virginia, Inc. | 4.625 | % | 3/15/13 | 3,600 | 3,258 | ||||
| 2 Verizon Wireless Inc. | 7.375 | % | 11/15/13 | 3,675 | 3,870 | ||||
| Vodafone AirTouch PLC | 7.750 | % | 2/15/10 | 6,235 | 6,370 | ||||
| Vodafone Group PLC | 5.350 | % | 2/27/12 | 9,025 | 8,936 | ||||
| Consumer Cyclical (1.6%) | |||||||||
| 2 Best Buy Co. | 6.750 | % | 7/15/13 | 1,750 | 1,613 | ||||
| Costco Wholesale Corp. | 5.300 | % | 3/15/12 | 4,000 | 4,198 | ||||
| CVS Caremark Corp. | 5.750 | % | 8/15/11 | 1,800 | 1,783 | ||||
| 3 CVS Caremark Corp. | 6.302 | % | 6/1/12 | 2,500 | 1,078 | ||||
| DaimlerChrysler North America Holding Corp. | 4.875 | % | 6/15/10 | 2,200 | 1,991 | ||||
| DaimlerChrysler North America Holding Corp. | 8.000 | % | 6/15/10 | 1,175 | 1,104 | ||||
| DaimlerChrysler North America Holding Corp. | 5.875 | % | 3/15/11 | 6,350 | 5,461 | ||||
| DaimlerChrysler North America Holding Corp. | 5.750 | % | 9/8/11 | 10,925 | 9,286 | ||||
| DaimlerChrysler North America Holding Corp. | 7.300 | % | 1/15/12 | 3,475 | 2,971 | ||||
| DaimlerChrysler North America Holding Corp. | 6.500 | % | 11/15/13 | 4,850 | 3,880 | ||||
| Darden Restaurants Inc. | 5.625 | % | 10/15/12 | 1,300 | 1,141 | ||||
| Federated Retail Holding | 5.350 | % | 3/15/12 | 6,100 | 4,566 | ||||
| Home Depot Inc. | 4.625 | % | 8/15/10 | 3,425 | 3,297 | ||||
| Home Depot Inc. | 5.200 | % | 3/1/11 | 1,325 | 1,295 | ||||
| Home Depot Inc. | 5.250 | % | 12/16/13 | 3,125 | 2,882 | ||||
| J.C. Penney Co., Inc. | 8.000 | % | 3/1/10 | 3,000 | 2,813 | ||||
| Johnson Controls, Inc. | 5.250 | % | 1/15/11 | 1,975 | 1,784 | ||||
Page 57
| Vanguard® Short-Term Bond Index Fund | |||||||||
| Schedule of Investments | |||||||||
| December 31, 2008 | |||||||||
| Face | Market | ||||||||
| Maturity | Amount | Value | |||||||
| Coupon | Date | ($ | 000 | ) | ($ | 000 | ) | ||
| Johnson Controls, Inc. | 4.875 | % | 9/15/13 | 1,000 | 823 | ||||
| Lowe’s Cos., Inc. | 8.250 | % | 6/1/10 | 2,000 | 2,110 | ||||
| Lowe’s Cos., Inc. | 5.600 | % | 9/15/12 | 3,200 | 3,224 | ||||
| Marriott International | 4.625 | % | 6/15/12 | 1,175 | 890 | ||||
| Marriott International | 5.625 | % | 2/15/13 | 1,425 | 1,079 | ||||
| McDonald’s Corp. | 5.750 | % | 3/1/12 | 1,800 | 1,916 | ||||
| McDonald’s Corp. | 4.300 | % | 3/1/13 | 2,000 | 2,058 | ||||
| Starwood Hotel Resorts | 7.875 | % | 5/1/12 | 3,350 | 2,580 | ||||
| Starwood Hotel Resorts | 6.250 | % | 2/15/13 | 1,900 | 1,312 | ||||
| Target Corp. | 7.500 | % | 8/15/10 | 3,000 | 3,127 | ||||
| Target Corp. | 6.350 | % | 1/15/11 | 4,900 | 5,056 | ||||
| Target Corp. | 5.125 | % | 1/15/13 | 1,075 | 1,069 | ||||
| Target Corp. | 4.000 | % | 6/15/13 | 825 | 784 | ||||
| The Walt Disney Co. | 5.700 | % | 7/15/11 | 3,100 | 3,269 | ||||
| The Walt Disney Co. | 6.375 | % | 3/1/12 | 1,500 | 1,595 | ||||
| The Walt Disney Co. | 4.700 | % | 12/1/12 | 7,200 | 7,389 | ||||
| The Walt Disney Co. | 4.500 | % | 12/15/13 | 325 | 327 | ||||
| Time Warner, Inc. | 6.750 | % | 4/15/11 | 1,750 | 1,720 | ||||
| Time Warner, Inc. | 5.500 | % | 11/15/11 | 7,925 | 7,388 | ||||
| Time Warner, Inc. | 6.875 | % | 5/1/12 | 5,675 | 5,511 | ||||
| Toll Brothers, Inc. | 6.875 | % | 11/15/12 | 750 | 640 | ||||
| Toll Brothers, Inc. | 5.950 | % | 9/15/13 | 575 | 448 | ||||
| Toyota Motor Credit Corp. | 4.250 | % | 3/15/10 | 3,575 | 3,595 | ||||
| Toyota Motor Credit Corp. | 4.350 | % | 12/15/10 | 2,300 | 2,333 | ||||
| Toyota Motor Credit Corp. | 5.450 | % | 5/18/11 | 3,000 | 3,107 | ||||
| Viacom Inc. | 5.750 | % | 4/30/11 | 2,925 | 2,638 | ||||
| Wal-Mart Stores, Inc. | 4.125 | % | 7/1/10 | 5,300 | 5,382 | ||||
| Wal-Mart Stores, Inc. | 4.750 | % | 8/15/10 | 2,850 | 2,964 | ||||
| Wal-Mart Stores, Inc. | 4.125 | % | 2/15/11 | 6,475 | 6,700 | ||||
| Wal-Mart Stores, Inc. | 4.250 | % | 4/15/13 | 2,400 | 2,486 | ||||
| Wal-Mart Stores, Inc. | 4.550 | % | 5/1/13 | 3,250 | 3,386 | ||||
| Wal-Mart Stores, Inc. | 7.250 | % | 6/1/13 | 2,300 | 2,627 | ||||
| Walgreen Co. | 4.875 | % | 8/1/13 | 4,200 | 4,358 | ||||
| Western Union Co. | 5.400 | % | 11/17/11 | 1,925 | 1,840 | ||||
| Yum! Brands, Inc. | 8.875 | % | 4/15/11 | 6,600 | 6,643 | ||||
| Yum! Brands, Inc. | 7.700 | % | 7/1/12 | 1,600 | 1,580 | ||||
| Consumer Noncyclical (2.3%) | |||||||||
| Abbott Laboratories | 3.750 | % | 3/15/11 | 2,275 | 2,322 | ||||
| Abbott Laboratories | 5.600 | % | 5/15/11 | 6,825 | 7,235 | ||||
| Abbott Laboratories | 5.150 | % | 11/30/12 | 3,325 | 3,568 | ||||
| Altria Group, Inc. | 8.500 | % | 11/10/13 | 4,100 | 4,290 | ||||
| AmerisourceBergen Corp. | 5.625 | % | 9/15/12 | 1,225 | 1,137 | ||||
| Anheuser Busch Cos., Inc. | 4.700 | % | 4/15/12 | 1,500 | 1,426 | ||||
| Anheuser-Busch Cos., Inc. | 6.000 | % | 4/15/11 | 800 | 808 | ||||
| Anheuser-Busch Cos., Inc. | 4.375 | % | 1/15/13 | 1,500 | 1,384 | ||||
| AstraZeneca PLC | 5.400 | % | 9/15/12 | 9,375 | 9,937 | ||||
| Baxter Finco, BV | 4.750 | % | 10/15/10 | 500 | 501 | ||||
| Biogen Idec Inc. | 6.000 | % | 3/1/13 | 2,700 | 2,735 | ||||
| Bottling Group LLC | 4.625 | % | 11/15/12 | 4,500 | 4,552 | ||||
| Bottling Group LLC | 5.000 | % | 11/15/13 | 1,500 | 1,491 | ||||
| Bristol-Myers Squibb Co. | 5.250 | % | 8/15/13 | 1,675 | 1,788 | ||||
| Campbell Soup Co. | 6.750 | % | 2/15/11 | 1,000 | 1,055 | ||||
| Cardinal Health, Inc. | 6.750 | % | 2/15/11 | 425 | 426 | ||||
| Cardinal Health, Inc. | 5.650 | % | 6/15/12 | 375 | 361 | ||||
| Cia. Brasil de Bebidas AmBev | 10.500 | % | 12/15/11 | 1,300 | 1,424 | ||||
| Cia. Brasil de Bebidas AmBev | 8.750 | % | 9/15/13 | 2,250 | 2,363 | ||||
| Clorox Co. | 4.200 | % | 1/15/10 | 2,650 | 2,622 | ||||
| Coca-Cola Enterprises Inc. | 5.000 | % | 8/15/13 | 2,300 | 2,287 | ||||
| Coca-Cola HBC Finance BV | 5.125 | % | 9/17/13 | 1,800 | 1,775 | ||||
| Colgate-Palmolive Co. | 5.980 | % | 4/25/12 | 1,250 | 1,348 | ||||
| ConAgra Foods, Inc. | 7.875 | % | 9/15/10 | 1,000 | 1,019 | ||||
| ConAgra Foods, Inc. | 6.750 | % | 9/15/11 | 387 | 389 | ||||
| Covidien International | 5.450 | % | 10/15/12 | 2,425 | 2,369 | ||||
| Diageo Capital PLC | 4.375 | % | 5/3/10 | 500 | 502 | ||||
Page 58
| Vanguard® Short-Term Bond Index Fund | |||||||||
| Schedule of Investments | |||||||||
| December 31, 2008 | |||||||||
| Face | Market | ||||||||
| Maturity | Amount | Value | |||||||
| Coupon | Date | ($ | 000 | ) | ($ | 000 | ) | ||
| Diageo Capital PLC | 5.200 | % | 1/30/13 | 5,036 | 5,036 | ||||
| Diageo Finance BV | 3.875 | % | 4/1/11 | 3,500 | 3,436 | ||||
| 2 Dr. Pepper Snapple Group | 6.120 | % | 5/1/13 | 325 | 318 | ||||
| Eli Lilly & Co. | 6.000 | % | 3/15/12 | 5,675 | 6,119 | ||||
| Fortune Brands Inc. | 5.125 | % | 1/15/11 | 3,150 | 3,042 | ||||
| Genentech Inc. | 4.400 | % | 7/15/10 | 850 | 856 | ||||
| General Mills, Inc. | 6.000 | % | 2/15/12 | 4,675 | 4,802 | ||||
| General Mills, Inc. | 5.650 | % | 9/10/12 | 3,050 | 3,114 | ||||
| General Mills, Inc. | 5.250 | % | 8/15/13 | 1,625 | 1,635 | ||||
| GlaxoSmithKline Capital Inc. | 4.850 | % | 5/15/13 | 9,250 | 9,506 | ||||
| H.J. Heinz Co. | 6.625 | % | 7/15/11 | 2,500 | 2,575 | ||||
| H.J. Heinz Co. | 6.000 | % | 3/15/12 | 1,500 | 1,525 | ||||
| H.J. Heinz Co. | 5.350 | % | 7/15/13 | 1,300 | 1,295 | ||||
| Johnson & Johnson | 5.150 | % | 8/15/12 | 2,975 | 3,253 | ||||
| Johnson & Johnson | 3.800 | % | 5/15/13 | 1,525 | 1,597 | ||||
| Kellogg Co. | 6.600 | % | 4/1/11 | 5,850 | 6,142 | ||||
| Kellogg Co. | 4.250 | % | 3/6/13 | 4,175 | 4,167 | ||||
| Kimberly-Clark Corp. | 5.625 | % | 2/15/12 | 2,075 | 2,157 | ||||
| Kraft Foods, Inc. | 4.125 | % | 11/12/09 | 2,300 | 2,337 | ||||
| Kraft Foods, Inc. | 5.625 | % | 11/1/11 | 5,150 | 5,243 | ||||
| Kraft Foods, Inc. | 6.250 | % | 6/1/12 | 7,525 | 7,736 | ||||
| Kraft Foods, Inc. | 5.250 | % | 10/1/13 | 3,200 | 3,107 | ||||
| Kroger Co. | 8.050 | % | 2/1/10 | 1,700 | 1,734 | ||||
| Kroger Co. | 6.800 | % | 4/1/11 | 1,000 | 1,011 | ||||
| Kroger Co. | 6.750 | % | 4/15/12 | 3,050 | 3,128 | ||||
| Kroger Co. | 6.200 | % | 6/15/12 | 2,525 | 2,550 | ||||
| Kroger Co. | 5.500 | % | 2/1/13 | 1,425 | 1,415 | ||||
| Kroger Co. | 5.000 | % | 4/15/13 | 1,550 | 1,509 | ||||
| Laboratory Corp. of America | 5.500 | % | 2/1/13 | 875 | 842 | ||||
| McKesson Corp. | 7.750 | % | 2/1/12 | 1,475 | 1,508 | ||||
| McKesson Corp. | 5.250 | % | 3/1/13 | 1,500 | 1,398 | ||||
| Medco Health Solutions | 6.125 | % | 3/15/13 | 1,450 | 1,352 | ||||
| Medco Health Solutions | 7.250 | % | 8/15/13 | 800 | 764 | ||||
| Medtronic Inc. | 4.375 | % | 9/15/10 | 1,625 | 1,620 | ||||
| Merck & Co. | 5.125 | % | 11/15/11 | 1,850 | 1,964 | ||||
| Molson Coors Capital Finance | 4.850 | % | 9/22/10 | 300 | 295 | ||||
| Newell Rubbermaid, Inc. | 4.000 | % | 5/1/10 | 1,000 | 940 | ||||
| Newell Rubbermaid, Inc. | 5.500 | % | 4/15/13 | 2,500 | 2,181 | ||||
| PepsiAmericas Inc. | 5.750 | % | 7/31/12 | 800 | 794 | ||||
| Pepsico, Inc. | 5.150 | % | 5/15/12 | 3,250 | 3,427 | ||||
| Pepsico, Inc. | 4.650 | % | 2/15/13 | 2,800 | 2,940 | ||||
| Philip Morris International Inc. | 4.875 | % | 5/16/13 | 5,525 | 5,596 | ||||
| Philips Electronics NV | 4.625 | % | 3/11/13 | 1,450 | 1,375 | ||||
| Procter & Gamble Co. | 4.600 | % | 1/15/14 | 2,000 | 2,069 | ||||
| Quest Diagnostic, Inc. | 5.125 | % | 11/1/10 | 3,500 | 3,417 | ||||
| Reynolds American Inc. | 6.500 | % | 7/15/10 | 1,350 | 1,310 | ||||
| Reynolds American Inc. | 7.250 | % | 6/1/12 | 3,850 | 3,566 | ||||
| Reynolds American Inc. | 7.250 | % | 6/1/13 | 1,500 | 1,343 | ||||
| Safeway, Inc. | 4.950 | % | 8/16/10 | 875 | 871 | ||||
| Safeway, Inc. | 6.500 | % | 3/1/11 | 1,625 | 1,630 | ||||
| Safeway, Inc. | 5.800 | % | 8/15/12 | 3,050 | 3,039 | ||||
| Sara Lee Corp. | 6.250 | % | 9/15/11 | 2,500 | 2,503 | ||||
| Sysco Corp. | 4.200 | % | 2/12/13 | 600 | 603 | ||||
| Unilever Capital Corp. | 7.125 | % | 11/1/10 | 4,550 | 4,870 | ||||
| UST, Inc. | 6.625 | % | 7/15/12 | 1,000 | 961 | ||||
| Whirlpool Corp. | 5.500 | % | 3/1/13 | 3,575 | 2,853 | ||||
| Wyeth | 6.950 | % | 3/15/11 | 5,300 | 5,613 | ||||
| Wyeth | 5.500 | % | 3/15/13 | 5,600 | 5,722 | ||||
| Energy (1.0%) | |||||||||
| Amerada Hess Corp. | 6.650 | % | 8/15/11 | 2,500 | 2,468 | ||||
| Anadarko Finance Co. | 6.750 | % | 5/1/11 | 3,375 | 3,329 | ||||
| Apache Corp. | 6.250 | % | 4/15/12 | 1,000 | 1,051 | ||||
| Apache Corp. | 5.250 | % | 4/15/13 | 1,500 | 1,535 | ||||
| Apache Corp. | 6.000 | % | 9/15/13 | 1,675 | 1,752 | ||||
Page 59
| Vanguard® Short-Term Bond Index Fund | |||||||||
| Schedule of Investments | |||||||||
| December 31, 2008 | |||||||||
| Face | Market | ||||||||
| Maturity | Amount | Value | |||||||
| Coupon | Date | ($ | 000 | ) | ($ | 000 | ) | ||
| BP Capital Markets PLC | 4.875 | % | 3/15/10 | 2,000 | 2,066 | ||||
| BP Capital Markets PLC | 5.250 | % | 11/7/13 | 7,850 | 8,260 | ||||
| Burlington Resources, Inc. | 6.680 | % | 2/15/11 | 2,000 | 2,059 | ||||
| Burlington Resources, Inc. | 6.500 | % | 12/1/11 | 500 | 512 | ||||
| Canadian Natural Resources | 6.700 | % | 7/15/11 | 2,500 | 2,504 | ||||
| Canadian Natural Resources | 5.450 | % | 10/1/12 | 3,550 | 3,344 | ||||
| Canadian Natural Resources | 5.150 | % | 2/1/13 | 500 | 459 | ||||
| Conoco Funding Co. | 6.350 | % | 10/15/11 | 11,375 | 11,950 | ||||
| ConocoPhillips | 8.750 | % | 5/25/10 | 3,800 | 4,068 | ||||
| ConocoPhillips Canada | 5.300 | % | 4/15/12 | 1,700 | 1,716 | ||||
| Devon Financing Corp. | 6.875 | % | 9/30/11 | 9,800 | 9,902 | ||||
| Encana Corp. | 4.750 | % | 10/15/13 | 1,125 | 984 | ||||
| EOG Resources Inc. | 6.125 | % | 10/1/13 | 1,200 | 1,257 | ||||
| Halliburton Co. | 5.500 | % | 10/15/10 | 1,500 | 1,557 | ||||
| Husky Energy Inc. | 6.250 | % | 6/15/12 | 1,000 | 992 | ||||
| Kerr McGee Corp. | 6.875 | % | 9/15/11 | 3,475 | 3,436 | ||||
| Marathon Oil Corp. | 6.125 | % | 3/15/12 | 2,000 | 1,948 | ||||
| Marathon Oil Corp. | 6.000 | % | 7/1/12 | 3,100 | 3,057 | ||||
| Occidental Petroleum | 4.250 | % | 3/15/10 | 2,560 | 2,582 | ||||
| PanCanadian Energy Corp. | 6.300 | % | 11/1/11 | 1,500 | 1,476 | ||||
| Petro-Canada | 4.000 | % | 7/15/13 | 3,210 | 2,764 | ||||
| Shell International Finance BV | 5.625 | % | 6/27/11 | 1,950 | 2,053 | ||||
| Shell International Finance BV | 4.950 | % | 3/22/12 | 700 | 724 | ||||
| Transocean Inc. | 5.250 | % | 3/15/13 | 3,400 | 3,153 | ||||
| Valero Energy Corp. | 6.875 | % | 4/15/12 | 3,000 | 3,027 | ||||
| Weatherford International Inc. | 5.950 | % | 6/15/12 | 2,250 | 2,098 | ||||
| Weatherford International Inc. | 5.150 | % | 3/15/13 | 2,775 | 2,444 | ||||
| XTO Energy, Inc. | 5.000 | % | 8/1/10 | 1,000 | 986 | ||||
| XTO Energy, Inc. | 5.900 | % | 8/1/12 | 8,850 | 8,725 | ||||
| Technology (0.9%) | |||||||||
| Arrow Electronics, Inc. | 6.875 | % | 7/1/13 | 800 | 734 | ||||
| Cisco Systems Inc. | 5.250 | % | 2/22/11 | 10,000 | 10,397 | ||||
| Computer Sciences Corp. | 5.000 | % | 2/15/13 | 1,775 | 1,569 | ||||
| 2 Computer Sciences Corp. | 5.500 | % | 3/15/13 | 725 | 652 | ||||
| Dell Inc. | 4.700 | % | 4/15/13 | 1,550 | 1,439 | ||||
| Dun & Bradstreet Corp. | 6.000 | % | 4/1/13 | 1,700 | 1,615 | ||||
| Electronic Data Systems | 6.000 | % | 8/1/13 | 2,450 | 2,535 | ||||
| Fiserv, Inc. | 6.125 | % | 11/20/12 | 3,000 | 2,811 | ||||
| Hewlett-Packard Co. | 6.500 | % | 7/1/12 | 1,025 | 1,111 | ||||
| Hewlett-Packard Co. | 4.500 | % | 3/1/13 | 11,775 | 12,001 | ||||
| IBM International Group Capital | 5.050 | % | 10/22/12 | 14,400 | 15,109 | ||||
| International Business Machines Corp. | 4.950 | % | 3/22/11 | 2,325 | 2,406 | ||||
| Intuit Inc. | 5.400 | % | 3/15/12 | 950 | 872 | ||||
| Lexmark International Inc. | 5.900 | % | 6/1/13 | 1,050 | 901 | ||||
| Motorola, Inc. | 7.625 | % | 11/15/10 | 390 | 344 | ||||
| Motorola, Inc. | 8.000 | % | 11/1/11 | 925 | 785 | ||||
| Motorola, Inc. | 5.375 | % | 11/15/12 | 3,500 | 2,613 | ||||
| National Semiconductor | 6.150 | % | 6/15/12 | 1,250 | 985 | ||||
| Oracle Corp. | 5.000 | % | 1/15/11 | 6,150 | 6,295 | ||||
| Oracle Corp. | 4.950 | % | 4/15/13 | 3,400 | 3,506 | ||||
| Pitney Bowes, Inc. | 4.625 | % | 10/1/12 | 2,000 | 1,965 | ||||
| Tyco Electronics Group | 6.000 | % | 10/1/12 | 2,550 | 2,063 | ||||
| Xerox Corp. | 7.125 | % | 6/15/10 | 1,825 | 1,714 | ||||
| Xerox Corp. | 6.875 | % | 8/15/11 | 1,025 | 894 | ||||
| Xerox Corp. | 5.500 | % | 5/15/12 | 11,750 | 9,207 | ||||
| Transportation (0.3%) | |||||||||
| Burlington Northern Santa Fe Corp. | 7.125 | % | 12/15/10 | 1,500 | 1,549 | ||||
| Burlington Northern Santa Fe Corp. | 6.750 | % | 7/15/11 | 2,500 | 2,567 | ||||
| Burlington Northern Santa Fe Corp. | 5.900 | % | 7/1/12 | 1,050 | 1,054 | ||||
| Canadian Pacific Railway Co. | 6.250 | % | 10/15/11 | 1,550 | 1,506 | ||||
| Canadian Pacific Railway Co. | 5.750 | % | 5/15/13 | 1,000 | 929 | ||||
| CSX Corp. | 6.300 | % | 3/15/12 | 2,000 | 1,966 | ||||
| Delta Air Lines Enhanced Equipment Trust Certificates | 6.417 | % | 7/2/12 | 2,000 | 1,445 | ||||
Page 60
| Vanguard® Short-Term Bond Index Fund | |||||||||
| Schedule of Investments | |||||||||
| December 31, 2008 | |||||||||
| Face | Market | ||||||||
| Maturity | Amount | Value | |||||||
| Coupon | Date | ($ | 000 | ) | ($ | 000 | ) | ||
| Delta Air Lines, Inc. | 7.111 | % | 9/18/11 | 4,327 | 3,332 | ||||
| Norfolk Southern Corp. | 6.750 | % | 2/15/11 | 2,925 | 2,974 | ||||
| Ryder System Inc. | 5.950 | % | 5/2/11 | 850 | 763 | ||||
| Ryder System Inc. | 6.000 | % | 3/1/13 | 1,500 | 1,211 | ||||
| Southwest Airlines Co. | 6.500 | % | 3/1/12 | 2,000 | 1,884 | ||||
| Union Pacific Corp. | 6.650 | % | 1/15/11 | 2,000 | 2,015 | ||||
| Union Pacific Corp. | 6.500 | % | 4/15/12 | 4,750 | 4,866 | ||||
| United Parcel Service of America | 4.500 | % | 1/15/13 | 2,750 | 2,880 | ||||
| 1,059,247 | |||||||||
| Utilities (1.8%) | |||||||||
| Electric (1.3%) | |||||||||
| American Electric Power Co., Inc. | 5.375 | % | 3/15/10 | 5,825 | 5,837 | ||||
| Carolina Power & Light Co. | 6.500 | % | 7/15/12 | 1,000 | 1,019 | ||||
| CenterPoint Energy Houston | 5.700 | % | 3/15/13 | 700 | 652 | ||||
| Cincinnati Gas & Electric Co. | 5.700 | % | 9/15/12 | 2,400 | 2,360 | ||||
| Commonwealth Edison Co. | 6.150 | % | 3/15/12 | 3,275 | 3,229 | ||||
| Consolidated Edison Co. of New York | 4.875 | % | 2/1/13 | 4,000 | 3,918 | ||||
| Constellation Energy Group, Inc. | 6.125 | % | 9/1/09 | 875 | 869 | ||||
| Constellation Energy Group, Inc. | 7.000 | % | 4/1/12 | 2,300 | 2,075 | ||||
| Consumers Energy Co. | 5.000 | % | 2/15/12 | 1,250 | 1,213 | ||||
| Consumers Energy Co. | 5.375 | % | 4/15/13 | 750 | 736 | ||||
| Dayton Power & Light | 5.125 | % | 10/1/13 | 1,875 | 1,905 | ||||
| Detroit Edison Co. | 6.125 | % | 10/1/10 | 1,000 | 1,020 | ||||
| Dominion Resources, Inc. | 4.750 | % | 12/15/10 | 2,125 | 2,063 | ||||
| 3 Dominion Resources, Inc. | 6.300 | % | 9/30/11 | 3,400 | 1,580 | ||||
| Dominion Resources, Inc. | 5.000 | % | 3/15/13 | 1,500 | 1,473 | ||||
| DTE Energy Co. | 7.050 | % | 6/1/11 | 1,000 | 991 | ||||
| 2 Duke Energy Carolinas LLC | 5.750 | % | 11/15/13 | 1,500 | 1,568 | ||||
| Duke Energy Corp. | 6.250 | % | 1/15/12 | 3,500 | 3,630 | ||||
| Energy East Corp. | 6.750 | % | 6/15/12 | 1,750 | 1,750 | ||||
| Entergy Arkansas Inc. | 5.400 | % | 8/1/13 | 1,000 | 942 | ||||
| Exelon Corp. | 6.750 | % | 5/1/11 | 1,000 | 989 | ||||
| Exelon Generation Co. LLC | 6.950 | % | 6/15/11 | 1,500 | 1,489 | ||||
| FirstEnergy Corp. | 6.450 | % | 11/15/11 | 6,875 | 6,710 | ||||
| Florida Power & Light Co. | 4.850 | % | 2/1/13 | 250 | 251 | ||||
| Florida Power Corp. | 4.500 | % | 6/1/10 | 1,150 | 1,143 | ||||
| FPL Group Capital, Inc. | 5.625 | % | 9/1/11 | 3,575 | 3,701 | ||||
| FPL Group Capital, Inc. | 5.350 | % | 6/15/13 | 400 | 402 | ||||
| Georgia Power Co. | 6.000 | % | 11/1/13 | 2,000 | 2,143 | ||||
| MidAmerican Energy Co. | 5.650 | % | 7/15/12 | 1,150 | 1,152 | ||||
| MidAmerican Energy Co. | 5.125 | % | 1/15/13 | 2,000 | 1,963 | ||||
| National Rural Utilities Cooperative Finance Corp. | 4.375 | % | 10/1/10 | 3,350 | 3,383 | ||||
| National Rural Utilities Cooperative Finance Corp. | 7.250 | % | 3/1/12 | 5,000 | 5,324 | ||||
| National Rural Utilities Cooperative Finance Corp. | 5.500 | % | 7/1/13 | 2,650 | 2,504 | ||||
| NiSource Finance Corp. | 7.875 | % | 11/15/10 | 2,800 | 2,578 | ||||
| NiSource Finance Corp. | 6.150 | % | 3/1/13 | 1,975 | 1,491 | ||||
| NStar Electric Co. | 4.875 | % | 10/15/12 | 1,925 | 1,927 | ||||
| Ohio Power Co. | 5.750 | % | 9/1/13 | 1,575 | 1,550 | ||||
| Oncor Electric Delivery Co. | 6.375 | % | 5/1/12 | 1,950 | 1,933 | ||||
| Pacific Gas & Electric Co. | 4.200 | % | 3/1/11 | 1,100 | 1,080 | ||||
| PacifiCorp | 6.900 | % | 11/15/11 | 3,650 | 3,843 | ||||
| Pepco Holdings, Inc. | 6.450 | % | 8/15/12 | 2,000 | 1,872 | ||||
| PPL Energy Supply LLC | 6.400 | % | 11/1/11 | 1,000 | 960 | ||||
| PPL Energy Supply LLC | 6.300 | % | 7/15/13 | 950 | 892 | ||||
| Progress Energy, Inc. | 7.100 | % | 3/1/11 | 9,918 | 9,940 | ||||
| Progress Energy, Inc. | 6.850 | % | 4/15/12 | 775 | 784 | ||||
| PSE&G Power LLC | 7.750 | % | 4/15/11 | 1,950 | 1,946 | ||||
| PSE&G Power LLC | 6.950 | % | 6/1/12 | 4,775 | 4,697 | ||||
| PSI Energy Inc. | 5.000 | % | 9/15/13 | 1,125 | 1,069 | ||||
| Public Service Co. of Colorado | 7.875 | % | 10/1/12 | 4,625 | 4,912 | ||||
| Public Service Electric & Gas | 5.375 | % | 9/1/13 | 2,000 | 1,938 | ||||
| SCANA Corp. | 6.875 | % | 5/15/11 | 1,500 | 1,539 | ||||
| Southern Co. | 5.300 | % | 1/15/12 | 2,550 | 2,579 | ||||
| Southern Power Co. | 6.250 | % | 7/15/12 | 1,000 | 1,010 | ||||
| Tampa Electric Co. | 6.875 | % | 6/15/12 | 1,000 | 992 |
Page 61
| Vanguard® Short-Term Bond Index Fund | |||||||||
| Schedule of Investments | |||||||||
| December 31, 2008 | |||||||||
| Face | Market | ||||||||
| Maturity | Amount | Value | |||||||
| Coupon | Date | ($ | 000 | ) | ($ | 000 | ) | ||
| Tampa Electric Co. | 6.375 | % | 8/15/12 | 2,000 | 1,952 | ||||
| Virginia Electric & Power Co. | 5.100 | % | 11/30/12 | 4,625 | 4,522 | ||||
| Wisconsin Energy Corp. | 6.500 | % | 4/1/11 | 4,595 | 4,721 | ||||
| Natural Gas (0.5%) | |||||||||
| AGL Capital Corp. | 7.125 | % | 1/14/11 | 500 | 504 | ||||
| CenterPoint Energy Resources | 7.875 | % | 4/1/13 | 1,500 | 1,488 | ||||
| Consolidated Natural Gas | 6.250 | % | 11/1/11 | 1,000 | 1,022 | ||||
| Duke Capital Corp. | 6.250 | % | 2/15/13 | 3,325 | 3,226 | ||||
| Duke Energy Field Services | 7.875 | % | 8/16/10 | 4,000 | 4,008 | ||||
| Energy Transfer Partners LP | 5.650 | % | 8/1/12 | 1,250 | 1,135 | ||||
| Energy Transfer Partners LP | 6.000 | % | 7/1/13 | 1,500 | 1,350 | ||||
| 5 Enron Corp. | 9.125 | % | 4/1/03 | 2,000 | 10 | ||||
| 5 Enron Corp. | 7.625 | % | 9/10/04 | 1,000 | 5 | ||||
| Enterprise Products Operating LP | 4.950 | % | 6/1/10 | 7,175 | 6,937 | ||||
| Enterprise Products Operating LP | 5.650 | % | 4/1/13 | 2,200 | 1,970 | ||||
| 5 HNG Internorth | 9.625 | % | 3/15/06 | 1,500 | 7 | ||||
| KeySpan Corp. | 7.625 | % | 11/15/10 | 1,500 | 1,561 | ||||
| Kinder Morgan Energy Partners LP | 6.750 | % | 3/15/11 | 1,225 | 1,186 | ||||
| Kinder Morgan Energy Partners LP | 7.125 | % | 3/15/12 | 550 | 511 | ||||
| Kinder Morgan Energy Partners LP | 5.850 | % | 9/15/12 | 3,000 | 2,762 | ||||
| ONEOK Inc. | 7.125 | % | 4/15/11 | 2,000 | 1,989 | ||||
| ONEOK Partners, LP | 5.900 | % | 4/1/12 | 3,400 | 3,205 | ||||
| Reliant Energy Resources | 7.750 | % | 2/15/11 | 2,500 | 2,551 | ||||
| Sempra Energy | 7.950 | % | 3/1/10 | 1,500 | 1,518 | ||||
| Sempra Energy | 6.000 | % | 2/1/13 | 2,525 | 2,433 | ||||
| Teppco Partners, LP | 5.900 | % | 4/15/13 | 1,150 | 1,032 | ||||
| Trans-Canada Pipelines | 4.000 | % | 6/15/13 | 1,650 | 1,482 | ||||
| Transcontinental Gas Pipe Line Corp. | 7.000 | % | 8/15/11 | 650 | 642 | ||||
| Valero Logistics | 6.050 | % | 3/15/13 | 2,000 | 1,790 | ||||
| Williams Cos., Inc. | 7.125 | % | 9/1/11 | 2,125 | 1,934 | ||||
| Williams Cos., Inc. | 8.125 | % | 3/15/12 | 2,100 | 1,953 | ||||
| 178,922 | |||||||||
| Total Corporate Bonds (Cost $2,507,862) | 2,412,174 | ||||||||
| Sovereign Bonds (U.S. Dollar-Denominated) (5.9%) | |||||||||
| Asian Development Bank | 4.500 | % | 9/4/12 | 5,000 | 5,367 | ||||
| Asian Development Bank | 3.625 | % | 9/5/13 | 5,850 | 6,140 | ||||
| Canada Mortgage & Housing Corp. | 4.800 | % | 10/1/10 | 1,500 | 1,576 | ||||
| Canadian Mortgage & Housing Corp. | 5.000 | % | 9/1/11 | 4,000 | 4,286 | ||||
| Corp. Andina de Fomento | 6.875 | % | 3/15/12 | 2,300 | 2,235 | ||||
| Corp. Andina de Fomento | 5.200 | % | 5/21/13 | 2,575 | 2,305 | ||||
| Eksportfinans | 5.125 | % | 10/26/11 | 6,000 | 6,290 | ||||
| European Investment Bank | 5.000 | % | 2/8/10 | 3,350 | 3,468 | ||||
| European Investment Bank | 4.000 | % | 3/3/10 | 2,925 | 2,995 | ||||
| European Investment Bank | 4.125 | % | 9/15/10 | 3,600 | 3,718 | ||||
| European Investment Bank | 4.625 | % | 9/15/10 | 19,750 | 20,646 | ||||
| European Investment Bank | 3.250 | % | 2/15/11 | 15,425 | 15,795 | ||||
| European Investment Bank | 2.625 | % | 5/16/11 | 3,800 | 3,847 | ||||
| European Investment Bank | 5.250 | % | 6/15/11 | 12,975 | 13,897 | ||||
| European Investment Bank | 3.125 | % | 7/15/11 | 16,425 | 16,782 | ||||
| European Investment Bank | 3.250 | % | 10/14/11 | 4,775 | 4,918 | ||||
| European Investment Bank | 2.625 | % | 11/15/11 | 10,450 | 10,627 | ||||
| European Investment Bank | 4.625 | % | 3/21/12 | 21,700 | 23,291 | ||||
| European Investment Bank | 4.250 | % | 7/15/13 | 16,950 | 18,120 | ||||
| Export Development Canada | 3.750 | % | 7/15/11 | 2,575 | 2,717 | ||||
| Export Development Canada | 2.625 | % | 11/15/11 | 3,300 | 3,387 | ||||
| Export Development Canada | 4.500 | % | 10/25/12 | 7,500 | 8,274 | ||||
| Export-Import Bank of Korea | 4.625 | % | 3/16/10 | 500 | 474 | ||||
| Export-Import Bank of Korea | 5.125 | % | 2/14/11 | 600 | 563 | ||||
| Export-Import Bank of Korea | 5.500 | % | 10/17/12 | 7,850 | 7,304 | ||||
| Federation of Malaysia | 7.500 | % | 7/15/11 | 2,875 | 3,082 | ||||
| Federative Republic of Brazil | 9.250 | % | 10/22/10 | 8,225 | 8,986 | ||||
| Federative Republic of Brazil | 11.000 | % | 1/11/12 | 3,875 | 4,602 | ||||
| Financement Quebec | 5.000 | % | 10/25/12 | 2,000 | 2,162 | ||||
Page 62
| Vanguard® Short-Term Bond Index Fund | |||||||||
| Schedule of Investments | |||||||||
| December 31, 2008 | |||||||||
| Face | Market | ||||||||
| Maturity | Amount | Value | |||||||
| Coupon | Date | ($ | 000 | ) | ($ | 000 | ) | ||
| Inter-American Development Bank | 7.375 | % | 1/15/10 | 2,800 | 2,952 | ||||
| Inter-American Development Bank | 5.000 | % | 4/5/11 | 5,000 | 5,329 | ||||
| Inter-American Development Bank | 3.250 | % | 11/15/11 | 4,500 | 4,656 | ||||
| Inter-American Development Bank | 4.750 | % | 10/19/12 | 12,500 | 13,513 | ||||
| Inter-American Development Bank | 3.500 | % | 3/15/13 | 3,000 | 3,108 | ||||
| International Bank for Reconstruction & Development | 3.625 | % | 5/21/13 | 5,500 | 5,745 | ||||
| International Finance Corp. | 4.000 | % | 6/15/10 | 1,250 | 1,305 | ||||
| International Finance Corp. | 5.125 | % | 5/2/11 | 7,100 | 7,519 | ||||
| Japan Bank International | 4.750 | % | 5/25/11 | 2,150 | 2,271 | ||||
| Japan Bank International | 4.375 | % | 11/26/12 | 2,200 | 2,310 | ||||
| Japan Bank International | 4.250 | % | 6/18/13 | 6,150 | 6,357 | ||||
| Japan Finance Corp. | 5.875 | % | 3/14/11 | 2,000 | 2,135 | ||||
| KFW International Finance Inc. | 3.250 | % | 10/14/11 | 10,950 | 11,281 | ||||
| Korea Development Bank | 5.300 | % | 1/17/13 | 4,650 | 4,288 | ||||
| Korea Development Bank | 5.750 | % | 9/10/13 | 5,525 | 4,714 | ||||
| Kreditanstalt fur Wiederaufbau | 4.250 | % | 6/15/10 | 17,875 | 18,465 | ||||
| Kreditanstalt fur Wiederaufbau | 3.250 | % | 2/15/11 | 15,000 | 15,379 | ||||
| Kreditanstalt fur Wiederaufbau | 3.750 | % | 6/27/11 | 8,825 | 9,170 | ||||
| Kreditanstalt fur Wiederaufbau | 4.750 | % | 5/15/12 | 21,700 | 23,418 | ||||
| Kreditanstalt fur Wiederaufbau | 3.250 | % | 3/15/13 | 4,350 | 4,472 | ||||
| Kreditanstalt fur Wiederaufbau | 3.500 | % | 5/16/13 | 12,375 | 12,838 | ||||
| Kreditanstalt fur Wiederaufbau | 4.000 | % | 10/15/13 | 6,125 | 6,483 | ||||
| Landeskreditbank Baden-Wuerttemberg - Foerderbank | 4.250 | % | 9/15/10 | 3,500 | 3,652 | ||||
| Landeskreditbank Baden-Wuerttemberg - Foerderbank | 4.875 | % | 1/13/12 | 1,500 | 1,631 | ||||
| Landwirtschaftliche Rentenbank | 3.875 | % | 3/15/10 | 3,500 | 3,618 | ||||
| Landwirtschaftliche Rentenbank | 4.875 | % | 2/14/11 | 6,000 | 6,284 | ||||
| Landwirtschaftliche Rentenbank | 5.250 | % | 7/15/11 | 3,500 | 3,730 | ||||
| Landwirtschaftliche Rentenbank | 5.250 | % | 7/2/12 | 4,500 | 4,911 | ||||
| Landwirtschaftliche Rentenbank | 3.250 | % | 3/15/13 | 2,100 | 2,162 | ||||
| Mass Transit Railway Corp. | 7.500 | % | 11/8/10 | 1,500 | 1,621 | ||||
| Nordic Investment Bank | 3.875 | % | 6/15/10 | 3,750 | 3,868 | ||||
| Nordic Investment Bank | 4.500 | % | 9/13/10 | 5,000 | 5,220 | ||||
| Nordic Investment Bank | 3.125 | % | 2/15/11 | 6,000 | 6,147 | ||||
| Oesterreichische Kontrollbank | 4.250 | % | 10/6/10 | 3,375 | 3,548 | ||||
| Oesterreichische Kontrollbank | 2.875 | % | 3/15/11 | 1,000 | 1,027 | ||||
| Oesterreichische Kontrollbank | 3.125 | % | 10/14/11 | 450 | 468 | ||||
| Oesterreichische Kontrollbank | 4.750 | % | 11/8/11 | 13,500 | 14,370 | ||||
| Oesterreichische Kontrollbank | 4.750 | % | 10/16/12 | 4,725 | 5,087 | ||||
| Ontario Hydro Electric | 7.450 | % | 3/31/13 | 1,000 | 1,211 | ||||
| Pemex Project Funding Master Trust | 9.125 | % | 10/13/10 | 2,500 | 2,628 | ||||
| Petrobras International Finance | 9.125 | % | 7/2/13 | 2,500 | 2,759 | ||||
| Province of Ontario | 3.125 | % | 9/8/10 | 3,975 | 4,017 | ||||
| Province of Ontario | 2.750 | % | 2/22/11 | 3,900 | 3,922 | ||||
| Province of Ontario | 3.375 | % | 5/20/11 | 950 | 969 | ||||
| Province of Ontario | 5.000 | % | 10/18/11 | 12,450 | 13,046 | ||||
| Province of Ontario | 3.500 | % | 7/15/13 | 6,000 | 6,053 | ||||
| Province of Quebec | 6.125 | % | 1/22/11 | 4,200 | 4,501 | ||||
| Province of Saskatchewan | 7.375 | % | 7/15/13 | 1,000 | 1,242 | ||||
| Quebec Hydro Electric | 6.300 | % | 5/11/11 | 2,500 | 2,674 | ||||
| Quebec Hydro Electric | 8.000 | % | 2/1/13 | 2,000 | 2,365 | ||||
| Republic of Chile | 7.125 | % | 1/11/12 | 3,000 | 3,373 | ||||
| Republic of Chile | 5.500 | % | 1/15/13 | 3,200 | 3,490 | ||||
| Republic of Italy | 6.000 | % | 2/22/11 | 5,775 | 6,167 | ||||
| Republic of Italy | 3.500 | % | 7/15/11 | 2,925 | 3,016 | ||||
| Republic of Italy | 5.625 | % | 6/15/12 | 16,600 | 18,091 | ||||
| Republic of Korea | 4.250 | % | 6/1/13 | 3,225 | 3,016 | ||||
| Republic of Peru | 9.125 | % | 2/21/12 | 2,500 | 2,675 | ||||
| Republic of Poland | 6.250 | % | 7/3/12 | 2,600 | 2,695 | ||||
| Republic of South Africa | 7.375 | % | 4/25/12 | 2,500 | 2,469 | ||||
| State of Israel | 4.625 | % | 6/15/13 | 2,350 | 2,462 | ||||
| Swedish Export Credit Corp. | 4.875 | % | 1/19/10 | 2,500 | 2,568 | ||||
| Swedish Export Credit Corp. | 4.000 | % | 6/15/10 | 2,175 | 2,239 | ||||
| Swedish Export Credit Corp. | 4.500 | % | 9/27/10 | 8,350 | 8,646 | ||||
| United Mexican States | 9.875 | % | 2/1/10 | 475 | 509 |
Page 63
| Vanguard® Short-Term Bond Index Fund | |||||||||
| Schedule of Investments | |||||||||
| December 31, 2008 | |||||||||
| Face | Market | ||||||||
| Maturity | Amount | Value | |||||||
| Coupon | Date | ($ | 000 | ) | ($ | 000 | ) | ||
| United Mexican States | 8.375 | % | 1/14/11 | 11,600 | 12,528 | ||||
| United Mexican States | 7.500 | % | 1/14/12 | 2,100 | 2,257 | ||||
| United Mexican States | 6.375 | % | 1/16/13 | 2,450 | 2,554 | ||||
| Total Sovereign Bonds (Cost $549,090) | 567,048 | ||||||||
| Shares | |||||||||
| Temporary Cash Investments (2.2%) | |||||||||
| 6 Vanguard Market Liquidity Fund (Cost $209,993) | 1.378 | % | 1/5/09 | 209,993,016 | 209,993 | ||||
| Total Investments (101.3%) (Cost $9,615,424) | 9,793,534 | ||||||||
| Other Assets and Liabilities—Net (–1.3%) | (121,080 | ) | |||||||
| Net Assets (100%) | 9,672,454 | ||||||||
1 The issuer operates under a congressional charter; its securities are neither issued nor guaranteed by the U.S. government.
2 Security exempt from registration under Rule 144A of the Securities Act of 1933. Such securities may be sold in transactions exempt from registration, normally to qualified institutional buyers. At December 31, 2008, the aggregate value of these securities was $23,999,000, representing 0.2% of net assets.
3 The average or expected maturity is shorter than the final maturity shown because of the possibility of interim principal payments and prepayments or the possibility of the issue being called.
4 Guaranteed by the Federal Deposit Insurance Corporation (FDIC) as part of the Temporary Liquidity Guarantee Program.
5 Non-Income Producing; Defaulted Bond.
6 Affiliated money market fund available only to Vanguard funds and certain trusts and accounts managed by Vanguard.
Rate shown is the 7-day yield.
Page 64
| Vanguard® Intermediate-Term Bond Index Fund | ||||||||||
| Schedule of Investments | ||||||||||
| December 31, 2008 | ||||||||||
| Face | Market | |||||||||
| Maturity | Amount | Value | ||||||||
| Coupon | Date | ($ | 000 | ) | ($ | 000 | ) | |||
| U.S. Government and Agency Obligations (52.2%) | ||||||||||
| U.S. Government Securities (41.0%) | ||||||||||
| U.S. Treasury Bond | 11.250 | % | 2/15/15 | 85,615 | 130,001 | |||||
| U.S. Treasury Bond | 10.625 | % | 8/15/15 | 98,410 | 148,984 | |||||
| U.S. Treasury Bond | 9.875 | % | 11/15/15 | 102,200 | 152,406 | |||||
| U.S. Treasury Bond | 9.250 | % | 2/15/16 | 106,370 | 155,317 | |||||
| U.S. Treasury Bond | 7.250 | % | 5/15/16 | 100,325 | 134,419 | |||||
| U.S. Treasury Bond | 7.500 | % | 11/15/16 | 164,345 | 224,665 | |||||
| U.S. Treasury Bond | 8.750 | % | 5/15/17 | 146,870 | 216,450 | |||||
| U.S. Treasury Bond | 8.875 | % | 8/15/17 | 113,285 | 168,936 | |||||
| U.S. Treasury Bond | 9.125 | % | 5/15/18 | 104,495 | 161,837 | |||||
| U.S. Treasury Bond | 8.875 | % | 2/15/19 | 21,850 | 33,646 | |||||
| U.S. Treasury Note | 3.125 | % | 11/30/09 | 780 | 800 | |||||
| U.S. Treasury Note | 2.125 | % | 1/31/10 | 3,800 | 3,869 | |||||
| U.S. Treasury Note | 2.625 | % | 5/31/10 | 2,560 | 2,637 | |||||
| U.S. Treasury Note | 4.875 | % | 6/30/12 | 8,350 | 9,387 | |||||
| U.S. Treasury Note | 3.875 | % | 10/31/12 | 14,125 | 15,635 | |||||
| U.S. Treasury Note | 3.375 | % | 6/30/13 | 2,975 | 3,243 | |||||
| U.S. Treasury Note | 3.375 | % | 7/31/13 | 36,775 | 40,165 | |||||
| U.S. Treasury Note | 3.125 | % | 8/31/13 | 16,745 | 18,051 | |||||
| U.S. Treasury Note | 3.125 | % | 9/30/13 | 32,825 | 35,410 | |||||
| U.S. Treasury Note | 2.750 | % | 10/31/13 | 96,175 | 102,247 | |||||
| U.S. Treasury Note | 4.250 | % | 11/15/13 | 22,345 | 25,498 | |||||
| U.S. Treasury Note | 2.000 | % | 11/30/13 | 93,575 | 96,016 | |||||
| U.S. Treasury Note | 1.500 | % | 12/31/13 | 43,875 | 43,765 | |||||
| U.S. Treasury Note | 4.000 | % | 2/15/14 | 13,160 | 14,920 | |||||
| U.S. Treasury Note | 4.750 | % | 5/15/14 | 3,180 | 3,741 | |||||
| U.S. Treasury Note | 4.250 | % | 8/15/14 | 1,745 | 2,006 | |||||
| U.S. Treasury Note | 4.000 | % | 2/15/15 | 23,175 | 26,405 | |||||
| U.S. Treasury Note | 4.125 | % | 5/15/15 | 49,470 | 56,736 | |||||
| U.S. Treasury Note | 4.250 | % | 8/15/15 | 71,450 | 83,027 | |||||
| U.S. Treasury Note | 4.500 | % | 11/15/15 | 7,000 | 8,306 | |||||
| U.S. Treasury Note | 4.500 | % | 2/15/16 | 15,450 | 18,195 | |||||
| U.S. Treasury Note | 5.125 | % | 5/15/16 | 102,800 | 124,517 | |||||
| U.S. Treasury Note | 4.875 | % | 8/15/16 | 127,380 | 152,219 | |||||
| U.S. Treasury Note | 4.625 | % | 11/15/16 | 35,400 | 41,844 | |||||
| U.S. Treasury Note | 4.625 | % | 2/15/17 | 160,290 | 189,894 | |||||
| U.S. Treasury Note | 4.500 | % | 5/15/17 | 221,720 | 260,625 | |||||
| U.S. Treasury Note | 4.750 | % | 8/15/17 | 173,475 | 207,790 | |||||
| U.S. Treasury Note | 4.250 | % | 11/15/17 | 11,405 | 13,315 | |||||
| U.S. Treasury Note | 3.500 | % | 2/15/18 | 30,100 | 33,388 | |||||
| U.S. Treasury Note | 4.000 | % | 8/15/18 | 93,875 | 108,631 | |||||
| U.S. Treasury Note | 3.750 | % | 11/15/18 | 230,535 | 261,477 | |||||
| 3,530,420 | ||||||||||
| Agency Bonds and Notes (11.2%) | ||||||||||
| Agency for International Development - Egypt | ||||||||||
| (U.S. Government Guaranteed) | 4.450 | % | 9/15/15 | 6,825 | 7,469 | |||||
| 1 | Federal Farm Credit Bank | 4.875 | % | 12/16/15 | 2,450 | 2,720 | ||||
| 1 | Federal Farm Credit Bank | 5.125 | % | 8/25/16 | 11,300 | 12,825 | ||||
| 1 | Federal Farm Credit Bank | 4.875 | % | 1/17/17 | 5,750 | 6,378 | ||||
| 1 | Federal Home Loan Bank | 5.250 | % | 6/18/14 | 150 | 170 | ||||
| 1 | Federal Home Loan Bank | 5.500 | % | 8/13/14 | 54,425 | 62,306 | ||||
| 1 | Federal Home Loan Bank | 5.000 | % | 12/21/15 | 11,660 | 13,068 | ||||
| 1 | Federal Home Loan Bank | 5.375 | % | 5/18/16 | 27,850 | 31,778 | ||||
| 1 | Federal Home Loan Bank | 5.625 | % | 6/13/16 | 4,325 | 4,604 | ||||
| 1 | Federal Home Loan Bank | 5.125 | % | 10/19/16 | 3,800 | 4,271 | ||||
| 1 | Federal Home Loan Bank | 4.750 | % | 12/16/16 | 30,500 | 33,758 | ||||
| 1 | Federal Home Loan Bank | 4.875 | % | 5/17/17 | 24,225 | 27,190 | ||||
| 1 | Federal Home Loan Bank | 5.000 | % | 11/17/17 | 25,700 | 29,255 | ||||
| 1 | Federal Home Loan Bank | 5.375 | % | 8/15/18 | 6,000 | 7,004 | ||||
| 1 | Federal Home Loan Mortgage Corp. | 4.500 | % | 1/15/14 | 12,300 | 13,511 | ||||
| 1 | Federal Home Loan Mortgage Corp. | 5.000 | % | 7/15/14 | 58,525 | 65,748 | ||||
| 1 | Federal Home Loan Mortgage Corp. | 4.500 | % | 1/15/15 | 23,050 | 25,316 | ||||
| 1 | Federal Home Loan Mortgage Corp. | 5.050 | % | 1/26/15 | 4,700 | 5,272 | ||||
| 1 | Federal Home Loan Mortgage Corp. | 4.750 | % | 1/19/16 | 27,925 | 30,948 | ||||
| 1 | Federal Home Loan Mortgage Corp. | 5.250 | % | 4/18/16 | 49,000 | 55,821 | ||||
Page 65
| Vanguard® Intermediate-Term Bond Index Fund | |||||||||||
| Schedule of Investments | |||||||||||
| December 31, 2008 | |||||||||||
| Face | Market | ||||||||||
| Maturity | Amount | Value | |||||||||
| Coupon | Date | ($ | 000 | ) | ($ | 000 | ) | ||||
| 1 | Federal Home Loan Mortgage Corp. | 5.500 | % | 7/18/16 | 42,500 | 49,323 | |||||
| 1 | Federal Home Loan Mortgage Corp. | 5.125 | % | 10/18/16 | 12,100 | 13,778 | |||||
| 1 | Federal Home Loan Mortgage Corp. | 5.000 | % | 2/16/17 | 17,000 | 19,307 | |||||
| 1 | Federal Home Loan Mortgage Corp. | 5.125 | % | 11/17/17 | 39,500 | 45,640 | |||||
| 1 | Federal Home Loan Mortgage Corp. | 4.875 | % | 6/13/18 | 27,100 | 31,092 | |||||
| 1 | Federal Home Loan Mortgage Corp. | 5.000 | % | 12/14/18 | 11,900 | 11,638 | |||||
| 1 | Federal National Mortgage Assn. | 3.250 | % | 2/15/09 | 10,000 | 10,036 | |||||
| 1 | Federal National Mortgage Assn. | 5.125 | % | 1/2/14 | 9,550 | 9,664 | |||||
| 1 | Federal National Mortgage Assn. | 4.125 | % | 4/15/14 | 25,600 | 27,657 | |||||
| 1 | Federal National Mortgage Assn. | 4.625 | % | 10/15/14 | 32,225 | 35,613 | |||||
| 1 | Federal National Mortgage Assn. | 5.000 | % | 4/15/15 | 25,000 | 28,161 | |||||
| 1 | Federal National Mortgage Assn. | 4.375 | % | 10/15/15 | 22,100 | 24,105 | |||||
| 1 | Federal National Mortgage Assn. | 5.000 | % | 3/15/16 | 13,000 | 14,590 | |||||
| 1 | Federal National Mortgage Assn. | 5.250 | % | 9/15/16 | 32,925 | 37,699 | |||||
| 1 | Federal National Mortgage Assn. | 4.875 | % | 12/15/16 | 29,900 | 33,532 | |||||
| 1 | Federal National Mortgage Assn. | 5.000 | % | 2/13/17 | 35,825 | 40,655 | |||||
| 1 | Federal National Mortgage Assn. | 5.000 | % | 5/11/17 | 26,000 | 29,618 | |||||
| 1 | Federal National Mortgage Assn. | 5.375 | % | 6/12/17 | 25,000 | 29,243 | |||||
| 1 | Financing Corp. | 10.350 | % | 8/3/18 | 1,700 | 2,694 | |||||
| 1 | Financing Corp. | 9.650 | % | 11/2/18 | 2,090 | 3,217 | |||||
| 1 | Tennessee Valley Auth. | 6.000 | % | 3/15/13 | 6,000 | 6,871 | |||||
| 1 | Tennessee Valley Auth. | 4.750 | % | 8/1/13 | 4,000 | 4,396 | |||||
| 1 | Tennessee Valley Auth. | 4.375 | % | 6/15/15 | 7,000 | 7,581 | |||||
| 1 | Tennessee Valley Auth. | 5.500 | % | 7/18/17 | 6,200 | 7,195 | |||||
| 1 | Tennessee Valley Auth. | 6.250 | % | 12/15/17 | 2,600 | 3,211 | |||||
| 1 | Tennessee Valley Auth. | 4.500 | % | 4/1/18 | 2,375 | 2,619 | |||||
| 968,547 | |||||||||||
| Total U.S. Government and Agency Obligations (Cost $4,038,039) | 4,498,967 | ||||||||||
| Corporate Bonds (38.5%) | |||||||||||
| Asset | -Backed/Commercial Mortgage-Backed Securities (0.0%) | ||||||||||
| 2 | Bear Stearns Commercial Mortgage Securities, Inc. | 5.610 | % | 11/15/33 | 2,500 | 2,223 | |||||
| 2,3 | Commercial Mortgage Lease-Backed Certificates | 6.746 | % | 6/20/31 | 323 | 338 | |||||
| 2,561 | |||||||||||
| Finance (17.0%) | |||||||||||
| Banking (10.8%) | |||||||||||
| ABN AMRO Bank NV | 4.650 | % | 6/4/18 | 1,925 | 1,546 | ||||||
| American Exoress Co. | 7.000 | % | 3/19/18 | 11,100 | 11,304 | ||||||
| American Express Bank, FSB | 6.000 | % | 9/13/17 | 3,325 | 2,955 | ||||||
| American Express Centurion Bank | 5.950 | % | 6/12/17 | 3,275 | 3,041 | ||||||
| American Express Centurion Bank | 6.000 | % | 9/13/17 | 4,125 | 3,875 | ||||||
| American Express Co. | 5.500 | % | 9/12/16 | 1,400 | 1,294 | ||||||
| American Express Co. | 6.150 | % | 8/28/17 | 9,750 | 9,509 | ||||||
| 2 | American Express Co. | 6.800 | % | 9/1/66 | 3,525 | 1,934 | |||||
| American Express Credit Corp. | 5.300 | % | 12/2/15 | 2,000 | 1,749 | ||||||
| AmSouth Bank NA | 5.200 | % | 4/1/15 | 2,650 | 2,016 | ||||||
| Associates Corp. of North America | 6.950 | % | 11/1/18 | 1,150 | 1,168 | ||||||
| 3 | Banco Bilbao Vizcaya ARG | 5.750 | % | 7/20/17 | 3,125 | 3,130 | |||||
| Bank of America Corp. | 5.375 | % | 6/15/14 | 3,425 | 3,417 | ||||||
| Bank of America Corp. | 5.125 | % | 11/15/14 | 4,550 | 4,389 | ||||||
| Bank of America Corp. | 5.250 | % | 12/1/15 | 1,900 | 1,723 | ||||||
| Bank of America Corp. | 5.750 | % | 8/15/16 | 3,900 | 3,682 | ||||||
| Bank of America Corp. | 5.625 | % | 10/14/16 | 17,150 | 16,934 | ||||||
| Bank of America Corp. | 5.300 | % | 3/15/17 | 15,550 | 14,933 | ||||||
| Bank of America Corp. | 5.420 | % | 3/15/17 | 10,200 | 9,074 | ||||||
| Bank of America Corp. | 6.100 | % | 6/15/17 | 2,100 | 2,096 | ||||||
| Bank of America Corp. | 6.000 | % | 9/1/17 | 4,150 | 4,226 | ||||||
| Bank of America Corp. | 5.750 | % | 12/1/17 | 7,975 | 8,093 | ||||||
| Bank of America Corp. | 5.650 | % | 5/1/18 | 24,900 | 24,974 | ||||||
| Bank of New York Mellon | 4.950 | % | 3/15/15 | 6,125 | 5,973 | ||||||
| Bank One Corp. | 4.900 | % | 4/30/15 | 6,150 | 5,747 | ||||||
| BB&T Corp. | 5.200 | % | 12/23/15 | 10,825 | 10,322 | ||||||
| BB&T Corp. | 5.625 | % | 9/15/16 | 50 | 51 | ||||||
| Bear Stearns Co., Inc. | 5.700 | % | 11/15/14 | 8,150 | 8,011 | ||||||
| Bear Stearns Co., Inc. | 5.300 | % | 10/30/15 | 1,100 | 1,076 | ||||||
Page 66
| Vanguard® Intermediate-Term Bond Index Fund | ||||||||||
| Schedule of Investments | ||||||||||
| December 31, 2008 | ||||||||||
| Face | Market | |||||||||
| Maturity | Amount | Value | ||||||||
| Coupon | Date | ($ | 000 | ) | ($ | 000 | ) | |||
| Bear Stearns Co., Inc. | 5.550 | % | 1/22/17 | 12,300 | 11,557 | |||||
| Bear Stearns Co., Inc. | 6.400 | % | 10/2/17 | 18,700 | 19,436 | |||||
| Bear Stearns Co., Inc. | 7.250 | % | 2/1/18 | 11,550 | 12,669 | |||||
| Capital One Financial Corp. | 5.500 | % | 6/1/15 | 3,750 | 3,165 | |||||
| Capital One Financial Corp. | 6.150 | % | 9/1/16 | 6,325 | 4,331 | |||||
| Capital One Financial Corp. | 6.750 | % | 9/15/17 | 5,050 | 4,880 | |||||
| 2,3 | Citicorp Lease Pass-Through Trust | 8.040 | % | 12/15/19 | 2,100 | 2,048 | ||||
| Citigroup, Inc. | 5.125 | % | 5/5/14 | 3,125 | 2,962 | |||||
| Citigroup, Inc. | 5.000 | % | 9/15/14 | 29,394 | 25,552 | |||||
| Citigroup, Inc. | 4.700 | % | 5/29/15 | 2,600 | 2,244 | |||||
| Citigroup, Inc. | 5.300 | % | 1/7/16 | 10,825 | 10,262 | |||||
| Citigroup, Inc. | 5.500 | % | 2/15/17 | 7,650 | 6,893 | |||||
| Citigroup, Inc. | 6.000 | % | 8/15/17 | 9,750 | 9,706 | |||||
| Citigroup, Inc. | 6.125 | % | 11/21/17 | 25,375 | 25,524 | |||||
| Citigroup, Inc. | 6.125 | % | 5/15/18 | 6,950 | 7,077 | |||||
| Colonial Bank NA | 6.375 | % | 12/1/15 | 1,250 | 816 | |||||
| Comerica Bank | 5.750 | % | 11/21/16 | 5,025 | 3,767 | |||||
| Comerica Bank | 5.200 | % | 8/22/17 | 3,025 | 2,285 | |||||
| Comerica Inc. | 4.800 | % | 5/1/15 | 1,500 | 1,133 | |||||
| Compass Bank | 6.400 | % | 10/1/17 | 1,600 | 1,364 | |||||
| Countrywide Financial Corp. | 6.250 | % | 5/15/16 | 6,250 | 5,961 | |||||
| Credit Suisse First Boston USA, Inc. | 4.875 | % | 1/15/15 | 5,550 | 5,204 | |||||
| Credit Suisse First Boston USA, Inc. | 5.125 | % | 8/15/15 | 12,275 | 11,233 | |||||
| Credit Suisse First Boston USA, Inc. | 5.375 | % | 3/2/16 | 1,125 | 1,033 | |||||
| Credit Suisse First Boston USA, Inc. | 5.850 | % | 8/16/16 | 3,250 | 3,138 | |||||
| 2 | Credit Suisse First Boston USA, Inc. | 5.860 | % | 5/15/49 | 6,200 | 3,099 | ||||
| Credit Suisse New York | 6.000 | % | 2/15/18 | 18,250 | 17,964 | |||||
| Deutsche Bank AG London | 6.000 | % | 9/1/17 | 17,275 | 18,330 | |||||
| Deutsche Bank Financial LLC | 5.375 | % | 3/2/15 | 4,050 | 3,664 | |||||
| Fifth Third Bancorp. | 4.750 | % | 2/1/15 | 2,800 | 2,400 | |||||
| Fifth Third Bancorp. | 5.450 | % | 1/15/17 | 3,000 | 2,430 | |||||
| Fifth Third Bancorp. | 4.500 | % | 6/1/18 | 1,550 | 1,136 | |||||
| 2 | Fifth Third Capital Trust IV | 6.500 | % | 4/15/67 | 5,750 | 2,933 | ||||
| First Tennessee Bank | 5.050 | % | 1/15/15 | 2,800 | 1,807 | |||||
| Goldman Sachs Group, Inc. | 5.000 | % | 10/1/14 | 14,075 | 12,177 | |||||
| Goldman Sachs Group, Inc. | 5.125 | % | 1/15/15 | 9,650 | 8,756 | |||||
| Goldman Sachs Group, Inc. | 5.350 | % | 1/15/16 | 13,275 | 12,043 | |||||
| Goldman Sachs Group, Inc. | 5.750 | % | 10/1/16 | 5,625 | 5,189 | |||||
| Goldman Sachs Group, Inc. | 5.625 | % | 1/15/17 | 11,725 | 9,776 | |||||
| Goldman Sachs Group, Inc. | 6.250 | % | 9/1/17 | 14,225 | 13,454 | |||||
| Goldman Sachs Group, Inc. | 5.950 | % | 1/18/18 | 23,675 | 22,005 | |||||
| Goldman Sachs Group, Inc. | 6.150 | % | 4/1/18 | 16,350 | 15,712 | |||||
| 3 | HBOS Treasury Services PLC | 5.250 | % | 2/21/17 | 3,225 | 3,188 | ||||
| 3 | HBOS Treasury Services PLC | 6.750 | % | 5/21/18 | 925 | 809 | ||||
| HSBC Bank USA | 4.625 | % | 4/1/14 | 8,000 | 7,612 | |||||
| Huntington National Bank | 5.500 | % | 2/15/16 | 2,500 | 2,049 | |||||
| JPMorgan Chase & Co. | 5.375 | % | 1/15/14 | 2,100 | 2,091 | |||||
| JPMorgan Chase & Co. | 4.875 | % | 3/15/14 | 7,100 | 6,863 | |||||
| JPMorgan Chase & Co. | 5.125 | % | 9/15/14 | 8,765 | 8,492 | |||||
| JPMorgan Chase & Co. | 4.750 | % | 3/1/15 | 9,875 | 9,579 | |||||
| JPMorgan Chase & Co. | 5.250 | % | 5/1/15 | 2,975 | 2,838 | |||||
| JPMorgan Chase & Co. | 5.150 | % | 10/1/15 | 9,100 | 8,775 | |||||
| JPMorgan Chase & Co. | 5.875 | % | 6/13/16 | 6,400 | 6,430 | |||||
| JPMorgan Chase & Co. | 6.125 | % | 6/27/17 | 4,325 | 4,338 | |||||
| JPMorgan Chase & Co. | 6.000 | % | 10/1/17 | 9,275 | 9,257 | |||||
| JPMorgan Chase & Co. | 6.000 | % | 1/15/18 | 11,450 | 12,105 | |||||
| KeyBank NA | 5.800 | % | 7/1/14 | 6,300 | 5,639 | |||||
| KeyBank NA | 4.950 | % | 9/15/15 | 1,000 | 780 | |||||
| KeyBank NA | 5.450 | % | 3/3/16 | 3,025 | 2,450 | |||||
| Manufacturers & Traders Trust Co. | 6.625 | % | 12/4/17 | 5,425 | 5,044 | |||||
| 2 | Manufacturers & Traders Trust Co. | 5.585 | % | 12/28/20 | 2,400 | 1,777 | ||||
| Marshall & Ilsley Bank | 4.850 | % | 6/16/15 | 700 | 532 | |||||
| Marshall & Ilsley Bank | 5.000 | % | 1/17/17 | 1,950 | 1,511 | |||||
| MBNA Corp. | 5.000 | % | 6/15/15 | 1,300 | 1,190 | |||||
| Mellon Bank NA | 4.750 | % | 12/15/14 | 3,800 | 3,727 | |||||
| Morgan Stanley Dean Witter | 4.750 | % | 4/1/14 | 14,500 | 11,426 | |||||
| Morgan Stanley Dean Witter | 6.000 | % | 4/28/15 | 10,800 | 9,487 | |||||
Page 67
| Vanguard® Intermediate-Term Bond Index Fund | ||||||||||
| Schedule of Investments | ||||||||||
| December 31, 2008 | ||||||||||
| Face | Market | |||||||||
| Maturity | Amount | Value | ||||||||
| Coupon | Date | ($ | 000 | ) | ($ | 000 | ) | |||
| Morgan Stanley Dean Witter | 5.375 | % | 10/15/15 | 7,050 | 5,923 | |||||
| Morgan Stanley Dean Witter | 5.750 | % | 10/18/16 | 7,750 | 6,465 | |||||
| Morgan Stanley Dean Witter | 5.450 | % | 1/9/17 | 19,325 | 16,202 | |||||
| Morgan Stanley Dean Witter | 5.550 | % | 4/27/17 | 9,225 | 7,709 | |||||
| Morgan Stanley Dean Witter | 6.250 | % | 8/28/17 | 12,000 | 10,166 | |||||
| Morgan Stanley Dean Witter | 5.950 | % | 12/28/17 | 18,725 | 15,938 | |||||
| Morgan Stanley Dean Witter | 6.625 | % | 4/1/18 | 16,825 | 15,132 | |||||
| National City Bank | 5.800 | % | 6/7/17 | 4,000 | 3,418 | |||||
| National City Corp. | 4.900 | % | 1/15/15 | 1,800 | 1,541 | |||||
| NationsBank Corp. | 7.750 | % | 8/15/15 | 1,000 | 1,041 | |||||
| 3 | Northern Rock PLC | 5.625 | % | 6/22/17 | 6,325 | 6,199 | ||||
| Northern Trust Co. | 6.500 | % | 8/15/18 | 1,275 | 1,370 | |||||
| PNC Bank NA | 4.875 | % | 9/21/17 | 1,450 | 1,334 | |||||
| PNC Bank NA | 6.000 | % | 12/7/17 | 1,125 | 1,120 | |||||
| PNC Bank NA | 6.875 | % | 4/1/18 | 1,500 | 1,578 | |||||
| PNC Funding Corp. | 5.250 | % | 11/15/15 | 3,575 | 3,405 | |||||
| PNC Funding Corp. | 5.625 | % | 2/1/17 | 7,625 | 7,337 | |||||
| Regions Bank | 7.500 | % | 5/15/18 | 3,600 | 3,215 | |||||
| Royal Bank of Scotland Group PLC | 5.050 | % | 1/8/15 | 9,400 | 8,007 | |||||
| Royal Bank of Scotland Group PLC | 4.700 | % | 7/3/18 | 800 | 555 | |||||
| 2 | Royal Bank of Scotland Group PLC | 7.640 | % | 3/31/49 | 8,175 | 3,270 | ||||
| 2 | Royal Bank of Scotland Group PLC | 5.512 | % | 9/29/49 | 6,550 | 2,798 | ||||
| Southtrust Corp. | 5.800 | % | 6/15/14 | 1,350 | 1,249 | |||||
| Sovereign Bancorp, Inc. | 8.750 | % | 5/30/18 | 2,825 | 2,585 | |||||
| 2,3 | Standard Chartered PLC | 6.409 | % | 12/31/49 | 1,500 | 627 | ||||
| State Street Capital Trust | 5.300 | % | 1/15/16 | 1,825 | 1,807 | |||||
| State Street Capital Trust | 5.250 | % | 10/15/18 | 1,000 | 984 | |||||
| SunTrust Banks, Inc. | 5.000 | % | 9/1/15 | 3,550 | 3,341 | |||||
| SunTrust Banks, Inc. | 5.200 | % | 1/17/17 | 150 | 136 | |||||
| SunTrust Banks, Inc. | 6.000 | % | 9/11/17 | 1,925 | 1,822 | |||||
| SunTrust Banks, Inc. | 5.450 | % | 12/1/17 | 2,350 | 2,211 | |||||
| SunTrust Banks, Inc. | 7.250 | % | 3/15/18 | 3,550 | 3,700 | |||||
| Synovus Financial Corp. | 5.125 | % | 6/15/17 | 750 | 574 | |||||
| UBS AG | 5.875 | % | 7/15/16 | 4,800 | 4,449 | |||||
| UBS AG | 5.875 | % | 12/20/17 | 16,875 | 15,472 | |||||
| UBS AG | 5.750 | % | 4/25/18 | 14,625 | 13,326 | |||||
| Union Bank of California NA | 5.950 | % | 5/11/16 | 4,100 | 3,298 | |||||
| US Bank NA | 6.300 | % | 2/4/14 | 2,600 | 2,798 | |||||
| US Bank NA | 4.950 | % | 10/30/14 | 9,625 | 9,563 | |||||
| US Bank NA | 4.800 | % | 4/15/15 | 1,000 | 1,017 | |||||
| Wachovia Bank NA | 4.800 | % | 11/1/14 | 4,425 | 4,087 | |||||
| Wachovia Bank NA | 4.875 | % | 2/1/15 | 4,475 | 4,099 | |||||
| Wachovia Bank NA | 6.000 | % | 11/15/17 | 5,275 | 5,138 | |||||
| Wachovia Corp. | 4.875 | % | 2/15/14 | 13,800 | 12,617 | |||||
| Wachovia Corp. | 5.625 | % | 10/15/16 | 10,900 | 9,874 | |||||
| Wachovia Corp. | 5.750 | % | 6/15/17 | 11,475 | 11,341 | |||||
| Wachovia Corp. | 5.750 | % | 2/1/18 | 10,450 | 10,525 | |||||
| Wells Fargo & Co. | 4.625 | % | 4/15/14 | 6,650 | 6,467 | |||||
| Wells Fargo & Co. | 5.625 | % | 12/11/17 | 18,175 | 18,816 | |||||
| Wells Fargo Bank NA | 4.750 | % | 2/9/15 | 10,450 | 10,087 | |||||
| Wells Fargo Bank NA | 5.750 | % | 5/16/16 | 5,300 | 5,435 | |||||
| Zions Bancorp. | 5.650 | % | 5/15/14 | 1,200 | 899 | |||||
| Zions Bancorp. | 5.500 | % | 11/16/15 | 6,850 | 5,116 | |||||
| Brokerage (1.2%) | ||||||||||
| Ameriprise Financial Inc. | 5.650 | % | 11/15/15 | 3,450 | 2,933 | |||||
| 2 | Ameriprise Financial Inc. | 7.518 | % | 6/1/66 | 2,000 | 1,102 | ||||
| BlackRock, Inc. | 6.250 | % | 9/15/17 | 2,950 | 2,784 | |||||
| Janus Capital Group | 6.700 | % | 6/15/17 | 1,700 | 849 | |||||
| Jefferies Group Inc. | 5.500 | % | 3/15/16 | 4,500 | 3,434 | |||||
| Lazard Group | 6.850 | % | 6/15/17 | 5,525 | 3,494 | |||||
| Merrill Lynch & Co., Inc. | 5.000 | % | 2/3/14 | 9,225 | 8,779 | |||||
| Merrill Lynch & Co., Inc. | 5.450 | % | 7/15/14 | 3,950 | 3,803 | |||||
| Merrill Lynch & Co., Inc. | 5.000 | % | 1/15/15 | 15,325 | 14,614 | |||||
| Merrill Lynch & Co., Inc. | 6.050 | % | 5/16/16 | 4,725 | 4,358 | |||||
| Merrill Lynch & Co., Inc. | 5.700 | % | 5/2/17 | 5,550 | 4,972 | |||||
Page 68
| Vanguard® Intermediate-Term Bond Index Fund | |||||||||
| Schedule of Investments | |||||||||
| December 31, 2008 | |||||||||
| Face | Market | ||||||||
| Maturity | Amount | Value | |||||||
| Coupon | Date | ($ | 000 | ) | ($ | 000 | ) | ||
| Merrill Lynch & Co., Inc. | 6.400 | % | 8/28/17 | 9,750 | 9,815 | ||||
| Merrill Lynch & Co., Inc. | 6.875 | % | 4/25/18 | 33,125 | 34,858 | ||||
| Merrill Lynch & Co., Inc. | 6.500 | % | 7/15/18 | 4,125 | 4,120 | ||||
| Merrill Lynch & Co., Inc. | 6.875 | % | 11/15/18 | 4,075 | 4,270 | ||||
| 2 Schwab Capital Trust I | 7.500 | % | 11/15/37 | 1,850 | 962 | ||||
| Finance Companies (1.9%) | |||||||||
| American General Finance Corp. | 5.750 | % | 9/15/16 | 5,725 | 2,175 | ||||
| American General Finance Corp. | 6.900 | % | 12/15/17 | 16,100 | 6,440 | ||||
| Capmark Financial Group | 6.300 | % | 5/10/17 | 1,625 | 455 | ||||
| CIT Group Funding Co. of Canada | 5.200 | % | 6/1/15 | 5,775 | 4,042 | ||||
| CIT Group, Inc. | 5.400 | % | 3/7/13 | 2,150 | 1,591 | ||||
| CIT Group, Inc. | 5.000 | % | 2/13/14 | 875 | 621 | ||||
| CIT Group, Inc. | 5.125 | % | 9/30/14 | 4,525 | 3,258 | ||||
| CIT Group, Inc. | 5.000 | % | 2/1/15 | 3,400 | 2,278 | ||||
| CIT Group, Inc. | 5.400 | % | 1/30/16 | 2,250 | 1,575 | ||||
| CIT Group, Inc. | 5.850 | % | 9/15/16 | 2,750 | 1,953 | ||||
| CIT Group, Inc. | 5.650 | % | 2/13/17 | 3,150 | 2,205 | ||||
| 2 CIT Group, Inc. | 6.100 | % | 3/15/67 | 3,200 | 960 | ||||
| Discover Financial Services | 6.450 | % | 6/12/17 | 1,500 | 1,036 | ||||
| General Electric Capital Corp. | 5.500 | % | 6/4/14 | 5,350 | 5,363 | ||||
| General Electric Capital Corp. | 5.650 | % | 6/9/14 | 9,275 | 9,353 | ||||
| General Electric Capital Corp. | 5.375 | % | 10/20/16 | 925 | 908 | ||||
| General Electric Capital Corp. | 5.400 | % | 2/15/17 | 18,750 | 18,415 | ||||
| General Electric Capital Corp. | 5.625 | % | 9/15/17 | 11,350 | 11,240 | ||||
| General Electric Capital Corp. | 5.625 | % | 5/1/18 | 27,800 | 27,994 | ||||
| 2 General Electric Capital Corp. | 6.375 | % | 11/15/67 | 14,675 | 9,330 | ||||
| 2 HSBC Finance Capital Trust IX | 5.911 | % | 11/30/35 | 3,925 | 2,251 | ||||
| HSBC Finance Corp. | 5.250 | % | 1/15/14 | 2,550 | 2,449 | ||||
| HSBC Finance Corp. | 5.000 | % | 6/30/15 | 30,550 | 27,814 | ||||
| International Lease Finance Corp. | 5.650 | % | 6/1/14 | 8,150 | 5,379 | ||||
| SLM Corp. | 5.375 | % | 5/15/14 | 4,750 | 3,236 | ||||
| SLM Corp. | 5.050 | % | 11/14/14 | 1,400 | 939 | ||||
| SLM Corp. | 8.450 | % | 6/15/18 | 15,325 | 12,205 | ||||
| Insurance (2.3%) | |||||||||
| ACE INA Holdings, Inc. | 5.875 | % | 6/15/14 | 2,000 | 1,888 | ||||
| ACE INA Holdings, Inc. | 5.600 | % | 5/15/15 | 2,050 | 1,887 | ||||
| ACE INA Holdings, Inc. | 5.700 | % | 2/15/17 | 2,400 | 2,185 | ||||
| ACE INA Holdings, Inc. | 5.800 | % | 3/15/18 | 1,850 | 1,680 | ||||
| Aetna, Inc. | 6.000 | % | 6/15/16 | 5,250 | 4,855 | ||||
| Aetna, Inc. | 6.500 | % | 9/15/18 | 1,450 | 1,407 | ||||
| Allied World Assurance | 7.500 | % | 8/1/16 | 3,275 | 2,890 | ||||
| Allstate Corp. | 5.000 | % | 8/15/14 | 6,225 | 5,840 | ||||
| 2 Allstate Corp. | 6.125 | % | 5/15/37 | 2,575 | 1,656 | ||||
| American International Group, Inc. | 5.050 | % | 10/1/15 | 9,675 | 6,482 | ||||
| American International Group, Inc. | 5.600 | % | 10/18/16 | 875 | 584 | ||||
| American International Group, Inc. | 5.450 | % | 5/18/17 | 6,425 | 4,200 | ||||
| American International Group, Inc. | 5.850 | % | 1/16/18 | 12,925 | 8,644 | ||||
| 3 American International Group, Inc. | 8.250 | % | 8/15/18 | 12,120 | 9,075 | ||||
| Aspen Insurance Holdings Ltd. | 6.000 | % | 8/15/14 | 1,100 | 742 | ||||
| Assurant, Inc. | 5.625 | % | 2/15/14 | 2,825 | 2,096 | ||||
| Axis Capital Holdings Ltd. | 5.750 | % | 12/1/14 | 1,800 | 1,209 | ||||
| Berkshire Hathaway Finance Corp. | 5.100 | % | 7/15/14 | 1,850 | 1,949 | ||||
| Berkshire Hathaway Finance Corp. | 4.850 | % | 1/15/15 | 5,325 | 5,552 | ||||
| Berkshire Hathaway Finance Corp. | 5.400 | % | 5/15/18 | 6,900 | 7,142 | ||||
| Chubb Corp. | 5.750 | % | 5/15/18 | 3,700 | 3,640 | ||||
| 2 Chubb Corp. | 6.375 | % | 3/29/67 | 5,225 | 3,274 | ||||
| CIGNA Corp. | 6.350 | % | 3/15/18 | 4,050 | 3,507 | ||||
| CNA Financial Corp. | 5.850 | % | 12/15/14 | 2,100 | 1,546 | ||||
| CNA Financial Corp. | 6.500 | % | 8/15/16 | 3,400 | 2,406 | ||||
| Commerce Group, Inc. | 5.950 | % | 12/9/13 | 900 | 770 | ||||
| Coventry Health Care Inc. | 6.300 | % | 8/15/14 | 1,000 | 638 | ||||
| Coventry Health Care Inc. | 5.950 | % | 3/15/17 | 3,000 | 1,546 | ||||
| 2 Everest Reinsurance Holdings, Inc. | 6.600 | % | 5/15/37 | 1,450 | 605 | ||||
| Genworth Financial, Inc. | 5.750 | % | 6/15/14 | 4,250 | 1,572 | ||||
Page 69
| Vanguard® Intermediate-Term Bond Index Fund | |||||||||
| Schedule of Investments | |||||||||
| December 31, 2008 | |||||||||
| Face | Market | ||||||||
| Maturity | Amount | Value | |||||||
| Coupon | Date | ($ | 000 | ) | ($ | 000 | ) | ||
| Genworth Financial, Inc. | 4.950 | % | 10/1/15 | 1,450 | 544 | ||||
| 2 Genworth Financial, Inc. | 6.150 | % | 11/15/66 | 3,025 | 302 | ||||
| Hartford Financial Services Group, Inc. | 5.500 | % | 10/15/16 | 1,975 | 1,488 | ||||
| Hartford Financial Services Group, Inc. | 5.375 | % | 3/15/17 | 2,200 | 1,554 | ||||
| Hartford Financial Services Group, Inc. | 6.300 | % | 3/15/18 | 2,200 | 1,618 | ||||
| 2 Hartford Financial Services Group, Inc. | 8.125 | % | 6/15/38 | 2,250 | 1,042 | ||||
| Humana Inc. | 6.450 | % | 6/1/16 | 3,775 | 3,013 | ||||
| Humana Inc. | 7.200 | % | 6/15/18 | 3,975 | 3,205 | ||||
| Humana Inc. | 6.300 | % | 8/1/18 | 750 | 560 | ||||
| 2 ING Capital Funding Trust III | 5.775 | % | 12/8/49 | 4,325 | 1,941 | ||||
| Jefferson Pilot Corp. | 4.750 | % | 1/30/14 | 4,000 | 3,084 | ||||
| 2 Lincoln National Corp. | 7.000 | % | 5/17/66 | 1,780 | 783 | ||||
| 2 Lincoln National Corp. | 6.050 | % | 4/20/67 | 4,375 | 1,575 | ||||
| Loews Corp. | 5.250 | % | 3/15/16 | 1,850 | 1,691 | ||||
| Marsh & McLennan Cos., Inc. | 5.375 | % | 7/15/14 | 1,500 | 1,328 | ||||
| Marsh & McLennan Cos., Inc. | 5.750 | % | 9/15/15 | 5,550 | 4,879 | ||||
| MetLife, Inc. | 5.000 | % | 6/15/15 | 7,450 | 6,878 | ||||
| MetLife, Inc. | 6.817 | % | 8/15/18 | 5,500 | 5,254 | ||||
| Principal Life Income Funding | 5.100 | % | 4/15/14 | 4,250 | 3,911 | ||||
| 2 Progressive Corp. | 6.700 | % | 6/15/37 | 5,975 | 2,785 | ||||
| Prudential Financial, Inc. | 4.750 | % | 4/1/14 | 1,750 | 1,368 | ||||
| Prudential Financial, Inc. | 5.100 | % | 9/20/14 | 8,700 | 6,711 | ||||
| Prudential Financial, Inc. | 5.500 | % | 3/15/16 | 575 | 418 | ||||
| Prudential Financial, Inc. | 6.100 | % | 6/15/17 | 500 | 365 | ||||
| Prudential Financial, Inc. | 6.000 | % | 12/1/17 | 4,450 | 3,567 | ||||
| Torchmark Corp. | 6.375 | % | 6/15/16 | 1,750 | 1,366 | ||||
| Transatlantic Holdings | 5.750 | % | 12/14/15 | 4,000 | 2,421 | ||||
| Travelers Cos. Inc. | 5.750 | % | 12/15/17 | 3,550 | 3,423 | ||||
| Travelers Cos. Inc. | 5.800 | % | 5/15/18 | 1,975 | 1,902 | ||||
| 2 Travelers Cos. Inc. | 6.250 | % | 3/15/37 | 3,950 | 2,487 | ||||
| Travelers Cos., Inc. | 5.500 | % | 12/1/15 | 1,350 | 1,288 | ||||
| Travelers Cos., Inc. | 6.250 | % | 6/20/16 | 2,025 | 2,016 | ||||
| UnitedHealth Group, Inc. | 5.000 | % | 8/15/14 | 5,400 | 5,049 | ||||
| UnitedHealth Group, Inc. | 4.875 | % | 3/15/15 | 3,825 | 3,311 | ||||
| UnitedHealth Group, Inc. | 6.000 | % | 6/15/17 | 5,325 | 4,708 | ||||
| UnitedHealth Group, Inc. | 6.000 | % | 11/15/17 | 2,400 | 2,132 | ||||
| UnitedHealth Group, Inc. | 6.000 | % | 2/15/18 | 3,050 | 2,822 | ||||
| WellPoint Inc. | 5.000 | % | 12/15/14 | 4,550 | 4,047 | ||||
| WellPoint Inc. | 5.250 | % | 1/15/16 | 3,900 | 3,422 | ||||
| WellPoint Inc. | 5.875 | % | 6/15/17 | 3,700 | 3,522 | ||||
| Willis North America Inc. | 5.625 | % | 7/15/15 | 3,150 | 2,256 | ||||
| Willis North America Inc. | 6.200 | % | 3/28/17 | 1,625 | 1,107 | ||||
| XL Capital Ltd. | 5.250 | % | 9/15/14 | 4,025 | 2,217 | ||||
| 2 XL Capital Ltd. | 6.500 | % | 12/15/49 | 3,950 | 865 | ||||
| Other Finance (0.0%) | |||||||||
| XTRA Finance Corp. | 5.150 | % | 4/1/17 | 1,600 | 1,577 | ||||
| Real Estate Investment Trusts (0.8%) | |||||||||
| Arden Realty LP | 5.250 | % | 3/1/15 | 1,250 | 1,087 | ||||
| AvalonBay Communities, Inc. | 5.750 | % | 9/15/16 | 1,750 | 1,162 | ||||
| Boston Properties, Inc. | 5.625 | % | 4/15/15 | 1,925 | 1,252 | ||||
| Brandywine Operating Partnership | 5.400 | % | 11/1/14 | 2,250 | 1,416 | ||||
| Brandywine Operating Partnership | 5.700 | % | 5/1/17 | 1,925 | 1,045 | ||||
| Camden Property Trust | 5.700 | % | 5/15/17 | 3,300 | 1,725 | ||||
| Colonial Realty LP | 5.500 | % | 10/1/15 | 4,200 | 2,429 | ||||
| Duke Realty LP | 5.950 | % | 2/15/17 | 4,975 | 2,591 | ||||
| ERP Operating LP | 5.250 | % | 9/15/14 | 4,025 | 2,768 | ||||
| ERP Operating LP | 5.125 | % | 3/15/16 | 5,000 | 3,520 | ||||
| ERP Operating LP | 5.375 | % | 8/1/16 | 475 | 342 | ||||
| ERP Operating LP | 5.750 | % | 6/15/17 | 1,675 | 1,201 | ||||
| HCP Inc. | 6.700 | % | 1/30/18 | 4,500 | 2,046 | ||||
| Health Care Property Investors, Inc. | 5.650 | % | 12/15/13 | 2,250 | 1,378 | ||||
| Health Care Property Investors, Inc. | 6.300 | % | 9/15/16 | 275 | 134 | ||||
| Health Care Property Investors, Inc. | 6.000 | % | 1/30/17 | 3,750 | 1,770 | ||||
| Health Care REIT, Inc. | 6.200 | % | 6/1/16 | 925 | 547 | ||||
Page 70
| Vanguard® Intermediate-Term Bond Index Fund | |||||||||
| Schedule of Investments | |||||||||
| December 31, 2008 | |||||||||
| Face | Market | ||||||||
| Maturity | Amount | Value | |||||||
| Coupon | Date | ($ | 000 | ) | ($ | 000 | ) | ||
| HealthCare Realty Trust | 5.125 | % | 4/1/14 | 2,925 | 1,826 | ||||
| Hospitality Properties | 5.125 | % | 2/15/15 | 4,150 | 2,060 | ||||
| Hospitality Properties | 5.625 | % | 3/15/17 | 2,500 | 1,095 | ||||
| HRPT Properties Trust | 6.250 | % | 8/15/16 | 5,150 | 2,791 | ||||
| HRPT Properties Trust | 6.250 | % | 6/15/17 | 3,200 | 1,655 | ||||
| Kimco Realty Corp. | 5.783 | % | 3/15/16 | 1,350 | 865 | ||||
| Liberty Property LP | 5.125 | % | 3/2/15 | 5,475 | 3,646 | ||||
| National Retail Properties | 6.875 | % | 10/15/17 | 3,000 | 1,935 | ||||
| ProLogis | 5.625 | % | 11/15/15 | 2,800 | 1,428 | ||||
| ProLogis | 5.750 | % | 4/1/16 | 3,000 | 1,560 | ||||
| ProLogis | 5.625 | % | 11/15/16 | 1,925 | 924 | ||||
| Realty Income Corp. | 5.950 | % | 9/15/16 | 1,000 | 730 | ||||
| Regency Centers LP | 5.250 | % | 8/1/15 | 1,000 | 629 | ||||
| Regency Centers LP | 5.875 | % | 6/15/17 | 3,000 | 1,790 | ||||
| Simon Property Group Inc. | 5.625 | % | 8/15/14 | 2,350 | 1,572 | ||||
| Simon Property Group Inc. | 5.100 | % | 6/15/15 | 1,800 | 1,112 | ||||
| Simon Property Group Inc. | 5.750 | % | 12/1/15 | 4,600 | 3,026 | ||||
| Simon Property Group Inc. | 6.100 | % | 5/1/16 | 1,800 | 1,187 | ||||
| Simon Property Group Inc. | 5.250 | % | 12/1/16 | 8,675 | 6,093 | ||||
| Simon Property Group Inc. | 6.125 | % | 5/30/18 | 3,225 | 2,184 | ||||
| Tanger Factory Outlet Centers, Inc. | 6.150 | % | 11/15/15 | 1,725 | 1,247 | ||||
| 1,470,178 | |||||||||
| Industrial (17.5%) | |||||||||
| Basic Industry (1.8%) | |||||||||
| Alcan, Inc. | 5.200 | % | 1/15/14 | 1,500 | 1,090 | ||||
| Alcan, Inc. | 5.000 | % | 6/1/15 | 1,575 | 1,135 | ||||
| Alcoa, Inc. | 5.550 | % | 2/1/17 | 1,900 | 1,504 | ||||
| Alcoa, Inc. | 6.750 | % | 7/15/18 | 4,700 | 3,933 | ||||
| Arcelormittal | 6.500 | % | 4/15/14 | 5,000 | 3,554 | ||||
| ArcelorMittal | 6.125 | % | 6/1/18 | 10,275 | 6,957 | ||||
| Barrick Gold Finance Inc. | 4.875 | % | 11/15/14 | 2,050 | 1,847 | ||||
| Barrick North America Finance LLC | 6.800 | % | 9/15/18 | 4,150 | 3,944 | ||||
| BHP Billiton Finance Ltd. | 5.400 | % | 3/29/17 | 2,300 | 2,135 | ||||
| BHP Finance USA | 5.250 | % | 12/15/15 | 2,725 | 2,469 | ||||
| Celulosa Arauco Constitution SA | 5.625 | % | 4/20/15 | 5,150 | 4,867 | ||||
| Commercial Metals Co. | 6.500 | % | 7/15/17 | 1,650 | 1,282 | ||||
| Commercial Metals Co. | 7.350 | % | 8/15/18 | 1,675 | 1,353 | ||||
| Dow Chemical Co. | 5.700 | % | 5/15/18 | 3,300 | 2,830 | ||||
| E.I. du Pont de Nemours & Co. | 5.875 | % | 1/15/14 | 5,175 | 5,364 | ||||
| E.I. du Pont de Nemours & Co. | 5.250 | % | 12/15/16 | 5,925 | 5,914 | ||||
| E.I. du Pont de Nemours & Co. | 6.000 | % | 7/15/18 | 5,275 | 5,516 | ||||
| Freeport-McMoRan Copper & Gold Inc. | 8.250 | % | 4/1/15 | 10,000 | 8,600 | ||||
| Freeport-McMoRan Copper & Gold Inc. | 8.375 | % | 4/1/17 | 18,750 | 15,422 | ||||
| ICI Wilmington | 5.625 | % | 12/1/13 | 1,600 | 1,564 | ||||
| Inco Ltd. | 5.700 | % | 10/15/15 | 1,675 | 1,408 | ||||
| International Paper Co. | 7.400 | % | 6/15/14 | 6,500 | 5,027 | ||||
| International Paper Co. | 5.300 | % | 4/1/15 | 175 | 119 | ||||
| International Paper Co. | 5.250 | % | 4/1/16 | 2,950 | 2,012 | ||||
| International Paper Co. | 7.950 | % | 6/15/18 | 8,200 | 6,341 | ||||
| Lubrizol Corp. | 5.500 | % | 10/1/14 | 2,575 | 2,330 | ||||
| Monsanto Co. | 5.125 | % | 4/15/18 | 925 | 975 | ||||
| 3 Mosaic Co. | 7.375 | % | 12/1/14 | 2,500 | 2,238 | ||||
| 3 Mosaic Co. | 7.625 | % | 12/1/16 | 4,000 | 3,400 | ||||
| Noranda, Inc. | 6.000 | % | 10/15/15 | 2,525 | 1,777 | ||||
| Nucor Corp. | 5.750 | % | 12/1/17 | 825 | 823 | ||||
| Nucor Corp. | 5.850 | % | 6/1/18 | 3,275 | 3,172 | ||||
| Plum Creek Timber Co. | 5.875 | % | 11/15/15 | 1,650 | 1,355 | ||||
| PPG Industries, Inc. | 6.650 | % | 3/15/18 | 3,425 | 3,377 | ||||
| Praxair, Inc. | 5.250 | % | 11/15/14 | 1,850 | 1,903 | ||||
| Praxair, Inc. | 4.625 | % | 3/30/15 | 2,575 | 2,439 | ||||
| Praxair, Inc. | 5.375 | % | 11/1/16 | 700 | 687 | ||||
| Praxair, Inc. | 5.200 | % | 3/15/17 | 1,500 | 1,454 | ||||
| Reliance Steel & Aluminum | 6.200 | % | 11/15/16 | 650 | 534 | ||||
| Rio Tinto Finance USA Ltd. | 6.500 | % | 7/15/18 | 10,450 | 7,483 | ||||
| Rohm & Haas Co. | 6.000 | % | 9/15/17 | 9,700 | 8,709 | ||||
| US Steel Corp. | 6.050 | % | 6/1/17 | 3,325 | 1,947 |
Page 71
| Vanguard® Intermediate-Term Bond Index Fund | ||||||||||
| Schedule of Investments | ||||||||||
| December 31, 2008 | ||||||||||
| Face | Market | |||||||||
| Maturity | Amount | Value | ||||||||
| Coupon | Date | ($ | 000 | ) | ($ | 000 | ) | |||
| US Steel Corp. | 7.000 | % | 2/1/18 | 1,300 | 881 | |||||
| Vale Overseas Ltd. | 6.250 | % | 1/11/16 | 5,825 | 5,607 | |||||
| Vale Overseas Ltd. | 6.250 | % | 1/23/17 | 4,575 | 4,323 | |||||
| Capital Goods (1.8%) | ||||||||||
| 2,3 | BAE Systems Asset Trust | 7.156 | % | 12/15/11 | 366 | 378 | ||||
| Black & Decker Corp. | 5.750 | % | 11/15/16 | 1,925 | 1,602 | |||||
| Brascan Corp. | 7.125 | % | 6/15/12 | 1,000 | 599 | |||||
| Caterpillar Financial Services Corp. | 4.750 | % | 2/17/15 | 7,625 | 7,189 | |||||
| Caterpillar Financial Services Corp. | 4.625 | % | 6/1/15 | 1,200 | 1,121 | |||||
| Caterpillar Financial Services Corp. | 5.450 | % | 4/15/18 | 5,300 | 4,995 | |||||
| Caterpillar, Inc. | 7.900 | % | 12/15/18 | 7,000 | 8,255 | |||||
| Cooper Industries, Inc. | 5.450 | % | 4/1/15 | 1,375 | 1,344 | |||||
| CRH America Inc. | 6.000 | % | 9/30/16 | 8,375 | 5,303 | |||||
| CRH America Inc. | 8.125 | % | 7/15/18 | 4,425 | 3,222 | |||||
| Danaher Corp. | 5.625 | % | 1/15/18 | 1,200 | 1,238 | |||||
| Deere & Co. | 6.950 | % | 4/25/14 | 6,230 | 6,587 | |||||
| Dover Corp. | 4.875 | % | 10/15/15 | 2,400 | 2,406 | |||||
| Dover Corp. | 5.450 | % | 3/15/18 | 900 | 931 | |||||
| Eaton Corp. | 5.600 | % | 5/15/18 | 1,825 | 1,751 | |||||
| Embraer Overseas Ltd. | 6.375 | % | 1/24/17 | 700 | 504 | |||||
| Emerson Electric Co. | 5.125 | % | 12/1/16 | 2,500 | 2,540 | |||||
| Emerson Electric Co. | 5.375 | % | 10/15/17 | 5,000 | 5,157 | |||||
| Emerson Electric Co. | 5.250 | % | 10/15/18 | 850 | 868 | |||||
| Fisher Scientific International Inc. | 6.125 | % | 7/1/15 | 4,000 | 3,514 | |||||
| General Dynamics Corp. | 5.250 | % | 2/1/14 | 6,050 | 6,227 | |||||
| General Electric Co. | 5.250 | % | 12/6/17 | 22,225 | 22,413 | |||||
| Harsco Corp. | 5.750 | % | 5/15/18 | 2,550 | 2,590 | |||||
| Honeywell International, Inc. | 5.400 | % | 3/15/16 | 1,825 | 1,865 | |||||
| Honeywell International, Inc. | 5.300 | % | 3/15/17 | 1,000 | 1,015 | |||||
| Honeywell International, Inc. | 5.300 | % | 3/1/18 | 4,025 | 4,089 | |||||
| Ingersoll-Rand GL Holding Company | 6.875 | % | 8/15/18 | 6,100 | 5,770 | |||||
| John Deere Capital Corp. | 5.500 | % | 4/13/17 | 2,300 | 2,222 | |||||
| John Deere Capital Corp. | 5.750 | % | 9/10/18 | 2,875 | 2,798 | |||||
| Joy Global, Inc. | 6.000 | % | 11/15/16 | 1,275 | 1,083 | |||||
| Lafarge SA | 6.500 | % | 7/15/16 | 6,500 | 4,391 | |||||
| Lockheed Martin Corp. | 7.650 | % | 5/1/16 | 3,000 | 3,441 | |||||
| Martin Marietta Material | 6.600 | % | 4/15/18 | 2,050 | 1,512 | |||||
| Masco Corp. | 4.800 | % | 6/15/15 | 4,875 | 3,203 | |||||
| Masco Corp. | 6.125 | % | 10/3/16 | 4,275 | 2,937 | |||||
| Mohawk Industries Inc. | 6.125 | % | 1/15/16 | 7,350 | 5,516 | |||||
| Northrop Grumman Corp. | 7.750 | % | 3/1/16 | 2,900 | 3,284 | |||||
| Parker-Hannifin Corp. | 5.500 | % | 5/15/18 | 2,000 | 1,946 | |||||
| Rockwell Automation | 5.650 | % | 12/1/17 | 1,550 | 1,619 | |||||
| Textron, Inc. | 5.600 | % | 12/1/17 | 3,700 | 2,671 | |||||
| United Technologies Corp. | 4.875 | % | 5/1/15 | 2,950 | 2,915 | |||||
| United Technologies Corp. | 5.375 | % | 12/15/17 | 5,100 | 5,226 | |||||
| United Technologies Corp. | 6.125 | % | 2/1/19 | 2,250 | 2,395 | |||||
| Vulcan Materials Co. | 7.000 | % | 6/15/18 | 3,275 | 2,527 | |||||
| Waste Management, Inc. | 6.375 | % | 11/15/12 | 1,000 | 951 | |||||
| Waste Management, Inc. | 5.000 | % | 3/15/14 | 625 | 544 | |||||
| Communication (3.6%) | ||||||||||
| America Movil SA de C.V. | 5.500 | % | 3/1/14 | 5,650 | 5,198 | |||||
| America Movil SA de C.V. | 5.750 | % | 1/15/15 | 1,525 | 1,405 | |||||
| AT&T Inc. | 5.100 | % | 9/15/14 | 24,450 | 24,397 | |||||
| AT&T Inc. | 5.625 | % | 6/15/16 | 4,975 | 4,986 | |||||
| AT&T Inc. | 5.500 | % | 2/1/18 | 13,900 | 13,873 | |||||
| AT&T Inc. | 5.600 | % | 5/15/18 | 2,475 | 2,552 | |||||
| BellSouth Corp. | 5.200 | % | 9/15/14 | 200 | 199 | |||||
| BellSouth Corp. | 5.200 | % | 12/15/16 | 1,025 | 1,000 | |||||
| British Telecommunications PLC | 5.950 | % | 1/15/18 | 3,875 | 3,321 | |||||
| CenturyTel, Inc. | 5.000 | % | 2/15/15 | 1,000 | 728 | |||||
| CenturyTel, Inc. | 6.000 | % | 4/1/17 | 2,475 | 1,786 | |||||
| Comcast Cable Communications, Inc. | 8.875 | % | 5/1/17 | 1,700 | 1,823 | |||||
| Comcast Corp. | 5.300 | % | 1/15/14 | 6,640 | 6,401 | |||||
Page 72
| Vanguard® Intermediate-Term Bond Index Fund | |||||||||
| Schedule of Investments | |||||||||
| December 31, 2008 | |||||||||
| Face | Market | ||||||||
| Maturity | Amount | Value | |||||||
| Coupon | Date | ($ | 000 | ) | ($ | 000 | ) | ||
| Comcast Corp. | 6.500 | % | 1/15/15 | 3,825 | 3,791 | ||||
| Comcast Corp. | 5.850 | % | 11/15/15 | 2,300 | 2,202 | ||||
| Comcast Corp. | 5.900 | % | 3/15/16 | 12,050 | 11,585 | ||||
| Comcast Corp. | 4.950 | % | 6/15/16 | 2,175 | 1,981 | ||||
| Comcast Corp. | 6.500 | % | 1/15/17 | 1,575 | 1,577 | ||||
| Comcast Corp. | 6.300 | % | 11/15/17 | 7,125 | 7,039 | ||||
| Comcast Corp. | 5.875 | % | 2/15/18 | 5,375 | 5,189 | ||||
| Comcast Corp. | 5.700 | % | 5/15/18 | 1,000 | 953 | ||||
| Cox Communications, Inc. | 5.450 | % | 12/15/14 | 6,725 | 5,874 | ||||
| Cox Communications, Inc. | 5.500 | % | 10/1/15 | 1,250 | 1,109 | ||||
| Deutsche Telekom International Finance | 5.750 | % | 3/23/16 | 2,725 | 2,598 | ||||
| Deutsche Telekom International Finance | 6.750 | % | 8/20/18 | 4,550 | 4,628 | ||||
| Embarq Corp. | 7.082 | % | 6/1/16 | 9,275 | 7,123 | ||||
| GTE Corp. | 6.840 | % | 4/15/18 | 1,000 | 994 | ||||
| McGraw-Hill Cos. Inc. | 5.900 | % | 11/15/17 | 2,950 | 2,489 | ||||
| News America Inc. | 5.300 | % | 12/15/14 | 9,250 | 8,426 | ||||
| Omnicom Group Inc. | 5.900 | % | 4/15/16 | 6,400 | 5,209 | ||||
| Qwest Communications International Inc. | 7.500 | % | 10/1/14 | 3,475 | 2,841 | ||||
| Qwest Communications International Inc. | 6.500 | % | 6/1/17 | 4,000 | 2,960 | ||||
| R.R. Donnelley & Sons Co. | 4.950 | % | 4/1/14 | 2,550 | 2,050 | ||||
| R.R. Donnelley & Sons Co. | 5.500 | % | 5/15/15 | 2,365 | 1,656 | ||||
| R.R. Donnelley & Sons Co. | 6.125 | % | 1/15/17 | 1,750 | 1,207 | ||||
| Rogers Communications Inc. | 6.375 | % | 3/1/14 | 8,000 | 7,710 | ||||
| Rogers Communications Inc. | 5.500 | % | 3/15/14 | 5,000 | 4,663 | ||||
| Rogers Communications Inc. | 6.800 | % | 8/15/18 | 5,500 | 5,569 | ||||
| TCI Communications, Inc. | 8.750 | % | 8/1/15 | 3,895 | 4,097 | ||||
| Telecom Italia Capital | 4.950 | % | 9/30/14 | 11,100 | 8,404 | ||||
| Telecom Italia Capital | 5.250 | % | 10/1/15 | 5,100 | 3,885 | ||||
| Telecom Italia Capital | 6.999 | % | 6/4/18 | 2,625 | 2,299 | ||||
| Telefonica Emisiones SAU | 6.421 | % | 6/20/16 | 11,075 | 11,045 | ||||
| Telefonos de Mexico SA | 5.500 | % | 1/27/15 | 6,050 | 5,475 | ||||
| Thomson Corp. | 5.700 | % | 10/1/14 | 5,550 | 4,988 | ||||
| Thomson Corp. | 6.500 | % | 7/15/18 | 3,950 | 3,667 | ||||
| Time Warner Cable Inc. | 5.850 | % | 5/1/17 | 12,925 | 11,712 | ||||
| Time Warner Cable Inc. | 6.750 | % | 7/1/18 | 11,900 | 11,436 | ||||
| Verizon Communications Corp. | 5.550 | % | 2/15/16 | 12,150 | 11,956 | ||||
| Verizon Communications Corp. | 5.500 | % | 2/15/18 | 13,075 | 12,911 | ||||
| Verizon Communications Corp. | 8.750 | % | 11/1/18 | 11,075 | 13,148 | ||||
| Verizon Global Funding Corp. | 4.900 | % | 9/15/15 | 2,000 | 1,856 | ||||
| 3 Verizon Wireless Inc. | 8.500 | % | 11/15/18 | 8,000 | 9,228 | ||||
| Vodafone Group PLC | 5.375 | % | 1/30/15 | 8,475 | 8,129 | ||||
| Vodafone Group PLC | 5.000 | % | 9/15/15 | 1,250 | 1,169 | ||||
| Vodafone Group PLC | 5.750 | % | 3/15/16 | 5,350 | 5,084 | ||||
| Vodafone Group PLC | 5.625 | % | 2/27/17 | 7,425 | 7,142 | ||||
| WPP Finance USA Corp. | 5.875 | % | 6/15/14 | 2,150 | 1,932 | ||||
| Consumer Cyclical (1.8%) | |||||||||
| Autozone, Inc. | 6.500 | % | 1/15/14 | 2,000 | 1,772 | ||||
| Brinker International Inc. | 5.750 | % | 6/1/14 | 1,700 | 1,263 | ||||
| Costco Wholesale Corp. | 5.500 | % | 3/15/17 | 6,475 | 6,901 | ||||
| CVS Caremark Corp. | 4.875 | % | 9/15/14 | 1,675 | 1,523 | ||||
| CVS Caremark Corp. | 5.750 | % | 6/1/17 | 12,675 | 11,941 | ||||
| Darden Restaurants Inc. | 6.200 | % | 10/15/17 | 4,025 | 3,158 | ||||
| Federated Retail Holding | 5.900 | % | 12/1/16 | 8,800 | 5,386 | ||||
| Home Depot Inc. | 5.400 | % | 3/1/16 | 15,050 | 13,377 | ||||
| ITT Corp. | 7.375 | % | 11/15/15 | 5,600 | 3,559 | ||||
| J.C. Penney Co., Inc. | 7.950 | % | 4/1/17 | 1,650 | 1,241 | ||||
| J.C. Penney Co., Inc. | 5.750 | % | 2/15/18 | 2,650 | 1,785 | ||||
| Johnson Controls, Inc. | 5.500 | % | 1/15/16 | 3,000 | 2,352 | ||||
| Kohl’s Corp. | 6.250 | % | 12/15/17 | 4,000 | 3,233 | ||||
| Lowe’s Cos., Inc. | 5.000 | % | 10/15/15 | 4,275 | 4,075 | ||||
| Lowe’s Cos., Inc. | 5.400 | % | 10/15/16 | 4,525 | 4,332 | ||||
| Lowe’s Cos., Inc. | 6.100 | % | 9/15/17 | 600 | 580 | ||||
| Macy’s Retail Holdings Inc. | 5.750 | % | 7/15/14 | 3,600 | 2,284 | ||||
| Marriott International | 6.200 | % | 6/15/16 | 2,600 | 1,809 | ||||
| Marriott International | 6.375 | % | 6/15/17 | 2,450 | 1,695 | ||||
Page 73
| Vanguard® Intermediate-Term Bond Index Fund | |||||||||
| Schedule of Investments | |||||||||
| December 31, 2008 | |||||||||
| Face | Market | ||||||||
| Maturity | Amount | Value | |||||||
| Coupon | Date | ($ | 000 | ) | ($ | 000 | ) | ||
| McDonald’s Corp. | 5.300 | % | 3/15/17 | 750 | 771 | ||||
| McDonald’s Corp. | 5.800 | % | 10/15/17 | 3,950 | 4,213 | ||||
| McDonald’s Corp. | 5.350 | % | 3/1/18 | 4,775 | 4,961 | ||||
| Nordstrom, Inc. | 6.250 | % | 1/15/18 | 1,800 | 1,267 | ||||
| Target Corp. | 5.875 | % | 7/15/16 | 6,600 | 6,481 | ||||
| Target Corp. | 5.375 | % | 5/1/17 | 550 | 520 | ||||
| Target Corp. | 6.000 | % | 1/15/18 | 8,600 | 8,380 | ||||
| The Walt Disney Co. | 5.625 | % | 9/15/16 | 7,700 | 7,970 | ||||
| The Walt Disney Co. | 5.875 | % | 12/15/17 | 2,600 | 2,730 | ||||
| Time Warner, Inc. | 5.875 | % | 11/15/16 | 9,600 | 8,676 | ||||
| Toll Brothers, Inc. | 5.150 | % | 5/15/15 | 2,150 | 1,548 | ||||
| VF Corp. | 5.950 | % | 11/1/17 | 1,125 | 1,003 | ||||
| Viacom Inc. | 6.250 | % | 4/30/16 | 6,800 | 5,672 | ||||
| Viacom Inc. | 6.125 | % | 10/5/17 | 50 | 41 | ||||
| Wal-Mart Stores, Inc. | 4.500 | % | 7/1/15 | 7,025 | 7,105 | ||||
| Wal-Mart Stores, Inc. | 5.375 | % | 4/5/17 | 2,575 | 2,759 | ||||
| Wal-Mart Stores, Inc. | 5.800 | % | 2/15/18 | 5,025 | 5,518 | ||||
| Western Union Co. | 5.930 | % | 10/1/16 | 3,800 | 3,309 | ||||
| Wyndham Worldwide | 6.000 | % | 12/1/16 | 3,825 | 1,549 | ||||
| Yum! Brands, Inc. | 6.250 | % | 4/15/16 | 2,750 | 2,351 | ||||
| Yum! Brands, Inc. | 6.250 | % | 3/15/18 | 2,625 | 2,285 | ||||
| Consumer Noncyclical (4.9%) | |||||||||
| Abbott Laboratories | 4.350 | % | 3/15/14 | 4,350 | 4,435 | ||||
| Abbott Laboratories | 5.875 | % | 5/15/16 | 11,000 | 12,061 | ||||
| Abbott Laboratories | 5.600 | % | 11/30/17 | 5,000 | 5,388 | ||||
| Allergan Inc. | 5.750 | % | 4/1/16 | 3,300 | 3,181 | ||||
| Altria Group, Inc. | 9.700 | % | 11/10/18 | 15,100 | 16,363 | ||||
| AmerisourceBergen Corp. | 5.875 | % | 9/15/15 | 4,425 | 3,917 | ||||
| Amgen Inc. | 4.850 | % | 11/18/14 | 4,125 | 4,055 | ||||
| Amgen Inc. | 5.850 | % | 6/1/17 | 7,975 | 8,225 | ||||
| Anheuser-Busch Cos., Inc. | 5.600 | % | 3/1/17 | 4,100 | 3,813 | ||||
| Anheuser-Busch Cos., Inc. | 5.500 | % | 1/15/18 | 4,450 | 4,056 | ||||
| Archer-Daniels-Midland Co. | 8.375 | % | 4/15/17 | 1,375 | 1,607 | ||||
| Archer-Daniels-Midland Co. | 5.450 | % | 3/15/18 | 4,050 | 4,027 | ||||
| AstraZeneca PLC | 5.400 | % | 6/1/14 | 3,400 | 3,557 | ||||
| AstraZeneca PLC | 5.900 | % | 9/15/17 | 10,925 | 11,676 | ||||
| Baxter International, Inc. | 4.625 | % | 3/15/15 | 3,150 | 3,166 | ||||
| Baxter International, Inc. | 5.900 | % | 9/1/16 | 2,600 | 2,802 | ||||
| Baxter International, Inc. | 5.375 | % | 6/1/18 | 3,500 | 3,629 | ||||
| Biogen Idec Inc. | 6.875 | % | 3/1/18 | 4,950 | 4,931 | ||||
| Bottling Group LLC | 6.950 | % | 3/15/14 | 3,500 | 3,801 | ||||
| Bottling Group LLC | 5.500 | % | 4/1/16 | 6,050 | 6,057 | ||||
| Bristol-Myers Squibb Co. | 5.450 | % | 5/1/18 | 3,125 | 3,233 | ||||
| Bunge Ltd. Finance Corp. | 5.350 | % | 4/15/14 | 2,900 | 2,073 | ||||
| Bunge Ltd. Finance Corp. | 5.100 | % | 7/15/15 | 1,925 | 1,426 | ||||
| Cardinal Health, Inc. | 4.000 | % | 6/15/15 | 2,200 | 1,854 | ||||
| Cardinal Health, Inc. | 5.800 | % | 10/15/16 | 1,250 | 1,141 | ||||
| Cardinal Health, Inc. | 6.000 | % | 6/15/17 | 900 | 818 | ||||
| Cardinal Health, Inc. | 5.850 | % | 12/15/17 | 1,900 | 1,701 | ||||
| Clorox Co. | 5.000 | % | 1/15/15 | 3,700 | 3,501 | ||||
| Coca-Cola Co. | 5.350 | % | 11/15/17 | 8,900 | 9,596 | ||||
| Coca-Cola Enterprises Inc. | 7.375 | % | 3/3/14 | 5,000 | 5,512 | ||||
| ConAgra Foods, Inc. | 5.819 | % | 6/15/17 | 1,500 | 1,408 | ||||
| Covidien International | 6.000 | % | 10/15/17 | 8,125 | 7,963 | ||||
| Delhaize America Inc. | 6.500 | % | 6/15/17 | 2,800 | 2,536 | ||||
| Diageo Capital PLC | 7.375 | % | 1/15/14 | 2,800 | 3,099 | ||||
| Diageo Capital PLC | 5.500 | % | 9/30/16 | 6,300 | 5,948 | ||||
| Diageo Capital PLC | 5.750 | % | 10/23/17 | 4,800 | 4,662 | ||||
| Diageo Finance BV | 5.300 | % | 10/28/15 | 2,675 | 2,620 | ||||
| 3 Dr. Pepper Snapple Group | 6.820 | % | 5/1/18 | 6,075 | 5,928 | ||||
| Eli Lilly & Co. | 5.200 | % | 3/15/17 | 4,925 | 5,030 | ||||
| Fortune Brands Inc. | 5.375 | % | 1/15/16 | 6,175 | 5,234 | ||||
| Genentech Inc. | 4.750 | % | 7/15/15 | 3,250 | 3,218 | ||||
| General Mills, Inc. | 5.200 | % | 3/17/15 | 1,100 | 1,048 | ||||
| General Mills, Inc. | 5.700 | % | 2/15/17 | 7,850 | 7,809 | ||||
Page 74
| Vanguard® Intermediate-Term Bond Index Fund | |||||||||
| Schedule of Investments | |||||||||
| December 31, 2008 | |||||||||
| Face | Market | ||||||||
| Maturity | Amount | Value | |||||||
| Coupon | Date | ($ | 000 | ) | ($ | 000 | ) | ||
| GlaxoSmithKline Capital Inc. | 4.375 | % | 4/15/14 | 8,075 | 8,074 | ||||
| GlaxoSmithKline Capital Inc. | 5.650 | % | 5/15/18 | 14,250 | 14,992 | ||||
| Hasbro Inc. | 6.300 | % | 9/15/17 | 2,175 | 2,026 | ||||
| Hershey Foods Corp. | 5.450 | % | 9/1/16 | 2,100 | 2,102 | ||||
| Hospira, Inc. | 5.900 | % | 6/15/14 | 675 | 582 | ||||
| Hospira, Inc. | 6.050 | % | 3/30/17 | 2,000 | 1,628 | ||||
| Johnson & Johnson | 5.550 | % | 8/15/17 | 4,600 | 5,230 | ||||
| Johnson & Johnson | 5.150 | % | 7/15/18 | 5,825 | 6,385 | ||||
| Kimberly-Clark Corp. | 4.875 | % | 8/15/15 | 1,025 | 1,006 | ||||
| Kimberly-Clark Corp. | 6.125 | % | 8/1/17 | 7,000 | 7,424 | ||||
| Kimberly-Clark Corp. | 6.250 | % | 7/15/18 | 675 | 726 | ||||
| Kraft Foods, Inc. | 6.750 | % | 2/19/14 | 450 | 465 | ||||
| Kraft Foods, Inc. | 6.500 | % | 8/11/17 | 15,575 | 15,456 | ||||
| Kraft Foods, Inc. | 6.125 | % | 2/1/18 | 5,750 | 5,632 | ||||
| Kraft Foods, Inc. | 6.125 | % | 8/23/18 | 6,700 | 6,669 | ||||
| Kroger Co. | 4.950 | % | 1/15/15 | 6,825 | 6,261 | ||||
| Kroger Co. | 6.400 | % | 8/15/17 | 1,950 | 1,959 | ||||
| Laboratory Corp. of America | 5.625 | % | 12/15/15 | 1,250 | 1,070 | ||||
| McKesson Corp. | 5.700 | % | 3/1/17 | 1,000 | 896 | ||||
| Medco Health Solutions | 7.125 | % | 3/15/18 | 4,100 | 3,738 | ||||
| Medtronic Inc. | 4.750 | % | 9/15/15 | 3,200 | 3,073 | ||||
| Merck & Co. | 4.750 | % | 3/1/15 | 5,425 | 5,420 | ||||
| PepsiAmericas Inc. | 4.875 | % | 1/15/15 | 2,875 | 2,640 | ||||
| PepsiAmericas Inc. | 5.000 | % | 5/15/17 | 750 | 678 | ||||
| Pepsico, Inc. | 5.000 | % | 6/1/18 | 9,200 | 9,431 | ||||
| Pepsico, Inc. | 7.900 | % | 11/1/18 | 8,000 | 9,875 | ||||
| Pfizer, Inc. | 4.500 | % | 2/15/14 | 2,575 | 2,697 | ||||
| Philip Morris International Inc | 5.650 | % | 5/16/18 | 11,975 | 11,916 | ||||
| Philip Morris International Inc. | 6.875 | % | 3/17/14 | 6,075 | 6,371 | ||||
| Philips Electronics NV | 5.750 | % | 3/11/18 | 7,100 | 6,630 | ||||
| Procter & Gamble Co. | 4.600 | % | 1/15/14 | 6,800 | 7,035 | ||||
| Procter & Gamble Co. | 4.950 | % | 8/15/14 | 10,025 | 10,358 | ||||
| Quest Diagnostic, Inc. | 5.450 | % | 11/1/15 | 4,900 | 4,319 | ||||
| Quest Diagnostic, Inc. | 6.400 | % | 7/1/17 | 1,325 | 1,218 | ||||
| Reynolds American Inc. | 7.625 | % | 6/1/16 | 1,000 | 824 | ||||
| Reynolds American Inc. | 6.750 | % | 6/15/17 | 6,000 | 4,515 | ||||
| Safeway, Inc. | 6.250 | % | 3/15/14 | 2,250 | 2,275 | ||||
| Safeway, Inc. | 6.350 | % | 8/15/17 | 3,875 | 3,906 | ||||
| Schering-Plough Corp. | 5.550 | % | 12/1/13 | 5,750 | 5,765 | ||||
| Schering-Plough Corp. | 6.000 | % | 9/15/17 | 7,700 | 7,538 | ||||
| Sysco Corp. | 5.250 | % | 2/12/18 | 2,500 | 2,542 | ||||
| Teva Pharmaceutical Finance LLC | 5.550 | % | 2/1/16 | 2,675 | 2,617 | ||||
| UST, Inc. | 5.750 | % | 3/1/18 | 975 | 811 | ||||
| Wyeth | 5.500 | % | 2/1/14 | 7,875 | 8,008 | ||||
| Wyeth | 5.500 | % | 2/15/16 | 9,050 | 9,275 | ||||
| Wyeth | 5.450 | % | 4/1/17 | 1,725 | 1,756 | ||||
| Energy (1.5%) | |||||||||
| Anadarko Petroleum Corp. | 5.950 | % | 9/15/16 | 10,200 | 8,945 | ||||
| Apache Corp. | 5.625 | % | 1/15/17 | 3,625 | 3,635 | ||||
| Apache Corp. | 6.900 | % | 9/15/18 | 2,800 | 3,052 | ||||
| Baker Hughes, Inc. | 7.500 | % | 11/15/18 | 3,000 | 3,317 | ||||
| BJ Services Co. | 6.000 | % | 6/1/18 | 1,225 | 1,089 | ||||
| Cameron International Corp. | 6.375 | % | 7/15/18 | 1,600 | 1,397 | ||||
| Canadian Natural Resources | 4.900 | % | 12/1/14 | 3,300 | 2,829 | ||||
| Canadian Natural Resources | 6.000 | % | 8/15/16 | 4,000 | 3,555 | ||||
| Canadian Natural Resources | 5.700 | % | 5/15/17 | 3,625 | 3,168 | ||||
| ConocoPhillips Canada | 5.625 | % | 10/15/16 | 9,825 | 10,154 | ||||
| Diamond Offshore Drilling | 4.875 | % | 7/1/15 | 2,050 | 1,909 | ||||
| Encana Corp. | 5.900 | % | 12/1/17 | 4,225 | 3,537 | ||||
| Encana Holdings Finance Corp. | 5.800 | % | 5/1/14 | 7,750 | 7,297 | ||||
| EOG Resources Inc. | 5.875 | % | 9/15/17 | 3,300 | 3,378 | ||||
| EOG Resources Inc. | 6.875 | % | 10/1/18 | 2,000 | 2,184 | ||||
| Halliburton Co. | 5.900 | % | 9/15/18 | 2,800 | 2,963 | ||||
| Marathon Oil Corp. | 6.000 | % | 10/1/17 | 8,875 | 7,764 | ||||
| Marathon Oil Corp. | 5.900 | % | 3/15/18 | 4,175 | 3,439 | ||||
Page 75
| Vanguard® Intermediate-Term Bond Index Fund | |||||||||
| Schedule of Investments | |||||||||
| December 31, 2008 | |||||||||
| Face | Market | ||||||||
| Maturity | Amount | Value | |||||||
| Coupon | Date | ($ | 000 | ) | ($ | 000 | ) | ||
| Nabors Industries Inc. | 6.150 | % | 2/15/18 | 5,475 | 4,787 | ||||
| Nexen, Inc. | 5.650 | % | 5/15/17 | 1,850 | 1,561 | ||||
| Petro-Canada Financial Partnership | 5.000 | % | 11/15/14 | 3,375 | 2,813 | ||||
| Petro-Canada Financial Partnership | 6.050 | % | 5/15/18 | 2,225 | 1,881 | ||||
| Questar Market Resources | 6.050 | % | 9/1/16 | 600 | 552 | ||||
| Questar Market Resources | 6.800 | % | 4/1/18 | 2,000 | 1,917 | ||||
| Shell International Finance BV | 5.200 | % | 3/22/17 | 2,775 | 2,884 | ||||
| Suncor Energy, Inc. | 6.100 | % | 6/1/18 | 5,200 | 4,485 | ||||
| Sunoco, Inc. | 4.875 | % | 10/15/14 | 950 | 793 | ||||
| Sunoco, Inc. | 5.750 | % | 1/15/17 | 2,075 | 1,749 | ||||
| Talisman Energy, Inc. | 5.125 | % | 5/15/15 | 2,150 | 1,908 | ||||
| Transocean Inc. | 6.000 | % | 3/15/18 | 4,750 | 4,292 | ||||
| Valero Energy Corp. | 6.125 | % | 6/15/17 | 6,000 | 5,109 | ||||
| Weatherford International Inc. | 5.500 | % | 2/15/16 | 3,000 | 2,496 | ||||
| Weatherford International Inc. | 6.350 | % | 6/15/17 | 2,600 | 2,264 | ||||
| Weatherford International Inc. | 6.000 | % | 3/15/18 | 2,575 | 2,166 | ||||
| XTO Energy, Inc. | 4.900 | % | 2/1/14 | 2,750 | 2,465 | ||||
| XTO Energy, Inc. | 5.000 | % | 1/31/15 | 400 | 353 | ||||
| XTO Energy, Inc. | 6.250 | % | 8/1/17 | 6,125 | 5,879 | ||||
| XTO Energy, Inc. | 5.500 | % | 6/15/18 | 5,000 | 4,540 | ||||
| XTO Energy, Inc. | 6.500 | % | 12/15/18 | 1,975 | 1,932 | ||||
| Other Industrial (0.0%) | |||||||||
| Cintas Corp. | 6.125 | % | 12/1/17 | 1,300 | 1,211 | ||||
| Technology (1.5%) | |||||||||
| Agilent Technologies Inc. | 6.500 | % | 11/1/17 | 3,325 | 2,286 | ||||
| Avnet Inc. | 6.625 | % | 9/15/16 | 3,000 | 2,306 | ||||
| BMC Software Inc. | 7.250 | % | 6/1/18 | 1,550 | 1,452 | ||||
| Cisco Systems Inc. | 5.500 | % | 2/22/16 | 16,775 | 17,704 | ||||
| 3 Computer Sciences Corp. | 6.500 | % | 3/15/18 | 4,800 | 4,012 | ||||
| Dell Inc. | 5.650 | % | 4/15/18 | 2,500 | 2,167 | ||||
| Equifax Inc. | 6.300 | % | 7/1/17 | 1,300 | 930 | ||||
| Fiserv, Inc. | 6.800 | % | 11/20/17 | 3,150 | 2,701 | ||||
| Harris Corp. | 5.000 | % | 10/1/15 | 1,425 | 1,204 | ||||
| Harris Corp. | 5.950 | % | 12/1/17 | 775 | 667 | ||||
| Hewlett-Packard Co. | 6.125 | % | 3/1/14 | 4,775 | 5,141 | ||||
| Hewlett-Packard Co. | 5.400 | % | 3/1/17 | 2,750 | 2,799 | ||||
| Hewlett-Packard Co. | 5.500 | % | 3/1/18 | 5,375 | 5,499 | ||||
| International Business Machines Corp. | 5.700 | % | 9/14/17 | 23,375 | 24,803 | ||||
| Intuit Inc. | 5.750 | % | 3/15/17 | 2,025 | 1,466 | ||||
| Lexmark International Inc. | 6.650 | % | 6/1/18 | 2,975 | 2,182 | ||||
| Motorola, Inc. | 6.000 | % | 11/15/17 | 725 | 445 | ||||
| National Semiconductor | 6.600 | % | 6/15/17 | 2,325 | 1,688 | ||||
| Oracle Corp. | 5.250 | % | 1/15/16 | 16,725 | 17,192 | ||||
| Oracle Corp. | 5.750 | % | 4/15/18 | 8,000 | 8,298 | ||||
| Pitney Bowes, Inc. | 4.875 | % | 8/15/14 | 2,025 | 1,952 | ||||
| Pitney Bowes, Inc. | 4.750 | % | 1/15/16 | 6,175 | 5,844 | ||||
| Pitney Bowes, Inc. | 5.750 | % | 9/15/17 | 2,400 | 2,366 | ||||
| Pitney Bowes, Inc. | 4.750 | % | 5/15/18 | 1,625 | 1,508 | ||||
| Tyco Electronics Group | 6.550 | % | 10/1/17 | 4,025 | 3,385 | ||||
| Xerox Corp. | 6.400 | % | 3/15/16 | 5,700 | 4,250 | ||||
| Xerox Corp. | 6.750 | % | 2/1/17 | 1,850 | 1,322 | ||||
| Xerox Corp. | 6.350 | % | 5/15/18 | 5,575 | 4,331 | ||||
| Transportation (0.6%) | |||||||||
| Burlington Northern Santa Fe Corp. | 5.650 | % | 5/1/17 | 9,050 | 8,827 | ||||
| Burlington Northern Santa Fe Corp. | 5.750 | % | 3/15/18 | 900 | 879 | ||||
| Canadian National Railway Co. | 4.950 | % | 1/15/14 | 1,300 | 1,270 | ||||
| Canadian National Railway Co. | 5.800 | % | 6/1/16 | 1,950 | 1,976 | ||||
| Canadian National Railway Co. | 5.850 | % | 11/15/17 | 500 | 509 | ||||
| Canadian National Railway Co. | 5.550 | % | 5/15/18 | 900 | 898 | ||||
| Canadian National Railway Co. | 6.800 | % | 7/15/18 | 750 | 817 | ||||
| Con-Way Inc. | 7.250 | % | 1/15/18 | 2,000 | 1,659 | ||||
| Continental Airlines, Inc. | 6.563 | % | 2/15/12 | 500 | 399 | ||||
| 2 Continental Airlines, Inc. | 6.648 | % | 9/15/17 | 992 | 757 | ||||
Page 76
| Vanguard® Intermediate-Term Bond Index Fund | |||||||||
| Schedule of Investments | |||||||||
| December 31, 2008 | |||||||||
| Face | Market | ||||||||
| Maturity | Amount | Value | |||||||
| Coupon | Date | ($ | 000 | ) | ($ | 000 | ) | ||
| 2 Continental Airlines, Inc. | 6.900 | % | 1/2/18 | 1,557 | 1,218 | ||||
| CSX Corp. | 6.250 | % | 4/1/15 | 4,000 | 3,933 | ||||
| CSX Corp. | 5.600 | % | 5/1/17 | 3,850 | 3,451 | ||||
| Norfolk Southern Corp. | 5.257 | % | 9/17/14 | 3,095 | 2,954 | ||||
| Norfolk Southern Corp. | 7.700 | % | 5/15/17 | 2,400 | 2,598 | ||||
| Norfolk Southern Corp. | 5.750 | % | 4/1/18 | 3,000 | 2,921 | ||||
| Ryder System Inc. | 5.850 | % | 3/1/14 | 1,350 | 1,051 | ||||
| Ryder System Inc. | 7.200 | % | 9/1/15 | 1,775 | 1,322 | ||||
| Ryder System Inc. | 5.850 | % | 11/1/16 | 1,000 | 827 | ||||
| Southwest Airlines Co. | 5.250 | % | 10/1/14 | 2,000 | 1,527 | ||||
| Southwest Airlines Co. | 5.750 | % | 12/15/16 | 1,300 | 890 | ||||
| Southwest Airlines Co. | 5.125 | % | 3/1/17 | 650 | 457 | ||||
| Union Pacific Corp. | 5.375 | % | 5/1/14 | 2,000 | 1,913 | ||||
| Union Pacific Corp. | 7.000 | % | 2/1/16 | 550 | 576 | ||||
| Union Pacific Corp. | 5.650 | % | 5/1/17 | 3,300 | 3,147 | ||||
| Union Pacific Corp. | 5.750 | % | 11/15/17 | 4,675 | 4,469 | ||||
| Union Pacific Corp. | 5.700 | % | 8/15/18 | 2,325 | 2,254 | ||||
| United Parcel Service of America | 5.500 | % | 1/15/18 | 1,600 | 1,702 | ||||
| 1,504,954 | |||||||||
| Utilities (4.0%) | |||||||||
| Electric (2.8%) | |||||||||
| Alabama Power Co. | 5.500 | % | 10/15/17 | 2,100 | 2,074 | ||||
| American Electric Power Co., Inc. | 5.250 | % | 6/1/15 | 1,850 | 1,687 | ||||
| American Water Capital Corp. | 6.085 | % | 10/15/17 | 3,025 | 2,644 | ||||
| Arizona Public Service Co. | 5.800 | % | 6/30/14 | 500 | 415 | ||||
| Arizona Public Service Co. | 4.650 | % | 5/15/15 | 3,825 | 2,942 | ||||
| Baltimore Gas & Electric Co. | 5.900 | % | 10/1/16 | 2,250 | 2,038 | ||||
| Carolina Power & Light Co. | 5.250 | % | 12/15/15 | 3,000 | 3,039 | ||||
| CenterPoint Energy Houston | 5.750 | % | 1/15/14 | 500 | 476 | ||||
| CenterPoint Energy Inc. | 6.500 | % | 5/1/18 | 4,500 | 3,682 | ||||
| Cleveland Electric Illumination Co. | 5.650 | % | 12/15/13 | 500 | 458 | ||||
| Cleveland Electric Illumination Co. | 7.880 | % | 11/1/17 | 250 | 256 | ||||
| Commonwealth Edison Co. | 4.700 | % | 4/15/15 | 700 | 628 | ||||
| Commonwealth Edison Co. | 5.950 | % | 8/15/16 | 1,975 | 1,857 | ||||
| Commonwealth Edison Co. | 6.150 | % | 9/15/17 | 4,250 | 3,997 | ||||
| Commonwealth Edison Co. | 5.800 | % | 3/15/18 | 650 | 584 | ||||
| Connecticut Light & Power Co. | 5.650 | % | 5/1/18 | 3,000 | 3,070 | ||||
| Consolidated Edison Co. of New York | 5.500 | % | 9/15/16 | 3,350 | 3,283 | ||||
| Consolidated Edison Co. of New York | 5.850 | % | 4/1/18 | 5,000 | 4,990 | ||||
| Consolidated Edison Co. of New York | 7.125 | % | 12/1/18 | 2,000 | 2,170 | ||||
| Constellation Energy Group, Inc. | 4.550 | % | 6/15/15 | 3,750 | 2,851 | ||||
| Consumers Energy Co. | 5.500 | % | 8/15/16 | 3,850 | 3,649 | ||||
| Dominion Resources, Inc. | 5.150 | % | 7/15/15 | 7,925 | 7,493 | ||||
| Dominion Resources, Inc. | 6.000 | % | 11/30/17 | 5,750 | 5,510 | ||||
| 2 Dominion Resources, Inc. | 7.500 | % | 6/30/66 | 500 | 257 | ||||
| Duke Energy Carolinas LLC | 5.250 | % | 1/15/18 | 3,000 | 3,059 | ||||
| Duke Energy Carolinas LLC | 5.100 | % | 4/15/18 | 5,750 | 5,802 | ||||
| Enersis SA | 7.375 | % | 1/15/14 | 3,500 | 3,640 | ||||
| 3 Entergy Gulf States, Inc. | 6.000 | % | 5/1/18 | 2,600 | 2,255 | ||||
| Entergy Louisiana LLC | 6.500 | % | 9/1/18 | 3,075 | 2,821 | ||||
| Exelon Corp. | 4.900 | % | 6/15/15 | 4,825 | 4,154 | ||||
| Exelon Generation Co. LLC | 5.350 | % | 1/15/14 | 1,000 | 849 | ||||
| Exelon Generation Co. LLC | 6.200 | % | 10/1/17 | 3,500 | 3,175 | ||||
| Florida Power & Light Co. | 5.550 | % | 11/1/17 | 3,950 | 4,124 | ||||
| Florida Power Corp. | 5.650 | % | 6/15/18 | 2,100 | 2,165 | ||||
| 2 FPL Group Capital, Inc. | 6.350 | % | 10/1/66 | 1,825 | 906 | ||||
| 2 FPL Group Capital, Inc. | 6.650 | % | 6/15/67 | 1,700 | 851 | ||||
| 2 FPL Group Capital, Inc. | 7.300 | % | 9/1/67 | 1,000 | 576 | ||||
| Georgia Power Co. | 5.700 | % | 6/1/17 | 7,000 | 7,080 | ||||
| Illinois Power | 6.125 | % | 11/15/17 | 3,100 | 2,740 | ||||
| Illinois Power | 6.250 | % | 4/1/18 | 2,000 | 1,747 | ||||
| 3 Illinois Power | 9.750 | % | 11/15/18 | 3,300 | 3,519 | ||||
| 2 Integrys Energy Group | 6.110 | % | 12/1/66 | 1,500 | 745 | ||||
| Jersey Central Power & Light | 5.625 | % | 5/1/16 | 5,675 | 5,240 | ||||
| Jersey Central Power & Light | 5.650 | % | 6/1/17 | 5,475 | 5,051 |
Page 77
| Vanguard® Intermediate-Term Bond Index Fund | |||||||||
| Schedule of Investments | |||||||||
| December 31, 2008 | |||||||||
| Face | Market | ||||||||
| Maturity | Amount | Value | |||||||
| Coupon | Date | ($ | 000 | ) | ($ | 000 | ) | ||
| Metropolitan Edison | 4.875 | % | 4/1/14 | 1,000 | 910 | ||||
| MidAmerican Energy Co. | 5.950 | % | 7/15/17 | 925 | 964 | ||||
| MidAmerican Energy Co. | 5.300 | % | 3/15/18 | 4,900 | 4,838 | ||||
| MidAmerican Energy Holdings Co. | 5.000 | % | 2/15/14 | 600 | 573 | ||||
| MidAmerican Energy Holdings Co. | 5.750 | % | 4/1/18 | 4,350 | 4,326 | ||||
| National Rural Utilities Cooperative Finance Corp. | 4.750 | % | 3/1/14 | 3,500 | 3,210 | ||||
| National Rural Utilities Cooperative Finance Corp. | 5.450 | % | 4/10/17 | 8,250 | 7,590 | ||||
| National Rural Utilities Cooperative Finance Corp. | 5.450 | % | 2/1/18 | 3,575 | 3,269 | ||||
| National Rural Utilities Cooperative Finance Corp. | 10.375 | % | 11/1/18 | 2,525 | 2,941 | ||||
| Nevada Power Co. | 6.500 | % | 5/15/18 | 2,675 | 2,567 | ||||
| Nevada Power Co. | 6.500 | % | 8/1/18 | 3,575 | 3,469 | ||||
| NiSource Finance Corp. | 5.400 | % | 7/15/14 | 1,025 | 692 | ||||
| NiSource Finance Corp. | 6.400 | % | 3/15/18 | 5,350 | 3,470 | ||||
| Northern States Power Co. | 5.250 | % | 3/1/18 | 5,350 | 5,397 | ||||
| NStar Electric Co. | 4.875 | % | 4/15/14 | 2,350 | 2,258 | ||||
| NStar Electric Co. | 5.625 | % | 11/15/17 | 625 | 593 | ||||
| Ohio Edison | 6.400 | % | 7/15/16 | 1,200 | 1,045 | ||||
| Ohio Power Co. | 6.000 | % | 6/1/16 | 2,425 | 2,386 | ||||
| Oncor Electric Delivery Co. | 6.375 | % | 1/15/15 | 3,025 | 2,866 | ||||
| Pacific Gas & Electric Co. | 4.800 | % | 3/1/14 | 9,100 | 8,859 | ||||
| Pacific Gas & Electric Co. | 5.625 | % | 11/30/17 | 4,850 | 4,968 | ||||
| Pacific Gas & Electric Co. | 8.250 | % | 10/15/18 | 1,325 | 1,572 | ||||
| PacifiCorp | 5.650 | % | 7/15/18 | 2,575 | 2,589 | ||||
| PECO Energy Co. | 5.350 | % | 3/1/18 | 2,475 | 2,383 | ||||
| Pennsylvania Electric Co. | 6.050 | % | 9/1/17 | 800 | 714 | ||||
| PPL Energy Supply LLC | 6.200 | % | 5/15/16 | 7,900 | 6,281 | ||||
| PPL Energy Supply LLC | 6.500 | % | 5/1/18 | 750 | 616 | ||||
| Progress Energy, Inc. | 5.625 | % | 1/15/16 | 1,425 | 1,316 | ||||
| PSE&G Power LLC | 5.000 | % | 4/1/14 | 2,650 | 2,342 | ||||
| PSE&G Power LLC | 5.500 | % | 12/1/15 | 3,125 | 2,727 | ||||
| PSI Energy Inc. | 6.050 | % | 6/15/16 | 1,500 | 1,424 | ||||
| Public Service Co. of Colorado | 5.500 | % | 4/1/14 | 1,000 | 978 | ||||
| Sierra Pacific Power Co. | 6.000 | % | 5/15/16 | 2,400 | 2,260 | ||||
| South Carolina Electric & Gas Co. | 6.500 | % | 11/1/18 | 800 | 884 | ||||
| Southern California Edison Co. | 5.000 | % | 1/15/14 | 2,000 | 2,041 | ||||
| Southern California Edison Co. | 5.750 | % | 3/15/14 | 2,000 | 2,125 | ||||
| Southern California Edison Co. | 4.650 | % | 4/1/15 | 2,875 | 2,817 | ||||
| Southern California Edison Co. | 5.000 | % | 1/15/16 | 675 | 674 | ||||
| Southern Power Co. | 4.875 | % | 7/15/15 | 1,125 | 989 | ||||
| Southwestern Electric Power | 5.550 | % | 1/15/17 | 3,500 | 3,279 | ||||
| Southwestern Electric Power | 6.450 | % | 1/15/19 | 1,900 | 1,862 | ||||
| TransAlta Corp. | 6.750 | % | 7/15/12 | 125 | 124 | ||||
| TransAlta Corp. | 6.650 | % | 5/15/18 | 2,975 | 2,671 | ||||
| Union Electric Co. | 5.400 | % | 2/1/16 | 300 | 260 | ||||
| Virginia Electric & Power Co. | 5.400 | % | 1/15/16 | 4,450 | 4,367 | ||||
| Westar Energy Inc. | 8.625 | % | 12/1/18 | 2,000 | 2,164 | ||||
| Wisconsin Electric Power Co. | 6.000 | % | 4/1/14 | 1,200 | 1,289 | ||||
| 2 Wisconsin Energy Corp. | 6.250 | % | 5/15/67 | 5,275 | 2,615 | ||||
| Natural Gas (1.2%) | |||||||||
| Atmos Energy Corp. | 4.950 | % | 10/15/14 | 3,400 | 2,979 | ||||
| Boardwalk Pipelines LLC | 5.500 | % | 2/1/17 | 3,725 | 2,992 | ||||
| Buckeye Partners LP | 6.050 | % | 1/15/18 | 4,550 | 3,940 | ||||
| CenterPoint Energy Resources | 6.150 | % | 5/1/16 | 1,350 | 1,174 | ||||
| CenterPoint Energy Resources | 6.000 | % | 5/15/18 | 5,000 | 4,182 | ||||
| Consolidated Natural Gas | 5.000 | % | 12/1/14 | 3,125 | 2,899 | ||||
| Duke Capital Corp. | 5.500 | % | 3/1/14 | 1,000 | 891 | ||||
| Duke Capital Corp. | 5.668 | % | 8/15/14 | 1,000 | 890 | ||||
| El Paso Natural Gas Co. | 5.950 | % | 4/15/17 | 1,700 | 1,382 | ||||
| Enbridge Energy Partners | 6.500 | % | 4/15/18 | 3,075 | 2,559 | ||||
| Enbridge Inc. | 5.600 | % | 4/1/17 | 4,050 | 3,379 | ||||
| Energy Transfer Partners LP | 5.950 | % | 2/1/15 | 5,250 | 4,540 | ||||
| Energy Transfer Partners LP | 6.125 | % | 2/15/17 | 4,850 | 4,076 | ||||
| Enterprise Products Operating LP | 5.600 | % | 10/15/14 | 6,250 | 5,321 | ||||
| Enterprise Products Operating LP | 6.300 | % | 9/15/17 | 2,525 | 2,178 | ||||
Page 78
| Vanguard® Intermediate-Term Bond Index Fund | |||||||||
| Schedule of Investments | |||||||||
| December 31, 2008 | |||||||||
| Face | Market | ||||||||
| Maturity | Amount | Value | |||||||
| Coupon | Date | ($ | 000 | ) | ($ | 000 | ) | ||
| Equitable Resources Inc. | 6.500 | % | 4/1/18 | 3,800 | 3,437 | ||||
| Kinder Morgan Energy Partners LP | 5.125 | % | 11/15/14 | 10,800 | 9,281 | ||||
| Kinder Morgan Energy Partners LP | 6.000 | % | 2/1/17 | 1,000 | 863 | ||||
| Kinder Morgan Energy Partners LP | 5.950 | % | 2/15/18 | 250 | 213 | ||||
| Magellan Midstream Partners, LP | 5.650 | % | 10/15/16 | 650 | 584 | ||||
| National Grid PLC | 6.300 | % | 8/1/16 | 6,200 | 5,332 | ||||
| NuStar Energy LP | 7.650 | % | 4/15/18 | 2,900 | 2,609 | ||||
| ONEOK Inc. | 5.200 | % | 6/15/15 | 3,100 | 2,570 | ||||
| ONEOK Partners, LP | 6.150 | % | 10/1/16 | 5,125 | 4,405 | ||||
| Panhandle Eastern Pipeline | 6.200 | % | 11/1/17 | 2,000 | 1,588 | ||||
| Panhandle Eastern Pipeline | 7.000 | % | 6/15/18 | 2,525 | 2,106 | ||||
| Plains All American Pipeline LP | 6.125 | % | 1/15/17 | 2,500 | 1,995 | ||||
| Plains All American Pipeline LP | 6.500 | % | 5/1/18 | 2,675 | 2,189 | ||||
| San Diego Gas & Electric | 5.300 | % | 11/15/15 | 300 | 300 | ||||
| Sempra Energy | 6.150 | % | 6/15/18 | 2,800 | 2,596 | ||||
| 3 Southern Natural Gas | 5.900 | % | 4/1/17 | 6,525 | 4,992 | ||||
| Spectra Energy Corp. | 6.200 | % | 4/15/18 | 1,700 | 1,494 | ||||
| Teppco Partners, LP | 6.650 | % | 4/15/18 | 550 | 472 | ||||
| Texas Gas Transmission | 4.600 | % | 6/1/15 | 500 | 418 | ||||
| Trans-Canada Pipelines | 6.500 | % | 8/15/18 | 5,000 | 4,879 | ||||
| 2 Trans-Canada Pipelines | 6.350 | % | 5/15/67 | 6,475 | 2,955 | ||||
| Transcontinental Gas Pipe Line Corp. | 6.050 | % | 6/15/18 | 2,500 | 2,173 | ||||
| Other Utility (0.0%) | |||||||||
| Veolia Environnement | 6.000 | % | 6/1/18 | 3,500 | 3,088 | ||||
| 345,024 | |||||||||
| Total Corporate Bonds (Cost $3,658,016) | 3,322,717 | ||||||||
| Sovereign Bonds (U.S. Dollar-Denominated) (6.7%) | |||||||||
| Asian Development Bank | 6.640 | % | 5/27/14 | 521 | 607 | ||||
| Asian Development Bank | 5.500 | % | 6/27/16 | 6,900 | 8,205 | ||||
| Asian Development Bank | 5.250 | % | 6/12/17 | 2,300 | 2,706 | ||||
| Asian Development Bank | 5.593 | % | 7/16/18 | 7,800 | 9,408 | ||||
| China Development Bank | 4.750 | % | 10/8/14 | 2,700 | 2,765 | ||||
| China Development Bank | 5.000 | % | 10/15/15 | 3,450 | 3,406 | ||||
| Corp. Andina de Fomento | 5.750 | % | 1/12/17 | 3,950 | 3,292 | ||||
| Development Bank of Japan | 4.250 | % | 6/9/15 | 2,325 | 2,428 | ||||
| Development Bank of Japan | 5.125 | % | 2/1/17 | 3,700 | 3,964 | ||||
| Eksportfinans | 5.500 | % | 5/25/16 | 3,125 | 3,375 | ||||
| Eksportfinans | 5.500 | % | 6/26/17 | 4,600 | 5,013 | ||||
| European Bank for Reconstruction & Development | 5.000 | % | 5/19/14 | 3,400 | 3,865 | ||||
| European Investment Bank | 4.625 | % | 5/15/14 | 12,350 | 13,349 | ||||
| European Investment Bank | 4.875 | % | 2/16/16 | 9,250 | 10,241 | ||||
| European Investment Bank | 5.125 | % | 9/13/16 | 14,550 | 16,466 | ||||
| European Investment Bank | 4.875 | % | 1/17/17 | 14,975 | 17,081 | ||||
| European Investment Bank | 5.125 | % | 5/30/17 | 12,600 | 14,697 | ||||
| Export-Import Bank of Korea | 5.125 | % | 3/16/15 | 4,800 | 3,888 | ||||
| Federative Republic of Brazil | 7.875 | % | 3/7/15 | 10,000 | 11,325 | ||||
| Federative Republic of Brazil | 6.000 | % | 1/17/17 | 18,000 | 18,495 | ||||
| 2 Federative Republic of Brazil | 8.000 | % | 1/15/18 | 16,000 | 17,864 | ||||
| Inter-American Development Bank | 4.500 | % | 9/15/14 | 3,000 | 3,311 | ||||
| Inter-American Development Bank | 4.250 | % | 9/14/15 | 9,420 | 10,296 | ||||
| Inter-American Development Bank | 5.125 | % | 9/13/16 | 6,700 | 7,696 | ||||
| International Bank for Reconstruction & Development | 5.000 | % | 4/1/16 | 9,375 | 10,850 | ||||
| Japan Finance Corp. | 4.625 | % | 4/21/15 | 5,600 | 5,816 | ||||
| Japan Finance Corp. | 5.000 | % | 5/16/17 | 3,800 | 4,060 | ||||
| Kreditanstalt fur Wiederaufbau | 4.125 | % | 10/15/14 | 6,475 | 6,849 | ||||
| Kreditanstalt fur Wiederaufbau | 5.125 | % | 3/14/16 | 35,975 | 40,817 | ||||
| ^ Kreditanstalt fur Wiederaufbau | 4.375 | % | 3/15/18 | 17,700 | 19,601 | ||||
| Kreditanstalt fur Wiederaufbau | 4.500 | % | 7/16/18 | 10,900 | 12,172 | ||||
| Landwirtschaftliche Rentenbank | 4.875 | % | 11/16/15 | 6,525 | 7,161 | ||||
| Landwirtschaftliche Rentenbank | 5.125 | % | 2/1/17 | 8,775 | 9,916 | ||||
| Nordic Investment Bank | 5.000 | % | 2/1/17 | 7,650 | 8,812 | ||||
Page 79
| Vanguard® Intermediate-Term Bond Index Fund | ||||||||||
| Schedule of Investments | ||||||||||
| December 31, 2008 | ||||||||||
| Face | Market | |||||||||
| Maturity | Amount | Value | ||||||||
| Coupon | Date | ($ | 000 | ) | ($ | 000 | ) | |||
| Oesterreichische Kontrollbank | 4.500 | % | 3/9/15 | 2,600 | 2,853 | |||||
| Oesterreichische Kontrollbank | 4.875 | % | 2/16/16 | 5,000 | 5,704 | |||||
| Oesterreichische Kontrollbank | 5.000 | % | 4/25/17 | 6,425 | 7,299 | |||||
| Pemex Project Funding Master Trust | 7.375 | % | 12/15/14 | 2,500 | 2,566 | |||||
| 3 | Pemex Project Funding Master Trust | 5.750 | % | 3/1/18 | 14,400 | 12,683 | ||||
| Petrobras International Finance | 6.125 | % | 10/6/16 | 8,475 | 8,214 | |||||
| Petrobras International Finance | 5.875 | % | 3/1/18 | 6,325 | 5,677 | |||||
| Province of Manitoba | 7.500 | % | 2/22/10 | 1,000 | 1,061 | |||||
| Province of Manitoba | 4.900 | % | 12/6/16 | 500 | 552 | |||||
| Province of Ontario | 4.750 | % | 1/19/16 | 16,725 | 18,043 | |||||
| Province of Ontario | 5.450 | % | 4/27/16 | 7,100 | 7,972 | |||||
| Province of Quebec | 4.875 | % | 5/5/14 | 6,000 | 6,432 | |||||
| Province of Quebec | 4.600 | % | 5/26/15 | 4,800 | 4,953 | |||||
| Province of Quebec | 5.000 | % | 3/1/16 | 2,000 | 2,120 | |||||
| Province of Quebec | 5.125 | % | 11/14/16 | 10,975 | 11,779 | |||||
| Province of Quebec | 4.625 | % | 5/14/18 | 5,900 | 6,172 | |||||
| Quebec Hydro Electric | 7.500 | % | 4/1/16 | 2,500 | 3,093 | |||||
| Republic of Hungary | 4.750 | % | 2/3/15 | 7,350 | 6,500 | |||||
| Republic of Italy | 4.500 | % | 1/21/15 | 5,650 | 5,820 | |||||
| Republic of Italy | 4.750 | % | 1/25/16 | 13,275 | 14,026 | |||||
| Republic of Italy | 5.250 | % | 9/20/16 | 30,800 | 33,704 | |||||
| Republic of Italy | 5.375 | % | 6/12/17 | 425 | 472 | |||||
| ^ | Republic of Korea | 4.875 | % | 9/22/14 | 6,750 | 6,404 | ||||
| Republic of Peru | 9.875 | % | 2/6/15 | 8,075 | 9,246 | |||||
| Republic of Peru | 8.375 | % | 5/3/16 | 2,000 | 2,155 | |||||
| Republic of Poland | 5.250 | % | 1/15/14 | 4,700 | 4,622 | |||||
| Republic of Poland | 5.000 | % | 10/19/15 | 4,500 | 4,336 | |||||
| Republic of South Africa | 6.500 | % | 6/2/14 | 5,725 | 5,410 | |||||
| State of Israel | 5.125 | % | 3/1/14 | 2,000 | 2,080 | |||||
| State of Israel (U.S. Government Guaranteed) | 5.500 | % | 11/9/16 | 4,025 | 4,304 | |||||
| Swedish Export Credit Corp. | 5.125 | % | 3/1/17 | 6,250 | 6,905 | |||||
| United Mexican States | 5.875 | % | 1/15/14 | 9,325 | 9,535 | |||||
| United Mexican States | 6.625 | % | 3/3/15 | 14,200 | 15,052 | |||||
| United Mexican States | 11.375 | % | 9/15/16 | 1,725 | 2,329 | |||||
| United Mexican States | 5.625 | % | 1/15/17 | 18,000 | 18,045 | |||||
| Total Sovereign Bonds (Cost $546,663) | 577,915 | |||||||||
| Taxable Municipal Bond (0.0%) | ||||||||||
| Wisconsin Public Service Rev. (Cost $1,348) | 4.800 | % | 5/1/13 | 1,350 | 1,350 | |||||
| Shares | ||||||||||
| Temporary Cash Investments (1.9%) | ||||||||||
| 4,5 | Vanguard Market Liquidity Fund (Cost $161,988) | 1.378 | % | 161,987,990 | 161,988 | |||||
| Total Investments (99.3%) (Cost $8,406,054) | 8,562,937 | |||||||||
| Other Assets and Liabilities—Net (0.7%)5 | 58,352 | |||||||||
| Net Assets (100%) | 8,621,289 | |||||||||
^ Part of security position is on loan to broker-dealers. The total value of securities on loan is $19,443,000.
1 The issuer operates under a congressional charter; its securities are neither issued nor guaranteed by the U.S. government.
2 The average or expected maturity is shorter than the final maturity shown because of the possibility of interim principal payments and prepayments or the possibility of the issue being called.
3 Security exempt from registration under Rule 144A of the Securities Act of 1933. Such securities may be sold in transactions exempt from registration, normally to qualified institutional buyers. At December 31, 2008, the aggregate value of these securities was $74,047,000, representing 0.9% of net assets.
4 Affiliated money market fund available only to Vanguard funds and certain trusts and accounts managed by Vanguard. Rate shown is the 7-day yield.
5 Includes $19,929,000 of collateral received for securities on loan.
Page 80
| Vanguard® Long-Term Bond Index Fund | ||||||||||
| Schedule of Investments | ||||||||||
| December 31, 2008 | ||||||||||
| Face | Market | |||||||||
| Maturity | Amount | Value | ||||||||
| Coupon | Date | ($ | 000 | ) | ($ | 000 | ) | |||
| U.S. Government and Agency Obligations (51.3%) | ||||||||||
| U.S. Government Securities (45.4%) | ||||||||||
| U.S. Treasury Bond | 8.750 | % | 5/15/17 | 1,540 | 2,270 | |||||
| U.S. Treasury Bond | 9.125 | % | 5/15/18 | 1,050 | 1,626 | |||||
| U.S. Treasury Bond | 9.000 | % | 11/15/18 | 840 | 1,299 | |||||
| U.S. Treasury Bond | 8.875 | % | 2/15/19 | 1,390 | 2,140 | |||||
| U.S. Treasury Bond | 8.125 | % | 8/15/19 | 300 | 444 | |||||
| U.S. Treasury Bond | 8.500 | % | 2/15/20 | 10 | 15 | |||||
| U.S. Treasury Bond | 8.750 | % | 5/15/20 | 28,730 | 44,774 | |||||
| U.S. Treasury Bond | 8.750 | % | 8/15/20 | 60,475 | 94,568 | |||||
| U.S. Treasury Bond | 7.875 | % | 2/15/21 | 39,280 | 58,466 | |||||
| U.S. Treasury Bond | 8.125 | % | 5/15/21 | 15 | 23 | |||||
| U.S. Treasury Bond | 8.125 | % | 8/15/21 | 44,985 | 68,567 | |||||
| U.S. Treasury Bond | 8.000 | % | 11/15/21 | 95,645 | 145,351 | |||||
| U.S. Treasury Bond | 7.250 | % | 8/15/22 | 11,695 | 17,049 | |||||
| U.S. Treasury Bond | 7.625 | % | 11/15/22 | 36,745 | 55,433 | |||||
| U.S. Treasury Bond | 7.125 | % | 2/15/23 | 42,610 | 61,937 | |||||
| U.S. Treasury Bond | 6.250 | % | 8/15/23 | 40,045 | 54,749 | |||||
| U.S. Treasury Bond | 7.500 | % | 11/15/24 | 50 | 80 | |||||
| U.S. Treasury Bond | 7.625 | % | 2/15/25 | 75 | 122 | |||||
| U.S. Treasury Bond | 6.000 | % | 2/15/26 | 51,825 | 72,329 | |||||
| U.S. Treasury Bond | 6.750 | % | 8/15/26 | 50,165 | 75,781 | |||||
| U.S. Treasury Bond | 6.500 | % | 11/15/26 | 800 | 1,181 | |||||
| U.S. Treasury Bond | 6.625 | % | 2/15/27 | 22,305 | 33,405 | |||||
| U.S. Treasury Bond | 6.375 | % | 8/15/27 | 43,105 | 63,182 | |||||
| U.S. Treasury Bond | 6.125 | % | 11/15/27 | 13,850 | 19,890 | |||||
| U.S. Treasury Bond | 5.500 | % | 8/15/28 | 62,455 | 84,568 | |||||
| U.S. Treasury Bond | 5.250 | % | 11/15/28 | 9,670 | 12,787 | |||||
| U.S. Treasury Bond | 5.250 | % | 2/15/29 | 16,600 | 22,042 | |||||
| U.S. Treasury Bond | 6.125 | % | 8/15/29 | 25,105 | 36,912 | |||||
| U.S. Treasury Bond | 6.250 | % | 5/15/30 | 4,855 | 7,313 | |||||
| U.S. Treasury Bond | 5.375 | % | 2/15/31 | 15,810 | 21,766 | |||||
| U.S. Treasury Bond | 4.500 | % | 2/15/36 | 42,605 | 56,745 | |||||
| U.S. Treasury Bond | 4.750 | % | 2/15/37 | 41,350 | 57,761 | |||||
| U.S. Treasury Bond | 5.000 | % | 5/15/37 | 39,200 | 56,950 | |||||
| U.S. Treasury Bond | 4.375 | % | 2/15/38 | 42,228 | 56,730 | |||||
| U.S. Treasury Bond | 4.500 | % | 5/15/38 | 54,885 | 75,090 | |||||
| U.S. Treasury Note | 3.250 | % | 1/15/09 | 800 | 801 | |||||
| U.S. Treasury Note | 4.500 | % | 2/15/09 | 800 | 804 | |||||
| U.S. Treasury Note | 4.750 | % | 2/28/09 | 1,425 | 1,435 | |||||
| U.S. Treasury Note | 4.750 | % | 2/15/10 | 660 | 691 | |||||
| U.S. Treasury Note | 6.500 | % | 2/15/10 | 2,550 | 2,720 | |||||
| U.S. Treasury Note | 3.750 | % | 11/15/18 | 15,100 | 17,127 | |||||
| 1,386,923 | ||||||||||
| Agency Bonds and Notes (5.9%) | ||||||||||
| 1 | Federal Farm Credit Bank | 5.150 | % | 11/15/19 | 1,000 | 1,160 | ||||
| 1 | Federal Home Loan Bank | 5.375 | % | 5/15/19 | 5,250 | 6,151 | ||||
| 1 | Federal Home Loan Bank | 5.125 | % | 8/15/19 | 5,220 | 6,028 | ||||
| 1 | Federal Home Loan Bank | 5.250 | % | 12/11/20 | 6,000 | 7,000 | ||||
| 1 | Federal Home Loan Bank | 5.625 | % | 6/11/21 | 2,500 | 2,963 | ||||
| 1 | Federal Home Loan Bank | 5.625 | % | 3/14/36 | 1,000 | 1,283 | ||||
| 1 | Federal Home Loan Bank | 5.500 | % | 7/15/36 | 1,600 | 2,055 | ||||
| 1 | Federal Home Loan Mortgage Corp. | 4.875 | % | 6/13/18 | 3,000 | 3,442 | ||||
| 1 | Federal Home Loan Mortgage Corp. | 6.750 | % | 9/15/29 | 7,700 | 11,032 | ||||
| 1 | Federal Home Loan Mortgage Corp. | 6.750 | % | 3/15/31 | 8,400 | 12,287 | ||||
| 1 | Federal Home Loan Mortgage Corp. | 6.250 | % | 7/15/32 | 8,175 | 11,544 | ||||
| 1 | Federal National Mortgage Assn. | 0.000 | % | 10/9/19 | 10,300 | 6,015 | ||||
| 1 | Federal National Mortgage Assn. | 6.250 | % | 5/15/29 | 7,625 | 10,388 | ||||
| 1 | Federal National Mortgage Assn. | 7.125 | % | 1/15/30 | 12,075 | 18,035 | ||||
| 1 | Federal National Mortgage Assn. | 7.250 | % | 5/15/30 | 12,435 | 18,986 | ||||
| 1 | Federal National Mortgage Assn. | 6.625 | % | 11/15/30 | 9,800 | 14,127 | ||||
| 1 | Federal National Mortgage Assn. | 5.625 | % | 7/15/37 | 2,325 | 2,969 | ||||
| 1 | Federal National Mortgage Assn. | 6.210 | % | 8/6/38 | 1,000 | 1,383 | ||||
| Financing Corp. | 8.600 | % | 9/26/19 | 1,275 | 1,877 | |||||
Page 81
| Vanguard® Long-Term Bond Index Fund | |||||||||||
| Schedule of Investments | |||||||||||
| December 31, 2008 | |||||||||||
| Face | Market | ||||||||||
| Maturity | Amount | Value | |||||||||
| Coupon | Date | ($ | 000 | ) | ($ | 000 | ) | ||||
| Resolution Funding Corp. (U.S. Government Guaranteed) | 8.625 | % | 1/15/21 | 850 | 1,283 | ||||||
| State of Israel (U.S. Government Guaranteed) | 5.500 | % | 9/18/23 | 1,375 | 1,675 | ||||||
| State of Israel (U.S. Government Guaranteed) | 5.500 | % | 12/4/23 | 5,325 | 6,498 | ||||||
| State of Israel (U.S. Government Guaranteed) | 5.500 | % | 4/26/24 | 2,900 | 3,552 | ||||||
| 1 | Tennessee Valley Auth. | 4.500 | % | 4/1/18 | 2,475 | 2,729 | |||||
| 1 | Tennessee Valley Auth. | 6.750 | % | 11/1/25 | 4,500 | 6,231 | |||||
| 1 | Tennessee Valley Auth. | 7.125 | % | 5/1/30 | 3,250 | 4,739 | |||||
| 1 | Tennessee Valley Auth. | 4.650 | % | 6/15/35 | 2,825 | 3,128 | |||||
| 1 | Tennessee Valley Auth. | 5.880 | % | 4/1/36 | 1,000 | 1,284 | |||||
| 1 | Tennessee Valley Auth. | 6.150 | % | 1/15/38 | 2,450 | 3,339 | |||||
| 1 | Tennessee Valley Auth. | 5.500 | % | 6/15/38 | 1,175 | 1,476 | |||||
| 1 | Tennessee Valley Auth. | 4.875 | % | 1/15/48 | 2,500 | 2,924 | |||||
| 1 | Tennessee Valley Auth. | 5.375 | % | 4/1/56 | 1,850 | 2,378 | |||||
| 179,961 | |||||||||||
| Total U.S. Government and Agency Obligations (Cost $1,284,749) | 1,566,884 | ||||||||||
| Corporate Bonds (39.0%) | |||||||||||
| Asset-Backed/Commercial Mortgage-Backed Securities (0.1%) | |||||||||||
| 2 | PSE&G Transition Funding LLC | 6.890 | % | 12/15/17 | 2,500 | 2,521 | |||||
| Finance (9.5%) | |||||||||||
| Banking (5.7%) | |||||||||||
| Abbey National PLC | 7.950 | % | 10/26/29 | 4,725 | 4,095 | ||||||
| American Express Co. | 8.150 | % | 3/19/38 | 2,350 | 2,743 | ||||||
| BAC Capital Trust XI | 6.625 | % | 5/23/36 | 225 | 214 | ||||||
| Banc One Corp. | 7.750 | % | 7/15/25 | 2,000 | 2,214 | ||||||
| Banc One Corp. | 7.625 | % | 10/15/26 | 4,350 | 4,851 | ||||||
| Bank of America Corp. | 4.500 | % | 8/1/10 | 150 | 151 | ||||||
| Bank of America Corp. | 4.250 | % | 10/1/10 | 450 | 449 | ||||||
| Bank of America Corp. | 4.375 | % | 12/1/10 | 300 | 300 | ||||||
| Bank of America Corp. | 5.375 | % | 8/15/11 | 1,150 | 1,178 | ||||||
| Bank of America Corp. | 5.375 | % | 9/11/12 | 650 | 658 | ||||||
| Bank of America Corp. | 5.375 | % | 6/15/14 | 400 | 399 | ||||||
| Bank of America Corp. | 5.625 | % | 3/8/35 | 5,575 | 4,648 | ||||||
| Bank of America Corp. | 6.000 | % | 10/15/36 | 4,675 | 5,026 | ||||||
| Bank of America Corp. | 6.500 | % | 9/15/37 | 1,600 | 1,635 | ||||||
| 2 | Barclays Bank PLC | 6.278 | % | 12/29/49 | 750 | 478 | |||||
| BB&T Capital Trust II | 6.750 | % | 6/7/36 | 4,225 | 3,205 | ||||||
| 2 | BB&T Capital Trust IV | 6.820 | % | 6/12/37 | 650 | 395 | |||||
| BB&T Corp. | 5.250 | % | 11/1/19 | 1,000 | 895 | ||||||
| Capital One Capital III | 7.686 | % | 8/15/36 | 1,700 | 714 | ||||||
| Capital One Capital IV | 6.745 | % | 2/17/37 | 1,100 | 506 | ||||||
| 2,3 | Citicorp Lease Pass-Through Trust | 8.040 | % | 12/15/19 | 450 | 439 | |||||
| 2 | Citigroup Capital XXI | 8.300 | % | 12/21/37 | 8,375 | 6,457 | |||||
| Citigroup, Inc. | 6.625 | % | 6/15/32 | 2,750 | 2,672 | ||||||
| Citigroup, Inc. | 5.875 | % | 2/22/33 | 2,750 | 2,358 | ||||||
| Citigroup, Inc. | 6.000 | % | 10/31/33 | 1,700 | 1,488 | ||||||
| Citigroup, Inc. | 5.850 | % | 12/11/34 | 2,300 | 2,246 | ||||||
| Citigroup, Inc. | 6.125 | % | 8/25/36 | 6,725 | 6,162 | ||||||
| Citigroup, Inc. | 5.875 | % | 5/29/37 | 1,575 | 1,587 | ||||||
| Citigroup, Inc. | 6.875 | % | 3/5/38 | 5,525 | 6,381 | ||||||
| 2 | Comerica Capital Trust II | 6.576 | % | 2/20/32 | 1,500 | 623 | |||||
| Compass Bank | 5.900 | % | 4/1/26 | 1,075 | 770 | ||||||
| Credit Suisse First Boston USA, Inc. | 7.125 | % | 7/15/32 | 2,100 | 2,316 | ||||||
| Fifth Third Bancorp. | 8.250 | % | 3/1/38 | 2,825 | 2,288 | ||||||
| First Union Institutional Capital I | 8.040 | % | 12/1/26 | 500 | 416 | ||||||
| Fleet Capital Trust II | 7.920 | % | 12/11/26 | 1,150 | 946 | ||||||
| Fleet Financial Group, Inc. | 6.875 | % | 1/15/28 | 400 | 401 | ||||||
| Goldman Sachs Group, Inc. | 5.950 | % | 1/15/27 | 5,950 | 4,409 | ||||||
| Goldman Sachs Group, Inc. | 6.125 | % | 2/15/33 | 6,650 | 6,180 | ||||||
| Goldman Sachs Group, Inc. | 6.345 | % | 2/15/34 | 7,350 | 5,407 | ||||||
| Goldman Sachs Group, Inc. | 6.750 | % | 10/1/37 | 10,875 | 8,947 | ||||||
| HSBC Bank USA | 5.875 | % | 11/1/34 | 4,100 | 3,985 | ||||||
| HSBC Bank USA | 5.625 | % | 8/15/35 | 5,300 | 4,924 | ||||||
Page 82
| Vanguard® Long-Term Bond Index Fund | ||||||||||
| Schedule of Investments | ||||||||||
| December 31, 2008 | ||||||||||
| Face | Market | |||||||||
| Maturity | Amount | Value | ||||||||
| Coupon | Date | ($ | 000 | ) | ($ | 000 | ) | |||
| HSBC Holdings PLC | 7.625 | % | 5/17/32 | 1,050 | 1,141 | |||||
| HSBC Holdings PLC | 7.350 | % | 11/27/32 | 200 | 211 | |||||
| HSBC Holdings PLC | 6.500 | % | 5/2/36 | 3,525 | 3,606 | |||||
| HSBC Holdings PLC | 6.500 | % | 9/15/37 | 5,500 | 5,803 | |||||
| HSBC Holdings PLC | 6.800 | % | 6/1/38 | 2,950 | 3,183 | |||||
| JPM Capital Trust | 6.550 | % | 9/29/36 | 3,375 | 2,858 | |||||
| JPMorgan Capital Trust | 5.875 | % | 3/15/35 | 2,350 | 1,833 | |||||
| JPMorgan Chase & Co. | 5.850 | % | 8/1/35 | 425 | 346 | |||||
| JPMorgan Chase & Co. | 6.400 | % | 5/15/38 | 5,025 | 6,004 | |||||
| JPMorgan Chase Capital XXII | 6.450 | % | 2/2/37 | 3,075 | 2,467 | |||||
| JPMorgan Chase Capital XXV | 6.800 | % | 10/1/37 | 3,750 | 3,433 | |||||
| KeyBank NA | 6.950 | % | 2/1/28 | 2,068 | 1,567 | |||||
| Morgan Stanley Dean Witter | 6.250 | % | 8/9/26 | 3,125 | 2,600 | |||||
| Morgan Stanley Dean Witter | 7.250 | % | 4/1/32 | 1,150 | 1,001 | |||||
| National City Corp. | 6.875 | % | 5/15/19 | 1,700 | 1,377 | |||||
| NationsBank Corp. | 6.800 | % | 3/15/28 | 375 | 357 | |||||
| NB Capital Trust IV | 8.250 | % | 4/15/27 | 400 | 319 | |||||
| Regions Bank | 6.450 | % | 6/26/37 | 2,000 | 1,389 | |||||
| 2 | Regions Financial Corp. | 6.625 | % | 5/15/27 | 1,800 | 986 | ||||
| Regions Financial Corp. | 7.375 | % | 12/10/37 | 800 | 627 | |||||
| 2 | Royal Bank of Scotland Group PLC | 7.648 | % | 8/29/49 | 4,975 | 2,475 | ||||
| SunTrust Capital VIII | 6.100 | % | 12/15/36 | 3,050 | 2,004 | |||||
| Swiss Bank Corp. | 7.000 | % | 10/15/15 | 1,000 | 1,000 | |||||
| Swiss Bank Corp. | 7.375 | % | 6/15/17 | 550 | 565 | |||||
| Wachovia Bank NA | 5.850 | % | 2/1/37 | 4,175 | 4,024 | |||||
| Wachovia Bank NA | 6.600 | % | 1/15/38 | 4,675 | 5,011 | |||||
| Wachovia Corp. | 6.605 | % | 10/1/25 | 725 | 675 | |||||
| 3 | Wachovia Corp. | 8.000 | % | 12/15/26 | 2,300 | 1,817 | ||||
| Wachovia Corp. | 7.500 | % | 4/15/35 | 150 | 145 | |||||
| Wachovia Corp. | 5.500 | % | 8/1/35 | 4,000 | 3,243 | |||||
| Wachovia Corp. | 6.550 | % | 10/15/35 | 125 | 107 | |||||
| Wells Fargo & Co. | 5.375 | % | 2/7/35 | 2,450 | 2,352 | |||||
| Wells Fargo Bank NA | 5.950 | % | 8/26/36 | 1,475 | 1,532 | |||||
| Wells Fargo Capital X | 5.950 | % | 12/15/36 | 1,650 | 1,378 | |||||
| Brokerage (0.4%) | ||||||||||
| Jefferies Group Inc. | 6.450 | % | 6/8/27 | 1,500 | 926 | |||||
| Jefferies Group Inc. | 6.250 | % | 1/15/36 | 1,400 | 837 | |||||
| Merrill Lynch & Co., Inc. | 6.220 | % | 9/15/26 | 4,775 | 4,427 | |||||
| Merrill Lynch & Co., Inc. | 6.110 | % | 1/29/37 | 3,500 | 3,159 | |||||
| Merrill Lynch & Co., Inc. | 7.750 | % | 5/14/38 | 3,000 | 3,270 | |||||
| Finance Companies (1.3%) | ||||||||||
| CIT Group, Inc. | 6.000 | % | 4/1/36 | 2,800 | 1,764 | |||||
| General Electric Capital Corp. | 6.750 | % | 3/15/32 | 16,350 | 17,720 | |||||
| General Electric Capital Corp. | 6.150 | % | 8/7/37 | 4,925 | 4,878 | |||||
| General Electric Capital Corp. | 5.875 | % | 1/14/38 | 14,100 | 14,011 | |||||
| SLM Corp. | 5.625 | % | 8/1/33 | 1,950 | 1,175 | |||||
| Insurance (2.1%) | ||||||||||
| ACE Capital Trust II | 9.700 | % | 4/1/30 | 850 | 665 | |||||
| AEGON Funding Corp. | 5.750 | % | 12/15/20 | 1,000 | 865 | |||||
| Aetna, Inc. | 6.625 | % | 6/15/36 | 1,850 | 1,522 | |||||
| Aetna, Inc. | 6.750 | % | 12/15/37 | 1,350 | 1,138 | |||||
| Allstate Corp. | 6.125 | % | 12/15/32 | 1,250 | 1,148 | |||||
| Allstate Corp. | 5.350 | % | 6/1/33 | 1,950 | 1,611 | |||||
| Allstate Corp. | 5.550 | % | 5/9/35 | 1,700 | 1,437 | |||||
| Allstate Corp. | 5.950 | % | 4/1/36 | 925 | 826 | |||||
| 2 | Allstate Corp. | 6.500 | % | 5/15/37 | 1,500 | 851 | ||||
| Ambac, Inc. | 5.950 | % | 12/5/35 | 1,050 | 323 | |||||
| American General Capital II | 8.500 | % | 7/1/30 | 850 | 366 | |||||
| American International Group, Inc. | 6.250 | % | 5/1/36 | 875 | 489 | |||||
| American International Group, Inc. | 6.250 | % | 3/15/37 | 2,425 | 909 | |||||
| 2,3 | American International Group, Inc. | 8.175 | % | 5/15/38 | 9,900 | 3,750 | ||||
| Aon Capital Trust | 8.205 | % | 1/1/27 | 1,175 | 651 | |||||
Page 83
| Vanguard® Long-Term Bond Index Fund | |||||||||
| Schedule of Investments | |||||||||
| December 31, 2008 | |||||||||
| Face | Market | ||||||||
| Maturity | Amount | Value | |||||||
| Coupon | Date | ($ | 000 | ) | ($ | 000 | ) | ||
| Arch Capital Group Ltd. | 7.350 | % | 5/1/34 | 625 | 516 | ||||
| Assurant, Inc. | 6.750 | % | 2/15/34 | 1,200 | 739 | ||||
| AXA SA | 8.600 | % | 12/15/30 | 3,700 | 2,642 | ||||
| Chubb Corp. | 6.000 | % | 5/11/37 | 1,725 | 1,558 | ||||
| Chubb Corp. | 6.500 | % | 5/15/38 | 1,925 | 1,835 | ||||
| CIGNA Corp. | 7.875 | % | 5/15/27 | 500 | 443 | ||||
| CIGNA Corp. | 6.150 | % | 11/15/36 | 2,000 | 1,395 | ||||
| Cincinnati Financial Corp. | 6.920 | % | 5/15/28 | 1,000 | 866 | ||||
| Cincinnati Financial Corp. | 6.125 | % | 11/1/34 | 850 | 653 | ||||
| Endurance Specialty Holdings | 7.000 | % | 7/15/34 | 700 | 455 | ||||
| GE Global Insurance Holdings Corp. | 6.450 | % | 3/1/19 | 400 | 372 | ||||
| GE Global Insurance Holdings Corp. | 7.000 | % | 2/15/26 | 1,850 | 1,700 | ||||
| GE Global Insurance Holdings Corp. | 7.750 | % | 6/15/30 | 400 | 385 | ||||
| Genworth Financial, Inc. | 6.500 | % | 6/15/34 | 825 | 248 | ||||
| Hartford Financial Services Group, Inc. | 6.000 | % | 1/15/19 | 1,125 | 809 | ||||
| Hartford Financial Services Group, Inc. | 5.950 | % | 10/15/36 | 650 | 414 | ||||
| Hartford Financial Services Group, Inc. | 6.100 | % | 10/1/41 | 1,200 | 777 | ||||
| Humana Inc. | 8.150 | % | 6/15/38 | 1,150 | 859 | ||||
| Lincoln National Corp. | 6.150 | % | 4/7/36 | 1,475 | 922 | ||||
| Loews Corp. | 6.000 | % | 2/1/35 | 800 | 600 | ||||
| MBIA, Inc. | 5.700 | % | 12/1/34 | 1,000 | 410 | ||||
| MetLife, Inc. | 6.500 | % | 12/15/32 | 3,000 | 2,546 | ||||
| MetLife, Inc. | 6.375 | % | 6/15/34 | 2,925 | 2,433 | ||||
| MetLife, Inc. | 6.400 | % | 12/15/36 | 2,700 | 1,627 | ||||
| Nationwide Financial Services | 6.750 | % | 5/15/37 | 1,000 | 410 | ||||
| Principal Financial Group, Inc. | 6.050 | % | 10/15/36 | 1,700 | 1,164 | ||||
| Progressive Corp. | 6.625 | % | 3/1/29 | 1,625 | 1,499 | ||||
| Prudential Financial, Inc. | 5.750 | % | 7/15/33 | 1,000 | 644 | ||||
| Prudential Financial, Inc. | 5.400 | % | 6/13/35 | 1,000 | 604 | ||||
| Prudential Financial, Inc. | 5.900 | % | 3/17/36 | 1,500 | 975 | ||||
| Prudential Financial, Inc. | 5.700 | % | 12/14/36 | 3,675 | 2,310 | ||||
| Travelers Cos. Inc. | 6.250 | % | 6/15/37 | 2,400 | 2,331 | ||||
| Travelers Cos., Inc. | 6.750 | % | 6/20/36 | 1,000 | 1,023 | ||||
| Travelers Property Casualty Corp. | 6.375 | % | 3/15/33 | 1,500 | 1,404 | ||||
| UnitedHealth Group, Inc. | 5.800 | % | 3/15/36 | 1,300 | 986 | ||||
| UnitedHealth Group, Inc. | 6.500 | % | 6/15/37 | 1,200 | 926 | ||||
| UnitedHealth Group, Inc. | 6.625 | % | 11/15/37 | 1,075 | 911 | ||||
| UnitedHealth Group, Inc. | 6.875 | % | 2/15/38 | 3,925 | 3,473 | ||||
| WellPoint Inc. | 5.950 | % | 12/15/34 | 1,300 | 1,081 | ||||
| WellPoint Inc. | 5.850 | % | 1/15/36 | 2,475 | 2,100 | ||||
| WellPoint Inc. | 6.375 | % | 6/15/37 | 800 | 701 | ||||
| XL Capital Ltd. | 6.375 | % | 11/15/24 | 1,150 | 596 | ||||
| XL Capital Ltd. | 6.250 | % | 5/15/27 | 700 | 313 | ||||
| Real Estate Investment Trusts (0.0%) | |||||||||
| Realty Income Corp. | 6.750 | % | 8/15/19 | 1,350 | 980 | ||||
| 291,945 | |||||||||
| Industrial (23.4%) | |||||||||
| Basic Industry (1.4%) | |||||||||
| Agrium Inc. | 6.750 | % | 1/15/19 | 2,625 | 2,517 | ||||
| Alcan, Inc. | 6.125 | % | 12/15/33 | 3,050 | 1,848 | ||||
| Alcan, Inc. | 5.750 | % | 6/1/35 | 1,250 | 710 | ||||
| Alcoa, Inc. | 5.870 | % | 2/23/22 | 1,250 | 900 | ||||
| Alcoa, Inc. | 5.900 | % | 2/1/27 | 4,925 | 3,417 | ||||
| Aluminum Co. of America | 6.750 | % | 1/15/28 | 850 | 645 | ||||
| Barrick North America Finance LLC | 7.500 | % | 9/15/38 | 1,225 | 1,196 | ||||
| BHP Billiton Finance Ltd. | 6.420 | % | 3/1/26 | 500 | 454 | ||||
| Dow Chemical Co. | 7.375 | % | 11/1/29 | 2,925 | 2,627 | ||||
| E.I. du Pont de Nemours & Co. | 6.500 | % | 1/15/28 | 1,175 | 1,218 | ||||
| Eastman Chemical Co. | 7.250 | % | 1/15/24 | 1,300 | 1,098 | ||||
| Eastman Chemical Co. | 7.600 | % | 2/1/27 | 300 | 271 | ||||
| Inco Ltd. | 7.200 | % | 9/15/32 | 1,050 | 806 | ||||
| Lubrizol Corp. | 6.500 | % | 10/1/34 | 900 | 704 | ||||
| Monsanto Co. | 5.500 | % | 8/15/25 | 1,350 | 1,354 | ||||
Page 84
| Vanguard® Long-Term Bond Index Fund | |||||||||
| Schedule of Investments | |||||||||
| December 31, 2008 | |||||||||
| Face | Market | ||||||||
| Maturity | Amount | Value | |||||||
| Coupon | Date | ($ | 000 | ) | ($ | 000 | ) | ||
| Newmont Mining | 5.875 | % | 4/1/35 | 1,250 | 713 | ||||
| Nucor Corp. | 6.400 | % | 12/1/37 | 1,800 | 1,727 | ||||
| Placer Dome, Inc. | 6.450 | % | 10/15/35 | 700 | 554 | ||||
| Potash Corp. of Saskatchewan | 5.875 | % | 12/1/36 | 1,750 | 1,547 | ||||
| Reliance Steel & Aluminum | 6.850 | % | 11/15/36 | 350 | 283 | ||||
| Rio Tinto Finance USA Ltd. | 7.125 | % | 7/15/28 | 1,775 | 1,256 | ||||
| 2 Rohm & Haas Co. | 9.800 | % | 4/15/20 | 316 | 363 | ||||
| Rohm & Haas Co. | 7.850 | % | 7/15/29 | 2,350 | 2,298 | ||||
| Southern Copper Corp. | 7.500 | % | 7/27/35 | 2,500 | 1,913 | ||||
| US Steel Corp. | 6.650 | % | 6/1/37 | 725 | 385 | ||||
| Vale Overseas Ltd. | 8.250 | % | 1/17/34 | 1,225 | 1,292 | ||||
| Vale Overseas Ltd. | 6.875 | % | 11/21/36 | 6,475 | 5,973 | ||||
| Weyerhaeuser Co. | 8.500 | % | 1/15/25 | 1,100 | 943 | ||||
| Weyerhaeuser Co. | 7.375 | % | 3/15/32 | 3,875 | 2,626 | ||||
| Capital Goods (1.8%) | |||||||||
| 3M Co. | 5.700 | % | 3/15/37 | 1,975 | 2,167 | ||||
| Boeing Co. | 8.750 | % | 8/15/21 | 300 | 367 | ||||
| Boeing Co. | 8.750 | % | 9/15/31 | 850 | 1,103 | ||||
| Boeing Co. | 6.125 | % | 2/15/33 | 925 | 974 | ||||
| Boeing Co. | 6.625 | % | 2/15/38 | 1,050 | 1,123 | ||||
| Caterpillar, Inc. | 6.625 | % | 7/15/28 | 1,575 | 1,584 | ||||
| Caterpillar, Inc. | 7.300 | % | 5/1/31 | 1,200 | 1,287 | ||||
| Caterpillar, Inc. | 6.050 | % | 8/15/36 | 1,625 | 1,653 | ||||
| Caterpillar, Inc. | 6.950 | % | 5/1/42 | 1,425 | 1,430 | ||||
| CRH America Inc. | 6.400 | % | 10/15/33 | 1,500 | 871 | ||||
| Deere & Co. | 8.100 | % | 5/15/30 | 1,000 | 1,130 | ||||
| Deere & Co. | 7.125 | % | 3/3/31 | 700 | 729 | ||||
| Dover Corp. | 5.375 | % | 10/15/35 | 350 | 336 | ||||
| Dover Corp. | 6.600 | % | 3/15/38 | 1,200 | 1,387 | ||||
| Emerson Electric Co. | 6.000 | % | 8/15/32 | 400 | 422 | ||||
| Goodrich Corp. | 6.800 | % | 7/1/36 | 1,000 | 1,049 | ||||
| Honeywell International, Inc. | 5.700 | % | 3/15/36 | 1,600 | 1,606 | ||||
| Honeywell International, Inc. | 5.700 | % | 3/15/37 | 1,000 | 1,018 | ||||
| Lafarge SA | 7.125 | % | 7/15/36 | 2,225 | 1,267 | ||||
| Lockheed Martin Corp. | 7.750 | % | 5/1/26 | 150 | 186 | ||||
| Lockheed Martin Corp. | 6.150 | % | 9/1/36 | 4,575 | 4,994 | ||||
| Masco Corp. | 7.750 | % | 8/1/29 | 150 | 100 | ||||
| Masco Corp. | 6.500 | % | 8/15/32 | 1,275 | 666 | ||||
| Minnesota Mining & Manufacturing Corp. | 6.375 | % | 2/15/28 | 500 | 577 | ||||
| Northrop Grumman Corp. | 7.750 | % | 2/15/31 | 2,790 | 3,475 | ||||
| PACTIV Corp. | 7.950 | % | 12/15/25 | 1,000 | 901 | ||||
| Parker-Hannifin Corp. | 6.250 | % | 5/15/38 | 725 | 724 | ||||
| Raytheon Co. | 6.400 | % | 12/15/18 | 500 | 544 | ||||
| Raytheon Co. | 7.200 | % | 8/15/27 | 400 | 453 | ||||
| Raytheon Co. | 7.000 | % | 11/1/28 | 1,000 | 1,126 | ||||
| Republic Services, Inc. | 6.086 | % | 3/15/35 | 225 | 159 | ||||
| Rockwell Automation | 6.700 | % | 1/15/28 | 300 | 339 | ||||
| Rockwell Automation | 6.250 | % | 12/1/37 | 1,100 | 1,215 | ||||
| TRW, Inc. | 7.750 | % | 6/1/29 | 1,475 | 1,696 | ||||
| Tyco International Group SA | 7.000 | % | 12/15/19 | 2,675 | 2,231 | ||||
| United Technologies Corp. | 6.125 | % | 2/1/19 | 1,750 | 1,863 | ||||
| United Technologies Corp. | 8.875 | % | 11/15/19 | 545 | 708 | ||||
| United Technologies Corp. | 6.700 | % | 8/1/28 | 250 | 277 | ||||
| United Technologies Corp. | 7.500 | % | 9/15/29 | 1,875 | 2,269 | ||||
| United Technologies Corp. | 5.400 | % | 5/1/35 | 2,400 | 2,296 | ||||
| United Technologies Corp. | 6.050 | % | 6/1/36 | 2,725 | 2,891 | ||||
| United Technologies Corp. | 6.125 | % | 7/15/38 | 1,250 | 1,359 | ||||
| USA Waste Services, Inc. | 7.000 | % | 7/15/28 | 2,000 | 1,641 | ||||
| Waste Management, Inc. | 7.750 | % | 5/15/32 | 875 | 776 | ||||
| WMX Technologies Inc. | 7.100 | % | 8/1/26 | 800 | 675 | ||||
| Communication (6.6%) | |||||||||
| America Movil SA de C.V. | 6.375 | % | 3/1/35 | 1,975 | 1,694 | ||||
| America Movil SA de C.V. | 6.125 | % | 11/15/37 | 1,200 | 978 | ||||
Page 85
| Vanguard® Long-Term Bond Index Fund | |||||||||
| Schedule of Investments | |||||||||
| December 31, 2008 | |||||||||
| Face | Market | ||||||||
| Maturity | Amount | Value | |||||||
| Coupon | Date | ($ | 000 | ) | ($ | 000 | ) | ||
| Ameritech Capital Funding | 6.550 | % | 1/15/28 | 1,000 | 903 | ||||
| AT&T Inc. | 8.000 | % | 11/15/31 | 6,000 | 7,777 | ||||
| AT&T Inc. | 6.450 | % | 6/15/34 | 7,750 | 8,614 | ||||
| AT&T Inc. | 6.800 | % | 5/15/36 | 1,175 | 1,367 | ||||
| AT&T Inc. | 6.500 | % | 9/1/37 | 4,700 | 5,239 | ||||
| AT&T Inc. | 6.300 | % | 1/15/38 | 7,175 | 7,869 | ||||
| AT&T Wireless | 8.750 | % | 3/1/31 | 5,850 | 7,168 | ||||
| BellSouth Capital Funding Corp. | 7.875 | % | 2/15/30 | 4,250 | 4,597 | ||||
| BellSouth Corp. | 6.875 | % | 10/15/31 | 1,275 | 1,313 | ||||
| BellSouth Corp. | 6.550 | % | 6/15/34 | 2,475 | 2,453 | ||||
| BellSouth Corp. | 6.000 | % | 11/15/34 | 1,480 | 1,317 | ||||
| BellSouth Telecommunications Inc. | 6.375 | % | 6/1/28 | 4,140 | 4,052 | ||||
| British Telecommunications PLC | 9.125 | % | 12/15/30 | 5,475 | 5,846 | ||||
| CBS Corp. | 7.875 | % | 7/30/30 | 2,815 | 1,782 | ||||
| CBS Corp. | 5.500 | % | 5/15/33 | 1,025 | 531 | ||||
| CenturyTel Enterprises | 6.875 | % | 1/15/28 | 550 | 346 | ||||
| Cingular Wireless LLC | 7.125 | % | 12/15/31 | 2,425 | 2,440 | ||||
| Comcast Cable Communications Holdings Inc. | 9.455 | % | 11/15/22 | 3,198 | 3,604 | ||||
| Comcast Corp. | 5.650 | % | 6/15/35 | 1,000 | 908 | ||||
| Comcast Corp. | 6.500 | % | 11/15/35 | 6,000 | 5,946 | ||||
| Comcast Corp. | 6.450 | % | 3/15/37 | 3,525 | 3,493 | ||||
| Comcast Corp. | 6.950 | % | 8/15/37 | 2,700 | 2,849 | ||||
| Comcast Corp. | 6.400 | % | 5/15/38 | 3,625 | 3,568 | ||||
| Deutsche Telekom International Finance | 8.750 | % | 6/15/30 | 8,825 | 10,855 | ||||
| Embarq Corp. | 7.995 | % | 6/1/36 | 3,000 | 1,912 | ||||
| France Telecom | 8.500 | % | 3/1/31 | 6,625 | 8,016 | ||||
| Grupo Televisa SA | 6.625 | % | 3/18/25 | 1,600 | 1,368 | ||||
| Grupo Televisa SA | 8.500 | % | 3/11/32 | 250 | 229 | ||||
| GTE Corp. | 8.750 | % | 11/1/21 | 900 | 968 | ||||
| GTE Corp. | 6.940 | % | 4/15/28 | 2,275 | 2,163 | ||||
| Koninklijke KPN NV | 8.375 | % | 10/1/30 | 1,825 | 1,910 | ||||
| McGraw-Hill Cos. Inc. | 6.550 | % | 11/15/37 | 1,150 | 824 | ||||
| Michigan Bell Telephone Co. | 7.850 | % | 1/15/22 | 1,522 | 1,501 | ||||
| New England Telephone & Telegraph Co. | 7.875 | % | 11/15/29 | 400 | 361 | ||||
| News America Holdings, Inc. | 8.150 | % | 10/17/36 | 1,225 | 1,332 | ||||
| News America Holdings, Inc. | 7.750 | % | 12/1/45 | 1,225 | 1,168 | ||||
| News America Inc. | 6.550 | % | 3/15/33 | 225 | 201 | ||||
| News America Inc. | 6.200 | % | 12/15/34 | 9,350 | 8,248 | ||||
| News America Inc. | 6.400 | % | 12/15/35 | 3,075 | 2,982 | ||||
| Pacific Bell | 7.125 | % | 3/15/26 | 550 | 575 | ||||
| Rogers Communications Inc. | 7.500 | % | 8/15/38 | 1,400 | 1,540 | ||||
| TCI Communications, Inc. | 7.875 | % | 2/15/26 | 2,200 | 2,201 | ||||
| Telecom Italia Capital | 6.375 | % | 11/15/33 | 4,025 | 2,855 | ||||
| Telecom Italia Capital | 6.000 | % | 9/30/34 | 1,400 | 958 | ||||
| Telecom Italia Capital | 7.200 | % | 7/18/36 | 1,625 | 1,272 | ||||
| Telecom Italia Capital | 7.721 | % | 6/4/38 | 1,375 | 1,143 | ||||
| Telefonica Emisiones SAU | 7.045 | % | 6/20/36 | 5,725 | 6,383 | ||||
| Telefonica Europe BV | 8.250 | % | 9/15/30 | 2,500 | 2,901 | ||||
| Thomson Corp. | 5.500 | % | 8/15/35 | 900 | 671 | ||||
| Time Warner Cable Inc. | 8.750 | % | 2/14/19 | 1,775 | 1,914 | ||||
| Time Warner Cable Inc. | 6.550 | % | 5/1/37 | 3,800 | 3,626 | ||||
| Time Warner Cable Inc. | 7.300 | % | 7/1/38 | 4,675 | 4,903 | ||||
| Time Warner Entertainment | 8.375 | % | 3/15/23 | 2,733 | 2,741 | ||||
| Time Warner Entertainment | 8.375 | % | 7/15/33 | 1,950 | 1,957 | ||||
| US Cellular | 6.700 | % | 12/15/33 | 950 | 693 | ||||
| US West Communications Group | 7.500 | % | 6/15/23 | 2,300 | 1,598 | ||||
| US West Communications Group | 6.875 | % | 9/15/33 | 4,200 | 2,499 | ||||
| Verizon Communications Corp. | 6.250 | % | 4/1/37 | 2,425 | 2,500 | ||||
| Verizon Communications Corp. | 6.400 | % | 2/15/38 | 3,900 | 4,186 | ||||
| Verizon Communications Corp. | 6.900 | % | 4/15/38 | 2,200 | 2,515 | ||||
| Verizon Communications Corp. | 8.950 | % | 3/1/39 | 2,775 | 3,637 | ||||
| Verizon Global Funding Corp. | 7.750 | % | 12/1/30 | 7,525 | 8,360 | ||||
| Verizon Global Funding Corp. | 5.850 | % | 9/15/35 | 2,775 | 2,694 | ||||
| Verizon Maryland, Inc. | 5.125 | % | 6/15/33 | 500 | 367 | ||||
| Verizon New York, Inc. | 7.375 | % | 4/1/32 | 650 | 544 | ||||
| Vodafone AirTouch PLC | 7.875 | % | 2/15/30 | 1,000 | 1,105 |
Page 86
| Vanguard® Long-Term Bond Index Fund | |||||||||
| Schedule of Investments | |||||||||
| December 31, 2008 | |||||||||
| Face | Market | ||||||||
| Maturity | Amount | Value | |||||||
| Coupon | Date | ($ | 000 | ) | ($ | 000 | ) | ||
| Vodafone Group PLC | 6.250 | % | 11/30/32 | 200 | 189 | ||||
| Vodafone Group PLC | 6.150 | % | 2/27/37 | 5,575 | 5,596 | ||||
| Consumer Cyclical (2.9%) | |||||||||
| CVS Caremark Corp. | 6.250 | % | 6/1/27 | 2,550 | 2,373 | ||||
| DaimlerChrysler North America Holding Corp. | 8.500 | % | 1/18/31 | 5,275 | 3,848 | ||||
| Darden Restaurants Inc. | 6.800 | % | 10/15/37 | 850 | 584 | ||||
| Federated Retail Holding | 6.375 | % | 3/15/37 | 2,700 | 1,538 | ||||
| Home Depot Inc. | 5.875 | % | 12/16/36 | 6,325 | 4,971 | ||||
| J.C. Penney Co., Inc. | 7.125 | % | 11/15/23 | 1,000 | 699 | ||||
| J.C. Penney Co., Inc. | 6.375 | % | 10/15/36 | 2,850 | 1,756 | ||||
| J.C. Penney Co., Inc. | 7.400 | % | 4/1/37 | 750 | 508 | ||||
| Johnson Controls, Inc. | 6.000 | % | 1/15/36 | 475 | 301 | ||||
| Kohl’s Corp. | 6.000 | % | 1/15/33 | 400 | 256 | ||||
| Kohl’s Corp. | 6.875 | % | 12/15/37 | 1,000 | 712 | ||||
| Lowe’s Cos., Inc. | 6.875 | % | 2/15/28 | 550 | 541 | ||||
| Lowe’s Cos., Inc. | 6.500 | % | 3/15/29 | 1,800 | 1,661 | ||||
| Lowe’s Cos., Inc. | 5.500 | % | 10/15/35 | 800 | 650 | ||||
| Lowe’s Cos., Inc. | 5.800 | % | 10/15/36 | 2,250 | 1,881 | ||||
| Macy’s Retail Holdings Inc. | 6.650 | % | 7/15/24 | 1,450 | 798 | ||||
| Macy’s Retail Holdings Inc. | 6.790 | % | 7/15/27 | 800 | 422 | ||||
| Macy’s Retail Holdings Inc. | 7.000 | % | 2/15/28 | 1,100 | 592 | ||||
| Macys Retail Holdings Inc. | 6.900 | % | 4/1/29 | 150 | 81 | ||||
| McDonald’s Corp. | 6.300 | % | 10/15/37 | 1,750 | 1,903 | ||||
| McDonald’s Corp. | 6.300 | % | 3/1/38 | 2,025 | 2,233 | ||||
| Nordstrom, Inc. | 6.950 | % | 3/15/28 | 300 | 197 | ||||
| Nordstrom, Inc. | 7.000 | % | 1/15/38 | 1,200 | 731 | ||||
| Target Corp. | 7.000 | % | 7/15/31 | 550 | 505 | ||||
| Target Corp. | 6.350 | % | 11/1/32 | 3,000 | 2,543 | ||||
| Target Corp. | 6.500 | % | 10/15/37 | 3,300 | 2,905 | ||||
| Target Corp. | 7.000 | % | 1/15/38 | 4,700 | 4,397 | ||||
| The Walt Disney Co. | 7.000 | % | 3/1/32 | 1,150 | 1,347 | ||||
| Time Warner, Inc. | 9.150 | % | 2/1/23 | 1,980 | 2,190 | ||||
| Time Warner, Inc. | 7.570 | % | 2/1/24 | 500 | 478 | ||||
| Time Warner, Inc. | 6.950 | % | 1/15/28 | 1,000 | 903 | ||||
| Time Warner, Inc. | 6.625 | % | 5/15/29 | 6,975 | 6,125 | ||||
| Time Warner, Inc. | 7.625 | % | 4/15/31 | 5,185 | 5,121 | ||||
| Time Warner, Inc. | 7.700 | % | 5/1/32 | 1,040 | 1,032 | ||||
| Time Warner, Inc. | 6.500 | % | 11/15/36 | 875 | 781 | ||||
| VF Corp. | 6.450 | % | 11/1/37 | 1,500 | 1,225 | ||||
| Viacom Inc. | 6.875 | % | 4/30/36 | 3,850 | 3,090 | ||||
| Wal-Mart Stores, Inc. | 5.875 | % | 4/5/27 | 4,025 | 4,308 | ||||
| Wal-Mart Stores, Inc. | 7.550 | % | 2/15/30 | 4,425 | 5,428 | ||||
| Wal-Mart Stores, Inc. | 5.250 | % | 9/1/35 | 4,900 | 4,920 | ||||
| Wal-Mart Stores, Inc. | 6.500 | % | 8/15/37 | 5,525 | 6,615 | ||||
| Wal-Mart Stores, Inc. | 6.200 | % | 4/15/38 | 2,100 | 2,349 | ||||
| Western Union Co. | 6.200 | % | 11/17/36 | 1,350 | 1,054 | ||||
| Yum! Brands, Inc. | 6.875 | % | 11/15/37 | 1,950 | 1,572 | ||||
| Consumer Noncyclical (5.2%) | |||||||||
| Abbott Laboratories | 6.150 | % | 11/30/37 | 2,375 | 2,802 | ||||
| Altria Group, Inc. | 9.950 | % | 11/10/38 | 3,500 | 3,834 | ||||
| Amgen Inc. | 6.375 | % | 6/1/37 | 2,125 | 2,257 | ||||
| Amgen Inc. | 6.900 | % | 6/1/38 | 1,750 | 2,001 | ||||
| Anheuser-Busch Cos., Inc. | 6.800 | % | 8/20/32 | 3,125 | 2,894 | ||||
| Anheuser-Busch Cos., Inc. | 5.950 | % | 1/15/33 | 650 | 540 | ||||
| Anheuser-Busch Cos., Inc. | 5.750 | % | 4/1/36 | 975 | 790 | ||||
| Archer-Daniels-Midland Co. | 6.625 | % | 5/1/29 | 250 | 250 | ||||
| Archer-Daniels-Midland Co. | 7.000 | % | 2/1/31 | 2,975 | 3,105 | ||||
| Archer-Daniels-Midland Co. | 5.935 | % | 10/1/32 | 255 | 238 | ||||
| Archer-Daniels-Midland Co. | 5.375 | % | 9/15/35 | 2,750 | 2,385 | ||||
| Archer-Daniels-Midland Co. | 6.450 | % | 1/15/38 | 675 | 687 | ||||
| AstraZeneca PLC | 6.450 | % | 9/15/37 | 7,275 | 8,311 | ||||
| Baxter International, Inc. | 6.250 | % | 12/1/37 | 800 | 909 | ||||
| Bristol-Myers Squibb Co. | 7.150 | % | 6/15/23 | 1,300 | 1,538 | ||||
Page 87
| Vanguard® Long-Term Bond Index Fund | |||||||||
| Schedule of Investments | |||||||||
| December 31, 2008 | |||||||||
| Face | Market | ||||||||
| Maturity | Amount | Value | |||||||
| Coupon | Date | ($ | 000 | ) | ($ | 000 | ) | ||
| Bristol-Myers Squibb Co. | 6.800 | % | 11/15/26 | 889 | 1,023 | ||||
| Bristol-Myers Squibb Co. | 5.875 | % | 11/15/36 | 2,700 | 2,895 | ||||
| Bristol-Myers Squibb Co. | 6.125 | % | 5/1/38 | 2,275 | 2,527 | ||||
| Bristol-Myers Squibb Co. | 6.875 | % | 8/1/97 | 200 | 232 | ||||
| C.R. Bard, Inc. | 6.700 | % | 12/1/26 | 500 | 499 | ||||
| Coca-Cola Enterprises Inc. | 8.500 | % | 2/1/22 | 2,000 | 2,333 | ||||
| Coca-Cola Enterprises Inc. | 8.000 | % | 9/15/22 | 500 | 563 | ||||
| Coca-Cola Enterprises Inc. | 7.000 | % | 10/1/26 | 1,175 | 1,227 | ||||
| Coca-Cola Enterprises Inc. | 6.950 | % | 11/15/26 | 3,475 | 3,612 | ||||
| Coca-Cola Enterprises Inc. | 6.750 | % | 9/15/28 | 1,675 | 1,708 | ||||
| ConAgra Foods, Inc. | 9.750 | % | 3/1/21 | 129 | 153 | ||||
| ConAgra Foods, Inc. | 7.125 | % | 10/1/26 | 1,150 | 1,100 | ||||
| ConAgra Foods, Inc. | 7.000 | % | 10/1/28 | 175 | 167 | ||||
| ConAgra Foods, Inc. | 8.250 | % | 9/15/30 | 950 | 1,008 | ||||
| Covidien International | 6.550 | % | 10/15/37 | 2,325 | 2,289 | ||||
| Delhaize America Inc. | 9.000 | % | 4/15/31 | 2,000 | 2,024 | ||||
| Diageo Capital PLC | 5.875 | % | 9/30/36 | 500 | 472 | ||||
| 3 Dr. Pepper Snapple Group | 7.450 | % | 5/1/38 | 600 | 595 | ||||
| Eli Lilly & Co. | 7.125 | % | 6/1/25 | 1,000 | 1,172 | ||||
| Eli Lilly & Co. | 5.500 | % | 3/15/27 | 4,300 | 4,389 | ||||
| Estee Lauder Ace Trust I | 6.000 | % | 5/15/37 | 1,025 | 963 | ||||
| Fortune Brands Inc. | 5.875 | % | 1/15/36 | 925 | 678 | ||||
| Genentech Inc. | 5.250 | % | 7/15/35 | 1,025 | 987 | ||||
| GlaxoSmithKline Capital Inc. | 5.375 | % | 4/15/34 | 1,850 | 1,838 | ||||
| GlaxoSmithKline Capital Inc. | 6.375 | % | 5/15/38 | 6,475 | 7,430 | ||||
| Grand Metropolitan Investment Corp. | 7.450 | % | 4/15/35 | 1,750 | 1,807 | ||||
| H.J. Heinz Co. | 6.750 | % | 3/15/32 | 1,625 | 1,461 | ||||
| Johnson & Johnson | 6.950 | % | 9/1/29 | 2,125 | 2,745 | ||||
| Johnson & Johnson | 4.950 | % | 5/15/33 | 1,325 | 1,369 | ||||
| Johnson & Johnson | 5.950 | % | 8/15/37 | 975 | 1,188 | ||||
| Johnson & Johnson | 5.850 | % | 7/15/38 | 2,600 | 3,089 | ||||
| Kellogg Co. | 7.450 | % | 4/1/31 | 2,600 | 3,226 | ||||
| Kimberly-Clark Corp. | 6.625 | % | 8/1/37 | 1,400 | 1,590 | ||||
| Kraft Foods, Inc. | 6.500 | % | 11/1/31 | 1,650 | 1,598 | ||||
| Kraft Foods, Inc. | 7.000 | % | 8/11/37 | 4,800 | 4,841 | ||||
| Kraft Foods, Inc. | 6.875 | % | 1/26/39 | 1,850 | 1,891 | ||||
| Kroger Co. | 6.150 | % | 1/15/20 | 2,400 | 2,348 | ||||
| Kroger Co. | 7.700 | % | 6/1/29 | 375 | 407 | ||||
| Kroger Co. | 8.000 | % | 9/15/29 | 1,925 | 2,154 | ||||
| Kroger Co. | 7.500 | % | 4/1/31 | 1,350 | 1,484 | ||||
| Merck & Co. | 6.300 | % | 1/1/26 | 500 | 540 | ||||
| Merck & Co. | 6.400 | % | 3/1/28 | 2,200 | 2,402 | ||||
| Merck & Co. | 5.950 | % | 12/1/28 | 1,050 | 1,091 | ||||
| Merck & Co. | 5.750 | % | 11/15/36 | 300 | 311 | ||||
| Pepsi Bottling Group, Inc. | 7.000 | % | 3/1/29 | 2,925 | 3,174 | ||||
| Pharmacia Corp. | 6.600 | % | 12/1/28 | 1,925 | 2,154 | ||||
| Philip Morris International Inc. | 6.375 | % | 5/16/38 | 3,600 | 3,810 | ||||
| Philips Electronics NV | 6.875 | % | 3/11/38 | 3,125 | 2,976 | ||||
| Procter & Gamble Co. | 6.450 | % | 1/15/26 | 1,600 | 1,830 | ||||
| Procter & Gamble Co. | 5.800 | % | 8/15/34 | 100 | 107 | ||||
| Procter & Gamble Co. | 5.550 | % | 3/5/37 | 4,650 | 5,216 | ||||
| 2 Procter & Gamble Co. ESOP | 9.360 | % | 1/1/21 | 2,178 | 2,610 | ||||
| Quest Diagnostic, Inc. | 6.950 | % | 7/1/37 | 925 | 796 | ||||
| Reynolds American Inc. | 7.250 | % | 6/15/37 | 600 | 426 | ||||
| Safeway, Inc. | 7.250 | % | 2/1/31 | 1,756 | 2,025 | ||||
| Sara Lee Corp. | 6.125 | % | 11/1/32 | 625 | 518 | ||||
| Schering-Plough Corp. | 6.750 | % | 12/1/33 | 2,825 | 2,940 | ||||
| Schering-Plough Corp. | 6.550 | % | 9/15/37 | 1,675 | 1,703 | ||||
| Sysco Corp. | 5.375 | % | 9/21/35 | 1,000 | 953 | ||||
| Teva Pharmaceutical Finance LLC | 6.150 | % | 2/1/36 | 2,400 | 2,320 | ||||
| Unilever Capital Corp. | 5.900 | % | 11/15/32 | 3,925 | 3,934 | ||||
| Wyeth | 6.450 | % | 2/1/24 | 2,225 | 2,508 | ||||
| Wyeth | 6.500 | % | 2/1/34 | 1,125 | 1,252 | ||||
| Wyeth | 6.000 | % | 2/15/36 | 3,075 | 3,336 | ||||
| Wyeth | 5.950 | % | 4/1/37 | 3,800 | 4,135 |
Page 88
| Vanguard® Long-Term Bond Index Fund | |||||||||
| Schedule of Investments | |||||||||
| December 31, 2008 | |||||||||
| Face | Market | ||||||||
| Maturity | Amount | Value | |||||||
| Coupon | Date | ($ | 000 | ) | ($ | 000 | ) | ||
| Energy (3.4%) | |||||||||
| Alberta Energy Co. Ltd. | 7.375 | % | 11/1/31 | 1,000 | 895 | ||||
| Amerada Hess Corp. | 7.875 | % | 10/1/29 | 3,850 | 3,736 | ||||
| Amerada Hess Corp. | 7.125 | % | 3/15/33 | 925 | 824 | ||||
| Anadarko Finance Co. | 7.500 | % | 5/1/31 | 1,500 | 1,328 | ||||
| Anadarko Petroleum Corp. | 6.450 | % | 9/15/36 | 5,725 | 4,521 | ||||
| Apache Corp. | 6.000 | % | 1/15/37 | 1,950 | 1,868 | ||||
| Apache Finance Canada Corp. | 7.750 | % | 12/15/29 | 650 | 715 | ||||
| Baker Hughes, Inc. | 6.875 | % | 1/15/29 | 1,000 | 1,017 | ||||
| Burlington Resources, Inc. | 7.200 | % | 8/15/31 | 1,050 | 1,065 | ||||
| Burlington Resources, Inc. | 7.400 | % | 12/1/31 | 1,675 | 1,741 | ||||
| Cameron International Corp. | 7.000 | % | 7/15/38 | 1,200 | 956 | ||||
| Canadian Natural Resources | 7.200 | % | 1/15/32 | 1,400 | 1,247 | ||||
| Canadian Natural Resources | 6.450 | % | 6/30/33 | 1,175 | 952 | ||||
| Canadian Natural Resources | 6.500 | % | 2/15/37 | 1,975 | 1,617 | ||||
| Canadian Natural Resources | 6.250 | % | 3/15/38 | 1,750 | 1,378 | ||||
| Canadian Natural Resources | 6.750 | % | 2/1/39 | 800 | 666 | ||||
| Conoco Funding Co. | 7.250 | % | 10/15/31 | 400 | 427 | ||||
| Conoco, Inc. | 6.950 | % | 4/15/29 | 450 | 488 | ||||
| ConocoPhillips | 5.900 | % | 10/15/32 | 1,050 | 1,047 | ||||
| ConocoPhillips Canada | 5.950 | % | 10/15/36 | 950 | 922 | ||||
| Devon Energy Corp. | 7.950 | % | 4/15/32 | 860 | 956 | ||||
| Devon Financing Corp. | 7.875 | % | 9/30/31 | 4,400 | 4,823 | ||||
| Encana Corp. | 6.500 | % | 8/15/34 | 4,825 | 3,857 | ||||
| Encana Corp. | 6.625 | % | 8/15/37 | 1,400 | 1,130 | ||||
| Global Marine, Inc. | 7.000 | % | 6/1/28 | 800 | 703 | ||||
| Halliburton Co. | 6.700 | % | 9/15/38 | 1,300 | 1,393 | ||||
| Husky Energy Inc. | 6.150 | % | 6/15/19 | 510 | 445 | ||||
| Husky Energy Inc. | 6.800 | % | 9/15/37 | 1,225 | 952 | ||||
| Kerr McGee Corp. | 6.950 | % | 7/1/24 | 2,000 | 1,726 | ||||
| Kerr McGee Corp. | 7.875 | % | 9/15/31 | 500 | 460 | ||||
| Lasmo Inc. | 7.300 | % | 11/15/27 | 600 | 650 | ||||
| Marathon Oil Corp. | 6.600 | % | 10/1/37 | 4,575 | 3,400 | ||||
| Nexen, Inc. | 7.875 | % | 3/15/32 | 550 | 522 | ||||
| Nexen, Inc. | 5.875 | % | 3/10/35 | 1,850 | 1,363 | ||||
| Nexen, Inc. | 6.400 | % | 5/15/37 | 3,300 | 2,587 | ||||
| Noble Energy Inc. | 8.000 | % | 4/1/27 | 775 | 759 | ||||
| Norsk Hydro | 7.250 | % | 9/23/27 | 3,150 | 3,490 | ||||
| Norsk Hydro | 7.150 | % | 1/15/29 | 1,000 | 1,089 | ||||
| Petro-Canada | 7.875 | % | 6/15/26 | 150 | 140 | ||||
| Petro-Canada | 7.000 | % | 11/15/28 | 250 | 212 | ||||
| Petro-Canada | 5.350 | % | 7/15/33 | 1,650 | 1,097 | ||||
| Petro-Canada | 5.950 | % | 5/15/35 | 2,500 | 1,724 | ||||
| Petro-Canada | 6.800 | % | 5/15/38 | 2,275 | 1,710 | ||||
| Shell International Finance BV | 6.375 | % | 12/15/38 | 6,225 | 7,090 | ||||
| Suncor Energy, Inc. | 7.150 | % | 2/1/32 | 800 | 679 | ||||
| Suncor Energy, Inc. | 5.950 | % | 12/1/34 | 875 | 631 | ||||
| Suncor Energy, Inc. | 6.500 | % | 6/15/38 | 4,825 | 3,671 | ||||
| Talisman Energy, Inc. | 7.250 | % | 10/15/27 | 450 | 340 | ||||
| Talisman Energy, Inc. | 5.850 | % | 2/1/37 | 2,700 | 1,871 | ||||
| Tosco Corp. | 8.125 | % | 2/15/30 | 7,500 | 8,820 | ||||
| Transocean Inc. | 7.500 | % | 4/15/31 | 1,525 | 1,364 | ||||
| Transocean Inc. | 6.800 | % | 3/15/38 | 2,300 | 2,024 | ||||
| Valero Energy Corp. | 7.500 | % | 4/15/32 | 2,450 | 1,951 | ||||
| Valero Energy Corp. | 6.625 | % | 6/15/37 | 2,725 | 2,006 | ||||
| Weatherford International Inc. | 6.500 | % | 8/1/36 | 1,500 | 1,106 | ||||
| Weatherford International Inc. | 6.800 | % | 6/15/37 | 700 | 528 | ||||
| Weatherford International Inc. | 7.000 | % | 3/15/38 | 1,100 | 854 | ||||
| XTO Energy, Inc. | 6.100 | % | 4/1/36 | 1,125 | 918 | ||||
| XTO Energy, Inc. | 6.750 | % | 8/1/37 | 4,150 | 3,891 | ||||
| XTO Energy, Inc. | 6.375 | % | 6/15/38 | 2,125 | 1,818 | ||||
| Technology (0.8%) | |||||||||
| Corning Inc. | 7.250 | % | 8/15/36 | 600 | 450 | ||||
| Dell Inc. | 7.100 | % | 4/15/28 | 500 | 435 | ||||
Page 89
| Vanguard® Long-Term Bond Index Fund | |||||||||
| Schedule of Investments | |||||||||
| December 31, 2008 | |||||||||
| Face | Market | ||||||||
| Maturity | Amount | Value | |||||||
| Coupon | Date | ($ | 000 | ) | ($ | 000 | ) | ||
| Dell Inc. | 6.500 | % | 4/15/38 | 1,400 | 1,154 | ||||
| Electronic Data Systems | 7.450 | % | 10/15/29 | 375 | 397 | ||||
| Equifax Inc. | 7.000 | % | 7/1/37 | 600 | 381 | ||||
| International Business Machines Corp. | 7.000 | % | 10/30/25 | 1,050 | 1,194 | ||||
| International Business Machines Corp. | 6.220 | % | 8/1/27 | 4,600 | 4,861 | ||||
| International Business Machines Corp. | 6.500 | % | 1/15/28 | 3,725 | 4,059 | ||||
| International Business Machines Corp. | 5.875 | % | 11/29/32 | 950 | 975 | ||||
| International Business Machines Corp. | 8.000 | % | 10/15/38 | 1,500 | 1,999 | ||||
| International Business Machines Corp. | 7.125 | % | 12/1/96 | 400 | 462 | ||||
| Motorola, Inc. | 7.500 | % | 5/15/25 | 225 | 121 | ||||
| Motorola, Inc. | 6.500 | % | 9/1/25 | 1,300 | 673 | ||||
| Motorola, Inc. | 6.500 | % | 11/15/28 | 975 | 505 | ||||
| Motorola, Inc. | 6.625 | % | 11/15/37 | 2,425 | 1,147 | ||||
| Oracle Corp. | 6.500 | % | 4/15/38 | 3,125 | 3,611 | ||||
| Pitney Bowes, Inc. | 5.250 | % | 1/15/37 | 450 | 415 | ||||
| Science Applications International Corp. | 5.500 | % | 7/1/33 | 500 | 375 | ||||
| Tyco Electronics Group | 7.125 | % | 10/1/37 | 1,250 | 933 | ||||
| Xerox Capital Trust I | 8.000 | % | 2/1/27 | 1,050 | 706 | ||||
| Transportation (1.3%) | |||||||||
| Burlington Northern Santa Fe Corp. | 7.000 | % | 12/15/25 | 700 | 702 | ||||
| Burlington Northern Santa Fe Corp. | 7.950 | % | 8/15/30 | 1,300 | 1,441 | ||||
| Burlington Northern Santa Fe Corp. | 6.200 | % | 8/15/36 | 775 | 715 | ||||
| Burlington Northern Santa Fe Corp. | 6.150 | % | 5/1/37 | 1,325 | 1,230 | ||||
| Canadian National Railway Co. | 6.250 | % | 8/1/34 | 2,450 | 2,475 | ||||
| Canadian National Railway Co. | 6.200 | % | 6/1/36 | 1,325 | 1,348 | ||||
| Canadian Pacific Railway Co. | 7.125 | % | 10/15/31 | 2,075 | 1,660 | ||||
| CNF, Inc. | 6.700 | % | 5/1/34 | 1,825 | 1,315 | ||||
| 2 Continental Airlines, Inc. | 6.545 | % | 2/2/19 | 955 | 759 | ||||
| 2 Continental Airlines, Inc. | 5.983 | % | 4/19/22 | 3,500 | 2,345 | ||||
| CSX Corp. | 7.950 | % | 5/1/27 | 675 | 687 | ||||
| CSX Corp. | 6.000 | % | 10/1/36 | 175 | 142 | ||||
| CSX Corp. | 6.150 | % | 5/1/37 | 2,025 | 1,671 | ||||
| CSX Corp. | 7.450 | % | 4/1/38 | 1,600 | 1,559 | ||||
| 2 Delta Air Lines Enhanced Equipment Trust Certificates | 6.718 | % | 1/2/23 | 901 | 578 | ||||
| 2 Delta Air Lines, Inc. | 6.821 | % | 8/10/22 | 2,057 | 1,224 | ||||
| Federal Express Corp. | 7.600 | % | 7/1/97 | 1,000 | 852 | ||||
| Norfolk Southern Corp. | 9.750 | % | 6/15/20 | 411 | 477 | ||||
| Norfolk Southern Corp. | 5.590 | % | 5/17/25 | 716 | 658 | ||||
| Norfolk Southern Corp. | 7.800 | % | 5/15/27 | 2,802 | 3,099 | ||||
| Norfolk Southern Corp. | 5.640 | % | 5/17/29 | 1,898 | 1,782 | ||||
| Norfolk Southern Corp. | 7.050 | % | 5/1/37 | 2,225 | 2,320 | ||||
| Norfolk Southern Corp. | 7.900 | % | 5/15/97 | 450 | 505 | ||||
| 2 Southwest Airlines Co. | 6.150 | % | 8/1/22 | 822 | 641 | ||||
| Union Pacific Corp. | 7.125 | % | 2/1/28 | 600 | 608 | ||||
| Union Pacific Corp. | 6.625 | % | 2/1/29 | 2,625 | 2,487 | ||||
| Union Pacific Corp. | 6.150 | % | 5/1/37 | 1,000 | 926 | ||||
| 2 Union Pacific Railroad Co. | 6.176 | % | 1/2/31 | 942 | 923 | ||||
| United Parcel Service of America | 8.375 | % | 4/1/20 | 500 | 646 | ||||
| United Parcel Service of America | 8.375 | % | 4/1/30 | 500 | 642 | ||||
| United Parcel Service of America | 6.200 | % | 1/15/38 | 3,600 | 3,969 | ||||
| 714,310 | |||||||||
| Utilities (6.0%) | |||||||||
| Electric (4.5%) | |||||||||
| AEP Texas Central Co. | 6.650 | % | 2/15/33 | 1,950 | 1,782 | ||||
| AmerenEnergy Generating | 7.950 | % | 6/1/32 | 1,750 | 1,545 | ||||
| American Water Capital Corp. | 6.593 | % | 10/15/37 | 2,025 | 1,548 | ||||
| Appalachian Power Co. | 5.800 | % | 10/1/35 | 350 | 286 | ||||
| Appalachian Power Co. | 7.000 | % | 4/1/38 | 850 | 812 | ||||
| Baltimore Gas & Electric Co. | 6.350 | % | 10/1/36 | 1,075 | 861 | ||||
| Carolina Power & Light Co. | 6.300 | % | 4/1/38 | 250 | 272 | ||||
| CenterPoint Energy Houston | 6.950 | % | 3/15/33 | 925 | 852 | ||||
| Cleveland Electric Illumination Co. | 5.950 | % | 12/15/36 | 1,000 | 760 | ||||
| Columbus Southern Power | 5.850 | % | 10/1/35 | 800 | 701 | ||||
Page 90
| Vanguard® Long-Term Bond Index Fund | |||||||||
| Schedule of Investments | |||||||||
| December 31, 2008 | |||||||||
| Face | Market | ||||||||
| Maturity | Amount | Value | |||||||
| Coupon | Date | ($ | 000 | ) | ($ | 000 | ) | ||
| Commonwealth Edison Co. | 5.875 | % | 2/1/33 | 250 | 213 | ||||
| Commonwealth Edison Co. | 5.900 | % | 3/15/36 | 2,000 | 1,663 | ||||
| Commonwealth Edison Co. | 6.450 | % | 1/15/38 | 400 | 365 | ||||
| Connecticut Light & Power Co. | 6.350 | % | 6/1/36 | 750 | 768 | ||||
| Consolidated Edison Co. of New York | 5.300 | % | 3/1/35 | 1,125 | 966 | ||||
| Consolidated Edison Co. of New York | 5.850 | % | 3/15/36 | 1,875 | 1,738 | ||||
| Consolidated Edison Co. of New York | 6.200 | % | 6/15/36 | 550 | 534 | ||||
| Consolidated Edison Co. of New York | 6.300 | % | 8/15/37 | 1,450 | 1,427 | ||||
| Consolidated Edison Co. of New York | 6.750 | % | 4/1/38 | 1,000 | 1,043 | ||||
| Constellation Energy Group, Inc. | 7.600 | % | 4/1/32 | 1,800 | 1,531 | ||||
| Consumers Energy Co. | 5.650 | % | 4/15/20 | 1,250 | 1,168 | ||||
| Detroit Edison Co. | 5.700 | % | 10/1/37 | 500 | 456 | ||||
| Dominion Resources, Inc. | 8.875 | % | 1/15/19 | 1,475 | 1,587 | ||||
| Dominion Resources, Inc. | 6.300 | % | 3/15/33 | 2,150 | 1,828 | ||||
| Dominion Resources, Inc. | 5.950 | % | 6/15/35 | 1,150 | 1,015 | ||||
| Dominion Resources, Inc. | 7.000 | % | 6/15/38 | 1,600 | 1,548 | ||||
| DTE Energy Co. | 6.375 | % | 4/15/33 | 800 | 632 | ||||
| Duke Energy Carolinas LLC | 6.100 | % | 6/1/37 | 825 | 828 | ||||
| Duke Energy Carolinas LLC | 6.000 | % | 1/15/38 | 875 | 873 | ||||
| Duke Energy Carolinas LLC | 6.050 | % | 4/15/38 | 2,000 | 2,008 | ||||
| Duke Energy Corp. | 6.000 | % | 12/1/28 | 1,000 | 1,015 | ||||
| Duke Energy Corp. | 6.450 | % | 10/15/32 | 1,050 | 1,127 | ||||
| Duke Energy Indiana Inc. | 6.350 | % | 8/15/38 | 1,000 | 1,067 | ||||
| El Paso Electric Co. | 6.000 | % | 5/15/35 | 1,400 | 956 | ||||
| Energy East Corp. | 6.750 | % | 7/15/36 | 1,425 | 1,205 | ||||
| Exelon Corp. | 5.625 | % | 6/15/35 | 1,975 | 1,318 | ||||
| FirstEnergy Corp. | 7.375 | % | 11/15/31 | 4,800 | 4,549 | ||||
| Florida Power & Light Co. | 5.950 | % | 10/1/33 | 950 | 1,018 | ||||
| Florida Power & Light Co. | 5.625 | % | 4/1/34 | 1,174 | 1,207 | ||||
| Florida Power & Light Co. | 5.400 | % | 9/1/35 | 1,875 | 1,869 | ||||
| Florida Power & Light Co. | 6.200 | % | 6/1/36 | 150 | 167 | ||||
| Florida Power & Light Co. | 5.650 | % | 2/1/37 | 2,150 | 2,233 | ||||
| Florida Power & Light Co. | 5.850 | % | 5/1/37 | 625 | 668 | ||||
| Florida Power & Light Co. | 5.950 | % | 2/1/38 | 350 | 380 | ||||
| Florida Power Corp. | 6.350 | % | 9/15/37 | 2,225 | 2,455 | ||||
| Florida Power Corp. | 6.400 | % | 6/15/38 | 2,575 | 2,944 | ||||
| Georgia Power Co. | 5.650 | % | 3/1/37 | 2,075 | 1,971 | ||||
| Indiana Michigan Power Co. | 6.050 | % | 3/15/37 | 3,075 | 2,503 | ||||
| Kansas City Power & Light | 6.050 | % | 11/15/35 | 500 | 399 | ||||
| MidAmerican Energy Co. | 6.750 | % | 12/30/31 | 1,800 | 1,817 | ||||
| MidAmerican Energy Co. | 5.750 | % | 11/1/35 | 850 | 753 | ||||
| MidAmerican Energy Co. | 5.800 | % | 10/15/36 | 875 | 788 | ||||
| MidAmerican Energy Holdings Co. | 8.480 | % | 9/15/28 | 300 | 318 | ||||
| MidAmerican Energy Holdings Co. | 6.125 | % | 4/1/36 | 6,925 | 6,412 | ||||
| MidAmerican Energy Holdings Co. | 5.950 | % | 5/15/37 | 4,275 | 3,885 | ||||
| MidAmerican Energy Holdings Co. | 6.500 | % | 9/15/37 | 700 | 676 | ||||
| National Rural Utilities Cooperative Finance Corp. | 8.000 | % | 3/1/32 | 2,400 | 2,333 | ||||
| Nevada Power Co. | 6.750 | % | 7/1/37 | 2,500 | 2,235 | ||||
| NiSource Finance Corp. | 6.800 | % | 1/15/19 | 850 | 584 | ||||
| NiSource Finance Corp. | 5.450 | % | 9/15/20 | 725 | 441 | ||||
| Northern States Power Co. | 5.250 | % | 7/15/35 | 1,175 | 1,115 | ||||
| Northern States Power Co. | 6.250 | % | 6/1/36 | 525 | 571 | ||||
| Northern States Power Co. | 6.200 | % | 7/1/37 | 1,050 | 1,136 | ||||
| Ohio Power Co. | 6.600 | % | 2/15/33 | 400 | 374 | ||||
| Oncor Electric Delivery Co. | 7.000 | % | 9/1/22 | 1,675 | 1,561 | ||||
| Oncor Electric Delivery Co. | 7.000 | % | 5/1/32 | 2,025 | 1,828 | ||||
| Oncor Electric Delivery Co. | 7.250 | % | 1/15/33 | 325 | 297 | ||||
| Pacific Gas & Electric Co. | 6.050 | % | 3/1/34 | 8,800 | 9,123 | ||||
| Pacific Gas & Electric Co. | 5.800 | % | 3/1/37 | 2,075 | 2,127 | ||||
| PacifiCorp | 7.700 | % | 11/15/31 | 400 | 480 | ||||
| PacifiCorp | 5.250 | % | 6/15/35 | 1,150 | 1,040 | ||||
| PacifiCorp | 5.750 | % | 4/1/37 | 1,000 | 970 | ||||
| PacifiCorp | 6.250 | % | 10/15/37 | 1,200 | 1,246 | ||||
| Pepco Holdings, Inc. | 7.450 | % | 8/15/32 | 300 | 248 | ||||
| Potomac Electric Power | 6.500 | % | 11/15/37 | 1,500 | 1,467 | ||||
| PPL Energy Supply LLC | 6.000 | % | 12/15/36 | 1,350 | 946 |
Page 91
| Vanguard® Long-Term Bond Index Fund | |||||||||
| Schedule of Investments | |||||||||
| December 31, 2008 | |||||||||
| Face | Market | ||||||||
| Maturity | Amount | Value | |||||||
| Coupon | Date | ($ | 000 | ) | ($ | 000 | ) | ||
| Progress Energy, Inc. | 7.750 | % | 3/1/31 | 1,725 | 1,739 | ||||
| Progress Energy, Inc. | 7.000 | % | 10/30/31 | 925 | 859 | ||||
| PSE&G Power LLC | 8.625 | % | 4/15/31 | 400 | 418 | ||||
| PSI Energy Inc. | 6.120 | % | 10/15/35 | 600 | 562 | ||||
| Public Service Co. of Colorado | 6.250 | % | 9/1/37 | 1,025 | 1,057 | ||||
| Public Service Co. of Colorado | 6.500 | % | 8/1/38 | 500 | 533 | ||||
| Public Service Co. of Oklahoma | 6.625 | % | 11/15/37 | 300 | 272 | ||||
| Public Service Electric & Gas | 5.250 | % | 7/1/35 | 675 | 587 | ||||
| Public Service Electric & Gas | 5.800 | % | 5/1/37 | 2,925 | 2,743 | ||||
| Puget Sound Energy Inc. | 5.483 | % | 6/1/35 | 825 | 661 | ||||
| Puget Sound Energy Inc. | 6.274 | % | 3/15/37 | 1,425 | 1,271 | ||||
| South Carolina Electric & Gas Co. | 6.625 | % | 2/1/32 | 500 | 558 | ||||
| South Carolina Electric & Gas Co. | 5.300 | % | 5/15/33 | 1,850 | 1,748 | ||||
| South Carolina Electric & Gas Co. | 6.050 | % | 1/15/38 | 1,225 | 1,282 | ||||
| Southern California Edison Co. | 6.650 | % | 4/1/29 | 700 | 734 | ||||
| Southern California Edison Co. | 5.750 | % | 4/1/35 | 400 | 430 | ||||
| Southern California Edison Co. | 5.350 | % | 7/15/35 | 3,175 | 3,234 | ||||
| Southern California Edison Co. | 5.625 | % | 2/1/36 | 1,100 | 1,164 | ||||
| Southern California Edison Co. | 5.550 | % | 1/15/37 | 600 | 629 | ||||
| Southern California Edison Co. | 5.950 | % | 2/1/38 | 975 | 1,081 | ||||
| Southwestern Electric Power | 6.450 | % | 1/15/19 | 175 | 171 | ||||
| Tampa Electric Co. | 6.550 | % | 5/15/36 | 450 | 395 | ||||
| Toledo Edison Co. | 6.150 | % | 5/15/37 | 600 | 478 | ||||
| United Utilities PLC | 5.375 | % | 2/1/19 | 1,000 | 853 | ||||
| United Utilities PLC | 6.875 | % | 8/15/28 | 375 | 312 | ||||
| Virginia Electric & Power Co. | 6.000 | % | 1/15/36 | 1,725 | 1,643 | ||||
| Virginia Electric & Power Co. | 6.000 | % | 5/15/37 | 825 | 806 | ||||
| Virginia Electric & Power Co. | 6.350 | % | 11/30/37 | 1,000 | 997 | ||||
| Virginia Electric & Power Co. | 8.875 | % | 11/15/38 | 1,700 | 2,156 | ||||
| Wisconsin Electric Power Co. | 5.625 | % | 5/15/33 | 450 | 430 | ||||
| Wisconsin Electric Power Co. | 5.700 | % | 12/1/36 | 1,675 | 1,614 | ||||
| Wisconsin Power & Light Co. | 6.375 | % | 8/15/37 | 950 | 914 | ||||
| Xcel Energy, Inc. | 6.500 | % | 7/1/36 | 650 | 598 | ||||
| Natural Gas (1.4%) | |||||||||
| AGL Capital Corp. | 6.000 | % | 10/1/34 | 850 | 618 | ||||
| Duke Capital Corp. | 8.000 | % | 10/1/19 | 425 | 406 | ||||
| Duke Capital Corp. | 6.750 | % | 2/15/32 | 1,705 | 1,311 | ||||
| Duke Energy Field Services | 8.125 | % | 8/16/30 | 500 | 451 | ||||
| El Paso Natural Gas Co. | 8.375 | % | 6/15/32 | 1,350 | 1,135 | ||||
| Enbridge Energy Partners | 9.875 | % | 3/1/19 | 1,700 | 1,713 | ||||
| Enbridge Energy Partners | 7.500 | % | 4/15/38 | 525 | 428 | ||||
| Energy Transfer Partners LP | 6.625 | % | 10/15/36 | 1,125 | 788 | ||||
| Energy Transfer Partners LP | 7.500 | % | 7/1/38 | 775 | 606 | ||||
| Enterprise Products Operating LP | 6.500 | % | 1/31/19 | 2,300 | 1,920 | ||||
| Enterprise Products Operating LP | 6.875 | % | 3/1/33 | 875 | 681 | ||||
| Enterprise Products Operating LP | 6.650 | % | 10/15/34 | 900 | 677 | ||||
| KeySpan Corp. | 8.000 | % | 11/15/30 | 1,175 | 1,160 | ||||
| Kinder Morgan Energy Partners LP | 7.750 | % | 3/15/32 | 500 | 441 | ||||
| Kinder Morgan Energy Partners LP | 7.300 | % | 8/15/33 | 1,000 | 835 | ||||
| Kinder Morgan Energy Partners LP | 5.800 | % | 3/15/35 | 1,675 | 1,142 | ||||
| Kinder Morgan Energy Partners LP | 6.500 | % | 2/1/37 | 1,350 | 1,043 | ||||
| Kinder Morgan Energy Partners LP | 6.950 | % | 1/15/38 | 3,425 | 2,803 | ||||
| ONEOK Inc. | 6.000 | % | 6/15/35 | 975 | 706 | ||||
| ONEOK Partners, LP | 6.650 | % | 10/1/36 | 3,425 | 2,717 | ||||
| ONEOK Partners, LP | 6.850 | % | 10/15/37 | 1,200 | 929 | ||||
| Plains All American Pipeline LP | 6.650 | % | 1/15/37 | 1,175 | 806 | ||||
| San Diego Gas & Electric | 5.350 | % | 5/15/35 | 1,775 | 1,641 | ||||
| San Diego Gas & Electric | 6.125 | % | 9/15/37 | 625 | 642 | ||||
| Southern California Gas Co. | 5.750 | % | 11/15/35 | 75 | 71 | ||||
| Southern Union Co. | 7.600 | % | 2/1/24 | 500 | 356 | ||||
| Southern Union Co. | 8.250 | % | 11/15/29 | 1,000 | 765 | ||||
| Tennessee Gas Pipeline | 7.000 | % | 10/15/28 | 2,650 | 1,975 | ||||
| Teppco Partners, LP | 7.550 | % | 4/15/38 | 1,125 | 853 | ||||
| Texas Eastern Transmission | 7.000 | % | 7/15/32 | 700 | 615 | ||||
Page 92
| Vanguard® Long-Term Bond Index Fund | |||||||||
| Schedule of Investments | |||||||||
| December 31, 2008 | |||||||||
| Face | Market | ||||||||
| Maturity | Amount | Value | |||||||
| Coupon | Date | ($ | 000 | ) | ($ | 000 | ) | ||
| Trans-Canada Pipelines | 5.600 | % | 3/31/34 | 1,725 | 1,369 | ||||
| Trans-Canada Pipelines | 5.850 | % | 3/15/36 | 2,575 | 2,128 | ||||
| Trans-Canada Pipelines | 6.200 | % | 10/15/37 | 2,000 | 1,787 | ||||
| Trans-Canada Pipelines | 7.250 | % | 8/15/38 | 1,700 | 1,696 | ||||
| Williams Cos., Inc. | 7.500 | % | 1/15/31 | 5,850 | 3,978 | ||||
| Williams Cos., Inc. | 7.750 | % | 6/15/31 | 2,750 | 1,897 | ||||
| Other Utility (0.1%) | |||||||||
| Veolia Environnement | 6.750 | % | 6/1/38 | 1,750 | 1,474 | ||||
| 182,924 | |||||||||
| Total Corporate Bonds (Cost $1,321,700) | 1,191,700 | ||||||||
| Sovereign Bonds (U.S. Dollar-Denominated) (5.7%) | |||||||||
| Asian Development Bank | 5.593 | % | 7/16/18 | 4,000 | 4,825 | ||||
| European Investment Bank | 4.875 | % | 2/15/36 | 2,400 | 2,941 | ||||
| Federative Republic of Brazil | 8.875 | % | 4/15/24 | 3,000 | 3,690 | ||||
| Federative Republic of Brazil | 8.750 | % | 2/4/25 | 8,500 | 10,370 | ||||
| Federative Republic of Brazil | 10.125 | % | 5/15/27 | 6,700 | 9,223 | ||||
| Federative Republic of Brazil | 8.250 | % | 1/20/34 | 6,500 | 7,914 | ||||
| Federative Republic of Brazil | 7.125 | % | 1/20/37 | 7,500 | 8,400 | ||||
| Federative Republic of Brazil | 11.000 | % | 8/17/40 | 13,000 | 16,900 | ||||
| Inter-American Development Bank | 7.000 | % | 6/15/25 | 750 | 1,045 | ||||
| International Bank for Reconstruction & Development | 7.625 | % | 1/19/23 | 1,807 | 2,646 | ||||
| International Bank for Reconstruction & Development | 8.875 | % | 3/1/26 | 1,000 | 1,623 | ||||
| International Bank for Reconstruction & Development | 4.750 | % | 2/15/35 | 2,225 | 2,626 | ||||
| Korea Electric Power | 7.000 | % | 2/1/27 | 750 | 634 | ||||
| Kreditanstalt fur Wiederaufbau | 0.000 | % | 4/18/36 | 6,200 | 2,178 | ||||
| Kreditanstalt fur Wiederaufbau | 0.000 | % | 6/29/37 | 6,275 | 2,019 | ||||
| Pemex Project Funding Master Trust | 6.625 | % | 6/15/35 | 4,900 | 4,140 | ||||
| 3 Pemex Project Funding Master Trust | 6.625 | % | 6/15/38 | 1,375 | 1,152 | ||||
| Petrobras International Finance | 8.375 | % | 12/10/18 | 1,500 | 1,539 | ||||
| Province of British Columbia | 6.500 | % | 1/15/26 | 1,500 | 2,034 | ||||
| Province of Manitoba | 9.250 | % | 4/1/20 | 1,500 | 2,309 | ||||
| Province of Nova Scotia | 9.125 | % | 5/1/21 | 1,280 | 2,021 | ||||
| Province of Quebec | 7.500 | % | 7/15/23 | 600 | 827 | ||||
| Province of Quebec | 7.125 | % | 2/9/24 | 3,800 | 4,898 | ||||
| Province of Quebec | 7.500 | % | 9/15/29 | 3,625 | 5,097 | ||||
| Province of Saskatchewan | 7.375 | % | 7/15/13 | 600 | 745 | ||||
| Quebec Hydro Electric | 9.400 | % | 2/1/21 | 1,480 | 2,290 | ||||
| Quebec Hydro Electric | 8.400 | % | 1/15/22 | 775 | 1,146 | ||||
| Quebec Hydro Electric | 8.050 | % | 7/7/24 | 5,000 | 7,127 | ||||
| Quebec Hydro Electric | 8.500 | % | 12/1/29 | 1,200 | 1,897 | ||||
| Region of Lombardy, Italy | 5.804 | % | 10/25/32 | 2,375 | 2,916 | ||||
| Republic of Finland | 6.950 | % | 2/15/26 | 195 | 292 | ||||
| Republic of Italy | 6.875 | % | 9/27/23 | 6,600 | 8,341 | ||||
| Republic of Italy | 5.375 | % | 6/15/33 | 5,750 | 6,613 | ||||
| Republic of Korea | 5.625 | % | 11/3/25 | 900 | 776 | ||||
| Republic of Peru | 7.350 | % | 7/21/25 | 3,000 | 2,955 | ||||
| 2 Republic of Peru | 6.550 | % | 3/14/37 | 5,000 | 4,450 | ||||
| Republic of South Africa | 5.875 | % | 5/30/22 | 3,000 | 2,520 | ||||
| United Mexican States | 5.950 | % | 3/19/19 | 3,500 | 3,517 | ||||
| United Mexican States | 8.125 | % | 12/30/19 | 5,750 | 6,713 | ||||
| United Mexican States | 8.300 | % | 8/15/31 | 2,275 | 2,747 | ||||
| United Mexican States | 6.750 | % | 9/27/34 | 15,625 | 16,328 | ||||
| United Mexican States | 6.050 | % | 1/11/40 | 3,700 | 3,598 | ||||
| Total Sovereign Bonds (Cost $173,101) | 176,022 | ||||||||
| Taxable Municipal Bonds (1.5%) | |||||||||
| Chicago IL Transit Auth. Rev. | 6.899 | % | 12/1/40 | 5,500 | 5,428 | ||||
| Connecticut GO | 5.850 | % | 3/15/32 | 4,200 | 4,020 | ||||
| Illinois (Taxable Pension) GO | 4.950 | % | 6/1/23 | 1,700 | 1,577 | ||||
| Illinois (Taxable Pension) GO | 5.100 | % | 6/1/33 | 22,125 | 19,381 | ||||
| Kansas Dev. Finance Auth. Rev. | |||||||||
| (Public Employee Retirement System) | 5.501 | % | 5/1/34 | 500 | 458 | ||||
Page 93
| Vanguard® Long-Term Bond Index Fund | |||||||||
| Schedule of Investments | |||||||||
| December 31, 2008 | |||||||||
| Face | Market | ||||||||
| Maturity | Amount | Value | |||||||
| Coupon | Date | ($ | 000 | ) | ($ | 000 | ) | ||
| New Jersey Econ. Dev. Auth. State Pension Rev. | 7.425 | % | 2/15/29 | 5,250 | 5,310 | ||||
| New Jersey Turnpike Auth. Rev. | 4.252 | % | 1/1/16 | 30 | 29 | ||||
| New Jersey Turnpike Auth. Rev. | 4.252 | % | 1/1/16 | 570 | 547 | ||||
| Oregon (Taxable Pension) GO | 5.762 | % | 6/1/23 | 600 | 592 | ||||
| Oregon (Taxable Pension) GO | 5.892 | % | 6/1/27 | 1,850 | 1,785 | ||||
| Oregon School Board Assn. | 4.759 | % | 6/30/28 | 1,850 | 1,557 | ||||
| Oregon School Board Assn. | 5.528 | % | 6/30/28 | 1,500 | 1,395 | ||||
| Tobacco Settlement Finance Auth. Rev. | 7.467 | % | 6/1/47 | 3,840 | 2,405 | ||||
| Wisconsin Public Service Rev. | 5.700 | % | 5/1/26 | 900 | 819 | ||||
| Total Taxable Municipal Bonds (Cost $50,184) | 45,303 | ||||||||
| Shares | |||||||||
| Temporary Cash Investments (1.7%) | |||||||||
| 4 Vanguard Market Liquidity Fund (Cost $50,700) | 1.378 | % | 50,699,568 | 50,700 | |||||
| Total Investments (99.2%) (Cost $2,880,434) | 3,030,609 | ||||||||
| Other Assets and Liabilities—Net (0.8%) | 24,918 | ||||||||
| Net Assets (100%) | 3,055,527 | ||||||||
1 The issuer operates under a congressional charter; its securities are neither issued nor guaranteed by the U.S. government.
2 The average or expected maturity is shorter than the final maturity shown because of the possibility of interim principal payments and prepayments or the possibility of the issue being called.
3 Security exempt from registration under Rule 144A of the Securities Act of 1933. Such securities may be sold in transactions exempt from registration, normally to qualified institutional buyers. At December 31, 2008, the aggregate value of these securities was $7,753,000, representing 0.3% of net assets.
4 Affiliated money market fund available only to Vanguard funds and certain trusts and accounts managed by Vanguard. Rate shown is the 7-day yield.
GO—General Obligation Bond.
Page 94
Report of Independent Registered Public Accounting Firm
To the Trustees of Vanguard Bond Index Funds and the Shareholders of Vanguard Total Bond Market Index Fund, Vanguard Short-Term Bond Index Fund, Vanguard Intermediate-Term Bond Index Fund and Vanguard Long-Term Bond Index Fund:
We have audited, in accordance with the standards of the Public Company Accounting Oversight Board (United States), the financial statements (not presented herein) of Vanguard Total Bond Market Index Fund, Vanguard Short-Term Bond Index Fund, Vanguard Intermediate-Term Bond Index Fund and Vanguard Long-Term Bond Index Fund (constituting separate portfolios of Vanguard Bond Index Funds, hereafter referred to as the “Funds”) as of December 31, 2008, and for the year then ended and have issued our unqualified report thereon dated February 23, 2009. Our audits included audits of the Funds’ schedules of investments as of December 31, 2008. These schedules of investments are the responsibility of the Funds’ management. Our responsibility is to express an opinion on these schedules of investments based on our audits.
In our opinion, the accompanying schedules of investments referred to above, when read in conjunction with the finan-cial statements of the Funds referred to above, present fairly, in all material respects, the information set forth therein.
PricewaterhouseCoopers LLP
Philadelphia, PA
February 23, 2009
Page 95
© 2009 Vanguard Group. Inc. All rights reserved.
Vanguard Marketing Corporation, Distributor.
SNAQ840 022009
![]()
Vanguard Inflation-Protected Securities Fund Annual Report

- The various share classes of Vanguard Inflation-Protected Securities Fund returned about 11% for the year as rising expectations of future inflation pushed up prices of inflation-adjusted securities.
- The fund modestly trailed its benchmark index but slightly outpaced its peers.
- Because 2008 ended with deflation and inflation was negligible for most of 2009, the fund made only a small dividend payment in the first quarter of 2009 and no dividend payment in the second and third quarters.
| Contents | |
| Your Fund’s Total Returns............... | 1 |
| Chairman’s Letter........................... | 2 |
| Advisor’s Report............................. | 9 |
| Results of Proxy Voting................. | 11 |
| Fund Profile................................. | 12 |
| Performance Summary................ | 13 |
| Financial Statements................. | 15 |
| About Your Fund’s Expenses.......... | 27 |
| Glossary......................................... | 29 |
Please note: The opinions expressed in this report are just that—informed opinions. They should not be considered promises or advice. Also, please keep in mind that the information and opinions cover the period through the date on the front of this report. Of course, the risks of investing in your fund are spelled out in the prospectus.
See the Glossary for definitions of investment terms used in this report.
Cover photograph: Veronica Coia.
| Your Fund’s Total Returns | ||||||||
| Fiscal Year Ended December 31, 2009 | ||||||||
| 30-Day SEC | Income | Capital | Total | |||||
| Yields | Returns | Returns | Returns | |||||
| Vanguard Inflation-Protected Securities Fund | ||||||||
| Investor Shares | 0.74 | % | 1.76 | % | 9.04 | % | 10.80 | % |
| Admiral™ Shares | 0.87 | 1.94 | 9.02 | 10.96 | ||||
| Institutional Shares | 0.90 | 2.02 | 9.01 | 11.03 | ||||
| Barclays Capital U.S. Treasury Inflation | ||||||||
| Protected Securities Index | 11.41 | |||||||
| Treasury Inflation-Protected Securities Funds | ||||||||
| Average | 10.79 | |||||||
| Treasury Inflation-Protected Securities Funds Average: Derived from data provided by Lipper Inc. | ||||||||
Admiral Shares are a lower-cost class of shares available to many longtime shareholders and to those with significant investments in the fund. Institutional Shares are available for a minimum initial investment of $5 million.
| Your Fund’s Performance at a Glance | ||||||||
| December 31, 2008 , Through December 31, 2009 | ||||||||
| Distributions Per Share | ||||||||
| Starting | Ending | Income | Capital | |||||
| Share Price | Share Price | Dividends | Gains | |||||
| Vanguard Inflation-Protected Securities Fund | ||||||||
| Investor Shares | $ | 11.52 | $ | 12.55 | $ | 0.214 | $ | 0.000 |
| Admiral Shares | 22.62 | 24.65 | 0.448 | 0.000 | ||||
| Institutional Shares | 9.21 | 10.04 | 0.185 | 0.000 | ||||
1

Chairman’s Letter
Dear Shareholder,
Vanguard Inflation-Protected Securities Fund returned about 11% for the year ended December 31, 2009. At the start of the year, the difference in yields between 10-year U.S. Treasury inflation-protected securities and conventional Treasuries was negligible, suggesting that investors were expecting very little inflation for the next ten years. But as winter turned to spring and the markets became more optimistic about future economic growth, the difference between the yields of inflation-protected and conventional Treasuries grew, indicating a belief that modest inflation was more likely. The change in sentiment helped to spark a rally in inflation-protected Treasuries.
However, declines in the Consumer Price Index (CPI), largely a result of sharply falling energy prices in late 2008 and early 2009, led to a downward adjustment in the fund’s income distributions. In fact, the fund paid only a small dividend in the first quarter ($0.005 per share for Investor Shares) and no dividend in the second or third quarter. As the CPI stayed mostly in positive territory in 2009, the fund’s Investor Shares were able to pay $0.209 per share in the fourth quarter.
For more on how the fund adjusts for inflation and deflation, see “Investment insight” on page 6.
2
Bond markets calmed down, money market funds endured
Compared with the last months of 2008, when credit markets seized up and investors fled to the safety of conventional U.S. Treasuries, 2009 represented a return to normalcy for bonds. Investors’ appetite for risk returned, and the demand for corporate bonds increased, raising their prices and bringing down their yields.
For the 12 months ended December 31, the broad taxable bond market returned about 6%, while municipal bonds returned about 13%.
Meanwhile, money market funds and other short-term savings vehicles did poorly in 2009. Interest rates at the shortest end of the maturity spectrum remained at historic lows, a casualty of the Federal Reserve Board’s efforts to revive the economy. The Fed kept its target for the federal funds rate between 0% and 0.25% for the entire year.
Impressive stock returns masked lingering uncertainties
For the 12 months, the broad U.S. stock market returned more than 29%, its highest calendar-year return since 2003. The year began with the market searching for a bottom, and it finally hit a low point in early March. From there, stocks mounted one of their strongest rallies ever—in magnitude and duration—resulting in a check mark-shaped stock chart for 2009.
The market’s outsized result came against a backdrop of economic uncertainty. The economy, which struggled to regain its
| Market Barometer | ||||||
| Average Annual Total Returns | ||||||
| Periods Ended December 31, 2009 | ||||||
| One | Three | Five | ||||
| Year | Years | Years | ||||
| Bonds | ||||||
| Barclays Capital U.S. Aggregate Bond Index (Broad | ||||||
| taxable market) | 5.93 | % | 6.04 | % | 4.97 | % |
| Barclays Capital Municipal Bond Index | 12.91 | 4.41 | 4.32 | |||
| Citigroup Three-Month U.S. Treasury Bill Index | 0.16 | 2.22 | 2.88 | |||
| Stocks | ||||||
| Russell 1000 Index (Large-caps) | 28.43 | % | -5.36 | % | 0.79 | % |
| Russell 2000 Index (Small-caps) | 27.17 | -6.07 | 0.51 | |||
| Dow Jones U.S. Total Stock Market Index | 29.35 | -5.01 | 1.09 | |||
| MSCI All Country World Index ex USA (International) | 42.14 | -3.04 | 6.30 | |||
| CPI | ||||||
| Consumer Price Index | 2.72 | % | 2.28 | % | 2.56 | % |
3
footing as the financial crisis abated, began to show signs of growth in the second half of the year, even as unemployment climbed to levels not seen since 1983.
Stock markets outside the United States fared even better during 2009, especially many emerging markets, which weathered the financial crisis in relatively better fiscal and economic shape than their developed-market counterparts.
The fund benefited as deflation fears subsided
Early in 2009, fears of a shrinking economy and accompanying deflation loomed over the market. Consumer prices fell by 2.5% between November 2008 and January 2009, and the gap between 5-year inflation-protected Treasuries and their conventional counterparts reflected expectations of sustained deflation for the next five years—a scenario not seen in the United States since the 1930s.
But as the financial crisis eased and the economy seemed to stabilize, expectations resurfaced for at least mild inflation in the future, which spurred the buying of inflation-indexed bonds. For the first time since 2003, the Inflation-Protected Securities Fund posted positive returns in each of the year’s four quarters. As its share price rose, its yield fell, ending the year at 0.74% for Investor Shares.
This rally was similar to what occurred in 2002 when the economy began recovering from the previous recession. Then, as in 2009, inflation-indexed Treasury bonds
| Expense Ratios | ||||||||
| Your Fund Compared With Its Peer Group | ||||||||
| Investor | Admiral | Institutional | Peer Group | |||||
| Shares | Shares | Shares | Average | |||||
| Inflation-Protected Securities Fund | 0.25 | % | 0.12 | % | 0.09 | % | 0.84 | % |
The fund expense ratios shown are from the prospectus dated April 24, 2009, and represent estimated costs for the current fiscal year based on the fund’s net assets as of the prospectus date. For the fiscal year ended December 31, 2009, the fund’s expense ratios were 0.25% for Investor Shares, 0.12% for Admiral Shares, and 0.09% for Institutional Shares. The peer-group expense ratio is derived from data provided by Lipper Inc. and captures information through year-end 2008.
Peer group: Treasury Inflation-Protected Securities Funds.
4
rose in value as investors reset their inflation expectations upward. The strong performance of inflation-indexed Treasury bonds this past year stood in contrast to that of conventional Treasuries, which had done so well in 2008 as investors fled to their perceived safety. (Inflation-protected Treasury securities are equally credit-worthy, but have not functioned as a similar haven for investors in times of stress.) With investors regaining their appetite for risk as 2009 unfolded, they sold conventional intermediate- and long-term Treasuries and sought higher-yielding alternatives, such as corporate bonds.
This willingness to venture beyond conventional Treasuries was evident in the steadily widening “break-even inflation rate,” a term for the difference in yields between conventional and inflation-protected Treasuries. At year-end 2008, the break-even rate for 10-year bonds reflected the expectation that annual inflation would be less than 1% for the subsequent ten years. By the end of 2009, investors were pricing in inflation of 2.4% per year over the next 10 years.
The change in outlook could be attributed to an economy that resumed growing in the third quarter (according to estimates of the output of U.S. goods and services), the Federal Reserve Board’s historic efforts at stimulating the economy, and the federal government’s increased spending, which will require heavy borrowing.
| Total Returns | ||
| Inception Through December 31, 2009 | ||
| Average | ||
| Annual Return | ||
| Inflation-Protected Securities Fund Investor Shares (Returns since inception: 6/29/2000) | 7.14 | % |
| Barclays Capital U.S. Treasury Inflation Protected Securities Index | 7.38 | |
| Treasury Inflation-Protected Securities Funds Average | 6.58 | |
| Treasury Inflation-Protected Securities Funds Average: Derived from data provided by Lipper Inc. |
The figures shown represent past performance, which is not a guarantee of future results. (Current performance may be lower or higher than the performance data cited. For performance data current to the most recent month-end, visit our website at www.vanguard.com/performance.) Note, too, that both investment returns and principal value can fluctuate widely, so an investor’s shares, when sold, could be worth more or less than their original cost.
5
The returns of the Inflation-Protection Securities Fund for 2009 modestly trailed the return of its benchmark index, in part because the index is not an investment and, unlike a mutual fund, has no operating expenses and in part because the fund did not hold some of the index’s better-performing shorter-term securities. The fund’s returns were just slightly ahead of the average return of peer-group funds.
Investment insight
Why the fund withheld dividends
The income distributions from Vanguard Inflation-Protected Securities Fund are based on the sum of two factors. One is the real yield at which the fund securities were purchased (the “real purchased yield”). The other is the inflation adjustment to the value of these holdings, which is based on monthly changes in the Consumer Price Index. A rise in the index (inflation) increases the principal value of those holdings. Together with the “real purchased yield,” this upward adjustment is distributed as income, as required by the Internal Revenue Service. A decline (deflation) reduces the principal value, partially or fully offsetting the real yield.
As the chart shows, the latter half of 2008 was a period of significantly falling prices, or deflation. Mild inflation reemerged in 2009, but the CPI turned slightly negative during two separate months. The inflation-related adjustments to the value of inflation-indexed securities are made with a two-month lag, so the deflation experienced in late 2008 offset enough of the “real purchased yield” accrued by the fund in 2009 that the fund distributed no income in the second and third quarters. The fund accrued sufficient income to pay a dividend in December.
Consumer Price Index: Monthly inflation and deflation, July 2008–December 2009

6
The fund’s long-term record is impressive from several perspectives
Since its June 2000 inception, the Inflation-Protected Securities Fund has returned an average of 7.14% a year for Investor Shares, outdistancing the returns of both the broad bond market and the stock market. The past decade, of course, began and ended with two historic periods of tumult in the financial markets, times in which government debt securities often get a boost. The fund has captured most of the return available from the growing market for inflation-protected securities, trailing its benchmark index by an amount nearly consistent with its costs, and outperforming its peers.
These results are a tribute to the fund’s advisor, Vanguard’s Fixed Income Group. As the size of the inflation-protected securities market has increased substantially in recent years, the fund has benefited from the Fixed Income Group’s experience and disciplined approach. The fund’s results also reflect the importance of low costs, which help investors receive a higher percentage of a fund’s gross returns. Your fund’s operating expenses are a small fraction of the costs incurred by funds of its type.
Fluctuations in yields don’t require strategy changes
As deflation fears subsided and longer-term interest rates rose in 2009, the U.S. Treasury yield curve returned to a more typical shape, with yields of long-term
| Yields and Returns | ||||||||||
| Components of Total Returns | ||||||||||
| 30-Day SEC | 12 Months Ended December 31, 2009 | |||||||||
| Yields on December 31, | Income | Capital | Total | |||||||
| Inflation-Protected Securities Fund | 2008 | 2009 | Return | Return | Return | |||||
| Investor Shares | 3.17 | % | 0.74 | % | 1.76 | % | 9.04 | % | 10.80 | % |
| Admiral Shares | 3.27 | 0.87 | 1.94 | 9.02 | 10.96 | |||||
| Institutional Shares | 3.32 | 0.90 | 2.02 | 9.01 | 11.03 | |||||
7
bonds becoming more generous than those of short-term bonds. However, this shift in interest rates does not mean you need to make changes to your own bond portfolio. No one knows with certainty what interest rates and bond prices will do in 2010. Vanguard Inflation-Protected Securities Fund offers a reliable cushion against inflation, which makes it a valuable addition to a well-rounded portfolio. In addition, as we saw in 2009, the fund’s securities can behave differently than conventional bonds, providing an added element of diversification in a portfolio that also holds conventional bond and stock funds.
However, like any bond, the top-rated inflation-protected securities held by your fund can still decline in market value—a reality that might be easy to forget after a year of rising prices. So we urge our clients to view the Inflation-Protected Securities Fund as one component of a well-diversified portfolio.
On another matter, I would like to inform you that on January 1, 2010, we completed a leadership transition that began in March 2008. I succeeded Jack Brennan as chairman of Vanguard and each of the funds. Jack has agreed to serve as chairman emeritus and senior advisor.
Under Jack’s leadership, Vanguard has grown to become a preeminent firm in the mutual fund industry. Jack’s energy, his relentless pursuit of perfection, and his unwavering focus on always doing the right thing for our clients are evident in every facet of Vanguard policy today.
As always, thank you for entrusting your assets to Vanguard.

F. William McNabb III
Chairman and Chief Executive Officer
January 15, 2010
8
Advisor’s Report
For the fiscal year ended December 31, 2009, the various share classes of Vanguard Inflation-Protected Securities Fund returned about 11%. These returns were a bit below the return of the Barclays Capital U.S. Treasury Inflation Protected Securities Index and just above the average return of the fund’s peer group.
The investment environment
At the start of the year, fears of deflation had lowered demand for Treasury Inflation-Protected Securities (TIPS) to the point that the difference in yields between TIPS and conventional Treasuries was minimal. This spread—called the break-even inflation rate because it essentially reflects the market’s estimate for future inflation—was only 0.12% for 10-year notes, a historic low. The figure meant that TIPS were valued with an expectation that inflation would be roughly zero over the next 10 years.
There were three main factors underlying this valuation. First, the financial crisis and steep recession lowered expectations for long-term economic growth and inflation. Second, the price of energy commodities fell by more than 50% during the second half of 2008, leading to negative adjustments to income from TIPS and putting downward pressure on their valuations. (Note the steady fall in the Consumer Price Index during the latter part of 2008, as shown in the chart on page 6.) Finally, while TIPS have the same credit quality as conventional Treasuries, they were left behind by the flight-to-quality rally in Treasuries in the second half of 2008.
Aided by aggressive government policies, the nation’s credit markets slowly but steadily returned to some sense of normalcy during 2009. The Federal Reserve kept its target for short-term interest rates near 0% and continued its unprecedented purchase of Treasury and mortgage-backed securities in an attempt to drive down longer-term interest rates. Meanwhile, the federal government tried to reverse a steep recession with nearly $800 billion worth of stimulus programs. These developments eased deflationary fears, causing TIPS valuations to increase smartly. By the same token, the 2008 bull market in conventional Treasuries—considered the safest and most liquid of investments—quickly switched into reverse as investors sought higher yields from corporate bonds.
The market’s turnaround in inflation expectations is encapsulated in the break-even inflation rate at the end of 2009. As of December 31, the yield of the 10-year inflation-indexed note stood at 1.4%, compared with a conventional 10-year Treasury yield of 3.8%. The spread suggested that investors expected prices to rise at an average rate of 2.4% a year over the next decade, up from a break-even inflation rate of 0.12% just 12 months earlier.
Management of the fund
The resurgence in interest in TIPS fueled a strong performance for the fund, with its share price rising about 9% by the end of the year. Inflation at various points in 2009 was quite low as the major sell-off in energy commodities depressed prices
9
overall. Consequently, the fund did not issue distributions for several quarters. Income distributions contributed only about 2% or less (depending on the share class) toward the fund’s return. At year’s end, the fund’s yield stood at 0.74% for Investor Shares.
Our strategies this year were generally successful; we were able to take advantage of periodic increases in the supply of TIPS to select securities that we found most attractive. The fund’s return trailed that of its market benchmark, the Barclays Capital U.S. Treasury Inflation Protected Securities Index. Besides operating expenses, the lag was due in part to our decision not to purchase some of the shorter-maturity issues that the Treasury offered at its quarterly auctions; many of those issues did well during the year.
Investment outlook
We believe that over the past year the market has reset the break-even inflation rate to a reasonable level, and that the fund faces a low risk of a downward shift in inflation expectations, which would lower TIPS prices. Indeed, given the unprecedented level of fiscal and monetary stimulus that has been delivered, we expect inflation rates to move higher as the recovery continues, albeit slowly.
John W. Hollyer, CFA, Principal
Kenneth E. Volpert, CFA, Principal
Vanguard Fixed Income Group
January 21, 2010
| Yields of U.S. Treasury Bonds | ||||
| December 31, | December 31, | |||
| Maturity | 2008 | 2009 | ||
| 2 years | 0.77 | % | 1.14 | % |
| 3 years | 0.97 | 1.67 | ||
| 5 years | 1.55 | 2.68 | ||
| 10 years | 2.21 | 3.84 | ||
| 30 years | 2.68 | 4.63 | ||
| Source: Vanguard |
10
Results of Proxy Voting
At a special meeting of shareholders on July 2, 2009, fund shareholders approved the following two proposals:
Proposal 1—Elect trustees for each fund.*
The individuals listed in the table below were elected as trustees for each fund. All trustees with the exception of Messrs. McNabb and Volanakis (both of whom already served as directors of The Vanguard Group, Inc.) served as trustees to the funds prior to the shareholder meeting.
| Percentage | ||||
| Trustee | For | Withheld | For | |
| John J. Brennan | 7,480,563,019 | 132,452,355 | 98.3 | % |
| Charles D. Ellis | 7,406,205,129 | 206,810,245 | 97.3 | % |
| Emerson U. Fullwood | 7,486,175,684 | 126,839,690 | 98.3 | % |
| Rajiv L. Gupta | 7,475,619,448 | 137,395,926 | 98.2 | % |
| Amy Gutmann | 7,494,805,274 | 118,210,101 | 98.4 | % |
| JoAnn Heffernan Heisen | 7,478,861,968 | 134,153,407 | 98.2 | % |
| F. William McNabb III | 7,490,714,832 | 122,300,542 | 98.4 | % |
| André F. Perold | 7,470,382,148 | 142,633,227 | 98.1 | % |
| Alfred M. Rankin, Jr. | 7,478,299,969 | 134,715,405 | 98.2 | % |
| Peter F. Volanakis | 7,496,308,685 | 116,706,689 | 98.5 | % |
| * Results are for all funds within the same trust. | ||||
| Proposal 2—Update and standardize the funds’ fundamental policies regarding: | ||||
| (a) Purchasing and selling real estate. | ||||
| (b) Issuing senior securities. | ||||
| (c) Borrowing money. | ||||
| (d) Making loans. | ||||
| (e) Purchasing and selling commodities. | ||||
| (f) Concentrating investments in a particular industry or group of industries. | ||||
| (g) Eliminating outdated fundamental investment policies not required by law. | ||||
The revised fundamental policies are clearly stated and simple, yet comprehensive, making oversight and compliance more efficient than under the former policies. The revised fundamental policies will allow the funds to respond more quickly to regulatory and market changes, while avoiding the costs and delays associated with successive shareholder meetings.
| Broker | Percentage | ||||||
| Vanguard Fund | For | Abstain | Against | Non-Votes | For | ||
| Inflation-Protected Securities Fund | |||||||
| 2a | 852,446,552 | 16,748,464 | 28,673,341 | 119,936,425 | 83.8 | % | |
| 2b | 851,351,822 | 18,023,950 | 28,492,580 | 119,936,430 | 83.6 | % | |
| 2c | 838,426,792 | 17,737,653 | 41,703,915 | 119,936,422 | 82.4 | % | |
| 2d | 844,713,973 | 17,779,197 | 35,375,190 | 119,936,423 | 83.0 | % | |
| 2e | 844,319,059 | 17,254,526 | 36,294,779 | 119,936,418 | 83.0 | % | |
| 2f | 851,020,785 | 19,187,601 | 27,659,973 | 119,936,423 | 83.6 | % | |
| 2g | 852,215,680 | 17,714,102 | 27,938,569 | 119,936,431 | 83.7 | % |
11
Inflation-Protected Securities Fund
| Fund Profile | ||||||
| As of December 31, 2009 | ||||||
| Share-Class Characteristics | ||||||
| Investor | Admiral | Institutional | ||||
| Shares | Shares | Shares | ||||
| Ticker Symbol | VIPSX | VAIPX | VIPIX | |||
| Expense Ratio1 | 0.25 | % | 0.12 | % | 0.09 | % |
| 30-Day SEC | ||||||
| Yield2 | 0.74 | % | 0.87 | % | 0.90 | % |
| Financial Attributes | ||||||
| Barclays | Barclays | |||||
| Inflation | U.S. | |||||
| Protected | Aggregate | |||||
| Securities | Bond | |||||
| Fund | Index | Index | ||||
| Number of Bonds | 28 | 28 | 8,413 | |||
| Average Quality | Aaa | Aaa/Aaa | Aa1/Aa2 | |||
| Yield to Maturity | ||||||
| (before expenses) | 1.0 | % | 0.9 | % | 3.7 | % |
| Average Coupon | 2.2 | % | 2.3 | % | 4.7 | % |
| Average Duration | 5.0 years | 4.9 years | 4.6 years | |||
| Average Effective | ||||||
| Maturity | 8.6 years | 8.8 years | 6.8 years | |||
| Short-Term | ||||||
| Reserves | 1.9 | % | — | — | ||
| Average quality: Moody’s Investors Service. | ||||||
| Sector Diversification (% of portfolio) | ||||||
| Treasury/Agency | 98.1 | % | ||||
| Other | 1.9 | |||||
The agency and mortgage-backed securities sectors may include issues from government-sponsored enterprises; such issues are not backed by the full faith and credit of the U.S. government.
| Volatility Measures | ||
| Barclays | ||
| Inflation | Barclays | |
| Protected | U.S. | |
| Securities | Aggregate | |
| Index | Bond Index | |
| R-Squared | 0.99 | 0.55 |
| Beta | 1.00 | 1.58 |
These measures show the degree and timing of the fund’s fluctuations compared with the indexes over 36 months.
Distribution by Maturity (% of portfolio)
| Under 1 Year | 1.9 | % |
| 1 - 3 Years | 10.7 | |
| 3 - 5 Years | 23.2 | |
| 5 - 10 Years | 34.7 | |
| 10 - 20 Years | 29.5 |
Distribution by Credit Quality (% of portfolio)
| Aaa | 100.0 | % |
| Ratings: Moody’s Investors Service. |
Investment Focus

1 The expense ratios shown are from the prospectus dated April 24, 2009, and represent estimated costs for the current fiscal year based on the fund’s net assets as of the prospectus date. For the fiscal year ended December 31, 2009, the expense ratios were 0.25% for Investor Shares, 0.12% for Admiral Shares, and 0.09% for Institutional Shares.
2 Yields of inflation-protected securities tend to be lower than those of bonds, because the former do not incorporate market expectations about inflation. The principal amounts—and thus the interest payments—of inflation-protected securities are adjusted over time to reflect inflation. See the Glossary.
12
Inflation-Protected Securities Fund
Performance Summary
All of the returns in this report represent past performance, which is not a guarantee of future results that may be achieved by the fund. (Current performance may be lower or higher than the performance data cited. For performance data current to the most recent month-end, visit our website at www.vanguard.com/performance.) Note, too, that both investment returns and principal value can fluctuate widely, so an investor’s shares, when sold, could be worth more or less than their original cost. The returns shown do not reflect taxes that a shareholder would pay on fund distributions or on the sale of fund shares.
Cumulative Performance: June 29, 2000, Through December 31, 2009
Initial Investment of $10,000

| Average Annual Total Returns | ||||||||
| Periods Ended December 31, 2009 | ||||||||
| Final Value | ||||||||
| One | Five | Since | of a $10,000 | |||||
| Year | Years | Inception | Investment | |||||
| Inflation-Protected Securities Fund | ||||||||
| Investor Shares | 10.80 | % | 4.36 | % | 7.14 | % | $ | 19,255 |
| Barclays Capital U.S. Aggregate Bond | ||||||||
| Index | 5.93 | 4.97 | 6.25 | 17,790 | ||||
| Barclays Capital U.S. Treasury Inflation | ||||||||
| Protected Securities Index | 11.41 | 4.63 | 7.38 | 19,681 | ||||
| Treasury Inflation-Protected Securities | ||||||||
| Funds Average | 10.79 | 3.49 | 6.58 | 18,331 | ||||
Treasury Inflation-Protected Securities Funds Average: Derived from data provided by Lipper Inc.
Performance for the fund’s Investor Shares and comparative standards is calculated since the Investor Shares’ inception.
Vanguard fund total returns do not include any transaction or account fees that applied in the periods shown. Fund prospectuses provide information about current fees.
See Financial Highlights for dividend and capital gains information.
13
| Inflation-Protected Securities Fund | ||||||
| Since | Final Value | |||||
| One | Inception | of a $100,000 | ||||
| Year | (6/10/2005 | ) | Investment | |||
| Inflation-Protected Securities Fund | ||||||
| Admiral Shares | 10.96 | % | 4.49 | % | $ | 122,194 |
| Barclays Capital U.S. Aggregate | ||||||
| Bond Index | 5.93 | 5.04 | 125,133 | |||
| Barclays Capital U.S. Treasury | ||||||
| Inflation Protected Securities Index | 11.41 | 4.68 | 123,167 | |||
Performance for the fund’s Admiral Shares and comparative standards is calculated since the Admiral Shares’ inception.
| Since | Final Value | |||||||
| One | Five | Inception | of a $5,000,000 | |||||
| Year | Years | (12/12/2003 | ) | Investment | ||||
| Inflation-Protected Securities Fund | ||||||||
| Institutional Shares | 11.03 | % | 4.49 | % | 5.02 | % | $ | 6,723,628 |
| Barclays Capital U.S. Aggregate | ||||||||
| Bond Index | 5.93 | 4.97 | 4.87 | 6,667,186 | ||||
| Barclays Capital U.S. Treasury | ||||||||
| Inflation Protected Securities Index | 11.41 | 4.63 | 5.17 | 6,783,795 |
Performance for the fund’s Institutional Shares and comparative standards is calculated since the Institutional Shares’ inception.
| Fiscal-Year Total Returns (%): June 29, 2000, Through December 31, 2009 | ||||||||
| Barclays Capital U.S | ||||||||
| Treasury Inflation | ||||||||
| Protected Securities | ||||||||
| Investor Shares | Index | |||||||
| Fiscal Year | Income Returns | Capital Returns | Total Returns | Total Returns | ||||
| 2000 | 2.73 | % | 3.29 | % | 6.02 | % | 6.13 | % |
| 2001 | 4.32 | 3.29 | 7.61 | 7.89 | ||||
| 2002 | 4.55 | 12.06 | 16.61 | 16.57 | ||||
| 2003 | 3.86 | 4.14 | 8.00 | 8.40 | ||||
| 2004 | 4.79 | 3.48 | 8.27 | 8.46 | ||||
| 2005 | 5.44 | -2.85 | 2.59 | 2.84 | ||||
| 2006 | 3.40 | -2.97 | 0.43 | 0.41 | ||||
| 2007 | 5.90 | 5.69 | 11.59 | 11.63 | ||||
| 2008 | 4.62 | -7.47 | -2.85 | -2.35 | ||||
| 2009 | 1.76 | 9.04 | 10.80 | 11.41 | ||||
Vanguard fund total returns do not include any transaction or account fees that applied in the periods shown. Fund prospectuses provide information about current fees.
14
Inflation-Protected Securities Fund
Financial Statements
Statement of Net Assets
As of December 31, 2009
The fund reports a complete list of its holdings in regulatory filings four times in each fiscal year, at the quarter-ends. For the second and fourth fiscal quarters, the lists appear in the fund’s semiannual and annual reports to shareholders. For the first and third fiscal quarters, the fund files the lists with the Securities and Exchange Commission on Form N-Q. Shareholders can look up the fund’s Forms
N-Q on the SEC’s website at www.sec.gov. Forms N-Q may also be reviewed and copied at the SEC’s Public Reference Room (see the back cover of this report for further information).
| Face | Market | |||||||||
| Maturity | Amount | Value• | ||||||||
| Coupon | Date | ($ | 000 | ) | ($ | 000 | ) | |||
| U.S. Government and Agency Obligations (98.3%) | ||||||||||
| U.S. Government Securities (98.3%) | ||||||||||
| 1 | United States Treasury Inflation Indexed Bonds | 3.500 | % | 1/15/11 | 284,500 | 366,511 | ||||
| United States Treasury Inflation Indexed Bonds | 2.375 | % | 4/15/11 | 685,050 | 768,141 | |||||
| United States Treasury Inflation Indexed Bonds | 3.375 | % | 1/15/12 | 325,640 | 424,082 | |||||
| United States Treasury Inflation Indexed Bonds | 3.000 | % | 7/15/12 | 1,230,775 | 1,591,465 | |||||
| United States Treasury Inflation Indexed Bonds | 0.625 | % | 4/15/13 | 360,000 | 374,409 | |||||
| United States Treasury Inflation Indexed Bonds | 1.875 | % | 7/15/13 | 1,301,875 | 1,614,451 | |||||
| United States Treasury Inflation Indexed Bonds | 2.000 | % | 1/15/14 | 1,564,100 | 1,935,139 | |||||
| United States Treasury Inflation Indexed Bonds | 1.250 | % | 4/15/14 | 625,000 | 659,863 | |||||
| United States Treasury Inflation Indexed Bonds | 2.000 | % | 7/15/14 | 747,845 | 909,126 | |||||
| United States Treasury Inflation Indexed Bonds | 1.625 | % | 1/15/15 | 1,179,015 | 1,388,416 | |||||
| United States Treasury Inflation Indexed Bonds | 1.875 | % | 7/15/15 | 926,225 | 1,084,892 | |||||
| United States Treasury Inflation Indexed Bonds | 2.000 | % | 1/15/16 | 913,050 | 1,050,415 | |||||
| United States Treasury Inflation Indexed Bonds | 2.500 | % | 7/15/16 | 656,525 | 765,359 | |||||
| United States Treasury Inflation Indexed Bonds | 2.375 | % | 1/15/17 | 834,025 | 965,708 | |||||
| United States Treasury Inflation Indexed Bonds | 2.625 | % | 7/15/17 | 1,199,650 | 1,376,411 | |||||
| United States Treasury Inflation Indexed Bonds | 1.625 | % | 1/15/18 | 685,600 | 724,485 | |||||
| United States Treasury Inflation Indexed Bonds | 1.375 | % | 7/15/18 | 527,200 | 529,670 | |||||
| United States Treasury Inflation Indexed Bonds | 2.125 | % | 1/15/19 | 472,600 | 504,774 | |||||
| United States Treasury Inflation Indexed Bonds | 1.875 | % | 7/15/19 | 1,113,450 | 1,170,646 | |||||
| United States Treasury Inflation Indexed Bonds | 2.375 | % | 1/15/25 | 1,665,270 | 2,017,548 | |||||
| United States Treasury Inflation Indexed Bonds | 2.000 | % | 1/15/26 | 1,395,298 | 1,527,329 | |||||
| United States Treasury Inflation Indexed Bonds | 2.375 | % | 1/15/27 | 1,299,989 | 1,467,575 | |||||
| United States Treasury Inflation Indexed Bonds | 1.750 | % | 1/15/28 | 839,625 | 831,476 | |||||
| United States Treasury Inflation Indexed Bonds | 3.625 | % | 4/15/28 | 523,125 | 864,706 | |||||
| United States Treasury Inflation Indexed Bonds | 2.500 | % | 1/15/29 | 736,200 | 795,815 | |||||
| United States Treasury Inflation Indexed Bonds | 3.875 | % | 4/15/29 | 302,150 | 511,622 | |||||
| United States Treasury Note/Bond | 2.375 | % | 10/31/14 | 470,000 | 465,009 | |||||
| United States Treasury Note/Bond | 2.125 | % | 11/30/14 | 455,000 | 444,408 | |||||
| Total U.S. Government and Agency Obligations (Cost $26,086,893) | 27,129,451 | |||||||||
| Shares | ||||||||||
| Temporary Cash Investment (0.9%) | ||||||||||
| Money Market Fund (0.9%) | ||||||||||
| 2 | Vanguard Market | |||||||||
| Liquidity Fund (Cost $259,686) | 0.187 | % | 259,686,006 | 259,686 | ||||||
| Total Investments (99.2%) (Cost $26,346,579) | 27,389,137 | |||||||||
15
| Inflation-Protected Securities Fund | |||
| Market | |||
| Value• | |||
| ($ | 000 | ) | |
| Other Assets and Liabilities (0.8%) | |||
| Other Assets | 316,824 | ||
| Liabilities | (106,588 | ) | |
| 210,236 | |||
| Net Assets (100%) | 27,599,373 | ||
| At December 31, 2009, net assets consisted of: | |||
| Amount | |||
| ($ | 000 | ) | |
| Paid-in Capital | 27,016,644 | ||
| Overdistributed Net Investment Income | (24,998 | ) | |
| Accumulated Net Realized Losses | (421,475 | ) | |
| Unrealized Appreciation (Depreciation) | |||
| Investment Securities | 1,042,558 | ||
| Futures Contracts | (13,356 | ) | |
| Net Assets | 27,599,373 | ||
| Investor Shares—Net Assets | |||
| Applicable to 1,031,461,395 outstanding $.001 par value shares of | |||
| beneficial interest (unlimited authorization) | 12,945,588 | ||
| Net Asset Value Per Share—Investor Shares | $ | 12.55 | |
| Admiral Shares—Net Assets | |||
| Applicable to 353,872,485 outstanding $.001 par value shares of | |||
| beneficial interest (unlimited authorization) | 8,723,232 | ||
| Net Asset Value Per Share—Admiral Shares | $ | 24.65 | |
| Institutional Shares—Net Assets | |||
| Applicable to 590,644,999 outstanding $.001 par value shares of | |||
| beneficial interest (unlimited authorization) | 5,930,553 | ||
| Net Asset Value Per Share—Institutional Shares | $ | 10.04 | |
• See Note A in Notes to Financial Statements.
1 Securities with a value of $25,100,000 have been segregated as initial margin for open futures contracts.
2 Affiliated money market fund available only to Vanguard funds and certain trusts and accounts managed by Vanguard. Rate shown is the 7-day yield.
See accompanying Notes, which are an integral part of the Financial Statements.
16
| Inflation-Protected Securities Fund | |||
| Statement of Operations | |||
| Year Ended | |||
| December 31, 2009 | |||
| ($ | 000 | ) | |
| Investment Income | |||
| Income | |||
| Interest1,2 | 497,172 | ||
| Total Income | 497,172 | ||
| Expenses | |||
| The Vanguard Group—Note B | |||
| Investment Advisory Services | 2,692 | ||
| Management and Administrative—Investor Shares | 21,607 | ||
| Management and Administrative—Admiral Shares | 5,521 | ||
| Management and Administrative—Institutional Shares | 2,027 | ||
| Marketing and Distribution—Investor Shares | 2,952 | ||
| Marketing and Distribution—Admiral Shares | 1,596 | ||
| Marketing and Distribution—Institutional Shares | 1,290 | ||
| Custodian Fees | 77 | ||
| Auditing Fees | 29 | ||
| Shareholders’ Reports and Proxies—Investor Shares | 685 | ||
| Shareholders’ Reports and Proxies—Admiral Shares | 52 | ||
| Shareholders’ Reports and Proxies—Institutional Shares | 31 | ||
| Trustees’ Fees and Expenses | 38 | ||
| Total Expenses | 38,597 | ||
| Net Investment Income | 458,575 | ||
| Realized Net Gain (Loss) | |||
| Investment Securities Sold | 5,584 | ||
| Futures Contracts | (31,288 | ) | |
| Realized Net Gain (Loss) | (25,704 | ) | |
| Change in Unrealized Appreciation (Depreciation) | |||
| Investment Securities | 1,810,019 | ||
| Futures Contracts | 1,210 | ||
| Change in Unrealized Appreciation (Depreciation) | 1,811,229 | ||
| Net Increase (Decrease) in Net Assets Resulting from Operations | 2,244,100 | ||
| 1 | Interest income from an affiliated company of the fund was $920,000. |
| 2 | Includes inflation (deflation) adjustments to income totaling $80,868,000. |
See accompanying Notes, which are an integral part of the Financial Statements.
17
| Inflation-Protected Securities Fund | ||||||
| Statement of Changes in Net Assets | ||||||
| Year Ended December 31, | ||||||
| 2009 | 2008 | |||||
| ($ | 000 | ) | ($ | 000 | ) | |
| Increase (Decrease) in Net Assets | ||||||
| Operations | ||||||
| Net Investment Income | 458,575 | 816,809 | ||||
| Realized Net Gain (Loss) | (25,704 | ) | (193,744 | ) | ||
| Change in Unrealized Appreciation (Depreciation) | 1,811,229 | (1,359,588 | ) | |||
| Net Increase (Decrease) in Net Assets Resulting from Operations | 2,244,100 | (736,523 | ) | |||
| Distributions | ||||||
| Net Investment Income | ||||||
| Investor Shares | (215,661 | ) | (437,788 | ) | ||
| Admiral Shares | (154,428 | ) | (232,295 | ) | ||
| Institutional Shares | (105,449 | ) | (151,469 | ) | ||
| Realized Capital Gain | ||||||
| Investor Shares | — | — | ||||
| Admiral Shares | — | — | ||||
| Institutional Shares | — | — | ||||
| Total Distributions | (475,538 | ) | (821,552 | ) | ||
| Capital Share Transactions | ||||||
| Investor Shares | 3,475,278 | 2,768,454 | ||||
| Admiral Shares | 3,466,647 | 1,674,728 | ||||
| Institutional Shares | 2,320,303 | 1,285,999 | ||||
| Net Increase (Decrease) from Capital Share Transactions | 9,262,228 | 5,729,181 | ||||
| Total Increase (Decrease) | 11,030,790 | 4,171,106 | ||||
| Net Assets | ||||||
| Beginning of Period | 16,568,583 | 12,397,477 | ||||
| End of Period1 | 27,599,373 | 16,568,583 | ||||
1 Net Assets—End of Period includes undistributed (overdistributed) net investment income of ($24,998,000) and ($15,411,000).
See accompanying Notes, which are an integral part of the Financial Statements.
18
| Inflation-Protected Securities Fund | ||||||||||||||||||
| Financial Highlights | ||||||||||||||||||
| Investor Shares | ||||||||||||||||||
| Feb. 1, | ||||||||||||||||||
| Year Ended | 2007, to | |||||||||||||||||
| For a Share Outstanding | December 31, | Dec. 31, | Year Ended January 31, | |||||||||||||||
| Throughout Each Period | 2009 | 2008 | 20071 | 2007 | 2006 | 2005 | ||||||||||||
| Net Asset Value, Beginning of Period | $ | 11.52 | $ | 12.45 | $ | 11.80 | $ | 12.18 | $ | 12.57 | $ | 12.36 | ||||||
| Investment Operations | ||||||||||||||||||
| Net Investment Income (Loss) | .210 | .614 | .651 | .483 | .573 | .596 | ||||||||||||
| Net Realized and Unrealized Gain (Loss) | ||||||||||||||||||
| on Investments | 1.034 | (.930 | ) | .646 | (.437 | ) | (.230 | ) | .244 | |||||||||
| Total from Investment Operations | 1.244 | (.316 | ) | 1.297 | .046 | .343 | .840 | |||||||||||
| Distributions | ||||||||||||||||||
| Dividends from Net Investment Income | (.214 | ) | (.614 | ) | (.647 | ) | (.407 | ) | (.681 | ) | (.565 | ) | ||||||
| Distributions from Realized Capital Gains | — | — | — | — | (.052 | ) | (.065 | ) | ||||||||||
| Return of Capital | — | — | — | (.019 | ) | — | — | |||||||||||
| Total Distributions | (.214 | ) | (.614 | ) | (.647 | ) | (.426 | ) | (.733 | ) | (.630 | ) | ||||||
| Net Asset Value, End of Period | $ | 12.55 | $ | 11.52 | $ | 12.45 | $ | 11.80 | $ | 12.18 | $ | 12.57 | ||||||
| Total Return2 | 10.80 | % | -2.85 | % | 11.40 | % | 0.43 | % | 2.76 | % | 6.96 | % | ||||||
| Ratios/Supplemental Data | ||||||||||||||||||
| Net Assets, End of Period (Millions) | $ | 12,946 | $ | 8,593 | $ | 6,662 | $ | 5,361 | $ | 6,227 | $ | 7,530 | ||||||
| Ratio of Total Expenses to | ||||||||||||||||||
| Average Net Assets | 0.25 | % | 0.20 | % | 0.20 | %3 | 0.20 | % | 0.20 | % | 0.17 | % | ||||||
| Ratio of Net Investment Income to | ||||||||||||||||||
| Average Net Assets | 2.00 | % | 5.02 | % | 5.92 | %3 | 3.87 | % | 4.83 | % | 4.83 | % | ||||||
| Portfolio Turnover Rate | 14 | % | 28 | % | 21 | % | 53 | % | 47 | % | 73 | % | ||||||
1 The fund’s fiscal year-end changed from January 31 to December 31, effective December 31, 2007.
2 Total returns do not include the account service fee that may be applicable to certain accounts with balances below $10,000 3 Annualized.
See accompanying Notes, which are an integral part of the Financial Statements.
19
| Inflation-Protected Securities Fund | |||||||||||||||
| Financial Highlights | |||||||||||||||
| Admiral Shares | |||||||||||||||
| Feb. 1, | Year | June 10, | |||||||||||||
| Year Ended | 2007, to | Ended | 20052 to | ||||||||||||
| December 31, | Dec. 31, | Jan. 31, | Jan.31, | ||||||||||||
| For a Share Outstanding Throughout Each Period | 2009 | 2008 | 20071 | 2007 | 2006 | ||||||||||
| Net Asset Value, Beginning of Period | $ | 22.62 | $ | 24.45 | $ | 23.17 | $ | 23.91 | $ | 25.00 | |||||
| Investment Operations | |||||||||||||||
| Net Investment Income (Loss) | .441 | 1.226 | 1.299 | .971 | .683 | ||||||||||
| Net Realized and Unrealized Gain (Loss) | |||||||||||||||
| on Investments | 2.037 | (1.829 | ) | 1.278 | (.858 | ) | (.432 | ) | |||||||
| Total from Investment Operations | 2.478 | (.603 | ) | 2.577 | .113 | .251 | |||||||||
| Distributions | |||||||||||||||
| Dividends from Net Investment Income | (.448 | ) | (1.227 | ) | (1.297 | ) | (.815 | ) | (1.315 | ) | |||||
| Distributions from Realized Capital Gains | — | — | — | — | (.026 | ) | |||||||||
| Return of Capital | — | — | — | (.038 | ) | — | |||||||||
| Total Distributions | (.448 | ) | (1.227 | ) | (1.297 | ) | (.853 | ) | (1.341 | ) | |||||
| Net Asset Value, End of Period | $ | 24.65 | $ | 22.62 | $ | 24.45 | $ | 23.17 | $ | 23.91 | |||||
| Total Return | 10.96 | % | -2.78 | % | 11.54 | % | 0.53 | % | 1.02 | % | |||||
| Ratios/Supplemental Data | |||||||||||||||
| Net Assets, End of Period (Millions) | $ | 8,723 | $ | 4,726 | $ | 3,487 | $ | 2,523 | $ | 2,474 | |||||
| Ratio of Total Expenses to Average Net Assets | 0.12 | % | 0.11 | % | 0.11 | %3 | 0.11 | % | 0.11 | %3 | |||||
| Ratio of Net Investment Income (Loss) | |||||||||||||||
| to Average Net Assets | 2.13 | % | 5.11 | % | 6.01 | %3 | 3.96 | % | 4.92 | %3 | |||||
| Portfolio Turnover Rate | 14 | % | 28 | % | 21 | % | 53 | % | 47 | % | |||||
| 1 | The fund’s fiscal year-end changed from January 31 to December 31, effective December 31, 2007. |
| 2 | Inception. |
| 3 | Annualized. |
See accompanying Notes, which are an integral part of the Financial Statements.
20
| Inflation-Protected Securities Fund | ||||||||||||||||||
| Financial Highlights | ||||||||||||||||||
| Institutional Shares | ||||||||||||||||||
| Feb. 1, | ||||||||||||||||||
| Year Ended | 2007, to | |||||||||||||||||
| For a Share Outstanding | December 31, | Dec. 31, | Year Ended January 31, | |||||||||||||||
| Throughout Each Period | 2009 | 2008 | 20071 | 2007 | 2006 | 2005 | ||||||||||||
| Net Asset Value, Beginning of Period | $ | 9.21 | $ | 9.96 | $ | 9.44 | $ | 9.74 | $ | 10.06 | $ | 9.88 | ||||||
| Investment Operations | ||||||||||||||||||
| Net Investment Income (Loss) | .181 | .502 | .532 | .398 | .471 | .483 | ||||||||||||
| Net Realized and Unrealized Gain (Loss) | ||||||||||||||||||
| on Investments | .834 | (.751 | ) | .521 | (.348 | ) | (.194 | ) | .207 | |||||||||
| Total from Investment Operations | 1.015 | (.249 | ) | 1.053 | .050 | .277 | .690 | |||||||||||
| Distributions | ||||||||||||||||||
| Dividends from Net Investment Income | (.185 | ) | (.501 | ) | (.533 | ) | (.335 | ) | (.556 | ) | (.458 | ) | ||||||
| Distributions from Realized Capital Gains | — | — | — | — | (.041 | ) | (.052 | ) | ||||||||||
| Return of Capital | — | — | — | (.015 | ) | — | — | |||||||||||
| Total Distributions | (.185 | ) | (.501 | ) | (.533 | ) | (.350 | ) | (.597 | ) | (.510 | ) | ||||||
| Net Asset Value, End of Period | $ | 10.04 | $ | 9.21 | $ | 9.96 | $ | 9.44 | $ | 9.74 | $ | 10.06 | ||||||
| Total Return | 11.03 | % | -2.81 | % | 11.58 | % | 0.57 | % | 2.79 | % | 7.15 | % | ||||||
| Ratios/Supplemental Data | ||||||||||||||||||
| Net Assets, End of Period (Millions) | $ | 5,931 | $ | 3,250 | $ | 2,248 | $ | 1,673 | $ | 1,238 | $ | 601 | ||||||
| Ratio of Total Expenses to | ||||||||||||||||||
| Average Net Assets | 0.09 | % | 0.08 | % | 0.08 | %2 | 0.08 | % | 0.08 | % | 0.11 | % | ||||||
| Ratio of Net Investment Income (Loss) | ||||||||||||||||||
| to Average Net Assets | 2.16 | % | 5.14 | % | 6.04 | %2 | 3.99 | % | 4.95 | % | 4.93 | % | ||||||
| Portfolio Turnover Rate | 14 | % | 28 | % | 21 | % | 53 | % | 47 | % | 73 | % | ||||||
| 1 | The fund’s fiscal year-end changed from January 31 to December 31, effective December 31, 2007. |
| 2 | Annualized. |
See accompanying Notes, which are an integral part of the Financial Statements.
21
Inflation-Protected Securities Fund
Notes to Financial Statements
Vanguard Inflation-Protected Securities Fund is registered under the Investment Company Act of 1940 as an open-end investment company, or mutual fund. The fund offers three classes of shares: Investor Shares, Admiral Shares, and Institutional Shares. Investor Shares are available to any investor who meets the fund’s minimum purchase requirements. Admiral Shares are designed for investors who meet certain administrative, service, tenure, and account-size criteria. Institutional Shares are designed for investors who meet certain administrative and service criteria and invest a minimum of $5 million.
A. The following significant accounting policies conform to generally accepted accounting princi ples for U.S. mutual funds. The fund consistently follows such policies in preparing its financial statements.
1. Security Valuation: Bonds, and temporary cash investments acquired over 60 days t o maturity, are valued using the latest bid prices or using valuations based on a matrix system (which considers such factors as security prices, yields, maturities, and ratings), both as furnished by independent pricing serv ices. Investments in Vanguard Market Liquidity Fund are valued at that fund’s net asset value. Other temporary cash investments are valued at amortized cost, which approximates market value. Securities for which market quotations are not readily available, or whose values have been affected by events occurring before the fund’s pricing time but after the close of the securities’ primary markets, are valued by methods deemed by t he board of trustees to represent fair value.
2. Futures Contracts: The fund uses futures contracts to invest in fixed income asset classes with greater efficiency and lower cost than is possible t hrough direct investment, to add value when these instruments are attractively priced, or to adjust sensitivity to changes in interest rates. The primary risks associated with the use of futures contracts are imperfect correlation between changes in market values of bonds held by the fund and the prices of futures contracts, and the possibility of an illiquid market.
Futures contracts are valued based upon their quoted daily settlement prices. The aggregate principal amounts of the contracts are not recorded in the Statement of Net Assets. Fluctuations in the value of the contracts are recorded in the Statement of Net Assets as an asset (liability) and in the Statement of Operations as unrealized appreciation (depreciation) until the contracts are closed, when they are recorded as realized futures gains (losses).
3. Federal Income Taxes: The fund intends to continue to qualify as a regulated investment company and distribute all of its taxable income. Management has analyzed the fund’s tax positions taken for all open federal income tax years (December 31, 2006–2009), and has concluded that no provision for federal income tax is required in the fund’s financial statements.
4. Distributions: Distributions to shareholders are recorded on the ex-dividend date .
5. Other: Interest income includes income distributions received from Vanguard Market Liquidity
Fund and is accrued daily. Premiums and discounts on debt securities purchased are amortized and accreted, respectively, to interest income over the lives of the respective securities. Inflation (deflation) adjustments to the face amount of inflation-indexed securities are recorded as increases (decreases) to interest income. Security transactions are accounted for on the date securities are bought or sold. Costs used to determine realized gains (losses) on the sale of investment securities are those of the specific securities sold.
Each class of shares has equal rights as to assets and earnings, except that each class separately bears certain class-specific expenses related to maintenance of shareholder accounts (included in Management and Administrative expenses), shareholder reporting, and proxies. Marketing and
22
Inflation-Protected Securities Fund
distribution expenses are allocated to each class of shares based on a method approv ed by the board of trustees. Income, other non-class-specific expenses, and gains and losses on investments are allocated to each class of shares based on its relative net assets.
B. The Vanguard Group furnishes at cost investment advisory, corporate management, administrative, marketing, and distribution services. The costs of such services are allocated to the fund under methods approved by the board of trustees. The fund has committed to provide up to 0.40% of its net assets in capital contributions to Vanguard. At December 31, 2009, the fund had contributed capital of $5,549,000 to Vanguard (included in Other Assets), representing 0.02% of the fund’s net assets and 2.22% of Vanguard’s ca pitalization. The fund’s trustees and officers are also directors and officers of Vanguard.
C. Various inputs may be used to determine the value of the fund’s investments. These inputs are summarized in three broad levels for financial statement purposes. The inputs or methodologies used to value securities are not necessarily an indication of the risk associated with investing in those securities.
Level 1—Quoted prices in active markets for identical securities.
Level 2—Other significant observable inputs (including quoted prices for similar securities, interest rates, prepayment speeds, credit risk, etc.).
Level 3—Significant unobservable inputs (including the fund’s own assumptions used to determine the fair value of investments).
The following table summarizes the fund’s investments as of December 31, 2009, based on the inputs used to value them:
| Level 1 | Level 2 | Level 3 | |||||||
| Investments | ($ | 000 | ) | ($ | 000 | ) | ($ | 000 | ) |
| U.S. Government and Agency Obligations | — | 27,129,451 | — | ||||||
| Temporary Cash Investments | 259,686 | — | — | ||||||
| Futures Contracts—Assets1 | 2,317 | — | — | ||||||
| Futures Contracts—Liabilities1 | (4,166 | ) | — | — | |||||
| Total | 257,837 | 27,129,451 | — |
| 1 | Represents variation margin on the last day of the reporting period. |
| D. | At December 31, 2009, the aggregate settlement value of open futures contracts and the related |
unrealized appreciation (depreciation) were:
| ($ | 000 | ) | |||||
| Number of | Aggregate | Unrealized | |||||
| Long (Short) | Settlement | Appreciation | |||||
| Futures Contracts | Expiration | Contracts | Value | (Depreciation) | |||
| 2-Year United States Treasury Note | March 2010 | (8,731 | ) | 1,888,215 | 9,835 | ||
| 10-Year United States Treasury Note | March 2010 | 10,665 | 1,231,308 | (28,900 | ) | ||
| 5-Year United States Treasury Note | March 2010 | (900 | ) | 102,945 | 1,596 | ||
| 30-Year United States Treasury Bond | March 2010 | (839 | ) | 96,800 | 4,113 |
Unrealized appreciation (depreciation) on open futures contracts is required to be treated as realized gain (loss) for tax purposes.
23
Inflation-Protected Securities Fund
E. Distributions are determined on a tax basis and may differ from net investment income and realized capital gains for financial reporting purposes. Differences may be permanent or temporary. Permanent differences are reclassified among capital accounts in the financial statements to reflect their tax character. Temporary differences arise when certain items of income, expense, gain, or loss are recognized in different periods for financial statement and tax purposes; these differences will reverse at some time in the future. Differences in classification may also result from the treatment of short-term gains as ordinary income for tax purposes.
Certain of the fund’s U.S. Treasury Inflation-Indexed securities experienced deflation adjustments that reduced interest income and the cost of investments for financial statement purposes by an amount greater than the reduction of taxable income; the additional income reduction will be deferred for tax purposes until it is used to offset future inflation adjustments that increase taxable income. The difference becomes permanent if the securities are sold. During the year ended December 31, 2009, the fund realized gains of $7,376,000 that were included in ordinary income for tax purposes as a result of deferred deflation adjustments; accordingly such gains have been reclassified from accumulated net realized losses to overdistributed net investment income. Deferred inflation adjustments to securities held at December 31, 2009, totaling $104,000 are reflected as a reduction of the amount of tax-basis unrealized appreciation of investment securities.
The fund had realized losses totaling $44,252,000 through December 31, 2009, which are deferred for tax purposes and reduce the amount of tax-basis unrealized appreciation on investment securities.
For tax purposes, at December 31, 2009, the fund had $3,801,000 of ordinary income available for distribution. The fund had available capital loss carryforwards totaling $353,240,000 to offset future net capital gains of $152,319,000 through December 31, 2014, $32,494,000 through December 31, 2015, $13,094,000 through December 31, 2016, and $155,333,000 through December 31, 2017. In addition, the fund realized losses of $37,339,000 during the period from November 1, 2009, through December 31, 2009, which are deferred and will be treated as realized for tax purposes in fiscal 2010.
At December 31, 2009, the cost of investment securities for tax purposes was $26,390,935,000. Net unrealized appreciation of investment securities for tax purposes was $998,202,000, consisting of unrealized gains of $1,016,956,000 on securities that had risen in value since their purchase and $18,754,000 in unrealized losses on securities that had fallen in value since their purchase.
F. During the year ended December 31, 2009, the fund purchased $12,110,557,000 of investment securities and sold $3,063,522,000 of investment securities, other than temporary cash investments.
24
Inflation-Protected Securities Fund
| G. Capital share transactions for each class of shares were: | ||||||||||
| Year Ended Decemer 31, | ||||||||||
| 2009 | 2008 | |||||||||
| Amount | Shares | Amount | Shares | |||||||
| ($ | 000 | ) | (000 | ) | ($ | 000 | ) | (000 | ) | |
| Investor Shares | ||||||||||
| Issued | 6,327,634 | 520,171 | 6,078,445 | 485,209 | ||||||
| Issued in Lieu of Cash Distributions | 194,362 | 15,508 | 393,510 | 31,553 | ||||||
| Redeemed | (3,046,718 | ) | (250,224 | ) | (3,703,501 | ) | (305,814 | ) | ||
| Net Increase (Decrease)—Investor Shares | 3,475,278 | 285,455 | 2,768,454 | 210,948 | ||||||
| Admiral Shares | ||||||||||
| Issued | 4,974,531 | 207,932 | 3,508,867 | 144,106 | ||||||
| Issued in Lieu of Cash Distributions | 138,172 | 5,613 | 209,091 | 8,542 | ||||||
| Redeemed | (1,646,056 | ) | (68,620 | ) | (2,043,230 | ) | (86,333 | ) | ||
| Net Increase (Decrease)—Admiral Shares | 3,466,647 | 144,925 | 1,674,728 | 66,315 | ||||||
| Institutional Shares | ||||||||||
| Issued | 3,246,284 | 332,331 | 2,165,117 | 218,461 | ||||||
| Issued in Lieu of Cash Distributions | 98,456 | 9,822 | 143,131 | 14,364 | ||||||
| Redeemed | (1,024,437 | ) | (104,255 | ) | (1,022,249 | ) | (105,857 | ) | ||
| Net Increase (Decrease)—Institutional Shares | 2,320,303 | 237,898 | 1,285,999 | 126,968 | ||||||
H. In preparing the financial statements as of December 31, 2009, management considered the impact of subsequent events occurring through February 16, 2010, for potential recognition or disclosure in these financial statements.
25
Report of Independent Registered Public A ccounting Firm
To the Trustees of Vanguard Bond Index Funds and the Shareholders of Vanguard Inflation-Protected
Securities Fund:
In our opinion, the accompanying statement of net assets and the related statements of operations and of changes in net assets and the financial highlights present fairly, in all material respects, the financial position of Vanguard Inflation-Protected Securities Fund (constituting a separate portfolio of Vanguard Bond Index Funds, hereafter referred to as the “Fund”) at December 31, 2009, and t he results of its operations for the year then ended, the changes in its net assets for each of the two years in the period then ended and the financial highlights for each of the periods indicated, in conformity with accounting principles generally accepted in the United States of America. These financial statements and financial highlights (hereafter referred to as “financial statements”) are the responsibility of the Fund’s management; our responsibility is to express an opinion on these financial statements based on our audits. We conducted our audits of these financial statements in accordance with the standards of the Public Company Accounting Oversight Board (United States). Those standards require that we plan and perform the audit to obtain reasonable assurance about whether the financial statements are free of material mi sstatement. An audit includes examining, on a test basis, evidence supporting the amounts and disclosures in the financial statements, assessing the accounting principles used and significant estimates made by management, and evaluating the overall financial statement presentation. We believe that our audits, which included confirmation of securities at December 31, 2009 by correspondence with the custodian and brokers and by agreement to the underlying ownership records of Vanguard Market Liquidity Fund, provide a reasonable basis for our opinion.
PricewaterhouseCoopers LLP
Philadelphia, Pennsylvania
February 16, 2010
Special 2009 tax information (unaudited) for Vanguard Inflation-Protected Securities Fund
This information for the fiscal year ended December 31, 2009, is included pursuant to provisions of the
Internal Revenue Code.
For nonresident alien shareholders, 100% of income dividends are interest-rela ted dividends.
26
About Your Fund’s Expenses
As a shareholder of the fund, you incur ongoing costs, which include costs for portfolio management, administrative services, and shareholder reports (like this one), among others. Operating expenses, which are deducted from a fund’s gross income, directly reduce the investment return of the fund.
A fund’s expenses are expressed as a percentage of its average net assets. This figure is known as the expense ratio. The following examples are intended to help you understand the ongoing costs (in dollars) of investing in your fund and to compare these costs with those of other mutual funds. The examples are based on an investment of $1,000 made at the beginning of the period shown and held for the entire period.
The accompanying table illustrates your fund’s costs in two ways:
• Based on actual fund return. This section helps you to estimate the actual expenses that you paid over the period. The ”Ending Account Value“ shown is derived from the fund‘s actual return, and the third column shows the dollar amount that would have been paid by an investor who started with $1,000 in the fund. You may use the information here, together with the amount you invested, to estimate the expenses that you paid over the period.
To do so, simply divide your account value by $1,000 (for example, an $8,600 account value divided by $1,000 = 8.6), then multiply the result by the number given for your fund under the heading ”Expenses Paid During Period.“
• Based on hypothetical 5% yearly return. This section is intended to help you compare your fund‘s costs with those of other mutual funds. It assumes that the fund had a yearly return of 5% before expenses, but that the expense ratio is unchanged. In this case—because the return used is not the fund’s actual return—the results do not apply to your investment. The example is useful in making comparisons because the Securities and Exchange Commission requires all mutual funds to calculate expenses based on a 5% return. You can assess your fund’s costs by comparing this hypothetical example with the hypothetical examples that appear in shareholder reports of other funds.
Note that the expenses shown in the table are meant to highlight and help you compare ongoing costs only and do not reflect transaction costs incurred by the fund for buying and selling securities. Further, the expenses do not include the account service fee described in the prospectus. If such a fee were applied to your account, your costs would be higher. Your fund does not charge transaction fees, such as purchase or redemption fees, nor does it carry a “sales load.” The calculations assume no shares were bought or sold during the period. Your actual costs may have been higher or lower, depending on the amount of your investment and the timing of any purchases or redemptions.
You can find more information about the fund’s expenses, including annual expense ratios, in the Financial Statements section of this report. For additional information on operating expenses and other shareholder costs, please refer to your fund’s current prospectus.
27
| Six Months Ended December 31, 2009 | ||||||
| Beginning | Ending | Expenses | ||||
| Account Value | Account Value | Paid During | ||||
| Inflation-Protected Securities Fund | 6/30/2009 | 12/31/2009 | Period | |||
| Based on Actual Fund Return | ||||||
| Investor Shares | $ | 1,000.00 | $ | 1,050.14 | $ | 1.29 |
| Admiral Shares | 1,000.00 | 1,050.56 | 0.62 | |||
| Institutional Shares | 1,000.00 | 1,050.38 | 0.47 | |||
| Based on Hypothetical 5% Yearly Return | ||||||
| Investor Shares | $ | 1,000.00 | $ | 1,023.95 | $ | 1.28 |
| Admiral Shares | 1,000.00 | 1,024.60 | 0.61 | |||
| Institutional Shares | 1,000.00 | 1,024.75 | 0.46 |
The calculations are based on expenses incurred in the most recent six-month period. The fund’s annualized six-month expense ratios for that period are 0.25% for Investor Shares, 0.12% for Admiral Shares, and 0.09% for Institutional Shares. The dollar amounts shown as “Expenses Paid” are equal to the annualized expense ratio multiplied by the average account value over the period, multiplied by the number of days in the most recent six-month period, then divided by the number of days in the most recent 12-month period.
28
Glossary
30-Day SEC Yield. A fund’s 30-day SEC yield is derived using a formula specified by the U.S. Securities and Exchange Commission. Under the formula, data related to the fund’s security holdings in the previous 30 days are used to calculate the fund’s hypothetical net income for that period, which is then annualized and divided by the fund’s estimated average net assets over the calculation period. For the purposes of this calculation, a security’s income is based on its current market yield to maturity (in the case of bonds) or its projected dividend yield (for stocks). Because the SEC yield represents hypothetical annualized income, it will differ—at times significantly—from the fund’s actual experience. As a result, the fund’s income distributions may be higher or lower than implied by the SEC yield.
Average Coupon. The average interest rate paid on the fixed income securities held by a fund. It is expressed as a percentage of face value.
Average Duration. An estimate of how much the value of the bonds held by a fund will fluctuate in response to a change in interest rates. To see how the value could change, multiply the average duration by the change in rates. If interest rates rise by 1 percentage point, the value of the bonds in a fund with an average duration of five years would decline by about 5%. If rates decrease by a percentage point, the value would rise by 5%.
Average Effective Maturity. The average length of time until fixed income securities held by a fund reach maturity and are repaid, taking into consideration the possibility that the issuer may call the bond before its maturity date. The figure reflects the proportion of fund assets represented by each security; it also reflects any futures contracts held. In general, the longer the average effective maturity, the more a fund’s share price will fluctuate in response to changes in market interest rates.
Average Quality. An indicator of credit risk, this figure is the average of the ratings assigned to a fund’s fixed income holdings by credit-rating agencies. The agencies make their judgment after appraising an issuer’s ability to meet its obligations. Quality is graded on a scale, with Aaa or AAA indicating the most creditworthy bond issuers. U.S. Treasury securities are considered to have the highest credit quality.
Beta. A measure of the magnitude of a fund’s past share-price fluctuations in relation to the ups and downs of a given market index. The index is assigned a beta of 1.00. Compared with a given index, a fund with a beta of 1.20 typically would have seen its share price rise or fall by 12% when the index rose or fell by 10%. For this report, beta is based on returns over the past 36 months for both the fund and the index. Note that a fund’s beta should be reviewed in conjunction with its R-squared (see definition). The lower the R-squared, the less correlation there is between the fund and the index, and the less reliable beta is as an indicator of volatility.
Distribution by Coupon. A breakdown of the securities in a fund according to coupon rate—the interest rate that an issuer promises to pay, expressed as an annual percentage of face value. Securities with unusually high coupon rates may be subject to call risk, the possibility that they will be redeemed (or “called”) early by the issuer.
Expense Ratio. The percentage of a fund’s average net assets used to pay its annual administrative and advisory expenses. These expenses directly reduce returns to investors.
29
Inception Date. The date on which the assets of a fund (or one of its share classes) are first invested in accordance with the fund’s investment objective. For funds with a subscription period, the inception date is the day after that period ends. Investment performance is measured from the inception date.
R-Squared. A measure of how much of a fund’s past returns can be explained by the returns from the market in general, as measured by a given index. If a fund’s total returns were precisely synchronized with an index’s returns, its R-squared would be 1.00. If the fund’s returns bore no relationship to the index’s returns, its R-squared would be 0. For this report, R-squared is based on returns over the past 36 months for both the fund and the index.
Short-Term Reserves. The percentage of a fund invested in highly liquid, short-term securities that can be readily converted to cash.
Yield to Maturity. The rate of return an investor would receive if the fixed income securities held by a fund were held to their maturity dates.
30
This page intentionally left blank.
The People Who Govern Your Fund
The trustees of your mutual fund are there to see that the fund is operated and managed in your best interests since, as a shareholder, you are a part owner of the fund. Your fund’s trustees also serve on the board of directors of The Vanguard Group, Inc., which is owned by the Vanguard funds and provides services to them on an at-cost basis.
A majority of Vanguard’s board members are independent, meaning that they have no affiliation with Vanguard or the funds they oversee, apart from the sizable personal investments they have made as private individuals. The independent board members have distinguished backgrounds in business, academia, and public service. Each of the trustees and executive office rs oversees 163 Vanguard funds.
The following table provides information for each trustee and executive officer of the fund. More information about the trustees is in the Statement of Additional Information, which can be obtained, without charge, by contacting Vanguard at 800-662-7447, or online at www.vanguard.com.
Interested Trustee1
F. William McNabb III
Born 1957. Trustee Since July 2009. Chairman of the Board. Principal Occupation(s) During the Past Five Years: Chairman of the Board of The Vanguard Group, Inc., and of each of the investment companies served by The Vanguard Group, since January 2010; Director of The Vanguard Group since 2008; Chief Executive Officer and President of The Vanguard Group and of each of the investment companies served by The Vanguard Group since 2008 ; Director of Vanguard Marketing Corporation; Managing Director of The Vanguard Group (1995–2008).
Independent Trustees
Emerson U. Fullwood
Born 1948. Trustee Since January 2008. Principal
Occupation(s) During the Past Five Years: Executive Chief Staff and Marketing Officer for North America and Corporate Vice President (retired 2008) of Xerox Corporation (photocopiers and printers); Director of SPX Corporation (multi-industry manufacturing), the United Way of Rochester, the Boy Scouts of America, Amerigroup Corporation (direct health and medical insurance carriers), and Monroe Community College Foundation.
Rajiv L. Gupta
Born 1945. Trustee Since December 2001.2 Principal Occupation(s) During the Past Five Years: Chairman and Chief Executive Officer (retired 2009) and President (2006–2008) of Rohm and Haas Co. (chemicals); Board Member of American Chemistry Council; Director of Tyco International, Ltd. (diversified manufacturing and services) and Hewlett-Packard Co. (electronic computer manufacturing); Trustee of The Conference Board.
Amy Gutmann
Born 1949. Trustee Since June 2006. Principal
Occupation(s) During the Past Five Years: President of the University of Pennsylvania; Christopher H. Browne Distinguished Professor of Political Science in the School of Arts and Sciences with secondary appointments at the Annenberg School for Communication and the Graduate School of Education of the University of Pennsylvania; Director of Carnegie Corporation of New York, Schuylkill River Development Corporation, and Greater Philadelphia Chamber of Commerce; Trustee of the National Constitution Center.
JoAnn Heffernan Heisen
Born 1950. Trustee Since July 1998. Principal Occupation(s) During the Past Five Years: Corporate Vice President and Chief Global Diversity Officer since 2006 (retired 2008) and Member of the Executive Committee (retired 2008) of Johnson & Johnson (pharmaceuticals/consumer products); Vice President and Chief Information Officer of Johnson & Johnson (1997–2005); Director of the University Medical Center at Princeton and Women’s Research and Education Institute; Member of the Advisory Board of the Maxwell School of Citizenship and Public Affairs at Syracuse University.
F. Joseph Loughrey
Born 1949. Trustee Since October 2009. Principal Occupation(s) During the Past Five Years: President and Chief Operating Officer since 2005 (retired 2009) and Vice Chairman of the Board (2008–2009) of Cummins Inc. (industrial machinery); Director of SKF AB (industrial machinery), Hillenbrand, Inc. (specialized consumer services), Sauer-Danfoss Inc. (machinery), the Lumina Foundation for Education, and the Columbus Community Education Coalition; Chairman of t he Advisory Council for the College of Arts and Letters at the Uni versity of Notre Dame.
André F. Perold
Born 1952. Trustee Since December 2004. Principal Occupation(s) During the Past Five Years: George Gund Professor of Finance and Banking, Harvard Business School; Chair of the Investment Committee of HighVista Strategies LLC (private investment firm).
Alfred M. Rankin, Jr.
Born 1941. Trustee Since January 1993. Principal Occupation(s) During the Past Five Years: Chairman, President, and Chief Executive Officer of NACCO Industries, Inc. (forklift trucks/housewares/lignite); Director of Goodrich Corporation (industrial products/ aircraft systems and services); Deputy Chairman of the Federal Reserve Bank of Cleveland; Trustee of University Hospitals of Cleveland, The Cleveland Museum of Art, and Case Western Reserve University.
Peter F. Volanakis
Born 1955. Trustee Since July 2009. Principal Occupation(s) During the Past Five Years: President since 2007 and Chief Operating Officer since 2005 of Corning Incorporated (communications equipment); President of Corning Technologies (2001–2005); Director of Corning Incorporated and Dow Corning; Trustee of the Corning Incorporated Foundation and the Corning Museum of Glass; Overseer of the Amos Tuck School of Business Administration at Dartmouth College.
Executive Officers
Thomas J. Higgins
Born 1957. Chief Financial Officer Since September 2008. Principal Occupation(s) During the Past Five Years: Principal of The Vanguard Group, Inc.; Chief Financial Officer of each of the investment companies served by The Vanguard Group since 2008; Treasurer of each of the investment companies served by The Vanguard Group (1998–2008).
Kathryn J. Hyatt
Born 1955. Treasurer Since November 2008. Principal Occupation(s) During the Past Five Years: Principal of The Vanguard Group, Inc.; Treasurer of each of the investment companies served by The Vanguard Group since 2008; Assistant Treasurer of each of the investment companiesserved by The Vanguard Group (1988–2008).
Heidi Stam
Born 1956. Secretary Since July 2005. Principal Occupation(s) During the Past Five Years: Managing Director of The Vanguard Group, Inc., since 2006; General Counsel of The Vanguard Group since 2005; Secretary of The Vanguard Group and of each of the investment companie s served by The Vanguard Group since 2005; Director and Senior Vice President of Vanguard Marketing Corporation since 2005; Principal of The Vanguard Group (1997–2006).
Vanguard Senior Management Team
R. Gregory Barton
Mortimer J. Buckley
Kathleen C. Gubanich
Paul A. Heller
Michael S. Miller
James M. Norris
Glenn W. Reed
George U. Sauter
Chairman Emeritus and Senior Advisor
John J. Brennan
Chairman, 1996–2009
Chief Executive Officer and President, 1996–2008
Founder
John C. Bogle
Chairman and Chief Executive Officer, 1974–1996
1 Mr. McNabb is considered an “interested person,” as defined in the Investment Company Act of 1940, because he is an officer of the Vanguard funds.
2 December 2002 for Vanguard Equity Income Fund, Vanguard Growth Equity Fund, the Vanguard Municipal Bond Funds, and the Vanguard State Tax-Exempt Funds.

P.O. Box 2600
Valley Forge, PA 19482-2600
Connect with Vanguard® > www.vanguard.com
Fund Information > 800-662-7447
CFA® is a trademark owned by CFA Institute.
Direct Investor Account Services > 800-662-2739
Institutional Investor Services > 800-523-1036
Text Telephone for People
With Hearing Impairment > 800-749-7273
This material may be used in conjunction
with the offering of shares of any Vanguard
fund only if preceded or accompanied by
the fund’s current prospectus.
All comparative mutual fund data are from Lipper Inc. or
Morningstar, Inc., unless otherwise noted.
You can obtain a free copy of Vanguard’s proxy voting
guidelines by visiting our website, www.vanguard.com,
and searching for “proxy voting guidelines,” or by calling
Vanguard at 800-662-2739. The guidelines are also
available from the SEC’s website, www.sec.gov. In
addition, you may obtain a free report on how your fund
voted the proxies for securities it owned during the 12
months ended June 30. To get the report, visit either
www.vanguard.com or www.sec.gov.
You can review and copy information about your fund at
the SEC’s Public Reference Room in Washington, D.C. To
find out more about this public service, call the SEC at
202-551-8090. Information about your fund is also
available on the SEC’s website, and you can receive
copies of this information, for a fee, by sending a
request in either of two ways: via e-mail addressed to
publicinfo@sec.gov or via regular mail addressed to the
Public Reference Section, Securities and Exchange
Commission, Washington, DC 20549-1520.

![]()
Vanguard Total Bond Market II
Index Fund Annual Report

- Investors began to regain their appetite for risk and reward in early 2009, helping to fuel a rally in the corporate bond market.
- Vanguard Total Bond Market II Index Fund returned about 6% for both Investor and Institutional Shares, from their respective inception dates in early 2009 through the end of the year.
- The returns of both share classes closely tracked those of the target benchmark, the Barclays Capital U.S. Aggregate Bond Index.
| Contents | |
| Your Fund’s Total Returns................... | 1 |
| Chairman’s Letter............................... | 2 |
| Results of Proxy Voting...................... | 6 |
| Fund Profile...................................... | 7 |
| Performance Summary..................... | 8 |
| Financial Statements....................... | 9 |
| About Your Fund’s Expenses............... | 81 |
| Glossary............................................. | 83 |
Please note: The opinions expressed in this report are just that—informed opinions. They should not be considered promises or advice. Also, please keep in mind that the information and opinions cover the period through the date on the front of this report. Of course, the risks of investing in your fund are spelled out in the prospectus.
Cover photograph: Veronica Coia.
| Your Fund’s Total Returns | |||||||||
| Fiscal Year Ended December 31, 2009 | |||||||||
| Return | |||||||||
| Since | |||||||||
| Ticker | Share-Class | ||||||||
| Symbol | Inception | ||||||||
| Vanguard Total Bond Market II Index Fund Investor Shares (Inception 1/26/2009) | VTBIX | 6.28 | % | ||||||
| Barclays Capital U.S. Aggregate Bond Index | 6.39 | ||||||||
| Intermediate Investment-Grade Debt Funds Average1 | 12.31 | ||||||||
| Vanguard Total Bond Market II Index Fund Institutional Shares (Inception 2/17/2009) | VTBNX | 5.80 | % | ||||||
| Barclays Capital U.S. Aggregate Bond Index | 5.91 | ||||||||
| Intermediate Investment-Grade Debt Funds Average1 | 12.89 | ||||||||
| Your Fund’s Performance at a Glance | |||||||||
| Inception Through December 31, 2009 | |||||||||
| Distributions Per Share | |||||||||
| Starting | Ending | Income | Capital | ||||||
| Share Price | Share Price | Dividends | Gains | ||||||
| Vanguard Total Bond Market II Index Fund | |||||||||
| Investor Shares | $ | 10.00 | $ | 10.26 | $ | 0.358 | $ | 0.000 | |
| Institutional Shares | 10.03 | 10.26 | 0.338 | 0.000 | |||||
1 Derived from data provided by Lipper Inc.
1

Chairman’s Letter
Dear Shareholder,
I am pleased to provide this first annual report for Vanguard Total Bond Market II Index Fund. We launched this fund on January 26 (with Investor Shares) as an investment vehicle for use only as an underlying fund in “funds of funds” sponsored by Vanguard—such as the Vanguard Target Retirement Funds—and those managed by third parties. The fund’s investment objective is identical to that of the widely available Vanguard Total Bond Market Index Fund: to track the performance of a broad, market-weighted U.S. bond index.
For the abbreviated fiscal year, the fund’s Investor Shares returned 6.28%, closely tracking the 6.39% return of the Barclays Capital U.S. Aggregate Bond Index. The Institutional Shares (which were launched on February 17) returned 5.80%, tracking the index’s 5.91% return since the shares’ inception. Amid a low-quality bond rally, however, the fund’s high-quality portfolio trailed the average return of peer funds.
On December 31, the 30-day SEC yield of the fund’s Investor Shares was 3.33%. The Institutional Shares yielded a bit less.
Please note that as of January 1, 2010, the fund adopted a new float-adjusted version of its former benchmark index. In announcing this change last autumn, we noted that float-adjusted indexes better represent the liquidity in the marketplace by including only those bonds that are actually available to investors. The Federal Reserve Board’s extraordinary efforts to stabilize the credit markets included plans
2
to purchase more than $1 trillion in U.S. agency mortgage-backed securities, effectively removing these bonds from the investable universe. Barclays Capital updates its float-adjusted indexes as such bonds are taken out of the public supply, and then again when they are sold back.
Bond markets calmed down, money market funds endured
Compared with the last months of 2008, when credit markets seized up and investors fled to the safety of U.S. Treasuries, 2009 represented a return to normalcy for bonds. Investors’ appetite for risk returned, and the demand for corporate bonds increased, raising their prices and bringing down their yields. For the 12 months ended December 31, the broad taxable bond market returned about 6%, while municipal bonds returned about 13%.
Meanwhile, money market funds and other short-term savings vehicles did poorly in 2009. Interest rates at the shortest end of the maturity spectrum remained at historic lows, a casualty of the Federal Reserve Board’s efforts to revive the economy. The Fed kept its target for the federal funds rate between 0% and 0.25% for the entire year.
Impressive stock returns masked lingering uncertainties
For the 12 months, the broad U.S. stock market returned more than 29%, its highest calendar-year return since 2003. The year began with the market searching for a bottom, and it finally hit a low point
| Market Barometer | ||||||
| Average Annual Total Returns | ||||||
| Periods Ended December 31, 2009 | ||||||
| One Year | Three Years | Five Years | ||||
| Bonds | ||||||
| Barclays Capital U.S. Aggregate Bond Index | ||||||
| (Broad taxable market) | 5.93 | % | 6.04 | % | 4.97 | % |
| Barclays Capital Municipal Bond Index | 12.91 | 4.41 | 4.32 | |||
| Citigroup 3-Month Treasury Bill Index | 0.16 | 2.22 | 2.88 | |||
| Stocks | ||||||
| Russell 1000 Index (Large-caps) | 28.43 | % | –5.36 | % | 0.79 | |
| Russell 2000 Index (Small-caps) | 27.17 | –6.07 | 0.51 | |||
| Dow Jones U.S. Total Stock Market Index | 29.35 | –5.01 | 1.09 | |||
| MSCI All Country World Index ex USA (International) | 42.14 | –3.04 | 6.30 | |||
| CPI | ||||||
| Consumer Price Index | 2.72 | % | 2.28 | % | 2.56 | % |
3
in early March. From there, stocks mounted one of their strongest rallies ever—in magnitude and duration—resulting in a check mark-shaped stock chart for 2009.
The market’s outsized result came against a backdrop of economic uncertainty. The economy, which struggled to regain its footing as the financial crisis abated, began to show signs of growth in the second half of the year, even as unemployment climbed to levels not seen since 1983.
Stock markets outside the United States fared even better during 2009, especially many emerging markets, which weathered the financial crisis in relatively better fiscal and economic shape than their developed-market counterparts.
Corporate bonds rallied as confidence returned
In the bond market, as in the stock market, 2009 stood in sharp contrast to 2008. In 2008, investors’ customary desire to earn a return on capital was trumped by a panic to preserve it. Strong demand pushed Treasury yields down (and prices up) to near-record lows, boosting returns to exceptional levels.
But by early 2009, as government rescue programs started to take hold, investors began to seek rewards again, favoring return “on” capital in the form of the higher yields offered by corporate bonds. In this generally more normal environment, Treasuries lagged while the riskiest, lowest-quality bonds significantly outperformed. (Another factor that pushed down Treasury prices was the government’s sale of a
Expense Ratios1
Your Portfolio Compared With Its Peer Group
| Intermediate | ||||||
| Investment- | ||||||
| Investor | Institutional | Grade Debt | ||||
| Shares | Shares | Funds Average | ||||
| Total Bond Market II Index Fund | 0.19 | % | 0.07 | % | 0.94 | % |
1 The fund expense ratios shown are from the prospectuses dated January 26, 2009, and represent estimated costs for the current fiscal year based on the fund’s net assets as of the prospectus date. For the fiscal period ended December 31, 2009, the annualized expense ratios were 0.11% for Investor Shares and 0.07% for Institutional Shares. The peer-group expense ratio is derived from data provided by Lipper Inc. and captures information through year-end 2008.
4
record $2.1 trillion of new securities.) When the dust settled, the broad U.S. bond market (as reflected in the Barclays Capital U.S. Aggregate Bond Index) returned 5.93% for all of 2009—similar to its 5.24% return in 2008 but masking significant differences.
Because Treasury bonds represent a substantial portion of the broad U.S. bond market, they can have a significant influence on its return. The Treasury component of the benchmark index fell into negative territory for the full year in 2009, pulling down the index’s return. In contrast, in 2008, Treasuries’ double-digit gain helped lift the index into positive territory in a mostly dismal year.
Corporate bonds—a smaller slice of the fixed income market—experienced a dramatic turnaround. After returning –4.94% in 2008—the worst annual return for this component of the benchmark since 1974—corporate bonds enjoyed double-digit gains in 2009. Some of the best performers were bonds considered more risky, because of their lower credit ratings, somewhat longer maturities, or both.
Diversification and indexing can help smooth the ride
Most investors with stock and bond investments have been taken on a roller-coaster ride over the last two years. In 2008, when virtually all asset classes except Treasuries experienced significant losses, holding a balanced and diversified portfolio helped cushion some of the shock. And when both stocks and corporate bonds came roaring back in 2009, diversification admittedly trimmed some of the potential gains. History has taught us, however, that trying to anticipate any market’s ups and downs can be a costly, and futile, exercise.
Instead, we encourage investors to maintain a portfolio that is diversified across and within asset classes. And by choosing a low-cost, well-managed index fund, investors have the ability to earn returns consistent with those of the target benchmark. That’s why the Total Bond Market II Index Fund plays a role, in many funds-of-funds portfolios, in providing broad exposure to U.S. bonds.
On another matter, I would like to inform you that on January 1, 2010, we completed a leadership transition that began in March 2008. I succeeded Jack Brennan as chairman of Vanguard and each of the funds. Jack has agreed to serve as chairman emeritus and senior advisor. Under Jack’s leadership, Vanguard has grown to become a preeminent firm in the mutual fund industry. Jack’s energy, his relentless pursuit of perfection, and his unwavering focus on always doing the right thing for our clients are evident in every facet of Vanguard policy today.
Thank you for entrusting your assets to Vanguard.
Sincerely,
F. William McNabb III
Chairman and Chief Executive Officer
January 20, 2010
5
Results of Proxy Voting
At a special meeting of shareholders on July 2, 2009, fund shareholders approved the following two proposals:
Proposal 1—Elect trustees for each fund.*
The individuals listed in the table below were elected as trustees for each fund. All trustees with the exception of Messrs. McNabb and Volanakis (both of whom already served as directors of The Vanguard Group, Inc.) served as trustees to the funds prior to the shareholder meeting.
| Percentage | ||||
| Trustee | For | Withheld | For | |
| John J. Brennan | 7,480,563,019 | 132,452,355 | 98.3 | % |
| Charles D. Ellis | 7,406,205,129 | 206,810,245 | 97.3 | % |
| Emerson U. Fullwood | 7,486,175,684 | 126,839,690 | 98.3 | % |
| Rajiv L. Gupta | 7,475,619,448 | 137,395,926 | 98.2 | % |
| Amy Gutmann | 7,494,805,274 | 118,210,101 | 98.4 | % |
| JoAnn Heffernan Heisen | 7,478,861,968 | 134,153,407 | 98.2 | % |
| F. William McNabb III | 7,490,714,832 | 122,300,542 | 98.4 | % |
| André F. Perold | 7,470,382,148 | 142,633,227 | 98.1 | % |
| Alfred M. Rankin, Jr. | 7,478,299,969 | 134,715,405 | 98.2 | % |
| Peter F. Volanakis | 7,496,308,685 | 116,706,689 | 98.5 | % |
| * Results are for all funds within the same trust. |
Proposal 2—Update and standardize the funds’ fundamental policies regarding:
(a) Purchasing and selling real estate.
(b) Issuing senior securities.
(c) Borrowing money.
(d) Making loans.
(e) Purchasing and selling commodities.
(f) Concentrating investments in a particular industry or group of industries.
(g) Eliminating outdated fundamental investment policies not required by law.
The revised fundamental policies are clearly stated and simple, yet comprehensive, making oversight and compliance more efficient than under the former policies. The revised fundamental policies will allow the funds to respond more quickly to regulatory and market changes, while avoiding the costs and delays associated with successive shareholder meetings.
| Broker | Percentage | ||||||
| Vanguard Fund | For | Abstain | Against | Non-Votes | For | ||
| Total Bond Market II Index Fund | |||||||
| 2a | 1,585,156,775 | 0 | 0 | 0 | 100.0 | % | |
| 2b | 1,585,156,775 | 0 | 0 | 0 | 100.0 | % | |
| 2c | 1,585,156,775 | 0 | 0 | 0 | 100.0 | % | |
| 2d | 1,585,156,775 | 0 | 0 | 0 | 100.0 | % | |
| 2e | 1,585,156,775 | 0 | 0 | 0 | 100.0 | % | |
| 2f | 1,585,156,775 | 0 | 0 | 0 | 100.0 | % | |
| 2g | 1,585,156,775 | 0 | 0 | 0 | 100.0 | % |
6
Total Bond Market II Index Fund
| Fund Profile | ||||
| As of December 31, 2009 | ||||
| Financial Attributes | ||||
| Target | ||||
| Fund | Index1 | |||
| Number of Issues | 3,284 | 8,413 | ||
| Yield2 | 3.7 | % | ||
| Investor Shares | 3.3 | % | ||
| Institutional Shares | 3.3 | % | ||
| Yield to Maturity | 3.5 | %3 | 3.7 | % |
| Average Coupon | 4.8 | % | 4.7 | % |
| Average Effective Maturity | 6.7 years | 6.8 years | ||
| Average Quality4 | Aa1 | /Aa2 | Aa1 | /Aa2 |
| Average Duration | 4.5 years | 4.6 years | ||
| Expense Ratio5 | — | |||
| Investor Shares | 0.19 | % | ||
| Institutional Shares | 0.07 | % | ||
| Short-Term Reserves | 0.2 | % | — | |
| Sector Diversification6 (% of portfolio) | ||||
| Asset-Backed/Commercial Mortgage-Backed | 3.4 | % | ||
| Finance | 7.0 | |||
| Foreign | 4.0 | |||
| Government Mortgage-Backed | 32.6 | |||
| Industrial | 10.5 | |||
| Treasury/Agency | 40.1 | |||
| Utilities | 2.2 | |||
| Other | 0.2 | |||
Distribution by Maturity (% of portfolio)
| Under 1 Year | 2.6 | % |
| 1–5 Years | 46.8 | |
| 5–10 Years | 38.4 | |
| 10–20 Years | 5.6 | |
| 20–30 Years | 6.5 | |
| Over 30 Years | 0.1 |
Distribution by Credit Quality4 (% of portfolio)
| Aaa | 77.4 | % |
| Aa | 3.9 | |
| A | 10.0 | |
| Baa | 8.7 |
Investment Focus

1 Barclays Capital U.S. Aggregate Bond Index.
2 30-day SEC yield for the fund; index yield assumes that all bonds are called or prepaid at the earliest possible date. See the Glossary. 3 Before expenses.
4 Moody’s Investors Service.
5 The expense ratios shown are from the prospectuses dated January 26, 2009, and represent estimated costs for the current fiscal year based on the fund’s net assets as of the prospectus date. For the fiscal period ended December 31, 2009, the annualized expense ratios were 0.11% for Investor Shares and 0.07% for Institutional Shares.
6 The agency and mortgage-backed securities may include issues from government-sponsored enterprises; such issues are not backed by the full faith and credit of the U.S. government.
7
Total Bond Market II Index Fund
Performance Summary
All of the returns in this report represent past performance, which is not a guarantee of future results that may be achieved by the fund. (Current performance may be lower or higher than the performance data cited. For performance data current to the most recent month-end, visit our website at www.vanguard.com/performance.) Note, too, that both investment returns and principal value can fluctuate widely, so an investor’s shares, when sold, could be worth more or less than their original cost. The returns shown do not reflect taxes that a shareholder would pay on fund distributions or on the sale of fund shares.

| Total Returns | ||||||
| Periods Ended December 31, 2009 | Final Value | |||||
| Since | of a $10,000 | |||||
| Inception1 | Investment | |||||
| Total Bond Market II Index Fund Investor Shares2 | 6.28 | % | $ | 10,628 | ||
| Barclays Capital U.S. Aggregate Bond Index | 6.39 | 10,639 | ||||
| Intermediate Investment-Grade Debt Funds Average3 | 12.31 | 11,231 | ||||
| Final Value of | ||||||
| Since | a $5,000,000 | |||||
| Inception1 | Investment | |||||
| Total Bond Market II Index Fund Institutional Shares | 5.80 | % | $ | 5,290,090 | ||
| Barclays Capital U.S. Aggregate Bond Index | 5.91 | 5,295,336 | ||||
| Fiscal-Period Total Returns (%): January 26, 2009–December 31, 2009 | ||||||
| Barclays | ||||||
| Investor Shares | Capital4 | |||||
| Fiscal | Capital | Income | Total | Total | ||
| Period | Return | Return | Return | Return | ||
| 2009 | 2.6 | 3.7 | 6.3 | 6.4 | ||
1 Performance for the fund and its comparative standards is calculated since the following inception dates: January 26, 2009, for the Investor Shares, and February 17, 2009, for the Institutional Shares.
2 Total returns do not reflect the account service fee that may be applicable to certain accounts with balances below $10,000.
3 Derived from data provided by Lipper Inc.
4 Barclays Capital U.S. Aggregate Bond Index.
See Financial Highlights for dividend and capital gains information.
8
Total Bond Market II Index Fund
Financial Statements
Statement of Net Assets
As of December 31, 2009
The fund reports a complete list of its holdings in regulatory filings four times in each fiscal year, at the quarter-ends. For the second and fourth fiscal quarters, the lists appear in the fund’s semiannual and annual reports to shareholders. For the first and third fiscal quarters, the fund files the lists with the Securities and Exchange Commission on Form N-Q. Shareholders can look up the fund’s Forms N-Q on the SEC’s website at www.sec.gov. Forms N-Q may also be reviewed and copied at the SEC’s Public Reference Room (see the back cover of this report for further information).
| Face | Market | ||||||||
| Maturity | Amount | Value• | |||||||
| Coupon | Date | ($ | 000 | ) | ($ | 000 | ) | ||
| U.S. Government and Agency Obligations (72.3%) | |||||||||
| U.S. Government Securities (31.7%) | |||||||||
| United States Treasury Inflation Indexed Bonds | 3.500 | % | 1/15/11 | 19,000 | 24,477 | ||||
| United States Treasury Note/Bond | 2.000 | % | 2/28/10 | 375 | 376 | ||||
| United States Treasury Note/Bond | 4.000 | % | 4/15/10 | 30,350 | 30,677 | ||||
| United States Treasury Note/Bond | 3.875 | % | 7/15/10 | 300 | 306 | ||||
| United States Treasury Note/Bond | 2.750 | % | 7/31/10 | 3,250 | 3,296 | ||||
| United States Treasury Note/Bond | 4.125 | % | 8/15/10 | 5,225 | 5,347 | ||||
| United States Treasury Note/Bond | 5.750 | % | 8/15/10 | 2,600 | 2,687 | ||||
| United States Treasury Note/Bond | 2.375 | % | 8/31/10 | 14,475 | 14,665 | ||||
| United States Treasury Note/Bond | 2.000 | % | 9/30/10 | 5,850 | 5,919 | ||||
| United States Treasury Note/Bond | 1.500 | % | 10/31/10 | 59,850 | 60,364 | ||||
| United States Treasury Note/Bond | 1.250 | % | 11/30/10 | 95,675 | 96,363 | ||||
| United States Treasury Note/Bond | 4.375 | % | 12/15/10 | 119,100 | 123,454 | ||||
| United States Treasury Note/Bond | 0.875 | % | 12/31/10 | 189,125 | 189,804 | ||||
| United States Treasury Note/Bond | 4.250 | % | 1/15/11 | 25,000 | 25,937 | ||||
| United States Treasury Note/Bond | 0.875 | % | 1/31/11 | 77,775 | 78,006 | ||||
| United States Treasury Note/Bond | 5.000 | % | 2/15/11 | 1,725 | 1,808 | ||||
| United States Treasury Note/Bond | 0.875 | % | 2/28/11 | 201,395 | 201,866 | ||||
| United States Treasury Note/Bond | 4.500 | % | 2/28/11 | 6,775 | 7,071 | ||||
| United States Treasury Note/Bond | 0.875 | % | 3/31/11 | 14,625 | 14,650 | ||||
| United States Treasury Note/Bond | 0.875 | % | 4/30/11 | 8,125 | 8,135 | ||||
| United States Treasury Note/Bond | 4.875 | % | 4/30/11 | 43,050 | 45,337 | ||||
| United States Treasury Note/Bond | 0.875 | % | 5/31/11 | 350 | 350 | ||||
| United States Treasury Note/Bond | 1.125 | % | 6/30/11 | 142,825 | 143,383 | ||||
| United States Treasury Note/Bond | 5.125 | % | 6/30/11 | 338,350 | 359,497 | ||||
| United States Treasury Note/Bond | 1.000 | % | 7/31/11 | 6,775 | 6,785 | ||||
| United States Treasury Note/Bond | 4.875 | % | 7/31/11 | 1,600 | 1,699 | ||||
| United States Treasury Note/Bond | 1.000 | % | 8/31/11 | 178,680 | 178,735 | ||||
| United States Treasury Note/Bond | 4.625 | % | 8/31/11 | 138,075 | 146,402 | ||||
| United States Treasury Note/Bond | 1.000 | % | 9/30/11 | 2,975 | 2,974 | ||||
| United States Treasury Note/Bond | 4.500 | % | 9/30/11 | 169,333 | 179,493 | ||||
| United States Treasury Note/Bond | 4.625 | % | 10/31/11 | 50,000 | 53,242 | ||||
| United States Treasury Note/Bond | 1.750 | % | 11/15/11 | 99,750 | 101,013 | ||||
| United States Treasury Note/Bond | 0.750 | % | 11/30/11 | 90,448 | 89,855 | ||||
| United States Treasury Note/Bond | 4.500 | % | 11/30/11 | 4,525 | 4,818 | ||||
| United States Treasury Note/Bond | 1.125 | % | 12/15/11 | 25,200 | 25,208 | ||||
| United States Treasury Note/Bond | 4.625 | % | 12/31/11 | 2,300 | 2,457 | ||||
| United States Treasury Note/Bond | 1.125 | % | 1/15/12 | 28,875 | 28,848 | ||||
| United States Treasury Note/Bond | 4.750 | % | 1/31/12 | 5,825 | 6,252 | ||||
| United States Treasury Note/Bond | 1.375 | % | 2/15/12 | 70,650 | 70,849 |
9
| Total Bond Market II Index Fund | |||||||||
| Face | Market | ||||||||
| Maturity | Amount | Value• | |||||||
| Coupon | Date | ($ | 000 | ) | ($ | 000 | ) | ||
| United States Treasury Note/Bond | 4.875 | % | 2/15/12 | 35,000 | 37,658 | ||||
| United States Treasury Note/Bond | 4.625 | % | 2/29/12 | 4,375 | 4,690 | ||||
| United States Treasury Note/Bond | 1.375 | % | 3/15/12 | 103,125 | 103,366 | ||||
| United States Treasury Note/Bond | 4.500 | % | 3/31/12 | 193,625 | 207,239 | ||||
| United States Treasury Note/Bond | 1.375 | % | 4/15/12 | 3,075 | 3,078 | ||||
| United States Treasury Note/Bond | 4.500 | % | 4/30/12 | 81,725 | 87,625 | ||||
| United States Treasury Note/Bond | 1.375 | % | 5/15/12 | 44,625 | 44,632 | ||||
| United States Treasury Note/Bond | 4.750 | % | 5/31/12 | 28,325 | 30,591 | ||||
| United States Treasury Note/Bond | 1.875 | % | 6/15/12 | 117,575 | 118,861 | ||||
| United States Treasury Note/Bond | 4.875 | % | 6/30/12 | 53,850 | 58,411 | ||||
| United States Treasury Note/Bond | 4.625 | % | 7/31/12 | 9,900 | 10,694 | ||||
| United States Treasury Note/Bond | 1.750 | % | 8/15/12 | 29,125 | 29,316 | ||||
| United States Treasury Note/Bond | 4.125 | % | 8/31/12 | 500 | 535 | ||||
| United States Treasury Note/Bond | 4.250 | % | 9/30/12 | 1,400 | 1,503 | ||||
| United States Treasury Note/Bond | 1.375 | % | 10/15/12 | 8,540 | 8,495 | ||||
| United States Treasury Note/Bond | 3.875 | % | 10/31/12 | 31,419 | 33,437 | ||||
| United States Treasury Note/Bond | 1.375 | % | 11/15/12 | 120,735 | 119,906 | ||||
| United States Treasury Note/Bond | 4.000 | % | 11/15/12 | 4,025 | 4,300 | ||||
| United States Treasury Note/Bond | 3.375 | % | 11/30/12 | 9,020 | 9,474 | ||||
| United States Treasury Note/Bond | 1.125 | % | 12/15/12 | 32,400 | 31,889 | ||||
| United States Treasury Note/Bond | 3.625 | % | 12/31/12 | 194,400 | 205,578 | ||||
| United States Treasury Note/Bond | 3.875 | % | 2/15/13 | 176,250 | 187,761 | ||||
| United States Treasury Note/Bond | 2.750 | % | 2/28/13 | 1,900 | 1,958 | ||||
| United States Treasury Note/Bond | 3.625 | % | 5/15/13 | 68,925 | 72,996 | ||||
| United States Treasury Note/Bond | 3.500 | % | 5/31/13 | 155,500 | 163,906 | ||||
| United States Treasury Note/Bond | 3.375 | % | 6/30/13 | 3,200 | 3,359 | ||||
| United States Treasury Note/Bond | 3.375 | % | 7/31/13 | 4,225 | 4,436 | ||||
| United States Treasury Note/Bond | 4.250 | % | 8/15/13 | 115,500 | 124,668 | ||||
| United States Treasury Note/Bond | 3.125 | % | 8/31/13 | 44,350 | 46,103 | ||||
| United States Treasury Note/Bond | 3.125 | % | 9/30/13 | 144,600 | 150,316 | ||||
| United States Treasury Note/Bond | 2.750 | % | 10/31/13 | 66,550 | 68,172 | ||||
| United States Treasury Note/Bond | 4.250 | % | 11/15/13 | 90,250 | 97,512 | ||||
| United States Treasury Note/Bond | 2.000 | % | 11/30/13 | 42,000 | 41,783 | ||||
| United States Treasury Note/Bond | 1.500 | % | 12/31/13 | 2,525 | 2,459 | ||||
| United States Treasury Note/Bond | 1.750 | % | 1/31/14 | 325 | 319 | ||||
| United States Treasury Note/Bond | 1.875 | % | 2/28/14 | 51,225 | 50,393 | ||||
| United States Treasury Note/Bond | 1.750 | % | 3/31/14 | 12,325 | 12,034 | ||||
| United States Treasury Note/Bond | 1.875 | % | 4/30/14 | 49,750 | 48,732 | ||||
| United States Treasury Note/Bond | 4.750 | % | 5/15/14 | 117,125 | 128,911 | ||||
| United States Treasury Note/Bond | 2.250 | % | 5/31/14 | 66,425 | 65,979 | ||||
| United States Treasury Note/Bond | 2.625 | % | 6/30/14 | 68,350 | 68,863 | ||||
| United States Treasury Note/Bond | 2.625 | % | 7/31/14 | 22,250 | 22,368 | ||||
| United States Treasury Note/Bond | 2.375 | % | 9/30/14 | 13,300 | 13,190 | ||||
| United States Treasury Note/Bond | 2.375 | % | 10/31/14 | 128,240 | 126,878 | ||||
| United States Treasury Note/Bond | 2.125 | % | 11/30/14 | 106,200 | 103,728 | ||||
| United States Treasury Note/Bond | 2.625 | % | 12/31/14 | 117,400 | 116,804 | ||||
| United States Treasury Note/Bond | 4.000 | % | 2/15/15 | 69,300 | 73,664 | ||||
| United States Treasury Note/Bond | 11.250 | % | 2/15/15 | 15,075 | 21,270 | ||||
| United States Treasury Note/Bond | 4.125 | % | 5/15/15 | 84,375 | 89,978 | ||||
| United States Treasury Note/Bond | 4.250 | % | 8/15/15 | 10,400 | 11,133 | ||||
| United States Treasury Note/Bond | 10.625 | % | 8/15/15 | 1,775 | 2,493 | ||||
| United States Treasury Note/Bond | 4.500 | % | 11/15/15 | 22,900 | 24,804 | ||||
| United States Treasury Note/Bond | 9.875 | % | 11/15/15 | 79,875 | 109,753 | ||||
| United States Treasury Note/Bond | 4.500 | % | 2/15/16 | 1,000 | 1,079 | ||||
| United States Treasury Note/Bond | 9.250 | % | 2/15/16 | 2,000 | 2,694 | ||||
| United States Treasury Note/Bond | 2.625 | % | 2/29/16 | 212,850 | 207,131 | ||||
| United States Treasury Note/Bond | 2.375 | % | 3/31/16 | 93,475 | 89,444 | ||||
10
| Total Bond Market II Index Fund | |||||||||
| Face | Market | ||||||||
| Maturity | Amount | Value• | |||||||
| Coupon | Date | ($ | 000 | ) | ($ | 000 | ) | ||
| United States Treasury Note/Bond | 2.625 | % | 4/30/16 | 55,300 | 53,598 | ||||
| United States Treasury Note/Bond | 5.125 | % | 5/15/16 | 112,175 | 125,110 | ||||
| United States Treasury Note/Bond | 7.250 | % | 5/15/16 | 3,075 | 3,808 | ||||
| United States Treasury Note/Bond | 3.250 | % | 5/31/16 | 70,175 | 70,493 | ||||
| United States Treasury Note/Bond | 3.250 | % | 6/30/16 | 55,425 | 55,598 | ||||
| United States Treasury Note/Bond | 4.875 | % | 8/15/16 | 20,625 | 22,684 | ||||
| United States Treasury Note/Bond | 3.000 | % | 9/30/16 | 50,600 | 49,675 | ||||
| United States Treasury Note/Bond | 3.125 | % | 10/31/16 | 25,000 | 24,691 | ||||
| United States Treasury Note/Bond | 4.625 | % | 11/15/16 | 850 | 919 | ||||
| United States Treasury Note/Bond | 7.500 | % | 11/15/16 | 17,950 | 22,623 | ||||
| United States Treasury Note/Bond | 2.750 | % | 11/30/16 | 1,125 | 1,083 | ||||
| United States Treasury Note/Bond | 4.625 | % | 2/15/17 | 125 | 135 | ||||
| United States Treasury Note/Bond | 4.500 | % | 5/15/17 | 1,250 | 1,337 | ||||
| United States Treasury Note/Bond | 8.750 | % | 5/15/17 | 99,925 | 135,133 | ||||
| United States Treasury Note/Bond | 4.750 | % | 8/15/17 | 10,725 | 11,642 | ||||
| United States Treasury Note/Bond | 8.875 | % | 8/15/17 | 41,325 | 56,350 | ||||
| United States Treasury Note/Bond | 4.250 | % | 11/15/17 | 4,275 | 4,483 | ||||
| United States Treasury Note/Bond | 3.500 | % | 2/15/18 | 28,900 | 28,674 | ||||
| United States Treasury Note/Bond | 3.875 | % | 5/15/18 | 346,750 | 352,222 | ||||
| United States Treasury Note/Bond | 9.125 | % | 5/15/18 | 1,625 | 2,282 | ||||
| United States Treasury Note/Bond | 4.000 | % | 8/15/18 | 145,975 | 149,146 | ||||
| United States Treasury Note/Bond | 8.875 | % | 2/15/19 | 53,775 | 75,134 | ||||
| United States Treasury Note/Bond | 3.625 | % | 8/15/19 | 23,000 | 22,619 | ||||
| United States Treasury Note/Bond | 8.125 | % | 8/15/19 | 17,450 | 23,495 | ||||
| United States Treasury Note/Bond | 3.375 | % | 11/15/19 | 182,363 | 175,495 | ||||
| United States Treasury Note/Bond | 8.500 | % | 2/15/20 | 425 | 589 | ||||
| United States Treasury Note/Bond | 8.750 | % | 8/15/20 | 81,655 | 115,542 | ||||
| United States Treasury Note/Bond | 7.875 | % | 2/15/21 | 70,550 | 94,868 | ||||
| United States Treasury Note/Bond | 8.125 | % | 5/15/21 | 3,350 | 4,585 | ||||
| United States Treasury Note/Bond | 8.125 | % | 8/15/21 | 42,550 | 58,380 | ||||
| United States Treasury Note/Bond | 8.000 | % | 11/15/21 | 3,700 | 5,040 | ||||
| United States Treasury Note/Bond | 7.250 | % | 8/15/22 | 4,450 | 5,768 | ||||
| United States Treasury Note/Bond | 7.625 | % | 11/15/22 | 16,900 | 22,548 | ||||
| United States Treasury Note/Bond | 7.125 | % | 2/15/23 | 25,675 | 32,944 | ||||
| United States Treasury Note/Bond | 6.250 | % | 8/15/23 | 224,850 | 268,660 | ||||
| United States Treasury Note/Bond | 6.875 | % | 8/15/25 | 50,650 | 64,294 | ||||
| United States Treasury Note/Bond | 6.000 | % | 2/15/26 | 1,175 | 1,375 | ||||
| United States Treasury Note/Bond | 6.750 | % | 8/15/26 | 375 | 473 | ||||
| United States Treasury Note/Bond | 6.500 | % | 11/15/26 | 8,425 | 10,390 | ||||
| United States Treasury Note/Bond | 6.625 | % | 2/15/27 | 79,150 | 98,876 | ||||
| United States Treasury Note/Bond | 6.375 | % | 8/15/27 | 9,600 | 11,726 | ||||
| United States Treasury Note/Bond | 6.125 | % | 11/15/27 | 6,050 | 7,209 | ||||
| United States Treasury Note/Bond | 5.500 | % | 8/15/28 | 4,775 | 5,323 | ||||
| United States Treasury Note/Bond | 5.250 | % | 11/15/28 | 650 | 705 | ||||
| United States Treasury Note/Bond | 5.250 | % | 2/15/29 | 25,175 | 27,287 | ||||
| United States Treasury Note/Bond | 6.125 | % | 8/15/29 | 37,250 | 44,741 | ||||
| United States Treasury Note/Bond | 6.250 | % | 5/15/30 | 25,450 | 31,109 | ||||
| United States Treasury Note/Bond | 5.375 | % | 2/15/31 | 31,975 | 35,352 | ||||
| United States Treasury Note/Bond | 4.500 | % | 2/15/36 | 35,675 | 35,162 | ||||
| United States Treasury Note/Bond | 4.750 | % | 2/15/37 | 204,100 | 208,725 | ||||
| United States Treasury Note/Bond | 5.000 | % | 5/15/37 | 44,600 | 47,401 | ||||
| United States Treasury Note/Bond | 4.375 | % | 2/15/38 | 32,475 | 31,201 | ||||
| United States Treasury Note/Bond | 4.250 | % | 5/15/39 | 76,550 | 71,861 | ||||
| United States Treasury Note/Bond | 4.500 | % | 8/15/39 | 76,326 | 74,668 | ||||
| 8,735,985 | |||||||||
11
| Total Bond Market II Index Fund | ||||||||||
| Face | Market | |||||||||
| Maturity | Amount | Value• | ||||||||
| Coupon | Date | ($ | 000 | ) | ($ | 000 | ) | |||
| Agency Bonds and Notes (7.4%) | ||||||||||
| 1 | American Express Bank FSB | 3.150 | % | 12/9/11 | 5,625 | 5,820 | ||||
| 1 | Bank of America Corp. | 2.100 | % | 4/30/12 | 17,050 | 17,244 | ||||
| 1 | Bank of America Corp. | 3.125 | % | 6/15/12 | 8,950 | 9,289 | ||||
| 1 | Bank of America Corp. | 2.375 | % | 6/22/12 | 1,725 | 1,758 | ||||
| 1 | Bank of America NA | 1.700 | % | 12/23/10 | 4,225 | 4,267 | ||||
| 1 | Bank of the West | 2.150 | % | 3/27/12 | 3,500 | 3,548 | ||||
| 1 | Citibank NA | 1.625 | % | 3/30/11 | 2,125 | 2,144 | ||||
| 1 | Citibank NA | 1.500 | % | 7/12/11 | 2,500 | 2,514 | ||||
| 1 | Citibank NA | 1.375 | % | 8/10/11 | 3,500 | 3,514 | ||||
| 1 | Citibank NA | 1.250 | % | 9/22/11 | 2,025 | 2,027 | ||||
| 1 | Citibank NA | 1.875 | % | 5/7/12 | 6,375 | 6,421 | ||||
| 1 | Citibank NA | 1.750 | % | 12/28/12 | 15,950 | 15,855 | ||||
| 1 | Citigroup Funding Inc. | 1.375 | % | 5/5/11 | 9,875 | 9,930 | ||||
| 1 | Citigroup Funding Inc. | 2.000 | % | 3/30/12 | 2,125 | 2,144 | ||||
| 1 | Citigroup Funding Inc. | 2.125 | % | 7/12/12 | 3,800 | 3,837 | ||||
| 1 | Citigroup Funding Inc. | 1.875 | % | 10/22/12 | 6,563 | 6,552 | ||||
| 1 | Citigroup Funding Inc. | 2.250 | % | 12/10/12 | 1,750 | 1,765 | ||||
| 1 | Citigroup Inc. | 2.875 | % | 12/9/11 | 6,300 | 6,483 | ||||
| 1 | Citigroup Inc. | 2.125 | % | 4/30/12 | 14,975 | 15,161 | ||||
| Egypt Government AID Bonds | 4.450 | % | 9/15/15 | 3,725 | 3,885 | |||||
| 2 | Federal Farm Credit Bank | 4.875 | % | 2/18/11 | 6,550 | 6,850 | ||||
| 2 | Federal Farm Credit Bank | 2.625 | % | 4/21/11 | 4,350 | 4,452 | ||||
| 2 | Federal Farm Credit Bank | 5.375 | % | 7/18/11 | 7,650 | 8,147 | ||||
| 2 | Federal Farm Credit Bank | 3.875 | % | 8/25/11 | 4,300 | 4,491 | ||||
| 2 | Federal Farm Credit Bank | 2.000 | % | 1/17/12 | 6,000 | 6,078 | ||||
| 2 | Federal Farm Credit Bank | 2.250 | % | 4/24/12 | 2,075 | 2,109 | ||||
| 2 | Federal Farm Credit Bank | 2.125 | % | 6/18/12 | 15,225 | 15,415 | ||||
| 2 | Federal Farm Credit Bank | 4.500 | % | 10/17/12 | 4,725 | 5,060 | ||||
| 2 | Federal Farm Credit Bank | 1.875 | % | 12/7/12 | 3,525 | 3,514 | ||||
| 2 | Federal Farm Credit Bank | 3.875 | % | 10/7/13 | 3,250 | 3,419 | ||||
| 2 | Federal Farm Credit Bank | 2.625 | % | 4/17/14 | 3,675 | 3,666 | ||||
| 2 | Federal Farm Credit Bank | 3.000 | % | 9/22/14 | 4,150 | 4,183 | ||||
| 2 | Federal Farm Credit Bank | 4.875 | % | 12/16/15 | 425 | 456 | ||||
| 2 | Federal Farm Credit Bank | 5.125 | % | 8/25/16 | 3,475 | 3,763 | ||||
| 2 | Federal Farm Credit Bank | 4.875 | % | 1/17/17 | 2,750 | 2,927 | ||||
| 2 | Federal Farm Credit Bank | 5.150 | % | 11/15/19 | 5,325 | 5,480 | ||||
| 2 | Federal Home Loan Bank of Chicago | 5.625 | % | 6/13/16 | 825 | 833 | ||||
| 2 | Federal Home Loan Banks | 2.625 | % | 3/11/11 | 5,625 | 5,743 | ||||
| 2 | Federal Home Loan Banks | 1.625 | % | 3/16/11 | 5,475 | 5,533 | ||||
| 2 | Federal Home Loan Banks | 1.375 | % | 5/16/11 | 4,975 | 5,007 | ||||
| 2 | Federal Home Loan Banks | 3.125 | % | 6/10/11 | 3,625 | 3,732 | ||||
| 2 | Federal Home Loan Banks | 3.625 | % | 7/1/11 | 5,050 | 5,246 | ||||
| 2 | Federal Home Loan Banks | 1.625 | % | 7/27/11 | 17,025 | 17,189 | ||||
| 2 | Federal Home Loan Banks | 5.375 | % | 8/19/11 | 30,500 | 32,628 | ||||
| 2 | Federal Home Loan Banks | 3.750 | % | 9/9/11 | 1,675 | 1,746 | ||||
| 2 | Federal Home Loan Banks | 3.625 | % | 9/16/11 | 46,725 | 48,711 | ||||
| 2 | Federal Home Loan Banks | 4.875 | % | 11/18/11 | 5,600 | 5,984 | ||||
| 2 | Federal Home Loan Banks | 1.000 | % | 12/28/11 | 6,350 | 6,325 | ||||
| 2 | Federal Home Loan Banks | 1.875 | % | 6/20/12 | 5,425 | 5,474 | ||||
| 2 | Federal Home Loan Banks | 1.750 | % | 8/22/12 | 22,825 | 22,850 | ||||
| 2 | Federal Home Loan Banks | 1.625 | % | 9/26/12 | 5,300 | 5,279 | ||||
| 2,3 | Federal Home Loan Banks | 2.000 | % | 10/5/12 | 11,430 | 11,416 | ||||
| 2,3 | Federal Home Loan Banks | 2.000 | % | 11/9/12 | 19,600 | 19,503 | ||||
| 2 | Federal Home Loan Banks | 1.750 | % | 12/14/12 | 6,200 | 6,158 | ||||
| 2 | Federal Home Loan Banks | 1.500 | % | 1/16/13 | 26,375 | 26,037 | ||||
| 2 | Federal Home Loan Banks | 3.375 | % | 2/27/13 | 3,175 | 3,308 | ||||
12
| Total Bond Market II Index Fund | |||||||||
| Face | Market | ||||||||
| Maturity | Amount | Value• | |||||||
| Coupon | Date | ($ | 000 | ) | ($ | 000 | ) | ||
| 2 Federal Home Loan Banks | 3.875 | % | 6/14/13 | 6,650 | 7,048 | ||||
| 2 Federal Home Loan Banks | 5.375 | % | 6/14/13 | 3,850 | 4,252 | ||||
| 2 Federal Home Loan Banks | 5.125 | % | 8/14/13 | 3,400 | 3,740 | ||||
| 2 Federal Home Loan Banks | 4.000 | % | 9/6/13 | 5,075 | 5,383 | ||||
| 2 Federal Home Loan Banks | 5.250 | % | 9/13/13 | 4,450 | 4,896 | ||||
| 2 Federal Home Loan Banks | 4.500 | % | 9/16/13 | 10,675 | 11,505 | ||||
| 2 Federal Home Loan Banks | 3.625 | % | 10/18/13 | 7,950 | 8,328 | ||||
| 2 Federal Home Loan Banks | 4.875 | % | 11/27/13 | 6,475 | 7,081 | ||||
| 2 Federal Home Loan Banks | 5.500 | % | 8/13/14 | 22,075 | 24,740 | ||||
| 2 Federal Home Loan Banks | 5.375 | % | 5/18/16 | 17,850 | 19,774 | ||||
| 2 Federal Home Loan Banks | 5.125 | % | 10/19/16 | 9,725 | 10,578 | ||||
| 2 Federal Home Loan Banks | 4.750 | % | 12/16/16 | 14,525 | 15,531 | ||||
| 2 Federal Home Loan Banks | 4.875 | % | 5/17/17 | 6,775 | 7,278 | ||||
| 2 Federal Home Loan Banks | 5.000 | % | 11/17/17 | 20,675 | 22,284 | ||||
| 2 Federal Home Loan Banks | 5.250 | % | 12/11/20 | 5,000 | 5,340 | ||||
| 2 Federal Home Loan Banks | 5.625 | % | 6/11/21 | 425 | 466 | ||||
| 2 Federal Home Loan Banks | 5.375 | % | 8/15/24 | 400 | 413 | ||||
| 2 Federal Home Loan Banks | 5.500 | % | 7/15/36 | 4,100 | 4,207 | ||||
| 2 Federal Home Loan Mortgage Corp. | 4.750 | % | 1/18/11 | 17,950 | 18,664 | ||||
| 2 Federal Home Loan Mortgage Corp. | 3.250 | % | 2/25/11 | 5,425 | 5,582 | ||||
| 2 Federal Home Loan Mortgage Corp. | 5.625 | % | 3/15/11 | 10,875 | 11,494 | ||||
| 2 Federal Home Loan Mortgage Corp. | 5.125 | % | 4/18/11 | 13,075 | 13,789 | ||||
| 2 Federal Home Loan Mortgage Corp. | 1.625 | % | 4/26/11 | 8,075 | 8,160 | ||||
| 2 Federal Home Loan Mortgage Corp. | 6.000 | % | 6/15/11 | 13,725 | 14,730 | ||||
| 2 Federal Home Loan Mortgage Corp. | 3.875 | % | 6/29/11 | 2,625 | 2,738 | ||||
| 2 Federal Home Loan Mortgage Corp. | 5.250 | % | 7/18/11 | 32,400 | 34,501 | ||||
| 2 Federal Home Loan Mortgage Corp. | 5.750 | % | 1/15/12 | 25,225 | 27,487 | ||||
| 2 Federal Home Loan Mortgage Corp. | 2.125 | % | 3/23/12 | 9,775 | 9,935 | ||||
| 2 Federal Home Loan Mortgage Corp. | 1.750 | % | 6/15/12 | 30,775 | 30,964 | ||||
| 2 Federal Home Loan Mortgage Corp. | 5.500 | % | 8/20/12 | 35,675 | 39,167 | ||||
| 2 Federal Home Loan Mortgage Corp. | 2.125 | % | 9/21/12 | 8,500 | 8,583 | ||||
| 2 Federal Home Loan Mortgage Corp. | 4.625 | % | 10/25/12 | 10,400 | 11,199 | ||||
| 2 Federal Home Loan Mortgage Corp. | 4.125 | % | 12/21/12 | 5,275 | 5,603 | ||||
| 2 Federal Home Loan Mortgage Corp. | 4.500 | % | 1/15/13 | 9,200 | 9,894 | ||||
| 2 Federal Home Loan Mortgage Corp. | 3.750 | % | 6/28/13 | 13,325 | 14,043 | ||||
| 2 Federal Home Loan Mortgage Corp. | 4.500 | % | 7/15/13 | 5,475 | 5,907 | ||||
| 2 Federal Home Loan Mortgage Corp. | 4.125 | % | 9/27/13 | 6,300 | 6,709 | ||||
| 2 Federal Home Loan Mortgage Corp. | 4.875 | % | 11/15/13 | 30,900 | 33,793 | ||||
| 2 Federal Home Loan Mortgage Corp. | 4.500 | % | 1/15/14 | 19,275 | 20,778 | ||||
| 2 Federal Home Loan Mortgage Corp. | 2.500 | % | 4/23/14 | 16,375 | 16,318 | ||||
| 2 Federal Home Loan Mortgage Corp. | 5.000 | % | 7/15/14 | 16,275 | 17,864 | ||||
| 2 Federal Home Loan Mortgage Corp. | 3.000 | % | 7/28/14 | 23,075 | 23,355 | ||||
| 2 Federal Home Loan Mortgage Corp. | 0.000 | % | 11/24/14 | 2,100 | 1,778 | ||||
| 2 Federal Home Loan Mortgage Corp. | 4.500 | % | 1/15/15 | 3,500 | 3,761 | ||||
| 2 Federal Home Loan Mortgage Corp. | 5.050 | % | 1/26/15 | 700 | 767 | ||||
| 2 Federal Home Loan Mortgage Corp. | 4.750 | % | 1/19/16 | 6,575 | 7,092 | ||||
| 2 Federal Home Loan Mortgage Corp. | 5.250 | % | 4/18/16 | 1,400 | 1,545 | ||||
| 2 Federal Home Loan Mortgage Corp. | 5.500 | % | 7/18/16 | 775 | 865 | ||||
| 2 Federal Home Loan Mortgage Corp. | 5.125 | % | 10/18/16 | 20,700 | 22,645 | ||||
| 2 Federal Home Loan Mortgage Corp. | 5.000 | % | 2/16/17 | 27,175 | 29,501 | ||||
| 2 Federal Home Loan Mortgage Corp. | 5.000 | % | 4/18/17 | 5,000 | 5,424 | ||||
| 2 Federal Home Loan Mortgage Corp. | 5.500 | % | 8/23/17 | 11,550 | 12,886 | ||||
| 2 Federal Home Loan Mortgage Corp. | 4.875 | % | 6/13/18 | 7,025 | 7,520 | ||||
| 2 Federal Home Loan Mortgage Corp. | 3.750 | % | 3/27/19 | 26,750 | 26,223 | ||||
| 2 Federal Home Loan Mortgage Corp. | 6.750 | % | 9/15/29 | 3,625 | 4,355 | ||||
| 2 Federal Home Loan Mortgage Corp. | 6.750 | % | 3/15/31 | 13,000 | 15,922 | ||||
| 2 Federal Home Loan Mortgage Corp. | 6.250 | % | 7/15/32 | 6,700 | 7,799 | ||||
13
| Total Bond Market II Index Fund | |||||||||
| Face | Market | ||||||||
| Maturity | Amount | Value• | |||||||
| Coupon | Date | ($ | 000 | ) | ($ | 000 | ) | ||
| 2 Federal National Mortgage Assn. | 6.250 | % | 2/1/11 | 3,850 | 4,034 | ||||
| 2 Federal National Mortgage Assn. | 1.750 | % | 3/23/11 | 6,950 | 7,021 | ||||
| 2 Federal National Mortgage Assn. | 2.750 | % | 4/11/11 | 12,350 | 12,642 | ||||
| 2 Federal National Mortgage Assn. | 5.125 | % | 4/15/11 | 9,975 | 10,515 | ||||
| 2 Federal National Mortgage Assn. | 1.375 | % | 4/28/11 | 83,800 | 84,371 | ||||
| 2 Federal National Mortgage Assn. | 6.000 | % | 5/15/11 | 12,500 | 13,365 | ||||
| 2 Federal National Mortgage Assn. | 3.375 | % | 5/19/11 | 10,875 | 11,241 | ||||
| 2 Federal National Mortgage Assn. | 5.000 | % | 10/15/11 | 20,000 | 21,355 | ||||
| 2 Federal National Mortgage Assn. | 1.000 | % | 11/23/11 | 1,775 | 1,769 | ||||
| 2 Federal National Mortgage Assn. | 2.000 | % | 1/9/12 | 11,400 | 11,571 | ||||
| 2 Federal National Mortgage Assn. | 0.875 | % | 1/12/12 | 8,900 | 8,838 | ||||
| 2 Federal National Mortgage Assn. | 5.000 | % | 2/16/12 | 10,875 | 11,711 | ||||
| 2 Federal National Mortgage Assn. | 6.125 | % | 3/15/12 | 19,075 | 21,038 | ||||
| 2 Federal National Mortgage Assn. | 1.875 | % | 4/20/12 | 32,275 | 32,588 | ||||
| 2 Federal National Mortgage Assn. | 4.875 | % | 5/18/12 | 10,225 | 11,028 | ||||
| 2 Federal National Mortgage Assn. | 5.250 | % | 8/1/12 | 2,425 | 2,595 | ||||
| 2 Federal National Mortgage Assn. | 1.750 | % | 8/10/12 | 39,075 | 39,138 | ||||
| 2 Federal National Mortgage Assn. | 4.375 | % | 9/15/12 | 11,975 | 12,801 | ||||
| 2 Federal National Mortgage Assn. | 3.625 | % | 2/12/13 | 5,350 | 5,614 | ||||
| 2 Federal National Mortgage Assn. | 4.750 | % | 2/21/13 | 2,525 | 2,729 | ||||
| 2 Federal National Mortgage Assn. | 4.375 | % | 3/15/13 | 4,200 | 4,506 | ||||
| 2 Federal National Mortgage Assn. | 4.625 | % | 5/1/13 | 8,650 | 9,092 | ||||
| 2 Federal National Mortgage Assn. | 3.875 | % | 7/12/13 | 6,050 | 6,397 | ||||
| 2 Federal National Mortgage Assn. | 4.625 | % | 10/15/13 | 19,225 | 20,837 | ||||
| 2 Federal National Mortgage Assn. | 2.875 | % | 12/11/13 | 28,075 | 28,630 | ||||
| 2 Federal National Mortgage Assn. | 5.125 | % | 1/2/14 | 1,175 | 1,237 | ||||
| 2 Federal National Mortgage Assn. | 2.750 | % | 2/5/14 | 6,550 | 6,607 | ||||
| 2 Federal National Mortgage Assn. | 2.750 | % | 3/13/14 | 7,475 | 7,535 | ||||
| 2 Federal National Mortgage Assn. | 4.125 | % | 4/15/14 | 8,225 | 8,738 | ||||
| 2 Federal National Mortgage Assn. | 2.500 | % | 5/15/14 | 28,825 | 28,700 | ||||
| 2 Federal National Mortgage Assn. | 3.000 | % | 9/16/14 | 6,200 | 6,266 | ||||
| 2 Federal National Mortgage Assn. | 4.625 | % | 10/15/14 | 22,100 | 23,876 | ||||
| 2 Federal National Mortgage Assn. | 2.625 | % | 11/20/14 | 18,775 | 18,587 | ||||
| 2 Federal National Mortgage Assn. | 5.000 | % | 4/15/15 | 5,450 | 5,977 | ||||
| 2 Federal National Mortgage Assn. | 4.375 | % | 10/15/15 | 4,325 | 4,587 | ||||
| 2 Federal National Mortgage Assn. | 5.375 | % | 7/15/16 | 4,325 | 4,796 | ||||
| 2 Federal National Mortgage Assn. | 5.250 | % | 9/15/16 | 25,775 | 28,391 | ||||
| 2 Federal National Mortgage Assn. | 4.875 | % | 12/15/16 | 4,000 | 4,320 | ||||
| 2 Federal National Mortgage Assn. | 5.000 | % | 2/13/17 | 28,600 | 31,027 | ||||
| 2 Federal National Mortgage Assn. | 5.000 | % | 5/11/17 | 11,275 | 12,215 | ||||
| 2 Federal National Mortgage Assn. | 5.375 | % | 6/12/17 | 2,800 | 3,098 | ||||
| 2 Federal National Mortgage Assn. | 0.000 | % | 10/9/19 | 625 | 345 | ||||
| 2 Federal National Mortgage Assn. | 6.250 | % | 5/15/29 | 5,550 | 6,392 | ||||
| 2 Federal National Mortgage Assn. | 7.125 | % | 1/15/30 | 7,925 | 10,023 | ||||
| 2 Federal National Mortgage Assn. | 7.250 | % | 5/15/30 | 10,200 | 13,072 | ||||
| 2 Federal National Mortgage Assn. | 6.625 | % | 11/15/30 | 1,900 | 2,290 | ||||
| 2 Federal National Mortgage Assn. | 5.625 | % | 7/15/37 | 3,625 | 3,819 | ||||
| 2 Financing Corp. Fico | 9.800 | % | 4/6/18 | 850 | 1,161 | ||||
| 2 Financing Corp. Fico | 10.350 | % | 8/3/18 | 100 | 144 | ||||
| 2 Financing Corp. Fico | 9.650 | % | 11/2/18 | 2,375 | 3,324 | ||||
| 2 Financing Corp. Fico | 9.700 | % | 4/5/19 | 425 | 599 | ||||
| 1 General Electric Capital Corp. | 1.625 | % | 1/7/11 | 8,300 | 8,376 | ||||
| 1 General Electric Capital Corp. | 1.800 | % | 3/11/11 | 300 | 303 | ||||
| 1 General Electric Capital Corp. | 3.000 | % | 12/9/11 | 15,625 | 16,113 | ||||
| 1 General Electric Capital Corp. | 2.250 | % | 3/12/12 | 15,125 | 15,375 | ||||
| 1 General Electric Capital Corp. | 2.200 | % | 6/8/12 | 11,275 | 11,428 | ||||
| 1 General Electric Capital Corp. | 2.125 | % | 12/21/12 | 5,975 | 6,006 | ||||
14
| Total Bond Market II Index Fund | ||||||||||
| Face | Market | |||||||||
| Maturity | Amount | Value• | ||||||||
| Coupon | Date | ($ | 000 | ) | ($ | 000 | ) | |||
| 1 | General Electric Capital Corp. | 2.625 | % | 12/28/12 | 4,450 | 4,536 | ||||
| 1 | GMAC Inc. | 2.200 | % | 12/19/12 | 5,725 | 5,766 | ||||
| 1 | Goldman Sachs Group Inc. | 1.700 | % | 3/15/11 | 1,950 | 1,971 | ||||
| 1 | Goldman Sachs Group Inc. | 1.625 | % | 7/15/11 | 3,675 | 3,708 | ||||
| 1 | Goldman Sachs Group Inc. | 2.150 | % | 3/15/12 | 2,525 | 2,563 | ||||
| 1 | Goldman Sachs Group Inc. | 3.250 | % | 6/15/12 | 7,925 | 8,243 | ||||
| 1 | HSBC USA Inc. | 3.125 | % | 12/16/11 | 5,650 | 5,850 | ||||
| Israel Government AID Bond | 5.500 | % | 9/18/23 | 1,425 | 1,519 | |||||
| Israel Government AID Bond | 5.500 | % | 12/4/23 | 1,050 | 1,115 | |||||
| Israel Government AID Bond | 5.500 | % | 4/26/24 | 4,450 | 4,726 | |||||
| 1 | JPMorgan Chase & Co. | 1.650 | % | 2/23/11 | 7,025 | 7,100 | ||||
| 1 | JPMorgan Chase & Co. | 3.125 | % | 12/1/11 | 9,175 | 9,483 | ||||
| 1 | JPMorgan Chase & Co. | 2.200 | % | 6/15/12 | 6,200 | 6,294 | ||||
| 1 | JPMorgan Chase & Co. | 2.125 | % | 6/22/12 | 5,150 | 5,225 | ||||
| 1 | JPMorgan Chase & Co. | 2.125 | % | 12/26/12 | 9,000 | 9,054 | ||||
| 1 | Morgan Stanley | 2.900 | % | 12/1/10 | 3,825 | 3,904 | ||||
| 1 | Morgan Stanley | 3.250 | % | 12/1/11 | 10,050 | 10,425 | ||||
| 1 | Morgan Stanley | 2.250 | % | 3/13/12 | 7,600 | 7,726 | ||||
| 1 | Morgan Stanley | 1.950 | % | 6/20/12 | 8,900 | 8,980 | ||||
| 1 | PNC Funding Corp. | 2.300 | % | 6/22/12 | 5,850 | 5,948 | ||||
| Private Export Funding Corp. | 3.050 | % | 10/15/14 | 4,000 | 3,976 | |||||
| Private Export Funding Corp. | 4.375 | % | 3/15/19 | 2,100 | 2,075 | |||||
| Private Export Funding Corp. | 4.300 | % | 12/15/21 | 1,000 | 937 | |||||
| 1 | Regions Bank | 2.750 | % | 12/10/10 | 100 | 102 | ||||
| 1 | Regions Bank | 3.250 | % | 12/9/11 | 27,150 | 28,143 | ||||
| Resolution Funding Corp. | 8.125 | % | 10/15/19 | 100 | 128 | |||||
| Resolution Funding Corp. | 8.875 | % | 7/15/20 | 100 | 134 | |||||
| 1 | Sovereign Bank | 2.750 | % | 1/17/12 | 2,600 | 2,669 | ||||
| 1 | State Street Corp. | 2.150 | % | 4/30/12 | 200 | 202 | ||||
| 2 | Tennessee Valley Authority | 5.625 | % | 1/18/11 | 2,350 | 2,470 | ||||
| 2 | Tennessee Valley Authority | 5.500 | % | 7/18/17 | 6,400 | 7,035 | ||||
| 2 | Tennessee Valley Authority | 4.500 | % | 4/1/18 | 2,050 | 2,107 | ||||
| 2 | Tennessee Valley Authority | 6.750 | % | 11/1/25 | 550 | 631 | ||||
| 2 | Tennessee Valley Authority | 7.125 | % | 5/1/30 | 8,975 | 11,016 | ||||
| 2 | Tennessee Valley Authority | 4.650 | % | 6/15/35 | 1,425 | 1,261 | ||||
| 2 | Tennessee Valley Authority | 5.500 | % | 6/15/38 | 850 | 846 | ||||
| 2 | Tennessee Valley Authority | 5.250 | % | 9/15/39 | 1,950 | 1,920 | ||||
| 2 | Tennessee Valley Authority | 4.875 | % | 1/15/48 | 2,075 | 1,859 | ||||
| 2 | Tennessee Valley Authority | 5.375 | % | 4/1/56 | 2,475 | 2,441 | ||||
| 1 | US Central Federal Credit Union | 1.900 | % | 10/19/12 | 3,450 | 3,452 | ||||
| 1 | Wells Fargo & Co. | 3.000 | % | 12/9/11 | 9,625 | 9,924 | ||||
| 1 | Wells Fargo & Co. | 2.125 | % | 6/15/12 | 2,925 | 2,965 | ||||
| 1 | Western Corporate Federal Credit Union | 1.750 | % | 11/2/12 | 1,750 | 1,741 | ||||
| 2,037,377 | ||||||||||
| Conventional Mortgage-Backed Securities (31.8%) | ||||||||||
| 2,3 | Fannie Mae Pool | 4.000 | % | 9/1/10–1/1/40 | 229,840 | 228,713 | ||||
| 2,3 | Fannie Mae Pool | 4.500 | % | 2/1/10–1/1/40 | 559,285 | 571,776 | ||||
| 2,3 | Fannie Mae Pool | 5.000 | % | 4/1/10–1/1/40 | 1,053,267 | 1,091,295 | ||||
| 2,3 | Fannie Mae Pool | 5.500 | % | 11/1/16–1/1/40 | 1,255,099 | 1,320,154 | ||||
| 2,3 | Fannie Mae Pool | 6.000 | % | 2/1/14–1/1/40 | 835,017 | 888,981 | ||||
| 2,3 | Fannie Mae Pool | 6.500 | % | 4/1/16–1/1/39 | 226,724 | 243,760 | ||||
| 2,3 | Fannie Mae Pool | 7.000 | % | 11/1/18–12/1/38 | 88,303 | 96,877 | ||||
| 2,3 | Fannie Mae Pool | 7.500 | % | 1/1/31–12/1/32 | 893 | 986 | ||||
| 2,3 | Fannie Mae Pool | 8.000 | % | 12/1/29 | 86 | 96 | ||||
| 2,3 | Freddie Mac Gold Pool | 4.000 | % | 1/1/10–1/1/40 | 147,193 | 147,206 | ||||
| 2,3 | Freddie Mac Gold Pool | 4.500 | % | 3/1/10–1/1/40 | 406,879 | 414,489 | ||||
| 2,3 | Freddie Mac Gold Pool | 5.000 | % | 4/1/11–1/1/40 | 684,739 | 707,886 | ||||
15
| Total Bond Market II Index Fund | ||||||||||
| Face | Market | |||||||||
| Maturity | Amount | Value• | ||||||||
| Coupon | Date | ($ | 000 | ) | ($ | 000 | ) | |||
| 2,3 | Freddie Mac Gold Pool | 5.500 | % | 12/1/13–1/1/40 | 752,473 | 791,108 | ||||
| 2,3 | Freddie Mac Gold Pool | 6.000 | % | 4/1/13–1/1/40 | 521,453 | 555,223 | ||||
| 2,3 | Freddie Mac Gold Pool | 6.500 | % | 6/1/13–4/1/39 | 196,118 | 211,244 | ||||
| 2,3 | Freddie Mac Gold Pool | 7.000 | % | 6/1/15–12/1/37 | 29,069 | 31,790 | ||||
| 2,3 | Freddie Mac Gold Pool | 7.500 | % | 6/1/27–2/1/32 | 363 | 400 | ||||
| 2,3 | Freddie Mac Gold Pool | 8.000 | % | 1/1/27–11/1/31 | 466 | 513 | ||||
| 2,3 | Freddie Mac Gold Pool | 8.500 | % | 6/1/25 | 82 | 91 | ||||
| 3 | Ginnie Mae I Pool | 4.000 | % | 8/15/18–8/15/39 | 25,712 | 24,893 | ||||
| 3 | Ginnie Mae I Pool | 4.500 | % | 6/15/18–1/1/40 | 241,040 | 241,486 | ||||
| 3 | Ginnie Mae I Pool | 5.000 | % | 12/15/17–1/1/40 | 273,982 | 282,401 | ||||
| 3 | Ginnie Mae I Pool | 5.500 | % | 4/15/17–1/1/40 | 259,779 | 272,866 | ||||
| 3 | Ginnie Mae I Pool | 6.000 | % | 4/15/17–1/1/40 | 206,281 | 218,555 | ||||
| 3 | Ginnie Mae I Pool | 6.500 | % | 7/15/24–12/15/38 | 55,841 | 59,734 | ||||
| 3 | Ginnie Mae I Pool | 7.000 | % | 7/15/23–9/15/36 | 2,772 | 3,044 | ||||
| 3 | Ginnie Mae I Pool | 7.500 | % | 12/15/23 | 87 | 96 | ||||
| 3 | Ginnie Mae I Pool | 8.000 | % | 6/15/25–1/15/27 | 176 | 193 | ||||
| 3 | Ginnie Mae I Pool | 9.000% 11/15/17–12/15/17 | 240 | 261 | ||||||
| 3 | Ginnie Mae II Pool | 4.500 | % | 1/20/35–12/20/39 | 23,043 | 23,096 | ||||
| 3 | Ginnie Mae II Pool | 5.000 | % | 12/20/32–1/1/40 | 58,562 | 60,277 | ||||
| 3 | Ginnie Mae II Pool | 5.500 | % | 11/20/34–8/20/39 | 105,769 | 111,019 | ||||
| 3 | Ginnie Mae II Pool | 6.000 | % | 3/20/31–1/20/39 | 101,564 | 107,581 | ||||
| 3 | Ginnie Mae II Pool | 6.500 | % | 3/20/31–12/20/37 | 31,342 | 33,431 | ||||
| 3 | Ginnie Mae II Pool | 7.000 | % | 8/20/34–4/20/38 | 1,155 | 1,267 | ||||
| 8,742,788 | ||||||||||
| Nonconventional Mortgage-Backed Securities (1.4%) | ||||||||||
| 2,3 | Fannie Mae Pool | 2.701 | % | 12/1/34 | 3,743 | 3,801 | ||||
| 2,3 | Fannie Mae Pool | 2.799 | % | 10/1/34 | 3,153 | 3,228 | ||||
| 2,3 | Fannie Mae Pool | 2.808 | % | 11/1/34 | 2,310 | 2,349 | ||||
| 2,3 | Fannie Mae Pool | 3.126 | % | 9/1/34 | 935 | 957 | ||||
| 2,3 | Fannie Mae Pool | 3.973 | % | 7/1/35 | 3,614 | 3,723 | ||||
| 2,3 | Fannie Mae Pool | 4.132 | % | 5/1/34 | 1,809 | 1,873 | ||||
| 2,3 | Fannie Mae Pool | 4.413 | % | 8/1/35 | 5,746 | 5,939 | ||||
| 2,3 | Fannie Mae Pool | 4.421 | % | 7/1/35 | 1,961 | 2,026 | ||||
| 2,3 | Fannie Mae Pool | 4.485 | % | 4/1/37 | 5,047 | 5,254 | ||||
| 2,3 | Fannie Mae Pool | 4.498 | % | 1/1/35 | 2,520 | 2,575 | ||||
| 2,3 | Fannie Mae Pool | 4.505 | % | 10/1/36 | 2,583 | 2,673 | ||||
| 2,3 | Fannie Mae Pool | 4.508 | % | 4/1/36 | 6,906 | 7,133 | ||||
| 2,3 | Fannie Mae Pool | 4.549 | % | 11/1/34 | 5,991 | 6,236 | ||||
| 2,3 | Fannie Mae Pool | 4.605 | % | 12/1/35 | 4,324 | 4,508 | ||||
| 2,3 | Fannie Mae Pool | 4.610 | % | 8/1/35 | 3,795 | 3,946 | ||||
| 2,3 | Fannie Mae Pool | 4.613 | % | 11/1/33 | 1,749 | 1,811 | ||||
| 2,3 | Fannie Mae Pool | 4.629 | % | 9/1/34 | 1,691 | 1,758 | ||||
| 2,3 | Fannie Mae Pool | 4.721 | % | 8/1/35 | 2,237 | 2,341 | ||||
| 2,3 | Fannie Mae Pool | 4.766 | % | 5/1/35 | 2,101 | 2,179 | ||||
| 2,3 | Fannie Mae Pool | 4.784 | % | 6/1/34 | 2,134 | 2,221 | ||||
| 2,3 | Fannie Mae Pool | 4.852 | % | 9/1/35 | 3,249 | 3,402 | ||||
| 2,3 | Fannie Mae Pool | 4.866 | % | 7/1/35 | 3,783 | 3,907 | ||||
| 2,3 | Fannie Mae Pool | 4.938 | % | 7/1/38 | 1,271 | 1,330 | ||||
| 2,3 | Fannie Mae Pool | 4.952 | % | 11/1/34 | 805 | 839 | ||||
| 2,3 | Fannie Mae Pool | 4.959 | % | 7/1/35 | 1,562 | 1,626 | ||||
| 2,3 | Fannie Mae Pool | 4.966 | % | 10/1/35 | 5,874 | 6,132 | ||||
| 2,3 | Fannie Mae Pool | 4.992 | % | 11/1/33 | 962 | 1,008 | ||||
| 2,3 | Fannie Mae Pool | 5.015 | % | 12/1/33 | 1,236 | 1,297 | ||||
| 2,3 | Fannie Mae Pool | 5.035 | % | 2/1/36 | 2,344 | 2,444 | ||||
| 2,3 | Fannie Mae Pool | 5.039 | % | 11/1/35 | 6,514 | 6,776 | ||||
| 2,3 | Fannie Mae Pool | 5.062 | % | 8/1/37 | 8,141 | 8,518 | ||||
| 2,3 | Fannie Mae Pool | 5.075 | % | 12/1/35 | 3,512 | 3,686 | ||||
16
| Total Bond Market II Index Fund | ||||||||||
| Face | Market | |||||||||
| Maturity | Amount | Value• | ||||||||
| Coupon | Date | ($ | 000 | ) | ($ | 000 | ) | |||
| 2,3 | Fannie Mae Pool | 5.109 | % | 1/1/36 | 2,715 | 2,837 | ||||
| 2,3 | Fannie Mae Pool | 5.128 | % | 12/1/35 | 6,667 | 6,976 | ||||
| 2,3 | Fannie Mae Pool | 5.142 | % | 3/1/38 | 3,226 | 3,367 | ||||
| 2,3 | Fannie Mae Pool | 5.186 | % | 3/1/37 | 3,699 | 3,875 | ||||
| 2,3 | Fannie Mae Pool | 5.204 | % | 8/1/38 | 333 | 346 | ||||
| 2,3 | Fannie Mae Pool | 5.301 | % | 7/1/38 | 457 | 475 | ||||
| 2,3 | Fannie Mae Pool | 5.347 | % | 12/1/35 | 2,516 | 2,627 | ||||
| 2,3 | Fannie Mae Pool | 5.396 | % | 2/1/36 | 2,935 | 3,062 | ||||
| 2,3 | Fannie Mae Pool | 5.450 | % | 2/1/36 | 4,450 | 4,650 | ||||
| 2,3 | Fannie Mae Pool | 5.495 | % | 5/1/37 | 1,856 | 1,908 | ||||
| 2,3 | Fannie Mae Pool | 5.509 | % | 4/1/37 | 330 | 347 | ||||
| 2,3 | Fannie Mae Pool | 5.547 | % | 1/1/37 | 3,753 | 3,954 | ||||
| 2,3 | Fannie Mae Pool | 5.614 | % | 5/1/36 | 1,087 | 1,144 | ||||
| 2,3 | Fannie Mae Pool | 5.617 | % | 7/1/36 | 2,629 | 2,746 | ||||
| 2,3 | Fannie Mae Pool | 5.645 | % | 3/1/37 | 3,199 | 3,370 | ||||
| 2,3 | Fannie Mae Pool | 5.647 | % | 6/1/37 | 1,913 | 2,003 | ||||
| 2,3 | Fannie Mae Pool | 5.665 | % | 6/1/36 | 3,308 | 3,492 | ||||
| 2,3 | Fannie Mae Pool | 5.675 | % | 3/1/37 | 3,028 | 3,191 | ||||
| 2,3 | Fannie Mae Pool | 5.676 | % | 2/1/37 | 3,112 | 3,266 | ||||
| 2,3 | Fannie Mae Pool | 5.686 | % | 2/1/37 | 5,708 | 6,024 | ||||
| 2,3 | Fannie Mae Pool | 5.710 | % | 9/1/36 | 1,700 | 1,783 | ||||
| 2,3 | Fannie Mae Pool | 5.729 | % | 3/1/37 | 10,224 | 10,799 | ||||
| 2,3 | Fannie Mae Pool | 5.756 | % | 1/1/36 | 2,040 | 2,162 | ||||
| 2,3 | Fannie Mae Pool | 5.756 | % | 4/1/37 | 6,536 | 6,858 | ||||
| 2,3 | Fannie Mae Pool | 5.756 | % | 12/1/37 | 6,183 | 6,510 | ||||
| 2,3 | Fannie Mae Pool | 5.764 | % | 4/1/36 | 3,835 | 4,050 | ||||
| 2,3 | Fannie Mae Pool | 5.793 | % | 4/1/37 | 5,211 | 5,495 | ||||
| 2,3 | Fannie Mae Pool | 5.838 | % | 9/1/36 | 3,071 | 3,226 | ||||
| 2,3 | Fannie Mae Pool | 5.893 | % | 11/1/36 | 3,504 | 3,707 | ||||
| 2,3 | Fannie Mae Pool | 5.999 | % | 10/1/37 | 4,762 | 5,030 | ||||
| 2,3 | Fannie Mae Pool | 6.011 | % | 4/1/36 | 2,602 | 2,751 | ||||
| 2,3 | Fannie Mae Pool | 6.045 | % | 6/1/36 | 604 | 640 | ||||
| 2,3 | Fannie Mae Pool | 6.062 | % | 8/1/37 | 3,747 | 3,918 | ||||
| 2,3 | Fannie Mae Pool | 6.499 | % | 9/1/37 | 5,004 | 5,309 | ||||
| 2,3 | Freddie Mac Non Gold Pool | 2.691 | % | 12/1/34 | 3,510 | 3,567 | ||||
| 2,3 | Freddie Mac Non Gold Pool | 3.072 | % | 9/1/34 | 1,878 | 1,935 | ||||
| 2,3 | Freddie Mac Non Gold Pool | 3.160 | % | 12/1/34 | 1,911 | 1,978 | ||||
| 2,3 | Freddie Mac Non Gold Pool | 3.448 | % | 12/1/36 | 2,179 | 2,250 | ||||
| 2,3 | Freddie Mac Non Gold Pool | 4.168 | % | 4/1/35 | 116 | 118 | ||||
| 2,3 | Freddie Mac Non Gold Pool | 4.358 | % | 1/1/35 | 213 | 219 | ||||
| 2,3 | Freddie Mac Non Gold Pool | 4.590 | % | 4/1/35 | 2,688 | 2,764 | ||||
| 2,3 | Freddie Mac Non Gold Pool | 4.594 | % | 11/1/34 | 3,138 | 3,261 | ||||
| 2,3 | Freddie Mac Non Gold Pool | 4.660 | % | 7/1/35 | 2,560 | 2,653 | ||||
| 2,3 | Freddie Mac Non Gold Pool | 4.688 | % | 12/1/35 | 3,381 | 3,527 | ||||
| 2,3 | Freddie Mac Non Gold Pool | 4.693 | % | 6/1/37 | 2,630 | 2,722 | ||||
| 2,3 | Freddie Mac Non Gold Pool | 4.738 | % | 3/1/36 | 3,754 | 3,872 | ||||
| 2,3 | Freddie Mac Non Gold Pool | 4.766 | % | 1/1/37 | 2,057 | 2,148 | ||||
| 2,3 | Freddie Mac Non Gold Pool | 4.789 | % | 7/1/35 | 6,073 | 6,288 | ||||
| 2,3 | Freddie Mac Non Gold Pool | 5.024 | % | 5/1/35 | 3,388 | 3,525 | ||||
| 2,3 | Freddie Mac Non Gold Pool | 5.044 | % | 7/1/38 | 2,805 | 2,936 | ||||
| 2,3 | Freddie Mac Non Gold Pool | 5.260 | % | 3/1/37 | 2,516 | 2,571 | ||||
| 2,3 | Freddie Mac Non Gold Pool | 5.287 | % | 3/1/36 | 4,264 | 4,461 | ||||
| 2,3 | Freddie Mac Non Gold Pool | 5.291 | % | 3/1/38 | 3,807 | 3,981 | ||||
| 2,3 | Freddie Mac Non Gold Pool | 5.329 | % | 12/1/35 | 3,026 | 3,173 | ||||
| 2,3 | Freddie Mac Non Gold Pool | 5.428 | % | 3/1/37 | 2,484 | 2,611 | ||||
| 2,3 | Freddie Mac Non Gold Pool | 5.435 | % | 4/1/37 | 5,284 | 5,554 | ||||
| 2,3 | Freddie Mac Non Gold Pool | 5.502 | % | 2/1/36 | 2,850 | 2,970 | ||||
17
| Total Bond Market II Index Fund | |||||||||||
| Face | Market | ||||||||||
| Maturity | Amount | Value• | |||||||||
| Coupon | Date | ($ | 000 | ) | ($ | 000 | ) | ||||
| 2,3 | Freddie Mac Non Gold Pool | 5.568 | % | 5/1/36 | 5,239 | 5,474 | |||||
| 2,3 | Freddie Mac Non Gold Pool | 5.582 | % | 4/1/37 | 4,140 | 4,339 | |||||
| 2,3 | Freddie Mac Non Gold Pool | 5.598 | % | 7/1/36 | 2,274 | 2,384 | |||||
| 2,3 | Freddie Mac Non Gold Pool | 5.656 | % | 12/1/36 | 4,182 | 4,406 | |||||
| 2,3 | Freddie Mac Non Gold Pool | 5.683 | % | 3/1/37 | 253 | 267 | |||||
| 2,3 | Freddie Mac Non Gold Pool | 5.711 | % | 11/1/36 | 1,861 | 1,951 | |||||
| 2,3 | Freddie Mac Non Gold Pool | 5.714 | % | 9/1/36 | 7,646 | 8,069 | |||||
| 2,3 | Freddie Mac Non Gold Pool | 5.749 | % | 4/1/37 | 8,865 | 9,244 | |||||
| 2,3 | Freddie Mac Non Gold Pool | 5.770 | % | 5/1/36 | 3,868 | 4,051 | |||||
| 2,3 | Freddie Mac Non Gold Pool | 5.772 | % | 3/1/37 | 1,780 | 1,880 | |||||
| 2,3 | Freddie Mac Non Gold Pool | 5.796 | % | 6/1/37 | 5,837 | 6,163 | |||||
| 2,3 | Freddie Mac Non Gold Pool | 5.797 | % | 3/1/37 | 600 | 630 | |||||
| 2,3 | Freddie Mac Non Gold Pool | 5.824 | % | 10/1/37 | 5,904 | 6,221 | |||||
| 2,3 | Freddie Mac Non Gold Pool | 5.861 | % | 6/1/37 | 3,651 | 3,862 | |||||
| 2,3 | Freddie Mac Non Gold Pool | 5.878 | % | 12/1/36 | 2,722 | 2,881 | |||||
| 2,3 | Freddie Mac Non Gold Pool | 5.892 | % | 5/1/37 | 7,069 | 7,458 | |||||
| 2,3 | Freddie Mac Non Gold Pool | 5.934 | % | 1/1/37 | 1,624 | 1,721 | |||||
| 2,3 | Freddie Mac Non Gold Pool | 5.973 | % | 10/1/37 | 1,516 | 1,608 | |||||
| 2,3 | Freddie Mac Non Gold Pool | 6.055 | % | 3/1/37 | 228 | 242 | |||||
| 2,3 | Freddie Mac Non Gold Pool | 6.064 | % | 8/1/37 | 5,115 | 5,406 | |||||
| 2,3 | Freddie Mac Non Gold Pool | 6.097 | % | 12/1/36 | 3,323 | 3,518 | |||||
| 2,3 | Freddie Mac Non Gold Pool | 6.102 | % | 3/1/37 | 152 | 159 | |||||
| 2,3 | Freddie Mac Non Gold Pool | 6.105 | % | 8/1/37 | 1,760 | 1,862 | |||||
| 2,3 | Freddie Mac Non Gold Pool | 6.201 | % | 6/1/37 | 3,071 | 3,220 | |||||
| 2,3 | Freddie Mac Non Gold Pool | 6.480 | % | 2/1/37 | 3,839 | 4,099 | |||||
| 3 | Ginnie Mae II Pool | 4.375 | % | 6/20/29 | 81 | 83 | |||||
| 389,676 | |||||||||||
| Total U.S. Government and Agency Obligations (Cost $19,923,812) | 19,905,826 | ||||||||||
| Asset-Backed/Commercial Mortgage-Backed Securities (3.5%) | |||||||||||
| 4 | BA Covered Bond Issuer | 5.500 | % | 6/14/12 | 4,950 | 5,183 | |||||
| 3 | BA Credit Card Trust | 4.720 | % | 5/15/13 | 2,325 | 2,389 | |||||
| 3 | Banc of America Commercial Mortgage Inc. | 5.787 | % | 5/11/35 | 3,878 | 3,938 | |||||
| 3 | Banc of America Commercial Mortgage Inc. | 6.503 | % | 4/15/36 | 2,984 | 3,086 | |||||
| 3 | Banc of America Commercial Mortgage Inc. | 4.050 | % | 11/10/38 | 1,928 | 1,917 | |||||
| 3 | Banc of America Commercial Mortgage Inc. | 4.153 | % | 11/10/38 | 1,400 | 1,370 | |||||
| 3,5 | Banc of America Commercial Mortgage Inc. | 5.398 | % | 6/10/39 | 8,617 | 8,634 | |||||
| 3 | Banc of America Commercial Mortgage Inc. | 4.877 | % | 7/10/42 | 15,200 | 14,486 | |||||
| 3,5 | Banc of America Commercial Mortgage Inc. | 5.142 | % | 11/10/42 | 720 | 725 | |||||
| 3 | Banc of America Commercial Mortgage Inc. | 4.727 | % | 7/10/43 | 2,825 | 2,357 | |||||
| 3 | Banc of America Commercial Mortgage Inc. | 5.118 | % | 7/11/43 | 4,000 | 4,117 | |||||
| 3 | Banc of America Commercial Mortgage Inc. | 5.372 | % | 9/10/45 | 6,800 | 6,422 | |||||
| 3,5 | Banc of America Commercial Mortgage Inc. | 5.421 | % | 9/10/45 | 40 | 31 | |||||
| 3 | Banc of America Commercial Mortgage Inc. | 5.115 | % | 10/10/45 | 6,425 | 6,197 | |||||
| 3,5 | Banc of America Commercial Mortgage Inc. | 5.120 | % | 10/10/45 | 1,125 | 1,100 | |||||
| 3,5 | Banc of America Commercial Mortgage Inc. | 5.176 | % | 10/10/45 | 120 | 99 | |||||
| 3 | Banc of America Commercial Mortgage Inc. | 5.634 | % | 7/10/46 | 6,725 | 6,254 | |||||
| 3 | Banc of America Commercial Mortgage Inc. | 5.675 | % | 7/10/46 | 2,110 | 1,660 | |||||
| 3,5 | Banc of America Commercial Mortgage Inc. | 5.179 | % | 9/10/47 | 500 | 440 | |||||
| 3 | Banc of America Commercial Mortgage Inc. | 5.414 | % | 9/10/47 | 4,955 | 4,614 | |||||
| 3 | Banc of America Commercial Mortgage Inc. | 5.448 | % | 9/10/47 | 775 | 618 | |||||
| 3,5 | Banc of America Commercial Mortgage Inc. | 6.166 | % | 2/10/51 | 8,375 | 7,503 | |||||
| 3 | Bear Stearns Commercial Mortgage Securities | 5.610 | % | 11/15/33 | 3,650 | 3,774 | |||||
| 3 | Bear Stearns Commercial Mortgage Securities | 5.462 | % | 4/12/38 | 6,600 | 6,558 | |||||
| 3,5 | Bear Stearns Commercial Mortgage Securities | 5.463 | % | 4/12/38 | 325 | 327 | |||||
| 3,5 | Bear Stearns Commercial Mortgage Securities | 5.463 | % | 4/12/38 | 1,500 | 1,144 | |||||
| 3 | Bear Stearns Commercial Mortgage Securities | 4.830 | % | 8/15/38 | 4,500 | 4,622 | |||||
18
| Total Bond Market II Index Fund | ||||||||||
| Face | Market | |||||||||
| Maturity | Amount | Value• | ||||||||
| Coupon | Date | ($ | 000 | ) | ($ | 000 | ) | |||
| 3,5 | Bear Stearns Commercial Mortgage Securities | 5.758 | % | 9/11/38 | 1,000 | 801 | ||||
| 3 | Bear Stearns Commercial Mortgage Securities | 5.455 | % | 3/11/39 | 12,725 | 12,368 | ||||
| 3 | Bear Stearns Commercial Mortgage Securities | 4.680 | % | 8/13/39 | 8,650 | 8,595 | ||||
| 3 | Bear Stearns Commercial Mortgage Securities | 4.740 | % | 3/13/40 | 2,275 | 2,339 | ||||
| 3 | Bear Stearns Commercial Mortgage Securities | 5.666 | % | 6/11/40 | 10,125 | 10,209 | ||||
| 3 | Bear Stearns Commercial Mortgage Securities | 5.405 | % | 12/11/40 | 645 | 623 | ||||
| 3 | Bear Stearns Commercial Mortgage Securities | 5.582 | % | 9/11/41 | 1,125 | 902 | ||||
| 3 | Bear Stearns Commercial Mortgage Securities | 4.521 | % | 11/11/41 | 1,400 | 1,403 | ||||
| 3 | Bear Stearns Commercial Mortgage Securities | 5.742 | % | 9/11/42 | 7,295 | 6,917 | ||||
| 3 | Bear Stearns Commercial Mortgage Securities | 5.793 | % | 9/11/42 | 1,825 | 1,735 | ||||
| 3 | Bear Stearns Commercial Mortgage Securities | 5.127 | % | 10/12/42 | 3,375 | 3,372 | ||||
| 3 | Bear Stearns Commercial Mortgage Securities | 5.149 | % | 10/12/42 | 725 | 719 | ||||
| 3,5 | Bear Stearns Commercial Mortgage Securities | 5.513 | % | 1/12/45 | 2,475 | 2,003 | ||||
| 3 | Bear Stearns Commercial Mortgage Securities | 5.613 | % | 6/11/50 | 3,450 | 3,442 | ||||
| 3 | Bear Stearns Commercial Mortgage Securities | 5.694 | % | 6/11/50 | 17,325 | 14,706 | ||||
| 3 | Bear Stearns Commercial Mortgage Securities | 5.700 | % | 6/11/50 | 4,340 | 3,704 | ||||
| 3,5 | Bear Stearns Commercial Mortgage Securities | 5.915 | % | 6/11/50 | 2,625 | 1,918 | ||||
| 3 | Capital Auto Receivables Asset Trust | 4.680 | % | 10/15/12 | 6,125 | 6,329 | ||||
| 3 | Capital One Multi-Asset Execution Trust | 5.300 | % | 2/18/14 | 2,150 | 2,248 | ||||
| 3 | Capital One Multi-Asset Execution Trust | 5.050 | % | 12/17/18 | 12,975 | 13,465 | ||||
| 3 | Capital One Multi-Asset Execution Trust | 5.750 | % | 7/15/20 | 1,640 | 1,780 | ||||
| 3 | CDC Commercial Mortgage Trust | 5.676 | % | 11/15/30 | 6,225 | 6,416 | ||||
| 3 | Chase Commercial Mortgage Securities Corp. | 7.757 | % | 4/15/32 | 106 | 106 | ||||
| 3 | Chase Issuance Trust | 4.650 | % | 12/17/12 | 9,275 | 9,532 | ||||
| 3 | Chase Issuance Trust | 4.650 | % | 3/15/15 | 11,375 | 12,082 | ||||
| 3 | Chase Issuance Trust | 5.400 | % | 7/15/15 | 3,325 | 3,616 | ||||
| 3 | CIT Group Home Equity Loan Trust | 6.200 | % | 2/25/30 | 279 | 250 | ||||
| 3 | Citibank Credit Card Issuance Trust | 5.450 | % | 5/10/13 | 1,225 | 1,290 | ||||
| 3 | Citibank Credit Card Issuance Trust | 4.900 | % | 6/23/16 | 7,575 | 8,163 | ||||
| 3 | Citibank Credit Card Issuance Trust | 4.850 | % | 3/10/17 | 1,155 | 1,219 | ||||
| 3 | Citibank Credit Card Issuance Trust | 4.150 | % | 7/7/17 | 1,225 | 1,236 | ||||
| 3 | Citibank Credit Card Issuance Trust | 5.650 | % | 9/20/19 | 1,200 | 1,295 | ||||
| 3 | Citigroup Commercial Mortgage Trust | 4.623 | % | 10/15/41 | 1,125 | 1,126 | ||||
| 3 | Citigroup Commercial Mortgage Trust | 4.830 | % | 5/15/43 | 375 | 321 | ||||
| 3,5 | Citigroup Commercial Mortgage Trust | 5.725 | % | 3/15/49 | 5,112 | 4,861 | ||||
| 3,5 | Citigroup Commercial Mortgage Trust | 5.700 | % | 12/10/49 | 1,875 | 1,261 | ||||
| 3,5 | Citigroup Commercial Mortgage Trust | 5.700 | % | 12/10/49 | 3,225 | 2,776 | ||||
| 3,5 | Citigroup Commercial Mortgage Trust | 6.092 | % | 12/10/49 | 1,335 | 1,016 | ||||
| 3,5 | Citigroup/Deutsche Bank | |||||||||
| Commercial Mortgage Trust | 5.224 | % | 7/15/44 | 2,475 | 2,144 | |||||
| 3 | Citigroup/Deutsche Bank | |||||||||
| Commercial Mortgage Trust | 5.224 | % | 7/15/44 | 10,175 | 10,139 | |||||
| 3 | Citigroup/Deutsche Bank | |||||||||
| Commercial Mortgage Trust | 5.886 | % | 11/15/44 | 6,780 | 5,984 | |||||
| 3 | Citigroup/Deutsche Bank | |||||||||
| Commercial Mortgage Trust | 5.648 | % | 10/15/48 | 3,150 | 2,410 | |||||
| 3 | Citigroup/Deutsche Bank | |||||||||
| Commercial Mortgage Trust | 5.205 | % | 12/11/49 | 7,925 | 7,944 | |||||
| 3 | Citigroup/Deutsche Bank | |||||||||
| Commercial Mortgage Trust | 5.322 | % | 12/11/49 | 5,650 | 4,840 | |||||
| 3,4 | Commercial Mortgage Lease-Backed Certificates | 6.746 | % | 6/20/31 | 3,065 | 3,216 | ||||
| 3 | Commercial Mortgage Pass Through Certificates | 4.084 | % | 6/10/38 | 1,900 | 1,878 | ||||
| 3 | Commercial Mortgage Pass Through Certificates | 5.116 | % | 6/10/44 | 8,075 | 7,659 | ||||
| 3 | Commercial Mortgage Pass Through Certificates | 5.767 | % | 6/10/46 | 6,400 | 6,301 | ||||
| 3 | Commercial Mortgage Pass Through Certificates | 5.248 | % | 12/10/46 | 1,075 | 1,081 | ||||
| 3,5 | Commercial Mortgage Pass Through Certificates | 5.816 | % | 12/10/49 | 5,925 | 5,381 | ||||
19
| Total Bond Market II Index Fund | ||||||||||
| Face | Market | |||||||||
| Maturity | Amount | Value• | ||||||||
| Coupon | Date | ($ | 000 | ) | ($ | 000 | ) | |||
| 3,5 | Countrywide Home Loan | |||||||||
| Mortgage Pass Through Trust | 4.065 | % | 5/25/33 | 1,143 | 983 | |||||
| 3 | Credit Suisse First Boston | |||||||||
| Mortgage Securities Corp. | 6.380 | % | 12/18/35 | 889 | 909 | |||||
| 3,5 | Credit Suisse First Boston | |||||||||
| Mortgage Securities Corp. | 4.750 | % | 1/15/37 | 5,180 | 5,026 | |||||
| 3 | Credit Suisse First Boston | |||||||||
| Mortgage Securities Corp. | 4.877 | % | 4/15/37 | 325 | 239 | |||||
| 3,5 | Credit Suisse First Boston | |||||||||
| Mortgage Securities Corp. | 5.014 | % | 2/15/38 | 3,800 | 3,752 | |||||
| 3 | Credit Suisse First Boston | |||||||||
| Mortgage Securities Corp. | 3.936 | % | 5/15/38 | 3,975 | 3,918 | |||||
| 3,5 | Credit Suisse First Boston | |||||||||
| Mortgage Securities Corp. | 5.100 | % | 8/15/38 | 670 | 563 | |||||
| 3 | Credit Suisse First Boston | |||||||||
| Mortgage Securities Corp. | 5.100 | % | 8/15/38 | 11,325 | 10,905 | |||||
| 3 | Credit Suisse Mortgage Capital Certificates | 5.825 | % | 6/15/38 | 8,550 | 7,376 | ||||
| 3 | Credit Suisse Mortgage Capital Certificates | 5.825 | % | 6/15/38 | 350 | 275 | ||||
| 3 | Credit Suisse Mortgage Capital Certificates | 5.548 | % | 2/15/39 | 15,575 | 15,157 | ||||
| 3,5 | Credit Suisse Mortgage Capital Certificates | 5.548 | % | 2/15/39 | 2,800 | 2,288 | ||||
| 3,5 | Credit Suisse Mortgage Capital Certificates | 5.723 | % | 6/15/39 | 11,150 | 8,939 | ||||
| 3 | Credit Suisse Mortgage Capital Certificates | 5.509 | % | 9/15/39 | 550 | 304 | ||||
| 3 | Credit Suisse Mortgage Capital Certificates | 5.311 | % | 12/15/39 | 12,575 | 10,367 | ||||
| 3 | Credit Suisse Mortgage Capital Certificates | 5.343 | % | 12/15/39 | 930 | 648 | ||||
| 3 | Credit Suisse Mortgage Capital Certificates | 5.383 | % | 2/15/40 | 2,250 | 1,858 | ||||
| 3,5 | CW Capital Cobalt Ltd. | 5.820 | % | 5/15/46 | 8,100 | 6,383 | ||||
| 3,5 | CW Capital Cobalt Ltd. | 5.484 | % | 4/15/47 | 525 | 418 | ||||
| 3 | Daimler Chrysler Auto Trust | 3.700 | % | 6/8/12 | 2,855 | 2,892 | ||||
| 3 | Discover Card Master Trust | 5.100 | % | 10/15/13 | 225 | 235 | ||||
| 3 | Discover Card Master Trust | 5.650 | % | 12/15/15 | 7,975 | 8,640 | ||||
| 3 | Discover Card Master Trust | 5.650 | % | 3/16/20 | 2,500 | 2,664 | ||||
| 3 | Fifth Third Auto Trust | 4.070 | % | 1/17/12 | 5,275 | 5,339 | ||||
| 3,5 | First Union Commercial Mortgage Trust | 6.638 | % | 10/15/35 | 2,940 | 2,963 | ||||
| 3 | First Union National Bank Commercial Mortgage | 6.223 | % | 12/12/33 | 4,350 | 4,547 | ||||
| 3 | Ford Credit Auto Owner Trust | 4.370 | % | 10/15/12 | 5,525 | 5,726 | ||||
| 3 | Ford Credit Auto Owner Trust | 2.420 | % | 11/15/14 | 1,875 | 1,842 | ||||
| 3 | GE Capital Commercial Mortgage Corp. | 6.531 | % | 5/15/33 | 3,700 | 3,835 | ||||
| 3 | GE Capital Commercial Mortgage Corp. | 6.290 | % | 8/11/33 | 625 | 649 | ||||
| 3 | GE Capital Commercial Mortgage Corp. | 5.994 | % | 12/10/35 | 136 | 137 | ||||
| 3 | GE Capital Commercial Mortgage Corp. | 6.269 | % | 12/10/35 | 3,050 | 3,240 | ||||
| 3 | GE Capital Commercial Mortgage Corp. | 5.145 | % | 7/10/37 | 325 | 331 | ||||
| 3 | GE Capital Commercial Mortgage Corp. | 4.996 | % | 12/10/37 | 4,325 | 4,424 | ||||
| 3,5 | GE Capital Commercial Mortgage Corp. | 5.336 | % | 3/10/44 | 10,975 | 10,392 | ||||
| 3,5 | GE Capital Commercial Mortgage Corp. | 5.334 | % | 11/10/45 | 2,725 | 2,248 | ||||
| 3 | GMAC Commercial Mortgage Securities Inc. | 7.455 | % | 8/16/33 | 2,104 | 2,137 | ||||
| 3 | GMAC Commercial Mortgage Securities Inc. | 6.465 | % | 4/15/34 | 2,875 | 2,962 | ||||
| 3 | GMAC Commercial Mortgage Securities Inc. | 6.700 | % | 4/15/34 | 3,543 | 3,682 | ||||
| 3 | GMAC Commercial Mortgage Securities Inc. | 4.908 | % | 3/10/38 | 525 | 512 | ||||
| 3 | GMAC Commercial Mortgage Securities Inc. | 4.646 | % | 4/10/40 | 1,525 | 1,548 | ||||
| 3 | GMAC Commercial Mortgage Securities Inc. | 4.864 | % | 12/10/41 | 1,825 | 1,790 | ||||
| 3 | GMAC Commercial Mortgage Securities Inc. | 4.754 | % | 5/10/43 | 575 | 499 | ||||
| 3 | Greenwich Capital Commercial Funding Corp. | 4.948 | % | 1/11/35 | 2,375 | 2,433 | ||||
| 3 | Greenwich Capital Commercial Funding Corp. | 4.533 | % | 1/5/36 | 950 | 960 | ||||
| 3 | Greenwich Capital Commercial Funding Corp. | 4.915 | % | 1/5/36 | 3,375 | 3,395 | ||||
| 3 | Greenwich Capital Commercial Funding Corp. | 5.317 | % | 6/10/36 | 4,875 | 4,945 | ||||
| 3 | Greenwich Capital Commercial Funding Corp. | 5.117 | % | 4/10/37 | 2,025 | 2,039 | ||||
| 3 | Greenwich Capital Commercial Funding Corp. | 5.224 | % | 4/10/37 | 8,540 | 7,993 | ||||
20
| Total Bond Market II Index Fund | ||||||||||
| Face | Market | |||||||||
| Maturity | Amount | Value• | ||||||||
| Coupon | Date | ($ | 000 | ) | ($ | 000 | ) | |||
| 3,5 | Greenwich Capital Commercial Funding Corp. | 5.277 | % | 4/10/37 | 1,900 | 1,599 | ||||
| 3,5 | Greenwich Capital Commercial Funding Corp. | 5.918 | % | 7/10/38 | 1,175 | 939 | ||||
| 3 | Greenwich Capital Commercial Funding Corp. | 5.475 | % | 3/10/39 | 575 | 410 | ||||
| 3 | Greenwich Capital Commercial Funding Corp. | 4.799 | % | 8/10/42 | 7,650 | 7,088 | ||||
| 3 | GS Mortgage Securities Corp. II | 5.506 | % | 4/10/38 | 5,525 | 5,586 | ||||
| 3,5 | GS Mortgage Securities Corp. II | 5.553 | % | 4/10/38 | 3,025 | 2,757 | ||||
| 3,5 | GS Mortgage Securities Corp. II | 5.622 | % | 4/10/38 | 1,725 | 1,376 | ||||
| 3 | GS Mortgage Securities Corp. II | 5.396 | % | 8/10/38 | 10,375 | 9,819 | ||||
| 3 | GS Mortgage Securities Corp. II | 4.608 | % | 1/10/40 | 4,325 | 4,318 | ||||
| 3 | Harley-Davidson Motorcycle Trust | 5.210 | % | 6/17/13 | 3,625 | 3,732 | ||||
| 3 | Honda Auto Receivables Owner Trust | 4.880 | % | 9/18/14 | 2,675 | 2,816 | ||||
| 3 | JP Morgan Chase Commercial | |||||||||
| Mortgage Securities Corp. | 6.260 | % | 3/15/33 | 4,203 | 4,288 | |||||
| 3 | JP Morgan Chase Commercial | |||||||||
| Mortgage Securities Corp. | 5.050 | % | 12/12/34 | 2,875 | 2,951 | |||||
| 3 | JP Morgan Chase Commercial | |||||||||
| Mortgage Securities Corp. | 4.985 | % | 1/12/37 | 3,275 | 3,367 | |||||
| 3 | JP Morgan Chase Commercial | |||||||||
| Mortgage Securities Corp. | 5.255 | % | 7/12/37 | 425 | 438 | |||||
| 3 | JP Morgan Chase Commercial | |||||||||
| Mortgage Securities Corp. | 5.376 | % | 7/12/37 | 2,750 | 2,826 | |||||
| 3 | JP Morgan Chase Commercial | |||||||||
| Mortgage Securities Corp. | 4.824 | % | 9/12/37 | 4,750 | 4,777 | |||||
| 3,5 | JP Morgan Chase Commercial | |||||||||
| Mortgage Securities Corp. | 4.948 | % | 9/12/37 | 275 | 218 | |||||
| 3 | JP Morgan Chase Commercial | |||||||||
| Mortgage Securities Corp. | 4.404 | % | 1/12/39 | 4,275 | 4,066 | |||||
| 3,5 | JP Morgan Chase Commercial | |||||||||
| Mortgage Securities Corp. | 5.377 | % | 6/12/41 | 7,750 | 7,802 | |||||
| 3 | JP Morgan Chase Commercial | |||||||||
| Mortgage Securities Corp. | 4.780 | % | 7/15/42 | 1,075 | 840 | |||||
| 3,5 | JP Morgan Chase Commercial | |||||||||
| Mortgage Securities Corp. | 5.321 | % | 1/12/43 | 40 | 31 | |||||
| 3 | JP Morgan Chase Commercial | |||||||||
| Mortgage Securities Corp. | 5.160 | % | 4/15/43 | 3,873 | 3,893 | |||||
| 3,5 | JP Morgan Chase Commercial | |||||||||
| Mortgage Securities Corp. | 5.475 | % | 4/15/43 | 1,295 | 1,243 | |||||
| 3,5 | JP Morgan Chase Commercial | |||||||||
| Mortgage Securities Corp. | 5.444 | % | 12/12/44 | 1,100 | 848 | |||||
| 3,5 | JP Morgan Chase Commercial | |||||||||
| Mortgage Securities Corp. | 5.221 | % | 12/15/44 | 1,095 | 955 | |||||
| 3 | JP Morgan Chase Commercial | |||||||||
| Mortgage Securities Corp. | 5.874 | % | 4/15/45 | 9,075 | 8,645 | |||||
| 3,5 | JP Morgan Chase Commercial | |||||||||
| Mortgage Securities Corp. | 5.875 | % | 4/15/45 | 635 | 488 | |||||
| 3 | JP Morgan Chase Commercial | |||||||||
| Mortgage Securities Corp. | 5.593 | % | 5/12/45 | 2,500 | 2,041 | |||||
| 3 | JP Morgan Chase Commercial | |||||||||
| Mortgage Securities Corp. | 5.440 | % | 5/15/45 | 1,720 | 1,417 | |||||
| 3 | JP Morgan Chase Commercial | |||||||||
| Mortgage Securities Corp. | 5.447 | % | 5/15/45 | 2,025 | 2,024 | |||||
| 3 | JP Morgan Chase Commercial | |||||||||
| Mortgage Securities Corp. | 5.803 | % | 6/15/49 | 3,850 | 3,864 | |||||
| 3 | JP Morgan Chase Commercial | |||||||||
| Mortgage Securities Corp. | 5.818 | % | 6/15/49 | 5,075 | 4,512 | |||||
| 3 | JP Morgan Chase Commercial | |||||||||
| Mortgage Securities Corp. | 5.794 | % | 2/12/51 | 9,300 | 7,896 | |||||
21
| Total Bond Market II Index Fund | ||||||||||
| Face | Market | |||||||||
| Maturity | Amount | Value• | ||||||||
| Coupon | Date | ($ | 000 | ) | ($ | 000 | ) | |||
| 3 | JP Morgan Chase Commercial | |||||||||
| Mortgage Securities Corp. | 5.855 | % | 2/12/51 | 3,075 | 3,064 | |||||
| 3,5 | JP Morgan Chase Commercial | |||||||||
| Mortgage Securities Corp. | 5.882 | % | 2/15/51 | 7,600 | 6,511 | |||||
| 3,5 | LB Commercial Conduit Mortgage Trust | 5.950 | % | 7/15/44 | 3,495 | 2,379 | ||||
| 3 | LB-UBS Commercial Mortgage Trust | 5.386 | % | 6/15/26 | 446 | 458 | ||||
| 3 | LB-UBS Commercial Mortgage Trust | 7.370 | % | 8/15/26 | 3,363 | 3,412 | ||||
| 3 | LB-UBS Commercial Mortgage Trust | 4.786 | % | 10/15/29 | 6,195 | 5,977 | ||||
| 3 | LB-UBS Commercial Mortgage Trust | 4.742 | % | 2/15/30 | 2,850 | 2,766 | ||||
| 3 | LB-UBS Commercial Mortgage Trust | 4.553 | % | 7/15/30 | 366 | 368 | ||||
| 3 | LB-UBS Commercial Mortgage Trust | 5.197 | % | 11/15/30 | 5,705 | 5,547 | ||||
| 3 | LB-UBS Commercial Mortgage Trust | 6.133 | % | 12/15/30 | 1,800 | 1,878 | ||||
| 3 | LB-UBS Commercial Mortgage Trust | 5.217 | % | 2/15/31 | 925 | 778 | ||||
| 3 | LB-UBS Commercial Mortgage Trust | 4.853 | % | 9/15/31 | 5,950 | 6,059 | ||||
| 3 | LB-UBS Commercial Mortgage Trust | 4.960 | % | 12/15/31 | 2,375 | 2,418 | ||||
| 3 | LB-UBS Commercial Mortgage Trust | 4.166 | % | 5/15/32 | 2,605 | 2,577 | ||||
| 3 | LB-UBS Commercial Mortgage Trust | 4.931 | % | 9/15/35 | 5,900 | 5,971 | ||||
| 3,5 | LB-UBS Commercial Mortgage Trust | 5.661 | % | 3/15/39 | 8,600 | 8,143 | ||||
| 3 | LB-UBS Commercial Mortgage Trust | 5.413 | % | 9/15/39 | 425 | 323 | ||||
| 3 | LB-UBS Commercial Mortgage Trust | 5.424 | % | 2/15/40 | 1,200 | 998 | ||||
| 3 | LB-UBS Commercial Mortgage Trust | 5.430 | % | 2/15/40 | 6,000 | 5,119 | ||||
| 3 | LB-UBS Commercial Mortgage Trust | 5.455 | % | 2/15/40 | 1,700 | 1,122 | ||||
| 3,5 | LB-UBS Commercial Mortgage Trust | 5.493 | % | 2/15/40 | 1,305 | 888 | ||||
| 3,5 | LB-UBS Commercial Mortgage Trust | 5.263 | % | 11/15/40 | 245 | 214 | ||||
| 3,5 | LB-UBS Commercial Mortgage Trust | 6.149 | % | 4/15/41 | 1,970 | 1,443 | ||||
| 3,5 | LB-UBS Commercial Mortgage Trust | 6.149 | % | 4/15/41 | 8,650 | 8,308 | ||||
| 3 | LB-UBS Commercial Mortgage Trust | 5.866 | % | 9/15/45 | 8,490 | 7,228 | ||||
| 3 | MBNA Master Credit Card Trust | 7.800 | % | 10/15/12 | 200 | 205 | ||||
| 3 | Merrill Lynch Mortgage Trust | 5.236 | % | 11/12/35 | 4,150 | 4,158 | ||||
| 3 | Merrill Lynch Mortgage Trust | 5.107 | % | 7/12/38 | 50 | 42 | ||||
| 3 | Merrill Lynch Mortgage Trust | 5.655 | % | 5/12/39 | 4,100 | 3,860 | ||||
| 3,5 | Merrill Lynch Mortgage Trust | 5.656 | % | 5/12/39 | 625 | 482 | ||||
| 3 | Merrill Lynch Mortgage Trust | 5.782 | % | 8/12/43 | 1,965 | 1,596 | ||||
| 3,5 | Merrill Lynch Mortgage Trust | 5.291 | % | 1/12/44 | 6,675 | 6,434 | ||||
| 3,5 | Merrill Lynch Mortgage Trust | 5.828 | % | 6/12/50 | 14,600 | 11,930 | ||||
| 3,5 | Merrill Lynch Mortgage Trust | 5.828 | % | 6/12/50 | 1,175 | 771 | ||||
| 3 | Merrill Lynch Mortgage Trust | 5.425 | % | 2/12/51 | 1,275 | 1,244 | ||||
| 3 | Merrill Lynch Mortgage Trust | 5.690 | % | 2/12/51 | 3,250 | 2,807 | ||||
| 3,5 | Merrill Lynch/Countrywide | |||||||||
| Commercial Mortgage Trust | 5.517 | % | 2/12/39 | 275 | 145 | |||||
| 3 | Merrill Lynch/Countrywide | |||||||||
| Commercial Mortgage Trust | 5.909 | % | 6/12/46 | 14,950 | 14,699 | |||||
| 3 | Merrill Lynch/Countrywide | |||||||||
| Commercial Mortgage Trust | 5.456 | % | 7/12/46 | 300 | 204 | |||||
| 3 | Merrill Lynch/Countrywide | |||||||||
| Commercial Mortgage Trust | 5.378 | % | 8/12/48 | 6,975 | 5,302 | |||||
| 3 | Merrill Lynch/Countrywide | |||||||||
| Commercial Mortgage Trust | 5.590 | % | 9/12/49 | 3,810 | 3,772 | |||||
| 3 | Merrill Lynch/Countrywide | |||||||||
| Commercial Mortgage Trust | 5.700 | % | 9/12/49 | 9,770 | 7,962 | |||||
| 3 | Morgan Stanley Capital I | 4.970 | % | 4/14/40 | 1,625 | 1,619 | ||||
| 3,5 | Morgan Stanley Capital I | 5.110 | % | 6/15/40 | 4,775 | 4,731 | ||||
| 3 | Morgan Stanley Capital I | 5.030 | % | 6/13/41 | 425 | 426 | ||||
| 3 | Morgan Stanley Capital I | 5.270 | % | 6/13/41 | 2,185 | 2,152 | ||||
| 3,5 | Morgan Stanley Capital I | 5.810 | % | 8/12/41 | 775 | 621 | ||||
| 3 | Morgan Stanley Capital I | 5.328 | % | 11/12/41 | 950 | 906 | ||||
| 3 | Morgan Stanley Capital I | 5.360 | % | 11/12/41 | 2,626 | 1,950 | ||||
22
| Total Bond Market II Index Fund | ||||||||||
| Face | Market | |||||||||
| Maturity | Amount | Value• | ||||||||
| Coupon | Date | ($ | 000 | ) | ($ | 000 | ) | |||
| 3 | Morgan Stanley Capital I | 4.970 | % | 12/15/41 | 4,450 | 4,440 | ||||
| 3 | Morgan Stanley Capital I | 5.168 | % | 1/14/42 | 1,500 | 1,506 | ||||
| 3,5 | Morgan Stanley Capital I | 5.649 | % | 6/11/42 | 4,625 | 4,478 | ||||
| 3,5 | Morgan Stanley Capital I | 5.649 | % | 6/11/42 | 175 | 125 | ||||
| 3 | Morgan Stanley Capital I | 4.989 | % | 8/13/42 | 7,250 | 7,097 | ||||
| 3 | Morgan Stanley Capital I | 5.230 | % | 9/15/42 | 9,800 | 9,573 | ||||
| 3 | Morgan Stanley Capital I | 5.769 | % | 10/15/42 | 2,700 | 2,619 | ||||
| 3,5 | Morgan Stanley Capital I | 5.774 | % | 10/15/42 | 75 | 61 | ||||
| 3,5 | Morgan Stanley Capital I | 5.207 | % | 11/14/42 | 170 | 148 | ||||
| 3,5 | Morgan Stanley Capital I | 5.207 | % | 11/14/42 | 5,750 | 5,782 | ||||
| 3 | Morgan Stanley Capital I | 6.280 | % | 1/11/43 | 6,525 | 6,062 | ||||
| 3 | Morgan Stanley Capital I | 5.332 | % | 12/15/43 | 2,100 | 1,924 | ||||
| 3,5 | Morgan Stanley Capital I | 5.385 | % | 3/12/44 | 10,375 | 9,909 | ||||
| 3,5 | Morgan Stanley Capital I | 5.773 | % | 7/12/44 | 1,575 | 1,253 | ||||
| 3 | Morgan Stanley Capital I | 4.660 | % | 9/13/45 | 2,150 | 2,069 | ||||
| 3,5 | Morgan Stanley Capital I | 5.691 | % | 4/15/49 | 1,600 | 948 | ||||
| 3,5 | Morgan Stanley Capital I | 5.544 | % | 11/12/49 | 2,500 | 1,827 | ||||
| 3 | Morgan Stanley Capital I | 5.809 | % | 12/12/49 | 3,425 | 2,897 | ||||
| 3 | Morgan Stanley Capital I | 5.090 | % | 10/12/52 | 2,650 | 2,678 | ||||
| 3,5 | Morgan Stanley Capital I | 5.204 | % | 10/12/52 | 1,725 | 1,356 | ||||
| 3 | Morgan Stanley Capital I | 4.770 | % | 7/15/56 | 1,345 | 1,002 | ||||
| 3 | Morgan Stanley Dean Witter Capital I | 6.660 | % | 2/15/33 | 1,274 | 1,308 | ||||
| 3 | Morgan Stanley Dean Witter Capital I | 6.390 | % | 7/15/33 | 1,363 | 1,415 | ||||
| 3 | Morgan Stanley Dean Witter Capital I | 4.920 | % | 3/12/35 | 4,325 | 4,360 | ||||
| 3 | Morgan Stanley Dean Witter Capital I | 6.390 | % | 10/15/35 | 2,280 | 2,407 | ||||
| 3 | Morgan Stanley Dean Witter Capital I | 4.740 | % | 11/13/36 | 6,505 | 6,374 | ||||
| 3 | Morgan Stanley Dean Witter Capital I | 5.980 | % | 1/15/39 | 3,625 | 3,716 | ||||
| 3 | Nissan Auto Receivables Owner Trust | 4.460 | % | 4/16/12 | 225 | 230 | ||||
| 3 | Nissan Auto Receivables Owner Trust | 5.050 | % | 11/17/14 | 2,275 | 2,413 | ||||
| 3 | Oncor Electric Delivery Transition Bond Co. LLC | 4.030 | % | 2/15/12 | 73 | 73 | ||||
| 3 | PG&E Energy Recovery Funding LLC | 4.140 | % | 9/25/12 | 1,032 | 1,048 | ||||
| 3 | PG&E Energy Recovery Funding LLC | 5.030 | % | 3/25/14 | 2,552 | 2,663 | ||||
| 3 | PNC Mortgage Acceptance Corp. | 7.300 | % | 10/12/33 | 178 | 182 | ||||
| 3 | PSE&G Transition Funding LLC | 6.890 | % | 12/15/17 | 6,975 | 8,104 | ||||
| 3 | Public Service New Hampshire Funding LLC | 6.480 | % | 5/1/15 | 319 | 344 | ||||
| 3 | Residential Asset Securities Corp. | 6.489 | % | 10/25/30 | 79 | 66 | ||||
| 3,5 | Salomon Brothers Mortgage Securities VII Inc. | 3.688 | % | 9/25/33 | 2,628 | 2,510 | ||||
| 3 | USAA Auto Owner Trust | 4.710 | % | 2/18/14 | 4,550 | 4,799 | ||||
| 3 | Wachovia Bank Commercial Mortgage Trust | 4.440 | % | 11/15/34 | 205 | 207 | ||||
| 3 | Wachovia Bank Commercial Mortgage Trust | 4.980 | % | 11/15/34 | 200 | 205 | ||||
| 3 | Wachovia Bank Commercial Mortgage Trust | 4.867 | % | 2/15/35 | 200 | 203 | ||||
| 3,5 | Wachovia Bank Commercial Mortgage Trust | 5.125 | % | 8/15/35 | 1,100 | 1,123 | ||||
| 3 | Wachovia Bank Commercial Mortgage Trust | 4.719 | % | 1/15/41 | 1,125 | 1,130 | ||||
| 3 | Wachovia Bank Commercial Mortgage Trust | 4.748 | % | 2/15/41 | 8,075 | 7,944 | ||||
| 3 | Wachovia Bank Commercial Mortgage Trust | 5.001 | % | 7/15/41 | 2,162 | 2,177 | ||||
| 3,5 | Wachovia Bank Commercial Mortgage Trust | 5.237 | % | 7/15/41 | 9,475 | 9,492 | ||||
| 3 | Wachovia Bank Commercial Mortgage Trust | 4.803 | % | 10/15/41 | 10,025 | 9,620 | ||||
| 3,5 | Wachovia Bank Commercial Mortgage Trust | 5.083 | % | 3/15/42 | 5,425 | 5,370 | ||||
| 3 | Wachovia Bank Commercial Mortgage Trust | 5.118 | % | 7/15/42 | 2,825 | 2,727 | ||||
| 3,5 | Wachovia Bank Commercial Mortgage Trust | 5.740 | % | 5/15/43 | 7,250 | 7,022 | ||||
| 3,5 | Wachovia Bank Commercial Mortgage Trust | 5.740 | % | 5/15/43 | 2,075 | 1,614 | ||||
| 3 | Wachovia Bank Commercial Mortgage Trust | 4.699 | % | 5/15/44 | 4,900 | 4,675 | ||||
| 3,5 | Wachovia Bank Commercial Mortgage Trust | 5.209 | % | 10/15/44 | 6,475 | 6,395 | ||||
| 3,5 | Wachovia Bank Commercial Mortgage Trust | 5.265 | % | 12/15/44 | 10,950 | 10,944 | ||||
| 3,5 | Wachovia Bank Commercial Mortgage Trust | 5.315 | % | 12/15/44 | 60 | 51 | ||||
| 3,5 | Wachovia Bank Commercial Mortgage Trust | 5.956 | % | 6/15/45 | 475 | 368 | ||||
| 3,5 | Wachovia Bank Commercial Mortgage Trust | 5.765 | % | 7/15/45 | 2,950 | 2,673 | ||||
23
| Total Bond Market II Index Fund | ||||||||||
| Face | Market | |||||||||
| Maturity | Amount | Value• | ||||||||
| Coupon | Date | ($ | 000 | ) | ($ | 000 | ) | |||
| 3,5 | Wachovia Bank Commercial Mortgage Trust | 5.818 | % | 5/15/46 | 1,540 | 1,020 | ||||
| 3 | Wachovia Bank Commercial Mortgage Trust | 5.313 | % | 11/15/48 | 5,275 | 4,999 | ||||
| 3 | Wachovia Bank Commercial Mortgage Trust | 5.339 | % | 11/15/48 | 3,850 | 2,885 | ||||
| 3 | World Omni Auto Receivables Trust | 3.940 | % | 10/15/12 | 5,650 | 5,761 | ||||
| Total Asset-Backed/Commercial Mortgage-Backed Securities (Cost $833,148) | 960,201 | |||||||||
| Corporate Bonds (19.5%) | ||||||||||
| Finance (7.0%) | ||||||||||
| Banking (4.7%) | ||||||||||
| 3 | Abbey National Capital Trust I | 8.963 | % | 12/29/49 | 500 | 492 | ||||
| Abbey National PLC | 7.950 | % | 10/26/29 | 2,575 | 2,869 | |||||
| ABN Amro Bank NV | 4.650 | % | 6/4/18 | 100 | 80 | |||||
| American Express Bank FSB | 5.550 | % | 10/17/12 | 1,300 | 1,383 | |||||
| American Express Bank FSB | 5.500 | % | 4/16/13 | 3,275 | 3,478 | |||||
| American Express Bank FSB | 6.000 | % | 9/13/17 | 1,500 | 1,548 | |||||
| American Express Centurion Bank | 5.550 | % | 10/17/12 | 1,025 | 1,093 | |||||
| American Express Centurion Bank | 5.950 | % | 6/12/17 | 650 | 674 | |||||
| American Express Centurion Bank | 6.000 | % | 9/13/17 | 9,450 | 9,810 | |||||
| American Express Co. | 4.875 | % | 7/15/13 | 1,575 | 1,639 | |||||
| American Express Co. | 7.250 | % | 5/20/14 | 1,250 | 1,409 | |||||
| American Express Co. | 5.500 | % | 9/12/16 | 1,025 | 1,055 | |||||
| American Express Co. | 6.150 | % | 8/28/17 | 2,025 | 2,113 | |||||
| American Express Co. | 7.000 | % | 3/19/18 | 12,050 | 13,290 | |||||
| American Express Co. | 8.125 | % | 5/20/19 | 1,625 | 1,930 | |||||
| American Express Co. | 8.150 | % | 3/19/38 | 525 | 650 | |||||
| 3 | American Express Co. | 6.800 | % | 9/1/66 | 2,125 | 1,839 | ||||
| American Express Credit Corp. | 5.000 | % | 12/2/10 | 1,925 | 1,987 | |||||
| American Express Credit Corp. | 5.875 | % | 5/2/13 | 3,175 | 3,399 | |||||
| American Express Credit Corp. | 7.300 | % | 8/20/13 | 6,300 | 7,084 | |||||
| American Express Credit Corp. | 5.125 | % | 8/25/14 | 2,900 | 3,057 | |||||
| 4 | American Express Travel Related Services Co. Inc. | 5.250 | % | 11/21/11 | 2,400 | 2,504 | ||||
| Amsouth Bank | 5.200 | % | 4/1/15 | 1,825 | 1,571 | |||||
| Associates Corp. of North America | 6.950 | % | 11/1/18 | 100 | 101 | |||||
| Banco Santander Chile | 2.875 | % | 11/13/12 | 2,000 | 2,012 | |||||
| Bank of America Corp. | 4.250 | % | 10/1/10 | 1,000 | 1,026 | |||||
| Bank of America Corp. | 4.375 | % | 12/1/10 | 1,425 | 1,469 | |||||
| Bank of America Corp. | 5.375 | % | 8/15/11 | 1,100 | 1,160 | |||||
| Bank of America Corp. | 5.375 | % | 9/11/12 | 2,175 | 2,307 | |||||
| Bank of America Corp. | 4.875 | % | 9/15/12 | 5,100 | 5,338 | |||||
| Bank of America Corp. | 4.875 | % | 1/15/13 | 2,825 | 2,946 | |||||
| Bank of America Corp. | 4.900 | % | 5/1/13 | 6,925 | 7,176 | |||||
| Bank of America Corp. | 7.375 | % | 5/15/14 | 9,650 | 10,943 | |||||
| Bank of America Corp. | 5.375 | % | 6/15/14 | 1,075 | 1,120 | |||||
| Bank of America Corp. | 5.125 | % | 11/15/14 | 6,350 | 6,570 | |||||
| Bank of America Corp. | 4.750 | % | 8/1/15 | 275 | 279 | |||||
| Bank of America Corp. | 5.250 | % | 12/1/15 | 1,225 | 1,235 | |||||
| Bank of America Corp. | 6.500 | % | 8/1/16 | 10,100 | 10,888 | |||||
| Bank of America Corp. | 5.750 | % | 8/15/16 | 3,250 | 3,279 | |||||
| Bank of America Corp. | 5.625 | % | 10/14/16 | 2,325 | 2,362 | |||||
| Bank of America Corp. | 5.420 | % | 3/15/17 | 5,375 | 5,328 | |||||
| Bank of America Corp. | 6.000 | % | 9/1/17 | 400 | 418 | |||||
| Bank of America Corp. | 5.750 | % | 12/1/17 | 1,575 | 1,622 | |||||
| Bank of America Corp. | 5.650 | % | 5/1/18 | 14,850 | 15,108 | |||||
| Bank of America Corp. | 7.625 | % | 6/1/19 | 4,025 | 4,657 | |||||
| Bank of America Corp. | 6.800 | % | 3/15/28 | 600 | 586 | |||||
| Bank of America Corp. | 6.500 | % | 9/15/37 | 875 | 850 | |||||
| Bank of America NA | 5.300 | % | 3/15/17 | 6,650 | 6,499 | |||||
24
| Total Bond Market II Index Fund | |||||||||
| Face | Market | ||||||||
| Maturity | Amount | Value• | |||||||
| Coupon | Date | ($ | 000 | ) | ($ | 000 | ) | ||
| Bank of America NA | 6.100 | % | 6/15/17 | 1,975 | 2,008 | ||||
| Bank of America NA | 6.000 | % | 10/15/36 | 4,225 | 4,085 | ||||
| Bank of New York Mellon Corp. | 4.950 | % | 1/14/11 | 1,125 | 1,167 | ||||
| Bank of New York Mellon Corp. | 6.375 | % | 4/1/12 | 100 | 109 | ||||
| Bank of New York Mellon Corp. | 4.950 | % | 11/1/12 | 9,500 | 10,233 | ||||
| Bank of New York Mellon Corp. | 4.500 | % | 4/1/13 | 525 | 553 | ||||
| Bank of New York Mellon Corp. | 5.125 | % | 8/27/13 | 1,000 | 1,079 | ||||
| Bank of New York Mellon Corp. | 4.300 | % | 5/15/14 | 2,000 | 2,103 | ||||
| Bank of New York Mellon Corp. | 4.950 | % | 3/15/15 | 2,325 | 2,450 | ||||
| Bank of New York Mellon Corp. | 5.450 | % | 5/15/19 | 3,645 | 3,823 | ||||
| 4 Bank of Scotland PLC | 5.250 | % | 2/21/17 | 4,300 | 4,278 | ||||
| Bank of Tokyo-Mitsubishi UFJ Ltd. | 7.400 | % | 6/15/11 | 450 | 487 | ||||
| Bank One Corp. | 5.900 | % | 11/15/11 | 1,150 | 1,229 | ||||
| Bank One Corp. | 5.250 | % | 1/30/13 | 1,450 | 1,535 | ||||
| Bank One Corp. | 4.900 | % | 4/30/15 | 975 | 1,006 | ||||
| Bank One Corp. | 7.625 | % | 10/15/26 | 425 | 483 | ||||
| Banque Paribas | 6.950 | % | 7/22/13 | 325 | 357 | ||||
| Barclays Bank PLC | 5.450 | % | 9/12/12 | 1,450 | 1,568 | ||||
| Barclays Bank PLC | 2.500 | % | 1/23/13 | 2,325 | 2,323 | ||||
| Barclays Bank PLC | 5.200 | % | 7/10/14 | 5,800 | 6,175 | ||||
| Barclays Bank PLC | 5.000 | % | 9/22/16 | 2,450 | 2,508 | ||||
| Barclays Bank PLC | 6.750 | % | 5/22/19 | 2,175 | 2,442 | ||||
| BB&T Capital Trust II | 6.750 | % | 6/7/36 | 2,675 | 2,493 | ||||
| 3 BB&T Capital Trust IV | 6.820 | % | 6/12/57 | 1,050 | 947 | ||||
| BB&T Corp. | 6.500 | % | 8/1/11 | 675 | 719 | ||||
| BB&T Corp. | 3.850 | % | 7/27/12 | 2,375 | 2,461 | ||||
| BB&T Corp. | 4.750 | % | 10/1/12 | 1,675 | 1,747 | ||||
| BB&T Corp. | 3.375 | % | 9/25/13 | 2,725 | 2,748 | ||||
| BB&T Corp. | 5.700 | % | 4/30/14 | 1,750 | 1,889 | ||||
| BB&T Corp. | 5.200 | % | 12/23/15 | 1,575 | 1,641 | ||||
| BB&T Corp. | 4.900 | % | 6/30/17 | 100 | 97 | ||||
| BB&T Corp. | 6.850 | % | 4/30/19 | 1,750 | 1,983 | ||||
| BB&T Corp. | 5.250 | % | 11/1/19 | 4,350 | 4,272 | ||||
| Bear Stearns Cos. LLC | 4.500 | % | 10/28/10 | 850 | 877 | ||||
| Bear Stearns Cos. LLC | 5.350 | % | 2/1/12 | 6,600 | 7,018 | ||||
| Bear Stearns Cos. LLC | 6.950 | % | 8/10/12 | 2,475 | 2,765 | ||||
| Bear Stearns Cos. LLC | 5.700 | % | 11/15/14 | 4,825 | 5,276 | ||||
| Bear Stearns Cos. LLC | 5.300 | % | 10/30/15 | 1,900 | 2,021 | ||||
| Bear Stearns Cos. LLC | 5.550 | % | 1/22/17 | 1,850 | 1,889 | ||||
| Bear Stearns Cos. LLC | 6.400 | % | 10/2/17 | 2,025 | 2,227 | ||||
| Bear Stearns Cos. LLC | 7.250 | % | 2/1/18 | 3,975 | 4,578 | ||||
| Bear Stearns Cos. LLC | 4.650 | % | 7/2/18 | 425 | 409 | ||||
| BNP Paribas US Medium-Term Note Program LLC | 2.125 | % | 12/21/12 | 350 | 350 | ||||
| BNY Mellon NA | 4.750 | % | 12/15/14 | 3,350 | 3,527 | ||||
| Branch Banking & Trust Co. | 5.625 | % | 9/15/16 | 1,875 | 1,853 | ||||
| Capital One Bank USA NA | 6.500 | % | 6/13/13 | 1,150 | 1,233 | ||||
| Capital One Bank USA NA | 8.800 | % | 7/15/19 | 7,200 | 8,556 | ||||
| Capital One Capital III | 7.686 | % | 8/15/36 | 2,025 | 1,782 | ||||
| Capital One Capital IV | 6.745 | % | 2/17/37 | 850 | 705 | ||||
| Capital One Capital V | 10.250 | % | 8/15/39 | 625 | 728 | ||||
| Capital One Capital VI | 8.875 | % | 5/15/40 | 700 | 745 | ||||
| Capital One Financial Corp. | 5.700 | % | 9/15/11 | 1,075 | 1,133 | ||||
| Capital One Financial Corp. | 4.800 | % | 2/21/12 | 525 | 545 | ||||
| Capital One Financial Corp. | 7.375 | % | 5/23/14 | 2,500 | 2,832 | ||||
| Capital One Financial Corp. | 5.500 | % | 6/1/15 | 2,800 | 2,920 | ||||
| Capital One Financial Corp. | 6.150 | % | 9/1/16 | 1,875 | 1,891 | ||||
| Capital One Financial Corp. | 5.250 | % | 2/21/17 | 1,075 | 1,057 | ||||
25
| Total Bond Market II Index Fund | ||||||||||
| Face | Market | |||||||||
| Maturity | Amount | Value• | ||||||||
| Coupon | Date | ($ | 000 | ) | ($ | 000 | ) | |||
| Capital One Financial Corp. | 6.750 | % | 9/15/17 | 1,575 | 1,690 | |||||
| Charter One Bank NA | 5.500 | % | 4/26/11 | 3,425 | 3,507 | |||||
| 3,4 | Citicorp Lease Pass-Through Trust 1999-1 | 8.040 | % | 12/15/19 | 4,025 | 3,930 | ||||
| Citigroup Inc. | 6.500 | % | 1/18/11 | 3,400 | 3,554 | |||||
| Citigroup Inc. | 5.125 | % | 2/14/11 | 1,800 | 1,856 | |||||
| Citigroup Inc. | 5.100 | % | 9/29/11 | 5,450 | 5,648 | |||||
| Citigroup Inc. | 6.000 | % | 2/21/12 | 1,525 | 1,610 | |||||
| Citigroup Inc. | 5.250 | % | 2/27/12 | 3,875 | 4,030 | |||||
| Citigroup Inc. | 5.500 | % | 8/27/12 | 1,050 | 1,091 | |||||
| Citigroup Inc. | 5.625 | % | 8/27/12 | 2,900 | 2,986 | |||||
| Citigroup Inc. | 5.300 | % | 10/17/12 | 12,725 | 13,307 | |||||
| Citigroup Inc. | 5.500 | % | 4/11/13 | 8,325 | 8,645 | |||||
| Citigroup Inc. | 6.500 | % | 8/19/13 | 6,450 | 6,880 | |||||
| Citigroup Inc. | 5.125 | % | 5/5/14 | 825 | 829 | |||||
| Citigroup Inc. | 6.375 | % | 8/12/14 | 6,125 | 6,407 | |||||
| Citigroup Inc. | 5.000 | % | 9/15/14 | 10,150 | 9,806 | |||||
| Citigroup Inc. | 5.500 | % | 10/15/14 | 4,850 | 4,920 | |||||
| Citigroup Inc. | 6.010 | % | 1/15/15 | 3,250 | 3,339 | |||||
| Citigroup Inc. | 4.700 | % | 5/29/15 | 1,000 | 966 | |||||
| Citigroup Inc. | 5.300 | % | 1/7/16 | 5,550 | 5,428 | |||||
| Citigroup Inc. | 5.500 | % | 2/15/17 | 850 | 807 | |||||
| Citigroup Inc. | 6.000 | % | 8/15/17 | 4,325 | 4,326 | |||||
| Citigroup Inc. | 6.125 | % | 11/21/17 | 9,625 | 9,773 | |||||
| Citigroup Inc. | 6.125 | % | 5/15/18 | 8,633 | 8,654 | |||||
| Citigroup Inc. | 8.500 | % | 5/22/19 | 8,875 | 10,284 | |||||
| Citigroup Inc. | 6.625 | % | 6/15/32 | 1,925 | 1,785 | |||||
| Citigroup Inc. | 5.875 | % | 2/22/33 | 3,250 | 2,728 | |||||
| Citigroup Inc. | 6.000 | % | 10/31/33 | 2,525 | 2,135 | |||||
| Citigroup Inc. | 5.850 | % | 12/11/34 | 650 | 560 | |||||
| Citigroup Inc. | 6.125 | % | 8/25/36 | 2,100 | 1,791 | |||||
| Citigroup Inc. | 5.875 | % | 5/29/37 | 4,550 | 4,053 | |||||
| Citigroup Inc. | 6.875 | % | 3/5/38 | 4,500 | 4,494 | |||||
| Citigroup Inc. | 8.125 | % | 7/15/39 | 2,700 | 3,082 | |||||
| Comerica Bank | 5.750 | % | 11/21/16 | 3,775 | 3,643 | |||||
| Comerica Bank | 5.200 | % | 8/22/17 | 2,800 | 2,611 | |||||
| 3 | Comerica Capital Trust II | 6.576 | % | 2/20/37 | 950 | 760 | ||||
| Comerica Inc. | 4.800 | % | 5/1/15 | 2,600 | 2,404 | |||||
| Compass Bank | 6.400 | % | 10/1/17 | 900 | 901 | |||||
| Compass Bank | 5.900 | % | 4/1/26 | 650 | 538 | |||||
| 4 | Corestates Capital I | 8.000 | % | 12/15/26 | 1,600 | 1,584 | ||||
| Countrywide Financial Corp. | 5.800 | % | 6/7/12 | 1,800 | 1,912 | |||||
| Countrywide Financial Corp. | 6.250 | % | 5/15/16 | 450 | 459 | |||||
| Countrywide Home Loans Inc. | 4.000 | % | 3/22/11 | 800 | 821 | |||||
| Credit Suisse | 5.000 | % | 5/15/13 | 3,975 | 4,237 | |||||
| Credit Suisse | 5.500 | % | 5/1/14 | 7,200 | 7,816 | |||||
| Credit Suisse | 6.000 | % | 2/15/18 | 6,150 | 6,456 | |||||
| Credit Suisse | 5.300 | % | 8/13/19 | 8,025 | 8,307 | |||||
| 3 | Credit Suisse | 5.860 | % | 5/15/49 | 2,450 | 2,174 | ||||
| Credit Suisse USA Inc. | 4.875 | % | 8/15/10 | 5,725 | 5,877 | |||||
| Credit Suisse USA Inc. | 5.250 | % | 3/2/11 | 2,500 | 2,620 | |||||
| Credit Suisse USA Inc. | 5.500 | % | 8/16/11 | 1,475 | 1,567 | |||||
| Credit Suisse USA Inc. | 6.125 | % | 11/15/11 | 3,825 | 4,144 | |||||
| Credit Suisse USA Inc. | 6.500 | % | 1/15/12 | 975 | 1,062 | |||||
| Credit Suisse USA Inc. | 5.500 | % | 8/15/13 | 4,500 | 4,859 | |||||
| Credit Suisse USA Inc. | 5.125 | % | 1/15/14 | 625 | 668 | |||||
| Credit Suisse USA Inc. | 4.875 | % | 1/15/15 | 5,435 | 5,701 | |||||
| Credit Suisse USA Inc. | 5.125 | % | 8/15/15 | 3,665 | 3,902 | |||||
26
| Total Bond Market II Index Fund | |||||||||
| Face | Market | ||||||||
| Maturity | Amount | Value• | |||||||
| Coupon | Date | ($ | 000 | ) | ($ | 000 | ) | ||
| Credit Suisse USA Inc. | 7.125 | % | 7/15/32 | 1,425 | 1,676 | ||||
| Deutsche Bank AG | 5.375 | % | 10/12/12 | 5,850 | 6,318 | ||||
| Deutsche Bank AG | 4.875 | % | 5/20/13 | 5,500 | 5,849 | ||||
| Deutsche Bank AG | 6.000 | % | 9/1/17 | 9,375 | 10,221 | ||||
| Deutsche Bank Financial LLC | 5.375 | % | 3/2/15 | 1,800 | 1,872 | ||||
| FIA Card Services NA | 6.625 | % | 6/15/12 | 1,100 | 1,168 | ||||
| Fifth Third Bancorp | 6.250 | % | 5/1/13 | 100 | 104 | ||||
| Fifth Third Bancorp | 4.500 | % | 6/1/18 | 725 | 590 | ||||
| Fifth Third Bancorp | 8.250 | % | 3/1/38 | 2,725 | 2,560 | ||||
| Fifth Third Bank/Ohio | 4.750 | % | 2/1/15 | 2,800 | 2,671 | ||||
| 3 Fifth Third Capital Trust IV | 6.500 | % | 4/15/67 | 950 | 693 | ||||
| First Tennessee Bank NA | 5.050 | % | 1/15/15 | 500 | 442 | ||||
| First Union Institutional Capital I | 8.040 | % | 12/1/26 | 525 | 524 | ||||
| Golden West Financial Corp. | 4.750 | % | 10/1/12 | 975 | 1,021 | ||||
| Goldman Sachs Capital I | 6.345 | % | 2/15/34 | 4,975 | 4,638 | ||||
| 3 Goldman Sachs Capital II | 5.793 | % | 12/29/49 | 2,550 | 1,963 | ||||
| Goldman Sachs Group Inc. | 4.500 | % | 6/15/10 | 2,350 | 2,392 | ||||
| Goldman Sachs Group Inc. | 6.875 | % | 1/15/11 | 3,175 | 3,372 | ||||
| Goldman Sachs Group Inc. | 6.600 | % | 1/15/12 | 6,750 | 7,314 | ||||
| Goldman Sachs Group Inc. | 5.300 | % | 2/14/12 | 325 | 345 | ||||
| Goldman Sachs Group Inc. | 5.700 | % | 9/1/12 | 275 | 297 | ||||
| Goldman Sachs Group Inc. | 5.450 | % | 11/1/12 | 3,550 | 3,821 | ||||
| Goldman Sachs Group Inc. | 5.250 | % | 4/1/13 | 3,150 | 3,326 | ||||
| Goldman Sachs Group Inc. | 4.750 | % | 7/15/13 | 4,275 | 4,472 | ||||
| Goldman Sachs Group Inc. | 5.250 | % | 10/15/13 | 5,100 | 5,416 | ||||
| Goldman Sachs Group Inc. | 5.150 | % | 1/15/14 | 2,050 | 2,172 | ||||
| Goldman Sachs Group Inc. | 6.000 | % | 5/1/14 | 17,425 | 19,095 | ||||
| Goldman Sachs Group Inc. | 5.000 | % | 10/1/14 | 11,175 | 11,759 | ||||
| Goldman Sachs Group Inc. | 5.125 | % | 1/15/15 | 6,525 | 6,858 | ||||
| Goldman Sachs Group Inc. | 5.350 | % | 1/15/16 | 6,200 | 6,447 | ||||
| Goldman Sachs Group Inc. | 5.750 | % | 10/1/16 | 2,000 | 2,113 | ||||
| Goldman Sachs Group Inc. | 5.625 | % | 1/15/17 | 4,275 | 4,397 | ||||
| Goldman Sachs Group Inc. | 6.250 | % | 9/1/17 | 8,625 | 9,254 | ||||
| Goldman Sachs Group Inc. | 5.950 | % | 1/18/18 | 5,775 | 6,096 | ||||
| Goldman Sachs Group Inc. | 6.150 | % | 4/1/18 | 10,125 | 10,841 | ||||
| Goldman Sachs Group Inc. | 7.500 | % | 2/15/19 | 4,000 | 4,666 | ||||
| Goldman Sachs Group Inc. | 5.950 | % | 1/15/27 | 4,650 | 4,479 | ||||
| Goldman Sachs Group Inc. | 6.125 | % | 2/15/33 | 4,900 | 5,016 | ||||
| Goldman Sachs Group Inc. | 6.450 | % | 5/1/36 | 2,175 | 2,144 | ||||
| Goldman Sachs Group Inc. | 6.750 | % | 10/1/37 | 11,025 | 11,255 | ||||
| 4 HBOS PLC | 6.750 | % | 5/21/18 | 2,075 | 1,920 | ||||
| HSBC Bank PLC | 6.950 | % | 3/15/11 | 2,625 | 2,744 | ||||
| HSBC Bank USA NA | 4.625 | % | 4/1/14 | 3,975 | 4,150 | ||||
| HSBC Bank USA NA | 5.875 | % | 11/1/34 | 1,200 | 1,159 | ||||
| HSBC Bank USA NA | 5.625 | % | 8/15/35 | 1,225 | 1,123 | ||||
| HSBC Holdings PLC | 7.625 | % | 5/17/32 | 325 | 352 | ||||
| HSBC Holdings PLC | 7.350 | % | 11/27/32 | 600 | 654 | ||||
| HSBC Holdings PLC | 6.500 | % | 5/2/36 | 5,000 | 5,236 | ||||
| HSBC Holdings PLC | 6.500 | % | 9/15/37 | 5,850 | 6,116 | ||||
| HSBC Holdings PLC | 6.800 | % | 6/1/38 | 1,325 | 1,433 | ||||
| 4 ICICI Bank Ltd. | 6.625 | % | 10/3/12 | 4,525 | 4,763 | ||||
| JP Morgan Chase Capital XV | 5.875 | % | 3/15/35 | 2,125 | 1,881 | ||||
| JP Morgan Chase Capital XVII | 5.850 | % | 8/1/35 | 250 | 216 | ||||
| JP Morgan Chase Capital XX | 6.550 | % | 9/29/36 | 2,250 | 2,081 | ||||
| JP Morgan Chase Capital XXII | 6.450 | % | 2/2/37 | 4,175 | 3,834 | ||||
| JP Morgan Chase Capital XXV | 6.800 | % | 10/1/37 | 2,775 | 2,745 | ||||
| JPMorgan Chase & Co. | 6.750 | % | 2/1/11 | 950 | 1,006 | ||||
27
| Total Bond Market II Index Fund | |||||||||
| Face | Market | ||||||||
| Maturity | Amount | Value• | |||||||
| Coupon | Date | ($ | 000 | ) | ($ | 000 | ) | ||
| JPMorgan Chase & Co. | 5.600 | % | 6/1/11 | 200 | 212 | ||||
| JPMorgan Chase & Co. | 4.850 | % | 6/16/11 | 2,425 | 2,544 | ||||
| JPMorgan Chase & Co. | 4.500 | % | 1/15/12 | 3,075 | 3,236 | ||||
| JPMorgan Chase & Co. | 6.625 | % | 3/15/12 | 2,975 | 3,252 | ||||
| JPMorgan Chase & Co. | 5.375 | % | 10/1/12 | 5,950 | 6,453 | ||||
| JPMorgan Chase & Co. | 5.750 | % | 1/2/13 | 2,175 | 2,340 | ||||
| JPMorgan Chase & Co. | 4.750 | % | 5/1/13 | 4,450 | 4,698 | ||||
| JPMorgan Chase & Co. | 5.375 | % | 1/15/14 | 450 | 482 | ||||
| JPMorgan Chase & Co. | 4.875 | % | 3/15/14 | 8,800 | 9,175 | ||||
| JPMorgan Chase & Co. | 4.650 | % | 6/1/14 | 4,600 | 4,856 | ||||
| JPMorgan Chase & Co. | 5.125 | % | 9/15/14 | 15,215 | 16,090 | ||||
| JPMorgan Chase & Co. | 4.750 | % | 3/1/15 | 6,975 | 7,301 | ||||
| JPMorgan Chase & Co. | 5.250 | % | 5/1/15 | 2,025 | 2,106 | ||||
| JPMorgan Chase & Co. | 5.150 | % | 10/1/15 | 2,525 | 2,621 | ||||
| JPMorgan Chase & Co. | 6.125 | % | 6/27/17 | 3,675 | 3,875 | ||||
| JPMorgan Chase & Co. | 6.000 | % | 1/15/18 | 950 | 1,028 | ||||
| JPMorgan Chase & Co. | 6.300 | % | 4/23/19 | 17,600 | 19,467 | ||||
| JPMorgan Chase & Co. | 6.400 | % | 5/15/38 | 10,650 | 11,731 | ||||
| JPMorgan Chase Bank NA | 5.875 | % | 6/13/16 | 1,350 | 1,415 | ||||
| JPMorgan Chase Capital XXVII | 7.000 | % | 11/1/39 | 975 | 990 | ||||
| KeyBank NA | 7.000 | % | 2/1/11 | 275 | 286 | ||||
| KeyBank NA | 5.500 | % | 9/17/12 | 2,000 | 2,077 | ||||
| KeyBank NA | 5.800 | % | 7/1/14 | 850 | 833 | ||||
| KeyBank NA | 4.950 | % | 9/15/15 | 2,025 | 1,893 | ||||
| KeyBank NA | 5.450 | % | 3/3/16 | 2,500 | 2,301 | ||||
| KeyCorp | 6.500 | % | 5/14/13 | 1,500 | 1,546 | ||||
| M&I Marshall & Ilsley Bank | 5.250 | % | 9/4/12 | 225 | 202 | ||||
| M&I Marshall & Ilsley Bank | 4.850 | % | 6/16/15 | 350 | 273 | ||||
| M&I Marshall & Ilsley Bank | 5.000 | % | 1/17/17 | 100 | 78 | ||||
| Manufacturers & Traders Trust Co. | 6.625 | % | 12/4/17 | 2,475 | 2,528 | ||||
| 3 Manufacturers & Traders Trust Co. | 5.585 | % | 12/28/20 | 100 | 83 | ||||
| MBNA Corp. | 7.500 | % | 3/15/12 | 1,125 | 1,232 | ||||
| MBNA Corp. | 6.125 | % | 3/1/13 | 1,375 | 1,451 | ||||
| MBNA Corp. | 5.000 | % | 6/15/15 | 1,425 | 1,422 | ||||
| Mellon Funding Corp. | 6.400 | % | 5/14/11 | 100 | 106 | ||||
| Mellon Funding Corp. | 5.000 | % | 12/1/14 | 425 | 453 | ||||
| Merrill Lynch & Co. Inc. | 4.790 | % | 8/4/10 | 525 | 536 | ||||
| Merrill Lynch & Co. Inc. | 5.770 | % | 7/25/11 | 1,075 | 1,137 | ||||
| Merrill Lynch & Co. Inc. | 6.050 | % | 8/15/12 | 3,475 | 3,735 | ||||
| Merrill Lynch & Co. Inc. | 5.450 | % | 2/5/13 | 3,225 | 3,395 | ||||
| Merrill Lynch & Co. Inc. | 6.150 | % | 4/25/13 | 7,200 | 7,819 | ||||
| Merrill Lynch & Co. Inc. | 5.000 | % | 2/3/14 | 5,325 | 5,460 | ||||
| Merrill Lynch & Co. Inc. | 5.450 | % | 7/15/14 | 850 | 894 | ||||
| Merrill Lynch & Co. Inc. | 5.000 | % | 1/15/15 | 11,281 | 11,505 | ||||
| Merrill Lynch & Co. Inc. | 6.050 | % | 5/16/16 | 1,025 | 1,036 | ||||
| Merrill Lynch & Co. Inc. | 5.700 | % | 5/2/17 | 5,825 | 5,720 | ||||
| Merrill Lynch & Co. Inc. | 6.400 | % | 8/28/17 | 5,425 | 5,679 | ||||
| Merrill Lynch & Co. Inc. | 6.875 | % | 4/25/18 | 16,925 | 18,263 | ||||
| Merrill Lynch & Co. Inc. | 6.500 | % | 7/15/18 | 100 | 103 | ||||
| Merrill Lynch & Co. Inc. | 6.220 | % | 9/15/26 | 4,525 | 4,301 | ||||
| Merrill Lynch & Co. Inc. | 6.110 | % | 1/29/37 | 2,375 | 2,175 | ||||
| Merrill Lynch & Co. Inc. | 7.750 | % | 5/14/38 | 4,200 | 4,627 | ||||
| Morgan Stanley | 4.000 | % | 1/15/10 | 800 | 801 | ||||
| Morgan Stanley | 5.050 | % | 1/21/11 | 3,925 | 4,071 | ||||
| Morgan Stanley | 6.750 | % | 4/15/11 | 2,000 | 2,122 | ||||
| Morgan Stanley | 5.625 | % | 1/9/12 | 9,020 | 9,560 | ||||
| Morgan Stanley | 6.600 | % | 4/1/12 | 3,400 | 3,690 | ||||
28
| Total Bond Market II Index Fund | ||||||||||
| Face | Market | |||||||||
| Maturity | Amount | Value• | ||||||||
| Coupon | Date | ($ | 000 | ) | ($ | 000 | ) | |||
| Morgan Stanley | 5.750 | % | 8/31/12 | 2,350 | 2,534 | |||||
| Morgan Stanley | 5.300 | % | 3/1/13 | 4,500 | 4,757 | |||||
| Morgan Stanley | 6.750 | % | 10/15/13 | 200 | 219 | |||||
| Morgan Stanley | 4.750 | % | 4/1/14 | 13,900 | 13,987 | |||||
| Morgan Stanley | 6.000 | % | 5/13/14 | 12,050 | 12,937 | |||||
| Morgan Stanley | 4.200 | % | 11/20/14 | 5,825 | 5,819 | |||||
| Morgan Stanley | 6.000 | % | 4/28/15 | 5,975 | 6,366 | |||||
| Morgan Stanley | 5.375 | % | 10/15/15 | 2,100 | 2,189 | |||||
| Morgan Stanley | 5.750 | % | 10/18/16 | 4,700 | 4,901 | |||||
| Morgan Stanley | 5.450 | % | 1/9/17 | 3,225 | 3,272 | |||||
| Morgan Stanley | 5.550 | % | 4/27/17 | 1,375 | 1,397 | |||||
| Morgan Stanley | 5.950 | % | 12/28/17 | 5,100 | 5,291 | |||||
| Morgan Stanley | 6.625 | % | 4/1/18 | 11,275 | 12,232 | |||||
| Morgan Stanley | 7.300 | % | 5/13/19 | 9,300 | 10,448 | |||||
| Morgan Stanley | 5.625 | % | 9/23/19 | 9,000 | 9,065 | |||||
| Morgan Stanley | 6.250 | % | 8/9/26 | 5,425 | 5,574 | |||||
| Morgan Stanley | 7.250 | % | 4/1/32 | 750 | 867 | |||||
| National City Bank | 6.250 | % | 3/15/11 | 625 | 652 | |||||
| National City Bank | 4.625 | % | 5/1/13 | 725 | 736 | |||||
| National City Corp. | 4.900 | % | 1/15/15 | 850 | 871 | |||||
| National City Corp. | 6.875 | % | 5/15/19 | 525 | 567 | |||||
| 3 | National City Preferred Capital Trust I | 12.000 | % | 12/31/49 | 1,575 | 1,803 | ||||
| 4 | Nationwide Building Society | 5.500 | % | 7/18/12 | 7,275 | 7,766 | ||||
| North Fork Bancorporation Inc. | 5.875 | % | 8/15/12 | 100 | 104 | |||||
| 4 | Northern Rock PLC | 5.625 | % | 6/22/17 | 14,075 | 13,486 | ||||
| Northern Trust Co. | 6.500 | % | 8/15/18 | 425 | 470 | |||||
| Northern Trust Corp. | 5.500 | % | 8/15/13 | 425 | 461 | |||||
| Northern Trust Corp. | 4.625 | % | 5/1/14 | 1,025 | 1,093 | |||||
| PNC Bank NA | 4.875 | % | 9/21/17 | 3,575 | 3,385 | |||||
| PNC Bank NA | 6.000 | % | 12/7/17 | 325 | 329 | |||||
| PNC Funding Corp. | 5.125 | % | 12/14/10 | 1,450 | 1,506 | |||||
| PNC Funding Corp. | 5.400 | % | 6/10/14 | 475 | 512 | |||||
| PNC Funding Corp. | 4.250 | % | 9/21/15 | 650 | 663 | |||||
| PNC Funding Corp. | 5.250 | % | 11/15/15 | 2,825 | 2,897 | |||||
| PNC Funding Corp. | 5.625 | % | 2/1/17 | 325 | 326 | |||||
| PNC Funding Corp. | 6.700 | % | 6/10/19 | 1,075 | 1,198 | |||||
| Regions Bank | 7.500 | % | 5/15/18 | 325 | 298 | |||||
| Regions Financial Corp. | 6.375 | % | 5/15/12 | 1,100 | 1,050 | |||||
| Regions Financial Corp. | 7.750 | % | 11/10/14 | 1,625 | 1,629 | |||||
| Regions Financial Corp. | 7.375 | % | 12/10/37 | 1,050 | 860 | |||||
| Royal Bank of Canada | 4.125 | % | 1/26/10 | 1,000 | 1,002 | |||||
| Royal Bank of Scotland Group PLC | 6.375 | % | 2/1/11 | 325 | 328 | |||||
| Royal Bank of Scotland Group PLC | 5.050 | % | 1/8/15 | 1,800 | 1,559 | |||||
| Royal Bank of Scotland Group PLC | 6.400 | % | 10/21/19 | 10,150 | 10,049 | |||||
| 4 | Royal Bank of Scotland PLC | 4.875 | % | 8/25/14 | 1,800 | 1,807 | ||||
| Santander Financial Issuances Ltd. | 6.375 | % | 2/15/11 | 600 | 625 | |||||
| SouthTrust Corp. | 5.800 | % | 6/15/14 | 750 | 783 | |||||
| Sovereign Bank | 5.125 | % | 3/15/13 | 625 | 635 | |||||
| Sovereign Bank | 8.750 | % | 5/30/18 | 675 | 777 | |||||
| 3,4 | Standard Chartered PLC | 6.409 | % | 12/31/49 | 1,975 | 1,600 | ||||
| State Street Bank and Trust Co. | 5.300 | % | 1/15/16 | 900 | 914 | |||||
| State Street Corp. | 4.300 | % | 5/30/14 | 1,600 | 1,664 | |||||
| Sumitomo Mitsui Banking Corp. | 8.000 | % | 6/15/12 | 4,075 | 4,555 | |||||
| SunTrust Bank | 6.375 | % | 4/1/11 | 1,900 | 1,976 | |||||
| SunTrust Bank | 5.000 | % | 9/1/15 | 100 | 96 | |||||
| SunTrust Bank | 5.450 | % | 12/1/17 | 100 | 96 | |||||
| SunTrust Bank | 7.250 | % | 3/15/18 | 375 | 389 | |||||
29
| Total Bond Market II Index Fund | |||||||||
| Face | Market | ||||||||
| Maturity | Amount | Value• | |||||||
| Coupon | Date | ($ | 000 | ) | ($ | 000 | ) | ||
| SunTrust Banks Inc. | 5.250 | % | 11/5/12 | 1,800 | 1,866 | ||||
| SunTrust Banks Inc. | 6.000 | % | 9/11/17 | 1,300 | 1,289 | ||||
| SunTrust Banks Inc. | 6.000 | % | 2/15/26 | 1,450 | 1,175 | ||||
| SunTrust Capital VIII | 6.100 | % | 12/15/36 | 657 | 456 | ||||
| UBS AG | 7.000 | % | 10/15/15 | 1,000 | 1,061 | ||||
| UBS AG | 5.875 | % | 7/15/16 | 2,325 | 2,359 | ||||
| UBS AG | 7.375 | % | 6/15/17 | 1,050 | 1,101 | ||||
| UBS AG | 5.875 | % | 12/20/17 | 6,525 | 6,716 | ||||
| UBS AG | 5.750 | % | 4/25/18 | 3,000 | 3,062 | ||||
| UFJ Finance Aruba AEC | 6.750 | % | 7/15/13 | 9,750 | 10,706 | ||||
| Union Bank NA | 5.950 | % | 5/11/16 | 1,375 | 1,376 | ||||
| Union Planters Corp. | 4.375 | % | 12/1/10 | 200 | 200 | ||||
| Union Planters Corp. | 7.750 | % | 3/1/11 | 2,350 | 2,304 | ||||
| UnionBanCal Corp. | 5.250 | % | 12/16/13 | 700 | 713 | ||||
| US Bank NA | 6.375 | % | 8/1/11 | 2,200 | 2,366 | ||||
| US Bank NA | 6.300 | % | 2/4/14 | 3,150 | 3,479 | ||||
| US Bank NA | 4.950 | % | 10/30/14 | 4,800 | 5,109 | ||||
| 3 USB Capital IX | 6.189 | % | 4/15/49 | 2,625 | 2,113 | ||||
| USB Capital XIII Trust | 6.625 | % | 12/15/39 | 675 | 678 | ||||
| Wachovia Bank NA | 7.800 | % | 8/18/10 | 2,850 | 2,979 | ||||
| Wachovia Bank NA | 4.800 | % | 11/1/14 | 425 | 432 | ||||
| Wachovia Bank NA | 4.875 | % | 2/1/15 | 6,050 | 6,186 | ||||
| Wachovia Bank NA | 5.000 | % | 8/15/15 | 325 | 330 | ||||
| Wachovia Bank NA | 6.000 | % | 11/15/17 | 2,500 | 2,621 | ||||
| Wachovia Bank NA | 5.850 | % | 2/1/37 | 5,775 | 5,581 | ||||
| Wachovia Bank NA | 6.600 | % | 1/15/38 | 4,225 | 4,457 | ||||
| 3 Wachovia Capital Trust III | 5.800 | % | 3/15/11 | 4,100 | 3,116 | ||||
| Wachovia Corp. | 5.300 | % | 10/15/11 | 4,125 | 4,384 | ||||
| Wachovia Corp. | 5.500 | % | 5/1/13 | 4,740 | 5,069 | ||||
| Wachovia Corp. | 4.875 | % | 2/15/14 | 5,275 | 5,369 | ||||
| Wachovia Corp. | 5.250 | % | 8/1/14 | 1,900 | 1,967 | ||||
| Wachovia Corp. | 5.625 | % | 10/15/16 | 3,800 | 3,872 | ||||
| Wachovia Corp. | 5.750 | % | 6/15/17 | 5,425 | 5,649 | ||||
| Wachovia Corp. | 5.750 | % | 2/1/18 | 325 | 338 | ||||
| Wachovia Corp. | 6.605 | % | 10/1/25 | 100 | 96 | ||||
| Wachovia Corp. | 7.500 | % | 4/15/35 | 275 | 287 | ||||
| Wachovia Corp. | 5.500 | % | 8/1/35 | 1,325 | 1,186 | ||||
| Wachovia Corp. | 6.550 | % | 10/15/35 | 250 | 234 | ||||
| Wells Fargo & Co. | 4.200 | % | 1/15/10 | 1,025 | 1,026 | ||||
| Wells Fargo & Co. | 4.875 | % | 1/12/11 | 3,425 | 3,555 | ||||
| Wells Fargo & Co. | 6.375 | % | 8/1/11 | 425 | 454 | ||||
| Wells Fargo & Co. | 5.300 | % | 8/26/11 | 9,575 | 10,130 | ||||
| Wells Fargo & Co. | 5.125 | % | 9/1/12 | 1,200 | 1,264 | ||||
| Wells Fargo & Co. | 5.250 | % | 10/23/12 | 11,575 | 12,379 | ||||
| Wells Fargo & Co. | 4.375 | % | 1/31/13 | 5,100 | 5,284 | ||||
| Wells Fargo & Co. | 4.950 | % | 10/16/13 | 1,150 | 1,196 | ||||
| Wells Fargo & Co. | 3.750 | % | 10/1/14 | 2,050 | 2,047 | ||||
| Wells Fargo & Co. | 5.625 | % | 12/11/17 | 6,725 | 6,976 | ||||
| Wells Fargo & Co. | 5.375 | % | 2/7/35 | 4,700 | 4,370 | ||||
| Wells Fargo Bank NA | 6.450 | % | 2/1/11 | 4,150 | 4,356 | ||||
| Wells Fargo Bank NA | 4.750 | % | 2/9/15 | 4,925 | 5,036 | ||||
| Wells Fargo Bank NA | 5.750 | % | 5/16/16 | 3,600 | 3,687 | ||||
| Wells Fargo Bank NA | 5.950 | % | 8/26/36 | 700 | 674 | ||||
| Wells Fargo Capital X | 5.950 | % | 12/15/36 | 725 | 631 | ||||
| 3 Wells Fargo Capital XIII | 7.700 | % | 12/29/49 | 2,325 | 2,255 | ||||
| 3 Wells Fargo Capital XV | 9.750 | % | 12/29/49 | 3,650 | 3,942 | ||||
| Wells Fargo Financial Inc. | 5.500 | % | 8/1/12 | 1,225 | 1,312 | ||||
30
| Total Bond Market II Index Fund | |||||||||
| Face | Market | ||||||||
| Maturity | Amount | Value• | |||||||
| Coupon | Date | ($ | 000 | ) | ($ | 000 | ) | ||
| Westpac Banking Corp. | 2.250 | % | 11/19/12 | 3,725 | 3,713 | ||||
| Westpac Banking Corp. | 4.200 | % | 2/27/15 | 5,325 | 5,410 | ||||
| Westpac Banking Corp. | 4.875 | % | 11/19/19 | 3,725 | 3,678 | ||||
| Brokerage (0.1%) | |||||||||
| Ameriprise Financial Inc. | 5.650 | % | 11/15/15 | 1,550 | 1,644 | ||||
| 3 Ameriprise Financial Inc. | 7.518 | % | 6/1/66 | 325 | 281 | ||||
| BlackRock Inc. | 2.250 | % | 12/10/12 | 2,300 | 2,289 | ||||
| BlackRock Inc. | 3.500 | % | 12/10/14 | 1,700 | 1,683 | ||||
| BlackRock Inc. | 6.250 | % | 9/15/17 | 1,150 | 1,239 | ||||
| BlackRock Inc. | 5.000 | % | 12/10/19 | 100 | 98 | ||||
| Charles Schwab Corp. | 4.950 | % | 6/1/14 | 3,925 | 4,150 | ||||
| 4 FMR LLC | 7.490 | % | 6/15/19 | 200 | 224 | ||||
| Jefferies Group Inc. | 8.500 | % | 7/15/19 | 1,775 | 1,902 | ||||
| Jefferies Group Inc. | 6.450 | % | 6/8/27 | 3,800 | 3,193 | ||||
| Jefferies Group Inc. | 6.250 | % | 1/15/36 | 4,225 | 3,350 | ||||
| Lazard Group LLC | 6.850 | % | 6/15/17 | 2,675 | 2,692 | ||||
| TD Ameritrade Holding Corp. | 2.950 | % | 12/1/12 | 775 | 769 | ||||
| TD Ameritrade Holding Corp. | 4.150 | % | 12/1/14 | 1,025 | 1,013 | ||||
| TD Ameritrade Holding Corp. | 5.600 | % | 12/1/19 | 925 | 919 | ||||
| Finance Companies (0.9%) | |||||||||
| Block Financial LLC | 7.875 | % | 1/15/13 | 525 | 584 | ||||
| Discover Financial Services | 6.450 | % | 6/12/17 | 325 | 305 | ||||
| GATX Corp. | 4.750 | % | 10/1/12 | 1,000 | 1,026 | ||||
| General Electric Capital Corp. | 4.250 | % | 9/13/10 | 1,025 | 1,049 | ||||
| General Electric Capital Corp. | 5.000 | % | 12/1/10 | 525 | 545 | ||||
| General Electric Capital Corp. | 5.200 | % | 2/1/11 | 600 | 624 | ||||
| General Electric Capital Corp. | 6.125 | % | 2/22/11 | 3,700 | 3,907 | ||||
| General Electric Capital Corp. | 5.500 | % | 4/28/11 | 2,075 | 2,184 | ||||
| General Electric Capital Corp. | 5.000 | % | 11/15/11 | 4,225 | 4,467 | ||||
| General Electric Capital Corp. | 4.375 | % | 11/21/11 | 550 | 572 | ||||
| General Electric Capital Corp. | 5.875 | % | 2/15/12 | 3,950 | 4,233 | ||||
| General Electric Capital Corp. | 4.375 | % | 3/3/12 | 4,000 | 4,155 | ||||
| General Electric Capital Corp. | 5.000 | % | 4/10/12 | 100 | 105 | ||||
| General Electric Capital Corp. | 6.000 | % | 6/15/12 | 15,175 | 16,380 | ||||
| General Electric Capital Corp. | 3.500 | % | 8/13/12 | 3,775 | 3,848 | ||||
| General Electric Capital Corp. | 5.250 | % | 10/19/12 | 19,100 | 20,339 | ||||
| General Electric Capital Corp. | 5.450 | % | 1/15/13 | 2,975 | 3,173 | ||||
| General Electric Capital Corp. | 4.800 | % | 5/1/13 | 3,425 | 3,588 | ||||
| General Electric Capital Corp. | 5.900 | % | 5/13/14 | 8,625 | 9,398 | ||||
| General Electric Capital Corp. | 5.500 | % | 6/4/14 | 5,150 | 5,471 | ||||
| General Electric Capital Corp. | 5.650 | % | 6/9/14 | 5,800 | 6,208 | ||||
| General Electric Capital Corp. | 3.750 | % | 11/14/14 | 7,350 | 7,300 | ||||
| General Electric Capital Corp. | 5.400 | % | 2/15/17 | 8,875 | 9,012 | ||||
| General Electric Capital Corp. | 5.625 | % | 9/15/17 | 1,775 | 1,785 | ||||
| General Electric Capital Corp. | 5.625 | % | 5/1/18 | 14,275 | 14,595 | ||||
| General Electric Capital Corp. | 6.000 | % | 8/7/19 | 10,675 | 11,078 | ||||
| General Electric Capital Corp. | 6.750 | % | 3/15/32 | 9,150 | 9,323 | ||||
| General Electric Capital Corp. | 6.150 | % | 8/7/37 | 5,350 | 5,075 | ||||
| General Electric Capital Corp. | 5.875 | % | 1/14/38 | 12,200 | 11,318 | ||||
| General Electric Capital Corp. | 6.875 | % | 1/10/39 | 6,125 | 6,313 | ||||
| 3 General Electric Capital Corp. | 6.375 | % | 11/15/67 | 3,675 | 3,197 | ||||
| 3 HSBC Finance Capital Trust IX | 5.911 | % | 11/30/35 | 675 | 552 | ||||
| HSBC Finance Corp. | 5.250 | % | 1/14/11 | 4,300 | 4,475 | ||||
| HSBC Finance Corp. | 5.700 | % | 6/1/11 | 3,075 | 3,214 | ||||
| HSBC Finance Corp. | 6.375 | % | 10/15/11 | 1,775 | 1,892 | ||||
31
| Total Bond Market II Index Fund | |||||||||
| Face | Market | ||||||||
| Maturity | Amount | Value• | |||||||
| Coupon | Date | ($ | 000 | ) | ($ | 000 | ) | ||
| HSBC Finance Corp. | 7.000 | % | 5/15/12 | 4,225 | 4,596 | ||||
| HSBC Finance Corp. | 5.900 | % | 6/19/12 | 1,250 | 1,332 | ||||
| HSBC Finance Corp. | 6.375 | % | 11/27/12 | 5,350 | 5,860 | ||||
| HSBC Finance Corp. | 4.750 | % | 7/15/13 | 625 | 652 | ||||
| HSBC Finance Corp. | 5.250 | % | 1/15/14 | 1,800 | 1,887 | ||||
| HSBC Finance Corp. | 5.000 | % | 6/30/15 | 9,900 | 10,272 | ||||
| HSBC Finance Corp. | 5.500 | % | 1/19/16 | 425 | 443 | ||||
| International Lease Finance Corp. | 4.950 | % | 2/1/11 | 4,025 | 3,743 | ||||
| International Lease Finance Corp. | 5.450 | % | 3/24/11 | 1,550 | 1,426 | ||||
| International Lease Finance Corp. | 5.750 | % | 6/15/11 | 2,000 | 1,830 | ||||
| International Lease Finance Corp. | 5.300 | % | 5/1/12 | 1,650 | 1,402 | ||||
| International Lease Finance Corp. | 5.000 | % | 9/15/12 | 2,000 | 1,680 | ||||
| International Lease Finance Corp. | 6.375 | % | 3/25/13 | 2,225 | 1,847 | ||||
| International Lease Finance Corp. | 5.625 | % | 9/20/13 | 3,450 | 2,700 | ||||
| International Lease Finance Corp. | 5.650 | % | 6/1/14 | 1,675 | 1,273 | ||||
| SLM Corp. | 5.400 | % | 10/25/11 | 7,050 | 7,044 | ||||
| SLM Corp. | 5.375 | % | 1/15/13 | 1,150 | 1,094 | ||||
| SLM Corp. | 5.000 | % | 10/1/13 | 1,250 | 1,147 | ||||
| SLM Corp. | 5.375 | % | 5/15/14 | 150 | 137 | ||||
| SLM Corp. | 5.050 | % | 11/14/14 | 975 | 880 | ||||
| SLM Corp. | 8.450 | % | 6/15/18 | 4,950 | 4,877 | ||||
| SLM Corp. | 5.625 | % | 8/1/33 | 2,000 | 1,521 | ||||
| Insurance (1.0%) | |||||||||
| ACE Capital Trust II | 9.700 | % | 4/1/30 | 1,000 | 1,143 | ||||
| ACE INA Holdings Inc. | 5.600 | % | 5/15/15 | 1,725 | 1,892 | ||||
| ACE INA Holdings Inc. | 5.700 | % | 2/15/17 | 1,400 | 1,486 | ||||
| ACE INA Holdings Inc. | 5.800 | % | 3/15/18 | 425 | 454 | ||||
| ACE INA Holdings Inc. | 5.900 | % | 6/15/19 | 550 | 594 | ||||
| ACE INA Holdings Inc. | 6.700 | % | 5/15/36 | 900 | 1,011 | ||||
| AEGON Funding Co. LLC | 5.750 | % | 12/15/20 | 375 | 348 | ||||
| Aegon NV | 4.750 | % | 6/1/13 | 800 | 815 | ||||
| Aetna Inc. | 7.875 | % | 3/1/11 | 525 | 559 | ||||
| Aetna Inc. | 5.750 | % | 6/15/11 | 500 | 525 | ||||
| Aetna Inc. | 6.000 | % | 6/15/16 | 1,200 | 1,257 | ||||
| Aetna Inc. | 6.500 | % | 9/15/18 | 875 | 939 | ||||
| Aetna Inc. | 6.625 | % | 6/15/36 | 3,075 | 3,094 | ||||
| Aflac Inc. | 8.500 | % | 5/15/19 | 1,100 | 1,258 | ||||
| Allied World Assurance Co. Holdings Ltd. | 7.500 | % | 8/1/16 | 5,375 | 5,561 | ||||
| Allstate Corp. | 6.125 | % | 2/15/12 | 900 | 975 | ||||
| Allstate Corp. | 5.000 | % | 8/15/14 | 3,325 | 3,507 | ||||
| Allstate Corp. | 6.125 | % | 12/15/32 | 950 | 943 | ||||
| Allstate Corp. | 5.350 | % | 6/1/33 | 225 | 211 | ||||
| Allstate Corp. | 5.550 | % | 5/9/35 | 475 | 449 | ||||
| Allstate Corp. | 5.950 | % | 4/1/36 | 1,000 | 1,011 | ||||
| 3 Allstate Corp. | 6.125 | % | 5/15/37 | 850 | 746 | ||||
| 3 Allstate Corp. | 6.500 | % | 5/15/57 | 1,625 | 1,360 | ||||
| Allstate Life Global Funding Trusts | 5.375 | % | 4/30/13 | 1,425 | 1,522 | ||||
| American Financial Group Inc. | 9.875 | % | 6/15/19 | 775 | 866 | ||||
| American International Group Inc. | 5.375 | % | 10/18/11 | 1,225 | 1,230 | ||||
| American International Group Inc. | 4.950 | % | 3/20/12 | 1,875 | 1,819 | ||||
| American International Group Inc. | 4.250 | % | 5/15/13 | 1,000 | 930 | ||||
| American International Group Inc. | 5.050 | % | 10/1/15 | 1,950 | 1,621 | ||||
| American International Group Inc. | 5.600 | % | 10/18/16 | 1,150 | 943 | ||||
| American International Group Inc. | 5.450 | % | 5/18/17 | 2,100 | 1,725 | ||||
| American International Group Inc. | 5.850 | % | 1/16/18 | 3,300 | 2,706 | ||||
| American International Group Inc. | 8.250 | % | 8/15/18 | 950 | 887 | ||||
32
| Total Bond Market II Index Fund | |||||||||
| Face | Market | ||||||||
| Maturity | Amount | Value• | |||||||
| Coupon | Date | ($ | 000 | ) | ($ | 000 | ) | ||
| American International Group Inc. | 6.250 | % | 5/1/36 | 11,200 | 8,218 | ||||
| AON Corp. | 8.205 | % | 1/1/27 | 325 | 326 | ||||
| Arch Capital Group Ltd. | 7.350 | % | 5/1/34 | 1,175 | 1,137 | ||||
| Assurant Inc. | 5.625 | % | 2/15/14 | 625 | 634 | ||||
| Assurant Inc. | 6.750 | % | 2/15/34 | 1,425 | 1,274 | ||||
| AXA SA | 8.600 | % | 12/15/30 | 3,325 | 3,775 | ||||
| Axis Capital Holdings Ltd. | 5.750 | % | 12/1/14 | 725 | 738 | ||||
| Berkshire Hathaway Finance Corp. | 4.200 | % | 12/15/10 | 675 | 698 | ||||
| Berkshire Hathaway Finance Corp. | 4.000 | % | 4/15/12 | 675 | 704 | ||||
| Berkshire Hathaway Finance Corp. | 4.600 | % | 5/15/13 | 100 | 106 | ||||
| Berkshire Hathaway Finance Corp. | 5.000 | % | 8/15/13 | 5,850 | 6,274 | ||||
| Berkshire Hathaway Finance Corp. | 4.850 | % | 1/15/15 | 1,050 | 1,122 | ||||
| Berkshire Hathaway Finance Corp. | 5.400 | % | 5/15/18 | 4,775 | 4,974 | ||||
| Chubb Corp. | 5.200 | % | 4/1/13 | 425 | 452 | ||||
| Chubb Corp. | 5.750 | % | 5/15/18 | 750 | 802 | ||||
| Chubb Corp. | 6.000 | % | 5/11/37 | 2,800 | 2,897 | ||||
| Chubb Corp. | 6.500 | % | 5/15/38 | 700 | 765 | ||||
| 3 Chubb Corp. | 6.375 | % | 3/29/67 | 1,650 | 1,536 | ||||
| CIGNA Corp. | 6.350 | % | 3/15/18 | 325 | 325 | ||||
| CIGNA Corp. | 7.875 | % | 5/15/27 | 425 | 425 | ||||
| CIGNA Corp. | 6.150 | % | 11/15/36 | 2,150 | 1,877 | ||||
| Cincinnati Financial Corp. | 6.920 | % | 5/15/28 | 325 | 304 | ||||
| Cincinnati Financial Corp. | 6.125 | % | 11/1/34 | 1,175 | 1,041 | ||||
| CNA Financial Corp. | 6.000 | % | 8/15/11 | 825 | 840 | ||||
| CNA Financial Corp. | 5.850 | % | 12/15/14 | 2,000 | 1,971 | ||||
| CNA Financial Corp. | 6.500 | % | 8/15/16 | 1,750 | 1,697 | ||||
| CNA Financial Corp. | 7.350 | % | 11/15/19 | 1,650 | 1,658 | ||||
| Commerce Group Inc. | 5.950 | % | 12/9/13 | 500 | 499 | ||||
| Coventry Health Care Inc. | 6.300 | % | 8/15/14 | 3,850 | 3,769 | ||||
| Fidelity National Financial Inc. | 7.300 | % | 8/15/11 | 1,150 | 1,189 | ||||
| Genworth Financial Inc. | 5.650 | % | 6/15/12 | 1,050 | 1,047 | ||||
| Genworth Financial Inc. | 5.750 | % | 6/15/14 | 300 | 287 | ||||
| Genworth Financial Inc. | 4.950 | % | 10/1/15 | 375 | 341 | ||||
| Genworth Financial Inc. | 8.625 | % | 12/15/16 | 1,125 | 1,174 | ||||
| Genworth Financial Inc. | 6.500 | % | 6/15/34 | 1,075 | 873 | ||||
| Genworth Global Funding Trusts | 5.125 | % | 3/15/11 | 550 | 558 | ||||
| Hartford Financial Services Group Inc. | 5.250 | % | 10/15/11 | 1,400 | 1,444 | ||||
| Hartford Financial Services Group Inc. | 4.625 | % | 7/15/13 | 625 | 626 | ||||
| Hartford Financial Services Group Inc. | 5.500 | % | 10/15/16 | 975 | 928 | ||||
| Hartford Financial Services Group Inc. | 5.375 | % | 3/15/17 | 900 | 869 | ||||
| Hartford Financial Services Group Inc. | 6.000 | % | 1/15/19 | 425 | 413 | ||||
| Hartford Financial Services Group Inc. | 5.950 | % | 10/15/36 | 550 | 453 | ||||
| Hartford Financial Services Group Inc. | 6.100 | % | 10/1/41 | 1,775 | 1,401 | ||||
| HCC Insurance Holdings Inc. | 6.300 | % | 11/15/19 | 1,600 | 1,617 | ||||
| Humana Inc. | 6.450 | % | 6/1/16 | 1,500 | 1,513 | ||||
| Humana Inc. | 7.200 | % | 6/15/18 | 100 | 103 | ||||
| Humana Inc. | 6.300 | % | 8/1/18 | 150 | 144 | ||||
| Humana Inc. | 8.150 | % | 6/15/38 | 2,500 | 2,380 | ||||
| 4 Liberty Mutual Group Inc. | 4.875 | % | 2/1/10 | 475 | 474 | ||||
| Lincoln National Corp. | 6.200 | % | 12/15/11 | 325 | 343 | ||||
| Lincoln National Corp. | 5.650 | % | 8/27/12 | 950 | 986 | ||||
| Lincoln National Corp. | 8.750 | % | 7/1/19 | 900 | 1,030 | ||||
| Lincoln National Corp. | 6.150 | % | 4/7/36 | 2,475 | 2,177 | ||||
| Loews Corp. | 5.250 | % | 3/15/16 | 950 | 964 | ||||
| Loews Corp. | 6.000 | % | 2/1/35 | 200 | 188 | ||||
| Markel Corp. | 7.125 | % | 9/30/19 | 825 | 848 | ||||
| Marsh & McLennan Cos. Inc. | 5.150 | % | 9/15/10 | 700 | 716 | ||||
33
| Total Bond Market II Index Fund | |||||||||
| Face | Market | ||||||||
| Maturity | Amount | Value• | |||||||
| Coupon | Date | ($ | 000 | ) | ($ | 000 | ) | ||
| Marsh & McLennan Cos. Inc. | 6.250 | % | 3/15/12 | 1,900 | 2,011 | ||||
| Marsh & McLennan Cos. Inc. | 5.375 | % | 7/15/14 | 100 | 103 | ||||
| Marsh & McLennan Cos. Inc. | 5.750 | % | 9/15/15 | 2,300 | 2,402 | ||||
| Marsh & McLennan Cos. Inc. | 9.250 | % | 4/15/19 | 825 | 1,012 | ||||
| Marsh & McLennan Cos. Inc. | 5.875 | % | 8/1/33 | 100 | 87 | ||||
| 4 Massachusetts Mutual Life Insurance Co. | 8.875 | % | 6/1/39 | 575 | 698 | ||||
| MetLife Inc. | 6.125 | % | 12/1/11 | 200 | 215 | ||||
| MetLife Inc. | 5.375 | % | 12/15/12 | 1,775 | 1,895 | ||||
| MetLife Inc. | 5.000 | % | 11/24/13 | 1,275 | 1,344 | ||||
| MetLife Inc. | 5.000 | % | 6/15/15 | 1,350 | 1,428 | ||||
| MetLife Inc. | 7.717 | % | 2/15/19 | 825 | 966 | ||||
| MetLife Inc. | 6.500 | % | 12/15/32 | 750 | 794 | ||||
| MetLife Inc. | 6.375 | % | 6/15/34 | 975 | 1,044 | ||||
| MetLife Inc. | 5.700 | % | 6/15/35 | 375 | 371 | ||||
| MetLife Inc. | 6.400 | % | 12/15/36 | 3,650 | 3,194 | ||||
| 4 Metropolitan Life Global Funding I | 2.875 | % | 9/17/12 | 2,200 | 2,218 | ||||
| 4 Metropolitan Life Global Funding I | 5.125 | % | 6/10/14 | 5,225 | 5,528 | ||||
| Nationwide Financial Services | 6.750 | % | 5/15/37 | 200 | 155 | ||||
| OneBeacon US Holdings Inc. | 5.875 | % | 5/15/13 | 675 | 667 | ||||
| Principal Financial Group Inc. | 7.875 | % | 5/15/14 | 1,525 | 1,708 | ||||
| Principal Financial Group Inc. | 6.050 | % | 10/15/36 | 950 | 839 | ||||
| Principal Life Income Funding Trusts | 5.300 | % | 12/14/12 | 1,450 | 1,560 | ||||
| Principal Life Income Funding Trusts | 5.300 | % | 4/24/13 | 1,825 | 1,929 | ||||
| Principal Life Income Funding Trusts | 5.100 | % | 4/15/14 | 1,250 | 1,281 | ||||
| Progressive Corp. | 6.375 | % | 1/15/12 | 700 | 754 | ||||
| Progressive Corp. | 6.625 | % | 3/1/29 | 1,300 | 1,327 | ||||
| Progressive Corp. | 6.250 | % | 12/1/32 | 100 | 101 | ||||
| 3 Progressive Corp. | 6.700 | % | 6/15/37 | 2,300 | 2,037 | ||||
| Protective Life Corp. | 7.375 | % | 10/15/19 | 950 | 953 | ||||
| Protective Life Corp. | 8.450 | % | 10/15/39 | 900 | 869 | ||||
| Protective Life Secured Trusts | 4.850 | % | 8/16/10 | 800 | 817 | ||||
| Prudential Financial Inc. | 5.100 | % | 12/14/11 | 125 | 131 | ||||
| Prudential Financial Inc. | 5.800 | % | 6/15/12 | 975 | 1,035 | ||||
| Prudential Financial Inc. | 3.625 | % | 9/17/12 | 775 | 794 | ||||
| Prudential Financial Inc. | 5.150 | % | 1/15/13 | 975 | 1,030 | ||||
| Prudential Financial Inc. | 4.500 | % | 7/15/13 | 1,825 | 1,834 | ||||
| Prudential Financial Inc. | 4.750 | % | 4/1/14 | 650 | 668 | ||||
| Prudential Financial Inc. | 5.100 | % | 9/20/14 | 8,000 | 8,341 | ||||
| Prudential Financial Inc. | 6.200 | % | 1/15/15 | 2,750 | 2,946 | ||||
| Prudential Financial Inc. | 5.500 | % | 3/15/16 | 175 | 179 | ||||
| Prudential Financial Inc. | 6.100 | % | 6/15/17 | 325 | 335 | ||||
| Prudential Financial Inc. | 6.000 | % | 12/1/17 | 1,225 | 1,258 | ||||
| Prudential Financial Inc. | 5.750 | % | 7/15/33 | 675 | 609 | ||||
| Prudential Financial Inc. | 5.400 | % | 6/13/35 | 775 | 663 | ||||
| Prudential Financial Inc. | 5.900 | % | 3/17/36 | 1,300 | 1,206 | ||||
| Prudential Financial Inc. | 5.700 | % | 12/14/36 | 5,475 | 4,937 | ||||
| Swiss Re Solutions Holding Corp. | 6.450 | % | 3/1/19 | 675 | 673 | ||||
| Swiss Re Solutions Holding Corp. | 7.000 | % | 2/15/26 | 1,225 | 1,209 | ||||
| Swiss Re Solutions Holding Corp. | 7.750 | % | 6/15/30 | 525 | 533 | ||||
| Torchmark Corp. | 6.375 | % | 6/15/16 | 1,225 | 1,228 | ||||
| Transatlantic Holdings Inc. | 8.000 | % | 11/30/39 | 2,500 | 2,507 | ||||
| Travelers Cos. Inc. | 5.375 | % | 6/15/12 | 100 | 106 | ||||
| Travelers Cos. Inc. | 5.500 | % | 12/1/15 | 625 | 676 | ||||
| Travelers Cos. Inc. | 6.250 | % | 6/20/16 | 1,100 | 1,199 | ||||
| Travelers Cos. Inc. | 5.750 | % | 12/15/17 | 1,375 | 1,450 | ||||
| Travelers Cos. Inc. | 5.800 | % | 5/15/18 | 100 | 106 | ||||
| Travelers Cos. Inc. | 5.900 | % | 6/2/19 | 1,275 | 1,387 | ||||
34
| Total Bond Market II Index Fund | |||||||||
| Face | Market | ||||||||
| Maturity | Amount | Value• | |||||||
| Coupon | Date | ($ | 000 | ) | ($ | 000 | ) | ||
| 3 Travelers Cos. Inc. | 6.250 | % | 3/15/37 | 800 | 725 | ||||
| Travelers Cos. Inc. | 6.250 | % | 6/15/37 | 4,100 | 4,308 | ||||
| Travelers Property Casualty Corp. | 6.375 | % | 3/15/33 | 100 | 106 | ||||
| UnitedHealth Group Inc. | 5.500 | % | 11/15/12 | 1,925 | 2,064 | ||||
| UnitedHealth Group Inc. | 4.875 | % | 2/15/13 | 975 | 1,025 | ||||
| UnitedHealth Group Inc. | 4.875 | % | 4/1/13 | 975 | 1,027 | ||||
| UnitedHealth Group Inc. | 5.000 | % | 8/15/14 | 4,900 | 5,135 | ||||
| UnitedHealth Group Inc. | 4.875 | % | 3/15/15 | 875 | 906 | ||||
| UnitedHealth Group Inc. | 6.000 | % | 6/15/17 | 1,825 | 1,902 | ||||
| UnitedHealth Group Inc. | 6.000 | % | 11/15/17 | 425 | 444 | ||||
| UnitedHealth Group Inc. | 6.000 | % | 2/15/18 | 4,750 | 4,948 | ||||
| UnitedHealth Group Inc. | 5.800 | % | 3/15/36 | 4,525 | 4,043 | ||||
| UnitedHealth Group Inc. | 6.500 | % | 6/15/37 | 625 | 612 | ||||
| UnitedHealth Group Inc. | 6.625 | % | 11/15/37 | 1,425 | 1,447 | ||||
| UnitedHealth Group Inc. | 6.875 | % | 2/15/38 | 1,675 | 1,737 | ||||
| Unum Group | 7.125 | % | 9/30/16 | 1,250 | 1,291 | ||||
| WellPoint Health Networks Inc. | 6.375 | % | 1/15/12 | 1,000 | 1,081 | ||||
| WellPoint Inc. | 5.000 | % | 1/15/11 | 1,875 | 1,945 | ||||
| WellPoint Inc. | 6.800 | % | 8/1/12 | 625 | 690 | ||||
| WellPoint Inc. | 6.000 | % | 2/15/14 | 550 | 598 | ||||
| WellPoint Inc. | 5.000 | % | 12/15/14 | 4,650 | 4,837 | ||||
| WellPoint Inc. | 5.250 | % | 1/15/16 | 550 | 555 | ||||
| WellPoint Inc. | 5.875 | % | 6/15/17 | 900 | 933 | ||||
| WellPoint Inc. | 5.950 | % | 12/15/34 | 2,200 | 2,084 | ||||
| WellPoint Inc. | 5.850 | % | 1/15/36 | 2,400 | 2,244 | ||||
| WellPoint Inc. | 6.375 | % | 6/15/37 | 325 | 329 | ||||
| Willis North America Inc. | 5.625 | % | 7/15/15 | 1,225 | 1,204 | ||||
| Willis North America Inc. | 6.200 | % | 3/28/17 | 1,125 | 1,078 | ||||
| Willis North America Inc. | 7.000 | % | 9/29/19 | 8,150 | 8,191 | ||||
| XL Capital Ltd. | 5.250 | % | 9/15/14 | 4,350 | 4,335 | ||||
| XL Capital Ltd. | 6.375 | % | 11/15/24 | 175 | 158 | ||||
| XL Capital Ltd. | 6.250 | % | 5/15/27 | 2,425 | 2,191 | ||||
| 3 XL Capital Ltd. | 6.500 | % | 12/15/49 | 1,475 | 1,119 | ||||
| Other Finance (0.0%) | |||||||||
| CME Group Inc. | 5.400 | % | 8/1/13 | 2,900 | 3,110 | ||||
| CME Group Inc. | 5.750 | % | 2/15/14 | 1,075 | 1,174 | ||||
| ORIX Corp. | 5.480 | % | 11/22/11 | 1,800 | 1,806 | ||||
| XTRA Finance Corp. | 5.150 | % | 4/1/17 | 4,525 | 4,596 | ||||
| Real Estate Investment Trusts (0.3%) | |||||||||
| AMB Property LP | 6.625 | % | 12/1/19 | 850 | 834 | ||||
| Arden Realty LP | 5.250 | % | 3/1/15 | 250 | 257 | ||||
| AvalonBay Communities Inc. | 5.500 | % | 1/15/12 | 356 | 372 | ||||
| AvalonBay Communities Inc. | 6.125 | % | 11/1/12 | 106 | 113 | ||||
| AvalonBay Communities Inc. | 5.750 | % | 9/15/16 | 275 | 282 | ||||
| Boston Properties LP | 6.250 | % | 1/15/13 | 1,400 | 1,493 | ||||
| Boston Properties LP | 5.625 | % | 4/15/15 | 1,375 | 1,410 | ||||
| Brandywine Operating Partnership LP | 5.750 | % | 4/1/12 | 550 | 552 | ||||
| Brandywine Operating Partnership LP | 5.400 | % | 11/1/14 | 875 | 817 | ||||
| Brandywine Operating Partnership LP | 7.500 | % | 5/15/15 | 1,400 | 1,422 | ||||
| Brandywine Operating Partnership LP | 5.700 | % | 5/1/17 | 275 | 247 | ||||
| Duke Realty LP | 6.250 | % | 5/15/13 | 2,350 | 2,405 | ||||
| Duke Realty LP | 7.375 | % | 2/15/15 | 925 | 983 | ||||
| Duke Realty LP | 5.950 | % | 2/15/17 | 1,300 | 1,212 | ||||
| Duke Realty LP | 8.250 | % | 8/15/19 | 875 | 918 | ||||
| ERP Operating LP | 6.625 | % | 3/15/12 | 1,150 | 1,228 | ||||
35
| Total Bond Market II Index Fund | |||||||||
| Face | Market | ||||||||
| Maturity | Amount | Value• | |||||||
| Coupon | Date | ($ | 000 | ) | ($ | 000 | ) | ||
| ERP Operating LP | 5.500 | % | 10/1/12 | 1,100 | 1,157 | ||||
| ERP Operating LP | 5.250 | % | 9/15/14 | 1,350 | 1,372 | ||||
| ERP Operating LP | 5.125 | % | 3/15/16 | 600 | 584 | ||||
| ERP Operating LP | 5.375 | % | 8/1/16 | 975 | 954 | ||||
| ERP Operating LP | 5.750 | % | 6/15/17 | 550 | 551 | ||||
| HCP Inc. | 6.450 | % | 6/25/12 | 2,075 | 2,159 | ||||
| HCP Inc. | 5.650 | % | 12/15/13 | 2,225 | 2,228 | ||||
| HCP Inc. | 6.300 | % | 9/15/16 | 950 | 929 | ||||
| HCP Inc. | 6.000 | % | 1/30/17 | 425 | 405 | ||||
| HCP Inc. | 6.700 | % | 1/30/18 | 1,700 | 1,655 | ||||
| Health Care REIT Inc. | 6.000 | % | 11/15/13 | 525 | 532 | ||||
| Health Care REIT Inc. | 6.200 | % | 6/1/16 | 3,250 | 3,180 | ||||
| Healthcare Realty Trust Inc. | 6.500 | % | 1/17/17 | 1,600 | 1,564 | ||||
| Hospitality Properties Trust | 7.875 | % | 8/15/14 | 1,375 | 1,422 | ||||
| Hospitality Properties Trust | 5.125 | % | 2/15/15 | 1,775 | 1,604 | ||||
| HRPT Properties Trust | 6.250 | % | 8/15/16 | 575 | 547 | ||||
| HRPT Properties Trust | 6.250 | % | 6/15/17 | 1,725 | 1,557 | ||||
| Kimco Realty Corp. | 5.783 | % | 3/15/16 | 400 | 395 | ||||
| Kimco Realty Corp. | 6.875 | % | 10/1/19 | 875 | 890 | ||||
| Liberty Property LP | 5.125 | % | 3/2/15 | 3,200 | 3,040 | ||||
| Liberty Property LP | 5.500 | % | 12/15/16 | 625 | 571 | ||||
| Mack-Cali Realty LP | 7.750 | % | 8/15/19 | 675 | 701 | ||||
| National Retail Properties Inc. | 6.875 | % | 10/15/17 | 2,700 | 2,607 | ||||
| Nationwide Health Properties Inc. | 6.250 | % | 2/1/13 | 1,400 | 1,432 | ||||
| ProLogis | 5.625 | % | 11/15/15 | 1,200 | 1,141 | ||||
| ProLogis | 5.750 | % | 4/1/16 | 1,025 | 962 | ||||
| ProLogis | 5.625 | % | 11/15/16 | 1,200 | 1,108 | ||||
| ProLogis | 7.375 | % | 10/30/19 | 2,075 | 2,055 | ||||
| Realty Income Corp. | 6.750 | % | 8/15/19 | 2,575 | 2,519 | ||||
| Regency Centers LP | 6.750 | % | 1/15/12 | 2,350 | 2,468 | ||||
| Regency Centers LP | 5.250 | % | 8/1/15 | 625 | 598 | ||||
| Simon Property Group LP | 4.875 | % | 8/15/10 | 1,875 | 1,906 | ||||
| Simon Property Group LP | 5.600 | % | 9/1/11 | 1,000 | 1,050 | ||||
| Simon Property Group LP | 5.000 | % | 3/1/12 | 1,050 | 1,085 | ||||
| Simon Property Group LP | 5.300 | % | 5/30/13 | 2,175 | 2,244 | ||||
| Simon Property Group LP | 6.750 | % | 5/15/14 | 6,350 | 6,766 | ||||
| Simon Property Group LP | 5.750 | % | 12/1/15 | 1,375 | 1,402 | ||||
| Simon Property Group LP | 6.100 | % | 5/1/16 | 150 | 153 | ||||
| Simon Property Group LP | 5.250 | % | 12/1/16 | 3,525 | 3,471 | ||||
| Simon Property Group LP | 5.875 | % | 3/1/17 | 1,375 | 1,388 | ||||
| Simon Property Group LP | 6.125 | % | 5/30/18 | 1,700 | 1,728 | ||||
| Tanger Properties LP | 6.150 | % | 11/15/15 | 1,250 | 1,224 | ||||
| 1,925,300 | |||||||||
| Industrial (10.3%) | |||||||||
| Basic Industry (0.9%) | |||||||||
| Agrium Inc. | 6.750 | % | 1/15/19 | 1,500 | 1,605 | ||||
| Airgas Inc. | 4.500 | % | 9/15/14 | 800 | 814 | ||||
| Alcoa Inc. | 6.000 | % | 1/15/12 | 950 | 994 | ||||
| Alcoa Inc. | 5.375 | % | 1/15/13 | 1,150 | 1,192 | ||||
| Alcoa Inc. | 6.000 | % | 7/15/13 | 3,050 | 3,225 | ||||
| Alcoa Inc. | 6.750 | % | 7/15/18 | 100 | 102 | ||||
| Alcoa Inc. | 5.720 | % | 2/23/19 | 2,300 | 2,226 | ||||
| Alcoa Inc. | 5.870 | % | 2/23/22 | 550 | 511 | ||||
| Alcoa Inc. | 5.900 | % | 2/1/27 | 1,950 | 1,741 | ||||
| Alcoa Inc. | 6.750 | % | 1/15/28 | 200 | 192 | ||||
| Alcoa Inc. | 5.950 | % | 2/1/37 | 5,000 | 4,320 | ||||
| Allegheny Technologies Inc. | 9.375 | % | 6/1/19 | 2,975 | 3,391 | ||||
36
| Total Bond Market II Index Fund | |||||||||
| Face | Market | ||||||||
| Maturity | Amount | Value• | |||||||
| Coupon | Date | ($ | 000 | ) | ($ | 000 | ) | ||
| ArcelorMittal | 5.375 | % | 6/1/13 | 4,025 | 4,222 | ||||
| ArcelorMittal | 9.000 | % | 2/15/15 | 1,350 | 1,572 | ||||
| ArcelorMittal | 6.125 | % | 6/1/18 | 3,000 | 3,069 | ||||
| ArcelorMittal | 9.850 | % | 6/1/19 | 1,700 | 2,188 | ||||
| ArcelorMittal | 7.000 | % | 10/15/39 | 2,400 | 2,532 | ||||
| Barrick Australian Finance Pty Ltd. | 5.950 | % | 10/15/39 | 1,550 | 1,513 | ||||
| Barrick Gold Corp. | 6.950 | % | 4/1/19 | 2,200 | 2,490 | ||||
| Barrick Gold Finance Co. | 4.875 | % | 11/15/14 | 2,900 | 3,052 | ||||
| Barrick Gold Financeco LLC | 6.125 | % | 9/15/13 | 2,275 | 2,502 | ||||
| Barrick North America Finance LLC | 6.800 | % | 9/15/18 | 1,650 | 1,840 | ||||
| Barrick North America Finance LLC | 7.500 | % | 9/15/38 | 2,100 | 2,421 | ||||
| BHP Billiton Finance USA Ltd. | 5.125 | % | 3/29/12 | 950 | 1,014 | ||||
| BHP Billiton Finance USA Ltd. | 8.500 | % | 12/1/12 | 175 | 205 | ||||
| BHP Billiton Finance USA Ltd. | 4.800 | % | 4/15/13 | 2,450 | 2,599 | ||||
| BHP Billiton Finance USA Ltd. | 5.500 | % | 4/1/14 | 5,125 | 5,624 | ||||
| BHP Billiton Finance USA Ltd. | 5.250 | % | 12/15/15 | 1,550 | 1,678 | ||||
| BHP Billiton Finance USA Ltd. | 5.400 | % | 3/29/17 | 350 | 374 | ||||
| BHP Billiton Finance USA Ltd. | 6.500 | % | 4/1/19 | 4,900 | 5,635 | ||||
| Celulosa Arauco y Constitucion SA | 5.125 | % | 7/9/13 | 325 | 342 | ||||
| Celulosa Arauco y Constitucion SA | 5.625 | % | 4/20/15 | 1,000 | 1,049 | ||||
| Commercial Metals Co. | 6.500 | % | 7/15/17 | 800 | 812 | ||||
| Commercial Metals Co. | 7.350 | % | 8/15/18 | 1,925 | 2,053 | ||||
| Cytec Industries Inc. | 8.950 | % | 7/1/17 | 550 | 653 | ||||
| Dow Chemical Co. | 6.125 | % | 2/1/11 | 3,650 | 3,810 | ||||
| Dow Chemical Co. | 4.850 | % | 8/15/12 | 5,050 | 5,306 | ||||
| Dow Chemical Co. | 6.000 | % | 10/1/12 | 500 | 538 | ||||
| Dow Chemical Co. | 7.600 | % | 5/15/14 | 4,375 | 4,979 | ||||
| Dow Chemical Co. | 5.900 | % | 2/15/15 | 12,300 | 13,232 | ||||
| Dow Chemical Co. | 8.550 | % | 5/15/19 | 4,175 | 4,977 | ||||
| Dow Chemical Co. | 7.375 | % | 11/1/29 | 1,500 | 1,630 | ||||
| Dow Chemical Co. | 9.400 | % | 5/15/39 | 725 | 966 | ||||
| Eastman Chemical Co. | 7.250 | % | 1/15/24 | 3,025 | 3,279 | ||||
| Eastman Chemical Co. | 7.600 | % | 2/1/27 | 675 | 741 | ||||
| EI du Pont de Nemours & Co. | 4.750 | % | 11/15/12 | 1,400 | 1,508 | ||||
| EI du Pont de Nemours & Co. | 5.000 | % | 1/15/13 | 4,525 | 4,865 | ||||
| EI du Pont de Nemours & Co. | 5.000 | % | 7/15/13 | 2,375 | 2,573 | ||||
| EI du Pont de Nemours & Co. | 5.875 | % | 1/15/14 | 4,055 | 4,479 | ||||
| EI du Pont de Nemours & Co. | 5.250 | % | 12/15/16 | 225 | 239 | ||||
| EI du Pont de Nemours & Co. | 6.000 | % | 7/15/18 | 7,275 | 7,956 | ||||
| EI du Pont de Nemours & Co. | 6.500 | % | 1/15/28 | 525 | 570 | ||||
| Freeport-McMoRan Copper & Gold Inc. | 8.250 | % | 4/1/15 | 3,550 | 3,843 | ||||
| Freeport-McMoRan Copper & Gold Inc. | 8.375 | % | 4/1/17 | 4,800 | 5,250 | ||||
| ICI Wilmington Inc. | 5.625 | % | 12/1/13 | 200 | 209 | ||||
| International Paper Co. | 5.300 | % | 4/1/15 | 1,600 | 1,645 | ||||
| International Paper Co. | 7.950 | % | 6/15/18 | 3,275 | 3,766 | ||||
| International Paper Co. | 9.375 | % | 5/15/19 | 4,800 | 5,962 | ||||
| International Paper Co. | 7.500 | % | 8/15/21 | 4,600 | 5,135 | ||||
| International Paper Co. | 7.300 | % | 11/15/39 | 2,225 | 2,356 | ||||
| Lubrizol Corp. | 5.500 | % | 10/1/14 | 2,100 | 2,236 | ||||
| Lubrizol Corp. | 8.875 | % | 2/1/19 | 1,075 | 1,324 | ||||
| Lubrizol Corp. | 6.500 | % | 10/1/34 | 4,000 | 4,107 | ||||
| Monsanto Co. | 7.375 | % | 8/15/12 | 475 | 538 | ||||
| Monsanto Co. | 5.125 | % | 4/15/18 | 850 | 884 | ||||
| Monsanto Co. | 5.875 | % | 4/15/38 | 4,300 | 4,476 | ||||
| 4 Mosaic Co. | 7.375 | % | 12/1/14 | 1,475 | 1,575 | ||||
| 4 Mosaic Co. | 7.625 | % | 12/1/16 | 3,349 | 3,608 | ||||
| Newmont Mining Corp. | 5.125 | % | 10/1/19 | 1,000 | 1,003 | ||||
37
| Total Bond Market II Index Fund | |||||||||
| Face | Market | ||||||||
| Maturity | Amount | Value• | |||||||
| Coupon | Date | ($ | 000 | ) | ($ | 000 | ) | ||
| Newmont Mining Corp. | 5.875 | % | 4/1/35 | 750 | 716 | ||||
| Newmont Mining Corp. | 6.250 | % | 10/1/39 | 3,150 | 3,156 | ||||
| Nucor Corp. | 5.000 | % | 12/1/12 | 200 | 216 | ||||
| Nucor Corp. | 5.000 | % | 6/1/13 | 100 | 106 | ||||
| Nucor Corp. | 5.750 | % | 12/1/17 | 425 | 457 | ||||
| Nucor Corp. | 5.850 | % | 6/1/18 | 1,725 | 1,857 | ||||
| Nucor Corp. | 6.400 | % | 12/1/37 | 1,225 | 1,323 | ||||
| Placer Dome Inc. | 6.450 | % | 10/15/35 | 1,050 | 1,052 | ||||
| Plum Creek Timberlands LP | 5.875 | % | 11/15/15 | 1,250 | 1,280 | ||||
| Potash Corp. of Saskatchewan Inc. | 7.750 | % | 5/31/11 | 3,325 | 3,605 | ||||
| Potash Corp. of Saskatchewan Inc. | 4.875 | % | 3/1/13 | 1,050 | 1,105 | ||||
| Potash Corp. of Saskatchewan Inc. | 3.750 | % | 9/30/15 | 2,000 | 1,996 | ||||
| Potash Corp. of Saskatchewan Inc. | 4.875 | % | 3/30/20 | 2,550 | 2,497 | ||||
| Potash Corp. of Saskatchewan Inc. | 5.875 | % | 12/1/36 | 200 | 197 | ||||
| PPG Industries Inc. | 5.750 | % | 3/15/13 | 1,050 | 1,121 | ||||
| PPG Industries Inc. | 6.650 | % | 3/15/18 | 950 | 1,034 | ||||
| Praxair Inc. | 6.375 | % | 4/1/12 | 525 | 576 | ||||
| Praxair Inc. | 1.750 | % | 11/15/12 | 1,050 | 1,044 | ||||
| Praxair Inc. | 3.950 | % | 6/1/13 | 200 | 209 | ||||
| Praxair Inc. | 4.375 | % | 3/31/14 | 825 | 870 | ||||
| Praxair Inc. | 5.250 | % | 11/15/14 | 2,000 | 2,185 | ||||
| Praxair Inc. | 4.625 | % | 3/30/15 | 100 | 107 | ||||
| Praxair Inc. | 5.200 | % | 3/15/17 | 325 | 342 | ||||
| Praxair Inc. | 4.500 | % | 8/15/19 | 1,600 | 1,614 | ||||
| Reliance Steel & Aluminum Co. | 6.200 | % | 11/15/16 | 100 | 100 | ||||
| Reliance Steel & Aluminum Co. | 6.850 | % | 11/15/36 | 100 | 86 | ||||
| Rio Tinto Alcan Inc. | 6.450 | % | 3/15/11 | 550 | 576 | ||||
| Rio Tinto Alcan Inc. | 4.875 | % | 9/15/12 | 600 | 633 | ||||
| Rio Tinto Alcan Inc. | 4.500 | % | 5/15/13 | 1,850 | 1,896 | ||||
| Rio Tinto Alcan Inc. | 5.200 | % | 1/15/14 | 200 | 212 | ||||
| Rio Tinto Alcan Inc. | 5.000 | % | 6/1/15 | 250 | 254 | ||||
| Rio Tinto Alcan Inc. | 6.125 | % | 12/15/33 | 2,725 | 2,721 | ||||
| Rio Tinto Finance USA Ltd. | 5.875 | % | 7/15/13 | 6,175 | 6,671 | ||||
| Rio Tinto Finance USA Ltd. | 8.950 | % | 5/1/14 | 4,625 | 5,538 | ||||
| Rio Tinto Finance USA Ltd. | 6.500 | % | 7/15/18 | 3,000 | 3,279 | ||||
| Rio Tinto Finance USA Ltd. | 9.000 | % | 5/1/19 | 3,700 | 4,685 | ||||
| Rio Tinto Finance USA Ltd. | 7.125 | % | 7/15/28 | 1,375 | 1,541 | ||||
| 3 Rohm & Haas Holdings Ltd. | 9.800 | % | 4/15/20 | 619 | 691 | ||||
| Rohm and Haas Co. | 6.000 | % | 9/15/17 | 2,325 | 2,391 | ||||
| Sherwin-Williams Co. | 3.125 | % | 12/15/14 | 1,350 | 1,341 | ||||
| Southern Copper Corp. | 7.500 | % | 7/27/35 | 2,500 | 2,414 | ||||
| Vale Inco Ltd. | 7.750 | % | 5/15/12 | 175 | 191 | ||||
| Vale Inco Ltd. | 5.700 | % | 10/15/15 | 1,200 | 1,212 | ||||
| Vale Inco Ltd. | 7.200 | % | 9/15/32 | 325 | 325 | ||||
| Vale Overseas Ltd. | 6.250 | % | 1/11/16 | 625 | 658 | ||||
| Vale Overseas Ltd. | 6.250 | % | 1/23/17 | 1,425 | 1,494 | ||||
| Vale Overseas Ltd. | 5.625 | % | 9/15/19 | 1,525 | 1,523 | ||||
| Vale Overseas Ltd. | 8.250 | % | 1/17/34 | 800 | 921 | ||||
| Vale Overseas Ltd. | 6.875 | % | 11/21/36 | 5,325 | 5,370 | ||||
| Vale Overseas Ltd. | 6.875 | % | 11/10/39 | 2,275 | 2,283 | ||||
| Valspar Corp. | 7.250 | % | 6/15/19 | 400 | 433 | ||||
| WMC Finance USA Ltd. | 5.125 | % | 5/15/13 | 575 | 616 | ||||
| Xstrata Canada Corp. | 7.350 | % | 6/5/12 | 475 | 513 | ||||
| Xstrata Canada Corp. | 7.250 | % | 7/15/12 | 1,375 | 1,486 | ||||
| Xstrata Canada Corp. | 5.375 | % | 6/1/15 | 100 | 104 | ||||
| Xstrata Canada Corp. | 6.000 | % | 10/15/15 | 325 | 343 | ||||
| Xstrata Canada Corp. | 5.500 | % | 6/15/17 | 1,975 | 1,906 | ||||
38
| Total Bond Market II Index Fund | |||||||||
| Face | Market | ||||||||
| Maturity | Amount | Value• | |||||||
| Coupon | Date | ($ | 000 | ) | ($ | 000 | ) | ||
| Capital Goods (1.0%) | |||||||||
| 3M Co. | 4.500 | % | 11/1/11 | 575 | 609 | ||||
| 3M Co. | 6.375 | % | 2/15/28 | 1,300 | 1,440 | ||||
| 3M Co. | 5.700 | % | 3/15/37 | 1,450 | 1,521 | ||||
| 4 Acuity Brands Lighting Inc. | 6.000 | % | 12/15/19 | 800 | 769 | ||||
| Allied Waste North America Inc. | 7.125 | % | 5/15/16 | 6,550 | 6,976 | ||||
| 4 BAE Systems Holdings Inc. | 5.200 | % | 8/15/15 | 100 | 105 | ||||
| Bemis Co. Inc. | 4.875 | % | 4/1/12 | 575 | 596 | ||||
| Bemis Co. Inc. | 5.650 | % | 8/1/14 | 7,225 | 7,708 | ||||
| Black & Decker Corp. | 7.125 | % | 6/1/11 | 375 | 399 | ||||
| Black & Decker Corp. | 5.750 | % | 11/15/16 | 625 | 643 | ||||
| Boeing Capital Corp. | 6.500 | % | 2/15/12 | 4,425 | 4,837 | ||||
| Boeing Capital Corp. | 5.800 | % | 1/15/13 | 1,475 | 1,610 | ||||
| Boeing Capital Corp. | 3.250 | % | 10/27/14 | 1,000 | 991 | ||||
| Boeing Co. | 1.875 | % | 11/20/12 | 2,050 | 2,040 | ||||
| Boeing Co. | 5.000 | % | 3/15/14 | 100 | 108 | ||||
| Boeing Co. | 3.500 | % | 2/15/15 | 3,250 | 3,264 | ||||
| Boeing Co. | 6.000 | % | 3/15/19 | 725 | 787 | ||||
| Boeing Co. | 4.875 | % | 2/15/20 | 950 | 954 | ||||
| Boeing Co. | 8.750 | % | 8/15/21 | 200 | 259 | ||||
| Boeing Co. | 7.250 | % | 6/15/25 | 1,025 | 1,146 | ||||
| Boeing Co. | 8.750 | % | 9/15/31 | 300 | 399 | ||||
| Boeing Co. | 6.125 | % | 2/15/33 | 225 | 233 | ||||
| Boeing Co. | 6.625 | % | 2/15/38 | 525 | 583 | ||||
| Boeing Co. | 5.875 | % | 2/15/40 | 1,075 | 1,114 | ||||
| Caterpillar Financial Services Corp. | 5.125 | % | 10/12/11 | 100 | 106 | ||||
| Caterpillar Financial Services Corp. | 4.850 | % | 12/7/12 | 100 | 108 | ||||
| Caterpillar Financial Services Corp. | 4.250 | % | 2/8/13 | 1,725 | 1,785 | ||||
| Caterpillar Financial Services Corp. | 6.125 | % | 2/17/14 | 9,400 | 10,488 | ||||
| Caterpillar Financial Services Corp. | 4.750 | % | 2/17/15 | 1,350 | 1,415 | ||||
| Caterpillar Financial Services Corp. | 4.625 | % | 6/1/15 | 775 | 799 | ||||
| Caterpillar Financial Services Corp. | 7.150 | % | 2/15/19 | 10,525 | 12,133 | ||||
| Caterpillar Inc. | 7.000 | % | 12/15/13 | 425 | 495 | ||||
| Caterpillar Inc. | 6.625 | % | 7/15/28 | 200 | 223 | ||||
| Caterpillar Inc. | 7.300 | % | 5/1/31 | 675 | 802 | ||||
| Caterpillar Inc. | 6.050 | % | 8/15/36 | 1,075 | 1,141 | ||||
| Caterpillar Inc. | 8.250 | % | 12/15/38 | 200 | 266 | �� | |||
| Caterpillar Inc. | 6.950 | % | 5/1/42 | 325 | 356 | ||||
| Caterpillar Inc. | 7.375 | % | 3/1/97 | 1,825 | 1,935 | ||||
| Cooper US Inc. | 5.250 | % | 11/15/12 | 1,275 | 1,370 | ||||
| Cooper US Inc. | 5.450 | % | 4/1/15 | 525 | 566 | ||||
| CRH America Inc. | 5.625 | % | 9/30/11 | 1,250 | 1,312 | ||||
| CRH America Inc. | 6.950 | % | 3/15/12 | 1,825 | 1,970 | ||||
| CRH America Inc. | 5.300 | % | 10/15/13 | 450 | 470 | ||||
| CRH America Inc. | 6.000 | % | 9/30/16 | 4,750 | 4,942 | ||||
| CRH America Inc. | 8.125 | % | 7/15/18 | 3,275 | 3,823 | ||||
| Danaher Corp. | 5.625 | % | 1/15/18 | 850 | 912 | ||||
| Deere & Co. | 6.950 | % | 4/25/14 | 3,925 | 4,540 | ||||
| Deere & Co. | 4.375 | % | 10/16/19 | 3,225 | 3,235 | ||||
| Deere & Co. | 5.375 | % | 10/16/29 | 1,800 | 1,798 | ||||
| Deere & Co. | 8.100 | % | 5/15/30 | 1,525 | 1,944 | ||||
| Deere & Co. | 7.125 | % | 3/3/31 | 975 | 1,153 | ||||
| Dover Corp. | 5.450 | % | 3/15/18 | 2,250 | 2,373 | ||||
| Dover Corp. | 5.375 | % | 10/15/35 | 100 | 98 | ||||
| Dover Corp. | 6.600 | % | 3/15/38 | 975 | 1,107 | ||||
| Eaton Corp. | 4.900 | % | 5/15/13 | 850 | 896 | ||||
| Eaton Corp. | 5.600 | % | 5/15/18 | 1,755 | 1,846 | ||||
39
| Total Bond Market II Index Fund | |||||||||
| Face | Market | ||||||||
| Maturity | Amount | Value• | |||||||
| Coupon | Date | ($ | 000 | ) | ($ | 000 | ) | ||
| Embraer Overseas Ltd. | 6.375 | % | 1/24/17 | 1,450 | 1,466 | ||||
| Embraer Overseas Ltd. | 6.375 | % | 1/15/20 | 575 | 573 | ||||
| Emerson Electric Co. | 7.125 | % | 8/15/10 | 1,225 | 1,273 | ||||
| Emerson Electric Co. | 4.625 | % | 10/15/12 | 1,800 | 1,923 | ||||
| Emerson Electric Co. | 4.500 | % | 5/1/13 | 1,275 | 1,350 | ||||
| Emerson Electric Co. | 5.250 | % | 10/15/18 | 2,200 | 2,324 | ||||
| Emerson Electric Co. | 4.875 | % | 10/15/19 | 900 | 927 | ||||
| Emerson Electric Co. | 4.250 | % | 11/15/20 | 950 | 922 | ||||
| Emerson Electric Co. | 5.250 | % | 11/15/39 | 2,875 | 2,776 | ||||
| General Dynamics Corp. | 4.250 | % | 5/15/13 | 2,850 | 3,014 | ||||
| General Dynamics Corp. | 5.250 | % | 2/1/14 | 900 | 987 | ||||
| General Electric Co. | 5.000 | % | 2/1/13 | 9,475 | 10,035 | ||||
| General Electric Co. | 5.250 | % | 12/6/17 | 16,775 | 17,115 | ||||
| Goodrich Corp. | 6.125 | % | 3/1/19 | 3,600 | 3,934 | ||||
| Harsco Corp. | 5.750 | % | 5/15/18 | 1,800 | 1,772 | ||||
| Honeywell International Inc. | 6.125 | % | 11/1/11 | 825 | 900 | ||||
| Honeywell International Inc. | 5.625 | % | 8/1/12 | 1,300 | 1,424 | ||||
| Honeywell International Inc. | 4.250 | % | 3/1/13 | 475 | 500 | ||||
| Honeywell International Inc. | 3.875 | % | 2/15/14 | 575 | 599 | ||||
| Honeywell International Inc. | 5.400 | % | 3/15/16 | 425 | 461 | ||||
| Honeywell International Inc. | 5.300 | % | 3/15/17 | 1,375 | 1,443 | ||||
| Honeywell International Inc. | 5.300 | % | 3/1/18 | 175 | 185 | ||||
| Honeywell International Inc. | 5.000 | % | 2/15/19 | 2,375 | 2,465 | ||||
| Honeywell International Inc. | 5.700 | % | 3/15/36 | 700 | 721 | ||||
| Honeywell International Inc. | 5.700 | % | 3/15/37 | 350 | 358 | ||||
| Illinois Tool Works Inc. | 5.150 | % | 4/1/14 | 1,950 | 2,125 | ||||
| Illinois Tool Works Inc. | 6.250 | % | 4/1/19 | 2,650 | 2,974 | ||||
| Ingersoll-Rand Global Holding Co. Ltd. | 6.000 | % | 8/15/13 | 1,425 | 1,535 | ||||
| Ingersoll-Rand Global Holding Co. Ltd. | 9.500 | % | 4/15/14 | 5,175 | 6,219 | ||||
| Ingersoll-Rand Global Holding Co. Ltd. | 6.875 | % | 8/15/18 | 1,850 | 2,058 | ||||
| John Deere Capital Corp. | 5.400 | % | 10/17/11 | 2,075 | 2,213 | ||||
| John Deere Capital Corp.�� | 5.350 | % | 1/17/12 | 1,200 | 1,283 | ||||
| John Deere Capital Corp. | 7.000 | % | 3/15/12 | 2,525 | 2,810 | ||||
| John Deere Capital Corp. | 5.250 | % | 10/1/12 | 1,000 | 1,076 | ||||
| John Deere Capital Corp. | 4.950 | % | 12/17/12 | 975 | 1,053 | ||||
| John Deere Capital Corp. | 4.900 | % | 9/9/13 | 2,925 | 3,143 | ||||
| John Deere Capital Corp. | 5.500 | % | 4/13/17 | 150 | 158 | ||||
| John Deere Capital Corp. | 5.750 | % | 9/10/18 | 1,275 | 1,383 | ||||
| Joy Global Inc. | 6.000 | % | 11/15/16 | 575 | 588 | ||||
| 4 L-3 Communications Corp. | 5.200 | % | 10/15/19 | 1,375 | 1,373 | ||||
| Lafarge SA | 6.150 | % | 7/15/11 | 225 | 235 | ||||
| Lafarge SA | 6.500 | % | 7/15/16 | 2,200 | 2,327 | ||||
| Lafarge SA | 7.125 | % | 7/15/36 | 3,725 | 3,927 | ||||
| Lockheed Martin Corp. | 4.121 | % | 3/14/13 | 625 | 655 | ||||
| Lockheed Martin Corp. | 7.650 | % | 5/1/16 | 1,950 | 2,339 | ||||
| Lockheed Martin Corp. | 4.250 | % | 11/15/19 | 900 | 873 | ||||
| Lockheed Martin Corp. | 7.750 | % | 5/1/26 | 100 | 120 | ||||
| Lockheed Martin Corp. | 6.150 | % | 9/1/36 | 3,075 | 3,270 | ||||
| Lockheed Martin Corp. | 5.500 | % | 11/15/39 | 900 | 889 | ||||
| Martin Marietta Materials Inc. | 6.600 | % | 4/15/18 | 1,850 | 1,905 | ||||
| Northrop Grumman Systems Corp. | 7.125 | % | 2/15/11 | 2,500 | 2,653 | ||||
| Northrop Grumman Systems Corp. | 7.750 | % | 3/1/16 | 250 | 297 | ||||
| Northrop Grumman Systems Corp. | 7.875 | % | 3/1/26 | 525 | 636 | ||||
| Northrop Grumman Systems Corp. | 7.750 | % | 2/15/31 | 150 | 185 | ||||
| Parker Hannifin Corp. | 5.500 | % | 5/15/18 | 450 | 478 | ||||
| Parker Hannifin Corp. | 6.250 | % | 5/15/38 | 550 | 592 | ||||
| Raytheon Co. | 5.500 | % | 11/15/12 | 925 | 1,014 | ||||
40
| Total Bond Market II Index Fund | ||||||||||
| Face | Market | |||||||||
| Maturity | Amount | Value• | ||||||||
| Coupon | Date | ($ | 000 | ) | ($ | 000 | ) | |||
| Raytheon Co. | 6.400 | % | 12/15/18 | 100 | 114 | |||||
| Raytheon Co. | 4.400 | % | 2/15/20 | 500 | 494 | |||||
| Raytheon Co. | 7.200 | % | 8/15/27 | 1,225 | 1,452 | |||||
| Republic Services Inc. | 6.750 | % | 8/15/11 | 625 | 657 | |||||
| 4 | Republic Services Inc. | 5.500 | % | 9/15/19 | 1,000 | 1,016 | ||||
| 4 | Republic Services Inc. | 5.250 | % | 11/15/21 | 3,375 | 3,306 | ||||
| Republic Services Inc. | 6.086 | % | 3/15/35 | 825 | 784 | |||||
| Rockwell Automation Inc. | 5.650 | % | 12/1/17 | 600 | 638 | |||||
| Rockwell Automation Inc. | 6.700 | % | 1/15/28 | 425 | 451 | |||||
| Rockwell Automation Inc. | 6.250 | % | 12/1/37 | 1,500 | 1,553 | |||||
| Rockwell Collins Inc. | 5.250 | % | 7/15/19 | 275 | 289 | |||||
| Roper Industries Inc. | 6.625 | % | 8/15/13 | 3,175 | 3,465 | |||||
| Roper Industries Inc. | 6.250 | % | 9/1/19 | 1,500 | 1,562 | |||||
| 3,4 | Systems 2001 AT LLC | 7.156 | % | 12/15/11 | 333 | 346 | ||||
| Textron Inc. | 5.600 | % | 12/1/17 | 325 | 314 | |||||
| Tyco International Finance SA | 6.750 | % | 2/15/11 | 3,625 | 3,809 | |||||
| Tyco International Finance SA | 6.375 | % | 10/15/11 | 2,750 | 2,946 | |||||
| Tyco International Finance SA | 6.000 | % | 11/15/13 | 1,275 | 1,395 | |||||
| Tyco International Ltd./ | ||||||||||
| Tyco International Finance SA | 7.000 | % | 12/15/19 | 2,375 | 2,677 | |||||
| United Technologies Corp. | 6.350 | % | 3/1/11 | 2,534 | 2,688 | |||||
| United Technologies Corp. | 6.100 | % | 5/15/12 | 175 | 192 | |||||
| United Technologies Corp. | 4.875 | % | 5/1/15 | 200 | 216 | |||||
| United Technologies Corp. | 5.375 | % | 12/15/17 | 3,675 | 3,937 | |||||
| United Technologies Corp. | 6.125 | % | 2/1/19 | 2,350 | 2,603 | |||||
| United Technologies Corp. | 6.700 | % | 8/1/28 | 325 | 366 | |||||
| United Technologies Corp. | 7.500 | % | 9/15/29 | 825 | 1,004 | |||||
| United Technologies Corp. | 5.400 | % | 5/1/35 | 2,025 | 2,015 | |||||
| United Technologies Corp. | 6.050 | % | 6/1/36 | 1,525 | 1,624 | |||||
| United Technologies Corp. | 6.125 | % | 7/15/38 | 625 | 673 | |||||
| Vulcan Materials Co. | 6.300 | % | 6/15/13 | 950 | 1,011 | |||||
| Vulcan Materials Co. | 7.000 | % | 6/15/18 | 1,550 | 1,679 | |||||
| Waste Management Inc. | 6.375 | % | 11/15/12 | 325 | 358 | |||||
| Waste Management Inc. | 5.000 | % | 3/15/14 | 350 | 370 | |||||
| Waste Management Inc. | 6.375 | % | 3/11/15 | 225 | 250 | |||||
| Waste Management Inc. | 7.375 | % | 3/11/19 | 3,750 | 4,358 | |||||
| Waste Management Inc. | 7.100 | % | 8/1/26 | 325 | 352 | |||||
| Waste Management Inc. | 7.750 | % | 5/15/32 | 100 | 117 | |||||
| Waste Management Inc. | 6.125 | % | 11/30/39 | 175 | 176 | |||||
| Communication (2.4%) | ||||||||||
| America Movil SAB de CV | 5.500 | % | 3/1/14 | 650 | 692 | |||||
| America Movil SAB de CV | 5.750 | % | 1/15/15 | 1,375 | 1,456 | |||||
| America Movil SAB de CV | 6.375 | % | 3/1/35 | 2,275 | 2,365 | |||||
| America Movil SAB de CV | 6.125 | % | 11/15/37 | 1,575 | 1,577 | |||||
| 4 | American Tower Corp. | 4.625 | % | 4/1/15 | 475 | 479 | ||||
| AT&T Corp. | 7.300 | % | 11/15/11 | 3,425 | 3,776 | |||||
| AT&T Corp. | 8.000 | % | 11/15/31 | 7,075 | 8,651 | |||||
| AT&T Inc. | 6.250 | % | 3/15/11 | 3,500 | 3,705 | |||||
| AT&T Inc. | 5.875 | % | 2/1/12 | 1,975 | 2,139 | |||||
| AT&T Inc. | 5.875 | % | 8/15/12 | 1,925 | 2,110 | |||||
| AT&T Inc. | 4.950 | % | 1/15/13 | 4,450 | 4,755 | |||||
| AT&T Inc. | 6.700 | % | 11/15/13 | 5,325 | 6,024 | |||||
| AT&T Inc. | 4.850 | % | 2/15/14 | 4,200 | 4,487 | |||||
| AT&T Inc. | 5.100 | % | 9/15/14 | 7,025 | 7,594 | |||||
| AT&T Inc. | 5.625 | % | 6/15/16 | 5,225 | 5,600 | |||||
| AT&T Inc. | 5.500 | % | 2/1/18 | 1,600 | 1,681 | |||||
41
| Total Bond Market II Index Fund | |||||||||
| Face | Market | ||||||||
| Maturity | Amount | Value• | |||||||
| Coupon | Date | ($ | 000 | ) | ($ | 000 | ) | ||
| AT&T Inc. | 5.600 | % | 5/15/18 | 1,150 | 1,214 | ||||
| AT&T Inc. | 5.800 | % | 2/15/19 | 7,775 | 8,321 | ||||
| AT&T Inc. | 6.450 | % | 6/15/34 | 2,025 | 2,079 | ||||
| AT&T Inc. | 6.500 | % | 9/1/37 | 11,200 | 11,604 | ||||
| AT&T Inc. | 6.300 | % | 1/15/38 | 4,575 | 4,657 | ||||
| AT&T Inc. | 6.400 | % | 5/15/38 | 2,675 | 2,769 | ||||
| AT&T Inc. | 6.550 | % | 2/15/39 | 6,700 | 7,074 | ||||
| AT&T Mobility LLC | 6.500 | % | 12/15/11 | 1,875 | 2,041 | ||||
| AT&T Mobility LLC | 7.125 | % | 12/15/31 | 3,575 | 4,022 | ||||
| Bellsouth Capital Funding Corp. | 7.875 | % | 2/15/30 | 3,200 | 3,637 | ||||
| BellSouth Corp. | 5.200 | % | 9/15/14 | 425 | 456 | ||||
| BellSouth Corp. | 5.200 | % | 12/15/16 | 1,875 | 1,931 | ||||
| BellSouth Corp. | 6.875 | % | 10/15/31 | 1,625 | 1,688 | ||||
| BellSouth Corp. | 6.550 | % | 6/15/34 | 1,750 | 1,753 | ||||
| BellSouth Corp. | 6.000 | % | 11/15/34 | 1,175 | 1,133 | ||||
| BellSouth Telecommunications Inc. | 6.375 | % | 6/1/28 | 2,750 | 2,732 | ||||
| British Telecommunications PLC | 9.125 | % | 12/15/10 | 2,750 | 2,945 | ||||
| British Telecommunications PLC | 5.150 | % | 1/15/13 | 825 | 861 | ||||
| British Telecommunications PLC | 5.950 | % | 1/15/18 | 4,525 | 4,601 | ||||
| British Telecommunications PLC | 9.625 | % | 12/15/30 | 4,725 | 6,055 | ||||
| CBS Corp. | 6.625 | % | 5/15/11 | 1,375 | 1,440 | ||||
| CBS Corp. | 5.625 | % | 8/15/12 | 1,100 | 1,145 | ||||
| CBS Corp. | 4.625 | % | 5/15/18 | 100 | 91 | ||||
| CBS Corp. | 8.875 | % | 5/15/19 | 1,100 | 1,316 | ||||
| CBS Corp. | 7.875 | % | 7/30/30 | 450 | 486 | ||||
| CBS Corp. | 5.500 | % | 5/15/33 | 200 | 167 | ||||
| Cellco Partnership/Verizon Wireless Capital LLC | 3.750 | % | 5/20/11 | 3,625 | 3,739 | ||||
| Cellco Partnership/Verizon Wireless Capital LLC | 5.250 | % | 2/1/12 | 3,050 | 3,232 | ||||
| Cellco Partnership/Verizon Wireless Capital LLC | 7.375 | % | 11/15/13 | 9,275 | 10,664 | ||||
| Cellco Partnership/Verizon Wireless Capital LLC | 5.550 | % | 2/1/14 | 7,694 | 8,384 | ||||
| Cellco Partnership/Verizon Wireless Capital LLC | 8.500 | % | 11/15/18 | 8,950 | 11,179 | ||||
| CenturyTel Inc. | 6.000 | % | 4/1/17 | 100 | 102 | ||||
| CenturyTel Inc. | 6.150 | % | 9/15/19 | 1,675 | 1,728 | ||||
| CenturyTel Inc. | 6.875 | % | 1/15/28 | 300 | 279 | ||||
| CenturyTel Inc. | 7.600 | % | 9/15/39 | 1,800 | 1,857 | ||||
| Comcast Cable Communications Holdings Inc. | 8.375 | % | 3/15/13 | 55 | 63 | ||||
| Comcast Cable Communications Holdings Inc. | 9.455 | % | 11/15/22 | 2,000 | 2,605 | ||||
| Comcast Cable Communications LLC | 6.750 | % | 1/30/11 | 5,325 | 5,623 | ||||
| Comcast Cable Communications LLC | 8.875 | % | 5/1/17 | 975 | 1,175 | ||||
| Comcast Corp. | 5.500 | % | 3/15/11 | 850 | 888 | ||||
| Comcast Corp. | 5.300 | % | 1/15/14 | 1,850 | 1,979 | ||||
| Comcast Corp. | 6.500 | % | 1/15/15 | 1,350 | 1,515 | ||||
| Comcast Corp. | 5.900 | % | 3/15/16 | 6,650 | 7,135 | ||||
| Comcast Corp. | 6.500 | % | 1/15/17 | 150 | 166 | ||||
| Comcast Corp. | 6.300 | % | 11/15/17 | 3,475 | 3,805 | ||||
| Comcast Corp. | 5.875 | % | 2/15/18 | 3,800 | 4,049 | ||||
| Comcast Corp. | 5.700 | % | 5/15/18 | 1,875 | 1,978 | ||||
| Comcast Corp. | 5.700 | % | 7/1/19 | 1,275 | 1,333 | ||||
| Comcast Corp. | 6.500 | % | 11/15/35 | 7,425 | 7,675 | ||||
| Comcast Corp. | 6.950 | % | 8/15/37 | 2,000 | 2,187 | ||||
| Comcast Corp. | 6.400 | % | 5/15/38 | 1,975 | 2,026 | ||||
| COX Communications Inc. | 6.750 | % | 3/15/11 | 3,325 | 3,498 | ||||
| COX Communications Inc. | 7.125 | % | 10/1/12 | 2,625 | 2,906 | ||||
| COX Communications Inc. | 5.450 | % | 12/15/14 | 8,200 | 8,791 | ||||
| COX Communications Inc. | 5.500 | % | 10/1/15 | 100 | 107 | ||||
| Deutsche Telekom International Finance BV | 5.875 | % | 8/20/13 | 5,400 | 5,828 | ||||
| Deutsche Telekom International Finance BV | 4.875 | % | 7/8/14 | 1,775 | 1,866 | ||||
42
| Total Bond Market II Index Fund | |||||||||
| Face | Market | ||||||||
| Maturity | Amount | Value• | |||||||
| Coupon | Date | ($ | 000 | ) | ($ | 000 | ) | ||
| Deutsche Telekom International Finance BV | 5.750 | % | 3/23/16 | 2,500 | 2,669 | ||||
| Deutsche Telekom International Finance BV | 6.750 | % | 8/20/18 | 100 | 111 | ||||
| Deutsche Telekom International Finance BV | 6.000 | % | 7/8/19 | 2,525 | 2,687 | ||||
| Deutsche Telekom International Finance BV | 8.750 | % | 6/15/30 | 5,950 | 7,715 | ||||
| 4 DirecTV Holdings LLC/DirecTV Financing Co. Inc. | 4.750 | % | 10/1/14 | 2,575 | 2,620 | ||||
| DirecTV Holdings LLC/DirecTV Financing Co. Inc. | 7.625 | % | 5/15/16 | 750 | 818 | ||||
| 4 DirecTV Holdings LLC/DirecTV Financing Co. Inc. | 5.875 | % | 10/1/19 | 12,975 | 13,106 | ||||
| Embarq Corp. | 7.082 | % | 6/1/16 | 6,050 | 6,620 | ||||
| Embarq Corp. | 7.995 | % | 6/1/36 | 2,869 | 3,124 | ||||
| France Telecom SA | 7.750 | % | 3/1/11 | 7,800 | 8,388 | ||||
| France Telecom SA | 4.375 | % | 7/8/14 | 1,850 | 1,938 | ||||
| France Telecom SA | 5.375 | % | 7/8/19 | 1,725 | 1,821 | ||||
| France Telecom SA | 8.500 | % | 3/1/31 | 5,175 | 6,876 | ||||
| Grupo Televisa SA | 6.625 | % | 3/18/25 | 1,300 | 1,285 | ||||
| Grupo Televisa SA | 8.500 | % | 3/11/32 | 200 | 234 | ||||
| 4 Grupo Televisa SA | 6.625 | % | 1/15/40 | 850 | 834 | ||||
| GTE Corp. | 8.750 | % | 11/1/21 | 950 | 1,179 | ||||
| GTE Corp. | 6.940 | % | 4/15/28 | 1,050 | 1,089 | ||||
| Koninklijke KPN NV | 8.375 | % | 10/1/30 | 1,550 | 1,954 | ||||
| McGraw-Hill Cos. Inc. | 5.375 | % | 11/15/12 | 750 | 792 | ||||
| McGraw-Hill Cos. Inc. | 5.900 | % | 11/15/17 | 1,750 | 1,790 | ||||
| McGraw-Hill Cos. Inc. | 6.550 | % | 11/15/37 | 1,600 | 1,563 | ||||
| New Cingular Wireless Services Inc. | 7.875 | % | 3/1/11 | 5,675 | 6,102 | ||||
| New Cingular Wireless Services Inc. | 8.125 | % | 5/1/12 | 4,175 | 4,715 | ||||
| New Cingular Wireless Services Inc. | 8.750 | % | 3/1/31 | 2,600 | 3,362 | ||||
| News America Holdings Inc. | 8.000 | % | 10/17/16 | 1,450 | 1,717 | ||||
| News America Holdings Inc. | 7.700 | % | 10/30/25 | 200 | 216 | ||||
| News America Holdings Inc. | 8.150 | % | 10/17/36 | 625 | 700 | ||||
| News America Holdings Inc. | 7.750 | % | 12/1/45 | 425 | 480 | ||||
| News America Inc. | 5.300 | % | 12/15/14 | 4,650 | 5,041 | ||||
| News America Inc. | 6.550 | % | 3/15/33 | 4,500 | 4,672 | ||||
| News America Inc. | 6.200 | % | 12/15/34 | 5,500 | 5,475 | ||||
| News America Inc. | 6.400 | % | 12/15/35 | 7,100 | 7,295 | ||||
| 4 News America Inc. | 6.900 | % | 8/15/39 | 1,850 | 2,015 | ||||
| Omnicom Group Inc. | 5.900 | % | 4/15/16 | 225 | 238 | ||||
| Pacific Bell Telephone Co. | 7.125 | % | 3/15/26 | 425 | 468 | ||||
| Qwest Corp. | 7.875 | % | 9/1/11 | 4,200 | 4,394 | ||||
| Qwest Corp. | 8.875 | % | 3/15/12 | 1,725 | 1,859 | ||||
| Qwest Corp. | 7.500 | % | 10/1/14 | 2,625 | 2,717 | ||||
| Qwest Corp. | 6.500 | % | 6/1/17 | 1,125 | 1,097 | ||||
| Qwest Corp. | 7.500 | % | 6/15/23 | 1,325 | 1,245 | ||||
| Qwest Corp. | 6.875 | % | 9/15/33 | 2,900 | 2,508 | ||||
| Reed Elsevier Capital Inc. | 4.625 | % | 6/15/12 | 375 | 388 | ||||
| Reed Elsevier Capital Inc. | 7.750 | % | 1/15/14 | 1,300 | 1,469 | ||||
| Reed Elsevier Capital Inc. | 8.625 | % | 1/15/19 | 1,275 | 1,562 | ||||
| Rogers Communications Inc. | 7.250 | % | 12/15/12 | 850 | 957 | ||||
| Rogers Communications Inc. | 6.375 | % | 3/1/14 | 5,325 | 5,887 | ||||
| Rogers Communications Inc. | 5.500 | % | 3/15/14 | 1,750 | 1,890 | ||||
| Rogers Communications Inc. | 6.800 | % | 8/15/18 | 10,400 | 11,629 | ||||
| Rogers Communications Inc. | 7.500 | % | 8/15/38 | 100 | 117 | ||||
| RR Donnelley & Sons Co. | 4.950 | % | 4/1/14 | 400 | 395 | ||||
| RR Donnelley & Sons Co. | 5.500 | % | 5/15/15 | 425 | 421 | ||||
| RR Donnelley & Sons Co. | 8.600 | % | 8/15/16 | 4,000 | 4,328 | ||||
| RR Donnelley & Sons Co. | 6.125 | % | 1/15/17 | 2,000 | 1,950 | ||||
| TCI Communications Inc. | 8.750 | % | 8/1/15 | 4,175 | 5,003 | ||||
| TCI Communications Inc. | 7.875 | % | 2/15/26 | 300 | 340 | ||||
| Telecom Italia Capital SA | 4.875 | % | 10/1/10 | 750 | 767 | ||||
43
| Total Bond Market II Index Fund | |||||||||
| Face | Market | ||||||||
| Maturity | Amount | Value• | |||||||
| Coupon | Date | ($ | 000 | ) | ($ | 000 | ) | ||
| Telecom Italia Capital SA | 6.200 | % | 7/18/11 | 5,525 | 5,856 | ||||
| Telecom Italia Capital SA | 5.250 | % | 11/15/13 | 6,750 | 7,117 | ||||
| Telecom Italia Capital SA | 6.175 | % | 6/18/14 | 1,475 | 1,612 | ||||
| Telecom Italia Capital SA | 4.950 | % | 9/30/14 | 7,475 | 7,767 | ||||
| Telecom Italia Capital SA | 5.250 | % | 10/1/15 | 3,500 | 3,670 | ||||
| Telecom Italia Capital SA | 6.999 | % | 6/4/18 | 200 | 219 | ||||
| Telecom Italia Capital SA | 7.175 | % | 6/18/19 | 4,150 | 4,645 | ||||
| Telecom Italia Capital SA | 6.375 | % | 11/15/33 | 2,875 | 2,836 | ||||
| Telecom Italia Capital SA | 6.000 | % | 9/30/34 | 200 | 188 | ||||
| Telecom Italia Capital SA | 7.200 | % | 7/18/36 | 1,100 | 1,184 | ||||
| Telecom Italia Capital SA | 7.721 | % | 6/4/38 | 325 | 374 | ||||
| Telefonica Emisiones SAU | 5.984 | % | 6/20/11 | 2,625 | 2,784 | ||||
| Telefonica Emisiones SAU | 5.855 | % | 2/4/13 | 525 | 569 | ||||
| Telefonica Emisiones SAU | 4.949 | % | 1/15/15 | 3,775 | 4,064 | ||||
| Telefonica Emisiones SAU | 6.421 | % | 6/20/16 | 4,975 | 5,538 | ||||
| Telefonica Emisiones SAU | 5.877 | % | 7/15/19 | 7,375 | 7,897 | ||||
| Telefonica Emisiones SAU | 7.045 | % | 6/20/36 | 2,175 | 2,479 | ||||
| Telefonica Europe BV | 8.250 | % | 9/15/30 | 1,500 | 1,879 | ||||
| Telefonos de Mexico SAB de CV | 5.500 | % | 1/27/15 | 5,725 | 5,926 | ||||
| TELUS Corp. | 8.000 | % | 6/1/11 | 1,137 | 1,232 | ||||
| Thomson Reuters Corp. | 6.200 | % | 1/5/12 | 1,525 | 1,647 | ||||
| Thomson Reuters Corp. | 5.950 | % | 7/15/13 | 725 | 795 | ||||
| Thomson Reuters Corp. | 5.700 | % | 10/1/14 | 5,075 | 5,573 | ||||
| Thomson Reuters Corp. | 6.500 | % | 7/15/18 | 250 | 282 | ||||
| Thomson Reuters Corp. | 4.700 | % | 10/15/19 | 1,625 | 1,608 | ||||
| Thomson Reuters Corp. | 5.500 | % | 8/15/35 | 1,500 | 1,433 | ||||
| Time Warner Cable Inc. | 5.400 | % | 7/2/12 | 1,925 | 2,055 | ||||
| Time Warner Cable Inc. | 6.200 | % | 7/1/13 | 2,775 | 3,035 | ||||
| Time Warner Cable Inc. | 8.250 | % | 2/14/14 | 1,225 | 1,429 | ||||
| Time Warner Cable Inc. | 7.500 | % | 4/1/14 | 2,475 | 2,853 | ||||
| Time Warner Cable Inc. | 3.500 | % | 2/1/15 | 925 | 913 | ||||
| Time Warner Cable Inc. | 5.850 | % | 5/1/17 | 7,600 | 7,974 | ||||
| Time Warner Cable Inc. | 6.750 | % | 7/1/18 | 9,250 | 10,199 | ||||
| Time Warner Cable Inc. | 8.750 | % | 2/14/19 | 3,100 | 3,780 | ||||
| Time Warner Cable Inc. | 8.250 | % | 4/1/19 | 11,050 | 13,149 | ||||
| Time Warner Cable Inc. | 5.000 | % | 2/1/20 | 1,900 | 1,847 | ||||
| Time Warner Cable Inc. | 6.550 | % | 5/1/37 | 975 | 996 | ||||
| Time Warner Cable Inc. | 6.750 | % | 6/15/39 | 2,365 | 2,479 | ||||
| Time Warner Entertainment Co. LP | 10.150 | % | 5/1/12 | 375 | 429 | ||||
| Time Warner Entertainment Co. LP | 8.875 | % | 10/1/12 | 550 | 632 | ||||
| Time Warner Entertainment Co. LP | 8.375 | % | 3/15/23 | 800 | 956 | ||||
| Time Warner Entertainment Co. LP | 8.375 | % | 7/15/33 | 2,975 | 3,547 | ||||
| United States Cellular Corp. | 6.700 | % | 12/15/33 | 1,025 | 1,003 | ||||
| Verizon Communications Inc. | 5.350 | % | 2/15/11 | 1,800 | 1,881 | ||||
| Verizon Communications Inc. | 4.350 | % | 2/15/13 | 200 | 210 | ||||
| Verizon Communications Inc. | 5.250 | % | 4/15/13 | 4,575 | 4,958 | ||||
| Verizon Communications Inc. | 4.900 | % | 9/15/15 | 575 | 617 | ||||
| Verizon Communications Inc. | 5.550 | % | 2/15/16 | 3,675 | 3,932 | ||||
| Verizon Communications Inc. | 5.500 | % | 2/15/18 | 17,750 | 18,470 | ||||
| Verizon Communications Inc. | 6.100 | % | 4/15/18 | 3,000 | 3,266 | ||||
| Verizon Communications Inc. | 8.750 | % | 11/1/18 | 1,775 | 2,247 | ||||
| Verizon Communications Inc. | 6.350 | % | 4/1/19 | 3,950 | 4,375 | ||||
| Verizon Communications Inc. | 5.850 | % | 9/15/35 | 5,150 | 5,006 | ||||
| Verizon Communications Inc. | 6.250 | % | 4/1/37 | 525 | 536 | ||||
| Verizon Communications Inc. | 6.400 | % | 2/15/38 | 2,075 | 2,191 | ||||
| Verizon Communications Inc. | 6.900 | % | 4/15/38 | 150 | 166 | ||||
| Verizon Communications Inc. | 8.950 | % | 3/1/39 | 4,300 | 5,859 | ||||
44
| Total Bond Market II Index Fund | |||||||||
| Face | Market | ||||||||
| Maturity | Amount | Value• | |||||||
| Coupon | Date | ($ | 000 | ) | ($ | 000 | ) | ||
| Verizon Communications Inc. | 7.350 | % | 4/1/39 | 5,425 | 6,315 | ||||
| Verizon Global Funding Corp. | 7.250 | % | 12/1/10 | 175 | 185 | ||||
| Verizon Global Funding Corp. | 6.875 | % | 6/15/12 | 5,750 | 6,389 | ||||
| Verizon Global Funding Corp. | 7.375 | % | 9/1/12 | 1,700 | 1,919 | ||||
| Verizon Global Funding Corp. | 4.375 | % | 6/1/13 | 200 | 211 | ||||
| Verizon Global Funding Corp. | 7.750 | % | 12/1/30 | 2,375 | 2,807 | ||||
| Verizon Maryland Inc. | 6.125 | % | 3/1/12 | 100 | 107 | ||||
| Verizon Maryland Inc. | 5.125 | % | 6/15/33 | 175 | 136 | ||||
| Verizon New England Inc. | 6.500 | % | 9/15/11 | 1,450 | 1,557 | ||||
| Verizon New England Inc. | 7.875 | % | 11/15/29 | 1,225 | 1,334 | ||||
| Verizon New Jersey Inc. | 5.875 | % | 1/17/12 | 1,700 | 1,815 | ||||
| Verizon New York Inc. | 6.875 | % | 4/1/12 | 900 | 978 | ||||
| Verizon New York Inc. | 7.375 | % | 4/1/32 | 650 | 686 | ||||
| Verizon Pennsylvania Inc. | 5.650 | % | 11/15/11 | 2,900 | 3,082 | ||||
| Verizon Virginia Inc. | 4.625 | % | 3/15/13 | 1,725 | 1,795 | ||||
| Vodafone Group PLC | 5.350 | % | 2/27/12 | 1,375 | 1,469 | ||||
| Vodafone Group PLC | 5.000 | % | 12/16/13 | 475 | 503 | ||||
| Vodafone Group PLC | 5.375 | % | 1/30/15 | 1,500 | 1,613 | ||||
| Vodafone Group PLC | 5.000 | % | 9/15/15 | 425 | 448 | ||||
| Vodafone Group PLC | 5.750 | % | 3/15/16 | 1,825 | 1,969 | ||||
| Vodafone Group PLC | 5.625 | % | 2/27/17 | 4,150 | 4,428 | ||||
| Vodafone Group PLC | 5.450 | % | 6/10/19 | 3,100 | 3,207 | ||||
| Vodafone Group PLC | 7.875 | % | 2/15/30 | 1,525 | 1,829 | ||||
| Vodafone Group PLC | 6.250 | % | 11/30/32 | 2,675 | 2,693 | ||||
| Vodafone Group PLC | 6.150 | % | 2/27/37 | 2,625 | 2,718 | ||||
| Washington Post Co. | 7.250 | % | 2/1/19 | 875 | 961 | ||||
| WPP Finance UK | 5.875 | % | 6/15/14 | 6,125 | 6,213 | ||||
| WPP Finance UK | 8.000 | % | 9/15/14 | 625 | 702 | ||||
| Consumer Cyclical (1.0%) | |||||||||
| AutoZone Inc. | 5.750 | % | 1/15/15 | 2,400 | 2,574 | ||||
| Best Buy Co. Inc. | 6.750 | % | 7/15/13 | 2,875 | 3,159 | ||||
| Costco Wholesale Corp. | 5.500 | % | 3/15/17 | 3,500 | 3,760 | ||||
| CVS Caremark Corp. | 5.750 | % | 8/15/11 | 875 | 931 | ||||
| CVS Caremark Corp. | 4.875 | % | 9/15/14 | 2,750 | 2,914 | ||||
| CVS Caremark Corp. | 6.125 | % | 8/15/16 | 2,375 | 2,560 | ||||
| CVS Caremark Corp. | 5.750 | % | 6/1/17 | 750 | 790 | ||||
| CVS Caremark Corp. | 6.600 | % | 3/15/19 | 4,525 | 4,936 | ||||
| CVS Caremark Corp. | 6.250 | % | 6/1/27 | 5,150 | 5,240 | ||||
| 3 CVS Caremark Corp. | 6.302 | % | 6/1/37 | 1,550 | 1,332 | ||||
| Daimler Finance North America LLC | 5.875 | % | 3/15/11 | 200 | 209 | ||||
| Daimler Finance North America LLC | 5.750 | % | 9/8/11 | 3,050 | 3,224 | ||||
| Daimler Finance North America LLC | 7.300 | % | 1/15/12 | 7,050 | 7,660 | ||||
| Daimler Finance North America LLC | 6.500 | % | 11/15/13 | 7,100 | 7,791 | ||||
| Daimler Finance North America LLC | 8.500 | % | 1/18/31 | 4,700 | 5,717 | ||||
| Darden Restaurants Inc. | 5.625 | % | 10/15/12 | 2,675 | 2,855 | ||||
| Darden Restaurants Inc. | 6.200 | % | 10/15/17 | 1,850 | 1,956 | ||||
| Darden Restaurants Inc. | 6.800 | % | 10/15/37 | 950 | 982 | ||||
| Historic TW Inc. | 9.125 | % | 1/15/13 | 1,475 | 1,715 | ||||
| Historic TW Inc. | 9.150 | % | 2/1/23 | 3,425 | 4,186 | ||||
| Historic TW Inc. | 6.625 | % | 5/15/29 | 2,925 | 3,069 | ||||
| Home Depot Inc. | 5.200 | % | 3/1/11 | 325 | 339 | ||||
| Home Depot Inc. | 5.250 | % | 12/16/13 | 6,050 | 6,475 | ||||
| Home Depot Inc. | 5.400 | % | 3/1/16 | 6,900 | 7,198 | ||||
| Home Depot Inc. | 5.875 | % | 12/16/36 | 2,000 | 1,932 | ||||
| Johnson Controls Inc. | 5.250 | % | 1/15/11 | 1,000 | 1,043 | ||||
| Johnson Controls Inc. | 6.000 | % | 1/15/36 | 350 | 300 | ||||
45
| Total Bond Market II Index Fund | |||||||||
| Face | Market | ||||||||
| Maturity | Amount | Value• | |||||||
| Coupon | Date | ($ | 000 | ) | ($ | 000 | ) | ||
| Kohl’s Corp. | 6.250 | % | 12/15/17 | 850 | 937 | ||||
| Kohl’s Corp. | 6.000 | % | 1/15/33 | 300 | 304 | ||||
| Kohl’s Corp. | 6.875 | % | 12/15/37 | 700 | 794 | ||||
| Lowe’s Cos. Inc. | 5.600 | % | 9/15/12 | 850 | 930 | ||||
| Lowe’s Cos. Inc. | 5.400 | % | 10/15/16 | 1,925 | 2,067 | ||||
| Lowe’s Cos. Inc. | 6.100 | % | 9/15/17 | 875 | 969 | ||||
| Lowe’s Cos. Inc. | 6.875 | % | 2/15/28 | 350 | 392 | ||||
| Lowe’s Cos. Inc. | 6.500 | % | 3/15/29 | 1,050 | 1,156 | ||||
| Lowe’s Cos. Inc. | 5.800 | % | 10/15/36 | 2,175 | 2,224 | ||||
| Marriott International Inc. | 4.625 | % | 6/15/12 | 1,000 | 1,012 | ||||
| Marriott International Inc. | 5.625 | % | 2/15/13 | 850 | 876 | ||||
| Marriott International Inc. | 6.200 | % | 6/15/16 | 550 | 559 | ||||
| Marriott International Inc. | 6.375 | % | 6/15/17 | 650 | 671 | ||||
| McDonald’s Corp. | 6.000 | % | 4/15/11 | 975 | 1,035 | ||||
| McDonald’s Corp. | 5.300 | % | 3/15/17 | 300 | 323 | ||||
| McDonald’s Corp. | 5.800 | % | 10/15/17 | 1,825 | 2,025 | ||||
| McDonald’s Corp. | 5.350 | % | 3/1/18 | 1,875 | 2,017 | ||||
| McDonald’s Corp. | 5.000 | % | 2/1/19 | 1,025 | 1,085 | ||||
| McDonald’s Corp. | 6.300 | % | 10/15/37 | 750 | 822 | ||||
| McDonald’s Corp. | 6.300 | % | 3/1/38 | 1,825 | 2,012 | ||||
| McDonald’s Corp. | 5.700 | % | 2/1/39 | 850 | 873 | ||||
| MDC Holdings Inc. | 5.500 | % | 5/15/13 | 750 | 753 | ||||
| Nordstrom Inc. | 6.750 | % | 6/1/14 | 175 | 194 | ||||
| Nordstrom Inc. | 6.250 | % | 1/15/18 | 525 | 570 | ||||
| Nordstrom Inc. | 6.950 | % | 3/15/28 | 425 | 460 | ||||
| Nordstrom Inc. | 7.000 | % | 1/15/38 | 475 | 526 | ||||
| PACCAR Financial Corp. | 1.950 | % | 12/17/12 | 2,150 | 2,124 | ||||
| PACCAR Inc. | 6.875 | % | 2/15/14 | 1,200 | 1,362 | ||||
| Staples Inc. | 7.750 | % | 4/1/11 | 5,800 | 6,231 | ||||
| Staples Inc. | 9.750 | % | 1/15/14 | 6,800 | 8,296 | ||||
| Target Corp. | 6.350 | % | 1/15/11 | 675 | 713 | ||||
| Target Corp. | 5.875 | % | 3/1/12 | 1,825 | 1,979 | ||||
| Target Corp. | 5.125 | % | 1/15/13 | 625 | 680 | ||||
| Target Corp. | 4.000 | % | 6/15/13 | 600 | 624 | ||||
| Target Corp. | 5.875 | % | 7/15/16 | 3,575 | 3,927 | ||||
| Target Corp. | 5.375 | % | 5/1/17 | 100 | 108 | ||||
| Target Corp. | 6.000 | % | 1/15/18 | 2,825 | 3,110 | ||||
| Target Corp. | 7.000 | % | 7/15/31 | 1,425 | 1,627 | ||||
| Target Corp. | 6.350 | % | 11/1/32 | 1,650 | 1,767 | ||||
| Target Corp. | 6.500 | % | 10/15/37 | 1,875 | 2,073 | ||||
| Target Corp. | 7.000 | % | 1/15/38 | 5,300 | 6,180 | ||||
| Time Warner Cos. Inc. | 7.570 | % | 2/1/24 | 325 | 354 | ||||
| Time Warner Cos. Inc. | 6.950 | % | 1/15/28 | 150 | 161 | ||||
| Time Warner Inc. | 6.750 | % | 4/15/11 | 2,450 | 2,599 | ||||
| Time Warner Inc. | 5.500 | % | 11/15/11 | 3,850 | 4,087 | ||||
| Time Warner Inc. | 6.875 | % | 5/1/12 | 1,825 | 1,998 | ||||
| Time Warner Inc. | 5.875 | % | 11/15/16 | 2,525 | 2,722 | ||||
| Time Warner Inc. | 7.625 | % | 4/15/31 | 3,100 | 3,624 | ||||
| Time Warner Inc. | 7.700 | % | 5/1/32 | 2,050 | 2,395 | ||||
| Time Warner Inc. | 6.500 | % | 11/15/36 | 1,900 | 1,990 | ||||
| TJX Cos. Inc. | 6.950 | % | 4/15/19 | 5,075 | 5,868 | ||||
| Toll Brothers Finance Corp. | 6.875 | % | 11/15/12 | 16 | 17 | ||||
| Toll Brothers Finance Corp. | 5.950 | % | 9/15/13 | 18 | 18 | ||||
| Toll Brothers Finance Corp. | 5.150 | % | 5/15/15 | 1,000 | 953 | ||||
| Toll Brothers Finance Corp. | 6.750 | % | 11/1/19 | 1,350 | 1,299 | ||||
| Toyota Motor Credit Corp. | 4.350 | % | 12/15/10 | 1,425 | 1,475 | ||||
| Toyota Motor Credit Corp. | 5.450 | % | 5/18/11 | 1,025 | 1,083 | ||||
46
| Total Bond Market II Index Fund | |||||||||
| Face | Market | ||||||||
| Maturity | Amount | Value• | |||||||
| Coupon | Date | ($ | 000 | ) | ($ | 000 | ) | ||
| VF Corp. | 5.950 | % | 11/1/17 | 850 | 917 | ||||
| VF Corp. | 6.450 | % | 11/1/37 | 850 | 891 | ||||
| Viacom Inc. | 4.375 | % | 9/15/14 | 375 | 385 | ||||
| Viacom Inc. | 6.250 | % | 4/30/16 | 1,625 | 1,781 | ||||
| Viacom Inc. | 6.125 | % | 10/5/17 | 1,250 | 1,349 | ||||
| Viacom Inc. | 5.625 | % | 9/15/19 | 9,270 | 9,611 | ||||
| Viacom Inc. | 6.875 | % | 4/30/36 | 100 | 106 | ||||
| Wal-Mart Stores Inc. | 4.125 | % | 2/15/11 | 5,475 | 5,685 | ||||
| Wal-Mart Stores Inc. | 4.250 | % | 4/15/13 | 25 | 26 | ||||
| Wal-Mart Stores Inc. | 4.550 | % | 5/1/13 | 2,250 | 2,392 | ||||
| Wal-Mart Stores Inc. | 7.250 | % | 6/1/13 | 550 | 633 | ||||
| Wal-Mart Stores Inc. | 3.200 | % | 5/15/14 | 1,800 | 1,829 | ||||
| Wal-Mart Stores Inc. | 4.500 | % | 7/1/15 | 2,225 | 2,374 | ||||
| Wal-Mart Stores Inc. | 5.375 | % | 4/5/17 | 625 | 676 | ||||
| Wal-Mart Stores Inc. | 5.800 | % | 2/15/18 | 5,625 | 6,313 | ||||
| Wal-Mart Stores Inc. | 5.875 | % | 4/5/27 | 8,150 | 8,785 | ||||
| Wal-Mart Stores Inc. | 7.550 | % | 2/15/30 | 3,650 | 4,561 | ||||
| Wal-Mart Stores Inc. | 5.250 | % | 9/1/35 | 1,425 | 1,418 | ||||
| Wal-Mart Stores Inc. | 6.500 | % | 8/15/37 | 5,250 | 6,036 | ||||
| Wal-Mart Stores Inc. | 6.200 | % | 4/15/38 | 5,025 | 5,576 | ||||
| Walgreen Co. | 4.875 | % | 8/1/13 | 3,575 | 3,825 | ||||
| Walgreen Co. | 5.250 | % | 1/15/19 | 1,675 | 1,782 | ||||
| Walt Disney Co. | 5.700 | % | 7/15/11 | 4,500 | 4,812 | ||||
| Walt Disney Co. | 6.375 | % | 3/1/12 | 700 | 769 | ||||
| Walt Disney Co. | 4.700 | % | 12/1/12 | 100 | 108 | ||||
| Walt Disney Co. | 4.500 | % | 12/15/13 | 2,300 | 2,443 | ||||
| Walt Disney Co. | 6.200 | % | 6/20/14 | 2,000 | 2,236 | ||||
| Walt Disney Co. | 5.625 | % | 9/15/16 | 2,425 | 2,635 | ||||
| Walt Disney Co. | 5.875 | % | 12/15/17 | 1,875 | 2,023 | ||||
| Walt Disney Co. | 7.000 | % | 3/1/32 | 325 | 378 | ||||
| Western Union Co. | 5.400 | % | 11/17/11 | 225 | 240 | ||||
| Western Union Co. | 6.500 | % | 2/26/14 | 3,275 | 3,674 | ||||
| Western Union Co. | 5.930 | % | 10/1/16 | 1,825 | 1,981 | ||||
| Western Union Co. | 6.200 | % | 11/17/36 | 950 | 957 | ||||
| Yum! Brands Inc. | 8.875 | % | 4/15/11 | 950 | 1,031 | ||||
| Yum! Brands Inc. | 7.700 | % | 7/1/12 | 775 | 868 | ||||
| Yum! Brands Inc. | 4.250 | % | 9/15/15 | 2,000 | 2,019 | ||||
| Yum! Brands Inc. | 6.250 | % | 4/15/16 | 100 | 107 | ||||
| Yum! Brands Inc. | 6.250 | % | 3/15/18 | 700 | 757 | ||||
| Yum! Brands Inc. | 6.875 | % | 11/15/37 | 1,350 | 1,463 | ||||
| Consumer Noncyclical (2.5%) | |||||||||
| Abbott Laboratories | 3.750 | % | 3/15/11 | 1,725 | 1,780 | ||||
| Abbott Laboratories | 5.600 | % | 5/15/11 | 2,025 | 2,152 | ||||
| Abbott Laboratories | 5.150 | % | 11/30/12 | 1,100 | 1,205 | ||||
| Abbott Laboratories | 4.350 | % | 3/15/14 | 2,075 | 2,193 | ||||
| Abbott Laboratories | 5.875 | % | 5/15/16 | 4,900 | 5,435 | ||||
| Abbott Laboratories | 5.600 | % | 11/30/17 | 4,450 | 4,863 | ||||
| Abbott Laboratories | 5.125 | % | 4/1/19 | 925 | 969 | ||||
| Abbott Laboratories | 6.150 | % | 11/30/37 | 5,600 | 6,044 | ||||
| Abbott Laboratories | 6.000 | % | 4/1/39 | 575 | 613 | ||||
| Allergan Inc./United States | 5.750 | % | 4/1/16 | 400 | 432 | ||||
| Altria Group Inc. | 8.500 | % | 11/10/13 | 8,450 | 9,784 | ||||
| Altria Group Inc. | 7.750 | % | 2/6/14 | 4,600 | 5,224 | ||||
| Altria Group Inc. | 9.700 | % | 11/10/18 | 3,300 | 4,090 | ||||
| Altria Group Inc. | 9.250 | % | 8/6/19 | 75 | 91 | ||||
| Altria Group Inc. | 9.950 | % | 11/10/38 | 6,750 | 8,904 | ||||
47
| Total Bond Market II Index Fund | |||||||||
| Face | Market | ||||||||
| Maturity | Amount | Value• | |||||||
| Coupon | Date | ($ | 000 | ) | ($ | 000 | ) | ||
| Altria Group Inc. | 10.200 | % | 2/6/39 | 4,625 | 6,187 | ||||
| AmerisourceBergen Corp. | 5.625 | % | 9/15/12 | 425 | 457 | ||||
| AmerisourceBergen Corp. | 5.875 | % | 9/15/15 | 2,825 | 3,082 | ||||
| AmerisourceBergen Corp. | 4.875 | % | 11/15/19 | 975 | 967 | ||||
| Amgen Inc. | 4.850 | % | 11/18/14 | 3,575 | 3,850 | ||||
| Amgen Inc. | 5.850 | % | 6/1/17 | 5,750 | 6,303 | ||||
| Amgen Inc. | 5.700 | % | 2/1/19 | 1,350 | 1,456 | ||||
| Amgen Inc. | 6.375 | % | 6/1/37 | 1,350 | 1,476 | ||||
| Amgen Inc. | 6.400 | % | 2/1/39 | 4,225 | 4,645 | ||||
| Anheuser-Busch Cos. Inc. | 6.000 | % | 4/15/11 | 725 | 766 | ||||
| Anheuser-Busch Cos. Inc. | 4.375 | % | 1/15/13 | 1,150 | 1,189 | ||||
| Anheuser-Busch Cos. Inc. | 5.600 | % | 3/1/17 | 1,375 | 1,423 | ||||
| Anheuser-Busch Cos. Inc. | 5.500 | % | 1/15/18 | 2,950 | 3,020 | ||||
| Anheuser-Busch Cos. Inc. | 6.800 | % | 8/20/32 | 775 | 831 | ||||
| Anheuser-Busch Cos. Inc. | 5.750 | % | 4/1/36 | 2,905 | 2,778 | ||||
| 4 Anheuser-Busch InBev Worldwide Inc. | 3.000 | % | 10/15/12 | 4,000 | 4,033 | ||||
| 4 Anheuser-Busch InBev Worldwide Inc. | 4.125 | % | 1/15/15 | 4,000 | 4,050 | ||||
| 4 Anheuser-Busch InBev Worldwide Inc. | 5.375 | % | 1/15/20 | 7,100 | 7,218 | ||||
| 4 Anheuser-Busch InBev Worldwide Inc. | 6.375 | % | 1/15/40 | 375 | 391 | ||||
| Archer-Daniels-Midland Co. | 8.375 | % | 4/15/17 | 100 | 122 | ||||
| Archer-Daniels-Midland Co. | 5.450 | % | 3/15/18 | 2,975 | 3,174 | ||||
| Archer-Daniels-Midland Co. | 7.000 | % | 2/1/31 | 1,075 | 1,240 | ||||
| Archer-Daniels-Midland Co. | 5.935 | % | 10/1/32 | 1,775 | 1,801 | ||||
| Archer-Daniels-Midland Co. | 5.375 | % | 9/15/35 | 1,850 | 1,790 | ||||
| Archer-Daniels-Midland Co. | 6.450 | % | 1/15/38 | 650 | 723 | ||||
| AstraZeneca PLC | 5.400 | % | 9/15/12 | 3,150 | 3,443 | ||||
| AstraZeneca PLC | 5.400 | % | 6/1/14 | 2,925 | 3,208 | ||||
| AstraZeneca PLC | 5.900 | % | 9/15/17 | 5,125 | 5,679 | ||||
| AstraZeneca PLC | 6.450 | % | 9/15/37 | 5,325 | 5,970 | ||||
| Baxter FinCo BV | 4.750 | % | 10/15/10 | 1,950 | 2,010 | ||||
| Baxter International Inc. | 5.900 | % | 9/1/16 | 875 | 972 | ||||
| Baxter International Inc. | 6.250 | % | 12/1/37 | 3,675 | 3,991 | ||||
| Becton Dickinson and Co. | 5.000 | % | 5/15/19 | 450 | 466 | ||||
| Biogen Idec Inc. | 6.000 | % | 3/1/13 | 750 | 807 | ||||
| Biogen Idec Inc. | 6.875 | % | 3/1/18 | 4,300 | 4,586 | ||||
| Bottling Group LLC | 4.625 | % | 11/15/12 | 5,025 | 5,408 | ||||
| Bottling Group LLC | 5.000 | % | 11/15/13 | 2,700 | 2,917 | ||||
| Bottling Group LLC | 6.950 | % | 3/15/14 | 4,225 | 4,897 | ||||
| Bottling Group LLC | 5.500 | % | 4/1/16 | 1,925 | 2,081 | ||||
| Bristol-Myers Squibb Co. | 5.250 | % | 8/15/13 | 650 | 708 | ||||
| Bristol-Myers Squibb Co. | 5.450 | % | 5/1/18 | 800 | 863 | ||||
| Bristol-Myers Squibb Co. | 7.150 | % | 6/15/23 | 100 | 120 | ||||
| Bristol-Myers Squibb Co. | 6.800 | % | 11/15/26 | 100 | 114 | ||||
| Bristol-Myers Squibb Co. | 5.875 | % | 11/15/36 | 3,100 | 3,251 | ||||
| Bristol-Myers Squibb Co. | 6.125 | % | 5/1/38 | 625 | 681 | ||||
| Bristol-Myers Squibb Co. | 6.875 | % | 8/1/97 | 325 | 355 | ||||
| Bunge Ltd. Finance Corp. | 5.100 | % | 7/15/15 | 575 | 570 | ||||
| Bunge Ltd. Finance Corp. | 8.500 | % | 6/15/19 | 775 | 881 | ||||
| Campbell Soup Co. | 6.750 | % | 2/15/11 | 2,100 | 2,238 | ||||
| Cardinal Health Inc. | 5.650 | % | 6/15/12 | 17 | 18 | ||||
| Cardinal Health Inc. | 4.000 | % | 6/15/15 | 100 | 98 | ||||
| 4 CareFusion Corp. | 4.125 | % | 8/1/12 | 350 | 362 | ||||
| 4 CareFusion Corp. | 5.125 | % | 8/1/14 | 1,985 | 2,087 | ||||
| 4 CareFusion Corp. | 6.375 | % | 8/1/19 | 4,850 | 5,242 | ||||
| Cia de Bebidas das Americas | 10.500 | % | 12/15/11 | 1,375 | 1,585 | ||||
| Cia de Bebidas das Americas | 8.750 | % | 9/15/13 | 1,450 | 1,686 | ||||
| Clorox Co. | 4.200 | % | 1/15/10 | 425 | 425 | ||||
48
| Total Bond Market II Index Fund | |||||||||
| Face | Market | ||||||||
| Maturity | Amount | Value• | |||||||
| Coupon | Date | ($ | 000 | ) | ($ | 000 | ) | ||
| Clorox Co. | 5.450 | % | 10/15/12 | 2,135 | 2,305 | ||||
| Clorox Co. | 5.000 | % | 1/15/15 | 525 | 556 | ||||
| Clorox Co. | 3.550 | % | 11/1/15 | 1,850 | 1,842 | ||||
| Coca-Cola Co. | 5.350 | % | 11/15/17 | 2,700 | 2,931 | ||||
| Coca-Cola Co. | 4.875 | % | 3/15/19 | 4,600 | 4,811 | ||||
| Coca-Cola Enterprises Inc. | 5.000 | % | 8/15/13 | 2,900 | 3,129 | ||||
| Coca-Cola Enterprises Inc. | 7.375 | % | 3/3/14 | 4,425 | 5,159 | ||||
| Coca-Cola Enterprises Inc. | 4.250 | % | 3/1/15 | 100 | 105 | ||||
| Coca-Cola Enterprises Inc. | 4.500 | % | 8/15/19 | 900 | 904 | ||||
| Coca-Cola Enterprises Inc. | 8.500 | % | 2/1/22 | 3,250 | 4,159 | ||||
| Coca-Cola Enterprises Inc. | 7.000 | % | 10/1/26 | 1,525 | 1,774 | ||||
| Coca-Cola Enterprises Inc. | 6.950 | % | 11/15/26 | 1,050 | 1,191 | ||||
| Coca-Cola Enterprises Inc. | 6.750 | % | 9/15/28 | 475 | 539 | ||||
| Coca-Cola HBC Finance BV | 5.125 | % | 9/17/13 | 325 | 348 | ||||
| Coca-Cola HBC Finance BV | 5.500 | % | 9/17/15 | 3,500 | 3,805 | ||||
| ConAgra Foods Inc. | 6.750 | % | 9/15/11 | 22 | 24 | ||||
| ConAgra Foods Inc. | 5.875 | % | 4/15/14 | 1,295 | 1,410 | ||||
| ConAgra Foods Inc. | 5.819 | % | 6/15/17 | 225 | 235 | ||||
| ConAgra Foods Inc. | 7.125 | % | 10/1/26 | 450 | 488 | ||||
| ConAgra Foods Inc. | 7.000 | % | 10/1/28 | 250 | 266 | ||||
| ConAgra Foods Inc. | 8.250 | % | 9/15/30 | 500 | 598 | ||||
| Covidien International Finance SA | 5.450 | % | 10/15/12 | 725 | 788 | ||||
| Covidien International Finance SA | 6.000 | % | 10/15/17 | 1,525 | 1,644 | ||||
| Covidien International Finance SA | 6.550 | % | 10/15/37 | 3,980 | 4,451 | ||||
| CR Bard Inc. | 6.700 | % | 12/1/26 | 1,800 | 1,916 | ||||
| Delhaize America Inc. | 9.000 | % | 4/15/31 | 625 | 801 | ||||
| Delhaize Group SA | 5.875 | % | 2/1/14 | 1,400 | 1,499 | ||||
| Diageo Capital PLC | 5.200 | % | 1/30/13 | 2,425 | 2,597 | ||||
| Diageo Capital PLC | 7.375 | % | 1/15/14 | 3,100 | 3,581 | ||||
| Diageo Capital PLC | 5.500 | % | 9/30/16 | 425 | 452 | ||||
| Diageo Capital PLC | 5.750 | % | 10/23/17 | 2,500 | 2,697 | ||||
| Diageo Capital PLC | 5.875 | % | 9/30/36 | 200 | 208 | ||||
| Diageo Finance BV | 5.300 | % | 10/28/15 | 1,800 | 1,944 | ||||
| Diageo Investment Corp. | 9.000 | % | 8/15/11 | 1,050 | 1,168 | ||||
| Diageo Investment Corp. | 7.450 | % | 4/15/35 | 200 | 239 | ||||
| Dr Pepper Snapple Group Inc. | 1.700 | % | 12/21/11 | 1,125 | 1,124 | ||||
| Dr Pepper Snapple Group Inc. | 2.350 | % | 12/21/12 | 1,125 | 1,128 | ||||
| Dr Pepper Snapple Group Inc. | 6.120 | % | 5/1/13 | 525 | 575 | ||||
| Dr Pepper Snapple Group Inc. | 6.820 | % | 5/1/18 | 1,600 | 1,806 | ||||
| Dr Pepper Snapple Group Inc. | 7.450 | % | 5/1/38 | 425 | 501 | ||||
| Eli Lilly & Co. | 3.550 | % | 3/6/12 | 3,100 | 3,226 | ||||
| Eli Lilly & Co. | 6.000 | % | 3/15/12 | 950 | 1,038 | ||||
| Eli Lilly & Co. | 4.200 | % | 3/6/14 | 2,200 | 2,315 | ||||
| Eli Lilly & Co. | 5.200 | % | 3/15/17 | 2,625 | 2,783 | ||||
| Eli Lilly & Co. | 5.500 | % | 3/15/27 | 2,150 | 2,172 | ||||
| Eli Lilly & Co. | 5.550 | % | 3/15/37 | 200 | 202 | ||||
| Estee Lauder Cos. Inc. | 6.000 | % | 5/15/37 | 200 | 194 | ||||
| Express Scripts Inc. | 5.250 | % | 6/15/12 | 1,625 | 1,729 | ||||
| Express Scripts Inc. | 6.250 | % | 6/15/14 | 4,700 | 5,150 | ||||
| Express Scripts Inc. | 7.250 | % | 6/15/19 | 650 | 741 | ||||
| Fortune Brands Inc. | 5.125 | % | 1/15/11 | 1,475 | 1,518 | ||||
| Fortune Brands Inc. | 3.000 | % | 6/1/12 | 3,200 | 3,174 | ||||
| Fortune Brands Inc. | 6.375 | % | 6/15/14 | 1,300 | 1,390 | ||||
| Fortune Brands Inc. | 5.375 | % | 1/15/16 | 1,500 | 1,507 | ||||
| Fortune Brands Inc. | 5.875 | % | 1/15/36 | 875 | 750 | ||||
| Genentech Inc. | 4.750 | % | 7/15/15 | 800 | 855 | ||||
| Genentech Inc. | 5.250 | % | 7/15/35 | 300 | 287 | ||||
49
| Total Bond Market II Index Fund | |||||||||
| Face | Market | ||||||||
| Maturity | Amount | Value• | |||||||
| Coupon | Date | ($ | 000 | ) | ($ | 000 | ) | ||
| General Mills Inc. | 6.000 | % | 2/15/12 | 5,525 | 5,980 | ||||
| General Mills Inc. | 5.650 | % | 9/10/12 | 625 | 681 | ||||
| General Mills Inc. | 5.250 | % | 8/15/13 | 1,650 | 1,783 | ||||
| General Mills Inc. | 5.200 | % | 3/17/15 | 2,000 | 2,147 | ||||
| General Mills Inc. | 5.700 | % | 2/15/17 | 8,025 | 8,713 | ||||
| General Mills Inc. | 5.650 | % | 2/15/19 | 1,125 | 1,200 | ||||
| GlaxoSmithKline Capital Inc. | 4.850 | % | 5/15/13 | 4,125 | 4,407 | ||||
| GlaxoSmithKline Capital Inc. | 4.375 | % | 4/15/14 | 1,800 | 1,900 | ||||
| GlaxoSmithKline Capital Inc. | 5.650 | % | 5/15/18 | 4,850 | 5,225 | ||||
| GlaxoSmithKline Capital Inc. | 5.375 | % | 4/15/34 | 950 | 911 | ||||
| GlaxoSmithKline Capital Inc. | 6.375 | % | 5/15/38 | 10,680 | 11,873 | ||||
| Hasbro Inc. | 6.300 | % | 9/15/17 | 2,125 | 2,246 | ||||
| Hershey Co. | 5.450 | % | 9/1/16 | 425 | 446 | ||||
| HJ Heinz Co. | 5.350 | % | 7/15/13 | 625 | 673 | ||||
| HJ Heinz Finance Co. | 6.625 | % | 7/15/11 | 2,175 | 2,330 | ||||
| HJ Heinz Finance Co. | 6.750 | % | 3/15/32 | 1,325 | 1,388 | ||||
| Hospira Inc. | 5.900 | % | 6/15/14 | 500 | 542 | ||||
| Hospira Inc. | 6.400 | % | 5/15/15 | 275 | 305 | ||||
| Hospira Inc. | 6.050 | % | 3/30/17 | 100 | 105 | ||||
| Johnson & Johnson | 5.150 | % | 8/15/12 | 1,525 | 1,666 | ||||
| Johnson & Johnson | 5.550 | % | 8/15/17 | 1,950 | 2,155 | ||||
| Johnson & Johnson | 5.150 | % | 7/15/18 | 550 | 591 | ||||
| Johnson & Johnson | 6.950 | % | 9/1/29 | 1,300 | 1,566 | ||||
| Johnson & Johnson | 4.950 | % | 5/15/33 | 1,600 | 1,560 | ||||
| Johnson & Johnson | 5.950 | % | 8/15/37 | 800 | 885 | ||||
| Johnson & Johnson | 5.850 | % | 7/15/38 | 950 | 1,029 | ||||
| Kellogg Co. | 5.125 | % | 12/3/12 | 1,475 | 1,610 | ||||
| Kellogg Co. | 4.250 | % | 3/6/13 | 1,375 | 1,454 | ||||
| Kellogg Co. | 4.150 | % | 11/15/19 | 2,150 | 2,101 | ||||
| Kellogg Co. | 7.450 | % | 4/1/31 | 2,500 | 3,043 | ||||
| Kimberly-Clark Corp. | 5.625 | % | 2/15/12 | 1,075 | 1,153 | ||||
| Kimberly-Clark Corp. | 4.875 | % | 8/15/15 | 1,875 | 2,022 | ||||
| Kimberly-Clark Corp. | 6.125 | % | 8/1/17 | 2,475 | 2,739 | ||||
| Kimberly-Clark Corp. | 7.500 | % | 11/1/18 | 800 | 967 | ||||
| Kimberly-Clark Corp. | 6.625 | % | 8/1/37 | 200 | 229 | ||||
| Koninklijke Philips Electronics NV | 4.625 | % | 3/11/13 | 1,300 | 1,362 | ||||
| Koninklijke Philips Electronics NV | 5.750 | % | 3/11/18 | 3,250 | 3,453 | ||||
| Koninklijke Philips Electronics NV | 6.875 | % | 3/11/38 | 3,050 | 3,463 | ||||
| Kraft Foods Inc. | 5.625 | % | 11/1/11 | 7,450 | 7,927 | ||||
| Kraft Foods Inc. | 6.250 | % | 6/1/12 | 1,225 | 1,321 | ||||
| Kraft Foods Inc. | 6.000 | % | 2/11/13 | 2,950 | 3,163 | ||||
| Kraft Foods Inc. | 5.250 | % | 10/1/13 | 100 | 106 | ||||
| Kraft Foods Inc. | 6.750 | % | 2/19/14 | 200 | 222 | ||||
| Kraft Foods Inc. | 6.500 | % | 8/11/17 | 5,375 | 5,831 | ||||
| Kraft Foods Inc. | 6.125 | % | 2/1/18 | 100 | 106 | ||||
| Kraft Foods Inc. | 6.125 | % | 8/23/18 | 1,900 | 2,016 | ||||
| Kraft Foods Inc. | 6.500 | % | 11/1/31 | 3,275 | 3,299 | ||||
| Kraft Foods Inc. | 7.000 | % | 8/11/37 | 3,675 | 3,916 | ||||
| Kraft Foods Inc. | 6.875 | % | 2/1/38 | 4,975 | 5,217 | ||||
| Kraft Foods Inc. | 6.875 | % | 1/26/39 | 525 | 552 | ||||
| Kroger Co. | 6.800 | % | 4/1/11 | 1,225 | 1,301 | ||||
| Kroger Co. | 6.750 | % | 4/15/12 | 100 | 110 | ||||
| Kroger Co. | 6.200 | % | 6/15/12 | 1,950 | 2,124 | ||||
| Kroger Co. | 5.500 | % | 2/1/13 | 425 | 454 | ||||
| Kroger Co. | 5.000 | % | 4/15/13 | 1,050 | 1,110 | ||||
| Kroger Co. | 4.950 | % | 1/15/15 | 1,950 | 2,053 | ||||
| Kroger Co. | 6.400 | % | 8/15/17 | 200 | 219 | ||||
50
| Total Bond Market II Index Fund | |||||||||
| Face | Market | ||||||||
| Maturity | Amount | Value• | |||||||
| Coupon | Date | ($ | 000 | ) | ($ | 000 | ) | ||
| Kroger Co. | 6.800 | % | 12/15/18 | 2,400 | 2,683 | ||||
| Kroger Co. | 6.150 | % | 1/15/20 | 2,525 | 2,703 | ||||
| Kroger Co. | 7.700 | % | 6/1/29 | 2,800 | 3,275 | ||||
| Kroger Co. | 8.000 | % | 9/15/29 | 3,775 | 4,524 | ||||
| Kroger Co. | 7.500 | % | 4/1/31 | 625 | 725 | ||||
| Kroger Co. | 6.900 | % | 4/15/38 | 625 | 698 | ||||
| Laboratory Corp. of America Holdings | 5.500 | % | 2/1/13 | 425 | 442 | ||||
| Laboratory Corp. of America Holdings | 5.625 | % | 12/15/15 | 850 | 889 | ||||
| Lorillard Tobacco Co. | 8.125 | % | 6/23/19 | 7,550 | 8,302 | ||||
| McKesson Corp. | 7.750 | % | 2/1/12 | 450 | 497 | ||||
| McKesson Corp. | 5.250 | % | 3/1/13 | 3,450 | 3,663 | ||||
| 4 Mead Johnson Nutrition Co. | 3.500 | % | 11/1/14 | 2,525 | 2,507 | ||||
| 4 Mead Johnson Nutrition Co. | 4.900 | % | 11/1/19 | 2,850 | 2,792 | ||||
| 4 Mead Johnson Nutrition Co. | 5.900 | % | 11/1/39 | 1,025 | 999 | ||||
| Medco Health Solutions Inc. | 6.125 | % | 3/15/13 | 1,425 | 1,528 | ||||
| Medco Health Solutions Inc. | 7.250 | % | 8/15/13 | 925 | 1,027 | ||||
| Medco Health Solutions Inc. | 7.125 | % | 3/15/18 | 4,785 | 5,383 | ||||
| Medtronic Inc. | 4.500 | % | 3/15/14 | 1,000 | 1,063 | ||||
| Medtronic Inc. | 4.750 | % | 9/15/15 | 1,775 | 1,914 | ||||
| Medtronic Inc. | 6.500 | % | 3/15/39 | 500 | 562 | ||||
| Merck & Co. Inc. | 1.875 | % | 6/30/11 | 3,000 | 3,040 | ||||
| Merck & Co. Inc. | 5.125 | % | 11/15/11 | 725 | 781 | ||||
| Merck & Co. Inc. | 4.375 | % | 2/15/13 | 1,225 | 1,302 | ||||
| Merck & Co. Inc. | 5.300 | % | 12/1/13 | 500 | 551 | ||||
| Merck & Co. Inc. | 4.750 | % | 3/1/15 | 1,200 | 1,296 | ||||
| Merck & Co. Inc. | 4.000 | % | 6/30/15 | 2,000 | 2,097 | ||||
| Merck & Co. Inc. | 6.000 | % | 9/15/17 | 2,300 | 2,573 | ||||
| Merck & Co. Inc. | 5.000 | % | 6/30/19 | 1,650 | 1,730 | ||||
| Merck & Co. Inc. | 6.400 | % | 3/1/28 | 1,525 | 1,669 | ||||
| Merck & Co. Inc. | 5.950 | % | 12/1/28 | 775 | 826 | ||||
| Merck & Co. Inc. | 6.500 | % | 12/1/33 | 4,675 | 5,289 | ||||
| Merck & Co. Inc. | 5.750 | % | 11/15/36 | 325 | 338 | ||||
| Merck & Co. Inc. | 6.550 | % | 9/15/37 | 4,425 | 5,078 | ||||
| Merck & Co. Inc. | 5.850 | % | 6/30/39 | 6,225 | 6,640 | ||||
| Novant Health Inc. | 5.850 | % | 11/1/19 | 2,125 | 2,111 | ||||
| Novartis Capital Corp. | 4.125 | % | 2/10/14 | 6,525 | 6,843 | ||||
| Novartis Securities Investment Ltd. | 5.125 | % | 2/10/19 | 4,825 | 5,034 | ||||
| Pepsi Bottling Group Inc. | 7.000 | % | 3/1/29 | 5,325 | 6,197 | ||||
| PepsiAmericas Inc. | 5.750 | % | 7/31/12 | 1,050 | 1,144 | ||||
| PepsiAmericas Inc. | 4.375 | % | 2/15/14 | 100 | 105 | ||||
| PepsiAmericas Inc. | 4.875 | % | 1/15/15 | 100 | 106 | ||||
| PepsiAmericas Inc. | 5.000 | % | 5/15/17 | 1,400 | 1,471 | ||||
| PepsiCo Inc. | 5.150 | % | 5/15/12 | 800 | 863 | ||||
| PepsiCo Inc. | 4.650 | % | 2/15/13 | 2,900 | 3,108 | ||||
| PepsiCo Inc. | 3.750 | % | 3/1/14 | 6,150 | 6,381 | ||||
| PepsiCo Inc. | 5.000 | % | 6/1/18 | 5,425 | 5,664 | ||||
| PepsiCo Inc. | 7.900 | % | 11/1/18 | 1,150 | 1,410 | ||||
| Pfizer Inc. | 4.450 | % | 3/15/12 | 12,650 | 13,393 | ||||
| Pfizer Inc. | 5.350 | % | 3/15/15 | 5,200 | 5,699 | ||||
| Pfizer Inc. | 6.200 | % | 3/15/19 | 6,850 | 7,627 | ||||
| Pfizer Inc. | 7.200 | % | 3/15/39 | 10,325 | 12,711 | ||||
| Pharmacia Corp. | 6.500 | % | 12/1/18 | 200 | 226 | ||||
| Pharmacia Corp. | 6.600 | % | 12/1/28 | 625 | 695 | ||||
| Philip Morris International Inc. | 4.875 | % | 5/16/13 | 3,150 | 3,349 | ||||
| Philip Morris International Inc. | 6.875 | % | 3/17/14 | 3,900 | 4,436 | ||||
| Philip Morris International Inc. | 5.650 | % | 5/16/18 | 2,950 | 3,103 | ||||
| Philip Morris International Inc. | 6.375 | % | 5/16/38 | 2,650 | 2,866 | ||||
51
| Total Bond Market II Index Fund | |||||||||
| Face | Market | ||||||||
| Maturity | Amount | Value• | |||||||
| Coupon | Date | ($ | 000 | ) | ($ | 000 | ) | ||
| 3 Procter & Gamble-Esop | 9.360 | % | 1/1/21 | 3,176 | 3,969 | ||||
| Procter & Gamble Co. | 4.600 | % | 1/15/14 | 1,300 | 1,392 | ||||
| Procter & Gamble Co. | 4.950 | % | 8/15/14 | 850 | 924 | ||||
| Procter & Gamble Co. | 3.500 | % | 2/15/15 | 4,500 | 4,605 | ||||
| Procter & Gamble Co. | 4.700 | % | 2/15/19 | 1,775 | 1,818 | ||||
| Procter & Gamble Co. | 6.450 | % | 1/15/26 | 2,750 | 3,106 | ||||
| Procter & Gamble Co. | 5.800 | % | 8/15/34 | 250 | 264 | ||||
| Procter & Gamble Co. | 5.550 | % | 3/5/37 | 2,950 | 3,036 | ||||
| Quest Diagnostics Inc. | 5.450 | % | 11/1/15 | 1,800 | 1,948 | ||||
| Quest Diagnostics Inc. | 6.400 | % | 7/1/17 | 175 | 193 | ||||
| Quest Diagnostics Inc. | 6.950 | % | 7/1/37 | 1,225 | 1,366 | ||||
| Reynolds American Inc. | 7.250 | % | 6/1/12 | 1,500 | 1,631 | ||||
| Reynolds American Inc. | 7.250 | % | 6/1/13 | 1,575 | 1,725 | ||||
| Reynolds American Inc. | 7.625 | % | 6/1/16 | 850 | 924 | ||||
| Reynolds American Inc. | 6.750 | % | 6/15/17 | 1,275 | 1,313 | ||||
| Reynolds American Inc. | 7.250 | % | 6/15/37 | 1,525 | 1,536 | ||||
| Safeway Inc. | 6.500 | % | 3/1/11 | 4,350 | 4,590 | ||||
| Safeway Inc. | 5.800 | % | 8/15/12 | 975 | 1,059 | ||||
| Safeway Inc. | 6.250 | % | 3/15/14 | 5,850 | 6,392 | ||||
| Safeway Inc. | 6.350 | % | 8/15/17 | 325 | 354 | ||||
| Safeway Inc. | 7.250 | % | 2/1/31 | 1,825 | 2,087 | ||||
| Sara Lee Corp. | 6.125 | % | 11/1/32 | 2,175 | 2,080 | ||||
| St. Jude Medical Inc. | 3.750 | % | 7/15/14 | 2,875 | 2,921 | ||||
| St. Jude Medical Inc. | 4.875 | % | 7/15/19 | 500 | 506 | ||||
| Sysco Corp. | 4.200 | % | 2/12/13 | 625 | 656 | ||||
| Sysco Corp. | 5.250 | % | 2/12/18 | 3,875 | 4,101 | ||||
| Sysco Corp. | 5.375 | % | 9/21/35 | 1,400 | 1,392 | ||||
| Teva Pharmaceutical Finance Co. LLC | 5.550 | % | 2/1/16 | 550 | 581 | ||||
| Teva Pharmaceutical Finance Co. LLC | 6.150 | % | 2/1/36 | 2,425 | 2,477 | ||||
| 4 Thermo Fisher Scientific Inc. | 2.150 | % | 12/28/12 | 875 | 870 | ||||
| 4 Thermo Fisher Scientific Inc. | 3.250 | % | 11/18/14 | 1,875 | 1,855 | ||||
| Unilever Capital Corp. | 7.125 | % | 11/1/10 | 3,400 | 3,580 | ||||
| Unilever Capital Corp. | 3.650 | % | 2/15/14 | 1,525 | 1,570 | ||||
| Unilever Capital Corp. | 4.800 | % | 2/15/19 | 700 | 719 | ||||
| UST Inc. | 6.625 | % | 7/15/12 | 200 | 217 | ||||
| UST Inc. | 5.750 | % | 3/1/18 | 1,000 | 982 | ||||
| Watson Pharmaceuticals Inc. | 5.000 | % | 8/15/14 | 1,250 | 1,279 | ||||
| Whirlpool Corp. | 5.500 | % | 3/1/13 | 4,075 | 4,203 | ||||
| Whirlpool Corp. | 8.600 | % | 5/1/14 | 900 | 1,019 | ||||
| Wyeth | 6.950 | % | 3/15/11 | 875 | 938 | ||||
| Wyeth | 5.500 | % | 3/15/13 | 2,750 | 2,986 | ||||
| Wyeth | 5.500 | % | 2/1/14 | 1,350 | 1,477 | ||||
| Wyeth | 5.500 | % | 2/15/16 | 7,500 | 8,077 | ||||
| Wyeth | 5.450 | % | 4/1/17 | 2,950 | 3,154 | ||||
| Wyeth | 6.450 | % | 2/1/24 | 525 | 587 | ||||
| Wyeth | 6.500 | % | 2/1/34 | 1,450 | 1,594 | ||||
| Wyeth | 6.000 | % | 2/15/36 | 2,025 | 2,103 | ||||
| Wyeth | 5.950 | % | 4/1/37 | 250 | 262 | ||||
| Zimmer Holdings Inc. | 4.625 | % | 11/30/19 | 700 | 702 | ||||
| Zimmer Holdings Inc. | 5.750 | % | 11/30/39 | 1,075 | 1,062 | ||||
| Energy (1.4%) | |||||||||
| Alberta Energy Co. Ltd. | 7.375 | % | 11/1/31 | 425 | 474 | ||||
| Anadarko Finance Co. | 6.750 | % | 5/1/11 | 1,450 | 1,539 | ||||
| Anadarko Finance Co. | 7.500 | % | 5/1/31 | 200 | 224 | ||||
| Anadarko Petroleum Corp. | 7.625 | % | 3/15/14 | 1,950 | 2,238 | ||||
| Anadarko Petroleum Corp. | 5.750 | % | 6/15/14 | 800 | 865 | ||||
52
| Total Bond Market II Index Fund | |||||||||
| Face | Market | ||||||||
| Maturity | Amount | Value• | |||||||
| Coupon | Date | ($ | 000 | ) | ($ | 000 | ) | ||
| Anadarko Petroleum Corp. | 5.950 | % | 9/15/16 | 5,475 | 5,878 | ||||
| Anadarko Petroleum Corp. | 6.950 | % | 6/15/19 | 500 | 567 | ||||
| Anadarko Petroleum Corp. | 6.450 | % | 9/15/36 | 9,025 | 9,395 | ||||
| Anadarko Petroleum Corp. | 7.950 | % | 6/15/39 | 825 | 1,015 | ||||
| Apache Corp. | 6.250 | % | 4/15/12 | 875 | 956 | ||||
| Apache Corp. | 5.250 | % | 4/15/13 | 300 | 321 | ||||
| Apache Corp. | 6.000 | % | 9/15/13 | 1,925 | 2,116 | ||||
| Apache Corp. | 5.625 | % | 1/15/17 | 250 | 268 | ||||
| Apache Corp. | 6.900 | % | 9/15/18 | 3,450 | 4,043 | ||||
| Apache Corp. | 6.000 | % | 1/15/37 | 1,550 | 1,639 | ||||
| Apache Finance Canada Corp. | 7.750 | % | 12/15/29 | 400 | 486 | ||||
| Baker Hughes Inc. | 7.500 | % | 11/15/18 | 325 | 389 | ||||
| Baker Hughes Inc. | 6.875 | % | 1/15/29 | 300 | 334 | ||||
| BJ Services Co. | 6.000 | % | 6/1/18 | 850 | 918 | ||||
| BP Capital Markets PLC | 3.125 | % | 3/10/12 | 200 | 206 | ||||
| BP Capital Markets PLC | 5.250 | % | 11/7/13 | 4,225 | 4,604 | ||||
| BP Capital Markets PLC | 3.625 | % | 5/8/14 | 3,650 | 3,731 | ||||
| BP Capital Markets PLC | 3.875 | % | 3/10/15 | 3,675 | 3,795 | ||||
| BP Capital Markets PLC | 4.750 | % | 3/10/19 | 5,300 | 5,404 | ||||
| Burlington Resources Finance Co. | 6.680 | % | 2/15/11 | 1,400 | 1,486 | ||||
| Burlington Resources Finance Co. | 6.500 | % | 12/1/11 | 1,400 | 1,531 | ||||
| Burlington Resources Finance Co. | 7.200 | % | 8/15/31 | 300 | 338 | ||||
| Burlington Resources Finance Co. | 7.400 | % | 12/1/31 | 1,775 | 2,032 | ||||
| Cameron International Corp. | 6.375 | % | 7/15/18 | 225 | 237 | ||||
| Cameron International Corp. | 7.000 | % | 7/15/38 | 100 | 106 | ||||
| Canadian Natural Resources Ltd. | 5.450 | % | 10/1/12 | 1,175 | 1,255 | ||||
| Canadian Natural Resources Ltd. | 5.150 | % | 2/1/13 | 475 | 502 | ||||
| Canadian Natural Resources Ltd. | 4.900 | % | 12/1/14 | 4,225 | 4,444 | ||||
| Canadian Natural Resources Ltd. | 6.000 | % | 8/15/16 | 1,150 | 1,218 | ||||
| Canadian Natural Resources Ltd. | 7.200 | % | 1/15/32 | 1,875 | 2,114 | ||||
| Canadian Natural Resources Ltd. | 6.450 | % | 6/30/33 | 2,025 | 2,104 | ||||
| Canadian Natural Resources Ltd. | 6.500 | % | 2/15/37 | 2,350 | 2,478 | ||||
| Canadian Natural Resources Ltd. | 6.250 | % | 3/15/38 | 650 | 671 | ||||
| Canadian Natural Resources Ltd. | 6.750 | % | 2/1/39 | 250 | 276 | ||||
| 4 Cenovus Energy Inc. | 4.500 | % | 9/15/14 | 1,875 | 1,924 | ||||
| 4 Cenovus Energy Inc. | 5.700 | % | 10/15/19 | 7,050 | 7,135 | ||||
| 4 Cenovus Energy Inc. | 6.750 | % | 11/15/39 | 7,575 | 7,981 | ||||
| Chevron Corp. | 3.450 | % | 3/3/12 | 1,825 | 1,902 | ||||
| Chevron Corp. | 3.950 | % | 3/3/14 | 2,775 | 2,918 | ||||
| Chevron Corp. | 4.950 | % | 3/3/19 | 4,000 | 4,214 | ||||
| Conoco Funding Co. | 6.350 | % | 10/15/11 | 4,200 | 4,587 | ||||
| Conoco Funding Co. | 7.250 | % | 10/15/31 | 200 | 233 | ||||
| ConocoPhillips | 4.750 | % | 2/1/14 | 1,650 | 1,771 | ||||
| ConocoPhillips | 4.600 | % | 1/15/15 | 1,100 | 1,172 | ||||
| ConocoPhillips | 5.750 | % | 2/1/19 | 7,775 | 8,530 | ||||
| ConocoPhillips | 6.000 | % | 1/15/20 | 875 | 970 | ||||
| ConocoPhillips | 5.900 | % | 10/15/32 | 425 | 434 | ||||
| ConocoPhillips | 6.500 | % | 2/1/39 | 2,200 | 2,447 | ||||
| ConocoPhillips Canada Funding Co. I | 5.300 | % | 4/15/12 | 1,975 | 2,125 | ||||
| ConocoPhillips Canada Funding Co. I | 5.625 | % | 10/15/16 | 4,525 | 4,919 | ||||
| ConocoPhillips Canada Funding Co. I | 5.950 | % | 10/15/36 | 1,325 | 1,319 | ||||
| ConocoPhillips Holding Co. | 6.950 | % | 4/15/29 | 1,350 | 1,531 | ||||
| Devon Energy Corp. | 5.625 | % | 1/15/14 | 1,475 | 1,605 | ||||
| Devon Energy Corp. | 7.950 | % | 4/15/32 | 550 | 694 | ||||
| Devon Financing Corp. ULC | 6.875 | % | 9/30/11 | 2,950 | 3,198 | ||||
| Devon Financing Corp. ULC | 7.875 | % | 9/30/31 | 3,275 | 4,073 | ||||
| Diamond Offshore Drilling Inc. | 4.875 | % | 7/1/15 | 225 | 239 | ||||
53
| Total Bond Market II Index Fund | |||||||||
| Face | Market | ||||||||
| Maturity | Amount | Value• | |||||||
| Coupon | Date | ($ | 000 | ) | ($ | 000 | ) | ||
| Diamond Offshore Drilling Inc. | 5.875 | % | 5/1/19 | 850 | 906 | ||||
| Diamond Offshore Drilling Inc. | 5.700 | % | 10/15/39 | 1,850 | 1,815 | ||||
| EnCana Corp. | 5.900 | % | 12/1/17 | 2,100 | 2,252 | ||||
| EnCana Corp. | 7.200 | % | 11/1/31 | 1,800 | 1,947 | ||||
| EnCana Corp. | 6.500 | % | 8/15/34 | 2,925 | 3,137 | ||||
| EnCana Corp. | 6.625 | % | 8/15/37 | 1,250 | 1,366 | ||||
| EnCana Holdings Finance Corp. | 5.800 | % | 5/1/14 | 4,350 | 4,760 | ||||
| EOG Resources Inc. | 6.125 | % | 10/1/13 | 575 | 635 | ||||
| EOG Resources Inc. | 5.875 | % | 9/15/17 | 1,900 | 2,089 | ||||
| EOG Resources Inc. | 5.625 | % | 6/1/19 | 3,350 | 3,587 | ||||
| Global Marine Inc. | 7.000 | % | 6/1/28 | 850 | 892 | ||||
| Halliburton Co. | 6.150 | % | 9/15/19 | 4,975 | 5,578 | ||||
| Halliburton Co. | 6.700 | % | 9/15/38 | 3,500 | 3,919 | ||||
| Halliburton Co. | 7.450 | % | 9/15/39 | 525 | 648 | ||||
| Hess Corp. | 8.125 | % | 2/15/19 | 3,900 | 4,707 | ||||
| Hess Corp. | 7.875 | % | 10/1/29 | 1,950 | 2,322 | ||||
| Hess Corp. | 7.125 | % | 3/15/33 | 1,375 | 1,533 | ||||
| Husky Energy Inc. | 6.250 | % | 6/15/12 | 725 | 779 | ||||
| Husky Energy Inc. | 5.900 | % | 6/15/14 | 7,025 | 7,657 | ||||
| Husky Energy Inc. | 6.150 | % | 6/15/19 | 200 | 213 | ||||
| Husky Energy Inc. | 7.250 | % | 12/15/19 | 1,225 | 1,413 | ||||
| Husky Energy Inc. | 6.800 | % | 9/15/37 | 875 | 916 | ||||
| Kerr-McGee Corp. | 6.875 | % | 9/15/11 | 1,950 | 2,099 | ||||
| Kerr-McGee Corp. | 6.950 | % | 7/1/24 | 3,300 | 3,588 | ||||
| Kerr-McGee Corp. | 7.875 | % | 9/15/31 | 875 | 999 | ||||
| Lasmo USA Inc. | 7.300 | % | 11/15/27 | 175 | 206 | ||||
| Marathon Global Funding Corp. | 6.000 | % | 7/1/12 | 1,000 | 1,082 | ||||
| Marathon Oil Corp. | 6.125 | % | 3/15/12 | 825 | 893 | ||||
| Marathon Oil Corp. | 6.000 | % | 10/1/17 | 3,750 | 3,979 | ||||
| Marathon Oil Corp. | 5.900 | % | 3/15/18 | 1,350 | 1,427 | ||||
| Marathon Oil Corp. | 6.600 | % | 10/1/37 | 200 | 212 | ||||
| Nabors Industries Inc. | 6.150 | % | 2/15/18 | 2,650 | 2,746 | ||||
| Nabors Industries Inc. | 9.250 | % | 1/15/19 | 1,375 | 1,690 | ||||
| Nexen Inc. | 5.050 | % | 11/20/13 | 5,516 | 5,816 | ||||
| Nexen Inc. | 5.650 | % | 5/15/17 | 850 | 884 | ||||
| Nexen Inc. | 7.875 | % | 3/15/32 | 325 | 376 | ||||
| Nexen Inc. | 5.875 | % | 3/10/35 | 100 | 94 | ||||
| Nexen Inc. | 6.400 | % | 5/15/37 | 2,850 | 2,837 | ||||
| Nexen Inc. | 7.500 | % | 7/30/39 | 3,400 | 3,822 | ||||
| Noble Energy Inc. | 8.250 | % | 3/1/19 | 3,000 | 3,590 | ||||
| Noble Energy Inc. | 8.000 | % | 4/1/27 | 275 | 307 | ||||
| Occidental Petroleum Corp. | 4.250 | % | 3/15/10 | 575 | 580 | ||||
| Occidental Petroleum Corp. | 6.750 | % | 1/15/12 | 1,675 | 1,837 | ||||
| Occidental Petroleum Corp. | 7.000 | % | 11/1/13 | 3,100 | 3,546 | ||||
| PC Financial Partnership | 5.000 | % | 11/15/14 | 900 | 934 | ||||
| Petro-Canada | 4.000 | % | 7/15/13 | 1,325 | 1,367 | ||||
| Petro-Canada | 6.050 | % | 5/15/18 | 1,050 | 1,122 | ||||
| Petro-Canada | 7.875 | % | 6/15/26 | 500 | 578 | ||||
| Petro-Canada | 7.000 | % | 11/15/28 | 475 | 509 | ||||
| Petro-Canada | 5.350 | % | 7/15/33 | 1,425 | 1,287 | ||||
| Petro-Canada | 5.950 | % | 5/15/35 | 2,100 | 1,998 | ||||
| Petro-Canada | 6.800 | % | 5/15/38 | 525 | 579 | ||||
| Questar Market Resources Inc. | 6.050 | % | 9/1/16 | 975 | 994 | ||||
| Questar Market Resources Inc. | 6.800 | % | 3/1/20 | 1,750 | 1,830 | ||||
| Rowan Cos. Inc. | 7.875 | % | 8/1/19 | 875 | 974 | ||||
| Shell International Finance BV | 5.625 | % | 6/27/11 | 3,150 | 3,351 | ||||
| Shell International Finance BV | 4.950 | % | 3/22/12 | 1,025 | 1,099 | ||||
54
| Total Bond Market II Index Fund | |||||||||
| Face | Market | ||||||||
| Maturity | Amount | Value• | |||||||
| Coupon | Date | ($ | 000 | ) | ($ | 000 | ) | ||
| Shell International Finance BV | 4.000 | % | 3/21/14 | 3,150 | 3,295 | ||||
| Shell International Finance BV | 3.250 | % | 9/22/15�� | 3,750 | 3,753 | ||||
| Shell International Finance BV | 5.200 | % | 3/22/17 | 975 | 1,048 | ||||
| Shell International Finance BV | 4.300 | % | 9/22/19 | 4,500 | 4,452 | ||||
| Shell International Finance BV | 6.375 | % | 12/15/38 | 10,125 | 11,266 | ||||
| Smith International Inc. | 9.750 | % | 3/15/19 | 5,000 | 6,335 | ||||
| Statoil ASA | 3.875 | % | 4/15/14 | 1,250 | 1,299 | ||||
| Statoil ASA | 2.900 | % | 10/15/14 | 950 | 946 | ||||
| Statoil ASA | 5.250 | % | 4/15/19 | 4,625 | 4,908 | ||||
| Statoil ASA | 7.250 | % | 9/23/27 | 1,975 | 2,329 | ||||
| 4 Statoil ASA | 6.500 | % | 12/1/28 | 225 | 246 | ||||
| Statoil ASA | 7.150 | % | 1/15/29 | 900 | 1,058 | ||||
| Suncor Energy Inc. | 6.100 | % | 6/1/18 | 1,100 | 1,183 | ||||
| Suncor Energy Inc. | 7.150 | % | 2/1/32 | 425 | 454 | ||||
| Suncor Energy Inc. | 5.950 | % | 12/1/34 | 175 | 173 | ||||
| Suncor Energy Inc. | 6.500 | % | 6/15/38 | 8,950 | 9,411 | ||||
| Suncor Energy Inc. | 6.850 | % | 6/1/39 | 3,700 | 4,112 | ||||
| Sunoco Inc. | 4.875 | % | 10/15/14 | 500 | 504 | ||||
| Sunoco Inc. | 5.750 | % | 1/15/17 | 725 | 738 | ||||
| Talisman Energy Inc. | 5.125 | % | 5/15/15 | 375 | 389 | ||||
| Talisman Energy Inc. | 7.750 | % | 6/1/19 | 3,125 | 3,664 | ||||
| Talisman Energy Inc. | 7.250 | % | 10/15/27 | 200 | 218 | ||||
| Talisman Energy Inc. | 5.850 | % | 2/1/37 | 1,975 | 1,876 | ||||
| Tosco Corp. | 8.125 | % | 2/15/30 | 4,950 | 6,013 | ||||
| Total Capital SA | 3.125 | % | 10/2/15 | 2,000 | 1,972 | ||||
| Transocean Inc. | 5.250 | % | 3/15/13 | 1,125 | 1,204 | ||||
| Transocean Inc. | 6.000 | % | 3/15/18 | 1,875 | 2,001 | ||||
| Transocean Inc. | 7.500 | % | 4/15/31 | 775 | 900 | ||||
| Transocean Inc. | 6.800 | % | 3/15/38 | 1,600 | 1,776 | ||||
| Valero Energy Corp. | 6.875 | % | 4/15/12 | 4,375 | 4,708 | ||||
| Valero Energy Corp. | 4.750 | % | 6/15/13 | 2,400 | 2,447 | ||||
| Valero Energy Corp. | 9.375 | % | 3/15/19 | 1,575 | 1,880 | ||||
| Valero Energy Corp. | 7.500 | % | 4/15/32 | 1,725 | 1,765 | ||||
| Valero Energy Corp. | 6.625 | % | 6/15/37 | 6,400 | 5,972 | ||||
| Weatherford International Inc. | 5.950 | % | 6/15/12 | 200 | 214 | ||||
| Weatherford International Inc. | 6.350 | % | 6/15/17 | 4,625 | 4,852 | ||||
| Weatherford International Inc. | 6.800 | % | 6/15/37 | 525 | 526 | ||||
| Weatherford International Ltd. | 5.150 | % | 3/15/13 | 325 | 341 | ||||
| Weatherford International Ltd. | 6.000 | % | 3/15/18 | 525 | 536 | ||||
| Weatherford International Ltd. | 9.625 | % | 3/1/19 | 4,600 | 5,747 | ||||
| Weatherford International Ltd. | 6.500 | % | 8/1/36 | 2,750 | 2,621 | ||||
| Weatherford International Ltd. | 7.000 | % | 3/15/38 | 425 | 431 | ||||
| XTO Energy Inc. | 5.900 | % | 8/1/12 | 1,525 | 1,662 | ||||
| XTO Energy Inc. | 6.250 | % | 4/15/13 | 2,175 | 2,424 | ||||
| XTO Energy Inc. | 5.750 | % | 12/15/13 | 2,200 | 2,446 | ||||
| XTO Energy Inc. | 4.900 | % | 2/1/14 | 600 | 645 | ||||
| XTO Energy Inc. | 5.000 | % | 1/31/15 | 500 | 541 | ||||
| XTO Energy Inc. | 6.250 | % | 8/1/17 | 3,250 | 3,692 | ||||
| XTO Energy Inc. | 6.500 | % | 12/15/18 | 2,075 | 2,380 | ||||
| XTO Energy Inc. | 6.100 | % | 4/1/36 | 350 | 380 | ||||
| XTO Energy Inc. | 6.750 | % | 8/1/37 | 2,775 | 3,262 | ||||
| XTO Energy Inc. | 6.375 | % | 6/15/38 | 425 | 479 | ||||
| Other Industrial (0.0%) | |||||||||
| Cintas Corp. No 2 | 6.125 | % | 12/1/17 | 850 | 907 | ||||
55
| Total Bond Market II Index Fund | |||||||||
| Face | Market | ||||||||
| Maturity | Amount | Value• | |||||||
| Coupon | Date | ($ | 000 | ) | ($ | 000 | ) | ||
| Technology (0.7%) | |||||||||
| Agilent Technologies Inc. | 4.450 | % | 9/14/12 | 175 | 181 | ||||
| Agilent Technologies Inc. | 5.500 | % | 9/14/15 | 1,300 | 1,366 | ||||
| Agilent Technologies Inc. | 6.500 | % | 11/1/17 | 5,325 | 5,646 | ||||
| Amphenol Corp. | 4.750 | % | 11/15/14 | 2,475 | 2,477 | ||||
| Analog Devices Inc. | 5.000 | % | 7/1/14 | 1,200 | 1,260 | ||||
| Avnet Inc. | 6.625 | % | 9/15/16 | 225 | 230 | ||||
| BMC Software Inc. | 7.250 | % | 6/1/18 | 825 | 896 | ||||
| CA Inc. | 5.375 | % | 12/1/19 | 2,250 | 2,274 | ||||
| Cisco Systems Inc. | 5.250 | % | 2/22/11 | 10,450 | 10,971 | ||||
| Cisco Systems Inc. | 5.500 | % | 2/22/16 | 1,625 | 1,792 | ||||
| Cisco Systems Inc. | 4.950 | % | 2/15/19 | 5,675 | 5,844 | ||||
| Cisco Systems Inc. | 4.450 | % | 1/15/20 | 500 | 491 | ||||
| Cisco Systems Inc. | 5.900 | % | 2/15/39 | 5,800 | 5,852 | ||||
| Cisco Systems Inc. | 5.500 | % | 1/15/40 | 8,075 | 7,749 | ||||
| Computer Sciences Corp. | 5.500 | % | 3/15/13 | 425 | 453 | ||||
| Computer Sciences Corp. | 6.500 | % | 3/15/18 | 100 | 108 | ||||
| Corning Inc. | 6.625 | % | 5/15/19 | 275 | 296 | ||||
| Corning Inc. | 7.250 | % | 8/15/36 | 100 | 102 | ||||
| Dell Inc. | 3.375 | % | 6/15/12 | 475 | 492 | ||||
| Dell Inc. | 4.700 | % | 4/15/13 | 2,025 | 2,134 | ||||
| Dell Inc. | 5.650 | % | 4/15/18 | 1,100 | 1,154 | ||||
| Dell Inc. | 5.875 | % | 6/15/19 | 1,000 | 1,068 | ||||
| Dell Inc. | 6.500 | % | 4/15/38 | 1,200 | 1,226 | ||||
| Dun & Bradstreet Corp. | 6.000 | % | 4/1/13 | 1,275 | 1,319 | ||||
| Electronic Data Systems LLC | 6.000 | % | 8/1/13 | 1,775 | 1,971 | ||||
| Equifax Inc. | 4.450 | % | 12/1/14 | 775 | 781 | ||||
| Equifax Inc. | 6.300 | % | 7/1/17 | 425 | 437 | ||||
| Equifax Inc. | 7.000 | % | 7/1/37 | 600 | 594 | ||||
| Fiserv Inc. | 6.125 | % | 11/20/12 | 2,875 | 3,135 | ||||
| Fiserv Inc. | 6.800 | % | 11/20/17 | 2,150 | 2,367 | ||||
| Harris Corp. | 5.000 | % | 10/1/15 | 1,275 | 1,321 | ||||
| Harris Corp. | 6.375 | % | 6/15/19 | 250 | 265 | ||||
| Hewlett-Packard Co. | 2.250 | % | 5/27/11 | 1,800 | 1,831 | ||||
| Hewlett-Packard Co. | 4.250 | % | 2/24/12 | 475 | 500 | ||||
| Hewlett-Packard Co. | 6.500 | % | 7/1/12 | 425 | 472 | ||||
| Hewlett-Packard Co. | 4.500 | % | 3/1/13 | 3,925 | 4,176 | ||||
| Hewlett-Packard Co. | 6.125 | % | 3/1/14 | 7,875 | 8,801 | ||||
| Hewlett-Packard Co. | 4.750 | % | 6/2/14 | 725 | 774 | ||||
| Hewlett-Packard Co. | 5.400 | % | 3/1/17 | 975 | 1,038 | ||||
| Hewlett-Packard Co. | 5.500 | % | 3/1/18 | 7,325 | 7,775 | ||||
| IBM International Group Capital LLC | 5.050 | % | 10/22/12 | 5,175 | 5,596 | ||||
| International Business Machines Corp. | 4.950 | % | 3/22/11 | 925 | 969 | ||||
| International Business Machines Corp. | 2.100 | % | 5/6/13 | 850 | 849 | ||||
| International Business Machines Corp. | 7.500 | % | 6/15/13 | 1,200 | 1,394 | ||||
| International Business Machines Corp. | 6.500 | % | 10/15/13 | 2,875 | 3,286 | ||||
| International Business Machines Corp. | 5.700 | % | 9/14/17 | 14,600 | 15,968 | ||||
| International Business Machines Corp. | 7.000 | % | 10/30/25 | 350 | 404 | ||||
| International Business Machines Corp. | 6.220 | % | 8/1/27 | 1,975 | 2,098 | ||||
| International Business Machines Corp. | 6.500 | % | 1/15/28 | 100 | 110 | ||||
| International Business Machines Corp. | 5.875 | % | 11/29/32 | 225 | 233 | ||||
| International Business Machines Corp. | 5.600 | % | 11/30/39 | 6,110 | 6,167 | ||||
| International Game Technology | 7.500 | % | 6/15/19 | 875 | 950 | ||||
| Intuit Inc. | 5.400 | % | 3/15/12 | 750 | 798 | ||||
| Intuit Inc. | 5.750 | % | 3/15/17 | 575 | 596 | ||||
| Lexmark International Inc. | 5.900 | % | 6/1/13 | 925 | 950 | ||||
56
| Total Bond Market II Index Fund | |||||||||
| Face | Market | ||||||||
| Maturity | Amount | Value• | |||||||
| Coupon | Date | ($ | 000 | ) | ($ | 000 | ) | ||
| Lexmark International Inc. | 6.650 | % | 6/1/18 | 1,700 | 1,674 | ||||
| Microsoft Corp. | 2.950 | % | 6/1/14 | 2,550 | 2,582 | ||||
| Microsoft Corp. | 4.200 | % | 6/1/19 | 375 | 378 | ||||
| Microsoft Corp. | 5.200 | % | 6/1/39 | 3,175 | 3,111 | ||||
| Motorola Inc. | 8.000 | % | 11/1/11 | 100 | 108 | ||||
| Motorola Inc. | 5.375 | % | 11/15/12 | 1,650 | 1,683 | ||||
| Motorola Inc. | 6.000 | % | 11/15/17 | 325 | 313 | ||||
| Motorola Inc. | 7.500 | % | 5/15/25 | 300 | 288 | ||||
| Motorola Inc. | 6.500 | % | 9/1/25 | 350 | 304 | ||||
| Motorola Inc. | 6.500 | % | 11/15/28 | 225 | 195 | ||||
| Motorola Inc. | 6.625 | % | 11/15/37 | 875 | 756 | ||||
| Nokia Oyj | 5.375 | % | 5/15/19 | 4,050 | 4,151 | ||||
| Nokia Oyj | 6.625 | % | 5/15/39 | 750 | 816 | ||||
| Oracle Corp. | 5.000 | % | 1/15/11 | 2,050 | 2,139 | ||||
| Oracle Corp. | 4.950 | % | 4/15/13 | 3,625 | 3,910 | ||||
| Oracle Corp. | 3.750 | % | 7/8/14 | 3,050 | 3,161 | ||||
| Oracle Corp. | 5.250 | % | 1/15/16 | 4,925 | 5,319 | ||||
| Oracle Corp. | 5.750 | % | 4/15/18 | 4,975 | 5,401 | ||||
| Oracle Corp. | 5.000 | % | 7/8/19 | 2,800 | 2,897 | ||||
| Oracle Corp. | 6.500 | % | 4/15/38 | 1,575 | 1,728 | ||||
| Oracle Corp. | 6.125 | % | 7/8/39 | 7,575 | 7,981 | ||||
| Pitney Bowes Inc. | 4.625 | % | 10/1/12 | 150 | 159 | ||||
| Pitney Bowes Inc. | 3.875 | % | 6/15/13 | 1,325 | 1,361 | ||||
| Pitney Bowes Inc. | 4.875 | % | 8/15/14 | 100 | 106 | ||||
| Pitney Bowes Inc. | 4.750 | % | 1/15/16 | 4,475 | 4,645 | ||||
| Pitney Bowes Inc. | 5.750 | % | 9/15/17 | 950 | 1,015 | ||||
| Pitney Bowes Inc. | 4.750 | % | 5/15/18 | 100 | 100 | ||||
| Pitney Bowes Inc. | 5.250 | % | 1/15/37 | 100 | 103 | ||||
| Science Applications International Corp. | 6.250 | % | 7/1/12 | 375 | 410 | ||||
| Science Applications International Corp. | 5.500 | % | 7/1/33 | 475 | 424 | ||||
| Xerox Capital Trust I | 8.000 | % | 2/1/27 | 1,575 | 1,555 | ||||
| Xerox Corp. | 7.125 | % | 6/15/10 | 1,400 | 1,438 | ||||
| Xerox Corp. | 6.875 | % | 8/15/11 | 700 | 748 | ||||
| Xerox Corp. | 5.500 | % | 5/15/12 | 1,125 | 1,191 | ||||
| Xerox Corp. | 7.625 | % | 6/15/13 | 1,125 | 1,153 | ||||
| Xerox Corp. | 8.250 | % | 5/15/14 | 4,550 | 5,250 | ||||
| Xerox Corp. | 4.250 | % | 2/15/15 | 700 | 697 | ||||
| Xerox Corp. | 6.400 | % | 3/15/16 | 1,525 | 1,614 | ||||
| Xerox Corp. | 6.750 | % | 2/1/17 | 1,100 | 1,184 | ||||
| Xerox Corp. | 6.350 | % | 5/15/18 | 2,950 | 3,098 | ||||
| Xerox Corp. | 5.625 | % | 12/15/19 | 525 | 525 | ||||
| Transportation (0.4%) | |||||||||
| 3 American Airlines Pass Through Trust 2009-1A | 10.375 | % | 7/2/19 | 825 | 924 | ||||
| Burlington Northern Santa Fe Corp. | 7.125 | % | 12/15/10 | 100 | 106 | ||||
| Burlington Northern Santa Fe Corp. | 6.750 | % | 7/15/11 | 1,200 | 1,295 | ||||
| Burlington Northern Santa Fe Corp. | 5.900 | % | 7/1/12 | 750 | 816 | ||||
| Burlington Northern Santa Fe Corp. | 5.650 | % | 5/1/17 | 2,025 | 2,151 | ||||
| Burlington Northern Santa Fe Corp. | 5.750 | % | 3/15/18 | 850 | 911 | ||||
| Burlington Northern Santa Fe Corp. | 7.000 | % | 12/15/25 | 1,700 | 1,866 | ||||
| Burlington Northern Santa Fe Corp. | 6.200 | % | 8/15/36 | 1,300 | 1,373 | ||||
| Canadian National Railway Co. | 6.375 | % | 10/15/11 | 425 | 462 | ||||
| Canadian National Railway Co. | 4.400 | % | 3/15/13 | 875 | 915 | ||||
| Canadian National Railway Co. | 4.950 | % | 1/15/14 | 125 | 133 | ||||
| Canadian National Railway Co. | 5.800 | % | 6/1/16 | 200 | 216 | ||||
| Canadian National Railway Co. | 5.850 | % | 11/15/17 | 350 | 380 | ||||
57
| Total Bond Market II Index Fund | |||||||||
| Face | Market | ||||||||
| Maturity | Amount | Value• | |||||||
| Coupon | Date | ($ | 000 | ) | ($ | 000 | ) | ||
| Canadian National Railway Co. | 6.900 | % | 7/15/28 | 100 | 114 | ||||
| Canadian National Railway Co. | 6.250 | % | 8/1/34 | 575 | 622 | ||||
| Canadian National Railway Co. | 6.200 | % | 6/1/36 | 975 | 1,057 | ||||
| Canadian Pacific Railway Co. | 7.125 | % | 10/15/31 | 200 | 211 | ||||
| Canadian Pacific Railway Co. | 5.950 | % | 5/15/37 | 325 | 309 | ||||
| Con-way Inc. | 6.700 | % | 5/1/34 | 2,475 | 1,939 | ||||
| 3 Continental Airlines Inc. | 6.648 | % | 9/15/17 | 2,505 | 2,392 | ||||
| 3 Continental Airlines Inc. | 6.900 | % | 1/2/18 | 936 | 922 | ||||
| 3 Continental Airlines Inc. | 6.545 | % | 2/2/19 | 80 | 79 | ||||
| Continental Airlines Inc. | 7.250 | % | 11/10/19 | 1,200 | 1,227 | ||||
| 3 Continental Airlines Inc. | 5.983 | % | 4/19/22 | 325 | 313 | ||||
| CSX Corp. | 6.750 | % | 3/15/11 | 1,200 | 1,273 | ||||
| CSX Corp. | 6.300 | % | 3/15/12 | 700 | 757 | ||||
| CSX Corp. | 5.500 | % | 8/1/13 | 1,900 | 2,027 | ||||
| CSX Corp. | 6.250 | % | 4/1/15 | 625 | 691 | ||||
| CSX Corp. | 5.600 | % | 5/1/17 | 450 | 467 | ||||
| CSX Corp. | 7.900 | % | 5/1/17 | 2,125 | 2,458 | ||||
| CSX Corp. | 6.250 | % | 3/15/18 | 3,375 | 3,659 | ||||
| CSX Corp. | 7.375 | % | 2/1/19 | 7,550 | 8,674 | ||||
| CSX Corp. | 7.950 | % | 5/1/27 | 100 | 117 | ||||
| CSX Corp. | 6.000 | % | 10/1/36 | 1,675 | 1,635 | ||||
| CSX Corp. | 6.150 | % | 5/1/37 | 900 | 914 | ||||
| CSX Corp. | 7.450 | % | 4/1/38 | 525 | 617 | ||||
| 3 Delta Air Lines Inc. | 7.750 | % | 12/17/19 | 2,500 | 2,575 | ||||
| 3 Delta Air Lines Inc. | 6.821 | % | 8/10/22 | 3,416 | 3,279 | ||||
| Norfolk Southern Corp. | 6.750 | % | 2/15/11 | 2,400 | 2,532 | ||||
| Norfolk Southern Corp. | 5.257 | % | 9/17/14 | 1,845 | 1,977 | ||||
| Norfolk Southern Corp. | 5.750 | % | 1/15/16 | 775 | 822 | ||||
| Norfolk Southern Corp. | 7.700 | % | 5/15/17 | 1,525 | 1,787 | ||||
| Norfolk Southern Corp. | 5.750 | % | 4/1/18 | 875 | 929 | ||||
| Norfolk Southern Corp. | 5.900 | % | 6/15/19 | 2,175 | 2,340 | ||||
| Norfolk Southern Corp. | 5.590 | % | 5/17/25 | 100 | 98 | ||||
| Norfolk Southern Corp. | 7.800 | % | 5/15/27 | 1,280 | 1,544 | ||||
| Norfolk Southern Corp. | 5.640 | % | 5/17/29 | 525 | 513 | ||||
| Norfolk Southern Corp. | 7.050 | % | 5/1/37 | 2,900 | 3,423 | ||||
| Norfolk Southern Corp. | 7.900 | % | 5/15/97 | 600 | 698 | ||||
| Norfolk Southern Railway Co. | 9.750 | % | 6/15/20 | 775 | 1,031 | ||||
| Ryder System Inc. | 5.950 | % | 5/2/11 | 428 | 442 | ||||
| Ryder System Inc. | 5.850 | % | 3/1/14 | 600 | 630 | ||||
| Ryder System Inc. | 7.200 | % | 9/1/15 | 1,250 | 1,353 | ||||
| Ryder System Inc. | 5.850 | % | 11/1/16 | 525 | 526 | ||||
| Southwest Airlines Co. | 6.500 | % | 3/1/12 | 2,300 | 2,403 | ||||
| Southwest Airlines Co. | 5.250 | % | 10/1/14 | 100 | 101 | ||||
| Southwest Airlines Co. | 5.750 | % | 12/15/16 | 1,125 | 1,091 | ||||
| Southwest Airlines Co. | 5.125 | % | 3/1/17 | 250 | 237 | ||||
| 3 Southwest Airlines Co. 2007-1 Pass Through Trust | 6.150 | % | 8/1/22 | 854 | 855 | ||||
| Union Pacific Corp. | 6.650 | % | 1/15/11 | 1,275 | 1,346 | ||||
| Union Pacific Corp. | 6.500 | % | 4/15/12 | 700 | 762 | ||||
| Union Pacific Corp. | 5.450 | % | 1/31/13 | 1,325 | 1,426 | ||||
| Union Pacific Corp. | 5.375 | % | 5/1/14 | 425 | 455 | ||||
| Union Pacific Corp. | 7.000 | % | 2/1/16 | 100 | 111 | ||||
| Union Pacific Corp. | 5.650 | % | 5/1/17 | 1,150 | 1,222 | ||||
| Union Pacific Corp. | 5.750 | % | 11/15/17 | 2,175 | 2,311 | ||||
| Union Pacific Corp. | 5.700 | % | 8/15/18 | 2,650 | 2,781 | ||||
| Union Pacific Corp. | 7.875 | % | 1/15/19 | 5,500 | 6,621 | ||||
| Union Pacific Corp. | 6.625 | % | 2/1/29 | 400 | 431 | ||||
58
| Total Bond Market II Index Fund | |||||||||
| Face | Market | ||||||||
| Maturity | Amount | Value• | |||||||
| Coupon | Date | ($ | 000 | ) | ($ | 000 | ) | ||
| 3 Union Pacific Railroad Co. | |||||||||
| 2007-3 Pass Through Trust | 6.176 | % | 1/2/31 | 450 | 473 | ||||
| United Parcel Service Inc. | 3.875 | % | 4/1/14 | 3,550 | 3,696 | ||||
| United Parcel Service Inc. | 5.500 | % | 1/15/18 | 2,200 | 2,364 | ||||
| United Parcel Service Inc. | 5.125 | % | 4/1/19 | 1,125 | 1,196 | ||||
| United Parcel Service Inc. | 6.200 | % | 1/15/38 | 1,450 | 1,609 | ||||
| 2,827,573 | |||||||||
| Utilities (2.2%) | |||||||||
| Electric (1.6%) | |||||||||
| AEP Texas Central Co. | 6.650 | % | 2/15/33 | 800 | 820 | ||||
| Alabama Power Co. | 4.850 | % | 12/15/12 | 525 | 562 | ||||
| Alabama Power Co. | 5.500 | % | 10/15/17 | 1,325 | 1,394 | ||||
| Alabama Power Co. | 6.125 | % | 5/15/38 | 1,000 | 1,069 | ||||
| Alabama Power Co. | 6.000 | % | 3/1/39 | 1,000 | 1,067 | ||||
| American Water Capital Corp. | 6.085 | % | 10/15/17 | 2,425 | 2,508 | ||||
| American Water Capital Corp. | 6.593 | % | 10/15/37 | 1,875 | 1,862 | ||||
| Appalachian Power Co. | 5.800 | % | 10/1/35 | 250 | 236 | ||||
| Appalachian Power Co. | 7.000 | % | 4/1/38 | 3,075 | 3,429 | ||||
| Arizona Public Service Co. | 6.375 | % | 10/15/11 | 200 | 213 | ||||
| Arizona Public Service Co. | 5.800 | % | 6/30/14 | 100 | 107 | ||||
| Arizona Public Service Co. | 4.650 | % | 5/15/15 | 400 | 403 | ||||
| Arizona Public Service Co. | 5.500 | % | 9/1/35 | 100 | 84 | ||||
| Baltimore Gas & Electric Co. | 5.900 | % | 10/1/16 | 1,225 | 1,305 | ||||
| Baltimore Gas & Electric Co. | 6.350 | % | 10/1/36 | 200 | 206 | ||||
| Carolina Power & Light Co. | 6.500 | % | 7/15/12 | 1,175 | 1,296 | ||||
| Carolina Power & Light Co. | 5.125 | % | 9/15/13 | 1,825 | 1,965 | ||||
| Carolina Power & Light Co. | 5.300 | % | 1/15/19 | 375 | 390 | ||||
| CenterPoint Energy Houston Electric LLC | 5.700 | % | 3/15/13 | 4,275 | 4,560 | ||||
| CenterPoint Energy Houston Electric LLC | 5.750 | % | 1/15/14 | 100 | 108 | ||||
| CenterPoint Energy Houston Electric LLC | 7.000 | % | 3/1/14 | 1,350 | 1,542 | ||||
| CenterPoint Energy Houston Electric LLC | 6.950 | % | 3/15/33 | 100 | 110 | ||||
| CenterPoint Energy Inc. | 6.500 | % | 5/1/18 | 150 | 153 | ||||
| Cleveland Electric Illuminating Co. | 7.880 | % | 11/1/17 | 425 | 501 | ||||
| Cleveland Electric Illuminating Co. | 5.500 | % | 8/15/24 | 1,125 | 1,115 | ||||
| Columbus Southern Power Co. | 5.850 | % | 10/1/35 | 1,750 | 1,653 | ||||
| Commonwealth Edison Co. | 6.150 | % | 3/15/12 | 650 | 703 | ||||
| Commonwealth Edison Co. | 5.950 | % | 8/15/16 | 2,975 | 3,236 | ||||
| Commonwealth Edison Co. | 6.150 | % | 9/15/17 | 9,200 | 9,998 | ||||
| Commonwealth Edison Co. | 5.800 | % | 3/15/18 | 1,075 | 1,148 | ||||
| Commonwealth Edison Co. | 5.875 | % | 2/1/33 | 100 | 100 | ||||
| Commonwealth Edison Co. | 5.900 | % | 3/15/36 | 875 | 875 | ||||
| Commonwealth Edison Co. | 6.450 | % | 1/15/38 | 850 | 909 | ||||
| Connecticut Light & Power Co. | 6.350 | % | 6/1/36 | 2,225 | 2,410 | ||||
| Consolidated Edison Co. of New York Inc. | 4.875 | % | 2/1/13 | 950 | 1,010 | ||||
| Consolidated Edison Co. of New York Inc. | 5.375 | % | 12/15/15 | 475 | 508 | ||||
| Consolidated Edison Co. of New York Inc. | 5.500 | % | 9/15/16 | 2,225 | 2,325 | ||||
| Consolidated Edison Co. of New York Inc. | 6.650 | % | 4/1/19 | 5,000 | 5,668 | ||||
| Consolidated Edison Co. of New York Inc. | 5.300 | % | 3/1/35 | 550 | 525 | ||||
| Consolidated Edison Co. of New York Inc. | 5.850 | % | 3/15/36 | 700 | 720 | ||||
| Consolidated Edison Co. of New York Inc. | 6.200 | % | 6/15/36 | 975 | 1,043 | ||||
| Consolidated Edison Co. of New York Inc. | 6.300 | % | 8/15/37 | 2,000 | 2,170 | ||||
| Consolidated Edison Co. of New York Inc. | 6.750 | % | 4/1/38 | 625 | 718 | ||||
| Consolidated Natural Gas Co. | 6.250 | % | 11/1/11 | 2,675 | 2,883 | ||||
| Consolidated Natural Gas Co. | 5.000 | % | 12/1/14 | 4,660 | 4,980 | ||||
| Constellation Energy Group Inc. | 7.000 | % | 4/1/12 | 350 | 380 | ||||
| Constellation Energy Group Inc. | 4.550 | % | 6/15/15 | 4,750 | 4,747 | ||||
| Constellation Energy Group Inc. | 7.600 | % | 4/1/32 | 700 | 756 | ||||
59
| Total Bond Market II Index Fund | |||||||||
| Face | Market | ||||||||
| Maturity | Amount | Value• | |||||||
| Coupon | Date | ($ | 000 | ) | ($ | 000 | ) | ||
| Consumers Energy Co. | 5.000 | % | 2/15/12 | 725 | 765 | ||||
| Consumers Energy Co. | 5.375 | % | 4/15/13 | 1,250 | 1,335 | ||||
| Consumers Energy Co. | 5.500 | % | 8/15/16 | 800 | 857 | ||||
| Consumers Energy Co. | 6.125 | % | 3/15/19 | 125 | 136 | ||||
| Consumers Energy Co. | 6.700 | % | 9/15/19 | 1,225 | 1,380 | ||||
| Consumers Energy Co. | 5.650 | % | 4/15/20 | 200 | 213 | ||||
| Detroit Edison Co. | 6.125 | % | 10/1/10 | 775 | 805 | ||||
| Detroit Edison Co. | 5.700 | % | 10/1/37 | 425 | 410 | ||||
| Dominion Resources Inc. | 4.750 | % | 12/15/10 | 875 | 906 | ||||
| Dominion Resources Inc. | 6.250 | % | 6/30/12 | 725 | 787 | ||||
| Dominion Resources Inc. | 5.700 | % | 9/17/12 | 300 | 324 | ||||
| Dominion Resources Inc. | 5.150 | % | 7/15/15 | 2,725 | 2,884 | ||||
| Dominion Resources Inc. | 6.000 | % | 11/30/17 | 1,750 | 1,894 | ||||
| Dominion Resources Inc. | 6.400 | % | 6/15/18 | 300 | 330 | ||||
| Dominion Resources Inc. | 6.300 | % | 3/15/33 | 350 | 357 | ||||
| Dominion Resources Inc. | 5.250 | % | 8/1/33 | 825 | 857 | ||||
| Dominion Resources Inc. | 5.950 | % | 6/15/35 | 2,375 | 2,379 | ||||
| 3 Dominion Resources Inc. | 7.500 | % | 6/30/66 | 950 | 916 | ||||
| 3 Dominion Resources Inc. | 6.300 | % | 9/30/66 | 800 | 708 | ||||
| DTE Energy Co. | 7.050 | % | 6/1/11 | 1,575 | 1,671 | ||||
| DTE Energy Co. | 6.375 | % | 4/15/33 | 100 | 95 | ||||
| Duke Energy Carolinas LLC | 6.250 | % | 1/15/12 | 2,575 | 2,790 | ||||
| Duke Energy Carolinas LLC | 5.750 | % | 11/15/13 | 100 | 110 | ||||
| Duke Energy Carolinas LLC | 6.000 | % | 12/1/28 | 425 | 428 | ||||
| Duke Energy Carolinas LLC | 6.450 | % | 10/15/32 | 825 | 895 | ||||
| Duke Energy Carolinas LLC | 6.100 | % | 6/1/37 | 3,050 | 3,246 | ||||
| Duke Energy Carolinas LLC | 6.000 | % | 1/15/38 | 200 | 212 | ||||
| Duke Energy Carolinas LLC | 6.050 | % | 4/15/38 | 775 | 820 | ||||
| Duke Energy Corp. | 3.950 | % | 9/15/14 | 4,350 | 4,431 | ||||
| Duke Energy Corp. | 5.050 | % | 9/15/19 | 3,775 | 3,778 | ||||
| Duke Energy Indiana Inc. | 5.000 | % | 9/15/13 | 275 | 288 | ||||
| Duke Energy Indiana Inc. | 6.050 | % | 6/15/16 | 100 | 107 | ||||
| Duke Energy Indiana Inc. | 6.120 | % | 10/15/35 | 325 | 329 | ||||
| Duke Energy Indiana Inc. | 6.350 | % | 8/15/38 | 2,675 | 2,925 | ||||
| Duke Energy Ohio Inc. | 5.700 | % | 9/15/12 | 1,175 | 1,279 | ||||
| Duke Energy Ohio Inc. | 2.100 | % | 6/15/13 | 675 | 667 | ||||
| El Paso Electric Co. | 6.000 | % | 5/15/35 | 600 | 537 | ||||
| Empresa Nacional de Electricidad SA | 8.350 | % | 8/1/13 | 625 | 725 | ||||
| Energy East Corp. | 6.750 | % | 6/15/12 | 1,700 | 1,854 | ||||
| Energy East Corp. | 6.750 | % | 7/15/36 | 1,375 | 1,534 | ||||
| Entergy Gulf States Louisiana LLC | 6.000 | % | 5/1/18 | 2,900 | 3,028 | ||||
| Entergy Louisiana LLC | 6.500 | % | 9/1/18 | 425 | 450 | ||||
| Entergy Louisiana LLC | 5.400 | % | 11/1/24 | 450 | 439 | ||||
| Exelon Corp. | 4.900 | % | 6/15/15 | 1,500 | 1,553 | ||||
| Exelon Corp. | 5.625 | % | 6/15/35 | 200 | 181 | ||||
| Exelon Generation Co. LLC | 6.250 | % | 10/1/39 | 950 | 965 | ||||
| FirstEnergy Corp. | 6.450 | % | 11/15/11 | 489 | 530 | ||||
| FirstEnergy Corp. | 7.375 | % | 11/15/31 | 5,360 | 5,879 | ||||
| FirstEnergy Solutions Corp. | 4.800 | % | 2/15/15 | 5,025 | 5,126 | ||||
| Florida Power & Light Co. | 4.850 | % | 2/1/13 | 625 | 666 | ||||
| Florida Power & Light Co. | 5.550 | % | 11/1/17 | 675 | 726 | ||||
| Florida Power & Light Co. | 5.950 | % | 10/1/33 | 225 | 234 | ||||
| Florida Power & Light Co. | 5.625 | % | 4/1/34 | 1,400 | 1,398 | ||||
| Florida Power & Light Co. | 4.950 | % | 6/1/35 | 250 | 227 | ||||
| Florida Power & Light Co. | 5.400 | % | 9/1/35 | 425 | 412 | ||||
| Florida Power & Light Co. | 6.200 | % | 6/1/36 | 1,050 | 1,128 | ||||
| Florida Power & Light Co. | 5.650 | % | 2/1/37 | 1,425 | 1,418 | ||||
60
| Total Bond Market II Index Fund | |||||||||
| Face | Market | ||||||||
| Maturity | Amount | Value• | |||||||
| Coupon | Date | ($ | 000 | ) | ($ | 000 | ) | ||
| Florida Power & Light Co. | 5.850 | % | 5/1/37 | 675 | 700 | ||||
| Florida Power & Light Co. | 5.950 | % | 2/1/38 | 2,200 | 2,281 | ||||
| Florida Power & Light Co. | 5.960 | % | 4/1/39 | 7,000 | 7,375 | ||||
| Florida Power Corp. | 4.800 | % | 3/1/13 | 3,075 | 3,263 | ||||
| Florida Power Corp. | 5.650 | % | 6/15/18 | 1,175 | 1,262 | ||||
| Florida Power Corp. | 6.350 | % | 9/15/37 | 1,375 | 1,481 | ||||
| Florida Power Corp. | 6.400 | % | 6/15/38 | 6,050 | 6,656 | ||||
| FPL Group Capital Inc. | 5.625 | % | 9/1/11 | 3,025 | 3,237 | ||||
| FPL Group Capital Inc. | 5.350 | % | 6/15/13 | 3,725 | 4,006 | ||||
| 3 FPL Group Capital Inc. | 6.350 | % | 10/1/66 | 675 | 624 | ||||
| 3 FPL Group Capital Inc. | 6.650 | % | 6/15/67 | 1,075 | 995 | ||||
| Georgia Power Co. | 5.700 | % | 6/1/17 | 525 | 566 | ||||
| Georgia Power Co. | 5.650 | % | 3/1/37 | 100 | 101 | ||||
| Georgia Power Co. | 5.950 | % | 2/1/39 | 6,025 | 6,294 | ||||
| Illinois Power Co. | 6.125 | % | 11/15/17 | 550 | 581 | ||||
| Illinois Power Co. | 6.250 | % | 4/1/18 | 1,275 | 1,360 | ||||
| Indiana Michigan Power Co. | 7.000 | % | 3/15/19 | 550 | 614 | ||||
| Indiana Michigan Power Co. | 6.050 | % | 3/15/37 | 2,850 | 2,799 | ||||
| 3 Integrys Energy Group Inc. | 6.110 | % | 12/1/66 | 1,600 | 1,328 | ||||
| Interstate Power & Light Co. | 6.250 | % | 7/15/39 | 925 | 959 | ||||
| Jersey Central Power & Light Co. | 5.625 | % | 5/1/16 | 1,025 | 1,067 | ||||
| Jersey Central Power & Light Co. | 5.650 | % | 6/1/17 | 775 | 797 | ||||
| Kansas City Power & Light Co. | 6.050 | % | 11/15/35 | 525 | 487 | ||||
| 3 Kansas Gas & Electric | 5.647 | % | 3/29/21 | 95 | 93 | ||||
| MidAmerican Energy Co. | 5.650 | % | 7/15/12 | 925 | 999 | ||||
| MidAmerican Energy Co. | 5.125 | % | 1/15/13 | 1,700 | 1,818 | ||||
| MidAmerican Energy Co. | 5.950 | % | 7/15/17 | 900 | 949 | ||||
| MidAmerican Energy Co. | 5.300 | % | 3/15/18 | 100 | 104 | ||||
| MidAmerican Energy Co. | 6.750 | % | 12/30/31 | 1,550 | 1,735 | ||||
| MidAmerican Energy Co. | 5.750 | % | 11/1/35 | 575 | 568 | ||||
| Midamerican Energy Holdings Co. | 5.875 | % | 10/1/12 | 2,075 | 2,263 | ||||
| Midamerican Energy Holdings Co. | 5.000 | % | 2/15/14 | 425 | 447 | ||||
| Midamerican Energy Holdings Co. | 5.750 | % | 4/1/18 | 1,275 | 1,349 | ||||
| Midamerican Energy Holdings Co. | 8.480 | % | 9/15/28 | 100 | 121 | ||||
| Midamerican Energy Holdings Co. | 6.125 | % | 4/1/36 | 10,675 | 10,870 | ||||
| Midamerican Energy Holdings Co. | 5.950 | % | 5/15/37 | 4,369 | 4,407 | ||||
| Midamerican Energy Holdings Co. | 6.500 | % | 9/15/37 | 200 | 212 | ||||
| National Rural Utilities Cooperative Finance Corp. | 7.250 | % | 3/1/12 | 5,900 | 6,500 | ||||
| National Rural Utilities Cooperative Finance Corp. | 2.625 | % | 9/16/12 | 100 | 101 | ||||
| National Rural Utilities Cooperative Finance Corp. | 5.500 | % | 7/1/13 | 1,725 | 1,876 | ||||
| National Rural Utilities Cooperative Finance Corp. | 4.750 | % | 3/1/14 | 3,375 | 3,591 | ||||
| National Rural Utilities Cooperative Finance Corp. | 5.450 | % | 4/10/17 | 175 | 183 | ||||
| National Rural Utilities Cooperative Finance Corp. | 5.450 | % | 2/1/18 | 1,525 | 1,583 | ||||
| National Rural Utilities Cooperative Finance Corp. | 10.375 | % | 11/1/18 | 3,500 | 4,671 | ||||
| National Rural Utilities Cooperative Finance Corp. | 8.000 | % | 3/1/32 | 975 | 1,155 | ||||
| Nevada Power Co. | 7.125 | % | 3/15/19 | 2,800 | 3,147 | ||||
| Nevada Power Co. | 6.750 | % | 7/1/37 | 325 | 347 | ||||
| 4 Niagara Mohawk Power Corp. | 4.881 | % | 8/15/19 | 2,600 | 2,589 | ||||
| Nisource Finance Corp. | 6.150 | % | 3/1/13 | 100 | 106 | ||||
| Nisource Finance Corp. | 5.400 | % | 7/15/14 | 425 | 441 | ||||
| Nisource Finance Corp. | 5.250 | % | 9/15/17 | 650 | 640 | ||||
| Nisource Finance Corp. | 6.400 | % | 3/15/18 | 200 | 209 | ||||
| Nisource Finance Corp. | 5.450 | % | 9/15/20 | 675 | 654 | ||||
| Nisource Finance Corp. | 6.125 | % | 3/1/22 | 1,300 | 1,327 | ||||
| Northern States Power Co. | 5.250 | % | 3/1/18 | 625 | 655 | ||||
| Northern States Power Co. | 5.250 | % | 7/15/35 | 100 | 95 | ||||
| Northern States Power Co. | 6.250 | % | 6/1/36 | 525 | 573 | ||||
61
| Total Bond Market II Index Fund | |||||||||
| Face | Market | ||||||||
| Maturity | Amount | Value• | |||||||
| Coupon | Date | ($ | 000 | ) | ($ | 000 | ) | ||
| Northern States Power Co. | 6.200 | % | 7/1/37 | 750 | 814 | ||||
| Northern States Power Co. | 5.350 | % | 11/1/39 | 1,325 | 1,280 | ||||
| NSTAR | 4.500 | % | 11/15/19 | 900 | 887 | ||||
| NSTAR Electric Co. | 4.875 | % | 4/15/14 | 625 | 666 | ||||
| NSTAR Electric Co. | 5.625 | % | 11/15/17 | 2,060 | 2,193 | ||||
| 4 Oglethorpe Power Corp. | 5.950 | % | 11/1/39 | 825 | 815 | ||||
| Ohio Edison Co. | 6.400 | % | 7/15/16 | 1,275 | 1,377 | ||||
| Ohio Power Co. | 5.750 | % | 9/1/13 | 2,025 | 2,154 | ||||
| Ohio Power Co. | 6.000 | % | 6/1/16 | 1,050 | 1,129 | ||||
| Ohio Power Co. | 5.375 | % | 10/1/21 | 3,000 | 3,036 | ||||
| Oncor Electric Delivery Co. LLC | 6.375 | % | 5/1/12 | 1,225 | 1,322 | ||||
| Oncor Electric Delivery Co. LLC | 5.950 | % | 9/1/13 | 4,800 | 5,163 | ||||
| Oncor Electric Delivery Co. LLC | 6.375 | % | 1/15/15 | 2,150 | 2,351 | ||||
| Oncor Electric Delivery Co. LLC | 7.000 | % | 9/1/22 | 100 | 111 | ||||
| Oncor Electric Delivery Co. LLC | 7.000 | % | 5/1/32 | 1,000 | 1,104 | ||||
| Oncor Electric Delivery Co. LLC | 7.250 | % | 1/15/33 | 1,150 | 1,323 | ||||
| Oncor Electric Delivery Co. LLC | 7.500 | % | 9/1/38 | 1,800 | 2,129 | ||||
| Pacific Gas & Electric Co. | 4.200 | % | 3/1/11 | 6,450 | 6,669 | ||||
| Pacific Gas & Electric Co. | 4.800 | % | 3/1/14 | 4,375 | 4,669 | ||||
| Pacific Gas & Electric Co. | 5.625 | % | 11/30/17 | 1,125 | 1,198 | ||||
| Pacific Gas & Electric Co. | 8.250 | % | 10/15/18 | 3,250 | 3,970 | ||||
| Pacific Gas & Electric Co. | 6.050 | % | 3/1/34 | 6,575 | 6,887 | ||||
| Pacific Gas & Electric Co. | 5.800 | % | 3/1/37 | 2,225 | 2,257 | ||||
| Pacific Gas & Electric Co. | 6.250 | % | 3/1/39 | 1,325 | 1,411 | ||||
| PacifiCorp | 6.900 | % | 11/15/11 | 1,950 | 2,145 | ||||
| PacifiCorp | 7.700 | % | 11/15/31 | 475 | 584 | ||||
| PacifiCorp | 5.250 | % | 6/15/35 | 125 | 117 | ||||
| PacifiCorp | 6.250 | % | 10/15/37 | 2,700 | 2,911 | ||||
| Peco Energy Co. | 5.350 | % | 3/1/18 | 575 | 609 | ||||
| Pennsylvania Electric Co. | 6.050 | % | 9/1/17 | 750 | 788 | ||||
| Pennsylvania Electric Co. | 5.200 | % | 4/1/20 | 2,250 | 2,226 | ||||
| Pennsylvania Electric Co. | 6.150 | % | 10/1/38 | 2,250 | 2,180 | ||||
| Pepco Holdings Inc. | 6.450 | % | 8/15/12 | 2,275 | 2,445 | ||||
| Pepco Holdings Inc. | 7.450 | % | 8/15/32 | 425 | 447 | ||||
| Potomac Electric Power Co. | 6.500 | % | 11/15/37 | 1,800 | 1,990 | ||||
| PPL Electric Utilities Corp. | 6.250 | % | 5/15/39 | 2,550 | 2,679 | ||||
| PPL Energy Supply LLC | 6.400 | % | 11/1/11 | 3,475 | 3,745 | ||||
| PPL Energy Supply LLC | 6.300 | % | 7/15/13 | 1,000 | 1,066 | ||||
| PPL Energy Supply LLC | 5.400 | % | 8/15/14 | 200 | 209 | ||||
| PPL Energy Supply LLC | 6.200 | % | 5/15/16 | 674 | 708 | ||||
| PPL Energy Supply LLC | 6.500 | % | 5/1/18 | 525 | 548 | ||||
| Progress Energy Inc. | 7.100 | % | 3/1/11 | 2,275 | 2,408 | ||||
| Progress Energy Inc. | 6.850 | % | 4/15/12 | 525 | 575 | ||||
| Progress Energy Inc. | 6.050 | % | 3/15/14 | 625 | 681 | ||||
| Progress Energy Inc. | 5.625 | % | 1/15/16 | 600 | 638 | ||||
| Progress Energy Inc. | 7.050 | % | 3/15/19 | 425 | 476 | ||||
| Progress Energy Inc. | 4.875 | % | 12/1/19 | 4,000 | 3,919 | ||||
| Progress Energy Inc. | 7.750 | % | 3/1/31 | 625 | 739 | ||||
| Progress Energy Inc. | 7.000 | % | 10/30/31 | 1,300 | 1,418 | ||||
| Progress Energy Inc. | 6.000 | % | 12/1/39 | 3,450 | 3,433 | ||||
| PSEG Power LLC | 7.750 | % | 4/15/11 | 675 | 722 | ||||
| PSEG Power LLC | 6.950 | % | 6/1/12 | 3,075 | 3,360 | ||||
| PSEG Power LLC | 5.000 | % | 4/1/14 | 2,425 | 2,541 | ||||
| PSEG Power LLC | 5.500 | % | 12/1/15 | 2,000 | 2,112 | ||||
| PSEG Power LLC | 8.625 | % | 4/15/31 | 975 | 1,261 | ||||
| Public Service Co. of Colorado | 7.875 | % | 10/1/12 | 3,150 | 3,615 | ||||
| Public Service Co. of Colorado | 5.500 | % | 4/1/14 | 175 | 190 | ||||
62
| Total Bond Market II Index Fund | |||||||||
| Face | Market | ||||||||
| Maturity | Amount | Value• | |||||||
| Coupon | Date | ($ | 000 | ) | ($ | 000 | ) | ||
| Public Service Co. of Colorado | 5.800 | % | 8/1/18 | 425 | 463 | ||||
| Public Service Co. of Colorado | 5.125 | % | 6/1/19 | 3,925 | 4,067 | ||||
| Public Service Co. of Colorado | 6.250 | % | 9/1/37 | 475 | 518 | ||||
| Public Service Co. of Colorado | 6.500 | % | 8/1/38 | 725 | 818 | ||||
| Public Service Co. of Oklahoma | 5.150 | % | 12/1/19 | 650 | 651 | ||||
| Public Service Co. of Oklahoma | 6.625 | % | 11/15/37 | 1,550 | 1,608 | ||||
| Public Service Electric & Gas Co. | 5.250 | % | 7/1/35 | 100 | 95 | ||||
| Public Service Electric & Gas Co. | 5.800 | % | 5/1/37 | 1,275 | 1,304 | ||||
| Puget Sound Energy Inc. | 5.483 | % | 6/1/35 | 250 | 238 | ||||
| Puget Sound Energy Inc. | 6.274 | % | 3/15/37 | 1,525 | 1,616 | ||||
| Puget Sound Energy Inc. | 5.757 | % | 10/1/39 | 1,400 | 1,384 | ||||
| San Diego Gas & Electric Co. | 5.300 | % | 11/15/15 | 650 | 713 | ||||
| San Diego Gas & Electric Co. | 5.350 | % | 5/15/35 | 250 | 242 | ||||
| San Diego Gas & Electric Co. | 6.125 | % | 9/15/37 | 125 | 134 | ||||
| San Diego Gas & Electric Co. | 6.000 | % | 6/1/39 | 225 | 240 | ||||
| SCANA Corp. | 6.875 | % | 5/15/11 | 2,400 | 2,552 | ||||
| Sierra Pacific Power Co. | 6.000 | % | 5/15/16 | 4,050 | 4,358 | ||||
| Sierra Pacific Power Co. | 6.750 | % | 7/1/37 | 1,450 | 1,538 | ||||
| South Carolina Electric & Gas Co. | 6.500 | % | 11/1/18 | 525 | 591 | ||||
| South Carolina Electric & Gas Co. | 6.625 | % | 2/1/32 | 625 | 698 | ||||
| South Carolina Electric & Gas Co. | 6.050 | % | 1/15/38 | 1,550 | 1,629 | ||||
| Southern California Edison Co. | 5.000 | % | 1/15/14 | 2,725 | 2,948 | ||||
| Southern California Edison Co. | 5.750 | % | 3/15/14 | 700 | 780 | ||||
| Southern California Edison Co. | 4.650 | % | 4/1/15 | 425 | 451 | ||||
| Southern California Edison Co. | 5.000 | % | 1/15/16 | 350 | 368 | ||||
| Southern California Edison Co. | 6.650 | % | 4/1/29 | 150 | 163 | ||||
| Southern California Edison Co. | 6.000 | % | 1/15/34 | 1,000 | 1,041 | ||||
| Southern California Edison Co. | 5.750 | % | 4/1/35 | 325 | 328 | ||||
| Southern California Edison Co. | 5.350 | % | 7/15/35 | 1,275 | 1,218 | ||||
| Southern California Edison Co. | 5.550 | % | 1/15/36 | 500 | 498 | ||||
| Southern California Edison Co. | 5.625 | % | 2/1/36 | 1,875 | 1,860 | ||||
| Southern California Edison Co. | 5.550 | % | 1/15/37 | 2,400 | 2,405 | ||||
| Southern Co. | 5.300 | % | 1/15/12 | 1,200 | 1,282 | ||||
| Southern Power Co. | 6.250 | % | 7/15/12 | 1,050 | 1,149 | ||||
| Southern Power Co. | 4.875 | % | 7/15/15 | 2,125 | 2,226 | ||||
| Southwestern Electric Power Co. | 5.550 | % | 1/15/17 | 100 | 101 | ||||
| Southwestern Electric Power Co. | 6.450 | % | 1/15/19 | 950 | 1,003 | ||||
| Tampa Electric Co. | 6.375 | % | 8/15/12 | 1,050 | 1,142 | ||||
| Tampa Electric Co. | 6.100 | % | 5/15/18 | 475 | 506 | ||||
| Tampa Electric Co. | 6.550 | % | 5/15/36 | 1,075 | 1,118 | ||||
| Toledo Edison Co. | 6.150 | % | 5/15/37 | 275 | 273 | ||||
| TransAlta Corp. | 4.750 | % | 1/15/15 | 400 | 404 | ||||
| TransAlta Corp. | 6.650 | % | 5/15/18 | 425 | 445 | ||||
| Union Electric Co. | 5.400 | % | 2/1/16 | 1,025 | 1,046 | ||||
| Union Electric Co. | 8.450 | % | 3/15/39 | 2,500 | 3,281 | ||||
| United Utilities PLC | 5.375 | % | 2/1/19 | 4,400 | 4,381 | ||||
| Virginia Electric and Power Co. | 5.100 | % | 11/30/12 | 375 | 406 | ||||
| Virginia Electric and Power Co. | 5.400 | % | 1/15/16 | 800 | 835 | ||||
| Virginia Electric and Power Co. | 6.000 | % | 1/15/36 | 1,575 | 1,653 | ||||
| Virginia Electric and Power Co. | 6.000 | % | 5/15/37 | 1,850 | 1,943 | ||||
| Virginia Electric and Power Co. | 6.350 | % | 11/30/37 | 3,450 | 3,795 | ||||
| Virginia Electric and Power Co. | 8.875 | % | 11/15/38 | 500 | 706 | ||||
| Wisconsin Electric Power Co. | 6.000 | % | 4/1/14 | 825 | 924 | ||||
| Wisconsin Electric Power Co. | 4.250 | % | 12/15/19 | 2,650 | 2,632 | ||||
| Wisconsin Electric Power Co. | 5.625 | % | 5/15/33 | 325 | 320 | ||||
| Wisconsin Electric Power Co. | 5.700 | % | 12/1/36 | 200 | 199 | ||||
| Wisconsin Energy Corp. | 6.500 | % | 4/1/11 | 2,550 | 2,697 | ||||
63
| Total Bond Market II Index Fund | |||||||||
| Face | Market | ||||||||
| Maturity | Amount | Value• | |||||||
| Coupon | Date | ($ | 000 | ) | ($ | 000 | ) | ||
| 3 Wisconsin Energy Corp. | 6.250 | % | 5/15/67 | 4,675 | 4,122 | ||||
| Wisconsin Power & Light Co. | 5.000 | % | 7/15/19 | 475 | 476 | ||||
| Wisconsin Power & Light Co. | 6.375 | % | 8/15/37 | 1,400 | 1,493 | ||||
| Xcel Energy Inc. | 5.613 | % | 4/1/17 | 275 | 286 | ||||
| Xcel Energy Inc. | 6.500 | % | 7/1/36 | 975 | 1,035 | ||||
| Natural Gas (0.6%) | |||||||||
| AGL Capital Corp. | 7.125 | % | 1/14/11 | 700 | 735 | ||||
| AGL Capital Corp. | 5.250 | % | 8/15/19 | 1,600 | 1,620 | ||||
| Atmos Energy Corp. | 4.950 | % | 10/15/14 | 2,125 | 2,220 | ||||
| Atmos Energy Corp. | 8.500 | % | 3/15/19 | 450 | 545 | ||||
| Boardwalk Pipelines LP | 5.500 | % | 2/1/17 | 925 | 923 | ||||
| British Transco Finance Inc. | 6.625 | % | 6/1/18 | 425 | 456 | ||||
| Buckeye Partners LP | 6.050 | % | 1/15/18 | 100 | 103 | ||||
| CenterPoint Energy Resources Corp. | 7.750 | % | 2/15/11 | 200 | 211 | ||||
| CenterPoint Energy Resources Corp. | 7.875 | % | 4/1/13 | 1,275 | 1,427 | ||||
| CenterPoint Energy Resources Corp. | 6.150 | % | 5/1/16 | 675 | 698 | ||||
| DCP Midstream LLC | 8.125 | % | 8/16/30 | 175 | 192 | ||||
| El Paso Natural Gas Co. | 5.950 | % | 4/15/17 | 8,800 | 9,036 | ||||
| Enbridge Energy Partners LP | 6.500 | % | 4/15/18 | 625 | 669 | ||||
| Enbridge Energy Partners LP | 9.875 | % | 3/1/19 | 1,975 | 2,502 | ||||
| Enbridge Energy Partners LP | 7.500 | % | 4/15/38 | 1,475 | 1,678 | ||||
| Enbridge Inc. | 5.600 | % | 4/1/17 | 100 | 105 | ||||
| Energy Transfer Partners LP | 5.650 | % | 8/1/12 | 1,875 | 2,015 | ||||
| Energy Transfer Partners LP | 8.500 | % | 4/15/14 | 5,000 | 5,794 | ||||
| Energy Transfer Partners LP | 5.950 | % | 2/1/15 | 4,900 | 5,211 | ||||
| Energy Transfer Partners LP | 6.125 | % | 2/15/17 | 500 | 519 | ||||
| Energy Transfer Partners LP | 9.000 | % | 4/15/19 | 2,425 | 2,910 | ||||
| Energy Transfer Partners LP | 6.625 | % | 10/15/36 | 750 | 749 | ||||
| Energy Transfer Partners LP | 7.500 | % | 7/1/38 | 100 | 110 | ||||
| 6 Enron Corp. | 7.625 | % | 9/10/04 | 400 | 1 | ||||
| 6 Enron Corp. | 6.625 | % | 11/15/05 | 300 | 1 | ||||
| 6 Enron Corp. | 7.125 | % | 5/15/07 | 1,800 | 4 | ||||
| 6 Enron Corp. | 6.875 | % | 10/15/07 | 1,800 | 4 | ||||
| 6 Enron Corp. | 6.750 | % | 8/1/09 | 1,300 | 3 | ||||
| Enterprise Products Operating LLC | 4.950 | % | 6/1/10 | 200 | 203 | ||||
| Enterprise Products Operating LLC | 5.650 | % | 4/1/13 | 950 | 1,009 | ||||
| Enterprise Products Operating LLC | 5.900 | % | 4/15/13 | 625 | 669 | ||||
| Enterprise Products Operating LLC | 9.750 | % | 1/31/14 | 7,325 | 8,743 | ||||
| Enterprise Products Operating LLC | 5.600 | % | 10/15/14 | 5,725 | 6,123 | ||||
| Enterprise Products Operating LLC | 6.300 | % | 9/15/17 | 2,850 | 3,077 | ||||
| Enterprise Products Operating LLC | 6.650 | % | 4/15/18 | 975 | 1,063 | ||||
| Enterprise Products Operating LLC | 6.500 | % | 1/31/19 | 750 | 812 | ||||
| Enterprise Products Operating LLC | 6.875 | % | 3/1/33 | 2,100 | 2,210 | ||||
| Enterprise Products Operating LLC | 7.550 | % | 4/15/38 | 425 | 480 | ||||
| EQT Corp. | 6.500 | % | 4/1/18 | 3,175 | 3,321 | ||||
| EQT Corp. | 8.125 | % | 6/1/19 | 2,275 | 2,656 | ||||
| 6 HNG Internorth | 9.625 | % | 3/15/06 | 1,000 | 2 | ||||
| KeySpan Corp. | 8.000 | % | 11/15/30 | 150 | 176 | ||||
| Kinder Morgan Energy Partners LP | 6.750 | % | 3/15/11 | 350 | 369 | ||||
| Kinder Morgan Energy Partners LP | 7.125 | % | 3/15/12 | 1,825 | 1,986 | ||||
| Kinder Morgan Energy Partners LP | 5.850 | % | 9/15/12 | 2,100 | 2,249 | ||||
| Kinder Morgan Energy Partners LP | 5.000 | % | 12/15/13 | 5,800 | 6,047 | ||||
| Kinder Morgan Energy Partners LP | 5.125 | % | 11/15/14 | 3,250 | 3,379 | ||||
| Kinder Morgan Energy Partners LP | 5.950 | % | 2/15/18 | 2,300 | 2,446 | ||||
| Kinder Morgan Energy Partners LP | 7.300 | % | 8/15/33 | 350 | 382 | ||||
| Kinder Morgan Energy Partners LP | 6.500 | % | 2/1/37 | 200 | 202 | ||||
64
| Total Bond Market II Index Fund | |||||||||
| Face | Market | ||||||||
| Maturity | Amount | Value• | |||||||
| Coupon | Date | ($ | 000 | ) | ($ | 000 | ) | ||
| Kinder Morgan Energy Partners LP | 6.500 | % | 9/1/39 | 3,275 | 3,303 | ||||
| Magellan Midstream Partners LP | 5.650 | % | 10/15/16 | 250 | 255 | ||||
| Magellan Midstream Partners LP | 6.550 | % | 7/15/19 | 1,750 | 1,900 | ||||
| National Grid PLC | 6.300 | % | 8/1/16 | 2,450 | 2,669 | ||||
| NuStar Logistics LP | 7.650 | % | 4/15/18 | 1,700 | 1,847 | ||||
| Oneok Inc. | 5.200 | % | 6/15/15 | 1,000 | 1,038 | ||||
| Oneok Inc. | 6.000 | % | 6/15/35 | 750 | 705 | ||||
| ONEOK Partners LP | 5.900 | % | 4/1/12 | 2,125 | 2,239 | ||||
| ONEOK Partners LP | 6.150 | % | 10/1/16 | 1,550 | 1,616 | ||||
| ONEOK Partners LP | 8.625 | % | 3/1/19 | 2,500 | 3,028 | ||||
| ONEOK Partners LP | 6.650 | % | 10/1/36 | 4,450 | 4,513 | ||||
| ONEOK Partners LP | 6.850 | % | 10/15/37 | 2,675 | 2,800 | ||||
| Panhandle Eastern Pipeline Co. LP | 6.200 | % | 11/1/17 | 2,900 | 3,049 | ||||
| Panhandle Eastern Pipeline Co. LP | 7.000 | % | 6/15/18 | 325 | 357 | ||||
| Plains All American Pipeline LP/ | |||||||||
| PAA Finance Corp. | 6.125 | % | 1/15/17 | 2,000 | 2,097 | ||||
| Plains All American Pipeline LP/ | |||||||||
| PAA Finance Corp. | 8.750 | % | 5/1/19 | 125 | 148 | ||||
| Plains All American Pipeline LP/ | |||||||||
| PAA Finance Corp. | 6.650 | % | 1/15/37 | 325 | 332 | ||||
| Sempra Energy | 6.000 | % | 2/1/13 | 200 | 217 | ||||
| Sempra Energy | 9.800 | % | 2/15/19 | 1,500 | 1,885 | ||||
| Southern California Gas Co. | 5.750 | % | 11/15/35 | 400 | 412 | ||||
| 4 Southern Natural Gas Co. | 5.900 | % | 4/1/17 | 2,925 | 2,979 | ||||
| Southern Union Co. | 7.600 | % | 2/1/24 | 200 | 216 | ||||
| Spectra Energy Capital LLC | 6.250 | % | 2/15/13 | 325 | 350 | ||||
| Spectra Energy Capital LLC | 5.500 | % | 3/1/14 | 1,250 | 1,284 | ||||
| Spectra Energy Capital LLC | 5.668 | % | 8/15/14 | 100 | 108 | ||||
| Spectra Energy Capital LLC | 6.200 | % | 4/15/18 | 325 | 347 | ||||
| Spectra Energy Capital LLC | 6.750 | % | 2/15/32 | 725 | 734 | ||||
| Tennessee Gas Pipeline Co. | 7.625 | % | 4/1/37 | 1,940 | 2,154 | ||||
| Texas Eastern Transmission LP | 7.000 | % | 7/15/32 | 100 | 112 | ||||
| Texas Gas Transmission LLC | 4.600 | % | 6/1/15 | 1,275 | 1,299 | ||||
| TransCanada PipeLines Ltd. | 4.000 | % | 6/15/13 | 1,800 | 1,842 | ||||
| TransCanada PipeLines Ltd. | 6.500 | % | 8/15/18 | 4,840 | 5,437 | ||||
| TransCanada PipeLines Ltd. | 7.125 | % | 1/15/19 | 3,000 | 3,514 | ||||
| TransCanada PipeLines Ltd. | 5.600 | % | 3/31/34 | 1,400 | 1,348 | ||||
| TransCanada PipeLines Ltd. | 5.850 | % | 3/15/36 | 2,675 | 2,662 | ||||
| TransCanada PipeLines Ltd. | 6.200 | % | 10/15/37 | 3,450 | 3,646 | ||||
| TransCanada PipeLines Ltd. | 7.625 | % | 1/15/39 | 375 | 459 | ||||
| 3 TransCanada PipeLines Ltd. | 6.350 | % | 5/15/67 | 4,100 | 3,785 | ||||
| Transcontinental Gas Pipe Line Co. LLC | 7.000 | % | 8/15/11 | 950 | 1,025 | ||||
| Williams Cos. Inc. | 7.125 | % | 9/1/11 | 2,075 | 2,206 | ||||
| Williams Cos. Inc. | 8.125 | % | 3/15/12 | 525 | 568 | ||||
| Williams Cos. Inc. | 7.625 | % | 7/15/19 | 3,325 | 3,691 | ||||
| Williams Cos. Inc. | 7.500 | % | 1/15/31 | 2,900 | 3,130 | ||||
| Williams Cos. Inc. | 7.750 | % | 6/15/31 | 850 | 932 | ||||
| Williams Cos. Inc. | 8.750 | % | 3/15/32 | 675 | 807 | ||||
| 607,891 | |||||||||
| Total Corporate Bonds (Cost $4,927,657) | 5,360,764 | ||||||||
| Sovereign Bonds (U.S. Dollar-Denominated) (3.7%) | |||||||||
| African Development Bank | 1.000 | % | 11/23/11 | 2,100 | 2,086 | ||||
| African Development Bank | 1.750 | % | 10/1/12 | 1,150 | 1,144 | ||||
| African Development Bank | 3.000 | % | 5/27/14 | 7,175 | 7,139 | ||||
| Asian Development Bank | 2.125 | % | 3/15/12 | 1,575 | 1,601 | ||||
65
| Total Bond Market II Index Fund | |||||||||
| Face | Market | ||||||||
| Maturity | Amount | Value• | |||||||
| Coupon | Date | ($ | 000 | ) | ($ | 000 | ) | ||
| Asian Development Bank | 4.500 | % | 9/4/12 | 325 | 346 | ||||
| Asian Development Bank | 3.625 | % | 9/5/13 | 7,400 | 7,791 | ||||
| Asian Development Bank | 2.750 | % | 5/21/14 | 8,875 | 8,862 | ||||
| Asian Development Bank | 5.500 | % | 6/27/16 | 1,850 | 2,047 | ||||
| Asian Development Bank | 5.250 | % | 6/12/17 | 100 | 109 | ||||
| Asian Development Bank | 5.593 | % | 7/16/18 | 1,700 | 1,838 | ||||
| Brazilian Government International Bond | 11.000 | % | 1/11/12 | 1,400 | 1,652 | ||||
| Brazilian Government International Bond | 10.250 | % | 6/17/13 | 800 | 987 | ||||
| Brazilian Government International Bond | 10.500 | % | 7/14/14 | 1,275 | 1,626 | ||||
| Brazilian Government International Bond | 7.875 | % | 3/7/15 | 2,375 | 2,771 | ||||
| Brazilian Government International Bond | 6.000 | % | 1/17/17 | 7,675 | 8,212 | ||||
| 3 Brazilian Government International Bond | 8.000 | % | 1/15/18 | 9,421 | 10,740 | ||||
| Brazilian Government International Bond | 5.875 | % | 1/15/19 | 14,250 | 15,141 | ||||
| Brazilian Government International Bond | 8.875 | % | 10/14/19 | 3,600 | 4,631 | ||||
| Brazilian Government International Bond | 8.875 | % | 4/15/24 | 1,525 | 1,975 | ||||
| Brazilian Government International Bond | 8.750 | % | 2/4/25 | 4,200 | 5,418 | ||||
| Brazilian Government International Bond | 10.125 | % | 5/15/27 | 4,200 | 6,164 | ||||
| Brazilian Government International Bond | 8.250 | % | 1/20/34 | 2,775 | 3,531 | ||||
| Brazilian Government International Bond | 7.125 | % | 1/20/37 | 11,425 | 13,079 | ||||
| Brazilian Government International Bond | 11.000 | % | 8/17/40 | 9,900 | 13,192 | ||||
| Brazilian Government International Bond | 5.625 | % | 1/7/41 | 3,525 | 3,305 | ||||
| Canada Mortgage & Housing Corp. | 4.800 | % | 10/1/10 | 325 | 332 | ||||
| Chile Government International Bond | 7.125 | % | 1/11/12 | 1,225 | 1,364 | ||||
| Chile Government International Bond | 5.500 | % | 1/15/13 | 1,000 | 1,106 | ||||
| China Development Bank Corp. | 4.750 | % | 10/8/14 | 2,625 | 2,690 | ||||
| China Development Bank Corp. | 5.000 | % | 10/15/15 | 525 | 566 | ||||
| China Government International Bond | 4.750 | % | 10/29/13 | 1,800 | 1,910 | ||||
| Corp. Andina de Fomento | 8.125 | % | 6/4/19 | 5,775 | 6,596 | ||||
| Corp. Andina de Fomento | 5.200 | % | 5/21/13 | 1,375 | 1,450 | ||||
| Corp. Andina de Fomento | 5.750 | % | 1/12/17 | 4,700 | 4,692 | ||||
| Development Bank of Japan | 4.250 | % | 6/9/15 | 625 | 647 | ||||
| Eksportfinans ASA | 3.000 | % | 11/17/14 | 1,675 | 1,649 | ||||
| Eksportfinans ASA | 5.500 | % | 5/25/16 | 2,700 | 2,905 | ||||
| Eksportfinans ASA | 5.500 | % | 6/26/17 | 4,175 | 4,427 | ||||
| European Bank for Reconstruction & Development | 1.250 | % | 6/10/11 | 300 | 300 | ||||
| European Investment Bank | 4.625 | % | 9/15/10 | 3,525 | 3,620 | ||||
| European Investment Bank | 3.250 | % | 2/15/11 | 12,125 | 12,367 | ||||
| European Investment Bank | 2.625 | % | 5/16/11 | 1,275 | 1,295 | ||||
| European Investment Bank | 5.250 | % | 6/15/11 | 5,625 | 5,931 | ||||
| European Investment Bank | 3.125 | % | 7/15/11 | 2,125 | 2,192 | ||||
| European Investment Bank | 3.250 | % | 10/14/11 | 1,150 | 1,187 | ||||
| European Investment Bank | 2.625 | % | 11/15/11 | 950 | 971 | ||||
| European Investment Bank | 2.000 | % | 2/10/12 | 24,100 | 24,367 | ||||
| European Investment Bank | 4.625 | % | 3/21/12 | 7,600 | 8,050 | ||||
| European Investment Bank | 1.750 | % | 9/14/12 | 8,000 | 7,970 | ||||
| European Investment Bank | 2.875 | % | 3/15/13 | 2,825 | 2,844 | ||||
| European Investment Bank | 3.250 | % | 5/15/13 | 6,900 | 7,031 | ||||
| European Investment Bank | 4.250 | % | 7/15/13 | 11,900 | 12,535 | ||||
| European Investment Bank | 2.375 | % | 3/14/14 | 7,400 | 7,396 | ||||
| European Investment Bank | 4.625 | % | 5/15/14 | 11,075 | 11,906 | ||||
| European Investment Bank | 3.125 | % | 6/4/14 | 20,425 | 20,712 | ||||
| European Investment Bank | 4.875 | % | 2/16/16 | 4,500 | 4,818 | ||||
| European Investment Bank | 5.125 | % | 9/13/16 | 700 | 766 | ||||
| European Investment Bank | 4.875 | % | 1/17/17 | 6,325 | 6,766 | ||||
| European Investment Bank | 5.125 | % | 5/30/17 | 9,150 | 9,909 | ||||
66
| Total Bond Market II Index Fund | |||||||||
| Face | Market | ||||||||
| Maturity | Amount | Value• | |||||||
| Coupon | Date | ($ | 000 | ) | ($ | 000 | ) | ||
| European Investment Bank | 4.875 | % | 2/15/36 | 100 | 95 | ||||
| Export Development Canada | 3.750 | % | 7/15/11 | 200 | 207 | ||||
| Export Development Canada | 2.625 | % | 11/15/11 | 1,475 | 1,512 | ||||
| Export Development Canada | 2.375 | % | 3/19/12 | 3,825 | 3,898 | ||||
| Export Development Canada | 1.750 | % | 9/24/12 | 7,575 | 7,550 | ||||
| Export Development Canada | 3.125 | % | 4/24/14 | 175 | 178 | ||||
| Export-Import Bank of Korea | 5.125 | % | 2/14/11 | 3,450 | 3,543 | ||||
| Export-Import Bank of Korea | 5.500 | % | 10/17/12 | 3,025 | 3,156 | ||||
| Export-Import Bank of Korea | 8.125 | % | 1/21/14 | 6,700 | 7,787 | ||||
| Export-Import Bank of Korea | 5.875 | % | 1/14/15 | 1,750 | 1,882 | ||||
| Export-Import Bank of Korea | 5.125 | % | 3/16/15 | 425 | 436 | ||||
| Financement-Quebec | 5.000 | % | 10/25/12 | 1,275 | 1,362 | ||||
| Hungary Government International Bond | 4.750 | % | 2/3/15 | 1,050 | 1,032 | ||||
| Hydro Quebec | 6.300 | % | 5/11/11 | 2,825 | 3,015 | ||||
| Hydro Quebec | 8.000 | % | 2/1/13 | 2,750 | 3,202 | ||||
| Hydro Quebec | 7.500 | % | 4/1/16 | 1,150 | 1,361 | ||||
| Hydro Quebec | 8.400 | % | 1/15/22 | 2,450 | 3,173 | ||||
| Hydro Quebec | 8.050 | % | 7/7/24 | 1,350 | 1,653 | ||||
| Hydro Quebec | 8.500 | % | 12/1/29 | 100 | 132 | ||||
| Inter-American Development Bank | 8.500 | % | 3/15/11 | 875 | 946 | ||||
| Inter-American Development Bank | 1.500 | % | 6/23/11 | 2,450 | 2,470 | ||||
| Inter-American Development Bank | 4.750 | % | 10/19/12 | 3,975 | 4,261 | ||||
| Inter-American Development Bank | 3.500 | % | 3/15/13 | 2,625 | 2,731 | ||||
| Inter-American Development Bank | 3.000 | % | 4/22/14 | 11,725 | 11,793 | ||||
| Inter-American Development Bank | 4.250 | % | 9/14/15 | 450 | 471 | ||||
| Inter-American Development Bank | 5.125 | % | 9/13/16 | 100 | 109 | ||||
| Inter-American Development Bank | 4.250 | % | 9/10/18 | 7,875 | 8,072 | ||||
| Inter-American Development Bank | 3.875 | % | 9/17/19 | 12,500 | 12,384 | ||||
| Inter-American Development Bank | 7.000 | % | 6/15/25 | 1,125 | 1,335 | ||||
| International Bank for | |||||||||
| Reconstruction & Development | 3.125 | % | 11/15/11 | 375 | 386 | ||||
| International Bank for | |||||||||
| Reconstruction & Development | 2.000 | % | 4/2/12 | 16,225 | 16,402 | ||||
| International Bank for | |||||||||
| Reconstruction & Development | 3.500 | % | 10/8/13 | 4,410 | 4,597 | ||||
| International Bank for | |||||||||
| Reconstruction & Development | 5.000 | % | 4/1/16 | 4,100 | 4,424 | ||||
| International Bank for | |||||||||
| Reconstruction & Development | 7.625 | % | 1/19/23 | 950 | 1,215 | ||||
| International Bank for | |||||||||
| Reconstruction & Development | 8.875 | % | 3/1/26 | 450 | 620 | ||||
| International Bank for | |||||||||
| Reconstruction & Development | 4.750 | % | 2/15/35 | 5,525 | 5,145 | ||||
| International Finance Corp. | 3.500 | % | 5/15/13 | 2,350 | 2,397 | ||||
| International Finance Corp. | 3.000 | % | 4/22/14 | 11,675 | 11,664 | ||||
| Israel Government International Bond | 4.625 | % | 6/15/13 | 750 | 795 | ||||
| Israel Government International Bond | 5.125 | % | 3/1/14 | 200 | 215 | ||||
| Israel Government International Bond | 5.500 | % | 11/9/16 | 2,800 | 3,006 | ||||
| Israel Government International Bond | 5.125 | % | 3/26/19 | 5,350 | 5,435 | ||||
| Italian Republic | 6.000 | % | 2/22/11 | 5,175 | 5,455 | ||||
| Italian Republic | 3.500 | % | 7/15/11 | 2,475 | 2,551 | ||||
| Italian Republic | 5.625 | % | 6/15/12 | 1,875 | 2,042 | ||||
| Italian Republic | 2.125 | % | 10/5/12 | 3,450 | 3,446 | ||||
| Italian Republic | 4.375 | % | 6/15/13 | 4,350 | 4,637 | ||||
| Italian Republic | 4.500 | % | 1/21/15 | 4,000 | 4,250 | ||||
67
| Total Bond Market II Index Fund | |||||||||
| Face | Market | ||||||||
| Maturity | Amount | Value• | |||||||
| Coupon | Date | ($ | 000 | ) | ($ | 000 | ) | ||
| Italian Republic | 4.750 | % | 1/25/16 | 8,075 | 8,387 | ||||
| Italian Republic | 5.250 | % | 9/20/16 | 13,275 | 14,141 | ||||
| Italian Republic | 6.875 | % | 9/27/23 | 4,600 | 5,193 | ||||
| Italian Republic | 5.375 | % | 6/15/33 | 5,650 | 5,532 | ||||
| Japan Bank for International Cooperation | 4.750 | % | 5/25/11 | 650 | 682 | ||||
| Japan Bank for International Cooperation | 2.125 | % | 11/5/12 | 8,000 | 7,969 | ||||
| Japan Bank for International Cooperation | 4.375 | % | 11/26/12 | 1,950 | 2,067 | ||||
| Japan Bank for International Cooperation | 4.250 | % | 6/18/13 | 4,800 | 5,073 | ||||
| Japan Finance Organization for Municipalities | 5.875 | % | 3/14/11 | 1,025 | 1,082 | ||||
| Japan Finance Organization for Municipalities | 4.625 | % | 4/21/15 | 2,150 | 2,253 | ||||
| Japan Finance Organization for Municipalities | 5.000 | % | 5/16/17 | 1,100 | 1,156 | ||||
| Korea Development Bank | 5.300 | % | 1/17/13 | 1,200 | 1,253 | ||||
| Korea Development Bank | 5.750 | % | 9/10/13 | 3,300 | 3,463 | ||||
| Korea Development Bank | 8.000 | % | 1/23/14 | 3,150 | 3,587 | ||||
| Korea Electric Power Corp. | 7.750 | % | 4/1/13 | 2,200 | 2,428 | ||||
| Kreditanstalt fuer Wiederaufbau | 3.125 | % | 11/15/10 | 1,425 | 1,456 | ||||
| Kreditanstalt fuer Wiederaufbau | 4.625 | % | 1/20/11 | 275 | 285 | ||||
| Kreditanstalt fuer Wiederaufbau | 3.250 | % | 2/15/11 | 12,600 | 12,916 | ||||
| Kreditanstalt fuer Wiederaufbau | 1.875 | % | 3/15/11 | 900 | 910 | ||||
| Kreditanstalt fuer Wiederaufbau | 3.750 | % | 6/27/11 | 7,550 | 7,832 | ||||
| Kreditanstalt fuer Wiederaufbau | 3.250 | % | 10/14/11 | 4,775 | 4,936 | ||||
| Kreditanstalt fuer Wiederaufbau | 2.000 | % | 1/17/12 | 5,125 | 5,190 | ||||
| Kreditanstalt fuer Wiederaufbau | 2.250 | % | 4/16/12 | 9,925 | 10,020 | ||||
| Kreditanstalt fuer Wiederaufbau | 4.750 | % | 5/15/12 | 4,425 | 4,707 | ||||
| Kreditanstalt fuer Wiederaufbau | 3.250 | % | 3/15/13 | 19,600 | 19,865 | ||||
| Kreditanstalt fuer Wiederaufbau | 3.500 | % | 5/16/13 | 4,000 | 4,082 | ||||
| Kreditanstalt fuer Wiederaufbau | 4.000 | % | 10/15/13 | 7,500 | 7,805 | ||||
| Kreditanstalt fuer Wiederaufbau | 3.500 | % | 3/10/14 | 300 | 306 | ||||
| Kreditanstalt fuer Wiederaufbau | 4.125 | % | 10/15/14 | 575 | 609 | ||||
| Kreditanstalt fuer Wiederaufbau | 2.750 | % | 10/21/14 | 10,250 | 10,151 | ||||
| Kreditanstalt fuer Wiederaufbau | 5.125 | % | 3/14/16 | 14,000 | 15,268 | ||||
| Kreditanstalt fuer Wiederaufbau | 4.375 | % | 3/15/18 | 4,600 | 4,675 | ||||
| Kreditanstalt fuer Wiederaufbau | 4.500 | % | 7/16/18 | 6,425 | 6,591 | ||||
| Kreditanstalt fuer Wiederaufbau | 4.875 | % | 6/17/19 | 19,300 | 20,420 | ||||
| Kreditanstalt fuer Wiederaufbau | 0.000 | % | 6/29/37 | 5,450 | 1,300 | ||||
| Landeskreditbank Baden- | |||||||||
| Wuerttemberg Foerderbank | 4.875 | % | 1/13/12 | 2,625 | 2,736 | ||||
| Landwirtschaftliche Rentenbank | 5.250 | % | 7/2/12 | 2,675 | 2,873 | ||||
| Landwirtschaftliche Rentenbank | 1.875 | % | 9/24/12 | 9,150 | 9,125 | ||||
| Landwirtschaftliche Rentenbank | 3.250 | % | 3/15/13 | 7,000 | 7,120 | ||||
| Landwirtschaftliche Rentenbank | 4.125 | % | 7/15/13 | 2,500 | 2,616 | ||||
| Landwirtschaftliche Rentenbank | 4.875 | % | 11/16/15 | 4,125 | 4,417 | ||||
| Landwirtschaftliche Rentenbank | 5.125 | % | 2/1/17 | 2,000 | 2,126 | ||||
| Malaysia Government International Bond | 7.500 | % | 7/15/11 | 3,575 | 3,876 | ||||
| Mexico Government International Bond | 8.375 | % | 1/14/11 | 3,700 | 3,978 | ||||
| Mexico Government International Bond | 7.500 | % | 1/14/12 | 3,325 | 3,682 | ||||
| Mexico Government International Bond | 6.375 | % | 1/16/13 | 4,250 | 4,670 | ||||
| Mexico Government International Bond | 5.875 | % | 1/15/14 | 1,875 | 2,044 | ||||
| Mexico Government International Bond | 6.625 | % | 3/3/15 | 2,550 | 2,835 | ||||
| Mexico Government International Bond | 11.375 | % | 9/15/16 | 1,325 | 1,830 | ||||
| Mexico Government International Bond | 5.625 | % | 1/15/17 | 16,375 | 17,173 | ||||
| Mexico Government International Bond | 8.125 | % | 12/30/19 | 200 | 244 | ||||
| Mexico Government International Bond | 8.300 | % | 8/15/31 | 3,125 | 3,866 | ||||
| Mexico Government International Bond | 6.750 | % | 9/27/34 | 11,800 | 12,506 | ||||
68
| Total Bond Market II Index Fund | |||||||||
| Face | Market | ||||||||
| Maturity | Amount | Value• | |||||||
| Coupon | Date | ($ | 000 | ) | ($ | 000 | ) | ||
| Nordic Investment Bank | 3.875 | % | 6/15/10 | 200 | 201 | ||||
| Nordic Investment Bank | 4.875 | % | 3/15/11 | 100 | 105 | ||||
| Nordic Investment Bank | 2.625 | % | 10/6/14 | 4,000 | 3,954 | ||||
| Nordic Investment Bank | 5.000 | % | 2/1/17 | 1,150 | 1,230 | ||||
| Oesterreichische Kontrollbank AG | 2.875 | % | 3/15/11 | 6,425 | 6,505 | ||||
| Oesterreichische Kontrollbank AG | 3.125 | % | 10/14/11 | 4,725 | 4,833 | ||||
| Oesterreichische Kontrollbank AG | 4.750 | % | 11/8/11 | 725 | 766 | ||||
| Oesterreichische Kontrollbank AG | 1.875 | % | 3/21/12 | 2,275 | 2,275 | ||||
| Oesterreichische Kontrollbank AG | 4.750 | % | 10/16/12 | 2,025 | 2,182 | ||||
| Oesterreichische Kontrollbank AG | 5.000 | % | 4/25/17 | 4,025 | 4,194 | ||||
| Ontario Electricity Financial Corp. | 7.450 | % | 3/31/13 | 1,450 | 1,646 | ||||
| Pemex Project Funding Master Trust | 9.125 | % | 10/13/10 | 175 | 184 | ||||
| Pemex Project Funding Master Trust | 7.375 | % | 12/15/14 | 2,500 | 2,776 | ||||
| Pemex Project Funding Master Trust | 5.750 | % | 3/1/18 | 8,925 | 8,989 | ||||
| Pemex Project Funding Master Trust | 6.625 | % | 6/15/35 | 4,600 | 4,365 | ||||
| Pemex Project Funding Master Trust | 6.625 | % | 6/15/38 | 2,025 | 1,883 | ||||
| Peruvian Government International Bond | 9.125 | % | 2/21/12 | 200 | 231 | ||||
| Peruvian Government International Bond | 9.875 | % | 2/6/15 | 2,150 | 2,714 | ||||
| Peruvian Government International Bond | 8.375 | % | 5/3/16 | 1,525 | 1,847 | ||||
| Peruvian Government International Bond | 7.125 | % | 3/30/19 | 7,350 | 8,453 | ||||
| Peruvian Government International Bond | 7.350 | % | 7/21/25 | 1,525 | 1,746 | ||||
| 3 Peruvian Government International Bond | 6.550 | % | 3/14/37 | 5,200 | 5,408 | ||||
| Petrobras International Finance Co. | 6.125 | % | 10/6/16 | 4,850 | 5,206 | ||||
| Petrobras International Finance Co. | 5.875 | % | 3/1/18 | 4,075 | 4,125 | ||||
| Petrobras International Finance Co. | 8.375 | % | 12/10/18 | 3,700 | 4,380 | ||||
| Petrobras International Finance Co. | 7.875 | % | 3/15/19 | 7,575 | 8,743 | ||||
| Petrobras International Finance Co. | 5.750 | % | 1/20/20 | 2,850 | 2,882 | ||||
| Petrobras International Finance Co. | 6.875 | % | 1/20/40 | 1,975 | 2,010 | ||||
| 4 Petroleos Mexicanos | 4.875 | % | 3/15/15 | 4,450 | 4,411 | ||||
| Petroleos Mexicanos | 8.000 | % | 5/3/19 | 1,675 | 1,934 | ||||
| Poland Government International Bond | 6.250 | % | 7/3/12 | 2,425 | 2,622 | ||||
| Poland Government International Bond | 5.250 | % | 1/15/14 | 800 | 856 | ||||
| Poland Government International Bond | 5.000 | % | 10/19/15 | 750 | 788 | ||||
| Poland Government International Bond | 6.375 | % | 7/15/19 | 15,275 | 16,612 | ||||
| Province of Manitoba Canada | 4.900 | % | 12/6/16 | 5,475 | 5,741 | ||||
| Province of Nova Scotia Canada | 5.750 | % | 2/27/12 | 550 | 588 | ||||
| Province of Ontario Canada | 2.750 | % | 2/22/11 | 3,500 | 3,562 | ||||
| Province of Ontario Canada | 3.375 | % | 5/20/11 | 5,575 | 5,740 | ||||
| Province of Ontario Canada | 5.000 | % | 10/18/11 | 4,625 | 4,916 | ||||
| Province of Ontario Canada | 1.875 | % | 11/19/12 | 8,450 | 8,396 | ||||
| Province of Ontario Canada | 4.100 | % | 6/16/14 | 13,250 | 13,805 | ||||
| Province of Ontario Canada | 4.750 | % | 1/19/16 | 1,025 | 1,073 | ||||
| Province of Ontario Canada | 5.450 | % | 4/27/16 | 5,675 | 6,171 | ||||
| Province of Ontario Canada | 4.000 | % | 10/7/19 | 7,750 | 7,395 | ||||
| Province of Quebec Canada | 4.875 | % | 5/5/14 | 275 | 292 | ||||
| Province of Quebec Canada | 4.600 | % | 5/26/15 | 2,250 | 2,349 | ||||
| Province of Quebec Canada | 5.125 | % | 11/14/16 | 7,275 | 7,831 | ||||
| Province of Quebec Canada | 4.625 | % | 5/14/18 | 3,975 | 4,027 | ||||
| Province of Quebec Canada | 7.125 | % | 2/9/24 | 325 | 380 | ||||
| Province of Quebec Canada | 7.500 | % | 9/15/29 | 2,575 | 3,227 | ||||
| Province of Saskatchewan Canada | 7.375 | % | 7/15/13 | 425 | 484 | ||||
| Region of Lombardy Italy | 5.804 | % | 10/25/32 | 1,050 | 1,026 | ||||
| Republic of Korea | 4.250 | % | 6/1/13 | 5,700 | 5,867 | ||||
69
| Total Bond Market II Index Fund | |||||||||
| Face | Market | ||||||||
| Maturity | Amount | Value• | |||||||
| Coupon | Date | ($ | 000 | ) | ($ | 000 | ) | ||
| Republic of Korea | 5.750 | % | 4/16/14 | 3,175 | 3,452 | ||||
| Republic of Korea | 4.875 | % | 9/22/14 | 2,400 | 2,538 | ||||
| Republic of Korea | 7.125 | % | 4/16/19 | 3,175 | 3,649 | ||||
| Republic of Korea | 5.625 | % | 11/3/25 | 575 | 583 | ||||
| South Africa Government International Bond | 7.375 | % | 4/25/12 | 2,650 | 2,912 | ||||
| South Africa Government International Bond | 6.875 | % | 5/27/19 | 7,375 | 8,278 | ||||
| South Africa Government International Bond | 5.875 | % | 5/30/22 | 1,075 | 1,102 | ||||
| Svensk Exportkredit AB | 4.000 | % | 6/15/10 | 875 | 889 | ||||
| Svensk Exportkredit AB | 3.250 | % | 9/16/14 | 5,050 | 5,049 | ||||
| Svensk Exportkredit AB | 5.125 | % | 3/1/17 | 550 | 582 | ||||
| United Mexican States | 5.875 | % | 2/17/14 | 6,150 | 6,688 | ||||
| United Mexican States | 5.950 | % | 3/19/19 | 5,975 | 6,319 | ||||
| United Mexican States | 6.050 | % | 1/11/40 | 1,375 | 1,322 | ||||
| Total Sovereign Bonds (Cost $995,496) | 1,015,678 | ||||||||
| Taxable Municipal Bonds (0.4%) | |||||||||
| American Muni. Power Ohio Inc. | 6.053 | % | 2/15/43 | 400 | 378 | ||||
| Bay Area Toll Auth. CA Toll Bridge Rev. | 6.263 | % | 4/1/49 | 2,325 | 2,230 | ||||
| Board of Trustees of The Leland Stanford | |||||||||
| Junior University | 3.625 | % | 5/1/14 | 2,250 | 2,315 | ||||
| Board of Trustees of The Leland Stanford | |||||||||
| Junior University | 4.250 | % | 5/1/16 | 750 | 767 | ||||
| California GO | 5.250 | % | 4/1/14 | 1,175 | 1,190 | ||||
| California GO | 6.200 | % | 10/1/19 | 3,925 | 3,821 | ||||
| California GO | 7.500 | % | 4/1/34 | 9,225 | 9,022 | ||||
| California GO | 5.650 | % | 4/1/39 | 1,225 | 1,267 | ||||
| California GO | 7.300 | % | 10/1/39 | 1,200 | 1,134 | ||||
| California GO | 7.350 | % | 11/1/39 | 8,200 | 7,986 | ||||
| Central Puget Sound WA Regional Transit | |||||||||
| Auth. Sales & Use Tax Rev. | 5.491 | % | 11/1/39 | 550 | 533 | ||||
| Chicago IL Board of Educ. GO | 6.138 | % | 12/1/39 | 400 | 403 | ||||
| Chicago IL Metro. Water Reclamation Dist. GO | 5.720 | % | 12/1/38 | 1,000 | 1,003 | ||||
| Chicago IL Transit Auth. Rev. | 6.899 | % | 12/1/40 | 2,625 | 2,741 | ||||
| Clark County NV Airport Improvement Rev. | 6.881 | % | 7/1/42 | 550 | 540 | ||||
| Commonwealth Financing Auth. Pennsylvania Rev. | 6.218 | % | 6/1/39 | 2,350 | 2,343 | ||||
| Connecticut GO | 5.850 | % | 3/15/32 | 2,675 | 2,707 | ||||
| Dallas County Hosp. Dist. GO | 5.621 | % | 8/15/44 | 750 | 736 | ||||
| Dallas TX Area Rapid Transit Rev. | 5.999 | % | 12/1/44 | 1,500 | 1,540 | ||||
| Dartmouth College | 4.750 | % | 6/1/19 | 275 | 278 | ||||
| Denver CO City & County School Dist. | 5.664 | % | 12/1/33 | 525 | 514 | ||||
| District of Columbia Income Tax Rev. | 5.591 | % | 12/1/34 | 450 | 438 | ||||
| Georgia GO | 4.503 | % | 11/1/25 | 2,300 | 2,207 | ||||
| Howard Hughes Medical Institute | 3.450 | % | 9/1/14 | 1,450 | 1,470 | ||||
| Illinois GO | 4.950 | % | 6/1/23 | 5,125 | 4,795 | ||||
| Illinois GO | 5.100 | % | 6/1/33 | 13,500 | 11,284 | ||||
| Illinois State Tollway Highway Auth. | |||||||||
| Toll Highway Rev. | 5.851 | % | 12/1/34 | 625 | 608 | ||||
| Johns Hopkins University | 5.250 | % | 7/1/19 | 2,275 | 2,351 | ||||
| Kansas Dev. Finance Auth. Rev. | |||||||||
| (Public Employee Retirement System) | 5.501 | % | 5/1/34 | 1,525 | 1,452 | ||||
| Las Vegas Valley Water Dist. Nevada GO | 7.013 | % | 6/1/39 | 650 | 686 | ||||
| Los Angeles CA Dept. of Water & Power Rev. | 6.008 | % | 7/1/39 | 2,400 | 2,351 | ||||
| Los Angeles CA USD GO | 5.750 | % | 7/1/34 | 1,800 | 1,658 | ||||
| Maryland Transp. Auth. Rev. | 5.888 | % | 7/1/43 | 700 | 704 | ||||
70
| Total Bond Market II Index Fund | |||||||||
| Face | Market | ||||||||
| Maturity | Amount | Value• | |||||||
| Coupon | Date | ($ | 000 | ) | ($ | 000 | ) | ||
| Massachusetts GO | 5.456 | % | 12/1/39 | 2,000 | 1,927 | ||||
| Massachusetts School Building Auth. | |||||||||
| Dedicated Sales Tax Rev. | 5.715 | % | 8/15/39 | 950 | 940 | ||||
| Metro. New York Transp. Auth. Rev. | 5.871 | % | 11/15/39 | 800 | 760 | ||||
| Metro. Washington DC Airports Auth. Rev. | 7.462 | % | 10/1/46 | 525 | 533 | ||||
| Missouri Highways & Transp. | |||||||||
| Comm. State Road Rev. | 5.445 | % | 5/1/33 | 600 | 574 | ||||
| New Jersey Econ. Dev. Auth. | 7.425 | % | 2/15/29 | 3,175 | 3,419 | ||||
| New Jersey Turnpike Auth. Rev. | 4.252 | % | 1/1/16 | 900 | 908 | ||||
| New Jersey Turnpike Auth. Rev. | 7.414 | % | 1/1/40 | 3,850 | 4,340 | ||||
| New York City NY GO | 5.985 | % | 12/1/36 | 600 | 589 | ||||
| New York City NY Muni. Water Finance Auth. | |||||||||
| Water & Sewer System Rev. | 5.750 | % | 6/15/41 | 500 | 487 | ||||
| New York City NY Transitional Finance Auth. Rev. | 5.767 | % | 8/1/36 | 750 | 727 | ||||
| New York Metro. Transp. Auth. Rev. | 7.336 | % | 11/15/39 | 625 | 698 | ||||
| New York State Urban Dev. Corp. Rev. | 5.770 | % | 3/15/39 | 2,175 | 2,154 | ||||
| North Texas Tollway Auth. Rev. | 6.718 | % | 1/1/49 | 1,250 | 1,315 | ||||
| Oregon (Taxable Pension) GO | 5.762 | % | 6/1/23 | 650 | 660 | ||||
| Oregon (Taxable Pension) GO | 5.892 | % | 6/1/27 | 975 | 979 | ||||
| Oregon GO | 4.759 | % | 6/30/28 | 700 | 578 | ||||
| Oregon GO | 5.528 | % | 6/30/28 | 375 | 361 | ||||
| Port Auth. of New York & New Jersey Rev. | 6.040 | % | 12/1/29 | 850 | 845 | ||||
| Princeton University | 5.700 | % | 3/1/39 | 1,500 | 1,546 | ||||
| San Antonio TX Electric & Gas Rev. | 5.985 | % | 2/1/39 | 1,500 | 1,527 | ||||
| Tobacco Settlement Finance Auth. Rev. | 7.467 | % | 6/1/47 | 1,415 | 1,117 | ||||
| Univ. of California Regents | 6.583 | % | 5/15/49 | 975 | 974 | ||||
| Univ. of Texas Permanent Univ. Fund Rev. | 5.262 | % | 7/1/39 | 650 | 624 | ||||
| Univ. of Texas Permanent Univ. Fund Rev. | 6.276 | % | 8/15/41 | 525 | 530 | ||||
| Utah GO | 4.554 | % | 7/1/24 | 1,000 | 979 | ||||
| Washington GO | 5.481 | % | 8/1/39 | 270 | 261 | ||||
| Wisconsin GO | 4.800 | % | 5/1/13 | 775 | 835 | ||||
| Wisconsin GO | 5.700 | % | 5/1/26 | 900 | 873 | ||||
| Total Taxable Municipal Bonds (Cost $105,031) | 105,512 | ||||||||
| Shares | |||||||||
| Temporary Cash Investment (4.9%) | |||||||||
| Money Market Fund (4.9%) | |||||||||
| 7 Vanguard Market Liquidity Fund | |||||||||
| (Cost $1,334,381) | 0.187 | % | 1,334,381,082 | 1,334,381 | |||||
| Total Investments (104.3%) (Cost $28,119,525) | 28,682,362 | ||||||||
| Other Assets and Liabilities (–4.3%) | |||||||||
| Other Assets | 888,889 | ||||||||
| Liabilities | (2,063,434 | ) | |||||||
| (1,174,545 | ) | ||||||||
| Net Assets (100%) | 27,507,817 | ||||||||
71
| Total Bond Market II Index Fund | |||
| At December 31, 2009, net assets consisted of: | |||
| Amount | |||
| ($ | 000 | ) | |
| Paid-in Capital | 26,950,968 | ||
| Undistributed Net Investment Income | — | ||
| Accumulated Net Realized Losses | (5,988 | ) | |
| Unrealized Appreciation (Depreciation) | 562,837 | ||
| Net Assets | 27,507,817 | ||
| Investor Shares—Net Assets | |||
| Applicable to 1,992,071,074 outstanding $.001 par value shares of | |||
| beneficial interest (unlimited authorization) | 20,431,798 | ||
| Net Asset Value Per Share—Investor Shares | $ | 10.26 | |
| Institutional Shares—Net Assets | |||
| Applicable to 689,904,313 outstanding $.001 par value shares of | |||
| beneficial interest (unlimited authorization) | 7,076,019 | ||
| Net Asset Value Per Share—Institutional Shares | $ | 10.26 | |
• See Note A in Notes to Financial Statements.
1 Guaranteed by the Federal Deposit Insurance Corporation (FDIC) as part of the Temporary Liquidity Guarantee Program.
2 The issuer operates under a congressional charter; its securities are not backed by the full faith and credit of the U.S. government.
3 The average or expected maturity is shorter than the final maturity shown because of the possibility of interim principal payments and prepayments or the possibility of the issue being called.
4 Security exempt from registration under Rule 144A of the Securities Act of 1933. Such securities may be sold in transactions exempt from registration, normally to qualified institutional buyers. At December 31, 2009, the aggregate value of these securities was $152,817,000, representing 0.6% of net assets.
5 Adjustable-rate security.
6 Non-income-producing security—security in default.
7 Affiliated money market fund available only to Vanguard funds and certain trusts and accounts managed by Vanguard. Rate shown is the 7-day yield.
GO—General Obligation Bond.
USD—United School District.
See accompanying Notes, which are an integral part of the Financial Statements.
72
| Total Bond Market II Index Fund | |||
| Statement of Operations | |||
| January 26, 20091 to | |||
| December 31, 2009 | |||
| ($ | 000 | ) | |
| Investment Income | |||
| Income | |||
| Interest2 | 757,601 | ||
| Total Income | 757,601 | ||
| Expenses | |||
| The Vanguard Group—Note B | |||
| Investment Advisory Services | 1,220 | ||
| Management and Administrative—Investor Shares | 13,714 | ||
| Management and Administrative—Institutional Shares | 2,097 | ||
| Marketing and Distribution—Investor Shares | 2,469 | ||
| Marketing and Distribution—Institutional Shares | 511 | ||
| Custodian Fees | 240 | ||
| Auditing Fees | 33 | ||
| Shareholders’ Reports and Proxies—Investor Shares | 4 | ||
| Shareholders’ Reports and Proxies—Institutional Shares | 2 | ||
| Trustees’ Fees and Expenses | 38 | ||
| Total Expenses | 20,328 | ||
| Net Investment Income | 737,273 | ||
| Realized Net Gain (Loss) on Investment Securities Sold | (5,942 | ) | |
| Change in Unrealized Appreciation (Depreciation) of Investment Securities | 562,837 | ||
| Net Increase (Decrease) in Net Assets Resulting from Operations | 1,294,168 | ||
| 1 | Inception. |
| 2 | Interest income from an affiliated company of the fund was $2,805,000. |
See accompanying Notes, which are an integral part of the Financial Statements.
73
| Total Bond Market II Index Fund | |||
| Statement of Changes in Net Assets | |||
| January 26, 20091 to | |||
| December 31, 2009 | |||
| ($ | 000 | ) | |
| Increase (Decrease) in Net Assets | |||
| Operations | |||
| Net Investment Income | 737,273 | ||
| Realized Net Gain (Loss) | (5,942 | ) | |
| Change in Unrealized Appreciation (Depreciation) | 562,837 | ||
| Net Increase (Decrease) in Net Assets Resulting from Operations | 1,294,168 | ||
| Distributions | |||
| Net Investment Income | |||
| Investor Shares | (577,735 | ) | |
| Institutional Shares | (159,584 | ) | |
| Realized Capital Gain | |||
| Investor Shares | — | ||
| Institutional Shares | — | ||
| Total Distributions | (737,319 | ) | |
| Capital Share Transactions | |||
| Investor Shares | 20,011,458 | ||
| Institutional Shares | 6,939,510 | ||
| Net Increase (Decrease) from Capital Share Transactions | 26,950,968 | ||
| Total Increase (Decrease) | 27,507,817 | ||
| Net Assets | |||
| Beginning of Period | — | ||
| End of Period | 27,507,817 | ||
| 1 Inception. | |||
See accompanying Notes, which are an integral part of the Financial Statements.
74
| Total Bond Market II Index Fund | |||
| Financial Highlights | |||
| Investor Shares | |||
| January 26, 20091 to | |||
| For a Share Outstanding Throughout the Period | December 31, 2009 | ||
| Net Asset Value, Beginning of Period | $ | 10.00 | |
| Investment Operations | |||
| Net Investment Income | .358 | ||
| Net Realized and Unrealized Gain (Loss) | |||
| on Investments | .260 | ||
| Total from Investment Operations | .618 | ||
| Distributions | |||
| Dividends from Net Investment Income | (.358 | ) | |
| Distributions from Realized Capital Gains | — | ||
| Total Distributions | (.358 | ) | |
| Net Asset Value, End of Period | $ | 10.26 | |
| Total Return2 | 6.28 | % | |
| Ratios/Supplemental Data | |||
| Net Assets, End of Period (Millions) | $ | 20,432 | |
| Ratio of Total Expenses to | |||
| Average Net Assets | 0.11 | %3 | |
| Ratio of Net Investment Income to | |||
| Average Net Assets | 3.76 | %3 | |
| Portfolio Turnover Rate4 | 110 | % | |
| 1 | Inception. |
| 2 | Total returns do not include the account service fee that may be applicable to certain accounts with balances below $10,000. |
| 3 | Annualized. |
| 4 | Excludes the value of portfolio securities received or delivered as a result of in-kind purchases or redemptions of the fund’s capital shares. |
See accompanying Notes, which are an integral part of the Financial Statements.
75
| Total Bond Market II Index Fund | |||
| Financial Highlights | |||
| Institutional Shares | |||
| February 17, 20091 to | |||
| For a Share Outstanding Throughout the Period | December 31, 2009 | ||
| Net Asset Value, Beginning of Period | $ | 10.03 | |
| Investment Operations | |||
| Net Investment Income | .338 | ||
| Net Realized and Unrealized Gain (Loss) | |||
| on Investments | .230 | ||
| Total from Investment Operations | .568 | ||
| Distributions | |||
| Dividends from Net Investment Income | (.338 | ) | |
| Distributions from Realized Capital Gains | — | ||
| Total Distributions | (.338 | ) | |
| Net Asset Value, End of Period | $ | 10.26 | |
| Total Return | 5.80 | % | |
| Ratios/Supplemental Data | |||
| Net Assets, End of Period (Millions) | $ | 7,076 | |
| Ratio of Total Expenses to | |||
| Average Net Assets | 0.07 | %2 | |
| Ratio of Net Investment Income to | |||
| Average Net Assets | 3.80 | %2 | |
| Portfolio Turnover Rate3 | 110 | % | |
| 1 | Inception. |
| 2 | Annualized. |
| 3 | Excludes the value of portfolio securities received or delivered as a result of in-kind purchases or redemptions of the fund’s capital shares. |
See accompanying Notes, which are an integral part of the Financial Statements.
76
Total Bond Market II Index Fund
Notes to Financial Statements
Vanguard Total Bond Market II Index Fund is registered under the Investment Company Act of 1940 as an open-end investment company, or mutual fund. The fund has been established by Vanguard as an investment vehicle for Vanguard funds-of-funds as well as certain similar trusts and accounts (“eligible investors”). The fund is not available to other investors. Certain of the fund’s investments are in corporate debt instruments; the issuers’ abilities to meet their obligations may be affected by economic developments in their respective industries. The fund offers two classes of shares: Investor Shares and Institutional Shares. Investor Shares were first issued on January 26, 2009, and are available to eligible investors who meet the fund’s minimum purchase requirements. Institutional Shares were first issued on February 17, 2009, and are available to eligible investors who generally do not require spec ial employee benefit plan services and invest a minimum of $5 million.
A. The following significant accounting policies conform to generally accepted accounting principles for U.S. mutual funds. The fund consistently follows such policies in preparing its financial statements.
1. Security Valuation: Bonds, and temporary cash investments acquired over 60 days to maturity, are valued using the latest bid prices or using valuations based on a matrix system (which considers such factors as security prices, yields, maturities, and ratings), both as furnished by independent pricing services. Investments in Vanguard Market Liquidity Fund are valued at that fund’s net asset value. Other temporary cash investments are valued at amortized cost, which approximates market value. Securities for which market quotations are not readily available, or whose values have been affected by events occurring before the fund’s pricing time but after the close of the securities’ primary markets, are valued by methods deemed by the board of trustees to represent fair value.
2. Mortgage Dollar Rolls: The fund has entered into mortgage-dollar-roll transactions, in which the fund sells mortgage-backed securities to a dealer and simultaneously agrees to purchase similar securities in the future at a predetermined price. The proceeds of the securities sold in mortgage-dollar-roll transactions are invested in high-quality short-term fixed income securities. The fund forgoes principal and interest paid on the securities, and is compensated by interest earned on the proceeds of the initial sale and by a lower price on the securities to be repurchased. The fund accounts for mortgage-dollar-roll transactions as purchases and sales; as such, these transactions may increase the fund’s portfolio turnover rate. Amounts to be received or paid in connection with open mortgage dollar rolls are included in Receivables for Investment Securities Sold (Other Assets) or Payables for Investment Securities Purc hased (Liabilities) in the Statement of Net Assets. The primary risk associated with mortgage dollar rolls is that a counterparty will default on its obligations to deliver purchased securities.
3. Federal Income Taxes: The fund intends to qualify as a regulated investment company and distribute all of its taxable income. Management has analyzed the fund’s tax positions taken for the period from inception to December 31, 2009, and has concluded that no provision for federal income tax is required in the fund’s financial statements.
4. Distributions: Distributions from net investment income are declared daily and paid on the first business day of the following month. Annual distributions from realized capital gains, if any, are recorded on the ex-dividend date.
5. Other: Interest income includes income distributions received from Vanguard Market Liquidity Fund and is accrued daily. Premiums and discounts on debt securities purchased are amortized and accreted, respectively, to interest income over the lives of the respective securities. Security transactions are accounted for on the date securities are bought or sold. Costs used to determine realized gains (losses) on the sale of investment securities are those of the specific securities sold.
77
Total Bond Market II Index Fund
Each class of shares has equal rights as to assets and earnings, except that each class separately bears certain class-specific expenses related to maintenance of shareholder accounts (included in Management and Administrative expenses), shareholder reporting, and proxies. Marketing and distribution expenses are allocated to each class of shares based on a method approved by the board of trustees. Income, other non-class-specific expenses, and gains and losses on investments are allocated to each class of shares based on its relative net assets.
B. The Vanguard Group furnishes at cost investment advisory, corporate management, administrative, marketing, and distribution services. The costs of such services are allocated to the fund under methods approved by the board of trustees. The fund has committed to provide up to 0.40% of its net assets in capital contributions to Vanguard. At December 31, 2009, the fund had contributed capital of $5,429,000 to Vanguard (included in Other Assets), representing 0.02% of the fund’s net assets and 2.17% of Vanguard’s capitalization. The fund’s trustees and officers are also directors and officers of Vanguard.
C. Various inputs may be used to determine the value of the fund’s investments. These inputs are summarized in three broad levels for financial statement purposes. The inputs or methodologies used to value securities are not necessarily an indication of the risk associated with investing in those securities.
Level 1—Quoted prices in active markets for identical securities.
Level 2—Other significant observable inputs (including quoted prices for similar securities, interest rates, prepayment speeds, credit risk, etc.).
Level 3—Significant unobservable inputs (including the fund’s own assumptions used to determine the fair value of investments).
The following table summarizes the fund’s investments as of December 31, 2009, based on the inputs used to value them:
| Level 1 | Level 2 | Level 3 | |||||||
| Investments | ($ | 000 | ) | ($ | 000 | ) | ($ | 000 | ) |
| U.S. Government and Agency Obligations | — | 19,905,826 | — | ||||||
| Asset-Backed/Commercial Mortgage-Backed Securities | — | 960,201 | — | ||||||
| Corporate Bonds | — | 5,360,749 | 15 | ||||||
| Sovereign Bonds | — | 1,015,678 | — | ||||||
| Taxable Municipal Bonds | — | 105,512 | — | ||||||
| Temporary Cash Investments | 1,334,381 | — | — | ||||||
| Total | 1,334,381 | 27,347,966 | 15 |
The following table summarizes changes in investments valued based on Level 3 inputs during the period ended December 31, 2009:
| Investments in | |||
| Corporate Bonds | |||
| Amount Valued Based on Level 3 Inputs | ($ | 000 | ) |
| Balance as of Inception Date | — | ||
| Transfers into Level 3 | 24 | ||
| Change in Unrealized Appreciation (Depreciation) | (9 | ) | |
| Balance as of December 31, 2009 | 15 |
78
Total Bond Market II Index Fund
D. Capital gain distributions are determined on a tax basis and may differ from realized capital gains for financial reporting purposes. Differences may be permanent or temporary. Permanent differences are reclassified among capital accounts in the financial statements to reflect their tax character. Temporary differences arise when gains or losses are recognized in different periods for financial statement and tax purposes; these differences will reverse at some time in the future.
For tax purposes, at December 31, 2009, the fund had short-term capital gains of $5,578,000 available for distribution. Short-term gain distributions are treated as ordinary income dividends for tax purposes.
Certain of the fund’s U.S. Treasury Inflation-Indexed securities experienced deflation adjustments that reduced interest income and the cost of investments for financial statement purposes by an amount greater than the reduction of taxable income; the additional income reduction will be deferred for tax purposes until it is used to offset future inflation adjustments that increase taxable income. The difference becomes permanent if the securities are sold. During the period ended December 31, 2009, the fund realized gains of $46,000 that were included in ordinary income for tax purposes as a result of deferred deflation adjustments; accordingly such gains have been reclassified from accumulated net realized losses to undistributed net investment income.
At December 31, 2009, the cost of investment securities for tax purposes was $28,131,090,000. Net unrealized appreciation of investment securities for tax purposes was $551,272,000, consisting of unrealized gains of $724,916,000 on securities that had risen in value since their purchase and $173,644,000 in unrealized losses on securities that had fallen in value since their purchase.
E. During the period ended December 31, 2009, the fund purchased $7,125,331,000 of investment securities and sold $490,576,000 of investment securities, other than U.S. government securities and temporary cash investments. Purchases and sales of U.S. government securities were $41,780,113,000 and $21,835,287,000 respectively.
| F. Capital share transactions for each class of shares were: | |||||
| January 26, 20091 to | |||||
| December 31, 2009 | |||||
| Amount | Shares | ||||
| ($ | 000 | ) | (000 | ) | |
| Investor Shares | |||||
| Issued | 22,626,096 | 2,252,203 | |||
| Issued in Lieu of Cash Distributions | 577,730 | 56,763 | |||
| Redeemed | (3,192,368 | ) | (316,895 | ) | |
| Net Increase (Decrease)—Investor Shares | 20,011,458 | 1,992,071 | |||
| Institutional Shares | |||||
| Issued | 7,305,053 | 726,011 | |||
| Issued in Lieu of Cash Distributions | 159,584 | 15,596 | |||
| Redeemed | (525,127 | ) | (51,703 | ) | |
| Net Increase (Decrease)—Institutional Shares | 6,939,510 | 689,904 | |||
| 1 Inception. | |||||
G. In preparing the financial statements as of December 31, 2009, management considered the impact of subsequent events occurring through February 16, 2010, for potential recognition or disclosure in these financial statements.
79
Report of Independent Registered Public Accounting Firm
To the Trustees of Vanguard Bond Index Funds and the Shareholders of Vanguard Total Bond Market II Index Fund:
In our opinion, the accompanying statement of net assets and the related statements of operations and of changes in net assets and the financial highlights present fairly, in all material respects, the financial position of Vanguard Total Bond Market II Index Fund (constituting a separate portfolio of Vanguard Bond Index Funds, hereafter referred to as the “Fund”) at December 31, 2009, and the results of its operations, the changes in its net assets and the financial highlights for the period January 26, 2009 (commencement of operations) through December 31, 2009, in conformity with accounting principles generally accepted in the United States of America. These financial statements and financial highlights (hereafter referred to as “financial statements”) are the responsibility of the Fund’s management; our responsibility is to express an opinion on these financial statements based on our audits. W e conducted our audit of these financial statements in accordance with the standards of the Public Company Accounting Oversight Board (United States). Those standards require that we plan and perform the audit to obtain reasonable assurance about whether the financial statements are free of material misstatement. An audit includes examining, on a test basis, evidence supporting the amounts and disclosures in the financial statements, assessing the accounting principles used and significant estimates made by management, and evaluating the overall financial statement presentation. We believe that our audits, which included confirmation of securities at December 31, 2009 by correspondence with the custodian and brokers and by agreement to the underlying ownership records of Vanguard Market Liquidity Fund, provide a reasonable basis for our opinion.
PricewaterhouseCoopers LLP
Philadelphia, Pennsylvania
February 16, 2010
Special 2009 tax information (unaudited) for Vanguard Total Bond Market II Index Fund
This information for the fiscal year ended December 31, 2009, is included pursuant to provisions of the Internal Revenue Code.
For nonresident alien shareholders, 91.5% of income dividends are interest-related dividends.
80
About Your Fund’s Expenses
As a shareholder of the fund, you incur ongoing costs, which include costs for portfolio management, administrative services, and shareholder reports (like this one), among others. Operating expenses, which are deducted from a fund’s gross income, directly reduce the investment return of the fund.
A fund’s expenses are expressed as a percentage of its average net assets. This figure is known as the expense ratio. The following examples are intended to help you understand the ongoing costs (in dollars) of investing in your fund and to compare these costs with those of other mutual funds. The examples are based on an investment of $1,000 made at the beginning of the period shown and held for the entire period.
The accompanying table illustrates your fund’s costs in two ways:
• Based on actual fund return. This section helps you to estimate the actual expenses that you paid over the period. The “Ending Account Value” shown is derived from the fund’s actual return, and the third column shows the dollar amount that would have been paid by an investor who started with $1,000 in the fund. You may use the information here, together with the amount you invested, to estimate the expenses that you paid over the period.
To do so, simply divide your account value by $1,000 (for example, an $8,600 account value divided by $1,000 = 8.6), then multiply the result by the number given for your fund under the heading “Expenses Paid During Period.”
• Based on hypothetical 5% yearly return. This section is intended to help you compare your fund’s costs with those of other mutual funds. It assumes that the fund had a yearly return of 5% before expenses, but that the expense ratio is unchanged. In this case—because the return used is not the fund’s actual return—the results do not apply to your investment. The example is useful in making comparisons because the Securities and Exchange Commission requires all mutual funds to calculate expenses based on a 5% return. You can assess your fund’s costs by comparing this hypothetical example with the hypothetical examples that appear in shareholder reports of other funds.
Note that the expenses shown in the table are meant to highlight and help you compare ongoing costs only and do not reflect transaction costs incurred by the fund for buying and selling securities. Further, the expenses do not include the account service fee described in the prospectus. If such a fee were applied to your account, your costs would be higher. Your fund does not charge transaction fees, such as purchase or redemption fees, nor does it carry a “sales load.”
The calculations assume no shares were bought or sold during the period. Your actual costs may have been higher or lower, depending on the amount of your investment and the timing of any purchases or redemptions.
You can find more information about the fund’s expenses, including annual expense ratios, in the Financial Statements section of this report. For additional information on operating expenses and other shareholder costs, please refer to your fund’s current prospectus.
81
| Six Months Ended December 31, 2009 | ||||||
| Beginning | Ending | Expenses | ||||
| Account Value | Account Value | Paid During | ||||
| Total Bond Market II Index Fund | 6/30/2009 | 12/31/2009 | Period1 | |||
| Based on Actual Fund Return | ||||||
| Investor Shares | $ | 1,000.00 | $ | 1,038.87 | $ | 0.31 |
| Institutional Shares | 1,000.00 | 1,038.87 | 0.36 | |||
| Based on Hypothetical 5% Yearly Return | ||||||
| Investor Shares | $ | 1,000.00 | $ | 1,024.90 | $ | 0.31 |
| Institutional Shares | 1,000.00 | 1,024.85 | 0.36 |
1 The calculations are based on expenses incurred in the most recent six-month period. The fund’s annualized six-month expense ratios for that period are 0.06% for Investor Shares and 0.07% for Institutional Shares. The dollar amounts shown as “Expenses Paid” are equal to the annualized expense ratio multiplied by the average account value over the period, multiplied by the number of days in the most recent six-month period, then divided by the number of days in the most recent 12-month period.
82
Glossary
30-Day SEC Yield. A fund’s 30-day SEC yield is derived using a formula specified by the U.S. Securities and Exchange Commission. Under the formula, data related to the fund’s security holdings in the previous 30 days are used to calculate the fund’s hypothetical net income for that period, which is then annualized and divided by the fund’s estimated average net assets over the calculation period. For the purposes of this calculation, a security’s income is based on its current market yield to maturity (in the case of bonds) or its projected dividend yield (for stocks). Because the SEC yield represents hypothetical annualized income, it will differ—at times significantly—from the fund’s actual experience. As a result, the fund’s income distributions may be higher or lower than implied by the SEC yield.
Average Coupon. The average interest rate paid on the fixed income securities held by a fund. It is expressed as a percentage of face value.
Average Duration. An estimate of how much the value of the bonds held by a fund will fluctuate in response to a change in interest rates. To see how the value could change, multiply the average duration by the change in rates. If interest rates rise by 1 percentage point, the value of the bonds in a fund with an average duration of five years would decline by about 5%. If rates decrease by a percentage point, the value would rise by 5%.
Average Effective Maturity. The average length of time until fixed income securities held by a fund reach maturity and are repaid, taking into consideration the possibility that the issuer may call the bond before its maturity date. The figure reflects the proportion of fund assets represented by each security; it also reflects any futures contracts held. In general, the longer the average effective maturity, the more a fund’s share price will fluctuate in response to changes in market interest rates.
Average Quality. An indicator of credit risk, this figure is the average of the ratings assigned to a fund’s fixed income holdings by credit-rating agencies. The agencies make their judgment after appraising an issuer’s ability to meet its obligations. Quality is graded on a scale, with Aaa or AAA indicating the most creditworthy bond issuers. U.S. Treasury securities are considered to have the highest credit quality.
Expense Ratio. The percentage of a fund’s average net assets used to pay its annual administrative and advisory expenses. These expenses directly reduce returns to investors.
Inception Date. The date on which the assets of a fund (or one of its share classes) are first invested in accordance with the fund’s investment objective. For funds with a subscription period, the inception date is the day after that period ends. Investment performance is measured from the inception date.
Short-Term Reserves. The percentage of a fund invested in highly liquid, short-term securities that can be readily converted to cash.
Yield to Maturity. The rate of return an investor would receive if the fixed income securities held by a fund were held to their maturity dates.
83
The People Who Govern Your Fund
The trustees of your mutual fund are there to see that the fund is operated and managed in your best interests since, as a shareholder, you are a part owner of the fund. Your fund’s trustees also serve on the board of directors of The Vanguard Group, Inc., which is owned by the Vanguard funds and provides services to them on an at-cost basis.
A majority of Vanguard’s board members are independent, meaning that they have no affiliation with Vanguard or the funds they oversee, apart from the sizable personal investments they have made as private individuals. The independent board members have distinguished backgrounds in business, academia, and public service. Each of the trustees and executive officers oversees 163 Vanguard funds.
The following table provides information for each trustee and executive officer of the fund. More information about the trustees is in the Statement of Additional Information, which can be obtained, without charge, by contacting Vanguard at 800-662-7447, or online at www.vanguard.com.
Interested Trustee1
F. William McNabb III
Born 1957. Trustee Since July 2009. Chairman of the Board. Principal Occupation(s) During the Past Five Years: Chairman of the Board of The Vanguard Group, Inc., and of each of the investment companies served by The Vanguard Group, since January 2010; Director of The Vanguard Group since 2008; Chief Executive Officer and President of The Vanguard Group and of each of the investment companies served by The Vanguard Group since 2008; Director of Vanguard Marketing Corporation; Managing Director of The Vanguard Group (1995–2008).
Independent Trustees
Emerson U. Fullwood
Born 1948. Trustee Since January 2008. Principal Occupation(s) During the Past Five Years: Executive Chief Staff and Marketing Officer for North America and Corporate Vice President (retired 2008) of Xerox Corporation (photocopiers and printers); Director of SPX Corporation (multi-industry manufacturing), the United Way of Rochester, the Boy Scouts of America, Amerigroup Corporation (direct health and medical insurance carriers), and Monroe Community College Foundation.
Rajiv L. Gupta
Born 1945. Trustee Since December 2001.2 Principal Occupation(s) During the Past Five Years: Chairman and Chief Executive Officer (retired 2009) and President (2006–2008) of Rohm and Haas Co. (chemicals); Board Member of American Chemistry Council; Director of Tyco International, Ltd. (diversified manufacturing and services) and Hewlett-Packard Co. (electronic computer manufacturing); Trustee of The Conference Board.
Amy Gutmann
Born 1949. Trustee Since June 2006. Principal Occupation(s) During the Past Five Years: President of the University of Pennsylvania; Christopher H. Browne Distinguished Professor of Political Science in the School of Arts and Sciences with secondary appointments at the Annenberg School for Communication and the Graduate School of Education of the University of Pennsylvania; Director of Carnegie Corporation of New York, Schuylkill River Development Corporation, and Greater Philadelphia Chamber of Commerce; Trustee of the National Constitution Center.
JoAnn Heffernan Heisen
Born 1950. Trustee Since July 1998. Principal Occupation(s) During the Past Five Years: Corporate Vice President and Chief Global Diversity Officer since 2006 (retired 2008) and Member of the Executive Committee (retired 2008) of Johnson & Johnson (pharmaceuticals/consumer products); Vice President and Chief Information Officer of Johnson & Johnson (1997–2005); Director of the University Medical Center at Princeton and Women’s Research and Education Institute; Member of the Advisory Board of the Maxwell School of Citizenship and Public Affairs at Syracuse University.
F. Joseph Loughrey
Born 1949. Trustee Since October 2009. Principal Occupation(s) During the Past Five Years: President and Chief Operating Officer since 2005 (retired 2009) and Vice Chairman of the Board (2008–2009) of Cummins Inc. (industrial machinery); Director of SKF AB (industrial machinery), Hillenbrand, Inc. (specialized consumer services), Sauer-Danfoss Inc. (machinery), the Lumina Foundation for Education, and the Columbus Community Education Coalition; Chairman of the Advisory Council for the College of Arts and Letters at the University of Notre Dame.
André F. Perold
Born 1952. Trustee Since December 2004. Principal Occupation(s) During the Past Five Years: George Gund Professor of Finance and Banking, Harvard Business School; Chair of the Investment Committee of HighVista Strategies LLC (private investment firm).
Alfred M. Rankin, Jr.
Born 1941. Trustee Since January 1993. Principal Occupation(s) During the Past Five Years: Chairman, President, and Chief Executive Officer of NACCO Industries, Inc. (forklift trucks/housewares/lignite); Director of Goodrich Corporation (industrial products/ aircraft systems and services); Deputy Chairman of the Federal Reserve Bank of Cleveland; Trustee of University Hospitals of Cleveland, The Cleveland Museum of Art, and Case Western Reserve University.
Peter F. Volanakis
Born 1955. Trustee Since July 2009. Principal Occupation(s) During the Past Five Years: President since 2007 and Chief Operating Officer since 2005 of Corning Incorporated (communications equipment); President of Corning Technologies (2001–2005); Director of Corning Incorporated and Dow Corning; Trustee of the Corning Incorporated Foundation and the Corning Museum of Glass; Overseer of the Amos Tuck School of Business Administration at Dartmouth College.
Executive Officers
Thomas J. Higgins
Born 1957. Chief Financial Officer Since September 2008. Principal Occupation(s) During the Past Five Years: Principal of The Vanguard Group, Inc.; Chief Financial Officer of each of the investment companies served by The Vanguard Group since 2008; Treasurer of each of the investment companies served by The Vanguard Group (1998–2008).
Kathryn J. Hyatt
Born 1955. Treasurer Since November 2008. Principal Occupation(s) During the Past Five Years: Principal of The Vanguard Group, Inc.; Treasurer of each of the investment companies served by The Vanguard Group since 2008; Assistant Treasurer of each of the investment companies served by The Vanguard Group (1988–2008).
Heidi Stam
Born 1956. Secretary Since July 2005. Principal Occupation(s) During the Past Five Years: Managing Director of The Vanguard Group, Inc., since 2006; General Counsel of The Vanguard Group since 2005; Secretary of The Vanguard Group and of each of the investment companies served by The Vanguard Group since 2005; Director and Senior Vice President of Vanguard Marketing Corporation since 2005; Principal of The Vanguard Group (1997–2006).
Vanguard Senior Management Team
R. Gregory Barton
Mortimer J. Buckley
Kathleen C. Gubanich
Paul A. Heller
Michael S. Miller
James M. Norris
Glenn W. Reed
George U. Sauter
Chairman Emeritus and Senior Advisor
John J. Brennan
Chairman, 1996–2009
Chief Executive Officer and President, 1996–2008
Founder
John C. Bogle
Chairman and Chief Executive Officer, 1974–1996
1 Mr. McNabb is considered an “interested person,” as defined in the Investment Company Act of 1940, because he is an officer of the Vanguard funds.
2 December 2002 for Vanguard Equity Income Fund, Vanguard Growth Equity Fund, the Vanguard Municipal Bond Funds, and the Vanguard State Tax-Exempt Funds.

P.O. Box 2600
Valley Forge, PA 19482-2600
Connect with Vanguard® > www.vanguard.com
Fund Information > 800-662-7447
Direct Investor Account Services > 800-662-2739
Institutional Investor Services > 800-523-1036
Text Telephone for People
With Hearing Impairment > 800-749-7273
This material may be used in conjunction with the offering of shares of any Vanguard fund only if preceded or accompanied by the fund’s current prospectus.
All comparative mutual fund data are from Lipper Inc. or Morningstar, Inc., unless otherwise noted.
You can obtain a free copy of Vanguard’s proxy voting guidelines by visiting our website, www.vanguard.com, and searching for “proxy voting guidelines,” or by calling Vanguard at 800-662-2739. The guidelines are also available from the SEC’s website, www.sec.gov. In addition, you may obtain a free report on how your fund voted the proxies for securities it owned during the 12 months ended June 30. To get the report, visit either www.vanguard.com or www.sec.gov.
You can review and copy information about your fund at the SEC’s Public Reference Room in Washington, D.C. To find out more about this public service, call the SEC at 202-551-8090. Information about your fund is also available on the SEC’s website, and you can receive copies of this information, for a fee, by sending a request in either of two ways: via e-mail addressed to publicinfo@sec.gov or via regular mail addressed to the Public Reference Section, Securities and Exchange Commission, Washington, DC 20549-1520.

© 2010 The Vanguard Group, Inc.
All rights reserved.
Vanguard Marketing Corporation, Distributor.
Q6350 022010
Item 2: Code of Ethics. The Registrant has adopted a code of ethics that applies to the Registrant’s principal executive officer, principal financial officer, principal accounting officer or controller or persons performing similar functions. The Code of Ethics was amended during the reporting period covered by this report to make certain technical, non-material changes.
Item 3: Audit Committee Financial Expert. The following members of the Audit Committee have been determined by the Registrant’s Board of Trustees to be Audit Committee Financial Experts serving on its Audit Committee, and to be independent: Charles D. Ellis, Rajiv L. Gupta, JoAnn Heffernan Heisen, André F. Perold, and Alfred M. Rankin, Jr.
Item 4: Principal Accountant Fees and Services.
(a) Audit Fees.
Audit Fees of the Registrant
Fiscal Year Ended December 31, 2009: $195,000 Fiscal Year Ended December 31, 2008: $166,000
Aggregate Audit Fees of Registered Investment Companies in the Vanguard Group.
Fiscal Year Ended December 31, 2009: $3,354,640
Fiscal Year Ended December 31, 2008: $3,055,590
(b) Audit-Related Fees.
Fiscal Year Ended December 31, 2009: $876,210
Fiscal Year Ended December 31, 2008: $626,240
Includes fees billed in connection with assurance and related services provided to the Registrant, The Vanguard Group, Inc., Vanguard Marketing Corporation, and other registered investment companies in the Vanguard Group.
(c) Tax Fees.
Fiscal Year Ended December 31, 2009: $423,070
Fiscal Year Ended December 31, 2008: $230,400
Includes fees billed in connection with tax compliance, planning and advice services provided to the Registrant, The Vanguard Group, Inc., Vanguard Marketing Corporation, and other registered investment companies in the Vanguard Group and related to income and excise taxes.
(d) All Other Fees.
Fiscal Year Ended December 31, 2009: $0
Fiscal Year Ended December 31, 2008: $0
Includes fees billed for services related to risk management and privacy matters. Services were provided to the Registrant, The Vanguard Group, Inc., Vanguard Marketing Corporation, and other registered investment companies in the Vanguard Group.
(e) (1) Pre-Approval Policies. The policy of the Registrant’s Audit Committee is to consider and, if appropriate, approve before the principal accountant is engaged for such services, all specific audit and non-audit services provided to: (1) the Registrant; (2) The Vanguard Group, Inc.; (3) other entities controlled by The Vanguard Group, Inc. that provide ongoing services to the Registrant; and (4) other registered investment companies in the Vanguard Group. In making a determination, the Audit Committee considers whether the services are consistent with maintaining the principal accountant’s independence.
In the event of a contingency situation in which the principal accountant is needed to provide services in between scheduled Audit Committee meetings, the Chairman of the Audit Committee would be called on to
Doc#0217639
consider and, if appropriate, pre-approve audit or permitted non-audit services in an amount sufficient to complete services through the next Audit Committee meeting, and to determine if such services would be consistent with maintaining the accountant’s independence. At the next scheduled Audit Committee meeting, services and fees would be presented to the Audit Committee for formal consideration, and, if appropriate, approval by the entire Audit Committee. The Audit Committee would again consider whether such services and fees are consistent with maintaining the principal accountant’s independence.
The Registrant’s Audit Committee is informed at least annually of all audit and non-audit services provided by the principal accountant to the Vanguard complex, whether such services are provided to: (1) the Registrant; (2) The Vanguard Group, Inc.; (3) other entities controlled by The Vanguard Group, Inc. that provide ongoing services to the Registrant; or (4) other registered investment companies in the Vanguard Group.
(2) No percentage of the principal accountant’s fees or services were approved pursuant to the waiver provision of paragraph (c)(7)(i)(C) of Rule 2-01 of Regulation S-X.
(f) For the most recent fiscal year, over 50% of the hours worked under the principal accountant’s engagement were not performed by persons other than full-time, permanent employees of the principal accountant.
(g) Aggregate Non-Audit Fees.
Fiscal Year Ended December 31, 2009: $423,070
Fiscal Year Ended December 31, 2008: $230,400
Includes fees billed for non-audit services provided to the Registrant, The Vanguard Group, Inc., Vanguard Marketing Corporation, and other registered investment companies in the Vanguard Group.
(h) For the most recent fiscal year, the Audit Committee has determined that the provision of all non-audit services was consistent with maintaining the principal accountant’s independence.
Item 5: Not Applicable.
Item 6: Not Applicable.
Item 7: Not Applicable.
Item 8: Not Applicable.
Item 9: Not Applicable.
Item 10: Not Applicable.
Item 11: Controls and Procedures.
(a) Disclosure Controls and Procedures. The Principal Executive and Financial Officers concluded that the Registrant's Disclosure Controls and Procedures are effective based on their evaluation of the Disclosure Controls and Procedures as of a date within 90 days of the filing date of this report.
(b) Internal Control Over Financial Reporting. There were no significant changes in Registrant’s Internal Control Over Financial Reporting or in other factors that could significantly affect this control subsequent to the date of the evaluation, including any corrective actions with regard to significant deficiencies and material weaknesses.
Item 12: Exhibits.
| (a) | Code of Ethics. |
| (b) | Certifications. |
Pursuant to the requirements of the Securities Exchange Act of 1934 and the Investment Company Act of 1940, the registrant has duly caused this report to be signed on its behalf by the undersigned, thereunto duly authorized.
Doc#0217639
| VANGUARD BOND INDEX FUNDS | |
| BY: | /s/ F. WILLIAM MCNABB III* |
| F. WILLIAM MCNABB III | |
| CHIEF EXECUTIVE OFFICER | |
| Date: | February 22, 2010 |
Pursuant to the requirements of the Securities Exchange Act of 1934 and the Investment Company Act of 1940, this report has been signed below by the following persons on behalf of the registrant and in the capacities and on the dates indicated.
| VANGUARD BOND INDEX FUNDS | |
| BY: | /s/ F. WILLIAM MCNABB III* |
| F. WILLIAM MCNABB III | |
| CHIEF EXECUTIVE OFFICER | |
| Date: | February 22, 2010 |
| VANGUARD BOND INDEX FUNDS | |
| BY: | /s/ THOMAS J. HIGGINS* |
| THOMAS J. HIGGINS | |
| CHIEF FINANCIAL OFFICER | |
| Date: | February 22, 2010 |
* By: /s/ Heidi Stam
Heidi Stam, pursuant to a Power of Attorney filed on July 24, 2009, see file Number 2-88373, and a Power of Attorney filed on October 16, 2009, see File Number 2-52698, both Incorporated by Reference.
Doc#0217639