UNITED STATES
SECURITIES AND EXCHANGE COMMISSION
Washington, D.C. 20549
FORM N-CSR
CERTIFIED SHAREHOLDER REPORT
OF
REGISTERED MANAGEMENT INVESTMENT COMPANIES
| Investment Company Act file number: | 811-04681 | |
Name of Registrant: | Vanguard Bond Index Funds | |
Address of Registrant: | P.O. Box 2600 | |
| Valley Forge, PA 19482 | ||
Name and address of agent for service: | Heidi Stam, Esquire | |
| P.O. Box 876 | ||
| Valley Forge, PA 19482 | ||
Registrant’s telephone number, including area code: (610) 669-1000 | ||
Date of fiscal year end: December 31 | ||
Date of reporting period: January 1, 2015 – December 31, 2015 | ||
Item 1: Reports to Shareholders | ||
Annual Report | December 31, 2015
Vanguard Bond Index Funds
Vanguard Short-Term Bond Index Fund
Vanguard Intermediate-Term Bond Index Fund
Vanguard Long-Term Bond Index Fund
Vanguard’s Principles for Investing Success
We want to give you the best chance of investment success. These principles, grounded in Vanguard’s research and experience, can put you on the right path.
Goals. Create clear, appropriate investment goals.
Balance. Develop a suitable asset allocation using broadly diversified funds. Cost. Minimize cost.
Discipline. Maintain perspective and long-term discipline.
A single theme unites these principles: Focus on the things you can control.
We believe there is no wiser course for any investor.
| Contents | |
| Your Fund’s Total Returns. | 1 |
| Chairman’s Letter. | 4 |
| Short-Term Bond Index Fund. | 11 |
| Intermediate-Term Bond Index Fund. | 31 |
| Long-Term Bond Index Fund. | 51 |
| About Your Fund’s Expenses. | 73 |
| Glossary. | 76 |
Please note: The opinions expressed in this report are just that—informed opinions. They should not be considered promises or advice.
Also, please keep in mind that the information and opinions cover the period through the date on the front of this report. Of course, the
risks of investing in your fund are spelled out in the prospectus.
See the Glossary for definitions of investment terms used in this report.
About the cover: Pictured is a sailing block on the Brilliant, a 1932 schooner docked in Mystic, Connecticut. A type of pulley, the
sailing block helps coordinate the setting of the sails. At Vanguard, the intricate coordination of technology and people allows
us to help millions of clients around the world reach their financial goals.
Your Fund’s Total Returns
| Fiscal Year Ended December 31, 2015 | ||||
| 30-Day SEC | Income | Capital | Total | |
| Yield | Returns | Returns | Returns | |
| Vanguard Short-Term Bond Index Fund | ||||
| Investor Shares | 1.37% | 1.23% | -0.38% | 0.85% |
| ETF Shares | 1.43 | |||
| Market Price | 0.91 | |||
| Net Asset Value | 0.92 | |||
| Admiral™ Shares | 1.43 | 1.30 | -0.38 | 0.92 |
| Institutional Shares | 1.46 | 1.33 | -0.38 | 0.95 |
| Institutional Plus Shares | 1.51 | 1.35 | -0.38 | 0.97 |
| Barclays U.S. 1–5 Year Government/Credit Float | ||||
| Adjusted Index | 0.97 | |||
| 1–5 Year Investment-Grade Debt Funds Average | 0.25 | |||
| 1–5 Year Investment-Grade Debt Funds Average: Derived from data provided by Lipper, a Thomson Reuters Company. | ||||
| Vanguard Intermediate-Term Bond Index Fund | ||||
| Investor Shares | 2.66% | 2.62% | -1.41% | 1.21% |
| ETF Shares | 2.67 | |||
| Market Price | 1.13 | |||
| Net Asset Value | 1.23 | |||
| Admiral Shares | 2.69 | 2.68 | -1.41 | 1.27 |
| Institutional Shares | 2.73 | 2.72 | -1.41 | 1.31 |
| Institutional Plus Shares | 2.77 | 2.74 | -1.41 | 1.33 |
| Barclays U.S. 5–10 Year Government/Credit Float | ||||
| Adjusted Index | 1.28 | |||
| Core Bond Funds Average | -0.11 | |||
Core Bond Funds Average: Derived from data provided by Lipper, a Thomson Reuters Company.
Admiral Shares carry lower expenses and are available to investors who meet certain account-balance requirements. Institutional Shares and
Institutional Plus Shares are available to certain institutional investors who meet specific administrative, service, and account-size criteria.
The Vanguard ETF® Shares shown are traded on the NYSE Arca exchange and are available only through brokers. The table provides ETF
returns based on both the NYSE Arca market price and the net asset value for a share. U.S. Pat. Nos. 6,879,964; 7,337,138; 7,720,749;
7,925,573; 8,090,646; and 8,417,623.
1
| Your Fund’s Total Returns | ||||
| Fiscal Year Ended December 31, 2015 | ||||
| 30-Day SEC | Income | Capital | Total | |
| Yield | Returns | Returns | Returns | |
| Vanguard Long-Term Bond Index Fund | ||||
| Investor Shares | 4.07% | 3.73% | -7.20% | -3.47% |
| ETF Shares | 4.09 | |||
| Market Price | -4.01 | |||
| Net Asset Value | -3.45 | |||
| Institutional Shares | 4.16 | 3.83 | -7.20 | -3.37 |
| Institutional Plus Shares | 4.21 | 3.85 | -7.20 | -3.35 |
| Barclays U.S. Long Government/Credit Float | ||||
| Adjusted Index | -3.31 | |||
| Corporate A-Rated Debt Funds Average | -0.75 | |||
Corporate A-Rated Debt Funds Average: Derived from data provided by Lipper, a Thomson Reuters Company.
Admiral Shares carry lower expenses and are available to investors who meet certain account-balance requirements. Institutional Shares and
Institutional Plus Shares are available to certain institutional investors who meet specific administrative, service, and account-size criteria.
The Vanguard ETF® Shares shown are traded on the NYSE Arca exchange and are available only through brokers. The table provides ETF
returns based on both the NYSE Arca market price and the net asset value for a share. U.S. Pat. Nos. 6,879,964; 7,337,138; 7,720,749;
7,925,573; 8,090,646; and 8,417,623.
For the ETF Shares, the market price is determined by the midpoint of the bid-offer spread as of the closing time of the New York Stock
Exchange (generally 4 p.m., Eastern time). The net asset value is also determined as of the NYSE closing time. For more information about
how the ETF Shares' market prices have compared with their net asset value, visit vanguard.com, select your ETF, and then select the Price
and Performance tab. The ETF premium/discount analysis there shows the percentages of days on which the ETF Shares' market price was
above or below the NAV.
2
Your Fund’s Performance at a Glance
| December 31, 2014, Through December 31, 2015 | ||||
| Distributions Per Share | ||||
| Starting | Ending | |||
| Share | Share | Income | Capital | |
| Price | Price | Dividends | Gains | |
| Vanguard Short-Term Bond Index Fund | ||||
| Investor Shares | $10.48 | $10.43 | $0.130 | $0.010 |
| ETF Shares | 79.87 | 79.49 | 1.039 | 0.077 |
| Admiral Shares | 10.48 | 10.43 | 0.137 | 0.010 |
| Institutional Shares | 10.48 | 10.43 | 0.140 | 0.010 |
| Institutional Plus Shares | 10.48 | 10.43 | 0.142 | 0.010 |
| Vanguard Intermediate-Term Bond Index Fund | ||||
| Investor Shares | $11.46 | $11.26 | $0.302 | $0.038 |
| ETF Shares | 84.41 | 82.95 | 2.227 | 0.283 |
| Admiral Shares | 11.46 | 11.26 | 0.309 | 0.038 |
| Institutional Shares | 11.46 | 11.26 | 0.313 | 0.038 |
| Institutional Plus Shares | 11.46 | 11.26 | 0.315 | 0.038 |
| Vanguard Long-Term Bond Index Fund | ||||
| Investor Shares | $14.26 | $13.20 | $0.546 | $0.035 |
| ETF Shares | 93.73 | 86.80 | 3.565 | 0.230 |
| Institutional Shares | 14.26 | 13.20 | 0.560 | 0.035 |
| Institutional Plus Shares | 14.26 | 13.20 | 0.563 | 0.035 |
3

Chairman’s Letter
Dear Shareholder,
Toward the close of 2015, the Federal Reserve took the long-awaited step of raising its target for overnight interest rates, which had hovered near zero since the Great Recession. Its vote of confidence in the U.S. economy’s resiliency helped short-term bond yields finish higher than where they started for the fiscal year ended December 31, 2015. The upward movement of intermediate-and long-term yields, however, was more muted given the fragile state of global growth and the subdued outlook for inflation.
With yields rising, bond prices adjusted downward, as the two move in opposite directions. The income generated by Vanguard Short- and Intermediate-Term Bond Index Funds was enough to offset the price depreciation of the bonds they held. The Short-Term Fund returned 0.85% and the Intermediate-Term Fund 1.21% for the fiscal year. With prices of longer-dated bonds falling more sharply, however, Vanguard Long-Term Bond Index Fund returned –3.47%. (All returns and yields cited in this letter are for the funds’ Investor Shares.)
The funds performed roughly in line with their expense-free benchmark indexes; the gap between the two ranged from 7 to 16 basis points. (A basis point is one-hundredth of a percentage point.) The Short- and Intermediate-Term Funds outperformed their peer group averages but the Long-Term Fund did not, in part because of its longer duration.
4
With yields rising, the 30-day SEC yield for the Short-Term Fund climbed to 1.37%, from 0.98% a year earlier. That yield rose to 2.66%, from 2.39%, for the Intermediate-Term Fund and to 4.07%, from 3.60%, for the Long-Term Fund.
A strong U.S. dollar depressed international bond returns
International bond markets (as measured by the Barclays Global Aggregate Index ex USD) returned –6.02%, reduced by the dollar’s strength against many foreign currencies. Without this currency effect, returns were modestly positive.
Although the Fed raised its interest rate target in mid-December, to 0.25%–0.5%, returns for money market funds and savings accounts remained limited by the 0%–0.25% level that had previously been in place for seven years.
Despite troubles, U.S. stocks eked out a seventh year of gains
U.S. stocks returned 0.48% for the 12 months. Although the broad market recorded its worst performance since 2008, it still advanced for the seventh straight year when dividends are factored in.
Stocks rose modestly over the first half of the year but slid in August and September as concerns mounted that China’s economic slowdown would spread globally. Falling oil and commodity prices also affected economies and markets across the world, for better or
| Market Barometer | |||
| Average Annual Total Returns | |||
| Periods Ended December 31, 2015 | |||
| One | Three | Five | |
| Year | Years | Years | |
| Bonds | |||
| Barclays U.S. Aggregate Bond Index (Broad taxable | |||
| market) | 0.55% | 1.44% | 3.25% |
| Barclays Municipal Bond Index (Broad tax-exempt market) | 3.30 | 3.16 | 5.35 |
| Citigroup Three-Month U.S. Treasury Bill Index | 0.03 | 0.02 | 0.04 |
| Stocks | |||
| Russell 1000 Index (Large-caps) | 0.92% | 15.01% | 12.44% |
| Russell 2000 Index (Small-caps) | -4.41 | 11.65 | 9.19 |
| Russell 3000 Index (Broad U.S. market) | 0.48 | 14.74 | 12.18 |
| FTSE All-World ex US Index (International) | -4.72 | 2.04 | 1.48 |
| CPI | |||
| Consumer Price Index | 0.73% | 1.00% | 1.53% |
5
worse. Central banks in Europe and Asia bolstered their stimulus efforts against weak growth and low inflation. And the Fed’s move in December ended months of uncertainty over its plans.
International stocks returned about –5%, restrained by the U.S. dollar’s strength. Emerging markets fared the worst.
Rising bond yields dampened returns over the period
As the Fed wound down its third round of stimulative bond-buying toward the end of 2014, speculation turned to when it might begin to raise short-term rates. The economy’s rebound from an early 2015 slowdown and further improvements in employment were favorable developments. On the other hand, inflation remained worryingly low as oil prices continued to fall. Greece’s debt crisis and slowing economic activity in China and other emerging markets may also have contributed to the Fed’s holding off on a rate increase until December.
Yields ended the fiscal year higher than where they started. The yield of the 2-year Treasury note, for example, climbed 38 basis points to 1.07%. (A basis point is one-hundredth of a percentage point.) The 10-year Treasury note rose 11 basis points to 2.30%, and longer maturities rose more than that.
Although higher interest rates should benefit buy-and-hold bond investors over the long term, their rise over the 12 months pushed bond prices down,
| Expense Ratios | ||||||
| Your Fund Compared With Its Peer Group | ||||||
| Peer | ||||||
| Investor | ETF | Admiral | Institutional | Institutional | Group | |
| Shares | Shares | Shares | Shares | Plus Shares | Average | |
| Short-Term Bond Index Fund | 0.20% | 0.10% | 0.10% | 0.07% | 0.05% | 0.79% |
| Intermediate-Term Bond Index Fund | 0.20 | 0.10 | 0.10 | 0.07 | 0.05 | 0.83 |
| Long-Term Bond Index Fund | 0.20 | 0.10 | — | 0.07 | 0.05 | 0.91 |
The fund expense ratios shown are from the prospectus dated April 28, 2015, and represent estimated costs for the current fiscal year. For the
fiscal year ended December 31, 2015, the funds’ expense ratios were: for the Short-Term Bond Index Fund, 0.16% for Investor Shares, 0.09%
for ETF Shares, 0.09% for Admiral Shares, 0.06% for Institutional Shares, and 0.04% for Institutional Plus Shares; for the Intermediate-Term
Bond Index Fund, 0.16% for Investor Shares, 0.09% for ETF Shares, 0.09% for Admiral Shares, 0.06% for Institutional Shares, and 0.04% for
Institutional Plus Shares; and for the Long-Term Bond Index Fund, 0.16% for Investor Shares, 0.09% for ETF Shares, 0.06% for Institutional
Shares, and 0.04% for Institutional Plus Shares. Peer-group expense ratios are derived from data provided by Lipper, a Thomson Reuters
Company, and capture information through year-end 2014.
Peer groups: For the Short-Term Bond Index Fund, 1–5 Year Investment-Grade Debt Funds; for the Intermediate-Term Bond Index Fund, Core
Bond Funds; for the Long-Term Bond Index Fund, Corporate A-Rated Debt Funds.
6
especially for longer-dated bonds, which are more sensitive to rate movements. That’s reflected in the capital returns for the funds, which were –0.38% for the Short-Term Fund and –1.41% for the Intermediate-Term Fund, and worse than –7% for the Long-Term Fund.
Treasuries, whose weightings in the funds ranged from roughly 39% in the Long-Term Fund to about 66% in the Short-Term Fund, returned close to 1%. Differences by maturity were fairly modest: short- and intermediate-term Treasuries remained in the black, while their long-term counterparts returned roughly –1%.
Investment-grade corporate bonds, however, dipped into negative territory as price declines outweighed the income they earned over the period. The difference, or “spread,” in their yields versus Treasuries widened, notably in the industrial sector among bonds issued by metals and mining companies and energy producers whose creditworthiness was hurt by falling
| Total Returns | |
| Ten Years Ended December 31, 2015 | |
| Average | |
| Annual Return | |
| Short-Term Bond Index Fund Investor Shares | 3.17% |
| Spliced Barclays U.S. 1–5 Year Government/Credit Float Adjusted Index | 3.32 |
| 1–5 Year Investment-Grade Debt Funds Average | 2.44 |
| For a benchmark description, see the Glossary. | |
| 1–5 Year Investment-Grade Debt Funds Average: Derived from data provided by Lipper, a Thomson Reuters Company. | |
| Intermediate-Term Bond Index Fund Investor Shares | 5.39% |
| Spliced Barclays U.S. 5–10 Year Government/Credit Float Adjusted Index | 5.45 |
| Spliced Intermediate Investment-Grade Debt Funds Average | 3.93 |
| For a benchmark description, see the Glossary. | |
| Spliced Intermediate Investment-Grade Debt Funds Average: Derived from data provided by Lipper, a Thomson Reuters Company. | |
| Long-Term Bond Index Fund Investor Shares | 6.37% |
| Spliced Barclays U.S. Long Government/Credit Float Adjusted Index | 6.45 |
| Corporate A-Rated Debt Funds Average | 4.19 |
| For a benchmark description, see the Glossary. | |
| Corporate A-Rated Debt Funds Average: Derived from data provided by Lipper, a Thomson Reuters Company. | |
The figures shown represent past performance, which is not a guarantee of future results. (Current performance may be
lower or higher than the performance data cited. For performance data current to the most recent month-end, visit our
website at vanguard.com/performance.) Note, too, that both investment returns and principal value can fluctuate widely, so
an investor’s shares, when sold, could be worth more or less than their original cost.
7
commodity prices. The spread widened less for bonds issued by financial institutions, as regulatory changes have led to stronger balance sheets overall in that sector.
Returns by maturity varied more for corporate bonds than for Treasuries. Here, too, the returns of short- and intermediate-term securities were positive, but those of long-term corporates were close to –5%. By credit quality, lower-rated investment-grade corporate bonds tended to underper-form their higher-rated counterparts.
Although it’s important to keep an eye on how your investments are performing, it’s also good not to lose sight of why you hold them. Bond returns may not be as strong going forward as we have become accustomed to in recent decades, but we believe they will continue to fulfill an important role as a diversifier for equities and other riskier assets you may have in your portfolio.
| Vanguard’s outlook for investors: Not bearish, but cautious |
| In Vanguard’s recently published global economic and investment outlook, Global Chief |
| Economist Joseph Davis and his team discuss various market and economic events 2016 |
| may bring, along with challenges and opportunities for investors. |
| Our forecast includes “frustratingly fragile” economic growth and more modest long-term |
| returns from the global stock and bond markets. The report cautions that for the decade ending |
| 2025, returns for a balanced portfolio are likely to be moderately below historical averages. |
| Our simulations indicate that the average annualized returns of a 60% equity/40% bond |
| portfolio for the decade are most likely to be centered in the 3%–5% range after inflation, |
| below the actual average after-inflation return of 5.5% for the same portfolio since 1926. |
| Even so, Vanguard’s steadfast belief in its principles for investing success—focusing on clear |
| goals, a suitable asset allocation, low costs, and long-term discipline—remains unchanged. |
| For more information about our expectations and the probability of various outcomes, see |
| Vanguard’s Economic and Investment Outlook, available at vanguard.com/research. |
| IMPORTANT: The projections or other information generated by the Vanguard Capital Markets Model® (VCMM) |
| regarding the likelihood of various investment outcomes are hypothetical in nature, do not reflect actual investment |
| results, and are not guarantees of future results. Distribution of return outcomes from VCMM, derived from |
| 10,000 simulations for U.S. equity returns and fixed income returns. Simulations as of September 30, 2015. |
| Results from the model may vary with each use and over time. For more information, please see page 9. |
8
Over a decade, the funds closely tracked their indexes
Every index fund aims to track the performance of its target index. That’s actually a taller order than you might think. Indexes incur no expenses, so they have a leg up from the start. Bond funds also have the challenge of negotiating prices, as bonds generally aren’t traded on central exchanges the way stocks are. And because these bond funds sample rather than replicate their benchmark indexes, the funds’ advisor has the challenge of putting together portfolios with a smaller number of bonds that nevertheless produce benchmark-like returns.
Over the decade ended December 31, 2015, the average annual return was 3.17% for the Short-Term Fund, 5.39% for the Intermediate-Term Fund, and 6.37% for the Long-Term Fund. The indexing skills of the fund’s advisor as well as their low expense ratio helped all three funds come in 15 basis points or less behind their benchmarks. The funds also outpaced the average returns of their peers.
To reach your long-term goals, be realistic and try to save more
Although there have been times when it felt as if stocks and bonds were riding a roller coaster, the markets have generally risen in recent years. The broad global stock market in particular has posted some impressive gains since its turnaround began in 2009.
But 2015 served as a reminder that markets aren’t always favorable. The U.S. stock and bond markets were basically flat, and international stocks and unhedged bonds finished in the red.
IMPORTANT: The projections or other information generated by the Vanguard Capital Markets Model (VCMM)
regarding the likelihood of various investment outcomes are hypothetical in nature, do not reflect actual
investment results, and are not guarantees of future results. VCMM results will vary with each use and over time.
The VCMM projections are based on a statistical analysis of historical data. Future returns may behave differently from the
historical patterns captured in the VCMM. More important, the VCMM may be underestimating extreme negative scenarios
unobserved in the historical period on which the model estimation is based.
The VCMM is a proprietary financial simulation tool developed and maintained by Vanguard’s primary investment research
and advice teams. The model forecasts distributions of future returns for a wide array of broad asset classes. Those asset
classes include U.S. and international equity markets, several maturities of the U.S. Treasury and corporate fixed income
markets, international fixed income markets, U.S. money markets, commodities, and certain alternative investment
strategies. The theoretical and empirical foundation for the VCMM is that the returns of various asset classes reflect the
compensation investors require for bearing different types of systematic risk (beta). At the core of the model are estimates
of the dynamic statistical relationship between risk factors and asset returns, obtained from statistical analysis based on
available monthly financial and economic data from as early as 1960. Using a system of estimated equations, the model
then applies a Monte Carlo simulation method to project the estimated interrelationships among risk factors and asset
classes as well as uncertainty and randomness over time. The model generates a large set of simulated outcomes for
each asset class over several time horizons. Forecasts are obtained by computing measures of central tendency in these
simulations. Results produced by the tool will vary with each use and over time.
9
In Vanguard’s recently updated long-term look at the economy and markets, our global economists explain why they expect economic growth to remain “frustratingly fragile,” and why their outlook for stock and bond markets is the most guarded since 2006. (For more details, see the box on page 8 and Vanguard’s Economic and Investment Outlook, available at vanguard.com/research.)
Given these muted expectations, what’s the best course of action? I’ve often encouraged shareholders to focus on the things they can control. That advice holds true today.
Consider saving more than you think you may need. That’s one way you can prepare for the volatility that may lie ahead, particularly as markets adjust to changes in policies from the Fed and other central banks.
And, as always, investors would be well-served to follow Vanguard’s principles for investing success:
• Goals. Create clear, appropriate investment goals.
• Balance. Develop a suitable asset allocation using broadly diversified funds.
• Cost. Minimize cost.
• Discipline. Maintain perspective and long-term discipline.
As with saving, each of these principles is within your control, and focusing on them can keep you on the right path.
As always, thank you for investing with Vanguard.
Sincerely,

F. William McNabb III
Chairman and Chief Executive Officer
January 19, 2016
10
Short-Term Bond Index Fund
Fund Profile
As of December 31, 2015
| Share-Class Characteristics | |||||
| Investor | Admiral | Institutional | Institutional | ||
| Shares | ETF Shares | Shares | Shares | Plus Shares | |
| Ticker Symbol | VBISX | BSV | VBIRX | VBITX | VBIPX |
| Expense Ratio1 | 0.20% | 0.10% | 0.10% | 0.07% | 0.05% |
| 30-Day SEC Yield | 1.37% | 1.43% | 1.43% | 1.46% | 1.51% |
| Financial Attributes | |||
| Barclays | |||
| 1–5 Year | |||
| Gov/ | Barclays | ||
| Credit | Aggregate | ||
| Float Adj | Float Adj | ||
| Fund | Index | Index | |
| Number of Bonds | 2,239 | 2,965 | 9,681 |
| Yield to Maturity | |||
| (before expenses) | 1.6% | 1.7% | 2.6% |
| Average Coupon | 1.9% | 2.2% | 3.1% |
| Average Duration | 2.7 years | 2.7 years | 5.8 years |
| Average Effective | |||
| Maturity | 2.8 years | 2.8 years | 7.9 years |
| Short-Term | |||
| Reserves | 0.6% | — | — |
| Sector Diversification (% of portfolio) | |
| Finance | 10.9% |
| Foreign | 7.1 |
| Industrial | 14.1 |
| Treasury/Agency | 66.3 |
| Utilities | 1.5 |
| Other | 0.1 |
The agency and mortgage-backed securities sectors may include issues from government-sponsored enterprises; such issues are
generally not backed by the full faith and credit of the U.S. government.
| Volatility Measures | ||
| Barclays | ||
| 1–5 Year | ||
| Gov/ | ||
| Credit | Barclays | |
| Float Adj | Aggregate Float | |
| Index | Adj Index | |
| R-Squared | 0.98 | 0.80 |
| Beta | 1.01 | 0.37 |
These measures show the degree and timing of the fund’s fluctuations compared with the indexes over 36 months.
| Distribution by Credit Quality (% of portfolio) | |
| U.S. Government | 66.3% |
| Aaa | 5.2 |
| Aa | 4.3 |
| A | 12.2 |
| Baa | 12.0 |
Credit-quality ratings are obtained from Barclays and are from Moody's, Fitch, and S&P. When ratings from all three agencies are
used, the median rating is shown. When ratings from two of the agencies are used, the lower rating for each issue is shown. "Not
Rated" is used to classify securities for which a rating is not available. Not rated securities include a fund's investment in
Vanguard Market Liquidity Fund or Vanguard Municipal Cash Management Fund, each of which invests in high-quality money
market instruments and may serve as a cash management vehicle for the Vanguard funds, trusts, and accounts. For more information
about these ratings, see the Glossary entry for Credit Quality.
| Distribution by Effective Maturity | |
| (% of portfolio) | |
| Under 1 Year | 1.5% |
| 1 - 3 Years | 57.9 |
| 3 - 5 Years | 40.6 |
1 The expense ratios shown are from the prospectus dated April 28, 2015, and represent estimated costs for the current fiscal year. For the fiscal
year ended December 31, 2015, the expense ratios were 0.16% for Investor Shares, 0.09% for ETF Shares, 0.09% for Admiral Shares, 0.06% for
Institutional Shares, and 0.04% for Institutional Plus Shares.
11
Short-Term Bond Index Fund
Investment Focus
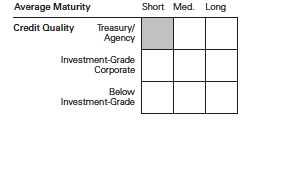
12
Short-Term Bond Index Fund
Performance Summary
All of the returns in this report represent past performance, which is not a guarantee of future results that may be achieved by the fund. (Current performance may be lower or higher than the performance data cited. For performance data current to the most recent month-end, visit our website at vanguard.com/performance.) Note, too, that both investment returns and principal value can fluctuate widely, so an investor’s shares, when sold, could be worth more or less than their original cost. The returns shown do not reflect taxes that a shareholder would pay on fund distributions or on the sale of fund shares.
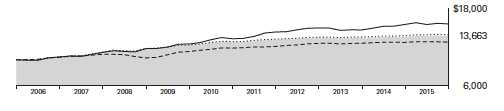
Cumulative Performance: December 31, 2005, Through December 31, 2015
Initial Investment of $10,000
| Average Annual Total Returns | |||||
| Periods Ended December 31, 2015 | |||||
| Final Value | |||||
| One | Five | Ten | of a $10,000 | ||
| Year | Years | Years | Investment | ||
| Short-Term Bond Index Fund Investor | |||||
| Shares | 0.85% | 1.39% | 3.17% | $13,663 | |
| Spliced Barclays U.S. 1–5 Year | |||||
| •••••••• | |||||
| Government/Credit Float Adjusted | |||||
| Index | 0.97 | 1.61 | 3.32 | 13,860 | |
| – – – – | 1–5 Year Investment-Grade Debt Funds | ||||
| Average | 0.25 | 1.52 | 2.44 | 12,730 | |
| Spliced Barclays U.S. Aggregate Float | |||||
| Adjusted Index | 0.44 | 3.25 | 4.52 | 15,559 | |
| For a benchmark description, see the Glossary. | |||||
| 1–5 Year Investment-Grade Debt Funds Average: Derived from data provided by Lipper, a Thomson Reuters Company. | |||||
| Since | Final Value | |||
| One | Five | Inception | of a $10,000 | |
| Year | Years | (4/3/2007) | Investment | |
| Short-Term Bond Index Fund | ||||
| ETF Shares Net Asset Value | 0.92% | 1.49% | 3.08% | $13,036 |
| Spliced Barclays U.S. 1–5 Year | ||||
| Government/Credit Float Adjusted Index | 0.97 | 1.61 | 3.14 | 13,100 |
| Spliced Barclays U.S. Aggregate Float | ||||
| Adjusted Index | 0.44 | 3.25 | 4.50 | 14,694 |
| "Since Inception" performance is calculated from the ETF Shares’ inception date for both the fund and its comparative standards. | ||||
See Financial Highlights for dividend and capital gains information.
13
Short-Term Bond Index Fund
| Average Annual Total Returns | ||||
| Periods Ended December 31, 2015 | ||||
| Final Value | ||||
| One | Five | Ten | of a $10,000 | |
| Year | Years | Years | Investment | |
| Short-Term Bond Index Fund Admiral Shares | 0.92% | 1.49% | 3.27% | $13,789 |
| Spliced Barclays U.S. 1–5 Year | ||||
| Government/Credit Float Adjusted Index | 0.97 | 1.61 | 3.32 | 13,860 |
| Spliced Barclays U.S. Aggregate Float | ||||
| Adjusted Index | 0.44 | 3.25 | 4.52 | 15,559 |
| Since | Final Value | ||
| One | Inception | of a $5,000,000 | |
| Year | (9/27/2011) | Investment | |
| Short-Term Bond Index Fund Institutional | |||
| Shares | 0.95% | 1.17% | $5,253,598 |
| Barclays U.S. 1–5 Year Government/Credit | |||
| Float Adjusted Index | 0.97 | 1.25 | 5,271,851 |
| Barclays U.S. Aggregate Float Adjusted | |||
| Index | 0.44 | 2.35 | 5,520,161 |
| "Since Inception" performance is calculated from the Institutional Shares’ inception date for both the fund and its comparative standards. | |||
| Since | Final Value | ||
| One | Inception | of a $100,000,000 | |
| Year | (9/29/2011) | Investment | |
| Short-Term Bond Index Fund Institutional Plus | |||
| Shares | 0.97% | 1.19% | $105,160,467 |
| Barclays U.S. 1–5 Year Government/Credit | |||
| Float Adjusted Index | 0.97 | 1.25 | 105,429,115 |
| Barclays U.S. Aggregate Float Adjusted Index | 0.44 | 2.29 | 110,106,734 |
| "Since Inception" performance is calculated from the Institutional Plus Shares’ inception date for both the fund and its comparative standards. | |||
| Cumulative Returns of ETF Shares: April 3, 2007, Through December 31, 2015 | |||
| Since | |||
| One | Five | Inception | |
| Year | Years | (4/3/2007) | |
| Short-Term Bond Index Fund ETF Shares Market | |||
| Price | 0.91% | 7.63% | 30.43% |
| Short-Term Bond Index Fund ETF Shares Net Asset | |||
| Value | 0.92 | 7.68 | 30.36 |
| Spliced Barclays U.S. 1–5 Year Government/Credit | |||
| Float Adjusted Index | 0.97 | 8.31 | 31.00 |
| "Since Inception" performance is calculated from the ETF Shares’ inception date for both the fund and its comparative standards. | |||
14
Short-Term Bond Index Fund
| Fiscal-Year Total Returns (%): December 31, 2005, Through December 31, 2015 | ||||
| Spliced | ||||
| Barclays | ||||
| 1–5 Year | ||||
| Gov/Credit | ||||
| Investor Shares | FA Index | |||
| Fiscal Year | Income Returns | Capital Returns | Total Returns | Total Returns |
| 2006 | 4.39% | -0.30% | 4.09% | 4.22% |
| 2007 | 4.79 | 2.43 | 7.22 | 7.27 |
| 2008 | 3.95 | 1.48 | 5.43 | 5.12 |
| 2009 | 2.91 | 1.37 | 4.28 | 4.62 |
| 2010 | 2.22 | 1.70 | 3.92 | 4.08 |
| 2011 | 1.85 | 1.11 | 2.96 | 3.13 |
| 2012 | 1.46 | 0.49 | 1.95 | 2.24 |
| 2013 | 1.10 | -1.03 | 0.07 | 0.29 |
| 2014 | 1.11 | 0.05 | 1.16 | 1.43 |
| 2015 | 1.23 | -0.38 | 0.85 | 0.97 |
| For a benchmark description, see the Glossary. | ||||
15
Short-Term Bond Index Fund
Financial Statements
Statement of Net Assets—Investments Summary
As of December 31, 2015
This Statement summarizes the fund’s holdings by asset type. Details are reported for each of the fund’s 50 largest individual holdings and for investments that, in total for any issuer, represent more than 1% of the fund’s net assets. The total value of smaller holdings is reported as a single amount within each category.
The fund reports a complete list of its holdings in regulatory filings four times in each fiscal year, at the quarter-ends. For the second and fourth fiscal quarters, the complete listing of the fund’s holdings is available electronically on vanguard.com and on the Securities and Exchange Commission’s website (sec.gov), or you can have it mailed to you without charge by calling 800-662-7447. For the first and third fiscal quarters, the fund files the lists with the SEC on Form N-Q. Shareholders can look up the fund’s Forms N-Q on the SEC’s website. Forms N-Q may also be reviewed and copied at the SEC’s Public Reference Room (see the back cover of this report for further information).
| Face | Market | Percentage | |||
| Maturity | Amount | Value• | of Net | ||
| Coupon | Date | ($000) | ($000) | Assets | |
| U.S. Government and Agency Obligations | |||||
| U.S. Government Securities | |||||
| United States Treasury Note/Bond | 1.500% | 11/30/19 | 729,865 | 727,128 | 1.7% |
| United States Treasury Note/Bond | 1.250% | 11/30/18 | 717,184 | 715,950 | 1.7% |
| United States Treasury Note/Bond | 1.625% | 11/30/20 | 707,950 | 703,858 | 1.7% |
| United States Treasury Note/Bond | 1.375% | 8/31/20 | 635,075 | 624,952 | 1.5% |
| United States Treasury Note/Bond | 0.625% | 9/30/17 | 565,125 | 561,237 | 1.3% |
| United States Treasury Note/Bond | 1.625% | 7/31/20 | 543,474 | 540,925 | 1.3% |
| United States Treasury Note/Bond | 1.375% | 2/29/20 | 536,907 | 530,781 | 1.3% |
| United States Treasury Note/Bond | 1.750% | 12/31/20 | 530,600 | 530,271 | 1.2% |
| United States Treasury Note/Bond | 1.375% | 10/31/20 | 530,380 | 521,098 | 1.2% |
| United States Treasury Note/Bond | 1.375% | 3/31/20 | 494,988 | 488,954 | 1.2% |
| United States Treasury Note/Bond | 1.000% | 5/31/18 | 479,115 | 476,719 | 1.1% |
| United States Treasury Note/Bond | 1.625% | 8/31/19 | 461,569 | 462,940 | 1.1% |
| United States Treasury Note/Bond | 1.500% | 5/31/19 | 458,140 | 458,571 | 1.1% |
| United States Treasury Note/Bond | 1.000% | 8/15/18 | 433,954 | 431,311 | 1.0% |
| United States Treasury Note/Bond | 1.250% | 1/31/20 | 433,842 | 427,200 | 1.0% |
| United States Treasury Note/Bond | 1.500% | 5/31/20 | 418,712 | 415,245 | 1.0% |
| United States Treasury Note/Bond | 0.750% | 1/15/17 | 414,800 | 414,476 | 1.0% |
| United States Treasury Note/Bond | 1.500% | 2/28/19 | 402,200 | 403,455 | 1.0% |
| United States Treasury Note/Bond | 0.875% | 11/30/17 | 402,328 | 401,197 | 0.9% |
| United States Treasury Note/Bond | 1.375% | 9/30/18 | 376,790 | 378,026 | 0.9% |
| United States Treasury Note/Bond | 1.750% | 9/30/19 | 368,231 | 370,764 | 0.9% |
| United States Treasury Note/Bond | 1.000% | 3/15/18 | 362,819 | 361,628 | 0.9% |
| United States Treasury Note/Bond | 0.875% | 4/15/17 | 348,715 | 348,659 | 0.8% |
| United States Treasury Note/Bond | 1.500% | 1/31/19 | 342,060 | 343,288 | 0.8% |
| United States Treasury Note/Bond | 1.625% | 6/30/19 | 336,566 | 338,091 | 0.8% |
| United States Treasury Note/Bond | 0.875% | 4/30/17 | 336,019 | 335,861 | 0.8% |
| United States Treasury Note/Bond | 1.375% | 9/30/20 | 339,758 | 333,918 | 0.8% |
| United States Treasury Note/Bond | 1.625% | 4/30/19 | 321,394 | 323,303 | 0.8% |
| United States Treasury Note/Bond | 1.000% | 9/15/17 | 321,935 | 321,784 | 0.8% |
| United States Treasury Note/Bond | 0.625% | 8/31/17 | 314,972 | 312,953 | 0.7% |
| United States Treasury Note/Bond | 0.500% | 7/31/17 | 314,520 | 312,161 | 0.7% |
16
Short-Term Bond Index Fund
| Face | Market | Percentage | ||||
| Maturity | Amount | Value• | of Net | |||
| Coupon | Date | ($000) | ($000) | Assets | ||
| United States Treasury Note/Bond | 1.500% | 8/31/18 | 308,780 | 310,855 | 0.7% | |
| United States Treasury Note/Bond | 1.000% | 9/15/18 | 312,335 | 310,186 | 0.7% | |
| United States Treasury Note/Bond | 1.375% | 4/30/20 | 312,770 | 308,713 | 0.7% | |
| United States Treasury Note/Bond | 0.750% | 6/30/17 | 308,210 | 307,248 | 0.7% | |
| United States Treasury Note/Bond | 0.875% | 10/15/17 | 306,475 | 305,565 | 0.7% | |
| United States Treasury Note/Bond | 0.875% | 8/15/17 | 298,815 | 298,161 | 0.7% | |
| United States Treasury Note/Bond | 0.625% | 5/31/17 | 298,795 | 297,486 | 0.7% | |
| United States Treasury Note/Bond | 1.625% | 7/31/19 | 294,605 | 295,663 | 0.7% | |
| United States Treasury Note/Bond | 0.875% | 6/15/17 | 295,100 | 294,823 | 0.7% | |
| United States Treasury Note/Bond | 0.625% | 2/15/17 | 293,885 | 293,197 | 0.7% | |
| United States Treasury Note/Bond | 1.000% | 3/31/17 | 281,775 | 282,260 | 0.7% | |
| United States Treasury Note/Bond | 0.875% | 2/28/17 | 282,024 | 282,199 | 0.7% | |
| United States Treasury Note/Bond | 0.625% | 11/30/17 | 279,970 | 277,697 | 0.7% | |
| United States Treasury Note/Bond | 0.875% | 7/15/18 | 278,540 | 276,103 | 0.6% | |
| United States Treasury Note/Bond | 1.625% | 3/31/19 | 268,390 | 270,151 | 0.6% | |
| United States Treasury Note/Bond | 0.750% | 2/28/18 | 256,685 | 254,519 | 0.6% | |
| United States Treasury Note/Bond | 1.000% | 5/15/18 | 254,995 | 253,799 | 0.6% | |
| United States Treasury Note/Bond | 1.875% | 10/31/17 | 249,746 | 253,415 | 0.6% | |
| United States Treasury Note/Bond | 0.875% | 11/15/17 | 252,417 | 251,589 | 0.6% | |
| United States Treasury | ||||||
| Note/Bond | 0.500%–9.125% | 3/31/16–10/31/20 | 6,303,137 | 6,325,474 | 14.9% | |
| 25,665,807 | 60.6% | |||||
| Agency Bonds and Notes | ||||||
| 1 Federal Home Loan Banks | 0.625%–5.375% | 3/10/17–12/11/20 | 496,715 | 508,427 | 1.2% | |
| 2 Federal Home Loan | ||||||
| Mortgage Corp. | 0.500%–5.500% | 1/27/17–5/1/20 | 711,236 | 714,023 | 1.7% | |
| 2 Federal National | ||||||
| Mortgage Assn. | 0.000%–5.000% | 1/30/17–12/28/20 | 923,465 | 920,880 | 2.2% | |
| Agency Bonds and Notes—Other † | 142,437 | 0.3% | ||||
| 2,285,767 | 5.4% | |||||
| Total U.S. Government and Agency Obligations (Cost $28,037,051) | 27,951,574 | 66.0% | ||||
| Corporate Bonds | ||||||
| Finance | ||||||
| 3 Banking † | 3,725,626 | 8.8% | ||||
| Brokerage † | 100,271 | 0.2% | ||||
| 3 Finance Companies † | 194,953 | 0.5% | ||||
| Insurance † | 406,473 | 1.0% | ||||
| Other Finance † | 3,003 | 0.0% | ||||
| 3 Real Estate Investment Trusts † | 223,525 | 0.5% | ||||
| 4,653,851 | 11.0% | |||||
| Industrial | ||||||
| Basic Industry † | 327,691 | 0.8% | ||||
| Capital Goods † | 589,516 | 1.4% | ||||
| 3 Communication † | 737,400 | 1.7% | ||||
| Consumer Cyclical † | 826,045 | 2.0% | ||||
| 3 Consumer Noncyclical † | 1,567,769 | 3.7% | ||||
| 3 Energy † | 1,003,445 | 2.4% | ||||
| Other Industrial † | 3,578 | 0.0% | ||||
| 3 Technology † | 739,380 | 1.7% | ||||
| 3 Transportation † | 140,807 | 0.3% | ||||
| 5,935,631 | 14.0% | |||||
17
Short-Term Bond Index Fund
| Face | Market | Percentage | ||
| Maturity | Amount | Value• | of Net | |
| Coupon Date | ($000) | ($000) | Assets | |
| Utilities | ||||
| Electric † | 561,253 | 1.3% | ||
| Natural Gas † | 55,684 | 0.1% | ||
| Other Utility † | 215 | 0.0% | ||
| 617,152 | 1.4% | |||
| Total Corporate Bonds (Cost $11,276,219) | 11,206,634 | 26.4% | ||
| Sovereign Bonds (U.S. Dollar-Denominated) | ||||
| European Investment Bank | 0.875%–5.125% 12/15/16–12/15/20 | 474,540 | 475,590 | 1.1% |
| FMS Wertmanagement | ||||
| AoeR | 0.625%–1.750% 1/30/17–3/17/20 | 64,075 | 63,830 | 0.1% |
| 4 KFW | 0.750%–4.875% 10/5/16–10/1/20 | 456,120 | 460,824 | 1.1% |
| 3 Sovereign Bonds | ||||
| (U.S. Dollar-Denominated)—Other † | 1,938,178 | 4.6% | ||
| Total Sovereign Bonds (Cost $2,947,933) | 2,938,422 | 6.9% | ||
| Taxable Municipal Bonds (Cost $45,307) † | 45,342 | 0.1% | ||
| Shares | ||||
| Temporary Cash Investment | ||||
| Money Market Fund | ||||
| 5 Vanguard Market Liquidity Fund | ||||
| (Cost $568,741) | 0.363% | 568,740,878 | 568,741 | 1.4% |
| Total Investments (Cost $42,875,251) | 42,710,713 | 100.8% | ||
| Amount | ||||
| ($000) | ||||
| Other Assets and Liabilities | ||||
| Other Assets | ||||
| Investment in Vanguard | 3,649 | |||
| Receivables for Investment Securities Sold | 253,489 | |||
| Receivables for Accrued Income | 205,294 | |||
| Receivables for Capital Shares Issued | 42,154 | |||
| Other Assets | 31,302 | |||
| Total Other Assets | 535,888 | 1.3% | ||
| Liabilities | ||||
| Payables for Investment Securities Purchased | (797,931) | |||
| Payables for Capital Shares Redeemed | (42,131) | |||
| Payables for Distributions | (3,260) | |||
| Payables to Vanguard | (15,821) | |||
| Other Liabilities | (8,133) | |||
| Total Liabilities | (867,276) | (2.1%) | ||
| Net Assets | 42,379,325 | 100.0% | ||
18
| Short-Term Bond Index Fund | |
| At December 31, 2015, net assets consisted of: | |
| Amount | |
| ($000) | |
| Paid-in Capital | 42,543,835 |
| Undistributed Net Investment Income | 28 |
| Accumulated Net Realized Losses | — |
| Unrealized Appreciation (Depreciation) | (164,538) |
| Net Assets | 42,379,325 |
| Investor Shares—Net Assets | |
| Applicable to 221,103,601 outstanding $.001 par value shares of | |
| beneficial interest (unlimited authorization) | 2,307,003 |
| Net Asset Value Per Share—Investor Shares | $10.43 |
| ETF Shares—Net Assets | |
| Applicable to 218,912,541 outstanding $.001 par value shares of | |
| beneficial interest (unlimited authorization) | 17,401,550 |
| Net Asset Value Per Share—ETF Shares | $79.49 |
| Admiral Shares—Net Assets | |
| Applicable to 1,405,252,685 outstanding $.001 par value shares of | |
| beneficial interest (unlimited authorization) | 14,662,473 |
| Net Asset Value Per Share—Admiral Shares | $10.43 |
| Institutional Shares—Net Assets | |
| Applicable to 431,840,208 outstanding $.001 par value shares of | |
| beneficial interest (unlimited authorization) | 4,505,837 |
| Net Asset Value Per Share—Institutional Shares | $10.43 |
| Institutional Plus Shares—Net Assets | |
| Applicable to 335,676,186 outstanding $.001 par value shares of | |
| beneficial interest (unlimited authorization) | 3,502,462 |
| Net Asset Value Per Share—Institutional Plus Shares | $10.43 |
• See Note A in Notes to Financial Statements.
† Represents the aggregate value, by category, of securities that are not among the 50 largest holdings and, in total for any issuer, represent
1% or less of net assets.
1 The issuer operates under a congressional charter; its securities are generally neither guaranteed by the U.S. Treasury nor backed by the full
faith and credit of the U.S. government.
2 The issuer was placed under federal conservatorship in September 2008; since that time, its daily operations have been managed by the
Federal Housing Finance Agency and it receives capital from the U.S. Treasury, as needed to maintain a positive net worth, in exchange for
senior preferred stock.
3 Certain of the fund’s securities are exempt from registration under Rule 144A of the Securities Act of 1933. Such securities may be sold in
transactions exempt from registration, normally to qualified institutional buyers. At December 31, 2015, the aggregate value of these
securities was $301,372,000, representing 0.7% of net assets.
4 Guaranteed by the Federal Republic of Germany.
5 Affiliated money market fund available only to Vanguard funds and certain trusts and accounts managed by Vanguard. Rate shown is the
7-day yield.
See accompanying Notes, which are an integral part of the Financial Statements.
19
Short-Term Bond Index Fund
Statement of Operations
| Year Ended | |
| December 31, 2015 | |
| ($000) | |
| Investment Income | |
| Income | |
| Interest1 | 563,182 |
| Total Income | 563,182 |
| Expenses | |
| The Vanguard Group—Note B | |
| Investment Advisory Services | 1,019 |
| Management and Administrative—Investor Shares | 3,140 |
| Management and Administrative—ETF Shares | 12,122 |
| Management and Administrative—Admiral Shares | 10,121 |
| Management and Administrative—Institutional Shares | 2,121 |
| Management and Administrative—Institutional Plus Shares | 893 |
| Marketing and Distribution—Investor Shares | 650 |
| Marketing and Distribution—ETF Shares | 1,672 |
| Marketing and Distribution—Admiral Shares | 1,746 |
| Marketing and Distribution—Institutional Shares | 378 |
| Marketing and Distribution—Institutional Plus Shares | 221 |
| Custodian Fees | 224 |
| Auditing Fees | 48 |
| Shareholders’ Reports—Investor Shares | 42 |
| Shareholders’ Reports—ETF Shares | 368 |
| Shareholders’ Reports—Admiral Shares | 253 |
| Shareholders’ Reports—Institutional Shares | 17 |
| Shareholders’ Reports—Institutional Plus Shares | 12 |
| Trustees’ Fees and Expenses | 29 |
| Total Expenses | 35,076 |
| Net Investment Income | 528,106 |
| Realized Net Gain (Loss) | |
| Investment Securities Sold | 46,617 |
| Futures Contracts | 87 |
| Realized Net Gain (Loss) | 46,704 |
| Change in Unrealized Appreciation (Depreciation) of Investment Securities | (219,526) |
| Net Increase (Decrease) in Net Assets Resulting from Operations | 355,284 |
| 1 Interest income from an affiliated company of the fund was $340,000. | |
See accompanying Notes, which are an integral part of the Financial Statements.
20
Short-Term Bond Index Fund
Statement of Changes in Net Assets
| Year Ended December 31, | ||
| 2015 | 2014 | |
| ($000) | ($000) | |
| Increase (Decrease) in Net Assets | ||
| Operations | ||
| Net Investment Income | 528,106 | 436,769 |
| Realized Net Gain (Loss) | 46,704 | 73,646 |
| Change in Unrealized Appreciation (Depreciation) | (219,526) | (42,803) |
| Net Increase (Decrease) in Net Assets Resulting from Operations | 355,284 | 467,612 |
| Distributions | ||
| Net Investment Income | ||
| Investor Shares | (30,328) | (31,983) |
| ETF Shares | (213,621) | (175,470) |
| Admiral Shares | (183,186) | (93,269) |
| Signal Shares | — | (58,165) |
| Institutional Shares | (59,798) | (50,579) |
| Institutional Plus Shares | (41,145) | (27,303) |
| Realized Capital Gain1 | ||
| Investor Shares | (2,326) | (3,865) |
| ETF Shares | (16,283) | (21,832) |
| Admiral Shares | (13,790) | (17,249) |
| Signal Shares | — | (1,282) |
| Institutional Shares | (4,296) | (6,217) |
| Institutional Plus Shares | (3,151) | (3,512) |
| Total Distributions | (567,924) | (490,726) |
| Capital Share Transactions | ||
| Investor Shares | (350,525) | (335,640) |
| ETF Shares | 1,832,192 | 1,738,776 |
| Admiral Shares | 1,526,203 | 8,220,185 |
| Signal Shares | — | (7,071,916) |
| Institutional Shares | 22,761 | 1,228,775 |
| Institutional Plus Shares | 1,006,832 | 649,762 |
| Net Increase (Decrease) from Capital Share Transactions | 4,037,463 | 4,429,942 |
| Total Increase (Decrease) | 3,824,823 | 4,406,828 |
| Net Assets | ||
| Beginning of Period | 38,554,502 | 34,147,674 |
| End of Period2 | 42,379,325 | 38,554,502 |
1 Includes fiscal 2015 and 2014 short-term gain distributions totaling $0 and $7,265,000, respectively. Short-term gain distributions are treated as ordinary income dividends for tax purposes.
2 Net Assets—End of Period includes undistributed (overdistributed) net investment income of $28,000 and $0.
See accompanying Notes, which are an integral part of the Financial Statements.
21
Short-Term Bond Index Fund
Financial Highlights
| Investor Shares | |||||
| For a Share Outstanding | Year Ended December 31, | ||||
| Throughout Each Period | 2015 | 2014 | 2013 | 2012 | 2011 |
| Net Asset Value, Beginning of Period | $10.48 | $10.49 | $10.63 | $10.61 | $10.55 |
| Investment Operations | |||||
| Net Investment Income | .130 | .116 | .116 | .153 | .193 |
| Net Realized and Unrealized Gain (Loss) | |||||
| on Investments | (.040) | .005 | (.109) | .052 | .117 |
| Total from Investment Operations | .090 | .121 | .007 | .205 | .310 |
| Distributions | |||||
| Dividends from Net Investment Income | (.130) | (.116) | (.116) | (.153) | (.193) |
| Distributions from Realized Capital Gains | (. 010) | (. 015) | (. 031) | (. 032) | (. 057) |
| Total Distributions | (.140) | (.131) | (.147) | (.185) | (. 250) |
| Net Asset Value, End of Period | $10.43 | $10.48 | $10.49 | $10.63 | $10.61 |
| Total Return1 | 0.85% | 1.16% | 0.07% | 1.95% | 2.96% |
| Ratios/Supplemental Data | |||||
| Net Assets, End of Period (Millions) | $2,307 | $2,667 | $3,003 | $3,185 | $3,802 |
| Ratio of Total Expenses to Average Net Assets | 0.16% | 0.20% | 0.20% | 0.20% | 0.22% |
| Ratio of Net Investment Income to | |||||
| Average Net Assets | 1.23% | 1.10% | 1.09% | 1.44% | 1.81% |
| Portfolio Turnover Rate2 | 52% | 45% | 50% | 51% | 67% |
1 Total returns do not include account service fees that may have applied in the periods shown. Fund prospectuses provide information about any applicable account service fees.
2 Excludes the value of portfolio securities received or delivered as a result of in-kind purchases or redemptions of the fund’s capital shares,
including ETF Creation Units.
See accompanying Notes, which are an integral part of the Financial Statements.
22
Short-Term Bond Index Fund
Financial Highlights
| ETF Shares | |||||
| For a Share Outstanding | Year Ended December 31, | ||||
| Throughout Each Period | 2015 | 2014 | 2013 | 2012 | 2011 |
| Net Asset Value, Beginning of Period | $79.87 | $79.89 | $80.94 | $80.80 | $80.35 |
| Investment Operations | |||||
| Net Investment Income | 1.039 | .959 | .950 | 1.239 | 1.538 |
| Net Realized and Unrealized Gain (Loss) | |||||
| on Investments | (.303) | .094 | (. 813) | .384 | .885 |
| Total from Investment Operations | .736 | 1.053 | .137 | 1.623 | 2.423 |
| Distributions | |||||
| Dividends from Net Investment Income | (1.039) | (.959) | (.950) | (1.239) | (1.538) |
| Distributions from Realized Capital Gains | (.077) | (.114) | (.237) | (.244) | (.435) |
| Total Distributions | (1.116) | (1.073) | (1.187) | (1.483) | (1.973) |
| Net Asset Value, End of Period | $79.49 | $79.87 | $79.89 | $80.94 | $80.80 |
| Total Return | 0.92% | 1.32% | 0.17% | 2.02% | 3.04% |
| Ratios/Supplemental Data | |||||
| Net Assets, End of Period (Millions) | $17,402 | $15,655 | $13,926 | $9,292 | $7,482 |
| Ratio of Total Expenses to Average Net Assets | 0.09% | 0.10% | 0.10% | 0.10% | 0.11% |
| Ratio of Net Investment Income to | |||||
| Average Net Assets | 1.30% | 1.20% | 1.19% | 1.54% | 1.92% |
| Portfolio Turnover Rate1 | 52% | 45% | 50% | 51% | 67% |
| 1 Excludes the value of portfolio securities received or delivered as a result of in-kind purchases or redemptions of the fund’s capital shares, including ETF Creation Units. | |||||
See accompanying Notes, which are an integral part of the Financial Statements.
23
Short-Term Bond Index Fund
Financial Highlights
| Admiral Shares | |||||
| For a Share Outstanding | Year Ended December 31, | ||||
| Throughout Each Period | 2015 | 2014 | 2013 | 2012 | 2011 |
| Net Asset Value, Beginning of Period | $10.48 | $10.49 | $10.63 | $10.61 | $10.55 |
| Investment Operations | |||||
| Net Investment Income | .137 | .126 | .127 | .164 | .205 |
| Net Realized and Unrealized Gain (Loss) | |||||
| on Investments | (.040) | .005 | (.109) | .052 | .117 |
| Total from Investment Operations | .097 | .131 | .018 | .216 | .322 |
| Distributions | |||||
| Dividends from Net Investment Income | (.137) | (.126) | (.127) | (.164) | (.205) |
| Distributions from Realized Capital Gains | (. 010) | (. 015) | (. 031) | (. 032) | (. 057) |
| Total Distributions | (.147) | (.141) | (.158) | (.196) | (. 262) |
| Net Asset Value, End of Period | $10.43 | $10.48 | $10.49 | $10.63 | $10.61 |
| Total Return1 | 0.92% | 1.26% | 0.17% | 2.05% | 3.08% |
| Ratios/Supplemental Data | |||||
| Net Assets, End of Period (Millions) | $14,662 | $13,212 | $5,035 | $4,401 | $4,094 |
| Ratio of Total Expenses to Average Net Assets | 0.09% | 0.10% | 0.10% | 0.10% | 0.11% |
| Ratio of Net Investment Income to | |||||
| Average Net Assets | 1.30% | 1.20% | 1.19% | 1.54% | 1.92% |
| Portfolio Turnover Rate2 | 52% | 45% | 50% | 51% | 67% |
1 Total returns do not include account service fees that may have applied in the periods shown. Fund prospectuses provide information about any applicable account service fees.
2 Excludes the value of portfolio securities received or delivered as a result of in-kind purchases or redemptions of the fund’s capital shares,
including ETF Creation Units.
See accompanying Notes, which are an integral part of the Financial Statements.
24
Short-Term Bond Index Fund
Financial Highlights
| Institutional Shares | |||||
| Sept. 27, | |||||
| 20111 to | |||||
| For a Share Outstanding | Year Ended December 31, | Dec. 31, | |||
| Throughout Each Period | 2015 | 2014 | 2013 | 2012 | 2011 |
| Net Asset Value, Beginning of Period | $10.48 | $10.49 | $10.63 | $10.61 | $10.66 |
| Investment Operations | |||||
| Net Investment Income | .140 | .130 | .130 | .167 | .050 |
| Net Realized and Unrealized Gain (Loss) | |||||
| on Investments | (.040) | .005 | (.109) | .052 | (.001) |
| Total from Investment Operations | .100 | .135 | .021 | .219 | .049 |
| Distributions | |||||
| Dividends from Net Investment Income | (.140) | (.130) | (.130) | (.167) | (.050) |
| Distributions from Realized Capital Gains | (. 010) | (. 015) | (. 031) | (. 032) | (. 049) |
| Total Distributions | (.150) | (.145) | (.161) | (.199) | (. 099) |
| Net Asset Value, End of Period | $10.43 | $10.48 | $10.49 | $10.63 | $10.61 |
| Total Return | 0.95% | 1.29% | 0.20% | 2.08% | 0.47% |
| Ratios/Supplemental Data | |||||
| Net Assets, End of Period (Millions) | $4,506 | $4,505 | $3,282 | $2,652 | $843 |
| Ratio of Total Expenses to Average Net Assets | 0.06% | 0.07% | 0.07% | 0.07% | 0.07%2 |
| Ratio of Net Investment Income to | |||||
| Average Net Assets | 1.33% | 1.23% | 1.22% | 1.57% | 1.96%2 |
| Portfolio Turnover Rate 3 | 52% | 45% | 50% | 51% | 67% |
| 1 Inception. | |||||
| 2 Annualized. | |||||
| 3 Excludes the value of portfolio securities received or delivered as a result of in-kind purchases or redemptions of the fund’s capital shares, including ETF Creation Units. | |||||
See accompanying Notes, which are an integral part of the Financial Statements.
25
Short-Term Bond Index Fund
Financial Highlights
| Institutional Plus Shares | |||||
| Sept. 29, | |||||
| 20111 to | |||||
| For a Share Outstanding | Year Ended December 31, | Dec. 31, | |||
| Throughout Each Period | 2015 | 2014 | 2013 | 2012 | 2011 |
| Net Asset Value, Beginning of Period | $10.48 | $10.49 | $10.63 | $10.61 | $10.66 |
| Investment Operations | |||||
| Net Investment Income | .142 | .132 | .132 | .169 | .051 |
| Net Realized and Unrealized Gain (Loss) | |||||
| on Investments | (.040) | .005 | (.109) | .052 | (.001) |
| Total from Investment Operations | .102 | .137 | .023 | . 221 | .050 |
| Distributions | |||||
| Dividends from Net Investment Income | (.142) | (.132) | (.132) | (.169) | (. 051) |
| Distributions from Realized Capital Gains | (. 010) | (. 015) | (. 031) | (. 032) | (. 049) |
| Total Distributions | (.152) | (.147) | (.163) | (. 201) | (.100) |
| Net Asset Value, End of Period | $10.43 | $10.48 | $10.49 | $10.63 | $10.61 |
| Total Return | 0.97% | 1.31% | 0.22% | 2.10% | 0.47% |
| Ratios/Supplemental Data | |||||
| Net Assets, End of Period (Millions) | $3,502 | $2,515 | $1,868 | $1,103 | $711 |
| Ratio of Total Expenses to Average Net Assets | 0.04% | 0.05% | 0.05% | 0.05% | 0.05%2 |
| Ratio of Net Investment Income to | |||||
| Average Net Assets | 1.35% | 1.25% | 1.24% | 1.59% | 1.98%2 |
| Portfolio Turnover Rate 3 | 52% | 45% | 50% | 51% | 67% |
1 Inception.
2 Annualized.
3 Excludes the value of portfolio securities received or delivered as a result of in-kind purchases or redemptions of the fund’s capital shares,
including ETF Creation Units.
See accompanying Notes, which are an integral part of the Financial Statements.
26
Short-Term Bond Index Fund
Notes to Financial Statements
Vanguard Short-Term Bond Index Fund is registered under the Investment Company Act of 1940 as an open-end investment company, or mutual fund. Certain of the fund’s investments are in corporate debt instruments; the issuers’ abilities to meet their obligations may be affected by economic developments in their respective industries. The fund offers five classes of shares: Investor Shares, ETF Shares, Admiral Shares, Institutional Shares, and Institutional Plus Shares. Investor Shares are available to any investor who meets the fund’s minimum purchase requirements. ETF Shares are listed for trading on Nasdaq; they can be purchased and sold through a broker. Admiral Shares, Institutional Shares, and Institutional Plus Shares are designed for investors who meet certain administrative, service, and account-size criteria. Prior to October 24, 2014, the fund offered Signal Shares. Effective at the close of business on October 24, 2014, the Signal Shares were converted to Admiral Shares.
A. The following significant accounting policies conform to generally accepted accounting principles for U.S. investment companies. The fund consistently follows such policies in preparing its financial statements.
1. Security Valuation: Securities are valued as of the close of trading on the New York Stock Exchange (generally 4 p.m., Eastern time) on the valuation date. Bonds, and temporary cash investments acquired over 60 days to maturity, are valued using the latest bid prices or using valuations based on a matrix system (which considers such factors as security prices, yields, maturities, and ratings), both as furnished by independent pricing services. Structured debt securities, including mortgages and asset-backed securities, are valued using the latest bid prices or using valuations based on a matrix system that considers such factors as issuer, tranche, nominal or option-adjusted spreads, weighted average coupon, weighted average maturity, credit enhancements, and collateral. Investments in Vanguard Market Liquidity Fund are valued at that fund’s net asset value. Other temporary cash investments are valued at amortized cost, which approximates market value. Securities for which market quotations are not readily available, or whose values have been affected by events occurring before the fund’s pricing time but after the close of the securities’ primary markets, are valued by methods deemed by the board of trustees to represent fair value.
2. Futures Contracts: The fund uses futures contracts to invest in fixed income asset classes with greater efficiency and lower cost than is possible through direct investment, to add value when these instruments are attractively priced, or to adjust sensitivity to changes in interest rates. The primary risks associated with the use of futures contracts are imperfect correlation between changes in market values of bonds held by the fund and the prices of futures contracts, and the possibility of an illiquid market. Counterparty risk involving futures is mitigated because a regulated clearinghouse is the counterparty instead of the clearing broker. To further mitigate counterparty risk, the fund trades futures contracts on an exchange, monitors the financial strength of its clearing brokers and clearinghouse, and has entered into clearing agreements with its clearing brokers. The clearinghouse imposes initial margin requirements to secure the fund’s performance and requires daily settlement of variation margin representing changes in the market value of each contract.
Futures contracts are valued at their quoted daily settlement prices. The aggregate settlement values of the contracts are not recorded in the Statement of Net Assets. Fluctuations in the value of the contracts are recorded in the Statement of Net Assets as an asset (liability) and in the Statement of Operations as unrealized appreciation (depreciation) until the contracts are closed, when they are recorded as realized futures gains (losses).
During the year ended December 31, 2015, the fund’s average investments in long and short futures contracts each represented 0% of net assets, based on the average of aggregate settlement values at each quarter-end during the period. The fund had no open futures contracts at December 31, 2015.
27
Short-Term Bond Index Fund
3. Federal Income Taxes: The fund intends to continue to qualify as a regulated investment company and distribute all of its taxable income. Management has analyzed the fund’s tax positions taken for all open federal income tax years (December 31, 2012–2015), and has concluded that no provision for federal income tax is required in the fund’s financial statements.
4. Distributions: Distributions from net investment income are declared daily by all share classes except ETF Shares, and paid on the first business day of the following month. Monthly income dividends from ETF Shares, and annual distributions from realized capital gains, if any, are recorded on the ex-dividend date.
5. Credit Facility: The fund and certain other funds managed by The Vanguard Group (“Vanguard”) participate in a $3 billion committed credit facility provided by a syndicate of lenders pursuant to a credit agreement that may be renewed annually; each fund is individually liable for its borrowings, if any, under the credit facility. Borrowings may be utilized for temporary and emergency purposes, and are subject to the fund’s regulatory and contractual borrowing restrictions. The participating funds are charged administrative fees and an annual commitment fee of 0.06% of the undrawn amount of the facility; these fees are allocated to the funds based on a method approved by the fund’s board of trustees and included in Management and Administrative expenses on the fund’s Statement of Operations. Any borrowings under this facility bear interest at a rate equal to the higher of the federal funds rate or LIBOR reference rate plus an agreed-upon spread.
The fund had no borrowings outstanding at December 31, 2015, or at any time during the period then ended.
6. Other: Interest income includes income distributions received from Vanguard Market Liquidity Fund and is accrued daily. Premiums and discounts on debt securities purchased are amortized and accreted, respectively, to interest income over the lives of the respective securities. Security transactions are accounted for on the date securities are bought or sold. Costs used to determine realized gains (losses) on the sale of investment securities are those of the specific securities sold.
Each class of shares has equal rights as to assets and earnings, except that each class separately bears certain class-specific expenses related to maintenance of shareholder accounts (included in Management and Administrative expenses) and shareholder reporting. Marketing and distribution expenses are allocated to each class of shares based on a method approved by the board of trustees. Income, other non-class-specific expenses, and gains and losses on investments are allocated to each class of shares based on its relative net assets.
B. In accordance with the terms of a Funds’ Service Agreement (the “FSA”) between Vanguard and the fund, Vanguard furnishes to the fund investment advisory, corporate management, administrative, marketing, and distribution services at Vanguard’s cost of operations (as defined by the FSA). These costs of operations are allocated to the fund based on methods and guidelines approved by the board of trustees. Vanguard does not require reimbursement in the current period for certain costs of operations (such as deferred compensation/benefits and risk/insurance costs); the fund’s liability for these costs of operations is included in Payables to Vanguard on the Statement of Net Assets.
Upon the request of Vanguard, the fund may invest up to 0.40% of its net assets as capital in Vanguard. At December 31, 2015, the fund had contributed to Vanguard capital in the amount of $3,649,000, representing 0.01% of the fund’s net assets and 1.46% of Vanguard’s capitalization. The fund’s trustees and officers are also directors and employees, respectively, of Vanguard.
28
Short-Term Bond Index Fund
C. Various inputs may be used to determine the value of the fund’s investments. These inputs are summarized in three broad levels for financial statement purposes. The inputs or methodologies used to value securities are not necessarily an indication of the risk associated with investing in those securities.
Level 1—Quoted prices in active markets for identical securities.
Level 2—Other significant observable inputs (including quoted prices for similar securities, interest rates, prepayment speeds, credit risk, etc.).
Level 3—Significant unobservable inputs (including the fund’s own assumptions used to determine the fair value of investments).
The following table summarizes the market value of the fund’s investments as of December 31, 2015, based on the inputs used to value them:
| Level 1 | Level 2 | Level 3 | |
| Investments | ($000) | ($000) | ($000) |
| U.S. Government and Agency Obligations | — | 27,951,574 | — |
| Corporate Bonds | — | 11,206,634 | — |
| Sovereign Bonds | — | 2,938,422 | — |
| Taxable Municipal Bonds | — | 45,342 | — |
| Temporary Cash Investments | 568,741 | — | — |
| Total | 568,741 | 42,141,972 | — |
D. Capital gain distributions are determined on a tax basis and may differ from realized capital gains for financial reporting purposes. Differences may be permanent or temporary. Permanent differences are reclassified among capital accounts in the financial statements to reflect their tax character. Temporary differences arise when gains or losses are recognized in different periods for financial statement and tax purposes. These differences will reverse at some time in the future.
During the year ended December 31, 2015, the fund realized $9,027,000 of net capital gains resulting from in-kind redemptions—in which shareholders exchanged fund shares for securities held by the fund rather than for cash. Because such gains are not taxable to the fund, and are not distributed to shareholders, they have been reclassified from accumulated net realized losses to paid-in capital.
The fund used a tax accounting practice to treat a portion of the price of capital shares redeemed during the year as distributions from realized capital gains. Accordingly, the fund has reclassified $6,934,000 from accumulated net realized gains to paid-in capital.
The fund used capital loss carryforwards of $2,302,000 to offset taxable capital gains realized during the year ended December 31, 2015, reducing the amount of capital gains that would otherwise be available to distribute to shareholders.
At December 31, 2015, the cost of investment securities for tax purposes was $42,875,251,000. Net unrealized depreciation of investment securities for tax purposes was $164,538,000, consisting of unrealized gains of $47,785,000 on securities that had risen in value since their purchase and $212,323,000 in unrealized losses on securities that had fallen in value since their purchase.
E. During the year ended December 31, 2015, the fund purchased $3,430,703,000 of investment securities and sold $3,210,366,000 of investment securities, other than U.S. government securities and temporary cash investments. Purchases and sales of U.S. government securities were
29
Short-Term Bond Index Fund
$19,652,508,000 and $17,532,454,000, respectively. Total purchases and sales include $3,123,497,000 and $1,315,239,000, respectively, in connection with in-kind purchases and redemptions of the fund’s capital shares.
F. Capital share transactions for each class of shares were:
| Year Ended December 31, | ||||
| 2015 | 2014 | |||
| Amount | Shares | Amount | Shares | |
| ($000) | (000) | ($000) | (000) | |
| Investor Shares | ||||
| Issued | 656,917 | 62,463 | 734,113 | 69,806 |
| Issued in Lieu of Cash Distributions | 28,303 | 2,692 | 30,025 | 2,855 |
| Redeemed | (1,035,745) | (98,434) | (1,099,778) | (104,595) |
| Net Increase (Decrease)—Investor Shares | (350,525) | (33,279) | (335,640) | (31,934) |
| ETF Shares | ||||
| Issued | 3,163,771 | 39,500 | 2,741,125 | 34,200 |
| Issued in Lieu of Cash Distributions | — | — | — | — |
| Redeemed | (1,331,579) | (16,600) | (1,002,349) | (12,500) |
| Net Increase (Decrease) —ETF Shares | 1,832,192 | 22,900 | 1,738,776 | 21,700 |
| Admiral Shares | ||||
| Issued1 | 5,402,211 | 513,722 | 10,637,578 | 1,009,964 |
| Issued in Lieu of Cash Distributions | 169,734 | 16,145 | 94,252 | 8,968 |
| Redeemed | (4,045,742) | (384,837) | (2,511,645) | (238,842) |
| Net Increase (Decrease)—Admiral Shares | 1,526,203 | 145,030 | 8,220,185 | 780,090 |
| Signal Shares | ||||
| Issued | — | — | 1,694,734 | 161,120 |
| Issued in Lieu of Cash Distributions | — | — | 29,645 | 2,818 |
| Redeemed1 | — | — | (8,796,295) | (834,734) |
| Net Increase (Decrease)—Signal Shares | — | — | (7,071,916) | (670,796) |
| Institutional Shares | ||||
| Issued | 2,055,471 | 195,516 | 2,459,196 | 233,839 |
| Issued in Lieu of Cash Distributions | 58,533 | 5,567 | 52,456 | 4,989 |
| Redeemed | (2,091,243) | (198,930) | (1,282,877) | (122,048) |
| Net Increase (Decrease) —Institutional Shares | 22,761 | 2,153 | 1,228,775 | 116,780 |
| Institutional Plus Shares | ||||
| Issued | 1,442,064 | 137,165 | 1,249,032 | 118,811 |
| Issued in Lieu of Cash Distributions | 39,926 | 3,799 | 27,262 | 2,593 |
| Redeemed | (475,158) | (45,207) | (626,532) | (59,603) |
| Net Increase (Decrease) —Institutional Plus Shares | 1,006,832 | 95,757 | 649,762 | 61,801 |
| 1 Admiral Shares Issued and Signal Shares Redeemed include $6,737,297,000 from the conversion of Signal Shares to Admiral Shares during the 2014 fiscal year. | ||||
G. Management has determined that no material events or transactions occurred subsequent to December 31, 2015, that would require recognition or disclosure in these financial statements.
30
Intermediate-Term Bond Index Fund
Fund Profile
As of December 31, 2015
| Share-Class Characteristics | |||||
| Investor | Admiral | Institutional | Institutional | ||
| Shares | ETF Shares | Shares | Shares | Plus Shares | |
| Ticker Symbol | VBIIX | BIV | VBILX | VBIMX | VBIUX |
| Expense Ratio1 | 0.20% | 0.10% | 0.10% | 0.07% | 0.05% |
| 30-Day SEC Yield | 2.66% | 2.67% | 2.69% | 2.73% | 2.77% |
| Financial Attributes | |||
| Barclays | |||
| 5–10 Year | |||
| Gov/ | Barclays | ||
| Credit | Aggregate | ||
| Float Adj | Float Adj | ||
| Fund | Index | Index | |
| Number of Bonds | 1,824 | 2,106 | 9,681 |
| Yield to Maturity | |||
| (before expenses) | 2.8% | 2.9% | 2.6% |
| Average Coupon | 3.0% | 3.0% | 3.1% |
| Average Duration | 6.5 years | 6.5 years | 5.8 years |
| Average Effective | |||
| Maturity | 7.2 years | 7.2 years | 7.9 years |
| Short-Term | |||
| Reserves | 1.0% | — | — |
| Sector Diversification (% of portfolio) | |
| Finance | 12.6% |
| Foreign | 6.6 |
| Industrial | 25.2 |
| Treasury/Agency | 53.5 |
| Utilities | 2.0 |
| Other | 0.1 |
The agency and mortgage-backed securities sectors may include issues from government-sponsored enterprises; such issues are generally not backed by the full faith and credit of the U.S. government.
| Volatility Measures | ||
| Barclays | ||
| 5–10 Year | ||
| Gov/ | ||
| Credit | Barclays | |
| Float Adj | Aggregate Float | |
| Index | Adj Index | |
| R-Squared | 0.99 | 0.97 |
| Beta | 1.03 | 1.47 |
These measures show the degree and timing of the fund’s fluctuations compared with the indexes over 36 months.
| Distribution by Credit Quality (% of portfolio) | |
| U.S. Government | 53.3% |
| Aaa | 3.1 |
| Aa | 4.3 |
| A | 15.5 |
| Baa | 23.7 |
| Less Than Baa | 0.1 |
Credit-quality ratings are obtained from Barclays and are from Moody's, Fitch, and S&P. When ratings from all three agencies are
used, the median rating is shown. When ratings from two of the agencies are used, the lower rating for each issue is shown. "Not
Rated" is used to classify securities for which a rating is not available. Not rated securities include a fund's investment in
Vanguard Market Liquidity Fund or Vanguard Municipal Cash Management Fund, each of which invests in high-quality money
market instruments and may serve as a cash management vehicle for the Vanguard funds, trusts, and accounts. For more information
about these ratings, see the Glossary entry for Credit Quality.
| Distribution by Effective Maturity | |
| (% of portfolio) | |
| Under 1 Year | 0.2% |
| 1 - 3 Years | 0.1 |
| 3 - 5 Years | 2.1 |
| 5 - 10 Years | 97.5 |
| 10 - 20 Years | 0.1 |
1 The expense ratios shown are from the prospectus dated April 28, 2015, and represent estimated costs for the current fiscal year. For the fiscal
year ended December 31, 2015, the expense ratios were 0.16% for Investor Shares, 0.09% for ETF Shares, 0.09% for Admiral Shares, 0.06% for
Institutional Shares, and 0.04% for Institutional Plus Shares.
31
Intermediate-Term Bond Index Fund
Investment Focus
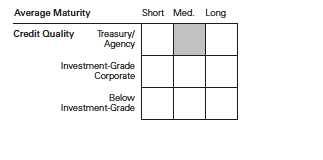
32
Intermediate-Term Bond Index Fund
Performance Summary
All of the returns in this report represent past performance, which is not a guarantee of future results that may be achieved by the fund. (Current performance may be lower or higher than the performance data cited. For performance data current to the most recent month-end, visit our website at vanguard.com/performance.) Note, too, that both investment returns and principal value can fluctuate widely, so an investor’s shares, when sold, could be worth more or less than their original cost. The returns shown do not reflect taxes that a shareholder would pay on fund distributions or on the sale of fund shares.
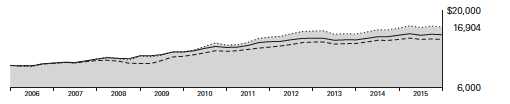
Cumulative Performance: December 31, 2005, Through December 31, 2015
Initial Investment of $10,000
| Average Annual Total Returns | |||||
| Periods Ended December 31, 2015 | |||||
| Final Value | |||||
| One | Five | Ten | of a $10,000 | ||
| Year | Years | Years | Investment | ||
| Intermediate-Term Bond Index Fund | |||||
| Investor Shares | 1.21% | 4.29% | 5.39% | $16,904 | |
| Spliced Barclays U.S. 5–10 Year | |||||
| •••••••• | |||||
| Government/Credit Float Adjusted | |||||
| Index | 1.28 | 4.45 | 5.45 | 16,993 | |
| – – – – | Spliced Intermediate Investment-Grade | ||||
| Debt Funds Average | -0.11 | 3.20 | 3.93 | 14,701 | |
| Spliced Barclays U.S. Aggregate Float | |||||
| Adjusted Index | 0.44 | 3.25 | 4.52 | 15,559 | |
| For a benchmark description, see the Glossary. | |||||
| Spliced Intermediate Investment-Grade Debt Funds Average: Derived from data provided by Lipper, a Thomson Reuters Company. | |||||
| Since | Final Value | |||
| One | Five | Inception | of a $10,000 | |
| Year | Years | (4/3/2007) | Investment | |
| Intermediate-Term Bond Index Fund | ||||
| ETF Shares Net Asset Value | 1.23% | 4.37% | 5.63% | $16,147 |
| Spliced Barclays U.S. 5–10 Year | ||||
| Government/Credit Float Adjusted Index | 1.28 | 4.45 | 5.61 | 16,118 |
| Spliced Barclays U.S. Aggregate Float | ||||
| Adjusted Index | 0.44 | 3.25 | 4.50 | 14,694 |
| "Since Inception" performance is calculated from the ETF Shares’ inception date for both the fund and its comparative standards. | ||||
See Financial Highlights for dividend and capital gains information.
33
Intermediate-Term Bond Index Fund
| Average Annual Total Returns | ||||
| Periods Ended December 31, 2015 | ||||
| Final Value | ||||
| One | Five | Ten | of a $10,000 | |
| Year | Years | Years | Investment | |
| Intermediate-Term Bond Index Fund Admiral | ||||
| Shares | 1.27% | 4.39% | 5.49% | $17,059 |
| Spliced Barclays U.S. 5–10 Year | ||||
| Government/Credit Float Adjusted Index | 1.28 | 4.45 | 5.45 | 16,993 |
| Spliced Barclays U.S. Aggregate Float | ||||
| Adjusted Index | 0.44 | 3.25 | 4.52 | 15,559 |
| Since | Final Value | |||
| One | Five | Inception | of a $5,000,000 | |
| Year | Years | (1/26/2006) | Investment | |
| Intermediate-Term Bond Index Fund | ||||
| Institutional Shares | 1.31% | 4.42% | 5.60% | $8,587,725 |
| Spliced Barclays U.S. 5–10 Year | ||||
| Government/Credit Float Adjusted Index | 1.28 | 4.45 | 5.52 | 8,523,210 |
| Spliced Barclays U.S. Aggregate Float | ||||
| Adjusted Index | 0.44 | 3.25 | 4.56 | 7,784,216 |
| "Since Inception" performance is calculated from the Institutional Shares’ inception date for both the fund and its comparative standards. | ||||
| Since | Final Value | ||
| One | Inception | of a $100,000,000 | |
| Year | (11/30/2011) | Investment | |
| Intermediate-Term Bond Index Fund | |||
| Institutional Plus Shares | 1.33% | 3.31% | $114,216,026 |
| Barclays U.S. 5–10 Year Government/Credit | |||
| Float Adjusted Index | 1.28 | 3.28 | 114,107,838 |
| Barclays U.S. Aggregate Float Adjusted Index | 0.44 | 2.35 | 109,946,869 |
| "Since Inception" performance is calculated from the Institutional Plus Shares’ inception date for both the fund and its comparative standards. | |||
| Cumulative Returns of ETF Shares: April 3, 2007, Through December 31, 2015 | |||
| Since | |||
| One | Five | Inception | |
| Year | Years | (4/3/2007) | |
| Intermediate-Term Bond Index Fund ETF Shares | |||
| Market Price | 1.13% | 24.09% | 61.59% |
| Intermediate-Term Bond Index Fund ETF Shares | |||
| Net Asset Value | 1.23 | 23.82 | 61.47 |
| Spliced Barclays U.S. 5–10 Year Government/Credit | |||
| Float Adjusted Index | 1.28 | 24.30 | 61.18 |
| "Since Inception" performance is calculated from the ETF Shares’ inception date for both the fund and its comparative standards. | |||
34
| Intermediate-Term Bond Index Fund | ||||
| Fiscal-Year Total Returns (%): December 31, 2005, Through December 31, 2015 | ||||
| Spliced | ||||
| Barclays | ||||
| 5–10 Year | ||||
| Gov/Credit | ||||
| Investor Shares | FA Index | |||
| Fiscal Year | Income Returns | Capital Returns | Total Returns | Total Returns |
| 2006 | 4.97% | -1.06% | 3.91% | 3.81% |
| 2007 | 5.17 | 2.44 | 7.61 | 7.55 |
| 2008 | 4.93 | 0.00 | 4.93 | 5.06 |
| 2009 | 4.69 | 2.10 | 6.79 | 6.50 |
| 2010 | 4.26 | 5.11 | 9.37 | 9.44 |
| 2011 | 4.01 | 6.61 | 10.62 | 10.79 |
| 2012 | 3.23 | 3.68 | 6.91 | 7.22 |
| 2013 | 2.71 | -6.25 | -3.54 | -3.37 |
| 2014 | 2.91 | 3.94 | 6.85 | 6.91 |
| 2015 | 2.62 | -1.41 | 1.21 | 1.28 |
| For a benchmark description, see the Glossary. | ||||
35
Intermediate-Term Bond Index Fund
Financial Statements
Statement of Net Assets—Investments Summary
As of December 31, 2015
This Statement summarizes the fund’s holdings by asset type. Details are reported for each of the fund’s 50 largest individual holdings and for investments that, in total for any issuer, represent more than 1% of the fund’s net assets. The total value of smaller holdings is reported as a single amount within each category.
The fund reports a complete list of its holdings in regulatory filings four times in each fiscal year, at the quarter-ends. For the second and fourth fiscal quarters, the complete listing of the fund’s holdings is available electronically on vanguard.com and on the Securities and Exchange Commission’s website (sec.gov), or you can have it mailed to you without charge by calling 800-662-7447. For the first and third fiscal quarters, the fund files the lists with the SEC on Form N-Q. Shareholders can look up the fund’s Forms N-Q on the SEC’s website. Forms N-Q may also be reviewed and copied at the SEC’s Public Reference Room (see the back cover of this report for further information).
| Face | Market | Percentage | |||
| Maturity | Amount | Value• | of Net | ||
| Coupon | Date | ($000) | ($000) | Assets | |
| U.S. Government and Agency Obligations | |||||
| U.S. Government Securities | |||||
| United States Treasury Note/Bond | 2.500% | 8/15/23 | 703,830 | 721,975 | 3.2% |
| United States Treasury Note/Bond | 1.750% | 5/15/23 | 574,750 | 559,755 | 2.5% |
| United States Treasury Note/Bond | 2.125% | 5/15/25 | 526,375 | 519,222 | 2.3% |
| United States Treasury Note/Bond | 2.250% | 11/15/25 | 470,882 | 449,119 | 2.0% |
| United States Treasury Note/Bond | 2.500% | 5/15/24 | 415,569 | 424,466 | 1.9% |
| United States Treasury Note/Bond | 2.250% | 11/15/24 | 414,024 | 413,701 | 1.8% |
| United States Treasury Note/Bond | 2.375% | 8/15/24 | 394,451 | 398,396 | 1.8% |
| United States Treasury Note/Bond | 2.000% | 2/15/25 | 399,836 | 390,651 | 1.7% |
| United States Treasury Note/Bond | 3.125% | 5/15/21 | 362,213 | 385,246 | 1.7% |
| United States Treasury Note/Bond | 2.750% | 11/15/23 | 358,122 | 373,679 | 1.7% |
| United States Treasury Note/Bond | 2.000% | 8/15/25 | 332,812 | 324,388 | 1.4% |
| United States Treasury Note/Bond | 2.000% | 11/30/22 | 318,740 | 316,898 | 1.4% |
| United States Treasury Note/Bond | 2.750% | 2/15/24 | 299,773 | 312,139 | 1.4% |
| United States Treasury Note/Bond | 3.625% | 2/15/21 | 261,615 | 284,383 | 1.3% |
| United States Treasury Note/Bond | 1.875% | 11/30/21 | 266,828 | 265,659 | 1.2% |
| United States Treasury Note/Bond | 1.625% | 11/15/22 | 269,175 | 261,436 | 1.2% |
| United States Treasury Note/Bond | 2.000% | 2/28/21 | 258,945 | 261,048 | 1.2% |
| United States Treasury Note/Bond | 2.000% | 11/15/21 | 251,645 | 252,314 | 1.1% |
| United States Treasury Note/Bond | 1.750% | 4/30/22 | 251,160 | 247,119 | 1.1% |
| United States Treasury Note/Bond | 1.625% | 8/15/22 | 247,652 | 241,191 | 1.1% |
| United States Treasury Note/Bond | 2.000% | 8/31/21 | 227,110 | 228,068 | 1.0% |
| United States Treasury Note/Bond | 2.125% | 6/30/21 | 223,030 | 225,818 | 1.0% |
| United States Treasury Note/Bond | 2.125% | 1/31/21 | 215,885 | 219,056 | 1.0% |
| United States Treasury Note/Bond | 1.750% | 3/31/22 | 207,992 | 204,710 | 0.9% |
| United States Treasury Note/Bond | 1.750% | 2/28/22 | 200,611 | 197,726 | 0.9% |
| United States Treasury Note/Bond | 2.000% | 2/15/23 | 197,020 | 195,820 | 0.9% |
| United States Treasury Note/Bond | 1.750% | 5/15/22 | 196,535 | 193,280 | 0.9% |
| United States Treasury Note/Bond | 2.125% | 8/15/21 | 189,473 | 191,694 | 0.8% |
| United States Treasury Note/Bond | 2.125% | 9/30/21 | 185,831 | 187,747 | 0.8% |
| United States Treasury Note/Bond | 1.875% | 8/31/22 | 189,311 | 187,092 | 0.8% |
36
| Intermediate-Term Bond Index Fund | ||||||
| Face | Market | Percentage | ||||
| Maturity | Amount | Value• | of Net | |||
| Coupon | Date | ($000) | ($000) | Assets | ||
| United States Treasury Note/Bond | 2.000% | 7/31/22 | 181,200 | 180,718 | 0.8% | |
| United States Treasury Note/Bond | 2.125% | 12/31/21 | 173,284 | 174,800 | 0.8% | |
| United States Treasury Note/Bond | 2.000% | 5/31/21 | 167,600 | 168,726 | 0.7% | |
| United States Treasury Note/Bond | 2.250% | 3/31/21 | 163,720 | 167,045 | 0.7% | |
| United States Treasury Note/Bond | 1.875% | 5/31/22 | 157,170 | 155,623 | 0.7% | |
| United States Treasury Note/Bond | 2.000% | 10/31/21 | 153,075 | 153,482 | 0.7% | |
| United States Treasury Note/Bond | 2.250% | 7/31/21 | 149,555 | 152,359 | 0.7% | |
| United States Treasury Note/Bond | 1.500% | 1/31/22 | 148,100 | 143,958 | 0.6% | |
| United States Treasury Note/Bond | 2.625% | 11/15/20 | 131,572 | 136,711 | 0.6% | |
| United States Treasury Note/Bond | 2.250% | 4/30/21 | 133,500 | 136,129 | 0.6% | |
| United States Treasury Note/Bond | 6.250% | 8/15/23 | 76,500 | 98,732 | 0.4% | |
| United States Treasury Note/Bond | 2.000% | 2/15/22 | 93,058 | 93,218 | 0.4% | |
| United States Treasury Note/Bond | 1.750% | 9/30/22 | 69,965 | 68,555 | 0.3% | |
| United States Treasury Note/Bond | 2.000% | 11/30/20 | 62,886 | 63,525 | 0.3% | |
| United States Treasury Note/Bond | 2.375% | 12/31/20 | 57,345 | 58,958 | 0.3% | |
| United States Treasury Note/Bond | 8.000% | 11/15/21 | 36,300 | 48,478 | 0.2% | |
| United States Treasury Note/Bond | 7.125% | 2/15/23 | 35,000 | 46,731 | 0.2% | |
| United States Treasury | ||||||
| Note/Bond | 1.750%–8.125% | 12/31/20–10/31/22 | 116,745 | 127,123 | 0.6% | |
| 11,608,667 | 51.6% | |||||
| Agency Bonds and Notes | ||||||
| 1 Federal Home Loan Mortgage Corp. | 2.375% | 1/13/22 | 81,350 | 82,513 | 0.4% | |
| 1 Federal National Mortgage Assn. | 2.625% | 9/6/24 | 58,645 | 59,258 | 0.3% | |
| Agency Bonds and Notes—Other † | 165,031 | 0.7% | ||||
| 306,802 | 1.4% | |||||
| Total U.S. Government and Agency Obligations (Cost $11,871,853) | 11,915,469 | 53.0% | ||||
| Corporate Bonds | ||||||
| Finance | ||||||
| 2 Banking † | 1,740,077 | 7.7% | ||||
| Brokerage † | 110,511 | 0.5% | ||||
| 2 Finance Companies † | 74,592 | 0.3% | ||||
| Insurance † | 414,455 | 1.9% | ||||
| Other Finance † | 1,332 | 0.0% | ||||
| 2 Real Estate Investment Trusts † | 452,464 | 2.0% | ||||
| 2,793,431 | 12.4% | |||||
| Industrial | ||||||
| Basic Industry † | 418,081 | 1.9% | ||||
| 2 Capital Goods † | 456,966 | 2.0% | ||||
| Communication | ||||||
| Verizon Communications Inc. | 5.150% | 9/15/23 | 55,380 | 60,749 | 0.2% | |
| 2 Communication—Other † | 694,308 | 3.1% | ||||
| 2 Consumer Cyclical † | 723,176 | 3.2% | ||||
| 2 Consumer Noncyclical † | 1,362,554 | 6.1% | ||||
| 2 Energy † | 949,920 | 4.2% | ||||
| Other Industrial † | 24,646 | 0.1% | ||||
| 2 Technology † | 735,604 | 3.3% | ||||
| 2 Transportation † | 197,576 | 0.9% | ||||
| 5,623,580 | 25.0% | |||||
37
| Intermediate-Term Bond Index Fund | ||
| Market | Percentage | |
| Value• | of Net | |
| ($000) | Assets | |
| Utilities | ||
| 2 Electric † | 421,148 | 1.9% |
| Natural Gas † | 33,396 | 0.2% |
| Other Utility † | 4,672 | 0.0% |
| 459,216 | 2.1% | |
| Total Corporate Bonds (Cost $8,994,343) | 8,876,227 | 39.5% |
| 2Sovereign Bonds (U.S. Dollar-Denominated) (Cost $1,452,997) † | 1,436,120 | 6.4% |
| Taxable Municipal Bonds (Cost $45,578) † | 45,587 | 0.2% |
| Total Investments (Cost $22,364,771) | 22,273,403 | 99.1% |
| Amount | ||
| ($000) | ||
| Other Assets and Liabilities | ||
| Other Assets | ||
| Investment in Vanguard | 1,949 | |
| Receivables for Investment Securities Sold | 251,109 | |
| Receivables for Accrued Income | 174,396 | |
| Receivables for Capital Shares Issued | 36,091 | |
| Other Assets | 14,616 | |
| Total Other Assets | 478,161 | 2.1% |
| Liabilities | ||
| Payables for Investment Securities Purchased | (230,759) | |
| Payables for Capital Shares Redeemed | (15,448) | |
| Payables for Distributions | (5,199) | |
| Payables to Vanguard | (13,039) | |
| Other Liabilities | (4,289) | |
| Total Liabilities | (268,734) | (1.2%) |
| Net Assets | 22,482,830 | 100.0% |
| At December 31, 2015, net assets consisted of: | ||
| Amount | ||
| ($000) | ||
| Paid-in Capital | 22,579,956 | |
| Undistributed Net Investment Income | 4 | |
| Accumulated Net Realized Losses | (5,762) | |
| Unrealized Appreciation (Depreciation) | (91,368) | |
| Net Assets | 22,482,830 | |
| Investor Shares—Net Assets | ||
| Applicable to 124,081,172 outstanding $.001 par value shares of | ||
| beneficial interest (unlimited authorization) | 1,396,928 | |
| Net Asset Value Per Share—Investor Shares | $11.26 | |
38
| Intermediate-Term Bond Index Fund | |
| Amount | |
| ($000) | |
| ETF Shares—Net Assets | |
| Applicable to 91,254,060 outstanding $.001 par value shares of | |
| beneficial interest (unlimited authorization) | 7,569,327 |
| Net Asset Value Per Share—ETF Shares | $82.95 |
| Admiral Shares—Net Assets | |
| Applicable to 893,636,073 outstanding $.001 par value shares of | |
| beneficial interest (unlimited authorization) | 10,060,711 |
| Net Asset Value Per Share—Admiral Shares | $11.26 |
| Institutional Shares—Net Assets | |
| Applicable to 213,078,711 outstanding $.001 par value shares of | |
| beneficial interest (unlimited authorization) | 2,398,884 |
| Net Asset Value Per Share—Institutional Shares | $11.26 |
| Institutional Plus Shares—Net Assets | |
| Applicable to 93,885,938 outstanding $.001 par value shares of | |
| beneficial interest (unlimited authorization) | 1,056,980 |
| Net Asset Value Per Share—Institutional Plus Shares | $11.26 |
• See Note A in Notes to Financial Statements.
† Represents the aggregate value, by category, of securities that are not among the 50 largest holdings and, in total for any issuer, represent
1% or less of net assets.
1 The issuer was placed under federal conservatorship in September 2008; since that time, its daily operations have been managed by the
Federal Housing Finance Agency and it receives capital from the U.S. Treasury, as needed to maintain a positive net worth, in exchange for
senior preferred stock.
2 Certain of the fund’s securities are exempt from registration under Rule 144A of the Securities Act of 1933. Such securities may be sold in
transactions exempt from registration, normally to qualified institutional buyers. At December 31, 2015, the aggregate value of these
securities was $241,220,000, representing 1.1% of net assets.
See accompanying Notes, which are an integral part of the Financial Statements.
39
Intermediate-Term Bond Index Fund
Statement of Operations
| Year Ended | |
| December 31, 2015 | |
| ($000) | |
| Investment Income | |
| Income | |
| Interest1 | 564,365 |
| Total Income | 564,365 |
| Expenses | |
| The Vanguard Group—Note B | |
| Investment Advisory Services | 511 |
| Management and Administrative—Investor Shares | 1,735 |
| Management and Administrative—ETF Shares | 4,745 |
| Management and Administrative—Admiral Shares | 7,138 |
| Management and Administrative—Institutional Shares | 1,022 |
| Management and Administrative—Institutional Plus Shares | 243 |
| Marketing and Distribution—Investor Shares | 356 |
| Marketing and Distribution—ETF Shares | 632 |
| Marketing and Distribution—Admiral Shares | 1,126 |
| Marketing and Distribution—Institutional Shares | 151 |
| Marketing and Distribution—Institutional Plus Shares | 30 |
| Custodian Fees | 128 |
| Auditing Fees | 46 |
| Shareholders’ Reports—Investor Shares | 209 |
| Shareholders’ Reports—ETF Shares | 111 |
| Shareholders’ Reports—Admiral Shares | 44 |
| Shareholders’ Reports—Institutional Shares | 27 |
| Shareholders’ Reports—Institutional Plus Shares | — |
| Trustees’ Fees and Expenses | 14 |
| Total Expenses | 18,268 |
| Net Investment Income | 546,097 |
| Realized Net Gain (Loss) | |
| Investment Securities Sold | 124,454 |
| Futures Contracts | 352 |
| Realized Net Gain (Loss) | 124,806 |
| Change in Unrealized Appreciation (Depreciation) | |
| Investment Securities | (480,360) |
| Futures Contracts | 15 |
| Change in Unrealized Appreciation (Depreciation) | (480,345) |
| Net Increase (Decrease) in Net Assets Resulting from Operations | 190,558 |
| 1 Interest income from an affiliated company of the fund was $193,000. | |
See accompanying Notes, which are an integral part of the Financial Statements.
40
Intermediate-Term Bond Index Fund
Statement of Changes in Net Assets
| Year Ended December 31, | ||
| 2015 | 2014 | |
| ($000) | ($000) | |
| Increase (Decrease) in Net Assets | ||
| Operations | ||
| Net Investment Income | 546,097 | 436,996 |
| Realized Net Gain (Loss) | 124,806 | 239,032 |
| Change in Unrealized Appreciation (Depreciation) | (480,345) | 335,793 |
| Net Increase (Decrease) in Net Assets Resulting from Operations | 190,558 | 1,011,821 |
| Distributions | ||
| Net Investment Income | ||
| Investor Shares | (39,172) | (42,655) |
| ETF Shares | (166,921) | (111,321) |
| Admiral Shares | (259,863) | (193,828) |
| Signal Shares | — | (42,860) |
| Institutional Shares | (59,475) | (39,538) |
| Institutional Plus Shares | (20,662) | (6,794) |
| Realized Capital Gain1 | ||
| Investor Shares | (4,780) | (9,006) |
| ETF Shares | (25,139) | (27,483) |
| Admiral Shares | (33,743) | (50,515) |
| Signal Shares | — | (961) |
| Institutional Shares | (8,007) | (9,229) |
| Institutional Plus Shares | (3,358) | (1,665) |
| Total Distributions | (621,120) | (535,855) |
| Capital Share Transactions | ||
| Investor Shares | (127,837) | (58,436) |
| ETF Shares | 2,860,225 | 1,045,558 |
| Admiral Shares | 1,328,327 | 3,427,351 |
| Signal Shares | — | (2,591,304) |
| Institutional Shares | 836,595 | 398,002 |
| Institutional Plus Shares | 781,935 | 69,938 |
| Net Increase (Decrease) from Capital Share Transactions | 5,679,245 | 2,291,109 |
| Total Increase (Decrease) | 5,248,683 | 2,767,075 |
| Net Assets | ||
| Beginning of Period | 17,234,147 | 14,467,072 |
| End of Period2 | 22,482,830 | 17,234,147 |
1 Includes fiscal 2015 and 2014 short-term gain distributions totaling $0 and $0, respectively. Short-term gain distributions are treated as ordinary income dividends for tax purposes.
2 Net Assets—End of Period includes undistributed (overdistributed) net investment income of $4,000 and $0.
See accompanying Notes, which are an integral part of the Financial Statements.
41
Intermediate-Term Bond Index Fund
Financial Highlights
| Investor Shares | |||||
| For a Share Outstanding | Year Ended December 31, | ||||
| Throughout Each Period | 2015 | 2014 | 2013 | 2012 | 2011 |
| Net Asset Value, Beginning of Period | $11.46 | $11.09 | $11.96 | $11.77 | $11.21 |
| Investment Operations | |||||
| Net Investment Income | .302 | .316 | .329 | .370 | .425 |
| Net Realized and Unrealized Gain (Loss) | |||||
| on Investments | (.162) | .437 | (.745) | . 432 | .738 |
| Total from Investment Operations | .140 | .753 | (.416) | .802 | 1.163 |
| Distributions | |||||
| Dividends from Net Investment Income | (.302) | (.316) | (.329) | (.370) | (.425) |
| Distributions from Realized Capital Gains | (.038) | (.067) | (.125) | (. 242) | (.178) |
| Total Distributions | (.340) | (. 383) | (. 454) | (. 612) | (. 603) |
| Net Asset Value, End of Period | $11.26 | $11.46 | $11.09 | $11.96 | $11.77 |
| Total Return1 | 1.21% | 6.85% | -3.54% | 6.91% | 10.62% |
| Ratios/Supplemental Data | |||||
| Net Assets, End of Period (Millions) | $1,397 | $1,551 | $1,558 | $2,120 | $2,129 |
| Ratio of Total Expenses to Average Net Assets | 0.16% | 0.20% | 0.20% | 0.20% | 0.22% |
| Ratio of Net Investment Income to | |||||
| Average Net Assets | 2.62% | 2.76% | 2.84% | 3.07% | 3.65% |
| Portfolio Turnover Rate2 | 51% | 60% | 70% | 65% | 61% |
1 Total returns do not include account service fees that may have applied in the periods shown. Fund prospectuses provide information about any applicable account service fees.
2 Excludes the value of portfolio securities received or delivered as a result of in-kind purchases or redemptions of the fund’s capital shares,
including ETF Creation Units.
See accompanying Notes, which are an integral part of the Financial Statements.
| 42 |
Intermediate-Term Bond Index Fund
Financial Highlights
| ETF Shares | |||||
| For a Share Outstanding | Year Ended December 31, | ||||
| Throughout Each Period | 2015 | 2014 | 2013 | 2012 | 2011 |
| Net Asset Value, Beginning of Period | $84.41 | $81.65 | $88.07 | $86.63 | $82.56 |
| Investment Operations | |||||
| Net Investment Income | 2.227 | 2.403 | 2.523 | 2.764 | 3.183 |
| Net Realized and Unrealized Gain (Loss) | |||||
| on Investments | (1.177) | 3.254 | (5.499) | 3.225 | 5.383 |
| Total from Investment Operations | 1.050 | 5.657 | (2.976) | 5.989 | 8.566 |
| Distributions | |||||
| Dividends from Net Investment Income | (2.227) | (2.403) | (2.523) | (2.764) | (3.183) |
| Distributions from Realized Capital Gains | (.283) | (.494) | (.921) | (1.785) | (1.313) |
| Total Distributions | (2.510) | (2.897) | (3.444) | (4.549) | (4.496) |
| Net Asset Value, End of Period | $82.95 | $84.41 | $81.65 | $88.07 | $86.63 |
| Total Return | 1.23% | 7.00% | -3.44% | 7.02% | 10.62% |
| Ratios/Supplemental Data | |||||
| Net Assets, End of Period (Millions) | $7,569 | $4,858 | $3,695 | $4,356 | $2,781 |
| Ratio of Total Expenses to Average Net Assets | 0.09% | 0.10% | 0.10% | 0.10% | 0.11% |
| Ratio of Net Investment Income to | |||||
| Average Net Assets | 2.69% | 2.86% | 2.94% | 3.17% | 3.76% |
| Portfolio Turnover Rate1 | 51% | 60% | 70% | 65% | 61% |
| 1 Excludes the value of portfolio securities received or delivered as a result of in-kind purchases or redemptions of the fund’s capital shares, including ETF Creation Units. | |||||
See accompanying Notes, which are an integral part of the Financial Statements.
43
Intermediate-Term Bond Index Fund
Financial Highlights
| Admiral Shares | |||||
| For a Share Outstanding | Year Ended December 31, | ||||
| Throughout Each Period | 2015 | 2014 | 2013 | 2012 | 2011 |
| Net Asset Value, Beginning of Period | $11.46 | $11.09 | $11.96 | $11.77 | $11.21 |
| Investment Operations | |||||
| Net Investment Income | . 309 | . 327 | .340 | .381 | .437 |
| Net Realized and Unrealized Gain (Loss) | |||||
| on Investments | (.162) | .437 | (.745) | . 432 | .738 |
| Total from Investment Operations | .147 | .764 | (. 405) | .813 | 1.175 |
| Distributions | |||||
| Dividends from Net Investment Income | (.309) | (.327) | (.340) | (. 381) | (.437) |
| Distributions from Realized Capital Gains | (.038) | (.067) | (.125) | (. 242) | (.178) |
| Total Distributions | (.347) | (.394) | (.465) | (. 623) | (. 615) |
| Net Asset Value, End of Period | $11.26 | $11.46 | $11.09 | $11.96 | $11.77 |
| Total Return1 | 1.27% | 6.96% | -3.45% | 7.02% | 10.74% |
| Ratios/Supplemental Data | |||||
| Net Assets, End of Period (Millions) | $10,061 | $8,922 | $5,320 | $6,252 | $5,320 |
| Ratio of Total Expenses to Average Net Assets | 0.09% | 0.10% | 0.10% | 0.10% | 0.11% |
| Ratio of Net Investment Income to | |||||
| Average Net Assets | 2.69% | 2.86% | 2.94% | 3.17% | 3.76% |
| Portfolio Turnover Rate2 | 51% | 60% | 70% | 65% | 61% |
1 Total returns do not include account service fees that may have applied in the periods shown. Fund prospectuses provide information about any applicable account service fees.
2 Excludes the value of portfolio securities received or delivered as a result of in-kind purchases or redemptions of the fund’s capital shares, including ETF Creation Units.
See accompanying Notes, which are an integral part of the Financial Statements.
44
Intermediate-Term Bond Index Fund
Financial Highlights
| Institutional Shares | |||||
| For a Share Outstanding | Year Ended December 31, | ||||
| Throughout Each Period | 2015 | 2014 | 2013 | 2012 | 2011 |
| Net Asset Value, Beginning of Period | $11.46 | $11.09 | $11.96 | $11.77 | $11.21 |
| Investment Operations | |||||
| Net Investment Income | .313 | .331 | .344 | .385 | .442 |
| Net Realized and Unrealized Gain (Loss) | |||||
| on Investments | (.162) | .437 | (.745) | . 432 | .738 |
| Total from Investment Operations | .151 | .768 | (. 401) | .817 | 1.180 |
| Distributions | |||||
| Dividends from Net Investment Income | (.313) | (.331) | (.344) | (.385) | (. 442) |
| Distributions from Realized Capital Gains | (.038) | (.067) | (.125) | (. 242) | (.178) |
| Total Distributions | (.351) | (.398) | (.469) | (.627) | (.620) |
| Net Asset Value, End of Period | $11.26 | $11.46 | $11.09 | $11.96 | $11.77 |
| Total Return | 1.31% | 6.99% | -3.42% | 7.05% | 10.78% |
| Ratios/Supplemental Data | |||||
| Net Assets, End of Period (Millions) | $2,399 | $1,610 | $1,172 | $1,154 | $689 |
| Ratio of Total Expenses to Average Net Assets | 0.06% | 0.07% | 0.07% | 0.07% | 0.07% |
| Ratio of Net Investment Income to | |||||
| Average Net Assets | 2.72% | 2.89% | 2.97% | 3.20% | 3.80% |
| Portfolio Turnover Rate1 | 51% | 60% | 70% | 65% | 61% |
| 1 Excludes the value of portfolio securities received or delivered as a result of in-kind purchases or redemptions of the fund’s capital shares, including ETF Creation Units. | |||||
See accompanying Notes, which are an integral part of the Financial Statements.
45
Intermediate-Term Bond Index Fund
Financial Highlights
| Institutional Plus Shares | |||||
| Nov. 30, | |||||
| 20111 to | |||||
| For a Share Outstanding | Year Ended December 31, | Dec. 31, | |||
| Throughout Each Period | 2015 | 2014 | 2013 | 2012 | 2011 |
| Net Asset Value, Beginning of Period | $11.46 | $11.09 | $11.96 | $11.77 | $11.73 |
| Investment Operations | |||||
| Net Investment Income | .315 | .333 | .346 | .388 | .072 |
| Net Realized and Unrealized Gain (Loss) | |||||
| on Investments | (.162) | .437 | (.745) | . 432 | .178 |
| Total from Investment Operations | .153 | .770 | (.399) | .820 | . 250 |
| Distributions | |||||
| Dividends from Net Investment Income | (.315) | (.333) | (.346) | (. 388) | (.072) |
| Distributions from Realized Capital Gains | (.038) | (.067) | (.125) | (. 242) | (.138) |
| Total Distributions | (.353) | (.400) | (.471) | (. 630) | (. 210) |
| Net Asset Value, End of Period | $11.26 | $11.46 | $11.09 | $11.96 | $11.77 |
| Total Return | 1.33% | 7.01% | -3.40% | 7.07% | 1.84% |
| Ratios/Supplemental Data | |||||
| Net Assets, End of Period (Millions) | $1,057 | $293 | $216 | $239 | $107 |
| Ratio of Total Expenses to Average Net Assets | 0.04% | 0.05% | 0.05% | 0.05% | 0.05%2 |
| Ratio of Net Investment Income to | |||||
| Average Net Assets | 2.74% | 2.91% | 2.99% | 3.22% | 3.82%2 |
| Portfolio Turnover Rate 3 | 51% | 60% | 70% | 65% | 61% |
| 1 Inception. | |||||
| 2 Annualized. | |||||
| 3 Excludes the value of portfolio securities received or delivered as a result of in-kind purchases or redemptions of the fund’s capital shares, | |||||
See accompanying Notes, which are an integral part of the Financial Statements.
46
Intermediate-Term Bond Index Fund
Notes to Financial Statements
Vanguard Intermediate-Term Bond Index Fund is registered under the Investment Company Act of 1940 as an open-end investment company, or mutual fund. Certain of the fund’s investments are in corporate debt instruments; the issuers’ abilities to meet their obligations may be affected by economic developments in their respective industries. The fund offers five classes of shares: Investor Shares, ETF Shares, Admiral Shares, Institutional Shares, and Institutional Plus Shares. Investor Shares are available to any investor who meets the fund’s minimum purchase requirements. ETF Shares are listed for trading on NYSE Arca; they can be purchased and sold through a broker. Admiral Shares, Institutional Shares, and Institutional Plus Shares are designed for investors who meet certain administrative, service, and account-size criteria. Prior to October 24, 2014, the fund offered Signal Shares. Effective at the close of business on October 24, 2014, the Signal Shares were converted to Admiral Shares.
A. The following significant accounting policies conform to generally accepted accounting principles for U.S. investment companies. The fund consistently follows such policies in preparing its financial statements.
1. Security Valuation: Securities are valued as of the close of trading on the New York Stock Exchange (generally 4 p.m., Eastern time) on the valuation date. Bonds, and temporary cash investments acquired over 60 days to maturity, are valued using the latest bid prices or using valuations based on a matrix system (which considers such factors as security prices, yields, maturities, and ratings), both as furnished by independent pricing services. Investments in Vanguard Market Liquidity Fund are valued at that fund’s net asset value. Other temporary cash investments are valued at amortized cost, which approximates market value. Securities for which market quotations are not readily available, or whose values have been affected by events occurring before the fund’s pricing time but after the close of the securities’ primary markets, are valued by methods deemed by the board of trustees to represent fair value.
2. Futures Contracts: The fund uses futures contracts to invest in fixed income asset classes with greater efficiency and lower cost than is possible through direct investment, to add value when these instruments are attractively priced, or to adjust sensitivity to changes in interest rates. The primary risks associated with the use of futures contracts are imperfect correlation between changes in market values of bonds held by the fund and the prices of futures contracts, and the possibility of an illiquid market. Counterparty risk involving futures is mitigated because a regulated clearinghouse is the counterparty instead of the clearing broker. To further mitigate counterparty risk, the fund trades futures contracts on an exchange, monitors the financial strength of its clearing brokers and clearinghouse, and has entered into clearing agreements with its clearing brokers. The clearinghouse imposes initial margin requirements to secure the fund’s performance and requires daily settlement of variation margin representing changes in the market value of each contract.
Futures contracts are valued at their quoted daily settlement prices. The aggregate settlement values of the contracts are not recorded in the Statement of Net Assets. Fluctuations in the value of the contracts are recorded in the Statement of Net Assets as an asset (liability) and in the Statement of Operations as unrealized appreciation (depreciation) until the contracts are closed, when they are recorded as realized futures gains (losses).
During the year ended December 31, 2015, the fund’s average investments in long and short futures contracts each represented less than 1% of net assets, based on the average of aggregate settlement values at each quarter-end during the period. The fund had no open futures contracts at December 31, 2015.
47
Intermediate-Term Bond Index Fund
3. Federal Income Taxes: The fund intends to continue to qualify as a regulated investment company and distribute all of its taxable income. Management has analyzed the fund’s tax positions taken for all open federal income tax years (December 31, 2012–2015), and has concluded that no provision for federal income tax is required in the fund’s financial statements.
4. Distributions: Distributions from net investment income are declared daily by all share classes except ETF Shares, and paid on the first business day of the following month. Monthly income dividends from ETF Shares, and annual distributions from realized capital gains, if any, are recorded on the ex-dividend date.
5. Credit Facility: The fund and certain other funds managed by The Vanguard Group (“Vanguard”) participate in a $3 billion committed credit facility provided by a syndicate of lenders pursuant to a credit agreement that may be renewed annually; each fund is individually liable for its borrowings, if any, under the credit facility. Borrowings may be utilized for temporary and emergency purposes, and are subject to the fund’s regulatory and contractual borrowing restrictions. The participating funds are charged administrative fees and an annual commitment fee of 0.06% of the undrawn amount of the facility; these fees are allocated to the funds based on a method approved by the fund’s board of trustees and included in Management and Administrative expenses on the fund’s Statement of Operations. Any borrowings under this facility bear interest at a rate equal to the higher of the federal funds rate or LIBOR reference rate plus an agreed-upon spread.
The fund had no borrowings outstanding at December 31, 2015, or at any time during the period then ended.
6. Other: Interest income includes income distributions received from Vanguard Market Liquidity Fund and is accrued daily. Premiums and discounts on debt securities purchased are amortized and accreted, respectively, to interest income over the lives of the respective securities. Security transactions are accounted for on the date securities are bought or sold. Costs used to determine realized gains (losses) on the sale of investment securities are those of the specific securities sold.
Each class of shares has equal rights as to assets and earnings, except that each class separately bears certain class-specific expenses related to maintenance of shareholder accounts (included in Management and Administrative expenses) and shareholder reporting. Marketing and distribution expenses are allocated to each class of shares based on a method approved by the board of trustees. Income, other non-class-specific expenses, and gains and losses on investments are allocated to each class of shares based on its relative net assets.
B. In accordance with the terms of a Funds’ Service Agreement (the “FSA”) between Vanguard and the fund, Vanguard furnishes to the fund investment advisory, corporate management, administrative, marketing, and distribution services at Vanguard’s cost of operations (as defined by the FSA). These costs of operations are allocated to the fund based on methods and guidelines approved by the board of trustees. Vanguard does not require reimbursement in the current period for certain costs of operations (such as deferred compensation/benefits and risk/insurance costs); the fund’s liability for these costs of operations is included in Payables to Vanguard on the Statement of Net Assets.
Upon the request of Vanguard, the fund may invest up to 0.40% of its net assets as capital in Vanguard. At December 31, 2015, the fund had contributed to Vanguard capital in the amount of $1,949,000, representing 0.01% of the fund’s net assets and 0.78% of Vanguard’s capitalization. The fund’s trustees and officers are also directors and employees, respectively, of Vanguard.
48
Intermediate-Term Bond Index Fund
C. Various inputs may be used to determine the value of the fund’s investments. These inputs are summarized in three broad levels for financial statement purposes. The inputs or methodologies used to value securities are not necessarily an indication of the risk associated with investing in those securities.
Level 1—Quoted prices in active markets for identical securities.
Level 2—Other significant observable inputs (including quoted prices for similar securities, interest rates, prepayment speeds, credit risk, etc.).
Level 3—Significant unobservable inputs (including the fund’s own assumptions used to determine the fair value of investments).
At December 31, 2015, 100% of the market value of the fund’s investments was determined based on Level 2 inputs.
D. Capital gain distributions are determined on a tax basis and may differ from realized capital gains for financial reporting purposes. Differences may be permanent or temporary. Permanent differences are reclassified among capital accounts in the financial statements to reflect their tax character. Temporary differences arise when gains or losses are recognized in different periods for financial statement and tax purposes. These differences will reverse at some time in the future.
During the year ended December 31, 2015, the fund realized $52,939,000 of net capital gains resulting from in-kind redemptions—in which shareholders exchanged fund shares for securities held by the fund rather than for cash. Because such gains are not taxable to the fund, and are not distributed to shareholders, they have been reclassified from accumulated net realized losses to paid-in capital.
The fund used a tax accounting practice to treat a portion of the price of capital shares redeemed during the year as distributions from realized capital gains. Accordingly, the fund has reclassified $8,276,000 from accumulated net realized losses to paid-in capital.
Capital gains required to be distributed in December 2015 included gains realized through October 31, 2015; subsequently the fund realized losses of $5,762,000, which are deferred and will be treated as realized for tax purposes in 2016.
At December 31, 2015, the cost of investment securities for tax purposes was $22,364,771,000. Net unrealized depreciation of investment securities for tax purposes was $91,368,000, consisting of unrealized gains of $205,224,000 on securities that had risen in value since their purchase and $296,592,000 in unrealized losses on securities that had fallen in value since their purchase.
E. During the year ended December 31, 2015, the fund purchased $5,555,428,000 of investment securities and sold $3,029,053,000 of investment securities, other than U.S. government securities and temporary cash investments. Purchases and sales of U.S. government securities were $11,031,065,000 and $7,995,555,000, respectively. Total purchases and sales include $2,764,726,000 and $773,553,000, respectively, in connection with in-kind purchases and redemptions of the fund’s capital shares.
49
Intermediate-Term Bond Index Fund
F. Capital share transactions for each class of shares were:
| Year Ended December 31, | ||||
| 2015 | 2014 | |||
| Amount | Shares | Amount | Shares | |
| ($000) | (000) | ($000) | (000) | |
| Investor Shares | ||||
| Issued | 380,583 | 33,072 | 324,984 | 28,453 |
| Issued in Lieu of Cash Distributions | 40,424 | 3,521 | 45,894 | 4,015 |
| Redeemed | (548,844) | (47,781) | (429,314) | (37,708) |
| Net Increase (Decrease)—Investor Shares | (127,837) | (11,188) | (58,436) | (5,240) |
| ETF Shares | ||||
| Issued | 3,643,962 | 42,900 | 2,630,431 | 31,300 |
| Issued in Lieu of Cash Distributions | — | — | — | — |
| Redeemed | (783,737) | (9,200) | (1,584,873) | (19,000) |
| Net Increase (Decrease) —ETF Shares | 2,860,225 | 33,700 | 1,045,558 | 12,300 |
| Admiral Shares | ||||
| Issued1 | 3,065,720 | 266,763 | 4,443,857 | 387,794 |
| Issued in Lieu of Cash Distributions | 253,284 | 22,080 | 214,579 | 18,757 |
| Redeemed | (1,990,677) | (173,526) | (1,231,085) | (107,913) |
| Net Increase (Decrease) —Admiral Shares | 1,328,327 | 115,317 | 3,427,351 | 298,638 |
| Signal Shares | ||||
| Issued | — | — | 410,108 | 36,075 |
| Issued in Lieu of Cash Distributions | — | — | 32,684 | 2,872 |
| Redeemed1 | — | — | (3,034,096) | (264,880) |
| Net Increase (Decrease)—Signal Shares | — | — | (2,591,304) | (225,933) |
| Institutional Shares | ||||
| Issued | 1,146,086 | 99,666 | 796,017 | 69,731 |
| Issued in Lieu of Cash Distributions | 59,082 | 5,153 | 47,257 | 4,132 |
| Redeemed | (368,573) | (32,156) | (445,272) | (39,093) |
| Net Increase (Decrease) —Institutional Shares | 836,595 | 72,663 | 398,002 | 34,770 |
| Institutional Plus Shares | ||||
| Issued | 813,400 | 71,027 | 98,599 | 8,592 |
| Issued in Lieu of Cash Distributions | 13,182 | 1,153 | 8,034 | 703 |
| Redeemed | (44,647) | (3,883) | (36,695) | (3,221) |
| Net Increase (Decrease) —Institutional Plus Shares | 781,935 | 68,297 | 69,938 | 6,074 |
| 1 Admiral Shares Issued and Signal Shares Redeemed include $1,995,144,000 from the conversion of Signal Shares to Admiral Shares during the 2014 fiscal year. | ||||
G. Management has determined that no material events or transactions occurred subsequent to December 31, 2015, that would require recognition or disclosure in these financial statements.
50
Long-Term Bond Index Fund
Fund Profile
As of December 31, 2015
| Share-Class Characteristics | ||||
| Investor | Institutional | Institutional | ||
| Shares | ETF Shares | Shares | Plus Shares | |
| Ticker Symbol | VBLTX | BLV | VBLLX | VBLIX |
| Expense Ratio1 | 0.20% | 0.10% | 0.07% | 0.05% |
| 30-Day SEC Yield | 4.07% | 4.09% | 4.16% | 4.21% |
| Financial Attributes | |||
| Barclays | |||
| Long | |||
| Gov/ | Barclays | ||
| Credit | Aggregate | ||
| Float Adj | Float Adj | ||
| Fund | Index | Index | |
| Number of Bonds | 2,037 | 2,225 | 9,681 |
| Yield to Maturity | |||
| (before expenses) | 4.2% | 4.2% | 2.6% |
| Average Coupon | 4.8% | 4.9% | 3.1% |
| Average Duration | 14.7 years 14.7 years | 5.8 years | |
| Average Effective | |||
| Maturity | 24.1 years 23.9 years | 7.9 years | |
| Short-Term | |||
| Reserves | 1.2% | — | — |
| Sector Diversification (% of portfolio) | |
| Finance | 9.5% |
| Foreign | 10.7 |
| Industrial | 33.9 |
| Treasury/Agency | 39.4 |
| Utilities | 6.4 |
| Other | 0.1 |
The agency and mortgage-backed securities sectors may include issues from government-sponsored enterprises; such issues are
generally not backed by the full faith and credit of the U.S. government.
| Volatility Measures | ||
| Barclays | ||
| Long | ||
| Gov/ | ||
| Credit | Barclays | |
| Float Adj | Aggregate Float | |
| Index | Adj Index | |
| R-Squared | 0.99 | 0.93 |
| Beta | 1.02 | 2.93 |
These measures show the degree and timing of the fund’s fluctuations compared with the indexes over 36 months.
| Distribution by Credit Quality (% of portfolio) | |
| U.S. Government | 39.4% |
| Aaa | 1.9 |
| Aa | 7.0 |
| A | 21.9 |
| Baa | 29.7 |
| Less Than Baa | 0.1 |
Credit-quality ratings are obtained from Barclays and are from Moody's, Fitch, and S&P. When ratings from all three agencies are
used, the median rating is shown. When ratings from two of the agencies are used, the lower rating for each issue is shown. "Not
Rated" is used to classify securities for which a rating is not available. Not rated securities include a fund's investment in
Vanguard Market Liquidity Fund or Vanguard Municipal Cash Management Fund, each of which invests in high-quality money
market instruments and may serve as a cash management vehicle for the Vanguard funds, trusts, and accounts. For more information
about these ratings, see the Glossary entry for Credit Quality.
| Distribution by Effective Maturity | |
| (% of portfolio) | |
| Under 1 Year | 0.2% |
| 3 - 5 Years | 0.2 |
| 5 - 10 Years | 1.2 |
| 10 - 20 Years | 22.8 |
| 20 - 30 Years | 72.6 |
| Over 30 Years | 3.0 |
1 The expense ratios shown are from the prospectus dated April 28, 2015, and represent estimated costs for the current fiscal year. For the fiscal
year ended December 31, 2015, the expense ratios were 0.16% for Investor Shares, 0.09% for ETF Shares, 0.06% for Institutional Shares, and 0.04%
for Institutional Plus Shares.
51
Long-Term Bond Index Fund
Investment Focus
52
Long-Term Bond Index Fund
Performance Summary
All of the returns in this report represent past performance, which is not a guarantee of future results that may be achieved by the fund. (Current performance may be lower or higher than the performance data cited. For performance data current to the most recent month-end, visit our website at vanguard.com/performance.) Note, too, that both investment returns and principal value can fluctuate widely, so an investor’s shares, when sold, could be worth more or less than their original cost. The returns shown do not reflect taxes that a shareholder would pay on fund distributions or on the sale of fund shares.
Cumulative Performance: December 31, 2005, Through December 31, 2015
Initial Investment of $10,000
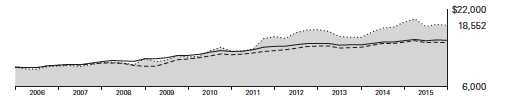
| Average Annual Total Returns | ||||
| Periods Ended December 31, 2015 | ||||
| Final Value | ||||
| One | Five | Ten | of a $10,000 | |
| Year | Years | Years | Investment | |
| Long-Term Bond Index Fund Investor | ||||
| Shares | -3.47% | 6.82% | 6.37% | $18,552 |
| Spliced Barclays U.S. Long | ||||
| •••••••• | ||||
| Government/Credit Float Adjusted | ||||
| Index | -3.31 | 6.98 | 6.45 | 18,683 |
| – – – – Corporate A-Rated Debt Funds Average | -0.75 | 3.67 | 4.19 | 15,074 |
| Spliced Barclays U.S. Aggregate Float | ||||
| Adjusted Index | 0.44 | 3.25 | 4.52 | 15,559 |
| For a benchmark description, see the Glossary. | ||||
| Corporate A-Rated Debt Funds Average: Derived from data provided by Lipper, a Thomson Reuters Company. | ||||
| Since | Final Value | |||
| One | Five | Inception | of a $10,000 | |
| Year | Years | (4/3/2007) | Investment | |
| Long-Term Bond Index Fund | ||||
| ETF Shares Net Asset Value | -3.45% | 6.90% | 6.97% | $18,029 |
| Spliced Barclays U.S. Long | ||||
| Government/Credit Float Adjusted Index | -3.31 | 6.98 | 6.97 | 18,021 |
| Spliced Barclays U.S. Aggregate Float | ||||
| Adjusted Index | 0.44 | 3.25 | 4.50 | 14,694 |
| "Since Inception" performance is calculated from the ETF Shares’ inception date for both the fund and its comparative standards. | ||||
See Financial Highlights for dividend and capital gains information.
53
Long-Term Bond Index Fund
| Average Annual Total Returns | ||||
| Periods Ended December 31, 2015 | ||||
| Since | Final Value | |||
| One | Five | Inception | of a $5,000,000 | |
| Year | Years | (2/2/2006) | Investment | |
| Long-Term Bond Index Fund Institutional | ||||
| Shares | -3.37% | 6.95% | 6.68% | $9,493,230 |
| Spliced Barclays U.S. Long | ||||
| Government/Credit Float Adjusted Index | -3.31 | 6.98 | 6.61 | 9,430,786 |
| Spliced Barclays U.S. Aggregate Float | ||||
| Adjusted Index | 0.44 | 3.25 | 4.58 | 7,790,706 |
| "Since Inception" performance is calculated from the Institutional Shares’ inception date for both the fund and its comparative standards. | ||||
| Since | Final Value | ||
| One | Inception | of a $100,000,000 | |
| Year | (10/6/2011) | Investment | |
| Long-Term Bond Index Fund Institutional Plus | |||
| Shares | -3.35% | 4.14% | $118,748,696 |
| Barclays U.S. Long Government/Credit Float | |||
| Adjusted Index | -3.31 | 4.04 | 118,275,502 |
| Barclays U.S. Aggregate Float Adjusted Index | 0.44 | 2.36 | 110,363,179 |
| "Since Inception" performance is calculated from the Institutional Plus Shares’ inception date for both the fund and its comparative standards. | |||
| Cumulative Returns of ETF Shares: April 3, 2007, Through December 31, 2015 | |||
| Since | |||
| One | Five | Inception | |
| Year | Years | (4/3/2007) | |
| Long-Term Bond Index Fund ETF Shares Market | |||
| Price | -4.01% | 39.00% | 80.05% |
| Long-Term Bond Index Fund ETF Shares Net Asset | |||
| Value | -3.45 | 39.58 | 80.29 |
| Spliced Barclays U.S. Long Government/Credit Float | |||
| Adjusted Index | -3.31 | 40.16 | 80.21 |
| "Since Inception" performance is calculated from the ETF Shares’ inception date for both the fund and its comparative standards. | |||
54
Long-Term Bond Index Fund
| Fiscal-Year Total Returns (%): December 31, 2005, Through December 31, 2015 | ||||
| Spliced | ||||
| Barclays | ||||
| Long | ||||
| Gov/Credit | ||||
| Investor Shares | FA Index | |||
| Fiscal Year | Income Returns | Capital Returns | Total Returns | Total Returns |
| 2006 | 5.29% | -2.62% | 2.67% | 2.71% |
| 2007 | 5.55 | 1.04 | 6.59 | 6.60 |
| 2008 | 5.81 | 2.83 | 8.64 | 8.44 |
| 2009 | 5.27 | -3.51 | 1.76 | 1.92 |
| 2010 | 5.21 | 5.06 | 10.27 | 10.16 |
| 2011 | 5.51 | 16.55 | 22.06 | 22.49 |
| 2012 | 4.23 | 4.26 | 8.49 | 8.79 |
| 2013 | 3.76 | -12.89 | -9.13 | -8.83 |
| 2014 | 4.79 | 14.93 | 19.72 | 19.31 |
| 2015 | 3.73 | -7.20 | -3.47 | -3.31 |
| For a benchmark description, see the Glossary. | ||||
55
Long-Term Bond Index Fund
Financial Statements
Statement of Net Assets—Investments Summary
As of December 31, 2015
This Statement summarizes the fund’s holdings by asset type. Details are reported for each of the fund’s 50 largest individual holdings and for investments that, in total for any issuer, represent more than 1% of the fund’s net assets. The total value of smaller holdings is reported as a single amount within each category.
The fund reports a complete list of its holdings in regulatory filings four times in each fiscal year, at the quarter-ends. For the second and fourth fiscal quarters, the complete listing of the fund’s holdings is available electronically on vanguard.com and on the Securities and Exchange Commission’s website (sec.gov), or you can have it mailed to you without charge by calling 800-662-7447. For the first and third fiscal quarters, the fund files the lists with the SEC on Form N-Q. Shareholders can look up the fund’s Forms N-Q on the SEC’s website. Forms N-Q may also be reviewed and copied at the SEC’s Public Reference Room (see the back cover of this report for further information).
| Face | Market | Percentage | |||
| Maturity | Amount | Value• | of Net | ||
| Coupon | Date | ($000) | ($000) | Assets | |
| U.S. Government and Agency Obligations | |||||
| U.S. Government Securities | |||||
| United States Treasury Note/Bond | 2.500% | 2/15/45 | 202,622 | 181,504 | 2.1% |
| United States Treasury Note/Bond | 2.875% | 5/15/43 | 182,355 | 177,568 | 2.0% |
| United States Treasury Note/Bond | 3.625% | 2/15/44 | 143,819 | 161,549 | 1.8% |
| United States Treasury Note/Bond | 3.625% | 8/15/43 | 142,500 | 160,312 | 1.8% |
| United States Treasury Note/Bond | 2.875% | 8/15/45 | 146,719 | 142,272 | 1.6% |
| United States Treasury Note/Bond | 3.750% | 11/15/43 | 120,580 | 138,742 | 1.6% |
| United States Treasury Note/Bond | 3.125% | 2/15/43 | 133,640 | 136,793 | 1.6% |
| United States Treasury Note/Bond | 2.750% | 11/15/42 | 141,223 | 134,492 | 1.5% |
| United States Treasury Note/Bond | 3.000% | 11/15/44 | 132,226 | 131,544 | 1.5% |
| United States Treasury Note/Bond | 3.375% | 5/15/44 | 116,337 | 124,681 | 1.4% |
| United States Treasury Note/Bond | 3.125% | 8/15/44 | 118,838 | 121,288 | 1.4% |
| United States Treasury Note/Bond | 2.750% | 8/15/42 | 115,693 | 110,432 | 1.3% |
| United States Treasury Note/Bond | 3.000% | 5/15/45 | 104,370 | 103,718 | 1.2% |
| United States Treasury Note/Bond | 4.625% | 2/15/40 | 69,706 | 90,661 | 1.0% |
| United States Treasury Note/Bond | 4.375% | 2/15/38 | 67,128 | 84,581 | 1.0% |
| United States Treasury Note/Bond | 4.750% | 2/15/41 | 62,405 | 82,862 | 0.9% |
| United States Treasury Note/Bond | 3.000% | 11/15/45 | 78,000 | 77,647 | 0.9% |
| United States Treasury Note/Bond | 4.375% | 5/15/40 | 56,368 | 70,839 | 0.8% |
| United States Treasury Note/Bond | 5.375% | 2/15/31 | 46,145 | 62,505 | 0.7% |
| United States Treasury Note/Bond | 4.250% | 11/15/40 | 49,785 | 61,469 | 0.7% |
| United States Treasury Note/Bond | 6.000% | 2/15/26 | 41,835 | 55,817 | 0.6% |
| United States Treasury Note/Bond | 4.500% | 8/15/39 | 42,981 | 54,929 | 0.6% |
| United States Treasury Note/Bond | 3.125% | 2/15/42 | 53,222 | 54,885 | 0.6% |
| United States Treasury Note/Bond | 6.250% | 5/15/30 | 37,020 | 53,621 | 0.6% |
| United States Treasury Note/Bond | 4.375% | 5/15/41 | 40,595 | 51,175 | 0.6% |
| United States Treasury Note/Bond | 4.250% | 5/15/39 | 40,942 | 50,505 | 0.6% |
| United States Treasury Note/Bond | 3.125% | 11/15/41 | 47,620 | 49,138 | 0.6% |
| United States Treasury Note/Bond | 3.875% | 8/15/40 | 41,775 | 48,766 | 0.6% |
| United States Treasury Note/Bond | 4.375% | 11/15/39 | 38,630 | 48,511 | 0.6% |
| United States Treasury Note/Bond | 4.500% | 5/15/38 | 36,850 | 47,243 | 0.5% |
56
| Long-Term Bond Index Fund | ||||||
| Face | Market | Percentage | ||||
| Maturity | Amount | Value• | of Net | |||
| Coupon | Date | ($000) | ($000) | Assets | ||
| United States Treasury Note/Bond | 5.250% | 2/15/29 | 34,926 | 45,709 | 0.5% | |
| United States Treasury Note/Bond | 6.125% | 8/15/29 | 31,320 | 44,406 | 0.5% | |
| United States Treasury Note/Bond | 6.750% | 8/15/26 | 23,510 | 33,289 | 0.4% | |
| United States Treasury Note/Bond | 3.500% | 2/15/39 | 29,792 | 32,902 | 0.4% | |
| United States Treasury Note/Bond | 6.500% | 11/15/26 | 21,005 | 29,367 | 0.3% | |
| United States Treasury Note/Bond | 3.750% | 8/15/41 | 25,500 | 29,261 | 0.3% | |
| United States Treasury Note/Bond | 4.500% | 2/15/36 | 22,110 | 28,294 | 0.3% | |
| United States Treasury Note/Bond | 5.500% | 8/15/28 | 18,690 | 24,846 | 0.3% | |
| United States Treasury Note/Bond | 3.000% | 5/15/42 | 20,415 | 20,514 | 0.2% | |
| United States Treasury Note/Bond | 4.750% | 2/15/37 | 14,530 | 19,232 | 0.2% | |
| United States Treasury Note/Bond | 6.375% | 8/15/27 | 11,955 | 16,780 | 0.2% | |
| United States Treasury Note/Bond | 2.250% | 11/15/25 | 16,755 | 16,710 | 0.2% | |
| United States Treasury | ||||||
| Note/Bond | 2.000%–6.125% | 8/15/25–5/15/37 | 39,126 | 48,340 | 0.5% | |
| 3,259,699 | 37.0% | |||||
| Agency Bonds and Notes | ||||||
| 1 Federal Home Loan Mortgage Corp. | 6.250% | 7/15/32 | 18,467 | 25,616 | 0.3% | |
| 1 Federal Home Loan Mortgage Corp. | 6.750% | 3/15/31 | 16,260 | 23,302 | 0.3% | |
| 1 Federal National Mortgage Assn. | 6.250% | 5/15/29 | 17,025 | 23,147 | 0.2% | |
| Agency Bonds and Notes—Other † | 108,454 | 1.2% | ||||
| 180,519 | 2.0% | |||||
| Total U.S. Government and Agency Obligations (Cost $3,293,338) | 3,440,218 | 39.0% | ||||
| Corporate Bonds | ||||||
| Finance | ||||||
| Banking | ||||||
| Goldman Sachs Group Inc. | 6.750% | 10/1/37 | 18,440 | 21,546 | 0.2% | |
| 2 Banking—Other † | 433,448 | 4.9% | ||||
| Brokerage † | 15,452 | 0.2% | ||||
| Finance Companies | ||||||
| 2 GE Capital International Funding Co. | 4.418% | 11/15/35 | 41,196 | 42,000 | 0.5% | |
| Finance Companies—Other † | 745 | 0.0% | ||||
| Insurance | ||||||
| Berkshire Hathaway | ||||||
| Finance Corp. | 4.300%–5.750% | 1/15/40–5/15/43 | 6,980 | 7,431 | 0.1% | |
| Berkshire Hathaway Inc. | 4.500% | 2/11/43 | 2,600 | 2,612 | 0.0% | |
| Insurance—Other † | 270,421 | 3.1% | ||||
| 2 Real Estate Investment Trusts † | 32,273 | 0.4% | ||||
| 825,928 | 9.4% | |||||
| Industrial | ||||||
| Basic Industry | ||||||
| Lubrizol Corp. | 6.500% | 10/1/34 | 925 | 1,168 | 0.0% | |
| Basic Industry—Other † | 201,576 | 2.3% | ||||
| Capital Goods | ||||||
| General Electric | ||||||
| Capital Corp. | 5.875%–6.875% | 3/15/32–1/10/39 | 28,592 | 36,628 | 0.4% | |
| General Electric Co. | 4.125%–4.500% | 10/9/42–3/11/44 | 18,210 | 18,169 | 0.2% | |
| Capital Goods—Other † | 194,546 | 2.2% | ||||
| Communication | ||||||
| Alltel Corp. | 7.875% | 7/1/32 | 1,500 | 1,842 | 0.0% | |
| Ameritech Capital Funding Corp. | 6.550% | 1/15/28 | 875 | 977 | 0.0% | |
| AT&T Corp. | 8.250% | 11/15/31 | 1,846 | 2,470 | 0.0% | |
| AT&T Inc. | 4.300%–6.550% | 9/15/34–5/15/46 | 79,816 | 77,158 | 0.9% | |
| AT&T Mobility LLC | 7.125% | 12/15/31 | 1,950 | 2,377 | 0.0% | |
57
| Long-Term Bond Index Fund | |||||
| Face | Market | Percentage | |||
| Maturity | Amount | Value• | of Net | ||
| Coupon | Date | ($000) | ($000) | Assets | |
| Bellsouth Capital | |||||
| Funding Corp. | 7.875% | 2/15/30 | 2,618 | 3,133 | 0.1% |
| BellSouth LLC | 6.000%–6.875% | 10/15/31–11/15/34 | 3,888 | 4,114 | 0.1% |
| BellSouth | |||||
| Telecommunications LLC | 6.375%–6.650% | 6/1/28–12/15/95 | 2,370 | 2,578 | 0.0% |
| DIRECTV Holdings LLC / | |||||
| DIRECTV Financing | |||||
| Co. Inc. | 5.150%–6.375% | 3/15/40–3/15/42 | 14,285 | 14,435 | 0.2% |
| GTE Corp. | 6.940% | 4/15/28 | 2,225 | 2,637 | 0.0% |
| New Cingular Wireless Services Inc. 8.750% | 3/1/31 | 2,585 | 3,565 | 0.1% | |
| Pacific Bell Telephone Co. | 7.125% | 3/15/26 | 1,847 | 2,262 | 0.0% |
| Verizon Communications Inc. | 6.550% | 9/15/43 | 24,105 | 28,529 | 0.3% |
| Verizon Communications Inc. | 5.012% | 8/21/54 | 18,318 | 16,781 | 0.2% |
| Verizon | |||||
| Communications Inc. | 3.850%–7.750% | 12/1/30–3/15/55 | 106,915 | 105,882 | 1.2% |
| Verizon Maryland LLC | 5.125% | 6/15/33 | 3,300 | 3,286 | 0.1% |
| Verizon New England Inc. | 7.875% | 11/15/29 | 2,340 | 2,905 | 0.0% |
| Verizon New York Inc. | 7.375% | 4/1/32 | 1,675 | 1,893 | 0.0% |
| 2 Communication—Other † | 399,263 | 4.5% | |||
| 2 Consumer Cyclical † | 323,682 | 3.7% | |||
| 2 Consumer Noncyclical † | 657,455 | 7.5% | |||
| 2 Energy † | 451,927 | 5.1% | |||
| Other Industrial † | 20,331 | 0.2% | |||
| 2 Technology † | 208,825 | 2.4% | |||
| Transportation | |||||
| 3 BNSF Funding Trust I | 6.613% | 12/15/55 | 1,030 | 1,148 | 0.0% |
| Burlington Northern | |||||
| Santa Fe LLC | 4.150%–7.950% | 8/15/30–9/1/45 | 31,140 | 31,995 | 0.4% |
| 2 Transportation—Other † | 126,353 | 1.4% | |||
| 2,949,890 | 33.5% | ||||
| Utilities | |||||
| Electric | |||||
| Berkshire Hathaway | |||||
| Energy Co. | 4.500%–8.480% | 9/15/28–2/1/45 | 15,125 | 17,930 | 0.2% |
| MidAmerican Energy Co. | 4.400%–6.750% | 12/30/31–10/15/44 | 7,120 | 8,361 | 0.1% |
| MidAmerican Funding LLC | 6.927% | 3/1/29 | 150 | 191 | 0.0% |
| Nevada Power Co. | 5.375%–6.750% | 4/1/36–5/15/41 | 5,760 | 6,868 | 0.1% |
| PacifiCorp | 4.100%–7.700% | 11/15/31–2/1/42 | 11,828 | 14,226 | 0.2% |
| Sierra Pacific Power Co. | 6.750% | 7/1/37 | 885 | 1,110 | 0.0% |
| 2 Electric—Other † | 462,295 | 5.2% | |||
| Natural Gas † | 37,118 | 0.4% | |||
| Other Utility † | 9,526 | 0.1% | |||
| 557,625 | 6.3% | ||||
| Total Corporate Bonds (Cost $4,393,715) | 4,333,443 | 49.2% | |||
| Sovereign Bonds (U.S. Dollar-Denominated) | |||||
| 2 Petroleos Mexicanos | 4.500%–6.625% | 1/23/26–1/23/46 | 59,810 | 49,642 | 0.5% |
| United Mexican States | 4.600%–8.300% | 8/15/31–10/12/10 | 68,243 | 70,272 | 0.8% |
| Sovereign Bonds | |||||
| (U.S. Dollar-Denominated)—Other † | 342,732 | 3.9% | |||
| Total Sovereign Bonds (Cost $489,425) | 462,646 | 5.2% | |||
58
| Long-Term Bond Index Fund | |||||
| Face | Market | Percentage | |||
| Maturity | Amount | Value• | of Net | ||
| Coupon | Date | ($000) | ($000) | Assets | |
| Taxable Municipal Bonds | |||||
| Illinois GO | 5.100% | 6/1/33 | 23,440 | 22,175 | 0.2% |
| Taxable Municipal Bonds—Other † | 454,511 | 5.2% | |||
| Total Taxable Municipal Bonds (Cost $428,230) | 476,686 | 5.4% | |||
| Shares | |||||
| Temporary Cash Investment | |||||
| Money Market Fund | |||||
| 4 Vanguard Market Liquidity Fund | |||||
| (Cost $23,090) | 0.363% | 23,089,687 | 23,090 | 0.3% | |
| Total Investments (Cost $8,627,798) | 8,736,083 | 99.1% | |||
| Amount | |||||
| ($000) | |||||
| Other Assets and Liabilities | |||||
| Other Assets | |||||
| Investment in Vanguard | 769 | ||||
| Receivables for Investment Securities Sold | 41,334 | ||||
| Receivables for Accrued Income | 105,128 | ||||
| Receivables for Capital Shares Issued | 2,782 | ||||
| Other Assets | 20 | ||||
| Total Other Assets | 150,033 | 1.7% | |||
| Liabilities | |||||
| Payables for Investment Securities Purchased | (57,728) | ||||
| Payables for Capital Shares Redeemed | (4,628) | ||||
| Payables for Distributions | (1,172) | ||||
| Payables to Vanguard | (5,070) | ||||
| Other Liabilities | (1,791) | ||||
| Total Liabilities | (70,389) | (0.8%) | |||
| Net Assets | 8,815,727 | 100.0% | |||
| At December 31, 2015, net assets consisted of: | |||||
| Amount | |||||
| ($000) | |||||
| Paid-in Capital | 8,722,518 | ||||
| Overdistributed Net Investment Income | (9) | ||||
| Accumulated Net Realized Losses | (15,067) | ||||
| Unrealized Appreciation (Depreciation) | 108,285 | ||||
| Net Assets | 8,815,727 | ||||
| Investor Shares—Net Assets | |||||
| Applicable to 183,042,134 outstanding $.001 par value shares of | |||||
| beneficial interest (unlimited authorization) | 2,415,485 | ||||
| Net Asset Value Per Share—Investor Shares | $13.20 | ||||
59
| Long-Term Bond Index Fund | |
| Amount | |
| ($000) | |
| ETF Shares—Net Assets | |
| Applicable to 19,500,000 outstanding $.001 par value shares of | |
| beneficial interest (unlimited authorization) | 1,692,651 |
| Net Asset Value Per Share—ETF Shares | $86.80 |
| Institutional Shares—Net Assets | |
| Applicable to 164,766,562 outstanding $.001 par value shares of | |
| beneficial interest (unlimited authorization) | 2,174,329 |
| Net Asset Value Per Share—Institutional Shares | $13.20 |
| Institutional Plus Shares—Net Assets | |
| Applicable to 191,965,794 outstanding $.001 par value shares of | |
| beneficial interest (unlimited authorization) | 2,533,262 |
| Net Asset Value Per Share—Institutional Plus Shares | $13.20 |
• See Note A in Notes to Financial Statements.
† Represents the aggregate value, by category, of securities that are not among the 50 largest holdings and, in total for any issuer, represent
1% or less of net assets.
1 The issuer was placed under federal conservatorship in September 2008; since that time, its daily operations have been managed by the
Federal Housing Finance Agency and it receives capital from the U.S. Treasury, as needed to maintain a positive net worth, in exchange for
senior preferred stock.
2 Certain of the fund’s securities are exempt from registration under Rule 144A of the Securities Act of 1933. Such securities may be sold in
transactions exempt from registration, normally to qualified institutional buyers. At December 31, 2015, the aggregate value of these
securities was $125,034,000, representing 1.4% of net assets.
3 The average or expected maturity is shorter than the final maturity shown because of the possibility of interim principal payments and
prepayments or the possibility of the issue being called.
4 Affiliated money market fund available only to Vanguard funds and certain trusts and accounts managed by Vanguard. Rate shown is the
7-day yield.
GO—General Obligation Bond.
See accompanying Notes, which are an integral part of the Financial Statements.
60
Long-Term Bond Index Fund
Statement of Operations
| Year Ended | |
| December 31, 2015 | |
| ($000) | |
| Investment Income | |
| Income | |
| Interest1 | 358,167 |
| Total Income | 358,167 |
| Expenses | |
| The Vanguard Group—Note B | |
| Investment Advisory Services | 222 |
| Management and Administrative—Investor Shares | 3,427 |
| Management and Administrative—ETF Shares | 1,024 |
| Management and Administrative—Institutional Shares | 1,071 |
| Management and Administrative—Institutional Plus Shares | 672 |
| Marketing and Distribution—Investor Shares | 521 |
| Marketing and Distribution—ETF Shares | 139 |
| Marketing and Distribution—Institutional Shares | 178 |
| Marketing and Distribution—Institutional Plus Shares | 201 |
| Custodian Fees | 61 |
| Auditing Fees | 44 |
| Shareholders’ Reports—Investor Shares | 21 |
| Shareholders’ Reports—ETF Shares | 70 |
| Shareholders’ Reports—Institutional Shares | 1 |
| Shareholders’ Reports—Institutional Plus Shares | — |
| Trustees’ Fees and Expenses | 6 |
| Total Expenses | 7,658 |
| Net Investment Income | 350,509 |
| Realized Net Gain (Loss) on Investment Securities Sold | 45,978 |
| Change in Unrealized Appreciation (Depreciation) of Investment Securities | (706,091) |
| Net Increase (Decrease) in Net Assets Resulting from Operations | (309,604) |
| 1 Interest income from an affiliated company of the fund was $74,000. | |
See accompanying Notes, which are an integral part of the Financial Statements.
61
Long-Term Bond Index Fund
Statement of Changes in Net Assets
| Year Ended December 31, | ||
| 2015 | 2014 | |
| ($000) | ($000) | |
| Increase (Decrease) in Net Assets | ||
| Operations | ||
| Net Investment Income | 350,509 | 288,500 |
| Realized Net Gain (Loss) | 45,978 | 75,690 |
| Change in Unrealized Appreciation (Depreciation) | (706,091) | 855,064 |
| Net Increase (Decrease) in Net Assets Resulting from Operations | (309,604) | 1,219,254 |
| Distributions | ||
| Net Investment Income | ||
| Investor Shares | (100,352) | (95,034) |
| ETF Shares | (55,668) | (30,305) |
| Institutional Shares | (90,148) | (84,528) |
| Institutional Plus Shares | (104,350) | (78,633) |
| Realized Capital Gain | ||
| Investor Shares | (6,417) | (541) |
| ETF Shares | (3,905) | (228) |
| Institutional Shares | (5,562) | (500) |
| Institutional Plus Shares | (6,633) | (540) |
| Total Distributions | (373,035) | (290,309) |
| Capital Share Transactions | ||
| Investor Shares | 21,778 | 262,379 |
| ETF Shares | 732,728 | 487,146 |
| Institutional Shares | 59,656 | 225,367 |
| Institutional Plus Shares | 167,830 | 877,354 |
| Net Increase (Decrease) from Capital Share Transactions | 981,992 | 1,852,246 |
| Total Increase (Decrease) | 299,353 | 2,781,191 |
| Net Assets | ||
| Beginning of Period | 8,516,374 | 5,735,183 |
| End of Period1 | 8,815,727 | 8,516,374 |
| 1 Net Assets—End of Period includes undistributed (overdistributed) net investment income of ($9,000) and $0. | ||
See accompanying Notes, which are an integral part of the Financial Statements.
62
Long-Term Bond Index Fund
Financial Highlights
| Investor Shares | |||||
| For a Share Outstanding | Year Ended December 31, | ||||
| Throughout Each Period | 2015 | 2014 | 2013 | 2012 | 2011 |
| Net Asset Value, Beginning of Period | $14.26 | $12.41 | $14.27 | $13.91 | $12.04 |
| Investment Operations | |||||
| Net Investment Income | . 546 | .556 | .557 | .570 | .587 |
| Net Realized and Unrealized Gain (Loss) | |||||
| on Investments | (1.025) | 1.853 | (1.837) | .591 | 1.991 |
| Total from Investment Operations | (.479) | 2.409 | (1.280) | 1.161 | 2.578 |
| Distributions | |||||
| Dividends from Net Investment Income | (.546) | (.556) | (.557) | (.570) | (.587) |
| Distributions from Realized Capital Gains | (. 035) | (. 003) | (. 023) | (. 231) | (.121) |
| Total Distributions | (.581) | (. 559) | (. 580) | (. 801) | (.708) |
| Net Asset Value, End of Period | $13.20 | $14.26 | $12.41 | $14.27 | $13.91 |
| Total Return1 | -3.47% | 19.72% | -9.13% | 8.49% | 22.06% |
| Ratios/Supplemental Data | |||||
| Net Assets, End of Period (Millions) | $2,415 | $2,594 | $2,019 | $2,904 | $2,727 |
| Ratio of Total Expenses to Average Net Assets | 0.16% | 0.20% | 0.20% | 0.20% | 0.22% |
| Ratio of Net Investment Income to | |||||
| Average Net Assets | 3.95% | 4.10% | 4.21% | 4.00% | 4.62% |
| Portfolio Turnover Rate2 | 42% | 39% | 50% | 41% | 45% |
1 Total returns do not include account service fees that may have applied in the periods shown. Fund prospectuses provide information about any applicable account service fees.
2 Excludes the value of portfolio securities received or delivered as a result of in-kind purchases or redemptions of the fund’s capital shares, including ETF Creation Units.
See accompanying Notes, which are an integral part of the Financial Statements.
63
Long-Term Bond Index Fund
Financial Highlights
| ETF Shares | |||||
| For a Share Outstanding | Year Ended December 31, | ||||
| Throughout Each Period | 2015 | 2014 | 2013 | 2012 | 2011 |
| Net Asset Value, Beginning of Period | $93.73 | $81.45 | $93.73 | $91.40 | $79.07 |
| Investment Operations | |||||
| Net Investment Income | 3.565 | 3.639 | 3.813 | 3.790 | 3.904 |
| Net Realized and Unrealized Gain (Loss) | |||||
| on Investments | (6.700) | 12.300 | (12.129) | 3.851 | 13.127 |
| Total from Investment Operations | (3.135) | 15.939 | (8.316) | 7.641 | 17.031 |
| Distributions | |||||
| Dividends from Net Investment Income | (3.565) | (3.639) | (3.813) | (3.790) | (3.904) |
| Distributions from Realized Capital Gains | (. 230) | (. 020) | (.151) | (1.521) | (.797) |
| Total Distributions | (3.795) | (3.659) | (3.964) | (5.311) | (4.701) |
| Net Asset Value, End of Period | $86.80 | $93.73 | $81.45 | $93.73 | $91.40 |
| Total Return | -3.45% | 19.89% | -9.03% | 8.49% | 22.18% |
| Ratios/Supplemental Data | |||||
| Net Assets, End of Period (Millions) | $1,693 | $1,068 | $489 | $806 | $512 |
| Ratio of Total Expenses to Average Net Assets | 0.09% | 0.10% | 0.10% | 0.10% | 0.11% |
| Ratio of Net Investment Income to | |||||
| Average Net Assets | 4.02% | 4.20% | 4.31% | 4.10% | 4.73% |
| Portfolio Turnover Rate1 | 42% | 39% | 50% | 41% | 45% |
| 1 Excludes the value of portfolio securities received or delivered as a result of in-kind purchases or redemptions of the fund’s capital shares, including ETF Creation Units. | |||||
See accompanying Notes, which are an integral part of the Financial Statements.
64
Long-Term Bond Index Fund
Financial Highlights
| Institutional Shares | |||||
| For a Share Outstanding | Year Ended December 31, | ||||
| Throughout Each Period | 2015 | 2014 | 2013 | 2012 | 2011 |
| Net Asset Value, Beginning of Period | $14.26 | $12.41 | $14.27 | $13.91 | $12.04 |
| Investment Operations | |||||
| Net Investment Income | . 560 | . 573 | .574 | .589 | .606 |
| Net Realized and Unrealized Gain (Loss) | |||||
| on Investments | (1.025) | 1.853 | (1.837) | .591 | 1.991 |
| Total from Investment Operations | (.465) | 2.426 | (1.263) | 1.180 | 2.597 |
| Distributions | |||||
| Dividends from Net Investment Income | (.560) | (.573) | (. 574) | (.589) | (.606) |
| Distributions from Realized Capital Gains | (. 035) | (. 003) | (. 023) | (. 231) | (.121) |
| Total Distributions | (.595) | (.576) | (.597) | (.820) | (.727) |
| Net Asset Value, End of Period | $13.20 | $14.26 | $12.41 | $14.27 | $13.91 |
| Total Return | -3.37% | 19.87% | -9.01% | 8.63% | 22.24% |
| Ratios/Supplemental Data | |||||
| Net Assets, End of Period (Millions) | $2,174 | $2,283 | $1,784 | $1,576 | $1,174 |
| Ratio of Total Expenses to Average Net Assets | 0.06% | 0.07% | 0.07% | 0.07% | 0.07% |
| Ratio of Net Investment Income to | |||||
| Average Net Assets | 4.05% | 4.23% | 4.34% | 4.13% | 4.77% |
| Portfolio Turnover Rate1 | 42% | 39% | 50% | 41% | 45% |
| 1 Excludes the value of portfolio securities received or delivered as a result of in-kind purchases or redemptions of the fund’s capital shares, including ETF Creation Units. | |||||
See accompanying Notes, which are an integral part of the Financial Statements.
65
Long-Term Bond Index Fund
Financial Highlights
| Institutional Plus Shares | |||||
| Oct. 6, | |||||
| 20111 to | |||||
| For a Share Outstanding | Year Ended December 31, | Dec. 31, | |||
| Throughout Each Period | 2015 | 2014 | 2013 | 2012 | 2011 |
| Net Asset Value, Beginning of Period | $14.26 | $12.41 | $14.27 | $13.91 | $13.69 |
| Investment Operations | |||||
| Net Investment Income | . 563 | . 576 | .577 | .592 | .152 |
| Net Realized and Unrealized Gain (Loss) | |||||
| on Investments | (1.025) | 1.853 | (1.837) | .591 | .341 |
| Total from Investment Operations | (.462) | 2.429 | (1.260) | 1.183 | .493 |
| Distributions | |||||
| Dividends from Net Investment Income | (.563) | (.576) | (.577) | (. 592) | (.152) |
| Distributions from Realized Capital Gains | (. 035) | (. 003) | (. 023) | (. 231) | (.121) |
| Total Distributions | (.598) | (.579) | (. 600) | (. 823) | (.273) |
| Net Asset Value, End of Period | $13.20 | $14.26 | $12.41 | $14.27 | $13.91 |
| Total Return | -3.35% | 19.89% | -8.99% | 8.65% | 3.64% |
| Ratios/Supplemental Data | |||||
| Net Assets, End of Period (Millions) | $2,533 | $2,571 | $1,444 | $424 | $440 |
| Ratio of Total Expenses to Average Net Assets | 0.04% | 0.05% | 0.05% | 0.05% | 0.05%2 |
| Ratio of Net Investment Income to | |||||
| Average Net Assets | 4.07% | 4.25% | 4.36% | 4.15% | 4.79%2 |
| Portfolio Turnover Rate 3 | 42% | 39% | 50% | 41% | 45% |
| 1 Inception. | |||||
| 2 Annualized. | |||||
| 3 Excludes the value of portfolio securities received or delivered as a result of in-kind purchases or redemptions of the fund’s capital shares, including ETF Creation Units. | |||||
See accompanying Notes, which are an integral part of the Financial Statements.
66
Long-Term Bond Index Fund
Notes to Financial Statements
Vanguard Long-Term Bond Index Fund is registered under the Investment Company Act of 1940 as an open-end investment company, or mutual fund. Certain of the fund’s investments are in corporate debt instruments; the issuers’ abilities to meet their obligations may be affected by economic developments in their respective industries. The fund offers four classes of shares: Investor Shares, ETF Shares, Institutional Shares, and Institutional Plus Shares. Investor Shares are available to any investor who meets the fund’s minimum purchase requirements. ETF Shares are listed for trading on NYSE Arca; they can be purchased and sold through a broker. Institutional Shares and Institutional Plus Shares are designed for investors who meet certain administrative, service, and account-size criteria.
A. The following significant accounting policies conform to generally accepted accounting principles for U.S. investment companies. The fund consistently follows such policies in preparing its financial statements.
1. Security Valuation: Securities are valued as of the close of trading on the New York Stock Exchange (generally 4 p.m., Eastern time) on the valuation date. Bonds, and temporary cash investments acquired over 60 days to maturity, are valued using the latest bid prices or using valuations based on a matrix system (which considers such factors as security prices, yields, maturities, and ratings), both as furnished by independent pricing services. Investments in Vanguard Market Liquidity Fund are valued at that fund’s net asset value. Other temporary cash investments are valued at amortized cost, which approximates market value. Securities for which market quotations are not readily available, or whose values have been affected by events occurring before the fund’s pricing time but after the close of the securities’ primary markets, are valued by methods deemed by the board of trustees to represent fair value.
2. Federal Income Taxes: The fund intends to continue to qualify as a regulated investment company and distribute all of its taxable income. Management has analyzed the fund’s tax positions taken for all open federal income tax years (December 31, 2012–2015), and has concluded that no provision for federal income tax is required in the fund’s financial statements.
3. Distributions: Distributions from net investment income are declared daily by all share classes except ETF Shares, and paid on the first business day of the following month. Monthly income dividends from ETF Shares, and annual distributions from realized capital gains, if any, are recorded on the ex-dividend date.
4. Credit Facility: The fund and certain other funds managed by The Vanguard Group (“Vanguard”) participate in a $3 billion committed credit facility provided by a syndicate of lenders pursuant to a credit agreement that may be renewed annually; each fund is individually liable for its borrowings, if any, under the credit facility. Borrowings may be utilized for temporary and emergency purposes, and are subject to the fund’s regulatory and contractual borrowing restrictions. The participating funds are charged administrative fees and an annual commitment fee of 0.06% of the undrawn amount of the facility; these fees are allocated to the funds based on a method approved by the fund’s board of trustees and included in Management and Administrative expenses on the fund’s Statement of Operations. Any borrowings under this facility bear interest at a rate equal to the higher of the federal funds rate or LIBOR reference rate plus an agreed-upon spread.
The fund had no borrowings outstanding at December 31, 2015, or at any time during the period then ended.
67
Long-Term Bond Index Fund
5. Other: Interest income includes income distributions received from Vanguard Market Liquidity Fund and is accrued daily. Premiums and discounts on debt securities purchased are amortized and accreted, respectively, to interest income over the lives of the respective securities. Security transactions are accounted for on the date securities are bought or sold. Costs used to determine realized gains (losses) on the sale of investment securities are those of the specific securities sold.
Each class of shares has equal rights as to assets and earnings, except that each class separately bears certain class-specific expenses related to maintenance of shareholder accounts (included in Management and Administrative expenses) and shareholder reporting. Marketing and distribution expenses are allocated to each class of shares based on a method approved by the board of trustees. Income, other non-class-specific expenses, and gains and losses on investments are allocated to each class of shares based on its relative net assets.
B. In accordance with the terms of a Funds’ Service Agreement (the “FSA”) between Vanguard and the fund, Vanguard furnishes to the fund investment advisory, corporate management, administrative, marketing, and distribution services at Vanguard’s cost of operations (as defined by the FSA). These costs of operations are allocated to the fund based on methods and guidelines approved by the board of trustees. Vanguard does not require reimbursement in the current period for certain costs of operations (such as deferred compensation/benefits and risk/insurance costs); the fund’s liability for these costs of operations is included in Payables to Vanguard on the Statement of Net Assets.
Upon the request of Vanguard, the fund may invest up to 0.40% of its net assets as capital in Vanguard. At December 31, 2015, the fund had contributed to Vanguard capital in the amount of $769,000, representing 0.01% of the fund’s net assets and 0.31% of Vanguard’s capitalization. The fund’s trustees and officers are also directors and employees, respectively, of Vanguard.
C. Various inputs may be used to determine the value of the fund’s investments. These inputs are summarized in three broad levels for financial statement purposes. The inputs or methodologies used to value securities are not necessarily an indication of the risk associated with investing in those securities.
Level 1—Quoted prices in active markets for identical securities.
Level 2—Other significant observable inputs (including quoted prices for similar securities, interest rates, prepayment speeds, credit risk, etc.).
Level 3—Significant unobservable inputs (including the fund’s own assumptions used to determine the fair value of investments).
The following table summarizes the market value of the fund’s investments as of December 31, 2015, based on the inputs used to value them:
| Level 1 | Level 2 | Level 3 | |
| Investments | ($000) | ($000) | ($000) |
| U.S. Government and Agency Obligations | — | 3,440,218 | — |
| Corporate Bonds | — | 4,333,443 | — |
| Sovereign Bonds | — | 462,646 | — |
| Taxable Municipal Bonds | — | 476,686 | — |
| Temporary Cash Investments | 23,090 | — | — |
| Total | 23,090 | 8,712,993 | — |
68
Long-Term Bond Index Fund
D. Capital gain distributions are determined on a tax basis and may differ from realized capital gains for financial reporting purposes. Differences may be permanent or temporary. Permanent differences are reclassified among capital accounts in the financial statements to reflect their tax character. Temporary differences arise when gains or losses are recognized in different periods for financial statement and tax purposes. These differences will reverse at some time in the future.
During the year ended December 31, 2015, the fund realized $42,069,000 of net capital gains resulting from in-kind redemptions—in which shareholders exchanged fund shares for securities held by the fund rather than for cash. Because such gains are not taxable to the fund, and are not distributed to shareholders, they have been reclassified from accumulated net realized losses to paid-in capital.
The fund used a tax accounting practice to treat a portion of the price of capital shares redeemed during the year as distributions from realized capital gains. Accordingly, the fund has reclassified $4,811,000 from accumulated net realized losses to paid-in capital.
Capital gains required to be distributed in December 2015 included gains realized through October 31, 2015; subsequently the fund realized losses of $15,067,000 which are deferred and will be treated as realized for tax purposes in 2016.
At December 31, 2015, the cost of investment securities for tax purposes was $8,627,798,000. Net unrealized appreciation of investment securities for tax purposes was $108,285,000, consisting of unrealized gains of $381,440,000 on securities that had risen in value since their purchase and $273,155,000 in unrealized losses on securities that had fallen in value since their purchase.
E. During the year ended December 31, 2015, the fund purchased $2,163,520,000 of investment securities and sold $1,605,682,000 of investment securities, other than U.S. government securities and temporary cash investments. Purchases and sales of U.S. government securities were $2,863,383,000 and $2,453,955,000, respectively. Total purchases and sales include $1,048,149,000 and $476,514,000, respectively, in connection with in-kind purchases and redemptions of the fund’s capital shares.
69
Long-Term Bond Index Fund
| F. Capital share transactions for each class of shares were: | ||||
| Year Ended December 31, | ||||
| 2015 | 2014 | |||
| Amount | Shares | Amount | Shares | |
| ($000) | (000) | ($000) | (000) | |
| Investor Shares | ||||
| Issued | 583,049 | 41,650 | 726,447 | 53,789 |
| Issued in Lieu of Cash Distributions | 93,791 | 6,780 | 83,598 | 6,139 |
| Redeemed | (655,062) | (47,308) | (547,666) | (40,722) |
| Net Increase (Decrease)—Investor Shares | 21,778 | 1,122 | 262,379 | 19,206 |
| ETF Shares | ||||
| Issued | 1,217,481 | 13,500 | 720,949 | 8,000 |
| Issued in Lieu of Cash Distributions | — | — | — | — |
| Redeemed | (484,753) | (5,400) | (233,803) | (2,600) |
| Net Increase (Decrease)—ETF Shares | 732,728 | 8,100 | 487,146 | 5,400 |
| Institutional Shares | ||||
| Issued | 461,222 | 33,587 | 776,880 | 56,976 |
| Issued in Lieu of Cash Distributions | 92,903 | 6,719 | 82,728 | 6,069 |
| Redeemed | (494,469) | (35,610) | (634,241) | (46,766) |
| Net Increase (Decrease) —Institutional Shares | 59,656 | 4,696 | 225,367 | 16,279 |
| Institutional Plus Shares | ||||
| Issued | 426,453 | 30,543 | 1,054,351 | 76,847 |
| Issued in Lieu of Cash Distributions | 107,570 | 7,786 | 72,641 | 5,327 |
| Redeemed | (366,193) | (26,645) | (249,638) | (18,266) |
| Net Increase (Decrease) —Institutional Plus Shares | 167,830 | 11,684 | 877,354 | 63,908 |
G. Management has determined that no material events or transactions occurred subsequent to December 31, 2015, that would require recognition or disclosure in these financial statements.
70
Report of Independent Registered
Public Accounting Firm
To the Board of Trustees of Vanguard Bond Index Funds and the Shareholders of Vanguard Short-Term Bond Index Fund, Vanguard Intermediate-Term Bond Index Fund and Vanguard Long-Term Bond Index Fund:
In our opinion, the accompanying statements of net assets—investments summary and the related statements of operations and of changes in net assets and the financial highlights present fairly, in all material respects, the financial position of Vanguard Short-Term Bond Index Fund, Vanguard Intermediate-Term Bond Index Fund and Vanguard Long-Term Bond Index Fund (constituting separate portfolios of Vanguard Bond Index Funds, hereafter referred to as the “Funds”) at December 31, 2015, the results of each of their operations for the year then ended, the changes in each of their net assets for each of the two years in the period then ended, and the financial highlights for each of the periods indicated, in conformity with accounting principles generally accepted in the United States of America. These financial statements and financial highlights (hereafter referred to as “financial statements”) are the responsibility of the Funds’ management. Our responsibility is to express an opinion on these financial statements based on our audits. We conducted our audits of these financial statements in accordance with the standards of the Public Company Accounting Oversight Board (United States). Those standards require that we plan and perform the audit to obtain reasonable assurance about whether the financial statements are free of material misstatement. An audit includes examining, on a test basis, evidence supporting the amounts and disclosures in the financial statements, assessing the accounting principles used and significant estimates made by management, and evaluating the overall financial statement presentation. We believe that our audits, which included confirmation of securities at December 31, 2015 by correspondence with the custodian and brokers, by agreement to the underlying ownership records of the transfer agent and the application of alternative auditing procedures where securities purchased had not been received, provide a reasonable basis for our opinion.
/s/PricewaterhouseCoopers LLP
Philadelphia, Pennsylvania
February 16, 2016
71

This information for the fiscal year ended December 31, 2015, is included pursuant to provisions
of the Internal Revenue Code.
The fund distributed $46,780,000 as capital gain dividends (20% rate gain distributions) to
shareholders during the fiscal year.
For nonresident alien shareholders, 84.6% of income dividends are interest-related dividends.

Special 2015 tax information (unaudited) for Vanguard Intermediate-Term Bond Index Fund
This information for the fiscal year ended December 31, 2015, is included pursuant to provisions
of the Internal Revenue Code.
The fund distributed $83,303,000 as capital gain dividends (20% rate gain distributions) to
shareholders during the fiscal year.
For nonresident alien shareholders, 85.5% of income dividends are interest-related dividends.

This information for the fiscal year ended December 31, 2015, is included pursuant to provisions
of the Internal Revenue Code.
The fund distributed $27,327,000 as capital gain dividends (20% rate gain distributions) to
shareholders during the fiscal year.
For nonresident alien shareholders, 79.3% of income dividends are interest-related dividends.
72
About Your Fund’s Expenses
As a shareholder of the fund, you incur ongoing costs, which include costs for portfolio management, administrative services, and shareholder reports (like this one), among others. Operating expenses, which are deducted from a fund’s gross income, directly reduce the investment return of the fund.
A fund’s expenses are expressed as a percentage of its average net assets. This figure is known as the expense ratio. The following examples are intended to help you understand the ongoing costs (in dollars) of investing in your fund and to compare these costs with those of other mutual funds. The examples are based on an investment of $1,000 made at the beginning of the period shown and held for the entire period.
The accompanying table illustrates your fund’s costs in two ways:
• Based on actual fund return. This section helps you to estimate the actual expenses that you paid over the period. The ”Ending Account Value“ shown is derived from the fund‘s actual return, and the third column shows the dollar amount that would have been paid by an investor who started with $1,000 in the fund. You may use the information here, together with the amount you invested, to estimate the expenses that you paid over the period.
To do so, simply divide your account value by $1,000 (for example, an $8,600 account value divided by $1,000 = 8.6), then multiply the result by the number given for your fund under the heading ”Expenses Paid During Period.“
• Based on hypothetical 5% yearly return. This section is intended to help you compare your fund‘s costs with those of other mutual funds. It assumes that the fund had a yearly return of 5% before expenses, but that the expense ratio is unchanged. In this case—because the return used is not the fund’s actual return—the results do not apply to your investment. The example is useful in making comparisons because the Securities and Exchange Commission requires all mutual funds to calculate expenses based on a 5% return. You can assess your fund’s costs by comparing this hypothetical example with the hypothetical examples that appear in shareholder reports of other funds.
Note that the expenses shown in the table are meant to highlight and help you compare ongoing costs only and do not reflect transaction costs incurred by the fund for buying and selling securities. Further, the expenses do not include any purchase, redemption, or account service fees described in the fund prospectus. If such fees were applied to your account, your costs would be higher. Your fund does not carry a “sales load.”
The calculations assume no shares were bought or sold during the period. Your actual costs may have been higher or lower, depending on the amount of your investment and the timing of any purchases or redemptions.
You can find more information about the fund’s expenses, including annual expense ratios, in the Financial Statements section of this report. For additional information on operating expenses and other shareholder costs, please refer to your fund’s current prospectus.
73
| Six Months Ended December 31, 2015 | |||
| Beginning | Ending | Expenses | |
| Account Value | Account Value | Paid During | |
| 6/30/2015 | 12/31/2015 | Period | |
| Based on Actual Fund Return | |||
| Short-Term Bond Index Fund | |||
| Investor Shares | $1,000.00 | $999.41 | $0.81 |
| ETF Shares | 1,000.00 | 1,000.34 | 0.50 |
| Admiral Shares | 1,000.00 | 999.71 | 0.50 |
| Institutional Shares | 1,000.00 | 999.86 | 0.35 |
| Institutional Plus Shares | 1,000.00 | 1,000.00 | 0.20 |
| Intermediate-Term Bond Index Fund | |||
| Investor Shares | $1,000.00 | $1,007.61 | $0.66 |
| ETF Shares | 1,000.00 | 1,007.44 | 0.51 |
| Admiral Shares | 1,000.00 | 1,007.79 | 0.51 |
| Institutional Shares | 1,000.00 | 1,007.95 | 0.35 |
| Institutional Plus Shares | 1,000.00 | 1,008.06 | 0.20 |
| Long-Term Bond Index Fund | |||
| Investor Shares | $1,000.00 | $1,013.03 | $0.71 |
| ETF Shares | 1,000.00 | 1,012.43 | 0.51 |
| Institutional Shares | 1,000.00 | 1,013.43 | 0.30 |
| Institutional Plus Shares | 1,000.00 | 1,013.58 | 0.15 |
74
| Six Months Ended December 31, 2015 | |||
| Beginning | Ending | Expenses | |
| Account Value | Account Value | Paid During | |
| 6/30/2015 | 12/31/2015 | Period | |
| Based on Hypothetical 5% Yearly Return | |||
| Short-Term Bond Index Fund | |||
| Investor Shares | $1,000.00 | $1,024.40 | $0.82 |
| ETF Shares | 1,000.00 | 1,024.70 | 0.51 |
| Admiral Shares | 1,000.00 | 1,024.70 | 0.51 |
| Institutional Shares | 1,000.00 | 1,024.85 | 0.36 |
| Institutional Plus Shares | 1,000.00 | 1,025.00 | 0.20 |
| Intermediate-Term Bond Index Fund | |||
| Investor Shares | $1,000.00 | $1,024.55 | $0.66 |
| ETF Shares | 1,000.00 | 1,024.70 | 0.51 |
| Admiral Shares | 1,000.00 | 1,024.70 | 0.51 |
| Institutional Shares | 1,000.00 | 1,024.85 | 0.36 |
| Institutional Plus Shares | 1,000.00 | 1,025.00 | 0.20 |
| Long-Term Bond Index Fund | |||
| Investor Shares | $1,000.00 | $1,024.50 | $0.71 |
| ETF Shares | 1,000.00 | 1,024.70 | 0.51 |
| Institutional Shares | 1,000.00 | 1,024.90 | 0.31 |
| Institutional Plus Shares | 1,000.00 | 1,025.05 | 0.15 |
The calculations are based on expenses incurred in the most recent six-month period. The funds’ annualized six-month expense ratios for that
period are: for the Short-Term Bond Index Fund, 0.16% for Investor Shares, 0.10% for ETF Shares, 0.10% for Admiral Shares, 0.07% for
Institutional Shares, and 0.04% for Institutional Plus Shares; for the Intermediate-Term Bond Index Fund, 0.13% for Investor Shares, 0.10% for
ETF Shares, 0.10% for Admiral Shares, 0.07% for Institutional Shares, and 0.04% for Institutional Plus Shares; and for the Long-Term Bond
Index Fund, 0.14% for Investor Shares, 0.10% for ETF Shares, 0.06% for Institutional Shares, and 0.03% for Institutional Plus Shares. The
dollar amounts shown as “Expenses Paid” are equal to the annualized expense ratio multiplied by the average account value over the period,
multiplied by the number of days in the most recent six-month period, then divided by the number of days in the most recent 12-month period
(184/365).
75
Glossary
30-Day SEC Yield. A fund’s 30-day SEC yield is derived using a formula specified by the U.S. Securities and Exchange Commission. Under the formula, data related to the fund’s security holdings in the previous 30 days are used to calculate the fund’s hypothetical net income for that period, which is then annualized and divided by the fund’s estimated average net assets over the calculation period. For the purposes of this calculation, a security’s income is based on its current market yield to maturity (for bonds), its actual income (for asset-backed securities), or its projected dividend yield (for stocks). Because the SEC yield represents hypothetical annualized income, it will differ—at times significantly—from the fund’s actual experience. As a result, the fund’s income distributions may be higher or lower than implied by the SEC yield.
Average Coupon. The average interest rate paid on the fixed income securities held by a fund. It is expressed as a percentage of face value.
Average Duration. An estimate of how much the value of the bonds held by a fund will fluctuate in response to a change in interest rates. To see how the value could change, multiply the average duration by the change in rates. If interest rates rise by 1 percentage point, the value of the bonds in a fund with an average duration of five years would decline by about 5%. If rates decrease by a percentage point, the value would rise by 5%.
Average Effective Maturity. The average length of time until fixed income securities held by a fund reach maturity and are repaid, taking into consideration the possibility that the issuer may call the bond before its maturity date. The figure reflects the proportion of fund assets represented by each security; it also reflects any futures contracts held. In general, the longer the average effective maturity, the more a fund’s share price will fluctuate in response to changes in market interest rates.
Beta. A measure of the magnitude of a fund’s past share-price fluctuations in relation to the ups and downs of a given market index. The index is assigned a beta of 1.00. Compared with a given index, a fund with a beta of 1.20 typically would have seen its share price rise or fall by 12% when the index rose or fell by 10%. For this report, beta is based on returns over the past 36 months for both the fund and the index. Note that a fund’s beta should be reviewed in conjunction with its R-squared (see definition). The lower the R-squared, the less correlation there is between the fund and the index, and the less reliable beta is as an indicator of volatility.
Credit Quality. Credit-quality ratings are measured on a scale that generally ranges from AAA (highest) to D (lowest). U.S. Treasury, U.S. Agency, and U.S. Agency mortgage-backed securities appear under “U.S. Government.” Credit-quality ratings are obtained from Barclays and are from Moody’s, Fitch, and S&P. When ratings from all three agencies are used, the median rating is shown. When ratings from two of the agencies are used, the lower rating for each issue is shown. ”Not Rated” is used to classify securities for which a rating is not available. Not rated securities include a fund’s investment in Vanguard Market Liquidity Fund or Vanguard Municipal Cash Management Fund, each of which invests in high-quality money market instruments and may serve as a cash management vehicle for the Vanguard funds, trusts, and accounts.
Expense Ratio. A fund’s total annual operating expenses expressed as a percentage of the fund’s average net assets. The expense ratio includes management and administrative expenses, but does not include the transaction costs of buying and selling portfolio securities.
76
Inception Date. The date on which the assets of a fund (or one of its share classes) are first invested in accordance with the fund’s investment objective. For funds with a subscription period, the inception date is the day after that period ends. Investment performance is measured from the inception date.
R-Squared. A measure of how much of a fund’s past returns can be explained by the returns from the market in general, as measured by a given index. If a fund’s total returns were precisely synchronized with an index’s returns, its R-squared would be 1.00. If the fund’s returns bore no relationship to the index’s returns, its R-squared would be 0. For this report, R-squared is based on returns over the past 36 months for both the fund and the index.
Short-Term Reserves. The percentage of a fund invested in highly liquid, short-term securities that can be readily converted to cash.
Yield to Maturity. The rate of return an investor would receive if the fixed income securities held by a fund were held to their maturity dates.
Benchmark Information
Spliced Barclays U.S. 1–5 Year Government/Credit Float Adjusted Index: Barclays U.S. 1-5 year
Government/Credit Bond Index through December 31, 2009; Barclays U.S. 1–5 Year
Government/Credit Float Adjusted Index thereafter.
Spliced Barclays U.S. 5–10 Year Government/Credit Float Adjusted Index: Barclays U.S. 5–10
Year Government/Credit Bond Index through December 31, 2009; Barclays U.S. 5–10 Year
Government/Credit Float Adjusted Index thereafter.
Spliced Barclays U.S. Aggregate Float Adjusted Index: Barclays U.S. Aggregate Bond Index
through December 31, 2009; Barclays U.S. Aggregate Float Adjusted Index thereafter.
Spliced Barclays U.S. Long Government/Credit Float Adjusted Index: Barclays U.S. Long
Government/Credit Bond Index through December 31, 2009; Barclays U.S. Long Government/Credit
Float Adjusted Index thereafter.
Spliced Intermediate Investment-Grade Debt Funds Average: Based on average returns for
Intermediate U.S. Government Funds through December 31, 2001, Intermediate Investment-Grade
Debt Funds through August 31, 2013, and Core Bond Funds thereafter.
77
The Vanguard funds are not sponsored, endorsed, issued, sold, or promoted by Barclays Capital Inc. or any of its affiliates
(“Barclays”). Barclays makes no representation or warranty, express or implied, to the owners or purchasers of the funds
or any member of the public regarding the advisability of investing in securities generally or in the funds particularly or the
ability of the Barclays indexes to track general bond market performance. Barclays has not passed on the legality or suitability
of the funds with respect to any person or entity. Barclays’ only relationship to Vanguard and the funds is the licensing of the
Barclays indexes, which are determined, composed, and calculated by Barclays without regard to Vanguard or the funds or any
owners or purchasers of the funds. Barclays has no obligation to take the needs of Vanguard, the funds, or the owners of the
funds into consideration in determining, composing, or calculating the Barclays indexes. Barclays is not responsible for and
has not participated in the determination of the timing of, prices at, or quantities of the funds to be issued. Barclays has no
obligation or liability in connection with the administration, marketing, or trading of the funds.
Barclays shall have no liability to third parties for the quality, accuracy, and/or completeness of the indexes or any data
included therein or for interruptions in the delivery of the indexes. Barclays makes no warranty, express or implied, as to
results to be obtained by owners of the funds or any other person or entity from the use of the indexes or any data included
therein in connection with the rights licensed hereunder or for any other use. Barclays reserves the right to change the
methods of calculation or publication, or to cease the calculation or publication of the Barclays U.S. 1–5 Year Government/
Credit Float Adjusted Index, Barclays U.S. 5–10 Year Government Credit Float Adjusted Index, and Barclays U.S. Long
Government/Credit Float Adjusted Index, and Barclays shall not be liable for any miscalculation of or any incorrect, delayed,
or interrupted publication with respect to any of the Barclays indexes. Barclays makes no express or implied warranties, and
hereby expressly disclaims all warranties of merchantability or fitness for a particular purpose or use with respect to the
indexes or any data included therein. Barclays shall not be liable for any damages, including, without limitation, any indirect
or consequential damages resulting from the use of the indexes or any data included therein.
78
This page intentionally left blank.
The People Who Govern Your Fund
The trustees of your mutual fund are there to see that the fund is operated and managed in your best interests since, as a shareholder, you are a part owner of the fund. Your fund’s trustees also serve on the board of directors of The Vanguard Group, Inc., which is owned by the Vanguard funds and provides services to them on an at-cost basis.
A majority of Vanguard’s board members are independent, meaning that they have no affiliation with Vanguard or the funds they oversee, apart from the sizable personal investments they have made as private individuals. The independent board members have distinguished backgrounds in business, academia, and public service. Each of the trustees and executive officers oversees 194 Vanguard funds.
The following table provides information for each trustee and executive officer of the fund. More information about the trustees is in the Statement of Additional Information, which can be obtained, without charge, by contacting Vanguard at 800-662-7447, or online at vanguard.com.
| InterestedTrustee1 | Rajiv L. Gupta |
| Born 1945. Trustee Since December 2001.2 Principal | |
| F. William McNabb III | Occupation(s) During the Past Five Years and Other |
| Born 1957. Trustee Since July 2009. Chairman of | Experience: Chairman and Chief Executive Officer |
| the Board. Principal Occupation(s) During the Past | (retired 2009) and President (2006–2008) of |
| Five Years and Other Experience: Chairman of the | Rohm and Haas Co. (chemicals); Director of Tyco |
| Board of The Vanguard Group, Inc., and of each of | International PLC (diversified manufacturing and |
| the investment companies served by The Vanguard | services), Hewlett-Packard Co. (electronic computer |
| Group, since January 2010; Director of The Vanguard | manufacturing), and Delphi Automotive PLC |
| Group since 2008; Chief Executive Officer and | (automotive components); Senior Advisor at New |
| President of The Vanguard Group, and of each of | Mountain Capital. |
| the investment companies served by The Vanguard | |
| Group, since 2008; Director of Vanguard Marketing | Amy Gutmann |
| Corporation; Managing Director of The Vanguard | Born 1949. Trustee Since June 2006. Principal |
| Group (1995–2008). | Occupation(s) During the Past Five Years and |
| Other Experience: President of the University of | |
| IndependentTrustees | Pennsylvania; Christopher H. Browne Distinguished |
| Professor of Political Science, School of Arts and | |
| Emerson U. Fullwood | Sciences, and Professor of Communication, Annenberg |
| Born 1948. Trustee Since January 2008. Principal | School for Communication, with secondary faculty |
| Occupation(s) During the Past Five Years and | appointments in the Department of Philosophy, School |
| Other Experience: Executive Chief Staff and | of Arts and Sciences, and at the Graduate School of |
| Marketing Officer for North America and Corporate | Education, University of Pennsylvania; Trustee of the |
| Vice President (retired 2008) of Xerox Corporation | National Constitution Center; Chair of the Presidential |
| (document management products and services); | Commission for the Study of Bioethical Issues. |
| Executive in Residence and 2009–2010 Distinguished | |
| Minett Professor at the Rochester Institute of | JoAnn Heffernan Heisen |
| Technology; Director of SPX Corporation (multi-industry | Born 1950. Trustee Since July 1998. Principal |
| manufacturing), the United Way of Rochester, the | Occupation(s) During the Past Five Years and |
| University of Rochester Medical Center, Monroe | Other Experience: Corporate Vice President and |
| Community College Foundation, and North Carolina | Chief Global Diversity Officer (retired 2008) and |
| A&T University. | Member of the Executive Committee (1997–2008) |
| of Johnson & Johnson (pharmaceuticals/medical | |
| devices/consumer products); Director of Skytop | |
| Lodge Corporation (hotels) and the Robert Wood | |
| Johnson Foundation; Member of the Advisory | |
| Board of the Institute for Women’s Leadership | |
| at Rutgers University. |
| F. Joseph Loughrey | Executive Officers | |
| Born 1949. Trustee Since October 2009. Principal | ||
| Occupation(s) During the Past Five Years and Other | Glenn Booraem | |
| Experience: President and Chief Operating Officer | Born 1967. Treasurer Since May 2015. Principal | |
| (retired 2009) of Cummins Inc. (industrial machinery); | Occupation(s) During the Past Five Years and | |
| Chairman of the Board of Hillenbrand, Inc. (specialized | Other Experience: Principal of The Vanguard Group, | |
| consumer services), and of Oxfam America; Director | Inc.; Treasurer of each of the investment companies | |
| of SKF AB (industrial machinery), Hyster-Yale Materials | served by The Vanguard Group; Controller of each of | |
| Handling, Inc. (forklift trucks), the Lumina Foundation | the investment companies served by The Vanguard | |
| for Education, and the V Foundation for Cancer | Group (2010–2015); Assistant Controller of each of | |
| Research; Member of the Advisory Council for the | the investment companies served by The Vanguard | |
| College of Arts and Letters and of the Advisory Board | Group (2001–2010). | |
| to the Kellogg Institute for International Studies, both | ||
| at the University of Notre Dame. | Thomas J. Higgins | |
| Born 1957. Chief Financial Officer Since September | ||
| Mark Loughridge | 2008. Principal Occupation(s) During the Past Five | |
| Born 1953. Trustee Since March 2012. Principal | Years and Other Experience: Principal of The Vanguard | |
| Occupation(s) During the Past Five Years and Other | Group, Inc.; Chief Financial Officer of each of the | |
| Experience: Senior Vice President and Chief Financial | investment companies served by The Vanguard Group; | |
| Officer (retired 2013) at IBM (information technology | Treasurer of each of the investment companies served | |
| services); Fiduciary Member of IBM’s Retirement Plan | by The Vanguard Group (1998–2008). | |
| Committee (2004–2013); Director of the Dow Chemical | ||
| Company; Member of the Council on Chicago Booth. | Peter Mahoney | |
| Born 1974. Controller Since May 2015. Principal | ||
| Scott C. Malpass | Occupation(s) During the Past Five Years and | |
| Born 1962. Trustee Since March 2012. Principal | Other Experience: Head of Global Fund Accounting | |
| Occupation(s) During the Past Five Years and Other | at The Vanguard Group, Inc.; Controller of each of the | |
| Experience: Chief Investment Officer and Vice | investment companies served by The Vanguard Group; | |
| President at the University of Notre Dame; Assistant | Head of International Fund Services at The Vanguard | |
| Professor of Finance at the Mendoza College of | Group (2008–2014). | |
| Business at Notre Dame; Member of the Notre Dame | ||
| 403(b) Investment Committee; Board Member of | Heidi Stam | |
| TIFF Advisory Services, Inc., and Catholic Investment | Born 1956. Secretary Since July 2005. Principal | |
| Services, Inc. (investment advisors); Member of | Occupation(s) During the Past Five Years and Other | |
| the Investment Advisory Committee of Major | Experience: Managing Director of The Vanguard | |
| League Baseball. | Group, Inc.; General Counsel of The Vanguard Group; | |
| Secretary of The Vanguard Group and of each of the | ||
| André F. Perold | investment companies served by The Vanguard Group; | |
| Born 1952. Trustee Since December 2004. Principal | Director and Senior Vice President of Vanguard | |
| Occupation(s) During the Past Five Years and Other | Marketing Corporation. | |
| Experience: George Gund Professor of Finance and | ||
| Banking, Emeritus at the Harvard Business School | Vanguard Senior ManagementTeam | |
| (retired 2011); Chief Investment Officer and Managing | Mortimer J. Buckley | Chris D. McIsaac |
| Partner of HighVista Strategies LLC (private investment | Kathleen C. Gubanich | James M. Norris |
| firm); Director of Rand Merchant Bank; Overseer of | Paul A. Heller | Thomas M. Rampulla |
| the Museum of Fine Arts Boston. | Martha G. King | Glenn W. Reed |
| John T. Marcante | Karin A. Risi | |
| Peter F. Volanakis | ||
| Born 1955. Trustee Since July 2009. Principal | ||
| Occupation(s) During the Past Five Years and Other | Chairman Emeritus and Senior Advisor | |
| Experience: President and Chief Operating Officer | John J. Brennan | |
| (retired 2010) of Corning Incorporated (communications | Chairman, 1996–2009 | |
| equipment); Trustee of Colby-Sawyer College; | Chief Executive Officer and President, 1996–2008 | |
| Member of the Advisory Board of the Norris Cotton | ||
| Cancer Center and of the Advisory Board of the | ||
| Parthenon Group (strategy consulting). | Founder | |
| John C. Bogle | ||
| Chairman and Chief Executive Officer, 1974–1996 | ||
1 Mr. McNabb is considered an “interested person,” as defined in the Investment Company Act of 1940, because he is an officer of the Vanguard funds.
2 December 2002 for Vanguard Equity Income Fund, the Vanguard Municipal Bond Funds, and the Vanguard State Tax-Exempt Funds.
 | |
| P.O. Box 2600 | |
| Valley Forge, PA 19482-2600 | |
| Connect with Vanguard® > vanguard.com | |
| Fund Information > 800-662-7447 | |
| Direct Investor Account Services > 800-662-2739 | |
| Institutional Investor Services > 800-523-1036 | |
| Text Telephone for People | |
| Who Are Deaf or Hard of Hearing> 800-749-7273 | |
| This material may be used in conjunction | |
| with the offering of shares of any Vanguard | |
| fund only if preceded or accompanied by | |
| the fund’s current prospectus. | |
| All comparative mutual fund data are from Lipper, a | |
| Thomson Reuters Company, or Morningstar, Inc., unless | |
| otherwise noted. | |
| You can obtain a free copy of Vanguard’s proxy voting | |
| guidelines by visiting vanguard.com/proxyreporting or by | |
| calling Vanguard at 800-662-2739. The guidelines are | |
| also available from the SEC’s website, sec.gov. In | |
| addition, you may obtain a free report on how your fund | |
| voted the proxies for securities it owned during the 12 | |
| months ended June 30. To get the report, visit either | |
| vanguard.com/proxyreporting or sec.gov. | |
| You can review and copy information about your fund at | |
| the SEC’s Public Reference Room in Washington, D.C. To | |
| find out more about this public service, call the SEC at | |
| 202-551-8090. Information about your fund is also | |
| available on the SEC’s website, and you can receive | |
| copies of this information, for a fee, by sending a | |
| request in either of two ways: via email addressed to | |
| publicinfo@sec.gov or via regular mail addressed to the | |
| Public Reference Section, Securities and Exchange | |
| Commission, Washington, DC 20549-1520. | |
| © 2016 The Vanguard Group, Inc. | |
| All rights reserved. | |
| Vanguard Marketing Corporation, Distributor. | |
| Q3140 022016 | |
Annual Report | December 31, 2015
Vanguard Total Bond Market Index Fund
Vanguard’s Principles for Investing Success
We want to give you the best chance of investment success. These principles, grounded in Vanguard’s research and experience, can put you on the right path.
Goals. Create clear, appropriate investment goals.
Balance. Develop a suitable asset allocation using broadly diversified funds. Cost. Minimize cost.
Discipline. Maintain perspective and long-term discipline.
A single theme unites these principles: Focus on the things you can control.
We believe there is no wiser course for any investor.
| Contents | |
| Your Fund’s Total Returns. | 1 |
| Chairman’s Letter. | 2 |
| Fund Profile. | 10 |
| Performance Summary. | 12 |
| Financial Statements. | 15 |
| About Your Fund’s Expenses. | 32 |
| Glossary. | 34 |
Please note: The opinions expressed in this report are just that—informed opinions. They should not be considered promises or advice.
Also, please keep in mind that the information and opinions cover the period through the date on the front of this report. Of course, the
risks of investing in your fund are spelled out in the prospectus.
See the Glossary for definitions of investment terms used in this report.
About the cover: Pictured is a sailing block on the Brilliant, a 1932 schooner docked in Mystic, Connecticut. A type of pulley, the
sailing block helps coordinate the setting of the sails. At Vanguard, the intricate coordination of technology and people allows
us to help millions of clients around the world reach their financial goals.
| Your Fund’s Total Returns | ||||
| Fiscal Year Ended December 31, 2015 | ||||
| 30-Day SEC | Income | Capital | Total | |
| Yield | Returns | Returns | Returns | |
| Vanguard Total Bond Market Index Fund | ||||
| Investor Shares | 2.33% | 2.32% | -2.02% | 0.30% |
| ETF Shares | 2.44 | |||
| Market Price | 0.49 | |||
| Net Asset Value | 0.39 | |||
| Admiral™ Shares | 2.44 | 2.42 | -2.02 | 0.40 |
| Institutional Shares | 2.45 | 2.43 | -2.02 | 0.41 |
| Institutional Plus Shares | 2.46 | 2.44 | -2.02 | 0.42 |
| Barclays U.S. Aggregate Float Adjusted Index | 0.44 | |||
| Core Bond Funds Average | -0.11 | |||
Core Bond Funds Average: Derived from data provided by Lipper, a Thomson Reuters Company.
Admiral Shares carry lower expenses and are available to investors who meet certain account-balance requirements. Institutional Shares and
Institutional Plus Shares are available to certain institutional investors who meet specific administrative, service, and account-size criteria.
The Vanguard ETF® Shares shown are traded on the NYSE Arca exchange and are available only through brokers. The table provides ETF
returns based on both the NYSE Arca market price and the net asset value for a share. U.S. Pat. Nos. 6,879,964; 7,337,138; 7,720,749;
7,925,573; 8,090,646; and 8,417,623.
For the ETF Shares, the market price is determined by the midpoint of the bid-offer spread as of the closing time of the New York Stock
Exchange (generally 4 p.m., Eastern time). The net asset value is also determined as of the NYSE closing time. For more information about
how the ETF Shares' market prices have compared with their net asset value, visit vanguard.com, select your ETF, and then select the Price
and Performance tab. The ETF premium/discount analysis there shows the percentages of days on which the ETF Shares' market price was
above or below the NAV.
1

Chairman’s Letter
Dear Shareholder,
Toward the close of 2015, the Federal Reserve took the long-awaited step of raising its target for overnight interest rates, which had hovered near zero since the Great Recession. Its vote of confidence in the U.S. economy’s resiliency helped short-term bond yields finish higher than where they started for the fiscal year ended December 31, 2015. The upward movement of intermediate-and long-term yields, however, was more muted given the fragile state of global growth and the subdued outlook for inflation.
With yields rising, bond prices adjusted downward, as the two move in opposite directions. Vanguard Total Bond Market Index Fund returned 0.30% for the fiscal year as the decline in the prices of its bond holdings offset much of the income they earned. (All returns and yields cited in this letter are for the fund’s Investor Shares.)
The fund’s result was not far off the 0.44% return of its expense-free benchmark, the Barclays U.S. Aggregate Float Adjusted Index, which consists primarily of U.S. Treasuries and agency bonds, government mortgage-backed securities, and investment-grade corporate bonds. The fund placed ahead of the average return of –0.11% for its peer group.
With yields rising, the fund’s 30-day SEC yield was 2.33% on December 31, up from 1.99% a year earlier.
2
A strong U.S. dollar depressed international bond returns
International bond markets (as measured by the Barclays Global Aggregate Index ex USD) returned –6.02% for the 12 months, reduced by the dollar’s strength against many foreign currencies. Without this currency effect, returns were modestly positive.
Although the Fed raised its interest rate target in mid-December to 0.25%–0.5%, returns for money market funds and savings accounts remained limited by the 0%–0.25% level that had previously been in place for seven years.
Despite troubles, U.S. stocks eked out a seventh year of gains
U.S. stocks returned 0.48% for the 12 months. Although the broad market recorded its worst performance since 2008, it still advanced for the seventh straight year when dividends are factored in.
Stocks rose modestly over the first half of the year but slid in August and September as concerns mounted that China’s economic slowdown would spread globally. Falling oil and commodity prices also affected economies and markets across the world, for better or worse. Central banks in Europe and Asia bolstered their stimulus efforts against weak growth and low inflation. And the Fed’s move in December ended months of uncertainty over its plans.
| Market Barometer | |||
| Average Annual Total Returns | |||
| Periods Ended December 31, 2015 | |||
| One | Three | Five | |
| Year | Years | Years | |
| Bonds | |||
| Barclays U.S. Aggregate Bond Index (Broad taxable | |||
| market) | 0.55% | 1.44% | 3.25% |
| Barclays Municipal Bond Index (Broad tax-exempt market) | 3.30 | 3.16 | 5.35 |
| Citigroup Three-Month U.S. Treasury Bill Index | 0.03 | 0.02 | 0.04 |
| Stocks | |||
| Russell 1000 Index (Large-caps) | 0.92% | 15.01% | 12.44% |
| Russell 2000 Index (Small-caps) | -4.41 | 11.65 | 9.19 |
| Russell 3000 Index (Broad U.S. market) | 0.48 | 14.74 | 12.18 |
| FTSE All-World ex US Index (International) | -4.72 | 2.04 | 1.48 |
| CPI | |||
| Consumer Price Index | 0.73% | 1.00% | 1.53% |
3
International stocks returned about –5%, restrained by the U.S. dollar’s strength. Emerging markets fared the worst.
Rising bond yields dampened returns over the period
As the Fed wound down its third round of stimulative bond-buying toward the end of 2014, speculation turned to when it might begin to raise short-term rates. The economy’s rebound from an early 2015 slowdown and further improvements in employment were favorable developments. On the other hand, inflation remained worryingly low as oil prices continued to fall. Greece’s debt crisis and slowing economic activity in China and other emerging markets may also have contributed to the Fed’s holding off on a rate increase until December.
Yields ended the fiscal year higher than where they started. The yield of the 2-year U.S. Treasury note, for example, climbed 38 basis points to 1.07%. (A basis point is one-hundredth of a percentage point.) The 10-year Treasury note rose 11 basis points to 2.30%, and longer maturities rose more than that.
Although higher interest rates should benefit buy-and-hold bond investors over the long term, their rise over the 12 months pushed bond prices down, especially for longer-dated bonds, which are more sensitive to rate movements.
Treasuries—about 40% of your fund’s assets—returned close to 1% as a whole. By maturity, short- and intermediate-term
| Expense Ratios | ||||||
| Your Fund Compared With Its Peer Group | ||||||
| Peer | ||||||
| Investor | ETF | Admiral | Institutional | Institutional | Group | |
| Shares | Shares | Shares | Shares | Plus Shares | Average | |
| Total Bond Market Index Fund | 0.20% | 0.07% | 0.07% | 0.06% | 0.05% | 0.83% |
The fund expense ratios shown are from the prospectus dated April 28, 2015, and represent estimated costs for the current fiscal year. For the
fiscal year ended December 31, 2015, the fund’s expense ratios were 0.16% for Investor Shares, 0.06% for ETF Shares, 0.06% for Admiral
Shares, 0.05% for Institutional Shares, and 0.04% for Institutional Plus Shares. The peer-group expense ratio is derived from data provided by
Lipper, a Thomson Reuters Company, and captures information through year-end 2014.
Peer group: Core Bond Funds Average.
4
Treasuries remained in the black; their long-term counterparts, whose prices depreciated more, returned roughly –1%.
Government mortgage-backed securities held up a little better. These high-quality investments benefited from continuing improvements in the housing market and the attractiveness of their yield premium compared with Treasuries of similar maturities.
Corporate bonds, however, dipped into negative territory as the income they earned did not fully offset their price declines. The difference, or “spread,” in their yields versus Treasuries widened, notably in the industrial sector among bonds issued by metals and mining companies and energy producers whose creditworthiness was hurt by falling commodity prices. The spread widened less for bonds issued by financial institutions, as regulatory changes have led to stronger balance sheets overall in that sector.
The fund outperformed its peer average by 41 basis points. While it can pay off for actively managed competitors to overweight credit sectors at the expense of Treasuries and mortgage-backed securities, that strategy probably didn’t in 2015. And with interest rates seesawing, tactical bets about duration would have been challenging to get right as well.
Although it’s important to keep an eye on how your investments are performing, it’s also good not to lose sight of why you hold
| Total Returns | |
| Ten Years Ended December 31, 2015 | |
| Average | |
| Annual Return | |
| Total Bond Market Index Fund Investor Shares | 4.36% |
| Spliced Barclays U.S. Aggregate Float Adjusted Index | 4.52 |
| Spliced Intermediate Investment-Grade Debt Funds Average | 3.93 |
For a benchmark description, see the Glossary.
Spliced Intermediate Investment-Grade Debt Funds Average: Derived from data provided by Lipper, a Thomson Reuters Company.
The figures shown represent past performance, which is not a guarantee of future results. (Current performance may be
lower or higher than the performance data cited. For performance data current to the most recent month-end, visit our
website at vanguard.com/performance.) Note, too, that both investment returns and principal value can fluctuate widely, so
an investor’s shares, when sold, could be worth more or less than their original cost.
5
them. Bond returns may not be as strong going forward as we have become accustomed to in recent decades, but we believe they will continue to fulfill an important role as a diversifier for equities and other riskier assets you may have in your portfolio.
For the last decade, the fund closely tracked its index
Every index fund aims to track the performance of its target index. That’s actually a taller order than you might think. The index incurs no expenses, so it has a leg up from the start. Bond funds also have the challenge of negotiating prices, as bonds generally aren’t traded on central exchanges the way stocks are.
Then there’s the size of the bond market—your fund’s benchmark includes more than 9,000 bonds. Owning all of them would be impractical, so your fund’s advisor has the challenge of putting together a portfolio with a smaller number of bonds that nevertheless produces benchmark-like returns.
| Vanguard’s outlook for investors: Not bearish, but cautious |
| In Vanguard’s recently published global economic and investment outlook, Global Chief |
| Economist Joseph Davis and his team discuss various market and economic events 2016 |
| may bring, along with challenges and opportunities for investors. |
| Our forecast includes “frustratingly fragile” economic growth and more modest long-term |
| returns from the global stock and bond markets. The report cautions that for the decade ending |
| 2025, returns for a balanced portfolio are likely to be moderately below historical averages. |
| Our simulations indicate that the average annualized returns of a 60% equity/40% bond |
| portfolio for the decade are most likely to be centered in the 3%–5% range after inflation, |
| below the actual average after-inflation return of 5.5% for the same portfolio since 1926. |
| Even so, Vanguard’s steadfast belief in its principles for investing success—focusing on clear |
| goals, a suitable asset allocation, low costs, and long-term discipline—remains unchanged. |
| For more information about our expectations and the probability of various outcomes, see |
| Vanguard’s Economic and Investment Outlook, available at vanguard.com/research. |
| IMPORTANT: The projections or other information generated by the Vanguard Capital Markets Model® (VCMM) |
| regarding the likelihood of various investment outcomes are hypothetical in nature, do not reflect actual investment |
| results, and are not guarantees of future results. Distribution of return outcomes from VCMM, derived from |
| 10,000 simulations for U.S. equity returns and fixed income returns. Simulations as of September 30, 2015. |
| Results from the model may vary with each use and over time. For more information, please see page 7. |
6
The indexing skills of the fund’s advisor as well as its low expense ratio helped the fund post an average annual return of 4.36% for the decade ended December 31, 2015, a result not far behind the 4.52% return of its benchmark. Its peer average over the period was 3.93%.
To reach your long-term goals, be realistic and try to save more
Although there have been times when it felt as if stocks and bonds were riding a roller coaster, the markets have generally risen in recent years. The broad global stock market in particular has posted some impressive gains since its turnaround began in 2009.
But 2015 served as a reminder that markets aren’t always favorable. The U.S. stock and bond markets were basically flat, and international stocks and unhedged bonds finished in the red.
In Vanguard’s recently updated long-term look at the economy and markets, our global economists explain why they expect economic growth to remain “frustratingly fragile,” and why their outlook for stock and bond markets is the most guarded since 2006. (For more details, see the box on page 6 and Vanguard’s Economic and Investment Outlook, available at vanguard.com/research.)
Given these muted expectations, what’s the best course of action? I’ve often encouraged shareholders to focus on the things they can control. That advice holds true today.
Consider saving more than you think you may need. That’s one way you can prepare for the volatility that may lie ahead, particularly as markets adjust to changes in policies from the Fed and other central banks.
IMPORTANT: The projections or other information generated by the Vanguard Capital Markets Model (VCMM)
regarding the likelihood of various investment outcomes are hypothetical in nature, do not reflect actual
investment results, and are not guarantees of future results. VCMM results will vary with each use and over time.
The VCMM projections are based on a statistical analysis of historical data. Future returns may behave differently from the
historical patterns captured in the VCMM. More important, the VCMM may be underestimating extreme negative scenarios
unobserved in the historical period on which the model estimation is based.
The VCMM is a proprietary financial simulation tool developed and maintained by Vanguard’s primary investment research
and advice teams. The model forecasts distributions of future returns for a wide array of broad asset classes. Those asset
classes include U.S. and international equity markets, several maturities of the U.S. Treasury and corporate fixed income
markets, international fixed income markets, U.S. money markets, commodities, and certain alternative investment
strategies. The theoretical and empirical foundation for the VCMM is that the returns of various asset classes reflect the
compensation investors require for bearing different types of systematic risk (beta). At the core of the model are estimates
of the dynamic statistical relationship between risk factors and asset returns, obtained from statistical analysis based on
available monthly financial and economic data from as early as 1960. Using a system of estimated equations, the model
then applies a Monte Carlo simulation method to project the estimated interrelationships among risk factors and asset
classes as well as uncertainty and randomness over time. The model generates a large set of simulated outcomes for
each asset class over several time horizons. Forecasts are obtained by computing measures of central tendency in these
simulations. Results produced by the tool will vary with each use and over time.
7
And, as always, investors would be well-served to follow Vanguard’s principles for investing success:
• Goals. Create clear, appropriate investment goals.
• Balance. Develop a suitable asset allocation using broadly diversified funds.
• Cost. Minimize cost.
• Discipline. Maintain perspective and long-term discipline.
As with saving, each of these principles is within your control, and focusing on them can keep you on the right path.
As always, thank you for investing with Vanguard.
Sincerely,

F. William McNabb III
Chairman and Chief Executive Officer
January 19, 2016
8
Your Fund’s Performance at a Glance
December 31, 2014, Through December 31, 2015
| Distributions Per Share | ||||
| Starting | Ending | Income | Capital | |
| Share Price | Share Price | Dividends | Gains | |
| Vanguard Total Bond Market Index Fund | ||||
| Investor Shares | $10.87 | $10.64 | $0.254 | $0.010 |
| ETF Shares | 82.33 | 80.58 | 2.001 | 0.078 |
| Admiral Shares | 10.87 | 10.64 | 0.264 | 0.010 |
| Institutional Shares | 10.87 | 10.64 | 0.266 | 0.010 |
| Institutional Plus Shares | 10.87 | 10.64 | 0.267 | 0.010 |
9
Total Bond Market Index Fund
Fund Profile
As of December 31, 2015
| Share-Class Characteristics | |||||
| Investor | Admiral | Institutional | Institutional | ||
| Shares | ETF Shares | Shares | Shares | Plus Shares | |
| Ticker Symbol | VBMFX | BND | VBTLX | VBTIX | VBMPX |
| Expense Ratio1 | 0.20% | 0.07% | 0.07% | 0.06% | 0.05% |
| 30-Day SEC Yield | 2.33% | 2.44% | 2.44% | 2.45% | 2.46% |
| Financial Attributes | ||
| Barclays | ||
| Aggregate | ||
| Float Adj | ||
| Fund | Index | |
| Number of Bonds | 7,860 | 9,681 |
| Yield to Maturity | ||
| (before expenses) | 2.6% | 2.6% |
| Average Coupon | 3.2% | 3.1% |
| Average Duration | 5.8 years | 5.8 years |
| Average Effective | ||
| Maturity | 8.0 years | 7.9 years |
| Short-Term | ||
| Reserves | 0.8% | — |
| Sector Diversification (% of portfolio) | |
| Asset-Backed | 0.7% |
| Commercial Mortgage-Backed | 2.1 |
| Finance | 8.6 |
| Foreign | 6.0 |
| Government Mortgage-Backed | 20.9 |
| Industrial | 16.3 |
| Treasury/Agency | 43.1 |
| Utilities | 2.0 |
| Other | 0.3 |
The agency and mortgage-backed securities sectors may include issues from government-sponsored enterprises; such issues are
generally not backed by the full faith and credit of the U.S. government.
| Volatility Measures | |
| Barclays | |
| Aggregate | |
| Float Adj | |
| Index | |
| R-Squared | 0.99 |
| Beta | 1.02 |
These measures show the degree and timing of the fund’s fluctuations compared with the index over 36 months.
| Distribution by Credit Quality (% of portfolio) | |
| U.S. Government | 64.1% |
| Aaa | 5.6 |
| Aa | 4.0 |
| A | 11.7 |
| Baa | 14.6 |
Credit-quality ratings are obtained from Barclays and are from Moody's, Fitch, and S&P. When ratings from all three agencies are
used, the median rating is shown. When ratings from two of the agencies are used, the lower rating for each issue is shown. "Not
Rated" is used to classify securities for which a rating is not available. Not rated securities include a fund's investment in
Vanguard Market Liquidity Fund or Vanguard Municipal Cash Management Fund, each of which invests in high-quality money
market instruments and may serve as a cash management vehicle for the Vanguard funds, trusts, and accounts. For more information
about these ratings, see the Glossary entry for Credit Quality.
| Distribution by Effective Maturity | |
| (% of portfolio) | |
| Under 1 Year | 0.8% |
| 1 - 3 Years | 23.6 |
| 3 - 5 Years | 21.5 |
| 5 - 10 Years | 37.9 |
| 10 - 20 Years | 4.0 |
| 20 - 30 Years | 11.7 |
| Over 30 Years | 0.5 |
1 The expense ratios shown are from the prospectus dated April 28, 2015, and represent estimated costs for the current fiscal year. For the fiscal
year ended December 31, 2015, the expense ratios were 0.16% for Investor Shares, 0.06% for ETF Shares, 0.06% for Admiral Shares, 0.05% for
Institutional Shares, and 0.04% for Institutional Plus Shares.
10
Total Bond Market Index Fund
Investment Focus
11
Total Bond Market Index Fund
Performance Summary
All of the returns in this report represent past performance, which is not a guarantee of future results that may be achieved by the fund. (Current performance may be lower or higher than the performance data cited. For performance data current to the most recent month-end, visit our website at vanguard.com/performance.) Note, too, that both investment returns and principal value can fluctuate widely, so an investor’s shares, when sold, could be worth more or less than their original cost. The returns shown do not reflect taxes that a shareholder would pay on fund distributions or on the sale of fund shares.
Cumulative Performance: December 31, 2005, Through December 31, 2015
Initial Investment of $10,000
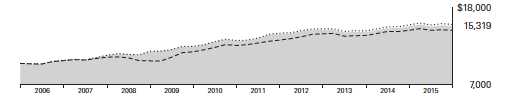
| Average Annual Total Returns | |||||
| Periods Ended December 31, 2015 | |||||
| Final Value | |||||
| One | Five | Ten | of a $10,000 | ||
| Year | Years | Years | Investment | ||
| Total Bond Market Index Fund Investor | |||||
| Shares | 0.30% | 3.02% | 4.36% | $15,319 | |
| Spliced Barclays U.S. Aggregate Float | |||||
| •••••••• | |||||
| Adjusted Index | 0.44 | 3.25 | 4.52 | 15,559 | |
| – – – – | Spliced Intermediate Investment-Grade | ||||
| Debt Funds Average | -0.11 | 3.20 | 3.93 | 14,701 | |
For a benchmark description, see the Glossary.
Spliced Intermediate Investment-Grade Debt Funds Average: Derived from data provided by Lipper, a Thomson Reuters Company.
| Since | Final Value | |||
| One | Five | Inception | of a $10,000 | |
| Year | Years | (4/3/2007) | Investment | |
| Total Bond Market Index Fund ETF Shares | ||||
| Net Asset Value | 0.39% | 3.13% | 4.43% | $14,610 |
| Spliced Barclays U.S. Aggregate Float | ||||
| Adjusted Index | 0.44 | 3.25 | 4.50 | 14,694 |
| "Since Inception" performance is calculated from the ETF Shares’ inception date for both the fund and its comparative standards. | ||||
See Financial Highlights for dividend and capital gains information.
12
Total Bond Market Index Fund
| Average Annual Total Returns | ||||
| Periods Ended December 31, 2015 | ||||
| Final Value | ||||
| One | Five | Ten | of a $10,000 | |
| Year | Years | Years | Investment | |
| Total Bond Market Index Fund Admiral | ||||
| Shares | 0.40% | 3.13% | 4.47% | $15,481 |
| Spliced Barclays U.S. Aggregate Float | ||||
| Adjusted Index | 0.44 | 3.25 | 4.52 | 15,559 |
| Final Value | ||||
| One | Five | Ten | of a $5,000,000 | |
| Year | Years | Years | Investment | |
| Total Bond Market Index Fund Institutional | ||||
| Shares | 0.41% | 3.15% | 4.50% | $7,762,737 |
| Spliced Barclays U.S. Aggregate Float | ||||
| Adjusted Index | 0.44 | 3.25 | 4.52 | 7,779,479 |
| Final Value | ||||
| One | Five | Ten | of a $100,000,000 | |
| Year | Years | Years | Investment | |
| Total Bond Market Index Fund Institutional | ||||
| Plus Shares | 0.42% | 3.17% | 4.51% | $155,405,157 |
| Spliced Barclays U.S. Aggregate Float Adjusted | ||||
| Index | 0.44 | 3.25 | 4.52 | 155,589,589 |
The creation of the Institutional Plus Shares occurred on February 5, 2010, when Vanguard Total Bond Market Index Fund acquired the net
assets of Vanguard Institutional Total Bond Market Index Fund. For the periods ended December 31, 2015, the returns and other data shown
in the table above reflect a blend of historical performance of the fund’s Institutional Shares prior to February 5, 2010, and of the Institutional
Plus Shares from then on.
Cumulative Returns of ETF Shares: April 3, 2007, Through December 31, 2015
| Since | |||
| One | Five | Inception | |
| Year | Years | (4/3/2007) | |
| Total Bond Market Index Fund ETF Shares Market | |||
| Price | 0.49% | 16.80% | 46.28% |
| Total Bond Market Index Fund ETF Shares Net | |||
| Asset Value | 0.39 | 16.64 | 46.10 |
| Spliced Barclays U.S. Aggregate Float Adjusted | |||
| Index | 0.44 | 17.33 | 46.94 |
| "Since Inception" performance is calculated from the ETF Shares’ inception date for both the fund and its comparative standards. | |||
13
Total Bond Market Index Fund
| Fiscal-Year Total Returns (%): December 31, 2005, Through December 31, 2015 | ||||
| Spliced | ||||
| Barclays | ||||
| Aggregate | ||||
| Investor Shares | FA Index | |||
| Fiscal Year | Income Returns | Capital Returns | Total Returns | Total Returns |
| 2006 | 4.97% | -0.70% | 4.27% | 4.33% |
| 2007 | 5.22 | 1.70 | 6.92 | 6.97 |
| 2008 | 4.85 | 0.20 | 5.05 | 5.24 |
| 2009 | 4.26 | 1.67 | 5.93 | 5.93 |
| 2010 | 3.55 | 2.87 | 6.42 | 6.58 |
| 2011 | 3.30 | 4.26 | 7.56 | 7.92 |
| 2012 | 2.63 | 1.42 | 4.05 | 4.32 |
| 2013 | 2.29 | -4.55 | -2.26 | -1.97 |
| 2014 | 2.55 | 3.21 | 5.76 | 5.85 |
| 2015 | 2.32 | -2.02 | 0.30 | 0.44 |
| For a benchmark description, see the Glossary. | ||||
14
Total Bond Market Index Fund
Financial Statements
Statement of Net Assets—Investments Summary
As of December 31, 2015
This Statement summarizes the fund’s holdings by asset type. Details are reported for each of the fund’s 50 largest individual holdings and for investments that, in total for any issuer, represent more than 1% of the fund’s net assets. The total value of smaller holdings is reported as a single amount within each category.
The fund reports a complete list of its holdings in regulatory filings four times in each fiscal year, at the quarter-ends. For the second and fourth fiscal quarters, the complete listing of the fund’s holdings is available electronically on vanguard.com and on the Securities and Exchange Commission’s website (sec.gov), or you can have it mailed to you without charge by calling 800-662-7447. For the first and third fiscal quarters, the fund files the lists with the SEC on Form N-Q. Shareholders can look up the fund’s Forms N-Q on the SEC’s website. Forms N-Q may also be reviewed and copied at the SEC’s Public Reference Room (see the back cover of this report for further information).
| Face | Market | Percentage | |||
| Maturity | Amount | Value• | of Net | ||
| Coupon | Date | ($000) | ($000) | Assets | |
| U.S. Government and Agency Obligations | |||||
| U.S. Government Securities | |||||
| United States Treasury Note/Bond | 2.250% | 11/15/25 | 879,290 | 876,951 | 0.6% |
| United States Treasury Note/Bond | 2.125% | 5/15/25 | 841,202 | 829,770 | 0.6% |
| United States Treasury Note/Bond | 1.000% | 9/15/18 | 808,885 | 803,320 | 0.5% |
| United States Treasury Note/Bond | 3.625% | 8/15/19 | 735,167 | 789,268 | 0.5% |
| United States Treasury Note/Bond | 4.750% | 8/15/17 | 641,705 | 680,406 | 0.5% |
| United States Treasury Note/Bond | 2.500% | 5/15/24 | 657,918 | 672,004 | 0.5% |
| United States Treasury Note/Bond | 1.750% | 5/15/23 | 671,148 | 653,638 | 0.4% |
| United States Treasury Note/Bond | 1.750% | 12/31/20 | 651,150 | 650,746 | 0.4% |
| United States Treasury Note/Bond | 1.000% | 5/31/18 | 652,760 | 649,496 | 0.4% |
| United States Treasury Note/Bond | 3.500% | 5/15/20 | 601,005 | 646,177 | 0.4% |
| United States Treasury Note/Bond | 3.375% | 11/15/19 | 578,485 | 617,712 | 0.4% |
| United States Treasury Note/Bond | 1.250% | 11/15/18 | 615,557 | 614,597 | 0.4% |
| United States Treasury Note/Bond | 0.875% | 11/15/17 | 604,081 | 602,100 | 0.4% |
| United States Treasury Note/Bond | 2.250% | 11/15/24 | 600,474 | 600,006 | 0.4% |
| United States Treasury Note/Bond | 1.500% | 8/31/18 | 578,775 | 582,664 | 0.4% |
| United States Treasury Note/Bond | 1.250% | 1/31/20 | 586,215 | 577,240 | 0.4% |
| United States Treasury Note/Bond | 2.500% | 6/30/17 | 559,395 | 571,981 | 0.4% |
| United States Treasury Note/Bond | 1.000% | 3/15/18 | 568,068 | 566,204 | 0.4% |
| United States Treasury Note/Bond | 0.875% | 4/15/17 | 556,825 | 556,736 | 0.4% |
| United States Treasury Note/Bond | 1.750% | 2/28/22 | 548,357 | 540,472 | 0.4% |
| United States Treasury Note/Bond | 2.500% | 8/15/23 | 526,785 | 540,366 | 0.4% |
| United States Treasury Note/Bond | 2.625% | 11/15/20 | 516,599 | 536,777 | 0.4% |
| United States Treasury Note/Bond | 2.750% | 11/15/42 | 546,619 | 520,567 | 0.4% |
| United States Treasury Note/Bond | 3.625% | 2/15/20 | 477,635 | 515,249 | 0.4% |
| United States Treasury Note/Bond | 2.000% | 8/15/25 | 528,325 | 514,953 | 0.3% |
| United States Treasury Note/Bond | 1.500% | 10/31/19 | 505,710 | 504,132 | 0.3% |
| United States Treasury Note/Bond | 0.875% | 1/31/18 | 506,300 | 503,850 | 0.3% |
| United States Treasury Note/Bond | 1.500% | 11/30/19 | 503,150 | 501,263 | 0.3% |
| United States Treasury Note/Bond | 0.875% | 8/15/17 | 498,645 | 497,553 | 0.3% |
| United States Treasury Note/Bond | 2.750% | 2/15/24 | 459,279 | 478,224 | 0.3% |
| United States Treasury Note/Bond | 3.000% | 5/15/45 | 479,435 | 476,438 | 0.3% |
15
Total Bond Market Index Fund
| Face | Market | Percentage | |||||
| Maturity | Amount | Value• | of Net | ||||
| Coupon | Date | ($000) | ($000) | Assets | |||
| United States Treasury Note/Bond | 1.000% | 9/15/17 | 473,982 | 473,759 | 0.3% | ||
| United States Treasury Note/Bond | 0.625% | 11/30/17 | 474,865 | 471,009 | 0.3% | ||
| United States Treasury Note/Bond | 2.375% | 8/15/24 | 455,390 | 459,944 | 0.3% | ||
| United States Treasury Note/Bond | 0.750% | 3/15/17 | 455,800 | 455,157 | 0.3% | ||
| United States Treasury Note/Bond | 3.625% | 2/15/44 | 401,117 | 450,567 | 0.3% | ||
| United States Treasury Note/Bond | 2.750% | 2/28/18 | 428,100 | 442,882 | 0.3% | ||
| United States Treasury Note/Bond | 0.875% | 7/15/18 | 443,519 | 439,638 | 0.3% | ||
| United States Treasury Note/Bond | 2.750% | 11/15/23 | 419,162 | 437,370 | 0.3% | ||
| United States Treasury Note/Bond | 2.750% | 8/15/42 | 456,815 | 436,044 | 0.3% | ||
| United States Treasury Note/Bond | 2.000% | 2/28/21 | 426,858 | 430,324 | 0.3% | ||
| United States Treasury Note/Bond | 3.125% | 5/15/19 | 401,309 | 423,445 | 0.3% | ||
| United States Treasury Note/Bond | 3.125% | 5/15/21 | 391,810 | 416,725 | 0.3% | ||
| United States Treasury Note/Bond | 3.625% | 2/15/21 | 381,842 | 415,074 | 0.3% | ||
| United States Treasury Note/Bond | 0.875% | 10/15/17 | 413,335 | 412,107 | 0.3% | ||
| United States Treasury Note/Bond | 2.375% | 6/30/18 | 394,585 | 406,115 | 0.3% | ||
| United States Treasury Note/Bond | 2.875% | 8/15/45 | 411,420 | 398,950 | 0.3% | ||
| United States Treasury Note/Bond | 2.875% | 5/15/43 | 408,940 | 398,205 | 0.3% | ||
| United States Treasury Note/Bond | 6.250% | 8/15/23 | 308,228 | 397,805 | 0.3% | ||
| 1 | United States Treasury | ||||||
| Note/Bond | 0.500%–9.125% | 1/31/17–11/15/45 | 31,171,454 | 32,337,225 | 21.9% | ||
| 58,773,205 | 39.8% | ||||||
| Agency Bonds and Notes | |||||||
| 2 | Federal Home Loan | ||||||
| Mortgage Corp. | 0.000%–6.750% | 1/27/17–7/15/32 | 1,232,989 | 1,276,194 | 0.9% | ||
| 2,3 | Federal National | ||||||
| Mortgage Assn. | 0.000%–7.250% | 1/30/17–7/15/37 | 1,753,177 | 1,816,415 | 1.2% | ||
| Agency Bonds and Notes—Other † | 1,339,379 | 0.9% | |||||
| 4,431,988 | 3.0% | ||||||
| Conventional Mortgage-Backed Securities | |||||||
| 2,3,4 Fannie Mae Pool | 2.000%–10.000% | 3/1/16–1/1/46 | 12,241,375 | 12,869,721 | 8.7% | ||
| 2,3,4 Freddie Mac Gold Pool | 2.000%–10.000% | 1/1/16–1/1/46 | 7,689,707 | 8,053,659 | 5.4% | ||
| 2,3 | Freddie Mac Non | ||||||
| Gold Pool | 8.000%–9.500% | 2/1/17–3/1/20 | 7 | 8 | 0.0% | ||
| 3 | Ginnie Mae I Pool | 3.000%–10.500% | 5/15/16–2/1/46 | 1,973,024 | 2,116,440 | 1.4% | |
| 3,4 | Ginnie Mae II Pool | 3.500% | 1/1/46 | 1,369,430 | 1,427,631 | 1.0% | |
| 3,4 | Ginnie Mae II Pool | 2.500%–8.500% | 4/20/18–1/1/46 | 5,728,199 | 6,054,180 | 4.1% | |
| 30,521,639 | 20.6% | ||||||
| Nonconventional Mortgage-Backed Securities | |||||||
| 2,3,5 Fannie Mae Pool | 1.591%–6.076% | 11/1/32–12/1/43 | 274,491 | 285,182 | 0.1% | ||
| 2,3,5 Freddie Mac Non Gold Pool | 1.735%–6.257% | 4/1/33–11/1/43 | 79,283 | 83,210 | 0.1% | ||
| 3,5 | Ginnie Mae II Pool | 1.625%–4.000% | 6/20/29–1/20/44 | 90,318 | 93,141 | 0.1% | |
| 461,533 | 0.3% | ||||||
| Total U.S. Government and Agency Obligations (Cost $93,209,666) | 94,188,365 | 63.7% | |||||
| 6Asset-Backed/Commercial Mortgage-Backed Securities (Cost $4,240,763) † | 4,277,682 | 2.9% | |||||
| Corporate Bonds | |||||||
| Finance | |||||||
| 6 | Banking † | 8,812,464 | 6.0% | ||||
| 6 | Brokerage † | 355,836 | 0.2% | ||||
| 6 | Finance Companies † | 666,983 | 0.4% | ||||
| Insurance † | 1,873,698 | 1.3% | |||||
| Other Finance † | 20,079 | 0.0% | |||||
| 6 | Real Estate Investment Trusts † | 990,793 | 0.7% | ||||
| 12,719,853 | 8.6% | ||||||
16
| Total Bond Market Index Fund | |||||
| Market | Percentage | ||||
| Value• | of Net | ||||
| ($000) | Assets | ||||
| Industrial | |||||
| 6 | Basic Industry † | 1,586,758 | 1.1% | ||
| 6 | Capital Goods † | 2,063,305 | 1.4% | ||
| 6 | Communication † | 3,900,461 | 2.6% | ||
| 6 | Consumer Cyclical † | 3,013,928 | 2.1% | ||
| 6 | Consumer Noncyclical † | 5,792,915 | 3.9% | ||
| 6 | Energy † | 3,880,846 | 2.6% | ||
| Other Industrial † | 121,455 | 0.1% | |||
| 6 | Technology † | 2,501,580 | 1.7% | ||
| 6 | Transportation † | 900,705 | 0.6% | ||
| 23,761,953 | 16.1% | ||||
| Utilities | |||||
| 6 | Electric † | 2,734,113 | 1.9% | ||
| Natural Gas † | 198,724 | 0.1% | |||
| Other Utility † | 41,533 | 0.0% | |||
| 2,974,370 | 2.0% | ||||
| Total Corporate Bonds (Cost $39,565,690) | 39,456,176 | 26.7% | |||
| 6Sovereign Bonds (U.S. Dollar-Denominated) (Cost $7,441,157) † | 7,389,653 | 5.0% | |||
| Taxable Municipal Bonds (Cost $1,277,538) † | 1,413,907 | 0.9% | |||
| Coupon | Shares | ||||
| Temporary Cash Investment | |||||
| Money Market Fund | |||||
| 7 | Vanguard Market Liquidity Fund | ||||
| (Cost $3,155,027) | 0.363% | 3,155,027,040 | 3,155,027 | 2.2% | |
| Total Investments (Cost $148,889,841) | 149,880,810 | 101.4% | |||
| Amount | |||||
| ($000) | |||||
| Other Assets and Liabilities | |||||
| Other Assets | |||||
| Investment in Vanguard | 12,843 | ||||
| Receivables for Investment Securities Sold | 1,923,983 | ||||
| Receivables for Accrued Income | 991,185 | ||||
| Receivables for Capital Shares Issued | 392,307 | ||||
| Other Assets | 29,486 | ||||
| Total Other Assets | 3,349,804 | 2.2% | |||
| Liabilities | |||||
| Payables for Investment Securities Purchased | (4,860,815) | ||||
| Payables for Capital Shares Redeemed | (348,417) | ||||
| Payables for Distributions | (17,741) | ||||
| Payables to Vanguard | (81,373) | ||||
| Other Liabilities | (44,033) | ||||
| Total Liabilities | (5,352,379) | (3.6%) | |||
| Net Assets | 147,878,235 | 100.0% | |||
17
| Total Bond Market Index Fund | |
| At December 31, 2015, net assets consisted of: | |
| Amount | |
| ($000) | |
| Paid-in Capital | 146,946,719 |
| Overdistributed Net Investment Income | (5,948) |
| Accumulated Net Realized Losses | (53,505) |
| Unrealized Appreciation (Depreciation) | 990,969 |
| Net Assets | 147,878,235 |
| Investor Shares—Net Assets | |
| Applicable to 604,691,313 outstanding $.001 par value shares of | |
| beneficial interest (unlimited authorization) | 6,434,097 |
| Net Asset Value Per Share—Investor Shares | $10.64 |
| ETF Shares—Net Assets | |
| Applicable to 338,523,018 outstanding $.001 par value shares of | |
| beneficial interest (unlimited authorization) | 27,279,077 |
| Net Asset Value Per Share—ETF Shares | $80.58 |
| Admiral Shares—Net Assets | |
| Applicable to 5,712,401,400 outstanding $.001 par value shares of | |
| beneficial interest (unlimited authorization) | 60,782,744 |
| Net Asset Value Per Share—Admiral Shares | $10.64 |
| Institutional Shares—Net Assets | |
| Applicable to 2,734,367,656 outstanding $.001 par value shares of | |
| beneficial interest (unlimited authorization) | 29,095,002 |
| Net Asset Value Per Share—Institutional Shares | $10.64 |
| Institutional Plus Shares—Net Assets | |
| Applicable to 2,282,514,553 outstanding $.001 par value shares of | |
| beneficial interest (unlimited authorization) | 24,287,315 |
| Net Asset Value Per Share—Institutional Plus Shares | $10.64 |
• See Note A in Notes to Financial Statements.
† Represents the aggregate value, by category, of securities that are not among the 50 largest holdings and, in total for any issuer, represent
1% or less of net assets.
1 Securities with a value of $3,919,000 have been segregated as collateral for certain open To Be Announced (TBA) transactions.
2 The issuer was placed under federal conservatorship in September 2008; since that time, its daily operations have been managed by the
Federal Housing Finance Agency and it receives capital from the U.S. Treasury, as needed to maintain a positive net worth, in exchange
for senior preferred stock.
3 The average or expected maturity is shorter than the final maturity shown because of the possibility of interim principal payments and
prepayments or the possibility of the issue being called.
4 Includes securities purchased on a when-issued or delayed-delivery basis for which the fund has not taken delivery as of
December 31, 2015.
5 Adjustable-rate security.
6 Certain of the fund’s securities are exempt from registration under Rule 144A of the Securities Act of 1933. Such securities may be sold
in transactions exempt from registration, normally to qualified institutional buyers. At December 31, 2015, the aggregate value of these
securities was $1,217,171,000, representing 0.8% of net assets.
7 Affiliated money market fund available only to Vanguard funds and certain trusts and accounts managed by Vanguard. Rate shown
is the 7-day yield.
See accompanying Notes, which are an integral part of the Financial Statements.
18
Total Bond Market Index Fund
Statement of Operations
| Year Ended | |
| December 31, 2015 | |
| ($000) | |
| Investment Income | |
| Income | |
| Interest1 | 3,605,776 |
| Total Income | 3,605,776 |
| Expenses | |
| The Vanguard Group—Note B | |
| Investment Advisory Services | 3,645 |
| Management and Administrative—Investor Shares | 9,020 |
| Management and Administrative—ETF Shares | 11,103 |
| Management and Administrative—Admiral Shares | 25,451 |
| Management and Administrative—Institutional Shares | 10,283 |
| Management and Administrative—Institutional Plus Shares | 6,692 |
| Marketing and Distribution—Investor Shares | 1,585 |
| Marketing and Distribution—ETF Shares | 3,072 |
| Marketing and Distribution—Admiral Shares | 6,514 |
| Marketing and Distribution—Institutional Shares | 2,249 |
| Marketing and Distribution—Institutional Plus Shares | 1,462 |
| Custodian Fees | 1,469 |
| Auditing Fees | 50 |
| Shareholders’ Reports—Investor Shares | 86 |
| Shareholders’ Reports—ETF Shares | 587 |
| Shareholders’ Reports—Admiral Shares | 240 |
| Shareholders’ Reports—Institutional Shares | 202 |
| Shareholders’ Reports—Institutional Plus Shares | 117 |
| Trustees’ Fees and Expenses | 99 |
| Total Expenses | 83,926 |
| Net Investment Income | 3,521,850 |
| Realized Net Gain (Loss) | |
| Investment Securities Sold | 328,808 |
| Futures Contracts | 58 |
| Realized Net Gain (Loss) | 328,866 |
| Change in Unrealized Appreciation (Depreciation) of Investment Securities | (3,394,903) |
| Net Increase (Decrease) in Net Assets Resulting from Operations | 455,813 |
| 1 Interest income from an affiliated company of the fund was $10,752,000. | |
See accompanying Notes, which are an integral part of the Financial Statements.
19
Total Bond Market Index Fund
Statement of Changes in Net Assets
| Year Ended December 31, | ||
| 2015 | 2014 | |
| ($000) | ($000) | |
| Increase (Decrease) in Net Assets | ||
| Operations | ||
| Net Investment Income | 3,521,850 | 3,060,202 |
| Realized Net Gain (Loss) | 328,866 | 702,381 |
| Change in Unrealized Appreciation (Depreciation) | (3,394,903) | 2,997,245 |
| Net Increase (Decrease) in Net Assets Resulting from Operations | 455,813 | 6,759,828 |
| Distributions | ||
| Net Investment Income | ||
| Investor Shares | (160,489) | (185,331) |
| ETF Shares | (654,327) | (539,800) |
| Admiral Shares | (1,433,427) | (1,067,164) |
| Signal Shares | — | (171,056) |
| Institutional Shares | (701,366) | (585,500) |
| Institutional Plus Shares | (578,189) | (511,351) |
| Realized Capital Gain1 | ||
| Investor Shares | (6,430) | (18,976) |
| ETF Shares | (26,052) | (70,215) |
| Admiral Shares | (57,022) | (141,765) |
| Signal Shares | — | (936) |
| Institutional Shares | (27,582) | (70,829) |
| Institutional Plus Shares | (22,855) | (58,057) |
| Total Distributions | (3,667,739) | (3,420,980) |
| Capital Share Transactions | ||
| Investor Shares | (489,056) | (1,090,288) |
| ETF Shares | 1,833,104 | 7,840,682 |
| Admiral Shares | 7,902,135 | 19,668,322 |
| Signal Shares | — | (10,549,767) |
| Institutional Shares | 2,623,890 | 6,264,465 |
| Institutional Plus Shares | 2,547,427 | 3,084,978 |
| Net Increase (Decrease) from Capital Share Transactions | 14,417,500 | 25,218,392 |
| Total Increase (Decrease) | 11,205,574 | 28,557,240 |
| Net Assets | ||
| Beginning of Period | 136,672,661 | 108,115,421 |
| End of Period2 | 147,878,235 | 136,672,661 |
1 Includes fiscal 2015 and 2014 short-term gain distributions totaling $19,617,000 and $162,608,000, respectively. Short-term gain
distributions are treated as ordinary income dividends for tax purposes.
2 Net Assets—End of Period includes undistributed (overdistributed) net investment income of ($5,948,000) and $0.
See accompanying Notes, which are an integral part of the Financial Statements.
20
Total Bond Market Index Fund
Financial Highlights
| Investor Shares | |||||
| For a Share Outstanding | Year Ended December 31, | ||||
| Throughout Each Period | 2015 | 2014 | 2013 | 2012 | 2011 |
| Net Asset Value, Beginning of Period | $10.87 | $10.56 | $11.09 | $11.00 | $10.60 |
| Investment Operations | |||||
| Net Investment Income | . 253 | . 264 | .256 | .285 | .337 |
| Net Realized and Unrealized Gain (Loss) | |||||
| on Investments | (.219) | .339 | (.504) | .156 | .451 |
| Total from Investment Operations | .034 | .603 | (. 248) | .441 | .788 |
| Distributions | |||||
| Dividends from Net Investment Income | (.254) | (.264) | (. 256) | (. 285) | (. 337) |
| Distributions from Realized Capital Gains | (. 010) | (. 029) | (. 026) | (. 066) | (. 051) |
| Total Distributions | (.264) | (. 293) | (. 282) | (. 351) | (. 388) |
| Net Asset Value, End of Period | $10.64 | $10.87 | $10.56 | $11.09 | $11.00 |
| Total Return1 | 0.30% | 5.76% | -2.26% | 4.05% | 7.56% |
| Ratios/Supplemental Data | |||||
| Net Assets, End of Period (Millions) | $6,434 | $7,076 | $7,939 | $11,794 | $12,584 |
| Ratio of Total Expenses to Average Net Assets | 0.16% | 0.20% | 0.20% | 0.20% | 0.22% |
| Ratio of Net Investment Income to | |||||
| Average Net Assets | 2.34% | 2.44% | 2.37% | 2.55% | 3.12% |
| Portfolio Turnover Rate2 | 84%3 | 72%3 | 73%3 | 80%3 | 73%3 |
1 Total returns do not include account service fees that may have applied in the periods shown. Fund prospectuses provide information about any applicable account service fees.
2 Excludes the value of portfolio securities received or delivered as a result of in-kind purchases or redemptions of the fund’s capital shares, including ETF Creation Units.
3 Includes 45%, 38%, 45%, 49%, and 34% attributable to mortgage-dollar-roll activity.
See accompanying Notes, which are an integral part of the Financial Statements.
21
Total Bond Market Index Fund
Financial Highlights
| ETF Shares | |||||
| For a Share Outstanding | Year Ended December 31, | ||||
| Throughout Each Period | 2015 | 2014 | 2013 | 2012 | 2011 |
| Net Asset Value, Beginning of Period | $82.33 | $79.91 | $83.92 | $83.31 | $80.21 |
| Investment Operations | |||||
| Net Investment Income | 2.000 | 2.073 | 2.031 | 2.222 | 2.598 |
| Net Realized and Unrealized Gain (Loss) | |||||
| on Investments | (1.671) | 2.641 | (3.812) | 1.111 | 3.487 |
| Total from Investment Operations | .329 | 4.714 | (1.781) | 3.333 | 6.085 |
| Distributions | |||||
| Dividends from Net Investment Income | (2.001) | (2.073) | (2.031) | (2.222) | (2.598) |
| Distributions from Realized Capital Gains | (.078) | (. 221) | (.198) | (. 501) | (. 387) |
| Total Distributions | (2.079) | (2.294) | (2.229) | (2.723) | (2.985) |
| Net Asset Value, End of Period | $80.58 | $82.33 | $79.91 | $83.92 | $83.31 |
| Total Return | 0.39% | 5.96% | -2.14% | 4.04% | 7.71% |
| Ratios/Supplemental Data | |||||
| Net Assets, End of Period (Millions) | $27,279 | $26,041 | $17,637 | $17,968 | $14,596 |
| Ratio of Total Expenses to Average Net Assets | 0.06% | 0.07% | 0.08% | 0.10% | 0.10% |
| Ratio of Net Investment Income to | |||||
| Average Net Assets | 2.44% | 2.57% | 2.49% | 2.65% | 3.24% |
| Portfolio Turnover Rate1 | 84%2 | 72%2 | 73%2 | 80%2 | 73%2 |
1 Excludes the value of portfolio securities received or delivered as a result of in-kind purchases or redemptions of the fund’s capital shares, including ETF Creation Units.
2 Includes 45%, 38%, 45%, 49%, and 34% attributable to mortgage-dollar-roll activity.
See accompanying Notes, which are an integral part of the Financial Statements.
22
Total Bond Market Index Fund
Financial Highlights
| Admiral Shares | |||||
| For a Share Outstanding | Year Ended December 31, | ||||
| Throughout Each Period | 2015 | 2014 | 2013 | 2012 | 2011 |
| Net Asset Value, Beginning of Period | $10.87 | $10.56 | $11.09 | $11.00 | $10.60 |
| Investment Operations | |||||
| Net Investment Income | . 263 | . 278 | .269 | .296 | .350 |
| Net Realized and Unrealized Gain (Loss) | |||||
| on Investments | (.219) | .339 | (.504) | .156 | .451 |
| Total from Investment Operations | .044 | .617 | (. 235) | . 452 | . 801 |
| Distributions | |||||
| Dividends from Net Investment Income | (.264) | (.278) | (. 269) | (. 296) | (. 350) |
| Distributions from Realized Capital Gains | (. 010) | (. 029) | (. 026) | (. 066) | (. 051) |
| Total Distributions | (.274) | (.307) | (. 295) | (. 362) | (. 401) |
| Net Asset Value, End of Period | $10.64 | $10.87 | $10.56 | $11.09 | $11.00 |
| Total Return1 | 0.40% | 5.89% | -2.15% | 4.15% | 7.69% |
| Ratios/Supplemental Data | |||||
| Net Assets, End of Period (Millions) | $60,783 | $54,198 | $33,450 | $35,533 | $31,366 |
| Ratio of Total Expenses to Average Net Assets | 0.06% | 0.07% | 0.08% | 0.10% | 0.10% |
| Ratio of Net Investment Income to | |||||
| Average Net Assets | 2.44% | 2.57% | 2.49% | 2.65% | 3.24% |
| Portfolio Turnover Rate2 | 84%3 | 72%3 | 73%3 | 80%3 | 73%3 |
1 Total returns do not include account service fees that may have applied in the periods shown. Fund prospectuses provide information about any applicable account service fees.
2 Excludes the value of portfolio securities received or delivered as a result of in-kind purchases or redemptions of the fund’s capital shares, including ETF Creation Units.
3 Includes 45%, 38%, 45%, 49%, and 34% attributable to mortgage-dollar-roll activity.
See accompanying Notes, which are an integral part of the Financial Statements.
23
Total Bond Market Index Fund
Financial Highlights
| Institutional Shares | |||||
| For a Share Outstanding | Year Ended December 31, | ||||
| Throughout Each Period | 2015 | 2014 | 2013 | 2012 | 2011 |
| Net Asset Value, Beginning of Period | $10.87 | $10.56 | $11.09 | $11.00 | $10.60 |
| Investment Operations | |||||
| Net Investment Income | . 265 | . 279 | .270 | .299 | .353 |
| Net Realized and Unrealized Gain (Loss) | |||||
| on Investments | (.219) | .339 | (.504) | .156 | .451 |
| Total from Investment Operations | .046 | .618 | (. 234) | .455 | .804 |
| Distributions | |||||
| Dividends from Net Investment Income | (.266) | (.279) | (. 270) | (. 299) | (. 353) |
| Distributions from Realized Capital Gains | (. 010) | (. 029) | (. 026) | (. 066) | (. 051) |
| Total Distributions | (.276) | (. 308) | (. 296) | (. 365) | (. 404) |
| Net Asset Value, End of Period | $10.64 | $10.87 | $10.56 | $11.09 | $11.00 |
| Total Return | 0.41% | 5.91% | -2.14% | 4.18% | 7.72% |
| Ratios/Supplemental Data | |||||
| Net Assets, End of Period (Millions) | $29,095 | $27,103 | $20,206 | $22,494 | $22,812 |
| Ratio of Total Expenses to Average Net Assets | 0.05% | 0.06% | 0.07% | 0.07% | 0.07% |
| Ratio of Net Investment Income to | |||||
| Average Net Assets | 2.45% | 2.58% | 2.50% | 2.68% | 3.27% |
| Portfolio Turnover Rate1 | 84%2 | 72%2 | 73%2 | 80%2 | 73%2 |
1 Excludes the value of portfolio securities received or delivered as a result of in-kind purchases or redemptions of the fund’s capital shares, including ETF Creation Units.
2 Includes 45%, 38%, 45%, 49%, and 34% attributable to mortgage-dollar-roll activity.
See accompanying Notes, which are an integral part of the Financial Statements.
24
Total Bond Market Index Fund
Financial Highlights
| Institutional Plus Shares | |||||
| For a Share Outstanding | Year Ended December 31, | ||||
| Throughout Each Period | 2015 | 2014 | 2013 | 2012 | 2011 |
| Net Asset Value, Beginning of Period | $10.87 | $10.56 | $11.09 | $11.00 | $10.60 |
| Investment Operations | |||||
| Net Investment Income | . 266 | . 280 | .272 | .301 | .355 |
| Net Realized and Unrealized Gain (Loss) | |||||
| on Investments | (.219) | .339 | (.504) | .156 | .451 |
| Total from Investment Operations | .047 | .619 | (. 232) | . 457 | .806 |
| Distributions | |||||
| Dividends from Net Investment Income | (.267) | (.280) | (. 272) | (. 301) | (. 355) |
| Distributions from Realized Capital Gains | (. 010) | (. 029) | (. 026) | (. 066) | (. 051) |
| Total Distributions | (.277) | (. 309) | (. 298) | (.367) | (.406) |
| Net Asset Value, End of Period | $10.64 | $10.87 | $10.56 | $11.09 | $11.00 |
| Total Return | 0.42% | 5.92% | -2.12% | 4.20% | 7.74% |
| Ratios/Supplemental Data | |||||
| Net Assets, End of Period (Millions) | $24,287 | $22,254 | $18,607 | $16,294 | $9,486 |
| Ratio of Total Expenses to Average Net Assets | 0.04% | 0.05% | 0.05% | 0.05% | 0.05% |
| Ratio of Net Investment Income to | |||||
| Average Net Assets | 2.46% | 2.59% | 2.52% | 2.70% | 3.29% |
| Portfolio Turnover Rate1 | 84%2 | 72%2 | 73%2 | 80%2 | 73%2 |
1 Excludes the value of portfolio securities received or delivered as a result of in-kind purchases or redemptions of the fund’s capital shares, including ETF Creation Units.
2 Includes 45%, 38%, 45%, 49%, and 34% attributable to mortgage-dollar-roll activity.
See accompanying Notes, which are an integral part of the Financial Statements.
25
Total Bond Market Index Fund
Notes to Financial Statements
Vanguard Total Bond Market Index Fund is registered under the Investment Company Act of 1940 as an open-end investment company, or mutual fund. Certain of the fund’s investments are in corporate debt instruments; the issuers’ abilities to meet their obligations may be affected by economic developments in their respective industries. The fund offers five classes of shares: Investor Shares, ETF Shares, Admiral Shares, Institutional Shares, and Institutional Plus Shares. Investor Shares are available to any investor who meets the fund’s minimum purchase requirements. ETF Shares are listed for trading on NYSE Arca; they can be purchased and sold through a broker. Admiral Shares, Institutional Shares, and Institutional Plus Shares are designed for investors who meet certain administrative, service, and account-size criteria. Prior to October 24, 2014, the fund offered Signal Shares. Effective at the close of business on October 24, 2014, the Signal Shares were converted to Admiral Shares.
A. The following significant accounting policies conform to generally accepted accounting principles for U.S. investment companies. The fund consistently follows such policies in preparing its financial statements.
1. Security Valuation: Securities are valued as of the close of trading on the New York Stock Exchange (generally 4 p.m., Eastern time) on the valuation date. Bonds, and temporary cash investments acquired over 60 days to maturity, are valued using the latest bid prices or using valuations based on a matrix system (which considers such factors as security prices, yields, maturities, and ratings), both as furnished by independent pricing services. Structured debt securities, including mortgages and asset-backed securities, are valued using the latest bid prices or using valuations based on a matrix system that considers such factors as issuer, tranche, nominal or option-adjusted spreads, weighted average coupon, weighted average maturity, credit enhancements, and collateral. Investments in Vanguard Market Liquidity Fund are valued at that fund’s net asset value. Other temporary cash investments are valued at amortized cost, which approximates market value. Securities for which market quotations are not readily available, or whose values have been affected by events occurring before the fund’s pricing time but after the close of the securities’ primary markets, are valued by methods deemed by the board of trustees to represent fair value.
2. Futures Contracts: The fund uses futures contracts to invest in fixed income asset classes with greater efficiency and lower cost than is possible through direct investment, to add value when these instruments are attractively priced, or to adjust sensitivity to changes in interest rates. The primary risks associated with the use of futures contracts are imperfect correlation between changes in market values of bonds held by the fund and the prices of futures contracts, and the possibility of an illiquid market. Counterparty risk involving futures is mitigated because a regulated clearinghouse is the counterparty instead of the clearing broker. To further mitigate counterparty risk, the fund trades futures contracts on an exchange, monitors the financial strength of its clearing brokers and clearinghouse, and has entered into clearing agreements with its clearing brokers. The clearinghouse imposes initial margin requirements to secure the fund’s performance and requires daily settlement of variation margin representing changes in the market value of each contract.
Futures contracts are valued at their quoted daily settlement prices. The aggregate settlement values of the contracts are not recorded in the Statement of Net Assets. Fluctuations in the value of the contracts are recorded in the Statement of Net Assets as an asset (liability) and in the Statement of Operations as unrealized appreciation (depreciation) until the contracts are closed, when they are recorded as realized futures gains (losses).
26
Total Bond Market Index Fund
During the year ended December 31, 2015, the fund’s average investments in long and short futures contracts represented 0% and less than 1% of net assets, respectively, based on the average of aggregate settlement values at each quarter-end during the period. The fund had no open futures contracts at December 31, 2015.
3. To Be Announced (TBA) Transactions: A TBA transaction is an agreement to buy or sell mortgage-backed securities with agreed-upon characteristics (face amount, coupon, maturity) for settlement at a future date. The fund may be a seller of TBA transactions to reduce its exposure to the mortgage-backed securities market or in order to sell mortgage-backed securities it owns under delayed-delivery arrangements. When the fund is a buyer of TBA transactions, it maintains cash or short-term investments in an amount sufficient to meet the purchase price at the settlement date of the TBA transaction. The primary risk associated with TBA transactions is that a counterparty may default on its obligations. The fund mitigates its counterparty risk by, among other things, performing a credit analysis of counterparties, allocating transactions among numerous counterparties, and monitoring its exposure to each counterparty. The fund may also enter into a Master Securities Forward Transaction Agreement (MSFTA) with certain counterparties and require them to transfer collateral as security for their performance. Under an MSFTA, upon a counterparty default (including bankruptcy), the fund may terminate any TBA transactions with that counterparty, determine the net amount owed by either party in accordance with its master netting arrangements, and sell or retain any collateral held up to the net amount owed to the fund under the master netting arrangements.
4. Mortgage Dollar Rolls: The fund enters into mortgage-dollar-roll transactions, in which the fund sells mortgage-backed securities to a dealer and simultaneously agrees to purchase similar securities in the future at a predetermined price. The proceeds of the securities sold in mortgage-dollar-roll transactions are typically invested in high-quality short-term fixed income securities. The fund forgoes principal and interest paid on the securities sold, and is compensated by interest earned on the proceeds of the sale and by a lower price on the securities to be repurchased. The fund has also entered into mortgage-dollar-roll transactions in which the fund buys mortgage-backed securities from a dealer pursuant to a TBA transaction and simultaneously agrees to sell similar securities in the future at a predetermined price. The securities bought in mortgage-dollar-roll transactions are used to cover an open TBA sell position. The fund continues to earn interest on mortgage-backed security pools already held and receives a lower price on the securities to be sold in the future. The fund accounts for mortgage-dollar-roll transactions as purchases and sales; as such, these transactions may increase the fund’s portfolio turnover rate. Amounts to be received or paid in connection with open mortgage dollar rolls are included in Receivables for Investment Securities Sold (Other Assets) or Payables for Investment Securities Purchased (Liabilities) in the Statement of Net Assets.
5. Federal Income Taxes: The fund intends to continue to qualify as a regulated investment company and distribute all of its taxable income. Management has analyzed the fund’s tax positions taken for all open federal income tax years (December 31, 2012–2015), and has concluded that no provision for federal income tax is required in the fund’s financial statements.
6. Distributions: Distributions from net investment income are declared daily by all share classes except ETF Shares, and paid on the first business day of the following month. Monthly income dividends from ETF Shares, and annual distributions from realized capital gains, if any, are recorded on the ex-dividend date.
7. Credit Facility: The fund and certain other funds managed by The Vanguard Group (“Vanguard”) participate in a $3 billion committed credit facility provided by a syndicate of lenders pursuant to a credit agreement that may be renewed annually; each fund is individually liable for its borrowings,
27
Total Bond Market Index Fund
if any, under the credit facility. Borrowings may be utilized for temporary and emergency purposes, and are subject to the fund’s regulatory and contractual borrowing restrictions. The participating funds are charged administrative fees and an annual commitment fee of 0.06% of the undrawn amount of the facility; these fees are allocated to the funds based on a method approved by the fund’s board of trustees and included in Management and Administrative expenses on the fund’s Statement of Operations. Any borrowings under this facility bear interest at a rate equal to the higher of the federal funds rate or LIBOR reference rate plus an agreed-upon spread.
The fund had no borrowings outstanding at December 31, 2015, or at any time during the period then ended.
8. Other: Interest income includes income distributions received from Vanguard Market Liquidity Fund and is accrued daily. Premiums and discounts on debt securities purchased are amortized and accreted, respectively, to interest income over the lives of the respective securities. Security transactions are accounted for on the date securities are bought or sold. Costs used to determine realized gains (losses) on the sale of investment securities are those of the specific securities sold.
Each class of shares has equal rights as to assets and earnings, except that each class separately bears certain class-specific expenses related to maintenance of shareholder accounts (included in Management and Administrative expenses) and shareholder reporting. Marketing and distribution expenses are allocated to each class of shares based on a method approved by the board of trustees. Income, other non-class-specific expenses, and gains and losses on investments are allocated to each class of shares based on its relative net assets.
B. In accordance with the terms of a Funds’ Service Agreement (the “FSA”) between Vanguard and the fund, Vanguard furnishes to the fund investment advisory, corporate management, administrative, marketing, and distribution services at Vanguard’s cost of operations (as defined by the FSA). These costs of operations are allocated to the fund based on methods and guidelines approved by the board of trustees. Vanguard does not require reimbursement in the current period for certain costs of operations (such as deferred compensation/benefits and risk/insurance costs); the fund’s liability for these costs of operations is included in Payables to Vanguard on the Statement of Net Assets.
Upon the request of Vanguard, the fund may invest up to 0.40% of its net assets as capital in Vanguard. At December 31, 2015, the fund had contributed to Vanguard capital in the amount of $12,843,000, representing 0.01% of the fund’s net assets and 5.14% of Vanguard’s capitalization. The fund’s trustees and officers are also directors and employees, respectively, of Vanguard.
C. Various inputs may be used to determine the value of the fund’s investments. These inputs are summarized in three broad levels for financial statement purposes. The inputs or methodologies used to value securities are not necessarily an indication of the risk associated with investing in those securities.
Level 1—Quoted prices in active markets for identical securities.
Level 2—Other significant observable inputs (including quoted prices for similar securities, interest rates, prepayment speeds, credit risk, etc.).
Level 3—Significant unobservable inputs (including the fund’s own assumptions used to determine the fair value of investments).
28
Total Bond Market Index Fund
The following table summarizes the market value of the fund’s investments as of December 31, 2015, based on the inputs used to value them:
| Level 1 | Level 2 | Level 3 | |
| Investments | ($000) | ($000) | ($000) |
| U.S. Government and Agency Obligations | — | 94,188,362 | 3 |
| Asset-Backed/Commercial Mortgage-Backed Securities | — | 4,277,681 | 1 |
| Corporate Bonds | — | 39,456,176 | — |
| Sovereign Bonds | — | 7,389,653 | — |
| Taxable Municipal Bonds | — | 1,413,907 | — |
| Temporary Cash Investments | 3,155,027 | — | — |
| Total | 3,155,027 | 146,725,779 | 4 |
D. Capital gain distributions are determined on a tax basis and may differ from realized capital gains for financial reporting purposes. Differences may be permanent or temporary. Permanent differences are reclassified among capital accounts in the financial statements to reflect their tax character. Temporary differences arise when gains or losses are recognized in different periods for financial statement and tax purposes. These differences will reverse at some time in the future.
During the year ended December 31, 2015, the fund realized $246,261,000 of net capital gains resulting from in-kind redemptions—in which shareholders exchanged fund shares for securities held by the fund rather than for cash. Because such gains are not taxable to the fund, and are not distributed to shareholders, they have been reclassified from accumulated net realized losses to paid-in capital.
The fund used a tax accounting practice to treat a portion of the price of capital shares redeemed during the year as distributions from realized capital gains. Accordingly, the fund has reclassified $22,016,000 from accumulated net realized losses to paid-in capital.
Capital gains required to be distributed in December 2015 included gains realized through October 31, 2015; subsequently the fund realized losses of $53,505,000, which are deferred and will be treated as realized for tax purposes in 2016.
At December 31, 2015, the cost of investment securities for tax purposes was $148,889,841,000. Net unrealized appreciation of investment securities for tax purposes was $990,969,000, consisting of unrealized gains of $2,509,812,000 on securities that had risen in value since their purchase and $1,518,843,000 in unrealized losses on securities that had fallen in value since their purchase.
E. During the year ended December 31, 2015, the fund purchased $18,510,853,000 of investment securities and sold $12,037,627,000 of investment securities, other than U.S. government securities and temporary cash investments. Purchases and sales of U.S. government securities were $120,192,563,000 and $112,247,354,000, respectively. Total purchases and sales include $5,190,370,000 and $4,043,472,000, respectively, in connection with in-kind purchases and redemptions of the fund’s capital shares.
29
Total Bond Market Index Fund
F. Capital share transactions for each class of shares were:
| Year Ended December 31, | ||||
| 2015 | 2014 | |||
| Amount | Shares | Amount | Shares | |
| ($000) | (000) | ($000) | (000) | |
| Investor Shares | ||||
| Issued | 1,525,352 | 140,333 | 1,513,130 | 140,315 |
| Issued in Lieu of Cash Distributions | 160,388 | 14,818 | 196,630 | 18,201 |
| Redeemed | (2,174,796) | (201,332) | (2,800,048) | (259,709) |
| Net Increase (Decrease)—Investor Shares | (489,056) | (46,181) | (1,090,288) | (101,193) |
| ETF Shares | ||||
| Issued | 6,868,533 | 83,300 | 14,064,655 | 171,800 |
| Issued in Lieu of Cash Distributions | — | — | — | — |
| Redeemed | (5,035,429) | (61,100) | (6,223,973) | (76,200) |
| Net Increase (Decrease) —ETF Shares | 1,833,104 | 22,200 | 7,840,682 | 95,600 |
| Admiral Shares | ||||
| Issued1 | 16,949,183 | 1,564,126 | 24,112,914 | 2,228,800 |
| Issued in Lieu of Cash Distributions | 1,345,060 | 124,352 | 1,104,379 | 102,113 |
| Redeemed | (10,392,108) | (961,534) | (5,548,971) | (514,371) |
| Net Increase (Decrease) —Admiral Shares | 7,902,135 | 726,944 | 19,668,322 | 1,816,542 |
| Signal Shares | ||||
| Issued | — | — | 2,101,570 | 195,307 |
| Issued in Lieu of Cash Distributions | — | — | 144,029 | 13,381 |
| Redeemed1 | — | — | (12,795,366) | (1,182,143) |
| Net Increase (Decrease)—Signal Shares | — | — | (10,549,767) | (973,455) |
| Institutional Shares | ||||
| Issued | 8,909,456 | 822,954 | 10,389,753 | 961,193 |
| Issued in Lieu of Cash Distributions | 686,159 | 63,425 | 616,393 | 57,013 |
| Redeemed | (6,971,725) | (645,028) | (4,741,681) | (439,384) |
| Net Increase (Decrease) —Institutional Shares | 2,623,890 | 241,351 | 6,264,465 | 578,822 |
| Institutional Plus Shares | ||||
| Issued | 5,012,396 | 463,375 | 5,556,783 | 514,144 |
| Issued in Lieu of Cash Distributions | 584,138 | 53,999 | 549,200 | 50,809 |
| Redeemed | (3,049,107) | (281,932) | (3,021,005) | (280,632) |
| Net Increase (Decrease) —Institutional Plus Shares | 2,547,427 | 235,442 | 3,084,978 | 284,321 |
| 1 Admiral Shares Issued and Signal Shares Redeemed include $7,788,349,000 from the conversion of Signal Shares to Admiral Shares during the 2014 fiscal year. | ||||
G. Management has determined that no material events or transactions occurred subsequent to December 31, 2015, that would require recognition or disclosure in these financial statements.
30
Report of Independent Registered
Public Accounting Firm
To the Board of Trustees of Vanguard Bond Index Funds and the Shareholders of Vanguard Total Bond Market Index Fund:
In our opinion, the accompanying statement of net assets—investments summary and the related statements of operations and of changes in net assets and the financial highlights present fairly, in all material respects, the financial position of Vanguard Total Bond Market Index Fund (constituting a separate portfolio of Vanguard Bond Index Funds, hereafter referred to as the “Fund”) at December 31, 2015, the results of its operations for the year then ended, the changes in its net assets for each of the two years in the period then ended, and the financial highlights for each of the five years in the period then ended, in conformity with accounting principles generally accepted in the United States of America. These financial statements and financial highlights (hereafter referred to as “financial statements”) are the responsibility of the Fund’s management. Our responsibility is to express an opinion on these financial statements based on our audits. We conducted our audits of these financial statements in accordance with the standards of the Public Company Accounting Oversight Board (United States). Those standards require that we plan and perform the audit to obtain reasonable assurance about whether the financial statements are free of material misstatement. An audit includes examining, on a test basis, evidence supporting the amounts and disclosures in the financial statements, assessing the accounting principles used and significant estimates made by management, and evaluating the overall financial statement presentation. We believe that our audits, which included confirmation of securities at December 31, 2015 by correspondence with the custodian and brokers, by agreement to the underlying ownership records of the transfer agent and application of alternative auditing procedures where securities purchased had not been received, provide a reasonable basis for our opinion.
/s/PricewaterhouseCoopers LLP
Philadelphia, Pennsylvania
February 16, 2016

This information for the fiscal year ended December 31, 2015, is included pursuant to provisions
of the Internal Revenue Code.
The fund distributed $142,339,000 as capital gain dividends (20% rate gain distributions) to
shareholders during the fiscal year.
For nonresident alien shareholders, 100% of short-term capital gain dividends distributed by the
fund are qualified short-term capital gains.
For nonresident alien shareholders, 86.8% of income dividends are interest-related dividends.
31
About Your Fund’s Expenses
As a shareholder of the fund, you incur ongoing costs, which include costs for portfolio management, administrative services, and shareholder reports (like this one), among others. Operating expenses, which are deducted from a fund’s gross income, directly reduce the investment return of the fund.
A fund’s expenses are expressed as a percentage of its average net assets. This figure is known as the expense ratio. The following examples are intended to help you understand the ongoing costs (in dollars) of investing in your fund and to compare these costs with those of other mutual funds. The examples are based on an investment of $1,000 made at the beginning of the period shown and held for the entire period.
The accompanying table illustrates your fund’s costs in two ways:
• Based on actual fund return. This section helps you to estimate the actual expenses that you paid over the period. The ”Ending Account Value“ shown is derived from the fund‘s actual return, and the third column shows the dollar amount that would have been paid by an investor who started with $1,000 in the fund. You may use the information here, together with the amount you invested, to estimate the expenses that you paid over the period.
To do so, simply divide your account value by $1,000 (for example, an $8,600 account value divided by $1,000 = 8.6), then multiply the result by the number given for your fund under the heading ”Expenses Paid During Period.“
• Based on hypothetical 5% yearly return. This section is intended to help you compare your fund‘s costs with those of other mutual funds. It assumes that the fund had a yearly return of 5% before expenses, but that the expense ratio is unchanged. In this case—because the return used is not the fund’s actual return—the results do not apply to your investment. The example is useful in making comparisons because the Securities and Exchange Commission requires all mutual funds to calculate expenses based on a 5% return. You can assess your fund’s costs by comparing this hypothetical example with the hypothetical examples that appear in shareholder reports of other funds.
Note that the expenses shown in the table are meant to highlight and help you compare ongoing costs only and do not reflect transaction costs incurred by the fund for buying and selling securities. Further, the expenses do not include any purchase, redemption, or account service fees described in the fund prospectus. If such fees were applied to your account, your costs would be higher. Your fund does not carry a “sales load.”
The calculations assume no shares were bought or sold during the period. Your actual costs may have been higher or lower, depending on the amount of your investment and the timing of any purchases or redemptions.
You can find more information about the fund’s expenses, including annual expense ratios, in the Financial Statements section of this report. For additional information on operating expenses and other shareholder costs, please refer to your fund’s current prospectus.
32
| Six Months Ended December 31, 2015 | |||
| Beginning | Ending | Expenses | |
| Account Value | Account Value | Paid During | |
| Total Bond Market Index Fund | 6/30/2015 | 12/31/2015 | Period |
| Based on Actual Fund Return | |||
| Investor Shares | $1,000.00 | $1,005.23 | $0.71 |
| ETF Shares | 1,000.00 | 1,006.13 | 0.25 |
| Admiral Shares | 1,000.00 | 1,005.68 | 0.25 |
| Institutional Shares | 1,000.00 | 1,005.73 | 0.20 |
| Institutional Plus Shares | 1,000.00 | 1,005.78 | 0.15 |
| Based on Hypothetical 5% Yearly Return | |||
| Investor Shares | $1,000.00 | $1,024.50 | $0.71 |
| ETF Shares | 1,000.00 | 1,024.95 | 0.26 |
| Admiral Shares | 1,000.00 | 1,024.95 | 0.26 |
| Institutional Shares | 1,000.00 | 1,025.00 | 0.20 |
| Institutional Plus Shares | 1,000.00 | 1,025.05 | 0.15 |
The calculations are based on expenses incurred in the most recent six-month period. The fund’s annualized six-month expense ratios for that
period are 0.14% for Investor Shares, 0.05% for ETF Shares, 0.05% for Admiral Shares, 0.04% for Institutional Shares, and 0.03% for
Institutional Plus Shares. The dollar amounts shown as “Expenses Paid” are equal to the annualized expense ratio multiplied by the average
account value over the period, multiplied by the number of days in the most recent six-month period, then divided by the number of days in
the most recent 12-month period (184/365).
33
Glossary
30-Day SEC Yield. A fund’s 30-day SEC yield is derived using a formula specified by the U.S. Securities and Exchange Commission. Under the formula, data related to the fund’s security holdings in the previous 30 days are used to calculate the fund’s hypothetical net income for that period, which is then annualized and divided by the fund’s estimated average net assets over the calculation period. For the purposes of this calculation, a security’s income is based on its current market yield to maturity (for bonds), its actual income (for asset-backed securities), or its projected dividend yield (for stocks). Because the SEC yield represents hypothetical annualized income, it will differ—at times significantly—from the fund’s actual experience. As a result, the fund’s income distributions may be higher or lower than implied by the SEC yield.
Average Coupon. The average interest rate paid on the fixed income securities held by a fund. It is expressed as a percentage of face value.
Average Duration. An estimate of how much the value of the bonds held by a fund will fluctuate in response to a change in interest rates. To see how the value could change, multiply the average duration by the change in rates. If interest rates rise by 1 percentage point, the value of the bonds in a fund with an average duration of five years would decline by about 5%. If rates decrease by a percentage point, the value would rise by 5%.
Average Effective Maturity. The average length of time until fixed income securities held by a fund reach maturity and are repaid, taking into consideration the possibility that the issuer may call the bond before its maturity date. The figure reflects the proportion of fund assets represented by each security; it also reflects any futures contracts held. In general, the longer the average effective maturity, the more a fund’s share price will fluctuate in response to changes in market interest rates.
Beta. A measure of the magnitude of a fund’s past share-price fluctuations in relation to the ups and downs of a given market index. The index is assigned a beta of 1.00. Compared with a given index, a fund with a beta of 1.20 typically would have seen its share price rise or fall by 12% when the index rose or fell by 10%. For this report, beta is based on returns over the past 36 months for both the fund and the index. Note that a fund’s beta should be reviewed in conjunction with its R-squared (see definition). The lower the R-squared, the less correlation there is between the fund and the index, and the less reliable beta is as an indicator of volatility.
Credit Quality. Credit-quality ratings are measured on a scale that generally ranges from AAA (highest) to D (lowest). U.S. Treasury, U.S. Agency, and U.S. Agency mortgage-backed securities appear under “U.S. Government.” Credit-quality ratings are obtained from Barclays and are from Moody’s, Fitch, and S&P. When ratings from all three agencies are used, the median rating is shown. When ratings from two of the agencies are used, the lower rating for each issue is shown. “Not Rated” is used to classify securities for which a rating is not available. Not rated securities include a fund’s investment in Vanguard Market Liquidity Fund or Vanguard Municipal Cash Management Fund, each of which invests in high-quality money market instruments and may serve as a cash management vehicle for the Vanguard funds, trusts, and accounts.
Expense Ratio. A fund’s total annual operating expenses expressed as a percentage of the fund’s average net assets. The expense ratio includes management and administrative expenses, but does not include the transaction costs of buying and selling portfolio securities.
34
Inception Date. The date on which the assets of a fund (or one of its share classes) are first invested in accordance with the fund’s investment objective. For funds with a subscription period, the inception date is the day after that period ends. Investment performance is measured from the inception date.
R-Squared. A measure of how much of a fund’s past returns can be explained by the returns from the market in general, as measured by a given index. If a fund’s total returns were precisely synchronized with an index’s returns, its R-squared would be 1.00. If the fund’s returns bore no relationship to the index’s returns, its R-squared would be 0. For this report, R-squared is based on returns over the past 36 months for both the fund and the index.
Short-Term Reserves. The percentage of a fund invested in highly liquid, short-term securities that can be readily converted to cash.
Yield to Maturity. The rate of return an investor would receive if the fixed income securities held by a fund were held to their maturity dates.
Benchmark Information
Spliced Barclays U.S. Aggregate Float Adjusted Index: Barclays U.S. Aggregate Bond Index
through December 31, 2009; Barclays U.S. Aggregate Float Adjusted Index thereafter.
Spliced Intermediate Investment-Grade Debt Funds Average: Based on average returns for
Intermediate U.S. Government Funds through December 31, 2001, Intermediate Investment-Grade
Debt Funds through August 31, 2013, and Core Bond Funds thereafter.
35
Vanguard Total Bond Market Index Fund is not sponsored, endorsed, issued, sold, or promoted by Barclays Capital Inc. or any
of its affiliates (“Barclays”). Barclays makes no representation or warranty, express or implied, to the owners or purchasers of
the fund or any member of the public regarding the advisability of investing in securities generally or in the fund particularly or
the ability of the Barclays index to track general bond market performance. Barclays has not passed on the legality or suitability
of the fund with respect to any person or entity. Barclays’ only relationship to Vanguard and the fund is the licensing of the
Barclays index, which is determined, composed, and calculated by Barclays without regard to Vanguard or the fund or any
owners or purchasers of the fund. Barclays has no obligation to take the needs of Vanguard, the fund, or the owners of the
fund into consideration in determining, composing, or calculating the Barclays index. Barclays is not responsible for and has
not participated in the determination of the timing of, prices at, or quantities of the fund to be issued. Barclays has no
obligation or liability in connection with the administration, marketing, or trading of the fund.
Barclays shall have no liability to third parties for the quality, accuracy, and/or completeness of the index or any data included
therein or for interruptions in the delivery of the index. Barclays makes no warranty, express or implied, as to results to be
obtained by owners of the fund or any other person or entity from the use of the index or any data included therein in connec-
tion with the rights licensed hereunder or for any other use. Barclays reserves the right to change the methods of calculation
or publication, or to cease the calculation or publication of the Barclays U.S. Aggregate Float Adjusted Index, and Barclays
shall not be liable for any miscalculation of or any incorrect, delayed, or interrupted publication with respect to the index.
Barclays makes no express or implied warranties, and hereby expressly disclaims all warranties of merchantability or fitness
for a particular purpose or use with respect to the index or any data included therein. Barclays shall not be liable for any
damages, including, without limitation, any indirect or consequential damages resulting from the use of the index or any
data included therein.
36
This page intentionally left blank.
This page intentionally left blank.
This page intentionally left blank.
The People Who Govern Your Fund
The trustees of your mutual fund are there to see that the fund is operated and managed in your best interests since, as a shareholder, you are a part owner of the fund. Your fund’s trustees also serve on the board of directors of The Vanguard Group, Inc., which is owned by the Vanguard funds and provides services to them on an at-cost basis.
A majority of Vanguard’s board members are independent, meaning that they have no affiliation with Vanguard or the funds they oversee, apart from the sizable personal investments they have made as private individuals. The independent board members have distinguished backgrounds in business, academia, and public service. Each of the trustees and executive officers oversees 194 Vanguard funds.
The following table provides information for each trustee and executive officer of the fund. More information about the trustees is in the Statement of Additional Information, which can be obtained, without charge, by contacting Vanguard at 800-662-7447, or online at vanguard.com.
| InterestedTrustee1 | Rajiv L. Gupta |
| Born 1945. Trustee Since December 2001.2 Principal | |
| F. William McNabb III | Occupation(s) During the Past Five Years and Other |
| Born 1957. Trustee Since July 2009. Chairman of | Experience: Chairman and Chief Executive Officer |
| the Board. Principal Occupation(s) During the Past | (retired 2009) and President (2006–2008) of |
| Five Years and Other Experience: Chairman of the | Rohm and Haas Co. (chemicals); Director of Tyco |
| Board of The Vanguard Group, Inc., and of each of | International PLC (diversified manufacturing and |
| the investment companies served by The Vanguard | services), Hewlett-Packard Co. (electronic computer |
| Group, since January 2010; Director of The Vanguard | manufacturing), and Delphi Automotive PLC |
| Group since 2008; Chief Executive Officer and | (automotive components); Senior Advisor at New |
| President of The Vanguard Group, and of each of | Mountain Capital. |
| the investment companies served by The Vanguard | |
| Group, since 2008; Director of Vanguard Marketing | Amy Gutmann |
| Corporation; Managing Director of The Vanguard | Born 1949. Trustee Since June 2006. Principal |
| Group (1995–2008). | Occupation(s) During the Past Five Years and |
| Other Experience: President of the University of | |
| IndependentTrustees | Pennsylvania; Christopher H. Browne Distinguished |
| Professor of Political Science, School of Arts and | |
| Emerson U. Fullwood | Sciences, and Professor of Communication, Annenberg |
| Born 1948. Trustee Since January 2008. Principal | School for Communication, with secondary faculty |
| Occupation(s) During the Past Five Years and | appointments in the Department of Philosophy, School |
| Other Experience: Executive Chief Staff and | of Arts and Sciences, and at the Graduate School of |
| Marketing Officer for North America and Corporate | Education, University of Pennsylvania; Trustee of the |
| Vice President (retired 2008) of Xerox Corporation | National Constitution Center; Chair of the Presidential |
| (document management products and services); | Commission for the Study of Bioethical Issues. |
| Executive in Residence and 2009–2010 Distinguished | |
| Minett Professor at the Rochester Institute of | JoAnn Heffernan Heisen |
| Technology; Director of SPX Corporation (multi-industry | Born 1950. Trustee Since July 1998. Principal |
| manufacturing), the United Way of Rochester, the | Occupation(s) During the Past Five Years and |
| University of Rochester Medical Center, Monroe | Other Experience: Corporate Vice President and |
| Community College Foundation, and North Carolina | Chief Global Diversity Officer (retired 2008) and |
| A&T University. | Member of the Executive Committee (1997–2008) |
| of Johnson & Johnson (pharmaceuticals/medical | |
| devices/consumer products); Director of Skytop | |
| Lodge Corporation (hotels) and the Robert Wood | |
| Johnson Foundation; Member of the Advisory | |
| Board of the Institute for Women’s Leadership | |
| at Rutgers University. |
| F. Joseph Loughrey | Executive Officers | |
| Born 1949. Trustee Since October 2009. Principal | ||
| Occupation(s) During the Past Five Years and Other | Glenn Booraem | |
| Experience: President and Chief Operating Officer | Born 1967. Treasurer Since May 2015. Principal | |
| (retired 2009) of Cummins Inc. (industrial machinery); | Occupation(s) During the Past Five Years and | |
| Chairman of the Board of Hillenbrand, Inc. (specialized | Other Experience: Principal of The Vanguard Group, | |
| consumer services), and of Oxfam America; Director | Inc.; Treasurer of each of the investment companies | |
| of SKF AB (industrial machinery), Hyster-Yale Materials | served by The Vanguard Group; Controller of each of | |
| Handling, Inc. (forklift trucks), the Lumina Foundation | the investment companies served by The Vanguard | |
| for Education, and the V Foundation for Cancer | Group (2010–2015); Assistant Controller of each of | |
| Research; Member of the Advisory Council for the | the investment companies served by The Vanguard | |
| College of Arts and Letters and of the Advisory Board | Group (2001–2010). | |
| to the Kellogg Institute for International Studies, both | ||
| at the University of Notre Dame. | Thomas J. Higgins | |
| Born 1957. Chief Financial Officer Since September | ||
| Mark Loughridge | 2008. Principal Occupation(s) During the Past Five | |
| Born 1953. Trustee Since March 2012. Principal | Years and Other Experience: Principal of The Vanguard | |
| Occupation(s) During the Past Five Years and Other | Group, Inc.; Chief Financial Officer of each of the | |
| Experience: Senior Vice President and Chief Financial | investment companies served by The Vanguard Group; | |
| Officer (retired 2013) at IBM (information technology | Treasurer of each of the investment companies served | |
| services); Fiduciary Member of IBM’s Retirement Plan | by The Vanguard Group (1998–2008). | |
| Committee (2004–2013); Director of the Dow Chemical | ||
| Company; Member of the Council on Chicago Booth. | Peter Mahoney | |
| Born 1974. Controller Since May 2015. Principal | ||
| Scott C. Malpass | Occupation(s) During the Past Five Years and | |
| Born 1962. Trustee Since March 2012. Principal | Other Experience: Head of Global Fund Accounting | |
| Occupation(s) During the Past Five Years and Other | at The Vanguard Group, Inc.; Controller of each of the | |
| Experience: Chief Investment Officer and Vice | investment companies served by The Vanguard Group; | |
| President at the University of Notre Dame; Assistant | Head of International Fund Services at The Vanguard | |
| Professor of Finance at the Mendoza College of | Group (2008–2014). | |
| Business at Notre Dame; Member of the Notre Dame | ||
| 403(b) Investment Committee; Board Member of | Heidi Stam | |
| TIFF Advisory Services, Inc., and Catholic Investment | Born 1956. Secretary Since July 2005. Principal | |
| Services, Inc. (investment advisors); Member of | Occupation(s) During the Past Five Years and Other | |
| the Investment Advisory Committee of Major | Experience: Managing Director of The Vanguard | |
| League Baseball. | Group, Inc.; General Counsel of The Vanguard Group; | |
| Secretary of The Vanguard Group and of each of the | ||
| André F. Perold | investment companies served by The Vanguard Group; | |
| Born 1952. Trustee Since December 2004. Principal | Director and Senior Vice President of Vanguard | |
| Occupation(s) During the Past Five Years and Other | Marketing Corporation. | |
| Experience: George Gund Professor of Finance and | ||
| Banking, Emeritus at the Harvard Business School | Vanguard Senior ManagementTeam | |
| (retired 2011); Chief Investment Officer and Managing | Mortimer J. Buckley | Chris D. McIsaac |
| Partner of HighVista Strategies LLC (private investment | Kathleen C. Gubanich | James M. Norris |
| firm); Director of Rand Merchant Bank; Overseer of | Paul A. Heller | Thomas M. Rampulla |
| the Museum of Fine Arts Boston. | Martha G. King | Glenn W. Reed |
| John T. Marcante | Karin A. Risi | |
| Peter F. Volanakis | ||
| Born 1955. Trustee Since July 2009. Principal | ||
| Occupation(s) During the Past Five Years and Other | Chairman Emeritus and Senior Advisor | |
| Experience: President and Chief Operating Officer | John J. Brennan | |
| (retired 2010) of Corning Incorporated (communications | Chairman, 1996–2009 | |
| equipment); Trustee of Colby-Sawyer College; | Chief Executive Officer and President, 1996–2008 | |
| Member of the Advisory Board of the Norris Cotton | ||
| Cancer Center and of the Advisory Board of the | ||
| Parthenon Group (strategy consulting). | Founder | |
| John C. Bogle | ||
| Chairman and Chief Executive Officer, 1974–1996 | ||
1 Mr. McNabb is considered an “interested person,” as defined in the Investment Company Act of 1940, because he is an officer of the Vanguard funds.
2 December 2002 for Vanguard Equity Income Fund, the Vanguard Municipal Bond Funds, and the Vanguard State Tax-Exempt Funds.
 | |
| P.O. Box 2600 | |
| Valley Forge, PA 19482-2600 | |
| Connect with Vanguard® > vanguard.com | |
| Fund Information > 800-662-7447 | |
| Direct Investor Account Services > 800-662-2739 | |
| Institutional Investor Services > 800-523-1036 | |
| Text Telephone for People | |
| Who Are Deaf or Hard of Hearing> 800-749-7273 | |
| This material may be used in conjunction | |
| with the offering of shares of any Vanguard | |
| fund only if preceded or accompanied by | |
| the fund’s current prospectus. | |
| All comparative mutual fund data are from Lipper, a | |
| Thomson Reuters Company, or Morningstar, Inc., unless | |
| otherwise noted. | |
| You can obtain a free copy of Vanguard’s proxy voting | |
| guidelines by visiting vanguard.com/proxyreporting or by | |
| calling Vanguard at 800-662-2739. The guidelines are | |
| also available from the SEC’s website, sec.gov. In | |
| addition, you may obtain a free report on how your fund | |
| voted the proxies for securities it owned during the 12 | |
| months ended June 30. To get the report, visit either | |
| vanguard.com/proxyreporting or sec.gov. | |
| You can review and copy information about your fund at | |
| the SEC’s Public Reference Room in Washington, D.C. To | |
| find out more about this public service, call the SEC at | |
| 202-551-8090. Information about your fund is also | |
| available on the SEC’s website, and you can receive | |
| copies of this information, for a fee, by sending a | |
| request in either of two ways: via email addressed to | |
| publicinfo@sec.gov or via regular mail addressed to the | |
| Public Reference Section, Securities and Exchange | |
| Commission, Washington, DC 20549-1520. | |
| © 2016 The Vanguard Group, Inc. | |
| All rights reserved. | |
| Vanguard Marketing Corporation, Distributor. | |
| Q840 022016 | |
Annual Report | December 31, 2015
Vanguard Total Bond Market II Index Fund
Vanguard’s Principles for Investing Success
We want to give you the best chance of investment success. These principles, grounded in Vanguard’s research and experience, can put you on the right path.
Goals. Create clear, appropriate investment goals.
Balance. Develop a suitable asset allocation using broadly diversified funds. Cost. Minimize cost.
Discipline. Maintain perspective and long-term discipline.
A single theme unites these principles: Focus on the things you can control.
We believe there is no wiser course for any investor.
| Contents | |
| Your Fund’s Total Returns. | 1 |
| Chairman’s Letter. | 2 |
| Fund Profile. | 9 |
| Performance Summary. | 11 |
| Financial Statements. | 13 |
| About Your Fund’s Expenses. | 151 |
| Glossary. | 153 |
Please note: The opinions expressed in this report are just that—informed opinions. They should not be considered promises or advice.
Also, please keep in mind that the information and opinions cover the period through the date on the front of this report. Of course, the
risks of investing in your fund are spelled out in the prospectus.
See the Glossary for definitions of investment terms used in this report.
About the cover: Pictured is a sailing block on the Brilliant, a 1932 schooner docked in Mystic, Connecticut. A type of pulley, the
sailing block helps coordinate the setting of the sails. At Vanguard, the intricate coordination of technology and people allows
us to help millions of clients around the world reach their financial goals.
| Your Fund’s Total Returns | ||||
| Fiscal Year Ended December 31, 2015 | ||||
| 30-Day SEC | Income | Capital | Total | |
| Yield | Returns | Returns | Returns | |
| Vanguard Total Bond Market II Index Fund | ||||
| Investor Shares | 2.36% | 2.28% | -2.00% | 0.28% |
| Institutional Shares | 2.43 | 2.35 | -2.00 | 0.35 |
| Barclays U.S. Aggregate Float Adjusted Index | 0.44 | |||
| Core Bond Funds Average | -0.11 | |||
Core Bond Funds Average: Derived from data provided by Lipper, a Thomson Reuters Company.
Institutional Shares are designed for eligible institutional investors who meet specific administrative, service, and account-size criteria.
| Your Fund’s Performance at a Glance | ||||
| December 31, 2014, Through December 31, 2015 | ||||
| Distributions Per Share | ||||
| Starting | Ending | |||
| Share | Share | Income | Capital | |
| Price | Price | Dividends | Gains | |
| Vanguard Total Bond Market II Index Fund | ||||
| Investor Shares | $10.84 | $10.60 | $0.248 | $0.024 |
| Institutional Shares | 10.84 | 10.60 | 0.256 | 0.024 |
1

Chairman’s Letter
Dear Shareholder,
Toward the close of 2015, the Federal Reserve took the long-awaited step of raising its target for overnight interest rates, which had hovered near zero since the Great Recession. Its vote of confidence in the U.S. economy’s resiliency helped short-term bond yields finish higher than where they started for the fiscal year ended December 31, 2015. The upward movement of intermediate-and long-term yields, however, was more muted given the fragile state of global growth and the subdued outlook for inflation.
With yields rising, bond prices adjusted downward, as the two move in opposite directions. Vanguard Total Bond Market II Index Fund returned 0.28% for the fiscal year as the decline in the prices of its bond holdings offset much of the income they earned. (All returns and yields cited in this letter are for the fund’s Investor Shares.)
The fund’s result was not far off the 0.44% return of its expense-free benchmark, the Barclays U.S. Aggregate Float Adjusted Index, which consists primarily of U.S. Treasuries and agency bonds, government mortgage-backed securities, and investment-grade corporate bonds. The fund placed ahead of the average return of –0.11% for its peer group.
The fund’s 30-day SEC yield was 2.36% on December 31, up from 2.04% a year earlier.
2
A strong U.S. dollar depressed international bond returns
International bond markets (as measured by the Barclays Global Aggregate Index ex USD) returned –6.02% for the 12 months, reduced by the dollar’s strength against many foreign currencies. Without this currency effect, returns were modestly positive.
Although the Fed raised its interest rate target in mid-December to 0.25%–0.5%, returns for money market funds and savings accounts remained limited by the 0%–0.25% level that had previously been in place for seven years.
Despite troubles, U.S. stocks eked out a seventh year of gains
U.S. stocks returned 0.48% for the 12 months. Although the broad market recorded its worst performance since 2008, it still advanced for the seventh straight year when dividends are factored in.
Stocks rose modestly over the first half of the year but slid in August and September as concerns mounted that China’s economic slowdown would spread globally. Falling oil and commodity prices also affected economies and markets across the world, for better or worse. Central banks in Europe and Asia bolstered their stimulus efforts against weak growth and low inflation.
And the Fed’s move in December ended months of uncertainty over its plans.
| Market Barometer | |||
| Average Annual Total Returns | |||
| Periods Ended December 31, 2015 | |||
| One | Three | Five | |
| Year | Years | Years | |
| Bonds | |||
| Barclays U.S. Aggregate Bond Index (Broad taxable | |||
| market) | 0.55% | 1.44% | 3.25% |
| Barclays Municipal Bond Index (Broad tax-exempt market) | 3.30 | 3.16 | 5.35 |
| Citigroup Three-Month U.S. Treasury Bill Index | 0.03 | 0.02 | 0.04 |
| Stocks | |||
| Russell 1000 Index (Large-caps) | 0.92% | 15.01% | 12.44% |
| Russell 2000 Index (Small-caps) | -4.41 | 11.65 | 9.19 |
| Russell 3000 Index (Broad U.S. market) | 0.48 | 14.74 | 12.18 |
| FTSE All-World ex US Index (International) | -4.72 | 2.04 | 1.48 |
| CPI | |||
| Consumer Price Index | 0.73% | 1.00% | 1.53% |
3
International stocks returned about –5%, restrained by the U.S. dollar’s strength. Emerging markets fared the worst.
Rising bond yields dampened returns over the period
As the Fed wound down its third round of stimulative bond-buying toward the end of 2014, speculation turned to when it might begin to raise short-term rates. The economy’s rebound from an early 2015 slowdown and further improvements in employment were favorable developments. On the other hand, inflation remained worryingly low as oil prices continued to fall. Greece’s debt crisis and slowing economic activity in China and other emerging markets may also have contributed to the Fed’s holding off on a rate increase until December.
Yields ended the fiscal year higher than where they started. The yield of the 2-year U.S. Treasury note, for example, climbed 38 basis points to 1.07%. (A basis point is one-hundredth of a percentage point.) The 10-year Treasury note rose 11 basis points to 2.30%, and longer maturities rose more than that.
Although higher interest rates should benefit buy-and-hold bond investors over the long term, their rise over the 12 months pushed bond prices down, especially for longer-dated bonds, which are more sensitive to rate movements.
Treasuries—about 40% of your fund’s assets—returned close to 1% as a whole. By maturity, short- and intermediate-term
| Expense Ratios | |||
| Your Fund Compared With Its Peer Group | |||
| Investor | Institutional | Peer Group | |
| Shares | Shares | Average | |
| Total Bond Market II Index Fund | 0.10% | 0.05% | 0.83% |
The fund expense ratios shown are from the prospectus dated April 28, 2015, and represent estimated costs for the current fiscal year. For the
fiscal year ended December 31, 2015, the fund’s expense ratios were 0.09% for Investor Shares and 0.02% for Institutional Shares. The
peer-group expense ratio is derived from data provided by Lipper, a Thomson Reuters Company, and captures information through year-end
2014.
Peer group: Core Bond Funds Average.
4
Treasuries remained in the black; their long-term counterparts, whose prices depreciated more, returned roughly –1%.
Government mortgage-backed securities held up a little better. These high-quality investments benefited from continuing improvements in the housing market and the attractiveness of their yield premium compared with Treasuries of similar maturities.
Corporate bonds, however, dipped into negative territory as the income they earned did not fully offset their price declines. The difference, or “spread,” in their yields versus Treasuries widened, notably in the industrial sector among bonds issued by metals and mining companies and energy producers whose creditworthiness was hurt by falling commodity prices. The spread widened less for bonds issued by financial institutions, as regulatory changes have led to stronger balance sheets overall in that sector.
The fund outperformed its peer average by 39 basis points. While it can pay off for actively managed competitors to overweight credit sectors at the expense of Treasuries and mortgage-backed securities, that strategy probably didn’t in 2015. And with interest rates seesawing, tactical bets about duration would have been challenging to get right as well.
Although it’s important to keep an eye on how your investments are performing, it’s also good not to lose sight of why you
| Total Returns | |
| Inception Through December 31, 2015 | |
| Average | |
| Annual Return | |
| Total Bond Market II Index Fund Investor Shares (Returns since inception: 1/26/2009) | 4.01% |
| Spliced Barclays U.S. Aggregate Float Adjusted Index | 4.21 |
| Spliced Core Bond Funds Average | 5.15 |
For a benchmark description, see the Glossary.
Spliced Core Bond Funds Average: Derived from data provided by Lipper, a Thomson Reuters Company.
The figures shown represent past performance, which is not a guarantee of future results. (Current performance may be
lower or higher than the performance data cited. For performance data current to the most recent month-end, visit our
website at vanguard.com/performance.) Note, too, that both investment returns and principal value can fluctuate widely, so
an investor’s shares, when sold, could be worth more or less than their original cost.
5
hold them. Bond returns may not be as strong going forward as we have become accustomed to in recent decades, but we believe they will continue to fulfill an important role as a diversifier for equities and other riskier assets you may have in your portfolio.
The fund has built a solid record of tracking its benchmark index
Every index fund aims to track the performance of its target index. That’s actually a taller order than you might think. The index incurs no expenses, so it has a leg up from the start. Bond funds also have the challenge of negotiating prices, as bonds generally aren’t traded on central exchanges the way stocks are.
Then there’s the size of the bond market—your fund’s benchmark includes more than 9,000 bonds. Owning all of them would be impractical, so your fund’s advisor has the challenge of putting together a portfolio with a smaller number of bonds that nevertheless produces benchmark-like returns.
| Vanguard’s outlook for investors: Not bearish, but cautious |
| In Vanguard’s recently published global economic and investment outlook, Global Chief |
| Economist Joseph Davis and his team discuss various market and economic events 2016 |
| may bring, along with challenges and opportunities for investors. |
| Our forecast includes “frustratingly fragile” economic growth and more modest long-term |
| returns from the global stock and bond markets. The report cautions that for the decade ending |
| 2025, returns for a balanced portfolio are likely to be moderately below historical averages. |
| Our simulations indicate that the average annualized returns of a 60% equity/40% bond |
| portfolio for the decade are most likely to be centered in the 3%–5% range after inflation, |
| below the actual average after-inflation return of 5.5% for the same portfolio since 1926. |
| Even so, Vanguard’s steadfast belief in its principles for investing success—focusing on clear |
| goals, a suitable asset allocation, low costs, and long-term discipline—remains unchanged. |
| For more information about our expectations and the probability of various outcomes, see |
| Vanguard’s Economic and Investment Outlook, available at vanguard.com/research. |
| IMPORTANT: The projections or other information generated by the Vanguard Capital Markets Model® (VCMM) |
| regarding the likelihood of various investment outcomes are hypothetical in nature, do not reflect actual investment |
| results, and are not guarantees of future results. Distribution of return outcomes from VCMM, derived from |
| 10,000 simulations for U.S. equity returns and fixed income returns. Simulations as of September 30, 2015. |
| Results from the model may vary with each use and over time. For more information, please see page 7. |
6
The indexing skills of the fund’s advisor as well as its low expense ratio helped the fund post an average annual return of 4.01% over the roughly seven years since its inception, a result not far behind the 4.21% return of its benchmark. Its peer average over the period was 5.15%.
To reach your long-term goals, be realistic and try to save more
Although there have been times when it felt as if stocks and bonds were riding a roller coaster, the markets have generally risen in recent years. The broad global stock market in particular has posted some impressive gains since its turnaround began in 2009.
But 2015 served as a reminder that markets aren’t always favorable. The U.S. stock and bond markets were basically flat, and international stocks and unhedged bonds finished in the red.
In Vanguard’s recently updated long-term look at the economy and markets, our global economists explain why they expect economic growth to remain “frustratingly fragile,” and why their outlook for stock and bond markets is the most guarded since 2006. (For more details, see the box on page 6 and Vanguard’s Economic and Investment Outlook, available at vanguard.com/research.)
Given these muted expectations, what’s the best course of action? I’ve often encouraged shareholders to focus on the things they can control. That advice holds true today.
Consider saving more than you think you may need. That’s one way you can prepare for the volatility that may lie ahead, particularly as markets adjust to changes in policies from the Fed and other central banks.
IMPORTANT: The projections or other information generated by the Vanguard Capital Markets Model (VCMM)
regarding the likelihood of various investment outcomes are hypothetical in nature, do not reflect actual
investment results, and are not guarantees of future results. VCMM results will vary with each use and over time.
The VCMM projections are based on a statistical analysis of historical data. Future returns may behave differently from the
historical patterns captured in the VCMM. More important, the VCMM may be underestimating extreme negative scenarios
unobserved in the historical period on which the model estimation is based.
The VCMM is a proprietary financial simulation tool developed and maintained by Vanguard’s primary investment research
and advice teams. The model forecasts distributions of future returns for a wide array of broad asset classes. Those asset
classes include U.S. and international equity markets, several maturities of the U.S. Treasury and corporate fixed income
markets, international fixed income markets, U.S. money markets, commodities, and certain alternative investment
strategies. The theoretical and empirical foundation for the VCMM is that the returns of various asset classes reflect the
compensation investors require for bearing different types of systematic risk (beta). At the core of the model are estimates
of the dynamic statistical relationship between risk factors and asset returns, obtained from statistical analysis based on
available monthly financial and economic data from as early as 1960. Using a system of estimated equations, the model
then applies a Monte Carlo simulation method to project the estimated interrelationships among risk factors and asset
classes as well as uncertainty and randomness over time. The model generates a large set of simulated outcomes for
each asset class over several time horizons. Forecasts are obtained by computing measures of central tendency in these
simulations. Results produced by the tool will vary with each use and over time.
7
And, as always, investors would be well-served to follow Vanguard’s principles for investing success:
• Goals. Create clear, appropriate investment goals.
• Balance. Develop a suitable asset allocation using broadly diversified funds.
• Cost. Minimize cost.
• Discipline. Maintain perspective and long-term discipline.
As with saving, each of these principles is within your control, and focusing on them can keep you on the right path.
As always, thank you for investing with Vanguard.
Sincerely,

F. William McNabb III
Chairman and Chief Executive Officer
January 21, 2016
8
Total Bond Market II Index Fund
Fund Profile
As of December 31, 2015
| Share-Class Characteristics | ||
| Investor | Institutional | |
| Shares | Shares | |
| Ticker Symbol | VTBIX | VTBNX |
| Expense Ratio1 | 0.10% | 0.05% |
| 30-Day SEC Yield | 2.36% | 2.43% |
| Financial Attributes | ||
| Barclays | ||
| Aggregate | ||
| Float Adj | ||
| Fund | Index | |
| Number of Bonds | 7,183 | 9,681 |
| Yield to Maturity | ||
| (before expenses) | 2.5% | 2.6% |
| Average Coupon | 3.1% | 3.1% |
| Average Duration | 5.8 years | 5.8 years |
| Average Effective | ||
| Maturity | 8.0 years | 7.9 years |
| Short-Term | ||
| Reserves | 0.6% | — |
| Sector Diversification (% of portfolio) | |
| Asset-Backed | 0.6% |
| Commercial Mortgage-Backed | 2.0 |
| Finance | 8.4 |
| Foreign | 5.9 |
| Government Mortgage-Backed | 20.7 |
| Industrial | 16.2 |
| Treasury/Agency | 44.0 |
| Utilities | 2.0 |
| Other | 0.2 |
The agency and mortgage-backed securities sectors may include issues from government-sponsored enterprises; such issues are
generally not backed by the full faith and credit of the U.S. government.
| Volatility Measures | |
| Barclays | |
| Aggregate | |
| Float Adj | |
| Index | |
| R-Squared | 0.99 |
| Beta | 1.02 |
These measures show the degree and timing of the fund’s fluctuations compared with the index over 36 months.
| Distribution by Effective Maturity | |
| (% of portfolio) | |
| Under 1 Year | 0.6% |
| 1 - 3 Years | 23.6 |
| 3 - 5 Years | 22.1 |
| 5 - 10 Years | 37.7 |
| 10 - 20 Years | 3.8 |
| 20 - 30 Years | 11.7 |
| Over 30 Years | 0.5 |
| Distribution by Credit Quality (% of portfolio) | |
| U.S. Government | 64.7% |
| Aaa | 5.4 |
| Aa | 4.0 |
| A | 11.6 |
| Baa | 14.3 |
Credit-quality ratings are obtained from Barclays and are from Moody's, Fitch, and S&P. When ratings from all three agencies are
used, the median rating is shown. When ratings from two of the agencies are used, the lower rating for each issue is shown. "Not
Rated" is used to classify securities for which a rating is not available. Not rated securities include a fund's investment in
Vanguard Market Liquidity Fund or Vanguard Municipal Cash Management Fund, each of which invests in high-quality money
market instruments and may serve as a cash management vehicle for the Vanguard funds, trusts, and accounts. For more information
about these ratings, see the Glossary entry for Credit Quality.
1 The expense ratios shown are from the prospectus dated April 28, 2015, and represent estimated costs for the current fiscal year. For the fiscal
year ended December 31, 2015, the expense ratios were 0.09% for Investor Shares and 0.02% for Institutional Shares.
9
Total Bond Market II Index Fund
Investment Focus
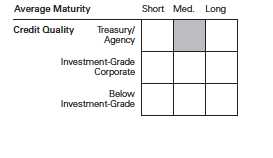
10
Total Bond Market II Index Fund
Performance Summary
All of the returns in this report represent past performance, which is not a guarantee of future results that may be achieved by the fund. (Current performance may be lower or higher than the performance data cited. For performance data current to the most recent month-end, visit our website at vanguard.com/performance.) Note, too, that both investment returns and principal value can fluctuate widely, so an investor’s shares, when sold, could be worth more or less than their original cost. The returns shown do not reflect taxes that a shareholder would pay on fund distributions or on the sale of fund shares.
Cumulative Performance: January 26, 2009, Through December 31, 2015
Initial Investment of $10,000
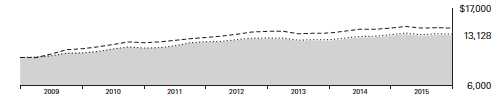
| Average Annual Total Returns | |||||
| Periods Ended December 31, 2015 | |||||
| Since | Final Value | ||||
| One | Five | Inception | of a $10,000 | ||
| Year | Years | (1/26/2009) | Investment | ||
| Total Bond Market II Index Fund | |||||
| Investor Shares | 0.28% | 3.03% | 4.01% | $13,128 | |
| Spliced Barclays U.S. Aggregate Float | |||||
| •••••••• | |||||
| Adjusted Index | 0.44 | 3.25 | 4.21 | 13,305 | |
| – – – – | Spliced Core Bond Funds Average | -0.11 | 3.20 | 5.15 | 14,160 |
For a benchmark description, see the Glossary.
Spliced Core Bond Funds Average: Derived from data provided by Lipper, a Thomson Reuters Company.
"Since Inception" performance is calculated from the Investor Shares’ inception date for both the fund and its comparative standards.
| Since | Final Value | |||
| One | Five | Inception | of a $5,000,000 | |
| Year | Years | (2/17/2009) | Investment | |
| Total Bond Market II Index Fund Institutional | ||||
| Shares | 0.35% | 3.10% | 4.02% | $6,555,801 |
| Spliced Barclays U.S. Aggregate Float | ||||
| Adjusted Index | 0.44 | 3.25 | 4.18 | 6,622,141 |
| "Since Inception" performance is calculated from the Institutional Shares’ inception date for both the fund and its comparative standards. | ||||
See Financial Highlights for dividend and capital gains information.
11
| Total Bond Market II Index Fund | ||||
| Fiscal-Year Total Returns (%): January 26, 2009, Through December 31, 2015 | ||||
| Spliced | ||||
| Barclays | ||||
| Aggregate | ||||
| Investor Shares | FA Index | |||
| Fiscal Year | Income Returns | Capital Returns | Total Returns | Total Returns |
| 2009 | 3.68% | 2.60% | 6.28% | 6.39% |
| 2010 | 3.42 | 3.00 | 6.42 | 6.58 |
| 2011 | 3.11 | 4.48 | 7.59 | 7.92 |
| 2012 | 2.36 | 1.55 | 3.91 | 4.32 |
| 2013 | 2.00 | -4.26 | -2.26 | -1.97 |
| 2014 | 2.35 | 3.58 | 5.93 | 5.85 |
| 2015 | 2.28 | -2.00 | 0.28 | 0.44 |
| For a benchmark description, see the Glossary. | ||||
12
Total Bond Market II Index Fund
Financial Statements
Statement of Net Assets
As of December 31, 2015
The fund reports a complete list of its holdings in regulatory filings four times in each fiscal year, at the quarter-ends. For the second and fourth fiscal quarters, the lists appear in the fund’s semiannual and annual reports to shareholders. For the first and third fiscal quarters, the fund files the lists with the Securities and Exchange Commission on Form N-Q. Shareholders can look up the fund’s Forms N-Q on the SEC’s website at sec.gov. Forms N-Q may also be reviewed and copied at the SEC’s Public Reference Room (see the back cover of this report for further information).
| Face | Market | |||
| Maturity | Amount | Value• | ||
| Coupon | Date | ($000) | ($000) | |
| U.S. Government and Agency Obligations (64.4%) | ||||
| U.S. Government Securities (40.6%) | ||||
| United States Treasury Note/Bond | 4.625% | 2/15/17 | 3,425 | 3,566 |
| United States Treasury Note/Bond | 3.000% | 2/28/17 | 27,053 | 27,713 |
| United States Treasury Note/Bond | 0.750% | 3/15/17 | 350,000 | 349,507 |
| United States Treasury Note/Bond | 3.250% | 3/31/17 | 145,650 | 149,837 |
| United States Treasury Note/Bond | 0.875% | 4/15/17 | 222,650 | 222,614 |
| United States Treasury Note/Bond | 0.500% | 4/30/17 | 73,910 | 73,529 |
| United States Treasury Note/Bond | 0.875% | 4/30/17 | 565,075 | 564,809 |
| United States Treasury Note/Bond | 3.125% | 4/30/17 | 75,250 | 77,425 |
| United States Treasury Note/Bond | 0.875% | 5/15/17 | 380,790 | 380,611 |
| United States Treasury Note/Bond | 4.500% | 5/15/17 | 146,125 | 153,157 |
| United States Treasury Note/Bond | 8.750% | 5/15/17 | 56,644 | 62,636 |
| United States Treasury Note/Bond | 0.625% | 5/31/17 | 218,914 | 217,955 |
| United States Treasury Note/Bond | 2.750% | 5/31/17 | 163,671 | 167,840 |
| United States Treasury Note/Bond | 0.875% | 6/15/17 | 309,375 | 309,084 |
| United States Treasury Note/Bond | 0.625% | 6/30/17 | 200,000 | 199,000 |
| United States Treasury Note/Bond | 0.750% | 6/30/17 | 189,000 | 188,410 |
| United States Treasury Note/Bond | 2.500% | 6/30/17 | 76,625 | 78,349 |
| United States Treasury Note/Bond | 0.875% | 7/15/17 | 174,113 | 173,841 |
| United States Treasury Note/Bond | 0.500% | 7/31/17 | 330,560 | 328,081 |
| United States Treasury Note/Bond | 0.625% | 7/31/17 | 328,215 | 326,420 |
| United States Treasury Note/Bond | 2.375% | 7/31/17 | 207,707 | 212,121 |
| United States Treasury Note/Bond | 0.875% | 8/15/17 | 154,395 | 154,057 |
| United States Treasury Note/Bond | 4.750% | 8/15/17 | 45,000 | 47,714 |
| United States Treasury Note/Bond | 8.875% | 8/15/17 | 56,325 | 63,480 |
| United States Treasury Note/Bond | 0.625% | 8/31/17 | 1,030,294 | 1,023,690 |
| United States Treasury Note/Bond | 1.875% | 8/31/17 | 101,700 | 103,115 |
| United States Treasury Note/Bond | 1.000% | 9/15/17 | 313,500 | 313,353 |
| United States Treasury Note/Bond | 0.625% | 9/30/17 | 720,040 | 715,086 |
| United States Treasury Note/Bond | 1.875% | 9/30/17 | 257,200 | 260,857 |
| United States Treasury Note/Bond | 0.875% | 10/15/17 | 399,214 | 398,028 |
| United States Treasury Note/Bond | 0.750% | 10/31/17 | 30,000 | 29,841 |
| United States Treasury Note/Bond | 1.875% | 10/31/17 | 118,838 | 120,584 |
| United States Treasury Note/Bond | 0.875% | 11/15/17 | 170,573 | 170,014 |
| United States Treasury Note/Bond | 4.250% | 11/15/17 | 18,865 | 19,976 |
| United States Treasury Note/Bond | 0.625% | 11/30/17 | 187,325 | 185,804 |
| United States Treasury Note/Bond | 0.875% | 11/30/17 | 511,756 | 510,318 |
| United States Treasury Note/Bond | 2.250% | 11/30/17 | 135,000 | 137,996 |
| United States Treasury Note/Bond | 1.000% | 12/15/17 | 300,072 | 299,697 |
13
| Total Bond Market II Index Fund | ||||
| Face | Market | |||
| Maturity | Amount | Value• | ||
| Coupon | Date | ($000) | ($000) | |
| United States Treasury Note/Bond | 0.750% | 12/31/17 | 55,000 | 54,639 |
| United States Treasury Note/Bond | 1.000% | 12/31/17 | 130,000 | 129,858 |
| United States Treasury Note/Bond | 2.750% | 12/31/17 | 30,000 | 30,970 |
| United States Treasury Note/Bond | 0.875% | 1/15/18 | 122,675 | 122,119 |
| United States Treasury Note/Bond | 0.875% | 1/31/18 | 113,495 | 112,946 |
| United States Treasury Note/Bond | 2.625% | 1/31/18 | 24,804 | 25,575 |
| United States Treasury Note/Bond | 3.500% | 2/15/18 | 51,055 | 53,608 |
| United States Treasury Note/Bond | 0.750% | 2/28/18 | 68,295 | 67,719 |
| United States Treasury Note/Bond | 2.750% | 2/28/18 | 10,000 | 10,345 |
| United States Treasury Note/Bond | 1.000% | 3/15/18 | 52,674 | 52,501 |
| United States Treasury Note/Bond | 0.750% | 3/31/18 | 30,680 | 30,412 |
| United States Treasury Note/Bond | 2.875% | 3/31/18 | 1,092 | 1,134 |
| United States Treasury Note/Bond | 0.750% | 4/15/18 | 45,000 | 44,564 |
| United States Treasury Note/Bond | 0.625% | 4/30/18 | 6,399 | 6,317 |
| United States Treasury Note/Bond | 9.125% | 5/15/18 | 11,300 | 13,412 |
| United States Treasury Note/Bond | 1.000% | 5/31/18 | 100,000 | 99,500 |
| United States Treasury Note/Bond | 2.375% | 5/31/18 | 28,300 | 29,100 |
| United States Treasury Note/Bond | 1.375% | 6/30/18 | 72,400 | 72,706 |
| United States Treasury Note/Bond | 1.375% | 7/31/18 | 58,258 | 58,486 |
| United States Treasury Note/Bond | 2.250% | 7/31/18 | 6,984 | 7,167 |
| United States Treasury Note/Bond | 1.000% | 8/15/18 | 191,275 | 190,110 |
| United States Treasury Note/Bond | 1.500% | 8/31/18 | 44,250 | 44,547 |
| United States Treasury Note/Bond | 1.000% | 9/15/18 | 230,000 | 228,418 |
| United States Treasury Note/Bond | 1.375% | 9/30/18 | 267,125 | 268,001 |
| United States Treasury Note/Bond | 0.875% | 10/15/18 | 152,745 | 151,074 |
| United States Treasury Note/Bond | 1.250% | 10/31/18 | 167,476 | 167,240 |
| United States Treasury Note/Bond | 1.750% | 10/31/18 | 126,804 | 128,449 |
| United States Treasury Note/Bond | 1.250% | 11/15/18 | 22,187 | 22,152 |
| United States Treasury Note/Bond | 3.750% | 11/15/18 | 93,917 | 100,462 |
| United States Treasury Note/Bond | 1.250% | 11/30/18 | 552,075 | 551,125 |
| United States Treasury Note/Bond | 1.375% | 11/30/18 | 52,530 | 52,653 |
| United States Treasury Note/Bond | 1.250% | 12/15/18 | 325,000 | 324,340 |
| United States Treasury Note/Bond | 1.375% | 12/31/18 | 155,925 | 156,047 |
| United States Treasury Note/Bond | 1.500% | 12/31/18 | 241,225 | 242,356 |
| United States Treasury Note/Bond | 1.250% | 1/31/19 | 110,775 | 110,429 |
| United States Treasury Note/Bond | 1.500% | 1/31/19 | 85,750 | 86,058 |
| United States Treasury Note/Bond | 2.750% | 2/15/19 | 135,365 | 141,054 |
| United States Treasury Note/Bond | 1.375% | 2/28/19 | 165,325 | 165,222 |
| United States Treasury Note/Bond | 1.500% | 2/28/19 | 407,155 | 408,425 |
| United States Treasury Note/Bond | 1.500% | 3/31/19 | 14,900 | 14,944 |
| United States Treasury Note/Bond | 1.625% | 3/31/19 | 210,530 | 211,911 |
| United States Treasury Note/Bond | 1.250% | 4/30/19 | 650 | 646 |
| United States Treasury Note/Bond | 1.625% | 4/30/19 | 204,000 | 205,212 |
| United States Treasury Note/Bond | 3.125% | 5/15/19 | 58,125 | 61,331 |
| United States Treasury Note/Bond | 1.125% | 5/31/19 | 86,175 | 85,206 |
| United States Treasury Note/Bond | 1.500% | 5/31/19 | 294,000 | 294,276 |
| United States Treasury Note/Bond | 1.000% | 6/30/19 | 37,103 | 36,489 |
| United States Treasury Note/Bond | 1.625% | 6/30/19 | 413,000 | 414,871 |
| United States Treasury Note/Bond | 0.875% | 7/31/19 | 269,261 | 263,203 |
| United States Treasury Note/Bond | 1.625% | 7/31/19 | 436,000 | 437,565 |
| United States Treasury Note/Bond | 3.625% | 8/15/19 | 271,150 | 291,104 |
| United States Treasury Note/Bond | 8.125% | 8/15/19 | 1,215 | 1,498 |
| United States Treasury Note/Bond | 1.000% | 8/31/19 | 246,000 | 241,156 |
| United States Treasury Note/Bond | 1.625% | 8/31/19 | 294,348 | 295,222 |
| United States Treasury Note/Bond | 1.000% | 9/30/19 | 15,253 | 14,931 |
| United States Treasury Note/Bond | 1.750% | 9/30/19 | 349,761 | 352,167 |
14
| Total Bond Market II Index Fund | ||||
| Face | Market | |||
| Maturity | Amount | Value• | ||
| Coupon | Date | ($000) | ($000) | |
| United States Treasury Note/Bond | 1.500% | 10/31/19 | 406,250 | 404,982 |
| United States Treasury Note/Bond | 1.000% | 11/30/19 | 10,000 | 9,775 |
| United States Treasury Note/Bond | 1.500% | 11/30/19 | 482,000 | 480,192 |
| United States Treasury Note/Bond | 1.125% | 12/31/19 | 47,315 | 46,420 |
| United States Treasury Note/Bond | 1.625% | 12/31/19 | 262,284 | 262,284 |
| United States Treasury Note/Bond | 1.250% | 1/31/20 | 148,244 | 145,974 |
| United States Treasury Note/Bond | 1.375% | 1/31/20 | 90,400 | 89,454 |
| United States Treasury Note/Bond | 8.500% | 2/15/20 | 5,018 | 6,390 |
| United States Treasury Note/Bond | 1.375% | 2/29/20 | 55,000 | 54,372 |
| United States Treasury Note/Bond | 1.375% | 3/31/20 | 62,255 | 61,496 |
| United States Treasury Note/Bond | 1.125% | 4/30/20 | 132,750 | 129,722 |
| United States Treasury Note/Bond | 1.375% | 4/30/20 | 60,000 | 59,222 |
| United States Treasury Note/Bond | 3.500% | 5/15/20 | 134,995 | 145,141 |
| United States Treasury Note/Bond | 1.375% | 5/31/20 | 110,615 | 109,024 |
| United States Treasury Note/Bond | 1.500% | 5/31/20 | 255,000 | 252,889 |
| United States Treasury Note/Bond | 1.625% | 6/30/20 | 105,945 | 105,515 |
| United States Treasury Note/Bond | 1.875% | 6/30/20 | 126,470 | 127,359 |
| United States Treasury Note/Bond | 1.625% | 7/31/20 | 130,995 | 130,381 |
| United States Treasury Note/Bond | 2.625% | 8/15/20 | 233,220 | 242,257 |
| United States Treasury Note/Bond | 8.750% | 8/15/20 | 21,755 | 28,492 |
| United States Treasury Note/Bond | 1.375% | 8/31/20 | 263,499 | 259,299 |
| United States Treasury Note/Bond | 2.125% | 8/31/20 | 195,683 | 198,832 |
| United States Treasury Note/Bond | 1.375% | 9/30/20 | 164,315 | 161,490 |
| United States Treasury Note/Bond | 2.000% | 9/30/20 | 14,642 | 14,802 |
| United States Treasury Note/Bond | 1.375% | 10/31/20 | 253,343 | 248,909 |
| United States Treasury Note/Bond | 1.750% | 10/31/20 | 277,557 | 277,124 |
| United States Treasury Note/Bond | 2.625% | 11/15/20 | 290,500 | 301,847 |
| United States Treasury Note/Bond | 1.625% | 11/30/20 | 166,109 | 165,149 |
| United States Treasury Note/Bond | 2.000% | 11/30/20 | 260,475 | 263,121 |
| United States Treasury Note/Bond | 1.750% | 12/31/20 | 470,235 | 469,943 |
| United States Treasury Note/Bond | 2.375% | 12/31/20 | 134,345 | 138,123 |
| United States Treasury Note/Bond | 2.125% | 1/31/21 | 219,525 | 222,750 |
| United States Treasury Note/Bond | 3.625% | 2/15/21 | 85,000 | 92,398 |
| United States Treasury Note/Bond | 7.875% | 2/15/21 | 22,550 | 29,188 |
| United States Treasury Note/Bond | 2.000% | 2/28/21 | 233,050 | 234,942 |
| United States Treasury Note/Bond | 2.250% | 3/31/21 | 291,923 | 297,851 |
| United States Treasury Note/Bond | 2.250% | 4/30/21 | 179,880 | 183,422 |
| United States Treasury Note/Bond | 3.125% | 5/15/21 | 53,845 | 57,269 |
| United States Treasury Note/Bond | 2.000% | 5/31/21 | 165,475 | 166,587 |
| United States Treasury Note/Bond | 2.125% | 6/30/21 | 308,285 | 312,139 |
| United States Treasury Note/Bond | 2.250% | 7/31/21 | 169,750 | 172,933 |
| United States Treasury Note/Bond | 2.125% | 8/15/21 | 276,860 | 280,105 |
| United States Treasury Note/Bond | 8.125% | 8/15/21 | 34,550 | 46,000 |
| United States Treasury Note/Bond | 2.000% | 8/31/21 | 241,380 | 242,399 |
| United States Treasury Note/Bond | 2.125% | 9/30/21 | 140,000 | 141,443 |
| United States Treasury Note/Bond | 2.000% | 10/31/21 | 220,795 | 221,382 |
| United States Treasury Note/Bond | 2.000% | 11/15/21 | 231,291 | 231,906 |
| United States Treasury Note/Bond | 8.000% | 11/15/21 | 9,450 | 12,620 |
| United States Treasury Note/Bond | 1.875% | 11/30/21 | 154,589 | 153,912 |
| United States Treasury Note/Bond | 2.125% | 12/31/21 | 213,300 | 215,166 |
| United States Treasury Note/Bond | 1.500% | 1/31/22 | 209,775 | 203,908 |
| United States Treasury Note/Bond | 2.000% | 2/15/22 | 83,537 | 83,681 |
| United States Treasury Note/Bond | 1.750% | 2/28/22 | 160,777 | 158,465 |
| United States Treasury Note/Bond | 1.750% | 3/31/22 | 22,512 | 22,157 |
| United States Treasury Note/Bond | 1.750% | 4/30/22 | 17,100 | 16,825 |
| United States Treasury Note/Bond | 1.750% | 5/15/22 | 10,000 | 9,834 |
15
| Total Bond Market II Index Fund | ||||
| Face | Market | |||
| Maturity | Amount | Value• | ||
| Coupon | Date | ($000) | ($000) | |
| United States Treasury Note/Bond | 1.875% | 5/31/22 | 144,700 | 143,276 |
| United States Treasury Note/Bond | 2.125% | 6/30/22 | 35,735 | 35,908 |
| United States Treasury Note/Bond | 2.000% | 7/31/22 | 92,180 | 91,935 |
| United States Treasury Note/Bond | 1.625% | 8/15/22 | 90,000 | 87,652 |
| United States Treasury Note/Bond | 7.250% | 8/15/22 | 75 | 99 |
| United States Treasury Note/Bond | 1.875% | 8/31/22 | 159,710 | 157,838 |
| United States Treasury Note/Bond | 1.750% | 9/30/22 | 436,253 | 427,458 |
| United States Treasury Note/Bond | 1.875% | 10/31/22 | 259,855 | 256,485 |
| United States Treasury Note/Bond | 1.625% | 11/15/22 | 93,976 | 91,274 |
| United States Treasury Note/Bond | 7.625% | 11/15/22 | 150 | 204 |
| United States Treasury Note/Bond | 2.000% | 11/30/22 | 190,800 | 189,697 |
| United States Treasury Note/Bond | 2.125% | 12/31/22 | 331,300 | 331,817 |
| United States Treasury Note/Bond | 2.000% | 2/15/23 | 129,625 | 128,836 |
| United States Treasury Note/Bond | 7.125% | 2/15/23 | 15,675 | 20,929 |
| United States Treasury Note/Bond | 1.750% | 5/15/23 | 282,500 | 275,130 |
| United States Treasury Note/Bond | 2.500% | 8/15/23 | 343,810 | 352,673 |
| United States Treasury Note/Bond | 6.250% | 8/15/23 | 31,045 | 40,067 |
| United States Treasury Note/Bond | 2.750% | 11/15/23 | 273,215 | 285,083 |
| United States Treasury Note/Bond | 2.750% | 2/15/24 | 284,774 | 296,521 |
| United States Treasury Note/Bond | 2.500% | 5/15/24 | 535,793 | 547,264 |
| United States Treasury Note/Bond | 2.375% | 8/15/24 | 412,320 | 416,443 |
| United States Treasury Note/Bond | 2.250% | 11/15/24 | 239,872 | 239,685 |
| United States Treasury Note/Bond | 7.500% | 11/15/24 | 16,650 | 23,726 |
| United States Treasury Note/Bond | 2.000% | 2/15/25 | 102,709 | 100,350 |
| United States Treasury Note/Bond | 2.125% | 5/15/25 | 525,546 | 518,404 |
| United States Treasury Note/Bond | 2.000% | 8/15/25 | 398,808 | 388,714 |
| United States Treasury Note/Bond | 6.875% | 8/15/25 | 4,072 | 5,699 |
| United States Treasury Note/Bond | 2.250% | 11/15/25 | 585,620 | 584,062 |
| United States Treasury Note/Bond | 6.000% | 2/15/26 | 1,750 | 2,335 |
| United States Treasury Note/Bond | 6.750% | 8/15/26 | 8,800 | 12,460 |
| United States Treasury Note/Bond | 6.500% | 11/15/26 | 58,215 | 81,392 |
| United States Treasury Note/Bond | 6.625% | 2/15/27 | 39,650 | 56,179 |
| United States Treasury Note/Bond | 6.375% | 8/15/27 | 6,850 | 9,615 |
| United States Treasury Note/Bond | 6.125% | 11/15/27 | 26,808 | 37,079 |
| United States Treasury Note/Bond | 5.500% | 8/15/28 | 30,775 | 40,912 |
| United States Treasury Note/Bond | 5.250% | 11/15/28 | 47,342 | 61,796 |
| United States Treasury Note/Bond | 5.250% | 2/15/29 | 89,279 | 116,844 |
| United States Treasury Note/Bond | 6.125% | 8/15/29 | 16,930 | 24,004 |
| United States Treasury Note/Bond | 6.250% | 5/15/30 | 21,435 | 31,047 |
| United States Treasury Note/Bond | 5.375% | 2/15/31 | 215,875 | 292,409 |
| United States Treasury Note/Bond | 4.500% | 2/15/36 | 119,300 | 152,667 |
| United States Treasury Note/Bond | 4.750% | 2/15/37 | 23,000 | 30,443 |
| United States Treasury Note/Bond | 5.000% | 5/15/37 | 33,327 | 45,611 |
| United States Treasury Note/Bond | 4.375% | 2/15/38 | 76,450 | 96,327 |
| United States Treasury Note/Bond | 4.500% | 5/15/38 | 41,079 | 52,665 |
| United States Treasury Note/Bond | 3.500% | 2/15/39 | 101,394 | 111,978 |
| United States Treasury Note/Bond | 4.250% | 5/15/39 | 93,367 | 115,177 |
| United States Treasury Note/Bond | 4.500% | 8/15/39 | 64,306 | 82,181 |
| United States Treasury Note/Bond | 4.375% | 11/15/39 | 82,905 | 104,110 |
| United States Treasury Note/Bond | 4.625% | 2/15/40 | 105,305 | 136,962 |
| United States Treasury Note/Bond | 4.375% | 5/15/40 | 118,820 | 149,323 |
| United States Treasury Note/Bond | 3.875% | 8/15/40 | 28,050 | 32,744 |
| United States Treasury Note/Bond | 4.250% | 11/15/40 | 96,577 | 119,243 |
| 1 United States Treasury Note/Bond | 4.750% | 2/15/41 | 77,092 | 102,364 |
| United States Treasury Note/Bond | 3.125% | 11/15/41 | 1,230 | 1,269 |
| United States Treasury Note/Bond | 3.125% | 2/15/42 | 25,742 | 26,546 |
16
| Total Bond Market II Index Fund | ||||
| Face | Market | |||
| Maturity | Amount | Value• | ||
| Coupon | Date | ($000) | ($000) | |
| United States Treasury Note/Bond | 2.750% | 8/15/42 | 485,438 | 463,365 |
| United States Treasury Note/Bond | 2.750% | 11/15/42 | 601,354 | 572,693 |
| United States Treasury Note/Bond | 3.125% | 2/15/43 | 81,409 | 83,329 |
| United States Treasury Note/Bond | 2.875% | 5/15/43 | 132,200 | 128,730 |
| United States Treasury Note/Bond | 3.625% | 8/15/43 | 304,652 | 342,733 |
| United States Treasury Note/Bond | 3.750% | 11/15/43 | 111,706 | 128,531 |
| United States Treasury Note/Bond | 3.625% | 2/15/44 | 155,994 | 175,225 |
| United States Treasury Note/Bond | 3.375% | 5/15/44 | 141,990 | 152,174 |
| United States Treasury Note/Bond | 3.125% | 8/15/44 | 198,400 | 202,490 |
| United States Treasury Note/Bond | 3.000% | 11/15/44 | 232,831 | 231,630 |
| United States Treasury Note/Bond | 2.500% | 2/15/45 | 205,882 | 184,425 |
| United States Treasury Note/Bond | 3.000% | 5/15/45 | 263,154 | 261,509 |
| United States Treasury Note/Bond | 2.875% | 8/15/45 | 262,813 | 254,847 |
| United States Treasury Note/Bond | 3.000% | 11/15/45 | 266,800 | 265,591 |
| 37,412,532 | ||||
| Agency Bonds and Notes (3.0%) | ||||
| 2 AID-Israel | 5.500% | 9/18/23 | 6,375 | 7,682 |
| 2 AID-Israel | 5.500% | 12/4/23 | 6,502 | 7,842 |
| 2 AID-Israel | 5.500% | 4/26/24 | 5,075 | 6,151 |
| 2 AID-Jordan | 1.945% | 6/23/19 | 5,200 | 5,239 |
| 2 AID-Jordan | 2.503% | 10/30/20 | 6,375 | 6,518 |
| 2 AID-Jordan | 2.578% | 6/30/22 | 2,680 | 2,713 |
| 2 AID-Tunisia | 2.452% | 7/24/21 | 2,300 | 2,317 |
| 2 AID-Ukraine | 1.844% | 5/16/19 | 3,200 | 3,228 |
| 2 AID-Ukraine | 1.847% | 5/29/20 | 5,700 | 5,676 |
| 3 Federal Farm Credit Banks | 4.875% | 1/17/17 | 7,100 | 7,394 |
| 3 Federal Farm Credit Banks | 1.125% | 9/22/17 | 4,425 | 4,427 |
| 3 Federal Farm Credit Banks | 1.000% | 9/25/17 | 3,975 | 3,968 |
| 3 Federal Farm Credit Banks | 1.125% | 12/18/17 | 12,000 | 11,997 |
| 3 Federal Farm Credit Banks | 1.110% | 2/20/18 | 3,800 | 3,793 |
| 3 Federal Farm Credit Banks | 1.100% | 6/1/18 | 2,000 | 1,992 |
| 3 Federal Farm Credit Banks | 5.150% | 11/15/19 | 5,325 | 6,022 |
| 3 Federal Farm Credit Banks | 3.500% | 12/20/23 | 5,000 | 5,385 |
| 3 Federal Home Loan Banks | 0.875% | 3/10/17 | 2,675 | 2,674 |
| 3 Federal Home Loan Banks | 4.875% | 5/17/17 | 10,500 | 11,050 |
| 3 Federal Home Loan Banks | 0.875% | 5/24/17 | 54,000 | 53,895 |
| 3 Federal Home Loan Banks | 0.625% | 5/30/17 | 20,425 | 20,314 |
| 3 Federal Home Loan Banks | 1.000% | 6/21/17 | 7,450 | 7,446 |
| 3 Federal Home Loan Banks | 0.750% | 8/28/17 | 43,000 | 42,772 |
| 3 Federal Home Loan Banks | 4.875% | 9/8/17 | 665 | 707 |
| 3 Federal Home Loan Banks | 0.625% | 10/26/17 | 45,000 | 44,621 |
| 3 Federal Home Loan Banks | 5.000% | 11/17/17 | 30,695 | 32,883 |
| 3 Federal Home Loan Banks | 1.000% | 12/19/17 | 30,000 | 29,921 |
| 3 Federal Home Loan Banks | 1.375% | 3/9/18 | 20,000 | 20,073 |
| 3 Federal Home Loan Banks | 1.125% | 4/25/18 | 30,000 | 29,918 |
| 3 Federal Home Loan Banks | 2.750% | 6/8/18 | 13,550 | 14,026 |
| 3 Federal Home Loan Banks | 5.375% | 8/15/18 | 5,250 | 5,795 |
| 3 Federal Home Loan Banks | 5.125% | 8/15/19 | 4,095 | 4,601 |
| 3 Federal Home Loan Banks | 1.875% | 3/13/20 | 3,425 | 3,449 |
| 3 Federal Home Loan Banks | 4.125% | 3/13/20 | 11,555 | 12,682 |
| 3 Federal Home Loan Banks | 3.375% | 6/12/20 | 15,200 | 16,228 |
| 3 Federal Home Loan Banks | 5.250% | 12/11/20 | 5,000 | 5,795 |
| 3 Federal Home Loan Banks | 2.250% | 6/11/21 | 30,000 | 30,352 |
| 3 Federal Home Loan Banks | 5.625% | 6/11/21 | 16,950 | 20,080 |
| 3 Federal Home Loan Banks | 2.125% | 3/10/23 | 38,600 | 38,178 |
| 3 Federal Home Loan Banks | 5.375% | 8/15/24 | 1,585 | 1,933 |
17
| Total Bond Market II Index Fund | ||||
| Face | Market | |||
| Maturity | Amount | Value• | ||
| Coupon | Date | ($000) | ($000) | |
| 3 Federal Home Loan Banks | 5.500% | 7/15/36 | 14,475 | 18,882 |
| 4 Federal Home Loan Mortgage Corp. | 0.500% | 1/27/17 | 75,000 | 74,718 |
| 4 Federal Home Loan Mortgage Corp. | 5.000% | 2/16/17 | 19,175 | 20,054 |
| 4 Federal Home Loan Mortgage Corp. | 0.875% | 2/22/17 | 50,000 | 50,005 |
| 4 Federal Home Loan Mortgage Corp. | 1.000% | 3/8/17 | 18,000 | 18,026 |
| 4 Federal Home Loan Mortgage Corp. | 5.000% | 4/18/17 | 5,000 | 5,257 |
| 4 Federal Home Loan Mortgage Corp. | 1.250% | 5/12/17 | 72,500 | 72,728 |
| 4 Federal Home Loan Mortgage Corp. | 1.000% | 6/29/17 | 67,694 | 67,649 |
| 4 Federal Home Loan Mortgage Corp. | 0.750% | 7/14/17 | 18,000 | 17,917 |
| 4 Federal Home Loan Mortgage Corp. | 1.000% | 7/28/17 | 36,179 | 36,148 |
| 4 Federal Home Loan Mortgage Corp. | 5.500% | 8/23/17 | 11,550 | 12,376 |
| 4 Federal Home Loan Mortgage Corp. | 1.000% | 9/29/17 | 98,125 | 97,946 |
| 4 Federal Home Loan Mortgage Corp. | 5.125% | 11/17/17 | 5,950 | 6,388 |
| 4 Federal Home Loan Mortgage Corp. | 1.000% | 12/15/17 | 75,000 | 74,804 |
| 4 Federal Home Loan Mortgage Corp. | 0.750% | 1/12/18 | 13,375 | 13,264 |
| 4 Federal Home Loan Mortgage Corp. | 0.875% | 3/7/18 | 20,900 | 20,752 |
| 4 Federal Home Loan Mortgage Corp. | 4.875% | 6/13/18 | 8,805 | 9,564 |
| 4 Federal Home Loan Mortgage Corp. | 3.750% | 3/27/19 | 16,500 | 17,666 |
| 4 Federal Home Loan Mortgage Corp. | 1.750% | 5/30/19 | 35,175 | 35,430 |
| 4 Federal Home Loan Mortgage Corp. | 1.250% | 8/1/19 | 43,100 | 42,592 |
| 4 Federal Home Loan Mortgage Corp. | 1.250% | 10/2/19 | 43,700 | 43,083 |
| 4 Federal Home Loan Mortgage Corp. | 1.375% | 5/1/20 | 16,700 | 16,459 |
| 4 Federal Home Loan Mortgage Corp. | 2.375% | 1/13/22 | 56,650 | 57,460 |
| 4 Federal Home Loan Mortgage Corp. | 6.750% | 9/15/29 | 1,150 | 1,633 |
| 4 Federal Home Loan Mortgage Corp. | 6.750% | 3/15/31 | 23,400 | 33,535 |
| 4 Federal Home Loan Mortgage Corp. | 6.250% | 7/15/32 | 23,382 | 32,434 |
| 4 Federal National Mortgage Assn. | 1.250% | 1/30/17 | 21,100 | 21,189 |
| 4 Federal National Mortgage Assn. | 5.000% | 2/13/17 | 50,225 | 52,510 |
| 4 Federal National Mortgage Assn. | 0.750% | 4/20/17 | 31,925 | 31,828 |
| 4 Federal National Mortgage Assn. | 1.125% | 4/27/17 | 56,300 | 56,395 |
| 4 Federal National Mortgage Assn. | 5.000% | 5/11/17 | 11,275 | 11,878 |
| 4 Federal National Mortgage Assn. | 5.375% | 6/12/17 | 2,800 | 2,973 |
| 4 Federal National Mortgage Assn. | 0.875% | 8/28/17 | 35,075 | 34,960 |
| 4 Federal National Mortgage Assn. | 1.000% | 9/27/17 | 20,100 | 20,064 |
| 4 Federal National Mortgage Assn. | 0.875% | 10/26/17 | 71,575 | 71,254 |
| 4 Federal National Mortgage Assn. | 0.875% | 12/20/17 | 71,025 | 70,667 |
| 4 Federal National Mortgage Assn. | 0.875% | 2/8/18 | 64,425 | 64,012 |
| 4 Federal National Mortgage Assn. | 0.875% | 5/21/18 | 47,380 | 46,936 |
| 4 Federal National Mortgage Assn. | 1.125% | 7/20/18 | 20,000 | 19,922 |
| 4 Federal National Mortgage Assn. | 1.875% | 9/18/18 | 42,975 | 43,583 |
| 4 Federal National Mortgage Assn. | 1.125% | 10/19/18 | 12,000 | 11,926 |
| 4 Federal National Mortgage Assn. | 1.625% | 11/27/18 | 41,640 | 41,940 |
| 4 Federal National Mortgage Assn. | 1.125% | 12/14/18 | 50,000 | 49,604 |
| 4 Federal National Mortgage Assn. | 1.875% | 2/19/19 | 43,000 | 43,556 |
| 4 Federal National Mortgage Assn. | 1.750% | 6/20/19 | 76,000 | 76,560 |
| 4 Federal National Mortgage Assn. | 1.750% | 9/12/19 | 67,575 | 67,887 |
| 4 Federal National Mortgage Assn. | 0.000% | 10/9/19 | 6,640 | 6,146 |
| 4 Federal National Mortgage Assn. | 1.750% | 11/26/19 | 16,500 | 16,568 |
| 4 Federal National Mortgage Assn. | 1.625% | 1/21/20 | 22,000 | 21,941 |
| 4 Federal National Mortgage Assn. | 1.500% | 6/22/20 | 17,000 | 16,787 |
| 4 Federal National Mortgage Assn. | 1.500% | 11/30/20 | 26,000 | 25,559 |
| 4 Federal National Mortgage Assn. | 1.875% | 12/28/20 | 40,000 | 40,022 |
| 4 Federal National Mortgage Assn. | 2.625% | 9/6/24 | 20,000 | 20,209 |
| 4 Federal National Mortgage Assn. | 6.250% | 5/15/29 | 5,550 | 7,546 |
| 4 Federal National Mortgage Assn. | 7.125% | 1/15/30 | 7,120 | 10,422 |
| 4 Federal National Mortgage Assn. | 7.250% | 5/15/30 | 28,925 | 42,882 |
18
| Total Bond Market II Index Fund | |||||
| Face | Market | ||||
| Maturity | Amount | Value• | |||
| Coupon | Date | ($000) | ($000) | ||
| 4 | Federal National Mortgage Assn. | 6.625% | 11/15/30 | 21,295 | 30,211 |
| 4 | Federal National Mortgage Assn. | 5.625% | 7/15/37 | 2,721 | 3,623 |
| 3 | Financing Corp. | 9.800% | 4/6/18 | 850 | 1,009 |
| 3 | Financing Corp. | 10.350% | 8/3/18 | 100 | 123 |
| 3 | Financing Corp. | 9.650% | 11/2/18 | 2,375 | 2,909 |
| 3 | Financing Corp. | 9.700% | 4/5/19 | 425 | 532 |
| Private Export Funding Corp. | 1.375% | 2/15/17 | 1,000 | 1,002 | |
| Private Export Funding Corp. | 2.250% | 12/15/17 | 1,775 | 1,805 | |
| Private Export Funding Corp. | 1.875% | 7/15/18 | 2,200 | 2,211 | |
| Private Export Funding Corp. | 4.375% | 3/15/19 | 6,867 | 7,414 | |
| Private Export Funding Corp. | 1.450% | 8/15/19 | 7,575 | 7,432 | |
| Private Export Funding Corp. | 2.250% | 3/15/20 | 6,900 | 6,954 | |
| Private Export Funding Corp. | 2.300% | 9/15/20 | 1,500 | 1,511 | |
| Private Export Funding Corp. | 4.300% | 12/15/21 | 7,760 | 8,567 | |
| Private Export Funding Corp. | 2.800% | 5/15/22 | 1,125 | 1,143 | |
| Private Export Funding Corp. | 2.050% | 11/15/22 | 15,350 | 14,823 | |
| Private Export Funding Corp. | 3.550% | 1/15/24 | 16,350 | 17,334 | |
| Private Export Funding Corp. | 2.450% | 7/15/24 | 4,750 | 4,625 | |
| Private Export Funding Corp. | 3.250% | 6/15/25 | 1,500 | 1,542 | |
| Resolution Funding Corp. | 8.125% | 10/15/19 | 100 | 123 | |
| Resolution Funding Corp. | 8.875% | 7/15/20 | 100 | 130 | |
| 3 | Tennessee Valley Authority | 5.500% | 7/18/17 | 6,400 | 6,827 |
| 3 | Tennessee Valley Authority | 4.500% | 4/1/18 | 6,425 | 6,881 |
| 3 | Tennessee Valley Authority | 1.750% | 10/15/18 | 9,500 | 9,588 |
| 3 | Tennessee Valley Authority | 3.875% | 2/15/21 | 5,170 | 5,638 |
| 3 | Tennessee Valley Authority | 1.875% | 8/15/22 | 3,750 | 3,652 |
| 3 | Tennessee Valley Authority | 2.875% | 9/15/24 | 11,831 | 11,844 |
| 3 | Tennessee Valley Authority | 6.750% | 11/1/25 | 17,756 | 23,402 |
| 3 | Tennessee Valley Authority | 7.125% | 5/1/30 | 8,975 | 12,817 |
| 3 | Tennessee Valley Authority | 4.650% | 6/15/35 | 3,425 | 3,836 |
| 3 | Tennessee Valley Authority | 5.880% | 4/1/36 | 4,265 | 5,444 |
| 3 | Tennessee Valley Authority | 5.500% | 6/15/38 | 850 | 1,047 |
| 3 | Tennessee Valley Authority | 5.250% | 9/15/39 | 3,150 | 3,813 |
| 3 | Tennessee Valley Authority | 3.500% | 12/15/42 | 5,500 | 5,038 |
| 3 | Tennessee Valley Authority | 4.875% | 1/15/48 | 14,075 | 15,731 |
| 3 | Tennessee Valley Authority | 5.375% | 4/1/56 | 2,770 | 3,293 |
| 3 | Tennessee Valley Authority | 4.625% | 9/15/60 | 3,365 | 3,524 |
| 3 | Tennessee Valley Authority | 4.250% | 9/15/65 | 5,500 | 5,309 |
| 2,728,940 | |||||
| Conventional Mortgage-Backed Securities (20.5%) | |||||
| 4,5 | Fannie Mae Pool | 2.000% | 8/1/28–10/1/28 | 50,245 | 49,442 |
| 4,5,6 Fannie Mae Pool | 2.500% | 1/1/27–2/1/43 | 499,054 | 503,432 | |
| 4,5,6 Fannie Mae Pool | 3.000% | 11/1/20–1/1/46 | 1,516,809 | 1,539,938 | |
| 4,5,6 Fannie Mae Pool | 3.500% | 3/1/21–1/1/46 | 2,072,534 | 2,148,575 | |
| 4,5,6 Fannie Mae Pool | 4.000% | 6/1/18–1/1/46 | 1,471,913 | 1,562,121 | |
| 4,5,6 Fannie Mae Pool | 4.500% | 2/1/18–1/1/46 | 803,510 | 868,550 | |
| 4,5 | Fannie Mae Pool | 5.000% | 3/1/17–1/1/44 | 451,822 | 496,783 |
| 4,5 | Fannie Mae Pool | 5.500% | 11/1/16–1/1/46 | 363,432 | 405,292 |
| 4,5 | Fannie Mae Pool | 6.000% | 4/1/16–5/1/41 | 243,545 | 275,922 |
| 4,5 | Fannie Mae Pool | 6.500% | 4/1/16–5/1/40 | 72,256 | 83,682 |
| 4,5 | Fannie Mae Pool | 7.000% | 11/1/18–12/1/38 | 21,300 | 24,608 |
| 4,5 | Fannie Mae Pool | 7.500% | 7/1/30–12/1/32 | 204 | 236 |
| 4,5 | Fannie Mae Pool | 8.000% | 12/1/29 | 26 | 30 |
| 4,5 | Freddie Mac Gold Pool | 2.000% | 7/1/28–1/1/29 | 39,070 | 38,436 |
| 4,5 | Freddie Mac Gold Pool | 2.500% | 4/1/27–3/1/43 | 398,945 | 402,469 |
| 4,5,6 Freddie Mac Gold Pool | 3.000% | 10/1/26–1/1/46 | 945,122 | 958,318 | |
19
| Total Bond Market II Index Fund | |||||
| Face | Market | ||||
| Maturity | Amount | Value• | |||
| Coupon | Date | ($000) | ($000) | ||
| 4,5,6 Freddie Mac Gold Pool | 3.500% | 12/1/20–1/1/46 | 1,252,473 | 1,295,244 | |
| 4,5,6 Freddie Mac Gold Pool | 4.000% | 3/1/18–1/1/46 | 950,490 | 1,006,393 | |
| 4,5,6 Freddie Mac Gold Pool | 4.500% | 12/1/17–1/1/46 | 482,796 | 520,031 | |
| 4,5,6 Freddie Mac Gold Pool | 5.000% | 4/1/17–1/1/46 | 284,397 | 310,255 | |
| 4,5 | Freddie Mac Gold Pool | 5.500% | 3/1/16–6/1/41 | 221,397 | 245,416 |
| 4,5 | Freddie Mac Gold Pool | 6.000% | 2/1/16–5/1/40 | 129,348 | 145,963 |
| 4,5 | Freddie Mac Gold Pool | 6.500% | 1/1/16–9/1/39 | 32,461 | 37,645 |
| 4,5 | Freddie Mac Gold Pool | 7.000% | 4/1/16–12/1/38 | 11,938 | 13,900 |
| 4,5 | Freddie Mac Gold Pool | 7.500% | 4/1/27–2/1/32 | 117 | 139 |
| 4,5 | Freddie Mac Gold Pool | 8.000% | 1/1/27–11/1/31 | 167 | 196 |
| 4,5 | Freddie Mac Gold Pool | 8.500% | 6/1/25 | 32 | 37 |
| 5 | Ginnie Mae I Pool | 3.000% | 1/15/26–1/1/46 | 172,856 | 175,833 |
| 5 | Ginnie Mae I Pool | 3.500% | 11/15/25–8/15/45 | 217,060 | 226,604 |
| 5,6 | Ginnie Mae I Pool | 4.000% | 8/15/18–2/1/46 | 240,593 | 256,049 |
| 5 | Ginnie Mae I Pool | 4.500% | 6/15/18–2/1/46 | 265,164 | 287,815 |
| 5 | Ginnie Mae I Pool | 5.000% | 12/15/17–5/15/41 | 167,684 | 184,815 |
| 5 | Ginnie Mae I Pool | 5.500% | 4/15/17–6/15/41 | 83,461 | 94,065 |
| 5 | Ginnie Mae I Pool | 6.000% | 4/15/17–6/15/41 | 52,408 | 59,369 |
| 5 | Ginnie Mae I Pool | 6.500% | 5/15/24–8/15/39 | 16,262 | 18,832 |
| 5 | Ginnie Mae I Pool | 7.000% | 7/15/23–9/15/36 | 749 | 868 |
| 5 | Ginnie Mae I Pool | 7.500% | 12/15/23 | 26 | 31 |
| 5 | Ginnie Mae I Pool | 8.000% | 6/15/25–1/15/27 | 64 | 74 |
| 5 | Ginnie Mae I Pool | 9.000% | 11/15/17–12/15/17 | 13 | 14 |
| 5 | Ginnie Mae II Pool | 2.500% | 2/20/28–1/20/43 | 19,581 | 19,888 |
| 5,6 | Ginnie Mae II Pool | 3.000% | 10/20/26–1/1/46 | 813,025 | 827,674 |
| 5,6 | Ginnie Mae II Pool | 3.500% | 9/20/25–1/1/46 | 1,642,625 | 1,715,603 |
| 5,6 | Ginnie Mae II Pool | 4.000% | 9/20/25–1/1/46 | 967,814 | 1,032,106 |
| 5,6 | Ginnie Mae II Pool | 4.500% | 8/20/33–1/1/46 | 513,521 | 554,119 |
| 5 | Ginnie Mae II Pool | 5.000% | 3/20/18–7/20/44 | 269,432 | 296,110 |
| 5 | Ginnie Mae II Pool | 5.500% | 8/20/23–7/20/43 | 91,319 | 101,817 |
| 5 | Ginnie Mae II Pool | 6.000% | 3/20/31–9/20/41 | 32,615 | 36,899 |
| 5 | Ginnie Mae II Pool | 6.500% | 10/20/28–11/20/39 | 12,406 | 14,193 |
| 5 | Ginnie Mae II Pool | 7.000% | 8/20/34–11/20/38 | 2,502 | 2,893 |
| 18,838,724 | |||||
| Nonconventional Mortgage-Backed Securities (0.3%) | |||||
| 4,5,7 Fannie Mae Pool | 1.591% | 4/1/37 | 1,193 | 1,240 | |
| 4,5,7 Fannie Mae Pool | 2.040% | 12/1/41 | 2,831 | 2,911 | |
| 4,5,7 Fannie Mae Pool | 2.052% | 9/1/37 | 1,813 | 1,942 | |
| 4,5 | Fannie Mae Pool | 2.118% | 3/1/43 | 6,060 | 6,130 |
| 4,5 | Fannie Mae Pool | 2.182% | 6/1/42 | 5,615 | 5,856 |
| 4,5 | Fannie Mae Pool | 2.187% | 6/1/43 | 4,876 | 4,957 |
| 4,5 | Fannie Mae Pool | 2.213% | 9/1/42 | 3,997 | 4,166 |
| 4,5 | Fannie Mae Pool | 2.240% | 10/1/42 | 3,420 | 3,487 |
| 4,5 | Fannie Mae Pool | 2.265% | 7/1/43 | 5,722 | 5,722 |
| 4,5,7 Fannie Mae Pool | 2.266% | 2/1/36 | 545 | 555 | |
| 4,5,7 Fannie Mae Pool | 2.288% | 8/1/37 | 726 | 766 | |
| 4,5,7 Fannie Mae Pool | 2.341% | 8/1/35 | 654 | 695 | |
| 4,5,7 Fannie Mae Pool | 2.359% | 5/1/40 | 618 | 657 | |
| 4,5,7 Fannie Mae Pool | 2.360% | 6/1/37 | 397 | 419 | |
| 4,5,7 Fannie Mae Pool | 2.370% | 5/1/35 | 651 | 685 | |
| 4,5,7 Fannie Mae Pool | 2.375% | 2/1/36 | 580 | 618 | |
| 4,5,7 Fannie Mae Pool | 2.382% | 4/1/36 | 205 | 213 | |
| 4,5 | Fannie Mae Pool | 2.393% | 7/1/42 | 4,905 | 5,019 |
| 4,5 | Fannie Mae Pool | 2.398% | 5/1/42 | 6,575 | 6,835 |
| 4,5,7 Fannie Mae Pool | 2.410% | 9/1/40 | 1,041 | 1,104 | |
| 4,5,7 Fannie Mae Pool | 2.415% | 6/1/36 | 15 | 16 | |
20
| Total Bond Market II Index Fund | |||||
| Face | Market | ||||
| Maturity | Amount | Value• | |||
| Coupon | Date | ($000) | ($000) | ||
| 4,5,7 Fannie Mae Pool | 2.418% | 1/1/37 | 716 | 769 | |
| 4,5,7 Fannie Mae Pool | 2.422% | 1/1/40 | 731 | 759 | |
| 4,5,7 Fannie Mae Pool | 2.427% | 7/1/35 | 491 | 516 | |
| 4,5 | Fannie Mae Pool | 2.429% | 5/1/43 | 10,157 | 10,267 |
| 4,5 | Fannie Mae Pool | 2.441% | 10/1/42 | 4,040 | 4,128 |
| 4,5,7 Fannie Mae Pool | 2.443% | 12/1/33 | 213 | 227 | |
| 4,5,7 Fannie Mae Pool | 2.445% | 7/1/39 | 247 | 257 | |
| 4,5,7 Fannie Mae Pool | 2.447% | 1/1/35 | 803 | 863 | |
| 4,5,7 Fannie Mae Pool | 2.450% | 7/1/37 | 237 | 253 | |
| 4,5,7 Fannie Mae Pool | 2.452% | 8/1/40 | 1,295 | 1,358 | |
| 4,5,7 Fannie Mae Pool | 2.465% | 11/1/36–9/1/43 | 1,314 | 1,359 | |
| 4,5,7 Fannie Mae Pool | 2.488% | 9/1/34–7/1/38 | 454 | 483 | |
| 4,5,7 Fannie Mae Pool | 2.492% | 7/1/42 | 2,111 | 2,239 | |
| 4,5,7 Fannie Mae Pool | 2.520% | 5/1/42 | 1,332 | 1,390 | |
| 4,5,7 Fannie Mae Pool | 2.524% | 5/1/40 | 437 | 469 | |
| 4,5,7 Fannie Mae Pool | 2.532% | 11/1/33 | 161 | 172 | |
| 4,5,7 Fannie Mae Pool | 2.535% | 10/1/39 | 579 | 602 | |
| 4,5,7 Fannie Mae Pool | 2.546% | 10/1/40 | 1,614 | 1,706 | |
| 4,5,7 Fannie Mae Pool | 2.555% | 4/1/37 | 30 | 32 | |
| 4,5,7 Fannie Mae Pool | 2.561% | 12/1/40 | 1,356 | 1,433 | |
| 4,5,7 Fannie Mae Pool | 2.574% | 11/1/39 | 400 | 425 | |
| 4,5,7 Fannie Mae Pool | 2.576% | 7/1/36–7/1/38 | 419 | 433 | |
| 4,5,7 Fannie Mae Pool | 2.596% | 11/1/34 | 780 | 819 | |
| 4,5 | Fannie Mae Pool | 2.601% | 12/1/41 | 2,569 | 2,705 |
| 4,5,7 Fannie Mae Pool | 2.609% | 12/1/35 | 607 | 643 | |
| 4,5 | Fannie Mae Pool | 2.620% | 11/1/41 | 2,556 | 2,690 |
| 4,5,7 Fannie Mae Pool | 2.671% | 11/1/40 | 1,290 | 1,362 | |
| 4,5,7 Fannie Mae Pool | 2.676% | 10/1/40 | 1,886 | 1,985 | |
| 4,5,7 Fannie Mae Pool | 2.685% | 11/1/33–11/1/39 | 1,104 | 1,168 | |
| 4,5 | Fannie Mae Pool | 2.697% | 1/1/42 | 2,482 | 2,594 |
| 4,5 | Fannie Mae Pool | 2.732% | 12/1/43 | 5,592 | 5,740 |
| 4,5,7 Fannie Mae Pool | 2.750% | 3/1/41 | 2,022 | 2,159 | |
| 4,5 | Fannie Mae Pool | 2.751% | 3/1/42 | 4,443 | 4,622 |
| 4,5,7 Fannie Mae Pool | 2.775% | 12/1/40 | 1,185 | 1,259 | |
| 4,5 | Fannie Mae Pool | 2.784% | 1/1/42 | 3,484 | 3,623 |
| 4,5 | Fannie Mae Pool | 2.805% | 11/1/41 | 2,257 | 2,412 |
| 4,5 | Fannie Mae Pool | 2.887% | 12/1/40 | 1,351 | 1,411 |
| 4,5,7 Fannie Mae Pool | 2.901% | 10/1/36 | 473 | 512 | |
| 4,5,7 Fannie Mae Pool | 2.914% | 3/1/42 | 3,077 | 3,205 | |
| 4,5 | Fannie Mae Pool | 2.957% | 9/1/43 | 5,915 | 6,162 |
| 4,5,7 Fannie Mae Pool | 3.022% | 3/1/41 | 1,975 | 2,079 | |
| 4,5,7 Fannie Mae Pool | 3.037% | 2/1/42 | 7,484 | 7,969 | |
| 4,5 | Fannie Mae Pool | 3.052% | 2/1/41 | 1,551 | 1,623 |
| 4,5,7 Fannie Mae Pool | 3.055% | 2/1/42 | 2,596 | 2,698 | |
| 4,5,7 Fannie Mae Pool | 3.077% | 2/1/41 | 835 | 838 | |
| 4,5 | Fannie Mae Pool | 3.137% | 2/1/41 | 1,362 | 1,427 |
| 4,5,7 Fannie Mae Pool | 3.200% | 12/1/40 | 1,433 | 1,505 | |
| 4,5 | Fannie Mae Pool | 3.207% | 5/1/41 | 1,602 | 1,691 |
| 4,5 | Fannie Mae Pool | 3.353% | 8/1/42 | 3,462 | 3,540 |
| 4,5 | Fannie Mae Pool | 3.553% | 7/1/41 | 4,041 | 4,270 |
| 4,5 | Fannie Mae Pool | 3.558% | 4/1/41 | 1,921 | 2,008 |
| 4,5 | Fannie Mae Pool | 3.580% | 8/1/39 | 645 | 695 |
| 4,5 | Fannie Mae Pool | 3.594% | 6/1/41 | 579 | 617 |
| 4,5 | Fannie Mae Pool | 3.745% | 6/1/41 | 2,316 | 2,456 |
| 4,5 | Fannie Mae Pool | 3.827% | 9/1/40 | 2,505 | 2,643 |
| 4,5,7 Fannie Mae Pool | 4.038% | 8/1/39 | 2,248 | 2,309 | |
21
| Total Bond Market II Index Fund | |||||
| Face | Market | ||||
| Maturity | Amount | Value• | |||
| Coupon | Date | ($000) | ($000) | ||
| 4,5,7 Fannie Mae Pool | 4.277% | 11/1/39 | 909 | 940 | |
| 4,5 | Fannie Mae Pool | 4.293% | 12/1/39 | 1,509 | 1,530 |
| 4,5 | Fannie Mae Pool | 4.917% | 3/1/38 | 495 | 509 |
| 4,5 | Fannie Mae Pool | 5.387% | 5/1/36 | 25 | 26 |
| 4,5 | Fannie Mae Pool | 5.508% | 4/1/37 | 709 | 747 |
| 4,5 | Fannie Mae Pool | 5.598% | 10/1/37 | 477 | 496 |
| 4,5 | Fannie Mae Pool | 5.760% | 12/1/37 | 862 | 913 |
| 4,5 | Fannie Mae Pool | 6.076% | 10/1/37 | 1,180 | 1,200 |
| 4,5,7 Freddie Mac Non Gold Pool | 1.735% | 10/1/37 | 23 | 23 | |
| 4,5,7 Freddie Mac Non Gold Pool | 1.855% | 6/1/37 | 528 | 542 | |
| 4,5,7 Freddie Mac Non Gold Pool | 2.018% | 3/1/37 | 42 | 44 | |
| 4,5,7 Freddie Mac Non Gold Pool | 2.110% | 1/1/37 | 660 | 698 | |
| 4,5,7 Freddie Mac Non Gold Pool | 2.125% | 1/1/38 | 326 | 347 | |
| 4,5,7 Freddie Mac Non Gold Pool | 2.195% | 3/1/37 | 33 | 35 | |
| 4,5,7 Freddie Mac Non Gold Pool | 2.250% | 1/1/35 | 89 | 96 | |
| 4,5,7 Freddie Mac Non Gold Pool | 2.253% | 7/1/35 | 280 | 295 | |
| 4,5,7 Freddie Mac Non Gold Pool | 2.271% | 2/1/37 | 163 | 174 | |
| 4,5 | Freddie Mac Non Gold Pool | 2.332% | 5/1/42 | 837 | 853 |
| 4,5,7 Freddie Mac Non Gold Pool | 2.337% | 3/1/37 | 170 | 180 | |
| 4,5,7 Freddie Mac Non Gold Pool | 2.375% | 5/1/38 | 99 | 103 | |
| 4,5,7 Freddie Mac Non Gold Pool | 2.390% | 4/1/35 | 27 | 28 | |
| 4,5,7 Freddie Mac Non Gold Pool | 2.448% | 12/1/36 | 279 | 297 | |
| 4,5,7 Freddie Mac Non Gold Pool | 2.462% | 12/1/35 | 433 | 457 | |
| 4,5,7 Freddie Mac Non Gold Pool | 2.492% | 10/1/37 | 892 | 959 | |
| 4,5,7 Freddie Mac Non Gold Pool | 2.500% | 5/1/36 | 458 | 483 | |
| 4,5,7 Freddie Mac Non Gold Pool | 2.505% | 5/1/40 | 459 | 492 | |
| 4,5,7 Freddie Mac Non Gold Pool | 2.531% | 11/1/36 | 159 | 165 | |
| 4,5,7 Freddie Mac Non Gold Pool | 2.540% | 6/1/37 | 652 | 697 | |
| 4,5 | Freddie Mac Non Gold Pool | 2.561% | 11/1/43 | 4,464 | 4,569 |
| 4,5,7 Freddie Mac Non Gold Pool | 2.574% | 5/1/40 | 471 | 500 | |
| 4,5,7 Freddie Mac Non Gold Pool | 2.587% | 12/1/34 | 438 | 466 | |
| 4,5 | Freddie Mac Non Gold Pool | 2.588% | 2/1/42 | 1,267 | 1,332 |
| 4,5,7 Freddie Mac Non Gold Pool | 2.607% | 12/1/36 | 605 | 641 | |
| 4,5,7 Freddie Mac Non Gold Pool | 2.608% | 1/1/37 | 241 | 256 | |
| 4,5,7 Freddie Mac Non Gold Pool | 2.620% | 3/1/37 | 494 | 526 | |
| 4,5,7 Freddie Mac Non Gold Pool | 2.621% | 11/1/34 | 684 | 718 | |
| 4,5,7 Freddie Mac Non Gold Pool | 2.630% | 6/1/40 | 613 | 630 | |
| 4,5,7 Freddie Mac Non Gold Pool | 2.631% | 6/1/40 | 695 | 739 | |
| 4,5,7 Freddie Mac Non Gold Pool | 2.635% | 7/1/38 | 231 | 234 | |
| 4,5 | Freddie Mac Non Gold Pool | 2.636% | 12/1/40 | 1,121 | 1,161 |
| 4,5 | Freddie Mac Non Gold Pool | 2.727% | 12/1/40 | 3,146 | 3,266 |
| 4,5,7 Freddie Mac Non Gold Pool | 2.728% | 3/1/37 | 60 | 60 | |
| 4,5,7 Freddie Mac Non Gold Pool | 2.731% | 6/1/37 | 504 | 538 | |
| 4,5 | Freddie Mac Non Gold Pool | 2.755% | 11/1/40 | 586 | 607 |
| 4,5 | Freddie Mac Non Gold Pool | 2.756% | 2/1/42 | 2,950 | 3,072 |
| 4,5,7 Freddie Mac Non Gold Pool | 2.758% | 10/1/36 | 548 | 588 | |
| 4,5,7 Freddie Mac Non Gold Pool | 2.762% | 11/1/40 | 1,319 | 1,361 | |
| 4,5 | Freddie Mac Non Gold Pool | 2.775% | 1/1/41 | 2,687 | 2,802 |
| 4,5 | Freddie Mac Non Gold Pool | 2.847% | 2/1/41 | 2,020 | 2,150 |
| 4,5 | Freddie Mac Non Gold Pool | 2.894% | 2/1/41 | 844 | 899 |
| 4,5 | Freddie Mac Non Gold Pool | 2.910% | 12/1/41 | 2,907 | 3,028 |
| 4,5 | Freddie Mac Non Gold Pool | 3.097% | 1/1/41 | 560 | 587 |
| 4,5 | Freddie Mac Non Gold Pool | 3.104% | 6/1/41 | 848 | 893 |
| 4,5 | Freddie Mac Non Gold Pool | 3.181% | 3/1/41 | 540 | 574 |
| 4,5 | Freddie Mac Non Gold Pool | 3.432% | 3/1/42 | 3,092 | 3,259 |
| 4,5 | Freddie Mac Non Gold Pool | 3.576% | 6/1/40 | 2,294 | 2,414 |
22
| Total Bond Market II Index Fund | |||||
| Face | Market | ||||
| Maturity | Amount | Value• | |||
| Coupon | Date | ($000) | ($000) | ||
| 4,5 | Freddie Mac Non Gold Pool | 3.659% | 9/1/40 | 2,551 | 2,691 |
| 4,5 | Freddie Mac Non Gold Pool | 5.237% | 3/1/38 | 621 | 660 |
| 4,5 | Freddie Mac Non Gold Pool | 5.502% | 2/1/36 | 197 | 203 |
| 4,5 | Freddie Mac Non Gold Pool | 5.800% | 9/1/37 | 291 | 300 |
| 4,5 | Freddie Mac Non Gold Pool | 5.862% | 5/1/37 | 1,676 | 1,730 |
| 4,5 | Freddie Mac Non Gold Pool | 6.140% | 12/1/36 | 303 | 316 |
| 4,5 | Freddie Mac Non Gold Pool | 6.257% | 8/1/37 | 214 | 227 |
| 5,7 | Ginnie Mae II Pool | 1.625% | 10/20/39 | 291 | 300 |
| 5,7 | Ginnie Mae II Pool | 1.750% | 6/20/29–4/20/41 | 686 | 702 |
| 5,7 | Ginnie Mae II Pool | 2.000% | 12/20/39–6/20/43 | 17,675 | 18,246 |
| 5,7 | Ginnie Mae II Pool | 2.250% | 5/20/41 | 848 | 880 |
| 5,7 | Ginnie Mae II Pool | 2.500% | 11/20/40–5/20/43 | 21,940 | 22,413 |
| 5,7 | Ginnie Mae II Pool | 3.000% | 7/20/38–11/20/41 | 9,204 | 9,538 |
| 5 | Ginnie Mae II Pool | 3.500% | 1/20/41–12/20/43 | 15,716 | 16,327 |
| 5 | Ginnie Mae II Pool | 4.000% | 4/20/41–10/20/41 | 4,823 | 4,978 |
| 298,282 | |||||
| Total U.S. Government and Agency Obligations (Cost $58,833,795) | 59,278,478 | ||||
| Asset-Backed/Commercial Mortgage-Backed Securities (2.8%) | |||||
| 5 | AEP Texas Central Transition Funding II | ||||
| LLC 2006-A | 5.170% | 1/1/18 | 1,733 | 1,811 | |
| 5 | Ally Auto Receivables Trust 2013-2 | 0.790% | 1/15/18 | 570 | 569 |
| 5 | Ally Auto Receivables Trust 2013-2 | 1.240% | 11/15/18 | 700 | 698 |
| 5 | Ally Auto Receivables Trust 2014-1 | 0.970% | 10/15/18 | 2,700 | 2,693 |
| 5 | Ally Auto Receivables Trust 2014-1 | 1.530% | 4/15/19 | 1,150 | 1,145 |
| 5 | Ally Auto Receivables Trust 2014-3 | 1.280% | 6/17/19 | 3,350 | 3,339 |
| 5 | Ally Auto Receivables Trust 2014-3 | 1.720% | 3/16/20 | 1,325 | 1,319 |
| 5 | Ally Auto Receivables Trust 2014-SN1 | 0.750% | 2/21/17 | 2,011 | 2,009 |
| 5 | Ally Auto Receivables Trust 2014-SN1 | 0.950% | 6/20/18 | 1,500 | 1,497 |
| 5 | Ally Auto Receivables Trust 2014-SN2 | 1.030% | 9/20/17 | 2,600 | 2,593 |
| 5 | Ally Auto Receivables Trust 2014-SN2 | 1.210% | 2/20/19 | 1,850 | 1,842 |
| 5 | Ally Auto Receivables Trust 2015-1 | 1.390% | 9/16/19 | 1,050 | 1,044 |
| 5 | Ally Auto Receivables Trust 2015-1 | 1.750% | 5/15/20 | 1,075 | 1,067 |
| 5 | Ally Auto Receivables Trust 2015-2 | 1.490% | 11/15/19 | 2,675 | 2,662 |
| 5 | Ally Auto Receivables Trust 2015-2 | 1.840% | 6/15/20 | 1,310 | 1,303 |
| 5 | Ally Master Owner Trust Series 2014-4 | 1.430% | 6/17/19 | 3,800 | 3,785 |
| 5 | Ally Master Owner Trust Series 2015-3 | 1.630% | 5/15/20 | 4,950 | 4,897 |
| 5 | American Express Credit Account Secured Note | ||||
| Trust 2013-3 | 0.980% | 5/15/19 | 1,000 | 997 | |
| 5 | American Express Credit Account Secured Note | ||||
| Trust 2014-3 | 1.490% | 4/15/20 | 5,750 | 5,751 | |
| 5 | American Express Credit Account Secured Note | ||||
| Trust 2014-4 | 1.430% | 6/15/20 | 3,025 | 3,021 | |
| 5 | AmeriCredit Automobile Receivables Trust 2013-2 | 0.650% | 12/8/17 | 54 | 54 |
| 5 | AmeriCredit Automobile Receivables Trust 2013-3 | 0.920% | 4/9/18 | 533 | 533 |
| 5 | AmeriCredit Automobile Receivables Trust 2013-4 | 0.960% | 4/9/18 | 243 | 243 |
| 5 | AmeriCredit Automobile Receivables Trust 2013-5 | 0.900% | 9/10/18 | 490 | 490 |
| 5 | AmeriCredit Automobile Receivables Trust 2013-5 | 1.520% | 1/8/19 | 400 | 400 |
| 5 | AmeriCredit Automobile Receivables Trust 2014-1 | 0.900% | 2/8/19 | 458 | 457 |
| 5 | AmeriCredit Automobile Receivables Trust 2014-1 | 1.680% | 7/8/19 | 375 | 375 |
| 5 | AmeriCredit Automobile Receivables Trust 2014-2 | 0.940% | 2/8/19 | 1,150 | 1,146 |
| 5 | AmeriCredit Automobile Receivables Trust 2014-3 | 1.150% | 6/10/19 | 1,925 | 1,918 |
| 5 | AmeriCredit Automobile Receivables Trust 2015-2 | 1.270% | 1/8/20 | 2,450 | 2,425 |
| 5 | BA Credit Card Trust 2007-A1 | 5.170% | 6/15/19 | 900 | 933 |
| 5 | Banc of America Commercial Mortgage Trust | ||||
| 2006-1 | 5.421% | 9/10/45 | 82 | 82 | |
23
| Total Bond Market II Index Fund | ||||
| Face | Market | |||
| Maturity | Amount | Value• | ||
| Coupon | Date | ($000) | ($000) | |
| 5 Banc of America Commercial Mortgage Trust | ||||
| 2006-2 | 5.869% | 5/10/45 | 1,380 | 1,385 |
| 5 Banc of America Commercial Mortgage Trust | ||||
| 2006-3 | 5.889% | 7/10/44 | 357 | 359 |
| 5 Banc of America Commercial Mortgage Trust | ||||
| 2006-5 | 5.414% | 9/10/47 | 4,505 | 4,554 |
| 5 Banc of America Commercial Mortgage Trust | ||||
| 2006-5 | 5.448% | 9/10/47 | 890 | 910 |
| 5 Banc of America Commercial Mortgage Trust | ||||
| 2007-2 | 5.619% | 4/10/49 | 1,399 | 1,433 |
| 5 Banc of America Commercial Mortgage Trust | ||||
| 2008-1 | 6.215% | 2/10/51 | 9,955 | 10,568 |
| 5 Banc of America Commercial Mortgage Trust | ||||
| 2015-UBS7 | 3.429% | 9/15/48 | 1,425 | 1,464 |
| 5 Banc of America Commercial Mortgage Trust | ||||
| 2015-UBS7 | 3.705% | 9/15/48 | 2,525 | 2,589 |
| Bank of Nova Scotia | 2.125% | 9/11/19 | 7,400 | 7,393 |
| Bank of Nova Scotia | 1.850% | 4/14/20 | 17,300 | 17,003 |
| 5 Barclays Dryrock Issuance Trust 2015-2 | 1.560% | 3/15/21 | 2,875 | 2,855 |
| 5 Bear Stearns Commercial Mortgage Securities | ||||
| Trust 2006-PWR12 | 5.713% | 9/11/38 | 1,049 | 1,053 |
| 5 Bear Stearns Commercial Mortgage Securities | ||||
| Trust 2006-PWR13 | 5.582% | 9/11/41 | 1,125 | 1,146 |
| 5 Bear Stearns Commercial Mortgage Securities | ||||
| Trust 2006-TOP22 | 5.620% | 4/12/38 | 3,145 | 3,150 |
| 5 Bear Stearns Commercial Mortgage Securities | ||||
| Trust 2006-TOP24 | 5.568% | 10/12/41 | 3,675 | 3,768 |
| 5 Bear Stearns Commercial Mortgage Securities | ||||
| Trust 2007-PWR16 | 5.722% | 6/11/40 | 3,600 | 3,762 |
| 5 Bear Stearns Commercial Mortgage Securities | ||||
| Trust 2007-PWR17 | 5.694% | 6/11/50 | 16,873 | 17,523 |
| 5 Bear Stearns Commercial Mortgage Securities | ||||
| Trust 2007-PWR17 | 5.882% | 6/11/50 | 4,095 | 4,330 |
| 5 Bear Stearns Commercial Mortgage Securities | ||||
| Trust 2007-TOP28 | 5.742% | 9/11/42 | 8,161 | 8,553 |
| 5 BMW Vehicle Owner Trust 2014-A | 0.970% | 11/26/18 | 3,425 | 3,417 |
| 5 BMW Vehicle Owner Trust 2014-A | 1.500% | 2/25/21 | 2,275 | 2,266 |
| 5 BMW Vehicle Owner Trust 2015-1 | 1.240% | 12/20/17 | 3,925 | 3,915 |
| 5 BMW Vehicle Owner Trust 2015-2 | 1.400% | 2/20/19 | 3,450 | 3,430 |
| 5 BMW Vehicle Owner Trust 2015-2 | 1.550% | 2/20/19 | 1,250 | 1,241 |
| 5 Capital Auto Receivables Asset Trust 2013-1 | 0.790% | 6/20/17 | 141 | 141 |
| 5 Capital Auto Receivables Asset Trust 2013-3 | 1.680% | 4/20/18 | 1,340 | 1,342 |
| 5 Capital Auto Receivables Asset Trust 2013-4 | 1.090% | 3/20/18 | 1,826 | 1,825 |
| 5 Capital Auto Receivables Asset Trust 2013-4 | 1.470% | 7/20/18 | 700 | 700 |
| 5 Capital Auto Receivables Asset Trust 2013-4 | 2.060% | 10/22/18 | 700 | 702 |
| 5 Capital Auto Receivables Asset Trust 2014-1 | 1.690% | 10/22/18 | 1,090 | 1,090 |
| 5 Capital Auto Receivables Asset Trust 2014-1 | 2.220% | 1/22/19 | 1,116 | 1,119 |
| 5 Capital Auto Receivables Asset Trust 2014-2 | 1.260% | 5/21/18 | 975 | 974 |
| 5 Capital Auto Receivables Asset Trust 2014-2 | 1.620% | 10/22/18 | 775 | 774 |
| 5 Capital Auto Receivables Asset Trust 2014-3 | 1.480% | 11/20/18 | 1,350 | 1,346 |
| 5 Capital Auto Receivables Asset Trust 2014-3 | 1.830% | 4/22/19 | 975 | 973 |
| 5 Capital Auto Receivables Asset Trust 2015-1 | 1.610% | 6/20/19 | 2,375 | 2,362 |
| 5 Capital Auto Receivables Asset Trust 2015-1 | 1.860% | 10/21/19 | 1,300 | 1,293 |
| 5 Capital Auto Receivables Asset Trust 2015-2 | 1.730% | 9/20/19 | 3,650 | 3,627 |
| 5 Capital Auto Receivables Asset Trust 2015-3 | 1.940% | 1/21/20 | 2,875 | 2,865 |
| 5 Capital Auto Receivables Asset Trust 2015-3 | 1.970% | 1/21/20 | 1,800 | 1,789 |
24
| Total Bond Market II Index Fund | ||||
| Face | Market | |||
| Maturity | Amount | Value• | ||
| Coupon | Date | ($000) | ($000) | |
| 5 Capital Auto Receivables Asset Trust 2015-3 | 2.130% | 5/20/20 | 1,840 | 1,834 |
| 5 Capital Auto Receivables Asset Trust 2015-4 | 1.830% | 3/20/20 | 2,750 | 2,725 |
| 5 Capital Auto Receivables Asset Trust 2015-4 | 2.010% | 7/20/20 | 1,775 | 1,755 |
| 5 Capital One Multi-asset Execution Trust 2007-A7 | 5.750% | 7/15/20 | 7,190 | 7,688 |
| 5 Capital One Multi-Asset Execution Trust 2014-A2 | 1.260% | 1/15/20 | 1,325 | 1,322 |
| 5 Capital One Multi-Asset Execution Trust 2014-A5 | 1.480% | 7/15/20 | 4,700 | 4,700 |
| 5 Capital One Multi-Asset Execution Trust 2015-A2 | 2.080% | 3/15/23 | 7,675 | 7,612 |
| 5 Capital One Multi-asset Execution Trust 2015-A5 | 1.600% | 5/17/21 | 3,625 | 3,615 |
| 5 Capital One Multi-asset Execution Trust 2015-A8 | 2.050% | 8/15/23 | 4,950 | 4,883 |
| 5 CarMax Auto Owner Trust 2012-3 | 0.790% | 4/16/18 | 1,320 | 1,317 |
| 5 CarMax Auto Owner Trust 2013-2 | 0.640% | 1/16/18 | 768 | 767 |
| 5 Carmax Auto Owner Trust 2013-2 | 0.840% | 11/15/18 | 799 | 793 |
| 5 Carmax Auto Owner Trust 2013-3 | 0.970% | 4/16/18 | 1,226 | 1,225 |
| 5 Carmax Auto Owner Trust 2013-3 | 1.490% | 1/15/19 | 1,210 | 1,207 |
| 5 Carmax Auto Owner Trust 2013-4 | 0.800% | 7/16/18 | 610 | 609 |
| 5 Carmax Auto Owner Trust 2013-4 | 1.280% | 5/15/19 | 375 | 372 |
| 5 Carmax Auto Owner Trust 2014-1 | 0.790% | 10/15/18 | 960 | 957 |
| 5 Carmax Auto Owner Trust 2014-1 | 1.320% | 7/15/19 | 735 | 729 |
| 5 Carmax Auto Owner Trust 2014-2 | 0.980% | 1/15/19 | 2,000 | 1,993 |
| 5 Carmax Auto Owner Trust 2014-2 | 1.610% | 10/15/19 | 1,000 | 996 |
| 5 Carmax Auto Owner Trust 2014-3 | 1.160% | 6/17/19 | 2,300 | 2,293 |
| 5 Carmax Auto Owner Trust 2014-3 | 1.730% | 2/18/20 | 1,150 | 1,146 |
| 5 Carmax Auto Owner Trust 2014-4 | 1.250% | 11/15/19 | 4,150 | 4,130 |
| 5 Carmax Auto Owner Trust 2015-2 | 1.370% | 3/16/20 | 2,175 | 2,159 |
| 5 Carmax Auto Owner Trust 2015-2 | 1.800% | 3/15/21 | 1,025 | 1,015 |
| 5 Carmax Auto Owner Trust 2015-3 | 1.630% | 5/15/20 | 3,300 | 3,283 |
| 5 Carmax Auto Owner Trust 2015-3 | 1.980% | 2/16/21 | 800 | 795 |
| 5 Carmax Auto Owner Trust 2015-4 | 1.560% | 11/16/20 | 2,500 | 2,485 |
| 5 Carmax Auto Owner Trust 2015-4 | 1.830% | 6/15/21 | 1,250 | 1,233 |
| 5 CD 2006-CD3 Mortgage Trust | 5.617% | 10/15/48 | 10,345 | 10,452 |
| 5 CD 2006-CD3 Mortgage Trust | 5.648% | 10/15/48 | 4,150 | 4,244 |
| 5 CD 2007-CD4 Commercial Mortgage Trust | 5.322% | 12/11/49 | 8,389 | 8,598 |
| 5 CD 2007-CD5 Mortgage Trust | 5.886% | 11/15/44 | 5,218 | 5,479 |
| 5 CenterPoint Energy Transition Bond Co. II LLC | ||||
| 2005-A | 5.170% | 8/1/19 | 627 | 642 |
| 5 CenterPoint Energy Transition Bond Co. II LLC | ||||
| 2005-A | 5.302% | 8/1/20 | 654 | 712 |
| 5 CenterPoint Energy Transition Bond Co. IV LLC | ||||
| 2012-1 | 3.028% | 10/15/25 | 5,300 | 5,378 |
| 5 Chase Issuance Trust 2012-A4 | 1.580% | 8/16/21 | 5,500 | 5,419 |
| 5 Chase Issuance Trust 2012-A7 | 2.160% | 9/16/24 | 12,805 | 12,383 |
| 5 Chase Issuance Trust 2013-A1 | 1.300% | 2/18/20 | 9,550 | 9,489 |
| 5 Chase Issuance Trust 2013-A8 | 1.010% | 10/15/18 | 6,425 | 6,409 |
| 5 Chase Issuance Trust 2014-A1 | 1.150% | 1/15/19 | 19,175 | 19,104 |
| 5 Chase Issuance Trust 2014-A2 | 2.770% | 3/15/23 | 7,550 | 7,678 |
| 5 Chase Issuance Trust 2014-A6 | 1.260% | 7/15/19 | 9,700 | 9,679 |
| 5 Chase Issuance Trust 2014-A7 | 1.380% | 11/15/19 | 7,400 | 7,378 |
| 5 Chase Issuance Trust 2015-A2 | 1.590% | 2/18/20 | 14,896 | 14,894 |
| 5 Chase Issuance Trust 2015-A4 | 1.840% | 4/15/22 | 5,400 | 5,328 |
| 5 Chase Issuance Trust 2015-A5 | 1.360% | 4/15/20 | 11,000 | 10,928 |
| 5 Citibank Credit Card Issuance Trust 2007-A8 | 5.650% | 9/20/19 | 7,150 | 7,634 |
| 5 Citibank Credit Card Issuance Trust 2008-A1 | 5.350% | 2/7/20 | 6,114 | 6,568 |
| 5 Citibank Credit Card Issuance Trust 2013-A10 | 0.730% | 2/7/18 | 2,900 | 2,900 |
| 5 Citibank Credit Card Issuance Trust 2014-A1 | 2.880% | 1/23/23 | 15,000 | 15,321 |
| 5 Citibank Credit Card Issuance Trust 2014-A4 | 1.230% | 4/24/19 | 7,600 | 7,580 |
| 5 Citibank Credit Card Issuance Trust 2014-A5 | 2.680% | 6/7/23 | 6,525 | 6,633 |
25
| Total Bond Market II Index Fund | |||||
| Face | Market | ||||
| Maturity | Amount | Value• | |||
| Coupon | Date | ($000) | ($000) | ||
| 5 | Citibank Credit Card Issuance Trust 2014-A6 | 2.150% | 7/15/21 | 18,925 | 19,017 |
| 5 | Citibank Credit Card Issuance Trust 2014-A8 | 1.730% | 4/9/20 | 11,625 | 11,646 |
| 5 | Citigroup Commercial Mortgage Trust 2006-C5 | 5.431% | 10/15/49 | 2,252 | 2,291 |
| 5 | Citigroup Commercial Mortgage Trust 2006-C5 | 5.462% | 10/15/49 | 1,585 | 1,622 |
| 5 | Citigroup Commercial Mortgage Trust 2007-C6 | 5.710% | 12/10/49 | 9,305 | 9,661 |
| 5 | Citigroup Commercial Mortgage Trust 2008-C7 | 6.137% | 12/10/49 | 9,708 | 10,179 |
| 5 | Citigroup Commercial Mortgage Trust 2012-GC8 | 3.024% | 9/10/45 | 3,950 | 3,967 |
| 5 | Citigroup Commercial Mortgage Trust 2013-GC11 | 3.093% | 4/10/46 | 1,500 | 1,498 |
| 5 | Citigroup Commercial Mortgage Trust 2013-GC11 | 3.422% | 4/10/46 | 1,300 | 1,309 |
| 5 | Citigroup Commercial Mortgage Trust 2013-GC15 | 3.161% | 9/10/46 | 1,700 | 1,746 |
| 5 | Citigroup Commercial Mortgage Trust 2013-GC15 | 3.942% | 9/10/46 | 800 | 846 |
| 5 | Citigroup Commercial Mortgage Trust 2013-GC15 | 4.371% | 9/10/46 | 1,200 | 1,296 |
| 5 | Citigroup Commercial Mortgage Trust 2013-GC15 | 4.649% | 9/10/46 | 1,700 | 1,862 |
| 5 | Citigroup Commercial Mortgage Trust 2013-GC17 | 3.675% | 11/10/46 | 550 | 577 |
| 5 | Citigroup Commercial Mortgage Trust 2013-GC17 | 4.131% | 11/10/46 | 1,825 | 1,933 |
| 5 | Citigroup Commercial Mortgage Trust 2013-GC17 | 4.544% | 11/10/46 | 750 | 805 |
| 5 | Citigroup Commercial Mortgage Trust 2013-GC17 | 5.095% | 11/10/46 | 750 | 817 |
| 5 | Citigroup Commercial Mortgage Trust 2014-GC19 | 2.790% | 3/10/47 | 3,210 | 3,259 |
| 5 | Citigroup Commercial Mortgage Trust 2014-GC19 | 3.552% | 3/10/47 | 750 | 774 |
| 5 | Citigroup Commercial Mortgage Trust 2014-GC19 | 4.023% | 3/10/47 | 1,150 | 1,207 |
| 5 | Citigroup Commercial Mortgage Trust 2014-GC19 | 4.345% | 3/10/47 | 955 | 1,025 |
| 5 | Citigroup Commercial Mortgage Trust 2014-GC21 | 3.477% | 5/10/47 | 375 | 384 |
| 5 | Citigroup Commercial Mortgage Trust 2014-GC21 | 3.855% | 5/10/47 | 1,675 | 1,739 |
| 5 | Citigroup Commercial Mortgage Trust 2014-GC21 | 4.328% | 5/10/47 | 1,350 | 1,386 |
| 5 | Citigroup Commercial Mortgage Trust 2014-GC23 | 3.622% | 7/10/47 | 2,725 | 2,782 |
| 5 | Citigroup Commercial Mortgage Trust 2014-GC25 | 3.635% | 10/10/47 | 5,650 | 5,749 |
| 5 | Citigroup Commercial Mortgage Trust 2015-GC27 | 3.137% | 2/10/48 | 7,425 | 7,254 |
| 5 | Citigroup Commercial Mortgage Trust 2015-GC27 | 3.571% | 2/10/48 | 3,025 | 2,967 |
| 5 | Citigroup Commercial Mortgage Trust 2015-GC29 | 2.674% | 4/10/48 | 1,525 | 1,536 |
| 5 | Citigroup Commercial Mortgage Trust 2015-GC29 | 3.758% | 4/10/48 | 2,937 | 2,848 |
| 5 | Citigroup Commercial Mortgage Trust 2015-GC31 | 3.762% | 6/10/48 | 2,925 | 2,993 |
| 5 | Citigroup Commercial Mortgage Trust 2015-GC33 | 3.778% | 9/10/58 | 3,375 | 3,455 |
| 5 | COBALT CMBS Commercial Mortgage Trust | ||||
| 2007-C2 | 5.484% | 4/15/47 | 5,032 | 5,203 | |
| 5 | COBALT CMBS Commercial Mortgage Trust | ||||
| 2007-C3 | 5.766% | 5/15/46 | 5,676 | 5,912 | |
| 5 | COMM 15-CR22 Mortgage Trust | 2.856% | 3/10/48 | 1,900 | 1,926 |
| 5 | COMM 15-CR22 Mortgage Trust | 3.309% | 3/10/48 | 5,325 | 5,283 |
| 5 | COMM 15-CR22 Mortgage Trust | 3.603% | 3/10/48 | 1,900 | 1,902 |
| 5 | COMM 15-CR23 Mortgage Trust | 3.257% | 5/10/48 | 2,200 | 2,260 |
| 5 | COMM 15-CR23 Mortgage Trust | 3.497% | 5/10/48 | 3,250 | 3,272 |
| 5 | COMM 15-CR23 Mortgage Trust | 3.801% | 5/10/48 | 1,450 | 1,461 |
| 5 | COMM 2006-C7 Mortgage Trust | 5.768% | 6/10/46 | 7,197 | 7,250 |
| 5 | COMM 2007-C9 Mortgage Trust | 5.796% | 12/10/49 | 8,264 | 8,607 |
| 5 | COMM 2012-CCRE2 Mortgage Trust | 3.147% | 8/15/45 | 1,285 | 1,299 |
| 5 | COMM 2012-CCRE2 Mortgage Trust | 3.791% | 8/15/45 | 1,825 | 1,904 |
| 5,8 | COMM 2012-CCRE3 Mortgage Trust | 3.416% | 10/15/45 | 2,195 | 2,228 |
| 5 | COMM 2012-CCRE4 Mortgage Trust | 2.853% | 10/15/45 | 6,300 | 6,253 |
| 5 | COMM 2012-CCRE5 Mortgage Trust | 2.771% | 12/10/45 | 1,500 | 1,480 |
| 5 | COMM 2012-CR3 Mortgage Trust | 2.822% | 10/15/45 | 5,000 | 4,950 |
| 5 | COMM 2013-CCRE11 Mortgage Trust | 3.047% | 10/10/46 | 1,310 | 1,349 |
| 5 | COMM 2013-CCRE11 Mortgage Trust | 3.660% | 10/10/46 | 1,310 | 1,368 |
| 5 | COMM 2013-CCRE11 Mortgage Trust | 3.983% | 10/10/46 | 1,750 | 1,862 |
| 5 | COMM 2013-CCRE11 Mortgage Trust | 4.258% | 10/10/46 | 2,190 | 2,346 |
| 5 | COMM 2013-CCRE11 Mortgage Trust | 4.715% | 10/10/46 | 1,310 | 1,435 |
| 5 | COMM 2013-CCRE12 Mortgage Trust | 1.295% | 10/10/46 | 482 | 480 |
26
| Total Bond Market II Index Fund | ||||
| Face | Market | |||
| Maturity | Amount | Value• | ||
| Coupon | Date | ($000) | ($000) | |
| 5 COMM 2013-CCRE12 Mortgage Trust | 2.904% | 10/10/46 | 1,075 | 1,094 |
| 5 COMM 2013-CCRE12 Mortgage Trust | 3.623% | 10/10/46 | 1,075 | 1,124 |
| 5 COMM 2013-CCRE12 Mortgage Trust | 3.765% | 10/10/46 | 1,500 | 1,565 |
| 5 COMM 2013-CCRE12 Mortgage Trust | 4.046% | 10/10/46 | 1,125 | 1,191 |
| 5 COMM 2013-CCRE12 Mortgage Trust | 4.300% | 10/10/46 | 750 | 804 |
| 5 COMM 2013-CCRE12 Mortgage Trust | 4.762% | 10/10/46 | 350 | 373 |
| 5 COMM 2013-CCRE13 Mortgage Trust | 1.259% | 11/10/18 | 345 | 346 |
| 5 COMM 2013-CCRE13 Mortgage Trust | 3.039% | 12/10/18 | 550 | 563 |
| 5 COMM 2013-CCRE13 Mortgage Trust | 3.706% | 10/10/23 | 375 | 389 |
| 5 COMM 2013-CCRE13 Mortgage Trust | 4.449% | 12/10/23 | 1,100 | 1,186 |
| 5 COMM 2013-CCRE6 Mortgage Trust | 3.101% | 3/10/46 | 1,744 | 1,746 |
| 5 COMM 2013-CCRE7 Mortgage Trust | 3.213% | 3/10/46 | 1,425 | 1,435 |
| 5 COMM 2013-CCRE8 Mortgage Trust | 3.612% | 6/10/46 | 1,888 | 1,947 |
| 5 COMM 2013-CCRE9 Mortgage Trust | 4.233% | 7/10/45 | 2,295 | 2,471 |
| 5 COMM 2013-CCRE9 Mortgage Trust | 4.210% | 8/10/46 | 660 | 707 |
| 5 COMM 2013-CR13 Mortgage Trust | 4.194% | 11/10/23 | 3,700 | 3,944 |
| 5 COMM 2013-LC13 Mortgage Trust | 3.009% | 8/10/46 | 2,050 | 2,095 |
| 5 COMM 2013-LC13 Mortgage Trust | 4.205% | 8/10/46 | 2,020 | 2,161 |
| 5 COMM 2013-LC6 Mortgage Trust | 2.941% | 1/10/46 | 3,981 | 3,962 |
| 5 COMM 2013-LC6 Mortgage Trust | 3.282% | 1/10/46 | 2,184 | 2,188 |
| 5 COMM 2014-CCRE14 Mortgage Trust | 3.147% | 2/10/47 | 3,275 | 3,357 |
| 5 COMM 2014-CCRE14 Mortgage Trust | 4.526% | 2/10/47 | 2,725 | 2,917 |
| 5 COMM 2014-CCRE14 Mortgage Trust | 4.607% | 2/10/47 | 1,650 | 1,774 |
| 5 COMM 2014-CCRE15 Mortgage Trust | 2.928% | 2/10/47 | 2,712 | 2,747 |
| 5 COMM 2014-CCRE15 Mortgage Trust | 3.595% | 2/10/47 | 935 | 976 |
| 5 COMM 2014-CCRE15 Mortgage Trust | 4.074% | 2/10/47 | 1,737 | 1,837 |
| 5 COMM 2014-CCRE15 Mortgage Trust | 4.715% | 2/10/47 | 869 | 943 |
| 5 COMM 2014-CCRE16 Mortgage Trust | 3.653% | 4/10/47 | 1,500 | 1,574 |
| 5 COMM 2014-CCRE16 Mortgage Trust | 4.278% | 4/10/47 | 1,975 | 2,088 |
| 5 COMM 2014-CCRE19 Mortgage Trust | 3.796% | 8/10/47 | 5,775 | 5,960 |
| 5 COMM 2014-CCRE19 Mortgage Trust | 4.080% | 8/10/47 | 1,550 | 1,610 |
| 5 COMM 2014-CCRE21 Mortgage Trust | 3.095% | 12/10/47 | 2,916 | 2,993 |
| 5 COMM 2014-CCRE21 Mortgage Trust | 3.528% | 12/10/47 | 5,625 | 5,692 |
| 5 COMM 2014-CR14 Mortgage Trust | 4.236% | 2/10/47 | 2,450 | 2,622 |
| 5 COMM 2014-CR17 Mortgage Trust | 3.012% | 5/10/47 | 1,900 | 1,944 |
| 5 COMM 2014-CR17 Mortgage Trust | 3.598% | 5/10/47 | 950 | 969 |
| 5 COMM 2014-CR17 Mortgage Trust | 3.977% | 5/10/47 | 1,525 | 1,597 |
| 5 COMM 2014-CR17 Mortgage Trust | 4.377% | 5/10/47 | 955 | 991 |
| 5 COMM 2014-CR18 Mortgage Trust | 3.452% | 7/15/47 | 2,950 | 3,063 |
| 5 COMM 2014-CR18 Mortgage Trust | 3.828% | 7/15/47 | 975 | 1,012 |
| 5 COMM 2014-CR18 Mortgage Trust | 4.103% | 7/15/47 | 1,281 | 1,335 |
| 5 COMM 2014-CR20 Mortgage Trust | 3.590% | 11/10/47 | 1,525 | 1,549 |
| 5 COMM 2014-LC15 Mortgage Trust | 2.840% | 4/10/47 | 1,150 | 1,167 |
| 5 COMM 2014-LC15 Mortgage Trust | 4.006% | 4/10/47 | 2,650 | 2,784 |
| 5 COMM 2014-LC17 Mortgage Trust | 3.164% | 10/10/47 | 3,900 | 4,033 |
| 5 COMM 2014-LC17 Mortgage Trust | 3.917% | 10/10/47 | 1,550 | 1,612 |
| 5 COMM 2014-LC19 Mortgage Trust | 3.040% | 2/10/48 | 750 | 755 |
| 5 COMM 2014-LC19 Mortgage Trust | 3.183% | 2/10/48 | 4,000 | 3,944 |
| 5 COMM 2014-LC19 Mortgage Trust | 3.527% | 2/10/48 | 1,775 | 1,781 |
| 5 COMM 2014-UBS2 Mortgage Trust | 2.820% | 3/10/47 | 757 | 768 |
| 5 COMM 2014-UBS2 Mortgage Trust | 3.472% | 3/10/47 | 658 | 674 |
| 5 COMM 2014-UBS2 Mortgage Trust | 3.961% | 3/10/47 | 1,699 | 1,775 |
| 5 COMM 2014-UBS2 Mortgage Trust | 4.199% | 3/10/47 | 475 | 498 |
| 5 COMM 2014-UBS2 Mortgage Trust | 4.701% | 3/10/47 | 301 | 318 |
| 5 COMM 2014-UBS3 Mortgage Trust | 2.844% | 6/10/47 | 1,150 | 1,167 |
| 5 COMM 2014-UBS3 Mortgage Trust | 3.819% | 6/10/47 | 3,075 | 3,178 |
27
| Total Bond Market II Index Fund | |||||
| Face | Market | ||||
| Maturity | Amount | Value• | |||
| Coupon | Date | ($000) | ($000) | ||
| 5 | COMM 2014-UBS4 Mortgage Trust | 3.694% | 8/10/47 | 6,000 | 6,109 |
| 5 | COMM 2014-UBS4 Mortgage Trust | 3.968% | 8/10/47 | 1,502 | 1,533 |
| 5 | COMM 2014-UBS5 Mortgage Trust | 3.838% | 9/10/47 | 4,575 | 4,728 |
| 5 | COMM 2014-UBS6 Mortgage Trust | 2.935% | 12/10/47 | 3,850 | 3,942 |
| 5 | COMM 2014-UBS6 Mortgage Trust | 3.387% | 12/10/47 | 3,850 | 3,944 |
| 5 | COMM 2014-UBS6 Mortgage Trust | 3.644% | 12/10/47 | 7,200 | 7,299 |
| 5 | COMM 2014-UBS6 Mortgage Trust | 4.048% | 12/10/47 | 1,925 | 1,979 |
| 5 | COMM 2015-CR25 Mortgage Trust | 3.759% | 8/10/48 | 3,500 | 3,582 |
| 5 | COMM 2015-CR26 Mortgage Trust | 3.630% | 10/10/48 | 6,675 | 6,749 |
| 5 | COMM 2015-CR27 Mortgage Trust | 3.404% | 10/10/48 | 3,575 | 3,638 |
| 5 | COMM 2015-CR27 Mortgage Trust | 3.612% | 10/10/48 | 3,575 | 3,614 |
| 5 | Commercial Mortgage Trust 2006-GG7 | 5.826% | 7/10/38 | 1,632 | 1,637 |
| 5 | Credit Suisse Commercial Mortgage Trust Series | ||||
| 2006-C1 | 5.461% | 2/15/39 | 1,594 | 1,593 | |
| 5 | Credit Suisse Commercial Mortgage Trust Series | ||||
| 2006-C4 | 5.509% | 9/15/39 | 550 | 561 | |
| 5 | Credit Suisse Commercial Mortgage Trust Series | ||||
| 2006-C5 | 5.311% | 12/15/39 | 7,013 | 7,133 | |
| 5 | Credit Suisse Commercial Mortgage Trust Series | ||||
| 2007-C1 | 5.383% | 2/15/40 | 2,201 | 2,246 | |
| 5 | Credit Suisse Commercial Mortgage Trust Series | ||||
| 2007-C3 | 5.699% | 6/15/39 | 8,921 | 9,181 | |
| 5 | CSAIL Commercial Mortgage Trust 2015-C1 | 3.505% | 4/15/50 | 3,750 | 3,785 |
| 5 | CSAIL Commercial Mortgage Trust 2015-C1 | 3.791% | 4/15/50 | 1,900 | 1,900 |
| 5 | CSAIL Commercial Mortgage Trust 2015-C1 | 4.044% | 4/15/50 | 1,525 | 1,514 |
| 5 | CSAIL Commercial Mortgage Trust 2015-C2 | 1.454% | 6/15/57 | 2,412 | 2,385 |
| 5 | CSAIL Commercial Mortgage Trust 2015-C2 | 3.504% | 6/15/57 | 4,700 | 4,718 |
| 5 | CSAIL Commercial Mortgage Trust 2015-C2 | 3.849% | 6/15/57 | 1,800 | 1,823 |
| 5 | CSAIL Commercial Mortgage Trust 2015-C3 | 3.448% | 8/15/48 | 2,772 | 2,820 |
| 5 | CSAIL Commercial Mortgage Trust 2015-C3 | 3.718% | 8/15/48 | 3,550 | 3,623 |
| 5 | CSAIL Commercial Mortgage Trust 2015-C3 | 4.112% | 8/15/48 | 1,625 | 1,595 |
| 5 | CSAIL Commercial Mortgage Trust 2015-C4 | 3.617% | 11/15/48 | 1,800 | 1,844 |
| 5 | CSAIL Commercial Mortgage Trust 2015-C4 | 3.808% | 11/15/48 | 2,850 | 2,916 |
| 5 | Discover Card Execution Note Trust 2007-A1 | 5.650% | 3/16/20 | 9,453 | 10,108 |
| 5 | Discover Card Execution Note Trust 2014-A3 | 1.220% | 10/15/19 | 12,325 | 12,285 |
| 5 | Discover Card Execution Note Trust 2014-A5 | 1.390% | 4/15/20 | 10,650 | 10,616 |
| 5 | Discover Card Execution Note Trust 2015-A2 | 1.900% | 10/17/22 | 9,175 | 9,052 |
| 5 | Discover Card Execution Note Trust 2015-A3 | 1.450% | 3/15/21 | 6,900 | 6,835 |
| 5 | Discover Card Execution Note Trust 2015-A4 | 2.190% | 4/17/23 | 6,950 | 6,888 |
| 4,5 | Fannie Mae-Aces 2010-M1 | 4.450% | 9/25/19 | 1,269 | 1,378 |
| 4,5 | Fannie Mae-Aces 2011-M2 | 3.764% | 4/25/21 | 5,200 | 5,578 |
| 4,5 | Fannie Mae-Aces 2011-M4 | 3.726% | 6/25/21 | 9,050 | 9,662 |
| 4,5 | Fannie Mae-Aces 2012-M9 | 1.553% | 4/25/22 | 932 | 924 |
| 4,5 | Fannie Mae-Aces 2013-M12 | 2.393% | 3/25/23 | 9,565 | 9,469 |
| 4,5 | Fannie Mae-Aces 2013-M14 | 2.505% | 4/25/23 | 10,922 | 10,999 |
| 4,5 | Fannie Mae-Aces 2013-M14 | 3.329% | 10/25/23 | 11,450 | 11,892 |
| 4,5 | Fannie Mae-Aces 2013-M4 | 2.608% | 3/25/22 | 675 | 684 |
| 4,5 | Fannie Mae-Aces 2013-M7 | 2.280% | 12/27/22 | 3,850 | 3,807 |
| 4,5 | Fannie Mae-Aces 2014-M10 | 2.171% | 9/25/19 | 7,250 | 7,319 |
| 4,5 | Fannie Mae-Aces 2014-M12 | 2.614% | 10/25/21 | 11,300 | 11,447 |
| 4,5 | Fannie Mae-Aces 2014-M13 | 1.637% | 11/25/17 | 1,758 | 1,768 |
| 4,5 | Fannie Mae-Aces 2014-M13 | 2.566% | 8/25/24 | 1,615 | 1,640 |
| 4,5 | Fannie Mae-Aces 2014-M13 | 3.021% | 8/25/24 | 4,500 | 4,563 |
| 4,5 | Fannie Mae-Aces 2014-M15 | 2.509% | 7/25/22 | 4,150 | 4,182 |
| 4,5 | Fannie Mae-Aces 2014-M2 | 1.916% | 6/25/21 | 3,619 | 3,639 |
| 4,5 | Fannie Mae-Aces 2014-M2 | 3.513% | 12/25/23 | 11,322 | 11,902 |
28
| Total Bond Market II Index Fund | |||||
| Face | Market | ||||
| Maturity | Amount | Value• | |||
| Coupon | Date | ($000) | ($000) | ||
| 4,5 | Fannie Mae-Aces 2014-M3 | 2.613% | 1/25/24 | 4,172 | 4,273 |
| 4,5 | Fannie Mae-Aces 2014-M3 | 3.475% | 1/25/24 | 5,400 | 5,657 |
| 4,5 | Fannie Mae-Aces 2014-M4 | 3.346% | 3/25/24 | 5,650 | 5,871 |
| 4,5 | Fannie Mae-Aces 2014-M6 | 2.679% | 5/25/21 | 10,600 | 10,757 |
| 4,5 | Fannie Mae-Aces 2014-M7 | 3.249% | 6/25/24 | 11,500 | 12,111 |
| 4,5 | Fannie Mae-Aces 2014-M8 | 2.346% | 6/25/24 | 1,760 | 1,784 |
| 4,5 | Fannie Mae-Aces 2014-M8 | 3.056% | 6/25/24 | 5,850 | 6,058 |
| 4,5 | Fannie Mae-Aces 2014-M9 | 1.462% | 4/25/17 | 7,836 | 7,858 |
| 4,5 | Fannie Mae-Aces 2014-M9 | 3.103% | 7/25/24 | 6,825 | 7,090 |
| 4,5 | Fannie Mae-Aces 2015-M1 | 1.626% | 2/25/18 | 2,950 | 2,957 |
| 4,5 | Fannie Mae-Aces 2015-M1 | 2.532% | 9/25/24 | 10,000 | 9,945 |
| 4,5 | Fannie Mae-Aces 2015-M10 | 3.092% | 4/25/27 | 2,750 | 2,839 |
| 4,5 | Fannie Mae-Aces 2015-M12 | 2.792% | 5/25/25 | 6,425 | 6,343 |
| 4,5 | Fannie Mae-Aces 2015-M15 | 2.923% | 10/25/25 | 8,825 | 8,786 |
| 4,5 | Fannie Mae-Aces 2015-M2 | 2.620% | 12/25/24 | 7,223 | 7,243 |
| 4,5 | Fannie Mae-Aces 2015-M3 | 2.723% | 10/25/24 | 3,700 | 3,732 |
| 4,5 | Fannie Mae-Aces 2015-M7 | 1.550% | 4/25/18 | 1,875 | 1,879 |
| 4,5 | Fannie Mae-Aces 2015-M7 | 2.590% | 12/25/24 | 6,650 | 6,635 |
| 4,5 | Fannie Mae-Aces 2015-M8 | 2.344% | 1/25/25 | 3,538 | 3,553 |
| 4,5 | Fannie Mae-Aces 2015-M8 | 2.900% | 1/25/25 | 3,600 | 3,621 |
| 4,5 | FHLMC Multifamily Structured Pass Through | ||||
| Certificates K004 | 4.186% | 8/25/19 | 2,050 | 2,202 | |
| 4,5 | FHLMC Multifamily Structured Pass Through | ||||
| Certificates K005 | 3.484% | 4/25/19 | 7,410 | 7,608 | |
| 4,5 | FHLMC Multifamily Structured Pass Through | ||||
| Certificates K006 | 3.398% | 7/25/19 | 5,302 | 5,460 | |
| 4,5 | FHLMC Multifamily Structured Pass Through | ||||
| Certificates K007 | 3.342% | 12/25/19 | 3,925 | 4,023 | |
| 4,5 | FHLMC Multifamily Structured Pass Through | ||||
| Certificates K009 | 2.757% | 5/25/20 | 6,820 | 6,956 | |
| 4,5 | FHLMC Multifamily Structured Pass Through | ||||
| Certificates K010 | 2.412% | 8/25/18 | 2,425 | 2,461 | |
| 4,5 | FHLMC Multifamily Structured Pass Through | ||||
| Certificates K010 | 3.320% | 7/25/20 | 3,455 | 3,554 | |
| 4,5 | FHLMC Multifamily Structured Pass Through | ||||
| Certificates K012 | 4.184% | 12/25/20 | 1,025 | 1,119 | |
| 4,5 | FHLMC Multifamily Structured Pass Through | ||||
| Certificates K014 | 3.871% | 4/25/21 | 4,667 | 5,010 | |
| 4,5 | FHLMC Multifamily Structured Pass Through | ||||
| Certificates K017 | 2.873% | 12/25/21 | 12,820 | 13,139 | |
| 4,5 | FHLMC Multifamily Structured Pass Through | ||||
| Certificates K019 | 2.272% | 3/25/22 | 5,430 | 5,378 | |
| 4,5 | FHLMC Multifamily Structured Pass Through | ||||
| Certificates K020 | 2.373% | 5/25/22 | 13,400 | 13,334 | |
| 4,5 | FHLMC Multifamily Structured Pass Through | ||||
| Certificates K021 | 2.396% | 6/25/22 | 8,300 | 8,265 | |
| 4,5 | FHLMC Multifamily Structured Pass Through | ||||
| Certificates K021 | 3.490% | 1/25/24 | 475 | 496 | |
| 4,5 | FHLMC Multifamily Structured Pass Through | ||||
| Certificates K022 | 2.355% | 7/25/22 | 575 | 571 | |
| 4,5 | FHLMC Multifamily Structured Pass Through | ||||
| Certificates K026 | 2.510% | 11/25/22 | 11,500 | 11,434 | |
| 4,5 | FHLMC Multifamily Structured Pass Through | ||||
| Certificates K028 | 3.111% | 2/25/23 | 8,625 | 8,863 | |
| 4,5 | FHLMC Multifamily Structured Pass Through | ||||
| Certificates K029 | 3.320% | 2/25/23 | 11,425 | 11,890 | |
29
| Total Bond Market II Index Fund | |||||
| Face | Market | ||||
| Maturity | Amount | Value• | |||
| Coupon | Date | ($000) | ($000) | ||
| 4,5 | FHLMC Multifamily Structured Pass Through | ||||
| Certificates K030 | 2.779% | 9/25/22 | 9,795 | 10,067 | |
| 4,5 | FHLMC Multifamily Structured Pass Through | ||||
| Certificates K030 | 3.250% | 4/25/23 | 11,425 | 11,906 | |
| 4,5 | FHLMC Multifamily Structured Pass Through | ||||
| Certificates K031 | 3.300% | 4/25/23 | 11,906 | 12,366 | |
| 4,5 | FHLMC Multifamily Structured Pass Through | ||||
| Certificates K032 | 3.016% | 2/25/23 | 5,811 | 6,023 | |
| 4,5 | FHLMC Multifamily Structured Pass Through | ||||
| Certificates K032 | 3.310% | 5/25/23 | 6,420 | 6,702 | |
| 4,5 | FHLMC Multifamily Structured Pass Through | ||||
| Certificates K033 | 2.871% | 2/25/23 | 10,462 | 10,797 | |
| 4,5 | FHLMC Multifamily Structured Pass Through | ||||
| Certificates K033 | 3.060% | 7/25/23 | 12,300 | 12,660 | |
| 4,5 | FHLMC Multifamily Structured Pass Through | ||||
| Certificates K034 | 3.531% | 7/25/23 | 10,633 | 11,279 | |
| 4,5 | FHLMC Multifamily Structured Pass Through | ||||
| Certificates K035 | 3.458% | 8/25/23 | 12,575 | 13,234 | |
| 4,5 | FHLMC Multifamily Structured Pass Through | ||||
| Certificates K038 | 2.604% | 10/25/23 | 3,544 | 3,620 | |
| 4,5 | FHLMC Multifamily Structured Pass Through | ||||
| Certificates K038 | 3.389% | 3/25/24 | 5,225 | 5,481 | |
| 4,5 | FHLMC Multifamily Structured Pass Through | ||||
| Certificates K039 | 2.683% | 12/25/23 | 2,504 | 2,565 | |
| 4,5 | FHLMC Multifamily Structured Pass Through | ||||
| Certificates K039 | 3.303% | 7/25/24 | 2,600 | 2,716 | |
| 4,5 | FHLMC Multifamily Structured Pass Through | ||||
| Certificates K040 | 2.768% | 4/25/24 | 3,564 | 3,641 | |
| 4,5 | FHLMC Multifamily Structured Pass Through | ||||
| Certificates K040 | 3.241% | 9/25/24 | 9,300 | 9,513 | |
| 4,5 | FHLMC Multifamily Structured Pass Through | ||||
| Certificates K041 | 3.171% | 10/25/24 | 9,300 | 9,589 | |
| 4,5 | FHLMC Multifamily Structured Pass Through | ||||
| Certificates K042 | 2.267% | 6/25/24 | 1,816 | 1,813 | |
| 4,5 | FHLMC Multifamily Structured Pass Through | ||||
| Certificates K042 | 2.670% | 12/25/24 | 7,225 | 7,188 | |
| 4,5 | FHLMC Multifamily Structured Pass Through | ||||
| Certificates K043 | 2.532% | 10/25/23 | 1,856 | 1,878 | |
| 4,5 | FHLMC Multifamily Structured Pass Through | ||||
| Certificates K043 | 2.493% | 11/25/24 | 3,587 | 3,612 | |
| 4,5 | FHLMC Multifamily Structured Pass Through | ||||
| Certificates K043 | 3.062% | 12/25/24 | 5,600 | 5,715 | |
| 4,5 | FHLMC Multifamily Structured Pass Through | ||||
| Certificates K043 | 3.023% | 1/25/25 | 5,800 | 5,852 | |
| 4,5 | FHLMC Multifamily Structured Pass Through | ||||
| Certificates K046 | 3.205% | 3/25/25 | 5,800 | 6,009 | |
| 4,5 | FHLMC Multifamily Structured Pass Through | ||||
| Certificates K047 | 2.827% | 12/25/24 | 1,785 | 1,827 | |
| 4,5 | FHLMC Multifamily Structured Pass Through | ||||
| Certificates K047 | 3.329% | 5/25/25 | 4,450 | 4,624 | |
| 4,5 | FHLMC Multifamily Structured Pass Through | ||||
| Certificates K048 | 3.284% | 6/25/25 | 6,350 | 6,487 | |
| 4,5 | FHLMC Multifamily Structured Pass Through | ||||
| Certificates K049 | 3.010% | 7/25/25 | 3,850 | 3,845 | |
| 4,5 | FHLMC Multifamily Structured Pass Through | ||||
| Certificates K050 | 3.334% | 8/25/25 | 6,375 | 6,582 | |
30
| Total Bond Market II Index Fund | |||||
| Face | Market | ||||
| Maturity | Amount | Value• | |||
| Coupon | Date | ($000) | ($000) | ||
| 4,5 | FHLMC Multifamily Structured Pass Through | ||||
| Certificates K503 | 1.384% | 1/25/19 | 5,141 | 5,102 | |
| 4,5 | FHLMC Multifamily Structured Pass Through | ||||
| Certificates K503 | 2.456% | 8/25/19 | 11,200 | 11,423 | |
| 4,5 | FHLMC Multifamily Structured Pass Through | ||||
| Certificates K702 | 3.154% | 2/25/18 | 15,583 | 16,026 | |
| 4,5 | FHLMC Multifamily Structured Pass Through | ||||
| Certificates K706 | 2.323% | 10/25/18 | 4,929 | 4,991 | |
| 4,5 | FHLMC Multifamily Structured Pass Through | ||||
| Certificates K707 | 2.220% | 12/25/18 | 4,725 | 4,786 | |
| 4,5 | FHLMC Multifamily Structured Pass Through | ||||
| Certificates K708 | 1.670% | 10/25/18 | 861 | 864 | |
| 4,5 | FHLMC Multifamily Structured Pass Through | ||||
| Certificates K710 | 1.883% | 5/25/19 | 1,005 | 1,006 | |
| 4,5 | FHLMC Multifamily Structured Pass Through | ||||
| Certificates K711 | 1.321% | 12/25/18 | 7,126 | 7,111 | |
| 4,5 | FHLMC Multifamily Structured Pass Through | ||||
| Certificates K711 | 1.730% | 7/25/19 | 14,925 | 14,857 | |
| 4,5 | FHLMC Multifamily Structured Pass Through | ||||
| Certificates K713 | 2.313% | 3/25/20 | 18,525 | 18,695 | |
| 4,5 | FHLMC Multifamily Structured Pass Through | ||||
| Certificates K714 | 3.034% | 10/25/20 | 12,850 | 13,265 | |
| 4,5 | FHLMC Multifamily Structured Pass Through | ||||
| Certificates K716 | 2.413% | 1/25/21 | 2,437 | 2,476 | |
| 4,5 | FHLMC Multifamily Structured Pass Through | ||||
| Certificates K716 | 3.130% | 6/25/21 | 12,630 | 13,113 | |
| 4,5 | FHLMC Multifamily Structured Pass Through | ||||
| Certificates K717 | 2.991% | 9/25/21 | 7,475 | 7,725 | |
| 4,5 | FHLMC Multifamily Structured Pass Through | ||||
| Certificates K718 | 2.375% | 9/25/21 | 7,213 | 7,303 | |
| 4,5 | FHLMC Multifamily Structured Pass Through | ||||
| Certificates K718 | 2.791% | 1/25/22 | 6,800 | 6,942 | |
| 4,5 | FHLMC Multifamily Structures Pass Through | ||||
| Certificates K715 | 2.856% | 1/25/21 | 4,225 | 4,354 | |
| 4,5 | FHLMC Multifamily Structures Pass Through | ||||
| Certificates K715 | 2.716% | 6/25/22 | 4,550 | 4,583 | |
| 5 | Fifth Third Auto 2014-1 | 0.680% | 4/16/18 | 1,445 | 1,442 |
| 5 | Fifth Third Auto 2014-1 | 1.420% | 3/16/20 | 3,575 | 3,548 |
| 5 | Fifth Third Auto 2014-1 | 1.140% | 10/15/20 | 1,500 | 1,492 |
| 5 | Fifth Third Auto 2014-2 | 0.890% | 11/15/18 | 1,525 | 1,521 |
| 5 | Fifth Third Auto 2014-2 | 1.380% | 12/15/20 | 975 | 972 |
| 5 | Ford Credit Auto Lease Trust 2013-B | 0.960% | 10/15/16 | 393 | 393 |
| 5 | Ford Credit Auto Lease Trust 2014-A | 0.900% | 6/15/17 | 575 | 574 |
| 5 | Ford Credit Auto Lease Trust 2014-A | 1.160% | 8/15/17 | 1,050 | 1,048 |
| 5 | Ford Credit Auto Lease Trust 2014-B | 0.890% | 9/15/17 | 2,075 | 2,072 |
| 5 | Ford Credit Auto Lease Trust 2015-A | 1.130% | 6/15/18 | 1,000 | 995 |
| 5 | Ford Credit Auto Lease Trust 2015-A | 1.310% | 8/15/18 | 725 | 719 |
| 5 | Ford Credit Auto Lease Trust 2015-B | 1.380% | 12/15/18 | 2,500 | 2,484 |
| 5 | Ford Credit Auto Lease Trust 2015-B | 1.540% | 2/15/19 | 1,775 | 1,761 |
| 5 | Ford Credit Auto Owner Trust 2012-A | 1.150% | 6/15/17 | 431 | 431 |
| 5 | Ford Credit Auto Owner Trust 2013-A | 0.550% | 7/15/17 | 331 | 331 |
| 5 | Ford Credit Auto Owner Trust 2013-B | 0.570% | 10/15/17 | 352 | 352 |
| 5 | Ford Credit Auto Owner Trust 2013-B | 0.760% | 8/15/18 | 800 | 797 |
| 5 | Ford Credit Auto Owner Trust 2013-C | 0.820% | 12/15/17 | 735 | 735 |
| 5 | Ford Credit Auto Owner Trust 2013-C | 1.250% | 10/15/18 | 692 | 692 |
| 5 | Ford Credit Auto Owner Trust 2013-D | 0.670% | 4/15/18 | 1,182 | 1,181 |
31
| Total Bond Market II Index Fund | ||||
| Face | Market | |||
| Maturity | Amount | Value• | ||
| Coupon | Date | ($000) | ($000) | |
| 5 Ford Credit Auto Owner Trust 2013-D | 1.110% | 2/15/19 | 350 | 349 |
| 5 Ford Credit Auto Owner Trust 2014-A | 0.790% | 5/15/18 | 917 | 916 |
| 5 Ford Credit Auto Owner Trust 2014-A | 1.290% | 4/15/19 | 800 | 798 |
| 5 Ford Credit Auto Owner Trust 2014-B | 0.900% | 10/15/18 | 3,375 | 3,370 |
| 5 Ford Credit Auto Owner Trust 2014-B | 1.420% | 8/15/19 | 575 | 573 |
| 5 Ford Credit Auto Owner Trust 2015-A | 1.280% | 9/15/19 | 1,850 | 1,846 |
| 5 Ford Credit Auto Owner Trust 2015-A | 1.640% | 6/15/20 | 575 | 573 |
| 5 Ford Credit Auto Owner Trust 2015-B | 1.160% | 11/15/19 | 2,300 | 2,286 |
| 5 Ford Credit Auto Owner Trust 2015-B | 1.580% | 8/15/20 | 900 | 892 |
| 5 Ford Credit Auto Owner Trust 2015-C | 1.410% | 2/15/20 | 1,725 | 1,720 |
| 5 Ford Credit Auto Owner Trust 2015-C | 1.740% | 2/15/21 | 800 | 795 |
| 5 Ford Credit Floorplan Master Owner Trust A | ||||
| Series 2013-5 | 1.500% | 9/15/18 | 2,800 | 2,803 |
| 5 Ford Credit Floorplan Master Owner Trust A | ||||
| Series 2014-1 | 1.200% | 2/15/19 | 3,550 | 3,541 |
| 5 Ford Credit Floorplan Master Owner Trust A | ||||
| Series 2014-4 | 1.400% | 8/15/19 | 2,725 | 2,714 |
| 5 GE Capital Credit Card Master Note Trust Series | ||||
| 2012-7 | 1.760% | 9/15/22 | 5,644 | 5,541 |
| 5 GE Commercial Mortgage Corp. Series 2005-C4 | ||||
| Trust | 5.427% | 11/10/45 | 2,505 | 2,504 |
| 5 GE Commercial Mortgage Corp. Series 2006-C1 | ||||
| Trust | 5.459% | 3/10/44 | 2,825 | 2,821 |
| 5 GE Commercial Mortgage Corp. Series 2007-C1 | ||||
| Trust | 5.543% | 12/10/49 | 4,300 | 4,406 |
| 5 GM Financial Leasing Trust 2015-2 | 1.680% | 12/20/18 | 3,000 | 2,984 |
| 5 GM Financial Leasing Trust 2015-2 | 1.850% | 7/22/19 | 1,600 | 1,591 |
| 5 GM Financial Leasing Trust 2015-3 | 1.690% | 3/20/19 | 1,725 | 1,712 |
| 5 GM Financial Leasing Trust 2015-3 | 1.810% | 11/20/19 | 1,775 | 1,759 |
| 5 GS Mortgage Securities Trust 2006-GG6 | 5.622% | 4/10/38 | 20 | 20 |
| 5 GS Mortgage Securities Trust 2007-GG10 | 5.794% | 8/10/45 | 4,480 | 4,637 |
| 5 GS Mortgage Securities Trust 2011-GC5 | 3.707% | 8/10/44 | 1,500 | 1,575 |
| 5 GS Mortgage Securities Trust 2012-GC6 | 3.482% | 1/10/45 | 6,350 | 6,581 |
| 5 GS Mortgage Securities Trust 2012-GCJ7 | 3.377% | 5/10/45 | 3,825 | 3,924 |
| 5 GS Mortgage Securities Trust 2012-GCJ9 | 2.773% | 11/10/45 | 2,955 | 2,913 |
| 5 GS Mortgage Securities Trust 2013-GC10 | 2.943% | 2/10/46 | 3,494 | 3,459 |
| 5 GS Mortgage Securities Trust 2013-GC10 | 3.279% | 2/10/46 | 1,310 | 1,309 |
| 5 GS Mortgage Securities Trust 2013-GCJ12 | 3.135% | 6/10/46 | 2,255 | 2,253 |
| 5 GS Mortgage Securities Trust 2013-GCJ12 | 3.375% | 6/10/46 | 966 | 964 |
| 5 GS Mortgage Securities Trust 2013-GCJ14 | 2.995% | 8/10/46 | 1,875 | 1,933 |
| 5 GS Mortgage Securities Trust 2013-GCJ14 | 3.817% | 8/10/46 | 1,340 | 1,408 |
| 5 GS Mortgage Securities Trust 2013-GCJ16 | 3.033% | 11/10/46 | 2,000 | 2,047 |
| 5 GS Mortgage Securities Trust 2013-GCJ16 | 3.813% | 11/10/46 | 710 | 741 |
| 5 GS Mortgage Securities Trust 2013-GCJ16 | 4.271% | 11/10/46 | 1,150 | 1,233 |
| 5 GS Mortgage Securities Trust 2014-GC18 | 1.298% | 1/10/47 | 3,098 | 3,061 |
| 5 GS Mortgage Securities Trust 2014-GC18 | 4.074% | 1/10/47 | 8,225 | 8,664 |
| 5 GS Mortgage Securities Trust 2014-GC18 | 4.383% | 1/10/47 | 2,750 | 2,944 |
| 5 GS Mortgage Securities Trust 2014-GC18 | 3.467% | 6/10/47 | 1,550 | 1,586 |
| 5 GS Mortgage Securities Trust 2014-GC18 | 3.516% | 6/10/47 | 500 | 513 |
| 5 GS Mortgage Securities Trust 2014-GC18 | 3.862% | 6/10/47 | 1,350 | 1,400 |
| 5 GS Mortgage Securities Trust 2014-GC24 | 3.931% | 9/10/47 | 4,275 | 4,445 |
| 5 GS Mortgage Securities Trust 2014-GC24 | 4.508% | 9/10/47 | 1,175 | 1,223 |
| 5 GS Mortgage Securities Trust 2014-GC26 | 2.902% | 11/10/47 | 1,225 | 1,251 |
| 5 GS Mortgage Securities Trust 2014-GC26 | 3.365% | 11/10/47 | 2,275 | 2,309 |
| 5 GS Mortgage Securities Trust 2014-GC26 | 3.629% | 11/10/47 | 7,475 | 7,672 |
| 5 GS Mortgage Securities Trust 2014-GC26 | 3.964% | 11/10/47 | 1,325 | 1,370 |
32
| Total Bond Market II Index Fund | ||||
| Face | Market | |||
| Maturity | Amount | Value• | ||
| Coupon | Date | ($000) | ($000) | |
| 5 GS Mortgage Securities Trust 2014-GC26 | 4.215% | 11/10/47 | 1,125 | 1,145 |
| 5 GS Mortgage Securities Trust 2015-GC28 | 3.396% | 2/10/48 | 4,150 | 4,134 |
| 5 GS Mortgage Securities Trust 2015-GC30 | 2.726% | 5/10/50 | 2,575 | 2,594 |
| 5 GS Mortgage Securities Trust 2015-GC30 | 3.382% | 5/10/50 | 3,700 | 3,682 |
| 5 GS Mortgage Securities Trust 2015-GC32 | 3.513% | 7/10/48 | 3,675 | 3,741 |
| 5 GS Mortgage Securities Trust 2015-GC32 | 3.764% | 7/10/48 | 1,425 | 1,459 |
| 5 GS Mortgage Securities Trust 2015-GC34 | 3.278% | 10/10/48 | 3,575 | 3,583 |
| 5 GS Mortgage Securities Trust 2015-GC34 | 3.506% | 10/10/48 | 3,400 | 3,407 |
| 5 Honda Auto Receivables 2013-4 Owner Trust | 1.040% | 2/18/20 | 1,100 | 1,097 |
| 5 Honda Auto Receivables 2014-1 Owner Trust | 1.040% | 2/21/20 | 1,122 | 1,117 |
| 5 Honda Auto Receivables 2014-2 Owner Trust | 1.180% | 5/18/20 | 1,000 | 996 |
| 5 Honda Auto Receivables 2014-3 Owner Trust | 1.310% | 10/15/20 | 1,925 | 1,913 |
| 5 Honda Auto Receivables 2015-1 Owner Trust | 1.050% | 10/15/18 | 3,325 | 3,310 |
| 5 Honda Auto Receivables 2015-1 Owner Trust | 1.320% | 11/16/20 | 2,250 | 2,233 |
| 5 Honda Auto Receivables 2015-2 Owner Trust | 1.040% | 2/21/19 | 2,500 | 2,483 |
| 5 Honda Auto Receivables 2015-2 Owner Trust | 1.470% | 8/23/21 | 1,450 | 1,438 |
| 5 Honda Auto Receivables 2015-3 Owner Trust | 1.270% | 4/18/19 | 2,575 | 2,563 |
| 5 Honda Auto Receivables 2015-3 Owner Trust | 1.560% | 10/18/21 | 700 | 694 |
| 5 Honda Auto Receivables 2015-4 Owner Trust | 1.230% | 9/23/19 | 3,605 | 3,570 |
| 5 Honda Auto Receivables 2015-4 Owner Trust | 1.440% | 1/21/22 | 900 | 888 |
| 5 Huntington Auto Trust 2015-1 | 1.240% | 9/16/19 | 3,675 | 3,658 |
| 5 Hyundai Auto Receivables Trust 2012-C | 0.730% | 6/15/18 | 1,720 | 1,718 |
| 5 Hyundai Auto Receivables Trust 2013-B | 0.710% | 9/15/17 | 668 | 668 |
| 5 Hyundai Auto Receivables Trust 2013-B | 1.010% | 2/15/19 | 1,325 | 1,324 |
| 5 Hyundai Auto Receivables Trust 2013-C | 1.550% | 3/15/19 | 1,730 | 1,734 |
| 5 Hyundai Auto Receivables Trust 2014-A | 0.790% | 7/16/18 | 1,421 | 1,418 |
| 5 Hyundai Auto Receivables Trust 2014-B | 0.900% | 12/17/18 | 2,913 | 2,907 |
| 5 Hyundai Auto Receivables Trust 2014-B | 1.460% | 11/15/19 | 900 | 896 |
| 5 Hyundai Auto Receivables Trust 2015-A | 1.370% | 7/15/20 | 1,125 | 1,114 |
| 5 Hyundai Auto Receivables Trust 2015-C | 1.460% | 2/18/20 | 1,225 | 1,220 |
| 5 Hyundai Auto Receivables Trust 2015-C | 1.780% | 11/15/21 | 850 | 845 |
| 5 JP Morgan Chase Commercial Mortgage | ||||
| Securities Trust 2005-CIBC11 | 5.411% | 8/12/37 | 182 | 182 |
| 5 JP Morgan Chase Commercial Mortgage | ||||
| Securities Trust 2005-LDP5 | 5.476% | 12/15/44 | 161 | 160 |
| 5 JP Morgan Chase Commercial Mortgage | ||||
| Securities Trust 2006-CB17 | 5.429% | 12/12/43 | 7,623 | 7,754 |
| 5 JP Morgan Chase Commercial Mortgage | ||||
| Securities Trust 2006-CIBC14 | 5.488% | 12/12/44 | 642 | 641 |
| 5 JP Morgan Chase Commercial Mortgage | ||||
| Securities Trust 2006-CIBC16 | 5.593% | 5/12/45 | 4,580 | 4,677 |
| 5 JP Morgan Chase Commercial Mortgage | ||||
| Securities Trust 2006-LDP6 | 5.475% | 4/15/43 | 698 | 698 |
| 5 JP Morgan Chase Commercial Mortgage | ||||
| Securities Trust 2006-LDP7 | 5.909% | 4/15/45 | 7,558 | 7,590 |
| 5 JP Morgan Chase Commercial Mortgage | ||||
| Securities Trust 2006-LDP7 | 5.909% | 4/15/45 | 2,360 | 2,401 |
| 5 JP Morgan Chase Commercial Mortgage | ||||
| Securities Trust 2006-LDP8 | 5.440% | 5/15/45 | 1,720 | 1,748 |
| 5 JP Morgan Chase Commercial Mortgage | ||||
| Securities Trust 2007-CIBC18 | 5.440% | 6/12/47 | 5,869 | 6,000 |
| 5 JP Morgan Chase Commercial Mortgage | ||||
| Securities Trust 2007-CIBC20 | 5.794% | 2/12/51 | 17,652 | 18,474 |
| 5 JP Morgan Chase Commercial Mortgage | ||||
| Securities Trust 2007-CIBC20 | 5.881% | 2/12/51 | 1,650 | 1,750 |
33
| Total Bond Market II Index Fund | ||||
| Face | Market | |||
| Maturity | Amount | Value• | ||
| Coupon | Date | ($000) | ($000) | |
| 5 JP Morgan Chase Commercial Mortgage | ||||
| Securities Trust 2007-LDP11 | 5.774% | 6/15/49 | 5,610 | 5,730 |
| 5 JP Morgan Chase Commercial Mortgage | ||||
| Securities Trust 2007-LDP12 | 5.882% | 2/15/51 | 6,620 | 6,853 |
| 5 JP Morgan Chase Commercial Mortgage | ||||
| Securities Trust 2012-C6 | 3.507% | 5/15/45 | 4,875 | 5,039 |
| 5 JP Morgan Chase Commercial Mortgage | ||||
| Securities Trust 2012-C8 | 2.829% | 10/15/45 | 11,975 | 11,901 |
| 5 JP Morgan Chase Commercial Mortgage | ||||
| Securities Trust 2012-CIBX | 3.483% | 6/15/45 | 3,816 | 3,980 |
| 5 JP Morgan Chase Commercial Mortgage | ||||
| Securities Trust 2012-LC9 | 2.840% | 12/15/47 | 2,250 | 2,240 |
| 5 JP Morgan Chase Commercial Mortgage | ||||
| Securities Trust 2013-C10 | 3.143% | 12/15/47 | 1,389 | 1,398 |
| 5 JP Morgan Chase Commercial Mortgage | ||||
| Securities Trust 2013-C10 | 3.372% | 12/15/47 | 1,042 | 1,049 |
| 5 JP Morgan Chase Commercial Mortgage | ||||
| Securities Trust 2013-C16 | 3.674% | 12/15/46 | 1,250 | 1,306 |
| 5 JP Morgan Chase Commercial Mortgage | ||||
| Securities Trust 2013-C16 | 3.881% | 12/15/46 | 1,500 | 1,579 |
| 5 JP Morgan Chase Commercial Mortgage | ||||
| Securities Trust 2013-C16 | 4.166% | 12/15/46 | 2,600 | 2,767 |
| 5 JP Morgan Chase Commercial Mortgage | ||||
| Securities Trust 2013-C16 | 4.517% | 12/15/46 | 1,250 | 1,345 |
| 5 JP Morgan Chase Commercial Mortgage | ||||
| Securities Trust 2013-C16 | 4.944% | 12/15/46 | 1,250 | 1,348 |
| 5 JP Morgan Chase Commercial Mortgage | ||||
| Securities Trust 2013-LC11 | 2.960% | 4/15/46 | 1,466 | 1,458 |
| 5 JP Morgan Chase Commercial Mortgage | ||||
| Securities Trust 2014-C20 | 2.872% | 7/15/47 | 1,525 | 1,557 |
| 5 JP Morgan Chase Commercial Mortgage | ||||
| Securities Trust 2014-C20 | 3.805% | 7/15/47 | 575 | 598 |
| 5 JPMBB Commercial Mortgage Securities Trust | ||||
| 2013-C12 | 3.664% | 7/15/45 | 1,982 | 2,056 |
| 5 JPMBB Commercial Mortgage Securities Trust | ||||
| 2013-C12 | 4.025% | 7/15/45 | 655 | 688 |
| 5 JPMBB Commercial Mortgage Securities Trust | ||||
| 2013-C14 | 3.761% | 8/15/46 | 990 | 1,039 |
| 5 JPMBB Commercial Mortgage Securities Trust | ||||
| 2013-C14 | 4.133% | 8/15/46 | 2,640 | 2,817 |
| 5 JPMBB Commercial Mortgage Securities Trust | ||||
| 2013-C14 | 4.409% | 8/15/46 | 740 | 791 |
| 5 JPMBB Commercial Mortgage Securities Trust | ||||
| 2013-C15 | 1.233% | 11/15/45 | 791 | 788 |
| 5 JPMBB Commercial Mortgage Securities Trust | ||||
| 2013-C15 | 2.977% | 11/15/45 | 5,030 | 5,144 |
| 5 JPMBB Commercial Mortgage Securities Trust | ||||
| 2013-C15 | 3.659% | 11/15/45 | 505 | 527 |
| 5 JPMBB Commercial Mortgage Securities Trust | ||||
| 2013-C15 | 4.131% | 11/15/45 | 3,520 | 3,754 |
| 5 JPMBB Commercial Mortgage Securities Trust | ||||
| 2013-C15 | 4.420% | 11/15/45 | 2,010 | 2,151 |
| 5 JPMBB Commercial Mortgage Securities Trust | ||||
| 2013-C17 | 3.003% | 1/15/47 | 1,550 | 1,588 |
| 5 JPMBB Commercial Mortgage Securities Trust | ||||
| 2013-C17 | 3.705% | 1/15/47 | 1,163 | 1,216 |
34
| Total Bond Market II Index Fund | ||||
| Face | Market | |||
| Maturity | Amount | Value• | ||
| Coupon | Date | ($000) | ($000) | |
| 5 JPMBB Commercial Mortgage Securities Trust | ||||
| 2013-C17 | 4.199% | 1/15/47 | 4,320 | 4,653 |
| 5 JPMBB Commercial Mortgage Securities Trust | ||||
| 2013-C17 | 4.458% | 1/15/47 | 775 | 838 |
| 5 JPMBB Commercial Mortgage Securities Trust | ||||
| 2013-C17 | 4.887% | 1/15/47 | 1,163 | 1,243 |
| 5 JPMBB Commercial Mortgage Securities Trust | ||||
| 2014-C18 | 4.079% | 2/15/47 | 4,338 | 4,603 |
| 5 JPMBB Commercial Mortgage Securities Trust | ||||
| 2014-C18 | 4.439% | 2/15/47 | 771 | 823 |
| 5 JPMBB Commercial Mortgage Securities Trust | ||||
| 2014-C18 | 4.810% | 2/15/47 | 935 | 996 |
| 5 JPMBB Commercial Mortgage Securities Trust | ||||
| 2014-C19 | 3.046% | 4/15/47 | 1,525 | 1,560 |
| 5 JPMBB Commercial Mortgage Securities Trust | ||||
| 2014-C19 | 3.669% | 4/15/47 | 1,900 | 1,969 |
| 5 JPMBB Commercial Mortgage Securities Trust | ||||
| 2014-C19 | 3.997% | 4/15/47 | 1,900 | 1,997 |
| 5 JPMBB Commercial Mortgage Securities Trust | ||||
| 2014-C19 | 4.243% | 4/15/47 | 1,525 | 1,611 |
| 5 JPMBB Commercial Mortgage Securities Trust | ||||
| 2014-C19 | 4.110% | 9/15/47 | 1,550 | 1,608 |
| 5 JPMBB Commercial Mortgage Securities Trust | ||||
| 2014-C21 | 3.428% | 8/15/47 | 979 | 1,001 |
| 5 JPMBB Commercial Mortgage Securities Trust | ||||
| 2014-C21 | 3.775% | 8/15/47 | 950 | 986 |
| 5 JPMBB Commercial Mortgage Securities Trust | ||||
| 2014-C21 | 3.997% | 8/15/47 | 575 | 596 |
| 5 JPMBB Commercial Mortgage Securities Trust | ||||
| 2014-C22 | 3.801% | 9/15/47 | 5,850 | 6,054 |
| 5 JPMBB Commercial Mortgage Securities Trust | ||||
| 2014-C23 | 3.934% | 9/15/47 | 2,919 | 3,065 |
| 5 JPMBB Commercial Mortgage Securities Trust | ||||
| 2014-C23 | 4.202% | 9/15/47 | 1,722 | 1,812 |
| 5 JPMBB Commercial Mortgage Securities Trust | ||||
| 2014-C24 | 2.940% | 11/15/47 | 1,900 | 1,943 |
| 5 JPMBB Commercial Mortgage Securities Trust | ||||
| 2014-C24 | 3.639% | 11/15/47 | 1,525 | 1,566 |
| 5 JPMBB Commercial Mortgage Securities Trust | ||||
| 2014-C24 | 3.914% | 11/15/47 | 2,750 | 2,822 |
| 5 JPMBB Commercial Mortgage Securities Trust | ||||
| 2014-C25 | 3.672% | 11/15/47 | 6,825 | 7,014 |
| 5 JPMBB Commercial Mortgage Securities Trust | ||||
| 2014-C25 | 4.065% | 11/15/47 | 1,900 | 1,992 |
| 5 JPMBB Commercial Mortgage Securities Trust | ||||
| 2014-C26 | 3.019% | 1/15/48 | 3,750 | 3,846 |
| 5 JPMBB Commercial Mortgage Securities Trust | ||||
| 2014-C26 | 3.494% | 1/15/48 | 5,525 | 5,601 |
| 5 JPMBB Commercial Mortgage Securities Trust | ||||
| 2014-C26 | 3.800% | 1/15/48 | 1,875 | 1,903 |
| 5 JPMBB Commercial Mortgage Securities Trust | ||||
| 2014-C26 | 3.951% | 1/15/48 | 1,875 | 1,875 |
| 5 JPMBB Commercial Mortgage Securities Trust | ||||
| 2015-C27 | 2.734% | 2/15/48 | 3,000 | 3,041 |
| 5 JPMBB Commercial Mortgage Securities Trust | ||||
| 2015-C27 | 3.017% | 2/15/48 | 3,763 | 3,768 |
35
| Total Bond Market II Index Fund | ||||
| Face | Market | |||
| Maturity | Amount | Value• | ||
| Coupon | Date | ($000) | ($000) | |
| 5 JPMBB Commercial Mortgage Securities Trust | ||||
| 2015-C28 | 2.773% | 10/15/48 | 3,750 | 3,801 |
| 5 JPMBB Commercial Mortgage Securities Trust | ||||
| 2015-C28 | 3.532% | 10/15/48 | 1,125 | 1,110 |
| 5 JPMBB Commercial Mortgage Securities Trust | ||||
| 2015-C29 | 2.921% | 5/15/48 | 3,000 | 3,061 |
| 5 JPMBB Commercial Mortgage Securities Trust | ||||
| 2015-C29 | 3.304% | 5/15/48 | 1,903 | 1,934 |
| 5 JPMBB Commercial Mortgage Securities Trust | ||||
| 2015-C29 | 3.611% | 5/15/48 | 2,900 | 2,937 |
| 5 JPMBB Commercial Mortgage Securities Trust | ||||
| 2015-C30 | 3.559% | 7/15/48 | 3,675 | 3,787 |
| 5 JPMBB Commercial Mortgage Securities Trust | ||||
| 2015-C30 | 3.822% | 7/15/48 | 3,600 | 3,724 |
| 5 JPMBB Commercial Mortgage Securities Trust | ||||
| 2015-C30 | 4.226% | 7/15/48 | 1,850 | 1,923 |
| 5 JPMBB Commercial Mortgage Securities Trust | ||||
| 2015-C31 | 3.540% | 8/15/48 | 1,709 | 1,757 |
| 5 JPMBB Commercial Mortgage Securities Trust | ||||
| 2015-C31 | 3.801% | 8/15/48 | 1,841 | 1,906 |
| 5 JPMBB Commercial Mortgage Securities Trust | ||||
| 2015-C32 | 3.358% | 11/15/48 | 3,575 | 3,637 |
| 5 JPMBB Commercial Mortgage Securities Trust | ||||
| 2015-C32 | 3.598% | 11/15/48 | 3,575 | 3,641 |
| 5 JPMBB Commercial Mortgage Securities Trust | ||||
| 2015-C33 | 3.770% | 12/15/48 | 2,610 | 2,671 |
| 5 JPMCC Commercial Mortgage Securities Trust | ||||
| 2015-JP1 | 3.914% | 1/15/49 | 2,825 | 2,911 |
| 5 LB-UBS Commercial Mortgage Trust 2006-C1 | 5.217% | 2/15/31 | 2,062 | 2,062 |
| 5 LB-UBS Commercial Mortgage Trust 2006-C4 | 5.820% | 6/15/38 | 5,697 | 5,740 |
| 5 LB-UBS Commercial Mortgage Trust 2006-C6 | 5.372% | 9/15/39 | 9,949 | 10,077 |
| 5 LB-UBS Commercial Mortgage Trust 2006-C6 | 5.413% | 9/15/39 | 1,176 | 1,203 |
| 5 LB-UBS Commercial Mortgage Trust 2006-C7 | 5.347% | 11/15/38 | 1,150 | 1,173 |
| 5 LB-UBS Commercial Mortgage Trust 2006-C7 | 5.378% | 11/15/38 | 1,585 | 1,621 |
| 5 LB-UBS Commercial Mortgage Trust 2007-C2 | 5.430% | 2/15/40 | 6,335 | 6,514 |
| 5 LB-UBS Commercial Mortgage Trust 2007-C7 | 5.866% | 9/15/45 | 11,976 | 12,744 |
| 5 LB-UBS Commercial Mortgage Trust 2008-C1 | 6.087% | 4/15/41 | 11,699 | 12,502 |
| 5 Mercedes-Benz Auto Lease Trust 2015-A | 1.210% | 10/15/20 | 5,650 | 5,627 |
| 5 Mercedes-Benz Auto Lease Trust 2015-B | 1.340% | 7/16/18 | 1,800 | 1,792 |
| 5 Mercedes-Benz Auto Lease Trust 2015-B | 1.530% | 5/17/21 | 1,075 | 1,067 |
| 5 Mercedes-Benz Auto Receivables Trust 2013-1 | 0.780% | 8/15/17 | 225 | 225 |
| 5 Mercedes-Benz Auto Receivables Trust 2013-1 | 1.130% | 11/15/19 | 692 | 692 |
| 5 Mercedes-Benz Auto Receivables Trust 2014-1 | 0.870% | 10/15/18 | 1,875 | 1,869 |
| 5 Mercedes-Benz Auto Receivables Trust 2014-1 | 1.310% | 11/16/20 | 600 | 596 |
| 5 Mercedes-Benz Auto Receivables Trust 2015-1 | 1.340% | 12/16/19 | 2,150 | 2,137 |
| 5 Mercedes-Benz Auto Receivables Trust 2015-1 | 1.750% | 12/15/21 | 725 | 720 |
| 5 Merrill Lynch Mortgage Trust 2006-C1 | 5.666% | 5/12/39 | 625 | 631 |
| 5 Merrill Lynch Mortgage Trust 2006-C2 | 5.782% | 8/12/43 | 1,965 | 2,003 |
| 5 Merrill Lynch Mortgage Trust 2007-C1 | 5.836% | 6/12/50 | 2,345 | 2,421 |
| 5 Merrill Lynch Mortgage Trust 2008-C1 | 5.690% | 2/12/51 | 5,290 | 5,526 |
| 5 ML-CFC Commercial Mortgage Trust 2006-3 | 5.456% | 7/12/46 | 435 | 443 |
| 5 ML-CFC Commercial Mortgage Trust 2006-4 | 5.204% | 12/12/49 | 1,225 | 1,259 |
| 5 ML-CFC Commercial Mortgage Trust 2007-5 | 5.378% | 8/12/48 | 6,708 | 6,861 |
| 5 ML-CFC Commercial Mortgage Trust 2007-7 | 5.743% | 6/12/50 | 4,551 | 4,724 |
| 5 ML-CFC Commercial Mortgage Trust 2007-9 | 5.700% | 9/12/49 | 10,786 | 11,236 |
36
| Total Bond Market II Index Fund | ||||
| Face | Market | |||
| Maturity | Amount | Value• | ||
| Coupon | Date | ($000) | ($000) | |
| 5 Morgan Stanley Bank of America Merrill Lynch | ||||
| Trust 2012-C5 | 3.176% | 8/15/45 | 1,600 | 1,624 |
| 5 Morgan Stanley Bank of America Merrill Lynch | ||||
| Trust 2012-C6 | 2.858% | 11/15/45 | 4,000 | 3,978 |
| 5 Morgan Stanley Bank of America Merrill Lynch | ||||
| Trust 2013-C11 | 4.214% | 8/15/46 | 990 | 1,059 |
| 5 Morgan Stanley Bank of America Merrill Lynch | ||||
| Trust 2013-C11 | 4.414% | 8/15/46 | 490 | 524 |
| 5 Morgan Stanley Bank of America Merrill Lynch | ||||
| Trust 2013-C12 | 3.001% | 10/15/46 | 2,260 | 2,315 |
| 5 Morgan Stanley Bank of America Merrill Lynch | ||||
| Trust 2013-C12 | 4.259% | 10/15/46 | 3,360 | 3,602 |
| 5 Morgan Stanley Bank of America Merrill Lynch | ||||
| Trust 2013-C13 | 2.936% | 11/15/46 | 1,100 | 1,125 |
| 5 Morgan Stanley Bank of America Merrill Lynch | ||||
| Trust 2013-C13 | 4.039% | 11/15/46 | 2,200 | 2,326 |
| 5 Morgan Stanley Bank of America Merrill Lynch | ||||
| Trust 2013-C13 | 4.742% | 11/15/46 | 1,100 | 1,176 |
| 5 Morgan Stanley Bank of America Merrill Lynch | ||||
| Trust 2013-C7 | 2.918% | 2/15/46 | 1,707 | 1,690 |
| 5 Morgan Stanley Bank of America Merrill Lynch | ||||
| Trust 2013-C7 | 3.214% | 2/15/46 | 341 | 340 |
| 5 Morgan Stanley Bank of America Merrill Lynch | ||||
| Trust 2013-C8 | 3.134% | 12/15/48 | 2,100 | 2,101 |
| 5 Morgan Stanley Bank of America Merrill Lynch | ||||
| Trust 2013-C8 | 3.376% | 12/15/48 | 1,000 | 1,006 |
| 5 Morgan Stanley Bank of America Merrill Lynch | ||||
| Trust 2013-C9 | 3.102% | 5/15/46 | 1,275 | 1,271 |
| 5 Morgan Stanley Bank of America Merrill Lynch | ||||
| Trust 2013-C9 | 3.456% | 5/15/46 | 975 | 980 |
| 5 Morgan Stanley Bank of America Merrill Lynch | ||||
| Trust 2014-C14 | 1.250% | 2/15/47 | 833 | 825 |
| 5 Morgan Stanley Bank of America Merrill Lynch | ||||
| Trust 2014-C14 | 2.916% | 2/15/47 | 1,525 | 1,558 |
| 5 Morgan Stanley Bank of America Merrill Lynch | ||||
| Trust 2014-C14 | 3.669% | 2/15/47 | 3,050 | 3,174 |
| 5 Morgan Stanley Bank of America Merrill Lynch | ||||
| Trust 2014-C14 | 4.064% | 2/15/47 | 3,050 | 3,222 |
| 5 Morgan Stanley Bank of America Merrill Lynch | ||||
| Trust 2014-C14 | 4.642% | 2/15/47 | 1,150 | 1,241 |
| 5 Morgan Stanley Bank of America Merrill Lynch | ||||
| Trust 2014-C16 | 2.849% | 6/15/47 | 575 | 586 |
| 5 Morgan Stanley Bank of America Merrill Lynch | ||||
| Trust 2014-C16 | 3.477% | 6/15/47 | 775 | 795 |
| 5 Morgan Stanley Bank of America Merrill Lynch | ||||
| Trust 2014-C16 | 3.892% | 6/15/47 | 2,875 | 2,996 |
| 5 Morgan Stanley Bank of America Merrill Lynch | ||||
| Trust 2014-C16 | 4.324% | 6/15/47 | 1,150 | 1,185 |
| 5 Morgan Stanley Bank of America Merrill Lynch | ||||
| Trust 2014-C18 | 3.194% | 10/15/47 | 3,500 | 3,589 |
| 5 Morgan Stanley Bank of America Merrill Lynch | ||||
| Trust 2014-C18 | 3.923% | 10/15/47 | 1,000 | 1,043 |
| 5 Morgan Stanley Bank of America Merrill Lynch | ||||
| Trust 2014-C18 | 4.444% | 10/15/47 | 1,150 | 1,214 |
| 5 Morgan Stanley Bank of America Merrill Lynch | ||||
| Trust 2014-C19 | 3.101% | 12/15/47 | 3,775 | 3,880 |
37
| Total Bond Market II Index Fund | ||||
| Face | Market | |||
| Maturity | Amount | Value• | ||
| Coupon | Date | ($000) | ($000) | |
| 5 Morgan Stanley Bank of America Merrill Lynch | ||||
| Trust 2014-C19 | 3.326% | 12/15/47 | 2,000 | 2,045 |
| 5 Morgan Stanley Bank of America Merrill Lynch | ||||
| Trust 2014-C19 | 3.526% | 12/15/47 | 3,275 | 3,317 |
| 5 Morgan Stanley Bank of America Merrill Lynch | ||||
| Trust 2015-C20 | 3.069% | 2/15/48 | 1,875 | 1,888 |
| 5 Morgan Stanley Bank of America Merrill Lynch | ||||
| Trust 2015-C20 | 3.249% | 2/15/48 | 6,650 | 6,565 |
| 5 Morgan Stanley Bank of America Merrill Lynch | ||||
| Trust 2015-C21 | 3.338% | 3/15/48 | 1,500 | 1,490 |
| 5 Morgan Stanley Bank of America Merrill Lynch | ||||
| Trust 2015-C22 | 3.040% | 4/15/48 | 3,750 | 3,760 |
| 5 Morgan Stanley Bank of America Merrill Lynch | ||||
| Trust 2015-C22 | 3.306% | 4/15/48 | 2,950 | 2,913 |
| 5 Morgan Stanley Bank of America Merrill Lynch | ||||
| Trust 2015-C22 | 3.883% | 4/15/48 | 1,875 | 1,856 |
| 5 Morgan Stanley Bank of America Merrill Lynch | ||||
| Trust 2015-C23 | 2.982% | 7/15/50 | 1,800 | 1,832 |
| 5 Morgan Stanley Bank of America Merrill Lynch | ||||
| Trust 2015-C23 | 3.398% | 7/15/50 | 1,050 | 1,075 |
| 5 Morgan Stanley Bank of America Merrill Lynch | ||||
| Trust 2015-C23 | 3.719% | 7/15/50 | 3,650 | 3,729 |
| 5 Morgan Stanley Bank of America Merrill Lynch | ||||
| Trust 2015-C25 | 3.383% | 10/15/48 | 3,850 | 3,916 |
| 5 Morgan Stanley Bank of America Merrill Lynch | ||||
| Trust 2015-C25 | 3.635% | 10/15/48 | 1,975 | 1,996 |
| 5 Morgan Stanley Bank of America Merrill Lynch | ||||
| Trust 2015-C26 | 3.323% | 10/15/48 | 2,325 | 2,364 |
| 5 Morgan Stanley Bank of America Merrill Lynch | ||||
| Trust 2015-C26 | 3.531% | 10/15/48 | 2,625 | 2,633 |
| 5 Morgan Stanley Bank of America Merrill Lynch | ||||
| Trust 2015-C27 | 3.557% | 12/15/47 | 1,800 | 1,839 |
| 5 Morgan Stanley Bank of America Merrill Lynch | ||||
| Trust 2015-C27 | 3.753% | 12/15/47 | 2,175 | 2,218 |
| 5 Morgan Stanley Capital I Trust 2005-IQ9 | 4.770% | 7/15/56 | 1,066 | 1,065 |
| 5 Morgan Stanley Capital I Trust 2005-TOP17 | 4.840% | 12/13/41 | 59 | 59 |
| 5 Morgan Stanley Capital I Trust 2005-TOP19 | 4.985% | 6/12/47 | 166 | 166 |
| 5 Morgan Stanley Capital I Trust 2006-HQ10 | 5.360% | 11/12/41 | 2,626 | 2,677 |
| 5 Morgan Stanley Capital I Trust 2006-HQ8 | 5.480% | 3/12/44 | 1,799 | 1,797 |
| 5 Morgan Stanley Capital I Trust 2006-HQ9 | 5.773% | 7/12/44 | 3,425 | 3,489 |
| 5 Morgan Stanley Capital I Trust 2006-HQ9 | 5.793% | 7/12/44 | 1,475 | 1,496 |
| 5 Morgan Stanley Capital I Trust 2006-IQ11 | 5.779% | 10/15/42 | 635 | 634 |
| 5 Morgan Stanley Capital I Trust 2006-IQ11 | 5.783% | 10/15/42 | 1,750 | 1,764 |
| 5 Morgan Stanley Capital I Trust 2006-IQ11 | 5.783% | 10/15/42 | 225 | 226 |
| 5 Morgan Stanley Capital I Trust 2006-IQ12 | 5.332% | 12/15/43 | 7,292 | 7,413 |
| 5 Morgan Stanley Capital I Trust 2006-IQ12 | 5.370% | 12/15/43 | 1,355 | 1,395 |
| 5 Morgan Stanley Capital I Trust 2006-TOP23 | 5.847% | 8/12/41 | 775 | 789 |
| 5 Morgan Stanley Capital I Trust 2007-IQ14 | 5.654% | 4/15/49 | 331 | 334 |
| 5 Morgan Stanley Capital I Trust 2007-IQ14 | 5.692% | 4/15/49 | 9,610 | 9,879 |
| 5 Morgan Stanley Capital I Trust 2007-IQ15 | 5.917% | 6/11/49 | 4,176 | 4,344 |
| 5 Morgan Stanley Capital I Trust 2007-IQ16 | 5.809% | 12/12/49 | 10,895 | 11,395 |
| 5 Morgan Stanley Capital I Trust 2007-IQ16 | 6.054% | 12/12/49 | 2,285 | 2,402 |
| 5 Morgan Stanley Capital I Trust 2007-TOP25 | 5.514% | 11/12/49 | 1,180 | 1,209 |
| 5 Morgan Stanley Capital I Trust 2007-TOP25 | 5.544% | 11/12/49 | 1,750 | 1,809 |
| 5 Morgan Stanley Capital I Trust 2007-TOP27 | 5.645% | 6/11/42 | 9,448 | 9,866 |
| 5 Morgan Stanley Capital I Trust 2007-TOP27 | 5.645% | 6/11/42 | 2,475 | 2,591 |
38
| Total Bond Market II Index Fund | ||||
| Face | Market | |||
| Maturity | Amount | Value• | ||
| Coupon | Date | ($000) | ($000) | |
| 5 Morgan Stanley Capital I Trust 2008-TOP29 | 6.268% | 1/11/43 | 15,889 | 16,980 |
| 5 Morgan Stanley Capital I Trust 2012-C4 | 3.244% | 3/15/45 | 6,000 | 6,120 |
| 5 Morgan Stanley Capital I Trust 2012-C4 | 3.773% | 3/15/45 | 1,800 | 1,868 |
| 5 Morgan Stanley Capital I Trust 2015-UBS8 | 3.809% | 12/15/48 | 2,525 | 2,576 |
| 5 Nissan Auto Lease Trust 2014-B | 1.120% | 9/15/17 | 1,125 | 1,121 |
| 5 Nissan Auto Lease Trust 2015-B | 1.540% | 4/16/18 | 2,500 | 2,491 |
| 5 Nissan Auto Lease Trust 2015-B | 1.700% | 4/15/21 | 1,625 | 1,618 |
| 5 Nissan Auto Receivables 2013-A Owner Trust | 0.500% | 5/15/17 | 174 | 174 |
| 5 Nissan Auto Receivables 2013-B Owner Trust | 0.840% | 11/15/17 | 617 | 617 |
| 5 Nissan Auto Receivables 2013-B Owner Trust | 1.310% | 10/15/19 | 1,040 | 1,038 |
| 5 Nissan Auto Receivables 2013-C Owner Trust | 0.670% | 8/15/18 | 1,149 | 1,146 |
| 5 Nissan Auto Receivables 2013-C Owner Trust | 1.300% | 6/15/20 | 1,150 | 1,145 |
| 5 Nissan Auto Receivables 2014-A Owner Trust | 0.720% | 8/15/18 | 1,076 | 1,073 |
| 5 Nissan Auto Receivables 2014-A Owner Trust | 1.340% | 8/17/20 | 1,475 | 1,466 |
| 5 Nissan Auto Receivables 2014-B Owner Trust | 1.110% | 5/15/19 | 1,800 | 1,792 |
| 5 Nissan Auto Receivables 2015-B Owner Trust | 1.340% | 3/16/20 | 2,125 | 2,112 |
| 5 Nissan Auto Receivables 2015-B Owner Trust | 1.790% | 1/17/22 | 1,075 | 1,069 |
| 5 Nissan Auto Receivables 2015-C Owner Trust | 1.370% | 5/15/20 | 1,025 | 1,016 |
| 5 Nissan Auto Receivables 2015-C Owner Trust | 1.670% | 2/15/22 | 1,750 | 1,728 |
| 5 Royal Bank of Canada | 1.200% | 9/19/18 | 11,600 | 11,521 |
| 5 Royal Bank of Canada | 2.000% | 10/1/19 | 12,000 | 12,041 |
| 5 Santander Drive Auto Receivables Trust 2013-4 | 0.870% | 1/16/18 | 274 | 274 |
| 5 Santander Drive Auto Receivables Trust 2013-4 | 1.590% | 10/15/18 | 2,100 | 2,100 |
| 5 Santander Drive Auto Receivables Trust 2014-2 | 0.800% | 4/16/18 | 589 | 589 |
| 5 Santander Drive Auto Receivables Trust 2014-3 | 0.810% | 7/16/18 | 504 | 504 |
| 5 Santander Drive Auto Receivables Trust 2014-4 | 1.080% | 9/17/18 | 1,950 | 1,949 |
| 5 Synchrony Credit Card Master Note Trust 2014-1 | 1.610% | 11/15/20 | 2,225 | 2,216 |
| 5 Synchrony Credit Card Master Note Trust 2015-2 | 1.600% | 4/15/21 | 2,200 | 2,187 |
| 5 TIAA Seasoned Commercial Mortgage Trust | ||||
| 2007-C4 | 5.510% | 8/15/39 | 676 | 677 |
| 5 Toyota Auto Receivables 2013-A Owner Trust | 0.550% | 1/17/17 | 101 | 101 |
| 5 Toyota Auto Receivables 2013-A Owner Trust | 0.690% | 11/15/18 | 1,160 | 1,157 |
| 5 Toyota Auto Receivables 2014-A Owner Trust | 1.180% | 6/17/19 | 850 | 847 |
| 5 Toyota Auto Receivables 2014-B Owner Trust | 0.760% | 3/15/18 | 950 | 948 |
| 5 Toyota Auto Receivables 2014-B Owner Trust | 1.310% | 9/16/19 | 750 | 747 |
| 5 Toyota Auto Receivables 2015-B Owner Trust | 1.270% | 5/15/19 | 5,300 | 5,286 |
| 5 Toyota Auto Receivables 2015-B Owner Trust | 1.740% | 9/15/20 | 3,275 | 3,275 |
| 5 Toyota Auto Receivables 2015-C Owner Trust | 1.340% | 6/17/19 | 3,050 | 3,039 |
| 5 Toyota Auto Receivables Owner Trust 2015-C | 1.690% | 12/15/20 | 3,000 | 2,994 |
| 5 UBS-Barclays Commercial Mortgage Trust | ||||
| 2013-C5 | 3.185% | 3/10/46 | 2,870 | 2,918 |
| 5 UBS-Barclays Commercial Mortgage Trust | ||||
| 2013-C6 | 3.244% | 4/10/46 | 1,775 | 1,792 |
| 5 UBS-Barclays Commercial Mortgage Trust | ||||
| 2013-C6 | 3.469% | 4/10/46 | 700 | 700 |
| 5 USAA Auto Owner Trust 2014-1 | 0.580% | 12/15/17 | 682 | 680 |
| 5 USAA Auto Owner Trust 2014-1 | 0.940% | 5/15/19 | 750 | 748 |
| 5 Volkswagen Auto Lease Trust 2014-A | 0.800% | 4/20/17 | 629 | 627 |
| 5 Volkswagen Auto Lease Trust 2014-A | 0.990% | 7/20/18 | 735 | 732 |
| 5 Volkswagen Auto Loan Enhanced Trust 2013-2 | 0.700% | 4/20/18 | 746 | 744 |
| 5 Volkswagen Auto Loan Enhanced Trust 2013-2 | 1.160% | 3/20/20 | 550 | 546 |
| 5 Volkswagen Auto Loan Enhanced Trust 2014-1 | 0.910% | 10/22/18 | 2,350 | 2,336 |
| 5 Volkswagen Auto Loan Enhanced Trust 2014-1 | 1.450% | 9/21/20 | 1,950 | 1,918 |
| 5 Volkswagen Auto Loan Enhanced Trust 2014-2 | 1.390% | 5/20/21 | 1,875 | 1,835 |
| 5 Wachovia Bank Commercial Mortgage Trust | ||||
| Series 2005-C21 | 5.301% | 10/15/44 | 156 | 157 |
39
| Total Bond Market II Index Fund | ||||
| Face | Market | |||
| Maturity | Amount | Value• | ||
| Coupon | Date | ($000) | ($000) | |
| 5 Wachovia Bank Commercial Mortgage Trust | ||||
| Series 2006-C26 | 5.962% | 6/15/45 | 475 | 482 |
| 5 Wachovia Bank Commercial Mortgage Trust | ||||
| Series 2006-C27 | 5.765% | 7/15/45 | 5,307 | 5,374 |
| 5 Wachovia Bank Commercial Mortgage Trust | ||||
| Series 2006-C29 | 5.339% | 11/15/48 | 2,400 | 2,459 |
| 5 Wachovia Bank Commercial Mortgage Trust | ||||
| Series 2007-C30 | 5.342% | 12/15/43 | 2,040 | 2,103 |
| 5 Wachovia Bank Commercial Mortgage Trust | ||||
| Series 2007-C33 | 5.952% | 2/15/51 | 3,968 | 4,096 |
| 5 Wells Fargo Commercial Mortgage Trust | ||||
| 2012-LC5 | 2.918% | 10/15/45 | 1,975 | 1,977 |
| 5 Wells Fargo Commercial Mortgage Trust | ||||
| 2014-LC16 | 2.819% | 8/15/50 | 1,150 | 1,171 |
| 5 Wells Fargo Commercial Mortgage Trust | ||||
| 2014-LC16 | 3.477% | 8/15/50 | 775 | 799 |
| 5 Wells Fargo Commercial Mortgage Trust | ||||
| 2014-LC16 | 3.817% | 8/15/50 | 2,700 | 2,810 |
| 5 Wells Fargo Commercial Mortgage Trust | ||||
| 2014-LC16 | 4.020% | 8/15/50 | 400 | 416 |
| 5 Wells Fargo Commercial Mortgage Trust | ||||
| 2014-LC18 | 2.954% | 12/15/47 | 2,250 | 2,300 |
| 5 Wells Fargo Commercial Mortgage Trust | ||||
| 2014-LC18 | 3.244% | 12/15/47 | 1,400 | 1,421 |
| 5 Wells Fargo Commercial Mortgage Trust | ||||
| 2014-LC18 | 3.271% | 12/15/47 | 2,625 | 2,644 |
| 5 Wells Fargo Commercial Mortgage Trust | ||||
| 2014-LC18 | 3.405% | 12/15/47 | 3,725 | 3,750 |
| 5 Wells Fargo Commercial Mortgage Trust | ||||
| 2014-LC18 | 3.808% | 12/15/47 | 1,875 | 1,890 |
| 5 Wells Fargo Commercial Mortgage Trust | ||||
| 2015-C26 | 2.991% | 2/15/48 | 3,750 | 3,746 |
| 5 Wells Fargo Commercial Mortgage Trust | ||||
| 2015-C26 | 3.166% | 2/15/48 | 2,075 | 2,042 |
| 5 Wells Fargo Commercial Mortgage Trust | ||||
| 2015-C26 | 3.580% | 2/15/48 | 1,500 | 1,491 |
| 5 Wells Fargo Commercial Mortgage Trust | ||||
| 2015-C28 | 3.540% | 5/15/48 | 5,425 | 5,455 |
| 5 Wells Fargo Commercial Mortgage Trust | ||||
| 2015-C28 | 3.872% | 5/15/48 | 1,040 | 1,052 |
| 5 Wells Fargo Commercial Mortgage Trust | ||||
| 2015-C29 | 3.400% | 6/15/48 | 3,650 | 3,695 |
| 5 Wells Fargo Commercial Mortgage Trust | ||||
| 2015-LC20 | 2.978% | 4/15/50 | 1,029 | 1,025 |
| 5 Wells Fargo Commercial Mortgage Trust | ||||
| 2015-LC20 | 3.719% | 4/15/50 | 1,900 | 1,821 |
| 5 Wells Fargo Commercial Mortgage Trust | ||||
| 2015-LC22 | 3.571% | 9/15/58 | 1,425 | 1,469 |
| 5 Wells Fargo Commercial Mortgage Trust | ||||
| 2015-LC22 | 3.839% | 9/15/58 | 2,000 | 2,081 |
| 5 Wells Fargo Commercial Mortgage Trust | ||||
| 2015-LC22 | 4.207% | 9/15/58 | 1,775 | 1,846 |
| 5 Wells Fargo Commercial Mortgage Trust | ||||
| 2015-NSX1 | 2.632% | 5/15/48 | 1,600 | 1,610 |
| 5 Wells Fargo Commercial Mortgage Trust | ||||
| 2015-NSX1 | 2.934% | 5/15/48 | 1,125 | 1,125 |
40
| Total Bond Market II Index Fund | ||||
| Face | Market | |||
| Maturity | Amount | Value• | ||
| Coupon | Date | ($000) | ($000) | |
| 5 Wells Fargo Commercial Mortgage Trust | ||||
| 2015-NSX1 | 3.148% | 5/15/48 | 1,500 | 1,468 |
| 5 Wells Fargo Commercial Mortgage Trust 2015-P2 | 3.656% | 12/15/48 | 2,875 | 2,950 |
| 5 Wells Fargo Commercial Mortgage Trust 2015-P2 | 3.809% | 12/15/48 | 1,800 | 1,846 |
| 5 Wells Fargo Commercial Mortgage Trust | ||||
| 2015-SG1 | 3.789% | 12/15/47 | 2,400 | 2,465 |
| 5 WFRBS Commercial Mortgage Trust 2012-C10 | 2.875% | 12/15/45 | 2,500 | 2,471 |
| 5 WFRBS Commercial Mortgage Trust 2012-C6 | 3.440% | 4/15/45 | 3,875 | 4,008 |
| 5 WFRBS Commercial Mortgage Trust 2012-C7 | 3.431% | 6/15/45 | 3,511 | 3,615 |
| 5 WFRBS Commercial Mortgage Trust 2012-C7 | 4.090% | 6/15/45 | 2,200 | 2,330 |
| 5 WFRBS Commercial Mortgage Trust 2012-C8 | 3.001% | 8/15/45 | 1,600 | 1,600 |
| 5 WFRBS Commercial Mortgage Trust 2012-C9 | 2.870% | 11/15/45 | 3,300 | 3,277 |
| 5 WFRBS Commercial Mortgage Trust 2013-C11 | 3.071% | 3/15/45 | 2,414 | 2,414 |
| 5 WFRBS Commercial Mortgage Trust 2013-C12 | 3.198% | 3/15/48 | 1,045 | 1,049 |
| 5 WFRBS Commercial Mortgage Trust 2013-C12 | 3.560% | 3/15/48 | 495 | 502 |
| 5 WFRBS Commercial Mortgage Trust 2013-C13 | 3.001% | 5/15/45 | 2,154 | 2,141 |
| 5 WFRBS Commercial Mortgage Trust 2013-C13 | 3.345% | 5/15/45 | 421 | 423 |
| 5 WFRBS Commercial Mortgage Trust 2013-C14 | 3.337% | 6/15/46 | 3,250 | 3,293 |
| 5 WFRBS Commercial Mortgage Trust 2013-C14 | 3.488% | 6/15/46 | 1,725 | 1,749 |
| 5 WFRBS Commercial Mortgage Trust 2013-C15 | 3.720% | 8/15/46 | 660 | 693 |
| 5 WFRBS Commercial Mortgage Trust 2013-C15 | 4.153% | 8/15/46 | 2,640 | 2,824 |
| 5 WFRBS Commercial Mortgage Trust 2013-C15 | 4.358% | 8/15/46 | 660 | 707 |
| 5 WFRBS Commercial Mortgage Trust 2013-C16 | 3.223% | 9/15/46 | 2,530 | 2,602 |
| 5 WFRBS Commercial Mortgage Trust 2013-C16 | 3.963% | 9/15/46 | 1,520 | 1,614 |
| 5 WFRBS Commercial Mortgage Trust 2013-C16 | 4.415% | 9/15/46 | 1,520 | 1,649 |
| 5 WFRBS Commercial Mortgage Trust 2013-C16 | 4.668% | 9/15/46 | 2,530 | 2,762 |
| 5 WFRBS Commercial Mortgage Trust 2013-C17 | 2.921% | 12/15/46 | 725 | 741 |
| 5 WFRBS Commercial Mortgage Trust 2013-C17 | 3.558% | 12/15/46 | 725 | 757 |
| 5 WFRBS Commercial Mortgage Trust 2013-C17 | 4.023% | 12/15/46 | 925 | 975 |
| 5 WFRBS Commercial Mortgage Trust 2013-C17 | 4.255% | 12/15/46 | 725 | 771 |
| 5 WFRBS Commercial Mortgage Trust 2013-C17 | 4.788% | 12/15/46 | 725 | 772 |
| 5 WFRBS Commercial Mortgage Trust 2013-C18 | 3.027% | 12/15/46 | 750 | 767 |
| 5 WFRBS Commercial Mortgage Trust 2013-C18 | 3.651% | 12/15/46 | 1,500 | 1,557 |
| 5 WFRBS Commercial Mortgage Trust 2013-C18 | 4.162% | 12/15/46 | 7,268 | 7,707 |
| 5 WFRBS Commercial Mortgage Trust 2013-C18 | 4.387% | 12/15/46 | 375 | 402 |
| 5 WFRBS Commercial Mortgage Trust 2013-C18 | 4.669% | 12/15/46 | 563 | 600 |
| 5 WFRBS Commercial Mortgage Trust 2013-UBS1 | 2.927% | 3/15/46 | 1,850 | 1,890 |
| 5 WFRBS Commercial Mortgage Trust 2013-UBS1 | 3.591% | 3/15/46 | 1,100 | 1,137 |
| 5 WFRBS Commercial Mortgage Trust 2013-UBS1 | 4.079% | 3/15/46 | 1,475 | 1,561 |
| 5 WFRBS Commercial Mortgage Trust 2013-UBS1 | 4.630% | 3/15/46 | 375 | 401 |
| 5 WFRBS Commercial Mortgage Trust 2014-C19 | 1.233% | 3/15/47 | 457 | 455 |
| 5 WFRBS Commercial Mortgage Trust 2014-C19 | 3.618% | 3/15/47 | 475 | 496 |
| 5 WFRBS Commercial Mortgage Trust 2014-C19 | 3.660% | 3/15/47 | 650 | 672 |
| 5 WFRBS Commercial Mortgage Trust 2014-C19 | 4.101% | 3/15/47 | 1,450 | 1,537 |
| 5 WFRBS Commercial Mortgage Trust 2014-C19 | 4.723% | 3/15/47 | 475 | 504 |
| 5 WFRBS Commercial Mortgage Trust 2014-C20 | 3.036% | 5/15/47 | 775 | 791 |
| 5 WFRBS Commercial Mortgage Trust 2014-C20 | 3.638% | 5/15/47 | 775 | 801 |
| 5 WFRBS Commercial Mortgage Trust 2014-C20 | 3.995% | 5/15/47 | 1,150 | 1,204 |
| 5 WFRBS Commercial Mortgage Trust 2014-C20 | 4.176% | 5/15/47 | 1,150 | 1,211 |
| 5 WFRBS Commercial Mortgage Trust 2014-C21 | 3.678% | 8/15/47 | 3,000 | 3,071 |
| 5 WFRBS Commercial Mortgage Trust 2014-C22 | 3.752% | 9/15/57 | 5,825 | 5,963 |
| 5 WFRBS Commercial Mortgage Trust 2014-C22 | 4.371% | 9/15/57 | 1,200 | 1,234 |
| 5 WFRBS Commercial Mortgage Trust 2014-C23 | 3.636% | 10/15/57 | 2,054 | 2,135 |
| 5 WFRBS Commercial Mortgage Trust 2014-C23 | 3.917% | 10/15/57 | 1,150 | 1,206 |
| 5 WFRBS Commercial Mortgage Trust 2014-C23 | 4.210% | 10/15/57 | 800 | 838 |
| 5 WFRBS Commercial Mortgage Trust 2014-C24 | 3.428% | 11/15/47 | 2,075 | 2,125 |
41
| Total Bond Market II Index Fund | ||||
| Face | Market | |||
| Maturity | Amount | Value• | ||
| Coupon | Date | ($000) | ($000) | |
| 5 WFRBS Commercial Mortgage Trust 2014-C24 | 3.607% | 11/15/47 | 2,075 | 2,119 |
| 5 WFRBS Commercial Mortgage Trust 2014-LC14 | 1.193% | 3/15/47 | 1,041 | 1,035 |
| 5 WFRBS Commercial Mortgage Trust 2014-LC14 | 2.862% | 3/15/47 | 735 | 750 |
| 5 WFRBS Commercial Mortgage Trust 2014-LC14 | 3.522% | 3/15/47 | 1,840 | 1,892 |
| 5 WFRBS Commercial Mortgage Trust 2014-LC14 | 4.045% | 3/15/47 | 4,415 | 4,687 |
| 5 WFRBS Commercial Mortgage Trust 2014-LC14 | 4.351% | 3/15/47 | 1,840 | 1,960 |
| 5 World Financial Network Credit Card Master Note | ||||
| Trust Series 2013-A | 1.610% | 12/15/21 | 900 | 896 |
| 5 World Omni Auto Receivables Trust 2012-B | 0.810% | 1/15/19 | 1,779 | 1,776 |
| 5 World Omni Auto Receivables Trust 2013-B | 0.830% | 8/15/18 | 780 | 779 |
| 5 World Omni Auto Receivables Trust 2013-B | 1.320% | 1/15/20 | 550 | 547 |
| 5 World Omni Auto Receivables Trust 2014-A | 0.940% | 4/15/19 | 1,914 | 1,910 |
| 5 World Omni Auto Receivables Trust 2014-A | 1.530% | 6/15/20 | 1,925 | 1,918 |
| 5 World Omni Auto Receivables Trust 2014-B | 1.140% | 1/15/20 | 2,475 | 2,464 |
| 5 World Omni Auto Receivables Trust 2014-B | 1.680% | 12/15/20 | 1,000 | 990 |
| 5 World Omni Auto Receivables Trust 2015-B | 1.490% | 12/15/20 | 1,775 | 1,759 |
| 5 World Omni Auto Receivables Trust 2015-B | 1.840% | 1/17/22 | 1,775 | 1,754 |
| 5 World Omni Automobile Lease Securitization | ||||
| Trust 2013-A | 1.100% | 12/15/16 | 639 | 639 |
| 5 World Omni Automobile Lease Securitization | ||||
| Trust 2014-A | 1.160% | 9/15/17 | 1,950 | 1,949 |
| 5 World Omni Automobile Lease Securitization | ||||
| Trust 2014-A | 1.370% | 1/15/20 | 575 | 575 |
| 5 World Omni Automobile Lease Securitization | ||||
| Trust 2015-A | 1.540% | 10/15/18 | 1,800 | 1,797 |
| Total Asset-Backed/Commercial Mortgage-Backed Securities (Cost $2,524,357) | 2,554,231 | |||
| Corporate Bonds (26.4%) | ||||
| Finance (8.5%) | ||||
| Banking (5.9%) | ||||
| Abbey National Treasury Services plc | 1.375% | 3/13/17 | 13,265 | 13,206 |
| Abbey National Treasury Services plc | 3.050% | 8/23/18 | 5,700 | 5,847 |
| Abbey National Treasury Services plc | 2.350% | 9/10/19 | 6,200 | 6,201 |
| Abbey National Treasury Services plc | 2.375% | 3/16/20 | 6,300 | 6,273 |
| Abbey National Treasury Services plc | 4.000% | 3/13/24 | 5,000 | 5,202 |
| American Express Bank FSB | 6.000% | 9/13/17 | 11,275 | 12,074 |
| American Express Centurion Bank | 5.950% | 6/12/17 | 650 | 687 |
| American Express Centurion Bank | 6.000% | 9/13/17 | 8,700 | 9,321 |
| American Express Co. | 6.150% | 8/28/17 | 15,715 | 16,827 |
| American Express Co. | 7.000% | 3/19/18 | 14,644 | 16,228 |
| American Express Co. | 1.550% | 5/22/18 | 4,175 | 4,137 |
| American Express Co. | 2.650% | 12/2/22 | 3,375 | 3,275 |
| American Express Co. | 3.625% | 12/5/24 | 6,775 | 6,696 |
| American Express Co. | 4.050% | 12/3/42 | 600 | 568 |
| American Express Credit Corp. | 2.375% | 3/24/17 | 5,700 | 5,762 |
| American Express Credit Corp. | 1.125% | 6/5/17 | 11,500 | 11,440 |
| American Express Credit Corp. | 2.125% | 7/27/18 | 10,700 | 10,769 |
| American Express Credit Corp. | 2.125% | 3/18/19 | 3,625 | 3,621 |
| American Express Credit Corp. | 2.250% | 8/15/19 | 13,275 | 13,276 |
| American Express Credit Corp. | 2.600% | 9/14/20 | 3,000 | 3,007 |
| Australia & New Zealand Banking Group Ltd. | 0.900% | 2/12/16 | 12,232 | 12,230 |
| Australia & New Zealand Banking Group Ltd. | 1.250% | 6/13/17 | 1,000 | 997 |
| Australia & New Zealand Banking Group Ltd. | 1.875% | 10/6/17 | 3,450 | 3,466 |
| Australia & New Zealand Banking Group Ltd. | 1.450% | 5/15/18 | 2,700 | 2,673 |
| Australia & New Zealand Banking Group Ltd. | 2.250% | 6/13/19 | 1,600 | 1,597 |
42
| Total Bond Market II Index Fund | ||||
| Face | Market | |||
| Maturity | Amount | Value• | ||
| Coupon | Date | ($000) | ($000) | |
| Australia & New Zealand Banking Group Ltd./ | ||||
| New York NY | 2.000% | 11/16/18 | 10,000 | 9,978 |
| Australia & New Zealand Banking Group Ltd./ | ||||
| New York NY | 2.700% | 11/16/20 | 10,000 | 10,030 |
| Australia & New Zealand Banking Group Ltd./ | ||||
| New York NY | 3.700% | 11/16/25 | 9,425 | 9,636 |
| Banco Bilbao Vizcaya Argentaria SA | 3.000% | 10/20/20 | 8,125 | 8,088 |
| Bank of America Corp. | 5.420% | 3/15/17 | 7,975 | 8,291 |
| Bank of America Corp. | 3.875% | 3/22/17 | 500 | 513 |
| Bank of America Corp. | 5.700% | 5/2/17 | 9,035 | 9,427 |
| Bank of America Corp. | 1.700% | 8/25/17 | 5,400 | 5,386 |
| Bank of America Corp. | 6.400% | 8/28/17 | 20,684 | 22,161 |
| Bank of America Corp. | 6.000% | 9/1/17 | 1,899 | 2,021 |
| Bank of America Corp. | 5.750% | 12/1/17 | 9,369 | 10,028 |
| Bank of America Corp. | 2.000% | 1/11/18 | 26,652 | 26,623 |
| Bank of America Corp. | 6.875% | 4/25/18 | 33,670 | 37,140 |
| Bank of America Corp. | 5.650% | 5/1/18 | 26,030 | 27,990 |
| Bank of America Corp. | 1.750% | 6/5/18 | 11,000 | 10,931 |
| Bank of America Corp. | 6.500% | 7/15/18 | 10,060 | 11,100 |
| Bank of America Corp. | 2.600% | 1/15/19 | 31,975 | 32,069 |
| Bank of America Corp. | 2.650% | 4/1/19 | 11,325 | 11,350 |
| Bank of America Corp. | 7.625% | 6/1/19 | 14,170 | 16,395 |
| Bank of America Corp. | 2.250% | 4/21/20 | 9,700 | 9,482 |
| Bank of America Corp. | 5.625% | 7/1/20 | 10,715 | 11,888 |
| Bank of America Corp. | 2.625% | 10/19/20 | 25,000 | 24,696 |
| Bank of America Corp. | 5.875% | 1/5/21 | 4,890 | 5,536 |
| Bank of America Corp. | 5.000% | 5/13/21 | 4,795 | 5,239 |
| Bank of America Corp. | 5.700% | 1/24/22 | 3,586 | 4,044 |
| Bank of America Corp. | 3.300% | 1/11/23 | 28,350 | 27,948 |
| Bank of America Corp. | 4.100% | 7/24/23 | 8,400 | 8,687 |
| Bank of America Corp. | 4.125% | 1/22/24 | 16,900 | 17,407 |
| Bank of America Corp. | 4.000% | 4/1/24 | 26,000 | 26,604 |
| Bank of America Corp. | 4.200% | 8/26/24 | 19,750 | 19,777 |
| Bank of America Corp. | 4.000% | 1/22/25 | 15,250 | 14,932 |
| Bank of America Corp. | 3.950% | 4/21/25 | 13,500 | 13,141 |
| Bank of America Corp. | 3.875% | 8/1/25 | 18,750 | 19,027 |
| Bank of America Corp. | 4.250% | 10/22/26 | 15,350 | 15,192 |
| Bank of America Corp. | 6.110% | 1/29/37 | 12,712 | 14,427 |
| Bank of America Corp. | 7.750% | 5/14/38 | 11,215 | 15,187 |
| Bank of America Corp. | 5.875% | 2/7/42 | 9,550 | 11,146 |
| Bank of America Corp. | 5.000% | 1/21/44 | 11,500 | 11,996 |
| Bank of America Corp. | 4.875% | 4/1/44 | 4,125 | 4,256 |
| Bank of America Corp. | 4.750% | 4/21/45 | 1,000 | 962 |
| Bank of America NA | 5.300% | 3/15/17 | 18,052 | 18,777 |
| Bank of America NA | 6.100% | 6/15/17 | 1,975 | 2,091 |
| Bank of America NA | 1.650% | 3/26/18 | 29,825 | 29,621 |
| Bank of America NA | 2.050% | 12/7/18 | 12,000 | 11,954 |
| Bank of America NA | 6.000% | 10/15/36 | 6,725 | 7,945 |
| Bank of Montreal | 2.500% | 1/11/17 | 11,125 | 11,254 |
| Bank of Montreal | 1.300% | 7/14/17 | 9,000 | 8,983 |
| Bank of Montreal | 1.400% | 9/11/17 | 2,000 | 2,000 |
| Bank of Montreal | 1.400% | 4/10/18 | 3,750 | 3,717 |
| Bank of Montreal | 2.375% | 1/25/19 | 14,975 | 15,109 |
| Bank of Montreal | 2.550% | 11/6/22 | 3,925 | 3,881 |
| Bank of New York Mellon Corp. | 2.400% | 1/17/17 | 325 | 328 |
| Bank of New York Mellon Corp. | 1.969% | 6/20/17 | 3,200 | 3,226 |
43
| Total Bond Market II Index Fund | ||||
| Face | Market | |||
| Maturity | Amount | Value• | ||
| Coupon | Date | ($000) | ($000) | |
| Bank of New York Mellon Corp. | 1.300% | 1/25/18 | 1,325 | 1,313 |
| Bank of New York Mellon Corp. | 1.350% | 3/6/18 | 11,000 | 10,964 |
| Bank of New York Mellon Corp. | 2.100% | 8/1/18 | 1,548 | 1,560 |
| Bank of New York Mellon Corp. | 2.100% | 1/15/19 | 2,675 | 2,684 |
| Bank of New York Mellon Corp. | 2.200% | 3/4/19 | 7,625 | 7,651 |
| Bank of New York Mellon Corp. | 5.450% | 5/15/19 | 6,645 | 7,322 |
| Bank of New York Mellon Corp. | 2.300% | 9/11/19 | 12,000 | 12,026 |
| Bank of New York Mellon Corp. | 4.600% | 1/15/20 | 6,875 | 7,444 |
| Bank of New York Mellon Corp. | 2.600% | 8/17/20 | 2,750 | 2,762 |
| Bank of New York Mellon Corp. | 2.450% | 11/27/20 | 7,000 | 6,965 |
| Bank of New York Mellon Corp. | 4.150% | 2/1/21 | 1,250 | 1,345 |
| Bank of New York Mellon Corp. | 3.550% | 9/23/21 | 5,700 | 5,965 |
| Bank of New York Mellon Corp. | 3.650% | 2/4/24 | 2,800 | 2,903 |
| Bank of New York Mellon Corp. | 3.400% | 5/15/24 | 2,875 | 2,921 |
| Bank of New York Mellon Corp. | 3.250% | 9/11/24 | 4,050 | 4,077 |
| Bank of New York Mellon Corp. | 3.000% | 2/24/25 | 4,000 | 3,931 |
| Bank of Nova Scotia | 2.550% | 1/12/17 | 6,730 | 6,823 |
| Bank of Nova Scotia | 1.250% | 4/11/17 | 1,540 | 1,538 |
| Bank of Nova Scotia | 1.300% | 7/21/17 | 3,800 | 3,789 |
| Bank of Nova Scotia | 1.375% | 12/18/17 | 4,590 | 4,574 |
| Bank of Nova Scotia | 1.700% | 6/11/18 | 6,920 | 6,902 |
| Bank of Nova Scotia | 2.050% | 10/30/18 | 26,475 | 26,568 |
| Bank of Nova Scotia | 2.050% | 6/5/19 | 5,963 | 5,949 |
| Bank of Nova Scotia | 2.350% | 10/21/20 | 9,800 | 9,711 |
| Bank of Nova Scotia | 4.375% | 1/13/21 | 1,570 | 1,696 |
| Bank of Nova Scotia | 2.800% | 7/21/21 | 17,825 | 18,051 |
| Bank of Nova Scotia | 4.500% | 12/16/25 | 18,950 | 18,844 |
| Bank One Capital III | 8.750% | 9/1/30 | 290 | 414 |
| Bank One Corp. | 7.625% | 10/15/26 | 975 | 1,237 |
| Bank One Corp. | 8.000% | 4/29/27 | 2,500 | 3,222 |
| Bank One Michigan | 8.250% | 11/1/24 | 6,000 | 7,739 |
| Barclays Bank plc | 2.500% | 2/20/19 | 25,906 | 26,074 |
| Barclays Bank plc | 6.750% | 5/22/19 | 3,040 | 3,471 |
| Barclays Bank plc | 5.125% | 1/8/20 | 5,015 | 5,511 |
| Barclays Bank plc | 5.140% | 10/14/20 | 4,745 | 5,151 |
| Barclays Bank plc | 3.750% | 5/15/24 | 5,500 | 5,599 |
| Barclays plc | 2.000% | 3/16/18 | 3,300 | 3,288 |
| Barclays plc | 2.750% | 11/8/19 | 12,225 | 12,193 |
| Barclays plc | 2.875% | 6/8/20 | 4,000 | 3,994 |
| Barclays plc | 4.375% | 9/11/24 | 5,000 | 4,888 |
| Barclays plc | 3.650% | 3/16/25 | 11,900 | 11,493 |
| Barclays plc | 5.250% | 8/17/45 | 7,900 | 8,039 |
| BB&T Corp. | 2.150% | 3/22/17 | 2,850 | 2,873 |
| BB&T Corp. | 4.900% | 6/30/17 | 100 | 104 |
| BB&T Corp. | 1.600% | 8/15/17 | 915 | 917 |
| BB&T Corp. | 1.450% | 1/12/18 | 3,825 | 3,797 |
| BB&T Corp. | 2.050% | 6/19/18 | 3,000 | 3,015 |
| BB&T Corp. | 2.250% | 2/1/19 | 1,800 | 1,806 |
| BB&T Corp. | 6.850% | 4/30/19 | 1,261 | 1,438 |
| BB&T Corp. | 5.250% | 11/1/19 | 3,650 | 3,991 |
| BB&T Corp. | 2.450% | 1/15/20 | 1,250 | 1,255 |
| BB&T Corp. | 3.950% | 3/22/22 | 2,049 | 2,151 |
| Bear Stearns Cos. LLC | 5.550% | 1/22/17 | 5,130 | 5,331 |
| Bear Stearns Cos. LLC | 6.400% | 10/2/17 | 17,650 | 19,007 |
| Bear Stearns Cos. LLC | 7.250% | 2/1/18 | 24,905 | 27,427 |
| BNP Paribas SA | 1.375% | 3/17/17 | 6,000 | 5,991 |
44
| Total Bond Market II Index Fund | |||||
| Face | Market | ||||
| Maturity | Amount | Value• | |||
| Coupon | Date | ($000) | ($000) | ||
| BNP Paribas SA | 2.375% | 9/14/17 | 16,175 | 16,344 | |
| BNP Paribas SA | 2.700% | 8/20/18 | 16,825 | 17,051 | |
| BNP Paribas SA | 2.450% | 3/17/19 | 1,200 | 1,204 | |
| BNP Paribas SA | 2.375% | 5/21/20 | 9,500 | 9,426 | |
| BNP Paribas SA | 5.000% | 1/15/21 | 13,065 | 14,414 | |
| BNP Paribas SA | 3.250% | 3/3/23 | 9,025 | 8,990 | |
| BNP Paribas SA | 4.250% | 10/15/24 | 4,600 | 4,557 | |
| BPCE SA | 1.625% | 2/10/17 | 5,150 | 5,155 | |
| BPCE SA | 1.613% | 7/25/17 | 7,000 | 6,985 | |
| BPCE SA | 2.500% | 12/10/18 | 5,500 | 5,554 | |
| BPCE SA | 2.500% | 7/15/19 | 6,320 | 6,338 | |
| BPCE SA | 2.250% | 1/27/20 | 2,375 | 2,356 | |
| BPCE SA | 4.000% | 4/15/24 | 9,800 | 10,149 | |
| Branch Banking & Trust Co. | 1.050% | 12/1/16 | 225 | 225 | |
| Branch Banking & Trust Co. | 1.350% | 10/1/17 | 10,345 | 10,334 | |
| Branch Banking & Trust Co. | 2.300% | 10/15/18 | 6,000 | 6,057 | |
| Branch Banking & Trust Co. | 2.850% | 4/1/21 | 3,000 | 3,032 | |
| Branch Banking & Trust Co. | 3.625% | 9/16/25 | 9,100 | 9,185 | |
| Branch Banking & Trust Co. | 3.800% | 10/30/26 | 2,800 | 2,837 | |
| Capital One Bank USA NA | 1.300% | 6/5/17 | 4,450 | 4,416 | |
| Capital One Bank USA NA | 2.250% | 2/13/19 | 10,000 | 9,944 | |
| Capital One Bank USA NA | 2.300% | 6/5/19 | 6,750 | 6,667 | |
| Capital One Bank USA NA | 8.800% | 7/15/19 | 6,825 | 8,135 | |
| Capital One Bank USA NA | 3.375% | 2/15/23 | 5,585 | 5,465 | |
| Capital One Financial Corp. | 6.150% | 9/1/16 | 2,825 | 2,913 | |
| Capital One Financial Corp. | 6.750% | 9/15/17 | 1,820 | 1,958 | |
| Capital One Financial Corp. | 2.450% | 4/24/19 | 6,875 | 6,884 | |
| Capital One Financial Corp. | 4.750% | 7/15/21 | 545 | 591 | |
| Capital One Financial Corp. | 3.500% | 6/15/23 | 1,210 | 1,199 | |
| Capital One Financial Corp. | 3.750% | 4/24/24 | 6,900 | 6,954 | |
| Capital One Financial Corp. | 3.200% | 2/5/25 | 7,000 | 6,769 | |
| Capital One Financial Corp. | 4.200% | 10/29/25 | 675 | 666 | |
| Capital One NA | 1.500% | 9/5/17 | 2,400 | 2,381 | |
| Capital One NA | 1.500% | 3/22/18 | 6,075 | 5,976 | |
| Capital One NA | 2.400% | 9/5/19 | 2,850 | 2,820 | |
| Capital One NA | 2.950% | 7/23/21 | 19,000 | 18,828 | |
| 5,8 | Citicorp Lease Pass-Through Trust 1999-1 | 8.040% | 12/15/19 | 4,025 | 4,739 |
| Citigroup Inc. | 5.500% | 2/15/17 | 4,945 | 5,146 | |
| Citigroup Inc. | 1.350% | 3/10/17 | 2,000 | 1,992 | |
| Citigroup Inc. | 1.550% | 8/14/17 | 5,275 | 5,251 | |
| Citigroup Inc. | 6.000% | 8/15/17 | 1,296 | 1,386 | |
| Citigroup Inc. | 6.125% | 11/21/17 | 8,065 | 8,684 | |
| Citigroup Inc. | 1.850% | 11/24/17 | 12,000 | 11,986 | |
| Citigroup Inc. | 1.800% | 2/5/18 | 6,425 | 6,396 | |
| Citigroup Inc. | 1.700% | 4/27/18 | 10,000 | 9,905 | |
| Citigroup Inc. | 1.750% | 5/1/18 | 7,575 | 7,502 | |
| Citigroup Inc. | 6.125% | 5/15/18 | 4,962 | 5,412 | |
| Citigroup Inc. | 2.150% | 7/30/18 | 10,500 | 10,493 | |
| Citigroup Inc. | 2.500% | 9/26/18 | 10,875 | 10,956 | |
| Citigroup Inc. | 2.050% | 12/7/18 | 45,000 | 44,689 | |
| Citigroup Inc. | 2.550% | 4/8/19 | 30,000 | 30,197 | |
| Citigroup Inc. | 2.500% | 7/29/19 | 10,975 | 10,946 | |
| Citigroup Inc. | 2.400% | 2/18/20 | 6,000 | 5,928 | |
| Citigroup Inc. | 5.375% | 8/9/20 | 5,564 | 6,193 | |
| Citigroup Inc. | 2.650% | 10/26/20 | 11,000 | 10,897 | |
| Citigroup Inc. | 4.500% | 1/14/22 | 14,300 | 15,311 | |
45
| Total Bond Market II Index Fund | ||||
| Face | Market | |||
| Maturity | Amount | Value• | ||
| Coupon | Date | ($000) | ($000) | |
| Citigroup Inc. | 4.050% | 7/30/22 | 4,050 | 4,137 |
| Citigroup Inc. | 3.500% | 5/15/23 | 15,425 | 15,198 |
| Citigroup Inc. | 3.875% | 10/25/23 | 4,880 | 5,041 |
| Citigroup Inc. | 3.750% | 6/16/24 | 2,450 | 2,494 |
| Citigroup Inc. | 4.000% | 8/5/24 | 5,525 | 5,473 |
| Citigroup Inc. | 3.875% | 3/26/25 | 7,200 | 7,011 |
| Citigroup Inc. | 3.300% | 4/27/25 | 7,150 | 7,020 |
| Citigroup Inc. | 4.400% | 6/10/25 | 30,200 | 30,501 |
| Citigroup Inc. | 5.500% | 9/13/25 | 6,025 | 6,538 |
| Citigroup Inc. | 4.450% | 9/29/27 | 15,900 | 15,798 |
| Citigroup Inc. | 6.625% | 1/15/28 | 2,700 | 3,282 |
| Citigroup Inc. | 6.625% | 6/15/32 | 1,125 | 1,327 |
| Citigroup Inc. | 6.000% | 10/31/33 | 2,700 | 3,026 |
| Citigroup Inc. | 6.125% | 8/25/36 | 7,118 | 8,041 |
| Citigroup Inc. | 8.125% | 7/15/39 | 12,924 | 18,472 |
| Citigroup Inc. | 5.875% | 1/30/42 | 4,264 | 4,892 |
| Citigroup Inc. | 6.675% | 9/13/43 | 4,000 | 4,907 |
| Citigroup Inc. | 4.950% | 11/7/43 | 10,300 | 10,811 |
| Citigroup Inc. | 5.300% | 5/6/44 | 7,725 | 8,025 |
| Citigroup Inc. | 4.650% | 7/30/45 | 5,000 | 5,064 |
| Citizens Bank NA | 1.600% | 12/4/17 | 3,000 | 2,971 |
| Citizens Bank NA | 2.450% | 12/4/19 | 3,100 | 3,050 |
| Citizens Bank NA/Providence RI | 2.300% | 12/3/18 | 4,225 | 4,220 |
| Citizens Financial Group Inc. | 4.300% | 12/3/25 | 4,000 | 4,016 |
| Comerica Bank | 5.200% | 8/22/17 | 2,550 | 2,680 |
| Comerica Bank | 4.000% | 7/27/25 | 1,750 | 1,775 |
| Comerica Inc. | 2.125% | 5/23/19 | 800 | 793 |
| Commonwealth Bank of Australia | 1.400% | 9/8/17 | 6,825 | 6,824 |
| Commonwealth Bank of Australia | 1.900% | 9/18/17 | 2,000 | 2,010 |
| Commonwealth Bank of Australia | 1.625% | 3/12/18 | 23,500 | 23,437 |
| Commonwealth Bank of Australia | 2.500% | 9/20/18 | 4,000 | 4,061 |
| Commonwealth Bank of Australia | 1.750% | 11/2/18 | 5,525 | 5,489 |
| Commonwealth Bank of Australia | 2.250% | 3/13/19 | 2,000 | 2,006 |
| Commonwealth Bank of Australia | 2.300% | 9/6/19 | 3,600 | 3,592 |
| Commonwealth Bank of Australia | 2.400% | 11/2/20 | 7,500 | 7,428 |
| 8 Commonwealth Bank of Australia | 4.500% | 12/9/25 | 6,500 | 6,428 |
| Compass Bank | 1.850% | 9/29/17 | 2,000 | 1,983 |
| Compass Bank | 6.400% | 10/1/17 | 1,940 | 2,046 |
| Compass Bank | 2.750% | 9/29/19 | 1,750 | 1,733 |
| Cooperatieve Centrale Raiffeisen- | ||||
| Boerenleenbank BA | 3.375% | 1/19/17 | 14,150 | 14,442 |
| Cooperatieve Centrale Raiffeisen- | ||||
| Boerenleenbank BA | 2.250% | 1/14/19 | 18,700 | 18,780 |
| Cooperatieve Centrale Raiffeisen- | ||||
| Boerenleenbank BA | 2.250% | 1/14/20 | 12,500 | 12,422 |
| Cooperatieve Centrale Raiffeisen- | ||||
| Boerenleenbank BA | 4.500% | 1/11/21 | 11,965 | 13,031 |
| Cooperatieve Centrale Raiffeisen- | ||||
| Boerenleenbank BA | 3.875% | 2/8/22 | 7,275 | 7,656 |
| Cooperatieve Centrale Raiffeisen- | ||||
| Boerenleenbank BA | 3.950% | 11/9/22 | 6,000 | 6,054 |
| Cooperatieve Centrale Raiffeisen- | ||||
| Boerenleenbank BA | 4.625% | 12/1/23 | 13,525 | 14,083 |
| Cooperatieve Centrale Raiffeisen- | ||||
| Boerenleenbank BA | 3.375% | 5/21/25 | 14,475 | 14,331 |
46
| Total Bond Market II Index Fund | ||||
| Face | Market | |||
| Maturity | Amount | Value• | ||
| Coupon | Date | ($000) | ($000) | |
| Cooperatieve Centrale Raiffeisen- | ||||
| Boerenleenbank BA | 4.375% | 8/4/25 | 1,650 | 1,670 |
| Cooperatieve Centrale Raiffeisen- | ||||
| Boerenleenbank BA | 5.250% | 5/24/41 | 9,715 | 10,981 |
| Cooperatieve Centrale Raiffeisen- | ||||
| Boerenleenbank BA | 5.750% | 12/1/43 | 7,925 | 8,797 |
| Cooperatieve Centrale Raiffeisen- | ||||
| Boerenleenbank BA | 5.250% | 8/4/45 | 3,700 | 3,870 |
| Credit Suisse | 1.375% | 5/26/17 | 21,550 | 21,441 |
| Credit Suisse | 6.000% | 2/15/18 | 15,314 | 16,458 |
| Credit Suisse | 1.700% | 4/27/18 | 21,500 | 21,338 |
| Credit Suisse | 2.300% | 5/28/19 | 26,025 | 26,052 |
| Credit Suisse | 5.300% | 8/13/19 | 8,400 | 9,273 |
| Credit Suisse | 5.400% | 1/14/20 | 5,975 | 6,543 |
| Credit Suisse | 3.000% | 10/29/21 | 4,600 | 4,588 |
| Credit Suisse | 3.625% | 9/9/24 | 10,775 | 10,850 |
| 8 Credit Suisse Group Funding Guernsey Ltd. | 3.800% | 9/15/22 | 10,100 | 10,070 |
| 8 Credit Suisse Group Funding Guernsey Ltd. | 3.750% | 3/26/25 | 4,750 | 4,630 |
| 8 Credit Suisse Group Funding Guernsey Ltd. | 4.875% | 5/15/45 | 8,800 | 8,667 |
| Credit Suisse USA Inc. | 5.375% | 3/2/16 | 680 | 685 |
| Credit Suisse USA Inc. | 7.125% | 7/15/32 | 4,885 | 6,281 |
| Deutsche Bank AG | 1.400% | 2/13/17 | 1,100 | 1,093 |
| Deutsche Bank AG | 6.000% | 9/1/17 | 14,463 | 15,324 |
| Deutsche Bank AG | 1.875% | 2/13/18 | 8,100 | 8,051 |
| Deutsche Bank AG | 2.500% | 2/13/19 | 18,250 | 18,351 |
| Deutsche Bank AG | 2.950% | 8/20/20 | 10,500 | 10,503 |
| Deutsche Bank AG | 3.700% | 5/30/24 | 4,550 | 4,540 |
| Discover Bank | 2.000% | 2/21/18 | 9,970 | 9,903 |
| Discover Bank | 2.600% | 11/13/18 | 2,000 | 2,001 |
| Discover Bank | 7.000% | 4/15/20 | 1,350 | 1,538 |
| Discover Bank | 3.200% | 8/9/21 | 1,400 | 1,392 |
| Discover Bank | 4.200% | 8/8/23 | 8,150 | 8,282 |
| Discover Bank | 4.250% | 3/13/26 | 2,175 | 2,191 |
| Discover Financial Services | 6.450% | 6/12/17 | 325 | 344 |
| Discover Financial Services | 5.200% | 4/27/22 | 950 | 1,016 |
| Discover Financial Services | 3.850% | 11/21/22 | 5,630 | 5,589 |
| Discover Financial Services | 3.750% | 3/4/25 | 3,600 | 3,459 |
| Fifth Third Bancorp | 4.500% | 6/1/18 | 425 | 447 |
| Fifth Third Bancorp | 2.300% | 3/1/19 | 4,000 | 4,004 |
| Fifth Third Bancorp | 3.500% | 3/15/22 | 6,025 | 6,132 |
| Fifth Third Bancorp | 4.300% | 1/16/24 | 7,050 | 7,223 |
| Fifth Third Bancorp | 8.250% | 3/1/38 | 5,771 | 8,079 |
| Fifth Third Bank | 1.450% | 2/28/18 | 4,400 | 4,353 |
| Fifth Third Bank | 2.150% | 8/20/18 | 7,000 | 7,004 |
| Fifth Third Bank | 2.375% | 4/25/19 | 10,000 | 10,002 |
| First Horizon National Corp. | 3.500% | 12/15/20 | 2,100 | 2,079 |
| First Niagara Financial Group Inc. | 6.750% | 3/19/20 | 2,300 | 2,615 |
| FirstMerit Bank NA | 4.270% | 11/25/26 | 4,150 | 4,146 |
| FirstMerit Corp. | 4.350% | 2/4/23 | 4,950 | 5,037 |
| Goldman Sachs Capital I | 6.345% | 2/15/34 | 8,175 | 9,614 |
| Goldman Sachs Group Inc. | 5.625% | 1/15/17 | 6,770 | 7,027 |
| Goldman Sachs Group Inc. | 6.250% | 9/1/17 | 12,380 | 13,253 |
| Goldman Sachs Group Inc. | 5.950% | 1/18/18 | 19,933 | 21,442 |
| Goldman Sachs Group Inc. | 2.375% | 1/22/18 | 22,892 | 23,083 |
| Goldman Sachs Group Inc. | 6.150% | 4/1/18 | 23,975 | 26,032 |
| Goldman Sachs Group Inc. | 2.900% | 7/19/18 | 26,586 | 27,105 |
47
| Total Bond Market II Index Fund | ||||
| Face | Market | |||
| Maturity | Amount | Value• | ||
| Coupon | Date | ($000) | ($000) | |
| Goldman Sachs Group Inc. | 2.625% | 1/31/19 | 18,000 | 18,145 |
| Goldman Sachs Group Inc. | 7.500% | 2/15/19 | 19,330 | 22,054 |
| Goldman Sachs Group Inc. | 2.550% | 10/23/19 | 18,500 | 18,487 |
| Goldman Sachs Group Inc. | 5.375% | 3/15/20 | 23,140 | 25,434 |
| Goldman Sachs Group Inc. | 2.600% | 4/23/20 | 5,150 | 5,138 |
| Goldman Sachs Group Inc. | 6.000% | 6/15/20 | 22,270 | 25,178 |
| Goldman Sachs Group Inc. | 2.750% | 9/15/20 | 6,775 | 6,764 |
| Goldman Sachs Group Inc. | 5.250% | 7/27/21 | 17,950 | 19,860 |
| Goldman Sachs Group Inc. | 5.750% | 1/24/22 | 32,850 | 37,346 |
| Goldman Sachs Group Inc. | 3.625% | 1/22/23 | 9,700 | 9,811 |
| Goldman Sachs Group Inc. | 4.000% | 3/3/24 | 24,000 | 24,638 |
| Goldman Sachs Group Inc. | 3.850% | 7/8/24 | 4,525 | 4,617 |
| Goldman Sachs Group Inc. | 3.500% | 1/23/25 | 8,125 | 7,970 |
| Goldman Sachs Group Inc. | 4.250% | 10/21/25 | 7,750 | 7,694 |
| Goldman Sachs Group Inc. | 5.950% | 1/15/27 | 5,945 | 6,589 |
| Goldman Sachs Group Inc. | 6.125% | 2/15/33 | 7,690 | 8,987 |
| Goldman Sachs Group Inc. | 6.450% | 5/1/36 | 10,750 | 12,116 |
| Goldman Sachs Group Inc. | 6.750% | 10/1/37 | 34,915 | 40,796 |
| Goldman Sachs Group Inc. | 6.250% | 2/1/41 | 14,805 | 17,670 |
| Goldman Sachs Group Inc. | 4.800% | 7/8/44 | 16,675 | 16,648 |
| Goldman Sachs Group Inc. | 5.150% | 5/22/45 | 20,600 | 19,990 |
| Goldman Sachs Group Inc. | 4.750% | 10/21/45 | 5,000 | 4,968 |
| HSBC Bank USA NA | 4.875% | 8/24/20 | 9,025 | 9,854 |
| HSBC Bank USA NA | 5.875% | 11/1/34 | 3,875 | 4,481 |
| HSBC Bank USA NA | 5.625% | 8/15/35 | 3,950 | 4,452 |
| HSBC Bank USA NA | 7.000% | 1/15/39 | 7,226 | 9,061 |
| HSBC Holdings plc | 5.100% | 4/5/21 | 14,020 | 15,559 |
| HSBC Holdings plc | 4.875% | 1/14/22 | 2,625 | 2,864 |
| HSBC Holdings plc | 4.000% | 3/30/22 | 11,725 | 12,305 |
| HSBC Holdings plc | 4.250% | 3/14/24 | 7,500 | 7,515 |
| HSBC Holdings plc | 4.250% | 8/18/25 | 5,000 | 4,996 |
| HSBC Holdings plc | 7.625% | 5/17/32 | 575 | 736 |
| HSBC Holdings plc | 7.350% | 11/27/32 | 600 | 745 |
| HSBC Holdings plc | 6.500% | 5/2/36 | 16,015 | 19,073 |
| HSBC Holdings plc | 6.500% | 9/15/37 | 16,215 | 19,404 |
| HSBC Holdings plc | 6.800% | 6/1/38 | 3,975 | 4,918 |
| HSBC Holdings plc | 6.100% | 1/14/42 | 4,075 | 5,132 |
| HSBC Holdings plc | 5.250% | 3/14/44 | 12,800 | 13,235 |
| HSBC USA Inc. | 1.300% | 6/23/17 | 400 | 398 |
| HSBC USA Inc. | 1.500% | 11/13/17 | 4,500 | 4,476 |
| HSBC USA Inc. | 1.625% | 1/16/18 | 11,975 | 11,916 |
| HSBC USA Inc. | 2.000% | 8/7/18 | 4,000 | 3,995 |
| HSBC USA Inc. | 2.625% | 9/24/18 | 9,670 | 9,802 |
| HSBC USA Inc. | 2.250% | 6/23/19 | 1,000 | 995 |
| HSBC USA Inc. | 2.375% | 11/13/19 | 9,500 | 9,467 |
| HSBC USA Inc. | 2.350% | 3/5/20 | 13,200 | 13,066 |
| HSBC USA Inc. | 2.750% | 8/7/20 | 3,000 | 3,004 |
| HSBC USA Inc. | 5.000% | 9/27/20 | 4,855 | 5,293 |
| HSBC USA Inc. | 3.500% | 6/23/24 | 11,425 | 11,458 |
| Huntington Bancshares Inc. | 2.600% | 8/2/18 | 1,100 | 1,101 |
| Huntington Bancshares Inc. | 7.000% | 12/15/20 | 6,800 | 7,922 |
| Huntington National Bank | 1.375% | 4/24/17 | 8,450 | 8,401 |
| Huntington National Bank | 2.000% | 6/30/18 | 4,250 | 4,224 |
| Huntington National Bank | 2.200% | 11/6/18 | 5,500 | 5,484 |
| Huntington National Bank | 2.200% | 4/1/19 | 925 | 916 |
| Huntington National Bank | 2.400% | 4/1/20 | 3,600 | 3,542 |
48
| Total Bond Market II Index Fund | ||||
| Face | Market | |||
| Maturity | Amount | Value• | ||
| Coupon | Date | ($000) | ($000) | |
| Huntington National Bank | 2.875% | 8/20/20 | 4,000 | 3,972 |
| Intesa Sanpaolo SPA | 2.375% | 1/13/17 | 3,475 | 3,486 |
| Intesa Sanpaolo SPA | 3.875% | 1/16/18 | 4,775 | 4,891 |
| Intesa Sanpaolo SPA | 3.875% | 1/15/19 | 14,120 | 14,535 |
| Intesa Sanpaolo SPA | 5.250% | 1/12/24 | 5,975 | 6,365 |
| JPMorgan Chase & Co. | 1.350% | 2/15/17 | 8,750 | 8,731 |
| JPMorgan Chase & Co. | 6.125% | 6/27/17 | 3,275 | 3,467 |
| JPMorgan Chase & Co. | 2.000% | 8/15/17 | 8,750 | 8,792 |
| JPMorgan Chase & Co. | 6.000% | 1/15/18 | 24,967 | 26,921 |
| JPMorgan Chase & Co. | 1.800% | 1/25/18 | 2,450 | 2,446 |
| JPMorgan Chase & Co. | 1.700% | 3/1/18 | 11,350 | 11,294 |
| JPMorgan Chase & Co. | 1.625% | 5/15/18 | 13,325 | 13,233 |
| JPMorgan Chase & Co. | 2.350% | 1/28/19 | 9,125 | 9,141 |
| JPMorgan Chase & Co. | 6.300% | 4/23/19 | 16,210 | 18,148 |
| JPMorgan Chase & Co. | 2.200% | 10/22/19 | 13,700 | 13,602 |
| JPMorgan Chase & Co. | 2.250% | 1/23/20 | 21,375 | 21,131 |
| JPMorgan Chase & Co. | 4.950% | 3/25/20 | 1,040 | 1,131 |
| JPMorgan Chase & Co. | 2.750% | 6/23/20 | 15,000 | 15,032 |
| JPMorgan Chase & Co. | 4.400% | 7/22/20 | 10,795 | 11,537 |
| JPMorgan Chase & Co. | 4.250% | 10/15/20 | 16,350 | 17,343 |
| JPMorgan Chase & Co. | 2.550% | 10/29/20 | 13,750 | 13,628 |
| JPMorgan Chase & Co. | 4.625% | 5/10/21 | 1,140 | 1,232 |
| JPMorgan Chase & Co. | 4.350% | 8/15/21 | 15,840 | 16,861 |
| JPMorgan Chase & Co. | 4.500% | 1/24/22 | 20,100 | 21,641 |
| JPMorgan Chase & Co. | 3.250% | 9/23/22 | 24,350 | 24,495 |
| JPMorgan Chase & Co. | 3.200% | 1/25/23 | 17,325 | 17,238 |
| JPMorgan Chase & Co. | 3.375% | 5/1/23 | 9,300 | 9,102 |
| JPMorgan Chase & Co. | 3.875% | 2/1/24 | 28,025 | 28,698 |
| JPMorgan Chase & Co. | 3.625% | 5/13/24 | 9,825 | 9,941 |
| JPMorgan Chase & Co. | 3.875% | 9/10/24 | 19,875 | 19,780 |
| JPMorgan Chase & Co. | 3.125% | 1/23/25 | 18,895 | 18,378 |
| JPMorgan Chase & Co. | 3.900% | 7/15/25 | 18,900 | 19,369 |
| JPMorgan Chase & Co. | 4.125% | 12/15/26 | 17,400 | 17,362 |
| JPMorgan Chase & Co. | 4.250% | 10/1/27 | 1,600 | 1,590 |
| JPMorgan Chase & Co. | 6.400% | 5/15/38 | 14,865 | 18,696 |
| JPMorgan Chase & Co. | 5.500% | 10/15/40 | 5,975 | 6,764 |
| JPMorgan Chase & Co. | 5.600% | 7/15/41 | 6,300 | 7,261 |
| JPMorgan Chase & Co. | 5.400% | 1/6/42 | 3,125 | 3,512 |
| JPMorgan Chase & Co. | 5.625% | 8/16/43 | 8,560 | 9,247 |
| JPMorgan Chase & Co. | 4.850% | 2/1/44 | 3,425 | 3,649 |
| JPMorgan Chase & Co. | 4.950% | 6/1/45 | 8,450 | 8,449 |
| JPMorgan Chase Bank NA | 6.000% | 10/1/17 | 16,524 | 17,683 |
| KeyBank NA | 1.650% | 2/1/18 | 11,150 | 11,106 |
| KeyBank NA | 1.700% | 6/1/18 | 2,050 | 2,036 |
| KeyBank NA | 2.500% | 12/15/19 | 2,000 | 2,003 |
| KeyBank NA | 2.250% | 3/16/20 | 2,000 | 1,976 |
| KeyBank NA | 3.300% | 6/1/25 | 2,500 | 2,472 |
| KeyCorp | 2.300% | 12/13/18 | 3,025 | 3,028 |
| KeyCorp | 5.100% | 3/24/21 | 8,490 | 9,311 |
| Lloyds Bank plc | 4.200% | 3/28/17 | 4,950 | 5,105 |
| Lloyds Bank plc | 1.750% | 3/16/18 | 3,550 | 3,541 |
| Lloyds Bank plc | 1.750% | 5/14/18 | 2,850 | 2,844 |
| Lloyds Bank plc | 2.300% | 11/27/18 | 13,850 | 13,900 |
| Lloyds Bank plc | 2.350% | 9/5/19 | 5,000 | 4,998 |
| Lloyds Bank plc | 2.400% | 3/17/20 | 1,750 | 1,737 |
| Lloyds Bank plc | 6.375% | 1/21/21 | 5,500 | 6,463 |
49
| Total Bond Market II Index Fund | ||||
| Face | Market | |||
| Maturity | Amount | Value• | ||
| Coupon | Date | ($000) | ($000) | |
| Lloyds Bank plc | 3.500% | 5/14/25 | 7,000 | 7,039 |
| Lloyds Banking Group plc | 4.500% | 11/4/24 | 3,300 | 3,338 |
| 8 Lloyds Banking Group plc | 5.300% | 12/1/45 | 1,500 | 1,522 |
| Manufacturers & Traders Trust Co. | 1.400% | 7/25/17 | 3,250 | 3,234 |
| Manufacturers & Traders Trust Co. | 6.625% | 12/4/17 | 2,475 | 2,687 |
| Manufacturers & Traders Trust Co. | 2.300% | 1/30/19 | 11,000 | 11,017 |
| Manufacturers & Traders Trust Co. | 2.250% | 7/25/19 | 11,000 | 10,948 |
| Manufacturers & Traders Trust Co. | 2.100% | 2/6/20 | 3,200 | 3,142 |
| Manufacturers & Traders Trust Co. | 2.900% | 2/6/25 | 5,295 | 5,126 |
| Morgan Stanley | 5.750% | 10/18/16 | 4,200 | 4,346 |
| Morgan Stanley | 5.450% | 1/9/17 | 3,215 | 3,337 |
| Morgan Stanley | 4.750% | 3/22/17 | 9,990 | 10,346 |
| Morgan Stanley | 5.550% | 4/27/17 | 12,000 | 12,580 |
| Morgan Stanley | 6.250% | 8/28/17 | 550 | 589 |
| Morgan Stanley | 5.950% | 12/28/17 | 11,865 | 12,759 |
| Morgan Stanley | 1.875% | 1/5/18 | 8,250 | 8,242 |
| Morgan Stanley | 6.625% | 4/1/18 | 11,865 | 12,997 |
| Morgan Stanley | 2.125% | 4/25/18 | 27,475 | 27,517 |
| Morgan Stanley | 2.200% | 12/7/18 | 1,900 | 1,900 |
| Morgan Stanley | 2.500% | 1/24/19 | 28,575 | 28,676 |
| Morgan Stanley | 7.300% | 5/13/19 | 26,085 | 29,979 |
| Morgan Stanley | 2.375% | 7/23/19 | 28,700 | 28,609 |
| Morgan Stanley | 5.625% | 9/23/19 | 11,455 | 12,623 |
| Morgan Stanley | 5.500% | 1/26/20 | 15,250 | 16,813 |
| Morgan Stanley | 2.650% | 1/27/20 | 11,774 | 11,716 |
| Morgan Stanley | 2.800% | 6/16/20 | 12,350 | 12,397 |
| Morgan Stanley | 5.500% | 7/24/20 | 2,150 | 2,397 |
| Morgan Stanley | 5.750% | 1/25/21 | 12,940 | 14,546 |
| Morgan Stanley | 5.500% | 7/28/21 | 3,175 | 3,555 |
| Morgan Stanley | 4.875% | 11/1/22 | 12,125 | 12,893 |
| Morgan Stanley | 3.750% | 2/25/23 | 10,400 | 10,655 |
| Morgan Stanley | 4.100% | 5/22/23 | 15,975 | 16,116 |
| Morgan Stanley | 3.875% | 4/29/24 | 8,590 | 8,758 |
| Morgan Stanley | 3.700% | 10/23/24 | 15,850 | 15,861 |
| Morgan Stanley | 4.000% | 7/23/25 | 2,810 | 2,895 |
| Morgan Stanley | 5.000% | 11/24/25 | 13,250 | 14,066 |
| Morgan Stanley | 6.250% | 8/9/26 | 8,800 | 10,329 |
| Morgan Stanley | 4.350% | 9/8/26 | 11,075 | 11,037 |
| Morgan Stanley | 3.950% | 4/23/27 | 9,000 | 8,736 |
| Morgan Stanley | 7.250% | 4/1/32 | 6,895 | 9,033 |
| Morgan Stanley | 6.375% | 7/24/42 | 15,075 | 18,747 |
| Morgan Stanley | 4.300% | 1/27/45 | 13,925 | 13,193 |
| MUFG Americas Holdings Corp. | 1.625% | 2/9/18 | 4,950 | 4,896 |
| MUFG Americas Holdings Corp. | 2.250% | 2/10/20 | 6,650 | 6,553 |
| MUFG Americas Holdings Corp. | 3.500% | 6/18/22 | 5,400 | 5,500 |
| MUFG Americas Holdings Corp. | 3.000% | 2/10/25 | 3,350 | 3,195 |
| MUFG Union Bank NA | 5.950% | 5/11/16 | 1,375 | 1,398 |
| MUFG Union Bank NA | 2.125% | 6/16/17 | 1,800 | 1,812 |
| MUFG Union Bank NA | 2.625% | 9/26/18 | 13,800 | 13,937 |
| MUFG Union Bank NA | 2.250% | 5/6/19 | 2,375 | 2,374 |
| Murray Street Investment Trust I | 4.647% | 3/9/17 | 6,300 | 6,502 |
| National Australia Bank Ltd. | 2.750% | 3/9/17 | 6,165 | 6,268 |
| National Australia Bank Ltd. | 2.300% | 7/25/18 | 3,225 | 3,247 |
| National Australia Bank Ltd. | 2.625% | 7/23/20 | 4,100 | 4,125 |
| National Australia Bank Ltd. | 3.000% | 1/20/23 | 3,450 | 3,424 |
| National Bank of Canada | 1.450% | 11/7/17 | 2,200 | 2,185 |
50
| Total Bond Market II Index Fund | ||||
| Face | Market | |||
| Maturity | Amount | Value• | ||
| Coupon | Date | ($000) | ($000) | |
| National City Bank | 5.800% | 6/7/17 | 2,055 | 2,172 |
| National City Corp. | 6.875% | 5/15/19 | 4,465 | 5,044 |
| Northern Trust Co. | 6.500% | 8/15/18 | 425 | 473 |
| Northern Trust Corp. | 3.450% | 11/4/20 | 3,000 | 3,130 |
| Northern Trust Corp. | 2.375% | 8/2/22 | 5,550 | 5,445 |
| Northern Trust Corp. | 3.950% | 10/30/25 | 8,750 | 9,126 |
| People’s United Bank | 4.000% | 7/15/24 | 3,000 | 2,962 |
| People’s United Financial Inc. | 3.650% | 12/6/22 | 2,945 | 2,922 |
| PNC Bank NA | 1.150% | 11/1/16 | 1,250 | 1,250 |
| PNC Bank NA | 4.875% | 9/21/17 | 3,575 | 3,738 |
| PNC Bank NA | 1.500% | 10/18/17 | 8,700 | 8,692 |
| PNC Bank NA | 6.000% | 12/7/17 | 1,950 | 2,089 |
| PNC Bank NA | 1.500% | 2/23/18 | 8,925 | 8,870 |
| PNC Bank NA | 1.600% | 6/1/18 | 5,650 | 5,607 |
| PNC Bank NA | 1.850% | 7/20/18 | 3,000 | 2,994 |
| PNC Bank NA | 1.800% | 11/5/18 | 8,500 | 8,457 |
| PNC Bank NA | 2.200% | 1/28/19 | 6,475 | 6,492 |
| PNC Bank NA | 2.250% | 7/2/19 | 3,700 | 3,710 |
| PNC Bank NA | 2.400% | 10/18/19 | 6,700 | 6,737 |
| PNC Bank NA | 2.300% | 6/1/20 | 5,250 | 5,198 |
| PNC Bank NA | 2.600% | 7/21/20 | 2,000 | 2,002 |
| PNC Bank NA | 2.450% | 11/5/20 | 6,000 | 5,957 |
| PNC Bank NA | 2.700% | 11/1/22 | 6,251 | 6,068 |
| PNC Bank NA | 2.950% | 1/30/23 | 4,500 | 4,371 |
| PNC Bank NA | 3.300% | 10/30/24 | 4,950 | 4,965 |
| PNC Bank NA | 2.950% | 2/23/25 | 6,750 | 6,518 |
| PNC Bank NA | 4.200% | 11/1/25 | 6,400 | 6,747 |
| PNC Financial Services Group Inc. | 2.854% | 11/9/22 | 2,875 | 2,835 |
| PNC Financial Services Group Inc. | 3.900% | 4/29/24 | 15,500 | 15,876 |
| PNC Funding Corp. | 5.625% | 2/1/17 | 325 | 338 |
| PNC Funding Corp. | 6.700% | 6/10/19 | 6,475 | 7,414 |
| PNC Funding Corp. | 5.125% | 2/8/20 | 5,700 | 6,274 |
| PNC Funding Corp. | 4.375% | 8/11/20 | 6,975 | 7,512 |
| PNC Funding Corp. | 3.300% | 3/8/22 | 3,500 | 3,563 |
| Regions Bank | 7.500% | 5/15/18 | 987 | 1,099 |
| Regions Bank | 6.450% | 6/26/37 | 1,329 | 1,573 |
| Regions Financial Corp. | 2.000% | 5/15/18 | 7,000 | 6,937 |
| Regions Financial Corp. | 7.375% | 12/10/37 | 7,000 | 8,784 |
| Royal Bank of Canada | 1.200% | 1/23/17 | 12,400 | 12,395 |
| Royal Bank of Canada | 1.000% | 4/27/17 | 5,000 | 4,978 |
| Royal Bank of Canada | 1.250% | 6/16/17 | 5,700 | 5,683 |
| Royal Bank of Canada | 1.400% | 10/13/17 | 3,150 | 3,149 |
| Royal Bank of Canada | 1.500% | 1/16/18 | 7,000 | 6,975 |
| Royal Bank of Canada | 2.200% | 7/27/18 | 11,875 | 11,987 |
| Royal Bank of Canada | 1.800% | 7/30/18 | 8,000 | 7,976 |
| Royal Bank of Canada | 2.000% | 12/10/18 | 5,700 | 5,711 |
| Royal Bank of Canada | 2.200% | 9/23/19 | 24,550 | 24,558 |
| Royal Bank of Canada | 2.100% | 10/14/20 | 35,000 | 34,431 |
| Royal Bank of Canada | 2.350% | 10/30/20 | 15,500 | 15,330 |
| Royal Bank of Scotland Group plc | 1.875% | 3/31/17 | 3,400 | 3,387 |
| Royal Bank of Scotland Group plc | 6.400% | 10/21/19 | 10,030 | 11,094 |
| Santander Bank NA | 2.000% | 1/12/18 | 2,950 | 2,929 |
| Santander Bank NA | 8.750% | 5/30/18 | 425 | 480 |
| Santander Holdings USA Inc. | 3.450% | 8/27/18 | 5,325 | 5,411 |
| Santander Holdings USA Inc. | 2.650% | 4/17/20 | 1,000 | 976 |
| Santander Holdings USA Inc. | 4.500% | 7/17/25 | 3,425 | 3,483 |
51
| Total Bond Market II Index Fund | ||||
| Face | Market | |||
| Maturity | Amount | Value• | ||
| Coupon | Date | ($000) | ($000) | |
| Santander Issuances SAU | 5.179% | 11/19/25 | 14,700 | 14,354 |
| Santander UK Group Holdings plc | 2.875% | 10/16/20 | 9,000 | 8,937 |
| Societe Generale SA | 2.625% | 10/1/18 | 12,050 | 12,185 |
| State Street Bank & Trust Co. | 5.250% | 10/15/18 | 2,579 | 2,804 |
| State Street Corp. | 4.956% | 3/15/18 | 868 | 911 |
| State Street Corp. | 2.550% | 8/18/20 | 300 | 304 |
| State Street Corp. | 4.375% | 3/7/21 | 1,235 | 1,341 |
| State Street Corp. | 3.100% | 5/15/23 | 11,175 | 11,022 |
| State Street Corp. | 3.700% | 11/20/23 | 6,950 | 7,214 |
| State Street Corp. | 3.300% | 12/16/24 | 2,500 | 2,523 |
| State Street Corp. | 3.550% | 8/18/25 | 10,811 | 11,149 |
| Sumitomo Mitsui Banking Corp. | 0.900% | 1/18/16 | 200 | 200 |
| Sumitomo Mitsui Banking Corp. | 1.300% | 1/10/17 | 575 | 574 |
| Sumitomo Mitsui Banking Corp. | 1.350% | 7/11/17 | 5,350 | 5,313 |
| Sumitomo Mitsui Banking Corp. | 1.800% | 7/18/17 | 6,925 | 6,923 |
| Sumitomo Mitsui Banking Corp. | 1.500% | 1/18/18 | 2,750 | 2,723 |
| Sumitomo Mitsui Banking Corp. | 2.500% | 7/19/18 | 7,025 | 7,090 |
| Sumitomo Mitsui Banking Corp. | 1.950% | 7/23/18 | 5,250 | 5,221 |
| Sumitomo Mitsui Banking Corp. | 2.450% | 1/10/19 | 4,025 | 4,028 |
| Sumitomo Mitsui Banking Corp. | 2.250% | 7/11/19 | 5,500 | 5,461 |
| Sumitomo Mitsui Banking Corp. | 2.450% | 1/16/20 | 750 | 746 |
| Sumitomo Mitsui Banking Corp. | 2.450% | 10/20/20 | 2,500 | 2,476 |
| Sumitomo Mitsui Banking Corp. | 3.200% | 7/18/22 | 2,675 | 2,684 |
| Sumitomo Mitsui Banking Corp. | 3.000% | 1/18/23 | 550 | 543 |
| Sumitomo Mitsui Banking Corp. | 3.950% | 7/19/23 | 5,350 | 5,573 |
| Sumitomo Mitsui Banking Corp. | 3.950% | 1/10/24 | 6,125 | 6,351 |
| Sumitomo Mitsui Banking Corp. | 3.400% | 7/11/24 | 2,650 | 2,631 |
| Sumitomo Mitsui Banking Corp. | 3.650% | 7/23/25 | 2,500 | 2,544 |
| SunTrust Bank | 7.250% | 3/15/18 | 1,200 | 1,326 |
| SunTrust Bank | 2.750% | 5/1/23 | 2,150 | 2,053 |
| SunTrust Banks Inc. | 3.500% | 1/20/17 | 4,070 | 4,146 |
| SunTrust Banks Inc. | 6.000% | 9/11/17 | 2,550 | 2,714 |
| SunTrust Banks Inc. | 2.350% | 11/1/18 | 6,575 | 6,606 |
| SunTrust Banks Inc. | 2.500% | 5/1/19 | 2,700 | 2,711 |
| SVB Financial Group | 3.500% | 1/29/25 | 2,100 | 2,007 |
| Svenska Handelsbanken AB | 2.875% | 4/4/17 | 10,975 | 11,166 |
| Svenska Handelsbanken AB | 1.625% | 3/21/18 | 10,975 | 10,924 |
| Svenska Handelsbanken AB | 2.500% | 1/25/19 | 6,250 | 6,330 |
| Svenska Handelsbanken AB | 2.250% | 6/17/19 | 7,300 | 7,309 |
| Svenska Handelsbanken AB | 2.400% | 10/1/20 | 6,350 | 6,304 |
| Synchrony Financial | 1.875% | 8/15/17 | 800 | 797 |
| Synchrony Financial | 2.600% | 1/15/19 | 5,700 | 5,679 |
| Synchrony Financial | 3.000% | 8/15/19 | 5,050 | 5,047 |
| Synchrony Financial | 2.700% | 2/3/20 | 3,275 | 3,216 |
| Synchrony Financial | 3.750% | 8/15/21 | 3,500 | 3,502 |
| Synchrony Financial | 4.250% | 8/15/24 | 17,700 | 17,473 |
| Synchrony Financial | 4.500% | 7/23/25 | 8,350 | 8,331 |
| Toronto-Dominion Bank | 1.125% | 5/2/17 | 7,750 | 7,730 |
| Toronto-Dominion Bank | 1.625% | 3/13/18 | 8,300 | 8,295 |
| Toronto-Dominion Bank | 1.400% | 4/30/18 | 11,054 | 10,981 |
| Toronto-Dominion Bank | 1.750% | 7/23/18 | 20,450 | 20,455 |
| Toronto-Dominion Bank | 2.625% | 9/10/18 | 10,000 | 10,228 |
| Toronto-Dominion Bank | 2.125% | 7/2/19 | 4,600 | 4,608 |
| Toronto-Dominion Bank | 2.250% | 11/5/19 | 13,000 | 13,000 |
| Toronto-Dominion Bank | 2.500% | 12/14/20 | 5,000 | 4,990 |
| UBS AG | 1.375% | 6/1/17 | 7,350 | 7,317 |
52
| Total Bond Market II Index Fund | ||||
| Face | Market | |||
| Maturity | Amount | Value• | ||
| Coupon | Date | ($000) | ($000) | |
| UBS AG | 1.375% | 8/14/17 | 14,025 | 13,932 |
| UBS AG | 5.875% | 12/20/17 | 860 | 928 |
| UBS AG | 1.800% | 3/26/18 | 5,000 | 4,994 |
| UBS AG | 5.750% | 4/25/18 | 3,265 | 3,539 |
| UBS AG | 2.375% | 8/14/19 | 19,000 | 19,017 |
| UBS AG | 2.350% | 3/26/20 | 3,700 | 3,694 |
| UBS AG | 4.875% | 8/4/20 | 875 | 963 |
| US Bancorp | 1.650% | 5/15/17 | 6,650 | 6,676 |
| US Bancorp | 1.950% | 11/15/18 | 3,725 | 3,748 |
| US Bancorp | 4.125% | 5/24/21 | 4,615 | 4,984 |
| US Bancorp | 3.000% | 3/15/22 | 4,225 | 4,294 |
| US Bancorp | 2.950% | 7/15/22 | 11,275 | 11,215 |
| US Bancorp | 3.700% | 1/30/24 | 11,050 | 11,552 |
| US Bancorp | 3.600% | 9/11/24 | 1,375 | 1,398 |
| US Bank NA | 1.100% | 1/30/17 | 3,350 | 3,347 |
| US Bank NA | 1.350% | 1/26/18 | 3,400 | 3,388 |
| US Bank NA | 2.125% | 10/28/19 | 9,800 | 9,784 |
| US Bank NA | 2.800% | 1/27/25 | 7,500 | 7,306 |
| Wachovia Bank NA | 5.850% | 2/1/37 | 11,025 | 13,120 |
| Wachovia Corp. | 5.750% | 6/15/17 | 6,570 | 6,958 |
| Wachovia Corp. | 5.750% | 2/1/18 | 14,665 | 15,844 |
| Wachovia Corp. | 6.605% | 10/1/25 | 825 | 979 |
| Wachovia Corp. | 5.500% | 8/1/35 | 1,775 | 1,960 |
| Wachovia Corp. | 6.550% | 10/15/35 | 250 | 301 |
| Wells Fargo & Co. | 2.625% | 12/15/16 | 5,100 | 5,171 |
| Wells Fargo & Co. | 2.100% | 5/8/17 | 3,625 | 3,661 |
| Wells Fargo & Co. | 1.150% | 6/2/17 | 7,675 | 7,650 |
| Wells Fargo & Co. | 1.400% | 9/8/17 | 7,825 | 7,801 |
| Wells Fargo & Co. | 5.625% | 12/11/17 | 20,451 | 21,947 |
| Wells Fargo & Co. | 1.500% | 1/16/18 | 6,300 | 6,274 |
| Wells Fargo & Co. | 2.150% | 1/15/19 | 9,250 | 9,299 |
| Wells Fargo & Co. | 2.125% | 4/22/19 | 12,850 | 12,861 |
| Wells Fargo & Co. | 2.150% | 1/30/20 | 9,625 | 9,551 |
| Wells Fargo & Co. | 2.600% | 7/22/20 | 22,850 | 22,851 |
| Wells Fargo & Co. | 2.550% | 12/7/20 | 10,375 | 10,290 |
| Wells Fargo & Co. | 3.000% | 1/22/21 | 8,000 | 8,121 |
| Wells Fargo & Co. | 4.600% | 4/1/21 | 15,140 | 16,482 |
| Wells Fargo & Co. | 3.500% | 3/8/22 | 18,200 | 18,729 |
| Wells Fargo & Co. | 3.450% | 2/13/23 | 12,075 | 12,082 |
| Wells Fargo & Co. | 4.125% | 8/15/23 | 18,350 | 18,985 |
| Wells Fargo & Co. | 4.480% | 1/16/24 | 10,000 | 10,523 |
| Wells Fargo & Co. | 3.300% | 9/9/24 | 9,250 | 9,181 |
| Wells Fargo & Co. | 3.000% | 2/19/25 | 4,675 | 4,515 |
| Wells Fargo & Co. | 3.550% | 9/29/25 | 13,000 | 13,095 |
| Wells Fargo & Co. | 4.100% | 6/3/26 | 13,650 | 13,776 |
| Wells Fargo & Co. | 4.300% | 7/22/27 | 11,800 | 12,026 |
| Wells Fargo & Co. | 5.375% | 2/7/35 | 3,825 | 4,378 |
| Wells Fargo & Co. | 5.375% | 11/2/43 | 12,379 | 13,225 |
| Wells Fargo & Co. | 5.606% | 1/15/44 | 7,500 | 8,301 |
| Wells Fargo & Co. | 4.650% | 11/4/44 | 14,475 | 14,091 |
| Wells Fargo & Co. | 3.900% | 5/1/45 | 11,325 | 10,343 |
| Wells Fargo & Co. | 4.900% | 11/17/45 | 11,025 | 11,058 |
| Wells Fargo Bank NA | 6.000% | 11/15/17 | 2,975 | 3,208 |
| Wells Fargo Bank NA | 5.950% | 8/26/36 | 2,700 | 3,210 |
| Wells Fargo Bank NA | 6.600% | 1/15/38 | 9,695 | 12,520 |
| 5 Wells Fargo Capital X | 5.950% | 12/1/86 | 3,500 | 3,531 |
53
| Total Bond Market II Index Fund | ||||
| Face | Market | |||
| Maturity | Amount | Value• | ||
| Coupon | Date | ($000) | ($000) | |
| Westpac Banking Corp. | 1.200% | 5/19/17 | 6,300 | 6,283 |
| Westpac Banking Corp. | 2.000% | 8/14/17 | 4,750 | 4,780 |
| Westpac Banking Corp. | 1.500% | 12/1/17 | 14,375 | 14,368 |
| Westpac Banking Corp. | 1.600% | 1/12/18 | 4,210 | 4,203 |
| Westpac Banking Corp. | 2.250% | 7/30/18 | 8,400 | 8,458 |
| Westpac Banking Corp. | 1.950% | 11/23/18 | 5,000 | 4,992 |
| Westpac Banking Corp. | 2.250% | 1/17/19 | 14,300 | 14,332 |
| Westpac Banking Corp. | 4.875% | 11/19/19 | 9,420 | 10,283 |
| Westpac Banking Corp. | 2.600% | 11/23/20 | 16,000 | 15,990 |
| Brokerage (0.2%) | ||||
| Affiliated Managers Group Inc. | 4.250% | 2/15/24 | 2,800 | 2,827 |
| Affiliated Managers Group Inc. | 3.500% | 8/1/25 | 4,600 | 4,373 |
| Ameriprise Financial Inc. | 4.000% | 10/15/23 | 3,150 | 3,252 |
| Ameriprise Financial Inc. | 3.700% | 10/15/24 | 4,500 | 4,557 |
| Apollo Investment Corp. | 5.250% | 3/3/25 | 1,100 | 1,060 |
| BGC Partners Inc. | 5.375% | 12/9/19 | 500 | 514 |
| BlackRock Inc. | 6.250% | 9/15/17 | 125 | 135 |
| BlackRock Inc. | 4.250% | 5/24/21 | 5,775 | 6,242 |
| BlackRock Inc. | 3.375% | 6/1/22 | 7,250 | 7,463 |
| BlackRock Inc. | 3.500% | 3/18/24 | 7,650 | 7,825 |
| Brookfield Asset Management Inc. | 4.000% | 1/15/25 | 4,725 | 4,616 |
| Brookfield Asset Management Inc. | 7.375% | 3/1/33 | 1,500 | 1,761 |
| Charles Schwab Corp. | 4.450% | 7/22/20 | 775 | 845 |
| Charles Schwab Corp. | 3.225% | 9/1/22 | 4,464 | 4,538 |
| Charles Schwab Corp. | 3.450% | 2/13/26 | 4,225 | 4,268 |
| CME Group Inc. | 3.000% | 9/15/22 | 5,800 | 5,828 |
| CME Group Inc. | 3.000% | 3/15/25 | 750 | 736 |
| CME Group Inc. | 5.300% | 9/15/43 | 6,185 | 7,081 |
| Eaton Vance Corp. | 3.625% | 6/15/23 | 1,875 | 1,883 |
| 8 FMR LLC | 7.490% | 6/15/19 | 200 | 232 |
| Franklin Resources Inc. | 1.375% | 9/15/17 | 1,775 | 1,772 |
| Franklin Resources Inc. | 2.800% | 9/15/22 | 4,875 | 4,755 |
| Franklin Resources Inc. | 2.850% | 3/30/25 | 3,000 | 2,829 |
| Intercontinental Exchange Inc. | 2.500% | 10/15/18 | 1,100 | 1,109 |
| Intercontinental Exchange Inc. | 2.750% | 12/1/20 | 4,525 | 4,513 |
| Intercontinental Exchange Inc. | 4.000% | 10/15/23 | 10,000 | 10,317 |
| Intercontinental Exchange Inc. | 3.750% | 12/1/25 | 5,400 | 5,409 |
| Invesco Finance plc | 3.125% | 11/30/22 | 6,575 | 6,472 |
| Invesco Finance plc | 4.000% | 1/30/24 | 6,125 | 6,321 |
| Invesco Finance plc | 5.375% | 11/30/43 | 6,050 | 6,608 |
| Janus Capital Group Inc. | 4.875% | 8/1/25 | 2,400 | 2,460 |
| Jefferies Group LLC | 5.125% | 4/13/18 | 4,125 | 4,290 |
| Jefferies Group LLC | 8.500% | 7/15/19 | 3,000 | 3,496 |
| Jefferies Group LLC | 6.875% | 4/15/21 | 6,645 | 7,412 |
| Jefferies Group LLC | 5.125% | 1/20/23 | 2,775 | 2,777 |
| Jefferies Group LLC | 6.450% | 6/8/27 | 1,225 | 1,294 |
| Jefferies Group LLC | 6.250% | 1/15/36 | 1,830 | 1,679 |
| Jefferies Group LLC | 6.500% | 1/20/43 | 2,850 | 2,636 |
| Lazard Group LLC | 6.850% | 6/15/17 | 464 | 492 |
| Lazard Group LLC | 4.250% | 11/14/20 | 425 | 441 |
| Lazard Group LLC | 3.750% | 2/13/25 | 100 | 92 |
| Legg Mason Inc. | 2.700% | 7/15/19 | 1,450 | 1,443 |
| Legg Mason Inc. | 3.950% | 7/15/24 | 400 | 393 |
| Legg Mason Inc. | 5.625% | 1/15/44 | 4,875 | 4,871 |
| Leucadia National Corp. | 5.500% | 10/18/23 | 8,050 | 7,865 |
54
| Total Bond Market II Index Fund | ||||
| Face | Market | |||
| Maturity | Amount | Value• | ||
| Coupon | Date | ($000) | ($000) | |
| Leucadia National Corp. | 6.625% | 10/23/43 | 825 | 681 |
| Nasdaq Inc. | 5.550% | 1/15/20 | 4,400 | 4,851 |
| Nomura Holdings Inc. | 2.750% | 3/19/19 | 19,675 | 19,763 |
| NYSE Euronext | 2.000% | 10/5/17 | 5,150 | 5,170 |
| Raymond James Financial Inc. | 8.600% | 8/15/19 | 1,575 | 1,869 |
| Stifel Financial Corp. | 3.500% | 12/1/20 | 1,500 | 1,479 |
| Stifel Financial Corp. | 4.250% | 7/18/24 | 1,650 | 1,635 |
| TD Ameritrade Holding Corp. | 2.950% | 4/1/22 | 2,500 | 2,479 |
| TD Ameritrade Holding Corp. | 3.625% | 4/1/25 | 1,600 | 1,618 |
| Finance Companies (0.4%) | ||||
| Air Lease Corp. | 5.625% | 4/1/17 | 7,325 | 7,600 |
| Air Lease Corp. | 2.125% | 1/15/18 | 3,750 | 3,684 |
| Air Lease Corp. | 3.375% | 1/15/19 | 6,100 | 6,138 |
| Air Lease Corp. | 4.750% | 3/1/20 | 4,000 | 4,195 |
| Air Lease Corp. | 3.875% | 4/1/21 | 9,175 | 9,221 |
| Air Lease Corp. | 3.750% | 2/1/22 | 5,525 | 5,415 |
| Air Lease Corp. | 4.250% | 9/15/24 | 600 | 589 |
| Ares Capital Corp. | 4.875% | 11/30/18 | 7,000 | 7,246 |
| FS Investment Corp. | 4.000% | 7/15/19 | 2,225 | 2,216 |
| FS Investment Corp. | 4.250% | 1/15/20 | 1,000 | 1,004 |
| FS Investment Corp. | 4.750% | 5/15/22 | 1,500 | 1,473 |
| GATX Corp. | 1.250% | 3/4/17 | 50 | 50 |
| GATX Corp. | 2.375% | 7/30/18 | 7,000 | 6,963 |
| GATX Corp. | 2.500% | 7/30/19 | 300 | 295 |
| GATX Corp. | 2.600% | 3/30/20 | 2,250 | 2,192 |
| GATX Corp. | 4.750% | 6/15/22 | 1,550 | 1,636 |
| GATX Corp. | 3.250% | 3/30/25 | 2,175 | 2,015 |
| GATX Corp. | 5.200% | 3/15/44 | 325 | 307 |
| GATX Corp. | 4.500% | 3/30/45 | 1,275 | 1,094 |
| 8 GE Capital International Funding Co. | 0.964% | 4/15/16 | 95,040 | 95,073 |
| 8 GE Capital International Funding Co. | 2.342% | 11/15/20 | 101,764 | 100,945 |
| 8 GE Capital International Funding Co. | 3.373% | 11/15/25 | 23,918 | 24,163 |
| 8 GE Capital International Funding Co. | 4.418% | 11/15/35 | 81,175 | 82,759 |
| HSBC Finance Corp. | 6.676% | 1/15/21 | 28,865 | 33,072 |
| 8 International Lease Finance Corp. | 7.125% | 9/1/18 | 12,615 | 13,829 |
| Prospect Capital Corp. | 5.000% | 7/15/19 | 2,150 | 2,160 |
| Prospect Capital Corp. | 5.875% | 3/15/23 | 550 | 534 |
| Insurance (1.3%) | ||||
| ACE Capital Trust II | 9.700% | 4/1/30 | 900 | 1,311 |
| ACE INA Holdings Inc. | 5.700% | 2/15/17 | 1,400 | 1,468 |
| ACE INA Holdings Inc. | 5.800% | 3/15/18 | 475 | 516 |
| ACE INA Holdings Inc. | 5.900% | 6/15/19 | 785 | 879 |
| ACE INA Holdings Inc. | 2.300% | 11/3/20 | 3,300 | 3,266 |
| ACE INA Holdings Inc. | 2.875% | 11/3/22 | 12,375 | 12,265 |
| ACE INA Holdings Inc. | 2.700% | 3/13/23 | 2,100 | 2,049 |
| ACE INA Holdings Inc. | 3.350% | 5/15/24 | 7,650 | 7,717 |
| ACE INA Holdings Inc. | 3.150% | 3/15/25 | 5,750 | 5,682 |
| ACE INA Holdings Inc. | 3.350% | 5/3/26 | 8,750 | 8,719 |
| ACE INA Holdings Inc. | 6.700% | 5/15/36 | 400 | 521 |
| ACE INA Holdings Inc. | 4.150% | 3/13/43 | 5,675 | 5,530 |
| ACE INA Holdings Inc. | 4.350% | 11/3/45 | 6,950 | 7,030 |
| AEGON Funding Co. LLC | 5.750% | 12/15/20 | 4,641 | 5,269 |
| Aetna Inc. | 1.500% | 11/15/17 | 500 | 499 |
| Aetna Inc. | 2.200% | 3/15/19 | 2,375 | 2,363 |
55
| Total Bond Market II Index Fund | ||||
| Face | Market | |||
| Maturity | Amount | Value• | ||
| Coupon | Date | ($000) | ($000) | |
| Aetna Inc. | 3.950% | 9/1/20 | 5,525 | 5,815 |
| Aetna Inc. | 4.125% | 6/1/21 | 2,230 | 2,334 |
| Aetna Inc. | 2.750% | 11/15/22 | 13,910 | 13,394 |
| Aetna Inc. | 3.500% | 11/15/24 | 1,700 | 1,697 |
| Aetna Inc. | 6.625% | 6/15/36 | 4,325 | 5,174 |
| Aetna Inc. | 6.750% | 12/15/37 | 3,000 | 3,755 |
| Aetna Inc. | 4.500% | 5/15/42 | 4,750 | 4,663 |
| Aetna Inc. | 4.125% | 11/15/42 | 1,425 | 1,336 |
| Aetna Inc. | 4.750% | 3/15/44 | 400 | 404 |
| Aflac Inc. | 2.650% | 2/15/17 | 2,415 | 2,447 |
| Aflac Inc. | 2.400% | 3/16/20 | 3,050 | 3,044 |
| Aflac Inc. | 3.625% | 6/15/23 | 8,900 | 9,160 |
| Aflac Inc. | 6.900% | 12/17/39 | 2,900 | 3,741 |
| Aflac Inc. | 6.450% | 8/15/40 | 1,800 | 2,208 |
| Alleghany Corp. | 5.625% | 9/15/20 | 800 | 877 |
| Alleghany Corp. | 4.950% | 6/27/22 | 3,200 | 3,428 |
| Alleghany Corp. | 4.900% | 9/15/44 | 4,575 | 4,338 |
| Allied World Assurance Co. Holdings Ltd. | 4.350% | 10/29/25 | 4,750 | 4,710 |
| Allied World Assurance Co. Ltd. | 5.500% | 11/15/20 | 1,180 | 1,285 |
| Allstate Corp. | 3.150% | 6/15/23 | 2,500 | 2,498 |
| Allstate Corp. | 5.350% | 6/1/33 | 225 | 248 |
| Allstate Corp. | 5.550% | 5/9/35 | 420 | 487 |
| Allstate Corp. | 5.950% | 4/1/36 | 525 | 635 |
| Allstate Corp. | 4.500% | 6/15/43 | 1,675 | 1,701 |
| 5 Allstate Corp. | 5.750% | 8/15/53 | 800 | 820 |
| 5 Allstate Corp. | 6.125% | 5/15/67 | 7,734 | 7,734 |
| 5 Allstate Corp. | 6.500% | 5/15/67 | 3,250 | 3,591 |
| Alterra Finance LLC | 6.250% | 9/30/20 | 745 | 837 |
| American Financial Group Inc. | 9.875% | 6/15/19 | 1,985 | 2,408 |
| American International Group Inc. | 5.850% | 1/16/18 | 6,450 | 6,942 |
| American International Group Inc. | 2.300% | 7/16/19 | 7,425 | 7,363 |
| American International Group Inc. | 3.375% | 8/15/20 | 2,650 | 2,721 |
| American International Group Inc. | 6.400% | 12/15/20 | 15,675 | 18,068 |
| American International Group Inc. | 4.875% | 6/1/22 | 9,300 | 10,039 |
| American International Group Inc. | 4.125% | 2/15/24 | 5,405 | 5,545 |
| American International Group Inc. | 3.875% | 1/15/35 | 8,675 | 7,631 |
| American International Group Inc. | 4.700% | 7/10/35 | 2,760 | 2,749 |
| American International Group Inc. | 6.250% | 5/1/36 | 15,420 | 17,902 |
| American International Group Inc. | 6.820% | 11/15/37 | 1,107 | 1,326 |
| American International Group Inc. | 4.500% | 7/16/44 | 7,300 | 6,748 |
| American International Group Inc. | 4.800% | 7/10/45 | 400 | 386 |
| American International Group Inc. | 4.375% | 1/15/55 | 3,375 | 2,896 |
| 5 American International Group Inc. | 8.175% | 5/15/68 | 1,950 | 2,546 |
| 5 American International Group Inc. | 6.250% | 3/15/87 | 4,685 | 5,041 |
| Anthem Inc. | 2.375% | 2/15/17 | 1,700 | 1,715 |
| Anthem Inc. | 5.875% | 6/15/17 | 3,075 | 3,249 |
| Anthem Inc. | 1.875% | 1/15/18 | 2,975 | 2,964 |
| Anthem Inc. | 7.000% | 2/15/19 | 630 | 708 |
| Anthem Inc. | 4.350% | 8/15/20 | 6,900 | 7,308 |
| Anthem Inc. | 3.700% | 8/15/21 | 4,780 | 4,865 |
| Anthem Inc. | 3.125% | 5/15/22 | 4,270 | 4,177 |
| Anthem Inc. | 3.300% | 1/15/23 | 5,600 | 5,452 |
| Anthem Inc. | 3.500% | 8/15/24 | 5,850 | 5,709 |
| Anthem Inc. | 5.950% | 12/15/34 | 5,170 | 5,766 |
| Anthem Inc. | 5.850% | 1/15/36 | 2,400 | 2,602 |
| Anthem Inc. | 6.375% | 6/15/37 | 3,620 | 4,286 |
56
| Total Bond Market II Index Fund | ||||
| Face | Market | |||
| Maturity | Amount | Value• | ||
| Coupon | Date | ($000) | ($000) | |
| Anthem Inc. | 4.625% | 5/15/42 | 7,900 | 7,434 |
| Anthem Inc. | 4.650% | 1/15/43 | 6,375 | 6,064 |
| Anthem Inc. | 5.100% | 1/15/44 | 3,205 | 3,238 |
| Anthem Inc. | 4.850% | 8/15/54 | 2,525 | 2,354 |
| Aon Corp. | 5.000% | 9/30/20 | 6,370 | 6,943 |
| Aon Corp. | 6.250% | 9/30/40 | 2,125 | 2,523 |
| Aon plc | 2.800% | 3/15/21 | 8,155 | 8,115 |
| Aon plc | 4.000% | 11/27/23 | 2,675 | 2,671 |
| Aon plc | 3.500% | 6/14/24 | 4,400 | 4,277 |
| Aon plc | 4.450% | 5/24/43 | 1,350 | 1,266 |
| Aon plc | 4.600% | 6/14/44 | 3,050 | 2,923 |
| Aon plc | 4.750% | 5/15/45 | 1,000 | 990 |
| Arch Capital Group Ltd. | 7.350% | 5/1/34 | 1,100 | 1,401 |
| Arch Capital Group US Inc. | 5.144% | 11/1/43 | 5,950 | 6,023 |
| Aspen Insurance Holdings Ltd. | 6.000% | 12/15/20 | 3,800 | 4,155 |
| Aspen Insurance Holdings Ltd. | 4.650% | 11/15/23 | 9,700 | 9,924 |
| Assurant Inc. | 4.000% | 3/15/23 | 1,000 | 1,000 |
| Assurant Inc. | 6.750% | 2/15/34 | 4,325 | 5,032 |
| AXA SA | 8.600% | 12/15/30 | 7,170 | 9,609 |
| Axis Specialty Finance LLC | 5.875% | 6/1/20 | 11,950 | 13,228 |
| AXIS Specialty Finance plc | 2.650% | 4/1/19 | 625 | 622 |
| AXIS Specialty Finance plc | 5.150% | 4/1/45 | 2,600 | 2,565 |
| Berkshire Hathaway Finance Corp. | 1.600% | 5/15/17 | 7,600 | 7,637 |
| Berkshire Hathaway Finance Corp. | 5.400% | 5/15/18 | 13,645 | 14,805 |
| Berkshire Hathaway Finance Corp. | 2.000% | 8/15/18 | 9,750 | 9,885 |
| Berkshire Hathaway Finance Corp. | 2.900% | 10/15/20 | 12,650 | 13,021 |
| Berkshire Hathaway Finance Corp. | 4.250% | 1/15/21 | 10,020 | 10,918 |
| Berkshire Hathaway Finance Corp. | 3.000% | 5/15/22 | 2,925 | 2,984 |
| Berkshire Hathaway Finance Corp. | 5.750% | 1/15/40 | 145 | 169 |
| Berkshire Hathaway Finance Corp. | 4.400% | 5/15/42 | 2,100 | 2,087 |
| Berkshire Hathaway Inc. | 1.900% | 1/31/17 | 4,500 | 4,540 |
| Berkshire Hathaway Inc. | 1.550% | 2/9/18 | 225 | 225 |
| Berkshire Hathaway Inc. | 2.100% | 8/14/19 | 7,075 | 7,112 |
| Berkshire Hathaway Inc. | 3.000% | 2/11/23 | 1,575 | 1,602 |
| Berkshire Hathaway Inc. | 4.500% | 2/11/43 | 2,825 | 2,838 |
| Brown & Brown Inc. | 4.200% | 9/15/24 | 4,830 | 4,785 |
| Chubb Corp. | 5.750% | 5/15/18 | 5,277 | 5,736 |
| Chubb Corp. | 6.000% | 5/11/37 | 1,975 | 2,406 |
| 5 Chubb Corp. | 6.375% | 3/29/67 | 4,465 | 4,281 |
| Cigna Corp. | 5.125% | 6/15/20 | 375 | 409 |
| Cigna Corp. | 4.375% | 12/15/20 | 200 | 212 |
| Cigna Corp. | 4.500% | 3/15/21 | 1,090 | 1,156 |
| Cigna Corp. | 4.000% | 2/15/22 | 1,385 | 1,430 |
| Cigna Corp. | 3.250% | 4/15/25 | 5,800 | 5,668 |
| Cigna Corp. | 7.875% | 5/15/27 | 425 | 558 |
| Cigna Corp. | 6.150% | 11/15/36 | 7,279 | 8,334 |
| Cigna Corp. | 5.875% | 3/15/41 | 1,665 | 1,903 |
| Cigna Corp. | 5.375% | 2/15/42 | 1,375 | 1,507 |
| Cincinnati Financial Corp. | 6.920% | 5/15/28 | 4,325 | 5,341 |
| CNA Financial Corp. | 7.350% | 11/15/19 | 2,755 | 3,178 |
| CNA Financial Corp. | 5.875% | 8/15/20 | 355 | 395 |
| CNA Financial Corp. | 5.750% | 8/15/21 | 1,765 | 1,975 |
| CNA Financial Corp. | 3.950% | 5/15/24 | 3,275 | 3,268 |
| Coventry Health Care Inc. | 5.950% | 3/15/17 | 1,800 | 1,890 |
| Coventry Health Care Inc. | 5.450% | 6/15/21 | 3,385 | 3,768 |
| Endurance Specialty Holdings Ltd. | 7.000% | 7/15/34 | 1,279 | 1,506 |
57
| Total Bond Market II Index Fund | ||||
| Face | Market | |||
| Maturity | Amount | Value• | ||
| Coupon | Date | ($000) | ($000) | |
| Everest Reinsurance Holdings Inc. | 4.868% | 6/1/44 | 3,500 | 3,338 |
| First American Financial Corp. | 4.300% | 2/1/23 | 1,025 | 1,018 |
| First American Financial Corp. | 4.600% | 11/15/24 | 4,675 | 4,743 |
| Hartford Financial Services Group Inc. | 5.375% | 3/15/17 | 900 | 939 |
| Hartford Financial Services Group Inc. | 6.300% | 3/15/18 | 1,584 | 1,726 |
| Hartford Financial Services Group Inc. | 6.000% | 1/15/19 | 925 | 1,017 |
| Hartford Financial Services Group Inc. | 5.500% | 3/30/20 | 4,100 | 4,525 |
| Hartford Financial Services Group Inc. | 5.125% | 4/15/22 | 825 | 904 |
| Hartford Financial Services Group Inc. | 5.950% | 10/15/36 | 225 | 258 |
| Hartford Financial Services Group Inc. | 6.625% | 3/30/40 | 1,500 | 1,850 |
| Hartford Financial Services Group Inc. | 6.100% | 10/1/41 | 2,150 | 2,497 |
| Hartford Financial Services Group Inc. | 6.625% | 4/15/42 | 1,793 | 2,192 |
| Horace Mann Educators Corp. | 4.500% | 12/1/25 | 1,000 | 1,004 |
| Humana Inc. | 6.300% | 8/1/18 | 150 | 165 |
| Humana Inc. | 2.625% | 10/1/19 | 1,525 | 1,525 |
| Humana Inc. | 3.150% | 12/1/22 | 3,825 | 3,727 |
| Humana Inc. | 3.850% | 10/1/24 | 3,900 | 3,934 |
| Humana Inc. | 8.150% | 6/15/38 | 2,275 | 3,109 |
| Humana Inc. | 4.625% | 12/1/42 | 2,175 | 2,061 |
| Humana Inc. | 4.950% | 10/1/44 | 2,100 | 2,090 |
| Infinity Property & Casualty Corp. | 5.000% | 9/19/22 | 950 | 954 |
| Kemper Corp. | 4.350% | 2/15/25 | 3,825 | 3,774 |
| Lincoln National Corp. | 8.750% | 7/1/19 | 2,026 | 2,434 |
| Lincoln National Corp. | 6.250% | 2/15/20 | 4,795 | 5,383 |
| Lincoln National Corp. | 4.850% | 6/24/21 | 1,652 | 1,775 |
| Lincoln National Corp. | 4.200% | 3/15/22 | 1,325 | 1,381 |
| Lincoln National Corp. | 4.000% | 9/1/23 | 2,000 | 2,042 |
| Lincoln National Corp. | 6.150% | 4/7/36 | 3,550 | 4,100 |
| Lincoln National Corp. | 7.000% | 6/15/40 | 4,335 | 5,449 |
| 5 Lincoln National Corp. | 6.050% | 4/20/67 | 2,008 | 1,576 |
| Loews Corp. | 2.625% | 5/15/23 | 9,600 | 9,095 |
| Loews Corp. | 6.000% | 2/1/35 | 200 | 230 |
| Loews Corp. | 4.125% | 5/15/43 | 9,865 | 8,814 |
| Manulife Financial Corp. | 4.900% | 9/17/20 | 4,875 | 5,304 |
| Markel Corp. | 7.125% | 9/30/19 | 825 | 948 |
| Markel Corp. | 4.900% | 7/1/22 | 4,665 | 5,005 |
| Markel Corp. | 3.625% | 3/30/23 | 2,175 | 2,148 |
| Markel Corp. | 5.000% | 3/30/43 | 575 | 577 |
| Marsh & McLennan Cos. Inc. | 2.350% | 9/10/19 | 1,700 | 1,695 |
| Marsh & McLennan Cos. Inc. | 2.350% | 3/6/20 | 5,600 | 5,547 |
| Marsh & McLennan Cos. Inc. | 4.800% | 7/15/21 | 2,265 | 2,465 |
| Marsh & McLennan Cos. Inc. | 3.500% | 6/3/24 | 3,100 | 3,073 |
| Marsh & McLennan Cos. Inc. | 3.500% | 3/10/25 | 2,425 | 2,387 |
| Marsh & McLennan Cos. Inc. | 3.750% | 3/14/26 | 4,050 | 4,060 |
| Marsh & McLennan Cos. Inc. | 5.875% | 8/1/33 | 3,425 | 3,956 |
| 8 Massachusetts Mutual Life Insurance Co. | 8.875% | 6/1/39 | 575 | 836 |
| MetLife Inc. | 1.756% | 12/15/17 | 8,000 | 8,002 |
| MetLife Inc. | 1.903% | 12/15/17 | 3,270 | 3,286 |
| MetLife Inc. | 6.817% | 8/15/18 | 895 | 1,008 |
| MetLife Inc. | 7.717% | 2/15/19 | 1,370 | 1,595 |
| MetLife Inc. | 4.750% | 2/8/21 | 9,545 | 10,446 |
| MetLife Inc. | 3.048% | 12/15/22 | 5,475 | 5,454 |
| MetLife Inc. | 3.600% | 4/10/24 | 13,100 | 13,477 |
| MetLife Inc. | 3.000% | 3/1/25 | 5,475 | 5,270 |
| MetLife Inc. | 6.500% | 12/15/32 | 250 | 307 |
| MetLife Inc. | 6.375% | 6/15/34 | 1,970 | 2,429 |
58
| Total Bond Market II Index Fund | ||||
| Face | Market | |||
| Maturity | Amount | Value• | ||
| Coupon | Date | ($000) | ($000) | |
| MetLife Inc. | 5.700% | 6/15/35 | 8,150 | 9,430 |
| MetLife Inc. | 5.875% | 2/6/41 | 6,870 | 8,073 |
| MetLife Inc. | 4.125% | 8/13/42 | 7,350 | 6,924 |
| MetLife Inc. | 4.875% | 11/13/43 | 5,700 | 5,962 |
| MetLife Inc. | 4.721% | 12/15/44 | 5,350 | 5,470 |
| MetLife Inc. | 4.050% | 3/1/45 | 4,600 | 4,244 |
| MetLife Inc. | 4.600% | 5/13/46 | 2,000 | 2,016 |
| 5 MetLife Inc. | 6.400% | 12/15/66 | 10,010 | 10,923 |
| 5 MetLife Inc. | 10.750% | 8/1/69 | 500 | 783 |
| Montpelier Re Holdings Ltd. | 4.700% | 10/15/22 | 275 | 279 |
| Munich Re America Corp. | 7.450% | 12/15/26 | 1,200 | 1,524 |
| 5 Nationwide Financial Services Inc. | 6.750% | 5/15/87 | 400 | 403 |
| Old Republic International Corp. | 4.875% | 10/1/24 | 4,200 | 4,303 |
| OneBeacon US Holdings Inc. | 4.600% | 11/9/22 | 1,000 | 992 |
| PartnerRe Finance B LLC | 5.500% | 6/1/20 | 9,458 | 10,365 |
| Primerica Inc. | 4.750% | 7/15/22 | 275 | 292 |
| Principal Financial Group Inc. | 8.875% | 5/15/19 | 2,915 | 3,489 |
| Principal Financial Group Inc. | 6.050% | 10/15/36 | 2,000 | 2,317 |
| Principal Financial Group Inc. | 4.350% | 5/15/43 | 450 | 417 |
| 5 Principal Financial Group Inc. | 4.700% | 5/15/55 | 2,700 | 2,693 |
| ProAssurance Corp. | 5.300% | 11/15/23 | 325 | 344 |
| Progressive Corp. | 3.750% | 8/23/21 | 10,655 | 11,236 |
| Progressive Corp. | 6.625% | 3/1/29 | 725 | 908 |
| Progressive Corp. | 4.350% | 4/25/44 | 1,850 | 1,871 |
| 5 Progressive Corp. | 6.700% | 6/15/67 | 3,465 | 3,469 |
| Protective Life Corp. | 7.375% | 10/15/19 | 950 | 1,099 |
| Protective Life Corp. | 8.450% | 10/15/39 | 6,244 | 8,244 |
| Prudential Financial Inc. | 5.500% | 3/15/16 | 1,575 | 1,589 |
| Prudential Financial Inc. | 3.000% | 5/12/16 | 3,150 | 3,170 |
| Prudential Financial Inc. | 6.000% | 12/1/17 | 5,000 | 5,372 |
| Prudential Financial Inc. | 2.300% | 8/15/18 | 3,200 | 3,221 |
| Prudential Financial Inc. | 7.375% | 6/15/19 | 795 | 923 |
| Prudential Financial Inc. | 2.350% | 8/15/19 | 2,300 | 2,292 |
| Prudential Financial Inc. | 5.375% | 6/21/20 | 3,695 | 4,101 |
| Prudential Financial Inc. | 4.500% | 11/15/20 | 5,000 | 5,363 |
| Prudential Financial Inc. | 4.500% | 11/16/21 | 675 | 727 |
| Prudential Financial Inc. | 3.500% | 5/15/24 | 4,175 | 4,190 |
| Prudential Financial Inc. | 5.750% | 7/15/33 | 1,280 | 1,449 |
| Prudential Financial Inc. | 5.400% | 6/13/35 | 2,875 | 3,137 |
| Prudential Financial Inc. | 5.900% | 3/17/36 | 2,300 | 2,641 |
| Prudential Financial Inc. | 5.700% | 12/14/36 | 6,920 | 7,805 |
| Prudential Financial Inc. | 6.625% | 12/1/37 | 5,050 | 6,203 |
| Prudential Financial Inc. | 6.625% | 6/21/40 | 7,900 | 9,790 |
| Prudential Financial Inc. | 5.625% | 5/12/41 | 1,345 | 1,479 |
| 5 Prudential Financial Inc. | 5.875% | 9/15/42 | 2,200 | 2,299 |
| 5 Prudential Financial Inc. | 5.625% | 6/15/43 | 8,775 | 8,907 |
| Prudential Financial Inc. | 5.100% | 8/15/43 | 4,075 | 4,248 |
| 5 Prudential Financial Inc. | 5.200% | 3/15/44 | 3,075 | 2,975 |
| Prudential Financial Inc. | 4.600% | 5/15/44 | 700 | 697 |
| 5 Prudential Financial Inc. | 5.375% | 5/15/45 | 1,550 | 1,548 |
| 5 Prudential Financial Inc. | 8.875% | 6/15/68 | 2,400 | 2,700 |
| Reinsurance Group of America Inc. | 5.625% | 3/15/17 | 1,505 | 1,569 |
| Reinsurance Group of America Inc. | 6.450% | 11/15/19 | 1,000 | 1,125 |
| Reinsurance Group of America Inc. | 5.000% | 6/1/21 | 2,275 | 2,453 |
| Reinsurance Group of America Inc. | 4.700% | 9/15/23 | 1,400 | 1,476 |
| 8 Reliance Standard Life Global Funding II | 2.500% | 1/15/20 | 500 | 495 |
59
| Total Bond Market II Index Fund | ||||
| Face | Market | |||
| Maturity | Amount | Value• | ||
| Coupon | Date | ($000) | ($000) | |
| StanCorp Financial Group Inc. | 5.000% | 8/15/22 | 1,400 | 1,461 |
| Swiss Re Solutions Holding Corp. | 7.000% | 2/15/26 | 2,425 | 3,011 |
| Torchmark Corp. | 6.375% | 6/15/16 | 1,225 | 1,252 |
| Torchmark Corp. | 9.250% | 6/15/19 | 895 | 1,083 |
| Transatlantic Holdings Inc. | 8.000% | 11/30/39 | 6,225 | 8,002 |
| Travelers Cos. Inc. | 5.750% | 12/15/17 | 4,475 | 4,822 |
| Travelers Cos. Inc. | 5.800% | 5/15/18 | 1,215 | 1,329 |
| Travelers Cos. Inc. | 5.900% | 6/2/19 | 475 | 535 |
| Travelers Cos. Inc. | 3.900% | 11/1/20 | 1,870 | 1,987 |
| Travelers Cos. Inc. | 6.750% | 6/20/36 | 1,525 | 2,010 |
| Travelers Cos. Inc. | 6.250% | 6/15/37 | 4,885 | 6,146 |
| Travelers Cos. Inc. | 5.350% | 11/1/40 | 4,245 | 4,899 |
| Travelers Cos. Inc. | 4.600% | 8/1/43 | 2,820 | 2,951 |
| Travelers Cos. Inc. | 4.300% | 8/25/45 | 500 | 502 |
| Trinity Acquisition plc | 4.625% | 8/15/23 | 500 | 512 |
| Trinity Acquisition plc | 6.125% | 8/15/43 | 2,725 | 2,907 |
| UnitedHealth Group Inc. | 6.000% | 6/15/17 | 3,825 | 4,075 |
| UnitedHealth Group Inc. | 1.450% | 7/17/17 | 5,100 | 5,098 |
| UnitedHealth Group Inc. | 1.400% | 10/15/17 | 2,450 | 2,445 |
| UnitedHealth Group Inc. | 1.400% | 12/15/17 | 125 | 125 |
| UnitedHealth Group Inc. | 6.000% | 2/15/18 | 8,035 | 8,736 |
| UnitedHealth Group Inc. | 1.900% | 7/16/18 | 7,250 | 7,285 |
| UnitedHealth Group Inc. | 1.625% | 3/15/19 | 7,000 | 6,926 |
| UnitedHealth Group Inc. | 2.300% | 12/15/19 | 2,450 | 2,459 |
| UnitedHealth Group Inc. | 2.700% | 7/15/20 | 8,225 | 8,313 |
| UnitedHealth Group Inc. | 3.875% | 10/15/20 | 4,825 | 5,089 |
| UnitedHealth Group Inc. | 4.700% | 2/15/21 | 2,235 | 2,447 |
| UnitedHealth Group Inc. | 3.375% | 11/15/21 | 145 | 149 |
| UnitedHealth Group Inc. | 2.875% | 12/15/21 | 4,225 | 4,277 |
| UnitedHealth Group Inc. | 2.875% | 3/15/22 | 3,300 | 3,295 |
| UnitedHealth Group Inc. | 3.350% | 7/15/22 | 10,900 | 11,105 |
| UnitedHealth Group Inc. | 2.750% | 2/15/23 | 3,600 | 3,522 |
| UnitedHealth Group Inc. | 2.875% | 3/15/23 | 1,500 | 1,480 |
| UnitedHealth Group Inc. | 3.750% | 7/15/25 | 10,750 | 11,071 |
| UnitedHealth Group Inc. | 4.625% | 7/15/35 | 3,050 | 3,176 |
| UnitedHealth Group Inc. | 5.800% | 3/15/36 | 3,525 | 4,154 |
| UnitedHealth Group Inc. | 6.500% | 6/15/37 | 625 | 783 |
| UnitedHealth Group Inc. | 6.625% | 11/15/37 | 4,550 | 5,789 |
| UnitedHealth Group Inc. | 6.875% | 2/15/38 | 12,920 | 16,884 |
| UnitedHealth Group Inc. | 5.950% | 2/15/41 | 1,150 | 1,364 |
| UnitedHealth Group Inc. | 4.625% | 11/15/41 | 2,975 | 3,040 |
| UnitedHealth Group Inc. | 4.375% | 3/15/42 | 1,300 | 1,275 |
| UnitedHealth Group Inc. | 3.950% | 10/15/42 | 3,500 | 3,253 |
| UnitedHealth Group Inc. | 4.250% | 3/15/43 | 3,275 | 3,172 |
| UnitedHealth Group Inc. | 4.750% | 7/15/45 | 11,085 | 11,608 |
| Unum Group | 5.625% | 9/15/20 | 625 | 686 |
| Unum Group | 4.000% | 3/15/24 | 5,300 | 5,289 |
| Unum Group | 5.750% | 8/15/42 | 1,925 | 2,112 |
| Validus Holdings Ltd. | 8.875% | 1/26/40 | 2,950 | 3,693 |
| Voya Financial Inc. | 2.900% | 2/15/18 | 5,355 | 5,413 |
| Voya Financial Inc. | 5.700% | 7/15/43 | 4,550 | 5,149 |
| Willis Towers Watson plc | 5.750% | 3/15/21 | 1,385 | 1,519 |
| Willis North America Inc. | 6.200% | 3/28/17 | 1,000 | 1,044 |
| WR Berkley Corp. | 5.375% | 9/15/20 | 375 | 410 |
| WR Berkley Corp. | 4.625% | 3/15/22 | 6,300 | 6,670 |
| WR Berkley Corp. | 4.750% | 8/1/44 | 2,705 | 2,594 |
60
| Total Bond Market II Index Fund | ||||
| Face | Market | |||
| Maturity | Amount | Value• | ||
| Coupon | Date | ($000) | ($000) | |
| XLIT Ltd. | 5.750% | 10/1/21 | 2,030 | 2,261 |
| XLIT Ltd. | 6.375% | 11/15/24 | 175 | 204 |
| XLIT Ltd. | 4.450% | 3/31/25 | 2,200 | 2,151 |
| XLIT Ltd. | 6.250% | 5/15/27 | 2,192 | 2,517 |
| XLIT Ltd. | 5.250% | 12/15/43 | 2,950 | 3,045 |
| XLIT Ltd. | 5.500% | 3/31/45 | 2,800 | 2,607 |
| 5 XLIT Ltd. | 6.500% | 10/29/49 | 924 | 671 |
| Other Finance (0.0%) | ||||
| Jones Lang LaSalle Inc. | 4.400% | 11/15/22 | 150 | 154 |
| ORIX Corp. | 3.750% | 3/9/17 | 2,350 | 2,392 |
| XTRA Finance Corp. | 5.150% | 4/1/17 | 4,125 | 4,303 |
| Real Estate Investment Trusts (0.7%) | ||||
| Alexandria Real Estate Equities Inc. | 2.750% | 1/15/20 | 2,000 | 1,971 |
| Alexandria Real Estate Equities Inc. | 4.600% | 4/1/22 | 1,825 | 1,893 |
| Alexandria Real Estate Equities Inc. | 4.300% | 1/15/26 | 3,500 | 3,480 |
| Alexandria Real Estate Equities Inc. | 4.500% | 7/30/29 | 2,325 | 2,260 |
| American Campus Communities Operating | ||||
| Partnership LP | 3.350% | 10/1/20 | 2,000 | 2,002 |
| American Campus Communities Operating | ||||
| Partnership LP | 4.125% | 7/1/24 | 2,200 | 2,184 |
| AvalonBay Communities Inc. | 3.625% | 10/1/20 | 4,000 | 4,158 |
| AvalonBay Communities Inc. | 2.950% | 9/15/22 | 75 | 74 |
| AvalonBay Communities Inc. | 2.850% | 3/15/23 | 1,720 | 1,659 |
| AvalonBay Communities Inc. | 4.200% | 12/15/23 | 1,655 | 1,742 |
| AvalonBay Communities Inc. | 3.500% | 11/15/24 | 850 | 845 |
| AvalonBay Communities Inc. | 3.450% | 6/1/25 | 8,425 | 8,325 |
| BioMed Realty LP | 2.625% | 5/1/19 | 2,150 | 2,086 |
| BioMed Realty LP | 4.250% | 7/15/22 | 4,900 | 4,861 |
| Boston Properties LP | 3.700% | 11/15/18 | 1,635 | 1,693 |
| Boston Properties LP | 5.625% | 11/15/20 | 6,675 | 7,430 |
| Boston Properties LP | 4.125% | 5/15/21 | 1,410 | 1,478 |
| Boston Properties LP | 3.850% | 2/1/23 | 8,325 | 8,501 |
| Boston Properties LP | 3.800% | 2/1/24 | 3,600 | 3,663 |
| Brandywine Operating Partnership LP | 5.700% | 5/1/17 | 275 | 287 |
| Brandywine Operating Partnership LP | 4.950% | 4/15/18 | 2,225 | 2,329 |
| Brandywine Operating Partnership LP | 3.950% | 2/15/23 | 950 | 926 |
| Brandywine Operating Partnership LP | 4.100% | 10/1/24 | 2,950 | 2,851 |
| Brandywine Operating Partnership LP | 4.550% | 10/1/29 | 3,705 | 3,569 |
| Brixmor Operating Partnership LP | 3.875% | 8/15/22 | 3,000 | 2,989 |
| Brixmor Operating Partnership LP | 3.850% | 2/1/25 | 10,450 | 10,161 |
| Camden Property Trust | 4.625% | 6/15/21 | 1,025 | 1,098 |
| Camden Property Trust | 2.950% | 12/15/22 | 5,575 | 5,364 |
| Camden Property Trust | 4.250% | 1/15/24 | 1,363 | 1,410 |
| CBL & Associates LP | 5.250% | 12/1/23 | 2,950 | 2,916 |
| CBL & Associates LP | 4.600% | 10/15/24 | 4,800 | 4,492 |
| Columbia Property Trust Operating Partnership LP | 4.150% | 4/1/25 | 4,000 | 3,951 |
| Corporate Office Properties LP | 3.700% | 6/15/21 | 6,375 | 6,176 |
| Corporate Office Properties LP | 3.600% | 5/15/23 | 1,300 | 1,199 |
| CubeSmart LP | 4.375% | 12/15/23 | 2,850 | 2,932 |
| CubeSmart LP | 4.000% | 11/15/25 | 1,375 | 1,366 |
| DCT Industrial Operating Partnership LP | 4.500% | 10/15/23 | 1,525 | 1,526 |
| DDR Corp. | 7.875% | 9/1/20 | 3,300 | 3,951 |
| DDR Corp. | 3.500% | 1/15/21 | 1,950 | 1,943 |
| DDR Corp. | 4.625% | 7/15/22 | 4,250 | 4,389 |
61
| Total Bond Market II Index Fund | ||||
| Face | Market | |||
| Maturity | Amount | Value• | ||
| Coupon | Date | ($000) | ($000) | |
| DDR Corp. | 3.375% | 5/15/23 | 3,825 | 3,613 |
| DDR Corp. | 4.250% | 2/1/26 | 1,700 | 1,655 |
| 8 Digital Delta Holdings LLC | 3.400% | 10/1/20 | 3,800 | 3,807 |
| 8 Digital Delta Holdings LLC | 4.750% | 10/1/25 | 2,725 | 2,750 |
| Digital Realty Trust LP | 5.250% | 3/15/21 | 3,265 | 3,533 |
| Digital Realty Trust LP | 3.950% | 7/1/22 | 7,375 | 7,317 |
| Digital Realty Trust LP | 3.625% | 10/1/22 | 3,675 | 3,514 |
| Duke Realty LP | 5.950% | 2/15/17 | 3,377 | 3,527 |
| Duke Realty LP | 3.875% | 2/15/21 | 10,000 | 10,212 |
| Duke Realty LP | 3.625% | 4/15/23 | 4,915 | 4,799 |
| Duke Realty LP | 3.750% | 12/1/24 | 1,500 | 1,460 |
| EPR Properties | 5.750% | 8/15/22 | 475 | 499 |
| EPR Properties | 5.250% | 7/15/23 | 3,375 | 3,438 |
| EPR Properties | 4.500% | 4/1/25 | 2,700 | 2,572 |
| Equity CommonWealth | 6.250% | 6/15/17 | 1,725 | 1,782 |
| Equity CommonWealth | 6.650% | 1/15/18 | 975 | 1,032 |
| Equity Commonwealth | 5.875% | 9/15/20 | 1,300 | 1,398 |
| Equity One Inc. | 3.750% | 11/15/22 | 2,000 | 1,929 |
| ERP Operating LP | 5.750% | 6/15/17 | 3,800 | 4,013 |
| ERP Operating LP | 2.375% | 7/1/19 | 2,400 | 2,407 |
| ERP Operating LP | 4.750% | 7/15/20 | 5,510 | 5,969 |
| ERP Operating LP | 4.625% | 12/15/21 | 2,150 | 2,332 |
| ERP Operating LP | 3.000% | 4/15/23 | 1,675 | 1,646 |
| ERP Operating LP | 3.375% | 6/1/25 | 300 | 297 |
| ERP Operating LP | 4.500% | 7/1/44 | 4,400 | 4,406 |
| ERP Operating LP | 4.500% | 6/1/45 | 3,250 | 3,314 |
| Essex Portfolio LP | 5.500% | 3/15/17 | 975 | 1,015 |
| Essex Portfolio LP | 3.375% | 1/15/23 | 1,125 | 1,104 |
| Essex Portfolio LP | 3.250% | 5/1/23 | 1,425 | 1,388 |
| Essex Portfolio LP | 3.500% | 4/1/25 | 8,800 | 8,469 |
| Federal Realty Investment Trust | 3.000% | 8/1/22 | 1,600 | 1,582 |
| Federal Realty Investment Trust | 2.750% | 6/1/23 | 950 | 909 |
| Federal Realty Investment Trust | 4.500% | 12/1/44 | 5,300 | 5,377 |
| HCP Inc. | 6.000% | 1/30/17 | 4,750 | 4,948 |
| HCP Inc. | 2.625% | 2/1/20 | 5,000 | 4,923 |
| HCP Inc. | 5.375% | 2/1/21 | 940 | 1,023 |
| HCP Inc. | 3.150% | 8/1/22 | 3,375 | 3,237 |
| HCP Inc. | 4.000% | 12/1/22 | 4,000 | 3,974 |
| HCP Inc. | 4.250% | 11/15/23 | 7,750 | 7,765 |
| HCP Inc. | 4.200% | 3/1/24 | 9,300 | 9,255 |
| HCP Inc. | 3.875% | 8/15/24 | 4,450 | 4,321 |
| HCP Inc. | 3.400% | 2/1/25 | 4,450 | 4,129 |
| HCP Inc. | 4.000% | 6/1/25 | 425 | 415 |
| HCP Inc. | 6.750% | 2/1/41 | 1,321 | 1,599 |
| Healthcare Realty Trust Inc. | 5.750% | 1/15/21 | 4,666 | 5,160 |
| Healthcare Realty Trust Inc. | 3.750% | 4/15/23 | 1,500 | 1,463 |
| Healthcare Trust of America Holdings LP | 3.375% | 7/15/21 | 2,200 | 2,162 |
| Healthcare Trust of America Holdings LP | 3.700% | 4/15/23 | 3,125 | 3,033 |
| Highwoods Realty LP | 3.200% | 6/15/21 | 4,000 | 3,910 |
| Hospitality Properties Trust | 5.625% | 3/15/17 | 3,050 | 3,155 |
| Hospitality Properties Trust | 6.700% | 1/15/18 | 6,350 | 6,718 |
| Hospitality Properties Trust | 4.650% | 3/15/24 | 3,725 | 3,670 |
| Hospitality Properties Trust | 4.500% | 3/15/25 | 1,475 | 1,415 |
| Host Hotels & Resorts LP | 6.000% | 10/1/21 | 3,000 | 3,323 |
| Host Hotels & Resorts LP | 5.250% | 3/15/22 | 3,794 | 4,041 |
| Host Hotels & Resorts LP | 3.750% | 10/15/23 | 2,125 | 2,052 |
62
| Total Bond Market II Index Fund | ||||
| Face | Market | |||
| Maturity | Amount | Value• | ||
| Coupon | Date | ($000) | ($000) | |
| Host Hotels & Resorts LP | 4.000% | 6/15/25 | 1,100 | 1,056 |
| Kilroy Realty LP | 4.800% | 7/15/18 | 1,625 | 1,697 |
| Kilroy Realty LP | 3.800% | 1/15/23 | 3,300 | 3,268 |
| Kilroy Realty LP | 4.375% | 10/1/25 | 575 | 586 |
| Kilroy Realty LP | 4.250% | 8/15/29 | 3,025 | 2,985 |
| Kimco Realty Corp. | 5.700% | 5/1/17 | 5,250 | 5,513 |
| Kimco Realty Corp. | 4.300% | 2/1/18 | 840 | 876 |
| Kimco Realty Corp. | 6.875% | 10/1/19 | 1,750 | 2,003 |
| Kimco Realty Corp. | 3.125% | 6/1/23 | 875 | 846 |
| Lexington Realty Trust | 4.400% | 6/15/24 | 1,875 | 1,867 |
| Liberty Property LP | 6.625% | 10/1/17 | 1,600 | 1,716 |
| Liberty Property LP | 4.750% | 10/1/20 | 1,535 | 1,633 |
| Liberty Property LP | 3.375% | 6/15/23 | 1,775 | 1,684 |
| Liberty Property LP | 4.400% | 2/15/24 | 1,700 | 1,724 |
| Liberty Property LP | 3.750% | 4/1/25 | 8,000 | 7,708 |
| Mack-Cali Realty LP | 2.500% | 12/15/17 | 1,700 | 1,699 |
| Mack-Cali Realty LP | 7.750% | 8/15/19 | 1,425 | 1,584 |
| Mack-Cali Realty LP | 4.500% | 4/18/22 | 3,250 | 3,132 |
| Mack-Cali Realty LP | 3.150% | 5/15/23 | 2,850 | 2,480 |
| Mid-America Apartments LP | 4.300% | 10/15/23 | 2,200 | 2,255 |
| Mid-America Apartments LP | 3.750% | 6/15/24 | 3,800 | 3,722 |
| National Retail Properties Inc. | 6.875% | 10/15/17 | 2,950 | 3,184 |
| National Retail Properties Inc. | 3.800% | 10/15/22 | 1,600 | 1,607 |
| National Retail Properties Inc. | 3.300% | 4/15/23 | 900 | 867 |
| National Retail Properties Inc. | 3.900% | 6/15/24 | 2,750 | 2,725 |
| National Retail Properties Inc. | 4.000% | 11/15/25 | 3,150 | 3,094 |
| Omega Healthcare Investors Inc. | 5.875% | 3/15/24 | 3,435 | 3,590 |
| Omega Healthcare Investors Inc. | 4.950% | 4/1/24 | 1,550 | 1,565 |
| Omega Healthcare Investors Inc. | 4.500% | 1/15/25 | 850 | 833 |
| 8 Omega Healthcare Investors Inc. | 5.250% | 1/15/26 | 2,500 | 2,550 |
| Omega Healthcare Investors Inc. | 4.500% | 4/1/27 | 11,000 | 10,450 |
| Piedmont Operating Partnership LP | 3.400% | 6/1/23 | 5,975 | 5,590 |
| Piedmont Operating Partnership LP | 4.450% | 3/15/24 | 1,650 | 1,652 |
| Post Apartment Homes LP | 3.375% | 12/1/22 | 1,025 | 992 |
| ProLogis LP | 2.750% | 2/15/19 | 8,025 | 8,104 |
| ProLogis LP | 4.250% | 8/15/23 | 1,800 | 1,893 |
| Prologis LP | 3.750% | 11/1/25 | 1,300 | 1,287 |
| Realty Income Corp. | 2.000% | 1/31/18 | 700 | 700 |
| Realty Income Corp. | 6.750% | 8/15/19 | 5,565 | 6,325 |
| Realty Income Corp. | 5.750% | 1/15/21 | 3,000 | 3,341 |
| Realty Income Corp. | 3.250% | 10/15/22 | 825 | 797 |
| Realty Income Corp. | 4.650% | 8/1/23 | 1,825 | 1,897 |
| Realty Income Corp. | 3.875% | 7/15/24 | 1,950 | 1,914 |
| Realty Income Corp. | 4.125% | 10/15/26 | 1,420 | 1,427 |
| Realty Income Corp. | 5.875% | 3/15/35 | 100 | 111 |
| Regency Centers LP | 5.875% | 6/15/17 | 1,806 | 1,903 |
| Regency Centers LP | 4.800% | 4/15/21 | 2,000 | 2,153 |
| Regency Centers LP | 3.750% | 6/15/24 | 2,700 | 2,683 |
| Retail Opportunity Investments LP | 5.000% | 12/15/23 | 750 | 771 |
| Retail Properties of America Inc. | 4.000% | 3/15/25 | 4,375 | 4,126 |
| Select Income REIT | 2.850% | 2/1/18 | 1,575 | 1,573 |
| Select Income REIT | 4.150% | 2/1/22 | 2,250 | 2,159 |
| Select Income REIT | 4.500% | 2/1/25 | 2,325 | 2,161 |
| Senior Housing Properties Trust | 3.250% | 5/1/19 | 4,000 | 3,983 |
| Senior Housing Properties Trust | 4.750% | 5/1/24 | 1,500 | 1,465 |
| Simon Property Group LP | 2.800% | 1/30/17 | 3,275 | 3,318 |
63
| Total Bond Market II Index Fund | ||||
| Face | Market | |||
| Maturity | Amount | Value• | ||
| Coupon | Date | ($000) | ($000) | |
| Simon Property Group LP | 2.150% | 9/15/17 | 6,150 | 6,206 |
| Simon Property Group LP | 2.200% | 2/1/19 | 12,850 | 12,911 |
| Simon Property Group LP | 5.650% | 2/1/20 | 7,400 | 8,291 |
| Simon Property Group LP | 2.500% | 9/1/20 | 4,800 | 4,813 |
| Simon Property Group LP | 4.375% | 3/1/21 | 1,395 | 1,511 |
| Simon Property Group LP | 4.125% | 12/1/21 | 750 | 804 |
| Simon Property Group LP | 3.375% | 3/15/22 | 1,675 | 1,728 |
| Simon Property Group LP | 2.750% | 2/1/23 | 3,650 | 3,563 |
| Simon Property Group LP | 3.750% | 2/1/24 | 5,000 | 5,209 |
| Simon Property Group LP | 3.500% | 9/1/25 | 2,800 | 2,841 |
| Simon Property Group LP | 6.750% | 2/1/40 | 4,075 | 5,392 |
| Simon Property Group LP | 4.750% | 3/15/42 | 1,300 | 1,387 |
| Simon Property Group LP | 4.250% | 10/1/44 | 3,800 | 3,781 |
| Tanger Properties LP | 3.875% | 12/1/23 | 725 | 721 |
| Tanger Properties LP | 3.750% | 12/1/24 | 1,000 | 984 |
| UDR Inc. | 4.250% | 6/1/18 | 575 | 600 |
| UDR Inc. | 3.700% | 10/1/20 | 1,000 | 1,034 |
| UDR Inc. | 4.625% | 1/10/22 | 3,800 | 4,053 |
| Ventas Realty LP | 1.250% | 4/17/17 | 2,200 | 2,184 |
| Ventas Realty LP | 3.750% | 5/1/24 | 2,325 | 2,278 |
| Ventas Realty LP | 4.375% | 2/1/45 | 3,100 | 2,813 |
| Ventas Realty LP / Ventas Capital Corp. | 2.000% | 2/15/18 | 1,125 | 1,122 |
| Ventas Realty LP / Ventas Capital Corp. | 4.000% | 4/30/19 | 4,025 | 4,187 |
| Ventas Realty LP / Ventas Capital Corp. | 2.700% | 4/1/20 | 2,425 | 2,389 |
| Ventas Realty LP / Ventas Capital Corp. | 4.750% | 6/1/21 | 975 | 1,040 |
| Ventas Realty LP / Ventas Capital Corp. | 4.250% | 3/1/22 | 1,300 | 1,341 |
| Ventas Realty LP / Ventas Capital Corp. | 3.250% | 8/15/22 | 5,375 | 5,237 |
| Vornado Realty LP | 2.500% | 6/30/19 | 2,400 | 2,365 |
| Vornado Realty LP | 5.000% | 1/15/22 | 5,500 | 5,846 |
| Washington Prime Group LP | 3.850% | 4/1/20 | 1,775 | 1,792 |
| Washington REIT | 4.950% | 10/1/20 | 800 | 851 |
| Washington REIT | 3.950% | 10/15/22 | 1,050 | 1,030 |
| Weingarten Realty Investors | 3.375% | 10/15/22 | 2,200 | 2,152 |
| Weingarten Realty Investors | 3.500% | 4/15/23 | 2,125 | 2,066 |
| Weingarten Realty Investors | 4.450% | 1/15/24 | 600 | 615 |
| Weingarten Realty Investors | 3.850% | 6/1/25 | 900 | 874 |
| Welltower Inc. | 4.700% | 9/15/17 | 1,650 | 1,724 |
| Welltower Inc. | 2.250% | 3/15/18 | 8,900 | 8,878 |
| Welltower Inc. | 4.125% | 4/1/19 | 2,995 | 3,125 |
| Welltower Inc. | 4.950% | 1/15/21 | 5,340 | 5,725 |
| Welltower Inc. | 5.250% | 1/15/22 | 175 | 189 |
| Welltower Inc. | 3.750% | 3/15/23 | 4,250 | 4,176 |
| Welltower Inc. | 4.000% | 6/1/25 | 10,250 | 10,092 |
| Welltower Inc. | 6.500% | 3/15/41 | 75 | 88 |
| Welltower Inc. | 5.125% | 3/15/43 | 1,675 | 1,686 |
| WP Carey Inc. | 4.600% | 4/1/24 | 3,980 | 3,969 |
| WP Carey Inc. | 4.000% | 2/1/25 | 1,000 | 957 |
| 7,820,866 | ||||
| Industrial (15.9%) | ||||
| Basic Industry (1.1%) | ||||
| Agrium Inc. | 6.750% | 1/15/19 | 500 | 558 |
| Agrium Inc. | 3.150% | 10/1/22 | 13,560 | 12,969 |
| Agrium Inc. | 3.500% | 6/1/23 | 6,664 | 6,341 |
| Agrium Inc. | 3.375% | 3/15/25 | 3,500 | 3,201 |
| Agrium Inc. | 4.125% | 3/15/35 | 3,250 | 2,792 |
| Agrium Inc. | 7.125% | 5/23/36 | 200 | 238 |
64
| Total Bond Market II Index Fund | ||||
| Face | Market | |||
| Maturity | Amount | Value• | ||
| Coupon | Date | ($000) | ($000) | |
| Agrium Inc. | 6.125% | 1/15/41 | 275 | 296 |
| Agrium Inc. | 4.900% | 6/1/43 | 6,310 | 5,741 |
| Agrium Inc. | 5.250% | 1/15/45 | 5,550 | 5,180 |
| Air Products & Chemicals Inc. | 1.200% | 10/15/17 | 775 | 770 |
| Air Products & Chemicals Inc. | 3.000% | 11/3/21 | 9,860 | 9,924 |
| Air Products & Chemicals Inc. | 3.350% | 7/31/24 | 3,875 | 3,872 |
| Airgas Inc. | 1.650% | 2/15/18 | 4,000 | 3,964 |
| Airgas Inc. | 3.050% | 8/1/20 | 700 | 706 |
| Airgas Inc. | 2.900% | 11/15/22 | 4,000 | 3,883 |
| Airgas Inc. | 3.650% | 7/15/24 | 3,750 | 3,726 |
| Albemarle Corp. | 3.000% | 12/1/19 | 4,025 | 3,952 |
| Albemarle Corp. | 4.500% | 12/15/20 | 250 | 258 |
| Albemarle Corp. | 4.150% | 12/1/24 | 3,200 | 3,062 |
| Albemarle Corp. | 5.450% | 12/1/44 | 2,800 | 2,716 |
| Barrick Gold Corp. | 6.950% | 4/1/19 | 152 | 157 |
| Barrick Gold Corp. | 4.100% | 5/1/23 | 212 | 183 |
| Barrick Gold Corp. | 5.250% | 4/1/42 | 6,450 | 4,348 |
| Barrick North America Finance LLC | 6.800% | 9/15/18 | 1,000 | 1,071 |
| Barrick North America Finance LLC | 4.400% | 5/30/21 | 10,885 | 9,958 |
| Barrick North America Finance LLC | 7.500% | 9/15/38 | 500 | 410 |
| Barrick North America Finance LLC | 5.700% | 5/30/41 | 6,025 | 4,203 |
| Barrick North America Finance LLC | 5.750% | 5/1/43 | 2,625 | 1,890 |
| Barrick PD Australia Finance Pty Ltd. | 5.950% | 10/15/39 | 6,044 | 4,098 |
| BHP Billiton Finance USA Ltd. | 1.875% | 11/21/16 | 2,300 | 2,301 |
| BHP Billiton Finance USA Ltd. | 1.625% | 2/24/17 | 7,550 | 7,507 |
| BHP Billiton Finance USA Ltd. | 5.400% | 3/29/17 | 1,425 | 1,481 |
| BHP Billiton Finance USA Ltd. | 2.050% | 9/30/18 | 8,767 | 8,606 |
| BHP Billiton Finance USA Ltd. | 6.500% | 4/1/19 | 4,740 | 5,220 |
| BHP Billiton Finance USA Ltd. | 3.250% | 11/21/21 | 5,550 | 5,242 |
| BHP Billiton Finance USA Ltd. | 2.875% | 2/24/22 | 12,175 | 11,155 |
| BHP Billiton Finance USA Ltd. | 3.850% | 9/30/23 | 4,275 | 4,026 |
| BHP Billiton Finance USA Ltd. | 4.125% | 2/24/42 | 3,950 | 3,131 |
| BHP Billiton Finance USA Ltd. | 5.000% | 9/30/43 | 15,910 | 14,299 |
| Cabot Corp. | 2.550% | 1/15/18 | 200 | 202 |
| Cabot Corp. | 3.700% | 7/15/22 | 400 | 395 |
| Carpenter Technology Corp. | 5.200% | 7/15/21 | 5,575 | 5,607 |
| Celulosa Arauco y Constitucion SA | 7.250% | 7/29/19 | 625 | 704 |
| Celulosa Arauco y Constitucion SA | 5.000% | 1/21/21 | 1,800 | 1,865 |
| Celulosa Arauco y Constitucion SA | 4.750% | 1/11/22 | 2,000 | 2,016 |
| CF Industries Inc. | 6.875% | 5/1/18 | 11,150 | 12,070 |
| CF Industries Inc. | 7.125% | 5/1/20 | 5,010 | 5,643 |
| CF Industries Inc. | 5.150% | 3/15/34 | 9,200 | 8,108 |
| CF Industries Inc. | 4.950% | 6/1/43 | 2,800 | 2,390 |
| CF Industries Inc. | 5.375% | 3/15/44 | 7,005 | 6,105 |
| Cytec Industries Inc. | 3.500% | 4/1/23 | 225 | 211 |
| Domtar Corp. | 6.250% | 9/1/42 | 475 | 447 |
| Domtar Corp. | 6.750% | 2/15/44 | 3,325 | 3,214 |
| Dow Chemical Co. | 8.550% | 5/15/19 | 11,189 | 13,194 |
| Dow Chemical Co. | 4.250% | 11/15/20 | 7,965 | 8,339 |
| Dow Chemical Co. | 4.125% | 11/15/21 | 5,240 | 5,475 |
| Dow Chemical Co. | 3.000% | 11/15/22 | 2,000 | 1,917 |
| Dow Chemical Co. | 3.500% | 10/1/24 | 1,700 | 1,651 |
| Dow Chemical Co. | 7.375% | 11/1/29 | 2,000 | 2,488 |
| Dow Chemical Co. | 4.250% | 10/1/34 | 4,600 | 4,273 |
| Dow Chemical Co. | 9.400% | 5/15/39 | 5,665 | 8,169 |
| Dow Chemical Co. | 5.250% | 11/15/41 | 3,515 | 3,437 |
65
| Total Bond Market II Index Fund | ||||
| Face | Market | |||
| Maturity | Amount | Value• | ||
| Coupon | Date | ($000) | ($000) | |
| Dow Chemical Co. | 4.375% | 11/15/42 | 10,250 | 8,885 |
| Eastman Chemical Co. | 2.400% | 6/1/17 | 6,448 | 6,493 |
| Eastman Chemical Co. | 5.500% | 11/15/19 | 4,321 | 4,732 |
| Eastman Chemical Co. | 2.700% | 1/15/20 | 7,000 | 6,927 |
| Eastman Chemical Co. | 4.500% | 1/15/21 | 6,310 | 6,658 |
| Eastman Chemical Co. | 3.600% | 8/15/22 | 5,055 | 5,028 |
| Eastman Chemical Co. | 3.800% | 3/15/25 | 1,750 | 1,693 |
| Eastman Chemical Co. | 4.800% | 9/1/42 | 3,250 | 2,997 |
| Eastman Chemical Co. | 4.650% | 10/15/44 | 5,700 | 5,056 |
| Ecolab Inc. | 1.450% | 12/8/17 | 6,375 | 6,316 |
| Ecolab Inc. | 1.550% | 1/12/18 | 3,000 | 2,974 |
| Ecolab Inc. | 2.250% | 1/12/20 | 2,100 | 2,086 |
| Ecolab Inc. | 4.350% | 12/8/21 | 5,600 | 5,964 |
| Ecolab Inc. | 5.500% | 12/8/41 | 1,500 | 1,636 |
| EI du Pont de Nemours & Co. | 6.000% | 7/15/18 | 14,890 | 16,207 |
| EI du Pont de Nemours & Co. | 4.625% | 1/15/20 | 2,615 | 2,755 |
| EI du Pont de Nemours & Co. | 3.625% | 1/15/21 | 7,068 | 7,290 |
| EI du Pont de Nemours & Co. | 4.250% | 4/1/21 | 1,650 | 1,750 |
| EI du Pont de Nemours & Co. | 2.800% | 2/15/23 | 1,250 | 1,183 |
| EI du Pont de Nemours & Co. | 6.500% | 1/15/28 | 525 | 612 |
| EI du Pont de Nemours & Co. | 4.900% | 1/15/41 | 7,900 | 7,569 |
| EI du Pont de Nemours & Co. | 4.150% | 2/15/43 | 1,125 | 984 |
| FMC Corp. | 3.950% | 2/1/22 | 3,275 | 3,264 |
| FMC Corp. | 4.100% | 2/1/24 | 6,500 | 6,447 |
| Freeport-McMoRan Inc. | 2.150% | 3/1/17 | 2,000 | 1,785 |
| Freeport-McMoRan Inc. | 2.375% | 3/15/18 | 7,480 | 5,947 |
| Freeport-McMoRan Inc. | 3.100% | 3/15/20 | 150 | 97 |
| Freeport-McMoRan Inc. | 3.550% | 3/1/22 | 12,338 | 7,218 |
| Freeport-McMoRan Inc. | 3.875% | 3/15/23 | 12,842 | 7,256 |
| Freeport-McMoRan Inc. | 5.400% | 11/14/34 | 9,902 | 5,001 |
| Freeport-McMoRan Inc. | 5.450% | 3/15/43 | 16,365 | 8,346 |
| Freeport-McMoRan Oil & Gas LLC/FCX Oil & | ||||
| Gas Inc. | 6.500% | 11/15/20 | 2,371 | 1,529 |
| Freeport-McMoRan Oil & Gas LLC/FCX Oil & | ||||
| Gas Inc. | 6.750% | 2/1/22 | 330 | 203 |
| Freeport-McMoRan Oil & Gas LLC/FCX Oil & | ||||
| Gas Inc. | 6.875% | 2/15/23 | 2,289 | 1,419 |
| Georgia-Pacific LLC | 7.375% | 12/1/25 | 4,092 | 4,028 |
| Georgia-Pacific LLC | 7.750% | 11/15/29 | 1,950 | 2,558 |
| Georgia-Pacific LLC | 8.000% | 1/15/24 | 6,871 | 8,671 |
| Georgia-Pacific LLC | 8.875% | 5/15/31 | 4,250 | 5,955 |
| Glencore Canada Corp. | 5.500% | 6/15/17 | 1,975 | 1,930 |
| Goldcorp Inc. | 2.125% | 3/15/18 | 5,800 | 5,625 |
| Goldcorp Inc. | 3.700% | 3/15/23 | 4,025 | 3,682 |
| Goldcorp Inc. | 5.450% | 6/9/44 | 2,933 | 2,377 |
| International Paper Co. | 7.950% | 6/15/18 | 2,750 | 3,113 |
| International Paper Co. | 7.500% | 8/15/21 | 7,265 | 8,611 |
| International Paper Co. | 4.750% | 2/15/22 | 5,491 | 5,865 |
| International Paper Co. | 3.800% | 1/15/26 | 1,275 | 1,256 |
| International Paper Co. | 5.000% | 9/15/35 | 3,050 | 3,031 |
| International Paper Co. | 7.300% | 11/15/39 | 3,570 | 4,070 |
| International Paper Co. | 6.000% | 11/15/41 | 2,150 | 2,248 |
| International Paper Co. | 4.800% | 6/15/44 | 9,200 | 8,327 |
| International Paper Co. | 5.150% | 5/15/46 | 4,100 | 3,900 |
| Kinross Gold Corp. | 5.950% | 3/15/24 | 3,225 | 2,229 |
| Kinross Gold Corp. | 6.875% | 9/1/41 | 1,275 | 727 |
66
| Total Bond Market II Index Fund | ||||
| Face | Market | |||
| Maturity | Amount | Value• | ||
| Coupon | Date | ($000) | ($000) | |
| Lubrizol Corp. | 8.875% | 2/1/19 | 1,075 | 1,284 |
| LYB International Finance BV | 4.000% | 7/15/23 | 3,000 | 2,990 |
| LYB International Finance BV | 5.250% | 7/15/43 | 4,516 | 4,330 |
| LYB International Finance BV | 4.875% | 3/15/44 | 2,450 | 2,231 |
| LyondellBasell Industries NV | 5.000% | 4/15/19 | 13,135 | 13,965 |
| LyondellBasell Industries NV | 6.000% | 11/15/21 | 10,875 | 12,207 |
| LyondellBasell Industries NV | 5.750% | 4/15/24 | 2,800 | 3,083 |
| LyondellBasell Industries NV | 4.625% | 2/26/55 | 7,250 | 5,869 |
| Meadwestvaco Corp. | 8.200% | 1/15/30 | 2,370 | 3,077 |
| Meadwestvaco Corp. | 7.950% | 2/15/31 | 3,050 | 3,792 |
| Methanex Corp. | 3.250% | 12/15/19 | 5,750 | 5,499 |
| Monsanto Co. | 1.150% | 6/30/17 | 4,635 | 4,603 |
| Monsanto Co. | 5.125% | 4/15/18 | 850 | 909 |
| Monsanto Co. | 2.125% | 7/15/19 | 5,000 | 4,991 |
| Monsanto Co. | 2.750% | 7/15/21 | 5,550 | 5,461 |
| Monsanto Co. | 2.200% | 7/15/22 | 650 | 599 |
| Monsanto Co. | 3.375% | 7/15/24 | 4,000 | 3,860 |
| Monsanto Co. | 2.850% | 4/15/25 | 3,600 | 3,287 |
| Monsanto Co. | 5.500% | 8/15/25 | 3,725 | 4,114 |
| Monsanto Co. | 4.200% | 7/15/34 | 5,875 | 5,080 |
| Monsanto Co. | 5.875% | 4/15/38 | 950 | 1,000 |
| Monsanto Co. | 3.600% | 7/15/42 | 3,250 | 2,357 |
| Monsanto Co. | 4.650% | 11/15/43 | 1,500 | 1,287 |
| Monsanto Co. | 4.400% | 7/15/44 | 550 | 456 |
| Monsanto Co. | 3.950% | 4/15/45 | 8,330 | 6,471 |
| Monsanto Co. | 4.700% | 7/15/64 | 6,200 | 4,739 |
| Mosaic Co. | 4.250% | 11/15/23 | 5,850 | 5,803 |
| Mosaic Co. | 5.450% | 11/15/33 | 1,600 | 1,631 |
| Mosaic Co. | 4.875% | 11/15/41 | 4,445 | 3,833 |
| Mosaic Co. | 5.625% | 11/15/43 | 1,600 | 1,534 |
| Newmont Mining Corp. | 5.125% | 10/1/19 | 3,525 | 3,682 |
| Newmont Mining Corp. | 3.500% | 3/15/22 | 2,400 | 2,140 |
| Newmont Mining Corp. | 5.875% | 4/1/35 | 650 | 528 |
| Newmont Mining Corp. | 6.250% | 10/1/39 | 7,375 | 5,893 |
| Newmont Mining Corp. | 4.875% | 3/15/42 | 7,025 | 4,984 |
| Nucor Corp. | 5.750% | 12/1/17 | 5,090 | 5,379 |
| Nucor Corp. | 5.850% | 6/1/18 | 1,725 | 1,846 |
| Nucor Corp. | 4.125% | 9/15/22 | 300 | 308 |
| Nucor Corp. | 4.000% | 8/1/23 | 1,650 | 1,584 |
| Nucor Corp. | 6.400% | 12/1/37 | 1,875 | 1,996 |
| Nucor Corp. | 5.200% | 8/1/43 | 10,275 | 9,591 |
| Packaging Corp. of America | 3.900% | 6/15/22 | 2,275 | 2,315 |
| Packaging Corp. of America | 4.500% | 11/1/23 | 10,025 | 10,482 |
| Packaging Corp. of America | 3.650% | 9/15/24 | 4,100 | 3,989 |
| Placer Dome Inc. | 6.450% | 10/15/35 | 1,050 | 869 |
| Plum Creek Timberlands LP | 4.700% | 3/15/21 | 445 | 474 |
| Plum Creek Timberlands LP | 3.250% | 3/15/23 | 1,000 | 961 |
| Potash Corp. of Saskatchewan Inc. | 3.250% | 12/1/17 | 8,500 | 8,694 |
| Potash Corp. of Saskatchewan Inc. | 6.500% | 5/15/19 | 1,077 | 1,212 |
| Potash Corp. of Saskatchewan Inc. | 4.875% | 3/30/20 | 7,765 | 8,441 |
| Potash Corp. of Saskatchewan Inc. | 3.000% | 4/1/25 | 4,000 | 3,773 |
| Potash Corp. of Saskatchewan Inc. | 5.625% | 12/1/40 | 4,375 | 4,618 |
| PPG Industries Inc. | 2.300% | 11/15/19 | 3,450 | 3,424 |
| PPG Industries Inc. | 5.500% | 11/15/40 | 2,950 | 3,284 |
| Praxair Inc. | 4.500% | 8/15/19 | 1,300 | 1,406 |
| Praxair Inc. | 3.000% | 9/1/21 | 2,725 | 2,756 |
67
| Total Bond Market II Index Fund | ||||
| Face | Market | |||
| Maturity | Amount | Value• | ||
| Coupon | Date | ($000) | ($000) | |
| Praxair Inc. | 2.450% | 2/15/22 | 9,800 | 9,592 |
| Praxair Inc. | 2.200% | 8/15/22 | 4,025 | 3,850 |
| Praxair Inc. | 2.650% | 2/5/25 | 3,400 | 3,261 |
| Praxair Inc. | 3.550% | 11/7/42 | 2,500 | 2,221 |
| Rayonier Inc. | 3.750% | 4/1/22 | 2,000 | 1,943 |
| Reliance Steel & Aluminum Co. | 4.500% | 4/15/23 | 1,700 | 1,591 |
| Rio Tinto Alcan Inc. | 6.125% | 12/15/33 | 3,144 | 3,155 |
| Rio Tinto Alcan Inc. | 5.750% | 6/1/35 | 3,850 | 4,000 |
| Rio Tinto Finance USA Ltd. | 6.500% | 7/15/18 | 21,335 | 23,110 |
| Rio Tinto Finance USA Ltd. | 9.000% | 5/1/19 | 5,100 | 5,968 |
| Rio Tinto Finance USA Ltd. | 3.500% | 11/2/20 | 7,940 | 7,793 |
| Rio Tinto Finance USA Ltd. | 4.125% | 5/20/21 | 5,650 | 5,637 |
| Rio Tinto Finance USA Ltd. | 3.750% | 9/20/21 | 5,961 | 5,793 |
| Rio Tinto Finance USA Ltd. | 3.750% | 6/15/25 | 27,000 | 24,370 |
| Rio Tinto Finance USA Ltd. | 7.125% | 7/15/28 | 2,225 | 2,668 |
| Rio Tinto Finance USA Ltd. | 5.200% | 11/2/40 | 4,560 | 4,172 |
| Rio Tinto Finance USA plc | 2.000% | 3/22/17 | 3,075 | 3,059 |
| Rio Tinto Finance USA plc | 1.625% | 8/21/17 | 5,075 | 4,989 |
| Rio Tinto Finance USA plc | 2.250% | 12/14/18 | 3,100 | 3,021 |
| Rio Tinto Finance USA plc | 3.500% | 3/22/22 | 1,675 | 1,576 |
| Rio Tinto Finance USA plc | 2.875% | 8/21/22 | 3,775 | 3,417 |
| Rio Tinto Finance USA plc | 4.750% | 3/22/42 | 475 | 402 |
| Rio Tinto Finance USA plc | 4.125% | 8/21/42 | 6,092 | 4,755 |
| Rock-Tenn Co. | 4.450% | 3/1/19 | 1,750 | 1,826 |
| Rock-Tenn Co. | 3.500% | 3/1/20 | 2,000 | 2,025 |
| Rock-Tenn Co. | 4.900% | 3/1/22 | 2,000 | 2,129 |
| Rock-Tenn Co. | 4.000% | 3/1/23 | 3,500 | 3,513 |
| Rohm & Haas Co. | 6.000% | 9/15/17 | 1,507 | 1,607 |
| Rohm & Haas Co. | 7.850% | 7/15/29 | 4,775 | 6,150 |
| RPM International Inc. | 6.125% | 10/15/19 | 650 | 711 |
| RPM International Inc. | 3.450% | 11/15/22 | 2,275 | 2,182 |
| RPM International Inc. | 5.250% | 6/1/45 | 200 | 189 |
| Sherwin-Williams Co. | 1.350% | 12/15/17 | 2,825 | 2,803 |
| Sherwin-Williams Co. | 3.450% | 8/1/25 | 5,150 | 5,234 |
| Sherwin-Williams Co. | 4.000% | 12/15/42 | 1,000 | 951 |
| Sherwin-Williams Co. | 4.550% | 8/1/45 | 1,590 | 1,650 |
| Southern Copper Corp. | 5.375% | 4/16/20 | 200 | 208 |
| Southern Copper Corp. | 3.500% | 11/8/22 | 1,300 | 1,193 |
| Southern Copper Corp. | 3.875% | 4/23/25 | 3,550 | 3,128 |
| Southern Copper Corp. | 7.500% | 7/27/35 | 8,475 | 7,892 |
| Southern Copper Corp. | 6.750% | 4/16/40 | 1,500 | 1,278 |
| Southern Copper Corp. | 5.250% | 11/8/42 | 8,225 | 5,840 |
| Southern Copper Corp. | 5.875% | 4/23/45 | 10,225 | 7,822 |
| Syngenta Finance NV | 3.125% | 3/28/22 | 2,250 | 2,179 |
| Syngenta Finance NV | 4.375% | 3/28/42 | 1,250 | 1,155 |
| The Dow Chemical Company | 4.625% | 10/1/44 | 1,150 | 1,050 |
| Vale Canada Ltd. | 7.200% | 9/15/32 | 3,341 | 2,485 |
| Vale Overseas Ltd. | 6.250% | 1/23/17 | 6,550 | 6,501 |
| Vale Overseas Ltd. | 5.625% | 9/15/19 | 6,925 | 6,241 |
| Vale Overseas Ltd. | 4.625% | 9/15/20 | 11,895 | 9,917 |
| Vale Overseas Ltd. | 4.375% | 1/11/22 | 16,555 | 12,520 |
| Vale Overseas Ltd. | 8.250% | 1/17/34 | 800 | 644 |
| Vale Overseas Ltd. | 6.875% | 11/21/36 | 15,035 | 10,374 |
| Vale Overseas Ltd. | 6.875% | 11/10/39 | 7,015 | 4,875 |
| Vale SA | 5.625% | 9/11/42 | 5,115 | 3,357 |
| Valspar Corp. | 7.250% | 6/15/19 | 1,675 | 1,893 |
68
| Total Bond Market II Index Fund | ||||
| Face | Market | |||
| Maturity | Amount | Value• | ||
| Coupon | Date | ($000) | ($000) | |
| Valspar Corp. | 4.200% | 1/15/22 | 375 | 384 |
| Valspar Corp. | 3.950% | 1/15/26 | 6,000 | 5,970 |
| Westlake Chemical Corp. | 3.600% | 7/15/22 | 400 | 392 |
| Weyerhaeuser Co. | 7.375% | 10/1/19 | 5,289 | 6,105 |
| Weyerhaeuser Co. | 4.625% | 9/15/23 | 8,125 | 8,447 |
| Weyerhaeuser Co. | 8.500% | 1/15/25 | 800 | 1,030 |
| Weyerhaeuser Co. | 7.375% | 3/15/32 | 3,625 | 4,312 |
| Weyerhaeuser Co. | 6.875% | 12/15/33 | 1,450 | 1,674 |
| Worthington Industries Inc. | 4.550% | 4/15/26 | 700 | 690 |
| Yamana Gold Inc. | 4.950% | 7/15/24 | 1,870 | 1,590 |
| Capital Goods (1.4%) | ||||
| 3M Co. | 1.375% | 8/7/18 | 2,800 | 2,795 |
| 3M Co. | 2.000% | 8/7/20 | 2,800 | 2,801 |
| 3M Co. | 2.000% | 6/26/22 | 5,000 | 4,857 |
| 3M Co. | 3.000% | 8/7/25 | 3,500 | 3,582 |
| 3M Co. | 6.375% | 2/15/28 | 1,300 | 1,684 |
| 3M Co. | 5.700% | 3/15/37 | 2,195 | 2,707 |
| ABB Finance USA Inc. | 1.625% | 5/8/17 | 800 | 801 |
| ABB Finance USA Inc. | 2.875% | 5/8/22 | 4,860 | 4,784 |
| ABB Finance USA Inc. | 4.375% | 5/8/42 | 1,250 | 1,239 |
| Acuity Brands Lighting Inc. | 6.000% | 12/15/19 | 800 | 872 |
| Boeing Capital Corp. | 2.900% | 8/15/18 | 1,000 | 1,033 |
| Boeing Capital Corp. | 4.700% | 10/27/19 | 5,875 | 6,447 |
| Boeing Co. | 0.950% | 5/15/18 | 7,500 | 7,413 |
| Boeing Co. | 6.000% | 3/15/19 | 5,950 | 6,673 |
| Boeing Co. | 4.875% | 2/15/20 | 3,550 | 3,964 |
| Boeing Co. | 1.650% | 10/30/20 | 4,250 | 4,154 |
| Boeing Co. | 8.750% | 8/15/21 | 200 | 265 |
| Boeing Co. | 2.350% | 10/30/21 | 1,000 | 989 |
| Boeing Co. | 2.200% | 10/30/22 | 4,000 | 3,866 |
| Boeing Co. | 2.500% | 3/1/25 | 2,000 | 1,930 |
| Boeing Co. | 7.250% | 6/15/25 | 325 | 424 |
| Boeing Co. | 2.600% | 10/30/25 | 4,000 | 3,868 |
| Boeing Co. | 6.125% | 2/15/33 | 5,875 | 7,377 |
| Boeing Co. | 3.300% | 3/1/35 | 2,500 | 2,292 |
| Boeing Co. | 6.625% | 2/15/38 | 525 | 701 |
| Boeing Co. | 6.875% | 3/15/39 | 1,715 | 2,359 |
| Boeing Co. | 5.875% | 2/15/40 | 780 | 986 |
| Boeing Co. | 3.500% | 3/1/45 | 3,000 | 2,767 |
| Carlisle Cos. Inc. | 3.750% | 11/15/22 | 1,650 | 1,632 |
| Caterpillar Financial Services Corp. | 1.000% | 3/3/17 | 1,344 | 1,340 |
| Caterpillar Financial Services Corp. | 1.750% | 3/24/17 | 2,000 | 2,007 |
| Caterpillar Financial Services Corp. | 1.250% | 8/18/17 | 2,400 | 2,391 |
| Caterpillar Financial Services Corp. | 1.250% | 11/6/17 | 850 | 848 |
| Caterpillar Financial Services Corp. | 5.450% | 4/15/18 | 4,642 | 5,020 |
| Caterpillar Financial Services Corp. | 7.050% | 10/1/18 | 3,575 | 4,050 |
| Caterpillar Financial Services Corp. | 1.800% | 11/13/18 | 4,700 | 4,704 |
| Caterpillar Financial Services Corp. | 7.150% | 2/15/19 | 9,990 | 11,442 |
| Caterpillar Financial Services Corp. | 2.100% | 6/9/19 | 1,367 | 1,366 |
| Caterpillar Financial Services Corp. | 2.250% | 12/1/19 | 5,550 | 5,554 |
| Caterpillar Financial Services Corp. | 2.000% | 3/5/20 | 2,500 | 2,477 |
| Caterpillar Financial Services Corp. | 2.500% | 11/13/20 | 4,350 | 4,342 |
| Caterpillar Financial Services Corp. | 2.750% | 8/20/21 | 1,300 | 1,289 |
| Caterpillar Financial Services Corp. | 2.850% | 6/1/22 | 6,104 | 6,072 |
| Caterpillar Financial Services Corp. | 3.300% | 6/9/24 | 4,175 | 4,154 |
69
| Total Bond Market II Index Fund | ||||
| Face | Market | |||
| Maturity | Amount | Value• | ||
| Coupon | Date | ($000) | ($000) | |
| Caterpillar Financial Services Corp. | 3.250% | 12/1/24 | 4,100 | 4,062 |
| Caterpillar Inc. | 1.500% | 6/26/17 | 6,155 | 6,168 |
| Caterpillar Inc. | 3.900% | 5/27/21 | 7,330 | 7,788 |
| Caterpillar Inc. | 2.600% | 6/26/22 | 1,000 | 988 |
| Caterpillar Inc. | 3.400% | 5/15/24 | 8,500 | 8,574 |
| Caterpillar Inc. | 6.050% | 8/15/36 | 4,241 | 5,003 |
| Caterpillar Inc. | 5.200% | 5/27/41 | 75 | 82 |
| Caterpillar Inc. | 3.803% | 8/15/42 | 16,144 | 14,429 |
| Caterpillar Inc. | 4.300% | 5/15/44 | 5,350 | 5,154 |
| Caterpillar Inc. | 4.750% | 5/15/64 | 900 | 875 |
| Crane Co. | 2.750% | 12/15/18 | 2,000 | 1,994 |
| Crane Co. | 4.450% | 12/15/23 | 5,690 | 5,863 |
| CRH America Inc. | 8.125% | 7/15/18 | 11,275 | 12,831 |
| CRH America Inc. | 5.750% | 1/15/21 | 3,415 | 3,837 |
| Danaher Corp. | 2.300% | 6/23/16 | 1,800 | 1,811 |
| Danaher Corp. | 5.625% | 1/15/18 | 850 | 917 |
| Danaher Corp. | 1.650% | 9/15/18 | 4,100 | 4,096 |
| Danaher Corp. | 2.400% | 9/15/20 | 4,000 | 4,000 |
| Danaher Corp. | 3.900% | 6/23/21 | 8,625 | 9,175 |
| Danaher Corp. | 3.350% | 9/15/25 | 2,775 | 2,833 |
| Danaher Corp. | 4.375% | 9/15/45 | 7,750 | 8,018 |
| Deere & Co. | 2.600% | 6/8/22 | 4,565 | 4,496 |
| Deere & Co. | 5.375% | 10/16/29 | 3,595 | 4,189 |
| Deere & Co. | 8.100% | 5/15/30 | 1,861 | 2,630 |
| Deere & Co. | 3.900% | 6/9/42 | 6,525 | 6,254 |
| Dover Corp. | 5.450% | 3/15/18 | 2,000 | 2,158 |
| Dover Corp. | 4.300% | 3/1/21 | 1,830 | 1,959 |
| Dover Corp. | 3.150% | 11/15/25 | 9,000 | 8,872 |
| Dover Corp. | 6.600% | 3/15/38 | 975 | 1,267 |
| Dover Corp. | 5.375% | 3/1/41 | 795 | 908 |
| Eaton Corp. | 1.500% | 11/2/17 | 1,000 | 994 |
| Eaton Corp. | 5.600% | 5/15/18 | 6,855 | 7,414 |
| Eaton Corp. | 2.750% | 11/2/22 | 11,175 | 10,809 |
| Eaton Corp. | 4.000% | 11/2/32 | 6,850 | 6,542 |
| Eaton Corp. | 4.150% | 11/2/42 | 1,250 | 1,153 |
| Eaton Electric Holdings Llc. | 3.875% | 12/15/20 | 1,075 | 1,115 |
| 8 Embraer Overseas Ltd. | 5.696% | 9/16/23 | 8,104 | 7,900 |
| Emerson Electric Co. | 5.250% | 10/15/18 | 2,200 | 2,409 |
| Emerson Electric Co. | 4.875% | 10/15/19 | 2,275 | 2,499 |
| Emerson Electric Co. | 4.250% | 11/15/20 | 4,807 | 5,192 |
| Emerson Electric Co. | 2.625% | 12/1/21 | 7,000 | 6,953 |
| Emerson Electric Co. | 2.625% | 2/15/23 | 2,500 | 2,447 |
| Emerson Electric Co. | 3.150% | 6/1/25 | 2,900 | 2,884 |
| Emerson Electric Co. | 6.000% | 8/15/32 | 750 | 898 |
| Emerson Electric Co. | 6.125% | 4/15/39 | 1,000 | 1,231 |
| Emerson Electric Co. | 5.250% | 11/15/39 | 440 | 496 |
| Exelis Inc. | 4.250% | 10/1/16 | 1,900 | 1,935 |
| Exelis Inc. | 5.550% | 10/1/21 | 1,000 | 1,098 |
| Flowserve Corp. | 3.500% | 9/15/22 | 11,905 | 11,578 |
| Flowserve Corp. | 4.000% | 11/15/23 | 4,575 | 4,566 |
| Fortune Brands Home & Security Inc. | 3.000% | 6/15/20 | 3,000 | 2,994 |
| Fortune Brands Home & Security Inc. | 4.000% | 6/15/25 | 1,000 | 991 |
| 5 GE Capital Trust I | 6.375% | 11/15/67 | 3,057 | 3,183 |
| General Dynamics Corp. | 1.000% | 11/15/17 | 6,225 | 6,206 |
| General Dynamics Corp. | 3.875% | 7/15/21 | 5,350 | 5,649 |
| General Dynamics Corp. | 2.250% | 11/15/22 | 3,500 | 3,364 |
70
| Total Bond Market II Index Fund | ||||
| Face | Market | |||
| Maturity | Amount | Value• | ||
| Coupon | Date | ($000) | ($000) | |
| General Dynamics Corp. | 3.600% | 11/15/42 | 4,150 | 3,852 |
| General Electric Capital Corp. | 6.000% | 8/7/19 | 2,856 | 3,228 |
| General Electric Capital Corp. | 2.100% | 12/11/19 | 900 | 898 |
| General Electric Capital Corp. | 5.500% | 1/8/20 | 7,432 | 8,338 |
| General Electric Capital Corp. | 2.200% | 1/9/20 | 8,359 | 8,369 |
| General Electric Capital Corp. | 5.550% | 5/4/20 | 11,282 | 12,785 |
| General Electric Capital Corp. | 4.375% | 9/16/20 | 3,722 | 4,048 |
| General Electric Capital Corp. | 4.625% | 1/7/21 | 4,185 | 4,595 |
| General Electric Capital Corp. | 5.300% | 2/11/21 | 3,781 | 4,258 |
| General Electric Capital Corp. | 4.650% | 10/17/21 | 8,392 | 9,258 |
| General Electric Capital Corp. | 3.150% | 9/7/22 | 2,995 | 3,065 |
| General Electric Capital Corp. | 3.100% | 1/9/23 | 7,431 | 7,534 |
| General Electric Capital Corp. | 3.450% | 5/15/24 | 2,732 | 2,818 |
| General Electric Capital Corp. | 6.750% | 3/15/32 | 15,784 | 20,519 |
| General Electric Capital Corp. | 6.150% | 8/7/37 | 5,021 | 6,277 |
| General Electric Capital Corp. | 5.875% | 1/14/38 | 14,170 | 17,325 |
| General Electric Capital Corp. | 6.875% | 1/10/39 | 7,220 | 9,827 |
| 5 General Electric Capital Corp. | 6.375% | 11/15/67 | 8,791 | 9,154 |
| General Electric Co. | 5.250% | 12/6/17 | 32,295 | 34,508 |
| General Electric Co. | 2.700% | 10/9/22 | 17,165 | 17,091 |
| General Electric Co. | 3.375% | 3/11/24 | 9,000 | 9,322 |
| General Electric Co. | 4.125% | 10/9/42 | 23,800 | 23,249 |
| General Electric Co. | 4.500% | 3/11/44 | 4,920 | 5,055 |
| Harris Corp. | 1.999% | 4/27/18 | 4,500 | 4,453 |
| Harris Corp. | 2.700% | 4/27/20 | 2,000 | 1,962 |
| Harris Corp. | 4.400% | 12/15/20 | 2,790 | 2,915 |
| Harris Corp. | 3.832% | 4/27/25 | 1,659 | 1,634 |
| Harris Corp. | 4.854% | 4/27/35 | 5,000 | 4,922 |
| Harris Corp. | 6.150% | 12/15/40 | 650 | 706 |
| Harris Corp. | 5.054% | 4/27/45 | 3,075 | 3,003 |
| Hexcel Corp. | 4.700% | 8/15/25 | 1,400 | 1,388 |
| Honeywell International Inc. | 5.300% | 3/15/17 | 1,975 | 2,070 |
| Honeywell International Inc. | 5.300% | 3/1/18 | 5,950 | 6,422 |
| Honeywell International Inc. | 5.000% | 2/15/19 | 520 | 570 |
| Honeywell International Inc. | 4.250% | 3/1/21 | 4,545 | 4,974 |
| Honeywell International Inc. | 3.350% | 12/1/23 | 9,050 | 9,323 |
| Honeywell International Inc. | 5.700% | 3/15/36 | 1,600 | 1,907 |
| Honeywell International Inc. | 5.700% | 3/15/37 | 1,895 | 2,288 |
| Honeywell International Inc. | 5.375% | 3/1/41 | 11,545 | 13,698 |
| Illinois Tool Works Inc. | 1.950% | 3/1/19 | 500 | 501 |
| Illinois Tool Works Inc. | 6.250% | 4/1/19 | 9,425 | 10,624 |
| Illinois Tool Works Inc. | 3.375% | 9/15/21 | 895 | 918 |
| Illinois Tool Works Inc. | 3.500% | 3/1/24 | 5,000 | 5,147 |
| Illinois Tool Works Inc. | 4.875% | 9/15/41 | 895 | 976 |
| Illinois Tool Works Inc. | 3.900% | 9/1/42 | 9,375 | 8,853 |
| Ingersoll-Rand Global Holding Co. Ltd. | 6.875% | 8/15/18 | 6,650 | 7,344 |
| Ingersoll-Rand Global Holding Co. Ltd. | 2.875% | 1/15/19 | 2,045 | 2,062 |
| Ingersoll-Rand Global Holding Co. Ltd. | 4.250% | 6/15/23 | 7,875 | 8,144 |
| Ingersoll-Rand Global Holding Co. Ltd. | 5.750% | 6/15/43 | 2,850 | 3,135 |
| Ingersoll-Rand Luxembourg Finance SA | 2.625% | 5/1/20 | 2,000 | 1,968 |
| Ingersoll-Rand Luxembourg Finance SA | 3.550% | 11/1/24 | 700 | 684 |
| Ingersoll-Rand Luxembourg Finance SA | 4.650% | 11/1/44 | 4,500 | 4,298 |
| John Deere Capital Corp. | 2.000% | 1/13/17 | 2,350 | 2,379 |
| John Deere Capital Corp. | 1.400% | 3/15/17 | 1,600 | 1,603 |
| John Deere Capital Corp. | 5.500% | 4/13/17 | 150 | 158 |
| John Deere Capital Corp. | 1.125% | 6/12/17 | 2,500 | 2,495 |
71
| Total Bond Market II Index Fund | ||||
| Face | Market | |||
| Maturity | Amount | Value• | ||
| Coupon | Date | ($000) | ($000) | |
| John Deere Capital Corp. | 2.800% | 9/18/17 | 4,225 | 4,319 |
| John Deere Capital Corp. | 1.200% | 10/10/17 | 4,400 | 4,379 |
| John Deere Capital Corp. | 1.350% | 1/16/18 | 2,950 | 2,938 |
| John Deere Capital Corp. | 5.350% | 4/3/18 | 825 | 891 |
| John Deere Capital Corp. | 1.750% | 8/10/18 | 3,100 | 3,100 |
| John Deere Capital Corp. | 5.750% | 9/10/18 | 12,160 | 13,381 |
| John Deere Capital Corp. | 1.950% | 12/13/18 | 4,783 | 4,793 |
| John Deere Capital Corp. | 1.950% | 3/4/19 | 3,400 | 3,386 |
| John Deere Capital Corp. | 2.250% | 4/17/19 | 1,275 | 1,281 |
| John Deere Capital Corp. | 1.700% | 1/15/20 | 5,400 | 5,256 |
| John Deere Capital Corp. | 2.050% | 3/10/20 | 5,400 | 5,336 |
| John Deere Capital Corp. | 2.450% | 9/11/20 | 2,175 | 2,171 |
| John Deere Capital Corp. | 2.800% | 3/4/21 | 5,000 | 5,036 |
| John Deere Capital Corp. | 3.900% | 7/12/21 | 5,993 | 6,350 |
| John Deere Capital Corp. | 3.150% | 10/15/21 | 6,981 | 7,100 |
| John Deere Capital Corp. | 2.750% | 3/15/22 | 2,250 | 2,222 |
| John Deere Capital Corp. | 2.800% | 1/27/23 | 6,315 | 6,196 |
| John Deere Capital Corp. | 3.350% | 6/12/24 | 8,731 | 8,840 |
| John Deere Capital Corp. | 3.400% | 9/11/25 | 2,350 | 2,379 |
| Kennametal Inc. | 2.650% | 11/1/19 | 4,478 | 4,436 |
| Kennametal Inc. | 3.875% | 2/15/22 | 1,550 | 1,531 |
| L-3 Communications Corp. | 5.200% | 10/15/19 | 9,855 | 10,443 |
| L-3 Communications Corp. | 4.750% | 7/15/20 | 9,950 | 10,361 |
| L-3 Communications Corp. | 4.950% | 2/15/21 | 7,100 | 7,303 |
| L-3 Communications Corp. | 3.950% | 5/28/24 | 1,730 | 1,643 |
| Lafarge SA | 7.125% | 7/15/36 | 3,400 | 4,003 |
| Leggett & Platt Inc. | 3.800% | 11/15/24 | 3,725 | 3,753 |
| Lockheed Martin Corp. | 1.850% | 11/23/18 | 2,350 | 2,345 |
| Lockheed Martin Corp. | 4.250% | 11/15/19 | 7,418 | 7,949 |
| Lockheed Martin Corp. | 2.500% | 11/23/20 | 5,000 | 4,982 |
| Lockheed Martin Corp. | 3.350% | 9/15/21 | 5,725 | 5,847 |
| Lockheed Martin Corp. | 3.100% | 1/15/23 | 1,330 | 1,327 |
| Lockheed Martin Corp. | 2.900% | 3/1/25 | 725 | 696 |
| Lockheed Martin Corp. | 3.550% | 1/15/26 | 10,450 | 10,502 |
| Lockheed Martin Corp. | 3.600% | 3/1/35 | 6,040 | 5,425 |
| Lockheed Martin Corp. | 4.500% | 5/15/36 | 2,600 | 2,631 |
| Lockheed Martin Corp. | 6.150% | 9/1/36 | 8,135 | 9,754 |
| Lockheed Martin Corp. | 5.500% | 11/15/39 | 5,445 | 6,048 |
| Lockheed Martin Corp. | 5.720% | 6/1/40 | 3,226 | 3,680 |
| Lockheed Martin Corp. | 4.850% | 9/15/41 | 3,000 | 3,103 |
| Lockheed Martin Corp. | 3.800% | 3/1/45 | 1,575 | 1,387 |
| Lockheed Martin Corp. | 4.700% | 5/15/46 | 10,500 | 10,756 |
| Martin Marietta Materials Inc. | 6.600% | 4/15/18 | 1,600 | 1,724 |
| Mohawk Industries Inc. | 3.850% | 2/1/23 | 12,025 | 12,114 |
| Northrop Grumman Corp. | 1.750% | 6/1/18 | 3,525 | 3,495 |
| Northrop Grumman Corp. | 3.500% | 3/15/21 | 4,725 | 4,877 |
| Northrop Grumman Corp. | 3.250% | 8/1/23 | 4,275 | 4,272 |
| Northrop Grumman Corp. | 5.050% | 11/15/40 | 1,775 | 1,863 |
| Northrop Grumman Corp. | 4.750% | 6/1/43 | 5,890 | 6,063 |
| Northrop Grumman Corp. | 3.850% | 4/15/45 | 1,900 | 1,686 |
| Northrop Grumman Systems Corp. | 7.750% | 2/15/31 | 2,770 | 3,648 |
| Owens Corning | 9.000% | 6/15/19 | 228 | 265 |
| Owens Corning | 4.200% | 12/15/22 | 3,875 | 3,882 |
| Owens Corning | 7.000% | 12/1/36 | 2,375 | 2,613 |
| Parker Hannifin Corp. | 5.500% | 5/15/18 | 1,250 | 1,352 |
| Parker Hannifin Corp. | 3.500% | 9/15/22 | 1,625 | 1,681 |
72
| Total Bond Market II Index Fund | ||||
| Face | Market | |||
| Maturity | Amount | Value• | ||
| Coupon | Date | ($000) | ($000) | |
| Parker Hannifin Corp. | 6.250% | 5/15/38 | 550 | 697 |
| Parker-Hannifin Corp. | 3.300% | 11/21/24 | 3,400 | 3,439 |
| Parker-Hannifin Corp. | 4.200% | 11/21/34 | 2,200 | 2,246 |
| Parker-Hannifin Corp. | 4.450% | 11/21/44 | 9,800 | 10,240 |
| Pentair Finance SA | 2.650% | 12/1/19 | 1,750 | 1,696 |
| Pentair Finance SA | 3.625% | 9/15/20 | 1,000 | 994 |
| Pentair Finance SA | 5.000% | 5/15/21 | 4,305 | 4,487 |
| Precision Castparts Corp. | 1.250% | 1/15/18 | 5,325 | 5,288 |
| Precision Castparts Corp. | 2.250% | 6/15/20 | 3,050 | 3,034 |
| Precision Castparts Corp. | 2.500% | 1/15/23 | 4,270 | 4,120 |
| Precision Castparts Corp. | 3.250% | 6/15/25 | 8,150 | 8,084 |
| Precision Castparts Corp. | 4.200% | 6/15/35 | 1,250 | 1,248 |
| Precision Castparts Corp. | 3.900% | 1/15/43 | 1,875 | 1,747 |
| Precision Castparts Corp. | 4.375% | 6/15/45 | 1,350 | 1,346 |
| Raytheon Co. | 6.400% | 12/15/18 | 100 | 113 |
| Raytheon Co. | 4.400% | 2/15/20 | 500 | 541 |
| Raytheon Co. | 3.125% | 10/15/20 | 9,075 | 9,350 |
| Raytheon Co. | 2.500% | 12/15/22 | 4,875 | 4,774 |
| Raytheon Co. | 7.200% | 8/15/27 | 2,010 | 2,669 |
| Raytheon Co. | 4.875% | 10/15/40 | 100 | 109 |
| Raytheon Co. | 4.700% | 12/15/41 | 5,950 | 6,446 |
| Republic Services Inc. | 3.800% | 5/15/18 | 6,970 | 7,223 |
| Republic Services Inc. | 5.500% | 9/15/19 | 6,220 | 6,837 |
| Republic Services Inc. | 5.000% | 3/1/20 | 5,700 | 6,193 |
| Republic Services Inc. | 5.250% | 11/15/21 | 2,650 | 2,934 |
| Republic Services Inc. | 3.550% | 6/1/22 | 2,200 | 2,252 |
| Republic Services Inc. | 4.750% | 5/15/23 | 525 | 572 |
| Republic Services Inc. | 3.200% | 3/15/25 | 1,500 | 1,446 |
| Republic Services Inc. | 6.086% | 3/15/35 | 825 | 971 |
| Republic Services Inc. | 6.200% | 3/1/40 | 6,365 | 7,478 |
| Republic Services Inc. | 5.700% | 5/15/41 | 3,600 | 4,043 |
| Rockwell Automation Inc. | 5.650% | 12/1/17 | 600 | 642 |
| Rockwell Automation Inc. | 2.050% | 3/1/20 | 3,800 | 3,764 |
| Rockwell Automation Inc. | 6.700% | 1/15/28 | 325 | 415 |
| Rockwell Automation Inc. | 6.250% | 12/1/37 | 1,500 | 1,858 |
| Rockwell Collins Inc. | 5.250% | 7/15/19 | 275 | 300 |
| Rockwell Collins Inc. | 3.100% | 11/15/21 | 1,000 | 1,014 |
| Rockwell Collins Inc. | 3.700% | 12/15/23 | 1,500 | 1,552 |
| Rockwell Collins Inc. | 4.800% | 12/15/43 | 1,050 | 1,122 |
| Roper Technologies Inc. | 1.850% | 11/15/17 | 1,175 | 1,171 |
| Roper Technologies Inc. | 2.050% | 10/1/18 | 7,850 | 7,802 |
| Roper Technologies Inc. | 6.250% | 9/1/19 | 5,500 | 6,110 |
| Roper Technologies Inc. | 3.125% | 11/15/22 | 400 | 391 |
| Roper Technologies Inc. | 3.850% | 12/15/25 | 1,925 | 1,930 |
| Snap-on Inc. | 6.125% | 9/1/21 | 2,000 | 2,301 |
| Sonoco Products Co. | 4.375% | 11/1/21 | 435 | 453 |
| Sonoco Products Co. | 5.750% | 11/1/40 | 3,910 | 4,230 |
| Stanley Black & Decker Inc. | 3.400% | 12/1/21 | 2,425 | 2,472 |
| Stanley Black & Decker Inc. | 2.900% | 11/1/22 | 3,000 | 2,967 |
| Textron Inc. | 5.600% | 12/1/17 | 3,416 | 3,628 |
| Textron Inc. | 4.300% | 3/1/24 | 2,975 | 3,030 |
| Textron Inc. | 3.875% | 3/1/25 | 2,500 | 2,452 |
| United Technologies Corp. | 1.800% | 6/1/17 | 1,785 | 1,793 |
| United Technologies Corp. | 5.375% | 12/15/17 | 9,675 | 10,398 |
| United Technologies Corp. | 6.125% | 2/1/19 | 10,190 | 11,368 |
| United Technologies Corp. | 4.500% | 4/15/20 | 6,680 | 7,301 |
73
| Total Bond Market II Index Fund | ||||
| Face | Market | |||
| Maturity | Amount | Value• | ||
| Coupon | Date | ($000) | ($000) | |
| United Technologies Corp. | 3.100% | 6/1/22 | 14,568 | 14,839 |
| United Technologies Corp. | 6.700% | 8/1/28 | 325 | 414 |
| United Technologies Corp. | 7.500% | 9/15/29 | 3,825 | 5,172 |
| United Technologies Corp. | 5.400% | 5/1/35 | 600 | 672 |
| United Technologies Corp. | 6.050% | 6/1/36 | 1,915 | 2,308 |
| United Technologies Corp. | 6.125% | 7/15/38 | 10,950 | 13,398 |
| United Technologies Corp. | 5.700% | 4/15/40 | 7,325 | 8,578 |
| United Technologies Corp. | 4.500% | 6/1/42 | 16,990 | 17,066 |
| United Technologies Corp. | 4.150% | 5/15/45 | 2,800 | 2,671 |
| Valmont Industries Inc. | 5.000% | 10/1/44 | 1,100 | 953 |
| Valmont Industries Inc. | 5.250% | 10/1/54 | 2,350 | 2,002 |
| Waste Management Inc. | 2.600% | 9/1/16 | 145 | 146 |
| Waste Management Inc. | 6.100% | 3/15/18 | 1,150 | 1,253 |
| Waste Management Inc. | 4.750% | 6/30/20 | 4,700 | 5,094 |
| Waste Management Inc. | 4.600% | 3/1/21 | 6,425 | 6,909 |
| Waste Management Inc. | 3.500% | 5/15/24 | 4,800 | 4,838 |
| Waste Management Inc. | 3.125% | 3/1/25 | 3,250 | 3,158 |
| Waste Management Inc. | 3.900% | 3/1/35 | 1,100 | 1,029 |
| Waste Management Inc. | 4.100% | 3/1/45 | 3,000 | 2,796 |
| WW Grainger Inc. | 4.600% | 6/15/45 | 8,325 | 8,682 |
| Communication (2.5%) | ||||
| 21st Century Fox America Inc. | 8.000% | 10/17/16 | 975 | 1,023 |
| 21st Century Fox America Inc. | 6.900% | 3/1/19 | 4,340 | 4,928 |
| 21st Century Fox America Inc. | 4.500% | 2/15/21 | 5,050 | 5,436 |
| 21st Century Fox America Inc. | 3.000% | 9/15/22 | 11,450 | 11,299 |
| 21st Century Fox America Inc. | 4.000% | 10/1/23 | 1,075 | 1,111 |
| 8 21st Century Fox America Inc. | 3.700% | 10/15/25 | 3,000 | 2,993 |
| 21st Century Fox America Inc. | 6.550% | 3/15/33 | 5,765 | 6,606 |
| 21st Century Fox America Inc. | 6.200% | 12/15/34 | 6,250 | 7,070 |
| 21st Century Fox America Inc. | 6.400% | 12/15/35 | 12,800 | 14,743 |
| 21st Century Fox America Inc. | 8.150% | 10/17/36 | 275 | 365 |
| 21st Century Fox America Inc. | 6.150% | 3/1/37 | 3,000 | 3,342 |
| 21st Century Fox America Inc. | 6.650% | 11/15/37 | 6,250 | 7,244 |
| 21st Century Fox America Inc. | 6.900% | 8/15/39 | 2,275 | 2,689 |
| 21st Century Fox America Inc. | 6.150% | 2/15/41 | 8,925 | 10,037 |
| 21st Century Fox America Inc. | 5.400% | 10/1/43 | 4,700 | 4,900 |
| 21st Century Fox America Inc. | 4.750% | 9/15/44 | 4,075 | 3,926 |
| 21st Century Fox America Inc. | 7.750% | 12/1/45 | 3,150 | 4,104 |
| America Movil SAB de CV | 5.625% | 11/15/17 | 900 | 956 |
| America Movil SAB de CV | 5.000% | 10/16/19 | 5,700 | 6,139 |
| America Movil SAB de CV | 5.000% | 3/30/20 | 16,173 | 17,554 |
| America Movil SAB de CV | 3.125% | 7/16/22 | 6,100 | 5,961 |
| America Movil SAB de CV | 6.375% | 3/1/35 | 1,475 | 1,633 |
| America Movil SAB de CV | 6.125% | 11/15/37 | 1,825 | 2,005 |
| America Movil SAB de CV | 6.125% | 3/30/40 | 14,440 | 15,838 |
| America Movil SAB de CV | 4.375% | 7/16/42 | 5,000 | 4,474 |
| American Tower Corp. | 4.500% | 1/15/18 | 16,300 | 17,005 |
| American Tower Corp. | 5.050% | 9/1/20 | 295 | 318 |
| American Tower Corp. | 5.900% | 11/1/21 | 4,965 | 5,535 |
| American Tower Corp. | 4.700% | 3/15/22 | 5,000 | 5,257 |
| American Tower Corp. | 3.500% | 1/31/23 | 19,050 | 18,789 |
| American Tower Corp. | 4.000% | 6/1/25 | 3,750 | 3,686 |
| Ameritech Capital Funding Corp. | 6.550% | 1/15/28 | 500 | 558 |
| AT&T Corp. | 8.250% | 11/15/31 | 5,149 | 6,891 |
| AT&T Inc. | 1.600% | 2/15/17 | 13,965 | 13,986 |
74
| Total Bond Market II Index Fund | ||||
| Face | Market | |||
| Maturity | Amount | Value• | ||
| Coupon | Date | ($000) | ($000) | |
| AT&T Inc. | 1.700% | 6/1/17 | 16,086 | 16,123 |
| AT&T Inc. | 1.400% | 12/1/17 | 11,660 | 11,600 |
| AT&T Inc. | 5.500% | 2/1/18 | 10,265 | 10,975 |
| AT&T Inc. | 5.600% | 5/15/18 | 3,700 | 4,022 |
| AT&T Inc. | 2.375% | 11/27/18 | 10,000 | 10,078 |
| AT&T Inc. | 5.800% | 2/15/19 | 3,900 | 4,305 |
| AT&T Inc. | 2.300% | 3/11/19 | 5,300 | 5,305 |
| AT&T Inc. | 2.450% | 6/30/20 | 16,400 | 16,195 |
| AT&T Inc. | 4.450% | 5/15/21 | 5,590 | 5,937 |
| AT&T Inc. | 3.875% | 8/15/21 | 11,485 | 11,881 |
| AT&T Inc. | 3.000% | 2/15/22 | 7,975 | 7,852 |
| AT&T Inc. | 3.000% | 6/30/22 | 17,500 | 17,016 |
| AT&T Inc. | 2.625% | 12/1/22 | 17,850 | 16,920 |
| AT&T Inc. | 3.400% | 5/15/25 | 18,425 | 17,708 |
| AT&T Inc. | 6.450% | 6/15/34 | 4,195 | 4,715 |
| AT&T Inc. | 4.500% | 5/15/35 | 7,500 | 6,967 |
| AT&T Inc. | 6.500% | 9/1/37 | 6,431 | 7,238 |
| AT&T Inc. | 6.300% | 1/15/38 | 6,590 | 7,213 |
| AT&T Inc. | 6.400% | 5/15/38 | 3,100 | 3,422 |
| AT&T Inc. | 6.550% | 2/15/39 | 12,015 | 13,533 |
| AT&T Inc. | 5.350% | 9/1/40 | 23,153 | 22,899 |
| AT&T Inc. | 5.550% | 8/15/41 | 5,450 | 5,486 |
| AT&T Inc. | 4.300% | 12/15/42 | 17,836 | 15,268 |
| AT&T Inc. | 4.800% | 6/15/44 | 21,200 | 19,445 |
| AT&T Inc. | 4.350% | 6/15/45 | 16,158 | 13,902 |
| AT&T Inc. | 4.750% | 5/15/46 | 20,000 | 18,317 |
| Bellsouth Capital Funding Corp. | 7.875% | 2/15/30 | 5,107 | 6,113 |
| BellSouth LLC | 6.875% | 10/15/31 | 3,786 | 4,161 |
| BellSouth LLC | 6.550% | 6/15/34 | 628 | 668 |
| BellSouth LLC | 6.000% | 11/15/34 | 419 | 418 |
| BellSouth Telecommunications LLC | 6.375% | 6/1/28 | 2,875 | 3,150 |
| British Telecommunications plc | 1.250% | 2/14/17 | 1,350 | 1,343 |
| British Telecommunications plc | 5.950% | 1/15/18 | 13,310 | 14,354 |
| British Telecommunications plc | 2.350% | 2/14/19 | 1,325 | 1,328 |
| British Telecommunications plc | 9.625% | 12/15/30 | 11,150 | 16,256 |
| CBS Corp. | 1.950% | 7/1/17 | 175 | 175 |
| CBS Corp. | 4.625% | 5/15/18 | 100 | 106 |
| CBS Corp. | 2.300% | 8/15/19 | 7,075 | 6,995 |
| CBS Corp. | 5.750% | 4/15/20 | 12,390 | 13,690 |
| CBS Corp. | 4.300% | 2/15/21 | 4,150 | 4,320 |
| CBS Corp. | 4.000% | 1/15/26 | 4,000 | 3,900 |
| CBS Corp. | 7.875% | 7/30/30 | 25 | 32 |
| CBS Corp. | 4.850% | 7/1/42 | 5,125 | 4,565 |
| CBS Corp. | 4.900% | 8/15/44 | 3,050 | 2,771 |
| CC Holdings GS V LLC / Crown Castle GS III Corp. | 3.849% | 4/15/23 | 10,050 | 9,861 |
| 8 CCO Safari II LLC | 3.579% | 7/23/20 | 12,575 | 12,497 |
| 8 CCO Safari II LLC | 4.464% | 7/23/22 | 16,125 | 16,101 |
| 8 CCO Safari II LLC | 4.908% | 7/23/25 | 29,000 | 28,907 |
| 8 CCO Safari II LLC | 6.384% | 10/23/35 | 11,700 | 11,768 |
| 8 CCO Safari II LLC | 6.484% | 10/23/45 | 18,550 | 18,678 |
| 8 CCO Safari II LLC | 6.834% | 10/23/55 | 2,675 | 2,626 |
| Comcast Cable Communications Holdings Inc. | 9.455% | 11/15/22 | 2,000 | 2,775 |
| Comcast Cable Communications LLC | 8.875% | 5/1/17 | 975 | 1,069 |
| Comcast Corp. | 6.500% | 1/15/17 | 550 | 579 |
| Comcast Corp. | 6.300% | 11/15/17 | 3,775 | 4,105 |
| Comcast Corp. | 5.875% | 2/15/18 | 6,450 | 7,015 |
75
| Total Bond Market II Index Fund | ||||
| Face | Market | |||
| Maturity | Amount | Value• | ||
| Coupon | Date | ($000) | ($000) | |
| Comcast Corp. | 5.700% | 5/15/18 | 12,675 | 13,863 |
| Comcast Corp. | 5.700% | 7/1/19 | 6,645 | 7,445 |
| Comcast Corp. | 5.150% | 3/1/20 | 4,555 | 5,086 |
| Comcast Corp. | 3.125% | 7/15/22 | 1,925 | 1,952 |
| Comcast Corp. | 2.850% | 1/15/23 | 7,266 | 7,211 |
| Comcast Corp. | 3.600% | 3/1/24 | 4,125 | 4,263 |
| Comcast Corp. | 3.375% | 2/15/25 | 5,600 | 5,655 |
| Comcast Corp. | 3.375% | 8/15/25 | 6,575 | 6,658 |
| Comcast Corp. | 4.250% | 1/15/33 | 11,700 | 11,657 |
| Comcast Corp. | 7.050% | 3/15/33 | 2,300 | 2,964 |
| Comcast Corp. | 4.200% | 8/15/34 | 7,075 | 7,011 |
| Comcast Corp. | 5.650% | 6/15/35 | 1,650 | 1,913 |
| Comcast Corp. | 4.400% | 8/15/35 | 8,000 | 8,083 |
| Comcast Corp. | 6.500% | 11/15/35 | 13,475 | 16,905 |
| Comcast Corp. | 6.450% | 3/15/37 | 6,075 | 7,528 |
| Comcast Corp. | 6.950% | 8/15/37 | 13,250 | 17,288 |
| Comcast Corp. | 6.400% | 5/15/38 | 5,975 | 7,342 |
| Comcast Corp. | 6.400% | 3/1/40 | 9,300 | 11,505 |
| Comcast Corp. | 4.650% | 7/15/42 | 16,325 | 16,498 |
| Comcast Corp. | 4.500% | 1/15/43 | 1,425 | 1,420 |
| Comcast Corp. | 4.750% | 3/1/44 | 675 | 702 |
| Comcast Corp. | 4.600% | 8/15/45 | 11,000 | 11,141 |
| Deutsche Telekom International Finance BV | 6.750% | 8/20/18 | 5,375 | 6,022 |
| Deutsche Telekom International Finance BV | 6.000% | 7/8/19 | 5,425 | 6,021 |
| Deutsche Telekom International Finance BV | 8.750% | 6/15/30 | 20,794 | 28,685 |
| Deutsche Telekom International Finance BV | 9.250% | 6/1/32 | 300 | 445 |
| DIRECTV Holdings LLC / DIRECTV Financing | ||||
| Co. Inc. | 2.400% | 3/15/17 | 350 | 353 |
| DIRECTV Holdings LLC / DIRECTV Financing | ||||
| Co. Inc. | 1.750% | 1/15/18 | 475 | 474 |
| DIRECTV Holdings LLC / DIRECTV Financing | ||||
| Co. Inc. | 5.875% | 10/1/19 | 4,850 | 5,399 |
| DIRECTV Holdings LLC / DIRECTV Financing | ||||
| Co. Inc. | 5.200% | 3/15/20 | 1,175 | 1,273 |
| DIRECTV Holdings LLC / DIRECTV Financing | ||||
| Co. Inc. | 4.600% | 2/15/21 | 3,075 | 3,254 |
| DIRECTV Holdings LLC / DIRECTV Financing | ||||
| Co. Inc. | 5.000% | 3/1/21 | 19,875 | 21,455 |
| DIRECTV Holdings LLC / DIRECTV Financing | ||||
| Co. Inc. | 3.800% | 3/15/22 | 5,125 | 5,178 |
| DIRECTV Holdings LLC / DIRECTV Financing | ||||
| Co. Inc. | 4.450% | 4/1/24 | 8,275 | 8,481 |
| DIRECTV Holdings LLC / DIRECTV Financing | ||||
| Co. Inc. | 3.950% | 1/15/25 | 19,975 | 19,677 |
| DIRECTV Holdings LLC / DIRECTV Financing | ||||
| Co. Inc. | 6.350% | 3/15/40 | 8,500 | 9,183 |
| DIRECTV Holdings LLC / DIRECTV Financing | ||||
| Co. Inc. | 6.000% | 8/15/40 | 675 | 691 |
| DIRECTV Holdings LLC / DIRECTV Financing | ||||
| Co. Inc. | 6.375% | 3/1/41 | 7,775 | 8,318 |
| DIRECTV Holdings LLC / DIRECTV Financing | ||||
| Co. Inc. | 5.150% | 3/15/42 | 9,950 | 9,272 |
| Discovery Communications LLC | 5.050% | 6/1/20 | 8,750 | 9,314 |
| Discovery Communications LLC | 4.375% | 6/15/21 | 870 | 891 |
| Discovery Communications LLC | 3.300% | 5/15/22 | 4,125 | 3,904 |
| Discovery Communications LLC | 3.250% | 4/1/23 | 1,325 | 1,221 |
76
| Total Bond Market II Index Fund | ||||
| Face | Market | |||
| Maturity | Amount | Value• | ||
| Coupon | Date | ($000) | ($000) | |
| Discovery Communications LLC | 3.450% | 3/15/25 | 1,650 | 1,496 |
| Discovery Communications LLC | 6.350% | 6/1/40 | 2,285 | 2,287 |
| Discovery Communications LLC | 4.950% | 5/15/42 | 6,400 | 5,374 |
| Embarq Corp. | 7.995% | 6/1/36 | 10,474 | 10,764 |
| Grupo Televisa SAB | 6.000% | 5/15/18 | 875 | 942 |
| Grupo Televisa SAB | 6.625% | 3/18/25 | 1,475 | 1,691 |
| Grupo Televisa SAB | 8.500% | 3/11/32 | 275 | 331 |
| Grupo Televisa SAB | 6.625% | 1/15/40 | 3,795 | 3,984 |
| Grupo Televisa SAB | 5.000% | 5/13/45 | 7,650 | 6,531 |
| Grupo Televisa SAB | 6.125% | 1/31/46 | 5,250 | 5,250 |
| GTE Corp. | 8.750% | 11/1/21 | 1,700 | 2,102 |
| GTE Corp. | 6.940% | 4/15/28 | 1,750 | 2,074 |
| Historic TW Inc. | 9.150% | 2/1/23 | 3,425 | 4,460 |
| Historic TW Inc. | 6.625% | 5/15/29 | 4,925 | 5,766 |
| Interpublic Group of Cos. Inc. | 3.750% | 2/15/23 | 16,246 | 15,655 |
| Interpublic Group of Cos. Inc. | 4.200% | 4/15/24 | 750 | 744 |
| Koninklijke KPN NV | 8.375% | 10/1/30 | 5,400 | 7,058 |
| McGraw Hill Financial Inc. | 5.900% | 11/15/17 | 1,450 | 1,539 |
| McGraw Hill Financial Inc. | 2.500% | 8/15/18 | 3,850 | 3,877 |
| McGraw Hill Financial Inc. | 3.300% | 8/14/20 | 3,950 | 3,986 |
| McGraw Hill Financial Inc. | 4.000% | 6/15/25 | 3,750 | 3,765 |
| McGraw Hill Financial Inc. | 4.400% | 2/15/26 | 7,825 | 8,017 |
| McGraw Hill Financial Inc. | 6.550% | 11/15/37 | 1,450 | 1,656 |
| Moody’s Corp. | 5.500% | 9/1/20 | 438 | 483 |
| Moody’s Corp. | 4.500% | 9/1/22 | 14,842 | 15,779 |
| Moody’s Corp. | 4.875% | 2/15/24 | 3,500 | 3,733 |
| Moody’s Corp. | 5.250% | 7/15/44 | 5,950 | 6,128 |
| NBCUniversal Media LLC | 5.150% | 4/30/20 | 8,550 | 9,550 |
| NBCUniversal Media LLC | 4.375% | 4/1/21 | 3,120 | 3,390 |
| NBCUniversal Media LLC | 2.875% | 1/15/23 | 9,150 | 9,084 |
| NBCUniversal Media LLC | 6.400% | 4/30/40 | 8,350 | 10,393 |
| NBCUniversal Media LLC | 5.950% | 4/1/41 | 2,575 | 3,082 |
| NBCUniversal Media LLC | 4.450% | 1/15/43 | 6,275 | 6,139 |
| New Cingular Wireless Services Inc. | 8.750% | 3/1/31 | 1,370 | 1,890 |
| Nippon Telegraph & Telephone Corp. | 1.400% | 7/18/17 | 825 | 822 |
| Omnicom Group Inc. | 4.450% | 8/15/20 | 3,850 | 4,104 |
| Omnicom Group Inc. | 3.625% | 5/1/22 | 20,290 | 20,512 |
| Omnicom Group Inc. | 3.650% | 11/1/24 | 3,825 | 3,819 |
| Orange SA | 2.750% | 2/6/19 | 5,950 | 6,041 |
| Orange SA | 5.375% | 7/8/19 | 6,825 | 7,477 |
| Orange SA | 4.125% | 9/14/21 | 7,095 | 7,482 |
| Orange SA | 9.000% | 3/1/31 | 11,940 | 16,871 |
| Orange SA | 5.375% | 1/13/42 | 275 | 290 |
| Orange SA | 5.500% | 2/6/44 | 7,175 | 7,597 |
| Pacific Bell Telephone Co. | 7.125% | 3/15/26 | 425 | 520 |
| Qwest Corp. | 6.500% | 6/1/17 | 1,825 | 1,932 |
| Qwest Corp. | 6.750% | 12/1/21 | 6,990 | 7,290 |
| Qwest Corp. | 7.250% | 9/15/25 | 900 | 960 |
| Qwest Corp. | 6.875% | 9/15/33 | 5,035 | 4,871 |
| Qwest Corp. | 7.125% | 11/15/43 | 4,500 | 4,281 |
| RELX Capital Inc. | 3.125% | 10/15/22 | 6,809 | 6,600 |
| Rogers Communications Inc. | 6.800% | 8/15/18 | 7,150 | 7,991 |
| Rogers Communications Inc. | 3.000% | 3/15/23 | 1,575 | 1,535 |
| Rogers Communications Inc. | 4.100% | 10/1/23 | 3,050 | 3,186 |
| Rogers Communications Inc. | 3.625% | 12/15/25 | 1,775 | 1,747 |
| Rogers Communications Inc. | 4.500% | 3/15/43 | 3,260 | 3,045 |
77
| Total Bond Market II Index Fund | ||||
| Face | Market | |||
| Maturity | Amount | Value• | ||
| Coupon | Date | ($000) | ($000) | |
| Rogers Communications Inc. | 5.000% | 3/15/44 | 11,885 | 12,023 |
| Scripps Networks Interactive Inc. | 2.750% | 11/15/19 | 4,525 | 4,453 |
| Scripps Networks Interactive Inc. | 2.800% | 6/15/20 | 4,000 | 3,902 |
| Scripps Networks Interactive Inc. | 3.500% | 6/15/22 | 2,500 | 2,408 |
| Scripps Networks Interactive Inc. | 3.900% | 11/15/24 | 2,275 | 2,171 |
| TCI Communications Inc. | 7.875% | 2/15/26 | 1,675 | 2,264 |
| TCI Communications Inc. | 7.125% | 2/15/28 | 450 | 582 |
| Telefonica Emisiones SAU | 3.192% | 4/27/18 | 9,700 | 9,875 |
| Telefonica Emisiones SAU | 5.877% | 7/15/19 | 13,400 | 14,811 |
| Telefonica Emisiones SAU | 5.462% | 2/16/21 | 540 | 603 |
| Telefonica Emisiones SAU | 4.570% | 4/27/23 | 7,450 | 7,788 |
| Telefonica Emisiones SAU | 7.045% | 6/20/36 | 13,235 | 15,998 |
| Telefonica Europe BV | 8.250% | 9/15/30 | 2,100 | 2,733 |
| Thomson Reuters Corp. | 1.300% | 2/23/17 | 1,000 | 994 |
| Thomson Reuters Corp. | 1.650% | 9/29/17 | 500 | 498 |
| Thomson Reuters Corp. | 6.500% | 7/15/18 | 4,225 | 4,665 |
| Thomson Reuters Corp. | 4.700% | 10/15/19 | 1,525 | 1,636 |
| Thomson Reuters Corp. | 3.950% | 9/30/21 | 5,250 | 5,424 |
| Thomson Reuters Corp. | 4.300% | 11/23/23 | 2,675 | 2,745 |
| Thomson Reuters Corp. | 3.850% | 9/29/24 | 1,000 | 985 |
| Thomson Reuters Corp. | 5.500% | 8/15/35 | 2,975 | 3,028 |
| Thomson Reuters Corp. | 5.850% | 4/15/40 | 10,610 | 11,161 |
| Thomson Reuters Corp. | 5.650% | 11/23/43 | 2,500 | 2,600 |
| Time Warner Cable Inc. | 5.850% | 5/1/17 | 5,275 | 5,517 |
| Time Warner Cable Inc. | 6.750% | 7/1/18 | 12,325 | 13,495 |
| Time Warner Cable Inc. | 8.750% | 2/14/19 | 8,100 | 9,380 |
| Time Warner Cable Inc. | 8.250% | 4/1/19 | 12,550 | 14,421 |
| Time Warner Cable Inc. | 5.000% | 2/1/20 | 3,045 | 3,223 |
| Time Warner Cable Inc. | 4.125% | 2/15/21 | 3,806 | 3,917 |
| Time Warner Cable Inc. | 4.000% | 9/1/21 | 3,050 | 3,078 |
| Time Warner Cable Inc. | 6.550% | 5/1/37 | 10,245 | 10,337 |
| Time Warner Cable Inc. | 7.300% | 7/1/38 | 9,408 | 10,220 |
| Time Warner Cable Inc. | 6.750% | 6/15/39 | 4,572 | 4,680 |
| Time Warner Cable Inc. | 5.875% | 11/15/40 | 8,075 | 7,626 |
| Time Warner Cable Inc. | 5.500% | 9/1/41 | 10,900 | 9,860 |
| Time Warner Cable Inc. | 4.500% | 9/15/42 | 2,725 | 2,145 |
| Time Warner Cos. Inc. | 7.570% | 2/1/24 | 325 | 398 |
| Time Warner Cos. Inc. | 6.950% | 1/15/28 | 7,050 | 8,366 |
| Time Warner Entertainment Co. LP | 8.375% | 7/15/33 | 3,650 | 4,321 |
| Time Warner Inc. | 2.100% | 6/1/19 | 3,450 | 3,425 |
| Time Warner Inc. | 4.875% | 3/15/20 | 8,360 | 9,042 |
| Time Warner Inc. | 4.700% | 1/15/21 | 4,050 | 4,359 |
| Time Warner Inc. | 4.750% | 3/29/21 | 7,975 | 8,578 |
| Time Warner Inc. | 4.000% | 1/15/22 | 295 | 306 |
| Time Warner Inc. | 3.400% | 6/15/22 | 250 | 249 |
| Time Warner Inc. | 4.050% | 12/15/23 | 525 | 536 |
| Time Warner Inc. | 3.600% | 7/15/25 | 4,350 | 4,240 |
| Time Warner Inc. | 3.875% | 1/15/26 | 2,650 | 2,627 |
| Time Warner Inc. | 7.625% | 4/15/31 | 15,700 | 19,449 |
| Time Warner Inc. | 7.700% | 5/1/32 | 4,600 | 5,743 |
| Time Warner Inc. | 6.500% | 11/15/36 | 9,090 | 10,281 |
| Time Warner Inc. | 6.200% | 3/15/40 | 950 | 1,045 |
| Time Warner Inc. | 6.100% | 7/15/40 | 4,150 | 4,488 |
| Time Warner Inc. | 6.250% | 3/29/41 | 5,275 | 5,864 |
| Time Warner Inc. | 5.375% | 10/15/41 | 295 | 302 |
| Time Warner Inc. | 4.900% | 6/15/42 | 2,785 | 2,623 |
78
| Total Bond Market II Index Fund | ||||
| Face | Market | |||
| Maturity | Amount | Value• | ||
| Coupon | Date | ($000) | ($000) | |
| Time Warner Inc. | 5.350% | 12/15/43 | 6,200 | 6,190 |
| Time Warner Inc. | 4.650% | 6/1/44 | 2,500 | 2,300 |
| Time Warner Inc. | 4.850% | 7/15/45 | 1,700 | 1,618 |
| Verizon Communications Inc. | 1.350% | 6/9/17 | 6,600 | 6,580 |
| Verizon Communications Inc. | 1.100% | 11/1/17 | 1,350 | 1,346 |
| Verizon Communications Inc. | 5.500% | 2/15/18 | 8,575 | 9,231 |
| Verizon Communications Inc. | 6.100% | 4/15/18 | 3,245 | 3,546 |
| Verizon Communications Inc. | 3.650% | 9/14/18 | 21,120 | 22,041 |
| Verizon Communications Inc. | 6.350% | 4/1/19 | 20,925 | 23,540 |
| Verizon Communications Inc. | 2.625% | 2/21/20 | 12,419 | 12,475 |
| Verizon Communications Inc. | 4.500% | 9/15/20 | 33,400 | 35,912 |
| Verizon Communications Inc. | 3.450% | 3/15/21 | 9,775 | 10,009 |
| Verizon Communications Inc. | 4.600% | 4/1/21 | 7,710 | 8,312 |
| Verizon Communications Inc. | 3.000% | 11/1/21 | 6,725 | 6,743 |
| Verizon Communications Inc. | 3.500% | 11/1/21 | 8,185 | 8,332 |
| Verizon Communications Inc. | 2.450% | 11/1/22 | 9,950 | 9,414 |
| Verizon Communications Inc. | 5.150% | 9/15/23 | 45,800 | 50,240 |
| Verizon Communications Inc. | 4.150% | 3/15/24 | 9,950 | 10,207 |
| Verizon Communications Inc. | 3.500% | 11/1/24 | 13,775 | 13,579 |
| Verizon Communications Inc. | 7.750% | 12/1/30 | 3,640 | 4,647 |
| Verizon Communications Inc. | 6.400% | 9/15/33 | 14,857 | 16,975 |
| Verizon Communications Inc. | 5.050% | 3/15/34 | 14,200 | 14,198 |
| Verizon Communications Inc. | 4.400% | 11/1/34 | 10,000 | 9,342 |
| Verizon Communications Inc. | 5.850% | 9/15/35 | 7,650 | 8,208 |
| Verizon Communications Inc. | 4.272% | 1/15/36 | 23,239 | 20,976 |
| Verizon Communications Inc. | 6.250% | 4/1/37 | 4,825 | 5,424 |
| Verizon Communications Inc. | 6.400% | 2/15/38 | 7,625 | 8,676 |
| Verizon Communications Inc. | 6.900% | 4/15/38 | 3,125 | 3,746 |
| Verizon Communications Inc. | 7.350% | 4/1/39 | 7,800 | 9,666 |
| Verizon Communications Inc. | 6.000% | 4/1/41 | 5,155 | 5,600 |
| Verizon Communications Inc. | 4.750% | 11/1/41 | 7,925 | 7,283 |
| Verizon Communications Inc. | 3.850% | 11/1/42 | 4,200 | 3,463 |
| Verizon Communications Inc. | 6.550% | 9/15/43 | 26,800 | 31,718 |
| Verizon Communications Inc. | 4.862% | 8/21/46 | 20,015 | 18,893 |
| Verizon Communications Inc. | 4.522% | 9/15/48 | 26,602 | 23,815 |
| Verizon Communications Inc. | 5.012% | 8/21/54 | 32,652 | 29,912 |
| Verizon Communications Inc. | 4.672% | 3/15/55 | 29,424 | 25,517 |
| Verizon Florida LLC | 6.860% | 2/1/28 | 250 | 236 |
| Verizon Maryland LLC | 5.125% | 6/15/33 | 3,275 | 3,262 |
| Verizon New England Inc. | 7.875% | 11/15/29 | 1,225 | 1,521 |
| Verizon New York Inc. | 7.375% | 4/1/32 | 7,900 | 8,927 |
| Viacom Inc. | 3.500% | 4/1/17 | 5,335 | 5,430 |
| Viacom Inc. | 6.125% | 10/5/17 | 1,250 | 1,331 |
| Viacom Inc. | 2.500% | 9/1/18 | 3,025 | 3,024 |
| Viacom Inc. | 2.200% | 4/1/19 | 2,075 | 2,028 |
| Viacom Inc. | 5.625% | 9/15/19 | 7,470 | 8,072 |
| Viacom Inc. | 3.875% | 12/15/21 | 13,790 | 13,643 |
| Viacom Inc. | 4.250% | 9/1/23 | 8,200 | 7,924 |
| Viacom Inc. | 4.850% | 12/15/34 | 3,320 | 2,712 |
| Viacom Inc. | 6.875% | 4/30/36 | 14,335 | 14,078 |
| Viacom Inc. | 4.500% | 2/27/42 | 1,800 | 1,354 |
| Viacom Inc. | 5.850% | 9/1/43 | 7,850 | 7,005 |
| Viacom Inc. | 5.250% | 4/1/44 | 1,850 | 1,526 |
| Vodafone Group plc | 5.625% | 2/27/17 | 16,490 | 17,227 |
| Vodafone Group plc | 1.625% | 3/20/17 | 900 | 899 |
| Vodafone Group plc | 1.250% | 9/26/17 | 13,725 | 13,594 |
79
| Total Bond Market II Index Fund | ||||
| Face | Market | |||
| Maturity | Amount | Value• | ||
| Coupon | Date | ($000) | ($000) | |
| Vodafone Group plc | 1.500% | 2/19/18 | 5,050 | 5,003 |
| Vodafone Group plc | 4.625% | 7/15/18 | 2,200 | 2,327 |
| Vodafone Group plc | 5.450% | 6/10/19 | 10,300 | 11,335 |
| Vodafone Group plc | 4.375% | 3/16/21 | 1,343 | 1,425 |
| Vodafone Group plc | 2.500% | 9/26/22 | 1,500 | 1,387 |
| Vodafone Group plc | 2.950% | 2/19/23 | 6,625 | 6,280 |
| Vodafone Group plc | 7.875% | 2/15/30 | 2,588 | 3,154 |
| Vodafone Group plc | 6.250% | 11/30/32 | 2,675 | 2,771 |
| Vodafone Group plc | 6.150% | 2/27/37 | 7,395 | 7,333 |
| Vodafone Group plc | 4.375% | 2/19/43 | 5,475 | 4,511 |
| Walt Disney Co. | 1.125% | 2/15/17 | 3,775 | 3,777 |
| Walt Disney Co. | 0.875% | 5/30/17 | 5,875 | 5,861 |
| Walt Disney Co. | 1.100% | 12/1/17 | 4,000 | 3,988 |
| Walt Disney Co. | 5.875% | 12/15/17 | 1,875 | 2,037 |
| Walt Disney Co. | 1.500% | 9/17/18 | 4,000 | 3,990 |
| Walt Disney Co. | 1.850% | 5/30/19 | 6,300 | 6,313 |
| Walt Disney Co. | 2.150% | 9/17/20 | 4,450 | 4,440 |
| Walt Disney Co. | 2.750% | 8/16/21 | 1,000 | 1,017 |
| Walt Disney Co. | 2.350% | 12/1/22 | 4,300 | 4,216 |
| Walt Disney Co. | 3.150% | 9/17/25 | 3,800 | 3,860 |
| Walt Disney Co. | 7.000% | 3/1/32 | 1,875 | 2,586 |
| Walt Disney Co. | 4.125% | 12/1/41 | 9,133 | 9,110 |
| Walt Disney Co. | 3.700% | 12/1/42 | 3,575 | 3,332 |
| Walt Disney Co. | 4.125% | 6/1/44 | 6,075 | 6,151 |
| WPP Finance 2010 | 4.750% | 11/21/21 | 7,701 | 8,284 |
| WPP Finance 2010 | 3.625% | 9/7/22 | 2,500 | 2,505 |
| WPP Finance 2010 | 3.750% | 9/19/24 | 3,325 | 3,303 |
| WPP Finance 2010 | 5.125% | 9/7/42 | 700 | 662 |
| WPP Finance 2010 | 5.625% | 11/15/43 | 1,750 | 1,770 |
| Consumer Cyclical (2.0%) | ||||
| Advance Auto Parts Inc. | 5.750% | 5/1/20 | 1,275 | 1,390 |
| Advance Auto Parts Inc. | 4.500% | 1/15/22 | 325 | 335 |
| Advance Auto Parts Inc. | 4.500% | 12/1/23 | 1,850 | 1,889 |
| Alibaba Group Holding Ltd. | 1.625% | 11/28/17 | 9,725 | 9,622 |
| Alibaba Group Holding Ltd. | 2.500% | 11/28/19 | 17,950 | 17,581 |
| Alibaba Group Holding Ltd. | 3.125% | 11/28/21 | 3,050 | 2,968 |
| Alibaba Group Holding Ltd. | 3.600% | 11/28/24 | 11,600 | 11,154 |
| Alibaba Group Holding Ltd. | 4.500% | 11/28/34 | 4,370 | 4,160 |
| Amazon.com Inc. | 1.200% | 11/29/17 | 6,650 | 6,633 |
| Amazon.com Inc. | 2.600% | 12/5/19 | 6,650 | 6,755 |
| Amazon.com Inc. | 3.300% | 12/5/21 | 6,500 | 6,691 |
| Amazon.com Inc. | 2.500% | 11/29/22 | 4,300 | 4,159 |
| Amazon.com Inc. | 3.800% | 12/5/24 | 2,400 | 2,498 |
| Amazon.com Inc. | 4.800% | 12/5/34 | 10,375 | 10,889 |
| Amazon.com Inc. | 4.950% | 12/5/44 | 8,200 | 8,737 |
| American Honda Finance Corp. | 1.200% | 7/14/17 | 7,550 | 7,517 |
| American Honda Finance Corp. | 1.550% | 12/11/17 | 17,000 | 17,002 |
| American Honda Finance Corp. | 2.125% | 10/10/18 | 3,650 | 3,675 |
| American Honda Finance Corp. | 2.250% | 8/15/19 | 3,000 | 3,016 |
| American Honda Finance Corp. | 2.450% | 9/24/20 | 7,300 | 7,313 |
| Automatic Data Processing Inc. | 2.250% | 9/15/20 | 5,500 | 5,517 |
| Automatic Data Processing Inc. | 3.375% | 9/15/25 | 1,300 | 1,327 |
| AutoNation Inc. | 6.750% | 4/15/18 | 2,000 | 2,181 |
| AutoNation Inc. | 5.500% | 2/1/20 | 1,655 | 1,793 |
| AutoNation Inc. | 3.350% | 1/15/21 | 1,600 | 1,602 |
80
| Total Bond Market II Index Fund | ||||
| Face | Market | |||
| Maturity | Amount | Value• | ||
| Coupon | Date | ($000) | ($000) | |
| AutoNation Inc. | 4.500% | 10/1/25 | 1,600 | 1,625 |
| AutoZone Inc. | 1.300% | 1/13/17 | 4,950 | 4,944 |
| AutoZone Inc. | 7.125% | 8/1/18 | 7,100 | 7,961 |
| AutoZone Inc. | 2.500% | 4/15/21 | 1,125 | 1,099 |
| AutoZone Inc. | 3.700% | 4/15/22 | 3,750 | 3,819 |
| AutoZone Inc. | 3.250% | 4/15/25 | 2,700 | 2,613 |
| Bed Bath & Beyond Inc. | 3.749% | 8/1/24 | 1,000 | 976 |
| Bed Bath & Beyond Inc. | 4.915% | 8/1/34 | 1,375 | 1,228 |
| Bed Bath & Beyond Inc. | 5.165% | 8/1/44 | 4,879 | 4,160 |
| Best Buy Co. Inc. | 5.500% | 3/15/21 | 850 | 886 |
| Block Financial LLC | 4.125% | 10/1/20 | 2,875 | 2,911 |
| Block Financial LLC | 5.250% | 10/1/25 | 9,225 | 9,429 |
| BorgWarner Inc. | 4.625% | 9/15/20 | 400 | 430 |
| BorgWarner Inc. | 3.375% | 3/15/25 | 1,250 | 1,182 |
| BorgWarner Inc. | 4.375% | 3/15/45 | 3,565 | 3,189 |
| Brinker International Inc. | 2.600% | 5/15/18 | 5,663 | 5,645 |
| Brinker International Inc. | 3.875% | 5/15/23 | 4,725 | 4,556 |
| Carnival Corp. | 1.875% | 12/15/17 | 1,150 | 1,149 |
| Carnival Corp. | 3.950% | 10/15/20 | 2,500 | 2,635 |
| Coach Inc. | 4.250% | 4/1/25 | 1,350 | 1,285 |
| Costco Wholesale Corp. | 5.500% | 3/15/17 | 5,400 | 5,682 |
| Costco Wholesale Corp. | 1.125% | 12/15/17 | 4,575 | 4,571 |
| Costco Wholesale Corp. | 1.700% | 12/15/19 | 6,500 | 6,444 |
| Costco Wholesale Corp. | 1.750% | 2/15/20 | 2,000 | 1,983 |
| Costco Wholesale Corp. | 2.250% | 2/15/22 | 1,900 | 1,865 |
| Cummins Inc. | 3.650% | 10/1/23 | 2,750 | 2,838 |
| Cummins Inc. | 7.125% | 3/1/28 | 100 | 131 |
| Cummins Inc. | 4.875% | 10/1/43 | 3,775 | 3,900 |
| CVS Health Corp. | 5.750% | 6/1/17 | 7,727 | 8,178 |
| CVS Health Corp. | 1.900% | 7/20/18 | 15,250 | 15,235 |
| CVS Health Corp. | 2.250% | 12/5/18 | 19,600 | 19,699 |
| CVS Health Corp. | 2.250% | 8/12/19 | 5,000 | 4,995 |
| CVS Health Corp. | 2.800% | 7/20/20 | 14,275 | 14,343 |
| CVS Health Corp. | 3.500% | 7/20/22 | 7,225 | 7,352 |
| CVS Health Corp. | 2.750% | 12/1/22 | 5,050 | 4,910 |
| 8 CVS Health Corp. | 4.750% | 12/1/22 | 6,100 | 6,568 |
| CVS Health Corp. | 4.000% | 12/5/23 | 5,570 | 5,788 |
| CVS Health Corp. | 3.375% | 8/12/24 | 3,600 | 3,559 |
| 8 CVS Health Corp. | 5.000% | 12/1/24 | 9,000 | 9,745 |
| CVS Health Corp. | 3.875% | 7/20/25 | 16,275 | 16,554 |
| CVS Health Corp. | 4.875% | 7/20/35 | 11,400 | 11,770 |
| CVS Health Corp. | 5.750% | 5/15/41 | 3,595 | 4,064 |
| CVS Health Corp. | 5.300% | 12/5/43 | 7,350 | 7,958 |
| CVS Health Corp. | 5.125% | 7/20/45 | 20,125 | 21,215 |
| Daimler Finance North America LLC | 8.500% | 1/18/31 | 7,620 | 11,061 |
| Delphi Automotive plc | 3.150% | 11/19/20 | 4,050 | 4,041 |
| Delphi Automotive plc | 4.250% | 1/15/26 | 9,000 | 9,028 |
| Delphi Corp. | 5.000% | 2/15/23 | 3,700 | 3,866 |
| Delphi Corp. | 4.150% | 3/15/24 | 3,205 | 3,243 |
| Dollar General Corp. | 3.250% | 4/15/23 | 8,493 | 8,104 |
| Dollar General Corp. | 4.150% | 11/1/25 | 300 | 297 |
| eBay Inc. | 1.350% | 7/15/17 | 5,375 | 5,338 |
| eBay Inc. | 2.200% | 8/1/19 | 6,925 | 6,841 |
| eBay Inc. | 3.250% | 10/15/20 | 5,425 | 5,483 |
| eBay Inc. | 2.875% | 8/1/21 | 2,925 | 2,880 |
| eBay Inc. | 2.600% | 7/15/22 | 3,250 | 3,016 |
81
| Total Bond Market II Index Fund | ||||
| Face | Market | |||
| Maturity | Amount | Value• | ||
| Coupon | Date | ($000) | ($000) | |
| eBay Inc. | 3.450% | 8/1/24 | 5,125 | 4,883 |
| eBay Inc. | 4.000% | 7/15/42 | 3,450 | 2,724 |
| Expedia Inc. | 7.456% | 8/15/18 | 250 | 279 |
| Expedia Inc. | 5.950% | 8/15/20 | 10,400 | 11,347 |
| Expedia Inc. | 4.500% | 8/15/24 | 2,800 | 2,697 |
| 8 Expedia Inc. | 5.000% | 2/15/26 | 6,000 | 5,882 |
| Ford Holdings LLC | 9.300% | 3/1/30 | 675 | 918 |
| Ford Motor Co. | 6.500% | 8/1/18 | 1,025 | 1,133 |
| Ford Motor Co. | 6.625% | 10/1/28 | 3,425 | 3,937 |
| Ford Motor Co. | 6.375% | 2/1/29 | 2,925 | 3,286 |
| Ford Motor Co. | 7.450% | 7/16/31 | 9,975 | 12,248 |
| Ford Motor Co. | 4.750% | 1/15/43 | 9,150 | 8,631 |
| Ford Motor Co. | 7.400% | 11/1/46 | 2,650 | 3,228 |
| Ford Motor Credit Co. LLC | 4.250% | 2/3/17 | 2,550 | 2,606 |
| Ford Motor Credit Co. LLC | 1.461% | 3/27/17 | 3,300 | 3,269 |
| Ford Motor Credit Co. LLC | 3.000% | 6/12/17 | 8,200 | 8,244 |
| Ford Motor Credit Co. LLC | 6.625% | 8/15/17 | 15,225 | 16,240 |
| Ford Motor Credit Co. LLC | 1.724% | 12/6/17 | 5,500 | 5,414 |
| Ford Motor Credit Co. LLC | 2.145% | 1/9/18 | 17,000 | 16,910 |
| Ford Motor Credit Co. LLC | 2.375% | 1/16/18 | 7,000 | 6,985 |
| Ford Motor Credit Co. LLC | 5.000% | 5/15/18 | 10,675 | 11,176 |
| Ford Motor Credit Co. LLC | 2.375% | 3/12/19 | 18,700 | 18,426 |
| Ford Motor Credit Co. LLC | 2.597% | 11/4/19 | 9,750 | 9,575 |
| Ford Motor Credit Co. LLC | 8.125% | 1/15/20 | 12,565 | 14,802 |
| Ford Motor Credit Co. LLC | 3.157% | 8/4/20 | 1,100 | 1,094 |
| Ford Motor Credit Co. LLC | 3.200% | 1/15/21 | 8,425 | 8,351 |
| Ford Motor Credit Co. LLC | 5.750% | 2/1/21 | 2,681 | 2,974 |
| Ford Motor Credit Co. LLC | 5.875% | 8/2/21 | 13,294 | 14,831 |
| Ford Motor Credit Co. LLC | 3.219% | 1/9/22 | 8,500 | 8,300 |
| Ford Motor Credit Co. LLC | 4.375% | 8/6/23 | 6,625 | 6,816 |
| Ford Motor Credit Co. LLC | 3.664% | 9/8/24 | 4,925 | 4,794 |
| Ford Motor Credit Co. LLC | 4.134% | 8/4/25 | 13,200 | 13,131 |
| Gap Inc. | 5.950% | 4/12/21 | 8,375 | 8,862 |
| General Motors Co. | 3.500% | 10/2/18 | 3,675 | 3,712 |
| General Motors Co. | 4.875% | 10/2/23 | 8,740 | 8,926 |
| General Motors Co. | 4.000% | 4/1/25 | 2,750 | 2,606 |
| General Motors Co. | 5.000% | 4/1/35 | 6,030 | 5,646 |
| General Motors Co. | 6.250% | 10/2/43 | 7,005 | 7,390 |
| General Motors Co. | 5.200% | 4/1/45 | 7,270 | 6,834 |
| General Motors Financial Co. Inc. | 2.625% | 7/10/17 | 1,725 | 1,729 |
| General Motors Financial Co. Inc. | 4.750% | 8/15/17 | 2,300 | 2,378 |
| General Motors Financial Co. Inc. | 3.000% | 9/25/17 | 3,342 | 3,359 |
| General Motors Financial Co. Inc. | 3.250% | 5/15/18 | 2,200 | 2,214 |
| General Motors Financial Co. Inc. | 6.750% | 6/1/18 | 5,065 | 5,489 |
| General Motors Financial Co. Inc. | 3.100% | 1/15/19 | 13,350 | 13,383 |
| General Motors Financial Co. Inc. | 3.500% | 7/10/19 | 5,750 | 5,764 |
| General Motors Financial Co. Inc. | 3.150% | 1/15/20 | 5,200 | 5,128 |
| General Motors Financial Co. Inc. | 3.200% | 7/13/20 | 24,475 | 24,047 |
| General Motors Financial Co. Inc. | 3.700% | 11/24/20 | 9,050 | 9,050 |
| General Motors Financial Co. Inc. | 4.375% | 9/25/21 | 3,265 | 3,298 |
| General Motors Financial Co. Inc. | 3.450% | 4/10/22 | 9,275 | 8,869 |
| General Motors Financial Co. Inc. | 4.250% | 5/15/23 | 3,550 | 3,506 |
| General Motors Financial Co. Inc. | 4.000% | 1/15/25 | 5,825 | 5,526 |
| General Motors Financial Co. Inc. | 4.300% | 7/13/25 | 9,000 | 8,764 |
| Harley-Davidson Inc. | 3.500% | 7/28/25 | 4,550 | 4,539 |
| Harley-Davidson Inc. | 4.625% | 7/28/45 | 2,800 | 2,731 |
82
| Total Bond Market II Index Fund | ||||
| Face | Market | |||
| Maturity | Amount | Value• | ||
| Coupon | Date | ($000) | ($000) | |
| Harman International Industries Inc. | 4.150% | 5/15/25 | 2,400 | 2,296 |
| Home Depot Inc. | 2.250% | 9/10/18 | 12,750 | 13,030 |
| Home Depot Inc. | 2.000% | 6/15/19 | 4,900 | 4,934 |
| Home Depot Inc. | 4.400% | 4/1/21 | 10,030 | 11,028 |
| Home Depot Inc. | 2.625% | 6/1/22 | 4,000 | 3,994 |
| Home Depot Inc. | 2.700% | 4/1/23 | 5,500 | 5,460 |
| Home Depot Inc. | 3.750% | 2/15/24 | 6,080 | 6,464 |
| Home Depot Inc. | 5.875% | 12/16/36 | 16,862 | 20,502 |
| Home Depot Inc. | 5.400% | 9/15/40 | 2,790 | 3,240 |
| Home Depot Inc. | 5.950% | 4/1/41 | 5,575 | 6,932 |
| Home Depot Inc. | 4.200% | 4/1/43 | 8,200 | 8,225 |
| Home Depot Inc. | 4.875% | 2/15/44 | 7,800 | 8,567 |
| Home Depot Inc. | 4.400% | 3/15/45 | 2,800 | 2,898 |
| Home Depot Inc. | 4.250% | 4/1/46 | 3,750 | 3,820 |
| Hyatt Hotels Corp. | 3.375% | 7/15/23 | 3,450 | 3,279 |
| Johnson Controls Inc. | 5.000% | 3/30/20 | 2,100 | 2,255 |
| Johnson Controls Inc. | 4.250% | 3/1/21 | 5,405 | 5,572 |
| Johnson Controls Inc. | 3.750% | 12/1/21 | 1,425 | 1,432 |
| Johnson Controls Inc. | 3.625% | 7/2/24 | 3,650 | 3,481 |
| Johnson Controls Inc. | 6.000% | 1/15/36 | 950 | 976 |
| Johnson Controls Inc. | 5.700% | 3/1/41 | 795 | 777 |
| Johnson Controls Inc. | 5.250% | 12/1/41 | 1,225 | 1,124 |
| Johnson Controls Inc. | 4.625% | 7/2/44 | 2,500 | 2,130 |
| Johnson Controls Inc. | 4.950% | 7/2/64 | 2,675 | 2,170 |
| Kohl’s Corp. | 4.000% | 11/1/21 | 2,955 | 3,035 |
| Kohl’s Corp. | 3.250% | 2/1/23 | 1,750 | 1,662 |
| Kohl’s Corp. | 4.250% | 7/17/25 | 3,675 | 3,582 |
| Kohl’s Corp. | 5.550% | 7/17/45 | 1,725 | 1,600 |
| Lowe’s Cos. Inc. | 6.100% | 9/15/17 | 875 | 942 |
| Lowe’s Cos. Inc. | 4.625% | 4/15/20 | 1,355 | 1,471 |
| Lowe’s Cos. Inc. | 3.750% | 4/15/21 | 1,545 | 1,630 |
| Lowe’s Cos. Inc. | 3.800% | 11/15/21 | 2,675 | 2,844 |
| Lowe’s Cos. Inc. | 3.120% | 4/15/22 | 1,725 | 1,766 |
| Lowe’s Cos. Inc. | 3.875% | 9/15/23 | 5,325 | 5,628 |
| Lowe’s Cos. Inc. | 3.125% | 9/15/24 | 12,350 | 12,298 |
| Lowe’s Cos. Inc. | 3.375% | 9/15/25 | 6,235 | 6,325 |
| Lowe’s Cos. Inc. | 6.875% | 2/15/28 | 175 | 222 |
| Lowe’s Cos. Inc. | 6.500% | 3/15/29 | 1,050 | 1,307 |
| Lowe’s Cos. Inc. | 5.800% | 10/15/36 | 6,400 | 7,572 |
| Lowe’s Cos. Inc. | 5.800% | 4/15/40 | 720 | 862 |
| Lowe’s Cos. Inc. | 5.125% | 11/15/41 | 1,200 | 1,327 |
| Lowe’s Cos. Inc. | 4.650% | 4/15/42 | 6,800 | 7,138 |
| Lowe’s Cos. Inc. | 5.000% | 9/15/43 | 5,494 | 6,008 |
| Lowe’s Cos. Inc. | 4.250% | 9/15/44 | 2,250 | 2,239 |
| Lowe’s Cos. Inc. | 4.375% | 9/15/45 | 6,050 | 6,207 |
| Macy’s Retail Holdings Inc. | 3.450% | 1/15/21 | 3,200 | 3,184 |
| Macy’s Retail Holdings Inc. | 3.875% | 1/15/22 | 4,100 | 4,038 |
| Macy’s Retail Holdings Inc. | 2.875% | 2/15/23 | 10,608 | 9,611 |
| Macy’s Retail Holdings Inc. | 4.375% | 9/1/23 | 5,715 | 5,658 |
| Macy’s Retail Holdings Inc. | 3.625% | 6/1/24 | 2,700 | 2,504 |
| Macy’s Retail Holdings Inc. | 7.000% | 2/15/28 | 2,400 | 2,820 |
| Macy’s Retail Holdings Inc. | 6.900% | 4/1/29 | 1,500 | 1,698 |
| Macy’s Retail Holdings Inc. | 4.500% | 12/15/34 | 3,000 | 2,486 |
| Macy’s Retail Holdings Inc. | 6.375% | 3/15/37 | 2,750 | 2,783 |
| Macy’s Retail Holdings Inc. | 5.125% | 1/15/42 | 4,750 | 4,149 |
| Macy’s Retail Holdings Inc. | 4.300% | 2/15/43 | 600 | 462 |
83
| Total Bond Market II Index Fund | ||||
| Face | Market | |||
| Maturity | Amount | Value• | ||
| Coupon | Date | ($000) | ($000) | |
| Magna International Inc. | 3.625% | 6/15/24 | 3,570 | 3,502 |
| Magna International Inc. | 4.150% | 10/1/25 | 2,000 | 2,037 |
| Marriott International Inc. | 3.000% | 3/1/19 | 1,750 | 1,774 |
| Marriott International Inc. | 3.375% | 10/15/20 | 2,075 | 2,114 |
| Marriott International Inc. | 2.875% | 3/1/21 | 2,500 | 2,477 |
| Marriott International Inc. | 3.125% | 10/15/21 | 3,800 | 3,779 |
| Marriott International Inc. | 3.250% | 9/15/22 | 3,525 | 3,462 |
| Marriott International Inc. | 3.750% | 10/1/25 | 2,000 | 1,963 |
| MasterCard Inc. | 2.000% | 4/1/19 | 2,175 | 2,185 |
| MasterCard Inc. | 3.375% | 4/1/24 | 4,050 | 4,133 |
| McDonald’s Corp. | 5.300% | 3/15/17 | 300 | 313 |
| McDonald’s Corp. | 5.800% | 10/15/17 | 4,250 | 4,532 |
| McDonald’s Corp. | 5.350% | 3/1/18 | 4,995 | 5,356 |
| McDonald’s Corp. | 2.100% | 12/7/18 | 500 | 500 |
| McDonald’s Corp. | 5.000% | 2/1/19 | 4,525 | 4,887 |
| McDonald’s Corp. | 1.875% | 5/29/19 | 6,450 | 6,395 |
| McDonald’s Corp. | 2.750% | 12/9/20 | 1,900 | 1,898 |
| McDonald’s Corp. | 3.625% | 5/20/21 | 1,000 | 1,031 |
| McDonald’s Corp. | 2.625% | 1/15/22 | 10,340 | 10,089 |
| McDonald’s Corp. | 3.375% | 5/26/25 | 3,105 | 3,050 |
| McDonald’s Corp. | 3.700% | 1/30/26 | 10,000 | 9,957 |
| McDonald’s Corp. | 4.700% | 12/9/35 | 4,475 | 4,457 |
| McDonald’s Corp. | 6.300% | 10/15/37 | 325 | 382 |
| McDonald’s Corp. | 6.300% | 3/1/38 | 1,525 | 1,782 |
| McDonald’s Corp. | 3.700% | 2/15/42 | 13,325 | 11,033 |
| McDonald’s Corp. | 3.625% | 5/1/43 | 1,725 | 1,425 |
| McDonald’s Corp. | 4.600% | 5/26/45 | 3,535 | 3,386 |
| McDonald’s Corp. | 4.875% | 12/9/45 | 11,500 | 11,525 |
| Metropolitan Museum of Art New York Revenue | 3.400% | 7/1/45 | 1,900 | 1,725 |
| NIKE Inc. | 2.250% | 5/1/23 | 375 | 367 |
| NIKE Inc. | 3.625% | 5/1/43 | 6,025 | 5,566 |
| NIKE Inc. | 3.875% | 11/1/45 | 7,575 | 7,307 |
| Nordstrom Inc. | 6.250% | 1/15/18 | 5,625 | 6,104 |
| Nordstrom Inc. | 4.750% | 5/1/20 | 2,675 | 2,893 |
| Nordstrom Inc. | 4.000% | 10/15/21 | 5,690 | 5,984 |
| Nordstrom Inc. | 6.950% | 3/15/28 | 1,500 | 1,834 |
| Nordstrom Inc. | 5.000% | 1/15/44 | 1,960 | 2,029 |
| NVR Inc. | 3.950% | 9/15/22 | 6,675 | 6,706 |
| O’Reilly Automotive Inc. | 4.875% | 1/14/21 | 600 | 652 |
| O’Reilly Automotive Inc. | 3.800% | 9/1/22 | 4,554 | 4,618 |
| O’Reilly Automotive Inc. | 3.850% | 6/15/23 | 1,575 | 1,592 |
| PACCAR Financial Corp. | 1.600% | 3/15/17 | 3,725 | 3,734 |
| PACCAR Financial Corp. | 1.100% | 6/6/17 | 200 | 199 |
| PACCAR Financial Corp. | 1.400% | 11/17/17 | 2,950 | 2,941 |
| PACCAR Financial Corp. | 1.450% | 3/9/18 | 800 | 795 |
| PACCAR Financial Corp. | 1.750% | 8/14/18 | 775 | 774 |
| PACCAR Financial Corp. | 2.200% | 9/15/19 | 1,600 | 1,594 |
| PACCAR Financial Corp. | 2.500% | 8/14/20 | 2,000 | 1,985 |
| Priceline Group Inc. | 3.650% | 3/15/25 | 1,200 | 1,171 |
| QVC Inc. | 3.125% | 4/1/19 | 1,550 | 1,532 |
| QVC Inc. | 5.125% | 7/2/22 | 425 | 425 |
| QVC Inc. | 4.375% | 3/15/23 | 650 | 617 |
| QVC Inc. | 4.850% | 4/1/24 | 3,400 | 3,242 |
| QVC Inc. | 5.450% | 8/15/34 | 350 | 303 |
| QVC Inc. | 5.950% | 3/15/43 | 3,175 | 2,704 |
| Ralph Lauren Corp. | 2.125% | 9/26/18 | 1,675 | 1,690 |
84
| Total Bond Market II Index Fund | ||||
| Face | Market | |||
| Maturity | Amount | Value• | ||
| Coupon | Date | ($000) | ($000) | |
| Ralph Lauren Corp. | 2.625% | 8/18/20 | 1,750 | 1,765 |
| Ross Stores Inc. | 3.375% | 9/15/24 | 1,500 | 1,477 |
| Signet UK Finance plc | 4.700% | 6/15/24 | 2,300 | 2,261 |
| Staples Inc. | 2.750% | 1/12/18 | 6,430 | 6,390 |
| Staples Inc. | 4.375% | 1/12/23 | 2,628 | 2,520 |
| Starbucks Corp. | 2.000% | 12/5/18 | 1,700 | 1,718 |
| Starbucks Corp. | 2.700% | 6/15/22 | 2,350 | 2,349 |
| Starbucks Corp. | 3.850% | 10/1/23 | 5,100 | 5,419 |
| Starbucks Corp. | 4.300% | 6/15/45 | 2,000 | 2,092 |
| Starwood Hotels & Resorts Worldwide Inc. | 3.125% | 2/15/23 | 2,000 | 1,953 |
| Starwood Hotels & Resorts Worldwide Inc. | 3.750% | 3/15/25 | 4,750 | 4,641 |
| Starwood Hotels & Resorts Worldwide Inc. | 4.500% | 10/1/34 | 1,875 | 1,641 |
| Target Corp. | 5.375% | 5/1/17 | 850 | 897 |
| Target Corp. | 6.000% | 1/15/18 | 10,055 | 10,954 |
| Target Corp. | 2.300% | 6/26/19 | 6,200 | 6,287 |
| Target Corp. | 3.875% | 7/15/20 | 5,630 | 6,049 |
| Target Corp. | 2.900% | 1/15/22 | 9,300 | 9,439 |
| Target Corp. | 3.500% | 7/1/24 | 7,800 | 8,072 |
| Target Corp. | 6.350% | 11/1/32 | 2,075 | 2,595 |
| Target Corp. | 6.500% | 10/15/37 | 6,778 | 8,780 |
| Target Corp. | 7.000% | 1/15/38 | 4,000 | 5,464 |
| Target Corp. | 4.000% | 7/1/42 | 4,500 | 4,406 |
| Tiffany & Co. | 4.900% | 10/1/44 | 1,650 | 1,537 |
| TJX Cos. Inc. | 6.950% | 4/15/19 | 1,925 | 2,216 |
| TJX Cos. Inc. | 2.750% | 6/15/21 | 9,850 | 9,984 |
| TJX Cos. Inc. | 2.500% | 5/15/23 | 2,250 | 2,173 |
| Toyota Motor Credit Corp. | 2.050% | 1/12/17 | 9,855 | 9,943 |
| Toyota Motor Credit Corp. | 1.125% | 5/16/17 | 4,125 | 4,123 |
| Toyota Motor Credit Corp. | 1.250% | 10/5/17 | 9,100 | 9,070 |
| Toyota Motor Credit Corp. | 1.375% | 1/10/18 | 6,025 | 6,009 |
| Toyota Motor Credit Corp. | 1.450% | 1/12/18 | 8,000 | 7,991 |
| Toyota Motor Credit Corp. | 2.000% | 10/24/18 | 7,625 | 7,669 |
| Toyota Motor Credit Corp. | 2.100% | 1/17/19 | 9,975 | 9,993 |
| Toyota Motor Credit Corp. | 2.125% | 7/18/19 | 7,500 | 7,497 |
| Toyota Motor Credit Corp. | 2.150% | 3/12/20 | 19,600 | 19,640 |
| Toyota Motor Credit Corp. | 4.500% | 6/17/20 | 1,723 | 1,868 |
| Toyota Motor Credit Corp. | 4.250% | 1/11/21 | 2,200 | 2,383 |
| Toyota Motor Credit Corp. | 2.750% | 5/17/21 | 7,500 | 7,590 |
| Toyota Motor Credit Corp. | 3.400% | 9/15/21 | 1,645 | 1,707 |
| Toyota Motor Credit Corp. | 3.300% | 1/12/22 | 5,550 | 5,715 |
| Toyota Motor Credit Corp. | 2.625% | 1/10/23 | 2,875 | 2,829 |
| VF Corp. | 5.950% | 11/1/17 | 1,975 | 2,127 |
| VF Corp. | 3.500% | 9/1/21 | 4,445 | 4,652 |
| VF Corp. | 6.450% | 11/1/37 | 3,325 | 4,258 |
| Visa Inc. | 1.200% | 12/14/17 | 25,000 | 24,974 |
| Visa Inc. | 2.200% | 12/14/20 | 19,750 | 19,715 |
| Visa Inc. | 2.800% | 12/14/22 | 17,250 | 17,304 |
| Visa Inc. | 3.150% | 12/14/25 | 31,550 | 31,603 |
| Visa Inc. | 4.150% | 12/14/35 | 8,500 | 8,580 |
| Visa Inc. | 4.300% | 12/14/45 | 19,250 | 19,508 |
| Wal-Mart Stores Inc. | 5.800% | 2/15/18 | 7,345 | 8,024 |
| Wal-Mart Stores Inc. | 1.950% | 12/15/18 | 9,575 | 9,715 |
| Wal-Mart Stores Inc. | 3.625% | 7/8/20 | 8,750 | 9,364 |
| Wal-Mart Stores Inc. | 3.250% | 10/25/20 | 4,395 | 4,633 |
| Wal-Mart Stores Inc. | 4.250% | 4/15/21 | 15,460 | 17,104 |
| Wal-Mart Stores Inc. | 2.550% | 4/11/23 | 7,300 | 7,190 |
85
| Total Bond Market II Index Fund | ||||
| Face | Market | |||
| Maturity | Amount | Value• | ||
| Coupon | Date | ($000) | ($000) | |
| Wal-Mart Stores Inc. | 3.300% | 4/22/24 | 21,000 | 21,677 |
| Wal-Mart Stores Inc. | 5.875% | 4/5/27 | 12,550 | 15,340 |
| Wal-Mart Stores Inc. | 7.550% | 2/15/30 | 4,900 | 6,912 |
| Wal-Mart Stores Inc. | 5.250% | 9/1/35 | 3,280 | 3,737 |
| Wal-Mart Stores Inc. | 6.500% | 8/15/37 | 14,665 | 18,905 |
| Wal-Mart Stores Inc. | 6.200% | 4/15/38 | 10,555 | 13,251 |
| Wal-Mart Stores Inc. | 5.625% | 4/1/40 | 2,475 | 2,928 |
| Wal-Mart Stores Inc. | 4.875% | 7/8/40 | 8,320 | 8,987 |
| Wal-Mart Stores Inc. | 5.000% | 10/25/40 | 6,325 | 6,954 |
| Wal-Mart Stores Inc. | 5.625% | 4/15/41 | 7,395 | 8,767 |
| Wal-Mart Stores Inc. | 4.000% | 4/11/43 | 9,460 | 9,183 |
| Wal-Mart Stores Inc. | 4.750% | 10/2/43 | 13,950 | 15,030 |
| Wal-Mart Stores Inc. | 4.300% | 4/22/44 | 4,900 | 4,996 |
| Walgreen Co. | 5.250% | 1/15/19 | 489 | 523 |
| Walgreen Co. | 3.100% | 9/15/22 | 2,650 | 2,564 |
| Walgreen Co. | 4.400% | 9/15/42 | 4,300 | 3,684 |
| Walgreens Boots Alliance Inc. | 1.750% | 11/17/17 | 6,000 | 5,966 |
| Walgreens Boots Alliance Inc. | 2.700% | 11/18/19 | 9,000 | 9,000 |
| Walgreens Boots Alliance Inc. | 3.300% | 11/18/21 | 4,300 | 4,212 |
| Walgreens Boots Alliance Inc. | 3.800% | 11/18/24 | 9,525 | 9,266 |
| Walgreens Boots Alliance Inc. | 4.500% | 11/18/34 | 5,975 | 5,455 |
| Walgreens Boots Alliance Inc. | 4.800% | 11/18/44 | 6,000 | 5,451 |
| Western Union Co. | 6.200% | 11/17/36 | 3,250 | 3,172 |
| Western Union Co. | 6.200% | 6/21/40 | 1,850 | 1,725 |
| Wyndham Worldwide Corp. | 2.500% | 3/1/18 | 975 | 972 |
| Wyndham Worldwide Corp. | 4.250% | 3/1/22 | 8,990 | 8,985 |
| Wyndham Worldwide Corp. | 3.900% | 3/1/23 | 600 | 579 |
| Consumer Noncyclical (3.9%) | ||||
| Abbott Laboratories | 5.125% | 4/1/19 | 6,902 | 7,584 |
| Abbott Laboratories | 2.000% | 3/15/20 | 6,975 | 6,950 |
| Abbott Laboratories | 4.125% | 5/27/20 | 2,700 | 2,920 |
| Abbott Laboratories | 2.550% | 3/15/22 | 4,000 | 3,968 |
| Abbott Laboratories | 2.950% | 3/15/25 | 5,500 | 5,426 |
| Abbott Laboratories | 6.150% | 11/30/37 | 3,405 | 4,237 |
| Abbott Laboratories | 6.000% | 4/1/39 | 350 | 429 |
| Abbott Laboratories | 5.300% | 5/27/40 | 1,930 | 2,169 |
| AbbVie Inc. | 1.750% | 11/6/17 | 15,835 | 15,802 |
| AbbVie Inc. | 1.800% | 5/14/18 | 20,900 | 20,818 |
| AbbVie Inc. | 2.000% | 11/6/18 | 12,550 | 12,498 |
| AbbVie Inc. | 2.500% | 5/14/20 | 21,370 | 21,136 |
| AbbVie Inc. | 2.900% | 11/6/22 | 16,532 | 15,972 |
| AbbVie Inc. | 3.200% | 11/6/22 | 5,195 | 5,119 |
| AbbVie Inc. | 3.600% | 5/14/25 | 21,370 | 21,085 |
| AbbVie Inc. | 4.500% | 5/14/35 | 13,595 | 13,318 |
| AbbVie Inc. | 4.400% | 11/6/42 | 15,854 | 14,742 |
| AbbVie Inc. | 4.700% | 5/14/45 | 14,713 | 14,390 |
| Actavis Funding SCS | 1.850% | 3/1/17 | 5,700 | 5,700 |
| Actavis Funding SCS | 1.300% | 6/15/17 | 13,600 | 13,461 |
| Actavis Funding SCS | 2.350% | 3/12/18 | 15,260 | 15,298 |
| Actavis Funding SCS | 2.450% | 6/15/19 | 12,070 | 11,966 |
| Actavis Funding SCS | 3.000% | 3/12/20 | 19,537 | 19,504 |
| Actavis Funding SCS | 3.450% | 3/15/22 | 16,100 | 16,099 |
| Actavis Funding SCS | 3.850% | 6/15/24 | 9,500 | 9,493 |
| Actavis Funding SCS | 3.800% | 3/15/25 | 20,448 | 20,264 |
| Actavis Funding SCS | 4.550% | 3/15/35 | 16,445 | 16,053 |
86
| Total Bond Market II Index Fund | ||||
| Face | Market | |||
| Maturity | Amount | Value• | ||
| Coupon | Date | ($000) | ($000) | |
| Actavis Funding SCS | 4.850% | 6/15/44 | 11,601 | 11,472 |
| Actavis Funding SCS | 4.750% | 3/15/45 | 11,975 | 11,637 |
| Actavis Inc. | 1.875% | 10/1/17 | 4,525 | 4,519 |
| Actavis Inc. | 3.250% | 10/1/22 | 6,900 | 6,785 |
| Actavis Inc. | 4.625% | 10/1/42 | 6,425 | 6,098 |
| Agilent Technologies Inc. | 5.000% | 7/15/20 | 4,500 | 4,829 |
| Agilent Technologies Inc. | 3.200% | 10/1/22 | 4,315 | 4,187 |
| Agilent Technologies Inc. | 3.875% | 7/15/23 | 3,850 | 3,851 |
| Ahold Finance USA LLC | 6.875% | 5/1/29 | 300 | 370 |
| Allergan Inc. | 3.375% | 9/15/20 | 5,000 | 5,038 |
| 5 Allina Health System | 4.805% | 11/15/45 | 1,000 | 1,029 |
| Altria Group Inc. | 9.250% | 8/6/19 | 401 | 491 |
| Altria Group Inc. | 2.625% | 1/14/20 | 18,150 | 18,196 |
| Altria Group Inc. | 4.750% | 5/5/21 | 10,250 | 11,133 |
| Altria Group Inc. | 2.850% | 8/9/22 | 10,800 | 10,558 |
| Altria Group Inc. | 2.950% | 5/2/23 | 3,175 | 3,085 |
| Altria Group Inc. | 4.000% | 1/31/24 | 10,100 | 10,473 |
| Altria Group Inc. | 9.950% | 11/10/38 | 4,184 | 6,735 |
| Altria Group Inc. | 10.200% | 2/6/39 | 8,795 | 14,460 |
| Altria Group Inc. | 4.250% | 8/9/42 | 3,400 | 3,125 |
| Altria Group Inc. | 4.500% | 5/2/43 | 5,175 | 4,909 |
| Altria Group Inc. | 5.375% | 1/31/44 | 1,325 | 1,426 |
| AmerisourceBergen Corp. | 1.150% | 5/15/17 | 5,070 | 5,034 |
| AmerisourceBergen Corp. | 4.875% | 11/15/19 | 2,741 | 2,955 |
| AmerisourceBergen Corp. | 3.500% | 11/15/21 | 5,200 | 5,305 |
| AmerisourceBergen Corp. | 3.400% | 5/15/24 | 4,000 | 3,920 |
| AmerisourceBergen Corp. | 3.250% | 3/1/25 | 1,750 | 1,695 |
| AmerisourceBergen Corp. | 4.250% | 3/1/45 | 2,200 | 2,040 |
| Amgen Inc. | 2.125% | 5/15/17 | 8,825 | 8,881 |
| Amgen Inc. | 1.250% | 5/22/17 | 3,300 | 3,291 |
| Amgen Inc. | 5.850% | 6/1/17 | 4,850 | 5,132 |
| Amgen Inc. | 6.150% | 6/1/18 | 6,320 | 6,949 |
| Amgen Inc. | 5.700% | 2/1/19 | 6,514 | 7,181 |
| Amgen Inc. | 2.200% | 5/22/19 | 1,650 | 1,648 |
| Amgen Inc. | 2.125% | 5/1/20 | 6,570 | 6,483 |
| Amgen Inc. | 3.450% | 10/1/20 | 825 | 849 |
| Amgen Inc. | 4.100% | 6/15/21 | 7,515 | 7,908 |
| Amgen Inc. | 3.875% | 11/15/21 | 3,510 | 3,659 |
| Amgen Inc. | 2.700% | 5/1/22 | 1,875 | 1,819 |
| Amgen Inc. | 3.625% | 5/15/22 | 17,075 | 17,578 |
| Amgen Inc. | 3.625% | 5/22/24 | 12,350 | 12,345 |
| Amgen Inc. | 3.125% | 5/1/25 | 10,502 | 9,973 |
| Amgen Inc. | 6.375% | 6/1/37 | 10,450 | 12,187 |
| Amgen Inc. | 6.900% | 6/1/38 | 5,023 | 6,237 |
| Amgen Inc. | 6.400% | 2/1/39 | 5,550 | 6,606 |
| Amgen Inc. | 5.750% | 3/15/40 | 3,012 | 3,251 |
| Amgen Inc. | 4.950% | 10/1/41 | 4,475 | 4,429 |
| Amgen Inc. | 5.150% | 11/15/41 | 13,061 | 13,246 |
| Amgen Inc. | 5.650% | 6/15/42 | 4,044 | 4,402 |
| Amgen Inc. | 4.400% | 5/1/45 | 3,425 | 3,170 |
| Anheuser-Busch Cos. LLC | 5.600% | 3/1/17 | 1,375 | 1,440 |
| Anheuser-Busch Cos. LLC | 5.500% | 1/15/18 | 6,307 | 6,742 |
| Anheuser-Busch Cos. LLC | 6.800% | 8/20/32 | 775 | 940 |
| Anheuser-Busch Cos. LLC | 5.750% | 4/1/36 | 2,105 | 2,299 |
| Anheuser-Busch InBev Finance Inc. | 1.250% | 1/17/18 | 13,465 | 13,342 |
| Anheuser-Busch InBev Finance Inc. | 2.150% | 2/1/19 | 7,000 | 7,002 |
87
| Total Bond Market II Index Fund | ||||
| Face | Market | |||
| Maturity | Amount | Value• | ||
| Coupon | Date | ($000) | ($000) | |
| Anheuser-Busch InBev Finance Inc. | 2.625% | 1/17/23 | 14,425 | 13,836 |
| Anheuser-Busch InBev Finance Inc. | 3.700% | 2/1/24 | 8,850 | 9,023 |
| Anheuser-Busch InBev Finance Inc. | 4.000% | 1/17/43 | 14,425 | 13,010 |
| Anheuser-Busch InBev Finance Inc. | 4.625% | 2/1/44 | 4,025 | 4,009 |
| Anheuser-Busch InBev Worldwide Inc. | 1.375% | 7/15/17 | 11,422 | 11,388 |
| Anheuser-Busch InBev Worldwide Inc. | 7.750% | 1/15/19 | 10,735 | 12,425 |
| Anheuser-Busch InBev Worldwide Inc. | 6.875% | 11/15/19 | 5,525 | 6,393 |
| Anheuser-Busch InBev Worldwide Inc. | 5.375% | 1/15/20 | 16,040 | 17,738 |
| Anheuser-Busch InBev Worldwide Inc. | 5.000% | 4/15/20 | 4,375 | 4,807 |
| Anheuser-Busch InBev Worldwide Inc. | 4.375% | 2/15/21 | 1,925 | 2,090 |
| Anheuser-Busch InBev Worldwide Inc. | 2.500% | 7/15/22 | 12,550 | 12,051 |
| Anheuser-Busch InBev Worldwide Inc. | 8.200% | 1/15/39 | 4,215 | 6,054 |
| Anheuser-Busch InBev Worldwide Inc. | 6.375% | 1/15/40 | 3,075 | 3,677 |
| Anheuser-Busch InBev Worldwide Inc. | 3.750% | 7/15/42 | 5,725 | 4,881 |
| Archer-Daniels-Midland Co. | 5.450% | 3/15/18 | 5,449 | 5,894 |
| Archer-Daniels-Midland Co. | 4.479% | 3/1/21 | 587 | 641 |
| Archer-Daniels-Midland Co. | 5.935% | 10/1/32 | 530 | 630 |
| Archer-Daniels-Midland Co. | 5.375% | 9/15/35 | 2,345 | 2,644 |
| Archer-Daniels-Midland Co. | 4.535% | 3/26/42 | 2,500 | 2,564 |
| Archer-Daniels-Midland Co. | 4.016% | 4/16/43 | 3,125 | 3,017 |
| 5 Ascension Health | 4.847% | 11/15/53 | 2,875 | 3,105 |
| AstraZeneca plc | 5.900% | 9/15/17 | 10,265 | 11,004 |
| AstraZeneca plc | 1.750% | 11/16/18 | 6,000 | 5,980 |
| AstraZeneca plc | 1.950% | 9/18/19 | 5,300 | 5,273 |
| AstraZeneca plc | 2.375% | 11/16/20 | 12,300 | 12,217 |
| AstraZeneca plc | 3.375% | 11/16/25 | 7,700 | 7,620 |
| AstraZeneca plc | 6.450% | 9/15/37 | 12,605 | 15,717 |
| AstraZeneca plc | 4.000% | 9/18/42 | 5,925 | 5,543 |
| AstraZeneca plc | 4.375% | 11/16/45 | 9,150 | 9,092 |
| Baptist Health South Florida Obligated Group | ||||
| Revenue | 4.590% | 8/15/21 | 850 | 921 |
| 8 Baxalta Inc. | 2.000% | 6/22/18 | 1,775 | 1,756 |
| 8 Baxalta Inc. | 2.875% | 6/23/20 | 5,475 | 5,422 |
| 8 Baxalta Inc. | 3.600% | 6/23/22 | 2,900 | 2,903 |
| 8 Baxalta Inc. | 4.000% | 6/23/25 | 10,000 | 9,891 |
| 8 Baxalta Inc. | 5.250% | 6/23/45 | 5,505 | 5,521 |
| Baxter International Inc. | 1.850% | 1/15/17 | 7,500 | 7,528 |
| Baxter International Inc. | 4.250% | 3/15/20 | 3,000 | 3,177 |
| Beam Suntory Inc. | 1.875% | 5/15/17 | 1,825 | 1,827 |
| Beam Suntory Inc. | 1.750% | 6/15/18 | 1,525 | 1,506 |
| Beam Suntory Inc. | 3.250% | 5/15/22 | 600 | 590 |
| Beam Suntory Inc. | 3.250% | 6/15/23 | 850 | 819 |
| Becton Dickinson & Co. | 1.450% | 5/15/17 | 3,750 | 3,735 |
| Becton Dickinson & Co. | 1.800% | 12/15/17 | 6,000 | 5,991 |
| Becton Dickinson & Co. | 5.000% | 5/15/19 | 450 | 486 |
| Becton Dickinson & Co. | 6.375% | 8/1/19 | 8,085 | 9,140 |
| Becton Dickinson & Co. | 2.675% | 12/15/19 | 10,900 | 10,964 |
| Becton Dickinson & Co. | 3.250% | 11/12/20 | 8,650 | 8,783 |
| Becton Dickinson & Co. | 3.125% | 11/8/21 | 2,985 | 3,011 |
| Becton Dickinson & Co. | 3.734% | 12/15/24 | 7,870 | 7,932 |
| Becton Dickinson & Co. | 6.000% | 5/15/39 | 100 | 115 |
| Becton Dickinson & Co. | 5.000% | 11/12/40 | 6,622 | 6,754 |
| Becton Dickinson & Co. | 4.685% | 12/15/44 | 5,400 | 5,490 |
| Becton Dickinson and Co. | 3.875% | 5/15/24 | 150 | 152 |
| Bio-Rad Laboratories Inc. | 4.875% | 12/15/20 | 500 | 531 |
| Biogen Inc. | 6.875% | 3/1/18 | 3,100 | 3,417 |
88
| Total Bond Market II Index Fund | ||||
| Face | Market | |||
| Maturity | Amount | Value• | ||
| Coupon | Date | ($000) | ($000) | |
| Biogen Inc. | 2.900% | 9/15/20 | 13,985 | 13,937 |
| Biogen Inc. | 3.625% | 9/15/22 | 5,750 | 5,823 |
| Biogen Inc. | 4.050% | 9/15/25 | 8,325 | 8,351 |
| Biogen Inc. | 5.200% | 9/15/45 | 9,715 | 9,713 |
| Boston Scientific Corp. | 5.125% | 1/12/17 | 5,000 | 5,159 |
| Boston Scientific Corp. | 2.650% | 10/1/18 | 4,050 | 4,072 |
| Boston Scientific Corp. | 6.000% | 1/15/20 | 3,670 | 4,077 |
| Boston Scientific Corp. | 3.375% | 5/15/22 | 2,150 | 2,129 |
| Boston Scientific Corp. | 4.125% | 10/1/23 | 2,700 | 2,758 |
| Boston Scientific Corp. | 3.850% | 5/15/25 | 5,500 | 5,411 |
| Boston Scientific Corp. | 7.000% | 11/15/35 | 4,100 | 4,804 |
| Boston Scientific Corp. | 7.375% | 1/15/40 | 1,875 | 2,303 |
| Bottling Group LLC | 5.125% | 1/15/19 | 4,119 | 4,510 |
| Bristol-Myers Squibb Co. | 0.875% | 8/1/17 | 2,800 | 2,787 |
| Bristol-Myers Squibb Co. | 1.750% | 3/1/19 | 5,375 | 5,359 |
| Bristol-Myers Squibb Co. | 2.000% | 8/1/22 | 8,275 | 8,031 |
| Bristol-Myers Squibb Co. | 7.150% | 6/15/23 | 100 | 127 |
| Bristol-Myers Squibb Co. | 3.250% | 11/1/23 | 3,625 | 3,754 |
| Bristol-Myers Squibb Co. | 5.875% | 11/15/36 | 2,163 | 2,635 |
| Bristol-Myers Squibb Co. | 6.125% | 5/1/38 | 480 | 608 |
| Bristol-Myers Squibb Co. | 3.250% | 8/1/42 | 4,465 | 3,893 |
| Bristol-Myers Squibb Co. | 4.500% | 3/1/44 | 2,000 | 2,161 |
| Brown-Forman Corp. | 1.000% | 1/15/18 | 800 | 789 |
| Brown-Forman Corp. | 2.250% | 1/15/23 | 1,375 | 1,317 |
| Brown-Forman Corp. | 3.750% | 1/15/43 | 2,250 | 2,053 |
| Brown-Forman Corp. | 4.500% | 7/15/45 | 2,750 | 2,841 |
| Bunge Ltd. Finance Corp. | 3.200% | 6/15/17 | 450 | 455 |
| Bunge Ltd. Finance Corp. | 8.500% | 6/15/19 | 4,025 | 4,672 |
| Bunge Ltd. Finance Corp. | 3.500% | 11/24/20 | 2,600 | 2,586 |
| Campbell Soup Co. | 4.250% | 4/15/21 | 975 | 1,034 |
| Campbell Soup Co. | 2.500% | 8/2/22 | 4,000 | 3,819 |
| Campbell Soup Co. | 3.300% | 3/19/25 | 1,700 | 1,689 |
| Campbell Soup Co. | 3.800% | 8/2/42 | 2,800 | 2,427 |
| Cardinal Health Inc. | 1.700% | 3/15/18 | 7,350 | 7,323 |
| Cardinal Health Inc. | 1.950% | 6/15/18 | 2,100 | 2,096 |
| Cardinal Health Inc. | 4.625% | 12/15/20 | 4,935 | 5,372 |
| Cardinal Health Inc. | 3.200% | 6/15/22 | 3,600 | 3,557 |
| Cardinal Health Inc. | 3.200% | 3/15/23 | 2,450 | 2,425 |
| Cardinal Health Inc. | 3.750% | 9/15/25 | 4,750 | 4,827 |
| Cardinal Health Inc. | 4.600% | 3/15/43 | 475 | 470 |
| Cardinal Health Inc. | 4.900% | 9/15/45 | 3,300 | 3,378 |
| Catholic Health Initiatives Colorado GO | 1.600% | 11/1/17 | 2,150 | 2,146 |
| 5 Catholic Health Initiatives Colorado GO | 4.350% | 11/1/42 | 6,900 | 6,462 |
| Celgene Corp. | 2.125% | 8/15/18 | 3,850 | 3,848 |
| Celgene Corp. | 2.300% | 8/15/18 | 2,500 | 2,511 |
| Celgene Corp. | 2.250% | 5/15/19 | 3,975 | 3,936 |
| Celgene Corp. | 2.875% | 8/15/20 | 4,000 | 3,970 |
| Celgene Corp. | 3.950% | 10/15/20 | 9,700 | 10,174 |
| Celgene Corp. | 3.250% | 8/15/22 | 3,950 | 3,913 |
| Celgene Corp. | 3.550% | 8/15/22 | 2,125 | 2,145 |
| Celgene Corp. | 4.000% | 8/15/23 | 3,550 | 3,648 |
| Celgene Corp. | 3.625% | 5/15/24 | 5,275 | 5,183 |
| Celgene Corp. | 3.875% | 8/15/25 | 18,650 | 18,583 |
| Celgene Corp. | 5.700% | 10/15/40 | 2,457 | 2,630 |
| Celgene Corp. | 5.250% | 8/15/43 | 6,005 | 6,137 |
| Celgene Corp. | 4.625% | 5/15/44 | 5,750 | 5,441 |
89
| Total Bond Market II Index Fund | ||||
| Face | Market | |||
| Maturity | Amount | Value• | ||
| Coupon | Date | ($000) | ($000) | |
| Celgene Corp. | 5.000% | 8/15/45 | 8,900 | 8,940 |
| Children’s Hospital Medical Center Ohio GO | 4.268% | 5/15/44 | 1,050 | 1,031 |
| Church & Dwight Co. Inc. | 2.450% | 12/15/19 | 2,590 | 2,580 |
| Cleveland Clinic Foundation Ohio Revenue | 4.858% | 1/1/14 | 2,765 | 2,687 |
| Clorox Co. | 5.950% | 10/15/17 | 2,832 | 3,042 |
| Clorox Co. | 3.050% | 9/15/22 | 4,800 | 4,745 |
| Clorox Co. | 3.500% | 12/15/24 | 2,625 | 2,623 |
| Coca-Cola Bottling Co. Consolidated | 3.800% | 11/25/25 | 2,050 | 2,050 |
| Coca-Cola Co. | 1.650% | 3/14/18 | 765 | 770 |
| Coca-Cola Co. | 1.150% | 4/1/18 | 4,921 | 4,910 |
| Coca-Cola Co. | 1.650% | 11/1/18 | 12,025 | 12,128 |
| Coca-Cola Co. | 1.875% | 10/27/20 | 3,750 | 3,708 |
| Coca-Cola Co. | 2.450% | 11/1/20 | 14,500 | 14,739 |
| Coca-Cola Co. | 3.150% | 11/15/20 | 1,100 | 1,150 |
| Coca-Cola Co. | 3.300% | 9/1/21 | 4,780 | 4,994 |
| Coca-Cola Co. | 2.500% | 4/1/23 | 5,250 | 5,222 |
| Coca-Cola Co. | 3.200% | 11/1/23 | 9,575 | 9,917 |
| Coca-Cola Co. | 2.875% | 10/27/25 | 12,275 | 12,073 |
| Coca-Cola Enterprises Inc. | 3.500% | 9/15/20 | 4,250 | 4,346 |
| Coca-Cola Enterprises Inc. | 4.500% | 9/1/21 | 1,675 | 1,792 |
| Coca-Cola Femsa SAB de CV | 2.375% | 11/26/18 | 4,900 | 4,908 |
| Coca-Cola Femsa SAB de CV | 4.625% | 2/15/20 | 1,925 | 2,067 |
| Coca-Cola Femsa SAB de CV | 3.875% | 11/26/23 | 6,100 | 6,189 |
| Coca-Cola Femsa SAB de CV | 5.250% | 11/26/43 | 7,450 | 8,006 |
| Coca-Cola Refreshments USA Inc. | 8.500% | 2/1/22 | 1,750 | 2,275 |
| Colgate-Palmolive Co. | 1.300% | 1/15/17 | 4,150 | 4,161 |
| Colgate-Palmolive Co. | 2.450% | 11/15/21 | 1,510 | 1,518 |
| Colgate-Palmolive Co. | 2.300% | 5/3/22 | 6,725 | 6,670 |
| Colgate-Palmolive Co. | 1.950% | 2/1/23 | 5,250 | 5,047 |
| Colgate-Palmolive Co. | 4.000% | 8/15/45 | 3,225 | 3,241 |
| ConAgra Foods Inc. | 1.900% | 1/25/18 | 7,810 | 7,769 |
| ConAgra Foods Inc. | 2.100% | 3/15/18 | 4,743 | 4,736 |
| ConAgra Foods Inc. | 7.000% | 4/15/19 | 919 | 1,036 |
| ConAgra Foods Inc. | 3.250% | 9/15/22 | 5,000 | 4,813 |
| ConAgra Foods Inc. | 3.200% | 1/25/23 | 5,169 | 4,975 |
| ConAgra Foods Inc. | 7.125% | 10/1/26 | 2,115 | 2,518 |
| ConAgra Foods Inc. | 7.000% | 10/1/28 | 200 | 238 |
| ConAgra Foods Inc. | 8.250% | 9/15/30 | 675 | 904 |
| ConAgra Foods Inc. | 6.625% | 8/15/39 | 6,850 | 7,377 |
| ConAgra Foods Inc. | 4.650% | 1/25/43 | 2,970 | 2,647 |
| Covidien International Finance SA | 6.000% | 10/15/17 | 9,332 | 10,054 |
| Covidien International Finance SA | 3.200% | 6/15/22 | 5,869 | 5,876 |
| Covidien International Finance SA | 2.950% | 6/15/23 | 8,500 | 8,355 |
| Covidien International Finance SA | 6.550% | 10/15/37 | 4,699 | 5,881 |
| CR Bard Inc. | 1.375% | 1/15/18 | 14,300 | 14,073 |
| CR Bard Inc. | 4.400% | 1/15/21 | 2,220 | 2,354 |
| CR Bard Inc. | 6.700% | 12/1/26 | 500 | 637 |
| Delhaize America LLC | 9.000% | 4/15/31 | 1,530 | 1,956 |
| Delhaize Group SA | 5.700% | 10/1/40 | 7,676 | 7,878 |
| Diageo Capital plc | 1.500% | 5/11/17 | 5,500 | 5,495 |
| Diageo Capital plc | 5.750% | 10/23/17 | 6,926 | 7,438 |
| Diageo Capital plc | 4.828% | 7/15/20 | 4,050 | 4,425 |
| Diageo Capital plc | 2.625% | 4/29/23 | 14,500 | 13,987 |
| Diageo Capital plc | 5.875% | 9/30/36 | 500 | 584 |
| Diageo Capital plc | 3.875% | 4/29/43 | 1,200 | 1,111 |
| Diageo Investment Corp. | 2.875% | 5/11/22 | 8,875 | 8,735 |
90
| Total Bond Market II Index Fund | ||||
| Face | Market | |||
| Maturity | Amount | Value• | ||
| Coupon | Date | ($000) | ($000) | |
| Diageo Investment Corp. | 7.450% | 4/15/35 | 200 | 268 |
| Diageo Investment Corp. | 4.250% | 5/11/42 | 5,137 | 5,151 |
| Dignity Health California GO | 2.637% | 11/1/19 | 3,000 | 3,015 |
| Dignity Health California GO | 3.125% | 11/1/22 | 900 | 895 |
| Dignity Health California GO | 3.812% | 11/1/24 | 2,050 | 2,092 |
| Dignity Health California GO | 4.500% | 11/1/42 | 4,500 | 4,271 |
| Dignity Health California GO | 5.267% | 11/1/64 | 1,000 | 1,026 |
| Dr Pepper Snapple Group Inc. | 6.820% | 5/1/18 | 1,920 | 2,130 |
| Dr Pepper Snapple Group Inc. | 2.600% | 1/15/19 | 4,785 | 4,805 |
| Dr Pepper Snapple Group Inc. | 2.000% | 1/15/20 | 2,475 | 2,420 |
| Dr Pepper Snapple Group Inc. | 2.700% | 11/15/22 | 1,300 | 1,252 |
| Dr Pepper Snapple Group Inc. | 3.400% | 11/15/25 | 1,650 | 1,620 |
| Dr Pepper Snapple Group Inc. | 7.450% | 5/1/38 | 504 | 694 |
| Dr Pepper Snapple Group Inc. | 4.500% | 11/15/45 | 2,000 | 1,964 |
| Edwards Lifesciences Corp. | 2.875% | 10/15/18 | 950 | 960 |
| Eli Lilly & Co. | 5.200% | 3/15/17 | 2,935 | 3,073 |
| Eli Lilly & Co. | 1.250% | 3/1/18 | 4,225 | 4,216 |
| Eli Lilly & Co. | 1.950% | 3/15/19 | 7,750 | 7,813 |
| Eli Lilly & Co. | 2.750% | 6/1/25 | 4,550 | 4,509 |
| Eli Lilly & Co. | 5.550% | 3/15/37 | 2,960 | 3,559 |
| Eli Lilly & Co. | 3.700% | 3/1/45 | 3,900 | 3,654 |
| Estee Lauder Cos. Inc. | 2.350% | 8/15/22 | 6,358 | 6,168 |
| Estee Lauder Cos. Inc. | 6.000% | 5/15/37 | 1,300 | 1,578 |
| Estee Lauder Cos. Inc. | 3.700% | 8/15/42 | 2,950 | 2,645 |
| Estee Lauder Cos. Inc. | 4.375% | 6/15/45 | 2,425 | 2,443 |
| Express Scripts Holding Co. | 2.650% | 2/15/17 | 11,915 | 12,033 |
| Express Scripts Holding Co. | 4.750% | 11/15/21 | 5,038 | 5,419 |
| Express Scripts Holding Co. | 3.900% | 2/15/22 | 13,256 | 13,633 |
| Express Scripts Holding Co. | 3.500% | 6/15/24 | 7,855 | 7,753 |
| Express Scripts Holding Co. | 6.125% | 11/15/41 | 780 | 888 |
| Flowers Foods Inc. | 4.375% | 4/1/22 | 1,200 | 1,249 |
| Fomento Economico Mexicano SAB de CV | 2.875% | 5/10/23 | 600 | 560 |
| Fomento Economico Mexicano SAB de CV | 4.375% | 5/10/43 | 3,100 | 2,752 |
| General Mills Inc. | 5.700% | 2/15/17 | 3,025 | 3,169 |
| General Mills Inc. | 1.400% | 10/20/17 | 3,000 | 2,986 |
| General Mills Inc. | 5.650% | 2/15/19 | 8,075 | 8,859 |
| General Mills Inc. | 2.200% | 10/21/19 | 2,400 | 2,407 |
| General Mills Inc. | 3.150% | 12/15/21 | 5,875 | 5,885 |
| General Mills Inc. | 3.650% | 2/15/24 | 2,025 | 2,088 |
| General Mills Inc. | 5.400% | 6/15/40 | 5,600 | 6,157 |
| General Mills Inc. | 4.150% | 2/15/43 | 750 | 705 |
| Gilead Sciences Inc. | 3.050% | 12/1/16 | 7,875 | 8,009 |
| Gilead Sciences Inc. | 1.850% | 9/4/18 | 6,125 | 6,149 |
| Gilead Sciences Inc. | 2.050% | 4/1/19 | 2,545 | 2,549 |
| Gilead Sciences Inc. | 2.350% | 2/1/20 | 4,775 | 4,775 |
| Gilead Sciences Inc. | 2.550% | 9/1/20 | 11,608 | 11,609 |
| Gilead Sciences Inc. | 4.500% | 4/1/21 | 2,025 | 2,192 |
| Gilead Sciences Inc. | 4.400% | 12/1/21 | 6,602 | 7,114 |
| Gilead Sciences Inc. | 3.250% | 9/1/22 | 5,575 | 5,608 |
| Gilead Sciences Inc. | 3.700% | 4/1/24 | 10,125 | 10,348 |
| Gilead Sciences Inc. | 3.500% | 2/1/25 | 4,575 | 4,603 |
| Gilead Sciences Inc. | 3.650% | 3/1/26 | 20,950 | 21,127 |
| Gilead Sciences Inc. | 4.600% | 9/1/35 | 4,075 | 4,143 |
| Gilead Sciences Inc. | 5.650% | 12/1/41 | 5,460 | 6,223 |
| Gilead Sciences Inc. | 4.800% | 4/1/44 | 14,225 | 14,244 |
| Gilead Sciences Inc. | 4.500% | 2/1/45 | 9,550 | 9,381 |
91
| Total Bond Market II Index Fund | ||||
| Face | Market | |||
| Maturity | Amount | Value• | ||
| Coupon | Date | ($000) | ($000) | |
| Gilead Sciences Inc. | 4.750% | 3/1/46 | 13,250 | 13,333 |
| GlaxoSmithKline Capital Inc. | 5.650% | 5/15/18 | 15,580 | 16,979 |
| GlaxoSmithKline Capital Inc. | 2.800% | 3/18/23 | 1,581 | 1,578 |
| GlaxoSmithKline Capital Inc. | 5.375% | 4/15/34 | 475 | 540 |
| GlaxoSmithKline Capital Inc. | 6.375% | 5/15/38 | 16,010 | 20,397 |
| GlaxoSmithKline Capital Inc. | 4.200% | 3/18/43 | 3,575 | 3,609 |
| GlaxoSmithKline Capital plc | 1.500% | 5/8/17 | 12,250 | 12,293 |
| GlaxoSmithKline Capital plc | 2.850% | 5/8/22 | 7,525 | 7,564 |
| Hasbro Inc. | 6.300% | 9/15/17 | 1,375 | 1,473 |
| Hasbro Inc. | 3.150% | 5/15/21 | 6,200 | 6,185 |
| Hasbro Inc. | 6.350% | 3/15/40 | 1,200 | 1,317 |
| Hasbro Inc. | 5.100% | 5/15/44 | 4,463 | 4,226 |
| Hershey Co. | 1.600% | 8/21/18 | 1,800 | 1,807 |
| Hershey Co. | 4.125% | 12/1/20 | 2,195 | 2,370 |
| Hershey Co. | 2.625% | 5/1/23 | 5,750 | 5,657 |
| Hershey Co. | 3.200% | 8/21/25 | 1,695 | 1,717 |
| Hillshire Brands Co. | 4.100% | 9/15/20 | 1,250 | 1,286 |
| Hormel Foods Corp. | 4.125% | 4/15/21 | 625 | 674 |
| Ingredion Inc. | 4.625% | 11/1/20 | 890 | 937 |
| Ingredion Inc. | 6.625% | 4/15/37 | 1,025 | 1,214 |
| International Flavors & Fragrances Inc. | 3.200% | 5/1/23 | 525 | 512 |
| JM Smucker Co. | 1.750% | 3/15/18 | 2,000 | 1,991 |
| JM Smucker Co. | 2.500% | 3/15/20 | 3,400 | 3,380 |
| JM Smucker Co. | 3.500% | 10/15/21 | 1,995 | 2,056 |
| JM Smucker Co. | 3.000% | 3/15/22 | 2,700 | 2,685 |
| JM Smucker Co. | 3.500% | 3/15/25 | 6,300 | 6,270 |
| JM Smucker Co. | 4.250% | 3/15/35 | 4,500 | 4,395 |
| JM Smucker Co. | 4.375% | 3/15/45 | 3,800 | 3,687 |
| Johnson & Johnson | 5.550% | 8/15/17 | 2,100 | 2,246 |
| Johnson & Johnson | 5.150% | 7/15/18 | 4,250 | 4,657 |
| Johnson & Johnson | 1.650% | 12/5/18 | 6,250 | 6,305 |
| Johnson & Johnson | 2.950% | 9/1/20 | 9,000 | 9,407 |
| Johnson & Johnson | 3.550% | 5/15/21 | 2,325 | 2,482 |
| Johnson & Johnson | 2.450% | 12/5/21 | 2,000 | 2,029 |
| Johnson & Johnson | 6.730% | 11/15/23 | 1,203 | 1,539 |
| Johnson & Johnson | 3.375% | 12/5/23 | 4,250 | 4,512 |
| Johnson & Johnson | 6.950% | 9/1/29 | 1,300 | 1,848 |
| Johnson & Johnson | 4.950% | 5/15/33 | 1,600 | 1,863 |
| Johnson & Johnson | 4.375% | 12/5/33 | 17,104 | 18,841 |
| Johnson & Johnson | 5.950% | 8/15/37 | 1,330 | 1,716 |
| Johnson & Johnson | 5.850% | 7/15/38 | 3,397 | 4,371 |
| Johnson & Johnson | 4.500% | 9/1/40 | 3,205 | 3,513 |
| Kaiser Foundation Hospitals | 3.500% | 4/1/22 | 1,900 | 1,925 |
| Kaiser Foundation Hospitals | 4.875% | 4/1/42 | 5,450 | 5,592 |
| Kellogg Co. | 4.000% | 12/15/20 | 8,805 | 9,261 |
| Kellogg Co. | 7.450% | 4/1/31 | 1,350 | 1,708 |
| Kimberly-Clark Corp. | 6.125% | 8/1/17 | 10,004 | 10,760 |
| Kimberly-Clark Corp. | 7.500% | 11/1/18 | 800 | 925 |
| Kimberly-Clark Corp. | 1.850% | 3/1/20 | 2,400 | 2,370 |
| Kimberly-Clark Corp. | 3.625% | 8/1/20 | 3,150 | 3,337 |
| Kimberly-Clark Corp. | 2.150% | 8/15/20 | 1,350 | 1,346 |
| Kimberly-Clark Corp. | 3.875% | 3/1/21 | 2,940 | 3,168 |
| Kimberly-Clark Corp. | 2.400% | 3/1/22 | 4,825 | 4,779 |
| Kimberly-Clark Corp. | 2.400% | 6/1/23 | 1,600 | 1,551 |
| Kimberly-Clark Corp. | 2.650% | 3/1/25 | 2,500 | 2,417 |
| Kimberly-Clark Corp. | 3.050% | 8/15/25 | 2,900 | 2,917 |
92
| Total Bond Market II Index Fund | ||||
| Face | Market | |||
| Maturity | Amount | Value• | ||
| Coupon | Date | ($000) | ($000) | |
| Kimberly-Clark Corp. | 6.625% | 8/1/37 | 200 | 267 |
| Kimberly-Clark Corp. | 5.300% | 3/1/41 | 2,350 | 2,642 |
| Kimberly-Clark Corp. | 3.700% | 6/1/43 | 1,275 | 1,185 |
| Koninklijke Philips NV | 5.750% | 3/11/18 | 2,725 | 2,917 |
| Koninklijke Philips NV | 3.750% | 3/15/22 | 6,350 | 6,516 |
| Koninklijke Philips NV | 6.875% | 3/11/38 | 2,390 | 2,783 |
| Koninklijke Philips NV | 5.000% | 3/15/42 | 3,125 | 3,017 |
| Kraft Foods Group Inc. | 2.250% | 6/5/17 | 2,150 | 2,165 |
| Kraft Foods Group Inc. | 6.125% | 8/23/18 | 12,252 | 13,487 |
| Kraft Foods Group Inc. | 5.375% | 2/10/20 | 2,539 | 2,780 |
| Kraft Foods Group Inc. | 3.500% | 6/6/22 | 10,325 | 10,437 |
| Kraft Foods Group Inc. | 6.875% | 1/26/39 | 7,950 | 9,438 |
| Kraft Foods Group Inc. | 6.500% | 2/9/40 | 7,900 | 9,156 |
| Kraft Foods Group Inc. | 5.000% | 6/4/42 | 8,520 | 8,581 |
| 8 Kraft Heinz Foods Co. | 1.600% | 6/30/17 | 7,250 | 7,229 |
| 8 Kraft Heinz Foods Co. | 2.000% | 7/2/18 | 6,690 | 6,666 |
| 8 Kraft Heinz Foods Co. | 2.800% | 7/2/20 | 6,045 | 6,025 |
| 8 Kraft Heinz Foods Co. | 3.500% | 7/15/22 | 6,450 | 6,499 |
| 8 Kraft Heinz Foods Co. | 3.950% | 7/15/25 | 10,925 | 11,020 |
| 8 Kraft Heinz Foods Co. | 5.000% | 7/15/35 | 5,490 | 5,628 |
| 8 Kraft Heinz Foods Co. | 5.200% | 7/15/45 | 4,800 | 5,015 |
| Kroger Co. | 2.200% | 1/15/17 | 6,175 | 6,236 |
| Kroger Co. | 6.400% | 8/15/17 | 435 | 468 |
| Kroger Co. | 6.800% | 12/15/18 | 2,400 | 2,719 |
| Kroger Co. | 2.300% | 1/15/19 | 5,345 | 5,348 |
| Kroger Co. | 6.150% | 1/15/20 | 650 | 732 |
| Kroger Co. | 3.300% | 1/15/21 | 3,100 | 3,149 |
| Kroger Co. | 2.950% | 11/1/21 | 5,650 | 5,575 |
| Kroger Co. | 3.850% | 8/1/23 | 3,000 | 3,093 |
| Kroger Co. | 4.000% | 2/1/24 | 1,793 | 1,862 |
| Kroger Co. | 7.700% | 6/1/29 | 3,200 | 4,207 |
| Kroger Co. | 8.000% | 9/15/29 | 8,875 | 11,947 |
| Kroger Co. | 7.500% | 4/1/31 | 875 | 1,115 |
| Kroger Co. | 6.900% | 4/15/38 | 5,250 | 6,434 |
| Kroger Co. | 5.150% | 8/1/43 | 1,000 | 1,047 |
| Laboratory Corp. of America Holdings | 2.200% | 8/23/17 | 4,175 | 4,194 |
| Laboratory Corp. of America Holdings | 2.500% | 11/1/18 | 500 | 502 |
| Laboratory Corp. of America Holdings | 2.625% | 2/1/20 | 1,500 | 1,488 |
| Laboratory Corp. of America Holdings | 3.200% | 2/1/22 | 1,800 | 1,769 |
| Laboratory Corp. of America Holdings | 3.750% | 8/23/22 | 475 | 479 |
| Laboratory Corp. of America Holdings | 4.000% | 11/1/23 | 550 | 557 |
| Laboratory Corp. of America Holdings | 3.600% | 2/1/25 | 1,000 | 966 |
| Laboratory Corp. of America Holdings | 4.700% | 2/1/45 | 3,150 | 2,880 |
| Life Technologies Corp. | 6.000% | 3/1/20 | 3,690 | 4,092 |
| Life Technologies Corp. | 5.000% | 1/15/21 | 2,175 | 2,315 |
| Mattel Inc. | 1.700% | 3/15/18 | 550 | 544 |
| Mattel Inc. | 2.350% | 5/6/19 | 1,000 | 994 |
| Mattel Inc. | 3.150% | 3/15/23 | 750 | 716 |
| Mattel Inc. | 5.450% | 11/1/41 | 4,250 | 4,203 |
| 5 Mayo Clinic | 3.774% | 11/15/43 | 5,125 | 4,803 |
| 5 Mayo Clinic | 4.000% | 11/15/47 | 1,225 | 1,161 |
| McCormick & Co. Inc. | 3.900% | 7/15/21 | 875 | 932 |
| McCormick & Co. Inc. | 3.500% | 9/1/23 | 1,400 | 1,425 |
| McCormick & Co. Inc. | 3.250% | 11/15/25 | 300 | 301 |
| McKesson Corp. | 5.700% | 3/1/17 | 5,000 | 5,239 |
| McKesson Corp. | 1.292% | 3/10/17 | 1,000 | 997 |
93
| Total Bond Market II Index Fund | ||||
| Face | Market | |||
| Maturity | Amount | Value• | ||
| Coupon | Date | ($000) | ($000) | |
| McKesson Corp. | 7.500% | 2/15/19 | 2,405 | 2,753 |
| McKesson Corp. | 2.284% | 3/15/19 | 5,250 | 5,236 |
| McKesson Corp. | 4.750% | 3/1/21 | 1,740 | 1,884 |
| McKesson Corp. | 2.700% | 12/15/22 | 5,600 | 5,366 |
| McKesson Corp. | 3.796% | 3/15/24 | 6,000 | 6,036 |
| McKesson Corp. | 6.000% | 3/1/41 | 5,500 | 6,359 |
| McKesson Corp. | 4.883% | 3/15/44 | 2,650 | 2,655 |
| Mead Johnson Nutrition Co. | 4.900% | 11/1/19 | 2,309 | 2,489 |
| Mead Johnson Nutrition Co. | 3.000% | 11/15/20 | 750 | 751 |
| Mead Johnson Nutrition Co. | 4.125% | 11/15/25 | 4,025 | 4,052 |
| Mead Johnson Nutrition Co. | 5.900% | 11/1/39 | 5,635 | 6,137 |
| Mead Johnson Nutrition Co. | 4.600% | 6/1/44 | 3,650 | 3,377 |
| Medco Health Solutions Inc. | 7.125% | 3/15/18 | 9,080 | 10,009 |
| Medco Health Solutions Inc. | 4.125% | 9/15/20 | 590 | 619 |
| Medtronic Inc. | 1.500% | 3/15/18 | 5,950 | 5,949 |
| Medtronic Inc. | 1.375% | 4/1/18 | 10,845 | 10,789 |
| Medtronic Inc. | 5.600% | 3/15/19 | 1,000 | 1,108 |
| Medtronic Inc. | 2.500% | 3/15/20 | 17,307 | 17,411 |
| Medtronic Inc. | 4.450% | 3/15/20 | 1,650 | 1,779 |
| Medtronic Inc. | 4.125% | 3/15/21 | 590 | 629 |
| Medtronic Inc. | 3.125% | 3/15/22 | 19,080 | 19,246 |
| Medtronic Inc. | 3.150% | 3/15/22 | 14,000 | 14,140 |
| Medtronic Inc. | 3.625% | 3/15/24 | 5,000 | 5,123 |
| Medtronic Inc. | 3.500% | 3/15/25 | 19,200 | 19,425 |
| Medtronic Inc. | 4.375% | 3/15/35 | 21,950 | 22,161 |
| Medtronic Inc. | 6.500% | 3/15/39 | 500 | 642 |
| Medtronic Inc. | 5.550% | 3/15/40 | 1,725 | 1,987 |
| Medtronic Inc. | 4.500% | 3/15/42 | 7,519 | 7,541 |
| Medtronic Inc. | 4.625% | 3/15/44 | 2,588 | 2,643 |
| Medtronic Inc. | 4.625% | 3/15/45 | 21,125 | 21,792 |
| Memorial Sloan-Kettering Cancer Center | 4.200% | 7/1/55 | 1,700 | 1,633 |
| Memorial Sloan-Kettering Cancer Center | ||||
| New York GO | 5.000% | 7/1/42 | 700 | 753 |
| Memorial Sloan-Kettering Cancer Center | ||||
| New York GO | 4.125% | 7/1/52 | 4,075 | 3,788 |
| Merck & Co. Inc. | 1.100% | 1/31/18 | 3,425 | 3,403 |
| Merck & Co. Inc. | 1.300% | 5/18/18 | 3,200 | 3,196 |
| Merck & Co. Inc. | 1.850% | 2/10/20 | 7,000 | 6,989 |
| Merck & Co. Inc. | 3.875% | 1/15/21 | 800 | 858 |
| Merck & Co. Inc. | 2.350% | 2/10/22 | 6,900 | 6,773 |
| Merck & Co. Inc. | 2.400% | 9/15/22 | 12,570 | 12,287 |
| Merck & Co. Inc. | 2.800% | 5/18/23 | 9,500 | 9,450 |
| Merck & Co. Inc. | 2.750% | 2/10/25 | 8,000 | 7,773 |
| Merck & Co. Inc. | 6.500% | 12/1/33 | 4,172 | 5,352 |
| Merck & Co. Inc. | 6.550% | 9/15/37 | 3,465 | 4,539 |
| Merck & Co. Inc. | 3.600% | 9/15/42 | 3,300 | 3,008 |
| Merck & Co. Inc. | 4.150% | 5/18/43 | 6,525 | 6,450 |
| Merck & Co. Inc. | 3.700% | 2/10/45 | 12,065 | 11,094 |
| Merck Sharp & Dohme Corp. | 5.000% | 6/30/19 | 12,845 | 14,163 |
| Merck Sharp & Dohme Corp. | 5.750% | 11/15/36 | 3,900 | 4,691 |
| Molson Coors Brewing Co. | 2.000% | 5/1/17 | 725 | 724 |
| Molson Coors Brewing Co. | 3.500% | 5/1/22 | 1,050 | 1,056 |
| Molson Coors Brewing Co. | 5.000% | 5/1/42 | 5,625 | 5,432 |
| Mondelez International Inc. | 6.500% | 8/11/17 | 6,275 | 6,738 |
| Mondelez International Inc. | 6.125% | 2/1/18 | 4,290 | 4,663 |
| Mondelez International Inc. | 6.125% | 8/23/18 | 2,500 | 2,755 |
94
| Total Bond Market II Index Fund | ||||
| Face | Market | |||
| Maturity | Amount | Value• | ||
| Coupon | Date | ($000) | ($000) | |
| Mondelez International Inc. | 2.250% | 2/1/19 | 2,500 | 2,497 |
| Mondelez International Inc. | 5.375% | 2/10/20 | 5,386 | 5,957 |
| Mondelez International Inc. | 4.000% | 2/1/24 | 10,075 | 10,390 |
| Mondelez International Inc. | 6.500% | 11/1/31 | 4,086 | 4,770 |
| Mondelez International Inc. | 6.500% | 2/9/40 | 5,015 | 6,158 |
| Mylan Inc. | 2.600% | 6/24/18 | 2,058 | 2,042 |
| Mylan Inc. | 2.550% | 3/28/19 | 5,462 | 5,389 |
| Mylan Inc. | 4.200% | 11/29/23 | 11,215 | 10,993 |
| Mylan Inc. | 5.400% | 11/29/43 | 2,450 | 2,283 |
| New York & Presbyterian Hospital | 4.024% | 8/1/45 | 2,200 | 2,074 |
| Newell Rubbermaid Inc. | 2.050% | 12/1/17 | 3,100 | 3,074 |
| Newell Rubbermaid Inc. | 2.150% | 10/15/18 | 1,600 | 1,553 |
| Newell Rubbermaid Inc. | 2.875% | 12/1/19 | 3,500 | 3,378 |
| Newell Rubbermaid Inc. | 4.000% | 6/15/22 | 6,020 | 5,801 |
| Newell Rubbermaid Inc. | 4.000% | 12/1/24 | 3,125 | 2,900 |
| Newell Rubbermaid Inc. | 3.900% | 11/1/25 | 1,600 | 1,467 |
| Novant Health Inc. | 5.850% | 11/1/19 | 2,125 | 2,385 |
| Novant Health Inc. | 4.371% | 11/1/43 | 1,000 | 958 |
| Novartis Capital Corp. | 2.400% | 9/21/22 | 26,325 | 25,906 |
| Novartis Capital Corp. | 3.000% | 11/20/25 | 9,750 | 9,610 |
| Novartis Capital Corp. | 3.700% | 9/21/42 | 2,575 | 2,440 |
| Novartis Capital Corp. | 4.400% | 5/6/44 | 12,815 | 13,322 |
| Novartis Capital Corp. | 4.000% | 11/20/45 | 6,950 | 6,806 |
| Novartis Securities Investment Ltd. | 5.125% | 2/10/19 | 10,590 | 11,612 |
| NYU Hospitals Center | 4.784% | 7/1/44 | 3,325 | 3,347 |
| Owens & Minor Inc. | 4.375% | 12/15/24 | 1,650 | 1,647 |
| Partners Healthcare System Inc. | 4.117% | 7/1/55 | 1,500 | 1,366 |
| Partners Healthcare System Massachusetts GO | 3.443% | 7/1/21 | 1,700 | 1,748 |
| PepsiAmericas Inc. | 5.000% | 5/15/17 | 1,400 | 1,470 |
| PepsiCo Inc. | 1.125% | 7/17/17 | 3,500 | 3,498 |
| PepsiCo Inc. | 1.250% | 8/13/17 | 8,900 | 8,905 |
| PepsiCo Inc. | 1.000% | 10/13/17 | 2,500 | 2,488 |
| PepsiCo Inc. | 1.250% | 4/30/18 | 3,100 | 3,089 |
| PepsiCo Inc. | 5.000% | 6/1/18 | 11,125 | 12,024 |
| PepsiCo Inc. | 7.900% | 11/1/18 | 1,575 | 1,844 |
| PepsiCo Inc. | 2.250% | 1/7/19 | 9,350 | 9,473 |
| PepsiCo Inc. | 4.500% | 1/15/20 | 2,800 | 3,040 |
| PepsiCo Inc. | 1.850% | 4/30/20 | 10,100 | 10,009 |
| PepsiCo Inc. | 2.150% | 10/14/20 | 11,450 | 11,384 |
| PepsiCo Inc. | 3.125% | 11/1/20 | 5,425 | 5,616 |
| PepsiCo Inc. | 3.000% | 8/25/21 | 12,530 | 12,832 |
| PepsiCo Inc. | 2.750% | 3/5/22 | 13,050 | 13,087 |
| PepsiCo Inc. | 3.100% | 7/17/22 | 3,425 | 3,513 |
| PepsiCo Inc. | 2.750% | 3/1/23 | 6,750 | 6,732 |
| PepsiCo Inc. | 3.600% | 3/1/24 | 1,200 | 1,253 |
| PepsiCo Inc. | 2.750% | 4/30/25 | 5,350 | 5,229 |
| PepsiCo Inc. | 3.500% | 7/17/25 | 6,250 | 6,444 |
| PepsiCo Inc. | 5.500% | 1/15/40 | 5,575 | 6,506 |
| PepsiCo Inc. | 4.875% | 11/1/40 | 6,625 | 7,117 |
| PepsiCo Inc. | 4.000% | 3/5/42 | 7,600 | 7,324 |
| PepsiCo Inc. | 3.600% | 8/13/42 | 250 | 227 |
| PepsiCo Inc. | 4.250% | 10/22/44 | 1,525 | 1,515 |
| PepsiCo Inc. | 4.600% | 7/17/45 | 4,660 | 4,916 |
| PepsiCo Inc. | 4.450% | 4/14/46 | 3,500 | 3,606 |
| PerkinElmer Inc. | 5.000% | 11/15/21 | 2,160 | 2,278 |
| Perrigo Co. plc | 2.300% | 11/8/18 | 5,310 | 5,233 |
95
| Total Bond Market II Index Fund | ||||
| Face | Market | |||
| Maturity | Amount | Value• | ||
| Coupon | Date | ($000) | ($000) | |
| Perrigo Co. plc | 4.000% | 11/15/23 | 5,716 | 5,562 |
| Perrigo Co. plc | 5.300% | 11/15/43 | 3,575 | 3,437 |
| Perrigo Finance plc | 3.500% | 12/15/21 | 4,000 | 3,886 |
| Perrigo Finance plc | 3.900% | 12/15/24 | 1,800 | 1,734 |
| Perrigo Finance plc | 4.900% | 12/15/44 | 2,800 | 2,523 |
| Pfizer Inc. | 1.100% | 5/15/17 | 5,300 | 5,300 |
| Pfizer Inc. | 1.500% | 6/15/18 | 5,475 | 5,468 |
| Pfizer Inc. | 6.200% | 3/15/19 | 23,670 | 26,643 |
| Pfizer Inc. | 2.100% | 5/15/19 | 6,000 | 6,035 |
| Pfizer Inc. | 3.400% | 5/15/24 | 650 | 667 |
| Pfizer Inc. | 7.200% | 3/15/39 | 11,540 | 15,850 |
| Pfizer Inc. | 4.300% | 6/15/43 | 3,706 | 3,706 |
| Pfizer Inc. | 4.400% | 5/15/44 | 2,875 | 2,903 |
| Pharmacia Corp. | 6.500% | 12/1/18 | 6,000 | 6,754 |
| Pharmacia Corp. | 6.600% | 12/1/28 | 4,548 | 5,837 |
| Philip Morris International Inc. | 1.250% | 8/11/17 | 1,875 | 1,877 |
| Philip Morris International Inc. | 1.125% | 8/21/17 | 5,275 | 5,268 |
| Philip Morris International Inc. | 1.250% | 11/9/17 | 8,700 | 8,687 |
| Philip Morris International Inc. | 5.650% | 5/16/18 | 11,390 | 12,429 |
| Philip Morris International Inc. | 4.500% | 3/26/20 | 575 | 626 |
| Philip Morris International Inc. | 4.125% | 5/17/21 | 4,458 | 4,769 |
| Philip Morris International Inc. | 2.900% | 11/15/21 | 1,500 | 1,515 |
| Philip Morris International Inc. | 2.500% | 8/22/22 | 3,000 | 2,933 |
| Philip Morris International Inc. | 2.625% | 3/6/23 | 2,500 | 2,448 |
| Philip Morris International Inc. | 3.600% | 11/15/23 | 550 | 573 |
| Philip Morris International Inc. | 3.250% | 11/10/24 | 4,000 | 4,034 |
| Philip Morris International Inc. | 3.375% | 8/11/25 | 2,850 | 2,886 |
| Philip Morris International Inc. | 6.375% | 5/16/38 | 5,600 | 7,033 |
| Philip Morris International Inc. | 4.375% | 11/15/41 | 5,458 | 5,428 |
| Philip Morris International Inc. | 4.500% | 3/20/42 | 9,720 | 9,703 |
| Philip Morris International Inc. | 3.875% | 8/21/42 | 5,125 | 4,690 |
| Philip Morris International Inc. | 4.125% | 3/4/43 | 2,850 | 2,692 |
| Philip Morris International Inc. | 4.875% | 11/15/43 | 6,425 | 6,773 |
| 5 Procter & Gamble - Esop | 9.360% | 1/1/21 | 1,141 | 1,364 |
| Procter & Gamble Co. | 4.700% | 2/15/19 | 8,265 | 9,010 |
| Procter & Gamble Co. | 1.900% | 11/1/19 | 1,200 | 1,206 |
| Procter & Gamble Co. | 2.300% | 2/6/22 | 5,164 | 5,181 |
| Procter & Gamble Co. | 3.100% | 8/15/23 | 3,800 | 3,965 |
| Procter & Gamble Co. | 6.450% | 1/15/26 | 7,750 | 9,834 |
| Procter & Gamble Co. | 5.500% | 2/1/34 | 5,000 | 5,979 |
| Procter & Gamble Co. | 5.550% | 3/5/37 | 9,350 | 11,435 |
| Quest Diagnostics Inc. | 2.700% | 4/1/19 | 1,475 | 1,471 |
| Quest Diagnostics Inc. | 4.750% | 1/30/20 | 2,500 | 2,650 |
| Quest Diagnostics Inc. | 2.500% | 3/30/20 | 2,250 | 2,216 |
| Quest Diagnostics Inc. | 4.700% | 4/1/21 | 1,335 | 1,413 |
| Quest Diagnostics Inc. | 4.250% | 4/1/24 | 1,550 | 1,600 |
| Quest Diagnostics Inc. | 3.500% | 3/30/25 | 1,250 | 1,209 |
| Quest Diagnostics Inc. | 5.750% | 1/30/40 | 3,500 | 3,625 |
| Quest Diagnostics Inc. | 4.700% | 3/30/45 | 1,250 | 1,130 |
| Reynolds American Inc. | 6.750% | 6/15/17 | 2,325 | 2,482 |
| Reynolds American Inc. | 2.300% | 8/21/17 | 5,100 | 5,138 |
| Reynolds American Inc. | 7.750% | 6/1/18 | 1,000 | 1,122 |
| Reynolds American Inc. | 2.300% | 6/12/18 | 5,900 | 5,936 |
| Reynolds American Inc. | 8.125% | 6/23/19 | 2,825 | 3,320 |
| Reynolds American Inc. | 3.250% | 6/12/20 | 6,620 | 6,727 |
| Reynolds American Inc. | 4.000% | 6/12/22 | 5,100 | 5,302 |
96
| Total Bond Market II Index Fund | ||||
| Face | Market | |||
| Maturity | Amount | Value• | ||
| Coupon | Date | ($000) | ($000) | |
| Reynolds American Inc. | 3.250% | 11/1/22 | 5,850 | 5,786 |
| Reynolds American Inc. | 3.750% | 5/20/23 | 1,175 | 1,176 |
| Reynolds American Inc. | 4.850% | 9/15/23 | 900 | 962 |
| Reynolds American Inc. | 4.450% | 6/12/25 | 18,350 | 19,199 |
| Reynolds American Inc. | 5.700% | 8/15/35 | 4,850 | 5,309 |
| Reynolds American Inc. | 7.250% | 6/15/37 | 875 | 1,075 |
| Reynolds American Inc. | 8.125% | 5/1/40 | 2,239 | 2,793 |
| Reynolds American Inc. | 7.000% | 8/4/41 | 1,085 | 1,226 |
| Reynolds American Inc. | 4.750% | 11/1/42 | 4,921 | 4,698 |
| Reynolds American Inc. | 6.150% | 9/15/43 | 725 | 823 |
| Reynolds American Inc. | 5.850% | 8/15/45 | 12,715 | 14,099 |
| Sanofi | 1.250% | 4/10/18 | 5,000 | 4,977 |
| Sanofi | 4.000% | 3/29/21 | 12,865 | 13,741 |
| Southern Baptist Hospital of Florida Inc. | 4.857% | 7/15/45 | 1,150 | 1,194 |
| St. Jude Medical Inc. | 2.000% | 9/15/18 | 2,700 | 2,695 |
| St. Jude Medical Inc. | 2.800% | 9/15/20 | 2,700 | 2,702 |
| St. Jude Medical Inc. | 3.250% | 4/15/23 | 13,825 | 13,561 |
| St. Jude Medical Inc. | 3.875% | 9/15/25 | 2,125 | 2,150 |
| St. Jude Medical Inc. | 4.750% | 4/15/43 | 4,325 | 4,240 |
| Stryker Corp. | 4.375% | 1/15/20 | 700 | 753 |
| Stryker Corp. | 3.375% | 5/15/24 | 9,500 | 9,538 |
| Stryker Corp. | 3.375% | 11/1/25 | 2,700 | 2,665 |
| Stryker Corp. | 4.375% | 5/15/44 | 400 | 396 |
| Sysco Corp. | 5.250% | 2/12/18 | 3,895 | 4,163 |
| Sysco Corp. | 2.600% | 10/1/20 | 6,800 | 6,806 |
| Sysco Corp. | 2.600% | 6/12/22 | 2,325 | 2,276 |
| Sysco Corp. | 3.750% | 10/1/25 | 3,575 | 3,619 |
| Sysco Corp. | 5.375% | 9/21/35 | 1,948 | 2,161 |
| Sysco Corp. | 4.850% | 10/1/45 | 1,975 | 2,051 |
| Teva Pharmaceutical Finance Co. BV | 3.650% | 11/10/21 | 5,889 | 5,982 |
| Teva Pharmaceutical Finance Co. BV | 2.950% | 12/18/22 | 8,474 | 8,113 |
| Teva Pharmaceutical Finance Co. LLC | 6.150% | 2/1/36 | 1,362 | 1,490 |
| Teva Pharmaceutical Finance IV BV | 3.650% | 11/10/21 | 1,578 | 1,596 |
| Teva Pharmaceutical Finance IV LLC | 2.250% | 3/18/20 | 10,075 | 9,779 |
| 5 Texas Health Resources | 4.330% | 11/15/55 | 900 | 866 |
| The Pepsi Bottling Group Inc. | 7.000% | 3/1/29 | 3,875 | 5,197 |
| Thermo Fisher Scientific Inc. | 1.300% | 2/1/17 | 325 | 324 |
| Thermo Fisher Scientific Inc. | 1.850% | 1/15/18 | 3,000 | 2,993 |
| Thermo Fisher Scientific Inc. | 2.150% | 12/14/18 | 2,500 | 2,499 |
| Thermo Fisher Scientific Inc. | 2.400% | 2/1/19 | 245 | 245 |
| Thermo Fisher Scientific Inc. | 4.700% | 5/1/20 | 525 | 562 |
| Thermo Fisher Scientific Inc. | 4.500% | 3/1/21 | 8,450 | 8,948 |
| Thermo Fisher Scientific Inc. | 3.600% | 8/15/21 | 6,750 | 6,846 |
| Thermo Fisher Scientific Inc. | 3.300% | 2/15/22 | 3,000 | 2,998 |
| Thermo Fisher Scientific Inc. | 3.150% | 1/15/23 | 2,950 | 2,883 |
| Thermo Fisher Scientific Inc. | 4.150% | 2/1/24 | 275 | 286 |
| Thermo Fisher Scientific Inc. | 3.650% | 12/15/25 | 6,475 | 6,437 |
| Thermo Fisher Scientific Inc. | 5.300% | 2/1/44 | 4,900 | 5,228 |
| Trinity Health Corp. | 4.125% | 12/1/45 | 1,400 | 1,327 |
| Tupperware Brands Corp. | 4.750% | 6/1/21 | 2,000 | 2,041 |
| Tyson Foods Inc. | 2.650% | 8/15/19 | 2,125 | 2,124 |
| Tyson Foods Inc. | 4.500% | 6/15/22 | 6,350 | 6,751 |
| Tyson Foods Inc. | 3.950% | 8/15/24 | 5,750 | 5,906 |
| Tyson Foods Inc. | 4.875% | 8/15/34 | 6,125 | 6,248 |
| Tyson Foods Inc. | 5.150% | 8/15/44 | 3,050 | 3,215 |
| Unilever Capital Corp. | 0.850% | 8/2/17 | 9,885 | 9,833 |
97
| Total Bond Market II Index Fund | ||||
| Face | Market | |||
| Maturity | Amount | Value• | ||
| Coupon | Date | ($000) | ($000) | |
| Unilever Capital Corp. | 4.800% | 2/15/19 | 200 | 218 |
| Unilever Capital Corp. | 2.200% | 3/6/19 | 4,205 | 4,266 |
| Unilever Capital Corp. | 4.250% | 2/10/21 | 10,310 | 11,250 |
| Unilever Capital Corp. | 3.100% | 7/30/25 | 2,700 | 2,738 |
| Unilever Capital Corp. | 5.900% | 11/15/32 | 3,025 | 3,835 |
| Whirlpool Corp. | 1.350% | 3/1/17 | 1,400 | 1,397 |
| Whirlpool Corp. | 1.650% | 11/1/17 | 5,500 | 5,487 |
| Whirlpool Corp. | 4.700% | 6/1/22 | 4,325 | 4,600 |
| Whirlpool Corp. | 4.000% | 3/1/24 | 2,500 | 2,559 |
| Whirlpool Corp. | 3.700% | 5/1/25 | 2,400 | 2,378 |
| Whirlpool Corp. | 5.150% | 3/1/43 | 1,775 | 1,749 |
| 8 Whole Foods Market Inc. | 5.200% | 12/3/25 | 8,775 | 8,768 |
| Wyeth LLC | 5.450% | 4/1/17 | 2,750 | 2,889 |
| Wyeth LLC | 7.250% | 3/1/23 | 2,000 | 2,505 |
| Wyeth LLC | 6.450% | 2/1/24 | 2,775 | 3,390 |
| Wyeth LLC | 6.500% | 2/1/34 | 3,425 | 4,285 |
| Wyeth LLC | 6.000% | 2/15/36 | 1,680 | 2,006 |
| Wyeth LLC | 5.950% | 4/1/37 | 15,460 | 18,408 |
| Zeneca Wilmington Inc. | 7.000% | 11/15/23 | 2,000 | 2,491 |
| Zimmer Biomet Holdings Inc. | 1.450% | 4/1/17 | 3,350 | 3,333 |
| Zimmer Biomet Holdings Inc. | 2.000% | 4/1/18 | 4,000 | 3,978 |
| Zimmer Biomet Holdings Inc. | 4.625% | 11/30/19 | 2,745 | 2,941 |
| Zimmer Biomet Holdings Inc. | 2.700% | 4/1/20 | 6,500 | 6,431 |
| Zimmer Biomet Holdings Inc. | 3.375% | 11/30/21 | 1,550 | 1,555 |
| Zimmer Biomet Holdings Inc. | 3.150% | 4/1/22 | 5,400 | 5,307 |
| Zimmer Biomet Holdings Inc. | 3.550% | 4/1/25 | 6,975 | 6,771 |
| Zimmer Biomet Holdings Inc. | 4.250% | 8/15/35 | 4,500 | 4,214 |
| Zimmer Biomet Holdings Inc. | 5.750% | 11/30/39 | 4,750 | 5,236 |
| Zimmer Biomet Holdings Inc. | 4.450% | 8/15/45 | 6,000 | 5,544 |
| Zoetis Inc. | 1.875% | 2/1/18 | 5,350 | 5,283 |
| Zoetis Inc. | 3.450% | 11/13/20 | 3,100 | 3,100 |
| Zoetis Inc. | 3.250% | 2/1/23 | 8,950 | 8,545 |
| Zoetis Inc. | 4.500% | 11/13/25 | 3,100 | 3,144 |
| Zoetis Inc. | 4.700% | 2/1/43 | 5,240 | 4,593 |
| Energy (2.6%) | ||||
| Alberta Energy Co. Ltd. | 7.375% | 11/1/31 | 575 | 554 |
| Anadarko Finance Co. | 7.500% | 5/1/31 | 7,275 | 7,745 |
| Anadarko Petroleum Corp. | 6.375% | 9/15/17 | 7,250 | 7,604 |
| Anadarko Petroleum Corp. | 8.700% | 3/15/19 | 3,845 | 4,387 |
| Anadarko Petroleum Corp. | 6.950% | 6/15/19 | 675 | 736 |
| Anadarko Petroleum Corp. | 6.450% | 9/15/36 | 13,980 | 13,372 |
| Anadarko Petroleum Corp. | 7.950% | 6/15/39 | 200 | 226 |
| Anadarko Petroleum Corp. | 6.200% | 3/15/40 | 8,250 | 7,730 |
| Apache Corp. | 6.900% | 9/15/18 | 4,745 | 5,211 |
| Apache Corp. | 3.625% | 2/1/21 | 6,560 | 6,475 |
| Apache Corp. | 3.250% | 4/15/22 | 3,001 | 2,864 |
| Apache Corp. | 6.000% | 1/15/37 | 8,425 | 8,141 |
| Apache Corp. | 5.100% | 9/1/40 | 14,075 | 12,004 |
| Apache Corp. | 5.250% | 2/1/42 | 340 | 295 |
| Apache Corp. | 4.750% | 4/15/43 | 4,924 | 4,172 |
| Apache Finance Canada Corp. | 7.750% | 12/15/29 | 350 | 439 |
| Baker Hughes Inc. | 7.500% | 11/15/18 | 3,365 | 3,799 |
| Baker Hughes Inc. | 3.200% | 8/15/21 | 9,670 | 9,573 |
| Baker Hughes Inc. | 6.875% | 1/15/29 | 300 | 356 |
| Baker Hughes Inc. | 5.125% | 9/15/40 | 8,640 | 8,585 |
98
| Total Bond Market II Index Fund | ||||
| Face | Market | |||
| Maturity | Amount | Value• | ||
| Coupon | Date | ($000) | ($000) | |
| BJ Services Co. | 6.000% | 6/1/18 | 150 | 162 |
| Boardwalk Pipelines LP | 5.500% | 2/1/17 | 925 | 937 |
| Boardwalk Pipelines LP | 5.750% | 9/15/19 | 7,545 | 7,594 |
| Boardwalk Pipelines LP | 3.375% | 2/1/23 | 2,150 | 1,738 |
| Boardwalk Pipelines LP | 4.950% | 12/15/24 | 575 | 500 |
| BP Capital Markets plc | 1.846% | 5/5/17 | 4,000 | 4,019 |
| BP Capital Markets plc | 1.625% | 8/17/17 | 325 | 325 |
| BP Capital Markets plc | 1.375% | 11/6/17 | 1,000 | 992 |
| BP Capital Markets plc | 1.674% | 2/13/18 | 8,775 | 8,767 |
| BP Capital Markets plc | 1.375% | 5/10/18 | 4,000 | 3,942 |
| BP Capital Markets plc | 2.241% | 9/26/18 | 6,650 | 6,650 |
| BP Capital Markets plc | 4.750% | 3/10/19 | 5,675 | 6,079 |
| BP Capital Markets plc | 2.237% | 5/10/19 | 6,000 | 5,942 |
| BP Capital Markets plc | 2.521% | 1/15/20 | 3,205 | 3,200 |
| BP Capital Markets plc | 2.315% | 2/13/20 | 16,650 | 16,435 |
| BP Capital Markets plc | 4.500% | 10/1/20 | 11,578 | 12,387 |
| BP Capital Markets plc | 4.742% | 3/11/21 | 12,665 | 13,785 |
| BP Capital Markets plc | 3.561% | 11/1/21 | 17,520 | 17,808 |
| BP Capital Markets plc | 3.062% | 3/17/22 | 3,900 | 3,820 |
| BP Capital Markets plc | 3.245% | 5/6/22 | 9,575 | 9,529 |
| BP Capital Markets plc | 2.500% | 11/6/22 | 7,675 | 7,320 |
| BP Capital Markets plc | 2.750% | 5/10/23 | 13,761 | 12,901 |
| BP Capital Markets plc | 3.994% | 9/26/23 | 2,700 | 2,742 |
| BP Capital Markets plc | 3.814% | 2/10/24 | 2,000 | 1,995 |
| BP Capital Markets plc | 3.535% | 11/4/24 | 5,000 | 4,854 |
| BP Capital Markets plc | 3.506% | 3/17/25 | 2,675 | 2,602 |
| Buckeye Partners LP | 6.050% | 1/15/18 | 825 | 848 |
| Buckeye Partners LP | 2.650% | 11/15/18 | 4,175 | 3,978 |
| Buckeye Partners LP | 4.150% | 7/1/23 | 2,650 | 2,281 |
| Buckeye Partners LP | 5.850% | 11/15/43 | 3,525 | 2,722 |
| Buckeye Partners LP | 5.600% | 10/15/44 | 900 | 672 |
| Burlington Resources Finance Co. | 7.200% | 8/15/31 | 9,562 | 10,952 |
| Burlington Resources Finance Co. | 7.400% | 12/1/31 | 2,550 | 3,040 |
| Cameron International Corp. | 6.375% | 7/15/18 | 1,875 | 2,033 |
| Cameron International Corp. | 4.000% | 12/15/23 | 1,375 | 1,381 |
| Cameron International Corp. | 3.700% | 6/15/24 | 7,000 | 6,836 |
| Cameron International Corp. | 7.000% | 7/15/38 | 815 | 974 |
| Cameron International Corp. | 5.950% | 6/1/41 | 1,300 | 1,411 |
| Cameron International Corp. | 5.125% | 12/15/43 | 2,900 | 2,876 |
| Canadian Natural Resources Ltd. | 5.700% | 5/15/17 | 1,735 | 1,773 |
| Canadian Natural Resources Ltd. | 1.750% | 1/15/18 | 7,925 | 7,747 |
| Canadian Natural Resources Ltd. | 3.450% | 11/15/21 | 8,365 | 7,895 |
| Canadian Natural Resources Ltd. | 3.800% | 4/15/24 | 5,645 | 5,038 |
| Canadian Natural Resources Ltd. | 3.900% | 2/1/25 | 3,885 | 3,469 |
| Canadian Natural Resources Ltd. | 7.200% | 1/15/32 | 2,175 | 2,248 |
| Canadian Natural Resources Ltd. | 6.450% | 6/30/33 | 2,325 | 2,249 |
| Canadian Natural Resources Ltd. | 5.850% | 2/1/35 | 350 | 313 |
| Canadian Natural Resources Ltd. | 6.500% | 2/15/37 | 2,200 | 2,065 |
| Canadian Natural Resources Ltd. | 6.250% | 3/15/38 | 1,725 | 1,567 |
| Canadian Natural Resources Ltd. | 6.750% | 2/1/39 | 1,000 | 958 |
| Cenovus Energy Inc. | 5.700% | 10/15/19 | 7,650 | 8,035 |
| Cenovus Energy Inc. | 3.000% | 8/15/22 | 3,300 | 2,943 |
| Cenovus Energy Inc. | 3.800% | 9/15/23 | 2,725 | 2,458 |
| Cenovus Energy Inc. | 6.750% | 11/15/39 | 8,025 | 7,639 |
| Cenovus Energy Inc. | 4.450% | 9/15/42 | 3,400 | 2,497 |
| Cenovus Energy Inc. | 5.200% | 9/15/43 | 2,813 | 2,216 |
99
| Total Bond Market II Index Fund | |||||
| Face | Market | ||||
| Maturity | Amount | Value• | |||
| Coupon | Date | ($000) | ($000) | ||
| Chevron Corp. | 1.344% | 11/9/17 | 10,000 | 9,967 | |
| Chevron Corp. | 1.345% | 11/15/17 | 10,750 | 10,709 | |
| Chevron Corp. | 1.104% | 12/5/17 | 2,775 | 2,755 | |
| Chevron Corp. | 1.365% | 3/2/18 | 4,275 | 4,239 | |
| Chevron Corp. | 1.718% | 6/24/18 | 12,575 | 12,508 | |
| Chevron Corp. | 1.790% | 11/16/18 | 12,000 | 11,907 | |
| Chevron Corp. | 4.950% | 3/3/19 | 2,750 | 2,995 | |
| Chevron Corp. | 2.193% | 11/15/19 | 12,000 | 11,980 | |
| Chevron Corp. | 1.961% | 3/3/20 | 13,075 | 12,860 | |
| Chevron Corp. | 2.419% | 11/17/20 | 8,000 | 7,967 | |
| Chevron Corp. | 2.411% | 3/3/22 | 5,150 | 5,000 | |
| Chevron Corp. | 2.355% | 12/5/22 | 8,700 | 8,299 | |
| Chevron Corp. | 3.191% | 6/24/23 | 15,330 | 15,392 | |
| Cimarex Energy Co. | 5.875% | 5/1/22 | 300 | 291 | |
| Cimarex Energy Co. | 4.375% | 6/1/24 | 4,750 | 4,251 | |
| 8 | Columbia Pipeline Group Inc. | 2.450% | 6/1/18 | 6,607 | 6,518 |
| 8 | Columbia Pipeline Group Inc. | 3.300% | 6/1/20 | 1,750 | 1,715 |
| 8 | Columbia Pipeline Group Inc. | 4.500% | 6/1/25 | 3,000 | 2,718 |
| 8 | Columbia Pipeline Group Inc. | 5.800% | 6/1/45 | 3,300 | 2,897 |
| Conoco Funding Co. | 7.250% | 10/15/31 | 1,475 | 1,697 | |
| ConocoPhillips | 6.650% | 7/15/18 | 2,475 | 2,733 | |
| ConocoPhillips | 5.750% | 2/1/19 | 8,690 | 9,402 | |
| ConocoPhillips | 6.000% | 1/15/20 | 2,885 | 3,211 | |
| ConocoPhillips | 5.900% | 10/15/32 | 725 | 742 | |
| ConocoPhillips | 5.900% | 5/15/38 | 2,370 | 2,318 | |
| ConocoPhillips | 6.500% | 2/1/39 | 13,788 | 14,499 | |
| ConocoPhillips Canada Funding Co. I | 5.950% | 10/15/36 | 5,471 | 5,627 | |
| ConocoPhillips Co. | 1.050% | 12/15/17 | 3,700 | 3,635 | |
| ConocoPhillips Co. | 1.500% | 5/15/18 | 4,100 | 4,044 | |
| ConocoPhillips Co. | 2.200% | 5/15/20 | 1,500 | 1,451 | |
| ConocoPhillips Co. | 2.875% | 11/15/21 | 6,145 | 5,968 | |
| ConocoPhillips Co. | 3.350% | 11/15/24 | 9,835 | 9,132 | |
| ConocoPhillips Co. | 3.350% | 5/15/25 | 565 | 509 | |
| ConocoPhillips Co. | 4.150% | 11/15/34 | 5,450 | 4,731 | |
| ConocoPhillips Co. | 4.300% | 11/15/44 | 6,275 | 5,191 | |
| ConocoPhillips Holding Co. | 6.950% | 4/15/29 | 2,850 | 3,250 | |
| Continental Resources Inc. | 5.000% | 9/15/22 | 15,275 | 11,227 | |
| Continental Resources Inc. | 4.500% | 4/15/23 | 2,800 | 1,998 | |
| Continental Resources Inc. | 3.800% | 6/1/24 | 7,040 | 4,936 | |
| Continental Resources Inc. | 4.900% | 6/1/44 | 2,750 | 1,612 | |
| Devon Energy Corp. | 6.300% | 1/15/19 | 3,275 | 3,377 | |
| Devon Energy Corp. | 4.000% | 7/15/21 | 1,800 | 1,637 | |
| Devon Energy Corp. | 3.250% | 5/15/22 | 16,325 | 13,848 | |
| Devon Energy Corp. | 7.950% | 4/15/32 | 4,850 | 5,015 | |
| Devon Energy Corp. | 5.600% | 7/15/41 | 3,445 | 2,602 | |
| Devon Energy Corp. | 4.750% | 5/15/42 | 5,900 | 4,323 | |
| Devon Energy Corp. | 5.000% | 6/15/45 | 5,000 | 3,789 | |
| Devon Financing Corp. LLC | 7.875% | 9/30/31 | 8,125 | 8,379 | |
| Diamond Offshore Drilling Inc. | 5.875% | 5/1/19 | 2,733 | 2,776 | |
| Diamond Offshore Drilling Inc. | 5.700% | 10/15/39 | 3,590 | 2,440 | |
| Diamond Offshore Drilling Inc. | 4.875% | 11/1/43 | 4,850 | 2,961 | |
| Dominion Gas Holdings LLC | 2.800% | 11/15/20 | 2,000 | 2,006 | |
| Dominion Gas Holdings LLC | 3.550% | 11/1/23 | 10,179 | 10,042 | |
| Dominion Gas Holdings LLC | 3.600% | 12/15/24 | 1,700 | 1,683 | |
| Dominion Gas Holdings LLC | 4.800% | 11/1/43 | 5,250 | 5,024 | |
| Dominion Gas Holdings LLC | 4.600% | 12/15/44 | 2,200 | 2,047 | |
| 100 | |||||
| Total Bond Market II Index Fund | ||||
| Face | Market | |||
| Maturity | Amount | Value• | ||
| Coupon | Date | ($000) | ($000) | |
| El Paso Natural Gas Co. LLC | 5.950% | 4/15/17 | 1,340 | 1,363 |
| Enable Midstream Partners LP | 2.400% | 5/15/19 | 2,600 | 2,338 |
| Enable Midstream Partners LP | 3.900% | 5/15/24 | 6,900 | 5,403 |
| Enable Midstream Partners LP | 5.000% | 5/15/44 | 925 | 543 |
| Enbridge Energy Partners LP | 9.875% | 3/1/19 | 4,680 | 5,333 |
| Enbridge Energy Partners LP | 5.200% | 3/15/20 | 525 | 535 |
| Enbridge Energy Partners LP | 4.200% | 9/15/21 | 5,300 | 5,054 |
| Enbridge Energy Partners LP | 5.875% | 10/15/25 | 1,500 | 1,445 |
| Enbridge Energy Partners LP | 7.500% | 4/15/38 | 5,950 | 5,898 |
| Enbridge Inc. | 5.600% | 4/1/17 | 2,160 | 2,230 |
| Enbridge Inc. | 3.500% | 6/10/24 | 1,200 | 1,006 |
| Enbridge Inc. | 4.500% | 6/10/44 | 2,725 | 1,846 |
| Encana Corp. | 3.900% | 11/15/21 | 11,885 | 9,819 |
| Encana Corp. | 7.200% | 11/1/31 | 1,800 | 1,644 |
| Encana Corp. | 6.500% | 8/15/34 | 4,125 | 3,436 |
| Encana Corp. | 6.625% | 8/15/37 | 5,350 | 4,469 |
| Encana Corp. | 5.150% | 11/15/41 | 5,600 | 3,856 |
| Energy Transfer Partners LP | 6.125% | 2/15/17 | 8,700 | 8,886 |
| Energy Transfer Partners LP | 6.700% | 7/1/18 | 948 | 998 |
| Energy Transfer Partners LP | 9.700% | 3/15/19 | 1,296 | 1,446 |
| Energy Transfer Partners LP | 9.000% | 4/15/19 | 1,714 | 1,886 |
| Energy Transfer Partners LP | 4.150% | 10/1/20 | 4,250 | 3,938 |
| Energy Transfer Partners LP | 4.650% | 6/1/21 | 1,905 | 1,788 |
| Energy Transfer Partners LP | 5.200% | 2/1/22 | 4,145 | 3,843 |
| Energy Transfer Partners LP | 3.600% | 2/1/23 | 4,375 | 3,604 |
| Energy Transfer Partners LP | 4.900% | 2/1/24 | 1,620 | 1,442 |
| Energy Transfer Partners LP | 4.050% | 3/15/25 | 6,000 | 4,972 |
| Energy Transfer Partners LP | 4.750% | 1/15/26 | 2,500 | 2,143 |
| Energy Transfer Partners LP | 8.250% | 11/15/29 | 400 | 439 |
| Energy Transfer Partners LP | 4.900% | 3/15/35 | 2,750 | 1,999 |
| Energy Transfer Partners LP | 6.625% | 10/15/36 | 1,750 | 1,495 |
| Energy Transfer Partners LP | 7.500% | 7/1/38 | 3,507 | 3,213 |
| Energy Transfer Partners LP | 6.050% | 6/1/41 | 11,675 | 9,030 |
| Energy Transfer Partners LP | 6.500% | 2/1/42 | 12,516 | 10,205 |
| Energy Transfer Partners LP | 5.150% | 2/1/43 | 5,600 | 3,994 |
| Energy Transfer Partners LP | 5.150% | 3/15/45 | 1,300 | 925 |
| Energy Transfer Partners LP | 6.125% | 12/15/45 | 2,700 | 2,197 |
| EnLink Midstream Partners LP | 2.700% | 4/1/19 | 2,450 | 2,239 |
| EnLink Midstream Partners LP | 4.400% | 4/1/24 | 1,900 | 1,515 |
| EnLink Midstream Partners LP | 5.600% | 4/1/44 | 1,450 | 987 |
| EnLink Midstream Partners LP | 5.050% | 4/1/45 | 5,150 | 3,193 |
| Ensco plc | 4.700% | 3/15/21 | 6,925 | 5,636 |
| Ensco plc | 4.500% | 10/1/24 | 2,810 | 1,926 |
| Ensco plc | 5.200% | 3/15/25 | 6,000 | 4,228 |
| Ensco plc | 5.750% | 10/1/44 | 6,800 | 4,480 |
| Enterprise Products Operating LLC | 6.300% | 9/15/17 | 4,200 | 4,421 |
| Enterprise Products Operating LLC | 6.650% | 4/15/18 | 1,900 | 2,055 |
| Enterprise Products Operating LLC | 1.650% | 5/7/18 | 7,100 | 6,898 |
| Enterprise Products Operating LLC | 6.500% | 1/31/19 | 7,000 | 7,701 |
| Enterprise Products Operating LLC | 2.550% | 10/15/19 | 6,900 | 6,611 |
| Enterprise Products Operating LLC | 5.200% | 9/1/20 | 8,600 | 9,016 |
| Enterprise Products Operating LLC | 3.350% | 3/15/23 | 5,000 | 4,518 |
| Enterprise Products Operating LLC | 3.900% | 2/15/24 | 8,525 | 7,954 |
| Enterprise Products Operating LLC | 3.750% | 2/15/25 | 12,150 | 11,066 |
| Enterprise Products Operating LLC | 3.700% | 2/15/26 | 5,075 | 4,534 |
| Enterprise Products Operating LLC | 6.875% | 3/1/33 | 5,323 | 5,566 |
101
| Total Bond Market II Index Fund | |||||
| Face | Market | ||||
| Maturity | Amount | Value• | |||
| Coupon | Date | ($000) | ($000) | ||
| Enterprise Products Operating LLC | 6.650% | 10/15/34 | 235 | 248 | |
| Enterprise Products Operating LLC | 7.550% | 4/15/38 | 3,130 | 3,348 | |
| Enterprise Products Operating LLC | 6.125% | 10/15/39 | 1,695 | 1,539 | |
| Enterprise Products Operating LLC | 6.450% | 9/1/40 | 2,425 | 2,304 | |
| Enterprise Products Operating LLC | 5.950% | 2/1/41 | 10,165 | 9,198 | |
| Enterprise Products Operating LLC | 5.700% | 2/15/42 | 2,425 | 2,157 | |
| Enterprise Products Operating LLC | 4.850% | 8/15/42 | 5,563 | 4,479 | |
| Enterprise Products Operating LLC | 4.450% | 2/15/43 | 7,067 | 5,318 | |
| Enterprise Products Operating LLC | 4.850% | 3/15/44 | 6,675 | 5,397 | |
| Enterprise Products Operating LLC | 5.100% | 2/15/45 | 4,700 | 3,908 | |
| Enterprise Products Operating LLC | 4.900% | 5/15/46 | 6,600 | 5,340 | |
| Enterprise Products Operating LLC | 4.950% | 10/15/54 | 2,125 | 1,653 | |
| 5 | Enterprise Products Operating LLC | 7.000% | 6/1/67 | 2,075 | 1,660 |
| EOG Resources Inc. | 2.500% | 2/1/16 | 705 | 706 | |
| EOG Resources Inc. | 5.875% | 9/15/17 | 2,200 | 2,344 | |
| EOG Resources Inc. | 4.400% | 6/1/20 | 1,880 | 1,996 | |
| EOG Resources Inc. | 4.100% | 2/1/21 | 9,450 | 9,891 | |
| EOG Resources Inc. | 2.625% | 3/15/23 | 8,550 | 8,072 | |
| EOG Resources Inc. | 3.150% | 4/1/25 | 5,400 | 5,096 | |
| EOG Resources Inc. | 3.900% | 4/1/35 | 2,900 | 2,635 | |
| EQT Corp. | 6.500% | 4/1/18 | 3,175 | 3,337 | |
| EQT Corp. | 8.125% | 6/1/19 | 5,975 | 6,456 | |
| EQT Corp. | 4.875% | 11/15/21 | 2,500 | 2,393 | |
| Exxon Mobil Corp. | 1.305% | 3/6/18 | 20,000 | 19,955 | |
| Exxon Mobil Corp. | 1.819% | 3/15/19 | 2,250 | 2,249 | |
| Exxon Mobil Corp. | 1.912% | 3/6/20 | 13,382 | 13,352 | |
| Exxon Mobil Corp. | 2.397% | 3/6/22 | 16,200 | 15,922 | |
| Exxon Mobil Corp. | 2.709% | 3/6/25 | 8,100 | 7,925 | |
| Exxon Mobil Corp. | 3.567% | 3/6/45 | 4,850 | 4,521 | |
| FMC Technologies Inc. | 2.000% | 10/1/17 | 2,500 | 2,463 | |
| FMC Technologies Inc. | 3.450% | 10/1/22 | 2,700 | 2,409 | |
| Gulf South Pipeline Co. LP | 4.000% | 6/15/22 | 1,725 | 1,562 | |
| Halliburton Co. | 2.000% | 8/1/18 | 4,125 | 4,097 | |
| Halliburton Co. | 5.900% | 9/15/18 | 1,005 | 1,098 | |
| Halliburton Co. | 6.150% | 9/15/19 | 800 | 900 | |
| Halliburton Co. | 2.700% | 11/15/20 | 4,000 | 3,952 | |
| Halliburton Co. | 3.250% | 11/15/21 | 4,235 | 4,202 | |
| Halliburton Co. | 3.375% | 11/15/22 | 5,000 | 4,935 | |
| Halliburton Co. | 3.500% | 8/1/23 | 6,650 | 6,485 | |
| Halliburton Co. | 3.800% | 11/15/25 | 11,500 | 11,286 | |
| Halliburton Co. | 4.850% | 11/15/35 | 5,500 | 5,410 | |
| Halliburton Co. | 6.700% | 9/15/38 | 5,720 | 6,743 | |
| Halliburton Co. | 7.450% | 9/15/39 | 1,859 | 2,371 | |
| Halliburton Co. | 4.500% | 11/15/41 | 2,607 | 2,373 | |
| Halliburton Co. | 4.750% | 8/1/43 | 9,200 | 8,660 | |
| Halliburton Co. | 5.000% | 11/15/45 | 6,675 | 6,592 | |
| Hess Corp. | 8.125% | 2/15/19 | 9,579 | 10,843 | |
| Hess Corp. | 3.500% | 7/15/24 | 1,600 | 1,398 | |
| Hess Corp. | 7.875% | 10/1/29 | 1,950 | 2,120 | |
| Hess Corp. | 7.300% | 8/15/31 | 950 | 947 | |
| Hess Corp. | 7.125% | 3/15/33 | 2,050 | 2,001 | |
| Hess Corp. | 6.000% | 1/15/40 | 7,500 | 6,609 | |
| Hess Corp. | 5.600% | 2/15/41 | 8,830 | 7,395 | |
| Husky Energy Inc. | 6.150% | 6/15/19 | 200 | 215 | |
| Husky Energy Inc. | 7.250% | 12/15/19 | 2,020 | 2,256 | |
| Husky Energy Inc. | 3.950% | 4/15/22 | 1,300 | 1,204 | |
| 102 | |||||
| Total Bond Market II Index Fund | ||||
| Face | Market | |||
| Maturity | Amount | Value• | ||
| Coupon | Date | ($000) | ($000) | |
| Husky Energy Inc. | 6.800% | 9/15/37 | 4,810 | 5,020 |
| Kerr-McGee Corp. | 6.950% | 7/1/24 | 5,505 | 5,913 |
| Kerr-McGee Corp. | 7.875% | 9/15/31 | 875 | 944 |
| Kinder Morgan Energy Partners LP | 5.950% | 2/15/18 | 6,350 | 6,510 |
| Kinder Morgan Energy Partners LP | 2.650% | 2/1/19 | 13,950 | 12,987 |
| Kinder Morgan Energy Partners LP | 9.000% | 2/1/19 | 5,127 | 5,539 |
| Kinder Morgan Energy Partners LP | 6.850% | 2/15/20 | 10,075 | 10,438 |
| Kinder Morgan Energy Partners LP | 6.500% | 4/1/20 | 9,961 | 10,169 |
| Kinder Morgan Energy Partners LP | 5.300% | 9/15/20 | 1,400 | 1,386 |
| Kinder Morgan Energy Partners LP | 5.000% | 10/1/21 | 7,265 | 6,849 |
| Kinder Morgan Energy Partners LP | 4.150% | 3/1/22 | 6,076 | 5,401 |
| Kinder Morgan Energy Partners LP | 3.950% | 9/1/22 | 10,190 | 8,874 |
| Kinder Morgan Energy Partners LP | 3.450% | 2/15/23 | 7,200 | 5,983 |
| Kinder Morgan Energy Partners LP | 3.500% | 9/1/23 | 8,783 | 7,284 |
| Kinder Morgan Energy Partners LP | 4.300% | 5/1/24 | 5,500 | 4,728 |
| Kinder Morgan Energy Partners LP | 7.400% | 3/15/31 | 1,980 | 1,826 |
| Kinder Morgan Energy Partners LP | 7.300% | 8/15/33 | 1,700 | 1,542 |
| Kinder Morgan Energy Partners LP | 6.500% | 2/1/37 | 6,150 | 5,228 |
| Kinder Morgan Energy Partners LP | 6.950% | 1/15/38 | 5,665 | 5,037 |
| Kinder Morgan Energy Partners LP | 6.500% | 9/1/39 | 6,925 | 5,809 |
| Kinder Morgan Energy Partners LP | 6.550% | 9/15/40 | 5,000 | 4,252 |
| Kinder Morgan Energy Partners LP | 6.375% | 3/1/41 | 3,600 | 2,937 |
| Kinder Morgan Energy Partners LP | 5.625% | 9/1/41 | 5,600 | 4,198 |
| Kinder Morgan Energy Partners LP | 5.000% | 8/15/42 | 2,775 | 2,038 |
| Kinder Morgan Energy Partners LP | 4.700% | 11/1/42 | 6,400 | 4,528 |
| Kinder Morgan Energy Partners LP | 5.000% | 3/1/43 | 1,000 | 733 |
| Kinder Morgan Energy Partners LP | 5.500% | 3/1/44 | 1,000 | 780 |
| Kinder Morgan Inc. | 7.000% | 6/15/17 | 7,595 | 7,826 |
| Kinder Morgan Inc. | 2.000% | 12/1/17 | 2,750 | 2,649 |
| Kinder Morgan Inc. | 6.500% | 9/15/20 | 1,500 | 1,494 |
| Kinder Morgan Inc. | 7.800% | 8/1/31 | 3,030 | 2,843 |
| Kinder Morgan Inc. | 7.750% | 1/15/32 | 5,500 | 5,219 |
| Kinder Morgan Inc. | 5.300% | 12/1/34 | 5,000 | 3,927 |
| Kinder Morgan Inc. | 5.550% | 6/1/45 | 10,385 | 8,084 |
| Kinder Morgan Inc. | 5.050% | 2/15/46 | 2,500 | 1,853 |
| Magellan Midstream Partners LP | 6.550% | 7/15/19 | 6,750 | 7,334 |
| Magellan Midstream Partners LP | 4.250% | 2/1/21 | 3,950 | 3,986 |
| Magellan Midstream Partners LP | 6.400% | 5/1/37 | 1,000 | 996 |
| Magellan Midstream Partners LP | 4.200% | 12/1/42 | 525 | 387 |
| Magellan Midstream Partners LP | 5.150% | 10/15/43 | 1,625 | 1,385 |
| Magellan Midstream Partners LP | 4.200% | 3/15/45 | 800 | 583 |
| Marathon Oil Corp. | 6.000% | 10/1/17 | 17,510 | 17,847 |
| Marathon Oil Corp. | 5.900% | 3/15/18 | 1,228 | 1,241 |
| Marathon Oil Corp. | 2.700% | 6/1/20 | 2,090 | 1,838 |
| Marathon Oil Corp. | 2.800% | 11/1/22 | 1,400 | 1,120 |
| Marathon Oil Corp. | 3.850% | 6/1/25 | 11,060 | 8,833 |
| Marathon Oil Corp. | 6.800% | 3/15/32 | 2,670 | 2,408 |
| Marathon Oil Corp. | 6.600% | 10/1/37 | 5,000 | 4,274 |
| Marathon Oil Corp. | 5.200% | 6/1/45 | 3,900 | 2,750 |
| Marathon Petroleum Corp. | 3.500% | 3/1/16 | 1,000 | 1,002 |
| Marathon Petroleum Corp. | 2.700% | 12/14/18 | 5,000 | 4,962 |
| Marathon Petroleum Corp. | 3.400% | 12/15/20 | 2,700 | 2,651 |
| Marathon Petroleum Corp. | 5.125% | 3/1/21 | 5,900 | 6,195 |
| Marathon Petroleum Corp. | 3.625% | 9/15/24 | 5,200 | 4,850 |
| Marathon Petroleum Corp. | 6.500% | 3/1/41 | 5,639 | 5,652 |
| Marathon Petroleum Corp. | 4.750% | 9/15/44 | 1,176 | 958 |
103
| Total Bond Market II Index Fund | ||||
| Face | Market | |||
| Maturity | Amount | Value• | ||
| Coupon | Date | ($000) | ($000) | |
| Marathon Petroleum Corp. | 5.850% | 12/15/45 | 2,500 | 2,339 |
| Marathon Petroleum Corp. | 5.000% | 9/15/54 | 2,050 | 1,631 |
| Murphy Oil Corp. | 2.500% | 12/1/17 | 3,100 | 2,788 |
| Murphy Oil Corp. | 3.700% | 12/1/22 | 1,700 | 1,285 |
| Murphy Oil Corp. | 7.050% | 5/1/29 | 2,000 | 1,731 |
| Murphy Oil Corp. | 5.125% | 12/1/42 | 1,875 | 1,152 |
| Nabors Industries Inc. | 6.150% | 2/15/18 | 8,945 | 9,155 |
| Nabors Industries Inc. | 9.250% | 1/15/19 | 875 | 899 |
| Nabors Industries Inc. | 5.000% | 9/15/20 | 5,985 | 5,337 |
| National Fuel Gas Co. | 6.500% | 4/15/18 | 5,129 | 5,508 |
| National Fuel Gas Co. | 8.750% | 5/1/19 | 1,500 | 1,704 |
| National Oilwell Varco Inc. | 1.350% | 12/1/17 | 1,875 | 1,834 |
| National Oilwell Varco Inc. | 2.600% | 12/1/22 | 20,465 | 17,912 |
| National Oilwell Varco Inc. | 3.950% | 12/1/42 | 3,600 | 2,750 |
| Noble Energy Inc. | 8.250% | 3/1/19 | 7,923 | 8,861 |
| Noble Energy Inc. | 4.150% | 12/15/21 | 10,300 | 10,052 |
| Noble Energy Inc. | 8.000% | 4/1/27 | 4,895 | 5,630 |
| Noble Energy Inc. | 6.000% | 3/1/41 | 9,800 | 8,410 |
| Noble Energy Inc. | 5.250% | 11/15/43 | 7,560 | 5,962 |
| Noble Holding International Ltd. | 2.500% | 3/15/17 | 2,400 | 2,264 |
| Noble Holding International Ltd. | 4.900% | 8/1/20 | 891 | 677 |
| Noble Holding International Ltd. | 4.625% | 3/1/21 | 950 | 668 |
| Noble Holding International Ltd. | 3.950% | 3/15/22 | 2,781 | 1,837 |
| Noble Holding International Ltd. | 5.950% | 4/1/25 | 3,250 | 2,257 |
| Noble Holding International Ltd. | 6.200% | 8/1/40 | 1,400 | 817 |
| Noble Holding International Ltd. | 6.050% | 3/1/41 | 2,500 | 1,493 |
| Noble Holding International Ltd. | 5.250% | 3/15/42 | 2,475 | 1,351 |
| Noble Holding International Ltd. | 6.950% | 4/1/45 | 1,818 | 1,131 |
| Occidental Petroleum Corp. | 1.750% | 2/15/17 | 14,600 | 14,625 |
| Occidental Petroleum Corp. | 1.500% | 2/15/18 | 4,650 | 4,577 |
| Occidental Petroleum Corp. | 4.100% | 2/1/21 | 10,560 | 11,078 |
| Occidental Petroleum Corp. | 3.125% | 2/15/22 | 7,725 | 7,575 |
| Occidental Petroleum Corp. | 2.700% | 2/15/23 | 5,125 | 4,819 |
| Occidental Petroleum Corp. | 3.500% | 6/15/25 | 8,000 | 7,792 |
| Occidental Petroleum Corp. | 4.625% | 6/15/45 | 2,800 | 2,710 |
| Oceaneering International Inc. | 4.650% | 11/15/24 | 2,500 | 2,106 |
| ONEOK Partners LP | 3.200% | 9/15/18 | 4,400 | 4,183 |
| ONEOK Partners LP | 3.375% | 10/1/22 | 12,675 | 10,133 |
| ONEOK Partners LP | 6.650% | 10/1/36 | 8,303 | 6,864 |
| ONEOK Partners LP | 6.850% | 10/15/37 | 2,325 | 1,951 |
| ONEOK Partners LP | 6.200% | 9/15/43 | 3,300 | 2,515 |
| Panhandle Eastern Pipe Line Co. LP | 6.200% | 11/1/17 | 4,703 | 5,008 |
| Panhandle Eastern Pipe Line Co. LP | 7.000% | 6/15/18 | 325 | 357 |
| Petro-Canada | 6.050% | 5/15/18 | 7,250 | 7,798 |
| Petro-Canada | 7.875% | 6/15/26 | 500 | 645 |
| Petro-Canada | 7.000% | 11/15/28 | 475 | 586 |
| Petro-Canada | 5.350% | 7/15/33 | 1,325 | 1,383 |
| Petro-Canada | 5.950% | 5/15/35 | 6,455 | 6,445 |
| Petro-Canada | 6.800% | 5/15/38 | 5,525 | 5,984 |
| Phillips 66 | 2.950% | 5/1/17 | 16,925 | 17,154 |
| Phillips 66 | 4.300% | 4/1/22 | 12,985 | 13,429 |
| Phillips 66 | 5.875% | 5/1/42 | 11,150 | 11,230 |
| Phillips 66 | 4.875% | 11/15/44 | 10,025 | 8,885 |
| Phillips 66 Partners LP | 2.646% | 2/15/20 | 1,255 | 1,190 |
| Phillips 66 Partners LP | 3.605% | 2/15/25 | 3,500 | 3,073 |
| Phillips 66 Partners LP | 4.680% | 2/15/45 | 1,375 | 1,024 |
104
| Total Bond Market II Index Fund | ||||
| Face | Market | |||
| Maturity | Amount | Value• | ||
| Coupon | Date | ($000) | ($000) | |
| Pioneer Natural Resources Co. | 6.875% | 5/1/18 | 2,905 | 3,093 |
| Pioneer Natural Resources Co. | 3.450% | 1/15/21 | 4,000 | 3,694 |
| Pioneer Natural Resources Co. | 3.950% | 7/15/22 | 4,010 | 3,661 |
| Pioneer Natural Resources Co. | 4.450% | 1/15/26 | 4,150 | 3,731 |
| Pioneer Natural Resources Co. | 7.200% | 1/15/28 | 2,378 | 2,540 |
| Plains All American Pipeline LP / PAA Finance | ||||
| Corp. | 6.125% | 1/15/17 | 1,900 | 1,952 |
| Plains All American Pipeline LP / PAA Finance | ||||
| Corp. | 8.750% | 5/1/19 | 1,375 | 1,511 |
| Plains All American Pipeline LP / PAA Finance | ||||
| Corp. | 5.750% | 1/15/20 | 12,660 | 12,527 |
| Plains All American Pipeline LP / PAA Finance | ||||
| Corp. | 5.000% | 2/1/21 | 3,460 | 3,311 |
| Plains All American Pipeline LP / PAA Finance | ||||
| Corp. | 3.650% | 6/1/22 | 800 | 683 |
| Plains All American Pipeline LP / PAA Finance | ||||
| Corp. | 2.850% | 1/31/23 | 2,200 | 1,813 |
| Plains All American Pipeline LP / PAA Finance | ||||
| Corp. | 3.850% | 10/15/23 | 2,396 | 2,023 |
| Plains All American Pipeline LP / PAA Finance | ||||
| Corp. | 3.600% | 11/1/24 | 10,960 | 8,813 |
| Plains All American Pipeline LP / PAA Finance | ||||
| Corp. | 4.650% | 10/15/25 | 6,600 | 5,743 |
| Plains All American Pipeline LP / PAA Finance | ||||
| Corp. | 6.700% | 5/15/36 | 970 | 864 |
| Plains All American Pipeline LP / PAA Finance | ||||
| Corp. | 5.150% | 6/1/42 | 2,325 | 1,690 |
| Plains All American Pipeline LP / PAA Finance | ||||
| Corp. | 4.300% | 1/31/43 | 8,875 | 5,825 |
| Plains All American Pipeline LP / PAA Finance | ||||
| Corp. | 4.700% | 6/15/44 | 4,625 | 3,221 |
| Pride International Inc. | 6.875% | 8/15/20 | 5,650 | 5,249 |
| Pride International Inc. | 7.875% | 8/15/40 | 3,500 | 2,755 |
| Regency Energy Partners LP / Regency Energy | ||||
| Finance Corp. | 5.750% | 9/1/20 | 5,725 | 5,625 |
| Regency Energy Partners LP / Regency Energy | ||||
| Finance Corp. | 5.875% | 3/1/22 | 5,500 | 5,225 |
| Regency Energy Partners LP / Regency Energy | ||||
| Finance Corp. | 5.000% | 10/1/22 | 10,300 | 9,244 |
| Regency Energy Partners LP / Regency Energy | ||||
| Finance Corp. | 5.500% | 4/15/23 | 5,650 | 5,141 |
| Regency Energy Partners LP / Regency Energy | ||||
| Finance Corp. | 4.500% | 11/1/23 | 7,500 | 6,544 |
| Respol Oil & Gas Canada Inc. | 7.750% | 6/1/19 | 11,475 | 12,350 |
| Rowan Cos. Inc. | 7.875% | 8/1/19 | 2,850 | 2,824 |
| Rowan Cos. Inc. | 4.875% | 6/1/22 | 9,297 | 6,835 |
| Rowan Cos. Inc. | 4.750% | 1/15/24 | 1,150 | 818 |
| Rowan Cos. Inc. | 5.400% | 12/1/42 | 2,475 | 1,482 |
| Rowan Cos. Inc. | 5.850% | 1/15/44 | 300 | 181 |
| Schlumberger Investment SA | 3.650% | 12/1/23 | 17,538 | 17,937 |
| SESI LLC | 7.125% | 12/15/21 | 625 | 553 |
| Shell International Finance BV | 5.200% | 3/22/17 | 3,750 | 3,846 |
| Shell International Finance BV | 1.125% | 8/21/17 | 1,400 | 1,391 |
| Shell International Finance BV | 1.250% | 11/10/17 | 11,250 | 11,192 |
| Shell International Finance BV | 1.900% | 8/10/18 | 5,975 | 5,970 |
| Shell International Finance BV | 1.625% | 11/10/18 | 12,500 | 12,371 |
105
| Total Bond Market II Index Fund | |||||
| Face | Market | ||||
| Maturity | Amount | Value• | |||
| Coupon | Date | ($000) | ($000) | ||
| Shell International Finance BV | 2.000% | 11/15/18 | 6,725 | 6,712 | |
| Shell International Finance BV | 4.300% | 9/22/19 | 18,300 | 19,511 | |
| Shell International Finance BV | 4.375% | 3/25/20 | 7,650 | 8,201 | |
| Shell International Finance BV | 2.125% | 5/11/20 | 10,000 | 9,804 | |
| Shell International Finance BV | 2.250% | 11/10/20 | 550 | 541 | |
| Shell International Finance BV | 2.375% | 8/21/22 | 11,865 | 11,326 | |
| Shell International Finance BV | 2.250% | 1/6/23 | 3,250 | 3,007 | |
| Shell International Finance BV | 3.400% | 8/12/23 | 7,080 | 7,052 | |
| Shell International Finance BV | 3.250% | 5/11/25 | 3,700 | 3,575 | |
| Shell International Finance BV | 4.125% | 5/11/35 | 9,700 | 9,229 | |
| Shell International Finance BV | 6.375% | 12/15/38 | 12,542 | 14,951 | |
| Shell International Finance BV | 5.500% | 3/25/40 | 4,025 | 4,333 | |
| Shell International Finance BV | 3.625% | 8/21/42 | 8,175 | 6,833 | |
| Shell International Finance BV | 4.550% | 8/12/43 | 7,975 | 7,586 | |
| Shell International Finance BV | 4.375% | 5/11/45 | 10,250 | 9,686 | |
| 8 | Southern Natural Gas Co. LLC | 5.900% | 4/1/17 | 1,950 | 1,983 |
| Southern Natural Gas Co. LLC | 8.000% | 3/1/32 | 2,299 | 2,258 | |
| Southern Natural Gas Co. LLC / Southern Natural | |||||
| Issuing Corp. | 4.400% | 6/15/21 | 7,315 | 6,795 | |
| Southwestern Energy Co. | 3.300% | 1/23/18 | 1,000 | 788 | |
| Southwestern Energy Co. | 7.500% | 2/1/18 | 8,240 | 7,004 | |
| Southwestern Energy Co. | 4.050% | 1/23/20 | 9,880 | 7,163 | |
| Southwestern Energy Co. | 4.100% | 3/15/22 | 6,650 | 4,181 | |
| Southwestern Energy Co. | 4.950% | 1/23/25 | 1,300 | 820 | |
| Spectra Energy Capital LLC | 6.200% | 4/15/18 | 8,350 | 8,847 | |
| Spectra Energy Capital LLC | 8.000% | 10/1/19 | 535 | 609 | |
| Spectra Energy Capital LLC | 3.300% | 3/15/23 | 3,800 | 3,252 | |
| Spectra Energy Capital LLC | 6.750% | 2/15/32 | 725 | 721 | |
| Spectra Energy Capital LLC | 7.500% | 9/15/38 | 325 | 325 | |
| Spectra Energy Partners LP | 2.950% | 9/25/18 | 575 | 565 | |
| Spectra Energy Partners LP | 4.750% | 3/15/24 | 3,500 | 3,412 | |
| Spectra Energy Partners LP | 3.500% | 3/15/25 | 10,500 | 9,222 | |
| Spectra Energy Partners LP | 5.950% | 9/25/43 | 2,240 | 2,137 | |
| Spectra Energy Partners LP | 4.500% | 3/15/45 | 2,000 | 1,537 | |
| Suncor Energy Inc. | 6.100% | 6/1/18 | 4,475 | 4,806 | |
| Suncor Energy Inc. | 7.150% | 2/1/32 | 3,625 | 4,147 | |
| Suncor Energy Inc. | 5.950% | 12/1/34 | 575 | 573 | |
| Suncor Energy Inc. | 6.500% | 6/15/38 | 9,920 | 10,873 | |
| Suncor Energy Inc. | 6.850% | 6/1/39 | 2,255 | 2,440 | |
| Sunoco Logistics Partners Operations LP | 4.400% | 4/1/21 | 17,000 | 16,476 | |
| Sunoco Logistics Partners Operations LP | 4.250% | 4/1/24 | 575 | 498 | |
| Sunoco Logistics Partners Operations LP | 5.950% | 12/1/25 | 4,000 | 3,849 | |
| Sunoco Logistics Partners Operations LP | 4.950% | 1/15/43 | 5,525 | 3,913 | |
| Sunoco Logistics Partners Operations LP | 5.300% | 4/1/44 | 7,375 | 5,488 | |
| Sunoco Logistics Partners Operations LP | 5.350% | 5/15/45 | 4,025 | 2,992 | |
| Tennessee Gas Pipeline Co. LLC | 7.500% | 4/1/17 | 720 | 746 | |
| Tennessee Gas Pipeline Co. LLC | 7.000% | 3/15/27 | 725 | 710 | |
| Texas Eastern Transmission LP | 7.000% | 7/15/32 | 2,905 | 3,191 | |
| Tosco Corp. | 7.800% | 1/1/27 | 315 | 383 | |
| Tosco Corp. | 8.125% | 2/15/30 | 4,000 | 4,931 | |
| Total Capital Canada Ltd. | 1.450% | 1/15/18 | 10,455 | 10,409 | |
| Total Capital Canada Ltd. | 2.750% | 7/15/23 | 6,800 | 6,539 | |
| Total Capital International SA | 1.500% | 2/17/17 | 1,075 | 1,075 | |
| Total Capital International SA | 1.550% | 6/28/17 | 8,350 | 8,348 | |
| Total Capital International SA | 2.125% | 1/10/19 | 8,000 | 7,993 | |
| Total Capital International SA | 2.100% | 6/19/19 | 11,500 | 11,588 | |
| 106 | |||||
| Total Bond Market II Index Fund | ||||
| Face | Market | |||
| Maturity | Amount | Value• | ||
| Coupon | Date | ($000) | ($000) | |
| Total Capital International SA | 2.750% | 6/19/21 | 12,625 | 12,574 |
| Total Capital International SA | 2.875% | 2/17/22 | 10,975 | 10,880 |
| Total Capital International SA | 2.700% | 1/25/23 | 7,550 | 7,193 |
| Total Capital International SA | 3.700% | 1/15/24 | 7,700 | 7,801 |
| Total Capital International SA | 3.750% | 4/10/24 | 9,000 | 9,153 |
| Total Capital SA | 2.125% | 8/10/18 | 2,900 | 2,907 |
| Total Capital SA | 4.450% | 6/24/20 | 5,075 | 5,441 |
| Total Capital SA | 4.125% | 1/28/21 | 3,005 | 3,208 |
| TransCanada PipeLines Ltd. | 1.625% | 11/9/17 | 8,950 | 8,905 |
| TransCanada PipeLines Ltd. | 6.500% | 8/15/18 | 11,540 | 12,612 |
| TransCanada PipeLines Ltd. | 3.800% | 10/1/20 | 9,832 | 10,066 |
| TransCanada PipeLines Ltd. | 2.500% | 8/1/22 | 6,075 | 5,593 |
| TransCanada PipeLines Ltd. | 3.750% | 10/16/23 | 4,775 | 4,740 |
| TransCanada PipeLines Ltd. | 4.625% | 3/1/34 | 5,750 | 5,420 |
| TransCanada PipeLines Ltd. | 5.600% | 3/31/34 | 1,400 | 1,418 |
| TransCanada PipeLines Ltd. | 5.850% | 3/15/36 | 3,225 | 3,312 |
| TransCanada PipeLines Ltd. | 6.200% | 10/15/37 | 6,975 | 7,341 |
| TransCanada PipeLines Ltd. | 7.250% | 8/15/38 | 2,600 | 3,100 |
| TransCanada PipeLines Ltd. | 7.625% | 1/15/39 | 4,940 | 6,083 |
| TransCanada PipeLines Ltd. | 6.100% | 6/1/40 | 4,000 | 4,170 |
| TransCanada PipeLines Ltd. | 5.000% | 10/16/43 | 5,250 | 4,841 |
| 5 TransCanada PipeLines Ltd. | 6.350% | 5/15/67 | 4,075 | 3,087 |
| Transcontinental Gas Pipe Line Co. LLC | 6.050% | 6/15/18 | 1,545 | 1,671 |
| Transcontinental Gas Pipe Line Co. LLC | 4.450% | 8/1/42 | 3,223 | 2,182 |
| Valero Energy Corp. | 6.125% | 6/15/17 | 7,655 | 8,054 |
| Valero Energy Corp. | 9.375% | 3/15/19 | 2,650 | 3,138 |
| Valero Energy Corp. | 6.125% | 2/1/20 | 3,875 | 4,276 |
| Valero Energy Corp. | 3.650% | 3/15/25 | 550 | 517 |
| Valero Energy Corp. | 7.500% | 4/15/32 | 3,675 | 4,001 |
| Valero Energy Corp. | 6.625% | 6/15/37 | 9,706 | 9,655 |
| Valero Energy Corp. | 4.900% | 3/15/45 | 3,900 | 3,228 |
| Western Gas Partners LP | 2.600% | 8/15/18 | 800 | 773 |
| Western Gas Partners LP | 5.375% | 6/1/21 | 2,950 | 2,987 |
| Western Gas Partners LP | 3.950% | 6/1/25 | 4,700 | 3,946 |
| Western Gas Partners LP | 5.450% | 4/1/44 | 4,925 | 3,909 |
| Williams Cos. Inc. | 4.550% | 6/24/24 | 6,250 | 4,344 |
| Williams Cos. Inc. | 7.500% | 1/15/31 | 2,304 | 1,590 |
| Williams Cos. Inc. | 7.750% | 6/15/31 | 1,967 | 1,448 |
| Williams Cos. Inc. | 8.750% | 3/15/32 | 3,560 | 2,648 |
| Williams Cos. Inc. | 5.750% | 6/24/44 | 3,950 | 2,311 |
| Williams Partners LP | 5.250% | 3/15/20 | 2,101 | 1,951 |
| Williams Partners LP | 4.000% | 11/15/21 | 4,800 | 4,005 |
| Williams Partners LP | 3.600% | 3/15/22 | 9,800 | 7,709 |
| Williams Partners LP | 3.350% | 8/15/22 | 4,350 | 3,367 |
| Williams Partners LP | 4.500% | 11/15/23 | 3,300 | 2,672 |
| Williams Partners LP | 4.300% | 3/4/24 | 1,000 | 793 |
| Williams Partners LP | 3.900% | 1/15/25 | 4,600 | 3,458 |
| Williams Partners LP | 4.000% | 9/15/25 | 5,175 | 3,875 |
| Williams Partners LP | 6.300% | 4/15/40 | 4,145 | 3,182 |
| Williams Partners LP | 5.800% | 11/15/43 | 10,125 | 7,079 |
| Williams Partners LP | 5.400% | 3/4/44 | 1,450 | 972 |
| Williams Partners LP | 4.900% | 1/15/45 | 1,100 | 700 |
| Williams Partners LP | 5.100% | 9/15/45 | 6,000 | 3,949 |
| Williams Partners LP / ACMP Finance Corp. | 4.875% | 5/15/23 | 3,875 | 3,119 |
| Williams Partners LP / ACMP Finance Corp. | 4.875% | 3/15/24 | 5,800 | 4,640 |
107
| Total Bond Market II Index Fund | |||||
| Face | Market | ||||
| Maturity | Amount | Value• | |||
| Coupon | Date | ($000) | ($000) | ||
| Williams Partners LP/Williams Partners Finance | |||||
| Corp. | 7.250% | 2/1/17 | 2,250 | 2,342 | |
| XTO Energy Inc. | 6.250% | 8/1/17 | 6,050 | 6,519 | |
| XTO Energy Inc. | 5.500% | 6/15/18 | 100 | 109 | |
| Other Industrial (0.1%) | |||||
| California Institute of Technology GO | 4.321% | 8/1/45 | 1,300 | 1,349 | |
| California Institute of Technology GO | 4.700% | 11/1/11 | 5,200 | 5,019 | |
| CBRE Services Inc. | 5.250% | 3/15/25 | 3,700 | 3,751 | |
| CBRE Services Inc. | 4.875% | 3/1/26 | 7,990 | 7,940 | |
| Cintas Corp. No 2 | 3.250% | 6/1/22 | 1,025 | 1,035 | |
| Fluor Corp. | 3.375% | 9/15/21 | 1,300 | 1,326 | |
| Fluor Corp. | 3.500% | 12/15/24 | 9,950 | 9,957 | |
| Howard Hughes Medical Institute Revenue | 3.500% | 9/1/23 | 1,975 | 2,054 | |
| 5 | Johns Hopkins University Maryland GO | 4.083% | 7/1/53 | 3,300 | 3,265 |
| Massachusetts Institute of Technology GO | 5.600% | 7/1/11 | 4,050 | 4,971 | |
| Massachusetts Institute of Technology GO | 4.678% | 7/1/14 | 13,600 | 14,129 | |
| 5 | Northwestern University Illinois GO | 3.688% | 12/1/38 | 1,750 | 1,767 |
| 5 | Northwestern University Illinois GO | 4.643% | 12/1/44 | 3,675 | 4,143 |
| President & Fellows of Harvard College | |||||
| Massachusetts GO | 3.619% | 10/1/37 | 2,400 | 2,357 | |
| 5 | University of Notre Dame DU LAC Indiana GO | 3.438% | 2/15/45 | 2,925 | 2,745 |
| University of Pennsylvania GO | 4.674% | 9/1/12 | 4,750 | 4,763 | |
| Yale University Connecticut GO | 2.086% | 4/15/19 | 2,000 | 2,016 | |
| Technology (1.7%) | |||||
| Adobe Systems Inc. | 4.750% | 2/1/20 | 4,275 | 4,633 | |
| Adobe Systems Inc. | 3.250% | 2/1/25 | 3,950 | 3,853 | |
| Altera Corp. | 1.750% | 5/15/17 | 1,250 | 1,255 | |
| Altera Corp. | 2.500% | 11/15/18 | 12,675 | 12,853 | |
| Altera Corp. | 4.100% | 11/15/23 | 6,000 | 6,275 | |
| Amphenol Corp. | 1.550% | 9/15/17 | 1,500 | 1,495 | |
| Amphenol Corp. | 2.550% | 1/30/19 | 8,525 | 8,540 | |
| Amphenol Corp. | 3.125% | 9/15/21 | 1,105 | 1,093 | |
| Analog Devices Inc. | 2.875% | 6/1/23 | 2,600 | 2,496 | |
| Apple Inc. | 1.050% | 5/5/17 | 8,325 | 8,330 | |
| Apple Inc. | 0.900% | 5/12/17 | 3,800 | 3,793 | |
| Apple Inc. | 1.000% | 5/3/18 | 11,000 | 10,917 | |
| Apple Inc. | 2.100% | 5/6/19 | 14,175 | 14,345 | |
| Apple Inc. | 1.550% | 2/7/20 | 9,500 | 9,352 | |
| Apple Inc. | 2.000% | 5/6/20 | 800 | 798 | |
| Apple Inc. | 2.850% | 5/6/21 | 36,660 | 37,557 | |
| Apple Inc. | 2.150% | 2/9/22 | 12,850 | 12,519 | |
| Apple Inc. | 2.700% | 5/13/22 | 10,750 | 10,775 | |
| Apple Inc. | 2.400% | 5/3/23 | 26,075 | 25,405 | |
| Apple Inc. | 3.450% | 5/6/24 | 16,450 | 17,041 | |
| Apple Inc. | 2.500% | 2/9/25 | 19,000 | 18,175 | |
| Apple Inc. | 3.200% | 5/13/25 | 4,100 | 4,143 | |
| Apple Inc. | 3.850% | 5/4/43 | 17,500 | 16,133 | |
| Apple Inc. | 4.450% | 5/6/44 | 3,800 | 3,842 | |
| Apple Inc. | 3.450% | 2/9/45 | 8,700 | 7,478 | |
| Apple Inc. | 4.375% | 5/13/45 | 7,625 | 7,630 | |
| Applied Materials Inc. | 2.625% | 10/1/20 | 4,250 | 4,247 | |
| Applied Materials Inc. | 4.300% | 6/15/21 | 4,840 | 5,159 | |
| Applied Materials Inc. | 3.900% | 10/1/25 | 11,400 | 11,418 | |
| Applied Materials Inc. | 5.100% | 10/1/35 | 2,550 | 2,588 | |
| 108 | |||||
| Total Bond Market II Index Fund | ||||
| Face | Market | |||
| Maturity | Amount | Value• | ||
| Coupon | Date | ($000) | ($000) | |
| Applied Materials Inc. | 5.850% | 6/15/41 | 5,885 | 6,377 |
| Arrow Electronics Inc. | 3.000% | 3/1/18 | 2,200 | 2,199 |
| Arrow Electronics Inc. | 5.125% | 3/1/21 | 515 | 541 |
| Arrow Electronics Inc. | 3.500% | 4/1/22 | 2,000 | 1,921 |
| Arrow Electronics Inc. | 4.500% | 3/1/23 | 3,450 | 3,486 |
| Arrow Electronics Inc. | 4.000% | 4/1/25 | 3,500 | 3,353 |
| Autodesk Inc. | 1.950% | 12/15/17 | 5,300 | 5,278 |
| Autodesk Inc. | 3.125% | 6/15/20 | 1,500 | 1,489 |
| Autodesk Inc. | 3.600% | 12/15/22 | 825 | 806 |
| Autodesk Inc. | 4.375% | 6/15/25 | 1,350 | 1,330 |
| Avnet Inc. | 5.875% | 6/15/20 | 4,300 | 4,669 |
| Avnet Inc. | 4.875% | 12/1/22 | 1,450 | 1,487 |
| Baidu Inc. | 2.250% | 11/28/17 | 7,400 | 7,412 |
| Baidu Inc. | 2.750% | 6/9/19 | 2,500 | 2,484 |
| Baidu Inc. | 3.500% | 11/28/22 | 7,200 | 7,095 |
| Broadcom Corp. | 2.700% | 11/1/18 | 5,385 | 5,437 |
| Broadcom Corp. | 2.500% | 8/15/22 | 10,453 | 10,402 |
| Broadcom Corp. | 3.500% | 8/1/24 | 2,000 | 2,006 |
| Broadridge Financial Solutions Inc. | 3.950% | 9/1/20 | 2,150 | 2,229 |
| CA Inc. | 5.375% | 12/1/19 | 3,545 | 3,839 |
| CA Inc. | 3.600% | 8/1/20 | 5,900 | 6,030 |
| Cadence Design Systems Inc. | 4.375% | 10/15/24 | 725 | 719 |
| Cisco Systems Inc. | 5.500% | 2/22/16 | 11,783 | 11,858 |
| Cisco Systems Inc. | 1.100% | 3/3/17 | 4,050 | 4,052 |
| Cisco Systems Inc. | 3.150% | 3/14/17 | 11,975 | 12,268 |
| Cisco Systems Inc. | 4.950% | 2/15/19 | 11,225 | 12,268 |
| Cisco Systems Inc. | 2.125% | 3/1/19 | 12,575 | 12,677 |
| Cisco Systems Inc. | 4.450% | 1/15/20 | 12,100 | 13,173 |
| Cisco Systems Inc. | 2.450% | 6/15/20 | 6,325 | 6,387 |
| Cisco Systems Inc. | 2.900% | 3/4/21 | 1,300 | 1,338 |
| Cisco Systems Inc. | 3.625% | 3/4/24 | 3,000 | 3,133 |
| Cisco Systems Inc. | 5.900% | 2/15/39 | 1,400 | 1,714 |
| Cisco Systems Inc. | 5.500% | 1/15/40 | 18,370 | 21,959 |
| Computer Sciences Corp. | 6.500% | 3/15/18 | 800 | 863 |
| Corning Inc. | 1.500% | 5/8/18 | 4,000 | 3,934 |
| Corning Inc. | 6.625% | 5/15/19 | 275 | 308 |
| Corning Inc. | 2.900% | 5/15/22 | 3,875 | 3,720 |
| Corning Inc. | 3.700% | 11/15/23 | 8,650 | 8,522 |
| Corning Inc. | 7.250% | 8/15/36 | 100 | 116 |
| Corning Inc. | 4.700% | 3/15/37 | 1,500 | 1,447 |
| Corning Inc. | 5.750% | 8/15/40 | 7,910 | 8,486 |
| Dun & Bradstreet Corp. | 4.375% | 12/1/22 | 950 | 931 |
| EMC Corp. | 1.875% | 6/1/18 | 11,285 | 10,529 |
| EMC Corp. | 2.650% | 6/1/20 | 4,620 | 4,090 |
| EMC Corp. | 3.375% | 6/1/23 | 7,125 | 5,778 |
| Equifax Inc. | 6.300% | 7/1/17 | 425 | 452 |
| Equifax Inc. | 7.000% | 7/1/37 | 1,250 | 1,413 |
| Fidelity National Information Services Inc. | 2.000% | 4/15/18 | 925 | 910 |
| Fidelity National Information Services Inc. | 2.850% | 10/15/18 | 5,200 | 5,218 |
| Fidelity National Information Services Inc. | 3.625% | 10/15/20 | 13,400 | 13,580 |
| Fidelity National Information Services Inc. | 5.000% | 3/15/22 | 7,850 | 8,135 |
| Fidelity National Information Services Inc. | 3.500% | 4/15/23 | 7,732 | 7,391 |
| Fidelity National Information Services Inc. | 5.000% | 10/15/25 | 2,625 | 2,709 |
| Fiserv Inc. | 2.700% | 6/1/20 | 4,575 | 4,579 |
| Fiserv Inc. | 3.500% | 10/1/22 | 2,425 | 2,429 |
| Fiserv Inc. | 3.850% | 6/1/25 | 6,625 | 6,614 |
109
| Total Bond Market II Index Fund | |||||
| Face | Market | ||||
| Maturity | Amount | Value• | |||
| Coupon | Date | ($000) | ($000) | ||
| Flextronics International Ltd. | 4.625% | 2/15/20 | 1,750 | 1,809 | |
| 8 | Flextronics International Ltd. | 4.750% | 6/15/25 | 1,400 | 1,363 |
| Google Inc. | 3.625% | 5/19/21 | 3,125 | 3,323 | |
| 8 | Hewlett Packard Enterprise Co. | 2.450% | 10/5/17 | 10,575 | 10,569 |
| 8 | Hewlett Packard Enterprise Co. | 2.850% | 10/5/18 | 11,075 | 11,069 |
| 8 | Hewlett Packard Enterprise Co. | 3.600% | 10/15/20 | 14,000 | 14,037 |
| 8 | Hewlett Packard Enterprise Co. | 4.400% | 10/15/22 | 12,275 | 12,231 |
| 8 | Hewlett Packard Enterprise Co. | 4.900% | 10/15/25 | 20,000 | 19,633 |
| 8 | Hewlett Packard Enterprise Co. | 6.200% | 10/15/35 | 2,000 | 1,927 |
| 8 | Hewlett Packard Enterprise Co. | 6.350% | 10/15/45 | 14,325 | 13,643 |
| HP Inc. | 3.750% | 12/1/20 | 2,009 | 1,992 | |
| HP Inc. | 4.300% | 6/1/21 | 2,280 | 2,269 | |
| HP Inc. | 4.375% | 9/15/21 | 13,375 | 13,069 | |
| HP Inc. | 4.650% | 12/9/21 | 11,965 | 11,917 | |
| HP Inc. | 6.000% | 9/15/41 | 7,445 | 6,459 | |
| Ingram Micro Inc. | 4.950% | 12/15/24 | 8,475 | 8,438 | |
| Intel Corp. | 1.350% | 12/15/17 | 27,205 | 27,239 | |
| Intel Corp. | 2.450% | 7/29/20 | 8,150 | 8,239 | |
| Intel Corp. | 3.300% | 10/1/21 | 2,000 | 2,071 | |
| Intel Corp. | 3.100% | 7/29/22 | 5,725 | 5,831 | |
| Intel Corp. | 2.700% | 12/15/22 | 13,525 | 13,381 | |
| Intel Corp. | 3.700% | 7/29/25 | 7,000 | 7,240 | |
| Intel Corp. | 4.000% | 12/15/32 | 3,300 | 3,272 | |
| Intel Corp. | 4.800% | 10/1/41 | 9,870 | 10,302 | |
| Intel Corp. | 4.250% | 12/15/42 | 7,325 | 7,095 | |
| Intel Corp. | 4.900% | 7/29/45 | 10,000 | 10,548 | |
| International Business Machines Corp. | 1.250% | 2/6/17 | 14,925 | 14,969 | |
| International Business Machines Corp. | 5.700% | 9/14/17 | 24,825 | 26,628 | |
| International Business Machines Corp. | 1.125% | 2/6/18 | 2,000 | 1,987 | |
| International Business Machines Corp. | 7.625% | 10/15/18 | 10,000 | 11,534 | |
| International Business Machines Corp. | 1.950% | 2/12/19 | 13,192 | 13,252 | |
| International Business Machines Corp. | 1.625% | 5/15/20 | 4,075 | 3,973 | |
| International Business Machines Corp. | 2.900% | 11/1/21 | 7,325 | 7,416 | |
| International Business Machines Corp. | 2.875% | 11/9/22 | 5,000 | 4,961 | |
| International Business Machines Corp. | 3.375% | 8/1/23 | 13,825 | 14,023 | |
| International Business Machines Corp. | 3.625% | 2/12/24 | 1,750 | 1,794 | |
| International Business Machines Corp. | 7.000% | 10/30/25 | 2,850 | 3,656 | |
| International Business Machines Corp. | 6.220% | 8/1/27 | 1,975 | 2,436 | |
| International Business Machines Corp. | 6.500% | 1/15/28 | 100 | 125 | |
| International Business Machines Corp. | 5.875% | 11/29/32 | 125 | 149 | |
| International Business Machines Corp. | 5.600% | 11/30/39 | 1,098 | 1,277 | |
| International Business Machines Corp. | 4.000% | 6/20/42 | 8,997 | 8,370 | |
| Intuit Inc. | 5.750% | 3/15/17 | 575 | 603 | |
| Jabil Circuit Inc. | 5.625% | 12/15/20 | 1,375 | 1,447 | |
| Jabil Circuit Inc. | 4.700% | 9/15/22 | 3,000 | 2,918 | |
| Juniper Networks Inc. | 3.300% | 6/15/20 | 1,000 | 998 | |
| Juniper Networks Inc. | 4.600% | 3/15/21 | 900 | 941 | |
| Juniper Networks Inc. | 4.350% | 6/15/25 | 1,725 | 1,683 | |
| Juniper Networks Inc. | 5.950% | 3/15/41 | 5,500 | 5,165 | |
| Keysight Technologies Inc. | 3.300% | 10/30/19 | 3,050 | 3,003 | |
| Keysight Technologies Inc. | 4.550% | 10/30/24 | 3,050 | 2,934 | |
| KLA-Tencor Corp. | 4.125% | 11/1/21 | 8,950 | 8,979 | |
| KLA-Tencor Corp. | 4.650% | 11/1/24 | 3,550 | 3,573 | |
| KLA-Tencor Corp. | 5.650% | 11/1/34 | 225 | 217 | |
| Lam Research Corp. | 2.750% | 3/15/20 | 3,300 | 3,194 | |
| Lam Research Corp. | 3.800% | 3/15/25 | 3,375 | 3,196 | |
| 110 | |||||
| Total Bond Market II Index Fund | ||||
| Face | Market | |||
| Maturity | Amount | Value• | ||
| Coupon | Date | ($000) | ($000) | |
| Lexmark International Inc. | 6.650% | 6/1/18 | 1,850 | 1,993 |
| Lexmark International Inc. | 5.125% | 3/15/20 | 2,450 | 2,530 |
| Maxim Integrated Products Inc. | 2.500% | 11/15/18 | 3,365 | 3,369 |
| Maxim Integrated Products Inc. | 3.375% | 3/15/23 | 3,875 | 3,827 |
| Microsoft Corp. | 0.875% | 11/15/17 | 2,150 | 2,143 |
| Microsoft Corp. | 1.000% | 5/1/18 | 4,050 | 4,022 |
| Microsoft Corp. | 1.300% | 11/3/18 | 14,500 | 14,460 |
| Microsoft Corp. | 4.200% | 6/1/19 | 1,265 | 1,367 |
| Microsoft Corp. | 3.000% | 10/1/20 | 2,000 | 2,093 |
| Microsoft Corp. | 2.000% | 11/3/20 | 25,625 | 25,627 |
| Microsoft Corp. | 4.000% | 2/8/21 | 950 | 1,035 |
| Microsoft Corp. | 2.375% | 2/12/22 | 6,625 | 6,541 |
| Microsoft Corp. | 2.650% | 11/3/22 | 6,225 | 6,217 |
| Microsoft Corp. | 2.125% | 11/15/22 | 4,350 | 4,200 |
| Microsoft Corp. | 2.375% | 5/1/23 | 1,150 | 1,133 |
| Microsoft Corp. | 2.700% | 2/12/25 | 8,625 | 8,393 |
| Microsoft Corp. | 3.125% | 11/3/25 | 27,300 | 27,379 |
| Microsoft Corp. | 3.500% | 2/12/35 | 8,800 | 8,126 |
| Microsoft Corp. | 4.200% | 11/3/35 | 7,750 | 7,906 |
| Microsoft Corp. | 5.200% | 6/1/39 | 4,875 | 5,541 |
| Microsoft Corp. | 4.500% | 10/1/40 | 2,435 | 2,539 |
| Microsoft Corp. | 5.300% | 2/8/41 | 2,500 | 2,873 |
| Microsoft Corp. | 3.500% | 11/15/42 | 7,580 | 6,729 |
| Microsoft Corp. | 3.750% | 5/1/43 | 1,865 | 1,726 |
| Microsoft Corp. | 4.875% | 12/15/43 | 5,075 | 5,520 |
| Microsoft Corp. | 3.750% | 2/12/45 | 9,825 | 9,054 |
| Microsoft Corp. | 4.450% | 11/3/45 | 15,350 | 15,864 |
| Microsoft Corp. | 4.000% | 2/12/55 | 16,075 | 14,437 |
| Microsoft Corp. | 4.750% | 11/3/55 | 5,200 | 5,351 |
| Motorola Solutions Inc. | 3.750% | 5/15/22 | 2,600 | 2,373 |
| Motorola Solutions Inc. | 4.000% | 9/1/24 | 4,000 | 3,441 |
| Motorola Solutions Inc. | 5.500% | 9/1/44 | 3,750 | 2,896 |
| NetApp Inc. | 2.000% | 12/15/17 | 3,675 | 3,653 |
| Oracle Corp. | 1.200% | 10/15/17 | 21,300 | 21,302 |
| Oracle Corp. | 5.750% | 4/15/18 | 16,710 | 18,241 |
| Oracle Corp. | 2.375% | 1/15/19 | 3,825 | 3,877 |
| Oracle Corp. | 5.000% | 7/8/19 | 5,500 | 6,056 |
| Oracle Corp. | 2.250% | 10/8/19 | 9,400 | 9,502 |
| Oracle Corp. | 3.875% | 7/15/20 | 7,983 | 8,528 |
| Oracle Corp. | 2.800% | 7/8/21 | 7,050 | 7,141 |
| Oracle Corp. | 2.500% | 5/15/22 | 8,800 | 8,627 |
| Oracle Corp. | 2.500% | 10/15/22 | 14,360 | 14,017 |
| Oracle Corp. | 3.400% | 7/8/24 | 21,150 | 21,447 |
| Oracle Corp. | 2.950% | 5/15/25 | 16,600 | 16,200 |
| Oracle Corp. | 3.250% | 5/15/30 | 5,700 | 5,343 |
| Oracle Corp. | 4.300% | 7/8/34 | 12,150 | 12,057 |
| Oracle Corp. | 3.900% | 5/15/35 | 11,200 | 10,586 |
| Oracle Corp. | 6.500% | 4/15/38 | 3,800 | 4,780 |
| Oracle Corp. | 6.125% | 7/8/39 | 5,355 | 6,485 |
| Oracle Corp. | 5.375% | 7/15/40 | 14,847 | 16,480 |
| Oracle Corp. | 4.500% | 7/8/44 | 7,550 | 7,549 |
| Oracle Corp. | 4.125% | 5/15/45 | 7,800 | 7,386 |
| Oracle Corp. | 4.375% | 5/15/55 | 7,475 | 6,902 |
| Pitney Bowes Inc. | 5.750% | 9/15/17 | 950 | 1,011 |
| Pitney Bowes Inc. | 6.250% | 3/15/19 | 375 | 408 |
| Pitney Bowes Inc. | 4.625% | 3/15/24 | 7,275 | 7,155 |
111
| Total Bond Market II Index Fund | |||||
| Face | Market | ||||
| Maturity | Amount | Value• | |||
| Coupon | Date | ($000) | ($000) | ||
| QUALCOMM Inc. | 1.400% | 5/18/18 | 8,000 | 7,927 | |
| QUALCOMM Inc. | 2.250% | 5/20/20 | 5,750 | 5,701 | |
| QUALCOMM Inc. | 3.450% | 5/20/25 | 10,050 | 9,644 | |
| QUALCOMM Inc. | 4.650% | 5/20/35 | 4,175 | 3,872 | |
| QUALCOMM Inc. | 4.800% | 5/20/45 | 10,825 | 9,568 | |
| Seagate HDD Cayman | 3.750% | 11/15/18 | 4,625 | 4,590 | |
| Seagate HDD Cayman | 4.750% | 6/1/23 | 13,750 | 12,031 | |
| Seagate HDD Cayman | 4.750% | 1/1/25 | 9,450 | 7,879 | |
| 8 | Seagate HDD Cayman | 4.875% | 6/1/27 | 5,000 | 3,838 |
| 8 | Seagate HDD Cayman | 5.750% | 12/1/34 | 2,450 | 1,740 |
| Symantec Corp. | 2.750% | 6/15/17 | 3,275 | 3,282 | |
| Symantec Corp. | 3.950% | 6/15/22 | 3,150 | 3,129 | |
| Telefonaktiebolaget LM Ericsson | 4.125% | 5/15/22 | 1,250 | 1,286 | |
| Texas Instruments Inc. | 1.650% | 8/3/19 | 5,300 | 5,240 | |
| Texas Instruments Inc. | 2.250% | 5/1/23 | 1,750 | 1,660 | |
| Total System Services Inc. | 2.375% | 6/1/18 | 3,050 | 3,025 | |
| Total System Services Inc. | 3.750% | 6/1/23 | 100 | 96 | |
| Trimble Navigation Ltd. | 4.750% | 12/1/24 | 2,500 | 2,500 | |
| Tyco Electronics Group SA | 6.550% | 10/1/17 | 6,866 | 7,424 | |
| Tyco Electronics Group SA | 4.875% | 1/15/21 | 3,750 | 4,023 | |
| Tyco Electronics Group SA | 3.500% | 2/3/22 | 3,900 | 3,968 | |
| Tyco Electronics Group SA | 7.125% | 10/1/37 | 9,575 | 12,221 | |
| Verisk Analytics Inc. | 5.800% | 5/1/21 | 2,300 | 2,551 | |
| Verisk Analytics Inc. | 4.125% | 9/12/22 | 8,050 | 8,103 | |
| Verisk Analytics Inc. | 4.000% | 6/15/25 | 1,525 | 1,492 | |
| Verisk Analytics Inc. | 5.500% | 6/15/45 | 2,000 | 1,907 | |
| Xerox Corp. | 6.750% | 2/1/17 | 2,350 | 2,463 | |
| Xerox Corp. | 2.950% | 3/15/17 | 3,425 | 3,452 | |
| Xerox Corp. | 6.350% | 5/15/18 | 11,270 | 12,085 | |
| Xerox Corp. | 5.625% | 12/15/19 | 1,165 | 1,247 | |
| Xerox Corp. | 2.800% | 5/15/20 | 2,500 | 2,385 | |
| Xerox Corp. | 2.750% | 9/1/20 | 1,825 | 1,726 | |
| Xerox Corp. | 4.500% | 5/15/21 | 12,765 | 12,917 | |
| Xerox Corp. | 3.800% | 5/15/24 | 1,300 | 1,209 | |
| Xerox Corp. | 6.750% | 12/15/39 | 100 | 96 | |
| Xilinx Inc. | 2.125% | 3/15/19 | 500 | 495 | |
| Xilinx Inc. | 3.000% | 3/15/21 | 9,375 | 9,393 | |
| Transportation (0.6%) | |||||
| 5 | American Airlines 2013-1 Class A Pass | ||||
| Through Trust | 4.000% | 1/15/27 | 1,945 | 1,969 | |
| 5 | American Airlines 2013-2 Class A Pass | ||||
| Through Trust | 4.950% | 7/15/24 | 4,730 | 5,013 | |
| 5 | American Airlines 2014-1 Class A Pass | ||||
| Through Trust | 3.700% | 4/1/28 | 3,650 | 3,650 | |
| 5 | American Airlines 2015-1 Class A Pass | ||||
| Through Trust | 3.375% | 11/1/28 | 10,116 | 9,787 | |
| 5 | American Airlines 2015-1 Class B Pass | ||||
| Through Trust | 3.700% | 11/1/24 | 1,630 | 1,577 | |
| 5 | American Airlines 2015-2 Class AA Pass | ||||
| Through Trust | 3.600% | 9/22/27 | 1,050 | 1,062 | |
| Burlington Northern Santa Fe LLC | 5.650% | 5/1/17 | 2,025 | 2,132 | |
| Burlington Northern Santa Fe LLC | 5.750% | 3/15/18 | 5,350 | 5,777 | |
| Burlington Northern Santa Fe LLC | 3.600% | 9/1/20 | 3,750 | 3,900 | |
| Burlington Northern Santa Fe LLC | 3.450% | 9/15/21 | 2,590 | 2,658 | |
| Burlington Northern Santa Fe LLC | 3.050% | 3/15/22 | 375 | 376 | |
| 112 | |||||
| Total Bond Market II Index Fund | ||||
| Face | Market | |||
| Maturity | Amount | Value• | ||
| Coupon | Date | ($000) | ($000) | |
| Burlington Northern Santa Fe LLC | 3.050% | 9/1/22 | 1,100 | 1,099 |
| Burlington Northern Santa Fe LLC | 3.000% | 3/15/23 | 2,000 | 1,971 |
| Burlington Northern Santa Fe LLC | 3.850% | 9/1/23 | 250 | 260 |
| Burlington Northern Santa Fe LLC | 3.750% | 4/1/24 | 3,475 | 3,567 |
| Burlington Northern Santa Fe LLC | 3.400% | 9/1/24 | 3,175 | 3,161 |
| Burlington Northern Santa Fe LLC | 3.000% | 4/1/25 | 14,000 | 13,451 |
| Burlington Northern Santa Fe LLC | 3.650% | 9/1/25 | 1,975 | 2,007 |
| Burlington Northern Santa Fe LLC | 7.000% | 12/15/25 | 1,700 | 2,124 |
| Burlington Northern Santa Fe LLC | 6.200% | 8/15/36 | 175 | 207 |
| Burlington Northern Santa Fe LLC | 6.150% | 5/1/37 | 4,100 | 4,809 |
| Burlington Northern Santa Fe LLC | 5.750% | 5/1/40 | 11,600 | 13,043 |
| Burlington Northern Santa Fe LLC | 5.050% | 3/1/41 | 1,875 | 1,937 |
| Burlington Northern Santa Fe LLC | 4.950% | 9/15/41 | 830 | 848 |
| Burlington Northern Santa Fe LLC | 4.400% | 3/15/42 | 4,304 | 4,091 |
| Burlington Northern Santa Fe LLC | 4.375% | 9/1/42 | 3,450 | 3,265 |
| Burlington Northern Santa Fe LLC | 4.450% | 3/15/43 | 7,055 | 6,733 |
| Burlington Northern Santa Fe LLC | 4.900% | 4/1/44 | 5,805 | 5,957 |
| Burlington Northern Santa Fe LLC | 4.550% | 9/1/44 | 4,105 | 3,945 |
| Burlington Northern Santa Fe LLC | 4.150% | 4/1/45 | 1,680 | 1,526 |
| Burlington Northern Santa Fe LLC | 4.700% | 9/1/45 | 1,050 | 1,045 |
| Canadian National Railway Co. | 5.850% | 11/15/17 | 350 | 376 |
| Canadian National Railway Co. | 5.550% | 3/1/19 | 5,085 | 5,586 |
| Canadian National Railway Co. | 2.850% | 12/15/21 | 11,235 | 11,294 |
| Canadian National Railway Co. | 6.900% | 7/15/28 | 100 | 132 |
| Canadian National Railway Co. | 6.250% | 8/1/34 | 250 | 315 |
| Canadian National Railway Co. | 6.200% | 6/1/36 | 5,525 | 7,044 |
| Canadian National Railway Co. | 6.375% | 11/15/37 | 250 | 324 |
| Canadian National Railway Co. | 3.500% | 11/15/42 | 3,600 | 3,248 |
| Canadian Pacific Railway Co. | 7.250% | 5/15/19 | 2,445 | 2,792 |
| Canadian Pacific Railway Co. | 4.450% | 3/15/23 | 3,830 | 4,082 |
| Canadian Pacific Railway Co. | 2.900% | 2/1/25 | 5,000 | 4,705 |
| Canadian Pacific Railway Co. | 3.700% | 2/1/26 | 2,100 | 2,069 |
| Canadian Pacific Railway Co. | 7.125% | 10/15/31 | 1,456 | 1,821 |
| Canadian Pacific Railway Co. | 5.750% | 3/15/33 | 100 | 109 |
| Canadian Pacific Railway Co. | 5.950% | 5/15/37 | 8,985 | 10,106 |
| Canadian Pacific Railway Co. | 4.800% | 8/1/45 | 150 | 147 |
| Canadian Pacific Railway Co. | 6.125% | 9/15/15 | 1,900 | 1,941 |
| Canadian Pacific Railway Ltd. | 4.500% | 1/15/22 | 4,375 | 4,632 |
| Canadian Pacific Railway Ltd. | 5.750% | 1/15/42 | 8,360 | 9,071 |
| 5 Continental Airlines 2009-2 Class A Pass | ||||
| Through Trust | 7.250% | 5/10/21 | 865 | 975 |
| 5 Continental Airlines 2010-1 Class A Pass | ||||
| Through Trust | 4.750% | 7/12/22 | 3,951 | 4,139 |
| 5 Continental Airlines 2012-1 Class A Pass | ||||
| Through Trust | 4.150% | 10/11/25 | 7,708 | 7,919 |
| 5 Continental Airlines 2012-2 Class A Pass | ||||
| Through Trust | 4.000% | 4/29/26 | 1,996 | 2,036 |
| CSX Corp. | 7.900% | 5/1/17 | 9,386 | 10,162 |
| CSX Corp. | 6.250% | 3/15/18 | 3,875 | 4,218 |
| CSX Corp. | 7.375% | 2/1/19 | 11,275 | 12,915 |
| CSX Corp. | 4.250% | 6/1/21 | 1,590 | 1,683 |
| CSX Corp. | 3.700% | 11/1/23 | 700 | 716 |
| CSX Corp. | 6.150% | 5/1/37 | 1,300 | 1,513 |
| CSX Corp. | 6.220% | 4/30/40 | 6,464 | 7,637 |
| CSX Corp. | 5.500% | 4/15/41 | 4,800 | 5,288 |
| CSX Corp. | 4.750% | 5/30/42 | 2,090 | 2,087 |
113
| Total Bond Market II Index Fund | |||||
| Face | Market | ||||
| Maturity | Amount | Value• | |||
| Coupon | Date | ($000) | ($000) | ||
| CSX Corp. | 4.100% | 3/15/44 | 5,175 | 4,684 | |
| CSX Corp. | 3.950% | 5/1/50 | 9,925 | 8,423 | |
| 5 | Delta Air Lines 2007-1 Class A Pass | ||||
| Through Trust | 6.821% | 2/10/24 | 5,333 | 6,120 | |
| 5 | Delta Air Lines 2009-1 Class A Pass | ||||
| Through Trust | 7.750% | 6/17/21 | 4,174 | 4,675 | |
| 5 | Delta Air Lines 2010-1 Class A Pass | ||||
| Through Trust | 6.200% | 1/2/20 | 745 | 795 | |
| 5 | Delta Air Lines 2010-2 Class A Pass | ||||
| Through Trust | 4.950% | 11/23/20 | 670 | 705 | |
| 5 | Delta Air Lines 2012-1 Class A Pass | ||||
| Through Trust | 4.750% | 11/7/21 | 1,271 | 1,333 | |
| 5 | Delta Air Lines 2015-1 Class AA Pass | ||||
| Through Trust | 3.625% | 7/30/27 | 1,050 | 1,062 | |
| FedEx Corp. | 8.000% | 1/15/19 | 3,075 | 3,582 | |
| FedEx Corp. | 2.300% | 2/1/20 | 4,100 | 4,111 | |
| FedEx Corp. | 2.625% | 8/1/22 | 1,475 | 1,440 | |
| FedEx Corp. | 4.000% | 1/15/24 | 250 | 261 | |
| FedEx Corp. | 3.200% | 2/1/25 | 3,300 | 3,211 | |
| FedEx Corp. | 4.900% | 1/15/34 | 800 | 824 | |
| FedEx Corp. | 3.900% | 2/1/35 | 4,050 | 3,692 | |
| FedEx Corp. | 3.875% | 8/1/42 | 275 | 238 | |
| FedEx Corp. | 4.100% | 4/15/43 | 2,425 | 2,148 | |
| FedEx Corp. | 5.100% | 1/15/44 | 3,450 | 3,576 | |
| FedEx Corp. | 4.750% | 11/15/45 | 5,100 | 5,043 | |
| 5 | Hawaiian Airlines 2013-1 Class A Pass | ||||
| Through Certificates | 3.900% | 1/15/26 | 7,799 | 7,526 | |
| JB Hunt Transport Services Inc. | 3.300% | 8/15/22 | 3,100 | 3,076 | |
| JB Hunt Transport Services Inc. | 3.850% | 3/15/24 | 1,850 | 1,880 | |
| 8 | Kansas City Southern | 2.350% | 5/15/20 | 875 | 839 |
| 8 | Kansas City Southern | 3.000% | 5/15/23 | 5,025 | 4,763 |
| 8 | Kansas City Southern | 4.300% | 5/15/43 | 3,125 | 2,771 |
| 8 | Kansas City Southern | 4.950% | 8/15/45 | 2,850 | 2,772 |
| 5,8 | Latam Airlines 2015-1 Pass Through Trust A | 4.200% | 11/15/27 | 3,300 | 3,043 |
| Norfolk Southern Corp. | 7.700% | 5/15/17 | 4,275 | 4,622 | |
| Norfolk Southern Corp. | 5.900% | 6/15/19 | 3,890 | 4,328 | |
| Norfolk Southern Corp. | 3.250% | 12/1/21 | 1,000 | 998 | |
| Norfolk Southern Corp. | 3.000% | 4/1/22 | 3,900 | 3,856 | |
| Norfolk Southern Corp. | 2.903% | 2/15/23 | 7,053 | 6,798 | |
| Norfolk Southern Corp. | 3.850% | 1/15/24 | 2,000 | 2,037 | |
| Norfolk Southern Corp. | 5.590% | 5/17/25 | 1,533 | 1,751 | |
| Norfolk Southern Corp. | 7.800% | 5/15/27 | 675 | 890 | |
| Norfolk Southern Corp. | 7.250% | 2/15/31 | 811 | 1,031 | |
| Norfolk Southern Corp. | 7.050% | 5/1/37 | 300 | 377 | |
| Norfolk Southern Corp. | 4.837% | 10/1/41 | 9,498 | 9,247 | |
| Norfolk Southern Corp. | 3.950% | 10/1/42 | 2,125 | 1,817 | |
| Norfolk Southern Corp. | 4.450% | 6/15/45 | 2,725 | 2,555 | |
| Norfolk Southern Corp. | 4.650% | 1/15/46 | 1,900 | 1,822 | |
| Norfolk Southern Corp. | 6.000% | 3/15/05 | 2,700 | 2,881 | |
| Norfolk Southern Corp. | 6.000% | 5/23/11 | 7,785 | 8,163 | |
| Norfolk Southern Railway Co. | 9.750% | 6/15/20 | 275 | 351 | |
| 5 | Northwest Airlines 2007-1 Class A Pass | ||||
| Through Trust | 7.027% | 5/1/21 | 198 | 221 | |
| Ryder System Inc. | 2.500% | 3/1/17 | 1,150 | 1,158 | |
| Ryder System Inc. | 3.500% | 6/1/17 | 2,850 | 2,913 | |
| 114 | |||||
| Total Bond Market II Index Fund | ||||
| Face | Market | |||
| Maturity | Amount | Value• | ||
| Coupon | Date | ($000) | ($000) | |
| Ryder System Inc. | 2.500% | 3/1/18 | 4,543 | 4,536 |
| Ryder System Inc. | 2.450% | 11/15/18 | 8,650 | 8,657 |
| Ryder System Inc. | 2.350% | 2/26/19 | 3,205 | 3,199 |
| Ryder System Inc. | 2.550% | 6/1/19 | 8,825 | 8,783 |
| Ryder System Inc. | 2.450% | 9/3/19 | 700 | 690 |
| Ryder System Inc. | 2.500% | 5/11/20 | 2,000 | 1,962 |
| Ryder System Inc. | 2.875% | 9/1/20 | 1,600 | 1,581 |
| Southwest Airlines Co. | 2.750% | 11/6/19 | 3,400 | 3,425 |
| Southwest Airlines Co. | 2.650% | 11/5/20 | 3,370 | 3,353 |
| 5 Southwest Airlines Co. 2007-1 Pass | ||||
| Through Trust | 6.150% | 2/1/24 | 308 | 344 |
| 5 Spirit Airlines Class A Pass Through Certificates | ||||
| Series 2015-1 | 4.100% | 10/1/29 | 2,650 | 2,630 |
| Trinity Industries Inc. | 4.550% | 10/1/24 | 1,790 | 1,640 |
| 5 UAL 2009-2A Pass Through Trust | 9.750% | 7/15/18 | 915 | 965 |
| Union Pacific Corp. | 5.700% | 8/15/18 | 850 | 936 |
| Union Pacific Corp. | 1.800% | 2/1/20 | 1,000 | 986 |
| Union Pacific Corp. | 2.250% | 6/19/20 | 6,500 | 6,500 |
| Union Pacific Corp. | 4.000% | 2/1/21 | 4,325 | 4,626 |
| Union Pacific Corp. | 4.163% | 7/15/22 | 4,290 | 4,642 |
| Union Pacific Corp. | 2.750% | 4/15/23 | 4,500 | 4,444 |
| Union Pacific Corp. | 3.646% | 2/15/24 | 1,698 | 1,773 |
| Union Pacific Corp. | 3.250% | 1/15/25 | 3,200 | 3,243 |
| Union Pacific Corp. | 3.250% | 8/15/25 | 10,350 | 10,469 |
| Union Pacific Corp. | 6.625% | 2/1/29 | 520 | 668 |
| Union Pacific Corp. | 3.375% | 2/1/35 | 6,000 | 5,443 |
| Union Pacific Corp. | 4.750% | 9/15/41 | 3,825 | 4,078 |
| Union Pacific Corp. | 4.250% | 4/15/43 | 100 | 100 |
| Union Pacific Corp. | 4.750% | 12/15/43 | 2,900 | 3,116 |
| Union Pacific Corp. | 4.821% | 2/1/44 | 4,264 | 4,616 |
| Union Pacific Corp. | 4.850% | 6/15/44 | 400 | 433 |
| Union Pacific Corp. | 4.150% | 1/15/45 | 350 | 345 |
| Union Pacific Corp. | 4.050% | 11/15/45 | 7,300 | 7,113 |
| Union Pacific Corp. | 3.875% | 2/1/55 | 5,325 | 4,670 |
| Union Pacific Corp. | 4.375% | 11/15/65 | 4,600 | 4,263 |
| 5 Union Pacific Railroad Co. 2007-3 Pass | ||||
| Through Trust | 6.176% | 1/2/31 | 356 | 405 |
| 5 United Airlines 2013-1 Class A Pass | ||||
| Through Trust | 4.300% | 2/15/27 | 4,070 | 4,212 |
| 5 United Airlines 2014-1 Class A Pass | ||||
| Through Trust | 4.000% | 10/11/27 | 5,797 | 5,928 |
| 5 United Airlines 2014-2 Class A Pass | ||||
| Through Trust | 3.750% | 3/3/28 | 2,800 | 2,821 |
| United Airlines 2015-1 Class A Pass | ||||
| Through Trust | 3.700% | 12/1/22 | 1,700 | 1,704 |
| 5 United Airlines 2015-1 Class AA Pass | ||||
| Through Trust | 3.450% | 12/1/27 | 4,800 | 4,806 |
| United Parcel Service Inc. | 1.125% | 10/1/17 | 875 | 874 |
| United Parcel Service Inc. | 5.500% | 1/15/18 | 6,005 | 6,510 |
| United Parcel Service Inc. | 5.125% | 4/1/19 | 4,875 | 5,379 |
| United Parcel Service Inc. | 3.125% | 1/15/21 | 7,600 | 7,907 |
| United Parcel Service Inc. | 2.450% | 10/1/22 | 7,925 | 7,823 |
| United Parcel Service Inc. | 6.200% | 1/15/38 | 8,450 | 10,862 |
| United Parcel Service Inc. | 4.875% | 11/15/40 | 3,625 | 4,036 |
| United Parcel Service Inc. | 3.625% | 10/1/42 | 2,050 | 1,896 |
115
| Total Bond Market II Index Fund | ||||
| Face | Market | |||
| Maturity | Amount | Value• | ||
| Coupon | Date | ($000) | ($000) | |
| United Parcel Service of America Inc. | 8.375% | 4/1/30 | 500 | 701 |
| 5 US Airways 2013-1 Class A Pass | ||||
| Through Trust | 3.950% | 5/15/27 | 498 | 500 |
| 14,679,881 | ||||
| Utilities (2.0%) | ||||
| Electric (1.8%) | ||||
| AEP Texas Central Co. | 6.650% | 2/15/33 | 3,652 | 4,453 |
| Alabama Power Co. | 3.550% | 12/1/23 | 8,800 | 9,057 |
| Alabama Power Co. | 2.800% | 4/1/25 | 1,600 | 1,544 |
| Alabama Power Co. | 6.125% | 5/15/38 | 900 | 1,095 |
| Alabama Power Co. | 6.000% | 3/1/39 | 1,750 | 2,080 |
| Alabama Power Co. | 5.200% | 6/1/41 | 5,575 | 6,081 |
| Alabama Power Co. | 4.100% | 1/15/42 | 1,475 | 1,402 |
| Alabama Power Co. | 3.850% | 12/1/42 | 1,850 | 1,698 |
| Alabama Power Co. | 4.150% | 8/15/44 | 2,400 | 2,291 |
| Alabama Power Co. | 3.750% | 3/1/45 | 3,100 | 2,789 |
| Ameren Corp. | 2.700% | 11/15/20 | 1,500 | 1,494 |
| Ameren Corp. | 3.650% | 2/15/26 | 2,275 | 2,266 |
| Ameren Illinois Co. | 2.700% | 9/1/22 | 2,245 | 2,207 |
| Ameren Illinois Co. | 3.250% | 3/1/25 | 1,890 | 1,902 |
| Ameren Illinois Co. | 4.800% | 12/15/43 | 4,775 | 5,160 |
| Ameren Illinois Co. | 4.300% | 7/1/44 | 325 | 327 |
| Ameren Illinois Co. | 4.150% | 3/15/46 | 525 | 522 |
| Appalachian Power Co. | 4.600% | 3/30/21 | 15,850 | 16,912 |
| Appalachian Power Co. | 3.400% | 6/1/25 | 2,400 | 2,343 |
| Appalachian Power Co. | 5.800% | 10/1/35 | 1,900 | 2,102 |
| Appalachian Power Co. | 6.375% | 4/1/36 | 750 | 869 |
| Appalachian Power Co. | 6.700% | 8/15/37 | 3,750 | 4,490 |
| Appalachian Power Co. | 7.000% | 4/1/38 | 1,865 | 2,326 |
| Appalachian Power Co. | 4.450% | 6/1/45 | 1,650 | 1,577 |
| Arizona Public Service Co. | 8.750% | 3/1/19 | 1,298 | 1,542 |
| Arizona Public Service Co. | 3.350% | 6/15/24 | 1,975 | 2,006 |
| Arizona Public Service Co. | 3.150% | 5/15/25 | 500 | 498 |
| Arizona Public Service Co. | 5.500% | 9/1/35 | 2,100 | 2,395 |
| Arizona Public Service Co. | 4.500% | 4/1/42 | 4,525 | 4,644 |
| Arizona Public Service Co. | 4.700% | 1/15/44 | 3,350 | 3,561 |
| Arizona Public Service Co. | 4.350% | 11/15/45 | 1,400 | 1,416 |
| Atlantic City Electric Co. | 7.750% | 11/15/18 | 2,700 | 3,116 |
| Baltimore Gas & Electric Co. | 3.500% | 11/15/21 | 4,825 | 5,001 |
| Baltimore Gas & Electric Co. | 2.800% | 8/15/22 | 3,000 | 2,971 |
| Baltimore Gas & Electric Co. | 3.350% | 7/1/23 | 3,225 | 3,266 |
| Berkshire Hathaway Energy Co. | 1.100% | 5/15/17 | 6,300 | 6,247 |
| Berkshire Hathaway Energy Co. | 5.750% | 4/1/18 | 6,211 | 6,710 |
| Berkshire Hathaway Energy Co. | 2.000% | 11/15/18 | 1,000 | 994 |
| Berkshire Hathaway Energy Co. | 3.750% | 11/15/23 | 5,925 | 6,079 |
| Berkshire Hathaway Energy Co. | 6.125% | 4/1/36 | 7,475 | 8,715 |
| Berkshire Hathaway Energy Co. | 5.950% | 5/15/37 | 5,317 | 6,073 |
| Berkshire Hathaway Energy Co. | 6.500% | 9/15/37 | 7,580 | 9,234 |
| Berkshire Hathaway Energy Co. | 5.150% | 11/15/43 | 6,950 | 7,340 |
| Berkshire Hathaway Energy Co. | 4.500% | 2/1/45 | 2,575 | 2,461 |
| CenterPoint Energy Houston Electric LLC | 2.250% | 8/1/22 | 1,700 | 1,632 |
| CenterPoint Energy Houston Electric LLC | 3.550% | 8/1/42 | 4,950 | 4,452 |
| CenterPoint Energy Houston Electric LLC | 4.500% | 4/1/44 | 125 | 129 |
| CenterPoint Energy Inc. | 6.500% | 5/1/18 | 5,450 | 5,944 |
| Cleco Power LLC | 6.000% | 12/1/40 | 1,600 | 1,797 |
| Cleveland Electric Illuminating Co. | 5.700% | 4/1/17 | 1,695 | 1,756 |
116
| Total Bond Market II Index Fund | ||||
| Face | Market | |||
| Maturity | Amount | Value• | ||
| Coupon | Date | ($000) | ($000) | |
| Cleveland Electric Illuminating Co. | 7.880% | 11/1/17 | 600 | 660 |
| Cleveland Electric Illuminating Co. | 5.500% | 8/15/24 | 1,300 | 1,464 |
| CMS Energy Corp. | 8.750% | 6/15/19 | 5,620 | 6,721 |
| CMS Energy Corp. | 6.250% | 2/1/20 | 2,900 | 3,290 |
| CMS Energy Corp. | 3.875% | 3/1/24 | 1,600 | 1,632 |
| CMS Energy Corp. | 3.600% | 11/15/25 | 3,225 | 3,206 |
| CMS Energy Corp. | 4.875% | 3/1/44 | 4,400 | 4,462 |
| Commonwealth Edison Co. | 6.150% | 9/15/17 | 15,357 | 16,498 |
| Commonwealth Edison Co. | 5.800% | 3/15/18 | 6,635 | 7,194 |
| Commonwealth Edison Co. | 2.150% | 1/15/19 | 9,250 | 9,210 |
| Commonwealth Edison Co. | 4.000% | 8/1/20 | 5,000 | 5,287 |
| Commonwealth Edison Co. | 3.400% | 9/1/21 | 3,000 | 3,114 |
| Commonwealth Edison Co. | 5.875% | 2/1/33 | 100 | 118 |
| Commonwealth Edison Co. | 5.900% | 3/15/36 | 3,380 | 4,038 |
| Commonwealth Edison Co. | 6.450% | 1/15/38 | 3,020 | 3,857 |
| Commonwealth Edison Co. | 3.800% | 10/1/42 | 4,450 | 4,104 |
| Commonwealth Edison Co. | 4.600% | 8/15/43 | 1,200 | 1,242 |
| Commonwealth Edison Co. | 3.700% | 3/1/45 | 3,900 | 3,507 |
| Commonwealth Edison Co. | 4.350% | 11/15/45 | 5,200 | 5,234 |
| Connecticut Light & Power Co. | 5.500% | 2/1/19 | 1,380 | 1,516 |
| Connecticut Light & Power Co. | 2.500% | 1/15/23 | 7,275 | 7,046 |
| Connecticut Light & Power Co. | 6.350% | 6/1/36 | 2,800 | 3,561 |
| Connecticut Light & Power Co. | 4.300% | 4/15/44 | 1,800 | 1,809 |
| Connecticut Light & Power Co. | 4.150% | 6/1/45 | 600 | 593 |
| Consolidated Edison Co. of New York Inc. | 6.650% | 4/1/19 | 4,850 | 5,506 |
| Consolidated Edison Co. of New York Inc. | 4.450% | 6/15/20 | 6,675 | 7,237 |
| Consolidated Edison Co. of New York Inc. | 5.300% | 3/1/35 | 800 | 892 |
| Consolidated Edison Co. of New York Inc. | 5.850% | 3/15/36 | 8,615 | 10,235 |
| Consolidated Edison Co. of New York Inc. | 6.200% | 6/15/36 | 1,628 | 1,971 |
| Consolidated Edison Co. of New York Inc. | 5.700% | 12/1/36 | 450 | 518 |
| Consolidated Edison Co. of New York Inc. | 6.750% | 4/1/38 | 500 | 644 |
| Consolidated Edison Co. of New York Inc. | 5.700% | 6/15/40 | 5,460 | 6,398 |
| Consolidated Edison Co. of New York Inc. | 3.950% | 3/1/43 | 4,400 | 4,066 |
| Consolidated Edison Co. of New York Inc. | 4.450% | 3/15/44 | 14,720 | 14,718 |
| Consolidated Edison Co. of New York Inc. | 4.500% | 12/1/45 | 1,875 | 1,892 |
| Constellation Energy Group Inc. | 5.150% | 12/1/20 | 3,705 | 4,024 |
| Consumers Energy Co. | 5.650% | 9/15/18 | 1,800 | 1,967 |
| Consumers Energy Co. | 6.700% | 9/15/19 | 7,960 | 9,165 |
| Consumers Energy Co. | 5.650% | 4/15/20 | 1,375 | 1,551 |
| Consumers Energy Co. | 2.850% | 5/15/22 | 3,516 | 3,510 |
| Consumers Energy Co. | 3.375% | 8/15/23 | 875 | 895 |
| Consumers Energy Co. | 3.950% | 5/15/43 | 3,900 | 3,777 |
| Consumers Energy Co. | 4.100% | 11/15/45 | 450 | 447 |
| Consumers Energy Co. | 4.350% | 8/31/64 | 1,675 | 1,588 |
| Dayton Power & Light Co. | 1.875% | 9/15/16 | 325 | 325 |
| Delmarva Power & Light Co. | 3.500% | 11/15/23 | 2,175 | 2,232 |
| Delmarva Power & Light Co. | 4.000% | 6/1/42 | 3,650 | 3,450 |
| Dominion Resources Inc. | 1.400% | 9/15/17 | 575 | 569 |
| Dominion Resources Inc. | 6.400% | 6/15/18 | 300 | 328 |
| Dominion Resources Inc. | 2.500% | 12/1/19 | 2,900 | 2,889 |
| Dominion Resources Inc. | 2.750% | 9/15/22 | 300 | 290 |
| Dominion Resources Inc. | 3.625% | 12/1/24 | 6,300 | 6,241 |
| Dominion Resources Inc. | 3.900% | 10/1/25 | 675 | 676 |
| Dominion Resources Inc. | 6.300% | 3/15/33 | 350 | 403 |
| Dominion Resources Inc. | 5.950% | 6/15/35 | 5,700 | 6,383 |
| Dominion Resources Inc. | 4.900% | 8/1/41 | 4,450 | 4,367 |
117
| Total Bond Market II Index Fund | |||||
| Face | Market | ||||
| Maturity | Amount | Value• | |||
| Coupon | Date | ($000) | ($000) | ||
| Dominion Resources Inc. | 4.050% | 9/15/42 | 4,997 | 4,408 | |
| Dominion Resources Inc. | 4.700% | 12/1/44 | 4,500 | 4,388 | |
| 5 | Dominion Resources Inc. | 5.750% | 10/1/54 | 2,975 | 2,921 |
| DTE Electric Co. | 3.450% | 10/1/20 | 6,805 | 7,114 | |
| DTE Electric Co. | 2.650% | 6/15/22 | 6,025 | 5,927 | |
| DTE Electric Co. | 3.650% | 3/15/24 | 6,325 | 6,612 | |
| DTE Electric Co. | 3.375% | 3/1/25 | 3,925 | 4,010 | |
| DTE Electric Co. | 5.700% | 10/1/37 | 1,825 | 2,186 | |
| DTE Electric Co. | 3.950% | 6/15/42 | 10,075 | 9,655 | |
| DTE Energy Co. | 2.400% | 12/1/19 | 2,200 | 2,191 | |
| DTE Energy Co. | 3.500% | 6/1/24 | 8,150 | 8,162 | |
| Duke Energy Carolinas LLC | 5.250% | 1/15/18 | 2,000 | 2,142 | |
| Duke Energy Carolinas LLC | 5.100% | 4/15/18 | 1,650 | 1,771 | |
| Duke Energy Carolinas LLC | 4.300% | 6/15/20 | 2,275 | 2,462 | |
| Duke Energy Carolinas LLC | 3.900% | 6/15/21 | 8,868 | 9,418 | |
| Duke Energy Carolinas LLC | 6.000% | 12/1/28 | 3,694 | 4,433 | |
| Duke Energy Carolinas LLC | 6.450% | 10/15/32 | 6,325 | 7,698 | |
| Duke Energy Carolinas LLC | 6.100% | 6/1/37 | 3,625 | 4,382 | |
| Duke Energy Carolinas LLC | 6.000% | 1/15/38 | 900 | 1,110 | |
| Duke Energy Carolinas LLC | 6.050% | 4/15/38 | 525 | 652 | |
| Duke Energy Carolinas LLC | 5.300% | 2/15/40 | 4,890 | 5,611 | |
| Duke Energy Carolinas LLC | 4.250% | 12/15/41 | 6,875 | 6,853 | |
| Duke Energy Carolinas LLC | 4.000% | 9/30/42 | 3,725 | 3,588 | |
| Duke Energy Carolinas LLC | 3.750% | 6/1/45 | 1,850 | 1,713 | |
| Duke Energy Corp. | 1.625% | 8/15/17 | 525 | 524 | |
| Duke Energy Corp. | 2.100% | 6/15/18 | 1,250 | 1,252 | |
| Duke Energy Corp. | 5.050% | 9/15/19 | 2,225 | 2,421 | |
| Duke Energy Corp. | 3.950% | 10/15/23 | 1,850 | 1,910 | |
| Duke Energy Corp. | 3.750% | 4/15/24 | 12,075 | 12,220 | |
| Duke Energy Corp. | 4.800% | 12/15/45 | 600 | 607 | |
| Duke Energy Florida Llc | 5.650% | 6/15/18 | 1,175 | 1,283 | |
| Duke Energy Florida LLC | 6.350% | 9/15/37 | 775 | 988 | |
| Duke Energy Florida LLC | 6.400% | 6/15/38 | 5,000 | 6,391 | |
| Duke Energy Florida LLC | 5.650% | 4/1/40 | 4,200 | 4,963 | |
| Duke Energy Indiana Inc. | 3.750% | 7/15/20 | 2,100 | 2,212 | |
| Duke Energy Indiana Inc. | 6.350% | 8/15/38 | 3,575 | 4,560 | |
| Duke Energy Indiana Inc. | 4.200% | 3/15/42 | 1,000 | 980 | |
| Duke Energy Indiana Inc. | 4.900% | 7/15/43 | 2,450 | 2,648 | |
| Duke Energy Progress Llc | 5.300% | 1/15/19 | 5,475 | 6,015 | |
| Duke Energy Progress Llc | 2.800% | 5/15/22 | 3,000 | 3,002 | |
| Duke Energy Progress LLC | 3.250% | 8/15/25 | 2,800 | 2,817 | |
| Duke Energy Progress LLC | 6.300% | 4/1/38 | 3,025 | 3,855 | |
| Duke Energy Progress LLC | 4.100% | 5/15/42 | 3,625 | 3,516 | |
| Duke Energy Progress LLC | 4.375% | 3/30/44 | 10,150 | 10,305 | |
| Duke Energy Progress LLC | 4.150% | 12/1/44 | 4,050 | 3,956 | |
| Edison International | 3.750% | 9/15/17 | 6,690 | 6,901 | |
| El Paso Electric Co. | 6.000% | 5/15/35 | 600 | 709 | |
| Entergy Arkansas Inc. | 3.750% | 2/15/21 | 3,350 | 3,486 | |
| Entergy Gulf States Louisiana LLC | 6.000% | 5/1/18 | 4,175 | 4,563 | |
| Entergy Gulf States Louisiana LLC | 3.950% | 10/1/20 | 8,450 | 8,902 | |
| Entergy Gulf States Louisiana LLC | 5.590% | 10/1/24 | 1,000 | 1,142 | |
| Entergy Louisiana LLC | 4.050% | 9/1/23 | 5,650 | 5,861 | |
| Entergy Louisiana LLC | 5.400% | 11/1/24 | 2,877 | 3,286 | |
| Entergy Louisiana LLC | 4.950% | 1/15/45 | 3,750 | 3,744 | |
| Entergy Mississippi Inc. | 3.100% | 7/1/23 | 300 | 294 | |
| Entergy Texas Inc. | 7.125% | 2/1/19 | 3,000 | 3,395 | |
| 118 | |||||
| Total Bond Market II Index Fund | ||||
| Face | Market | |||
| Maturity | Amount | Value• | ||
| Coupon | Date | ($000) | ($000) | |
| Entergy Texas Inc. | 5.150% | 6/1/45 | 2,350 | 2,304 |
| Eversource Energy | 1.450% | 5/1/18 | 1,700 | 1,672 |
| Eversource Energy | 4.500% | 11/15/19 | 10,332 | 11,021 |
| Exelon Corp. | 1.550% | 6/9/17 | 2,000 | 1,993 |
| Exelon Corp. | 2.850% | 6/15/20 | 1,625 | 1,623 |
| 8 Exelon Corp. | 3.950% | 6/15/25 | 11,425 | 11,443 |
| 8 Exelon Corp. | 4.950% | 6/15/35 | 4,900 | 4,912 |
| Exelon Corp. | 5.625% | 6/15/35 | 3,250 | 3,467 |
| 8 Exelon Corp. | 5.100% | 6/15/45 | 4,775 | 4,767 |
| Exelon Generation Co. LLC | 6.200% | 10/1/17 | 9,320 | 9,944 |
| Exelon Generation Co. LLC | 2.950% | 1/15/20 | 800 | 797 |
| Exelon Generation Co. LLC | 4.000% | 10/1/20 | 3,300 | 3,402 |
| Exelon Generation Co. LLC | 4.250% | 6/15/22 | 6,000 | 6,088 |
| Exelon Generation Co. LLC | 6.250% | 10/1/39 | 3,000 | 3,037 |
| Exelon Generation Co. LLC | 5.750% | 10/1/41 | 5,175 | 5,005 |
| Exelon Generation Co. LLC | 5.600% | 6/15/42 | 5,848 | 5,444 |
| FirstEnergy Solutions Corp. | 6.800% | 8/15/39 | 5,275 | 4,962 |
| Florida Power & Light Co. | 5.550% | 11/1/17 | 3,200 | 3,424 |
| Florida Power & Light Co. | 2.750% | 6/1/23 | 2,400 | 2,373 |
| Florida Power & Light Co. | 3.250% | 6/1/24 | 2,800 | 2,852 |
| Florida Power & Light Co. | 5.625% | 4/1/34 | 1,700 | 2,025 |
| Florida Power & Light Co. | 5.650% | 2/1/37 | 692 | 831 |
| Florida Power & Light Co. | 5.950% | 2/1/38 | 3,250 | 4,046 |
| Florida Power & Light Co. | 5.960% | 4/1/39 | 9,950 | 12,428 |
| Florida Power & Light Co. | 5.250% | 2/1/41 | 975 | 1,118 |
| Florida Power & Light Co. | 4.125% | 2/1/42 | 10,575 | 10,532 |
| Florida Power & Light Co. | 3.800% | 12/15/42 | 4,350 | 4,124 |
| Florida Power & Light Co. | 4.050% | 10/1/44 | 500 | 495 |
| Georgia Power Co. | 5.700% | 6/1/17 | 2,125 | 2,243 |
| Georgia Power Co. | 1.950% | 12/1/18 | 17,375 | 17,323 |
| Georgia Power Co. | 4.750% | 9/1/40 | 1,200 | 1,169 |
| Georgia Power Co. | 4.300% | 3/15/42 | 8,290 | 7,663 |
| Georgia Power Co. | 4.300% | 3/15/43 | 3,810 | 3,495 |
| Iberdrola International BV | 6.750% | 7/15/36 | 3,985 | 4,878 |
| Indiana Michigan Power Co. | 7.000% | 3/15/19 | 2,012 | 2,281 |
| Indiana Michigan Power Co. | 6.050% | 3/15/37 | 2,850 | 3,238 |
| Interstate Power & Light Co. | 3.250% | 12/1/24 | 1,400 | 1,408 |
| Interstate Power & Light Co. | 6.250% | 7/15/39 | 925 | 1,163 |
| ITC Holdings Corp. | 4.050% | 7/1/23 | 5,000 | 5,143 |
| ITC Holdings Corp. | 5.300% | 7/1/43 | 1,600 | 1,640 |
| Jersey Central Power & Light Co. | 5.625% | 5/1/16 | 2,525 | 2,556 |
| Jersey Central Power & Light Co. | 5.650% | 6/1/17 | 2,775 | 2,915 |
| 5 John Sevier Combined Cycle Generation LLC | 4.626% | 1/15/42 | 1,262 | 1,373 |
| Kansas City Power & Light Co. | 3.150% | 3/15/23 | 850 | 835 |
| Kansas City Power & Light Co. | 6.050% | 11/15/35 | 125 | 151 |
| Kansas City Power & Light Co. | 5.300% | 10/1/41 | 4,795 | 5,214 |
| Kentucky Utilities Co. | 3.250% | 11/1/20 | 5,145 | 5,336 |
| Kentucky Utilities Co. | 3.300% | 10/1/25 | 1,500 | 1,515 |
| Kentucky Utilities Co. | 5.125% | 11/1/40 | 3,425 | 3,835 |
| Kentucky Utilities Co. | 4.650% | 11/15/43 | 425 | 450 |
| Kentucky Utilities Co. | 4.375% | 10/1/45 | 1,425 | 1,464 |
| LG&E & KU Energy LLC | 3.750% | 11/15/20 | 1,600 | 1,653 |
| LG&E & KU Energy LLC | 4.375% | 10/1/21 | 3,625 | 3,892 |
| Louisville Gas & Electric Co. | 3.300% | 10/1/25 | 1,500 | 1,511 |
| Louisville Gas & Electric Co. | 5.125% | 11/15/40 | 2,590 | 2,897 |
| Louisville Gas & Electric Co. | 4.650% | 11/15/43 | 725 | 765 |
119
| Total Bond Market II Index Fund | |||||
| Face | Market | ||||
| Maturity | Amount | Value• | |||
| Coupon | Date | ($000) | ($000) | ||
| Louisville Gas & Electric Co. | 4.375% | 10/1/45 | 2,325 | 2,373 | |
| Metropolitan Edison Co. | 7.700% | 1/15/19 | 500 | 570 | |
| MidAmerican Energy Co. | 5.950% | 7/15/17 | 2,810 | 2,979 | |
| MidAmerican Energy Co. | 5.300% | 3/15/18 | 100 | 107 | |
| MidAmerican Energy Co. | 6.750% | 12/30/31 | 4,150 | 5,305 | |
| MidAmerican Energy Co. | 5.750% | 11/1/35 | 1,575 | 1,875 | |
| MidAmerican Energy Co. | 5.800% | 10/15/36 | 1,350 | 1,624 | |
| MidAmerican Energy Co. | 4.800% | 9/15/43 | 675 | 722 | |
| MidAmerican Energy Co. | 4.400% | 10/15/44 | 8,800 | 8,914 | |
| MidAmerican Funding LLC | 6.927% | 3/1/29 | 3,935 | 5,020 | |
| Mississippi Power Co. | 4.250% | 3/15/42 | 4,475 | 3,422 | |
| National Rural Utilities Cooperative Finance Corp. | 3.050% | 3/1/16 | 2,950 | 2,960 | |
| National Rural Utilities Cooperative Finance Corp. | 5.450% | 4/10/17 | 175 | 183 | |
| National Rural Utilities Cooperative Finance Corp. | 0.950% | 4/24/17 | 3,000 | 2,986 | |
| National Rural Utilities Cooperative Finance Corp. | 5.450% | 2/1/18 | 4,850 | 5,191 | |
| National Rural Utilities Cooperative Finance Corp. | 10.375% | 11/1/18 | 2,475 | 3,023 | |
| National Rural Utilities Cooperative Finance Corp. | 2.300% | 11/15/19 | 4,250 | 4,225 | |
| National Rural Utilities Cooperative Finance Corp. | 2.000% | 1/27/20 | 3,000 | 2,945 | |
| National Rural Utilities Cooperative Finance Corp. | 2.350% | 6/15/20 | 8,775 | 8,688 | |
| National Rural Utilities Cooperative Finance Corp. | 2.300% | 11/1/20 | 3,779 | 3,743 | |
| National Rural Utilities Cooperative Finance Corp. | 3.050% | 2/15/22 | 7,510 | 7,581 | |
| National Rural Utilities Cooperative Finance Corp. | 2.850% | 1/27/25 | 5,500 | 5,316 | |
| National Rural Utilities Cooperative Finance Corp. | 4.023% | 11/1/32 | 7,278 | 7,149 | |
| Nevada Power Co. | 6.500% | 5/15/18 | 1,865 | 2,078 | |
| Nevada Power Co. | 6.500% | 8/1/18 | 14,093 | 15,641 | |
| Nevada Power Co. | 7.125% | 3/15/19 | 550 | 629 | |
| Nevada Power Co. | 6.650% | 4/1/36 | 965 | 1,219 | |
| Nevada Power Co. | 6.750% | 7/1/37 | 1,350 | 1,713 | |
| Nevada Power Co. | 5.375% | 9/15/40 | 100 | 110 | |
| Nevada Power Co. | 5.450% | 5/15/41 | 500 | 562 | |
| NextEra Energy Capital Holdings Inc. | 6.000% | 3/1/19 | 3,613 | 3,957 | |
| NextEra Energy Capital Holdings Inc. | 2.400% | 9/15/19 | 6,500 | 6,410 | |
| NextEra Energy Capital Holdings Inc. | 2.700% | 9/15/19 | 950 | 947 | |
| NextEra Energy Capital Holdings Inc. | 4.500% | 6/1/21 | 885 | 938 | |
| NextEra Energy Capital Holdings Inc. | 3.625% | 6/15/23 | 3,175 | 3,164 | |
| 5 | NextEra Energy Capital Holdings Inc. | 6.650% | 6/15/67 | 1,403 | 1,066 |
| Northern States Power Co. | 2.200% | 8/15/20 | 1,700 | 1,688 | |
| Northern States Power Co. | 2.600% | 5/15/23 | 1,330 | 1,296 | |
| Northern States Power Co. | 5.250% | 7/15/35 | 100 | 114 | |
| Northern States Power Co. | 6.250% | 6/1/36 | 840 | 1,066 | |
| Northern States Power Co. | 6.200% | 7/1/37 | 1,595 | 2,022 | |
| Northern States Power Co. | 5.350% | 11/1/39 | 3,245 | 3,739 | |
| Northern States Power Co. | 4.850% | 8/15/40 | 950 | 1,044 | |
| Northern States Power Co. | 3.400% | 8/15/42 | 525 | 463 | |
| Northern States Power Co. | 4.125% | 5/15/44 | 5,850 | 5,806 | |
| Northern States Power Co. | 4.000% | 8/15/45 | 1,150 | 1,124 | |
| NorthWestern Corp. | 6.340% | 4/1/19 | 3,000 | 3,375 | |
| NorthWestern Corp. | 4.176% | 11/15/44 | 2,400 | 2,366 | |
| NSTAR Electric Co. | 5.625% | 11/15/17 | 4,360 | 4,663 | |
| NSTAR Electric Co. | 2.375% | 10/15/22 | 1,700 | 1,636 | |
| NSTAR Electric Co. | 3.250% | 11/15/25 | 3,700 | 3,694 | |
| NSTAR Electric Co. | 5.500% | 3/15/40 | 3,655 | 4,237 | |
| Oglethorpe Power Corp. | 5.950% | 11/1/39 | 350 | 393 | |
| Oglethorpe Power Corp. | 5.375% | 11/1/40 | 5,145 | 5,524 | |
| Oglethorpe Power Corp. | 4.200% | 12/1/42 | 2,500 | 2,281 | |
| Ohio Edison Co. | 6.875% | 7/15/36 | 3,800 | 4,458 | |
| 120 | |||||
| Total Bond Market II Index Fund | ||||
| Face | Market | |||
| Maturity | Amount | Value• | ||
| Coupon | Date | ($000) | ($000) | |
| Ohio Power Co. | 5.375% | 10/1/21 | 3,775 | 4,202 |
| Ohio Power Co. | 5.850% | 10/1/35 | 1,525 | 1,732 |
| Oklahoma Gas & Electric Co. | 5.850% | 6/1/40 | 1,200 | 1,438 |
| Oklahoma Gas & Electric Co. | 5.250% | 5/15/41 | 1,250 | 1,401 |
| Oklahoma Gas & Electric Co. | 3.900% | 5/1/43 | 1,825 | 1,681 |
| Oklahoma Gas & Electric Co. | 4.000% | 12/15/44 | 3,225 | 3,025 |
| Oncor Electric Delivery Co. LLC | 5.000% | 9/30/17 | 3,000 | 3,151 |
| Oncor Electric Delivery Co. LLC | 2.150% | 6/1/19 | 2,125 | 2,091 |
| Oncor Electric Delivery Co. LLC | 4.100% | 6/1/22 | 3,515 | 3,651 |
| Oncor Electric Delivery Co. LLC | 2.950% | 4/1/25 | 2,000 | 1,879 |
| Oncor Electric Delivery Co. LLC | 7.000% | 5/1/32 | 7,045 | 8,756 |
| Oncor Electric Delivery Co. LLC | 7.250% | 1/15/33 | 150 | 192 |
| Oncor Electric Delivery Co. LLC | 7.500% | 9/1/38 | 2,800 | 3,719 |
| Oncor Electric Delivery Co. LLC | 4.550% | 12/1/41 | 7,590 | 7,331 |
| Oncor Electric Delivery Co. LLC | 5.300% | 6/1/42 | 2,300 | 2,459 |
| Pacific Gas & Electric Co. | 5.625% | 11/30/17 | 9,476 | 10,129 |
| Pacific Gas & Electric Co. | 8.250% | 10/15/18 | 3,705 | 4,307 |
| Pacific Gas & Electric Co. | 3.500% | 10/1/20 | 3,590 | 3,733 |
| Pacific Gas & Electric Co. | 4.250% | 5/15/21 | 4,400 | 4,713 |
| Pacific Gas & Electric Co. | 3.250% | 9/15/21 | 9,226 | 9,444 |
| Pacific Gas & Electric Co. | 2.450% | 8/15/22 | 6,397 | 6,184 |
| Pacific Gas & Electric Co. | 3.250% | 6/15/23 | 1,675 | 1,680 |
| Pacific Gas & Electric Co. | 3.400% | 8/15/24 | 3,225 | 3,254 |
| Pacific Gas & Electric Co. | 3.500% | 6/15/25 | 2,850 | 2,894 |
| Pacific Gas & Electric Co. | 6.050% | 3/1/34 | 12,874 | 15,311 |
| Pacific Gas & Electric Co. | 5.800% | 3/1/37 | 9,005 | 10,468 |
| Pacific Gas & Electric Co. | 6.350% | 2/15/38 | 4,000 | 4,869 |
| Pacific Gas & Electric Co. | 6.250% | 3/1/39 | 1,073 | 1,311 |
| Pacific Gas & Electric Co. | 4.450% | 4/15/42 | 13,052 | 13,110 |
| Pacific Gas & Electric Co. | 4.600% | 6/15/43 | 3,776 | 3,847 |
| Pacific Gas & Electric Co. | 4.750% | 2/15/44 | 3,080 | 3,202 |
| Pacific Gas & Electric Co. | 4.300% | 3/15/45 | 1,100 | 1,082 |
| Pacific Gas & Electric Co. | 4.250% | 3/15/46 | 6,200 | 6,022 |
| PacifiCorp | 5.650% | 7/15/18 | 3,000 | 3,269 |
| PacifiCorp | 5.500% | 1/15/19 | 4,000 | 4,389 |
| PacifiCorp | 2.950% | 2/1/22 | 3,250 | 3,273 |
| PacifiCorp | 3.600% | 4/1/24 | 4,350 | 4,494 |
| PacifiCorp | 7.700% | 11/15/31 | 985 | 1,356 |
| PacifiCorp | 5.250% | 6/15/35 | 2,900 | 3,240 |
| PacifiCorp | 5.750% | 4/1/37 | 10,850 | 12,756 |
| PacifiCorp | 6.250% | 10/15/37 | 900 | 1,113 |
| PacifiCorp | 6.000% | 1/15/39 | 100 | 121 |
| PacifiCorp | 4.100% | 2/1/42 | 2,800 | 2,700 |
| Peco Energy Co. | 5.350% | 3/1/18 | 575 | 618 |
| Peco Energy Co. | 2.375% | 9/15/22 | 875 | 848 |
| Peco Energy Co. | 5.950% | 10/1/36 | 4,275 | 5,196 |
| Pennsylvania Electric Co. | 6.150% | 10/1/38 | 2,075 | 2,226 |
| PG&E Corp. | 2.400% | 3/1/19 | 2,425 | 2,427 |
| Potomac Electric Power Co. | 3.600% | 3/15/24 | 200 | 207 |
| Potomac Electric Power Co. | 6.500% | 11/15/37 | 4,043 | 5,198 |
| Potomac Electric Power Co. | 7.900% | 12/15/38 | 400 | 584 |
| PPL Capital Funding Inc. | 1.900% | 6/1/18 | 3,120 | 3,092 |
| PPL Capital Funding Inc. | 3.500% | 12/1/22 | 490 | 493 |
| PPL Capital Funding Inc. | 3.400% | 6/1/23 | 10,400 | 10,299 |
| PPL Capital Funding Inc. | 3.950% | 3/15/24 | 275 | 281 |
| PPL Capital Funding Inc. | 4.700% | 6/1/43 | 3,900 | 3,888 |
121
| Total Bond Market II Index Fund | |||||
| Face | Market | ||||
| Maturity | Amount | Value• | |||
| Coupon | Date | ($000) | ($000) | ||
| PPL Capital Funding Inc. | 5.000% | 3/15/44 | 2,000 | 2,061 | |
| PPL Electric Utilities Corp. | 3.000% | 9/15/21 | 590 | 599 | |
| PPL Electric Utilities Corp. | 6.250% | 5/15/39 | 800 | 1,016 | |
| PPL Electric Utilities Corp. | 5.200% | 7/15/41 | 1,250 | 1,417 | |
| PPL Electric Utilities Corp. | 4.750% | 7/15/43 | 3,885 | 4,191 | |
| PPL Electric Utilities Corp. | 4.125% | 6/15/44 | 1,700 | 1,676 | |
| Progress Energy Inc. | 4.875% | 12/1/19 | 150 | 161 | |
| Progress Energy Inc. | 4.400% | 1/15/21 | 5,186 | 5,488 | |
| Progress Energy Inc. | 3.150% | 4/1/22 | 5,800 | 5,735 | |
| Progress Energy Inc. | 6.000% | 12/1/39 | 2,365 | 2,751 | |
| PSEG Power LLC | 5.125% | 4/15/20 | 415 | 448 | |
| PSEG Power LLC | 4.150% | 9/15/21 | 1,275 | 1,308 | |
| PSEG Power LLC | 8.625% | 4/15/31 | 2,335 | 2,907 | |
| Public Service Co. of Colorado | 5.800% | 8/1/18 | 425 | 465 | |
| Public Service Co. of Colorado | 5.125% | 6/1/19 | 3,725 | 4,091 | |
| Public Service Co. of Colorado | 3.200% | 11/15/20 | 5,900 | 6,094 | |
| Public Service Co. of Colorado | 2.250% | 9/15/22 | 1,250 | 1,206 | |
| Public Service Co. of Colorado | 2.900% | 5/15/25 | 5,000 | 4,915 | |
| Public Service Co. of Colorado | 4.750% | 8/15/41 | 1,500 | 1,616 | |
| Public Service Co. of Colorado | 3.600% | 9/15/42 | 800 | 729 | |
| Public Service Co. of Colorado | 4.300% | 3/15/44 | 5,450 | 5,557 | |
| Public Service Co. of New Hampshire | 3.500% | 11/1/23 | 875 | 897 | |
| Public Service Co. of New Mexico | 3.850% | 8/1/25 | 1,250 | 1,244 | |
| Public Service Co. of Oklahoma | 5.150% | 12/1/19 | 650 | 711 | |
| Public Service Co. of Oklahoma | 4.400% | 2/1/21 | 2,585 | 2,733 | |
| Public Service Co. of Oklahoma | 6.625% | 11/15/37 | 1,550 | 1,866 | |
| Public Service Electric & Gas Co. | 2.300% | 9/15/18 | 9,500 | 9,604 | |
| Public Service Electric & Gas Co. | 1.800% | 6/1/19 | 3,500 | 3,451 | |
| Public Service Electric & Gas Co. | 3.500% | 8/15/20 | 625 | 653 | |
| Public Service Electric & Gas Co. | 2.375% | 5/15/23 | 2,700 | 2,586 | |
| Public Service Electric & Gas Co. | 3.000% | 5/15/25 | 1,100 | 1,086 | |
| Public Service Electric & Gas Co. | 5.800% | 5/1/37 | 875 | 1,061 | |
| Public Service Electric & Gas Co. | 5.375% | 11/1/39 | 4,189 | 4,835 | |
| Public Service Electric & Gas Co. | 3.950% | 5/1/42 | 3,800 | 3,667 | |
| Public Service Electric & Gas Co. | 3.650% | 9/1/42 | 4,575 | 4,228 | |
| Public Service Electric & Gas Co. | 4.000% | 6/1/44 | 1,300 | 1,265 | |
| Public Service Electric & Gas Co. | 4.050% | 5/1/45 | 100 | 98 | |
| Public Service Electric & Gas Co. | 4.150% | 11/1/45 | 5,300 | 5,245 | |
| Puget Energy Inc. | 6.500% | 12/15/20 | 4,050 | 4,639 | |
| Puget Energy Inc. | 6.000% | 9/1/21 | 4,325 | 4,875 | |
| Puget Energy Inc. | 5.625% | 7/15/22 | 2,500 | 2,774 | |
| 8 | Puget Energy Inc. | 3.650% | 5/15/25 | 4,150 | 4,022 |
| Puget Sound Energy Inc. | 5.483% | 6/1/35 | 3,650 | 4,245 | |
| Puget Sound Energy Inc. | 6.724% | 6/15/36 | 200 | 267 | |
| Puget Sound Energy Inc. | 6.274% | 3/15/37 | 1,825 | 2,308 | |
| Puget Sound Energy Inc. | 5.757% | 10/1/39 | 1,400 | 1,701 | |
| Puget Sound Energy Inc. | 5.795% | 3/15/40 | 1,510 | 1,824 | |
| Puget Sound Energy Inc. | 5.764% | 7/15/40 | 600 | 724 | |
| Puget Sound Energy Inc. | 4.434% | 11/15/41 | 4,800 | 4,943 | |
| Puget Sound Energy Inc. | 4.300% | 5/20/45 | 6,025 | 6,105 | |
| San Diego Gas & Electric Co. | 3.000% | 8/15/21 | 1,350 | 1,379 | |
| San Diego Gas & Electric Co. | 6.000% | 6/1/26 | 4,000 | 4,920 | |
| San Diego Gas & Electric Co. | 5.350% | 5/15/35 | 250 | 287 | |
| San Diego Gas & Electric Co. | 6.125% | 9/15/37 | 1,000 | 1,267 | |
| San Diego Gas & Electric Co. | 5.350% | 5/15/40 | 2,000 | 2,338 | |
| San Diego Gas & Electric Co. | 4.500% | 8/15/40 | 3,870 | 4,046 | |
| 122 | |||||
| Total Bond Market II Index Fund | ||||
| Face | Market | |||
| Maturity | Amount | Value• | ||
| Coupon | Date | ($000) | ($000) | |
| San Diego Gas & Electric Co. | 3.950% | 11/15/41 | 400 | 386 |
| San Diego Gas & Electric Co. | 4.300% | 4/1/42 | 1,500 | 1,516 |
| SCANA Corp. | 6.250% | 4/1/20 | 455 | 503 |
| SCANA Corp. | 4.750% | 5/15/21 | 1,295 | 1,343 |
| Sierra Pacific Power Co. | 3.375% | 8/15/23 | 1,450 | 1,468 |
| Sierra Pacific Power Co. | 6.750% | 7/1/37 | 1,450 | 1,819 |
| South Carolina Electric & Gas Co. | 5.250% | 11/1/18 | 1,500 | 1,629 |
| South Carolina Electric & Gas Co. | 6.500% | 11/1/18 | 2,700 | 3,036 |
| South Carolina Electric & Gas Co. | 6.625% | 2/1/32 | 2,525 | 3,059 |
| South Carolina Electric & Gas Co. | 6.050% | 1/15/38 | 1,550 | 1,823 |
| South Carolina Electric & Gas Co. | 5.450% | 2/1/41 | 525 | 578 |
| South Carolina Electric & Gas Co. | 4.600% | 6/15/43 | 2,300 | 2,310 |
| South Carolina Electric & Gas Co. | 4.500% | 6/1/64 | 6,090 | 5,671 |
| South Carolina Electric & Gas Co. | 5.100% | 6/1/65 | 2,675 | 2,784 |
| Southern California Edison Co. | 1.125% | 5/1/17 | 600 | 596 |
| Southern California Edison Co. | 3.875% | 6/1/21 | 2,000 | 2,117 |
| 5 Southern California Edison Co. | 1.845% | 2/1/22 | 3,250 | 3,216 |
| Southern California Edison Co. | 2.400% | 2/1/22 | 2,700 | 2,647 |
| Southern California Edison Co. | 3.500% | 10/1/23 | 12,300 | 12,730 |
| Southern California Edison Co. | 6.650% | 4/1/29 | 450 | 562 |
| Southern California Edison Co. | 6.000% | 1/15/34 | 750 | 909 |
| Southern California Edison Co. | 5.750% | 4/1/35 | 800 | 947 |
| Southern California Edison Co. | 5.350% | 7/15/35 | 4,185 | 4,743 |
| Southern California Edison Co. | 5.550% | 1/15/36 | 500 | 581 |
| Southern California Edison Co. | 5.625% | 2/1/36 | 1,875 | 2,198 |
| Southern California Edison Co. | 5.950% | 2/1/38 | 2,800 | 3,427 |
| Southern California Edison Co. | 6.050% | 3/15/39 | 1,460 | 1,808 |
| Southern California Edison Co. | 4.500% | 9/1/40 | 10,307 | 10,761 |
| Southern California Edison Co. | 3.900% | 12/1/41 | 150 | 142 |
| Southern California Edison Co. | 4.050% | 3/15/42 | 6,450 | 6,296 |
| Southern California Edison Co. | 3.900% | 3/15/43 | 725 | 692 |
| Southern California Edison Co. | 4.650% | 10/1/43 | 3,950 | 4,172 |
| Southern California Edison Co. | 3.600% | 2/1/45 | 2,200 | 1,993 |
| Southern Co. | 1.300% | 8/15/17 | 2,100 | 2,080 |
| Southern Co. | 2.150% | 9/1/19 | 1,650 | 1,616 |
| Southern Co. | 2.750% | 6/15/20 | 2,400 | 2,372 |
| Southern Power Co. | 1.850% | 12/1/17 | 850 | 850 |
| Southern Power Co. | 4.150% | 12/1/25 | 2,000 | 1,997 |
| Southern Power Co. | 5.150% | 9/15/41 | 6,290 | 5,881 |
| Southern Power Co. | 5.250% | 7/15/43 | 5,275 | 5,031 |
| Southwestern Electric Power Co. | 5.550% | 1/15/17 | 100 | 104 |
| Southwestern Electric Power Co. | 5.875% | 3/1/18 | 75 | 81 |
| Southwestern Electric Power Co. | 6.450% | 1/15/19 | 4,763 | 5,323 |
| Southwestern Electric Power Co. | 3.550% | 2/15/22 | 4,200 | 4,260 |
| Southwestern Electric Power Co. | 3.900% | 4/1/45 | 3,000 | 2,625 |
| Southwestern Public Service Co. | 4.500% | 8/15/41 | 2,079 | 2,149 |
| Tampa Electric Co. | 6.100% | 5/15/18 | 2,175 | 2,371 |
| Tampa Electric Co. | 5.400% | 5/15/21 | 2,590 | 2,905 |
| Tampa Electric Co. | 2.600% | 9/15/22 | 1,000 | 971 |
| Tampa Electric Co. | 6.550% | 5/15/36 | 350 | 442 |
| Tampa Electric Co. | 4.350% | 5/15/44 | 3,500 | 3,454 |
| Tampa Electric Co. | 4.200% | 5/15/45 | 3,400 | 3,288 |
| TECO Finance Inc. | 6.572% | 11/1/17 | 220 | 237 |
| TECO Finance Inc. | 5.150% | 3/15/20 | 4,862 | 5,231 |
| Toledo Edison Co. | 6.150% | 5/15/37 | 4,744 | 5,340 |
| TransAlta Corp. | 1.900% | 6/3/17 | 15,134 | 14,805 |
123
| Total Bond Market II Index Fund | |||||
| Face | Market | ||||
| Maturity | Amount | Value• | |||
| Coupon | Date | ($000) | ($000) | ||
| TransAlta Corp. | 4.500% | 11/15/22 | 2,275 | 1,988 | |
| TransAlta Corp. | 6.500% | 3/15/40 | 2,500 | 1,873 | |
| Tri-State Generation & Transmission | |||||
| Association Inc. | 3.700% | 11/1/24 | 1,475 | 1,466 | |
| 8 | Tri-State Generation & Transmission | ||||
| Association Inc. | 6.000% | 6/15/40 | 800 | 942 | |
| Tri-State Generation & Transmission | |||||
| Association Inc. | 4.700% | 11/1/44 | 1,400 | 1,402 | |
| Tucson Electric Power Co. | 5.150% | 11/15/21 | 1,045 | 1,150 | |
| Tucson Electric Power Co. | 3.050% | 3/15/25 | 2,000 | 1,895 | |
| UIL Holdings Corp. | 4.625% | 10/1/20 | 4,400 | 4,632 | |
| Union Electric Co. | 6.700% | 2/1/19 | 2,432 | 2,764 | |
| Union Electric Co. | 3.500% | 4/15/24 | 5,300 | 5,457 | |
| Union Electric Co. | 5.300% | 8/1/37 | 2,869 | 3,269 | |
| Union Electric Co. | 8.450% | 3/15/39 | 2,000 | 3,098 | |
| Union Electric Co. | 3.900% | 9/15/42 | 175 | 167 | |
| Union Electric Co. | 3.650% | 4/15/45 | 575 | 518 | |
| Virginia Electric & Power Co. | 1.200% | 1/15/18 | 3,000 | 2,971 | |
| Virginia Electric & Power Co. | 2.950% | 1/15/22 | 2,025 | 2,036 | |
| Virginia Electric & Power Co. | 3.450% | 9/1/22 | 10,595 | 10,887 | |
| Virginia Electric & Power Co. | 2.750% | 3/15/23 | 6,300 | 6,207 | |
| Virginia Electric & Power Co. | 3.100% | 5/15/25 | 1,500 | 1,486 | |
| Virginia Electric & Power Co. | 6.000% | 1/15/36 | 2,840 | 3,492 | |
| Virginia Electric & Power Co. | 6.000% | 5/15/37 | 300 | 368 | |
| Virginia Electric & Power Co. | 6.350% | 11/30/37 | 2,800 | 3,581 | |
| Virginia Electric & Power Co. | 4.000% | 1/15/43 | 15,575 | 14,927 | |
| Virginia Electric & Power Co. | 4.650% | 8/15/43 | 225 | 238 | |
| Virginia Electric & Power Co. | 4.450% | 2/15/44 | 1,595 | 1,641 | |
| Virginia Electric & Power Co. | 4.200% | 5/15/45 | 3,050 | 3,024 | |
| WEC Energy Group Inc. | 1.650% | 6/15/18 | 2,150 | 2,133 | |
| WEC Energy Group Inc. | 2.450% | 6/15/20 | 2,075 | 2,065 | |
| WEC Energy Group Inc. | 3.550% | 6/15/25 | 2,950 | 2,966 | |
| 5 | WEC Energy Group Inc. | 6.110% | 12/1/66 | 2,345 | 1,782 |
| 5 | WEC Energy Group Inc. | 6.250% | 5/15/67 | 5,175 | 3,855 |
| Westar Energy Inc. | 3.250% | 12/1/25 | 1,900 | 1,906 | |
| Westar Energy Inc. | 4.125% | 3/1/42 | 4,375 | 4,309 | |
| Westar Energy Inc. | 4.100% | 4/1/43 | 900 | 882 | |
| Westar Energy Inc. | 4.625% | 9/1/43 | 2,900 | 3,066 | |
| Westar Energy Inc. | 4.250% | 12/1/45 | 750 | 756 | |
| Western Massachusetts Electric Co. | 3.500% | 9/15/21 | 1,050 | 1,094 | |
| Wisconsin Electric Power Co. | 4.250% | 12/15/19 | 2,650 | 2,846 | |
| Wisconsin Electric Power Co. | 3.100% | 6/1/25 | 400 | 401 | |
| Wisconsin Electric Power Co. | 3.650% | 12/15/42 | 400 | 366 | |
| Wisconsin Electric Power Co. | 4.250% | 6/1/44 | 600 | 607 | |
| Wisconsin Electric Power Co. | 4.300% | 12/15/45 | 1,475 | 1,510 | |
| Wisconsin Power & Light Co. | 5.000% | 7/15/19 | 475 | 521 | |
| Wisconsin Power & Light Co. | 2.250% | 11/15/22 | 3,850 | 3,688 | |
| Wisconsin Power & Light Co. | 6.375% | 8/15/37 | 1,625 | 2,072 | |
| Wisconsin Power & Light Co. | 4.100% | 10/15/44 | 1,150 | 1,119 | |
| Wisconsin Public Service Corp. | 1.650% | 12/4/18 | 4,500 | 4,466 | |
| Wisconsin Public Service Corp. | 3.671% | 12/1/42 | 2,100 | 1,915 | |
| Wisconsin Public Service Corp. | 4.752% | 11/1/44 | 2,175 | 2,359 | |
| Xcel Energy Inc. | 5.613% | 4/1/17 | 275 | 289 | |
| Xcel Energy Inc. | 1.200% | 6/1/17 | 450 | 448 | |
| Xcel Energy Inc. | 4.700% | 5/15/20 | 4,120 | 4,429 | |
| 124 | |||||
| Total Bond Market II Index Fund | ||||
| Face | Market | |||
| Maturity | Amount | Value• | ||
| Coupon | Date | ($000) | ($000) | |
| Xcel Energy Inc. | 3.300% | 6/1/25 | 500 | 489 |
| Xcel Energy Inc. | 6.500% | 7/1/36 | 1,111 | 1,342 |
| Natural Gas (0.2%) | ||||
| AGL Capital Corp. | 5.250% | 8/15/19 | 1,600 | 1,721 |
| AGL Capital Corp. | 3.500% | 9/15/21 | 1,580 | 1,587 |
| AGL Capital Corp. | 5.875% | 3/15/41 | 5,600 | 6,219 |
| AGL Capital Corp. | 4.400% | 6/1/43 | 1,000 | 921 |
| Atmos Energy Corp. | 8.500% | 3/15/19 | 760 | 892 |
| Atmos Energy Corp. | 5.500% | 6/15/41 | 4,050 | 4,644 |
| Atmos Energy Corp. | 4.150% | 1/15/43 | 275 | 266 |
| Atmos Energy Corp. | 4.125% | 10/15/44 | 3,250 | 3,115 |
| British Transco Finance Inc. | 6.625% | 6/1/18 | 3,125 | 3,456 |
| CenterPoint Energy Resources Corp. | 6.000% | 5/15/18 | 2,636 | 2,856 |
| CenterPoint Energy Resources Corp. | 4.500% | 1/15/21 | 7,001 | 7,351 |
| CenterPoint Energy Resources Corp. | 6.625% | 11/1/37 | 2,300 | 2,733 |
| CenterPoint Energy Resources Corp. | 5.850% | 1/15/41 | 2,125 | 2,368 |
| KeySpan Corp. | 8.000% | 11/15/30 | 150 | 199 |
| Laclede Group Inc. | 4.700% | 8/15/44 | 3,500 | 3,478 |
| NiSource Finance Corp. | 6.400% | 3/15/18 | 635 | 692 |
| NiSource Finance Corp. | 6.800% | 1/15/19 | 5,900 | 6,620 |
| NiSource Finance Corp. | 5.450% | 9/15/20 | 800 | 877 |
| NiSource Finance Corp. | 6.125% | 3/1/22 | 12,295 | 14,082 |
| NiSource Finance Corp. | 6.250% | 12/15/40 | 2,350 | 2,781 |
| NiSource Finance Corp. | 5.950% | 6/15/41 | 5,150 | 5,914 |
| NiSource Finance Corp. | 5.800% | 2/1/42 | 3,375 | 3,835 |
| NiSource Finance Corp. | 4.800% | 2/15/44 | 3,075 | 3,127 |
| ONE Gas Inc. | 2.070% | 2/1/19 | 2,350 | 2,337 |
| ONE Gas Inc. | 4.658% | 2/1/44 | 1,200 | 1,244 |
| Piedmont Natural Gas Co. Inc. | 4.650% | 8/1/43 | 1,375 | 1,423 |
| Sempra Energy | 2.300% | 4/1/17 | 175 | 176 |
| Sempra Energy | 6.150% | 6/15/18 | 2,775 | 3,028 |
| Sempra Energy | 9.800% | 2/15/19 | 1,500 | 1,815 |
| Sempra Energy | 2.400% | 3/15/20 | 2,950 | 2,883 |
| Sempra Energy | 2.850% | 11/15/20 | 3,930 | 3,928 |
| Sempra Energy | 2.875% | 10/1/22 | 2,125 | 2,056 |
| Sempra Energy | 4.050% | 12/1/23 | 13,785 | 14,217 |
| Sempra Energy | 3.750% | 11/15/25 | 8,855 | 8,855 |
| Sempra Energy | 6.000% | 10/15/39 | 6,960 | 7,785 |
| Southern California Gas Co. | 5.750% | 11/15/35 | 400 | 487 |
| Southern California Gas Co. | 3.750% | 9/15/42 | 3,325 | 3,101 |
| Southern California Gas Co. | 4.450% | 3/15/44 | 1,450 | 1,507 |
| Other Utility (0.0%) | ||||
| American Water Capital Corp. | 6.085% | 10/15/17 | 8,041 | 8,638 |
| American Water Capital Corp. | 3.400% | 3/1/25 | 2,825 | 2,869 |
| American Water Capital Corp. | 6.593% | 10/15/37 | 6,125 | 7,963 |
| American Water Capital Corp. | 4.300% | 9/1/45 | 1,000 | 1,012 |
| United Utilities plc | 5.375% | 2/1/19 | 5,675 | 6,087 |
| Veolia Environnement SA | 6.750% | 6/1/38 | 4,850 | 5,931 |
| 1,844,829 | ||||
| Total Corporate Bonds (Cost $24,428,559) | 24,345,576 | |||
125
| Total Bond Market II Index Fund | ||||
| Face | Market | |||
| Maturity | Amount | Value• | ||
| Coupon | Date | ($000) | ($000) | |
| Sovereign Bonds (U.S. Dollar-Denominated) (4.9%) | ||||
| African Development Bank | 0.750% | 10/18/16 | 8,920 | 8,883 |
| African Development Bank | 1.125% | 3/15/17 | 4,200 | 4,207 |
| African Development Bank | 0.875% | 3/15/18 | 5,200 | 5,154 |
| African Development Bank | 1.625% | 10/2/18 | 11,500 | 11,557 |
| African Development Bank | 1.375% | 2/12/20 | 5,700 | 5,602 |
| African Development Bank | 2.375% | 9/23/21 | 13,000 | 13,190 |
| Agricultural Bank Of China | 2.000% | 5/21/18 | 2,200 | 2,188 |
| Agricultural Bank Of China | 2.750% | 5/21/20 | 2,000 | 1,986 |
| Asian Development Bank | 0.750% | 1/11/17 | 16,575 | 16,545 |
| Asian Development Bank | 1.125% | 3/15/17 | 29,275 | 29,322 |
| Asian Development Bank | 5.250% | 6/12/17 | 100 | 106 |
| Asian Development Bank | 1.125% | 6/5/18 | 19,000 | 18,849 |
| Asian Development Bank | 5.593% | 7/16/18 | 1,700 | 1,861 |
| Asian Development Bank | 1.750% | 9/11/18 | 1,650 | 1,665 |
| Asian Development Bank | 1.500% | 9/28/18 | 15,000 | 15,032 |
| Asian Development Bank | 1.875% | 10/23/18 | 5,120 | 5,182 |
| Asian Development Bank | 1.750% | 3/21/19 | 14,600 | 14,691 |
| Asian Development Bank | 1.875% | 4/12/19 | 13,250 | 13,382 |
| Asian Development Bank | 1.500% | 1/22/20 | 10,400 | 10,286 |
| Asian Development Bank | 1.375% | 3/23/20 | 2,750 | 2,706 |
| Asian Development Bank | 1.875% | 2/18/22 | 15,700 | 15,471 |
| Asian Development Bank | 2.000% | 1/22/25 | 10,750 | 10,394 |
| Banco do Brasil SA | 3.875% | 1/23/17 | 6,450 | 6,453 |
| Banco do Brasil SA | 3.875% | 10/10/22 | 2,725 | 2,092 |
| Canada | 0.875% | 2/14/17 | 21,750 | 21,719 |
| Canada | 1.125% | 3/19/18 | 20,150 | 20,073 |
| Canada | 1.625% | 2/27/19 | 1,300 | 1,303 |
| CNOOC Finance 2013 Ltd. | 1.750% | 5/9/18 | 2,850 | 2,812 |
| CNOOC Finance 2013 Ltd. | 3.000% | 5/9/23 | 13,900 | 13,099 |
| CNOOC Finance 2015 Australia Pty Ltd. | 2.625% | 5/5/20 | 8,000 | 7,821 |
| CNOOC Finance 2015 USA LLC | 3.500% | 5/5/25 | 17,400 | 16,557 |
| CNOOC Nexen Finance 2014 ULC | 1.625% | 4/30/17 | 20,100 | 19,998 |
| CNOOC Nexen Finance 2014 ULC | 4.250% | 4/30/24 | 14,600 | 14,855 |
| Corp. Andina de Fomento | 3.750% | 1/15/16 | 9,460 | 9,441 |
| Corp. Andina de Fomento | 1.500% | 8/8/17 | 8,000 | 7,959 |
| Corp. Andina de Fomento | 8.125% | 6/4/19 | 1,850 | 2,176 |
| Corp. Andina de Fomento | 4.375% | 6/15/22 | 21,767 | 23,166 |
| Council Of Europe Development Bank | 1.500% | 2/22/17 | 5,900 | 5,930 |
| Council Of Europe Development Bank | 1.500% | 6/19/17 | 1,350 | 1,357 |
| Council Of Europe Development Bank | 1.000% | 3/7/18 | 10,450 | 10,375 |
| Council Of Europe Development Bank | 1.125% | 5/31/18 | 4,550 | 4,521 |
| Council Of Europe Development Bank | 1.750% | 11/14/19 | 5,000 | 5,000 |
| Council Of Europe Development Bank | 1.625% | 3/10/20 | 15,500 | 15,352 |
| Ecopetrol SA | 7.625% | 7/23/19 | 5,050 | 5,491 |
| Ecopetrol SA | 5.875% | 9/18/23 | 10,200 | 9,295 |
| Ecopetrol SA | 4.125% | 1/16/25 | 12,775 | 10,204 |
| Ecopetrol SA | 5.375% | 6/26/26 | 5,750 | 4,880 |
| Ecopetrol SA | 7.375% | 9/18/43 | 9,750 | 8,202 |
| Ecopetrol SA | 5.875% | 5/28/45 | 9,975 | 7,120 |
| Emirates Telecommunications PJSC | 3.500% | 6/18/24 | 5,000 | 5,069 |
| European Bank for Reconstruction | ||||
| & Development | 2.500% | 3/15/16 | 11,975 | 12,019 |
| European Bank for Reconstruction | ||||
| & Development | 1.375% | 10/20/16 | 4,535 | 4,552 |
126
| Total Bond Market II Index Fund | ||||
| Face | Market | |||
| Maturity | Amount | Value• | ||
| Coupon | Date | ($000) | ($000) | |
| European Bank for Reconstruction | ||||
| & Development | 1.000% | 2/16/17 | 5,000 | 5,001 |
| European Bank for Reconstruction | ||||
| & Development | 0.750% | 9/1/17 | 8,075 | 8,024 |
| European Bank for Reconstruction | ||||
| & Development | 1.000% | 9/17/18 | 2,050 | 2,022 |
| European Bank for Reconstruction | ||||
| & Development | 1.625% | 11/15/18 | 4,675 | 4,692 |
| European Bank for Reconstruction | ||||
| & Development | 1.750% | 6/14/19 | 21,525 | 21,596 |
| European Bank for Reconstruction | ||||
| & Development | 1.750% | 11/26/19 | 2,700 | 2,697 |
| European Bank for Reconstruction | ||||
| & Development | 1.500% | 3/16/20 | 10,750 | 10,597 |
| European Bank for Reconstruction | ||||
| & Development | 1.875% | 2/23/22 | 14,500 | 14,271 |
| European Investment Bank | 1.125% | 12/15/16 | 1,400 | 1,401 |
| European Investment Bank | 4.875% | 1/17/17 | 5,400 | 5,611 |
| European Investment Bank | 0.875% | 4/18/17 | 15,100 | 15,052 |
| European Investment Bank | 5.125% | 5/30/17 | 9,150 | 9,662 |
| European Investment Bank | 1.625% | 6/15/17 | 1,000 | 1,008 |
| European Investment Bank | 1.000% | 8/17/17 | 17,000 | 16,950 |
| European Investment Bank | 1.125% | 9/15/17 | 14,425 | 14,391 |
| European Investment Bank | 1.000% | 12/15/17 | 13,850 | 13,774 |
| European Investment Bank | 1.000% | 3/15/18 | 20,575 | 20,422 |
| European Investment Bank | 1.250% | 5/15/18 | 15,750 | 15,695 |
| European Investment Bank | 1.000% | 6/15/18 | 48,100 | 47,651 |
| European Investment Bank | 1.125% | 8/15/18 | 33,300 | 32,964 |
| European Investment Bank | 1.625% | 12/18/18 | 34,225 | 34,328 |
| European Investment Bank | 1.875% | 3/15/19 | 46,000 | 46,391 |
| European Investment Bank | 1.750% | 6/17/19 | 62,970 | 63,116 |
| European Investment Bank | 1.625% | 3/16/20 | 32,400 | 32,090 |
| European Investment Bank | 1.375% | 6/15/20 | 21,200 | 20,743 |
| European Investment Bank | 2.875% | 9/15/20 | 16,125 | 16,803 |
| European Investment Bank | 1.625% | 12/15/20 | 21,500 | 21,099 |
| European Investment Bank | 4.000% | 2/16/21 | 11,575 | 12,634 |
| European Investment Bank | 2.500% | 4/15/21 | 22,125 | 22,594 |
| European Investment Bank | 2.125% | 10/15/21 | 7,600 | 7,568 |
| European Investment Bank | 2.250% | 8/15/22 | 21,100 | 21,086 |
| European Investment Bank | 3.250% | 1/29/24 | 12,100 | 12,886 |
| European Investment Bank | 1.875% | 2/10/25 | 9,400 | 8,954 |
| Export Development Canada | 0.625% | 12/15/16 | 1,675 | 1,676 |
| 9 Export Development Canada | 1.000% | 5/15/17 | 7,400 | 7,388 |
| Export Development Canada | 0.750% | 12/15/17 | 9,025 | 8,886 |
| Export Development Canada | 1.500% | 10/3/18 | 15,125 | 15,133 |
| 9 Export Development Canada | 1.625% | 12/3/19 | 3,600 | 3,583 |
| Export-Import Bank of Korea | 3.750% | 10/20/16 | 5,375 | 5,476 |
| Export-Import Bank of Korea | 4.000% | 1/11/17 | 15,050 | 15,416 |
| Export-Import Bank of Korea | 1.750% | 2/27/18 | 4,150 | 4,127 |
| Export-Import Bank of Korea | 2.875% | 9/17/18 | 7,300 | 7,445 |
| Export-Import Bank of Korea | 2.375% | 8/12/19 | 5,000 | 5,019 |
| Export-Import Bank of Korea | 5.125% | 6/29/20 | 5,300 | 5,871 |
| Export-Import Bank of Korea | 4.000% | 1/29/21 | 2,500 | 2,670 |
| Export-Import Bank of Korea | 2.500% | 5/10/21 | 8,000 | 7,920 |
| Export-Import Bank of Korea | 4.375% | 9/15/21 | 4,000 | 4,355 |
| Export-Import Bank of Korea | 5.000% | 4/11/22 | 3,300 | 3,702 |
127
| Total Bond Market II Index Fund | ||||
| Face | Market | |||
| Maturity | Amount | Value• | ||
| Coupon | Date | ($000) | ($000) | |
| Export-Import Bank of Korea | 4.000% | 1/14/24 | 17,500 | 18,509 |
| Export-Import Bank of Korea | 2.875% | 1/21/25 | 3,000 | 2,933 |
| Export-Import Bank of Korea | 3.250% | 11/10/25 | 6,200 | 6,262 |
| Federative Republic of Brazil | 8.875% | 10/14/19 | 2,135 | 2,402 |
| Federative Republic of Brazil | 2.625% | 1/5/23 | 2,525 | 1,925 |
| Federative Republic of Brazil | 10.125% | 5/15/27 | 1,400 | 1,662 |
| FMS Wertmanagement AoeR | 0.625% | 1/30/17 | 17,200 | 17,113 |
| FMS Wertmanagement AoeR | 1.125% | 9/5/17 | 5,700 | 5,682 |
| FMS Wertmanagement AoeR | 1.000% | 11/21/17 | 4,150 | 4,123 |
| FMS Wertmanagement AoeR | 1.250% | 7/30/18 | 13,000 | 12,908 |
| FMS Wertmanagement AoeR | 1.625% | 11/20/18 | 11,000 | 11,035 |
| FMS Wertmanagement AoeR | 1.750% | 3/17/20 | 6,000 | 5,958 |
| Hydro-Quebec | 2.000% | 6/30/16 | 14,625 | 14,712 |
| Hydro-Quebec | 1.375% | 6/19/17 | 9,300 | 9,287 |
| Hydro-Quebec | 8.400% | 1/15/22 | 3,040 | 3,919 |
| Hydro-Quebec | 8.050% | 7/7/24 | 1,150 | 1,556 |
| Industrial & Commercial Bank of China Ltd. | 2.351% | 11/13/17 | 4,200 | 4,216 |
| Industrial & Commercial Bank of China Ltd. | 3.231% | 11/13/19 | 5,850 | 5,960 |
| Inter-American Development Bank | 1.125% | 3/15/17 | 10,650 | 10,665 |
| Inter-American Development Bank | 1.000% | 7/14/17 | 21,625 | 21,591 |
| Inter-American Development Bank | 2.375% | 8/15/17 | 5,100 | 5,201 |
| Inter-American Development Bank | 0.875% | 3/15/18 | 9,925 | 9,841 |
| Inter-American Development Bank | 1.750% | 8/24/18 | 7,620 | 7,693 |
| Inter-American Development Bank | 1.125% | 8/28/18 | 21,000 | 20,796 |
| Inter-American Development Bank | 1.125% | 9/12/19 | 24,800 | 24,316 |
| Inter-American Development Bank | 3.875% | 9/17/19 | 16,750 | 18,023 |
| Inter-American Development Bank | 1.750% | 10/15/19 | 20,200 | 20,236 |
| Inter-American Development Bank | 3.875% | 2/14/20 | 1,800 | 1,947 |
| Inter-American Development Bank | 2.125% | 11/9/20 | 10,400 | 10,477 |
| Inter-American Development Bank | 1.750% | 4/14/22 | 25,600 | 25,001 |
| Inter-American Development Bank | 3.000% | 10/4/23 | 2,350 | 2,468 |
| Inter-American Development Bank | 3.000% | 2/21/24 | 13,000 | 13,631 |
| Inter-American Development Bank | 2.125% | 1/15/25 | 14,000 | 13,689 |
| Inter-American Development Bank | 7.000% | 6/15/25 | 1,125 | 1,506 |
| Inter-American Development Bank | 3.200% | 8/7/42 | 2,000 | 1,929 |
| Inter-American Development Bank | 4.375% | 1/24/44 | 5,200 | 6,088 |
| International Bank for Reconstruction | ||||
| & Development | 0.750% | 12/15/16 | 10,625 | 10,608 |
| International Bank for Reconstruction | ||||
| & Development | 0.875% | 4/17/17 | 33,125 | 33,070 |
| International Bank for Reconstruction | ||||
| & Development | 1.125% | 7/18/17 | 7,500 | 7,501 |
| International Bank for Reconstruction | ||||
| & Development | 1.000% | 11/15/17 | 10,000 | 9,968 |
| International Bank for Reconstruction | ||||
| & Development | 1.375% | 4/10/18 | 36,200 | 36,272 |
| International Bank for Reconstruction | ||||
| & Development | 1.000% | 6/15/18 | 24,400 | 24,178 |
| International Bank for Reconstruction | ||||
| & Development | 1.000% | 10/5/18 | 9,000 | 8,903 |
| International Bank for Reconstruction | ||||
| & Development | 1.875% | 3/15/19 | 42,875 | 43,293 |
| International Bank for Reconstruction | ||||
| & Development | 1.875% | 10/7/19 | 5,100 | 5,134 |
| International Bank for Reconstruction | ||||
| & Development | 2.125% | 11/1/20 | 20,400 | 20,607 |
128
| Total Bond Market II Index Fund | |||||
| Face | Market | ||||
| Maturity | Amount | Value• | |||
| Coupon | Date | ($000) | ($000) | ||
| International Bank for Reconstruction | |||||
| & Development | 2.250% | 6/24/21 | 10,250 | 10,349 | |
| International Bank for Reconstruction | |||||
| & Development | 1.625% | 2/10/22 | 33,425 | 32,426 | |
| International Bank for Reconstruction | |||||
| & Development | 7.625% | 1/19/23 | 950 | 1,275 | |
| International Bank for Reconstruction | |||||
| & Development | 2.500% | 11/25/24 | 34,500 | 34,884 | |
| International Bank for Reconstruction | |||||
| & Development | 8.875% | 3/1/26 | 450 | 685 | |
| International Finance Corp. | 1.125% | 11/23/16 | 11,850 | 11,868 | |
| International Finance Corp. | 1.000% | 4/24/17 | 5,650 | 5,634 | |
| International Finance Corp. | 2.125% | 11/17/17 | 25,300 | 25,639 | |
| International Finance Corp. | 0.625% | 12/21/17 | 6,850 | 6,749 | |
| International Finance Corp. | 1.250% | 7/16/18 | 15,400 | 15,352 | |
| International Finance Corp. | 1.750% | 9/4/18 | 6,400 | 6,457 | |
| International Finance Corp. | 1.750% | 9/16/19 | 10,500 | 10,489 | |
| 10 | Japan Bank for International Cooperation | 1.125% | 7/19/17 | 6,475 | 6,435 |
| 10 | Japan Bank for International Cooperation | 1.750% | 7/31/18 | 10,625 | 10,595 |
| 10 | Japan Bank for International Cooperation | 1.750% | 11/13/18 | 19,900 | 19,795 |
| 10 | Japan Bank for International Cooperation | 2.125% | 2/7/19 | 5,000 | 5,023 |
| 10 | Japan Bank for International Cooperation | 1.750% | 5/28/20 | 4,750 | 4,635 |
| 10 | Japan Bank for International Cooperation | 3.375% | 7/31/23 | 2,400 | 2,518 |
| 10 | Japan Bank for International Cooperation | 3.000% | 5/29/24 | 17,000 | 17,405 |
| 10 | Japan Bank for International Cooperation | 2.125% | 2/10/25 | 14,500 | 13,741 |
| 10 | Japan Bank for International Cooperation | 2.500% | 5/28/25 | 3,900 | 3,791 |
| 10 | Japan Finance Organization for Municipalities | 5.000% | 5/16/17 | 1,500 | 1,567 |
| 10 | Japan Finance Organization for Municipalities | 4.000% | 1/13/21 | 5,625 | 6,056 |
| 11 | KFW | 0.625% | 12/15/16 | 30,050 | 29,965 |
| 11 | KFW | 4.875% | 1/17/17 | 2,900 | 3,016 |
| 11 | KFW | 1.250% | 2/15/17 | 29,000 | 29,078 |
| 11 | KFW | 0.750% | 3/17/17 | 7,000 | 6,966 |
| 11 | KFW | 0.875% | 9/5/17 | 14,200 | 14,134 |
| 11 | KFW | 0.875% | 12/15/17 | 8,000 | 7,914 |
| 11 | KFW | 1.000% | 1/26/18 | 2,000 | 1,980 |
| 11 | KFW | 4.375% | 3/15/18 | 18,850 | 20,100 |
| 11 | KFW | 1.000% | 6/11/18 | 26,350 | 26,111 |
| 11 | KFW | 4.500% | 7/16/18 | 6,225 | 6,704 |
| 11 | KFW | 1.125% | 8/6/18 | 11,600 | 11,478 |
| 11 | KFW | 1.125% | 11/16/18 | 35,000 | 34,594 |
| 11 | KFW | 1.875% | 4/1/19 | 48,590 | 49,009 |
| 11 | KFW | 4.875% | 6/17/19 | 10,075 | 11,163 |
| 11 | KFW | 1.750% | 10/15/19 | 23,650 | 23,587 |
| 11 | KFW | 4.000% | 1/27/20 | 5,400 | 5,858 |
| 11 | KFW | 1.500% | 4/20/20 | 27,500 | 27,034 |
| 11 | KFW | 2.750% | 9/8/20 | 14,250 | 14,767 |
| 11 | KFW | 2.750% | 10/1/20 | 13,200 | 13,685 |
| 11 | KFW | 2.375% | 8/25/21 | 19,590 | 19,872 |
| 11 | KFW | 2.625% | 1/25/22 | 14,200 | 14,565 |
| 11 | KFW | 2.000% | 10/4/22 | 24,875 | 24,486 |
| 11 | KFW | 2.125% | 1/17/23 | 23,500 | 23,218 |
| 11 | KFW | 2.500% | 11/20/24 | 39,500 | 39,719 |
| 11 | KFW | 2.000% | 5/2/25 | 31,350 | 30,155 |
| 11 | KFW | 0.000% | 4/18/36 | 7,000 | 3,674 |
| Korea Development Bank | 3.250% | 3/9/16 | 1,180 | 1,184 | |
| Korea Development Bank | 4.000% | 9/9/16 | 2,150 | 2,190 | |
129
| Total Bond Market II Index Fund | |||||
| Face | Market | ||||
| Maturity | Amount | Value• | |||
| Coupon | Date | ($000) | ($000) | ||
| Korea Development Bank | 3.250% | 9/20/16 | 4,000 | 4,057 | |
| Korea Development Bank | 3.875% | 5/4/17 | 2,500 | 2,569 | |
| Korea Development Bank | 2.250% | 8/7/17 | 1,475 | 1,485 | |
| Korea Development Bank | 3.500% | 8/22/17 | 3,450 | 3,547 | |
| Korea Development Bank | 4.625% | 11/16/21 | 9,250 | 10,176 | |
| Korea Development Bank | 3.000% | 9/14/22 | 18,750 | 18,874 | |
| Korea Development Bank | 3.750% | 1/22/24 | 9,600 | 9,986 | |
| 11 | Landwirtschaftliche Rentenbank | 5.125% | 2/1/17 | 10,600 | 11,057 |
| 11 | Landwirtschaftliche Rentenbank | 0.875% | 9/12/17 | 2,225 | 2,211 |
| 11 | Landwirtschaftliche Rentenbank | 2.375% | 9/13/17 | 3,900 | 3,973 |
| 11 | Landwirtschaftliche Rentenbank | 1.000% | 4/4/18 | 11,400 | 11,309 |
| 11 | Landwirtschaftliche Rentenbank | 1.875% | 9/17/18 | 5,600 | 5,639 |
| 11 | Landwirtschaftliche Rentenbank | 1.375% | 10/23/19 | 3,000 | 2,951 |
| 11 | Landwirtschaftliche Rentenbank | 2.250% | 10/1/21 | 16,700 | 16,796 |
| 11 | Landwirtschaftliche Rentenbank | 2.000% | 1/13/25 | 16,300 | 15,697 |
| 11 | Landwirtschaftliche Rentenbank | 2.375% | 6/10/25 | 14,575 | 14,326 |
| Nexen Energy ULC | 7.875% | 3/15/32 | 325 | 419 | |
| Nexen Energy ULC | 5.875% | 3/10/35 | 690 | 753 | |
| Nexen Energy ULC | 6.400% | 5/15/37 | 13,400 | 15,135 | |
| Nexen Energy ULC | 7.500% | 7/30/39 | 3,400 | 4,470 | |
| Nordic Investment Bank | 5.000% | 2/1/17 | 550 | 574 | |
| Nordic Investment Bank | 1.000% | 3/7/17 | 2,250 | 2,250 | |
| Nordic Investment Bank | 0.750% | 1/17/18 | 14,450 | 14,313 | |
| Nordic Investment Bank | 1.125% | 3/19/18 | 9,250 | 9,221 | |
| Nordic Investment Bank | 1.875% | 6/14/19 | 8,300 | 8,379 | |
| North American Development Bank | 2.300% | 10/10/18 | 2,087 | 2,098 | |
| North American Development Bank | 4.375% | 2/11/20 | 975 | 1,050 | |
| North American Development Bank | 2.400% | 10/26/22 | 3,300 | 3,216 | |
| 12 | Oesterreichische Kontrollbank AG | 0.750% | 12/15/16 | 8,000 | 7,979 |
| 12 | Oesterreichische Kontrollbank AG | 5.000% | 4/25/17 | 4,025 | 4,229 |
| 12 | Oesterreichische Kontrollbank AG | 1.625% | 3/12/19 | 3,500 | 3,505 |
| 12 | Oesterreichische Kontrollbank AG | 1.375% | 2/10/20 | 5,675 | 5,555 |
| 12 | Oesterreichische Kontrollbank AG | 1.500% | 10/21/20 | 30,000 | 29,286 |
| 12 | Oesterreichische Kontrollbank AG | 2.375% | 10/1/21 | 5,000 | 5,049 |
| 5 | Oriental Republic of Uruguay | 8.000% | 11/18/22 | 3,900 | 4,851 |
| 5 | Oriental Republic of Uruguay | 4.500% | 8/14/24 | 19,525 | 19,838 |
| 5 | Oriental Republic of Uruguay | 4.375% | 10/27/27 | 2,850 | 2,811 |
| 5 | Oriental Republic of Uruguay | 7.625% | 3/21/36 | 4,725 | 5,835 |
| 5 | Oriental Republic of Uruguay | 4.125% | 11/20/45 | 6,579 | 5,098 |
| 5 | Oriental Republic of Uruguay | 5.100% | 6/18/50 | 17,975 | 15,458 |
| Petroleos Mexicanos | 5.750% | 3/1/18 | 41,075 | 43,017 | |
| Petroleos Mexicanos | 8.000% | 5/3/19 | 6,675 | 7,364 | |
| Petroleos Mexicanos | 6.000% | 3/5/20 | 5,000 | 5,275 | |
| 8 | Petroleos Mexicanos | 3.500% | 7/23/20 | 4,200 | 4,000 |
| Petroleos Mexicanos | 5.500% | 1/21/21 | 19,645 | 19,883 | |
| Petroleos Mexicanos | 4.875% | 1/24/22 | 38,350 | 36,881 | |
| Petroleos Mexicanos | 3.500% | 1/30/23 | 11,050 | 9,640 | |
| Petroleos Mexicanos | 4.875% | 1/18/24 | 700 | 653 | |
| 5 | Petroleos Mexicanos | 2.290% | 2/15/24 | 1,275 | 1,267 |
| 8 | Petroleos Mexicanos | 4.250% | 1/15/25 | 5,050 | 4,457 |
| Petroleos Mexicanos | 2.378% | 4/15/25 | 1,805 | 1,798 | |
| 8 | Petroleos Mexicanos | 4.500% | 1/23/26 | 7,400 | 6,551 |
| Petroleos Mexicanos | 6.625% | 6/15/35 | 9,600 | 8,618 | |
| Petroleos Mexicanos | 6.625% | 6/15/38 | 3,025 | 2,662 | |
| Petroleos Mexicanos | 6.500% | 6/2/41 | 17,725 | 15,467 | |
| Petroleos Mexicanos | 5.500% | 6/27/44 | 17,500 | 13,237 | |
130
| Total Bond Market II Index Fund | ||||
| Face | Market | |||
| Maturity | Amount | Value• | ||
| Coupon | Date | ($000) | ($000) | |
| 8 Petroleos Mexicanos | 5.500% | 6/27/44 | 13,000 | 9,833 |
| Petroleos Mexicanos | 6.375% | 1/23/45 | 12,300 | 10,452 |
| 8 Petroleos Mexicanos | 5.625% | 1/23/46 | 14,000 | 10,717 |
| Province of British Columbia | 1.200% | 4/25/17 | 4,700 | 4,701 |
| Province of British Columbia | 2.650% | 9/22/21 | 8,200 | 8,351 |
| Province of British Columbia | 2.000% | 10/23/22 | 9,800 | 9,525 |
| Province of Manitoba | 4.900% | 12/6/16 | 5,865 | 6,092 |
| Province of Manitoba | 1.300% | 4/3/17 | 4,050 | 4,052 |
| Province of Manitoba | 1.125% | 6/1/18 | 1,250 | 1,234 |
| Province of Manitoba | 2.100% | 9/6/22 | 3,000 | 2,900 |
| Province of Manitoba | 3.050% | 5/14/24 | 19,500 | 19,802 |
| Province of New Brunswick | 2.750% | 6/15/18 | 7,375 | 7,559 |
| Province of Nova Scotia | 5.125% | 1/26/17 | 500 | 521 |
| Province of Nova Scotia | 9.125% | 5/1/21 | 1,280 | 1,658 |
| Province of Ontario | 1.100% | 10/25/17 | 10,350 | 10,281 |
| Province of Ontario | 3.150% | 12/15/17 | 5,525 | 5,669 |
| Province of Ontario | 1.200% | 2/14/18 | 5,600 | 5,569 |
| Province of Ontario | 3.000% | 7/16/18 | 2,550 | 2,635 |
| Province of Ontario | 2.000% | 9/27/18 | 12,500 | 12,576 |
| Province of Ontario | 2.000% | 1/30/19 | 20,000 | 20,077 |
| Province of Ontario | 1.650% | 9/27/19 | 11,000 | 10,835 |
| Province of Ontario | 4.000% | 10/7/19 | 3,550 | 3,797 |
| Province of Ontario | 4.400% | 4/14/20 | 13,100 | 14,312 |
| Province of Ontario | 1.875% | 5/21/20 | 7,500 | 7,423 |
| Province of Ontario | 2.500% | 9/10/21 | 13,500 | 13,490 |
| Province of Ontario | 2.450% | 6/29/22 | 1,525 | 1,506 |
| Province of Ontario | 3.200% | 5/16/24 | 10,000 | 10,296 |
| Quebec | 4.625% | 5/14/18 | 9,050 | 9,669 |
| Quebec | 3.500% | 7/29/20 | 8,770 | 9,277 |
| Quebec | 2.750% | 8/25/21 | 13,475 | 13,642 |
| Quebec | 2.625% | 2/13/23 | 34,919 | 34,682 |
| Quebec | 7.125% | 2/9/24 | 3,075 | 3,962 |
| Quebec | 2.875% | 10/16/24 | 9,400 | 9,411 |
| Quebec | 7.500% | 9/15/29 | 4,875 | 6,981 |
| Republic of Chile | 3.875% | 8/5/20 | 2,100 | 2,229 |
| Republic of Chile | 3.250% | 9/14/21 | 200 | 206 |
| Republic of Chile | 2.250% | 10/30/22 | 10,400 | 9,997 |
| Republic of Chile | 3.125% | 3/27/25 | 6,090 | 6,073 |
| Republic of Chile | 3.625% | 10/30/42 | 3,600 | 3,121 |
| Republic of Colombia | 7.375% | 1/27/17 | 4,900 | 5,133 |
| Republic of Colombia | 7.375% | 3/18/19 | 3,010 | 3,364 |
| Republic of Colombia | 11.750% | 2/25/20 | 850 | 1,101 |
| Republic of Colombia | 4.375% | 7/12/21 | 17,295 | 17,338 |
| 5 Republic of Colombia | 2.625% | 3/15/23 | 11,950 | 10,498 |
| Republic of Colombia | 4.000% | 2/26/24 | 12,800 | 12,192 |
| Republic of Colombia | 8.125% | 5/21/24 | 2,800 | 3,353 |
| 5 Republic of Colombia | 4.500% | 1/28/26 | 26,500 | 25,506 |
| Republic of Colombia | 7.375% | 9/18/37 | 11,500 | 12,679 |
| Republic of Colombia | 6.125% | 1/18/41 | 8,550 | 8,286 |
| 5 Republic of Colombia | 5.625% | 2/26/44 | 6,600 | 6,022 |
| 5 Republic of Colombia | 5.000% | 6/15/45 | 20,500 | 17,271 |
| Republic of Finland | 6.950% | 2/15/26 | 1,000 | 1,332 |
| Republic of Italy | 5.375% | 6/12/17 | 9,100 | 9,566 |
| Republic of Italy | 6.875% | 9/27/23 | 17,925 | 22,083 |
| Republic of Italy | 5.375% | 6/15/33 | 13,750 | 15,383 |
| Republic of Korea | 5.125% | 12/7/16 | 2,155 | 2,228 |
131
| Total Bond Market II Index Fund | |||||
| Face | Market | ||||
| Maturity | Amount | Value• | |||
| Coupon | Date | ($000) | ($000) | ||
| Republic of Korea | 7.125% | 4/16/19 | 15,878 | 18,401 | |
| Republic of Korea | 3.875% | 9/11/23 | 9,400 | 10,161 | |
| Republic of Korea | 5.625% | 11/3/25 | 575 | 707 | |
| Republic of Korea | 4.125% | 6/10/44 | 250 | 282 | |
| Republic of Panama | 5.200% | 1/30/20 | 15,455 | 16,769 | |
| 5 | Republic of Panama | 3.750% | 3/16/25 | 6,300 | 6,174 |
| Republic of Panama | 7.125% | 1/29/26 | 13,500 | 16,807 | |
| Republic of Panama | 9.375% | 4/1/29 | 5,500 | 7,934 | |
| 5 | Republic of Panama | 6.700% | 1/26/36 | 9,848 | 11,709 |
| 5 | Republic of Panama | 4.300% | 4/29/53 | 5,000 | 4,275 |
| Republic of Peru | 7.125% | 3/30/19 | 12,350 | 14,157 | |
| Republic of Peru | 7.350% | 7/21/25 | 2,725 | 3,416 | |
| Republic of Peru | 4.125% | 8/25/27 | 3,400 | 3,355 | |
| Republic of Peru | 8.750% | 11/21/33 | 14,327 | 20,298 | |
| 5 | Republic of Peru | 6.550% | 3/14/37 | 10,500 | 12,166 |
| Republic of Peru | 5.625% | 11/18/50 | 13,100 | 13,387 | |
| Republic of Poland | 6.375% | 7/15/19 | 12,860 | 14,693 | |
| Republic of Poland | 5.125% | 4/21/21 | 15,650 | 17,403 | |
| Republic of Poland | 5.000% | 3/23/22 | 23,085 | 25,601 | |
| Republic of Poland | 3.000% | 3/17/23 | 17,800 | 17,622 | |
| Republic of Poland | 4.000% | 1/22/24 | 225 | 237 | |
| Republic of South Africa | 6.875% | 5/27/19 | 4,425 | 4,747 | |
| Republic of South Africa | 5.500% | 3/9/20 | 14,490 | 14,834 | |
| Republic of South Africa | 5.875% | 5/30/22 | 875 | 911 | |
| Republic of South Africa | 4.665% | 1/17/24 | 9,300 | 8,858 | |
| Republic of South Africa | 5.875% | 9/16/25 | 10,600 | 10,838 | |
| Republic of South Africa | 5.375% | 7/24/44 | 10,000 | 8,925 | |
| Republic of the Philippines | 8.375% | 6/17/19 | 5,000 | 6,062 | |
| Republic of the Philippines | 6.500% | 1/20/20 | 3,000 | 3,502 | |
| Republic of the Philippines | 4.000% | 1/15/21 | 15,025 | 16,274 | |
| Republic of the Philippines | 10.625% | 3/16/25 | 8,525 | 13,431 | |
| Republic of the Philippines | 5.500% | 3/30/26 | 9,150 | 10,808 | |
| Republic of the Philippines | 9.500% | 2/2/30 | 7,450 | 11,724 | |
| Republic of the Philippines | 7.750% | 1/14/31 | 13,000 | 18,314 | |
| Republic of the Philippines | 6.375% | 1/15/32 | 9,650 | 12,312 | |
| Republic of the Philippines | 6.375% | 10/23/34 | 20,325 | 26,651 | |
| Republic of the Philippines | 5.000% | 1/13/37 | 1,950 | 2,274 | |
| Republic of the Philippines | 3.950% | 1/20/40 | 8,999 | 9,100 | |
| Republic of Turkey | 7.500% | 7/14/17 | 14,775 | 15,886 | |
| Republic of Turkey | 6.750% | 4/3/18 | 22,175 | 23,839 | |
| Republic of Turkey | 7.000% | 3/11/19 | 17,600 | 19,302 | |
| Republic of Turkey | 7.000% | 6/5/20 | 5,600 | 6,243 | |
| Republic of Turkey | 5.625% | 3/30/21 | 11,875 | 12,573 | |
| Republic of Turkey | 5.125% | 3/25/22 | 8,925 | 9,173 | |
| Republic of Turkey | 6.250% | 9/26/22 | 6,000 | 6,539 | |
| Republic of Turkey | 5.750% | 3/22/24 | 27,800 | 29,323 | |
| Republic of Turkey | 7.375% | 2/5/25 | 15,475 | 18,087 | |
| Republic of Turkey | 11.875% | 1/15/30 | 11,000 | 18,043 | |
| Republic of Turkey | 8.000% | 2/14/34 | 11,200 | 14,000 | |
| Republic of Turkey | 6.875% | 3/17/36 | 14,600 | 16,388 | |
| Republic of Turkey | 6.750% | 5/30/40 | 8,000 | 8,920 | |
| Republic of Turkey | 6.000% | 1/14/41 | 24,750 | 25,344 | |
| Republic of Turkey | 4.875% | 4/16/43 | 23,800 | 20,966 | |
| 2 | State of Israel | 5.500% | 11/9/16 | 2,980 | 3,091 |
| 2 | State of Israel | 5.125% | 3/26/19 | 5,350 | 5,884 |
| 2 | State of Israel | 4.000% | 6/30/22 | 8,200 | 8,804 |
| 132 | |||||
| Total Bond Market II Index Fund | ||||
| Face | Market | |||
| Maturity | Amount | Value• | ||
| Coupon | Date | ($000) | ($000) | |
| 2 State of Israel | 3.150% | 6/30/23 | 2,400 | 2,435 |
| 2 State of Israel | 4.500% | 1/30/43 | 14,100 | 14,137 |
| Statoil ASA | 3.125% | 8/17/17 | 5,390 | 5,523 |
| Statoil ASA | 6.700% | 1/15/18 | 1,000 | 1,096 |
| Statoil ASA | 1.200% | 1/17/18 | 1,500 | 1,484 |
| Statoil ASA | 1.950% | 11/8/18 | 3,500 | 3,499 |
| Statoil ASA | 5.250% | 4/15/19 | 3,990 | 4,347 |
| Statoil ASA | 2.250% | 11/8/19 | 7,500 | 7,480 |
| Statoil ASA | 2.900% | 11/8/20 | 3,125 | 3,155 |
| Statoil ASA | 2.750% | 11/10/21 | 10,400 | 10,238 |
| Statoil ASA | 3.150% | 1/23/22 | 3,175 | 3,147 |
| Statoil ASA | 2.450% | 1/17/23 | 17,550 | 16,599 |
| Statoil ASA | 2.650% | 1/15/24 | 6,500 | 6,156 |
| Statoil ASA | 3.700% | 3/1/24 | 15,868 | 16,012 |
| Statoil ASA | 3.250% | 11/10/24 | 5,100 | 4,973 |
| Statoil ASA | 7.250% | 9/23/27 | 1,975 | 2,564 |
| 8 Statoil ASA | 6.500% | 12/1/28 | 225 | 279 |
| Statoil ASA | 7.150% | 1/15/29 | 1,165 | 1,496 |
| Statoil ASA | 5.100% | 8/17/40 | 4,000 | 4,278 |
| Statoil ASA | 4.250% | 11/23/41 | 2,300 | 2,181 |
| Statoil ASA | 3.950% | 5/15/43 | 2,400 | 2,168 |
| Statoil ASA | 4.800% | 11/8/43 | 5,000 | 5,169 |
| Svensk Exportkredit AB | 5.125% | 3/1/17 | 550 | 575 |
| Svensk Exportkredit AB | 1.750% | 5/30/17 | 4,050 | 4,082 |
| Svensk Exportkredit AB | 1.125% | 4/5/18 | 14,800 | 14,676 |
| Svensk Exportkredit AB | 1.875% | 6/17/19 | 11,700 | 11,768 |
| United Mexican States | 5.625% | 1/15/17 | 24,465 | 25,396 |
| United Mexican States | 5.950% | 3/19/19 | 18,725 | 20,839 |
| United Mexican States | 3.500% | 1/21/21 | 9,100 | 9,188 |
| United Mexican States | 3.625% | 3/15/22 | 41,250 | 41,419 |
| United Mexican States | 4.000% | 10/2/23 | 38,917 | 39,414 |
| United Mexican States | 3.600% | 1/30/25 | 11,226 | 10,854 |
| United Mexican States | 7.500% | 4/8/33 | 2,250 | 2,925 |
| United Mexican States | 6.750% | 9/27/34 | 5,200 | 6,239 |
| United Mexican States | 6.050% | 1/11/40 | 25,852 | 28,502 |
| United Mexican States | 4.750% | 3/8/44 | 33,433 | 30,651 |
| United Mexican States | 5.550% | 1/21/45 | 6,900 | 7,048 |
| United Mexican States | 4.600% | 1/23/46 | 2,701 | 2,402 |
| United Mexican States | 5.750% | 10/12/10 | 26,260 | 24,385 |
| Total Sovereign Bonds (Cost $4,555,868) | 4,525,504 | |||
| Taxable Municipal Bonds (0.9%) | ||||
| Alameda County CA Joint Powers Authority | ||||
| Lease Revenue | 7.046% | 12/1/44 | 2,080 | 2,728 |
| American Municipal Power Ohio Inc. Revenue | ||||
| (Prairie State Energy Campus Project) | 7.834% | 2/15/41 | 3,575 | 4,903 |
| American Municipal Power Ohio Inc. Revenue | ||||
| (Prairie State Energy Campus Project) | 6.053% | 2/15/43 | 400 | 465 |
| American Municipal Power Ohio Inc. Revenue | ||||
| (Prairie State Energy Campus Project) | 5.939% | 2/15/47 | 5,445 | 6,282 |
| American Municipal Power Ohio Inc. Revenue | ||||
| (Prairie State Energy Campus Project) | 6.270% | 2/15/50 | 1,090 | 1,269 |
| American Municipal Power Ohio Inc. Revenue | ||||
| (Prairie State Energy Campus Project) | 7.499% | 2/15/50 | 750 | 1,002 |
| American Municipal Power Ohio Inc. Revenue | ||||
| (Prairie State Energy Campus Project) | 8.084% | 2/15/50 | 2,850 | 4,141 |
133
| Total Bond Market II Index Fund | ||||
| Face | Market | |||
| Maturity | Amount | Value• | ||
| Coupon | Date | ($000) | ($000) | |
| Bay Area Toll Authority California Toll Bridge | ||||
| Revenue (San Francisco Bay Area) | 6.793% | 4/1/30 | 875 | 1,073 |
| Bay Area Toll Authority California Toll Bridge | ||||
| Revenue (San Francisco Bay Area) | 6.918% | 4/1/40 | 1,500 | 1,976 |
| Bay Area Toll Authority California Toll Bridge | ||||
| Revenue (San Francisco Bay Area) | 6.263% | 4/1/49 | 8,133 | 10,941 |
| Bay Area Toll Authority California Toll Bridge | ||||
| Revenue (San Francisco Bay Area) | 7.043% | 4/1/50 | 1,325 | 1,823 |
| Bay Area Toll Authority California Toll Bridge | ||||
| Revenue (San Francisco Bay Area) | 6.907% | 10/1/50 | 4,265 | 5,823 |
| California GO | 5.750% | 3/1/17 | 4,000 | 4,213 |
| California GO | 6.200% | 3/1/19 | 1,100 | 1,248 |
| California GO | 6.200% | 10/1/19 | 4,935 | 5,674 |
| California GO | 5.700% | 11/1/21 | 9,655 | 11,310 |
| California GO | 7.500% | 4/1/34 | 18,955 | 26,540 |
| California GO | 7.550% | 4/1/39 | 14,855 | 21,594 |
| California GO | 7.300% | 10/1/39 | 2,400 | 3,353 |
| California GO | 7.350% | 11/1/39 | 7,825 | 10,985 |
| California GO | 7.625% | 3/1/40 | 6,425 | 9,344 |
| California GO | 7.600% | 11/1/40 | 18,185 | 27,030 |
| Central Puget Sound WA Regional Transit | ||||
| Authority Sales & Use Tax Revenue | 5.491% | 11/1/39 | 550 | 670 |
| Chicago IL GO | 7.375% | 1/1/33 | 1,800 | 1,879 |
| Chicago IL GO | 7.781% | 1/1/35 | 825 | 887 |
| Chicago IL Metropolitan Water Reclamation | ||||
| District GO | 5.720% | 12/1/38 | 3,060 | 3,511 |
| Chicago IL O’Hare International Airport Revenue | 6.845% | 1/1/38 | 400 | 448 |
| Chicago IL O’Hare International Airport Revenue | 6.395% | 1/1/40 | 600 | 751 |
| Chicago IL Transit Authority Sales Tax Receipts | ||||
| Revenue | 6.200% | 12/1/40 | 1,650 | 1,779 |
| Chicago IL Transit Authority Transfer Tax | ||||
| Receipts Revenue | 6.899% | 12/1/40 | 4,255 | 4,911 |
| Chicago IL Wastewater Transmission Revenue | 6.900% | 1/1/40 | 2,600 | 2,985 |
| Chicago IL Water Revenue | 6.742% | 11/1/40 | 4,400 | 5,001 |
| Clark County NV Airport System Revenue | 6.881% | 7/1/42 | 550 | 616 |
| Clark County NV Airport System Revenue | 6.820% | 7/1/45 | 3,400 | 4,683 |
| Colorado Bridge Enterprise Revenue | 6.078% | 12/1/40 | 3,300 | 4,108 |
| Commonwealth Financing Authority | ||||
| Pennsylvania Revenue | 6.218% | 6/1/39 | 2,350 | 2,727 |
| Connecticut GO | 5.632% | 12/1/29 | 1,110 | 1,285 |
| Connecticut GO | 5.090% | 10/1/30 | 800 | 886 |
| Connecticut GO | 5.850% | 3/15/32 | 9,015 | 10,548 |
| Connecticut Special Tax Revenue | ||||
| (Transportation Infrastructure) | 5.459% | 11/1/30 | 100 | 115 |
| Cook County IL GO | 6.229% | 11/15/34 | 1,750 | 1,867 |
| Curators of the University of Missouri System | ||||
| Facilities Revenue | 5.960% | 11/1/39 | 1,000 | 1,242 |
| Curators of the University of Missouri System | ||||
| Facilities Revenue | 5.792% | 11/1/41 | 1,000 | 1,273 |
| Dallas County TX Hospital District Revenue | 5.621% | 8/15/44 | 850 | 1,049 |
| Dallas TX Area Rapid Transit Revenue | 4.922% | 12/1/41 | 1,650 | 1,880 |
| Dallas TX Area Rapid Transit Revenue | 5.999% | 12/1/44 | 1,100 | 1,441 |
| Dallas TX Area Rapid Transit Revenue | 5.022% | 12/1/48 | 2,825 | 3,300 |
| Dallas TX Convention Center Hotel Development | ||||
| Corp. Hotel Revenue | 7.088% | 1/1/42 | 5,225 | 6,714 |
| Dallas TX Independent School District GO | 6.450% | 2/15/35 | 1,500 | 1,741 |
134
| Total Bond Market II Index Fund | |||||
| Face | Market | ||||
| Maturity | Amount | Value• | |||
| Coupon | Date | ($000) | ($000) | ||
| Dartmouth College New Hampshire GO | 4.750% | 6/1/19 | 275 | 299 | |
| Denver CO City & County School District No. 1 | |||||
| COP | 7.017% | 12/15/37 | 1,050 | 1,377 | |
| Denver CO City & County School District No. 1 | |||||
| GO | 5.664% | 12/1/33 | 525 | 621 | |
| District of Columbia Income Tax Revenue | 5.591% | 12/1/34 | 450 | 539 | |
| District of Columbia Income Tax Revenue | 5.582% | 12/1/35 | 650 | 785 | |
| District of Columbia Water & Sewer Authority | |||||
| Public Utility Revenue | 4.814% | 10/1/14 | 8,200 | 8,123 | |
| East Baton Rouge LA Sewer Commission | |||||
| Revenue | 6.087% | 2/1/45 | 975 | 1,072 | |
| East Bay CA Municipal Utility District Water | |||||
| System Revenue | 5.874% | 6/1/40 | 1,100 | 1,374 | |
| Emory University Georgia GO | 5.625% | 9/1/19 | 1,430 | 1,598 | |
| Energy Northwest Washington Electric Revenue | |||||
| (Columbia Generating Station) | 2.197% | 7/1/19 | 2,000 | 2,010 | |
| Florida Hurricane Catastrophe Fund Finance Corp. | |||||
| Revenue | 2.107% | 7/1/18 | 6,650 | 6,690 | |
| Florida Hurricane Catastrophe Fund Finance Corp. | |||||
| Revenue | 2.995% | 7/1/20 | 8,100 | 8,214 | |
| George Washington University District of | |||||
| Columbia GO | 3.485% | 9/15/22 | 2,700 | 2,746 | |
| George Washington University District of | |||||
| Columbia GO | 4.300% | 9/15/44 | 900 | 867 | |
| Georgia GO | 4.503% | 11/1/25 | 5,300 | 5,895 | |
| Georgia Municipal Electric Power Authority | |||||
| Revenue | 6.637% | 4/1/57 | 6,645 | 7,914 | |
| Georgia Municipal Electric Power Authority | |||||
| Revenue | 6.655% | 4/1/57 | 2,150 | 2,531 | |
| Georgia Municipal Electric Power Authority | |||||
| Revenue | 7.055% | 4/1/57 | 5,100 | 5,577 | |
| Houston TX Utility System Revenue | 3.828% | 5/15/28 | 2,400 | 2,488 | |
| Illinois GO | 5.365% | 3/1/17 | 3,000 | 3,105 | |
| Illinois GO | 5.665% | 3/1/18 | 5,000 | 5,270 | |
| Illinois GO | 4.950% | 6/1/23 | 2,125 | 2,126 | |
| Illinois GO | 5.100% | 6/1/33 | 37,640 | 35,609 | |
| Illinois GO | 6.630% | 2/1/35 | 5,400 | 5,576 | |
| Illinois GO | 6.725% | 4/1/35 | 3,250 | 3,364 | |
| Illinois GO | 7.350% | 7/1/35 | 10,750 | 11,662 | |
| Illinois Toll Highway Authority Revenue | 6.184% | 1/1/34 | 460 | 572 | |
| Illinois Toll Highway Authority Revenue | 5.851% | 12/1/34 | 625 | 752 | |
| Indianapolis IN Local Public Improvement | |||||
| Revenue | 6.116% | 1/15/40 | 3,700 | 4,595 | |
| 13 | Industry CA Sales Tax Revenue | 5.125% | 1/1/51 | 1,400 | 1,417 |
| JobsOhio Beverage System Statewide Liquor | |||||
| Profits Revenue | 3.985% | 1/1/29 | 3,100 | 3,227 | |
| JobsOhio Beverage System Statewide Liquor | |||||
| Profits Revenue | 4.532% | 1/1/35 | 2,350 | 2,487 | |
| Kansas Department of Transportation Highway | |||||
| Revenue | 4.596% | 9/1/35 | 2,700 | 2,917 | |
| Kansas Development Finance Authority Revenue | 4.727% | 4/15/37 | 1,900 | 1,899 | |
| 13 | Kansas Development Finance Authority Revenue | ||||
| (Public Employees Retirement System) | 5.501% | 5/1/34 | 1,525 | 1,693 | |
| Kentucky Asset/Liability Commission General | |||||
| Fund Revenue | 3.165% | 4/1/18 | 139 | 141 | |
| Los Angeles CA Community College District GO | 6.600% | 8/1/42 | 2,050 | 2,803 | |
135
| Total Bond Market II Index Fund | |||||
| Face | Market | ||||
| Maturity | Amount | Value• | |||
| Coupon | Date | ($000) | ($000) | ||
| Los Angeles CA Community College District GO | 6.750% | 8/1/49 | 4,250 | 6,005 | |
| Los Angeles CA Department of Airports | |||||
| International Airport Revenue | 6.582% | 5/15/39 | 450 | 576 | |
| Los Angeles CA Department of Water & Power | |||||
| Revenue | 5.716% | 7/1/39 | 850 | 1,024 | |
| Los Angeles CA Department of Water & Power | |||||
| Revenue | 6.008% | 7/1/39 | 2,400 | 2,932 | |
| Los Angeles CA Department of Water & Power | |||||
| Revenue | 6.166% | 7/1/40 | 600 | 673 | |
| Los Angeles CA Department of Water & Power | |||||
| Revenue | 6.574% | 7/1/45 | 6,555 | 8,897 | |
| Los Angeles CA Department of Water & Power | |||||
| Revenue | 6.603% | 7/1/50 | 500 | 682 | |
| Los Angeles CA Unified School District GO | 5.755% | 7/1/29 | 1,800 | 2,133 | |
| Los Angeles CA Unified School District GO | 5.750% | 7/1/34 | 6,590 | 7,939 | |
| Los Angeles CA Unified School District GO | 6.758% | 7/1/34 | 1,050 | 1,383 | |
| Los Angeles County CA Metropolitan | |||||
| Transportation Authority Sales Tax Revenue | 5.735% | 6/1/39 | 5,500 | 6,685 | |
| Los Angeles County CA Public Works Financing | |||||
| Authority Lease Revenue | 7.488% | 8/1/33 | 1,700 | 2,213 | |
| Los Angeles County CA Public Works Financing | |||||
| Authority Lease Revenue | 7.618% | 8/1/40 | 850 | 1,187 | |
| Maryland Transportation Authority Facilities | |||||
| Projects Revenue | 5.888% | 7/1/43 | 800 | 969 | |
| Massachusetts GO | 4.200% | 12/1/21 | 6,070 | 6,581 | |
| Massachusetts GO | 5.456% | 12/1/39 | 5,250 | 6,329 | |
| Massachusetts School Building Authority | |||||
| Dedicated Sales Tax Revenue | 5.715% | 8/15/39 | 2,100 | 2,555 | |
| Massachusetts Transportation Fund Revenue | 5.731% | 6/1/40 | 475 | 590 | |
| Massachusetts Water Pollution Abatement | |||||
| Trust Revenue | 5.192% | 8/1/40 | 2,415 | 2,808 | |
| Metropolitan Government of Nashville & | |||||
| Davidson County TN Convention Center | |||||
| Authority Tourism Tax Revenue | 6.731% | 7/1/43 | 1,500 | 1,905 | |
| Metropolitan Government of Nashville & | |||||
| Davidson County TN GO | 5.707% | 7/1/34 | 1,000 | 1,169 | |
| Metropolitan Washington DC/VA Airports | |||||
| Authority Dulles Toll Road Revenue | 7.462% | 10/1/46 | 425 | 572 | |
| Metropolitan Water District of Southern | |||||
| California Revenue | 6.947% | 7/1/40 | 650 | 757 | |
| Mississippi GO | 5.245% | 11/1/34 | 1,300 | 1,477 | |
| Missouri Highways & Transportation | |||||
| Commission Road Revenue | 5.445% | 5/1/33 | 600 | 702 | |
| 14 | New Jersey Economic Development Authority | ||||
| Revenue (State Pension Funding) | 7.425% | 2/15/29 | 9,515 | 10,805 | |
| New Jersey Transportation Trust Fund Authority | |||||
| Transportation System Revenue | 5.754% | 12/15/28 | 7,080 | 7,367 | |
| New Jersey Transportation Trust Fund Authority | |||||
| Transportation System Revenue | 6.561% | 12/15/40 | 2,680 | 2,837 | |
| 15 | New Jersey Turnpike Authority Revenue | 4.252% | 1/1/16 | 125 | 125 |
| New Jersey Turnpike Authority Revenue | 7.414% | 1/1/40 | 6,400 | 9,097 | |
| New Jersey Turnpike Authority Revenue | 7.102% | 1/1/41 | 13,526 | 18,630 | |
| New York City NY GO | 6.646% | 12/1/31 | 100 | 116 | |
| New York City NY GO | 6.246% | 6/1/35 | 950 | 1,074 | |
| New York City NY GO | 5.968% | 3/1/36 | 1,390 | 1,718 | |
136
| Total Bond Market II Index Fund | ||||
| Face | Market | |||
| Maturity | Amount | Value• | ||
| Coupon | Date | ($000) | ($000) | |
| New York City NY GO | 5.985% | 12/1/36 | 600 | 735 |
| New York City NY GO | 5.517% | 10/1/37 | 3,225 | 3,813 |
| New York City NY GO | 6.271% | 12/1/37 | 5,950 | 7,633 |
| New York City NY GO | 5.846% | 6/1/40 | 750 | 932 |
| New York City NY Municipal Water Finance | ||||
| Authority Water & Sewer System Revenue | 5.750% | 6/15/41 | 500 | 631 |
| New York City NY Municipal Water Finance | ||||
| Authority Water & Sewer System Revenue | 5.790% | 6/15/41 | 4,000 | 4,410 |
| New York City NY Municipal Water Finance | ||||
| Authority Water & Sewer System Revenue | 5.952% | 6/15/42 | 1,000 | 1,291 |
| New York City NY Municipal Water Finance | ||||
| Authority Water & Sewer System Revenue | 6.011% | 6/15/42 | 350 | 455 |
| New York City NY Municipal Water Finance | ||||
| Authority Water & Sewer System Revenue | 6.282% | 6/15/42 | 2,275 | 2,590 |
| New York City NY Municipal Water Finance | ||||
| Authority Water & Sewer System Revenue | 5.440% | 6/15/43 | 2,300 | 2,800 |
| New York City NY Municipal Water Finance | ||||
| Authority Water & Sewer System Revenue | 5.882% | 6/15/44 | 12,590 | 16,261 |
| New York City NY Transitional Finance Authority | ||||
| Building Aid Revenue | 6.828% | 7/15/40 | 2,200 | 2,902 |
| New York City NY Transitional Finance Authority | ||||
| Future Tax Revenue | 5.767% | 8/1/36 | 750 | 905 |
| New York City NY Transitional Finance Authority | ||||
| Future Tax Revenue | 5.508% | 8/1/37 | 3,300 | 3,967 |
| New York City NY Transitional Finance Authority | ||||
| Future Tax Revenue | 5.572% | 11/1/38 | 1,000 | 1,206 |
| New York Metropolitan Transportation Authority | ||||
| Revenue (Dedicated Tax Fund) | 7.336% | 11/15/39 | 4,950 | 7,217 |
| New York Metropolitan Transportation Authority | ||||
| Revenue (Dedicated Tax Fund) | 6.089% | 11/15/40 | 400 | 506 |
| New York Metropolitan Transportation Authority | ||||
| Revenue (Transit Revenue) | 6.548% | 11/15/31 | 300 | 377 |
| New York Metropolitan Transportation Authority | ||||
| Revenue (Transit Revenue) | 5.871% | 11/15/39 | 975 | 1,160 |
| New York Metropolitan Transportation Authority | ||||
| Revenue (Transit Revenue) | 6.648% | 11/15/39 | 2,540 | 3,301 |
| New York Metropolitan Transportation Authority | ||||
| Revenue (Transit Revenue) | 6.668% | 11/15/39 | 5,825 | 7,635 |
| New York State Dormitory Authority Revenue | ||||
| (Personal Income Tax) | 5.500% | 3/15/30 | 3,745 | 4,454 |
| New York State Dormitory Authority Revenue | ||||
| (Personal Income Tax) | 5.289% | 3/15/33 | 1,250 | 1,459 |
| New York State Dormitory Authority Revenue | ||||
| (Personal Income Tax) | 5.628% | 3/15/39 | 400 | 480 |
| New York State Dormitory Authority Revenue | ||||
| (Personal Income Tax) | 5.389% | 3/15/40 | 750 | 891 |
| New York State Urban Development Corp. | ||||
| Revenue (Personal Income Tax) | 5.770% | 3/15/39 | 2,375 | 2,880 |
| New York State Urban Development Corp. | ||||
| Revenue (Personal Income Tax) | 5.838% | 3/15/40 | 650 | 794 |
| New York University Hospitals Center GO | 4.428% | 7/1/42 | 1,350 | 1,293 |
| New York University Hospitals Center Revenue | 5.750% | 7/1/43 | 3,050 | 3,505 |
| North Texas Tollway Authority System Revenue | 6.718% | 1/1/49 | 4,525 | 6,202 |
| Ohio State University General Receipts Revenue | 4.910% | 6/1/40 | 1,575 | 1,766 |
137
| Total Bond Market II Index Fund | |||||
| Face | Market | ||||
| Maturity | Amount | Value• | |||
| Coupon | Date | ($000) | ($000) | ||
| Ohio State University General Receipts Revenue | 4.800% | 6/1/11 | 5,456 | 5,260 | |
| Ohio State University General Receipts Revenue | 5.590% | 12/1/14 | 3,400 | 3,605 | |
| Ohio Water Development Authority Water | |||||
| Pollution Control Loan Fund Revenue | 4.879% | 12/1/34 | 1,000 | 1,120 | |
| Orange County CA Local Transportation Authority | |||||
| Sales Tax Revenue | 6.908% | 2/15/41 | 650 | 876 | |
| Oregon Department of Transportation Highway | |||||
| User Tax Revenue | 5.834% | 11/15/34 | 1,050 | 1,319 | |
| Oregon GO | 5.762% | 6/1/23 | 850 | 972 | |
| Oregon GO | 5.892% | 6/1/27 | 1,125 | 1,348 | |
| 15 | Oregon School Boards Association GO | 4.759% | 6/30/28 | 11,450 | 12,574 |
| 13 | Oregon School Boards Association GO | 5.528% | 6/30/28 | 375 | 431 |
| Pennsylvania GO | 4.650% | 2/15/26 | 2,015 | 2,170 | |
| Pennsylvania GO | 5.350% | 5/1/30 | 3,000 | 3,298 | |
| Pennsylvania Public School Building Authority | |||||
| Lease Revenue (School District of Philadelphia) | 5.000% | 9/15/27 | 999 | 1,074 | |
| Pennsylvania Turnpike Commission Revenue | 5.511% | 12/1/45 | 2,250 | 2,619 | |
| Pennsylvania Turnpike Commission Revenue | 5.561% | 12/1/49 | 550 | 637 | |
| Philadelphia PA Industrial Development Authority | |||||
| City Service Agreement Revenue | 3.964% | 4/15/26 | 1,500 | 1,484 | |
| Port Authority of New York & New Jersey | |||||
| Revenue | 6.040% | 12/1/29 | 850 | 1,022 | |
| Port Authority of New York & New Jersey | |||||
| Revenue | 5.647% | 11/1/40 | 2,950 | 3,491 | |
| Port Authority of New York & New Jersey | |||||
| Revenue | 5.647% | 11/1/40 | 4,800 | 5,680 | |
| Port Authority of New York & New Jersey | |||||
| Revenue | 4.960% | 8/1/46 | 4,925 | 5,320 | |
| Port Authority of New York & New Jersey | |||||
| Revenue | 5.310% | 8/1/46 | 3,350 | 3,539 | |
| Port Authority of New York & New Jersey | |||||
| Revenue | 4.926% | 10/1/51 | 7,465 | 7,919 | |
| Port Authority of New York & New Jersey | |||||
| Revenue | 4.458% | 10/1/62 | 13,850 | 13,187 | |
| President & Fellows of Harvard College | |||||
| Massachusetts GO | 4.875% | 10/15/40 | 2,775 | 3,226 | |
| Princeton University New Jersey GO | 4.950% | 3/1/19 | 3,400 | 3,721 | |
| Princeton University New Jersey GO | 5.700% | 3/1/39 | 1,650 | 2,169 | |
| Regional Transportation District of Colorado | |||||
| Sales Tax Revenue | 5.844% | 11/1/50 | 1,250 | 1,602 | |
| Rutgers State University New Jersey Revenue | 5.665% | 5/1/40 | 2,900 | 3,446 | |
| Sacramento CA Public Financing Authority Lease | |||||
| Revenue | 5.637% | 4/1/50 | 1,500 | 1,592 | |
| Salt River Project Arizona Agricultural | |||||
| Improvement & Power District Revenue | 4.839% | 1/1/41 | 750 | 854 | |
| San Antonio TX Electric & Gas Systems Revenue | 5.985% | 2/1/39 | 1,500 | 1,899 | |
| San Antonio TX Electric & Gas Systems Revenue | 5.718% | 2/1/41 | 1,175 | 1,446 | |
| San Antonio TX Electric & Gas Systems Revenue | 5.808% | 2/1/41 | 6,700 | 8,349 | |
| San Antonio TX Electric & Gas Systems Revenue | 4.427% | 2/1/42 | 1,360 | 1,430 | |
| San Diego County CA Regional Airport Authority | |||||
| Revenue | 5.594% | 7/1/43 | 2,375 | 2,568 | |
| San Diego County CA Regional Transportation | |||||
| Commission Sales Tax Revenue | 5.911% | 4/1/48 | 1,470 | 1,851 | |
| San Diego County CA Water Authority Revenue | 6.138% | 5/1/49 | 3,265 | 4,235 | |
138
| Total Bond Market II Index Fund | |||||
| Face | Market | ||||
| Maturity | Amount | Value• | |||
| Coupon | Date | ($000) | ($000) | ||
| San Francisco CA City & County Public Utilities | |||||
| Commission Water Revenue | 6.000% | 11/1/40 | 1,600 | 1,950 | |
| San Francisco CA City & County Public Utilities | |||||
| Commission Water Revenue | 6.950% | 11/1/50 | 5,450 | 7,625 | |
| Santa Clara Valley CA Transportation Authority | |||||
| Sales Tax Revenue | 5.876% | 4/1/32 | 3,355 | 4,021 | |
| Sonoma County CA Pension Obligation Revenue | 6.000% | 12/1/29 | 775 | 904 | |
| South Carolina Public Service Authority Revenue | 6.454% | 1/1/50 | 6,625 | 8,294 | |
| Stanford University California GO | 3.460% | 5/1/47 | 1,750 | 1,651 | |
| Texas GO | 5.517% | 4/1/39 | 6,590 | 8,233 | |
| Texas Transportation Commission Revenue | 5.028% | 4/1/26 | 750 | 857 | |
| Texas Transportation Commission Revenue | 5.178% | 4/1/30 | 3,850 | 4,526 | |
| Texas Transportation Commission Revenue | 4.631% | 4/1/33 | 4,000 | 4,393 | |
| Texas Transportation Commission Revenue | 4.681% | 4/1/40 | 1,375 | 1,545 | |
| Tufts University Massachusetts GO | 5.017% | 4/15/12 | 4,700 | 4,849 | |
| University of California Regents General Revenue | 4.601% | 5/15/31 | 12,830 | 13,673 | |
| University of California Regents Medical Center | |||||
| Revenue | 6.548% | 5/15/48 | 1,675 | 2,155 | |
| University of California Regents Medical Center | |||||
| Revenue | 6.583% | 5/15/49 | 1,055 | 1,355 | |
| University of California Revenue | 1.796% | 7/1/19 | 6,560 | 6,561 | |
| University of California Revenue | 5.770% | 5/15/43 | 5,790 | 7,063 | |
| University of California Revenue | 5.946% | 5/15/45 | 4,950 | 6,039 | |
| University of California Revenue | 4.858% | 5/15/12 | 5,325 | 5,094 | |
| University of Massachusetts Building Authority | |||||
| Revenue | 5.450% | 11/1/40 | 600 | 705 | |
| University of Southern California GO | 5.250% | 10/1/11 | 1,650 | 1,868 | |
| University of Texas System Revenue Financing | |||||
| System Revenue | 5.262% | 7/1/39 | 5,214 | 6,286 | |
| University of Texas System Revenue Financing | |||||
| System Revenue | 6.276% | 8/15/41 | 525 | 584 | |
| University of Texas System Revenue Financing | |||||
| System Revenue | 5.134% | 8/15/42 | 150 | 176 | |
| University of Texas System Revenue Financing | |||||
| System Revenue | 4.794% | 8/15/46 | 1,665 | 1,888 | |
| University of Virginia Revenue | 6.200% | 9/1/39 | 1,000 | 1,367 | |
| Utah GO | 4.554% | 7/1/24 | 300 | 337 | |
| Utah GO | 3.539% | 7/1/25 | 4,300 | 4,536 | |
| Utah Transit Authority Sales Tax Revenue | 5.937% | 6/15/39 | 3,875 | 4,877 | |
| Virginia Commonwealth Transportation Board | |||||
| Revenue | 5.350% | 5/15/35 | 730 | 839 | |
| Washington GO | 5.090% | 8/1/33 | 3,825 | 4,355 | |
| Washington GO | 5.481% | 8/1/39 | 270 | 326 | |
| Washington GO | 5.140% | 8/1/40 | 1,920 | 2,258 | |
| 13 | Wisconsin GO | 5.700% | 5/1/26 | 3,020 | 3,497 |
| Total Taxable Municipal Bonds (Cost $769,444) | 838,932 | ||||
139
| Total Bond Market II Index Fund | |||
| Market | |||
| Value• | |||
| Coupon | Shares | ($000) | |
| Temporary Cash Investment (2.1%) | |||
| Money Market Fund (2.1%) | |||
| 16 Vanguard Market Liquidity Fund | |||
| (Cost $1,950,202) | 0.363% | 1,950,201,798 | 1,950,202 |
| Total Investments (101.5%) (Cost $93,062,225) | 93,492,923 | ||
| Amount | |||
| ($000) | |||
| Other Assets and Liabilities (-1.5%) | |||
| Other Assets | |||
| Investment in Vanguard | 7,936 | ||
| Receivables for Investment Securities Sold | 997,498 | ||
| Receivables for Accrued Income | 582,550 | ||
| Receivables for Capital Shares Issued | 1,053,832 | ||
| Other Assets | 156,906 | ||
| Total Other Assets | 2,798,722 | ||
| Liabilities | |||
| Payables for Investment Securities Purchased | (4,043,961) | ||
| Payables for Capital Shares Redeemed | (19,838) | ||
| Payables to Vanguard | (41,034) | ||
| Other Liabilities | (34,312) | ||
| Total Liabilities | (4,139,145) | ||
| Net Assets (100%) | 92,152,500 | ||
| At December 31, 2015, net assets consisted of: | |||
| Amount | |||
| ($000) | |||
| Paid-in Capital | 91,768,264 | ||
| Overdistributed Net Investment Income | (3,977) | ||
| Accumulated Net Realized Losses | (42,485) | ||
| Unrealized Appreciation (Depreciation) | 430,698 | ||
| Net Assets | 92,152,500 | ||
140
| Total Bond Market II Index Fund | |
| Amount | |
| ($000) | |
| Investor Shares—Net Assets | |
| Applicable to 5,223,687,326 outstanding $.001 par value shares of | |
| beneficial interest (unlimited authorization) | 55,392,044 |
| Net Asset Value Per Share—Investor Shares | $10.60 |
| Institutional Shares—Net Assets | |
| Applicable to 3,466,606,455 outstanding $.001 par value shares of | |
| beneficial interest (unlimited authorization) | 36,760,456 |
| Net Asset Value Per Share—Institutional Shares | $10.60 |
• See Note A in Notes to Financial Statements.
1 Securities with a value of $2,340,000 have been segregated as collateral for certain open To Be Announced (TBA) transactions.
2 U.S. government-guaranteed.
3 The issuer operates under a congressional charter; its securities are generally neither guaranteed by the U.S. Treasury nor backed
by the full faith and credit of the U.S. government.
4 The issuer was placed under federal conservatorship in September 2008; since that time, its daily operations have been managed
by the Federal Housing Finance Agency and it receives capital from the U.S. Treasury, as needed to maintain a positive net worth,
in exchange for senior preferred stock.
5 The average or expected maturity is shorter than the final maturity shown because of the possibility of interim principal payments
and prepayments or the possibility of the issue being called.
6 Includes securities purchased on a when-issued or delayed-delivery basis for which the fund has not taken delivery as of
December 31, 2015.
7 Adjustable-rate security.
8 Security exempt from registration under Rule 144A of the Securities Act of 1933. Such securities may be sold in transactions exempt
from registration, normally to qualified institutional buyers. At December 31, 2015, the aggregate value of these securities was
$753,723,000, representing 0.8% of net assets.
9 Guaranteed by the Government of Canada.
10 Guaranteed by the Government of Japan.
11 Guaranteed by the Federal Republic of Germany.
12 Guaranteed by the Republic of Austria.
13 Scheduled principal and interest payments are guaranteed by AGM (Assured Guaranty Municipal Corporation).
14 Scheduled principal and interest payments are guaranteed by National Public Finance Guarantee Corp.
15 Scheduled principal and interest payments are guaranteed by AMBAC (Ambac Assurance Corporation).
16 Affiliated money market fund available only to Vanguard funds and certain trusts and accounts managed by Vanguard. Rate shown
is the 7-day yield.
COP—Certificate of Participation.
GO—General Obligation Bond.
REIT—Real Estate Investment Trust.
See accompanying Notes, which are an integral part of the Financial Statements.
141
Total Bond Market II Index Fund
Statement of Operations
| Year Ended | |
| December 31, 2015 | |
| ($000) | |
| Investment Income | |
| Income | |
| Interest1 | 2,182,732 |
| Total Income | 2,182,732 |
| Expenses | |
| The Vanguard Group—Note B | |
| Investment Advisory Services | 2,321 |
| Management and Administrative—Investor Shares | 33,697 |
| Management and Administrative—Institutional Shares | 2,979 |
| Marketing and Distribution—Investor Shares | 13,534 |
| Marketing and Distribution—Institutional Shares | 3,057 |
| Custodian Fees | 891 |
| Auditing Fees | 47 |
| Shareholders’ Reports—Investor Shares | 31 |
| Shareholders’ Reports—Institutional Shares | 1 |
| Trustees’ Fees and Expenses | 56 |
| Total Expenses | 56,614 |
| Net Investment Income | 2,126,118 |
| Realized Net Gain (Loss) on Investment Securities Sold | 138,439 |
| Change in Unrealized Appreciation (Depreciation) of Investment Securities | (1,938,900) |
| Net Increase (Decrease) in Net Assets Resulting from Operations | 325,657 |
| 1 Interest income from an affiliated company of the fund was $6,806,000. | |
See accompanying Notes, which are an integral part of the Financial Statements.
142
| Total Bond Market II Index Fund | ||
| Statement of Changes in Net Assets | ||
| Year Ended December 31, | ||
| 2015 | 2014 | |
| ($000) | ($000) | |
| Increase (Decrease) in Net Assets | ||
| Operations | ||
| Net Investment Income | 2,126,118 | 1,843,099 |
| Realized Net Gain (Loss) | 138,439 | 302,470 |
| Change in Unrealized Appreciation (Depreciation) | (1,938,900) | 2,448,655 |
| Net Increase (Decrease) in Net Assets Resulting from Operations | 325,657 | 4,594,224 |
| Distributions | ||
| Net Investment Income | ||
| Investor Shares | (1,258,281) | (1,147,785) |
| Institutional Shares | (871,814) | (695,314) |
| Realized Capital Gain1 | ||
| Investor Shares | (122,170) | (123,015) |
| Institutional Shares | (80,857) | (80,330) |
| Total Distributions | (2,333,122) | (2,046,444) |
| Capital Share Transactions | ||
| Investor Shares | 2,323,595 | 5,148,025 |
| Institutional Shares | 1,083,733 | 10,467,385 |
| Net Increase (Decrease) from Capital Share Transactions | 3,407,328 | 15,615,410 |
| Total Increase (Decrease) | 1,399,863 | 18,163,190 |
| Net Assets | ||
| Beginning of Period | 90,752,637 | 72,589,447 |
| End of Period2 | 92,152,500 | 90,752,637 |
1 Includes fiscal 2015 and 2014 short-term gain distributions totaling $53,855,000 and $146,408,000, respectively. Short-term gain
distributions are treated as ordinary income dividends for tax purposes.
2 Net Assets—End of Period includes undistributed (overdistributed) net investment income of ($3,977,000) and $0.
See accompanying Notes, which are an integral part of the Financial Statements.
143
| Total Bond Market II Index Fund | |||||
| Financial Highlights | |||||
| Investor Shares | |||||
| For a Share Outstanding | Year Ended December 31, | ||||
| Throughout Each Period | 2015 | 2014 | 2013 | 2012 | 2011 |
| Net Asset Value, Beginning of Period | $10.84 | $10.49 | $10.97 | $10.87 | $10.50 |
| Investment Operations | |||||
| Net Investment Income | .248 | .242 | .221 | .253 | .315 |
| Net Realized and Unrealized Gain (Loss) | |||||
| on Investments | (.216) | .375 | (.467) | .168 | .470 |
| Total from Investment Operations | .032 | .617 | (.246) | .421 | .785 |
| Distributions | |||||
| Dividends from Net Investment Income | (.248) | (.242) | (.221) | (.253) | (.315) |
| Distributions from Realized Capital Gains | (.024) | (.025) | (.013) | (.068) | (.100) |
| Total Distributions | (.272) | (.267) | (.234) | (.321) | (.415) |
| Net Asset Value, End of Period | $10.60 | $10.84 | $10.49 | $10.97 | $10.87 |
| Total Return1 | 0.28% | 5.93% | -2.26% | 3.91% | 7.59% |
| Ratios/Supplemental Data | |||||
| Net Assets, End of Period (Millions) | $55,392 | $54,268 | $47,497 | $45,758 | $35,626 |
| Ratio of Total Expenses to Average Net Assets | 0.09% | 0.10% | 0.12% | 0.12% | 0.12% |
| Ratio of Net Investment Income to | |||||
| Average Net Assets | 2.30% | 2.26% | 2.07% | 2.29% | 2.94% |
| Portfolio Turnover Rate2,3 | 116% | 108% | 111% | 102% | 134% |
1 Total returns do not include account service fees that may have applied in the periods shown. Fund prospectuses provide information about any applicable account service fees.
2 Includes 46%, 56%, 52%, 53%, and 41% attributable to mortgage-dollar-roll activity.
3 Excludes the value of portfolio securities, if any, received or delivered as a result of in-kind purchases or redemptions of the fund’s capital shares.
See accompanying Notes, which are an integral part of the Financial Statements.
144
| Total Bond Market II Index Fund | |||||
| Financial Highlights | |||||
| Institutional Shares | |||||
| For a Share Outstanding | Year Ended December 31, | ||||
| Throughout Each Period | 2015 | 2014 | 2013 | 2012 | 2011 |
| Net Asset Value, Beginning of Period | $10.84 | $10.49 | $10.97 | $10.87 | $10.50 |
| Investment Operations | |||||
| Net Investment Income | .256 | .248 | .228 | .261 | .322 |
| Net Realized and Unrealized Gain (Loss) | |||||
| on Investments | (.216) | .375 | (.467) | .168 | .470 |
| Total from Investment Operations | .040 | .623 | (.239) | .429 | .792 |
| Distributions | |||||
| Dividends from Net Investment Income | (.256) | (.248) | (.228) | (.261) | (.322) |
| Distributions from Realized Capital Gains | (.024) | (.025) | (.013) | (.068) | (.100) |
| Total Distributions | (.280) | (.273) | (.241) | (.329) | (.422) |
| Net Asset Value, End of Period | $10.60 | $10.84 | $10.49 | $10.97 | $10.87 |
| Total Return | 0.35% | 5.99% | -2.20% | 3.99% | 7.67% |
| Ratios/Supplemental Data | |||||
| Net Assets, End of Period (Millions) | $36,760 | $36,485 | $25,093 | $18,704 | $14,403 |
| Ratio of Total Expenses to Average Net Assets | 0.02% | 0.05% | 0.05% | 0.05% | 0.05% |
| Ratio of Net Investment Income to | |||||
| Average Net Assets | 2.37% | 2.31% | 2.14% | 2.36% | 3.01% |
| Portfolio Turnover Rate1,2 | 116% | 108% | 111% | 102% | 134% |
1 Includes 46%, 56%, 52%, 53%, and 41% attributable to mortgage-dollar-roll activity.
2 Excludes the value of portfolio securities, if any, received or delivered as a result of in-kind purchases or redemptions of the fund’s capital shares.
See accompanying Notes, which are an integral part of the Financial Statements.
145
Total Bond Market II Index Fund
Notes to Financial Statements
Vanguard Total Bond Market II Index Fund is registered under the Investment Company Act of 1940 as an open-end investment company, or mutual fund. The fund has been established by Vanguard as an investment vehicle for Vanguard funds of funds as well as certain similar trusts and accounts (“eligible investors”). The fund is not available to other investors. Certain of the fund’s investments are in corporate debt instruments; the issuers’ abilities to meet their obligations may be affected by economic developments in their respective industries. The fund offers two classes of shares: Investor Shares and Institutional Shares. Investor Shares are available to any investor who meets the fund’s minimum purchase requirements. Institutional Shares are designed for investors who meet certain administrative, service, and account-size criteria.
A. The following significant accounting policies conform to generally accepted accounting principles for U.S. investment companies. The fund consistently follows such policies in preparing its financial statements.
1. Security Valuation: Securities are valued as of the close of trading on the New York Stock Exchange (generally 4 p.m., Eastern time) on the valuation date. Bonds, and temporary cash investments acquired over 60 days to maturity, are valued using the latest bid prices or using valuations based on a matrix system (which considers such factors as security prices, yields, maturities, and ratings), both as furnished by independent pricing services. Structured debt securities, including mortgages and asset-backed securities, are valued using the latest bid prices or using valuations based on a matrix system that considers such factors as issuer, tranche, nominal or option-adjusted spreads, weighted average coupon, weighted average maturity, credit enhancements, and collateral. Investments in Vanguard Market Liquidity Fund are valued at that fund’s net asset value. Other temporary cash investments are valued at amortized cost, which approximates market value. Securities for which market quotations are not readily available, or whose values have been affected by events occurring before the fund’s pricing time but after the close of the securities’ primary markets, are valued by methods deemed by the board of trustees to represent fair value.
2. To Be Announced (TBA) Transactions: A TBA transaction is an agreement to buy or sell mortgage-backed securities with agreed-upon characteristics (face amount, coupon, maturity) for settlement at a future date. The fund may be a seller of TBA transactions to reduce its exposure to the mortgage-backed securities market or in order to sell mortgage-backed securities it owns under delayed-delivery arrangements. When the fund is a buyer of TBA transactions, it maintains cash or short-term investments in an amount sufficient to meet the purchase price at the settlement date of the TBA transaction. The primary risk associated with TBA transactions is that a counterparty may default on its obligations. The fund mitigates its counterparty risk by, among other things, performing a credit analysis of counterparties, allocating transactions among numerous counterparties, and monitoring its exposure to each counterparty. The fund may also enter into a Master Securities Forward Transaction Agreement (MSFTA) with certain counterparties and require them to transfer collateral as security for their performance. Under an MSFTA, upon a counterparty default (including bankruptcy), the fund may terminate any TBA transactions with that counterparty, determine the net amount owed by either party in accordance with its master netting arrangements, and sell or retain any collateral held up to the net amount owed to the fund under the master netting arrangements.
3. Mortgage Dollar Rolls: The fund enters into mortgage-dollar-roll transactions, in which the fund sells mortgage-backed securities to a dealer and simultaneously agrees to purchase similar securities in the future at a predetermined price. The proceeds of the securities sold in mortgage-dollar-roll transactions are typically invested in high-quality short-term fixed income securities. The fund forgoes principal and interest paid on the securities sold, and is compensated by interest earned on the
146
Total Bond Market II Index Fund
proceeds of the sale and by a lower price on the securities to be repurchased. The fund has also entered into mortgage-dollar-roll transactions in which the fund buys mortgage-backed securities from a dealer pursuant to a TBA transaction and simultaneously agrees to sell similar securities in the future at a predetermined price. The securities bought in mortgage-dollar-roll transactions are used to cover an open TBA sell position. The fund continues to earn interest on mortgage-backed security pools already held and receives a lower price on the securities to be sold in the future. The fund accounts for mortgage-dollar-roll transactions as purchases and sales; as such, these transactions may increase the fund’s portfolio turnover rate. Amounts to be received or paid in connection with open mortgage dollar rolls are included in Receivables for Investment Securities Sold (Other Assets) or Payables for Investment Securities Purchased (Liabilities) in the Statement of Net Assets.
4. Federal Income Taxes: The fund intends to continue to qualify as a regulated investment company and distribute all of its taxable income. Management has analyzed the fund’s tax positions taken for all open federal income tax years (December 31, 2012–2015), and has concluded that no provision for federal income tax is required in the fund’s financial statements.
5. Distributions: Distributions from net investment income are declared daily and paid on the first business day of the following month. Annual distributions from realized capital gains, if any, are recorded on the ex-dividend date.
6. Credit Facility: The fund and certain other funds managed by The Vanguard Group (“Vanguard”) participate in a $3 billion committed credit facility provided by a syndicate of lenders pursuant to a credit agreement that may be renewed annually; each fund is individually liable for its borrowings, if any, under the credit facility. Borrowings may be utilized for temporary and emergency purposes, and are subject to the fund’s regulatory and contractual borrowing restrictions. The participating funds are charged administrative fees and an annual commitment fee of 0.06% of the undrawn amount of the facility; these fees are allocated to the funds based on a method approved by the fund’s board of trustees and included in Management and Administrative expenses on the fund’s Statement of Operations. Any borrowings under this facility bear interest at a rate equal to the higher of the federal funds rate or LIBOR reference rate plus an agreed-upon spread.
The fund had no borrowings outstanding at December 31, 2015, or at any time during the period then ended.
7. Other: Interest income includes income distributions received from Vanguard Market Liquidity Fund and is accrued daily. Premiums and discounts on debt securities purchased are amortized and accreted, respectively, to interest income over the lives of the respective securities. Security transactions are accounted for on the date securities are bought or sold. Costs used to determine realized gains (losses) on the sale of investment securities are those of the specific securities sold.
Each class of shares has equal rights as to assets and earnings, except that each class separately bears certain class-specific expenses related to maintenance of shareholder accounts (included in Management and Administrative expenses) and shareholder reporting. Marketing and distribution expenses are allocated to each class of shares based on a method approved by the board of trustees. Income, other non-class-specific expenses, and gains and losses on investments are allocated to each class of shares based on its relative net assets.
B. In accordance with the terms of a Funds’ Service Agreement (the “FSA”) between Vanguard and the fund, Vanguard furnishes to the fund investment advisory, corporate management, administrative, marketing, and distribution services at Vanguard’s cost of operations (as defined by the FSA). These costs of operations are allocated to the fund based on methods and guidelines approved by the board
147
Total Bond Market II Index Fund
of trustees. Vanguard does not require reimbursement in the current period for certain costs of operations (such as deferred compensation/benefits and risk/insurance costs); the fund’s liability for these costs of operations is included in Payables to Vanguard on the Statement of Net Assets.
Upon the request of Vanguard, the fund may invest up to 0.40% of its net assets as capital in Vanguard. At December 31, 2015, the fund had contributed to Vanguard capital in the amount of $7,936,000, representing 0.01% of the fund’s net assets and 3.17% of Vanguard’s capitalization. The fund’s trustees and officers are also directors and employees, respectively, of Vanguard.
C. Various inputs may be used to determine the value of the fund’s investments. These inputs are summarized in three broad levels for financial statement purposes. The inputs or methodologies used to value securities are not necessarily an indication of the risk associated with investing in those securities.
Level 1—Quoted prices in active markets for identical securities.
Level 2—Other significant observable inputs (including quoted prices for similar securities, interest rates, prepayment speeds, credit risk, etc.).
Level 3—Significant unobservable inputs (including the fund’s own assumptions used to determine the fair value of investments).
The following table summarizes the market value of the fund’s investments as of December 31, 2015, based on the inputs used to value them:
| Level 1 | Level 2 | Level 3 | |
| Investments | ($000) | ($000) | ($000) |
| U.S. Government and Agency Obligations | — | 59,278,478 | — |
| Asset-Backed/Commercial Mortgage-Backed Securities | — | 2,554,231 | — |
| Corporate Bonds | — | 24,345,576 | — |
| Sovereign Bonds | — | 4,525,504 | — |
| Taxable Municipal Bonds | — | 838,932 | — |
| Temporary Cash Investments | 1,950,202 | — | — |
| Total | 1,950,202 | 91,542,721 | — |
D. Capital gain distributions are determined on a tax basis and may differ from realized capital gains for financial reporting purposes. Differences may be permanent or temporary. Permanent differences are reclassified among capital accounts in the financial statements to reflect their tax character. Temporary differences arise when gains or losses are recognized in different periods for financial statement and tax purposes. These differences will reverse at some time in the future.
The fund used a tax accounting practice to treat a portion of the price of capital shares redeemed during the year as distributions from realized capital gains. Accordingly, the fund has reclassified $20,062,000 from accumulated net realized gains to paid-in capital.
For tax purposes, at December 31, 2015, the fund had $3,549,000 of short-term gains available for distribution. Short-term gain distributions are treated as ordinary income for tax purposes. Capital gains required to be distributed in December 2015 included gains realized through October 31, 2015; subsequently the fund realized losses of $45,986,000, which are deferred and will be treated as realized for tax purposes in 2016.
148
Total Bond Market II Index Fund
At December 31, 2015, the cost of investment securities for tax purposes was $93,062,225,000. Net unrealized appreciation of investment securities for tax purposes was $430,698,000, consisting of unrealized gains of $1,306,424,000 on securities that had risen in value since their purchase and $875,726,000 in unrealized losses on securities that had fallen in value since their purchase.
E. During the year ended December 31, 2015, the fund purchased $10,933,650,000 of investment securities and sold $8,648,966,000 of investment securities, other than U.S. government securities and temporary cash investments. Purchases and sales of U.S. government securities were $98,130,622,000 and $96,987,374,000, respectively.
F. Capital share transactions for each class of shares were:
| Year Ended December 31, | ||||
| 2015 | 2014 | |||
| Amount | Shares | Amount | Shares | |
| ($000) | (000) | ($000) | (000) | |
| Investor Shares | ||||
| Issued | 15,331,328 | 1,426,512 | 13,057,518 | 1,216,679 |
| Issued in Lieu of Cash Distributions | 1,380,450 | 127,968 | 1,270,717 | 118,032 |
| Redeemed | (14,388,183) | (1,337,721) | (9,180,210) | (853,737) |
| Net Increase (Decrease)—Investor Shares | 2,323,595 | 216,759 | 5,148,025 | 480,974 |
| Institutional Shares | ||||
| Issued | 7,767,416 | 722,027 | 13,689,756 | 1,274,493 |
| Issued in Lieu of Cash Distributions | 952,670 | 88,300 | 775,644 | 72,023 |
| Redeemed | (7,636,353) | (709,875) | (3,998,015) | (371,581) |
| Net Increase (Decrease) —Institutional Shares | 1,083,733 | 100,452 | 10,467,385 | 974,935 |
At December 31, 2015, several Vanguard funds and trusts managed by Vanguard or its affiliates were each a record or beneficial owner of the fund, and had combined ownership of 62% of the fund’s net assets.
G. Management has determined that no material events or transactions occurred subsequent to December 31, 2015, that would require recognition or disclosure in these financial statements.
149
Report of Independent Registered
Public Accounting Firm
To the Board of Trustees of Vanguard Bond Index Funds and the Shareholders of Vanguard Total Bond Market II Index Fund:
In our opinion, the accompanying statement of net assets and the related statements of operations and of changes in net assets and the financial highlights present fairly, in all material respects, the financial position of Vanguard Total Bond Market II Index Fund (constituting a separate portfolio of Vanguard Bond Index Funds, hereafter referred to as the “Fund”) at December 31, 2015, the results of its operations for the year then ended, the changes in its net assets for each of the two years for the period then ended, and the financial highlights for each of the five years in the period then ended, in conformity with accounting principles generally accepted in the United States of America. These financial statements and financial highlights (hereafter referred to as “financial statements”) are the responsibility of the Fund’s management. Our responsibility is to express an opinion on these financial statements based on our audits. We conducted our audits of these financial statements in accordance with the standards of the Public Company Accounting Oversight Board (United States). Those standards require that we plan and perform the audit to obtain reasonable assurance about whether the financial statements are free of material misstatement. An audit includes examining, on a test basis, evidence supporting the amounts and disclosures in the financial statements, assessing the accounting principles used and significant estimates made by management, and evaluating the overall financial statement presentation. We believe that our audits, which included confirmation of securities at December 31, 2015 by correspondence with the custodian and brokers, by agreement to the underlying ownership records of the transfer agent and the application of alternative auditing procedures where securities purchased had not been received, provide a reasonable basis for our opinion.
/s/PricewaterhouseCoopers LLP
Philadelphia, Pennsylvania
February 18, 2016

This information for the fiscal year ended December 31, 2015, is included pursuant to provisions of
the Internal Revenue Code.
The fund distributed $167,121,000 as capital gain dividends (20% rate gain distributions) to
shareholders during the fiscal year.
For nonresident alien shareholders, 100% of short-term capital gain dividends distributed by the fund
are qualified short-term capital gains.
For nonresident alien shareholders, 86.7% of income dividends are interest-related dividends.
150
About Your Fund’s Expenses
As a shareholder of the fund, you incur ongoing costs, which include costs for portfolio management, administrative services, and shareholder reports (like this one), among others. Operating expenses, which are deducted from a fund’s gross income, directly reduce the investment return of the fund.
A fund’s expenses are expressed as a percentage of its average net assets. This figure is known as the expense ratio. The following examples are intended to help you understand the ongoing costs (in dollars) of investing in your fund and to compare these costs with those of other mutual funds. The examples are based on an investment of $1,000 made at the beginning of the period shown and held for the entire period.
The accompanying table illustrates your fund’s costs in two ways:
• Based on actual fund return. This section helps you to estimate the actual expenses that you paid over the period. The ”Ending Account Value“ shown is derived from the fund‘s actual return, and the third column shows the dollar amount that would have been paid by an investor who started with $1,000 in the fund. You may use the information here, together with the amount you invested, to estimate the expenses that you paid over the period.
To do so, simply divide your account value by $1,000 (for example, an $8,600 account value divided by $1,000 = 8.6), then multiply the result by the number given for your fund under the heading ”Expenses Paid During Period.“
• Based on hypothetical 5% yearly return. This section is intended to help you compare your fund‘s costs with those of other mutual funds. It assumes that the fund had a yearly return of 5% before expenses, but that the expense ratio is unchanged. In this case—because the return used is not the fund’s actual return—the results do not apply to your investment. The example is useful in making comparisons because the Securities and Exchange Commission requires all mutual funds to calculate expenses based on a 5% return. You can assess your fund’s costs by comparing this hypothetical example with the hypothetical examples that appear in shareholder reports of other funds.
Note that the expenses shown in the table are meant to highlight and help you compare ongoing costs only and do not reflect transaction costs incurred by the fund for buying and selling securities. Further, the expenses do not include any purchase, redemption, or account service fees described in the fund prospectus. If such fees were applied to your account, your costs would be higher. Your fund does not carry a “sales load.”
The calculations assume no shares were bought or sold during the period. Your actual costs may have been higher or lower, depending on the amount of your investment and the timing of any purchases or redemptions.
You can find more information about the fund’s expenses, including annual expense ratios, in the Financial Statements section of this report. For additional information on operating expenses and other shareholder costs, please refer to your fund’s current prospectus.
151
| Six Months Ended December 31, 2015 | |||
| Beginning | Ending | Expenses | |
| Account Value | Account Value | Paid During | |
| Total Bond Market II Index Fund | 6/30/2015 | 12/31/2015 | Period |
| Based on Actual Fund Return | |||
| Investor Shares | $1,000.00 | $1,004.92 | $0.45 |
| Institutional Shares | 1,000.00 | 1,005.27 | 0.10 |
| Based on Hypothetical 5% Yearly Return | |||
| Investor Shares | $1,000.00 | $1,024.75 | $0.46 |
| Institutional Shares | 1,000.00 | 1,025.10 | 0.10 |
The calculations are based on expenses incurred in the most recent six-month period. The fund’s annualized six-month expense ratios for that
period are 0.09% for Investor Shares and 0.02% for Institutional Shares. The dollar amounts shown as “Expenses Paid” are equal to the
annualized expense ratio multiplied by the average account value over the period, multiplied by the number of days in the most recent
six-month period, then divided by the number of days in the most recent 12-month period (184/365).
152
Glossary
30-Day SEC Yield. A fund’s 30-day SEC yield is derived using a formula specified by the U.S. Securities and Exchange Commission. Under the formula, data related to the fund’s security holdings in the previous 30 days are used to calculate the fund’s hypothetical net income for that period, which is then annualized and divided by the fund’s estimated average net assets over the calculation period. For the purposes of this calculation, a security’s income is based on its current market yield to maturity (for bonds), its actual income (for asset-backed securities), or its projected dividend yield (for stocks). Because the SEC yield represents hypothetical annualized income, it will differ—at times significantly—from the fund’s actual experience. As a result, the fund’s income distributions may be higher or lower than implied by the SEC yield.
Average Coupon. The average interest rate paid on the fixed income securities held by a fund. It is expressed as a percentage of face value.
Average Duration. An estimate of how much the value of the bonds held by a fund will fluctuate in response to a change in interest rates. To see how the value could change, multiply the average duration by the change in rates. If interest rates rise by 1 percentage point, the value of the bonds in a fund with an average duration of five years would decline by about 5%. If rates decrease by a percentage point, the value would rise by 5%.
Average Effective Maturity. The average length of time until fixed income securities held by a fund reach maturity and are repaid, taking into consideration the possibility that the issuer may call the bond before its maturity date. The figure reflects the proportion of fund assets represented by each security; it also reflects any futures contracts held. In general, the longer the average effective maturity, the more a fund’s share price will fluctuate in response to changes in market interest rates.
Credit Quality. Credit-quality ratings are measured on a scale that generally ranges from AAA (highest) to D (lowest). U.S. Treasury, U.S. Agency, and U.S. Agency mortgage-backed securities appear under “U.S. Government.” Credit-quality ratings are obtained from Barclays and are from Moody’s, Fitch, and S&P. When ratings from all three agencies are used, the median rating is shown. When ratings from two of the agencies are used, the lower rating for each issue is shown. “Not Rated” is used to classify securities for which a rating is not available. Not rated securities include a fund’s investment in Vanguard Market Liquidity Fund or Vanguard Municipal Cash Management Fund, each of which invests in high-quality money market instruments and may serve as a cash management vehicle for the Vanguard funds, trusts, and accounts.
Expense Ratio. A fund’s total annual operating expenses expressed as a percentage of the fund’s average net assets. The expense ratio includes management and administrative expenses, but does not include the transaction costs of buying and selling portfolio securities.
Inception Date. The date on which the assets of a fund (or one of its share classes) are first invested in accordance with the fund’s investment objective. For funds with a subscription period, the inception date is the day after that period ends. Investment performance is measured from the inception date.
Short-Term Reserves. The percentage of a fund invested in highly liquid, short-term securities that can be readily converted to cash.
153
Yield to Maturity. The rate of return an investor would receive if the fixed income securities held by a fund were held to their maturity dates.
Benchmark Information
Spliced Barclays U.S. Aggregate Float Adjusted Index: Barclays U.S. Aggregate Bond Index
through December 31, 2009; Barclays U.S. Aggregate Float Adjusted Index thereafter.
Spliced Core Bond Funds Average: Intermediate Investment-Grade Debt Funds Average through
August 31, 2013; Core Bond Funds Average thereafter.
154
Vanguard Total Bond Market II Index Fund is not sponsored, endorsed, issued, sold, or promoted by Barclays Capital Inc. or any
of its affiliates (“Barclays”). Barclays makes no representation or warranty, express or implied, to the owners or purchasers of
the fund or any member of the public regarding the advisability of investing in securities generally or in the fund particularly or
the ability of the Barclays index to track general bond market performance. Barclays has not passed on the legality or suitability
of the fund with respect to any person or entity. Barclays’ only relationship to Vanguard and the fund is the licensing of the
Barclays index, which is determined, composed, and calculated by Barclays without regard to Vanguard or the fund or any
owners or purchasers of the fund. Barclays has no obligation to take the needs of Vanguard, the fund, or the owners of the
fund into consideration in determining, composing, or calculating the Barclays index. Barclays is not responsible for and has
not participated in the determination of the timing of, prices at, or quantities of the fund to be issued. Barclays has no
obligation or liability in connection with the administration, marketing, or trading of the fund.
Barclays shall have no liability to third parties for the quality, accuracy, and/or completeness of the index or any data included
therein or for interruptions in the delivery of the index. Barclays makes no warranty, express or implied, as to results to be
obtained by owners of the fund or any other person or entity from the use of the index or any data included therein in connec-
tion with the rights licensed hereunder or for any other use. Barclays reserves the right to change the methods of calculation
or publication, or to cease the calculation or publication of the Barclays U.S. Aggregate Float Adjusted Index, and Barclays
shall not be liable for any miscalculation of or any incorrect, delayed, or interrupted publication with respect to the index.
Barclays makes no express or implied warranties, and hereby expressly disclaims all warranties of merchantability or fitness
for a particular purpose or use with respect to the index or any data included therein. Barclays shall not be liable for any
damages, including, without limitation, any indirect or consequential damages resulting from the use of the index or any
data included therein.
155
The People Who Govern Your Fund
The trustees of your mutual fund are there to see that the fund is operated and managed in your best interests since, as a shareholder, you are a part owner of the fund. Your fund’s trustees also serve on the board of directors of The Vanguard Group, Inc., which is owned by the Vanguard funds and provides services to them on an at-cost basis.
A majority of Vanguard’s board members are independent, meaning that they have no affiliation with Vanguard or the funds they oversee, apart from the sizable personal investments they have made as private individuals. The independent board members have distinguished backgrounds in business, academia, and public service. Each of the trustees and executive officers oversees 194 Vanguard funds.
The following table provides information for each trustee and executive officer of the fund. More information about the trustees is in the Statement of Additional Information, which can be obtained, without charge, by contacting Vanguard at 800-662-7447, or online at vanguard.com.
| InterestedTrustee1 | Rajiv L. Gupta |
| Born 1945. Trustee Since December 2001.2 Principal | |
| F. William McNabb III | Occupation(s) During the Past Five Years and Other |
| Born 1957. Trustee Since July 2009. Chairman of | Experience: Chairman and Chief Executive Officer |
| the Board. Principal Occupation(s) During the Past | (retired 2009) and President (2006–2008) of |
| Five Years and Other Experience: Chairman of the | Rohm and Haas Co. (chemicals); Director of Tyco |
| Board of The Vanguard Group, Inc., and of each of | International PLC (diversified manufacturing and |
| the investment companies served by The Vanguard | services), Hewlett-Packard Co. (electronic computer |
| Group, since January 2010; Director of The Vanguard | manufacturing), and Delphi Automotive PLC |
| Group since 2008; Chief Executive Officer and | (automotive components); Senior Advisor at New |
| President of The Vanguard Group, and of each of | Mountain Capital. |
| the investment companies served by The Vanguard | |
| Group, since 2008; Director of Vanguard Marketing | Amy Gutmann |
| Corporation; Managing Director of The Vanguard | Born 1949. Trustee Since June 2006. Principal |
| Group (1995–2008). | Occupation(s) During the Past Five Years and |
| Other Experience: President of the University of | |
| IndependentTrustees | Pennsylvania; Christopher H. Browne Distinguished |
| Professor of Political Science, School of Arts and | |
| Emerson U. Fullwood | Sciences, and Professor of Communication, Annenberg |
| Born 1948. Trustee Since January 2008. Principal | School for Communication, with secondary faculty |
| Occupation(s) During the Past Five Years and | appointments in the Department of Philosophy, School |
| Other Experience: Executive Chief Staff and | of Arts and Sciences, and at the Graduate School of |
| Marketing Officer for North America and Corporate | Education, University of Pennsylvania; Trustee of the |
| Vice President (retired 2008) of Xerox Corporation | National Constitution Center; Chair of the Presidential |
| (document management products and services); | Commission for the Study of Bioethical Issues. |
| Executive in Residence and 2009–2010 Distinguished | |
| Minett Professor at the Rochester Institute of | JoAnn Heffernan Heisen |
| Technology; Director of SPX Corporation (multi-industry | Born 1950. Trustee Since July 1998. Principal |
| manufacturing), the United Way of Rochester, the | Occupation(s) During the Past Five Years and |
| University of Rochester Medical Center, Monroe | Other Experience: Corporate Vice President and |
| Community College Foundation, and North Carolina | Chief Global Diversity Officer (retired 2008) and |
| A&T University. | Member of the Executive Committee (1997–2008) |
| of Johnson & Johnson (pharmaceuticals/medical | |
| devices/consumer products); Director of Skytop | |
| Lodge Corporation (hotels) and the Robert Wood | |
| Johnson Foundation; Member of the Advisory | |
| Board of the Institute for Women’s Leadership | |
| at Rutgers University. |
| F. Joseph Loughrey | Executive Officers | |
| Born 1949. Trustee Since October 2009. Principal | ||
| Occupation(s) During the Past Five Years and Other | Glenn Booraem | |
| Experience: President and Chief Operating Officer | Born 1967. Treasurer Since May 2015. Principal | |
| (retired 2009) of Cummins Inc. (industrial machinery); | Occupation(s) During the Past Five Years and | |
| Chairman of the Board of Hillenbrand, Inc. (specialized | Other Experience: Principal of The Vanguard Group, | |
| consumer services), and of Oxfam America; Director | Inc.; Treasurer of each of the investment companies | |
| of SKF AB (industrial machinery), Hyster-Yale Materials | served by The Vanguard Group; Controller of each of | |
| Handling, Inc. (forklift trucks), the Lumina Foundation | the investment companies served by The Vanguard | |
| for Education, and the V Foundation for Cancer | Group (2010–2015); Assistant Controller of each of | |
| Research; Member of the Advisory Council for the | the investment companies served by The Vanguard | |
| College of Arts and Letters and of the Advisory Board | Group (2001–2010). | |
| to the Kellogg Institute for International Studies, both | ||
| at the University of Notre Dame. | Thomas J. Higgins | |
| Born 1957. Chief Financial Officer Since September | ||
| Mark Loughridge | 2008. Principal Occupation(s) During the Past Five | |
| Born 1953. Trustee Since March 2012. Principal | Years and Other Experience: Principal of The Vanguard | |
| Occupation(s) During the Past Five Years and Other | Group, Inc.; Chief Financial Officer of each of the | |
| Experience: Senior Vice President and Chief Financial | investment companies served by The Vanguard Group; | |
| Officer (retired 2013) at IBM (information technology | Treasurer of each of the investment companies served | |
| services); Fiduciary Member of IBM’s Retirement Plan | by The Vanguard Group (1998–2008). | |
| Committee (2004–2013); Director of the Dow Chemical | ||
| Company; Member of the Council on Chicago Booth. | Peter Mahoney | |
| Born 1974. Controller Since May 2015. Principal | ||
| Scott C. Malpass | Occupation(s) During the Past Five Years and | |
| Born 1962. Trustee Since March 2012. Principal | Other Experience: Head of Global Fund Accounting | |
| Occupation(s) During the Past Five Years and Other | at The Vanguard Group, Inc.; Controller of each of the | |
| Experience: Chief Investment Officer and Vice | investment companies served by The Vanguard Group; | |
| President at the University of Notre Dame; Assistant | Head of International Fund Services at The Vanguard | |
| Professor of Finance at the Mendoza College of | Group (2008–2014). | |
| Business at Notre Dame; Member of the Notre Dame | ||
| 403(b) Investment Committee; Board Member of | Heidi Stam | |
| TIFF Advisory Services, Inc., and Catholic Investment | Born 1956. Secretary Since July 2005. Principal | |
| Services, Inc. (investment advisors); Member of | Occupation(s) During the Past Five Years and Other | |
| the Investment Advisory Committee of Major | Experience: Managing Director of The Vanguard | |
| League Baseball. | Group, Inc.; General Counsel of The Vanguard Group; | |
| Secretary of The Vanguard Group and of each of the | ||
| André F. Perold | investment companies served by The Vanguard Group; | |
| Born 1952. Trustee Since December 2004. Principal | Director and Senior Vice President of Vanguard | |
| Occupation(s) During the Past Five Years and Other | Marketing Corporation. | |
| Experience: George Gund Professor of Finance and | ||
| Banking, Emeritus at the Harvard Business School | Vanguard Senior ManagementTeam | |
| (retired 2011); Chief Investment Officer and Managing | Mortimer J. Buckley | Chris D. McIsaac |
| Partner of HighVista Strategies LLC (private investment | Kathleen C. Gubanich | James M. Norris |
| firm); Director of Rand Merchant Bank; Overseer of | Paul A. Heller | Thomas M. Rampulla |
| the Museum of Fine Arts Boston. | Martha G. King | Glenn W. Reed |
| John T. Marcante | Karin A. Risi | |
| Peter F. Volanakis | ||
| Born 1955. Trustee Since July 2009. Principal | ||
| Occupation(s) During the Past Five Years and Other | Chairman Emeritus and Senior Advisor | |
| Experience: President and Chief Operating Officer | John J. Brennan | |
| (retired 2010) of Corning Incorporated (communications | Chairman, 1996–2009 | |
| equipment); Trustee of Colby-Sawyer College; | Chief Executive Officer and President, 1996–2008 | |
| Member of the Advisory Board of the Norris Cotton | ||
| Cancer Center and of the Advisory Board of the | ||
| Parthenon Group (strategy consulting). | Founder | |
| John C. Bogle | ||
| Chairman and Chief Executive Officer, 1974–1996 | ||
1 Mr. McNabb is considered an “interested person,” as defined in the Investment Company Act of 1940, because he is an officer of the Vanguard funds.
2 December 2002 for Vanguard Equity Income Fund, the Vanguard Municipal Bond Funds, and the Vanguard State Tax-Exempt Funds.
 | |
| P.O. Box 2600 | |
| Valley Forge, PA 19482-2600 | |
| Connect with Vanguard® > vanguard.com | |
| Fund Information > 800-662-7447 | |
| Direct Investor Account Services > 800-662-2739 | |
| Institutional Investor Services > 800-523-1036 | |
| Text Telephone for People | |
| Who Are Deaf or Hard of Hearing> 800-749-7273 | |
| This material may be used in conjunction | |
| with the offering of shares of any Vanguard | |
| fund only if preceded or accompanied by | |
| the fund’s current prospectus. | |
| All comparative mutual fund data are from Lipper, a | |
| Thomson Reuters Company, or Morningstar, Inc., unless | |
| otherwise noted. | |
| You can obtain a free copy of Vanguard’s proxy voting | |
| guidelines by visiting vanguard.com/proxyreporting or by | |
| calling Vanguard at 800-662-2739. The guidelines are | |
| also available from the SEC’s website, sec.gov. In | |
| addition, you may obtain a free report on how your fund | |
| voted the proxies for securities it owned during the 12 | |
| months ended June 30. To get the report, visit either | |
| vanguard.com/proxyreporting or sec.gov. | |
| You can review and copy information about your fund at | |
| the SEC’s Public Reference Room in Washington, D.C. To | |
| find out more about this public service, call the SEC at | |
| 202-551-8090. Information about your fund is also | |
| available on the SEC’s website, and you can receive | |
| copies of this information, for a fee, by sending a | |
| request in either of two ways: via email addressed to | |
| publicinfo@sec.gov or via regular mail addressed to the | |
| Public Reference Section, Securities and Exchange | |
| Commission, Washington, DC 20549-1520. | |
| © 2016 The Vanguard Group, Inc. | |
| All rights reserved. | |
| Vanguard Marketing Corporation, Distributor. | |
| Q6350 022016 | |
Annual Report | December 31, 2015
Vanguard Inflation-Protected Securities Fund
Vanguard’s Principles for Investing Success
We want to give you the best chance of investment success. These principles, grounded in Vanguard’s research and experience, can put you on the right path.
Goals. Create clear, appropriate investment goals.
Balance. Develop a suitable asset allocation using broadly diversified funds. Cost. Minimize cost.
Discipline. Maintain perspective and long-term discipline.
A single theme unites these principles: Focus on the things you can control.
We believe there is no wiser course for any investor.
| Contents | |
| Your Fund’s Total Returns. | 1 |
| Chairman’s Letter. | 2 |
| Advisor’s Report. | 9 |
| Fund Profile. | 12 |
| Performance Summary. | 13 |
| Financial Statements. | 15 |
| About Your Fund’s Expenses. | 29 |
| Glossary. | 31 |
Please note: The opinions expressed in this report are just that—informed opinions. They should not be considered promises or advice.
Also, please keep in mind that the information and opinions cover the period through the date on the front of this report. Of course, the
risks of investing in your fund are spelled out in the prospectus.
See the Glossary for definitions of investment terms used in this report.
About the cover: Pictured is a sailing block on the Brilliant, a 1932 schooner docked in Mystic, Connecticut. A type of pulley, the
sailing block helps coordinate the setting of the sails. At Vanguard, the intricate coordination of technology and people allows
us to help millions of clients around the world reach their financial goals.
Your Fund’s Total Returns
| Fiscal Year Ended December 31, 2015 | ||||
| 30-Day SEC | Income | Capital | Total | |
| Yield | Returns | Returns | Returns | |
| Vanguard Inflation-Protected Securities Fund | ||||
| Investor Shares | 0.47% | 0.74% | -2.57% | -1.83% |
| Admiral™ Shares | 0.55 | 0.85 | -2.54 | -1.69 |
| Institutional Shares | 0.59 | 0.88 | -2.55 | -1.67 |
| Barclays U.S. Treasury Inflation Protected | ||||
| Securities Index | -1.44 | |||
| Inflation-Protected Bond Funds Average | -2.43 | |||
Inflation-Protected Bond Funds Average: Derived from data provided by Lipper, a Thomson Reuters Company.
Admiral Shares carry lower expenses and are available to investors who meet certain account-balance requirements. Institutional Shares are
available to certain institutional investors who meet specific administrative, service, and account-size criteria.
Your Fund’s Performance at a Glance
December 31, 2014, Through December 31, 2015
| Distributions Per Share | ||||
| Starting | Ending | |||
| Share | Share | Income | Capital | |
| Price | Price | Dividends | Gains | |
| Vanguard Inflation-Protected Securities Fund | ||||
| Investor Shares | $13.18 | $12.84 | $0.098 | $0.001 |
| Admiral Shares | 25.87 | 25.21 | 0.220 | 0.003 |
| Institutional Shares | 10.54 | 10.27 | 0.093 | 0.001 |

Chairman’s Letter
Dear Shareholder,
The Investor Shares of Vanguard Inflation-Protected Securities Fund returned –1.83% for the fiscal year ended December 31, 2015. Returns for Admiral and Institutional Shares were slightly higher.
The fund returned a bit less than the –1.44% result of its benchmark, the Barclays U.S. Treasury Inflation Protected Securities Index, but beat the –2.43% average return of its peer group. It was hurt by sinking inflation expectations, which caused investors to bid down the prices of Treasury Inflation-Protected Securities (TIPS).
Despite troubles, U.S. stocks eked out a seventh year of gains
U.S. stocks returned 0.48% for the 12 months ended December 31, 2015. Although the broad market recorded its worst performance since 2008, it still posted gains for the seventh straight calendar year when dividends are factored into returns.
Stocks rose modestly over the first half of the year but slid in August and September as concerns mounted that China’s economic slowdown would spread globally. Falling oil and commodity prices also affected economies and markets across the world for better or worse. Central
2
banks in Europe and Asia bolstered their stimulus efforts against weak growth and low inflation. And in December, the Federal Reserve ended months of uncertainty when it raised the target for short-term interest rates to 0.25%–0.5%.
International stocks returned about –5%, restrained by the U.S. dollar’s strength against many foreign currencies. Emerging markets fared the worst.
U.S. bonds ended the year with a slender advance
The broad U.S. taxable bond market gained 0.55% over the 12 months; income accounted for the modestly positive result. The yield of the 10-year Treasury note ended December at 2.30%, up from 2.19% a year earlier. (Bond prices and yields move in opposite directions.)
Investors focused on the Fed’s stance on short-term interest rates and alternately embraced or avoided safe-haven assets depending on the stock market’s strength.
International bond markets (as measured by the Barclays Global Aggregate Index ex USD) returned –6.02%, reduced by the dollar’s strength against many foreign currencies. Without this currency effect, returns were modestly positive.
Although the Fed raised its target for short-term interest rates in mid-December, returns for money market funds and savings
| Market Barometer | |||
| Average Annual Total Returns | |||
| Periods Ended December 31, 2015 | |||
| One | Three | Five | |
| Year | Years | Years | |
| Bonds | |||
| Barclays U.S. Aggregate Bond Index (Broad taxable | |||
| market) | 0.55% | 1.44% | 3.25% |
| Barclays Municipal Bond Index (Broad tax-exempt market) | 3.30 | 3.16 | 5.35 |
| Citigroup Three-Month U.S. Treasury Bill Index | 0.03 | 0.02 | 0.04 |
| Stocks | |||
| Russell 1000 Index (Large-caps) | 0.92% | 15.01% | 12.44% |
| Russell 2000 Index (Small-caps) | -4.41 | 11.65 | 9.19 |
| Russell 3000 Index (Broad U.S. market) | 0.48 | 14.74 | 12.18 |
| FTSE All-World ex US Index (International) | -4.72 | 2.04 | 1.48 |
| CPI | |||
| Consumer Price Index | 0.73% | 1.00% | 1.53% |
3
accounts remained limited by the 0%–0.25% levels in place for much of the past seven years.
Inflation remained tame; expectations drifted lower
Inflation continued to be mild in 2015, and Vanguard Inflation-Protected Securities Fund recorded a negative total return for only the third fiscal year since its inception in June 2000.
The seasonally adjusted Consumer Price Index (CPI) rose just 0.7% as prices continued to fall for oil, natural gas, and a long list of other commodities. The more stable core CPI, which excludes food and energy prices, rose a bit, from 1.6% to 2.1%, the largest year-end gain in four years.
Nonetheless, inflation expectations—reflected by the difference in yields between conventional and inflation-protected Treasury bonds—drifted lower. This measure, the “breakeven inflation rate,” showed that at the start of 2015, investors expected inflation to average about 1.4% annually over the next five years. Twelve months later, the expected rate had declined to about 1.26%. The 10-year breakeven inflation rate fell from 1.62% to 1.45%, and its 30-year counterpart sank from 1.89% to 1.65%.
| Expense Ratios | ||||
| Your Fund Compared With Its Peer Group | ||||
| Investor | Admiral | Institutional | Peer Group | |
| Shares | Shares | Shares | Average | |
| Inflation-Protected Securities Fund | 0.20% | 0.10% | 0.07% | 0.80% |
The fund expense ratios shown are from the prospectus dated April 28, 2015, and represent estimated costs for the current fiscal year. For the
fiscal year ended December 31, 2015, the fund’s expense ratios were 0.20% for Investor Shares, 0.10% for Admiral Shares, and 0.07% for
Institutional Shares. The peer-group expense ratio is derived from data provided by Lipper, a Thomson Reuters Company, and captures
information through year-end 2014.
Peer group: Inflation-Protected Bond Funds.
4
TIPS prices rose a bit but then fell back in the first half of the year. In the second half, they drifted further downward as renewed worries over global disinflation made the securities’ built-in inflation insurance seem less necessary. The SEC yield of the fund’s Investor Shares—representing their annualized income before any inflation adjustment—rose from 0.19% in January 2015 to 0.47% by year end.
Incidentally, the fund’s total return was lower than the –0.21% return for the Investor Shares of its counterpart, Vanguard Short-Term Inflation-Protected Securities Index Fund. Your fund’s longer average maturity brings both a higher return potential and the probability that it will experience greater price volatility over the long term.
A note on the fund’s distributions this year
In 2014, the fund did not pay out its third-quarter dividend, the first time it had skipped a quarterly distribution since 2009. This reduced the possibility that it would have to distribute a return of capital, a potential recordkeeping headache for shareholders in taxable accounts. The risk is greatest during periods of deflation, low or slowing inflation, and low or negative yields on inflation-indexed securities. Such conditions have characterized the TIPS market for much of the past few years.
For the same reasons, in 2015 the fund made only two of its quarterly distributions, in March and December. The fund’s advisor
| Total Returns | |
| Ten Years Ended December 31, 2015 | |
| Average | |
| Annual Return | |
| Inflation-Protected Securities Fund Investor Shares | 3.70% |
| Barclays U.S. Treasury Inflation Protected Securities Index | 3.93 |
| Inflation-Protected Bond Funds Average | 2.92 |
Inflation-Protected Bond Funds Average: Derived from data provided by Lipper, a Thomson Reuters Company.
The figures shown represent past performance, which is not a guarantee of future results. (Current performance may be
lower or higher than the performance data cited. For performance data current to the most recent month-end, visit our
website at vanguard.com/performance.) Note, too, that both investment returns and principal value can fluctuate widely, so
an investor’s shares, when sold, could be worth more or less than their original cost.
5
offers a more detailed discussion of the investment environment in the Advisor’s Report that follows this letter.
Over the long term, the fund has proven itself
The average annual return of the fund’s Investor Shares over the decade ended December 31, 2015, was 3.70%, slightly behind its index but ahead of its peers. The fund’s advisor, Vanguard Fixed Income Group, is an experienced manager of both nominal and inflation-adjusted bonds. It has an excellent track record of navigating your fund through the cross-currents that influence the inflation-protected securities market.
Of course, the fund’s performance is always aided by its low expenses, which allow it to pass along a greater share of gross returns to shareholders. They also ensure that it doesn’t have to take extra risks in reaching for higher returns to compensate for a more expensive operation.
| Vanguard’s outlook for investors: Not bearish, but cautious |
| In Vanguard’s recently published global economic and investment outlook, Global Chief |
| Economist Joseph Davis and his team discuss various market and economic events 2016 |
| may bring, along with challenges and opportunities for investors. |
| Our forecast includes “frustratingly fragile” economic growth and more modest long-term |
| returns from the global stock and bond markets. The report cautions that for the decade ending |
| 2025, returns for a balanced portfolio are likely to be moderately below historical averages. |
| Our simulations indicate that the average annualized returns of a 60% equity/40% bond |
| portfolio for the decade are most likely to be centered in the 3%–5% range after inflation, |
| below the actual average after-inflation return of 5.5% for the same portfolio since 1926. |
| Even so, Vanguard’s steadfast belief in its principles for investing success—focusing on clear |
| goals, a suitable asset allocation, low costs, and long-term discipline—remains unchanged. |
| For more information about our expectations and the probability of various outcomes, see |
| Vanguard’s Economic and Investment Outlook, available at vanguard.com/research. |
| IMPORTANT: The projections or other information generated by the Vanguard Capital Markets Model® (VCMM) |
| regarding the likelihood of various investment outcomes are hypothetical in nature, do not reflect actual investment |
| results, and are not guarantees of future results. Distribution of return outcomes from VCMM, derived from |
| 10,000 simulations for U.S. equity returns and fixed income returns. Simulations as of September 30, 2015. |
| Results from the model may vary with each use and over time. For more information, please see page 7. |
6
To reach your long-term goals, be realistic and try to save more
Although there have been times when it felt as if stocks and bonds were riding a roller coaster, returns have generally risen in recent years. The broad global stock market in particular has posted some impressive gains since its turnaround began in 2009.
But 2015 served as a reminder that results aren’t always favorable. The U.S. stock and bond markets were barely positive, and international stocks and unhedged bonds finished in the red.
In Vanguard’s recently updated long-term look at the economy and markets, our global economists explain why they expect economic growth to remain “frustratingly fragile,” and why their outlook for stock and bond markets is the most guarded since 2006. (For more details, see the box on page 6 and Vanguard’s Economic and Investment Outlook, available at vanguard.com/research.)
Given these muted expectations, what’s the best course of action? I’ve often encouraged shareholders to focus on the things they can control. That advice holds true today.
Consider saving more than you think you may need. That’s one way you can prepare for the volatility that may lie ahead, particularly as markets adjust to changes in policies from the Fed and other central banks.
IMPORTANT: The projections or other information generated by the Vanguard Capital Markets Model (VCMM)
regarding the likelihood of various investment outcomes are hypothetical in nature, do not reflect actual
investment results, and are not guarantees of future results. VCMM results will vary with each use and over time.
The VCMM projections are based on a statistical analysis of historical data. Future returns may behave differently from the
historical patterns captured in the VCMM. More important, the VCMM may be underestimating extreme negative scenarios
unobserved in the historical period on which the model estimation is based.
The VCMM is a proprietary financial simulation tool developed and maintained by Vanguard’s primary investment research
and advice teams. The model forecasts distributions of future returns for a wide array of broad asset classes. Those asset
classes include U.S. and international equity markets, several maturities of the U.S. Treasury and corporate fixed income
markets, international fixed income markets, U.S. money markets, commodities, and certain alternative investment
strategies. The theoretical and empirical foundation for the VCMM is that the returns of various asset classes reflect the
compensation investors require for bearing different types of systematic risk (beta). At the core of the model are estimates
of the dynamic statistical relationship between risk factors and asset returns, obtained from statistical analysis based on
available monthly financial and economic data from as early as 1960. Using a system of estimated equations, the model
then applies a Monte Carlo simulation method to project the estimated interrelationships among risk factors and asset
classes as well as uncertainty and randomness over time. The model generates a large set of simulated outcomes for
each asset class over several time horizons. Forecasts are obtained by computing measures of central tendency in these
simulations. Results produced by the tool will vary with each use and over time.
7
And, as always, investors would be well-served to follow Vanguard’s principles for investing success:
• Goals. Create clear, appropriate investment goals.
• Balance. Develop a suitable asset allocation using broadly diversified funds.
• Cost. Minimize cost.
• Discipline. Maintain perspective and long-term discipline.
As with saving, each of these principles is within your control, and focusing on them can keep you on the right path.
As always, thank you for investing with Vanguard.
Sincerely,

F. William McNabb III
Chairman and Chief Executive Officer
January 20, 2016
8
Advisor’s Report
For the 12 months ended December 31, 2015, Investor Shares of Vanguard Inflation-Protected Securities Fund returned –1.83%. The fund’s result was close to the –1.44% return of its benchmark, the Barclays U.S. Treasury Inflation Protected Securities Index, and ahead of the average –2.43% return of peer-group funds.
The investment environment
The first half of the year was challenging. Low inflation and low or negative real yields in the Treasury inflation-protected securities (TIPS) market led the fund’s three share classes to register negative, zero, or negligible income. But during the second half of the year, yields rose and TIPS prices fell as market expectations for future inflation declined.
The SEC yield of the fund’s Investor Shares rose from 0.19% in January 2015 to 0.47% by year end. This allowed the fund to earn enough income to make two dividend distributions during the fiscal year, including one in December. Of course, rising yields equate to declining prices, hence the fund’s negative principal return.
As it has in the past few years, the U.S. economy started the year slowly. Gross national product (GDP) rose only 0.6% in the first quarter but then accelerated to 3.9% in the second quarter. The third-quarter growth rate was 2%, which is near the economy’s long-term rate since the end of the financial crisis. (All GDP figures are annualized and adjusted for inflation.)
| Yields of U.S. Treasury Inflation-Protected Securities | |||
| (Real Yields) | |||
| December 31, | June 30, | December 31, | |
| Maturity | 2014 | 2015 | 2015 |
| 2 years | –0.37% | –0.60% | –0.01% |
| 3 years | –0.03 | –0.47 | 0.19 |
| 5 Years | 0.28 | 0.01 | 0.53 |
| 7 Years | 0.43 | 0.34 | 0.73 |
| 10 Years | 0.57 | 0.53 | 0.85 |
| 20 Years | 0.70 | 0.93 | 1.11 |
| 30 Years | 0.87 | 1.20 | 1.38 |
| Source: Vanguard. | |||
9
The economy was helped by vigorous auto sales and some strength in the housing market. Wage growth also ticked up. The fall in energy prices continued, giving consumers a windfall that they appeared to use to bolster savings or pay down debt more than economists expected. This development, although positive for long-term growth, tempered expectations for near-term growth.
Meanwhile, the relative health of the U.S. economy boosted the U.S. dollar on currency markets, which reduced import prices and thus inflationary pressures. The dollar’s rise also pinched manufacturing exports as U.S.-made products became more expensive for other nations to import.
Amid these crosscurrents, the seasonally adjusted Consumer Price Index (CPI) rose just 0.7% in 2015. But the core CPI, which excludes volatile food and energy prices, rose from 1.6% at the end of 2014 to 2.1% in December, the largest year-end gain in four years. After delaying its long-anticipated “liftoff,” the Fed made its first rate hike in December, from near zero to a 0.25%–0.5% range.
Management of the portfolio
The U.S. Treasury uses the non-seasonally adjusted CPI for Urban Consumers (CPI-U NSA) to calculate inflation adjustments to TIPS, which are then accrued to the fund’s portfolio. The 12-month change in the CPI-U NSA was zero or lower until it rose 0.1% in June. It stayed at or above zero for the rest of the year, ending at 0.7% for December. This trend, if it continues, will help the fund sustain dividend payments.
Dividend distributions were withheld in June and September to reduce the possibility that the fund would have to distribute a return of capital at the end of the year.
In the TIPS market, real yields moved upward for longer-dated maturities. Five-year TIPS’ real yield edged up slightly to 0.53% from 0.28%, 10-year TIPS’ real yields rose from 0.57% to 0.85%, and the 30-year figure rose from 0.87% to 1.38%.
Nominal Treasury yields rose a bit on the long end of the curve but not much on the short end. As measured by breakeven inflation rates (the differences between nominal yields and the lower TIPS yields), inflation expectations lifted in the first half of the year but then drifted lower. The 2-year breakeven rate did rise from 1.04% to 1.08%. But the 5-year rate went from 1.40% to 1.26%, the 10-year rate went from 1.62% to 1.45%, and the 30-year sank from 1.89% to 1.65%.
We deployed several tactics to compensate for the low level of income from our portfolio’s holdings.
Based on our views on the direction of interest rates and expectations for inflation and monetary policy, we modestly underweighted short-term TIPS early in the year. We overweighted longer-term TIPS to collect more income and capture a narrowing yield spread between short and long maturities. This is a strategy typically deployed when the Federal Reserve is expected to raise short-term interest rates. We later reversed this approach.
10
These modest movements helped reduce the negative income the fund would have recorded had we weighted our portfolio in line with the benchmark. The team also was very proactive in positioning for movements in the breakeven inflation spread. Nonetheless, the fund’s total return modestly trailed its benchmark because of our slight overall tilt toward the longer end of the yield curve.
Outlook
At Vanguard, we expect U.S. GDP to grow at an annual rate of between 2% and 2.5% in 2016, and we think there will be an increase in the U.S. labor force participation rate. We also anticipate that the CPI-U NSA will continue to normalize and move toward 2% over the next one to two years.
After the Fed’s first short-term rate increase announced in December, we expect any subsequent increases to be slow and gradual. We would not be surprised if the rate were still below 1% at the end of 2016.
Rising interest rates put bond investors at risk of short-term declines in principal. But we expect no significant price declines in bonds because we expect the Federal Reserve to pursue a very gradual path of rate increases. A gradual move would signal that the economy is consolidating the slow-but-steady growth of recent years. The good news for long-term investors is that higher rates will enable the fund to reinvest the proceeds from maturing TIPS at higher yields for the first time in several years.
Disinflationary pressures from a strong U.S. dollar, the slowing of China’s economy, and an ongoing oversupply of oil will probably continue to restrain any acceleration of headline inflation. The yield curve is likely to flatten, and breakeven inflation rates should stay relatively stable or go higher. Nominal short-term rates could be a bit volatile as investors speculate on the timing and pace of more Fed rate hikes.
We think the normalization of U.S. monetary policy may not occur until 2017 or later. Your fund management team will continue to position the fund accordingly, working to add incremental income when prudent in the hope of resuming quarterly dividend distributions in 2016.
Gemma Wright-Casparius, Principal
Vanguard Fixed Income Group
January 22, 2016
11
Inflation-Protected Securities Fund
Fund Profile
As of December 31, 2015
| Share-Class Characteristics | |||
| Investor | Admiral | Institutional | |
| Shares | Shares | Shares | |
| Ticker Symbol | VIPSX | VAIPX | VIPIX |
| Expense Ratio1 | 0.20% | 0.10% | 0.07% |
| 30-Day SEC Yield2 | 0.47% | 0.55% | 0.59% |
| Financial Attributes | |||
| Barclays | |||
| Inflation | Barclays | ||
| Protected Aggregate | |||
| Securities | Bond | ||
| Fund | Index | Index | |
| Number of Bonds | 46 | 36 | 9,681 |
| Yield to Maturity | |||
| (before expenses) | 2.3% | 2.3% | 2.6% |
| Average Coupon | 0.9% | 0.9% | 3.2% |
| Average Duration | 7.9 years | 7.8 years | 5.7 years |
| Average Effective | |||
| Maturity | 8.5 years | 8.3 years | 7.9 years |
| Short-Term | |||
| Reserves | 1.1% | — | — |
| Sector Diversification (% of portfolio) | |
| Treasury/Agency | 99.0% |
| Other | 1.0 |
The agency and mortgage-backed securities sectors may include issues from government-sponsored enterprises; such issues are
generally not backed by the full faith and credit of the U.S. government.
| Volatility Measures | ||
| Barclays | ||
| Inflation | Barclays | |
| Protected | Aggregate | |
| Securities | Bond | |
| Index | Index | |
| R-Squared | 0.99 | 0.79 |
| Beta | 1.02 | 1.58 |
These measures show the degree and timing of the fund’s fluctuations compared with the indexes over 36 months.
| Distribution by Effective Maturity | |
| (% of portfolio) | |
| Under 1 Year | 1.0% |
| 1 - 3 Years | 13.1 |
| 3 - 5 Years | 18.1 |
| 5 - 10 Years | 43.5 |
| 10 - 20 Years | 15.3 |
| 20 - 30 Years | 9.0 |
| Distribution by Credit Quality (% of portfolio) | |
| U.S. Government | 99.0% |
| Aaa | 1.0 |
Credit-quality ratings are obtained from Moody's and S&P, and the higher rating for each issue is shown. "Not Rated" is used to
classify securities for which a rating is not available. Not rated securities include a fund's investment in Vanguard Market Liquidity
Fund or Vanguard Municipal Cash Management Fund, each of which invests in high-quality money market instruments and may
serve as a cash management vehicle for the Vanguard funds, trusts, and accounts. For more information about these ratings, see
the Glossary entry for Credit Quality.
Investment Focus
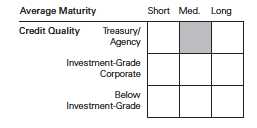
1 The expense ratios shown are from the prospectus dated April 28, 2015, and represent estimated costs for the current fiscal year. For the fiscal
year ended December 31, 2015, the expense ratios were 0.20% for Investor Shares, 0.10% for Admiral Shares, and 0.07% for Institutional Shares.
2 Yields of inflation-protected securities tend to be lower than those of nominal bonds, because the former do not incorporate market expectations
about inflation. The principal amounts—and thus the interest payments—of inflation-protected securities are adjusted over time to reflect inflation.
12
Inflation-Protected Securities Fund
Performance Summary
All of the returns in this report represent past performance, which is not a guarantee of future results that may be achieved by the fund. (Current performance may be lower or higher than the performance data cited. For performance data current to the most recent month-end, visit our website at vanguard.com/performance.) Note, too, that both investment returns and principal value can fluctuate widely, so an investor’s shares, when sold, could be worth more or less than their original cost. The returns shown do not reflect taxes that a shareholder would pay on fund distributions or on the sale of fund shares.
Cumulative Performance: December 31, 2005, Through December 31, 2015
Initial Investment of $10,000
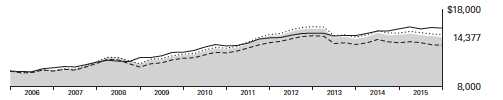
| Average Annual Total Returns | |||||
| Periods Ended December 31, 2015 | |||||
| Final Value | |||||
| One | Five | Ten | of a $10,000 | ||
| Year | Years | Years | Investment | ||
| Inflation-Protected Securities Fund | |||||
| Investor Shares | -1.83% | 2.34% | 3.70% | $14,377 | |
| Barclays U.S. Treasury Inflation | |||||
| •••••••• | Protected Securities Index | -1.44 | 2.55 | 3.93 | 14,703 |
| – – – – | Barclays Inflation-Protected U.S. Aggregate Bond Bond Funds Index Average | -2.43 0.55 | 3.25 1.55 | 4.51 2.92 | 13,331 15,552 |
| Inflation-Protected Bond Funds Average: Derived from data provided by Lipper, a Thomson Reuters Company. | |||||
| Final Value | ||||
| One | Five | Ten | of a $50,000 | |
| Year | Years | Years | Investment | |
| Inflation-Protected Securities Fund Admiral | ||||
| Shares | -1.69% | 2.44% | 3.80% | $72,631 |
| Barclays U.S. Treasury Inflation Protected | ||||
| Securities Index | -1.44 | 2.55 | 3.93 | 73,517 |
| Barclays U.S. Aggregate Bond Index | 0.55 | 3.25 | 4.51 | 77,759 |
See Financial Highlights for dividend and capital gains information.
13
Inflation-Protected Securities Fund
| Average Annual Total Returns | ||||
| Periods Ended December 31, 2015 | ||||
| Final Value | ||||
| One | Five | Ten | of a $5,000,000 | |
| Year | Years | Years | Investment | |
| Inflation-Protected Securities Fund | ||||
| Institutional Shares | -1.67% | 2.48% | 3.84% | $7,285,550 |
| Barclays U.S. Treasury Inflation Protected | ||||
| Securities Index | -1.44 | 2.55 | 3.93 | 7,351,680 |
| Barclays U.S. Aggregate Bond Index | 0.55 | 3.25 | 4.51 | 7,775,892 |
Fiscal-Year Total Returns (%): December 31, 2005, Through December 31, 2015
| Barclays | ||||
| Inflation | ||||
| Protected | ||||
| Securities | ||||
| Investor Shares | Index | |||
| Fiscal Year | Income Returns | Capital Returns | Total Returns | Total Returns |
| 2006 | 3.40% | -2.97% | 0.43% | 0.41% |
| 2007 | 5.90 | 5.69 | 11.59 | 11.63 |
| 2008 | 4.62 | -7.47 | -2.85 | -2.35 |
| 2009 | 1.86 | 8.94 | 10.80 | 11.41 |
| 2010 | 2.58 | 3.59 | 6.17 | 6.31 |
| 2011 | 4.56 | 8.68 | 13.24 | 13.56 |
| 2012 | 2.62 | 4.16 | 6.78 | 6.98 |
| 2013 | 1.47 | -10.39 | -8.92 | -8.61 |
| 2014 | 2.17 | 1.66 | 3.83 | 3.64 |
| 2015 | 0.74 | -2.57 | -1.83 | -1.44 |
14
Inflation-Protected Securities Fund
Financial Statements
Statement of Net Assets
As of December 31, 2015
The fund reports a complete list of its holdings in regulatory filings four times in each fiscal year, at the quarter-ends. For the second and fourth fiscal quarters, the lists appear in the fund’s semiannual and annual reports to shareholders. For the first and third fiscal quarters, the fund files the lists with the Securities and Exchange Commission on Form N-Q. Shareholders can look up the fund’s Forms N-Q on the SEC’s website at sec.gov. Forms N-Q may also be reviewed and copied at the SEC’s Public Reference Room (see the back cover of this report for further information).
| Face | Market | ||||
| Maturity | Amount | Value• | |||
| Coupon | Date | ($000) | ($000) | ||
| U.S. Government and Agency Obligations (99.1%) | |||||
| U.S. Government Securities (99.1%) | |||||
| 1 | United States Treasury Inflation Indexed Bonds | 0.125% | 4/15/17 | 980,693 | 1,024,356 |
| United States Treasury Inflation Indexed Bonds | 2.625% | 7/15/17 | 170,040 | 203,790 | |
| United States Treasury Inflation Indexed Bonds | 1.625% | 1/15/18 | 292,915 | 342,985 | |
| United States Treasury Inflation Indexed Bonds | 0.125% | 4/15/18 | 1,142,521 | 1,173,506 | |
| United States Treasury Inflation Indexed Bonds | 1.375% | 7/15/18 | 243,795 | 278,345 | |
| United States Treasury Inflation Indexed Bonds | 2.125% | 1/15/19 | 265,097 | 310,691 | |
| United States Treasury Inflation Indexed Bonds | 0.125% | 4/15/19 | 1,149,480 | 1,159,639 | |
| United States Treasury Inflation Indexed Bonds | 1.875% | 7/15/19 | 333,876 | 394,278 | |
| United States Treasury Inflation Indexed Bonds | 1.375% | 1/15/20 | 412,584 | 472,004 | |
| United States Treasury Inflation Indexed Bonds | 0.125% | 4/15/20 | 1,148,000 | 1,151,719 | |
| United States Treasury Inflation Indexed Bonds | 1.250% | 7/15/20 | 639,410 | 725,431 | |
| United States Treasury Inflation Indexed Bonds | 1.125% | 1/15/21 | 739,199 | 829,187 | |
| United States Treasury Inflation Indexed Bonds | 0.625% | 7/15/21 | 807,801 | 858,304 | |
| United States Treasury Inflation Indexed Bonds | 0.125% | 1/15/22 | 895,171 | 912,002 | |
| United States Treasury Inflation Indexed Bonds | 0.125% | 7/15/22 | 939,719 | 942,282 | |
| United States Treasury Inflation Indexed Bonds | 0.125% | 1/15/23 | 949,030 | 937,543 | |
| United States Treasury Inflation Indexed Bonds | 0.375% | 7/15/23 | 945,936 | 944,396 | |
| United States Treasury Inflation Indexed Bonds | 0.625% | 1/15/24 | 922,956 | 929,761 | |
| United States Treasury Inflation Indexed Bonds | 0.125% | 7/15/24 | 921,471 | 876,408 | |
| United States Treasury Inflation Indexed Bonds | 0.250% | 1/15/25 | 947,000 | 907,102 | |
| United States Treasury Inflation Indexed Bonds | 2.375% | 1/15/25 | 498,151 | 714,186 | |
| United States Treasury Inflation Indexed Bonds | 0.375% | 7/15/25 | 1,215,625 | 1,179,758 | |
| United States Treasury Inflation Indexed Bonds | 2.000% | 1/15/26 | 376,627 | 501,241 | |
| United States Treasury Inflation Indexed Bonds | 2.375% | 1/15/27 | 337,247 | 459,699 | |
| United States Treasury Inflation Indexed Bonds | 1.750% | 1/15/28 | 327,466 | 405,864 | |
| United States Treasury Inflation Indexed Bonds | 3.625% | 4/15/28 | 222,675 | 427,671 | |
| United States Treasury Inflation Indexed Bonds | 2.500% | 1/15/29 | 320,770 | 420,633 | |
| United States Treasury Inflation Indexed Bonds | 3.875% | 4/15/29 | 266,542 | 523,482 | |
| United States Treasury Inflation Indexed Bonds | 3.375% | 4/15/32 | 111,629 | 202,089 | |
| United States Treasury Inflation Indexed Bonds | 2.125% | 2/15/40 | 171,456 | 221,832 | |
| United States Treasury Inflation Indexed Bonds | 2.125% | 2/15/41 | 221,358 | 284,283 | |
| United States Treasury Inflation Indexed Bonds | 0.750% | 2/15/42 | 400,145 | 369,384 | |
| United States Treasury Inflation Indexed Bonds | 0.625% | 2/15/43 | 302,255 | 264,162 | |
| United States Treasury Inflation Indexed Bonds | 1.375% | 2/15/44 | 463,035 | 479,989 | |
| United States Treasury Inflation Indexed Bonds | 0.750% | 2/15/45 | 566,450 | 497,653 | |
15
| Inflation-Protected Securities Fund | ||||
| Face | Market | |||
| Maturity | Amount | Value• | ||
| Coupon | Date | ($000) | ($000) | |
| United States Treasury Note/Bond | 2.000% | 5/31/21 | 30,000 | 30,202 |
| United States Treasury Note/Bond | 2.000% | 10/31/21 | 30,000 | 30,080 |
| United States Treasury Note/Bond | 1.875% | 11/30/21 | 30,000 | 29,869 |
| United States Treasury Note/Bond | 1.750% | 9/30/22 | 63,000 | 61,730 |
| United States Treasury Note/Bond | 2.000% | 2/15/23 | 29,000 | 28,823 |
| United States Treasury Note/Bond | 1.750% | 5/15/23 | 29,000 | 28,243 |
| Total U.S. Government and Agency Obligations (Cost $22,308,773) | 22,534,602 | |||
| Expiration Date | Contracts | |||
| Options on Futures Purchased (0.0%) | ||||
| Put Options on 10-year U.S. Treasury Note | ||||
| Futures Contracts, Strike Price $124.00 | ||||
| (Cost $226) | 1/22/16 | 717 | 56 | |
| Total Investments (99.1%) (Cost $22,308,999) | 22,534,658 | |||
| Liability for Options Written (0.0%) | ||||
| Call Options on 10-year U.S. Treasury Note | ||||
| Futures Contracts, Strike Price $127.00 | 1/22/16 | 765 | (143) | |
| Call Options on 10-year U.S. Treasury Note | ||||
| Futures Contracts, Strike Price $127.50 | 1/22/16 | 573 | (63) | |
| Call Options on 10-year U.S. Treasury Note | ||||
| Futures Contracts, Strike Price $128.00 | 2/19/16 | 143 | (34) | |
| Call Options on 10-year U.S. Treasury Note | ||||
| Futures Contracts, Strike Price $128.50 | 2/19/16 | 144 | (25) | |
| Put Options on 10-year U.S. Treasury Note | ||||
| Futures Contracts, Strike Price $125.50 | 1/22/16 | 573 | (224) | |
| Put Options on 10-year U.S. Treasury Note | ||||
| Futures Contracts, Strike Price $125.00 | 1/22/16 | 765 | (179) | |
| Total Liability for Options Written (Premiums Received $937) | (668) | |||
| Amount | ||||
| ($000) | ||||
| Other Assets and Liabilities (0.9%) | ||||
| Other Assets | ||||
| Investment in Vanguard | 2,031 | |||
| Receivables for Investment Securities Sold | 233,097 | |||
| Receivables for Accrued Income | 77,948 | |||
| Receivables for Capital Shares Issued | 29,864 | |||
| Other Assets | 4,972 | |||
| Total Other Assets | 347,912 | |||
| Liabilities | ||||
| Payables for Capital Shares Redeemed | (98,429) | |||
| Payables to Vanguard | (32,156) | |||
| Other Liabilities | (1,147) | |||
| Total Liabilities | (131,732) | |||
| Net Assets (100%) | 22,750,170 | |||
16
| Inflation-Protected Securities Fund | |
| At December 31, 2015, net assets consisted of: | |
| Amount | |
| ($000) | |
| Paid-in Capital | 22,564,439 |
| Overdistributed Net Investment Income | (27,370) |
| Accumulated Net Realized Losses | (12,531) |
| Unrealized Appreciation (Depreciation) | |
| Investment Securities | 225,829 |
| Futures Contracts | (296) |
| Options on Futures Contracts | 99 |
| Net Assets | 22,750,170 |
| Investor Shares—Net Assets | |
| Applicable to 369,553,423 outstanding $.001 par value shares of | |
| beneficial interest (unlimited authorization) | 4,746,461 |
| Net Asset Value Per Share—Investor Shares | $12.84 |
| Admiral Shares—Net Assets | |
| Applicable to 417,817,238 outstanding $.001 par value shares of | |
| beneficial interest (unlimited authorization) | 10,532,773 |
| Net Asset Value Per Share—Admiral Shares | $25.21 |
| Institutional Shares—Net Assets | |
| Applicable to 727,594,947 outstanding $.001 par value shares of | |
| beneficial interest (unlimited authorization) | 7,470,936 |
| Net Asset Value Per Share—Institutional Shares | $10.27 |
• See Note A in Notes to Financial Statements.
1 Securities with a value of $5,786,000 have been segregated as initial margin for open futures contracts.
See accompanying Notes, which are an integral part of the Financial Statements.
17
Inflation-Protected Securities Fund
Statement of Operations
| Year Ended | |
| December 31, 2015 | |
| ($000) | |
| Investment Income | |
| Income | |
| Interest1 | 225,927 |
| Total Income | 225,927 |
| Expenses | |
| The Vanguard Group—Note B | |
| Investment Advisory Services | 2,492 |
| Management and Administrative—Investor Shares | 8,438 |
| Management and Administrative—Admiral Shares | 8,038 |
| Management and Administrative—Institutional Shares | 4,084 |
| Marketing and Distribution—Investor Shares | 1,149 |
| Marketing and Distribution—Admiral Shares | 1,377 |
| Marketing and Distribution—Institutional Shares | 696 |
| Custodian Fees | 129 |
| Auditing Fees | 39 |
| Shareholders’ Reports—Investor Shares | 145 |
| Shareholders’ Reports—Admiral Shares | 90 |
| Shareholders’ Reports—Institutional Shares | 110 |
| Trustees’ Fees and Expenses | 18 |
| Total Expenses | 26,805 |
| Net Investment Income | 199,122 |
| Realized Net Gain (Loss) | |
| Investment Securities Sold | 64,200 |
| Futures Contracts | (23,812) |
| Options on Futures Contracts | 2,418 |
| Realized Net Gain (Loss) | 42,806 |
| Change in Unrealized Appreciation (Depreciation) | |
| Investment Securities | (649,604) |
| Futures Contracts | 389 |
| Options on Futures Contracts | 70 |
| Change in Unrealized Appreciation (Depreciation) | (649,145) |
| Net Increase (Decrease) in Net Assets Resulting from Operations | (407,217) |
| 1 Interest income from an affiliated company of the fund was $695,000. | |
See accompanying Notes, which are an integral part of the Financial Statements.
18
Inflation-Protected Securities Fund
Statement of Changes in Net Assets
| Year Ended December 31, | ||
| 2015 | 2014 | |
| ($000) | ($000) | |
| Increase (Decrease) in Net Assets | ||
| Operations | ||
| Net Investment Income | 199,122 | 545,745 |
| Realized Net Gain (Loss) | 42,806 | 128,383 |
| Change in Unrealized Appreciation (Depreciation) | (649,145) | 347,960 |
| Net Increase (Decrease) in Net Assets Resulting from Operations | (407,217) | 1,022,088 |
| Distributions | ||
| Net Investment Income | ||
| Investor Shares | (36,231) | (123,813) |
| Admiral Shares | (91,547) | (238,998) |
| Institutional Shares | (67,708) | (191,999) |
| Realized Capital Gain | ||
| Investor Shares | (579) | (6,797) |
| Admiral Shares | (1,124) | (12,806) |
| Institutional Shares | (933) | (10,264) |
| Total Distributions | (198,122) | (584,677) |
| Capital Share Transactions | ||
| Investor Shares | (734,224) | (1,090,021) |
| Admiral Shares | 29,952 | (396,341) |
| Institutional Shares | (772,077) | (620,855) |
| Net Increase (Decrease) from Capital Share Transactions | (1,476,349) | (2,107,217) |
| Total Increase (Decrease) | (2,081,688) | (1,669,806) |
| Net Assets | ||
| Beginning of Period | 24,831,858 | 26,501,664 |
| End of Period1 | 22,750,170 | 24,831,858 |
| 1 Net Assets—End of Period includes undistributed (overdistributed) net investment income of ($27,370,000) and ($33,115,000). | ||
See accompanying Notes, which are an integral part of the Financial Statements.
19
Inflation-Protected Securities Fund
Financial Highlights
| Investor Shares | |||||
| For a Share Outstanding | Year Ended December 31, | ||||
| Throughout Each Period | 2015 | 2014 | 2013 | 2012 | 2011 |
| Net Asset Value, Beginning of Period | $13.18 | $12.98 | $14.53 | $14.11 | $13.00 |
| Investment Operations | |||||
| Net Investment Income | . 098 | . 224 | .210 | .367 | .568 |
| Net Realized and Unrealized Gain (Loss) | |||||
| on Investments | (. 339) | . 273 | (1.499) | .586 | 1.127 |
| Total from Investment Operations | (. 241) | .497 | (1.289) | .953 | 1.695 |
| Distributions | |||||
| Dividends from Net Investment Income | (.098) | (.281) | (.216) | (.366) | (.567) |
| Distributions from Realized Capital Gains | (.001) | (.016) | (.045) | (.167) | (.018) |
| Total Distributions | (. 099) | (. 297) | (.261) | (.533) | (.585) |
| Net Asset Value, End of Period | $12.84 | $13.18 | $12.98 | $14.53 | $14.11 |
| Total Return1 | -1.83% | 3.83% | -8.92% | 6.78% | 13.24% |
| Ratios/Supplemental Data | |||||
| Net Assets, End of Period (Millions) | $4,746 | $5,604 | $6,577 | $16,075 | $15,220 |
| Ratio of Total Expenses to Average Net Assets | 0.20% | 0.20% | 0.20% | 0.20% | 0.20% |
| Ratio of Net Investment Income to | |||||
| Average Net Assets | 0.72% | 2.01% | 1.33% | 2.55% | 4.21% |
| Portfolio Turnover Rate | 43% | 39% | 44%2 | 33% | 28% |
1 Total returns do not include account service fees that may have applied in the periods shown. Fund prospectuses provide information about any applicable account service fees.
2 Excludes the value of portfolio securities received or delivered as a result of in-kind purchases or redemptions of the fund’s capital shares.
See accompanying Notes, which are an integral part of the Financial Statements.
20
Inflation-Protected Securities Fund
Financial Highlights
| Admiral Shares | |||||
| For a Share Outstanding | Year Ended December 31, | ||||
| Throughout Each Period | 2015 | 2014 | 2013 | 2012 | 2011 |
| Net Asset Value, Beginning of Period | $25.87 | $25.47 | $28.54 | $27.71 | $25.54 |
| Investment Operations | |||||
| Net Investment Income | . 221 | . 468 | .449 | .750 | 1.140 |
| Net Realized and Unrealized Gain (Loss) | |||||
| on Investments | (. 658) | .544 | (2.965) | 1.155 | 2.202 |
| Total from Investment Operations | (. 437) | 1.012 | (2.516) | 1.905 | 3.342 |
| Distributions | |||||
| Dividends from Net Investment Income | (.220) | (.581) | (.465) | (.747) | (1.137) |
| Distributions from Realized Capital Gains | (.003) | (.031) | (.089) | (. 328) | (.035) |
| Total Distributions | (.223) | (.612) | (.554) | (1.075) | (1.172) |
| Net Asset Value, End of Period | $25.21 | $25.87 | $25.47 | $28.54 | $27.71 |
| Total Return | -1.69% | 3.97% | -8.86% | 6.90% | 13.29% |
| Ratios/Supplemental Data | |||||
| Net Assets, End of Period (Millions) | $10,533 | $10,778 | $11,005 | $16,011 | $13,533 |
| Ratio of Total Expenses to Average Net Assets | 0.10% | 0.10% | 0.10% | 0.10% | 0.11% |
| Ratio of Net Investment Income to | |||||
| Average Net Assets | 0.82% | 2.11% | 1.43% | 2.65% | 4.30% |
| Portfolio Turnover Rate | 43% | 39% | 44%1 | 33% | 28% |
| 1 Excludes the value of portfolio securities received or delivered as a result of in-kind purchases or redemptions of the fund’s capital shares. | |||||
See accompanying Notes, which are an integral part of the Financial Statements.
21
Inflation-Protected Securities Fund
Financial Highlights
| Institutional Shares | |||||
| For a Share Outstanding | Year Ended December 31, | ||||
| Throughout Each Period | 2015 | 2014 | 2013 | 2012 | 2011 |
| Net Asset Value, Beginning of Period | $10.54 | $10.37 | $11.62 | $11.29 | $10.40 |
| Investment Operations | |||||
| Net Investment Income | . 093 | .193 | .187 | .310 | .468 |
| Net Realized and Unrealized Gain (Loss) | |||||
| on Investments | (.269) | .229 | (1.208) | .463 | .903 |
| Total from Investment Operations | (.176) | .422 | (1.021) | .773 | 1.371 |
| Distributions | |||||
| Dividends from Net Investment Income | (.093) | (.239) | (.193) | (.309) | (.467) |
| Distributions from Realized Capital Gains | (.001) | (.013) | (.036) | (.134) | (.014) |
| Total Distributions | (. 094) | (.252) | (.229) | (.443) | (.481) |
| Net Asset Value, End of Period | $10.27 | $10.54 | $10.37 | $11.62 | $11.29 |
| Total Return | -1.67% | 4.07% | -8.83% | 6.87% | 13.39% |
| Ratios/Supplemental Data | |||||
| Net Assets, End of Period (Millions) | $7,471 | $8,449 | $8,919 | $12,491 | $10,367 |
| Ratio of Total Expenses to Average Net Assets | 0.07% | 0.07% | 0.07% | 0.07% | 0.07% |
| Ratio of Net Investment Income to | |||||
| Average Net Assets | 0.85% | 2.14% | 1.46% | 2.68% | 4.34% |
| Portfolio Turnover Rate | 43% | 39% | 44%1 | 33% | 28% |
| 1 Excludes the value of portfolio securities received or delivered as a result of in-kind purchases or redemptions of the fund’s capital shares. | |||||
See accompanying Notes, which are an integral part of the Financial Statements.
22
Inflation-Protected Securities Fund
Notes to Financial Statements
Vanguard Inflation-Protected Securities Fund is registered under the Investment Company Act of 1940 as an open-end investment company, or mutual fund. The fund offers three classes of shares: Investor Shares, Admiral Shares, and Institutional Shares. Investor Shares are available to any investor who meets the fund’s minimum purchase requirements. Admiral Shares and Institutional Shares are designed for investors who meet certain administrative, service, and account-size criteria.
A. The following significant accounting policies conform to generally accepted accounting principles for U.S. investment companies. The fund consistently follows such policies in preparing its financial statements.
1. Security Valuation: Securities are valued as of the close of trading on the New York Stock Exchange (generally 4 p.m., Eastern time) on the valuation date. Bonds, and temporary cash investments acquired over 60 days to maturity, are valued using the latest bid prices or using valuations based on a matrix system (which considers such factors as security prices, yields, maturities, and ratings), both as furnished by independent pricing services. Investments in Vanguard Market Liquidity Fund are valued at that fund’s net asset value. Other temporary cash investments are valued at amortized cost, which approximates market value. Securities for which market quotations are not readily available, or whose values have been affected by events occurring before the fund’s pricing time but after the close of the securities’ primary markets, are valued by methods deemed by the board of trustees to represent fair value.
2. Futures and Options: The fund uses futures contracts and options on futures contracts to invest in fixed income asset classes with greater efficiency and lower cost than is possible through direct investment, to add value when these instruments are attractively priced, or to adjust sensitivity to changes in interest rates. The primary risks associated with the use of futures contracts are imperfect correlation between changes in market values of bonds held by the fund and the prices of futures contracts, and the possibility of an illiquid market. The primary risk associated with purchasing options is that interest rates move in such a way that the option is out-of-the-money, the position is worthless at expiration, and the fund loses the premium paid. The primary risk associated with writing options is that interest rates move in such a way that the option is in-the-money, the counterparty exercises the option, and the fund loses an amount equal to the market value of the option written less the premium received. Counterparty risk involving futures and exchange-traded options is mitigated because a regulated clearinghouse is the counterparty instead of the clearing broker. To further mitigate counterparty risk, the fund trades futures and options on an exchange, monitors the financial strength of its clearing brokers and clearinghouse, and has entered into clearing agreements with its clearing brokers. The clearinghouse imposes initial margin requirements to secure the fund’s performance and requires daily settlement of variation margin representing changes in the market value of each contract.
Futures contracts are valued at their quoted daily settlement prices. The aggregate settlement values of the contracts are not recorded in the Statement of Net Assets. Fluctuations in the value of the contracts are recorded in the Statement of Net Assets as an asset (liability) and in the Statement of Operations as unrealized appreciation (depreciation) until the contracts are closed, when they are recorded as realized futures gains (losses).
During the year ended December 31, 2015, the fund’s average investments in long and short futures contracts represented 1% and 2% of net assets, respectively, based on the average of aggregate settlement values at each quarter-end during the period.
23
Inflation-Protected Securities Fund
Options on futures contracts are also valued at their quoted daily settlement prices. The premium paid for a purchased option is recorded in the Statement of Net Assets as an asset that is subsequently adjusted daily to the current market value of the option purchased. The premium received for a written option is recorded in the Statement of Net Assets as an asset with an equal liability that is subsequently adjusted daily to the current market value of the option written. Fluctuations in the value of the options are recorded in the Statement of Operations as unrealized appreciation (depreciation) until expired, closed, or exercised, at which time realized gains (losses) are recognized.
During the year ended December 31, 2015, the fund’s average value of investments in options purchased and options written each represented less than 1% of net assets, based on the average market values at each quarter-end during the period.
3. Federal Income Taxes: The fund intends to continue to qualify as a regulated investment company and distribute all of its taxable income. Management has analyzed the fund’s tax positions taken for all open federal income tax years (December 31, 2012–2015), and has concluded that no provision for federal income tax is required in the fund’s financial statements.
4. Distributions: Distributions to shareholders are recorded on the ex-dividend date.
5. Credit Facility: The fund and certain other funds managed by The Vanguard Group (“Vanguard”) participate in a $3 billion committed credit facility provided by a syndicate of lenders pursuant to a credit agreement that may be renewed annually; each fund is individually liable for its borrowings, if any, under the credit facility. Borrowings may be utilized for temporary and emergency purposes, and are subject to the fund’s regulatory and contractual borrowing restrictions. The participating funds are charged administrative fees and an annual commitment fee of 0.06% of the undrawn amount of the facility; these fees are allocated to the funds based on a method approved by the fund’s board of trustees and included in Management and Administrative expenses on the fund’s Statement of Operations. Any borrowings under this facility bear interest at a rate equal to the higher of the federal funds rate or LIBOR reference rate plus an agreed-upon spread.
The fund had no borrowings outstanding at December 31, 2015, or at any time during the period then ended.
6. Other: Interest income includes income distributions received from Vanguard Market Liquidity Fund and is accrued daily. Premiums and discounts on debt securities purchased are amortized and accreted, respectively, to interest income over the lives of the respective securities. Inflation adjustments to the face amount of inflation-indexed securities are included in interest income. Security transactions are accounted for on the date securities are bought or sold. Costs used to determine realized gains (losses) on the sale of investment securities are those of the specific securities sold.
Each class of shares has equal rights as to assets and earnings, except that each class separately bears certain class-specific expenses related to maintenance of shareholder accounts (included in Management and Administrative expenses) and shareholder reporting. Marketing and distribution expenses are allocated to each class of shares based on a method approved by the board of trustees. Income, other non-class-specific expenses, and gains and losses on investments are allocated to each class of shares based on its relative net assets.
B. In accordance with the terms of a Funds’ Service Agreement (the “FSA”) between Vanguard and the fund, Vanguard furnishes to the fund investment advisory, corporate management, administrative, marketing, and distribution services at Vanguard’s cost of operations (as defined by the FSA). These costs of operations are allocated to the fund based on methods and guidelines approved by the
24
Inflation-Protected Securities Fund
board of trustees. Vanguard does not require reimbursement in the current period for certain costs of operations (such as deferred compensation/benefits and risk/insurance costs); the fund’s liability for these costs of operations is included in Payables to Vanguard on the Statement of Net Assets.
Upon the request of Vanguard, the fund may invest up to 0.40% of its net assets as capital in Vanguard. At December 31, 2015, the fund had contributed to Vanguard capital in the amount of $2,031,000, representing 0.01% of the fund’s net assets and 0.81% of Vanguard’s capitalization. The fund’s trustees and officers are also directors and employees, respectively, of Vanguard.
C. Various inputs may be used to determine the value of the fund’s investments. These inputs are summarized in three broad levels for financial statement purposes. The inputs or methodologies used to value securities are not necessarily an indication of the risk associated with investing in those securities.
Level 1—Quoted prices in active markets for identical securities.
Level 2—Other significant observable inputs (including quoted prices for similar securities, interest rates, prepayment speeds, credit risk, etc.).
Level 3—Significant unobservable inputs (including the fund’s own assumptions used to determine the fair value of investments).
The following table summarizes the market value of the fund’s investments as of December 31, 2015, based on the inputs used to value them:
| Level 1 | Level 2 | Level 3 | |
| Investments | ($000) | ($000) | ($000) |
| U.S. Government and Agency Obligations | — | 22,534,602 | — |
| Options on Futures Purchased | 56 | — | — |
| Liability for Options Written | (668) | — | — |
| Futures Contracts—Assets1 | 748 | — | — |
| Futures Contracts—Liabilities1 | (1,147) | — | — |
| Total | (1,011) | 22,534,602 | — |
| 1 Represents variation margin on the last day of the reporting period. | |||
D. At December 31, 2015, the aggregate settlement value of open futures contracts and the related unrealized appreciation (depreciation) were:
| ($000) | ||||
| Aggregate | ||||
| Number of | Settlement | Unrealized | ||
| Long (Short) | Value | Appreciation | ||
| Futures Contracts | Expiration | Contracts | Long (Short) | (Depreciation) |
| 5-Year U.S. Treasury Note | March 2016 | (4,539) | (537,056) | 1,634 |
| 2-Year U.S. Treasury Note | March 2016 | 2,131 | 462,926 | (264) |
| 10-Year U.S. Treasury Note | March 2016 | (1,892) | (238,215) | (124) |
| Ultra Long U.S. Treasury Bond | March 2016 | 648 | 102,830 | (1,542) |
| (296) | ||||
Unrealized appreciation (depreciation) on open futures contracts is required to be treated as realized gain (loss) for tax purposes.
25
Inflation-Protected Securities Fund
E. Distributions are determined on a tax basis and may differ from net investment income and realized capital gains for financial reporting purposes. Differences may be permanent or temporary. Permanent differences are reclassified among capital accounts in the financial statements to reflect their tax character. Temporary differences arise when certain items of income, expense, gain, or loss are recognized in different periods for financial statement and tax purposes. These differences will reverse at some time in the future. Differences in classification may also result from the treatment of short-term gains as ordinary income for tax purposes.
Certain of the fund’s U.S. Treasury inflation-indexed securities experienced deflation and amortization adjustments that reduced interest income and the cost of investments for financial statement purposes by an amount greater than the reduction of taxable income; the additional income reduction will be deferred for tax purposes until it is used to offset future inflation adjustments that increase taxable income. The difference becomes permanent if the securities are sold. During the year ended December 31, 2015, the fund realized gains of $2,109,000 that were included in ordinary income for tax purposes as a result of deferred deflation and amortization adjustments; accordingly, such gains have been reclassified from accumulated net realized losses to overdistributed net investment income. Deferred inflation and amortization adjustments to securities held at December 31, 2015, totaling $2,114,000 are reflected as a reduction of the amount of tax-basis unrealized appreciation of investment securities.
During the year ended December 31, 2015, the fund realized $46,175,000 of net capital gains resulting from in-kind redemptions—in which shareholders exchanged fund shares for securities held by the fund rather than for cash. Because such gains are not taxable to the fund, and are not distributed to shareholders, they have been reclassified from accumulated net realized losses to paid-in capital.
The fund used a tax accounting practice to treat a portion of the price of capital shares redeemed during the year as distributions from realized capital gains. Accordingly, the fund has reclassified $6,325,000 from accumulated net realized losses to paid-in capital.
For tax purposes, at December 31, 2015, the fund had $4,134,000 of ordinary income available for distribution. The fund had available capital losses totaling $11,344,000 that may be carried forward indefinitely to offset future net capital gains.
At December 31, 2015, the cost of investment securities for tax purposes was $22,310,887,000. Net unrealized appreciation of investment securities for tax purposes was $223,715,000, consisting of unrealized gains of $712,884,000 on securities that had risen in value since their purchase and $489,169,000 in unrealized losses on securities that had fallen in value since their purchase.
F. During the year ended December 31, 2015, the fund purchased $10,381,061,000 of investment securities and sold $11,388,001,000 of investment securities, other than temporary cash investments. Purchases and sales include $0 and $535,614,000, respectively, in connection with in-kind purchases and redemptions of the fund’s capital shares.
26
Inflation-Protected Securities Fund
The following table summarizes the fund’s options written during the year ended December 31, 2015.
| Premiums | ||
| Number of | Received | |
| Options Written | Contracts | ($000) |
| Balance at December 31, 2014 | 10,726 | 3,557 |
| Options Written | 47,064 | 16,627 |
| Options Expired | (16,963) | (5,674) |
| Options Closed | (37,864) | (13,573) |
| Options Exercised | — | — |
| Balance at December 31, 2015 | 2,963 | 937 |
G. Capital share transactions for each class of shares were:
| Year Ended December 31, | ||||
| 2015 | 2014 | |||
| Amount | Shares | Amount | Shares | |
| ($000) | (000) | ($000) | (000) | |
| Investor Shares | ||||
| Issued | 681,832 | 51,628 | 923,903 | 68,793 |
| Issued in Lieu of Cash Distributions | 34,201 | 2,658 | 121,281 | 9,138 |
| Redeemed | (1,450,257) | (110,005) | (2,135,205) | (159,547) |
| Net Increase (Decrease) —Investor Shares | (734,224) | (55,719) | (1,090,021) | (81,616) |
| Admiral Shares | ||||
| Issued | 2,317,552 | 89,557 | 2,207,405 | 83,744 |
| Issued in Lieu of Cash Distributions | 82,177 | 3,253 | 222,967 | 8,564 |
| Redeemed | (2,369,777) | (91,684) | (2,826,713) | (107,678) |
| Net Increase (Decrease) —Admiral Shares | 29,952 | 1,126 | (396,341) | (15,370) |
| Institutional Shares | ||||
| Issued | 1,989,694 | 188,047 | 2,449,216 | 228,773 |
| Issued in Lieu of Cash Distributions | 66,430 | 6,460 | 193,131 | 18,207 |
| Redeemed | (2,828,201) | (268,857) | (3,263,202) | (304,746) |
| Net Increase (Decrease) —Institutional Shares | (772,077) | (74,350) | (620,855) | (57,766) |
H. Management has determined that no material events or transactions occurred subsequent to December 31, 2015, that would require recognition or disclosure in these financial statements.
27
Report of Independent Registered
Public Accounting Firm
To the Board of Trustees of Vanguard Bond Index Funds and the Shareholders of Vanguard Inflation-Protected Securities Fund: In our opinion, the accompanying statement of net assets and the related statements of operations and of changes in net assets and the financial highlights present fairly, in all material respects, the financial position of Vanguard Inflation-Protected Securities Fund (constituting a separate portfolio of Vanguard Bond Index Funds, hereafter referred to as the “Fund”) at December 31, 2015, the results of its operations for the year then ended, the changes in its net assets for each of the two years in the period then ended, and the financial highlights for the five years in the period then ended, in conformity with accounting principles generally accepted in the United States of America. These financial statements and financial highlights (hereafter referred to as “financial statements”) are the responsibility of the Fund’s management. Our responsibility is to express an opinion on these financial statements based on our audits. We conducted our audits of these financial statements in accordance with the standards of the Public Company Accounting Oversight Board (United States). Those standards require that we plan and perform the audit to obtain reasonable assurance about whether the financial statements are free of material misstatement. An audit includes examining, on a test basis, evidence supporting the amounts and disclosures in the financial statements, assessing the accounting principles used and significant estimates made by management, and evaluating the overall financial statement presentation. We believe that our audits, which included confirmation of securities at December 31, 2015 by correspondence with the custodian and brokers, provide a reasonable basis for our opinion.
/s/PricewaterhouseCoopers LLP
Philadelphia, Pennsylvania
February 18, 2016

This information for the fiscal year ended December 31, 2015, is included pursuant to provisions of
the Internal Revenue Code.
The fund distributed $9,035,000 as capital gain dividends (20% rate gain distributions) to shareholders
during the fiscal year.
For nonresident alien shareholders, 100% of income dividends are interest-related dividends.
28
About Your Fund’s Expenses
As a shareholder of the fund, you incur ongoing costs, which include costs for portfolio management, administrative services, and shareholder reports (like this one), among others. Operating expenses, which are deducted from a fund’s gross income, directly reduce the investment return of the fund.
A fund’s expenses are expressed as a percentage of its average net assets. This figure is known as the expense ratio. The following examples are intended to help you understand the ongoing costs (in dollars) of investing in your fund and to compare these costs with those of other mutual funds. The examples are based on an investment of $1,000 made at the beginning of the period shown and held for the entire period.
The accompanying table illustrates your fund’s costs in two ways:
• Based on actual fund return. This section helps you to estimate the actual expenses that you paid over the period. The ”Ending Account Value“ shown is derived from the fund‘s actual return, and the third column shows the dollar amount that would have been paid by an investor who started with $1,000 in the fund. You may use the information here, together with the amount you invested, to estimate the expenses that you paid over the period.
To do so, simply divide your account value by $1,000 (for example, an $8,600 account value divided by $1,000 = 8.6), then multiply the result by the number given for your fund under the heading ”Expenses Paid During Period.“
• Based on hypothetical 5% yearly return. This section is intended to help you compare your fund‘s costs with those of other mutual funds. It assumes that the fund had a yearly return of 5% before expenses, but that the expense ratio is unchanged. In this case—because the return used is not the fund’s actual return—the results do not apply to your investment. The example is useful in making comparisons because the Securities and Exchange Commission requires all mutual funds to calculate expenses based on a 5% return. You can assess your fund’s costs by comparing this hypothetical example with the hypothetical examples that appear in shareholder reports of other funds.
Note that the expenses shown in the table are meant to highlight and help you compare ongoing costs only and do not reflect transaction costs incurred by the fund for buying and selling securities. Further, the expenses do not include any purchase, redemption, or account service fees described in the fund prospectus. If such fees were applied to your account, your costs would be higher. Your fund does not carry a “sales load.”
The calculations assume no shares were bought or sold during the period. Your actual costs may have been higher or lower, depending on the amount of your investment and the timing of any purchases or redemptions.
You can find more information about the fund’s expenses, including annual expense ratios, in the Financial Statements section of this report. For additional information on operating expenses and other shareholder costs, please refer to your fund’s current prospectus.
29
| Six Months Ended December 31, 2015 | |||
| Beginning | Ending | Expenses | |
| Account Value | Account Value | Paid During | |
| Inflation-Protected Securities Fund | 6/30/2015 | 12/31/2015 | Period |
| Based on Actual Fund Return | |||
| Investor Shares | $1,000.00 | $982.23 | $1.00 |
| Admiral Shares | 1,000.00 | 983.17 | 0.55 |
| Institutional Shares | 1,000.00 | 983.95 | 0.35 |
| Based on Hypothetical 5% Yearly Return | |||
| Investor Shares | $1,000.00 | $1,024.20 | $1.02 |
| Admiral Shares | 1,000.00 | 1,024.65 | 0.56 |
| Institutional Shares | 1,000.00 | 1,024.85 | 0.36 |
The calculations are based on expenses incurred in the most recent six-month period. The fund’s annualized six-month expense ratios for that
period are 0.20% for Investor Shares, 0.11% for Admiral Shares, and 0.07% for Institutional Shares. The dollar amounts shown as “Expenses
Paid” are equal to the annualized expense ratio multiplied by the average account value over the period, multiplied by the number of days in
the most recent six-month period, then divided by the number of days in the most recent 12-month period (184/365).
30
Glossary
30-Day SEC Yield. A fund’s 30-day SEC yield is derived using a formula specified by the U.S. Securities and Exchange Commission. Under the formula, data related to the fund’s security holdings in the previous 30 days are used to calculate the fund’s hypothetical net income for that period, which is then annualized and divided by the fund’s estimated average net assets over the calculation period. For the purposes of this calculation, a security’s income is based on its current market yield to maturity (for bonds), its actual income (for asset-backed securities), or its projected dividend yield (for stocks). Because the SEC yield represents hypothetical annualized income, it will differ—at times significantly—from the fund’s actual experience. As a result, the fund’s income distributions may be higher or lower than implied by the SEC yield.
Average Coupon. The average interest rate paid on the fixed income securities held by a fund. It is expressed as a percentage of face value.
Average Duration. An estimate of how much the value of the fund’s bonds will fluctuate in response to a change in “real” interest rates—meaning rates without inflation expectations built in. Real interest rates are reflected in market yields for inflation-adjusted securities. To see how the fund’s bond values could change, multiply the average duration by the change in real rates. For example, if the average duration were five years, then the value of the fund’s bonds would decline by about 5% if real interest rates rose by 1 percentage point. Conversely, if real rates fell by a percentage point, the value of the bonds would rise about 5%.
Average Effective Maturity. The average length of time until fixed income securities held by a fund reach maturity and are repaid, taking into consideration the possibility that the issuer may call the bond before its maturity date. The figure reflects the proportion of fund assets represented by each security; it also reflects any futures contracts held. In general, the longer the average effective maturity, the more a fund’s share price will fluctuate in response to changes in market interest rates.
Beta. A measure of the magnitude of a fund’s past share-price fluctuations in relation to the ups and downs of a given market index. The index is assigned a beta of 1.00. Compared with a given index, a fund with a beta of 1.20 typically would have seen its share price rise or fall by 12% when the index rose or fell by 10%. For this report, beta is based on returns over the past 36 months for both the fund and the index. Note that a fund’s beta should be reviewed in conjunction with its R-squared (see definition). The lower the R-squared, the less correlation there is between the fund and the index, and the less reliable beta is as an indicator of volatility.
Credit Quality. Credit-quality ratings are measured on a scale that generally ranges from AAA (highest) to D (lowest). U.S. Treasury, U.S. Agency, and U.S. Agency mortgage-backed securities appear under “U.S. Government.” Credit-quality ratings are obtained from Moody’s and S&P, and the higher rating for each issue is shown. ”Not Rated” is used to classify securities for which a rating is not available. Not rated securities include a fund’s investment in Vanguard Market Liquidity Fund or Vanguard Municipal Cash Management Fund, each of which invests in high-quality money market instruments and may serve as a cash management vehicle for the Vanguard funds, trusts, and accounts.
Expense Ratio. A fund’s total annual operating expenses expressed as a percentage of the fund’s average net assets. The expense ratio includes management and administrative expenses, but does not include the transaction costs of buying and selling portfolio securities.
31
Inception Date. The date on which the assets of a fund (or one of its share classes) are first invested in accordance with the fund’s investment objective. For funds with a subscription period, the inception date is the day after that period ends. Investment performance is measured from the inception date.
R-Squared. A measure of how much of a fund’s past returns can be explained by the returns from the market in general, as measured by a given index. If a fund’s total returns were precisely synchronized with an index’s returns, its R-squared would be 1.00. If the fund’s returns bore no relationship to the index’s returns, its R-squared would be 0. For this report, R-squared is based on returns over the past 36 months for both the fund and the index.
Short-Term Reserves. The percentage of a fund invested in highly liquid, short-term securities that can be readily converted to cash.
Yield to Maturity. This term generally refers to the rate of return an investor would receive if the fixed income securities held by a fund were held to their maturity dates. For the Inflation-Protected Securities Fund, the calculation is modified by adding in the inflation adjustment made over the past 12 months. This change results in a figure more directly comparable to the yield-to-maturity figures for other types of bond funds. (An unmodified yield to maturity is used in calculating the fund’s 30-Day SEC Yield.)
32
This page intentionally left blank.
This page intentionally left blank.
This page intentionally left blank.
The People Who Govern Your Fund
The trustees of your mutual fund are there to see that the fund is operated and managed in your best interests since, as a shareholder, you are a part owner of the fund. Your fund’s trustees also serve on the board of directors of The Vanguard Group, Inc., which is owned by the Vanguard funds and provides services to them on an at-cost basis.
A majority of Vanguard’s board members are independent, meaning that they have no affiliation with Vanguard or the funds they oversee, apart from the sizable personal investments they have made as private individuals. The independent board members have distinguished backgrounds in business, academia, and public service. Each of the trustees and executive officers oversees 194 Vanguard funds.
The following table provides information for each trustee and executive officer of the fund. More information about the trustees is in the Statement of Additional Information, which can be obtained, without charge, by contacting Vanguard at 800-662-7447, or online at vanguard.com.
| InterestedTrustee1 | Rajiv L. Gupta |
| Born 1945. Trustee Since December 2001.2 Principal | |
| F. William McNabb III | Occupation(s) During the Past Five Years and Other |
| Born 1957. Trustee Since July 2009. Chairman of | Experience: Chairman and Chief Executive Officer |
| the Board. Principal Occupation(s) During the Past | (retired 2009) and President (2006–2008) of |
| Five Years and Other Experience: Chairman of the | Rohm and Haas Co. (chemicals); Director of Tyco |
| Board of The Vanguard Group, Inc., and of each of | International PLC (diversified manufacturing and |
| the investment companies served by The Vanguard | services), Hewlett-Packard Co. (electronic computer |
| Group, since January 2010; Director of The Vanguard | manufacturing), and Delphi Automotive PLC |
| Group since 2008; Chief Executive Officer and | (automotive components); Senior Advisor at New |
| President of The Vanguard Group, and of each of | Mountain Capital. |
| the investment companies served by The Vanguard | |
| Group, since 2008; Director of Vanguard Marketing | Amy Gutmann |
| Corporation; Managing Director of The Vanguard | Born 1949. Trustee Since June 2006. Principal |
| Group (1995–2008). | Occupation(s) During the Past Five Years and |
| Other Experience: President of the University of | |
| IndependentTrustees | Pennsylvania; Christopher H. Browne Distinguished |
| Professor of Political Science, School of Arts and | |
| Emerson U. Fullwood | Sciences, and Professor of Communication, Annenberg |
| Born 1948. Trustee Since January 2008. Principal | School for Communication, with secondary faculty |
| Occupation(s) During the Past Five Years and | appointments in the Department of Philosophy, School |
| Other Experience: Executive Chief Staff and | of Arts and Sciences, and at the Graduate School of |
| Marketing Officer for North America and Corporate | Education, University of Pennsylvania; Trustee of the |
| Vice President (retired 2008) of Xerox Corporation | National Constitution Center; Chair of the Presidential |
| (document management products and services); | Commission for the Study of Bioethical Issues. |
| Executive in Residence and 2009–2010 Distinguished | |
| Minett Professor at the Rochester Institute of | JoAnn Heffernan Heisen |
| Technology; Director of SPX Corporation (multi-industry | Born 1950. Trustee Since July 1998. Principal |
| manufacturing), the United Way of Rochester, the | Occupation(s) During the Past Five Years and |
| University of Rochester Medical Center, Monroe | Other Experience: Corporate Vice President and |
| Community College Foundation, and North Carolina | Chief Global Diversity Officer (retired 2008) and |
| A&T University. | Member of the Executive Committee (1997–2008) |
| of Johnson & Johnson (pharmaceuticals/medical | |
| devices/consumer products); Director of Skytop | |
| Lodge Corporation (hotels) and the Robert Wood | |
| Johnson Foundation; Member of the Advisory | |
| Board of the Institute for Women’s Leadership | |
| at Rutgers University. |
| F. Joseph Loughrey | Executive Officers | |
| Born 1949. Trustee Since October 2009. Principal | ||
| Occupation(s) During the Past Five Years and Other | Glenn Booraem | |
| Experience: President and Chief Operating Officer | Born 1967. Treasurer Since May 2015. Principal | |
| (retired 2009) of Cummins Inc. (industrial machinery); | Occupation(s) During the Past Five Years and | |
| Chairman of the Board of Hillenbrand, Inc. (specialized | Other Experience: Principal of The Vanguard Group, | |
| consumer services), and of Oxfam America; Director | Inc.; Treasurer of each of the investment companies | |
| of SKF AB (industrial machinery), Hyster-Yale Materials | served by The Vanguard Group; Controller of each of | |
| Handling, Inc. (forklift trucks), the Lumina Foundation | the investment companies served by The Vanguard | |
| for Education, and the V Foundation for Cancer | Group (2010–2015); Assistant Controller of each of | |
| Research; Member of the Advisory Council for the | the investment companies served by The Vanguard | |
| College of Arts and Letters and of the Advisory Board | Group (2001–2010). | |
| to the Kellogg Institute for International Studies, both | ||
| at the University of Notre Dame. | Thomas J. Higgins | |
| Born 1957. Chief Financial Officer Since September | ||
| Mark Loughridge | 2008. Principal Occupation(s) During the Past Five | |
| Born 1953. Trustee Since March 2012. Principal | Years and Other Experience: Principal of The Vanguard | |
| Occupation(s) During the Past Five Years and Other | Group, Inc.; Chief Financial Officer of each of the | |
| Experience: Senior Vice President and Chief Financial | investment companies served by The Vanguard Group; | |
| Officer (retired 2013) at IBM (information technology | Treasurer of each of the investment companies served | |
| services); Fiduciary Member of IBM’s Retirement Plan | by The Vanguard Group (1998–2008). | |
| Committee (2004–2013); Director of the Dow Chemical | ||
| Company; Member of the Council on Chicago Booth. | Peter Mahoney | |
| Born 1974. Controller Since May 2015. Principal | ||
| Scott C. Malpass | Occupation(s) During the Past Five Years and | |
| Born 1962. Trustee Since March 2012. Principal | Other Experience: Head of Global Fund Accounting | |
| Occupation(s) During the Past Five Years and Other | at The Vanguard Group, Inc.; Controller of each of the | |
| Experience: Chief Investment Officer and Vice | investment companies served by The Vanguard Group; | |
| President at the University of Notre Dame; Assistant | Head of International Fund Services at The Vanguard | |
| Professor of Finance at the Mendoza College of | Group (2008–2014). | |
| Business at Notre Dame; Member of the Notre Dame | ||
| 403(b) Investment Committee; Board Member of | Heidi Stam | |
| TIFF Advisory Services, Inc., and Catholic Investment | Born 1956. Secretary Since July 2005. Principal | |
| Services, Inc. (investment advisors); Member of | Occupation(s) During the Past Five Years and Other | |
| the Investment Advisory Committee of Major | Experience: Managing Director of The Vanguard | |
| League Baseball. | Group, Inc.; General Counsel of The Vanguard Group; | |
| Secretary of The Vanguard Group and of each of the | ||
| André F. Perold | investment companies served by The Vanguard Group; | |
| Born 1952. Trustee Since December 2004. Principal | Director and Senior Vice President of Vanguard | |
| Occupation(s) During the Past Five Years and Other | Marketing Corporation. | |
| Experience: George Gund Professor of Finance and | ||
| Banking, Emeritus at the Harvard Business School | Vanguard Senior ManagementTeam | |
| (retired 2011); Chief Investment Officer and Managing | Mortimer J. Buckley | Chris D. McIsaac |
| Partner of HighVista Strategies LLC (private investment | Kathleen C. Gubanich | James M. Norris |
| firm); Director of Rand Merchant Bank; Overseer of | Paul A. Heller | Thomas M. Rampulla |
| the Museum of Fine Arts Boston. | Martha G. King | Glenn W. Reed |
| John T. Marcante | Karin A. Risi | |
| Peter F. Volanakis | ||
| Born 1955. Trustee Since July 2009. Principal | ||
| Occupation(s) During the Past Five Years and Other | Chairman Emeritus and Senior Advisor | |
| Experience: President and Chief Operating Officer | John J. Brennan | |
| (retired 2010) of Corning Incorporated (communications | Chairman, 1996–2009 | |
| equipment); Trustee of Colby-Sawyer College; | Chief Executive Officer and President, 1996–2008 | |
| Member of the Advisory Board of the Norris Cotton | ||
| Cancer Center and of the Advisory Board of the | ||
| Parthenon Group (strategy consulting). | Founder | |
| John C. Bogle | ||
| Chairman and Chief Executive Officer, 1974–1996 | ||
1 Mr. McNabb is considered an “interested person,” as defined in the Investment Company Act of 1940, because he is an officer of the Vanguard funds.
2 December 2002 for Vanguard Equity Income Fund, the Vanguard Municipal Bond Funds, and the Vanguard State Tax-Exempt Funds.
 | |
| P.O. Box 2600 | |
| Valley Forge, PA 19482-2600 | |
| Connect with Vanguard® > vanguard.com | |
| Fund Information > 800-662-7447 | |
| Direct Investor Account Services > 800-662-2739 | |
| Institutional Investor Services > 800-523-1036 | |
| Text Telephone for People | |
| Who Are Deaf or Hard of Hearing> 800-749-7273 | |
| This material may be used in conjunction | |
| with the offering of shares of any Vanguard | |
| fund only if preceded or accompanied by | |
| the fund’s current prospectus. | |
| All comparative mutual fund data are from Lipper, a | |
| Thomson Reuters Company, or Morningstar, Inc., unless | |
| otherwise noted. | |
| You can obtain a free copy of Vanguard’s proxy voting | |
| guidelines by visiting vanguard.com/proxyreporting or by | |
| calling Vanguard at 800-662-2739. The guidelines are | |
| also available from the SEC’s website, sec.gov. In | |
| addition, you may obtain a free report on how your fund | |
| voted the proxies for securities it owned during the 12 | |
| months ended June 30. To get the report, visit either | |
| vanguard.com/proxyreporting or sec.gov. | |
| You can review and copy information about your fund at | |
| the SEC’s Public Reference Room in Washington, D.C. To | |
| find out more about this public service, call the SEC at | |
| 202-551-8090. Information about your fund is also | |
| available on the SEC’s website, and you can receive | |
| copies of this information, for a fee, by sending a | |
| request in either of two ways: via email addressed to | |
| publicinfo@sec.gov or via regular mail addressed to the | |
| Public Reference Section, Securities and Exchange | |
| Commission, Washington, DC 20549-1520. | |
| © 2016 The Vanguard Group, Inc. | |
| All rights reserved. | |
| Vanguard Marketing Corporation, Distributor. | |
| Q1190 022016 | |
Item 2: Code of Ethics. The Registrant has adopted a code of ethics that applies to the Registrant’s principal executive officer, principal financial officer, principal accounting officer or controller or persons performing similar functions. The Code of Ethics was amended during the reporting period covered by this report to make certain technical, non-material changes.
Item 3: Audit Committee Financial Expert. The following members of the Audit Committee have been determined by the Registrant’s Board of Trustees to be Audit Committee Financial Experts serving on its Audit Committee, and to be independent: Rajiv L. Gupta, Amy Gutmann, JoAnn Heffernan Heisen, F. Joseph Loughrey, Mark Loughridge, Scott C. Malpass, and André F. Perold.
Item 4: Principal Accountant Fees and Services.
(a) Audit Fees.
Audit Fees of the Registrant
Fiscal Year Ended December 31, 2015: $274,000
Fiscal Year Ended December 31, 2014: $263,000
Aggregate Audit Fees of Registered Investment Companies in the Vanguard Group.
Fiscal Year Ended December 31, 2015: $7,000,200
Fiscal Year Ended December 31, 2014: $6,605,127
Includes fees billed in connection with audits of the Registrant, other registered investment companies in the Vanguard complex, The Vanguard Group, Inc. and Vanguard Marketing Corporation.
(b) Audit-Related Fees.
Fiscal Year Ended December 31, 2015: $2,899,096
Fiscal Year Ended December 31, 2014: $2,176,479
Includes fees billed in connection with assurance and related services provided to the Registrant, other registered investment companies in the Vanguard complex, The Vanguard Group, Inc., and Vanguard Marketing Corporation.
(c) Tax Fees.
Fiscal Year Ended December 31, 2015: $353,389
Fiscal Year Ended December 31, 2014: $316,869
Includes fees billed in connection with tax compliance, planning, and advice services provided to the Registrant, other registered investment companies in the Vanguard complex, The Vanguard Group, Inc., and Vanguard Marketing Corporation.
(d) All Other Fees.
Fiscal Year Ended December 31, 2015: $202,313
Fiscal Year Ended December 31, 2014: $198,163
Includes fees billed for services related to tax reported information provided to the Registrant, other registered investment companies in the Vanguard complex, The Vanguard Group, Inc., and Vanguard Marketing Corporation.
(e) (1) Pre-Approval Policies. The policy of the Registrant’s Audit Committee is to consider and, if appropriate, approve before the principal accountant is engaged for such services, all specific audit and non-audit services provided to: the Registrant, other registered investment companies in the Vanguard complex, The Vanguard Group, Inc., and entities controlled by The Vanguard Group, Inc. that provide ongoing services to the Registrant. In making a determination, the Audit Committee considers whether the services are consistent with maintaining the principal accountant’s independence.
In the event of a contingency situation in which the principal accountant is needed to provide services in between scheduled Audit Committee meetings, the Chairman of the Audit Committee would be called on to consider and, if appropriate, pre-approve audit or permitted non-audit services in an amount sufficient to complete services through the next Audit Committee meeting, and to determine if such services would be consistent with maintaining the accountant’s independence. At the next scheduled Audit Committee meeting, services and fees would be presented to the Audit Committee for formal consideration, and, if appropriate, approval by the entire Audit Committee. The Audit Committee would again consider whether such services and fees are consistent with maintaining the principal accountant’s independence.
The Registrant’s Audit Committee is informed at least annually of all audit and non-audit services provided by the principal accountant to the Vanguard complex, whether such services are provided to: the Registrant, other registered investment companies in the Vanguard complex, The Vanguard Group, Inc., or other entities controlled by The Vanguard Group, Inc. that provide ongoing services to the Registrant.
(2) No percentage of the principal accountant’s fees or services were approved pursuant to the waiver provision of paragraph (c)(7)(i)(C) of Rule 2-01 of Regulation S-X.
(f) For the most recent fiscal year, over 50% of the hours worked under the principal accountant’s engagement were not performed by persons other than full-time, permanent employees of the principal accountant.
(g) Aggregate Non-Audit Fees.
Fiscal Year Ended December 31, 2015: $555,702
Fiscal Year Ended December 31, 2014: $515,032
Includes fees billed for non-audit services provided to the Registrant, other registered investment companies in the Vanguard complex, The Vanguard Group, Inc., and Vanguard Marketing Corporation.
(h) For the most recent fiscal year, the Audit Committee has determined that the provision of all non-audit services was consistent with maintaining the principal accountant’s independence.
Item 5: Audit Committee of Listed Registrants.
The Registrant is a listed issuer as defined in rule 10A-3 under the Securities Exchange Act of 1934 (“Exchange Act”). The Registrant has a separately-designated standing audit committee established in accordance with Section 3(a)(58)(A) of the Exchange Act. The Registrant’s audit committee members are: Emerson U. Fullwood, Rajiv L. Gupta, Amy Gutmann, JoAnn Heffernan Heisen, F. Joseph Loughrey, Mark Loughridge, Scott C. Malpass, André F. Perold, and Peter F. Volanakis.
Item 6: Investments.
Vanguard® Short-Term Bond Index Fund
Schedule of Investments
December 31, 2015
| Face | Market | |||
| Maturity | Amount | Value | ||
| Coupon | Date | ($000) | ($000) | |
| U.S. Government and Agency Obligations (66.0%) | ||||
| U.S. Government Securities (60.6%) | ||||
| United States Treasury Note/Bond | 2.250% | 3/31/16 | 6,900 | 6,931 |
| United States Treasury Note/Bond | 1.750% | 5/31/16 | 125,435 | 126,101 |
| United States Treasury Note/Bond | 1.500% | 6/30/16 | 27,546 | 27,675 |
| United States Treasury Note/Bond | 0.875% | 12/31/16 | 206,059 | 206,187 |
| United States Treasury Note/Bond | 0.750% | 1/15/17 | 414,800 | 414,476 |
| United States Treasury Note/Bond | 0.875% | 1/31/17 | 148,840 | 148,910 |
| United States Treasury Note/Bond | 0.625% | 2/15/17 | 293,885 | 293,197 |
| United States Treasury Note/Bond | 0.500% | 2/28/17 | 107,061 | 106,642 |
| United States Treasury Note/Bond | 0.875% | 2/28/17 | 282,024 | 282,199 |
| United States Treasury Note/Bond | 3.000% | 2/28/17 | 70,485 | 72,203 |
| United States Treasury Note/Bond | 0.750% | 3/15/17 | 225,668 | 225,350 |
| United States Treasury Note/Bond | 0.500% | 3/31/17 | 140,681 | 140,064 |
| United States Treasury Note/Bond | 1.000% | 3/31/17 | 281,775 | 282,260 |
| United States Treasury Note/Bond | 3.250% | 3/31/17 | 1,830 | 1,883 |
| United States Treasury Note/Bond | 0.875% | 4/15/17 | 348,715 | 348,659 |
| United States Treasury Note/Bond | 0.500% | 4/30/17 | 215,720 | 214,607 |
| United States Treasury Note/Bond | 0.875% | 4/30/17 | 336,019 | 335,861 |
| United States Treasury Note/Bond | 0.875% | 5/15/17 | 167,475 | 167,396 |
| United States Treasury Note/Bond | 4.500% | 5/15/17 | 68,310 | 71,597 |
| United States Treasury Note/Bond | 0.625% | 5/31/17 | 298,795 | 297,486 |
| United States Treasury Note/Bond | 2.750% | 5/31/17 | 4,644 | 4,762 |
| United States Treasury Note/Bond | 0.875% | 6/15/17 | 295,100 | 294,823 |
| United States Treasury Note/Bond | 0.625% | 6/30/17 | 52,553 | 52,290 |
| United States Treasury Note/Bond | 0.750% | 6/30/17 | 308,210 | 307,248 |
| United States Treasury Note/Bond | 0.875% | 7/15/17 | 122,125 | 121,934 |
| United States Treasury Note/Bond | 0.500% | 7/31/17 | 314,520 | 312,161 |
| United States Treasury Note/Bond | 0.625% | 7/31/17 | 74,853 | 74,444 |
| United States Treasury Note/Bond | 2.375% | 7/31/17 | 86,596 | 88,436 |
| United States Treasury Note/Bond | 0.875% | 8/15/17 | 298,815 | 298,161 |
| United States Treasury Note/Bond | 4.750% | 8/15/17 | 68,295 | 72,414 |
| United States Treasury Note/Bond | 0.625% | 8/31/17 | 314,972 | 312,953 |
| United States Treasury Note/Bond | 1.875% | 8/31/17 | 67,155 | 68,089 |
| United States Treasury Note/Bond | 1.000% | 9/15/17 | 321,935 | 321,784 |
| United States Treasury Note/Bond | 0.625% | 9/30/17 | 565,125 | 561,237 |
| United States Treasury Note/Bond | 1.875% | 9/30/17 | 69,825 | 70,818 |
| United States Treasury Note/Bond | 0.875% | 10/15/17 | 306,475 | 305,565 |
| United States Treasury Note/Bond | 0.750% | 10/31/17 | 64,454 | 64,112 |
| United States Treasury Note/Bond | 1.875% | 10/31/17 | 249,746 | 253,415 |
| United States Treasury Note/Bond | 0.875% | 11/15/17 | 252,417 | 251,589 |
| United States Treasury Note/Bond | 0.625% | 11/30/17 | 279,970 | 277,697 |
| United States Treasury Note/Bond | 0.875% | 11/30/17 | 402,328 | 401,197 |
| United States Treasury Note/Bond | 2.250% | 11/30/17 | 12,620 | 12,900 |
| United States Treasury Note/Bond | 1.000% | 12/15/17 | 172,111 | 171,896 |
| United States Treasury Note/Bond | 0.750% | 12/31/17 | 189,250 | 188,009 |
| United States Treasury Note/Bond | 1.000% | 12/31/17 | 83,864 | 83,773 |
| United States Treasury Note/Bond | 2.750% | 12/31/17 | 140,990 | 145,550 |
| United States Treasury Note/Bond | 0.875% | 1/15/18 | 36,850 | 36,683 |
| United States Treasury Note/Bond | 0.875% | 1/31/18 | 179,320 | 178,452 |
| United States Treasury Note/Bond | 2.625% | 1/31/18 | 79,974 | 82,460 |
| United States Treasury Note/Bond | 1.000% | 2/15/18 | 98,380 | 98,104 |
| United States Treasury Note/Bond | 3.500% | 2/15/18 | 80,105 | 84,110 |
| United States Treasury Note/Bond | 0.750% | 2/28/18 | 256,685 | 254,519 |
| United States Treasury Note/Bond | 2.750% | 2/28/18 | 56,165 | 58,104 |
| United States Treasury Note/Bond | 1.000% | 3/15/18 | 362,819 | 361,628 |
| United States Treasury Note/Bond | 0.750% | 3/31/18 | 160,380 | 158,977 |
| United States Treasury Note/Bond | 2.875% | 3/31/18 | 68,794 | 71,416 |
| United States Treasury Note/Bond | 0.750% | 4/15/18 | 189,530 | 187,693 |
| United States Treasury Note/Bond | 0.625% | 4/30/18 | 192,675 | 190,207 |
| United States Treasury Note/Bond | 1.000% | 5/15/18 | 254,995 | 253,799 |
| United States Treasury Note/Bond | 9.125% | 5/15/18 | 900 | 1,068 |
| United States Treasury Note/Bond | 1.000% | 5/31/18 | 479,115 | 476,719 |
1
| Vanguard® Short-Term Bond Index Fund | ||||
| Schedule of Investments | ||||
| December 31, 2015 | ||||
| Face | Market | |||
| Maturity | Amount | Value | ||
| Coupon | Date | ($000) | ($000) | |
| United States Treasury Note/Bond | 2.375% | 5/31/18 | 38,470 | 39,558 |
| United States Treasury Note/Bond | 1.125% | 6/15/18 | 145,724 | 145,428 |
| United States Treasury Note/Bond | 1.375% | 6/30/18 | 233,875 | 234,862 |
| United States Treasury Note/Bond | 2.375% | 6/30/18 | 38,867 | 40,003 |
| United States Treasury Note/Bond | 0.875% | 7/15/18 | 278,540 | 276,103 |
| United States Treasury Note/Bond | 1.375% | 7/31/18 | 234,210 | 235,126 |
| United States Treasury Note/Bond | 1.000% | 8/15/18 | 433,954 | 431,311 |
| United States Treasury Note/Bond | 1.500% | 8/31/18 | 308,780 | 310,855 |
| United States Treasury Note/Bond | 1.000% | 9/15/18 | 312,335 | 310,186 |
| United States Treasury Note/Bond | 1.375% | 9/30/18 | 376,790 | 378,026 |
| United States Treasury Note/Bond | 0.875% | 10/15/18 | 249,430 | 246,701 |
| United States Treasury Note/Bond | 1.250% | 10/31/18 | 185,900 | 185,638 |
| United States Treasury Note/Bond | 1.250% | 11/15/18 | 23,436 | 23,399 |
| United States Treasury Note/Bond | 3.750% | 11/15/18 | 5,932 | 6,345 |
| United States Treasury Note/Bond | 1.250% | 11/30/18 | 717,184 | 715,950 |
| United States Treasury Note/Bond | 1.375% | 11/30/18 | 13,360 | 13,391 |
| United States Treasury Note/Bond | 1.250% | 12/15/18 | 156,025 | 155,708 |
| United States Treasury Note/Bond | 1.500% | 12/31/18 | 164,859 | 165,632 |
| United States Treasury Note/Bond | 1.250% | 1/31/19 | 2,020 | 2,014 |
| United States Treasury Note/Bond | 1.500% | 1/31/19 | 342,060 | 343,288 |
| United States Treasury Note/Bond | 2.750% | 2/15/19 | 15,115 | 15,750 |
| United States Treasury Note/Bond | 1.375% | 2/28/19 | 9,070 | 9,064 |
| United States Treasury Note/Bond | 1.500% | 2/28/19 | 402,200 | 403,455 |
| United States Treasury Note/Bond | 1.500% | 3/31/19 | 3,885 | 3,897 |
| United States Treasury Note/Bond | 1.625% | 3/31/19 | 268,390 | 270,151 |
| United States Treasury Note/Bond | 1.250% | 4/30/19 | 16 | 16 |
| United States Treasury Note/Bond | 1.625% | 4/30/19 | 321,394 | 323,303 |
| United States Treasury Note/Bond | 3.125% | 5/15/19 | 1,140 | 1,203 |
| United States Treasury Note/Bond | 1.125% | 5/31/19 | 800 | 791 |
| United States Treasury Note/Bond | 1.500% | 5/31/19 | 458,140 | 458,571 |
| United States Treasury Note/Bond | 1.000% | 6/30/19 | 11,185 | 11,000 |
| United States Treasury Note/Bond | 1.625% | 6/30/19 | 336,566 | 338,091 |
| United States Treasury Note/Bond | 0.875% | 7/31/19 | 52,544 | 51,362 |
| United States Treasury Note/Bond | 1.625% | 7/31/19 | 294,605 | 295,663 |
| United States Treasury Note/Bond | 1.000% | 8/31/19 | 2,660 | 2,608 |
| United States Treasury Note/Bond | 1.625% | 8/31/19 | 461,569 | 462,940 |
| United States Treasury Note/Bond | 1.750% | 9/30/19 | 368,231 | 370,764 |
| United States Treasury Note/Bond | 1.500% | 10/31/19 | 185,151 | 184,573 |
| United States Treasury Note/Bond | 1.500% | 11/30/19 | 729,865 | 727,128 |
| United States Treasury Note/Bond | 1.625% | 12/31/19 | 168,309 | 168,309 |
| United States Treasury Note/Bond | 1.250% | 1/31/20 | 433,842 | 427,200 |
| United States Treasury Note/Bond | 3.625% | 2/15/20 | 65,000 | 70,119 |
| United States Treasury Note/Bond | 1.375% | 2/29/20 | 536,907 | 530,781 |
| United States Treasury Note/Bond | 1.125% | 3/31/20 | 15,000 | 14,663 |
| United States Treasury Note/Bond | 1.375% | 3/31/20 | 494,988 | 488,954 |
| United States Treasury Note/Bond | 1.375% | 4/30/20 | 312,770 | 308,713 |
| United States Treasury Note/Bond | 1.500% | 5/31/20 | 418,712 | 415,245 |
| United States Treasury Note/Bond | 1.625% | 6/30/20 | 250,465 | 249,448 |
| United States Treasury Note/Bond | 1.625% | 7/31/20 | 543,474 | 540,925 |
| United States Treasury Note/Bond | 1.375% | 8/31/20 | 635,075 | 624,952 |
| United States Treasury Note/Bond | 2.125% | 8/31/20 | 27,598 | 28,042 |
| United States Treasury Note/Bond | 1.375% | 9/30/20 | 339,758 | 333,918 |
| United States Treasury Note/Bond | 2.000% | 9/30/20 | 9,633 | 9,738 |
| United States Treasury Note/Bond | 1.375% | 10/31/20 | 530,380 | 521,098 |
| United States Treasury Note/Bond | 1.750% | 10/31/20 | 129,040 | 128,839 |
| United States Treasury Note/Bond | 1.625% | 11/30/20 | 707,950 | 703,858 |
| United States Treasury Note/Bond | 1.750% | 12/31/20 | 530,600 | 530,271 |
| 25,665,807 | ||||
| Agency Bonds and Notes (5.4%) | ||||
| 1 AID-Jordan | 1.945% | 6/23/19 | 5,600 | 5,642 |
| AID-Jordan | 2.503% | 10/30/20 | 7,250 | 7,412 |
| 1 AID-Ukraine | 1.844% | 5/16/19 | 3,400 | 3,430 |
| 1 AID-Ukraine | 1.847% | 5/29/20 | 6,000 | 5,975 |
| 2 Federal Farm Credit Banks | 4.875% | 1/17/17 | 6,400 | 6,665 |
2
| Vanguard® Short-Term Bond Index Fund | ||||
| Schedule of Investments | ||||
| December 31, 2015 | ||||
| Face | Market | |||
| Maturity | Amount | Value | ||
| Coupon | Date | ($000) | ($000) | |
| 2 Federal Farm Credit Banks | 1.125% | 9/22/17 | 6,000 | 6,003 |
| 2 Federal Farm Credit Banks | 1.000% | 9/25/17 | 4,150 | 4,143 |
| 2 Federal Farm Credit Banks | 1.125% | 12/18/17 | 15,000 | 14,997 |
| 2 Federal Farm Credit Banks | 1.110% | 2/20/18 | 4,150 | 4,143 |
| 2 Federal Farm Credit Banks | 1.100% | 6/1/18 | 2,000 | 1,992 |
| 2 Federal Farm Credit Banks | 5.150% | 11/15/19 | 7,621 | 8,618 |
| 2 Federal Home Loan Banks | 0.875% | 3/10/17 | 2,600 | 2,599 |
| 2 Federal Home Loan Banks | 4.875% | 5/17/17 | 79,920 | 84,103 |
| 2 Federal Home Loan Banks | 0.875% | 5/24/17 | 25,000 | 24,951 |
| 2 Federal Home Loan Banks | 0.625% | 5/30/17 | 40,000 | 39,782 |
| 2 Federal Home Loan Banks | 1.000% | 6/21/17 | 47,520 | 47,495 |
| 2 Federal Home Loan Banks | 0.860% | 8/1/17 | 9,500 | 9,471 |
| 2 Federal Home Loan Banks | 0.625% | 10/26/17 | 53,500 | 53,050 |
| 2 Federal Home Loan Banks | 1.125% | 12/8/17 | 12,500 | 12,498 |
| 2 Federal Home Loan Banks | 1.000% | 12/19/17 | 40,000 | 39,895 |
| 2 Federal Home Loan Banks | 1.375% | 3/9/18 | 20,000 | 20,073 |
| 2 Federal Home Loan Banks | 1.125% | 4/25/18 | 48,060 | 47,928 |
| 2 Federal Home Loan Banks | 2.750% | 6/8/18 | 15,675 | 16,226 |
| 2 Federal Home Loan Banks | 5.375% | 8/15/18 | 14,025 | 15,481 |
| 2 Federal Home Loan Banks | 5.375% | 5/15/19 | 11,920 | 13,425 |
| 2 Federal Home Loan Banks | 1.250% | 12/13/19 | 8,875 | 8,732 |
| 2 Federal Home Loan Banks | 1.875% | 3/13/20 | 16,525 | 16,639 |
| 2 Federal Home Loan Banks | 4.125% | 3/13/20 | 40,670 | 44,638 |
| 2 Federal Home Loan Banks | 3.375% | 6/12/20 | 7,025 | 7,500 |
| 2 Federal Home Loan Banks | 5.250% | 12/11/20 | 3,400 | 3,941 |
| 3 Federal Home Loan Mortgage Corp. | 0.500% | 1/27/17 | 25,000 | 24,906 |
| 3 Federal Home Loan Mortgage Corp. | 0.875% | 2/22/17 | 40,000 | 40,004 |
| 3 Federal Home Loan Mortgage Corp. | 1.000% | 3/8/17 | 12,925 | 12,944 |
| 3 Federal Home Loan Mortgage Corp. | 1.250% | 5/12/17 | 40,710 | 40,838 |
| 3 Federal Home Loan Mortgage Corp. | 1.000% | 6/29/17 | 15,778 | 15,767 |
| 3 Federal Home Loan Mortgage Corp. | 0.750% | 7/14/17 | 15,000 | 14,931 |
| 3 Federal Home Loan Mortgage Corp. | 1.000% | 7/28/17 | 53,953 | 53,906 |
| 3 Federal Home Loan Mortgage Corp. | 5.500% | 8/23/17 | 51,130 | 54,788 |
| 3 Federal Home Loan Mortgage Corp. | 1.000% | 9/29/17 | 33,700 | 33,639 |
| 3 Federal Home Loan Mortgage Corp. | 1.000% | 12/15/17 | 45,800 | 45,680 |
| 3 Federal Home Loan Mortgage Corp. | 0.750% | 1/12/18 | 74,490 | 73,872 |
| 3 Federal Home Loan Mortgage Corp. | 0.875% | 3/7/18 | 77,175 | 76,629 |
| 3 Federal Home Loan Mortgage Corp. | 4.875% | 6/13/18 | 11,500 | 12,492 |
| 3 Federal Home Loan Mortgage Corp. | 3.750% | 3/27/19 | 23,680 | 25,353 |
| 3 Federal Home Loan Mortgage Corp. | 1.750% | 5/30/19 | 27,305 | 27,503 |
| 3 Federal Home Loan Mortgage Corp. | 1.250% | 10/2/19 | 120,560 | 118,856 |
| 3 Federal Home Loan Mortgage Corp. | 1.375% | 5/1/20 | 42,530 | 41,915 |
| 3 Federal National Mortgage Assn. | 1.250% | 1/30/17 | 19,950 | 20,034 |
| 3 Federal National Mortgage Assn. | 5.000% | 2/13/17 | 49,000 | 51,229 |
| 3 Federal National Mortgage Assn. | 0.750% | 4/20/17 | 23,875 | 23,803 |
| 3 Federal National Mortgage Assn. | 1.125% | 4/27/17 | 105,225 | 105,402 |
| 3 Federal National Mortgage Assn. | 0.875% | 8/28/17 | 48,325 | 48,166 |
| 3 Federal National Mortgage Assn. | 1.000% | 9/27/17 | 17,000 | 16,969 |
| 3 Federal National Mortgage Assn. | 0.875% | 10/26/17 | 59,200 | 58,935 |
| 3 Federal National Mortgage Assn. | 0.875% | 12/20/17 | 58,750 | 58,454 |
| 3 Federal National Mortgage Assn. | 0.875% | 2/8/18 | 58,475 | 58,100 |
| 3 Federal National Mortgage Assn. | 0.875% | 5/21/18 | 46,360 | 45,926 |
| 3 Federal National Mortgage Assn. | 1.125% | 7/20/18 | 25,000 | 24,903 |
| 3 Federal National Mortgage Assn. | 1.875% | 9/18/18 | 31,025 | 31,464 |
| 3 Federal National Mortgage Assn. | 1.125% | 10/19/18 | 18,500 | 18,386 |
| 3 Federal National Mortgage Assn. | 1.625% | 11/27/18 | 64,005 | 64,466 |
| 3 Federal National Mortgage Assn. | 1.125% | 12/14/18 | 20,000 | 19,842 |
| 3 Federal National Mortgage Assn. | 1.875% | 2/19/19 | 9,000 | 9,116 |
| 3 Federal National Mortgage Assn. | 1.750% | 6/20/19 | 45,000 | 45,332 |
| 3 Federal National Mortgage Assn. | 1.750% | 9/12/19 | 35,000 | 35,161 |
| 3 Federal National Mortgage Assn. | 0.000% | 10/9/19 | 47,300 | 43,783 |
| 3 Federal National Mortgage Assn. | 1.750% | 11/26/19 | 18,000 | 18,074 |
| 3 Federal National Mortgage Assn. | 1.625% | 1/21/20 | 22,500 | 22,440 |
| 3 Federal National Mortgage Assn. | 1.500% | 6/22/20 | 33,325 | 32,907 |
3
| Vanguard® Short-Term Bond Index Fund | ||||
| Schedule of Investments | ||||
| December 31, 2015 | ||||
| Face | Market | |||
| Maturity | Amount | Value | ||
| Coupon | Date | ($000) | ($000) | |
| 3 Federal National Mortgage Assn. | 1.500% | 11/30/20 | 40,000 | 39,322 |
| 3 Federal National Mortgage Assn. | 1.875% | 12/28/20 | 28,650 | 28,666 |
| 2 Financing Corp. | 9.800% | 4/6/18 | 1,440 | 1,709 |
| 2 Financing Corp. | 10.350% | 8/3/18 | 3,755 | 4,602 |
| 2 Financing Corp. | 9.650% | 11/2/18 | 12,540 | 15,359 |
| 2 Financing Corp. | 8.600% | 9/26/19 | 1,810 | 2,248 |
| Private Export Funding Corp. | 1.375% | 2/15/17 | 500 | 501 |
| Private Export Funding Corp. | 2.250% | 12/15/17 | 9,225 | 9,380 |
| Private Export Funding Corp. | 1.875% | 7/15/18 | 4,000 | 4,020 |
| Private Export Funding Corp. | 4.375% | 3/15/19 | 10,650 | 11,499 |
| Private Export Funding Corp. | 1.450% | 8/15/19 | 1,000 | 981 |
| Private Export Funding Corp. | 2.300% | 9/15/20 | 1,650 | 1,662 |
| 2 Tennessee Valley Authority | 5.500% | 7/18/17 | 6,200 | 6,614 |
| 2 Tennessee Valley Authority | 6.250% | 12/15/17 | 2,630 | 2,885 |
| 2 Tennessee Valley Authority | 4.500% | 4/1/18 | 8,300 | 8,889 |
| 2 Tennessee Valley Authority | 1.750% | 10/15/18 | 3,040 | 3,068 |
| 2,285,767 | ||||
| Total U.S. Government and Agency Obligations (Cost $28,037,051) | 27,951,574 | |||
| Corporate Bonds (26.4%) | ||||
| Finance (11.0%) | ||||
| Banking (8.8%) | ||||
| Abbey National Treasury Services plc | 1.375% | 3/13/17 | 2,034 | 2,025 |
| Abbey National Treasury Services plc | 1.650% | 9/29/17 | 250 | 249 |
| Abbey National Treasury Services plc | 3.050% | 8/23/18 | 8,000 | 8,206 |
| Abbey National Treasury Services plc | 2.000% | 8/24/18 | 8,700 | 8,682 |
| Abbey National Treasury Services plc | 2.350% | 9/10/19 | 16,800 | 16,804 |
| American Express Bank FSB | 6.000% | 9/13/17 | 3,800 | 4,069 |
| American Express Centurion Bank | 5.950% | 6/12/17 | 2,175 | 2,298 |
| American Express Centurion Bank | 6.000% | 9/13/17 | 2,250 | 2,411 |
| American Express Co. | 5.500% | 9/12/16 | 2,785 | 2,867 |
| American Express Co. | 6.150% | 8/28/17 | 18,959 | 20,300 |
| American Express Co. | 7.000% | 3/19/18 | 7,500 | 8,311 |
| American Express Co. | 1.550% | 5/22/18 | 5,675 | 5,623 |
| American Express Credit Corp. | 2.375% | 3/24/17 | 14,565 | 14,722 |
| American Express Credit Corp. | 1.125% | 6/5/17 | 22,639 | 22,521 |
| American Express Credit Corp. | 2.125% | 7/27/18 | 9,075 | 9,133 |
| American Express Credit Corp. | 1.800% | 7/31/18 | 3,745 | 3,729 |
| American Express Credit Corp. | 1.875% | 11/5/18 | 5,000 | 4,975 |
| American Express Credit Corp. | 2.125% | 3/18/19 | 5,650 | 5,644 |
| American Express Credit Corp. | 2.375% | 5/26/20 | 15,300 | 15,159 |
| American Express Credit Corp. | 2.600% | 9/14/20 | 5,500 | 5,512 |
| Associates Corp. of North America | 6.950% | 11/1/18 | 500 | 567 |
| Australia & New Zealand Banking Group Ltd. | 0.900% | 2/12/16 | 6,185 | 6,184 |
| Australia & New Zealand Banking Group Ltd. | 1.250% | 1/10/17 | 2,750 | 2,755 |
| Australia & New Zealand Banking Group Ltd. | 1.250% | 6/13/17 | 3,350 | 3,341 |
| Australia & New Zealand Banking Group Ltd. | 1.875% | 10/6/17 | 9,300 | 9,343 |
| Australia & New Zealand Banking Group Ltd. | 1.450% | 5/15/18 | 5,000 | 4,951 |
| Australia & New Zealand Banking Group Ltd. | 2.000% | 11/16/18 | 10,100 | 10,077 |
| Australia & New Zealand Banking Group Ltd. | 2.250% | 6/13/19 | 4,650 | 4,642 |
| Australia & New Zealand Banking Group Ltd. | 2.700% | 11/16/20 | 6,375 | 6,394 |
| Banco Bilbao Vizcaya Argentaria SA | 3.000% | 10/20/20 | 8,000 | 7,963 |
| Bank of America Corp. | 5.625% | 10/14/16 | 2,330 | 2,404 |
| Bank of America Corp. | 1.350% | 11/21/16 | 3,110 | 3,106 |
| Bank of America Corp. | 5.420% | 3/15/17 | 7,049 | 7,328 |
| Bank of America Corp. | 3.875% | 3/22/17 | 3,931 | 4,032 |
| Bank of America Corp. | 5.700% | 5/2/17 | 10,000 | 10,434 |
| Bank of America Corp. | 1.700% | 8/25/17 | 6,850 | 6,832 |
| Bank of America Corp. | 6.400% | 8/28/17 | 7,050 | 7,553 |
| Bank of America Corp. | 6.000% | 9/1/17 | 10,304 | 10,966 |
| Bank of America Corp. | 5.750% | 12/1/17 | 17,725 | 18,972 |
| Bank of America Corp. | 2.000% | 1/11/18 | 14,639 | 14,623 |
| Bank of America Corp. | 6.875% | 4/25/18 | 38,160 | 42,092 |
4
| Vanguard® Short-Term Bond Index Fund | ||||
| Schedule of Investments | ||||
| December 31, 2015 | ||||
| Face | Market | |||
| Maturity | Amount | Value | ||
| Coupon | Date | ($000) | ($000) | |
| Bank of America Corp. | 5.650% | 5/1/18 | 23,125 | 24,867 |
| Bank of America Corp. | 6.875% | 11/15/18 | 5,125 | 5,757 |
| Bank of America Corp. | 2.600% | 1/15/19 | 30,925 | 31,016 |
| Bank of America Corp. | 5.490% | 3/15/19 | 1,075 | 1,170 |
| Bank of America Corp. | 2.650% | 4/1/19 | 16,300 | 16,336 |
| Bank of America Corp. | 7.625% | 6/1/19 | 32,925 | 38,094 |
| Bank of America Corp. | 2.250% | 4/21/20 | 11,850 | 11,584 |
| Bank of America Corp. | 5.625% | 7/1/20 | 19,145 | 21,241 |
| Bank of America Corp. | 2.625% | 10/19/20 | 17,000 | 16,793 |
| Bank of America NA | 1.250% | 2/14/17 | 14,900 | 14,873 |
| Bank of America NA | 5.300% | 3/15/17 | 19,929 | 20,729 |
| Bank of America NA | 6.100% | 6/15/17 | 1,272 | 1,347 |
| Bank of America NA | 1.650% | 3/26/18 | 3,125 | 3,104 |
| Bank of America NA | 1.750% | 6/5/18 | 15,100 | 15,006 |
| Bank of America NA | 2.050% | 12/7/18 | 20,000 | 19,924 |
| Bank of Montreal | 2.500% | 1/11/17 | 8,476 | 8,574 |
| Bank of Montreal | 1.300% | 7/14/17 | 4,130 | 4,122 |
| Bank of Montreal | 1.400% | 9/11/17 | 1,437 | 1,437 |
| Bank of Montreal | 1.450% | 4/9/18 | 9,375 | 9,311 |
| Bank of Montreal | 1.400% | 4/10/18 | 5,475 | 5,427 |
| Bank of Montreal | 1.800% | 7/31/18 | 14,750 | 14,727 |
| Bank of Montreal | 2.375% | 1/25/19 | 5,520 | 5,569 |
| Bank of New York Mellon Corp. | 2.400% | 1/17/17 | 2,591 | 2,616 |
| Bank of New York Mellon Corp. | 1.969% | 6/20/17 | 2,000 | 2,016 |
| Bank of New York Mellon Corp. | 1.300% | 1/25/18 | 1,700 | 1,685 |
| Bank of New York Mellon Corp. | 1.350% | 3/6/18 | 12,340 | 12,299 |
| Bank of New York Mellon Corp. | 2.200% | 3/4/19 | 6,625 | 6,647 |
| Bank of New York Mellon Corp. | 2.200% | 5/15/19 | 9,925 | 9,935 |
| Bank of New York Mellon Corp. | 5.450% | 5/15/19 | 2,677 | 2,950 |
| Bank of New York Mellon Corp. | 2.300% | 9/11/19 | 9,250 | 9,270 |
| Bank of New York Mellon Corp. | 4.600% | 1/15/20 | 3,350 | 3,627 |
| Bank of New York Mellon Corp. | 2.150% | 2/24/20 | 5,200 | 5,147 |
| Bank of New York Mellon Corp. | 2.600% | 8/17/20 | 8,000 | 8,035 |
| Bank of New York Mellon Corp. | 2.450% | 11/27/20 | 5,000 | 4,975 |
| Bank of Nova Scotia | 2.550% | 1/12/17 | 7,113 | 7,212 |
| Bank of Nova Scotia | 1.250% | 4/11/17 | 792 | 791 |
| Bank of Nova Scotia | 1.300% | 7/21/17 | 4,806 | 4,792 |
| Bank of Nova Scotia | 1.375% | 12/18/17 | 6,522 | 6,499 |
| Bank of Nova Scotia | 1.450% | 4/25/18 | 6,170 | 6,138 |
| Bank of Nova Scotia | 1.700% | 6/11/18 | 4,600 | 4,588 |
| Bank of Nova Scotia | 2.050% | 10/30/18 | 13,277 | 13,324 |
| Bank of Nova Scotia | 2.050% | 6/5/19 | 8,575 | 8,555 |
| Bank of Nova Scotia | 2.350% | 10/21/20 | 17,500 | 17,340 |
| Barclays Bank plc | 2.500% | 2/20/19 | 21,085 | 21,222 |
| Barclays Bank plc | 6.750% | 5/22/19 | 9,125 | 10,420 |
| Barclays Bank plc | 5.140% | 10/14/20 | 200 | 217 |
| Barclays plc | 2.000% | 3/16/18 | 6,300 | 6,277 |
| Barclays plc | 2.750% | 11/8/19 | 12,125 | 12,093 |
| Barclays plc | 2.875% | 6/8/20 | 4,500 | 4,493 |
| BB&T Corp. | 2.150% | 3/22/17 | 3,421 | 3,448 |
| BB&T Corp. | 4.900% | 6/30/17 | 2,000 | 2,084 |
| BB&T Corp. | 1.600% | 8/15/17 | 126 | 126 |
| BB&T Corp. | 1.450% | 1/12/18 | 7,725 | 7,668 |
| BB&T Corp. | 2.050% | 6/19/18 | 6,860 | 6,893 |
| BB&T Corp. | 2.250% | 2/1/19 | 5,476 | 5,496 |
| BB&T Corp. | 6.850% | 4/30/19 | 6,800 | 7,757 |
| BB&T Corp. | 2.450% | 1/15/20 | 11,068 | 11,111 |
| Bear Stearns Cos. LLC | 5.550% | 1/22/17 | 8,500 | 8,833 |
| Bear Stearns Cos. LLC | 6.400% | 10/2/17 | 15,127 | 16,290 |
| Bear Stearns Cos. LLC | 7.250% | 2/1/18 | 24,850 | 27,366 |
| Bear Stearns Cos. LLC | 4.650% | 7/2/18 | 4,939 | 5,264 |
| BNP Paribas SA | 1.375% | 3/17/17 | 24 | 24 |
| BNP Paribas SA | 2.375% | 9/14/17 | 16,725 | 16,899 |
| BNP Paribas SA | 2.700% | 8/20/18 | 10,850 | 10,995 |
5
| Vanguard® Short-Term Bond Index Fund | |||||
| Schedule of Investments | |||||
| December 31, 2015 | |||||
| Face | Market | ||||
| Maturity | Amount | Value | |||
| Coupon | Date | ($000) | ($000) | ||
| BNP Paribas SA | 2.400% | 12/12/18 | 7,900 | 7,962 | |
| BNP Paribas SA | 2.450% | 3/17/19 | 4,575 | 4,588 | |
| BNP Paribas SA | 2.375% | 5/21/20 | 12,897 | 12,797 | |
| BPCE SA | 1.625% | 2/10/17 | 5,500 | 5,505 | |
| BPCE SA | 1.613% | 7/25/17 | 2,075 | 2,070 | |
| BPCE SA | 2.500% | 12/10/18 | 12,950 | 13,078 | |
| BPCE SA | 2.500% | 7/15/19 | 8,225 | 8,249 | |
| BPCE SA | 2.250% | 1/27/20 | 6,200 | 6,149 | |
| Branch Banking & Trust Co. | 1.050% | 12/1/16 | 825 | 824 | |
| Branch Banking & Trust Co. | 1.000% | 4/3/17 | 2,000 | 1,988 | |
| Branch Banking & Trust Co. | 1.350% | 10/1/17 | 2,875 | 2,872 | |
| Branch Banking & Trust Co. | 2.300% | 10/15/18 | 4,750 | 4,795 | |
| Canadian Imperial Bank of Commerce | 1.550% | 1/23/18 | 8,020 | 7,977 | |
| Capital One Bank USA NA | 1.300% | 6/5/17 | 400 | 397 | |
| Capital One Bank USA NA | 2.150% | 11/21/18 | 1,200 | 1,190 | |
| Capital One Bank USA NA | 2.250% | 2/13/19 | 20,400 | 20,286 | |
| Capital One Bank USA NA | 2.300% | 6/5/19 | 1,150 | 1,136 | |
| Capital One Bank USA NA | 8.800% | 7/15/19 | 1,925 | 2,295 | |
| Capital One Financial Corp. | 6.750% | 9/15/17 | 3,787 | 4,074 | |
| Capital One Financial Corp. | 2.450% | 4/24/19 | 100 | 100 | |
| Capital One NA | 1.500% | 9/5/17 | 3,350 | 3,324 | |
| Capital One NA | 1.650% | 2/5/18 | 13,000 | 12,867 | |
| Capital One NA | 1.500% | 3/22/18 | 2,550 | 2,509 | |
| Capital One NA | 2.350% | 8/17/18 | 8,000 | 8,005 | |
| Capital One NA | 2.400% | 9/5/19 | 3,300 | 3,266 | |
| 4,5 | Citicorp Lease Pass-Through Trust 1999-1 | 8.040% | 12/15/19 | 450 | 530 |
| Citigroup Inc. | 5.500% | 2/15/17 | 2,910 | 3,028 | |
| Citigroup Inc. | 1.350% | 3/10/17 | 10,733 | 10,693 | |
| Citigroup Inc. | 1.550% | 8/14/17 | 5,532 | 5,506 | |
| Citigroup Inc. | 6.000% | 8/15/17 | 3,157 | 3,376 | |
| Citigroup Inc. | 6.125% | 11/21/17 | 9,161 | 9,864 | |
| Citigroup Inc. | 1.850% | 11/24/17 | 3,963 | 3,958 | |
| Citigroup Inc. | 1.800% | 2/5/18 | 10,436 | 10,388 | |
| Citigroup Inc. | 1.700% | 4/27/18 | 32,500 | 32,190 | |
| Citigroup Inc. | 1.750% | 5/1/18 | 12,699 | 12,577 | |
| Citigroup Inc. | 6.125% | 5/15/18 | 4,337 | 4,731 | |
| Citigroup Inc. | 2.150% | 7/30/18 | 4,000 | 3,997 | |
| Citigroup Inc. | 2.500% | 9/26/18 | 17,246 | 17,375 | |
| Citigroup Inc. | 2.050% | 12/7/18 | 13,000 | 12,910 | |
| Citigroup Inc. | 2.550% | 4/8/19 | 18,550 | 18,672 | |
| Citigroup Inc. | 2.500% | 7/29/19 | 18,692 | 18,642 | |
| Citigroup Inc. | 2.400% | 2/18/20 | 20,200 | 19,959 | |
| Citigroup Inc. | 5.375% | 8/9/20 | 1,325 | 1,475 | |
| Citigroup Inc. | 2.650% | 10/26/20 | 13,000 | 12,879 | |
| Citizens Bank NA | 1.600% | 12/4/17 | 3,225 | 3,194 | |
| Citizens Bank NA | 2.450% | 12/4/19 | 3,225 | 3,173 | |
| Citizens Bank NA/Providence RI | 2.300% | 12/3/18 | 4,975 | 4,969 | |
| City National Corp. | 5.250% | 9/15/20 | 100 | 111 | |
| Comerica Bank | 5.200% | 8/22/17 | 2,900 | 3,048 | |
| Comerica Inc. | 2.125% | 5/23/19 | 3,000 | 2,975 | |
| Commonwealth Bank of Australia | 1.125% | 3/13/17 | 10,000 | 9,968 | |
| Commonwealth Bank of Australia | 1.400% | 9/8/17 | 4,900 | 4,900 | |
| Commonwealth Bank of Australia | 1.900% | 9/18/17 | 9,055 | 9,102 | |
| Commonwealth Bank of Australia | 1.625% | 3/12/18 | 13,600 | 13,563 | |
| Commonwealth Bank of Australia | 2.500% | 9/20/18 | 6,235 | 6,330 | |
| Commonwealth Bank of Australia | 1.750% | 11/2/18 | 6,400 | 6,358 | |
| Commonwealth Bank of Australia | 2.250% | 3/13/19 | 7,825 | 7,848 | |
| Commonwealth Bank of Australia | 2.300% | 9/6/19 | 10,500 | 10,477 | |
| Commonwealth Bank of Australia | 2.400% | 11/2/20 | 17,375 | 17,208 | |
| Compass Bank | 1.850% | 9/29/17 | 3,700 | 3,669 | |
| Compass Bank | 2.750% | 9/29/19 | 2,175 | 2,154 | |
| Cooperatieve Rabobank UA | 3.375% | 1/19/17 | 16,966 | 17,315 | |
| Cooperatieve Rabobank UA | 1.700% | 3/19/18 | 26,800 | 26,656 | |
| Cooperatieve Rabobank UA | 2.250% | 1/14/19 | 9,750 | 9,792 | |
6
| Vanguard® Short-Term Bond Index Fund | ||||
| Schedule of Investments | ||||
| December 31, 2015 | ||||
| Face | Market | |||
| Maturity | Amount | Value | ||
| Coupon | Date | ($000) | ($000) | |
| Cooperatieve Rabobank UA | 2.250% | 1/14/20 | 8,500 | 8,447 |
| Corpbanca SA | 3.125% | 1/15/18 | 5,000 | 4,983 |
| 5 Corpbanca SA | 3.875% | 9/22/19 | 400 | 396 |
| Credit Suisse | 1.375% | 5/26/17 | 18,625 | 18,531 |
| Credit Suisse | 1.750% | 1/29/18 | 2,150 | 2,143 |
| Credit Suisse | 6.000% | 2/15/18 | 11,725 | 12,601 |
| Credit Suisse | 1.700% | 4/27/18 | 13,575 | 13,473 |
| Credit Suisse | 2.300% | 5/28/19 | 18,850 | 18,869 |
| Credit Suisse | 5.300% | 8/13/19 | 3,300 | 3,643 |
| Credit Suisse | 5.400% | 1/14/20 | 9,092 | 9,957 |
| Credit Suisse | 4.375% | 8/5/20 | 4,754 | 5,106 |
| 5 Credit Suisse Group Funding Guernsey Ltd. | 2.750% | 3/26/20 | 17,500 | 17,352 |
| Deutsche Bank AG | 1.400% | 2/13/17 | 5,024 | 4,994 |
| Deutsche Bank AG | 1.350% | 5/30/17 | 8,174 | 8,122 |
| Deutsche Bank AG | 6.000% | 9/1/17 | 22,356 | 23,687 |
| Deutsche Bank AG | 1.875% | 2/13/18 | 12,500 | 12,424 |
| Deutsche Bank AG | 2.500% | 2/13/19 | 10,175 | 10,231 |
| Deutsche Bank AG | 2.950% | 8/20/20 | 3,000 | 3,001 |
| Discover Bank | 2.000% | 2/21/18 | 15,338 | 15,235 |
| Discover Bank | 2.600% | 11/13/18 | 4,500 | 4,501 |
| Discover Bank | 7.000% | 4/15/20 | 2,485 | 2,832 |
| Discover Bank | 3.100% | 6/4/20 | 4,000 | 4,013 |
| Discover Financial Services | 6.450% | 6/12/17 | 2,075 | 2,193 |
| Fifth Third Bancorp | 5.450% | 1/15/17 | 200 | 208 |
| Fifth Third Bancorp | 4.500% | 6/1/18 | 4,175 | 4,391 |
| Fifth Third Bancorp | 2.300% | 3/1/19 | 3,000 | 3,003 |
| Fifth Third Bancorp | 2.875% | 7/27/20 | 5,400 | 5,399 |
| Fifth Third Bank | 1.350% | 6/1/17 | 6,400 | 6,387 |
| Fifth Third Bank | 1.450% | 2/28/18 | 2,951 | 2,920 |
| Fifth Third Bank | 2.150% | 8/20/18 | 9,300 | 9,306 |
| Fifth Third Bank | 2.375% | 4/25/19 | 3,725 | 3,726 |
| First Horizon National Corp. | 3.500% | 12/15/20 | 1,875 | 1,857 |
| First Niagara Financial Group Inc. | 6.750% | 3/19/20 | 1,275 | 1,450 |
| First Republic Bank | 2.375% | 6/17/19 | 4,708 | 4,695 |
| Goldman Sachs Group Inc. | 5.625% | 1/15/17 | 12,660 | 13,141 |
| Goldman Sachs Group Inc. | 6.250% | 9/1/17 | 16,737 | 17,917 |
| Goldman Sachs Group Inc. | 5.950% | 1/18/18 | 32,700 | 35,175 |
| Goldman Sachs Group Inc. | 2.375% | 1/22/18 | 14,950 | 15,075 |
| Goldman Sachs Group Inc. | 6.150% | 4/1/18 | 30,632 | 33,260 |
| Goldman Sachs Group Inc. | 2.900% | 7/19/18 | 18,360 | 18,718 |
| Goldman Sachs Group Inc. | 2.625% | 1/31/19 | 32,650 | 32,913 |
| Goldman Sachs Group Inc. | 7.500% | 2/15/19 | 18,410 | 21,004 |
| Goldman Sachs Group Inc. | 2.550% | 10/23/19 | 18,900 | 18,887 |
| Goldman Sachs Group Inc. | 5.375% | 3/15/20 | 16,525 | 18,163 |
| Goldman Sachs Group Inc. | 2.600% | 4/23/20 | 5,950 | 5,936 |
| Goldman Sachs Group Inc. | 6.000% | 6/15/20 | 6,975 | 7,886 |
| Goldman Sachs Group Inc. | 2.750% | 9/15/20 | 13,427 | 13,404 |
| HSBC Bank USA NA | 6.000% | 8/9/17 | 1,050 | 1,114 |
| HSBC Bank USA NA | 4.875% | 8/24/20 | 1,100 | 1,201 |
| HSBC USA Inc. | 1.300% | 6/23/17 | 100 | 99 |
| HSBC USA Inc. | 1.500% | 11/13/17 | 9,775 | 9,723 |
| HSBC USA Inc. | 1.625% | 1/16/18 | 20,695 | 20,592 |
| HSBC USA Inc. | 1.700% | 3/5/18 | 7,750 | 7,702 |
| HSBC USA Inc. | 2.000% | 8/7/18 | 5,125 | 5,119 |
| HSBC USA Inc. | 2.625% | 9/24/18 | 4,750 | 4,815 |
| HSBC USA Inc. | 2.250% | 6/23/19 | 4,200 | 4,181 |
| HSBC USA Inc. | 2.375% | 11/13/19 | 10,625 | 10,589 |
| HSBC USA Inc. | 2.350% | 3/5/20 | 3,400 | 3,365 |
| HSBC USA Inc. | 2.750% | 8/7/20 | 9,450 | 9,463 |
| HSBC USA Inc. | 5.000% | 9/27/20 | 7,961 | 8,680 |
| Huntington Bancshares Inc. | 2.600% | 8/2/18 | 3,225 | 3,229 |
| Huntington Bancshares Inc. | 7.000% | 12/15/20 | 900 | 1,049 |
| Huntington National Bank | 1.375% | 4/24/17 | 2,800 | 2,784 |
| Huntington National Bank | 2.000% | 6/30/18 | 5,000 | 4,969 |
7
| Vanguard® Short-Term Bond Index Fund | ||||
| Schedule of Investments | ||||
| December 31, 2015 | ||||
| Face | Market | |||
| Maturity | Amount | Value | ||
| Coupon | Date | ($000) | ($000) | |
| Huntington National Bank | 2.200% | 11/6/18 | 6,300 | 6,282 |
| Huntington National Bank | 2.200% | 4/1/19 | 3,775 | 3,737 |
| Huntington National Bank | 2.400% | 4/1/20 | 4,275 | 4,206 |
| Huntington National Bank | 2.875% | 8/20/20 | 4,200 | 4,171 |
| Intesa Sanpaolo SPA | 2.375% | 1/13/17 | 13,050 | 13,092 |
| Intesa Sanpaolo SPA | 3.875% | 1/16/18 | 5,825 | 5,966 |
| Intesa Sanpaolo SPA | 3.875% | 1/15/19 | 8,425 | 8,673 |
| JPMorgan Chase & Co. | 1.350% | 2/15/17 | 15,499 | 15,466 |
| JPMorgan Chase & Co. | 2.000% | 8/15/17 | 11,346 | 11,401 |
| JPMorgan Chase & Co. | 6.000% | 1/15/18 | 32,084 | 34,595 |
| JPMorgan Chase & Co. | 1.800% | 1/25/18 | 2,257 | 2,254 |
| JPMorgan Chase & Co. | 1.700% | 3/1/18 | 13,800 | 13,732 |
| JPMorgan Chase & Co. | 1.625% | 5/15/18 | 13,075 | 12,985 |
| JPMorgan Chase & Co. | 2.350% | 1/28/19 | 10,475 | 10,494 |
| JPMorgan Chase & Co. | 6.300% | 4/23/19 | 23,650 | 26,478 |
| JPMorgan Chase & Co. | 2.200% | 10/22/19 | 12,100 | 12,013 |
| JPMorgan Chase & Co. | 2.250% | 1/23/20 | 35,657 | 35,250 |
| JPMorgan Chase & Co. | 2.750% | 6/23/20 | 29,000 | 29,062 |
| JPMorgan Chase & Co. | 4.400% | 7/22/20 | 14,540 | 15,540 |
| JPMorgan Chase & Co. | 4.250% | 10/15/20 | 10,100 | 10,714 |
| JPMorgan Chase & Co. | 2.550% | 10/29/20 | 36,100 | 35,778 |
| JPMorgan Chase Bank NA | 6.000% | 7/5/17 | 3,000 | 3,188 |
| JPMorgan Chase Bank NA | 6.000% | 10/1/17 | 17,862 | 19,114 |
| KeyBank NA | 1.650% | 2/1/18 | 12,825 | 12,774 |
| KeyBank NA | 1.700% | 6/1/18 | 3,425 | 3,402 |
| KeyBank NA | 2.500% | 12/15/19 | 2,000 | 2,003 |
| KeyBank NA | 2.250% | 3/16/20 | 500 | 494 |
| KeyCorp | 2.300% | 12/13/18 | 2,800 | 2,803 |
| KeyCorp | 2.900% | 9/15/20 | 10,000 | 9,966 |
| Lloyds Bank plc | 4.200% | 3/28/17 | 2,245 | 2,315 |
| Lloyds Bank plc | 1.750% | 3/16/18 | 7,350 | 7,331 |
| Lloyds Bank plc | 1.750% | 5/14/18 | 3,750 | 3,742 |
| Lloyds Bank plc | 2.300% | 11/27/18 | 7,075 | 7,100 |
| Lloyds Bank plc | 2.350% | 9/5/19 | 9,000 | 8,996 |
| Lloyds Bank plc | 2.400% | 3/17/20 | 5,200 | 5,162 |
| Lloyds Bank plc | 2.700% | 8/17/20 | 10,000 | 10,046 |
| Manufacturers & Traders Trust Co. | 1.400% | 7/25/17 | 1,625 | 1,617 |
| Manufacturers & Traders Trust Co. | 6.625% | 12/4/17 | 3,550 | 3,854 |
| Manufacturers & Traders Trust Co. | 1.450% | 3/7/18 | 250 | 247 |
| Manufacturers & Traders Trust Co. | 2.300% | 1/30/19 | 20,500 | 20,531 |
| Manufacturers & Traders Trust Co. | 2.250% | 7/25/19 | 11,010 | 10,958 |
| Manufacturers & Traders Trust Co. | 2.100% | 2/6/20 | 1,450 | 1,424 |
| Morgan Stanley | 5.450% | 1/9/17 | 12,425 | 12,897 |
| Morgan Stanley | 4.750% | 3/22/17 | 15,751 | 16,312 |
| Morgan Stanley | 5.550% | 4/27/17 | 9,900 | 10,378 |
| Morgan Stanley | 6.250% | 8/28/17 | 6,125 | 6,557 |
| Morgan Stanley | 5.950% | 12/28/17 | 13,150 | 14,140 |
| Morgan Stanley | 1.875% | 1/5/18 | 19,150 | 19,131 |
| Morgan Stanley | 6.625% | 4/1/18 | 24,809 | 27,176 |
| Morgan Stanley | 2.125% | 4/25/18 | 20,000 | 20,031 |
| Morgan Stanley | 2.200% | 12/7/18 | 4,000 | 3,999 |
| Morgan Stanley | 2.500% | 1/24/19 | 17,373 | 17,435 |
| Morgan Stanley | 7.300% | 5/13/19 | 14,885 | 17,107 |
| Morgan Stanley | 2.375% | 7/23/19 | 16,400 | 16,348 |
| Morgan Stanley | 5.625% | 9/23/19 | 11,375 | 12,535 |
| Morgan Stanley | 5.500% | 1/26/20 | 8,157 | 8,993 |
| Morgan Stanley | 2.650% | 1/27/20 | 31,579 | 31,424 |
| Morgan Stanley | 2.800% | 6/16/20 | 21,000 | 21,080 |
| Morgan Stanley | 5.500% | 7/24/20 | 5,100 | 5,687 |
| MUFG Union Bank NA | 2.125% | 6/16/17 | 3,575 | 3,598 |
| MUFG Union Bank NA | 2.625% | 9/26/18 | 23,450 | 23,683 |
| MUFG Union Bank NA | 2.250% | 5/6/19 | 5,950 | 5,946 |
| Murray Street Investment Trust I | 4.647% | 3/9/17 | 11,949 | 12,332 |
| National Australia Bank Ltd. | 2.750% | 3/9/17 | 7,025 | 7,142 |
8
| Vanguard® Short-Term Bond Index Fund | ||||
| Schedule of Investments | ||||
| December 31, 2015 | ||||
| Face | Market | |||
| Maturity | Amount | Value | ||
| Coupon | Date | ($000) | ($000) | |
| National Australia Bank Ltd. | 2.300% | 7/25/18 | 5,225 | 5,261 |
| National Australia Bank Ltd. | 2.625% | 7/23/20 | 6,550 | 6,590 |
| National Bank of Canada | 1.450% | 11/7/17 | 3,350 | 3,327 |
| National Bank of Canada | 2.100% | 12/14/18 | 3,000 | 2,997 |
| National City Bank | 5.800% | 6/7/17 | 2,225 | 2,352 |
| National City Corp. | 6.875% | 5/15/19 | 3,825 | 4,321 |
| Northern Trust Co. | 6.500% | 8/15/18 | 775 | 862 |
| Northern Trust Corp. | 3.450% | 11/4/20 | 300 | 313 |
| PNC Bank NA | 4.875% | 9/21/17 | 4,870 | 5,092 |
| PNC Bank NA | 1.500% | 10/18/17 | 5,200 | 5,195 |
| PNC Bank NA | 6.000% | 12/7/17 | 6,125 | 6,563 |
| PNC Bank NA | 1.500% | 2/23/18 | 8,150 | 8,100 |
| PNC Bank NA | 6.875% | 4/1/18 | 1,400 | 1,541 |
| PNC Bank NA | 1.600% | 6/1/18 | 4,500 | 4,466 |
| PNC Bank NA | 1.850% | 7/20/18 | 4,000 | 3,993 |
| PNC Bank NA | 1.800% | 11/5/18 | 5,000 | 4,975 |
| PNC Bank NA | 2.200% | 1/28/19 | 7,875 | 7,896 |
| PNC Bank NA | 2.250% | 7/2/19 | 10,575 | 10,604 |
| PNC Bank NA | 2.400% | 10/18/19 | 13,744 | 13,819 |
| PNC Bank NA | 2.300% | 6/1/20 | 10,430 | 10,327 |
| PNC Bank NA | 2.600% | 7/21/20 | 5,320 | 5,325 |
| PNC Bank NA | 2.450% | 11/5/20 | 2,500 | 2,482 |
| PNC Funding Corp. | 5.625% | 2/1/17 | 6,477 | 6,736 |
| PNC Funding Corp. | 6.700% | 6/10/19 | 3,346 | 3,831 |
| PNC Funding Corp. | 5.125% | 2/8/20 | 8,763 | 9,645 |
| PNC Funding Corp. | 4.375% | 8/11/20 | 200 | 215 |
| Regions Bank | 7.500% | 5/15/18 | 790 | 879 |
| Regions Bank | 2.250% | 9/14/18 | 3,000 | 2,997 |
| Regions Financial Corp. | 2.000% | 5/15/18 | 8,200 | 8,126 |
| Royal Bank of Canada | 1.200% | 1/23/17 | 10,769 | 10,765 |
| Royal Bank of Canada | 1.000% | 4/27/17 | 8,000 | 7,964 |
| Royal Bank of Canada | 1.250% | 6/16/17 | 6,770 | 6,750 |
| Royal Bank of Canada | 1.400% | 10/13/17 | 4,825 | 4,823 |
| Royal Bank of Canada | 1.500% | 1/16/18 | 6,275 | 6,252 |
| Royal Bank of Canada | 2.200% | 7/27/18 | 10,576 | 10,676 |
| Royal Bank of Canada | 1.800% | 7/30/18 | 13,400 | 13,360 |
| Royal Bank of Canada | 2.000% | 12/10/18 | 6,600 | 6,613 |
| Royal Bank of Canada | 2.150% | 3/15/19 | 9,566 | 9,604 |
| Royal Bank of Canada | 2.150% | 3/6/20 | 1,750 | 1,737 |
| Royal Bank of Canada | 2.350% | 10/30/20 | 9,600 | 9,495 |
| Royal Bank of Scotland Group plc | 1.875% | 3/31/17 | 4,400 | 4,383 |
| Royal Bank of Scotland Group plc | 6.400% | 10/21/19 | 9,205 | 10,181 |
| Santander Bank NA | 8.750% | 5/30/18 | 2,825 | 3,191 |
| Santander Holdings USA Inc. | 3.450% | 8/27/18 | 7,944 | 8,072 |
| Santander Holdings USA Inc. | 2.650% | 4/17/20 | 3,020 | 2,946 |
| Santander UK Group Holdings plc | 2.875% | 10/16/20 | 7,200 | 7,150 |
| Societe Generale SA | 2.750% | 10/12/17 | 8,125 | 8,239 |
| Societe Generale SA | 2.625% | 10/1/18 | 4,435 | 4,485 |
| State Street Bank & Trust Co. | 5.250% | 10/15/18 | 775 | 843 |
| State Street Corp. | 4.956% | 3/15/18 | 6,619 | 6,944 |
| State Street Corp. | 1.350% | 5/15/18 | 4,675 | 4,642 |
| State Street Corp. | 2.550% | 8/18/20 | 7,500 | 7,595 |
| Sumitomo Mitsui Banking Corp. | 1.300% | 1/10/17 | 1,200 | 1,197 |
| Sumitomo Mitsui Banking Corp. | 1.350% | 7/11/17 | 4,700 | 4,667 |
| Sumitomo Mitsui Banking Corp. | 1.800% | 7/18/17 | 5,800 | 5,799 |
| Sumitomo Mitsui Banking Corp. | 1.500% | 1/18/18 | 3,575 | 3,540 |
| Sumitomo Mitsui Banking Corp. | 2.500% | 7/19/18 | 2,425 | 2,448 |
| Sumitomo Mitsui Banking Corp. | 1.950% | 7/23/18 | 2,250 | 2,238 |
| Sumitomo Mitsui Banking Corp. | 2.450% | 1/10/19 | 4,700 | 4,704 |
| Sumitomo Mitsui Banking Corp. | 2.250% | 7/11/19 | 7,900 | 7,844 |
| Sumitomo Mitsui Banking Corp. | 2.450% | 1/16/20 | 15,300 | 15,223 |
| Sumitomo Mitsui Banking Corp. | 2.650% | 7/23/20 | 7,575 | 7,587 |
| Sumitomo Mitsui Banking Corp. | 2.450% | 10/20/20 | 3,000 | 2,971 |
| SunTrust Bank | 1.350% | 2/15/17 | 5,290 | 5,283 |
9
| Vanguard® Short-Term Bond Index Fund | ||||
| Schedule of Investments | ||||
| December 31, 2015 | ||||
| Face | Market | |||
| Maturity | Amount | Value | ||
| Coupon | Date | ($000) | ($000) | |
| SunTrust Bank | 7.250% | 3/15/18 | 3,200 | 3,535 |
| SunTrust Banks Inc. | 3.500% | 1/20/17 | 2,205 | 2,246 |
| SunTrust Banks Inc. | 6.000% | 9/11/17 | 1,615 | 1,719 |
| SunTrust Banks Inc. | 2.350% | 11/1/18 | 1,100 | 1,105 |
| SunTrust Banks Inc. | 2.500% | 5/1/19 | 3,735 | 3,751 |
| Svenska Handelsbanken AB | 2.875% | 4/4/17 | 8,900 | 9,055 |
| Svenska Handelsbanken AB | 1.625% | 3/21/18 | 10,095 | 10,048 |
| Svenska Handelsbanken AB | 2.500% | 1/25/19 | 9,375 | 9,495 |
| Svenska Handelsbanken AB | 2.250% | 6/17/19 | 5,700 | 5,707 |
| Svenska Handelsbanken AB | 2.400% | 10/1/20 | 1,300 | 1,291 |
| Synchrony Financial | 1.875% | 8/15/17 | 2,515 | 2,506 |
| Synchrony Financial | 2.600% | 1/15/19 | 5,600 | 5,580 |
| Synchrony Financial | 3.000% | 8/15/19 | 12,535 | 12,527 |
| Synchrony Financial | 2.700% | 2/3/20 | 5,837 | 5,731 |
| Toronto-Dominion Bank | 1.125% | 5/2/17 | 7,200 | 7,181 |
| Toronto-Dominion Bank | 1.625% | 3/13/18 | 10,500 | 10,494 |
| Toronto-Dominion Bank | 1.400% | 4/30/18 | 16,833 | 16,722 |
| Toronto-Dominion Bank | 1.750% | 7/23/18 | 11,000 | 11,003 |
| Toronto-Dominion Bank | 2.625% | 9/10/18 | 14,000 | 14,319 |
| Toronto-Dominion Bank | 2.125% | 7/2/19 | 6,500 | 6,512 |
| Toronto-Dominion Bank | 2.250% | 11/5/19 | 8,975 | 8,975 |
| Toronto-Dominion Bank | 2.500% | 12/14/20 | 6,600 | 6,587 |
| UBS AG | 1.375% | 6/1/17 | 8,600 | 8,561 |
| UBS AG | 1.375% | 8/14/17 | 15,050 | 14,951 |
| UBS AG | 5.875% | 12/20/17 | 1,550 | 1,673 |
| UBS AG | 1.800% | 3/26/18 | 6,550 | 6,542 |
| UBS AG | 5.750% | 4/25/18 | 1,401 | 1,518 |
| UBS AG | 2.375% | 8/14/19 | 14,000 | 14,013 |
| UBS AG | 2.350% | 3/26/20 | 9,550 | 9,535 |
| UBS AG | 4.875% | 8/4/20 | 3,900 | 4,293 |
| US Bancorp | 1.650% | 5/15/17 | 6,525 | 6,551 |
| US Bancorp | 1.950% | 11/15/18 | 5,225 | 5,257 |
| US Bancorp | 2.200% | 4/25/19 | 11,420 | 11,500 |
| US Bank NA | 1.100% | 1/30/17 | 3,605 | 3,602 |
| US Bank NA | 1.350% | 1/26/18 | 7,300 | 7,274 |
| US Bank NA | 2.125% | 10/28/19 | 11,000 | 10,983 |
| Wachovia Corp. | 5.750% | 6/15/17 | 10,834 | 11,473 |
| Wachovia Corp. | 5.750% | 2/1/18 | 21,155 | 22,856 |
| Wells Fargo & Co. | 2.100% | 5/8/17 | 4,303 | 4,346 |
| Wells Fargo & Co. | 1.150% | 6/2/17 | 10,075 | 10,042 |
| Wells Fargo & Co. | 1.400% | 9/8/17 | 13,838 | 13,796 |
| Wells Fargo & Co. | 5.625% | 12/11/17 | 21,288 | 22,845 |
| Wells Fargo & Co. | 1.500% | 1/16/18 | 8,977 | 8,940 |
| Wells Fargo & Co. | 2.150% | 1/15/19 | 5,360 | 5,388 |
| Wells Fargo & Co. | 2.125% | 4/22/19 | 19,124 | 19,140 |
| Wells Fargo & Co. | 2.150% | 1/30/20 | 13,372 | 13,270 |
| Wells Fargo & Co. | 2.600% | 7/22/20 | 26,200 | 26,202 |
| Wells Fargo & Co. | 2.550% | 12/7/20 | 13,250 | 13,142 |
| Wells Fargo Bank NA | 6.000% | 11/15/17 | 1,875 | 2,022 |
| Westpac Banking Corp. | 1.200% | 5/19/17 | 6,550 | 6,532 |
| Westpac Banking Corp. | 2.000% | 8/14/17 | 18,850 | 18,970 |
| Westpac Banking Corp. | 1.500% | 12/1/17 | 3,675 | 3,673 |
| Westpac Banking Corp. | 1.600% | 1/12/18 | 6,645 | 6,634 |
| Westpac Banking Corp. | 1.550% | 5/25/18 | 450 | 447 |
| Westpac Banking Corp. | 2.250% | 7/30/18 | 700 | 705 |
| Westpac Banking Corp. | 1.950% | 11/23/18 | 8,000 | 7,986 |
| Westpac Banking Corp. | 2.250% | 1/17/19 | 9,875 | 9,897 |
| Westpac Banking Corp. | 4.875% | 11/19/19 | 6,865 | 7,494 |
| Westpac Banking Corp. | 2.300% | 5/26/20 | 19,377 | 19,246 |
| Westpac Banking Corp. | 2.600% | 11/23/20 | 10,000 | 9,994 |
| Brokerage (0.2%) | ||||
| Ameriprise Financial Inc. | 7.300% | 6/28/19 | 1,600 | 1,848 |
| Ameriprise Financial Inc. | 5.300% | 3/15/20 | 3,775 | 4,185 |
10
| Vanguard® Short-Term Bond Index Fund | ||||
| Schedule of Investments | ||||
| December 31, 2015 | ||||
| Face | Market | |||
| Maturity | Amount | Value | ||
| Coupon | Date | ($000) | ($000) | |
| BGC Partners Inc. | 5.375% | 12/9/19 | 1,700 | 1,747 |
| BlackRock Inc. | 6.250% | 9/15/17 | 1,785 | 1,928 |
| BlackRock Inc. | 5.000% | 12/10/19 | 8,175 | 9,032 |
| Charles Schwab Corp. | 1.500% | 3/10/18 | 2,175 | 2,166 |
| Charles Schwab Corp. | 2.200% | 7/25/18 | 4,974 | 4,988 |
| Charles Schwab Corp. | 4.450% | 7/22/20 | 1,250 | 1,364 |
| Eaton Vance Corp. | 6.500% | 10/2/17 | 257 | 275 |
| Franklin Resources Inc. | 1.375% | 9/15/17 | 2,675 | 2,671 |
| Franklin Resources Inc. | 4.625% | 5/20/20 | 700 | 757 |
| Intercontinental Exchange Inc. | 2.500% | 10/15/18 | 3,500 | 3,529 |
| Intercontinental Exchange Inc. | 2.750% | 12/1/20 | 4,775 | 4,762 |
| Jefferies Group LLC | 5.125% | 4/13/18 | 4,300 | 4,472 |
| Jefferies Group LLC | 8.500% | 7/15/19 | 6,325 | 7,370 |
| Lazard Group LLC | 6.850% | 6/15/17 | 572 | 607 |
| Lazard Group LLC | 4.250% | 11/14/20 | 1,625 | 1,685 |
| Legg Mason Inc. | 2.700% | 7/15/19 | 3,800 | 3,783 |
| Nasdaq Inc. | 5.250% | 1/16/18 | 36 | 38 |
| Nasdaq Inc. | 5.550% | 1/15/20 | 4,650 | 5,126 |
| Nomura Holdings Inc. | 2.750% | 3/19/19 | 13,100 | 13,158 |
| Nomura Holdings Inc. | 6.700% | 3/4/20 | 6,460 | 7,431 |
| NYSE Euronext | 2.000% | 10/5/17 | 9,440 | 9,476 |
| Raymond James Financial Inc. | 8.600% | 8/15/19 | 3,320 | 3,940 |
| Stifel Financial Corp. | 3.500% | 12/1/20 | 1,975 | 1,947 |
| TD Ameritrade Holding Corp. | 5.600% | 12/1/19 | 1,775 | 1,986 |
| Finance Companies (0.5%) | ||||
| Air Lease Corp. | 5.625% | 4/1/17 | 8,270 | 8,580 |
| Air Lease Corp. | 2.125% | 1/15/18 | 2,925 | 2,874 |
| Air Lease Corp. | 2.625% | 9/4/18 | 2,140 | 2,119 |
| Air Lease Corp. | 3.375% | 1/15/19 | 8,525 | 8,578 |
| Air Lease Corp. | 4.750% | 3/1/20 | 100 | 105 |
| Ares Capital Corp. | 4.875% | 11/30/18 | 8,000 | 8,282 |
| Ares Capital Corp. | 3.875% | 1/15/20 | 2,000 | 2,032 |
| FS Investment Corp. | 4.000% | 7/15/19 | 3,850 | 3,834 |
| FS Investment Corp. | 4.250% | 1/15/20 | 775 | 778 |
| GATX Corp. | 1.250% | 3/4/17 | 2,017 | 1,997 |
| GATX Corp. | 2.375% | 7/30/18 | 1,450 | 1,442 |
| GATX Corp. | 2.500% | 7/30/19 | 1,470 | 1,447 |
| GATX Corp. | 2.600% | 3/30/20 | 2,925 | 2,849 |
| 5 GE Capital International Funding Co | 0.964% | 4/15/16 | 66,679 | 66,702 |
| 5 GE Capital International Funding Co | 2.342% | 11/15/20 | 68,975 | 68,420 |
| 5 International Lease Finance Corp. | 7.125% | 9/1/18 | 12,000 | 13,155 |
| Prospect Capital Corp. | 5.000% | 7/15/19 | 1,750 | 1,759 |
| Insurance (1.0%) | ||||
| ACE INA Holdings Inc. | 5.700% | 2/15/17 | 1,713 | 1,796 |
| ACE INA Holdings Inc. | 5.800% | 3/15/18 | 1,500 | 1,628 |
| ACE INA Holdings Inc. | 5.900% | 6/15/19 | 2,450 | 2,745 |
| ACE INA Holdings Inc. | 2.300% | 11/3/20 | 5,125 | 5,072 |
| AEGON Funding Co. LLC | 5.750% | 12/15/20 | 2,443 | 2,774 |
| Aetna Inc. | 1.750% | 5/15/17 | 3,100 | 3,102 |
| Aetna Inc. | 1.500% | 11/15/17 | 10,025 | 10,000 |
| Aetna Inc. | 2.200% | 3/15/19 | 2,525 | 2,513 |
| Aflac Inc. | 2.650% | 2/15/17 | 9,355 | 9,477 |
| Aflac Inc. | 2.400% | 3/16/20 | 3,500 | 3,493 |
| Allied World Assurance Co. Ltd. | 5.500% | 11/15/20 | 1,375 | 1,497 |
| 4 Allstate Corp. | 6.125% | 5/15/67 | 5,150 | 5,150 |
| Alterra Finance LLC | 6.250% | 9/30/20 | 5,145 | 5,779 |
| American Financial Group Inc. | 9.875% | 6/15/19 | 2,130 | 2,584 |
| American International Group Inc. | 5.850% | 1/16/18 | 9,300 | 10,009 |
| American International Group Inc. | 2.300% | 7/16/19 | 15,400 | 15,272 |
| American International Group Inc. | 3.375% | 8/15/20 | 1,350 | 1,386 |
| American International Group Inc. | 6.400% | 12/15/20 | 4,600 | 5,302 |
| Anthem Inc. | 2.375% | 2/15/17 | 1,350 | 1,362 |
| Anthem Inc. | 5.875% | 6/15/17 | 3,118 | 3,295 |
11
| Vanguard® Short-Term Bond Index Fund | ||||
| Schedule of Investments | ||||
| December 31, 2015 | ||||
| Face | Market | |||
| Maturity | Amount | Value | ||
| Coupon | Date | ($000) | ($000) | |
| Anthem Inc. | 1.875% | 1/15/18 | 2,025 | 2,017 |
| Anthem Inc. | 7.000% | 2/15/19 | 1,080 | 1,213 |
| Anthem Inc. | 2.250% | 8/15/19 | 8,275 | 8,224 |
| Anthem Inc. | 4.350% | 8/15/20 | 7,800 | 8,261 |
| Aon Corp. | 5.000% | 9/30/20 | 1,825 | 1,989 |
| Aspen Insurance Holdings Ltd. | 6.000% | 12/15/20 | 1,225 | 1,339 |
| Assurant Inc. | 2.500% | 3/15/18 | 700 | 700 |
| Axis Specialty Finance LLC | 5.875% | 6/1/20 | 10,638 | 11,775 |
| AXIS Specialty Finance plc | 2.650% | 4/1/19 | 4,901 | 4,874 |
| Berkshire Hathaway Finance Corp. | 1.600% | 5/15/17 | 16,095 | 16,174 |
| Berkshire Hathaway Finance Corp. | 5.400% | 5/15/18 | 9,850 | 10,687 |
| Berkshire Hathaway Finance Corp. | 2.000% | 8/15/18 | 3,160 | 3,204 |
| Berkshire Hathaway Inc. | 1.900% | 1/31/17 | 11,543 | 11,645 |
| Berkshire Hathaway Inc. | 1.550% | 2/9/18 | 2,870 | 2,873 |
| Berkshire Hathaway Inc. | 2.100% | 8/14/19 | 10,475 | 10,530 |
| Chubb Corp. | 5.750% | 5/15/18 | 14,015 | 15,234 |
| 4 Chubb Corp. | 6.375% | 3/29/67 | 5,325 | 5,105 |
| Cigna Corp. | 5.125% | 6/15/20 | 425 | 463 |
| Cigna Corp. | 4.375% | 12/15/20 | 950 | 1,005 |
| CNA Financial Corp. | 7.350% | 11/15/19 | 375 | 433 |
| CNA Financial Corp. | 5.875% | 8/15/20 | 2,000 | 2,228 |
| Coventry Health Care Inc. | 5.950% | 3/15/17 | 1,265 | 1,329 |
| Hartford Financial Services Group Inc. | 5.500% | 10/15/16 | 3,750 | 3,875 |
| Hartford Financial Services Group Inc. | 5.375% | 3/15/17 | 525 | 547 |
| Hartford Financial Services Group Inc. | 6.300% | 3/15/18 | 930 | 1,013 |
| Hartford Financial Services Group Inc. | 6.000% | 1/15/19 | 3,125 | 3,435 |
| Hartford Financial Services Group Inc. | 5.500% | 3/30/20 | 2,429 | 2,681 |
| Humana Inc. | 7.200% | 6/15/18 | 2,325 | 2,600 |
| Humana Inc. | 2.625% | 10/1/19 | 1,500 | 1,500 |
| Lincoln National Corp. | 8.750% | 7/1/19 | 5,025 | 6,036 |
| Lincoln National Corp. | 6.250% | 2/15/20 | 2,350 | 2,638 |
| 4 Lincoln National Corp. | 6.050% | 4/20/67 | 1,000 | 785 |
| Loews Corp. | 5.250% | 3/15/16 | 1,275 | 1,286 |
| Manulife Financial Corp. | 4.900% | 9/17/20 | 3,225 | 3,509 |
| Marsh & McLennan Cos. Inc. | 2.300% | 4/1/17 | 1,100 | 1,109 |
| Marsh & McLennan Cos. Inc. | 2.550% | 10/15/18 | 400 | 404 |
| Marsh & McLennan Cos. Inc. | 2.350% | 9/10/19 | 5,700 | 5,682 |
| Marsh & McLennan Cos. Inc. | 2.350% | 3/6/20 | 2,400 | 2,377 |
| MetLife Inc. | 1.756% | 12/15/17 | 3,104 | 3,105 |
| MetLife Inc. | 1.903% | 12/15/17 | 15,350 | 15,426 |
| MetLife Inc. | 6.817% | 8/15/18 | 5,968 | 6,718 |
| MetLife Inc. | 7.717% | 2/15/19 | 1,604 | 1,868 |
| PartnerRe Finance B LLC | 5.500% | 6/1/20 | 3,100 | 3,397 |
| Principal Financial Group Inc. | 1.850% | 11/15/17 | 1,016 | 1,018 |
| Principal Financial Group Inc. | 8.875% | 5/15/19 | 1,710 | 2,047 |
| 4 Principal Financial Group Inc. | 4.700% | 5/15/55 | 4,000 | 3,989 |
| 4 Progressive Corp. | 6.700% | 6/15/67 | 3,775 | 3,780 |
| Protective Life Corp. | 7.375% | 10/15/19 | 1,600 | 1,851 |
| Prudential Financial Inc. | 6.100% | 6/15/17 | 562 | 595 |
| Prudential Financial Inc. | 6.000% | 12/1/17 | 4,625 | 4,969 |
| Prudential Financial Inc. | 2.300% | 8/15/18 | 2,200 | 2,214 |
| Prudential Financial Inc. | 7.375% | 6/15/19 | 4,695 | 5,449 |
| Prudential Financial Inc. | 2.350% | 8/15/19 | 6,840 | 6,817 |
| Prudential Financial Inc. | 5.375% | 6/21/20 | 3,700 | 4,107 |
| Prudential Financial Inc. | 4.500% | 11/15/20 | 1,800 | 1,931 |
| 4 Prudential Financial Inc. | 8.875% | 6/15/68 | 2,781 | 3,129 |
| Reinsurance Group of America Inc. | 6.450% | 11/15/19 | 1,850 | 2,082 |
| 4 StanCorp Financial Group Inc. | 6.900% | 6/1/67 | 1,000 | 830 |
| Torchmark Corp. | 9.250% | 6/15/19 | 1,500 | 1,814 |
| Travelers Cos. Inc. | 5.800% | 5/15/18 | 2,825 | 3,090 |
| Travelers Cos. Inc. | 5.900% | 6/2/19 | 1,756 | 1,977 |
| UnitedHealth Group Inc. | 6.000% | 6/15/17 | 2,875 | 3,063 |
| UnitedHealth Group Inc. | 1.450% | 7/17/17 | 7,513 | 7,510 |
| UnitedHealth Group Inc. | 1.400% | 10/15/17 | 3,022 | 3,015 |
12
| Vanguard® Short-Term Bond Index Fund | ||||
| Schedule of Investments | ||||
| December 31, 2015 | ||||
| Face | Market | |||
| Maturity | Amount | Value | ||
| Coupon | Date | ($000) | ($000) | |
| UnitedHealth Group Inc. | 1.400% | 12/15/17 | 3,075 | 3,065 |
| UnitedHealth Group Inc. | 6.000% | 2/15/18 | 7,550 | 8,209 |
| UnitedHealth Group Inc. | 1.900% | 7/16/18 | 8,200 | 8,239 |
| UnitedHealth Group Inc. | 1.625% | 3/15/19 | 4,000 | 3,958 |
| UnitedHealth Group Inc. | 2.300% | 12/15/19 | 3,125 | 3,137 |
| UnitedHealth Group Inc. | 2.700% | 7/15/20 | 9,650 | 9,753 |
| UnitedHealth Group Inc. | 3.875% | 10/15/20 | 175 | 185 |
| Unum Group | 5.625% | 9/15/20 | 1,150 | 1,262 |
| Voya Financial Inc. | 2.900% | 2/15/18 | 7,155 | 7,232 |
| Willis North America Inc. | 6.200% | 3/28/17 | 2,707 | 2,825 |
| WR Berkley Corp. | 7.375% | 9/15/19 | 100 | 116 |
| XLIT Ltd. | 2.300% | 12/15/18 | 1,376 | 1,376 |
| 4 XLIT Ltd. | 6.500% | 10/29/49 | 8,688 | 6,310 |
| Other Finance (0.0%) | ||||
| ORIX Corp. | 3.750% | 3/9/17 | 2,950 | 3,003 |
| Real Estate Investment Trusts (0.5%) | ||||
| Alexandria Real Estate Equities Inc. | 2.750% | 1/15/20 | 2,598 | 2,560 |
| American Campus Communities Operating Partnership | ||||
| LP | 3.350% | 10/1/20 | 1,600 | 1,601 |
| AvalonBay Communities Inc. | 5.700% | 3/15/17 | 35 | 37 |
| AvalonBay Communities Inc. | 3.625% | 10/1/20 | 4,345 | 4,517 |
| BioMed Realty LP | 2.625% | 5/1/19 | 2,513 | 2,439 |
| Boston Properties LP | 3.700% | 11/15/18 | 5,450 | 5,645 |
| Boston Properties LP | 5.875% | 10/15/19 | 600 | 666 |
| Boston Properties LP | 5.625% | 11/15/20 | 9,135 | 10,168 |
| Brandywine Operating Partnership LP | 5.700% | 5/1/17 | 5,275 | 5,497 |
| Brandywine Operating Partnership LP | 4.950% | 4/15/18 | 1,926 | 2,016 |
| DDR Corp. | 7.875% | 9/1/20 | 1,500 | 1,796 |
| 5 Digital Delta Holdings LLC | 3.400% | 10/1/20 | 1,700 | 1,703 |
| Digital Realty Trust LP | 5.250% | 3/15/21 | 5,775 | 6,248 |
| Equity CommonWealth | 6.250% | 6/15/17 | 2,200 | 2,273 |
| Equity CommonWealth | 6.650% | 1/15/18 | 2,860 | 3,027 |
| ERP Operating LP | 5.750% | 6/15/17 | 5,019 | 5,300 |
| ERP Operating LP | 2.375% | 7/1/19 | 4,725 | 4,739 |
| Essex Portfolio LP | 5.500% | 3/15/17 | 2,175 | 2,264 |
| Federal Realty Investment Trust | 2.550% | 1/15/21 | 600 | 596 |
| HCP Inc. | 6.000% | 1/30/17 | 5,000 | 5,208 |
| HCP Inc. | 5.625% | 5/1/17 | 1,300 | 1,360 |
| HCP Inc. | 6.700% | 1/30/18 | 12,410 | 13,504 |
| HCP Inc. | 2.625% | 2/1/20 | 4,053 | 3,991 |
| Hospitality Properties Trust | 5.625% | 3/15/17 | 2,590 | 2,679 |
| Hospitality Properties Trust | 6.700% | 1/15/18 | 2,000 | 2,116 |
| Kilroy Realty LP | 4.800% | 7/15/18 | 5,050 | 5,274 |
| Kimco Realty Corp. | 5.700% | 5/1/17 | 9,998 | 10,499 |
| Kimco Realty Corp. | 4.300% | 2/1/18 | 1,250 | 1,303 |
| Liberty Property LP | 6.625% | 10/1/17 | 318 | 341 |
| Liberty Property LP | 4.750% | 10/1/20 | 1,950 | 2,074 |
| Mack-Cali Realty LP | 2.500% | 12/15/17 | 1,800 | 1,799 |
| Mack-Cali Realty LP | 7.750% | 8/15/19 | 6,250 | 6,946 |
| National Retail Properties Inc. | 6.875% | 10/15/17 | 4,000 | 4,317 |
| ProLogis LP | 2.750% | 2/15/19 | 5,000 | 5,049 |
| Realty Income Corp. | 2.000% | 1/31/18 | 4,300 | 4,300 |
| Realty Income Corp. | 6.750% | 8/15/19 | 3,275 | 3,722 |
| Regency Centers LP | 5.875% | 6/15/17 | 1,312 | 1,383 |
| Select Income REIT | 2.850% | 2/1/18 | 4,650 | 4,644 |
| Select Income REIT | 3.600% | 2/1/20 | 234 | 236 |
| Senior Housing Properties Trust | 3.250% | 5/1/19 | 9,605 | 9,563 |
| Simon Property Group LP | 5.250% | 12/1/16 | 6,225 | 6,370 |
| Simon Property Group LP | 2.800% | 1/30/17 | 4,536 | 4,596 |
| Simon Property Group LP | 2.150% | 9/15/17 | 3,935 | 3,971 |
| Simon Property Group LP | 2.200% | 2/1/19 | 4,000 | 4,019 |
| Simon Property Group LP | 5.650% | 2/1/20 | 4,425 | 4,958 |
13
| Vanguard® Short-Term Bond Index Fund | ||||
| Schedule of Investments | ||||
| December 31, 2015 | ||||
| Face | Market | |||
| Maturity | Amount | Value | ||
| Coupon | Date | ($000) | ($000) | |
| Simon Property Group LP | 2.500% | 9/1/20 | 3,200 | 3,208 |
| SL Green Realty Corp. | 7.750% | 3/15/20 | 2,500 | 2,923 |
| Tanger Properties LP | 6.125% | 6/1/20 | 2,500 | 2,826 |
| UDR Inc. | 4.250% | 6/1/18 | 850 | 888 |
| Ventas Realty LP | 1.250% | 4/17/17 | 4,775 | 4,740 |
| Ventas Realty LP / Ventas Capital Corp. | 2.000% | 2/15/18 | 8,100 | 8,076 |
| Ventas Realty LP / Ventas Capital Corp. | 4.000% | 4/30/19 | 2,740 | 2,851 |
| Vornado Realty LP | 2.500% | 6/30/19 | 4,000 | 3,942 |
| Washington Prime Group LP | 3.850% | 4/1/20 | 1,525 | 1,539 |
| Washington REIT | 4.950% | 10/1/20 | 1,700 | 1,807 |
| Welltower Inc. | 4.700% | 9/15/17 | 50 | 52 |
| Welltower Inc. | 2.250% | 3/15/18 | 8,514 | 8,493 |
| Welltower Inc. | 4.125% | 4/1/19 | 1,656 | 1,728 |
| Welltower Inc. | 6.125% | 4/15/20 | 2,802 | 3,138 |
| 4,653,851 | ||||
| Industrial (14.0%) | ||||
| Basic Industry (0.8%) | ||||
| Agrium Inc. | 6.750% | 1/15/19 | 1,250 | 1,395 |
| Airgas Inc. | 1.650% | 2/15/18 | 1,690 | 1,675 |
| Airgas Inc. | 3.050% | 8/1/20 | 3,500 | 3,529 |
| Albemarle Corp. | 3.000% | 12/1/19 | 1,500 | 1,473 |
| Albemarle Corp. | 4.500% | 12/15/20 | 1,725 | 1,783 |
| Barrick Gold Corp. | 6.950% | 4/1/19 | 2,346 | 2,426 |
| Barrick North America Finance LLC | 6.800% | 9/15/18 | 825 | 883 |
| Barrick PD Australia Finance Pty Ltd. | 4.950% | 1/15/20 | 3,525 | 3,568 |
| BHP Billiton Finance USA Ltd. | 1.625% | 2/24/17 | 15,326 | 15,239 |
| BHP Billiton Finance USA Ltd. | 5.400% | 3/29/17 | 1,675 | 1,741 |
| BHP Billiton Finance USA Ltd. | 2.050% | 9/30/18 | 12,065 | 11,844 |
| BHP Billiton Finance USA Ltd. | 6.500% | 4/1/19 | 7,625 | 8,396 |
| Celulosa Arauco y Constitucion SA | 7.250% | 7/29/19 | 2,100 | 2,366 |
| CF Industries Inc. | 6.875% | 5/1/18 | 6,482 | 7,017 |
| CF Industries Inc. | 7.125% | 5/1/20 | 2,815 | 3,170 |
| Dow Chemical Co. | 8.550% | 5/15/19 | 15,246 | 17,978 |
| Eastman Chemical Co. | 2.400% | 6/1/17 | 18,572 | 18,701 |
| Eastman Chemical Co. | 2.700% | 1/15/20 | 5,680 | 5,620 |
| Ecolab Inc. | 1.450% | 12/8/17 | 3,725 | 3,690 |
| Ecolab Inc. | 1.550% | 1/12/18 | 1,500 | 1,487 |
| Ecolab Inc. | 2.250% | 1/12/20 | 2,000 | 1,986 |
| EI du Pont de Nemours & Co. | 6.000% | 7/15/18 | 11,025 | 12,000 |
| Freeport-McMoRan Inc. | 2.150% | 3/1/17 | 9,020 | 8,050 |
| Freeport-McMoRan Inc. | 2.300% | 11/14/17 | 3,000 | 2,558 |
| Freeport-McMoRan Inc. | 2.375% | 3/15/18 | 11,725 | 9,321 |
| Freeport-McMoRan Inc. | 3.100% | 3/15/20 | 2,400 | 1,548 |
| Freeport-McMoran Oil & Gas LLC / FCX Oil & Gas Inc. | 6.500% | 11/15/20 | 1,367 | 882 |
| Goldcorp Inc. | 2.125% | 3/15/18 | 7,621 | 7,391 |
| International Paper Co. | 7.950% | 6/15/18 | 6,098 | 6,902 |
| International Paper Co. | 9.375% | 5/15/19 | 35 | 42 |
| Lubrizol Corp. | 8.875% | 2/1/19 | 575 | 687 |
| LyondellBasell Industries NV | 5.000% | 4/15/19 | 14,875 | 15,815 |
| Methanex Corp. | 3.250% | 12/15/19 | 2,240 | 2,142 |
| Monsanto Co. | 1.150% | 6/30/17 | 8,996 | 8,934 |
| Monsanto Co. | 5.125% | 4/15/18 | 925 | 989 |
| Monsanto Co. | 1.850% | 11/15/18 | 825 | 820 |
| Monsanto Co. | 2.125% | 7/15/19 | 16,550 | 16,520 |
| Newmont Mining Corp. | 5.125% | 10/1/19 | 1,925 | 2,011 |
| Nucor Corp. | 5.750% | 12/1/17 | 5,683 | 6,006 |
| Nucor Corp. | 5.850% | 6/1/18 | 2,843 | 3,042 |
| Potash Corp. of Saskatchewan Inc. | 3.250% | 12/1/17 | 1,225 | 1,253 |
| Potash Corp. of Saskatchewan Inc. | 6.500% | 5/15/19 | 1,075 | 1,209 |
| Potash Corp. of Saskatchewan Inc. | 4.875% | 3/30/20 | 1,800 | 1,957 |
| PPG Industries Inc. | 2.300% | 11/15/19 | 10,000 | 9,924 |
| PPG Industries Inc. | 3.600% | 11/15/20 | 6,350 | 6,553 |
| Praxair Inc. | 5.200% | 3/15/17 | 1,250 | 1,306 |
14
| Vanguard® Short-Term Bond Index Fund | ||||
| Schedule of Investments | ||||
| December 31, 2015 | ||||
| Face | Market | |||
| Maturity | Amount | Value | ||
| Coupon | Date | ($000) | ($000) | |
| Praxair Inc. | 1.050% | 11/7/17 | 7,160 | 7,095 |
| Praxair Inc. | 1.250% | 11/7/18 | 2,500 | 2,467 |
| Praxair Inc. | 2.250% | 9/24/20 | 100 | 100 |
| Rio Tinto Finance USA Ltd. | 6.500% | 7/15/18 | 11,413 | 12,363 |
| Rio Tinto Finance USA Ltd. | 9.000% | 5/1/19 | 6,300 | 7,372 |
| Rio Tinto Finance USA Ltd. | 3.500% | 11/2/20 | 2,475 | 2,429 |
| Rio Tinto Finance USA plc | 2.000% | 3/22/17 | 10,700 | 10,645 |
| Rio Tinto Finance USA plc | 1.625% | 8/21/17 | 2,500 | 2,458 |
| Rio Tinto Finance USA plc | 2.250% | 12/14/18 | 4,430 | 4,318 |
| Rock-Tenn Co. | 4.450% | 3/1/19 | 5,000 | 5,218 |
| Rock-Tenn Co. | 3.500% | 3/1/20 | 2,634 | 2,666 |
| Rohm & Haas Co. | 6.000% | 9/15/17 | 1,000 | 1,067 |
| RPM International Inc. | 6.500% | 2/15/18 | 1,510 | 1,623 |
| RPM International Inc. | 6.125% | 10/15/19 | 325 | 356 |
| Southern Copper Corp. | 5.375% | 4/16/20 | 2,600 | 2,698 |
| Vale Overseas Ltd. | 6.250% | 1/23/17 | 10,150 | 10,074 |
| Vale Overseas Ltd. | 5.625% | 9/15/19 | 3,025 | 2,726 |
| Vale Overseas Ltd. | 4.625% | 9/15/20 | 8,650 | 7,212 |
| Valspar Corp. | 7.250% | 6/15/19 | 863 | 975 |
| Capital Goods (1.4%) | ||||
| 3M Co. | 1.000% | 6/26/17 | 3,000 | 2,998 |
| 3M Co. | 1.375% | 8/7/18 | 3,100 | 3,094 |
| 3M Co. | 2.000% | 8/7/20 | 3,100 | 3,102 |
| Acuity Brands Lighting Inc. | 6.000% | 12/15/19 | 675 | 735 |
| Bemis Co. Inc. | 6.800% | 8/1/19 | 500 | 566 |
| Boeing Capital Corp. | 2.900% | 8/15/18 | 11 | 11 |
| Boeing Capital Corp. | 4.700% | 10/27/19 | 6,695 | 7,347 |
| Boeing Co. | 0.950% | 5/15/18 | 5,800 | 5,733 |
| Boeing Co. | 6.000% | 3/15/19 | 3,425 | 3,841 |
| Boeing Co. | 4.875% | 2/15/20 | 4,125 | 4,606 |
| Boeing Co. | 1.650% | 10/30/20 | 4,000 | 3,909 |
| Caterpillar Financial Services Corp. | 1.000% | 3/3/17 | 8,524 | 8,497 |
| Caterpillar Financial Services Corp. | 1.625% | 6/1/17 | 13,650 | 13,697 |
| Caterpillar Financial Services Corp. | 1.250% | 8/18/17 | 8 | 8 |
| Caterpillar Financial Services Corp. | 1.250% | 11/6/17 | 9,872 | 9,850 |
| Caterpillar Financial Services Corp. | 1.300% | 3/1/18 | 5,750 | 5,701 |
| Caterpillar Financial Services Corp. | 5.450% | 4/15/18 | 4,650 | 5,029 |
| Caterpillar Financial Services Corp. | 2.450% | 9/6/18 | 2,800 | 2,842 |
| Caterpillar Financial Services Corp. | 1.800% | 11/13/18 | 4,000 | 4,004 |
| Caterpillar Financial Services Corp. | 7.150% | 2/15/19 | 8,358 | 9,573 |
| Caterpillar Financial Services Corp. | 2.100% | 6/9/19 | 1,750 | 1,749 |
| Caterpillar Financial Services Corp. | 2.250% | 12/1/19 | 500 | 500 |
| Caterpillar Financial Services Corp. | 2.000% | 3/5/20 | 4,850 | 4,806 |
| Caterpillar Financial Services Corp. | 2.500% | 11/13/20 | 3,500 | 3,494 |
| Caterpillar Inc. | 1.500% | 6/26/17 | 5,889 | 5,901 |
| Caterpillar Inc. | 7.900% | 12/15/18 | 1,020 | 1,193 |
| Cooper US Inc. | 6.100% | 7/1/17 | 515 | 549 |
| Crane Co. | 2.750% | 12/15/18 | 6,906 | 6,886 |
| CRH America Inc. | 8.125% | 7/15/18 | 1,000 | 1,138 |
| Danaher Corp. | 2.300% | 6/23/16 | 1,500 | 1,509 |
| Danaher Corp. | 5.625% | 1/15/18 | 950 | 1,025 |
| Danaher Corp. | 1.650% | 9/15/18 | 6,000 | 5,994 |
| Danaher Corp. | 5.400% | 3/1/19 | 2,305 | 2,534 |
| Danaher Corp. | 2.400% | 9/15/20 | 6,000 | 6,000 |
| Eaton Corp. | 1.500% | 11/2/17 | 9,570 | 9,511 |
| Eaton Corp. | 5.600% | 5/15/18 | 7,725 | 8,355 |
| Eaton Corp. | 6.950% | 3/20/19 | 1,028 | 1,167 |
| Eaton Electric Holdings LLC | 3.875% | 12/15/20 | 1,500 | 1,556 |
| Emerson Electric Co. | 4.875% | 10/15/19 | 3,720 | 4,086 |
| Emerson Electric Co. | 4.250% | 11/15/20 | 825 | 891 |
| Fortune Brands Home & Security Inc. | 3.000% | 6/15/20 | 3,000 | 2,994 |
| 4 GE Capital Trust I | 6.375% | 11/15/67 | 4,810 | 5,008 |
| General Dynamics Corp. | 1.000% | 11/15/17 | 5,958 | 5,940 |
15
| Vanguard® Short-Term Bond Index Fund | ||||
| Schedule of Investments | ||||
| December 31, 2015 | ||||
| Face | Market | |||
| Maturity | Amount | Value | ||
| Coupon | Date | ($000) | ($000) | |
| General Electric Capital Corp. | 1.000% | 1/8/16 | 6,180 | 6,180 |
| General Electric Capital Corp. | 5.625% | 9/15/17 | 4,095 | 4,379 |
| General Electric Capital Corp. | 6.000% | 8/7/19 | 3,193 | 3,609 |
| General Electric Capital Corp. | 2.100% | 12/11/19 | 2,925 | 2,917 |
| General Electric Capital Corp. | 5.500% | 1/8/20 | 7,476 | 8,387 |
| General Electric Capital Corp. | 2.200% | 1/9/20 | 13,736 | 13,753 |
| General Electric Capital Corp. | 5.550% | 5/4/20 | 7,556 | 8,562 |
| General Electric Capital Corp. | 4.375% | 9/16/20 | 2,048 | 2,228 |
| 4 General Electric Capital Corp. | 6.375% | 11/15/67 | 10,225 | 10,647 |
| General Electric Co. | 5.250% | 12/6/17 | 34,950 | 37,345 |
| Harris Corp. | 1.999% | 4/27/18 | 7,550 | 7,470 |
| Harris Corp. | 2.700% | 4/27/20 | 7,042 | 6,907 |
| Harris Corp. | 4.400% | 12/15/20 | 2,525 | 2,638 |
| Honeywell International Inc. | 5.300% | 3/1/18 | 12,106 | 13,066 |
| Honeywell International Inc. | 5.000% | 2/15/19 | 8,918 | 9,769 |
| Illinois Tool Works Inc. | 1.950% | 3/1/19 | 2,757 | 2,763 |
| Illinois Tool Works Inc. | 6.250% | 4/1/19 | 2,675 | 3,015 |
| Ingersoll-Rand Global Holding Co. Ltd. | 6.875% | 8/15/18 | 11,995 | 13,248 |
| Ingersoll-Rand Global Holding Co. Ltd. | 2.875% | 1/15/19 | 1,150 | 1,160 |
| Ingersoll-Rand Luxembourg Finance SA | 2.625% | 5/1/20 | 1,500 | 1,476 |
| John Deere Capital Corp. | 2.000% | 1/13/17 | 2,008 | 2,033 |
| John Deere Capital Corp. | 1.400% | 3/15/17 | 8,039 | 8,053 |
| John Deere Capital Corp. | 1.125% | 6/12/17 | 6,110 | 6,097 |
| John Deere Capital Corp. | 2.800% | 9/18/17 | 1,319 | 1,348 |
| John Deere Capital Corp. | 1.200% | 10/10/17 | 3,112 | 3,097 |
| John Deere Capital Corp. | 1.550% | 12/15/17 | 6,614 | 6,618 |
| John Deere Capital Corp. | 1.350% | 1/16/18 | 2,200 | 2,191 |
| John Deere Capital Corp. | 1.300% | 3/12/18 | 600 | 595 |
| John Deere Capital Corp. | 5.350% | 4/3/18 | 470 | 508 |
| John Deere Capital Corp. | 1.600% | 7/13/18 | 2,650 | 2,642 |
| John Deere Capital Corp. | 1.750% | 8/10/18 | 3,200 | 3,200 |
| John Deere Capital Corp. | 1.950% | 12/13/18 | 14,325 | 14,355 |
| John Deere Capital Corp. | 1.950% | 3/4/19 | 13,155 | 13,099 |
| John Deere Capital Corp. | 2.250% | 4/17/19 | 5,685 | 5,712 |
| John Deere Capital Corp. | 2.300% | 9/16/19 | 2,500 | 2,500 |
| John Deere Capital Corp. | 2.050% | 3/10/20 | 4,400 | 4,348 |
| John Deere Capital Corp. | 2.375% | 7/14/20 | 2,500 | 2,493 |
| John Deere Capital Corp. | 2.450% | 9/11/20 | 2,600 | 2,596 |
| Kennametal Inc. | 2.650% | 11/1/19 | 3,400 | 3,368 |
| L-3 Communications Corp. | 1.500% | 5/28/17 | 7,600 | 7,521 |
| L-3 Communications Corp. | 5.200% | 10/15/19 | 6,925 | 7,338 |
| L-3 Communications Corp. | 4.750% | 7/15/20 | 4,427 | 4,610 |
| Lockheed Martin Corp. | 1.850% | 11/23/18 | 4,450 | 4,441 |
| Lockheed Martin Corp. | 4.250% | 11/15/19 | 5,285 | 5,664 |
| Lockheed Martin Corp. | 2.500% | 11/23/20 | 9,800 | 9,765 |
| Martin Marietta Materials Inc. | 6.600% | 4/15/18 | 100 | 108 |
| Northrop Grumman Corp. | 1.750% | 6/1/18 | 2,375 | 2,355 |
| Parker Hannifin Corp. | 5.500% | 5/15/18 | 35 | 38 |
| Pentair Finance SA | 1.875% | 9/15/17 | 3,200 | 3,165 |
| Pentair Finance SA | 2.900% | 9/15/18 | 275 | 274 |
| Pentair Finance SA | 3.625% | 9/15/20 | 3,200 | 3,181 |
| Precision Castparts Corp. | 1.250% | 1/15/18 | 7,225 | 7,175 |
| Precision Castparts Corp. | 2.250% | 6/15/20 | 3,550 | 3,531 |
| Raytheon Co. | 6.750% | 3/15/18 | 3,000 | 3,324 |
| Raytheon Co. | 6.400% | 12/15/18 | 500 | 563 |
| Raytheon Co. | 3.125% | 10/15/20 | 2,465 | 2,540 |
| Republic Services Inc. | 3.800% | 5/15/18 | 6,542 | 6,780 |
| Republic Services Inc. | 5.500% | 9/15/19 | 4,175 | 4,589 |
| Republic Services Inc. | 5.000% | 3/1/20 | 5,543 | 6,023 |
| Rockwell Automation Inc. | 2.050% | 3/1/20 | 5,850 | 5,795 |
| Roper Technologies Inc. | 1.850% | 11/15/17 | 7,821 | 7,795 |
| Roper Technologies Inc. | 2.050% | 10/1/18 | 11,050 | 10,983 |
| Roper Technologies Inc. | 6.250% | 9/1/19 | 1,000 | 1,111 |
| Roper Technologies Inc. | 3.000% | 12/15/20 | 4,000 | 3,989 |
16
| Vanguard® Short-Term Bond Index Fund | ||||
| Schedule of Investments | ||||
| December 31, 2015 | ||||
| Face | Market | |||
| Maturity | Amount | Value | ||
| Coupon | Date | ($000) | ($000) | |
| 4 Stanley Black & Decker Inc. | 5.750% | 12/15/53 | 2,190 | 2,302 |
| Textron Inc. | 5.600% | 12/1/17 | 1,000 | 1,062 |
| Textron Inc. | 7.250% | 10/1/19 | 1,070 | 1,219 |
| United Technologies Corp. | 1.800% | 6/1/17 | 15,667 | 15,740 |
| United Technologies Corp. | 5.375% | 12/15/17 | 4,410 | 4,740 |
| United Technologies Corp. | 6.125% | 2/1/19 | 3,795 | 4,234 |
| United Technologies Corp. | 4.500% | 4/15/20 | 9,675 | 10,574 |
| Valmont Industries Inc. | 6.625% | 4/20/20 | 464 | 514 |
| Waste Management Inc. | 6.100% | 3/15/18 | 9,410 | 10,256 |
| Waste Management Inc. | 4.750% | 6/30/20 | 3,500 | 3,794 |
| Xylem Inc. | 3.550% | 9/20/16 | 120 | 122 |
| Communication (1.7%) | ||||
| 21st Century Fox America Inc. | 6.900% | 3/1/19 | 6,550 | 7,438 |
| 21st Century Fox America Inc. | 5.650% | 8/15/20 | 7,683 | 8,638 |
| America Movil SAB de CV | 5.000% | 3/30/20 | 12,603 | 13,679 |
| American Tower Corp. | 4.500% | 1/15/18 | 13,510 | 14,095 |
| American Tower Corp. | 3.400% | 2/15/19 | 6,000 | 6,139 |
| American Tower Corp. | 2.800% | 6/1/20 | 3,025 | 2,992 |
| American Tower Corp. | 5.050% | 9/1/20 | 2,370 | 2,557 |
| AT&T Inc. | 1.600% | 2/15/17 | 15,872 | 15,895 |
| AT&T Inc. | 1.700% | 6/1/17 | 11,922 | 11,949 |
| AT&T Inc. | 1.400% | 12/1/17 | 10,175 | 10,123 |
| AT&T Inc. | 5.500% | 2/1/18 | 19,234 | 20,565 |
| AT&T Inc. | 5.600% | 5/15/18 | 5,400 | 5,870 |
| AT&T Inc. | 2.375% | 11/27/18 | 3,650 | 3,678 |
| AT&T Inc. | 2.300% | 3/11/19 | 11,600 | 11,611 |
| AT&T Inc. | 2.450% | 6/30/20 | 21,900 | 21,626 |
| British Telecommunications plc | 1.250% | 2/14/17 | 1,150 | 1,144 |
| British Telecommunications plc | 5.950% | 1/15/18 | 5,625 | 6,066 |
| British Telecommunications plc | 2.350% | 2/14/19 | 11,775 | 11,802 |
| CBS Corp. | 1.950% | 7/1/17 | 1,050 | 1,050 |
| CBS Corp. | 2.300% | 8/15/19 | 11,575 | 11,445 |
| CBS Corp. | 5.750% | 4/15/20 | 910 | 1,005 |
| CC Holdings GS V LLC / Crown Castle GS III Corp. | 2.381% | 12/15/17 | 2,555 | 2,561 |
| 5 CCO Safari II LLC | 3.579% | 7/23/20 | 15,250 | 15,155 |
| Comcast Cable Communications LLC | 8.875% | 5/1/17 | 3,510 | 3,849 |
| Comcast Corp. | 6.500% | 1/15/17 | 4,009 | 4,220 |
| Comcast Corp. | 6.300% | 11/15/17 | 4,976 | 5,411 |
| Comcast Corp. | 5.875% | 2/15/18 | 7,650 | 8,320 |
| Comcast Corp. | 5.700% | 5/15/18 | 9,436 | 10,321 |
| Comcast Corp. | 5.150% | 3/1/20 | 5,703 | 6,367 |
| Deutsche Telekom International Finance BV | 6.750% | 8/20/18 | 6,745 | 7,557 |
| Deutsche Telekom International Finance BV | 6.000% | 7/8/19 | 4,150 | 4,606 |
| DIRECTV Holdings LLC / DIRECTV Financing Co. Inc. | 2.400% | 3/15/17 | 9,926 | 10,016 |
| DIRECTV Holdings LLC / DIRECTV Financing Co. Inc. | 1.750% | 1/15/18 | 8,260 | 8,235 |
| DIRECTV Holdings LLC / DIRECTV Financing Co. Inc. | 5.875% | 10/1/19 | 5,800 | 6,457 |
| DIRECTV Holdings LLC / DIRECTV Financing Co. Inc. | 5.200% | 3/15/20 | 9,196 | 9,961 |
| DIRECTV Holdings LLC / DIRECTV Financing Co. Inc. | 4.600% | 2/15/21 | 6,830 | 7,228 |
| Discovery Communications LLC | 5.625% | 8/15/19 | 750 | 816 |
| Discovery Communications LLC | 5.050% | 6/1/20 | 6,775 | 7,212 |
| Historic TW Inc. | 6.875% | 6/15/18 | 820 | 911 |
| Interpublic Group of Cos. Inc. | 2.250% | 11/15/17 | 260 | 260 |
| McGraw Hill Financial Inc. | 2.500% | 8/15/18 | 3,100 | 3,122 |
| McGraw Hill Financial Inc. | 3.300% | 8/14/20 | 4,300 | 4,339 |
| Moody's Corp. | 2.750% | 7/15/19 | 5,850 | 5,909 |
| NBCUniversal Media LLC | 5.150% | 4/30/20 | 14,472 | 16,165 |
| Nippon Telegraph & Telephone Corp. | 1.400% | 7/18/17 | 2,487 | 2,478 |
| Omnicom Group Inc. | 6.250% | 7/15/19 | 5,035 | 5,654 |
| Omnicom Group Inc. | 4.450% | 8/15/20 | 5,900 | 6,289 |
| Orange SA | 2.750% | 2/6/19 | 16,325 | 16,575 |
| Orange SA | 5.375% | 7/8/19 | 4,025 | 4,409 |
| Qwest Corp. | 6.500% | 6/1/17 | 5,050 | 5,346 |
| Rogers Communications Inc. | 6.800% | 8/15/18 | 8,814 | 9,850 |
17
| Vanguard® Short-Term Bond Index Fund | ||||
| Schedule of Investments | ||||
| December 31, 2015 | ||||
| Face | Market | |||
| Maturity | Amount | Value | ||
| Coupon | Date | ($000) | ($000) | |
| Scripps Networks Interactive Inc. | 2.750% | 11/15/19 | 2,850 | 2,805 |
| Scripps Networks Interactive Inc. | 2.800% | 6/15/20 | 3,650 | 3,561 |
| Telefonica Emisiones SAU | 6.221% | 7/3/17 | 4,780 | 5,072 |
| Telefonica Emisiones SAU | 3.192% | 4/27/18 | 18,100 | 18,427 |
| Telefonica Emisiones SAU | 5.134% | 4/27/20 | 9,452 | 10,332 |
| Thomson Reuters Corp. | 1.300% | 2/23/17 | 7,918 | 7,873 |
| Thomson Reuters Corp. | 1.650% | 9/29/17 | 4,014 | 3,994 |
| Thomson Reuters Corp. | 6.500% | 7/15/18 | 2,055 | 2,269 |
| Thomson Reuters Corp. | 4.700% | 10/15/19 | 50 | 54 |
| Time Warner Cable Inc. | 5.850% | 5/1/17 | 8,950 | 9,360 |
| Time Warner Cable Inc. | 6.750% | 7/1/18 | 25,925 | 28,387 |
| Time Warner Cable Inc. | 8.750% | 2/14/19 | 8,941 | 10,354 |
| Time Warner Cable Inc. | 8.250% | 4/1/19 | 2,055 | 2,361 |
| Time Warner Cable Inc. | 5.000% | 2/1/20 | 5,135 | 5,435 |
| Time Warner Inc. | 2.100% | 6/1/19 | 5,175 | 5,138 |
| Time Warner Inc. | 4.875% | 3/15/20 | 8,795 | 9,512 |
| Verizon Communications Inc. | 1.350% | 6/9/17 | 30 | 30 |
| Verizon Communications Inc. | 1.100% | 11/1/17 | 5,455 | 5,437 |
| Verizon Communications Inc. | 5.500% | 2/15/18 | 12,471 | 13,425 |
| Verizon Communications Inc. | 6.100% | 4/15/18 | 4,275 | 4,671 |
| Verizon Communications Inc. | 3.650% | 9/14/18 | 35,912 | 37,478 |
| Verizon Communications Inc. | 6.350% | 4/1/19 | 13,275 | 14,934 |
| Verizon Communications Inc. | 2.625% | 2/21/20 | 22,226 | 22,327 |
| Verizon Communications Inc. | 4.500% | 9/15/20 | 19,410 | 20,870 |
| Viacom Inc. | 2.500% | 12/15/16 | 1,425 | 1,428 |
| Viacom Inc. | 3.500% | 4/1/17 | 3,900 | 3,969 |
| Viacom Inc. | 2.500% | 9/1/18 | 6,000 | 5,998 |
| Viacom Inc. | 2.200% | 4/1/19 | 12,000 | 11,728 |
| Viacom Inc. | 5.625% | 9/15/19 | 1,000 | 1,081 |
| Vodafone Group plc | 5.625% | 2/27/17 | 8,786 | 9,179 |
| Vodafone Group plc | 1.625% | 3/20/17 | 5,220 | 5,213 |
| Vodafone Group plc | 1.250% | 9/26/17 | 4,770 | 4,725 |
| Vodafone Group plc | 1.500% | 2/19/18 | 7,000 | 6,935 |
| Vodafone Group plc | 4.625% | 7/15/18 | 5,320 | 5,628 |
| Vodafone Group plc | 5.450% | 6/10/19 | 9,681 | 10,654 |
| Walt Disney Co. | 1.125% | 2/15/17 | 8,256 | 8,261 |
| Walt Disney Co. | 0.875% | 5/30/17 | 6,200 | 6,185 |
| Walt Disney Co. | 1.100% | 12/1/17 | 11,776 | 11,742 |
| Walt Disney Co. | 1.500% | 9/17/18 | 550 | 549 |
| Walt Disney Co. | 1.850% | 5/30/19 | 6,450 | 6,463 |
| Walt Disney Co. | 2.150% | 9/17/20 | 4,600 | 4,590 |
| Consumer Cyclical (2.0%) | ||||
| Advance Auto Parts Inc. | 5.750% | 5/1/20 | 850 | 927 |
| Alibaba Group Holding Ltd. | 1.625% | 11/28/17 | 7,600 | 7,520 |
| Alibaba Group Holding Ltd. | 2.500% | 11/28/19 | 16,200 | 15,867 |
| Amazon.com Inc. | 1.200% | 11/29/17 | 4,700 | 4,688 |
| Amazon.com Inc. | 2.600% | 12/5/19 | 9,250 | 9,396 |
| American Honda Finance Corp. | 1.200% | 7/14/17 | 2,650 | 2,638 |
| American Honda Finance Corp. | 1.550% | 12/11/17 | 10,884 | 10,885 |
| American Honda Finance Corp. | 1.500% | 3/13/18 | 3,150 | 3,129 |
| American Honda Finance Corp. | 1.600% | 7/13/18 | 5,325 | 5,294 |
| American Honda Finance Corp. | 2.125% | 10/10/18 | 7,100 | 7,149 |
| American Honda Finance Corp. | 2.250% | 8/15/19 | 9,175 | 9,223 |
| American Honda Finance Corp. | 2.450% | 9/24/20 | 6,375 | 6,387 |
| Automatic Data Processing Inc. | 2.250% | 9/15/20 | 6,800 | 6,821 |
| AutoNation Inc. | 6.750% | 4/15/18 | 2,500 | 2,726 |
| AutoNation Inc. | 5.500% | 2/1/20 | 1,620 | 1,755 |
| AutoZone Inc. | 1.300% | 1/13/17 | 3,575 | 3,571 |
| AutoZone Inc. | 7.125% | 8/1/18 | 3,975 | 4,457 |
| AutoZone Inc. | 4.000% | 11/15/20 | 275 | 289 |
| Block Financial LLC | 4.125% | 10/1/20 | 2,450 | 2,481 |
| BorgWarner Inc. | 4.625% | 9/15/20 | 450 | 483 |
| Brinker International Inc. | 2.600% | 5/15/18 | 1,625 | 1,620 |
18
| Vanguard® Short-Term Bond Index Fund | ||||
| Schedule of Investments | ||||
| December 31, 2015 | ||||
| Face | Market | |||
| Maturity | Amount | Value | ||
| Coupon | Date | ($000) | ($000) | |
| Carnival Corp. | 1.875% | 12/15/17 | 3,200 | 3,196 |
| Carnival Corp. | 3.950% | 10/15/20 | 2,400 | 2,530 |
| Costco Wholesale Corp. | 5.500% | 3/15/17 | 4,961 | 5,220 |
| Costco Wholesale Corp. | 1.125% | 12/15/17 | 7,700 | 7,693 |
| Costco Wholesale Corp. | 1.700% | 12/15/19 | 4,525 | 4,486 |
| Costco Wholesale Corp. | 1.750% | 2/15/20 | 3,475 | 3,445 |
| CVS Health Corp. | 5.750% | 6/1/17 | 3,062 | 3,241 |
| CVS Health Corp. | 1.900% | 7/20/18 | 17,751 | 17,733 |
| CVS Health Corp. | 2.250% | 12/5/18 | 9,500 | 9,548 |
| CVS Health Corp. | 2.250% | 8/12/19 | 9,030 | 9,021 |
| CVS Health Corp. | 4.750% | 5/18/20 | 725 | 782 |
| CVS Health Corp. | 2.800% | 7/20/20 | 22,525 | 22,632 |
| Delphi Automotive plc | 3.150% | 11/19/20 | 3,400 | 3,393 |
| Dollar General Corp. | 4.125% | 7/15/17 | 5,648 | 5,809 |
| eBay Inc. | 1.350% | 7/15/17 | 4,693 | 4,660 |
| eBay Inc. | 2.200% | 8/1/19 | 8,825 | 8,718 |
| eBay Inc. | 3.250% | 10/15/20 | 500 | 505 |
| Expedia Inc. | 7.456% | 8/15/18 | 3,250 | 3,624 |
| Expedia Inc. | 5.950% | 8/15/20 | 10,722 | 11,698 |
| Ford Motor Co. | 6.500% | 8/1/18 | 1,392 | 1,538 |
| Ford Motor Credit Co. LLC | 4.250% | 2/3/17 | 7,125 | 7,282 |
| Ford Motor Credit Co. LLC | 1.461% | 3/27/17 | 4,200 | 4,161 |
| Ford Motor Credit Co. LLC | 3.000% | 6/12/17 | 12,418 | 12,485 |
| Ford Motor Credit Co. LLC | 6.625% | 8/15/17 | 7,800 | 8,320 |
| Ford Motor Credit Co. LLC | 1.724% | 12/6/17 | 9,500 | 9,352 |
| Ford Motor Credit Co. LLC | 2.145% | 1/9/18 | 12,239 | 12,174 |
| Ford Motor Credit Co. LLC | 2.375% | 1/16/18 | 24,969 | 24,915 |
| Ford Motor Credit Co. LLC | 5.000% | 5/15/18 | 12,906 | 13,511 |
| Ford Motor Credit Co. LLC | 2.240% | 6/15/18 | 7,200 | 7,113 |
| Ford Motor Credit Co. LLC | 2.875% | 10/1/18 | 6,305 | 6,315 |
| Ford Motor Credit Co. LLC | 2.375% | 3/12/19 | 4,050 | 3,991 |
| Ford Motor Credit Co. LLC | 2.597% | 11/4/19 | 5,800 | 5,696 |
| Ford Motor Credit Co. LLC | 8.125% | 1/15/20 | 8,100 | 9,542 |
| Ford Motor Credit Co. LLC | 2.459% | 3/27/20 | 550 | 534 |
| Ford Motor Credit Co. LLC | 3.157% | 8/4/20 | 5,850 | 5,820 |
| General Motors Co. | 3.500% | 10/2/18 | 5,600 | 5,656 |
| General Motors Financial Co. Inc. | 2.625% | 7/10/17 | 2,237 | 2,243 |
| General Motors Financial Co. Inc. | 4.750% | 8/15/17 | 6,038 | 6,242 |
| General Motors Financial Co. Inc. | 3.000% | 9/25/17 | 6,524 | 6,557 |
| General Motors Financial Co. Inc. | 3.250% | 5/15/18 | 4,070 | 4,095 |
| General Motors Financial Co. Inc. | 6.750% | 6/1/18 | 7,325 | 7,938 |
| General Motors Financial Co. Inc. | 3.100% | 1/15/19 | 15,500 | 15,539 |
| General Motors Financial Co. Inc. | 3.500% | 7/10/19 | 7,750 | 7,769 |
| General Motors Financial Co. Inc. | 3.150% | 1/15/20 | 5,190 | 5,119 |
| General Motors Financial Co. Inc. | 3.200% | 7/13/20 | 17,857 | 17,545 |
| General Motors Financial Co. Inc. | 3.700% | 11/24/20 | 10,000 | 10,000 |
| Home Depot Inc. | 2.250% | 9/10/18 | 8,075 | 8,252 |
| Home Depot Inc. | 2.000% | 6/15/19 | 8,555 | 8,615 |
| Home Depot Inc. | 3.950% | 9/15/20 | 1,300 | 1,397 |
| Johnson Controls Inc. | 1.400% | 11/2/17 | 5,825 | 5,764 |
| Johnson Controls Inc. | 5.000% | 3/30/20 | 1,575 | 1,692 |
| Lowe's Cos. Inc. | 1.625% | 4/15/17 | 6,625 | 6,664 |
| Lowe's Cos. Inc. | 4.625% | 4/15/20 | 3,900 | 4,234 |
| Macy's Retail Holdings Inc. | 7.450% | 7/15/17 | 1,000 | 1,078 |
| Macy's Retail Holdings Inc. | 3.450% | 1/15/21 | 1,000 | 995 |
| Marriott International Inc. | 6.375% | 6/15/17 | 1,310 | 1,399 |
| Marriott International Inc. | 3.000% | 3/1/19 | 1,500 | 1,520 |
| Marriott International Inc. | 3.375% | 10/15/20 | 3,575 | 3,642 |
| MasterCard Inc. | 2.000% | 4/1/19 | 4,225 | 4,245 |
| McDonald's Corp. | 5.300% | 3/15/17 | 873 | 911 |
| McDonald's Corp. | 5.800% | 10/15/17 | 4,021 | 4,288 |
| McDonald's Corp. | 5.350% | 3/1/18 | 6,594 | 7,070 |
| McDonald's Corp. | 2.100% | 12/7/18 | 4,800 | 4,801 |
| McDonald's Corp. | 1.875% | 5/29/19 | 3,445 | 3,415 |
19
| Vanguard® Short-Term Bond Index Fund | ||||
| Schedule of Investments | ||||
| December 31, 2015 | ||||
| Face | Market | |||
| Maturity | Amount | Value | ||
| Coupon | Date | ($000) | ($000) | |
| McDonald's Corp. | 3.500% | 7/15/20 | 750 | 774 |
| McDonald's Corp. | 2.750% | 12/9/20 | 12,006 | 11,996 |
| Nordstrom Inc. | 6.250% | 1/15/18 | 4,854 | 5,267 |
| Nordstrom Inc. | 4.750% | 5/1/20 | 2,825 | 3,055 |
| PACCAR Financial Corp. | 1.600% | 3/15/17 | 1,350 | 1,353 |
| PACCAR Financial Corp. | 1.100% | 6/6/17 | 4,900 | 4,876 |
| PACCAR Financial Corp. | 1.400% | 11/17/17 | 1,260 | 1,256 |
| PACCAR Financial Corp. | 1.450% | 3/9/18 | 2,450 | 2,434 |
| PACCAR Financial Corp. | 1.400% | 5/18/18 | 2,000 | 1,981 |
| PACCAR Financial Corp. | 1.750% | 8/14/18 | 1,250 | 1,248 |
| PACCAR Financial Corp. | 2.500% | 8/14/20 | 2,000 | 1,985 |
| QVC Inc. | 3.125% | 4/1/19 | 2,250 | 2,224 |
| Ralph Lauren Corp. | 2.125% | 9/26/18 | 1,700 | 1,715 |
| Ralph Lauren Corp. | 2.625% | 8/18/20 | 1,800 | 1,815 |
| Staples Inc. | 2.750% | 1/12/18 | 950 | 944 |
| Starbucks Corp. | 2.000% | 12/5/18 | 3,175 | 3,208 |
| Starwood Hotels & Resorts Worldwide Inc. | 6.750% | 5/15/18 | 2,108 | 2,307 |
| Target Corp. | 5.375% | 5/1/17 | 9,550 | 10,080 |
| Target Corp. | 6.000% | 1/15/18 | 11,870 | 12,931 |
| Target Corp. | 2.300% | 6/26/19 | 8,004 | 8,117 |
| TJX Cos. Inc. | 6.950% | 4/15/19 | 9,703 | 11,168 |
| Toyota Motor Credit Corp. | 2.050% | 1/12/17 | 16,581 | 16,729 |
| Toyota Motor Credit Corp. | 1.125% | 5/16/17 | 2,750 | 2,749 |
| Toyota Motor Credit Corp. | 1.750% | 5/22/17 | 472 | 475 |
| Toyota Motor Credit Corp. | 1.250% | 10/5/17 | 6,012 | 5,992 |
| Toyota Motor Credit Corp. | 1.375% | 1/10/18 | 2,375 | 2,369 |
| Toyota Motor Credit Corp. | 1.450% | 1/12/18 | 8,500 | 8,491 |
| Toyota Motor Credit Corp. | 1.550% | 7/13/18 | 7,900 | 7,878 |
| Toyota Motor Credit Corp. | 2.000% | 10/24/18 | 12,400 | 12,472 |
| Toyota Motor Credit Corp. | 2.100% | 1/17/19 | 3,330 | 3,336 |
| Toyota Motor Credit Corp. | 2.125% | 7/18/19 | 9,700 | 9,696 |
| Toyota Motor Credit Corp. | 2.150% | 3/12/20 | 15,000 | 15,031 |
| Toyota Motor Credit Corp. | 4.500% | 6/17/20 | 2,000 | 2,168 |
| Visa Inc. | 1.200% | 12/14/17 | 16,500 | 16,483 |
| Visa Inc. | 2.200% | 12/14/20 | 20,000 | 19,964 |
| Wal-Mart Stores Inc. | 5.375% | 4/5/17 | 2,572 | 2,708 |
| Wal-Mart Stores Inc. | 1.000% | 4/21/17 | 150 | 150 |
| Wal-Mart Stores Inc. | 5.800% | 2/15/18 | 13,277 | 14,504 |
| Wal-Mart Stores Inc. | 1.125% | 4/11/18 | 8,694 | 8,654 |
| Wal-Mart Stores Inc. | 1.950% | 12/15/18 | 4,675 | 4,743 |
| Wal-Mart Stores Inc. | 4.125% | 2/1/19 | 1,955 | 2,097 |
| Wal-Mart Stores Inc. | 3.625% | 7/8/20 | 13,857 | 14,830 |
| Wal-Mart Stores Inc. | 3.250% | 10/25/20 | 9,575 | 10,094 |
| Walgreen Co. | 5.250% | 1/15/19 | 927 | 991 |
| Walgreens Boots Alliance Inc. | 1.750% | 11/17/17 | 5,918 | 5,884 |
| Walgreens Boots Alliance Inc. | 2.700% | 11/18/19 | 10,615 | 10,615 |
| Western Union Co. | 2.875% | 12/10/17 | 735 | 746 |
| Western Union Co. | 3.650% | 8/22/18 | 3,450 | 3,537 |
| Western Union Co. | 5.253% | 4/1/20 | 200 | 215 |
| Wyndham Worldwide Corp. | 2.950% | 3/1/17 | 3,905 | 3,930 |
| Wyndham Worldwide Corp. | 2.500% | 3/1/18 | 1,110 | 1,106 |
| Consumer Noncyclical (3.7%) | ||||
| Abbott Laboratories | 5.125% | 4/1/19 | 550 | 604 |
| Abbott Laboratories | 2.000% | 3/15/20 | 10,175 | 10,139 |
| Abbott Laboratories | 4.125% | 5/27/20 | 4,825 | 5,218 |
| AbbVie Inc. | 1.750% | 11/6/17 | 23,099 | 23,051 |
| AbbVie Inc. | 1.800% | 5/14/18 | 22,434 | 22,346 |
| AbbVie Inc. | 2.000% | 11/6/18 | 6,400 | 6,374 |
| AbbVie Inc. | 2.500% | 5/14/20 | 28,276 | 27,966 |
| Actavis Funding SCS | 1.850% | 3/1/17 | 12,014 | 12,013 |
| Actavis Funding SCS | 1.300% | 6/15/17 | 8,675 | 8,587 |
| Actavis Funding SCS | 2.350% | 3/12/18 | 18,878 | 18,926 |
| Actavis Funding SCS | 2.450% | 6/15/19 | 4,463 | 4,425 |
20
| Vanguard® Short-Term Bond Index Fund | ||||
| Schedule of Investments | ||||
| December 31, 2015 | ||||
| Face | Market | |||
| Maturity | Amount | Value | ||
| Coupon | Date | ($000) | ($000) | |
| Actavis Funding SCS | 3.000% | 3/12/20 | 26,795 | 26,749 |
| Actavis Inc. | 1.875% | 10/1/17 | 11,022 | 11,007 |
| Agilent Technologies Inc. | 5.000% | 7/15/20 | 3,300 | 3,541 |
| Allergan Inc. | 1.350% | 3/15/18 | 2,975 | 2,915 |
| Allergan Inc. | 3.375% | 9/15/20 | 1,400 | 1,411 |
| Altria Group Inc. | 9.250% | 8/6/19 | 5,124 | 6,277 |
| Altria Group Inc. | 2.625% | 1/14/20 | 11,700 | 11,730 |
| AmerisourceBergen Corp. | 1.150% | 5/15/17 | 6,410 | 6,364 |
| AmerisourceBergen Corp. | 4.875% | 11/15/19 | 2,105 | 2,269 |
| Amgen Inc. | 2.125% | 5/15/17 | 14,348 | 14,438 |
| Amgen Inc. | 1.250% | 5/22/17 | 6,064 | 6,047 |
| Amgen Inc. | 5.850% | 6/1/17 | 9,439 | 9,987 |
| Amgen Inc. | 2.200% | 5/22/19 | 11,225 | 11,211 |
| Amgen Inc. | 2.125% | 5/1/20 | 6,650 | 6,562 |
| Amgen Inc. | 3.450% | 10/1/20 | 9,250 | 9,524 |
| Anheuser-Busch Cos. LLC | 5.500% | 1/15/18 | 9,166 | 9,798 |
| Anheuser-Busch Cos. LLC | 5.000% | 3/1/19 | 750 | 807 |
| Anheuser-Busch InBev Finance Inc. | 1.125% | 1/27/17 | 1,276 | 1,271 |
| Anheuser-Busch InBev Finance Inc. | 1.250% | 1/17/18 | 4,150 | 4,112 |
| Anheuser-Busch InBev Finance Inc. | 2.150% | 2/1/19 | 15,575 | 15,580 |
| Anheuser-Busch InBev Worldwide Inc. | 1.375% | 7/15/17 | 25,762 | 25,685 |
| Anheuser-Busch InBev Worldwide Inc. | 7.750% | 1/15/19 | 15,325 | 17,738 |
| Anheuser-Busch InBev Worldwide Inc. | 5.375% | 1/15/20 | 10,900 | 12,054 |
| Anheuser-Busch InBev Worldwide Inc. | 5.000% | 4/15/20 | 1,855 | 2,038 |
| Archer-Daniels-Midland Co. | 5.450% | 3/15/18 | 3,413 | 3,692 |
| AstraZeneca plc | 5.900% | 9/15/17 | 7,588 | 8,134 |
| AstraZeneca plc | 1.750% | 11/16/18 | 6,600 | 6,578 |
| AstraZeneca plc | 1.950% | 9/18/19 | 5,585 | 5,557 |
| AstraZeneca plc | 2.375% | 11/16/20 | 14,000 | 13,905 |
| 5 Baxalta Inc. | 2.000% | 6/22/18 | 2,300 | 2,275 |
| 5 Baxalta Inc. | 2.875% | 6/23/20 | 6,500 | 6,437 |
| Baxter International Inc. | 5.375% | 6/1/18 | 975 | 1,047 |
| Baxter International Inc. | 1.850% | 6/15/18 | 8,230 | 8,187 |
| Baxter International Inc. | 4.250% | 3/15/20 | 600 | 635 |
| Beam Suntory Inc. | 1.875% | 5/15/17 | 875 | 876 |
| Beam Suntory Inc. | 1.750% | 6/15/18 | 925 | 913 |
| Becton Dickinson & Co. | 1.450% | 5/15/17 | 2,900 | 2,888 |
| Becton Dickinson & Co. | 1.800% | 12/15/17 | 16,751 | 16,727 |
| Becton Dickinson & Co. | 5.000% | 5/15/19 | 125 | 135 |
| Becton Dickinson & Co. | 6.375% | 8/1/19 | 5,085 | 5,748 |
| Becton Dickinson & Co. | 2.675% | 12/15/19 | 9,110 | 9,163 |
| Becton Dickinson & Co. | 3.250% | 11/12/20 | 4,523 | 4,592 |
| Bio-Rad Laboratories Inc. | 4.875% | 12/15/20 | 2,150 | 2,284 |
| Biogen Inc. | 6.875% | 3/1/18 | 5,550 | 6,117 |
| Biogen Inc. | 2.900% | 9/15/20 | 14,710 | 14,659 |
| Boston Scientific Corp. | 5.125% | 1/12/17 | 3,079 | 3,177 |
| Boston Scientific Corp. | 2.650% | 10/1/18 | 5,700 | 5,731 |
| Boston Scientific Corp. | 6.000% | 1/15/20 | 4,100 | 4,555 |
| Boston Scientific Corp. | 2.850% | 5/15/20 | 4,050 | 4,026 |
| Bottling Group LLC | 5.125% | 1/15/19 | 8,600 | 9,417 |
| Bristol-Myers Squibb Co. | 0.875% | 8/1/17 | 5,764 | 5,736 |
| Brown-Forman Corp. | 1.000% | 1/15/18 | 2,275 | 2,243 |
| Bunge Ltd. Finance Corp. | 3.200% | 6/15/17 | 1,060 | 1,071 |
| Bunge Ltd. Finance Corp. | 8.500% | 6/15/19 | 6,750 | 7,836 |
| Bunge Ltd. Finance Corp. | 3.500% | 11/24/20 | 2,900 | 2,885 |
| Campbell Soup Co. | 3.050% | 7/15/17 | 1,000 | 1,023 |
| Cardinal Health Inc. | 1.700% | 3/15/18 | 8,650 | 8,618 |
| Cardinal Health Inc. | 1.950% | 6/15/18 | 1,700 | 1,697 |
| Cardinal Health Inc. | 4.625% | 12/15/20 | 3,725 | 4,055 |
| Catholic Health Initiatives Colorado GO | 1.600% | 11/1/17 | 1,700 | 1,697 |
| Celgene Corp. | 1.900% | 8/15/17 | 4,004 | 4,021 |
| Celgene Corp. | 2.125% | 8/15/18 | 4,450 | 4,448 |
| Celgene Corp. | 2.300% | 8/15/18 | 2,188 | 2,198 |
| Celgene Corp. | 2.250% | 5/15/19 | 4,850 | 4,802 |
21
| Vanguard® Short-Term Bond Index Fund | ||||
| Schedule of Investments | ||||
| December 31, 2015 | ||||
| Face | Market | |||
| Maturity | Amount | Value | ||
| Coupon | Date | ($000) | ($000) | |
| Celgene Corp. | 2.875% | 8/15/20 | 6,600 | 6,551 |
| Celgene Corp. | 3.950% | 10/15/20 | 6,004 | 6,297 |
| Church & Dwight Co. Inc. | 2.450% | 12/15/19 | 2,550 | 2,541 |
| Clorox Co. | 5.950% | 10/15/17 | 4,520 | 4,855 |
| Coca-Cola Co. | 1.650% | 3/14/18 | 1,750 | 1,762 |
| Coca-Cola Co. | 1.150% | 4/1/18 | 7,979 | 7,961 |
| Coca-Cola Co. | 1.650% | 11/1/18 | 14,725 | 14,851 |
| Coca-Cola Co. | 1.875% | 10/27/20 | 5,000 | 4,945 |
| Coca-Cola Co. | 2.450% | 11/1/20 | 7,975 | 8,106 |
| Coca-Cola Co. | 3.150% | 11/15/20 | 3,785 | 3,957 |
| Coca-Cola Enterprises Inc. | 3.500% | 9/15/20 | 4,750 | 4,858 |
| Coca-Cola Femsa SAB de CV | 2.375% | 11/26/18 | 11,945 | 11,965 |
| Coca-Cola Femsa SAB de CV | 4.625% | 2/15/20 | 275 | 295 |
| Colgate-Palmolive Co. | 1.300% | 1/15/17 | 300 | 301 |
| Colgate-Palmolive Co. | 2.625% | 5/1/17 | 3,085 | 3,147 |
| Colgate-Palmolive Co. | 0.900% | 5/1/18 | 3,833 | 3,797 |
| Colgate-Palmolive Co. | 1.500% | 11/1/18 | 1,575 | 1,580 |
| Colgate-Palmolive Co. | 1.750% | 3/15/19 | 4,175 | 4,197 |
| ConAgra Foods Inc. | 1.900% | 1/25/18 | 14,425 | 14,350 |
| ConAgra Foods Inc. | 7.000% | 4/15/19 | 1,036 | 1,167 |
| Covidien International Finance SA | 6.000% | 10/15/17 | 10,918 | 11,763 |
| Covidien International Finance SA | 4.200% | 6/15/20 | 2,550 | 2,729 |
| CR Bard Inc. | 1.375% | 1/15/18 | 3,425 | 3,371 |
| Diageo Capital plc | 1.500% | 5/11/17 | 9,215 | 9,206 |
| Diageo Capital plc | 5.750% | 10/23/17 | 5,501 | 5,908 |
| Diageo Capital plc | 1.125% | 4/29/18 | 3,250 | 3,189 |
| Dignity Health California GO | 2.637% | 11/1/19 | 1,950 | 1,960 |
| Dr Pepper Snapple Group Inc. | 6.820% | 5/1/18 | 4,962 | 5,504 |
| Dr Pepper Snapple Group Inc. | 2.600% | 1/15/19 | 3,550 | 3,565 |
| Dr Pepper Snapple Group Inc. | 2.000% | 1/15/20 | 1,025 | 1,002 |
| Edwards Lifesciences Corp. | 2.875% | 10/15/18 | 3,025 | 3,058 |
| Eli Lilly & Co. | 5.200% | 3/15/17 | 4,345 | 4,550 |
| Eli Lilly & Co. | 1.250% | 3/1/18 | 3,700 | 3,692 |
| Eli Lilly & Co. | 1.950% | 3/15/19 | 3,250 | 3,276 |
| Express Scripts Holding Co. | 2.650% | 2/15/17 | 20,980 | 21,187 |
| Express Scripts Holding Co. | 1.250% | 6/2/17 | 18 | 18 |
| Express Scripts Holding Co. | 7.250% | 6/15/19 | 2,750 | 3,174 |
| General Mills Inc. | 5.700% | 2/15/17 | 1,157 | 1,212 |
| General Mills Inc. | 1.400% | 10/20/17 | 4,300 | 4,280 |
| General Mills Inc. | 5.650% | 2/15/19 | 8,993 | 9,866 |
| General Mills Inc. | 2.200% | 10/21/19 | 8,000 | 8,024 |
| Gilead Sciences Inc. | 1.850% | 9/4/18 | 7,550 | 7,579 |
| Gilead Sciences Inc. | 2.050% | 4/1/19 | 11,725 | 11,744 |
| Gilead Sciences Inc. | 2.350% | 2/1/20 | 1,000 | 1,000 |
| Gilead Sciences Inc. | 2.550% | 9/1/20 | 15,703 | 15,704 |
| GlaxoSmithKline Capital Inc. | 5.650% | 5/15/18 | 14,295 | 15,579 |
| GlaxoSmithKline Capital plc | 1.500% | 5/8/17 | 17,435 | 17,496 |
| Hasbro Inc. | 6.300% | 9/15/17 | 1,375 | 1,473 |
| Hershey Co. | 1.600% | 8/21/18 | 1,600 | 1,607 |
| Hershey Co. | 4.125% | 12/1/20 | 1,450 | 1,566 |
| Hillshire Brands Co. | 4.100% | 9/15/20 | 1,673 | 1,721 |
| Ingredion Inc. | 4.625% | 11/1/20 | 2,100 | 2,212 |
| JM Smucker Co. | 1.750% | 3/15/18 | 2,100 | 2,091 |
| JM Smucker Co. | 2.500% | 3/15/20 | 6,900 | 6,859 |
| Johnson & Johnson | 5.550% | 8/15/17 | 5,655 | 6,049 |
| Johnson & Johnson | 1.125% | 11/21/17 | 2,816 | 2,816 |
| Johnson & Johnson | 5.150% | 7/15/18 | 7,950 | 8,712 |
| Johnson & Johnson | 1.650% | 12/5/18 | 3,475 | 3,506 |
| Johnson & Johnson | 1.875% | 12/5/19 | 3,250 | 3,257 |
| Johnson & Johnson | 2.950% | 9/1/20 | 2,750 | 2,874 |
| Kellogg Co. | 1.750% | 5/17/17 | 475 | 477 |
| Kellogg Co. | 3.250% | 5/21/18 | 5,150 | 5,288 |
| Kellogg Co. | 4.150% | 11/15/19 | 400 | 424 |
| Kellogg Co. | 4.000% | 12/15/20 | 5,068 | 5,330 |
22
| Vanguard® Short-Term Bond Index Fund | ||||
| Schedule of Investments | ||||
| December 31, 2015 | ||||
| Face | Market | |||
| Maturity | Amount | Value | ||
| Coupon | Date | ($000) | ($000) | |
| Kimberly-Clark Corp. | 6.125% | 8/1/17 | 6,958 | 7,484 |
| Kimberly-Clark Corp. | 6.250% | 7/15/18 | 693 | 772 |
| Kimberly-Clark Corp. | 7.500% | 11/1/18 | 2,780 | 3,214 |
| Kimberly-Clark Corp. | 1.900% | 5/22/19 | 4,070 | 4,051 |
| Kimberly-Clark Corp. | 1.850% | 3/1/20 | 1,500 | 1,481 |
| Kimberly-Clark Corp. | 2.150% | 8/15/20 | 1,500 | 1,496 |
| Koninklijke Philips NV | 5.750% | 3/11/18 | 6,117 | 6,547 |
| Kraft Foods Group Inc. | 2.250% | 6/5/17 | 8,800 | 8,863 |
| Kraft Foods Group Inc. | 6.125% | 8/23/18 | 13,398 | 14,749 |
| 5 Kraft Heinz Foods Co. | 1.600% | 6/30/17 | 7,300 | 7,279 |
| 5 Kraft Heinz Foods Co. | 2.000% | 7/2/18 | 8,165 | 8,135 |
| 5 Kraft Heinz Foods Co. | 2.800% | 7/2/20 | 7,405 | 7,381 |
| Kroger Co. | 2.200% | 1/15/17 | 3,252 | 3,284 |
| Kroger Co. | 2.300% | 1/15/19 | 10,150 | 10,156 |
| Kroger Co. | 6.150% | 1/15/20 | 5,949 | 6,698 |
| Laboratory Corp. of America Holdings | 2.200% | 8/23/17 | 3,139 | 3,153 |
| Laboratory Corp. of America Holdings | 2.500% | 11/1/18 | 1,425 | 1,432 |
| Laboratory Corp. of America Holdings | 2.625% | 2/1/20 | 900 | 893 |
| Life Technologies Corp. | 6.000% | 3/1/20 | 5,150 | 5,711 |
| Mattel Inc. | 1.700% | 3/15/18 | 2,606 | 2,578 |
| Mattel Inc. | 2.350% | 5/6/19 | 1,970 | 1,959 |
| McKesson Corp. | 1.292% | 3/10/17 | 9,734 | 9,708 |
| McKesson Corp. | 1.400% | 3/15/18 | 325 | 321 |
| McKesson Corp. | 7.500% | 2/15/19 | 1,989 | 2,277 |
| McKesson Corp. | 2.284% | 3/15/19 | 11,446 | 11,416 |
| Mead Johnson Nutrition Co. | 4.900% | 11/1/19 | 825 | 889 |
| Mead Johnson Nutrition Co. | 3.000% | 11/15/20 | 5,850 | 5,861 |
| Medco Health Solutions Inc. | 7.125% | 3/15/18 | 8,735 | 9,628 |
| Medco Health Solutions Inc. | 4.125% | 9/15/20 | 1,000 | 1,050 |
| Medtronic Inc. | 1.500% | 3/15/18 | 2,800 | 2,799 |
| Medtronic Inc. | 1.375% | 4/1/18 | 9,625 | 9,575 |
| Medtronic Inc. | 5.600% | 3/15/19 | 3,501 | 3,879 |
| Medtronic Inc. | 2.500% | 3/15/20 | 26,250 | 26,407 |
| Medtronic Inc. | 4.450% | 3/15/20 | 10,585 | 11,411 |
| Merck & Co. Inc. | 1.100% | 1/31/18 | 13,650 | 13,563 |
| Merck & Co. Inc. | 1.300% | 5/18/18 | 2,600 | 2,597 |
| Merck & Co. Inc. | 1.850% | 2/10/20 | 5,245 | 5,237 |
| Merck Sharp & Dohme Corp. | 5.000% | 6/30/19 | 6,325 | 6,974 |
| Molson Coors Brewing Co. | 2.000% | 5/1/17 | 250 | 250 |
| Mondelez International Inc. | 6.500% | 8/11/17 | 4,075 | 4,375 |
| Mondelez International Inc. | 6.125% | 2/1/18 | 8,349 | 9,076 |
| Mondelez International Inc. | 6.125% | 8/23/18 | 2,800 | 3,086 |
| Mondelez International Inc. | 2.250% | 2/1/19 | 5,325 | 5,319 |
| Mondelez International Inc. | 5.375% | 2/10/20 | 3,200 | 3,539 |
| Mylan Inc. | 2.600% | 6/24/18 | 4,305 | 4,272 |
| Mylan Inc. | 2.550% | 3/28/19 | 12,713 | 12,542 |
| Newell Rubbermaid Inc. | 2.050% | 12/1/17 | 2,275 | 2,256 |
| Newell Rubbermaid Inc. | 6.250% | 4/15/18 | 100 | 108 |
| Newell Rubbermaid Inc. | 2.150% | 10/15/18 | 2,000 | 1,942 |
| Newell Rubbermaid Inc. | 2.875% | 12/1/19 | 6,500 | 6,273 |
| Novartis Capital Corp. | 4.400% | 4/24/20 | 6,250 | 6,855 |
| Novartis Securities Investment Ltd. | 5.125% | 2/10/19 | 6,025 | 6,606 |
| PepsiCo Inc. | 0.950% | 2/22/17 | 3,924 | 3,917 |
| PepsiCo Inc. | 1.125% | 7/17/17 | 4,268 | 4,265 |
| PepsiCo Inc. | 1.250% | 8/13/17 | 10,028 | 10,034 |
| PepsiCo Inc. | 1.000% | 10/13/17 | 3,000 | 2,985 |
| PepsiCo Inc. | 1.250% | 4/30/18 | 4,825 | 4,808 |
| PepsiCo Inc. | 5.000% | 6/1/18 | 16,788 | 18,144 |
| PepsiCo Inc. | 7.900% | 11/1/18 | 6,906 | 8,084 |
| PepsiCo Inc. | 2.250% | 1/7/19 | 8,725 | 8,840 |
| PepsiCo Inc. | 4.500% | 1/15/20 | 1,000 | 1,086 |
| PepsiCo Inc. | 1.850% | 4/30/20 | 7,750 | 7,680 |
| PepsiCo Inc. | 2.150% | 10/14/20 | 14,550 | 14,466 |
| PepsiCo Inc. | 3.125% | 11/1/20 | 3,750 | 3,882 |
23
| Vanguard® Short-Term Bond Index Fund | ||||
| Schedule of Investments | ||||
| December 31, 2015 | ||||
| Face | Market | |||
| Maturity | Amount | Value | ||
| Coupon | Date | ($000) | ($000) | |
| Perrigo Co. plc | 2.300% | 11/8/18 | 5,550 | 5,470 |
| Pfizer Inc. | 0.900% | 1/15/17 | 10,810 | 10,784 |
| Pfizer Inc. | 6.050% | 3/30/17 | 10 | 11 |
| Pfizer Inc. | 1.100% | 5/15/17 | 8,246 | 8,246 |
| Pfizer Inc. | 1.500% | 6/15/18 | 1,693 | 1,691 |
| Pfizer Inc. | 6.200% | 3/15/19 | 17,548 | 19,752 |
| Pfizer Inc. | 2.100% | 5/15/19 | 14,900 | 14,987 |
| Philip Morris International Inc. | 1.625% | 3/20/17 | 2,904 | 2,920 |
| Philip Morris International Inc. | 1.250% | 8/11/17 | 2,175 | 2,178 |
| Philip Morris International Inc. | 1.125% | 8/21/17 | 12,226 | 12,210 |
| Philip Morris International Inc. | 1.250% | 11/9/17 | 2,018 | 2,015 |
| Philip Morris International Inc. | 5.650% | 5/16/18 | 12,475 | 13,613 |
| Philip Morris International Inc. | 1.875% | 1/15/19 | 4,645 | 4,624 |
| Philip Morris International Inc. | 4.500% | 3/26/20 | 3,411 | 3,711 |
| Procter & Gamble Co. | 1.600% | 11/15/18 | 367 | 369 |
| Procter & Gamble Co. | 4.700% | 2/15/19 | 10,051 | 10,957 |
| Procter & Gamble Co. | 1.900% | 11/1/19 | 4,095 | 4,115 |
| Quest Diagnostics Inc. | 2.700% | 4/1/19 | 2,900 | 2,891 |
| Quest Diagnostics Inc. | 2.500% | 3/30/20 | 2,700 | 2,660 |
| Reynolds American Inc. | 6.750% | 6/15/17 | 4,735 | 5,055 |
| Reynolds American Inc. | 7.750% | 6/1/18 | 150 | 168 |
| Reynolds American Inc. | 2.300% | 6/12/18 | 8,075 | 8,124 |
| Reynolds American Inc. | 8.125% | 6/23/19 | 3,425 | 4,026 |
| Reynolds American Inc. | 6.875% | 5/1/20 | 1,375 | 1,590 |
| Reynolds American Inc. | 3.250% | 6/12/20 | 16,782 | 17,054 |
| Sanofi | 1.250% | 4/10/18 | 11,663 | 11,609 |
| St. Jude Medical Inc. | 2.000% | 9/15/18 | 3,300 | 3,294 |
| St. Jude Medical Inc. | 2.800% | 9/15/20 | 3,300 | 3,303 |
| Stryker Corp. | 1.300% | 4/1/18 | 700 | 694 |
| Stryker Corp. | 4.375% | 1/15/20 | 3,735 | 4,018 |
| Sysco Corp. | 5.250% | 2/12/18 | 3,200 | 3,420 |
| Sysco Corp. | 2.600% | 10/1/20 | 700 | 701 |
| Teva Pharmaceutical Finance IV LLC | 2.250% | 3/18/20 | 5,790 | 5,620 |
| Thermo Fisher Scientific Inc. | 1.300% | 2/1/17 | 613 | 611 |
| Thermo Fisher Scientific Inc. | 1.850% | 1/15/18 | 6,750 | 6,734 |
| Thermo Fisher Scientific Inc. | 2.150% | 12/14/18 | 4,000 | 3,999 |
| Thermo Fisher Scientific Inc. | 2.400% | 2/1/19 | 1,200 | 1,201 |
| Thermo Fisher Scientific Inc. | 4.700% | 5/1/20 | 1,375 | 1,473 |
| Tyson Foods Inc. | 2.650% | 8/15/19 | 11,978 | 11,970 |
| Unilever Capital Corp. | 0.850% | 8/2/17 | 7,475 | 7,436 |
| Unilever Capital Corp. | 4.800% | 2/15/19 | 4,383 | 4,770 |
| Unilever Capital Corp. | 2.200% | 3/6/19 | 4,250 | 4,311 |
| Unilever Capital Corp. | 2.100% | 7/30/20 | 1,200 | 1,196 |
| Whirlpool Corp. | 1.350% | 3/1/17 | 2,325 | 2,321 |
| Whirlpool Corp. | 1.650% | 11/1/17 | 1,000 | 998 |
| Whirlpool Corp. | 2.400% | 3/1/19 | 7,845 | 7,808 |
| Wyeth LLC | 5.450% | 4/1/17 | 1,400 | 1,471 |
| Zimmer Biomet Holdings Inc. | 1.450% | 4/1/17 | 7,110 | 7,075 |
| Zimmer Biomet Holdings Inc. | 2.000% | 4/1/18 | 8,700 | 8,653 |
| Zimmer Biomet Holdings Inc. | 4.625% | 11/30/19 | 1,075 | 1,152 |
| Zimmer Biomet Holdings Inc. | 2.700% | 4/1/20 | 8,418 | 8,328 |
| Zoetis Inc. | 1.875% | 2/1/18 | 3,675 | 3,629 |
| Zoetis Inc. | 3.450% | 11/13/20 | 3,225 | 3,225 |
| Energy (2.4%) | ||||
| Anadarko Petroleum Corp. | 6.375% | 9/15/17 | 13,587 | 14,251 |
| Anadarko Petroleum Corp. | 8.700% | 3/15/19 | 4,465 | 5,095 |
| Anadarko Petroleum Corp. | 6.950% | 6/15/19 | 4,123 | 4,497 |
| Apache Corp. | 6.900% | 9/15/18 | 6,750 | 7,413 |
| Baker Hughes Inc. | 7.500% | 11/15/18 | 1,045 | 1,180 |
| Boardwalk Pipelines LP | 5.500% | 2/1/17 | 2,025 | 2,052 |
| BP Capital Markets plc | 1.846% | 5/5/17 | 8,106 | 8,145 |
| BP Capital Markets plc | 1.375% | 11/6/17 | 9,914 | 9,839 |
| BP Capital Markets plc | 1.674% | 2/13/18 | 5,938 | 5,933 |
24
| Vanguard® Short-Term Bond Index Fund | ||||
| Schedule of Investments | ||||
| December 31, 2015 | ||||
| Face | Market | |||
| Maturity | Amount | Value | ||
| Coupon | Date | ($000) | ($000) | |
| BP Capital Markets plc | 1.375% | 5/10/18 | 12,575 | 12,391 |
| BP Capital Markets plc | 2.241% | 9/26/18 | 5,025 | 5,025 |
| BP Capital Markets plc | 4.750% | 3/10/19 | 5,800 | 6,213 |
| BP Capital Markets plc | 2.237% | 5/10/19 | 22,578 | 22,361 |
| BP Capital Markets plc | 2.315% | 2/13/20 | 8,750 | 8,637 |
| BP Capital Markets plc | 4.500% | 10/1/20 | 7,950 | 8,506 |
| Buckeye Partners LP | 6.050% | 1/15/18 | 650 | 668 |
| Buckeye Partners LP | 2.650% | 11/15/18 | 1,125 | 1,072 |
| Cameron International Corp. | 1.150% | 12/15/16 | 2,700 | 2,673 |
| Cameron International Corp. | 6.375% | 7/15/18 | 10,900 | 11,816 |
| Canadian Natural Resources Ltd. | 5.700% | 5/15/17 | 7,755 | 7,925 |
| Canadian Natural Resources Ltd. | 1.750% | 1/15/18 | 3,175 | 3,104 |
| Canadian Natural Resources Ltd. | 5.900% | 2/1/18 | 1,630 | 1,698 |
| Cenovus Energy Inc. | 5.700% | 10/15/19 | 6,225 | 6,538 |
| Chevron Corp. | 1.344% | 11/9/17 | 16,500 | 16,446 |
| Chevron Corp. | 1.345% | 11/15/17 | 10,204 | 10,165 |
| Chevron Corp. | 1.104% | 12/5/17 | 11,594 | 11,511 |
| Chevron Corp. | 1.365% | 3/2/18 | 9,700 | 9,619 |
| Chevron Corp. | 1.718% | 6/24/18 | 15,950 | 15,865 |
| Chevron Corp. | 1.790% | 11/16/18 | 6,500 | 6,450 |
| Chevron Corp. | 4.950% | 3/3/19 | 383 | 417 |
| Chevron Corp. | 2.193% | 11/15/19 | 13,693 | 13,670 |
| Chevron Corp. | 1.961% | 3/3/20 | 7,950 | 7,819 |
| Chevron Corp. | 2.427% | 6/24/20 | 4,600 | 4,596 |
| Chevron Corp. | 2.419% | 11/17/20 | 7,000 | 6,971 |
| 5 Columbia Pipeline Group Inc. | 2.450% | 6/1/18 | 15,500 | 15,291 |
| 5 Columbia Pipeline Group Inc. | 3.300% | 6/1/20 | 1,000 | 980 |
| ConocoPhillips | 6.650% | 7/15/18 | 2,280 | 2,518 |
| ConocoPhillips | 5.750% | 2/1/19 | 13,475 | 14,579 |
| ConocoPhillips Co. | 1.050% | 12/15/17 | 14,955 | 14,693 |
| ConocoPhillips Co. | 1.500% | 5/15/18 | 7,500 | 7,397 |
| ConocoPhillips Co. | 2.200% | 5/15/20 | 3,100 | 2,998 |
| Devon Energy Corp. | 2.250% | 12/15/18 | 3,945 | 3,634 |
| Devon Energy Corp. | 6.300% | 1/15/19 | 5,075 | 5,232 |
| Diamond Offshore Drilling Inc. | 5.875% | 5/1/19 | 1,425 | 1,447 |
| Dominion Gas Holdings LLC | 2.500% | 12/15/19 | 6,815 | 6,808 |
| Dominion Gas Holdings LLC | 2.800% | 11/15/20 | 4,000 | 4,013 |
| El Paso Natural Gas Co. LLC | 5.950% | 4/15/17 | 3,025 | 3,078 |
| Enable Midstream Partners LP | 2.400% | 5/15/19 | 3,925 | 3,529 |
| Enbridge Energy Partners LP | 6.500% | 4/15/18 | 7,075 | 7,420 |
| Enbridge Energy Partners LP | 9.875% | 3/1/19 | 2,100 | 2,393 |
| Enbridge Energy Partners LP | 4.375% | 10/15/20 | 2,000 | 1,952 |
| Energy Transfer Partners LP | 6.125% | 2/15/17 | 12,200 | 12,461 |
| Energy Transfer Partners LP | 2.500% | 6/15/18 | 3,150 | 2,998 |
| Energy Transfer Partners LP | 6.700% | 7/1/18 | 13,035 | 13,718 |
| Energy Transfer Partners LP | 9.000% | 4/15/19 | 7,018 | 7,722 |
| Energy Transfer Partners LP | 4.150% | 10/1/20 | 8,415 | 7,798 |
| EnLink Midstream Partners LP | 2.700% | 4/1/19 | 2,250 | 2,056 |
| Enterprise Products Operating LLC | 6.300% | 9/15/17 | 8,166 | 8,597 |
| Enterprise Products Operating LLC | 6.650% | 4/15/18 | 4,465 | 4,829 |
| Enterprise Products Operating LLC | 1.650% | 5/7/18 | 10,300 | 10,006 |
| Enterprise Products Operating LLC | 6.500% | 1/31/19 | 3,675 | 4,043 |
| Enterprise Products Operating LLC | 2.550% | 10/15/19 | 3,725 | 3,569 |
| Enterprise Products Operating LLC | 5.250% | 1/31/20 | 3,500 | 3,676 |
| Enterprise Products Operating LLC | 5.200% | 9/1/20 | 2,825 | 2,962 |
| 4 Enterprise Products Operating LLC | 7.000% | 6/1/67 | 3,000 | 2,400 |
| 4 Enterprise Products Operating LLC | 7.034% | 1/15/68 | 7,822 | 7,959 |
| EOG Resources Inc. | 2.500% | 2/1/16 | 1,495 | 1,496 |
| EOG Resources Inc. | 5.875% | 9/15/17 | 10 | 11 |
| EOG Resources Inc. | 6.875% | 10/1/18 | 3,336 | 3,722 |
| EOG Resources Inc. | 5.625% | 6/1/19 | 3,350 | 3,655 |
| EOG Resources Inc. | 2.450% | 4/1/20 | 2,770 | 2,721 |
| EQT Corp. | 6.500% | 4/1/18 | 835 | 878 |
| EQT Corp. | 8.125% | 6/1/19 | 6,780 | 7,325 |
25
| Vanguard® Short-Term Bond Index Fund | ||||
| Schedule of Investments | ||||
| December 31, 2015 | ||||
| Face | Market | |||
| Maturity | Amount | Value | ||
| Coupon | Date | ($000) | ($000) | |
| Exxon Mobil Corp. | 0.921% | 3/15/17 | 12 | 12 |
| Exxon Mobil Corp. | 1.305% | 3/6/18 | 20,175 | 20,130 |
| Exxon Mobil Corp. | 1.819% | 3/15/19 | 2,790 | 2,789 |
| Exxon Mobil Corp. | 1.912% | 3/6/20 | 16,110 | 16,074 |
| FMC Technologies Inc. | 2.000% | 10/1/17 | 1,650 | 1,626 |
| Halliburton Co. | 1.000% | 8/1/16 | 2,150 | 2,146 |
| Halliburton Co. | 2.000% | 8/1/18 | 1,750 | 1,738 |
| Halliburton Co. | 5.900% | 9/15/18 | 4,675 | 5,109 |
| Halliburton Co. | 6.150% | 9/15/19 | 1,525 | 1,716 |
| Halliburton Co. | 2.700% | 11/15/20 | 6,300 | 6,224 |
| Hess Corp. | 8.125% | 2/15/19 | 4,650 | 5,264 |
| Husky Energy Inc. | 7.250% | 12/15/19 | 400 | 447 |
| Kinder Morgan Energy Partners LP | 6.000% | 2/1/17 | 8,000 | 8,164 |
| Kinder Morgan Energy Partners LP | 5.950% | 2/15/18 | 10,903 | 11,178 |
| Kinder Morgan Energy Partners LP | 2.650% | 2/1/19 | 2,516 | 2,342 |
| Kinder Morgan Energy Partners LP | 6.850% | 2/15/20 | 3,850 | 3,989 |
| Kinder Morgan Energy Partners LP | 6.500% | 4/1/20 | 9,915 | 10,122 |
| Kinder Morgan Inc. | 7.000% | 6/15/17 | 4,895 | 5,044 |
| Kinder Morgan Inc. | 2.000% | 12/1/17 | 3,000 | 2,890 |
| Kinder Morgan Inc. | 7.250% | 6/1/18 | 5,789 | 6,032 |
| Kinder Morgan Inc. | 6.500% | 9/15/20 | 2,225 | 2,216 |
| Magellan Midstream Partners LP | 6.550% | 7/15/19 | 685 | 744 |
| Marathon Oil Corp. | 6.000% | 10/1/17 | 12 | 12 |
| Marathon Oil Corp. | 5.900% | 3/15/18 | 6,725 | 6,797 |
| Marathon Oil Corp. | 2.700% | 6/1/20 | 9,900 | 8,705 |
| Marathon Petroleum Corp. | 3.500% | 3/1/16 | 3,550 | 3,559 |
| Marathon Petroleum Corp. | 3.400% | 12/15/20 | 2,500 | 2,454 |
| Murphy Oil Corp. | 2.500% | 12/1/17 | 3,800 | 3,418 |
| Nabors Industries Inc. | 6.150% | 2/15/18 | 7,075 | 7,241 |
| Nabors Industries Inc. | 9.250% | 1/15/19 | 825 | 848 |
| National Fuel Gas Co. | 8.750% | 5/1/19 | 2,000 | 2,272 |
| National Oilwell Varco Inc. | 1.350% | 12/1/17 | 4,150 | 4,060 |
| Noble Energy Inc. | 8.250% | 3/1/19 | 5,518 | 6,171 |
| Noble Holding International Ltd. | 2.500% | 3/15/17 | 1,175 | 1,108 |
| Noble Holding International Ltd. | 4.900% | 8/1/20 | 3,465 | 2,632 |
| Occidental Petroleum Corp. | 1.750% | 2/15/17 | 11,042 | 11,061 |
| Occidental Petroleum Corp. | 1.500% | 2/15/18 | 2,000 | 1,968 |
| ONEOK Partners LP | 2.000% | 10/1/17 | 5,900 | 5,648 |
| ONEOK Partners LP | 3.200% | 9/15/18 | 150 | 143 |
| ONEOK Partners LP | 8.625% | 3/1/19 | 2,400 | 2,647 |
| Panhandle Eastern Pipe Line Co. LP | 6.200% | 11/1/17 | 3,000 | 3,195 |
| Panhandle Eastern Pipe Line Co. LP | 7.000% | 6/15/18 | 800 | 879 |
| Petro-Canada | 6.050% | 5/15/18 | 4,480 | 4,818 |
| Phillips 66 | 2.950% | 5/1/17 | 16,691 | 16,917 |
| Phillips 66 Partners LP | 2.646% | 2/15/20 | 1,600 | 1,517 |
| Pioneer Natural Resources Co. | 6.650% | 3/15/17 | 5,375 | 5,553 |
| Pioneer Natural Resources Co. | 6.875% | 5/1/18 | 2,620 | 2,790 |
| Pioneer Natural Resources Co. | 7.500% | 1/15/20 | 4,000 | 4,248 |
| Pioneer Natural Resources Co. | 3.450% | 1/15/21 | 200 | 185 |
| Plains All American Pipeline LP / PAA Finance Corp. | 6.125% | 1/15/17 | 2,500 | 2,569 |
| Plains All American Pipeline LP / PAA Finance Corp. | 6.500% | 5/1/18 | 1,930 | 1,984 |
| Plains All American Pipeline LP / PAA Finance Corp. | 8.750% | 5/1/19 | 2,000 | 2,198 |
| Plains All American Pipeline LP / PAA Finance Corp. | 5.750% | 1/15/20 | 7,110 | 7,035 |
| Plains All American Pipeline LP / PAA Finance Corp. | 2.600% | 12/15/19 | 2,100 | 1,873 |
| Pride International Inc. | 8.500% | 6/15/19 | 4,745 | 4,622 |
| Pride International Inc. | 6.875% | 8/15/20 | 3,385 | 3,145 |
| REPSOL Oil & Gas Canada Inc. | 7.750% | 6/1/19 | 4,425 | 4,762 |
| Rowan Cos. Inc. | 7.875% | 8/1/19 | 4,500 | 4,459 |
| Shell International Finance BV | 5.200% | 3/22/17 | 5,005 | 5,134 |
| Shell International Finance BV | 1.125% | 8/21/17 | 12,695 | 12,612 |
| Shell International Finance BV | 1.250% | 11/10/17 | 1,500 | 1,492 |
| Shell International Finance BV | 1.900% | 8/10/18 | 13,675 | 13,663 |
| Shell International Finance BV | 1.625% | 11/10/18 | 6,300 | 6,235 |
| Shell International Finance BV | 2.000% | 11/15/18 | 10,000 | 9,980 |
26
Vanguard® Short-Term Bond Index Fund
Schedule of Investments
December 31, 2015
| Face | Market | |||
| Maturity | Amount | Value | ||
| Coupon | Date | ($000) | ($000) | |
| Shell International Finance BV | 4.300% | 9/22/19 | 13,750 | 14,660 |
| Shell International Finance BV | 4.375% | 3/25/20 | 200 | 214 |
| Shell International Finance BV | 2.125% | 5/11/20 | 14,000 | 13,726 |
| Shell International Finance BV | 2.250% | 11/10/20 | 9,000 | 8,860 |
| 5 Southern Natural Gas Co. LLC | 5.900% | 4/1/17 | 5,325 | 5,415 |
| Southwestern Energy Co. | 3.300% | 1/23/18 | 2,750 | 2,166 |
| Southwestern Energy Co. | 4.050% | 1/23/20 | 12,644 | 9,167 |
| Spectra Energy Capital LLC | 6.200% | 4/15/18 | 5,400 | 5,721 |
| Spectra Energy Capital LLC | 8.000% | 10/1/19 | 325 | 370 |
| Spectra Energy Partners LP | 2.950% | 9/25/18 | 1,725 | 1,695 |
| Suncor Energy Inc. | 6.100% | 6/1/18 | 16,572 | 17,797 |
| Total Capital Canada Ltd. | 1.450% | 1/15/18 | 11,175 | 11,126 |
| Total Capital International SA | 1.000% | 8/12/16 | 710 | 710 |
| Total Capital International SA | 1.500% | 2/17/17 | 3,739 | 3,740 |
| Total Capital International SA | 1.550% | 6/28/17 | 9,317 | 9,315 |
| Total Capital International SA | 2.125% | 1/10/19 | 10,975 | 10,966 |
| Total Capital International SA | 2.100% | 6/19/19 | 8,900 | 8,968 |
| Total Capital SA | 2.125% | 8/10/18 | 5,771 | 5,785 |
| Total Capital SA | 4.450% | 6/24/20 | 8,000 | 8,577 |
| TransCanada PipeLines Ltd. | 1.625% | 11/9/17 | 14,000 | 13,929 |
| TransCanada PipeLines Ltd. | 1.875% | 1/12/18 | 6,850 | 6,824 |
| TransCanada PipeLines Ltd. | 6.500% | 8/15/18 | 5,500 | 6,011 |
| TransCanada PipeLines Ltd. | 7.125% | 1/15/19 | 2,575 | 2,871 |
| 4 TransCanada PipeLines Ltd. | 6.350% | 5/15/67 | 5,975 | 4,526 |
| Valero Energy Corp. | 6.125% | 6/15/17 | 12,494 | 13,145 |
| Valero Energy Corp. | 9.375% | 3/15/19 | 2,400 | 2,842 |
| Western Gas Partners LP | 2.600% | 8/15/18 | 4,500 | 4,348 |
| Williams Partners LP | 5.250% | 3/15/20 | 18,185 | 16,889 |
| Williams Partners LP/Williams Partners Finance Corp. | 7.250% | 2/1/17 | 6,250 | 6,505 |
| XTO Energy Inc. | 6.250% | 8/1/17 | 1,557 | 1,678 |
| XTO Energy Inc. | 5.500% | 6/15/18 | 2,910 | 3,169 |
| Other Industrial (0.0%) | ||||
| Yale University Connecticut GO | 2.086% | 4/15/19 | 3,550 | 3,578 |
| Technology (1.7%) | ||||
| Adobe Systems Inc. | 4.750% | 2/1/20 | 1,900 | 2,059 |
| Altera Corp. | 1.750% | 5/15/17 | 3,945 | 3,960 |
| Altera Corp. | 2.500% | 11/15/18 | 15,550 | 15,769 |
| Amphenol Corp. | 1.550% | 9/15/17 | 3,320 | 3,309 |
| Amphenol Corp. | 2.550% | 1/30/19 | 8,435 | 8,450 |
| Apple Inc. | 1.050% | 5/5/17 | 7,805 | 7,810 |
| Apple Inc. | 0.900% | 5/12/17 | 4,650 | 4,642 |
| Apple Inc. | 1.000% | 5/3/18 | 26,037 | 25,841 |
| Apple Inc. | 2.100% | 5/6/19 | 10,000 | 10,120 |
| Apple Inc. | 1.550% | 2/7/20 | 18,000 | 17,720 |
| Apple Inc. | 2.000% | 5/6/20 | 22,350 | 22,296 |
| Applied Materials Inc. | 2.625% | 10/1/20 | 2,700 | 2,698 |
| Arrow Electronics Inc. | 3.000% | 3/1/18 | 2,000 | 1,999 |
| Arrow Electronics Inc. | 6.000% | 4/1/20 | 1,299 | 1,416 |
| Autodesk Inc. | 1.950% | 12/15/17 | 4,075 | 4,058 |
| Autodesk Inc. | 3.125% | 6/15/20 | 1,975 | 1,961 |
| Avnet Inc. | 6.625% | 9/15/16 | 1,435 | 1,481 |
| Baidu Inc. | 2.250% | 11/28/17 | 5,719 | 5,728 |
| Baidu Inc. | 3.250% | 8/6/18 | 5,955 | 6,036 |
| Baidu Inc. | 2.750% | 6/9/19 | 7,300 | 7,254 |
| Baidu Inc. | 3.000% | 6/30/20 | 4,600 | 4,542 |
| Broadcom Corp. | 2.700% | 11/1/18 | 3,966 | 4,005 |
| CA Inc. | 5.375% | 12/1/19 | 825 | 894 |
| CA Inc. | 3.600% | 8/1/20 | 4,325 | 4,420 |
| CDK Global Inc. | 3.300% | 10/15/19 | 1,500 | 1,496 |
| Cisco Systems Inc. | 1.100% | 3/3/17 | 7,286 | 7,289 |
| Cisco Systems Inc. | 3.150% | 3/14/17 | 2,995 | 3,068 |
| Cisco Systems Inc. | 1.650% | 6/15/18 | 8,650 | 8,687 |
27
| Vanguard® Short-Term Bond Index Fund | ||||
| Schedule of Investments | ||||
| December 31, 2015 | ||||
| Face | Market | |||
| Maturity | Amount | Value | ||
| Coupon | Date | ($000) | ($000) | |
| Cisco Systems Inc. | 4.950% | 2/15/19 | 9,701 | 10,603 |
| Cisco Systems Inc. | 2.125% | 3/1/19 | 17,960 | 18,106 |
| Cisco Systems Inc. | 4.450% | 1/15/20 | 12,519 | 13,629 |
| Cisco Systems Inc. | 2.450% | 6/15/20 | 21,700 | 21,911 |
| Computer Sciences Corp. | 6.500% | 3/15/18 | 2,525 | 2,725 |
| Corning Inc. | 1.450% | 11/15/17 | 1,750 | 1,735 |
| Corning Inc. | 6.625% | 5/15/19 | 5,000 | 5,592 |
| Corning Inc. | 4.250% | 8/15/20 | 832 | 873 |
| Dun & Bradstreet Corp. | 3.250% | 12/1/17 | 2,100 | 2,118 |
| EMC Corp. | 1.875% | 6/1/18 | 19,475 | 18,171 |
| EMC Corp. | 2.650% | 6/1/20 | 4,072 | 3,605 |
| Fidelity National Information Services Inc. | 1.450% | 6/5/17 | 3,515 | 3,477 |
| Fidelity National Information Services Inc. | 2.000% | 4/15/18 | 1,882 | 1,851 |
| Fidelity National Information Services Inc. | 2.850% | 10/15/18 | 5,400 | 5,419 |
| Fidelity National Information Services Inc. | 3.625% | 10/15/20 | 12,320 | 12,485 |
| Fiserv Inc. | 2.700% | 6/1/20 | 2,500 | 2,502 |
| Fiserv Inc. | 4.625% | 10/1/20 | 3,047 | 3,255 |
| Flextronics International Ltd. | 4.625% | 2/15/20 | 3,000 | 3,101 |
| 5 Hewlett Packard Enterprise Co. | 2.450% | 10/5/17 | 14,325 | 14,316 |
| 5 Hewlett Packard Enterprise Co. | 2.850% | 10/5/18 | 17,025 | 17,016 |
| 5 Hewlett Packard Enterprise Co. | 3.600% | 10/15/20 | 19,700 | 19,752 |
| HP Inc. | 3.750% | 12/1/20 | 400 | 397 |
| Intel Corp. | 1.350% | 12/15/17 | 33,780 | 33,822 |
| Intel Corp. | 2.450% | 7/29/20 | 3,350 | 3,386 |
| International Business Machines Corp. | 0.450% | 5/6/16 | 2,295 | 2,293 |
| International Business Machines Corp. | 1.250% | 2/6/17 | 5,665 | 5,682 |
| International Business Machines Corp. | 5.700% | 9/14/17 | 15,753 | 16,897 |
| International Business Machines Corp. | 1.125% | 2/6/18 | 3,125 | 3,105 |
| International Business Machines Corp. | 1.250% | 2/8/18 | 8,625 | 8,593 |
| International Business Machines Corp. | 7.625% | 10/15/18 | 6,775 | 7,814 |
| International Business Machines Corp. | 1.950% | 2/12/19 | 12,275 | 12,331 |
| International Business Machines Corp. | 1.625% | 5/15/20 | 1,696 | 1,654 |
| Intuit Inc. | 5.750% | 3/15/17 | 2,460 | 2,578 |
| Jabil Circuit Inc. | 8.250% | 3/15/18 | 1,350 | 1,487 |
| Jabil Circuit Inc. | 5.625% | 12/15/20 | 2,563 | 2,698 |
| Juniper Networks Inc. | 3.300% | 6/15/20 | 1,550 | 1,546 |
| Keysight Technologies Inc. | 3.300% | 10/30/19 | 3,200 | 3,150 |
| KLA-Tencor Corp. | 2.375% | 11/1/17 | 1,275 | 1,276 |
| KLA-Tencor Corp. | 3.375% | 11/1/19 | 1,600 | 1,616 |
| Lam Research Corp. | 2.750% | 3/15/20 | 3,500 | 3,388 |
| Lexmark International Inc. | 6.650% | 6/1/18 | 2,800 | 3,016 |
| Maxim Integrated Products Inc. | 2.500% | 11/15/18 | 3,000 | 3,003 |
| Microsoft Corp. | 0.875% | 11/15/17 | 318 | 317 |
| Microsoft Corp. | 1.000% | 5/1/18 | 150 | 149 |
| Microsoft Corp. | 1.300% | 11/3/18 | 25,350 | 25,280 |
| Microsoft Corp. | 4.200% | 6/1/19 | 6,575 | 7,107 |
| Microsoft Corp. | 1.850% | 2/12/20 | 10,000 | 10,028 |
| Microsoft Corp. | 3.000% | 10/1/20 | 250 | 262 |
| Microsoft Corp. | 2.000% | 11/3/20 | 23,600 | 23,601 |
| National Semiconductor Corp. | 6.600% | 6/15/17 | 2,825 | 3,036 |
| NetApp Inc. | 2.000% | 12/15/17 | 4,850 | 4,821 |
| Oracle Corp. | 1.200% | 10/15/17 | 23,806 | 23,808 |
| Oracle Corp. | 5.750% | 4/15/18 | 6,455 | 7,046 |
| Oracle Corp. | 2.375% | 1/15/19 | 8,856 | 8,977 |
| Oracle Corp. | 5.000% | 7/8/19 | 13,350 | 14,700 |
| Oracle Corp. | 2.250% | 10/8/19 | 19,275 | 19,484 |
| Oracle Corp. | 3.875% | 7/15/20 | 9,625 | 10,282 |
| Pitney Bowes Inc. | 5.750% | 9/15/17 | 2,200 | 2,341 |
| Pitney Bowes Inc. | 5.600% | 3/15/18 | 1,825 | 1,941 |
| Pitney Bowes Inc. | 6.250% | 3/15/19 | 4,549 | 4,949 |
| QUALCOMM Inc. | 1.400% | 5/18/18 | 9,500 | 9,413 |
| QUALCOMM Inc. | 2.250% | 5/20/20 | 10,072 | 9,985 |
| Seagate HDD Cayman | 3.750% | 11/15/18 | 5,667 | 5,625 |
| Symantec Corp. | 2.750% | 6/15/17 | 2,589 | 2,594 |
28
| Vanguard® Short-Term Bond Index Fund | ||||
| Schedule of Investments | ||||
| December 31, 2015 | ||||
| Face | Market | |||
| Maturity | Amount | Value | ||
| Coupon | Date | ($000) | ($000) | |
| Symantec Corp. | 4.200% | 9/15/20 | 2,555 | 2,654 |
| Tech Data Corp. | 3.750% | 9/21/17 | 2,500 | 2,540 |
| Texas Instruments Inc. | 0.875% | 3/12/17 | 150 | 150 |
| Texas Instruments Inc. | 1.650% | 8/3/19 | 3,695 | 3,653 |
| Texas Instruments Inc. | 1.750% | 5/1/20 | 100 | 98 |
| Total System Services Inc. | 2.375% | 6/1/18 | 3,425 | 3,397 |
| Tyco Electronics Group SA | 6.550% | 10/1/17 | 7,369 | 7,968 |
| Tyco Electronics Group SA | 2.350% | 8/1/19 | 3,450 | 3,450 |
| Xerox Corp. | 2.950% | 3/15/17 | 5,825 | 5,871 |
| Xerox Corp. | 6.350% | 5/15/18 | 1,029 | 1,104 |
| Xerox Corp. | 2.750% | 3/15/19 | 13,500 | 13,237 |
| Xerox Corp. | 5.625% | 12/15/19 | 1,075 | 1,151 |
| Xerox Corp. | 2.800% | 5/15/20 | 2,725 | 2,600 |
| Xilinx Inc. | 2.125% | 3/15/19 | 4,825 | 4,779 |
| Transportation (0.3%) | ||||
| Burlington Northern Santa Fe LLC | 5.650% | 5/1/17 | 875 | 921 |
| Burlington Northern Santa Fe LLC | 5.750% | 3/15/18 | 5,121 | 5,529 |
| Burlington Northern Santa Fe LLC | 4.700% | 10/1/19 | 100 | 108 |
| Burlington Northern Santa Fe LLC | 3.600% | 9/1/20 | 175 | 182 |
| Canadian National Railway Co. | 5.800% | 6/1/16 | 1,250 | 1,275 |
| Canadian National Railway Co. | 5.850% | 11/15/17 | 175 | 188 |
| Canadian National Railway Co. | 5.550% | 5/15/18 | 300 | 326 |
| Canadian National Railway Co. | 5.550% | 3/1/19 | 625 | 687 |
| Canadian Pacific Railway Co. | 6.500% | 5/15/18 | 494 | 541 |
| Canadian Pacific Railway Co. | 7.250% | 5/15/19 | 6,705 | 7,657 |
| 4 Continental Airlines 2009-2 Class A Pass Through Trust | 7.250% | 5/10/21 | 2,504 | 2,823 |
| CSX Corp. | 5.600% | 5/1/17 | 3,550 | 3,731 |
| CSX Corp. | 6.250% | 3/15/18 | 9,400 | 10,233 |
| CSX Corp. | 7.375% | 2/1/19 | 2,388 | 2,735 |
| 4 Delta Air Lines 2009-1 Class A Pass Through Trust | 7.750% | 6/17/21 | 2,124 | 2,379 |
| 4 Delta Air Lines 2010-2 Class A Pass Through Trust | 4.950% | 11/23/20 | 1,587 | 1,670 |
| 4 Delta Air Lines 2012-1 Class A Pass Through Trust | 4.750% | 11/7/21 | 1,076 | 1,128 |
| FedEx Corp. | 8.000% | 1/15/19 | 2,690 | 3,133 |
| JB Hunt Transport Services Inc. | 2.400% | 3/15/19 | 1,900 | 1,899 |
| 5 Kansas City Southern | 2.350% | 5/15/20 | 2,150 | 2,062 |
| Norfolk Southern Corp. | 5.750% | 1/15/16 | 1,197 | 1,199 |
| Norfolk Southern Corp. | 7.700% | 5/15/17 | 4,350 | 4,703 |
| Norfolk Southern Corp. | 5.750% | 4/1/18 | 2,825 | 3,051 |
| Norfolk Southern Corp. | 5.900% | 6/15/19 | 2,625 | 2,921 |
| 4 Northwest Airlines 2007-1 Class A Pass Through Trust | 7.027% | 5/1/21 | 1,009 | 1,124 |
| Ryder System Inc. | 2.500% | 3/1/17 | 3,800 | 3,825 |
| Ryder System Inc. | 3.500% | 6/1/17 | 1,500 | 1,533 |
| Ryder System Inc. | 2.500% | 3/1/18 | 2,650 | 2,646 |
| Ryder System Inc. | 2.450% | 11/15/18 | 7,925 | 7,931 |
| Ryder System Inc. | 2.350% | 2/26/19 | 4,135 | 4,128 |
| Ryder System Inc. | 2.550% | 6/1/19 | 350 | 348 |
| Ryder System Inc. | 2.450% | 9/3/19 | 6,200 | 6,113 |
| Ryder System Inc. | 2.500% | 5/11/20 | 3,800 | 3,728 |
| Ryder System Inc. | 2.875% | 9/1/20 | 1,800 | 1,779 |
| Southwest Airlines Co. | 5.125% | 3/1/17 | 290 | 302 |
| Southwest Airlines Co. | 2.750% | 11/6/19 | 4,600 | 4,634 |
| Southwest Airlines Co. | 2.650% | 11/5/20 | 1,670 | 1,662 |
| 4 UAL 2009-2A Pass Through Trust | 9.750% | 7/15/18 | 3,435 | 3,624 |
| Union Pacific Corp. | 5.750% | 11/15/17 | 2,000 | 2,156 |
| Union Pacific Corp. | 5.700% | 8/15/18 | 2,650 | 2,917 |
| Union Pacific Corp. | 2.250% | 2/15/19 | 3,452 | 3,483 |
| Union Pacific Corp. | 1.800% | 2/1/20 | 3,550 | 3,499 |
| Union Pacific Corp. | 2.250% | 6/19/20 | 6,300 | 6,300 |
| United Parcel Service Inc. | 5.500% | 1/15/18 | 6,460 | 7,003 |
| United Parcel Service Inc. | 5.125% | 4/1/19 | 9,961 | 10,991 |
| 5,935,631 | ||||
29
| Vanguard® Short-Term Bond Index Fund | ||||
| Schedule of Investments | ||||
| December 31, 2015 | ||||
| Face | Market | |||
| Maturity | Amount | Value | ||
| Coupon | Date | ($000) | ($000) | |
| Utilities (1.4%) | ||||
| Electric (1.3%) | ||||
| Alabama Power Co. | 5.500% | 10/15/17 | 300 | 319 |
| Ameren Corp. | 2.700% | 11/15/20 | 6,750 | 6,723 |
| Ameren Illinois Co. | 6.125% | 11/15/17 | 2,000 | 2,161 |
| American Electric Power Co. Inc. | 1.650% | 12/15/17 | 6,250 | 6,203 |
| Arizona Public Service Co. | 8.750% | 3/1/19 | 2,535 | 3,011 |
| Arizona Public Service Co. | 2.200% | 1/15/20 | 4,847 | 4,801 |
| Atlantic City Electric Co. | 7.750% | 11/15/18 | 1,550 | 1,789 |
| Baltimore Gas & Electric Co. | 5.900% | 10/1/16 | 2,390 | 2,471 |
| Berkshire Hathaway Energy Co. | 1.100% | 5/15/17 | 3,925 | 3,892 |
| Berkshire Hathaway Energy Co. | 5.750% | 4/1/18 | 4,525 | 4,888 |
| Berkshire Hathaway Energy Co. | 2.000% | 11/15/18 | 1,825 | 1,813 |
| Berkshire Hathaway Energy Co. | 2.400% | 2/1/20 | 2,000 | 1,981 |
| CenterPoint Energy Inc. | 6.500% | 5/1/18 | 2,550 | 2,781 |
| Cleveland Electric Illuminating Co. | 5.700% | 4/1/17 | 519 | 538 |
| Cleveland Electric Illuminating Co. | 8.875% | 11/15/18 | 900 | 1,055 |
| CMS Energy Corp. | 6.550% | 7/17/17 | 2,500 | 2,672 |
| CMS Energy Corp. | 5.050% | 2/15/18 | 2,800 | 2,959 |
| CMS Energy Corp. | 8.750% | 6/15/19 | 4,925 | 5,890 |
| Commonwealth Edison Co. | 1.950% | 9/1/16 | 4,397 | 4,417 |
| Commonwealth Edison Co. | 6.150% | 9/15/17 | 2,525 | 2,713 |
| Commonwealth Edison Co. | 5.800% | 3/15/18 | 757 | 821 |
| Commonwealth Edison Co. | 2.150% | 1/15/19 | 4,375 | 4,356 |
| Commonwealth Edison Co. | 4.000% | 8/1/20 | 3,651 | 3,860 |
| Connecticut Light & Power Co. | 5.650% | 5/1/18 | 780 | 848 |
| Consolidated Edison Co. of New York Inc. | 5.850% | 4/1/18 | 6,095 | 6,605 |
| Consolidated Edison Co. of New York Inc. | 7.125% | 12/1/18 | 1,675 | 1,912 |
| Consolidated Edison Co. of New York Inc. | 6.650% | 4/1/19 | 3,550 | 4,030 |
| Consolidated Edison Co. of New York Inc. | 4.450% | 6/15/20 | 425 | 461 |
| Constellation Energy Group Inc. | 5.150% | 12/1/20 | 2,035 | 2,210 |
| Consumers Energy Co. | 5.650% | 9/15/18 | 2,625 | 2,868 |
| Consumers Energy Co. | 6.125% | 3/15/19 | 8,600 | 9,641 |
| Consumers Energy Co. | 6.700% | 9/15/19 | 150 | 173 |
| Dayton Power & Light Co. | 1.875% | 9/15/16 | 1,850 | 1,852 |
| Dominion Resources Inc. | 1.250% | 3/15/17 | 2,225 | 2,211 |
| Dominion Resources Inc. | 1.400% | 9/15/17 | 3,700 | 3,663 |
| Dominion Resources Inc. | 6.400% | 6/15/18 | 864 | 946 |
| Dominion Resources Inc. | 5.200% | 8/15/19 | 1,650 | 1,797 |
| Dominion Resources Inc. | 2.500% | 12/1/19 | 7,900 | 7,871 |
| DTE Electric Co. | 5.600% | 6/15/18 | 35 | 38 |
| DTE Electric Co. | 3.450% | 10/1/20 | 1,855 | 1,939 |
| DTE Energy Co. | 2.400% | 12/1/19 | 3,150 | 3,137 |
| Duke Energy Carolinas LLC | 5.100% | 4/15/18 | 6,702 | 7,193 |
| Duke Energy Carolinas LLC | 7.000% | 11/15/18 | 640 | 730 |
| Duke Energy Carolinas LLC | 4.300% | 6/15/20 | 2,800 | 3,030 |
| Duke Energy Corp. | 1.625% | 8/15/17 | 7,347 | 7,337 |
| Duke Energy Corp. | 2.100% | 6/15/18 | 3,950 | 3,957 |
| Duke Energy Corp. | 6.250% | 6/15/18 | 695 | 763 |
| Duke Energy Corp. | 5.050% | 9/15/19 | 1,050 | 1,142 |
| Duke Energy Florida LLC | 5.650% | 6/15/18 | 4,847 | 5,291 |
| Duke Energy Indiana Inc. | 3.750% | 7/15/20 | 3,874 | 4,080 |
| Duke Energy Ohio Inc. | 5.450% | 4/1/19 | 2,743 | 3,016 |
| Duke Energy Progress LLC | 5.300% | 1/15/19 | 3,575 | 3,928 |
| Edison International | 3.750% | 9/15/17 | 932 | 962 |
| Entergy Corp. | 5.125% | 9/15/20 | 5,725 | 6,153 |
| Entergy Gulf States Louisiana LLC | 6.000% | 5/1/18 | 7,000 | 7,650 |
| Entergy Gulf States Louisiana LLC | 3.950% | 10/1/20 | 500 | 527 |
| Entergy Texas Inc. | 7.125% | 2/1/19 | 4,435 | 5,019 |
| Eversource Energy | 1.450% | 5/1/18 | 4,015 | 3,949 |
| Eversource Energy | 4.500% | 11/15/19 | 2,425 | 2,587 |
| Exelon Corp. | 1.550% | 6/9/17 | 2,110 | 2,103 |
| Exelon Corp. | 2.850% | 6/15/20 | 3,500 | 3,495 |
| Exelon Generation Co. LLC | 6.200% | 10/1/17 | 5,241 | 5,592 |
30
| Vanguard® Short-Term Bond Index Fund | ||||
| Schedule of Investments | ||||
| December 31, 2015 | ||||
| Face | Market | |||
| Maturity | Amount | Value | ||
| Coupon | Date | ($000) | ($000) | |
| Exelon Generation Co. LLC | 5.200% | 10/1/19 | 2,150 | 2,316 |
| Exelon Generation Co. LLC | 2.950% | 1/15/20 | 9,200 | 9,169 |
| Exelon Generation Co. LLC | 4.000% | 10/1/20 | 625 | 644 |
| Florida Power & Light Co. | 5.550% | 11/1/17 | 1,850 | 1,979 |
| Georgia Power Co. | 5.700% | 6/1/17 | 3,700 | 3,906 |
| Georgia Power Co. | 5.400% | 6/1/18 | 3,510 | 3,818 |
| Georgia Power Co. | 1.950% | 12/1/18 | 7,725 | 7,702 |
| Indiana Michigan Power Co. | 7.000% | 3/15/19 | 4,772 | 5,410 |
| Jersey Central Power & Light Co. | 5.650% | 6/1/17 | 1,550 | 1,628 |
| Kansas City Power & Light Co. | 5.850% | 6/15/17 | 125 | 132 |
| Kansas City Power & Light Co. | 7.150% | 4/1/19 | 5,200 | 5,993 |
| LG&E & KU Energy LLC | 3.750% | 11/15/20 | 6,470 | 6,682 |
| Metropolitan Edison Co. | 7.700% | 1/15/19 | 2,423 | 2,760 |
| MidAmerican Energy Co. | 5.950% | 7/15/17 | 925 | 981 |
| MidAmerican Energy Co. | 5.300% | 3/15/18 | 900 | 967 |
| National Rural Utilities Cooperative Finance Corp. | 5.450% | 4/10/17 | 6,045 | 6,332 |
| National Rural Utilities Cooperative Finance Corp. | 0.950% | 4/24/17 | 3,494 | 3,478 |
| National Rural Utilities Cooperative Finance Corp. | 5.450% | 2/1/18 | 10,535 | 11,276 |
| National Rural Utilities Cooperative Finance Corp. | 10.375% | 11/1/18 | 125 | 153 |
| National Rural Utilities Cooperative Finance Corp. | 2.150% | 2/1/19 | 9,250 | 9,264 |
| National Rural Utilities Cooperative Finance Corp. | 2.300% | 11/15/19 | 400 | 398 |
| National Rural Utilities Cooperative Finance Corp. | 2.000% | 1/27/20 | 7,524 | 7,386 |
| National Rural Utilities Cooperative Finance Corp. | 2.300% | 11/1/20 | 3,325 | 3,294 |
| Nevada Power Co. | 6.500% | 5/15/18 | 4,725 | 5,264 |
| Nevada Power Co. | 6.500% | 8/1/18 | 6,765 | 7,508 |
| Nevada Power Co. | 7.125% | 3/15/19 | 2,200 | 2,516 |
| NextEra Energy Capital Holdings Inc. | 6.000% | 3/1/19 | 2,850 | 3,122 |
| NextEra Energy Capital Holdings Inc. | 2.400% | 9/15/19 | 2,150 | 2,120 |
| NextEra Energy Capital Holdings Inc. | 2.700% | 9/15/19 | 2,000 | 1,993 |
| 4 NextEra Energy Capital Holdings Inc. | 6.650% | 6/15/67 | 5,050 | 3,838 |
| Northern States Power Co. | 5.250% | 3/1/18 | 2,325 | 2,495 |
| Northern States Power Co. | 2.200% | 8/15/20 | 2,300 | 2,284 |
| NorthWestern Corp. | 6.340% | 4/1/19 | 2,000 | 2,250 |
| NSTAR Electric Co. | 5.625% | 11/15/17 | 3,025 | 3,235 |
| Ohio Power Co. | 6.050% | 5/1/18 | 4,990 | 5,420 |
| Oncor Electric Delivery Co. LLC | 5.000% | 9/30/17 | 2,000 | 2,101 |
| Oncor Electric Delivery Co. LLC | 6.800% | 9/1/18 | 1,215 | 1,350 |
| Oncor Electric Delivery Co. LLC | 2.150% | 6/1/19 | 4,400 | 4,329 |
| Pacific Gas & Electric Co. | 5.625% | 11/30/17 | 11,834 | 12,649 |
| Pacific Gas & Electric Co. | 8.250% | 10/15/18 | 2,625 | 3,051 |
| Pacific Gas & Electric Co. | 3.500% | 10/1/20 | 5,910 | 6,146 |
| PacifiCorp | 5.650% | 7/15/18 | 6,050 | 6,593 |
| PacifiCorp | 5.500% | 1/15/19 | 5,740 | 6,299 |
| Peco Energy Co. | 1.200% | 10/15/16 | 5,930 | 5,937 |
| Peco Energy Co. | 5.350% | 3/1/18 | 3,782 | 4,064 |
| Pennsylvania Electric Co. | 6.050% | 9/1/17 | 2,550 | 2,715 |
| Pennsylvania Electric Co. | 5.200% | 4/1/20 | 1,550 | 1,653 |
| PG&E Corp. | 2.400% | 3/1/19 | 6,100 | 6,104 |
| Portland General Electric Co. | 6.100% | 4/15/19 | 2,855 | 3,185 |
| PPL Capital Funding Inc. | 1.900% | 6/1/18 | 11,060 | 10,961 |
| Progress Energy Inc. | 7.050% | 3/15/19 | 1,650 | 1,872 |
| Progress Energy Inc. | 4.875% | 12/1/19 | 2,736 | 2,934 |
| PSEG Power LLC | 5.125% | 4/15/20 | 4,037 | 4,357 |
| Public Service Co. of Colorado | 5.125% | 6/1/19 | 2,425 | 2,663 |
| Public Service Co. of Colorado | 3.200% | 11/15/20 | 1,800 | 1,859 |
| Public Service Co. of New Mexico | 7.950% | 5/15/18 | 3,531 | 3,947 |
| Public Service Co. of Oklahoma | 5.150% | 12/1/19 | 1,725 | 1,887 |
| Public Service Electric & Gas Co. | 2.300% | 9/15/18 | 11,725 | 11,853 |
| Public Service Electric & Gas Co. | 2.000% | 8/15/19 | 3,000 | 2,979 |
| Public Service Electric & Gas Co. | 3.500% | 8/15/20 | 1,375 | 1,436 |
| Puget Energy Inc. | 6.500% | 12/15/20 | 2,100 | 2,405 |
| South Carolina Electric & Gas Co. | 5.250% | 11/1/18 | 5,433 | 5,900 |
| South Carolina Electric & Gas Co. | 6.500% | 11/1/18 | 813 | 914 |
| Southern California Edison Co. | 1.125% | 5/1/17 | 6,960 | 6,914 |
31
| Vanguard® Short-Term Bond Index Fund | ||||
| Schedule of Investments | ||||
| December 31, 2015 | ||||
| Face | Market | |||
| Maturity | Amount | Value | ||
| Coupon | Date | ($000) | ($000) | |
| Southern California Edison Co. | 5.500% | 8/15/18 | 5,565 | 6,063 |
| Southern Co. | 1.300% | 8/15/17 | 2,350 | 2,328 |
| Southern Co. | 2.150% | 9/1/19 | 2,675 | 2,620 |
| Southern Co. | 2.750% | 6/15/20 | 9,850 | 9,735 |
| Southern Power Co. | 1.850% | 12/1/17 | 8,000 | 7,996 |
| Southwestern Electric Power Co. | 5.550% | 1/15/17 | 2,825 | 2,939 |
| Southwestern Electric Power Co. | 5.875% | 3/1/18 | 250 | 270 |
| Southwestern Electric Power Co. | 6.450% | 1/15/19 | 3,772 | 4,215 |
| Tampa Electric Co. | 6.100% | 5/15/18 | 2,845 | 3,101 |
| TECO Finance Inc. | 5.150% | 3/15/20 | 5,100 | 5,487 |
| TransAlta Corp. | 6.900% | 5/15/18 | 3,550 | 3,614 |
| Union Electric Co. | 5.400% | 2/1/16 | 5,000 | 5,017 |
| Union Electric Co. | 6.700% | 2/1/19 | 2,025 | 2,301 |
| Virginia Electric & Power Co. | 5.400% | 1/15/16 | 100 | 100 |
| Virginia Electric & Power Co. | 5.950% | 9/15/17 | 2,587 | 2,781 |
| Virginia Electric & Power Co. | 1.200% | 1/15/18 | 6,330 | 6,268 |
| Virginia Electric & Power Co. | 5.400% | 4/30/18 | 125 | 135 |
| WEC Energy Group Inc. | 1.650% | 6/15/18 | 1,800 | 1,786 |
| WEC Energy Group Inc. | 2.450% | 6/15/20 | 2,000 | 1,990 |
| 4 WEC Energy Group Inc. | 6.110% | 12/1/66 | 1,650 | 1,254 |
| 4 WEC Energy Group Inc. | 6.250% | 5/15/67 | 3,100 | 2,310 |
| Wisconsin Electric Power Co. | 1.700% | 6/15/18 | 500 | 498 |
| Wisconsin Electric Power Co. | 4.250% | 12/15/19 | 350 | 376 |
| Wisconsin Power & Light Co. | 5.000% | 7/15/19 | 2,260 | 2,479 |
| Wisconsin Public Service Corp. | 1.650% | 12/4/18 | 9,700 | 9,627 |
| Xcel Energy Inc. | 1.200% | 6/1/17 | 750 | 746 |
| Xcel Energy Inc. | 4.700% | 5/15/20 | 5,235 | 5,627 |
| Natural Gas (0.1%) | ||||
| AGL Capital Corp. | 5.250% | 8/15/19 | 225 | 242 |
| Atmos Energy Corp. | 6.350% | 6/15/17 | 45 | 48 |
| British Transco Finance Inc. | 6.625% | 6/1/18 | 350 | 387 |
| CenterPoint Energy Resources Corp. | 6.125% | 11/1/17 | 3,587 | 3,860 |
| CenterPoint Energy Resources Corp. | 6.000% | 5/15/18 | 5,310 | 5,752 |
| NiSource Finance Corp. | 6.400% | 3/15/18 | 7,840 | 8,541 |
| NiSource Finance Corp. | 6.800% | 1/15/19 | 1,888 | 2,119 |
| NiSource Finance Corp. | 5.450% | 9/15/20 | 150 | 164 |
| ONE Gas Inc. | 2.070% | 2/1/19 | 5,675 | 5,643 |
| Sempra Energy | 2.300% | 4/1/17 | 6,450 | 6,498 |
| Sempra Energy | 6.150% | 6/15/18 | 11,000 | 12,004 |
| Sempra Energy | 9.800% | 2/15/19 | 3,445 | 4,170 |
| Sempra Energy | 2.400% | 3/15/20 | 2,975 | 2,907 |
| Sempra Energy | 2.850% | 11/15/20 | 3,350 | 3,349 |
| Other Utility (0.0%) | ||||
| American Water Capital Corp. | 6.085% | 10/15/17 | 200 | 215 |
| 617,152 | ||||
| Total Corporate Bonds (Cost $11,276,219) | 11,206,634 | |||
| Sovereign Bonds (U.S. Dollar-Denominated) (6.9%) | ||||
| African Development Bank | 1.125% | 3/15/17 | 9,085 | 9,100 |
| African Development Bank | 0.875% | 5/15/17 | 7,000 | 6,983 |
| African Development Bank | 0.875% | 3/15/18 | 30,500 | 30,231 |
| African Development Bank | 1.625% | 10/2/18 | 5,400 | 5,427 |
| African Development Bank | 1.375% | 2/12/20 | 3,650 | 3,587 |
| Agricultural Bank Of China | 2.000% | 5/21/18 | 2,250 | 2,237 |
| Agricultural Bank Of China | 2.750% | 5/21/20 | 2,100 | 2,086 |
| Asian Development Bank | 0.750% | 1/11/17 | 15,600 | 15,572 |
| Asian Development Bank | 1.125% | 3/15/17 | 18,875 | 18,906 |
| Asian Development Bank | 5.250% | 6/12/17 | 3,300 | 3,495 |
| Asian Development Bank | 0.750% | 7/28/17 | 24,070 | 23,941 |
| Asian Development Bank | 1.125% | 6/5/18 | 22,000 | 21,826 |
| Asian Development Bank | 5.593% | 7/16/18 | 6,380 | 6,984 |
| Asian Development Bank | 1.750% | 9/11/18 | 7,550 | 7,619 |
32
| Vanguard® Short-Term Bond Index Fund | ||||
| Schedule of Investments | ||||
| December 31, 2015 | ||||
| Face | Market | |||
| Maturity | Amount | Value | ||
| Coupon | Date | ($000) | ($000) | |
| Asian Development Bank | 1.500% | 9/28/18 | 600 | 601 |
| Asian Development Bank | 1.875% | 10/23/18 | 4,260 | 4,312 |
| Asian Development Bank | 1.750% | 3/21/19 | 13,200 | 13,282 |
| Asian Development Bank | 1.875% | 4/12/19 | 3,900 | 3,939 |
| Asian Development Bank | 1.500% | 1/22/20 | 8,400 | 8,308 |
| Asian Development Bank | 1.375% | 3/23/20 | 4,000 | 3,936 |
| Asian Development Bank | 1.625% | 8/26/20 | 10,000 | 9,908 |
| Banco do Brasil SA | 3.875% | 1/23/17 | 2,275 | 2,276 |
| Canada | 0.875% | 2/14/17 | 25,400 | 25,363 |
| Canada | 1.125% | 3/19/18 | 21,500 | 21,418 |
| Canada | 1.625% | 2/27/19 | 6,870 | 6,883 |
| CNOOC Finance 2013 Ltd. | 1.750% | 5/9/18 | 9,475 | 9,348 |
| CNOOC Finance 2015 Australia Pty Ltd. | 2.625% | 5/5/20 | 2,825 | 2,762 |
| CNOOC Nexen Finance 2014 ULC | 1.625% | 4/30/17 | 7,300 | 7,263 |
| Corp. Andina de Fomento | 5.750% | 1/12/17 | 1,415 | 1,474 |
| Corp. Andina de Fomento | 1.500% | 8/8/17 | 15,750 | 15,670 |
| Corp. Andina de Fomento | 8.125% | 6/4/19 | 4,705 | 5,534 |
| Council Of Europe Development Bank | 1.500% | 2/22/17 | 2,350 | 2,362 |
| Council Of Europe Development Bank | 1.500% | 6/19/17 | 14,675 | 14,754 |
| Council Of Europe Development Bank | 1.000% | 3/7/18 | 6,075 | 6,032 |
| Council Of Europe Development Bank | 1.125% | 5/31/18 | 6,775 | 6,732 |
| Council Of Europe Development Bank | 1.750% | 11/14/19 | 2,000 | 2,000 |
| Council Of Europe Development Bank | 1.625% | 3/10/20 | 9,755 | 9,662 |
| 6 Development Bank of Japan Inc. | 5.125% | 2/1/17 | 3,650 | 3,803 |
| Ecopetrol SA | 4.250% | 9/18/18 | 5,000 | 4,994 |
| Ecopetrol SA | 7.625% | 7/23/19 | 10,050 | 10,927 |
| European Bank for Reconstruction & Development | 2.500% | 3/15/16 | 11,950 | 11,994 |
| European Bank for Reconstruction & Development | 1.375% | 10/20/16 | 7,600 | 7,628 |
| European Bank for Reconstruction & Development | 1.000% | 2/16/17 | 12,350 | 12,352 |
| European Bank for Reconstruction & Development | 0.750% | 9/1/17 | 10,125 | 10,061 |
| European Bank for Reconstruction & Development | 1.000% | 6/15/18 | 8,100 | 8,028 |
| European Bank for Reconstruction & Development | 1.000% | 9/17/18 | 18,850 | 18,596 |
| European Bank for Reconstruction & Development | 1.625% | 11/15/18 | 8,775 | 8,808 |
| European Bank for Reconstruction & Development | 1.750% | 6/14/19 | 8,000 | 8,026 |
| European Bank for Reconstruction & Development | 1.750% | 11/26/19 | 4,250 | 4,245 |
| European Bank for Reconstruction & Development | 1.500% | 3/16/20 | 7,650 | 7,541 |
| European Investment Bank | 1.125% | 12/15/16 | 37,050 | 37,084 |
| European Investment Bank | 4.875% | 1/17/17 | 19,600 | 20,365 |
| European Investment Bank | 1.750% | 3/15/17 | 20,100 | 20,271 |
| European Investment Bank | 0.875% | 4/18/17 | 26,400 | 26,316 |
| European Investment Bank | 5.125% | 5/30/17 | 25,100 | 26,505 |
| European Investment Bank | 1.625% | 6/15/17 | 19,000 | 19,143 |
| European Investment Bank | 1.000% | 8/17/17 | 30,950 | 30,858 |
| European Investment Bank | 1.125% | 9/15/17 | 32,350 | 32,274 |
| European Investment Bank | 1.000% | 12/15/17 | 19,700 | 19,592 |
| European Investment Bank | 1.000% | 3/15/18 | 17,900 | 17,767 |
| European Investment Bank | 1.250% | 5/15/18 | 15,500 | 15,446 |
| European Investment Bank | 1.000% | 6/15/18 | 30,800 | 30,512 |
| European Investment Bank | 1.125% | 8/15/18 | 21,975 | 21,753 |
| European Investment Bank | 1.625% | 12/18/18 | 13,500 | 13,541 |
| European Investment Bank | 1.875% | 3/15/19 | 40,200 | 40,542 |
| European Investment Bank | 1.750% | 6/17/19 | 46,700 | 46,808 |
| European Investment Bank | 1.625% | 3/16/20 | 12,150 | 12,034 |
| European Investment Bank | 1.375% | 6/15/20 | 30,450 | 29,794 |
| European Investment Bank | 2.875% | 9/15/20 | 2,500 | 2,605 |
| European Investment Bank | 1.625% | 12/15/20 | 12,615 | 12,380 |
| Export Development Canada | 1.250% | 10/26/16 | 8,000 | 8,019 |
| 7 Export Development Canada | 1.000% | 5/15/17 | 9,925 | 9,910 |
| Export Development Canada | 0.750% | 12/15/17 | 2,950 | 2,904 |
| Export Development Canada | 1.000% | 6/15/18 | 9,075 | 8,990 |
| Export Development Canada | 1.500% | 10/3/18 | 3,800 | 3,802 |
| Export Development Canada | 1.000% | 11/1/18 | 6,000 | 5,930 |
| 7 Export Development Canada | 1.750% | 8/19/19 | 3,800 | 3,808 |
| 7 Export Development Canada | 1.625% | 12/3/19 | 12,200 | 12,142 |
33
| Vanguard® Short-Term Bond Index Fund | ||||
| Schedule of Investments | ||||
| December 31, 2015 | ||||
| Face | Market | |||
| Maturity | Amount | Value | ||
| Coupon | Date | ($000) | ($000) | |
| Export-Import Bank of Korea | 4.000% | 1/11/17 | 21,000 | 21,511 |
| Export-Import Bank of Korea | 1.750% | 2/27/18 | 3,250 | 3,232 |
| Export-Import Bank of Korea | 2.875% | 9/17/18 | 7,900 | 8,057 |
| Export-Import Bank of Korea | 2.375% | 8/12/19 | 1,650 | 1,656 |
| Export-Import Bank of Korea | 2.250% | 1/21/20 | 500 | 496 |
| Export-Import Bank of Korea | 5.125% | 6/29/20 | 6,400 | 7,090 |
| Federative Republic of Brazil | 6.000% | 1/17/17 | 4,280 | 4,398 |
| FMS Wertmanagement AoeR | 0.625% | 1/30/17 | 16,100 | 16,018 |
| FMS Wertmanagement AoeR | 1.125% | 9/5/17 | 5,600 | 5,582 |
| FMS Wertmanagement AoeR | 1.000% | 11/21/17 | 9,725 | 9,661 |
| FMS Wertmanagement AoeR | 1.250% | 7/30/18 | 9,700 | 9,632 |
| FMS Wertmanagement AoeR | 1.625% | 11/20/18 | 14,450 | 14,496 |
| FMS Wertmanagement AoeR | 1.750% | 3/17/20 | 8,500 | 8,441 |
| Hydro-Quebec | 1.375% | 6/19/17 | 6,100 | 6,091 |
| Industrial & Commercial Bank of China Ltd. | 2.351% | 11/13/17 | 8,900 | 8,933 |
| Industrial & Commercial Bank of China Ltd. | 3.231% | 11/13/19 | 6,250 | 6,368 |
| Inter-American Development Bank | 1.375% | 10/18/16 | 200 | 201 |
| Inter-American Development Bank | 1.125% | 3/15/17 | 23,985 | 24,018 |
| Inter-American Development Bank | 1.000% | 7/14/17 | 15,300 | 15,276 |
| Inter-American Development Bank | 2.375% | 8/15/17 | 8,800 | 8,975 |
| Inter-American Development Bank | 0.875% | 3/15/18 | 13,725 | 13,609 |
| Inter-American Development Bank | 1.750% | 8/24/18 | 14,725 | 14,865 |
| Inter-American Development Bank | 1.125% | 8/28/18 | 16,550 | 16,389 |
| Inter-American Development Bank | 4.250% | 9/10/18 | 200 | 215 |
| Inter-American Development Bank | 1.125% | 9/12/19 | 9,200 | 9,021 |
| Inter-American Development Bank | 3.875% | 9/17/19 | 10,500 | 11,298 |
| Inter-American Development Bank | 1.750% | 10/15/19 | 18,200 | 18,233 |
| Inter-American Development Bank | 3.875% | 2/14/20 | 5,675 | 6,138 |
| Inter-American Development Bank | 1.875% | 6/16/20 | 33,800 | 33,817 |
| Inter-American Development Bank | 2.125% | 11/9/20 | 11,750 | 11,837 |
| International Bank for Reconstruction & Development | 0.750% | 12/15/16 | 10,950 | 10,933 |
| International Bank for Reconstruction & Development | 0.875% | 4/17/17 | 26,900 | 26,855 |
| International Bank for Reconstruction & Development | 1.125% | 7/18/17 | 11,700 | 11,702 |
| International Bank for Reconstruction & Development | 1.000% | 11/15/17 | 14,300 | 14,254 |
| International Bank for Reconstruction & Development | 1.375% | 4/10/18 | 22,400 | 22,444 |
| International Bank for Reconstruction & Development | 1.000% | 6/15/18 | 40,000 | 39,636 |
| International Bank for Reconstruction & Development | 1.000% | 10/5/18 | 23,000 | 22,753 |
| International Bank for Reconstruction & Development | 1.875% | 3/15/19 | 28,500 | 28,778 |
| International Bank for Reconstruction & Development | 1.875% | 10/7/19 | 19,600 | 19,731 |
| International Bank for Reconstruction & Development | 2.125% | 11/1/20 | 26,000 | 26,264 |
| International Finance Corp. | 2.250% | 4/11/16 | 3,500 | 3,515 |
| International Finance Corp. | 1.000% | 4/24/17 | 18,950 | 18,898 |
| International Finance Corp. | 2.125% | 11/17/17 | 1,050 | 1,064 |
| International Finance Corp. | 0.875% | 6/15/18 | 21,800 | 21,554 |
| International Finance Corp. | 1.250% | 7/16/18 | 3,300 | 3,290 |
| International Finance Corp. | 1.750% | 9/4/18 | 22,700 | 22,903 |
| International Finance Corp. | 1.750% | 9/16/19 | 12,500 | 12,487 |
| International Finance Corp. | 1.625% | 7/16/20 | 14,500 | 14,360 |
| 6 Japan Bank for International Cooperation | 1.125% | 7/19/17 | 12,325 | 12,248 |
| 6 Japan Bank for International Cooperation | 1.750% | 7/31/18 | 14,900 | 14,858 |
| 6 Japan Bank for International Cooperation | 1.750% | 11/13/18 | 12,200 | 12,136 |
| 6 Japan Bank for International Cooperation | 2.125% | 2/7/19 | 6,300 | 6,329 |
| 6 Japan Bank for International Cooperation | 1.750% | 5/29/19 | 11,950 | 11,887 |
| 6 Japan Bank for International Cooperation | 1.750% | 5/28/20 | 8,500 | 8,294 |
| 6 Japan Finance Organization for Municipalities | 5.000% | 5/16/17 | 4,000 | 4,180 |
| 8 KFW | 1.250% | 10/5/16 | 18,700 | 18,756 |
| 8 KFW | 4.875% | 1/17/17 | 400 | 416 |
| 8 KFW | 1.250% | 2/15/17 | 18,925 | 18,976 |
| 8 KFW | 0.750% | 3/17/17 | 30,300 | 30,154 |
| 8 KFW | 0.875% | 9/5/17 | 27,400 | 27,273 |
| 8 KFW | 0.875% | 12/15/17 | 19,000 | 18,797 |
| 8 KFW | 1.000% | 1/26/18 | 46,500 | 46,026 |
| 8 KFW | 4.375% | 3/15/18 | 19,050 | 20,313 |
| 8 KFW | 1.000% | 6/11/18 | 35,200 | 34,881 |
34
| Vanguard® Short-Term Bond Index Fund | ||||
| Schedule of Investments | ||||
| December 31, 2015 | ||||
| Face | Market | |||
| Maturity | Amount | Value | ||
| Coupon | Date | ($000) | ($000) | |
| 8 KFW | 4.500% | 7/16/18 | 13,075 | 14,081 |
| 8 KFW | 1.125% | 8/6/18 | 43,000 | 42,549 |
| 8 KFW | 1.125% | 11/16/18 | 15,000 | 14,826 |
| 8 KFW | 1.875% | 4/1/19 | 10,800 | 10,893 |
| 8 KFW | 4.875% | 6/17/19 | 18,120 | 20,076 |
| 8 KFW | 1.750% | 10/15/19 | 11,000 | 10,971 |
| 8 KFW | 4.000% | 1/27/20 | 21,475 | 23,296 |
| 8 KFW | 1.500% | 4/20/20 | 48,050 | 47,236 |
| 8 KFW | 1.875% | 6/30/20 | 25,450 | 25,365 |
| 8 KFW | 2.750% | 9/8/20 | 23,475 | 24,327 |
| 8 KFW | 2.750% | 10/1/20 | 11,200 | 11,612 |
| Korea Development Bank | 3.250% | 3/9/16 | 1,875 | 1,882 |
| Korea Development Bank | 3.875% | 5/4/17 | 14,825 | 15,233 |
| Korea Development Bank | 2.250% | 8/7/17 | 2,650 | 2,667 |
| Korea Development Bank | 3.500% | 8/22/17 | 6,650 | 6,836 |
| Korea Development Bank | 1.500% | 1/22/18 | 4,500 | 4,460 |
| Korea Development Bank | 2.875% | 8/22/18 | 500 | 510 |
| Korea Development Bank | 3.000% | 3/17/19 | 9,800 | 9,961 |
| 8 Landwirtschaftliche Rentenbank | 5.000% | 11/8/16 | 1,700 | 1,757 |
| 8 Landwirtschaftliche Rentenbank | 5.125% | 2/1/17 | 6,690 | 6,978 |
| 8 Landwirtschaftliche Rentenbank | 0.875% | 9/12/17 | 6,125 | 6,087 |
| 8 Landwirtschaftliche Rentenbank | 1.000% | 4/4/18 | 18,950 | 18,798 |
| 8 Landwirtschaftliche Rentenbank | 1.875% | 9/17/18 | 11,200 | 11,277 |
| 8 Landwirtschaftliche Rentenbank | 1.750% | 4/15/19 | 5,925 | 5,941 |
| 8 Landwirtschaftliche Rentenbank | 1.375% | 10/23/19 | 5,225 | 5,139 |
| Nexen Energy ULC | 6.200% | 7/30/19 | 3,500 | 3,886 |
| Nordic Investment Bank | 5.000% | 2/1/17 | 8,650 | 9,023 |
| Nordic Investment Bank | 1.000% | 3/7/17 | 6,150 | 6,149 |
| Nordic Investment Bank | 1.875% | 6/14/19 | 11,050 | 11,155 |
| Nordic Investment Bank | 1.500% | 9/29/20 | 8,000 | 7,887 |
| North American Development Bank | 2.300% | 10/10/18 | 2,700 | 2,714 |
| North American Development Bank | 4.375% | 2/11/20 | 675 | 727 |
| 9 Oesterreichische Kontrollbank AG | 0.750% | 5/19/17 | 8,000 | 7,957 |
| 9 Oesterreichische Kontrollbank AG | 1.125% | 5/29/18 | 12,050 | 11,968 |
| 9 Oesterreichische Kontrollbank AG | 1.625% | 3/12/19 | 6,500 | 6,508 |
| 9 Oesterreichische Kontrollbank AG | 1.375% | 2/10/20 | 8,550 | 8,370 |
| 9 Oesterreichische Kontrollbank AG | 1.500% | 10/21/20 | 15,200 | 14,838 |
| Petroleos Mexicanos | 5.750% | 3/1/18 | 23,875 | 25,004 |
| Petroleos Mexicanos | 3.500% | 7/18/18 | 20,875 | 20,738 |
| Petroleos Mexicanos | 3.125% | 1/23/19 | 400 | 389 |
| Petroleos Mexicanos | 8.000% | 5/3/19 | 5,650 | 6,233 |
| Petroleos Mexicanos | 6.000% | 3/5/20 | 4,550 | 4,800 |
| 5 Petroleos Mexicanos | 3.500% | 7/23/20 | 12,200 | 11,620 |
| Province of British Columbia | 1.200% | 4/25/17 | 4,000 | 4,001 |
| Province of Manitoba | 4.900% | 12/6/16 | 5,450 | 5,661 |
| Province of Manitoba | 1.300% | 4/3/17 | 1,000 | 1,000 |
| Province of Manitoba | 1.125% | 6/1/18 | 2,330 | 2,300 |
| Province of Manitoba | 1.750% | 5/30/19 | 5,525 | 5,483 |
| Province of Manitoba | 9.250% | 4/1/20 | 1,500 | 1,911 |
| Province of Manitoba | 2.050% | 11/30/20 | 9,700 | 9,636 |
| Province of New Brunswick | 5.200% | 2/21/17 | 220 | 230 |
| Province of New Brunswick | 2.750% | 6/15/18 | 6,425 | 6,586 |
| Province of Nova Scotia | 5.125% | 1/26/17 | 245 | 255 |
| Province of Ontario | 4.950% | 11/28/16 | 200 | 207 |
| Province of Ontario | 1.100% | 10/25/17 | 15,850 | 15,744 |
| Province of Ontario | 3.150% | 12/15/17 | 1,150 | 1,180 |
| Province of Ontario | 1.200% | 2/14/18 | 17,900 | 17,800 |
| Province of Ontario | 2.000% | 9/27/18 | 6,900 | 6,942 |
| Province of Ontario | 2.000% | 1/30/19 | 17,700 | 17,768 |
| Province of Ontario | 1.650% | 9/27/19 | 11,825 | 11,648 |
| Province of Ontario | 4.000% | 10/7/19 | 11,400 | 12,194 |
| Province of Ontario | 4.400% | 4/14/20 | 2,425 | 2,649 |
| Province of Ontario | 1.875% | 5/21/20 | 8,000 | 7,917 |
| Quebec | 3.500% | 7/29/20 | 3,300 | 3,491 |
35
| Vanguard® Short-Term Bond Index Fund | ||||
| Schedule of Investments | ||||
| December 31, 2015 | ||||
| Face | Market | |||
| Maturity | Amount | Value | ||
| Coupon | Date | ($000) | ($000) | |
| Republic of Chile | 3.875% | 8/5/20 | 5,350 | 5,678 |
| Republic of Colombia | 7.375% | 1/27/17 | 9,600 | 10,056 |
| Republic of Colombia | 7.375% | 3/18/19 | 22,385 | 25,015 |
| Republic of Colombia | 11.750% | 2/25/20 | 1,900 | 2,460 |
| Republic of Italy | 5.375% | 6/12/17 | 5,600 | 5,887 |
| Republic of Korea | 7.125% | 4/16/19 | 15,350 | 17,789 |
| Republic of Panama | 5.200% | 1/30/20 | 8,895 | 9,651 |
| Republic of Peru | 7.125% | 3/30/19 | 8,100 | 9,285 |
| Republic of Poland | 6.375% | 7/15/19 | 24,000 | 27,420 |
| Republic of South Africa | 6.875% | 5/27/19 | 11,875 | 12,738 |
| Republic of South Africa | 5.500% | 3/9/20 | 8,280 | 8,477 |
| Republic of the Philippines | 9.875% | 1/15/19 | 6,650 | 8,221 |
| Republic of the Philippines | 8.375% | 6/17/19 | 12,275 | 14,883 |
| Republic of Turkey | 7.500% | 7/14/17 | 11,375 | 12,231 |
| Republic of Turkey | 6.750% | 4/3/18 | 19,575 | 21,044 |
| Republic of Turkey | 7.000% | 3/11/19 | 14,075 | 15,436 |
| Republic of Turkey | 7.500% | 11/7/19 | 2,350 | 2,635 |
| Republic of Turkey | 7.000% | 6/5/20 | 13,223 | 14,742 |
| State of Israel | 5.500% | 11/9/16 | 3,525 | 3,656 |
| State of Israel | 5.125% | 3/26/19 | 13,605 | 14,964 |
| Statoil ASA | 3.125% | 8/17/17 | 9,329 | 9,559 |
| Statoil ASA | 1.250% | 11/9/17 | 6,100 | 6,067 |
| Statoil ASA | 6.700% | 1/15/18 | 4,640 | 5,084 |
| Statoil ASA | 1.200% | 1/17/18 | 1,475 | 1,459 |
| Statoil ASA | 1.150% | 5/15/18 | 5,070 | 5,002 |
| Statoil ASA | 1.950% | 11/8/18 | 1,325 | 1,325 |
| Statoil ASA | 5.250% | 4/15/19 | 9,200 | 10,023 |
| Statoil ASA | 2.250% | 11/8/19 | 8,897 | 8,873 |
| Statoil ASA | 2.900% | 11/8/20 | 6,175 | 6,235 |
| Svensk Exportkredit AB | 5.125% | 3/1/17 | 6,392 | 6,688 |
| Svensk Exportkredit AB | 1.750% | 5/30/17 | 3,335 | 3,362 |
| Svensk Exportkredit AB | 1.125% | 4/5/18 | 6,000 | 5,950 |
| Svensk Exportkredit AB | 1.875% | 6/17/19 | 6,700 | 6,739 |
| Svensk Exportkredit AB | 1.875% | 6/23/20 | 8,500 | 8,450 |
| United Mexican States | 11.375% | 9/15/16 | 12,375 | 13,204 |
| United Mexican States | 5.625% | 1/15/17 | 26,050 | 27,041 |
| United Mexican States | 5.950% | 3/19/19 | 7,700 | 8,569 |
| United Mexican States | 5.125% | 1/15/20 | 11,721 | 12,787 |
| Total Sovereign Bonds (Cost $2,947,933) | 2,938,422 | |||
| Taxable Municipal Bonds (0.1%) | ||||
| California GO | 1.050% | 2/1/16 | 145 | 145 |
| California GO | 5.950% | 4/1/16 | 2,890 | 2,931 |
| California GO | 6.200% | 3/1/19 | 500 | 567 |
| California GO | 6.200% | 10/1/19 | 3,575 | 4,111 |
| Cornell University New York GO | 5.450% | 2/1/19 | 175 | 194 |
| Dartmouth College New Hampshire GO | 4.750% | 6/1/19 | 910 | 991 |
| Emory University Georgia GO | 5.625% | 9/1/19 | 195 | 218 |
| Energy Northwest Washington Electric Revenue | ||||
| (Columbia Generating Station) | 2.197% | 7/1/19 | 1,650 | 1,658 |
| Florida Hurricane Catastrophe Fund Finance Corp. | ||||
| Revenue | 2.995% | 7/1/20 | 6,745 | 6,840 |
| Illinois GO | 5.365% | 3/1/17 | 5,000 | 5,175 |
| Illinois GO | 5.665% | 3/1/18 | 9,450 | 9,960 |
| Illinois GO | 5.877% | 3/1/19 | 3,980 | 4,259 |
| 10 New Jersey Economic Development Authority | ||||
| Revenue | 0.000% | 2/15/20 | 1,175 | 1,009 |
| Princeton University New Jersey GO | 4.950% | 3/1/19 | 720 | 788 |
| Stanford University California GO | 4.750% | 5/1/19 | 1,150 | 1,253 |
| University of California Revenue | 1.796% | 7/1/19 | 5,220 | 5,221 |
| Vanderbilt University Tennessee GO | 5.250% | 4/1/19 | 20 | 22 |
| Total Taxable Municipal Bonds (Cost $45,307) | 45,342 | |||
36
Vanguard® Short-Term Bond Index Fund
Schedule of Investments
December 31, 2015
| Market | |||
| Value | |||
| Coupon | Shares | ($000) | |
| Temporary Cash Investment (1.4%) | |||
| Money Market Fund (1.4%) | |||
| 11 Vanguard Market Liquidity Fund (Cost $568,741) | 0.363% | 568,740,878 | 568,741 |
| Total Investments (100.8%) (Cost $42,875,251) | 42,710,713 | ||
| Other Assets and Liabilities—Net (-0.8%) | (331,388) | ||
| Net Assets (100%) | 42,379,325 |
1 U.S. government-guaranteed.
2 The issuer operates under a congressional charter; its securities are generally neither guaranteed by the U.S. Treasury nor backed by the full faith
and credit of the U.S. government.
3 The issuer was placed under federal conservatorship in September 2008; since that time, its daily operations have been managed by the Federal
Housing Finance Agency and it receives capital from the U.S. Treasury, as needed to maintain a positive net worth, in exchange for senior
preferred stock.
4 The average or expected maturity is shorter than the final maturity shown because of the possibility of interim principal payments and
prepayments or the possibility of the issue being called.
5 Security exempt from registration under Rule 144A of the Securities Act of 1933. Such securities may be sold in transactions exempt from
registration, normally to qualified institutional buyers. At December 31, 2015, the aggregate value of these securities was $301,372,000,
representing 0.7% of net assets.
6 Guaranteed by the Government of Japan.
7 Guaranteed by the Government of Canada.
8 Guaranteed by the Federal Republic of Germany.
9 Guaranteed by the Republic of Austria.
10 Scheduled principal and interest payments are guaranteed by AGM (Assured Guaranty Municipal Corporation).
11 Affiliated money market fund available only to Vanguard funds and certain trusts and accounts managed by Vanguard. Rate shown is the 7-day
yield.
GO—General Obligation Bond.
REIT—Real Estate Investment Trust.
37
Vanguard® Intermediate-Term Bond Index Fund
Schedule of Investments
December 31, 2015
| Face | Market | ||||
| Maturity | Amount | Value | |||
| Coupon | Date | ($000) | ($000) | ||
| U.S. Government and Agency Obligations (53.0%) | |||||
| U.S. Government Securities (51.6%) | |||||
| United States Treasury Note/Bond | 2.625% | 11/15/20 | 131,572 | 136,711 | |
| United States Treasury Note/Bond | 2.000% | 11/30/20 | 62,886 | 63,525 | |
| United States Treasury Note/Bond | 1.750% | 12/31/20 | 14,900 | 14,891 | |
| United States Treasury Note/Bond | 2.375% | 12/31/20 | 57,345 | 58,958 | |
| United States Treasury Note/Bond | 2.125% | 1/31/21 | 215,885 | 219,056 | |
| United States Treasury Note/Bond | 3.625% | 2/15/21 | 261,615 | 284,383 | |
| United States Treasury Note/Bond | 2.000% | 2/28/21 | 258,945 | 261,048 | |
| United States Treasury Note/Bond | 2.250% | 3/31/21 | 163,720 | 167,045 | |
| United States Treasury Note/Bond | 2.250% | 4/30/21 | 133,500 | 136,129 | |
| United States Treasury Note/Bond | 3.125% | 5/15/21 | 362,213 | 385,246 | |
| United States Treasury Note/Bond | 8.125% | 5/15/21 | 10,000 | 13,186 | |
| United States Treasury Note/Bond | 2.000% | 5/31/21 | 167,600 | 168,726 | |
| United States Treasury Note/Bond | 2.125% | 6/30/21 | 223,030 | 225,818 | |
| United States Treasury Note/Bond | 2.250% | 7/31/21 | 149,555 | 152,359 | |
| United States Treasury Note/Bond | 2.125% | 8/15/21 | 189,473 | 191,694 | |
| United States Treasury Note/Bond | 8.125% | 8/15/21 | 17,300 | 23,033 | |
| United States Treasury Note/Bond | 2.000% | 8/31/21 | 227,110 | 228,068 | |
| United States Treasury Note/Bond | 2.125% | 9/30/21 | 185,831 | 187,747 | |
| United States Treasury Note/Bond | 2.000% | 10/31/21 | 153,075 | 153,482 | |
| United States Treasury Note/Bond | 2.000% | 11/15/21 | 251,645 | 252,314 | |
| United States Treasury Note/Bond | 8.000% | 11/15/21 | 36,300 | 48,478 | |
| United States Treasury Note/Bond | 1.875% | 11/30/21 | 266,828 | 265,659 | |
| United States Treasury Note/Bond | 2.125% | 12/31/21 | 173,284 | 174,800 | |
| United States Treasury Note/Bond | 1.500% | 1/31/22 | 148,100 | 143,958 | |
| United States Treasury Note/Bond | 2.000% | 2/15/22 | 93,058 | 93,218 | |
| United States Treasury Note/Bond | 1.750% | 2/28/22 | 200,611 | 197,726 | |
| United States Treasury Note/Bond | 1.750% | 3/31/22 | 207,992 | 204,710 | |
| United States Treasury Note/Bond | 1.750% | 4/30/22 | 251,160 | 247,119 | |
| United States Treasury Note/Bond | 1.750% | 5/15/22 | 196,535 | 193,280 | |
| United States Treasury Note/Bond | 1.875% | 5/31/22 | 157,170 | 155,623 | |
| United States Treasury Note/Bond | 2.125% | 6/30/22 | 33,130 | 33,290 | |
| United States Treasury Note/Bond | 2.000% | 7/31/22 | 181,200 | 180,718 | |
| United States Treasury Note/Bond | 1.625% | 8/15/22 | 247,652 | 241,191 | |
| United States Treasury Note/Bond | 7.250% | 8/15/22 | 5,500 | 7,274 | |
| United States Treasury Note/Bond | 1.875% | 8/31/22 | 189,311 | 187,092 | |
| United States Treasury Note/Bond | 1.750% | 9/30/22 | 69,965 | 68,555 | |
| United States Treasury Note/Bond | 1.875% | 10/31/22 | 35,915 | 35,449 | |
| United States Treasury Note/Bond | 1.625% | 11/15/22 | 269,175 | 261,436 | |
| United States Treasury Note/Bond | 2.000% | 11/30/22 | 318,740 | 316,898 | |
| United States Treasury Note/Bond | 2.000% | 2/15/23 | 197,020 | 195,820 | |
| United States Treasury Note/Bond | 7.125% | 2/15/23 | 35,000 | 46,731 | |
| United States Treasury Note/Bond | 1.750% | 5/15/23 | 574,750 | 559,755 | |
| United States Treasury Note/Bond | 2.500% | 8/15/23 | 703,830 | 721,975 | |
| United States Treasury Note/Bond | 6.250% | 8/15/23 | 76,500 | 98,732 | |
| United States Treasury Note/Bond | 2.750% | 11/15/23 | 358,122 | 373,679 | |
| United States Treasury Note/Bond | 2.750% | 2/15/24 | 299,773 | 312,139 | |
| United States Treasury Note/Bond | 2.500% | 5/15/24 | 415,569 | 424,466 | |
| United States Treasury Note/Bond | 2.375% | 8/15/24 | 394,451 | 398,396 | |
| United States Treasury Note/Bond | 2.250% | 11/15/24 | 414,024 | 413,701 | |
| United States Treasury Note/Bond | 2.000% | 2/15/25 | 399,836 | 390,651 | |
| United States Treasury Note/Bond | 2.125% | 5/15/25 | 526,375 | 519,222 | |
| United States Treasury Note/Bond | 2.000% | 8/15/25 | 332,812 | 324,388 | |
| United States Treasury Note/Bond | 2.250% | 11/15/25 | 450,317 | 449,119 | |
| 11,608,667 | |||||
| Agency Bonds and Notes (1.4%) | |||||
| 1 | AID-Israel | 5.500% | 9/18/23 | 4,300 | 5,181 |
| 1 | AID-Israel | 5.500% | 4/26/24 | 12,058 | 14,614 |
| 1 | AID-Jordan | 2.578% | 6/30/22 | 3,200 | 3,240 |
| 1 | AID-Tunisia | 2.452% | 7/24/21 | 2,175 | 2,191 |
| 2 | Federal Farm Credit Banks | 3.500% | 12/20/23 | 4,250 | 4,577 |
| 2 | Federal Home Loan Banks | 5.625% | 6/11/21 | 13,465 | 15,951 |
38
| Vanguard® Intermediate-Term Bond Index Fund | ||||
| Schedule of Investments | ||||
| December 31, 2015 | ||||
| Face | Market | |||
| Maturity | Amount | Value | ||
| Coupon | Date | ($000) | ($000) | |
| 2 Federal Home Loan Banks | 2.125% | 3/10/23 | 12,200 | 12,066 |
| 2 Federal Home Loan Banks | 2.875% | 6/14/24 | 20,000 | 20,598 |
| 2 Federal Home Loan Banks | 5.375% | 8/15/24 | 100 | 122 |
| 2 Federal Home Loan Banks | 2.875% | 9/13/24 | 20,000 | 20,503 |
| 3 Federal Home Loan Mortgage Corp. | 2.375% | 1/13/22 | 81,350 | 82,513 |
| 3 Federal National Mortgage Assn. | 2.625% | 9/6/24 | 58,645 | 59,258 |
| Private Export Funding Corp. | 4.300% | 12/15/21 | 9,940 | 10,974 |
| Private Export Funding Corp. | 2.800% | 5/15/22 | 3,725 | 3,786 |
| Private Export Funding Corp. | 2.050% | 11/15/22 | 10,276 | 9,923 |
| Private Export Funding Corp. | 3.550% | 1/15/24 | 3,500 | 3,711 |
| Private Export Funding Corp. | 2.450% | 7/15/24 | 3,350 | 3,262 |
| Private Export Funding Corp. | 3.250% | 6/15/25 | 1,675 | 1,722 |
| Resolution Funding Corp. | 8.625% | 1/15/21 | 850 | 1,110 |
| 2 Tennessee Valley Authority | 3.875% | 2/15/21 | 6,100 | 6,652 |
| 2 Tennessee Valley Authority | 1.875% | 8/15/22 | 8,175 | 7,962 |
| 2 Tennessee Valley Authority | 2.875% | 9/15/24 | 7,875 | 7,884 |
| 2 Tennessee Valley Authority | 6.750% | 11/1/25 | 6,830 | 9,002 |
| 306,802 | ||||
| Total U.S. Government and Agency Obligations (Cost $11,871,853) | 11,915,469 | |||
| Corporate Bonds (39.5%) | ||||
| Finance (12.4%) | ||||
| Banking (7.7%) | ||||
| Abbey National Treasury Services plc | 4.000% | 3/13/24 | 7,725 | 8,037 |
| American Express Co. | 2.650% | 12/2/22 | 10,048 | 9,750 |
| American Express Co. | 3.625% | 12/5/24 | 4,775 | 4,719 |
| Australia & New Zealand Banking Group Ltd. | 3.700% | 11/16/25 | 7,125 | 7,285 |
| Bancolombia SA | 5.950% | 6/3/21 | 6,900 | 7,120 |
| Bank of America Corp. | 5.875% | 1/5/21 | 9,600 | 10,868 |
| Bank of America Corp. | 5.000% | 5/13/21 | 14,235 | 15,553 |
| Bank of America Corp. | 5.700% | 1/24/22 | 13,889 | 15,663 |
| Bank of America Corp. | 3.300% | 1/11/23 | 22,025 | 21,712 |
| Bank of America Corp. | 4.100% | 7/24/23 | 21,450 | 22,182 |
| Bank of America Corp. | 4.125% | 1/22/24 | 13,000 | 13,390 |
| Bank of America Corp. | 4.000% | 4/1/24 | 20,509 | 20,985 |
| Bank of America Corp. | 4.200% | 8/26/24 | 17,550 | 17,574 |
| Bank of America Corp. | 4.000% | 1/22/25 | 18,500 | 18,114 |
| Bank of America Corp. | 3.950% | 4/21/25 | 15,000 | 14,601 |
| Bank of America Corp. | 3.875% | 8/1/25 | 31,000 | 31,458 |
| Bank of Montreal | 2.550% | 11/6/22 | 7,318 | 7,236 |
| Bank of New York Mellon Corp. | 4.150% | 2/1/21 | 2,150 | 2,314 |
| Bank of New York Mellon Corp. | 3.550% | 9/23/21 | 4,875 | 5,101 |
| Bank of New York Mellon Corp. | 3.400% | 5/15/24 | 5,925 | 6,020 |
| Bank of New York Mellon Corp. | 3.250% | 9/11/24 | 9,000 | 9,061 |
| Bank of New York Mellon Corp. | 3.000% | 2/24/25 | 8,750 | 8,598 |
| Bank of Nova Scotia | 4.375% | 1/13/21 | 4,800 | 5,184 |
| Bank of Nova Scotia | 2.800% | 7/21/21 | 13,722 | 13,896 |
| Bank of Nova Scotia | 4.500% | 12/16/25 | 9,950 | 9,894 |
| Barclays Bank plc | 3.750% | 5/15/24 | 14,310 | 14,567 |
| Barclays plc | 4.375% | 9/11/24 | 8,000 | 7,821 |
| Barclays plc | 3.650% | 3/16/25 | 12,200 | 11,782 |
| BB&T Corp. | 3.950% | 3/22/22 | 1,800 | 1,890 |
| BNP Paribas SA | 5.000% | 1/15/21 | 22,185 | 24,476 |
| BNP Paribas SA | 3.250% | 3/3/23 | 7,583 | 7,554 |
| BNP Paribas SA | 4.250% | 10/15/24 | 3,500 | 3,467 |
| BPCE SA | 4.000% | 4/15/24 | 7,900 | 8,181 |
| Branch Banking & Trust Co. | 2.850% | 4/1/21 | 2,150 | 2,173 |
| Branch Banking & Trust Co. | 3.625% | 9/16/25 | 7,900 | 7,974 |
| Capital One Bank USA NA | 3.375% | 2/15/23 | 10,121 | 9,904 |
| Capital One Financial Corp. | 4.750% | 7/15/21 | 8,200 | 8,887 |
| Capital One Financial Corp. | 3.500% | 6/15/23 | 5,050 | 5,004 |
| Capital One Financial Corp. | 3.750% | 4/24/24 | 4,600 | 4,636 |
| Capital One Financial Corp. | 3.200% | 2/5/25 | 7,780 | 7,523 |
39
| Vanguard® Intermediate-Term Bond Index Fund | |||||
| Schedule of Investments | |||||
| December 31, 2015 | |||||
| Face | Market | ||||
| Maturity | Amount | Value | |||
| Coupon | Date | ($000) | ($000) | ||
| Capital One Financial Corp. | 4.200% | 10/29/25 | 9,000 | 8,886 | |
| Capital One NA | 2.950% | 7/23/21 | 9,000 | 8,919 | |
| 4,5 | Citicorp Lease Pass-Through Trust 1999-1 | 8.040% | 12/15/19 | 2,100 | 2,472 |
| Citigroup Inc. | 4.500% | 1/14/22 | 15,925 | 17,051 | |
| Citigroup Inc. | 4.050% | 7/30/22 | 5,735 | 5,858 | |
| Citigroup Inc. | 3.500% | 5/15/23 | 10,685 | 10,528 | |
| Citigroup Inc. | 3.875% | 10/25/23 | 14,400 | 14,875 | |
| Citigroup Inc. | 3.750% | 6/16/24 | 9,659 | 9,834 | |
| Citigroup Inc. | 4.000% | 8/5/24 | 4,325 | 4,285 | |
| Citigroup Inc. | 3.875% | 3/26/25 | 11,500 | 11,199 | |
| Citigroup Inc. | 3.300% | 4/27/25 | 12,300 | 12,077 | |
| Citigroup Inc. | 4.400% | 6/10/25 | 22,650 | 22,876 | |
| Citizens Financial Group Inc. | 4.300% | 12/3/25 | 5,000 | 5,020 | |
| Comerica Bank | 4.000% | 7/27/25 | 1,825 | 1,851 | |
| Compass Bank | 3.875% | 4/10/25 | 500 | 458 | |
| Cooperatieve Rabobank UA | 4.500% | 1/11/21 | 4,188 | 4,561 | |
| Cooperatieve Rabobank UA | 3.875% | 2/8/22 | 22,896 | 24,094 | |
| Cooperatieve Rabobank UA | 3.950% | 11/9/22 | 15,034 | 15,168 | |
| Cooperatieve Rabobank UA | 4.625% | 12/1/23 | 14,375 | 14,968 | |
| Cooperatieve Rabobank UA | 3.375% | 5/21/25 | 7,655 | 7,579 | |
| Cooperatieve Rabobank UA | 4.375% | 8/4/25 | 4,481 | 4,535 | |
| Credit Suisse | 3.000% | 10/29/21 | 20,350 | 20,297 | |
| Credit Suisse | 3.625% | 9/9/24 | 18,700 | 18,831 | |
| 5 | Credit Suisse Group Funding Guernsey Ltd. | 3.800% | 9/15/22 | 12,000 | 11,964 |
| 5 | Credit Suisse Group Funding Guernsey Ltd. | 3.750% | 3/26/25 | 13,700 | 13,355 |
| Deutsche Bank AG | 3.700% | 5/30/24 | 10,975 | 10,951 | |
| Discover Bank | 3.200% | 8/9/21 | 1,000 | 994 | |
| Discover Bank | 4.200% | 8/8/23 | 13,043 | 13,255 | |
| Discover Financial Services | 3.850% | 11/21/22 | 6,445 | 6,399 | |
| Discover Financial Services | 3.950% | 11/6/24 | 1,125 | 1,107 | |
| Discover Financial Services | 3.750% | 3/4/25 | 3,000 | 2,883 | |
| Fifth Third Bancorp | 3.500% | 3/15/22 | 2,252 | 2,292 | |
| Fifth Third Bancorp | 4.300% | 1/16/24 | 5,500 | 5,635 | |
| Fifth Third Bank | 2.875% | 10/1/21 | 4,700 | 4,687 | |
| FirstMerit Corp. | 4.350% | 2/4/23 | 4,420 | 4,498 | |
| Goldman Sachs Group Inc. | 5.250% | 7/27/21 | 24,595 | 27,211 | |
| Goldman Sachs Group Inc. | 5.750% | 1/24/22 | 32,596 | 37,057 | |
| Goldman Sachs Group Inc. | 3.625% | 1/22/23 | 14,817 | 14,987 | |
| Goldman Sachs Group Inc. | 4.000% | 3/3/24 | 24,755 | 25,413 | |
| Goldman Sachs Group Inc. | 3.850% | 7/8/24 | 17,700 | 18,061 | |
| Goldman Sachs Group Inc. | 3.500% | 1/23/25 | 28,275 | 27,736 | |
| Goldman Sachs Group Inc. | 4.250% | 10/21/25 | 13,325 | 13,229 | |
| HSBC Holdings plc | 5.100% | 4/5/21 | 17,309 | 19,209 | |
| HSBC Holdings plc | 4.875% | 1/14/22 | 2,824 | 3,081 | |
| HSBC Holdings plc | 4.000% | 3/30/22 | 15,341 | 16,100 | |
| HSBC Holdings plc | 4.250% | 3/14/24 | 18,200 | 18,236 | |
| HSBC Holdings plc | 4.250% | 8/18/25 | 9,100 | 9,092 | |
| HSBC USA Inc. | 3.500% | 6/23/24 | 4,500 | 4,513 | |
| Intesa Sanpaolo SPA | 5.250% | 1/12/24 | 7,025 | 7,483 | |
| JPMorgan Chase & Co. | 4.625% | 5/10/21 | 9,508 | 10,271 | |
| JPMorgan Chase & Co. | 4.350% | 8/15/21 | 23,675 | 25,202 | |
| JPMorgan Chase & Co. | 4.500% | 1/24/22 | 26,598 | 28,637 | |
| JPMorgan Chase & Co. | 3.250% | 9/23/22 | 15,760 | 15,854 | |
| JPMorgan Chase & Co. | 3.200% | 1/25/23 | 23,110 | 22,994 | |
| JPMorgan Chase & Co. | 3.375% | 5/1/23 | 11,350 | 11,108 | |
| JPMorgan Chase & Co. | 3.875% | 2/1/24 | 16,420 | 16,814 | |
| JPMorgan Chase & Co. | 3.625% | 5/13/24 | 14,025 | 14,191 | |
| JPMorgan Chase & Co. | 3.875% | 9/10/24 | 28,015 | 27,881 | |
| JPMorgan Chase & Co. | 3.125% | 1/23/25 | 13,600 | 13,228 | |
| JPMorgan Chase & Co. | 3.900% | 7/15/25 | 15,950 | 16,346 | |
| KeyBank NA | 3.300% | 6/1/25 | 2,500 | 2,472 | |
| KeyCorp | 5.100% | 3/24/21 | 6,185 | 6,783 | |
| Lloyds Bank plc | 6.375% | 1/21/21 | 8,725 | 10,252 | |
| Lloyds Bank plc | 3.500% | 5/14/25 | 5,050 | 5,078 | |
40
| Vanguard® Intermediate-Term Bond Index Fund | ||||
| Schedule of Investments | ||||
| December 31, 2015 | ||||
| Face | Market | |||
| Maturity | Amount | Value | ||
| Coupon | Date | ($000) | ($000) | |
| Lloyds Banking Group plc | 4.500% | 11/4/24 | 5,175 | 5,235 |
| Manufacturers & Traders Trust Co. | 2.900% | 2/6/25 | 7,725 | 7,478 |
| Morgan Stanley | 5.750% | 1/25/21 | 14,675 | 16,496 |
| Morgan Stanley | 5.500% | 7/28/21 | 19,760 | 22,124 |
| Morgan Stanley | 4.875% | 11/1/22 | 14,080 | 14,972 |
| Morgan Stanley | 3.750% | 2/25/23 | 26,357 | 27,004 |
| Morgan Stanley | 4.100% | 5/22/23 | 12,490 | 12,600 |
| Morgan Stanley | 3.875% | 4/29/24 | 19,660 | 20,045 |
| Morgan Stanley | 3.700% | 10/23/24 | 19,840 | 19,854 |
| Morgan Stanley | 4.000% | 7/23/25 | 14,440 | 14,879 |
| Morgan Stanley | 5.000% | 11/24/25 | 13,000 | 13,801 |
| MUFG Americas Holdings Corp. | 3.500% | 6/18/22 | 3,075 | 3,132 |
| MUFG Americas Holdings Corp. | 3.000% | 2/10/25 | 4,607 | 4,394 |
| National Australia Bank Ltd. | 3.000% | 1/20/23 | 4,350 | 4,317 |
| Northern Trust Corp. | 3.375% | 8/23/21 | 3,300 | 3,425 |
| Northern Trust Corp. | 2.375% | 8/2/22 | 4,895 | 4,803 |
| Northern Trust Corp. | 3.950% | 10/30/25 | 400 | 417 |
| People's United Bank | 4.000% | 7/15/24 | 1,675 | 1,654 |
| People's United Financial Inc. | 3.650% | 12/6/22 | 2,775 | 2,753 |
| PNC Bank NA | 2.700% | 11/1/22 | 5,650 | 5,485 |
| PNC Bank NA | 2.950% | 1/30/23 | 4,800 | 4,662 |
| PNC Bank NA | 3.800% | 7/25/23 | 3,425 | 3,520 |
| PNC Bank NA | 3.300% | 10/30/24 | 6,262 | 6,281 |
| PNC Bank NA | 2.950% | 2/23/25 | 2,300 | 2,221 |
| PNC Bank NA | 4.200% | 11/1/25 | 800 | 843 |
| PNC Financial Services Group Inc. | 2.854% | 11/9/22 | 4,820 | 4,753 |
| PNC Financial Services Group Inc. | 3.900% | 4/29/24 | 7,550 | 7,733 |
| PNC Funding Corp. | 3.300% | 3/8/22 | 9,778 | 9,953 |
| Santander Holdings USA Inc. | 4.500% | 7/17/25 | 6,000 | 6,102 |
| Santander Issuances SAU | 5.179% | 11/19/25 | 9,800 | 9,569 |
| State Street Corp. | 4.375% | 3/7/21 | 5,151 | 5,593 |
| State Street Corp. | 3.100% | 5/15/23 | 6,675 | 6,584 |
| State Street Corp. | 3.700% | 11/20/23 | 4,415 | 4,583 |
| State Street Corp. | 3.300% | 12/16/24 | 6,000 | 6,056 |
| State Street Corp. | 3.550% | 8/18/25 | 11,715 | 12,081 |
| Sumitomo Mitsui Banking Corp. | 3.200% | 7/18/22 | 4,750 | 4,767 |
| Sumitomo Mitsui Banking Corp. | 3.000% | 1/18/23 | 1,375 | 1,357 |
| Sumitomo Mitsui Banking Corp. | 3.950% | 7/19/23 | 4,975 | 5,182 |
| Sumitomo Mitsui Banking Corp. | 3.950% | 1/10/24 | 2,075 | 2,151 |
| Sumitomo Mitsui Banking Corp. | 3.400% | 7/11/24 | 3,575 | 3,549 |
| Sumitomo Mitsui Banking Corp. | 3.650% | 7/23/25 | 1,400 | 1,425 |
| SunTrust Bank | 2.750% | 5/1/23 | 3,425 | 3,271 |
| SVB Financial Group | 3.500% | 1/29/25 | 3,825 | 3,655 |
| Svenska Handelsbanken AB | 2.400% | 10/1/20 | 2,575 | 2,556 |
| Synchrony Financial | 3.750% | 8/15/21 | 3,850 | 3,852 |
| Synchrony Financial | 4.250% | 8/15/24 | 7,725 | 7,626 |
| Synchrony Financial | 4.500% | 7/23/25 | 9,650 | 9,628 |
| US Bancorp | 4.125% | 5/24/21 | 6,545 | 7,068 |
| US Bancorp | 3.000% | 3/15/22 | 6,354 | 6,458 |
| US Bancorp | 2.950% | 7/15/22 | 9,925 | 9,872 |
| US Bancorp | 3.700% | 1/30/24 | 2,370 | 2,478 |
| US Bancorp | 3.600% | 9/11/24 | 5,100 | 5,184 |
| US Bank NA | 2.800% | 1/27/25 | 8,350 | 8,134 |
| Wells Fargo & Co. | 3.000% | 1/22/21 | 3,100 | 3,147 |
| Wells Fargo & Co. | 4.600% | 4/1/21 | 19,995 | 21,768 |
| Wells Fargo & Co. | 3.500% | 3/8/22 | 20,478 | 21,074 |
| Wells Fargo & Co. | 3.450% | 2/13/23 | 13,162 | 13,170 |
| Wells Fargo & Co. | 4.125% | 8/15/23 | 14,520 | 15,023 |
| Wells Fargo & Co. | 4.480% | 1/16/24 | 5,639 | 5,934 |
| Wells Fargo & Co. | 3.300% | 9/9/24 | 15,375 | 15,260 |
| Wells Fargo & Co. | 3.000% | 2/19/25 | 19,200 | 18,543 |
| Wells Fargo & Co. | 3.550% | 9/29/25 | 17,500 | 17,628 |
41
| Vanguard® Intermediate-Term Bond Index Fund | ||||
| Schedule of Investments | ||||
| December 31, 2015 | ||||
| Face | Market | |||
| Maturity | Amount | Value | ||
| Coupon | Date | ($000) | ($000) | |
| Brokerage (0.5%) | ||||
| Affiliated Managers Group Inc. | 4.250% | 2/15/24 | 2,425 | 2,448 |
| Affiliated Managers Group Inc. | 3.500% | 8/1/25 | 1,125 | 1,069 |
| Ameriprise Financial Inc. | 4.000% | 10/15/23 | 5,864 | 6,054 |
| Ameriprise Financial Inc. | 3.700% | 10/15/24 | 4,000 | 4,051 |
| Apollo Investment Corp. | 5.250% | 3/3/25 | 1,625 | 1,567 |
| BlackRock Inc. | 4.250% | 5/24/21 | 4,175 | 4,513 |
| BlackRock Inc. | 3.375% | 6/1/22 | 5,279 | 5,434 |
| BlackRock Inc. | 3.500% | 3/18/24 | 8,311 | 8,501 |
| Brookfield Asset Management Inc. | 4.000% | 1/15/25 | 5,125 | 5,007 |
| Charles Schwab Corp. | 3.225% | 9/1/22 | 2,425 | 2,465 |
| CME Group Inc. | 3.000% | 9/15/22 | 5,075 | 5,099 |
| CME Group Inc. | 3.000% | 3/15/25 | 4,800 | 4,709 |
| Eaton Vance Corp. | 3.625% | 6/15/23 | 1,800 | 1,808 |
| Franklin Resources Inc. | 2.800% | 9/15/22 | 2,425 | 2,365 |
| Franklin Resources Inc. | 2.850% | 3/30/25 | 2,920 | 2,754 |
| Intercontinental Exchange Inc. | 4.000% | 10/15/23 | 5,500 | 5,674 |
| Intercontinental Exchange Inc. | 3.750% | 12/1/25 | 6,325 | 6,335 |
| Invesco Finance plc | 3.125% | 11/30/22 | 4,654 | 4,581 |
| Invesco Finance plc | 4.000% | 1/30/24 | 6,225 | 6,424 |
| Invesco Finance plc | 3.750% | 1/15/26 | 600 | 603 |
| Janus Capital Group Inc. | 4.875% | 8/1/25 | 1,900 | 1,947 |
| Jefferies Group LLC | 6.875% | 4/15/21 | 4,527 | 5,049 |
| Jefferies Group LLC | 5.125% | 1/20/23 | 3,625 | 3,628 |
| Lazard Group LLC | 3.750% | 2/13/25 | 2,550 | 2,353 |
| Legg Mason Inc. | 3.950% | 7/15/24 | 1,650 | 1,623 |
| Leucadia National Corp. | 5.500% | 10/18/23 | 4,675 | 4,568 |
| Nasdaq Inc. | 4.250% | 6/1/24 | 400 | 403 |
| Stifel Financial Corp. | 4.250% | 7/18/24 | 1,900 | 1,883 |
| TD Ameritrade Holding Corp. | 2.950% | 4/1/22 | 4,550 | 4,511 |
| TD Ameritrade Holding Corp. | 3.625% | 4/1/25 | 3,050 | 3,085 |
| Finance Companies (0.3%) | ||||
| Air Lease Corp. | 3.875% | 4/1/21 | 3,618 | 3,636 |
| Air Lease Corp. | 3.750% | 2/1/22 | 5,600 | 5,488 |
| Air Lease Corp. | 4.250% | 9/15/24 | 2,300 | 2,257 |
| FS Investment Corp. | 4.750% | 5/15/22 | 1,600 | 1,571 |
| GATX Corp. | 4.750% | 6/15/22 | 1,800 | 1,900 |
| GATX Corp. | 3.900% | 3/30/23 | 1,575 | 1,564 |
| GATX Corp. | 3.250% | 3/30/25 | 2,425 | 2,247 |
| 5 GE Capital International Funding Co. | 3.373% | 11/15/25 | 27,971 | 28,258 |
| HSBC Finance Corp. | 6.676% | 1/15/21 | 22,774 | 26,093 |
| Prospect Capital Corp. | 5.875% | 3/15/23 | 1,625 | 1,578 |
| Insurance (1.9%) | ||||
| ACE INA Holdings Inc. | 2.875% | 11/3/22 | 8,950 | 8,870 |
| ACE INA Holdings Inc. | 2.700% | 3/13/23 | 1,825 | 1,781 |
| ACE INA Holdings Inc. | 3.350% | 5/15/24 | 2,885 | 2,910 |
| ACE INA Holdings Inc. | 3.150% | 3/15/25 | 7,500 | 7,411 |
| Aetna Inc. | 4.125% | 6/1/21 | 3,125 | 3,271 |
| Aetna Inc. | 2.750% | 11/15/22 | 8,175 | 7,872 |
| Aetna Inc. | 3.500% | 11/15/24 | 5,000 | 4,992 |
| Aflac Inc. | 4.000% | 2/15/22 | 2,550 | 2,687 |
| Aflac Inc. | 3.625% | 6/15/23 | 7,800 | 8,028 |
| Aflac Inc. | 3.625% | 11/15/24 | 2,245 | 2,278 |
| Aflac Inc. | 3.250% | 3/17/25 | 2,525 | 2,478 |
| Alleghany Corp. | 4.950% | 6/27/22 | 4,000 | 4,286 |
| Allied World Assurance Co. Holdings Ltd. | 4.350% | 10/29/25 | 3,800 | 3,768 |
| Allstate Corp. | 3.150% | 6/15/23 | 3,120 | 3,118 |
| 4 Allstate Corp. | 5.750% | 8/15/53 | 4,810 | 4,930 |
| American International Group Inc. | 4.875% | 6/1/22 | 13,250 | 14,302 |
| American International Group Inc. | 4.125% | 2/15/24 | 6,875 | 7,054 |
| American International Group Inc. | 3.750% | 7/10/25 | 2,000 | 1,979 |
| Anthem Inc. | 3.700% | 8/15/21 | 2,225 | 2,265 |
| Anthem Inc. | 3.125% | 5/15/22 | 5,135 | 5,023 |
42
| Vanguard® Intermediate-Term Bond Index Fund | ||||
| Schedule of Investments | ||||
| December 31, 2015 | ||||
| Face | Market | |||
| Maturity | Amount | Value | ||
| Coupon | Date | ($000) | ($000) | |
| Anthem Inc. | 3.300% | 1/15/23 | 5,271 | 5,132 |
| Anthem Inc. | 3.500% | 8/15/24 | 9,050 | 8,832 |
| Aon plc | 2.800% | 3/15/21 | 1,100 | 1,095 |
| Aon plc | 4.000% | 11/27/23 | 850 | 849 |
| Aon plc | 3.500% | 6/14/24 | 4,600 | 4,472 |
| Aspen Insurance Holdings Ltd. | 4.650% | 11/15/23 | 6,225 | 6,369 |
| Assurant Inc. | 4.000% | 3/15/23 | 1,725 | 1,725 |
| Assured Guaranty US Holdings Inc. | 5.000% | 7/1/24 | 2,000 | 2,058 |
| Berkshire Hathaway Finance Corp. | 4.250% | 1/15/21 | 6,375 | 6,946 |
| Berkshire Hathaway Finance Corp. | 3.000% | 5/15/22 | 4,599 | 4,693 |
| Berkshire Hathaway Inc. | 3.750% | 8/15/21 | 5,650 | 6,027 |
| Berkshire Hathaway Inc. | 3.000% | 2/11/23 | 4,125 | 4,196 |
| Brown & Brown Inc. | 4.200% | 9/15/24 | 5,775 | 5,721 |
| Cigna Corp. | 4.500% | 3/15/21 | 2,425 | 2,572 |
| Cigna Corp. | 4.000% | 2/15/22 | 4,525 | 4,673 |
| Cigna Corp. | 3.250% | 4/15/25 | 5,600 | 5,472 |
| CNA Financial Corp. | 5.750% | 8/15/21 | 3,555 | 3,978 |
| CNA Financial Corp. | 3.950% | 5/15/24 | 3,125 | 3,118 |
| Coventry Health Care Inc. | 5.450% | 6/15/21 | 6,045 | 6,729 |
| Fidelity National Financial Inc. | 5.500% | 9/1/22 | 775 | 834 |
| First American Financial Corp. | 4.300% | 2/1/23 | 1,525 | 1,515 |
| First American Financial Corp. | 4.600% | 11/15/24 | 2,400 | 2,435 |
| Hanover Insurance Group Inc. | 6.375% | 6/15/21 | 300 | 340 |
| Hartford Financial Services Group Inc. | 5.125% | 4/15/22 | 5,175 | 5,669 |
| Horace Mann Educators Corp. | 4.500% | 12/1/25 | 1,125 | 1,129 |
| Humana Inc. | 3.150% | 12/1/22 | 2,425 | 2,363 |
| Humana Inc. | 3.850% | 10/1/24 | 4,475 | 4,515 |
| Infinity Property & Casualty Corp. | 5.000% | 9/19/22 | 1,750 | 1,757 |
| Kemper Corp. | 4.350% | 2/15/25 | 2,000 | 1,973 |
| Lincoln National Corp. | 4.200% | 3/15/22 | 300 | 313 |
| Lincoln National Corp. | 4.000% | 9/1/23 | 4,000 | 4,085 |
| Lincoln National Corp. | 3.350% | 3/9/25 | 4,950 | 4,767 |
| Loews Corp. | 2.625% | 5/15/23 | 3,300 | 3,126 |
| Markel Corp. | 4.900% | 7/1/22 | 3,450 | 3,701 |
| Markel Corp. | 3.625% | 3/30/23 | 2,750 | 2,716 |
| Marsh & McLennan Cos. Inc. | 4.800% | 7/15/21 | 5,885 | 6,405 |
| Marsh & McLennan Cos. Inc. | 3.500% | 6/3/24 | 9,125 | 9,046 |
| MetLife Inc. | 4.750% | 2/8/21 | 6,525 | 7,141 |
| MetLife Inc. | 3.048% | 12/15/22 | 4,500 | 4,483 |
| MetLife Inc. | 4.368% | 9/15/23 | 3,314 | 3,570 |
| MetLife Inc. | 3.600% | 4/10/24 | 7,350 | 7,562 |
| MetLife Inc. | 3.000% | 3/1/25 | 6,000 | 5,776 |
| MetLife Inc. | 3.600% | 11/13/25 | 5,550 | 5,577 |
| Montpelier Re Holdings Ltd. | 4.700% | 10/15/22 | 1,425 | 1,446 |
| Navigators Group Inc. | 5.750% | 10/15/23 | 2,000 | 2,131 |
| Old Republic International Corp. | 4.875% | 10/1/24 | 2,575 | 2,638 |
| OneBeacon US Holdings Inc. | 4.600% | 11/9/22 | 1,925 | 1,910 |
| Primerica Inc. | 4.750% | 7/15/22 | 1,750 | 1,860 |
| Principal Financial Group Inc. | 3.300% | 9/15/22 | 2,460 | 2,441 |
| Principal Financial Group Inc. | 3.125% | 5/15/23 | 1,025 | 998 |
| Principal Financial Group Inc. | 3.400% | 5/15/25 | 1,966 | 1,915 |
| ProAssurance Corp. | 5.300% | 11/15/23 | 900 | 954 |
| Progressive Corp. | 3.750% | 8/23/21 | 3,285 | 3,464 |
| Prudential Financial Inc. | 4.500% | 11/16/21 | 2,450 | 2,640 |
| Prudential Financial Inc. | 3.500% | 5/15/24 | 9,275 | 9,308 |
| 4 Prudential Financial Inc. | 5.875% | 9/15/42 | 5,475 | 5,721 |
| 4 Prudential Financial Inc. | 5.625% | 6/15/43 | 8,775 | 8,907 |
| 4 Prudential Financial Inc. | 5.200% | 3/15/44 | 3,575 | 3,459 |
| 4 Prudential Financial Inc. | 5.375% | 5/15/45 | 6,000 | 5,993 |
| Reinsurance Group of America Inc. | 5.000% | 6/1/21 | 6,391 | 6,892 |
| Reinsurance Group of America Inc. | 4.700% | 9/15/23 | 2,450 | 2,582 |
| StanCorp Financial Group Inc. | 5.000% | 8/15/22 | 1,700 | 1,774 |
| Symetra Financial Corp. | 4.250% | 7/15/24 | 1,000 | 1,006 |
| Torchmark Corp. | 3.800% | 9/15/22 | 1,850 | 1,842 |
43
| Vanguard® Intermediate-Term Bond Index Fund | ||||
| Schedule of Investments | ||||
| December 31, 2015 | ||||
| Face | Market | |||
| Maturity | Amount | Value | ||
| Coupon | Date | ($000) | ($000) | |
| UnitedHealth Group Inc. | 4.700% | 2/15/21 | 3,025 | 3,312 |
| UnitedHealth Group Inc. | 3.375% | 11/15/21 | 1,625 | 1,674 |
| UnitedHealth Group Inc. | 2.875% | 12/15/21 | 4,500 | 4,556 |
| UnitedHealth Group Inc. | 2.875% | 3/15/22 | 7,354 | 7,343 |
| UnitedHealth Group Inc. | 3.350% | 7/15/22 | 5,220 | 5,318 |
| UnitedHealth Group Inc. | 2.750% | 2/15/23 | 7,575 | 7,412 |
| UnitedHealth Group Inc. | 2.875% | 3/15/23 | 3,865 | 3,814 |
| UnitedHealth Group Inc. | 3.750% | 7/15/25 | 13,800 | 14,213 |
| Unum Group | 4.000% | 3/15/24 | 3,770 | 3,762 |
| Voya Financial Inc. | 5.500% | 7/15/22 | 3,973 | 4,450 |
| Willis Towers Watson plc | 5.750% | 3/15/21 | 3,900 | 4,276 |
| WR Berkley Corp. | 4.625% | 3/15/22 | 2,150 | 2,276 |
| XLIT Ltd. | 5.750% | 10/1/21 | 2,600 | 2,896 |
| XLIT Ltd. | 6.375% | 11/15/24 | 875 | 1,019 |
| XLIT Ltd. | 4.450% | 3/31/25 | 3,575 | 3,495 |
| Other Finance (0.0%) | ||||
| Jones Lang LaSalle Inc. | 4.400% | 11/15/22 | 1,300 | 1,332 |
| Real Estate Investment Trusts (2.0%) | ||||
| Alexandria Real Estate Equities Inc. | 4.600% | 4/1/22 | 3,206 | 3,325 |
| Alexandria Real Estate Equities Inc. | 3.900% | 6/15/23 | 4,025 | 3,969 |
| American Campus Communities Operating Partnership | ||||
| LP | 3.750% | 4/15/23 | 1,800 | 1,773 |
| American Campus Communities Operating Partnership | ||||
| LP | 4.125% | 7/1/24 | 2,150 | 2,134 |
| AvalonBay Communities Inc. | 2.950% | 9/15/22 | 3,050 | 3,008 |
| AvalonBay Communities Inc. | 2.850% | 3/15/23 | 1,500 | 1,447 |
| AvalonBay Communities Inc. | 4.200% | 12/15/23 | 1,390 | 1,463 |
| AvalonBay Communities Inc. | 3.450% | 6/1/25 | 6,242 | 6,168 |
| AvalonBay Communities Inc. | 3.500% | 11/15/25 | 3,200 | 3,174 |
| BioMed Realty LP | 4.250% | 7/15/22 | 2,100 | 2,083 |
| Boston Properties LP | 4.125% | 5/15/21 | 5,660 | 5,933 |
| Boston Properties LP | 3.850% | 2/1/23 | 4,300 | 4,391 |
| Boston Properties LP | 3.125% | 9/1/23 | 3,137 | 3,050 |
| Boston Properties LP | 3.800% | 2/1/24 | 4,050 | 4,120 |
| Brandywine Operating Partnership LP | 3.950% | 2/15/23 | 2,669 | 2,603 |
| Brandywine Operating Partnership LP | 4.100% | 10/1/24 | 2,715 | 2,624 |
| Brixmor Operating Partnership LP | 3.875% | 8/15/22 | 3,100 | 3,088 |
| Brixmor Operating Partnership LP | 3.850% | 2/1/25 | 7,450 | 7,244 |
| Camden Property Trust | 2.950% | 12/15/22 | 5,675 | 5,460 |
| Camden Property Trust | 4.250% | 1/15/24 | 1,100 | 1,138 |
| Camden Property Trust | 3.500% | 9/15/24 | 2,000 | 1,956 |
| CBL & Associates LP | 5.250% | 12/1/23 | 3,500 | 3,460 |
| CBL & Associates LP | 4.600% | 10/15/24 | 2,790 | 2,611 |
| Columbia Property Trust Operating Partnership LP | 4.150% | 4/1/25 | 150 | 148 |
| Corporate Office Properties LP | 3.700% | 6/15/21 | 2,770 | 2,684 |
| Corporate Office Properties LP | 3.600% | 5/15/23 | 4,450 | 4,104 |
| CubeSmart LP | 4.375% | 12/15/23 | 3,150 | 3,240 |
| CubeSmart LP | 4.000% | 11/15/25 | 825 | 820 |
| DCT Industrial Operating Partnership LP | 4.500% | 10/15/23 | 1,475 | 1,476 |
| DDR Corp. | 3.500% | 1/15/21 | 1,625 | 1,619 |
| DDR Corp. | 4.625% | 7/15/22 | 5,565 | 5,747 |
| DDR Corp. | 3.375% | 5/15/23 | 1,338 | 1,264 |
| DDR Corp. | 3.625% | 2/1/25 | 2,600 | 2,456 |
| 5 Digital Delta Holdings LLC | 4.750% | 10/1/25 | 3,625 | 3,658 |
| Digital Realty Trust LP | 5.250% | 3/15/21 | 150 | 162 |
| Digital Realty Trust LP | 3.950% | 7/1/22 | 4,425 | 4,390 |
| Digital Realty Trust LP | 3.625% | 10/1/22 | 6,275 | 6,001 |
| Duke Realty LP | 6.750% | 3/15/20 | 350 | 401 |
| Duke Realty LP | 3.875% | 10/15/22 | 5,850 | 5,883 |
| Duke Realty LP | 3.625% | 4/15/23 | 2,525 | 2,466 |
| Duke Realty LP | 3.750% | 12/1/24 | 1,900 | 1,849 |
| Education Realty Operating Partnership LP | 4.600% | 12/1/24 | 800 | 788 |
44
| Vanguard® Intermediate-Term Bond Index Fund | ||||
| Schedule of Investments | ||||
| December 31, 2015 | ||||
| Face | Market | |||
| Maturity | Amount | Value | ||
| Coupon | Date | ($000) | ($000) | |
| EPR Properties | 5.750% | 8/15/22 | 2,875 | 3,018 |
| EPR Properties | 5.250% | 7/15/23 | 1,800 | 1,834 |
| EPR Properties | 4.500% | 4/1/25 | 1,800 | 1,715 |
| Equity One Inc. | 3.750% | 11/15/22 | 2,000 | 1,929 |
| ERP Operating LP | 4.625% | 12/15/21 | 7,470 | 8,101 |
| ERP Operating LP | 3.000% | 4/15/23 | 2,575 | 2,530 |
| ERP Operating LP | 3.375% | 6/1/25 | 2,300 | 2,277 |
| Essex Portfolio LP | 3.375% | 1/15/23 | 2,000 | 1,962 |
| Essex Portfolio LP | 3.250% | 5/1/23 | 4,255 | 4,144 |
| Essex Portfolio LP | 3.500% | 4/1/25 | 6,150 | 5,919 |
| Federal Realty Investment Trust | 2.550% | 1/15/21 | 2,850 | 2,832 |
| Federal Realty Investment Trust | 3.000% | 8/1/22 | 1,525 | 1,508 |
| Federal Realty Investment Trust | 2.750% | 6/1/23 | 1,600 | 1,530 |
| HCP Inc. | 5.375% | 2/1/21 | 8,622 | 9,384 |
| HCP Inc. | 4.000% | 12/1/22 | 1,400 | 1,391 |
| HCP Inc. | 4.250% | 11/15/23 | 4,650 | 4,659 |
| HCP Inc. | 4.200% | 3/1/24 | 4,342 | 4,321 |
| HCP Inc. | 3.875% | 8/15/24 | 5,250 | 5,098 |
| HCP Inc. | 3.400% | 2/1/25 | 8,320 | 7,721 |
| HCP Inc. | 4.000% | 6/1/25 | 2,887 | 2,818 |
| Healthcare Realty Trust Inc. | 5.750% | 1/15/21 | 1,500 | 1,659 |
| Healthcare Realty Trust Inc. | 3.750% | 4/15/23 | 2,625 | 2,561 |
| Healthcare Realty Trust Inc. | 3.875% | 5/1/25 | 1,125 | 1,089 |
| Healthcare Trust of America Holdings LP | 3.375% | 7/15/21 | 3,000 | 2,949 |
| Healthcare Trust of America Holdings LP | 3.700% | 4/15/23 | 1,625 | 1,577 |
| Highwoods Realty LP | 3.200% | 6/15/21 | 4,600 | 4,497 |
| Hospitality Properties Trust | 5.000% | 8/15/22 | 2,768 | 2,840 |
| Hospitality Properties Trust | 4.500% | 6/15/23 | 2,875 | 2,861 |
| Hospitality Properties Trust | 4.650% | 3/15/24 | 3,925 | 3,867 |
| Host Hotels & Resorts LP | 6.000% | 10/1/21 | 3,850 | 4,264 |
| Host Hotels & Resorts LP | 5.250% | 3/15/22 | 5,650 | 6,018 |
| Host Hotels & Resorts LP | 4.750% | 3/1/23 | 22 | 23 |
| Host Hotels & Resorts LP | 3.750% | 10/15/23 | 2,489 | 2,404 |
| Host Hotels & Resorts LP | 4.000% | 6/15/25 | 2,100 | 2,015 |
| Kilroy Realty LP | 3.800% | 1/15/23 | 1,425 | 1,411 |
| Kilroy Realty LP | 4.375% | 10/1/25 | 1,725 | 1,758 |
| Kimco Realty Corp. | 3.200% | 5/1/21 | 1,500 | 1,502 |
| Kimco Realty Corp. | 3.400% | 11/1/22 | 2,500 | 2,480 |
| Kimco Realty Corp. | 3.125% | 6/1/23 | 1,250 | 1,209 |
| Lexington Realty Trust | 4.400% | 6/15/24 | 3,950 | 3,933 |
| Liberty Property LP | 4.125% | 6/15/22 | 1,100 | 1,116 |
| Liberty Property LP | 4.400% | 2/15/24 | 375 | 380 |
| Liberty Property LP | 3.750% | 4/1/25 | 7,850 | 7,564 |
| Mack-Cali Realty LP | 4.500% | 4/18/22 | 2,700 | 2,602 |
| Mack-Cali Realty LP | 3.150% | 5/15/23 | 1,000 | 870 |
| Mid-America Apartments LP | 4.300% | 10/15/23 | 2,850 | 2,922 |
| Mid-America Apartments LP | 3.750% | 6/15/24 | 1,700 | 1,665 |
| Mid-America Apartments LP | 4.000% | 11/15/25 | 3,900 | 3,871 |
| National Retail Properties Inc. | 3.800% | 10/15/22 | 1,900 | 1,909 |
| National Retail Properties Inc. | 3.300% | 4/15/23 | 4,770 | 4,593 |
| National Retail Properties Inc. | 3.900% | 6/15/24 | 3,250 | 3,220 |
| National Retail Properties Inc. | 4.000% | 11/15/25 | 600 | 589 |
| Omega Healthcare Investors Inc. | 5.875% | 3/15/24 | 2,075 | 2,168 |
| Omega Healthcare Investors Inc. | 4.950% | 4/1/24 | 2,250 | 2,272 |
| Omega Healthcare Investors Inc. | 4.500% | 1/15/25 | 6,050 | 5,929 |
| Piedmont Operating Partnership LP | 3.400% | 6/1/23 | 1,325 | 1,240 |
| Piedmont Operating Partnership LP | 4.450% | 3/15/24 | 5,925 | 5,933 |
| Post Apartment Homes LP | 3.375% | 12/1/22 | 1,500 | 1,452 |
| ProLogis LP | 4.250% | 8/15/23 | 7,885 | 8,293 |
| Prologis LP | 3.750% | 11/1/25 | 4,000 | 3,961 |
| Realty Income Corp. | 5.750% | 1/15/21 | 1,000 | 1,114 |
| Realty Income Corp. | 3.250% | 10/15/22 | 5,485 | 5,296 |
| Realty Income Corp. | 4.650% | 8/1/23 | 4,425 | 4,599 |
| Realty Income Corp. | 3.875% | 7/15/24 | 2,350 | 2,307 |
45
| Vanguard® Intermediate-Term Bond Index Fund | ||||
| Schedule of Investments | ||||
| December 31, 2015 | ||||
| Face | Market | |||
| Maturity | Amount | Value | ||
| Coupon | Date | ($000) | ($000) | |
| Regency Centers LP | 4.800% | 4/15/21 | 1,575 | 1,696 |
| Regency Centers LP | 3.750% | 6/15/24 | 2,875 | 2,856 |
| Retail Opportunity Investments Partnership LP | 5.000% | 12/15/23 | 1,150 | 1,182 |
| Retail Properties of America Inc. | 4.000% | 3/15/25 | 2,400 | 2,264 |
| Select Income REIT | 4.150% | 2/1/22 | 1,725 | 1,655 |
| Select Income REIT | 4.500% | 2/1/25 | 2,900 | 2,695 |
| Senior Housing Properties Trust | 4.750% | 5/1/24 | 3,625 | 3,540 |
| Simon Property Group LP | 4.375% | 3/1/21 | 9,185 | 9,948 |
| Simon Property Group LP | 4.125% | 12/1/21 | 11,900 | 12,753 |
| Simon Property Group LP | 3.375% | 3/15/22 | 3,841 | 3,963 |
| Simon Property Group LP | 3.750% | 2/1/24 | 1,345 | 1,401 |
| Simon Property Group LP | 3.375% | 10/1/24 | 225 | 227 |
| Simon Property Group LP | 3.500% | 9/1/25 | 6,000 | 6,088 |
| Tanger Properties LP | 3.875% | 12/1/23 | 3,175 | 3,159 |
| Tanger Properties LP | 3.750% | 12/1/24 | 1,525 | 1,500 |
| UDR Inc. | 4.625% | 1/10/22 | 2,700 | 2,880 |
| UDR Inc. | 3.750% | 7/1/24 | 750 | 749 |
| UDR Inc. | 4.000% | 10/1/25 | 3,100 | 3,135 |
| Ventas Realty LP | 3.750% | 5/1/24 | 3,400 | 3,331 |
| Ventas Realty LP | 3.500% | 2/1/25 | 4,020 | 3,848 |
| Ventas Realty LP / Ventas Capital Corp. | 4.750% | 6/1/21 | 3,668 | 3,913 |
| Ventas Realty LP / Ventas Capital Corp. | 4.250% | 3/1/22 | 3,852 | 3,974 |
| Ventas Realty LP / Ventas Capital Corp. | 3.250% | 8/15/22 | 4,702 | 4,582 |
| Vornado Realty LP | 5.000% | 1/15/22 | 2,500 | 2,657 |
| Weingarten Realty Investors | 3.375% | 10/15/22 | 3,275 | 3,204 |
| Weingarten Realty Investors | 3.500% | 4/15/23 | 2,275 | 2,212 |
| Weingarten Realty Investors | 4.450% | 1/15/24 | 150 | 154 |
| Weingarten Realty Investors | 3.850% | 6/1/25 | 3,500 | 3,398 |
| Welltower Inc. | 4.950% | 1/15/21 | 7,225 | 7,746 |
| Welltower Inc. | 5.250% | 1/15/22 | 1,870 | 2,019 |
| Welltower Inc. | 3.750% | 3/15/23 | 6,200 | 6,092 |
| Welltower Inc. | 4.000% | 6/1/25 | 11,550 | 11,372 |
| WP Carey Inc. | 4.600% | 4/1/24 | 3,525 | 3,515 |
| WP Carey Inc. | 4.000% | 2/1/25 | 1,990 | 1,905 |
| 2,793,431 | ||||
| Industrial (25.0%) | ||||
| Basic Industry (1.9%) | ||||
| Agrium Inc. | 3.150% | 10/1/22 | 4,491 | 4,295 |
| Agrium Inc. | 3.500% | 6/1/23 | 9,575 | 9,111 |
| Agrium Inc. | 3.375% | 3/15/25 | 3,060 | 2,799 |
| Air Products & Chemicals Inc. | 3.000% | 11/3/21 | 4,250 | 4,277 |
| Air Products & Chemicals Inc. | 2.750% | 2/3/23 | 1,250 | 1,230 |
| Air Products & Chemicals Inc. | 3.350% | 7/31/24 | 2,350 | 2,348 |
| Airgas Inc. | 2.900% | 11/15/22 | 750 | 728 |
| Airgas Inc. | 3.650% | 7/15/24 | 1,650 | 1,639 |
| Albemarle Corp. | 4.150% | 12/1/24 | 2,500 | 2,392 |
| Barrick Gold Corp. | 4.100% | 5/1/23 | 2,922 | 2,517 |
| Barrick North America Finance LLC | 4.400% | 5/30/21 | 8,154 | 7,459 |
| BHP Billiton Finance USA Ltd. | 3.250% | 11/21/21 | 6,550 | 6,186 |
| BHP Billiton Finance USA Ltd. | 2.875% | 2/24/22 | 7,975 | 7,307 |
| BHP Billiton Finance USA Ltd. | 3.850% | 9/30/23 | 12,975 | 12,218 |
| Braskem Finance Ltd. | 6.450% | 2/3/24 | 3,850 | 3,272 |
| Cabot Corp. | 3.700% | 7/15/22 | 2,050 | 2,025 |
| Carpenter Technology Corp. | 5.200% | 7/15/21 | 2,350 | 2,364 |
| Carpenter Technology Corp. | 4.450% | 3/1/23 | 925 | 884 |
| Celulosa Arauco y Constitucion SA | 5.000% | 1/21/21 | 1,525 | 1,580 |
| Celulosa Arauco y Constitucion SA | 4.750% | 1/11/22 | 5,425 | 5,467 |
| Celulosa Arauco y Constitucion SA | 4.500% | 8/1/24 | 2,000 | 1,960 |
| CF Industries Inc. | 3.450% | 6/1/23 | 4,850 | 4,512 |
| Cytec Industries Inc. | 3.500% | 4/1/23 | 125 | 117 |
| Domtar Corp. | 4.400% | 4/1/22 | 660 | 669 |
| Dow Chemical Co. | 4.125% | 11/15/21 | 8,900 | 9,298 |
| Dow Chemical Co. | 3.000% | 11/15/22 | 7,985 | 7,654 |
46
| Vanguard® Intermediate-Term Bond Index Fund | ||||
| Schedule of Investments | ||||
| December 31, 2015 | ||||
| Face | Market | |||
| Maturity | Amount | Value | ||
| Coupon | Date | ($000) | ($000) | |
| Dow Chemical Co. | 3.500% | 10/1/24 | 8,050 | 7,819 |
| Eastman Chemical Co. | 4.500% | 1/15/21 | 2,270 | 2,395 |
| Eastman Chemical Co. | 3.600% | 8/15/22 | 11,312 | 11,252 |
| Eastman Chemical Co. | 3.800% | 3/15/25 | 3,700 | 3,580 |
| Ecolab Inc. | 4.350% | 12/8/21 | 7,450 | 7,934 |
| EI du Pont de Nemours & Co. | 3.625% | 1/15/21 | 7,025 | 7,245 |
| EI du Pont de Nemours & Co. | 4.250% | 4/1/21 | 3,000 | 3,182 |
| EI du Pont de Nemours & Co. | 2.800% | 2/15/23 | 6,800 | 6,437 |
| Fibria Overseas Finance Ltd. | 5.250% | 5/12/24 | 3,000 | 2,835 |
| FMC Corp. | 3.950% | 2/1/22 | 3,235 | 3,225 |
| FMC Corp. | 4.100% | 2/1/24 | 1,500 | 1,488 |
| Freeport-McMoRan Inc. | 4.000% | 11/14/21 | 2,500 | 1,525 |
| Freeport-McMoRan Inc. | 3.550% | 3/1/22 | 17,100 | 10,003 |
| Freeport-McMoRan Inc. | 3.875% | 3/15/23 | 16,489 | 9,316 |
| Freeport-McMoRan Inc. | 4.550% | 11/14/24 | 1,600 | 928 |
| Freeport-McMoRan Oil & Gas LLC / FCX Oil & Gas Inc. | 6.750% | 2/1/22 | 1,652 | 1,016 |
| Freeport-McMoRan Oil & Gas LLC / FCX Oil & Gas Inc. | 6.875% | 2/15/23 | 4,934 | 3,059 |
| Georgia-Pacific LLC | 8.000% | 1/15/24 | 3,750 | 4,733 |
| Georgia-Pacific LLC | 7.375% | 12/1/25 | 500 | 620 |
| Goldcorp Inc. | 3.625% | 6/9/21 | 4,125 | 3,873 |
| Goldcorp Inc. | 3.700% | 3/15/23 | 6,780 | 6,203 |
| International Paper Co. | 7.500% | 8/15/21 | 8,465 | 10,034 |
| International Paper Co. | 4.750% | 2/15/22 | 5,222 | 5,578 |
| International Paper Co. | 3.650% | 6/15/24 | 2,500 | 2,450 |
| Kinross Gold Corp. | 5.125% | 9/1/21 | 2,450 | 1,666 |
| Kinross Gold Corp. | 5.950% | 3/15/24 | 3,150 | 2,177 |
| LYB International Finance BV | 4.000% | 7/15/23 | 5,100 | 5,084 |
| LyondellBasell Industries NV | 6.000% | 11/15/21 | 8,650 | 9,710 |
| LyondellBasell Industries NV | 5.750% | 4/15/24 | 3,125 | 3,441 |
| Methanex Corp. | 4.250% | 12/1/24 | 2,000 | 1,783 |
| Monsanto Co. | 2.750% | 7/15/21 | 5,220 | 5,136 |
| Monsanto Co. | 2.200% | 7/15/22 | 2,150 | 1,982 |
| Monsanto Co. | 3.375% | 7/15/24 | 9,119 | 8,800 |
| Monsanto Co. | 2.850% | 4/15/25 | 6,700 | 6,117 |
| Mosaic Co. | 3.750% | 11/15/21 | 1,800 | 1,822 |
| Mosaic Co. | 4.250% | 11/15/23 | 11,350 | 11,260 |
| NewMarket Corp. | 4.100% | 12/15/22 | 315 | 316 |
| Newmont Mining Corp. | 3.500% | 3/15/22 | 8,119 | 7,241 |
| Nucor Corp. | 4.125% | 9/15/22 | 3,450 | 3,540 |
| Nucor Corp. | 4.000% | 8/1/23 | 6,285 | 6,034 |
| Packaging Corp. of America | 3.900% | 6/15/22 | 1,900 | 1,934 |
| Packaging Corp. of America | 4.500% | 11/1/23 | 9,650 | 10,089 |
| Packaging Corp. of America | 3.650% | 9/15/24 | 1,300 | 1,265 |
| Plum Creek Timberlands LP | 4.700% | 3/15/21 | 3,900 | 4,157 |
| Potash Corp. of Saskatchewan Inc. | 3.625% | 3/15/24 | 4,750 | 4,620 |
| Potash Corp. of Saskatchewan Inc. | 3.000% | 4/1/25 | 2,750 | 2,594 |
| Praxair Inc. | 4.050% | 3/15/21 | 575 | 612 |
| Praxair Inc. | 3.000% | 9/1/21 | 6,425 | 6,499 |
| Praxair Inc. | 2.450% | 2/15/22 | 8,021 | 7,851 |
| Praxair Inc. | 2.200% | 8/15/22 | 3,450 | 3,300 |
| Praxair Inc. | 2.650% | 2/5/25 | 600 | 576 |
| Rayonier Inc. | 3.750% | 4/1/22 | 2,125 | 2,065 |
| Reliance Steel & Aluminum Co. | 4.500% | 4/15/23 | 2,125 | 1,989 |
| Rio Tinto Finance USA Ltd. | 4.125% | 5/20/21 | 3,325 | 3,317 |
| Rio Tinto Finance USA Ltd. | 3.750% | 9/20/21 | 5,775 | 5,612 |
| Rio Tinto Finance USA Ltd. | 3.750% | 6/15/25 | 9,000 | 8,123 |
| Rio Tinto Finance USA plc | 3.500% | 3/22/22 | 5,500 | 5,176 |
| Rio Tinto Finance USA plc | 2.875% | 8/21/22 | 15,975 | 14,458 |
| Rock-Tenn Co. | 4.000% | 3/1/23 | 6,500 | 6,524 |
| RPM International Inc. | 3.450% | 11/15/22 | 2,900 | 2,781 |
| Southern Copper Corp. | 3.500% | 11/8/22 | 1,500 | 1,376 |
| Southern Copper Corp. | 3.875% | 4/23/25 | 4,750 | 4,186 |
| Syngenta Finance NV | 3.125% | 3/28/22 | 2,565 | 2,484 |
| Vale Overseas Ltd. | 4.375% | 1/11/22 | 13,420 | 10,149 |
47
| Vanguard® Intermediate-Term Bond Index Fund | ||||
| Schedule of Investments | ||||
| December 31, 2015 | ||||
| Face | Market | |||
| Maturity | Amount | Value | ||
| Coupon | Date | ($000) | ($000) | |
| Valspar Corp. | 4.200% | 1/15/22 | 1,590 | 1,630 |
| Westlake Chemical Corp. | 3.600% | 7/15/22 | 550 | 539 |
| Weyerhaeuser Co. | 4.625% | 9/15/23 | 3,540 | 3,680 |
| Weyerhaeuser Co. | 8.500% | 1/15/25 | 600 | 773 |
| Yamana Gold Inc. | 4.950% | 7/15/24 | 3,030 | 2,575 |
| Capital Goods (2.0%) | ||||
| 3M Co. | 2.000% | 6/26/22 | 3,165 | 3,075 |
| 3M Co. | 3.000% | 8/7/25 | 2,100 | 2,149 |
| ABB Finance USA Inc. | 2.875% | 5/8/22 | 7,665 | 7,544 |
| Avery Dennison Corp. | 3.350% | 4/15/23 | 350 | 340 |
| Bemis Co. Inc. | 4.500% | 10/15/21 | 1,975 | 2,064 |
| Boeing Co. | 2.350% | 10/30/21 | 5,100 | 5,045 |
| Boeing Co. | 2.200% | 10/30/22 | 5,000 | 4,833 |
| Boeing Co. | 7.950% | 8/15/24 | 287 | 383 |
| Boeing Co. | 2.850% | 10/30/24 | 2,695 | 2,678 |
| Boeing Co. | 2.500% | 3/1/25 | 2,800 | 2,702 |
| Boeing Co. | 2.600% | 10/30/25 | 3,000 | 2,901 |
| Carlisle Cos. Inc. | 3.750% | 11/15/22 | 3,950 | 3,907 |
| Caterpillar Financial Services Corp. | 2.850% | 6/1/22 | 1,750 | 1,741 |
| Caterpillar Financial Services Corp. | 3.750% | 11/24/23 | 2,000 | 2,079 |
| Caterpillar Financial Services Corp. | 3.300% | 6/9/24 | 1,000 | 995 |
| Caterpillar Inc. | 3.900% | 5/27/21 | 10,435 | 11,087 |
| Caterpillar Inc. | 2.600% | 6/26/22 | 8,900 | 8,790 |
| Caterpillar Inc. | 3.400% | 5/15/24 | 7,000 | 7,061 |
| Crane Co. | 4.450% | 12/15/23 | 2,890 | 2,978 |
| CRH America Inc. | 5.750% | 1/15/21 | 450 | 506 |
| Danaher Corp. | 3.900% | 6/23/21 | 4,425 | 4,707 |
| Danaher Corp. | 3.350% | 9/15/25 | 3,875 | 3,955 |
| Deere & Co. | 2.600% | 6/8/22 | 13,050 | 12,852 |
| Dover Corp. | 4.300% | 3/1/21 | 5,250 | 5,620 |
| Dover Corp. | 3.150% | 11/15/25 | 600 | 591 |
| Eaton Corp. | 2.750% | 11/2/22 | 8,370 | 8,096 |
| Embraer Netherlands Finance BV | 5.050% | 6/15/25 | 2,500 | 2,262 |
| 5 Embraer Overseas Ltd. | 5.696% | 9/16/23 | 8,043 | 7,840 |
| Embraer SA | 5.150% | 6/15/22 | 1,800 | 1,756 |
| Emerson Electric Co. | 2.625% | 12/1/21 | 3,150 | 3,129 |
| Emerson Electric Co. | 2.625% | 2/15/23 | 5,525 | 5,407 |
| Emerson Electric Co. | 3.150% | 6/1/25 | 3,300 | 3,281 |
| Exelis Inc. | 5.550% | 10/1/21 | 1,000 | 1,098 |
| Flowserve Corp. | 3.500% | 9/15/22 | 7,590 | 7,382 |
| Flowserve Corp. | 4.000% | 11/15/23 | 2,000 | 1,996 |
| Fortune Brands Home & Security Inc. | 4.000% | 6/15/25 | 3,000 | 2,972 |
| General Dynamics Corp. | 3.875% | 7/15/21 | 4,125 | 4,355 |
| General Dynamics Corp. | 2.250% | 11/15/22 | 6,970 | 6,698 |
| General Electric Capital Corp. | 4.625% | 1/7/21 | 3,720 | 4,084 |
| General Electric Capital Corp. | 5.300% | 2/11/21 | 5,943 | 6,693 |
| General Electric Capital Corp. | 4.650% | 10/17/21 | 10,908 | 12,034 |
| General Electric Capital Corp. | 3.150% | 9/7/22 | 3,280 | 3,357 |
| General Electric Capital Corp. | 3.100% | 1/9/23 | 10,014 | 10,153 |
| General Electric Capital Corp. | 3.450% | 5/15/24 | 3,516 | 3,627 |
| General Electric Co. | 2.700% | 10/9/22 | 20,019 | 19,932 |
| General Electric Co. | 3.375% | 3/11/24 | 9,200 | 9,530 |
| Harris Corp. | 3.832% | 4/27/25 | 2,418 | 2,381 |
| Hexcel Corp. | 4.700% | 8/15/25 | 1,500 | 1,487 |
| Honeywell International Inc. | 4.250% | 3/1/21 | 8,711 | 9,532 |
| IDEX Corp. | 4.200% | 12/15/21 | 400 | 418 |
| Illinois Tool Works Inc. | 3.500% | 3/1/24 | 4,000 | 4,117 |
| Ingersoll-Rand Global Holding Co. Ltd. | 4.250% | 6/15/23 | 7,325 | 7,575 |
| Ingersoll-Rand Luxembourg Finance SA | 3.550% | 11/1/24 | 4,300 | 4,201 |
| John Deere Capital Corp. | 2.800% | 3/4/21 | 3,600 | 3,626 |
| John Deere Capital Corp. | 3.900% | 7/12/21 | 4,300 | 4,556 |
| John Deere Capital Corp. | 3.150% | 10/15/21 | 3,335 | 3,392 |
| John Deere Capital Corp. | 2.750% | 3/15/22 | 425 | 420 |
48
| Vanguard® Intermediate-Term Bond Index Fund | ||||
| Schedule of Investments | ||||
| December 31, 2015 | ||||
| Face | Market | |||
| Maturity | Amount | Value | ||
| Coupon | Date | ($000) | ($000) | |
| John Deere Capital Corp. | 2.800% | 1/27/23 | 3,275 | 3,213 |
| John Deere Capital Corp. | 3.350% | 6/12/24 | 5,000 | 5,062 |
| John Deere Capital Corp. | 3.400% | 9/11/25 | 1,700 | 1,721 |
| Joy Global Inc. | 5.125% | 10/15/21 | 3,420 | 2,677 |
| Kennametal Inc. | 3.875% | 2/15/22 | 2,425 | 2,396 |
| L-3 Communications Corp. | 4.950% | 2/15/21 | 6,400 | 6,583 |
| L-3 Communications Corp. | 3.950% | 5/28/24 | 1,436 | 1,364 |
| Leggett & Platt Inc. | 3.800% | 11/15/24 | 3,200 | 3,224 |
| Legrand France SA | 8.500% | 2/15/25 | 1,325 | 1,758 |
| Lockheed Martin Corp. | 3.350% | 9/15/21 | 5,905 | 6,031 |
| Lockheed Martin Corp. | 3.100% | 1/15/23 | 1,700 | 1,697 |
| Lockheed Martin Corp. | 2.900% | 3/1/25 | 5,125 | 4,921 |
| Lockheed Martin Corp. | 3.550% | 1/15/26 | 7,800 | 7,839 |
| Martin Marietta Materials Inc. | 4.250% | 7/2/24 | 1,390 | 1,365 |
| Mohawk Industries Inc. | 3.850% | 2/1/23 | 8,795 | 8,860 |
| Northrop Grumman Corp. | 3.500% | 3/15/21 | 4,450 | 4,593 |
| Northrop Grumman Corp. | 3.250% | 8/1/23 | 6,000 | 5,996 |
| Owens Corning | 4.200% | 12/15/22 | 3,300 | 3,306 |
| Owens Corning | 4.200% | 12/1/24 | 3,250 | 3,165 |
| Parker-Hannifin Corp. | 3.300% | 11/21/24 | 6,250 | 6,322 |
| Pentair Finance SA | 5.000% | 5/15/21 | 3,000 | 3,127 |
| Pentair Finance SA | 3.150% | 9/15/22 | 3,470 | 3,259 |
| Precision Castparts Corp. | 2.500% | 1/15/23 | 5,700 | 5,499 |
| Precision Castparts Corp. | 3.250% | 6/15/25 | 7,400 | 7,340 |
| Raytheon Co. | 2.500% | 12/15/22 | 7,775 | 7,614 |
| Raytheon Co. | 3.150% | 12/15/24 | 2,100 | 2,105 |
| Republic Services Inc. | 5.250% | 11/15/21 | 10,638 | 11,777 |
| Republic Services Inc. | 3.550% | 6/1/22 | 2,797 | 2,863 |
| Republic Services Inc. | 4.750% | 5/15/23 | 825 | 899 |
| Republic Services Inc. | 3.200% | 3/15/25 | 5,896 | 5,686 |
| Rockwell Collins Inc. | 3.100% | 11/15/21 | 1,875 | 1,901 |
| Rockwell Collins Inc. | 3.700% | 12/15/23 | 2,200 | 2,277 |
| Roper Technologies Inc. | 3.125% | 11/15/22 | 2,350 | 2,297 |
| Roper Technologies Inc. | 3.850% | 12/15/25 | 1,575 | 1,579 |
| Snap-on Inc. | 6.125% | 9/1/21 | 2,825 | 3,251 |
| Sonoco Products Co. | 4.375% | 11/1/21 | 1,100 | 1,146 |
| Stanley Black & Decker Inc. | 3.400% | 12/1/21 | 4,975 | 5,071 |
| Stanley Black & Decker Inc. | 2.900% | 11/1/22 | 2,610 | 2,581 |
| Textron Inc. | 3.650% | 3/1/21 | 4,750 | 4,779 |
| Textron Inc. | 4.300% | 3/1/24 | 2,500 | 2,546 |
| United Technologies Corp. | 3.100% | 6/1/22 | 15,996 | 16,294 |
| Waste Management Inc. | 4.600% | 3/1/21 | 3,900 | 4,194 |
| Waste Management Inc. | 2.900% | 9/15/22 | 1,966 | 1,932 |
| Waste Management Inc. | 3.500% | 5/15/24 | 1,000 | 1,008 |
| Waste Management Inc. | 3.125% | 3/1/25 | 6,050 | 5,878 |
| Communication (3.3%) | ||||
| 21st Century Fox America Inc. | 4.500% | 2/15/21 | 7,050 | 7,589 |
| 21st Century Fox America Inc. | 3.000% | 9/15/22 | 6,139 | 6,058 |
| 21st Century Fox America Inc. | 8.875% | 4/26/23 | 1,255 | 1,650 |
| 21st Century Fox America Inc. | 4.000% | 10/1/23 | 2,375 | 2,455 |
| 21st Century Fox America Inc. | 3.700% | 9/15/24 | 2,825 | 2,848 |
| 5 21st Century Fox America Inc. | 3.700% | 10/15/25 | 5,250 | 5,237 |
| America Movil SAB de CV | 3.125% | 7/16/22 | 8,150 | 7,964 |
| American Tower Corp. | 3.450% | 9/15/21 | 4,750 | 4,772 |
| American Tower Corp. | 5.900% | 11/1/21 | 4,200 | 4,682 |
| American Tower Corp. | 4.700% | 3/15/22 | 565 | 594 |
| American Tower Corp. | 3.500% | 1/31/23 | 10,301 | 10,160 |
| American Tower Corp. | 5.000% | 2/15/24 | 3,850 | 4,076 |
| American Tower Corp. | 4.000% | 6/1/25 | 6,125 | 6,021 |
| AT&T Inc. | 4.450% | 5/15/21 | 9,277 | 9,854 |
| AT&T Inc. | 3.875% | 8/15/21 | 10,550 | 10,914 |
| AT&T Inc. | 3.000% | 2/15/22 | 12,626 | 12,431 |
| AT&T Inc. | 3.000% | 6/30/22 | 17,450 | 16,967 |
49
| Vanguard® Intermediate-Term Bond Index Fund | ||||
| Schedule of Investments | ||||
| December 31, 2015 | ||||
| Face | Market | |||
| Maturity | Amount | Value | ||
| Coupon | Date | ($000) | ($000) | |
| AT&T Inc. | 2.625% | 12/1/22 | 8,523 | 8,079 |
| AT&T Inc. | 3.400% | 5/15/25 | 35,756 | 34,364 |
| CBS Corp. | 4.300% | 2/15/21 | 1,300 | 1,353 |
| CBS Corp. | 3.375% | 3/1/22 | 250 | 247 |
| CBS Corp. | 3.700% | 8/15/24 | 9,000 | 8,753 |
| CBS Corp. | 3.500% | 1/15/25 | 3,250 | 3,099 |
| CC Holdings GS V LLC / Crown Castle GS III Corp. | 3.849% | 4/15/23 | 6,810 | 6,682 |
| 5 CCO Safari II LLC | 4.464% | 7/23/22 | 19,775 | 19,745 |
| 5 CCO Safari II LLC | 4.908% | 7/23/25 | 32,575 | 32,471 |
| Comcast Cable Communications Holdings Inc. | 9.455% | 11/15/22 | 6,568 | 9,114 |
| Comcast Corp. | 3.125% | 7/15/22 | 6,307 | 6,394 |
| Comcast Corp. | 2.850% | 1/15/23 | 5,870 | 5,826 |
| Comcast Corp. | 3.600% | 3/1/24 | 7,970 | 8,237 |
| Comcast Corp. | 3.375% | 2/15/25 | 11,425 | 11,536 |
| Comcast Corp. | 3.375% | 8/15/25 | 4,000 | 4,051 |
| DIRECTV Holdings LLC / DIRECTV Financing Co. Inc. | 4.600% | 2/15/21 | 5,700 | 6,032 |
| DIRECTV Holdings LLC / DIRECTV Financing Co. Inc. | 5.000% | 3/1/21 | 8,706 | 9,398 |
| DIRECTV Holdings LLC / DIRECTV Financing Co. Inc. | 3.800% | 3/15/22 | 10,867 | 10,980 |
| DIRECTV Holdings LLC / DIRECTV Financing Co. Inc. | 4.450% | 4/1/24 | 15,665 | 16,055 |
| DIRECTV Holdings LLC / DIRECTV Financing Co. Inc. | 3.950% | 1/15/25 | 9,850 | 9,703 |
| Discovery Communications LLC | 4.375% | 6/15/21 | 4,750 | 4,867 |
| Discovery Communications LLC | 3.300% | 5/15/22 | 1,900 | 1,798 |
| Discovery Communications LLC | 3.250% | 4/1/23 | 2,150 | 1,982 |
| Discovery Communications LLC | 3.450% | 3/15/25 | 3,400 | 3,083 |
| Grupo Televisa SAB | 4.625% | 1/30/26 | 2,750 | 2,744 |
| Interpublic Group of Cos. Inc. | 4.000% | 3/15/22 | 3,010 | 3,025 |
| Interpublic Group of Cos. Inc. | 3.750% | 2/15/23 | 2,250 | 2,168 |
| Interpublic Group of Cos. Inc. | 4.200% | 4/15/24 | 2,925 | 2,901 |
| McGraw Hill Financial Inc. | 4.000% | 6/15/25 | 6,100 | 6,124 |
| Moody's Corp. | 4.500% | 9/1/22 | 7,741 | 8,230 |
| Moody's Corp. | 4.875% | 2/15/24 | 9,600 | 10,238 |
| NBCUniversal Media LLC | 4.375% | 4/1/21 | 12,755 | 13,857 |
| NBCUniversal Media LLC | 2.875% | 1/15/23 | 7,850 | 7,793 |
| Omnicom Group Inc. | 3.625% | 5/1/22 | 6,386 | 6,456 |
| Omnicom Group Inc. | 3.650% | 11/1/24 | 5,235 | 5,227 |
| Orange SA | 4.125% | 9/14/21 | 6,775 | 7,144 |
| Qwest Corp. | 6.750% | 12/1/21 | 7,370 | 7,686 |
| RELX Capital Inc. | 3.125% | 10/15/22 | 6,482 | 6,283 |
| Rogers Communications Inc. | 3.000% | 3/15/23 | 3,665 | 3,572 |
| Rogers Communications Inc. | 4.100% | 10/1/23 | 8,500 | 8,878 |
| Rogers Communications Inc. | 3.625% | 12/15/25 | 900 | 886 |
| Scripps Networks Interactive Inc. | 3.500% | 6/15/22 | 3,000 | 2,889 |
| Scripps Networks Interactive Inc. | 3.900% | 11/15/24 | 2,400 | 2,291 |
| Telefonica Emisiones SAU | 5.462% | 2/16/21 | 10,560 | 11,794 |
| Telefonica Emisiones SAU | 4.570% | 4/27/23 | 3,900 | 4,077 |
| Thomson Reuters Corp. | 3.950% | 9/30/21 | 1,975 | 2,041 |
| Thomson Reuters Corp. | 4.300% | 11/23/23 | 6,750 | 6,927 |
| Time Warner Cable Inc. | 4.125% | 2/15/21 | 3,675 | 3,782 |
| Time Warner Cable Inc. | 4.000% | 9/1/21 | 8,500 | 8,577 |
| Time Warner Entertainment Co. LP | 8.375% | 3/15/23 | 4,303 | 5,291 |
| Time Warner Inc. | 4.700% | 1/15/21 | 4,335 | 4,666 |
| Time Warner Inc. | 4.750% | 3/29/21 | 9,375 | 10,084 |
| Time Warner Inc. | 4.000% | 1/15/22 | 7,082 | 7,339 |
| Time Warner Inc. | 3.400% | 6/15/22 | 4,076 | 4,060 |
| Time Warner Inc. | 4.050% | 12/15/23 | 3,175 | 3,240 |
| Time Warner Inc. | 3.550% | 6/1/24 | 2,425 | 2,383 |
| Time Warner Inc. | 3.600% | 7/15/25 | 10,250 | 9,991 |
| Verizon Communications Inc. | 3.450% | 3/15/21 | 6,260 | 6,410 |
| Verizon Communications Inc. | 4.600% | 4/1/21 | 9,342 | 10,071 |
| Verizon Communications Inc. | 3.000% | 11/1/21 | 13,200 | 13,236 |
| Verizon Communications Inc. | 3.500% | 11/1/21 | 16,986 | 17,292 |
| Verizon Communications Inc. | 2.450% | 11/1/22 | 3,939 | 3,727 |
| Verizon Communications Inc. | 5.150% | 9/15/23 | 55,380 | 60,749 |
| Verizon Communications Inc. | 4.150% | 3/15/24 | 11,775 | 12,079 |
50
| Vanguard® Intermediate-Term Bond Index Fund | ||||
| Schedule of Investments | ||||
| December 31, 2015 | ||||
| Face | Market | |||
| Maturity | Amount | Value | ||
| Coupon | Date | ($000) | ($000) | |
| Verizon Communications Inc. | 3.500% | 11/1/24 | 26,800 | 26,418 |
| Viacom Inc. | 3.875% | 12/15/21 | 910 | 900 |
| Viacom Inc. | 3.125% | 6/15/22 | 4,875 | 4,511 |
| Viacom Inc. | 4.250% | 9/1/23 | 7,925 | 7,658 |
| Viacom Inc. | 3.875% | 4/1/24 | 7,675 | 7,156 |
| Vodafone Group plc | 4.375% | 3/16/21 | 3,399 | 3,606 |
| Vodafone Group plc | 2.500% | 9/26/22 | 4,650 | 4,299 |
| Vodafone Group plc | 2.950% | 2/19/23 | 9,830 | 9,319 |
| Walt Disney Co. | 3.750% | 6/1/21 | 2,875 | 3,059 |
| Walt Disney Co. | 2.750% | 8/16/21 | 7,425 | 7,553 |
| Walt Disney Co. | 2.550% | 2/15/22 | 2,050 | 2,060 |
| Walt Disney Co. | 2.350% | 12/1/22 | 4,107 | 4,027 |
| Walt Disney Co. | 3.150% | 9/17/25 | 5,750 | 5,841 |
| WPP Finance 2010 | 4.750% | 11/21/21 | 8,127 | 8,742 |
| WPP Finance 2010 | 3.750% | 9/19/24 | 5,616 | 5,579 |
| Consumer Cyclical (3.2%) | ||||
| Advance Auto Parts Inc. | 4.500% | 1/15/22 | 1,500 | 1,547 |
| Advance Auto Parts Inc. | 4.500% | 12/1/23 | 3,646 | 3,724 |
| Alibaba Group Holding Ltd. | 3.125% | 11/28/21 | 9,750 | 9,489 |
| Alibaba Group Holding Ltd. | 3.600% | 11/28/24 | 14,425 | 13,871 |
| Amazon.com Inc. | 3.300% | 12/5/21 | 5,975 | 6,150 |
| Amazon.com Inc. | 2.500% | 11/29/22 | 11,608 | 11,227 |
| Amazon.com Inc. | 3.800% | 12/5/24 | 5,900 | 6,140 |
| Automatic Data Processing Inc. | 3.375% | 9/15/25 | 6,400 | 6,535 |
| AutoNation Inc. | 3.350% | 1/15/21 | 1,800 | 1,803 |
| AutoNation Inc. | 4.500% | 10/1/25 | 500 | 508 |
| AutoZone Inc. | 2.500% | 4/15/21 | 1,250 | 1,222 |
| AutoZone Inc. | 3.700% | 4/15/22 | 9,056 | 9,223 |
| AutoZone Inc. | 2.875% | 1/15/23 | 125 | 121 |
| AutoZone Inc. | 3.125% | 7/15/23 | 2,025 | 1,982 |
| AutoZone Inc. | 3.250% | 4/15/25 | 2,300 | 2,226 |
| Bed Bath & Beyond Inc. | 3.749% | 8/1/24 | 1,925 | 1,878 |
| Best Buy Co. Inc. | 5.500% | 3/15/21 | 3,750 | 3,909 |
| Block Financial LLC | 5.500% | 11/1/22 | 3,200 | 3,390 |
| Block Financial LLC | 5.250% | 10/1/25 | 3,700 | 3,782 |
| BorgWarner Inc. | 3.375% | 3/15/25 | 2,950 | 2,790 |
| Brinker International Inc. | 3.875% | 5/15/23 | 1,850 | 1,784 |
| Coach Inc. | 4.250% | 4/1/25 | 2,000 | 1,904 |
| Costco Wholesale Corp. | 2.250% | 2/15/22 | 3,104 | 3,046 |
| Cummins Inc. | 3.650% | 10/1/23 | 2,839 | 2,930 |
| CVS Health Corp. | 3.500% | 7/20/22 | 9,550 | 9,718 |
| CVS Health Corp. | 2.750% | 12/1/22 | 9,331 | 9,072 |
| 5 CVS Health Corp. | 4.750% | 12/1/22 | 2,000 | 2,153 |
| CVS Health Corp. | 4.000% | 12/5/23 | 11,750 | 12,210 |
| CVS Health Corp. | 3.375% | 8/12/24 | 4,750 | 4,696 |
| 5 CVS Health Corp. | 5.000% | 12/1/24 | 4,926 | 5,334 |
| CVS Health Corp. | 3.875% | 7/20/25 | 21,571 | 21,941 |
| Delphi Automotive plc | 4.250% | 1/15/26 | 500 | 502 |
| Delphi Corp. | 5.000% | 2/15/23 | 4,970 | 5,194 |
| Delphi Corp. | 4.150% | 3/15/24 | 4,600 | 4,654 |
| Dollar General Corp. | 3.250% | 4/15/23 | 4,470 | 4,265 |
| Dollar General Corp. | 4.150% | 11/1/25 | 4,300 | 4,262 |
| eBay Inc. | 2.875% | 8/1/21 | 3,700 | 3,643 |
| eBay Inc. | 2.600% | 7/15/22 | 6,915 | 6,417 |
| eBay Inc. | 3.450% | 8/1/24 | 5,919 | 5,639 |
| Expedia Inc. | 4.500% | 8/15/24 | 3,610 | 3,477 |
| Ford Motor Credit Co. LLC | 3.200% | 1/15/21 | 8,400 | 8,327 |
| Ford Motor Credit Co. LLC | 5.750% | 2/1/21 | 8,225 | 9,123 |
| Ford Motor Credit Co. LLC | 5.875% | 8/2/21 | 13,675 | 15,256 |
| Ford Motor Credit Co. LLC | 3.219% | 1/9/22 | 4,070 | 3,974 |
| Ford Motor Credit Co. LLC | 4.250% | 9/20/22 | 4,850 | 4,992 |
| Ford Motor Credit Co. LLC | 4.375% | 8/6/23 | 8,850 | 9,106 |
| Ford Motor Credit Co. LLC | 3.664% | 9/8/24 | 9,750 | 9,491 |
51
| Vanguard® Intermediate-Term Bond Index Fund | ||||
| Schedule of Investments | ||||
| December 31, 2015 | ||||
| Face | Market | |||
| Maturity | Amount | Value | ||
| Coupon | Date | ($000) | ($000) | |
| Ford Motor Credit Co. LLC | 4.134% | 8/4/25 | 7,900 | 7,859 |
| Gap Inc. | 5.950% | 4/12/21 | 8,230 | 8,709 |
| General Motors Co. | 4.875% | 10/2/23 | 13,955 | 14,251 |
| General Motors Co. | 4.000% | 4/1/25 | 1,000 | 947 |
| General Motors Financial Co. Inc. | 4.375% | 9/25/21 | 12,460 | 12,585 |
| General Motors Financial Co. Inc. | 3.450% | 4/10/22 | 8,090 | 7,736 |
| General Motors Financial Co. Inc. | 4.250% | 5/15/23 | 4,575 | 4,518 |
| General Motors Financial Co. Inc. | 4.000% | 1/15/25 | 8,670 | 8,226 |
| General Motors Financial Co. Inc. | 4.300% | 7/13/25 | 5,250 | 5,112 |
| Harley-Davidson Inc. | 3.500% | 7/28/25 | 3,125 | 3,117 |
| Harman International Industries Inc. | 4.150% | 5/15/25 | 2,400 | 2,296 |
| Home Depot Inc. | 4.400% | 4/1/21 | 10,433 | 11,471 |
| Home Depot Inc. | 2.625% | 6/1/22 | 4,960 | 4,953 |
| Home Depot Inc. | 2.700% | 4/1/23 | 3,675 | 3,649 |
| Home Depot Inc. | 3.750% | 2/15/24 | 5,475 | 5,821 |
| Home Depot Inc. | 3.350% | 9/15/25 | 6,800 | 6,947 |
| Hyatt Hotels Corp. | 5.375% | 8/15/21 | 1,325 | 1,446 |
| Hyatt Hotels Corp. | 3.375% | 7/15/23 | 2,025 | 1,924 |
| Johnson Controls Inc. | 4.250% | 3/1/21 | 2,350 | 2,422 |
| Johnson Controls Inc. | 3.750% | 12/1/21 | 3,850 | 3,868 |
| Johnson Controls Inc. | 3.625% | 7/2/24 | 3,725 | 3,553 |
| Kohl's Corp. | 4.000% | 11/1/21 | 4,950 | 5,085 |
| Kohl's Corp. | 3.250% | 2/1/23 | 3,460 | 3,285 |
| Kohl's Corp. | 4.250% | 7/17/25 | 4,350 | 4,240 |
| Lowe's Cos. Inc. | 3.750% | 4/15/21 | 2,300 | 2,426 |
| Lowe's Cos. Inc. | 3.800% | 11/15/21 | 2,870 | 3,051 |
| Lowe's Cos. Inc. | 3.120% | 4/15/22 | 5,992 | 6,133 |
| Lowe's Cos. Inc. | 3.875% | 9/15/23 | 3,400 | 3,593 |
| Lowe's Cos. Inc. | 3.125% | 9/15/24 | 3,090 | 3,077 |
| Lowe's Cos. Inc. | 3.375% | 9/15/25 | 7,840 | 7,953 |
| Macy's Retail Holdings Inc. | 3.450% | 1/15/21 | 2,500 | 2,487 |
| Macy's Retail Holdings Inc. | 3.875% | 1/15/22 | 9,320 | 9,180 |
| Macy's Retail Holdings Inc. | 2.875% | 2/15/23 | 1,500 | 1,359 |
| Macy's Retail Holdings Inc. | 4.375% | 9/1/23 | 575 | 569 |
| Macy's Retail Holdings Inc. | 3.625% | 6/1/24 | 4,875 | 4,521 |
| Magna International Inc. | 3.625% | 6/15/24 | 4,500 | 4,415 |
| Magna International Inc. | 4.150% | 10/1/25 | 1,500 | 1,528 |
| Marriott International Inc. | 2.875% | 3/1/21 | 2,900 | 2,873 |
| Marriott International Inc. | 3.125% | 10/15/21 | 2,575 | 2,561 |
| Marriott International Inc. | 3.250% | 9/15/22 | 2,625 | 2,578 |
| Marriott International Inc. | 3.750% | 10/1/25 | 2,000 | 1,963 |
| MasterCard Inc. | 3.375% | 4/1/24 | 6,075 | 6,200 |
| McDonald's Corp. | 3.625% | 5/20/21 | 4,878 | 5,028 |
| McDonald's Corp. | 2.625% | 1/15/22 | 6,382 | 6,227 |
| McDonald's Corp. | 3.375% | 5/26/25 | 4,355 | 4,277 |
| McDonald's Corp. | 3.700% | 1/30/26 | 5,000 | 4,979 |
| NIKE Inc. | 2.250% | 5/1/23 | 2,473 | 2,419 |
| Nordstrom Inc. | 4.000% | 10/15/21 | 3,254 | 3,422 |
| NVR Inc. | 3.950% | 9/15/22 | 4,881 | 4,904 |
| O'Reilly Automotive Inc. | 4.875% | 1/14/21 | 3,337 | 3,627 |
| O'Reilly Automotive Inc. | 3.800% | 9/1/22 | 2,500 | 2,535 |
| O'Reilly Automotive Inc. | 3.850% | 6/15/23 | 2,425 | 2,452 |
| Priceline Group Inc. | 3.650% | 3/15/25 | 3,350 | 3,268 |
| QVC Inc. | 5.125% | 7/2/22 | 4,450 | 4,451 |
| QVC Inc. | 4.375% | 3/15/23 | 4,050 | 3,847 |
| QVC Inc. | 4.850% | 4/1/24 | 9,125 | 8,701 |
| QVC Inc. | 4.450% | 2/15/25 | 265 | 246 |
| Ross Stores Inc. | 3.375% | 9/15/24 | 1,275 | 1,256 |
| Signet UK Finance plc | 4.700% | 6/15/24 | 2,950 | 2,900 |
| Staples Inc. | 4.375% | 1/12/23 | 3,025 | 2,900 |
| Starbucks Corp. | 2.700% | 6/15/22 | 1,900 | 1,899 |
| Starbucks Corp. | 3.850% | 10/1/23 | 6,890 | 7,321 |
| Starwood Hotels & Resorts Worldwide Inc. | 3.125% | 2/15/23 | 2,380 | 2,324 |
| Starwood Hotels & Resorts Worldwide Inc. | 3.750% | 3/15/25 | 2,500 | 2,443 |
52
| Vanguard® Intermediate-Term Bond Index Fund | ||||
| Schedule of Investments | ||||
| December 31, 2015 | ||||
| Face | Market | |||
| Maturity | Amount | Value | ||
| Coupon | Date | ($000) | ($000) | |
| Target Corp. | 2.900% | 1/15/22 | 7,277 | 7,386 |
| Target Corp. | 3.500% | 7/1/24 | 6,360 | 6,582 |
| TJX Cos. Inc. | 2.750% | 6/15/21 | 7,200 | 7,298 |
| TJX Cos. Inc. | 2.500% | 5/15/23 | 2,725 | 2,632 |
| Toyota Motor Credit Corp. | 4.250% | 1/11/21 | 3,975 | 4,305 |
| Toyota Motor Credit Corp. | 2.750% | 5/17/21 | 3,109 | 3,146 |
| Toyota Motor Credit Corp. | 3.400% | 9/15/21 | 6,005 | 6,232 |
| Toyota Motor Credit Corp. | 3.300% | 1/12/22 | 9,350 | 9,628 |
| Toyota Motor Credit Corp. | 2.800% | 7/13/22 | 3,225 | 3,210 |
| Toyota Motor Credit Corp. | 2.625% | 1/10/23 | 3,000 | 2,952 |
| VF Corp. | 3.500% | 9/1/21 | 3,450 | 3,611 |
| Visa Inc. | 2.800% | 12/14/22 | 11,700 | 11,736 |
| Visa Inc. | 3.150% | 12/14/25 | 31,700 | 31,753 |
| Wal-Mart Stores Inc. | 4.250% | 4/15/21 | 5,550 | 6,140 |
| Wal-Mart Stores Inc. | 2.550% | 4/11/23 | 11,850 | 11,671 |
| Wal-Mart Stores Inc. | 3.300% | 4/22/24 | 17,875 | 18,451 |
| Walgreen Co. | 3.100% | 9/15/22 | 3,961 | 3,833 |
| Walgreens Boots Alliance Inc. | 3.300% | 11/18/21 | 11,900 | 11,658 |
| Walgreens Boots Alliance Inc. | 3.800% | 11/18/24 | 13,868 | 13,490 |
| Wyndham Worldwide Corp. | 4.250% | 3/1/22 | 4,002 | 4,000 |
| Wyndham Worldwide Corp. | 3.900% | 3/1/23 | 7,175 | 6,922 |
| Consumer Noncyclical (6.1%) | ||||
| Abbott Laboratories | 2.550% | 3/15/22 | 2,500 | 2,480 |
| Abbott Laboratories | 2.950% | 3/15/25 | 6,100 | 6,018 |
| AbbVie Inc. | 2.900% | 11/6/22 | 20,890 | 20,183 |
| AbbVie Inc. | 3.200% | 11/6/22 | 6,850 | 6,750 |
| AbbVie Inc. | 3.600% | 5/14/25 | 25,160 | 24,824 |
| Actavis Funding SCS | 3.450% | 3/15/22 | 19,568 | 19,567 |
| Actavis Funding SCS | 3.850% | 6/15/24 | 9,100 | 9,093 |
| Actavis Funding SCS | 3.800% | 3/15/25 | 26,981 | 26,738 |
| Actavis Inc. | 3.250% | 10/1/22 | 13,437 | 13,213 |
| Agilent Technologies Inc. | 3.200% | 10/1/22 | 4,475 | 4,343 |
| Agilent Technologies Inc. | 3.875% | 7/15/23 | 3,000 | 3,001 |
| Allergan Inc. | 2.800% | 3/15/23 | 2,975 | 2,796 |
| Altria Group Inc. | 4.750% | 5/5/21 | 11,525 | 12,518 |
| Altria Group Inc. | 2.850% | 8/9/22 | 10,756 | 10,515 |
| Altria Group Inc. | 2.950% | 5/2/23 | 2,550 | 2,478 |
| Altria Group Inc. | 4.000% | 1/31/24 | 9,600 | 9,954 |
| AmerisourceBergen Corp. | 3.500% | 11/15/21 | 5,125 | 5,229 |
| AmerisourceBergen Corp. | 3.400% | 5/15/24 | 4,200 | 4,116 |
| AmerisourceBergen Corp. | 3.250% | 3/1/25 | 1,100 | 1,065 |
| Amgen Inc. | 4.100% | 6/15/21 | 6,900 | 7,261 |
| Amgen Inc. | 3.875% | 11/15/21 | 12,650 | 13,186 |
| Amgen Inc. | 2.700% | 5/1/22 | 850 | 824 |
| Amgen Inc. | 3.625% | 5/15/22 | 6,667 | 6,864 |
| Amgen Inc. | 3.625% | 5/22/24 | 8,995 | 8,992 |
| Amgen Inc. | 3.125% | 5/1/25 | 7,175 | 6,814 |
| Anheuser-Busch InBev Finance Inc. | 2.625% | 1/17/23 | 9,475 | 9,088 |
| Anheuser-Busch InBev Finance Inc. | 3.700% | 2/1/24 | 8,015 | 8,172 |
| Anheuser-Busch InBev Worldwide Inc. | 4.375% | 2/15/21 | 1,925 | 2,090 |
| Anheuser-Busch InBev Worldwide Inc. | 2.500% | 7/15/22 | 21,200 | 20,356 |
| Archer-Daniels-Midland Co. | 4.479% | 3/1/21 | 3,073 | 3,355 |
| AstraZeneca plc | 3.375% | 11/16/25 | 13,000 | 12,865 |
| 5 Baxalta Inc. | 3.600% | 6/23/22 | 3,025 | 3,028 |
| 5 Baxalta Inc. | 4.000% | 6/23/25 | 11,800 | 11,672 |
| Beam Suntory Inc. | 3.250% | 5/15/22 | 925 | 910 |
| Beam Suntory Inc. | 3.250% | 6/15/23 | 500 | 482 |
| Becton Dickinson & Co. | 3.125% | 11/8/21 | 8,355 | 8,429 |
| Becton Dickinson & Co. | 3.734% | 12/15/24 | 11,662 | 11,754 |
| Becton Dickinson and Co. | 3.300% | 3/1/23 | 2,000 | 1,985 |
| Becton Dickinson and Co. | 3.875% | 5/15/24 | 515 | 523 |
| Biogen Inc. | 3.625% | 9/15/22 | 6,550 | 6,633 |
| Biogen Inc. | 4.050% | 9/15/25 | 11,500 | 11,536 |
53
| Vanguard® Intermediate-Term Bond Index Fund | ||||
| Schedule of Investments | ||||
| December 31, 2015 | ||||
| Face | Market | |||
| Maturity | Amount | Value | ||
| Coupon | Date | ($000) | ($000) | |
| Boston Scientific Corp. | 3.375% | 5/15/22 | 3,175 | 3,144 |
| Boston Scientific Corp. | 4.125% | 10/1/23 | 3,906 | 3,990 |
| Boston Scientific Corp. | 3.850% | 5/15/25 | 7,550 | 7,427 |
| Bristol-Myers Squibb Co. | 2.000% | 8/1/22 | 8,025 | 7,788 |
| Bristol-Myers Squibb Co. | 7.150% | 6/15/23 | 425 | 539 |
| Brown-Forman Corp. | 2.250% | 1/15/23 | 800 | 766 |
| Campbell Soup Co. | 4.250% | 4/15/21 | 2,768 | 2,934 |
| Campbell Soup Co. | 2.500% | 8/2/22 | 3,000 | 2,864 |
| Campbell Soup Co. | 3.300% | 3/19/25 | 1,900 | 1,888 |
| Cardinal Health Inc. | 3.200% | 6/15/22 | 1,500 | 1,482 |
| Cardinal Health Inc. | 3.200% | 3/15/23 | 3,000 | 2,969 |
| Cardinal Health Inc. | 3.750% | 9/15/25 | 5,100 | 5,183 |
| Catholic Health Initiatives Colorado GO | 2.950% | 11/1/22 | 3,200 | 3,122 |
| Celgene Corp. | 3.250% | 8/15/22 | 6,918 | 6,853 |
| Celgene Corp. | 3.550% | 8/15/22 | 2,900 | 2,927 |
| Celgene Corp. | 4.000% | 8/15/23 | 5,000 | 5,139 |
| Celgene Corp. | 3.625% | 5/15/24 | 13,000 | 12,774 |
| Celgene Corp. | 3.875% | 8/15/25 | 14,580 | 14,527 |
| Clorox Co. | 3.800% | 11/15/21 | 575 | 601 |
| Clorox Co. | 3.050% | 9/15/22 | 4,540 | 4,488 |
| Clorox Co. | 3.500% | 12/15/24 | 3,600 | 3,597 |
| Coca-Cola Bottling Co. Consolidated | 3.800% | 11/25/25 | 2,350 | 2,350 |
| Coca-Cola Co. | 3.300% | 9/1/21 | 9,925 | 10,368 |
| Coca-Cola Co. | 2.500% | 4/1/23 | 970 | 965 |
| Coca-Cola Co. | 3.200% | 11/1/23 | 11,750 | 12,170 |
| Coca-Cola Co. | 2.875% | 10/27/25 | 15,500 | 15,245 |
| Coca-Cola Enterprises Inc. | 4.500% | 9/1/21 | 3,550 | 3,798 |
| Coca-Cola Femsa SAB de CV | 3.875% | 11/26/23 | 6,900 | 7,001 |
| Coca-Cola Refreshments USA Inc. | 8.500% | 2/1/22 | 300 | 390 |
| Colgate-Palmolive Co. | 2.450% | 11/15/21 | 5,050 | 5,078 |
| Colgate-Palmolive Co. | 2.300% | 5/3/22 | 4,148 | 4,114 |
| Colgate-Palmolive Co. | 1.950% | 2/1/23 | 3,000 | 2,884 |
| Colgate-Palmolive Co. | 2.100% | 5/1/23 | 1,932 | 1,863 |
| Colgate-Palmolive Co. | 3.250% | 3/15/24 | 2,660 | 2,761 |
| ConAgra Foods Inc. | 3.250% | 9/15/22 | 3,525 | 3,393 |
| ConAgra Foods Inc. | 3.200% | 1/25/23 | 8,665 | 8,341 |
| Covidien International Finance SA | 3.200% | 6/15/22 | 6,579 | 6,587 |
| Covidien International Finance SA | 2.950% | 6/15/23 | 10,175 | 10,001 |
| CR Bard Inc. | 4.400% | 1/15/21 | 3,293 | 3,491 |
| DENTSPLY International Inc. | 4.125% | 8/15/21 | 100 | 102 |
| Diageo Capital plc | 2.625% | 4/29/23 | 6,585 | 6,352 |
| Diageo Investment Corp. | 2.875% | 5/11/22 | 12,410 | 12,215 |
| Dignity Health California GO | 3.125% | 11/1/22 | 1,600 | 1,591 |
| Dignity Health California GO | 3.812% | 11/1/24 | 3,000 | 3,061 |
| Dr Pepper Snapple Group Inc. | 3.200% | 11/15/21 | 3,967 | 3,990 |
| Dr Pepper Snapple Group Inc. | 2.700% | 11/15/22 | 1,500 | 1,445 |
| Dr Pepper Snapple Group Inc. | 3.400% | 11/15/25 | 1,400 | 1,375 |
| Eli Lilly & Co. | 2.750% | 6/1/25 | 5,100 | 5,054 |
| Estee Lauder Cos. Inc. | 2.350% | 8/15/22 | 2,603 | 2,525 |
| Express Scripts Holding Co. | 4.750% | 11/15/21 | 4,298 | 4,623 |
| Express Scripts Holding Co. | 3.900% | 2/15/22 | 10,250 | 10,542 |
| Express Scripts Holding Co. | 3.500% | 6/15/24 | 5,900 | 5,823 |
| Flowers Foods Inc. | 4.375% | 4/1/22 | 2,750 | 2,862 |
| Fomento Economico Mexicano SAB de CV | 2.875% | 5/10/23 | 1,600 | 1,492 |
| General Mills Inc. | 3.150% | 12/15/21 | 5,750 | 5,760 |
| General Mills Inc. | 3.650% | 2/15/24 | 3,089 | 3,185 |
| Gilead Sciences Inc. | 4.500% | 4/1/21 | 4,585 | 4,962 |
| Gilead Sciences Inc. | 4.400% | 12/1/21 | 8,175 | 8,809 |
| Gilead Sciences Inc. | 3.250% | 9/1/22 | 7,475 | 7,519 |
| Gilead Sciences Inc. | 3.700% | 4/1/24 | 16,450 | 16,813 |
| Gilead Sciences Inc. | 3.500% | 2/1/25 | 10,725 | 10,791 |
| GlaxoSmithKline Capital Inc. | 2.800% | 3/18/23 | 4,650 | 4,641 |
| GlaxoSmithKline Capital plc | 2.850% | 5/8/22 | 14,023 | 14,096 |
| Hasbro Inc. | 3.150% | 5/15/21 | 3,015 | 3,008 |
54
| Vanguard® Intermediate-Term Bond Index Fund | ||||
| Schedule of Investments | ||||
| December 31, 2015 | ||||
| Face | Market | |||
| Maturity | Amount | Value | ||
| Coupon | Date | ($000) | ($000) | |
| Hershey Co. | 2.625% | 5/1/23 | 3,000 | 2,952 |
| Hershey Co. | 3.200% | 8/21/25 | 1,900 | 1,925 |
| Hormel Foods Corp. | 4.125% | 4/15/21 | 875 | 944 |
| International Flavors & Fragrances Inc. | 3.200% | 5/1/23 | 1,525 | 1,486 |
| JM Smucker Co. | 3.500% | 10/15/21 | 4,950 | 5,102 |
| JM Smucker Co. | 3.000% | 3/15/22 | 1,900 | 1,889 |
| JM Smucker Co. | 3.500% | 3/15/25 | 6,700 | 6,668 |
| Johnson & Johnson | 3.550% | 5/15/21 | 2,350 | 2,508 |
| Johnson & Johnson | 2.450% | 12/5/21 | 3,000 | 3,043 |
| Johnson & Johnson | 3.375% | 12/5/23 | 6,000 | 6,370 |
| Kaiser Foundation Hospitals | 3.500% | 4/1/22 | 3,155 | 3,197 |
| Kimberly-Clark Corp. | 3.875% | 3/1/21 | 2,195 | 2,366 |
| Kimberly-Clark Corp. | 2.400% | 3/1/22 | 1,600 | 1,585 |
| Kimberly-Clark Corp. | 2.400% | 6/1/23 | 1,625 | 1,575 |
| Kimberly-Clark Corp. | 2.650% | 3/1/25 | 1,625 | 1,571 |
| Kimberly-Clark Corp. | 3.050% | 8/15/25 | 2,350 | 2,364 |
| Koninklijke Philips NV | 3.750% | 3/15/22 | 6,500 | 6,670 |
| Kraft Foods Group Inc. | 3.500% | 6/6/22 | 14,164 | 14,318 |
| 5 Kraft Heinz Foods Co. | 3.500% | 7/15/22 | 7,500 | 7,557 |
| 5 Kraft Heinz Foods Co. | 3.950% | 7/15/25 | 11,275 | 11,373 |
| Kroger Co. | 3.300% | 1/15/21 | 5,425 | 5,511 |
| Kroger Co. | 2.950% | 11/1/21 | 3,400 | 3,355 |
| Kroger Co. | 3.400% | 4/15/22 | 3,129 | 3,170 |
| Kroger Co. | 3.850% | 8/1/23 | 2,295 | 2,367 |
| Kroger Co. | 4.000% | 2/1/24 | 5,186 | 5,385 |
| Laboratory Corp. of America Holdings | 3.200% | 2/1/22 | 504 | 495 |
| Laboratory Corp. of America Holdings | 3.750% | 8/23/22 | 3,000 | 3,028 |
| Laboratory Corp. of America Holdings | 4.000% | 11/1/23 | 1,875 | 1,900 |
| Laboratory Corp. of America Holdings | 3.600% | 2/1/25 | 5,150 | 4,975 |
| Life Technologies Corp. | 5.000% | 1/15/21 | 2,525 | 2,688 |
| Mattel Inc. | 3.150% | 3/15/23 | 1,650 | 1,576 |
| McCormick & Co. Inc. | 3.900% | 7/15/21 | 1,850 | 1,971 |
| McCormick & Co. Inc. | 3.500% | 9/1/23 | 475 | 484 |
| McCormick & Co. Inc. | 3.250% | 11/15/25 | 2,500 | 2,510 |
| McKesson Corp. | 4.750% | 3/1/21 | 4,196 | 4,544 |
| McKesson Corp. | 2.700% | 12/15/22 | 3,000 | 2,875 |
| McKesson Corp. | 3.796% | 3/15/24 | 9,200 | 9,255 |
| Mead Johnson Nutrition Co. | 4.125% | 11/15/25 | 6,275 | 6,318 |
| Medtronic Inc. | 4.125% | 3/15/21 | 1,840 | 1,963 |
| Medtronic Inc. | 3.125% | 3/15/22 | 4,878 | 4,920 |
| Medtronic Inc. | 3.150% | 3/15/22 | 21,195 | 21,407 |
| Medtronic Inc. | 2.750% | 4/1/23 | 10,050 | 9,811 |
| Medtronic Inc. | 3.625% | 3/15/24 | 3,950 | 4,047 |
| Medtronic Inc. | 3.500% | 3/15/25 | 23,341 | 23,615 |
| Merck & Co. Inc. | 3.875% | 1/15/21 | 13,150 | 14,096 |
| Merck & Co. Inc. | 2.350% | 2/10/22 | 4,471 | 4,388 |
| Merck & Co. Inc. | 2.400% | 9/15/22 | 6,863 | 6,709 |
| Merck & Co. Inc. | 2.800% | 5/18/23 | 13,350 | 13,279 |
| Merck & Co. Inc. | 2.750% | 2/10/25 | 14,975 | 14,550 |
| Molson Coors Brewing Co. | 3.500% | 5/1/22 | 2,300 | 2,314 |
| Mondelez International Inc. | 4.000% | 2/1/24 | 11,047 | 11,393 |
| Mylan Inc. | 4.200% | 11/29/23 | 6,025 | 5,906 |
| Newell Rubbermaid Inc. | 4.000% | 6/15/22 | 3,600 | 3,469 |
| Newell Rubbermaid Inc. | 4.000% | 12/1/24 | 3,305 | 3,067 |
| Newell Rubbermaid Inc. | 3.900% | 11/1/25 | 1,700 | 1,559 |
| Novartis Capital Corp. | 2.400% | 9/21/22 | 8,847 | 8,706 |
| Novartis Capital Corp. | 3.400% | 5/6/24 | 13,375 | 13,806 |
| Novartis Capital Corp. | 3.000% | 11/20/25 | 12,780 | 12,597 |
| Owens & Minor Inc. | 4.375% | 12/15/24 | 1,100 | 1,098 |
| Partners Healthcare System Massachusetts GO | 3.443% | 7/1/21 | 1,325 | 1,363 |
| PepsiCo Inc. | 3.000% | 8/25/21 | 9,600 | 9,831 |
| PepsiCo Inc. | 2.750% | 3/5/22 | 11,175 | 11,206 |
| PepsiCo Inc. | 3.100% | 7/17/22 | 3,750 | 3,846 |
| PepsiCo Inc. | 2.750% | 3/1/23 | 9,300 | 9,276 |
55
| Vanguard® Intermediate-Term Bond Index Fund | ||||
| Schedule of Investments | ||||
| December 31, 2015 | ||||
| Face | Market | |||
| Maturity | Amount | Value | ||
| Coupon | Date | ($000) | ($000) | |
| PepsiCo Inc. | 3.600% | 3/1/24 | 3,025 | 3,158 |
| PepsiCo Inc. | 2.750% | 4/30/25 | 5,800 | 5,669 |
| PepsiCo Inc. | 3.500% | 7/17/25 | 6,600 | 6,805 |
| PerkinElmer Inc. | 5.000% | 11/15/21 | 7,100 | 7,487 |
| Perrigo Co. plc | 4.000% | 11/15/23 | 4,725 | 4,597 |
| Perrigo Finance plc | 3.500% | 12/15/21 | 4,600 | 4,469 |
| Perrigo Finance plc | 3.900% | 12/15/24 | 4,065 | 3,916 |
| Pfizer Inc. | 3.000% | 6/15/23 | 5,043 | 5,127 |
| Pfizer Inc. | 3.400% | 5/15/24 | 4,450 | 4,564 |
| Philip Morris International Inc. | 4.125% | 5/17/21 | 2,500 | 2,674 |
| Philip Morris International Inc. | 2.900% | 11/15/21 | 4,000 | 4,039 |
| Philip Morris International Inc. | 2.500% | 8/22/22 | 3,768 | 3,684 |
| Philip Morris International Inc. | 2.625% | 3/6/23 | 3,400 | 3,329 |
| Philip Morris International Inc. | 3.600% | 11/15/23 | 3,375 | 3,513 |
| Philip Morris International Inc. | 3.250% | 11/10/24 | 5,700 | 5,748 |
| Philip Morris International Inc. | 3.375% | 8/11/25 | 4,900 | 4,962 |
| 4 Procter & Gamble - Esop | 9.360% | 1/1/21 | 804 | 961 |
| Procter & Gamble Co. | 2.300% | 2/6/22 | 5,200 | 5,218 |
| Procter & Gamble Co. | 3.100% | 8/15/23 | 10,420 | 10,873 |
| Quest Diagnostics Inc. | 4.700% | 4/1/21 | 1,750 | 1,852 |
| Quest Diagnostics Inc. | 4.250% | 4/1/24 | 1,800 | 1,858 |
| Quest Diagnostics Inc. | 3.500% | 3/30/25 | 3,450 | 3,336 |
| Reynolds American Inc. | 4.000% | 6/12/22 | 6,200 | 6,446 |
| Reynolds American Inc. | 3.250% | 11/1/22 | 7,350 | 7,270 |
| Reynolds American Inc. | 3.750% | 5/20/23 | 3,475 | 3,479 |
| Reynolds American Inc. | 4.850% | 9/15/23 | 3,000 | 3,208 |
| Reynolds American Inc. | 4.450% | 6/12/25 | 19,661 | 20,570 |
| Sanofi | 4.000% | 3/29/21 | 12,900 | 13,779 |
| St. Jude Medical Inc. | 3.250% | 4/15/23 | 8,060 | 7,906 |
| St. Jude Medical Inc. | 3.875% | 9/15/25 | 1,875 | 1,897 |
| Stryker Corp. | 3.375% | 5/15/24 | 3,625 | 3,639 |
| Stryker Corp. | 3.375% | 11/1/25 | 1,950 | 1,925 |
| Sysco Corp. | 2.600% | 6/12/22 | 1,950 | 1,909 |
| Sysco Corp. | 3.750% | 10/1/25 | 1,400 | 1,417 |
| Teva Pharmaceutical Finance Co. BV | 3.650% | 11/10/21 | 9,021 | 9,164 |
| Teva Pharmaceutical Finance Co. BV | 2.950% | 12/18/22 | 4,909 | 4,700 |
| Teva Pharmaceutical Finance IV BV | 3.650% | 11/10/21 | 981 | 992 |
| Thermo Fisher Scientific Inc. | 4.500% | 3/1/21 | 6,065 | 6,422 |
| Thermo Fisher Scientific Inc. | 3.600% | 8/15/21 | 15,395 | 15,615 |
| Thermo Fisher Scientific Inc. | 3.300% | 2/15/22 | 5,556 | 5,553 |
| Thermo Fisher Scientific Inc. | 3.150% | 1/15/23 | 1,475 | 1,441 |
| Thermo Fisher Scientific Inc. | 4.150% | 2/1/24 | 4,500 | 4,675 |
| Thermo Fisher Scientific Inc. | 3.650% | 12/15/25 | 2,500 | 2,486 |
| Tupperware Brands Corp. | 4.750% | 6/1/21 | 4,025 | 4,108 |
| Tyson Foods Inc. | 4.500% | 6/15/22 | 9,320 | 9,908 |
| Tyson Foods Inc. | 3.950% | 8/15/24 | 7,475 | 7,678 |
| Unilever Capital Corp. | 4.250% | 2/10/21 | 7,262 | 7,924 |
| Unilever Capital Corp. | 3.100% | 7/30/25 | 2,675 | 2,713 |
| Whirlpool Corp. | 4.850% | 6/15/21 | 3,500 | 3,779 |
| Whirlpool Corp. | 3.700% | 3/1/23 | 2,300 | 2,291 |
| Whirlpool Corp. | 4.000% | 3/1/24 | 1,925 | 1,971 |
| Whirlpool Corp. | 3.700% | 5/1/25 | 2,275 | 2,254 |
| 5 Whole Foods Market Inc. | 5.200% | 12/3/25 | 6,500 | 6,495 |
| Wyeth LLC | 7.250% | 3/1/23 | 1,000 | 1,253 |
| Wyeth LLC | 6.450% | 2/1/24 | 4,000 | 4,886 |
| Zeneca Wilmington Inc. | 7.000% | 11/15/23 | 2,050 | 2,553 |
| Zimmer Biomet Holdings Inc. | 3.375% | 11/30/21 | 970 | 973 |
| Zimmer Biomet Holdings Inc. | 3.150% | 4/1/22 | 5,900 | 5,798 |
| Zimmer Biomet Holdings Inc. | 3.550% | 4/1/25 | 13,625 | 13,227 |
| Zoetis Inc. | 3.250% | 2/1/23 | 13,123 | 12,530 |
| Zoetis Inc. | 4.500% | 11/13/25 | 3,600 | 3,651 |
| Energy (4.2%) | ||||
| Anadarko Petroleum Corp. | 3.450% | 7/15/24 | 6,000 | 5,326 |
56
| Vanguard® Intermediate-Term Bond Index Fund | ||||
| Schedule of Investments | ||||
| December 31, 2015 | ||||
| Face | Market | |||
| Maturity | Amount | Value | ||
| Coupon | Date | ($000) | ($000) | |
| Apache Corp. | 3.625% | 2/1/21 | 6,125 | 6,046 |
| Apache Corp. | 3.250% | 4/15/22 | 7,221 | 6,892 |
| Baker Hughes Inc. | 3.200% | 8/15/21 | 4,425 | 4,380 |
| Boardwalk Pipelines LP | 3.375% | 2/1/23 | 1,000 | 808 |
| Boardwalk Pipelines LP | 4.950% | 12/15/24 | 3,250 | 2,826 |
| BP Capital Markets plc | 4.742% | 3/11/21 | 10,900 | 11,864 |
| BP Capital Markets plc | 3.561% | 11/1/21 | 3,600 | 3,659 |
| BP Capital Markets plc | 3.062% | 3/17/22 | 1,500 | 1,469 |
| BP Capital Markets plc | 3.245% | 5/6/22 | 13,236 | 13,172 |
| BP Capital Markets plc | 2.500% | 11/6/22 | 10,048 | 9,583 |
| BP Capital Markets plc | 2.750% | 5/10/23 | 17,363 | 16,278 |
| BP Capital Markets plc | 3.994% | 9/26/23 | 6,800 | 6,906 |
| BP Capital Markets plc | 3.814% | 2/10/24 | 6,555 | 6,539 |
| BP Capital Markets plc | 3.535% | 11/4/24 | 375 | 364 |
| BP Capital Markets plc | 3.506% | 3/17/25 | 8,194 | 7,971 |
| Buckeye Partners LP | 4.875% | 2/1/21 | 4,685 | 4,537 |
| Buckeye Partners LP | 4.150% | 7/1/23 | 4,550 | 3,917 |
| Cameron International Corp. | 4.500% | 6/1/21 | 3,150 | 3,296 |
| Cameron International Corp. | 3.600% | 4/30/22 | 2,800 | 2,787 |
| Cameron International Corp. | 4.000% | 12/15/23 | 1,761 | 1,769 |
| Cameron International Corp. | 3.700% | 6/15/24 | 4,550 | 4,443 |
| Canadian Natural Resources Ltd. | 3.450% | 11/15/21 | 1,010 | 953 |
| Canadian Natural Resources Ltd. | 3.800% | 4/15/24 | 3,175 | 2,834 |
| Canadian Natural Resources Ltd. | 3.900% | 2/1/25 | 2,725 | 2,433 |
| Cenovus Energy Inc. | 3.000% | 8/15/22 | 4,327 | 3,858 |
| Cenovus Energy Inc. | 3.800% | 9/15/23 | 2,020 | 1,822 |
| Chevron Corp. | 2.411% | 3/3/22 | 4,950 | 4,806 |
| Chevron Corp. | 2.355% | 12/5/22 | 15,110 | 14,414 |
| Chevron Corp. | 3.191% | 6/24/23 | 12,025 | 12,073 |
| Chevron Corp. | 3.326% | 11/17/25 | 6,250 | 6,295 |
| Cimarex Energy Co. | 5.875% | 5/1/22 | 3,870 | 3,754 |
| Cimarex Energy Co. | 4.375% | 6/1/24 | 5,250 | 4,699 |
| 5 Columbia Pipeline Group Inc. | 4.500% | 6/1/25 | 5,500 | 4,983 |
| ConocoPhillips Co. | 2.875% | 11/15/21 | 500 | 486 |
| ConocoPhillips Co. | 2.400% | 12/15/22 | 6,588 | 5,985 |
| ConocoPhillips Co. | 3.350% | 11/15/24 | 12,850 | 11,931 |
| ConocoPhillips Co. | 3.350% | 5/15/25 | 850 | 765 |
| Continental Resources Inc. | 5.000% | 9/15/22 | 13,201 | 9,703 |
| Continental Resources Inc. | 4.500% | 4/15/23 | 11,252 | 8,030 |
| Continental Resources Inc. | 3.800% | 6/1/24 | 6,200 | 4,347 |
| Copano Energy LLC / Copano Energy Finance Corp. | 7.125% | 4/1/21 | 3,170 | 3,138 |
| Devon Energy Corp. | 4.000% | 7/15/21 | 4,300 | 3,910 |
| Devon Energy Corp. | 3.250% | 5/15/22 | 5,675 | 4,814 |
| Diamond Offshore Drilling Inc. | 3.450% | 11/1/23 | 1,275 | 1,044 |
| Dominion Gas Holdings LLC | 3.550% | 11/1/23 | 6,791 | 6,699 |
| Enable Midstream Partners LP | 3.900% | 5/15/24 | 4,000 | 3,132 |
| Enbridge Energy Partners LP | 4.200% | 9/15/21 | 3,700 | 3,529 |
| Enbridge Energy Partners LP | 5.875% | 10/15/25 | 2,500 | 2,409 |
| Enbridge Inc. | 4.000% | 10/1/23 | 950 | 843 |
| Enbridge Inc. | 3.500% | 6/10/24 | 6,110 | 5,122 |
| Encana Corp. | 3.900% | 11/15/21 | 3,835 | 3,169 |
| Energy Transfer Partners LP | 4.650% | 6/1/21 | 4,072 | 3,822 |
| Energy Transfer Partners LP | 5.200% | 2/1/22 | 12,752 | 11,822 |
| Energy Transfer Partners LP | 3.600% | 2/1/23 | 9,958 | 8,202 |
| Energy Transfer Partners LP | 4.900% | 2/1/24 | 4,000 | 3,561 |
| Energy Transfer Partners LP | 4.050% | 3/15/25 | 7,550 | 6,257 |
| EnLink Midstream Partners LP | 4.400% | 4/1/24 | 3,975 | 3,169 |
| EnLink Midstream Partners LP | 4.150% | 6/1/25 | 4,725 | 3,636 |
| Ensco plc | 4.700% | 3/15/21 | 10,865 | 8,843 |
| Ensco plc | 4.500% | 10/1/24 | 2,900 | 1,987 |
| Ensco plc | 5.200% | 3/15/25 | 6,315 | 4,450 |
| Enterprise Products Operating LLC | 4.050% | 2/15/22 | 4,043 | 3,955 |
| Enterprise Products Operating LLC | 3.350% | 3/15/23 | 12,515 | 11,308 |
| Enterprise Products Operating LLC | 3.900% | 2/15/24 | 4,300 | 4,012 |
57
| Vanguard® Intermediate-Term Bond Index Fund | ||||
| Schedule of Investments | ||||
| December 31, 2015 | ||||
| Face | Market | |||
| Maturity | Amount | Value | ||
| Coupon | Date | ($000) | ($000) | |
| Enterprise Products Operating LLC | 3.750% | 2/15/25 | 9,597 | 8,741 |
| EOG Resources Inc. | 4.100% | 2/1/21 | 9,675 | 10,126 |
| EOG Resources Inc. | 2.625% | 3/15/23 | 6,355 | 6,000 |
| EOG Resources Inc. | 3.150% | 4/1/25 | 1,525 | 1,439 |
| EQT Corp. | 4.875% | 11/15/21 | 5,340 | 5,110 |
| EQT Midstream Partners LP | 4.000% | 8/1/24 | 3,300 | 2,720 |
| Exxon Mobil Corp. | 2.397% | 3/6/22 | 10,775 | 10,590 |
| Exxon Mobil Corp. | 3.176% | 3/15/24 | 2,000 | 2,034 |
| Exxon Mobil Corp. | 2.709% | 3/6/25 | 11,400 | 11,153 |
| FMC Technologies Inc. | 3.450% | 10/1/22 | 3,125 | 2,788 |
| Gulf South Pipeline Co. LP | 4.000% | 6/15/22 | 3,475 | 3,146 |
| Halliburton Co. | 3.250% | 11/15/21 | 2,320 | 2,302 |
| Halliburton Co. | 3.375% | 11/15/22 | 4,500 | 4,441 |
| Halliburton Co. | 3.500% | 8/1/23 | 5,295 | 5,164 |
| Halliburton Co. | 3.800% | 11/15/25 | 15,000 | 14,721 |
| Hess Corp. | 3.500% | 7/15/24 | 1,500 | 1,311 |
| Husky Energy Inc. | 3.950% | 4/15/22 | 500 | 463 |
| Husky Energy Inc. | 4.000% | 4/15/24 | 5,105 | 4,703 |
| Kerr-McGee Corp. | 6.950% | 7/1/24 | 3,250 | 3,491 |
| Kinder Morgan Energy Partners LP | 5.800% | 3/1/21 | 2,650 | 2,638 |
| Kinder Morgan Energy Partners LP | 5.000% | 10/1/21 | 7,500 | 7,071 |
| Kinder Morgan Energy Partners LP | 4.150% | 3/1/22 | 1,925 | 1,711 |
| Kinder Morgan Energy Partners LP | 3.950% | 9/1/22 | 9,535 | 8,304 |
| Kinder Morgan Energy Partners LP | 3.450% | 2/15/23 | 3,550 | 2,950 |
| Kinder Morgan Energy Partners LP | 3.500% | 9/1/23 | 7,700 | 6,386 |
| Kinder Morgan Energy Partners LP | 4.150% | 2/1/24 | 4,475 | 3,863 |
| Kinder Morgan Energy Partners LP | 4.300% | 5/1/24 | 7,849 | 6,748 |
| Kinder Morgan Energy Partners LP | 4.250% | 9/1/24 | 8,000 | 6,808 |
| Magellan Midstream Partners LP | 4.250% | 2/1/21 | 1,300 | 1,312 |
| Magellan Midstream Partners LP | 3.200% | 3/15/25 | 2,975 | 2,618 |
| Marathon Oil Corp. | 2.800% | 11/1/22 | 4,950 | 3,958 |
| Marathon Oil Corp. | 3.850% | 6/1/25 | 10,200 | 8,146 |
| Marathon Petroleum Corp. | 5.125% | 3/1/21 | 9,810 | 10,301 |
| Marathon Petroleum Corp. | 3.625% | 9/15/24 | 1,600 | 1,492 |
| 5 MPLX LP | 4.875% | 12/1/24 | 2,500 | 2,239 |
| 5 MPLX LP | 4.875% | 6/1/25 | 4,000 | 3,566 |
| Murphy Oil Corp. | 4.000% | 6/1/22 | 1,593 | 1,210 |
| Murphy Oil Corp. | 3.700% | 12/1/22 | 5,417 | 4,096 |
| Nabors Industries Inc. | 4.625% | 9/15/21 | 4,600 | 3,760 |
| Nabors Industries Inc. | 5.100% | 9/15/23 | 3,525 | 2,795 |
| National Fuel Gas Co. | 4.900% | 12/1/21 | 4,025 | 4,133 |
| National Fuel Gas Co. | 3.750% | 3/1/23 | 4,525 | 4,191 |
| National Fuel Gas Co. | 5.200% | 7/15/25 | 1,000 | 917 |
| National Oilwell Varco Inc. | 2.600% | 12/1/22 | 11,143 | 9,753 |
| Noble Energy Inc. | 5.625% | 5/1/21 | 3,001 | 2,938 |
| Noble Energy Inc. | 4.150% | 12/15/21 | 6,105 | 5,958 |
| Noble Energy Inc. | 5.875% | 6/1/24 | 3,000 | 2,878 |
| Noble Energy Inc. | 3.900% | 11/15/24 | 8,895 | 7,942 |
| Noble Holding International Ltd. | 4.625% | 3/1/21 | 3,375 | 2,373 |
| Noble Holding International Ltd. | 3.950% | 3/15/22 | 3,527 | 2,329 |
| Noble Holding International Ltd. | 5.950% | 4/1/25 | 1,025 | 712 |
| Occidental Petroleum Corp. | 4.100% | 2/1/21 | 16,019 | 16,804 |
| Occidental Petroleum Corp. | 3.125% | 2/15/22 | 7,725 | 7,575 |
| Occidental Petroleum Corp. | 2.700% | 2/15/23 | 7,600 | 7,147 |
| Occidental Petroleum Corp. | 3.500% | 6/15/25 | 3,600 | 3,507 |
| Oceaneering International Inc. | 4.650% | 11/15/24 | 2,775 | 2,338 |
| ONEOK Partners LP | 3.375% | 10/1/22 | 7,144 | 5,712 |
| ONEOK Partners LP | 5.000% | 9/15/23 | 2,000 | 1,751 |
| ONEOK Partners LP | 4.900% | 3/15/25 | 3,100 | 2,611 |
| Phillips 66 | 4.300% | 4/1/22 | 15,987 | 16,534 |
| Phillips 66 Partners LP | 3.605% | 2/15/25 | 4,875 | 4,281 |
| Pioneer Natural Resources Co. | 3.450% | 1/15/21 | 1,500 | 1,385 |
| Pioneer Natural Resources Co. | 3.950% | 7/15/22 | 5,528 | 5,046 |
| Pioneer Natural Resources Co. | 4.450% | 1/15/26 | 1,000 | 899 |
58
| Vanguard® Intermediate-Term Bond Index Fund | ||||
| Schedule of Investments | ||||
| December 31, 2015 | ||||
| Face | Market | |||
| Maturity | Amount | Value | ||
| Coupon | Date | ($000) | ($000) | |
| Plains All American Pipeline LP / PAA Finance Corp. | 5.000% | 2/1/21 | 4,975 | 4,760 |
| Plains All American Pipeline LP / PAA Finance Corp. | 3.650% | 6/1/22 | 2,815 | 2,403 |
| Plains All American Pipeline LP / PAA Finance Corp. | 3.850% | 10/15/23 | 3,968 | 3,351 |
| Plains All American Pipeline LP / PAA Finance Corp. | 3.600% | 11/1/24 | 10,995 | 8,841 |
| Plains All American Pipeline LP / PAA Finance Corp. | 4.650% | 10/15/25 | 5,950 | 5,177 |
| Regency Energy Partners LP / Regency Energy Finance | ||||
| Corp. | 6.500% | 7/15/21 | 806 | 810 |
| Regency Energy Partners LP / Regency Energy Finance | ||||
| Corp. | 5.875% | 3/1/22 | 7,793 | 7,403 |
| Regency Energy Partners LP / Regency Energy Finance | ||||
| Corp. | 5.000% | 10/1/22 | 4,100 | 3,680 |
| Regency Energy Partners LP / Regency Energy Finance | ||||
| Corp. | 5.500% | 4/15/23 | 3,000 | 2,730 |
| Regency Energy Partners LP / Regency Energy Finance | ||||
| Corp. | 4.500% | 11/1/23 | 7,831 | 6,833 |
| Repsol Oil & Gas Canada Inc. | 3.750% | 2/1/21 | 3,600 | 3,285 |
| Rowan Cos. Inc. | 4.875% | 6/1/22 | 5,268 | 3,873 |
| Rowan Cos. Inc. | 4.750% | 1/15/24 | 2,400 | 1,707 |
| Sasol Financing International plc | 4.500% | 11/14/22 | 5,415 | 4,969 |
| Schlumberger Investment SA | 3.650% | 12/1/23 | 7,695 | 7,870 |
| SESI LLC | 7.125% | 12/15/21 | 4,954 | 4,384 |
| Shell International Finance BV | 2.375% | 8/21/22 | 11,964 | 11,420 |
| Shell International Finance BV | 2.250% | 1/6/23 | 9,825 | 9,092 |
| Shell International Finance BV | 3.400% | 8/12/23 | 3,150 | 3,137 |
| Shell International Finance BV | 3.250% | 5/11/25 | 16,650 | 16,087 |
| Southwestern Energy Co. | 4.100% | 3/15/22 | 5,614 | 3,530 |
| Southwestern Energy Co. | 4.950% | 1/23/25 | 8,175 | 5,157 |
| Spectra Energy Capital LLC | 3.300% | 3/15/23 | 4,735 | 4,052 |
| Spectra Energy Partners LP | 4.600% | 6/15/21 | 1,850 | 1,868 |
| Spectra Energy Partners LP | 4.750% | 3/15/24 | 9,900 | 9,650 |
| Spectra Energy Partners LP | 3.500% | 3/15/25 | 2,400 | 2,108 |
| Suncor Energy Inc. | 3.600% | 12/1/24 | 5,800 | 5,498 |
| Sunoco Logistics Partners Operations LP | 4.400% | 4/1/21 | 9,000 | 8,722 |
| Sunoco Logistics Partners Operations LP | 3.450% | 1/15/23 | 2,525 | 2,131 |
| Sunoco Logistics Partners Operations LP | 4.250% | 4/1/24 | 4,800 | 4,155 |
| Sunoco Logistics Partners Operations LP | 5.950% | 12/1/25 | 250 | 241 |
| Total Capital Canada Ltd. | 2.750% | 7/15/23 | 5,975 | 5,746 |
| Total Capital International SA | 2.750% | 6/19/21 | 11,400 | 11,354 |
| Total Capital International SA | 2.875% | 2/17/22 | 5,825 | 5,775 |
| Total Capital International SA | 2.700% | 1/25/23 | 11,900 | 11,338 |
| Total Capital International SA | 3.700% | 1/15/24 | 8,525 | 8,637 |
| Total Capital International SA | 3.750% | 4/10/24 | 6,175 | 6,280 |
| Total Capital SA | 4.125% | 1/28/21 | 3,355 | 3,581 |
| Total Capital SA | 4.250% | 12/15/21 | 2,585 | 2,748 |
| TransCanada PipeLines Ltd. | 2.500% | 8/1/22 | 8,800 | 8,102 |
| TransCanada PipeLines Ltd. | 3.750% | 10/16/23 | 4,500 | 4,467 |
| Valero Energy Corp. | 3.650% | 3/15/25 | 3,450 | 3,246 |
| Western Gas Partners LP | 5.375% | 6/1/21 | 10,350 | 10,478 |
| Western Gas Partners LP | 3.950% | 6/1/25 | 3,500 | 2,938 |
| Williams Cos. Inc. | 7.875% | 9/1/21 | 429 | 386 |
| Williams Cos. Inc. | 3.700% | 1/15/23 | 7,200 | 4,878 |
| Williams Cos. Inc. | 4.550% | 6/24/24 | 8,000 | 5,560 |
| Williams Partners LP | 4.000% | 11/15/21 | 4,625 | 3,859 |
| Williams Partners LP | 3.600% | 3/15/22 | 12,000 | 9,440 |
| Williams Partners LP | 3.350% | 8/15/22 | 5,150 | 3,986 |
| Williams Partners LP | 4.500% | 11/15/23 | 3,000 | 2,429 |
| Williams Partners LP | 4.300% | 3/4/24 | 7,227 | 5,728 |
| Williams Partners LP | 3.900% | 1/15/25 | 4,300 | 3,232 |
| Williams Partners LP / ACMP Finance Corp. | 4.875% | 5/15/23 | 7,000 | 5,635 |
| Williams Partners LP / ACMP Finance Corp. | 4.875% | 3/15/24 | 9,010 | 7,208 |
| Other Industrial (0.1%) | ||||
| CBRE Services Inc. | 5.000% | 3/15/23 | 4,175 | 4,170 |
| CBRE Services Inc. | 5.250% | 3/15/25 | 4,700 | 4,765 |
59
| Vanguard® Intermediate-Term Bond Index Fund | ||||
| Schedule of Investments | ||||
| December 31, 2015 | ||||
| Face | Market | |||
| Maturity | Amount | Value | ||
| Coupon | Date | ($000) | ($000) | |
| Cintas Corp. No 2 | 4.300% | 6/1/21 | 1,315 | 1,392 |
| Cintas Corp. No 2 | 3.250% | 6/1/22 | 1,450 | 1,464 |
| Fluor Corp. | 3.375% | 9/15/21 | 2,800 | 2,856 |
| Fluor Corp. | 3.500% | 12/15/24 | 4,300 | 4,303 |
| Howard Hughes Medical Institute Revenue | 3.500% | 9/1/23 | 5,476 | 5,696 |
| Technology (3.3%) | ||||
| Adobe Systems Inc. | 3.250% | 2/1/25 | 7,150 | 6,974 |
| Altera Corp. | 4.100% | 11/15/23 | 8,025 | 8,392 |
| Amphenol Corp. | 3.125% | 9/15/21 | 2,700 | 2,670 |
| Amphenol Corp. | 4.000% | 2/1/22 | 1,950 | 1,989 |
| Analog Devices Inc. | 2.875% | 6/1/23 | 2,900 | 2,784 |
| Analog Devices Inc. | 3.900% | 12/15/25 | 4,925 | 4,978 |
| Apple Inc. | 2.850% | 5/6/21 | 18,593 | 19,048 |
| Apple Inc. | 2.150% | 2/9/22 | 12,940 | 12,607 |
| Apple Inc. | 2.700% | 5/13/22 | 10,000 | 10,023 |
| Apple Inc. | 2.400% | 5/3/23 | 31,995 | 31,173 |
| Apple Inc. | 3.450% | 5/6/24 | 18,890 | 19,568 |
| Apple Inc. | 2.500% | 2/9/25 | 9,500 | 9,088 |
| Apple Inc. | 3.200% | 5/13/25 | 15,160 | 15,319 |
| Applied Materials Inc. | 4.300% | 6/15/21 | 6,475 | 6,902 |
| Applied Materials Inc. | 3.900% | 10/1/25 | 5,500 | 5,508 |
| Arrow Electronics Inc. | 5.125% | 3/1/21 | 2,000 | 2,102 |
| Arrow Electronics Inc. | 3.500% | 4/1/22 | 1,650 | 1,584 |
| Arrow Electronics Inc. | 4.500% | 3/1/23 | 2,574 | 2,601 |
| Arrow Electronics Inc. | 4.000% | 4/1/25 | 1,850 | 1,772 |
| Autodesk Inc. | 3.600% | 12/15/22 | 1,550 | 1,514 |
| Autodesk Inc. | 4.375% | 6/15/25 | 1,800 | 1,773 |
| Avnet Inc. | 4.875% | 12/1/22 | 3,725 | 3,820 |
| Baidu Inc. | 3.500% | 11/28/22 | 3,725 | 3,671 |
| Baidu Inc. | 4.125% | 6/30/25 | 4,000 | 3,964 |
| Broadcom Corp. | 2.500% | 8/15/22 | 3,275 | 3,259 |
| Broadcom Corp. | 3.500% | 8/1/24 | 3,271 | 3,281 |
| CA Inc. | 4.500% | 8/15/23 | 3,100 | 3,146 |
| Cadence Design Systems Inc. | 4.375% | 10/15/24 | 2,275 | 2,258 |
| CDK Global Inc. | 4.500% | 10/15/24 | 2,965 | 2,941 |
| Cisco Systems Inc. | 2.900% | 3/4/21 | 2,350 | 2,420 |
| Cisco Systems Inc. | 3.000% | 6/15/22 | 550 | 560 |
| Cisco Systems Inc. | 3.625% | 3/4/24 | 7,695 | 8,035 |
| Cisco Systems Inc. | 3.500% | 6/15/25 | 3,000 | 3,093 |
| Corning Inc. | 2.900% | 5/15/22 | 2,500 | 2,400 |
| Corning Inc. | 3.700% | 11/15/23 | 2,500 | 2,463 |
| Dun & Bradstreet Corp. | 4.375% | 12/1/22 | 1,925 | 1,887 |
| EMC Corp. | 3.375% | 6/1/23 | 6,003 | 4,868 |
| Equifax Inc. | 3.300% | 12/15/22 | 1,200 | 1,198 |
| Fidelity National Information Services Inc. | 5.000% | 3/15/22 | 3,253 | 3,371 |
| Fidelity National Information Services Inc. | 3.500% | 4/15/23 | 6,992 | 6,683 |
| Fidelity National Information Services Inc. | 3.875% | 6/5/24 | 11,320 | 10,921 |
| Fidelity National Information Services Inc. | 5.000% | 10/15/25 | 9,625 | 9,932 |
| Fiserv Inc. | 3.500% | 10/1/22 | 2,073 | 2,077 |
| Fiserv Inc. | 3.850% | 6/1/25 | 8,150 | 8,137 |
| 5 Flextronics International Ltd. | 4.750% | 6/15/25 | 6,750 | 6,573 |
| Google Inc. | 3.625% | 5/19/21 | 5,910 | 6,285 |
| Google Inc. | 3.375% | 2/25/24 | 5,400 | 5,681 |
| 5 Hewlett Packard Enterprise Co. | 4.400% | 10/15/22 | 14,475 | 14,423 |
| 5 Hewlett Packard Enterprise Co. | 4.900% | 10/15/25 | 17,000 | 16,688 |
| HP Inc. | 4.300% | 6/1/21 | 9,425 | 9,380 |
| HP Inc. | 4.375% | 9/15/21 | 12,950 | 12,654 |
| HP Inc. | 4.650% | 12/9/21 | 8,550 | 8,515 |
| Ingram Micro Inc. | 5.000% | 8/10/22 | 100 | 102 |
| Ingram Micro Inc. | 4.950% | 12/15/24 | 5,050 | 5,028 |
| Intel Corp. | 3.300% | 10/1/21 | 14,823 | 15,349 |
| Intel Corp. | 3.100% | 7/29/22 | 5,700 | 5,805 |
| Intel Corp. | 2.700% | 12/15/22 | 9,700 | 9,597 |
60
| Vanguard® Intermediate-Term Bond Index Fund | ||||
| Schedule of Investments | ||||
| December 31, 2015 | ||||
| Face | Market | |||
| Maturity | Amount | Value | ||
| Coupon | Date | ($000) | ($000) | |
| Intel Corp. | 3.700% | 7/29/25 | 16,525 | 17,090 |
| International Business Machines Corp. | 2.900% | 11/1/21 | 200 | 202 |
| International Business Machines Corp. | 1.875% | 8/1/22 | 7,700 | 7,262 |
| International Business Machines Corp. | 2.875% | 11/9/22 | 10,000 | 9,923 |
| International Business Machines Corp. | 3.375% | 8/1/23 | 7,650 | 7,760 |
| International Business Machines Corp. | 3.625% | 2/12/24 | 16,900 | 17,323 |
| Jabil Circuit Inc. | 4.700% | 9/15/22 | 1,700 | 1,653 |
| Juniper Networks Inc. | 4.600% | 3/15/21 | 1,171 | 1,224 |
| Juniper Networks Inc. | 4.500% | 3/15/24 | 2,475 | 2,465 |
| Juniper Networks Inc. | 4.350% | 6/15/25 | 2,025 | 1,976 |
| Keysight Technologies Inc. | 4.550% | 10/30/24 | 3,000 | 2,886 |
| KLA-Tencor Corp. | 4.125% | 11/1/21 | 3,750 | 3,762 |
| KLA-Tencor Corp. | 4.650% | 11/1/24 | 7,420 | 7,468 |
| Lam Research Corp. | 3.800% | 3/15/25 | 3,550 | 3,362 |
| Lender Processing Services Inc / Black Knight Lending | ||||
| Solutions Inc | 5.750% | 4/15/23 | 2,571 | 2,680 |
| Maxim Integrated Products Inc. | 3.375% | 3/15/23 | 2,375 | 2,346 |
| Microsoft Corp. | 4.000% | 2/8/21 | 3,000 | 3,268 |
| Microsoft Corp. | 2.375% | 2/12/22 | 14,509 | 14,326 |
| Microsoft Corp. | 2.650% | 11/3/22 | 7,000 | 6,991 |
| Microsoft Corp. | 2.125% | 11/15/22 | 5,458 | 5,269 |
| Microsoft Corp. | 2.375% | 5/1/23 | 1,575 | 1,551 |
| Microsoft Corp. | 3.625% | 12/15/23 | 9,025 | 9,492 |
| Microsoft Corp. | 2.700% | 2/12/25 | 15,450 | 15,035 |
| Microsoft Corp. | 3.125% | 11/3/25 | 22,050 | 22,114 |
| Motorola Solutions Inc. | 3.750% | 5/15/22 | 10,650 | 9,720 |
| Motorola Solutions Inc. | 3.500% | 3/1/23 | 750 | 655 |
| Motorola Solutions Inc. | 4.000% | 9/1/24 | 5,650 | 4,861 |
| NetApp Inc. | 3.375% | 6/15/21 | 3,400 | 3,320 |
| Oracle Corp. | 2.800% | 7/8/21 | 9,410 | 9,531 |
| Oracle Corp. | 2.500% | 5/15/22 | 11,150 | 10,931 |
| Oracle Corp. | 2.500% | 10/15/22 | 25,186 | 24,585 |
| Oracle Corp. | 3.625% | 7/15/23 | 3,500 | 3,618 |
| Oracle Corp. | 3.400% | 7/8/24 | 17,051 | 17,290 |
| Oracle Corp. | 2.950% | 5/15/25 | 17,925 | 17,494 |
| Pitney Bowes Inc. | 4.625% | 3/15/24 | 4,200 | 4,131 |
| QUALCOMM Inc. | 3.000% | 5/20/22 | 12,000 | 11,862 |
| QUALCOMM Inc. | 3.450% | 5/20/25 | 13,700 | 13,146 |
| Seagate HDD Cayman | 4.750% | 6/1/23 | 7,550 | 6,606 |
| Seagate HDD Cayman | 4.750% | 1/1/25 | 6,430 | 5,361 |
| Symantec Corp. | 3.950% | 6/15/22 | 3,650 | 3,625 |
| Telefonaktiebolaget LM Ericsson | 4.125% | 5/15/22 | 6,404 | 6,586 |
| Texas Instruments Inc. | 2.250% | 5/1/23 | 2,025 | 1,921 |
| Total System Services Inc. | 3.750% | 6/1/23 | 1,600 | 1,542 |
| Trimble Navigation Ltd. | 4.750% | 12/1/24 | 1,650 | 1,650 |
| Tyco Electronics Group SA | 4.875% | 1/15/21 | 4,102 | 4,401 |
| Tyco Electronics Group SA | 3.500% | 2/3/22 | 3,179 | 3,235 |
| Tyco Electronics Group SA | 3.450% | 8/1/24 | 950 | 945 |
| Verisk Analytics Inc. | 4.125% | 9/12/22 | 4,575 | 4,605 |
| Verisk Analytics Inc. | 4.000% | 6/15/25 | 6,000 | 5,870 |
| Xerox Corp. | 4.500% | 5/15/21 | 6,950 | 7,033 |
| Xerox Corp. | 3.800% | 5/15/24 | 1,550 | 1,441 |
| Xilinx Inc. | 3.000% | 3/15/21 | 3,370 | 3,377 |
| Transportation (0.9%) | ||||
| 4 American Airlines 2011-1 Class A Pass Through Trust | 5.250% | 7/31/22 | 1,842 | 1,957 |
| 4 American Airlines 2013-1 Class A Pass Through Trust | 4.000% | 1/15/27 | 1,729 | 1,750 |
| 4 American Airlines 2013-2 Class A Pass Through Trust | 4.950% | 7/15/24 | 7,181 | 7,612 |
| 4 American Airlines 2015-1 Class B Pass Through Trust | 3.700% | 11/1/24 | 3,501 | 3,387 |
| Burlington Northern Santa Fe LLC | 4.100% | 6/1/21 | 577 | 607 |
| Burlington Northern Santa Fe LLC | 3.450% | 9/15/21 | 4,400 | 4,515 |
| Burlington Northern Santa Fe LLC | 3.050% | 3/15/22 | 3,775 | 3,783 |
| Burlington Northern Santa Fe LLC | 3.050% | 9/1/22 | 4,300 | 4,297 |
| Burlington Northern Santa Fe LLC | 3.000% | 3/15/23 | 3,425 | 3,375 |
61
| Vanguard® Intermediate-Term Bond Index Fund | ||||
| Schedule of Investments | ||||
| December 31, 2015 | ||||
| Face | Market | |||
| Maturity | Amount | Value | ||
| Coupon | Date | ($000) | ($000) | |
| Burlington Northern Santa Fe LLC | 3.850% | 9/1/23 | 4,300 | 4,467 |
| Burlington Northern Santa Fe LLC | 3.750% | 4/1/24 | 3,600 | 3,695 |
| Burlington Northern Santa Fe LLC | 3.400% | 9/1/24 | 3,925 | 3,907 |
| Burlington Northern Santa Fe LLC | 3.000% | 4/1/25 | 3,850 | 3,699 |
| Burlington Northern Santa Fe LLC | 3.650% | 9/1/25 | 700 | 711 |
| Burlington Northern Santa Fe LLC | 7.000% | 12/15/25 | 670 | 837 |
| Canadian National Railway Co. | 2.850% | 12/15/21 | 3,725 | 3,745 |
| Canadian National Railway Co. | 2.250% | 11/15/22 | 1,095 | 1,051 |
| Canadian National Railway Co. | 2.950% | 11/21/24 | 1,325 | 1,311 |
| Canadian Pacific Railway Co. | 9.450% | 8/1/21 | 4,050 | 5,245 |
| Canadian Pacific Railway Co. | 4.450% | 3/15/23 | 4,180 | 4,455 |
| Canadian Pacific Railway Co. | 2.900% | 2/1/25 | 500 | 470 |
| Canadian Pacific Railway Ltd. | 4.500% | 1/15/22 | 2,200 | 2,329 |
| 4 Continental Airlines 2007-1 Class A Pass Through Trust | 5.983% | 10/19/23 | 3,082 | 3,383 |
| 4 Continental Airlines 2010-1 Class A Pass Through Trust | 4.750% | 7/12/22 | 3,330 | 3,488 |
| 4 Continental Airlines 2012-1 Class A Pass Through Trust | 4.150% | 10/11/25 | 4,319 | 4,438 |
| 4 Continental Airlines 2012-2 Class A Pass Through Trust | 4.000% | 4/29/26 | 3,588 | 3,660 |
| CSX Corp. | 4.250% | 6/1/21 | 6,075 | 6,430 |
| CSX Corp. | 3.700% | 11/1/23 | 5,175 | 5,295 |
| CSX Corp. | 3.400% | 8/1/24 | 1,100 | 1,093 |
| CSX Corp. | 3.350% | 11/1/25 | 3,350 | 3,254 |
| 4 Delta Air Lines 2007-1 Class A Pass Through Trust | 6.821% | 2/10/24 | 3,022 | 3,468 |
| FedEx Corp. | 2.625% | 8/1/22 | 2,528 | 2,467 |
| FedEx Corp. | 4.000% | 1/15/24 | 4,251 | 4,432 |
| FedEx Corp. | 3.200% | 2/1/25 | 2,800 | 2,724 |
| JB Hunt Transport Services Inc. | 3.300% | 8/15/22 | 2,450 | 2,431 |
| JB Hunt Transport Services Inc. | 3.850% | 3/15/24 | 2,525 | 2,566 |
| 5 Kansas City Southern | 3.000% | 5/15/23 | 3,150 | 2,986 |
| Norfolk Southern Corp. | 3.250% | 12/1/21 | 4,693 | 4,686 |
| Norfolk Southern Corp. | 3.000% | 4/1/22 | 5,205 | 5,146 |
| Norfolk Southern Corp. | 2.903% | 2/15/23 | 4,774 | 4,602 |
| Norfolk Southern Corp. | 3.850% | 1/15/24 | 2,075 | 2,114 |
| Norfolk Southern Corp. | 5.590% | 5/17/25 | 1,339 | 1,530 |
| 4 Southwest Airlines Co. 2007-1 Pass Through Trust | 6.150% | 2/1/24 | 1,605 | 1,793 |
| Trinity Industries Inc. | 4.550% | 10/1/24 | 2,460 | 2,255 |
| Union Pacific Corp. | 4.000% | 2/1/21 | 5,550 | 5,936 |
| Union Pacific Corp. | 4.163% | 7/15/22 | 8,196 | 8,868 |
| Union Pacific Corp. | 2.950% | 1/15/23 | 1,500 | 1,505 |
| Union Pacific Corp. | 2.750% | 4/15/23 | 2,200 | 2,173 |
| Union Pacific Corp. | 3.646% | 2/15/24 | 325 | 339 |
| Union Pacific Corp. | 3.250% | 1/15/25 | 3,350 | 3,395 |
| Union Pacific Corp. | 3.250% | 8/15/25 | 7,500 | 7,586 |
| 4 United Airlines 2013-1 Class A Pass Through Trust | 4.300% | 2/15/27 | 4,617 | 4,779 |
| United Parcel Service Inc. | 3.125% | 1/15/21 | 7,350 | 7,647 |
| United Parcel Service Inc. | 2.450% | 10/1/22 | 12,606 | 12,443 |
| 4 US Airways 2012-1 Class A Pass Through Trust | 5.900% | 4/1/26 | 349 | 384 |
| 4 US Airways Inc. 2012-2 Class A Pass Through Trust | 4.625% | 12/3/26 | 1,036 | 1,075 |
| 5,623,580 | ||||
| Utilities (2.1%) | ||||
| Electric (1.9%) | ||||
| Alabama Power Co. | 3.550% | 12/1/23 | 1,600 | 1,647 |
| Alabama Power Co. | 2.800% | 4/1/25 | 600 | 579 |
| Ameren Corp. | 3.650% | 2/15/26 | 1,975 | 1,967 |
| Ameren Illinois Co. | 2.700% | 9/1/22 | 3,925 | 3,859 |
| Appalachian Power Co. | 4.600% | 3/30/21 | 1,700 | 1,814 |
| Appalachian Power Co. | 3.400% | 6/1/25 | 1,650 | 1,611 |
| Arizona Public Service Co. | 3.350% | 6/15/24 | 1,690 | 1,716 |
| Arizona Public Service Co. | 3.150% | 5/15/25 | 4,750 | 4,731 |
| Baltimore Gas & Electric Co. | 3.500% | 11/15/21 | 3,575 | 3,706 |
62
| Vanguard® Intermediate-Term Bond Index Fund | ||||
| Schedule of Investments | ||||
| December 31, 2015 | ||||
| Face | Market | |||
| Maturity | Amount | Value | ||
| Coupon | Date | ($000) | ($000) | |
| Baltimore Gas & Electric Co. | 2.800% | 8/15/22 | 175 | 173 |
| Baltimore Gas & Electric Co. | 3.350% | 7/1/23 | 4,499 | 4,556 |
| Berkshire Hathaway Energy Co. | 3.750% | 11/15/23 | 5,925 | 6,079 |
| Berkshire Hathaway Energy Co. | 3.500% | 2/1/25 | 2,675 | 2,652 |
| Black Hills Corp. | 4.250% | 11/30/23 | 798 | 815 |
| Cleveland Electric Illuminating Co. | 5.500% | 8/15/24 | 250 | 281 |
| CMS Energy Corp. | 5.050% | 3/15/22 | 3,550 | 3,891 |
| CMS Energy Corp. | 3.875% | 3/1/24 | 3,745 | 3,820 |
| CMS Energy Corp. | 3.600% | 11/15/25 | 250 | 249 |
| Commonwealth Edison Co. | 3.400% | 9/1/21 | 3,650 | 3,789 |
| Commonwealth Edison Co. | 3.100% | 11/1/24 | 1,300 | 1,288 |
| Connecticut Light & Power Co. | 2.500% | 1/15/23 | 6,408 | 6,206 |
| Consumers Energy Co. | 2.850% | 5/15/22 | 3,000 | 2,995 |
| Consumers Energy Co. | 3.375% | 8/15/23 | 2,000 | 2,045 |
| Consumers Energy Co. | 3.125% | 8/31/24 | 3,025 | 3,019 |
| Delmarva Power & Light Co. | 3.500% | 11/15/23 | 4,825 | 4,952 |
| Dominion Resources Inc. | 4.450% | 3/15/21 | 9,439 | 10,014 |
| Dominion Resources Inc. | 2.750% | 9/15/22 | 1,650 | 1,594 |
| Dominion Resources Inc. | 3.625% | 12/1/24 | 4,055 | 4,017 |
| Dominion Resources Inc. | 3.900% | 10/1/25 | 1,800 | 1,803 |
| 4 Dominion Resources Inc. | 5.750% | 10/1/54 | 3,600 | 3,534 |
| DTE Electric Co. | 3.900% | 6/1/21 | 800 | 852 |
| DTE Electric Co. | 2.650% | 6/15/22 | 1,950 | 1,918 |
| DTE Electric Co. | 3.650% | 3/15/24 | 4,550 | 4,756 |
| 5 DTE Energy Co. | 3.300% | 6/15/22 | 100 | 100 |
| DTE Energy Co. | 3.850% | 12/1/23 | 275 | 283 |
| DTE Energy Co. | 3.500% | 6/1/24 | 3,783 | 3,788 |
| Duke Energy Carolinas LLC | 3.900% | 6/15/21 | 2,450 | 2,602 |
| Duke Energy Corp. | 3.050% | 8/15/22 | 5,547 | 5,465 |
| Duke Energy Corp. | 3.950% | 10/15/23 | 3,362 | 3,471 |
| Duke Energy Corp. | 3.750% | 4/15/24 | 2,025 | 2,049 |
| Duke Energy Florida LLC | 3.100% | 8/15/21 | 2,000 | 2,043 |
| Duke Energy Ohio Inc. | 3.800% | 9/1/23 | 120 | 125 |
| Duke Energy Progress LLC | 3.000% | 9/15/21 | 5,500 | 5,603 |
| Duke Energy Progress LLC | 2.800% | 5/15/22 | 2,619 | 2,620 |
| Duke Energy Progress LLC | 3.250% | 8/15/25 | 3,500 | 3,521 |
| Empresa Nacional de Electricidad SA | 4.250% | 4/15/24 | 565 | 567 |
| Entergy Arkansas Inc. | 3.050% | 6/1/23 | 4,100 | 4,033 |
| Entergy Gulf States Louisiana LLC | 5.590% | 10/1/24 | 5,825 | 6,649 |
| Entergy Louisiana LLC | 4.050% | 9/1/23 | 4,500 | 4,668 |
| Entergy Louisiana LLC | 5.400% | 11/1/24 | 1,575 | 1,799 |
| Entergy Mississippi Inc. | 3.100% | 7/1/23 | 175 | 172 |
| Eversource Energy | 2.800% | 5/1/23 | 2,325 | 2,231 |
| Eversource Energy | 3.150% | 1/15/25 | 2,150 | 2,100 |
| 5 Exelon Corp. | 3.950% | 6/15/25 | 9,650 | 9,665 |
| Exelon Generation Co. LLC | 4.250% | 6/15/22 | 4,393 | 4,457 |
| FirstEnergy Solutions Corp. | 6.050% | 8/15/21 | 3,200 | 3,414 |
| Florida Power & Light Co. | 2.750% | 6/1/23 | 7,550 | 7,465 |
| Florida Power & Light Co. | 3.250% | 6/1/24 | 2,475 | 2,521 |
| Georgia Power Co. | 2.850% | 5/15/22 | 4,300 | 4,219 |
| Great Plains Energy Inc. | 4.850% | 6/1/21 | 4,995 | 5,368 |
| Indiana Michigan Power Co. | 3.200% | 3/15/23 | 825 | 813 |
| Integrys Energy Group Inc. | 4.170% | 11/1/20 | 1,170 | 1,236 |
| Interstate Power & Light Co. | 3.400% | 8/15/25 | 1,675 | 1,685 |
| ITC Holdings Corp. | 4.050% | 7/1/23 | 900 | 926 |
| ITC Holdings Corp. | 3.650% | 6/15/24 | 2,270 | 2,237 |
| Kansas City Power & Light Co. | 3.150% | 3/15/23 | 3,140 | 3,084 |
| Kentucky Utilities Co. | 3.300% | 10/1/25 | 1,400 | 1,414 |
| LG&E & KU Energy LLC | 4.375% | 10/1/21 | 325 | 349 |
| Louisville Gas & Electric Co. | 3.300% | 10/1/25 | 2,625 | 2,644 |
| MidAmerican Energy Co. | 3.500% | 10/15/24 | 3,300 | 3,373 |
| National Rural Utilities Cooperative Finance Corp. | 3.050% | 2/15/22 | 4,950 | 4,997 |
| National Rural Utilities Cooperative Finance Corp. | 2.850% | 1/27/25 | 4,000 | 3,866 |
| National Rural Utilities Cooperative Finance Corp. | 3.250% | 11/1/25 | 3,300 | 3,278 |
63
| Vanguard® Intermediate-Term Bond Index Fund | ||||
| Schedule of Investments | ||||
| December 31, 2015 | ||||
| Face | Market | |||
| Maturity | Amount | Value | ||
| Coupon | Date | ($000) | ($000) | |
| 4 National Rural Utilities Cooperative Finance Corp. | 4.750% | 4/30/43 | 2,100 | 2,073 |
| NextEra Energy Capital Holdings Inc. | 4.500% | 6/1/21 | 3,025 | 3,206 |
| NextEra Energy Capital Holdings Inc. | 3.625% | 6/15/23 | 325 | 324 |
| Northern States Power Co. | 2.150% | 8/15/22 | 825 | 795 |
| Northern States Power Co. | 2.600% | 5/15/23 | 1,300 | 1,267 |
| NSTAR Electric Co. | 2.375% | 10/15/22 | 1,575 | 1,516 |
| NSTAR Electric Co. | 3.250% | 11/15/25 | 2,650 | 2,645 |
| Ohio Power Co. | 5.375% | 10/1/21 | 5,175 | 5,761 |
| Oncor Electric Delivery Co. LLC | 4.100% | 6/1/22 | 3,325 | 3,454 |
| Oncor Electric Delivery Co. LLC | 7.000% | 9/1/22 | 1,660 | 1,999 |
| Oncor Electric Delivery Co. LLC | 2.950% | 4/1/25 | 2,000 | 1,879 |
| Pacific Gas & Electric Co. | 4.250% | 5/15/21 | 2,940 | 3,149 |
| Pacific Gas & Electric Co. | 3.250% | 9/15/21 | 2,500 | 2,559 |
| Pacific Gas & Electric Co. | 2.450% | 8/15/22 | 2,450 | 2,368 |
| Pacific Gas & Electric Co. | 3.250% | 6/15/23 | 2,500 | 2,508 |
| Pacific Gas & Electric Co. | 3.750% | 2/15/24 | 5,135 | 5,309 |
| Pacific Gas & Electric Co. | 3.400% | 8/15/24 | 3,200 | 3,228 |
| Pacific Gas & Electric Co. | 3.500% | 6/15/25 | 4,200 | 4,264 |
| PacifiCorp | 3.850% | 6/15/21 | 600 | 631 |
| PacifiCorp | 2.950% | 2/1/22 | 5,222 | 5,260 |
| PacifiCorp | 3.600% | 4/1/24 | 3,275 | 3,383 |
| Peco Energy Co. | 2.375% | 9/15/22 | 2,450 | 2,374 |
| Potomac Electric Power Co. | 3.600% | 3/15/24 | 150 | 155 |
| PPL Capital Funding Inc. | 4.200% | 6/15/22 | 6,301 | 6,635 |
| PPL Capital Funding Inc. | 3.500% | 12/1/22 | 1,760 | 1,772 |
| PPL Capital Funding Inc. | 3.400% | 6/1/23 | 3,975 | 3,936 |
| PPL Capital Funding Inc. | 3.950% | 3/15/24 | 975 | 998 |
| PPL Electric Utilities Corp. | 3.000% | 9/15/21 | 3,775 | 3,835 |
| Progress Energy Inc. | 4.400% | 1/15/21 | 5,681 | 6,012 |
| Progress Energy Inc. | 3.150% | 4/1/22 | 3,825 | 3,782 |
| PSEG Power LLC | 4.150% | 9/15/21 | 1,225 | 1,257 |
| PSEG Power LLC | 4.300% | 11/15/23 | 1,500 | 1,492 |
| Public Service Co. of Colorado | 2.500% | 3/15/23 | 1,325 | 1,291 |
| Public Service Co. of Colorado | 2.900% | 5/15/25 | 3,200 | 3,146 |
| Public Service Co. of New Hampshire | 3.500% | 11/1/23 | 1,325 | 1,358 |
| Public Service Co. of New Mexico | 3.850% | 8/1/25 | 1,650 | 1,642 |
| Public Service Co. of Oklahoma | 4.400% | 2/1/21 | 2,471 | 2,612 |
| Public Service Electric & Gas Co. | 2.375% | 5/15/23 | 7,129 | 6,827 |
| Public Service Electric & Gas Co. | 3.150% | 8/15/24 | 2,550 | 2,556 |
| Public Service Electric & Gas Co. | 3.050% | 11/15/24 | 3,000 | 2,984 |
| Public Service Electric & Gas Co. | 3.000% | 5/15/25 | 3,045 | 3,006 |
| Puget Energy Inc. | 6.000% | 9/1/21 | 1,787 | 2,014 |
| Puget Energy Inc. | 5.625% | 7/15/22 | 6,675 | 7,406 |
| 5 Puget Energy Inc. | 3.650% | 5/15/25 | 3,750 | 3,634 |
| San Diego Gas & Electric Co. | 3.000% | 8/15/21 | 2,597 | 2,652 |
| San Diego Gas & Electric Co. | 3.600% | 9/1/23 | 4,573 | 4,762 |
| SCANA Corp. | 4.750% | 5/15/21 | 3,875 | 4,018 |
| SCANA Corp. | 4.125% | 2/1/22 | 3,725 | 3,714 |
| Sierra Pacific Power Co. | 3.375% | 8/15/23 | 3,750 | 3,796 |
| Southern California Edison Co. | 3.875% | 6/1/21 | 4,289 | 4,539 |
| 4 Southern California Edison Co. | 1.845% | 2/1/22 | 2,925 | 2,894 |
| Southern California Edison Co. | 2.400% | 2/1/22 | 1,000 | 980 |
| Southern California Edison Co. | 3.500% | 10/1/23 | 2,225 | 2,303 |
| Southern Power Co. | 4.150% | 12/1/25 | 3,400 | 3,394 |
| Southwestern Electric Power Co. | 3.550% | 2/15/22 | 1,575 | 1,597 |
| Southwestern Public Service Co. | 3.300% | 6/15/24 | 2,200 | 2,223 |
| Tampa Electric Co. | 5.400% | 5/15/21 | 3,500 | 3,926 |
| Tampa Electric Co. | 2.600% | 9/15/22 | 2,350 | 2,282 |
| TransAlta Corp. | 4.500% | 11/15/22 | 2,500 | 2,185 |
| Tri-State Generation & Transmission Association Inc. | 3.700% | 11/1/24 | 1,325 | 1,317 |
| Tucson Electric Power Co. | 5.150% | 11/15/21 | 2,150 | 2,366 |
| Tucson Electric Power Co. | 3.050% | 3/15/25 | 750 | 711 |
| Union Electric Co. | 3.500% | 4/15/24 | 3,025 | 3,115 |
| Virginia Electric & Power Co. | 2.950% | 1/15/22 | 3,200 | 3,218 |
64
| Vanguard® Intermediate-Term Bond Index Fund | ||||
| Schedule of Investments | ||||
| December 31, 2015 | ||||
| Face | Market | |||
| Maturity | Amount | Value | ||
| Coupon | Date | ($000) | ($000) | |
| Virginia Electric & Power Co. | 3.450% | 9/1/22 | 1,550 | 1,593 |
| Virginia Electric & Power Co. | 3.450% | 2/15/24 | 1,525 | 1,555 |
| Virginia Electric & Power Co. | 3.100% | 5/15/25 | 2,900 | 2,872 |
| WEC Energy Group Inc. | 3.550% | 6/15/25 | 3,100 | 3,117 |
| Westar Energy Inc. | 3.250% | 12/1/25 | 2,325 | 2,333 |
| Western Massachusetts Electric Co. | 3.500% | 9/15/21 | 2,275 | 2,371 |
| Wisconsin Electric Power Co. | 3.100% | 6/1/25 | 1,600 | 1,604 |
| Wisconsin Power & Light Co. | 2.250% | 11/15/22 | 1,850 | 1,772 |
| Xcel Energy Inc. | 3.300% | 6/1/25 | 1,850 | 1,809 |
| Natural Gas (0.2%) | ||||
| AGL Capital Corp. | 3.500% | 9/15/21 | 75 | 75 |
| AGL Capital Corp. | 3.875% | 11/15/25 | 1,100 | 1,107 |
| CenterPoint Energy Resources Corp. | 4.500% | 1/15/21 | 4,677 | 4,911 |
| Laclede Gas Co. | 3.400% | 8/15/23 | 1,375 | 1,392 |
| NiSource Finance Corp. | 6.125% | 3/1/22 | 4,329 | 4,958 |
| Nisource Finance Corp. | 3.850% | 2/15/23 | 600 | 612 |
| ONE Gas Inc. | 3.610% | 2/1/24 | 1,870 | 1,904 |
| Sempra Energy | 2.875% | 10/1/22 | 3,254 | 3,148 |
| Sempra Energy | 4.050% | 12/1/23 | 6,500 | 6,704 |
| Sempra Energy | 3.750% | 11/15/25 | 8,585 | 8,585 |
| Other Utility (0.0%) | ||||
| American Water Capital Corp. | 3.400% | 3/1/25 | 4,600 | 4,672 |
| 459,216 | ||||
| Total Corporate Bonds (Cost $8,994,343) | 8,876,227 | |||
| Sovereign Bonds (U.S. Dollar-Denominated) (6.4%) | ||||
| African Development Bank | 2.375% | 9/23/21 | 5,000 | 5,073 |
| Asian Development Bank | 2.125% | 11/24/21 | 4,300 | 4,298 |
| Asian Development Bank | 1.875% | 2/18/22 | 18,250 | 17,983 |
| Asian Development Bank | 2.000% | 1/22/25 | 9,150 | 8,847 |
| Banco do Brasil SA | 3.875% | 10/10/22 | 9,950 | 7,638 |
| CNOOC Finance 2013 Ltd. | 3.000% | 5/9/23 | 14,475 | 13,641 |
| CNOOC Finance 2015 USA LLC | 3.500% | 5/5/25 | 13,600 | 12,942 |
| CNOOC Nexen Finance 2014 ULC | 4.250% | 4/30/24 | 14,200 | 14,448 |
| Corp. Andina de Fomento | 4.375% | 6/15/22 | 12,570 | 13,378 |
| Ecopetrol SA | 5.875% | 9/18/23 | 9,200 | 8,384 |
| Ecopetrol SA | 4.125% | 1/16/25 | 9,100 | 7,269 |
| Emirates Telecommunications Corp. PJSC | 3.500% | 6/18/24 | 2,000 | 2,028 |
| European Bank for Reconstruction & Development | 1.875% | 2/23/22 | 8,025 | 7,898 |
| European Investment Bank | 4.000% | 2/16/21 | 13,270 | 14,484 |
| European Investment Bank | 2.500% | 4/15/21 | 24,725 | 25,249 |
| European Investment Bank | 2.125% | 10/15/21 | 20,850 | 20,762 |
| European Investment Bank | 2.250% | 8/15/22 | 15,250 | 15,240 |
| European Investment Bank | 3.250% | 1/29/24 | 24,250 | 25,826 |
| European Investment Bank | 2.500% | 10/15/24 | 5,825 | 5,880 |
| European Investment Bank | 1.875% | 2/10/25 | 28,800 | 27,434 |
| Export-Import Bank of Korea | 2.625% | 12/30/20 | 5,700 | 5,716 |
| Export-Import Bank of Korea | 4.000% | 1/29/21 | 8,484 | 9,059 |
| Export-Import Bank of Korea | 4.375% | 9/15/21 | 8,000 | 8,710 |
| Export-Import Bank of Korea | 5.000% | 4/11/22 | 4,400 | 4,936 |
| Export-Import Bank of Korea | 4.000% | 1/14/24 | 4,900 | 5,183 |
| Export-Import Bank of Korea | 2.875% | 1/21/25 | 7,000 | 6,844 |
| Export-Import Bank of Korea | 3.250% | 11/10/25 | 7,000 | 7,071 |
| Federative Republic of Brazil | 2.625% | 1/5/23 | 7,015 | 5,349 |
| Hydro-Quebec | 9.400% | 2/1/21 | 2,025 | 2,651 |
| Hydro-Quebec | 8.400% | 1/15/22 | 4,825 | 6,220 |
| Hydro-Quebec | 8.050% | 7/7/24 | 8,825 | 11,942 |
| Inter-American Development Bank | 1.750% | 4/14/22 | 18,750 | 18,311 |
| Inter-American Development Bank | 3.000% | 10/4/23 | 9,000 | 9,450 |
| Inter-American Development Bank | 3.000% | 2/21/24 | 14,650 | 15,361 |
| Inter-American Development Bank | 2.125% | 1/15/25 | 17,500 | 17,111 |
| Inter-American Development Bank | 7.000% | 6/15/25 | 750 | 1,004 |
65
| Vanguard® Intermediate-Term Bond Index Fund | ||||
| Schedule of Investments | ||||
| December 31, 2015 | ||||
| Face | Market | |||
| Maturity | Amount | Value | ||
| Coupon | Date | ($000) | ($000) | |
| International Bank for Reconstruction & Development | 2.250% | 6/24/21 | 16,900 | 17,062 |
| International Bank for Reconstruction & Development | 1.625% | 2/10/22 | 28,500 | 27,648 |
| International Bank for Reconstruction & Development | 7.625% | 1/19/23 | 2,107 | 2,827 |
| International Bank for Reconstruction & Development | 2.500% | 11/25/24 | 30,200 | 30,536 |
| International Bank for Reconstruction & Development | 2.500% | 7/29/25 | 26,000 | 26,176 |
| 6 Japan Bank for International Cooperation | 3.375% | 7/31/23 | 2,775 | 2,912 |
| 6 Japan Bank for International Cooperation | 3.000% | 5/29/24 | 6,200 | 6,348 |
| 6 Japan Bank for International Cooperation | 2.125% | 2/10/25 | 11,000 | 10,424 |
| 6 Japan Bank for International Cooperation | 2.500% | 5/28/25 | 7,500 | 7,291 |
| 6 Japan Finance Organization for Municipalities | 4.000% | 1/13/21 | 6,000 | 6,459 |
| 7 KFW | 2.375% | 8/25/21 | 15,500 | 15,723 |
| 7 KFW | 2.625% | 1/25/22 | 30,980 | 31,775 |
| 7 KFW | 2.000% | 10/4/22 | 15,550 | 15,307 |
| 7 KFW | 2.125% | 1/17/23 | 28,425 | 28,084 |
| 7 KFW | 2.500% | 11/20/24 | 32,050 | 32,228 |
| 7 KFW | 2.000% | 5/2/25 | 22,500 | 21,642 |
| Korea Development Bank | 4.625% | 11/16/21 | 4,350 | 4,785 |
| Korea Development Bank | 3.000% | 9/14/22 | 7,300 | 7,348 |
| Korea Development Bank | 3.750% | 1/22/24 | 7,050 | 7,333 |
| 7 Landwirtschaftliche Rentenbank | 2.250% | 10/1/21 | 8,645 | 8,695 |
| 7 Landwirtschaftliche Rentenbank | 2.000% | 1/13/25 | 9,000 | 8,667 |
| 7 Landwirtschaftliche Rentenbank | 2.375% | 6/10/25 | 11,000 | 10,812 |
| North American Development Bank | 2.400% | 10/26/22 | 2,500 | 2,437 |
| 8 Oesterreichische Kontrollbank AG | 2.375% | 10/1/21 | 5,250 | 5,301 |
| 4 Oriental Republic of Uruguay | 8.000% | 11/18/22 | 3,430 | 4,266 |
| 4 Oriental Republic of Uruguay | 4.500% | 8/14/24 | 12,725 | 12,929 |
| Petroleos Mexicanos | 5.500% | 1/21/21 | 21,010 | 21,264 |
| Petroleos Mexicanos | 4.875% | 1/24/22 | 25,400 | 24,427 |
| Petroleos Mexicanos | 3.500% | 1/30/23 | 10,860 | 9,474 |
| Petroleos Mexicanos | 4.875% | 1/18/24 | 13,750 | 12,825 |
| 4 Petroleos Mexicanos | 2.290% | 2/15/24 | 1,615 | 1,604 |
| 5 Petroleos Mexicanos | 4.250% | 1/15/25 | 4,250 | 3,751 |
| Province of British Columbia | 2.650% | 9/22/21 | 6,450 | 6,569 |
| Province of British Columbia | 2.000% | 10/23/22 | 7,000 | 6,803 |
| Province of Manitoba | 2.100% | 9/6/22 | 3,550 | 3,431 |
| Province of Manitoba | 3.050% | 5/14/24 | 13,600 | 13,811 |
| Province of Nova Scotia | 8.250% | 7/30/22 | 4,700 | 6,160 |
| Province of Ontario | 2.500% | 9/10/21 | 15,000 | 14,989 |
| Province of Ontario | 2.450% | 6/29/22 | 2,150 | 2,123 |
| Province of Ontario | 3.200% | 5/16/24 | 8,650 | 8,906 |
| Quebec | 2.750% | 8/25/21 | 20,500 | 20,753 |
| Quebec | 2.625% | 2/13/23 | 7,075 | 7,027 |
| Quebec | 7.125% | 2/9/24 | 5,775 | 7,441 |
| Quebec | 2.875% | 10/16/24 | 10,050 | 10,061 |
| Republic of Chile | 3.250% | 9/14/21 | 9,100 | 9,377 |
| Republic of Chile | 2.250% | 10/30/22 | 4,075 | 3,917 |
| Republic of Chile | 3.125% | 3/27/25 | 8,650 | 8,626 |
| Republic of Colombia | 4.375% | 7/12/21 | 14,442 | 14,478 |
| 4 Republic of Colombia | 2.625% | 3/15/23 | 10,225 | 8,983 |
| Republic of Colombia | 4.000% | 2/26/24 | 15,250 | 14,526 |
| Republic of Colombia | 8.125% | 5/21/24 | 5,690 | 6,814 |
| Republic of Italy | 6.875% | 9/27/23 | 21,600 | 26,611 |
| Republic of Korea | 3.875% | 9/11/23 | 9,300 | 10,053 |
| Republic of Korea | 5.625% | 11/3/25 | 1,775 | 2,184 |
| 4 Republic of Panama | 4.000% | 9/22/24 | 8,000 | 8,000 |
| 4 Republic of Panama | 3.750% | 3/16/25 | 9,500 | 9,310 |
| Republic of Peru | 7.350% | 7/21/25 | 13,000 | 16,297 |
| Republic of Poland | 5.125% | 4/21/21 | 14,000 | 15,568 |
| Republic of Poland | 5.000% | 3/23/22 | 24,435 | 27,098 |
| Republic of Poland | 3.000% | 3/17/23 | 7,805 | 7,727 |
| Republic of Poland | 4.000% | 1/22/24 | 13,425 | 14,116 |
| Republic of South Africa | 5.875% | 5/30/22 | 3,800 | 3,957 |
| Republic of South Africa | 4.665% | 1/17/24 | 14,075 | 13,406 |
| Republic of South Africa | 5.875% | 9/16/25 | 11,000 | 11,248 |
66
Vanguard® Intermediate-Term Bond Index Fund
Schedule of Investments
December 31, 2015
| Face | Market | |||
| Maturity | Amount | Value | ||
| Coupon | Date | ($000) | ($000) | |
| Republic of the Philippines | 4.000% | 1/15/21 | 9,350 | 10,127 |
| Republic of the Philippines | 4.200% | 1/21/24 | 10,750 | 11,637 |
| Republic of the Philippines | 9.500% | 10/21/24 | 400 | 592 |
| Republic of the Philippines | 10.625% | 3/16/25 | 9,405 | 14,818 |
| Republic of Turkey | 5.625% | 3/30/21 | 17,200 | 18,211 |
| Republic of Turkey | 5.125% | 3/25/22 | 8,475 | 8,710 |
| Republic of Turkey | 6.250% | 9/26/22 | 20,450 | 22,289 |
| Republic of Turkey | 3.250% | 3/23/23 | 3,400 | 3,115 |
| Republic of Turkey | 5.750% | 3/22/24 | 19,600 | 20,674 |
| Republic of Turkey | 7.375% | 2/5/25 | 15,500 | 18,116 |
| State of Israel | 4.000% | 6/30/22 | 9,475 | 10,173 |
| State of Israel | 3.150% | 6/30/23 | 9,600 | 9,741 |
| Statoil ASA | 2.750% | 11/10/21 | 2,000 | 1,969 |
| Statoil ASA | 3.150% | 1/23/22 | 5,975 | 5,923 |
| Statoil ASA | 2.450% | 1/17/23 | 9,642 | 9,120 |
| Statoil ASA | 2.650% | 1/15/24 | 7,675 | 7,268 |
| Statoil ASA | 3.700% | 3/1/24 | 10,213 | 10,306 |
| Statoil ASA | 3.250% | 11/10/24 | 6,062 | 5,911 |
| United Mexican States | 3.500% | 1/21/21 | 8,800 | 8,885 |
| United Mexican States | 3.625% | 3/15/22 | 25,624 | 25,729 |
| United Mexican States | 4.000% | 10/2/23 | 31,515 | 31,917 |
| United Mexican States | 3.600% | 1/30/25 | 19,175 | 18,539 |
| Total Sovereign Bonds (Cost $1,452,997) | 1,436,120 | |||
| Taxable Municipal Bonds (0.2%) | ||||
| California GO | 5.700% | 11/1/21 | 2,300 | 2,694 |
| California GO | 6.650% | 3/1/22 | 3,500 | 4,193 |
| Cornell University New York GO | 5.450% | 2/1/19 | 1,350 | 1,499 |
| Energy Northwest Washington Electric Revenue | ||||
| (Columbia Generating Station) | 2.814% | 7/1/24 | 4,000 | 3,936 |
| George Washington University District of Columbia GO | 3.485% | 9/15/22 | 2,500 | 2,542 |
| Georgia GO | 4.503% | 11/1/25 | 1,825 | 2,030 |
| Illinois GO | 4.950% | 6/1/23 | 8,899 | 8,903 |
| Massachusetts GO | 4.200% | 12/1/21 | 6,375 | 6,911 |
| 9 New Jersey Economic Development Authority Lease | ||||
| Revenue | 0.000% | 2/15/22 | 5,000 | 3,826 |
| Port Authority of New York & New Jersey Revenue | 5.859% | 12/1/24 | 2,930 | 3,563 |
| Utah GO | 4.554% | 7/1/24 | 4,895 | 5,490 |
| Total Taxable Municipal Bonds (Cost $45,578) | 45,587 | |||
| Total Investments (99.1%) (Cost $22,364,771) | 22,273,403 | |||
| Other Assets and Liabilities—Net (0.9%) | 209,427 | |||
| Net Assets (100%) | 22,482,830 | |||
1 U.S. government-guaranteed.
2 The issuer operates under a congressional charter; its securities are generally neither guaranteed by the U.S. Treasury nor backed by the full
faith and credit of the U.S. government.
3 The issuer was placed under federal conservatorship in September 2008; since that time, its daily operations have been managed by the Federal
Housing Finance Agency and it receives capital from the U.S. Treasury, as needed to maintain a positive net worth, in exchange for senior
preferred stock.
4 The average or expected maturity is shorter than the final maturity shown because of the possibility of interim principal payments and
prepayments or the possibility of the issue being called.
5 Security exempt from registration under Rule 144A of the Securities Act of 1933. Such securities may be sold in transactions exempt from
registration, normally to qualified institutional buyers. At December 31, 2015, the aggregate value of these securities was $241,220,000,
representing 1.1% of net assets.
6 Guaranteed by the Government of Japan.
7 Guaranteed by the Federal Republic of Germany.
8 Guaranteed by the Republic of Austria.
9 Scheduled principal and interest payments are guaranteed by AGM (Assured Guaranty Municipal Corporation).
GO—General Obligation Bond.
67
Vanguard® Intermediate-Term Bond Index Fund
Schedule of Investments
December 31, 2015
REIT—Real Estate Investment Trust.
68
Vanguard® Long-Term Bond Index Fund
Schedule of Investments
December 31, 2015
| Face | Market | ||||
| Maturity | Amount | Value | |||
| Coupon | Date | ($000) | ($000) | ||
| U.S. Government and Agency Obligations (39.0%) | |||||
| U.S. Government Securities (37.0%) | |||||
| United States Treasury Note/Bond | 2.000% | 8/15/25 | 11,606 | 11,312 | |
| United States Treasury Note/Bond | 2.250% | 11/15/25 | 16,755 | 16,710 | |
| United States Treasury Note/Bond | 6.000% | 2/15/26 | 41,835 | 55,817 | |
| United States Treasury Note/Bond | 6.750% | 8/15/26 | 23,510 | 33,289 | |
| United States Treasury Note/Bond | 6.500% | 11/15/26 | 21,005 | 29,367 | |
| United States Treasury Note/Bond | 6.375% | 8/15/27 | 11,955 | 16,780 | |
| United States Treasury Note/Bond | 6.125% | 11/15/27 | 8,571 | 11,855 | |
| United States Treasury Note/Bond | 5.500% | 8/15/28 | 18,690 | 24,846 | |
| United States Treasury Note/Bond | 5.250% | 11/15/28 | 12,005 | 15,670 | |
| United States Treasury Note/Bond | 5.250% | 2/15/29 | 34,926 | 45,709 | |
| United States Treasury Note/Bond | 6.125% | 8/15/29 | 31,320 | 44,406 | |
| United States Treasury Note/Bond | 6.250% | 5/15/30 | 37,020 | 53,621 | |
| United States Treasury Note/Bond | 5.375% | 2/15/31 | 46,145 | 62,505 | |
| United States Treasury Note/Bond | 4.500% | 2/15/36 | 22,110 | 28,294 | |
| United States Treasury Note/Bond | 4.750% | 2/15/37 | 14,530 | 19,232 | |
| United States Treasury Note/Bond | 5.000% | 5/15/37 | 6,944 | 9,503 | |
| United States Treasury Note/Bond | 4.375% | 2/15/38 | 67,128 | 84,581 | |
| United States Treasury Note/Bond | 4.500% | 5/15/38 | 36,850 | 47,243 | |
| United States Treasury Note/Bond | 3.500% | 2/15/39 | 29,792 | 32,902 | |
| United States Treasury Note/Bond | 4.250% | 5/15/39 | 40,942 | 50,505 | |
| United States Treasury Note/Bond | 4.500% | 8/15/39 | 42,981 | 54,929 | |
| United States Treasury Note/Bond | 4.375% | 11/15/39 | 38,630 | 48,511 | |
| United States Treasury Note/Bond | 4.625% | 2/15/40 | 69,706 | 90,661 | |
| United States Treasury Note/Bond | 4.375% | 5/15/40 | 56,368 | 70,839 | |
| United States Treasury Note/Bond | 3.875% | 8/15/40 | 41,775 | 48,766 | |
| United States Treasury Note/Bond | 4.250% | 11/15/40 | 49,785 | 61,469 | |
| United States Treasury Note/Bond | 4.750% | 2/15/41 | 62,405 | 82,862 | |
| United States Treasury Note/Bond | 4.375% | 5/15/41 | 40,595 | 51,175 | |
| United States Treasury Note/Bond | 3.750% | 8/15/41 | 25,500 | 29,261 | |
| United States Treasury Note/Bond | 3.125% | 11/15/41 | 47,620 | 49,138 | |
| United States Treasury Note/Bond | 3.125% | 2/15/42 | 53,222 | 54,885 | |
| United States Treasury Note/Bond | 3.000% | 5/15/42 | 20,415 | 20,514 | |
| United States Treasury Note/Bond | 2.750% | 8/15/42 | 115,693 | 110,432 | |
| United States Treasury Note/Bond | 2.750% | 11/15/42 | 141,223 | 134,492 | |
| United States Treasury Note/Bond | 3.125% | 2/15/43 | 133,640 | 136,793 | |
| United States Treasury Note/Bond | 2.875% | 5/15/43 | 182,355 | 177,568 | |
| United States Treasury Note/Bond | 3.625% | 8/15/43 | 142,500 | 160,312 | |
| United States Treasury Note/Bond | 3.750% | 11/15/43 | 120,580 | 138,742 | |
| United States Treasury Note/Bond | 3.625% | 2/15/44 | 143,819 | 161,549 | |
| United States Treasury Note/Bond | 3.375% | 5/15/44 | 116,337 | 124,681 | |
| United States Treasury Note/Bond | 3.125% | 8/15/44 | 118,838 | 121,288 | |
| United States Treasury Note/Bond | 3.000% | 11/15/44 | 132,226 | 131,544 | |
| United States Treasury Note/Bond | 2.500% | 2/15/45 | 202,622 | 181,504 | |
| United States Treasury Note/Bond | 3.000% | 5/15/45 | 104,370 | 103,718 | |
| United States Treasury Note/Bond | 2.875% | 8/15/45 | 146,719 | 142,272 | |
| United States Treasury Note/Bond | 3.000% | 11/15/45 | 78,000 | 77,647 | |
| 3,259,699 | |||||
| Agency Bonds and Notes (2.0%) | |||||
| 1 | Federal Home Loan Banks | 5.625% | 3/14/36 | 1,000 | 1,282 |
| 1 | Federal Home Loan Banks | 5.500% | 7/15/36 | 7,080 | 9,236 |
| 2 | Federal Home Loan Mortgage Corp. | 6.750% | 9/15/29 | 1,890 | 2,684 |
| 2 | Federal Home Loan Mortgage Corp. | 6.750% | 3/15/31 | 16,260 | 23,302 |
| 2 | Federal Home Loan Mortgage Corp. | 6.250% | 7/15/32 | 18,467 | 25,616 |
| 2 | Federal National Mortgage Assn. | 6.250% | 5/15/29 | 17,025 | 23,147 |
| 2 | Federal National Mortgage Assn. | 7.125% | 1/15/30 | 9,175 | 13,430 |
| 2 | Federal National Mortgage Assn. | 7.250% | 5/15/30 | 8,835 | 13,098 |
| 2 | Federal National Mortgage Assn. | 6.625% | 11/15/30 | 9,050 | 12,839 |
| 2,3 | Federal National Mortgage Assn. | 6.000% | 4/18/36 | 2,000 | 2,026 |
| 2 | Federal National Mortgage Assn. | 5.625% | 7/15/37 | 6,080 | 8,097 |
| 2 | Federal National Mortgage Assn. | 6.210% | 8/6/38 | 700 | 993 |
| 1 | Tennessee Valley Authority | 7.125% | 5/1/30 | 3,970 | 5,669 |
69
| Vanguard® Long-Term Bond Index Fund | ||||
| Schedule of Investments | ||||
| December 31, 2015 | ||||
| Face | Market | |||
| Maturity | Amount | Value | ||
| Coupon | Date | ($000) | ($000) | |
| 1 Tennessee Valley Authority | 4.650% | 6/15/35 | 4,510 | 5,051 |
| 1 Tennessee Valley Authority | 5.880% | 4/1/36 | 4,535 | 5,789 |
| 1 Tennessee Valley Authority | 5.980% | 4/1/36 | 1,000 | 1,290 |
| 1 Tennessee Valley Authority | 6.150% | 1/15/38 | 2,450 | 3,259 |
| 1 Tennessee Valley Authority | 5.500% | 6/15/38 | 1,175 | 1,448 |
| 1 Tennessee Valley Authority | 5.250% | 9/15/39 | 7,645 | 9,254 |
| 1 Tennessee Valley Authority | 3.500% | 12/15/42 | 3,150 | 2,885 |
| 1 Tennessee Valley Authority | 4.875% | 1/15/48 | 2,650 | 2,962 |
| 1 Tennessee Valley Authority | 5.375% | 4/1/56 | 1,950 | 2,318 |
| 1 Tennessee Valley Authority | 4.625% | 9/15/60 | 1,400 | 1,466 |
| 1 Tennessee Valley Authority | 4.250% | 9/15/65 | 3,500 | 3,378 |
| 180,519 | ||||
| Total U.S. Government and Agency Obligations (Cost $3,293,338) | 3,440,218 | |||
| Corporate Bonds (49.2%) | ||||
| Finance (9.4%) | ||||
| Banking (5.1%) | ||||
| American Express Co. | 4.050% | 12/3/42 | 1,606 | 1,520 |
| Bank of America Corp. | 4.250% | 10/22/26 | 8,429 | 8,342 |
| Bank of America Corp. | 6.750% | 6/1/28 | 425 | 514 |
| Bank of America Corp. | 6.110% | 1/29/37 | 6,300 | 7,150 |
| Bank of America Corp. | 7.750% | 5/14/38 | 6,245 | 8,457 |
| Bank of America Corp. | 5.875% | 2/7/42 | 6,635 | 7,744 |
| Bank of America Corp. | 5.000% | 1/21/44 | 6,975 | 7,276 |
| Bank of America Corp. | 4.875% | 4/1/44 | 5,400 | 5,572 |
| Bank of America Corp. | 4.750% | 4/21/45 | 1,900 | 1,827 |
| Bank of America NA | 6.000% | 10/15/36 | 3,600 | 4,253 |
| Bank One Capital III | 8.750% | 9/1/30 | 425 | 607 |
| Bank One Corp. | 7.625% | 10/15/26 | 4,975 | 6,310 |
| Bank One Corp. | 8.000% | 4/29/27 | 185 | 238 |
| Barclays plc | 5.250% | 8/17/45 | 5,000 | 5,088 |
| Branch Banking & Trust Co. | 3.800% | 10/30/26 | 2,450 | 2,482 |
| Citigroup Inc. | 4.400% | 6/10/25 | 6,000 | 6,060 |
| Citigroup Inc. | 4.300% | 11/20/26 | 2,750 | 2,731 |
| Citigroup Inc. | 4.450% | 9/29/27 | 3,500 | 3,478 |
| Citigroup Inc. | 6.625% | 1/15/28 | 625 | 760 |
| Citigroup Inc. | 6.625% | 6/15/32 | 3,350 | 3,951 |
| Citigroup Inc. | 6.000% | 10/31/33 | 3,525 | 3,950 |
| Citigroup Inc. | 6.125% | 8/25/36 | 4,633 | 5,234 |
| Citigroup Inc. | 8.125% | 7/15/39 | 7,907 | 11,301 |
| Citigroup Inc. | 5.875% | 1/30/42 | 2,915 | 3,344 |
| Citigroup Inc. | 6.675% | 9/13/43 | 4,066 | 4,988 |
| Citigroup Inc. | 4.950% | 11/7/43 | 4,363 | 4,579 |
| Citigroup Inc. | 5.300% | 5/6/44 | 3,450 | 3,584 |
| Citigroup Inc. | 4.650% | 7/30/45 | 4,000 | 4,051 |
| Comerica Inc. | 3.800% | 7/22/26 | 750 | 740 |
| Cooperatieve Rabobank UA | 5.250% | 5/24/41 | 5,025 | 5,680 |
| Cooperatieve Rabobank UA | 5.750% | 12/1/43 | 6,225 | 6,910 |
| Cooperatieve Rabobank UA | 5.250% | 8/4/45 | 2,300 | 2,405 |
| 4 Credit Suisse Group Funding Guernsey Ltd. | 4.875% | 5/15/45 | 6,625 | 6,525 |
| Credit Suisse USA Inc. | 7.125% | 7/15/32 | 2,400 | 3,086 |
| Discover Bank | 4.250% | 3/13/26 | 1,725 | 1,738 |
| Fifth Third Bancorp | 8.250% | 3/1/38 | 3,420 | 4,788 |
| FirstMerit Bank NA | 4.270% | 11/25/26 | 1,225 | 1,224 |
| Goldman Sachs Capital I | 6.345% | 2/15/34 | 5,175 | 6,086 |
| Goldman Sachs Group Inc. | 5.950% | 1/15/27 | 4,008 | 4,442 |
| Goldman Sachs Group Inc. | 6.125% | 2/15/33 | 9,900 | 11,570 |
| Goldman Sachs Group Inc. | 6.450% | 5/1/36 | 5,100 | 5,748 |
| Goldman Sachs Group Inc. | 6.750% | 10/1/37 | 18,440 | 21,546 |
| Goldman Sachs Group Inc. | 6.250% | 2/1/41 | 7,400 | 8,832 |
| Goldman Sachs Group Inc. | 4.800% | 7/8/44 | 7,325 | 7,313 |
| Goldman Sachs Group Inc. | 5.150% | 5/22/45 | 6,700 | 6,502 |
| Goldman Sachs Group Inc. | 4.750% | 10/21/45 | 4,000 | 3,974 |
70
| Vanguard® Long-Term Bond Index Fund | ||||
| Schedule of Investments | ||||
| December 31, 2015 | ||||
| Face | Market | |||
| Maturity | Amount | Value | ||
| Coupon | Date | ($000) | ($000) | |
| HSBC Bank USA NA | 5.875% | 11/1/34 | 4,390 | 5,077 |
| HSBC Bank USA NA | 5.625% | 8/15/35 | 3,525 | 3,973 |
| HSBC Bank USA NA | 7.000% | 1/15/39 | 2,625 | 3,292 |
| HSBC Holdings plc | 7.625% | 5/17/32 | 1,050 | 1,344 |
| HSBC Holdings plc | 7.350% | 11/27/32 | 200 | 248 |
| HSBC Holdings plc | 6.500% | 5/2/36 | 6,500 | 7,741 |
| HSBC Holdings plc | 6.500% | 9/15/37 | 10,950 | 13,104 |
| HSBC Holdings plc | 6.800% | 6/1/38 | 3,540 | 4,380 |
| HSBC Holdings plc | 6.100% | 1/14/42 | 3,370 | 4,244 |
| HSBC Holdings plc | 5.250% | 3/14/44 | 4,925 | 5,092 |
| JPMorgan Chase & Co. | 4.125% | 12/15/26 | 6,150 | 6,136 |
| JPMorgan Chase & Co. | 4.250% | 10/1/27 | 4,400 | 4,372 |
| JPMorgan Chase & Co. | 6.400% | 5/15/38 | 6,800 | 8,552 |
| JPMorgan Chase & Co. | 5.500% | 10/15/40 | 4,325 | 4,896 |
| JPMorgan Chase & Co. | 5.600% | 7/15/41 | 4,825 | 5,561 |
| JPMorgan Chase & Co. | 5.400% | 1/6/42 | 4,354 | 4,893 |
| JPMorgan Chase & Co. | 5.625% | 8/16/43 | 5,750 | 6,211 |
| JPMorgan Chase & Co. | 4.850% | 2/1/44 | 5,425 | 5,779 |
| JPMorgan Chase & Co. | 4.950% | 6/1/45 | 5,200 | 5,199 |
| KeyBank NA | 6.950% | 2/1/28 | 1,018 | 1,268 |
| 4 Lloyds Banking Group plc | 5.300% | 12/1/45 | 2,000 | 2,029 |
| Morgan Stanley | 6.250% | 8/9/26 | 3,625 | 4,255 |
| Morgan Stanley | 4.350% | 9/8/26 | 8,400 | 8,371 |
| Morgan Stanley | 3.950% | 4/23/27 | 6,550 | 6,358 |
| Morgan Stanley | 7.250% | 4/1/32 | 2,025 | 2,653 |
| Morgan Stanley | 6.375% | 7/24/42 | 6,275 | 7,803 |
| Morgan Stanley | 4.300% | 1/27/45 | 8,500 | 8,053 |
| Regions Bank | 6.450% | 6/26/37 | 1,850 | 2,190 |
| Regions Financial Corp. | 7.375% | 12/10/37 | 1,100 | 1,380 |
| Wachovia Bank NA | 5.850% | 2/1/37 | 3,000 | 3,570 |
| Wachovia Corp. | 7.574% | 8/1/26 | 1,125 | 1,430 |
| Wachovia Corp. | 7.500% | 4/15/35 | 1,940 | 2,510 |
| Wachovia Corp. | 5.500% | 8/1/35 | 1,585 | 1,750 |
| Wachovia Corp. | 6.550% | 10/15/35 | 125 | 151 |
| Wells Fargo & Co. | 4.100% | 6/3/26 | 9,000 | 9,083 |
| Wells Fargo & Co. | 4.300% | 7/22/27 | 8,100 | 8,255 |
| Wells Fargo & Co. | 5.375% | 2/7/35 | 2,450 | 2,804 |
| Wells Fargo & Co. | 5.375% | 11/2/43 | 8,610 | 9,199 |
| Wells Fargo & Co. | 5.606% | 1/15/44 | 7,595 | 8,407 |
| Wells Fargo & Co. | 4.650% | 11/4/44 | 4,600 | 4,478 |
| Wells Fargo & Co. | 3.900% | 5/1/45 | 5,500 | 5,023 |
| Wells Fargo & Co. | 4.900% | 11/17/45 | 6,700 | 6,720 |
| Wells Fargo Bank NA | 5.950% | 8/26/36 | 1,755 | 2,087 |
| Wells Fargo Bank NA | 6.600% | 1/15/38 | 5,825 | 7,522 |
| 3 Wells Fargo Capital X | 5.950% | 12/1/86 | 3,025 | 3,051 |
| Brokerage (0.2%) | ||||
| Brookfield Asset Management Inc. | 7.375% | 3/1/33 | 850 | 998 |
| Charles Schwab Corp. | 3.450% | 2/13/26 | 1,200 | 1,212 |
| CME Group Inc. | 5.300% | 9/15/43 | 2,475 | 2,833 |
| Invesco Finance plc | 5.375% | 11/30/43 | 3,465 | 3,785 |
| Jefferies Group LLC | 6.450% | 6/8/27 | 950 | 1,003 |
| Jefferies Group LLC | 6.250% | 1/15/36 | 1,975 | 1,813 |
| Jefferies Group LLC | 6.500% | 1/20/43 | 1,350 | 1,249 |
| Legg Mason Inc. | 5.625% | 1/15/44 | 1,900 | 1,899 |
| Leucadia National Corp. | 6.625% | 10/23/43 | 800 | 660 |
| Finance Companies (0.5%) | ||||
| GATX Corp. | 5.200% | 3/15/44 | 425 | 402 |
| GATX Corp. | 4.500% | 3/30/45 | 400 | 343 |
| 4 GE Capital International Funding Co. | 4.418% | 11/15/35 | 41,196 | 42,000 |
| Insurance (3.2%) | ||||
| ACE Capital Trust II | 9.700% | 4/1/30 | 1,100 | 1,602 |
| ACE INA Holdings Inc. | 3.350% | 5/3/26 | 4,100 | 4,086 |
| ACE INA Holdings Inc. | 6.700% | 5/15/36 | 1,000 | 1,302 |
71
| Vanguard® Long-Term Bond Index Fund | ||||
| Schedule of Investments | ||||
| December 31, 2015 | ||||
| Face | Market | |||
| Maturity | Amount | Value | ||
| Coupon | Date | ($000) | ($000) | |
| ACE INA Holdings Inc. | 4.150% | 3/13/43 | 3,150 | 3,069 |
| ACE INA Holdings Inc. | 4.350% | 11/3/45 | 3,900 | 3,945 |
| Aetna Inc. | 6.625% | 6/15/36 | 2,700 | 3,230 |
| Aetna Inc. | 6.750% | 12/15/37 | 1,925 | 2,409 |
| Aetna Inc. | 4.500% | 5/15/42 | 1,725 | 1,693 |
| Aetna Inc. | 4.125% | 11/15/42 | 1,450 | 1,359 |
| Aetna Inc. | 4.750% | 3/15/44 | 1,525 | 1,541 |
| Aflac Inc. | 6.900% | 12/17/39 | 1,300 | 1,677 |
| Aflac Inc. | 6.450% | 8/15/40 | 1,335 | 1,638 |
| Alleghany Corp. | 4.900% | 9/15/44 | 2,025 | 1,920 |
| Allstate Corp. | 5.350% | 6/1/33 | 1,950 | 2,153 |
| Allstate Corp. | 5.550% | 5/9/35 | 1,435 | 1,662 |
| Allstate Corp. | 5.950% | 4/1/36 | 950 | 1,149 |
| Allstate Corp. | 4.500% | 6/15/43 | 2,380 | 2,417 |
| 3 Allstate Corp. | 6.500% | 5/15/67 | 1,000 | 1,105 |
| American International Group Inc. | 3.875% | 1/15/35 | 3,400 | 2,991 |
| American International Group Inc. | 4.700% | 7/10/35 | 1,650 | 1,644 |
| American International Group Inc. | 6.250% | 5/1/36 | 2,800 | 3,251 |
| American International Group Inc. | 6.820% | 11/15/37 | 326 | 391 |
| American International Group Inc. | 4.500% | 7/16/44 | 7,825 | 7,233 |
| American International Group Inc. | 4.800% | 7/10/45 | 2,450 | 2,364 |
| American International Group Inc. | 4.375% | 1/15/55 | 2,900 | 2,489 |
| 3 American International Group Inc. | 8.175% | 5/15/68 | 1,500 | 1,959 |
| 3 American International Group Inc. | 6.250% | 3/15/87 | 2,173 | 2,338 |
| Anthem Inc. | 5.950% | 12/15/34 | 671 | 748 |
| Anthem Inc. | 5.850% | 1/15/36 | 2,375 | 2,575 |
| Anthem Inc. | 6.375% | 6/15/37 | 2,445 | 2,895 |
| Anthem Inc. | 4.625% | 5/15/42 | 2,900 | 2,729 |
| Anthem Inc. | 4.650% | 1/15/43 | 3,325 | 3,163 |
| Anthem Inc. | 5.100% | 1/15/44 | 2,500 | 2,526 |
| Anthem Inc. | 4.650% | 8/15/44 | 2,600 | 2,477 |
| Anthem Inc. | 4.850% | 8/15/54 | 800 | 746 |
| Aon Corp. | 8.205% | 1/1/27 | 1,050 | 1,314 |
| Aon Corp. | 6.250% | 9/30/40 | 1,750 | 2,078 |
| Aon plc | 4.250% | 12/12/42 | 575 | 514 |
| Aon plc | 4.450% | 5/24/43 | 1,575 | 1,477 |
| Aon plc | 4.600% | 6/14/44 | 2,950 | 2,827 |
| Arch Capital Group Ltd. | 7.350% | 5/1/34 | 625 | 796 |
| Arch Capital Group US Inc. | 5.144% | 11/1/43 | 2,050 | 2,075 |
| Assurant Inc. | 6.750% | 2/15/34 | 1,489 | 1,732 |
| AXA SA | 8.600% | 12/15/30 | 4,895 | 6,560 |
| AXIS Specialty Finance plc | 5.150% | 4/1/45 | 875 | 863 |
| Berkshire Hathaway Finance Corp. | 5.750% | 1/15/40 | 3,025 | 3,532 |
| Berkshire Hathaway Finance Corp. | 4.400% | 5/15/42 | 1,775 | 1,764 |
| Berkshire Hathaway Finance Corp. | 4.300% | 5/15/43 | 2,180 | 2,135 |
| Berkshire Hathaway Inc. | 4.500% | 2/11/43 | 2,600 | 2,612 |
| Chubb Corp. | 6.000% | 5/11/37 | 2,150 | 2,619 |
| Chubb Corp. | 6.500% | 5/15/38 | 1,905 | 2,461 |
| Cigna Corp. | 7.875% | 5/15/27 | 500 | 656 |
| Cigna Corp. | 6.150% | 11/15/36 | 1,625 | 1,860 |
| Cigna Corp. | 5.875% | 3/15/41 | 1,560 | 1,783 |
| Cigna Corp. | 5.375% | 2/15/42 | 2,445 | 2,680 |
| Cincinnati Financial Corp. | 6.920% | 5/15/28 | 1,200 | 1,482 |
| Cincinnati Financial Corp. | 6.125% | 11/1/34 | 1,350 | 1,537 |
| Endurance Specialty Holdings Ltd. | 7.000% | 7/15/34 | 1,425 | 1,678 |
| Everest Reinsurance Holdings Inc. | 4.868% | 6/1/44 | 1,500 | 1,431 |
| Hartford Financial Services Group Inc. | 5.950% | 10/15/36 | 2,075 | 2,380 |
| Hartford Financial Services Group Inc. | 6.625% | 3/30/40 | 486 | 599 |
| Hartford Financial Services Group Inc. | 6.100% | 10/1/41 | 1,700 | 1,974 |
| Hartford Financial Services Group Inc. | 4.300% | 4/15/43 | 400 | 373 |
| Humana Inc. | 8.150% | 6/15/38 | 1,060 | 1,448 |
| Humana Inc. | 4.625% | 12/1/42 | 1,476 | 1,399 |
| Humana Inc. | 4.950% | 10/1/44 | 2,195 | 2,185 |
| Lincoln National Corp. | 6.150% | 4/7/36 | 2,125 | 2,454 |
72
| Vanguard® Long-Term Bond Index Fund | ||||
| Schedule of Investments | ||||
| December 31, 2015 | ||||
| Face | Market | |||
| Maturity | Amount | Value | ||
| Coupon | Date | ($000) | ($000) | |
| Lincoln National Corp. | 7.000% | 6/15/40 | 2,295 | 2,885 |
| Loews Corp. | 6.000% | 2/1/35 | 800 | 921 |
| Loews Corp. | 4.125% | 5/15/43 | 2,075 | 1,854 |
| Markel Corp. | 5.000% | 3/30/43 | 1,100 | 1,103 |
| Marsh & McLennan Cos. Inc. | 3.750% | 3/14/26 | 3,800 | 3,809 |
| Marsh & McLennan Cos. Inc. | 5.875% | 8/1/33 | 1,125 | 1,299 |
| MetLife Inc. | 6.500% | 12/15/32 | 2,025 | 2,488 |
| MetLife Inc. | 6.375% | 6/15/34 | 2,400 | 2,959 |
| MetLife Inc. | 5.700% | 6/15/35 | 3,275 | 3,789 |
| MetLife Inc. | 5.875% | 2/6/41 | 3,150 | 3,702 |
| MetLife Inc. | 4.125% | 8/13/42 | 2,450 | 2,308 |
| MetLife Inc. | 4.875% | 11/13/43 | 3,250 | 3,399 |
| MetLife Inc. | 4.721% | 12/15/44 | 2,675 | 2,735 |
| MetLife Inc. | 4.050% | 3/1/45 | 3,150 | 2,906 |
| MetLife Inc. | 4.600% | 5/13/46 | 1,000 | 1,008 |
| 3 MetLife Inc. | 6.400% | 12/15/66 | 5,420 | 5,915 |
| 3 MetLife Inc. | 10.750% | 8/1/69 | 840 | 1,315 |
| Munich Re America Corp. | 7.450% | 12/15/26 | 1,000 | 1,270 |
| 3 Nationwide Financial Services Inc. | 6.750% | 5/15/87 | 1,000 | 1,007 |
| Principal Financial Group Inc. | 6.050% | 10/15/36 | 1,975 | 2,288 |
| Principal Financial Group Inc. | 4.625% | 9/15/42 | 675 | 656 |
| Principal Financial Group Inc. | 4.350% | 5/15/43 | 1,000 | 927 |
| Progressive Corp. | 6.625% | 3/1/29 | 2,850 | 3,569 |
| Progressive Corp. | 4.350% | 4/25/44 | 2,190 | 2,215 |
| Protective Life Corp. | 8.450% | 10/15/39 | 1,020 | 1,347 |
| Prudential Financial Inc. | 5.750% | 7/15/33 | 350 | 396 |
| Prudential Financial Inc. | 5.400% | 6/13/35 | 1,820 | 1,986 |
| Prudential Financial Inc. | 5.900% | 3/17/36 | 2,100 | 2,411 |
| Prudential Financial Inc. | 5.700% | 12/14/36 | 3,650 | 4,117 |
| Prudential Financial Inc. | 6.625% | 12/1/37 | 2,450 | 3,010 |
| Prudential Financial Inc. | 6.625% | 6/21/40 | 3,250 | 4,027 |
| Prudential Financial Inc. | 6.200% | 11/15/40 | 2,350 | 2,767 |
| Prudential Financial Inc. | 5.625% | 5/12/41 | 1,025 | 1,127 |
| Prudential Financial Inc. | 5.100% | 8/15/43 | 1,145 | 1,193 |
| Prudential Financial Inc. | 4.600% | 5/15/44 | 425 | 423 |
| Swiss Re Solutions Holding Corp. | 7.000% | 2/15/26 | 1,565 | 1,943 |
| Transatlantic Holdings Inc. | 8.000% | 11/30/39 | 1,175 | 1,510 |
| Travelers Cos. Inc. | 6.750% | 6/20/36 | 1,000 | 1,318 |
| Travelers Cos. Inc. | 6.250% | 6/15/37 | 2,700 | 3,397 |
| Travelers Cos. Inc. | 5.350% | 11/1/40 | 2,750 | 3,174 |
| Travelers Cos. Inc. | 4.600% | 8/1/43 | 1,825 | 1,910 |
| Travelers Cos. Inc. | 4.300% | 8/25/45 | 450 | 451 |
| Travelers Property Casualty Corp. | 6.375% | 3/15/33 | 1,750 | 2,149 |
| Trinity Acquisition plc | 6.125% | 8/15/43 | 1,000 | 1,067 |
| UnitedHealth Group Inc. | 4.625% | 7/15/35 | 3,350 | 3,488 |
| UnitedHealth Group Inc. | 5.800% | 3/15/36 | 2,635 | 3,105 |
| UnitedHealth Group Inc. | 6.500% | 6/15/37 | 890 | 1,115 |
| UnitedHealth Group Inc. | 6.625% | 11/15/37 | 2,575 | 3,276 |
| UnitedHealth Group Inc. | 6.875% | 2/15/38 | 3,985 | 5,207 |
| UnitedHealth Group Inc. | 5.950% | 2/15/41 | 1,150 | 1,364 |
| UnitedHealth Group Inc. | 4.625% | 11/15/41 | 2,025 | 2,069 |
| UnitedHealth Group Inc. | 4.375% | 3/15/42 | 1,500 | 1,471 |
| UnitedHealth Group Inc. | 3.950% | 10/15/42 | 3,050 | 2,835 |
| UnitedHealth Group Inc. | 4.250% | 3/15/43 | 2,550 | 2,470 |
| UnitedHealth Group Inc. | 4.750% | 7/15/45 | 7,260 | 7,603 |
| Unum Group | 5.750% | 8/15/42 | 650 | 713 |
| Validus Holdings Ltd. | 8.875% | 1/26/40 | 940 | 1,177 |
| Voya Financial Inc. | 5.700% | 7/15/43 | 1,625 | 1,839 |
| WR Berkley Corp. | 4.750% | 8/1/44 | 1,370 | 1,314 |
| XLIT Ltd. | 6.250% | 5/15/27 | 825 | 947 |
| XLIT Ltd. | 5.250% | 12/15/43 | 1,050 | 1,084 |
| XLIT Ltd. | 5.500% | 3/31/45 | 1,700 | 1,583 |
73
| Vanguard® Long-Term Bond Index Fund | ||||
| Schedule of Investments | ||||
| December 31, 2015 | ||||
| Face | Market | |||
| Maturity | Amount | Value | ||
| Coupon | Date | ($000) | ($000) | |
| Real Estate Investment Trusts (0.4%) | ||||
| Alexandria Real Estate Equities Inc. | 4.300% | 1/15/26 | 500 | 497 |
| Alexandria Real Estate Equities Inc. | 4.500% | 7/30/29 | 1,350 | 1,313 |
| Brandywine Operating Partnership LP | 4.550% | 10/1/29 | 1,970 | 1,898 |
| DDR Corp. | 4.250% | 2/1/26 | 1,350 | 1,314 |
| ERP Operating LP | 4.500% | 7/1/44 | 1,450 | 1,452 |
| ERP Operating LP | 4.500% | 6/1/45 | 2,200 | 2,243 |
| Federal Realty Investment Trust | 4.500% | 12/1/44 | 2,800 | 2,840 |
| HCP Inc. | 6.750% | 2/1/41 | 900 | 1,090 |
| Kilroy Realty LP | 4.250% | 8/15/29 | 1,300 | 1,283 |
| 4 Omega Healthcare Investors Inc. | 5.250% | 1/15/26 | 1,400 | 1,428 |
| Omega Healthcare Investors Inc. | 4.500% | 4/1/27 | 3,625 | 3,444 |
| Realty Income Corp. | 4.125% | 10/15/26 | 850 | 854 |
| Realty Income Corp. | 5.875% | 3/15/35 | 1,170 | 1,297 |
| Simon Property Group LP | 6.750% | 2/1/40 | 2,350 | 3,109 |
| Simon Property Group LP | 4.750% | 3/15/42 | 2,100 | 2,240 |
| Simon Property Group LP | 4.250% | 10/1/44 | 1,040 | 1,035 |
| Ventas Realty LP | 5.700% | 9/30/43 | 750 | 826 |
| Ventas Realty LP | 4.375% | 2/1/45 | 1,325 | 1,202 |
| Welltower Inc. | 6.500% | 3/15/41 | 1,700 | 1,992 |
| Welltower Inc. | 5.125% | 3/15/43 | 910 | 916 |
| 825,928 | ||||
| Industrial (33.5%) | ||||
| Basic Industry (2.3%) | ||||
| Agrium Inc. | 4.125% | 3/15/35 | 2,400 | 2,062 |
| Agrium Inc. | 7.125% | 5/23/36 | 500 | 594 |
| Agrium Inc. | 6.125% | 1/15/41 | 1,850 | 1,992 |
| Agrium Inc. | 4.900% | 6/1/43 | 3,075 | 2,798 |
| Agrium Inc. | 5.250% | 1/15/45 | 1,840 | 1,717 |
| Albemarle Corp. | 5.450% | 12/1/44 | 1,250 | 1,213 |
| Barrick Gold Corp. | 5.250% | 4/1/42 | 2,325 | 1,567 |
| Barrick North America Finance LLC | 7.500% | 9/15/38 | 850 | 696 |
| Barrick North America Finance LLC | 5.700% | 5/30/41 | 3,600 | 2,511 |
| Barrick North America Finance LLC | 5.750% | 5/1/43 | 3,425 | 2,466 |
| Barrick PD Australia Finance Pty Ltd. | 5.950% | 10/15/39 | 2,220 | 1,505 |
| BHP Billiton Finance USA Ltd. | 6.420% | 3/1/26 | 500 | 543 |
| BHP Billiton Finance USA Ltd. | 4.125% | 2/24/42 | 2,185 | 1,732 |
| BHP Billiton Finance USA Ltd. | 5.000% | 9/30/43 | 9,600 | 8,628 |
| CF Industries Inc. | 5.150% | 3/15/34 | 3,425 | 3,018 |
| CF Industries Inc. | 4.950% | 6/1/43 | 2,575 | 2,198 |
| CF Industries Inc. | 5.375% | 3/15/44 | 2,920 | 2,545 |
| Domtar Corp. | 6.250% | 9/1/42 | 1,475 | 1,389 |
| Dow Chemical Co. | 7.375% | 11/1/29 | 2,400 | 2,985 |
| Dow Chemical Co. | 4.250% | 10/1/34 | 2,200 | 2,044 |
| Dow Chemical Co. | 9.400% | 5/15/39 | 1,850 | 2,668 |
| Dow Chemical Co. | 5.250% | 11/15/41 | 2,425 | 2,371 |
| Dow Chemical Co. | 4.375% | 11/15/42 | 3,350 | 2,904 |
| Eastman Chemical Co. | 4.800% | 9/1/42 | 3,165 | 2,919 |
| Eastman Chemical Co. | 4.650% | 10/15/44 | 2,530 | 2,244 |
| Ecolab Inc. | 5.500% | 12/8/41 | 2,690 | 2,933 |
| EI du Pont de Nemours & Co. | 6.500% | 1/15/28 | 775 | 904 |
| EI du Pont de Nemours & Co. | 5.600% | 12/15/36 | 625 | 648 |
| EI du Pont de Nemours & Co. | 4.900% | 1/15/41 | 2,575 | 2,467 |
| EI du Pont de Nemours & Co. | 4.150% | 2/15/43 | 2,075 | 1,814 |
| Freeport-McMoRan Inc. | 5.400% | 11/14/34 | 2,200 | 1,111 |
| Freeport-McMoRan Inc. | 5.450% | 3/15/43 | 6,605 | 3,369 |
| Georgia-Pacific LLC | 7.250% | 6/1/28 | 1,200 | 1,507 |
| Georgia-Pacific LLC | 7.750% | 11/15/29 | 1,215 | 1,594 |
| Georgia-Pacific LLC | 8.875% | 5/15/31 | 1,500 | 2,102 |
| Glencore Canada Corp. | 6.200% | 6/15/35 | 1,000 | 781 |
| Goldcorp Inc. | 5.450% | 6/9/44 | 1,825 | 1,479 |
| International Paper Co. | 3.800% | 1/15/26 | 1,925 | 1,897 |
| International Paper Co. | 5.000% | 9/15/35 | 1,750 | 1,739 |
74
| Vanguard® Long-Term Bond Index Fund | ||||
| Schedule of Investments | ||||
| December 31, 2015 | ||||
| Face | Market | |||
| Maturity | Amount | Value | ||
| Coupon | Date | ($000) | ($000) | |
| International Paper Co. | 8.700% | 6/15/38 | 795 | 1,030 |
| International Paper Co. | 7.300% | 11/15/39 | 1,740 | 1,984 |
| International Paper Co. | 6.000% | 11/15/41 | 1,750 | 1,830 |
| International Paper Co. | 4.800% | 6/15/44 | 3,300 | 2,987 |
| International Paper Co. | 5.150% | 5/15/46 | 2,600 | 2,473 |
| Kinross Gold Corp. | 6.875% | 9/1/41 | 895 | 510 |
| Lubrizol Corp. | 6.500% | 10/1/34 | 925 | 1,168 |
| LYB International Finance BV | 5.250% | 7/15/43 | 1,600 | 1,534 |
| LYB International Finance BV | 4.875% | 3/15/44 | 4,060 | 3,697 |
| LyondellBasell Industries NV | 4.625% | 2/26/55 | 3,375 | 2,732 |
| Meadwestvaco Corp. | 8.200% | 1/15/30 | 500 | 649 |
| Meadwestvaco Corp. | 7.950% | 2/15/31 | 2,125 | 2,642 |
| Methanex Corp. | 5.650% | 12/1/44 | 500 | 406 |
| Monsanto Co. | 4.200% | 7/15/34 | 2,900 | 2,508 |
| Monsanto Co. | 5.875% | 4/15/38 | 2,450 | 2,580 |
| Monsanto Co. | 3.600% | 7/15/42 | 425 | 308 |
| Monsanto Co. | 4.400% | 7/15/44 | 3,800 | 3,149 |
| Monsanto Co. | 3.950% | 4/15/45 | 3,000 | 2,330 |
| Monsanto Co. | 4.700% | 7/15/64 | 2,070 | 1,582 |
| Mosaic Co. | 5.450% | 11/15/33 | 1,725 | 1,758 |
| Mosaic Co. | 4.875% | 11/15/41 | 1,030 | 888 |
| Mosaic Co. | 5.625% | 11/15/43 | 2,250 | 2,157 |
| Newmont Mining Corp. | 5.875% | 4/1/35 | 1,210 | 983 |
| Newmont Mining Corp. | 6.250% | 10/1/39 | 3,185 | 2,545 |
| Newmont Mining Corp. | 4.875% | 3/15/42 | 3,525 | 2,501 |
| Nucor Corp. | 6.400% | 12/1/37 | 2,143 | 2,282 |
| Nucor Corp. | 5.200% | 8/1/43 | 2,100 | 1,960 |
| Placer Dome Inc. | 6.450% | 10/15/35 | 700 | 580 |
| Potash Corp. of Saskatchewan Inc. | 5.875% | 12/1/36 | 1,465 | 1,621 |
| Potash Corp. of Saskatchewan Inc. | 5.625% | 12/1/40 | 1,850 | 1,953 |
| PPG Industries Inc. | 5.500% | 11/15/40 | 1,480 | 1,648 |
| Praxair Inc. | 3.550% | 11/7/42 | 2,300 | 2,043 |
| Reliance Steel & Aluminum Co. | 6.850% | 11/15/36 | 350 | 365 |
| Rio Tinto Alcan Inc. | 5.750% | 6/1/35 | 5,550 | 5,766 |
| Rio Tinto Finance USA Ltd. | 7.125% | 7/15/28 | 3,425 | 4,107 |
| Rio Tinto Finance USA Ltd. | 5.200% | 11/2/40 | 3,175 | 2,905 |
| Rio Tinto Finance USA plc | 4.750% | 3/22/42 | 1,250 | 1,059 |
| Rio Tinto Finance USA plc | 4.125% | 8/21/42 | 2,300 | 1,795 |
| Rohm & Haas Co. | 7.850% | 7/15/29 | 3,050 | 3,928 |
| RPM International Inc. | 5.250% | 6/1/45 | 400 | 378 |
| Sherwin-Williams Co. | 4.550% | 8/1/45 | 960 | 997 |
| Southern Copper Corp. | 7.500% | 7/27/35 | 3,850 | 3,585 |
| Southern Copper Corp. | 6.750% | 4/16/40 | 3,070 | 2,616 |
| Southern Copper Corp. | 5.250% | 11/8/42 | 3,845 | 2,730 |
| Southern Copper Corp. | 5.875% | 4/23/45 | 5,475 | 4,188 |
| Syngenta Finance NV | 4.375% | 3/28/42 | 650 | 600 |
| The Dow Chemical Company | 4.625% | 10/1/44 | 4,000 | 3,653 |
| Vale Canada Ltd. | 7.200% | 9/15/32 | 1,050 | 781 |
| Vale Overseas Ltd. | 8.250% | 1/17/34 | 1,725 | 1,389 |
| Vale Overseas Ltd. | 6.875% | 11/21/36 | 9,400 | 6,486 |
| Vale Overseas Ltd. | 6.875% | 11/10/39 | 5,290 | 3,677 |
| Vale SA | 5.625% | 9/11/42 | 4,690 | 3,078 |
| Valspar Corp. | 3.950% | 1/15/26 | 2,000 | 1,990 |
| Weyerhaeuser Co. | 7.375% | 3/15/32 | 2,765 | 3,289 |
| Weyerhaeuser Co. | 6.875% | 12/15/33 | 1,750 | 2,020 |
| Worthington Industries Inc. | 4.550% | 4/15/26 | 700 | 690 |
| Capital Goods (2.8%) | ||||
| 3M Co. | 6.375% | 2/15/28 | 500 | 648 |
| 3M Co. | 5.700% | 3/15/37 | 1,760 | 2,170 |
| 3M Co. | 3.875% | 6/15/44 | 500 | 487 |
| ABB Finance USA Inc. | 4.375% | 5/8/42 | 1,525 | 1,512 |
| Boeing Co. | 6.125% | 2/15/33 | 1,325 | 1,664 |
| Boeing Co. | 3.300% | 3/1/35 | 3,250 | 2,980 |
75
| Vanguard® Long-Term Bond Index Fund | ||||
| Schedule of Investments | ||||
| December 31, 2015 | ||||
| Face | Market | |||
| Maturity | Amount | Value | ||
| Coupon | Date | ($000) | ($000) | |
| Boeing Co. | 6.625% | 2/15/38 | 1,600 | 2,135 |
| Boeing Co. | 6.875% | 3/15/39 | 2,125 | 2,923 |
| Boeing Co. | 5.875% | 2/15/40 | 325 | 411 |
| Boeing Co. | 3.500% | 3/1/45 | 1,050 | 968 |
| Caterpillar Inc. | 5.300% | 9/15/35 | 600 | 660 |
| Caterpillar Inc. | 6.050% | 8/15/36 | 1,325 | 1,563 |
| Caterpillar Inc. | 5.200% | 5/27/41 | 1,600 | 1,740 |
| Caterpillar Inc. | 3.803% | 8/15/42 | 6,716 | 6,003 |
| Caterpillar Inc. | 4.300% | 5/15/44 | 1,500 | 1,445 |
| Caterpillar Inc. | 4.750% | 5/15/64 | 1,200 | 1,167 |
| Danaher Corp. | 4.375% | 9/15/45 | 3,800 | 3,931 |
| Deere & Co. | 5.375% | 10/16/29 | 2,469 | 2,877 |
| Deere & Co. | 8.100% | 5/15/30 | 1,450 | 2,049 |
| Deere & Co. | 7.125% | 3/3/31 | 200 | 259 |
| Deere & Co. | 3.900% | 6/9/42 | 4,110 | 3,939 |
| Dover Corp. | 5.375% | 10/15/35 | 825 | 932 |
| Dover Corp. | 6.600% | 3/15/38 | 1,075 | 1,397 |
| Dover Corp. | 5.375% | 3/1/41 | 1,450 | 1,656 |
| Eaton Corp. | 4.000% | 11/2/32 | 2,495 | 2,383 |
| Eaton Corp. | 4.150% | 11/2/42 | 2,650 | 2,444 |
| Emerson Electric Co. | 6.000% | 8/15/32 | 1,650 | 1,976 |
| Emerson Electric Co. | 6.125% | 4/15/39 | 1,400 | 1,723 |
| Emerson Electric Co. | 5.250% | 11/15/39 | 175 | 197 |
| General Dynamics Corp. | 3.600% | 11/15/42 | 1,900 | 1,763 |
| General Electric Capital Corp. | 6.750% | 3/15/32 | 10,025 | 13,032 |
| General Electric Capital Corp. | 6.150% | 8/7/37 | 2,657 | 3,322 |
| General Electric Capital Corp. | 5.875% | 1/14/38 | 9,973 | 12,193 |
| General Electric Capital Corp. | 6.875% | 1/10/39 | 5,937 | 8,081 |
| General Electric Co. | 4.125% | 10/9/42 | 10,680 | 10,433 |
| General Electric Co. | 4.500% | 3/11/44 | 7,530 | 7,736 |
| Harris Corp. | 4.854% | 4/27/35 | 1,500 | 1,476 |
| Harris Corp. | 6.150% | 12/15/40 | 845 | 918 |
| Harris Corp. | 5.054% | 4/27/45 | 2,250 | 2,197 |
| Honeywell International Inc. | 5.700% | 3/15/36 | 1,700 | 2,026 |
| Honeywell International Inc. | 5.700% | 3/15/37 | 3,100 | 3,743 |
| Honeywell International Inc. | 5.375% | 3/1/41 | 2,670 | 3,168 |
| Illinois Tool Works Inc. | 4.875% | 9/15/41 | 2,100 | 2,290 |
| Illinois Tool Works Inc. | 3.900% | 9/1/42 | 1,750 | 1,653 |
| Ingersoll-Rand Global Holding Co. Ltd. | 5.750% | 6/15/43 | 1,950 | 2,145 |
| Ingersoll-Rand Luxembourg Finance SA | 4.650% | 11/1/44 | 1,200 | 1,146 |
| Lafarge SA | 7.125% | 7/15/36 | 850 | 1,001 |
| Lockheed Martin Corp. | 3.550% | 1/15/26 | 7,000 | 7,035 |
| Lockheed Martin Corp. | 3.600% | 3/1/35 | 2,950 | 2,650 |
| Lockheed Martin Corp. | 4.500% | 5/15/36 | 1,650 | 1,670 |
| Lockheed Martin Corp. | 6.150% | 9/1/36 | 4,535 | 5,438 |
| Lockheed Martin Corp. | 5.500% | 11/15/39 | 2,600 | 2,888 |
| Lockheed Martin Corp. | 5.720% | 6/1/40 | 2,189 | 2,497 |
| Lockheed Martin Corp. | 4.850% | 9/15/41 | 1,625 | 1,681 |
| Lockheed Martin Corp. | 4.070% | 12/15/42 | 3,075 | 2,847 |
| Lockheed Martin Corp. | 4.700% | 5/15/46 | 6,550 | 6,710 |
| Northrop Grumman Corp. | 5.050% | 11/15/40 | 1,900 | 1,994 |
| Northrop Grumman Corp. | 4.750% | 6/1/43 | 3,450 | 3,551 |
| Northrop Grumman Corp. | 3.850% | 4/15/45 | 2,116 | 1,877 |
| Northrop Grumman Systems Corp. | 7.750% | 2/15/31 | 1,315 | 1,732 |
| Owens Corning | 7.000% | 12/1/36 | 1,375 | 1,513 |
| Parker Hannifin Corp. | 6.250% | 5/15/38 | 1,095 | 1,388 |
| Parker-Hannifin Corp. | 4.200% | 11/21/34 | 2,250 | 2,297 |
| Parker-Hannifin Corp. | 4.450% | 11/21/44 | 1,950 | 2,037 |
| Precision Castparts Corp. | 3.900% | 1/15/43 | 2,375 | 2,213 |
| Precision Castparts Corp. | 4.375% | 6/15/45 | 500 | 499 |
| Raytheon Co. | 7.200% | 8/15/27 | 700 | 929 |
| Raytheon Co. | 4.875% | 10/15/40 | 2,300 | 2,518 |
| Raytheon Co. | 4.700% | 12/15/41 | 2,450 | 2,654 |
| Republic Services Inc. | 6.200% | 3/1/40 | 2,760 | 3,242 |
76
| Vanguard® Long-Term Bond Index Fund | ||||
| Schedule of Investments | ||||
| December 31, 2015 | ||||
| Face | Market | |||
| Maturity | Amount | Value | ||
| Coupon | Date | ($000) | ($000) | |
| Republic Services Inc. | 5.700% | 5/15/41 | 2,875 | 3,229 |
| Rockwell Automation Inc. | 6.700% | 1/15/28 | 300 | 383 |
| Rockwell Automation Inc. | 6.250% | 12/1/37 | 800 | 991 |
| Rockwell Collins Inc. | 4.800% | 12/15/43 | 1,025 | 1,096 |
| Sonoco Products Co. | 5.750% | 11/1/40 | 2,050 | 2,218 |
| Stanley Black & Decker Inc. | 5.200% | 9/1/40 | 1,400 | 1,518 |
| Tyco International Finance SA | 3.900% | 2/14/26 | 1,400 | 1,396 |
| Tyco International Finance SA | 5.125% | 9/14/45 | 1,700 | 1,764 |
| United Technologies Corp. | 6.700% | 8/1/28 | 1,175 | 1,497 |
| United Technologies Corp. | 7.500% | 9/15/29 | 1,850 | 2,502 |
| United Technologies Corp. | 5.400% | 5/1/35 | 2,275 | 2,546 |
| United Technologies Corp. | 6.050% | 6/1/36 | 4,525 | 5,454 |
| United Technologies Corp. | 6.125% | 7/15/38 | 2,275 | 2,784 |
| United Technologies Corp. | 5.700% | 4/15/40 | 4,835 | 5,662 |
| United Technologies Corp. | 4.500% | 6/1/42 | 9,750 | 9,794 |
| United Technologies Corp. | 4.150% | 5/15/45 | 1,700 | 1,622 |
| Valmont Industries Inc. | 5.000% | 10/1/44 | 825 | 715 |
| Valmont Industries Inc. | 5.250% | 10/1/54 | 1,000 | 852 |
| Waste Management Inc. | 3.900% | 3/1/35 | 2,650 | 2,479 |
| Waste Management Inc. | 4.100% | 3/1/45 | 2,970 | 2,769 |
| WW Grainger Inc. | 4.600% | 6/15/45 | 3,500 | 3,650 |
| Communication (7.7%) | ||||
| 21st Century Fox America Inc. | 6.550% | 3/15/33 | 725 | 831 |
| 21st Century Fox America Inc. | 6.200% | 12/15/34 | 4,015 | 4,542 |
| 21st Century Fox America Inc. | 6.400% | 12/15/35 | 4,330 | 4,987 |
| 21st Century Fox America Inc. | 8.150% | 10/17/36 | 1,225 | 1,627 |
| 21st Century Fox America Inc. | 6.150% | 3/1/37 | 2,605 | 2,902 |
| 21st Century Fox America Inc. | 6.650% | 11/15/37 | 3,370 | 3,906 |
| 21st Century Fox America Inc. | 7.850% | 3/1/39 | 825 | 1,067 |
| 21st Century Fox America Inc. | 6.900% | 8/15/39 | 2,550 | 3,015 |
| 21st Century Fox America Inc. | 6.150% | 2/15/41 | 4,875 | 5,482 |
| 21st Century Fox America Inc. | 5.400% | 10/1/43 | 2,735 | 2,851 |
| 21st Century Fox America Inc. | 4.750% | 9/15/44 | 2,525 | 2,433 |
| 21st Century Fox America Inc. | 7.750% | 12/1/45 | 1,995 | 2,599 |
| Alltel Corp. | 7.875% | 7/1/32 | 1,500 | 1,842 |
| America Movil SAB de CV | 6.375% | 3/1/35 | 3,460 | 3,832 |
| America Movil SAB de CV | 6.125% | 11/15/37 | 2,225 | 2,445 |
| America Movil SAB de CV | 6.125% | 3/30/40 | 5,800 | 6,362 |
| America Movil SAB de CV | 4.375% | 7/16/42 | 4,300 | 3,848 |
| Ameritech Capital Funding Corp. | 6.550% | 1/15/28 | 875 | 977 |
| AT&T Corp. | 8.250% | 11/15/31 | 1,846 | 2,470 |
| AT&T Inc. | 6.150% | 9/15/34 | 2,450 | 2,607 |
| AT&T Inc. | 4.500% | 5/15/35 | 9,000 | 8,360 |
| AT&T Inc. | 6.500% | 9/1/37 | 2,460 | 2,769 |
| AT&T Inc. | 6.300% | 1/15/38 | 6,790 | 7,432 |
| AT&T Inc. | 6.400% | 5/15/38 | 1,925 | 2,125 |
| AT&T Inc. | 6.550% | 2/15/39 | 5,010 | 5,643 |
| AT&T Inc. | 5.350% | 9/1/40 | 11,581 | 11,454 |
| AT&T Inc. | 5.550% | 8/15/41 | 6,655 | 6,699 |
| AT&T Inc. | 4.300% | 12/15/42 | 8,025 | 6,870 |
| AT&T Inc. | 4.800% | 6/15/44 | 5,025 | 4,609 |
| AT&T Inc. | 4.350% | 6/15/45 | 9,845 | 8,470 |
| AT&T Inc. | 4.750% | 5/15/46 | 11,050 | 10,120 |
| AT&T Mobility LLC | 7.125% | 12/15/31 | 1,950 | 2,377 |
| Bellsouth Capital Funding Corp. | 7.875% | 2/15/30 | 2,618 | 3,133 |
| BellSouth LLC | 6.875% | 10/15/31 | 1,702 | 1,871 |
| BellSouth LLC | 6.550% | 6/15/34 | 915 | 974 |
| BellSouth LLC | 6.000% | 11/15/34 | 1,271 | 1,269 |
| BellSouth Telecommunications LLC | 6.375% | 6/1/28 | 1,815 | 1,989 |
| BellSouth Telecommunications LLC | 6.650% | 12/15/95 | 555 | 589 |
| British Telecommunications plc | 9.625% | 12/15/30 | 8,825 | 12,867 |
| CBS Corp. | 4.000% | 1/15/26 | 2,675 | 2,608 |
| CBS Corp. | 7.875% | 7/30/30 | 3,615 | 4,611 |
77
| Vanguard® Long-Term Bond Index Fund | ||||
| Schedule of Investments | ||||
| December 31, 2015 | ||||
| Face | Market | |||
| Maturity | Amount | Value | ||
| Coupon | Date | ($000) | ($000) | |
| CBS Corp. | 5.500% | 5/15/33 | 1,223 | 1,216 |
| CBS Corp. | 5.900% | 10/15/40 | 900 | 936 |
| CBS Corp. | 4.850% | 7/1/42 | 2,000 | 1,781 |
| CBS Corp. | 4.900% | 8/15/44 | 3,180 | 2,889 |
| 4 CCO Safari II LLC | 6.384% | 10/23/35 | 7,000 | 7,041 |
| 4 CCO Safari II LLC | 6.484% | 10/23/45 | 12,275 | 12,360 |
| 4 CCO Safari II LLC | 6.834% | 10/23/55 | 1,625 | 1,595 |
| Comcast Corp. | 4.250% | 1/15/33 | 5,357 | 5,337 |
| Comcast Corp. | 7.050% | 3/15/33 | 950 | 1,224 |
| Comcast Corp. | 4.200% | 8/15/34 | 3,050 | 3,022 |
| Comcast Corp. | 5.650% | 6/15/35 | 4,650 | 5,390 |
| Comcast Corp. | 4.400% | 8/15/35 | 2,700 | 2,728 |
| Comcast Corp. | 6.500% | 11/15/35 | 6,265 | 7,860 |
| Comcast Corp. | 6.450% | 3/15/37 | 6,530 | 8,092 |
| Comcast Corp. | 6.950% | 8/15/37 | 5,335 | 6,961 |
| Comcast Corp. | 6.400% | 5/15/38 | 2,575 | 3,164 |
| Comcast Corp. | 6.550% | 7/1/39 | 4,325 | 5,470 |
| Comcast Corp. | 6.400% | 3/1/40 | 2,800 | 3,464 |
| Comcast Corp. | 4.650% | 7/15/42 | 2,605 | 2,633 |
| Comcast Corp. | 4.500% | 1/15/43 | 2,125 | 2,118 |
| Comcast Corp. | 4.750% | 3/1/44 | 1,325 | 1,377 |
| Comcast Corp. | 4.600% | 8/15/45 | 5,735 | 5,809 |
| Deutsche Telekom International Finance BV | 8.750% | 6/15/30 | 9,730 | 13,422 |
| Deutsche Telekom International Finance BV | 9.250% | 6/1/32 | 2,965 | 4,397 |
| DIRECTV Holdings LLC / DIRECTV Financing Co. Inc. | 6.350% | 3/15/40 | 1,860 | 2,010 |
| DIRECTV Holdings LLC / DIRECTV Financing Co. Inc. | 6.000% | 8/15/40 | 3,800 | 3,888 |
| DIRECTV Holdings LLC / DIRECTV Financing Co. Inc. | 6.375% | 3/1/41 | 3,625 | 3,878 |
| DIRECTV Holdings LLC / DIRECTV Financing Co. Inc. | 5.150% | 3/15/42 | 5,000 | 4,659 |
| Discovery Communications LLC | 6.350% | 6/1/40 | 2,850 | 2,853 |
| Discovery Communications LLC | 4.950% | 5/15/42 | 2,600 | 2,183 |
| Discovery Communications LLC | 4.875% | 4/1/43 | 1,850 | 1,523 |
| Embarq Corp. | 7.995% | 6/1/36 | 5,420 | 5,570 |
| Grupo Televisa SAB | 4.625% | 1/30/26 | 600 | 599 |
| Grupo Televisa SAB | 8.500% | 3/11/32 | 260 | 313 |
| Grupo Televisa SAB | 6.625% | 1/15/40 | 2,035 | 2,136 |
| Grupo Televisa SAB | 5.000% | 5/13/45 | 4,000 | 3,415 |
| Grupo Televisa SAB | 6.125% | 1/31/46 | 3,400 | 3,400 |
| GTE Corp. | 6.940% | 4/15/28 | 2,225 | 2,637 |
| Historic TW Inc. | 6.625% | 5/15/29 | 5,575 | 6,527 |
| Koninklijke KPN NV | 8.375% | 10/1/30 | 3,325 | 4,346 |
| McGraw Hill Financial Inc. | 4.400% | 2/15/26 | 2,950 | 3,023 |
| McGraw Hill Financial Inc. | 6.550% | 11/15/37 | 1,150 | 1,313 |
| Moody's Corp. | 5.250% | 7/15/44 | 1,700 | 1,751 |
| NBCUniversal Media LLC | 6.400% | 4/30/40 | 3,695 | 4,599 |
| NBCUniversal Media LLC | 5.950% | 4/1/41 | 3,600 | 4,308 |
| NBCUniversal Media LLC | 4.450% | 1/15/43 | 4,100 | 4,011 |
| New Cingular Wireless Services Inc. | 8.750% | 3/1/31 | 2,585 | 3,565 |
| Orange SA | 9.000% | 3/1/31 | 7,740 | 10,936 |
| Orange SA | 5.375% | 1/13/42 | 3,025 | 3,192 |
| Orange SA | 5.500% | 2/6/44 | 3,535 | 3,743 |
| Pacific Bell Telephone Co. | 7.125% | 3/15/26 | 1,847 | 2,262 |
| Qwest Corp. | 6.875% | 9/15/33 | 2,624 | 2,539 |
| Qwest Corp. | 7.125% | 11/15/43 | 1,500 | 1,427 |
| Rogers Communications Inc. | 7.500% | 8/15/38 | 2,605 | 3,382 |
| Rogers Communications Inc. | 4.500% | 3/15/43 | 2,275 | 2,125 |
| Rogers Communications Inc. | 5.450% | 10/1/43 | 650 | 688 |
| Rogers Communications Inc. | 5.000% | 3/15/44 | 2,465 | 2,494 |
| TCI Communications Inc. | 7.875% | 2/15/26 | 980 | 1,324 |
| TCI Communications Inc. | 7.125% | 2/15/28 | 1,095 | 1,416 |
| Telefonica Emisiones SAU | 7.045% | 6/20/36 | 6,675 | 8,068 |
| Telefonica Europe BV | 8.250% | 9/15/30 | 4,400 | 5,727 |
| Thomson Reuters Corp. | 5.500% | 8/15/35 | 1,440 | 1,466 |
| Thomson Reuters Corp. | 5.850% | 4/15/40 | 2,625 | 2,761 |
| Thomson Reuters Corp. | 4.500% | 5/23/43 | 300 | 263 |
78
| Vanguard® Long-Term Bond Index Fund | ||||
| Schedule of Investments | ||||
| December 31, 2015 | ||||
| Face | Market | |||
| Maturity | Amount | Value | ||
| Coupon | Date | ($000) | ($000) | |
| Thomson Reuters Corp. | 5.650% | 11/23/43 | 2,525 | 2,626 |
| Time Warner Cable Inc. | 6.550% | 5/1/37 | 4,785 | 4,828 |
| Time Warner Cable Inc. | 7.300% | 7/1/38 | 4,905 | 5,328 |
| Time Warner Cable Inc. | 6.750% | 6/15/39 | 5,075 | 5,195 |
| Time Warner Cable Inc. | 5.875% | 11/15/40 | 3,850 | 3,636 |
| Time Warner Cable Inc. | 5.500% | 9/1/41 | 4,225 | 3,822 |
| Time Warner Cable Inc. | 4.500% | 9/15/42 | 4,075 | 3,207 |
| Time Warner Cos. Inc. | 6.950% | 1/15/28 | 2,250 | 2,670 |
| Time Warner Entertainment Co. LP | 8.375% | 7/15/33 | 3,325 | 3,936 |
| Time Warner Inc. | 3.875% | 1/15/26 | 1,700 | 1,685 |
| Time Warner Inc. | 7.625% | 4/15/31 | 5,175 | 6,411 |
| Time Warner Inc. | 7.700% | 5/1/32 | 5,766 | 7,199 |
| Time Warner Inc. | 6.500% | 11/15/36 | 2,850 | 3,224 |
| Time Warner Inc. | 6.200% | 3/15/40 | 2,350 | 2,585 |
| Time Warner Inc. | 6.100% | 7/15/40 | 4,235 | 4,580 |
| Time Warner Inc. | 6.250% | 3/29/41 | 2,925 | 3,252 |
| Time Warner Inc. | 5.375% | 10/15/41 | 2,350 | 2,408 |
| Time Warner Inc. | 4.900% | 6/15/42 | 1,825 | 1,719 |
| Time Warner Inc. | 5.350% | 12/15/43 | 1,385 | 1,383 |
| Time Warner Inc. | 4.650% | 6/1/44 | 2,550 | 2,346 |
| Time Warner Inc. | 4.850% | 7/15/45 | 950 | 904 |
| Verizon Communications Inc. | 7.750% | 12/1/30 | 4,700 | 6,000 |
| Verizon Communications Inc. | 6.400% | 9/15/33 | 8,435 | 9,637 |
| Verizon Communications Inc. | 5.050% | 3/15/34 | 4,100 | 4,099 |
| Verizon Communications Inc. | 4.400% | 11/1/34 | 4,975 | 4,648 |
| Verizon Communications Inc. | 5.850% | 9/15/35 | 6,425 | 6,893 |
| Verizon Communications Inc. | 4.272% | 1/15/36 | 10,025 | 9,049 |
| Verizon Communications Inc. | 6.250% | 4/1/37 | 6,275 | 7,054 |
| Verizon Communications Inc. | 6.400% | 2/15/38 | 4,515 | 5,137 |
| Verizon Communications Inc. | 6.900% | 4/15/38 | 2,225 | 2,667 |
| Verizon Communications Inc. | 7.350% | 4/1/39 | 1,560 | 1,933 |
| Verizon Communications Inc. | 6.000% | 4/1/41 | 4,325 | 4,698 |
| Verizon Communications Inc. | 4.750% | 11/1/41 | 3,250 | 2,987 |
| Verizon Communications Inc. | 3.850% | 11/1/42 | 2,015 | 1,662 |
| Verizon Communications Inc. | 6.550% | 9/15/43 | 24,105 | 28,529 |
| Verizon Communications Inc. | 4.862% | 8/21/46 | 8,888 | 8,390 |
| Verizon Communications Inc. | 4.522% | 9/15/48 | 17,823 | 15,956 |
| Verizon Communications Inc. | 5.012% | 8/21/54 | 18,318 | 16,781 |
| Verizon Communications Inc. | 4.672% | 3/15/55 | 17,379 | 15,072 |
| Verizon Maryland LLC | 5.125% | 6/15/33 | 3,300 | 3,286 |
| Verizon New England Inc. | 7.875% | 11/15/29 | 2,340 | 2,905 |
| Verizon New York Inc. | 7.375% | 4/1/32 | 1,675 | 1,893 |
| Viacom Inc. | 4.850% | 12/15/34 | 1,750 | 1,430 |
| Viacom Inc. | 6.875% | 4/30/36 | 3,810 | 3,742 |
| Viacom Inc. | 4.500% | 2/27/42 | 700 | 526 |
| Viacom Inc. | 4.375% | 3/15/43 | 5,037 | 3,689 |
| Viacom Inc. | 4.875% | 6/15/43 | 550 | 437 |
| Viacom Inc. | 5.850% | 9/1/43 | 4,325 | 3,859 |
| Viacom Inc. | 5.250% | 4/1/44 | 1,400 | 1,155 |
| Vodafone Group plc | 7.875% | 2/15/30 | 2,800 | 3,412 |
| Vodafone Group plc | 6.250% | 11/30/32 | 1,150 | 1,191 |
| Vodafone Group plc | 6.150% | 2/27/37 | 5,500 | 5,454 |
| Vodafone Group plc | 4.375% | 2/19/43 | 4,375 | 3,605 |
| Walt Disney Co. | 7.000% | 3/1/32 | 1,863 | 2,569 |
| Walt Disney Co. | 4.375% | 8/16/41 | 1,025 | 1,061 |
| Walt Disney Co. | 4.125% | 12/1/41 | 2,805 | 2,798 |
| Walt Disney Co. | 3.700% | 12/1/42 | 1,350 | 1,258 |
| Walt Disney Co. | 4.125% | 6/1/44 | 1,250 | 1,266 |
| WPP Finance 2010 | 5.125% | 9/7/42 | 875 | 828 |
| WPP Finance 2010 | 5.625% | 11/15/43 | 1,500 | 1,517 |
| Consumer Cyclical (3.7%) | ||||
| Alibaba Group Holding Ltd. | 4.500% | 11/28/34 | 2,500 | 2,380 |
| Amazon.com Inc. | 4.800% | 12/5/34 | 4,925 | 5,169 |
79
| Vanguard® Long-Term Bond Index Fund | ||||
| Schedule of Investments | ||||
| December 31, 2015 | ||||
| Face | Market | |||
| Maturity | Amount | Value | ||
| Coupon | Date | ($000) | ($000) | |
| Amazon.com Inc. | 4.950% | 12/5/44 | 4,600 | 4,901 |
| Bed Bath & Beyond Inc. | 4.915% | 8/1/34 | 900 | 803 |
| Bed Bath & Beyond Inc. | 5.165% | 8/1/44 | 3,175 | 2,707 |
| BorgWarner Inc. | 4.375% | 3/15/45 | 1,750 | 1,565 |
| Cummins Inc. | 7.125% | 3/1/28 | 950 | 1,246 |
| Cummins Inc. | 4.875% | 10/1/43 | 1,625 | 1,679 |
| CVS Health Corp. | 4.875% | 7/20/35 | 6,500 | 6,711 |
| CVS Health Corp. | 6.125% | 9/15/39 | 1,500 | 1,753 |
| CVS Health Corp. | 5.750% | 5/15/41 | 2,575 | 2,911 |
| CVS Health Corp. | 5.300% | 12/5/43 | 3,580 | 3,876 |
| CVS Health Corp. | 5.125% | 7/20/45 | 12,325 | 12,993 |
| Daimler Finance North America LLC | 8.500% | 1/18/31 | 4,940 | 7,171 |
| Darden Restaurants Inc. | 7.050% | 10/15/37 | 875 | 926 |
| Delphi Automotive plc | 4.250% | 1/15/26 | 2,500 | 2,508 |
| eBay Inc. | 4.000% | 7/15/42 | 2,150 | 1,697 |
| 4 Expedia Inc. | 5.000% | 2/15/26 | 2,500 | 2,451 |
| Ford Holdings LLC | 9.300% | 3/1/30 | 1,225 | 1,667 |
| Ford Motor Co. | 6.625% | 10/1/28 | 2,225 | 2,558 |
| Ford Motor Co. | 6.375% | 2/1/29 | 1,025 | 1,152 |
| Ford Motor Co. | 7.450% | 7/16/31 | 6,150 | 7,552 |
| Ford Motor Co. | 4.750% | 1/15/43 | 5,599 | 5,281 |
| Ford Motor Co. | 7.400% | 11/1/46 | 1,925 | 2,345 |
| General Motors Co. | 5.000% | 4/1/35 | 2,730 | 2,556 |
| General Motors Co. | 6.250% | 10/2/43 | 5,015 | 5,291 |
| General Motors Co. | 5.200% | 4/1/45 | 4,495 | 4,225 |
| Harley-Davidson Inc. | 4.625% | 7/28/45 | 1,225 | 1,195 |
| Home Depot Inc. | 5.875% | 12/16/36 | 10,550 | 12,828 |
| Home Depot Inc. | 5.400% | 9/15/40 | 1,725 | 2,003 |
| Home Depot Inc. | 5.950% | 4/1/41 | 1,975 | 2,456 |
| Home Depot Inc. | 4.200% | 4/1/43 | 2,225 | 2,232 |
| Home Depot Inc. | 4.875% | 2/15/44 | 5,000 | 5,492 |
| Home Depot Inc. | 4.400% | 3/15/45 | 4,099 | 4,242 |
| Home Depot Inc. | 4.250% | 4/1/46 | 3,375 | 3,438 |
| Johnson Controls Inc. | 6.000% | 1/15/36 | 850 | 873 |
| Johnson Controls Inc. | 5.700% | 3/1/41 | 1,050 | 1,026 |
| Johnson Controls Inc. | 5.250% | 12/1/41 | 1,135 | 1,042 |
| Johnson Controls Inc. | 4.625% | 7/2/44 | 1,575 | 1,342 |
| Johnson Controls Inc. | 4.950% | 7/2/64 | 1,550 | 1,257 |
| Kohl's Corp. | 5.550% | 7/17/45 | 1,100 | 1,020 |
| Lowe's Cos. Inc. | 6.875% | 2/15/28 | 550 | 697 |
| Lowe's Cos. Inc. | 6.500% | 3/15/29 | 1,300 | 1,618 |
| Lowe's Cos. Inc. | 5.800% | 10/15/36 | 2,250 | 2,662 |
| Lowe's Cos. Inc. | 6.650% | 9/15/37 | 825 | 1,073 |
| Lowe's Cos. Inc. | 5.800% | 4/15/40 | 2,825 | 3,382 |
| Lowe's Cos. Inc. | 5.125% | 11/15/41 | 3,025 | 3,346 |
| Lowe's Cos. Inc. | 4.650% | 4/15/42 | 3,260 | 3,422 |
| Lowe's Cos. Inc. | 5.000% | 9/15/43 | 2,125 | 2,324 |
| Lowe's Cos. Inc. | 4.250% | 9/15/44 | 125 | 124 |
| Lowe's Cos. Inc. | 4.375% | 9/15/45 | 1,400 | 1,436 |
| Macy's Retail Holdings Inc. | 6.900% | 4/1/29 | 2,300 | 2,604 |
| Macy's Retail Holdings Inc. | 4.500% | 12/15/34 | 1,925 | 1,595 |
| Macy's Retail Holdings Inc. | 6.375% | 3/15/37 | 2,675 | 2,707 |
| Macy's Retail Holdings Inc. | 5.125% | 1/15/42 | 500 | 437 |
| Macy's Retail Holdings Inc. | 4.300% | 2/15/43 | 2,400 | 1,846 |
| McDonald's Corp. | 3.700% | 1/30/26 | 6,200 | 6,174 |
| McDonald's Corp. | 4.700% | 12/9/35 | 2,500 | 2,490 |
| McDonald's Corp. | 6.300% | 10/15/37 | 2,375 | 2,792 |
| McDonald's Corp. | 6.300% | 3/1/38 | 2,000 | 2,337 |
| McDonald's Corp. | 5.700% | 2/1/39 | 1,575 | 1,720 |
| McDonald's Corp. | 3.700% | 2/15/42 | 3,275 | 2,712 |
| McDonald's Corp. | 3.625% | 5/1/43 | 2,475 | 2,044 |
| McDonald's Corp. | 4.600% | 5/26/45 | 1,280 | 1,226 |
| McDonald's Corp. | 4.875% | 12/9/45 | 6,850 | 6,865 |
| Metropolitan Museum of Art New York Revenue | 3.400% | 7/1/45 | 1,100 | 999 |
80
| Vanguard® Long-Term Bond Index Fund | ||||
| Schedule of Investments | ||||
| December 31, 2015 | ||||
| Face | Market | |||
| Maturity | Amount | Value | ||
| Coupon | Date | ($000) | ($000) | |
| NIKE Inc. | 3.625% | 5/1/43 | 1,475 | 1,363 |
| NIKE Inc. | 3.875% | 11/1/45 | 3,600 | 3,473 |
| Nordstrom Inc. | 6.950% | 3/15/28 | 850 | 1,039 |
| Nordstrom Inc. | 5.000% | 1/15/44 | 2,249 | 2,328 |
| QVC Inc. | 5.450% | 8/15/34 | 1,750 | 1,514 |
| QVC Inc. | 5.950% | 3/15/43 | 575 | 490 |
| Starbucks Corp. | 4.300% | 6/15/45 | 800 | 837 |
| Starwood Hotels & Resorts Worldwide Inc. | 4.500% | 10/1/34 | 1,000 | 875 |
| Target Corp. | 6.350% | 11/1/32 | 2,259 | 2,825 |
| Target Corp. | 6.500% | 10/15/37 | 4,192 | 5,430 |
| Target Corp. | 7.000% | 1/15/38 | 2,994 | 4,090 |
| Target Corp. | 4.000% | 7/1/42 | 3,750 | 3,672 |
| Tiffany & Co. | 4.900% | 10/1/44 | 1,025 | 955 |
| VF Corp. | 6.450% | 11/1/37 | 2,190 | 2,804 |
| Visa Inc. | 4.150% | 12/14/35 | 5,000 | 5,047 |
| Visa Inc. | 4.300% | 12/14/45 | 12,075 | 12,237 |
| Wal-Mart Stores Inc. | 5.875% | 4/5/27 | 4,237 | 5,179 |
| Wal-Mart Stores Inc. | 7.550% | 2/15/30 | 4,225 | 5,960 |
| Wal-Mart Stores Inc. | 5.250% | 9/1/35 | 7,140 | 8,135 |
| Wal-Mart Stores Inc. | 6.500% | 8/15/37 | 9,350 | 12,053 |
| Wal-Mart Stores Inc. | 6.200% | 4/15/38 | 6,833 | 8,578 |
| Wal-Mart Stores Inc. | 5.625% | 4/1/40 | 2,850 | 3,371 |
| Wal-Mart Stores Inc. | 4.875% | 7/8/40 | 3,950 | 4,266 |
| Wal-Mart Stores Inc. | 5.000% | 10/25/40 | 4,010 | 4,409 |
| Wal-Mart Stores Inc. | 5.625% | 4/15/41 | 5,685 | 6,740 |
| Wal-Mart Stores Inc. | 4.000% | 4/11/43 | 4,168 | 4,046 |
| Wal-Mart Stores Inc. | 4.750% | 10/2/43 | 3,275 | 3,529 |
| Wal-Mart Stores Inc. | 4.300% | 4/22/44 | 3,375 | 3,441 |
| Walgreen Co. | 4.400% | 9/15/42 | 1,775 | 1,521 |
| Walgreens Boots Alliance Inc. | 4.500% | 11/18/34 | 1,700 | 1,552 |
| Walgreens Boots Alliance Inc. | 4.800% | 11/18/44 | 5,025 | 4,565 |
| Western Union Co. | 6.200% | 11/17/36 | 1,950 | 1,903 |
| Western Union Co. | 6.200% | 6/21/40 | 325 | 303 |
| Consumer Noncyclical (7.5%) | ||||
| Abbott Laboratories | 6.150% | 11/30/37 | 3,175 | 3,950 |
| Abbott Laboratories | 6.000% | 4/1/39 | 1,225 | 1,502 |
| Abbott Laboratories | 5.300% | 5/27/40 | 1,700 | 1,911 |
| AbbVie Inc. | 4.500% | 5/14/35 | 8,140 | 7,974 |
| AbbVie Inc. | 4.400% | 11/6/42 | 8,811 | 8,193 |
| AbbVie Inc. | 4.700% | 5/14/45 | 9,220 | 9,017 |
| Actavis Funding SCS | 4.550% | 3/15/35 | 7,665 | 7,482 |
| Actavis Funding SCS | 4.850% | 6/15/44 | 6,675 | 6,601 |
| Actavis Funding SCS | 4.750% | 3/15/45 | 7,325 | 7,118 |
| Actavis Inc. | 4.625% | 10/1/42 | 4,575 | 4,342 |
| Ahold Finance USA LLC | 6.875% | 5/1/29 | 1,575 | 1,941 |
| 3 Allina Health System | 4.805% | 11/15/45 | 850 | 874 |
| Altria Group Inc. | 9.950% | 11/10/38 | 2,999 | 4,827 |
| Altria Group Inc. | 10.200% | 2/6/39 | 2,546 | 4,186 |
| Altria Group Inc. | 4.250% | 8/9/42 | 2,575 | 2,367 |
| Altria Group Inc. | 4.500% | 5/2/43 | 4,120 | 3,908 |
| Altria Group Inc. | 5.375% | 1/31/44 | 1,505 | 1,620 |
| AmerisourceBergen Corp. | 4.250% | 3/1/45 | 1,720 | 1,595 |
| Amgen Inc. | 6.375% | 6/1/37 | 3,925 | 4,577 |
| Amgen Inc. | 6.900% | 6/1/38 | 2,250 | 2,794 |
| Amgen Inc. | 6.400% | 2/1/39 | 3,500 | 4,166 |
| Amgen Inc. | 5.750% | 3/15/40 | 2,919 | 3,151 |
| Amgen Inc. | 4.950% | 10/1/41 | 3,010 | 2,979 |
| Amgen Inc. | 5.150% | 11/15/41 | 7,671 | 7,780 |
| Amgen Inc. | 5.650% | 6/15/42 | 3,318 | 3,611 |
| Amgen Inc. | 4.400% | 5/1/45 | 4,045 | 3,743 |
| Anheuser-Busch Cos. LLC | 6.800% | 8/20/32 | 1,675 | 2,032 |
| Anheuser-Busch Cos. LLC | 5.950% | 1/15/33 | 650 | 727 |
| Anheuser-Busch Cos. LLC | 5.750% | 4/1/36 | 1,575 | 1,720 |
81
| Vanguard® Long-Term Bond Index Fund | ||||
| Schedule of Investments | ||||
| December 31, 2015 | ||||
| Face | Market | |||
| Maturity | Amount | Value | ||
| Coupon | Date | ($000) | ($000) | |
| Anheuser-Busch Cos. LLC | 6.450% | 9/1/37 | 650 | 773 |
| Anheuser-Busch Cos. LLC | 6.500% | 2/1/43 | 140 | 172 |
| Anheuser-Busch InBev Finance Inc. | 4.000% | 1/17/43 | 2,815 | 2,539 |
| Anheuser-Busch InBev Finance Inc. | 4.625% | 2/1/44 | 2,950 | 2,938 |
| Anheuser-Busch InBev Worldwide Inc. | 8.200% | 1/15/39 | 5,125 | 7,361 |
| Anheuser-Busch InBev Worldwide Inc. | 8.000% | 11/15/39 | 2,025 | 2,833 |
| Anheuser-Busch InBev Worldwide Inc. | 6.375% | 1/15/40 | 1,225 | 1,465 |
| Anheuser-Busch InBev Worldwide Inc. | 3.750% | 7/15/42 | 3,600 | 3,070 |
| Archer-Daniels-Midland Co. | 5.935% | 10/1/32 | 1,540 | 1,830 |
| Archer-Daniels-Midland Co. | 5.375% | 9/15/35 | 1,615 | 1,821 |
| Archer-Daniels-Midland Co. | 4.535% | 3/26/42 | 2,160 | 2,215 |
| Archer-Daniels-Midland Co. | 4.016% | 4/16/43 | 1,660 | 1,603 |
| 3 Ascension Health | 4.847% | 11/15/53 | 1,475 | 1,593 |
| AstraZeneca plc | 6.450% | 9/15/37 | 8,750 | 10,910 |
| AstraZeneca plc | 4.000% | 9/18/42 | 3,500 | 3,274 |
| AstraZeneca plc | 4.375% | 11/16/45 | 3,225 | 3,205 |
| 4 Baxalta Inc. | 5.250% | 6/23/45 | 3,300 | 3,309 |
| Becton Dickinson & Co. | 6.000% | 5/15/39 | 850 | 980 |
| Becton Dickinson & Co. | 5.000% | 11/12/40 | 1,000 | 1,020 |
| Becton Dickinson & Co. | 4.875% | 5/15/44 | 1,180 | 1,192 |
| Becton Dickinson & Co. | 4.685% | 12/15/44 | 3,700 | 3,761 |
| Biogen Inc. | 5.200% | 9/15/45 | 5,900 | 5,899 |
| Boston Scientific Corp. | 7.000% | 11/15/35 | 1,175 | 1,377 |
| Boston Scientific Corp. | 7.375% | 1/15/40 | 1,755 | 2,155 |
| Bristol-Myers Squibb Co. | 5.875% | 11/15/36 | 1,307 | 1,592 |
| Bristol-Myers Squibb Co. | 6.125% | 5/1/38 | 750 | 950 |
| Bristol-Myers Squibb Co. | 3.250% | 8/1/42 | 3,040 | 2,651 |
| Bristol-Myers Squibb Co. | 4.500% | 3/1/44 | 1,675 | 1,809 |
| Bristol-Myers Squibb Co. | 6.875% | 8/1/97 | 900 | 1,248 |
| Brown-Forman Corp. | 3.750% | 1/15/43 | 1,000 | 912 |
| Brown-Forman Corp. | 4.500% | 7/15/45 | 1,650 | 1,705 |
| Campbell Soup Co. | 3.800% | 8/2/42 | 1,100 | 954 |
| Cardinal Health Inc. | 4.600% | 3/15/43 | 2,775 | 2,745 |
| Cardinal Health Inc. | 4.900% | 9/15/45 | 1,250 | 1,279 |
| 3 Catholic Health Initiatives Colorado GO | 4.350% | 11/1/42 | 2,525 | 2,365 |
| Celgene Corp. | 5.700% | 10/15/40 | 1,000 | 1,070 |
| Celgene Corp. | 5.250% | 8/15/43 | 7,200 | 7,358 |
| Celgene Corp. | 4.625% | 5/15/44 | 3,925 | 3,714 |
| Celgene Corp. | 5.000% | 8/15/45 | 1,000 | 1,004 |
| Children's Hospital Medical Center Ohio GO | 4.268% | 5/15/44 | 1,250 | 1,227 |
| Cleveland Clinic Foundation Ohio Revenue | 4.858% | 1/1/14 | 1,415 | 1,375 |
| Coca-Cola Femsa SAB de CV | 5.250% | 11/26/43 | 2,375 | 2,552 |
| Colgate-Palmolive Co. | 4.000% | 8/15/45 | 2,000 | 2,010 |
| ConAgra Foods Inc. | 7.125% | 10/1/26 | 3,675 | 4,375 |
| ConAgra Foods Inc. | 7.000% | 10/1/28 | 925 | 1,100 |
| ConAgra Foods Inc. | 8.250% | 9/15/30 | 1,450 | 1,942 |
| ConAgra Foods Inc. | 6.625% | 8/15/39 | 971 | 1,046 |
| ConAgra Foods Inc. | 4.650% | 1/25/43 | 2,261 | 2,015 |
| Covidien International Finance SA | 6.550% | 10/15/37 | 4,075 | 5,100 |
| Delhaize America LLC | 9.000% | 4/15/31 | 425 | 543 |
| Delhaize Group SA | 5.700% | 10/1/40 | 3,514 | 3,607 |
| Diageo Capital plc | 5.875% | 9/30/36 | 1,825 | 2,130 |
| Diageo Capital plc | 3.875% | 4/29/43 | 1,725 | 1,597 |
| Diageo Investment Corp. | 7.450% | 4/15/35 | 1,500 | 2,011 |
| Diageo Investment Corp. | 4.250% | 5/11/42 | 1,800 | 1,805 |
| Dignity Health California GO | 4.500% | 11/1/42 | 1,050 | 997 |
| Dignity Health California GO | 5.267% | 11/1/64 | 1,100 | 1,129 |
| Dr Pepper Snapple Group Inc. | 7.450% | 5/1/38 | 860 | 1,185 |
| Dr Pepper Snapple Group Inc. | 4.500% | 11/15/45 | 800 | 786 |
| Eli Lilly & Co. | 5.550% | 3/15/37 | 1,435 | 1,725 |
| Eli Lilly & Co. | 3.700% | 3/1/45 | 5,925 | 5,552 |
| Estee Lauder Cos. Inc. | 6.000% | 5/15/37 | 1,025 | 1,244 |
| Estee Lauder Cos. Inc. | 3.700% | 8/15/42 | 1,575 | 1,412 |
| Estee Lauder Cos. Inc. | 4.375% | 6/15/45 | 1,000 | 1,007 |
82
| Vanguard® Long-Term Bond Index Fund | ||||
| Schedule of Investments | ||||
| December 31, 2015 | ||||
| Face | Market | |||
| Maturity | Amount | Value | ||
| Coupon | Date | ($000) | ($000) | |
| Express Scripts Holding Co. | 6.125% | 11/15/41 | 2,527 | 2,876 |
| Fomento Economico Mexicano SAB de CV | 4.375% | 5/10/43 | 2,325 | 2,064 |
| General Mills Inc. | 5.400% | 6/15/40 | 1,675 | 1,841 |
| General Mills Inc. | 4.150% | 2/15/43 | 1,775 | 1,667 |
| Gilead Sciences Inc. | 3.650% | 3/1/26 | 11,870 | 11,970 |
| Gilead Sciences Inc. | 4.600% | 9/1/35 | 1,775 | 1,805 |
| Gilead Sciences Inc. | 5.650% | 12/1/41 | 2,995 | 3,413 |
| Gilead Sciences Inc. | 4.800% | 4/1/44 | 7,630 | 7,640 |
| Gilead Sciences Inc. | 4.500% | 2/1/45 | 6,500 | 6,385 |
| Gilead Sciences Inc. | 4.750% | 3/1/46 | 8,100 | 8,151 |
| GlaxoSmithKline Capital Inc. | 5.375% | 4/15/34 | 1,450 | 1,650 |
| GlaxoSmithKline Capital Inc. | 6.375% | 5/15/38 | 9,569 | 12,191 |
| GlaxoSmithKline Capital Inc. | 4.200% | 3/18/43 | 1,400 | 1,413 |
| Hasbro Inc. | 6.350% | 3/15/40 | 1,729 | 1,897 |
| Hasbro Inc. | 5.100% | 5/15/44 | 1,025 | 971 |
| Hershey Co. | 7.200% | 8/15/27 | 90 | 122 |
| Ingredion Inc. | 6.625% | 4/15/37 | 1,025 | 1,214 |
| JM Smucker Co. | 4.250% | 3/15/35 | 2,000 | 1,953 |
| JM Smucker Co. | 4.375% | 3/15/45 | 2,900 | 2,813 |
| Johnson & Johnson | 6.950% | 9/1/29 | 1,850 | 2,630 |
| Johnson & Johnson | 4.950% | 5/15/33 | 2,325 | 2,708 |
| Johnson & Johnson | 4.375% | 12/5/33 | 2,300 | 2,534 |
| Johnson & Johnson | 5.950% | 8/15/37 | 2,705 | 3,491 |
| Johnson & Johnson | 5.850% | 7/15/38 | 2,115 | 2,722 |
| Johnson & Johnson | 4.500% | 9/1/40 | 3,204 | 3,512 |
| Johnson & Johnson | 4.850% | 5/15/41 | 1,000 | 1,150 |
| Johnson & Johnson | 4.500% | 12/5/43 | 250 | 275 |
| Kaiser Foundation Hospitals | 4.875% | 4/1/42 | 2,801 | 2,874 |
| Kellogg Co. | 7.450% | 4/1/31 | 3,775 | 4,776 |
| Kimberly-Clark Corp. | 6.625% | 8/1/37 | 2,675 | 3,566 |
| Kimberly-Clark Corp. | 5.300% | 3/1/41 | 1,220 | 1,372 |
| Kimberly-Clark Corp. | 3.700% | 6/1/43 | 880 | 818 |
| Koninklijke Philips NV | 6.875% | 3/11/38 | 2,805 | 3,266 |
| Koninklijke Philips NV | 5.000% | 3/15/42 | 1,890 | 1,825 |
| Kraft Foods Group Inc. | 6.875% | 1/26/39 | 2,850 | 3,383 |
| Kraft Foods Group Inc. | 6.500% | 2/9/40 | 3,925 | 4,549 |
| Kraft Foods Group Inc. | 5.000% | 6/4/42 | 5,515 | 5,555 |
| 4 Kraft Heinz Foods Co. | 5.000% | 7/15/35 | 4,680 | 4,797 |
| 4 Kraft Heinz Foods Co. | 5.200% | 7/15/45 | 4,015 | 4,195 |
| Kroger Co. | 7.700% | 6/1/29 | 1,300 | 1,709 |
| Kroger Co. | 8.000% | 9/15/29 | 1,475 | 1,986 |
| Kroger Co. | 7.500% | 4/1/31 | 1,720 | 2,192 |
| Kroger Co. | 6.900% | 4/15/38 | 1,300 | 1,593 |
| Kroger Co. | 5.400% | 7/15/40 | 770 | 822 |
| Kroger Co. | 5.000% | 4/15/42 | 900 | 917 |
| Kroger Co. | 5.150% | 8/1/43 | 1,300 | 1,361 |
| Laboratory Corp. of America Holdings | 4.700% | 2/1/45 | 2,500 | 2,285 |
| Mattel Inc. | 5.450% | 11/1/41 | 1,750 | 1,731 |
| 3 Mayo Clinic | 3.774% | 11/15/43 | 900 | 843 |
| 3 Mayo Clinic | 4.000% | 11/15/47 | 1,200 | 1,137 |
| McKesson Corp. | 6.000% | 3/1/41 | 2,615 | 3,024 |
| McKesson Corp. | 4.883% | 3/15/44 | 1,100 | 1,102 |
| Mead Johnson Nutrition Co. | 5.900% | 11/1/39 | 1,335 | 1,454 |
| Mead Johnson Nutrition Co. | 4.600% | 6/1/44 | 1,500 | 1,388 |
| Medtronic Inc. | 4.375% | 3/15/35 | 8,200 | 8,279 |
| Medtronic Inc. | 6.500% | 3/15/39 | 1,100 | 1,413 |
| Medtronic Inc. | 5.550% | 3/15/40 | 1,535 | 1,768 |
| Medtronic Inc. | 4.500% | 3/15/42 | 1,950 | 1,956 |
| Medtronic Inc. | 4.000% | 4/1/43 | 2,770 | 2,578 |
| Medtronic Inc. | 4.625% | 3/15/44 | 3,161 | 3,228 |
| Medtronic Inc. | 4.625% | 3/15/45 | 13,675 | 14,107 |
| Memorial Sloan-Kettering Cancer Center | 4.200% | 7/1/55 | 1,250 | 1,201 |
| Memorial Sloan-Kettering Cancer Center New York GO | 5.000% | 7/1/42 | 975 | 1,048 |
| Memorial Sloan-Kettering Cancer Center New York GO | 4.125% | 7/1/52 | 1,400 | 1,301 |
83
| Vanguard® Long-Term Bond Index Fund | ||||
| Schedule of Investments | ||||
| December 31, 2015 | ||||
| Face | Market | |||
| Maturity | Amount | Value | ||
| Coupon | Date | ($000) | ($000) | |
| Merck & Co. Inc. | 6.500% | 12/1/33 | 3,795 | 4,868 |
| Merck & Co. Inc. | 6.550% | 9/15/37 | 3,505 | 4,592 |
| Merck & Co. Inc. | 3.600% | 9/15/42 | 1,275 | 1,162 |
| Merck & Co. Inc. | 4.150% | 5/18/43 | 5,084 | 5,026 |
| Merck & Co. Inc. | 3.700% | 2/10/45 | 5,765 | 5,301 |
| Merck Sharp & Dohme Corp. | 5.950% | 12/1/28 | 1,300 | 1,627 |
| Molson Coors Brewing Co. | 5.000% | 5/1/42 | 3,675 | 3,549 |
| Mondelez International Inc. | 6.500% | 11/1/31 | 2,525 | 2,947 |
| Mondelez International Inc. | 6.500% | 2/9/40 | 2,089 | 2,565 |
| Mylan Inc. | 5.400% | 11/29/43 | 1,240 | 1,155 |
| New York & Presbyterian Hospital | 4.024% | 8/1/45 | 2,100 | 1,980 |
| Novant Health Inc. | 4.371% | 11/1/43 | 975 | 934 |
| Novartis Capital Corp. | 3.700% | 9/21/42 | 1,275 | 1,208 |
| Novartis Capital Corp. | 4.400% | 5/6/44 | 7,075 | 7,355 |
| Novartis Capital Corp. | 4.000% | 11/20/45 | 3,700 | 3,624 |
| NYU Hospitals Center | 4.784% | 7/1/44 | 1,150 | 1,158 |
| Partners Healthcare System Inc. | 4.117% | 7/1/55 | 1,000 | 911 |
| PepsiCo Inc. | 5.500% | 1/15/40 | 2,875 | 3,355 |
| PepsiCo Inc. | 4.875% | 11/1/40 | 3,740 | 4,018 |
| PepsiCo Inc. | 4.000% | 3/5/42 | 2,970 | 2,862 |
| PepsiCo Inc. | 3.600% | 8/13/42 | 1,625 | 1,474 |
| PepsiCo Inc. | 4.250% | 10/22/44 | 1,083 | 1,076 |
| PepsiCo Inc. | 4.600% | 7/17/45 | 2,349 | 2,478 |
| PepsiCo Inc. | 4.450% | 4/14/46 | 2,900 | 2,988 |
| Perrigo Co. plc | 5.300% | 11/15/43 | 1,600 | 1,538 |
| Perrigo Finance plc | 4.900% | 12/15/44 | 1,750 | 1,577 |
| Pfizer Inc. | 7.200% | 3/15/39 | 7,110 | 9,765 |
| Pfizer Inc. | 4.300% | 6/15/43 | 2,550 | 2,550 |
| Pfizer Inc. | 4.400% | 5/15/44 | 1,850 | 1,868 |
| Pharmacia Corp. | 6.600% | 12/1/28 | 2,950 | 3,786 |
| Philip Morris International Inc. | 6.375% | 5/16/38 | 4,290 | 5,388 |
| Philip Morris International Inc. | 4.375% | 11/15/41 | 2,450 | 2,436 |
| Philip Morris International Inc. | 4.500% | 3/20/42 | 4,728 | 4,720 |
| Philip Morris International Inc. | 3.875% | 8/21/42 | 3,675 | 3,363 |
| Philip Morris International Inc. | 4.125% | 3/4/43 | 3,000 | 2,833 |
| Philip Morris International Inc. | 4.875% | 11/15/43 | 2,685 | 2,830 |
| Procter & Gamble Co. | 6.450% | 1/15/26 | 1,450 | 1,840 |
| Procter & Gamble Co. | 5.500% | 2/1/34 | 1,500 | 1,794 |
| Procter & Gamble Co. | 5.800% | 8/15/34 | 500 | 603 |
| Procter & Gamble Co. | 5.550% | 3/5/37 | 5,945 | 7,271 |
| Quest Diagnostics Inc. | 5.750% | 1/30/40 | 1,196 | 1,239 |
| Quest Diagnostics Inc. | 4.700% | 3/30/45 | 1,175 | 1,063 |
| Reynolds American Inc. | 5.700% | 8/15/35 | 2,700 | 2,955 |
| Reynolds American Inc. | 7.250% | 6/15/37 | 1,875 | 2,304 |
| Reynolds American Inc. | 8.125% | 5/1/40 | 729 | 909 |
| Reynolds American Inc. | 7.000% | 8/4/41 | 955 | 1,079 |
| Reynolds American Inc. | 4.750% | 11/1/42 | 2,975 | 2,840 |
| Reynolds American Inc. | 6.150% | 9/15/43 | 550 | 624 |
| Reynolds American Inc. | 5.850% | 8/15/45 | 7,325 | 8,122 |
| Southern Baptist Hospital of Florida Inc. | 4.857% | 7/15/45 | 600 | 623 |
| St. Jude Medical Inc. | 4.750% | 4/15/43 | 2,400 | 2,353 |
| Stryker Corp. | 4.100% | 4/1/43 | 2,325 | 2,215 |
| Stryker Corp. | 4.375% | 5/15/44 | 475 | 470 |
| Sysco Corp. | 5.375% | 9/21/35 | 2,550 | 2,828 |
| Sysco Corp. | 4.850% | 10/1/45 | 1,250 | 1,298 |
| Teva Pharmaceutical Finance Co. LLC | 6.150% | 2/1/36 | 2,306 | 2,522 |
| 3 Texas Health Resources | 4.330% | 11/15/55 | 1,000 | 962 |
| The Pepsi Bottling Group Inc. | 7.000% | 3/1/29 | 3,925 | 5,264 |
| Thermo Fisher Scientific Inc. | 5.300% | 2/1/44 | 1,175 | 1,254 |
| Trinity Health Corp. | 4.125% | 12/1/45 | 650 | 616 |
| Tyson Foods Inc. | 4.875% | 8/15/34 | 1,650 | 1,683 |
| Tyson Foods Inc. | 5.150% | 8/15/44 | 3,173 | 3,344 |
| Unilever Capital Corp. | 5.900% | 11/15/32 | 4,808 | 6,096 |
| Whirlpool Corp. | 5.150% | 3/1/43 | 950 | 936 |
84
| Vanguard® Long-Term Bond Index Fund | ||||
| Schedule of Investments | ||||
| December 31, 2015 | ||||
| Face | Market | |||
| Maturity | Amount | Value | ||
| Coupon | Date | ($000) | ($000) | |
| Wyeth LLC | 6.500% | 2/1/34 | 2,485 | 3,109 |
| Wyeth LLC | 6.000% | 2/15/36 | 510 | 609 |
| Wyeth LLC | 5.950% | 4/1/37 | 7,135 | 8,495 |
| Zimmer Biomet Holdings Inc. | 4.250% | 8/15/35 | 2,200 | 2,060 |
| Zimmer Biomet Holdings Inc. | 5.750% | 11/30/39 | 2,000 | 2,205 |
| Zimmer Biomet Holdings Inc. | 4.450% | 8/15/45 | 4,700 | 4,343 |
| Zoetis Inc. | 4.700% | 2/1/43 | 3,870 | 3,392 |
| Energy (5.1%) | ||||
| Alberta Energy Co. Ltd. | 7.375% | 11/1/31 | 1,920 | 1,851 |
| Anadarko Finance Co. | 7.500% | 5/1/31 | 3,185 | 3,391 |
| Anadarko Petroleum Corp. | 6.450% | 9/15/36 | 5,975 | 5,715 |
| Anadarko Petroleum Corp. | 7.950% | 6/15/39 | 1,250 | 1,412 |
| Anadarko Petroleum Corp. | 6.200% | 3/15/40 | 2,470 | 2,314 |
| Anadarko Petroleum Corp. | 4.500% | 7/15/44 | 2,425 | 1,882 |
| Apache Corp. | 6.000% | 1/15/37 | 4,306 | 4,161 |
| Apache Corp. | 5.100% | 9/1/40 | 5,250 | 4,478 |
| Apache Corp. | 5.250% | 2/1/42 | 2,575 | 2,231 |
| Apache Corp. | 4.750% | 4/15/43 | 5,115 | 4,334 |
| Apache Finance Canada Corp. | 7.750% | 12/15/29 | 1,150 | 1,443 |
| Baker Hughes Inc. | 6.875% | 1/15/29 | 1,200 | 1,422 |
| Baker Hughes Inc. | 5.125% | 9/15/40 | 5,065 | 5,033 |
| Buckeye Partners LP | 5.850% | 11/15/43 | 1,350 | 1,042 |
| Buckeye Partners LP | 5.600% | 10/15/44 | 1,025 | 765 |
| Burlington Resources Finance Co. | 7.200% | 8/15/31 | 1,050 | 1,203 |
| Burlington Resources Finance Co. | 7.400% | 12/1/31 | 2,175 | 2,593 |
| Cameron International Corp. | 7.000% | 7/15/38 | 375 | 448 |
| Cameron International Corp. | 5.950% | 6/1/41 | 650 | 706 |
| Cameron International Corp. | 5.125% | 12/15/43 | 1,850 | 1,835 |
| Canadian Natural Resources Ltd. | 7.200% | 1/15/32 | 1,775 | 1,834 |
| Canadian Natural Resources Ltd. | 6.450% | 6/30/33 | 875 | 846 |
| Canadian Natural Resources Ltd. | 5.850% | 2/1/35 | 650 | 581 |
| Canadian Natural Resources Ltd. | 6.500% | 2/15/37 | 2,490 | 2,337 |
| Canadian Natural Resources Ltd. | 6.250% | 3/15/38 | 2,345 | 2,130 |
| Canadian Natural Resources Ltd. | 6.750% | 2/1/39 | 1,650 | 1,581 |
| Cenovus Energy Inc. | 6.750% | 11/15/39 | 4,755 | 4,526 |
| Cenovus Energy Inc. | 4.450% | 9/15/42 | 2,600 | 1,909 |
| Cenovus Energy Inc. | 5.200% | 9/15/43 | 1,375 | 1,083 |
| 4 Columbia Pipeline Group Inc. | 5.800% | 6/1/45 | 1,700 | 1,493 |
| Conoco Funding Co. | 7.250% | 10/15/31 | 1,945 | 2,238 |
| ConocoPhillips | 5.900% | 10/15/32 | 2,850 | 2,917 |
| ConocoPhillips | 5.900% | 5/15/38 | 2,025 | 1,980 |
| ConocoPhillips | 6.500% | 2/1/39 | 7,675 | 8,071 |
| ConocoPhillips Canada Funding Co. I | 5.950% | 10/15/36 | 1,100 | 1,131 |
| ConocoPhillips Co. | 4.150% | 11/15/34 | 2,675 | 2,322 |
| ConocoPhillips Holding Co. | 6.950% | 4/15/29 | 7,208 | 8,219 |
| Continental Resources Inc. | 4.900% | 6/1/44 | 2,325 | 1,363 |
| Devon Energy Corp. | 7.950% | 4/15/32 | 4,010 | 4,146 |
| Devon Energy Corp. | 5.600% | 7/15/41 | 4,635 | 3,500 |
| Devon Energy Corp. | 4.750% | 5/15/42 | 2,490 | 1,825 |
| Devon Financing Corp. LLC | 7.875% | 9/30/31 | 4,990 | 5,146 |
| Diamond Offshore Drilling Inc. | 5.700% | 10/15/39 | 2,075 | 1,411 |
| Diamond Offshore Drilling Inc. | 4.875% | 11/1/43 | 2,250 | 1,374 |
| Dominion Gas Holdings LLC | 4.800% | 11/1/43 | 1,100 | 1,053 |
| Dominion Gas Holdings LLC | 4.600% | 12/15/44 | 2,150 | 2,000 |
| El Paso Natural Gas Co. LLC | 8.375% | 6/15/32 | 1,182 | 1,143 |
| Enable Midstream Partners LP | 5.000% | 5/15/44 | 1,725 | 1,013 |
| Enbridge Energy Partners LP | 7.500% | 4/15/38 | 2,170 | 2,151 |
| Enbridge Energy Partners LP | 5.500% | 9/15/40 | 2,425 | 1,899 |
| Enbridge Inc. | 4.500% | 6/10/44 | 1,500 | 1,016 |
| Encana Corp. | 7.200% | 11/1/31 | 250 | 228 |
| Encana Corp. | 6.500% | 8/15/34 | 3,300 | 2,749 |
| Encana Corp. | 6.625% | 8/15/37 | 2,375 | 1,984 |
| Encana Corp. | 6.500% | 2/1/38 | 1,834 | 1,514 |
85
| Vanguard® Long-Term Bond Index Fund | ||||
| Schedule of Investments | ||||
| December 31, 2015 | ||||
| Face | Market | |||
| Maturity | Amount | Value | ||
| Coupon | Date | ($000) | ($000) | |
| Encana Corp. | 5.150% | 11/15/41 | 1,960 | 1,350 |
| Energy Transfer Partners LP | 4.750% | 1/15/26 | 2,750 | 2,358 |
| Energy Transfer Partners LP | 8.250% | 11/15/29 | 1,450 | 1,591 |
| Energy Transfer Partners LP | 4.900% | 3/15/35 | 2,450 | 1,781 |
| Energy Transfer Partners LP | 6.625% | 10/15/36 | 1,500 | 1,282 |
| Energy Transfer Partners LP | 7.500% | 7/1/38 | 2,775 | 2,542 |
| Energy Transfer Partners LP | 6.050% | 6/1/41 | 2,400 | 1,856 |
| Energy Transfer Partners LP | 6.500% | 2/1/42 | 3,280 | 2,674 |
| Energy Transfer Partners LP | 5.150% | 2/1/43 | 1,424 | 1,016 |
| Energy Transfer Partners LP | 5.950% | 10/1/43 | 500 | 390 |
| Energy Transfer Partners LP | 5.150% | 3/15/45 | 3,000 | 2,134 |
| Energy Transfer Partners LP | 6.125% | 12/15/45 | 3,750 | 3,051 |
| Eni USA Inc. | 7.300% | 11/15/27 | 600 | 754 |
| EnLink Midstream Partners LP | 5.600% | 4/1/44 | 1,075 | 732 |
| EnLink Midstream Partners LP | 5.050% | 4/1/45 | 1,750 | 1,085 |
| Ensco plc | 5.750% | 10/1/44 | 3,800 | 2,503 |
| Enterprise Products Operating LLC | 3.700% | 2/15/26 | 1,425 | 1,273 |
| Enterprise Products Operating LLC | 6.875% | 3/1/33 | 2,370 | 2,478 |
| Enterprise Products Operating LLC | 6.650% | 10/15/34 | 1,220 | 1,287 |
| Enterprise Products Operating LLC | 5.750% | 3/1/35 | 1,205 | 1,103 |
| Enterprise Products Operating LLC | 7.550% | 4/15/38 | 1,225 | 1,310 |
| Enterprise Products Operating LLC | 6.125% | 10/15/39 | 1,650 | 1,498 |
| Enterprise Products Operating LLC | 6.450% | 9/1/40 | 1,275 | 1,212 |
| Enterprise Products Operating LLC | 5.950% | 2/1/41 | 2,350 | 2,127 |
| Enterprise Products Operating LLC | 5.700% | 2/15/42 | 1,725 | 1,535 |
| Enterprise Products Operating LLC | 4.850% | 8/15/42 | 3,460 | 2,786 |
| Enterprise Products Operating LLC | 4.450% | 2/15/43 | 3,980 | 2,995 |
| Enterprise Products Operating LLC | 4.850% | 3/15/44 | 5,925 | 4,791 |
| Enterprise Products Operating LLC | 5.100% | 2/15/45 | 4,100 | 3,409 |
| Enterprise Products Operating LLC | 4.900% | 5/15/46 | 2,775 | 2,245 |
| Enterprise Products Operating LLC | 4.950% | 10/15/54 | 1,150 | 895 |
| EOG Resources Inc. | 3.900% | 4/1/35 | 2,082 | 1,892 |
| Exxon Mobil Corp. | 3.567% | 3/6/45 | 3,600 | 3,356 |
| Halliburton Co. | 4.850% | 11/15/35 | 6,500 | 6,393 |
| Halliburton Co. | 6.700% | 9/15/38 | 4,125 | 4,863 |
| Halliburton Co. | 7.450% | 9/15/39 | 275 | 351 |
| Halliburton Co. | 4.500% | 11/15/41 | 2,080 | 1,893 |
| Halliburton Co. | 4.750% | 8/1/43 | 1,700 | 1,600 |
| Halliburton Co. | 5.000% | 11/15/45 | 5,500 | 5,432 |
| Hess Corp. | 7.875% | 10/1/29 | 2,750 | 2,990 |
| Hess Corp. | 7.300% | 8/15/31 | 1,895 | 1,889 |
| Hess Corp. | 7.125% | 3/15/33 | 1,375 | 1,342 |
| Hess Corp. | 6.000% | 1/15/40 | 2,740 | 2,415 |
| Hess Corp. | 5.600% | 2/15/41 | 4,425 | 3,706 |
| Husky Energy Inc. | 6.800% | 9/15/37 | 1,350 | 1,409 |
| Kerr-McGee Corp. | 7.875% | 9/15/31 | 1,000 | 1,079 |
| Kinder Morgan Energy Partners LP | 7.400% | 3/15/31 | 500 | 461 |
| Kinder Morgan Energy Partners LP | 7.750% | 3/15/32 | 500 | 480 |
| Kinder Morgan Energy Partners LP | 7.300% | 8/15/33 | 1,600 | 1,452 |
| Kinder Morgan Energy Partners LP | 5.800% | 3/15/35 | 2,575 | 2,051 |
| Kinder Morgan Energy Partners LP | 6.500% | 2/1/37 | 1,950 | 1,658 |
| Kinder Morgan Energy Partners LP | 6.950% | 1/15/38 | 3,979 | 3,538 |
| Kinder Morgan Energy Partners LP | 6.500% | 9/1/39 | 3,375 | 2,831 |
| Kinder Morgan Energy Partners LP | 6.550% | 9/15/40 | 375 | 319 |
| Kinder Morgan Energy Partners LP | 7.500% | 11/15/40 | 1,500 | 1,368 |
| Kinder Morgan Energy Partners LP | 6.375% | 3/1/41 | 1,750 | 1,428 |
| Kinder Morgan Energy Partners LP | 5.625% | 9/1/41 | 1,929 | 1,446 |
| Kinder Morgan Energy Partners LP | 5.000% | 8/15/42 | 1,675 | 1,230 |
| Kinder Morgan Energy Partners LP | 4.700% | 11/1/42 | 1,650 | 1,167 |
| Kinder Morgan Energy Partners LP | 5.000% | 3/1/43 | 1,000 | 733 |
| Kinder Morgan Energy Partners LP | 5.500% | 3/1/44 | 3,000 | 2,340 |
| Kinder Morgan Energy Partners LP | 5.400% | 9/1/44 | 1,600 | 1,211 |
| Kinder Morgan Inc. | 7.750% | 1/15/32 | 5,074 | 4,815 |
| Kinder Morgan Inc. | 5.300% | 12/1/34 | 3,550 | 2,788 |
86
| Vanguard® Long-Term Bond Index Fund | ||||
| Schedule of Investments | ||||
| December 31, 2015 | ||||
| Face | Market | |||
| Maturity | Amount | Value | ||
| Coupon | Date | ($000) | ($000) | |
| Kinder Morgan Inc. | 5.550% | 6/1/45 | 5,850 | 4,554 |
| Magellan Midstream Partners LP | 6.400% | 5/1/37 | 475 | 473 |
| Magellan Midstream Partners LP | 4.200% | 12/1/42 | 1,150 | 847 |
| Magellan Midstream Partners LP | 5.150% | 10/15/43 | 1,875 | 1,598 |
| Magellan Midstream Partners LP | 4.200% | 3/15/45 | 600 | 437 |
| Marathon Oil Corp. | 6.800% | 3/15/32 | 1,600 | 1,443 |
| Marathon Oil Corp. | 6.600% | 10/1/37 | 3,175 | 2,714 |
| Marathon Oil Corp. | 5.200% | 6/1/45 | 1,650 | 1,164 |
| Marathon Petroleum Corp. | 6.500% | 3/1/41 | 3,575 | 3,583 |
| Marathon Petroleum Corp. | 4.750% | 9/15/44 | 1,850 | 1,507 |
| Marathon Petroleum Corp. | 5.850% | 12/15/45 | 1,000 | 936 |
| Marathon Petroleum Corp. | 5.000% | 9/15/54 | 3,000 | 2,386 |
| Murphy Oil Corp. | 7.050% | 5/1/29 | 570 | 493 |
| Murphy Oil Corp. | 5.125% | 12/1/42 | 1,550 | 952 |
| National Oilwell Varco Inc. | 3.950% | 12/1/42 | 3,625 | 2,769 |
| Noble Energy Inc. | 8.000% | 4/1/27 | 1,275 | 1,466 |
| Noble Energy Inc. | 6.000% | 3/1/41 | 3,245 | 2,785 |
| Noble Energy Inc. | 5.250% | 11/15/43 | 3,565 | 2,812 |
| Noble Energy Inc. | 5.050% | 11/15/44 | 1,900 | 1,530 |
| Noble Holding International Ltd. | 6.200% | 8/1/40 | 1,845 | 1,077 |
| Noble Holding International Ltd. | 6.050% | 3/1/41 | 950 | 567 |
| Noble Holding International Ltd. | 5.250% | 3/15/42 | 1,425 | 778 |
| Noble Holding International Ltd. | 6.950% | 4/1/45 | 1,600 | 995 |
| Occidental Petroleum Corp. | 4.625% | 6/15/45 | 2,500 | 2,420 |
| ONEOK Partners LP | 6.650% | 10/1/36 | 2,725 | 2,253 |
| ONEOK Partners LP | 6.850% | 10/15/37 | 850 | 713 |
| ONEOK Partners LP | 6.125% | 2/1/41 | 2,725 | 2,083 |
| ONEOK Partners LP | 6.200% | 9/15/43 | 1,450 | 1,105 |
| Petro-Canada | 7.875% | 6/15/26 | 625 | 806 |
| Petro-Canada | 7.000% | 11/15/28 | 1,425 | 1,759 |
| Petro-Canada | 5.350% | 7/15/33 | 1,450 | 1,513 |
| Petro-Canada | 5.950% | 5/15/35 | 2,480 | 2,476 |
| Petro-Canada | 6.800% | 5/15/38 | 4,275 | 4,630 |
| Phillips 66 | 4.650% | 11/15/34 | 3,400 | 3,188 |
| Phillips 66 | 5.875% | 5/1/42 | 5,776 | 5,817 |
| Phillips 66 | 4.875% | 11/15/44 | 4,529 | 4,014 |
| Phillips 66 Partners LP | 4.680% | 2/15/45 | 1,000 | 745 |
| Pioneer Natural Resources Co. | 4.450% | 1/15/26 | 1,750 | 1,573 |
| Pioneer Natural Resources Co. | 7.200% | 1/15/28 | 800 | 855 |
| Plains All American Pipeline LP / PAA Finance Corp. | 6.700% | 5/15/36 | 845 | 752 |
| Plains All American Pipeline LP / PAA Finance Corp. | 6.650% | 1/15/37 | 1,950 | 1,714 |
| Plains All American Pipeline LP / PAA Finance Corp. | 5.150% | 6/1/42 | 2,761 | 2,007 |
| Plains All American Pipeline LP / PAA Finance Corp. | 4.300% | 1/31/43 | 2,700 | 1,772 |
| Plains All American Pipeline LP / PAA Finance Corp. | 4.700% | 6/15/44 | 2,875 | 2,002 |
| Pride International Inc. | 7.875% | 8/15/40 | 1,000 | 787 |
| Rowan Cos. Inc. | 5.400% | 12/1/42 | 2,585 | 1,548 |
| Rowan Cos. Inc. | 5.850% | 1/15/44 | 260 | 157 |
| Shell International Finance BV | 4.125% | 5/11/35 | 6,000 | 5,709 |
| Shell International Finance BV | 6.375% | 12/15/38 | 9,400 | 11,205 |
| Shell International Finance BV | 5.500% | 3/25/40 | 2,725 | 2,934 |
| Shell International Finance BV | 3.625% | 8/21/42 | 1,900 | 1,588 |
| Shell International Finance BV | 4.550% | 8/12/43 | 3,650 | 3,472 |
| Shell International Finance BV | 4.375% | 5/11/45 | 10,100 | 9,544 |
| Southern Natural Gas Co. LLC | 8.000% | 3/1/32 | 858 | 843 |
| Spectra Energy Capital LLC | 6.750% | 2/15/32 | 905 | 900 |
| Spectra Energy Partners LP | 5.950% | 9/25/43 | 1,250 | 1,193 |
| Spectra Energy Partners LP | 4.500% | 3/15/45 | 1,825 | 1,402 |
| Suncor Energy Inc. | 7.150% | 2/1/32 | 800 | 915 |
| Suncor Energy Inc. | 5.950% | 12/1/34 | 855 | 853 |
| Suncor Energy Inc. | 6.500% | 6/15/38 | 3,540 | 3,880 |
| Suncor Energy Inc. | 6.850% | 6/1/39 | 2,275 | 2,461 |
| Sunoco Logistics Partners Operations LP | 6.850% | 2/15/40 | 850 | 752 |
| Sunoco Logistics Partners Operations LP | 6.100% | 2/15/42 | 1,000 | 805 |
| Sunoco Logistics Partners Operations LP | 4.950% | 1/15/43 | 700 | 496 |
87
| Vanguard® Long-Term Bond Index Fund | ||||
| Schedule of Investments | ||||
| December 31, 2015 | ||||
| Face | Market | |||
| Maturity | Amount | Value | ||
| Coupon | Date | ($000) | ($000) | |
| Sunoco Logistics Partners Operations LP | 5.300% | 4/1/44 | 3,250 | 2,418 |
| Sunoco Logistics Partners Operations LP | 5.350% | 5/15/45 | 2,150 | 1,598 |
| Tennessee Gas Pipeline Co. LLC | 7.000% | 3/15/27 | 1,830 | 1,791 |
| Tennessee Gas Pipeline Co. LLC | 7.000% | 10/15/28 | 1,400 | 1,354 |
| Tennessee Gas Pipeline Co. LLC | 7.625% | 4/1/37 | 960 | 925 |
| Texas Eastern Transmission LP | 7.000% | 7/15/32 | 1,125 | 1,236 |
| Tosco Corp. | 7.800% | 1/1/27 | 155 | 189 |
| Tosco Corp. | 8.125% | 2/15/30 | 2,700 | 3,329 |
| TransCanada PipeLines Ltd. | 4.625% | 3/1/34 | 2,400 | 2,262 |
| TransCanada PipeLines Ltd. | 5.600% | 3/31/34 | 1,525 | 1,545 |
| TransCanada PipeLines Ltd. | 5.850% | 3/15/36 | 3,150 | 3,235 |
| TransCanada PipeLines Ltd. | 6.200% | 10/15/37 | 2,400 | 2,526 |
| TransCanada PipeLines Ltd. | 7.250% | 8/15/38 | 2,925 | 3,487 |
| TransCanada PipeLines Ltd. | 7.625% | 1/15/39 | 1,665 | 2,050 |
| TransCanada PipeLines Ltd. | 6.100% | 6/1/40 | 3,075 | 3,206 |
| TransCanada PipeLines Ltd. | 5.000% | 10/16/43 | 3,150 | 2,905 |
| Transcontinental Gas Pipe Line Co. LLC | 5.400% | 8/15/41 | 1,625 | 1,212 |
| Transcontinental Gas Pipe Line Co. LLC | 4.450% | 8/1/42 | 1,075 | 728 |
| Valero Energy Corp. | 7.500% | 4/15/32 | 2,321 | 2,527 |
| Valero Energy Corp. | 6.625% | 6/15/37 | 5,639 | 5,610 |
| Valero Energy Corp. | 10.500% | 3/15/39 | 250 | 341 |
| Valero Energy Corp. | 4.900% | 3/15/45 | 2,200 | 1,821 |
| Western Gas Partners LP | 5.450% | 4/1/44 | 1,250 | 992 |
| Williams Cos. Inc. | 7.500% | 1/15/31 | 1,151 | 794 |
| Williams Cos. Inc. | 8.750% | 3/15/32 | 1,191 | 886 |
| Williams Cos. Inc. | 5.750% | 6/24/44 | 3,450 | 2,018 |
| Williams Partners LP | 6.300% | 4/15/40 | 2,500 | 1,919 |
| Williams Partners LP | 5.800% | 11/15/43 | 2,325 | 1,626 |
| Williams Partners LP | 5.400% | 3/4/44 | 1,700 | 1,139 |
| Williams Partners LP | 4.900% | 1/15/45 | 1,625 | 1,034 |
| Williams Partners LP | 5.100% | 9/15/45 | 3,300 | 2,172 |
| XTO Energy Inc. | 6.750% | 8/1/37 | 440 | 604 |
| Other Industrial (0.2%) | ||||
| California Institute of Technology GO | 4.321% | 8/1/45 | 1,000 | 1,037 |
| California Institute of Technology GO | 4.700% | 11/1/11 | 1,675 | 1,617 |
| CBRE Services Inc. | 4.875% | 3/1/26 | 2,050 | 2,037 |
| 3 Johns Hopkins University Maryland GO | 4.083% | 7/1/53 | 1,475 | 1,459 |
| 3 Massachusetts Institute of Technology GO | 3.959% | 7/1/38 | 1,050 | 1,083 |
| Massachusetts Institute of Technology GO | 5.600% | 7/1/11 | 2,725 | 3,345 |
| Massachusetts Institute of Technology GO | 4.678% | 7/1/14 | 2,075 | 2,156 |
| 3 Northwestern University Illinois GO | 3.688% | 12/1/38 | 1,750 | 1,767 |
| 3 Northwestern University Illinois GO | 4.643% | 12/1/44 | 1,850 | 2,086 |
| President & Fellows of Harvard College Massachusetts | ||||
| GO | 3.619% | 10/1/37 | 900 | 884 |
| 3 Rice University Texas GO | 3.774% | 5/15/55 | 150 | 142 |
| 3 University of Notre Dame DU LAC Indiana GO | 3.438% | 2/15/45 | 1,400 | 1,314 |
| University of Pennsylvania GO | 4.674% | 9/1/12 | 1,400 | 1,404 |
| Technology (2.4%) | ||||
| Analog Devices Inc. | 5.300% | 12/15/45 | 1,000 | 1,027 |
| Apple Inc. | 3.850% | 5/4/43 | 10,010 | 9,228 |
| Apple Inc. | 4.450% | 5/6/44 | 4,075 | 4,120 |
| Apple Inc. | 3.450% | 2/9/45 | 4,500 | 3,868 |
| Apple Inc. | 4.375% | 5/13/45 | 8,025 | 8,030 |
| Applied Materials Inc. | 5.100% | 10/1/35 | 1,750 | 1,776 |
| Applied Materials Inc. | 5.850% | 6/15/41 | 2,205 | 2,389 |
| Broadcom Corp. | 4.500% | 8/1/34 | 835 | 837 |
| Cisco Systems Inc. | 5.900% | 2/15/39 | 5,150 | 6,305 |
| Cisco Systems Inc. | 5.500% | 1/15/40 | 6,510 | 7,782 |
| Corning Inc. | 7.250% | 8/15/36 | 600 | 694 |
| Corning Inc. | 4.700% | 3/15/37 | 2,825 | 2,725 |
| Corning Inc. | 5.750% | 8/15/40 | 1,450 | 1,556 |
| Equifax Inc. | 7.000% | 7/1/37 | 750 | 848 |
| 4 Hewlett Packard Enterprise Co. | 6.200% | 10/15/35 | 1,700 | 1,638 |
88
| Vanguard® Long-Term Bond Index Fund | ||||
| Schedule of Investments | ||||
| December 31, 2015 | ||||
| Face | Market | |||
| Maturity | Amount | Value | ||
| Coupon | Date | ($000) | ($000) | |
| 4 Hewlett Packard Enterprise Co. | 6.350% | 10/15/45 | 8,550 | 8,143 |
| HP Enterprise Services LLC | 7.450% | 10/15/29 | 875 | 1,017 |
| HP Inc. | 6.000% | 9/15/41 | 1,585 | 1,375 |
| Intel Corp. | 4.000% | 12/15/32 | 3,130 | 3,103 |
| Intel Corp. | 4.800% | 10/1/41 | 5,045 | 5,266 |
| Intel Corp. | 4.250% | 12/15/42 | 3,020 | 2,925 |
| Intel Corp. | 4.900% | 7/29/45 | 6,210 | 6,550 |
| International Business Machines Corp. | 6.500% | 1/15/28 | 1,725 | 2,164 |
| International Business Machines Corp. | 5.875% | 11/29/32 | 2,750 | 3,288 |
| International Business Machines Corp. | 5.600% | 11/30/39 | 3,228 | 3,755 |
| International Business Machines Corp. | 4.000% | 6/20/42 | 3,753 | 3,491 |
| Juniper Networks Inc. | 5.950% | 3/15/41 | 1,350 | 1,268 |
| Microsoft Corp. | 3.500% | 2/12/35 | 5,000 | 4,617 |
| Microsoft Corp. | 4.200% | 11/3/35 | 5,600 | 5,713 |
| Microsoft Corp. | 5.200% | 6/1/39 | 3,355 | 3,813 |
| Microsoft Corp. | 4.500% | 10/1/40 | 2,965 | 3,091 |
| Microsoft Corp. | 5.300% | 2/8/41 | 3,175 | 3,648 |
| Microsoft Corp. | 3.500% | 11/15/42 | 2,825 | 2,508 |
| Microsoft Corp. | 3.750% | 5/1/43 | 185 | 171 |
| Microsoft Corp. | 4.875% | 12/15/43 | 1,900 | 2,067 |
| Microsoft Corp. | 3.750% | 2/12/45 | 5,325 | 4,907 |
| Microsoft Corp. | 4.450% | 11/3/45 | 9,650 | 9,973 |
| Microsoft Corp. | 4.000% | 2/12/55 | 9,750 | 8,757 |
| Microsoft Corp. | 4.750% | 11/3/55 | 3,500 | 3,601 |
| Motorola Solutions Inc. | 5.500% | 9/1/44 | 1,225 | 946 |
| Oracle Corp. | 3.250% | 5/15/30 | 1,500 | 1,406 |
| Oracle Corp. | 4.300% | 7/8/34 | 7,205 | 7,150 |
| Oracle Corp. | 3.900% | 5/15/35 | 4,325 | 4,088 |
| Oracle Corp. | 6.500% | 4/15/38 | 3,590 | 4,516 |
| Oracle Corp. | 6.125% | 7/8/39 | 4,225 | 5,117 |
| Oracle Corp. | 5.375% | 7/15/40 | 8,464 | 9,395 |
| Oracle Corp. | 4.500% | 7/8/44 | 3,875 | 3,875 |
| Oracle Corp. | 4.125% | 5/15/45 | 7,200 | 6,817 |
| Oracle Corp. | 4.375% | 5/15/55 | 2,700 | 2,493 |
| QUALCOMM Inc. | 4.650% | 5/20/35 | 2,475 | 2,295 |
| QUALCOMM Inc. | 4.800% | 5/20/45 | 5,475 | 4,839 |
| 4 Seagate HDD Cayman | 4.875% | 6/1/27 | 2,000 | 1,535 |
| 4 Seagate HDD Cayman | 5.750% | 12/1/34 | 1,550 | 1,101 |
| Tyco Electronics Group SA | 7.125% | 10/1/37 | 2,250 | 2,872 |
| Verisk Analytics Inc. | 5.500% | 6/15/45 | 1,275 | 1,216 |
| Xerox Corp. | 6.750% | 12/15/39 | 1,175 | 1,130 |
| Transportation (1.8%) | ||||
| 3 American Airlines 2014-1 Class A Pass Through Trust | 3.700% | 4/1/28 | 2,284 | 2,284 |
| 3 American Airlines 2015-1 Class A Pass Through Trust | 3.375% | 11/1/28 | 3,126 | 3,024 |
| 3 American Airlines 2015-2 Class AA Pass Through Trust | 3.600% | 9/22/27 | 2,025 | 2,048 |
| 3 BNSF Funding Trust I | 6.613% | 12/15/55 | 1,030 | 1,148 |
| Burlington Northern Santa Fe LLC | 7.950% | 8/15/30 | 905 | 1,257 |
| Burlington Northern Santa Fe LLC | 6.200% | 8/15/36 | 1,660 | 1,959 |
| Burlington Northern Santa Fe LLC | 6.150% | 5/1/37 | 1,670 | 1,959 |
| Burlington Northern Santa Fe LLC | 5.750% | 5/1/40 | 2,275 | 2,558 |
| Burlington Northern Santa Fe LLC | 5.050% | 3/1/41 | 1,425 | 1,472 |
| Burlington Northern Santa Fe LLC | 5.400% | 6/1/41 | 1,830 | 1,987 |
| Burlington Northern Santa Fe LLC | 4.950% | 9/15/41 | 525 | 536 |
| Burlington Northern Santa Fe LLC | 4.400% | 3/15/42 | 2,060 | 1,958 |
| Burlington Northern Santa Fe LLC | 4.375% | 9/1/42 | 2,680 | 2,536 |
| Burlington Northern Santa Fe LLC | 4.450% | 3/15/43 | 2,050 | 1,956 |
| Burlington Northern Santa Fe LLC | 5.150% | 9/1/43 | 2,250 | 2,373 |
| Burlington Northern Santa Fe LLC | 4.900% | 4/1/44 | 2,250 | 2,309 |
| Burlington Northern Santa Fe LLC | 4.550% | 9/1/44 | 2,845 | 2,734 |
| Burlington Northern Santa Fe LLC | 4.150% | 4/1/45 | 3,240 | 2,943 |
| Burlington Northern Santa Fe LLC | 4.700% | 9/1/45 | 3,475 | 3,458 |
| Canadian National Railway Co. | 6.900% | 7/15/28 | 1,950 | 2,578 |
| Canadian National Railway Co. | 6.250% | 8/1/34 | 2,470 | 3,117 |
89
| Vanguard® Long-Term Bond Index Fund | |||||
| Schedule of Investments | |||||
| December 31, 2015 | |||||
| Face | Market | ||||
| Maturity | Amount | Value | |||
| Coupon | Date | ($000) | ($000) | ||
| Canadian National Railway Co. | 6.200% | 6/1/36 | 2,117 | 2,699 | |
| Canadian National Railway Co. | 6.375% | 11/15/37 | 490 | 635 | |
| Canadian National Railway Co. | 3.500% | 11/15/42 | 900 | 812 | |
| Canadian Pacific Railway Co. | 3.700% | 2/1/26 | 825 | 813 | |
| Canadian Pacific Railway Co. | 7.125% | 10/15/31 | 1,815 | 2,270 | |
| Canadian Pacific Railway Co. | 5.750% | 3/15/33 | 1,065 | 1,161 | |
| Canadian Pacific Railway Co. | 4.800% | 9/15/35 | 1,025 | 1,014 | |
| Canadian Pacific Railway Co. | 5.950% | 5/15/37 | 1,710 | 1,923 | |
| Canadian Pacific Railway Co. | 4.800% | 8/1/45 | 1,720 | 1,687 | |
| Canadian Pacific Railway Co. | 6.125% | 9/15/15 | 3,250 | 3,321 | |
| Canadian Pacific Railway Ltd. | 5.750% | 1/15/42 | 900 | 977 | |
| CSX Corp. | 6.000% | 10/1/36 | 795 | 902 | |
| CSX Corp. | 6.150% | 5/1/37 | 2,080 | 2,421 | |
| CSX Corp. | 6.220% | 4/30/40 | 2,975 | 3,515 | |
| CSX Corp. | 5.500% | 4/15/41 | 1,810 | 1,994 | |
| CSX Corp. | 4.750% | 5/30/42 | 1,950 | 1,947 | |
| CSX Corp. | 4.400% | 3/1/43 | 1,150 | 1,087 | |
| CSX Corp. | 4.100% | 3/15/44 | 2,400 | 2,172 | |
| CSX Corp. | 3.950% | 5/1/50 | 2,325 | 1,973 | |
| CSX Corp. | 4.500% | 8/1/54 | 1,665 | 1,513 | |
| 3 | Delta Air Lines 2015-1 Class AA Pass Through Trust | 3.625% | 7/30/27 | 1,050 | 1,062 |
| FedEx Corp. | 4.900% | 1/15/34 | 1,625 | 1,674 | |
| FedEx Corp. | 3.900% | 2/1/35 | 2,020 | 1,842 | |
| FedEx Corp. | 3.875% | 8/1/42 | 1,940 | 1,677 | |
| FedEx Corp. | 4.100% | 4/15/43 | 1,700 | 1,506 | |
| FedEx Corp. | 5.100% | 1/15/44 | 2,240 | 2,322 | |
| FedEx Corp. | 4.100% | 2/1/45 | 1,070 | 953 | |
| FedEx Corp. | 4.750% | 11/15/45 | 3,475 | 3,436 | |
| FedEx Corp. | 4.500% | 2/1/65 | 785 | 670 | |
| 3 | Hawaiian Airlines 2013-1 Class A Pass Through | ||||
| Certificates | 3.900% | 1/15/26 | 1,364 | 1,316 | |
| 4 | Kansas City Southern | 4.300% | 5/15/43 | 1,450 | 1,286 |
| 4 | Kansas City Southern | 4.950% | 8/15/45 | 1,730 | 1,683 |
| 3,4 | Latam Airlines 2015-1 Pass Through Trust A | 4.200% | 11/15/27 | 2,675 | 2,467 |
| Norfolk Southern Corp. | 7.800% | 5/15/27 | 2,117 | 2,793 | |
| Norfolk Southern Corp. | 7.250% | 2/15/31 | 660 | 839 | |
| Norfolk Southern Corp. | 7.050% | 5/1/37 | 845 | 1,063 | |
| Norfolk Southern Corp. | 4.837% | 10/1/41 | 1,873 | 1,823 | |
| Norfolk Southern Corp. | 3.950% | 10/1/42 | 1,635 | 1,398 | |
| Norfolk Southern Corp. | 4.800% | 8/15/43 | 1,304 | 1,271 | |
| Norfolk Southern Corp. | 4.450% | 6/15/45 | 4,410 | 4,134 | |
| Norfolk Southern Corp. | 4.650% | 1/15/46 | 1,400 | 1,343 | |
| Norfolk Southern Corp. | 7.900% | 5/15/97 | 325 | 444 | |
| Norfolk Southern Corp. | 6.000% | 3/15/05 | 1,930 | 2,059 | |
| Norfolk Southern Corp. | 6.000% | 5/23/11 | 1,880 | 1,971 | |
| 3 | Spirit Airlines Class A Pass Through Certificates Series | ||||
| 2015-1 | 4.100% | 10/1/29 | 1,715 | 1,702 | |
| Union Pacific Corp. | 6.625% | 2/1/29 | 2,055 | 2,641 | |
| Union Pacific Corp. | 3.375% | 2/1/35 | 625 | 567 | |
| Union Pacific Corp. | 4.750% | 9/15/41 | 2,300 | 2,452 | |
| Union Pacific Corp. | 4.300% | 6/15/42 | 80 | 80 | |
| Union Pacific Corp. | 4.250% | 4/15/43 | 1,050 | 1,052 | |
| Union Pacific Corp. | 4.750% | 12/15/43 | 2,040 | 2,192 | |
| Union Pacific Corp. | 4.821% | 2/1/44 | 2,110 | 2,284 | |
| Union Pacific Corp. | 4.850% | 6/15/44 | 1,065 | 1,153 | |
| Union Pacific Corp. | 4.150% | 1/15/45 | 400 | 394 | |
| Union Pacific Corp. | 4.050% | 11/15/45 | 1,200 | 1,169 | |
| Union Pacific Corp. | 3.875% | 2/1/55 | 1,810 | 1,588 | |
| Union Pacific Corp. | 4.375% | 11/15/65 | 1,600 | 1,483 | |
| 3 | Union Pacific Railroad Co. 2007-3 Pass Through Trust | 6.176% | 1/2/31 | 740 | 841 |
| 3 | United Airlines 2014-1 Class A Pass Through Trust | 4.000% | 10/11/27 | 2,595 | 2,654 |
| 3 | United Airlines 2014-2 Class A Pass Through Trust | 3.750% | 3/3/28 | 2,660 | 2,680 |
| 3 | United Airlines 2015-1 Class AA Pass Through Trust | 3.450% | 12/1/27 | 2,000 | 2,002 |
| United Parcel Service Inc. | 6.200% | 1/15/38 | 4,860 | 6,247 | |
90
| Vanguard® Long-Term Bond Index Fund | ||||
| Schedule of Investments | ||||
| December 31, 2015 | ||||
| Face | Market | |||
| Maturity | Amount | Value | ||
| Coupon | Date | ($000) | ($000) | |
| United Parcel Service Inc. | 4.875% | 11/15/40 | 1,355 | 1,508 |
| United Parcel Service Inc. | 3.625% | 10/1/42 | 2,210 | 2,044 |
| United Parcel Service of America Inc. | 8.375% | 4/1/30 | 500 | 701 |
| 2,949,890 | ||||
| Utilities (6.3%) | ||||
| Electric (5.8%) | ||||
| AEP Texas Central Co. | 6.650% | 2/15/33 | 1,952 | 2,380 |
| Alabama Power Co. | 6.125% | 5/15/38 | 1,460 | 1,776 |
| Alabama Power Co. | 6.000% | 3/1/39 | 1,490 | 1,771 |
| Alabama Power Co. | 5.500% | 3/15/41 | 1,125 | 1,273 |
| Alabama Power Co. | 5.200% | 6/1/41 | 1,365 | 1,489 |
| Alabama Power Co. | 4.100% | 1/15/42 | 755 | 718 |
| Alabama Power Co. | 3.850% | 12/1/42 | 1,100 | 1,010 |
| Alabama Power Co. | 4.150% | 8/15/44 | 1,975 | 1,886 |
| Alabama Power Co. | 3.750% | 3/1/45 | 1,470 | 1,323 |
| Ameren Corp. | 3.650% | 2/15/26 | 2,060 | 2,051 |
| Ameren Illinois Co. | 4.800% | 12/15/43 | 1,638 | 1,770 |
| Ameren Illinois Co. | 4.300% | 7/1/44 | 593 | 596 |
| Ameren Illinois Co. | 4.150% | 3/15/46 | 1,150 | 1,144 |
| Appalachian Power Co | 4.400% | 5/15/44 | 740 | 702 |
| Appalachian Power Co. | 5.800% | 10/1/35 | 1,105 | 1,222 |
| Appalachian Power Co. | 6.375% | 4/1/36 | 1,505 | 1,745 |
| Appalachian Power Co. | 6.700% | 8/15/37 | 740 | 886 |
| Appalachian Power Co. | 7.000% | 4/1/38 | 2,543 | 3,172 |
| Appalachian Power Co. | 4.450% | 6/1/45 | 1,100 | 1,051 |
| Arizona Public Service Co. | 5.500% | 9/1/35 | 485 | 553 |
| Arizona Public Service Co. | 5.050% | 9/1/41 | 1,005 | 1,100 |
| Arizona Public Service Co. | 4.500% | 4/1/42 | 1,930 | 1,981 |
| Arizona Public Service Co. | 4.700% | 1/15/44 | 1,255 | 1,334 |
| Arizona Public Service Co. | 4.350% | 11/15/45 | 550 | 556 |
| Baltimore Gas & Electric Co. | 6.350% | 10/1/36 | 1,651 | 2,056 |
| Berkshire Hathaway Energy Co. | 8.480% | 9/15/28 | 1,025 | 1,456 |
| Berkshire Hathaway Energy Co. | 6.125% | 4/1/36 | 5,360 | 6,249 |
| Berkshire Hathaway Energy Co. | 5.950% | 5/15/37 | 3,125 | 3,569 |
| Berkshire Hathaway Energy Co. | 6.500% | 9/15/37 | 4,580 | 5,579 |
| Berkshire Hathaway Energy Co. | 5.150% | 11/15/43 | 875 | 924 |
| Berkshire Hathaway Energy Co. | 4.500% | 2/1/45 | 160 | 153 |
| CenterPoint Energy Houston Electric LLC | 6.950% | 3/15/33 | 1,105 | 1,456 |
| CenterPoint Energy Houston Electric LLC | 3.550% | 8/1/42 | 2,475 | 2,226 |
| CenterPoint Energy Houston Electric LLC | 4.500% | 4/1/44 | 1,175 | 1,213 |
| Cleco Power LLC | 6.500% | 12/1/35 | 575 | 668 |
| Cleco Power LLC | 6.000% | 12/1/40 | 1,290 | 1,449 |
| Cleveland Electric Illuminating Co. | 5.950% | 12/15/36 | 730 | 763 |
| CMS Energy Corp. | 4.700% | 3/31/43 | 935 | 926 |
| CMS Energy Corp. | 4.875% | 3/1/44 | 805 | 816 |
| Commonwealth Edison Co. | 5.900% | 3/15/36 | 2,235 | 2,670 |
| Commonwealth Edison Co. | 6.450% | 1/15/38 | 1,530 | 1,954 |
| Commonwealth Edison Co. | 3.800% | 10/1/42 | 1,100 | 1,015 |
| Commonwealth Edison Co. | 4.600% | 8/15/43 | 1,990 | 2,059 |
| Commonwealth Edison Co. | 3.700% | 3/1/45 | 1,785 | 1,605 |
| Commonwealth Edison Co. | 4.350% | 11/15/45 | 2,425 | 2,441 |
| Connecticut Light & Power Co. | 6.350% | 6/1/36 | 1,250 | 1,590 |
| Connecticut Light & Power Co. | 4.300% | 4/15/44 | 715 | 718 |
| Consolidated Edison Co. of New York Inc. | 5.300% | 3/1/35 | 2,445 | 2,727 |
| Consolidated Edison Co. of New York Inc. | 5.850% | 3/15/36 | 2,020 | 2,400 |
| Consolidated Edison Co. of New York Inc. | 6.200% | 6/15/36 | 370 | 448 |
| Consolidated Edison Co. of New York Inc. | 5.700% | 12/1/36 | 1,815 | 2,089 |
| Consolidated Edison Co. of New York Inc. | 6.300% | 8/15/37 | 870 | 1,060 |
| Consolidated Edison Co. of New York Inc. | 6.750% | 4/1/38 | 2,125 | 2,739 |
| Consolidated Edison Co. of New York Inc. | 5.500% | 12/1/39 | 1,140 | 1,295 |
| Consolidated Edison Co. of New York Inc. | 5.700% | 6/15/40 | 1,970 | 2,308 |
| Consolidated Edison Co. of New York Inc. | 4.200% | 3/15/42 | 675 | 648 |
| Consolidated Edison Co. of New York Inc. | 3.950% | 3/1/43 | 3,300 | 3,050 |
91
| Vanguard® Long-Term Bond Index Fund | ||||
| Schedule of Investments | ||||
| December 31, 2015 | ||||
| Face | Market | |||
| Maturity | Amount | Value | ||
| Coupon | Date | ($000) | ($000) | |
| Consolidated Edison Co. of New York Inc. | 4.450% | 3/15/44 | 2,450 | 2,450 |
| Consolidated Edison Co. of New York Inc. | 4.500% | 12/1/45 | 725 | 732 |
| Consolidated Edison Co. of New York Inc. | 4.625% | 12/1/54 | 2,835 | 2,787 |
| Consumers Energy Co. | 3.950% | 5/15/43 | 1,805 | 1,748 |
| Consumers Energy Co. | 4.100% | 11/15/45 | 625 | 620 |
| Consumers Energy Co. | 4.350% | 8/31/64 | 820 | 777 |
| Delmarva Power & Light Co. | 4.000% | 6/1/42 | 1,610 | 1,522 |
| Dominion Resources Inc. | 6.300% | 3/15/33 | 2,460 | 2,832 |
| Dominion Resources Inc. | 5.250% | 8/1/33 | 230 | 239 |
| Dominion Resources Inc. | 5.950% | 6/15/35 | 2,140 | 2,396 |
| Dominion Resources Inc. | 4.900% | 8/1/41 | 1,725 | 1,693 |
| Dominion Resources Inc. | 4.050% | 9/15/42 | 995 | 878 |
| Dominion Resources Inc. | 4.700% | 12/1/44 | 3,120 | 3,042 |
| DTE Electric Co. | 5.700% | 10/1/37 | 1,060 | 1,270 |
| DTE Electric Co. | 3.950% | 6/15/42 | 885 | 848 |
| DTE Electric Co. | 4.000% | 4/1/43 | 1,025 | 993 |
| DTE Electric Co. | 4.300% | 7/1/44 | 1,420 | 1,443 |
| DTE Electric Co. | 3.700% | 3/15/45 | 1,915 | 1,761 |
| DTE Energy Co. | 6.375% | 4/15/33 | 2,180 | 2,649 |
| Duke Energy Carolinas LLC | 6.000% | 12/1/28 | 925 | 1,110 |
| Duke Energy Carolinas LLC | 6.450% | 10/15/32 | 1,225 | 1,491 |
| Duke Energy Carolinas LLC | 6.100% | 6/1/37 | 1,405 | 1,698 |
| Duke Energy Carolinas LLC | 6.000% | 1/15/38 | 2,025 | 2,498 |
| Duke Energy Carolinas LLC | 6.050% | 4/15/38 | 2,075 | 2,578 |
| Duke Energy Carolinas LLC | 5.300% | 2/15/40 | 2,190 | 2,513 |
| Duke Energy Carolinas LLC | 4.250% | 12/15/41 | 2,420 | 2,412 |
| Duke Energy Carolinas LLC | 4.000% | 9/30/42 | 1,700 | 1,637 |
| Duke Energy Carolinas LLC | 3.750% | 6/1/45 | 1,710 | 1,583 |
| Duke Energy Corp. | 4.800% | 12/15/45 | 2,175 | 2,199 |
| Duke Energy Florida LLC | 6.350% | 9/15/37 | 1,390 | 1,772 |
| Duke Energy Florida LLC | 6.400% | 6/15/38 | 3,100 | 3,962 |
| Duke Energy Florida LLC | 5.650% | 4/1/40 | 1,115 | 1,318 |
| Duke Energy Florida LLC | 3.850% | 11/15/42 | 1,190 | 1,114 |
| Duke Energy Indiana Inc. | 6.120% | 10/15/35 | 1,055 | 1,263 |
| Duke Energy Indiana Inc. | 6.350% | 8/15/38 | 1,915 | 2,443 |
| Duke Energy Indiana Inc. | 4.200% | 3/15/42 | 870 | 852 |
| Duke Energy Indiana Inc. | 4.900% | 7/15/43 | 1,725 | 1,865 |
| Duke Energy Progress LLC | 6.300% | 4/1/38 | 1,775 | 2,262 |
| Duke Energy Progress LLC | 4.100% | 5/15/42 | 1,625 | 1,576 |
| Duke Energy Progress LLC | 4.100% | 3/15/43 | 1,115 | 1,083 |
| Duke Energy Progress LLC | 4.375% | 3/30/44 | 2,005 | 2,036 |
| Duke Energy Progress LLC | 4.150% | 12/1/44 | 1,705 | 1,665 |
| Duke Energy Progress LLC | 4.200% | 8/15/45 | 2,550 | 2,515 |
| El Paso Electric Co. | 6.000% | 5/15/35 | 550 | 650 |
| Entergy Louisiana LLC | 4.440% | 1/15/26 | 675 | 718 |
| Entergy Louisiana LLC | 4.950% | 1/15/45 | 1,406 | 1,404 |
| Entergy Texas Inc. | 5.150% | 6/1/45 | 945 | 927 |
| 4 Exelon Corp. | 4.950% | 6/15/35 | 1,835 | 1,839 |
| Exelon Corp. | 5.625% | 6/15/35 | 2,268 | 2,419 |
| 4 Exelon Corp. | 5.100% | 6/15/45 | 1,665 | 1,662 |
| Exelon Generation Co. LLC | 6.250% | 10/1/39 | 3,560 | 3,603 |
| Exelon Generation Co. LLC | 5.750% | 10/1/41 | 835 | 808 |
| Exelon Generation Co. LLC | 5.600% | 6/15/42 | 2,975 | 2,770 |
| FirstEnergy Solutions Corp. | 6.800% | 8/15/39 | 665 | 626 |
| Florida Power & Light Co. | 5.625% | 4/1/34 | 1,199 | 1,428 |
| Florida Power & Light Co. | 4.950% | 6/1/35 | 755 | 828 |
| Florida Power & Light Co. | 5.650% | 2/1/37 | 1,193 | 1,433 |
| Florida Power & Light Co. | 5.950% | 2/1/38 | 2,325 | 2,895 |
| Florida Power & Light Co. | 5.960% | 4/1/39 | 1,985 | 2,479 |
| Florida Power & Light Co. | 5.690% | 3/1/40 | 1,315 | 1,601 |
| Florida Power & Light Co. | 5.250% | 2/1/41 | 1,770 | 2,029 |
| Florida Power & Light Co. | 5.125% | 6/1/41 | 850 | 969 |
| Florida Power & Light Co. | 4.125% | 2/1/42 | 1,925 | 1,917 |
| Florida Power & Light Co. | 4.050% | 6/1/42 | 2,117 | 2,086 |
92
| Vanguard® Long-Term Bond Index Fund | ||||
| Schedule of Investments | ||||
| December 31, 2015 | ||||
| Face | Market | |||
| Maturity | Amount | Value | ||
| Coupon | Date | ($000) | ($000) | |
| Florida Power & Light Co. | 3.800% | 12/15/42 | 1,765 | 1,673 |
| Florida Power & Light Co. | 4.050% | 10/1/44 | 1,680 | 1,663 |
| Georgia Power Co. | 5.650% | 3/1/37 | 1,510 | 1,635 |
| Georgia Power Co. | 5.950% | 2/1/39 | 1,130 | 1,284 |
| Georgia Power Co. | 5.400% | 6/1/40 | 1,910 | 2,014 |
| Georgia Power Co. | 4.750% | 9/1/40 | 1,545 | 1,505 |
| Georgia Power Co. | 4.300% | 3/15/42 | 2,655 | 2,454 |
| Georgia Power Co. | 4.300% | 3/15/43 | 1,270 | 1,165 |
| Iberdrola International BV | 6.750% | 7/15/36 | 1,565 | 1,916 |
| Indiana Michigan Power Co. | 6.050% | 3/15/37 | 1,040 | 1,182 |
| Interstate Power & Light Co. | 6.250% | 7/15/39 | 1,835 | 2,307 |
| ITC Holdings Corp. | 5.300% | 7/1/43 | 890 | 912 |
| Jersey Central Power & Light Co. | 6.150% | 6/1/37 | 980 | 1,045 |
| 3 John Sevier Combined Cycle Generation LLC | 4.626% | 1/15/42 | 2,129 | 2,316 |
| Kansas City Power & Light Co. | 6.050% | 11/15/35 | 680 | 821 |
| Kansas City Power & Light Co. | 5.300% | 10/1/41 | 1,545 | 1,680 |
| Kentucky Utilities Co. | 5.125% | 11/1/40 | 2,565 | 2,872 |
| Kentucky Utilities Co. | 4.650% | 11/15/43 | 1,665 | 1,764 |
| Kentucky Utilities Co. | 4.375% | 10/1/45 | 1,250 | 1,285 |
| Louisville Gas & Electric Co. | 5.125% | 11/15/40 | 950 | 1,063 |
| Louisville Gas & Electric Co. | 4.650% | 11/15/43 | 525 | 554 |
| Louisville Gas & Electric Co. | 4.375% | 10/1/45 | 900 | 919 |
| MidAmerican Energy Co. | 6.750% | 12/30/31 | 1,655 | 2,116 |
| MidAmerican Energy Co. | 5.750% | 11/1/35 | 1,550 | 1,845 |
| MidAmerican Energy Co. | 5.800% | 10/15/36 | 1,930 | 2,322 |
| MidAmerican Energy Co. | 4.800% | 9/15/43 | 1,190 | 1,273 |
| MidAmerican Energy Co. | 4.400% | 10/15/44 | 795 | 805 |
| MidAmerican Funding LLC | 6.927% | 3/1/29 | 150 | 191 |
| Mississippi Power Co. | 4.250% | 3/15/42 | 1,950 | 1,491 |
| National Rural Utilities Cooperative Finance Corp. | 4.023% | 11/1/32 | 3,699 | 3,633 |
| Nevada Power Co. | 6.650% | 4/1/36 | 775 | 979 |
| Nevada Power Co. | 6.750% | 7/1/37 | 2,145 | 2,722 |
| Nevada Power Co. | 5.375% | 9/15/40 | 1,210 | 1,336 |
| Nevada Power Co. | 5.450% | 5/15/41 | 1,630 | 1,831 |
| Northern States Power Co. | 5.250% | 7/15/35 | 915 | 1,045 |
| Northern States Power Co. | 6.250% | 6/1/36 | 1,175 | 1,491 |
| Northern States Power Co. | 6.200% | 7/1/37 | 1,200 | 1,521 |
| Northern States Power Co. | 5.350% | 11/1/39 | 625 | 720 |
| Northern States Power Co. | 4.850% | 8/15/40 | 1,360 | 1,495 |
| Northern States Power Co. | 3.400% | 8/15/42 | 1,515 | 1,337 |
| Northern States Power Co. | 4.125% | 5/15/44 | 1,450 | 1,439 |
| Northern States Power Co. | 4.000% | 8/15/45 | 1,000 | 978 |
| NorthWestern Corp. | 4.176% | 11/15/44 | 1,380 | 1,361 |
| NSTAR Electric Co. | 5.500% | 3/15/40 | 2,455 | 2,846 |
| NSTAR Electric Co. | 4.400% | 3/1/44 | 610 | 619 |
| Oglethorpe Power Corp. | 5.950% | 11/1/39 | 915 | 1,028 |
| Oglethorpe Power Corp. | 5.375% | 11/1/40 | 1,655 | 1,777 |
| Oglethorpe Power Corp. | 4.200% | 12/1/42 | 485 | 443 |
| Oglethorpe Power Corp. | 4.550% | 6/1/44 | 1,770 | 1,678 |
| Oglethorpe Power Corp. | 5.250% | 9/1/50 | 440 | 459 |
| Ohio Edison Co. | 6.875% | 7/15/36 | 2,610 | 3,062 |
| Ohio Edison Co. | 8.250% | 10/15/38 | 475 | 659 |
| Ohio Power Co. | 6.600% | 2/15/33 | 695 | 840 |
| Ohio Power Co. | 5.850% | 10/1/35 | 1,080 | 1,226 |
| Oklahoma Gas & Electric Co. | 5.850% | 6/1/40 | 460 | 551 |
| Oklahoma Gas & Electric Co. | 5.250% | 5/15/41 | 555 | 622 |
| Oklahoma Gas & Electric Co. | 3.900% | 5/1/43 | 1,245 | 1,146 |
| Oklahoma Gas & Electric Co. | 4.550% | 3/15/44 | 655 | 667 |
| Oklahoma Gas & Electric Co. | 4.000% | 12/15/44 | 1,700 | 1,594 |
| Oncor Electric Delivery Co. LLC | 7.000% | 5/1/32 | 2,845 | 3,536 |
| Oncor Electric Delivery Co. LLC | 7.250% | 1/15/33 | 1,140 | 1,462 |
| Oncor Electric Delivery Co. LLC | 7.500% | 9/1/38 | 1,050 | 1,395 |
| Oncor Electric Delivery Co. LLC | 5.250% | 9/30/40 | 1,190 | 1,253 |
| Oncor Electric Delivery Co. LLC | 4.550% | 12/1/41 | 1,130 | 1,091 |
93
| Vanguard® Long-Term Bond Index Fund | ||||
| Schedule of Investments | ||||
| December 31, 2015 | ||||
| Face | Market | |||
| Maturity | Amount | Value | ||
| Coupon | Date | ($000) | ($000) | |
| Oncor Electric Delivery Co. LLC | 5.300% | 6/1/42 | 1,490 | 1,593 |
| Oncor Electric Delivery Co. LLC | 3.750% | 4/1/45 | 1,545 | 1,317 |
| Pacific Gas & Electric Co. | 6.050% | 3/1/34 | 9,490 | 11,287 |
| Pacific Gas & Electric Co. | 5.800% | 3/1/37 | 2,925 | 3,400 |
| Pacific Gas & Electric Co. | 6.350% | 2/15/38 | 2,345 | 2,855 |
| Pacific Gas & Electric Co. | 6.250% | 3/1/39 | 1,955 | 2,389 |
| Pacific Gas & Electric Co. | 5.400% | 1/15/40 | 2,795 | 3,157 |
| Pacific Gas & Electric Co. | 4.500% | 12/15/41 | 595 | 593 |
| Pacific Gas & Electric Co. | 4.450% | 4/15/42 | 1,850 | 1,858 |
| Pacific Gas & Electric Co. | 4.600% | 6/15/43 | 1,995 | 2,032 |
| Pacific Gas & Electric Co. | 5.125% | 11/15/43 | 2,180 | 2,384 |
| Pacific Gas & Electric Co. | 4.750% | 2/15/44 | 1,555 | 1,616 |
| Pacific Gas & Electric Co. | 4.300% | 3/15/45 | 1,765 | 1,736 |
| Pacific Gas & Electric Co. | 4.250% | 3/15/46 | 1,875 | 1,821 |
| PacifiCorp | 7.700% | 11/15/31 | 1,120 | 1,541 |
| PacifiCorp | 5.250% | 6/15/35 | 885 | 989 |
| PacifiCorp | 6.100% | 8/1/36 | 570 | 693 |
| PacifiCorp | 5.750% | 4/1/37 | 2,130 | 2,504 |
| PacifiCorp | 6.250% | 10/15/37 | 2,353 | 2,909 |
| PacifiCorp | 6.350% | 7/15/38 | 1,190 | 1,484 |
| PacifiCorp | 6.000% | 1/15/39 | 2,620 | 3,180 |
| PacifiCorp | 4.100% | 2/1/42 | 960 | 926 |
| Peco Energy Co. | 5.950% | 10/1/36 | 1,140 | 1,386 |
| Peco Energy Co. | 4.150% | 10/1/44 | 1,690 | 1,662 |
| Pennsylvania Electric Co. | 6.150% | 10/1/38 | 1,140 | 1,223 |
| Potomac Electric Power Co. | 6.500% | 11/15/37 | 1,945 | 2,501 |
| Potomac Electric Power Co. | 7.900% | 12/15/38 | 60 | 88 |
| Potomac Electric Power Co. | 4.150% | 3/15/43 | 1,690 | 1,639 |
| PPL Capital Funding Inc. | 4.700% | 6/1/43 | 3,275 | 3,264 |
| PPL Capital Funding Inc. | 5.000% | 3/15/44 | 1,235 | 1,273 |
| PPL Electric Utilities Corp. | 6.250% | 5/15/39 | 1,165 | 1,479 |
| PPL Electric Utilities Corp. | 5.200% | 7/15/41 | 775 | 878 |
| PPL Electric Utilities Corp. | 4.750% | 7/15/43 | 75 | 81 |
| PPL Electric Utilities Corp. | 4.125% | 6/15/44 | 1,020 | 1,006 |
| Progress Energy Inc. | 7.750% | 3/1/31 | 2,480 | 3,195 |
| Progress Energy Inc. | 7.000% | 10/30/31 | 1,225 | 1,509 |
| Progress Energy Inc. | 6.000% | 12/1/39 | 1,525 | 1,774 |
| PSEG Power LLC | 8.625% | 4/15/31 | 2,060 | 2,565 |
| Public Service Co. of Colorado | 6.250% | 9/1/37 | 265 | 341 |
| Public Service Co. of Colorado | 6.500% | 8/1/38 | 400 | 527 |
| Public Service Co. of Colorado | 4.750% | 8/15/41 | 1,255 | 1,352 |
| Public Service Co. of Colorado | 3.600% | 9/15/42 | 1,765 | 1,609 |
| Public Service Co. of Colorado | 3.950% | 3/15/43 | 205 | 200 |
| Public Service Co. of Colorado | 4.300% | 3/15/44 | 1,875 | 1,912 |
| Public Service Co. of Oklahoma | 6.625% | 11/15/37 | 525 | 632 |
| Public Service Electric & Gas Co. | 5.800% | 5/1/37 | 1,435 | 1,740 |
| Public Service Electric & Gas Co. | 5.375% | 11/1/39 | 2,111 | 2,436 |
| Public Service Electric & Gas Co. | 3.950% | 5/1/42 | 2,195 | 2,118 |
| Public Service Electric & Gas Co. | 3.650% | 9/1/42 | 1,320 | 1,220 |
| Public Service Electric & Gas Co. | 4.000% | 6/1/44 | 835 | 813 |
| Public Service Electric & Gas Co. | 4.050% | 5/1/45 | 1,295 | 1,269 |
| Public Service Electric & Gas Co. | 4.150% | 11/1/45 | 2,175 | 2,153 |
| Puget Sound Energy Inc. | 7.020% | 12/1/27 | 1,461 | 1,853 |
| Puget Sound Energy Inc. | 5.483% | 6/1/35 | 855 | 994 |
| Puget Sound Energy Inc. | 6.274% | 3/15/37 | 1,470 | 1,859 |
| Puget Sound Energy Inc. | 5.757% | 10/1/39 | 1,400 | 1,701 |
| Puget Sound Energy Inc. | 5.795% | 3/15/40 | 720 | 870 |
| Puget Sound Energy Inc. | 5.764% | 7/15/40 | 965 | 1,164 |
| Puget Sound Energy Inc. | 5.638% | 4/15/41 | 365 | 434 |
| Puget Sound Energy Inc. | 4.434% | 11/15/41 | 2,451 | 2,524 |
| Puget Sound Energy Inc. | 4.300% | 5/20/45 | 1,385 | 1,403 |
| San Diego Gas & Electric Co. | 6.000% | 6/1/26 | 625 | 769 |
| San Diego Gas & Electric Co. | 5.350% | 5/15/35 | 800 | 919 |
| San Diego Gas & Electric Co. | 6.125% | 9/15/37 | 1,046 | 1,325 |
94
| Vanguard® Long-Term Bond Index Fund | ||||
| Schedule of Investments | ||||
| December 31, 2015 | ||||
| Face | Market | |||
| Maturity | Amount | Value | ||
| Coupon | Date | ($000) | ($000) | |
| San Diego Gas & Electric Co. | 6.000% | 6/1/39 | 485 | 603 |
| San Diego Gas & Electric Co. | 5.350% | 5/15/40 | 1,160 | 1,356 |
| San Diego Gas & Electric Co. | 4.500% | 8/15/40 | 1,640 | 1,715 |
| San Diego Gas & Electric Co. | 3.950% | 11/15/41 | 980 | 944 |
| San Diego Gas & Electric Co. | 4.300% | 4/1/42 | 1,150 | 1,162 |
| Sierra Pacific Power Co. | 6.750% | 7/1/37 | 885 | 1,110 |
| South Carolina Electric & Gas Co. | 6.625% | 2/1/32 | 850 | 1,030 |
| South Carolina Electric & Gas Co. | 5.300% | 5/15/33 | 1,475 | 1,606 |
| South Carolina Electric & Gas Co. | 6.050% | 1/15/38 | 1,325 | 1,559 |
| South Carolina Electric & Gas Co. | 5.450% | 2/1/41 | 1,015 | 1,118 |
| South Carolina Electric & Gas Co. | 4.350% | 2/1/42 | 1,835 | 1,760 |
| South Carolina Electric & Gas Co. | 4.600% | 6/15/43 | 1,155 | 1,160 |
| South Carolina Electric & Gas Co. | 4.500% | 6/1/64 | 1,400 | 1,304 |
| South Carolina Electric & Gas Co. | 5.100% | 6/1/65 | 1,590 | 1,655 |
| Southern California Edison Co. | 6.650% | 4/1/29 | 2,125 | 2,654 |
| Southern California Edison Co. | 6.000% | 1/15/34 | 1,185 | 1,436 |
| Southern California Edison Co. | 5.750% | 4/1/35 | 1,250 | 1,480 |
| Southern California Edison Co. | 5.350% | 7/15/35 | 2,340 | 2,652 |
| Southern California Edison Co. | 5.550% | 1/15/36 | 300 | 349 |
| Southern California Edison Co. | 5.625% | 2/1/36 | 1,585 | 1,858 |
| Southern California Edison Co. | 5.550% | 1/15/37 | 690 | 801 |
| Southern California Edison Co. | 5.950% | 2/1/38 | 2,040 | 2,496 |
| Southern California Edison Co. | 6.050% | 3/15/39 | 475 | 588 |
| Southern California Edison Co. | 5.500% | 3/15/40 | 305 | 360 |
| Southern California Edison Co. | 4.500% | 9/1/40 | 1,955 | 2,041 |
| Southern California Edison Co. | 3.900% | 12/1/41 | 2,825 | 2,683 |
| Southern California Edison Co. | 4.050% | 3/15/42 | 2,445 | 2,387 |
| Southern California Edison Co. | 3.900% | 3/15/43 | 350 | 334 |
| Southern California Edison Co. | 4.650% | 10/1/43 | 2,415 | 2,551 |
| Southern California Edison Co. | 3.600% | 2/1/45 | 315 | 285 |
| Southern Power Co. | 5.150% | 9/15/41 | 2,570 | 2,403 |
| Southern Power Co. | 5.250% | 7/15/43 | 1,905 | 1,817 |
| Southwestern Electric Power Co. | 6.200% | 3/15/40 | 1,135 | 1,344 |
| Southwestern Electric Power Co. | 3.900% | 4/1/45 | 910 | 796 |
| Southwestern Public Service Co. | 6.000% | 10/1/36 | 300 | 350 |
| Southwestern Public Service Co. | 4.500% | 8/15/41 | 1,630 | 1,685 |
| Tampa Electric Co. | 6.550% | 5/15/36 | 780 | 986 |
| Tampa Electric Co. | 6.150% | 5/15/37 | 1,025 | 1,251 |
| Tampa Electric Co. | 4.100% | 6/15/42 | 1,650 | 1,578 |
| Tampa Electric Co. | 4.350% | 5/15/44 | 185 | 183 |
| Tampa Electric Co. | 4.200% | 5/15/45 | 1,380 | 1,335 |
| Toledo Edison Co. | 6.150% | 5/15/37 | 385 | 433 |
| TransAlta Corp. | 6.500% | 3/15/40 | 590 | 442 |
| Tri-State Generation & Transmission Association Inc. | 4.700% | 11/1/44 | 805 | 806 |
| Union Electric Co. | 5.300% | 8/1/37 | 1,640 | 1,869 |
| Union Electric Co. | 8.450% | 3/15/39 | 440 | 682 |
| Union Electric Co. | 3.900% | 9/15/42 | 1,650 | 1,571 |
| Union Electric Co. | 3.650% | 4/15/45 | 410 | 370 |
| Virginia Electric & Power Co. | 6.000% | 1/15/36 | 2,085 | 2,564 |
| Virginia Electric & Power Co. | 6.000% | 5/15/37 | 2,045 | 2,511 |
| Virginia Electric & Power Co. | 6.350% | 11/30/37 | 1,725 | 2,206 |
| Virginia Electric & Power Co. | 8.875% | 11/15/38 | 2,175 | 3,417 |
| Virginia Electric & Power Co. | 4.000% | 1/15/43 | 1,475 | 1,414 |
| Virginia Electric & Power Co. | 4.650% | 8/15/43 | 1,485 | 1,571 |
| Virginia Electric & Power Co. | 4.450% | 2/15/44 | 1,845 | 1,899 |
| Virginia Electric & Power Co. | 4.200% | 5/15/45 | 1,196 | 1,186 |
| Westar Energy Inc. | 4.125% | 3/1/42 | 1,355 | 1,335 |
| Westar Energy Inc. | 4.100% | 4/1/43 | 1,475 | 1,446 |
| Westar Energy Inc. | 4.625% | 9/1/43 | 1,740 | 1,839 |
| Westar Energy Inc. | 4.250% | 12/1/45 | 575 | 580 |
| Wisconsin Electric Power Co. | 5.625% | 5/15/33 | 620 | 726 |
| Wisconsin Electric Power Co. | 5.700% | 12/1/36 | 750 | 897 |
| Wisconsin Electric Power Co. | 3.650% | 12/15/42 | 375 | 344 |
| Wisconsin Electric Power Co. | 4.250% | 6/1/44 | 805 | 814 |
95
| Vanguard® Long-Term Bond Index Fund | ||||
| Schedule of Investments | ||||
| December 31, 2015 | ||||
| Face | Market | |||
| Maturity | Amount | Value | ||
| Coupon | Date | ($000) | ($000) | |
| Wisconsin Electric Power Co. | 4.300% | 12/15/45 | 1,025 | 1,049 |
| Wisconsin Power & Light Co. | 6.375% | 8/15/37 | 890 | 1,135 |
| Wisconsin Power & Light Co. | 4.100% | 10/15/44 | 1,970 | 1,918 |
| Wisconsin Public Service Corp. | 3.671% | 12/1/42 | 1,105 | 1,007 |
| Wisconsin Public Service Corp. | 4.752% | 11/1/44 | 2,380 | 2,581 |
| Xcel Energy Inc. | 6.500% | 7/1/36 | 1,700 | 2,054 |
| Xcel Energy Inc. | 4.800% | 9/15/41 | 685 | 688 |
| Natural Gas (0.4%) | ||||
| AGL Capital Corp. | 6.000% | 10/1/34 | 850 | 949 |
| AGL Capital Corp. | 5.875% | 3/15/41 | 2,305 | 2,560 |
| AGL Capital Corp. | 4.400% | 6/1/43 | 1,350 | 1,243 |
| Atmos Energy Corp. | 5.500% | 6/15/41 | 1,575 | 1,806 |
| Atmos Energy Corp. | 4.150% | 1/15/43 | 1,680 | 1,627 |
| Atmos Energy Corp. | 4.125% | 10/15/44 | 1,450 | 1,390 |
| CenterPoint Energy Resources Corp. | 5.850% | 1/15/41 | 1,600 | 1,783 |
| KeySpan Corp. | 8.000% | 11/15/30 | 1,175 | 1,562 |
| KeySpan Corp. | 5.803% | 4/1/35 | 1,000 | 1,094 |
| Laclede Group Inc. | 4.700% | 8/15/44 | 850 | 845 |
| NiSource Finance Corp. | 6.250% | 12/15/40 | 2,730 | 3,230 |
| NiSource Finance Corp. | 5.950% | 6/15/41 | 2,875 | 3,302 |
| Nisource Finance Corp. | 5.250% | 2/15/43 | 2,750 | 2,923 |
| NiSource Finance Corp. | 4.800% | 2/15/44 | 1,825 | 1,856 |
| ONE Gas Inc. | 4.658% | 2/1/44 | 1,778 | 1,843 |
| Piedmont Natural Gas Co. Inc. | 4.100% | 9/18/34 | 850 | 828 |
| Piedmont Natural Gas Co. Inc. | 4.650% | 8/1/43 | 850 | 879 |
| Sempra Energy | 6.000% | 10/15/39 | 3,061 | 3,424 |
| Southern California Gas Co. | 5.750% | 11/15/35 | 75 | 91 |
| Southern California Gas Co. | 3.750% | 9/15/42 | 1,350 | 1,259 |
| Southern California Gas Co. | 4.450% | 3/15/44 | 2,525 | 2,624 |
| Other Utility (0.1%) | ||||
| American Water Capital Corp. | 6.593% | 10/15/37 | 2,675 | 3,477 |
| American Water Capital Corp. | 4.300% | 12/1/42 | 1,300 | 1,314 |
| American Water Capital Corp. | 4.300% | 9/1/45 | 1,000 | 1,012 |
| United Utilities plc | 6.875% | 8/15/28 | 1,625 | 1,858 |
| Veolia Environnement SA | 6.750% | 6/1/38 | 1,525 | 1,865 |
| 557,625 | ||||
| Total Corporate Bonds (Cost $4,393,715) | 4,333,443 | |||
| Sovereign Bonds (U.S. Dollar-Denominated) (5.2%) | ||||
| Asian Development Bank | 6.220% | 8/15/27 | 2,275 | 3,017 |
| Asian Development Bank | 5.820% | 6/16/28 | 1,480 | 1,875 |
| CNOOC Finance 2013 Ltd. | 4.250% | 5/9/43 | 1,925 | 1,786 |
| CNOOC Finance 2015 Australia Pty Ltd. | 4.200% | 5/5/45 | 500 | 454 |
| CNOOC Nexen Finance 2014 ULC | 4.875% | 4/30/44 | 2,300 | 2,354 |
| Ecopetrol SA | 5.375% | 6/26/26 | 3,100 | 2,631 |
| Ecopetrol SA | 7.375% | 9/18/43 | 3,000 | 2,524 |
| Ecopetrol SA | 5.875% | 5/28/45 | 6,875 | 4,907 |
| European Investment Bank | 4.875% | 2/15/36 | 3,230 | 3,977 |
| Export-Import Bank of Korea | 3.250% | 8/12/26 | 4,100 | 4,089 |
| Federative Republic of Brazil | 10.125% | 5/15/27 | 3,650 | 4,334 |
| Federative Republic of Brazil | 12.250% | 3/6/30 | 900 | 1,250 |
| Hydro-Quebec | 8.500% | 12/1/29 | 1,421 | 2,117 |
| Inter-American Development Bank | 3.875% | 10/28/41 | 1,730 | 1,879 |
| Inter-American Development Bank | 3.200% | 8/7/42 | 1,750 | 1,688 |
| Inter-American Development Bank | 4.375% | 1/24/44 | 1,325 | 1,551 |
| International Bank for Reconstruction & Development | 8.875% | 3/1/26 | 1,000 | 1,523 |
| International Bank for Reconstruction & Development | 4.750% | 2/15/35 | 1,725 | 2,099 |
| 5 KFW | 0.000% | 4/18/36 | 11,300 | 5,931 |
| 5 KFW | 0.000% | 6/29/37 | 1,825 | 916 |
| Korea Electric Power Corp. | 7.000% | 2/1/27 | 750 | 934 |
| Nexen Energy ULC | 7.875% | 3/15/32 | 1,800 | 2,319 |
| Nexen Energy ULC | 5.875% | 3/10/35 | 2,650 | 2,891 |
96
| Vanguard® Long-Term Bond Index Fund | ||||
| Schedule of Investments | ||||
| December 31, 2015 | ||||
| Face | Market | |||
| Maturity | Amount | Value | ||
| Coupon | Date | ($000) | ($000) | |
| Nexen Energy ULC | 6.400% | 5/15/37 | 4,055 | 4,580 |
| Nexen Energy ULC | 7.500% | 7/30/39 | 2,025 | 2,662 |
| 3 Oriental Republic of Uruguay | 4.375% | 10/27/27 | 4,000 | 3,945 |
| 3 Oriental Republic of Uruguay | 7.625% | 3/21/36 | 2,043 | 2,523 |
| 3 Oriental Republic of Uruguay | 4.125% | 11/20/45 | 2,600 | 2,015 |
| 3 Oriental Republic of Uruguay | 5.100% | 6/18/50 | 13,350 | 11,481 |
| 4 Petroleos Mexicanos | 4.500% | 1/23/26 | 5,300 | 4,692 |
| Petroleos Mexicanos | 6.625% | 6/15/35 | 8,220 | 7,379 |
| Petroleos Mexicanos | 6.625% | 6/15/38 | 2,075 | 1,826 |
| Petroleos Mexicanos | 6.500% | 6/2/41 | 10,300 | 8,988 |
| Petroleos Mexicanos | 5.500% | 6/27/44 | 10,190 | 7,708 |
| 4 Petroleos Mexicanos | 5.500% | 6/27/44 | 3,700 | 2,799 |
| Petroleos Mexicanos | 6.375% | 1/23/45 | 10,925 | 9,284 |
| 4 Petroleos Mexicanos | 5.625% | 1/23/46 | 9,100 | 6,966 |
| Province of British Columbia | 6.500% | 1/15/26 | 1,935 | 2,514 |
| Province of British Columbia | 7.250% | 9/1/36 | 500 | 754 |
| Quebec | 7.500% | 9/15/29 | 7,715 | 11,049 |
| Republic of Chile | 3.625% | 10/30/42 | 3,200 | 2,774 |
| 3 Republic of Colombia | 4.500% | 1/28/26 | 5,100 | 4,909 |
| Republic of Colombia | 10.375% | 1/28/33 | 700 | 966 |
| Republic of Colombia | 7.375% | 9/18/37 | 6,637 | 7,317 |
| Republic of Colombia | 6.125% | 1/18/41 | 9,225 | 8,940 |
| 3 Republic of Colombia | 5.625% | 2/26/44 | 6,900 | 6,296 |
| 3 Republic of Colombia | 5.000% | 6/15/45 | 8,350 | 7,035 |
| Republic of Finland | 6.950% | 2/15/26 | 695 | 926 |
| Republic of Italy | 5.375% | 6/15/33 | 5,825 | 6,517 |
| Republic of Korea | 4.125% | 6/10/44 | 3,400 | 3,831 |
| Republic of Panama | 7.125% | 1/29/26 | 2,390 | 2,976 |
| Republic of Panama | 8.875% | 9/30/27 | 2,560 | 3,539 |
| Republic of Panama | 9.375% | 4/1/29 | 2,735 | 3,945 |
| 3 Republic of Panama | 6.700% | 1/26/36 | 7,001 | 8,324 |
| 3 Republic of Panama | 4.300% | 4/29/53 | 3,050 | 2,608 |
| Republic of Peru | 4.125% | 8/25/27 | 3,700 | 3,651 |
| Republic of Peru | 8.750% | 11/21/33 | 8,150 | 11,547 |
| 3 Republic of Peru | 6.550% | 3/14/37 | 5,425 | 6,286 |
| Republic of Peru | 5.625% | 11/18/50 | 7,340 | 7,501 |
| Republic of South Africa | 6.250% | 3/8/41 | 2,200 | 2,244 |
| Republic of South Africa | 5.375% | 7/24/44 | 2,100 | 1,874 |
| Republic of the Philippines | 5.500% | 3/30/26 | 2,075 | 2,451 |
| Republic of the Philippines | 9.500% | 2/2/30 | 5,900 | 9,285 |
| Republic of the Philippines | 7.750% | 1/14/31 | 8,975 | 12,644 |
| Republic of the Philippines | 6.375% | 1/15/32 | 4,700 | 5,997 |
| Republic of the Philippines | 6.375% | 10/23/34 | 9,175 | 12,031 |
| Republic of the Philippines | 5.000% | 1/13/37 | 4,375 | 5,102 |
| Republic of the Philippines | 3.950% | 1/20/40 | 7,702 | 7,789 |
| Republic of Turkey | 4.250% | 4/14/26 | 5,000 | 4,694 |
| Republic of Turkey | 11.875% | 1/15/30 | 4,150 | 6,807 |
| Republic of Turkey | 8.000% | 2/14/34 | 5,675 | 7,094 |
| Republic of Turkey | 6.875% | 3/17/36 | 10,700 | 12,011 |
| Republic of Turkey | 7.250% | 3/5/38 | 2,900 | 3,404 |
| Republic of Turkey | 6.750% | 5/30/40 | 6,300 | 7,025 |
| Republic of Turkey | 6.000% | 1/14/41 | 10,339 | 10,587 |
| Republic of Turkey | 4.875% | 4/16/43 | 11,980 | 10,553 |
| Republic of Turkey | 6.625% | 2/17/45 | 2,475 | 2,787 |
| State of Israel | 4.500% | 1/30/43 | 2,950 | 2,958 |
| Statoil ASA | 7.250% | 9/23/27 | 3,000 | 3,895 |
| Statoil ASA | 6.800% | 1/15/28 | 185 | 234 |
| Statoil ASA | 7.150% | 1/15/29 | 1,290 | 1,657 |
| Statoil ASA | 5.100% | 8/17/40 | 3,309 | 3,539 |
| Statoil ASA | 4.250% | 11/23/41 | 1,925 | 1,826 |
| Statoil ASA | 3.950% | 5/15/43 | 3,420 | 3,089 |
| Statoil ASA | 4.800% | 11/8/43 | 2,610 | 2,698 |
| United Mexican States | 8.300% | 8/15/31 | 3,160 | 4,673 |
| United Mexican States | 7.500% | 4/8/33 | 2,440 | 3,172 |
97
| Vanguard® Long-Term Bond Index Fund | ||||
| Schedule of Investments | ||||
| December 31, 2015 | ||||
| Face | Market | |||
| Maturity | Amount | Value | ||
| Coupon | Date | ($000) | ($000) | |
| United Mexican States | 6.750% | 9/27/34 | 7,022 | 8,424 |
| United Mexican States | 6.050% | 1/11/40 | 11,300 | 12,458 |
| United Mexican States | 4.750% | 3/8/44 | 14,615 | 13,399 |
| United Mexican States | 5.550% | 1/21/45 | 10,380 | 10,602 |
| United Mexican States | 4.600% | 1/23/46 | 10,276 | 9,140 |
| United Mexican States | 5.750% | 10/12/10 | 9,050 | 8,404 |
| Total Sovereign Bonds (Cost $489,425) | 462,646 | |||
| Taxable Municipal Bonds (5.4%) | ||||
| Alameda County CA Joint Powers Authority Lease | ||||
| Revenue | 7.046% | 12/1/44 | 1,100 | 1,443 |
| American Municipal Power Ohio Inc. Revenue | ||||
| (Hydroelectric Projects) | 6.449% | 2/15/44 | 680 | 810 |
| American Municipal Power Ohio Inc. Revenue (Prairie | ||||
| State Energy Campus Project) | 7.834% | 2/15/41 | 645 | 885 |
| American Municipal Power Ohio Inc. Revenue (Prairie | ||||
| State Energy Campus Project) | 6.053% | 2/15/43 | 550 | 639 |
| American Municipal Power Ohio Inc. Revenue (Prairie | ||||
| State Energy Campus Project) | 5.939% | 2/15/47 | 3,300 | 3,808 |
| American Municipal Power Ohio Inc. Revenue (Prairie | ||||
| State Energy Campus Project) | 6.270% | 2/15/50 | 450 | 524 |
| American Municipal Power Ohio Inc. Revenue (Prairie | ||||
| State Energy Campus Project) | 7.499% | 2/15/50 | 175 | 234 |
| American Municipal Power Ohio Inc. Revenue (Prairie | ||||
| State Energy Campus Project) | 8.084% | 2/15/50 | 2,995 | 4,352 |
| Bay Area Toll Authority California Toll Bridge Revenue | ||||
| (San Francisco Bay Area) | 6.793% | 4/1/30 | 600 | 736 |
| Bay Area Toll Authority California Toll Bridge Revenue | ||||
| (San Francisco Bay Area) | 6.918% | 4/1/40 | 1,095 | 1,442 |
| Bay Area Toll Authority California Toll Bridge Revenue | ||||
| (San Francisco Bay Area) | 6.263% | 4/1/49 | 4,400 | 5,919 |
| Bay Area Toll Authority California Toll Bridge Revenue | ||||
| (San Francisco Bay Area) | 7.043% | 4/1/50 | 2,850 | 3,922 |
| Bay Area Toll Authority California Toll Bridge Revenue | ||||
| (San Francisco Bay Area) | 6.907% | 10/1/50 | 2,140 | 2,922 |
| California GO | 7.700% | 11/1/30 | 1,260 | 1,526 |
| California GO | 7.500% | 4/1/34 | 8,280 | 11,593 |
| California GO | 7.950% | 3/1/36 | 1,450 | 1,719 |
| California GO | 7.550% | 4/1/39 | 10,500 | 15,264 |
| California GO | 7.300% | 10/1/39 | 5,405 | 7,552 |
| California GO | 7.350% | 11/1/39 | 3,675 | 5,159 |
| California GO | 7.625% | 3/1/40 | 4,815 | 7,002 |
| California GO | 7.600% | 11/1/40 | 5,750 | 8,547 |
| California Public Works Board Lease Revenue (Various | ||||
| Capital Projects) | 8.361% | 10/1/34 | 725 | 1,024 |
| Central Puget Sound WA Regional Transit Authority | ||||
| Sales & Use Tax Revenue | 5.491% | 11/1/39 | 800 | 975 |
| Chicago IL GO | 7.375% | 1/1/33 | 2,600 | 2,714 |
| Chicago IL GO | 7.781% | 1/1/35 | 675 | 726 |
| Chicago IL GO | 5.432% | 1/1/42 | 900 | 762 |
| Chicago IL GO | 6.314% | 1/1/44 | 1,050 | 994 |
| Chicago IL Metropolitan Water Reclamation District GO | 5.720% | 12/1/38 | 1,625 | 1,864 |
| Chicago IL O'Hare International Airport Revenue | 6.845% | 1/1/38 | 625 | 700 |
| Chicago IL O'Hare International Airport Revenue | 6.395% | 1/1/40 | 1,275 | 1,596 |
| Chicago IL Transit Authority Sales Tax Receipts | ||||
| Revenue | 6.200% | 12/1/40 | 1,450 | 1,564 |
| Chicago IL Transit Authority Transfer Tax Receipts | ||||
| Revenue | 6.899% | 12/1/40 | 5,650 | 6,520 |
| Chicago IL Wastewater Transmission Revenue | 6.900% | 1/1/40 | 1,075 | 1,234 |
| Chicago IL Water Revenue | 6.742% | 11/1/40 | 1,600 | 1,819 |
| Clark County NV Airport System Revenue | 6.881% | 7/1/42 | 1,650 | 1,847 |
| Clark County NV Airport System Revenue | 6.820% | 7/1/45 | 1,400 | 1,928 |
| Colorado Bridge Enterprise Revenue | 6.078% | 12/1/40 | 1,280 | 1,594 |
98
| Vanguard® Long-Term Bond Index Fund | ||||
| Schedule of Investments | ||||
| December 31, 2015 | ||||
| Face | Market | |||
| Maturity | Amount | Value | ||
| Coupon | Date | ($000) | ($000) | |
| Commonwealth Financing Authority Pennsylvania | ||||
| Revenue | 6.218% | 6/1/39 | 1,190 | 1,381 |
| Connecticut GO | 5.632% | 12/1/29 | 2,000 | 2,315 |
| Connecticut GO | 5.090% | 10/1/30 | 750 | 830 |
| Connecticut GO | 5.850% | 3/15/32 | 3,350 | 3,920 |
| Connecticut Special Tax Revenue (Transportation | ||||
| Infrastructure) | 5.459% | 11/1/30 | 900 | 1,038 |
| Cook County IL GO | 6.229% | 11/15/34 | 1,050 | 1,120 |
| Curators of the University of Missouri System Facilities | ||||
| Revenue | 5.960% | 11/1/39 | 1,220 | 1,515 |
| Curators of the University of Missouri System Facilities | ||||
| Revenue | 5.792% | 11/1/41 | 420 | 535 |
| Dallas County TX Hospital District Revenue | 5.621% | 8/15/44 | 850 | 1,049 |
| Dallas TX Area Rapid Transit Revenue | 4.922% | 12/1/41 | 890 | 1,014 |
| Dallas TX Area Rapid Transit Revenue | 5.999% | 12/1/44 | 1,745 | 2,286 |
| Dallas TX Area Rapid Transit Revenue | 5.022% | 12/1/48 | 1,665 | 1,945 |
| Dallas TX Convention Center Hotel Development Corp. | ||||
| Hotel Revenue | 7.088% | 1/1/42 | 1,640 | 2,107 |
| Dallas TX Independent School District GO | 6.450% | 2/15/35 | 1,495 | 1,735 |
| Denver CO City & County School District No. 1 COP | 4.242% | 12/15/37 | 800 | 791 |
| Denver CO City & County School District No. 1 COP | 7.017% | 12/15/37 | 850 | 1,115 |
| Denver CO City & County School District No. 1 GO | 5.664% | 12/1/33 | 525 | 621 |
| District of Columbia Income Tax Revenue | 5.591% | 12/1/34 | 675 | 808 |
| District of Columbia Income Tax Revenue | 5.582% | 12/1/35 | 735 | 888 |
| District of Columbia Water & Sewer Authority Public | ||||
| Utility Revenue | 5.522% | 10/1/44 | 575 | 676 |
| District of Columbia Water & Sewer Authority Public | ||||
| Utility Revenue | 4.814% | 10/1/14 | 1,575 | 1,560 |
| East Baton Rouge LA Sewer Commission Revenue | 6.087% | 2/1/45 | 700 | 770 |
| East Bay CA Municipal Utility District Water System | ||||
| Revenue | 5.874% | 6/1/40 | 1,990 | 2,486 |
| George Washington University District of Columbia GO | 4.300% | 9/15/44 | 2,325 | 2,239 |
| Georgia Municipal Electric Power Authority Revenue | 6.637% | 4/1/57 | 5,275 | 6,282 |
| Georgia Municipal Electric Power Authority Revenue | 6.655% | 4/1/57 | 2,825 | 3,325 |
| Georgia Municipal Electric Power Authority Revenue | 7.055% | 4/1/57 | 850 | 930 |
| Grand Parkway Transportation Corp. Texas System Toll | ||||
| Revenue | 5.184% | 10/1/42 | 1,000 | 1,177 |
| Houston TX GO | 6.290% | 3/1/32 | 1,370 | 1,676 |
| Houston TX Utility System Revenue | 3.828% | 5/15/28 | 1,200 | 1,244 |
| Illinois GO | 5.100% | 6/1/33 | 23,440 | 22,175 |
| Illinois GO | 6.630% | 2/1/35 | 2,870 | 2,964 |
| Illinois GO | 6.725% | 4/1/35 | 2,000 | 2,070 |
| Illinois GO | 7.350% | 7/1/35 | 2,855 | 3,097 |
| Illinois Toll Highway Authority Revenue | 6.184% | 1/1/34 | 1,670 | 2,078 |
| Illinois Toll Highway Authority Revenue | 5.851% | 12/1/34 | 600 | 722 |
| Indianapolis IN Local Public Improvement Revenue | 6.116% | 1/15/40 | 1,075 | 1,335 |
| 6 Industry CA Sales Tax Revenue | 5.125% | 1/1/51 | 1,000 | 1,012 |
| JobsOhio Beverage System Statewide Liquor Profits | ||||
| Revenue | 3.985% | 1/1/29 | 1,725 | 1,795 |
| JobsOhio Beverage System Statewide Liquor Profits | ||||
| Revenue | 4.532% | 1/1/35 | 1,050 | 1,111 |
| Kansas Department of Transportation Highway | ||||
| Revenue | 4.596% | 9/1/35 | 1,225 | 1,324 |
| Kansas Development Finance Authority Revenue | 4.727% | 4/15/37 | 1,700 | 1,699 |
| 6 Kansas Development Finance Authority Revenue | ||||
| (Public Employees Retirement System) | 5.501% | 5/1/34 | 500 | 555 |
| Los Angeles CA Community College District GO | 6.600% | 8/1/42 | 1,300 | 1,777 |
| Los Angeles CA Community College District GO | 6.750% | 8/1/49 | 1,950 | 2,755 |
| Los Angeles CA Department of Airports International | ||||
| Airport Revenue | 6.582% | 5/15/39 | 305 | 391 |
| Los Angeles CA Department of Water & Power | ||||
| Revenue | 5.716% | 7/1/39 | 2,125 | 2,560 |
| Los Angeles CA Department of Water & Power | ||||
| Revenue | 6.008% | 7/1/39 | 795 | 971 |
99
| Vanguard® Long-Term Bond Index Fund | ||||
| Schedule of Investments | ||||
| December 31, 2015 | ||||
| Face | Market | |||
| Maturity | Amount | Value | ||
| Coupon | Date | ($000) | ($000) | |
| Los Angeles CA Department of Water & Power | ||||
| Revenue | 6.166% | 7/1/40 | 625 | 701 |
| Los Angeles CA Department of Water & Power | ||||
| Revenue | 6.574% | 7/1/45 | 1,575 | 2,138 |
| Los Angeles CA Department of Water & Power | ||||
| Revenue | 6.603% | 7/1/50 | 1,500 | 2,046 |
| Los Angeles CA Unified School District GO | 5.755% | 7/1/29 | 1,140 | 1,351 |
| Los Angeles CA Unified School District GO | 5.750% | 7/1/34 | 4,345 | 5,234 |
| Los Angeles CA Unified School District GO | 6.758% | 7/1/34 | 2,760 | 3,636 |
| Los Angeles County CA Metropolitan Transportation | ||||
| Authority Sales Tax Revenue | 5.735% | 6/1/39 | 2,350 | 2,856 |
| Los Angeles County CA Public Works Financing | ||||
| Authority Lease Revenue | 7.488% | 8/1/33 | 1,760 | 2,292 |
| Los Angeles County CA Public Works Financing | ||||
| Authority Lease Revenue | 7.618% | 8/1/40 | 700 | 978 |
| Maryland Transportation Authority Facilities Projects | ||||
| Revenue | 5.888% | 7/1/43 | 850 | 1,029 |
| Massachusetts GO | 4.500% | 8/1/31 | 1,500 | 1,605 |
| Massachusetts GO | 5.456% | 12/1/39 | 3,550 | 4,279 |
| Massachusetts School Building Authority Dedicated | ||||
| Sales Tax Revenue | 5.715% | 8/15/39 | 1,430 | 1,740 |
| Massachusetts Transportation Fund Revenue | 5.731% | 6/1/40 | 1,515 | 1,883 |
| Massachusetts Water Pollution Abatement Trust | ||||
| Revenue | 5.192% | 8/1/40 | 900 | 1,047 |
| Metropolitan Government of Nashville & Davidson | ||||
| County TN Convention Center Authority Tourism Tax | ||||
| Revenue | 6.731% | 7/1/43 | 1,000 | 1,270 |
| Metropolitan Government of Nashville & Davidson | ||||
| County TN GO | 5.707% | 7/1/34 | 1,200 | 1,403 |
| Metropolitan Washington DC/VA Airports Authority | ||||
| Dulles Toll Road Revenue | 7.462% | 10/1/46 | 1,055 | 1,419 |
| Metropolitan Water District of Southern California | ||||
| Revenue | 6.947% | 7/1/40 | 575 | 669 |
| Mississippi GO | 5.245% | 11/1/34 | 1,100 | 1,249 |
| Missouri Highways & Transportation Commission Road | ||||
| Revenue | 5.445% | 5/1/33 | 600 | 702 |
| 7 New Jersey Economic Development Authority | ||||
| Revenue (State Pension Funding) | 7.425% | 2/15/29 | 5,800 | 6,586 |
| New Jersey Transportation Trust Fund Authority | ||||
| Transportation System Revenue | 5.754% | 12/15/28 | 2,650 | 2,757 |
| New Jersey Transportation Trust Fund Authority | ||||
| Transportation System Revenue | 6.104% | 12/15/28 | 2,660 | 2,778 |
| New Jersey Transportation Trust Fund Authority | ||||
| Transportation System Revenue | 6.561% | 12/15/40 | 1,425 | 1,509 |
| New Jersey Turnpike Authority Revenue | 7.414% | 1/1/40 | 4,689 | 6,665 |
| New Jersey Turnpike Authority Revenue | 7.102% | 1/1/41 | 6,060 | 8,347 |
| New York City NY GO | 5.206% | 10/1/31 | 1,070 | 1,204 |
| New York City NY GO | 6.646% | 12/1/31 | 400 | 465 |
| New York City NY GO | 6.246% | 6/1/35 | 1,075 | 1,215 |
| New York City NY GO | 5.968% | 3/1/36 | 1,265 | 1,564 |
| New York City NY GO | 5.985% | 12/1/36 | 625 | 765 |
| New York City NY GO | 5.517% | 10/1/37 | 1,175 | 1,389 |
| New York City NY GO | 6.271% | 12/1/37 | 2,170 | 2,784 |
| New York City NY GO | 5.846% | 6/1/40 | 550 | 684 |
| New York City NY Municipal Water Finance Authority | ||||
| Water & Sewer System Revenue | 5.750% | 6/15/41 | 1,075 | 1,358 |
| New York City NY Municipal Water Finance Authority | ||||
| Water & Sewer System Revenue | 5.790% | 6/15/41 | 500 | 551 |
| New York City NY Municipal Water Finance Authority | ||||
| Water & Sewer System Revenue | 5.724% | 6/15/42 | 1,205 | 1,528 |
| New York City NY Municipal Water Finance Authority | ||||
| Water & Sewer System Revenue | 5.952% | 6/15/42 | 800 | 1,033 |
| New York City NY Municipal Water Finance Authority | ||||
| Water & Sewer System Revenue | 6.011% | 6/15/42 | 1,500 | 1,950 |
100
| Vanguard® Long-Term Bond Index Fund | ||||
| Schedule of Investments | ||||
| December 31, 2015 | ||||
| Face | Market | |||
| Maturity | Amount | Value | ||
| Coupon | Date | ($000) | ($000) | |
| New York City NY Municipal Water Finance Authority | ||||
| Water & Sewer System Revenue | 5.440% | 6/15/43 | 1,995 | 2,428 |
| New York City NY Municipal Water Finance Authority | ||||
| Water & Sewer System Revenue | 5.882% | 6/15/44 | 2,570 | 3,319 |
| New York City NY Transitional Finance Authority | ||||
| Building Aid Revenue | 6.828% | 7/15/40 | 1,100 | 1,451 |
| New York City NY Transitional Finance Authority Future | ||||
| Tax Revenue | 5.267% | 5/1/27 | 200 | 226 |
| New York City NY Transitional Finance Authority Future | ||||
| Tax Revenue | 5.767% | 8/1/36 | 775 | 936 |
| New York City NY Transitional Finance Authority Future | ||||
| Tax Revenue | 5.508% | 8/1/37 | 2,215 | 2,663 |
| New York City NY Transitional Finance Authority Future | ||||
| Tax Revenue | 5.572% | 11/1/38 | 1,150 | 1,386 |
| New York Metropolitan Transportation Authority | ||||
| Revenue | 6.687% | 11/15/40 | 730 | 955 |
| New York Metropolitan Transportation Authority | ||||
| Revenue | 6.814% | 11/15/40 | 65 | 86 |
| New York Metropolitan Transportation Authority | ||||
| Revenue (Dedicated Tax Fund) | 7.336% | 11/15/39 | 3,625 | 5,285 |
| New York Metropolitan Transportation Authority | ||||
| Revenue (Dedicated Tax Fund) | 6.089% | 11/15/40 | 575 | 727 |
| New York Metropolitan Transportation Authority | ||||
| Revenue (Transit Revenue) | 6.548% | 11/15/31 | 500 | 628 |
| New York Metropolitan Transportation Authority | ||||
| Revenue (Transit Revenue) | 5.871% | 11/15/39 | 700 | 833 |
| New York Metropolitan Transportation Authority | ||||
| Revenue (Transit Revenue) | 6.648% | 11/15/39 | 1,750 | 2,274 |
| New York Metropolitan Transportation Authority | ||||
| Revenue (Transit Revenue) | 6.668% | 11/15/39 | 2,345 | 3,074 |
| New York State Dormitory Authority Revenue (Personal | ||||
| Income Tax) | 5.500% | 3/15/30 | 2,750 | 3,271 |
| New York State Dormitory Authority Revenue (Personal | ||||
| Income Tax) | 5.289% | 3/15/33 | 500 | 583 |
| New York State Dormitory Authority Revenue (Personal | ||||
| Income Tax) | 5.427% | 3/15/39 | 500 | 590 |
| New York State Dormitory Authority Revenue (Personal | ||||
| Income Tax) | 5.628% | 3/15/39 | 2,580 | 3,096 |
| New York State Dormitory Authority Revenue (Personal | ||||
| Income Tax) | 5.389% | 3/15/40 | 735 | 874 |
| New York State Dormitory Authority Revenue (Personal | ||||
| Income Tax) | 5.600% | 3/15/40 | 200 | 242 |
| New York State Urban Development Corp. Revenue | ||||
| (Personal Income Tax) | 5.770% | 3/15/39 | 1,625 | 1,970 |
| New York State Urban Development Corp. Revenue | ||||
| (Personal Income Tax) | 5.838% | 3/15/40 | 625 | 764 |
| New York University Hospitals Center GO | 4.428% | 7/1/42 | 1,525 | 1,460 |
| New York University Hospitals Center Revenue | 5.750% | 7/1/43 | 925 | 1,063 |
| North Carolina Turnpike Authority Revenue | 6.700% | 1/1/39 | 170 | 188 |
| North Texas Tollway Authority System Revenue | 6.718% | 1/1/49 | 3,135 | 4,297 |
| Ohio State University General Receipts Revenue | 4.910% | 6/1/40 | 2,175 | 2,439 |
| Ohio State University General Receipts Revenue | 4.800% | 6/1/11 | 1,882 | 1,815 |
| Ohio State University General Receipts Revenue | 5.590% | 12/1/14 | 900 | 954 |
| Ohio Water Development Authority Water Pollution | ||||
| Control Loan Fund Revenue | 4.879% | 12/1/34 | 1,125 | 1,260 |
| Orange County CA Local Transportation Authority Sales | ||||
| Tax Revenue | 6.908% | 2/15/41 | 1,060 | 1,428 |
| Oregon Department of Transportation Highway User | ||||
| Tax Revenue | 5.834% | 11/15/34 | 1,305 | 1,640 |
| Oregon GO | 5.892% | 6/1/27 | 3,500 | 4,194 |
| 8 Oregon School Boards Association GO | 4.759% | 6/30/28 | 3,550 | 3,899 |
| 6 Oregon School Boards Association GO | 5.528% | 6/30/28 | 1,500 | 1,724 |
| Pennsylvania GO | 4.650% | 2/15/26 | 2,100 | 2,262 |
| Pennsylvania GO | 5.350% | 5/1/30 | 1,000 | 1,099 |
101
| Vanguard® Long-Term Bond Index Fund | ||||
| Schedule of Investments | ||||
| December 31, 2015 | ||||
| Face | Market | |||
| Maturity | Amount | Value | ||
| Coupon | Date | ($000) | ($000) | |
| Pennsylvania Public School Building Authority Lease | ||||
| Revenue (School District of Philadelphia) | 5.000% | 9/15/27 | 1,098 | 1,180 |
| Pennsylvania Turnpike Commission Revenue | 6.105% | 12/1/39 | 600 | 743 |
| Pennsylvania Turnpike Commission Revenue | 5.511% | 12/1/45 | 2,075 | 2,415 |
| Pennsylvania Turnpike Commission Revenue | 5.561% | 12/1/49 | 850 | 984 |
| Philadelphia PA Industrial Development Authority City | ||||
| Service Agreement Revenue | 3.964% | 4/15/26 | 1,000 | 989 |
| Phoenix AZ GO | 5.269% | 7/1/34 | 100 | 117 |
| Port Authority of New York & New Jersey Revenue | 6.040% | 12/1/29 | 2,260 | 2,716 |
| Port Authority of New York & New Jersey Revenue | 5.647% | 11/1/40 | 1,025 | 1,213 |
| Port Authority of New York & New Jersey Revenue | 5.647% | 11/1/40 | 2,695 | 3,189 |
| Port Authority of New York & New Jersey Revenue | 4.960% | 8/1/46 | 2,350 | 2,538 |
| Port Authority of New York & New Jersey Revenue | 5.310% | 8/1/46 | 1,200 | 1,268 |
| Port Authority of New York & New Jersey Revenue | 4.926% | 10/1/51 | 1,520 | 1,613 |
| Port Authority of New York & New Jersey Revenue | 4.458% | 10/1/62 | 7,625 | 7,260 |
| Port of Seattle WA Revenue | 7.000% | 5/1/36 | 100 | 113 |
| President & Fellows of Harvard College Massachusetts | ||||
| GO | 6.300% | 10/1/37 | 1,000 | 1,014 |
| President & Fellows of Harvard College Massachusetts | ||||
| GO | 4.875% | 10/15/40 | 1,150 | 1,337 |
| Princeton University New Jersey GO | 5.700% | 3/1/39 | 1,400 | 1,840 |
| Regional Transportation District of Colorado Sales Tax | ||||
| Revenue | 5.844% | 11/1/50 | 1,110 | 1,422 |
| Rutgers State University New Jersey Revenue | 5.665% | 5/1/40 | 1,185 | 1,408 |
| Sacramento CA Municipal Utility District Revenue | 6.156% | 5/15/36 | 905 | 1,099 |
| Sacramento CA Public Financing Authority Lease | ||||
| Revenue | 5.637% | 4/1/50 | 900 | 955 |
| Salt River Project Arizona Agricultural Improvement & | ||||
| Power District Revenue | 4.839% | 1/1/41 | 1,100 | 1,253 |
| San Antonio TX Electric & Gas Systems Revenue | 5.985% | 2/1/39 | 600 | 760 |
| San Antonio TX Electric & Gas Systems Revenue | 5.718% | 2/1/41 | 1,190 | 1,465 |
| San Antonio TX Electric & Gas Systems Revenue | 5.808% | 2/1/41 | 1,750 | 2,181 |
| San Antonio TX Electric & Gas Systems Revenue | 4.427% | 2/1/42 | 1,100 | 1,157 |
| San Diego County CA Regional Airport Authority | ||||
| Revenue | 5.594% | 7/1/43 | 900 | 973 |
| San Diego County CA Regional Transportation | ||||
| Commission Sales Tax Revenue | 5.911% | 4/1/48 | 1,365 | 1,719 |
| San Diego County CA Water Authority Revenue | 6.138% | 5/1/49 | 2,450 | 3,178 |
| San Francisco CA City & County Public Utilities | ||||
| Commission Water Revenue | 6.000% | 11/1/40 | 1,325 | 1,615 |
| San Francisco CA City & County Public Utilities | ||||
| Commission Water Revenue | 6.950% | 11/1/50 | 1,815 | 2,539 |
| Santa Clara Valley CA Transportation Authority Sales | ||||
| Tax Revenue | 5.876% | 4/1/32 | 1,500 | 1,798 |
| Sonoma County CA Pension Obligation Revenue | 6.000% | 12/1/29 | 1,500 | 1,749 |
| South Carolina Public Service Authority Revenue | 5.784% | 12/1/41 | 250 | 288 |
| South Carolina Public Service Authority Revenue | 6.454% | 1/1/50 | 2,100 | 2,629 |
| Stanford University California GO | 3.460% | 5/1/47 | 950 | 896 |
| Texas GO | 5.517% | 4/1/39 | 3,490 | 4,360 |
| Texas Transportation Commission Revenue | 5.028% | 4/1/26 | 1,000 | 1,143 |
| Texas Transportation Commission Revenue | 5.178% | 4/1/30 | 3,900 | 4,585 |
| Texas Transportation Commission Revenue | 4.631% | 4/1/33 | 1,960 | 2,153 |
| Texas Transportation Commission Revenue | 4.681% | 4/1/40 | 950 | 1,067 |
| Tufts University Massachusetts GO | 5.017% | 4/15/12 | 935 | 965 |
| University of California Regents General Revenue | 4.601% | 5/15/31 | 1,500 | 1,599 |
| University of California Regents Medical Center | ||||
| Revenue | 6.548% | 5/15/48 | 900 | 1,158 |
| University of California Regents Medical Center | ||||
| Revenue | 6.583% | 5/15/49 | 1,075 | 1,380 |
| University of California Revenue | 6.270% | 5/15/31 | 500 | 558 |
| University of California Revenue | 5.770% | 5/15/43 | 3,000 | 3,660 |
| University of California Revenue | 4.765% | 5/15/44 | 1,600 | 1,628 |
| University of California Revenue | 4.131% | 5/15/45 | 1,500 | 1,472 |
| University of California Revenue | 5.946% | 5/15/45 | 1,400 | 1,708 |
102
Vanguard® Long-Term Bond Index Fund
Schedule of Investments
December 31, 2015
| Face | Market | ||||
| Maturity | Amount | Value | |||
| Coupon | Date | ($000) | ($000) | ||
| University of California Revenue | 4.858% | 5/15/12 | 3,550 | 3,396 | |
| University of California Revenue | 4.767% | 5/15/15 | 2,050 | 1,924 | |
| University of Massachusetts Building Authority | |||||
| Revenue | 5.450% | 11/1/40 | 575 | 675 | |
| University of North Carolina at Chapel Hill Revenue | 3.847% | 12/1/34 | 2,000 | 2,075 | |
| University of Southern California GO | 5.250% | 10/1/11 | 950 | 1,075 | |
| University of Texas System Revenue Financing System | |||||
| Revenue | 5.262% | 7/1/39 | 1,920 | 2,315 | |
| University of Texas System Revenue Financing System | |||||
| Revenue | 6.276% | 8/15/41 | 890 | 989 | |
| University of Texas System Revenue Financing System | |||||
| Revenue | 5.134% | 8/15/42 | 550 | 646 | |
| University of Texas System Revenue Financing System | |||||
| Revenue | 4.794% | 8/15/46 | 1,575 | 1,786 | |
| University of Virginia Revenue | 6.200% | 9/1/39 | 330 | 451 | |
| Utah Transit Authority Sales Tax Revenue | 5.937% | 6/15/39 | 990 | 1,246 | |
| Virginia Commonwealth Transportation Board Revenue | 5.350% | 5/15/35 | 640 | 735 | |
| Washington Convention Center Public Facilities District | |||||
| Revenue | 6.790% | 7/1/40 | 600 | 733 | |
| Washington GO | 5.090% | 8/1/33 | 945 | 1,076 | |
| Washington GO | 5.481% | 8/1/39 | 1,160 | 1,402 | |
| Washington GO | 5.140% | 8/1/40 | 1,210 | 1,423 | |
| 6 | Wisconsin GO | 5.700% | 5/1/26 | 1,745 | 2,020 |
| Total Taxable Municipal Bonds (Cost $428,230) | 476,686 | ||||
| Shares | |||||
| Temporary Cash Investment (0.3%) | |||||
| Money Market Fund (0.3%) | |||||
| 9 | Vanguard Market Liquidity Fund (Cost | ||||
| $23,090) | 0.363% | 23,089,687 | 23,090 | ||
| Total Investments (99.1%) (Cost $8,627,798) | 8,736,083 | ||||
| Other Assets and Liabilities—Net (0.9%) | 79,644 | ||||
| Net Assets (100%) | 8,815,727 | ||||
1 The issuer operates under a congressional charter; its securities are generally neither guaranteed by the U.S. Treasury nor backed by the full
faith and credit of the U.S. government.
2 The issuer was placed under federal conservatorship in September 2008; since that time, its daily operations have been managed by the Federal
Housing Finance Agency and it receives capital from the U.S. Treasury, as needed to maintain a positive net worth, in exchange for senior
preferred stock.
3 The average or expected maturity is shorter than the final maturity shown because of the possibility of interim principal payments and
prepayments or the possibility of the issue being called.
4 Security exempt from registration under Rule 144A of the Securities Act of 1933. Such securities may be sold in transactions exempt from
registration, normally to qualified institutional buyers. At December 31, 2015, the aggregate value of these securities was $125,034,000,
representing 1.4% of net assets.
5 Guaranteed by the Federal Republic of Germany.
6 Scheduled principal and interest payments are guaranteed by AGM (Assured Guaranty Municipal Corporation).
7 Scheduled principal and interest payments are guaranteed by National Public Finance Guarantee Corp.
8 Scheduled principal and interest payments are guaranteed by AMBAC (Ambac Assurance Corporation).
9 Affiliated money market fund available only to Vanguard funds and certain trusts and accounts managed by Vanguard. Rate shown is the 7-day
yield.
COP—Certificate of Participation.
GO—General Obligation Bond.
103
© 2016 The Vanguard Group, Inc.
All rights reserved.
Vanguard Marketing Corporation, Distributor.
SNA3140 022016
| Vanguard® Total Bond Market Index Fund | ||||
| Schedule of Investments | ||||
| December 31, 2015 | ||||
| Face | Market | |||
| Maturity | Amount | Value | ||
| Coupon | Date | ($000) | ($000) | |
| U.S. Government and Agency Obligations (63.7%) | ||||
| U.S. Government Securities (39.8%) | ||||
| United States Treasury Note/Bond | 3.125% | 1/31/17 | 230,980 | 236,574 |
| United States Treasury Note/Bond | 0.625% | 2/15/17 | 185,251 | 184,818 |
| United States Treasury Note/Bond | 4.625% | 2/15/17 | 81,615 | 84,982 |
| United States Treasury Note/Bond | 0.500% | 2/28/17 | 121,025 | 120,552 |
| United States Treasury Note/Bond | 0.875% | 2/28/17 | 175,516 | 175,625 |
| United States Treasury Note/Bond | 3.000% | 2/28/17 | 71,140 | 72,874 |
| United States Treasury Note/Bond | 0.750% | 3/15/17 | 455,800 | 455,157 |
| United States Treasury Note/Bond | 0.500% | 3/31/17 | 60,016 | 59,753 |
| United States Treasury Note/Bond | 1.000% | 3/31/17 | 305,735 | 306,261 |
| United States Treasury Note/Bond | 3.250% | 3/31/17 | 136,940 | 140,877 |
| United States Treasury Note/Bond | 0.875% | 4/15/17 | 556,825 | 556,736 |
| United States Treasury Note/Bond | 0.500% | 4/30/17 | 59,500 | 59,193 |
| United States Treasury Note/Bond | 0.875% | 4/30/17 | 173,100 | 173,019 |
| United States Treasury Note/Bond | 3.125% | 4/30/17 | 7,319 | 7,531 |
| United States Treasury Note/Bond | 0.875% | 5/15/17 | 218,285 | 218,182 |
| United States Treasury Note/Bond | 4.500% | 5/15/17 | 41,605 | 43,607 |
| United States Treasury Note/Bond | 8.750% | 5/15/17 | 183,135 | 202,507 |
| United States Treasury Note/Bond | 0.625% | 5/31/17 | 287,358 | 286,099 |
| United States Treasury Note/Bond | 2.750% | 5/31/17 | 262,075 | 268,750 |
| United States Treasury Note/Bond | 0.875% | 6/15/17 | 301,455 | 301,172 |
| United States Treasury Note/Bond | 0.625% | 6/30/17 | 4,920 | 4,895 |
| United States Treasury Note/Bond | 0.750% | 6/30/17 | 110,110 | 109,766 |
| United States Treasury Note/Bond | 2.500% | 6/30/17 | 559,395 | 571,981 |
| United States Treasury Note/Bond | 0.875% | 7/15/17 | 313,175 | 312,686 |
| United States Treasury Note/Bond | 0.500% | 7/31/17 | 139,446 | 138,400 |
| United States Treasury Note/Bond | 2.375% | 7/31/17 | 170,594 | 174,219 |
| United States Treasury Note/Bond | 0.875% | 8/15/17 | 498,645 | 497,553 |
| United States Treasury Note/Bond | 4.750% | 8/15/17 | 641,705 | 680,406 |
| United States Treasury Note/Bond | 8.875% | 8/15/17 | 115,330 | 129,980 |
| United States Treasury Note/Bond | 0.625% | 8/31/17 | 99,731 | 99,092 |
| United States Treasury Note/Bond | 1.875% | 8/31/17 | 16,875 | 17,110 |
| United States Treasury Note/Bond | 1.000% | 9/15/17 | 473,982 | 473,759 |
| United States Treasury Note/Bond | 0.625% | 9/30/17 | 103,215 | 102,505 |
| United States Treasury Note/Bond | 1.875% | 9/30/17 | 55,175 | 55,960 |
| United States Treasury Note/Bond | 0.875% | 10/15/17 | 413,335 | 412,107 |
| United States Treasury Note/Bond | 0.750% | 10/31/17 | 301,377 | 299,777 |
| United States Treasury Note/Bond | 1.875% | 10/31/17 | 298,321 | 302,703 |
| United States Treasury Note/Bond | 0.875% | 11/15/17 | 604,081 | 602,100 |
| United States Treasury Note/Bond | 4.250% | 11/15/17 | 215,725 | 228,433 |
| United States Treasury Note/Bond | 0.625% | 11/30/17 | 474,865 | 471,009 |
| United States Treasury Note/Bond | 0.875% | 11/30/17 | 68,000 | 67,809 |
| United States Treasury Note/Bond | 2.250% | 11/30/17 | 30,600 | 31,279 |
| United States Treasury Note/Bond | 1.000% | 12/15/17 | 356,470 | 356,024 |
| United States Treasury Note/Bond | 0.750% | 12/31/17 | 19,235 | 19,109 |
| United States Treasury Note/Bond | 2.750% | 12/31/17 | 400 | 413 |
| United States Treasury Note/Bond | 0.875% | 1/15/18 | 211,175 | 210,218 |
| United States Treasury Note/Bond | 0.875% | 1/31/18 | 506,300 | 503,850 |
| United States Treasury Note/Bond | 2.625% | 1/31/18 | 278,308 | 286,961 |
| United States Treasury Note/Bond | 1.000% | 2/15/18 | 333,000 | 332,064 |
| United States Treasury Note/Bond | 3.500% | 2/15/18 | 182,405 | 191,525 |
| United States Treasury Note/Bond | 0.750% | 2/28/18 | 160,105 | 158,754 |
| United States Treasury Note/Bond | 2.750% | 2/28/18 | 428,100 | 442,882 |
| United States Treasury Note/Bond | 1.000% | 3/15/18 | 568,068 | 566,204 |
| United States Treasury Note/Bond | 0.750% | 3/31/18 | 138,065 | 136,857 |
| United States Treasury Note/Bond | 2.875% | 3/31/18 | 94,354 | 97,951 |
| United States Treasury Note/Bond | 0.750% | 4/15/18 | 207,110 | 205,103 |
| United States Treasury Note/Bond | 0.625% | 4/30/18 | 63,983 | 63,163 |
| United States Treasury Note/Bond | 1.000% | 5/15/18 | 171,109 | 170,307 |
| United States Treasury Note/Bond | 9.125% | 5/15/18 | 20,890 | 24,794 |
| United States Treasury Note/Bond | 1.000% | 5/31/18 | 652,760 | 649,496 |
| United States Treasury Note/Bond | 2.375% | 5/31/18 | 370,620 | 381,101 |
1
| Vanguard® Total Bond Market Index Fund | ||||
| Schedule of Investments | ||||
| December 31, 2015 | ||||
| Face | Market | |||
| Maturity | Amount | Value | ||
| Coupon | Date | ($000) | ($000) | |
| United States Treasury Note/Bond | 1.125% | 6/15/18 | 333,106 | 332,430 |
| United States Treasury Note/Bond | 1.375% | 6/30/18 | 137,070 | 137,648 |
| United States Treasury Note/Bond | 2.375% | 6/30/18 | 394,585 | 406,115 |
| United States Treasury Note/Bond | 0.875% | 7/15/18 | 443,519 | 439,638 |
| United States Treasury Note/Bond | 1.375% | 7/31/18 | 222,793 | 223,664 |
| United States Treasury Note/Bond | 2.250% | 7/31/18 | 26,604 | 27,302 |
| United States Treasury Note/Bond | 1.000% | 8/15/18 | 251,158 | 249,628 |
| United States Treasury Note/Bond | 4.000% | 8/15/18 | 400 | 429 |
| United States Treasury Note/Bond | 1.500% | 8/31/18 | 578,775 | 582,664 |
| United States Treasury Note/Bond | 1.000% | 9/15/18 | 808,885 | 803,320 |
| United States Treasury Note/Bond | 1.375% | 9/30/18 | 275,200 | 276,103 |
| United States Treasury Note/Bond | 0.875% | 10/15/18 | 57,401 | 56,773 |
| United States Treasury Note/Bond | 1.250% | 10/31/18 | 153,280 | 153,064 |
| United States Treasury Note/Bond | 1.750% | 10/31/18 | 159,775 | 161,847 |
| United States Treasury Note/Bond | 1.250% | 11/15/18 | 615,557 | 614,597 |
| United States Treasury Note/Bond | 3.750% | 11/15/18 | 257,786 | 275,751 |
| United States Treasury Note/Bond | 9.000% | 11/15/18 | 125 | 152 |
| United States Treasury Note/Bond | 1.250% | 11/30/18 | 295,160 | 294,652 |
| United States Treasury Note/Bond | 1.375% | 11/30/18 | 400 | 401 |
| United States Treasury Note/Bond | 1.375% | 12/31/18 | 68,175 | 68,228 |
| United States Treasury Note/Bond | 1.500% | 12/31/18 | 153,440 | 154,160 |
| United States Treasury Note/Bond | 1.250% | 1/31/19 | 54,800 | 54,629 |
| United States Treasury Note/Bond | 1.500% | 1/31/19 | 268,075 | 269,037 |
| United States Treasury Note/Bond | 2.750% | 2/15/19 | 258,075 | 268,922 |
| United States Treasury Note/Bond | 8.875% | 2/15/19 | 72,220 | 88,842 |
| United States Treasury Note/Bond | 1.375% | 2/28/19 | 122,070 | 121,994 |
| United States Treasury Note/Bond | 1.500% | 2/28/19 | 85,545 | 85,812 |
| United States Treasury Note/Bond | 1.500% | 3/31/19 | 30,965 | 31,057 |
| United States Treasury Note/Bond | 1.625% | 3/31/19 | 300,785 | 302,758 |
| United States Treasury Note/Bond | 1.250% | 4/30/19 | 2,781 | 2,764 |
| United States Treasury Note/Bond | 1.625% | 4/30/19 | 375,075 | 377,303 |
| United States Treasury Note/Bond | 3.125% | 5/15/19 | 401,309 | 423,445 |
| United States Treasury Note/Bond | 1.125% | 5/31/19 | 203,315 | 201,028 |
| United States Treasury Note/Bond | 1.500% | 5/31/19 | 275,605 | 275,864 |
| United States Treasury Note/Bond | 1.000% | 6/30/19 | 13,462 | 13,239 |
| United States Treasury Note/Bond | 1.625% | 6/30/19 | 259,575 | 260,751 |
| United States Treasury Note/Bond | 0.875% | 7/31/19 | 83,706 | 81,823 |
| United States Treasury Note/Bond | 1.625% | 7/31/19 | 230,496 | 231,323 |
| United States Treasury Note/Bond | 3.625% | 8/15/19 | 735,167 | 789,268 |
| United States Treasury Note/Bond | 8.125% | 8/15/19 | 6,636 | 8,181 |
| United States Treasury Note/Bond | 1.625% | 8/31/19 | 387,144 | 388,293 |
| United States Treasury Note/Bond | 1.000% | 9/30/19 | 38,600 | 37,786 |
| United States Treasury Note/Bond | 1.750% | 9/30/19 | 354,421 | 356,859 |
| United States Treasury Note/Bond | 1.250% | 10/31/19 | 600 | 593 |
| United States Treasury Note/Bond | 1.500% | 10/31/19 | 505,710 | 504,132 |
| United States Treasury Note/Bond | 3.375% | 11/15/19 | 578,485 | 617,712 |
| United States Treasury Note/Bond | 1.000% | 11/30/19 | 147,175 | 143,864 |
| United States Treasury Note/Bond | 1.500% | 11/30/19 | 503,150 | 501,263 |
| United States Treasury Note/Bond | 1.125% | 12/31/19 | 95,000 | 93,204 |
| United States Treasury Note/Bond | 1.625% | 12/31/19 | 39,053 | 39,053 |
| United States Treasury Note/Bond | 1.250% | 1/31/20 | 586,215 | 577,240 |
| United States Treasury Note/Bond | 1.375% | 1/31/20 | 160,508 | 158,827 |
| United States Treasury Note/Bond | 3.625% | 2/15/20 | 477,635 | 515,249 |
| United States Treasury Note/Bond | 8.500% | 2/15/20 | 15,275 | 19,452 |
| United States Treasury Note/Bond | 1.250% | 2/29/20 | 77,506 | 76,247 |
| United States Treasury Note/Bond | 1.375% | 2/29/20 | 173,735 | 171,753 |
| United States Treasury Note/Bond | 1.125% | 3/31/20 | 300 | 293 |
| United States Treasury Note/Bond | 1.375% | 3/31/20 | 145,643 | 143,868 |
| United States Treasury Note/Bond | 1.125% | 4/30/20 | 209,925 | 205,137 |
| United States Treasury Note/Bond | 1.375% | 4/30/20 | 113,298 | 111,829 |
| United States Treasury Note/Bond | 3.500% | 5/15/20 | 601,005 | 646,177 |
| United States Treasury Note/Bond | 8.750% | 5/15/20 | 70 | 91 |
| United States Treasury Note/Bond | 1.375% | 5/31/20 | 292,855 | 288,644 |
| United States Treasury Note/Bond | 1.500% | 5/31/20 | 118,577 | 117,595 |
2
| Vanguard® Total Bond Market Index Fund | ||||
| Schedule of Investments | ||||
| December 31, 2015 | ||||
| Face | Market | |||
| Maturity | Amount | Value | ||
| Coupon | Date | ($000) | ($000) | |
| United States Treasury Note/Bond | 1.625% | 6/30/20 | 87,480 | 87,125 |
| United States Treasury Note/Bond | 1.875% | 6/30/20 | 270,460 | 272,361 |
| United States Treasury Note/Bond | 1.625% | 7/31/20 | 334,265 | 332,697 |
| United States Treasury Note/Bond | 2.000% | 7/31/20 | 105,803 | 107,026 |
| United States Treasury Note/Bond | 2.625% | 8/15/20 | 375,247 | 389,788 |
| United States Treasury Note/Bond | 8.750% | 8/15/20 | 192,190 | 251,709 |
| United States Treasury Note/Bond | 1.375% | 8/31/20 | 388,755 | 382,558 |
| United States Treasury Note/Bond | 2.125% | 8/31/20 | 155,666 | 158,171 |
| United States Treasury Note/Bond | 2.000% | 9/30/20 | 30,741 | 31,077 |
| United States Treasury Note/Bond | 1.375% | 10/31/20 | 205,217 | 201,626 |
| United States Treasury Note/Bond | 1.750% | 10/31/20 | 232,227 | 231,865 |
| United States Treasury Note/Bond | 2.625% | 11/15/20 | 516,599 | 536,777 |
| United States Treasury Note/Bond | 1.625% | 11/30/20 | 394,003 | 391,726 |
| United States Treasury Note/Bond | 2.000% | 11/30/20 | 279,455 | 282,294 |
| United States Treasury Note/Bond | 1.750% | 12/31/20 | 651,150 | 650,746 |
| United States Treasury Note/Bond | 2.375% | 12/31/20 | 342,770 | 352,409 |
| United States Treasury Note/Bond | 2.125% | 1/31/21 | 104,586 | 106,122 |
| United States Treasury Note/Bond | 3.625% | 2/15/21 | 381,842 | 415,074 |
| United States Treasury Note/Bond | 7.875% | 2/15/21 | 209,734 | 271,476 |
| United States Treasury Note/Bond | 2.000% | 2/28/21 | 426,858 | 430,324 |
| United States Treasury Note/Bond | 2.250% | 3/31/21 | 364,501 | 371,904 |
| United States Treasury Note/Bond | 2.250% | 4/30/21 | 369,725 | 377,005 |
| United States Treasury Note/Bond | 3.125% | 5/15/21 | 391,810 | 416,725 |
| United States Treasury Note/Bond | 8.125% | 5/15/21 | 110 | 145 |
| United States Treasury Note/Bond | 2.000% | 5/31/21 | 180,660 | 181,874 |
| United States Treasury Note/Bond | 2.125% | 6/30/21 | 344,450 | 348,756 |
| United States Treasury Note/Bond | 2.250% | 7/31/21 | 224,925 | 229,142 |
| United States Treasury Note/Bond | 2.125% | 8/15/21 | 51,200 | 51,800 |
| United States Treasury Note/Bond | 8.125% | 8/15/21 | 35,690 | 47,518 |
| United States Treasury Note/Bond | 2.000% | 8/31/21 | 374,915 | 376,497 |
| United States Treasury Note/Bond | 2.125% | 9/30/21 | 363,791 | 367,542 |
| United States Treasury Note/Bond | 2.000% | 10/31/21 | 287,265 | 288,029 |
| United States Treasury Note/Bond | 2.000% | 11/15/21 | 335,482 | 336,374 |
| United States Treasury Note/Bond | 8.000% | 11/15/21 | 49,276 | 65,807 |
| United States Treasury Note/Bond | 1.875% | 11/30/21 | 362,398 | 360,811 |
| United States Treasury Note/Bond | 2.125% | 12/31/21 | 308,010 | 310,705 |
| United States Treasury Note/Bond | 1.500% | 1/31/22 | 170,965 | 166,183 |
| United States Treasury Note/Bond | 2.000% | 2/15/22 | 81,791 | 81,932 |
| United States Treasury Note/Bond | 1.750% | 2/28/22 | 548,357 | 540,472 |
| United States Treasury Note/Bond | 1.750% | 3/31/22 | 204,550 | 201,322 |
| United States Treasury Note/Bond | 1.750% | 4/30/22 | 257,300 | 253,160 |
| United States Treasury Note/Bond | 1.750% | 5/15/22 | 31,220 | 30,703 |
| United States Treasury Note/Bond | 1.875% | 5/31/22 | 259,720 | 257,164 |
| United States Treasury Note/Bond | 2.125% | 6/30/22 | 220,235 | 221,301 |
| United States Treasury Note/Bond | 2.000% | 7/31/22 | 246,925 | 246,268 |
| United States Treasury Note/Bond | 1.625% | 8/15/22 | 55,910 | 54,451 |
| United States Treasury Note/Bond | 7.250% | 8/15/22 | 3,014 | 3,986 |
| United States Treasury Note/Bond | 1.875% | 8/31/22 | 393,030 | 388,424 |
| United States Treasury Note/Bond | 1.750% | 9/30/22 | 322,915 | 316,405 |
| United States Treasury Note/Bond | 1.875% | 10/31/22 | 356,940 | 352,311 |
| United States Treasury Note/Bond | 1.625% | 11/15/22 | 135,200 | 131,313 |
| United States Treasury Note/Bond | 2.000% | 11/30/22 | 272,290 | 270,716 |
| United States Treasury Note/Bond | 2.125% | 12/31/22 | 262,400 | 262,809 |
| United States Treasury Note/Bond | 2.000% | 2/15/23 | 60,251 | 59,884 |
| United States Treasury Note/Bond | 7.125% | 2/15/23 | 163,535 | 218,345 |
| United States Treasury Note/Bond | 1.750% | 5/15/23 | 671,148 | 653,638 |
| United States Treasury Note/Bond | 2.500% | 8/15/23 | 526,785 | 540,366 |
| United States Treasury Note/Bond | 6.250% | 8/15/23 | 308,228 | 397,805 |
| United States Treasury Note/Bond | 2.750% | 11/15/23 | 419,162 | 437,370 |
| United States Treasury Note/Bond | 2.750% | 2/15/24 | 459,279 | 478,224 |
| United States Treasury Note/Bond | 2.500% | 5/15/24 | 657,918 | 672,004 |
| United States Treasury Note/Bond | 2.375% | 8/15/24 | 455,390 | 459,944 |
| United States Treasury Note/Bond | 2.250% | 11/15/24 | 600,474 | 600,006 |
| United States Treasury Note/Bond | 7.500% | 11/15/24 | 1,325 | 1,888 |
3
| Vanguard® Total Bond Market Index Fund | ||||
| Schedule of Investments | ||||
| December 31, 2015 | ||||
| Face | Market | |||
| Maturity | Amount | Value | ||
| Coupon | Date | ($000) | ($000) | |
| United States Treasury Note/Bond | 2.000% | 2/15/25 | 224,279 | 219,127 |
| United States Treasury Note/Bond | 7.625% | 2/15/25 | 2,112 | 3,052 |
| United States Treasury Note/Bond | 2.125% | 5/15/25 | 841,202 | 829,770 |
| United States Treasury Note/Bond | 2.000% | 8/15/25 | 528,325 | 514,953 |
| United States Treasury Note/Bond | 6.875% | 8/15/25 | 17,689 | 24,756 |
| United States Treasury Note/Bond | 2.250% | 11/15/25 | 879,290 | 876,951 |
| United States Treasury Note/Bond | 6.000% | 2/15/26 | 50,679 | 67,617 |
| United States Treasury Note/Bond | 6.750% | 8/15/26 | 32,360 | 45,820 |
| United States Treasury Note/Bond | 6.500% | 11/15/26 | 65,779 | 91,967 |
| United States Treasury Note/Bond | 6.375% | 8/15/27 | 63,585 | 89,247 |
| United States Treasury Note/Bond | 5.500% | 8/15/28 | 39,225 | 52,145 |
| United States Treasury Note/Bond | 5.250% | 11/15/28 | 3,485 | 4,549 |
| United States Treasury Note/Bond | 5.250% | 2/15/29 | 48,145 | 63,010 |
| United States Treasury Note/Bond | 6.125% | 8/15/29 | 75,455 | 106,981 |
| United States Treasury Note/Bond | 6.250% | 5/15/30 | 93,038 | 134,760 |
| United States Treasury Note/Bond | 5.375% | 2/15/31 | 278,660 | 377,453 |
| United States Treasury Note/Bond | 4.500% | 2/15/36 | 160,499 | 205,389 |
| United States Treasury Note/Bond | 4.750% | 2/15/37 | 5,000 | 6,618 |
| United States Treasury Note/Bond | 5.000% | 5/15/37 | 6,000 | 8,212 |
| United States Treasury Note/Bond | 4.375% | 2/15/38 | 69,403 | 87,448 |
| United States Treasury Note/Bond | 4.500% | 5/15/38 | 22,613 | 28,991 |
| United States Treasury Note/Bond | 3.500% | 2/15/39 | 167,651 | 185,150 |
| United States Treasury Note/Bond | 4.250% | 5/15/39 | 98,885 | 121,983 |
| United States Treasury Note/Bond | 4.500% | 8/15/39 | 66,272 | 84,694 |
| United States Treasury Note/Bond | 4.375% | 11/15/39 | 184,026 | 231,096 |
| United States Treasury Note/Bond | 4.625% | 2/15/40 | 186,077 | 242,015 |
| United States Treasury Note/Bond | 4.375% | 5/15/40 | 216,060 | 271,527 |
| United States Treasury Note/Bond | 3.875% | 8/15/40 | 113,672 | 132,694 |
| United States Treasury Note/Bond | 4.250% | 11/15/40 | 208,570 | 257,519 |
| 1 United States Treasury Note/Bond | 4.750% | 2/15/41 | 208,930 | 277,419 |
| United States Treasury Note/Bond | 4.375% | 5/15/41 | 119,898 | 151,146 |
| United States Treasury Note/Bond | 3.750% | 8/15/41 | 10 | 11 |
| United States Treasury Note/Bond | 3.125% | 11/15/41 | 79,150 | 81,673 |
| United States Treasury Note/Bond | 3.125% | 2/15/42 | 36,027 | 37,153 |
| United States Treasury Note/Bond | 3.000% | 5/15/42 | 125,799 | 126,408 |
| United States Treasury Note/Bond | 2.750% | 8/15/42 | 456,815 | 436,044 |
| United States Treasury Note/Bond | 2.750% | 11/15/42 | 546,619 | 520,567 |
| United States Treasury Note/Bond | 3.125% | 2/15/43 | 166,938 | 170,876 |
| United States Treasury Note/Bond | 2.875% | 5/15/43 | 408,940 | 398,205 |
| United States Treasury Note/Bond | 3.625% | 8/15/43 | 281,900 | 317,138 |
| United States Treasury Note/Bond | 3.750% | 11/15/43 | 268,181 | 308,574 |
| United States Treasury Note/Bond | 3.625% | 2/15/44 | 401,117 | 450,567 |
| United States Treasury Note/Bond | 3.375% | 5/15/44 | 259,981 | 278,627 |
| United States Treasury Note/Bond | 3.125% | 8/15/44 | 292,450 | 298,480 |
| United States Treasury Note/Bond | 3.000% | 11/15/44 | 316,027 | 314,396 |
| United States Treasury Note/Bond | 2.500% | 2/15/45 | 400,489 | 358,750 |
| United States Treasury Note/Bond | 3.000% | 5/15/45 | 479,435 | 476,438 |
| United States Treasury Note/Bond | 2.875% | 8/15/45 | 411,420 | 398,950 |
| United States Treasury Note/Bond | 3.000% | 11/15/45 | 299,325 | 297,969 |
| 58,773,205 | ||||
| Agency Bonds and Notes (3.0%) | ||||
| 2 AID-Israel | 5.500% | 9/18/23 | 542 | 653 |
| 2 AID-Israel | 5.500% | 12/4/23 | 3,268 | 3,941 |
| 2 AID-Israel | 5.500% | 4/26/24 | 20,405 | 24,730 |
| 2 AID-Jordan | 1.945% | 6/23/19 | 7,750 | 7,808 |
| 2 AID-Jordan | 2.503% | 10/30/20 | 10,100 | 10,326 |
| 2 AID-Jordan | 2.578% | 6/30/22 | 3,400 | 3,442 |
| 2 AID-Tunisia | 2.452% | 7/24/21 | 3,275 | 3,299 |
| 2 AID-Ukraine | 1.844% | 5/16/19 | 4,650 | 4,691 |
| 2 AID-Ukraine | 1.847% | 5/29/20 | 11,500 | 11,451 |
| 3 Federal Farm Credit Banks | 4.875% | 1/17/17 | 13,120 | 13,664 |
| 3 Federal Farm Credit Banks | 1.125% | 9/22/17 | 5,000 | 5,002 |
| 3 Federal Farm Credit Banks | 1.000% | 9/25/17 | 5,975 | 5,964 |
| 3 Federal Farm Credit Banks | 1.125% | 12/18/17 | 16,800 | 16,796 |
4
| Vanguard® Total Bond Market Index Fund | ||||
| Schedule of Investments | ||||
| December 31, 2015 | ||||
| Face | Market | |||
| Maturity | Amount | Value | ||
| Coupon | Date | ($000) | ($000) | |
| 3 Federal Farm Credit Banks | 1.110% | 2/20/18 | 5,800 | 5,790 |
| 3 Federal Farm Credit Banks | 1.100% | 6/1/18 | 10,000 | 9,958 |
| 3 Federal Farm Credit Banks | 5.150% | 11/15/19 | 15,675 | 17,726 |
| 3 Federal Farm Credit Banks | 3.500% | 12/20/23 | 5,000 | 5,385 |
| 3 Federal Home Loan Banks | 0.875% | 3/10/17 | 3,950 | 3,949 |
| 3 Federal Home Loan Banks | 4.875% | 5/17/17 | 114,335 | 120,319 |
| 3 Federal Home Loan Banks | 0.875% | 5/24/17 | 41,460 | 41,380 |
| 3 Federal Home Loan Banks | 0.625% | 5/30/17 | 75,000 | 74,592 |
| 3 Federal Home Loan Banks | 1.000% | 6/21/17 | 144,740 | 144,665 |
| 3 Federal Home Loan Banks | 0.860% | 8/1/17 | 13,800 | 13,758 |
| 3 Federal Home Loan Banks | 0.750% | 8/28/17 | 9,000 | 8,952 |
| 3 Federal Home Loan Banks | 0.625% | 10/26/17 | 53,000 | 52,554 |
| 3 Federal Home Loan Banks | 5.000% | 11/17/17 | 7,690 | 8,238 |
| 3 Federal Home Loan Banks | 1.000% | 12/19/17 | 52,000 | 51,864 |
| 3 Federal Home Loan Banks | 1.375% | 3/9/18 | 31,000 | 31,113 |
| 3 Federal Home Loan Banks | 1.125% | 4/25/18 | 36,475 | 36,375 |
| 3 Federal Home Loan Banks | 2.750% | 6/8/18 | 26,950 | 27,897 |
| 3 Federal Home Loan Banks | 5.375% | 8/15/18 | 4,820 | 5,320 |
| 3 Federal Home Loan Banks | 1.875% | 3/13/20 | 795 | 801 |
| 3 Federal Home Loan Banks | 4.125% | 3/13/20 | 8,100 | 8,890 |
| 3 Federal Home Loan Banks | 3.375% | 6/12/20 | 25,725 | 27,465 |
| 3 Federal Home Loan Banks | 5.250% | 12/11/20 | 6,850 | 7,939 |
| 3 Federal Home Loan Banks | 2.250% | 6/11/21 | 30,750 | 31,111 |
| 3 Federal Home Loan Banks | 5.625% | 6/11/21 | 19,450 | 23,041 |
| 3 Federal Home Loan Banks | 2.125% | 3/10/23 | 36,695 | 36,294 |
| 3 Federal Home Loan Banks | 2.875% | 6/14/24 | 40,400 | 41,608 |
| 3 Federal Home Loan Banks | 5.375% | 8/15/24 | 24,600 | 30,007 |
| 3 Federal Home Loan Banks | 2.875% | 9/13/24 | 14,985 | 15,362 |
| 3 Federal Home Loan Banks | 5.500% | 7/15/36 | 19,780 | 25,803 |
| 4 Federal Home Loan Mortgage Corp. | 0.500% | 1/27/17 | 36,395 | 36,258 |
| 4 Federal Home Loan Mortgage Corp. | 5.000% | 2/16/17 | 28,225 | 29,519 |
| 4 Federal Home Loan Mortgage Corp. | 0.875% | 2/22/17 | 39,850 | 39,854 |
| 4 Federal Home Loan Mortgage Corp. | 1.000% | 3/8/17 | 35,200 | 35,251 |
| 4 Federal Home Loan Mortgage Corp. | 5.000% | 4/18/17 | 10,000 | 10,514 |
| 4 Federal Home Loan Mortgage Corp. | 1.250% | 5/12/17 | 90,225 | 90,508 |
| 4 Federal Home Loan Mortgage Corp. | 1.000% | 6/29/17 | 36,050 | 36,026 |
| 4 Federal Home Loan Mortgage Corp. | 0.750% | 7/14/17 | 32,125 | 31,977 |
| 4 Federal Home Loan Mortgage Corp. | 1.000% | 7/28/17 | 136,906 | 136,787 |
| 4 Federal Home Loan Mortgage Corp. | 5.500% | 8/23/17 | 33,450 | 35,843 |
| 4 Federal Home Loan Mortgage Corp. | 1.000% | 9/29/17 | 87,850 | 87,690 |
| 4 Federal Home Loan Mortgage Corp. | 5.125% | 11/17/17 | 26,045 | 27,961 |
| 4 Federal Home Loan Mortgage Corp. | 1.000% | 12/15/17 | 70,000 | 69,817 |
| 4 Federal Home Loan Mortgage Corp. | 0.750% | 1/12/18 | 31,725 | 31,462 |
| 4 Federal Home Loan Mortgage Corp. | 0.875% | 3/7/18 | 29,170 | 28,963 |
| 4 Federal Home Loan Mortgage Corp. | 4.875% | 6/13/18 | 22,750 | 24,712 |
| 4 Federal Home Loan Mortgage Corp. | 3.750% | 3/27/19 | 60,848 | 65,148 |
| 4 Federal Home Loan Mortgage Corp. | 1.750% | 5/30/19 | 62,007 | 62,457 |
| 4 Federal Home Loan Mortgage Corp. | 1.250% | 8/1/19 | 31,910 | 31,534 |
| 4 Federal Home Loan Mortgage Corp. | 1.250% | 10/2/19 | 103,270 | 101,811 |
| 4 Federal Home Loan Mortgage Corp. | 0.000% | 11/29/19 | 150 | 138 |
| 4 Federal Home Loan Mortgage Corp. | 1.375% | 5/1/20 | 63,970 | 63,045 |
| 4 Federal Home Loan Mortgage Corp. | 2.375% | 1/13/22 | 88,189 | 89,450 |
| 4 Federal Home Loan Mortgage Corp. | 6.750% | 9/15/29 | 3,606 | 5,120 |
| 4 Federal Home Loan Mortgage Corp. | 6.750% | 3/15/31 | 64,969 | 93,108 |
| 4 Federal Home Loan Mortgage Corp. | 6.250% | 7/15/32 | 8,104 | 11,241 |
| 4 Federal National Mortgage Assn. | 1.250% | 1/30/17 | 28,070 | 28,188 |
| 4 Federal National Mortgage Assn. | 5.000% | 2/13/17 | 79,595 | 83,217 |
| 4 Federal National Mortgage Assn. | 0.750% | 4/20/17 | 13,275 | 13,235 |
| 4 Federal National Mortgage Assn. | 1.125% | 4/27/17 | 117,475 | 117,672 |
| 4 Federal National Mortgage Assn. | 5.000% | 5/11/17 | 142,581 | 150,212 |
| 4 Federal National Mortgage Assn. | 5.375% | 6/12/17 | 91,640 | 97,304 |
| 4 Federal National Mortgage Assn. | 0.875% | 8/28/17 | 8,055 | 8,029 |
| 4 Federal National Mortgage Assn. | 1.000% | 9/27/17 | 25,000 | 24,955 |
| 4 Federal National Mortgage Assn. | 0.875% | 10/26/17 | 82,150 | 81,782 |
5
| Vanguard® Total Bond Market Index Fund | |||||
| Schedule of Investments | |||||
| December 31, 2015 | |||||
| Face | Market | ||||
| Maturity | Amount | Value | |||
| Coupon | Date | ($000) | ($000) | ||
| 4,5 | Federal National Mortgage Assn. | 0.900% | 11/7/17 | 70 | 70 |
| 4,5 | Federal National Mortgage Assn. | 1.000% | 11/15/17 | 40 | 40 |
| 4 | Federal National Mortgage Assn. | 0.875% | 12/20/17 | 51,400 | 51,141 |
| 4,5 | Federal National Mortgage Assn. | 1.000% | 12/28/17 | 70 | 70 |
| 4 | Federal National Mortgage Assn. | 0.875% | 2/8/18 | 79,070 | 78,563 |
| 4 | Federal National Mortgage Assn. | 0.875% | 5/21/18 | 141,365 | 140,040 |
| 4 | Federal National Mortgage Assn. | 1.125% | 7/20/18 | 100,775 | 100,384 |
| 4 | Federal National Mortgage Assn. | 1.875% | 9/18/18 | 41,050 | 41,631 |
| 4 | Federal National Mortgage Assn. | 1.125% | 10/19/18 | 63,950 | 63,556 |
| 4 | Federal National Mortgage Assn. | 1.625% | 11/27/18 | 70,440 | 70,947 |
| 4 | Federal National Mortgage Assn. | 1.125% | 12/14/18 | 55,000 | 54,564 |
| 4 | Federal National Mortgage Assn. | 1.875% | 2/19/19 | 53,110 | 53,796 |
| 4 | Federal National Mortgage Assn. | 1.750% | 6/20/19 | 48,425 | 48,782 |
| 4 | Federal National Mortgage Assn. | 1.750% | 9/12/19 | 67,575 | 67,887 |
| 4 | Federal National Mortgage Assn. | 0.000% | 10/9/19 | 19,695 | 18,231 |
| 4 | Federal National Mortgage Assn. | 1.750% | 11/26/19 | 61,950 | 62,205 |
| 4 | Federal National Mortgage Assn. | 1.625% | 1/21/20 | 30,800 | 30,718 |
| 4 | Federal National Mortgage Assn. | 1.500% | 6/22/20 | 52,100 | 51,447 |
| 4 | Federal National Mortgage Assn. | 1.500% | 11/30/20 | 41,400 | 40,698 |
| 4 | Federal National Mortgage Assn. | 1.875% | 12/28/20 | 40,000 | 40,022 |
| 4 | Federal National Mortgage Assn. | 2.625% | 9/6/24 | 36,525 | 36,907 |
| 4 | Federal National Mortgage Assn. | 6.250% | 5/15/29 | 3,995 | 5,431 |
| 4 | Federal National Mortgage Assn. | 7.125% | 1/15/30 | 26,389 | 38,627 |
| 4 | Federal National Mortgage Assn. | 7.250% | 5/15/30 | 47,677 | 70,682 |
| 4 | Federal National Mortgage Assn. | 6.625% | 11/15/30 | 24,700 | 35,042 |
| 4 | Federal National Mortgage Assn. | 5.625% | 7/15/37 | 7,765 | 10,340 |
| 3 | Financing Corp. | 9.800% | 4/6/18 | 1,750 | 2,076 |
| 3 | Financing Corp. | 10.350% | 8/3/18 | 4,910 | 6,017 |
| 3 | Financing Corp. | 9.650% | 11/2/18 | 10,615 | 13,001 |
| 3 | Financing Corp. | 9.700% | 4/5/19 | 1,575 | 1,972 |
| Private Export Funding Corp. | 1.375% | 2/15/17 | 2,030 | 2,033 | |
| Private Export Funding Corp. | 2.250% | 12/15/17 | 4,600 | 4,677 | |
| Private Export Funding Corp. | 1.875% | 7/15/18 | 4,300 | 4,322 | |
| Private Export Funding Corp. | 4.375% | 3/15/19 | 8,760 | 9,458 | |
| Private Export Funding Corp. | 1.450% | 8/15/19 | 13,800 | 13,540 | |
| Private Export Funding Corp. | 2.250% | 3/15/20 | 8,000 | 8,063 | |
| Private Export Funding Corp. | 2.300% | 9/15/20 | 2,475 | 2,493 | |
| Private Export Funding Corp. | 4.300% | 12/15/21 | 10,975 | 12,116 | |
| Private Export Funding Corp. | 2.800% | 5/15/22 | 2,625 | 2,668 | |
| Private Export Funding Corp. | 2.050% | 11/15/22 | 8,335 | 8,049 | |
| Private Export Funding Corp. | 3.550% | 1/15/24 | 4,200 | 4,453 | |
| Private Export Funding Corp. | 2.450% | 7/15/24 | 8,300 | 8,081 | |
| Private Export Funding Corp. | 3.250% | 6/15/25 | 2,475 | 2,544 | |
| Resolution Funding Corp. | 8.125% | 10/15/19 | 450 | 553 | |
| Resolution Funding Corp. | 8.875% | 7/15/20 | 180 | 234 | |
| Resolution Funding Corp. | 8.625% | 1/15/30 | 110 | 176 | |
| Small Business Administration Variable Rate Interest | |||||
| Only Custodial Receipts (U.S. Government | |||||
| Guaranteed) | 2.719% | 7/15/17 | 4,449 | 3 | |
| 3 | Tennessee Valley Authority | 5.500% | 7/18/17 | 17,208 | 18,356 |
| 3 | Tennessee Valley Authority | 4.500% | 4/1/18 | 6,360 | 6,812 |
| 3 | Tennessee Valley Authority | 1.750% | 10/15/18 | 6,460 | 6,520 |
| 3 | Tennessee Valley Authority | 3.875% | 2/15/21 | 10,915 | 11,903 |
| 3 | Tennessee Valley Authority | 1.875% | 8/15/22 | 7,300 | 7,110 |
| 3 | Tennessee Valley Authority | 2.875% | 9/15/24 | 9,637 | 9,648 |
| 3 | Tennessee Valley Authority | 6.750% | 11/1/25 | 17,306 | 22,809 |
| 3 | Tennessee Valley Authority | 7.125% | 5/1/30 | 27,165 | 38,793 |
| 3 | Tennessee Valley Authority | 4.650% | 6/15/35 | 15,169 | 16,990 |
| 3 | Tennessee Valley Authority | 5.880% | 4/1/36 | 10,200 | 13,020 |
| 3 | Tennessee Valley Authority | 6.150% | 1/15/38 | 920 | 1,224 |
| 3 | Tennessee Valley Authority | 5.500% | 6/15/38 | 2,550 | 3,142 |
| 3 | Tennessee Valley Authority | 5.250% | 9/15/39 | 9,178 | 11,110 |
| 3 | Tennessee Valley Authority | 3.500% | 12/15/42 | 9,015 | 8,257 |
| 3 | Tennessee Valley Authority | 4.875% | 1/15/48 | 6,951 | 7,769 |
6
| Vanguard® Total Bond Market Index Fund | |||||
| Schedule of Investments | |||||
| December 31, 2015 | |||||
| Face | Market | ||||
| Maturity | Amount | Value | |||
| Coupon | Date | ($000) | ($000) | ||
| 3 | Tennessee Valley Authority | 5.375% | 4/1/56 | 6,250 | 7,430 |
| 3 | Tennessee Valley Authority | 4.625% | 9/15/60 | 7,468 | 7,820 |
| 3 | Tennessee Valley Authority | 4.250% | 9/15/65 | 14,725 | 14,214 |
| 4,431,988 | |||||
| Conventional Mortgage-Backed Securities (20.6%) | |||||
| 4,5 | Fannie Mae Pool | 2.000% | 8/1/28–10/1/28 | 80,801 | 79,512 |
| 4,5,6 | Fannie Mae Pool | 2.500% | 11/1/26–2/1/43 | 859,101 | 864,819 |
| 4,5,6 | Fannie Mae Pool | 3.000% | 9/1/20–1/1/46 | 2,427,668 | 2,464,753 |
| 4,5,6 | Fannie Mae Pool | 3.500% | 10/1/18–1/1/46 | 3,353,001 | 3,475,528 |
| 4,5,6 | Fannie Mae Pool | 4.000% | 6/1/18–1/1/46 | 2,388,639 | 2,535,172 |
| 4,5,6 | Fannie Mae Pool | 4.500% | 1/1/18–1/1/46 | 1,286,620 | 1,391,433 |
| 4,5,6 | Fannie Mae Pool | 5.000% | 3/1/17–1/1/46 | 735,888 | 809,038 |
| 4,5 | Fannie Mae Pool | 5.500% | 11/1/16–1/1/46 | 577,895 | 644,276 |
| 4,5 | Fannie Mae Pool | 6.000% | 3/1/16–5/1/41 | 377,002 | 426,703 |
| 4,5 | Fannie Mae Pool | 6.500% | 4/1/16–10/1/39 | 112,753 | 130,271 |
| 4,5 | Fannie Mae Pool | 7.000% | 3/1/16–11/1/38 | 37,172 | 42,777 |
| 4,5 | Fannie Mae Pool | 7.500% | 3/1/16–12/1/32 | 3,061 | 3,428 |
| 4,5 | Fannie Mae Pool | 8.000% | 7/1/17–9/1/31 | 1,056 | 1,189 |
| 4,5 | Fannie Mae Pool | 8.500% | 11/1/18–5/1/32 | 457 | 526 |
| 4,5 | Fannie Mae Pool | 9.000% | 2/1/17–8/1/30 | 109 | 121 |
| 4,5 | Fannie Mae Pool | 9.500% | 3/1/17–11/1/25 | 151 | 174 |
| 4,5 | Fannie Mae Pool | 10.000% | 10/1/16–12/1/17 | 1 | 1 |
| 4,5 | Freddie Mac Gold Pool | 2.000% | 7/1/28–1/1/29 | 52,253 | 51,404 |
| 4,5 | Freddie Mac Gold Pool | 2.500% | 4/1/27–3/1/43 | 661,515 | 667,670 |
| 4,5,6 | Freddie Mac Gold Pool | 3.000% | 3/1/21–1/1/46 | 1,540,188 | 1,561,102 |
| 4,5,6 | Freddie Mac Gold Pool | 3.500% | 12/1/20–1/1/46 | 2,041,250 | 2,110,721 |
| 4,5,6 | Freddie Mac Gold Pool | 4.000% | 3/1/18–1/1/46 | 1,531,946 | 1,622,231 |
| 4,5,6 | Freddie Mac Gold Pool | 4.500% | 12/1/17–1/1/46 | 777,941 | 838,297 |
| 4,5,6 | Freddie Mac Gold Pool | 5.000% | 12/1/16–1/1/46 | 438,322 | 477,663 |
| 4,5 | Freddie Mac Gold Pool | 5.500% | 3/1/16–6/1/41 | 351,271 | 389,390 |
| 4,5 | Freddie Mac Gold Pool | 6.000% | 2/1/16–5/1/40 | 208,200 | 234,652 |
| 4,5 | Freddie Mac Gold Pool | 6.500% | 1/1/16–9/1/39 | 60,451 | 70,010 |
| 4,5 | Freddie Mac Gold Pool | 7.000% | 1/1/16–12/1/38 | 22,091 | 25,641 |
| 4,5 | Freddie Mac Gold Pool | 7.500% | 1/1/16–2/1/32 | 1,794 | 2,056 |
| 4,5 | Freddie Mac Gold Pool | 8.000% | 1/1/16–1/1/32 | 1,829 | 2,080 |
| 4,5 | Freddie Mac Gold Pool | 8.500% | 3/1/21–7/1/31 | 352 | 401 |
| 4,5 | Freddie Mac Gold Pool | 9.000% | 7/1/20–3/1/31 | 268 | 301 |
| 4,5 | Freddie Mac Gold Pool | 9.500% | 4/1/16–6/1/25 | 33 | 36 |
| 4,5 | Freddie Mac Gold Pool | 10.000% | 11/1/16–4/1/25 | 3 | 4 |
| 4,5 | Freddie Mac Non Gold Pool | 8.000% | 2/1/17–6/1/17 | 2 | 2 |
| 4,5 | Freddie Mac Non Gold Pool | 8.500% | 6/1/18 | 3 | 4 |
| 4,5 | Freddie Mac Non Gold Pool | 9.500% | 3/1/20 | 2 | 2 |
| 5 | Ginnie Mae I Pool | 3.000% | 1/15/26–6/15/45 | 277,217 | 281,947 |
| 5 | Ginnie Mae I Pool | 3.500% | 11/15/25–4/15/45 | 356,298 | 372,071 |
| 5 | Ginnie Mae I Pool | 4.000% | 8/15/18–1/1/46 | 386,916 | 411,873 |
| 5 | Ginnie Mae I Pool | 4.500% | 5/15/18–2/1/46 | 422,015 | 458,012 |
| 5 | Ginnie Mae I Pool | 4.750% | 8/15/33 | 13 | 14 |
| 5 | Ginnie Mae I Pool | 5.000% | 1/15/17–4/15/41 | 251,758 | 277,429 |
| 5 | Ginnie Mae I Pool | 5.500% | 2/15/17–2/15/41 | 133,745 | 150,677 |
| 5 | Ginnie Mae I Pool | 6.000% | 5/15/16–6/15/41 | 104,971 | 118,840 |
| 5 | Ginnie Mae I Pool | 6.500% | 9/15/23–1/15/39 | 27,111 | 31,050 |
| 5 | Ginnie Mae I Pool | 7.000% | 9/15/22–9/15/36 | 6,730 | 7,626 |
| 5 | Ginnie Mae I Pool | 7.250% | 9/15/25 | 31 | 32 |
| 5 | Ginnie Mae I Pool | 7.500% | 5/15/17–6/15/32 | 3,040 | 3,383 |
| 5 | Ginnie Mae I Pool | 7.750% | 2/15/30 | 2 | 2 |
| 5 | Ginnie Mae I Pool | 8.000% | 1/15/17–12/15/30 | 2,068 | 2,295 |
| 5 | Ginnie Mae I Pool | 8.250% | 6/15/27 | 1 | 2 |
| 5 | Ginnie Mae I Pool | 8.500% | 1/15/17–3/15/31 | 448 | 482 |
| 5 | Ginnie Mae I Pool | 9.000% | 6/15/16–1/15/31 | 461 | 488 |
| 5 | Ginnie Mae I Pool | 9.500% | 7/15/16–9/15/25 | 143 | 158 |
| 5 | Ginnie Mae I Pool | 10.000% | 2/15/18–2/15/25 | 33 | 36 |
| 5 | Ginnie Mae I Pool | 10.500% | 9/15/17–4/15/25 | 23 | 23 |
7
| Vanguard® Total Bond Market Index Fund | |||||
| Schedule of Investments | |||||
| December 31, 2015 | |||||
| Face | Market | ||||
| Maturity | Amount | Value | |||
| Coupon | Date | ($000) | ($000) | ||
| 5 | Ginnie Mae II Pool | 2.500% | 6/20/27–1/20/43 | 31,981 | 32,497 |
| 5,6 | Ginnie Mae II Pool | 3.000% | 10/20/26–1/1/46 | 1,323,403 | 1,347,056 |
| 5,6 | Ginnie Mae II Pool | 3.500% | 9/20/25–1/1/46 | 2,666,801 | 2,785,088 |
| 5,6 | Ginnie Mae II Pool | 4.000% | 9/20/25–1/1/46 | 1,577,793 | 1,682,436 |
| 5,6 | Ginnie Mae II Pool | 4.500% | 4/20/18–1/1/46 | 850,652 | 917,999 |
| 5 | Ginnie Mae II Pool | 5.000% | 12/20/32–11/20/44 | 427,491 | 470,394 |
| 5 | Ginnie Mae II Pool | 5.500% | 8/20/23–4/20/45 | 137,688 | 153,372 |
| 5 | Ginnie Mae II Pool | 6.000% | 7/20/23–12/20/41 | 54,073 | 61,151 |
| 5 | Ginnie Mae II Pool | 6.500% | 12/20/23–9/20/40 | 23,292 | 26,662 |
| 5 | Ginnie Mae II Pool | 7.000% | 3/20/28–11/20/38 | 4,439 | 5,137 |
| 5 | Ginnie Mae II Pool | 7.500% | 8/20/30 | 5 | 6 |
| 5 | Ginnie Mae II Pool | 8.500% | 10/20/30 | 11 | 13 |
| 30,521,639 | |||||
| Nonconventional Mortgage-Backed Securities (0.3%) | |||||
| 4,5,7 | Fannie Mae Pool | 1.591% | 4/1/37 | 1,884 | 1,958 |
| 4,5,7 | Fannie Mae Pool | 1.858% | 7/1/34 | 359 | 382 |
| 4,5,7 | Fannie Mae Pool | 1.884% | 1/1/35 | 218 | 226 |
| 4,5,7 | Fannie Mae Pool | 2.040% | 12/1/41 | 4,620 | 4,750 |
| 4,5,7 | Fannie Mae Pool | 2.049% | 2/1/37 | 4 | 4 |
| 4,5,7 | Fannie Mae Pool | 2.052% | 9/1/37 | 2,054 | 2,200 |
| 4,5 | Fannie Mae Pool | 2.118% | 3/1/43 | 9,833 | 9,948 |
| 4,5 | Fannie Mae Pool | 2.182% | 6/1/42 | 6,551 | 6,832 |
| 4,5 | Fannie Mae Pool | 2.187% | 6/1/43 | 8,500 | 8,641 |
| 4,5 | Fannie Mae Pool | 2.213% | 9/1/42 | 7,379 | 7,692 |
| 4,5 | Fannie Mae Pool | 2.240% | 10/1/42 | 5,585 | 5,694 |
| 4,5,7 | Fannie Mae Pool | 2.247% | 1/1/35 | 6 | 6 |
| 4,5 | Fannie Mae Pool | 2.265% | 7/1/43 | 11,030 | 11,031 |
| 4,5,7 | Fannie Mae Pool | 2.266% | 2/1/36 | 1,789 | 1,823 |
| 4,5,7 | Fannie Mae Pool | 2.288% | 8/1/37 | 2,349 | 2,479 |
| 4,5,7 | Fannie Mae Pool | 2.321% | 4/1/36 | 267 | 283 |
| 4,5,7 | Fannie Mae Pool | 2.327% | 12/1/35 | 9 | 9 |
| 4,5,7 | Fannie Mae Pool | 2.341% | 8/1/35 | 1,988 | 2,113 |
| 4,5,7 | Fannie Mae Pool | 2.352% | 4/1/37 | 284 | 299 |
| 4,5,7 | Fannie Mae Pool | 2.359% | 5/1/40 | 1,236 | 1,315 |
| 4,5,7 | Fannie Mae Pool | 2.360% | 6/1/37 | 1,429 | 1,507 |
| 4,5,7 | Fannie Mae Pool | 2.370% | 5/1/35 | 1,403 | 1,475 |
| 4,5,7 | Fannie Mae Pool | 2.375% | 2/1/36 | 926 | 987 |
| 4,5,7 | Fannie Mae Pool | 2.382% | 4/1/36 | 724 | 754 |
| 4,5,7 | Fannie Mae Pool | 2.384% | 10/1/34 | 21 | 22 |
| 4,5 | Fannie Mae Pool | 2.393% | 7/1/42 | 7,960 | 8,145 |
| 4,5 | Fannie Mae Pool | 2.398% | 5/1/42 | 11,695 | 12,157 |
| 4,5,7 | Fannie Mae Pool | 2.410% | 9/1/40 | 2,641 | 2,802 |
| 4,5,7 | Fannie Mae Pool | 2.415% | 6/1/36 | 47 | 50 |
| 4,5,7 | Fannie Mae Pool | 2.418% | 1/1/37 | 2,017 | 2,166 |
| 4,5,7 | Fannie Mae Pool | 2.422% | 1/1/40 | 1,988 | 2,064 |
| 4,5,7 | Fannie Mae Pool | 2.427% | 7/1/35 | 1,033 | 1,086 |
| 4,5 | Fannie Mae Pool | 2.429% | 5/1/43 | 16,456 | 16,633 |
| 4,5,7 | Fannie Mae Pool | 2.436% | 5/1/36 | 108 | 115 |
| 4,5,7 | Fannie Mae Pool | 2.437% | 4/1/37 | 394 | 424 |
| 4,5,7 | Fannie Mae Pool | 2.439% | 12/1/36 | 16 | 16 |
| 4,5 | Fannie Mae Pool | 2.441% | 10/1/42 | 6,705 | 6,851 |
| 4,5,7 | Fannie Mae Pool | 2.443% | 12/1/33 | 605 | 644 |
| 4,5,7 | Fannie Mae Pool | 2.445% | 7/1/39 | 505 | 526 |
| 4,5,7 | Fannie Mae Pool | 2.447% | 1/1/35 | 1,655 | 1,778 |
| 4,5,7 | Fannie Mae Pool | 2.450% | 7/1/37 | 491 | 524 |
| 4,5,7 | Fannie Mae Pool | 2.452% | 8/1/40 | 3,352 | 3,514 |
| 4,5,7 | Fannie Mae Pool | 2.465% | 11/1/36–9/1/43 | 2,655 | 2,764 |
| 4,5,7 | Fannie Mae Pool | 2.488% | 9/1/34–7/1/38 | 1,265 | 1,348 |
| 4,5,7 | Fannie Mae Pool | 2.492% | 7/1/42 | 2,275 | 2,413 |
| 4,5,7 | Fannie Mae Pool | 2.517% | 5/1/33–9/1/33 | 17 | 17 |
| 4,5,7 | Fannie Mae Pool | 2.520% | 5/1/42 | 690 | 719 |
| 4,5,7 | Fannie Mae Pool | 2.524% | 5/1/40 | 899 | 965 |
| 4,5,7 | Fannie Mae Pool | 2.532% | 11/1/33 | 458 | 489 |
| 4,5,7 | Fannie Mae Pool | 2.535% | 10/1/39 | 1,256 | 1,307 |
8
| Vanguard® Total Bond Market Index Fund | |||||
| Schedule of Investments | |||||
| December 31, 2015 | |||||
| Face | Market | ||||
| Maturity | Amount | Value | |||
| Coupon | Date | ($000) | ($000) | ||
| 4,5,7 | Fannie Mae Pool | 2.546% | 10/1/40 | 3,735 | 3,949 |
| 4,5,7 | Fannie Mae Pool | 2.555% | 4/1/37 | 102 | 108 |
| 4,5,7 | Fannie Mae Pool | 2.561% | 12/1/40 | 2,652 | 2,802 |
| 4,5,7 | Fannie Mae Pool | 2.574% | 11/1/39 | 873 | 926 |
| 4,5,7 | Fannie Mae Pool | 2.576% | 7/1/36–7/1/38 | 1,006 | 1,042 |
| 4,5,7 | Fannie Mae Pool | 2.596% | 11/1/34 | 969 | 1,017 |
| 4,5 | Fannie Mae Pool | 2.601% | 12/1/41 | 4,351 | 4,581 |
| 4,5,7 | Fannie Mae Pool | 2.609% | 12/1/35 | 1,502 | 1,592 |
| 4,5 | Fannie Mae Pool | 2.620% | 11/1/41 | 4,497 | 4,733 |
| 4,5,7 | Fannie Mae Pool | 2.650% | 11/1/32 | 16 | 18 |
| 4,5,7 | Fannie Mae Pool | 2.671% | 11/1/40 | 1,613 | 1,703 |
| 4,5,7 | Fannie Mae Pool | 2.676% | 10/1/40 | 2,847 | 2,995 |
| 4,5,7 | Fannie Mae Pool | 2.685% | 9/1/33–11/1/39 | 3,235 | 3,425 |
| 4,5,7 | Fannie Mae Pool | 2.690% | 11/1/36 | 32 | 34 |
| 4,5,7 | Fannie Mae Pool | 2.695% | 1/1/37 | 76 | 80 |
| 4,5 | Fannie Mae Pool | 2.697% | 1/1/42 | 4,015 | 4,197 |
| 4,5,7 | Fannie Mae Pool | 2.707% | 10/1/37 | 68 | 73 |
| 4,5,7 | Fannie Mae Pool | 2.710% | 11/1/35 | 1 | 1 |
| 4,5 | Fannie Mae Pool | 2.732% | 12/1/43 | 6,152 | 6,314 |
| 4,5,7 | Fannie Mae Pool | 2.750% | 3/1/41 | 3,755 | 4,010 |
| 4,5 | Fannie Mae Pool | 2.751% | 3/1/42 | 6,492 | 6,753 |
| 4,5,7 | Fannie Mae Pool | 2.775% | 12/1/40 | 2,026 | 2,152 |
| 4,5 | Fannie Mae Pool | 2.784% | 1/1/42 | 4,589 | 4,773 |
| 4,5 | Fannie Mae Pool | 2.805% | 11/1/41 | 4,307 | 4,603 |
| 4,5 | Fannie Mae Pool | 2.887% | 12/1/40 | 2,060 | 2,152 |
| 4,5,7 | Fannie Mae Pool | 2.901% | 10/1/36 | 971 | 1,052 |
| 4,5,7 | Fannie Mae Pool | 2.914% | 3/1/42 | 2,019 | 2,103 |
| 4,5 | Fannie Mae Pool | 2.957% | 9/1/43 | 9,432 | 9,826 |
| 4,5,7 | Fannie Mae Pool | 3.022% | 3/1/41 | 3,996 | 4,207 |
| 4,5 | Fannie Mae Pool | 3.052% | 2/1/41 | 2,043 | 2,137 |
| 4,5,7 | Fannie Mae Pool | 3.055% | 2/1/42 | 4,240 | 4,406 |
| 4,5,7 | Fannie Mae Pool | 3.077% | 2/1/41 | 1,723 | 1,731 |
| 4,5 | Fannie Mae Pool | 3.137% | 2/1/41 | 2,169 | 2,274 |
| 4,5,7 | Fannie Mae Pool | 3.200% | 12/1/40 | 2,390 | 2,510 |
| 4,5 | Fannie Mae Pool | 3.207% | 5/1/41 | 2,944 | 3,107 |
| 4,5 | Fannie Mae Pool | 3.353% | 8/1/42 | 6,486 | 6,633 |
| 4,5 | Fannie Mae Pool | 3.553% | 7/1/41 | 7,422 | 7,844 |
| 4,5 | Fannie Mae Pool | 3.558% | 4/1/41 | 3,918 | 4,096 |
| 4,5 | Fannie Mae Pool | 3.580% | 8/1/39 | 1,305 | 1,405 |
| 4,5 | Fannie Mae Pool | 3.594% | 6/1/41 | 1,055 | 1,124 |
| 4,5 | Fannie Mae Pool | 3.745% | 6/1/41 | 3,977 | 4,218 |
| 4,5 | Fannie Mae Pool | 3.827% | 9/1/40 | 4,839 | 5,107 |
| 4,5,7 | Fannie Mae Pool | 4.038% | 8/1/39 | 3,633 | 3,733 |
| 4,5,7 | Fannie Mae Pool | 4.277% | 11/1/39 | 1,443 | 1,492 |
| 4,5 | Fannie Mae Pool | 4.293% | 12/1/39 | 2,708 | 2,746 |
| 4,5 | Fannie Mae Pool | 4.917% | 3/1/38 | 638 | 657 |
| 4,5 | Fannie Mae Pool | 5.387% | 5/1/36 | 91 | 93 |
| 4,5 | Fannie Mae Pool | 5.508% | 4/1/37 | 1,207 | 1,271 |
| 4,5 | Fannie Mae Pool | 5.598% | 10/1/37 | 1,711 | 1,778 |
| 4,5 | Fannie Mae Pool | 5.760% | 12/1/37 | 1,472 | 1,560 |
| 4,5 | Fannie Mae Pool | 6.076% | 10/1/37 | 2,058 | 2,092 |
| 4,5,7 | Freddie Mac Non Gold Pool | 1.735% | 10/1/37 | 57 | 58 |
| 4,5,7 | Freddie Mac Non Gold Pool | 1.855% | 6/1/37 | 1,815 | 1,863 |
| 4,5,7 | Freddie Mac Non Gold Pool | 1.964% | 5/1/37 | 114 | 121 |
| 4,5,7 | Freddie Mac Non Gold Pool | 2.018% | 3/1/37 | 582 | 615 |
| 4,5,7 | Freddie Mac Non Gold Pool | 2.110% | 1/1/37 | 1,859 | 1,964 |
| 4,5,7 | Freddie Mac Non Gold Pool | 2.125% | 1/1/38 | 685 | 730 |
| 4,5,7 | Freddie Mac Non Gold Pool | 2.165% | 4/1/37 | 36 | 38 |
| 4,5,7 | Freddie Mac Non Gold Pool | 2.166% | 8/1/37 | 92 | 96 |
| 4,5,7 | Freddie Mac Non Gold Pool | 2.195% | 3/1/37 | 101 | 107 |
| 4,5,7 | Freddie Mac Non Gold Pool | 2.250% | 1/1/35 | 259 | 279 |
| 4,5,7 | Freddie Mac Non Gold Pool | 2.253% | 7/1/35 | 861 | 909 |
| 4,5,7 | Freddie Mac Non Gold Pool | 2.271% | 2/1/37 | 398 | 424 |
9
| Vanguard® Total Bond Market Index Fund | |||||
| Schedule of Investments | |||||
| December 31, 2015 | |||||
| Face | Market | ||||
| Maturity | Amount | Value | |||
| Coupon | Date | ($000) | ($000) | ||
| 4,5 | Freddie Mac Non Gold Pool | 2.332% | 5/1/42 | 1,225 | 1,249 |
| 4,5,7 | Freddie Mac Non Gold Pool | 2.337% | 3/1/37 | 362 | 384 |
| 4,5,7 | Freddie Mac Non Gold Pool | 2.375% | 4/1/33–5/1/38 | 248 | 257 |
| 4,5,7 | Freddie Mac Non Gold Pool | 2.390% | 4/1/35 | 101 | 106 |
| 4,5,7 | Freddie Mac Non Gold Pool | 2.448% | 12/1/36 | 724 | 771 |
| 4,5,7 | Freddie Mac Non Gold Pool | 2.462% | 12/1/35 | 1,133 | 1,196 |
| 4,5,7 | Freddie Mac Non Gold Pool | 2.492% | 10/1/37 | 1,320 | 1,419 |
| 4,5,7 | Freddie Mac Non Gold Pool | 2.500% | 6/1/34–5/1/36 | 1,449 | 1,526 |
| 4,5,7 | Freddie Mac Non Gold Pool | 2.505% | 5/1/40 | 821 | 880 |
| 4,5,7 | Freddie Mac Non Gold Pool | 2.523% | 6/1/36 | 10 | 10 |
| 4,5,7 | Freddie Mac Non Gold Pool | 2.527% | 3/1/36 | 14 | 15 |
| 4,5,7 | Freddie Mac Non Gold Pool | 2.531% | 11/1/36 | 459 | 476 |
| 4,5,7 | Freddie Mac Non Gold Pool | 2.538% | 5/1/33 | 43 | 44 |
| 4,5,7 | Freddie Mac Non Gold Pool | 2.540% | 6/1/37 | 1,479 | 1,580 |
| 4,5 | Freddie Mac Non Gold Pool | 2.561% | 11/1/43 | 2,260 | 2,313 |
| 4,5,7 | Freddie Mac Non Gold Pool | 2.574% | 5/1/40 | 723 | 767 |
| 4,5,7 | Freddie Mac Non Gold Pool | 2.583% | 12/1/34 | 42 | 43 |
| 4,5,7 | Freddie Mac Non Gold Pool | 2.587% | 12/1/34 | 1,214 | 1,291 |
| 4,5 | Freddie Mac Non Gold Pool | 2.588% | 2/1/42 | 2,466 | 2,591 |
| 4,5,7 | Freddie Mac Non Gold Pool | 2.607% | 12/1/36 | 1,676 | 1,778 |
| 4,5,7 | Freddie Mac Non Gold Pool | 2.608% | 1/1/37 | 853 | 906 |
| 4,5,7 | Freddie Mac Non Gold Pool | 2.620% | 3/1/37 | 1,428 | 1,521 |
| 4,5,7 | Freddie Mac Non Gold Pool | 2.621% | 11/1/34 | 1,694 | 1,778 |
| 4,5,7 | Freddie Mac Non Gold Pool | 2.624% | 12/1/34 | 17 | 18 |
| 4,5,7 | Freddie Mac Non Gold Pool | 2.630% | 6/1/40 | 1,537 | 1,580 |
| 4,5,7 | Freddie Mac Non Gold Pool | 2.631% | 6/1/40 | 1,596 | 1,696 |
| 4,5,7 | Freddie Mac Non Gold Pool | 2.635% | 7/1/38 | 815 | 828 |
| 4,5 | Freddie Mac Non Gold Pool | 2.636% | 12/1/40 | 1,240 | 1,285 |
| 4,5 | Freddie Mac Non Gold Pool | 2.727% | 12/1/40 | 4,069 | 4,225 |
| 4,5,7 | Freddie Mac Non Gold Pool | 2.728% | 3/1/37 | 141 | 141 |
| 4,5,7 | Freddie Mac Non Gold Pool | 2.731% | 6/1/37 | 1,356 | 1,446 |
| 4,5 | Freddie Mac Non Gold Pool | 2.755% | 11/1/40 | 1,410 | 1,461 |
| 4,5 | Freddie Mac Non Gold Pool | 2.756% | 2/1/42 | 3,232 | 3,366 |
| 4,5,7 | Freddie Mac Non Gold Pool | 2.758% | 10/1/36 | 1,106 | 1,186 |
| 4,5,7 | Freddie Mac Non Gold Pool | 2.762% | 11/1/40 | 2,277 | 2,350 |
| 4,5 | Freddie Mac Non Gold Pool | 2.775% | 1/1/41 | 4,034 | 4,207 |
| 4,5,7 | Freddie Mac Non Gold Pool | 2.777% | 11/1/33 | 4 | 4 |
| 4,5,7 | Freddie Mac Non Gold Pool | 2.817% | 6/1/41 | 302 | 307 |
| 4,5 | Freddie Mac Non Gold Pool | 2.847% | 2/1/41 | 4,305 | 4,583 |
| 4,5 | Freddie Mac Non Gold Pool | 2.894% | 2/1/41 | 979 | 1,042 |
| 4,5 | Freddie Mac Non Gold Pool | 3.097% | 1/1/41 | 817 | 858 |
| 4,5 | Freddie Mac Non Gold Pool | 3.104% | 6/1/41 | 1,803 | 1,897 |
| 4,5 | Freddie Mac Non Gold Pool | 3.181% | 3/1/41 | 1,182 | 1,257 |
| 4,5 | Freddie Mac Non Gold Pool | 3.432% | 3/1/42 | 3,115 | 3,284 |
| 4,5 | Freddie Mac Non Gold Pool | 3.576% | 6/1/40 | 3,446 | 3,627 |
| 4,5 | Freddie Mac Non Gold Pool | 3.659% | 9/1/40 | 3,269 | 3,448 |
| 4,5 | Freddie Mac Non Gold Pool | 4.064% | 12/1/39 | 631 | 665 |
| 4,5 | Freddie Mac Non Gold Pool | 5.237% | 3/1/38 | 1,952 | 2,074 |
| 4,5 | Freddie Mac Non Gold Pool | 5.502% | 2/1/36 | 619 | 637 |
| 4,5 | Freddie Mac Non Gold Pool | 5.800% | 9/1/37 | 1,488 | 1,536 |
| 4,5 | Freddie Mac Non Gold Pool | 5.862% | 5/1/37 | 2,220 | 2,292 |
| 4,5 | Freddie Mac Non Gold Pool | 6.140% | 12/1/36 | 1,104 | 1,152 |
| 4,5 | Freddie Mac Non Gold Pool | 6.257% | 8/1/37 | 614 | 653 |
| 5,7 | Ginnie Mae II Pool | 1.625% | 10/20/39 | 635 | 654 |
| 5,7 | Ginnie Mae II Pool | 1.750% | 6/20/29–4/20/41 | 1,455 | 1,491 |
| 5,7 | Ginnie Mae II Pool | 2.000% | 12/20/39–6/20/43 | 24,205 | 24,978 |
| 5,7 | Ginnie Mae II Pool | 2.250% | 5/20/41 | 1,837 | 1,906 |
| 5 | Ginnie Mae II Pool | 2.500% | 1/20/41–1/20/42 | 20,051 | 20,441 |
| 5,7 | Ginnie Mae II Pool | 3.000% | 7/20/38–11/20/41 | 14,547 | 15,070 |
| 5 | Ginnie Mae II Pool | 3.500% | 1/20/41–1/20/44 | 21,942 | 22,773 |
| 5 | Ginnie Mae II Pool | 4.000% | 4/20/41–10/20/41 | 5,646 | 5,828 |
| 461,533 | |||||
| Total U.S. Government and Agency Obligations (Cost $93,209,666) | 94,188,365 | ||||
10
| Vanguard® Total Bond Market Index Fund | ||||
| Schedule of Investments | ||||
| December 31, 2015 | ||||
| Face | Market | |||
| Maturity | Amount | Value | ||
| Coupon | Date | ($000) | ($000) | |
| Asset-Backed/Commercial Mortgage-Backed Securities (2.9%) | ||||
| 5 AEP Texas Central Transition Funding II LLC 2006-A | 5.170% | 1/1/18 | 2,829 | 2,955 |
| 5 Ally Auto Receivables Trust 2013-2 | 0.790% | 1/15/18 | 854 | 853 |
| 5 Ally Auto Receivables Trust 2013-2 | 1.240% | 11/15/18 | 1,125 | 1,122 |
| 5 Ally Auto Receivables Trust 2014-1 | 0.970% | 10/15/18 | 3,925 | 3,914 |
| 5 Ally Auto Receivables Trust 2014-1 | 1.530% | 4/15/19 | 1,675 | 1,667 |
| 5 Ally Auto Receivables Trust 2014-3 | 1.280% | 6/17/19 | 5,000 | 4,984 |
| 5 Ally Auto Receivables Trust 2014-3 | 1.720% | 3/16/20 | 2,000 | 1,991 |
| 5 Ally Auto Receivables Trust 2014-SN1 | 0.750% | 2/21/17 | 3,039 | 3,036 |
| 5 Ally Auto Receivables Trust 2014-SN1 | 0.950% | 6/20/18 | 2,275 | 2,270 |
| 5 Ally Auto Receivables Trust 2014-SN2 | 1.030% | 9/20/17 | 4,025 | 4,014 |
| 5 Ally Auto Receivables Trust 2014-SN2 | 1.210% | 2/20/19 | 2,875 | 2,862 |
| 5 Ally Auto Receivables Trust 2015-1 | 1.390% | 9/16/19 | 1,700 | 1,691 |
| 5 Ally Auto Receivables Trust 2015-1 | 1.750% | 5/15/20 | 1,750 | 1,738 |
| 5 Ally Auto Receivables Trust 2015-2 | 1.490% | 11/15/19 | 4,600 | 4,578 |
| 5 Ally Auto Receivables Trust 2015-2 | 1.840% | 6/15/20 | 2,225 | 2,213 |
| 5 Ally Master Owner Trust Series 2014-4 | 1.430% | 6/17/19 | 5,475 | 5,454 |
| 5 Ally Master Owner Trust Series 2015-3 | 1.630% | 5/15/20 | 7,725 | 7,643 |
| 5 American Express Credit Account Secured Note Trust | ||||
| 2013-3 | 0.980% | 5/15/19 | 1,516 | 1,512 |
| 5 American Express Credit Account Secured Note Trust | ||||
| 2014-3 | 1.490% | 4/15/20 | 8,200 | 8,201 |
| 5 American Express Credit Account Secured Note Trust | ||||
| 2014-4 | 1.430% | 6/15/20 | 4,550 | 4,545 |
| 5 AmeriCredit Automobile Receivables Trust 2013-2 | 0.650% | 12/8/17 | 87 | 87 |
| 5 AmeriCredit Automobile Receivables Trust 2013-3 | 0.920% | 4/9/18 | 965 | 965 |
| 5 AmeriCredit Automobile Receivables Trust 2013-4 | 0.960% | 4/9/18 | 407 | 407 |
| 5 AmeriCredit Automobile Receivables Trust 2013-5 | 0.900% | 9/10/18 | 736 | 735 |
| 5 AmeriCredit Automobile Receivables Trust 2013-5 | 1.520% | 1/8/19 | 600 | 600 |
| 5 AmeriCredit Automobile Receivables Trust 2014-1 | 0.900% | 2/8/19 | 708 | 707 |
| 5 AmeriCredit Automobile Receivables Trust 2014-1 | 1.680% | 7/8/19 | 550 | 549 |
| 5 AmeriCredit Automobile Receivables Trust 2014-2 | 0.940% | 2/8/19 | 1,700 | 1,695 |
| 5 AmeriCredit Automobile Receivables Trust 2014-3 | 1.150% | 6/10/19 | 2,800 | 2,790 |
| 5 AmeriCredit Automobile Receivables Trust 2015-2 | 1.270% | 1/8/20 | 3,700 | 3,662 |
| 5 Banc of America Commercial Mortgage Trust 2006-1 | 5.421% | 9/10/45 | 61 | 61 |
| 5 Banc of America Commercial Mortgage Trust 2006-2 | 5.834% | 5/10/45 | 4,144 | 4,161 |
| 5 Banc of America Commercial Mortgage Trust 2006-2 | 5.869% | 5/10/45 | 3,290 | 3,301 |
| 5 Banc of America Commercial Mortgage Trust 2006-3 | 5.889% | 7/10/44 | 624 | 628 |
| 5 Banc of America Commercial Mortgage Trust 2006-5 | 5.448% | 9/10/47 | 2,175 | 2,224 |
| 5 Banc of America Commercial Mortgage Trust 2008-1 | 6.215% | 2/10/51 | 17,026 | 18,075 |
| 5 Banc of America Commercial Mortgage Trust 2015- | ||||
| UBS7 | 3.429% | 9/15/48 | 2,350 | 2,414 |
| 5 Banc of America Commercial Mortgage Trust 2015- | ||||
| UBS7 | 3.705% | 9/15/48 | 4,100 | 4,204 |
| 8 Banco Bilbao Vizcaya Argentaria SA | 5.750% | 7/20/17 | 1,975 | 2,090 |
| Bank of Nova Scotia | 2.125% | 9/11/19 | 10,500 | 10,490 |
| Bank of Nova Scotia | 1.850% | 4/14/20 | 25,000 | 24,571 |
| 5 Barclays Dryrock Issuance Trust 2015-2 | 1.560% | 3/15/21 | 4,525 | 4,494 |
| 5 Bear Stearns Commercial Mortgage Securities Trust | ||||
| 2006-PWR12 | 5.713% | 9/11/38 | 151 | 152 |
| 5 Bear Stearns Commercial Mortgage Securities Trust | ||||
| 2006-PWR13 | 5.582% | 9/11/41 | 1,625 | 1,656 |
| 5 Bear Stearns Commercial Mortgage Securities Trust | ||||
| 2006-TOP22 | 5.620% | 4/12/38 | 7,245 | 7,256 |
| 5 Bear Stearns Commercial Mortgage Securities Trust | ||||
| 2007-PWR16 | 5.722% | 6/11/40 | 6,525 | 6,818 |
| 5 Bear Stearns Commercial Mortgage Securities Trust | ||||
| 2007-PWR17 | 5.694% | 6/11/50 | 25,004 | 25,967 |
| 5 Bear Stearns Commercial Mortgage Securities Trust | ||||
| 2007-PWR17 | 5.882% | 6/11/50 | 6,853 | 7,247 |
| 5 Bear Stearns Commercial Mortgage Securities Trust | ||||
| 2007-PWR18 | 5.700% | 6/11/50 | 10,400 | 10,856 |
11
| Vanguard® Total Bond Market Index Fund | ||||
| Schedule of Investments | ||||
| December 31, 2015 | ||||
| Face | Market | |||
| Maturity | Amount | Value | ||
| Coupon | Date | ($000) | ($000) | |
| 5 Bear Stearns Commercial Mortgage Securities Trust | ||||
| 2007-TOP26 | 5.471% | 1/12/45 | 5,080 | 5,233 |
| 5 Bear Stearns Commercial Mortgage Securities Trust | ||||
| 2007-TOP26 | 5.513% | 1/12/45 | 6,280 | 6,493 |
| 5 Bear Stearns Commercial Mortgage Securities Trust | ||||
| 2007-TOP28 | 5.742% | 9/11/42 | 15,540 | 16,287 |
| 5 BMW Vehicle Owner Trust 2014-A | 0.970% | 11/26/18 | 5,100 | 5,088 |
| 5 BMW Vehicle Owner Trust 2014-A | 1.500% | 2/25/21 | 3,400 | 3,387 |
| 5 BMW Vehicle Owner Trust 2015-1 | 1.240% | 12/20/17 | 5,950 | 5,934 |
| 5 BMW Vehicle Owner Trust 2015-2 | 1.400% | 2/20/19 | 5,800 | 5,767 |
| 5 BMW Vehicle Owner Trust 2015-2 | 1.550% | 2/20/19 | 2,075 | 2,059 |
| 5 Capital Auto Receivables Asset Trust 2013-1 | 0.790% | 6/20/17 | 247 | 247 |
| 5 Capital Auto Receivables Asset Trust 2013-3 | 1.310% | 12/20/17 | 1,682 | 1,683 |
| 5 Capital Auto Receivables Asset Trust 2013-3 | 1.680% | 4/20/18 | 1,470 | 1,472 |
| 5 Capital Auto Receivables Asset Trust 2013-4 | 1.090% | 3/20/18 | 2,665 | 2,663 |
| 5 Capital Auto Receivables Asset Trust 2013-4 | 1.470% | 7/20/18 | 1,000 | 1,000 |
| 5 Capital Auto Receivables Asset Trust 2013-4 | 2.060% | 10/22/18 | 1,130 | 1,133 |
| 5 Capital Auto Receivables Asset Trust 2014-1 | 1.320% | 6/20/18 | 3,150 | 3,149 |
| 5 Capital Auto Receivables Asset Trust 2014-1 | 1.690% | 10/22/18 | 785 | 785 |
| 5 Capital Auto Receivables Asset Trust 2014-1 | 2.220% | 1/22/19 | 1,042 | 1,045 |
| 5 Capital Auto Receivables Asset Trust 2014-2 | 0.910% | 4/20/17 | 1,329 | 1,328 |
| 5 Capital Auto Receivables Asset Trust 2014-2 | 1.260% | 5/21/18 | 1,375 | 1,373 |
| 5 Capital Auto Receivables Asset Trust 2014-2 | 1.620% | 10/22/18 | 1,100 | 1,099 |
| 5 Capital Auto Receivables Asset Trust 2014-3 | 1.480% | 11/20/18 | 1,950 | 1,945 |
| 5 Capital Auto Receivables Asset Trust 2014-3 | 1.830% | 4/22/19 | 1,400 | 1,397 |
| 5 Capital Auto Receivables Asset Trust 2015-1 | 1.610% | 6/20/19 | 11,225 | 11,165 |
| 5 Capital Auto Receivables Asset Trust 2015-1 | 1.860% | 10/21/19 | 2,000 | 1,989 |
| 5 Capital Auto Receivables Asset Trust 2015-2 | 1.730% | 9/20/19 | 5,800 | 5,764 |
| 5 Capital Auto Receivables Asset Trust 2015-3 | 1.720% | 1/22/19 | 4,675 | 4,665 |
| 5 Capital Auto Receivables Asset Trust 2015-3 | 1.940% | 1/21/20 | 4,675 | 4,658 |
| 5 Capital Auto Receivables Asset Trust 2015-3 | 1.970% | 1/21/20 | 2,900 | 2,882 |
| 5 Capital Auto Receivables Asset Trust 2015-3 | 2.130% | 5/20/20 | 3,000 | 2,989 |
| 5 Capital Auto Receivables Asset Trust 2015-4 | 1.830% | 3/20/20 | 4,550 | 4,508 |
| 5 Capital Auto Receivables Asset Trust 2015-4 | 2.010% | 7/20/20 | 2,950 | 2,917 |
| 5 Capital One Multi-asset Execution Trust 2007-A7 | 5.750% | 7/15/20 | 10,300 | 11,013 |
| 5 Capital One Multi-Asset Execution Trust 2014-A2 | 1.260% | 1/15/20 | 1,925 | 1,921 |
| 5 Capital One Multi-Asset Execution Trust 2014-A5 | 1.480% | 7/15/20 | 7,000 | 7,000 |
| 5 Capital One Multi-Asset Execution Trust 2015-A2 | 2.080% | 3/15/23 | 12,000 | 11,901 |
| 5 Capital One Multi-asset Execution Trust 2015-A5 | 1.600% | 5/17/21 | 5,675 | 5,659 |
| 5 Capital One Multi-asset Execution Trust 2015-A8 | 2.050% | 8/15/23 | 8,200 | 8,090 |
| 5 CarMax Auto Owner Trust 2012-3 | 0.790% | 4/16/18 | 2,450 | 2,444 |
| 5 CarMax Auto Owner Trust 2013-2 | 0.640% | 1/16/18 | 1,444 | 1,442 |
| 5 Carmax Auto Owner Trust 2013-2 | 0.840% | 11/15/18 | 1,502 | 1,491 |
| 5 Carmax Auto Owner Trust 2013-3 | 0.970% | 4/16/18 | 2,075 | 2,072 |
| 5 Carmax Auto Owner Trust 2013-3 | 1.490% | 1/15/19 | 2,040 | 2,035 |
| 5 Carmax Auto Owner Trust 2013-4 | 0.800% | 7/16/18 | 983 | 980 |
| 5 Carmax Auto Owner Trust 2013-4 | 1.280% | 5/15/19 | 550 | 545 |
| 5 Carmax Auto Owner Trust 2014-1 | 0.790% | 10/15/18 | 1,460 | 1,455 |
| 5 Carmax Auto Owner Trust 2014-1 | 1.320% | 7/15/19 | 1,120 | 1,111 |
| 5 Carmax Auto Owner Trust 2014-2 | 0.980% | 1/15/19 | 3,650 | 3,638 |
| 5 Carmax Auto Owner Trust 2014-2 | 1.610% | 10/15/19 | 1,875 | 1,868 |
| 5 Carmax Auto Owner Trust 2014-3 | 1.160% | 6/17/19 | 3,275 | 3,265 |
| 5 Carmax Auto Owner Trust 2014-3 | 1.730% | 2/18/20 | 1,625 | 1,620 |
| 5 Carmax Auto Owner Trust 2014-4 | 1.250% | 11/15/19 | 6,075 | 6,046 |
| 5 Carmax Auto Owner Trust 2015-2 | 1.370% | 3/16/20 | 3,400 | 3,376 |
| 5 Carmax Auto Owner Trust 2015-2 | 1.800% | 3/15/21 | 1,575 | 1,559 |
| 5 Carmax Auto Owner Trust 2015-3 | 1.630% | 5/15/20 | 5,350 | 5,323 |
| 5 Carmax Auto Owner Trust 2015-3 | 1.980% | 2/16/21 | 1,300 | 1,292 |
| 5 Carmax Auto Owner Trust 2015-4 | 1.560% | 11/16/20 | 4,125 | 4,100 |
| 5 Carmax Auto Owner Trust 2015-4 | 1.830% | 6/15/21 | 2,050 | 2,023 |
| 5 CD 2006-CD3 Mortgage Trust | 5.617% | 10/15/48 | 7,445 | 7,522 |
| 5 CD 2007-CD5 Mortgage Trust | 5.886% | 11/15/44 | 15,668 | 16,450 |
| 5 CenterPoint Energy Transition Bond Co. II LLC 2005-A | 5.170% | 8/1/19 | 1,135 | 1,163 |
| 5 CenterPoint Energy Transition Bond Co. II LLC 2005-A | 5.302% | 8/1/20 | 1,184 | 1,290 |
12
| Vanguard® Total Bond Market Index Fund | ||||
| Schedule of Investments | ||||
| December 31, 2015 | ||||
| Face | Market | |||
| Maturity | Amount | Value | ||
| Coupon | Date | ($000) | ($000) | |
| 5 CenterPoint Energy Transition Bond Co. IV LLC 2012-1 | 3.028% | 10/15/25 | 9,483 | 9,622 |
| 5 Chase Issuance Trust 2012-A4 | 1.580% | 8/16/21 | 8,596 | 8,470 |
| 5 Chase Issuance Trust 2012-A7 | 2.160% | 9/16/24 | 20,440 | 19,766 |
| 5 Chase Issuance Trust 2013-A1 | 1.300% | 2/18/20 | 13,650 | 13,563 |
| 5 Chase Issuance Trust 2013-A8 | 1.010% | 10/15/18 | 10,225 | 10,200 |
| 5 Chase Issuance Trust 2014-A1 | 1.150% | 1/15/19 | 14,400 | 14,347 |
| 5 Chase Issuance Trust 2014-A2 | 2.770% | 3/15/23 | 11,150 | 11,339 |
| 5 Chase Issuance Trust 2014-A6 | 1.260% | 7/15/19 | 13,700 | 13,670 |
| 5 Chase Issuance Trust 2014-A7 | 1.380% | 11/15/19 | 11,225 | 11,191 |
| 5 Chase Issuance Trust 2015-A2 | 1.590% | 2/18/20 | 25,052 | 25,049 |
| 5 Chase Issuance Trust 2015-A4 | 1.840% | 4/15/22 | 8,400 | 8,287 |
| 5 Chase Issuance Trust 2015-A5 | 1.360% | 4/15/20 | 16,950 | 16,839 |
| 5 Citibank Credit Card Issuance Trust 2007-A8 | 5.650% | 9/20/19 | 10,600 | 11,318 |
| 5 Citibank Credit Card Issuance Trust 2008-A1 | 5.350% | 2/7/20 | 11,546 | 12,404 |
| 5 Citibank Credit Card Issuance Trust 2013-A10 | 0.730% | 2/7/18 | 4,650 | 4,650 |
| 5 Citibank Credit Card Issuance Trust 2014-A1 | 2.880% | 1/23/23 | 10,460 | 10,684 |
| 5 Citibank Credit Card Issuance Trust 2014-A4 | 1.230% | 4/24/19 | 18,050 | 18,003 |
| 5 Citibank Credit Card Issuance Trust 2014-A5 | 2.680% | 6/7/23 | 12,342 | 12,547 |
| 5 Citibank Credit Card Issuance Trust 2014-A6 | 2.150% | 7/15/21 | 27,675 | 27,809 |
| 5 Citibank Credit Card Issuance Trust 2014-A8 | 1.730% | 4/9/20 | 16,450 | 16,480 |
| 5 Citigroup Commercial Mortgage Trust 2006-C4 | 5.811% | 3/15/49 | 7,863 | 7,897 |
| 5 Citigroup Commercial Mortgage Trust 2006-C5 | 5.431% | 10/15/49 | 3,589 | 3,651 |
| 5 Citigroup Commercial Mortgage Trust 2006-C5 | 5.462% | 10/15/49 | 3,375 | 3,453 |
| 5 Citigroup Commercial Mortgage Trust 2007-C6 | 5.710% | 12/10/49 | 20,075 | 20,843 |
| 5 Citigroup Commercial Mortgage Trust 2008-C7 | 6.137% | 12/10/49 | 18,919 | 19,836 |
| 5 Citigroup Commercial Mortgage Trust 2012-GC8 | 3.024% | 9/10/45 | 5,450 | 5,474 |
| 5 Citigroup Commercial Mortgage Trust 2013-GC11 | 3.093% | 4/10/46 | 3,165 | 3,160 |
| 5 Citigroup Commercial Mortgage Trust 2013-GC11 | 3.422% | 4/10/46 | 2,000 | 2,014 |
| 5 Citigroup Commercial Mortgage Trust 2013-GC15 | 3.161% | 9/10/46 | 2,900 | 2,978 |
| 5 Citigroup Commercial Mortgage Trust 2013-GC15 | 3.942% | 9/10/46 | 1,200 | 1,269 |
| 5 Citigroup Commercial Mortgage Trust 2013-GC15 | 4.371% | 9/10/46 | 1,975 | 2,132 |
| 5 Citigroup Commercial Mortgage Trust 2013-GC15 | 4.649% | 9/10/46 | 2,875 | 3,148 |
| 5 Citigroup Commercial Mortgage Trust 2013-GC17 | 3.675% | 11/10/46 | 875 | 917 |
| 5 Citigroup Commercial Mortgage Trust 2013-GC17 | 4.131% | 11/10/46 | 2,900 | 3,072 |
| 5 Citigroup Commercial Mortgage Trust 2013-GC17 | 4.544% | 11/10/46 | 1,150 | 1,235 |
| 5 Citigroup Commercial Mortgage Trust 2013-GC17 | 5.095% | 11/10/46 | 1,150 | 1,253 |
| 5 Citigroup Commercial Mortgage Trust 2014-GC19 | 2.790% | 3/10/47 | 1,840 | 1,868 |
| 5 Citigroup Commercial Mortgage Trust 2014-GC19 | 3.552% | 3/10/47 | 1,150 | 1,186 |
| 5 Citigroup Commercial Mortgage Trust 2014-GC19 | 4.023% | 3/10/47 | 1,700 | 1,785 |
| 5 Citigroup Commercial Mortgage Trust 2014-GC19 | 4.345% | 3/10/47 | 1,425 | 1,529 |
| 5 Citigroup Commercial Mortgage Trust 2014-GC21 | 3.477% | 5/10/47 | 625 | 640 |
| 5 Citigroup Commercial Mortgage Trust 2014-GC21 | 3.855% | 5/10/47 | 3,025 | 3,141 |
| 5 Citigroup Commercial Mortgage Trust 2014-GC21 | 4.328% | 5/10/47 | 2,450 | 2,516 |
| 5 Citigroup Commercial Mortgage Trust 2014-GC23 | 3.622% | 7/10/47 | 3,875 | 3,956 |
| 5 Citigroup Commercial Mortgage Trust 2014-GC25 | 3.635% | 10/10/47 | 8,525 | 8,674 |
| 5 Citigroup Commercial Mortgage Trust 2015-GC27 | 3.137% | 2/10/48 | 11,450 | 11,186 |
| 5 Citigroup Commercial Mortgage Trust 2015-GC27 | 3.571% | 2/10/48 | 4,550 | 4,463 |
| 5 Citigroup Commercial Mortgage Trust 2015-GC29 | 2.674% | 4/10/48 | 2,275 | 2,291 |
| 5 Citigroup Commercial Mortgage Trust 2015-GC29 | 3.192% | 4/10/48 | 9,075 | 8,900 |
| 5 Citigroup Commercial Mortgage Trust 2015-GC29 | 3.758% | 4/10/48 | 4,365 | 4,233 |
| 5 Citigroup Commercial Mortgage Trust 2015-GC31 | 3.762% | 6/10/48 | 4,625 | 4,733 |
| 5 Citigroup Commercial Mortgage Trust 2015-GC33 | 3.778% | 9/10/58 | 5,725 | 5,861 |
| 5 COBALT CMBS Commercial Mortgage Trust 2007-C2 | 5.484% | 4/15/47 | 2,927 | 3,027 |
| 5 COBALT CMBS Commercial Mortgage Trust 2007-C3 | 5.766% | 5/15/46 | 10,057 | 10,475 |
| 5 COMM 15-CR22 Mortgage Trust | 2.856% | 3/10/48 | 2,850 | 2,890 |
| 5 COMM 15-CR22 Mortgage Trust | 3.309% | 3/10/48 | 7,950 | 7,888 |
| 5 COMM 15-CR22 Mortgage Trust | 3.603% | 3/10/48 | 2,850 | 2,852 |
| 5 COMM 15-CR23 Mortgage Trust | 3.257% | 5/10/48 | 3,475 | 3,570 |
| 5 COMM 15-CR23 Mortgage Trust | 3.497% | 5/10/48 | 5,219 | 5,254 |
| 5 COMM 15-CR23 Mortgage Trust | 3.801% | 5/10/48 | 2,325 | 2,343 |
| 5 COMM 2006-C7 Mortgage Trust | 5.768% | 6/10/46 | 11,612 | 11,698 |
| 5 COMM 2007-C9 Mortgage Trust | 5.796% | 12/10/49 | 18,805 | 19,587 |
| 5 COMM 2012-CCRE2 Mortgage Trust | 3.147% | 8/15/45 | 2,485 | 2,511 |
| 5 COMM 2012-CCRE2 Mortgage Trust | 3.791% | 8/15/45 | 2,950 | 3,078 |
13
| Vanguard® Total Bond Market Index Fund | |||||
| Schedule of Investments | |||||
| December 31, 2015 | |||||
| Face | Market | ||||
| Maturity | Amount | Value | |||
| Coupon | Date | ($000) | ($000) | ||
| 5,8 | COMM 2012-CCRE3 Mortgage Trust | 3.416% | 10/15/45 | 3,548 | 3,601 |
| 5 | COMM 2012-CCRE4 Mortgage Trust | 2.853% | 10/15/45 | 5,150 | 5,112 |
| 5 | COMM 2012-CCRE5 Mortgage Trust | 2.771% | 12/10/45 | 1,500 | 1,481 |
| 5 | COMM 2012-CR3 Mortgage Trust | 2.822% | 10/15/45 | 5,000 | 4,950 |
| 5 | COMM 2013-CCRE11 Mortgage Trust | 3.047% | 10/10/46 | 1,430 | 1,472 |
| 5 | COMM 2013-CCRE11 Mortgage Trust | 3.660% | 10/10/46 | 1,430 | 1,493 |
| 5 | COMM 2013-CCRE11 Mortgage Trust | 3.983% | 10/10/46 | 1,910 | 2,032 |
| 5 | COMM 2013-CCRE11 Mortgage Trust | 4.258% | 10/10/46 | 2,390 | 2,560 |
| 5 | COMM 2013-CCRE11 Mortgage Trust | 4.715% | 10/10/46 | 1,430 | 1,566 |
| 5 | COMM 2013-CCRE12 Mortgage Trust | 1.295% | 10/10/46 | 792 | 788 |
| 5 | COMM 2013-CCRE12 Mortgage Trust | 2.904% | 10/10/46 | 1,700 | 1,730 |
| 5 | COMM 2013-CCRE12 Mortgage Trust | 3.623% | 10/10/46 | 1,700 | 1,777 |
| 5 | COMM 2013-CCRE12 Mortgage Trust | 3.765% | 10/10/46 | 2,275 | 2,374 |
| 5 | COMM 2013-CCRE12 Mortgage Trust | 4.046% | 10/10/46 | 1,700 | 1,799 |
| 5 | COMM 2013-CCRE12 Mortgage Trust | 4.300% | 10/10/46 | 1,150 | 1,232 |
| 5 | COMM 2013-CCRE12 Mortgage Trust | 4.762% | 10/10/46 | 575 | 613 |
| 5 | COMM 2013-CCRE13 Mortgage Trust | 1.259% | 11/10/18 | 550 | 550 |
| 5 | COMM 2013-CCRE13 Mortgage Trust | 3.039% | 12/10/18 | 875 | 895 |
| 5 | COMM 2013-CCRE13 Mortgage Trust | 3.706% | 10/10/23 | 575 | 596 |
| 5 | COMM 2013-CCRE13 Mortgage Trust | 4.449% | 12/10/23 | 1,750 | 1,886 |
| 5 | COMM 2013-CCRE6 Mortgage Trust | 3.101% | 3/10/46 | 2,908 | 2,911 |
| 5 | COMM 2013-CCRE7 Mortgage Trust | 3.213% | 3/10/46 | 2,300 | 2,316 |
| 5 | COMM 2013-CCRE8 Mortgage Trust | 3.612% | 6/10/46 | 3,262 | 3,364 |
| 5 | COMM 2013-CCRE9 Mortgage Trust | 4.233% | 7/10/45 | 4,060 | 4,371 |
| 5 | COMM 2013-CCRE9 Mortgage Trust | 4.210% | 8/10/46 | 1,120 | 1,200 |
| 5 | COMM 2013-CR13 Mortgage Trust | 4.194% | 11/10/23 | 5,850 | 6,236 |
| 5 | COMM 2013-LC13 Mortgage Trust | 3.009% | 8/10/46 | 1,680 | 1,717 |
| 5 | COMM 2013-LC13 Mortgage Trust | 4.205% | 8/10/46 | 1,680 | 1,797 |
| 5 | COMM 2013-LC6 Mortgage Trust | 2.941% | 1/10/46 | 5,246 | 5,221 |
| 5 | COMM 2013-LC6 Mortgage Trust | 3.282% | 1/10/46 | 2,547 | 2,552 |
| 5 | COMM 2014-CCRE14 Mortgage Trust | 3.147% | 2/10/47 | 2,375 | 2,435 |
| 5 | COMM 2014-CCRE14 Mortgage Trust | 4.526% | 2/10/47 | 1,950 | 2,087 |
| 5 | COMM 2014-CCRE14 Mortgage Trust | 4.607% | 2/10/47 | 1,175 | 1,263 |
| 5 | COMM 2014-CCRE15 Mortgage Trust | 2.928% | 2/10/47 | 4,124 | 4,178 |
| 5 | COMM 2014-CCRE15 Mortgage Trust | 3.595% | 2/10/47 | 1,422 | 1,485 |
| 5 | COMM 2014-CCRE15 Mortgage Trust | 4.074% | 2/10/47 | 2,641 | 2,793 |
| 5 | COMM 2014-CCRE15 Mortgage Trust | 4.715% | 2/10/47 | 1,320 | 1,432 |
| 5 | COMM 2014-CCRE16 Mortgage Trust | 3.653% | 4/10/47 | 2,206 | 2,315 |
| 5 | COMM 2014-CCRE16 Mortgage Trust | 4.278% | 4/10/47 | 2,950 | 3,118 |
| 5 | COMM 2014-CCRE19 Mortgage Trust | 3.796% | 8/10/47 | 8,400 | 8,669 |
| 5 | COMM 2014-CCRE19 Mortgage Trust | 4.080% | 8/10/47 | 2,250 | 2,337 |
| 5 | COMM 2014-CCRE21 Mortgage Trust | 3.095% | 12/10/47 | 4,429 | 4,546 |
| 5 | COMM 2014-CCRE21 Mortgage Trust | 3.528% | 12/10/47 | 8,575 | 8,677 |
| 5 | COMM 2014-CR14 Mortgage Trust | 4.236% | 2/10/47 | 1,775 | 1,900 |
| 5 | COMM 2014-CR17 Mortgage Trust | 3.012% | 5/10/47 | 2,800 | 2,866 |
| 5 | COMM 2014-CR17 Mortgage Trust | 3.598% | 5/10/47 | 1,400 | 1,428 |
| 5 | COMM 2014-CR17 Mortgage Trust | 3.977% | 5/10/47 | 2,225 | 2,330 |
| 5 | COMM 2014-CR17 Mortgage Trust | 4.377% | 5/10/47 | 1,375 | 1,427 |
| 5 | COMM 2014-CR18 Mortgage Trust | 3.452% | 7/15/47 | 4,315 | 4,481 |
| 5 | COMM 2014-CR18 Mortgage Trust | 3.828% | 7/15/47 | 1,400 | 1,453 |
| 5 | COMM 2014-CR18 Mortgage Trust | 4.103% | 7/15/47 | 1,845 | 1,923 |
| 5 | COMM 2014-CR20 Mortgage Trust | 3.590% | 11/10/47 | 2,375 | 2,412 |
| 5 | COMM 2014-LC15 Mortgage Trust | 2.840% | 4/10/47 | 1,675 | 1,700 |
| 5 | COMM 2014-LC15 Mortgage Trust | 4.006% | 4/10/47 | 3,950 | 4,150 |
| 5 | COMM 2014-LC17 Mortgage Trust | 3.164% | 10/10/47 | 5,575 | 5,766 |
| 5 | COMM 2014-LC17 Mortgage Trust | 3.917% | 10/10/47 | 2,225 | 2,314 |
| 5 | COMM 2014-LC19 Mortgage Trust | 3.040% | 2/10/48 | 1,150 | 1,157 |
| 5 | COMM 2014-LC19 Mortgage Trust | 3.183% | 2/10/48 | 5,894 | 5,812 |
| 5 | COMM 2014-LC19 Mortgage Trust | 3.527% | 2/10/48 | 2,687 | 2,695 |
| 5 | COMM 2014-UBS2 Mortgage Trust | 2.820% | 3/10/47 | 1,129 | 1,146 |
| 5 | COMM 2014-UBS2 Mortgage Trust | 3.472% | 3/10/47 | 981 | 1,005 |
| 5 | COMM 2014-UBS2 Mortgage Trust | 3.961% | 3/10/47 | 2,533 | 2,646 |
| 5 | COMM 2014-UBS2 Mortgage Trust | 4.199% | 3/10/47 | 709 | 743 |
| 5 | COMM 2014-UBS2 Mortgage Trust | 4.701% | 3/10/47 | 449 | 474 |
14
| Vanguard® Total Bond Market Index Fund | |||||
| Schedule of Investments | |||||
| December 31, 2015 | |||||
| Face | Market | ||||
| Maturity | Amount | Value | |||
| Coupon | Date | ($000) | ($000) | ||
| 5 | COMM 2014-UBS3 Mortgage Trust | 2.844% | 6/10/47 | 1,675 | 1,700 |
| 5 | COMM 2014-UBS3 Mortgage Trust | 3.819% | 6/10/47 | 4,475 | 4,625 |
| 5 | COMM 2014-UBS4 Mortgage Trust | 3.694% | 8/10/47 | 5,575 | 5,676 |
| 5 | COMM 2014-UBS4 Mortgage Trust | 3.968% | 8/10/47 | 2,144 | 2,188 |
| 5 | COMM 2014-UBS5 Mortgage Trust | 3.838% | 9/10/47 | 6,650 | 6,873 |
| 5 | COMM 2014-UBS6 Mortgage Trust | 2.935% | 12/10/47 | 5,600 | 5,734 |
| 5 | COMM 2014-UBS6 Mortgage Trust | 3.387% | 12/10/47 | 5,600 | 5,737 |
| 5 | COMM 2014-UBS6 Mortgage Trust | 3.644% | 12/10/47 | 10,725 | 10,873 |
| 5 | COMM 2014-UBS6 Mortgage Trust | 4.048% | 12/10/47 | 2,800 | 2,879 |
| 5 | COMM 2015-CR25 Mortgage Trust | 3.759% | 8/10/48 | 5,725 | 5,859 |
| 5 | COMM 2015-CR26 Mortgage Trust | 3.630% | 10/10/48 | 11,600 | 11,728 |
| 5 | COMM 2015-CR27 Mortgage Trust | 3.404% | 10/10/48 | 5,900 | 6,005 |
| 5 | COMM 2015-CR27 Mortgage Trust | 3.612% | 10/10/48 | 5,900 | 5,964 |
| 5 | Commercial Mortgage Trust 2006-GG7 | 5.826% | 7/10/38 | 1,865 | 1,871 |
| 5 | Credit Suisse Commercial Mortgage Trust Series 2006- | ||||
| C1 | 5.461% | 2/15/39 | 3,177 | 3,175 | |
| 5 | Credit Suisse Commercial Mortgage Trust Series 2006- | ||||
| C3 | 5.816% | 6/15/38 | 15,241 | 15,318 | |
| 5 | Credit Suisse Commercial Mortgage Trust Series 2006- | ||||
| C4 | 5.509% | 9/15/39 | 1,725 | 1,760 | |
| 5 | Credit Suisse Commercial Mortgage Trust Series 2006- | ||||
| C5 | 5.311% | 12/15/39 | 14,130 | 14,372 | |
| 5 | Credit Suisse Commercial Mortgage Trust Series 2007- | ||||
| C1 | 5.383% | 2/15/40 | 5,017 | 5,120 | |
| 5 | Credit Suisse Commercial Mortgage Trust Series 2007- | ||||
| C3 | 5.699% | 6/15/39 | 15,396 | 15,844 | |
| 5 | CSAIL Commercial Mortgage Trust 2015-C1 | 3.505% | 4/15/50 | 5,550 | 5,601 |
| 5 | CSAIL Commercial Mortgage Trust 2015-C1 | 3.791% | 4/15/50 | 2,825 | 2,825 |
| 5 | CSAIL Commercial Mortgage Trust 2015-C1 | 4.044% | 4/15/50 | 2,250 | 2,234 |
| 5 | CSAIL Commercial Mortgage Trust 2015-C2 | 1.454% | 6/15/57 | 4,333 | 4,283 |
| 5 | CSAIL Commercial Mortgage Trust 2015-C2 | 3.504% | 6/15/57 | 7,400 | 7,428 |
| 5 | CSAIL Commercial Mortgage Trust 2015-C2 | 3.849% | 6/15/57 | 2,900 | 2,937 |
| 5 | CSAIL Commercial Mortgage Trust 2015-C3 | 3.448% | 8/15/48 | 4,443 | 4,520 |
| 5 | CSAIL Commercial Mortgage Trust 2015-C3 | 3.718% | 8/15/48 | 5,700 | 5,817 |
| 5 | CSAIL Commercial Mortgage Trust 2015-C3 | 4.112% | 8/15/48 | 2,625 | 2,576 |
| 5 | CSAIL Commercial Mortgage Trust 2015-C4 | 3.617% | 11/15/48 | 2,950 | 3,023 |
| 5 | CSAIL Commercial Mortgage Trust 2015-C4 | 3.808% | 11/15/48 | 4,600 | 4,706 |
| 5 | Discover Card Execution Note Trust 2007-A1 | 5.650% | 3/16/20 | 14,891 | 15,923 |
| 5 | Discover Card Execution Note Trust 2014-A3 | 1.220% | 10/15/19 | 17,675 | 17,618 |
| 5 | Discover Card Execution Note Trust 2014-A5 | 1.390% | 4/15/20 | 16,025 | 15,974 |
| 5 | Discover Card Execution Note Trust 2015-A2 | 1.900% | 10/17/22 | 14,494 | 14,300 |
| 5 | Discover Card Execution Note Trust 2015-A3 | 1.450% | 3/15/21 | 11,575 | 11,466 |
| 5 | Discover Card Execution Note Trust 2015-A4 | 2.190% | 4/17/23 | 11,500 | 11,397 |
| 4,5 | Fannie Mae-Aces 2010-M1 | 4.450% | 9/25/19 | 2,248 | 2,441 |
| 4,5 | Fannie Mae-Aces 2011-M2 | 3.764% | 4/25/21 | 8,412 | 9,024 |
| 4,5 | Fannie Mae-Aces 2011-M4 | 3.726% | 6/25/21 | 14,650 | 15,640 |
| 4,5 | Fannie Mae-Aces 2012-M9 | 1.553% | 4/25/22 | 1,334 | 1,323 |
| 4,5 | Fannie Mae-Aces 2013-M12 | 2.393% | 3/25/23 | 13,768 | 13,629 |
| 4,5 | Fannie Mae-Aces 2013-M14 | 2.505% | 4/25/23 | 15,656 | 15,767 |
| 4,5 | Fannie Mae-Aces 2013-M14 | 3.329% | 10/25/23 | 16,575 | 17,215 |
| 4,5 | Fannie Mae-Aces 2013-M4 | 2.608% | 3/25/22 | 1,000 | 1,014 |
| 4,5 | Fannie Mae-Aces 2013-M7 | 2.280% | 12/27/22 | 5,600 | 5,538 |
| 4,5 | Fannie Mae-Aces 2014-M1 | 2.323% | 11/25/18 | 20,720 | 21,035 |
| 4,5 | Fannie Mae-Aces 2014-M1 | 3.311% | 7/25/23 | 21,800 | 22,893 |
| 4,5 | Fannie Mae-Aces 2014-M10 | 2.171% | 9/25/19 | 11,300 | 11,408 |
| 4,5 | Fannie Mae-Aces 2014-M12 | 2.614% | 10/25/21 | 16,850 | 17,069 |
| 4,5 | Fannie Mae-Aces 2014-M13 | 1.637% | 11/25/17 | 2,626 | 2,641 |
| 4,5 | Fannie Mae-Aces 2014-M13 | 2.566% | 8/25/24 | 2,459 | 2,496 |
| 4,5 | Fannie Mae-Aces 2014-M13 | 3.021% | 8/25/24 | 6,750 | 6,845 |
| 4,5 | Fannie Mae-Aces 2014-M15 | 2.509% | 7/25/22 | 6,200 | 6,248 |
| 4,5 | Fannie Mae-Aces 2014-M2 | 1.916% | 6/25/21 | 5,263 | 5,293 |
| 4,5 | Fannie Mae-Aces 2014-M2 | 3.513% | 12/25/23 | 16,360 | 17,198 |
| 4,5 | Fannie Mae-Aces 2014-M3 | 2.613% | 1/25/24 | 6,099 | 6,247 |
| 4,5 | Fannie Mae-Aces 2014-M3 | 3.475% | 1/25/24 | 7,825 | 8,197 |
15
| Vanguard® Total Bond Market Index Fund | |||||
| Schedule of Investments | |||||
| December 31, 2015 | |||||
| Face | Market | ||||
| Maturity | Amount | Value | |||
| Coupon | Date | ($000) | ($000) | ||
| 4,5 | Fannie Mae-Aces 2014-M4 | 3.346% | 3/25/24 | 8,175 | 8,495 |
| 4,5 | Fannie Mae-Aces 2014-M6 | 2.679% | 5/25/21 | 19,665 | 19,956 |
| 4,5 | Fannie Mae-Aces 2014-M7 | 3.249% | 6/25/24 | 16,485 | 17,361 |
| 4,5 | Fannie Mae-Aces 2014-M8 | 2.346% | 6/25/24 | 2,505 | 2,538 |
| 4,5 | Fannie Mae-Aces 2014-M8 | 3.056% | 6/25/24 | 8,325 | 8,621 |
| 4,5 | Fannie Mae-Aces 2014-M9 | 1.462% | 4/25/17 | 12,033 | 12,068 |
| 4,5 | Fannie Mae-Aces 2014-M9 | 3.103% | 7/25/24 | 10,459 | 10,865 |
| 4,5 | Fannie Mae-Aces 2015-M1 | 1.626% | 2/25/18 | 4,450 | 4,461 |
| 4,5 | Fannie Mae-Aces 2015-M1 | 2.532% | 9/25/24 | 15,000 | 14,918 |
| 4,5 | Fannie Mae-Aces 2015-M10 | 3.092% | 4/25/27 | 4,600 | 4,749 |
| 4,5 | Fannie Mae-Aces 2015-M12 | 2.792% | 5/25/25 | 11,600 | 11,453 |
| 4,5 | Fannie Mae-Aces 2015-M15 | 2.923% | 10/25/25 | 14,400 | 14,336 |
| 4,5 | Fannie Mae-Aces 2015-M2 | 2.620% | 12/25/24 | 10,919 | 10,949 |
| 4,5 | Fannie Mae-Aces 2015-M3 | 2.723% | 10/25/24 | 5,650 | 5,699 |
| 4,5 | Fannie Mae-Aces 2015-M7 | 1.550% | 4/25/18 | 2,850 | 2,856 |
| 4,5 | Fannie Mae-Aces 2015-M7 | 2.590% | 12/25/24 | 10,125 | 10,102 |
| 4,5 | Fannie Mae-Aces 2015-M8 | 2.344% | 1/25/25 | 5,622 | 5,646 |
| 4,5 | Fannie Mae-Aces 2015-M8 | 2.900% | 1/25/25 | 5,700 | 5,733 |
| 4 | Federal Housing Administration | 7.430% | 10/1/20 | 1 | 1 |
| 4,5 | FHLMC Multifamily Structured Pass Through | ||||
| Certificates K005 | 3.484% | 4/25/19 | 10,569 | 10,851 | |
| 4,5 | FHLMC Multifamily Structured Pass Through | ||||
| Certificates K006 | 3.398% | 7/25/19 | 7,660 | 7,887 | |
| 4,5 | FHLMC Multifamily Structured Pass Through | ||||
| Certificates K007 | 3.342% | 12/25/19 | 5,729 | 5,873 | |
| 4,5 | FHLMC Multifamily Structured Pass Through | ||||
| Certificates K009 | 2.757% | 5/25/20 | 9,836 | 10,032 | |
| 4,5 | FHLMC Multifamily Structured Pass Through | ||||
| Certificates K010 | 2.412% | 8/25/18 | 3,650 | 3,704 | |
| 4,5 | FHLMC Multifamily Structured Pass Through | ||||
| Certificates K010 | 3.320% | 7/25/20 | 9,970 | 10,255 | |
| 4,5 | FHLMC Multifamily Structured Pass Through | ||||
| Certificates K011 | 4.084% | 11/25/20 | 13,225 | 14,362 | |
| 4,5 | FHLMC Multifamily Structured Pass Through | ||||
| Certificates K012 | 4.184% | 12/25/20 | 1,025 | 1,119 | |
| 4,5 | FHLMC Multifamily Structured Pass Through | ||||
| Certificates K014 | 3.871% | 4/25/21 | 6,800 | 7,300 | |
| 4,5 | FHLMC Multifamily Structured Pass Through | ||||
| Certificates K017 | 2.873% | 12/25/21 | 18,650 | 19,114 | |
| 4,5 | FHLMC Multifamily Structured Pass Through | ||||
| Certificates K019 | 2.272% | 3/25/22 | 7,835 | 7,761 | |
| 4,5 | FHLMC Multifamily Structured Pass Through | ||||
| Certificates K020 | 2.373% | 5/25/22 | 19,300 | 19,205 | |
| 4,5 | FHLMC Multifamily Structured Pass Through | ||||
| Certificates K021 | 2.396% | 6/25/22 | 11,840 | 11,790 | |
| 4,5 | FHLMC Multifamily Structured Pass Through | ||||
| Certificates K021 | 3.490% | 1/25/24 | 675 | 705 | |
| 4,5 | FHLMC Multifamily Structured Pass Through | ||||
| Certificates K022 | 2.355% | 7/25/22 | 795 | 789 | |
| 4,5 | FHLMC Multifamily Structured Pass Through | ||||
| Certificates K026 | 2.510% | 11/25/22 | 16,600 | 16,505 | |
| 4,5 | FHLMC Multifamily Structured Pass Through | ||||
| Certificates K027 | 2.637% | 1/25/23 | 16,625 | 16,741 | |
| 4,5 | FHLMC Multifamily Structured Pass Through | ||||
| Certificates K028 | 3.111% | 2/25/23 | 24,425 | 25,098 | |
| 4,5 | FHLMC Multifamily Structured Pass Through | ||||
| Certificates K029 | 3.320% | 2/25/23 | 16,425 | 17,094 | |
| 4,5 | FHLMC Multifamily Structured Pass Through | ||||
| Certificates K030 | 2.779% | 9/25/22 | 15,039 | 15,456 | |
| 4,5 | FHLMC Multifamily Structured Pass Through | ||||
| Certificates K030 | 3.250% | 4/25/23 | 16,425 | 17,116 | |
| 4,5 | FHLMC Multifamily Structured Pass Through | ||||
| Certificates K031 | 3.300% | 4/25/23 | 16,452 | 17,088 | |
16
| Vanguard® Total Bond Market Index Fund | |||||
| Schedule of Investments | |||||
| December 31, 2015 | |||||
| Face | Market | ||||
| Maturity | Amount | Value | |||
| Coupon | Date | ($000) | ($000) | ||
| 4,5 | FHLMC Multifamily Structured Pass Through | ||||
| Certificates K032 | 3.016% | 2/25/23 | 14,658 | 15,192 | |
| 4,5 | FHLMC Multifamily Structured Pass Through | ||||
| Certificates K032 | 3.310% | 5/25/23 | 16,400 | 17,120 | |
| 4,5 | FHLMC Multifamily Structured Pass Through | ||||
| Certificates K033 | 2.871% | 2/25/23 | 15,154 | 15,640 | |
| 4,5 | FHLMC Multifamily Structured Pass Through | ||||
| Certificates K033 | 3.060% | 7/25/23 | 17,750 | 18,269 | |
| 4,5 | FHLMC Multifamily Structured Pass Through | ||||
| Certificates K034 | 3.531% | 7/25/23 | 15,354 | 16,287 | |
| 4,5 | FHLMC Multifamily Structured Pass Through | ||||
| Certificates K035 | 3.458% | 8/25/23 | 18,375 | 19,338 | |
| 4,5 | FHLMC Multifamily Structured Pass Through | ||||
| Certificates K036 | 3.527% | 10/25/23 | 17,403 | 18,423 | |
| 4,5 | FHLMC Multifamily Structured Pass Through | ||||
| Certificates K038 | 2.604% | 10/25/23 | 5,155 | 5,265 | |
| 4,5 | FHLMC Multifamily Structured Pass Through | ||||
| Certificates K038 | 3.389% | 3/25/24 | 19,450 | 20,401 | |
| 4,5 | FHLMC Multifamily Structured Pass Through | ||||
| Certificates K039 | 2.683% | 12/25/23 | 3,640 | 3,729 | |
| 4,5 | FHLMC Multifamily Structured Pass Through | ||||
| Certificates K039 | 3.303% | 7/25/24 | 10,850 | 11,336 | |
| 4,5 | FHLMC Multifamily Structured Pass Through | ||||
| Certificates K040 | 2.768% | 4/25/24 | 5,587 | 5,708 | |
| 4,5 | FHLMC Multifamily Structured Pass Through | ||||
| Certificates K040 | 3.241% | 9/25/24 | 14,400 | 14,730 | |
| 4,5 | FHLMC Multifamily Structured Pass Through | ||||
| Certificates K041 | 3.171% | 10/25/24 | 14,025 | 14,461 | |
| 4,5 | FHLMC Multifamily Structured Pass Through | ||||
| Certificates K042 | 2.267% | 6/25/24 | 2,785 | 2,780 | |
| 4,5 | FHLMC Multifamily Structured Pass Through | ||||
| Certificates K042 | 2.670% | 12/25/24 | 11,225 | 11,168 | |
| 4,5 | FHLMC Multifamily Structured Pass Through | ||||
| Certificates K043 | 2.532% | 10/25/23 | 2,785 | 2,817 | |
| 4,5 | FHLMC Multifamily Structured Pass Through | ||||
| Certificates K043 | 2.493% | 11/25/24 | 5,699 | 5,739 | |
| 4,5 | FHLMC Multifamily Structured Pass Through | ||||
| Certificates K043 | 3.062% | 12/25/24 | 8,400 | 8,573 | |
| 4,5 | FHLMC Multifamily Structured Pass Through | ||||
| Certificates K043 | 3.023% | 1/25/25 | 9,050 | 9,132 | |
| 4,5 | FHLMC Multifamily Structured Pass Through | ||||
| Certificates K046 | 3.205% | 3/25/25 | 9,175 | 9,505 | |
| 4,5 | FHLMC Multifamily Structured Pass Through | ||||
| Certificates K047 | 2.827% | 12/25/24 | 2,851 | 2,918 | |
| 4,5 | FHLMC Multifamily Structured Pass Through | ||||
| Certificates K047 | 3.329% | 5/25/25 | 6,850 | 7,118 | |
| 4,5 | FHLMC Multifamily Structured Pass Through | ||||
| Certificates K048 | 3.284% | 6/25/25 | 11,600 | 11,850 | |
| 4,5 | FHLMC Multifamily Structured Pass Through | ||||
| Certificates K049 | 3.010% | 7/25/25 | 6,350 | 6,342 | |
| 4,5 | FHLMC Multifamily Structured Pass Through | ||||
| Certificates K050 | 3.334% | 8/25/25 | 10,325 | 10,661 | |
| 4,5 | FHLMC Multifamily Structured Pass Through | ||||
| Certificates K503 | 1.384% | 1/25/19 | 7,894 | 7,835 | |
| 4,5 | FHLMC Multifamily Structured Pass Through | ||||
| Certificates K503 | 2.456% | 8/25/19 | 17,225 | 17,569 | |
| 4,5 | FHLMC Multifamily Structured Pass Through | ||||
| Certificates K702 | 3.154% | 2/25/18 | 24,038 | 24,722 | |
| 4,5 | FHLMC Multifamily Structured Pass Through | ||||
| Certificates K706 | 2.323% | 10/25/18 | 6,769 | 6,854 | |
| 4,5 | FHLMC Multifamily Structured Pass Through | ||||
| Certificates K707 | 2.220% | 12/25/18 | 7,650 | 7,748 | |
| 4,5 | FHLMC Multifamily Structured Pass Through | ||||
| Certificates K708 | 1.670% | 10/25/18 | 1,244 | 1,248 | |
17
| Vanguard® Total Bond Market Index Fund | |||||
| Schedule of Investments | |||||
| December 31, 2015 | |||||
| Face | Market | ||||
| Maturity | Amount | Value | |||
| Coupon | Date | ($000) | ($000) | ||
| 4,5 | FHLMC Multifamily Structured Pass Through | ||||
| Certificates K709 | 2.086% | 3/25/19 | 350 | 352 | |
| 4,5 | FHLMC Multifamily Structured Pass Through | ||||
| Certificates K710 | 1.883% | 5/25/19 | 1,475 | 1,477 | |
| 4,5 | FHLMC Multifamily Structured Pass Through | ||||
| Certificates K711 | 1.321% | 12/25/18 | 10,302 | 10,281 | |
| 4,5 | FHLMC Multifamily Structured Pass Through | ||||
| Certificates K711 | 1.730% | 7/25/19 | 23,375 | 23,268 | |
| 4,5 | FHLMC Multifamily Structured Pass Through | ||||
| Certificates K713 | 2.313% | 3/25/20 | 27,800 | 28,055 | |
| 4,5 | FHLMC Multifamily Structured Pass Through | ||||
| Certificates K714 | 3.034% | 10/25/20 | 23,455 | 24,213 | |
| 4,5 | FHLMC Multifamily Structured Pass Through | ||||
| Certificates K716 | 2.413% | 1/25/21 | 3,488 | 3,544 | |
| 4,5 | FHLMC Multifamily Structured Pass Through | ||||
| Certificates K716 | 3.130% | 6/25/21 | 18,645 | 19,359 | |
| 4,5 | FHLMC Multifamily Structured Pass Through | ||||
| Certificates K717 | 2.991% | 9/25/21 | 11,200 | 11,574 | |
| 4,5 | FHLMC Multifamily Structured Pass Through | ||||
| Certificates K718 | 2.375% | 9/25/21 | 11,296 | 11,437 | |
| 4,5 | FHLMC Multifamily Structured Pass Through | ||||
| Certificates K718 | 2.791% | 1/25/22 | 10,825 | 11,052 | |
| 4,5 | FHLMC Multifamily Structures Pass Through | ||||
| Certificates K715 | 2.856% | 1/25/21 | 6,180 | 6,368 | |
| 4,5 | FHLMC Multifamily Structures Pass Through | ||||
| Certificates K715 | 2.716% | 6/25/22 | 7,525 | 7,580 | |
| 5 | Fifth Third Auto 2014-1 | 0.680% | 4/16/18 | 2,183 | 2,179 |
| 5 | Fifth Third Auto 2014-1 | 1.420% | 3/16/20 | 5,900 | 5,856 |
| 5 | Fifth Third Auto 2014-1 | 1.140% | 10/15/20 | 2,370 | 2,358 |
| 5 | Fifth Third Auto 2014-2 | 0.890% | 11/15/18 | 2,250 | 2,244 |
| 5 | Fifth Third Auto 2014-2 | 1.380% | 12/15/20 | 1,425 | 1,420 |
| 5 | Ford Credit Auto Lease Trust 2013-B | 0.960% | 10/15/16 | 515 | 514 |
| 5 | Ford Credit Auto Lease Trust 2014-A | 0.680% | 4/15/17 | 1,252 | 1,251 |
| 5 | Ford Credit Auto Lease Trust 2014-A | 0.900% | 6/15/17 | 850 | 849 |
| 5 | Ford Credit Auto Lease Trust 2014-A | 1.160% | 8/15/17 | 1,575 | 1,572 |
| 5 | Ford Credit Auto Lease Trust 2014-B | 0.890% | 9/15/17 | 2,950 | 2,946 |
| 5 | Ford Credit Auto Lease Trust 2015-A | 1.130% | 6/15/18 | 4,575 | 4,552 |
| 5 | Ford Credit Auto Lease Trust 2015-A | 1.310% | 8/15/18 | 1,150 | 1,141 |
| 5 | Ford Credit Auto Lease Trust 2015-B | 1.380% | 12/15/18 | 4,125 | 4,098 |
| 5 | Ford Credit Auto Lease Trust 2015-B | 1.540% | 2/15/19 | 2,950 | 2,926 |
| 5 | Ford Credit Auto Owner Trust 2012-A | 1.150% | 6/15/17 | 835 | 835 |
| 5 | Ford Credit Auto Owner Trust 2013-A | 0.550% | 7/15/17 | 553 | 553 |
| 5 | Ford Credit Auto Owner Trust 2013-B | 0.570% | 10/15/17 | 661 | 660 |
| 5 | Ford Credit Auto Owner Trust 2013-B | 0.760% | 8/15/18 | 1,500 | 1,494 |
| 5 | Ford Credit Auto Owner Trust 2013-C | 0.820% | 12/15/17 | 1,253 | 1,253 |
| 5 | Ford Credit Auto Owner Trust 2013-C | 1.250% | 10/15/18 | 1,180 | 1,179 |
| 5 | Ford Credit Auto Owner Trust 2013-D | 0.670% | 4/15/18 | 1,914 | 1,911 |
| 5 | Ford Credit Auto Owner Trust 2013-D | 1.110% | 2/15/19 | 550 | 548 |
| 5 | Ford Credit Auto Owner Trust 2014-A | 0.790% | 5/15/18 | 2,139 | 2,136 |
| 5 | Ford Credit Auto Owner Trust 2014-A | 1.290% | 4/15/19 | 600 | 598 |
| 5 | Ford Credit Auto Owner Trust 2014-B | 0.900% | 10/15/18 | 4,900 | 4,892 |
| 5 | Ford Credit Auto Owner Trust 2014-B | 1.420% | 8/15/19 | 850 | 847 |
| 5 | Ford Credit Auto Owner Trust 2015-A | 1.280% | 9/15/19 | 2,700 | 2,694 |
| 5 | Ford Credit Auto Owner Trust 2015-A | 1.640% | 6/15/20 | 850 | 847 |
| 5 | Ford Credit Auto Owner Trust 2015-B | 1.160% | 11/15/19 | 3,675 | 3,652 |
| 5 | Ford Credit Auto Owner Trust 2015-B | 1.580% | 8/15/20 | 1,450 | 1,437 |
| 5 | Ford Credit Auto Owner Trust 2015-C | 1.410% | 2/15/20 | 2,825 | 2,816 |
| 5 | Ford Credit Auto Owner Trust 2015-C | 1.740% | 2/15/21 | 1,300 | 1,292 |
| 5 | Ford Credit Floorplan Master Owner Trust A Series | ||||
| 2013-5 | 1.500% | 9/15/18 | 4,675 | 4,680 | |
| 5 | Ford Credit Floorplan Master Owner Trust A Series | ||||
| 2014-1 | 1.200% | 2/15/19 | 5,400 | 5,386 | |
| 5 | Ford Credit Floorplan Master Owner Trust A Series | ||||
| 2014-4 | 1.400% | 8/15/19 | 11,200 | 11,156 | |
18
| Vanguard® Total Bond Market Index Fund | ||||
| Schedule of Investments | ||||
| December 31, 2015 | ||||
| Face | Market | |||
| Maturity | Amount | Value | ||
| Coupon | Date | ($000) | ($000) | |
| 5 GE Capital Credit Card Master Note Trust Series 2012-7 | 1.760% | 9/15/22 | 6,545 | 6,426 |
| 5 GE Commercial Mortgage Corp. Series 2005-C4 Trust | 5.427% | 11/10/45 | 6,480 | 6,477 |
| 5 GE Commercial Mortgage Corp. Series 2006-C1 Trust | 5.459% | 3/10/44 | 6,675 | 6,667 |
| 5 GE Commercial Mortgage Corp. Series 2007-C1 Trust | 5.543% | 12/10/49 | 5,925 | 6,071 |
| 5 GM Financial Leasing Trust 2015-2 | 1.680% | 12/20/18 | 5,200 | 5,172 |
| 5 GM Financial Leasing Trust 2015-2 | 1.850% | 7/22/19 | 2,630 | 2,615 |
| 5 GM Financial Leasing Trust 2015-3 | 1.690% | 3/20/19 | 2,850 | 2,828 |
| 5 GM Financial Leasing Trust 2015-3 | 1.810% | 11/20/19 | 2,975 | 2,948 |
| 5 GS Mortgage Securities Trust 2006-GG6 | 5.622% | 4/10/38 | 56 | 56 |
| 5 GS Mortgage Securities Trust 2007-GG10 | 5.794% | 8/10/45 | 5,488 | 5,681 |
| 5 GS Mortgage Securities Trust 2011-GC5 | 3.707% | 8/10/44 | 3,220 | 3,381 |
| 5 GS Mortgage Securities Trust 2012-GC6 | 3.482% | 1/10/45 | 12,500 | 12,955 |
| 5 GS Mortgage Securities Trust 2012-GCJ7 | 3.377% | 5/10/45 | 7,475 | 7,668 |
| 5 GS Mortgage Securities Trust 2012-GCJ9 | 2.773% | 11/10/45 | 5,530 | 5,451 |
| 5 GS Mortgage Securities Trust 2013-GC10 | 2.943% | 2/10/46 | 4,077 | 4,036 |
| 5 GS Mortgage Securities Trust 2013-GC10 | 3.279% | 2/10/46 | 1,529 | 1,528 |
| 5 GS Mortgage Securities Trust 2013-GCJ12 | 3.135% | 6/10/46 | 5,682 | 5,677 |
| 5 GS Mortgage Securities Trust 2013-GCJ12 | 3.375% | 6/10/46 | 1,792 | 1,789 |
| 5 GS Mortgage Securities Trust 2013-GCJ14 | 2.995% | 8/10/46 | 2,055 | 2,119 |
| 5 GS Mortgage Securities Trust 2013-GCJ14 | 3.817% | 8/10/46 | 1,470 | 1,545 |
| 5 GS Mortgage Securities Trust 2013-GCJ14 | 4.243% | 8/10/46 | 7,350 | 7,870 |
| 5 GS Mortgage Securities Trust 2013-GCJ16 | 3.033% | 11/10/46 | 2,600 | 2,661 |
| 5 GS Mortgage Securities Trust 2013-GCJ16 | 3.813% | 11/10/46 | 1,100 | 1,148 |
| 5 GS Mortgage Securities Trust 2013-GCJ16 | 4.271% | 11/10/46 | 1,525 | 1,635 |
| 5 GS Mortgage Securities Trust 2014-GC18 | 1.298% | 1/10/47 | 2,213 | 2,186 |
| 5 GS Mortgage Securities Trust 2014-GC18 | 4.074% | 1/10/47 | 5,950 | 6,268 |
| 5 GS Mortgage Securities Trust 2014-GC18 | 4.383% | 1/10/47 | 1,975 | 2,115 |
| 5 GS Mortgage Securities Trust 2014-GC18 | 3.467% | 6/10/47 | 2,225 | 2,277 |
| 5 GS Mortgage Securities Trust 2014-GC18 | 3.516% | 6/10/47 | 500 | 514 |
| 5 GS Mortgage Securities Trust 2014-GC18 | 3.862% | 6/10/47 | 1,950 | 2,023 |
| 5 GS Mortgage Securities Trust 2014-GC24 | 3.931% | 9/10/47 | 6,125 | 6,368 |
| 5 GS Mortgage Securities Trust 2014-GC24 | 4.508% | 9/10/47 | 1,675 | 1,743 |
| 5 GS Mortgage Securities Trust 2014-GC26 | 2.902% | 11/10/47 | 1,850 | 1,889 |
| 5 GS Mortgage Securities Trust 2014-GC26 | 3.365% | 11/10/47 | 3,400 | 3,450 |
| 5 GS Mortgage Securities Trust 2014-GC26 | 3.629% | 11/10/47 | 11,450 | 11,752 |
| 5 GS Mortgage Securities Trust 2014-GC26 | 3.964% | 11/10/47 | 2,000 | 2,068 |
| 5 GS Mortgage Securities Trust 2014-GC26 | 4.215% | 11/10/47 | 1,700 | 1,730 |
| 5 GS Mortgage Securities Trust 2015-GC28 | 3.396% | 2/10/48 | 6,200 | 6,176 |
| 5 GS Mortgage Securities Trust 2015-GC30 | 2.726% | 5/10/50 | 4,025 | 4,055 |
| 5 GS Mortgage Securities Trust 2015-GC30 | 3.382% | 5/10/50 | 5,700 | 5,672 |
| 5 GS Mortgage Securities Trust 2015-GC32 | 3.513% | 7/10/48 | 5,775 | 5,879 |
| 5 GS Mortgage Securities Trust 2015-GC32 | 3.764% | 7/10/48 | 2,275 | 2,329 |
| 5 GS Mortgage Securities Trust 2015-GC34 | 3.278% | 10/10/48 | 5,900 | 5,913 |
| 5 GS Mortgage Securities Trust 2015-GC34 | 3.506% | 10/10/48 | 5,600 | 5,612 |
| 5 Honda Auto Receivables 2013-1 Owner Trust | 0.480% | 11/21/16 | 245 | 245 |
| 5 Honda Auto Receivables 2013-1 Owner Trust | 0.620% | 3/21/19 | 4,802 | 4,799 |
| 5 Honda Auto Receivables 2013-2 Owner Trust | 0.530% | 2/16/17 | 359 | 359 |
| 5 Honda Auto Receivables 2013-2 Owner Trust | 0.660% | 6/17/19 | 1,718 | 1,714 |
| 5 Honda Auto Receivables 2013-4 Owner Trust | 0.690% | 9/18/17 | 1,117 | 1,115 |
| 5 Honda Auto Receivables 2013-4 Owner Trust | 1.040% | 2/18/20 | 1,650 | 1,645 |
| 5 Honda Auto Receivables 2014-1 Owner Trust | 0.670% | 11/21/17 | 3,188 | 3,182 |
| 5 Honda Auto Receivables 2014-1 Owner Trust | 1.040% | 2/21/20 | 1,707 | 1,699 |
| 5 Honda Auto Receivables 2014-2 Owner Trust | 0.770% | 3/19/18 | 2,422 | 2,417 |
| 5 Honda Auto Receivables 2014-2 Owner Trust | 1.180% | 5/18/20 | 1,375 | 1,369 |
| 5 Honda Auto Receivables 2014-3 Owner Trust | 0.880% | 6/15/18 | 4,900 | 4,887 |
| 5 Honda Auto Receivables 2014-3 Owner Trust | 1.310% | 10/15/20 | 2,800 | 2,783 |
| 5 Honda Auto Receivables 2015-1 Owner Trust | 1.050% | 10/15/18 | 5,050 | 5,028 |
| 5 Honda Auto Receivables 2015-1 Owner Trust | 1.320% | 11/16/20 | 3,425 | 3,399 |
| 5 Honda Auto Receivables 2015-2 Owner Trust | 1.040% | 2/21/19 | 3,975 | 3,949 |
| 5 Honda Auto Receivables 2015-2 Owner Trust | 1.470% | 8/23/21 | 2,325 | 2,306 |
| 5 Honda Auto Receivables 2015-3 Owner Trust | 1.270% | 4/18/19 | 4,300 | 4,280 |
| 5 Honda Auto Receivables 2015-3 Owner Trust | 1.560% | 10/18/21 | 1,150 | 1,141 |
| 5 Honda Auto Receivables 2015-4 Owner Trust | 1.230% | 9/23/19 | 5,900 | 5,843 |
| 5 Honda Auto Receivables 2015-4 Owner Trust | 1.440% | 1/21/22 | 1,500 | 1,480 |
19
| Vanguard® Total Bond Market Index Fund | ||||
| Schedule of Investments | ||||
| December 31, 2015 | ||||
| Face | Market | |||
| Maturity | Amount | Value | ||
| Coupon | Date | ($000) | ($000) | |
| 5 Huntington Auto Trust 2015-1 | 1.240% | 9/16/19 | 5,775 | 5,748 |
| 5 Hyundai Auto Receivables Trust 2012-C | 0.730% | 6/15/18 | 2,215 | 2,212 |
| 5 Hyundai Auto Receivables Trust 2013-A | 0.560% | 7/17/17 | 253 | 253 |
| 5 Hyundai Auto Receivables Trust 2013-A | 0.750% | 9/17/18 | 5,096 | 5,087 |
| 5 Hyundai Auto Receivables Trust 2013-B | 0.710% | 9/15/17 | 1,198 | 1,198 |
| 5 Hyundai Auto Receivables Trust 2013-B | 1.010% | 2/15/19 | 2,400 | 2,399 |
| 5 Hyundai Auto Receivables Trust 2013-C | 1.550% | 3/15/19 | 2,890 | 2,896 |
| 5 Hyundai Auto Receivables Trust 2014-A | 0.790% | 7/16/18 | 2,076 | 2,072 |
| 5 Hyundai Auto Receivables Trust 2014-B | 0.900% | 12/17/18 | 5,341 | 5,329 |
| 5 Hyundai Auto Receivables Trust 2014-B | 1.460% | 11/15/19 | 1,370 | 1,363 |
| 5 Hyundai Auto Receivables Trust 2015-A | 1.370% | 7/15/20 | 1,700 | 1,683 |
| 5 Hyundai Auto Receivables Trust 2015-C | 1.460% | 2/18/20 | 2,075 | 2,066 |
| 5 Hyundai Auto Receivables Trust 2015-C | 1.780% | 11/15/21 | 1,500 | 1,492 |
| 5 JP Morgan Chase Commercial Mortgage Securities | ||||
| Trust 2005-CIBC11 | 5.411% | 8/12/37 | 297 | 296 |
| 5 JP Morgan Chase Commercial Mortgage Securities | ||||
| Trust 2005-LDP5 | 5.476% | 12/15/44 | 381 | 381 |
| 5 JP Morgan Chase Commercial Mortgage Securities | ||||
| Trust 2006-CIBC14 | 5.488% | 12/12/44 | 1,926 | 1,924 |
| 5 JP Morgan Chase Commercial Mortgage Securities | ||||
| Trust 2006-LDP6 | 5.475% | 4/15/43 | 732 | 731 |
| 5 JP Morgan Chase Commercial Mortgage Securities | ||||
| Trust 2006-LDP7 | 5.909% | 4/15/45 | 3,300 | 3,357 |
| 5 JP Morgan Chase Commercial Mortgage Securities | ||||
| Trust 2006-LDP8 | 5.440% | 5/15/45 | 4,525 | 4,600 |
| 5 JP Morgan Chase Commercial Mortgage Securities | ||||
| Trust 2007-CIBC20 | 5.794% | 2/12/51 | 25,007 | 26,172 |
| 5 JP Morgan Chase Commercial Mortgage Securities | ||||
| Trust 2007-CIBC20 | 5.881% | 2/12/51 | 3,350 | 3,554 |
| 5 JP Morgan Chase Commercial Mortgage Securities | ||||
| Trust 2007-LDP11 | 5.774% | 6/15/49 | 8,035 | 8,206 |
| 5 JP Morgan Chase Commercial Mortgage Securities | ||||
| Trust 2007-LDP12 | 5.882% | 2/15/51 | 13,170 | 13,634 |
| 5 JP Morgan Chase Commercial Mortgage Securities | ||||
| Trust 2012-C6 | 3.507% | 5/15/45 | 9,250 | 9,561 |
| 5 JP Morgan Chase Commercial Mortgage Securities | ||||
| Trust 2012-C8 | 2.829% | 10/15/45 | 6,675 | 6,634 |
| 5 JP Morgan Chase Commercial Mortgage Securities | ||||
| Trust 2012-CIBX | 3.483% | 6/15/45 | 7,490 | 7,811 |
| 5 JP Morgan Chase Commercial Mortgage Securities | ||||
| Trust 2012-LC9 | 2.840% | 12/15/47 | 3,750 | 3,733 |
| 5 JP Morgan Chase Commercial Mortgage Securities | ||||
| Trust 2013-C10 | 3.143% | 12/15/47 | 2,314 | 2,329 |
| 5 JP Morgan Chase Commercial Mortgage Securities | ||||
| Trust 2013-C10 | 3.372% | 12/15/47 | 1,735 | 1,747 |
| 5 JP Morgan Chase Commercial Mortgage Securities | ||||
| Trust 2013-C16 | 3.674% | 12/15/46 | 1,600 | 1,671 |
| 5 JP Morgan Chase Commercial Mortgage Securities | ||||
| Trust 2013-C16 | 3.881% | 12/15/46 | 2,300 | 2,422 |
| 5 JP Morgan Chase Commercial Mortgage Securities | ||||
| Trust 2013-C16 | 4.166% | 12/15/46 | 3,100 | 3,299 |
| 5 JP Morgan Chase Commercial Mortgage Securities | ||||
| Trust 2013-C16 | 4.517% | 12/15/46 | 1,600 | 1,722 |
| 5 JP Morgan Chase Commercial Mortgage Securities | ||||
| Trust 2013-C16 | 4.944% | 12/15/46 | 1,600 | 1,726 |
| 5 JP Morgan Chase Commercial Mortgage Securities | ||||
| Trust 2013-LC11 | 2.960% | 4/15/46 | 2,678 | 2,663 |
| 5 JP Morgan Chase Commercial Mortgage Securities | ||||
| Trust 2014-C20 | 2.872% | 7/15/47 | 2,250 | 2,297 |
| 5 JP Morgan Chase Commercial Mortgage Securities | ||||
| Trust 2014-C20 | 3.805% | 7/15/47 | 850 | 885 |
| 5 JPMBB Commercial Mortgage Securities Trust 2013- | ||||
| C12 | 3.664% | 7/15/45 | 1,776 | 1,842 |
20
| Vanguard® Total Bond Market Index Fund | ||||
| Schedule of Investments | ||||
| December 31, 2015 | ||||
| Face | Market | |||
| Maturity | Amount | Value | ||
| Coupon | Date | ($000) | ($000) | |
| 5 JPMBB Commercial Mortgage Securities Trust 2013- | ||||
| C12 | 4.025% | 7/15/45 | 1,184 | 1,244 |
| 5 JPMBB Commercial Mortgage Securities Trust 2013- | ||||
| C14 | 3.761% | 8/15/46 | 1,680 | 1,762 |
| 5 JPMBB Commercial Mortgage Securities Trust 2013- | ||||
| C14 | 4.133% | 8/15/46 | 4,470 | 4,769 |
| 5 JPMBB Commercial Mortgage Securities Trust 2013- | ||||
| C14 | 4.409% | 8/15/46 | 1,260 | 1,348 |
| 5 JPMBB Commercial Mortgage Securities Trust 2013- | ||||
| C15 | 1.233% | 11/15/45 | 662 | 659 |
| 5 JPMBB Commercial Mortgage Securities Trust 2013- | ||||
| C15 | 2.977% | 11/15/45 | 4,200 | 4,295 |
| 5 JPMBB Commercial Mortgage Securities Trust 2013- | ||||
| C15 | 3.659% | 11/15/45 | 420 | 439 |
| 5 JPMBB Commercial Mortgage Securities Trust 2013- | ||||
| C15 | 4.131% | 11/15/45 | 2,940 | 3,135 |
| 5 JPMBB Commercial Mortgage Securities Trust 2013- | ||||
| C15 | 4.420% | 11/15/45 | 1,680 | 1,798 |
| 5 JPMBB Commercial Mortgage Securities Trust 2013- | ||||
| C17 | 3.003% | 1/15/47 | 2,200 | 2,253 |
| 5 JPMBB Commercial Mortgage Securities Trust 2013- | ||||
| C17 | 3.705% | 1/15/47 | 1,650 | 1,726 |
| 5 JPMBB Commercial Mortgage Securities Trust 2013- | ||||
| C17 | 4.199% | 1/15/47 | 5,500 | 5,924 |
| 5 JPMBB Commercial Mortgage Securities Trust 2013- | ||||
| C17 | 4.458% | 1/15/47 | 1,100 | 1,189 |
| 5 JPMBB Commercial Mortgage Securities Trust 2013- | ||||
| C17 | 4.887% | 1/15/47 | 1,650 | 1,765 |
| 5 JPMBB Commercial Mortgage Securities Trust 2014- | ||||
| C18 | 4.079% | 2/15/47 | 6,590 | 6,993 |
| 5 JPMBB Commercial Mortgage Securities Trust 2014- | ||||
| C18 | 4.439% | 2/15/47 | 1,173 | 1,252 |
| 5 JPMBB Commercial Mortgage Securities Trust 2014- | ||||
| C18 | 4.810% | 2/15/47 | 1,422 | 1,515 |
| 5 JPMBB Commercial Mortgage Securities Trust 2014- | ||||
| C19 | 3.046% | 4/15/47 | 2,225 | 2,276 |
| 5 JPMBB Commercial Mortgage Securities Trust 2014- | ||||
| C19 | 3.669% | 4/15/47 | 2,800 | 2,901 |
| 5 JPMBB Commercial Mortgage Securities Trust 2014- | ||||
| C19 | 3.997% | 4/15/47 | 2,800 | 2,943 |
| 5 JPMBB Commercial Mortgage Securities Trust 2014- | ||||
| C19 | 4.243% | 4/15/47 | 2,225 | 2,350 |
| 5 JPMBB Commercial Mortgage Securities Trust 2014- | ||||
| C19 | 4.110% | 9/15/47 | 2,225 | 2,308 |
| 5 JPMBB Commercial Mortgage Securities Trust 2014- | ||||
| C21 | 3.428% | 8/15/47 | 1,411 | 1,442 |
| 5 JPMBB Commercial Mortgage Securities Trust 2014- | ||||
| C21 | 3.775% | 8/15/47 | 1,375 | 1,427 |
| 5 JPMBB Commercial Mortgage Securities Trust 2014- | ||||
| C21 | 3.997% | 8/15/47 | 850 | 881 |
| 5 JPMBB Commercial Mortgage Securities Trust 2014- | ||||
| C22 | 3.801% | 9/15/47 | 8,325 | 8,616 |
| 5 JPMBB Commercial Mortgage Securities Trust 2014- | ||||
| C23 | 3.934% | 9/15/47 | 4,175 | 4,384 |
| 5 JPMBB Commercial Mortgage Securities Trust 2014- | ||||
| C23 | 4.202% | 9/15/47 | 2,462 | 2,591 |
| 5 JPMBB Commercial Mortgage Securities Trust 2014- | ||||
| C24 | 2.940% | 11/15/47 | 2,850 | 2,915 |
| 5 JPMBB Commercial Mortgage Securities Trust 2014- | ||||
| C24 | 3.639% | 11/15/47 | 2,275 | 2,336 |
| 5 JPMBB Commercial Mortgage Securities Trust 2014- | ||||
| C24 | 3.914% | 11/15/47 | 4,125 | 4,233 |
| 5 JPMBB Commercial Mortgage Securities Trust 2014- | ||||
| C25 | 3.672% | 11/15/47 | 9,975 | 10,251 |
21
| Vanguard® Total Bond Market Index Fund | ||||
| Schedule of Investments | ||||
| December 31, 2015 | ||||
| Face | Market | |||
| Maturity | Amount | Value | ||
| Coupon | Date | ($000) | ($000) | |
| 5 JPMBB Commercial Mortgage Securities Trust 2014- | ||||
| C25 | 4.065% | 11/15/47 | 2,775 | 2,909 |
| 5 JPMBB Commercial Mortgage Securities Trust 2014- | ||||
| C26 | 3.019% | 1/15/48 | 5,725 | 5,871 |
| 5 JPMBB Commercial Mortgage Securities Trust 2014- | ||||
| C26 | 3.494% | 1/15/48 | 8,450 | 8,567 |
| 5 JPMBB Commercial Mortgage Securities Trust 2014- | ||||
| C26 | 3.800% | 1/15/48 | 2,875 | 2,917 |
| 5 JPMBB Commercial Mortgage Securities Trust 2014- | ||||
| C26 | 3.951% | 1/15/48 | 2,875 | 2,875 |
| 5 JPMBB Commercial Mortgage Securities Trust 2015- | ||||
| C27 | 2.734% | 2/15/48 | 4,575 | 4,637 |
| 5 JPMBB Commercial Mortgage Securities Trust 2015- | ||||
| C27 | 3.017% | 2/15/48 | 5,715 | 5,723 |
| 5 JPMBB Commercial Mortgage Securities Trust 2015- | ||||
| C27 | 3.179% | 2/15/48 | 3,048 | 3,016 |
| 5 JPMBB Commercial Mortgage Securities Trust 2015- | ||||
| C28 | 2.773% | 10/15/48 | 5,725 | 5,803 |
| 5 JPMBB Commercial Mortgage Securities Trust 2015- | ||||
| C28 | 3.227% | 10/15/48 | 6,775 | 6,683 |
| 5 JPMBB Commercial Mortgage Securities Trust 2015- | ||||
| C28 | 3.532% | 10/15/48 | 1,725 | 1,702 |
| 5 JPMBB Commercial Mortgage Securities Trust 2015- | ||||
| C29 | 2.921% | 5/15/48 | 5,000 | 5,102 |
| 5 JPMBB Commercial Mortgage Securities Trust 2015- | ||||
| C29 | 3.304% | 5/15/48 | 2,963 | 3,012 |
| 5 JPMBB Commercial Mortgage Securities Trust 2015- | ||||
| C29 | 3.611% | 5/15/48 | 4,650 | 4,709 |
| 5 JPMBB Commercial Mortgage Securities Trust 2015- | ||||
| C30 | 3.559% | 7/15/48 | 5,775 | 5,951 |
| 5 JPMBB Commercial Mortgage Securities Trust 2015- | ||||
| C30 | 3.822% | 7/15/48 | 5,675 | 5,871 |
| 5 JPMBB Commercial Mortgage Securities Trust 2015- | ||||
| C30 | 4.226% | 7/15/48 | 2,900 | 3,014 |
| 5 JPMBB Commercial Mortgage Securities Trust 2015- | ||||
| C31 | 3.540% | 8/15/48 | 2,772 | 2,849 |
| 5 JPMBB Commercial Mortgage Securities Trust 2015- | ||||
| C31 | 3.801% | 8/15/48 | 2,960 | 3,064 |
| 5 JPMBB Commercial Mortgage Securities Trust 2015- | ||||
| C32 | 3.358% | 11/15/48 | 5,875 | 5,977 |
| 5 JPMBB Commercial Mortgage Securities Trust 2015- | ||||
| C32 | 3.598% | 11/15/48 | 5,875 | 5,983 |
| 5 JPMBB Commercial Mortgage Securities Trust 2015- | ||||
| C33 | 3.770% | 12/15/48 | 4,230 | 4,329 |
| 5 JPMCC Commercial Mortgage Securities Trust 2015- | ||||
| JP1 | 3.914% | 1/15/49 | 4,600 | 4,740 |
| 5 LB Commercial Mortgage Trust 2007-C3 | 5.898% | 7/15/44 | 645 | 669 |
| 5 LB-UBS Commercial Mortgage Trust 2006-C1 | 5.217% | 2/15/31 | 2,719 | 2,718 |
| 5 LB-UBS Commercial Mortgage Trust 2006-C3 | 5.661% | 3/15/39 | 1,438 | 1,438 |
| 5 LB-UBS Commercial Mortgage Trust 2006-C4 | 5.820% | 6/15/38 | 8,327 | 8,390 |
| 5 LB-UBS Commercial Mortgage Trust 2006-C6 | 5.372% | 9/15/39 | 13,204 | 13,373 |
| 5 LB-UBS Commercial Mortgage Trust 2006-C6 | 5.413% | 9/15/39 | 1,175 | 1,202 |
| 5 LB-UBS Commercial Mortgage Trust 2006-C7 | 5.347% | 11/15/38 | 3,838 | 3,914 |
| 5 LB-UBS Commercial Mortgage Trust 2006-C7 | 5.378% | 11/15/38 | 3,125 | 3,197 |
| 5 LB-UBS Commercial Mortgage Trust 2007-C1 | 5.424% | 2/15/40 | 23,834 | 24,484 |
| 5 LB-UBS Commercial Mortgage Trust 2007-C2 | 5.430% | 2/15/40 | 10,246 | 10,536 |
| 5 LB-UBS Commercial Mortgage Trust 2007-C7 | 5.866% | 9/15/45 | 16,859 | 17,940 |
| 5 LB-UBS Commercial Mortgage Trust 2008-C1 | 6.087% | 4/15/41 | 20,526 | 21,935 |
| 5 Mercedes-Benz Auto Lease Trust 2015-A | 1.210% | 10/15/20 | 8,550 | 8,516 |
| 5 Mercedes-Benz Auto Lease Trust 2015-B | 1.340% | 7/16/18 | 2,950 | 2,937 |
| 5 Mercedes-Benz Auto Lease Trust 2015-B | 1.530% | 5/17/21 | 1,750 | 1,737 |
| 5 Mercedes-Benz Auto Receivables Trust 2013-1 | 0.780% | 8/15/17 | 383 | 383 |
| 5 Mercedes-Benz Auto Receivables Trust 2013-1 | 1.130% | 11/15/19 | 1,180 | 1,179 |
| 5 Mercedes-Benz Auto Receivables Trust 2014-1 | 0.870% | 10/15/18 | 2,725 | 2,716 |
22
| Vanguard® Total Bond Market Index Fund | ||||
| Schedule of Investments | ||||
| December 31, 2015 | ||||
| Face | Market | |||
| Maturity | Amount | Value | ||
| Coupon | Date | ($000) | ($000) | |
| 5 Mercedes-Benz Auto Receivables Trust 2014-1 | 1.310% | 11/16/20 | 825 | 820 |
| 5 Mercedes-Benz Auto Receivables Trust 2015-1 | 1.340% | 12/16/19 | 3,400 | 3,379 |
| 5 Mercedes-Benz Auto Receivables Trust 2015-1 | 1.750% | 12/15/21 | 1,175 | 1,166 |
| 5 Merrill Lynch Mortgage Trust 2006-C1 | 5.666% | 5/12/39 | 8,329 | 8,353 |
| 5 Merrill Lynch Mortgage Trust 2006-C1 | 5.666% | 5/12/39 | 1,825 | 1,842 |
| 5 Merrill Lynch Mortgage Trust 2006-C2 | 5.782% | 8/12/43 | 2,865 | 2,920 |
| 5 Merrill Lynch Mortgage Trust 2007-C1 | 5.836% | 6/12/50 | 24,868 | 25,672 |
| 5 Merrill Lynch Mortgage Trust 2008-C1 | 5.690% | 2/12/51 | 14,971 | 15,640 |
| 5 ML-CFC Commercial Mortgage Trust 2006-2 | 5.882% | 6/12/46 | 8,599 | 8,648 |
| 5 ML-CFC Commercial Mortgage Trust 2006-3 | 5.456% | 7/12/46 | 3,660 | 3,726 |
| 5 ML-CFC Commercial Mortgage Trust 2006-4 | 5.204% | 12/12/49 | 2,496 | 2,565 |
| 5 ML-CFC Commercial Mortgage Trust 2007-5 | 5.378% | 8/12/48 | 13,099 | 13,398 |
| 5 ML-CFC Commercial Mortgage Trust 2007-7 | 5.743% | 6/12/50 | 7,268 | 7,545 |
| 5 ML-CFC Commercial Mortgage Trust 2007-9 | 5.700% | 9/12/49 | 14,266 | 14,862 |
| 5 Morgan Stanley Bank of America Merrill Lynch Trust | ||||
| 2012-C5 | 3.176% | 8/15/45 | 3,025 | 3,070 |
| 5 Morgan Stanley Bank of America Merrill Lynch Trust | ||||
| 2012-C6 | 2.858% | 11/15/45 | 3,000 | 2,983 |
| 5 Morgan Stanley Bank of America Merrill Lynch Trust | ||||
| 2013-C10 | 4.081% | 7/15/46 | 8,000 | 8,509 |
| 5 Morgan Stanley Bank of America Merrill Lynch Trust | ||||
| 2013-C11 | 4.214% | 8/15/46 | 1,680 | 1,798 |
| 5 Morgan Stanley Bank of America Merrill Lynch Trust | ||||
| 2013-C11 | 4.414% | 8/15/46 | 840 | 899 |
| 5 Morgan Stanley Bank of America Merrill Lynch Trust | ||||
| 2013-C12 | 3.001% | 10/15/46 | 2,340 | 2,397 |
| 5 Morgan Stanley Bank of America Merrill Lynch Trust | ||||
| 2013-C12 | 4.259% | 10/15/46 | 3,915 | 4,197 |
| 5 Morgan Stanley Bank of America Merrill Lynch Trust | ||||
| 2013-C13 | 2.936% | 11/15/46 | 1,750 | 1,791 |
| 5 Morgan Stanley Bank of America Merrill Lynch Trust | ||||
| 2013-C13 | 4.039% | 11/15/46 | 3,500 | 3,701 |
| 5 Morgan Stanley Bank of America Merrill Lynch Trust | ||||
| 2013-C13 | 4.742% | 11/15/46 | 1,750 | 1,870 |
| 5 Morgan Stanley Bank of America Merrill Lynch Trust | ||||
| 2013-C7 | 2.918% | 2/15/46 | 3,011 | 2,980 |
| 5 Morgan Stanley Bank of America Merrill Lynch Trust | ||||
| 2013-C7 | 3.214% | 2/15/46 | 599 | 597 |
| 5 Morgan Stanley Bank of America Merrill Lynch Trust | ||||
| 2013-C8 | 3.134% | 12/15/48 | 3,475 | 3,477 |
| 5 Morgan Stanley Bank of America Merrill Lynch Trust | ||||
| 2013-C8 | 3.376% | 12/15/48 | 1,800 | 1,810 |
| 5 Morgan Stanley Bank of America Merrill Lynch Trust | ||||
| 2013-C9 | 3.102% | 5/15/46 | 2,475 | 2,467 |
| 5 Morgan Stanley Bank of America Merrill Lynch Trust | ||||
| 2013-C9 | 3.456% | 5/15/46 | 1,800 | 1,809 |
| 5 Morgan Stanley Bank of America Merrill Lynch Trust | ||||
| 2014-C14 | 1.250% | 2/15/47 | 1,159 | 1,148 |
| 5 Morgan Stanley Bank of America Merrill Lynch Trust | ||||
| 2014-C14 | 2.916% | 2/15/47 | 2,200 | 2,247 |
| 5 Morgan Stanley Bank of America Merrill Lynch Trust | ||||
| 2014-C14 | 3.669% | 2/15/47 | 4,475 | 4,657 |
| 5 Morgan Stanley Bank of America Merrill Lynch Trust | ||||
| 2014-C14 | 4.064% | 2/15/47 | 4,475 | 4,727 |
| 5 Morgan Stanley Bank of America Merrill Lynch Trust | ||||
| 2014-C14 | 4.642% | 2/15/47 | 1,600 | 1,727 |
| 5 Morgan Stanley Bank of America Merrill Lynch Trust | ||||
| 2014-C16 | 2.849% | 6/15/47 | 850 | 867 |
| 5 Morgan Stanley Bank of America Merrill Lynch Trust | ||||
| 2014-C16 | 3.477% | 6/15/47 | 1,125 | 1,155 |
| 5 Morgan Stanley Bank of America Merrill Lynch Trust | ||||
| 2014-C16 | 3.892% | 6/15/47 | 4,200 | 4,376 |
| 5 Morgan Stanley Bank of America Merrill Lynch Trust | ||||
| 2014-C16 | 4.324% | 6/15/47 | 1,675 | 1,727 |
23
| Vanguard® Total Bond Market Index Fund | ||||
| Schedule of Investments | ||||
| December 31, 2015 | ||||
| Face | Market | |||
| Maturity | Amount | Value | ||
| Coupon | Date | ($000) | ($000) | |
| 5 Morgan Stanley Bank of America Merrill Lynch Trust | ||||
| 2014-C18 | 3.194% | 10/15/47 | 5,000 | 5,128 |
| 5 Morgan Stanley Bank of America Merrill Lynch Trust | ||||
| 2014-C18 | 3.923% | 10/15/47 | 1,400 | 1,460 |
| 5 Morgan Stanley Bank of America Merrill Lynch Trust | ||||
| 2014-C18 | 4.444% | 10/15/47 | 1,675 | 1,768 |
| 5 Morgan Stanley Bank of America Merrill Lynch Trust | ||||
| 2014-C19 | 3.101% | 12/15/47 | 5,700 | 5,858 |
| 5 Morgan Stanley Bank of America Merrill Lynch Trust | ||||
| 2014-C19 | 3.326% | 12/15/47 | 3,025 | 3,093 |
| 5 Morgan Stanley Bank of America Merrill Lynch Trust | ||||
| 2014-C19 | 3.526% | 12/15/47 | 5,050 | 5,115 |
| 5 Morgan Stanley Bank of America Merrill Lynch Trust | ||||
| 2015-C20 | 3.069% | 2/15/48 | 2,875 | 2,895 |
| 5 Morgan Stanley Bank of America Merrill Lynch Trust | ||||
| 2015-C20 | 3.249% | 2/15/48 | 10,125 | 9,996 |
| 5 Morgan Stanley Bank of America Merrill Lynch Trust | ||||
| 2015-C21 | 3.338% | 3/15/48 | 2,500 | 2,483 |
| 5 Morgan Stanley Bank of America Merrill Lynch Trust | ||||
| 2015-C22 | 3.040% | 4/15/48 | 5,725 | 5,741 |
| 5 Morgan Stanley Bank of America Merrill Lynch Trust | ||||
| 2015-C22 | 3.306% | 4/15/48 | 4,500 | 4,444 |
| 5 Morgan Stanley Bank of America Merrill Lynch Trust | ||||
| 2015-C22 | 3.883% | 4/15/48 | 2,875 | 2,846 |
| 5 Morgan Stanley Bank of America Merrill Lynch Trust | ||||
| 2015-C23 | 2.982% | 7/15/50 | 2,900 | 2,952 |
| 5 Morgan Stanley Bank of America Merrill Lynch Trust | ||||
| 2015-C23 | 3.398% | 7/15/50 | 1,750 | 1,791 |
| 5 Morgan Stanley Bank of America Merrill Lynch Trust | ||||
| 2015-C23 | 3.719% | 7/15/50 | 5,775 | 5,900 |
| 5 Morgan Stanley Bank of America Merrill Lynch Trust | ||||
| 2015-C25 | 3.383% | 10/15/48 | 6,550 | 6,663 |
| 5 Morgan Stanley Bank of America Merrill Lynch Trust | ||||
| 2015-C25 | 3.635% | 10/15/48 | 3,475 | 3,513 |
| 5 Morgan Stanley Bank of America Merrill Lynch Trust | ||||
| 2015-C26 | 3.323% | 10/15/48 | 3,825 | 3,888 |
| 5 Morgan Stanley Bank of America Merrill Lynch Trust | ||||
| 2015-C26 | 3.531% | 10/15/48 | 4,325 | 4,338 |
| 5 Morgan Stanley Bank of America Merrill Lynch Trust | ||||
| 2015-C27 | 3.557% | 12/15/47 | 2,950 | 3,014 |
| 5 Morgan Stanley Bank of America Merrill Lynch Trust | ||||
| 2015-C27 | 3.753% | 12/15/47 | 3,500 | 3,570 |
| 5 Morgan Stanley Capital I Trust 2005-IQ9 | 4.770% | 7/15/56 | 2,533 | 2,532 |
| 5 Morgan Stanley Capital I Trust 2005-TOP17 | 4.840% | 12/13/41 | 149 | 149 |
| 5 Morgan Stanley Capital I Trust 2005-TOP19 | 4.985% | 6/12/47 | 238 | 238 |
| 5 Morgan Stanley Capital I Trust 2006-HQ10 | 5.328% | 11/12/41 | 5,520 | 5,584 |
| 5 Morgan Stanley Capital I Trust 2006-HQ8 | 5.480% | 3/12/44 | 3,503 | 3,499 |
| 5 Morgan Stanley Capital I Trust 2006-HQ9 | 5.773% | 7/12/44 | 4,721 | 4,809 |
| 5 Morgan Stanley Capital I Trust 2006-HQ9 | 5.793% | 7/12/44 | 4,100 | 4,160 |
| 5 Morgan Stanley Capital I Trust 2006-IQ11 | 5.779% | 10/15/42 | 1,178 | 1,176 |
| 5 Morgan Stanley Capital I Trust 2006-IQ11 | 5.783% | 10/15/42 | 4,325 | 4,359 |
| 5 Morgan Stanley Capital I Trust 2006-IQ11 | 5.783% | 10/15/42 | 725 | 729 |
| 5 Morgan Stanley Capital I Trust 2006-IQ12 | 5.370% | 12/15/43 | 1,960 | 2,018 |
| 5 Morgan Stanley Capital I Trust 2006-T23 | 5.847% | 8/12/41 | 1,907 | 1,924 |
| 5 Morgan Stanley Capital I Trust 2006-TOP23 | 5.847% | 8/12/41 | 2,175 | 2,214 |
| 5 Morgan Stanley Capital I Trust 2007-IQ14 | 5.654% | 4/15/49 | 465 | 469 |
| 5 Morgan Stanley Capital I Trust 2007-IQ14 | 5.692% | 4/15/49 | 14,295 | 14,696 |
| 5 Morgan Stanley Capital I Trust 2007-IQ15 | 5.917% | 6/11/49 | 15,685 | 16,315 |
| 5 Morgan Stanley Capital I Trust 2007-IQ16 | 5.809% | 12/12/49 | 15,250 | 15,950 |
| 5 Morgan Stanley Capital I Trust 2007-IQ16 | 6.054% | 12/12/49 | 5,075 | 5,335 |
| 5 Morgan Stanley Capital I Trust 2007-TOP25 | 5.514% | 11/12/49 | 1,910 | 1,956 |
| 5 Morgan Stanley Capital I Trust 2007-TOP25 | 5.544% | 11/12/49 | 4,525 | 4,679 |
| 5 Morgan Stanley Capital I Trust 2007-TOP27 | 5.645% | 6/11/42 | 5,075 | 5,312 |
| 5 Morgan Stanley Capital I Trust 2007-TOP27 | 5.645% | 6/11/42 | 20,474 | 21,380 |
24
| Vanguard® Total Bond Market Index Fund | ||||
| Schedule of Investments | ||||
| December 31, 2015 | ||||
| Face | Market | |||
| Maturity | Amount | Value | ||
| Coupon | Date | ($000) | ($000) | |
| 5 Morgan Stanley Capital I Trust 2008-TOP29 | 6.268% | 1/11/43 | 21,549 | 23,029 |
| 5 Morgan Stanley Capital I Trust 2012-C4 | 3.244% | 3/15/45 | 7,000 | 7,140 |
| 5 Morgan Stanley Capital I Trust 2012-C4 | 3.773% | 3/15/45 | 2,900 | 3,009 |
| 5 Morgan Stanley Capital I Trust 2015-UBS8 | 3.809% | 12/15/48 | 4,100 | 4,182 |
| 5 Nissan Auto Lease Trust 2014-B | 1.120% | 9/15/17 | 1,700 | 1,695 |
| 5 Nissan Auto Lease Trust 2015-B | 1.540% | 4/16/18 | 4,100 | 4,085 |
| 5 Nissan Auto Lease Trust 2015-B | 1.700% | 4/15/21 | 2,625 | 2,613 |
| 5 Nissan Auto Receivables 2013-A Owner Trust | 0.500% | 5/15/17 | 307 | 307 |
| 5 Nissan Auto Receivables 2013-A Owner Trust | 0.750% | 7/15/19 | 10,750 | 10,724 |
| 5 Nissan Auto Receivables 2013-B Owner Trust | 0.840% | 11/15/17 | 1,052 | 1,051 |
| 5 Nissan Auto Receivables 2013-B Owner Trust | 1.310% | 10/15/19 | 1,770 | 1,767 |
| 5 Nissan Auto Receivables 2013-C Owner Trust | 0.670% | 8/15/18 | 1,739 | 1,735 |
| 5 Nissan Auto Receivables 2013-C Owner Trust | 1.300% | 6/15/20 | 1,600 | 1,593 |
| 5 Nissan Auto Receivables 2014-A Owner Trust | 0.720% | 8/15/18 | 1,634 | 1,630 |
| 5 Nissan Auto Receivables 2014-A Owner Trust | 1.340% | 8/17/20 | 2,250 | 2,237 |
| 5 Nissan Auto Receivables 2014-B Owner Trust | 1.110% | 5/15/19 | 2,800 | 2,788 |
| 5 Nissan Auto Receivables 2015-B Owner Trust | 1.050% | 10/15/19 | 5,050 | 5,014 |
| 5 Nissan Auto Receivables 2015-B Owner Trust | 1.340% | 3/16/20 | 3,400 | 3,379 |
| 5 Nissan Auto Receivables 2015-B Owner Trust | 1.790% | 1/17/22 | 1,750 | 1,740 |
| 5 Nissan Auto Receivables 2015-C Owner Trust | 1.370% | 5/15/20 | 1,800 | 1,784 |
| 5 Nissan Auto Receivables 2015-C Owner Trust | 1.670% | 2/15/22 | 2,975 | 2,938 |
| 5 Royal Bank of Canada | 1.200% | 9/19/18 | 11,315 | 11,238 |
| 5 Royal Bank of Canada | 2.000% | 10/1/19 | 20,000 | 20,069 |
| Royal Bank of Canada | 1.875% | 2/5/20 | 8,625 | 8,479 |
| Royal Bank of Canada | 2.100% | 10/14/20 | 58,000 | 57,056 |
| 5 Santander Drive Auto Receivables Trust 2013-4 | 0.870% | 1/16/18 | 236 | 236 |
| 5 Santander Drive Auto Receivables Trust 2013-4 | 1.590% | 10/15/18 | 2,600 | 2,600 |
| 5 Santander Drive Auto Receivables Trust 2014-2 | 0.800% | 4/16/18 | 830 | 830 |
| 5 Santander Drive Auto Receivables Trust 2014-3 | 0.810% | 7/16/18 | 745 | 745 |
| 5 Santander Drive Auto Receivables Trust 2014-4 | 1.080% | 9/17/18 | 2,800 | 2,798 |
| 5 Synchrony Credit Card Master Note Trust 2014-1 | 1.610% | 11/15/20 | 3,325 | 3,311 |
| 5 Synchrony Credit Card Master Note Trust 2015-2 | 1.600% | 4/15/21 | 3,375 | 3,355 |
| 5 TIAA Seasoned Commercial Mortgage Trust 2007-C4 | 5.510% | 8/15/39 | 1,604 | 1,605 |
| 5 Toyota Auto Receivables 2013-A Owner Trust | 0.550% | 1/17/17 | 163 | 163 |
| 5 Toyota Auto Receivables 2013-A Owner Trust | 0.690% | 11/15/18 | 1,625 | 1,621 |
| 5 Toyota Auto Receivables 2014-A Owner Trust | 1.180% | 6/17/19 | 1,250 | 1,245 |
| 5 Toyota Auto Receivables 2014-B Owner Trust | 0.760% | 3/15/18 | 1,400 | 1,397 |
| 5 Toyota Auto Receivables 2014-B Owner Trust | 1.310% | 9/16/19 | 1,125 | 1,121 |
| 5 Toyota Auto Receivables 2015-B Owner Trust | 1.270% | 5/15/19 | 8,500 | 8,478 |
| 5 Toyota Auto Receivables 2015-B Owner Trust | 1.740% | 9/15/20 | 5,200 | 5,201 |
| 5 Toyota Auto Receivables 2015-C Owner Trust | 1.340% | 6/17/19 | 5,200 | 5,182 |
| 5 Toyota Auto Receivables Owner Trust 2015-C | 1.690% | 12/15/20 | 4,900 | 4,891 |
| 5 UBS-Barclays Commercial Mortgage Trust 2013-C5 | 3.185% | 3/10/46 | 4,636 | 4,714 |
| 5 UBS-Barclays Commercial Mortgage Trust 2013-C6 | 3.244% | 4/10/46 | 2,875 | 2,902 |
| 5 UBS-Barclays Commercial Mortgage Trust 2013-C6 | 3.469% | 4/10/46 | 1,150 | 1,150 |
| 5 USAA Auto Owner Trust 2014-1 | 0.580% | 12/15/17 | 1,015 | 1,013 |
| 5 USAA Auto Owner Trust 2014-1 | 0.940% | 5/15/19 | 1,150 | 1,147 |
| 5 Volkswagen Auto Lease Trust 2014-A | 0.800% | 4/20/17 | 958 | 956 |
| 5 Volkswagen Auto Lease Trust 2014-A | 0.990% | 7/20/18 | 1,120 | 1,115 |
| 5 Volkswagen Auto Loan Enhanced Trust 2013-2 | 0.700% | 4/20/18 | 1,187 | 1,183 |
| 5 Volkswagen Auto Loan Enhanced Trust 2013-2 | 1.160% | 3/20/20 | 875 | 868 |
| 5 Volkswagen Auto Loan Enhanced Trust 2014-1 | 0.910% | 10/22/18 | 3,325 | 3,305 |
| 5 Volkswagen Auto Loan Enhanced Trust 2014-1 | 1.450% | 9/21/20 | 2,775 | 2,730 |
| 5 Volkswagen Auto Loan Enhanced Trust 2014-2 | 0.950% | 4/22/19 | 8,450 | 8,370 |
| 5 Volkswagen Auto Loan Enhanced Trust 2014-2 | 1.390% | 5/20/21 | 2,850 | 2,789 |
| 5 Wachovia Bank Commercial Mortgage Trust Series | ||||
| 2005-C21 | 5.301% | 10/15/44 | 368 | 369 |
| 5 Wachovia Bank Commercial Mortgage Trust Series | ||||
| 2006-C25 | 5.767% | 5/15/43 | 1,610 | 1,608 |
| 5 Wachovia Bank Commercial Mortgage Trust Series | ||||
| 2006-C26 | 5.962% | 6/15/45 | 1,300 | 1,319 |
| 5 Wachovia Bank Commercial Mortgage Trust Series | ||||
| 2006-C27 | 5.765% | 7/15/45 | 7,797 | 7,896 |
25
| Vanguard® Total Bond Market Index Fund | ||||
| Schedule of Investments | ||||
| December 31, 2015 | ||||
| Face | Market | |||
| Maturity | Amount | Value | ||
| Coupon | Date | ($000) | ($000) | |
| 5 Wachovia Bank Commercial Mortgage Trust Series | ||||
| 2006-C29 | 5.339% | 11/15/48 | 2,225 | 2,280 |
| 5 Wachovia Bank Commercial Mortgage Trust Series | ||||
| 2007-C33 | 5.952% | 2/15/51 | 6,266 | 6,469 |
| 5 Wells Fargo Commercial Mortgage Trust 2012-LC5 | 2.918% | 10/15/45 | 3,675 | 3,680 |
| 5 Wells Fargo Commercial Mortgage Trust 2014-LC16 | 2.819% | 8/15/50 | 1,675 | 1,706 |
| 5 Wells Fargo Commercial Mortgage Trust 2014-LC16 | 3.477% | 8/15/50 | 1,125 | 1,161 |
| 5 Wells Fargo Commercial Mortgage Trust 2014-LC16 | 3.817% | 8/15/50 | 3,925 | 4,085 |
| 5 Wells Fargo Commercial Mortgage Trust 2014-LC16 | 4.020% | 8/15/50 | 550 | 572 |
| 5 Wells Fargo Commercial Mortgage Trust 2014-LC18 | 2.954% | 12/15/47 | 3,400 | 3,475 |
| 5 Wells Fargo Commercial Mortgage Trust 2014-LC18 | 3.244% | 12/15/47 | 1,961 | 1,991 |
| 5 Wells Fargo Commercial Mortgage Trust 2014-LC18 | 3.271% | 12/15/47 | 4,000 | 4,030 |
| 5 Wells Fargo Commercial Mortgage Trust 2014-LC18 | 3.405% | 12/15/47 | 5,650 | 5,688 |
| 5 Wells Fargo Commercial Mortgage Trust 2014-LC18 | 3.808% | 12/15/47 | 2,850 | 2,872 |
| 5 Wells Fargo Commercial Mortgage Trust 2015-C26 | 2.991% | 2/15/48 | 5,725 | 5,720 |
| 5 Wells Fargo Commercial Mortgage Trust 2015-C26 | 3.166% | 2/15/48 | 3,150 | 3,099 |
| 5 Wells Fargo Commercial Mortgage Trust 2015-C26 | 3.580% | 2/15/48 | 2,275 | 2,261 |
| 5 Wells Fargo Commercial Mortgage Trust 2015-C27 | 3.190% | 2/15/48 | 14,150 | 13,848 |
| 5 Wells Fargo Commercial Mortgage Trust 2015-C28 | 3.540% | 5/15/48 | 8,500 | 8,547 |
| 5 Wells Fargo Commercial Mortgage Trust 2015-C28 | 3.872% | 5/15/48 | 1,619 | 1,637 |
| 5 Wells Fargo Commercial Mortgage Trust 2015-C29 | 3.400% | 6/15/48 | 5,800 | 5,871 |
| 5 Wells Fargo Commercial Mortgage Trust 2015-C29 | 3.637% | 6/15/48 | 8,500 | 8,629 |
| 5 Wells Fargo Commercial Mortgage Trust 2015-LC20 | 2.978% | 4/15/50 | 1,536 | 1,531 |
| 5 Wells Fargo Commercial Mortgage Trust 2015-LC20 | 3.184% | 4/15/50 | 11,350 | 11,163 |
| 5 Wells Fargo Commercial Mortgage Trust 2015-LC20 | 3.719% | 4/15/50 | 2,850 | 2,732 |
| 5 Wells Fargo Commercial Mortgage Trust 2015-LC22 | 3.571% | 9/15/58 | 2,350 | 2,423 |
| 5 Wells Fargo Commercial Mortgage Trust 2015-LC22 | 3.839% | 9/15/58 | 3,425 | 3,564 |
| 5 Wells Fargo Commercial Mortgage Trust 2015-LC22 | 4.207% | 9/15/58 | 2,925 | 3,042 |
| 5 Wells Fargo Commercial Mortgage Trust 2015-NSX1 | 2.632% | 5/15/48 | 2,425 | 2,440 |
| 5 Wells Fargo Commercial Mortgage Trust 2015-NSX1 | 2.934% | 5/15/48 | 1,700 | 1,700 |
| 5 Wells Fargo Commercial Mortgage Trust 2015-NSX1 | 3.148% | 5/15/48 | 2,275 | 2,227 |
| 5 Wells Fargo Commercial Mortgage Trust 2015-P2 | 3.656% | 12/15/48 | 4,700 | 4,822 |
| 5 Wells Fargo Commercial Mortgage Trust 2015-P2 | 3.809% | 12/15/48 | 2,950 | 3,026 |
| 5 Wells Fargo Commercial Mortgage Trust 2015-SG1 | 3.789% | 12/15/47 | 4,000 | 4,109 |
| 5 WFRBS Commercial Mortgage Trust 2012-C10 | 2.875% | 12/15/45 | 3,000 | 2,965 |
| 5 WFRBS Commercial Mortgage Trust 2012-C6 | 3.440% | 4/15/45 | 7,425 | 7,679 |
| 5 WFRBS Commercial Mortgage Trust 2012-C7 | 3.431% | 6/15/45 | 4,975 | 5,122 |
| 5 WFRBS Commercial Mortgage Trust 2012-C7 | 4.090% | 6/15/45 | 4,400 | 4,659 |
| 5 WFRBS Commercial Mortgage Trust 2012-C8 | 3.001% | 8/15/45 | 3,100 | 3,101 |
| 5 WFRBS Commercial Mortgage Trust 2012-C9 | 2.870% | 11/15/45 | 6,125 | 6,082 |
| 5 WFRBS Commercial Mortgage Trust 2013-C11 | 3.071% | 3/15/45 | 4,148 | 4,149 |
| 5 WFRBS Commercial Mortgage Trust 2013-C12 | 3.198% | 3/15/48 | 1,733 | 1,740 |
| 5 WFRBS Commercial Mortgage Trust 2013-C12 | 3.560% | 3/15/48 | 820 | 832 |
| 5 WFRBS Commercial Mortgage Trust 2013-C13 | 3.001% | 5/15/45 | 3,436 | 3,415 |
| 5 WFRBS Commercial Mortgage Trust 2013-C13 | 3.345% | 5/15/45 | 673 | 677 |
| 5 WFRBS Commercial Mortgage Trust 2013-C14 | 3.337% | 6/15/46 | 6,000 | 6,080 |
| 5 WFRBS Commercial Mortgage Trust 2013-C14 | 3.488% | 6/15/46 | 3,000 | 3,042 |
| 5 WFRBS Commercial Mortgage Trust 2013-C15 | 3.720% | 8/15/46 | 1,120 | 1,175 |
| 5 WFRBS Commercial Mortgage Trust 2013-C15 | 4.153% | 8/15/46 | 4,470 | 4,782 |
| 5 WFRBS Commercial Mortgage Trust 2013-C15 | 4.358% | 8/15/46 | 1,120 | 1,200 |
| 5 WFRBS Commercial Mortgage Trust 2013-C16 | 3.223% | 9/15/46 | 2,100 | 2,160 |
| 5 WFRBS Commercial Mortgage Trust 2013-C16 | 3.963% | 9/15/46 | 1,250 | 1,327 |
| 5 WFRBS Commercial Mortgage Trust 2013-C16 | 4.415% | 9/15/46 | 1,250 | 1,356 |
| 5 WFRBS Commercial Mortgage Trust 2013-C16 | 4.668% | 9/15/46 | 2,100 | 2,292 |
| 5 WFRBS Commercial Mortgage Trust 2013-C17 | 2.921% | 12/15/46 | 1,150 | 1,175 |
| 5 WFRBS Commercial Mortgage Trust 2013-C17 | 3.558% | 12/15/46 | 1,150 | 1,200 |
| 5 WFRBS Commercial Mortgage Trust 2013-C17 | 4.023% | 12/15/46 | 1,450 | 1,529 |
| 5 WFRBS Commercial Mortgage Trust 2013-C17 | 4.255% | 12/15/46 | 1,150 | 1,223 |
| 5 WFRBS Commercial Mortgage Trust 2013-C17 | 4.788% | 12/15/46 | 1,150 | 1,224 |
| 5 WFRBS Commercial Mortgage Trust 2013-C18 | 3.027% | 12/15/46 | 1,150 | 1,176 |
| 5 WFRBS Commercial Mortgage Trust 2013-C18 | 3.651% | 12/15/46 | 2,300 | 2,387 |
| 5 WFRBS Commercial Mortgage Trust 2013-C18 | 4.162% | 12/15/46 | 5,010 | 5,312 |
| 5 WFRBS Commercial Mortgage Trust 2013-C18 | 4.387% | 12/15/46 | 575 | 617 |
| 5 WFRBS Commercial Mortgage Trust 2013-C18 | 4.669% | 12/15/46 | 862 | 918 |
26
| Vanguard® Total Bond Market Index Fund | ||||
| Schedule of Investments | ||||
| December 31, 2015 | ||||
| Face | Market | |||
| Maturity | Amount | Value | ||
| Coupon | Date | ($000) | ($000) | |
| 5 WFRBS Commercial Mortgage Trust 2013-UBS1 | 2.927% | 3/15/46 | 3,100 | 3,167 |
| 5 WFRBS Commercial Mortgage Trust 2013-UBS1 | 3.591% | 3/15/46 | 1,750 | 1,809 |
| 5 WFRBS Commercial Mortgage Trust 2013-UBS1 | 4.079% | 3/15/46 | 2,350 | 2,487 |
| 5 WFRBS Commercial Mortgage Trust 2013-UBS1 | 4.630% | 3/15/46 | 575 | 615 |
| 5 WFRBS Commercial Mortgage Trust 2014-C19 | 1.233% | 3/15/47 | 880 | 875 |
| 5 WFRBS Commercial Mortgage Trust 2014-C19 | 3.618% | 3/15/47 | 950 | 991 |
| 5 WFRBS Commercial Mortgage Trust 2014-C19 | 3.660% | 3/15/47 | 1,250 | 1,293 |
| 5 WFRBS Commercial Mortgage Trust 2014-C19 | 4.101% | 3/15/47 | 2,825 | 2,994 |
| 5 WFRBS Commercial Mortgage Trust 2014-C19 | 4.723% | 3/15/47 | 950 | 1,008 |
| 5 WFRBS Commercial Mortgage Trust 2014-C20 | 3.036% | 5/15/47 | 1,100 | 1,122 |
| 5 WFRBS Commercial Mortgage Trust 2014-C20 | 3.638% | 5/15/47 | 1,100 | 1,137 |
| 5 WFRBS Commercial Mortgage Trust 2014-C20 | 3.995% | 5/15/47 | 1,675 | 1,754 |
| 5 WFRBS Commercial Mortgage Trust 2014-C20 | 4.176% | 5/15/47 | 1,675 | 1,764 |
| 5 WFRBS Commercial Mortgage Trust 2014-C21 | 3.678% | 8/15/47 | 4,000 | 4,095 |
| 5 WFRBS Commercial Mortgage Trust 2014-C22 | 3.752% | 9/15/57 | 8,200 | 8,394 |
| 5 WFRBS Commercial Mortgage Trust 2014-C22 | 4.371% | 9/15/57 | 1,675 | 1,722 |
| 5 WFRBS Commercial Mortgage Trust 2014-C23 | 3.636% | 10/15/57 | 3,143 | 3,267 |
| 5 WFRBS Commercial Mortgage Trust 2014-C23 | 3.917% | 10/15/57 | 1,675 | 1,756 |
| 5 WFRBS Commercial Mortgage Trust 2014-C23 | 4.210% | 10/15/57 | 1,125 | 1,179 |
| 5 WFRBS Commercial Mortgage Trust 2014-C24 | 3.428% | 11/15/47 | 2,860 | 2,928 |
| 5 WFRBS Commercial Mortgage Trust 2014-C24 | 3.607% | 11/15/47 | 2,860 | 2,921 |
| 5 WFRBS Commercial Mortgage Trust 2014-LC14 | 1.193% | 3/15/47 | 1,586 | 1,577 |
| 5 WFRBS Commercial Mortgage Trust 2014-LC14 | 2.862% | 3/15/47 | 1,120 | 1,142 |
| 5 WFRBS Commercial Mortgage Trust 2014-LC14 | 3.522% | 3/15/47 | 2,800 | 2,879 |
| 5 WFRBS Commercial Mortgage Trust 2014-LC14 | 4.045% | 3/15/47 | 6,720 | 7,133 |
| 5 WFRBS Commercial Mortgage Trust 2014-LC14 | 4.351% | 3/15/47 | 2,800 | 2,982 |
| 5 World Omni Auto Receivables Trust 2012-B | 0.810% | 1/15/19 | 3,296 | 3,291 |
| 5 World Omni Auto Receivables Trust 2013-B | 0.830% | 8/15/18 | 1,232 | 1,230 |
| 5 World Omni Auto Receivables Trust 2013-B | 1.320% | 1/15/20 | 825 | 821 |
| 5 World Omni Auto Receivables Trust 2014-A | 0.940% | 4/15/19 | 2,760 | 2,754 |
| 5 World Omni Auto Receivables Trust 2014-A | 1.530% | 6/15/20 | 2,775 | 2,765 |
| 5 World Omni Auto Receivables Trust 2014-B | 1.140% | 1/15/20 | 3,850 | 3,833 |
| 5 World Omni Auto Receivables Trust 2014-B | 1.680% | 12/15/20 | 1,530 | 1,515 |
| 5 World Omni Auto Receivables Trust 2015-B | 1.490% | 12/15/20 | 2,975 | 2,948 |
| 5 World Omni Auto Receivables Trust 2015-B | 1.840% | 1/17/22 | 2,975 | 2,940 |
| 5 World Omni Automobile Lease Securitization Trust | ||||
| 2013-A | 1.100% | 12/15/16 | 1,062 | 1,063 |
| 5 World Omni Automobile Lease Securitization Trust | ||||
| 2014-A | 1.160% | 9/15/17 | 2,800 | 2,799 |
| 5 World Omni Automobile Lease Securitization Trust | ||||
| 2014-A | 1.370% | 1/15/20 | 850 | 850 |
| 5 World Omni Automobile Lease Securitization Trust | ||||
| 2015-A | 1.540% | 10/15/18 | 2,875 | 2,869 |
| Total Asset-Backed/Commercial Mortgage-Backed Securities (Cost $4,240,763) | 4,277,682 | |||
| Corporate Bonds (26.7%) | ||||
| Finance (8.6%) | ||||
| Banking (6.0%) | ||||
| Abbey National Treasury Services plc | 1.375% | 3/13/17 | 9,333 | 9,291 |
| Abbey National Treasury Services plc | 1.650% | 9/29/17 | 10,000 | 9,977 |
| Abbey National Treasury Services plc | 3.050% | 8/23/18 | 8,275 | 8,488 |
| Abbey National Treasury Services plc | 2.000% | 8/24/18 | 10,195 | 10,174 |
| Abbey National Treasury Services plc | 2.350% | 9/10/19 | 8,035 | 8,037 |
| Abbey National Treasury Services plc | 2.375% | 3/16/20 | 5,200 | 5,178 |
| Abbey National Treasury Services plc | 4.000% | 3/13/24 | 17,125 | 17,816 |
| American Express Bank FSB | 6.000% | 9/13/17 | 13,151 | 14,083 |
| American Express Centurion Bank | 5.950% | 6/12/17 | 2,650 | 2,800 |
| American Express Centurion Bank | 6.000% | 9/13/17 | 23,425 | 25,098 |
| American Express Co. | 6.150% | 8/28/17 | 6,339 | 6,787 |
| American Express Co. | 7.000% | 3/19/18 | 60,072 | 66,572 |
| American Express Co. | 2.650% | 12/2/22 | 4,215 | 4,090 |
| American Express Co. | 3.625% | 12/5/24 | 9,600 | 9,488 |
| American Express Co. | 4.050% | 12/3/42 | 1,881 | 1,780 |
27
| Vanguard® Total Bond Market Index Fund | ||||
| Schedule of Investments | ||||
| December 31, 2015 | ||||
| Face | Market | |||
| Maturity | Amount | Value | ||
| Coupon | Date | ($000) | ($000) | |
| American Express Credit Corp. | 2.375% | 3/24/17 | 3,050 | 3,083 |
| American Express Credit Corp. | 1.125% | 6/5/17 | 16,000 | 15,917 |
| American Express Credit Corp. | 2.125% | 7/27/18 | 875 | 881 |
| American Express Credit Corp. | 1.800% | 7/31/18 | 100 | 100 |
| American Express Credit Corp. | 2.125% | 3/18/19 | 5,440 | 5,434 |
| American Express Credit Corp. | 2.250% | 8/15/19 | 9,825 | 9,825 |
| American Express Credit Corp. | 2.375% | 5/26/20 | 5,025 | 4,979 |
| American Express Credit Corp. | 2.600% | 9/14/20 | 24,250 | 24,305 |
| Australia & New Zealand Banking Group Ltd. | 1.250% | 1/10/17 | 9,135 | 9,150 |
| Australia & New Zealand Banking Group Ltd. | 1.250% | 6/13/17 | 5,775 | 5,759 |
| Australia & New Zealand Banking Group Ltd. | 1.875% | 10/6/17 | 4,590 | 4,611 |
| Australia & New Zealand Banking Group Ltd. | 1.450% | 5/15/18 | 250 | 248 |
| Australia & New Zealand Banking Group Ltd. | 2.000% | 11/16/18 | 20,000 | 19,955 |
| Australia & New Zealand Banking Group Ltd. | 2.250% | 6/13/19 | 16,300 | 16,271 |
| Australia & New Zealand Banking Group Ltd. | 2.700% | 11/16/20 | 14,525 | 14,569 |
| Australia & New Zealand Banking Group Ltd. | 3.700% | 11/16/25 | 12,175 | 12,448 |
| Banco Bilbao Vizcaya Argentaria SA | 3.000% | 10/20/20 | 13,625 | 13,562 |
| Bancolombia SA | 5.950% | 6/3/21 | 6,425 | 6,630 |
| Bank of America Corp. | 5.625% | 10/14/16 | 3 | 3 |
| Bank of America Corp. | 5.420% | 3/15/17 | 14,400 | 14,971 |
| Bank of America Corp. | 3.875% | 3/22/17 | 13,120 | 13,457 |
| Bank of America Corp. | 5.700% | 5/2/17 | 10,881 | 11,353 |
| Bank of America Corp. | 1.700% | 8/25/17 | 10,708 | 10,680 |
| Bank of America Corp. | 6.400% | 8/28/17 | 5,481 | 5,872 |
| Bank of America Corp. | 6.000% | 9/1/17 | 6,716 | 7,148 |
| Bank of America Corp. | 5.750% | 12/1/17 | 15,128 | 16,192 |
| Bank of America Corp. | 2.000% | 1/11/18 | 43,830 | 43,782 |
| Bank of America Corp. | 6.875% | 4/25/18 | 79,969 | 88,210 |
| Bank of America Corp. | 5.650% | 5/1/18 | 62,219 | 66,905 |
| Bank of America Corp. | 6.500% | 7/15/18 | 3,125 | 3,448 |
| Bank of America Corp. | 6.875% | 11/15/18 | 635 | 713 |
| Bank of America Corp. | 2.600% | 1/15/19 | 43,150 | 43,277 |
| Bank of America Corp. | 2.650% | 4/1/19 | 5,347 | 5,359 |
| Bank of America Corp. | 7.625% | 6/1/19 | 37,970 | 43,931 |
| Bank of America Corp. | 2.250% | 4/21/20 | 18,175 | 17,767 |
| Bank of America Corp. | 5.625% | 7/1/20 | 57,288 | 63,560 |
| Bank of America Corp. | 2.625% | 10/19/20 | 19,800 | 19,559 |
| Bank of America Corp. | 5.875% | 1/5/21 | 3,930 | 4,449 |
| Bank of America Corp. | 5.000% | 5/13/21 | 11,110 | 12,139 |
| Bank of America Corp. | 5.700% | 1/24/22 | 21,298 | 24,018 |
| Bank of America Corp. | 3.300% | 1/11/23 | 24,567 | 24,218 |
| Bank of America Corp. | 4.100% | 7/24/23 | 10,983 | 11,358 |
| Bank of America Corp. | 4.125% | 1/22/24 | 34,280 | 35,309 |
| Bank of America Corp. | 4.000% | 4/1/24 | 20,314 | 20,786 |
| Bank of America Corp. | 4.200% | 8/26/24 | 26,876 | 26,913 |
| Bank of America Corp. | 4.000% | 1/22/25 | 25,875 | 25,336 |
| Bank of America Corp. | 3.950% | 4/21/25 | 18,780 | 18,280 |
| Bank of America Corp. | 3.875% | 8/1/25 | 36,600 | 37,141 |
| Bank of America Corp. | 4.250% | 10/22/26 | 18,200 | 18,013 |
| Bank of America Corp. | 6.110% | 1/29/37 | 8,635 | 9,800 |
| Bank of America Corp. | 7.750% | 5/14/38 | 22,973 | 31,109 |
| Bank of America Corp. | 5.875% | 2/7/42 | 27,084 | 31,609 |
| Bank of America Corp. | 5.000% | 1/21/44 | 24,820 | 25,891 |
| Bank of America Corp. | 4.875% | 4/1/44 | 10,075 | 10,395 |
| Bank of America Corp. | 4.750% | 4/21/45 | 1,250 | 1,202 |
| Bank of America NA | 5.300% | 3/15/17 | 42,323 | 44,022 |
| Bank of America NA | 6.100% | 6/15/17 | 6,575 | 6,960 |
| Bank of America NA | 1.650% | 3/26/18 | 4,150 | 4,122 |
| Bank of America NA | 1.750% | 6/5/18 | 12,000 | 11,925 |
| Bank of America NA | 2.050% | 12/7/18 | 25,625 | 25,527 |
| Bank of America NA | 6.000% | 10/15/36 | 10,955 | 12,942 |
| Bank of Montreal | 2.500% | 1/11/17 | 17,435 | 17,637 |
| Bank of Montreal | 1.300% | 7/14/17 | 6,446 | 6,434 |
| Bank of Montreal | 1.400% | 9/11/17 | 1,945 | 1,945 |
28
| Vanguard® Total Bond Market Index Fund | ||||
| Schedule of Investments | ||||
| December 31, 2015 | ||||
| Face | Market | |||
| Maturity | Amount | Value | ||
| Coupon | Date | ($000) | ($000) | |
| Bank of Montreal | 1.450% | 4/9/18 | 5,375 | 5,338 |
| Bank of Montreal | 1.400% | 4/10/18 | 9,800 | 9,713 |
| Bank of Montreal | 2.375% | 1/25/19 | 9,250 | 9,333 |
| Bank of Montreal | 2.550% | 11/6/22 | 22,185 | 21,936 |
| Bank of New York Mellon Corp. | 2.400% | 1/17/17 | 19,960 | 20,156 |
| Bank of New York Mellon Corp. | 1.969% | 6/20/17 | 6,800 | 6,855 |
| Bank of New York Mellon Corp. | 1.300% | 1/25/18 | 3,250 | 3,221 |
| Bank of New York Mellon Corp. | 2.100% | 1/15/19 | 30,326 | 30,425 |
| Bank of New York Mellon Corp. | 2.200% | 3/4/19 | 6,643 | 6,665 |
| Bank of New York Mellon Corp. | 2.200% | 5/15/19 | 225 | 225 |
| Bank of New York Mellon Corp. | 5.450% | 5/15/19 | 5,285 | 5,824 |
| Bank of New York Mellon Corp. | 2.300% | 9/11/19 | 15,000 | 15,032 |
| Bank of New York Mellon Corp. | 4.600% | 1/15/20 | 6,375 | 6,903 |
| Bank of New York Mellon Corp. | 2.150% | 2/24/20 | 5,000 | 4,949 |
| Bank of New York Mellon Corp. | 2.600% | 8/17/20 | 4,875 | 4,896 |
| Bank of New York Mellon Corp. | 2.450% | 11/27/20 | 6,275 | 6,244 |
| Bank of New York Mellon Corp. | 3.550% | 9/23/21 | 4,530 | 4,740 |
| Bank of New York Mellon Corp. | 3.650% | 2/4/24 | 6,325 | 6,558 |
| Bank of New York Mellon Corp. | 3.250% | 9/11/24 | 13,750 | 13,843 |
| Bank of New York Mellon Corp. | 3.000% | 2/24/25 | 4,700 | 4,619 |
| Bank of Nova Scotia | 2.550% | 1/12/17 | 11,410 | 11,568 |
| Bank of Nova Scotia | 1.250% | 4/11/17 | 5,095 | 5,088 |
| Bank of Nova Scotia | 1.300% | 7/21/17 | 6,275 | 6,257 |
| Bank of Nova Scotia | 1.375% | 12/18/17 | 15,175 | 15,121 |
| Bank of Nova Scotia | 1.450% | 4/25/18 | 2,750 | 2,736 |
| Bank of Nova Scotia | 1.700% | 6/11/18 | 6,000 | 5,984 |
| Bank of Nova Scotia | 2.050% | 10/30/18 | 16,885 | 16,944 |
| Bank of Nova Scotia | 2.050% | 6/5/19 | 10,515 | 10,491 |
| Bank of Nova Scotia | 2.350% | 10/21/20 | 21,500 | 21,304 |
| Bank of Nova Scotia | 4.375% | 1/13/21 | 1,560 | 1,685 |
| Bank of Nova Scotia | 2.800% | 7/21/21 | 31,325 | 31,722 |
| Bank of Nova Scotia | 4.500% | 12/16/25 | 30,600 | 30,429 |
| Bank One Capital III | 8.750% | 9/1/30 | 1,675 | 2,392 |
| Bank One Corp. | 7.625% | 10/15/26 | 2,055 | 2,606 |
| Bank One Corp. | 8.000% | 4/29/27 | 2,500 | 3,222 |
| Barclays Bank plc | 2.500% | 2/20/19 | 40,250 | 40,511 |
| Barclays Bank plc | 6.750% | 5/22/19 | 13,200 | 15,073 |
| Barclays Bank plc | 5.125% | 1/8/20 | 9,225 | 10,138 |
| Barclays Bank plc | 5.140% | 10/14/20 | 1,680 | 1,824 |
| Barclays Bank plc | 3.750% | 5/15/24 | 250 | 254 |
| Barclays plc | 2.000% | 3/16/18 | 4,350 | 4,334 |
| Barclays plc | 2.750% | 11/8/19 | 13,623 | 13,587 |
| Barclays plc | 2.875% | 6/8/20 | 4,600 | 4,593 |
| Barclays plc | 4.375% | 9/11/24 | 7,400 | 7,235 |
| Barclays plc | 3.650% | 3/16/25 | 25,000 | 24,144 |
| Barclays plc | 5.250% | 8/17/45 | 14,900 | 15,163 |
| BB&T Corp. | 2.150% | 3/22/17 | 6,475 | 6,526 |
| BB&T Corp. | 4.900% | 6/30/17 | 1,240 | 1,292 |
| BB&T Corp. | 1.600% | 8/15/17 | 4,940 | 4,950 |
| BB&T Corp. | 1.450% | 1/12/18 | 5,010 | 4,973 |
| BB&T Corp. | 2.050% | 6/19/18 | 11,805 | 11,862 |
| BB&T Corp. | 2.250% | 2/1/19 | 3,950 | 3,964 |
| BB&T Corp. | 6.850% | 4/30/19 | 3,754 | 4,282 |
| BB&T Corp. | 5.250% | 11/1/19 | 10,240 | 11,197 |
| BB&T Corp. | 2.450% | 1/15/20 | 14,620 | 14,677 |
| Bear Stearns Cos. LLC | 5.550% | 1/22/17 | 26,310 | 27,342 |
| Bear Stearns Cos. LLC | 6.400% | 10/2/17 | 19,700 | 21,214 |
| Bear Stearns Cos. LLC | 7.250% | 2/1/18 | 35,983 | 39,627 |
| Bear Stearns Cos. LLC | 4.650% | 7/2/18 | 1,660 | 1,769 |
| BNP Paribas SA | 1.375% | 3/17/17 | 395 | 394 |
| BNP Paribas SA | 2.375% | 9/14/17 | 29,441 | 29,748 |
| BNP Paribas SA | 2.700% | 8/20/18 | 3,175 | 3,218 |
| BNP Paribas SA | 2.400% | 12/12/18 | 12,180 | 12,276 |
| BNP Paribas SA | 2.450% | 3/17/19 | 2,575 | 2,583 |
29
| Vanguard® Total Bond Market Index Fund | |||||
| Schedule of Investments | |||||
| December 31, 2015 | |||||
| Face | Market | ||||
| Maturity | Amount | Value | |||
| Coupon | Date | ($000) | ($000) | ||
| BNP Paribas SA | 2.375% | 5/21/20 | 6,525 | 6,474 | |
| BNP Paribas SA | 5.000% | 1/15/21 | 38,055 | 41,985 | |
| BNP Paribas SA | 3.250% | 3/3/23 | 21,280 | 21,199 | |
| BNP Paribas SA | 4.250% | 10/15/24 | 2,300 | 2,278 | |
| BPCE SA | 1.625% | 2/10/17 | 8,500 | 8,508 | |
| BPCE SA | 1.613% | 7/25/17 | 8,000 | 7,982 | |
| BPCE SA | 2.500% | 12/10/18 | 14,225 | 14,365 | |
| BPCE SA | 2.500% | 7/15/19 | 10,600 | 10,631 | |
| BPCE SA | 2.250% | 1/27/20 | 4,600 | 4,562 | |
| BPCE SA | 4.000% | 4/15/24 | 17,625 | 18,253 | |
| Branch Banking & Trust Co. | 1.350% | 10/1/17 | 5,925 | 5,918 | |
| Branch Banking & Trust Co. | 2.300% | 10/15/18 | 8,200 | 8,278 | |
| Branch Banking & Trust Co. | 3.625% | 9/16/25 | 18,400 | 18,572 | |
| Branch Banking & Trust Co. | 3.800% | 10/30/26 | 2,500 | 2,533 | |
| Capital One Bank USA NA | 1.300% | 6/5/17 | 6,700 | 6,648 | |
| Capital One Bank USA NA | 2.150% | 11/21/18 | 10,850 | 10,755 | |
| Capital One Bank USA NA | 2.250% | 2/13/19 | 10,950 | 10,889 | |
| Capital One Bank USA NA | 2.300% | 6/5/19 | 10,500 | 10,371 | |
| Capital One Bank USA NA | 8.800% | 7/15/19 | 5,975 | 7,122 | |
| Capital One Bank USA NA | 3.375% | 2/15/23 | 19,550 | 19,131 | |
| Capital One Financial Corp. | 6.150% | 9/1/16 | 8,324 | 8,582 | |
| Capital One Financial Corp. | 6.750% | 9/15/17 | 10,310 | 11,091 | |
| Capital One Financial Corp. | 2.450% | 4/24/19 | 9,105 | 9,117 | |
| Capital One Financial Corp. | 4.750% | 7/15/21 | 3,110 | 3,371 | |
| Capital One Financial Corp. | 3.500% | 6/15/23 | 3,832 | 3,797 | |
| Capital One Financial Corp. | 3.750% | 4/24/24 | 7,100 | 7,155 | |
| Capital One Financial Corp. | 4.200% | 10/29/25 | 8,500 | 8,392 | |
| Capital One NA | 1.500% | 9/5/17 | 4,075 | 4,043 | |
| Capital One NA | 1.650% | 2/5/18 | 12,500 | 12,372 | |
| Capital One NA | 2.400% | 9/5/19 | 7,275 | 7,200 | |
| Capital One NA | 2.950% | 7/23/21 | 7,000 | 6,937 | |
| 5,8 | Citicorp Lease Pass-Through Trust 1999-1 | 8.040% | 12/15/19 | 14,225 | 16,748 |
| Citigroup Inc. | 5.500% | 2/15/17 | 4,190 | 4,360 | |
| Citigroup Inc. | 1.350% | 3/10/17 | 6,000 | 5,977 | |
| Citigroup Inc. | 1.550% | 8/14/17 | 7,825 | 7,789 | |
| Citigroup Inc. | 6.000% | 8/15/17 | 9,052 | 9,680 | |
| Citigroup Inc. | 6.125% | 11/21/17 | 9,830 | 10,585 | |
| Citigroup Inc. | 1.850% | 11/24/17 | 27,240 | 27,208 | |
| Citigroup Inc. | 1.800% | 2/5/18 | 11,250 | 11,198 | |
| Citigroup Inc. | 1.700% | 4/27/18 | 38,060 | 37,697 | |
| Citigroup Inc. | 1.750% | 5/1/18 | 21,947 | 21,737 | |
| Citigroup Inc. | 6.125% | 5/15/18 | 9,065 | 9,888 | |
| Citigroup Inc. | 2.150% | 7/30/18 | 17,000 | 16,989 | |
| Citigroup Inc. | 2.500% | 9/26/18 | 25,468 | 25,658 | |
| Citigroup Inc. | 2.050% | 12/7/18 | 45,000 | 44,689 | |
| Citigroup Inc. | 2.550% | 4/8/19 | 19,245 | 19,372 | |
| Citigroup Inc. | 2.500% | 7/29/19 | 3,700 | 3,690 | |
| Citigroup Inc. | 2.400% | 2/18/20 | 7,040 | 6,956 | |
| Citigroup Inc. | 5.375% | 8/9/20 | 10,375 | 11,547 | |
| Citigroup Inc. | 2.650% | 10/26/20 | 18,950 | 18,773 | |
| Citigroup Inc. | 4.500% | 1/14/22 | 30,357 | 32,503 | |
| Citigroup Inc. | 4.050% | 7/30/22 | 8,250 | 8,426 | |
| Citigroup Inc. | 3.500% | 5/15/23 | 6,833 | 6,732 | |
| Citigroup Inc. | 3.875% | 10/25/23 | 7,117 | 7,352 | |
| Citigroup Inc. | 4.000% | 8/5/24 | 21,925 | 21,720 | |
| Citigroup Inc. | 3.875% | 3/26/25 | 2,000 | 1,948 | |
| Citigroup Inc. | 3.300% | 4/27/25 | 10,700 | 10,506 | |
| Citigroup Inc. | 4.400% | 6/10/25 | 50,095 | 50,594 | |
| Citigroup Inc. | 5.500% | 9/13/25 | 22,099 | 23,980 | |
| Citigroup Inc. | 4.300% | 11/20/26 | 100 | 99 | |
| Citigroup Inc. | 4.450% | 9/29/27 | 13,800 | 13,712 | |
| Citigroup Inc. | 6.625% | 6/15/32 | 4,340 | 5,118 | |
| Citigroup Inc. | 6.000% | 10/31/33 | 7,495 | 8,399 | |
| Citigroup Inc. | 6.125% | 8/25/36 | 13,964 | 15,775 | |
30
| Vanguard® Total Bond Market Index Fund | ||||
| Schedule of Investments | ||||
| December 31, 2015 | ||||
| Face | Market | |||
| Maturity | Amount | Value | ||
| Coupon | Date | ($000) | ($000) | |
| Citigroup Inc. | 8.125% | 7/15/39 | 26,316 | 37,613 |
| Citigroup Inc. | 5.875% | 1/30/42 | 7,655 | 8,783 |
| Citigroup Inc. | 6.675% | 9/13/43 | 10,100 | 12,391 |
| Citigroup Inc. | 4.950% | 11/7/43 | 906 | 951 |
| Citigroup Inc. | 5.300% | 5/6/44 | 13,150 | 13,660 |
| Citigroup Inc. | 4.650% | 7/30/45 | 16,350 | 16,559 |
| Citizens Bank NA | 1.600% | 12/4/17 | 4,575 | 4,531 |
| Citizens Bank NA | 2.450% | 12/4/19 | 4,550 | 4,477 |
| Citizens Bank NA/Providence RI | 2.300% | 12/3/18 | 5,025 | 5,019 |
| Citizens Financial Group Inc. | 4.300% | 12/3/25 | 6,300 | 6,325 |
| Comerica Bank | 5.200% | 8/22/17 | 4,600 | 4,834 |
| Comerica Bank | 4.000% | 7/27/25 | 2,800 | 2,840 |
| Comerica Inc. | 2.125% | 5/23/19 | 1,000 | 992 |
| Commonwealth Bank of Australia | 1.400% | 9/8/17 | 10,475 | 10,474 |
| Commonwealth Bank of Australia | 1.900% | 9/18/17 | 4,200 | 4,222 |
| Commonwealth Bank of Australia | 1.625% | 3/12/18 | 30,710 | 30,627 |
| Commonwealth Bank of Australia | 2.500% | 9/20/18 | 2,925 | 2,969 |
| Commonwealth Bank of Australia | 1.750% | 11/2/18 | 9,050 | 8,990 |
| Commonwealth Bank of Australia | 2.250% | 3/13/19 | 3,875 | 3,886 |
| Commonwealth Bank of Australia | 2.300% | 9/6/19 | 17,200 | 17,162 |
| Commonwealth Bank of Australia | 2.400% | 11/2/20 | 12,925 | 12,801 |
| 8 Commonwealth Bank of Australia | 4.500% | 12/9/25 | 10,400 | 10,285 |
| Compass Bank | 1.850% | 9/29/17 | 2,675 | 2,653 |
| Compass Bank | 6.400% | 10/1/17 | 2,875 | 3,033 |
| Compass Bank | 2.750% | 9/29/19 | 3,110 | 3,080 |
| Cooperatieve Rabobank UA | 3.375% | 1/19/17 | 32,565 | 33,236 |
| Cooperatieve Rabobank UA | 1.700% | 3/19/18 | 14,000 | 13,925 |
| Cooperatieve Rabobank UA | 2.250% | 1/14/19 | 21,630 | 21,723 |
| Cooperatieve Rabobank UA | 4.500% | 1/11/21 | 21,520 | 23,438 |
| Cooperatieve Rabobank UA | 3.875% | 2/8/22 | 40,044 | 42,140 |
| Cooperatieve Rabobank UA | 3.950% | 11/9/22 | 29,642 | 29,906 |
| Cooperatieve Rabobank UA | 4.625% | 12/1/23 | 17,015 | 17,717 |
| Cooperatieve Rabobank UA | 3.375% | 5/21/25 | 15,450 | 15,296 |
| Cooperatieve Rabobank UA | 4.375% | 8/4/25 | 2,000 | 2,024 |
| Cooperatieve Rabobank UA | 5.250% | 5/24/41 | 7,870 | 8,895 |
| Cooperatieve Rabobank UA | 5.750% | 12/1/43 | 10,575 | 11,739 |
| Cooperatieve Rabobank UA | 5.250% | 8/4/45 | 2,100 | 2,196 |
| 5 Cooperatieve Rabobank UA | 8.400% | 11/29/49 | 125 | 135 |
| Credit Suisse | 1.375% | 5/26/17 | 17,788 | 17,698 |
| Credit Suisse | 6.000% | 2/15/18 | 27,325 | 29,367 |
| Credit Suisse | 1.700% | 4/27/18 | 24,625 | 24,439 |
| Credit Suisse | 2.300% | 5/28/19 | 42,859 | 42,903 |
| Credit Suisse | 5.300% | 8/13/19 | 12,675 | 13,992 |
| Credit Suisse | 5.400% | 1/14/20 | 8,511 | 9,321 |
| Credit Suisse | 3.000% | 10/29/21 | 24,819 | 24,755 |
| Credit Suisse | 3.625% | 9/9/24 | 22,375 | 22,532 |
| 8 Credit Suisse Group Funding Guernsey Ltd. | 2.750% | 3/26/20 | 2,850 | 2,826 |
| 8 Credit Suisse Group Funding Guernsey Ltd. | 3.800% | 9/15/22 | 16,800 | 16,749 |
| 8 Credit Suisse Group Funding Guernsey Ltd. | 3.750% | 3/26/25 | 13,500 | 13,160 |
| 8 Credit Suisse Group Funding Guernsey Ltd. | 4.875% | 5/15/45 | 13,500 | 13,296 |
| Credit Suisse USA Inc. | 5.375% | 3/2/16 | 524 | 528 |
| Credit Suisse USA Inc. | 7.125% | 7/15/32 | 10,954 | 14,085 |
| Deutsche Bank AG | 1.400% | 2/13/17 | 2,125 | 2,112 |
| Deutsche Bank AG | 1.350% | 5/30/17 | 21,585 | 21,447 |
| Deutsche Bank AG | 6.000% | 9/1/17 | 17,955 | 19,024 |
| Deutsche Bank AG | 1.875% | 2/13/18 | 7,764 | 7,717 |
| Deutsche Bank AG | 2.500% | 2/13/19 | 16,500 | 16,592 |
| Deutsche Bank AG | 2.950% | 8/20/20 | 6,800 | 6,802 |
| Deutsche Bank AG | 3.700% | 5/30/24 | 22,280 | 22,231 |
| Discover Bank | 2.000% | 2/21/18 | 14,600 | 14,502 |
| Discover Bank | 2.600% | 11/13/18 | 5,300 | 5,302 |
| Discover Bank | 3.100% | 6/4/20 | 4,000 | 4,013 |
| Discover Bank | 3.200% | 8/9/21 | 4,440 | 4,413 |
| Discover Bank | 4.200% | 8/8/23 | 13,275 | 13,490 |
31
| Vanguard® Total Bond Market Index Fund | ||||
| Schedule of Investments | ||||
| December 31, 2015 | ||||
| Face | Market | |||
| Maturity | Amount | Value | ||
| Coupon | Date | ($000) | ($000) | |
| Discover Bank | 4.250% | 3/13/26 | 2,150 | 2,166 |
| Discover Financial Services | 6.450% | 6/12/17 | 2,235 | 2,362 |
| Discover Financial Services | 5.200% | 4/27/22 | 1,867 | 1,997 |
| Discover Financial Services | 3.850% | 11/21/22 | 9,495 | 9,427 |
| Discover Financial Services | 3.750% | 3/4/25 | 5,525 | 5,309 |
| Fifth Third Bancorp | 5.450% | 1/15/17 | 10,415 | 10,818 |
| Fifth Third Bancorp | 4.500% | 6/1/18 | 1,555 | 1,635 |
| Fifth Third Bancorp | 2.300% | 3/1/19 | 4,395 | 4,399 |
| Fifth Third Bancorp | 2.875% | 7/27/20 | 150 | 150 |
| Fifth Third Bancorp | 3.500% | 3/15/22 | 2,136 | 2,174 |
| Fifth Third Bancorp | 4.300% | 1/16/24 | 8,345 | 8,550 |
| Fifth Third Bancorp | 8.250% | 3/1/38 | 9,170 | 12,837 |
| Fifth Third Bank | 1.350% | 6/1/17 | 3,700 | 3,693 |
| Fifth Third Bank | 2.150% | 8/20/18 | 16,425 | 16,435 |
| Fifth Third Bank | 2.375% | 4/25/19 | 10,400 | 10,402 |
| Fifth Third Bank | 2.875% | 10/1/21 | 7,250 | 7,229 |
| First Horizon National Corp. | 3.500% | 12/15/20 | 3,500 | 3,465 |
| First Niagara Financial Group Inc. | 6.750% | 3/19/20 | 1,875 | 2,132 |
| First Republic Bank | 2.375% | 6/17/19 | 4,100 | 4,089 |
| FirstMerit Bank NA | 4.270% | 11/25/26 | 5,750 | 5,745 |
| FirstMerit Corp. | 4.350% | 2/4/23 | 2,750 | 2,799 |
| Goldman Sachs Capital I | 6.345% | 2/15/34 | 12,175 | 14,318 |
| Goldman Sachs Group Inc. | 5.625% | 1/15/17 | 22,045 | 22,883 |
| Goldman Sachs Group Inc. | 6.250% | 9/1/17 | 21,570 | 23,091 |
| Goldman Sachs Group Inc. | 5.950% | 1/18/18 | 34,798 | 37,432 |
| Goldman Sachs Group Inc. | 2.375% | 1/22/18 | 45,520 | 45,901 |
| Goldman Sachs Group Inc. | 6.150% | 4/1/18 | 39,858 | 43,277 |
| Goldman Sachs Group Inc. | 2.900% | 7/19/18 | 24,000 | 24,468 |
| Goldman Sachs Group Inc. | 2.625% | 1/31/19 | 17,785 | 17,928 |
| Goldman Sachs Group Inc. | 7.500% | 2/15/19 | 23,692 | 27,031 |
| Goldman Sachs Group Inc. | 2.550% | 10/23/19 | 20,800 | 20,786 |
| Goldman Sachs Group Inc. | 5.375% | 3/15/20 | 39,040 | 42,910 |
| Goldman Sachs Group Inc. | 2.600% | 4/23/20 | 19,174 | 19,128 |
| Goldman Sachs Group Inc. | 6.000% | 6/15/20 | 33,204 | 37,540 |
| Goldman Sachs Group Inc. | 2.750% | 9/15/20 | 13,350 | 13,327 |
| Goldman Sachs Group Inc. | 5.250% | 7/27/21 | 11,489 | 12,711 |
| Goldman Sachs Group Inc. | 5.750% | 1/24/22 | 57,268 | 65,106 |
| Goldman Sachs Group Inc. | 3.625% | 1/22/23 | 26,200 | 26,501 |
| Goldman Sachs Group Inc. | 4.000% | 3/3/24 | 29,879 | 30,673 |
| Goldman Sachs Group Inc. | 3.850% | 7/8/24 | 9,417 | 9,609 |
| Goldman Sachs Group Inc. | 3.500% | 1/23/25 | 25,775 | 25,284 |
| Goldman Sachs Group Inc. | 4.250% | 10/21/25 | 9,850 | 9,779 |
| Goldman Sachs Group Inc. | 5.950% | 1/15/27 | 17,981 | 19,930 |
| Goldman Sachs Group Inc. | 6.125% | 2/15/33 | 24,539 | 28,678 |
| Goldman Sachs Group Inc. | 6.450% | 5/1/36 | 32,690 | 36,844 |
| Goldman Sachs Group Inc. | 6.750% | 10/1/37 | 45,856 | 53,580 |
| Goldman Sachs Group Inc. | 6.250% | 2/1/41 | 26,152 | 31,212 |
| Goldman Sachs Group Inc. | 4.800% | 7/8/44 | 13,645 | 13,622 |
| Goldman Sachs Group Inc. | 5.150% | 5/22/45 | 27,203 | 26,397 |
| Goldman Sachs Group Inc. | 4.750% | 10/21/45 | 9,300 | 9,240 |
| HSBC Bank USA NA | 6.000% | 8/9/17 | 775 | 822 |
| HSBC Bank USA NA | 4.875% | 8/24/20 | 26,350 | 28,771 |
| HSBC Bank USA NA | 5.875% | 11/1/34 | 6,850 | 7,922 |
| HSBC Bank USA NA | 5.625% | 8/15/35 | 4,282 | 4,827 |
| HSBC Bank USA NA | 7.000% | 1/15/39 | 7,909 | 9,918 |
| HSBC Holdings plc | 5.100% | 4/5/21 | 41,250 | 45,778 |
| HSBC Holdings plc | 4.875% | 1/14/22 | 4,140 | 4,517 |
| HSBC Holdings plc | 4.000% | 3/30/22 | 14,126 | 14,825 |
| HSBC Holdings plc | 4.250% | 3/14/24 | 29,100 | 29,158 |
| HSBC Holdings plc | 4.250% | 8/18/25 | 12,000 | 11,990 |
| HSBC Holdings plc | 7.625% | 5/17/32 | 1,925 | 2,464 |
| HSBC Holdings plc | 7.350% | 11/27/32 | 2,040 | 2,533 |
| HSBC Holdings plc | 6.500% | 5/2/36 | 27,420 | 32,656 |
| HSBC Holdings plc | 6.500% | 9/15/37 | 30,075 | 35,990 |
32
| Vanguard® Total Bond Market Index Fund | ||||
| Schedule of Investments | ||||
| December 31, 2015 | ||||
| Face | Market | |||
| Maturity | Amount | Value | ||
| Coupon | Date | ($000) | ($000) | |
| HSBC Holdings plc | 6.800% | 6/1/38 | 6,135 | 7,591 |
| HSBC Holdings plc | 6.100% | 1/14/42 | 6,625 | 8,344 |
| HSBC Holdings plc | 5.250% | 3/14/44 | 10,075 | 10,417 |
| HSBC USA Inc. | 1.300% | 6/23/17 | 2,075 | 2,064 |
| HSBC USA Inc. | 1.500% | 11/13/17 | 21,275 | 21,161 |
| HSBC USA Inc. | 1.625% | 1/16/18 | 15,000 | 14,925 |
| HSBC USA Inc. | 1.700% | 3/5/18 | 2,500 | 2,484 |
| HSBC USA Inc. | 2.000% | 8/7/18 | 6,000 | 5,993 |
| HSBC USA Inc. | 2.250% | 6/23/19 | 6,550 | 6,520 |
| HSBC USA Inc. | 2.375% | 11/13/19 | 17,700 | 17,639 |
| HSBC USA Inc. | 2.350% | 3/5/20 | 15,650 | 15,491 |
| HSBC USA Inc. | 2.750% | 8/7/20 | 4,875 | 4,882 |
| HSBC USA Inc. | 5.000% | 9/27/20 | 8,200 | 8,940 |
| HSBC USA Inc. | 3.500% | 6/23/24 | 7,400 | 7,421 |
| Huntington Bancshares Inc. | 7.000% | 12/15/20 | 4,200 | 4,893 |
| Huntington National Bank | 1.350% | 8/2/16 | 1,125 | 1,125 |
| Huntington National Bank | 1.375% | 4/24/17 | 1,000 | 994 |
| Huntington National Bank | 2.000% | 6/30/18 | 5,000 | 4,969 |
| Huntington National Bank | 2.200% | 11/6/18 | 6,225 | 6,207 |
| Huntington National Bank | 2.400% | 4/1/20 | 12,575 | 12,371 |
| Huntington National Bank | 2.875% | 8/20/20 | 7,750 | 7,696 |
| Intesa Sanpaolo SPA | 2.375% | 1/13/17 | 9,225 | 9,255 |
| Intesa Sanpaolo SPA | 3.875% | 1/16/18 | 10,350 | 10,601 |
| Intesa Sanpaolo SPA | 3.875% | 1/15/19 | 9,500 | 9,779 |
| Intesa Sanpaolo SPA | 5.250% | 1/12/24 | 28,381 | 30,232 |
| JPMorgan Chase & Co. | 1.350% | 2/15/17 | 27,100 | 27,042 |
| JPMorgan Chase & Co. | 6.125% | 6/27/17 | 7,131 | 7,550 |
| JPMorgan Chase & Co. | 2.000% | 8/15/17 | 34,900 | 35,068 |
| JPMorgan Chase & Co. | 6.000% | 1/15/18 | 24,539 | 26,459 |
| JPMorgan Chase & Co. | 1.800% | 1/25/18 | 13,666 | 13,645 |
| JPMorgan Chase & Co. | 1.700% | 3/1/18 | 21,200 | 21,095 |
| JPMorgan Chase & Co. | 1.625% | 5/15/18 | 17,925 | 17,801 |
| JPMorgan Chase & Co. | 2.350% | 1/28/19 | 14,000 | 14,025 |
| JPMorgan Chase & Co. | 6.300% | 4/23/19 | 26,995 | 30,223 |
| JPMorgan Chase & Co. | 2.200% | 10/22/19 | 16,145 | 16,029 |
| JPMorgan Chase & Co. | 2.250% | 1/23/20 | 35,400 | 34,996 |
| JPMorgan Chase & Co. | 2.750% | 6/23/20 | 29,000 | 29,062 |
| JPMorgan Chase & Co. | 4.400% | 7/22/20 | 4,785 | 5,114 |
| JPMorgan Chase & Co. | 4.250% | 10/15/20 | 14,604 | 15,491 |
| JPMorgan Chase & Co. | 2.550% | 10/29/20 | 38,000 | 37,661 |
| JPMorgan Chase & Co. | 4.625% | 5/10/21 | 1,944 | 2,100 |
| JPMorgan Chase & Co. | 4.350% | 8/15/21 | 25,109 | 26,728 |
| JPMorgan Chase & Co. | 4.500% | 1/24/22 | 28,905 | 31,121 |
| JPMorgan Chase & Co. | 3.250% | 9/23/22 | 18,585 | 18,696 |
| JPMorgan Chase & Co. | 3.200% | 1/25/23 | 32,094 | 31,933 |
| JPMorgan Chase & Co. | 3.375% | 5/1/23 | 24,590 | 24,065 |
| JPMorgan Chase & Co. | 3.875% | 2/1/24 | 18,910 | 19,364 |
| JPMorgan Chase & Co. | 3.625% | 5/13/24 | 46,115 | 46,661 |
| JPMorgan Chase & Co. | 3.875% | 9/10/24 | 34,583 | 34,417 |
| JPMorgan Chase & Co. | 3.125% | 1/23/25 | 26,295 | 25,575 |
| JPMorgan Chase & Co. | 3.900% | 7/15/25 | 25,200 | 25,825 |
| JPMorgan Chase & Co. | 4.125% | 12/15/26 | 23,300 | 23,249 |
| JPMorgan Chase & Co. | 4.250% | 10/1/27 | 2,250 | 2,235 |
| JPMorgan Chase & Co. | 6.400% | 5/15/38 | 25,034 | 31,486 |
| JPMorgan Chase & Co. | 5.500% | 10/15/40 | 27,737 | 31,400 |
| JPMorgan Chase & Co. | 5.600% | 7/15/41 | 11,695 | 13,478 |
| JPMorgan Chase & Co. | 5.400% | 1/6/42 | 7,874 | 8,848 |
| JPMorgan Chase & Co. | 5.625% | 8/16/43 | 6,565 | 7,092 |
| JPMorgan Chase & Co. | 4.850% | 2/1/44 | 8,000 | 8,522 |
| JPMorgan Chase & Co. | 4.950% | 6/1/45 | 15,950 | 15,947 |
| JPMorgan Chase Bank NA | 6.000% | 7/5/17 | 825 | 877 |
| JPMorgan Chase Bank NA | 6.000% | 10/1/17 | 21,265 | 22,756 |
| KeyBank NA | 5.450% | 3/3/16 | 6,405 | 6,449 |
| KeyBank NA | 1.650% | 2/1/18 | 19,365 | 19,288 |
33
| Vanguard® Total Bond Market Index Fund | |||||
| Schedule of Investments | |||||
| December 31, 2015 | |||||
| Face | Market | ||||
| Maturity | Amount | Value | |||
| Coupon | Date | ($000) | ($000) | ||
| KeyBank NA | 1.700% | 6/1/18 | 4,500 | 4,470 | |
| KeyBank NA | 2.500% | 12/15/19 | 3,000 | 3,005 | |
| KeyBank NA | 2.250% | 3/16/20 | 1,250 | 1,235 | |
| KeyBank NA | 3.300% | 6/1/25 | 6,125 | 6,056 | |
| KeyBank NA | 6.950% | 2/1/28 | 1,275 | 1,588 | |
| KeyCorp | 5.100% | 3/24/21 | 9,200 | 10,090 | |
| Lloyds Bank plc | 4.200% | 3/28/17 | 17,219 | 17,760 | |
| Lloyds Bank plc | 1.750% | 3/16/18 | 4,750 | 4,738 | |
| Lloyds Bank plc | 1.750% | 5/14/18 | 5,700 | 5,688 | |
| Lloyds Bank plc | 2.300% | 11/27/18 | 9,350 | 9,384 | |
| Lloyds Bank plc | 2.350% | 9/5/19 | 9,925 | 9,920 | |
| Lloyds Bank plc | 2.400% | 3/17/20 | 1,275 | 1,266 | |
| Lloyds Bank plc | 2.700% | 8/17/20 | 7,200 | 7,233 | |
| Lloyds Bank plc | 6.375% | 1/21/21 | 11,125 | 13,073 | |
| Lloyds Bank plc | 3.500% | 5/14/25 | 13,500 | 13,575 | |
| Lloyds Banking Group plc | 4.500% | 11/4/24 | 6,975 | 7,056 | |
| 8 | Lloyds Banking Group plc | 5.300% | 12/1/45 | 2,400 | 2,435 |
| Manufacturers & Traders Trust Co. | 1.400% | 7/25/17 | 4,000 | 3,980 | |
| Manufacturers & Traders Trust Co. | 6.625% | 12/4/17 | 5,950 | 6,459 | |
| Manufacturers & Traders Trust Co. | 2.300% | 1/30/19 | 28,700 | 28,743 | |
| Manufacturers & Traders Trust Co. | 2.250% | 7/25/19 | 8,000 | 7,962 | |
| Manufacturers & Traders Trust Co. | 2.100% | 2/6/20 | 14,000 | 13,747 | |
| 5,7 | Manufacturers & Traders Trust Co. | 1.637% | 12/28/20 | 75 | 74 |
| Manufacturers & Traders Trust Co. | 2.900% | 2/6/25 | 7,075 | 6,849 | |
| Morgan Stanley | 5.450% | 1/9/17 | 18,638 | 19,346 | |
| Morgan Stanley | 4.750% | 3/22/17 | 24,458 | 25,328 | |
| Morgan Stanley | 5.550% | 4/27/17 | 11,870 | 12,444 | |
| Morgan Stanley | 6.250% | 8/28/17 | 13,610 | 14,570 | |
| Morgan Stanley | 5.950% | 12/28/17 | 19,975 | 21,480 | |
| Morgan Stanley | 1.875% | 1/5/18 | 17,706 | 17,688 | |
| Morgan Stanley | 6.625% | 4/1/18 | 37,985 | 41,609 | |
| Morgan Stanley | 2.125% | 4/25/18 | 31,145 | 31,193 | |
| Morgan Stanley | 2.200% | 12/7/18 | 1,000 | 1,000 | |
| Morgan Stanley | 2.500% | 1/24/19 | 29,972 | 30,078 | |
| Morgan Stanley | 7.300% | 5/13/19 | 37,389 | 42,971 | |
| Morgan Stanley | 2.375% | 7/23/19 | 18,553 | 18,494 | |
| Morgan Stanley | 5.625% | 9/23/19 | 34,125 | 37,605 | |
| Morgan Stanley | 5.500% | 1/26/20 | 10,414 | 11,481 | |
| Morgan Stanley | 2.650% | 1/27/20 | 20,650 | 20,549 | |
| Morgan Stanley | 2.800% | 6/16/20 | 17,000 | 17,065 | |
| Morgan Stanley | 5.500% | 7/24/20 | 1,245 | 1,388 | |
| Morgan Stanley | 5.750% | 1/25/21 | 21,100 | 23,719 | |
| Morgan Stanley | 5.500% | 7/28/21 | 11,900 | 13,324 | |
| Morgan Stanley | 4.875% | 11/1/22 | 20,783 | 22,100 | |
| Morgan Stanley | 3.750% | 2/25/23 | 36,365 | 37,257 | |
| Morgan Stanley | 4.100% | 5/22/23 | 20,730 | 20,913 | |
| Morgan Stanley | 3.875% | 4/29/24 | 18,110 | 18,464 | |
| Morgan Stanley | 3.700% | 10/23/24 | 26,784 | 26,803 | |
| Morgan Stanley | 4.000% | 7/23/25 | 18,810 | 19,382 | |
| Morgan Stanley | 5.000% | 11/24/25 | 23,460 | 24,906 | |
| Morgan Stanley | 6.250% | 8/9/26 | 10,075 | 11,826 | |
| Morgan Stanley | 4.350% | 9/8/26 | 17,023 | 16,964 | |
| Morgan Stanley | 3.950% | 4/23/27 | 17,450 | 16,937 | |
| Morgan Stanley | 7.250% | 4/1/32 | 7,527 | 9,861 | |
| Morgan Stanley | 6.375% | 7/24/42 | 16,892 | 21,007 | |
| Morgan Stanley | 4.300% | 1/27/45 | 19,200 | 18,191 | |
| MUFG Americas Holdings Corp. | 1.625% | 2/9/18 | 4,800 | 4,747 | |
| MUFG Americas Holdings Corp. | 2.250% | 2/10/20 | 10,500 | 10,347 | |
| MUFG Americas Holdings Corp. | 3.500% | 6/18/22 | 11,410 | 11,621 | |
| MUFG Americas Holdings Corp. | 3.000% | 2/10/25 | 7,000 | 6,677 | |
| MUFG Union Bank NA | 5.950% | 5/11/16 | 4,275 | 4,345 | |
| MUFG Union Bank NA | 1.500% | 9/26/16 | 3,775 | 3,786 | |
| MUFG Union Bank NA | 2.125% | 6/16/17 | 2,695 | 2,713 | |
| MUFG Union Bank NA | 2.625% | 9/26/18 | 17,075 | 17,245 | |
34
| Vanguard® Total Bond Market Index Fund | ||||
| Schedule of Investments | ||||
| December 31, 2015 | ||||
| Face | Market | |||
| Maturity | Amount | Value | ||
| Coupon | Date | ($000) | ($000) | |
| MUFG Union Bank NA | 2.250% | 5/6/19 | 4,925 | 4,922 |
| Murray Street Investment Trust I | 4.647% | 3/9/17 | 18,003 | 18,581 |
| National Australia Bank Ltd. | 2.750% | 3/9/17 | 4,095 | 4,163 |
| National Australia Bank Ltd. | 2.300% | 7/25/18 | 11,200 | 11,278 |
| National Australia Bank Ltd. | 3.000% | 1/20/23 | 5,050 | 5,012 |
| National Bank of Canada | 1.450% | 11/7/17 | 8,250 | 8,194 |
| National City Bank | 5.800% | 6/7/17 | 1,800 | 1,902 |
| National City Corp. | 6.875% | 5/15/19 | 1,640 | 1,853 |
| Northern Trust Co. | 6.500% | 8/15/18 | 1,125 | 1,252 |
| Northern Trust Corp. | 3.450% | 11/4/20 | 7,820 | 8,160 |
| Northern Trust Corp. | 3.375% | 8/23/21 | 1,690 | 1,754 |
| Northern Trust Corp. | 2.375% | 8/2/22 | 6,000 | 5,887 |
| Northern Trust Corp. | 3.950% | 10/30/25 | 8,475 | 8,839 |
| People's United Bank | 4.000% | 7/15/24 | 3,850 | 3,801 |
| People's United Financial Inc. | 3.650% | 12/6/22 | 4,650 | 4,613 |
| PNC Bank NA | 5.250% | 1/15/17 | 325 | 337 |
| PNC Bank NA | 4.875% | 9/21/17 | 9,969 | 10,423 |
| PNC Bank NA | 1.500% | 10/18/17 | 10,595 | 10,585 |
| PNC Bank NA | 6.000% | 12/7/17 | 1,050 | 1,125 |
| PNC Bank NA | 1.500% | 2/23/18 | 2,425 | 2,410 |
| PNC Bank NA | 1.600% | 6/1/18 | 8,000 | 7,939 |
| PNC Bank NA | 1.850% | 7/20/18 | 4,500 | 4,492 |
| PNC Bank NA | 1.800% | 11/5/18 | 10,325 | 10,272 |
| PNC Bank NA | 2.250% | 7/2/19 | 5,400 | 5,415 |
| PNC Bank NA | 2.400% | 10/18/19 | 21,345 | 21,461 |
| PNC Bank NA | 2.300% | 6/1/20 | 10,730 | 10,624 |
| PNC Bank NA | 2.600% | 7/21/20 | 5,320 | 5,325 |
| PNC Bank NA | 2.450% | 11/5/20 | 7,800 | 7,744 |
| PNC Bank NA | 2.700% | 11/1/22 | 7,317 | 7,103 |
| PNC Bank NA | 2.950% | 1/30/23 | 10,077 | 9,788 |
| PNC Bank NA | 3.800% | 7/25/23 | 15,575 | 16,008 |
| PNC Bank NA | 3.300% | 10/30/24 | 8,400 | 8,425 |
| PNC Bank NA | 2.950% | 2/23/25 | 8,425 | 8,136 |
| PNC Bank NA | 3.250% | 6/1/25 | 3,600 | 3,568 |
| PNC Financial Services Group Inc. | 2.854% | 11/9/22 | 14,450 | 14,250 |
| PNC Financial Services Group Inc. | 3.900% | 4/29/24 | 20,635 | 21,135 |
| PNC Funding Corp. | 5.625% | 2/1/17 | 955 | 993 |
| PNC Funding Corp. | 6.700% | 6/10/19 | 6,379 | 7,304 |
| PNC Funding Corp. | 5.125% | 2/8/20 | 12,108 | 13,327 |
| PNC Funding Corp. | 4.375% | 8/11/20 | 19,200 | 20,677 |
| PNC Funding Corp. | 3.300% | 3/8/22 | 12,200 | 12,418 |
| Regions Bank | 7.500% | 5/15/18 | 2,546 | 2,834 |
| Regions Bank | 6.450% | 6/26/37 | 3,100 | 3,669 |
| Regions Financial Corp. | 2.000% | 5/15/18 | 20,190 | 20,008 |
| Regions Financial Corp. | 7.375% | 12/10/37 | 3,380 | 4,242 |
| Royal Bank of Canada | 1.000% | 4/27/17 | 11,950 | 11,897 |
| Royal Bank of Canada | 1.250% | 6/16/17 | 18,750 | 18,695 |
| Royal Bank of Canada | 1.400% | 10/13/17 | 14,781 | 14,774 |
| Royal Bank of Canada | 1.500% | 1/16/18 | 674 | 672 |
| Royal Bank of Canada | 2.200% | 7/27/18 | 20,080 | 20,270 |
| Royal Bank of Canada | 1.800% | 7/30/18 | 16,300 | 16,251 |
| Royal Bank of Canada | 2.000% | 12/10/18 | 8,800 | 8,817 |
| Royal Bank of Canada | 2.200% | 9/23/19 | 19,475 | 19,481 |
| Royal Bank of Canada | 2.350% | 10/30/20 | 22,400 | 22,155 |
| Royal Bank of Scotland Group plc | 1.875% | 3/31/17 | 5,500 | 5,478 |
| Royal Bank of Scotland Group plc | 6.400% | 10/21/19 | 25,480 | 28,183 |
| Santander Bank NA | 8.750% | 5/30/18 | 820 | 926 |
| Santander Holdings USA Inc. | 3.450% | 8/27/18 | 9,072 | 9,219 |
| Santander Holdings USA Inc. | 2.650% | 4/17/20 | 2,360 | 2,303 |
| Santander Holdings USA Inc. | 4.500% | 7/17/25 | 5,800 | 5,899 |
| Santander Issuances SAU | 5.179% | 11/19/25 | 23,000 | 22,459 |
| Santander UK Group Holdings plc | 2.875% | 10/16/20 | 14,450 | 14,349 |
| Societe Generale SA | 2.750% | 10/12/17 | 9,325 | 9,456 |
| Societe Generale SA | 2.625% | 10/1/18 | 14,000 | 14,157 |
35
| Vanguard® Total Bond Market Index Fund | ||||
| Schedule of Investments | ||||
| December 31, 2015 | ||||
| Face | Market | |||
| Maturity | Amount | Value | ||
| Coupon | Date | ($000) | ($000) | |
| State Street Bank & Trust Co. | 5.300% | 1/15/16 | 2,975 | 2,978 |
| State Street Bank & Trust Co. | 5.250% | 10/15/18 | 275 | 299 |
| State Street Corp. | 4.956% | 3/15/18 | 5,986 | 6,280 |
| State Street Corp. | 1.350% | 5/15/18 | 9,075 | 9,011 |
| State Street Corp. | 4.375% | 3/7/21 | 700 | 760 |
| State Street Corp. | 3.100% | 5/15/23 | 7,500 | 7,398 |
| State Street Corp. | 3.700% | 11/20/23 | 8,275 | 8,590 |
| State Street Corp. | 3.300% | 12/16/24 | 7,600 | 7,670 |
| State Street Corp. | 3.550% | 8/18/25 | 21,237 | 21,901 |
| Sumitomo Mitsui Banking Corp. | 1.300% | 1/10/17 | 4,275 | 4,264 |
| Sumitomo Mitsui Banking Corp. | 1.350% | 7/11/17 | 10,650 | 10,576 |
| Sumitomo Mitsui Banking Corp. | 1.800% | 7/18/17 | 12,375 | 12,372 |
| Sumitomo Mitsui Banking Corp. | 2.500% | 7/19/18 | 3,325 | 3,356 |
| Sumitomo Mitsui Banking Corp. | 1.950% | 7/23/18 | 6,625 | 6,589 |
| Sumitomo Mitsui Banking Corp. | 2.450% | 1/10/19 | 6,825 | 6,830 |
| Sumitomo Mitsui Banking Corp. | 2.250% | 7/11/19 | 3,850 | 3,823 |
| Sumitomo Mitsui Banking Corp. | 2.650% | 7/23/20 | 4,700 | 4,707 |
| Sumitomo Mitsui Banking Corp. | 2.450% | 10/20/20 | 3,000 | 2,971 |
| Sumitomo Mitsui Banking Corp. | 3.200% | 7/18/22 | 5,025 | 5,043 |
| Sumitomo Mitsui Banking Corp. | 3.000% | 1/18/23 | 550 | 543 |
| Sumitomo Mitsui Banking Corp. | 3.950% | 7/19/23 | 9,998 | 10,415 |
| Sumitomo Mitsui Banking Corp. | 3.950% | 1/10/24 | 9,850 | 10,213 |
| Sumitomo Mitsui Banking Corp. | 3.400% | 7/11/24 | 14,050 | 13,947 |
| Sumitomo Mitsui Banking Corp. | 3.650% | 7/23/25 | 3,100 | 3,155 |
| SunTrust Bank | 7.250% | 3/15/18 | 1,000 | 1,105 |
| SunTrust Bank | 2.750% | 5/1/23 | 6,600 | 6,303 |
| SunTrust Banks Inc. | 3.500% | 1/20/17 | 10,115 | 10,304 |
| SunTrust Banks Inc. | 6.000% | 9/11/17 | 2,508 | 2,670 |
| SunTrust Banks Inc. | 2.500% | 5/1/19 | 4,040 | 4,057 |
| SVB Financial Group | 3.500% | 1/29/25 | 3,375 | 3,225 |
| Svenska Handelsbanken AB | 2.875% | 4/4/17 | 38,100 | 38,764 |
| Svenska Handelsbanken AB | 1.625% | 3/21/18 | 4,775 | 4,753 |
| Svenska Handelsbanken AB | 2.500% | 1/25/19 | 9,775 | 9,901 |
| Svenska Handelsbanken AB | 2.250% | 6/17/19 | 13,680 | 13,697 |
| Svenska Handelsbanken AB | 2.400% | 10/1/20 | 4,600 | 4,567 |
| Synchrony Financial | 1.875% | 8/15/17 | 705 | 702 |
| Synchrony Financial | 2.600% | 1/15/19 | 12,675 | 12,629 |
| Synchrony Financial | 3.000% | 8/15/19 | 5,024 | 5,021 |
| Synchrony Financial | 2.700% | 2/3/20 | 7,225 | 7,094 |
| Synchrony Financial | 3.750% | 8/15/21 | 6,263 | 6,266 |
| Synchrony Financial | 4.250% | 8/15/24 | 27,691 | 27,336 |
| Synchrony Financial | 4.500% | 7/23/25 | 14,750 | 14,716 |
| Toronto-Dominion Bank | 1.125% | 5/2/17 | 4,865 | 4,852 |
| Toronto-Dominion Bank | 1.625% | 3/13/18 | 31,750 | 31,733 |
| Toronto-Dominion Bank | 1.400% | 4/30/18 | 27,527 | 27,346 |
| Toronto-Dominion Bank | 1.750% | 7/23/18 | 6,000 | 6,001 |
| Toronto-Dominion Bank | 2.625% | 9/10/18 | 30,276 | 30,965 |
| Toronto-Dominion Bank | 2.125% | 7/2/19 | 3,300 | 3,306 |
| Toronto-Dominion Bank | 2.250% | 11/5/19 | 27,447 | 27,446 |
| Toronto-Dominion Bank | 2.500% | 12/14/20 | 7,600 | 7,585 |
| UBS AG | 1.375% | 6/1/17 | 13,200 | 13,140 |
| UBS AG | 1.375% | 8/14/17 | 10,000 | 9,934 |
| UBS AG | 5.875% | 12/20/17 | 3,074 | 3,317 |
| UBS AG | 1.800% | 3/26/18 | 28,075 | 28,041 |
| UBS AG | 5.750% | 4/25/18 | 2,092 | 2,267 |
| UBS AG | 2.375% | 8/14/19 | 5,250 | 5,255 |
| UBS AG | 2.350% | 3/26/20 | 7,400 | 7,389 |
| UBS AG | 4.875% | 8/4/20 | 2,510 | 2,763 |
| US Bancorp | 1.650% | 5/15/17 | 4,300 | 4,317 |
| US Bancorp | 1.950% | 11/15/18 | 6,225 | 6,264 |
| US Bancorp | 2.200% | 4/25/19 | 15,620 | 15,730 |
| US Bancorp | 4.125% | 5/24/21 | 7,185 | 7,759 |
| US Bancorp | 3.000% | 3/15/22 | 2,240 | 2,277 |
| US Bancorp | 2.950% | 7/15/22 | 15,399 | 15,317 |
36
| Vanguard® Total Bond Market Index Fund | ||||
| Schedule of Investments | ||||
| December 31, 2015 | ||||
| Face | Market | |||
| Maturity | Amount | Value | ||
| Coupon | Date | ($000) | ($000) | |
| US Bancorp | 3.600% | 9/11/24 | 2,175 | 2,211 |
| US Bank NA | 1.375% | 9/11/17 | 6,775 | 6,782 |
| US Bank NA | 1.350% | 1/26/18 | 12,500 | 12,456 |
| US Bank NA | 2.125% | 10/28/19 | 14,500 | 14,477 |
| US Bank NA | 2.800% | 1/27/25 | 16,400 | 15,976 |
| Vesey Street Investment Trust I | 4.404% | 9/1/16 | 2,295 | 2,335 |
| Wachovia Bank NA | 5.850% | 2/1/37 | 16,347 | 19,453 |
| Wachovia Corp. | 5.750% | 6/15/17 | 26,695 | 28,269 |
| Wachovia Corp. | 5.750% | 2/1/18 | 9,515 | 10,280 |
| Wachovia Corp. | 6.605% | 10/1/25 | 3,175 | 3,766 |
| Wachovia Corp. | 5.500% | 8/1/35 | 11,770 | 12,997 |
| Wachovia Corp. | 6.550% | 10/15/35 | 7,625 | 9,184 |
| Wells Fargo & Co. | 2.625% | 12/15/16 | 42,239 | 42,831 |
| Wells Fargo & Co. | 2.100% | 5/8/17 | 21,150 | 21,361 |
| Wells Fargo & Co. | 1.150% | 6/2/17 | 7,260 | 7,236 |
| Wells Fargo & Co. | 1.400% | 9/8/17 | 26,500 | 26,419 |
| Wells Fargo & Co. | 5.625% | 12/11/17 | 33,370 | 35,811 |
| Wells Fargo & Co. | 1.500% | 1/16/18 | 3,562 | 3,547 |
| Wells Fargo & Co. | 2.150% | 1/15/19 | 5,810 | 5,841 |
| Wells Fargo & Co. | 2.125% | 4/22/19 | 18,415 | 18,430 |
| Wells Fargo & Co. | 2.150% | 1/30/20 | 5,925 | 5,880 |
| Wells Fargo & Co. | 2.600% | 7/22/20 | 19,350 | 19,351 |
| Wells Fargo & Co. | 2.550% | 12/7/20 | 18,000 | 17,853 |
| Wells Fargo & Co. | 3.000% | 1/22/21 | 13,070 | 13,267 |
| Wells Fargo & Co. | 4.600% | 4/1/21 | 20,619 | 22,447 |
| Wells Fargo & Co. | 3.500% | 3/8/22 | 22,190 | 22,836 |
| Wells Fargo & Co. | 3.450% | 2/13/23 | 16,648 | 16,658 |
| Wells Fargo & Co. | 4.125% | 8/15/23 | 14,104 | 14,592 |
| Wells Fargo & Co. | 4.480% | 1/16/24 | 10,987 | 11,562 |
| Wells Fargo & Co. | 3.300% | 9/9/24 | 15,400 | 15,285 |
| Wells Fargo & Co. | 3.000% | 2/19/25 | 18,965 | 18,316 |
| Wells Fargo & Co. | 3.550% | 9/29/25 | 22,400 | 22,564 |
| Wells Fargo & Co. | 4.100% | 6/3/26 | 24,050 | 24,273 |
| Wells Fargo & Co. | 4.300% | 7/22/27 | 21,000 | 21,402 |
| Wells Fargo & Co. | 5.375% | 2/7/35 | 13,700 | 15,680 |
| Wells Fargo & Co. | 5.375% | 11/2/43 | 17,900 | 19,124 |
| Wells Fargo & Co. | 5.606% | 1/15/44 | 8,465 | 9,369 |
| Wells Fargo & Co. | 4.650% | 11/4/44 | 9,460 | 9,209 |
| Wells Fargo & Co. | 3.900% | 5/1/45 | 13,900 | 12,695 |
| Wells Fargo & Co. | 4.900% | 11/17/45 | 26,500 | 26,578 |
| Wells Fargo Bank NA | 6.000% | 11/15/17 | 8,775 | 9,463 |
| Wells Fargo Bank NA | 5.950% | 8/26/36 | 10,053 | 11,952 |
| Wells Fargo Bank NA | 6.600% | 1/15/38 | 10,135 | 13,088 |
| 5 Wells Fargo Capital X | 5.950% | 12/1/86 | 3,907 | 3,941 |
| Westpac Banking Corp. | 1.200% | 5/19/17 | 7,990 | 7,968 |
| Westpac Banking Corp. | 2.000% | 8/14/17 | 5,620 | 5,656 |
| Westpac Banking Corp. | 1.500% | 12/1/17 | 11,500 | 11,494 |
| Westpac Banking Corp. | 1.600% | 1/12/18 | 11,200 | 11,182 |
| Westpac Banking Corp. | 2.250% | 7/30/18 | 16,525 | 16,640 |
| Westpac Banking Corp. | 1.950% | 11/23/18 | 9,800 | 9,783 |
| Westpac Banking Corp. | 2.250% | 1/17/19 | 11,680 | 11,706 |
| Westpac Banking Corp. | 4.875% | 11/19/19 | 16,450 | 17,956 |
| Westpac Banking Corp. | 2.300% | 5/26/20 | 12,750 | 12,664 |
| Westpac Banking Corp. | 2.600% | 11/23/20 | 20,975 | 20,962 |
| Brokerage (0.2%) | ||||
| Affiliated Managers Group Inc. | 4.250% | 2/15/24 | 8,625 | 8,707 |
| Affiliated Managers Group Inc. | 3.500% | 8/1/25 | 11,475 | 10,908 |
| Ameriprise Financial Inc. | 7.300% | 6/28/19 | 2,227 | 2,572 |
| Ameriprise Financial Inc. | 5.300% | 3/15/20 | 3,792 | 4,204 |
| Ameriprise Financial Inc. | 4.000% | 10/15/23 | 8,975 | 9,265 |
| Ameriprise Financial Inc. | 3.700% | 10/15/24 | 6,740 | 6,826 |
| Apollo Investment Corp. | 5.250% | 3/3/25 | 3,700 | 3,567 |
| BGC Partners Inc. | 5.375% | 12/9/19 | 500 | 514 |
37
| Vanguard® Total Bond Market Index Fund | ||||
| Schedule of Investments | ||||
| December 31, 2015 | ||||
| Face | Market | |||
| Maturity | Amount | Value | ||
| Coupon | Date | ($000) | ($000) | |
| BlackRock Inc. | 6.250% | 9/15/17 | 3,000 | 3,240 |
| BlackRock Inc. | 5.000% | 12/10/19 | 7,598 | 8,395 |
| BlackRock Inc. | 4.250% | 5/24/21 | 6,540 | 7,069 |
| BlackRock Inc. | 3.375% | 6/1/22 | 10,125 | 10,422 |
| BlackRock Inc. | 3.500% | 3/18/24 | 16,025 | 16,392 |
| Brookfield Asset Management Inc. | 4.000% | 1/15/25 | 6,475 | 6,326 |
| Brookfield Asset Management Inc. | 7.375% | 3/1/33 | 2,140 | 2,512 |
| Charles Schwab Corp. | 4.450% | 7/22/20 | 10,525 | 11,483 |
| Charles Schwab Corp. | 3.225% | 9/1/22 | 4,005 | 4,071 |
| Charles Schwab Corp. | 3.450% | 2/13/26 | 5,925 | 5,986 |
| CME Group Inc. | 3.000% | 9/15/22 | 7,870 | 7,908 |
| CME Group Inc. | 3.000% | 3/15/25 | 5,475 | 5,371 |
| CME Group Inc. | 5.300% | 9/15/43 | 6,895 | 7,894 |
| Eaton Vance Corp. | 3.625% | 6/15/23 | 2,650 | 2,661 |
| 8 FMR LLC | 7.490% | 6/15/19 | 800 | 927 |
| Franklin Resources Inc. | 1.375% | 9/15/17 | 2,775 | 2,771 |
| Franklin Resources Inc. | 4.625% | 5/20/20 | 1,550 | 1,676 |
| Franklin Resources Inc. | 2.800% | 9/15/22 | 10,550 | 10,291 |
| Franklin Resources Inc. | 2.850% | 3/30/25 | 1,725 | 1,627 |
| Intercontinental Exchange Inc. | 2.500% | 10/15/18 | 4,795 | 4,835 |
| Intercontinental Exchange Inc. | 2.750% | 12/1/20 | 11,150 | 11,120 |
| Intercontinental Exchange Inc. | 4.000% | 10/15/23 | 16,071 | 16,580 |
| Intercontinental Exchange Inc. | 3.750% | 12/1/25 | 10,000 | 10,016 |
| Invesco Finance plc | 3.125% | 11/30/22 | 7,000 | 6,891 |
| Invesco Finance plc | 4.000% | 1/30/24 | 4,253 | 4,389 |
| Invesco Finance plc | 3.750% | 1/15/26 | 4,250 | 4,270 |
| Invesco Finance plc | 5.375% | 11/30/43 | 10,960 | 11,971 |
| Janus Capital Group Inc. | 4.875% | 8/1/25 | 3,950 | 4,049 |
| Jefferies Group LLC | 5.125% | 4/13/18 | 5,870 | 6,105 |
| Jefferies Group LLC | 8.500% | 7/15/19 | 3,132 | 3,649 |
| Jefferies Group LLC | 6.875% | 4/15/21 | 12,400 | 13,831 |
| Jefferies Group LLC | 5.125% | 1/20/23 | 1,025 | 1,026 |
| Jefferies Group LLC | 6.450% | 6/8/27 | 2,535 | 2,678 |
| Jefferies Group LLC | 6.250% | 1/15/36 | 2,925 | 2,684 |
| Jefferies Group LLC | 6.500% | 1/20/43 | 5,525 | 5,110 |
| Lazard Group LLC | 6.850% | 6/15/17 | 1,245 | 1,321 |
| Legg Mason Inc. | 2.700% | 7/15/19 | 950 | 946 |
| Legg Mason Inc. | 3.950% | 7/15/24 | 1,775 | 1,746 |
| Legg Mason Inc. | 5.625% | 1/15/44 | 7,270 | 7,264 |
| Leucadia National Corp. | 5.500% | 10/18/23 | 5,150 | 5,032 |
| Leucadia National Corp. | 6.625% | 10/23/43 | 2,765 | 2,282 |
| Nasdaq Inc. | 5.550% | 1/15/20 | 10,025 | 11,052 |
| Nomura Holdings Inc. | 2.750% | 3/19/19 | 22,209 | 22,308 |
| Nomura Holdings Inc. | 6.700% | 3/4/20 | 7,880 | 9,064 |
| NYSE Euronext | 2.000% | 10/5/17 | 6,800 | 6,826 |
| Raymond James Financial Inc. | 4.250% | 4/15/16 | 375 | 378 |
| Stifel Financial Corp. | 4.250% | 7/18/24 | 2,825 | 2,799 |
| TD Ameritrade Holding Corp. | 5.600% | 12/1/19 | 2,400 | 2,685 |
| TD Ameritrade Holding Corp. | 2.950% | 4/1/22 | 3,100 | 3,074 |
| TD Ameritrade Holding Corp. | 3.625% | 4/1/25 | 6,200 | 6,270 |
| Finance Companies (0.4%) | ||||
| Air Lease Corp. | 5.625% | 4/1/17 | 9,725 | 10,090 |
| Air Lease Corp. | 2.125% | 1/15/18 | 4,000 | 3,930 |
| Air Lease Corp. | 3.375% | 1/15/19 | 26,435 | 26,600 |
| Air Lease Corp. | 4.750% | 3/1/20 | 11,700 | 12,270 |
| Air Lease Corp. | 3.875% | 4/1/21 | 4,245 | 4,266 |
| Air Lease Corp. | 3.750% | 2/1/22 | 3,925 | 3,847 |
| Ares Capital Corp. | 4.875% | 11/30/18 | 9,525 | 9,860 |
| Ares Capital Corp. | 3.875% | 1/15/20 | 1,800 | 1,829 |
| FS Investment Corp. | 4.000% | 7/15/19 | 3,775 | 3,759 |
| FS Investment Corp. | 4.250% | 1/15/20 | 2,150 | 2,159 |
| FS Investment Corp. | 4.750% | 5/15/22 | 2,250 | 2,210 |
| GATX Corp. | 3.500% | 7/15/16 | 1,875 | 1,896 |
38
| Vanguard® Total Bond Market Index Fund | ||||
| Schedule of Investments | ||||
| December 31, 2015 | ||||
| Face | Market | |||
| Maturity | Amount | Value | ||
| Coupon | Date | ($000) | ($000) | |
| GATX Corp. | 1.250% | 3/4/17 | 1,875 | 1,857 |
| GATX Corp. | 2.375% | 7/30/18 | 7,060 | 7,022 |
| GATX Corp. | 2.500% | 7/30/19 | 2,050 | 2,018 |
| GATX Corp. | 4.850% | 6/1/21 | 50 | 53 |
| GATX Corp. | 4.750% | 6/15/22 | 4,700 | 4,961 |
| GATX Corp. | 3.250% | 3/30/25 | 3,500 | 3,242 |
| GATX Corp. | 5.200% | 3/15/44 | 925 | 875 |
| GATX Corp. | 4.500% | 3/30/45 | 2,150 | 1,844 |
| 8 GE Capital International Funding Co. | 0.964% | 4/15/16 | 184,929 | 184,994 |
| 8 GE Capital International Funding Co. | 2.342% | 11/15/20 | 127,636 | 126,609 |
| 8 GE Capital International Funding Co. | 3.373% | 11/15/25 | 31,442 | 31,764 |
| 8 GE Capital International Funding Co. | 4.418% | 11/15/35 | 145,702 | 148,545 |
| HSBC Finance Corp. | 6.676% | 1/15/21 | 45,794 | 52,468 |
| 8 International Lease Finance Corp. | 7.125% | 9/1/18 | 11,440 | 12,541 |
| Prospect Capital Corp. | 5.000% | 7/15/19 | 3,650 | 3,668 |
| Prospect Capital Corp. | 5.875% | 3/15/23 | 1,860 | 1,806 |
| Insurance (1.3%) | ||||
| ACE Capital Trust II | 9.700% | 4/1/30 | 2,089 | 3,042 |
| ACE INA Holdings Inc. | 5.700% | 2/15/17 | 2,968 | 3,112 |
| ACE INA Holdings Inc. | 5.800% | 3/15/18 | 1,256 | 1,364 |
| ACE INA Holdings Inc. | 5.900% | 6/15/19 | 2,755 | 3,086 |
| ACE INA Holdings Inc. | 2.300% | 11/3/20 | 6,000 | 5,938 |
| ACE INA Holdings Inc. | 2.875% | 11/3/22 | 7,350 | 7,284 |
| ACE INA Holdings Inc. | 2.700% | 3/13/23 | 8,648 | 8,437 |
| ACE INA Holdings Inc. | 3.350% | 5/15/24 | 4,999 | 5,042 |
| ACE INA Holdings Inc. | 3.150% | 3/15/25 | 6,990 | 6,907 |
| ACE INA Holdings Inc. | 3.350% | 5/3/26 | 14,500 | 14,449 |
| ACE INA Holdings Inc. | 6.700% | 5/15/36 | 1,040 | 1,354 |
| ACE INA Holdings Inc. | 4.150% | 3/13/43 | 2,583 | 2,517 |
| ACE INA Holdings Inc. | 4.350% | 11/3/45 | 11,700 | 11,835 |
| AEGON Funding Co. LLC | 5.750% | 12/15/20 | 12,100 | 13,737 |
| Aetna Inc. | 1.750% | 5/15/17 | 2,975 | 2,977 |
| Aetna Inc. | 1.500% | 11/15/17 | 9,397 | 9,374 |
| Aetna Inc. | 2.200% | 3/15/19 | 3,580 | 3,563 |
| Aetna Inc. | 4.125% | 6/1/21 | 375 | 392 |
| Aetna Inc. | 2.750% | 11/15/22 | 9,300 | 8,955 |
| Aetna Inc. | 3.500% | 11/15/24 | 6,955 | 6,944 |
| Aetna Inc. | 6.625% | 6/15/36 | 8,161 | 9,763 |
| Aetna Inc. | 6.750% | 12/15/37 | 4,905 | 6,139 |
| Aetna Inc. | 4.500% | 5/15/42 | 4,653 | 4,568 |
| Aetna Inc. | 4.125% | 11/15/42 | 1,842 | 1,726 |
| Aetna Inc. | 4.750% | 3/15/44 | 3,325 | 3,361 |
| Aflac Inc. | 2.650% | 2/15/17 | 8,495 | 8,606 |
| Aflac Inc. | 2.400% | 3/16/20 | 12,856 | 12,831 |
| Aflac Inc. | 4.000% | 2/15/22 | 1,550 | 1,633 |
| Aflac Inc. | 3.625% | 6/15/23 | 4,200 | 4,323 |
| Aflac Inc. | 6.900% | 12/17/39 | 5,225 | 6,740 |
| Aflac Inc. | 6.450% | 8/15/40 | 5,058 | 6,204 |
| Alleghany Corp. | 5.625% | 9/15/20 | 3,450 | 3,783 |
| Alleghany Corp. | 4.950% | 6/27/22 | 4,100 | 4,393 |
| Alleghany Corp. | 4.900% | 9/15/44 | 6,789 | 6,438 |
| Allied World Assurance Co. Holdings Ltd. | 4.350% | 10/29/25 | 11,650 | 11,551 |
| Allied World Assurance Co. Ltd. | 5.500% | 11/15/20 | 1,850 | 2,015 |
| Allstate Corp. | 7.450% | 5/16/19 | 500 | 584 |
| Allstate Corp. | 3.150% | 6/15/23 | 9,850 | 9,843 |
| Allstate Corp. | 5.350% | 6/1/33 | 1,354 | 1,495 |
| Allstate Corp. | 5.550% | 5/9/35 | 2,856 | 3,309 |
| Allstate Corp. | 5.950% | 4/1/36 | 28 | 34 |
| Allstate Corp. | 4.500% | 6/15/43 | 6,335 | 6,435 |
| 5 Allstate Corp. | 5.750% | 8/15/53 | 3,950 | 4,049 |
| 5 Allstate Corp. | 6.125% | 5/15/67 | 1,456 | 1,456 |
| 5 Allstate Corp. | 6.500% | 5/15/67 | 4,425 | 4,890 |
| Alterra Finance LLC | 6.250% | 9/30/20 | 2,235 | 2,510 |
39
| Vanguard® Total Bond Market Index Fund | ||||
| Schedule of Investments | ||||
| December 31, 2015 | ||||
| Face | Market | |||
| Maturity | Amount | Value | ||
| Coupon | Date | ($000) | ($000) | |
| American Financial Group Inc. | 9.875% | 6/15/19 | 8,054 | 9,770 |
| American International Group Inc. | 5.850% | 1/16/18 | 16,931 | 18,221 |
| American International Group Inc. | 2.300% | 7/16/19 | 11,386 | 11,291 |
| American International Group Inc. | 3.375% | 8/15/20 | 15,150 | 15,558 |
| American International Group Inc. | 6.400% | 12/15/20 | 22,513 | 25,950 |
| American International Group Inc. | 4.875% | 6/1/22 | 11,423 | 12,330 |
| American International Group Inc. | 4.125% | 2/15/24 | 13,215 | 13,558 |
| American International Group Inc. | 3.750% | 7/10/25 | 1,050 | 1,039 |
| American International Group Inc. | 3.875% | 1/15/35 | 10,700 | 9,412 |
| American International Group Inc. | 4.700% | 7/10/35 | 4,445 | 4,428 |
| American International Group Inc. | 6.250% | 5/1/36 | 8,085 | 9,386 |
| American International Group Inc. | 6.820% | 11/15/37 | 1,955 | 2,342 |
| American International Group Inc. | 4.500% | 7/16/44 | 20,700 | 19,134 |
| American International Group Inc. | 4.800% | 7/10/45 | 7,975 | 7,694 |
| American International Group Inc. | 4.375% | 1/15/55 | 4,900 | 4,205 |
| 5 American International Group Inc. | 8.175% | 5/15/68 | 5,700 | 7,443 |
| 5 American International Group Inc. | 6.250% | 3/15/87 | 3,721 | 4,004 |
| Anthem Inc. | 5.875% | 6/15/17 | 450 | 475 |
| Anthem Inc. | 1.875% | 1/15/18 | 9,618 | 9,582 |
| Anthem Inc. | 7.000% | 2/15/19 | 875 | 983 |
| Anthem Inc. | 2.250% | 8/15/19 | 5,595 | 5,561 |
| Anthem Inc. | 4.350% | 8/15/20 | 6,275 | 6,646 |
| Anthem Inc. | 3.700% | 8/15/21 | 6,125 | 6,234 |
| Anthem Inc. | 3.125% | 5/15/22 | 7,340 | 7,180 |
| Anthem Inc. | 3.300% | 1/15/23 | 8,815 | 8,583 |
| Anthem Inc. | 3.500% | 8/15/24 | 7,559 | 7,377 |
| Anthem Inc. | 5.950% | 12/15/34 | 7,525 | 8,393 |
| Anthem Inc. | 5.850% | 1/15/36 | 6,985 | 7,572 |
| Anthem Inc. | 6.375% | 6/15/37 | 6,403 | 7,580 |
| Anthem Inc. | 4.625% | 5/15/42 | 13,842 | 13,026 |
| Anthem Inc. | 4.650% | 1/15/43 | 12,618 | 12,002 |
| Anthem Inc. | 5.100% | 1/15/44 | 5,075 | 5,127 |
| Anthem Inc. | 4.850% | 8/15/54 | 2,200 | 2,051 |
| Aon Corp. | 5.000% | 9/30/20 | 6,235 | 6,796 |
| Aon Corp. | 8.205% | 1/1/27 | 1,569 | 1,963 |
| Aon Corp. | 6.250% | 9/30/40 | 3,550 | 4,215 |
| Aon plc | 2.800% | 3/15/21 | 12,775 | 12,712 |
| Aon plc | 3.500% | 6/14/24 | 6,250 | 6,076 |
| Aon plc | 4.450% | 5/24/43 | 1,900 | 1,782 |
| Aon plc | 4.600% | 6/14/44 | 7,075 | 6,779 |
| Arch Capital Group Ltd. | 7.350% | 5/1/34 | 4,510 | 5,744 |
| Arch Capital Group US Inc. | 5.144% | 11/1/43 | 750 | 759 |
| Aspen Insurance Holdings Ltd. | 6.000% | 12/15/20 | 5,325 | 5,822 |
| Aspen Insurance Holdings Ltd. | 4.650% | 11/15/23 | 9,440 | 9,658 |
| Assurant Inc. | 4.000% | 3/15/23 | 100 | 100 |
| Assurant Inc. | 6.750% | 2/15/34 | 6,000 | 6,981 |
| Assured Guaranty US Holdings Inc. | 5.000% | 7/1/24 | 2,025 | 2,084 |
| AXA SA | 8.600% | 12/15/30 | 15,232 | 20,412 |
| Axis Specialty Finance LLC | 5.875% | 6/1/20 | 11,325 | 12,536 |
| AXIS Specialty Finance plc | 2.650% | 4/1/19 | 1,000 | 994 |
| AXIS Specialty Finance plc | 5.150% | 4/1/45 | 1,225 | 1,208 |
| Berkshire Hathaway Finance Corp. | 1.600% | 5/15/17 | 7,950 | 7,989 |
| Berkshire Hathaway Finance Corp. | 1.300% | 5/15/18 | 12,350 | 12,294 |
| Berkshire Hathaway Finance Corp. | 5.400% | 5/15/18 | 4,985 | 5,409 |
| Berkshire Hathaway Finance Corp. | 2.000% | 8/15/18 | 5,900 | 5,982 |
| Berkshire Hathaway Finance Corp. | 2.900% | 10/15/20 | 4,525 | 4,658 |
| Berkshire Hathaway Finance Corp. | 4.250% | 1/15/21 | 2,500 | 2,724 |
| Berkshire Hathaway Finance Corp. | 3.000% | 5/15/22 | 12,425 | 12,678 |
| Berkshire Hathaway Finance Corp. | 5.750% | 1/15/40 | 7,365 | 8,600 |
| Berkshire Hathaway Finance Corp. | 4.400% | 5/15/42 | 4,250 | 4,223 |
| Berkshire Hathaway Finance Corp. | 4.300% | 5/15/43 | 4,600 | 4,505 |
| Berkshire Hathaway Inc. | 1.900% | 1/31/17 | 225 | 227 |
| Berkshire Hathaway Inc. | 1.550% | 2/9/18 | 1,199 | 1,200 |
| Berkshire Hathaway Inc. | 2.100% | 8/14/19 | 10,025 | 10,078 |
40
| Vanguard® Total Bond Market Index Fund | ||||
| Schedule of Investments | ||||
| December 31, 2015 | ||||
| Face | Market | |||
| Maturity | Amount | Value | ||
| Coupon | Date | ($000) | ($000) | |
| Berkshire Hathaway Inc. | 3.750% | 8/15/21 | 3,070 | 3,275 |
| Berkshire Hathaway Inc. | 3.000% | 2/11/23 | 6,590 | 6,704 |
| Berkshire Hathaway Inc. | 4.500% | 2/11/43 | 9,540 | 9,583 |
| Brown & Brown Inc. | 4.200% | 9/15/24 | 7,215 | 7,147 |
| Chubb Corp. | 5.750% | 5/15/18 | 5,885 | 6,397 |
| Chubb Corp. | 6.000% | 5/11/37 | 5,475 | 6,670 |
| Chubb Corp. | 6.500% | 5/15/38 | 2,165 | 2,796 |
| 5 Chubb Corp. | 6.375% | 3/29/67 | 11,300 | 10,834 |
| Cigna Corp. | 5.125% | 6/15/20 | 8,339 | 9,093 |
| Cigna Corp. | 4.375% | 12/15/20 | 3,600 | 3,807 |
| Cigna Corp. | 4.500% | 3/15/21 | 1,300 | 1,379 |
| Cigna Corp. | 4.000% | 2/15/22 | 6,390 | 6,600 |
| Cigna Corp. | 3.250% | 4/15/25 | 8,350 | 8,160 |
| Cigna Corp. | 7.875% | 5/15/27 | 1,325 | 1,739 |
| Cigna Corp. | 6.150% | 11/15/36 | 4,443 | 5,087 |
| Cigna Corp. | 5.875% | 3/15/41 | 2,725 | 3,115 |
| Cigna Corp. | 5.375% | 2/15/42 | 1,096 | 1,201 |
| Cincinnati Financial Corp. | 6.920% | 5/15/28 | 3,575 | 4,415 |
| Cincinnati Financial Corp. | 6.125% | 11/1/34 | 2,045 | 2,329 |
| CNA Financial Corp. | 7.350% | 11/15/19 | 8,525 | 9,833 |
| CNA Financial Corp. | 5.875% | 8/15/20 | 5,870 | 6,538 |
| CNA Financial Corp. | 5.750% | 8/15/21 | 1,118 | 1,251 |
| CNA Financial Corp. | 3.950% | 5/15/24 | 100 | 100 |
| Coventry Health Care Inc. | 5.950% | 3/15/17 | 2,265 | 2,379 |
| Coventry Health Care Inc. | 5.450% | 6/15/21 | 4,895 | 5,449 |
| Endurance Specialty Holdings Ltd. | 7.000% | 7/15/34 | 6,875 | 8,096 |
| Everest Reinsurance Holdings Inc. | 4.868% | 6/1/44 | 4,500 | 4,292 |
| Fidelity National Financial Inc. | 5.500% | 9/1/22 | 500 | 538 |
| First American Financial Corp. | 4.300% | 2/1/23 | 2,675 | 2,657 |
| First American Financial Corp. | 4.600% | 11/15/24 | 4,625 | 4,692 |
| Hartford Financial Services Group Inc. | 5.500% | 10/15/16 | 3,085 | 3,188 |
| Hartford Financial Services Group Inc. | 5.375% | 3/15/17 | 1,915 | 1,997 |
| Hartford Financial Services Group Inc. | 6.300% | 3/15/18 | 7,270 | 7,921 |
| Hartford Financial Services Group Inc. | 6.000% | 1/15/19 | 3,309 | 3,637 |
| Hartford Financial Services Group Inc. | 5.125% | 4/15/22 | 1,155 | 1,265 |
| Hartford Financial Services Group Inc. | 5.950% | 10/15/36 | 3,245 | 3,722 |
| Hartford Financial Services Group Inc. | 6.625% | 3/30/40 | 2,000 | 2,466 |
| Hartford Financial Services Group Inc. | 6.100% | 10/1/41 | 2,775 | 3,223 |
| Hartford Financial Services Group Inc. | 4.300% | 4/15/43 | 6,615 | 6,161 |
| Horace Mann Educators Corp. | 4.500% | 12/1/25 | 1,300 | 1,305 |
| Humana Inc. | 7.200% | 6/15/18 | 6,115 | 6,837 |
| Humana Inc. | 6.300% | 8/1/18 | 205 | 226 |
| Humana Inc. | 2.625% | 10/1/19 | 2,100 | 2,100 |
| Humana Inc. | 3.150% | 12/1/22 | 6,325 | 6,164 |
| Humana Inc. | 3.850% | 10/1/24 | 5,675 | 5,725 |
| Humana Inc. | 8.150% | 6/15/38 | 5,018 | 6,857 |
| Humana Inc. | 4.625% | 12/1/42 | 4,328 | 4,101 |
| Humana Inc. | 4.950% | 10/1/44 | 975 | 970 |
| Infinity Property & Casualty Corp. | 5.000% | 9/19/22 | 1,575 | 1,581 |
| Kemper Corp. | 4.350% | 2/15/25 | 6,500 | 6,413 |
| Lincoln National Corp. | 8.750% | 7/1/19 | 252 | 303 |
| Lincoln National Corp. | 6.250% | 2/15/20 | 1,268 | 1,424 |
| Lincoln National Corp. | 4.850% | 6/24/21 | 400 | 430 |
| Lincoln National Corp. | 4.200% | 3/15/22 | 2,850 | 2,971 |
| Lincoln National Corp. | 4.000% | 9/1/23 | 3,455 | 3,528 |
| Lincoln National Corp. | 3.350% | 3/9/25 | 2,547 | 2,453 |
| Lincoln National Corp. | 6.150% | 4/7/36 | 7,525 | 8,691 |
| Lincoln National Corp. | 7.000% | 6/15/40 | 8,071 | 10,145 |
| 5 Lincoln National Corp. | 6.050% | 4/20/67 | 3,200 | 2,512 |
| Loews Corp. | 2.625% | 5/15/23 | 11,490 | 10,885 |
| Loews Corp. | 6.000% | 2/1/35 | 718 | 827 |
| Loews Corp. | 4.125% | 5/15/43 | 14,691 | 13,126 |
| Manulife Financial Corp. | 4.900% | 9/17/20 | 14,284 | 15,541 |
| Markel Corp. | 7.125% | 9/30/19 | 6,665 | 7,655 |
41
| Vanguard® Total Bond Market Index Fund | ||||
| Schedule of Investments | ||||
| December 31, 2015 | ||||
| Face | Market | |||
| Maturity | Amount | Value | ||
| Coupon | Date | ($000) | ($000) | |
| Markel Corp. | 4.900% | 7/1/22 | 700 | 751 |
| Markel Corp. | 3.625% | 3/30/23 | 625 | 617 |
| Markel Corp. | 5.000% | 3/30/43 | 3,325 | 3,334 |
| Marsh & McLennan Cos. Inc. | 2.300% | 4/1/17 | 475 | 479 |
| Marsh & McLennan Cos. Inc. | 2.550% | 10/15/18 | 3,225 | 3,257 |
| Marsh & McLennan Cos. Inc. | 2.350% | 9/10/19 | 1,225 | 1,221 |
| Marsh & McLennan Cos. Inc. | 2.350% | 3/6/20 | 6,700 | 6,637 |
| Marsh & McLennan Cos. Inc. | 4.800% | 7/15/21 | 1,945 | 2,117 |
| Marsh & McLennan Cos. Inc. | 4.050% | 10/15/23 | 4,568 | 4,731 |
| Marsh & McLennan Cos. Inc. | 3.500% | 6/3/24 | 8,525 | 8,451 |
| Marsh & McLennan Cos. Inc. | 3.500% | 3/10/25 | 6,220 | 6,124 |
| Marsh & McLennan Cos. Inc. | 3.750% | 3/14/26 | 5,275 | 5,288 |
| Marsh & McLennan Cos. Inc. | 5.875% | 8/1/33 | 2,634 | 3,042 |
| MetLife Inc. | 1.756% | 12/15/17 | 6,583 | 6,584 |
| MetLife Inc. | 1.903% | 12/15/17 | 9,540 | 9,587 |
| MetLife Inc. | 6.817% | 8/15/18 | 3,840 | 4,323 |
| MetLife Inc. | 7.717% | 2/15/19 | 4,896 | 5,702 |
| MetLife Inc. | 4.750% | 2/8/21 | 6,515 | 7,130 |
| MetLife Inc. | 3.048% | 12/15/22 | 7,250 | 7,222 |
| MetLife Inc. | 4.368% | 9/15/23 | 5,435 | 5,855 |
| MetLife Inc. | 3.600% | 4/10/24 | 10,025 | 10,314 |
| MetLife Inc. | 3.000% | 3/1/25 | 10,000 | 9,626 |
| MetLife Inc. | 3.600% | 11/13/25 | 5,250 | 5,276 |
| MetLife Inc. | 6.500% | 12/15/32 | 1,750 | 2,150 |
| MetLife Inc. | 6.375% | 6/15/34 | 2,350 | 2,898 |
| MetLife Inc. | 5.700% | 6/15/35 | 10,850 | 12,555 |
| MetLife Inc. | 5.875% | 2/6/41 | 14,315 | 16,822 |
| MetLife Inc. | 4.125% | 8/13/42 | 8,720 | 8,214 |
| MetLife Inc. | 4.875% | 11/13/43 | 7,150 | 7,479 |
| MetLife Inc. | 4.721% | 12/15/44 | 9,500 | 9,713 |
| MetLife Inc. | 4.050% | 3/1/45 | 9,250 | 8,534 |
| MetLife Inc. | 4.600% | 5/13/46 | 5,575 | 5,620 |
| 5 MetLife Inc. | 6.400% | 12/15/66 | 19,647 | 21,440 |
| 5 MetLife Inc. | 10.750% | 8/1/69 | 885 | 1,385 |
| Montpelier Re Holdings Ltd. | 4.700% | 10/15/22 | 600 | 609 |
| Munich Re America Corp. | 7.450% | 12/15/26 | 2,350 | 2,983 |
| 5 Nationwide Financial Services Inc. | 6.750% | 5/15/87 | 500 | 504 |
| Navigators Group Inc. | 5.750% | 10/15/23 | 2,000 | 2,131 |
| Old Republic International Corp. | 4.875% | 10/1/24 | 5,800 | 5,943 |
| OneBeacon US Holdings Inc. | 4.600% | 11/9/22 | 1,725 | 1,712 |
| PartnerRe Finance B LLC | 5.500% | 6/1/20 | 14,734 | 16,148 |
| Primerica Inc. | 4.750% | 7/15/22 | 200 | 213 |
| Principal Financial Group Inc. | 1.850% | 11/15/17 | 1,300 | 1,303 |
| Principal Financial Group Inc. | 8.875% | 5/15/19 | 8,253 | 9,879 |
| Principal Financial Group Inc. | 3.300% | 9/15/22 | 2,675 | 2,654 |
| Principal Financial Group Inc. | 3.125% | 5/15/23 | 3,645 | 3,550 |
| Principal Financial Group Inc. | 6.050% | 10/15/36 | 4,600 | 5,330 |
| Principal Financial Group Inc. | 4.625% | 9/15/42 | 2,655 | 2,581 |
| Principal Financial Group Inc. | 4.350% | 5/15/43 | 968 | 898 |
| 5 Principal Financial Group Inc. | 4.700% | 5/15/55 | 3,750 | 3,740 |
| ProAssurance Corp. | 5.300% | 11/15/23 | 1,415 | 1,500 |
| Progressive Corp. | 3.750% | 8/23/21 | 10,088 | 10,638 |
| Progressive Corp. | 6.625% | 3/1/29 | 4,600 | 5,761 |
| Progressive Corp. | 6.250% | 12/1/32 | 25 | 31 |
| Progressive Corp. | 4.350% | 4/25/44 | 2,985 | 3,019 |
| 5 Progressive Corp. | 6.700% | 6/15/67 | 7,050 | 7,059 |
| Protective Life Corp. | 7.375% | 10/15/19 | 4,855 | 5,617 |
| Protective Life Corp. | 8.450% | 10/15/39 | 5,985 | 7,902 |
| Prudential Financial Inc. | 5.500% | 3/15/16 | 3,773 | 3,807 |
| Prudential Financial Inc. | 6.000% | 12/1/17 | 4,199 | 4,511 |
| Prudential Financial Inc. | 2.300% | 8/15/18 | 165 | 166 |
| Prudential Financial Inc. | 7.375% | 6/15/19 | 1,090 | 1,265 |
| Prudential Financial Inc. | 2.350% | 8/15/19 | 10,650 | 10,614 |
| Prudential Financial Inc. | 5.375% | 6/21/20 | 5,730 | 6,360 |
42
| Vanguard® Total Bond Market Index Fund | ||||
| Schedule of Investments | ||||
| December 31, 2015 | ||||
| Face | Market | |||
| Maturity | Amount | Value | ||
| Coupon | Date | ($000) | ($000) | |
| Prudential Financial Inc. | 4.500% | 11/15/20 | 8,775 | 9,411 |
| Prudential Financial Inc. | 4.500% | 11/16/21 | 370 | 399 |
| Prudential Financial Inc. | 3.500% | 5/15/24 | 3,375 | 3,387 |
| Prudential Financial Inc. | 5.750% | 7/15/33 | 445 | 504 |
| Prudential Financial Inc. | 5.400% | 6/13/35 | 9,035 | 9,858 |
| Prudential Financial Inc. | 5.900% | 3/17/36 | 11,712 | 13,447 |
| Prudential Financial Inc. | 5.700% | 12/14/36 | 11,693 | 13,188 |
| Prudential Financial Inc. | 6.625% | 12/1/37 | 10,463 | 12,853 |
| Prudential Financial Inc. | 6.625% | 6/21/40 | 5,525 | 6,847 |
| Prudential Financial Inc. | 6.200% | 11/15/40 | 2,275 | 2,679 |
| 5 Prudential Financial Inc. | 5.875% | 9/15/42 | 4,700 | 4,911 |
| 5 Prudential Financial Inc. | 5.625% | 6/15/43 | 13,575 | 13,779 |
| Prudential Financial Inc. | 5.100% | 8/15/43 | 3,100 | 3,231 |
| 5 Prudential Financial Inc. | 5.200% | 3/15/44 | 5,490 | 5,312 |
| Prudential Financial Inc. | 4.600% | 5/15/44 | 2,550 | 2,538 |
| 5 Prudential Financial Inc. | 5.375% | 5/15/45 | 5,070 | 5,064 |
| 5 Prudential Financial Inc. | 8.875% | 6/15/68 | 705 | 793 |
| Reinsurance Group of America Inc. | 5.000% | 6/1/21 | 1,025 | 1,105 |
| Reinsurance Group of America Inc. | 4.700% | 9/15/23 | 3,575 | 3,768 |
| StanCorp Financial Group Inc. | 5.000% | 8/15/22 | 2,775 | 2,895 |
| 5 StanCorp Financial Group Inc. | 6.900% | 6/1/67 | 15 | 12 |
| Swiss Re Solutions Holding Corp. | 7.000% | 2/15/26 | 2,064 | 2,563 |
| Torchmark Corp. | 6.375% | 6/15/16 | 1,500 | 1,533 |
| Torchmark Corp. | 3.800% | 9/15/22 | 90 | 90 |
| Transatlantic Holdings Inc. | 8.000% | 11/30/39 | 9,863 | 12,679 |
| Travelers Cos. Inc. | 5.750% | 12/15/17 | 3,830 | 4,127 |
| Travelers Cos. Inc. | 5.800% | 5/15/18 | 160 | 175 |
| Travelers Cos. Inc. | 5.900% | 6/2/19 | 11,225 | 12,640 |
| Travelers Cos. Inc. | 3.900% | 11/1/20 | 2,965 | 3,150 |
| Travelers Cos. Inc. | 6.750% | 6/20/36 | 10 | 13 |
| Travelers Cos. Inc. | 6.250% | 6/15/37 | 4,667 | 5,872 |
| Travelers Cos. Inc. | 5.350% | 11/1/40 | 2,290 | 2,643 |
| Travelers Cos. Inc. | 4.600% | 8/1/43 | 14,635 | 15,314 |
| Travelers Cos. Inc. | 4.300% | 8/25/45 | 500 | 502 |
| Travelers Property Casualty Corp. | 6.375% | 3/15/33 | 710 | 872 |
| Trinity Acquisition plc | 4.625% | 8/15/23 | 3,375 | 3,454 |
| Trinity Acquisition plc | 6.125% | 8/15/43 | 3,650 | 3,894 |
| UnitedHealth Group Inc. | 6.000% | 6/15/17 | 7,990 | 8,512 |
| UnitedHealth Group Inc. | 1.450% | 7/17/17 | 10,100 | 10,096 |
| UnitedHealth Group Inc. | 1.400% | 10/15/17 | 20 | 20 |
| UnitedHealth Group Inc. | 1.400% | 12/15/17 | 7,200 | 7,176 |
| UnitedHealth Group Inc. | 6.000% | 2/15/18 | 10,645 | 11,574 |
| UnitedHealth Group Inc. | 1.900% | 7/16/18 | 10,000 | 10,048 |
| UnitedHealth Group Inc. | 1.625% | 3/15/19 | 5,035 | 4,982 |
| UnitedHealth Group Inc. | 2.300% | 12/15/19 | 12,050 | 12,096 |
| UnitedHealth Group Inc. | 2.700% | 7/15/20 | 12,200 | 12,331 |
| UnitedHealth Group Inc. | 3.875% | 10/15/20 | 205 | 216 |
| UnitedHealth Group Inc. | 4.700% | 2/15/21 | 4,775 | 5,228 |
| UnitedHealth Group Inc. | 3.375% | 11/15/21 | 4,025 | 4,145 |
| UnitedHealth Group Inc. | 2.875% | 12/15/21 | 8,000 | 8,099 |
| UnitedHealth Group Inc. | 2.875% | 3/15/22 | 3,960 | 3,954 |
| UnitedHealth Group Inc. | 3.350% | 7/15/22 | 10,825 | 11,028 |
| UnitedHealth Group Inc. | 2.750% | 2/15/23 | 10,030 | 9,814 |
| UnitedHealth Group Inc. | 2.875% | 3/15/23 | 1,896 | 1,871 |
| UnitedHealth Group Inc. | 3.750% | 7/15/25 | 24,000 | 24,718 |
| UnitedHealth Group Inc. | 4.625% | 7/15/35 | 7,325 | 7,627 |
| UnitedHealth Group Inc. | 5.800% | 3/15/36 | 2,593 | 3,056 |
| UnitedHealth Group Inc. | 6.500% | 6/15/37 | 1,425 | 1,785 |
| UnitedHealth Group Inc. | 6.625% | 11/15/37 | 9,025 | 11,482 |
| UnitedHealth Group Inc. | 6.875% | 2/15/38 | 17,083 | 22,324 |
| UnitedHealth Group Inc. | 5.700% | 10/15/40 | 170 | 197 |
| UnitedHealth Group Inc. | 5.950% | 2/15/41 | 2,705 | 3,209 |
| UnitedHealth Group Inc. | 4.625% | 11/15/41 | 7,005 | 7,158 |
| UnitedHealth Group Inc. | 4.375% | 3/15/42 | 270 | 265 |
43
| Vanguard® Total Bond Market Index Fund | ||||
| Schedule of Investments | ||||
| December 31, 2015 | ||||
| Face | Market | |||
| Maturity | Amount | Value | ||
| Coupon | Date | ($000) | ($000) | |
| UnitedHealth Group Inc. | 3.950% | 10/15/42 | 11,581 | 10,764 |
| UnitedHealth Group Inc. | 4.250% | 3/15/43 | 6,050 | 5,859 |
| UnitedHealth Group Inc. | 4.750% | 7/15/45 | 17,799 | 18,639 |
| Unum Group | 5.625% | 9/15/20 | 2,200 | 2,415 |
| Unum Group | 4.000% | 3/15/24 | 2,190 | 2,185 |
| Unum Group | 3.875% | 11/5/25 | 75 | 73 |
| Unum Group | 5.750% | 8/15/42 | 2,225 | 2,441 |
| Validus Holdings Ltd. | 8.875% | 1/26/40 | 3,800 | 4,757 |
| Voya Financial Inc. | 2.900% | 2/15/18 | 9,057 | 9,154 |
| Voya Financial Inc. | 5.500% | 7/15/22 | 309 | 346 |
| Voya Financial Inc. | 5.700% | 7/15/43 | 9,375 | 10,608 |
| Willis North America Inc. | 6.200% | 3/28/17 | 2,510 | 2,620 |
| Willis Towers Watson plc | 5.750% | 3/15/21 | 9,351 | 10,253 |
| WR Berkley Corp. | 5.375% | 9/15/20 | 595 | 650 |
| WR Berkley Corp. | 4.625% | 3/15/22 | 2,400 | 2,541 |
| WR Berkley Corp. | 4.750% | 8/1/44 | 3,000 | 2,877 |
| XLIT Ltd. | 2.300% | 12/15/18 | 1,050 | 1,050 |
| XLIT Ltd. | 5.750% | 10/1/21 | 7,155 | 7,969 |
| XLIT Ltd. | 6.375% | 11/15/24 | 1,060 | 1,234 |
| XLIT Ltd. | 4.450% | 3/31/25 | 2,700 | 2,640 |
| XLIT Ltd. | 6.250% | 5/15/27 | 2,500 | 2,871 |
| XLIT Ltd. | 5.250% | 12/15/43 | 7,900 | 8,155 |
| XLIT Ltd. | 5.500% | 3/31/45 | 6,250 | 5,818 |
| 5 XLIT Ltd. | 6.500% | 10/29/49 | 4,874 | 3,540 |
| Other Finance (0.0%) | ||||
| Jones Lang LaSalle Inc. | 4.400% | 11/15/22 | 825 | 845 |
| ORIX Corp. | 3.750% | 3/9/17 | 6,960 | 7,086 |
| XTRA Finance Corp. | 5.150% | 4/1/17 | 11,645 | 12,148 |
| Real Estate Investment Trusts (0.7%) | ||||
| Alexandria Real Estate Equities Inc. | 2.750% | 1/15/20 | 4,225 | 4,163 |
| Alexandria Real Estate Equities Inc. | 4.600% | 4/1/22 | 5,025 | 5,212 |
| Alexandria Real Estate Equities Inc. | 3.900% | 6/15/23 | 450 | 444 |
| Alexandria Real Estate Equities Inc. | 4.300% | 1/15/26 | 2,400 | 2,386 |
| Alexandria Real Estate Equities Inc. | 4.500% | 7/30/29 | 3,275 | 3,184 |
| American Campus Communities Operating Partnership | ||||
| LP | 3.350% | 10/1/20 | 3,000 | 3,003 |
| American Campus Communities Operating Partnership | ||||
| LP | 3.750% | 4/15/23 | 1,040 | 1,024 |
| American Campus Communities Operating Partnership | ||||
| LP | 4.125% | 7/1/24 | 3,200 | 3,176 |
| AvalonBay Communities Inc. | 5.700% | 3/15/17 | 2,515 | 2,631 |
| AvalonBay Communities Inc. | 2.850% | 3/15/23 | 5,944 | 5,733 |
| AvalonBay Communities Inc. | 4.200% | 12/15/23 | 1,555 | 1,637 |
| AvalonBay Communities Inc. | 3.500% | 11/15/24 | 4,500 | 4,473 |
| AvalonBay Communities Inc. | 3.450% | 6/1/25 | 11,200 | 11,067 |
| AvalonBay Communities Inc. | 3.500% | 11/15/25 | 600 | 595 |
| BioMed Realty LP | 2.625% | 5/1/19 | 3,445 | 3,343 |
| Boston Properties LP | 3.700% | 11/15/18 | 1,800 | 1,864 |
| Boston Properties LP | 5.875% | 10/15/19 | 745 | 827 |
| Boston Properties LP | 5.625% | 11/15/20 | 9,225 | 10,268 |
| Boston Properties LP | 4.125% | 5/15/21 | 3,665 | 3,842 |
| Boston Properties LP | 3.850% | 2/1/23 | 10,868 | 11,097 |
| Boston Properties LP | 3.125% | 9/1/23 | 2,900 | 2,820 |
| Boston Properties LP | 3.800% | 2/1/24 | 5,025 | 5,112 |
| Brandywine Operating Partnership LP | 5.700% | 5/1/17 | 7,070 | 7,368 |
| Brandywine Operating Partnership LP | 4.950% | 4/15/18 | 3,325 | 3,480 |
| Brandywine Operating Partnership LP | 4.100% | 10/1/24 | 5,140 | 4,967 |
| Brandywine Operating Partnership LP | 4.550% | 10/1/29 | 3,700 | 3,564 |
| Brixmor Operating Partnership LP | 3.875% | 8/15/22 | 5,950 | 5,927 |
| Brixmor Operating Partnership LP | 3.850% | 2/1/25 | 12,785 | 12,431 |
| Camden Property Trust | 2.950% | 12/15/22 | 4,850 | 4,666 |
| Camden Property Trust | 4.875% | 6/15/23 | 1,470 | 1,584 |
| Camden Property Trust | 4.250% | 1/15/24 | 2,350 | 2,431 |
44
| Vanguard® Total Bond Market Index Fund | ||||
| Schedule of Investments | ||||
| December 31, 2015 | ||||
| Face | Market | |||
| Maturity | Amount | Value | ||
| Coupon | Date | ($000) | ($000) | |
| CBL & Associates LP | 5.250% | 12/1/23 | 5,150 | 5,091 |
| CBL & Associates LP | 4.600% | 10/15/24 | 5,125 | 4,797 |
| Columbia Property Trust Operating Partnership LP | 4.150% | 4/1/25 | 3,000 | 2,964 |
| Corporate Office Properties LP | 3.700% | 6/15/21 | 1,500 | 1,453 |
| Corporate Office Properties LP | 3.600% | 5/15/23 | 7,431 | 6,853 |
| CubeSmart LP | 4.375% | 12/15/23 | 9,425 | 9,696 |
| CubeSmart LP | 4.000% | 11/15/25 | 2,265 | 2,250 |
| DCT Industrial Operating Partnership LP | 4.500% | 10/15/23 | 2,550 | 2,551 |
| DDR Corp. | 7.875% | 9/1/20 | 10,975 | 13,140 |
| DDR Corp. | 3.500% | 1/15/21 | 11,155 | 11,115 |
| DDR Corp. | 4.625% | 7/15/22 | 8,940 | 9,232 |
| DDR Corp. | 3.375% | 5/15/23 | 8,225 | 7,769 |
| DDR Corp. | 3.625% | 2/1/25 | 10,750 | 10,155 |
| DDR Corp. | 4.250% | 2/1/26 | 2,140 | 2,084 |
| 8 Digital Delta Holdings LLC | 3.400% | 10/1/20 | 5,600 | 5,610 |
| 8 Digital Delta Holdings LLC | 4.750% | 10/1/25 | 6,050 | 6,106 |
| Digital Realty Trust LP | 5.875% | 2/1/20 | 2,175 | 2,400 |
| Digital Realty Trust LP | 5.250% | 3/15/21 | 9,170 | 9,922 |
| Digital Realty Trust LP | 3.950% | 7/1/22 | 11,650 | 11,558 |
| Duke Realty LP | 5.950% | 2/15/17 | 3,675 | 3,838 |
| Duke Realty LP | 3.875% | 10/15/22 | 923 | 928 |
| Duke Realty LP | 3.625% | 4/15/23 | 2,748 | 2,683 |
| Duke Realty LP | 3.750% | 12/1/24 | 2,325 | 2,263 |
| EPR Properties | 5.750% | 8/15/22 | 1,350 | 1,417 |
| EPR Properties | 5.250% | 7/15/23 | 6,300 | 6,417 |
| EPR Properties | 4.500% | 4/1/25 | 3,025 | 2,882 |
| Equity CommonWealth | 6.250% | 6/15/17 | 5,075 | 5,243 |
| Equity Commonwealth | 5.875% | 9/15/20 | 3,200 | 3,442 |
| Equity One Inc. | 3.750% | 11/15/22 | 3,000 | 2,894 |
| ERP Operating LP | 5.750% | 6/15/17 | 6,240 | 6,590 |
| ERP Operating LP | 4.750% | 7/15/20 | 2,810 | 3,044 |
| ERP Operating LP | 4.625% | 12/15/21 | 14,260 | 15,465 |
| ERP Operating LP | 3.000% | 4/15/23 | 2,603 | 2,558 |
| ERP Operating LP | 4.500% | 7/1/44 | 7,325 | 7,336 |
| Essex Portfolio LP | 5.500% | 3/15/17 | 40 | 42 |
| Essex Portfolio LP | 3.375% | 1/15/23 | 3,409 | 3,345 |
| Essex Portfolio LP | 3.250% | 5/1/23 | 3,025 | 2,946 |
| Essex Portfolio LP | 3.500% | 4/1/25 | 10,340 | 9,951 |
| Federal Realty Investment Trust | 3.000% | 8/1/22 | 4,348 | 4,299 |
| Federal Realty Investment Trust | 2.750% | 6/1/23 | 4,285 | 4,099 |
| Federal Realty Investment Trust | 4.500% | 12/1/44 | 13,025 | 13,213 |
| HCP Inc. | 6.300% | 9/15/16 | 9,450 | 9,752 |
| HCP Inc. | 6.000% | 1/30/17 | 3,235 | 3,370 |
| HCP Inc. | 5.625% | 5/1/17 | 115 | 120 |
| HCP Inc. | 6.700% | 1/30/18 | 2,944 | 3,204 |
| HCP Inc. | 3.750% | 2/1/19 | 9,925 | 10,260 |
| HCP Inc. | 2.625% | 2/1/20 | 775 | 763 |
| HCP Inc. | 5.375% | 2/1/21 | 2,865 | 3,118 |
| HCP Inc. | 3.150% | 8/1/22 | 700 | 671 |
| HCP Inc. | 4.000% | 12/1/22 | 28,750 | 28,560 |
| HCP Inc. | 4.250% | 11/15/23 | 2,702 | 2,707 |
| HCP Inc. | 4.200% | 3/1/24 | 2,950 | 2,936 |
| HCP Inc. | 3.875% | 8/15/24 | 5,985 | 5,812 |
| HCP Inc. | 6.750% | 2/1/41 | 300 | 363 |
| Healthcare Realty Trust Inc. | 5.750% | 1/15/21 | 2,575 | 2,848 |
| Healthcare Realty Trust Inc. | 3.750% | 4/15/23 | 425 | 415 |
| Healthcare Realty Trust Inc. | 3.875% | 5/1/25 | 4,450 | 4,309 |
| Healthcare Trust of America Holdings LP | 3.375% | 7/15/21 | 2,815 | 2,767 |
| Healthcare Trust of America Holdings LP | 3.700% | 4/15/23 | 1,500 | 1,456 |
| Highwoods Realty LP | 3.200% | 6/15/21 | 14,100 | 13,783 |
| Hospitality Properties Trust | 6.700% | 1/15/18 | 10,380 | 10,981 |
| Hospitality Properties Trust | 5.000% | 8/15/22 | 1,255 | 1,288 |
| Hospitality Properties Trust | 4.500% | 6/15/23 | 4,050 | 4,030 |
| Hospitality Properties Trust | 4.650% | 3/15/24 | 1,200 | 1,182 |
45
| Vanguard® Total Bond Market Index Fund | ||||
| Schedule of Investments | ||||
| December 31, 2015 | ||||
| Face | Market | |||
| Maturity | Amount | Value | ||
| Coupon | Date | ($000) | ($000) | |
| Hospitality Properties Trust | 4.500% | 3/15/25 | 3,300 | 3,165 |
| Host Hotels & Resorts LP | 6.000% | 10/1/21 | 10,550 | 11,685 |
| Host Hotels & Resorts LP | 5.250% | 3/15/22 | 5,000 | 5,325 |
| Host Hotels & Resorts LP | 4.750% | 3/1/23 | 1,100 | 1,138 |
| Host Hotels & Resorts LP | 3.750% | 10/15/23 | 8,550 | 8,258 |
| Host Hotels & Resorts LP | 4.000% | 6/15/25 | 2,050 | 1,967 |
| Kilroy Realty LP | 4.800% | 7/15/18 | 10,750 | 11,226 |
| Kilroy Realty LP | 3.800% | 1/15/23 | 3,050 | 3,020 |
| Kilroy Realty LP | 4.250% | 8/15/29 | 550 | 543 |
| Kimco Realty Corp. | 5.700% | 5/1/17 | 5,630 | 5,912 |
| Kimco Realty Corp. | 4.300% | 2/1/18 | 1,430 | 1,491 |
| Kimco Realty Corp. | 6.875% | 10/1/19 | 5,537 | 6,339 |
| Kimco Realty Corp. | 3.200% | 5/1/21 | 5,515 | 5,523 |
| Kimco Realty Corp. | 3.125% | 6/1/23 | 3,300 | 3,193 |
| Lexington Realty Trust | 4.400% | 6/15/24 | 2,775 | 2,763 |
| Liberty Property LP | 5.500% | 12/15/16 | 1,875 | 1,935 |
| Liberty Property LP | 6.625% | 10/1/17 | 2,917 | 3,128 |
| Liberty Property LP | 4.750% | 10/1/20 | 545 | 580 |
| Liberty Property LP | 3.375% | 6/15/23 | 1,250 | 1,186 |
| Liberty Property LP | 4.400% | 2/15/24 | 1,300 | 1,319 |
| Liberty Property LP | 3.750% | 4/1/25 | 5,900 | 5,685 |
| Mack-Cali Realty LP | 2.500% | 12/15/17 | 650 | 650 |
| Mack-Cali Realty LP | 7.750% | 8/15/19 | 6,550 | 7,279 |
| Mack-Cali Realty LP | 4.500% | 4/18/22 | 3,550 | 3,422 |
| Mack-Cali Realty LP | 3.150% | 5/15/23 | 2,000 | 1,741 |
| Mid-America Apartments LP | 4.300% | 10/15/23 | 12,500 | 12,815 |
| Mid-America Apartments LP | 3.750% | 6/15/24 | 4,335 | 4,246 |
| National Retail Properties Inc. | 6.875% | 10/15/17 | 10,360 | 11,180 |
| National Retail Properties Inc. | 5.500% | 7/15/21 | 5,500 | 6,081 |
| National Retail Properties Inc. | 3.800% | 10/15/22 | 3,000 | 3,014 |
| National Retail Properties Inc. | 3.300% | 4/15/23 | 4,799 | 4,621 |
| Omega Healthcare Investors Inc. | 5.875% | 3/15/24 | 1,524 | 1,593 |
| Omega Healthcare Investors Inc. | 4.950% | 4/1/24 | 4,075 | 4,116 |
| Omega Healthcare Investors Inc. | 4.500% | 1/15/25 | 2,750 | 2,695 |
| 8 Omega Healthcare Investors Inc. | 5.250% | 1/15/26 | 5,158 | 5,261 |
| Omega Healthcare Investors Inc. | 4.500% | 4/1/27 | 22,600 | 21,470 |
| Piedmont Operating Partnership LP | 3.400% | 6/1/23 | 1,912 | 1,789 |
| Piedmont Operating Partnership LP | 4.450% | 3/15/24 | 3,875 | 3,880 |
| Post Apartment Homes LP | 3.375% | 12/1/22 | 1,825 | 1,766 |
| ProLogis LP | 2.750% | 2/15/19 | 2,430 | 2,454 |
| ProLogis LP | 3.350% | 2/1/21 | 4,440 | 4,496 |
| ProLogis LP | 4.250% | 8/15/23 | 3,445 | 3,623 |
| Realty Income Corp. | 2.000% | 1/31/18 | 1,175 | 1,175 |
| Realty Income Corp. | 6.750% | 8/15/19 | 8,577 | 9,748 |
| Realty Income Corp. | 5.750% | 1/15/21 | 5,175 | 5,763 |
| Realty Income Corp. | 3.875% | 7/15/24 | 3,150 | 3,093 |
| Realty Income Corp. | 5.875% | 3/15/35 | 8,085 | 8,961 |
| Regency Centers LP | 3.750% | 6/15/24 | 4,849 | 4,818 |
| Retail Opportunity Investments Partnership LP | 5.000% | 12/15/23 | 1,675 | 1,721 |
| Retail Properties of America Inc. | 4.000% | 3/15/25 | 5,850 | 5,518 |
| Select Income REIT | 2.850% | 2/1/18 | 2,300 | 2,297 |
| Select Income REIT | 4.150% | 2/1/22 | 4,000 | 3,838 |
| Select Income REIT | 4.500% | 2/1/25 | 3,575 | 3,322 |
| Senior Housing Properties Trust | 3.250% | 5/1/19 | 5,040 | 5,018 |
| Senior Housing Properties Trust | 4.750% | 5/1/24 | 3,775 | 3,686 |
| Simon Property Group LP | 5.250% | 12/1/16 | 17,641 | 18,051 |
| Simon Property Group LP | 2.800% | 1/30/17 | 3,420 | 3,465 |
| Simon Property Group LP | 2.150% | 9/15/17 | 6,640 | 6,700 |
| Simon Property Group LP | 5.650% | 2/1/20 | 13,895 | 15,568 |
| Simon Property Group LP | 2.500% | 9/1/20 | 600 | 602 |
| Simon Property Group LP | 4.375% | 3/1/21 | 8,445 | 9,147 |
| Simon Property Group LP | 4.125% | 12/1/21 | 7,438 | 7,971 |
| Simon Property Group LP | 3.375% | 3/15/22 | 2,775 | 2,863 |
| Simon Property Group LP | 2.750% | 2/1/23 | 7,200 | 7,028 |
46
| Vanguard® Total Bond Market Index Fund | ||||
| Schedule of Investments | ||||
| December 31, 2015 | ||||
| Face | Market | |||
| Maturity | Amount | Value | ||
| Coupon | Date | ($000) | ($000) | |
| Simon Property Group LP | 3.750% | 2/1/24 | 6,014 | 6,265 |
| Simon Property Group LP | 3.500% | 9/1/25 | 1,440 | 1,461 |
| Simon Property Group LP | 6.750% | 2/1/40 | 11,568 | 15,306 |
| Simon Property Group LP | 4.750% | 3/15/42 | 2,000 | 2,134 |
| Simon Property Group LP | 4.250% | 10/1/44 | 2,310 | 2,298 |
| Tanger Properties LP | 3.875% | 12/1/23 | 3,445 | 3,428 |
| Tanger Properties LP | 3.750% | 12/1/24 | 1,325 | 1,303 |
| UDR Inc. | 3.700% | 10/1/20 | 6,150 | 6,358 |
| UDR Inc. | 4.625% | 1/10/22 | 12,145 | 12,954 |
| Ventas Realty LP | 1.250% | 4/17/17 | 4,000 | 3,971 |
| Ventas Realty LP | 3.750% | 5/1/24 | 2,000 | 1,959 |
| Ventas Realty LP | 3.500% | 2/1/25 | 2,900 | 2,776 |
| Ventas Realty LP | 5.700% | 9/30/43 | 4,475 | 4,927 |
| Ventas Realty LP | 4.375% | 2/1/45 | 6,250 | 5,672 |
| Ventas Realty LP / Ventas Capital Corp. | 2.000% | 2/15/18 | 6,423 | 6,404 |
| Ventas Realty LP / Ventas Capital Corp. | 4.000% | 4/30/19 | 100 | 104 |
| Ventas Realty LP / Ventas Capital Corp. | 2.700% | 4/1/20 | 5,625 | 5,541 |
| Ventas Realty LP / Ventas Capital Corp. | 4.750% | 6/1/21 | 4,925 | 5,253 |
| Ventas Realty LP / Ventas Capital Corp. | 4.250% | 3/1/22 | 1,140 | 1,176 |
| Ventas Realty LP / Ventas Capital Corp. | 3.250% | 8/15/22 | 10,563 | 10,292 |
| Vornado Realty LP | 2.500% | 6/30/19 | 8,525 | 8,402 |
| Washington Prime Group LP | 3.850% | 4/1/20 | 4,525 | 4,567 |
| Washington REIT | 4.950% | 10/1/20 | 825 | 877 |
| Washington REIT | 3.950% | 10/15/22 | 2,650 | 2,599 |
| Weingarten Realty Investors | 3.375% | 10/15/22 | 1,275 | 1,247 |
| Weingarten Realty Investors | 3.500% | 4/15/23 | 3,925 | 3,817 |
| Weingarten Realty Investors | 4.450% | 1/15/24 | 450 | 461 |
| Welltower Inc. | 4.700% | 9/15/17 | 4,250 | 4,440 |
| Welltower Inc. | 2.250% | 3/15/18 | 4,653 | 4,642 |
| Welltower Inc. | 4.125% | 4/1/19 | 4,555 | 4,754 |
| Welltower Inc. | 4.950% | 1/15/21 | 7,680 | 8,234 |
| Welltower Inc. | 5.250% | 1/15/22 | 7,984 | 8,620 |
| Welltower Inc. | 3.750% | 3/15/23 | 4,650 | 4,569 |
| Welltower Inc. | 4.000% | 6/1/25 | 13,225 | 13,021 |
| Welltower Inc. | 6.500% | 3/15/41 | 4,525 | 5,302 |
| Welltower Inc. | 5.125% | 3/15/43 | 5,050 | 5,082 |
| WP Carey Inc. | 4.600% | 4/1/24 | 6,050 | 6,033 |
| WP Carey Inc. | 4.000% | 2/1/25 | 2,050 | 1,963 |
| 12,719,853 | ||||
| Industrial (16.1%) | ||||
| Basic Industry (1.1%) | ||||
| Agrium Inc. | 6.750% | 1/15/19 | 7,095 | 7,918 |
| Agrium Inc. | 3.150% | 10/1/22 | 2,721 | 2,602 |
| Agrium Inc. | 3.500% | 6/1/23 | 11,000 | 10,467 |
| Agrium Inc. | 3.375% | 3/15/25 | 6,325 | 5,785 |
| Agrium Inc. | 4.125% | 3/15/35 | 3,500 | 3,007 |
| Agrium Inc. | 6.125% | 1/15/41 | 7,043 | 7,584 |
| Agrium Inc. | 4.900% | 6/1/43 | 3,200 | 2,912 |
| Agrium Inc. | 5.250% | 1/15/45 | 9,615 | 8,975 |
| Air Products & Chemicals Inc. | 3.000% | 11/3/21 | 1,325 | 1,334 |
| Air Products & Chemicals Inc. | 2.750% | 2/3/23 | 7,125 | 7,012 |
| Air Products & Chemicals Inc. | 3.350% | 7/31/24 | 6,350 | 6,345 |
| Airgas Inc. | 3.050% | 8/1/20 | 6,500 | 6,553 |
| Airgas Inc. | 3.650% | 7/15/24 | 7,000 | 6,954 |
| Albemarle Corp. | 3.000% | 12/1/19 | 2,475 | 2,430 |
| Albemarle Corp. | 4.500% | 12/15/20 | 500 | 517 |
| Albemarle Corp. | 4.150% | 12/1/24 | 4,525 | 4,330 |
| Albemarle Corp. | 5.450% | 12/1/44 | 4,950 | 4,802 |
| 8 Anglo American Capital plc | 4.125% | 9/27/22 | 575 | 377 |
| Barrick Gold Corp. | 6.950% | 4/1/19 | 934 | 966 |
| Barrick Gold Corp. | 4.100% | 5/1/23 | 4,945 | 4,259 |
| Barrick Gold Corp. | 5.250% | 4/1/42 | 6,825 | 4,601 |
| Barrick North America Finance LLC | 6.800% | 9/15/18 | 2,850 | 3,051 |
47
| Vanguard® Total Bond Market Index Fund | ||||
| Schedule of Investments | ||||
| December 31, 2015 | ||||
| Face | Market | |||
| Maturity | Amount | Value | ||
| Coupon | Date | ($000) | ($000) | |
| Barrick North America Finance LLC | 4.400% | 5/30/21 | 10,962 | 10,028 |
| Barrick North America Finance LLC | 7.500% | 9/15/38 | 2,950 | 2,417 |
| Barrick North America Finance LLC | 5.700% | 5/30/41 | 9,788 | 6,828 |
| Barrick North America Finance LLC | 5.750% | 5/1/43 | 3,633 | 2,615 |
| Barrick PD Australia Finance Pty Ltd. | 5.950% | 10/15/39 | 6,043 | 4,098 |
| BHP Billiton Finance USA Ltd. | 1.625% | 2/24/17 | 13,101 | 13,026 |
| BHP Billiton Finance USA Ltd. | 5.400% | 3/29/17 | 220 | 229 |
| BHP Billiton Finance USA Ltd. | 2.050% | 9/30/18 | 2,400 | 2,356 |
| BHP Billiton Finance USA Ltd. | 6.500% | 4/1/19 | 13,517 | 14,885 |
| BHP Billiton Finance USA Ltd. | 3.250% | 11/21/21 | 6,396 | 6,041 |
| BHP Billiton Finance USA Ltd. | 2.875% | 2/24/22 | 18,494 | 16,944 |
| BHP Billiton Finance USA Ltd. | 3.850% | 9/30/23 | 8,546 | 8,047 |
| BHP Billiton Finance USA Ltd. | 4.125% | 2/24/42 | 12,183 | 9,656 |
| BHP Billiton Finance USA Ltd. | 5.000% | 9/30/43 | 25,718 | 23,113 |
| Braskem Finance Ltd. | 6.450% | 2/3/24 | 1,600 | 1,360 |
| Cabot Corp. | 2.550% | 1/15/18 | 1,004 | 1,016 |
| Cabot Corp. | 3.700% | 7/15/22 | 800 | 790 |
| Carpenter Technology Corp. | 5.200% | 7/15/21 | 10,225 | 10,284 |
| Celulosa Arauco y Constitucion SA | 7.250% | 7/29/19 | 1,225 | 1,380 |
| Celulosa Arauco y Constitucion SA | 5.000% | 1/21/21 | 2,300 | 2,383 |
| Celulosa Arauco y Constitucion SA | 4.750% | 1/11/22 | 6,863 | 6,916 |
| Celulosa Arauco y Constitucion SA | 4.500% | 8/1/24 | 500 | 490 |
| CF Industries Inc. | 6.875% | 5/1/18 | 16,873 | 18,265 |
| CF Industries Inc. | 7.125% | 5/1/20 | 8,925 | 10,052 |
| CF Industries Inc. | 3.450% | 6/1/23 | 510 | 474 |
| CF Industries Inc. | 5.150% | 3/15/34 | 21,444 | 18,898 |
| CF Industries Inc. | 4.950% | 6/1/43 | 4,076 | 3,479 |
| CF Industries Inc. | 5.375% | 3/15/44 | 7,500 | 6,536 |
| Cytec Industries Inc. | 3.500% | 4/1/23 | 100 | 94 |
| Domtar Corp. | 6.250% | 9/1/42 | 850 | 800 |
| Domtar Corp. | 6.750% | 2/15/44 | 5,000 | 4,833 |
| Dow Chemical Co. | 8.550% | 5/15/19 | 21,204 | 25,004 |
| Dow Chemical Co. | 4.250% | 11/15/20 | 17,570 | 18,395 |
| Dow Chemical Co. | 4.125% | 11/15/21 | 1,996 | 2,085 |
| Dow Chemical Co. | 3.000% | 11/15/22 | 14,425 | 13,826 |
| Dow Chemical Co. | 3.500% | 10/1/24 | 2,700 | 2,623 |
| Dow Chemical Co. | 7.375% | 11/1/29 | 2,398 | 2,983 |
| Dow Chemical Co. | 4.250% | 10/1/34 | 8,436 | 7,836 |
| Dow Chemical Co. | 9.400% | 5/15/39 | 13,193 | 19,026 |
| Dow Chemical Co. | 5.250% | 11/15/41 | 8,027 | 7,848 |
| Dow Chemical Co. | 4.375% | 11/15/42 | 6,980 | 6,051 |
| Eastman Chemical Co. | 2.400% | 6/1/17 | 11,893 | 11,976 |
| Eastman Chemical Co. | 5.500% | 11/15/19 | 4,771 | 5,224 |
| Eastman Chemical Co. | 2.700% | 1/15/20 | 12,980 | 12,844 |
| Eastman Chemical Co. | 4.500% | 1/15/21 | 775 | 818 |
| Eastman Chemical Co. | 3.600% | 8/15/22 | 20,805 | 20,695 |
| Eastman Chemical Co. | 3.800% | 3/15/25 | 8,250 | 7,982 |
| Eastman Chemical Co. | 4.800% | 9/1/42 | 6,249 | 5,763 |
| Eastman Chemical Co. | 4.650% | 10/15/44 | 4,850 | 4,302 |
| Ecolab Inc. | 1.450% | 12/8/17 | 4,807 | 4,762 |
| Ecolab Inc. | 1.550% | 1/12/18 | 2,000 | 1,983 |
| Ecolab Inc. | 2.250% | 1/12/20 | 3,243 | 3,221 |
| Ecolab Inc. | 4.350% | 12/8/21 | 3,714 | 3,955 |
| Ecolab Inc. | 5.500% | 12/8/41 | 9,680 | 10,556 |
| EI du Pont de Nemours & Co. | 6.000% | 7/15/18 | 9,965 | 10,846 |
| EI du Pont de Nemours & Co. | 4.625% | 1/15/20 | 5,302 | 5,585 |
| EI du Pont de Nemours & Co. | 3.625% | 1/15/21 | 14,975 | 15,445 |
| EI du Pont de Nemours & Co. | 4.250% | 4/1/21 | 2,950 | 3,129 |
| EI du Pont de Nemours & Co. | 2.800% | 2/15/23 | 9,685 | 9,168 |
| EI du Pont de Nemours & Co. | 6.500% | 1/15/28 | 1,400 | 1,632 |
| EI du Pont de Nemours & Co. | 4.900% | 1/15/41 | 10,878 | 10,423 |
| EI du Pont de Nemours & Co. | 4.150% | 2/15/43 | 2,950 | 2,580 |
| Fibria Overseas Finance Ltd. | 5.250% | 5/12/24 | 350 | 331 |
| FMC Corp. | 3.950% | 2/1/22 | 1,425 | 1,420 |
48
| Vanguard® Total Bond Market Index Fund | ||||
| Schedule of Investments | ||||
| December 31, 2015 | ||||
| Face | Market | |||
| Maturity | Amount | Value | ||
| Coupon | Date | ($000) | ($000) | |
| FMC Corp. | 4.100% | 2/1/24 | 9,750 | 9,670 |
| Freeport-McMoRan Inc. | 2.150% | 3/1/17 | 3,366 | 3,004 |
| Freeport-McMoRan Inc. | 2.375% | 3/15/18 | 29,310 | 23,301 |
| Freeport-McMoRan Inc. | 3.100% | 3/15/20 | 7,098 | 4,578 |
| Freeport-McMoRan Inc. | 3.550% | 3/1/22 | 18,551 | 10,852 |
| Freeport-McMoRan Inc. | 3.875% | 3/15/23 | 14,649 | 8,277 |
| Freeport-McMoRan Inc. | 4.550% | 11/14/24 | 500 | 290 |
| Freeport-McMoRan Inc. | 5.400% | 11/14/34 | 12,500 | 6,312 |
| Freeport-McMoRan Inc. | 5.450% | 3/15/43 | 20,421 | 10,415 |
| Freeport-McMoran Oil & Gas LLC / FCX Oil & Gas Inc. | 6.500% | 11/15/20 | 2,999 | 1,934 |
| Freeport-McMoran Oil & Gas LLC / FCX Oil & Gas Inc. | 6.750% | 2/1/22 | 1,744 | 1,073 |
| Freeport-McMoran Oil & Gas LLC / FCX Oil & Gas Inc. | 6.875% | 2/15/23 | 4,555 | 2,824 |
| Georgia-Pacific LLC | 8.000% | 1/15/24 | 7,829 | 9,881 |
| Georgia-Pacific LLC | 7.375% | 12/1/25 | 6,350 | 7,870 |
| Georgia-Pacific LLC | 7.750% | 11/15/29 | 3,318 | 4,352 |
| Georgia-Pacific LLC | 8.875% | 5/15/31 | 4,965 | 6,957 |
| Glencore Canada Corp. | 5.500% | 6/15/17 | 4,680 | 4,573 |
| Goldcorp Inc. | 2.125% | 3/15/18 | 15,785 | 15,308 |
| Goldcorp Inc. | 3.625% | 6/9/21 | 1,250 | 1,174 |
| Goldcorp Inc. | 3.700% | 3/15/23 | 9,575 | 8,760 |
| Goldcorp Inc. | 5.450% | 6/9/44 | 2,675 | 2,168 |
| International Paper Co. | 7.950% | 6/15/18 | 9,758 | 11,044 |
| International Paper Co. | 7.500% | 8/15/21 | 13,510 | 16,014 |
| International Paper Co. | 3.650% | 6/15/24 | 10,910 | 10,692 |
| International Paper Co. | 3.800% | 1/15/26 | 3,825 | 3,768 |
| International Paper Co. | 5.000% | 9/15/35 | 4,125 | 4,099 |
| International Paper Co. | 8.700% | 6/15/38 | 1,200 | 1,555 |
| International Paper Co. | 7.300% | 11/15/39 | 4,268 | 4,865 |
| International Paper Co. | 6.000% | 11/15/41 | 2,250 | 2,353 |
| International Paper Co. | 4.800% | 6/15/44 | 14,430 | 13,061 |
| International Paper Co. | 5.150% | 5/15/46 | 6,950 | 6,611 |
| Kinross Gold Corp. | 5.125% | 9/1/21 | 2,300 | 1,564 |
| Kinross Gold Corp. | 5.950% | 3/15/24 | 5,025 | 3,474 |
| Kinross Gold Corp. | 6.875% | 9/1/41 | 2,150 | 1,225 |
| Lubrizol Corp. | 8.875% | 2/1/19 | 875 | 1,045 |
| Lubrizol Corp. | 6.500% | 10/1/34 | 6,025 | 7,609 |
| LYB International Finance BV | 4.000% | 7/15/23 | 1,250 | 1,246 |
| LYB International Finance BV | 5.250% | 7/15/43 | 1,600 | 1,534 |
| LYB International Finance BV | 4.875% | 3/15/44 | 11,000 | 10,015 |
| LyondellBasell Industries NV | 5.000% | 4/15/19 | 19,310 | 20,530 |
| LyondellBasell Industries NV | 6.000% | 11/15/21 | 14,925 | 16,753 |
| LyondellBasell Industries NV | 5.750% | 4/15/24 | 4,950 | 5,450 |
| LyondellBasell Industries NV | 4.625% | 2/26/55 | 11,275 | 9,127 |
| Meadwestvaco Corp. | 8.200% | 1/15/30 | 2,268 | 2,945 |
| Meadwestvaco Corp. | 7.950% | 2/15/31 | 5,253 | 6,530 |
| Methanex Corp. | 3.250% | 12/15/19 | 6,650 | 6,360 |
| Methanex Corp. | 4.250% | 12/1/24 | 865 | 771 |
| Monsanto Co. | 1.150% | 6/30/17 | 8,000 | 7,945 |
| Monsanto Co. | 5.125% | 4/15/18 | 3,105 | 3,319 |
| Monsanto Co. | 2.125% | 7/15/19 | 4,400 | 4,392 |
| Monsanto Co. | 2.750% | 7/15/21 | 11,810 | 11,620 |
| Monsanto Co. | 2.200% | 7/15/22 | 7,580 | 6,989 |
| Monsanto Co. | 3.375% | 7/15/24 | 6,449 | 6,224 |
| Monsanto Co. | 2.850% | 4/15/25 | 3,800 | 3,470 |
| Monsanto Co. | 5.500% | 8/15/25 | 383 | 423 |
| Monsanto Co. | 4.200% | 7/15/34 | 9,175 | 7,934 |
| Monsanto Co. | 5.875% | 4/15/38 | 5,281 | 5,560 |
| Monsanto Co. | 3.600% | 7/15/42 | 6,341 | 4,599 |
| Monsanto Co. | 4.650% | 11/15/43 | 2,450 | 2,102 |
| Monsanto Co. | 4.400% | 7/15/44 | 12,925 | 10,711 |
| Monsanto Co. | 3.950% | 4/15/45 | 14,400 | 11,186 |
| Monsanto Co. | 4.700% | 7/15/64 | 10,260 | 7,843 |
| Mosaic Co. | 3.750% | 11/15/21 | 2,550 | 2,581 |
| Mosaic Co. | 4.250% | 11/15/23 | 17,532 | 17,392 |
49
| Vanguard® Total Bond Market Index Fund | ||||
| Schedule of Investments | ||||
| December 31, 2015 | ||||
| Face | Market | |||
| Maturity | Amount | Value | ||
| Coupon | Date | ($000) | ($000) | |
| Mosaic Co. | 5.450% | 11/15/33 | 2,750 | 2,803 |
| Mosaic Co. | 4.875% | 11/15/41 | 1,268 | 1,093 |
| Mosaic Co. | 5.625% | 11/15/43 | 3,500 | 3,355 |
| Newmont Mining Corp. | 5.125% | 10/1/19 | 1,495 | 1,562 |
| Newmont Mining Corp. | 3.500% | 3/15/22 | 4,493 | 4,007 |
| Newmont Mining Corp. | 5.875% | 4/1/35 | 2,605 | 2,116 |
| Newmont Mining Corp. | 6.250% | 10/1/39 | 16,252 | 12,986 |
| Newmont Mining Corp. | 4.875% | 3/15/42 | 5,394 | 3,827 |
| Nucor Corp. | 5.750% | 12/1/17 | 3,869 | 4,089 |
| Nucor Corp. | 5.850% | 6/1/18 | 6,865 | 7,346 |
| Nucor Corp. | 4.125% | 9/15/22 | 382 | 392 |
| Nucor Corp. | 4.000% | 8/1/23 | 5,795 | 5,564 |
| Nucor Corp. | 6.400% | 12/1/37 | 5,613 | 5,976 |
| Nucor Corp. | 5.200% | 8/1/43 | 13,250 | 12,368 |
| Packaging Corp. of America | 3.900% | 6/15/22 | 6,015 | 6,121 |
| Packaging Corp. of America | 4.500% | 11/1/23 | 15,870 | 16,593 |
| Packaging Corp. of America | 3.650% | 9/15/24 | 4,525 | 4,403 |
| Placer Dome Inc. | 6.450% | 10/15/35 | 2,175 | 1,801 |
| Plum Creek Timberlands LP | 4.700% | 3/15/21 | 4,605 | 4,908 |
| Potash Corp. of Saskatchewan Inc. | 3.250% | 12/1/17 | 4,441 | 4,542 |
| Potash Corp. of Saskatchewan Inc. | 6.500% | 5/15/19 | 190 | 214 |
| Potash Corp. of Saskatchewan Inc. | 4.875% | 3/30/20 | 7,128 | 7,749 |
| Potash Corp. of Saskatchewan Inc. | 3.625% | 3/15/24 | 5,375 | 5,228 |
| Potash Corp. of Saskatchewan Inc. | 3.000% | 4/1/25 | 9,096 | 8,581 |
| Potash Corp. of Saskatchewan Inc. | 5.875% | 12/1/36 | 875 | 968 |
| Potash Corp. of Saskatchewan Inc. | 5.625% | 12/1/40 | 4,918 | 5,191 |
| PPG Industries Inc. | 2.300% | 11/15/19 | 6,043 | 5,997 |
| PPG Industries Inc. | 3.600% | 11/15/20 | 4,650 | 4,799 |
| PPG Industries Inc. | 5.500% | 11/15/40 | 3,725 | 4,147 |
| Praxair Inc. | 5.200% | 3/15/17 | 1,115 | 1,165 |
| Praxair Inc. | 4.500% | 8/15/19 | 2,640 | 2,854 |
| Praxair Inc. | 3.000% | 9/1/21 | 5,900 | 5,968 |
| Praxair Inc. | 2.450% | 2/15/22 | 20,085 | 19,659 |
| Praxair Inc. | 2.200% | 8/15/22 | 4,319 | 4,131 |
| Praxair Inc. | 2.650% | 2/5/25 | 4,500 | 4,317 |
| Praxair Inc. | 3.550% | 11/7/42 | 2,200 | 1,955 |
| Rayonier Inc. | 3.750% | 4/1/22 | 2,775 | 2,697 |
| Reliance Steel & Aluminum Co. | 6.200% | 11/15/16 | 260 | 266 |
| Reliance Steel & Aluminum Co. | 4.500% | 4/15/23 | 1,600 | 1,498 |
| Reliance Steel & Aluminum Co. | 6.850% | 11/15/36 | 1,635 | 1,705 |
| Rio Tinto Alcan Inc. | 5.750% | 6/1/35 | 9,254 | 9,614 |
| Rio Tinto Finance USA Ltd. | 6.500% | 7/15/18 | 18,935 | 20,511 |
| Rio Tinto Finance USA Ltd. | 9.000% | 5/1/19 | 7,873 | 9,213 |
| Rio Tinto Finance USA Ltd. | 3.500% | 11/2/20 | 11,961 | 11,740 |
| Rio Tinto Finance USA Ltd. | 4.125% | 5/20/21 | 4,750 | 4,739 |
| Rio Tinto Finance USA Ltd. | 3.750% | 9/20/21 | 5,139 | 4,994 |
| Rio Tinto Finance USA Ltd. | 3.750% | 6/15/25 | 45,000 | 40,617 |
| Rio Tinto Finance USA Ltd. | 7.125% | 7/15/28 | 7,009 | 8,405 |
| Rio Tinto Finance USA Ltd. | 5.200% | 11/2/40 | 13,381 | 12,243 |
| Rio Tinto Finance USA plc | 2.000% | 3/22/17 | 7,470 | 7,431 |
| Rio Tinto Finance USA plc | 1.625% | 8/21/17 | 7,025 | 6,906 |
| Rio Tinto Finance USA plc | 2.250% | 12/14/18 | 9,615 | 9,371 |
| Rio Tinto Finance USA plc | 3.500% | 3/22/22 | 5,972 | 5,620 |
| Rio Tinto Finance USA plc | 2.875% | 8/21/22 | 12,205 | 11,046 |
| Rio Tinto Finance USA plc | 4.750% | 3/22/42 | 418 | 354 |
| Rio Tinto Finance USA plc | 4.125% | 8/21/42 | 2,453 | 1,915 |
| Rock-Tenn Co. | 4.450% | 3/1/19 | 9,150 | 9,549 |
| Rock-Tenn Co. | 3.500% | 3/1/20 | 3,755 | 3,801 |
| Rock-Tenn Co. | 4.900% | 3/1/22 | 3,650 | 3,885 |
| Rohm & Haas Co. | 6.000% | 9/15/17 | 2,811 | 2,998 |
| Rohm & Haas Co. | 7.850% | 7/15/29 | 2,950 | 3,800 |
| RPM International Inc. | 6.125% | 10/15/19 | 2,493 | 2,728 |
| RPM International Inc. | 3.450% | 11/15/22 | 4,585 | 4,398 |
| RPM International Inc. | 5.250% | 6/1/45 | 200 | 189 |
50
| Vanguard® Total Bond Market Index Fund | ||||
| Schedule of Investments | ||||
| December 31, 2015 | ||||
| Face | Market | |||
| Maturity | Amount | Value | ||
| Coupon | Date | ($000) | ($000) | |
| Sherwin-Williams Co. | 3.450% | 8/1/25 | 11,200 | 11,383 |
| Sherwin-Williams Co. | 4.000% | 12/15/42 | 2,000 | 1,901 |
| Sherwin-Williams Co. | 4.550% | 8/1/45 | 2,790 | 2,896 |
| Southern Copper Corp. | 5.375% | 4/16/20 | 1,238 | 1,284 |
| Southern Copper Corp. | 3.875% | 4/23/25 | 3,725 | 3,283 |
| Southern Copper Corp. | 7.500% | 7/27/35 | 17,050 | 15,878 |
| Southern Copper Corp. | 6.750% | 4/16/40 | 2,565 | 2,186 |
| Southern Copper Corp. | 5.250% | 11/8/42 | 12,320 | 8,747 |
| Southern Copper Corp. | 5.875% | 4/23/45 | 19,350 | 14,803 |
| Syngenta Finance NV | 3.125% | 3/28/22 | 4,100 | 3,970 |
| Syngenta Finance NV | 4.375% | 3/28/42 | 2,675 | 2,471 |
| The Dow Chemical Company | 4.625% | 10/1/44 | 2,000 | 1,826 |
| Vale Canada Ltd. | 7.200% | 9/15/32 | 1,375 | 1,023 |
| Vale Overseas Ltd. | 6.250% | 1/23/17 | 7,410 | 7,354 |
| Vale Overseas Ltd. | 5.625% | 9/15/19 | 6,075 | 5,475 |
| Vale Overseas Ltd. | 4.625% | 9/15/20 | 16,660 | 13,890 |
| Vale Overseas Ltd. | 4.375% | 1/11/22 | 11,935 | 9,026 |
| Vale Overseas Ltd. | 8.250% | 1/17/34 | 2,537 | 2,042 |
| Vale Overseas Ltd. | 6.875% | 11/21/36 | 28,559 | 19,706 |
| Vale Overseas Ltd. | 6.875% | 11/10/39 | 14,464 | 10,052 |
| Vale SA | 5.625% | 9/11/42 | 11,959 | 7,848 |
| Valspar Corp. | 7.250% | 6/15/19 | 675 | 763 |
| Valspar Corp. | 4.200% | 1/15/22 | 1,000 | 1,025 |
| Valspar Corp. | 3.950% | 1/15/26 | 10,200 | 10,150 |
| Westlake Chemical Corp. | 3.600% | 7/15/22 | 775 | 760 |
| Weyerhaeuser Co. | 7.375% | 10/1/19 | 8,291 | 9,570 |
| Weyerhaeuser Co. | 4.625% | 9/15/23 | 8,125 | 8,447 |
| Weyerhaeuser Co. | 8.500% | 1/15/25 | 2,400 | 3,091 |
| Weyerhaeuser Co. | 7.375% | 3/15/32 | 7,093 | 8,437 |
| Weyerhaeuser Co. | 6.875% | 12/15/33 | 2,975 | 3,434 |
| Worthington Industries Inc. | 4.550% | 4/15/26 | 1,300 | 1,281 |
| Yamana Gold Inc. | 4.950% | 7/15/24 | 2,605 | 2,214 |
| Capital Goods (1.4%) | ||||
| 3M Co. | 1.375% | 8/7/18 | 4,650 | 4,641 |
| 3M Co. | 2.000% | 8/7/20 | 4,650 | 4,652 |
| 3M Co. | 3.000% | 8/7/25 | 4,450 | 4,554 |
| 3M Co. | 6.375% | 2/15/28 | 3,650 | 4,729 |
| 3M Co. | 5.700% | 3/15/37 | 6,023 | 7,427 |
| ABB Finance USA Inc. | 1.625% | 5/8/17 | 2,400 | 2,402 |
| ABB Finance USA Inc. | 2.875% | 5/8/22 | 5,005 | 4,926 |
| ABB Finance USA Inc. | 4.375% | 5/8/42 | 1,578 | 1,564 |
| Avery Dennison Corp. | 3.350% | 4/15/23 | 6,675 | 6,477 |
| Boeing Capital Corp. | 2.900% | 8/15/18 | 150 | 155 |
| Boeing Capital Corp. | 4.700% | 10/27/19 | 5,025 | 5,514 |
| Boeing Co. | 0.950% | 5/15/18 | 425 | 420 |
| Boeing Co. | 6.000% | 3/15/19 | 640 | 718 |
| Boeing Co. | 4.875% | 2/15/20 | 11,290 | 12,607 |
| Boeing Co. | 8.750% | 8/15/21 | 1,600 | 2,118 |
| Boeing Co. | 2.350% | 10/30/21 | 9,645 | 9,542 |
| Boeing Co. | 2.200% | 10/30/22 | 2,900 | 2,803 |
| Boeing Co. | 7.950% | 8/15/24 | 3,023 | 4,037 |
| Boeing Co. | 2.850% | 10/30/24 | 6,933 | 6,890 |
| Boeing Co. | 2.500% | 3/1/25 | 6,700 | 6,465 |
| Boeing Co. | 7.250% | 6/15/25 | 675 | 881 |
| Boeing Co. | 2.600% | 10/30/25 | 1,600 | 1,547 |
| Boeing Co. | 8.750% | 9/15/31 | 850 | 1,247 |
| Boeing Co. | 6.125% | 2/15/33 | 4,450 | 5,587 |
| Boeing Co. | 3.300% | 3/1/35 | 6,150 | 5,639 |
| Boeing Co. | 6.625% | 2/15/38 | 2,905 | 3,877 |
| Boeing Co. | 6.875% | 3/15/39 | 2,003 | 2,755 |
| Boeing Co. | 5.875% | 2/15/40 | 3,310 | 4,186 |
| Boeing Co. | 3.500% | 3/1/45 | 5,650 | 5,211 |
| Carlisle Cos. Inc. | 3.750% | 11/15/22 | 3,080 | 3,047 |
51
| Vanguard® Total Bond Market Index Fund | ||||
| Schedule of Investments | ||||
| December 31, 2015 | ||||
| Face | Market | |||
| Maturity | Amount | Value | ||
| Coupon | Date | ($000) | ($000) | |
| Caterpillar Financial Services Corp. | 2.050% | 8/1/16 | 28,475 | 28,648 |
| Caterpillar Financial Services Corp. | 1.000% | 3/3/17 | 6,475 | 6,455 |
| Caterpillar Financial Services Corp. | 1.250% | 8/18/17 | 6,000 | 5,977 |
| Caterpillar Financial Services Corp. | 1.250% | 11/6/17 | 8,024 | 8,006 |
| Caterpillar Financial Services Corp. | 5.450% | 4/15/18 | 134 | 145 |
| Caterpillar Financial Services Corp. | 7.050% | 10/1/18 | 1,115 | 1,263 |
| Caterpillar Financial Services Corp. | 1.800% | 11/13/18 | 4,000 | 4,004 |
| Caterpillar Financial Services Corp. | 7.150% | 2/15/19 | 20,178 | 23,111 |
| Caterpillar Financial Services Corp. | 2.100% | 6/9/19 | 4,825 | 4,822 |
| Caterpillar Financial Services Corp. | 2.250% | 12/1/19 | 250 | 250 |
| Caterpillar Financial Services Corp. | 2.000% | 3/5/20 | 3,760 | 3,726 |
| Caterpillar Financial Services Corp. | 2.500% | 11/13/20 | 2,950 | 2,945 |
| Caterpillar Financial Services Corp. | 2.750% | 8/20/21 | 3,400 | 3,372 |
| Caterpillar Financial Services Corp. | 3.750% | 11/24/23 | 5,000 | 5,197 |
| Caterpillar Financial Services Corp. | 3.300% | 6/9/24 | 2,000 | 1,990 |
| Caterpillar Financial Services Corp. | 3.250% | 12/1/24 | 4,315 | 4,275 |
| Caterpillar Inc. | 7.900% | 12/15/18 | 525 | 614 |
| Caterpillar Inc. | 3.900% | 5/27/21 | 11,128 | 11,823 |
| Caterpillar Inc. | 3.400% | 5/15/24 | 19,490 | 19,659 |
| Caterpillar Inc. | 6.050% | 8/15/36 | 14,372 | 16,955 |
| Caterpillar Inc. | 5.200% | 5/27/41 | 950 | 1,033 |
| Caterpillar Inc. | 3.803% | 8/15/42 | 22,848 | 20,422 |
| Caterpillar Inc. | 4.300% | 5/15/44 | 4,700 | 4,528 |
| Caterpillar Inc. | 4.750% | 5/15/64 | 2,550 | 2,479 |
| Crane Co. | 2.750% | 12/15/18 | 2,525 | 2,518 |
| Crane Co. | 4.450% | 12/15/23 | 8,650 | 8,912 |
| CRH America Inc. | 8.125% | 7/15/18 | 9,420 | 10,720 |
| CRH America Inc. | 5.750% | 1/15/21 | 6,800 | 7,640 |
| Danaher Corp. | 2.300% | 6/23/16 | 1,760 | 1,771 |
| Danaher Corp. | 5.625% | 1/15/18 | 2,385 | 2,574 |
| Danaher Corp. | 1.650% | 9/15/18 | 6,850 | 6,843 |
| Danaher Corp. | 5.400% | 3/1/19 | 1,725 | 1,897 |
| Danaher Corp. | 2.400% | 9/15/20 | 6,800 | 6,800 |
| Danaher Corp. | 3.900% | 6/23/21 | 9,335 | 9,930 |
| Danaher Corp. | 3.350% | 9/15/25 | 5,000 | 5,104 |
| Danaher Corp. | 4.375% | 9/15/45 | 12,350 | 12,777 |
| Deere & Co. | 4.375% | 10/16/19 | 6,097 | 6,575 |
| Deere & Co. | 2.600% | 6/8/22 | 27,553 | 27,135 |
| Deere & Co. | 5.375% | 10/16/29 | 10,357 | 12,069 |
| Deere & Co. | 8.100% | 5/15/30 | 4,865 | 6,875 |
| Deere & Co. | 7.125% | 3/3/31 | 925 | 1,198 |
| Deere & Co. | 3.900% | 6/9/42 | 12,370 | 11,856 |
| Dover Corp. | 5.450% | 3/15/18 | 7,160 | 7,727 |
| Dover Corp. | 4.300% | 3/1/21 | 850 | 910 |
| Dover Corp. | 3.150% | 11/15/25 | 8,500 | 8,379 |
| Dover Corp. | 5.375% | 10/15/35 | 550 | 621 |
| Dover Corp. | 6.600% | 3/15/38 | 3,115 | 4,047 |
| Dover Corp. | 5.375% | 3/1/41 | 1,759 | 2,009 |
| Eaton Corp. | 1.500% | 11/2/17 | 13,370 | 13,288 |
| Eaton Corp. | 5.600% | 5/15/18 | 12,060 | 13,043 |
| Eaton Corp. | 2.750% | 11/2/22 | 9,885 | 9,561 |
| Eaton Corp. | 4.000% | 11/2/32 | 10,456 | 9,985 |
| Eaton Corp. | 4.150% | 11/2/42 | 1,275 | 1,176 |
| Eaton Electric Holdings LLC | 3.875% | 12/15/20 | 2,325 | 2,411 |
| Embraer Netherlands Finance BV | 5.050% | 6/15/25 | 4,005 | 3,623 |
| 8 Embraer Overseas Ltd. | 5.696% | 9/16/23 | 18,075 | 17,619 |
| Embraer SA | 5.150% | 6/15/22 | 2,940 | 2,868 |
| Emerson Electric Co. | 5.250% | 10/15/18 | 6,645 | 7,278 |
| Emerson Electric Co. | 4.875% | 10/15/19 | 6,595 | 7,244 |
| Emerson Electric Co. | 4.250% | 11/15/20 | 745 | 805 |
| Emerson Electric Co. | 2.625% | 12/1/21 | 13,250 | 13,161 |
| Emerson Electric Co. | 2.625% | 2/15/23 | 4,350 | 4,257 |
| Emerson Electric Co. | 3.150% | 6/1/25 | 5,900 | 5,867 |
| Emerson Electric Co. | 6.000% | 8/15/32 | 940 | 1,126 |
52
| Vanguard® Total Bond Market Index Fund | ||||
| Schedule of Investments | ||||
| December 31, 2015 | ||||
| Face | Market | |||
| Maturity | Amount | Value | ||
| Coupon | Date | ($000) | ($000) | |
| Emerson Electric Co. | 6.125% | 4/15/39 | 1,960 | 2,413 |
| Exelis Inc. | 4.250% | 10/1/16 | 3,525 | 3,589 |
| Exelis Inc. | 5.550% | 10/1/21 | 1,400 | 1,537 |
| Flowserve Corp. | 3.500% | 9/15/22 | 12,800 | 12,449 |
| Flowserve Corp. | 4.000% | 11/15/23 | 4,325 | 4,316 |
| Fortune Brands Home & Security Inc. | 3.000% | 6/15/20 | 4,430 | 4,421 |
| Fortune Brands Home & Security Inc. | 4.000% | 6/15/25 | 5,500 | 5,449 |
| 5 GE Capital Trust I | 6.375% | 11/15/67 | 6,385 | 6,648 |
| General Dynamics Corp. | 1.000% | 11/15/17 | 12,300 | 12,263 |
| General Dynamics Corp. | 3.875% | 7/15/21 | 11,219 | 11,845 |
| General Dynamics Corp. | 2.250% | 11/15/22 | 8,965 | 8,616 |
| General Dynamics Corp. | 3.600% | 11/15/42 | 5,943 | 5,516 |
| General Electric Capital Corp. | 5.625% | 9/15/17 | 60 | 64 |
| General Electric Capital Corp. | 6.000% | 8/7/19 | 4,750 | 5,369 |
| General Electric Capital Corp. | 2.100% | 12/11/19 | 1,865 | 1,860 |
| General Electric Capital Corp. | 5.500% | 1/8/20 | 16,424 | 18,425 |
| General Electric Capital Corp. | 2.200% | 1/9/20 | 9,657 | 9,669 |
| General Electric Capital Corp. | 5.550% | 5/4/20 | 7,926 | 8,982 |
| General Electric Capital Corp. | 4.375% | 9/16/20 | 6,084 | 6,618 |
| General Electric Capital Corp. | 4.625% | 1/7/21 | 5,239 | 5,752 |
| General Electric Capital Corp. | 5.300% | 2/11/21 | 3,972 | 4,473 |
| General Electric Capital Corp. | 4.650% | 10/17/21 | 12,934 | 14,269 |
| General Electric Capital Corp. | 3.150% | 9/7/22 | 4,493 | 4,599 |
| General Electric Capital Corp. | 3.100% | 1/9/23 | 11,056 | 11,209 |
| General Electric Capital Corp. | 3.450% | 5/15/24 | 3,545 | 3,657 |
| General Electric Capital Corp. | 6.750% | 3/15/32 | 26,482 | 34,426 |
| General Electric Capital Corp. | 7.500% | 8/21/35 | 100 | 140 |
| General Electric Capital Corp. | 6.150% | 8/7/37 | 8,417 | 10,523 |
| General Electric Capital Corp. | 5.875% | 1/14/38 | 18,274 | 22,342 |
| General Electric Capital Corp. | 6.875% | 1/10/39 | 12,196 | 16,600 |
| 5 General Electric Capital Corp. | 6.375% | 11/15/67 | 14,142 | 14,725 |
| General Electric Co. | 5.250% | 12/6/17 | 60,680 | 64,838 |
| General Electric Co. | 2.700% | 10/9/22 | 27,195 | 27,078 |
| General Electric Co. | 3.375% | 3/11/24 | 6,260 | 6,484 |
| General Electric Co. | 4.125% | 10/9/42 | 22,315 | 21,798 |
| General Electric Co. | 4.500% | 3/11/44 | 25,640 | 26,341 |
| Harris Corp. | 1.999% | 4/27/18 | 5,850 | 5,788 |
| Harris Corp. | 2.700% | 4/27/20 | 2,540 | 2,491 |
| Harris Corp. | 4.400% | 12/15/20 | 1,725 | 1,802 |
| Harris Corp. | 3.832% | 4/27/25 | 3,300 | 3,250 |
| Harris Corp. | 4.854% | 4/27/35 | 7,475 | 7,358 |
| Harris Corp. | 6.150% | 12/15/40 | 7,828 | 8,502 |
| Harris Corp. | 5.054% | 4/27/45 | 4,300 | 4,199 |
| Hexcel Corp. | 4.700% | 8/15/25 | 1,400 | 1,388 |
| Honeywell International Inc. | 5.300% | 3/15/17 | 6,520 | 6,835 |
| Honeywell International Inc. | 5.300% | 3/1/18 | 5,900 | 6,368 |
| Honeywell International Inc. | 5.000% | 2/15/19 | 5,836 | 6,393 |
| Honeywell International Inc. | 4.250% | 3/1/21 | 19,821 | 21,690 |
| Honeywell International Inc. | 3.350% | 12/1/23 | 9,160 | 9,436 |
| Honeywell International Inc. | 5.700% | 3/15/36 | 1,435 | 1,711 |
| Honeywell International Inc. | 5.700% | 3/15/37 | 6,851 | 8,272 |
| Honeywell International Inc. | 5.375% | 3/1/41 | 13,713 | 16,270 |
| Illinois Tool Works Inc. | 1.950% | 3/1/19 | 1,000 | 1,002 |
| Illinois Tool Works Inc. | 6.250% | 4/1/19 | 12,700 | 14,315 |
| Illinois Tool Works Inc. | 4.875% | 9/15/41 | 45 | 49 |
| Illinois Tool Works Inc. | 3.900% | 9/1/42 | 14,500 | 13,693 |
| Ingersoll-Rand Global Holding Co. Ltd. | 6.875% | 8/15/18 | 11,590 | 12,800 |
| Ingersoll-Rand Global Holding Co. Ltd. | 2.875% | 1/15/19 | 6,850 | 6,907 |
| Ingersoll-Rand Global Holding Co. Ltd. | 4.250% | 6/15/23 | 5,925 | 6,127 |
| Ingersoll-Rand Global Holding Co. Ltd. | 5.750% | 6/15/43 | 3,800 | 4,180 |
| Ingersoll-Rand Luxembourg Finance SA | 2.625% | 5/1/20 | 4,000 | 3,936 |
| Ingersoll-Rand Luxembourg Finance SA | 3.550% | 11/1/24 | 2,200 | 2,149 |
| Ingersoll-Rand Luxembourg Finance SA | 4.650% | 11/1/44 | 3,500 | 3,343 |
| John Deere Capital Corp. | 2.000% | 1/13/17 | 10,050 | 10,175 |
53
| Vanguard® Total Bond Market Index Fund | ||||
| Schedule of Investments | ||||
| December 31, 2015 | ||||
| Face | Market | |||
| Maturity | Amount | Value | ||
| Coupon | Date | ($000) | ($000) | |
| John Deere Capital Corp. | 5.500% | 4/13/17 | 4,360 | 4,588 |
| John Deere Capital Corp. | 1.125% | 6/12/17 | 2,480 | 2,475 |
| John Deere Capital Corp. | 2.800% | 9/18/17 | 8,050 | 8,230 |
| John Deere Capital Corp. | 1.200% | 10/10/17 | 3,200 | 3,185 |
| John Deere Capital Corp. | 1.550% | 12/15/17 | 7,000 | 7,005 |
| John Deere Capital Corp. | 1.350% | 1/16/18 | 3,000 | 2,988 |
| John Deere Capital Corp. | 1.300% | 3/12/18 | 13,769 | 13,658 |
| John Deere Capital Corp. | 1.600% | 7/13/18 | 1,000 | 997 |
| John Deere Capital Corp. | 1.750% | 8/10/18 | 4,500 | 4,499 |
| John Deere Capital Corp. | 5.750% | 9/10/18 | 3,965 | 4,363 |
| John Deere Capital Corp. | 1.950% | 12/13/18 | 9,500 | 9,520 |
| John Deere Capital Corp. | 1.950% | 3/4/19 | 10,200 | 10,157 |
| John Deere Capital Corp. | 2.250% | 4/17/19 | 5,300 | 5,325 |
| John Deere Capital Corp. | 1.700% | 1/15/20 | 5,735 | 5,582 |
| John Deere Capital Corp. | 2.050% | 3/10/20 | 4,500 | 4,447 |
| John Deere Capital Corp. | 2.375% | 7/14/20 | 1,000 | 997 |
| John Deere Capital Corp. | 2.450% | 9/11/20 | 3,500 | 3,494 |
| John Deere Capital Corp. | 2.800% | 3/4/21 | 5,600 | 5,641 |
| John Deere Capital Corp. | 3.900% | 7/12/21 | 5,850 | 6,199 |
| John Deere Capital Corp. | 3.150% | 10/15/21 | 7,349 | 7,474 |
| John Deere Capital Corp. | 2.750% | 3/15/22 | 1,145 | 1,131 |
| John Deere Capital Corp. | 2.800% | 1/27/23 | 6,060 | 5,945 |
| John Deere Capital Corp. | 3.350% | 6/12/24 | 12,825 | 12,985 |
| John Deere Capital Corp. | 3.400% | 9/11/25 | 3,550 | 3,594 |
| Joy Global Inc. | 5.125% | 10/15/21 | 1,075 | 842 |
| Kennametal Inc. | 2.650% | 11/1/19 | 3,650 | 3,616 |
| Kennametal Inc. | 3.875% | 2/15/22 | 2,700 | 2,667 |
| L-3 Communications Corp. | 1.500% | 5/28/17 | 3,200 | 3,167 |
| L-3 Communications Corp. | 5.200% | 10/15/19 | 9,075 | 9,616 |
| L-3 Communications Corp. | 4.750% | 7/15/20 | 13,100 | 13,641 |
| L-3 Communications Corp. | 4.950% | 2/15/21 | 11,525 | 11,855 |
| L-3 Communications Corp. | 3.950% | 5/28/24 | 1,766 | 1,677 |
| Lafarge SA | 7.125% | 7/15/36 | 5,300 | 6,241 |
| Leggett & Platt Inc. | 3.800% | 11/15/24 | 4,600 | 4,634 |
| Legrand France SA | 8.500% | 2/15/25 | 875 | 1,161 |
| Lockheed Martin Corp. | 1.850% | 11/23/18 | 3,000 | 2,994 |
| Lockheed Martin Corp. | 4.250% | 11/15/19 | 9,281 | 9,946 |
| Lockheed Martin Corp. | 2.500% | 11/23/20 | 7,760 | 7,732 |
| Lockheed Martin Corp. | 3.350% | 9/15/21 | 15,053 | 15,375 |
| Lockheed Martin Corp. | 3.100% | 1/15/23 | 2,300 | 2,296 |
| Lockheed Martin Corp. | 2.900% | 3/1/25 | 2,100 | 2,016 |
| Lockheed Martin Corp. | 3.550% | 1/15/26 | 18,000 | 18,089 |
| Lockheed Martin Corp. | 3.600% | 3/1/35 | 6,235 | 5,601 |
| Lockheed Martin Corp. | 4.500% | 5/15/36 | 4,600 | 4,655 |
| Lockheed Martin Corp. | 6.150% | 9/1/36 | 18,810 | 22,554 |
| Lockheed Martin Corp. | 5.500% | 11/15/39 | 1,850 | 2,055 |
| Lockheed Martin Corp. | 5.720% | 6/1/40 | 5,360 | 6,114 |
| Lockheed Martin Corp. | 4.850% | 9/15/41 | 4,622 | 4,780 |
| Lockheed Martin Corp. | 4.070% | 12/15/42 | 100 | 93 |
| Lockheed Martin Corp. | 3.800% | 3/1/45 | 2,832 | 2,495 |
| Lockheed Martin Corp. | 4.700% | 5/15/46 | 18,625 | 19,079 |
| Martin Marietta Materials Inc. | 6.600% | 4/15/18 | 4,455 | 4,801 |
| Mohawk Industries Inc. | 3.850% | 2/1/23 | 21,940 | 22,102 |
| Northrop Grumman Corp. | 5.050% | 8/1/19 | 2,810 | 3,044 |
| Northrop Grumman Corp. | 3.500% | 3/15/21 | 14,828 | 15,305 |
| Northrop Grumman Corp. | 3.250% | 8/1/23 | 2,500 | 2,498 |
| Northrop Grumman Corp. | 5.050% | 11/15/40 | 6,925 | 7,267 |
| Northrop Grumman Corp. | 4.750% | 6/1/43 | 7,927 | 8,160 |
| Northrop Grumman Corp. | 3.850% | 4/15/45 | 1,650 | 1,464 |
| Northrop Grumman Systems Corp. | 7.750% | 2/15/31 | 381 | 502 |
| Owens Corning | 4.200% | 12/15/22 | 8,254 | 8,269 |
| Owens Corning | 4.200% | 12/1/24 | 2,040 | 1,987 |
| Owens Corning | 7.000% | 12/1/36 | 1,525 | 1,678 |
| Parker Hannifin Corp. | 5.500% | 5/15/18 | 965 | 1,044 |
54
| Vanguard® Total Bond Market Index Fund | ||||
| Schedule of Investments | ||||
| December 31, 2015 | ||||
| Face | Market | |||
| Maturity | Amount | Value | ||
| Coupon | Date | ($000) | ($000) | |
| Parker Hannifin Corp. | 3.500% | 9/15/22 | 500 | 517 |
| Parker Hannifin Corp. | 6.250% | 5/15/38 | 4,203 | 5,330 |
| Parker-Hannifin Corp. | 3.300% | 11/21/24 | 5,075 | 5,133 |
| Parker-Hannifin Corp. | 4.200% | 11/21/34 | 5,050 | 5,155 |
| Parker-Hannifin Corp. | 4.450% | 11/21/44 | 6,050 | 6,321 |
| Pentair Finance SA | 2.650% | 12/1/19 | 2,204 | 2,136 |
| Pentair Finance SA | 5.000% | 5/15/21 | 1,310 | 1,365 |
| Pentair Finance SA | 3.150% | 9/15/22 | 880 | 827 |
| Pentair Finance SA | 4.650% | 9/15/25 | 125 | 128 |
| Precision Castparts Corp. | 1.250% | 1/15/18 | 12,358 | 12,272 |
| Precision Castparts Corp. | 2.250% | 6/15/20 | 4,600 | 4,575 |
| Precision Castparts Corp. | 2.500% | 1/15/23 | 9,425 | 9,094 |
| Precision Castparts Corp. | 3.250% | 6/15/25 | 6,500 | 6,448 |
| Precision Castparts Corp. | 4.200% | 6/15/35 | 1,500 | 1,498 |
| Precision Castparts Corp. | 3.900% | 1/15/43 | 3,625 | 3,378 |
| Precision Castparts Corp. | 4.375% | 6/15/45 | 2,000 | 1,995 |
| Raytheon Co. | 6.400% | 12/15/18 | 290 | 327 |
| Raytheon Co. | 4.400% | 2/15/20 | 2,820 | 3,052 |
| Raytheon Co. | 3.125% | 10/15/20 | 4,235 | 4,363 |
| Raytheon Co. | 2.500% | 12/15/22 | 5,470 | 5,357 |
| Raytheon Co. | 7.200% | 8/15/27 | 4,360 | 5,789 |
| Raytheon Co. | 4.875% | 10/15/40 | 1,825 | 1,998 |
| Raytheon Co. | 4.700% | 12/15/41 | 8,175 | 8,857 |
| Republic Services Inc. | 3.800% | 5/15/18 | 4,600 | 4,767 |
| Republic Services Inc. | 5.500% | 9/15/19 | 15,040 | 16,533 |
| Republic Services Inc. | 5.000% | 3/1/20 | 5,810 | 6,313 |
| Republic Services Inc. | 5.250% | 11/15/21 | 11,494 | 12,725 |
| Republic Services Inc. | 3.550% | 6/1/22 | 3,300 | 3,378 |
| Republic Services Inc. | 4.750% | 5/15/23 | 2,150 | 2,342 |
| Republic Services Inc. | 3.200% | 3/15/25 | 7,600 | 7,329 |
| Republic Services Inc. | 6.086% | 3/15/35 | 2,600 | 3,059 |
| Republic Services Inc. | 6.200% | 3/1/40 | 5,823 | 6,841 |
| Republic Services Inc. | 5.700% | 5/15/41 | 10,998 | 12,352 |
| Rockwell Automation Inc. | 5.650% | 12/1/17 | 1,650 | 1,765 |
| Rockwell Automation Inc. | 2.050% | 3/1/20 | 5,900 | 5,844 |
| Rockwell Automation Inc. | 6.700% | 1/15/28 | 4,025 | 5,139 |
| Rockwell Automation Inc. | 6.250% | 12/1/37 | 4,385 | 5,432 |
| Rockwell Collins Inc. | 5.250% | 7/15/19 | 265 | 289 |
| Rockwell Collins Inc. | 3.100% | 11/15/21 | 2,350 | 2,383 |
| Rockwell Collins Inc. | 4.800% | 12/15/43 | 3,300 | 3,527 |
| Roper Technologies Inc. | 1.850% | 11/15/17 | 3,550 | 3,538 |
| Roper Technologies Inc. | 2.050% | 10/1/18 | 16,700 | 16,598 |
| Roper Technologies Inc. | 6.250% | 9/1/19 | 3,760 | 4,177 |
| Roper Technologies Inc. | 3.000% | 12/15/20 | 1,000 | 997 |
| Roper Technologies Inc. | 3.125% | 11/15/22 | 3,968 | 3,878 |
| Roper Technologies Inc. | 3.850% | 12/15/25 | 1,200 | 1,203 |
| Snap-on Inc. | 6.125% | 9/1/21 | 3,700 | 4,258 |
| Sonoco Products Co. | 4.375% | 11/1/21 | 745 | 776 |
| Sonoco Products Co. | 5.750% | 11/1/40 | 7,150 | 7,735 |
| Stanley Black & Decker Inc. | 3.400% | 12/1/21 | 4,340 | 4,424 |
| Stanley Black & Decker Inc. | 2.900% | 11/1/22 | 1,881 | 1,860 |
| Stanley Black & Decker Inc. | 5.200% | 9/1/40 | 2,075 | 2,251 |
| Textron Inc. | 5.600% | 12/1/17 | 1,895 | 2,013 |
| Textron Inc. | 7.250% | 10/1/19 | 4,140 | 4,715 |
| Textron Inc. | 4.300% | 3/1/24 | 3,725 | 3,794 |
| Textron Inc. | 3.875% | 3/1/25 | 5,950 | 5,835 |
| Tyco International Finance SA | 5.125% | 9/14/45 | 400 | 415 |
| United Technologies Corp. | 1.800% | 6/1/17 | 2,161 | 2,171 |
| United Technologies Corp. | 5.375% | 12/15/17 | 10,376 | 11,152 |
| United Technologies Corp. | 6.125% | 2/1/19 | 920 | 1,026 |
| United Technologies Corp. | 4.500% | 4/15/20 | 29,953 | 32,737 |
| United Technologies Corp. | 3.100% | 6/1/22 | 10,956 | 11,160 |
| United Technologies Corp. | 6.700% | 8/1/28 | 2,397 | 3,053 |
| United Technologies Corp. | 7.500% | 9/15/29 | 4,821 | 6,519 |
55
| Vanguard® Total Bond Market Index Fund | ||||
| Schedule of Investments | ||||
| December 31, 2015 | ||||
| Face | Market | |||
| Maturity | Amount | Value | ||
| Coupon | Date | ($000) | ($000) | |
| United Technologies Corp. | 5.400% | 5/1/35 | 7,275 | 8,143 |
| United Technologies Corp. | 6.050% | 6/1/36 | 7,452 | 8,982 |
| United Technologies Corp. | 6.125% | 7/15/38 | 6,796 | 8,316 |
| United Technologies Corp. | 5.700% | 4/15/40 | 7,595 | 8,894 |
| United Technologies Corp. | 4.500% | 6/1/42 | 37,783 | 37,952 |
| United Technologies Corp. | 4.150% | 5/15/45 | 4,000 | 3,816 |
| Valmont Industries Inc. | 5.000% | 10/1/44 | 1,200 | 1,039 |
| Valmont Industries Inc. | 5.250% | 10/1/54 | 4,450 | 3,791 |
| Waste Management Inc. | 2.600% | 9/1/16 | 7,250 | 7,301 |
| Waste Management Inc. | 6.100% | 3/15/18 | 450 | 490 |
| Waste Management Inc. | 4.750% | 6/30/20 | 10,824 | 11,732 |
| Waste Management Inc. | 4.600% | 3/1/21 | 9,520 | 10,238 |
| Waste Management Inc. | 3.500% | 5/15/24 | 2,600 | 2,621 |
| Waste Management Inc. | 3.125% | 3/1/25 | 3,500 | 3,401 |
| Waste Management Inc. | 3.900% | 3/1/35 | 2,000 | 1,871 |
| Waste Management Inc. | 4.100% | 3/1/45 | 4,724 | 4,404 |
| WW Grainger Inc. | 4.600% | 6/15/45 | 11,600 | 12,097 |
| Xylem Inc. | 4.875% | 10/1/21 | 150 | 160 |
| Communication (2.6%) | ||||
| 21st Century Fox America Inc. | 8.000% | 10/17/16 | 3,830 | 4,017 |
| 21st Century Fox America Inc. | 7.250% | 5/18/18 | 165 | 183 |
| 21st Century Fox America Inc. | 6.900% | 3/1/19 | 2,545 | 2,890 |
| 21st Century Fox America Inc. | 4.500% | 2/15/21 | 7,375 | 7,939 |
| 21st Century Fox America Inc. | 3.000% | 9/15/22 | 3,050 | 3,010 |
| 21st Century Fox America Inc. | 3.700% | 9/15/24 | 275 | 277 |
| 8 21st Century Fox America Inc. | 3.700% | 10/15/25 | 4,900 | 4,888 |
| 21st Century Fox America Inc. | 7.700% | 10/30/25 | 1,225 | 1,539 |
| 21st Century Fox America Inc. | 6.550% | 3/15/33 | 13,365 | 15,314 |
| 21st Century Fox America Inc. | 6.200% | 12/15/34 | 15,141 | 17,127 |
| 21st Century Fox America Inc. | 6.400% | 12/15/35 | 24,265 | 27,948 |
| 21st Century Fox America Inc. | 8.150% | 10/17/36 | 2,075 | 2,757 |
| 21st Century Fox America Inc. | 6.150% | 3/1/37 | 9,873 | 10,998 |
| 21st Century Fox America Inc. | 6.650% | 11/15/37 | 785 | 910 |
| 21st Century Fox America Inc. | 6.900% | 8/15/39 | 7,260 | 8,583 |
| 21st Century Fox America Inc. | 6.150% | 2/15/41 | 4,230 | 4,757 |
| 21st Century Fox America Inc. | 5.400% | 10/1/43 | 10,250 | 10,686 |
| 21st Century Fox America Inc. | 4.750% | 9/15/44 | 8,050 | 7,756 |
| 8 21st Century Fox America Inc. | 4.950% | 10/15/45 | 500 | 494 |
| 21st Century Fox America Inc. | 7.750% | 12/1/45 | 5,160 | 6,723 |
| America Movil SAB de CV | 5.625% | 11/15/17 | 6,550 | 6,959 |
| America Movil SAB de CV | 5.000% | 10/16/19 | 2,125 | 2,289 |
| America Movil SAB de CV | 5.000% | 3/30/20 | 8,325 | 9,036 |
| America Movil SAB de CV | 3.125% | 7/16/22 | 35,500 | 34,688 |
| America Movil SAB de CV | 6.375% | 3/1/35 | 21,267 | 23,551 |
| America Movil SAB de CV | 6.125% | 11/15/37 | 4,818 | 5,293 |
| America Movil SAB de CV | 6.125% | 3/30/40 | 12,600 | 13,820 |
| America Movil SAB de CV | 4.375% | 7/16/42 | 10,175 | 9,105 |
| American Tower Corp. | 4.500% | 1/15/18 | 20,740 | 21,637 |
| American Tower Corp. | 3.400% | 2/15/19 | 3,325 | 3,402 |
| American Tower Corp. | 2.800% | 6/1/20 | 6,675 | 6,602 |
| American Tower Corp. | 5.050% | 9/1/20 | 5,025 | 5,422 |
| American Tower Corp. | 3.450% | 9/15/21 | 18,125 | 18,208 |
| American Tower Corp. | 5.900% | 11/1/21 | 7,025 | 7,832 |
| American Tower Corp. | 3.500% | 1/31/23 | 17,900 | 17,655 |
| American Tower Corp. | 4.000% | 6/1/25 | 4,450 | 4,374 |
| Ameritech Capital Funding Corp. | 6.550% | 1/15/28 | 445 | 497 |
| AT&T Corp. | 8.250% | 11/15/31 | 17,759 | 23,766 |
| AT&T Inc. | 2.400% | 8/15/16 | 1,055 | 1,062 |
| AT&T Inc. | 1.600% | 2/15/17 | 990 | 991 |
| AT&T Inc. | 1.700% | 6/1/17 | 28,800 | 28,866 |
| AT&T Inc. | 1.400% | 12/1/17 | 2,150 | 2,139 |
| AT&T Inc. | 5.500% | 2/1/18 | 6,171 | 6,598 |
| AT&T Inc. | 5.600% | 5/15/18 | 8,995 | 9,777 |
56
| Vanguard® Total Bond Market Index Fund | ||||
| Schedule of Investments | ||||
| December 31, 2015 | ||||
| Face | Market | |||
| Maturity | Amount | Value | ||
| Coupon | Date | ($000) | ($000) | |
| AT&T Inc. | 2.375% | 11/27/18 | 18,990 | 19,138 |
| AT&T Inc. | 5.800% | 2/15/19 | 28,560 | 31,525 |
| AT&T Inc. | 2.300% | 3/11/19 | 6,192 | 6,198 |
| AT&T Inc. | 2.450% | 6/30/20 | 38,800 | 38,315 |
| AT&T Inc. | 3.875% | 8/15/21 | 23,323 | 24,127 |
| AT&T Inc. | 3.000% | 2/15/22 | 12,461 | 12,269 |
| AT&T Inc. | 3.000% | 6/30/22 | 27,000 | 26,253 |
| AT&T Inc. | 2.625% | 12/1/22 | 17,204 | 16,308 |
| AT&T Inc. | 3.400% | 5/15/25 | 19,400 | 18,645 |
| AT&T Inc. | 6.450% | 6/15/34 | 8,835 | 9,931 |
| AT&T Inc. | 6.150% | 9/15/34 | 100 | 106 |
| AT&T Inc. | 4.500% | 5/15/35 | 17,900 | 16,628 |
| AT&T Inc. | 6.500% | 9/1/37 | 15,028 | 16,914 |
| AT&T Inc. | 6.300% | 1/15/38 | 11,300 | 12,368 |
| AT&T Inc. | 6.400% | 5/15/38 | 7,070 | 7,804 |
| AT&T Inc. | 6.550% | 2/15/39 | 27,479 | 30,950 |
| AT&T Inc. | 5.350% | 9/1/40 | 39,593 | 39,159 |
| AT&T Inc. | 5.550% | 8/15/41 | 6,135 | 6,176 |
| AT&T Inc. | 4.300% | 12/15/42 | 15,950 | 13,654 |
| AT&T Inc. | 4.800% | 6/15/44 | 22,090 | 20,262 |
| AT&T Inc. | 4.350% | 6/15/45 | 10,705 | 9,210 |
| AT&T Inc. | 4.750% | 5/15/46 | 31,544 | 28,890 |
| AT&T Mobility LLC | 7.125% | 12/15/31 | 7,865 | 9,588 |
| Bellsouth Capital Funding Corp. | 7.875% | 2/15/30 | 7,165 | 8,576 |
| Bellsouth Capital Funding Corp. | 7.120% | 7/15/97 | 350 | 388 |
| BellSouth LLC | 6.875% | 10/15/31 | 7,765 | 8,534 |
| BellSouth LLC | 6.550% | 6/15/34 | 2,805 | 2,985 |
| BellSouth LLC | 6.000% | 11/15/34 | 2,262 | 2,259 |
| BellSouth Telecommunications LLC | 6.375% | 6/1/28 | 6,248 | 6,846 |
| British Telecommunications plc | 1.625% | 6/28/16 | 4,400 | 4,408 |
| British Telecommunications plc | 1.250% | 2/14/17 | 1,000 | 995 |
| British Telecommunications plc | 5.950% | 1/15/18 | 18,400 | 19,843 |
| British Telecommunications plc | 2.350% | 2/14/19 | 600 | 601 |
| British Telecommunications plc | 9.625% | 12/15/30 | 7,600 | 11,081 |
| CBS Corp. | 1.950% | 7/1/17 | 1,125 | 1,125 |
| CBS Corp. | 4.625% | 5/15/18 | 4,924 | 5,204 |
| CBS Corp. | 2.300% | 8/15/19 | 5,750 | 5,685 |
| CBS Corp. | 5.750% | 4/15/20 | 10,060 | 11,116 |
| CBS Corp. | 4.300% | 2/15/21 | 7,475 | 7,781 |
| CBS Corp. | 3.375% | 3/1/22 | 6,437 | 6,364 |
| CBS Corp. | 3.700% | 8/15/24 | 1,775 | 1,726 |
| CBS Corp. | 4.000% | 1/15/26 | 6,750 | 6,581 |
| CBS Corp. | 7.875% | 7/30/30 | 2,139 | 2,728 |
| CBS Corp. | 5.500% | 5/15/33 | 668 | 664 |
| CBS Corp. | 5.900% | 10/15/40 | 1,525 | 1,586 |
| CBS Corp. | 4.850% | 7/1/42 | 3,443 | 3,067 |
| CBS Corp. | 4.900% | 8/15/44 | 11,524 | 10,470 |
| CBS Corp. | 4.600% | 1/15/45 | 3,800 | 3,282 |
| CC Holdings GS V LLC / Crown Castle GS III Corp. | 3.849% | 4/15/23 | 11,001 | 10,794 |
| 8 CCO Safari II LLC | 3.579% | 7/23/20 | 20,975 | 20,845 |
| 8 CCO Safari II LLC | 4.464% | 7/23/22 | 8,325 | 8,312 |
| 8 CCO Safari II LLC | 4.908% | 7/23/25 | 32,500 | 32,396 |
| 8 CCO Safari II LLC | 6.384% | 10/23/35 | 14,540 | 14,625 |
| 8 CCO Safari II LLC | 6.484% | 10/23/45 | 33,475 | 33,706 |
| 8 CCO Safari II LLC | 6.834% | 10/23/55 | 4,600 | 4,515 |
| Comcast Cable Communications Holdings Inc. | 9.455% | 11/15/22 | 7,156 | 9,930 |
| Comcast Cable Communications LLC | 8.875% | 5/1/17 | 3,375 | 3,701 |
| Comcast Corp. | 6.500% | 1/15/17 | 1,335 | 1,405 |
| Comcast Corp. | 6.300% | 11/15/17 | 39,453 | 42,899 |
| Comcast Corp. | 5.875% | 2/15/18 | 21,178 | 23,033 |
| Comcast Corp. | 5.700% | 5/15/18 | 13,012 | 14,232 |
| Comcast Corp. | 5.700% | 7/1/19 | 5,575 | 6,247 |
| Comcast Corp. | 5.150% | 3/1/20 | 7,413 | 8,277 |
| Comcast Corp. | 3.125% | 7/15/22 | 3,654 | 3,705 |
57
| Vanguard® Total Bond Market Index Fund | ||||
| Schedule of Investments | ||||
| December 31, 2015 | ||||
| Face | Market | |||
| Maturity | Amount | Value | ||
| Coupon | Date | ($000) | ($000) | |
| Comcast Corp. | 2.850% | 1/15/23 | 5,120 | 5,081 |
| Comcast Corp. | 3.600% | 3/1/24 | 875 | 904 |
| Comcast Corp. | 3.375% | 2/15/25 | 3,432 | 3,465 |
| Comcast Corp. | 3.375% | 8/15/25 | 12,000 | 12,152 |
| Comcast Corp. | 4.250% | 1/15/33 | 15,320 | 15,263 |
| Comcast Corp. | 7.050% | 3/15/33 | 3,150 | 4,059 |
| Comcast Corp. | 4.200% | 8/15/34 | 9,150 | 9,067 |
| Comcast Corp. | 5.650% | 6/15/35 | 3,171 | 3,676 |
| Comcast Corp. | 4.400% | 8/15/35 | 7,500 | 7,578 |
| Comcast Corp. | 6.500% | 11/15/35 | 17,250 | 21,640 |
| Comcast Corp. | 6.450% | 3/15/37 | 9,729 | 12,056 |
| Comcast Corp. | 6.950% | 8/15/37 | 20,076 | 26,194 |
| Comcast Corp. | 6.400% | 5/15/38 | 15,421 | 18,948 |
| Comcast Corp. | 6.550% | 7/1/39 | 800 | 1,012 |
| Comcast Corp. | 6.400% | 3/1/40 | 1,800 | 2,227 |
| Comcast Corp. | 4.650% | 7/15/42 | 20,822 | 21,042 |
| Comcast Corp. | 4.500% | 1/15/43 | 7,450 | 7,426 |
| Comcast Corp. | 4.750% | 3/1/44 | 6,840 | 7,110 |
| Comcast Corp. | 4.600% | 8/15/45 | 23,325 | 23,624 |
| Deutsche Telekom International Finance BV | 5.750% | 3/23/16 | 500 | 505 |
| Deutsche Telekom International Finance BV | 6.750% | 8/20/18 | 4,965 | 5,563 |
| Deutsche Telekom International Finance BV | 6.000% | 7/8/19 | 11,075 | 12,292 |
| Deutsche Telekom International Finance BV | 8.750% | 6/15/30 | 37,495 | 51,724 |
| Deutsche Telekom International Finance BV | 9.250% | 6/1/32 | 100 | 148 |
| DIRECTV Holdings LLC / DIRECTV Financing Co. Inc. | 2.400% | 3/15/17 | 15,525 | 15,666 |
| DIRECTV Holdings LLC / DIRECTV Financing Co. Inc. | 5.875% | 10/1/19 | 23,720 | 26,407 |
| DIRECTV Holdings LLC / DIRECTV Financing Co. Inc. | 5.200% | 3/15/20 | 16,889 | 18,294 |
| DIRECTV Holdings LLC / DIRECTV Financing Co. Inc. | 4.600% | 2/15/21 | 8,540 | 9,038 |
| DIRECTV Holdings LLC / DIRECTV Financing Co. Inc. | 5.000% | 3/1/21 | 6,115 | 6,601 |
| DIRECTV Holdings LLC / DIRECTV Financing Co. Inc. | 3.800% | 3/15/22 | 21,501 | 21,725 |
| DIRECTV Holdings LLC / DIRECTV Financing Co. Inc. | 4.450% | 4/1/24 | 5,375 | 5,509 |
| DIRECTV Holdings LLC / DIRECTV Financing Co. Inc. | 3.950% | 1/15/25 | 1,200 | 1,182 |
| DIRECTV Holdings LLC / DIRECTV Financing Co. Inc. | 6.350% | 3/15/40 | 11,125 | 12,020 |
| DIRECTV Holdings LLC / DIRECTV Financing Co. Inc. | 6.000% | 8/15/40 | 9,547 | 9,769 |
| DIRECTV Holdings LLC / DIRECTV Financing Co. Inc. | 6.375% | 3/1/41 | 8,782 | 9,396 |
| DIRECTV Holdings LLC / DIRECTV Financing Co. Inc. | 5.150% | 3/15/42 | 28,434 | 26,497 |
| Discovery Communications LLC | 5.050% | 6/1/20 | 9,975 | 10,618 |
| Discovery Communications LLC | 4.375% | 6/15/21 | 4,925 | 5,046 |
| Discovery Communications LLC | 3.300% | 5/15/22 | 6,850 | 6,483 |
| Discovery Communications LLC | 3.250% | 4/1/23 | 2,500 | 2,304 |
| Discovery Communications LLC | 3.450% | 3/15/25 | 3,500 | 3,174 |
| Discovery Communications LLC | 6.350% | 6/1/40 | 295 | 295 |
| Discovery Communications LLC | 4.950% | 5/15/42 | 14,800 | 12,427 |
| Discovery Communications LLC | 4.875% | 4/1/43 | 973 | 801 |
| Embarq Corp. | 7.995% | 6/1/36 | 10,385 | 10,672 |
| Grupo Televisa SAB | 6.625% | 3/18/25 | 3,439 | 3,942 |
| Grupo Televisa SAB | 4.625% | 1/30/26 | 2,750 | 2,744 |
| Grupo Televisa SAB | 8.500% | 3/11/32 | 735 | 884 |
| Grupo Televisa SAB | 6.625% | 1/15/40 | 5,918 | 6,212 |
| Grupo Televisa SAB | 5.000% | 5/13/45 | 7,500 | 6,403 |
| Grupo Televisa SAB | 6.125% | 1/31/46 | 9,900 | 9,900 |
| GTE Corp. | 8.750% | 11/1/21 | 3,435 | 4,246 |
| GTE Corp. | 6.940% | 4/15/28 | 13,105 | 15,535 |
| Historic TW Inc. | 9.150% | 2/1/23 | 8,925 | 11,622 |
| Historic TW Inc. | 6.625% | 5/15/29 | 8,275 | 9,688 |
| Interpublic Group of Cos. Inc. | 3.750% | 2/15/23 | 5,800 | 5,589 |
| Interpublic Group of Cos. Inc. | 4.200% | 4/15/24 | 16,600 | 16,462 |
| Koninklijke KPN NV | 8.375% | 10/1/30 | 7,271 | 9,503 |
| McGraw Hill Financial Inc. | 5.900% | 11/15/17 | 3,505 | 3,719 |
| McGraw Hill Financial Inc. | 2.500% | 8/15/18 | 3,800 | 3,827 |
| McGraw Hill Financial Inc. | 3.300% | 8/14/20 | 6,125 | 6,180 |
| McGraw Hill Financial Inc. | 4.000% | 6/15/25 | 5,375 | 5,396 |
| McGraw Hill Financial Inc. | 4.400% | 2/15/26 | 10,900 | 11,168 |
| McGraw Hill Financial Inc. | 6.550% | 11/15/37 | 6,900 | 7,881 |
58
| Vanguard® Total Bond Market Index Fund | ||||
| Schedule of Investments | ||||
| December 31, 2015 | ||||
| Face | Market | |||
| Maturity | Amount | Value | ||
| Coupon | Date | ($000) | ($000) | |
| Moody's Corp. | 2.750% | 7/15/19 | 3,404 | 3,438 |
| Moody's Corp. | 5.500% | 9/1/20 | 1,000 | 1,102 |
| Moody's Corp. | 4.500% | 9/1/22 | 15,250 | 16,213 |
| Moody's Corp. | 4.875% | 2/15/24 | 6,810 | 7,263 |
| Moody's Corp. | 5.250% | 7/15/44 | 8,175 | 8,420 |
| NBCUniversal Media LLC | 5.150% | 4/30/20 | 13,450 | 15,023 |
| NBCUniversal Media LLC | 4.375% | 4/1/21 | 18,120 | 19,686 |
| NBCUniversal Media LLC | 2.875% | 1/15/23 | 12,470 | 12,380 |
| NBCUniversal Media LLC | 6.400% | 4/30/40 | 22,825 | 28,408 |
| NBCUniversal Media LLC | 5.950% | 4/1/41 | 7,783 | 9,314 |
| NBCUniversal Media LLC | 4.450% | 1/15/43 | 7,755 | 7,587 |
| New Cingular Wireless Services Inc. | 8.750% | 3/1/31 | 695 | 959 |
| Nippon Telegraph & Telephone Corp. | 1.400% | 7/18/17 | 2,125 | 2,117 |
| Omnicom Group Inc. | 6.250% | 7/15/19 | 20 | 22 |
| Omnicom Group Inc. | 4.450% | 8/15/20 | 21,715 | 23,148 |
| Omnicom Group Inc. | 3.625% | 5/1/22 | 24,678 | 24,948 |
| Omnicom Group Inc. | 3.650% | 11/1/24 | 10,653 | 10,637 |
| Orange SA | 5.375% | 7/8/19 | 9,559 | 10,471 |
| Orange SA | 4.125% | 9/14/21 | 23,300 | 24,569 |
| Orange SA | 9.000% | 3/1/31 | 18,389 | 25,983 |
| Orange SA | 5.375% | 1/13/42 | 9,930 | 10,479 |
| Orange SA | 5.500% | 2/6/44 | 7,286 | 7,715 |
| Pacific Bell Telephone Co. | 7.125% | 3/15/26 | 625 | 765 |
| Qwest Corp. | 6.500% | 6/1/17 | 5,325 | 5,638 |
| Qwest Corp. | 6.750% | 12/1/21 | 13,124 | 13,687 |
| Qwest Corp. | 7.250% | 9/15/25 | 1,360 | 1,450 |
| Qwest Corp. | 6.875% | 9/15/33 | 25,408 | 24,582 |
| Qwest Corp. | 7.125% | 11/15/43 | 13,825 | 13,151 |
| RELX Capital Inc. | 3.125% | 10/15/22 | 18,518 | 17,948 |
| Rogers Communications Inc. | 6.800% | 8/15/18 | 29,886 | 33,399 |
| Rogers Communications Inc. | 3.000% | 3/15/23 | 3,175 | 3,094 |
| Rogers Communications Inc. | 7.500% | 8/15/38 | 975 | 1,266 |
| Rogers Communications Inc. | 4.500% | 3/15/43 | 3,640 | 3,400 |
| Rogers Communications Inc. | 5.000% | 3/15/44 | 14,807 | 14,979 |
| Scripps Networks Interactive Inc. | 2.750% | 11/15/19 | 5,850 | 5,757 |
| Scripps Networks Interactive Inc. | 2.800% | 6/15/20 | 5,375 | 5,243 |
| Scripps Networks Interactive Inc. | 3.500% | 6/15/22 | 9,100 | 8,763 |
| Scripps Networks Interactive Inc. | 3.900% | 11/15/24 | 2,875 | 2,744 |
| TCI Communications Inc. | 7.875% | 2/15/26 | 4,968 | 6,714 |
| TCI Communications Inc. | 7.125% | 2/15/28 | 2,022 | 2,615 |
| Telefonica Emisiones SAU | 6.221% | 7/3/17 | 251 | 266 |
| Telefonica Emisiones SAU | 3.192% | 4/27/18 | 15,850 | 16,136 |
| Telefonica Emisiones SAU | 5.877% | 7/15/19 | 9,193 | 10,161 |
| Telefonica Emisiones SAU | 5.134% | 4/27/20 | 8,605 | 9,406 |
| Telefonica Emisiones SAU | 5.462% | 2/16/21 | 11,839 | 13,222 |
| Telefonica Emisiones SAU | 4.570% | 4/27/23 | 14,525 | 15,185 |
| Telefonica Emisiones SAU | 7.045% | 6/20/36 | 20,266 | 24,497 |
| Telefonica Europe BV | 8.250% | 9/15/30 | 13,327 | 17,347 |
| Thomson Reuters Corp. | 1.300% | 2/23/17 | 5,000 | 4,972 |
| Thomson Reuters Corp. | 1.650% | 9/29/17 | 8,125 | 8,084 |
| Thomson Reuters Corp. | 4.700% | 10/15/19 | 1,850 | 1,985 |
| Thomson Reuters Corp. | 4.300% | 11/23/23 | 8,558 | 8,782 |
| Thomson Reuters Corp. | 3.850% | 9/29/24 | 7,050 | 6,947 |
| Thomson Reuters Corp. | 5.500% | 8/15/35 | 8,375 | 8,525 |
| Thomson Reuters Corp. | 5.850% | 4/15/40 | 6,375 | 6,706 |
| Thomson Reuters Corp. | 4.500% | 5/23/43 | 1,800 | 1,576 |
| Thomson Reuters Corp. | 5.650% | 11/23/43 | 7,000 | 7,280 |
| Time Warner Cable Inc. | 5.850% | 5/1/17 | 19,250 | 20,131 |
| Time Warner Cable Inc. | 6.750% | 7/1/18 | 30,969 | 33,910 |
| Time Warner Cable Inc. | 8.750% | 2/14/19 | 11,200 | 12,970 |
| Time Warner Cable Inc. | 8.250% | 4/1/19 | 12,426 | 14,278 |
| Time Warner Cable Inc. | 5.000% | 2/1/20 | 16,735 | 17,713 |
| Time Warner Cable Inc. | 4.125% | 2/15/21 | 1,850 | 1,904 |
| Time Warner Cable Inc. | 4.000% | 9/1/21 | 11,025 | 11,126 |
59
| Vanguard® Total Bond Market Index Fund | ||||
| Schedule of Investments | ||||
| December 31, 2015 | ||||
| Face | Market | |||
| Maturity | Amount | Value | ||
| Coupon | Date | ($000) | ($000) | |
| Time Warner Cable Inc. | 6.550% | 5/1/37 | 11,321 | 11,423 |
| Time Warner Cable Inc. | 7.300% | 7/1/38 | 8,383 | 9,106 |
| Time Warner Cable Inc. | 6.750% | 6/15/39 | 13,825 | 14,152 |
| Time Warner Cable Inc. | 5.875% | 11/15/40 | 20,658 | 19,510 |
| Time Warner Cable Inc. | 5.500% | 9/1/41 | 9,250 | 8,367 |
| Time Warner Cable Inc. | 4.500% | 9/15/42 | 12,670 | 9,971 |
| Time Warner Cos. Inc. | 7.570% | 2/1/24 | 1,680 | 2,058 |
| Time Warner Cos. Inc. | 6.950% | 1/15/28 | 7,912 | 9,388 |
| Time Warner Entertainment Co. LP | 8.375% | 7/15/33 | 6,975 | 8,257 |
| Time Warner Inc. | 2.100% | 6/1/19 | 10,725 | 10,649 |
| Time Warner Inc. | 4.875% | 3/15/20 | 5,155 | 5,575 |
| Time Warner Inc. | 4.700% | 1/15/21 | 7,920 | 8,525 |
| Time Warner Inc. | 4.750% | 3/29/21 | 6,901 | 7,423 |
| Time Warner Inc. | 4.000% | 1/15/22 | 3,200 | 3,316 |
| Time Warner Inc. | 4.050% | 12/15/23 | 550 | 561 |
| Time Warner Inc. | 3.550% | 6/1/24 | 7,525 | 7,396 |
| Time Warner Inc. | 3.600% | 7/15/25 | 5,250 | 5,117 |
| Time Warner Inc. | 3.875% | 1/15/26 | 4,500 | 4,461 |
| Time Warner Inc. | 7.625% | 4/15/31 | 14,510 | 17,975 |
| Time Warner Inc. | 7.700% | 5/1/32 | 12,809 | 15,991 |
| Time Warner Inc. | 6.500% | 11/15/36 | 6,250 | 7,069 |
| Time Warner Inc. | 6.200% | 3/15/40 | 4,895 | 5,384 |
| Time Warner Inc. | 6.100% | 7/15/40 | 10,976 | 11,871 |
| Time Warner Inc. | 6.250% | 3/29/41 | 12,090 | 13,441 |
| Time Warner Inc. | 5.375% | 10/15/41 | 2,275 | 2,331 |
| Time Warner Inc. | 4.900% | 6/15/42 | 500 | 471 |
| Time Warner Inc. | 5.350% | 12/15/43 | 2,360 | 2,356 |
| Time Warner Inc. | 4.650% | 6/1/44 | 8,110 | 7,462 |
| Time Warner Inc. | 4.850% | 7/15/45 | 2,800 | 2,665 |
| Verizon Communications Inc. | 1.350% | 6/9/17 | 9,540 | 9,511 |
| Verizon Communications Inc. | 1.100% | 11/1/17 | 2,300 | 2,292 |
| Verizon Communications Inc. | 5.500% | 2/15/18 | 22,490 | 24,210 |
| Verizon Communications Inc. | 6.100% | 4/15/18 | 5,614 | 6,134 |
| Verizon Communications Inc. | 3.650% | 9/14/18 | 41,898 | 43,726 |
| Verizon Communications Inc. | 6.350% | 4/1/19 | 41,201 | 46,349 |
| Verizon Communications Inc. | 2.625% | 2/21/20 | 17,556 | 17,636 |
| Verizon Communications Inc. | 4.500% | 9/15/20 | 29,840 | 32,084 |
| Verizon Communications Inc. | 3.450% | 3/15/21 | 12,045 | 12,333 |
| Verizon Communications Inc. | 4.600% | 4/1/21 | 13,100 | 14,122 |
| Verizon Communications Inc. | 3.000% | 11/1/21 | 10,055 | 10,082 |
| Verizon Communications Inc. | 3.500% | 11/1/21 | 12,815 | 13,046 |
| Verizon Communications Inc. | 2.450% | 11/1/22 | 23,250 | 21,997 |
| Verizon Communications Inc. | 5.150% | 9/15/23 | 73,815 | 80,971 |
| Verizon Communications Inc. | 4.150% | 3/15/24 | 17,260 | 17,705 |
| Verizon Communications Inc. | 3.500% | 11/1/24 | 12,399 | 12,222 |
| Verizon Communications Inc. | 7.750% | 12/1/30 | 12,476 | 15,927 |
| Verizon Communications Inc. | 6.400% | 9/15/33 | 21,950 | 25,079 |
| Verizon Communications Inc. | 5.050% | 3/15/34 | 12,825 | 12,823 |
| Verizon Communications Inc. | 4.400% | 11/1/34 | 13,949 | 13,031 |
| Verizon Communications Inc. | 5.850% | 9/15/35 | 10,565 | 11,335 |
| Verizon Communications Inc. | 4.272% | 1/15/36 | 34,450 | 31,095 |
| Verizon Communications Inc. | 6.250% | 4/1/37 | 2,775 | 3,120 |
| Verizon Communications Inc. | 6.400% | 2/15/38 | 7,302 | 8,308 |
| Verizon Communications Inc. | 6.900% | 4/15/38 | 14,190 | 17,009 |
| Verizon Communications Inc. | 7.350% | 4/1/39 | 8,959 | 11,103 |
| Verizon Communications Inc. | 6.000% | 4/1/41 | 22,690 | 24,649 |
| Verizon Communications Inc. | 4.750% | 11/1/41 | 7,560 | 6,948 |
| Verizon Communications Inc. | 3.850% | 11/1/42 | 4,850 | 3,999 |
| Verizon Communications Inc. | 6.550% | 9/15/43 | 55,577 | 65,776 |
| Verizon Communications Inc. | 4.862% | 8/21/46 | 21,486 | 20,282 |
| Verizon Communications Inc. | 4.522% | 9/15/48 | 45,263 | 40,521 |
| Verizon Communications Inc. | 5.012% | 8/21/54 | 54,466 | 49,895 |
| Verizon Communications Inc. | 4.672% | 3/15/55 | 47,760 | 41,419 |
| Verizon Florida LLC | 6.860% | 2/1/28 | 500 | 472 |
60
| Vanguard® Total Bond Market Index Fund | ||||
| Schedule of Investments | ||||
| December 31, 2015 | ||||
| Face | Market | |||
| Maturity | Amount | Value | ||
| Coupon | Date | ($000) | ($000) | |
| Verizon Maryland LLC | 5.125% | 6/15/33 | 4,480 | 4,462 |
| Verizon New England Inc. | 7.875% | 11/15/29 | 1,585 | 1,968 |
| Verizon New York Inc. | 7.375% | 4/1/32 | 11,447 | 12,935 |
| Viacom Inc. | 2.500% | 12/15/16 | 3,450 | 3,457 |
| Viacom Inc. | 3.500% | 4/1/17 | 12,025 | 12,239 |
| Viacom Inc. | 6.125% | 10/5/17 | 6,415 | 6,830 |
| Viacom Inc. | 2.500% | 9/1/18 | 440 | 440 |
| Viacom Inc. | 2.200% | 4/1/19 | 12,100 | 11,826 |
| Viacom Inc. | 5.625% | 9/15/19 | 20,325 | 21,962 |
| Viacom Inc. | 3.875% | 12/15/21 | 3,450 | 3,413 |
| Viacom Inc. | 4.250% | 9/1/23 | 2,364 | 2,284 |
| Viacom Inc. | 3.875% | 4/1/24 | 4,040 | 3,767 |
| Viacom Inc. | 4.850% | 12/15/34 | 5,100 | 4,166 |
| Viacom Inc. | 6.875% | 4/30/36 | 15,136 | 14,865 |
| Viacom Inc. | 4.500% | 2/27/42 | 3,175 | 2,388 |
| Viacom Inc. | 4.375% | 3/15/43 | 1,328 | 973 |
| Viacom Inc. | 5.850% | 9/1/43 | 7,615 | 6,795 |
| Viacom Inc. | 5.250% | 4/1/44 | 10,350 | 8,535 |
| Vodafone Group plc | 5.625% | 2/27/17 | 13,221 | 13,812 |
| Vodafone Group plc | 1.625% | 3/20/17 | 24,025 | 23,994 |
| Vodafone Group plc | 1.250% | 9/26/17 | 20,715 | 20,517 |
| Vodafone Group plc | 1.500% | 2/19/18 | 3,200 | 3,170 |
| Vodafone Group plc | 4.625% | 7/15/18 | 210 | 222 |
| Vodafone Group plc | 5.450% | 6/10/19 | 8,215 | 9,041 |
| Vodafone Group plc | 4.375% | 3/16/21 | 3,025 | 3,209 |
| Vodafone Group plc | 2.500% | 9/26/22 | 6,025 | 5,571 |
| Vodafone Group plc | 2.950% | 2/19/23 | 9,185 | 8,707 |
| Vodafone Group plc | 7.875% | 2/15/30 | 880 | 1,072 |
| Vodafone Group plc | 6.250% | 11/30/32 | 7,775 | 8,054 |
| Vodafone Group plc | 6.150% | 2/27/37 | 7,788 | 7,723 |
| Vodafone Group plc | 4.375% | 2/19/43 | 12,170 | 10,028 |
| Walt Disney Co. | 5.625% | 9/15/16 | 5,775 | 5,966 |
| Walt Disney Co. | 1.125% | 2/15/17 | 5,046 | 5,049 |
| Walt Disney Co. | 0.875% | 5/30/17 | 5,725 | 5,712 |
| Walt Disney Co. | 1.100% | 12/1/17 | 5,739 | 5,722 |
| Walt Disney Co. | 5.875% | 12/15/17 | 5,375 | 5,840 |
| Walt Disney Co. | 1.850% | 5/30/19 | 8,291 | 8,308 |
| Walt Disney Co. | 2.150% | 9/17/20 | 4,000 | 3,991 |
| Walt Disney Co. | 2.750% | 8/16/21 | 11,318 | 11,514 |
| Walt Disney Co. | 2.550% | 2/15/22 | 9,656 | 9,705 |
| Walt Disney Co. | 2.350% | 12/1/22 | 5,768 | 5,656 |
| Walt Disney Co. | 3.150% | 9/17/25 | 5,200 | 5,283 |
| Walt Disney Co. | 7.000% | 3/1/32 | 2,943 | 4,059 |
| Walt Disney Co. | 4.375% | 8/16/41 | 3,835 | 3,970 |
| Walt Disney Co. | 4.125% | 12/1/41 | 13,425 | 13,391 |
| Walt Disney Co. | 3.700% | 12/1/42 | 5,654 | 5,269 |
| Walt Disney Co. | 4.125% | 6/1/44 | 6,800 | 6,885 |
| WPP Finance 2010 | 4.750% | 11/21/21 | 14,204 | 15,280 |
| WPP Finance 2010 | 3.625% | 9/7/22 | 11,006 | 11,028 |
| WPP Finance 2010 | 3.750% | 9/19/24 | 2,600 | 2,583 |
| WPP Finance 2010 | 5.625% | 11/15/43 | 2,250 | 2,276 |
| Consumer Cyclical (2.1%) | ||||
| Advance Auto Parts Inc. | 4.500% | 1/15/22 | 3,225 | 3,326 |
| Advance Auto Parts Inc. | 4.500% | 12/1/23 | 5,221 | 5,332 |
| Alibaba Group Holding Ltd. | 1.625% | 11/28/17 | 14,145 | 13,996 |
| Alibaba Group Holding Ltd. | 2.500% | 11/28/19 | 24,125 | 23,629 |
| Alibaba Group Holding Ltd. | 3.125% | 11/28/21 | 12,350 | 12,019 |
| Alibaba Group Holding Ltd. | 3.600% | 11/28/24 | 11,700 | 11,250 |
| Alibaba Group Holding Ltd. | 4.500% | 11/28/34 | 7,050 | 6,711 |
| Amazon.com Inc. | 1.200% | 11/29/17 | 5,265 | 5,252 |
| Amazon.com Inc. | 2.600% | 12/5/19 | 16,069 | 16,322 |
| Amazon.com Inc. | 3.300% | 12/5/21 | 9,800 | 10,088 |
| Amazon.com Inc. | 2.500% | 11/29/22 | 7,538 | 7,291 |
61
| Vanguard® Total Bond Market Index Fund | ||||
| Schedule of Investments | ||||
| December 31, 2015 | ||||
| Face | Market | |||
| Maturity | Amount | Value | ||
| Coupon | Date | ($000) | ($000) | |
| Amazon.com Inc. | 3.800% | 12/5/24 | 6,730 | 7,004 |
| Amazon.com Inc. | 4.800% | 12/5/34 | 16,300 | 17,108 |
| Amazon.com Inc. | 4.950% | 12/5/44 | 13,050 | 13,905 |
| American Honda Finance Corp. | 1.200% | 7/14/17 | 5,499 | 5,475 |
| American Honda Finance Corp. | 1.550% | 12/11/17 | 14,175 | 14,176 |
| American Honda Finance Corp. | 1.600% | 7/13/18 | 5,700 | 5,667 |
| American Honda Finance Corp. | 2.125% | 10/10/18 | 7,998 | 8,053 |
| American Honda Finance Corp. | 2.250% | 8/15/19 | 9,975 | 10,027 |
| American Honda Finance Corp. | 2.450% | 9/24/20 | 14,750 | 14,777 |
| Automatic Data Processing Inc. | 2.250% | 9/15/20 | 9,826 | 9,857 |
| Automatic Data Processing Inc. | 3.375% | 9/15/25 | 6,300 | 6,433 |
| AutoNation Inc. | 6.750% | 4/15/18 | 2,600 | 2,835 |
| AutoNation Inc. | 5.500% | 2/1/20 | 2,375 | 2,573 |
| AutoNation Inc. | 3.350% | 1/15/21 | 2,755 | 2,759 |
| AutoNation Inc. | 4.500% | 10/1/25 | 2,750 | 2,793 |
| AutoZone Inc. | 1.300% | 1/13/17 | 4,350 | 4,344 |
| AutoZone Inc. | 7.125% | 8/1/18 | 7,950 | 8,914 |
| AutoZone Inc. | 2.500% | 4/15/21 | 4,105 | 4,012 |
| AutoZone Inc. | 3.700% | 4/15/22 | 9,436 | 9,610 |
| AutoZone Inc. | 2.875% | 1/15/23 | 3,760 | 3,637 |
| AutoZone Inc. | 3.125% | 7/15/23 | 375 | 367 |
| AutoZone Inc. | 3.250% | 4/15/25 | 2,775 | 2,686 |
| Bed Bath & Beyond Inc. | 3.749% | 8/1/24 | 1,590 | 1,551 |
| Bed Bath & Beyond Inc. | 4.915% | 8/1/34 | 2,200 | 1,964 |
| Bed Bath & Beyond Inc. | 5.165% | 8/1/44 | 9,250 | 7,887 |
| Best Buy Co. Inc. | 5.500% | 3/15/21 | 1,666 | 1,737 |
| Block Financial LLC | 4.125% | 10/1/20 | 4,375 | 4,430 |
| Block Financial LLC | 5.500% | 11/1/22 | 2,000 | 2,119 |
| Block Financial LLC | 5.250% | 10/1/25 | 9,625 | 9,838 |
| BorgWarner Inc. | 4.625% | 9/15/20 | 1,000 | 1,074 |
| BorgWarner Inc. | 3.375% | 3/15/25 | 3,000 | 2,837 |
| BorgWarner Inc. | 4.375% | 3/15/45 | 5,615 | 5,023 |
| Brinker International Inc. | 2.600% | 5/15/18 | 5,925 | 5,906 |
| Brinker International Inc. | 3.875% | 5/15/23 | 7,400 | 7,135 |
| Carnival Corp. | 1.875% | 12/15/17 | 1,950 | 1,948 |
| Carnival Corp. | 3.950% | 10/15/20 | 4,050 | 4,269 |
| Coach Inc. | 4.250% | 4/1/25 | 3,325 | 3,166 |
| Costco Wholesale Corp. | 5.500% | 3/15/17 | 9,882 | 10,398 |
| Costco Wholesale Corp. | 1.125% | 12/15/17 | 3,850 | 3,846 |
| Costco Wholesale Corp. | 1.700% | 12/15/19 | 10,908 | 10,814 |
| Costco Wholesale Corp. | 1.750% | 2/15/20 | 5,475 | 5,428 |
| Costco Wholesale Corp. | 2.250% | 2/15/22 | 2,000 | 1,963 |
| Cummins Inc. | 3.650% | 10/1/23 | 4,425 | 4,566 |
| Cummins Inc. | 7.125% | 3/1/28 | 1,250 | 1,640 |
| Cummins Inc. | 4.875% | 10/1/43 | 5,325 | 5,501 |
| CVS Health Corp. | 5.750% | 6/1/17 | 6,002 | 6,353 |
| CVS Health Corp. | 1.900% | 7/20/18 | 24,000 | 23,976 |
| CVS Health Corp. | 2.250% | 12/5/18 | 21,150 | 21,257 |
| CVS Health Corp. | 2.250% | 8/12/19 | 19,630 | 19,611 |
| CVS Health Corp. | 4.750% | 5/18/20 | 925 | 997 |
| CVS Health Corp. | 2.800% | 7/20/20 | 25,500 | 25,621 |
| CVS Health Corp. | 3.500% | 7/20/22 | 13,225 | 13,457 |
| CVS Health Corp. | 2.750% | 12/1/22 | 13,525 | 13,150 |
| 8 CVS Health Corp. | 4.750% | 12/1/22 | 5,000 | 5,383 |
| CVS Health Corp. | 4.000% | 12/5/23 | 9,848 | 10,234 |
| CVS Health Corp. | 3.375% | 8/12/24 | 11,060 | 10,933 |
| 8 CVS Health Corp. | 5.000% | 12/1/24 | 7,700 | 8,338 |
| CVS Health Corp. | 3.875% | 7/20/25 | 26,630 | 27,087 |
| CVS Health Corp. | 4.875% | 7/20/35 | 17,220 | 17,779 |
| CVS Health Corp. | 6.125% | 9/15/39 | 3,750 | 4,383 |
| CVS Health Corp. | 5.750% | 5/15/41 | 2,436 | 2,753 |
| CVS Health Corp. | 5.300% | 12/5/43 | 12,295 | 13,313 |
| CVS Health Corp. | 5.125% | 7/20/45 | 33,400 | 35,209 |
| Daimler Finance North America LLC | 8.500% | 1/18/31 | 12,842 | 18,640 |
62
| Vanguard® Total Bond Market Index Fund | ||||
| Schedule of Investments | ||||
| December 31, 2015 | ||||
| Face | Market | |||
| Maturity | Amount | Value | ||
| Coupon | Date | ($000) | ($000) | |
| Delphi Automotive plc | 3.150% | 11/19/20 | 7,750 | 7,733 |
| Delphi Automotive plc | 4.250% | 1/15/26 | 14,000 | 14,044 |
| Delphi Corp. | 4.150% | 3/15/24 | 7,020 | 7,102 |
| Dollar General Corp. | 4.125% | 7/15/17 | 1,150 | 1,183 |
| Dollar General Corp. | 3.250% | 4/15/23 | 10,770 | 10,277 |
| Dollar General Corp. | 4.150% | 11/1/25 | 2,200 | 2,181 |
| eBay Inc. | 1.350% | 7/15/17 | 11,256 | 11,178 |
| eBay Inc. | 2.200% | 8/1/19 | 8,425 | 8,323 |
| eBay Inc. | 3.250% | 10/15/20 | 4,840 | 4,891 |
| eBay Inc. | 2.875% | 8/1/21 | 6,390 | 6,292 |
| eBay Inc. | 2.600% | 7/15/22 | 5,675 | 5,266 |
| eBay Inc. | 3.450% | 8/1/24 | 7,900 | 7,526 |
| eBay Inc. | 4.000% | 7/15/42 | 3,118 | 2,462 |
| Expedia Inc. | 7.456% | 8/15/18 | 2,650 | 2,955 |
| Expedia Inc. | 5.950% | 8/15/20 | 8,546 | 9,324 |
| Expedia Inc. | 4.500% | 8/15/24 | 4,855 | 4,677 |
| 8 Expedia Inc. | 5.000% | 2/15/26 | 14,975 | 14,681 |
| Ford Holdings LLC | 9.300% | 3/1/30 | 4,125 | 5,612 |
| Ford Motor Co. | 6.625% | 10/1/28 | 5,546 | 6,376 |
| Ford Motor Co. | 6.375% | 2/1/29 | 6,794 | 7,633 |
| Ford Motor Co. | 7.450% | 7/16/31 | 21,380 | 26,252 |
| Ford Motor Co. | 4.750% | 1/15/43 | 4,670 | 4,405 |
| Ford Motor Co. | 7.400% | 11/1/46 | 5,525 | 6,731 |
| Ford Motor Credit Co. LLC | 1.500% | 1/17/17 | 1,300 | 1,292 |
| Ford Motor Credit Co. LLC | 4.250% | 2/3/17 | 9,050 | 9,249 |
| Ford Motor Credit Co. LLC | 1.461% | 3/27/17 | 2,200 | 2,180 |
| Ford Motor Credit Co. LLC | 3.000% | 6/12/17 | 12,450 | 12,517 |
| Ford Motor Credit Co. LLC | 6.625% | 8/15/17 | 13,693 | 14,606 |
| Ford Motor Credit Co. LLC | 1.724% | 12/6/17 | 10,900 | 10,730 |
| Ford Motor Credit Co. LLC | 2.145% | 1/9/18 | 1,500 | 1,492 |
| Ford Motor Credit Co. LLC | 2.375% | 1/16/18 | 11,113 | 11,089 |
| Ford Motor Credit Co. LLC | 5.000% | 5/15/18 | 23,920 | 25,042 |
| Ford Motor Credit Co. LLC | 2.875% | 10/1/18 | 8,195 | 8,208 |
| Ford Motor Credit Co. LLC | 2.375% | 3/12/19 | 23,905 | 23,555 |
| Ford Motor Credit Co. LLC | 2.597% | 11/4/19 | 10,200 | 10,016 |
| Ford Motor Credit Co. LLC | 8.125% | 1/15/20 | 18,545 | 21,847 |
| Ford Motor Credit Co. LLC | 3.157% | 8/4/20 | 1,800 | 1,791 |
| Ford Motor Credit Co. LLC | 3.200% | 1/15/21 | 15,925 | 15,786 |
| Ford Motor Credit Co. LLC | 5.750% | 2/1/21 | 24,550 | 27,229 |
| Ford Motor Credit Co. LLC | 5.875% | 8/2/21 | 21,379 | 23,850 |
| Ford Motor Credit Co. LLC | 3.219% | 1/9/22 | 6,400 | 6,249 |
| Ford Motor Credit Co. LLC | 4.250% | 9/20/22 | 8,790 | 9,048 |
| Ford Motor Credit Co. LLC | 4.375% | 8/6/23 | 14,695 | 15,120 |
| Ford Motor Credit Co. LLC | 3.664% | 9/8/24 | 4,575 | 4,453 |
| Ford Motor Credit Co. LLC | 4.134% | 8/4/25 | 11,000 | 10,943 |
| Gap Inc. | 5.950% | 4/12/21 | 13,526 | 14,313 |
| General Motors Co. | 3.500% | 10/2/18 | 8,825 | 8,913 |
| General Motors Co. | 4.875% | 10/2/23 | 12,665 | 12,934 |
| General Motors Co. | 4.000% | 4/1/25 | 4,481 | 4,246 |
| General Motors Co. | 5.000% | 4/1/35 | 10,930 | 10,233 |
| General Motors Co. | 6.250% | 10/2/43 | 11,245 | 11,863 |
| General Motors Co. | 5.200% | 4/1/45 | 14,045 | 13,202 |
| General Motors Financial Co. Inc. | 2.625% | 7/10/17 | 3,280 | 3,288 |
| General Motors Financial Co. Inc. | 4.750% | 8/15/17 | 6,518 | 6,738 |
| General Motors Financial Co. Inc. | 3.000% | 9/25/17 | 2,195 | 2,206 |
| General Motors Financial Co. Inc. | 3.250% | 5/15/18 | 5,615 | 5,650 |
| General Motors Financial Co. Inc. | 6.750% | 6/1/18 | 9,000 | 9,754 |
| General Motors Financial Co. Inc. | 3.100% | 1/15/19 | 16,850 | 16,892 |
| General Motors Financial Co. Inc. | 3.500% | 7/10/19 | 9,944 | 9,969 |
| General Motors Financial Co. Inc. | 3.150% | 1/15/20 | 10,225 | 10,084 |
| General Motors Financial Co. Inc. | 3.200% | 7/13/20 | 35,325 | 34,707 |
| General Motors Financial Co. Inc. | 3.700% | 11/24/20 | 15,120 | 15,120 |
| General Motors Financial Co. Inc. | 4.375% | 9/25/21 | 5,100 | 5,151 |
| General Motors Financial Co. Inc. | 3.450% | 4/10/22 | 7,806 | 7,464 |
63
| Vanguard® Total Bond Market Index Fund | ||||
| Schedule of Investments | ||||
| December 31, 2015 | ||||
| Face | Market | |||
| Maturity | Amount | Value | ||
| Coupon | Date | ($000) | ($000) | |
| General Motors Financial Co. Inc. | 4.250% | 5/15/23 | 5,663 | 5,592 |
| General Motors Financial Co. Inc. | 4.000% | 1/15/25 | 9,925 | 9,416 |
| General Motors Financial Co. Inc. | 4.300% | 7/13/25 | 17,294 | 16,840 |
| Harley-Davidson Inc. | 3.500% | 7/28/25 | 5,325 | 5,312 |
| Harley-Davidson Inc. | 4.625% | 7/28/45 | 5,000 | 4,877 |
| Harman International Industries Inc. | 4.150% | 5/15/25 | 3,900 | 3,730 |
| Home Depot Inc. | 2.000% | 6/15/19 | 8,050 | 8,107 |
| Home Depot Inc. | 3.950% | 9/15/20 | 4,825 | 5,186 |
| Home Depot Inc. | 4.400% | 4/1/21 | 33,423 | 36,747 |
| Home Depot Inc. | 2.625% | 6/1/22 | 6,550 | 6,540 |
| Home Depot Inc. | 2.700% | 4/1/23 | 3,715 | 3,688 |
| Home Depot Inc. | 3.750% | 2/15/24 | 8,783 | 9,338 |
| Home Depot Inc. | 5.875% | 12/16/36 | 26,238 | 31,902 |
| Home Depot Inc. | 5.400% | 9/15/40 | 4,668 | 5,420 |
| Home Depot Inc. | 5.950% | 4/1/41 | 13,933 | 17,325 |
| Home Depot Inc. | 4.200% | 4/1/43 | 15,800 | 15,848 |
| Home Depot Inc. | 4.875% | 2/15/44 | 8,399 | 9,225 |
| Home Depot Inc. | 4.400% | 3/15/45 | 5,714 | 5,914 |
| Home Depot Inc. | 4.250% | 4/1/46 | 6,280 | 6,397 |
| Hyatt Hotels Corp. | 5.375% | 8/15/21 | 1,347 | 1,470 |
| Hyatt Hotels Corp. | 3.375% | 7/15/23 | 3,646 | 3,465 |
| Johnson Controls Inc. | 5.000% | 3/30/20 | 18,687 | 20,070 |
| Johnson Controls Inc. | 4.250% | 3/1/21 | 750 | 773 |
| Johnson Controls Inc. | 3.750% | 12/1/21 | 50 | 50 |
| Johnson Controls Inc. | 6.000% | 1/15/36 | 1,920 | 1,972 |
| Johnson Controls Inc. | 5.700% | 3/1/41 | 1,500 | 1,466 |
| Johnson Controls Inc. | 5.250% | 12/1/41 | 5,183 | 4,757 |
| Johnson Controls Inc. | 4.625% | 7/2/44 | 1,610 | 1,371 |
| Johnson Controls Inc. | 4.950% | 7/2/64 | 3,955 | 3,209 |
| Kohl's Corp. | 4.000% | 11/1/21 | 6,025 | 6,189 |
| Kohl's Corp. | 3.250% | 2/1/23 | 2,518 | 2,391 |
| Kohl's Corp. | 4.250% | 7/17/25 | 3,000 | 2,924 |
| Kohl's Corp. | 5.550% | 7/17/45 | 4,000 | 3,710 |
| Lowe's Cos. Inc. | 1.625% | 4/15/17 | 7,060 | 7,102 |
| Lowe's Cos. Inc. | 6.100% | 9/15/17 | 3,350 | 3,607 |
| Lowe's Cos. Inc. | 4.625% | 4/15/20 | 100 | 109 |
| Lowe's Cos. Inc. | 3.750% | 4/15/21 | 1,000 | 1,055 |
| Lowe's Cos. Inc. | 3.800% | 11/15/21 | 3,350 | 3,562 |
| Lowe's Cos. Inc. | 3.120% | 4/15/22 | 5,675 | 5,808 |
| Lowe's Cos. Inc. | 3.875% | 9/15/23 | 9,183 | 9,705 |
| Lowe's Cos. Inc. | 3.125% | 9/15/24 | 16,769 | 16,699 |
| Lowe's Cos. Inc. | 3.375% | 9/15/25 | 6,600 | 6,695 |
| Lowe's Cos. Inc. | 6.875% | 2/15/28 | 560 | 710 |
| Lowe's Cos. Inc. | 6.500% | 3/15/29 | 3,694 | 4,599 |
| Lowe's Cos. Inc. | 5.500% | 10/15/35 | 318 | 365 |
| Lowe's Cos. Inc. | 5.800% | 10/15/36 | 8,699 | 10,292 |
| Lowe's Cos. Inc. | 5.800% | 4/15/40 | 1,075 | 1,287 |
| Lowe's Cos. Inc. | 5.125% | 11/15/41 | 5,750 | 6,361 |
| Lowe's Cos. Inc. | 4.650% | 4/15/42 | 15,248 | 16,007 |
| Lowe's Cos. Inc. | 5.000% | 9/15/43 | 3,000 | 3,281 |
| Lowe's Cos. Inc. | 4.250% | 9/15/44 | 3,525 | 3,507 |
| Lowe's Cos. Inc. | 4.375% | 9/15/45 | 7,625 | 7,823 |
| Macy's Retail Holdings Inc. | 7.450% | 7/15/17 | 5,350 | 5,768 |
| Macy's Retail Holdings Inc. | 3.450% | 1/15/21 | 5,100 | 5,074 |
| Macy's Retail Holdings Inc. | 3.875% | 1/15/22 | 7,618 | 7,503 |
| Macy's Retail Holdings Inc. | 2.875% | 2/15/23 | 1,780 | 1,613 |
| Macy's Retail Holdings Inc. | 3.625% | 6/1/24 | 2,300 | 2,133 |
| Macy's Retail Holdings Inc. | 6.650% | 7/15/24 | 105 | 118 |
| Macy's Retail Holdings Inc. | 6.900% | 4/1/29 | 15,910 | 18,015 |
| Macy's Retail Holdings Inc. | 6.900% | 1/15/32 | 25 | 28 |
| Macy's Retail Holdings Inc. | 6.700% | 7/15/34 | 118 | 123 |
| Macy's Retail Holdings Inc. | 4.500% | 12/15/34 | 6,250 | 5,178 |
| Macy's Retail Holdings Inc. | 6.375% | 3/15/37 | 8,025 | 8,121 |
| Macy's Retail Holdings Inc. | 5.125% | 1/15/42 | 1,165 | 1,018 |
64
| Vanguard® Total Bond Market Index Fund | ||||
| Schedule of Investments | ||||
| December 31, 2015 | ||||
| Face | Market | |||
| Maturity | Amount | Value | ||
| Coupon | Date | ($000) | ($000) | |
| Macy's Retail Holdings Inc. | 4.300% | 2/15/43 | 3,143 | 2,418 |
| Magna International Inc. | 3.625% | 6/15/24 | 6,350 | 6,230 |
| Magna International Inc. | 4.150% | 10/1/25 | 3,500 | 3,564 |
| Marriott International Inc. | 6.375% | 6/15/17 | 1,750 | 1,869 |
| Marriott International Inc. | 3.000% | 3/1/19 | 2,721 | 2,758 |
| Marriott International Inc. | 3.375% | 10/15/20 | 9,658 | 9,839 |
| Marriott International Inc. | 2.875% | 3/1/21 | 4,600 | 4,558 |
| Marriott International Inc. | 3.125% | 10/15/21 | 4,892 | 4,865 |
| Marriott International Inc. | 3.250% | 9/15/22 | 3,000 | 2,947 |
| Marriott International Inc. | 3.750% | 10/1/25 | 3,825 | 3,754 |
| MasterCard Inc. | 2.000% | 4/1/19 | 6,875 | 6,907 |
| MasterCard Inc. | 3.375% | 4/1/24 | 9,035 | 9,221 |
| McDonald's Corp. | 5.300% | 3/15/17 | 3,350 | 3,494 |
| McDonald's Corp. | 5.800% | 10/15/17 | 5,780 | 6,164 |
| McDonald's Corp. | 5.350% | 3/1/18 | 9,445 | 10,127 |
| McDonald's Corp. | 2.100% | 12/7/18 | 1,750 | 1,750 |
| McDonald's Corp. | 5.000% | 2/1/19 | 4,165 | 4,498 |
| McDonald's Corp. | 1.875% | 5/29/19 | 7,100 | 7,039 |
| McDonald's Corp. | 3.500% | 7/15/20 | 115 | 119 |
| McDonald's Corp. | 2.750% | 12/9/20 | 4,407 | 4,403 |
| McDonald's Corp. | 3.625% | 5/20/21 | 750 | 773 |
| McDonald's Corp. | 2.625% | 1/15/22 | 6,105 | 5,956 |
| McDonald's Corp. | 3.375% | 5/26/25 | 6,715 | 6,595 |
| McDonald's Corp. | 3.700% | 1/30/26 | 16,075 | 16,007 |
| McDonald's Corp. | 4.700% | 12/9/35 | 7,125 | 7,097 |
| McDonald's Corp. | 6.300% | 10/15/37 | 4,753 | 5,587 |
| McDonald's Corp. | 6.300% | 3/1/38 | 9,225 | 10,778 |
| McDonald's Corp. | 5.700% | 2/1/39 | 6,827 | 7,456 |
| McDonald's Corp. | 3.700% | 2/15/42 | 6,439 | 5,332 |
| McDonald's Corp. | 3.625% | 5/1/43 | 4,933 | 4,075 |
| McDonald's Corp. | 4.600% | 5/26/45 | 2,119 | 2,030 |
| McDonald's Corp. | 4.875% | 12/9/45 | 15,850 | 15,885 |
| Metropolitan Museum of Art New York Revenue | 3.400% | 7/1/45 | 3,400 | 3,087 |
| NIKE Inc. | 2.250% | 5/1/23 | 830 | 812 |
| NIKE Inc. | 3.625% | 5/1/43 | 1,718 | 1,587 |
| NIKE Inc. | 3.875% | 11/1/45 | 15,700 | 15,145 |
| Nordstrom Inc. | 6.250% | 1/15/18 | 8,125 | 8,817 |
| Nordstrom Inc. | 4.750% | 5/1/20 | 2,875 | 3,109 |
| Nordstrom Inc. | 4.000% | 10/15/21 | 12,166 | 12,794 |
| Nordstrom Inc. | 6.950% | 3/15/28 | 1,425 | 1,742 |
| Nordstrom Inc. | 5.000% | 1/15/44 | 4,610 | 4,772 |
| NVR Inc. | 3.950% | 9/15/22 | 7,751 | 7,787 |
| O'Reilly Automotive Inc. | 4.875% | 1/14/21 | 900 | 978 |
| O'Reilly Automotive Inc. | 4.625% | 9/15/21 | 5,343 | 5,714 |
| O'Reilly Automotive Inc. | 3.800% | 9/1/22 | 3,906 | 3,961 |
| O'Reilly Automotive Inc. | 3.850% | 6/15/23 | 1,500 | 1,516 |
| PACCAR Financial Corp. | 1.600% | 3/15/17 | 1,165 | 1,168 |
| PACCAR Financial Corp. | 1.100% | 6/6/17 | 500 | 497 |
| PACCAR Financial Corp. | 1.400% | 11/17/17 | 3,795 | 3,784 |
| PACCAR Financial Corp. | 1.450% | 3/9/18 | 3,175 | 3,154 |
| PACCAR Financial Corp. | 1.400% | 5/18/18 | 3,000 | 2,972 |
| PACCAR Financial Corp. | 1.750% | 8/14/18 | 1,100 | 1,098 |
| PACCAR Financial Corp. | 2.200% | 9/15/19 | 2,350 | 2,342 |
| PACCAR Financial Corp. | 2.500% | 8/14/20 | 3,200 | 3,177 |
| Priceline Group Inc. | 3.650% | 3/15/25 | 1,325 | 1,293 |
| QVC Inc. | 3.125% | 4/1/19 | 3,135 | 3,099 |
| QVC Inc. | 5.125% | 7/2/22 | 1,860 | 1,860 |
| QVC Inc. | 4.375% | 3/15/23 | 1,574 | 1,495 |
| QVC Inc. | 4.850% | 4/1/24 | 5,713 | 5,447 |
| QVC Inc. | 5.450% | 8/15/34 | 2,800 | 2,422 |
| QVC Inc. | 5.950% | 3/15/43 | 4,478 | 3,813 |
| Ralph Lauren Corp. | 2.125% | 9/26/18 | 2,900 | 2,926 |
| Ralph Lauren Corp. | 2.625% | 8/18/20 | 3,000 | 3,026 |
| Ross Stores Inc. | 3.375% | 9/15/24 | 2,115 | 2,083 |
65
| Vanguard® Total Bond Market Index Fund | ||||
| Schedule of Investments | ||||
| December 31, 2015 | ||||
| Face | Market | |||
| Maturity | Amount | Value | ||
| Coupon | Date | ($000) | ($000) | |
| Signet UK Finance plc | 4.700% | 6/15/24 | 3,665 | 3,603 |
| Staples Inc. | 2.750% | 1/12/18 | 7,700 | 7,652 |
| Staples Inc. | 4.375% | 1/12/23 | 3,300 | 3,164 |
| Starbucks Corp. | 2.000% | 12/5/18 | 4,975 | 5,027 |
| Starbucks Corp. | 2.700% | 6/15/22 | 3,275 | 3,273 |
| Starbucks Corp. | 3.850% | 10/1/23 | 5,660 | 6,014 |
| Starbucks Corp. | 4.300% | 6/15/45 | 3,525 | 3,688 |
| Starwood Hotels & Resorts Worldwide Inc. | 6.750% | 5/15/18 | 510 | 558 |
| Starwood Hotels & Resorts Worldwide Inc. | 3.125% | 2/15/23 | 6,416 | 6,266 |
| Starwood Hotels & Resorts Worldwide Inc. | 3.750% | 3/15/25 | 4,300 | 4,202 |
| Starwood Hotels & Resorts Worldwide Inc. | 4.500% | 10/1/34 | 2,850 | 2,495 |
| Target Corp. | 5.375% | 5/1/17 | 11,305 | 11,932 |
| Target Corp. | 6.000% | 1/15/18 | 12,975 | 14,135 |
| Target Corp. | 2.300% | 6/26/19 | 8,060 | 8,174 |
| Target Corp. | 3.875% | 7/15/20 | 2,675 | 2,874 |
| Target Corp. | 2.900% | 1/15/22 | 10,505 | 10,662 |
| Target Corp. | 3.500% | 7/1/24 | 11,990 | 12,409 |
| Target Corp. | 6.350% | 11/1/32 | 7,645 | 9,559 |
| Target Corp. | 6.500% | 10/15/37 | 8,767 | 11,357 |
| Target Corp. | 7.000% | 1/15/38 | 7,075 | 9,664 |
| Target Corp. | 4.000% | 7/1/42 | 12,894 | 12,624 |
| Tiffany & Co. | 4.900% | 10/1/44 | 2,475 | 2,305 |
| TJX Cos. Inc. | 6.950% | 4/15/19 | 10,140 | 11,671 |
| TJX Cos. Inc. | 2.750% | 6/15/21 | 6,070 | 6,153 |
| TJX Cos. Inc. | 2.500% | 5/15/23 | 50 | 48 |
| Toyota Motor Credit Corp. | 2.050% | 1/12/17 | 18,460 | 18,625 |
| Toyota Motor Credit Corp. | 1.125% | 5/16/17 | 7,475 | 7,471 |
| Toyota Motor Credit Corp. | 1.750% | 5/22/17 | 2,025 | 2,039 |
| Toyota Motor Credit Corp. | 1.250% | 10/5/17 | 6,300 | 6,279 |
| Toyota Motor Credit Corp. | 1.375% | 1/10/18 | 13,305 | 13,271 |
| Toyota Motor Credit Corp. | 1.450% | 1/12/18 | 7,900 | 7,891 |
| Toyota Motor Credit Corp. | 2.000% | 10/24/18 | 5,875 | 5,909 |
| Toyota Motor Credit Corp. | 2.100% | 1/17/19 | 6,425 | 6,437 |
| Toyota Motor Credit Corp. | 2.125% | 7/18/19 | 14,985 | 14,978 |
| Toyota Motor Credit Corp. | 2.150% | 3/12/20 | 18,000 | 18,037 |
| Toyota Motor Credit Corp. | 4.500% | 6/17/20 | 10,285 | 11,151 |
| Toyota Motor Credit Corp. | 4.250% | 1/11/21 | 2,575 | 2,789 |
| Toyota Motor Credit Corp. | 2.750% | 5/17/21 | 7,275 | 7,363 |
| Toyota Motor Credit Corp. | 3.400% | 9/15/21 | 8,636 | 8,963 |
| Toyota Motor Credit Corp. | 3.300% | 1/12/22 | 14,830 | 15,271 |
| Toyota Motor Credit Corp. | 2.800% | 7/13/22 | 2,875 | 2,861 |
| Toyota Motor Credit Corp. | 2.625% | 1/10/23 | 13,625 | 13,406 |
| VF Corp. | 5.950% | 11/1/17 | 3,955 | 4,260 |
| VF Corp. | 3.500% | 9/1/21 | 6,750 | 7,064 |
| VF Corp. | 6.450% | 11/1/37 | 5,519 | 7,067 |
| Visa Inc. | 1.200% | 12/14/17 | 40,450 | 40,408 |
| Visa Inc. | 2.200% | 12/14/20 | 32,625 | 32,567 |
| Visa Inc. | 2.800% | 12/14/22 | 26,750 | 26,833 |
| Visa Inc. | 3.150% | 12/14/25 | 49,450 | 49,533 |
| Visa Inc. | 4.150% | 12/14/35 | 12,925 | 13,046 |
| Visa Inc. | 4.300% | 12/14/45 | 31,525 | 31,947 |
| Wal-Mart Stores Inc. | 5.375% | 4/5/17 | 2,570 | 2,705 |
| Wal-Mart Stores Inc. | 5.800% | 2/15/18 | 20,850 | 22,776 |
| Wal-Mart Stores Inc. | 1.125% | 4/11/18 | 1,651 | 1,643 |
| Wal-Mart Stores Inc. | 3.625% | 7/8/20 | 38,219 | 40,902 |
| Wal-Mart Stores Inc. | 3.250% | 10/25/20 | 30,025 | 31,653 |
| Wal-Mart Stores Inc. | 4.250% | 4/15/21 | 10,294 | 11,389 |
| Wal-Mart Stores Inc. | 2.550% | 4/11/23 | 13,260 | 13,060 |
| Wal-Mart Stores Inc. | 3.300% | 4/22/24 | 11,185 | 11,546 |
| Wal-Mart Stores Inc. | 5.875% | 4/5/27 | 21,230 | 25,950 |
| Wal-Mart Stores Inc. | 7.550% | 2/15/30 | 12,890 | 18,183 |
| Wal-Mart Stores Inc. | 5.250% | 9/1/35 | 13,751 | 15,668 |
| Wal-Mart Stores Inc. | 6.500% | 8/15/37 | 30,767 | 39,662 |
| Wal-Mart Stores Inc. | 6.200% | 4/15/38 | 7,694 | 9,659 |
66
| Vanguard® Total Bond Market Index Fund | ||||
| Schedule of Investments | ||||
| December 31, 2015 | ||||
| Face | Market | |||
| Maturity | Amount | Value | ||
| Coupon | Date | ($000) | ($000) | |
| Wal-Mart Stores Inc. | 5.625% | 4/1/40 | 6,450 | 7,630 |
| Wal-Mart Stores Inc. | 4.875% | 7/8/40 | 4,975 | 5,374 |
| Wal-Mart Stores Inc. | 5.000% | 10/25/40 | 8,670 | 9,532 |
| Wal-Mart Stores Inc. | 5.625% | 4/15/41 | 26,846 | 31,827 |
| Wal-Mart Stores Inc. | 4.000% | 4/11/43 | 11,001 | 10,679 |
| Wal-Mart Stores Inc. | 4.750% | 10/2/43 | 12,290 | 13,241 |
| Wal-Mart Stores Inc. | 4.300% | 4/22/44 | 7,420 | 7,566 |
| Walgreen Co. | 5.250% | 1/15/19 | 3,862 | 4,128 |
| Walgreen Co. | 3.100% | 9/15/22 | 7,722 | 7,472 |
| Walgreen Co. | 4.400% | 9/15/42 | 7,750 | 6,640 |
| Walgreens Boots Alliance Inc. | 1.750% | 11/17/17 | 4,700 | 4,673 |
| Walgreens Boots Alliance Inc. | 2.700% | 11/18/19 | 12,855 | 12,855 |
| Walgreens Boots Alliance Inc. | 3.300% | 11/18/21 | 12,895 | 12,633 |
| Walgreens Boots Alliance Inc. | 3.800% | 11/18/24 | 16,646 | 16,193 |
| Walgreens Boots Alliance Inc. | 4.500% | 11/18/34 | 820 | 749 |
| Walgreens Boots Alliance Inc. | 4.800% | 11/18/44 | 13,520 | 12,283 |
| Western Union Co. | 5.253% | 4/1/20 | 4,126 | 4,446 |
| Western Union Co. | 6.200% | 11/17/36 | 5,973 | 5,829 |
| Western Union Co. | 6.200% | 6/21/40 | 4,475 | 4,172 |
| Wyndham Worldwide Corp. | 2.950% | 3/1/17 | 915 | 921 |
| Wyndham Worldwide Corp. | 2.500% | 3/1/18 | 1,950 | 1,943 |
| Wyndham Worldwide Corp. | 4.250% | 3/1/22 | 12,898 | 12,890 |
| Wyndham Worldwide Corp. | 3.900% | 3/1/23 | 2,650 | 2,557 |
| Consumer Noncyclical (3.9%) | ||||
| Abbott Laboratories | 5.125% | 4/1/19 | 19,628 | 21,567 |
| Abbott Laboratories | 2.000% | 3/15/20 | 6,500 | 6,477 |
| Abbott Laboratories | 4.125% | 5/27/20 | 9,493 | 10,267 |
| Abbott Laboratories | 2.550% | 3/15/22 | 4,025 | 3,993 |
| Abbott Laboratories | 2.950% | 3/15/25 | 8,000 | 7,892 |
| Abbott Laboratories | 6.150% | 11/30/37 | 5,346 | 6,652 |
| Abbott Laboratories | 6.000% | 4/1/39 | 1,175 | 1,441 |
| Abbott Laboratories | 5.300% | 5/27/40 | 803 | 903 |
| AbbVie Inc. | 1.750% | 11/6/17 | 29,005 | 28,945 |
| AbbVie Inc. | 1.800% | 5/14/18 | 29,679 | 29,563 |
| AbbVie Inc. | 2.000% | 11/6/18 | 12,850 | 12,797 |
| AbbVie Inc. | 2.500% | 5/14/20 | 34,210 | 33,835 |
| AbbVie Inc. | 2.900% | 11/6/22 | 27,913 | 26,968 |
| AbbVie Inc. | 3.200% | 11/6/22 | 19,425 | 19,142 |
| AbbVie Inc. | 3.600% | 5/14/25 | 33,800 | 33,349 |
| AbbVie Inc. | 4.500% | 5/14/35 | 22,145 | 21,693 |
| AbbVie Inc. | 4.400% | 11/6/42 | 24,833 | 23,091 |
| AbbVie Inc. | 4.700% | 5/14/45 | 21,740 | 21,262 |
| Actavis Funding SCS | 1.850% | 3/1/17 | 18,345 | 18,344 |
| Actavis Funding SCS | 1.300% | 6/15/17 | 14,810 | 14,659 |
| Actavis Funding SCS | 2.350% | 3/12/18 | 25,265 | 25,329 |
| Actavis Funding SCS | 3.000% | 3/12/20 | 31,945 | 31,890 |
| Actavis Funding SCS | 3.450% | 3/15/22 | 22,754 | 22,753 |
| Actavis Funding SCS | 3.850% | 6/15/24 | 11,251 | 11,243 |
| Actavis Funding SCS | 3.800% | 3/15/25 | 35,867 | 35,544 |
| Actavis Funding SCS | 4.550% | 3/15/35 | 23,978 | 23,407 |
| Actavis Funding SCS | 4.850% | 6/15/44 | 19,805 | 19,584 |
| Actavis Funding SCS | 4.750% | 3/15/45 | 19,225 | 18,682 |
| Actavis Inc. | 1.875% | 10/1/17 | 12,065 | 12,049 |
| Actavis Inc. | 6.125% | 8/15/19 | 5,410 | 6,000 |
| Actavis Inc. | 3.250% | 10/1/22 | 21,013 | 20,662 |
| Actavis Inc. | 4.625% | 10/1/42 | 11,888 | 11,283 |
| Agilent Technologies Inc. | 5.000% | 7/15/20 | 10,505 | 11,273 |
| Agilent Technologies Inc. | 3.200% | 10/1/22 | 6,200 | 6,016 |
| Agilent Technologies Inc. | 3.875% | 7/15/23 | 3,656 | 3,657 |
| Ahold Finance USA LLC | 6.875% | 5/1/29 | 200 | 246 |
| Allergan Inc. | 3.375% | 9/15/20 | 3,335 | 3,360 |
| Allergan Inc. | 2.800% | 3/15/23 | 4,250 | 3,995 |
| 5 Allina Health System | 4.805% | 11/15/45 | 1,700 | 1,749 |
67
| Vanguard® Total Bond Market Index Fund | ||||
| Schedule of Investments | ||||
| December 31, 2015 | ||||
| Face | Market | |||
| Maturity | Amount | Value | ||
| Coupon | Date | ($000) | ($000) | |
| Altria Group Inc. | 9.250% | 8/6/19 | 11,154 | 13,664 |
| Altria Group Inc. | 2.625% | 1/14/20 | 8,085 | 8,105 |
| Altria Group Inc. | 4.750% | 5/5/21 | 13,900 | 15,098 |
| Altria Group Inc. | 2.850% | 8/9/22 | 18,515 | 18,100 |
| Altria Group Inc. | 2.950% | 5/2/23 | 7,860 | 7,637 |
| Altria Group Inc. | 4.000% | 1/31/24 | 9,355 | 9,700 |
| Altria Group Inc. | 9.950% | 11/10/38 | 6,234 | 10,034 |
| Altria Group Inc. | 10.200% | 2/6/39 | 8,000 | 13,153 |
| Altria Group Inc. | 4.250% | 8/9/42 | 9,197 | 8,453 |
| Altria Group Inc. | 4.500% | 5/2/43 | 10,667 | 10,119 |
| Altria Group Inc. | 5.375% | 1/31/44 | 11,875 | 12,784 |
| AmerisourceBergen Corp. | 1.150% | 5/15/17 | 3,250 | 3,227 |
| AmerisourceBergen Corp. | 4.875% | 11/15/19 | 5,395 | 5,816 |
| AmerisourceBergen Corp. | 3.500% | 11/15/21 | 7,419 | 7,569 |
| AmerisourceBergen Corp. | 3.400% | 5/15/24 | 5,725 | 5,610 |
| AmerisourceBergen Corp. | 3.250% | 3/1/25 | 4,990 | 4,832 |
| AmerisourceBergen Corp. | 4.250% | 3/1/45 | 4,775 | 4,428 |
| Amgen Inc. | 2.125% | 5/15/17 | 11,320 | 11,391 |
| Amgen Inc. | 5.850% | 6/1/17 | 11,530 | 12,199 |
| Amgen Inc. | 5.700% | 2/1/19 | 19,088 | 21,043 |
| Amgen Inc. | 2.200% | 5/22/19 | 11,958 | 11,943 |
| Amgen Inc. | 2.125% | 5/1/20 | 8,585 | 8,472 |
| Amgen Inc. | 3.450% | 10/1/20 | 2,800 | 2,883 |
| Amgen Inc. | 4.100% | 6/15/21 | 12,330 | 12,975 |
| Amgen Inc. | 3.875% | 11/15/21 | 10,955 | 11,419 |
| Amgen Inc. | 2.700% | 5/1/22 | 3,000 | 2,910 |
| Amgen Inc. | 3.625% | 5/15/22 | 12,829 | 13,207 |
| Amgen Inc. | 3.625% | 5/22/24 | 10,030 | 10,026 |
| Amgen Inc. | 3.125% | 5/1/25 | 17,055 | 16,197 |
| Amgen Inc. | 6.375% | 6/1/37 | 2,818 | 3,286 |
| Amgen Inc. | 6.900% | 6/1/38 | 11,080 | 13,757 |
| Amgen Inc. | 6.400% | 2/1/39 | 13,121 | 15,617 |
| Amgen Inc. | 5.750% | 3/15/40 | 5,755 | 6,212 |
| Amgen Inc. | 4.950% | 10/1/41 | 6,090 | 6,028 |
| Amgen Inc. | 5.150% | 11/15/41 | 26,230 | 26,602 |
| Amgen Inc. | 5.650% | 6/15/42 | 8,690 | 9,458 |
| Amgen Inc. | 5.375% | 5/15/43 | 5,000 | 5,308 |
| Amgen Inc. | 4.400% | 5/1/45 | 7,470 | 6,913 |
| Anheuser-Busch Cos. LLC | 5.600% | 3/1/17 | 8,855 | 9,271 |
| Anheuser-Busch Cos. LLC | 5.500% | 1/15/18 | 12,468 | 13,327 |
| Anheuser-Busch Cos. LLC | 5.000% | 3/1/19 | 2,250 | 2,420 |
| Anheuser-Busch Cos. LLC | 6.800% | 8/20/32 | 2,275 | 2,759 |
| Anheuser-Busch Cos. LLC | 5.950% | 1/15/33 | 10 | 11 |
| Anheuser-Busch Cos. LLC | 5.750% | 4/1/36 | 5,995 | 6,546 |
| Anheuser-Busch Cos. LLC | 6.450% | 9/1/37 | 670 | 796 |
| Anheuser-Busch Cos. LLC | 6.500% | 5/1/42 | 2,336 | 2,849 |
| Anheuser-Busch InBev Finance Inc. | 1.125% | 1/27/17 | 1,475 | 1,470 |
| Anheuser-Busch InBev Finance Inc. | 1.250% | 1/17/18 | 8,450 | 8,373 |
| Anheuser-Busch InBev Finance Inc. | 2.150% | 2/1/19 | 20,000 | 20,007 |
| Anheuser-Busch InBev Finance Inc. | 2.625% | 1/17/23 | 26,396 | 25,318 |
| Anheuser-Busch InBev Finance Inc. | 3.700% | 2/1/24 | 12,700 | 12,949 |
| Anheuser-Busch InBev Finance Inc. | 4.000% | 1/17/43 | 9,915 | 8,942 |
| Anheuser-Busch InBev Finance Inc. | 4.625% | 2/1/44 | 6,400 | 6,374 |
| Anheuser-Busch InBev Worldwide Inc. | 1.375% | 7/15/17 | 14,633 | 14,589 |
| Anheuser-Busch InBev Worldwide Inc. | 7.750% | 1/15/19 | 15,032 | 17,399 |
| Anheuser-Busch InBev Worldwide Inc. | 6.875% | 11/15/19 | 6,925 | 8,014 |
| Anheuser-Busch InBev Worldwide Inc. | 5.375% | 1/15/20 | 21,122 | 23,358 |
| Anheuser-Busch InBev Worldwide Inc. | 5.000% | 4/15/20 | 12,765 | 14,025 |
| Anheuser-Busch InBev Worldwide Inc. | 4.375% | 2/15/21 | 2,624 | 2,848 |
| Anheuser-Busch InBev Worldwide Inc. | 2.500% | 7/15/22 | 23,519 | 22,583 |
| Anheuser-Busch InBev Worldwide Inc. | 8.200% | 1/15/39 | 2,818 | 4,048 |
| Anheuser-Busch InBev Worldwide Inc. | 6.375% | 1/15/40 | 10,603 | 12,677 |
| Anheuser-Busch InBev Worldwide Inc. | 3.750% | 7/15/42 | 10,805 | 9,213 |
| Archer-Daniels-Midland Co. | 5.450% | 3/15/18 | 6,872 | 7,433 |
68
| Vanguard® Total Bond Market Index Fund | ||||
| Schedule of Investments | ||||
| December 31, 2015 | ||||
| Face | Market | |||
| Maturity | Amount | Value | ||
| Coupon | Date | ($000) | ($000) | |
| Archer-Daniels-Midland Co. | 4.479% | 3/1/21 | 3,818 | 4,168 |
| Archer-Daniels-Midland Co. | 5.935% | 10/1/32 | 3,505 | 4,165 |
| Archer-Daniels-Midland Co. | 5.375% | 9/15/35 | 2,438 | 2,749 |
| Archer-Daniels-Midland Co. | 4.535% | 3/26/42 | 3,700 | 3,794 |
| Archer-Daniels-Midland Co. | 4.016% | 4/16/43 | 4,082 | 3,941 |
| 5 Ascension Health | 4.847% | 11/15/53 | 8,850 | 9,557 |
| AstraZeneca plc | 5.900% | 9/15/17 | 3,578 | 3,835 |
| AstraZeneca plc | 1.750% | 11/16/18 | 14,825 | 14,775 |
| AstraZeneca plc | 1.950% | 9/18/19 | 4,795 | 4,771 |
| AstraZeneca plc | 2.375% | 11/16/20 | 24,100 | 23,937 |
| AstraZeneca plc | 3.375% | 11/16/25 | 17,200 | 17,021 |
| AstraZeneca plc | 6.450% | 9/15/37 | 24,586 | 30,656 |
| AstraZeneca plc | 4.000% | 9/18/42 | 9,806 | 9,174 |
| AstraZeneca plc | 4.375% | 11/16/45 | 7,375 | 7,328 |
| 8 Baxalta Inc. | 2.000% | 6/22/18 | 2,955 | 2,923 |
| 8 Baxalta Inc. | 2.875% | 6/23/20 | 9,365 | 9,274 |
| 8 Baxalta Inc. | 3.600% | 6/23/22 | 4,765 | 4,770 |
| 8 Baxalta Inc. | 4.000% | 6/23/25 | 16,440 | 16,261 |
| 8 Baxalta Inc. | 5.250% | 6/23/45 | 8,975 | 9,001 |
| Baxter International Inc. | 5.375% | 6/1/18 | 5,010 | 5,379 |
| Baxter International Inc. | 1.850% | 6/15/18 | 10,675 | 10,619 |
| Beam Suntory Inc. | 1.875% | 5/15/17 | 1,025 | 1,026 |
| Beam Suntory Inc. | 1.750% | 6/15/18 | 2,775 | 2,740 |
| Beam Suntory Inc. | 3.250% | 5/15/22 | 2,050 | 2,017 |
| Beam Suntory Inc. | 3.250% | 6/15/23 | 550 | 530 |
| Becton Dickinson & Co. | 1.450% | 5/15/17 | 2,700 | 2,689 |
| Becton Dickinson & Co. | 1.800% | 12/15/17 | 13,216 | 13,197 |
| Becton Dickinson & Co. | 5.000% | 5/15/19 | 1,500 | 1,621 |
| Becton Dickinson & Co. | 6.375% | 8/1/19 | 15,747 | 17,802 |
| Becton Dickinson & Co. | 2.675% | 12/15/19 | 10,868 | 10,931 |
| Becton Dickinson & Co. | 3.250% | 11/12/20 | 6,349 | 6,446 |
| Becton Dickinson & Co. | 3.125% | 11/8/21 | 18,718 | 18,884 |
| Becton Dickinson & Co. | 3.875% | 5/15/24 | 125 | 127 |
| Becton Dickinson & Co. | 3.734% | 12/15/24 | 13,220 | 13,324 |
| Becton Dickinson & Co. | 6.000% | 5/15/39 | 3,095 | 3,570 |
| Becton Dickinson & Co. | 5.000% | 11/12/40 | 675 | 688 |
| Becton Dickinson & Co. | 4.875% | 5/15/44 | 300 | 303 |
| Becton Dickinson & Co. | 4.685% | 12/15/44 | 10,900 | 11,081 |
| Biogen Inc. | 6.875% | 3/1/18 | 10,350 | 11,407 |
| Biogen Inc. | 2.900% | 9/15/20 | 16,865 | 16,807 |
| Biogen Inc. | 3.625% | 9/15/22 | 8,825 | 8,937 |
| Biogen Inc. | 4.050% | 9/15/25 | 14,400 | 14,445 |
| Biogen Inc. | 5.200% | 9/15/45 | 16,250 | 16,247 |
| Boston Scientific Corp. | 5.125% | 1/12/17 | 7,930 | 8,182 |
| Boston Scientific Corp. | 2.650% | 10/1/18 | 9,650 | 9,703 |
| Boston Scientific Corp. | 6.000% | 1/15/20 | 7,584 | 8,426 |
| Boston Scientific Corp. | 3.375% | 5/15/22 | 3,350 | 3,317 |
| Boston Scientific Corp. | 4.125% | 10/1/23 | 2,650 | 2,707 |
| Boston Scientific Corp. | 3.850% | 5/15/25 | 6,050 | 5,952 |
| Boston Scientific Corp. | 7.000% | 11/15/35 | 7,650 | 8,963 |
| Boston Scientific Corp. | 7.375% | 1/15/40 | 3,430 | 4,213 |
| Bottling Group LLC | 5.125% | 1/15/19 | 5,450 | 5,968 |
| Bristol-Myers Squibb Co. | 0.875% | 8/1/17 | 9,890 | 9,843 |
| Bristol-Myers Squibb Co. | 1.750% | 3/1/19 | 1,790 | 1,785 |
| Bristol-Myers Squibb Co. | 2.000% | 8/1/22 | 8,215 | 7,972 |
| Bristol-Myers Squibb Co. | 7.150% | 6/15/23 | 400 | 507 |
| Bristol-Myers Squibb Co. | 3.250% | 11/1/23 | 2,975 | 3,081 |
| Bristol-Myers Squibb Co. | 5.875% | 11/15/36 | 8,602 | 10,481 |
| Bristol-Myers Squibb Co. | 6.125% | 5/1/38 | 1,858 | 2,354 |
| Bristol-Myers Squibb Co. | 3.250% | 8/1/42 | 5,621 | 4,901 |
| Bristol-Myers Squibb Co. | 6.875% | 8/1/97 | 655 | 908 |
| Brown-Forman Corp. | 1.000% | 1/15/18 | 1,300 | 1,281 |
| Brown-Forman Corp. | 2.250% | 1/15/23 | 2,435 | 2,332 |
| Brown-Forman Corp. | 3.750% | 1/15/43 | 2,675 | 2,441 |
69
| Vanguard® Total Bond Market Index Fund | ||||
| Schedule of Investments | ||||
| December 31, 2015 | ||||
| Face | Market | |||
| Maturity | Amount | Value | ||
| Coupon | Date | ($000) | ($000) | |
| Brown-Forman Corp. | 4.500% | 7/15/45 | 4,350 | 4,494 |
| Bunge Ltd. Finance Corp. | 8.500% | 6/15/19 | 9,480 | 11,005 |
| Bunge Ltd. Finance Corp. | 3.500% | 11/24/20 | 2,900 | 2,885 |
| Campbell Soup Co. | 3.050% | 7/15/17 | 1,275 | 1,304 |
| Campbell Soup Co. | 4.250% | 4/15/21 | 3,875 | 4,108 |
| Campbell Soup Co. | 2.500% | 8/2/22 | 3,575 | 3,413 |
| Campbell Soup Co. | 3.300% | 3/19/25 | 3,975 | 3,950 |
| Campbell Soup Co. | 3.800% | 8/2/42 | 3,228 | 2,798 |
| Cardinal Health Inc. | 1.700% | 3/15/18 | 3,340 | 3,328 |
| Cardinal Health Inc. | 1.950% | 6/15/18 | 3,000 | 2,995 |
| Cardinal Health Inc. | 4.625% | 12/15/20 | 15,165 | 16,508 |
| Cardinal Health Inc. | 3.200% | 6/15/22 | 3,220 | 3,181 |
| Cardinal Health Inc. | 3.200% | 3/15/23 | 7,533 | 7,456 |
| Cardinal Health Inc. | 3.750% | 9/15/25 | 6,900 | 7,012 |
| Cardinal Health Inc. | 4.600% | 3/15/43 | 1,125 | 1,113 |
| Cardinal Health Inc. | 4.900% | 9/15/45 | 4,150 | 4,248 |
| 5 Catholic Health Initiatives Colorado GO | 4.350% | 11/1/42 | 9,250 | 8,662 |
| Celgene Corp. | 1.900% | 8/15/17 | 2,625 | 2,636 |
| Celgene Corp. | 2.125% | 8/15/18 | 6,200 | 6,198 |
| Celgene Corp. | 2.300% | 8/15/18 | 3,075 | 3,089 |
| Celgene Corp. | 2.250% | 5/15/19 | 7,775 | 7,698 |
| Celgene Corp. | 2.875% | 8/15/20 | 6,250 | 6,204 |
| Celgene Corp. | 3.950% | 10/15/20 | 16,455 | 17,258 |
| Celgene Corp. | 3.250% | 8/15/22 | 7,225 | 7,157 |
| Celgene Corp. | 3.550% | 8/15/22 | 3,200 | 3,230 |
| Celgene Corp. | 4.000% | 8/15/23 | 5,345 | 5,493 |
| Celgene Corp. | 3.625% | 5/15/24 | 13,375 | 13,142 |
| Celgene Corp. | 3.875% | 8/15/25 | 22,384 | 22,303 |
| Celgene Corp. | 5.700% | 10/15/40 | 3,250 | 3,479 |
| Celgene Corp. | 5.250% | 8/15/43 | 10,525 | 10,756 |
| Celgene Corp. | 4.625% | 5/15/44 | 8,880 | 8,402 |
| Celgene Corp. | 5.000% | 8/15/45 | 15,275 | 15,343 |
| Children's Hospital Medical Center Ohio GO | 4.268% | 5/15/44 | 2,100 | 2,062 |
| Church & Dwight Co. Inc. | 2.450% | 12/15/19 | 4,825 | 4,807 |
| Cleveland Clinic Foundation Ohio Revenue | 4.858% | 1/1/14 | 4,985 | 4,844 |
| Clorox Co. | 5.950% | 10/15/17 | 15,525 | 16,675 |
| Clorox Co. | 3.800% | 11/15/21 | 450 | 470 |
| Clorox Co. | 3.050% | 9/15/22 | 1,072 | 1,060 |
| Clorox Co. | 3.500% | 12/15/24 | 1,150 | 1,149 |
| Coca-Cola Bottling Co. Consolidated | 3.800% | 11/25/25 | 3,300 | 3,300 |
| Coca-Cola Co. | 1.150% | 4/1/18 | 7,896 | 7,879 |
| Coca-Cola Co. | 1.650% | 11/1/18 | 25,664 | 25,883 |
| Coca-Cola Co. | 1.875% | 10/27/20 | 3,750 | 3,708 |
| Coca-Cola Co. | 2.450% | 11/1/20 | 15,120 | 15,369 |
| Coca-Cola Co. | 3.150% | 11/15/20 | 8,364 | 8,744 |
| Coca-Cola Co. | 3.300% | 9/1/21 | 6,027 | 6,296 |
| Coca-Cola Co. | 2.500% | 4/1/23 | 1,600 | 1,592 |
| Coca-Cola Co. | 3.200% | 11/1/23 | 12,719 | 13,173 |
| Coca-Cola Co. | 2.875% | 10/27/25 | 20,525 | 20,188 |
| Coca-Cola Enterprises Inc. | 3.500% | 9/15/20 | 5,600 | 5,727 |
| Coca-Cola Enterprises Inc. | 3.250% | 8/19/21 | 1,575 | 1,586 |
| Coca-Cola Enterprises Inc. | 4.500% | 9/1/21 | 2,045 | 2,188 |
| Coca-Cola Femsa SAB de CV | 2.375% | 11/26/18 | 600 | 601 |
| Coca-Cola Femsa SAB de CV | 4.625% | 2/15/20 | 1,300 | 1,396 |
| Coca-Cola Femsa SAB de CV | 3.875% | 11/26/23 | 16,500 | 16,741 |
| Coca-Cola Femsa SAB de CV | 5.250% | 11/26/43 | 12,650 | 13,595 |
| Coca-Cola Refreshments USA Inc. | 8.500% | 2/1/22 | 6,361 | 8,268 |
| Colgate-Palmolive Co. | 1.300% | 1/15/17 | 7,325 | 7,345 |
| Colgate-Palmolive Co. | 2.625% | 5/1/17 | 700 | 714 |
| Colgate-Palmolive Co. | 1.750% | 3/15/19 | 1,000 | 1,005 |
| Colgate-Palmolive Co. | 2.950% | 11/1/20 | 2,370 | 2,450 |
| Colgate-Palmolive Co. | 2.450% | 11/15/21 | 3,500 | 3,519 |
| Colgate-Palmolive Co. | 1.950% | 2/1/23 | 9,575 | 9,205 |
| Colgate-Palmolive Co. | 2.100% | 5/1/23 | 5,133 | 4,949 |
70
| Vanguard® Total Bond Market Index Fund | ||||
| Schedule of Investments | ||||
| December 31, 2015 | ||||
| Face | Market | |||
| Maturity | Amount | Value | ||
| Coupon | Date | ($000) | ($000) | |
| Colgate-Palmolive Co. | 3.250% | 3/15/24 | 4,475 | 4,645 |
| Colgate-Palmolive Co. | 4.000% | 8/15/45 | 5,375 | 5,402 |
| ConAgra Foods Inc. | 1.900% | 1/25/18 | 10,260 | 10,207 |
| ConAgra Foods Inc. | 7.000% | 4/15/19 | 681 | 767 |
| ConAgra Foods Inc. | 3.250% | 9/15/22 | 10,012 | 9,637 |
| ConAgra Foods Inc. | 3.200% | 1/25/23 | 10,273 | 9,888 |
| ConAgra Foods Inc. | 7.125% | 10/1/26 | 3,445 | 4,101 |
| ConAgra Foods Inc. | 7.000% | 10/1/28 | 1,020 | 1,212 |
| ConAgra Foods Inc. | 8.250% | 9/15/30 | 4,799 | 6,426 |
| ConAgra Foods Inc. | 6.625% | 8/15/39 | 6,708 | 7,224 |
| ConAgra Foods Inc. | 4.650% | 1/25/43 | 5,834 | 5,200 |
| Covidien International Finance SA | 6.000% | 10/15/17 | 5,293 | 5,703 |
| Covidien International Finance SA | 3.200% | 6/15/22 | 15,875 | 15,893 |
| Covidien International Finance SA | 2.950% | 6/15/23 | 10,600 | 10,419 |
| Covidien International Finance SA | 6.550% | 10/15/37 | 14,673 | 18,363 |
| CR Bard Inc. | 1.375% | 1/15/18 | 7,557 | 7,437 |
| CR Bard Inc. | 4.400% | 1/15/21 | 3,862 | 4,094 |
| CR Bard Inc. | 6.700% | 12/1/26 | 5,250 | 6,685 |
| Delhaize America LLC | 9.000% | 4/15/31 | 4,880 | 6,238 |
| Delhaize Group SA | 5.700% | 10/1/40 | 9,500 | 9,750 |
| Diageo Capital plc | 1.500% | 5/11/17 | 15,425 | 15,410 |
| Diageo Capital plc | 5.750% | 10/23/17 | 4,497 | 4,829 |
| Diageo Capital plc | 1.125% | 4/29/18 | 3,312 | 3,250 |
| Diageo Capital plc | 4.828% | 7/15/20 | 5,795 | 6,332 |
| Diageo Capital plc | 2.625% | 4/29/23 | 18,021 | 17,384 |
| Diageo Capital plc | 5.875% | 9/30/36 | 2,622 | 3,060 |
| Diageo Capital plc | 3.875% | 4/29/43 | 5,676 | 5,253 |
| Diageo Investment Corp. | 2.875% | 5/11/22 | 19,525 | 19,218 |
| Diageo Investment Corp. | 7.450% | 4/15/35 | 1,250 | 1,676 |
| Diageo Investment Corp. | 4.250% | 5/11/42 | 4,097 | 4,108 |
| Dignity Health California GO | 2.637% | 11/1/19 | 3,000 | 3,015 |
| Dignity Health California GO | 3.125% | 11/1/22 | 2,100 | 2,088 |
| Dignity Health California GO | 3.812% | 11/1/24 | 2,525 | 2,577 |
| Dignity Health California GO | 4.500% | 11/1/42 | 8,325 | 7,901 |
| Dignity Health California GO | 5.267% | 11/1/64 | 2,100 | 2,155 |
| Dr Pepper Snapple Group Inc. | 6.820% | 5/1/18 | 5,847 | 6,485 |
| Dr Pepper Snapple Group Inc. | 2.600% | 1/15/19 | 7,050 | 7,079 |
| Dr Pepper Snapple Group Inc. | 2.000% | 1/15/20 | 275 | 269 |
| Dr Pepper Snapple Group Inc. | 3.200% | 11/15/21 | 10,839 | 10,903 |
| Dr Pepper Snapple Group Inc. | 2.700% | 11/15/22 | 2,697 | 2,598 |
| Dr Pepper Snapple Group Inc. | 3.400% | 11/15/25 | 500 | 491 |
| Dr Pepper Snapple Group Inc. | 7.450% | 5/1/38 | 970 | 1,336 |
| Dr Pepper Snapple Group Inc. | 4.500% | 11/15/45 | 2,150 | 2,111 |
| Edwards Lifesciences Corp. | 2.875% | 10/15/18 | 1,550 | 1,567 |
| Eli Lilly & Co. | 5.200% | 3/15/17 | 6,145 | 6,435 |
| Eli Lilly & Co. | 1.250% | 3/1/18 | 6,700 | 6,686 |
| Eli Lilly & Co. | 1.950% | 3/15/19 | 9,424 | 9,500 |
| Eli Lilly & Co. | 2.750% | 6/1/25 | 9,095 | 9,013 |
| Eli Lilly & Co. | 5.550% | 3/15/37 | 1,734 | 2,085 |
| Eli Lilly & Co. | 3.700% | 3/1/45 | 8,040 | 7,534 |
| Estee Lauder Cos. Inc. | 2.350% | 8/15/22 | 8,500 | 8,245 |
| Estee Lauder Cos. Inc. | 6.000% | 5/15/37 | 2,767 | 3,358 |
| Estee Lauder Cos. Inc. | 3.700% | 8/15/42 | 7,790 | 6,984 |
| Estee Lauder Cos. Inc. | 4.375% | 6/15/45 | 2,700 | 2,720 |
| Express Scripts Holding Co. | 2.650% | 2/15/17 | 24,400 | 24,641 |
| Express Scripts Holding Co. | 7.250% | 6/15/19 | 1,950 | 2,251 |
| Express Scripts Holding Co. | 4.750% | 11/15/21 | 13,886 | 14,936 |
| Express Scripts Holding Co. | 3.900% | 2/15/22 | 16,532 | 17,002 |
| Express Scripts Holding Co. | 6.125% | 11/15/41 | 6,963 | 7,926 |
| Flowers Foods Inc. | 4.375% | 4/1/22 | 2,400 | 2,497 |
| Fomento Economico Mexicano SAB de CV | 2.875% | 5/10/23 | 1,000 | 933 |
| Fomento Economico Mexicano SAB de CV | 4.375% | 5/10/43 | 4,215 | 3,742 |
| General Mills Inc. | 5.700% | 2/15/17 | 7,955 | 8,335 |
| General Mills Inc. | 1.400% | 10/20/17 | 2,500 | 2,488 |
71
| Vanguard® Total Bond Market Index Fund | ||||
| Schedule of Investments | ||||
| December 31, 2015 | ||||
| Face | Market | |||
| Maturity | Amount | Value | ||
| Coupon | Date | ($000) | ($000) | |
| General Mills Inc. | 5.650% | 2/15/19 | 21,143 | 23,196 |
| General Mills Inc. | 2.200% | 10/21/19 | 4,000 | 4,012 |
| General Mills Inc. | 3.150% | 12/15/21 | 13,578 | 13,601 |
| General Mills Inc. | 5.400% | 6/15/40 | 1,850 | 2,034 |
| General Mills Inc. | 4.150% | 2/15/43 | 2,875 | 2,701 |
| Gilead Sciences Inc. | 3.050% | 12/1/16 | 8,225 | 8,365 |
| Gilead Sciences Inc. | 1.850% | 9/4/18 | 9,100 | 9,135 |
| Gilead Sciences Inc. | 2.050% | 4/1/19 | 4,505 | 4,512 |
| Gilead Sciences Inc. | 2.550% | 9/1/20 | 17,300 | 17,301 |
| Gilead Sciences Inc. | 4.500% | 4/1/21 | 10,881 | 11,777 |
| Gilead Sciences Inc. | 4.400% | 12/1/21 | 19,484 | 20,995 |
| Gilead Sciences Inc. | 3.250% | 9/1/22 | 8,400 | 8,450 |
| Gilead Sciences Inc. | 3.700% | 4/1/24 | 28,100 | 28,720 |
| Gilead Sciences Inc. | 3.500% | 2/1/25 | 5,940 | 5,977 |
| Gilead Sciences Inc. | 3.650% | 3/1/26 | 30,875 | 31,135 |
| Gilead Sciences Inc. | 4.600% | 9/1/35 | 7,875 | 8,007 |
| Gilead Sciences Inc. | 5.650% | 12/1/41 | 8,435 | 9,613 |
| Gilead Sciences Inc. | 4.800% | 4/1/44 | 16,015 | 16,037 |
| Gilead Sciences Inc. | 4.500% | 2/1/45 | 16,450 | 16,159 |
| Gilead Sciences Inc. | 4.750% | 3/1/46 | 23,790 | 23,939 |
| GlaxoSmithKline Capital Inc. | 5.650% | 5/15/18 | 22,538 | 24,562 |
| GlaxoSmithKline Capital Inc. | 2.800% | 3/18/23 | 10,175 | 10,155 |
| GlaxoSmithKline Capital Inc. | 5.375% | 4/15/34 | 4,023 | 4,577 |
| GlaxoSmithKline Capital Inc. | 6.375% | 5/15/38 | 27,549 | 35,098 |
| GlaxoSmithKline Capital Inc. | 4.200% | 3/18/43 | 4,500 | 4,543 |
| GlaxoSmithKline Capital plc | 1.500% | 5/8/17 | 23,440 | 23,522 |
| GlaxoSmithKline Capital plc | 2.850% | 5/8/22 | 8,506 | 8,550 |
| Hasbro Inc. | 6.300% | 9/15/17 | 3,800 | 4,070 |
| Hasbro Inc. | 6.350% | 3/15/40 | 7,026 | 7,708 |
| Hasbro Inc. | 5.100% | 5/15/44 | 5,270 | 4,990 |
| Hershey Co. | 1.600% | 8/21/18 | 3,160 | 3,173 |
| Hershey Co. | 4.125% | 12/1/20 | 7,295 | 7,878 |
| Hershey Co. | 2.625% | 5/1/23 | 6,150 | 6,051 |
| Hershey Co. | 3.200% | 8/21/25 | 3,620 | 3,668 |
| Hershey Co. | 7.200% | 8/15/27 | 14 | 19 |
| Hillshire Brands Co. | 4.100% | 9/15/20 | 2,002 | 2,060 |
| Hormel Foods Corp. | 4.125% | 4/15/21 | 1,275 | 1,376 |
| Ingredion Inc. | 4.625% | 11/1/20 | 935 | 985 |
| Ingredion Inc. | 6.625% | 4/15/37 | 1,475 | 1,748 |
| International Flavors & Fragrances Inc. | 3.200% | 5/1/23 | 1,785 | 1,739 |
| JM Smucker Co. | 1.750% | 3/15/18 | 2,900 | 2,888 |
| JM Smucker Co. | 2.500% | 3/15/20 | 4,780 | 4,752 |
| JM Smucker Co. | 3.500% | 10/15/21 | 7,525 | 7,756 |
| JM Smucker Co. | 3.000% | 3/15/22 | 3,500 | 3,480 |
| JM Smucker Co. | 3.500% | 3/15/25 | 7,080 | 7,047 |
| JM Smucker Co. | 4.250% | 3/15/35 | 6,600 | 6,447 |
| JM Smucker Co. | 4.375% | 3/15/45 | 6,200 | 6,015 |
| Johnson & Johnson | 5.550% | 8/15/17 | 7,731 | 8,270 |
| Johnson & Johnson | 1.125% | 11/21/17 | 6,100 | 6,100 |
| Johnson & Johnson | 5.150% | 7/15/18 | 6,459 | 7,078 |
| Johnson & Johnson | 1.650% | 12/5/18 | 13,556 | 13,675 |
| Johnson & Johnson | 1.875% | 12/5/19 | 6,000 | 6,013 |
| Johnson & Johnson | 2.950% | 9/1/20 | 4,125 | 4,312 |
| Johnson & Johnson | 2.450% | 12/5/21 | 2,800 | 2,840 |
| Johnson & Johnson | 3.375% | 12/5/23 | 8,050 | 8,547 |
| Johnson & Johnson | 6.950% | 9/1/29 | 3,920 | 5,573 |
| Johnson & Johnson | 4.950% | 5/15/33 | 5,025 | 5,852 |
| Johnson & Johnson | 4.375% | 12/5/33 | 13,599 | 14,980 |
| Johnson & Johnson | 5.950% | 8/15/37 | 9,053 | 11,682 |
| Johnson & Johnson | 5.850% | 7/15/38 | 4,067 | 5,234 |
| Johnson & Johnson | 4.500% | 9/1/40 | 8,483 | 9,297 |
| Johnson & Johnson | 4.850% | 5/15/41 | 210 | 242 |
| Kaiser Foundation Hospitals | 3.500% | 4/1/22 | 3,365 | 3,410 |
| Kaiser Foundation Hospitals | 4.875% | 4/1/42 | 8,775 | 9,004 |
72
| Vanguard® Total Bond Market Index Fund | ||||
| Schedule of Investments | ||||
| December 31, 2015 | ||||
| Face | Market | |||
| Maturity | Amount | Value | ||
| Coupon | Date | ($000) | ($000) | |
| Kellogg Co. | 3.250% | 5/21/18 | 7,600 | 7,803 |
| Kellogg Co. | 4.150% | 11/15/19 | 1,100 | 1,165 |
| Kellogg Co. | 4.000% | 12/15/20 | 8,125 | 8,546 |
| Kellogg Co. | 7.450% | 4/1/31 | 6,650 | 8,413 |
| Kimberly-Clark Corp. | 6.125% | 8/1/17 | 14,518 | 15,616 |
| Kimberly-Clark Corp. | 6.250% | 7/15/18 | 185 | 206 |
| Kimberly-Clark Corp. | 1.850% | 3/1/20 | 1,250 | 1,234 |
| Kimberly-Clark Corp. | 3.625% | 8/1/20 | 8,424 | 8,925 |
| Kimberly-Clark Corp. | 2.150% | 8/15/20 | 2,175 | 2,168 |
| Kimberly-Clark Corp. | 3.875% | 3/1/21 | 575 | 620 |
| Kimberly-Clark Corp. | 2.400% | 3/1/22 | 5,925 | 5,868 |
| Kimberly-Clark Corp. | 2.400% | 6/1/23 | 4,372 | 4,239 |
| Kimberly-Clark Corp. | 2.650% | 3/1/25 | 2,000 | 1,933 |
| Kimberly-Clark Corp. | 3.050% | 8/15/25 | 4,025 | 4,048 |
| Kimberly-Clark Corp. | 6.625% | 8/1/37 | 2,010 | 2,679 |
| Kimberly-Clark Corp. | 5.300% | 3/1/41 | 6,468 | 7,273 |
| Kimberly-Clark Corp. | 3.700% | 6/1/43 | 2,085 | 1,938 |
| Koninklijke Philips NV | 5.750% | 3/11/18 | 11,375 | 12,174 |
| Koninklijke Philips NV | 3.750% | 3/15/22 | 10,250 | 10,518 |
| Koninklijke Philips NV | 6.875% | 3/11/38 | 2,623 | 3,054 |
| Koninklijke Philips NV | 5.000% | 3/15/42 | 4,709 | 4,547 |
| Kraft Foods Group Inc. | 2.250% | 6/5/17 | 9,000 | 9,064 |
| Kraft Foods Group Inc. | 6.125% | 8/23/18 | 18,266 | 20,108 |
| Kraft Foods Group Inc. | 5.375% | 2/10/20 | 8,138 | 8,911 |
| Kraft Foods Group Inc. | 3.500% | 6/6/22 | 16,556 | 16,736 |
| Kraft Foods Group Inc. | 6.875% | 1/26/39 | 13,766 | 16,342 |
| Kraft Foods Group Inc. | 6.500% | 2/9/40 | 5,155 | 5,975 |
| Kraft Foods Group Inc. | 5.000% | 6/4/42 | 17,992 | 18,121 |
| 8 Kraft Heinz Foods Co. | 1.600% | 6/30/17 | 11,725 | 11,692 |
| 8 Kraft Heinz Foods Co. | 2.000% | 7/2/18 | 10,480 | 10,442 |
| 8 Kraft Heinz Foods Co. | 2.800% | 7/2/20 | 14,355 | 14,308 |
| 8 Kraft Heinz Foods Co. | 3.500% | 7/15/22 | 9,450 | 9,521 |
| 8 Kraft Heinz Foods Co. | 3.950% | 7/15/25 | 17,730 | 17,884 |
| 8 Kraft Heinz Foods Co. | 5.000% | 7/15/35 | 9,115 | 9,343 |
| 8 Kraft Heinz Foods Co. | 5.200% | 7/15/45 | 11,055 | 11,551 |
| Kroger Co. | 2.200% | 1/15/17 | 775 | 783 |
| Kroger Co. | 6.400% | 8/15/17 | 8,710 | 9,363 |
| Kroger Co. | 6.800% | 12/15/18 | 2,185 | 2,475 |
| Kroger Co. | 2.300% | 1/15/19 | 10,790 | 10,797 |
| Kroger Co. | 6.150% | 1/15/20 | 14,949 | 16,831 |
| Kroger Co. | 3.300% | 1/15/21 | 5,775 | 5,866 |
| Kroger Co. | 2.950% | 11/1/21 | 5,034 | 4,967 |
| Kroger Co. | 3.400% | 4/15/22 | 3,890 | 3,940 |
| Kroger Co. | 3.850% | 8/1/23 | 2,525 | 2,604 |
| Kroger Co. | 4.000% | 2/1/24 | 5,250 | 5,452 |
| Kroger Co. | 7.700% | 6/1/29 | 8,200 | 10,780 |
| Kroger Co. | 8.000% | 9/15/29 | 2,185 | 2,941 |
| Kroger Co. | 7.500% | 4/1/31 | 7,570 | 9,645 |
| Kroger Co. | 6.900% | 4/15/38 | 4,668 | 5,721 |
| Kroger Co. | 5.400% | 7/15/40 | 18 | 19 |
| Kroger Co. | 5.000% | 4/15/42 | 925 | 943 |
| Kroger Co. | 5.150% | 8/1/43 | 700 | 733 |
| Laboratory Corp. of America Holdings | 2.200% | 8/23/17 | 2,375 | 2,386 |
| Laboratory Corp. of America Holdings | 2.500% | 11/1/18 | 2,025 | 2,035 |
| Laboratory Corp. of America Holdings | 2.625% | 2/1/20 | 2,825 | 2,803 |
| Laboratory Corp. of America Holdings | 3.200% | 2/1/22 | 3,900 | 3,832 |
| Laboratory Corp. of America Holdings | 3.750% | 8/23/22 | 860 | 868 |
| Laboratory Corp. of America Holdings | 4.000% | 11/1/23 | 1,800 | 1,824 |
| Laboratory Corp. of America Holdings | 3.600% | 2/1/25 | 8,100 | 7,825 |
| Laboratory Corp. of America Holdings | 4.700% | 2/1/45 | 7,500 | 6,856 |
| Life Technologies Corp. | 6.000% | 3/1/20 | 1,700 | 1,885 |
| Life Technologies Corp. | 5.000% | 1/15/21 | 3,725 | 3,965 |
| Mattel Inc. | 1.700% | 3/15/18 | 2,710 | 2,681 |
| Mattel Inc. | 2.350% | 5/6/19 | 5,150 | 5,121 |
73
| Vanguard® Total Bond Market Index Fund | ||||
| Schedule of Investments | ||||
| December 31, 2015 | ||||
| Face | Market | |||
| Maturity | Amount | Value | ||
| Coupon | Date | ($000) | ($000) | |
| Mattel Inc. | 3.150% | 3/15/23 | 1,350 | 1,289 |
| Mattel Inc. | 5.450% | 11/1/41 | 3,818 | 3,776 |
| 5 Mayo Clinic | 3.774% | 11/15/43 | 6,502 | 6,093 |
| 5 Mayo Clinic | 4.000% | 11/15/47 | 4,025 | 3,813 |
| McCormick & Co. Inc. | 3.900% | 7/15/21 | 3,025 | 3,223 |
| McCormick & Co. Inc. | 3.500% | 9/1/23 | 1,891 | 1,925 |
| McCormick & Co. Inc. | 3.250% | 11/15/25 | 100 | 100 |
| McKesson Corp. | 5.700% | 3/1/17 | 2,336 | 2,448 |
| McKesson Corp. | 1.292% | 3/10/17 | 5,300 | 5,286 |
| McKesson Corp. | 7.500% | 2/15/19 | 3,484 | 3,988 |
| McKesson Corp. | 2.284% | 3/15/19 | 12,100 | 12,069 |
| McKesson Corp. | 4.750% | 3/1/21 | 14,695 | 15,915 |
| McKesson Corp. | 2.700% | 12/15/22 | 4,550 | 4,360 |
| McKesson Corp. | 3.796% | 3/15/24 | 10,158 | 10,219 |
| McKesson Corp. | 6.000% | 3/1/41 | 4,439 | 5,133 |
| McKesson Corp. | 4.883% | 3/15/44 | 6,400 | 6,412 |
| Mead Johnson Nutrition Co. | 4.900% | 11/1/19 | 5,460 | 5,885 |
| Mead Johnson Nutrition Co. | 3.000% | 11/15/20 | 2,000 | 2,004 |
| Mead Johnson Nutrition Co. | 4.125% | 11/15/25 | 7,625 | 7,677 |
| Mead Johnson Nutrition Co. | 5.900% | 11/1/39 | 7,150 | 7,787 |
| Medco Health Solutions Inc. | 7.125% | 3/15/18 | 15,037 | 16,575 |
| Medtronic Inc. | 1.500% | 3/15/18 | 8,000 | 7,998 |
| Medtronic Inc. | 1.375% | 4/1/18 | 17,750 | 17,658 |
| Medtronic Inc. | 5.600% | 3/15/19 | 1,450 | 1,606 |
| Medtronic Inc. | 2.500% | 3/15/20 | 31,914 | 32,105 |
| Medtronic Inc. | 4.450% | 3/15/20 | 4,145 | 4,468 |
| Medtronic Inc. | 3.150% | 3/15/22 | 26,029 | 26,289 |
| Medtronic Inc. | 2.750% | 4/1/23 | 17,100 | 16,692 |
| Medtronic Inc. | 3.625% | 3/15/24 | 8,750 | 8,965 |
| Medtronic Inc. | 3.500% | 3/15/25 | 28,470 | 28,804 |
| Medtronic Inc. | 4.375% | 3/15/35 | 33,945 | 34,271 |
| Medtronic Inc. | 6.500% | 3/15/39 | 2,445 | 3,140 |
| Medtronic Inc. | 5.550% | 3/15/40 | 4,350 | 5,011 |
| Medtronic Inc. | 4.500% | 3/15/42 | 7,125 | 7,146 |
| Medtronic Inc. | 4.000% | 4/1/43 | 4,850 | 4,514 |
| Medtronic Inc. | 4.625% | 3/15/44 | 5,068 | 5,176 |
| Medtronic Inc. | 4.625% | 3/15/45 | 28,600 | 29,503 |
| Memorial Sloan-Kettering Cancer Center | 4.200% | 7/1/55 | 1,500 | 1,441 |
| Memorial Sloan-Kettering Cancer Center New York GO | 5.000% | 7/1/42 | 1,250 | 1,344 |
| Memorial Sloan-Kettering Cancer Center New York GO | 4.125% | 7/1/52 | 8,100 | 7,530 |
| Merck & Co. Inc. | 1.100% | 1/31/18 | 6,169 | 6,130 |
| Merck & Co. Inc. | 1.300% | 5/18/18 | 13,220 | 13,204 |
| Merck & Co. Inc. | 1.850% | 2/10/20 | 10,010 | 9,995 |
| Merck & Co. Inc. | 3.875% | 1/15/21 | 13,920 | 14,922 |
| Merck & Co. Inc. | 2.350% | 2/10/22 | 11,800 | 11,582 |
| Merck & Co. Inc. | 2.400% | 9/15/22 | 4,900 | 4,790 |
| Merck & Co. Inc. | 2.800% | 5/18/23 | 20,800 | 20,690 |
| Merck & Co. Inc. | 2.750% | 2/10/25 | 22,825 | 22,178 |
| Merck & Co. Inc. | 6.500% | 12/1/33 | 3,793 | 4,866 |
| Merck & Co. Inc. | 6.550% | 9/15/37 | 6,063 | 7,943 |
| Merck & Co. Inc. | 3.600% | 9/15/42 | 4,497 | 4,099 |
| Merck & Co. Inc. | 4.150% | 5/18/43 | 14,373 | 14,208 |
| Merck & Co. Inc. | 3.700% | 2/10/45 | 18,479 | 16,991 |
| Merck Sharp & Dohme Corp. | 5.000% | 6/30/19 | 12,610 | 13,904 |
| Merck Sharp & Dohme Corp. | 5.950% | 12/1/28 | 150 | 188 |
| Merck Sharp & Dohme Corp. | 5.750% | 11/15/36 | 2,000 | 2,406 |
| Molson Coors Brewing Co. | 2.000% | 5/1/17 | 1,300 | 1,299 |
| Molson Coors Brewing Co. | 3.500% | 5/1/22 | 1,450 | 1,459 |
| Molson Coors Brewing Co. | 5.000% | 5/1/42 | 11,540 | 11,145 |
| Mondelez International Inc. | 6.500% | 8/11/17 | 3,305 | 3,549 |
| Mondelez International Inc. | 6.125% | 2/1/18 | 1,335 | 1,451 |
| Mondelez International Inc. | 6.125% | 8/23/18 | 5,000 | 5,511 |
| Mondelez International Inc. | 2.250% | 2/1/19 | 4,675 | 4,670 |
| Mondelez International Inc. | 5.375% | 2/10/20 | 13,431 | 14,854 |
74
| Vanguard® Total Bond Market Index Fund | ||||
| Schedule of Investments | ||||
| December 31, 2015 | ||||
| Face | Market | |||
| Maturity | Amount | Value | ||
| Coupon | Date | ($000) | ($000) | |
| Mondelez International Inc. | 4.000% | 2/1/24 | 22,550 | 23,256 |
| Mondelez International Inc. | 6.500% | 11/1/31 | 7,290 | 8,509 |
| Mondelez International Inc. | 6.500% | 2/9/40 | 6,860 | 8,423 |
| Mylan Inc. | 2.600% | 6/24/18 | 1,106 | 1,098 |
| Mylan Inc. | 2.550% | 3/28/19 | 11,211 | 11,061 |
| Mylan Inc. | 4.200% | 11/29/23 | 14,608 | 14,319 |
| Mylan Inc. | 5.400% | 11/29/43 | 4,475 | 4,170 |
| New York & Presbyterian Hospital | 4.024% | 8/1/45 | 4,100 | 3,865 |
| Newell Rubbermaid Inc. | 2.050% | 12/1/17 | 2,525 | 2,504 |
| Newell Rubbermaid Inc. | 2.150% | 10/15/18 | 2,700 | 2,621 |
| Newell Rubbermaid Inc. | 2.875% | 12/1/19 | 7,025 | 6,779 |
| Newell Rubbermaid Inc. | 4.000% | 6/15/22 | 1,400 | 1,349 |
| Newell Rubbermaid Inc. | 4.000% | 12/1/24 | 10,200 | 9,467 |
| Newell Rubbermaid Inc. | 3.900% | 11/1/25 | 2,875 | 2,636 |
| Novant Health Inc. | 5.850% | 11/1/19 | 6,125 | 6,875 |
| Novant Health Inc. | 4.371% | 11/1/43 | 7,100 | 6,802 |
| Novartis Capital Corp. | 4.400% | 4/24/20 | 2,101 | 2,304 |
| Novartis Capital Corp. | 2.400% | 9/21/22 | 22,379 | 22,023 |
| Novartis Capital Corp. | 3.400% | 5/6/24 | 17,520 | 18,085 |
| Novartis Capital Corp. | 3.000% | 11/20/25 | 15,100 | 14,883 |
| Novartis Capital Corp. | 3.700% | 9/21/42 | 3,875 | 3,672 |
| Novartis Capital Corp. | 4.400% | 5/6/44 | 21,646 | 22,502 |
| Novartis Capital Corp. | 4.000% | 11/20/45 | 11,000 | 10,773 |
| Novartis Securities Investment Ltd. | 5.125% | 2/10/19 | 14,245 | 15,620 |
| NYU Hospitals Center | 4.784% | 7/1/44 | 4,425 | 4,455 |
| Owens & Minor Inc. | 4.375% | 12/15/24 | 2,250 | 2,246 |
| Partners Healthcare System Inc. | 4.117% | 7/1/55 | 1,950 | 1,776 |
| Partners Healthcare System Massachusetts GO | 3.443% | 7/1/21 | 2,450 | 2,520 |
| PepsiAmericas Inc. | 5.000% | 5/15/17 | 3,805 | 3,996 |
| PepsiCo Inc. | 0.950% | 2/22/17 | 100 | 100 |
| PepsiCo Inc. | 1.125% | 7/17/17 | 12,825 | 12,817 |
| PepsiCo Inc. | 1.250% | 8/13/17 | 12,275 | 12,282 |
| PepsiCo Inc. | 1.000% | 10/13/17 | 5,700 | 5,672 |
| PepsiCo Inc. | 1.250% | 4/30/18 | 6,300 | 6,278 |
| PepsiCo Inc. | 5.000% | 6/1/18 | 18,810 | 20,330 |
| PepsiCo Inc. | 7.900% | 11/1/18 | 4,974 | 5,822 |
| PepsiCo Inc. | 2.250% | 1/7/19 | 14,450 | 14,640 |
| PepsiCo Inc. | 4.500% | 1/15/20 | 8,155 | 8,855 |
| PepsiCo Inc. | 1.850% | 4/30/20 | 14,746 | 14,613 |
| PepsiCo Inc. | 2.150% | 10/14/20 | 19,015 | 18,905 |
| PepsiCo Inc. | 3.125% | 11/1/20 | 5,600 | 5,797 |
| PepsiCo Inc. | 3.000% | 8/25/21 | 8,037 | 8,231 |
| PepsiCo Inc. | 2.750% | 3/5/22 | 11,590 | 11,622 |
| PepsiCo Inc. | 3.100% | 7/17/22 | 5,375 | 5,513 |
| PepsiCo Inc. | 2.750% | 3/1/23 | 1,600 | 1,596 |
| PepsiCo Inc. | 3.600% | 3/1/24 | 7,450 | 7,776 |
| PepsiCo Inc. | 2.750% | 4/30/25 | 14,924 | 14,587 |
| PepsiCo Inc. | 3.500% | 7/17/25 | 13,150 | 13,559 |
| PepsiCo Inc. | 5.500% | 1/15/40 | 9,425 | 10,998 |
| PepsiCo Inc. | 4.875% | 11/1/40 | 4,670 | 5,017 |
| PepsiCo Inc. | 4.000% | 3/5/42 | 11,875 | 11,443 |
| PepsiCo Inc. | 3.600% | 8/13/42 | 4,296 | 3,898 |
| PepsiCo Inc. | 4.250% | 10/22/44 | 2,400 | 2,384 |
| PepsiCo Inc. | 4.600% | 7/17/45 | 8,195 | 8,645 |
| PepsiCo Inc. | 4.450% | 4/14/46 | 5,050 | 5,203 |
| PerkinElmer Inc. | 5.000% | 11/15/21 | 4,475 | 4,719 |
| Perrigo Co. plc | 2.300% | 11/8/18 | 5,560 | 5,480 |
| Perrigo Co. plc | 4.000% | 11/15/23 | 15,635 | 15,212 |
| Perrigo Co. plc | 5.300% | 11/15/43 | 1,900 | 1,827 |
| Perrigo Finance plc | 3.500% | 12/15/21 | 3,600 | 3,498 |
| Perrigo Finance plc | 3.900% | 12/15/24 | 4,650 | 4,480 |
| Perrigo Finance plc | 4.900% | 12/15/44 | 4,300 | 3,875 |
| Pfizer Inc. | 6.050% | 3/30/17 | 800 | 848 |
| Pfizer Inc. | 1.100% | 5/15/17 | 2,575 | 2,575 |
75
| Vanguard® Total Bond Market Index Fund | ||||
| Schedule of Investments | ||||
| December 31, 2015 | ||||
| Face | Market | |||
| Maturity | Amount | Value | ||
| Coupon | Date | ($000) | ($000) | |
| Pfizer Inc. | 1.500% | 6/15/18 | 6,550 | 6,542 |
| Pfizer Inc. | 6.200% | 3/15/19 | 24,302 | 27,355 |
| Pfizer Inc. | 2.100% | 5/15/19 | 14,000 | 14,082 |
| Pfizer Inc. | 3.000% | 6/15/23 | 9,585 | 9,745 |
| Pfizer Inc. | 3.400% | 5/15/24 | 13,775 | 14,128 |
| Pfizer Inc. | 7.200% | 3/15/39 | 10,010 | 13,748 |
| Pfizer Inc. | 4.300% | 6/15/43 | 1,318 | 1,318 |
| Pfizer Inc. | 4.400% | 5/15/44 | 5,400 | 5,452 |
| Pharmacia Corp. | 6.600% | 12/1/28 | 7,500 | 9,626 |
| Philip Morris International Inc. | 2.500% | 5/16/16 | 101 | 102 |
| Philip Morris International Inc. | 1.625% | 3/20/17 | 8,506 | 8,553 |
| Philip Morris International Inc. | 1.250% | 8/11/17 | 3,125 | 3,129 |
| Philip Morris International Inc. | 1.125% | 8/21/17 | 275 | 275 |
| Philip Morris International Inc. | 1.250% | 11/9/17 | 7,350 | 7,339 |
| Philip Morris International Inc. | 5.650% | 5/16/18 | 18,756 | 20,467 |
| Philip Morris International Inc. | 1.875% | 1/15/19 | 13,250 | 13,191 |
| Philip Morris International Inc. | 4.125% | 5/17/21 | 3,050 | 3,263 |
| Philip Morris International Inc. | 2.900% | 11/15/21 | 1,540 | 1,555 |
| Philip Morris International Inc. | 2.500% | 8/22/22 | 1,000 | 978 |
| Philip Morris International Inc. | 2.625% | 3/6/23 | 5,240 | 5,131 |
| Philip Morris International Inc. | 3.600% | 11/15/23 | 11,000 | 11,451 |
| Philip Morris International Inc. | 3.250% | 11/10/24 | 9,350 | 9,429 |
| Philip Morris International Inc. | 3.375% | 8/11/25 | 5,964 | 6,040 |
| Philip Morris International Inc. | 6.375% | 5/16/38 | 17,967 | 22,564 |
| Philip Morris International Inc. | 4.375% | 11/15/41 | 9,050 | 9,000 |
| Philip Morris International Inc. | 4.500% | 3/20/42 | 5,938 | 5,928 |
| Philip Morris International Inc. | 3.875% | 8/21/42 | 7,285 | 6,666 |
| Philip Morris International Inc. | 4.125% | 3/4/43 | 4,050 | 3,825 |
| Philip Morris International Inc. | 4.875% | 11/15/43 | 7,673 | 8,088 |
| 5 Procter & Gamble - Esop | 9.360% | 1/1/21 | 3,309 | 3,955 |
| Procter & Gamble Co. | 1.600% | 11/15/18 | 6,700 | 6,745 |
| Procter & Gamble Co. | 4.700% | 2/15/19 | 4,105 | 4,475 |
| Procter & Gamble Co. | 1.900% | 11/1/19 | 8,800 | 8,842 |
| Procter & Gamble Co. | 2.300% | 2/6/22 | 17,625 | 17,685 |
| Procter & Gamble Co. | 3.100% | 8/15/23 | 8,042 | 8,391 |
| Procter & Gamble Co. | 6.450% | 1/15/26 | 5,186 | 6,581 |
| Procter & Gamble Co. | 5.500% | 2/1/34 | 6,363 | 7,609 |
| Procter & Gamble Co. | 5.800% | 8/15/34 | 195 | 235 |
| Procter & Gamble Co. | 5.550% | 3/5/37 | 17,685 | 21,628 |
| Quest Diagnostics Inc. | 2.700% | 4/1/19 | 6,950 | 6,929 |
| Quest Diagnostics Inc. | 4.750% | 1/30/20 | 2,700 | 2,862 |
| Quest Diagnostics Inc. | 2.500% | 3/30/20 | 3,000 | 2,955 |
| Quest Diagnostics Inc. | 4.700% | 4/1/21 | 2,000 | 2,117 |
| Quest Diagnostics Inc. | 4.250% | 4/1/24 | 3,087 | 3,186 |
| Quest Diagnostics Inc. | 3.500% | 3/30/25 | 3,900 | 3,771 |
| Quest Diagnostics Inc. | 5.750% | 1/30/40 | 4,214 | 4,365 |
| Quest Diagnostics Inc. | 4.700% | 3/30/45 | 2,149 | 1,943 |
| Reynolds American Inc. | 6.750% | 6/15/17 | 5,871 | 6,268 |
| Reynolds American Inc. | 2.300% | 8/21/17 | 175 | 176 |
| Reynolds American Inc. | 2.300% | 6/12/18 | 11,610 | 11,681 |
| Reynolds American Inc. | 8.125% | 6/23/19 | 7,728 | 9,083 |
| Reynolds American Inc. | 6.875% | 5/1/20 | 1,400 | 1,619 |
| Reynolds American Inc. | 3.250% | 6/12/20 | 13,735 | 13,957 |
| Reynolds American Inc. | 4.000% | 6/12/22 | 8,250 | 8,577 |
| Reynolds American Inc. | 3.250% | 11/1/22 | 5,225 | 5,168 |
| Reynolds American Inc. | 3.750% | 5/20/23 | 6,275 | 6,283 |
| Reynolds American Inc. | 4.850% | 9/15/23 | 3,425 | 3,663 |
| Reynolds American Inc. | 4.450% | 6/12/25 | 30,550 | 31,963 |
| Reynolds American Inc. | 5.700% | 8/15/35 | 10,500 | 11,493 |
| Reynolds American Inc. | 7.250% | 6/15/37 | 3,008 | 3,696 |
| Reynolds American Inc. | 8.125% | 5/1/40 | 1,840 | 2,295 |
| Reynolds American Inc. | 7.000% | 8/4/41 | 3,375 | 3,813 |
| Reynolds American Inc. | 4.750% | 11/1/42 | 3,600 | 3,437 |
| Reynolds American Inc. | 6.150% | 9/15/43 | 1,300 | 1,476 |
76
| Vanguard® Total Bond Market Index Fund | ||||
| Schedule of Investments | ||||
| December 31, 2015 | ||||
| Face | Market | |||
| Maturity | Amount | Value | ||
| Coupon | Date | ($000) | ($000) | |
| Reynolds American Inc. | 5.850% | 8/15/45 | 19,900 | 22,066 |
| Sanofi | 1.250% | 4/10/18 | 13,285 | 13,223 |
| Sanofi | 4.000% | 3/29/21 | 17,973 | 19,197 |
| Southern Baptist Hospital of Florida Inc. | 4.857% | 7/15/45 | 1,900 | 1,972 |
| St. Jude Medical Inc. | 2.000% | 9/15/18 | 4,650 | 4,641 |
| St. Jude Medical Inc. | 2.800% | 9/15/20 | 4,650 | 4,654 |
| St. Jude Medical Inc. | 3.250% | 4/15/23 | 16,575 | 16,258 |
| St. Jude Medical Inc. | 3.875% | 9/15/25 | 3,400 | 3,440 |
| St. Jude Medical Inc. | 4.750% | 4/15/43 | 9,950 | 9,754 |
| Stryker Corp. | 4.375% | 1/15/20 | 736 | 792 |
| Stryker Corp. | 3.375% | 5/15/24 | 11,300 | 11,345 |
| Stryker Corp. | 3.375% | 11/1/25 | 5,000 | 4,936 |
| Stryker Corp. | 4.375% | 5/15/44 | 3,400 | 3,364 |
| Sysco Corp. | 5.250% | 2/12/18 | 3,145 | 3,361 |
| Sysco Corp. | 2.600% | 10/1/20 | 5,575 | 5,580 |
| Sysco Corp. | 3.750% | 10/1/25 | 5,700 | 5,769 |
| Sysco Corp. | 5.375% | 9/21/35 | 6,780 | 7,520 |
| Sysco Corp. | 4.850% | 10/1/45 | 2,100 | 2,181 |
| Teva Pharmaceutical Finance Co. BV | 3.650% | 11/10/21 | 7,342 | 7,458 |
| Teva Pharmaceutical Finance Co. BV | 2.950% | 12/18/22 | 15,225 | 14,576 |
| Teva Pharmaceutical Finance Co. LLC | 6.150% | 2/1/36 | 1,670 | 1,826 |
| Teva Pharmaceutical Finance IV BV | 3.650% | 11/10/21 | 5,270 | 5,331 |
| Teva Pharmaceutical Finance IV LLC | 2.250% | 3/18/20 | 12,467 | 12,101 |
| 5 Texas Health Resources | 4.330% | 11/15/55 | 1,575 | 1,515 |
| The Pepsi Bottling Group Inc. | 7.000% | 3/1/29 | 12,449 | 16,696 |
| Thermo Fisher Scientific Inc. | 1.300% | 2/1/17 | 1,650 | 1,644 |
| Thermo Fisher Scientific Inc. | 1.850% | 1/15/18 | 4,360 | 4,350 |
| Thermo Fisher Scientific Inc. | 2.150% | 12/14/18 | 3,525 | 3,524 |
| Thermo Fisher Scientific Inc. | 2.400% | 2/1/19 | 7,062 | 7,066 |
| Thermo Fisher Scientific Inc. | 4.700% | 5/1/20 | 750 | 804 |
| Thermo Fisher Scientific Inc. | 4.500% | 3/1/21 | 8,800 | 9,318 |
| Thermo Fisher Scientific Inc. | 3.600% | 8/15/21 | 1,609 | 1,632 |
| Thermo Fisher Scientific Inc. | 3.300% | 2/15/22 | 11,420 | 11,413 |
| Thermo Fisher Scientific Inc. | 3.150% | 1/15/23 | 5,900 | 5,765 |
| Thermo Fisher Scientific Inc. | 4.150% | 2/1/24 | 3,999 | 4,155 |
| Thermo Fisher Scientific Inc. | 3.650% | 12/15/25 | 8,300 | 8,252 |
| Thermo Fisher Scientific Inc. | 5.300% | 2/1/44 | 5,197 | 5,544 |
| Trinity Health Corp. | 4.125% | 12/1/45 | 2,200 | 2,086 |
| Tupperware Brands Corp. | 4.750% | 6/1/21 | 3,075 | 3,138 |
| Tyson Foods Inc. | 6.600% | 4/1/16 | 92 | 93 |
| Tyson Foods Inc. | 2.650% | 8/15/19 | 5,211 | 5,208 |
| Tyson Foods Inc. | 4.500% | 6/15/22 | 19,493 | 20,724 |
| Tyson Foods Inc. | 3.950% | 8/15/24 | 12,730 | 13,076 |
| Tyson Foods Inc. | 4.875% | 8/15/34 | 8,799 | 8,976 |
| Tyson Foods Inc. | 5.150% | 8/15/44 | 3,725 | 3,926 |
| Unilever Capital Corp. | 0.850% | 8/2/17 | 5,500 | 5,471 |
| Unilever Capital Corp. | 4.800% | 2/15/19 | 6,986 | 7,603 |
| Unilever Capital Corp. | 2.200% | 3/6/19 | 6,600 | 6,695 |
| Unilever Capital Corp. | 2.100% | 7/30/20 | 7,600 | 7,574 |
| Unilever Capital Corp. | 4.250% | 2/10/21 | 12,820 | 13,989 |
| Unilever Capital Corp. | 3.100% | 7/30/25 | 6,200 | 6,287 |
| Unilever Capital Corp. | 5.900% | 11/15/32 | 4,250 | 5,388 |
| Whirlpool Corp. | 1.350% | 3/1/17 | 4,765 | 4,756 |
| Whirlpool Corp. | 1.650% | 11/1/17 | 3,300 | 3,292 |
| Whirlpool Corp. | 4.850% | 6/15/21 | 2,763 | 2,983 |
| Whirlpool Corp. | 4.700% | 6/1/22 | 2,155 | 2,292 |
| Whirlpool Corp. | 4.000% | 3/1/24 | 5,234 | 5,358 |
| Whirlpool Corp. | 3.700% | 5/1/25 | 3,805 | 3,769 |
| Whirlpool Corp. | 5.150% | 3/1/43 | 2,820 | 2,779 |
| 8 Whole Foods Market Inc. | 5.200% | 12/3/25 | 17,200 | 17,186 |
| Wyeth LLC | 5.450% | 4/1/17 | 3,345 | 3,514 |
| Wyeth LLC | 7.250% | 3/1/23 | 2,400 | 3,006 |
| Wyeth LLC | 6.450% | 2/1/24 | 1,925 | 2,351 |
| Wyeth LLC | 6.500% | 2/1/34 | 6,675 | 8,351 |
77
| Vanguard® Total Bond Market Index Fund | ||||
| Schedule of Investments | ||||
| December 31, 2015 | ||||
| Face | Market | |||
| Maturity | Amount | Value | ||
| Coupon | Date | ($000) | ($000) | |
| Wyeth LLC | 6.000% | 2/15/36 | 5,940 | 7,092 |
| Wyeth LLC | 5.950% | 4/1/37 | 33,633 | 40,046 |
| Zeneca Wilmington Inc. | 7.000% | 11/15/23 | 3,175 | 3,955 |
| Zimmer Biomet Holdings Inc. | 1.450% | 4/1/17 | 6,050 | 6,020 |
| Zimmer Biomet Holdings Inc. | 2.000% | 4/1/18 | 9,000 | 8,951 |
| Zimmer Biomet Holdings Inc. | 4.625% | 11/30/19 | 1,850 | 1,982 |
| Zimmer Biomet Holdings Inc. | 2.700% | 4/1/20 | 10,400 | 10,289 |
| Zimmer Biomet Holdings Inc. | 3.375% | 11/30/21 | 5,175 | 5,193 |
| Zimmer Biomet Holdings Inc. | 3.150% | 4/1/22 | 8,480 | 8,333 |
| Zimmer Biomet Holdings Inc. | 3.550% | 4/1/25 | 18,200 | 17,668 |
| Zimmer Biomet Holdings Inc. | 4.250% | 8/15/35 | 6,600 | 6,181 |
| Zimmer Biomet Holdings Inc. | 5.750% | 11/30/39 | 4,058 | 4,473 |
| Zimmer Biomet Holdings Inc. | 4.450% | 8/15/45 | 9,000 | 8,316 |
| Zoetis Inc. | 1.875% | 2/1/18 | 2,550 | 2,518 |
| Zoetis Inc. | 3.450% | 11/13/20 | 5,000 | 5,000 |
| Zoetis Inc. | 3.250% | 2/1/23 | 12,985 | 12,398 |
| Zoetis Inc. | 4.500% | 11/13/25 | 5,025 | 5,097 |
| Zoetis Inc. | 4.700% | 2/1/43 | 10,403 | 9,118 |
| Energy (2.6%) | ||||
| Alberta Energy Co. Ltd. | 7.375% | 11/1/31 | 3,209 | 3,093 |
| Anadarko Finance Co. | 7.500% | 5/1/31 | 9,851 | 10,488 |
| Anadarko Petroleum Corp. | 6.375% | 9/15/17 | 23,900 | 25,068 |
| Anadarko Petroleum Corp. | 3.450% | 7/15/24 | 6,589 | 5,849 |
| Anadarko Petroleum Corp. | 6.450% | 9/15/36 | 14,026 | 13,416 |
| Anadarko Petroleum Corp. | 7.950% | 6/15/39 | 3,475 | 3,926 |
| Anadarko Petroleum Corp. | 6.200% | 3/15/40 | 14,165 | 13,272 |
| Apache Corp. | 6.900% | 9/15/18 | 7,110 | 7,808 |
| Apache Corp. | 3.625% | 2/1/21 | 5,100 | 5,034 |
| Apache Corp. | 3.250% | 4/15/22 | 6,163 | 5,882 |
| Apache Corp. | 2.625% | 1/15/23 | 175 | 160 |
| Apache Corp. | 6.000% | 1/15/37 | 18,505 | 17,882 |
| Apache Corp. | 5.100% | 9/1/40 | 12,718 | 10,847 |
| Apache Corp. | 5.250% | 2/1/42 | 10,400 | 9,009 |
| Apache Corp. | 4.750% | 4/15/43 | 4,799 | 4,066 |
| Apache Finance Canada Corp. | 7.750% | 12/15/29 | 1,130 | 1,418 |
| Baker Hughes Inc. | 3.200% | 8/15/21 | 10,502 | 10,396 |
| Baker Hughes Inc. | 6.875% | 1/15/29 | 990 | 1,173 |
| Baker Hughes Inc. | 5.125% | 9/15/40 | 15,030 | 14,934 |
| BJ Services Co. | 6.000% | 6/1/18 | 4,465 | 4,819 |
| Boardwalk Pipelines LP | 5.500% | 2/1/17 | 3,735 | 3,784 |
| Boardwalk Pipelines LP | 5.750% | 9/15/19 | 50 | 50 |
| Boardwalk Pipelines LP | 3.375% | 2/1/23 | 4,025 | 3,253 |
| Boardwalk Pipelines LP | 4.950% | 12/15/24 | 8,250 | 7,174 |
| BP Capital Markets plc | 1.846% | 5/5/17 | 18,295 | 18,384 |
| BP Capital Markets plc | 1.375% | 11/6/17 | 3,890 | 3,861 |
| BP Capital Markets plc | 1.375% | 5/10/18 | 35,765 | 35,242 |
| BP Capital Markets plc | 2.241% | 9/26/18 | 6,375 | 6,375 |
| BP Capital Markets plc | 4.750% | 3/10/19 | 12,310 | 13,186 |
| BP Capital Markets plc | 2.237% | 5/10/19 | 23,986 | 23,755 |
| BP Capital Markets plc | 2.315% | 2/13/20 | 6,550 | 6,466 |
| BP Capital Markets plc | 4.742% | 3/11/21 | 18,659 | 20,310 |
| BP Capital Markets plc | 3.561% | 11/1/21 | 14,445 | 14,682 |
| BP Capital Markets plc | 3.062% | 3/17/22 | 3,425 | 3,355 |
| BP Capital Markets plc | 3.245% | 5/6/22 | 15,230 | 15,156 |
| BP Capital Markets plc | 2.500% | 11/6/22 | 13,082 | 12,477 |
| BP Capital Markets plc | 2.750% | 5/10/23 | 24,420 | 22,894 |
| BP Capital Markets plc | 3.994% | 9/26/23 | 4,800 | 4,874 |
| BP Capital Markets plc | 3.814% | 2/10/24 | 5,722 | 5,708 |
| BP Capital Markets plc | 3.535% | 11/4/24 | 20,960 | 20,347 |
| BP Capital Markets plc | 3.506% | 3/17/25 | 16,973 | 16,511 |
| Buckeye Partners LP | 6.050% | 1/15/18 | 370 | 380 |
| Buckeye Partners LP | 2.650% | 11/15/18 | 7,000 | 6,670 |
| Buckeye Partners LP | 4.150% | 7/1/23 | 2,025 | 1,743 |
78
| Vanguard® Total Bond Market Index Fund | ||||
| Schedule of Investments | ||||
| December 31, 2015 | ||||
| Face | Market | |||
| Maturity | Amount | Value | ||
| Coupon | Date | ($000) | ($000) | |
| Buckeye Partners LP | 5.850% | 11/15/43 | 5,175 | 3,996 |
| Buckeye Partners LP | 5.600% | 10/15/44 | 1,425 | 1,063 |
| Burlington Resources Finance Co. | 7.200% | 8/15/31 | 750 | 859 |
| Burlington Resources Finance Co. | 7.400% | 12/1/31 | 4,150 | 4,947 |
| Cameron International Corp. | 1.150% | 12/15/16 | 2,200 | 2,178 |
| Cameron International Corp. | 6.375% | 7/15/18 | 6,834 | 7,408 |
| Cameron International Corp. | 4.000% | 12/15/23 | 4,390 | 4,411 |
| Cameron International Corp. | 3.700% | 6/15/24 | 10,810 | 10,557 |
| Cameron International Corp. | 7.000% | 7/15/38 | 1,407 | 1,682 |
| Cameron International Corp. | 5.950% | 6/1/41 | 2,918 | 3,168 |
| Cameron International Corp. | 5.125% | 12/15/43 | 3,175 | 3,149 |
| Canadian Natural Resources Ltd. | 5.700% | 5/15/17 | 13,681 | 13,980 |
| Canadian Natural Resources Ltd. | 3.450% | 11/15/21 | 725 | 684 |
| Canadian Natural Resources Ltd. | 3.800% | 4/15/24 | 4,573 | 4,081 |
| Canadian Natural Resources Ltd. | 7.200% | 1/15/32 | 5,318 | 5,496 |
| Canadian Natural Resources Ltd. | 6.450% | 6/30/33 | 5,865 | 5,672 |
| Canadian Natural Resources Ltd. | 5.850% | 2/1/35 | 175 | 156 |
| Canadian Natural Resources Ltd. | 6.500% | 2/15/37 | 9,240 | 8,673 |
| Canadian Natural Resources Ltd. | 6.250% | 3/15/38 | 3,714 | 3,374 |
| Cenovus Energy Inc. | 5.700% | 10/15/19 | 8,379 | 8,801 |
| Cenovus Energy Inc. | 3.000% | 8/15/22 | 1,050 | 936 |
| Cenovus Energy Inc. | 6.750% | 11/15/39 | 19,015 | 18,100 |
| Cenovus Energy Inc. | 4.450% | 9/15/42 | 4,388 | 3,223 |
| Cenovus Energy Inc. | 5.200% | 9/15/43 | 1,500 | 1,182 |
| Chevron Corp. | 1.344% | 11/9/17 | 11,100 | 11,064 |
| Chevron Corp. | 1.345% | 11/15/17 | 1,750 | 1,743 |
| Chevron Corp. | 1.104% | 12/5/17 | 7,250 | 7,198 |
| Chevron Corp. | 1.365% | 3/2/18 | 30,350 | 30,097 |
| Chevron Corp. | 1.718% | 6/24/18 | 16,965 | 16,874 |
| Chevron Corp. | 1.790% | 11/16/18 | 11,300 | 11,212 |
| Chevron Corp. | 4.950% | 3/3/19 | 28,300 | 30,816 |
| Chevron Corp. | 2.193% | 11/15/19 | 11,355 | 11,336 |
| Chevron Corp. | 1.961% | 3/3/20 | 16,550 | 16,278 |
| Chevron Corp. | 2.427% | 6/24/20 | 6,500 | 6,494 |
| Chevron Corp. | 2.419% | 11/17/20 | 11,000 | 10,955 |
| Chevron Corp. | 2.411% | 3/3/22 | 6,700 | 6,505 |
| Chevron Corp. | 2.355% | 12/5/22 | 10,071 | 9,607 |
| Chevron Corp. | 3.191% | 6/24/23 | 16,630 | 16,697 |
| Chevron Corp. | 3.326% | 11/17/25 | 3,100 | 3,122 |
| Cimarex Energy Co. | 5.875% | 5/1/22 | 3,500 | 3,395 |
| Cimarex Energy Co. | 4.375% | 6/1/24 | 11,950 | 10,695 |
| 8 Columbia Pipeline Group Inc. | 2.450% | 6/1/18 | 3,475 | 3,428 |
| 8 Columbia Pipeline Group Inc. | 3.300% | 6/1/20 | 1,350 | 1,323 |
| 8 Columbia Pipeline Group Inc. | 4.500% | 6/1/25 | 4,900 | 4,440 |
| 8 Columbia Pipeline Group Inc. | 5.800% | 6/1/45 | 4,200 | 3,687 |
| ConocoPhillips | 6.650% | 7/15/18 | 45 | 50 |
| ConocoPhillips | 5.750% | 2/1/19 | 13,455 | 14,557 |
| ConocoPhillips | 5.900% | 10/15/32 | 11,876 | 12,154 |
| ConocoPhillips | 5.900% | 5/15/38 | 4,312 | 4,217 |
| ConocoPhillips | 6.500% | 2/1/39 | 17,493 | 18,395 |
| ConocoPhillips Canada Funding Co. I | 5.625% | 10/15/16 | 28,755 | 29,659 |
| ConocoPhillips Canada Funding Co. I | 5.950% | 10/15/36 | 4,470 | 4,597 |
| ConocoPhillips Co. | 1.050% | 12/15/17 | 1,828 | 1,796 |
| ConocoPhillips Co. | 2.200% | 5/15/20 | 1,150 | 1,112 |
| ConocoPhillips Co. | 2.875% | 11/15/21 | 2,200 | 2,137 |
| ConocoPhillips Co. | 2.400% | 12/15/22 | 8,275 | 7,517 |
| ConocoPhillips Co. | 3.350% | 11/15/24 | 6,763 | 6,279 |
| ConocoPhillips Co. | 3.350% | 5/15/25 | 459 | 413 |
| ConocoPhillips Co. | 4.150% | 11/15/34 | 6,361 | 5,522 |
| ConocoPhillips Co. | 4.300% | 11/15/44 | 18,350 | 15,180 |
| ConocoPhillips Holding Co. | 6.950% | 4/15/29 | 8,715 | 9,938 |
| Continental Resources Inc. | 5.000% | 9/15/22 | 22,636 | 16,637 |
| Continental Resources Inc. | 4.500% | 4/15/23 | 9,995 | 7,133 |
| Continental Resources Inc. | 3.800% | 6/1/24 | 4,679 | 3,281 |
79
| Vanguard® Total Bond Market Index Fund | ||||
| Schedule of Investments | ||||
| December 31, 2015 | ||||
| Face | Market | |||
| Maturity | Amount | Value | ||
| Coupon | Date | ($000) | ($000) | |
| Continental Resources Inc. | 4.900% | 6/1/44 | 8,225 | 4,822 |
| Devon Energy Corp. | 2.250% | 12/15/18 | 2,800 | 2,579 |
| Devon Energy Corp. | 6.300% | 1/15/19 | 35 | 36 |
| Devon Energy Corp. | 4.000% | 7/15/21 | 4,965 | 4,515 |
| Devon Energy Corp. | 3.250% | 5/15/22 | 14,980 | 12,707 |
| Devon Energy Corp. | 7.950% | 4/15/32 | 8,055 | 8,329 |
| Devon Energy Corp. | 5.600% | 7/15/41 | 6,681 | 5,046 |
| Devon Energy Corp. | 4.750% | 5/15/42 | 1,797 | 1,317 |
| Devon Energy Corp. | 5.000% | 6/15/45 | 5,000 | 3,789 |
| Devon Financing Corp. LLC | 7.875% | 9/30/31 | 16,736 | 17,259 |
| Diamond Offshore Drilling Inc. | 5.875% | 5/1/19 | 4,020 | 4,083 |
| Diamond Offshore Drilling Inc. | 3.450% | 11/1/23 | 1,575 | 1,290 |
| Diamond Offshore Drilling Inc. | 5.700% | 10/15/39 | 5,835 | 3,967 |
| Diamond Offshore Drilling Inc. | 4.875% | 11/1/43 | 5,525 | 3,373 |
| Dominion Gas Holdings LLC | 2.800% | 11/15/20 | 4,500 | 4,515 |
| Dominion Gas Holdings LLC | 3.550% | 11/1/23 | 13,075 | 12,899 |
| Dominion Gas Holdings LLC | 3.600% | 12/15/24 | 5,825 | 5,768 |
| Dominion Gas Holdings LLC | 4.800% | 11/1/43 | 5,400 | 5,167 |
| Dominion Gas Holdings LLC | 4.600% | 12/15/44 | 4,925 | 4,582 |
| El Paso Natural Gas Co. LLC | 5.950% | 4/15/17 | 13,145 | 13,374 |
| El Paso Natural Gas Co. LLC | 8.625% | 1/15/22 | 6,694 | 7,269 |
| El Paso Natural Gas Co. LLC | 8.375% | 6/15/32 | 1,330 | 1,286 |
| Enable Midstream Partners LP | 2.400% | 5/15/19 | 4,000 | 3,597 |
| Enable Midstream Partners LP | 3.900% | 5/15/24 | 11,725 | 9,181 |
| Enable Midstream Partners LP | 5.000% | 5/15/44 | 1,275 | 749 |
| Enbridge Energy Partners LP | 6.500% | 4/15/18 | 6,305 | 6,612 |
| Enbridge Energy Partners LP | 9.875% | 3/1/19 | 8,235 | 9,384 |
| Enbridge Energy Partners LP | 4.375% | 10/15/20 | 1,400 | 1,366 |
| Enbridge Energy Partners LP | 5.875% | 10/15/25 | 3,100 | 2,987 |
| Enbridge Energy Partners LP | 7.500% | 4/15/38 | 11,035 | 10,938 |
| Enbridge Energy Partners LP | 5.500% | 9/15/40 | 543 | 425 |
| Enbridge Inc. | 5.600% | 4/1/17 | 3,975 | 4,103 |
| Enbridge Inc. | 4.500% | 6/10/44 | 4,100 | 2,778 |
| Encana Corp. | 3.900% | 11/15/21 | 7,475 | 6,176 |
| Encana Corp. | 7.200% | 11/1/31 | 4,975 | 4,545 |
| Encana Corp. | 6.500% | 8/15/34 | 10,548 | 8,786 |
| Encana Corp. | 6.625% | 8/15/37 | 8,504 | 7,103 |
| Encana Corp. | 6.500% | 2/1/38 | 4,155 | 3,431 |
| Encana Corp. | 5.150% | 11/15/41 | 242 | 167 |
| Energy Transfer Partners LP | 6.125% | 2/15/17 | 1,010 | 1,032 |
| Energy Transfer Partners LP | 2.500% | 6/15/18 | 3,530 | 3,360 |
| Energy Transfer Partners LP | 6.700% | 7/1/18 | 8,372 | 8,811 |
| Energy Transfer Partners LP | 9.000% | 4/15/19 | 22,188 | 24,415 |
| Energy Transfer Partners LP | 4.150% | 10/1/20 | 7,251 | 6,719 |
| Energy Transfer Partners LP | 4.650% | 6/1/21 | 13,375 | 12,552 |
| Energy Transfer Partners LP | 5.200% | 2/1/22 | 6,966 | 6,458 |
| Energy Transfer Partners LP | 3.600% | 2/1/23 | 17,233 | 14,194 |
| Energy Transfer Partners LP | 4.900% | 2/1/24 | 1,620 | 1,442 |
| Energy Transfer Partners LP | 7.600% | 2/1/24 | 4,822 | 5,007 |
| Energy Transfer Partners LP | 4.050% | 3/15/25 | 5,775 | 4,786 |
| Energy Transfer Partners LP | 4.750% | 1/15/26 | 8,660 | 7,424 |
| Energy Transfer Partners LP | 8.250% | 11/15/29 | 10 | 11 |
| Energy Transfer Partners LP | 4.900% | 3/15/35 | 3,000 | 2,181 |
| Energy Transfer Partners LP | 6.625% | 10/15/36 | 3,495 | 2,986 |
| Energy Transfer Partners LP | 7.500% | 7/1/38 | 6,757 | 6,191 |
| Energy Transfer Partners LP | 6.050% | 6/1/41 | 4,300 | 3,326 |
| Energy Transfer Partners LP | 6.500% | 2/1/42 | 24,120 | 19,666 |
| Energy Transfer Partners LP | 5.150% | 2/1/43 | 1,024 | 730 |
| Energy Transfer Partners LP | 5.950% | 10/1/43 | 3,935 | 3,065 |
| Energy Transfer Partners LP | 5.150% | 3/15/45 | 500 | 356 |
| Energy Transfer Partners LP | 6.125% | 12/15/45 | 7,600 | 6,184 |
| EnLink Midstream Partners LP | 2.700% | 4/1/19 | 5,250 | 4,798 |
| EnLink Midstream Partners LP | 4.400% | 4/1/24 | 8,275 | 6,596 |
| EnLink Midstream Partners LP | 4.150% | 6/1/25 | 400 | 308 |
80
| Vanguard® Total Bond Market Index Fund | ||||
| Schedule of Investments | ||||
| December 31, 2015 | ||||
| Face | Market | |||
| Maturity | Amount | Value | ||
| Coupon | Date | ($000) | ($000) | |
| EnLink Midstream Partners LP | 5.600% | 4/1/44 | 2,250 | 1,532 |
| EnLink Midstream Partners LP | 5.050% | 4/1/45 | 6,400 | 3,968 |
| Ensco plc | 4.700% | 3/15/21 | 8,418 | 6,851 |
| Ensco plc | 4.500% | 10/1/24 | 1,800 | 1,233 |
| Ensco plc | 5.200% | 3/15/25 | 10,000 | 7,047 |
| Ensco plc | 5.750% | 10/1/44 | 9,500 | 6,258 |
| Enterprise Products Operating LLC | 6.300% | 9/15/17 | 13,515 | 14,228 |
| Enterprise Products Operating LLC | 6.650% | 4/15/18 | 5,950 | 6,435 |
| Enterprise Products Operating LLC | 1.650% | 5/7/18 | 8,040 | 7,811 |
| Enterprise Products Operating LLC | 6.500% | 1/31/19 | 9,444 | 10,390 |
| Enterprise Products Operating LLC | 2.550% | 10/15/19 | 10,685 | 10,238 |
| Enterprise Products Operating LLC | 5.250% | 1/31/20 | 845 | 887 |
| Enterprise Products Operating LLC | 5.200% | 9/1/20 | 3,143 | 3,295 |
| Enterprise Products Operating LLC | 4.050% | 2/15/22 | 225 | 220 |
| Enterprise Products Operating LLC | 3.350% | 3/15/23 | 9,961 | 9,000 |
| Enterprise Products Operating LLC | 3.900% | 2/15/24 | 18,570 | 17,327 |
| Enterprise Products Operating LLC | 3.750% | 2/15/25 | 15,225 | 13,866 |
| Enterprise Products Operating LLC | 3.700% | 2/15/26 | 7,515 | 6,714 |
| Enterprise Products Operating LLC | 6.875% | 3/1/33 | 6,843 | 7,155 |
| Enterprise Products Operating LLC | 6.650% | 10/15/34 | 1,485 | 1,567 |
| Enterprise Products Operating LLC | 5.750% | 3/1/35 | 4,300 | 3,936 |
| Enterprise Products Operating LLC | 7.550% | 4/15/38 | 2,969 | 3,176 |
| Enterprise Products Operating LLC | 6.125% | 10/15/39 | 5,335 | 4,843 |
| Enterprise Products Operating LLC | 6.450% | 9/1/40 | 743 | 706 |
| Enterprise Products Operating LLC | 5.950% | 2/1/41 | 4,769 | 4,315 |
| Enterprise Products Operating LLC | 5.700% | 2/15/42 | 7,145 | 6,356 |
| Enterprise Products Operating LLC | 4.850% | 8/15/42 | 7,775 | 6,260 |
| Enterprise Products Operating LLC | 4.450% | 2/15/43 | 8,742 | 6,578 |
| Enterprise Products Operating LLC | 4.850% | 3/15/44 | 17,387 | 14,059 |
| Enterprise Products Operating LLC | 5.100% | 2/15/45 | 10,940 | 9,096 |
| Enterprise Products Operating LLC | 4.900% | 5/15/46 | 16,795 | 13,590 |
| Enterprise Products Operating LLC | 4.950% | 10/15/54 | 4,320 | 3,360 |
| 5 Enterprise Products Operating LLC | 7.000% | 6/1/67 | 2,450 | 1,960 |
| EOG Resources Inc. | 5.875% | 9/15/17 | 5,425 | 5,781 |
| EOG Resources Inc. | 5.625% | 6/1/19 | 1,006 | 1,098 |
| EOG Resources Inc. | 4.400% | 6/1/20 | 6,675 | 7,086 |
| EOG Resources Inc. | 4.100% | 2/1/21 | 9,625 | 10,074 |
| EOG Resources Inc. | 2.625% | 3/15/23 | 6,353 | 5,998 |
| EOG Resources Inc. | 3.150% | 4/1/25 | 7,200 | 6,795 |
| EOG Resources Inc. | 3.900% | 4/1/35 | 4,750 | 4,317 |
| EQT Corp. | 6.500% | 4/1/18 | 16,650 | 17,499 |
| EQT Corp. | 8.125% | 6/1/19 | 4,400 | 4,754 |
| EQT Corp. | 4.875% | 11/15/21 | 6,100 | 5,838 |
| EQT Midstream Partners LP | 4.000% | 8/1/24 | 3,310 | 2,729 |
| Exxon Mobil Corp. | 1.305% | 3/6/18 | 25,000 | 24,944 |
| Exxon Mobil Corp. | 1.819% | 3/15/19 | 2,078 | 2,077 |
| Exxon Mobil Corp. | 1.912% | 3/6/20 | 12,141 | 12,114 |
| Exxon Mobil Corp. | 2.397% | 3/6/22 | 28,000 | 27,520 |
| Exxon Mobil Corp. | 2.709% | 3/6/25 | 19,700 | 19,274 |
| Exxon Mobil Corp. | 3.567% | 3/6/45 | 9,225 | 8,600 |
| FMC Technologies Inc. | 2.000% | 10/1/17 | 5,075 | 5,000 |
| FMC Technologies Inc. | 3.450% | 10/1/22 | 1,242 | 1,108 |
| Gulf South Pipeline Co. LP | 4.000% | 6/15/22 | 1,050 | 951 |
| Halliburton Co. | 1.000% | 8/1/16 | 5,125 | 5,116 |
| Halliburton Co. | 2.000% | 8/1/18 | 5,125 | 5,091 |
| Halliburton Co. | 5.900% | 9/15/18 | 2,970 | 3,246 |
| Halliburton Co. | 6.150% | 9/15/19 | 2,145 | 2,413 |
| Halliburton Co. | 2.700% | 11/15/20 | 7,500 | 7,409 |
| Halliburton Co. | 3.375% | 11/15/22 | 6,550 | 6,465 |
| Halliburton Co. | 3.500% | 8/1/23 | 4,669 | 4,553 |
| Halliburton Co. | 3.800% | 11/15/25 | 18,000 | 17,665 |
| Halliburton Co. | 4.850% | 11/15/35 | 5,000 | 4,918 |
| Halliburton Co. | 6.700% | 9/15/38 | 10,240 | 12,072 |
| Halliburton Co. | 7.450% | 9/15/39 | 5,484 | 6,993 |
81
| Vanguard® Total Bond Market Index Fund | ||||
| Schedule of Investments | ||||
| December 31, 2015 | ||||
| Face | Market | |||
| Maturity | Amount | Value | ||
| Coupon | Date | ($000) | ($000) | |
| Halliburton Co. | 4.500% | 11/15/41 | 5,196 | 4,729 |
| Halliburton Co. | 4.750% | 8/1/43 | 9,150 | 8,613 |
| Halliburton Co. | 5.000% | 11/15/45 | 15,575 | 15,382 |
| Hess Corp. | 8.125% | 2/15/19 | 12,574 | 14,233 |
| Hess Corp. | 3.500% | 7/15/24 | 5,250 | 4,589 |
| Hess Corp. | 7.875% | 10/1/29 | 5,933 | 6,451 |
| Hess Corp. | 7.300% | 8/15/31 | 4,628 | 4,614 |
| Hess Corp. | 7.125% | 3/15/33 | 4,642 | 4,531 |
| Hess Corp. | 6.000% | 1/15/40 | 10,368 | 9,137 |
| Hess Corp. | 5.600% | 2/15/41 | 8,231 | 6,893 |
| Husky Energy Inc. | 6.150% | 6/15/19 | 800 | 859 |
| Husky Energy Inc. | 7.250% | 12/15/19 | 6,416 | 7,164 |
| Husky Energy Inc. | 3.950% | 4/15/22 | 2,921 | 2,705 |
| Husky Energy Inc. | 4.000% | 4/15/24 | 9,830 | 9,056 |
| Husky Energy Inc. | 6.800% | 9/15/37 | 2,600 | 2,714 |
| Kerr-McGee Corp. | 6.950% | 7/1/24 | 8,820 | 9,474 |
| Kerr-McGee Corp. | 7.875% | 9/15/31 | 1,704 | 1,839 |
| Kinder Morgan Energy Partners LP | 3.500% | 3/1/16 | 310 | 310 |
| Kinder Morgan Energy Partners LP | 6.000% | 2/1/17 | 245 | 250 |
| Kinder Morgan Energy Partners LP | 5.950% | 2/15/18 | 11,440 | 11,729 |
| Kinder Morgan Energy Partners LP | 2.650% | 2/1/19 | 13,765 | 12,815 |
| Kinder Morgan Energy Partners LP | 6.850% | 2/15/20 | 4,960 | 5,139 |
| Kinder Morgan Energy Partners LP | 6.500% | 4/1/20 | 2,200 | 2,246 |
| Kinder Morgan Energy Partners LP | 3.500% | 3/1/21 | 5,625 | 5,124 |
| Kinder Morgan Energy Partners LP | 5.800% | 3/1/21 | 5,415 | 5,391 |
| Kinder Morgan Energy Partners LP | 5.000% | 10/1/21 | 10,450 | 9,852 |
| Kinder Morgan Energy Partners LP | 4.150% | 3/1/22 | 4,000 | 3,555 |
| Kinder Morgan Energy Partners LP | 3.950% | 9/1/22 | 8,000 | 6,967 |
| Kinder Morgan Energy Partners LP | 3.450% | 2/15/23 | 6,880 | 5,718 |
| Kinder Morgan Energy Partners LP | 3.500% | 9/1/23 | 9,699 | 8,043 |
| Kinder Morgan Energy Partners LP | 4.300% | 5/1/24 | 4,300 | 3,697 |
| Kinder Morgan Energy Partners LP | 4.250% | 9/1/24 | 7,870 | 6,697 |
| Kinder Morgan Energy Partners LP | 7.400% | 3/15/31 | 10 | 9 |
| Kinder Morgan Energy Partners LP | 7.300% | 8/15/33 | 2,465 | 2,236 |
| Kinder Morgan Energy Partners LP | 5.800% | 3/15/35 | 5,680 | 4,525 |
| Kinder Morgan Energy Partners LP | 6.500% | 2/1/37 | 20,690 | 17,588 |
| Kinder Morgan Energy Partners LP | 6.950% | 1/15/38 | 4,050 | 3,601 |
| Kinder Morgan Energy Partners LP | 6.500% | 9/1/39 | 5,695 | 4,777 |
| Kinder Morgan Energy Partners LP | 6.550% | 9/15/40 | 5,000 | 4,252 |
| Kinder Morgan Energy Partners LP | 7.500% | 11/15/40 | 6,331 | 5,774 |
| Kinder Morgan Energy Partners LP | 5.625% | 9/1/41 | 10,600 | 7,945 |
| Kinder Morgan Energy Partners LP | 5.000% | 8/15/42 | 1,345 | 988 |
| Kinder Morgan Energy Partners LP | 4.700% | 11/1/42 | 7,369 | 5,213 |
| Kinder Morgan Energy Partners LP | 5.000% | 3/1/43 | 1,691 | 1,240 |
| Kinder Morgan Energy Partners LP | 5.500% | 3/1/44 | 10,845 | 8,461 |
| Kinder Morgan Energy Partners LP | 5.400% | 9/1/44 | 809 | 612 |
| Kinder Morgan Inc. | 7.000% | 6/15/17 | 6,600 | 6,801 |
| Kinder Morgan Inc. | 2.000% | 12/1/17 | 5,000 | 4,817 |
| Kinder Morgan Inc. | 3.050% | 12/1/19 | 9,925 | 9,187 |
| Kinder Morgan Inc. | 4.300% | 6/1/25 | 2,250 | 1,969 |
| Kinder Morgan Inc. | 7.800% | 8/1/31 | 4,550 | 4,269 |
| Kinder Morgan Inc. | 7.750% | 1/15/32 | 9,050 | 8,588 |
| Kinder Morgan Inc. | 5.300% | 12/1/34 | 10,475 | 8,227 |
| Kinder Morgan Inc. | 5.550% | 6/1/45 | 11,650 | 9,068 |
| Kinder Morgan Inc. | 5.050% | 2/15/46 | 3,625 | 2,687 |
| Magellan Midstream Partners LP | 6.400% | 7/15/18 | 9,010 | 9,632 |
| Magellan Midstream Partners LP | 6.550% | 7/15/19 | 9,640 | 10,474 |
| Magellan Midstream Partners LP | 4.250% | 2/1/21 | 3,945 | 3,981 |
| Magellan Midstream Partners LP | 3.200% | 3/15/25 | 925 | 814 |
| Magellan Midstream Partners LP | 6.400% | 5/1/37 | 2,900 | 2,889 |
| Magellan Midstream Partners LP | 4.200% | 12/1/42 | 2,100 | 1,547 |
| Magellan Midstream Partners LP | 4.200% | 3/15/45 | 2,200 | 1,602 |
| Marathon Oil Corp. | 6.000% | 10/1/17 | 13,905 | 14,173 |
| Marathon Oil Corp. | 5.900% | 3/15/18 | 4,057 | 4,101 |
82
| Vanguard® Total Bond Market Index Fund | ||||
| Schedule of Investments | ||||
| December 31, 2015 | ||||
| Face | Market | |||
| Maturity | Amount | Value | ||
| Coupon | Date | ($000) | ($000) | |
| Marathon Oil Corp. | 2.700% | 6/1/20 | 4,515 | 3,970 |
| Marathon Oil Corp. | 2.800% | 11/1/22 | 11,596 | 9,273 |
| Marathon Oil Corp. | 3.850% | 6/1/25 | 23,765 | 18,980 |
| Marathon Oil Corp. | 6.800% | 3/15/32 | 7,117 | 6,419 |
| Marathon Oil Corp. | 6.600% | 10/1/37 | 4,438 | 3,793 |
| Marathon Oil Corp. | 5.200% | 6/1/45 | 6,050 | 4,266 |
| Marathon Petroleum Corp. | 2.700% | 12/14/18 | 5,500 | 5,458 |
| Marathon Petroleum Corp. | 3.400% | 12/15/20 | 4,700 | 4,614 |
| Marathon Petroleum Corp. | 5.125% | 3/1/21 | 11,615 | 12,196 |
| Marathon Petroleum Corp. | 3.625% | 9/15/24 | 6,025 | 5,620 |
| Marathon Petroleum Corp. | 6.500% | 3/1/41 | 14,305 | 14,337 |
| Marathon Petroleum Corp. | 4.750% | 9/15/44 | 1,800 | 1,466 |
| Marathon Petroleum Corp. | 5.850% | 12/15/45 | 3,600 | 3,369 |
| Marathon Petroleum Corp. | 5.000% | 9/15/54 | 1,800 | 1,432 |
| Murphy Oil Corp. | 3.700% | 12/1/22 | 5,204 | 3,935 |
| Murphy Oil Corp. | 7.050% | 5/1/29 | 4,785 | 4,142 |
| Murphy Oil Corp. | 5.125% | 12/1/42 | 2,186 | 1,343 |
| Nabors Industries Inc. | 6.150% | 2/15/18 | 20,785 | 21,273 |
| Nabors Industries Inc. | 9.250% | 1/15/19 | 1,725 | 1,773 |
| Nabors Industries Inc. | 5.000% | 9/15/20 | 2,325 | 2,073 |
| Nabors Industries Inc. | 5.100% | 9/15/23 | 3,825 | 3,033 |
| National Fuel Gas Co. | 6.500% | 4/15/18 | 3,000 | 3,222 |
| National Fuel Gas Co. | 8.750% | 5/1/19 | 1,600 | 1,817 |
| National Fuel Gas Co. | 4.900% | 12/1/21 | 550 | 565 |
| National Fuel Gas Co. | 3.750% | 3/1/23 | 3,760 | 3,482 |
| National Fuel Gas Co. | 5.200% | 7/15/25 | 1,900 | 1,743 |
| National Oilwell Varco Inc. | 1.350% | 12/1/17 | 13,150 | 12,865 |
| National Oilwell Varco Inc. | 2.600% | 12/1/22 | 23,091 | 20,210 |
| National Oilwell Varco Inc. | 3.950% | 12/1/42 | 8,598 | 6,568 |
| Noble Energy Inc. | 8.250% | 3/1/19 | 9,799 | 10,959 |
| Noble Energy Inc. | 4.150% | 12/15/21 | 9,015 | 8,798 |
| Noble Energy Inc. | 5.875% | 6/1/22 | 120 | 113 |
| Noble Energy Inc. | 5.875% | 6/1/24 | 2,500 | 2,398 |
| Noble Energy Inc. | 8.000% | 4/1/27 | 525 | 604 |
| Noble Energy Inc. | 6.000% | 3/1/41 | 22,601 | 19,396 |
| Noble Energy Inc. | 5.250% | 11/15/43 | 8,225 | 6,487 |
| Noble Energy Inc. | 5.050% | 11/15/44 | 3,025 | 2,436 |
| Noble Holding International Ltd. | 4.900% | 8/1/20 | 3,350 | 2,545 |
| Noble Holding International Ltd. | 4.625% | 3/1/21 | 2,020 | 1,420 |
| Noble Holding International Ltd. | 3.950% | 3/15/22 | 8,840 | 5,838 |
| Noble Holding International Ltd. | 5.950% | 4/1/25 | 4,300 | 2,986 |
| Noble Holding International Ltd. | 6.200% | 8/1/40 | 4,468 | 2,608 |
| Noble Holding International Ltd. | 6.050% | 3/1/41 | 1,220 | 729 |
| Noble Holding International Ltd. | 5.250% | 3/15/42 | 1,495 | 816 |
| Noble Holding International Ltd. | 6.950% | 4/1/45 | 3,500 | 2,177 |
| Occidental Petroleum Corp. | 1.750% | 2/15/17 | 7,713 | 7,726 |
| Occidental Petroleum Corp. | 1.500% | 2/15/18 | 2,250 | 2,215 |
| Occidental Petroleum Corp. | 4.100% | 2/1/21 | 20,135 | 21,122 |
| Occidental Petroleum Corp. | 3.125% | 2/15/22 | 4,885 | 4,790 |
| Occidental Petroleum Corp. | 2.700% | 2/15/23 | 10,968 | 10,314 |
| Occidental Petroleum Corp. | 3.500% | 6/15/25 | 16,550 | 16,120 |
| Occidental Petroleum Corp. | 4.625% | 6/15/45 | 7,750 | 7,501 |
| Oceaneering International Inc. | 4.650% | 11/15/24 | 4,331 | 3,649 |
| ONEOK Partners LP | 8.625% | 3/1/19 | 10,150 | 11,195 |
| ONEOK Partners LP | 3.375% | 10/1/22 | 14,802 | 11,834 |
| ONEOK Partners LP | 4.900% | 3/15/25 | 5,700 | 4,802 |
| ONEOK Partners LP | 6.650% | 10/1/36 | 13,873 | 11,469 |
| ONEOK Partners LP | 6.850% | 10/15/37 | 1,575 | 1,322 |
| ONEOK Partners LP | 6.125% | 2/1/41 | 5,165 | 3,948 |
| Panhandle Eastern Pipe Line Co. LP | 6.200% | 11/1/17 | 13,357 | 14,224 |
| Panhandle Eastern Pipe Line Co. LP | 7.000% | 6/15/18 | 300 | 330 |
| Petro-Canada | 6.050% | 5/15/18 | 12,660 | 13,616 |
| Petro-Canada | 7.875% | 6/15/26 | 2,800 | 3,613 |
| Petro-Canada | 5.350% | 7/15/33 | 4,825 | 5,036 |
83
| Vanguard® Total Bond Market Index Fund | ||||
| Schedule of Investments | ||||
| December 31, 2015 | ||||
| Face | Market | |||
| Maturity | Amount | Value | ||
| Coupon | Date | ($000) | ($000) | |
| Petro-Canada | 5.950% | 5/15/35 | 8,560 | 8,547 |
| Petro-Canada | 6.800% | 5/15/38 | 8,159 | 8,836 |
| Phillips 66 | 2.950% | 5/1/17 | 47,560 | 48,204 |
| Phillips 66 | 4.300% | 4/1/22 | 16,440 | 17,002 |
| Phillips 66 | 4.650% | 11/15/34 | 3,887 | 3,645 |
| Phillips 66 | 5.875% | 5/1/42 | 13,188 | 13,283 |
| Phillips 66 | 4.875% | 11/15/44 | 20,856 | 18,484 |
| Phillips 66 Partners LP | 2.646% | 2/15/20 | 1,850 | 1,754 |
| Phillips 66 Partners LP | 3.605% | 2/15/25 | 7,618 | 6,689 |
| Phillips 66 Partners LP | 4.680% | 2/15/45 | 2,050 | 1,527 |
| Pioneer Natural Resources Co. | 6.875% | 5/1/18 | 9,800 | 10,435 |
| Pioneer Natural Resources Co. | 3.450% | 1/15/21 | 3,100 | 2,863 |
| Pioneer Natural Resources Co. | 3.950% | 7/15/22 | 8,060 | 7,358 |
| Pioneer Natural Resources Co. | 4.450% | 1/15/26 | 4,250 | 3,821 |
| Pioneer Natural Resources Co. | 7.200% | 1/15/28 | 2,400 | 2,563 |
| Plains All American Pipeline LP / PAA Finance Corp. | 6.125% | 1/15/17 | 4,440 | 4,562 |
| Plains All American Pipeline LP / PAA Finance Corp. | 6.500% | 5/1/18 | 4,210 | 4,328 |
| Plains All American Pipeline LP / PAA Finance Corp. | 8.750% | 5/1/19 | 2,986 | 3,281 |
| Plains All American Pipeline LP / PAA Finance Corp. | 2.600% | 12/15/19 | 100 | 89 |
| Plains All American Pipeline LP / PAA Finance Corp. | 5.750% | 1/15/20 | 9,856 | 9,752 |
| Plains All American Pipeline LP / PAA Finance Corp. | 5.000% | 2/1/21 | 6,512 | 6,231 |
| Plains All American Pipeline LP / PAA Finance Corp. | 3.650% | 6/1/22 | 4,154 | 3,546 |
| Plains All American Pipeline LP / PAA Finance Corp. | 2.850% | 1/31/23 | 11,470 | 9,453 |
| Plains All American Pipeline LP / PAA Finance Corp. | 3.850% | 10/15/23 | 3,834 | 3,238 |
| Plains All American Pipeline LP / PAA Finance Corp. | 3.600% | 11/1/24 | 17,220 | 13,846 |
| Plains All American Pipeline LP / PAA Finance Corp. | 4.650% | 10/15/25 | 7,308 | 6,359 |
| Plains All American Pipeline LP / PAA Finance Corp. | 6.700% | 5/15/36 | 400 | 356 |
| Plains All American Pipeline LP / PAA Finance Corp. | 6.650% | 1/15/37 | 2,300 | 2,022 |
| Plains All American Pipeline LP / PAA Finance Corp. | 5.150% | 6/1/42 | 6,675 | 4,852 |
| Plains All American Pipeline LP / PAA Finance Corp. | 4.300% | 1/31/43 | 13,297 | 8,728 |
| Plains All American Pipeline LP / PAA Finance Corp. | 4.700% | 6/15/44 | 4,310 | 3,001 |
| Plains All American Pipeline LP / PAA Finance Corp. | 4.900% | 2/15/45 | 200 | 144 |
| Pride International Inc. | 8.500% | 6/15/19 | 725 | 706 |
| Pride International Inc. | 6.875% | 8/15/20 | 10,672 | 9,914 |
| Pride International Inc. | 7.875% | 8/15/40 | 9,720 | 7,651 |
| Questar Corp. | 2.750% | 2/1/16 | 680 | 681 |
| Regency Energy Partners LP / Regency Energy Finance | ||||
| Corp. | 5.750% | 9/1/20 | 50 | 49 |
| Regency Energy Partners LP / Regency Energy Finance | ||||
| Corp. | 6.500% | 7/15/21 | 3,550 | 3,568 |
| Regency Energy Partners LP / Regency Energy Finance | ||||
| Corp. | 5.875% | 3/1/22 | 7,565 | 7,187 |
| Regency Energy Partners LP / Regency Energy Finance | ||||
| Corp. | 5.000% | 10/1/22 | 19,550 | 17,546 |
| Regency Energy Partners LP / Regency Energy Finance | ||||
| Corp. | 5.500% | 4/15/23 | 6,700 | 6,097 |
| Regency Energy Partners LP / Regency Energy Finance | ||||
| Corp. | 4.500% | 11/1/23 | 13,700 | 11,953 |
| Repsol Oil & Gas Canada Inc. | 7.750% | 6/1/19 | 26,223 | 28,223 |
| Repsol Oil & Gas Canada Inc. | 3.750% | 2/1/21 | 5,579 | 5,091 |
| Rowan Cos. Inc. | 7.875% | 8/1/19 | 4,035 | 3,999 |
| Rowan Cos. Inc. | 4.875% | 6/1/22 | 6,200 | 4,558 |
| Rowan Cos. Inc. | 4.750% | 1/15/24 | 3,175 | 2,259 |
| Rowan Cos. Inc. | 5.400% | 12/1/42 | 7,430 | 4,449 |
| Rowan Cos. Inc. | 5.850% | 1/15/44 | 1,420 | 856 |
| Schlumberger Investment SA | 3.650% | 12/1/23 | 9,825 | 10,048 |
| SESI LLC | 7.125% | 12/15/21 | 625 | 553 |
| Shell International Finance BV | 1.125% | 8/21/17 | 9,185 | 9,125 |
| Shell International Finance BV | 1.250% | 11/10/17 | 4,000 | 3,979 |
| Shell International Finance BV | 1.900% | 8/10/18 | 31,340 | 31,311 |
| Shell International Finance BV | 1.625% | 11/10/18 | 7,700 | 7,620 |
| Shell International Finance BV | 2.000% | 11/15/18 | 8,950 | 8,932 |
| Shell International Finance BV | 4.300% | 9/22/19 | 28,250 | 30,120 |
| Shell International Finance BV | 4.375% | 3/25/20 | 7,950 | 8,522 |
84
| Vanguard® Total Bond Market Index Fund | ||||
| Schedule of Investments | ||||
| December 31, 2015 | ||||
| Face | Market | |||
| Maturity | Amount | Value | ||
| Coupon | Date | ($000) | ($000) | |
| Shell International Finance BV | 2.125% | 5/11/20 | 12,375 | 12,133 |
| Shell International Finance BV | 2.250% | 11/10/20 | 1,450 | 1,427 |
| Shell International Finance BV | 2.375% | 8/21/22 | 7,015 | 6,696 |
| Shell International Finance BV | 2.250% | 1/6/23 | 10,553 | 9,765 |
| Shell International Finance BV | 3.400% | 8/12/23 | 9,520 | 9,482 |
| Shell International Finance BV | 3.250% | 5/11/25 | 18,950 | 18,310 |
| Shell International Finance BV | 4.125% | 5/11/35 | 17,700 | 16,841 |
| Shell International Finance BV | 6.375% | 12/15/38 | 31,242 | 37,243 |
| Shell International Finance BV | 5.500% | 3/25/40 | 6,908 | 7,437 |
| Shell International Finance BV | 4.550% | 8/12/43 | 12,891 | 12,262 |
| Shell International Finance BV | 4.375% | 5/11/45 | 18,775 | 17,742 |
| 8 Southern Natural Gas Co. LLC | 5.900% | 4/1/17 | 5,715 | 5,811 |
| Southern Natural Gas Co. LLC | 8.000% | 3/1/32 | 8,150 | 8,004 |
| Southern Natural Gas Co. LLC / Southern Natural | ||||
| Issuing Corp. | 4.400% | 6/15/21 | 6,443 | 5,985 |
| Southwestern Energy Co. | 3.300% | 1/23/18 | 4,268 | 3,362 |
| Southwestern Energy Co. | 7.500% | 2/1/18 | 12,304 | 10,458 |
| Southwestern Energy Co. | 4.050% | 1/23/20 | 18,002 | 13,051 |
| Southwestern Energy Co. | 4.100% | 3/15/22 | 10,412 | 6,547 |
| Southwestern Energy Co. | 4.950% | 1/23/25 | 150 | 95 |
| Spectra Energy Capital LLC | 6.200% | 4/15/18 | 14,100 | 14,939 |
| Spectra Energy Capital LLC | 6.750% | 2/15/32 | 3,050 | 3,034 |
| Spectra Energy Capital LLC | 7.500% | 9/15/38 | 895 | 895 |
| Spectra Energy Partners LP | 2.950% | 9/25/18 | 575 | 565 |
| Spectra Energy Partners LP | 4.750% | 3/15/24 | 2,600 | 2,534 |
| Spectra Energy Partners LP | 3.500% | 3/15/25 | 16,770 | 14,729 |
| Spectra Energy Partners LP | 5.950% | 9/25/43 | 500 | 477 |
| Spectra Energy Partners LP | 4.500% | 3/15/45 | 9,550 | 7,339 |
| Suncor Energy Inc. | 6.100% | 6/1/18 | 1,775 | 1,906 |
| Suncor Energy Inc. | 3.600% | 12/1/24 | 1,265 | 1,199 |
| Suncor Energy Inc. | 7.150% | 2/1/32 | 4,903 | 5,609 |
| Suncor Energy Inc. | 5.950% | 12/1/34 | 260 | 259 |
| Suncor Energy Inc. | 6.500% | 6/15/38 | 18,002 | 19,732 |
| Suncor Energy Inc. | 6.850% | 6/1/39 | 3,109 | 3,363 |
| Sunoco Logistics Partners Operations LP | 5.500% | 2/15/20 | 3,305 | 3,428 |
| Sunoco Logistics Partners Operations LP | 4.400% | 4/1/21 | 25,850 | 25,053 |
| Sunoco Logistics Partners Operations LP | 3.450% | 1/15/23 | 1,014 | 856 |
| Sunoco Logistics Partners Operations LP | 4.250% | 4/1/24 | 2,250 | 1,948 |
| Sunoco Logistics Partners Operations LP | 5.950% | 12/1/25 | 6,700 | 6,447 |
| Sunoco Logistics Partners Operations LP | 6.850% | 2/15/40 | 750 | 663 |
| Sunoco Logistics Partners Operations LP | 6.100% | 2/15/42 | 10,440 | 8,403 |
| Sunoco Logistics Partners Operations LP | 4.950% | 1/15/43 | 225 | 159 |
| Sunoco Logistics Partners Operations LP | 5.300% | 4/1/44 | 4,375 | 3,255 |
| Sunoco Logistics Partners Operations LP | 5.350% | 5/15/45 | 5,925 | 4,405 |
| Tennessee Gas Pipeline Co. LLC | 7.000% | 10/15/28 | 1,720 | 1,664 |
| Tennessee Gas Pipeline Co. LLC | 7.625% | 4/1/37 | 1,342 | 1,293 |
| Texas Eastern Transmission LP | 7.000% | 7/15/32 | 5,000 | 5,491 |
| Tosco Corp. | 7.800% | 1/1/27 | 875 | 1,065 |
| Tosco Corp. | 8.125% | 2/15/30 | 17,805 | 21,950 |
| Total Capital Canada Ltd. | 1.450% | 1/15/18 | 7,264 | 7,232 |
| Total Capital Canada Ltd. | 2.750% | 7/15/23 | 22,415 | 21,556 |
| Total Capital International SA | 1.000% | 8/12/16 | 1,740 | 1,740 |
| Total Capital International SA | 1.500% | 2/17/17 | 300 | 300 |
| Total Capital International SA | 1.550% | 6/28/17 | 10,000 | 9,998 |
| Total Capital International SA | 2.125% | 1/10/19 | 12,960 | 12,949 |
| Total Capital International SA | 2.100% | 6/19/19 | 8,400 | 8,464 |
| Total Capital International SA | 2.750% | 6/19/21 | 23,625 | 23,529 |
| Total Capital International SA | 2.875% | 2/17/22 | 6,465 | 6,409 |
| Total Capital International SA | 2.700% | 1/25/23 | 7,800 | 7,432 |
| Total Capital International SA | 3.700% | 1/15/24 | 14,825 | 15,020 |
| Total Capital International SA | 3.750% | 4/10/24 | 9,480 | 9,642 |
| Total Capital SA | 2.125% | 8/10/18 | 11,460 | 11,489 |
| Total Capital SA | 4.450% | 6/24/20 | 7,565 | 8,111 |
| Total Capital SA | 4.125% | 1/28/21 | 18,075 | 19,294 |
85
| Vanguard® Total Bond Market Index Fund | ||||
| Schedule of Investments | ||||
| December 31, 2015 | ||||
| Face | Market | |||
| Maturity | Amount | Value | ||
| Coupon | Date | ($000) | ($000) | |
| TransCanada PipeLines Ltd. | 1.625% | 11/9/17 | 24,500 | 24,376 |
| TransCanada PipeLines Ltd. | 6.500% | 8/15/18 | 16,655 | 18,203 |
| TransCanada PipeLines Ltd. | 7.125% | 1/15/19 | 925 | 1,031 |
| TransCanada PipeLines Ltd. | 3.800% | 10/1/20 | 19,050 | 19,503 |
| TransCanada PipeLines Ltd. | 2.500% | 8/1/22 | 11,655 | 10,730 |
| TransCanada PipeLines Ltd. | 4.625% | 3/1/34 | 5,100 | 4,808 |
| TransCanada PipeLines Ltd. | 5.600% | 3/31/34 | 3,055 | 3,095 |
| TransCanada PipeLines Ltd. | 5.850% | 3/15/36 | 14,410 | 14,800 |
| TransCanada PipeLines Ltd. | 6.200% | 10/15/37 | 8,035 | 8,456 |
| TransCanada PipeLines Ltd. | 7.250% | 8/15/38 | 5,436 | 6,481 |
| TransCanada PipeLines Ltd. | 7.625% | 1/15/39 | 7,774 | 9,572 |
| TransCanada PipeLines Ltd. | 5.000% | 10/16/43 | 6,400 | 5,901 |
| 5 TransCanada PipeLines Ltd. | 6.350% | 5/15/67 | 14,811 | 11,219 |
| Transcontinental Gas Pipe Line Co. LLC | 5.400% | 8/15/41 | 18 | 13 |
| Valero Energy Corp. | 9.375% | 3/15/19 | 9,926 | 11,755 |
| Valero Energy Corp. | 6.125% | 2/1/20 | 12,690 | 14,004 |
| Valero Energy Corp. | 3.650% | 3/15/25 | 1,050 | 988 |
| Valero Energy Corp. | 7.500% | 4/15/32 | 10,671 | 11,618 |
| Valero Energy Corp. | 6.625% | 6/15/37 | 9,528 | 9,478 |
| Valero Energy Corp. | 10.500% | 3/15/39 | 323 | 441 |
| Valero Energy Corp. | 4.900% | 3/15/45 | 6,725 | 5,567 |
| Western Gas Partners LP | 2.600% | 8/15/18 | 5,700 | 5,507 |
| Western Gas Partners LP | 5.375% | 6/1/21 | 5,075 | 5,138 |
| Western Gas Partners LP | 3.950% | 6/1/25 | 4,755 | 3,992 |
| Western Gas Partners LP | 5.450% | 4/1/44 | 8,150 | 6,469 |
| Williams Cos. Inc. | 7.875% | 9/1/21 | 694 | 624 |
| Williams Cos. Inc. | 4.550% | 6/24/24 | 12,960 | 9,007 |
| Williams Cos. Inc. | 7.500% | 1/15/31 | 6,696 | 4,620 |
| Williams Cos. Inc. | 7.750% | 6/15/31 | 2,085 | 1,535 |
| Williams Cos. Inc. | 8.750% | 3/15/32 | 3,749 | 2,788 |
| Williams Cos. Inc. | 5.750% | 6/24/44 | 6,335 | 3,706 |
| Williams Partners LP | 5.250% | 3/15/20 | 7,375 | 6,850 |
| Williams Partners LP | 4.000% | 11/15/21 | 4,425 | 3,692 |
| Williams Partners LP | 3.600% | 3/15/22 | 21,560 | 16,960 |
| Williams Partners LP | 3.350% | 8/15/22 | 9,500 | 7,353 |
| Williams Partners LP | 4.500% | 11/15/23 | 3,800 | 3,077 |
| Williams Partners LP | 4.300% | 3/4/24 | 13,325 | 10,560 |
| Williams Partners LP | 3.900% | 1/15/25 | 9,891 | 7,435 |
| Williams Partners LP | 4.000% | 9/15/25 | 5,060 | 3,789 |
| Williams Partners LP | 6.300% | 4/15/40 | 2,840 | 2,181 |
| Williams Partners LP | 5.800% | 11/15/43 | 15,205 | 10,630 |
| Williams Partners LP | 5.400% | 3/4/44 | 4,000 | 2,680 |
| Williams Partners LP | 4.900% | 1/15/45 | 1,085 | 691 |
| Williams Partners LP | 5.100% | 9/15/45 | 5,140 | 3,383 |
| Williams Partners LP / ACMP Finance Corp. | 4.875% | 5/15/23 | 6,305 | 5,076 |
| Williams Partners LP / ACMP Finance Corp. | 4.875% | 3/15/24 | 9,848 | 7,878 |
| Williams Partners LP/Williams Partners Finance Corp. | 7.250% | 2/1/17 | 11,225 | 11,684 |
| XTO Energy Inc. | 6.250% | 8/1/17 | 9,075 | 9,779 |
| XTO Energy Inc. | 5.500% | 6/15/18 | 500 | 545 |
| XTO Energy Inc. | 6.750% | 8/1/37 | 600 | 824 |
| Other Industrial (0.1%) | ||||
| California Institute of Technology GO | 4.321% | 8/1/45 | 700 | 726 |
| California Institute of Technology GO | 4.700% | 11/1/11 | 11,700 | 11,293 |
| CBRE Services Inc. | 5.250% | 3/15/25 | 5,425 | 5,500 |
| CBRE Services Inc. | 4.875% | 3/1/26 | 13,435 | 13,351 |
| Cintas Corp. No 2 | 6.125% | 12/1/17 | 1,625 | 1,756 |
| Cintas Corp. No 2 | 3.250% | 6/1/22 | 4,015 | 4,052 |
| Fluor Corp. | 3.375% | 9/15/21 | 2,025 | 2,066 |
| Fluor Corp. | 3.500% | 12/15/24 | 10,459 | 10,467 |
| Howard Hughes Medical Institute Revenue | 3.500% | 9/1/23 | 8,791 | 9,144 |
| 5 Johns Hopkins University Maryland GO | 4.083% | 7/1/53 | 4,125 | 4,081 |
| 5 Massachusetts Institute of Technology GO | 3.959% | 7/1/38 | 7,975 | 8,231 |
| Massachusetts Institute of Technology GO | 5.600% | 7/1/11 | 9,085 | 11,151 |
86
| Vanguard® Total Bond Market Index Fund | ||||
| Schedule of Investments | ||||
| December 31, 2015 | ||||
| Face | Market | |||
| Maturity | Amount | Value | ||
| Coupon | Date | ($000) | ($000) | |
| Massachusetts Institute of Technology GO | 4.678% | 7/1/14 | 4,450 | 4,623 |
| 5 Northwestern University | 3.868% | 12/1/48 | 100 | 98 |
| 5 Northwestern University Illinois GO | 3.688% | 12/1/38 | 5,650 | 5,705 |
| 5 Northwestern University Illinois GO | 4.643% | 12/1/44 | 3,750 | 4,228 |
| President & Fellows of Harvard College Massachusetts | ||||
| GO | 3.619% | 10/1/37 | 2,500 | 2,455 |
| 5 University of Notre Dame DU LAC Indiana GO | 3.438% | 2/15/45 | 4,500 | 4,223 |
| University of Pennsylvania GO | 4.674% | 9/1/12 | 10,350 | 10,379 |
| Yale University Connecticut GO | 2.086% | 4/15/19 | 7,865 | 7,926 |
| Technology (1.7%) | ||||
| Adobe Systems Inc. | 4.750% | 2/1/20 | 6,150 | 6,665 |
| Adobe Systems Inc. | 3.250% | 2/1/25 | 11,333 | 11,054 |
| Altera Corp. | 1.750% | 5/15/17 | 10,210 | 10,249 |
| Altera Corp. | 2.500% | 11/15/18 | 15,865 | 16,088 |
| Altera Corp. | 4.100% | 11/15/23 | 6,530 | 6,829 |
| Amphenol Corp. | 1.550% | 9/15/17 | 1,650 | 1,645 |
| Amphenol Corp. | 2.550% | 1/30/19 | 14,890 | 14,917 |
| Amphenol Corp. | 4.000% | 2/1/22 | 640 | 653 |
| Analog Devices Inc. | 2.875% | 6/1/23 | 5,525 | 5,305 |
| Apple Inc. | 1.050% | 5/5/17 | 11,750 | 11,757 |
| Apple Inc. | 0.900% | 5/12/17 | 6,100 | 6,089 |
| Apple Inc. | 1.000% | 5/3/18 | 31,543 | 31,305 |
| Apple Inc. | 2.100% | 5/6/19 | 17,300 | 17,507 |
| Apple Inc. | 1.550% | 2/7/20 | 9,620 | 9,470 |
| Apple Inc. | 2.000% | 5/6/20 | 7,300 | 7,282 |
| Apple Inc. | 2.850% | 5/6/21 | 60,765 | 62,253 |
| Apple Inc. | 2.150% | 2/9/22 | 14,420 | 14,048 |
| Apple Inc. | 2.700% | 5/13/22 | 22,950 | 23,003 |
| Apple Inc. | 2.400% | 5/3/23 | 52,617 | 51,265 |
| Apple Inc. | 3.450% | 5/6/24 | 15,562 | 16,121 |
| Apple Inc. | 2.500% | 2/9/25 | 14,020 | 13,412 |
| Apple Inc. | 3.200% | 5/13/25 | 13,840 | 13,985 |
| Apple Inc. | 3.850% | 5/4/43 | 34,680 | 31,970 |
| Apple Inc. | 4.450% | 5/6/44 | 9,975 | 10,086 |
| Apple Inc. | 3.450% | 2/9/45 | 11,428 | 9,823 |
| Apple Inc. | 4.375% | 5/13/45 | 11,400 | 11,407 |
| Applied Materials Inc. | 2.625% | 10/1/20 | 8,025 | 8,020 |
| Applied Materials Inc. | 4.300% | 6/15/21 | 8,105 | 8,639 |
| Applied Materials Inc. | 3.900% | 10/1/25 | 12,650 | 12,670 |
| Applied Materials Inc. | 5.100% | 10/1/35 | 4,500 | 4,567 |
| Applied Materials Inc. | 5.850% | 6/15/41 | 7,036 | 7,624 |
| Arrow Electronics Inc. | 3.000% | 3/1/18 | 2,500 | 2,498 |
| Arrow Electronics Inc. | 5.125% | 3/1/21 | 1,185 | 1,245 |
| Arrow Electronics Inc. | 3.500% | 4/1/22 | 4,350 | 4,177 |
| Arrow Electronics Inc. | 4.500% | 3/1/23 | 2,154 | 2,176 |
| Arrow Electronics Inc. | 4.000% | 4/1/25 | 6,250 | 5,988 |
| Autodesk Inc. | 1.950% | 12/15/17 | 9,014 | 8,977 |
| Autodesk Inc. | 3.125% | 6/15/20 | 2,500 | 2,482 |
| Autodesk Inc. | 3.600% | 12/15/22 | 1,675 | 1,636 |
| Autodesk Inc. | 4.375% | 6/15/25 | 2,100 | 2,069 |
| Avnet Inc. | 6.625% | 9/15/16 | 900 | 929 |
| Avnet Inc. | 5.875% | 6/15/20 | 120 | 130 |
| Avnet Inc. | 4.875% | 12/1/22 | 4,725 | 4,846 |
| Baidu Inc. | 2.250% | 11/28/17 | 5,250 | 5,258 |
| Baidu Inc. | 3.250% | 8/6/18 | 2,800 | 2,838 |
| Baidu Inc. | 2.750% | 6/9/19 | 3,875 | 3,851 |
| Baidu Inc. | 3.500% | 11/28/22 | 14,975 | 14,757 |
| Broadcom Corp. | 2.700% | 11/1/18 | 7,105 | 7,174 |
| Broadcom Corp. | 2.500% | 8/15/22 | 10,865 | 10,812 |
| Broadcom Corp. | 3.500% | 8/1/24 | 4,870 | 4,884 |
| Broadridge Financial Solutions Inc. | 3.950% | 9/1/20 | 2,425 | 2,514 |
| CA Inc. | 2.875% | 8/15/18 | 3,000 | 3,016 |
| CA Inc. | 5.375% | 12/1/19 | 3,525 | 3,818 |
87
| Vanguard® Total Bond Market Index Fund | ||||
| Schedule of Investments | ||||
| December 31, 2015 | ||||
| Face | Market | |||
| Maturity | Amount | Value | ||
| Coupon | Date | ($000) | ($000) | |
| CA Inc. | 3.600% | 8/1/20 | 6,525 | 6,669 |
| CA Inc. | 4.500% | 8/15/23 | 4,950 | 5,023 |
| Cadence Design Systems Inc. | 4.375% | 10/15/24 | 725 | 719 |
| Cisco Systems Inc. | 1.100% | 3/3/17 | 7,380 | 7,383 |
| Cisco Systems Inc. | 3.150% | 3/14/17 | 7,190 | 7,366 |
| Cisco Systems Inc. | 4.950% | 2/15/19 | 35,850 | 39,182 |
| Cisco Systems Inc. | 2.125% | 3/1/19 | 20,885 | 21,055 |
| Cisco Systems Inc. | 4.450% | 1/15/20 | 32,025 | 34,865 |
| Cisco Systems Inc. | 2.450% | 6/15/20 | 3,350 | 3,383 |
| Cisco Systems Inc. | 2.900% | 3/4/21 | 1,800 | 1,853 |
| Cisco Systems Inc. | 3.625% | 3/4/24 | 5,625 | 5,873 |
| Cisco Systems Inc. | 5.900% | 2/15/39 | 29,558 | 36,189 |
| Cisco Systems Inc. | 5.500% | 1/15/40 | 6,341 | 7,580 |
| Computer Sciences Corp. | 6.500% | 3/15/18 | 4,950 | 5,342 |
| Corning Inc. | 1.450% | 11/15/17 | 1,350 | 1,339 |
| Corning Inc. | 1.500% | 5/8/18 | 6,750 | 6,638 |
| Corning Inc. | 6.625% | 5/15/19 | 3,860 | 4,317 |
| Corning Inc. | 4.250% | 8/15/20 | 7,474 | 7,844 |
| Corning Inc. | 2.900% | 5/15/22 | 6,000 | 5,760 |
| Corning Inc. | 3.700% | 11/15/23 | 4,925 | 4,852 |
| Corning Inc. | 7.250% | 8/15/36 | 75 | 87 |
| Corning Inc. | 4.700% | 3/15/37 | 7,168 | 6,915 |
| Corning Inc. | 5.750% | 8/15/40 | 5,256 | 5,639 |
| Dun & Bradstreet Corp. | 3.250% | 12/1/17 | 800 | 807 |
| Dun & Bradstreet Corp. | 4.375% | 12/1/22 | 1,955 | 1,917 |
| EMC Corp. | 1.875% | 6/1/18 | 21,929 | 20,461 |
| EMC Corp. | 2.650% | 6/1/20 | 10,925 | 9,671 |
| EMC Corp. | 3.375% | 6/1/23 | 16,013 | 12,985 |
| Equifax Inc. | 6.300% | 7/1/17 | 1,075 | 1,143 |
| Fidelity National Information Services Inc. | 1.450% | 6/5/17 | 150 | 148 |
| Fidelity National Information Services Inc. | 2.000% | 4/15/18 | 1,917 | 1,885 |
| Fidelity National Information Services Inc. | 2.850% | 10/15/18 | 8,250 | 8,278 |
| Fidelity National Information Services Inc. | 3.625% | 10/15/20 | 17,000 | 17,228 |
| Fidelity National Information Services Inc. | 5.000% | 3/15/22 | 8,294 | 8,595 |
| Fidelity National Information Services Inc. | 3.500% | 4/15/23 | 9,000 | 8,603 |
| Fidelity National Information Services Inc. | 3.875% | 6/5/24 | 2,350 | 2,267 |
| Fidelity National Information Services Inc. | 5.000% | 10/15/25 | 4,350 | 4,489 |
| Fiserv Inc. | 2.700% | 6/1/20 | 6,015 | 6,020 |
| Fiserv Inc. | 4.750% | 6/15/21 | 175 | 188 |
| Fiserv Inc. | 3.500% | 10/1/22 | 8,431 | 8,446 |
| Fiserv Inc. | 3.850% | 6/1/25 | 10,275 | 10,259 |
| Flextronics International Ltd. | 4.625% | 2/15/20 | 3,890 | 4,021 |
| 8 Flextronics International Ltd. | 4.750% | 6/15/25 | 4,720 | 4,596 |
| Google Inc. | 3.625% | 5/19/21 | 12,755 | 13,565 |
| 8 Hewlett Packard Enterprise Co. | 2.450% | 10/5/17 | 27,800 | 27,783 |
| 8 Hewlett Packard Enterprise Co. | 2.850% | 10/5/18 | 18,300 | 18,290 |
| 8 Hewlett Packard Enterprise Co. | 3.600% | 10/15/20 | 22,525 | 22,584 |
| 8 Hewlett Packard Enterprise Co. | 4.400% | 10/15/22 | 20,000 | 19,929 |
| 8 Hewlett Packard Enterprise Co. | 4.900% | 10/15/25 | 27,150 | 26,652 |
| 8 Hewlett Packard Enterprise Co. | 6.200% | 10/15/35 | 4,775 | 4,600 |
| 8 Hewlett Packard Enterprise Co. | 6.350% | 10/15/45 | 22,775 | 21,691 |
| HP Enterprise Services LLC | 7.450% | 10/15/29 | 1,950 | 2,266 |
| HP Inc. | 3.750% | 12/1/20 | 1,149 | 1,139 |
| HP Inc. | 4.300% | 6/1/21 | 14,455 | 14,387 |
| HP Inc. | 4.375% | 9/15/21 | 16,420 | 16,044 |
| HP Inc. | 4.650% | 12/9/21 | 26,975 | 26,866 |
| HP Inc. | 6.000% | 9/15/41 | 8,993 | 7,802 |
| Ingram Micro Inc. | 4.950% | 12/15/24 | 12,750 | 12,695 |
| Intel Corp. | 1.350% | 12/15/17 | 16,646 | 16,667 |
| Intel Corp. | 2.450% | 7/29/20 | 15,500 | 15,668 |
| Intel Corp. | 3.300% | 10/1/21 | 15,694 | 16,251 |
| Intel Corp. | 3.100% | 7/29/22 | 12,000 | 12,221 |
| Intel Corp. | 2.700% | 12/15/22 | 12,320 | 12,189 |
| Intel Corp. | 3.700% | 7/29/25 | 15,600 | 16,134 |
88
| Vanguard® Total Bond Market Index Fund | ||||
| Schedule of Investments | ||||
| December 31, 2015 | ||||
| Face | Market | |||
| Maturity | Amount | Value | ||
| Coupon | Date | ($000) | ($000) | |
| Intel Corp. | 4.000% | 12/15/32 | 5,025 | 4,982 |
| Intel Corp. | 4.800% | 10/1/41 | 24,054 | 25,106 |
| Intel Corp. | 4.250% | 12/15/42 | 14,091 | 13,649 |
| Intel Corp. | 4.900% | 7/29/45 | 9,250 | 9,756 |
| International Business Machines Corp. | 1.250% | 2/6/17 | 7,100 | 7,121 |
| International Business Machines Corp. | 5.700% | 9/14/17 | 18,586 | 19,936 |
| International Business Machines Corp. | 1.125% | 2/6/18 | 22,725 | 22,578 |
| International Business Machines Corp. | 1.250% | 2/8/18 | 1,300 | 1,295 |
| International Business Machines Corp. | 7.625% | 10/15/18 | 10,506 | 12,118 |
| International Business Machines Corp. | 1.950% | 2/12/19 | 15,350 | 15,420 |
| International Business Machines Corp. | 1.875% | 5/15/19 | 1,000 | 998 |
| International Business Machines Corp. | 8.375% | 11/1/19 | 4,741 | 5,859 |
| International Business Machines Corp. | 2.900% | 11/1/21 | 800 | 810 |
| International Business Machines Corp. | 1.875% | 8/1/22 | 3,300 | 3,112 |
| International Business Machines Corp. | 2.875% | 11/9/22 | 9,600 | 9,526 |
| International Business Machines Corp. | 3.375% | 8/1/23 | 14,100 | 14,302 |
| International Business Machines Corp. | 3.625% | 2/12/24 | 12,800 | 13,121 |
| International Business Machines Corp. | 7.000% | 10/30/25 | 2,965 | 3,804 |
| International Business Machines Corp. | 6.220% | 8/1/27 | 10,050 | 12,394 |
| International Business Machines Corp. | 6.500% | 1/15/28 | 620 | 778 |
| International Business Machines Corp. | 5.600% | 11/30/39 | 10,380 | 12,073 |
| International Business Machines Corp. | 4.000% | 6/20/42 | 11,342 | 10,552 |
| Intuit Inc. | 5.750% | 3/15/17 | 4,365 | 4,574 |
| Jabil Circuit Inc. | 5.625% | 12/15/20 | 2,150 | 2,263 |
| Jabil Circuit Inc. | 4.700% | 9/15/22 | 150 | 146 |
| Juniper Networks Inc. | 3.300% | 6/15/20 | 4,000 | 3,990 |
| Juniper Networks Inc. | 4.600% | 3/15/21 | 3,830 | 4,003 |
| Juniper Networks Inc. | 4.500% | 3/15/24 | 2,100 | 2,091 |
| Juniper Networks Inc. | 4.350% | 6/15/25 | 1,550 | 1,512 |
| Juniper Networks Inc. | 5.950% | 3/15/41 | 2,925 | 2,747 |
| Keysight Technologies Inc. | 3.300% | 10/30/19 | 4,540 | 4,470 |
| Keysight Technologies Inc. | 4.550% | 10/30/24 | 5,325 | 5,122 |
| KLA-Tencor Corp. | 2.375% | 11/1/17 | 3,975 | 3,977 |
| KLA-Tencor Corp. | 3.375% | 11/1/19 | 2,615 | 2,642 |
| KLA-Tencor Corp. | 4.125% | 11/1/21 | 10,250 | 10,284 |
| KLA-Tencor Corp. | 4.650% | 11/1/24 | 5,174 | 5,207 |
| KLA-Tencor Corp. | 5.650% | 11/1/34 | 625 | 602 |
| Lam Research Corp. | 2.750% | 3/15/20 | 4,515 | 4,370 |
| Lam Research Corp. | 3.800% | 3/15/25 | 5,500 | 5,208 |
| Lexmark International Inc. | 6.650% | 6/1/18 | 5,160 | 5,558 |
| Maxim Integrated Products Inc. | 3.375% | 3/15/23 | 6,050 | 5,976 |
| Microsoft Corp. | 0.875% | 11/15/17 | 1,350 | 1,346 |
| Microsoft Corp. | 1.000% | 5/1/18 | 4,300 | 4,271 |
| Microsoft Corp. | 1.300% | 11/3/18 | 28,800 | 28,720 |
| Microsoft Corp. | 4.200% | 6/1/19 | 9,120 | 9,859 |
| Microsoft Corp. | 1.850% | 2/12/20 | 4,650 | 4,663 |
| Microsoft Corp. | 3.000% | 10/1/20 | 7,930 | 8,298 |
| Microsoft Corp. | 2.000% | 11/3/20 | 24,625 | 24,626 |
| Microsoft Corp. | 2.375% | 2/12/22 | 11,925 | 11,774 |
| Microsoft Corp. | 2.650% | 11/3/22 | 10,000 | 9,987 |
| Microsoft Corp. | 2.125% | 11/15/22 | 3,168 | 3,058 |
| Microsoft Corp. | 2.375% | 5/1/23 | 2,210 | 2,177 |
| Microsoft Corp. | 3.625% | 12/15/23 | 3,090 | 3,250 |
| Microsoft Corp. | 2.700% | 2/12/25 | 9,550 | 9,293 |
| Microsoft Corp. | 3.125% | 11/3/25 | 45,000 | 45,131 |
| Microsoft Corp. | 3.500% | 2/12/35 | 12,525 | 11,566 |
| Microsoft Corp. | 4.200% | 11/3/35 | 8,825 | 9,003 |
| Microsoft Corp. | 5.200% | 6/1/39 | 5,563 | 6,323 |
| Microsoft Corp. | 4.500% | 10/1/40 | 5,893 | 6,144 |
| Microsoft Corp. | 5.300% | 2/8/41 | 5,985 | 6,877 |
| Microsoft Corp. | 3.500% | 11/15/42 | 12,875 | 11,430 |
| Microsoft Corp. | 3.750% | 5/1/43 | 1,981 | 1,834 |
| Microsoft Corp. | 4.875% | 12/15/43 | 1,075 | 1,169 |
| Microsoft Corp. | 3.750% | 2/12/45 | 16,500 | 15,205 |
89
| Vanguard® Total Bond Market Index Fund | ||||
| Schedule of Investments | ||||
| December 31, 2015 | ||||
| Face | Market | |||
| Maturity | Amount | Value | ||
| Coupon | Date | ($000) | ($000) | |
| Microsoft Corp. | 4.450% | 11/3/45 | 42,025 | 43,431 |
| Microsoft Corp. | 4.000% | 2/12/55 | 24,980 | 22,435 |
| Microsoft Corp. | 4.750% | 11/3/55 | 9,000 | 9,261 |
| Motorola Solutions Inc. | 3.750% | 5/15/22 | 6,975 | 6,366 |
| Motorola Solutions Inc. | 3.500% | 3/1/23 | 900 | 786 |
| Motorola Solutions Inc. | 4.000% | 9/1/24 | 3,600 | 3,097 |
| Motorola Solutions Inc. | 7.500% | 5/15/25 | 410 | 449 |
| Motorola Solutions Inc. | 5.500% | 9/1/44 | 6,050 | 4,672 |
| NetApp Inc. | 2.000% | 12/15/17 | 5,905 | 5,870 |
| NetApp Inc. | 3.250% | 12/15/22 | 1,025 | 977 |
| Oracle Corp. | 1.200% | 10/15/17 | 20,175 | 20,177 |
| Oracle Corp. | 5.750% | 4/15/18 | 19,852 | 21,671 |
| Oracle Corp. | 2.375% | 1/15/19 | 20,250 | 20,526 |
| Oracle Corp. | 5.000% | 7/8/19 | 17,162 | 18,898 |
| Oracle Corp. | 2.250% | 10/8/19 | 14,735 | 14,895 |
| Oracle Corp. | 3.875% | 7/15/20 | 13,690 | 14,625 |
| Oracle Corp. | 2.800% | 7/8/21 | 11,355 | 11,501 |
| Oracle Corp. | 2.500% | 5/15/22 | 15,390 | 15,087 |
| Oracle Corp. | 2.500% | 10/15/22 | 14,898 | 14,542 |
| Oracle Corp. | 3.400% | 7/8/24 | 37,035 | 37,555 |
| Oracle Corp. | 2.950% | 5/15/25 | 31,080 | 30,332 |
| Oracle Corp. | 3.250% | 5/15/30 | 12,025 | 11,272 |
| Oracle Corp. | 4.300% | 7/8/34 | 15,770 | 15,649 |
| Oracle Corp. | 3.900% | 5/15/35 | 16,244 | 15,353 |
| Oracle Corp. | 6.500% | 4/15/38 | 5,740 | 7,221 |
| Oracle Corp. | 6.125% | 7/8/39 | 7,878 | 9,541 |
| Oracle Corp. | 5.375% | 7/15/40 | 33,363 | 37,032 |
| Oracle Corp. | 4.500% | 7/8/44 | 9,600 | 9,599 |
| Oracle Corp. | 4.125% | 5/15/45 | 14,700 | 13,919 |
| Oracle Corp. | 4.375% | 5/15/55 | 16,175 | 14,935 |
| Pitney Bowes Inc. | 5.750% | 9/15/17 | 6,980 | 7,427 |
| Pitney Bowes Inc. | 6.250% | 3/15/19 | 200 | 218 |
| Pitney Bowes Inc. | 4.625% | 3/15/24 | 12,525 | 12,319 |
| QUALCOMM Inc. | 1.400% | 5/18/18 | 12,000 | 11,890 |
| QUALCOMM Inc. | 2.250% | 5/20/20 | 9,435 | 9,354 |
| QUALCOMM Inc. | 3.450% | 5/20/25 | 16,815 | 16,136 |
| QUALCOMM Inc. | 4.650% | 5/20/35 | 6,275 | 5,820 |
| QUALCOMM Inc. | 4.800% | 5/20/45 | 17,500 | 15,468 |
| Seagate HDD Cayman | 3.750% | 11/15/18 | 18,050 | 17,915 |
| Seagate HDD Cayman | 4.750% | 6/1/23 | 11,750 | 10,281 |
| Seagate HDD Cayman | 4.750% | 1/1/25 | 9,975 | 8,317 |
| 8 Seagate HDD Cayman | 4.875% | 6/1/27 | 8,325 | 6,389 |
| 8 Seagate HDD Cayman | 5.750% | 12/1/34 | 4,375 | 3,106 |
| Symantec Corp. | 2.750% | 6/15/17 | 4,415 | 4,424 |
| Symantec Corp. | 4.200% | 9/15/20 | 7,125 | 7,402 |
| Symantec Corp. | 3.950% | 6/15/22 | 4,925 | 4,892 |
| Telefonaktiebolaget LM Ericsson | 4.125% | 5/15/22 | 5,944 | 6,113 |
| Texas Instruments Inc. | 1.650% | 8/3/19 | 9,540 | 9,432 |
| Total System Services Inc. | 2.375% | 6/1/18 | 3,045 | 3,020 |
| Trimble Navigation Ltd. | 4.750% | 12/1/24 | 4,800 | 4,800 |
| Tyco Electronics Group SA | 6.550% | 10/1/17 | 3,743 | 4,047 |
| Tyco Electronics Group SA | 2.350% | 8/1/19 | 3,366 | 3,366 |
| Tyco Electronics Group SA | 3.500% | 2/3/22 | 2,225 | 2,264 |
| Tyco Electronics Group SA | 3.450% | 8/1/24 | 4,400 | 4,377 |
| Tyco Electronics Group SA | 7.125% | 10/1/37 | 9,950 | 12,700 |
| Verisk Analytics Inc. | 5.800% | 5/1/21 | 2,125 | 2,357 |
| Verisk Analytics Inc. | 4.125% | 9/12/22 | 5,464 | 5,500 |
| Verisk Analytics Inc. | 4.000% | 6/15/25 | 13,050 | 12,768 |
| Verisk Analytics Inc. | 5.500% | 6/15/45 | 7,675 | 7,320 |
| Xerox Corp. | 6.750% | 2/1/17 | 3,910 | 4,098 |
| Xerox Corp. | 2.950% | 3/15/17 | 250 | 252 |
| Xerox Corp. | 6.350% | 5/15/18 | 17,205 | 18,450 |
| Xerox Corp. | 2.750% | 3/15/19 | 7,646 | 7,497 |
| Xerox Corp. | 5.625% | 12/15/19 | 5,700 | 6,104 |
90
| Vanguard® Total Bond Market Index Fund | ||||
| Schedule of Investments | ||||
| December 31, 2015 | ||||
| Face | Market | |||
| Maturity | Amount | Value | ||
| Coupon | Date | ($000) | ($000) | |
| Xerox Corp. | 2.800% | 5/15/20 | 4,300 | 4,102 |
| Xerox Corp. | 2.750% | 9/1/20 | 2,700 | 2,554 |
| Xerox Corp. | 4.500% | 5/15/21 | 6,215 | 6,289 |
| Xerox Corp. | 3.800% | 5/15/24 | 1,850 | 1,720 |
| Xilinx Inc. | 2.125% | 3/15/19 | 600 | 594 |
| Xilinx Inc. | 3.000% | 3/15/21 | 13,675 | 13,702 |
| Transportation (0.6%) | ||||
| 5 American Airlines 2013-1 Class A Pass Through Trust | 4.000% | 1/15/27 | 3,795 | 3,843 |
| 5 American Airlines 2013-2 Class A Pass Through Trust | 4.950% | 7/15/24 | 8,982 | 9,521 |
| 5 American Airlines 2014-1 Class A Pass Through Trust | 3.700% | 4/1/28 | 6,546 | 6,546 |
| 5 American Airlines 2015-1 Class A Pass Through Trust | 3.375% | 11/1/28 | 13,643 | 13,200 |
| 5 American Airlines 2015-1 Class B Pass Through Trust | 3.700% | 11/1/24 | 2,494 | 2,413 |
| 5 American Airlines 2015-2 Class AA Pass Through Trust | 3.600% | 9/22/27 | 2,070 | 2,093 |
| 5 BNSF Funding Trust I | 6.613% | 12/15/55 | 420 | 468 |
| Burlington Northern Santa Fe LLC | 5.750% | 3/15/18 | 7,047 | 7,609 |
| Burlington Northern Santa Fe LLC | 3.600% | 9/1/20 | 5,800 | 6,032 |
| Burlington Northern Santa Fe LLC | 3.450% | 9/15/21 | 6,875 | 7,054 |
| Burlington Northern Santa Fe LLC | 3.050% | 3/15/22 | 2,890 | 2,896 |
| Burlington Northern Santa Fe LLC | 3.050% | 9/1/22 | 4,537 | 4,534 |
| Burlington Northern Santa Fe LLC | 3.000% | 3/15/23 | 5,066 | 4,992 |
| Burlington Northern Santa Fe LLC | 3.850% | 9/1/23 | 4,000 | 4,156 |
| Burlington Northern Santa Fe LLC | 3.750% | 4/1/24 | 3,212 | 3,297 |
| Burlington Northern Santa Fe LLC | 3.400% | 9/1/24 | 5,290 | 5,266 |
| Burlington Northern Santa Fe LLC | 3.000% | 4/1/25 | 15,000 | 14,412 |
| Burlington Northern Santa Fe LLC | 3.650% | 9/1/25 | 3,900 | 3,963 |
| Burlington Northern Santa Fe LLC | 7.000% | 12/15/25 | 6,186 | 7,730 |
| Burlington Northern Santa Fe LLC | 7.950% | 8/15/30 | 330 | 458 |
| Burlington Northern Santa Fe LLC | 6.200% | 8/15/36 | 3,200 | 3,777 |
| Burlington Northern Santa Fe LLC | 6.150% | 5/1/37 | 3,259 | 3,822 |
| Burlington Northern Santa Fe LLC | 5.750% | 5/1/40 | 8,065 | 9,069 |
| Burlington Northern Santa Fe LLC | 5.050% | 3/1/41 | 8,255 | 8,529 |
| Burlington Northern Santa Fe LLC | 5.400% | 6/1/41 | 7,175 | 7,791 |
| Burlington Northern Santa Fe LLC | 4.950% | 9/15/41 | 1,750 | 1,788 |
| Burlington Northern Santa Fe LLC | 4.400% | 3/15/42 | 5,523 | 5,250 |
| Burlington Northern Santa Fe LLC | 4.375% | 9/1/42 | 6,600 | 6,246 |
| Burlington Northern Santa Fe LLC | 4.450% | 3/15/43 | 9,995 | 9,538 |
| Burlington Northern Santa Fe LLC | 5.150% | 9/1/43 | 7,275 | 7,673 |
| Burlington Northern Santa Fe LLC | 4.900% | 4/1/44 | 6,870 | 7,050 |
| Burlington Northern Santa Fe LLC | 4.550% | 9/1/44 | 1,885 | 1,812 |
| Burlington Northern Santa Fe LLC | 4.150% | 4/1/45 | 4,400 | 3,997 |
| Burlington Northern Santa Fe LLC | 4.700% | 9/1/45 | 2,700 | 2,687 |
| Canadian National Railway Co. | 1.450% | 12/15/16 | 1,850 | 1,853 |
| Canadian National Railway Co. | 5.850% | 11/15/17 | 175 | 188 |
| Canadian National Railway Co. | 5.550% | 3/1/19 | 2,410 | 2,648 |
| Canadian National Railway Co. | 2.850% | 12/15/21 | 1,185 | 1,191 |
| Canadian National Railway Co. | 2.250% | 11/15/22 | 2,765 | 2,654 |
| Canadian National Railway Co. | 2.950% | 11/21/24 | 1,100 | 1,088 |
| Canadian National Railway Co. | 6.900% | 7/15/28 | 2,875 | 3,801 |
| Canadian National Railway Co. | 6.250% | 8/1/34 | 1,075 | 1,357 |
| Canadian National Railway Co. | 6.200% | 6/1/36 | 2,568 | 3,274 |
| Canadian National Railway Co. | 6.375% | 11/15/37 | 2,068 | 2,681 |
| Canadian National Railway Co. | 3.500% | 11/15/42 | 9,925 | 8,956 |
| Canadian Pacific Railway Co. | 6.500% | 5/15/18 | 250 | 274 |
| Canadian Pacific Railway Co. | 7.250% | 5/15/19 | 5,764 | 6,582 |
| Canadian Pacific Railway Co. | 4.450% | 3/15/23 | 6,303 | 6,718 |
| Canadian Pacific Railway Co. | 2.900% | 2/1/25 | 7,764 | 7,306 |
| Canadian Pacific Railway Co. | 3.700% | 2/1/26 | 2,125 | 2,093 |
| Canadian Pacific Railway Co. | 7.125% | 10/15/31 | 2,035 | 2,545 |
| Canadian Pacific Railway Co. | 5.750% | 3/15/33 | 75 | 82 |
| Canadian Pacific Railway Co. | 4.800% | 9/15/35 | 725 | 717 |
| Canadian Pacific Railway Co. | 5.950% | 5/15/37 | 14,254 | 16,032 |
| Canadian Pacific Railway Co. | 4.800% | 8/1/45 | 1,800 | 1,766 |
| Canadian Pacific Railway Co. | 6.125% | 9/15/15 | 3,660 | 3,740 |
91
| Vanguard® Total Bond Market Index Fund | |||||
| Schedule of Investments | |||||
| December 31, 2015 | |||||
| Face | Market | ||||
| Maturity | Amount | Value | |||
| Coupon | Date | ($000) | ($000) | ||
| Canadian Pacific Railway Ltd. | 4.500% | 1/15/22 | 8,500 | 9,000 | |
| Canadian Pacific Railway Ltd. | 5.750% | 1/15/42 | 13,430 | 14,572 | |
| 5 | Continental Airlines 2007-1 Class A Pass Through Trust | 5.983% | 10/19/23 | 2,615 | 2,870 |
| 5 | Continental Airlines 2009-2 Class A Pass Through Trust | 7.250% | 5/10/21 | 180 | 203 |
| 5 | Continental Airlines 2012-1 Class A Pass Through Trust | 4.150% | 10/11/25 | 12,269 | 12,607 |
| 5 | Continental Airlines 2012-2 Class A Pass Through Trust | 4.000% | 4/29/26 | 3,878 | 3,955 |
| CSX Corp. | 7.900% | 5/1/17 | 1,795 | 1,943 | |
| CSX Corp. | 6.250% | 3/15/18 | 2,870 | 3,124 | |
| CSX Corp. | 7.375% | 2/1/19 | 34,110 | 39,071 | |
| CSX Corp. | 3.700% | 10/30/20 | 1,155 | 1,207 | |
| CSX Corp. | 4.250% | 6/1/21 | 2,690 | 2,847 | |
| CSX Corp. | 3.700% | 11/1/23 | 2,000 | 2,046 | |
| CSX Corp. | 3.350% | 11/1/25 | 3,075 | 2,987 | |
| CSX Corp. | 6.000% | 10/1/36 | 6,119 | 6,945 | |
| CSX Corp. | 6.150% | 5/1/37 | 2,635 | 3,067 | |
| CSX Corp. | 6.220% | 4/30/40 | 8,585 | 10,142 | |
| CSX Corp. | 5.500% | 4/15/41 | 9,000 | 9,915 | |
| CSX Corp. | 4.750% | 5/30/42 | 4,290 | 4,283 | |
| CSX Corp. | 4.400% | 3/1/43 | 143 | 135 | |
| CSX Corp. | 4.100% | 3/15/44 | 9,800 | 8,871 | |
| CSX Corp. | 3.950% | 5/1/50 | 4,400 | 3,734 | |
| CSX Corp. | 4.500% | 8/1/54 | 25 | 23 | |
| 5 | Delta Air Lines 2007-1 Class A Pass Through Trust | 6.821% | 2/10/24 | 4,214 | 4,835 |
| 5 | Delta Air Lines 2009-1 Class A Pass Through Trust | 7.750% | 6/17/21 | 3,858 | 4,321 |
| 5 | Delta Air Lines 2010-2 Class A Pass Through Trust | 4.950% | 11/23/20 | 2,009 | 2,115 |
| 5 | Delta Air Lines 2012-1 Class A Pass Through Trust | 4.750% | 11/7/21 | 763 | 800 |
| 5 | Delta Air Lines 2015-1 Class AA Pass Through Trust | 3.625% | 7/30/27 | 4,025 | 4,070 |
| FedEx Corp. | 8.000% | 1/15/19 | 5,880 | 6,849 | |
| FedEx Corp. | 2.300% | 2/1/20 | 4,200 | 4,212 | |
| FedEx Corp. | 2.625% | 8/1/22 | 2,265 | 2,211 | |
| FedEx Corp. | 4.000% | 1/15/24 | 500 | 521 | |
| FedEx Corp. | 3.200% | 2/1/25 | 5,000 | 4,865 | |
| FedEx Corp. | 4.900% | 1/15/34 | 300 | 309 | |
| FedEx Corp. | 3.900% | 2/1/35 | 2,400 | 2,188 | |
| FedEx Corp. | 3.875% | 8/1/42 | 1,675 | 1,448 | |
| FedEx Corp. | 4.100% | 4/15/43 | 4,225 | 3,742 | |
| FedEx Corp. | 5.100% | 1/15/44 | 7,500 | 7,773 | |
| FedEx Corp. | 4.100% | 2/1/45 | 550 | 490 | |
| FedEx Corp. | 4.750% | 11/15/45 | 8,575 | 8,479 | |
| FedEx Corp. | 4.500% | 2/1/65 | 740 | 631 | |
| 5 | Hawaiian Airlines 2013-1 Class A Pass Through | ||||
| Certificates | 3.900% | 1/15/26 | 12,624 | 12,182 | |
| JB Hunt Transport Services Inc. | 2.400% | 3/15/19 | 1,270 | 1,269 | |
| JB Hunt Transport Services Inc. | 3.300% | 8/15/22 | 7,150 | 7,095 | |
| 8 | Kansas City Southern | 2.350% | 5/15/20 | 3,800 | 3,644 |
| 8 | Kansas City Southern | 3.000% | 5/15/23 | 6,805 | 6,450 |
| 8 | Kansas City Southern | 4.300% | 5/15/43 | 5,300 | 4,699 |
| 8 | Kansas City Southern | 4.950% | 8/15/45 | 4,500 | 4,377 |
| 5,8 | Latam Airlines 2015-1 Pass Through Trust A | 4.200% | 11/15/27 | 5,380 | 4,961 |
| Norfolk Southern Corp. | 7.700% | 5/15/17 | 3,240 | 3,503 | |
| Norfolk Southern Corp. | 5.750% | 4/1/18 | 2,595 | 2,802 | |
| Norfolk Southern Corp. | 5.900% | 6/15/19 | 9,350 | 10,402 | |
| Norfolk Southern Corp. | 3.250% | 12/1/21 | 4,759 | 4,752 | |
| Norfolk Southern Corp. | 3.000% | 4/1/22 | 6,358 | 6,286 | |
| Norfolk Southern Corp. | 2.903% | 2/15/23 | 3,518 | 3,391 | |
| Norfolk Southern Corp. | 3.850% | 1/15/24 | 2,000 | 2,037 | |
| Norfolk Southern Corp. | 5.590% | 5/17/25 | 2,302 | 2,630 | |
| Norfolk Southern Corp. | 7.800% | 5/15/27 | 4,800 | 6,332 | |
| Norfolk Southern Corp. | 7.250% | 2/15/31 | 3,912 | 4,972 | |
| Norfolk Southern Corp. | 7.050% | 5/1/37 | 2,000 | 2,515 | |
| Norfolk Southern Corp. | 4.837% | 10/1/41 | 19,381 | 18,868 | |
| Norfolk Southern Corp. | 3.950% | 10/1/42 | 100 | 85 | |
| Norfolk Southern Corp. | 4.450% | 6/15/45 | 2,800 | 2,625 | |
| Norfolk Southern Corp. | 4.650% | 1/15/46 | 2,300 | 2,206 | |
92
| Vanguard® Total Bond Market Index Fund | ||||
| Schedule of Investments | ||||
| December 31, 2015 | ||||
| Face | Market | |||
| Maturity | Amount | Value | ||
| Coupon | Date | ($000) | ($000) | |
| Norfolk Southern Corp. | 7.900% | 5/15/97 | 205 | 280 |
| Norfolk Southern Corp. | 6.000% | 3/15/05 | 2,350 | 2,507 |
| Norfolk Southern Corp. | 6.000% | 5/23/11 | 11,925 | 12,504 |
| 5 Northwest Airlines 2007-1 Class A Pass Through Trust | 7.027% | 5/1/21 | 660 | 736 |
| Ryder System Inc. | 3.500% | 6/1/17 | 1,625 | 1,661 |
| Ryder System Inc. | 2.500% | 3/1/18 | 3,907 | 3,901 |
| Ryder System Inc. | 2.450% | 11/15/18 | 12,740 | 12,750 |
| Ryder System Inc. | 2.350% | 2/26/19 | 13,637 | 13,613 |
| Ryder System Inc. | 2.550% | 6/1/19 | 10,195 | 10,146 |
| Ryder System Inc. | 2.500% | 5/11/20 | 3,050 | 2,992 |
| Ryder System Inc. | 2.875% | 9/1/20 | 3,325 | 3,286 |
| Southern Railway Co. | 9.750% | 6/15/20 | 1,559 | 1,990 |
| Southwest Airlines Co. | 2.750% | 11/6/19 | 3,650 | 3,677 |
| Southwest Airlines Co. | 2.650% | 11/5/20 | 6,680 | 6,647 |
| 5 Southwest Airlines Co. 2007-1 Pass Through Trust | 6.150% | 2/1/24 | 1,293 | 1,445 |
| 5 Spirit Airlines Class A Pass Through Certificates Series | ||||
| 2015-1 | 4.100% | 10/1/29 | 4,500 | 4,466 |
| Trinity Industries Inc. | 4.550% | 10/1/24 | 2,980 | 2,731 |
| 5 UAL 2009-2A Pass Through Trust | 9.750% | 7/15/18 | 1,497 | 1,579 |
| Union Pacific Corp. | 5.750% | 11/15/17 | 155 | 167 |
| Union Pacific Corp. | 5.700% | 8/15/18 | 1,181 | 1,300 |
| Union Pacific Corp. | 1.800% | 2/1/20 | 2,525 | 2,489 |
| Union Pacific Corp. | 2.250% | 6/19/20 | 11,775 | 11,776 |
| Union Pacific Corp. | 4.000% | 2/1/21 | 2,475 | 2,647 |
| Union Pacific Corp. | 4.163% | 7/15/22 | 27,619 | 29,884 |
| Union Pacific Corp. | 2.750% | 4/15/23 | 1,475 | 1,457 |
| Union Pacific Corp. | 3.646% | 2/15/24 | 1,405 | 1,467 |
| Union Pacific Corp. | 3.750% | 3/15/24 | 1,440 | 1,509 |
| Union Pacific Corp. | 3.250% | 8/15/25 | 23,325 | 23,593 |
| Union Pacific Corp. | 6.625% | 2/1/29 | 2,310 | 2,969 |
| Union Pacific Corp. | 3.375% | 2/1/35 | 7,000 | 6,350 |
| Union Pacific Corp. | 4.750% | 9/15/41 | 8,422 | 8,979 |
| Union Pacific Corp. | 4.250% | 4/15/43 | 1,156 | 1,158 |
| Union Pacific Corp. | 4.750% | 12/15/43 | 3,909 | 4,200 |
| Union Pacific Corp. | 4.821% | 2/1/44 | 3,634 | 3,934 |
| Union Pacific Corp. | 4.850% | 6/15/44 | 645 | 698 |
| Union Pacific Corp. | 4.150% | 1/15/45 | 1,000 | 985 |
| Union Pacific Corp. | 4.050% | 11/15/45 | 1,880 | 1,832 |
| Union Pacific Corp. | 3.875% | 2/1/55 | 8,700 | 7,631 |
| Union Pacific Corp. | 4.375% | 11/15/65 | 7,580 | 7,024 |
| 5 Union Pacific Railroad Co. 2007-3 Pass Through Trust | 6.176% | 1/2/31 | 1,065 | 1,211 |
| 5 United Airlines 2013-1 Class A Pass Through Trust | 4.300% | 2/15/27 | 6,331 | 6,552 |
| 5 United Airlines 2014-1 Class A Pass Through Trust | 4.000% | 10/11/27 | 9,130 | 9,336 |
| 5 United Airlines 2014-2 Class A Pass Through Trust | 3.750% | 3/3/28 | 7,575 | 7,632 |
| United Airlines 2015-1 Class A Pass Through Trust | 3.700% | 12/1/22 | 2,880 | 2,887 |
| 5 United Airlines 2015-1 Class AA Pass Through Trust | 3.450% | 12/1/27 | 11,625 | 11,640 |
| United Parcel Service Inc. | 1.125% | 10/1/17 | 2,525 | 2,523 |
| United Parcel Service Inc. | 5.500% | 1/15/18 | 2,815 | 3,052 |
| United Parcel Service Inc. | 5.125% | 4/1/19 | 6,708 | 7,402 |
| United Parcel Service Inc. | 3.125% | 1/15/21 | 8,574 | 8,921 |
| United Parcel Service Inc. | 2.450% | 10/1/22 | 6,765 | 6,678 |
| United Parcel Service Inc. | 6.200% | 1/15/38 | 17,971 | 23,100 |
| United Parcel Service Inc. | 4.875% | 11/15/40 | 3,492 | 3,887 |
| United Parcel Service Inc. | 3.625% | 10/1/42 | 3,768 | 3,484 |
| United Parcel Service of America Inc. | 8.375% | 4/1/20 | 10 | 12 |
| United Parcel Service of America Inc. | 8.375% | 4/1/30 | 1,513 | 2,121 |
| 5 US Airways 2013-1 Class A Pass Through Trust | 3.950% | 5/15/27 | 927 | 932 |
| 5 US Airways Inc. 2012-2 Class A Pass Through Trust | 4.625% | 12/3/26 | 1,762 | 1,828 |
| 23,761,953 | ||||
| Utilities (2.0%) | ||||
| Electric (1.9%) | ||||
| AEP Texas Central Co. | 6.650% | 2/15/33 | 4,550 | 5,548 |
| Alabama Power Co. | 2.800% | 4/1/25 | 3,600 | 3,474 |
93
| Vanguard® Total Bond Market Index Fund | ||||
| Schedule of Investments | ||||
| December 31, 2015 | ||||
| Face | Market | |||
| Maturity | Amount | Value | ||
| Coupon | Date | ($000) | ($000) | |
| Alabama Power Co. | 6.125% | 5/15/38 | 168 | 204 |
| Alabama Power Co. | 6.000% | 3/1/39 | 145 | 172 |
| Alabama Power Co. | 5.500% | 3/15/41 | 475 | 538 |
| Alabama Power Co. | 5.200% | 6/1/41 | 2,800 | 3,054 |
| Alabama Power Co. | 4.100% | 1/15/42 | 5,125 | 4,872 |
| Alabama Power Co. | 3.850% | 12/1/42 | 1,250 | 1,148 |
| Alabama Power Co. | 4.150% | 8/15/44 | 3,575 | 3,413 |
| Alabama Power Co. | 3.750% | 3/1/45 | 3,750 | 3,374 |
| Ameren Corp. | 2.700% | 11/15/20 | 10,025 | 9,985 |
| Ameren Corp. | 3.650% | 2/15/26 | 4,690 | 4,670 |
| Ameren Illinois Co. | 6.125% | 11/15/17 | 1,424 | 1,539 |
| Ameren Illinois Co. | 2.700% | 9/1/22 | 12,731 | 12,517 |
| Ameren Illinois Co. | 3.250% | 3/1/25 | 1,335 | 1,343 |
| Ameren Illinois Co. | 4.800% | 12/15/43 | 2,575 | 2,783 |
| Ameren Illinois Co. | 4.300% | 7/1/44 | 3,324 | 3,340 |
| Ameren Illinois Co. | 4.150% | 3/15/46 | 2,700 | 2,686 |
| American Electric Power Co. Inc. | 1.650% | 12/15/17 | 5,325 | 5,285 |
| American Electric Power Co. Inc. | 2.950% | 12/15/22 | 4,850 | 4,790 |
| Appalachian Power Co. | 4.600% | 3/30/21 | 5,372 | 5,732 |
| Appalachian Power Co. | 3.400% | 6/1/25 | 5,025 | 4,906 |
| Appalachian Power Co. | 5.800% | 10/1/35 | 2,693 | 2,979 |
| Appalachian Power Co. | 6.375% | 4/1/36 | 2,800 | 3,246 |
| Appalachian Power Co. | 4.450% | 6/1/45 | 6,700 | 6,403 |
| Arizona Public Service Co. | 8.750% | 3/1/19 | 1,555 | 1,847 |
| Arizona Public Service Co. | 3.350% | 6/15/24 | 2,625 | 2,666 |
| Arizona Public Service Co. | 3.150% | 5/15/25 | 4,350 | 4,332 |
| Arizona Public Service Co. | 5.500% | 9/1/35 | 3,580 | 4,084 |
| Arizona Public Service Co. | 4.500% | 4/1/42 | 8,388 | 8,609 |
| Arizona Public Service Co. | 4.700% | 1/15/44 | 4,651 | 4,944 |
| Arizona Public Service Co. | 4.350% | 11/15/45 | 725 | 733 |
| Atlantic City Electric Co. | 7.750% | 11/15/18 | 2,680 | 3,093 |
| Baltimore Gas & Electric Co. | 5.900% | 10/1/16 | 3,535 | 3,654 |
| Baltimore Gas & Electric Co. | 3.500% | 11/15/21 | 1,738 | 1,802 |
| Baltimore Gas & Electric Co. | 3.350% | 7/1/23 | 7,650 | 7,746 |
| Baltimore Gas & Electric Co. | 6.350% | 10/1/36 | 643 | 801 |
| Berkshire Hathaway Energy Co. | 1.100% | 5/15/17 | 9,900 | 9,816 |
| Berkshire Hathaway Energy Co. | 5.750% | 4/1/18 | 19,708 | 21,291 |
| Berkshire Hathaway Energy Co. | 2.000% | 11/15/18 | 2,500 | 2,484 |
| Berkshire Hathaway Energy Co. | 2.400% | 2/1/20 | 5,500 | 5,448 |
| Berkshire Hathaway Energy Co. | 3.750% | 11/15/23 | 7,699 | 7,899 |
| Berkshire Hathaway Energy Co. | 3.500% | 2/1/25 | 6,750 | 6,693 |
| Berkshire Hathaway Energy Co. | 8.480% | 9/15/28 | 555 | 788 |
| Berkshire Hathaway Energy Co. | 6.125% | 4/1/36 | 4,486 | 5,230 |
| Berkshire Hathaway Energy Co. | 5.950% | 5/15/37 | 8,250 | 9,423 |
| Berkshire Hathaway Energy Co. | 6.500% | 9/15/37 | 1,305 | 1,590 |
| Berkshire Hathaway Energy Co. | 5.150% | 11/15/43 | 6,649 | 7,022 |
| Berkshire Hathaway Energy Co. | 4.500% | 2/1/45 | 6,550 | 6,260 |
| CenterPoint Energy Houston Electric LLC | 2.250% | 8/1/22 | 5,300 | 5,089 |
| CenterPoint Energy Houston Electric LLC | 3.550% | 8/1/42 | 11,122 | 10,003 |
| CenterPoint Energy Houston Electric LLC | 4.500% | 4/1/44 | 1,200 | 1,239 |
| CenterPoint Energy Inc. | 6.500% | 5/1/18 | 470 | 513 |
| Cleco Power LLC | 6.500% | 12/1/35 | 4,300 | 4,999 |
| Cleco Power LLC | 6.000% | 12/1/40 | 4,075 | 4,576 |
| Cleveland Electric Illuminating Co. | 7.880% | 11/1/17 | 2,767 | 3,045 |
| Cleveland Electric Illuminating Co. | 5.500% | 8/15/24 | 5,590 | 6,295 |
| CMS Energy Corp. | 8.750% | 6/15/19 | 9,710 | 11,613 |
| CMS Energy Corp. | 6.250% | 2/1/20 | 3,476 | 3,944 |
| CMS Energy Corp. | 5.050% | 3/15/22 | 1,275 | 1,397 |
| CMS Energy Corp. | 3.875% | 3/1/24 | 2,524 | 2,574 |
| CMS Energy Corp. | 3.600% | 11/15/25 | 1,600 | 1,591 |
| CMS Energy Corp. | 4.700% | 3/31/43 | 6,300 | 6,239 |
| CMS Energy Corp. | 4.875% | 3/1/44 | 2,300 | 2,332 |
| Commonwealth Edison Co. | 5.950% | 8/15/16 | 11,620 | 11,966 |
| Commonwealth Edison Co. | 6.150% | 9/15/17 | 13,675 | 14,691 |
94
| Vanguard® Total Bond Market Index Fund | ||||
| Schedule of Investments | ||||
| December 31, 2015 | ||||
| Face | Market | |||
| Maturity | Amount | Value | ||
| Coupon | Date | ($000) | ($000) | |
| Commonwealth Edison Co. | 5.800% | 3/15/18 | 10,705 | 11,607 |
| Commonwealth Edison Co. | 4.000% | 8/1/20 | 3,795 | 4,013 |
| Commonwealth Edison Co. | 3.400% | 9/1/21 | 4,650 | 4,827 |
| Commonwealth Edison Co. | 3.100% | 11/1/24 | 625 | 619 |
| Commonwealth Edison Co. | 5.875% | 2/1/33 | 590 | 695 |
| Commonwealth Edison Co. | 5.900% | 3/15/36 | 3,086 | 3,687 |
| Commonwealth Edison Co. | 6.450% | 1/15/38 | 9,223 | 11,779 |
| Commonwealth Edison Co. | 3.800% | 10/1/42 | 2,314 | 2,134 |
| Commonwealth Edison Co. | 4.600% | 8/15/43 | 3,315 | 3,431 |
| Commonwealth Edison Co. | 4.700% | 1/15/44 | 6,263 | 6,594 |
| Commonwealth Edison Co. | 3.700% | 3/1/45 | 8,550 | 7,688 |
| Commonwealth Edison Co. | 4.350% | 11/15/45 | 11,400 | 11,474 |
| Connecticut Light & Power Co. | 2.500% | 1/15/23 | 6,940 | 6,722 |
| Connecticut Light & Power Co. | 6.350% | 6/1/36 | 5,100 | 6,486 |
| Connecticut Light & Power Co. | 4.300% | 4/15/44 | 7,075 | 7,108 |
| Consolidated Edison Co. of New York Inc. | 5.850% | 4/1/18 | 765 | 829 |
| Consolidated Edison Co. of New York Inc. | 7.125% | 12/1/18 | 1,200 | 1,370 |
| Consolidated Edison Co. of New York Inc. | 6.650% | 4/1/19 | 13,240 | 15,031 |
| Consolidated Edison Co. of New York Inc. | 4.450% | 6/15/20 | 2,250 | 2,439 |
| Consolidated Edison Co. of New York Inc. | 5.300% | 3/1/35 | 6,475 | 7,221 |
| Consolidated Edison Co. of New York Inc. | 5.850% | 3/15/36 | 4,890 | 5,809 |
| Consolidated Edison Co. of New York Inc. | 6.200% | 6/15/36 | 3,020 | 3,655 |
| Consolidated Edison Co. of New York Inc. | 6.300% | 8/15/37 | 750 | 914 |
| Consolidated Edison Co. of New York Inc. | 6.750% | 4/1/38 | 1,080 | 1,392 |
| Consolidated Edison Co. of New York Inc. | 5.500% | 12/1/39 | 553 | 628 |
| Consolidated Edison Co. of New York Inc. | 5.700% | 6/15/40 | 6,725 | 7,880 |
| Consolidated Edison Co. of New York Inc. | 4.200% | 3/15/42 | 18 | 17 |
| Consolidated Edison Co. of New York Inc. | 4.450% | 3/15/44 | 22,535 | 22,531 |
| Consolidated Edison Co. of New York Inc. | 4.500% | 12/1/45 | 10,950 | 11,052 |
| Consolidated Edison Co. of New York Inc. | 4.625% | 12/1/54 | 4,957 | 4,873 |
| Constellation Energy Group Inc. | 5.150% | 12/1/20 | 9,038 | 9,815 |
| Consumers Energy Co. | 6.125% | 3/15/19 | 19,156 | 21,474 |
| Consumers Energy Co. | 6.700% | 9/15/19 | 12,362 | 14,234 |
| Consumers Energy Co. | 2.850% | 5/15/22 | 8,950 | 8,934 |
| Consumers Energy Co. | 3.375% | 8/15/23 | 3,185 | 3,257 |
| Consumers Energy Co. | 3.950% | 5/15/43 | 3,493 | 3,383 |
| Consumers Energy Co. | 4.100% | 11/15/45 | 1,125 | 1,117 |
| Consumers Energy Co. | 4.350% | 8/31/64 | 2,225 | 2,109 |
| Dayton Power & Light Co. | 1.875% | 9/15/16 | 1,550 | 1,552 |
| Delmarva Power & Light Co. | 3.500% | 11/15/23 | 3,525 | 3,618 |
| Delmarva Power & Light Co. | 4.000% | 6/1/42 | 375 | 354 |
| Dominion Resources Inc. | 1.950% | 8/15/16 | 7,675 | 7,708 |
| Dominion Resources Inc. | 1.400% | 9/15/17 | 550 | 544 |
| Dominion Resources Inc. | 6.400% | 6/15/18 | 300 | 328 |
| Dominion Resources Inc. | 2.500% | 12/1/19 | 3,908 | 3,894 |
| Dominion Resources Inc. | 4.450% | 3/15/21 | 8,754 | 9,287 |
| Dominion Resources Inc. | 3.625% | 12/1/24 | 6,550 | 6,488 |
| Dominion Resources Inc. | 3.900% | 10/1/25 | 925 | 926 |
| Dominion Resources Inc. | 6.300% | 3/15/33 | 8,275 | 9,525 |
| Dominion Resources Inc. | 5.250% | 8/1/33 | 2,195 | 2,282 |
| Dominion Resources Inc. | 5.950% | 6/15/35 | 10,385 | 11,629 |
| Dominion Resources Inc. | 4.900% | 8/1/41 | 3,895 | 3,822 |
| Dominion Resources Inc. | 4.050% | 9/15/42 | 825 | 728 |
| Dominion Resources Inc. | 4.700% | 12/1/44 | 7,525 | 7,338 |
| 5 Dominion Resources Inc. | 5.750% | 10/1/54 | 4,950 | 4,860 |
| Dominion Resources Inc. | 1.900% | 6/15/18 | 300 | 297 |
| DTE Electric Co. | 3.450% | 10/1/20 | 2,800 | 2,927 |
| DTE Electric Co. | 3.900% | 6/1/21 | 600 | 639 |
| DTE Electric Co. | 2.650% | 6/15/22 | 5,975 | 5,877 |
| DTE Electric Co. | 3.650% | 3/15/24 | 11,900 | 12,440 |
| DTE Electric Co. | 3.375% | 3/1/25 | 9,875 | 10,090 |
| DTE Electric Co. | 5.700% | 10/1/37 | 1,170 | 1,401 |
| DTE Electric Co. | 3.950% | 6/15/42 | 11,055 | 10,594 |
| DTE Electric Co. | 4.000% | 4/1/43 | 6,575 | 6,372 |
95
| Vanguard® Total Bond Market Index Fund | ||||
| Schedule of Investments | ||||
| December 31, 2015 | ||||
| Face | Market | |||
| Maturity | Amount | Value | ||
| Coupon | Date | ($000) | ($000) | |
| DTE Electric Co. | 4.300% | 7/1/44 | 375 | 381 |
| DTE Electric Co. | 3.700% | 3/15/45 | 3,750 | 3,447 |
| DTE Energy Co. | 2.400% | 12/1/19 | 5,858 | 5,834 |
| DTE Energy Co. | 3.500% | 6/1/24 | 7,456 | 7,467 |
| DTE Energy Co. | 6.375% | 4/15/33 | 4,275 | 5,195 |
| Duke Energy Carolinas LLC | 4.300% | 6/15/20 | 5,900 | 6,385 |
| Duke Energy Carolinas LLC | 3.900% | 6/15/21 | 925 | 982 |
| Duke Energy Carolinas LLC | 6.000% | 12/1/28 | 5,170 | 6,204 |
| Duke Energy Carolinas LLC | 6.450% | 10/15/32 | 1,575 | 1,917 |
| Duke Energy Carolinas LLC | 6.100% | 6/1/37 | 11,026 | 13,329 |
| Duke Energy Carolinas LLC | 6.000% | 1/15/38 | 6,145 | 7,582 |
| Duke Energy Carolinas LLC | 6.050% | 4/15/38 | 4,586 | 5,698 |
| Duke Energy Carolinas LLC | 5.300% | 2/15/40 | 3,198 | 3,669 |
| Duke Energy Carolinas LLC | 4.250% | 12/15/41 | 5,600 | 5,582 |
| Duke Energy Carolinas LLC | 4.000% | 9/30/42 | 3,045 | 2,933 |
| Duke Energy Carolinas LLC | 3.750% | 6/1/45 | 5,300 | 4,907 |
| Duke Energy Corp. | 1.625% | 8/15/17 | 9,491 | 9,478 |
| Duke Energy Corp. | 2.100% | 6/15/18 | 8,575 | 8,590 |
| Duke Energy Corp. | 5.050% | 9/15/19 | 11,200 | 12,185 |
| Duke Energy Corp. | 3.550% | 9/15/21 | 7,139 | 7,291 |
| Duke Energy Corp. | 3.050% | 8/15/22 | 13,015 | 12,823 |
| Duke Energy Corp. | 3.750% | 4/15/24 | 2,600 | 2,631 |
| Duke Energy Corp. | 4.800% | 12/15/45 | 875 | 885 |
| Duke Energy Florida LLC | 6.350% | 9/15/37 | 10,725 | 13,676 |
| Duke Energy Florida LLC | 6.400% | 6/15/38 | 8,900 | 11,376 |
| Duke Energy Florida LLC | 5.650% | 4/1/40 | 1,000 | 1,182 |
| Duke Energy Indiana Inc. | 3.750% | 7/15/20 | 539 | 568 |
| Duke Energy Indiana Inc. | 6.120% | 10/15/35 | 6,178 | 7,397 |
| Duke Energy Indiana Inc. | 6.350% | 8/15/38 | 9,004 | 11,486 |
| Duke Energy Indiana Inc. | 6.450% | 4/1/39 | 1,350 | 1,729 |
| Duke Energy Indiana Inc. | 4.200% | 3/15/42 | 2,875 | 2,816 |
| Duke Energy Indiana Inc. | 4.900% | 7/15/43 | 1,450 | 1,567 |
| Duke Energy Progress Llc | 5.300% | 1/15/19 | 14,805 | 16,265 |
| Duke Energy Progress LLC | 3.000% | 9/15/21 | 5,800 | 5,909 |
| Duke Energy Progress LLC | 3.250% | 8/15/25 | 5,050 | 5,080 |
| Duke Energy Progress LLC | 6.300% | 4/1/38 | 6,099 | 7,772 |
| Duke Energy Progress LLC | 4.100% | 5/15/42 | 18 | 17 |
| Duke Energy Progress LLC | 4.100% | 3/15/43 | 525 | 510 |
| Duke Energy Progress LLC | 4.375% | 3/30/44 | 6,375 | 6,473 |
| Duke Energy Progress LLC | 4.150% | 12/1/44 | 5,634 | 5,503 |
| Duke Energy Progress LLC | 4.200% | 8/15/45 | 1,900 | 1,874 |
| Edison International | 3.750% | 9/15/17 | 3,000 | 3,095 |
| El Paso Electric Co. | 6.000% | 5/15/35 | 1,725 | 2,039 |
| Entergy Arkansas Inc. | 3.750% | 2/15/21 | 10,575 | 11,005 |
| Entergy Corp. | 4.700% | 1/15/17 | 2,874 | 2,947 |
| Entergy Gulf States Louisiana LLC | 6.000% | 5/1/18 | 3,735 | 4,082 |
| Entergy Gulf States Louisiana LLC | 5.590% | 10/1/24 | 2,305 | 2,631 |
| Entergy Louisiana LLC | 4.050% | 9/1/23 | 6,600 | 6,846 |
| Entergy Louisiana LLC | 5.400% | 11/1/24 | 2,725 | 3,113 |
| Entergy Louisiana LLC | 4.950% | 1/15/45 | 5,500 | 5,491 |
| Entergy Mississippi Inc. | 3.100% | 7/1/23 | 1,787 | 1,753 |
| Entergy Texas Inc. | 7.125% | 2/1/19 | 11,785 | 13,338 |
| Entergy Texas Inc. | 5.150% | 6/1/45 | 4,125 | 4,045 |
| Eversource Energy | 1.450% | 5/1/18 | 2,340 | 2,302 |
| Eversource Energy | 4.500% | 11/15/19 | 5,753 | 6,137 |
| Eversource Energy | 3.150% | 1/15/25 | 5,400 | 5,275 |
| Exelon Corp. | 1.550% | 6/9/17 | 3,100 | 3,089 |
| Exelon Corp. | 2.850% | 6/15/20 | 3,000 | 2,996 |
| 8 Exelon Corp. | 3.950% | 6/15/25 | 16,050 | 16,075 |
| 8 Exelon Corp. | 4.950% | 6/15/35 | 6,500 | 6,515 |
| Exelon Corp. | 5.625% | 6/15/35 | 5,765 | 6,150 |
| 8 Exelon Corp. | 5.100% | 6/15/45 | 3,850 | 3,844 |
| Exelon Generation Co. LLC | 6.200% | 10/1/17 | 5,465 | 5,831 |
| Exelon Generation Co. LLC | 5.200% | 10/1/19 | 888 | 957 |
96
| Vanguard® Total Bond Market Index Fund | ||||
| Schedule of Investments | ||||
| December 31, 2015 | ||||
| Face | Market | |||
| Maturity | Amount | Value | ||
| Coupon | Date | ($000) | ($000) | |
| Exelon Generation Co. LLC | 4.000% | 10/1/20 | 11,323 | 11,673 |
| Exelon Generation Co. LLC | 4.250% | 6/15/22 | 20,125 | 20,419 |
| Exelon Generation Co. LLC | 6.250% | 10/1/39 | 7,912 | 8,008 |
| Exelon Generation Co. LLC | 5.750% | 10/1/41 | 1,825 | 1,765 |
| Exelon Generation Co. LLC | 5.600% | 6/15/42 | 11,586 | 10,786 |
| FirstEnergy Solutions Corp. | 6.800% | 8/15/39 | 5,153 | 4,848 |
| Florida Power & Light Co. | 5.550% | 11/1/17 | 730 | 781 |
| Florida Power & Light Co. | 2.750% | 6/1/23 | 7,625 | 7,539 |
| Florida Power & Light Co. | 3.250% | 6/1/24 | 9,925 | 10,108 |
| Florida Power & Light Co. | 3.125% | 12/1/25 | 10,700 | 10,713 |
| Florida Power & Light Co. | 5.625% | 4/1/34 | 3,000 | 3,573 |
| Florida Power & Light Co. | 4.950% | 6/1/35 | 645 | 708 |
| Florida Power & Light Co. | 5.650% | 2/1/37 | 3,297 | 3,961 |
| Florida Power & Light Co. | 5.950% | 2/1/38 | 10,050 | 12,513 |
| Florida Power & Light Co. | 5.250% | 2/1/41 | 500 | 573 |
| Florida Power & Light Co. | 4.125% | 2/1/42 | 15,168 | 15,106 |
| Florida Power & Light Co. | 3.800% | 12/15/42 | 5,095 | 4,831 |
| Florida Power & Light Co. | 4.050% | 10/1/44 | 4,700 | 4,652 |
| Georgia Power Co. | 5.700% | 6/1/17 | 16,459 | 17,373 |
| Georgia Power Co. | 1.950% | 12/1/18 | 6,715 | 6,695 |
| Georgia Power Co. | 4.250% | 12/1/19 | 45 | 48 |
| Georgia Power Co. | 2.850% | 5/15/22 | 8,675 | 8,511 |
| Georgia Power Co. | 5.650% | 3/1/37 | 1,133 | 1,227 |
| Georgia Power Co. | 5.950% | 2/1/39 | 2,000 | 2,273 |
| Georgia Power Co. | 5.400% | 6/1/40 | 6,040 | 6,369 |
| Georgia Power Co. | 4.750% | 9/1/40 | 4,777 | 4,654 |
| Georgia Power Co. | 4.300% | 3/15/42 | 14,123 | 13,054 |
| Georgia Power Co. | 4.300% | 3/15/43 | 4,055 | 3,719 |
| Great Plains Energy Inc. | 4.850% | 6/1/21 | 1,253 | 1,347 |
| Iberdrola International BV | 6.750% | 7/15/36 | 3,375 | 4,131 |
| Indiana Michigan Power Co. | 7.000% | 3/15/19 | 4,490 | 5,090 |
| Indiana Michigan Power Co. | 3.200% | 3/15/23 | 7,277 | 7,175 |
| Indiana Michigan Power Co. | 6.050% | 3/15/37 | 7,250 | 8,236 |
| Interstate Power & Light Co. | 3.250% | 12/1/24 | 2,375 | 2,388 |
| Interstate Power & Light Co. | 3.400% | 8/15/25 | 3,650 | 3,671 |
| Interstate Power & Light Co. | 6.250% | 7/15/39 | 3,314 | 4,167 |
| ITC Holdings Corp. | 4.050% | 7/1/23 | 2,925 | 3,009 |
| ITC Holdings Corp. | 3.650% | 6/15/24 | 1,515 | 1,493 |
| ITC Holdings Corp. | 5.300% | 7/1/43 | 11,410 | 11,693 |
| Jersey Central Power & Light Co. | 5.650% | 6/1/17 | 4,185 | 4,397 |
| Jersey Central Power & Light Co. | 6.150% | 6/1/37 | 6,273 | 6,689 |
| 5 John Sevier Combined Cycle Generation LLC | 4.626% | 1/15/42 | 2,477 | 2,695 |
| Kansas City Power & Light Co. | 5.850% | 6/15/17 | 100 | 106 |
| Kansas City Power & Light Co. | 7.150% | 4/1/19 | 3,040 | 3,503 |
| Kansas City Power & Light Co. | 3.150% | 3/15/23 | 2,750 | 2,701 |
| Kansas City Power & Light Co. | 3.650% | 8/15/25 | 50 | 50 |
| Kansas City Power & Light Co. | 6.050% | 11/15/35 | 1,725 | 2,084 |
| Kansas City Power & Light Co. | 5.300% | 10/1/41 | 5,493 | 5,972 |
| Kentucky Utilities Co. | 3.250% | 11/1/20 | 3,375 | 3,500 |
| Kentucky Utilities Co. | 5.125% | 11/1/40 | 3,081 | 3,450 |
| Kentucky Utilities Co. | 4.650% | 11/15/43 | 11,820 | 12,526 |
| LG&E & KU Energy LLC | 3.750% | 11/15/20 | 13,700 | 14,149 |
| LG&E & KU Energy LLC | 4.375% | 10/1/21 | 75 | 81 |
| Louisville Gas & Electric Co. | 5.125% | 11/15/40 | 1,675 | 1,873 |
| Louisville Gas & Electric Co. | 4.650% | 11/15/43 | 8,400 | 8,859 |
| Metropolitan Edison Co. | 7.700% | 1/15/19 | 4,761 | 5,423 |
| MidAmerican Energy Co. | 5.950% | 7/15/17 | 1,835 | 1,945 |
| MidAmerican Energy Co. | 5.300% | 3/15/18 | 815 | 875 |
| MidAmerican Energy Co. | 3.500% | 10/15/24 | 5,050 | 5,161 |
| MidAmerican Energy Co. | 6.750% | 12/30/31 | 9,000 | 11,505 |
| MidAmerican Energy Co. | 5.750% | 11/1/35 | 1,400 | 1,667 |
| MidAmerican Energy Co. | 5.800% | 10/15/36 | 275 | 331 |
| MidAmerican Energy Co. | 4.250% | 5/1/46 | 200 | 198 |
| Mississippi Power Co. | 4.250% | 3/15/42 | 7,875 | 6,023 |
97
| Vanguard® Total Bond Market Index Fund | ||||
| Schedule of Investments | ||||
| December 31, 2015 | ||||
| Face | Market | |||
| Maturity | Amount | Value | ||
| Coupon | Date | ($000) | ($000) | |
| National Rural Utilities Cooperative Finance Corp. | 5.450% | 4/10/17 | 520 | 545 |
| National Rural Utilities Cooperative Finance Corp. | 0.950% | 4/24/17 | 6,035 | 6,007 |
| National Rural Utilities Cooperative Finance Corp. | 5.450% | 2/1/18 | 6,915 | 7,401 |
| National Rural Utilities Cooperative Finance Corp. | 10.375% | 11/1/18 | 17,790 | 21,730 |
| National Rural Utilities Cooperative Finance Corp. | 2.150% | 2/1/19 | 6,225 | 6,234 |
| National Rural Utilities Cooperative Finance Corp. | 2.300% | 11/15/19 | 5,000 | 4,971 |
| National Rural Utilities Cooperative Finance Corp. | 2.000% | 1/27/20 | 3,500 | 3,436 |
| National Rural Utilities Cooperative Finance Corp. | 2.350% | 6/15/20 | 6,900 | 6,831 |
| National Rural Utilities Cooperative Finance Corp. | 2.300% | 11/1/20 | 4,500 | 4,458 |
| National Rural Utilities Cooperative Finance Corp. | 3.050% | 2/15/22 | 2,117 | 2,137 |
| National Rural Utilities Cooperative Finance Corp. | 2.850% | 1/27/25 | 8,970 | 8,670 |
| National Rural Utilities Cooperative Finance Corp. | 3.250% | 11/1/25 | 650 | 646 |
| National Rural Utilities Cooperative Finance Corp. | 4.023% | 11/1/32 | 12,383 | 12,163 |
| 5 National Rural Utilities Cooperative Finance Corp. | 4.750% | 4/30/43 | 1,500 | 1,481 |
| Nevada Power Co. | 6.500% | 5/15/18 | 5,722 | 6,374 |
| Nevada Power Co. | 7.125% | 3/15/19 | 17,805 | 20,363 |
| Nevada Power Co. | 6.650% | 4/1/36 | 6,100 | 7,706 |
| Nevada Power Co. | 6.750% | 7/1/37 | 6,372 | 8,086 |
| Nevada Power Co. | 5.375% | 9/15/40 | 3,905 | 4,311 |
| Nevada Power Co. | 5.450% | 5/15/41 | 1,825 | 2,050 |
| NextEra Energy Capital Holdings Inc. | 6.000% | 3/1/19 | 15,600 | 17,087 |
| NextEra Energy Capital Holdings Inc. | 2.400% | 9/15/19 | 8,075 | 7,963 |
| NextEra Energy Capital Holdings Inc. | 2.700% | 9/15/19 | 2,575 | 2,566 |
| NextEra Energy Capital Holdings Inc. | 3.625% | 6/15/23 | 6,900 | 6,875 |
| 5 NextEra Energy Capital Holdings Inc. | 6.650% | 6/15/67 | 2,450 | 1,862 |
| Northern States Power Co. | 5.250% | 3/1/18 | 1,890 | 2,028 |
| Northern States Power Co. | 2.200% | 8/15/20 | 2,700 | 2,681 |
| Northern States Power Co. | 5.250% | 7/15/35 | 325 | 371 |
| Northern States Power Co. | 6.250% | 6/1/36 | 3,670 | 4,658 |
| Northern States Power Co. | 6.200% | 7/1/37 | 5,443 | 6,901 |
| Northern States Power Co. | 5.350% | 11/1/39 | 9,296 | 10,710 |
| Northern States Power Co. | 4.850% | 8/15/40 | 525 | 577 |
| Northern States Power Co. | 3.400% | 8/15/42 | 18 | 16 |
| Northern States Power Co. | 4.000% | 8/15/45 | 3,250 | 3,178 |
| NorthWestern Corp. | 6.340% | 4/1/19 | 4,500 | 5,062 |
| NorthWestern Corp. | 4.176% | 11/15/44 | 3,425 | 3,377 |
| NSTAR Electric Co. | 5.625% | 11/15/17 | 5,365 | 5,738 |
| NSTAR Electric Co. | 2.375% | 10/15/22 | 7,725 | 7,435 |
| NSTAR Electric Co. | 5.500% | 3/15/40 | 4,871 | 5,647 |
| Oglethorpe Power Corp. | 5.950% | 11/1/39 | 1,700 | 1,910 |
| Oglethorpe Power Corp. | 5.375% | 11/1/40 | 4,650 | 4,992 |
| Oglethorpe Power Corp. | 5.250% | 9/1/50 | 18 | 19 |
| Ohio Edison Co. | 6.875% | 7/15/36 | 1,150 | 1,349 |
| Ohio Edison Co. | 8.250% | 10/15/38 | 3,000 | 4,162 |
| Ohio Power Co. | 5.375% | 10/1/21 | 4,256 | 4,738 |
| Ohio Power Co. | 6.600% | 2/15/33 | 2,000 | 2,417 |
| Ohio Power Co. | 5.850% | 10/1/35 | 4,518 | 5,130 |
| Oklahoma Gas & Electric Co. | 5.850% | 6/1/40 | 2,925 | 3,506 |
| Oklahoma Gas & Electric Co. | 3.900% | 5/1/43 | 3,575 | 3,292 |
| Oklahoma Gas & Electric Co. | 4.550% | 3/15/44 | 135 | 138 |
| Oklahoma Gas & Electric Co. | 4.000% | 12/15/44 | 4,825 | 4,525 |
| Oncor Electric Delivery Co. LLC | 5.000% | 9/30/17 | 2,620 | 2,752 |
| Oncor Electric Delivery Co. LLC | 6.800% | 9/1/18 | 5,785 | 6,430 |
| Oncor Electric Delivery Co. LLC | 2.150% | 6/1/19 | 5,725 | 5,633 |
| Oncor Electric Delivery Co. LLC | 7.000% | 9/1/22 | 5,496 | 6,618 |
| Oncor Electric Delivery Co. LLC | 2.950% | 4/1/25 | 5,000 | 4,697 |
| Oncor Electric Delivery Co. LLC | 7.000% | 5/1/32 | 2,400 | 2,983 |
| Oncor Electric Delivery Co. LLC | 7.250% | 1/15/33 | 3,680 | 4,720 |
| Oncor Electric Delivery Co. LLC | 7.500% | 9/1/38 | 1,721 | 2,286 |
| Oncor Electric Delivery Co. LLC | 5.250% | 9/30/40 | 1,400 | 1,474 |
| Oncor Electric Delivery Co. LLC | 4.550% | 12/1/41 | 4,404 | 4,254 |
| Oncor Electric Delivery Co. LLC | 5.300% | 6/1/42 | 475 | 508 |
| Pacific Gas & Electric Co. | 5.625% | 11/30/17 | 6,945 | 7,423 |
| Pacific Gas & Electric Co. | 3.500% | 10/1/20 | 23,475 | 24,412 |
98
| Vanguard® Total Bond Market Index Fund | ||||
| Schedule of Investments | ||||
| December 31, 2015 | ||||
| Face | Market | |||
| Maturity | Amount | Value | ||
| Coupon | Date | ($000) | ($000) | |
| Pacific Gas & Electric Co. | 4.250% | 5/15/21 | 9,150 | 9,802 |
| Pacific Gas & Electric Co. | 3.250% | 9/15/21 | 750 | 768 |
| Pacific Gas & Electric Co. | 3.250% | 6/15/23 | 9,980 | 10,013 |
| Pacific Gas & Electric Co. | 3.750% | 2/15/24 | 9,975 | 10,313 |
| Pacific Gas & Electric Co. | 3.400% | 8/15/24 | 5,575 | 5,625 |
| Pacific Gas & Electric Co. | 3.500% | 6/15/25 | 5,800 | 5,889 |
| Pacific Gas & Electric Co. | 6.050% | 3/1/34 | 30,262 | 35,991 |
| Pacific Gas & Electric Co. | 5.800% | 3/1/37 | 8,995 | 10,457 |
| Pacific Gas & Electric Co. | 6.350% | 2/15/38 | 750 | 913 |
| Pacific Gas & Electric Co. | 6.250% | 3/1/39 | 4,575 | 5,590 |
| Pacific Gas & Electric Co. | 5.400% | 1/15/40 | 160 | 181 |
| Pacific Gas & Electric Co. | 4.450% | 4/15/42 | 8,369 | 8,406 |
| Pacific Gas & Electric Co. | 3.750% | 8/15/42 | 175 | 158 |
| Pacific Gas & Electric Co. | 4.600% | 6/15/43 | 14,500 | 14,771 |
| Pacific Gas & Electric Co. | 5.125% | 11/15/43 | 55 | 60 |
| Pacific Gas & Electric Co. | 4.750% | 2/15/44 | 4,393 | 4,566 |
| Pacific Gas & Electric Co. | 4.300% | 3/15/45 | 1,950 | 1,918 |
| Pacific Gas & Electric Co. | 4.250% | 3/15/46 | 10,200 | 9,907 |
| PacifiCorp | 5.650% | 7/15/18 | 7,504 | 8,178 |
| PacifiCorp | 5.500% | 1/15/19 | 10,477 | 11,497 |
| PacifiCorp | 2.950% | 2/1/22 | 8,000 | 8,058 |
| PacifiCorp | 3.600% | 4/1/24 | 9,214 | 9,519 |
| PacifiCorp | 7.700% | 11/15/31 | 1,174 | 1,616 |
| PacifiCorp | 5.250% | 6/15/35 | 100 | 112 |
| PacifiCorp | 6.100% | 8/1/36 | 500 | 608 |
| PacifiCorp | 5.750% | 4/1/37 | 3,175 | 3,733 |
| PacifiCorp | 6.250% | 10/15/37 | 8,355 | 10,330 |
| PacifiCorp | 6.000% | 1/15/39 | 3,225 | 3,914 |
| PacifiCorp | 4.100% | 2/1/42 | 2,945 | 2,839 |
| Peco Energy Co. | 1.200% | 10/15/16 | 12,675 | 12,690 |
| Peco Energy Co. | 5.350% | 3/1/18 | 695 | 747 |
| Peco Energy Co. | 2.375% | 9/15/22 | 2,925 | 2,834 |
| Pennsylvania Electric Co. | 5.200% | 4/1/20 | 3,850 | 4,106 |
| Pennsylvania Electric Co. | 6.150% | 10/1/38 | 11,015 | 11,816 |
| PG&E Corp. | 2.400% | 3/1/19 | 3,700 | 3,702 |
| Potomac Electric Power Co. | 3.600% | 3/15/24 | 3,650 | 3,776 |
| Potomac Electric Power Co. | 6.500% | 11/15/37 | 7,757 | 9,973 |
| PPL Capital Funding Inc. | 1.900% | 6/1/18 | 1,245 | 1,234 |
| PPL Capital Funding Inc. | 4.200% | 6/15/22 | 1,265 | 1,332 |
| PPL Capital Funding Inc. | 3.500% | 12/1/22 | 1,795 | 1,807 |
| PPL Capital Funding Inc. | 3.400% | 6/1/23 | 3,495 | 3,461 |
| PPL Capital Funding Inc. | 3.950% | 3/15/24 | 1,065 | 1,090 |
| PPL Capital Funding Inc. | 4.700% | 6/1/43 | 2,750 | 2,741 |
| PPL Capital Funding Inc. | 5.000% | 3/15/44 | 11,571 | 11,924 |
| PPL Electric Utilities Corp. | 3.000% | 9/15/21 | 1,100 | 1,117 |
| PPL Electric Utilities Corp. | 6.250% | 5/15/39 | 5,552 | 7,050 |
| PPL Electric Utilities Corp. | 5.200% | 7/15/41 | 3,915 | 4,438 |
| PPL Electric Utilities Corp. | 4.125% | 6/15/44 | 2,700 | 2,662 |
| Progress Energy Inc. | 4.875% | 12/1/19 | 4,310 | 4,622 |
| Progress Energy Inc. | 4.400% | 1/15/21 | 9,782 | 10,351 |
| Progress Energy Inc. | 7.750% | 3/1/31 | 1,885 | 2,428 |
| Progress Energy Inc. | 7.000% | 10/30/31 | 500 | 616 |
| Progress Energy Inc. | 6.000% | 12/1/39 | 5,970 | 6,944 |
| PSEG Power LLC | 2.750% | 9/15/16 | 4,400 | 4,443 |
| PSEG Power LLC | 5.125% | 4/15/20 | 1,286 | 1,388 |
| PSEG Power LLC | 4.150% | 9/15/21 | 4,269 | 4,380 |
| PSEG Power LLC | 4.300% | 11/15/23 | 350 | 348 |
| PSEG Power LLC | 8.625% | 4/15/31 | 350 | 436 |
| Public Service Co. of Colorado | 5.800% | 8/1/18 | 1,485 | 1,623 |
| Public Service Co. of Colorado | 5.125% | 6/1/19 | 7,725 | 8,484 |
| Public Service Co. of Colorado | 3.200% | 11/15/20 | 4,100 | 4,235 |
| Public Service Co. of Colorado | 2.250% | 9/15/22 | 5,650 | 5,451 |
| Public Service Co. of Colorado | 2.900% | 5/15/25 | 5,200 | 5,112 |
| Public Service Co. of Colorado | 6.250% | 9/1/37 | 900 | 1,159 |
99
| Vanguard® Total Bond Market Index Fund | ||||
| Schedule of Investments | ||||
| December 31, 2015 | ||||
| Face | Market | |||
| Maturity | Amount | Value | ||
| Coupon | Date | ($000) | ($000) | |
| Public Service Co. of Colorado | 4.750% | 8/15/41 | 3,000 | 3,232 |
| Public Service Co. of Colorado | 3.600% | 9/15/42 | 11,100 | 10,119 |
| Public Service Co. of New Hampshire | 3.500% | 11/1/23 | 2,054 | 2,105 |
| Public Service Co. of New Mexico | 3.850% | 8/1/25 | 2,100 | 2,090 |
| Public Service Co. of Oklahoma | 5.150% | 12/1/19 | 100 | 109 |
| Public Service Co. of Oklahoma | 6.625% | 11/15/37 | 4,675 | 5,628 |
| Public Service Electric & Gas Co. | 2.300% | 9/15/18 | 6,200 | 6,268 |
| Public Service Electric & Gas Co. | 1.800% | 6/1/19 | 2,125 | 2,095 |
| Public Service Electric & Gas Co. | 3.500% | 8/15/20 | 525 | 548 |
| Public Service Electric & Gas Co. | 3.150% | 8/15/24 | 4,200 | 4,209 |
| Public Service Electric & Gas Co. | 3.050% | 11/15/24 | 1,575 | 1,566 |
| Public Service Electric & Gas Co. | 3.000% | 5/15/25 | 2,700 | 2,665 |
| Public Service Electric & Gas Co. | 5.700% | 12/1/36 | 4,207 | 5,065 |
| Public Service Electric & Gas Co. | 5.800% | 5/1/37 | 1,700 | 2,061 |
| Public Service Electric & Gas Co. | 5.375% | 11/1/39 | 7,972 | 9,201 |
| Public Service Electric & Gas Co. | 3.950% | 5/1/42 | 15,365 | 14,826 |
| Public Service Electric & Gas Co. | 3.650% | 9/1/42 | 1,200 | 1,109 |
| Public Service Electric & Gas Co. | 4.000% | 6/1/44 | 2,875 | 2,798 |
| Public Service Electric & Gas Co. | 4.050% | 5/1/45 | 2,700 | 2,645 |
| Puget Energy Inc. | 6.500% | 12/15/20 | 18,200 | 20,846 |
| Puget Energy Inc. | 6.000% | 9/1/21 | 4,865 | 5,484 |
| Puget Energy Inc. | 5.625% | 7/15/22 | 2,500 | 2,774 |
| 8 Puget Energy Inc. | 3.650% | 5/15/25 | 7,000 | 6,783 |
| Puget Sound Energy Inc. | 7.020% | 12/1/27 | 1,000 | 1,268 |
| Puget Sound Energy Inc. | 5.483% | 6/1/35 | 805 | 936 |
| Puget Sound Energy Inc. | 6.274% | 3/15/37 | 5,475 | 6,923 |
| Puget Sound Energy Inc. | 5.757% | 10/1/39 | 2,675 | 3,251 |
| Puget Sound Energy Inc. | 5.795% | 3/15/40 | 1,624 | 1,962 |
| Puget Sound Energy Inc. | 5.764% | 7/15/40 | 2,145 | 2,588 |
| Puget Sound Energy Inc. | 5.638% | 4/15/41 | 3,718 | 4,422 |
| Puget Sound Energy Inc. | 4.434% | 11/15/41 | 4,009 | 4,128 |
| Puget Sound Energy Inc. | 4.300% | 5/20/45 | 7,225 | 7,321 |
| San Diego Gas & Electric Co. | 3.000% | 8/15/21 | 3,000 | 3,064 |
| San Diego Gas & Electric Co. | 3.600% | 9/1/23 | 3,675 | 3,827 |
| San Diego Gas & Electric Co. | 5.350% | 5/15/35 | 1,200 | 1,378 |
| San Diego Gas & Electric Co. | 6.125% | 9/15/37 | 118 | 150 |
| San Diego Gas & Electric Co. | 6.000% | 6/1/39 | 905 | 1,126 |
| San Diego Gas & Electric Co. | 5.350% | 5/15/40 | 2,760 | 3,227 |
| San Diego Gas & Electric Co. | 4.500% | 8/15/40 | 2,870 | 3,001 |
| San Diego Gas & Electric Co. | 3.950% | 11/15/41 | 8,725 | 8,408 |
| San Diego Gas & Electric Co. | 4.300% | 4/1/42 | 1,945 | 1,966 |
| SCANA Corp. | 4.750% | 5/15/21 | 5,600 | 5,806 |
| SCANA Corp. | 4.125% | 2/1/22 | 6,805 | 6,785 |
| Scottish Power Ltd. | 5.810% | 3/15/25 | 900 | 1,019 |
| Sierra Pacific Power Co. | 3.375% | 8/15/23 | 8,448 | 8,553 |
| Sierra Pacific Power Co. | 6.750% | 7/1/37 | 4,250 | 5,331 |
| South Carolina Electric & Gas Co. | 6.500% | 11/1/18 | 1,670 | 1,878 |
| South Carolina Electric & Gas Co. | 6.625% | 2/1/32 | 5,725 | 6,936 |
| South Carolina Electric & Gas Co. | 5.300% | 5/15/33 | 343 | 373 |
| South Carolina Electric & Gas Co. | 6.050% | 1/15/38 | 3,685 | 4,334 |
| South Carolina Electric & Gas Co. | 5.450% | 2/1/41 | 4,220 | 4,650 |
| South Carolina Electric & Gas Co. | 4.350% | 2/1/42 | 7,418 | 7,115 |
| South Carolina Electric & Gas Co. | 4.600% | 6/15/43 | 8,708 | 8,747 |
| South Carolina Electric & Gas Co. | 4.500% | 6/1/64 | 3,250 | 3,027 |
| South Carolina Electric & Gas Co. | 5.100% | 6/1/65 | 6,225 | 6,479 |
| Southern California Edison Co. | 3.875% | 6/1/21 | 24,450 | 25,874 |
| 5 Southern California Edison Co. | 1.845% | 2/1/22 | 5,084 | 5,030 |
| Southern California Edison Co. | 2.400% | 2/1/22 | 10,100 | 9,903 |
| Southern California Edison Co. | 6.650% | 4/1/29 | 2,056 | 2,568 |
| Southern California Edison Co. | 6.000% | 1/15/34 | 6,035 | 7,312 |
| Southern California Edison Co. | 5.750% | 4/1/35 | 2,913 | 3,449 |
| Southern California Edison Co. | 5.350% | 7/15/35 | 7,323 | 8,300 |
| Southern California Edison Co. | 5.550% | 1/15/36 | 1,400 | 1,627 |
| Southern California Edison Co. | 5.625% | 2/1/36 | 6,925 | 8,118 |
100
| Vanguard® Total Bond Market Index Fund | ||||
| Schedule of Investments | ||||
| December 31, 2015 | ||||
| Face | Market | |||
| Maturity | Amount | Value | ||
| Coupon | Date | ($000) | ($000) | |
| Southern California Edison Co. | 5.550% | 1/15/37 | 7,350 | 8,534 |
| Southern California Edison Co. | 5.950% | 2/1/38 | 6,113 | 7,481 |
| Southern California Edison Co. | 6.050% | 3/15/39 | 1,185 | 1,467 |
| Southern California Edison Co. | 5.500% | 3/15/40 | 1,148 | 1,354 |
| Southern California Edison Co. | 4.500% | 9/1/40 | 6,075 | 6,343 |
| Southern California Edison Co. | 3.900% | 12/1/41 | 300 | 285 |
| Southern California Edison Co. | 4.050% | 3/15/42 | 5,925 | 5,784 |
| Southern California Edison Co. | 4.650% | 10/1/43 | 4,429 | 4,678 |
| Southern California Edison Co. | 3.600% | 2/1/45 | 9,350 | 8,470 |
| Southern Co. | 1.300% | 8/15/17 | 3,400 | 3,368 |
| Southern Co. | 2.150% | 9/1/19 | 3,500 | 3,428 |
| Southern Co. | 2.750% | 6/15/20 | 18,710 | 18,491 |
| Southern Power Co. | 1.850% | 12/1/17 | 1,800 | 1,799 |
| Southern Power Co. | 4.150% | 12/1/25 | 11,350 | 11,331 |
| Southern Power Co. | 5.150% | 9/15/41 | 11,215 | 10,486 |
| Southern Power Co. | 5.250% | 7/15/43 | 150 | 143 |
| Southwestern Electric Power Co. | 5.550% | 1/15/17 | 1,138 | 1,184 |
| Southwestern Electric Power Co. | 5.875% | 3/1/18 | 1,327 | 1,433 |
| Southwestern Electric Power Co. | 6.450% | 1/15/19 | 3,735 | 4,174 |
| Southwestern Electric Power Co. | 3.550% | 2/15/22 | 7,044 | 7,144 |
| Southwestern Electric Power Co. | 6.200% | 3/15/40 | 2,060 | 2,440 |
| Southwestern Electric Power Co. | 3.900% | 4/1/45 | 3,900 | 3,412 |
| Southwestern Public Service Co. | 3.300% | 6/15/24 | 3,500 | 3,536 |
| Southwestern Public Service Co. | 4.500% | 8/15/41 | 3,645 | 3,768 |
| System Energy Resources Inc. | 4.100% | 4/1/23 | 350 | 357 |
| Tampa Electric Co. | 6.100% | 5/15/18 | 275 | 300 |
| Tampa Electric Co. | 5.400% | 5/15/21 | 2,262 | 2,537 |
| Tampa Electric Co. | 2.600% | 9/15/22 | 5,065 | 4,919 |
| Tampa Electric Co. | 6.550% | 5/15/36 | 800 | 1,011 |
| Tampa Electric Co. | 4.100% | 6/15/42 | 100 | 96 |
| Tampa Electric Co. | 4.350% | 5/15/44 | 6,925 | 6,835 |
| Tampa Electric Co. | 4.200% | 5/15/45 | 4,000 | 3,868 |
| TECO Finance Inc. | 6.572% | 11/1/17 | 2,520 | 2,716 |
| TECO Finance Inc. | 5.150% | 3/15/20 | 3,367 | 3,623 |
| TransAlta Corp. | 1.900% | 6/3/17 | 2,200 | 2,152 |
| TransAlta Corp. | 6.900% | 5/15/18 | 1,135 | 1,155 |
| TransAlta Corp. | 4.500% | 11/15/22 | 500 | 437 |
| TransAlta Corp. | 6.500% | 3/15/40 | 3,439 | 2,577 |
| Tri-State Generation & Transmission Association Inc. | 3.700% | 11/1/24 | 1,500 | 1,491 |
| Tri-State Generation & Transmission Association Inc. | 4.700% | 11/1/44 | 2,350 | 2,353 |
| Tucson Electric Power Co. | 5.150% | 11/15/21 | 2,125 | 2,339 |
| Tucson Electric Power Co. | 3.050% | 3/15/25 | 2,375 | 2,250 |
| UIL Holdings Corp. | 4.625% | 10/1/20 | 1,650 | 1,737 |
| Union Electric Co. | 6.700% | 2/1/19 | 4,641 | 5,274 |
| Union Electric Co. | 3.500% | 4/15/24 | 7,160 | 7,373 |
| Union Electric Co. | 5.300% | 8/1/37 | 3,745 | 4,267 |
| Union Electric Co. | 8.450% | 3/15/39 | 1,775 | 2,750 |
| Union Electric Co. | 3.900% | 9/15/42 | 2,225 | 2,118 |
| Union Electric Co. | 3.650% | 4/15/45 | 1,800 | 1,623 |
| Virginia Electric & Power Co. | 5.400% | 1/15/16 | 1,320 | 1,320 |
| Virginia Electric & Power Co. | 5.400% | 4/30/18 | 5,170 | 5,592 |
| Virginia Electric & Power Co. | 5.000% | 6/30/19 | 3,300 | 3,591 |
| Virginia Electric & Power Co. | 2.950% | 1/15/22 | 3,600 | 3,620 |
| Virginia Electric & Power Co. | 3.450% | 9/1/22 | 665 | 683 |
| Virginia Electric & Power Co. | 3.450% | 2/15/24 | 2,850 | 2,907 |
| Virginia Electric & Power Co. | 3.100% | 5/15/25 | 4,130 | 4,090 |
| Virginia Electric & Power Co. | 6.000% | 1/15/36 | 5,575 | 6,855 |
| Virginia Electric & Power Co. | 6.000% | 5/15/37 | 3,275 | 4,021 |
| Virginia Electric & Power Co. | 6.350% | 11/30/37 | 3,450 | 4,412 |
| Virginia Electric & Power Co. | 8.875% | 11/15/38 | 28 | 44 |
| Virginia Electric & Power Co. | 4.000% | 1/15/43 | 4,058 | 3,889 |
| Virginia Electric & Power Co. | 4.650% | 8/15/43 | 7,305 | 7,727 |
| Virginia Electric & Power Co. | 4.450% | 2/15/44 | 9,475 | 9,751 |
| Virginia Electric & Power Co. | 4.200% | 5/15/45 | 5,450 | 5,404 |
101
| Vanguard® Total Bond Market Index Fund | ||||
| Schedule of Investments | ||||
| December 31, 2015 | ||||
| Face | Market | |||
| Maturity | Amount | Value | ||
| Coupon | Date | ($000) | ($000) | |
| WEC Energy Group Inc. | 1.650% | 6/15/18 | 3,500 | 3,472 |
| WEC Energy Group Inc. | 2.450% | 6/15/20 | 3,000 | 2,985 |
| WEC Energy Group Inc. | 3.550% | 6/15/25 | 4,775 | 4,802 |
| 5 WEC Energy Group Inc. | 6.110% | 12/1/66 | 4,350 | 3,306 |
| 5 WEC Energy Group Inc. | 6.250% | 5/15/67 | 13,990 | 10,423 |
| Westar Energy Inc. | 4.125% | 3/1/42 | 8,530 | 8,401 |
| Westar Energy Inc. | 4.100% | 4/1/43 | 5,475 | 5,368 |
| Westar Energy Inc. | 4.625% | 9/1/43 | 925 | 978 |
| Westar Energy Inc. | 4.250% | 12/1/45 | 1,225 | 1,235 |
| Western Massachusetts Electric Co. | 3.500% | 9/15/21 | 2,650 | 2,761 |
| Wisconsin Electric Power Co. | 4.250% | 12/15/19 | 4,600 | 4,940 |
| Wisconsin Electric Power Co. | 2.950% | 9/15/21 | 2,500 | 2,526 |
| Wisconsin Electric Power Co. | 5.625% | 5/15/33 | 1,025 | 1,201 |
| Wisconsin Electric Power Co. | 5.700% | 12/1/36 | 1,250 | 1,495 |
| Wisconsin Electric Power Co. | 3.650% | 12/15/42 | 418 | 383 |
| Wisconsin Electric Power Co. | 4.250% | 6/1/44 | 2,125 | 2,149 |
| Wisconsin Power & Light Co. | 2.250% | 11/15/22 | 3,075 | 2,946 |
| Wisconsin Power & Light Co. | 6.375% | 8/15/37 | 4,875 | 6,216 |
| Wisconsin Power & Light Co. | 4.100% | 10/15/44 | 1,325 | 1,290 |
| Wisconsin Public Service Corp. | 1.650% | 12/4/18 | 3,450 | 3,424 |
| Wisconsin Public Service Corp. | 3.671% | 12/1/42 | 1,625 | 1,482 |
| Xcel Energy Inc. | 5.613% | 4/1/17 | 592 | 622 |
| Xcel Energy Inc. | 1.200% | 6/1/17 | 2,250 | 2,239 |
| Xcel Energy Inc. | 4.700% | 5/15/20 | 825 | 887 |
| Xcel Energy Inc. | 3.300% | 6/1/25 | 1,400 | 1,369 |
| Xcel Energy Inc. | 6.500% | 7/1/36 | 8,090 | 9,774 |
| Natural Gas (0.1%) | ||||
| AGL Capital Corp. | 5.250% | 8/15/19 | 885 | 952 |
| AGL Capital Corp. | 3.500% | 9/15/21 | 4,865 | 4,888 |
| AGL Capital Corp. | 3.875% | 11/15/25 | 2,000 | 2,012 |
| AGL Capital Corp. | 5.875% | 3/15/41 | 4,485 | 4,981 |
| AGL Capital Corp. | 4.400% | 6/1/43 | 3,825 | 3,522 |
| Atmos Energy Corp. | 8.500% | 3/15/19 | 1,810 | 2,123 |
| Atmos Energy Corp. | 5.500% | 6/15/41 | 10,395 | 11,920 |
| Atmos Energy Corp. | 4.150% | 1/15/43 | 9,400 | 9,102 |
| British Transco Finance Inc. | 6.625% | 6/1/18 | 5,315 | 5,878 |
| CenterPoint Energy Resources Corp. | 4.500% | 1/15/21 | 16,687 | 17,521 |
| CenterPoint Energy Resources Corp. | 6.625% | 11/1/37 | 600 | 713 |
| CenterPoint Energy Resources Corp. | 5.850% | 1/15/41 | 7,150 | 7,968 |
| KeySpan Corp. | 8.000% | 11/15/30 | 60 | 80 |
| Laclede Group Inc. | 4.700% | 8/15/44 | 4,925 | 4,894 |
| NiSource Finance Corp. | 6.400% | 3/15/18 | 10,234 | 11,149 |
| NiSource Finance Corp. | 6.800% | 1/15/19 | 1,270 | 1,425 |
| NiSource Finance Corp. | 5.450% | 9/15/20 | 6,732 | 7,378 |
| NiSource Finance Corp. | 6.125% | 3/1/22 | 875 | 1,002 |
| NiSource Finance Corp. | 6.250% | 12/15/40 | 8,375 | 9,910 |
| NiSource Finance Corp. | 5.950% | 6/15/41 | 4,390 | 5,041 |
| NiSource Finance Corp. | 5.800% | 2/1/42 | 11,798 | 13,407 |
| Nisource Finance Corp. | 5.250% | 2/15/43 | 200 | 213 |
| NiSource Finance Corp. | 4.800% | 2/15/44 | 950 | 966 |
| ONE Gas Inc. | 2.070% | 2/1/19 | 4,149 | 4,126 |
| ONE Gas Inc. | 4.658% | 2/1/44 | 1,525 | 1,580 |
| Piedmont Natural Gas Co. Inc. | 4.650% | 8/1/43 | 2,350 | 2,431 |
| Sempra Energy | 2.300% | 4/1/17 | 6,470 | 6,518 |
| Sempra Energy | 6.150% | 6/15/18 | 2,815 | 3,072 |
| Sempra Energy | 9.800% | 2/15/19 | 6,755 | 8,176 |
| Sempra Energy | 2.400% | 3/15/20 | 2,721 | 2,659 |
| Sempra Energy | 2.850% | 11/15/20 | 1,075 | 1,075 |
| Sempra Energy | 2.875% | 10/1/22 | 3,406 | 3,295 |
| Sempra Energy | 4.050% | 12/1/23 | 7,685 | 7,926 |
| Sempra Energy | 6.000% | 10/15/39 | 21,466 | 24,010 |
| Southern California Gas Co. | 5.750% | 11/15/35 | 960 | 1,169 |
| Southern California Gas Co. | 3.750% | 9/15/42 | 5,270 | 4,915 |
102
| Vanguard® Total Bond Market Index Fund | ||||
| Schedule of Investments | ||||
| December 31, 2015 | ||||
| Face | Market | |||
| Maturity | Amount | Value | ||
| Coupon | Date | ($000) | ($000) | |
| Southern California Gas Co. | 4.450% | 3/15/44 | 700 | 727 |
| Other Utility (0.0%) | ||||
| American Water Capital Corp. | 6.085% | 10/15/17 | 7,045 | 7,568 |
| American Water Capital Corp. | 3.850% | 3/1/24 | 8,050 | 8,422 |
| American Water Capital Corp. | 3.400% | 3/1/25 | 1,000 | 1,016 |
| American Water Capital Corp. | 6.593% | 10/15/37 | 5,670 | 7,371 |
| American Water Capital Corp. | 4.300% | 9/1/45 | 5,500 | 5,564 |
| United Utilities plc | 5.375% | 2/1/19 | 5,475 | 5,873 |
| United Utilities plc | 6.875% | 8/15/28 | 885 | 1,012 |
| Veolia Environnement SA | 6.750% | 6/1/38 | 3,849 | 4,707 |
| 2,974,370 | ||||
| Total Corporate Bonds (Cost $39,565,690) | 39,456,176 | |||
| Sovereign Bonds (U.S. Dollar-Denominated) (5.0%) | ||||
| African Development Bank | 1.125% | 3/15/17 | 8,485 | 8,499 |
| African Development Bank | 0.875% | 5/15/17 | 3,015 | 3,008 |
| African Development Bank | 0.875% | 3/15/18 | 9,175 | 9,094 |
| African Development Bank | 1.625% | 10/2/18 | 22,650 | 22,762 |
| African Development Bank | 1.375% | 2/12/20 | 9,600 | 9,435 |
| African Development Bank | 2.375% | 9/23/21 | 29,400 | 29,829 |
| Agricultural Bank Of China | 2.000% | 5/21/18 | 4,750 | 4,723 |
| Agricultural Bank Of China | 2.750% | 5/21/20 | 2,650 | 2,632 |
| Asian Development Bank | 2.500% | 3/15/16 | 18,375 | 18,442 |
| Asian Development Bank | 0.750% | 1/11/17 | 35,600 | 35,536 |
| Asian Development Bank | 1.125% | 3/15/17 | 20,920 | 20,954 |
| Asian Development Bank | 5.250% | 6/12/17 | 600 | 636 |
| Asian Development Bank | 1.125% | 6/5/18 | 15,500 | 15,377 |
| Asian Development Bank | 5.593% | 7/16/18 | 3,528 | 3,862 |
| Asian Development Bank | 1.750% | 9/11/18 | 21,365 | 21,561 |
| Asian Development Bank | 1.875% | 10/23/18 | 13,850 | 14,018 |
| Asian Development Bank | 1.750% | 3/21/19 | 3,970 | 3,995 |
| Asian Development Bank | 1.875% | 4/12/19 | 5,770 | 5,828 |
| Asian Development Bank | 1.500% | 1/22/20 | 17,100 | 16,912 |
| Asian Development Bank | 1.375% | 3/23/20 | 12,525 | 12,323 |
| Asian Development Bank | 2.125% | 11/24/21 | 20,000 | 19,991 |
| Asian Development Bank | 1.875% | 2/18/22 | 25,950 | 25,571 |
| Asian Development Bank | 2.000% | 1/22/25 | 15,850 | 15,325 |
| Asian Development Bank | 6.220% | 8/15/27 | 375 | 497 |
| Asian Development Bank | 5.820% | 6/16/28 | 148 | 188 |
| Banco do Brasil SA | 3.875% | 1/23/17 | 12,176 | 12,182 |
| Banco do Brasil SA | 3.875% | 10/10/22 | 1,400 | 1,075 |
| Canada | 0.875% | 2/14/17 | 36,320 | 36,268 |
| Canada | 1.125% | 3/19/18 | 29,070 | 28,960 |
| Canada | 1.625% | 2/27/19 | 1,060 | 1,062 |
| CNOOC Curtis Funding No 1 pty Ltd. | 4.500% | 10/3/23 | 5,000 | 5,181 |
| CNOOC Finance 2013 Ltd. | 3.000% | 5/9/23 | 6,250 | 5,890 |
| CNOOC Finance 2015 Australia Pty Ltd. | 2.625% | 5/5/20 | 21,275 | 20,798 |
| CNOOC Finance 2015 Australia Pty Ltd. | 4.200% | 5/5/45 | 4,500 | 4,082 |
| CNOOC Finance 2015 USA LLC | 3.500% | 5/5/25 | 27,000 | 25,693 |
| CNOOC Nexen Finance 2014 ULC | 1.625% | 4/30/17 | 20,460 | 20,356 |
| CNOOC Nexen Finance 2014 ULC | 4.250% | 4/30/24 | 31,900 | 32,458 |
| Corp. Andina de Fomento | 3.750% | 1/15/16 | 12,925 | 12,899 |
| Corp. Andina de Fomento | 8.125% | 6/4/19 | 19,700 | 23,172 |
| Corp. Andina de Fomento | 4.375% | 6/15/22 | 26,425 | 28,123 |
| Council Of Europe Development Bank | 1.500% | 2/22/17 | 13,190 | 13,257 |
| Council Of Europe Development Bank | 1.500% | 6/19/17 | 3,325 | 3,343 |
| Council Of Europe Development Bank | 1.000% | 3/7/18 | 13,440 | 13,344 |
| Council Of Europe Development Bank | 1.125% | 5/31/18 | 12,695 | 12,615 |
| Council Of Europe Development Bank | 1.750% | 11/14/19 | 2,900 | 2,900 |
| Council Of Europe Development Bank | 1.625% | 3/10/20 | 17,620 | 17,452 |
| Ecopetrol SA | 4.250% | 9/18/18 | 3,015 | 3,011 |
| Ecopetrol SA | 7.625% | 7/23/19 | 6,500 | 7,067 |
| Ecopetrol SA | 5.875% | 9/18/23 | 28,050 | 25,561 |
103
| Vanguard® Total Bond Market Index Fund | ||||
| Schedule of Investments | ||||
| December 31, 2015 | ||||
| Face | Market | |||
| Maturity | Amount | Value | ||
| Coupon | Date | ($000) | ($000) | |
| Ecopetrol SA | 4.125% | 1/16/25 | 18,650 | 14,897 |
| Ecopetrol SA | 5.375% | 6/26/26 | 8,150 | 6,917 |
| Ecopetrol SA | 7.375% | 9/18/43 | 5,000 | 4,206 |
| Ecopetrol SA | 5.875% | 5/28/45 | 22,175 | 15,827 |
| Emirates Telecommunications Corp. | 3.500% | 6/18/24 | 5,000 | 5,069 |
| European Bank for Reconstruction & Development | 2.500% | 3/15/16 | 20,100 | 20,173 |
| European Bank for Reconstruction & Development | 1.375% | 10/20/16 | 2,550 | 2,560 |
| European Bank for Reconstruction & Development | 1.000% | 2/16/17 | 5,870 | 5,871 |
| European Bank for Reconstruction & Development | 0.750% | 9/1/17 | 11,400 | 11,328 |
| European Bank for Reconstruction & Development | 1.000% | 6/15/18 | 5,340 | 5,293 |
| European Bank for Reconstruction & Development | 1.000% | 9/17/18 | 4,650 | 4,587 |
| European Bank for Reconstruction & Development | 1.625% | 11/15/18 | 9,600 | 9,636 |
| European Bank for Reconstruction & Development | 1.750% | 6/14/19 | 20,600 | 20,668 |
| European Bank for Reconstruction & Development | 1.750% | 11/26/19 | 14,300 | 14,282 |
| European Bank for Reconstruction & Development | 1.500% | 3/16/20 | 23,050 | 22,723 |
| European Bank for Reconstruction & Development | 1.875% | 2/23/22 | 13,800 | 13,582 |
| European Investment Bank | 4.875% | 1/17/17 | 32,585 | 33,856 |
| European Investment Bank | 1.750% | 3/15/17 | 44,955 | 45,338 |
| European Investment Bank | 0.875% | 4/18/17 | 19,120 | 19,059 |
| European Investment Bank | 5.125% | 5/30/17 | 44,885 | 47,397 |
| European Investment Bank | 1.625% | 6/15/17 | 5,570 | 5,612 |
| European Investment Bank | 1.000% | 8/17/17 | 24,025 | 23,954 |
| European Investment Bank | 1.125% | 9/15/17 | 31,655 | 31,581 |
| European Investment Bank | 1.000% | 12/15/17 | 23,000 | 22,874 |
| European Investment Bank | 1.000% | 3/15/18 | 17,575 | 17,444 |
| European Investment Bank | 1.250% | 5/15/18 | 38,850 | 38,715 |
| European Investment Bank | 1.000% | 6/15/18 | 30,700 | 30,413 |
| European Investment Bank | 1.125% | 8/15/18 | 41,060 | 40,646 |
| European Investment Bank | 1.625% | 12/18/18 | 23,145 | 23,214 |
| European Investment Bank | 1.875% | 3/15/19 | 77,380 | 78,038 |
| European Investment Bank | 1.750% | 6/17/19 | 68,060 | 68,218 |
| European Investment Bank | 1.625% | 3/16/20 | 58,370 | 57,811 |
| European Investment Bank | 1.375% | 6/15/20 | 17,000 | 16,633 |
| European Investment Bank | 2.875% | 9/15/20 | 12,445 | 12,968 |
| European Investment Bank | 1.625% | 12/15/20 | 37,500 | 36,801 |
| European Investment Bank | 4.000% | 2/16/21 | 30,490 | 33,278 |
| European Investment Bank | 2.500% | 4/15/21 | 40,760 | 41,625 |
| European Investment Bank | 2.125% | 10/15/21 | 4,550 | 4,531 |
| European Investment Bank | 2.250% | 8/15/22 | 30,625 | 30,604 |
| European Investment Bank | 3.250% | 1/29/24 | 18,900 | 20,128 |
| European Investment Bank | 2.500% | 10/15/24 | 23,660 | 23,883 |
| European Investment Bank | 1.875% | 2/10/25 | 41,300 | 39,341 |
| European Investment Bank | 4.875% | 2/15/36 | 935 | 1,151 |
| Export Development Canada | 1.250% | 10/26/16 | 12,820 | 12,850 |
| 9 Export Development Canada | 1.000% | 5/15/17 | 6,300 | 6,290 |
| Export Development Canada | 0.750% | 12/15/17 | 14,975 | 14,744 |
| Export Development Canada | 1.000% | 6/15/18 | 9,500 | 9,411 |
| Export Development Canada | 1.500% | 10/3/18 | 4,275 | 4,277 |
| Export Development Canada | 1.000% | 11/1/18 | 7,750 | 7,660 |
| 9 Export Development Canada | 1.750% | 8/19/19 | 8,200 | 8,217 |
| 9 Export Development Canada | 1.625% | 12/3/19 | 4,000 | 3,981 |
| Export-Import Bank of Korea | 3.750% | 10/20/16 | 11,550 | 11,767 |
| Export-Import Bank of Korea | 4.000% | 1/11/17 | 24,050 | 24,635 |
| Export-Import Bank of Korea | 1.750% | 2/27/18 | 17,810 | 17,712 |
| Export-Import Bank of Korea | 2.875% | 9/17/18 | 10,400 | 10,607 |
| Export-Import Bank of Korea | 2.375% | 8/12/19 | 7,000 | 7,027 |
| Export-Import Bank of Korea | 5.125% | 6/29/20 | 10,000 | 11,078 |
| Export-Import Bank of Korea | 2.625% | 12/30/20 | 2,450 | 2,457 |
| Export-Import Bank of Korea | 4.000% | 1/29/21 | 4,324 | 4,617 |
| Export-Import Bank of Korea | 2.500% | 5/10/21 | 5,200 | 5,148 |
| Export-Import Bank of Korea | 4.375% | 9/15/21 | 3,925 | 4,273 |
| Export-Import Bank of Korea | 5.000% | 4/11/22 | 4,150 | 4,656 |
| Export-Import Bank of Korea | 4.000% | 1/14/24 | 34,750 | 36,753 |
| Export-Import Bank of Korea | 3.250% | 11/10/25 | 6,000 | 6,060 |
104
| Vanguard® Total Bond Market Index Fund | ||||
| Schedule of Investments | ||||
| December 31, 2015 | ||||
| Face | Market | |||
| Maturity | Amount | Value | ||
| Coupon | Date | ($000) | ($000) | |
| Federative Republic of Brazil | 8.875% | 10/14/19 | 3,870 | 4,354 |
| Federative Republic of Brazil | 2.625% | 1/5/23 | 3,910 | 2,981 |
| Federative Republic of Brazil | 10.125% | 5/15/27 | 2,042 | 2,425 |
| FMS Wertmanagement AoeR | 0.625% | 1/30/17 | 33,800 | 33,628 |
| FMS Wertmanagement AoeR | 1.125% | 9/5/17 | 8,500 | 8,473 |
| FMS Wertmanagement AoeR | 1.000% | 11/21/17 | 8,500 | 8,444 |
| FMS Wertmanagement AoeR | 1.625% | 11/20/18 | 22,200 | 22,271 |
| FMS Wertmanagement AoeR | 1.750% | 3/17/20 | 8,000 | 7,944 |
| Hydro-Quebec | 2.000% | 6/30/16 | 26,495 | 26,652 |
| Hydro-Quebec | 1.375% | 6/19/17 | 3,775 | 3,770 |
| Hydro-Quebec | 8.400% | 1/15/22 | 8,195 | 10,565 |
| Hydro-Quebec | 8.050% | 7/7/24 | 3,310 | 4,479 |
| Hydro-Quebec | 8.500% | 12/1/29 | 825 | 1,229 |
| Industrial & Commercial Bank of China Ltd. | 2.351% | 11/13/17 | 5,450 | 5,470 |
| Industrial & Commercial Bank of China Ltd. | 3.231% | 11/13/19 | 4,400 | 4,483 |
| Inter-American Development Bank | 1.125% | 3/15/17 | 19,990 | 20,018 |
| Inter-American Development Bank | 1.000% | 7/14/17 | 20,190 | 20,158 |
| Inter-American Development Bank | 2.375% | 8/15/17 | 25,256 | 25,757 |
| Inter-American Development Bank | 0.875% | 3/15/18 | 19,260 | 19,098 |
| Inter-American Development Bank | 1.750% | 8/24/18 | 5,050 | 5,098 |
| Inter-American Development Bank | 1.125% | 8/28/18 | 40,150 | 39,761 |
| Inter-American Development Bank | 4.250% | 9/10/18 | 2,980 | 3,201 |
| Inter-American Development Bank | 1.125% | 9/12/19 | 1,150 | 1,128 |
| Inter-American Development Bank | 3.875% | 9/17/19 | 56,980 | 61,310 |
| Inter-American Development Bank | 1.250% | 10/15/19 | 12,750 | 12,541 |
| Inter-American Development Bank | 1.750% | 10/15/19 | 31,400 | 31,456 |
| Inter-American Development Bank | 3.875% | 2/14/20 | 6,475 | 7,003 |
| Inter-American Development Bank | 1.875% | 6/16/20 | 24,000 | 24,012 |
| Inter-American Development Bank | 2.125% | 11/9/20 | 10,470 | 10,548 |
| Inter-American Development Bank | 1.750% | 4/14/22 | 37,725 | 36,842 |
| Inter-American Development Bank | 3.000% | 10/4/23 | 6,200 | 6,510 |
| Inter-American Development Bank | 3.000% | 2/21/24 | 15,095 | 15,828 |
| Inter-American Development Bank | 2.125% | 1/15/25 | 19,810 | 19,370 |
| Inter-American Development Bank | 7.000% | 6/15/25 | 2,950 | 3,948 |
| Inter-American Development Bank | 3.875% | 10/28/41 | 45 | 49 |
| Inter-American Development Bank | 3.200% | 8/7/42 | 5,575 | 5,378 |
| Inter-American Development Bank | 4.375% | 1/24/44 | 8,125 | 9,512 |
| International Bank for Reconstruction & Development | 8.625% | 10/15/16 | 10 | 11 |
| International Bank for Reconstruction & Development | 0.875% | 4/17/17 | 60,370 | 60,270 |
| International Bank for Reconstruction & Development | 9.250% | 7/15/17 | 10 | 11 |
| International Bank for Reconstruction & Development | 1.125% | 7/18/17 | 2,500 | 2,500 |
| International Bank for Reconstruction & Development | 1.000% | 11/15/17 | 39,300 | 39,173 |
| International Bank for Reconstruction & Development | 1.375% | 4/10/18 | 32,960 | 33,025 |
| International Bank for Reconstruction & Development | 1.000% | 6/15/18 | 34,110 | 33,799 |
| International Bank for Reconstruction & Development | 1.000% | 10/5/18 | 18,000 | 17,806 |
| International Bank for Reconstruction & Development | 1.875% | 3/15/19 | 66,430 | 67,078 |
| International Bank for Reconstruction & Development | 1.875% | 10/7/19 | 44,125 | 44,419 |
| International Bank for Reconstruction & Development | 2.125% | 11/1/20 | 8,500 | 8,586 |
| International Bank for Reconstruction & Development | 2.250% | 6/24/21 | 22,460 | 22,676 |
| International Bank for Reconstruction & Development | 1.625% | 2/10/22 | 24,225 | 23,501 |
| International Bank for Reconstruction & Development | 7.625% | 1/19/23 | 4,000 | 5,367 |
| International Bank for Reconstruction & Development | 2.500% | 11/25/24 | 63,450 | 64,157 |
| International Bank for Reconstruction & Development | 2.125% | 3/3/25 | 100 | 98 |
| International Bank for Reconstruction & Development | 2.500% | 7/29/25 | 30,500 | 30,707 |
| International Bank for Reconstruction & Development | 8.875% | 3/1/26 | 1,050 | 1,599 |
| International Bank for Reconstruction & Development | 4.750% | 2/15/35 | 3,523 | 4,286 |
| International Finance Corp. | 1.125% | 11/23/16 | 34,220 | 34,271 |
| International Finance Corp. | 1.000% | 4/24/17 | 3,975 | 3,964 |
| International Finance Corp. | 2.125% | 11/17/17 | 16,975 | 17,202 |
| International Finance Corp. | 0.625% | 12/21/17 | 12,270 | 12,088 |
| International Finance Corp. | 0.875% | 6/15/18 | 1,625 | 1,607 |
| International Finance Corp. | 1.250% | 7/16/18 | 8,600 | 8,573 |
| International Finance Corp. | 1.750% | 9/4/18 | 29,050 | 29,310 |
| International Finance Corp. | 1.750% | 9/16/19 | 15,600 | 15,584 |
105
| Vanguard® Total Bond Market Index Fund | ||||
| Schedule of Investments | ||||
| December 31, 2015 | ||||
| Face | Market | |||
| Maturity | Amount | Value | ||
| Coupon | Date | ($000) | ($000) | |
| International Finance Corp. | 1.625% | 7/16/20 | 29,500 | 29,215 |
| 10 Japan Bank for International Cooperation | 1.125% | 7/19/17 | 39,500 | 39,255 |
| 10 Japan Bank for International Cooperation | 1.750% | 7/31/18 | 17,900 | 17,850 |
| 10 Japan Bank for International Cooperation | 1.750% | 11/13/18 | 19,000 | 18,900 |
| 10 Japan Bank for International Cooperation | 3.375% | 7/31/23 | 6,600 | 6,925 |
| 10 Japan Bank for International Cooperation | 3.000% | 5/29/24 | 25,500 | 26,108 |
| 10 Japan Bank for International Cooperation | 2.125% | 2/10/25 | 25,900 | 24,545 |
| 10 Japan Bank for International Cooperation | 2.500% | 5/28/25 | 1,750 | 1,701 |
| 10 Japan Finance Organization for Municipalities | 5.000% | 5/16/17 | 4,050 | 4,232 |
| 10 Japan Finance Organization for Municipalities | 4.000% | 1/13/21 | 10,400 | 11,196 |
| 11 KFW | 0.625% | 12/15/16 | 23,300 | 23,234 |
| 11 KFW | 4.875% | 1/17/17 | 9,373 | 9,747 |
| 11 KFW | 1.250% | 2/15/17 | 67,075 | 67,255 |
| 11 KFW | 0.750% | 3/17/17 | 37,400 | 37,220 |
| 11 KFW | 0.875% | 9/5/17 | 26,710 | 26,587 |
| 11 KFW | 0.875% | 12/15/17 | 44,000 | 43,529 |
| 11 KFW | 1.000% | 1/26/18 | 21,810 | 21,588 |
| 11 KFW | 4.375% | 3/15/18 | 19,080 | 20,345 |
| 11 KFW | 1.000% | 6/11/18 | 36,000 | 35,674 |
| 11 KFW | 4.500% | 7/16/18 | 14,415 | 15,525 |
| 11 KFW | 1.125% | 8/6/18 | 28,000 | 27,706 |
| 11 KFW | 1.125% | 11/16/18 | 29,500 | 29,158 |
| 11 KFW | 1.875% | 4/1/19 | 38,290 | 38,620 |
| 11 KFW | 4.875% | 6/17/19 | 38,975 | 43,183 |
| 11 KFW | 1.750% | 10/15/19 | 12,200 | 12,167 |
| 11 KFW | 4.000% | 1/27/20 | 38,945 | 42,247 |
| 11 KFW | 1.500% | 4/20/20 | 38,275 | 37,627 |
| 11 KFW | 1.875% | 6/30/20 | 51,350 | 51,178 |
| 11 KFW | 2.750% | 9/8/20 | 55,130 | 57,132 |
| 11 KFW | 2.750% | 10/1/20 | 45,949 | 47,639 |
| 11 KFW | 2.375% | 8/25/21 | 12,375 | 12,553 |
| 11 KFW | 2.000% | 10/4/22 | 23,650 | 23,280 |
| 11 KFW | 2.125% | 1/17/23 | 39,630 | 39,154 |
| 11 KFW | 2.500% | 11/20/24 | 45,400 | 45,652 |
| 11 KFW | 2.000% | 5/2/25 | 14,350 | 13,803 |
| 11 KFW | 0.000% | 4/18/36 | 14,700 | 7,716 |
| 11 KFW | 0.000% | 6/29/37 | 6,770 | 3,399 |
| Korea Development Bank | 3.250% | 3/9/16 | 13,200 | 13,246 |
| Korea Development Bank | 4.000% | 9/9/16 | 4,250 | 4,330 |
| Korea Development Bank | 3.250% | 9/20/16 | 11,100 | 11,259 |
| Korea Development Bank | 3.875% | 5/4/17 | 15,500 | 15,927 |
| Korea Development Bank | 2.250% | 8/7/17 | 850 | 856 |
| Korea Development Bank | 3.500% | 8/22/17 | 5,400 | 5,551 |
| Korea Development Bank | 1.500% | 1/22/18 | 11,000 | 10,901 |
| Korea Development Bank | 3.000% | 3/17/19 | 8,000 | 8,131 |
| Korea Development Bank | 2.500% | 3/11/20 | 2,500 | 2,494 |
| Korea Development Bank | 4.625% | 11/16/21 | 5,975 | 6,573 |
| Korea Development Bank | 3.000% | 9/14/22 | 15,000 | 15,099 |
| Korea Development Bank | 3.750% | 1/22/24 | 24,400 | 25,380 |
| Landesbank Baden-Wuerttemberg | 7.625% | 2/1/23 | 1,000 | 1,256 |
| 11 Landwirtschaftliche Rentenbank | 5.125% | 2/1/17 | 9,910 | 10,337 |
| 11 Landwirtschaftliche Rentenbank | 0.875% | 9/12/17 | 11,825 | 11,751 |
| 11 Landwirtschaftliche Rentenbank | 1.000% | 4/4/18 | 7,525 | 7,465 |
| 11 Landwirtschaftliche Rentenbank | 1.875% | 9/17/18 | 12,540 | 12,626 |
| 11 Landwirtschaftliche Rentenbank | 1.750% | 4/15/19 | 3,425 | 3,434 |
| 11 Landwirtschaftliche Rentenbank | 1.375% | 10/23/19 | 13,665 | 13,441 |
| 11 Landwirtschaftliche Rentenbank | 2.000% | 1/13/25 | 45,060 | 43,392 |
| 11 Landwirtschaftliche Rentenbank | 2.375% | 6/10/25 | 22,575 | 22,190 |
| Nexen Energy ULC | 6.200% | 7/30/19 | 3,505 | 3,892 |
| Nexen Energy ULC | 7.875% | 3/15/32 | 9,765 | 12,583 |
| Nexen Energy ULC | 5.875% | 3/10/35 | 4,687 | 5,114 |
| Nexen Energy ULC | 6.400% | 5/15/37 | 9,880 | 11,159 |
| Nexen Energy ULC | 7.500% | 7/30/39 | 7,105 | 9,341 |
| Nordic Investment Bank | 5.000% | 2/1/17 | 5,700 | 5,946 |
106
| Vanguard® Total Bond Market Index Fund | ||||
| Schedule of Investments | ||||
| December 31, 2015 | ||||
| Face | Market | |||
| Maturity | Amount | Value | ||
| Coupon | Date | ($000) | ($000) | |
| Nordic Investment Bank | 1.000% | 3/7/17 | 2,650 | 2,649 |
| Nordic Investment Bank | 0.750% | 1/17/18 | 18,350 | 18,175 |
| Nordic Investment Bank | 1.125% | 3/19/18 | 10,250 | 10,218 |
| Nordic Investment Bank | 1.875% | 6/14/19 | 13,900 | 14,032 |
| Nordic Investment Bank | 1.500% | 9/29/20 | 1,300 | 1,282 |
| North American Development Bank | 2.300% | 10/10/18 | 2,138 | 2,149 |
| North American Development Bank | 4.375% | 2/11/20 | 2,600 | 2,799 |
| North American Development Bank | 2.400% | 10/26/22 | 6,000 | 5,848 |
| 12 Oesterreichische Kontrollbank AG | 5.000% | 4/25/17 | 20,170 | 21,194 |
| 12 Oesterreichische Kontrollbank AG | 0.750% | 5/19/17 | 11,830 | 11,767 |
| 12 Oesterreichische Kontrollbank AG | 1.125% | 5/29/18 | 8,150 | 8,095 |
| 12 Oesterreichische Kontrollbank AG | 1.375% | 2/10/20 | 8,175 | 8,003 |
| 12 Oesterreichische Kontrollbank AG | 1.500% | 10/21/20 | 24,000 | 23,429 |
| 12 Oesterreichische Kontrollbank AG | 2.375% | 10/1/21 | 5,000 | 5,049 |
| 5 Oriental Republic of Uruguay | 4.500% | 8/14/24 | 13,531 | 13,748 |
| 5 Oriental Republic of Uruguay | 4.375% | 10/27/27 | 24,519 | 24,182 |
| 5 Oriental Republic of Uruguay | 7.625% | 3/21/36 | 4,845 | 5,984 |
| 5 Oriental Republic of Uruguay | 4.125% | 11/20/45 | 14,775 | 11,451 |
| 5 Oriental Republic of Uruguay | 5.100% | 6/18/50 | 27,490 | 23,642 |
| Petroleos Mexicanos | 5.750% | 3/1/18 | 51,415 | 53,845 |
| Petroleos Mexicanos | 3.500% | 7/18/18 | 12,720 | 12,637 |
| Petroleos Mexicanos | 8.000% | 5/3/19 | 18,816 | 20,758 |
| Petroleos Mexicanos | 6.000% | 3/5/20 | 12,393 | 13,075 |
| 8 Petroleos Mexicanos | 3.500% | 7/23/20 | 22,760 | 21,677 |
| Petroleos Mexicanos | 5.500% | 1/21/21 | 18,090 | 18,309 |
| Petroleos Mexicanos | 4.875% | 1/24/22 | 19,000 | 18,272 |
| Petroleos Mexicanos | 3.500% | 1/30/23 | 18,375 | 16,030 |
| Petroleos Mexicanos | 4.875% | 1/18/24 | 25,858 | 24,118 |
| 5 Petroleos Mexicanos | 2.290% | 2/15/24 | 2,019 | 2,005 |
| 8 Petroleos Mexicanos | 4.250% | 1/15/25 | 565 | 499 |
| Petroleos Mexicanos | 2.378% | 4/15/25 | 2,684 | 2,674 |
| 8 Petroleos Mexicanos | 4.500% | 1/23/26 | 17,700 | 15,669 |
| Petroleos Mexicanos | 6.625% | 6/15/35 | 25,811 | 23,171 |
| Petroleos Mexicanos | 6.625% | 6/15/38 | 6,975 | 6,137 |
| Petroleos Mexicanos | 6.500% | 6/2/41 | 19,030 | 16,606 |
| Petroleos Mexicanos | 5.500% | 6/27/44 | 30,127 | 22,788 |
| 8 Petroleos Mexicanos | 5.500% | 6/27/44 | 16,350 | 12,367 |
| Petroleos Mexicanos | 6.375% | 1/23/45 | 21,450 | 18,228 |
| 8 Petroleos Mexicanos | 5.625% | 1/23/46 | 26,400 | 20,210 |
| Province of British Columbia | 1.200% | 4/25/17 | 7,040 | 7,041 |
| Province of British Columbia | 2.650% | 9/22/21 | 16,660 | 16,967 |
| Province of British Columbia | 2.000% | 10/23/22 | 6,400 | 6,220 |
| Province of British Columbia | 6.500% | 1/15/26 | 266 | 346 |
| Province of Manitoba | 4.900% | 12/6/16 | 13,470 | 13,991 |
| Province of Manitoba | 1.300% | 4/3/17 | 3,635 | 3,637 |
| Province of Manitoba | 1.125% | 6/1/18 | 3,470 | 3,426 |
| Province of Manitoba | 1.750% | 5/30/19 | 4,000 | 3,970 |
| Province of Manitoba | 2.100% | 9/6/22 | 6,375 | 6,162 |
| Province of Manitoba | 3.050% | 5/14/24 | 24,750 | 25,133 |
| Province of New Brunswick | 5.200% | 2/21/17 | 50 | 52 |
| Province of New Brunswick | 2.750% | 6/15/18 | 14,750 | 15,119 |
| Province of Nova Scotia | 5.125% | 1/26/17 | 3,520 | 3,667 |
| Province of Ontario | 1.100% | 10/25/17 | 17,865 | 17,746 |
| Province of Ontario | 3.150% | 12/15/17 | 13,025 | 13,364 |
| Province of Ontario | 1.200% | 2/14/18 | 1,800 | 1,790 |
| Province of Ontario | 3.000% | 7/16/18 | 8,475 | 8,759 |
| Province of Ontario | 2.000% | 9/27/18 | 11,090 | 11,157 |
| Province of Ontario | 2.000% | 1/30/19 | 5,795 | 5,817 |
| Province of Ontario | 1.650% | 9/27/19 | 9,970 | 9,820 |
| Province of Ontario | 4.000% | 10/7/19 | 21,240 | 22,720 |
| Province of Ontario | 4.400% | 4/14/20 | 32,900 | 35,943 |
| Province of Ontario | 1.875% | 5/21/20 | 23,770 | 23,525 |
| Province of Ontario | 2.500% | 9/10/21 | 34,550 | 34,525 |
| Province of Ontario | 2.450% | 6/29/22 | 9,975 | 9,851 |
107
| Vanguard® Total Bond Market Index Fund | ||||
| Schedule of Investments | ||||
| December 31, 2015 | ||||
| Face | Market | |||
| Maturity | Amount | Value | ||
| Coupon | Date | ($000) | ($000) | |
| Province of Ontario | 3.200% | 5/16/24 | 1,950 | 2,008 |
| Quebec | 4.625% | 5/14/18 | 12,310 | 13,152 |
| Quebec | 3.500% | 7/29/20 | 17,120 | 18,109 |
| Quebec | 2.750% | 8/25/21 | 16,955 | 17,165 |
| Quebec | 2.625% | 2/13/23 | 24,960 | 24,790 |
| Quebec | 7.500% | 7/15/23 | 250 | 327 |
| Quebec | 7.125% | 2/9/24 | 5,475 | 7,055 |
| Quebec | 2.875% | 10/16/24 | 11,900 | 11,913 |
| Quebec | 7.500% | 9/15/29 | 10,910 | 15,624 |
| Republic of Chile | 3.875% | 8/5/20 | 5,125 | 5,439 |
| Republic of Chile | 3.250% | 9/14/21 | 2,675 | 2,756 |
| Republic of Chile | 2.250% | 10/30/22 | 9,975 | 9,588 |
| Republic of Chile | 3.125% | 3/27/25 | 14,599 | 14,558 |
| Republic of Chile | 3.625% | 10/30/42 | 9,550 | 8,278 |
| Republic of Colombia | 7.375% | 1/27/17 | 20,575 | 21,552 |
| Republic of Colombia | 7.375% | 3/18/19 | 9,050 | 10,113 |
| Republic of Colombia | 11.750% | 2/25/20 | 3,350 | 4,337 |
| Republic of Colombia | 4.375% | 7/12/21 | 20,451 | 20,502 |
| 5 Republic of Colombia | 2.625% | 3/15/23 | 25,000 | 21,962 |
| Republic of Colombia | 4.000% | 2/26/24 | 15,400 | 14,669 |
| Republic of Colombia | 8.125% | 5/21/24 | 6,440 | 7,712 |
| 5 Republic of Colombia | 4.500% | 1/28/26 | 18,350 | 17,662 |
| Republic of Colombia | 7.375% | 9/18/37 | 19,672 | 21,688 |
| Republic of Colombia | 6.125% | 1/18/41 | 26,225 | 25,416 |
| 5 Republic of Colombia | 5.625% | 2/26/44 | 16,800 | 15,330 |
| 5 Republic of Colombia | 5.000% | 6/15/45 | 25,175 | 21,210 |
| Republic of Finland | 6.950% | 2/15/26 | 1,905 | 2,537 |
| Republic of Italy | 5.375% | 6/12/17 | 9,150 | 9,619 |
| Republic of Italy | 6.875% | 9/27/23 | 37,815 | 46,587 |
| Republic of Italy | 5.375% | 6/15/33 | 16,595 | 18,565 |
| Republic of Korea | 5.125% | 12/7/16 | 1,100 | 1,137 |
| Republic of Korea | 7.125% | 4/16/19 | 18,013 | 20,875 |
| Republic of Korea | 3.875% | 9/11/23 | 18,100 | 19,566 |
| Republic of Korea | 5.625% | 11/3/25 | 425 | 523 |
| Republic of Korea | 4.125% | 6/10/44 | 1,650 | 1,859 |
| Republic of Panama | 5.200% | 1/30/20 | 16,125 | 17,496 |
| 5 Republic of Panama | 4.000% | 9/22/24 | 1,350 | 1,350 |
| 5 Republic of Panama | 3.750% | 3/16/25 | 15,750 | 15,435 |
| Republic of Panama | 7.125% | 1/29/26 | 22,150 | 27,577 |
| Republic of Panama | 8.875% | 9/30/27 | 650 | 899 |
| Republic of Panama | 9.375% | 4/1/29 | 6,645 | 9,585 |
| 5 Republic of Panama | 6.700% | 1/26/36 | 18,895 | 22,466 |
| 5 Republic of Panama | 4.300% | 4/29/53 | 5,000 | 4,275 |
| Republic of Peru | 7.125% | 3/30/19 | 21,740 | 24,921 |
| Republic of Peru | 7.350% | 7/21/25 | 14,150 | 17,738 |
| Republic of Peru | 8.750% | 11/21/33 | 20,937 | 29,663 |
| 5 Republic of Peru | 6.550% | 3/14/37 | 12,131 | 14,056 |
| Republic of Peru | 5.625% | 11/18/50 | 28,945 | 29,579 |
| Republic of Poland | 6.375% | 7/15/19 | 42,012 | 47,999 |
| Republic of Poland | 5.125% | 4/21/21 | 24,025 | 26,716 |
| Republic of Poland | 5.000% | 3/23/22 | 18,102 | 20,075 |
| Republic of Poland | 3.000% | 3/17/23 | 15,550 | 15,395 |
| Republic of Poland | 4.000% | 1/22/24 | 8,995 | 9,458 |
| Republic of South Africa | 6.875% | 5/27/19 | 3,675 | 3,942 |
| Republic of South Africa | 5.500% | 3/9/20 | 14,350 | 14,691 |
| Republic of South Africa | 5.875% | 5/30/22 | 1,425 | 1,484 |
| Republic of South Africa | 4.665% | 1/17/24 | 10,255 | 9,768 |
| Republic of South Africa | 5.875% | 9/16/25 | 27,150 | 27,761 |
| Republic of South Africa | 6.250% | 3/8/41 | 2,100 | 2,142 |
| Republic of South Africa | 5.375% | 7/24/44 | 11,900 | 10,621 |
| Republic of the Philippines | 8.375% | 6/17/19 | 20,650 | 25,038 |
| Republic of the Philippines | 6.500% | 1/20/20 | 8,925 | 10,420 |
| Republic of the Philippines | 4.000% | 1/15/21 | 13,075 | 14,162 |
| Republic of the Philippines | 9.500% | 10/21/24 | 900 | 1,331 |
108
| Vanguard® Total Bond Market Index Fund | ||||
| Schedule of Investments | ||||
| December 31, 2015 | ||||
| Face | Market | |||
| Maturity | Amount | Value | ||
| Coupon | Date | ($000) | ($000) | |
| Republic of the Philippines | 10.625% | 3/16/25 | 17,325 | 27,295 |
| Republic of the Philippines | 5.500% | 3/30/26 | 26,625 | 31,451 |
| Republic of the Philippines | 9.500% | 2/2/30 | 13,250 | 20,852 |
| Republic of the Philippines | 7.750% | 1/14/31 | 21,170 | 29,823 |
| Republic of the Philippines | 6.375% | 1/15/32 | 9,500 | 12,121 |
| Republic of the Philippines | 6.375% | 10/23/34 | 38,690 | 50,732 |
| Republic of the Philippines | 5.000% | 1/13/37 | 975 | 1,137 |
| Republic of the Philippines | 3.950% | 1/20/40 | 6,950 | 7,028 |
| Republic of Turkey | 7.500% | 7/14/17 | 26,175 | 28,144 |
| Republic of Turkey | 6.750% | 4/3/18 | 19,225 | 20,667 |
| Republic of Turkey | 7.000% | 3/11/19 | 23,650 | 25,938 |
| Republic of Turkey | 7.000% | 6/5/20 | 17,875 | 19,928 |
| Republic of Turkey | 5.625% | 3/30/21 | 27,325 | 28,930 |
| Republic of Turkey | 5.125% | 3/25/22 | 13,085 | 13,448 |
| Republic of Turkey | 6.250% | 9/26/22 | 24,000 | 26,158 |
| Republic of Turkey | 3.250% | 3/23/23 | 12,800 | 11,728 |
| Republic of Turkey | 5.750% | 3/22/24 | 22,710 | 23,954 |
| Republic of Turkey | 7.375% | 2/5/25 | 29,275 | 34,217 |
| Republic of Turkey | 4.250% | 4/14/26 | 20,750 | 19,479 |
| Republic of Turkey | 11.875% | 1/15/30 | 11,800 | 19,355 |
| Republic of Turkey | 8.000% | 2/14/34 | 2,450 | 3,063 |
| Republic of Turkey | 6.875% | 3/17/36 | 23,400 | 26,266 |
| Republic of Turkey | 6.750% | 5/30/40 | 25,550 | 28,488 |
| Republic of Turkey | 6.000% | 1/14/41 | 28,300 | 28,979 |
| Republic of Turkey | 4.875% | 4/16/43 | 46,200 | 40,699 |
| Republic of Turkey | 6.625% | 2/17/45 | 350 | 394 |
| State of Israel | 5.500% | 11/9/16 | 8,130 | 8,432 |
| State of Israel | 5.125% | 3/26/19 | 15,595 | 17,153 |
| State of Israel | 4.000% | 6/30/22 | 16,600 | 17,824 |
| State of Israel | 3.150% | 6/30/23 | 10,000 | 10,147 |
| State of Israel | 4.500% | 1/30/43 | 17,400 | 17,446 |
| Statoil ASA | 3.125% | 8/17/17 | 11,097 | 11,371 |
| Statoil ASA | 1.250% | 11/9/17 | 8,135 | 8,091 |
| Statoil ASA | 1.200% | 1/17/18 | 2,050 | 2,028 |
| Statoil ASA | 1.950% | 11/8/18 | 5,733 | 5,731 |
| Statoil ASA | 5.250% | 4/15/19 | 24,398 | 26,580 |
| Statoil ASA | 2.250% | 11/8/19 | 15,050 | 15,010 |
| Statoil ASA | 2.900% | 11/8/20 | 4,475 | 4,519 |
| Statoil ASA | 2.750% | 11/10/21 | 16,000 | 15,750 |
| Statoil ASA | 3.150% | 1/23/22 | 11,340 | 11,241 |
| Statoil ASA | 2.450% | 1/17/23 | 9,050 | 8,560 |
| Statoil ASA | 7.750% | 6/15/23 | 25 | 31 |
| Statoil ASA | 2.650% | 1/15/24 | 18,041 | 17,085 |
| Statoil ASA | 3.700% | 3/1/24 | 10,962 | 11,062 |
| Statoil ASA | 3.250% | 11/10/24 | 8,060 | 7,860 |
| Statoil ASA | 7.250% | 9/23/27 | 5,375 | 6,978 |
| 8 Statoil ASA | 6.500% | 12/1/28 | 975 | 1,210 |
| Statoil ASA | 7.150% | 1/15/29 | 2,950 | 3,789 |
| Statoil ASA | 5.100% | 8/17/40 | 7,860 | 8,407 |
| Statoil ASA | 4.250% | 11/23/41 | 8,395 | 7,961 |
| Statoil ASA | 3.950% | 5/15/43 | 6,280 | 5,672 |
| Statoil ASA | 4.800% | 11/8/43 | 7,500 | 7,754 |
| Svensk Exportkredit AB | 2.125% | 7/13/16 | 7,950 | 8,003 |
| Svensk Exportkredit AB | 5.125% | 3/1/17 | 1,630 | 1,705 |
| Svensk Exportkredit AB | 1.750% | 5/30/17 | 8,970 | 9,041 |
| Svensk Exportkredit AB | 1.875% | 6/17/19 | 12,000 | 12,070 |
| Svensk Exportkredit AB | 1.875% | 6/23/20 | 10,700 | 10,637 |
| United Mexican States | 5.625% | 1/15/17 | 41,058 | 42,620 |
| United Mexican States | 5.950% | 3/19/19 | 10,430 | 11,608 |
| United Mexican States | 5.125% | 1/15/20 | 17,060 | 18,612 |
| United Mexican States | 3.500% | 1/21/21 | 13,875 | 14,009 |
| United Mexican States | 3.625% | 3/15/22 | 41,650 | 41,820 |
| United Mexican States | 4.000% | 10/2/23 | 52,384 | 53,053 |
| United Mexican States | 3.600% | 1/30/25 | 25,287 | 24,449 |
109
| Vanguard® Total Bond Market Index Fund | ||||
| Schedule of Investments | ||||
| December 31, 2015 | ||||
| Face | Market | |||
| Maturity | Amount | Value | ||
| Coupon | Date | ($000) | ($000) | |
| United Mexican States | 7.500% | 4/8/33 | 16,775 | 21,807 |
| United Mexican States | 6.750% | 9/27/34 | 30,391 | 36,461 |
| United Mexican States | 6.050% | 1/11/40 | 16,741 | 18,457 |
| United Mexican States | 4.750% | 3/8/44 | 64,277 | 58,928 |
| United Mexican States | 5.550% | 1/21/45 | 26,200 | 26,760 |
| United Mexican States | 4.600% | 1/23/46 | 14,039 | 12,487 |
| United Mexican States | 5.750% | 10/12/10 | 18,130 | 16,835 |
| Total Sovereign Bonds (Cost $7,441,157) | 7,389,653 | |||
| Taxable Municipal Bonds (0.9%) | ||||
| Alameda County CA Joint Powers Authority Lease | ||||
| Revenue | 7.046% | 12/1/44 | 2,250 | 2,951 |
| American Municipal Power Ohio Inc. Revenue | ||||
| (Hydroelectric Projects) | 6.449% | 2/15/44 | 50 | 59 |
| American Municipal Power Ohio Inc. Revenue (Prairie | ||||
| State Energy Campus Project) | 7.834% | 2/15/41 | 2,300 | 3,154 |
| American Municipal Power Ohio Inc. Revenue (Prairie | ||||
| State Energy Campus Project) | 6.053% | 2/15/43 | 1,000 | 1,162 |
| American Municipal Power Ohio Inc. Revenue (Prairie | ||||
| State Energy Campus Project) | 5.939% | 2/15/47 | 8,100 | 9,346 |
| American Municipal Power Ohio Inc. Revenue (Prairie | ||||
| State Energy Campus Project) | 6.270% | 2/15/50 | 1,775 | 2,067 |
| American Municipal Power Ohio Inc. Revenue (Prairie | ||||
| State Energy Campus Project) | 7.499% | 2/15/50 | 1,550 | 2,071 |
| American Municipal Power Ohio Inc. Revenue (Prairie | ||||
| State Energy Campus Project) | 8.084% | 2/15/50 | 7,725 | 11,224 |
| Bay Area Toll Authority California Toll Bridge Revenue | ||||
| (San Francisco Bay Area) | 6.793% | 4/1/30 | 2,375 | 2,914 |
| Bay Area Toll Authority California Toll Bridge Revenue | ||||
| (San Francisco Bay Area) | 6.918% | 4/1/40 | 4,075 | 5,368 |
| Bay Area Toll Authority California Toll Bridge Revenue | ||||
| (San Francisco Bay Area) | 6.263% | 4/1/49 | 16,535 | 22,243 |
| Bay Area Toll Authority California Toll Bridge Revenue | ||||
| (San Francisco Bay Area) | 7.043% | 4/1/50 | 1,000 | 1,376 |
| Bay Area Toll Authority California Toll Bridge Revenue | ||||
| (San Francisco Bay Area) | 6.907% | 10/1/50 | 7,530 | 10,280 |
| California GO | 5.750% | 3/1/17 | 10,750 | 11,323 |
| California GO | 6.200% | 3/1/19 | 1,400 | 1,588 |
| California GO | 6.200% | 10/1/19 | 11,600 | 13,337 |
| California GO | 5.700% | 11/1/21 | 24,250 | 28,406 |
| California GO | 7.500% | 4/1/34 | 28,350 | 39,694 |
| California GO | 7.950% | 3/1/36 | 550 | 652 |
| California GO | 7.550% | 4/1/39 | 11,030 | 16,034 |
| California GO | 7.300% | 10/1/39 | 6,010 | 8,397 |
| California GO | 7.350% | 11/1/39 | 22,025 | 30,919 |
| California GO | 7.625% | 3/1/40 | 14,900 | 21,669 |
| California GO | 7.600% | 11/1/40 | 11,200 | 16,648 |
| Central Puget Sound WA Regional Transit Authority | ||||
| Sales & Use Tax Revenue | 5.491% | 11/1/39 | 1,510 | 1,840 |
| Chicago IL GO | 7.375% | 1/1/33 | 1,800 | 1,879 |
| Chicago IL GO | 7.781% | 1/1/35 | 1,860 | 2,000 |
| Chicago IL GO | 6.314% | 1/1/44 | 3,800 | 3,595 |
| Chicago IL Metropolitan Water Reclamation District GO | 5.720% | 12/1/38 | 10,100 | 11,588 |
| Chicago IL O'Hare International Airport Revenue | 6.845% | 1/1/38 | 1,450 | 1,625 |
| Chicago IL O'Hare International Airport Revenue | 6.395% | 1/1/40 | 1,745 | 2,185 |
| Chicago IL Transit Authority Sales Tax Receipts | ||||
| Revenue | 6.200% | 12/1/40 | 2,850 | 3,073 |
| Chicago IL Transit Authority Transfer Tax Receipts | ||||
| Revenue | 6.899% | 12/1/40 | 6,985 | 8,061 |
| Chicago IL Wastewater Transmission Revenue | 6.900% | 1/1/40 | 4,200 | 4,822 |
| Chicago IL Water Revenue | 6.742% | 11/1/40 | 5,350 | 6,081 |
| Clark County NV Airport System Revenue | 6.881% | 7/1/42 | 475 | 532 |
| Clark County NV Airport System Revenue | 6.820% | 7/1/45 | 3,520 | 4,848 |
110
| Vanguard® Total Bond Market Index Fund | ||||
| Schedule of Investments | ||||
| December 31, 2015 | ||||
| Face | Market | |||
| Maturity | Amount | Value | ||
| Coupon | Date | ($000) | ($000) | |
| Commonwealth Financing Authority Pennsylvania | ||||
| Revenue | 6.218% | 6/1/39 | 6,375 | 7,398 |
| Connecticut GO | 5.090% | 10/1/30 | 8,770 | 9,711 |
| Connecticut GO | 5.850% | 3/15/32 | 6,610 | 7,734 |
| Connecticut Special Tax Revenue (Transportation | ||||
| Infrastructure) | 5.459% | 11/1/30 | 3,300 | 3,805 |
| Cook County IL GO | 6.229% | 11/15/34 | 5,550 | 5,919 |
| Curators of the University of Missouri System Facilities | ||||
| Revenue | 5.960% | 11/1/39 | 3,000 | 3,725 |
| Curators of the University of Missouri System Facilities | ||||
| Revenue | 5.792% | 11/1/41 | 3,000 | 3,819 |
| Dallas County TX Hospital District Revenue | 5.621% | 8/15/44 | 2,100 | 2,593 |
| Dallas TX Area Rapid Transit Revenue | 4.922% | 12/1/41 | 6,850 | 7,807 |
| Dallas TX Area Rapid Transit Revenue | 5.999% | 12/1/44 | 1,050 | 1,376 |
| Dallas TX Area Rapid Transit Revenue | 5.022% | 12/1/48 | 4,000 | 4,672 |
| Dallas TX Convention Center Hotel Development Corp. | ||||
| Hotel Revenue | 7.088% | 1/1/42 | 4,725 | 6,072 |
| Dallas TX Independent School District GO | 6.450% | 2/15/35 | 3,750 | 4,352 |
| Dartmouth College New Hampshire GO | 4.750% | 6/1/19 | 1,190 | 1,295 |
| Denver CO City & County School District No. 1 COP | 4.242% | 12/15/37 | 215 | 213 |
| Denver CO City & County School District No. 1 COP | 7.017% | 12/15/37 | 2,100 | 2,754 |
| Denver CO City & County School District No. 1 GO | 5.664% | 12/1/33 | 1,325 | 1,566 |
| District of Columbia Income Tax Revenue | 5.591% | 12/1/34 | 1,175 | 1,407 |
| District of Columbia Income Tax Revenue | 5.582% | 12/1/35 | 1,600 | 1,933 |
| District of Columbia Water & Sewer Authority Public | ||||
| Utility Revenue | 5.522% | 10/1/44 | 700 | 823 |
| District of Columbia Water & Sewer Authority Public | ||||
| Utility Revenue | 4.814% | 10/1/14 | 11,700 | 11,590 |
| East Baton Rouge LA Sewer Commission Revenue | 6.087% | 2/1/45 | 2,300 | 2,529 |
| East Bay CA Municipal Utility District Water System | ||||
| Revenue | 5.874% | 6/1/40 | 5,220 | 6,521 |
| Emory University Georgia GO | 5.625% | 9/1/19 | 7,000 | 7,822 |
| Energy Northwest Washington Electric Revenue | ||||
| (Columbia Generating Station) | 2.197% | 7/1/19 | 4,000 | 4,020 |
| Energy Northwest Washington Electric Revenue | ||||
| (Columbia Generating Station) | 2.814% | 7/1/24 | 2,000 | 1,968 |
| Florida Hurricane Catastrophe Fund Finance Corp. | ||||
| Revenue | 2.107% | 7/1/18 | 7,800 | 7,847 |
| Florida Hurricane Catastrophe Fund Finance Corp. | ||||
| Revenue | 2.995% | 7/1/20 | 14,565 | 14,771 |
| George Washington University District of Columbia GO | 3.485% | 9/15/22 | 7,450 | 7,577 |
| George Washington University District of Columbia GO | 4.300% | 9/15/44 | 5,750 | 5,538 |
| Georgia GO | 4.503% | 11/1/25 | 7,220 | 8,031 |
| Georgia Municipal Electric Power Authority Revenue | 6.637% | 4/1/57 | 12,100 | 14,411 |
| Georgia Municipal Electric Power Authority Revenue | 6.655% | 4/1/57 | 5,980 | 7,039 |
| Georgia Municipal Electric Power Authority Revenue | 7.055% | 4/1/57 | 3,525 | 3,855 |
| Houston TX GO | 6.290% | 3/1/32 | 1,095 | 1,339 |
| Houston TX Utility System Revenue | 3.828% | 5/15/28 | 3,050 | 3,162 |
| Illinois GO | 5.365% | 3/1/17 | 15,925 | 16,483 |
| Illinois GO | 5.665% | 3/1/18 | 130 | 137 |
| Illinois GO | 4.350% | 6/1/18 | 15 | 15 |
| Illinois GO | 5.877% | 3/1/19 | 8,695 | 9,304 |
| Illinois GO | 4.950% | 6/1/23 | 14,875 | 14,881 |
| Illinois GO | 5.100% | 6/1/33 | 52,224 | 49,406 |
| Illinois GO | 6.630% | 2/1/35 | 7,055 | 7,285 |
| Illinois GO | 6.725% | 4/1/35 | 5,975 | 6,184 |
| Illinois GO | 7.350% | 7/1/35 | 2,400 | 2,604 |
| Illinois Toll Highway Authority Revenue | 6.184% | 1/1/34 | 880 | 1,095 |
| Illinois Toll Highway Authority Revenue | 5.851% | 12/1/34 | 1,650 | 1,986 |
| Indianapolis IN Local Public Improvement Revenue | 6.116% | 1/15/40 | 9,700 | 12,047 |
| 13 Industry CA Sales Tax Revenue | 5.125% | 1/1/51 | 2,400 | 2,429 |
| JobsOhio Beverage System Statewide Liquor Profits | ||||
| Revenue | 3.985% | 1/1/29 | 6,600 | 6,870 |
111
| Vanguard® Total Bond Market Index Fund | ||||
| Schedule of Investments | ||||
| December 31, 2015 | ||||
| Face | Market | |||
| Maturity | Amount | Value | ||
| Coupon | Date | ($000) | ($000) | |
| JobsOhio Beverage System Statewide Liquor Profits | ||||
| Revenue | 4.532% | 1/1/35 | 4,175 | 4,418 |
| Kansas Department of Transportation Highway | ||||
| Revenue | 4.596% | 9/1/35 | 2,000 | 2,161 |
| Kansas Development Finance Authority Revenue | 4.727% | 4/15/37 | 5,700 | 5,698 |
| Kansas Development Finance Authority Revenue | 4.927% | 4/15/45 | 400 | 397 |
| 13 Kansas Development Finance Authority Revenue | ||||
| (Public Employees Retirement System) | 5.501% | 5/1/34 | 4,300 | 4,773 |
| Kentucky Asset/Liability Commission General Fund | ||||
| Revenue | 3.165% | 4/1/18 | 370 | 375 |
| Los Angeles CA Community College District GO | 6.600% | 8/1/42 | 5,400 | 7,383 |
| Los Angeles CA Community College District GO | 6.750% | 8/1/49 | 3,500 | 4,946 |
| Los Angeles CA Department of Airports International | ||||
| Airport Revenue | 6.582% | 5/15/39 | 20 | 26 |
| Los Angeles CA Department of Water & Power | ||||
| Revenue | 5.716% | 7/1/39 | 3,540 | 4,264 |
| Los Angeles CA Department of Water & Power | ||||
| Revenue | 6.008% | 7/1/39 | 6,350 | 7,758 |
| Los Angeles CA Department of Water & Power | ||||
| Revenue | 6.166% | 7/1/40 | 1,550 | 1,739 |
| Los Angeles CA Department of Water & Power | ||||
| Revenue | 6.574% | 7/1/45 | 2,700 | 3,665 |
| Los Angeles CA Department of Water & Power | ||||
| Revenue | 6.603% | 7/1/50 | 5,150 | 7,024 |
| Los Angeles CA Unified School District GO | 5.750% | 7/1/34 | 9,225 | 11,113 |
| Los Angeles CA Unified School District GO | 6.758% | 7/1/34 | 7,210 | 9,499 |
| Los Angeles County CA Metropolitan Transportation | ||||
| Authority Sales Tax Revenue | 5.735% | 6/1/39 | 8,875 | 10,788 |
| Los Angeles County CA Public Works Financing | ||||
| Authority Lease Revenue | 7.488% | 8/1/33 | 4,300 | 5,599 |
| Los Angeles County CA Public Works Financing | ||||
| Authority Lease Revenue | 7.618% | 8/1/40 | 2,250 | 3,142 |
| Maryland Transportation Authority Facilities Projects | ||||
| Revenue | 5.888% | 7/1/43 | 2,330 | 2,821 |
| Massachusetts GO | 4.200% | 12/1/21 | 5,020 | 5,442 |
| Massachusetts GO | 4.500% | 8/1/31 | 500 | 535 |
| Massachusetts GO | 5.456% | 12/1/39 | 4,600 | 5,545 |
| Massachusetts School Building Authority Dedicated | ||||
| Sales Tax Revenue | 5.715% | 8/15/39 | 2,900 | 3,528 |
| Massachusetts Transportation Fund Revenue | 5.731% | 6/1/40 | 1,000 | 1,243 |
| Massachusetts Water Pollution Abatement Trust | ||||
| Revenue | 5.192% | 8/1/40 | 2,825 | 3,285 |
| Metropolitan Government of Nashville & Davidson | ||||
| County TN Convention Center Authority Tourism Tax | ||||
| Revenue | 6.731% | 7/1/43 | 2,360 | 2,997 |
| Metropolitan Government of Nashville & Davidson | ||||
| County TN GO | 5.707% | 7/1/34 | 2,625 | 3,070 |
| Metropolitan Washington DC/VA Airports Authority | ||||
| Dulles Toll Road Revenue | 7.462% | 10/1/46 | 1,475 | 1,983 |
| Metropolitan Water District of Southern California | ||||
| Revenue | 6.947% | 7/1/40 | 1,670 | 1,944 |
| Mississippi GO | 5.245% | 11/1/34 | 1,375 | 1,562 |
| Missouri Highways & Transportation Commission Road | ||||
| Revenue | 5.445% | 5/1/33 | 1,650 | 1,930 |
| 13 New Jersey Economic Development Authority | ||||
| Revenue | 0.000% | 2/15/20 | 50 | 43 |
| 14 New Jersey Economic Development Authority | ||||
| Revenue (State Pension Funding) | 7.425% | 2/15/29 | 16,650 | 18,907 |
| New Jersey Transportation Trust Fund Authority | ||||
| Transportation System Revenue | 5.754% | 12/15/28 | 12,075 | 12,565 |
| New Jersey Transportation Trust Fund Authority | ||||
| Transportation System Revenue | 6.104% | 12/15/28 | 14,355 | 14,991 |
| New Jersey Transportation Trust Fund Authority | ||||
| Transportation System Revenue | 6.561% | 12/15/40 | 4,285 | 4,536 |
112
| Vanguard® Total Bond Market Index Fund | ||||
| Schedule of Investments | ||||
| December 31, 2015 | ||||
| Face | Market | |||
| Maturity | Amount | Value | ||
| Coupon | Date | ($000) | ($000) | |
| 15 New Jersey Turnpike Authority Revenue | 4.252% | 1/1/16 | 325 | 325 |
| New Jersey Turnpike Authority Revenue | 7.414% | 1/1/40 | 14,300 | 20,325 |
| New Jersey Turnpike Authority Revenue | 7.102% | 1/1/41 | 8,450 | 11,638 |
| New York City NY GO | 6.646% | 12/1/31 | 20 | 23 |
| New York City NY GO | 6.246% | 6/1/35 | 2,150 | 2,430 |
| New York City NY GO | 5.968% | 3/1/36 | 3,200 | 3,956 |
| New York City NY GO | 5.985% | 12/1/36 | 1,650 | 2,020 |
| New York City NY GO | 5.517% | 10/1/37 | 7,150 | 8,454 |
| New York City NY GO | 6.271% | 12/1/37 | 2,000 | 2,566 |
| New York City NY GO | 5.846% | 6/1/40 | 2,100 | 2,610 |
| New York City NY Municipal Water Finance Authority | ||||
| Water & Sewer System Revenue | 5.750% | 6/15/41 | 1,435 | 1,812 |
| New York City NY Municipal Water Finance Authority | ||||
| Water & Sewer System Revenue | 5.724% | 6/15/42 | 470 | 596 |
| New York City NY Municipal Water Finance Authority | ||||
| Water & Sewer System Revenue | 5.952% | 6/15/42 | 2,900 | 3,745 |
| New York City NY Municipal Water Finance Authority | ||||
| Water & Sewer System Revenue | 6.011% | 6/15/42 | 1,050 | 1,365 |
| New York City NY Municipal Water Finance Authority | ||||
| Water & Sewer System Revenue | 5.440% | 6/15/43 | 4,400 | 5,356 |
| New York City NY Municipal Water Finance Authority | ||||
| Water & Sewer System Revenue | 5.882% | 6/15/44 | 20,950 | 27,059 |
| New York City NY Transitional Finance Authority | ||||
| Building Aid Revenue | 6.828% | 7/15/40 | 6,300 | 8,311 |
| New York City NY Transitional Finance Authority Future | ||||
| Tax Revenue | 5.767% | 8/1/36 | 2,125 | 2,565 |
| New York City NY Transitional Finance Authority Future | ||||
| Tax Revenue | 5.508% | 8/1/37 | 8,650 | 10,398 |
| New York Metropolitan Transportation Authority | ||||
| Revenue (Dedicated Tax Fund) | 7.336% | 11/15/39 | 19,105 | 27,856 |
| New York Metropolitan Transportation Authority | ||||
| Revenue (Dedicated Tax Fund) | 6.089% | 11/15/40 | 975 | 1,232 |
| New York Metropolitan Transportation Authority | ||||
| Revenue (Transit Revenue) | 6.548% | 11/15/31 | 700 | 880 |
| New York Metropolitan Transportation Authority | ||||
| Revenue (Transit Revenue) | 5.871% | 11/15/39 | 2,200 | 2,617 |
| New York Metropolitan Transportation Authority | ||||
| Revenue (Transit Revenue) | 6.648% | 11/15/39 | 4,170 | 5,419 |
| New York State Dormitory Authority Revenue (Personal | ||||
| Income Tax) | 5.500% | 3/15/30 | 6,900 | 8,207 |
| New York State Dormitory Authority Revenue (Personal | ||||
| Income Tax) | 5.289% | 3/15/33 | 3,150 | 3,676 |
| New York State Dormitory Authority Revenue (Personal | ||||
| Income Tax) | 5.628% | 3/15/39 | 2,215 | 2,658 |
| New York State Dormitory Authority Revenue (Personal | ||||
| Income Tax) | 5.389% | 3/15/40 | 1,425 | 1,694 |
| New York State Urban Development Corp. Revenue | ||||
| (Personal Income Tax) | 5.770% | 3/15/39 | 5,875 | 7,124 |
| New York State Urban Development Corp. Revenue | ||||
| (Personal Income Tax) | 5.838% | 3/15/40 | 1,600 | 1,955 |
| New York University Hospitals Center GO | 4.428% | 7/1/42 | 3,500 | 3,351 |
| New York University Hospitals Center Revenue | 5.750% | 7/1/43 | 5,125 | 5,889 |
| North Texas Tollway Authority System Revenue | 6.718% | 1/1/49 | 11,070 | 15,171 |
| Ohio State University General Receipts Revenue | 4.910% | 6/1/40 | 5,010 | 5,619 |
| Ohio State University General Receipts Revenue | 4.800% | 6/1/11 | 2,675 | 2,579 |
| Ohio State University General Receipts Revenue | 5.590% | 12/1/14 | 5,450 | 5,779 |
| Ohio Water Development Authority Water Pollution | ||||
| Control Loan Fund Revenue | 4.879% | 12/1/34 | 2,550 | 2,857 |
| Orange County CA Local Transportation Authority Sales | ||||
| Tax Revenue | 6.908% | 2/15/41 | 2,090 | 2,816 |
| Oregon Department of Transportation Highway User | ||||
| Tax Revenue | 5.834% | 11/15/34 | 2,425 | 3,047 |
| Oregon GO | 5.762% | 6/1/23 | 1,950 | 2,231 |
| Oregon GO | 5.892% | 6/1/27 | 2,730 | 3,271 |
113
| Vanguard® Total Bond Market Index Fund | ||||
| Schedule of Investments | ||||
| December 31, 2015 | ||||
| Face | Market | |||
| Maturity | Amount | Value | ||
| Coupon | Date | ($000) | ($000) | |
| 15 Oregon School Boards Association GO | 4.759% | 6/30/28 | 9,955 | 10,932 |
| 13 Oregon School Boards Association GO | 5.528% | 6/30/28 | 1,200 | 1,379 |
| 14 Oregon School Boards Association GO | 5.680% | 6/30/28 | 1,475 | 1,730 |
| Pennsylvania GO | 4.650% | 2/15/26 | 2,875 | 3,097 |
| Pennsylvania GO | 5.350% | 5/1/30 | 7,400 | 8,134 |
| Pennsylvania Public School Building Authority Lease | ||||
| Revenue (School District of Philadelphia) | 5.000% | 9/15/27 | 2,617 | 2,813 |
| Pennsylvania Turnpike Commission Revenue | 6.105% | 12/1/39 | 400 | 495 |
| Pennsylvania Turnpike Commission Revenue | 5.511% | 12/1/45 | 1,450 | 1,688 |
| Pennsylvania Turnpike Commission Revenue | 5.561% | 12/1/49 | 1,475 | 1,707 |
| Philadelphia PA Industrial Development Authority City | ||||
| Service Agreement Revenue | 3.964% | 4/15/26 | 2,285 | 2,260 |
| Phoenix AZ GO | 5.269% | 7/1/34 | 5 | 6 |
| Port Authority of New York & New Jersey Revenue | 6.040% | 12/1/29 | 2,550 | 3,064 |
| Port Authority of New York & New Jersey Revenue | 5.647% | 11/1/40 | 11,575 | 13,697 |
| Port Authority of New York & New Jersey Revenue | 5.647% | 11/1/40 | 6,955 | 8,230 |
| Port Authority of New York & New Jersey Revenue | 4.960% | 8/1/46 | 6,300 | 6,805 |
| Port Authority of New York & New Jersey Revenue | 5.310% | 8/1/46 | 4,625 | 4,885 |
| Port Authority of New York & New Jersey Revenue | 4.926% | 10/1/51 | 1,200 | 1,273 |
| Port Authority of New York & New Jersey Revenue | 4.458% | 10/1/62 | 21,400 | 20,376 |
| President & Fellows of Harvard College Massachusetts | ||||
| GO | 4.875% | 10/15/40 | 7,450 | 8,661 |
| Princeton University New Jersey GO | 4.950% | 3/1/19 | 65 | 71 |
| Princeton University New Jersey GO | 5.700% | 3/1/39 | 3,732 | 4,906 |
| Regional Transportation District of Colorado Sales Tax | ||||
| Revenue | 5.844% | 11/1/50 | 3,500 | 4,484 |
| Rutgers State University New Jersey Revenue | 5.665% | 5/1/40 | 3,225 | 3,832 |
| Sacramento CA Public Financing Authority Lease | ||||
| Revenue | 5.637% | 4/1/50 | 2,400 | 2,548 |
| Salt River Project Arizona Agricultural Improvement & | ||||
| Power District Revenue | 4.839% | 1/1/41 | 1,900 | 2,164 |
| San Antonio TX Electric & Gas Systems Revenue | 5.985% | 2/1/39 | 4,335 | 5,489 |
| San Antonio TX Electric & Gas Systems Revenue | 5.718% | 2/1/41 | 2,725 | 3,354 |
| San Antonio TX Electric & Gas Systems Revenue | 5.808% | 2/1/41 | 6,750 | 8,412 |
| San Antonio TX Electric & Gas Systems Revenue | 4.427% | 2/1/42 | 5,300 | 5,574 |
| San Diego County CA Regional Airport Authority | ||||
| Revenue | 5.594% | 7/1/43 | 3,350 | 3,622 |
| San Diego County CA Regional Transportation | ||||
| Commission Sales Tax Revenue | 5.911% | 4/1/48 | 2,075 | 2,613 |
| San Diego County CA Water Authority Revenue | 6.138% | 5/1/49 | 14,020 | 18,184 |
| San Francisco CA City & County Public Utilities | ||||
| Commission Water Revenue | 6.000% | 11/1/40 | 4,950 | 6,034 |
| San Francisco CA City & County Public Utilities | ||||
| Commission Water Revenue | 6.950% | 11/1/50 | 5,000 | 6,995 |
| Santa Clara Valley CA Transportation Authority Sales | ||||
| Tax Revenue | 5.876% | 4/1/32 | 8,800 | 10,547 |
| Sonoma County CA Pension Obligation Revenue | 6.000% | 12/1/29 | 2,935 | 3,423 |
| South Carolina Public Service Authority Revenue | 6.454% | 1/1/50 | 8,300 | 10,391 |
| Stanford University California GO | 4.750% | 5/1/19 | 30 | 33 |
| Stanford University California GO | 3.460% | 5/1/47 | 2,300 | 2,169 |
| Texas GO | 5.517% | 4/1/39 | 4,815 | 6,015 |
| Texas Transportation Commission Revenue | 5.028% | 4/1/26 | 2,100 | 2,401 |
| Texas Transportation Commission Revenue | 5.178% | 4/1/30 | 5,035 | 5,920 |
| Texas Transportation Commission Revenue | 4.631% | 4/1/33 | 7,950 | 8,732 |
| Texas Transportation Commission Revenue | 4.681% | 4/1/40 | 2,850 | 3,202 |
| Tufts University Massachusetts GO | 5.017% | 4/15/12 | 8,425 | 8,693 |
| University of California Regents Medical Center | ||||
| Revenue | 6.548% | 5/15/48 | 4,250 | 5,468 |
| University of California Regents Medical Center | ||||
| Revenue | 6.583% | 5/15/49 | 2,575 | 3,306 |
| University of California Revenue | 1.796% | 7/1/19 | 13,165 | 13,168 |
| University of California Revenue | 6.270% | 5/15/31 | 500 | 558 |
| University of California Revenue | 5.770% | 5/15/43 | 1,220 | 1,488 |
| University of California Revenue | 4.765% | 5/15/44 | 5,350 | 5,444 |
114
Vanguard® Total Bond Market Index Fund
Schedule of Investments
December 31, 2015
| Face | Market | ||||
| Maturity | Amount | Value | |||
| Coupon | Date | ($000) | ($000) | ||
| University of California Revenue | 5.946% | 5/15/45 | 13,100 | 15,982 | |
| University of California Revenue | 4.858% | 5/15/12 | 18,000 | 17,219 | |
| University of California Revenue | 4.767% | 5/15/15 | 7,500 | 7,041 | |
| University of Massachusetts Building Authority | |||||
| Revenue | 5.450% | 11/1/40 | 1,700 | 1,996 | |
| University of North Carolina at Chapel Hill Revenue | 3.847% | 12/1/34 | 3,000 | 3,112 | |
| University of Southern California GO | 5.250% | 10/1/11 | 3,900 | 4,415 | |
| University of Texas System Revenue Financing System | |||||
| Revenue | 5.262% | 7/1/39 | 1,650 | 1,989 | |
| University of Texas System Revenue Financing System | |||||
| Revenue | 6.276% | 8/15/41 | 1,535 | 1,706 | |
| University of Texas System Revenue Financing System | |||||
| Revenue | 5.134% | 8/15/42 | 100 | 117 | |
| University of Texas System Revenue Financing System | |||||
| Revenue | 4.794% | 8/15/46 | 1,310 | 1,485 | |
| University of Virginia Revenue | 6.200% | 9/1/39 | 3,000 | 4,100 | |
| Utah GO | 4.554% | 7/1/24 | 2,525 | 2,832 | |
| Utah GO | 3.539% | 7/1/25 | 8,710 | 9,188 | |
| Utah Transit Authority Sales Tax Revenue | 5.937% | 6/15/39 | 3,330 | 4,191 | |
| Washington Convention Center Public Facilities District | |||||
| Revenue | 6.790% | 7/1/40 | 400 | 489 | |
| Washington GO | 5.090% | 8/1/33 | 9,025 | 10,275 | |
| Washington GO | 5.481% | 8/1/39 | 870 | 1,052 | |
| Washington GO | 5.140% | 8/1/40 | 6,035 | 7,096 | |
| 13 | Wisconsin GO | 5.700% | 5/1/26 | 2,800 | 3,242 |
| Total Taxable Municipal Bonds (Cost $1,277,538) | 1,413,907 | ||||
| Shares | |||||
| Temporary Cash Investment (2.2%) | |||||
| Money Market Fund (2.2%) | |||||
| 16 | Vanguard Market Liquidity Fund (Cost | ||||
| $3,155,027) | 0.363% | 3,155,027,040 | 3,155,027 | ||
| Total Investments (101.4%) (Cost $148,889,841) | 149,880,810 | ||||
| Other Assets and Liabilities—Net (-1.4%) | (2,002,575) | ||||
| Net Assets (100%) | 147,878,235 | ||||
1 Securities with a value of $3,919,000 have been segregated as collateral for certain open To Be Announced (TBA) transactions.
2 U.S. government-guaranteed.
3 The issuer operates under a congressional charter; its securities are generally neither guaranteed by the U.S. Treasury nor backed by the full
faith and credit of the U.S. government.
4 The issuer was placed under federal conservatorship in September 2008; since that time, its daily operations have been managed by the Federal
Housing Finance Agency and it receives capital from the U.S. Treasury, as needed to maintain a positive net worth, in exchange for senior
preferred stock.
5 The average or expected maturity is shorter than the final maturity shown because of the possibility of interim principal payments and
prepayments or the possibility of the issue being called.
6 Includes securities purchased on a when-issued or delayed-delivery basis for which the fund has not taken delivery as of December 31, 2015.
7 Adjustable-rate security.
8 Security exempt from registration under Rule 144A of the Securities Act of 1933. Such securities may be sold in transactions exempt from
registration, normally to qualified institutional buyers. At December 31, 2015, the aggregate value of these securities was $1,217,171,000,
representing 0.8% of net assets.
9 Guaranteed by the Government of Canada.
10 Guaranteed by the Government of Japan.
11 Guaranteed by the Federal Republic of Germany.
12 Guaranteed by the Republic of Austria.
13 Scheduled principal and interest payments are guaranteed by AGM (Assured Guaranty Municipal Corporation).
14 Scheduled principal and interest payments are guaranteed by National Public Finance Guarantee Corp.
15 Scheduled principal and interest payments are guaranteed by AMBAC (Ambac Assurance Corporation).
115
Vanguard® Total Bond Market Index Fund
Schedule of Investments
December 31, 2015
16 Affiliated money market fund available only to Vanguard funds and certain trusts and accounts managed by Vanguard. Rate shown is the 7-day
yield.
COP—Certificate of Participation.
GO—General Obligation Bond.
REIT—Real Estate Investment Trust.
116
This page intentionally left blank.
© 2016 The Vanguard Group, Inc.
All rights reserved.
Vanguard Marketing Corporation, Distributor.
SNA840 022016
Report of Independent Registered Public Accounting Firm
To the Board of Trustees of Vanguard Bond Index Funds and the Shareholders of Vanguard Short-Term Bond Index Fund, Vanguard Intermediate-Term Bond Index Fund and Vanguard Long-Term Bond Index Fund:
In our opinion, the accompanying statements of net assets – investments summary and the related statements of operations and of changes in net assets and the financial highlights (included in Item 1 of this Form N-CSR) and the schedules of investments (included in Item 6 of this Form N-CSR) present fairly, in all material respects, the financial position of Vanguard Short-Term Bond Index Fund, Vanguard Intermediate-Term Bond Index Fund and Vanguard Long-Term Bond Index Fund (constituting separate portfolios of Vanguard Bond Index Funds, hereafter referred to as the “Funds”) at December 31, 2015, the results of each of their operations for the year then ended, the changes in each of their net assets for each of the two years in the period then ended, and the financial highlights for each of the periods indicated, in conformity with accounting principles generally accepted in the United States of America. These financial statements, financial highlights, and schedules of investments (hereafter referred to as "financial statements") are the responsibility of the Funds’ management. Our responsibility is to express an opinion on these financial statements based on our audits. We conducted our audits of these financial statements in accordance with the standards of the Public Company Accounting Oversight Board (United States). Those standards require that we plan and perform the audit to obtain reasonable assurance about whether the financial statements are free of material misstatement. An audit includes examining, on a test basis, evidence supporting the amounts and disclosures in the financial statements, assessing the accounting principles used and significant estimates made by management, and evaluating the overall financial statement presentation. We believe that our audits, which included confirmation of securities at December 31, 2015 by correspondence with the custodian and brokers, by agreement to the underlying ownership records of the transfer agent and the application of alternative auditing procedures where securities purchased had not been received, provide a reasonable basis for our opinion.

PricewaterhouseCoopers LLP
February 16, 2016
PricewaterhouseCoopers LLP, Two Commerce Square, 2001 Market Street, Suite 1800, Philadelphia, PA 19103-7042
T: (267) 330-3000, F: (267) 330-3300, www.pwc.com/us
Report of Independent Registered Public Accounting Firm
To the Board of Trustees of Vanguard Bond Index Funds and the Shareholders of Vanguard Total Bond Market Index Fund:
In our opinion, the accompanying statement of net assets – investments summary and the related statements of operations and of changes in net assets and the financial highlights (included in Item 1 of this Form N-CSR) and the schedule of investments (included in Item 6 of this Form N-CSR) present fairly, in all material respects, the financial position of Vanguard Total Bond Market Index Fund (constituting a separate portfolio of Vanguard Bond Index Funds, hereafter referred to as the "Fund") at December 31, 2015, the results of its operations for the year then ended, the changes in its net assets for each of the two years in the period then ended, and the financial highlights for each of the five years in the period then ended, in conformity with accounting principles generally accepted in the United States of America. These financial statements, financial highlights, and schedule of investments (hereafter referred to as "financial statements") are the responsibility of the Fund's management. Our responsibility is to express an opinion on these financial statements based on our audits. We conducted our audits of these financial statements in accordance with the standards of the Public Company Accounting Oversight Board (United States). Those standards require that we plan and perform the audit to obtain reasonable assurance about whether the financial statements are free of material misstatement. An audit includes examining, on a test basis, evidence supporting the amounts and disclosures in the financial statements, assessing the accounting principles used and significant estimates made by management, and evaluating the overall financial statement presentation. We believe that our audits, which included confirmation of securities at December 31, 2015 by correspondence with the custodian and brokers, by agreement to the underlying ownership records of the transfer agent and the application of alternative auditing procedures where securities purchased had not been received, provide a reasonable basis for our opinion.

PricewaterhouseCoopers LLP
February 16, 2016
PricewaterhouseCoopers LLP, Two Commerce Square, 2001 Market Street, Suite 1800, Philadelphia, PA 19103-7042
T: (267) 330-3000, F: (267) 330-3300, www.pwc.com/us
Item 7: Disclosure of Proxy Voting Policies and Procedures for Closed-End Management
Investment Companies.
Not Applicable.
Item 8: Portfolio Managers of Closed-End Management Investment Companies.
Not Applicable.
Item 9: Purchase of Equity Securities by Closed-End Management Investment Company and
Affiliated Purchasers.
Not Applicable.
Item 10: Submission of Matters to a Vote of Security Holders.
Not Applicable.
Item 11: Controls and Procedures.
(a) Disclosure Controls and Procedures. The Principal Executive and Financial Officers concluded that the Registrant’s Disclosure Controls and Procedures are effective based on their evaluation of the Disclosure Controls and Procedures as of a date within 90 days of the filing date of this report.
(b) Internal Control Over Financial Reporting. There were no significant changes in Registrant’s Internal Control Over Financial Reporting or in other factors that could significantly affect this control subsequent to the date of the evaluation, including any corrective actions with regard to significant deficiencies and material weaknesses.
Item 12: Exhibits.
(a) Code of Ethics.
(b) Certifications.
Pursuant to the requirements of the Securities Exchange Act of 1934 and the Investment Company Act of 1940, the registrant has duly caused this report to be signed on its behalf by the undersigned, thereunto duly authorized.
| VANGUARD BOND INDEX FUNDS | |
| BY: | /s/ F. WILLIAM MCNABB III* |
| F. WILLIAM MCNABB III | |
| CHIEF EXECUTIVE OFFICER | |
| Date: February 18, 2016 | |
Pursuant to the requirements of the Securities Exchange Act of 1934 and the Investment Company Act of 1940, this report has been signed below by the following persons on behalf of the registrant and in the capacities and on the dates indicated.
| VANGUARD BOND INDEX FUNDS | |
| BY: | /s/ F. WILLIAM MCNABB III* |
| F. WILLIAM MCNABB III | |
| CHIEF EXECUTIVE OFFICER | |
| Date: February 18, 2016 | |
| VANGUARD BOND INDEX FUNDS |
BY: | /s/ THOMAS J. HIGGINS* |
| THOMAS J. HIGGINS | |
| CHIEF FINANCIAL OFFICER | |
| Date: February 18, 2016 | |
* By: /s/ Heidi Stam
Heidi Stam, pursuant to a Power of Attorney filed on April 22, 2014 see file Number 2-17620, Incorporated by Reference.