UNITED STATES
SECURITIES AND EXCHANGE COMMISSION
Washington, D.C. 20549
FORM N-CSR
Certified Shareholder Report of
Registered Management Investment Companies
Investment Company Act File Number: 811-04692
Emerging Markets Growth Fund, Inc.
(Exact Name of Registrant as Specified in Charter)
6455 Irvine Center Drive
Irvine, California 92618
(Address of Principal Executive Offices)
Registrant's telephone number, including area code: (213) 486-9200
Date of fiscal year end: June 30
Date of reporting period: December 31, 2018
Courtney R. Taylor
Emerging Markets Growth Fund, Inc.
333 South Hope Street
Los Angeles, California 90071
(Name and Address of Agent for Service)
ITEM 1 – Reports to Stockholders

| | Emerging Markets
Growth FundSM |
| | |
| | Semi-annual
report for the six months ended
December 31, 2018 |

Beginning January 1, 2021, as permitted by regulations adopted by the U.S. Securities and Exchange Commission, we intend to no longer mail paper copies of the fund’s shareholder reports, unless specifically requested from the fund or your financial intermediary, such as a broker-dealer or bank. Instead, the reports will be made available on the fund’s website (capitalgroup.com/us/investments/ emerging-markets-growth-fund.html); you will be notified by mail and provided with a website link to access the report each time a report is posted.
You may elect to receive paper copies of all future reports free of charge. If you invest through a financial intermediary, you may contact your financial intermediary to request that you continue to receive paper copies of your shareholder reports. If you invest directly with the fund, you may inform the fund that you wish to continue receiving paper copies of your shareholder reports by contacting us at (800) 421-4225. Your election to receive paper reports will apply to all funds held with the fund’s transfer agent or through your financial intermediary.
Emerging Markets Growth Fund seeks long-term growth of capital and invests primarily in common stock and other equity securities of issuers in developing countries.
Fund results shown in this report are for past periods and are not predictive of results for future periods. The results shown are before taxes on fund distributions and sale of fund shares. Current and future results may be lower or higher than those shown. Share prices and returns will vary, so investors may lose money. Investing for short periods makes losses more likely. For current information and month-end results, please call (800) 421-4989.
Investing in developing markets may be subject to risks, such as significant currency and price fluctuations, political instability, differing securities regulations and periods of illiquidity, which are detailed in the fund’s prospectus. Investments in developing markets have been more volatile than investments in developed markets, reflecting the greater uncertainties of investing in less established economies. Individuals investing in developing markets should have a long-term perspective and be able to tolerate potentially sharp declines in the value of their investments.
Investments are not FDIC-insured, nor are they deposits of or guaranteed by a bank or any other entity, so they may lose value.
Contents
Fellow investors:
Emerging markets stocks declined during the second half of 2018, undercut by China’s decelerating economy, heightened uncertainty over U.S.-China trade relations and rising U.S. interest rates. A strong U.S. dollar and trade tariffs also pressured equity prices. The value of Emerging Markets Growth Fund decreased 8.41% with dividends reinvested for the six months ended December 31, 2018, while its benchmark, the unmanaged MSCI Emerging Markets Investable Market Index (IMI), lost 8.79%.*
Market review
Global markets were volatile. A brewing trade war involving the U.S., China and Europe reverberated around the world and signs of slowing global economic growth pressured stocks and commodities. At the same time, the dollar’s rebound and U.S. interest rate increases raised questions about the vulnerabilities of developing countries with high levels of dollar debt. Central banks in several developing countries hiked interest rates in attempts to stem capital flight and protect their currencies. The Turkish lira, Argentine peso and several other emerging markets currencies sank to multiyear lows.
Almost all sectors in the MSCI Emerging Markets IMI declined. Shares of several leading Asian technology companies —which rank among the largest by weight in the benchmark index — retreated after strong returns over the past two years. Chinese technology giants fell on concerns around valuation and the
| * | Unless otherwise noted, country and sector returns are based on MSCI EM IMI indices, expressed in U.S. dollars, and assume the reinvestment of dividends. Results reflect dividends net of withholding taxes. |
Results at a glance
| | | Cumulative
total returns | | Average annual total returns |
For periods ended December 31, 2018,
with distributions reinvested | | 6 months | | 1 year | | 3 years | | 5 years | | 10 years | | Lifetime1 |
| | | | | | | | | | | | | |
| Emerging Markets Growth Fund (Class M shares) | | | –8.41 | % | | | –14.60 | % | | | 9.74 | % | | | 0.72 | % | | | 6.83 | % | | | 12.64 | % |
| MSCI Emerging Markets IMI2,3 | | | –8.79 | | | | –15.05 | | | | 8.51 | | | | 1.56 | | | | 8.24 | | | | 9.79 | 4 |
| MSCI Emerging Markets Index3,5 | | | –8.49 | | | | –14.58 | | | | 9.25 | | | | 1.65 | | | | 8.02 | | | | 9.75 | 4 |
| 1 | Since May 30, 1986. |
| 2 | Returns for the MSCI Emerging Markets Investable Market Index (IMI) were calculated using the MSCI Emerging Markets Index with dividends gross of withholding taxes from December 31, 1987, to December 31, 2000, and with dividends net of withholding taxes from January 1, 2001, to November 30, 2007, and using the MSCI Emerging Markets IMI with dividends net of withholding taxes thereafter. |
| 3 | The indices are unmanaged and, therefore, have no expenses. Investors cannot invest directly in an index. Source: MSCI. |
| 4 | The MSCI Emerging Markets Index did not start until December 31, 1987. As a result, the International Finance Corporation (IFC) Global Composite Index was used in lieu of the MSCI Emerging Markets Index from May 30, 1986, to December 31, 1987. |
| 5 | Results reflect dividends gross of withholding taxes through December 31, 2000, and dividends net of withholding taxes thereafter. |
The total annual fund operating expense ratio for Class M shares is 0.87% as of the most recent fiscal year-end, and is 0.89% including “acquired fund” fees and expenses.
| Emerging Markets Growth Fund | 1 |
20 largest equity holdings
| | | Percent of
net assets as
of 12/31/18 | | Price change
for the
6 months ended
12/31/18* |
| Taiwan Semiconductor Manufacturing | | | 4.4 | % | | | 2.6 | % |
| Samsung Electronics | | | 4.2 | | | | –17.4 | |
| China Overseas Land & Investment | | | 3.0 | | | | 4.3 | |
| AIA Group | | | 2.8 | | | | –5.1 | |
| Tencent Holdings | | | 2.8 | | | | –20.1 | |
| HDFC Bank | | | 2.7 | | | | –1.3 | |
| Ctrip.com International | | | 2.4 | | | | –43.2 | |
| Longfor Properties | | | 2.2 | | | | 10.9 | |
| China Resources Land | | | 2.2 | | | | 14.0 | |
| ICICI Bank | | | 2.2 | | | | 28.3 | |
| Galaxy Entertainment Group | | | 2.0 | | | | –17.9 | |
| Jiangsu Hengrui Medicine | | | 1.9 | | | | –32.4 | |
| Astra International | | | 1.7 | | | | 23.8 | |
| América Móvil | | | 1.7 | | | | –14.5 | |
| Ping An Insurance Group | | | 1.6 | | | | –4.0 | |
| Carlsberg | | | 1.5 | | | | –9.8 | |
| Alibaba Group Holding | | | 1.5 | | | | –26.1 | |
| Huazhu Group | | | 1.4 | | | | –31.8 | |
| Sberbank of Russia | | | 1.3 | | | | –23.8 | |
| Naspers | | | 1.3 | | | | –20.9 | |
| Total | | | 44.8 | % | | | | |
| * | The percent change is reflected in U.S. dollars. The actual gain or loss on the total position in the fund may differ from the percentage shown. |
pace of consumer spending in China; electronic components suppliers in Asia were hit by uncertainty over trade tariffs and a slowdown in orders for next-generation smartphones.
Chinese stocks declined the most among Asian countries. The MSCI China IMI tumbled 17.59%. Stocks fell as China’s economy slowed and the country’s trade clash with the U.S. intensified, which caused uncertainty among businesses and consumers and hurt sentiment for emerging markets more broadly. Growth in sales of cars, retail goods and homes all weakened. Industrial production also fell. Challenging conditions hit the Chinese renminbi, which fell 3.50% against the dollar.
China’s slowdown came after government leaders cut back on stimulus measures and tightened credit to help reduce debt and curb risks in parts of the economy. Top party officials in Beijing have loosened monetary policy and pledged more tax cuts and funds for infrastructure projects to help stabilize the economy and shore up market confidence. And on December 1, U.S. and Chinese leaders agreed to a 90-day negotiating timeline that might resolve their differences.
Indian stocks fell 1.24% despite strong economic growth. Cautious sentiment stemmed from the price of oil, tighter monetary policy and nonperforming loans at state-owned banks and specialty lenders. Nervousness ahead of an election year and relatively high valuations for Indian equities compared with other developing countries also affected stock prices. India is a large oil importer. However, oil prices fell sharply late in the year, relieving some pressure on the country’s current account deficit. The Indian rupee traded at record lows against the dollar and lost 1.86% during the period.
Asian markets finished mixed overall. South Korean equities dropped 12.51% and Taiwanese stocks fell 9.17%. Both countries are key players in the global technology supply chain. Meanwhile, Indonesian stocks surged 8.70%, gaining largely after oil prices plunged. Indonesia is a net importer of oil and the government was unwilling to raise fuel prices in advance of elections this year. Despite struggles with oil prices, Indonesia’s economy grew at a rate above 5%, which ranked among the best worldwide.
In Latin America, Brazilian stocks surged 20.08%. Equities gained on slowly improving economic growth and after right-wing candidate Jair Bolsonaro won October’s election over a socialist-party leader. Bolsanaro, who took office January 1, has voiced his hope of
| 2 | Emerging Markets Growth Fund |
Where the fund’s assets were invested
| | | Percent of net assets | | MSCI EM IMI1 | | Value of holdings
12/31/18 |
| | | 12/31/17 | | 6/30/18 | | 12/31/18 | | 6/30/18 | | 12/31/18 | | (in thousands) |
| | | | | | | | | | | | | | | | | | |
| Asia-Pacific | | | | | | | | | | | | | | | | | | | | | | | | |
| China | | | 24.4 | % | | | 25.9 | % | | | 27.2 | % | | | 30.6 | % | | | 28.3 | % | | $ | 593,451 | |
| Hong Kong | | | 7.1 | | | | 8.1 | | | | 7.7 | | | | — | | | | — | | | | 168,567 | |
| India | | | 11.3 | | | | 11.6 | | | | 12.8 | | | | 9.4 | | | | 10.2 | | | | 278,541 | |
| Indonesia | | | 5.2 | | | | 5.0 | | | | 6.5 | | | | 2.0 | | | | 2.3 | | | | 141,612 | |
| Malaysia | | | .5 | | | | .1 | | | | — | | | | 2.4 | | | | 2.5 | | | | — | |
| Philippines | | | 2.0 | | | | 2.4 | | | | 3.1 | | | | .9 | | | | 1.1 | | | | 67,460 | |
| Singapore | | | .9 | | | | .7 | | | | .7 | | | | — | | | | — | | | | 15,336 | |
| South Korea | | | 5.7 | | | | 5.1 | | | | 4.9 | | | | 15.1 | | | | 14.3 | | | | 107,736 | |
| Taiwan | | | 5.9 | | | | 5.9 | | | | 6.0 | | | | 12.6 | | | | 12.2 | | | | 131,628 | |
| Thailand | | | .9 | | | | .3 | | | | — | | | | 2.3 | | | | 2.6 | | | | — | |
| Vietnam | | | — | | | | 1.3 | | | | 1.7 | | | | — | | | | — | | | | 36,265 | |
| | | | 63.9 | | | | 66.4 | | | | 70.6 | | | | 75.3 | | | | 73.5 | | | | 1,540,596 | |
| | | | | | | | | | | | | | | | | | | | | | | | | |
| Latin America | | | | | | | | | | | | | | | | | | | | | | | | |
| Argentina | | | .4 | | | | .3 | | | | .6 | | | | — | | | | — | | | | 12,147 | |
| Brazil | | | 7.0 | | | | 5.9 | | | | 6.4 | | | | 5.7 | | | | 7.4 | | | | 138,980 | |
| Chile | | | 1.3 | | | | 1.1 | | | | .7 | | | | 1.1 | | | | 1.2 | | | | 14,910 | |
| Mexico | | | 2.5 | | | | 2.2 | | | | 2.2 | | | | 2.9 | | | | 2.8 | | | | 47,157 | |
| Peru | | | 1.4 | | | | 1.2 | | | | 1.3 | | | | .4 | | | | .4 | | | | 29,156 | |
| | | | 12.6 | | | | 10.7 | | | | 11.1 | | | | 10.1 | | | | 11.8 | | | | 242,350 | |
| | | | | | | | | | | | | | | | | | | | | | | | | |
| Eastern Europe and Middle East | | | | | | | | | | | | | | | | | | | | | | | |
| Greece | | | — | | | | — | | | | — | | | | .4 | | | | .3 | | | | — | |
| Hungary | | | .2 | | | | .2 | | | | .2 | | | | .3 | | | | .3 | | | | 3,819 | |
| Romania | | | — | | | | — | | | | | | | | | | | | .1 | | | | 2,685 | |
| Russia | | | 5.6 | | | | 6.4 | | | | 5.5 | | | | 3.2 | | | | 3.4 | | | | 120,402 | |
| Saudi Arabia | | | .9 | | | | .9 | | | | .1 | | | | — | | | | — | | | | 2,268 | |
| Slovenia | | | — | | | | — | | | | | | | | | | | | .5 | | | | 11,973 | |
| Turkey | | | .4 | | | | .5 | | | | 1.1 | | | | .8 | | | | .7 | | | | 23,061 | |
| United Arab Emirates | | | .5 | | | | .5 | | | | .5 | | | | .6 | | | | .7 | | | | 11,116 | |
| | | | 7.6 | | | | 8.5 | | | | 8.0 | | | | 5.3 | | | | 5.4 | | | | 175,324 | |
| | | | | | | | | | | | | | | | | | | | | | | | | |
| Africa | | | | | | | | | | | | | | | | | | | | | | | | |
| South Africa | | | 6.3 | | | | 4.9 | | | | 4.4 | | | | 6.4 | | | | 6.2 | | | | 95,435 | |
| | | | 6.3 | | | | 4.9 | | | | 4.4 | | | | 6.4 | | | | 6.2 | | | | 95,435 | |
| | | | | | | | | | | | | | | | | | | | | | | | | |
| Other markets3 | | | | | | | | | | | | | | | | | | | | | | | | |
| Australia | | | — | 2 | | | .2 | | | | .2 | | | | | | | | | | | | 3,251 | |
| Canada | | | .3 | | | | — | | | | — | | | | | | | | | | | | — | |
| Denmark | | | 1.4 | | | | 1.5 | | | | 1.5 | | | | | | | | | | | | 33,695 | |
| France | | | — | 2 | | | — | 2 | | | — | 2 | | | | | | | | | | | 927 | |
| Italy | | | .2 | | | | .2 | | | | — | | | | | | | | | | | | — | |
| Netherlands | | | — | 2 | | | — | 2 | | | — | | | | | | | | | | | | — | |
| Norway | | | .1 | | | | .1 | | | | .1 | | | | | | | | | | | | 2,019 | |
| United Kingdom | | | .8 | | | | .7 | | | | .4 | | | | | | | | | | | | 8,173 | |
| United States of America | | | 3.2 | | | | 3.0 | | | | 1.7 | | | | | | | | | | | | 37,114 | |
| | | | 6.0 | | | | 5.7 | | | | 3.9 | | | | | | | | | | | | 85,179 | |
| | | | | | | | | | | | | | | | | | | | | | | | | |
| Short-term securities and other assets less liabilities | | | 3.6 | | | | 3.8 | | | | 2.0 | | | | | | | | | | | | 42,936 | |
| Total net assets | | | 100.0 | % | | | 100.0 | % | | | 100.0 | % | | | | | | | | | | $ | 2,181,820 | |
| 1 | A dash indicates that the market is not included in the index. Source: MSCI. |
| 2 | Amount less than .1% |
| 3 | Includes investments in companies incorporated in other regions that have significant operations in emerging markets. |
| Emerging Markets Growth Fund | 3 |
reforming Brazil’s pension system and tackling other measures to revive growth in Latin America’s largest economy. But the shape those policies take — and the support they receive — remain unclear given the country’s divided legislature.
Mexican stocks fell 13.04%. While Mexico reached a deal with the U.S. to restructure the North American Free Trade Agreement — renamed the United States-Mexico-Canada Agreement — the election of leftist president Andrés Manuel López Obrador raised concerns over the direction of the country’s economic policies and business investment.
Portfolio review
The choice of Chinese property developers in the real estate sector helped relative returns. Shares of China Overseas Land & Investment, China Resources Land and Longfor Group all gained even as home sales slowed in China. With solid balance sheets and attractive valuations, these companies are anticipated to benefit from improving inventory levels in major Chinese cities. Tighter access to credit has also squeezed smaller rivals. There’s hope that the government will relax home buying restrictions as part of a plan to boost consumer confidence, which has been hurt by the U.S. trade war.
Investments in Indian private sector banks supported returns. Shares of ICICI Bank surged after it swung to a profit and reported a decrease in nonperforming loans for the quarter ended September 30. HDFC Bank was another contributor. HDFC continued to report stable asset quality and loan growth.
Holdings in Indonesia contributed. Conglomerate Astra International, which sells automotive vehicles and heavy equipment, reported solid results for the nine months ended September 30. Profit rose 21% and sales grew 16%. Shares of Bank Central Asia advanced on a growing loan book and a strong deposit base.
Positioning in the information technology sector also helped. Compared with the benchmark, the fund was less exposed to share price declines from some Chinese technology companies and Asian suppliers of semiconductor components.
In contrast, holdings in the Chinese health care sector detracted on a relative basis. Shares of Shanghai Fosun Pharmaceutical and Jiangsu Hengrui Medicine both declined on broader market pressures. A vaccine scandal not related to either company’s business roiled Chinese pharmaceutical stocks in July and August, leading to increased government scrutiny of manufacturing facilities. Government officials also laid out plans to lower generic drug prices and speed up approvals for foreign firms to sell in China.
| | | Six months ended 12/31/18 |
| | | Expressed in | | Expressed in |
| Percent change in key markets* | | U.S. dollars | | local currency |
| | | | | | | | | |
| Asia-Pacific | | | | | | | | |
| China | | | –17.59 | % | | | –17.68 | % |
| India | | | –1.24 | | | | 0.64 | |
| Indonesia | | | 8.70 | | | | 9.08 | |
| Malaysia | | | –4.04 | | | | –1.83 | |
| Philippines | | | 5.62 | | | | 4.07 | |
| South Korea | | | –12.51 | | | | –12.40 | |
| Taiwan | | | –9.17 | | | | –8.43 | |
| Thailand | | | 1.17 | | | | –0.57 | |
| | | | | | | | | |
| Latin America | | | | | | | | |
| Brazil | | | 20.08 | | | | 20.97 | |
| Chile | | | –9.87 | | | | –3.92 | |
| Colombia | | | –22.69 | | | | –14.51 | |
| Mexico | | | –13.04 | | | | –12.87 | |
| Peru | | | –5.17 | | | | –5.10 | |
| | | | | | | | | |
| Eastern Europe and Middle East | | | | | | | | |
| Czech Republic | | | –6.01 | | | | –5.03 | |
| Greece | | | –25.59 | | | | –24.00 | |
| Hungary | | | 10.11 | | | | 9.62 | |
| Pakistan | | | –24.45 | | | | –13.66 | |
| Poland | | | 6.16 | | | | 6.52 | |
| Qatar | | | 20.06 | | | | 20.07 | |
| Russia | | | –3.62 | | | | 5.13 | |
| Turkey | | | –18.17 | | | | –4.97 | |
| United Arab Emirates | | | –3.59 | | | | –3.59 | |
| | | | | | | | | |
| Africa | | | | | | | | |
| Egypt | | | –19.23 | | | | –19.09 | |
| South Africa | | | –10.57 | | | | –6.13 | |
| | | | | | | | | |
| Emerging Markets Growth Fund | | | –8.41 | % | | | | |
| * | The market indices, which are based on the MSCI Emerging Markets Investable Market Index, reflect dividends net of withholding taxes and are unmanaged and therefore, have no expenses. Investors cannot invest directly in the indices. Source: MSCI. |
| 4 | Emerging Markets Growth Fund |
Chinese travel bookings website Ctrip.com was another top detractor. Its shares declined on a weak profit margin forecast, with the company citing economic uncertainty related to the U.S.-China trade dispute.
Investments in Hong Kong–listed casino operators Wynn Macau and Galaxy Entertainment detracted. Both companies posted higher revenue and profit for the three months ended September 30. But signs of a spending slowdown in Macau —partly related to weakening consumer confidence in China — weighed on the shares of both companies. Looking ahead, new rail infrastructure and bridges into Macau may help drive more visitors from China to the gaming enclave.
Outlook
It’s been a tough environment for emerging markets equities, and we would expect some bouts of volatility in the months ahead. There is uncertainty about the pace of global growth and whether U.S. and Chinese leaders can resolve their trade differences. Dollar strength remains a headwind as well.
Sentiment for developing-country stocks could also be challenged by leadership changes in Brazil and Mexico, where new administrations may disappoint investors with their economic agendas.
Despite current challenges, we believe longer term trends such as the growth of mobile services on internet-connected devices, an expanding consumer class in Asia and widening demand for specialty semiconductors look sustainable.
We also believe corporate fundamentals in developing countries look encouraging. Cash flows have improved and debt levels have decreased. In aggregate, profits for emerging markets companies are still projected to grow in the low double-digits in 2019. Valuations compared with developed markets look attractive as well.
We invest on a company-by-company basis, seeking businesses that are potential beneficiaries of increasing consumer spending power, improving economies and demand related to internet-connected products and services. In this environment, managers are also focused on companies with stronger balance sheets, those with leading market share positions and those having company-specific catalysts that can potentially drive future revenue and earnings growth regardless of macro uncertainty.
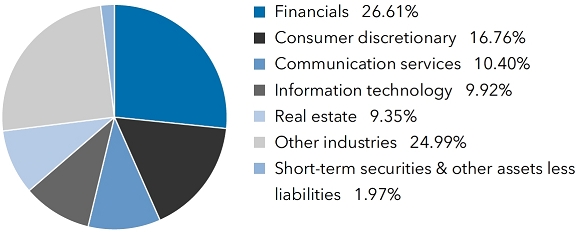
By region, the portfolio has the highest exposure to Asia, particularly China and India.
On a sector basis, approximately 27% of the portfolio is invested in financial stocks. Managers are primarily focused on banks in Asian countries where economic growth looks promising. This includes private sector banks in India that they believe have good asset quality and can continue to take market share from less nimble state-run banks. Asian-based insurers and Chinese financial companies selling products to China’s middle class and high-net-worth individuals are another area of emphasis.
Holdings in consumer discretionary companies — ranging from businesses involved in online services, travel, entertainment and lodging — make up close to 17% of the fund’s net assets. Selective investments in Chinese property companies with strong brand equity, solid balance sheets and access to capital are also well-represented in the portfolio. Semiconductor companies with dominant market share positions in the manufacture and design of components are among the portfolio’s core holdings.
We thank you for the trust you have placed in us and for your continued investment in the fund, and look forward to reporting to you again in six months.
Sincerely,

Victor D. Kohn
President
February 20, 2019
| Emerging Markets Growth Fund | 5 |
About the fund and its adviser
Emerging Markets Growth Fund was organized in 1986 by the International Finance Corporation (IFC), an affiliate of the World Bank, as a vehicle for investing in the securities of companies based in developing countries. The premise behind the formation of the fund was that rapid growth in these countries could create very attractive investment opportunities. It also was felt that the availability of equity capital would stimulate the development of capital markets and encourage countries to liberalize their investment regulations.
Capital International, Inc., the fund’s investment adviser, is part of The Capital Group Companies,SMInc., one of the world’s most experienced investment advisory organizations, with roots dating back to 1931. The fund has been managed by Capital International or an affiliate since 1986. Capital Group employs a research-driven approach to investing and has a global investment research network spanning three continents. This network of analysts and portfolio managers travel the world scrutinizing thousands of companies and keeping a close watch on industry trends and government actions.
Capital Group has devoted substantial resources to the task of evaluating and managing investments in developing countries. It is an intensive effort that combines company and industry analysis with broader political and macroeconomic views. We believe that our extensive worldwide research capabilities and integrated global investment process continue to provide Emerging Markets Growth Fund with a competitive edge.
| 6 | Emerging Markets Growth Fund |
| Investment portfolioDecember 31, 2018 | unaudited |
| | |
| Industry sector diversification | Percent of net assets |
| Common stocks 97.94% | | Shares | | | Value
(000) | |
| Asia-Pacific 70.52% | | | | | | | | |
| China 27.20% | | | | | | | | |
| AAC Technologies Holdings Inc. | | | 74,000 | | | $ | 429 | |
| Alibaba Group Holding Ltd. (ADR)1 | | | 242,580 | | | | 33,250 | |
| BeiGene, Ltd. (ADR)1 | | | 193,372 | | | | 27,122 | |
| China Gas Holdings Ltd. | | | 1,113,200 | | | | 3,966 | |
| China International Capital Corp. Ltd., Class H | | | 2,372,062 | | | | 4,453 | |
| China Merchants Bank Co., Ltd., Class H | | | 6,057,500 | | | | 22,202 | |
| China Oilfield Services Ltd., Class H | | | 10,958,000 | | | | 9,418 | |
| China Overseas Land & Investment Ltd. | | | 19,213,950 | | | | 66,005 | |
| China Pacific Insurance (Group) Co., Ltd., Class H | | | 1,735,981 | | | | 5,620 | |
| China Resources Land Ltd. | | | 12,255,181 | | | | 47,108 | |
| China Tower Corp. Ltd., Class H1 | | | 33,920,000 | | | | 6,411 | |
| China Unicom (Hong Kong) Ltd. | | | 3,482,000 | | | | 3,717 | |
| CNOOC Ltd. (ADR) | | | 19,400 | | | | 2,957 | |
| Ctrip.com International, Ltd. (ADR)1 | | | 1,938,417 | | | | 52,454 | |
| Huazhu Group Ltd. (ADR) | | | 1,064,000 | | | | 30,462 | |
| Hutchison China MediTech Ltd. | | | 2,818 | | | | 126 | |
| Hutchison China MediTech Ltd. (ADR)1 | | | 386,767 | | | | 8,930 | |
| HUYA, Inc. (ADR)1 | | | 26,200 | | | | 406 | |
| IMAX China Holding, Inc. | | | 3,199,488 | | | | 8,499 | |
| Inner Mongolia Yili Industrial Group Co., Ltd., Class A2 | | | 2,241,005 | | | | 7,506 | |
| JD.com, Inc., Class A (ADR) | | | 16,718 | | | | 350 | |
| Jiangsu Hengrui Medicine Co., Ltd., Class A2 | | | 5,495,711 | | | | 42,464 | |
| Kweichow Moutai Co., Ltd., Class A2 | | | 30,300 | | | | 2,601 | |
| Longfor Group Holdings Ltd. | | | 16,334,613 | | | | 48,813 | |
| Midea Group Co., Ltd., Class A2 | | | 1,420,416 | | | | 7,670 | |
| Noah Holdings Ltd., Class A (ADR)1 | | | 467,100 | | | | 20,235 | |
| Pinduoduo Inc. (ADR)1 | | | 191,385 | | | | 4,295 | |
| Ping An Insurance (Group) Co. of China, Ltd., Class H | | | 3,878,700 | | | | 34,252 | |
| Shanghai Fosun Pharmaceutical (Group) Co., Ltd. Class H | | | 6,870,594 | | | | 20,180 | |
| Shanghai Pharmaceutical (Group) Co., Ltd., Class H | | | 4,085,800 | | | | 8,307 | |
| Sun Art Retail Group Ltd. | | | 1,863,000 | | | | 1,899 | |
| Tencent Holdings Ltd. | | | 1,529,800 | | | | 61,344 | |
| | | | | | | | 593,451 | |
| | | | | | | | | |
| Hong Kong 7.73% | | | | | | | | |
| AIA Group Ltd. | | | 7,421,800 | | | | 61,607 | |
| Galaxy Entertainment Group Ltd. | | | 7,024,000 | | | | 44,671 | |
| Goodbaby International Holdings Ltd. | | | 3,764,000 | | | | 1,182 | |
| Hong Kong Exchanges and Clearing Ltd. | | | 357,200 | | | | 10,337 | |
| Jardine Matheson Holdings Ltd. | | | 11,000 | | | | 765 | |
| MGM China Holdings, Ltd. | | | 2,466,000 | | | | 4,138 | |
| Minth Group Ltd. | | | 2,037,369 | | | | 6,570 | |
| NagaCorp Ltd. | | | 6,814,000 | | | | 7,327 | |
| Sands China Ltd. | | | 1,523,200 | | | | 6,672 | |
| Emerging Markets Growth Fund | 7 |
| Common stocks (continued) | | Shares | | | Value
(000) | |
| Asia-Pacific (continued) | | | | | | | | |
| Hong Kong (continued) | | | | | | | | |
| WH Group Limited | | | 2,956,455 | | | $ | 2,277 | |
| Wynn Macau, Ltd. | | | 7,785,829 | | | | 16,983 | |
| Xin Point Holdings Ltd. | | | 17,775,000 | | | | 6,038 | |
| | | | | | | | 168,567 | |
| | | | | | | | | |
| India 12.68% | | | | | | | | |
| Bharti Airtel Ltd. | | | 3,748,497 | | | | 16,779 | |
| CRISIL Ltd. | | | 91,272 | | | | 2,109 | |
| Godrej Consumer Products Ltd. | | | 1,753,290 | | | | 20,358 | |
| HDFC Asset Management Co., Ltd.1 | | | 165 | | | | 4 | |
| HDFC Bank Ltd. | | | 1,003,472 | | | | 30,496 | |
| HDFC Bank Ltd. (ADR) | | | 264,000 | | | | 27,348 | |
| Housing Development Finance Corp. Ltd. | | | 828,723 | | | | 23,365 | |
| ICICI Bank Ltd. | | | 4,253,229 | | | | 21,941 | |
| ICICI Bank Ltd. (ADR) | | | 2,445,770 | | | | 25,167 | |
| IndusInd Bank Ltd. | | | 1,220,027 | | | | 27,948 | |
| Info Edge (India) Ltd. | | | 542,141 | | | | 11,187 | |
| ITC Ltd. | | | 631,861 | | | | 2,549 | |
| Kotak Mahindra Bank Ltd. | | | 983,714 | | | | 17,704 | |
| Maruti Suzuki India Ltd. | | | 50,528 | | | | 5,403 | |
| Nestlé India Ltd. | | | 24,666 | | | | 3,916 | |
| Oracle Financial Services Software Ltd. | | | 9,803 | | | | 521 | |
| Piramal Enterprises Ltd. | | | 112,175 | | | | 3,827 | |
| Quess Corp Ltd. | | | 556,972 | | | | 5,268 | |
| Tata Steel Ltd. | | | 1,217,166 | | | | 9,084 | |
| TeamLease Services Ltd. | | | 384,017 | | | | 15,752 | |
| United Spirits Ltd.1 | | | 640,771 | | | | 5,835 | |
| | | | | | | | 276,561 | |
| | | | | | | | | |
| Indonesia 6.49% | | | | | | | | |
| Astra International Tbk PT2 | | | 64,613,100 | | | | 36,848 | |
| Bank Central Asia Tbk PT2 | | | 11,535,800 | | | | 20,815 | |
| Bank Mandiri (Persero) Tbk PT, Series B2 | | | 21,893,708 | | | | 11,185 | |
| Bank Rakyat Indonesia (Persero) Tbk PT2 | | | 58,556,000 | | | | 14,852 | |
| Elang Mahkota Teknologi Tbk PT2 | | | 44,422,400 | | | | 25,965 | |
| Indocement Tunggal Prakarsa Tbk PT2 | | | 1,231,100 | | | | 1,583 | |
| Matahari Department Store Tbk PT2 | | | 22,843,700 | | | | 8,920 | |
| PT Surya Citra Media Tbk2 | | | 113,449,600 | | | | 14,783 | |
| Semen Indonesia (Persero) Tbk PT2 | | | 8,353,500 | | | | 6,661 | |
| | | | | | | | 141,612 | |
| | | | | | | | | |
| Philippines 3.09% | | | | | | | | |
| Ayala Corp.2 | | | 694,340 | | | | 11,893 | |
| Bank of the Philippine Islands2 | | | 7,937,789 | | | | 14,187 | |
| Bloomberry Resorts Corp.2 | | | 110,486,500 | | | | 19,768 | |
| International Container Terminal Services, Inc.2 | | | 11,363,408 | | | | 21,612 | |
| | | | | | | | 67,460 | |
| | | | | | | | | |
| Singapore 0.70% | | | | | | | | |
| Yoma Strategic Holdings Ltd. | | | 61,477,805 | | | | 15,336 | |
| | | | | | | | | |
| South Korea 4.94% | | | | | | | | |
| Hugel, Inc.1,2 | | | 11,830 | | | | 4,034 | |
| Hyundai Motor Co.2 | | | 104,837 | | | | 11,113 | |
| NAVER Corp.2 | | | 2,415 | | | | 265 | |
| Samsung Electronics Co., Ltd.2 | | | 2,186,303 | | | | 75,517 | |
| Samsung Electronics Co., Ltd. (GDR)3 | | | 18,002 | | | | 15,608 | |
| Samsung Electronics Co., Ltd., nonvoting preferred2 | | | 42,300 | | | | 1,199 | |
| | | | | | | | 107,736 | |
| 8 | Emerging Markets Growth Fund |
| | | Shares | | | Value
(000) | |
| Taiwan 6.03% | | | | | | | | |
| CTCI Corp.2 | | | 5,613,100 | | | $ | 8,102 | |
| Delta Electronics, Inc.2 | | | 77,521 | | | | 326 | |
| E.SUN Financial Holding Co., Ltd.2 | | | 419,476 | | | | 274 | |
| MediaTek Inc.2 | | | 3,210,000 | | | | 23,764 | |
| Taiwan Semiconductor Manufacturing Co., Ltd.2 | | | 13,165,094 | | | | 95,875 | |
| Vanguard International Semiconductor Corp.2 | | | 1,718,000 | | | | 3,287 | |
| | | | | | | | 131,628 | |
| | | | | | | | | |
| Vietnam 1.66% | | | | | | | | |
| Masan Group Corp.1,2 | | | 3,231,980 | | | | 10,787 | |
| Vinhomes JSC1,2 | | | 8,018,825 | | | | 25,478 | |
| | | | | | | | 36,265 | |
| | | | | | | | | |
| Total Asia-Pacific | | | | | | | 1,538,616 | |
| | | | | | | | | |
| Latin America 11.11% | | | | | | | | |
| Argentina 0.56% | | | | | | | | |
| Grupo Financiero Galicia SA, Class B | | | 5 | | | | — | 4 |
| Loma Negra Compania Industrial Argentina SA (ADR)1 | | | 1,091,379 | | | | 12,147 | |
| | | | | | | | 12,147 | |
| | | | | | | | | |
| Brazil 6.37% | | | | | | | | |
| CCR SA, ordinary nominative | | | 5,069,389 | | | | 14,649 | |
| Centro de Imagem Diagnosticos SA | | | 3,325,200 | | | | 11,419 | |
| Cia. Energética de Minas Gerais - CEMIG, preferred nominative | | | 2,194,490 | | | | 7,848 | |
| Cyrela Brazil Realty SA, ordinary nominative | | | 2,530,100 | | | | 10,099 | |
| ENGIE Brasil Energia SA, ordinary nominative (ADR) | | | 6 | | | | — | 4 |
| Estre Ambiental Inc.2,3,5 | | | 739,920 | | | | 767 | |
| GOL Linhas Aéreas Inteligentes SA, preferred nominative (ADR)1 | | | 714,800 | | | | 9,686 | |
| Hypera SA, ordinary nominative | | | 1,980,917 | | | | 15,435 | |
| IRB Brasil Resseguros SA | | | 429,700 | | | | 9,253 | |
| Lojas Americanas SA, ordinary nominative | | | 1,151,677 | | | | 4,466 | |
| Lojas Americanas SA, preferred nominative | | | 1,922,000 | | | | 9,769 | |
| Nexa Resources SA | | | 766,900 | | | | 9,126 | |
| OdontoPrev SA, ordinary nominative | | | 168,200 | | | | 597 | |
| Omega Geracao SA | | | 813,500 | | | | 3,663 | |
| Petróleo Brasileiro SA (Petrobras), ordinary nominative (ADR) | | | 177,300 | | | | 2,307 | |
| Petróleo Brasileiro SA (Petrobras), preferred nominative | | | 1,008,100 | | | | 5,899 | |
| Petróleo Brasileiro SA (Petrobras), preferred nominative (ADR) | | | 406,100 | | | | 4,707 | |
| Vale SA, ordinary nominative | | | 525,753 | | | | 6,918 | |
| Vale SA, ordinary nominative (ADR) | | | 937,993 | | | | 12,372 | |
| | | | | | | | 138,980 | |
| | | | | | | | | |
| Chile 0.68% | | | | | | | | |
| Enel Américas SA | | | 385,191 | | | | 68 | |
| Enel Américas SA (ADR) | | | 848,691 | | | | 7,570 | |
| Inversiones La Construcción SA | | | 452,526 | | | | 7,272 | |
| | | | | | | | 14,910 | |
| | | | | | | | | |
| Mexico 2.16% | | | | | | | | |
| América Móvil, SAB de CV, Series L (ADR) | | | 2,551,235 | | | | 36,355 | |
| Banco del Bajio, SA | | | 3,165,800 | | | | 6,181 | |
| Controladora Vuela Compañía de Aviación, SAB de CV, | | | | | | | | |
| ordinary participation certificates, Class A | | | 677,200 | | | | 361 | |
| Fibra Uno Administración, SA de CV REIT | | | 1,123,934 | | | | 1,249 | |
| Fomento Económico Mexicano, SAB de CV | | | 350,600 | | | | 3,011 | |
| | | | | | | | 47,157 | |
| | | | | | | | | |
| Peru 1.34% | | | | | | | | |
| Credicorp Ltd. | | | 131,528 | | | | 29,156 | |
| | | | | | | | | |
| Total Latin America | | | | | | | 242,350 | |
| | | | | | | | | |
| Eastern Europe and Middle East 8.04% | | | | | | | | |
| | | | | | | | | |
| Hungary 0.18% | | | | | | | | |
| Wizz Air Holdings PLC1 | | | 106,929 | | | | 3,819 | |
| Emerging Markets Growth Fund | 9 |
| Common stocks(continued) | | Shares | | | Value
(000) | |
| Eastern Europe and Middle East (continued) | | | | | | | | |
| Kingdom of Saudi Arabia 0.10% | | | | | | | | |
| Al Rajhi Banking and Investment Corp., non-registered shares | | | 37,900 | | | $ | 884 | |
| Savola Group Co. | | | 193,778 | | | | 1,384 | |
| | | | | | | | 2,268 | |
| | | | | | | | | |
| Romania 0.12% | | | | | | | | |
| OMV Petrom SA | | | 36,484,776 | | | | 2,685 | |
| | | | | | | | | |
| Russian Federation 5.52% | | | | | | | | |
| Aeroflot - Russian Airlines PJSC2 | | | 3,862,058 | | | | 5,608 | |
| Alrosa PJSC2 | | | 16,835,608 | | | | 23,829 | |
| Baring Vostok Capital Fund IV Supplemental Fund, LP1,2,5,6,7,8 | | | 39,747,144 | | | | 16,499 | |
| Baring Vostok Private Equity Fund IV, LP1,2,5,6,7,8 | | | 22,481,017 | | | | 12,637 | |
| Detsky Mir PJSC2 | | | 1,317,840 | | | | 1,711 | |
| Globaltrans Investment PLC (GDR) | | | 22,701 | | | | 206 | |
| Moscow Exchange MICEX-RTS PJSC2 | | | 8,581,547 | | | | 9,976 | |
| New Century Capital Partners, LP1,2,5,6,8 | | | 5,247,900 | | | | 382 | |
| Rosneft Oil Co. PJSC (GDR) | | | 732,700 | | | | 4,528 | |
| Sberbank of Russia PJSC2 | | | 2,419,579 | | | | 6,469 | |
| Sberbank of Russia PJSC (ADR) | | | 2,096,600 | | | | 22,979 | |
| Sistema PJSFC2 | | | 438,652 | | | | 50 | |
| TCS Group Holding PLC (GDR)3 | | | 145,500 | | | | 2,264 | |
| TCS Group Holding PLC (GDR) | | | 267,400 | | | | 4,161 | |
| Yandex NV, Class A1 | | | 332,835 | | | | 9,103 | |
| | | | | | | | 120,402 | |
| | | | | | | | | |
| Slovenia 0.55% | | | | | | | | |
| Nova Ljubljanska banka dd (GDR)1 | | | 803,200 | | | | 11,973 | |
| | | | | | | | | |
| Turkey 1.06% | | | | | | | | |
| Akbank TAS | | | 17,791,650 | | | | 23,061 | |
| Aktas Elektrik Ticaret AS1,2,5 | | | 4,273 | | | | — | 4 |
| | | | | | | | 23,061 | |
| | | | | | | | | |
| United Arab Emirates 0.51% | | | | | | | | |
| DP World Ltd. | | | 482,055 | | | | 8,243 | |
| First Abu Dhabi Bank PJSC, non-registered shares | | | 748,381 | | | | 2,873 | |
| | | | | | | | 11,116 | |
| | | | | | | | | |
| Total Eastern Europe and Middle East | | | | | | | 175,324 | |
| | | | | | | | | |
| Africa 4.37% South Africa 4.37% | | | | | | | | |
| AngloGold Ashanti Ltd. | | | 42,120 | | | | 532 | |
| Dis-Chem Pharmacies Ltd. | | | 2,226,079 | | | | 4,485 | |
| Discovery Ltd. | | | 2,028,221 | | | | 22,526 | |
| JSE Ltd. | | | 1,172,165 | | | | 13,488 | |
| Mr Price Group Ltd. | | | 179,591 | | | | 3,073 | |
| MTN Group Ltd. | | | 87,904 | | | | 544 | |
| Naspers Ltd., Class N | | | 145,091 | | | | 29,167 | |
| Shoprite Holdings Ltd. | | | 1,463,406 | | | | 19,341 | |
| Telkom SA SOC Ltd.1 | | | 518,031 | | | | 2,279 | |
| | | | | | | | 95,435 | |
| | | | | | | | | |
| Other markets 3.90% | | | | | | | | |
| Australia 0.15% | | | | | | | | |
| Newcrest Mining Ltd. | | | 30,752 | | | | 472 | |
| Oil Search Ltd. | | | 550,962 | | | | 2,779 | |
| | | | | | | | 3,251 | |
| | | | | | | | | |
| Denmark 1.54% | | | | | | | | |
| Carlsberg A/S, Class B2 | | | 317,121 | | | | 33,695 | |
| 10 | Emerging Markets Growth Fund |
| | | Shares | | | Value
(000) | |
| France 0.04% | | | | | | | | |
| Edenred SA | | | 25,185 | | | $ | 927 | |
| | | | | | | | | |
| Norway 0.09% | | | | | | | | |
| Borr Drilling Ltd.2 | | | 126,738 | | | | 313 | |
| BW LPG Ltd.1,2 | | | 564,046 | | | | 1,706 | |
| | | | | | | | 2,019 | |
| | | | | | | | | |
| United Kingdom 0.38% | | | | | | | | |
| British American Tobacco PLC | | | 32,900 | | | | 1,048 | |
| PZ Cussons PLC | | | 975,720 | | | | 2,646 | |
| Sedibelo Platinum Mines Ltd.1,2,5 | | | 17,665,800 | | | | 4,479 | |
| | | | | | | | 8,173 | |
| | | | | | | | | |
| United States 1.70% | | | | | | | | |
| AES Corp. | | | 42,300 | | | | 612 | |
| Capital International Private Equity Fund IV LP1,2,5,6,7,8,9 | | | 50,842,740 | | | | 132 | |
| Ensco PLC, Class A | | | 1,085,700 | | | | 3,865 | |
| MercadoLibre, Inc. | | | 92,048 | | | | 26,956 | |
| Samsonite International SA | | | 1,952,699 | | | | 5,549 | |
| | | | | | | | 37,114 | |
| | | | | | | | | |
| Total Other markets | | | | | | | 85,179 | |
| | | | | | | | | |
| Total common stocks (cost: $1,827,128,000) | | | | | | | 2,136,904 | |
| | | | | | | | | |
| Convertible stocks 0.09% | | | | | | | | |
| Asia-Pacific 0.09% | | | | | | | | |
| India 0.09% | | | | | | | | |
| Piramal Enterprises Ltd., convertible debenture, 7.80% 20192 | | | 1,492 | | | | 1,980 | |
| | | | | | | | | |
| Total convertible stocks (cost: $2,472,000) | | | | | | | 1,980 | |
| | | | | | | | | |
| | | | | | | | | |
| Convertible bonds 0.00% | | Principal amount
(000) | | | | | |
| Asia-Pacific 0.00% | | | | | | | | |
| China 0.00% | | | | | | | | |
| Fu Ji Food and Catering Services Holdings Ltd., convertible notes, 0% 20202,5,10 | | CNY | 97,700 | | | | — | 4 |
| | | | | | | | | |
| Total convertible bonds (cost: $0) | | | | | | | — | 4 |
| | | | | | | | | |
| Short-term securities 0.99% | | | | | | | | |
| Federal Home Loan Bank 2.15% due 1/2/2019 | | $ | 11,500 | | | | 11,497 | |
| Starbird Funding Corp. 2.42% due 1/2/20193 | | | 10,000 | | | | 9,998 | |
| | | | | | | | | |
| Total short-term securities (cost: $21,499,000) | | | | | | | 21,495 | |
| Total investment securities 99.02 % (cost: $1,851,099,000) | | | | | | | 2,160,379 | |
| Other assets less liabilities 0.98% | | | | | | | 21,441 | |
| | | | | | | | | |
| Net assets 100.00% | | | | | | | 2,181,820 | |
Forward currency contracts
| Contract amount | | | | | | Unrealized
depreciation | |
Purchases
(000) | | Sales
(000) | | Counterparty | | Settlement
date | | at 12/31/2018
(000) | |
| USD29,196 | | CNH203,217 | | JPMorgan Chase | | 1/7/2019 | | | $ | (393 | ) |
| USD29,195 | | CNH203,218 | | Citibank | | 1/7/2019 | | | | (394 | ) |
| | | | | | | | | | $ | (787 | ) |
| Emerging Markets Growth Fund | 11 |
Investments in affiliates
A company is an affiliate of the fund under the Investment Company Act of 1940 if the fund’s holdings in that company represent 5% or more of the outstanding voting shares. In addition, Capital International Private Equity Fund IV, LP is considered an affiliate since this issuer has the same investment adviser as the fund. Further details on these holdings and related transactions during the six months ended December 31, 2018, appear below.
| | | Beginning
shares | | | Additions | | | Reductions | | | Ending
shares | | | Net
realized
loss
(000) | | | Net unrealized
appreciation
(depreciation)
(000) | | | Dividend
income
(000) | | | Value of
affiliates at
12/31/2018
(000) | |
| Common stocks 0.00% | | | | | | | | | | | | | | | | | | | | | | | | | | | | | | | | |
| Other markets 0.00% | | | | | | | | | | | | | | | | | | | | | | | | | | | | | | | | |
| Netherlands 0.00% | | | | | | | | | | | | | | | | | | | | | | | | | | | | | | | | |
| | | | | | | | | | | | | | | | | | | | | | | | | | | | | | | | | |
| International Hospital Corp. Holding NV, Class A1,2,5,11 | | | 609,873 | | | | — | | | | 609,873 | | | | — | | | $ | (7,281 | ) | | $ | 7,609 | | | $ | — | | | $ | — | |
| United States 0.00% | | | | | | | | | | | | | | | | | | | | | | | | | | | | | | | | |
| | | | | | | | | | | | | | | | | | | | | | | | | | | | | | | | | |
| Capital International Private Equity Fund IV LP1,2,5,6,7,8 | | | 50,842,740 | | | | — | | | | — | | | | 50,842,740 | | | | — | | | | (56 | ) | | | — | | | | 132 | |
| | | | | | | | | | | | | | | | | | | | | | | | | | | | | | | | 132 | |
| Convertible stocks 0.00% | | | | | | | | | | | | | | | | | | | | | | | | | | | | | | | | |
| Other markets 0.00% | | | | | | | | | | | | | | | | | | | | | | | | | | | | | | | | |
| Netherlands 0.00% | | | | | | | | | | | | | | | | | | | | | | | | | | | | | | | | |
| | | | | | | | | | | | | | | | | | | | | | | | | | | | | | | | | |
| International Hospital Corp. Holding NV, Series B, cumulative convertible preferred1,2,5,11 | | | 622,354 | | | | — | | | | 622,354 | | | | — | | | | (2,759 | ) | | | 3,093 | | | | — | | | | — | |
| Total 0.00% | | | | | | | | | | | | | | | | | | $ | (10,040 | ) | | $ | 10,646 | | | $ | — | | | $ | 132 | |
| 1 | Security did not produce income during the last 12 months. |
| 2 | Valued under fair value procedures adopted by authority of the board of directors. The total value of all such securities was $649,567,000, which represented 29.77% of the net assets of the fund. This amount includes $612,691,000 related to certain securities trading outside the U.S. whose values were adjusted as a result of significant market movements following the close of local trading. |
| 3 | Acquired in a transaction exempt from registration under Rule 144A or Section 4(2) of the Securities Act of 1933. May be resold in the U.S. in transactions exempt from registration, normally to qualified institutional buyers. The total value of all such securities was $28,637,000, which represented 1.31% of the net assets of the fund. |
| 4 | Amount less than one thousand. |
| 5 | Value determined using significant unobservable inputs. |
| 6 | Cost and market value do not include prior distributions to the fund from income or proceeds realized from securities held by the private equity fund. Therefore, the cost and market value may not be indicative of the private equity fund’s performance. For private equity funds structured as limited partnerships, shares are not applicable and therefore the fund’s interest in the partnership is reported. |
| 7 | Excludes an unfunded capital commitment representing an agreement which obligates the fund to meet capital calls in the future. Capital calls can only be made if and when certain requirements have been fulfilled; thus, the timing and the amount of such capital calls cannot readily be determined. |
| 8 | Acquired through a private placement transaction exempt from registration under the Securities Act of 1933. May be subject to legal or contractual restrictions on resale. Further details on these holdings appear below. |
| 9 | Represents an affiliated company as defined under the Investment Company Act of 1940. Capital International Private Equity Fund IV LP is also considered an affiliate since this issuer has the same investment adviser as the fund. |
| 10 | Scheduled interest and/or principal payment was not received. |
| 11 | Unaffiliated issuer at 12/31/2018. |
| Private placement securities | | Acquisition
date | | Cost
(000) | | | Value
(000) | | | Percent
of net
assets | |
| Baring Vostok Capital Fund IV Supplemental Fund, LP | | 10/8/2007 | | $ | 32,756 | | | $ | 16,499 | | | | .76 | % |
| Baring Vostok Private Equity Fund IV, LP | | 4/25/2007 | | | 17,127 | | | | 12,637 | | | | .58 | |
| New Century Capital Partners, LP | | 12/7/1995 | | | — | | | | 382 | | | | .02 | |
| Capital International Private Equity Fund IV LP | | 3/29/2005 | | | 7,098 | | | | 132 | | | | .01 | |
| Total private placement securities | | | | $ | 56,981 | | | $ | 29,650 | | | | 1.37 | % |
Key to abbreviations and symbol
ADR = American Depositary Receipts
CNH = Chinese yuan renminbi
CNY = Chinese yuan renminbi
GDR = Global Depositary Receipts
USD/$ = U.S. dollars
See notes to financial statements
| 12 | Emerging Markets Growth Fund |
| Financial statements | |
| | |
Statement of assets and liabilities
at December 31, 2018 | unaudited
(dollars in thousands) |
| Assets: | | | | | | |
| Investment securities, at value: | | | | | | | | |
| Unaffiliated issuers (cost: $1,844,001) | | $ | 2,160,247 | | | | | |
| Affiliated issuers (cost: $7,098) | | | 132 | | | $ | 2,160,379 | |
| Cash | | | | | | | 389 | |
| Cash pledged for forward currency contracts | | | | | | | 320 | |
| Cash denominated in currencies other than U.S. dollars (cost: $22,516) | | | | | | | 22,723 | |
| Receivables for: | | | | | | | | |
| Sales of investments | | | 2,044 | | | | | |
| Sales of fund’s shares | | | 384 | | | | | |
| Dividends | | | 3,102 | | | | | |
| Other | | | 2 | | | | 5,532 | |
| | | | | | | | 2,189,343 | |
| Liabilities: | | | | | | | | |
| Unrealized depreciation on open forward currency contracts | | | | | | | 787 | |
| Payables for: | | | | | | | | |
| Purchases of investments | | | 2,428 | | | | | |
| Repurchases of fund’s shares | | | 547 | | | | | |
| Investment advisory services | | | 1,424 | | | | | |
| Services provided by related parties | | | 1 | | | | | |
| Directors’ deferred compensation | | | 1,712 | | | | | |
| Non-U.S. taxes | | | 245 | | | | | |
| Other | | | 379 | | | | 6,736 | |
| Net assets at December 31, 2018 | | | | | | $ | 2,181,820 | |
| | | | | | | | | |
| Net assets consist of: | | | | | | | | |
| Capital paid in on shares of capital stock | | | | | | $ | 1,875,994 | |
| Total distributable earnings | | | | | | | 305,826 | |
| | | | | | | | | |
| Net assets at December 31, 2018 | | | | | | $ | 2,181,820 | |
(dollars and shares in thousands, except per-share amounts)
Total authorized capital stock — 2,000,000 shares,
$.01 par value (309,499 total shares outstanding)
| | | Net assets | | | Shares
outstanding | | | Net asset value
per share | |
| Class M | | $ | 2,163,460 | | | | 306,892 | | | $ | 7.05 | |
| Class F-3 | | | 18,351 | | | | 2,606 | | | | 7.04 | |
| Class R-6 | | | 9 | | | | 1 | | | | 7.05 | |
See notes to financial statements
| Emerging Markets Growth Fund | 13 |
Statement of operations
for the six months ended December 31, 2018 | unaudited
(dollars in thousands) |
| Investment income: | | | | | | | | |
| Income: | | | | | | | | |
| Dividends (net of non-U.S. taxes of $1,397) | | $ | 18,770 | | | | | |
| Interest (net of non-U.S. taxes of $89) | | | 2,160 | | | $ | 20,930 | |
| Fees and expenses*: | | | | | | | | |
| Investment advisory services | | | 8,698 | | | | | |
| Transfer agent services | | | 2 | | | | | |
| Administrative services | | | 3 | | | | | |
| Reports to shareholders | | | 8 | | | | | |
| Registration statement and prospectus | | | 47 | | | | | |
| Directors’ compensation | | | (112 | ) | | | | |
| Auditing and legal | | | 184 | | | | | |
| Custodian | | | 678 | | | | | |
| State and local taxes | | | 15 | | | | | |
| Other | | | 105 | | | | | |
| Total fees and expenses before reimbursements | | | 9,628 | | | | | |
| Less transfer agent services reimbursements | | | — | † | | | | |
| Total fees and expenses after reimbursements | | | | | | | 9,628 | |
| Net investment income | | | | | | | 11,302 | |
| | | | | | | | | |
| Net realized gain and unrealized depreciation: | | | | | | | | |
| Net realized gain (loss) on: | | | | | | | | |
| Investments: | | | | | | | | |
| Unaffiliated issuers | | | 56,106 | | | | | |
| Affiliated issuers | | | (10,040 | ) | | | | |
| Forward currency contracts | | | (77 | ) | | | | |
| Currency transactions | | | (714 | ) | | | 45,275 | |
| Net unrealized (depreciation) appreciation on: | | | | | | | | |
| Investments: | | | | | | | | |
| Unaffiliated issuers | | | (272,698 | ) | | | | |
| Affiliated issuers | | | 10,646 | | | | | |
| Forward currency contracts | | | (787 | ) | | | | |
| Currency translations | | | 2,021 | | | | (260,818 | ) |
| Net realized gain and unrealized depreciation | | | | | | | (215,543 | ) |
| | | | | | | | | |
| Net decrease in net assets resulting from operations | | | | | | $ | (204,241 | ) |
| * | Additional information related to class-specific fees and expenses is included in the notes to financial statements. |
| † | Amount less than one thousand. |
See notes to financial statements
| 14 | Emerging Markets Growth Fund |
Statements of changes in net assets
(dollars in thousands)
| | | Six months ended
December 31,
2018* | | | Year ended June 30,
2018 | |
| Operations: | | | | | | | | |
| Net investment income | | $ | 11,302 | | | $ | 28,269 | |
| Net realized gain | | | 45,275 | | | | 289,278 | |
| Net unrealized depreciation | | | (260,818 | ) | | | (98,347 | ) |
| Net (decrease) increase in net assets resulting from operations | | | (204,241 | ) | | | 219,200 | |
| | | | | | | | | |
| Distributions paid to shareholders | | | (47,815 | ) | | | (30,240 | ) |
| | | | | | | | | |
| Net capital share transactions | | | (59,475 | ) | | | (240,936 | ) |
| | | | | | | | | |
| Total decrease in net assets | | | (311,531 | ) | | | (51,976 | ) |
| | | | | | | | | |
| Net assets: | | | | | | | | |
| Beginning of period | | | 2,493,351 | | | | 2,545,327 | |
| End of period | | $ | 2,181,820 | | | $ | 2,493,351 | |
See notes to financial statements
| Emerging Markets Growth Fund | 15 |
| Notes to financial statements | unaudited |
1. Organization
Emerging Markets Growth Fund, Inc. (the “fund”) is registered under the Investment Company Act of 1940 as an open-end, diversified management investment company. The fund seeks long-term growth of capital and invests primarily in common stock and other equity securities of issuers in developing countries.
The fund has three share classes consisting of two retail share classes (Classes M and F-3), and one retirement plan share class (Class R-6). The retirement plan share class is generally offered only through eligible employer-sponsored retirement plans. The fund’s share classes are described further in the following table:
| Share class | | Initial sales charge | | Contingent deferred sales charge upon
redemption | | Conversion feature | |
| Classes M* and F-3 | | None | | None | | None | |
| Class R-6 | | None | | None | | None | |
| * | Class M shares of the fund are not available for purchase. |
Holders of all share classes have equal pro rata rights to the assets, dividends and liquidation proceeds of the fund. Each share class has identical voting rights, except for the exclusive right to vote on matters affecting only its class. Share classes have different fees and expenses (“class-specific fees and expenses”), primarily due to different arrangements for distribution, transfer agent and administrative services. Differences in class-specific fees and expenses will result in differences in net investment income and, therefore, the payment of different per-share dividends by each share class.
2. Significant accounting policies
The fund is an investment company that applies the accounting and reporting guidance issued in Topic 946 by the U.S. Financial Accounting Standards Board. The fund’s financial statements have been prepared to comply with U.S. generally accepted accounting principles (“U.S. GAAP”). These principles require the fund’s investment adviser to make estimates and assumptions that affect reported amounts and disclosures. Actual results could differ from those estimates. Subsequent events, if any, have been evaluated through the date of issuance in the preparation of the financial statements. The fund follows the significant accounting policies described in this section, as well as the valuation policies described in the next section on valuation.
Security transactions and related investment income— Security transactions are recorded by the fund as of the date the trades are executed with brokers. Realized gains and losses from security transactions are determined based on the specific identified cost of the securities. In the event a security is purchased with a delayed payment date, the fund will segregate liquid assets sufficient to meet its payment obligations. Dividend income is recognized on the ex-dividend date and interest income is recognized on an accrual basis. Market discounts, premiums and original issue discounts on fixed-income securities are amortized daily over the expected life of the security.
Class allocations— Income, fees and expenses (other than class-specific fees and expenses) and realized and unrealized gains and losses are allocated daily among the various share classes based on their relative net assets. Class-specific fees and expenses, such as distribution, transfer agent and administrative services, are charged directly to the respective share class.
Distributions paid to shareholders— Income dividends and capital gain distributions are recorded on the ex-dividend date.
Currency translation— Assets and liabilities, including investment securities, denominated in currencies other than U.S. dollars are translated into U.S. dollars at the exchange rates supplied by one or more pricing vendors on the valuation date. Purchases and sales of investment securities and income and expenses are translated into U.S. dollars at the exchange rates on the dates of such transactions. The effects of changes in exchange rates on investment securities are included with the net realized gain or loss and net unrealized appreciation or depreciation on investments in the fund’s statement of operations. The realized gain or loss and unrealized appreciation or depreciation resulting from all other transactions denominated in currencies other than U.S. dollars are disclosed separately.
Shares redeemed— The fund normally redeems shares in cash; however, under certain conditions and circumstances, payment of the redemption price wholly or partly with portfolio securities or other fund assets may be permitted. A redemption of shares in-kind is based upon the closing value of the shares being redeemed as of the trade date. Realized gains/losses resulting from redemptions of shares in-kind are reflected separately in the statement of operations.
| 16 | Emerging Markets Growth Fund |
3. Valuation
Capital International, Inc. (“CIInc”), the fund’s investment adviser, values the fund’s investments at fair value as defined by U.S. GAAP. The net asset value of each share class of the fund is generally determined as of approximately 4:00 p.m. New York time each day the New York Stock Exchange is open.
Methods and inputs— The fund’s investment adviser uses the following methods and inputs to establish the fair value of the fund’s assets and liabilities. Use of particular methods and inputs may vary over time based on availability and relevance as market and economic conditions evolve.
Equity securities are generally valued at the official closing price of, or the last reported sale price on, the exchange or market on which such securities are traded, as of the close of business on the day the securities are being valued or, lacking any sales, at the last available bid price. Prices for each security are taken from the principal exchange or market on which the security trades.
Fixed-income securities, including short-term securities, are generally valued at prices obtained from one or more pricing vendors. Vendors value such securities based on one or more of the inputs described in the following table. The table provides examples of inputs that are commonly relevant for valuing particular classes of fixed-income securities in which the fund is authorized to invest. However, these classifications are not exclusive, and any of the inputs may be used to value any other class of fixed-income security.
| Fixed-income class | | Examples of standard inputs |
| All | | Benchmark yields, transactions, bids, offers, quotations from dealers and trading systems, new issues, spreads and other relationships observed in the markets among comparable securities; and proprietary pricing models such as yield measures calculated using factors such as cash flows, financial or collateral performance and other reference data (collectively referred to as “standard inputs”) |
| Corporate bonds & notes; convertible securities | | Standard inputs and underlying equity of the issuer |
| Bonds & notes of governments & government agencies | | Standard inputs and interest rate volatilities |
When the fund’s investment adviser deems it appropriate to do so (such as when vendor prices are unavailable or deemed to be not representative), fixed-income securities will be valued in good faith at the mean quoted bid and ask prices that are reasonably and timely available (or bid prices, if ask prices are not available) or at prices for securities of comparable maturity, quality and type.
Securities with both fixed-income and equity characteristics, or equity securities traded principally among fixed-income dealers, are generally valued in the manner described for either equity or fixed-income securities, depending on which method is deemed most appropriate by the fund’s investment adviser. Forward currency contracts are valued at the mean of representative quoted bid and ask prices, generally based on prices supplied by one or more pricing vendors.
Securities and other assets for which representative market quotations are not readily available or are considered unreliable by the fund’s investment adviser are fair valued as determined in good faith under fair valuation guidelines adopted by authority of the fund’s board of directors as further described. The investment adviser follows fair valuation guidelines, consistent with U.S. Securities and Exchange Commission rules and guidance, to consider relevant principles and factors when making fair value determinations. The investment adviser considers relevant indications of value that are reasonably and timely available to it in determining the fair value to be assigned to a particular security, such as the type and cost of the security; contractual or legal restrictions on resale of the security; relevant financial or business developments of the issuer; actively traded similar or related securities; conversion or exchange rights on the security; related corporate actions; significant events occurring after the close of trading in the security; and changes in overall market conditions. In addition, the closing prices of equity securities that trade in markets outside U.S. time zones may be adjusted to reflect significant events that occur after the close of local trading but before the net asset value of each share class of the fund is determined. Fair valuations and valuations of investments that are not actively trading involve judgment and may differ materially from valuations that would have been used had greater market activity occurred.
Processes and structure— The fund’s board of directors has delegated authority to the fund’s investment adviser to make fair value determinations, subject to board oversight. The investment adviser has established a Joint Fair Valuation Committee (the “Fair Valuation Committee”) to administer, implement and oversee the fair valuation process, and to make fair value decisions. The Fair Valuation Committee regularly reviews its own fair value decisions, as well as decisions made under its standing instructions to the investment adviser’s valuation teams. The Fair Valuation Committee reviews changes in fair value measurements from period to period and may, as deemed appropriate, update the fair valuation guidelines to better reflect the results of back testing and address new or evolving issues.
| Emerging Markets Growth Fund | 17 |
The Fair Valuation Committee reports any changes to the fair valuation guidelines to the board of directors. The fund’s board and audit committee also regularly review reports that describe fair value determinations and methods.
The fund’s investment adviser has also established a Fixed-Income Pricing Review Group to administer and oversee the fixed-income valuation process, including the use of fixed-income pricing vendors. This group regularly reviews pricing vendor information and market data. Pricing decisions, processes and controls over security valuation are also subject to additional internal reviews, including an annual control self-evaluation program facilitated by the investment adviser’s compliance group.
Classifications— The fund’s investment adviser classifies the fund’s assets and liabilities into three levels based on the inputs used to value the assets or liabilities. Level 1 values are based on quoted prices in active markets for identical securities. Level 2 values are based on significant observable market inputs, such as quoted prices for similar securities and quoted prices in inactive markets. Certain securities trading outside the U.S. may transfer between Level 1 and Level 2 due to valuation adjustments resulting from significant market movements following the close of local trading. Level 3 values are based on significant unobservable inputs that reflect the investment adviser’s determination of assumptions that market participants might reasonably use in valuing the securities. The valuation levels are not necessarily an indication of the risk or liquidity associated with the underlying investment. For example, U.S. government securities are reflected as Level 2 because the inputs used to determine fair value may not always be quoted prices in an active market. The following tables present the fund’s valuation levels as of December 31, 2018 (dollars in thousands):
| | | Investment securities |
| | | Level 1 | | | Level 2 | | | Level 3 | | | Total | |
| Assets: | | | | | | | | | | | | | | | | |
| Common stocks: | | | | | | | | | | | | | | | | |
| Asia-Pacific | | $ | 1,009,282 | | | $ | 529,334 | | | $ | — | | | $ | 1,538,616 | |
| Latin America | | | 241,583 | | | | — | | | | 767 | | | | 242,350 | |
| Eastern Europe and Middle East | | | 98,163 | | | | 47,643 | | | | 29,518 | | | | 175,324 | |
| Africa | | | 95,435 | | | | — | | | | — | | | | 95,435 | |
| Other markets | | | 44,854 | | | | 35,714 | | | | 4,611 | | | | 85,179 | |
| Convertible stocks | | | — | | | | 1,980 | | | | — | | | | 1,980 | |
| Convertible bonds | | | — | | | | — | | | | — | 1 | | | — | 1 |
| Short-term securities | | | — | | | | 21,495 | | | | — | | | | 21,495 | |
| Total | | $ | 1,489,317 | | | $ | 636,166 | | | $ | 34,896 | | | $ | 2,160,379 | |
| | | Other investments2 |
| | | Level 1 | | | Level 2 | | | Level 3 | | | Total | |
| Liabilities: | | | | | | | | | | | | | | | | |
| Unrealized depreciation on open forward currency contracts | | $ | — | | | $ | (787 | ) | | $ | — | | | $ | (787 | ) |
| 1 | Amount less than one thousand. |
| 2 | Forward currency contracts are not included in the investment portfolio. |
The following table reconciles the valuation of the fund’s Level 3 investment securities and related transactions for the six months ended December 31, 2018 (dollars in thousands):
| | | Beginning
value at
7/1/2018 | | | Transfers
into
Level 33 | | | Purchases | | | Sales | | | Net
realized
loss4 | | | Unrealized
depreciation4 | | | Transfers
out of
Level 33 | | | Ending
value at
12/31/2018 | |
| Private equity funds | | $ | 32,620 | | | $ | — | | | $ | 614 | | | $ | — | | | $ | — | | | ($ | 3,584 | ) | | $ | — | | | $ | 29,650 | |
| Other securities | | | 12,348 | | | | 13,782 | | | | 1,253 | | | | (1,474 | ) | | | (10,040 | ) | | | (2,304 | ) | | | (8,319 | ) | | | 5,246 | |
| Total | | $ | 44,968 | | | $ | 13,782 | | | $ | 1,867 | | | ($ | 1,474 | ) | | ($ | 10,040 | ) | | ($ | 5,888 | ) | | ($ | 8,319 | ) | | $ | 34,896 | |
| Net unrealized depreciation during the period on Level 3 investment securities held at December 31, 2018 | | | $ | (3,256 | ) |
| 2 | Transfers into or out of Level 3 are based on the beginning market value of the quarter in which they occurred. |
| 3 | Net realized loss and unrealized depreciation are included in the related amounts on investments in the statement of operations. |
Unobservable inputs— Valuation of the fund’s Level 3 securities is based on significant unobservable inputs that reflect the investment adviser’s determination of assumptions that market participants might reasonably use in valuing the securities. The fund owns an interest in multiple private equity funds, which are considered alternative investments and are classified as Level 3 investment securities. The private equity funds are fair valued using the net asset value based on the fund’s financial statements adjusted for known company or
| 18 | Emerging Markets Growth Fund |
market events, updated market pricing for underlying securities, and/or fund transactions (i.e., drawdowns and distributions) and may include other unobservable inputs.
The other unobservable inputs used in the fair value measurements of the fund’s private equity investments are directional adjustments based on relevant market data (such as significant movement of a country-specific exchange-traded fund or index after the financial statement date of the private equity fund). Significant increases (decreases) of these inputs could result in significantly higher (lower) fair valuation. There were no other unobservable inputs as of December 31, 2018.
The following table provides additional information used by the fund’s investment adviser to fair value the fund’s Level 3 securities (dollars in thousands):
| | | Investment strategy | | Fair
Value | | | Unfunded
commitment* | | | Remaining
life† | | Redemption terms | | Unobservable
input(s) | | Range | |
| Private equity funds | | Primarily private sector equity investments (i.e., expansion capital, buyouts) in emerging markets | | | 29,650 | | | | 6,506 | | | ≤ 0 to 2 years | | Redemptions are not permitted. These funds distribute proceeds from the liquidation of underlying assets of the funds. | | Market index adjustment | | | 0 to 15% | |
| * | Unfunded capital commitments represent agreements which obligate the fund to meet capital calls in the future. Payment would be made when a capital call is requested. Capital calls can only be made if and when certain requirements have been fulfilled; thus, the timing of such capital calls cannot readily be determined. |
| † | Represents the remaining life of the fund term or the estimated period of liquidation. |
4. Risk factors
Investing in the fund may involve certain risks including, but not limited to, those described below.
Market conditions— The prices of, and the income generated by, the common stocks and other securities held by the fund may decline –sometimes rapidly or unpredictably – due to various factors, including events or conditions affecting the general economy or particular industries; overall market changes; local, regional or global political, social or economic instability; governmental or governmental agency responses to economic conditions; and currency exchange rate, interest rate and commodity price fluctuations.
Issuer risks— The prices of, and the income generated by, securities held by the fund may decline in response to various factors directly related to the issuers of such securities, including reduced demand for an issuer’s goods or services, poor management performance and strategic initiatives such as mergers, acquisitions or dispositions and the market response to any such initiatives.
Investing in growth-oriented stocks— Growth-oriented common stocks and other equity-type securities (such as preferred stocks, convertible preferred stocks and convertible bonds) may involve larger price swings and greater potential for loss than other types of investments. These risks may be even greater in the case of smaller capitalization stocks.
Investing outside the U.S.— Securities of issuers domiciled outside the U.S., or with significant operations or revenues outside the U.S., may lose value because of adverse political, social, economic or market developments (including social instability, regional conflicts, terrorism and war) in the countries or regions in which the issuers operate or generate revenue. These securities may also lose value due to changes in foreign currency exchange rates against the U.S. dollar and/or currencies of other countries. Issuers of these securities may be more susceptible to actions of foreign governments, such as the imposition of price controls or punitive taxes, that could adversely impact the value of these securities. Securities markets in certain countries may be more volatile and/or less liquid than those in the U.S. Investments outside the U.S. may also be subject to different accounting practices and different regulatory, legal and reporting standards and practices, and may be more difficult to value, than those in the U.S. In addition, the value of investments outside the U.S. may be reduced by foreign taxes, including foreign withholding taxes on interest and dividends. Further, there may be increased risks of delayed settlement of securities purchased or sold by the fund. The risks of investing outside the U.S. may be heightened in connection with investments in developing countries.
Investing in developing countries— Investing in countries with developing economies and/or markets may involve risks in addition to and greater than those generally associated with investing in the securities markets of developed countries. For instance, developing countries may have less developed legal and accounting systems than those in developed countries. The governments of these countries may be less stable and more likely to impose capital controls, nationalize a company or industry, place restrictions on foreign ownership and on withdrawing sale proceeds of securities from the country, and/or impose punitive taxes that could adversely affect the prices of securities. In addition, the economies of these countries may be dependent on relatively few industries that are more susceptible to local
| Emerging Markets Growth Fund | 19 |
and global changes. Securities markets in these countries can also be relatively small and have substantially lower trading volumes. As a result, securities issued in these countries may be more volatile and less liquid, and may be more difficult to value, than securities issued in countries with more developed economies and/or markets. Less certainty with respect to security valuations may lead to additional challenges and risks in calculating the fund’s net asset value. Additionally, there may be increased settlement risks for transactions in local securities.
Investing in small companies— Investing in smaller companies may pose additional risks. For example, it is often more difficult to value or dispose of small company stocks and more difficult to obtain information about smaller companies than about larger companies. Furthermore, smaller companies often have limited product lines, operating histories, markets and/or financial resources, may be dependent on one or a few key persons for management, and can be more susceptible to losses. Moreover, the prices of their stocks may be more volatile than stocks of larger, more established companies.
Management— The investment adviser to the fund actively manages the fund’s investments. Consequently, the fund is subject to the risk that the methods and analyses employed by the investment adviser in this process may not produce the desired results. This could cause the fund to lose value or its investment results to lag relevant benchmarks or other funds with similar objectives.
5. Certain investment techniques
Forward currency contracts— The fund has entered into forward currency contracts, which represent agreements to exchange currencies on specific future dates at predetermined rates. The fund’s investment adviser uses forward currency contracts to manage the fund’s exposure to changes in exchange rates. Upon entering into these contracts, risks may arise from the potential inability of counterparties to meet the terms of their contracts and from possible movements in exchange rates.
On a daily basis, the fund’s investment adviser values forward currency contracts and records unrealized appreciation or depreciation for open forward currency contracts in the fund’s statement of assets and liabilities. Realized gains or losses are recorded at the time the forward currency contract is closed or offset by another contract with the same broker for the same settlement date and currency.
Closed forward currency contracts that have not reached their settlement date are included in the respective receivables or payables for closed forward currency contracts in the fund’s statement of assets and liabilities. Net realized gains or losses from closed forward currency contracts and net unrealized appreciation or depreciation from open forward currency contracts are recorded in the fund’s statement of operations. The average month-end notional amount of open forward currency contracts while held was $177,322,000.
The following tables present the financial statement impacts resulting from the fund’s use of forward currency contracts as of, or for the six months ended, December 31, 2018 (dollars in thousands):
| | | | | Assets | | | Liabilities | |
| Contracts | | Risk type | | Location on statement of
assets and liabilities | | Value | | | Location on statement of
assets and liabilities | | Value | |
| Forward currency | | Currency | | Unrealized appreciation on open forward currency contracts | | $ | — | | | Unrealized depreciation on open forward currency contracts | | $ | 787 | |
| | | | | | | | | | | | | |
| | | | | Net realized loss | | | Net unrealized depreciation | |
| Contracts | | Risk type | | Location on statement of
operations | | Value | | | Location on statement of
operations | | Value | |
| Forward currency | | Currency | | Net realized loss on forward currency contracts | | $ | (77 | ) | | Net unrealized depreciation on forward currency contracts | | $ | (787 | ) |
Collateral— The fund participates in a collateral program due to its use of forward currency contracts that calls for the fund to either receive or pledge highly liquid assets, such as cash or U.S. government securities, as collateral based on the net gain or loss on unsettled forward currency contracts by counterparty. The purpose of the collateral is to cover potential losses that could occur in the event that either party cannot meet its contractual obligation. Non-cash collateral pledged by the fund, if any, is disclosed in the fund’s investment portfolio, and cash collateral pledged by the fund, if any, is held in a segregated account with the fund’s custodian, which is reflected as pledged cash in the fund’s statement of assets and liabilities.
| 20 | Emerging Markets Growth Fund |
Rights of offset— The fund has entered into enforceable master netting agreements with certain counterparties for forward currency contracts, where on any date amounts payable by each party to the other (in the same currency with respect to the same transaction) may be closed or offset by each party’s payment obligation. If an early termination date occurs under these agreements following an event of default or termination event, all obligations of each party to its counterparty are settled net through a single payment in a single currency (“close-out netting”). For financial reporting purposes, the fund does not offset financial assets and financial liabilities that are subject to these master netting arrangements in the statement of assets and liabilities.
The following table presents the fund’s forward currency contracts by counterparty that are subject to master netting agreements but that are not offset in the fund’s statement of assets and liabilities. The net amount column shows the impact of offsetting on the fund’s statement of assets and liabilities as of December 31, 2018, if close-out netting was exercised (dollars in thousands):
| | | | | | Gross amounts not offset in the | | | | |
| | | Gross amounts | | | statement of assets and liabilities and | | | | |
| | | recognized in the | | | subject to a master netting agreement | | | | |
| | | statement of assets | | | Available | | | Non-cash | | | Cash | | | Net | |
| Counterparty | | and liabilities | | | to offset | | | collateral* | | | collateral | | | amount | |
| Liabilities: | | | | | | | | | | | | | | | | | | | | |
| Citibank | | $ | 394 | | | $ | — | | | $ | — | | | $ | — | | | $ | 394 | |
| JPMorgan Chase | | | 393 | | | | — | | | | — | | | | (320 | ) | | | 73 | |
| Total | | $ | 787 | | | $ | — | | | $ | — | | | $ | (320 | ) | | $ | 467 | |
| | |
| * | Non-cash collateral is shown on a settlement basis. |
6. Taxation and distributions
Federal income taxation— The fund complies with the requirements under Subchapter M of the Internal Revenue Code applicable to mutual funds and intends to distribute substantially all of its net taxable income and net capital gains each year. The fund is not subject to income taxes to the extent such distributions are made. Therefore, no federal income tax provision is required.
As of and during the period ended December 31, 2018, the fund did not have a liability for any unrecognized tax benefits. The fund recognizes interest and penalties, if any, related to unrecognized tax benefits as income tax expense in the statement of operations. During the period, the fund did not incur any significant interest or penalties.
The fund’s tax returns are not subject to examination by federal, state and, if applicable, non-U.S. tax authorities after the expiration of each jurisdiction’s statute of limitations, which is generally three years after the date of filing but can be extended in certain jurisdictions.
Non-U.S. taxation— Dividend and interest income are recorded net of non-U.S. taxes paid. The fund may file withholding tax reclaims in certain jurisdictions to recover a portion of amounts previously withheld. As a result of rulings from European courts, the fund filed for additional reclaims related to prior years. These reclaims are recorded when the amount is known and there are no significant uncertainties on collectability. Gains realized by the fund on the sale of securities in certain countries, if any, may be subject to non-U.S. taxes. If applicable, the fund records an estimated deferred tax liability based on unrealized gains to provide for potential non-U.S. taxes payable upon the sale of these securities.
Distributions— Distributions paid to shareholders are based on net investment income and net realized gains determined on a tax basis, which may differ from net investment income and net realized gains for financial reporting purposes. These differences are due primarily to different treatment for items such as currency gains and losses; short-term capital gains and losses; capital losses related to sales of certain securities within 30 days of purchase; unrealized appreciation of certain investments in securities outside the U.S.; deferred expenses; cost of investments sold; net capital losses; non-U.S. taxes on capital gains and income on certain investments. The fiscal year in which amounts are distributed may differ from the year in which the net investment income and net realized gains are recorded by the fund for financial reporting purposes.
The components of distributable earnings on a tax basis are reported as of the fund’s most recent year-end. As of June 30, 2018, the components of distributable earnings on a tax basis were as follows (dollars in thousands):
| Undistributed ordinary income | | | $ 19,996 | |
| Capital loss carryforward* | | | (20,101 | ) |
| * | The capital loss carryforward will be used to offset any capital gains realized by the fund in the current year or in subsequent years. The fund will not make distributions from capital gains while a capital loss carryforward remains. |
| Emerging Markets Growth Fund | 21 |
As of December 31, 2018, the tax basis unrealized appreciation (depreciation) and cost of investments were as follows (dollars in thousands):
| Gross unrealized appreciation on investments | | $ | 522,609 | |
| Gross unrealized depreciation on investments | | | (212,846 | ) |
| Net unrealized appreciation on investments | | | 309,763 | |
| Cost of investments | | | 1,849,829 | |
Distributions paid were characterized for tax purposes as follows (dollars in thousands):
| | | Six months ended December 31, 2018 | | | Year ended June 30, 2018 |
| Share class | | Ordinary
income | | | Long-term
capital gains | | | Total
distributions
paid | | | Ordinary
income | | | Long-term
capital gains | | | Total
distributions
paid | |
| Class M | | $ | 27,966 | | | $ | 19,451 | | | $ | 47,417 | | | $ | 30,206 | | | $ | — | | | $ | 30,206 | |
| Class F-3* | | | 233 | | | | 165 | | | | 398 | | | | 34 | | | | — | | | | 34 | |
| Class R-6* | | | — | † | | | — | † | | | — | † | | | — | † | | | — | | | | — | † |
| Total | | $ | 28,199 | | | $ | 19,616 | | | $ | 47,815 | | | $ | 30,240 | | | $ | — | | | $ | 30,240 | |
| * | Class F-3 and R-6 shares began investment operations on September 1, 2017. |
| † | Amount less than one thousand. |
7. Fees and transactions with related parties
CIInc is the fund’s investment adviser. American Funds Distributors®, Inc. (“AFD”), the fund’s principal underwriter, and American Funds Service Company® (“AFS”), the fund’s transfer agent are affiliated with CIInc. CIInc, AFD and AFS are considered related parties to the fund.
Investment advisory services— The fund has an investment advisory and service agreement with CIInc that provides for monthly fees accrued daily. These fees are based on a series of decreasing annual rates beginning with 0.900% on the first $400 million of daily net assets and decreasing to 0.520% on such assets in excess of $20 billion. For the six months ended December 31, 2018, the investment advisory services fee was $8,698,000, which was equivalent to an annualized rate of 0.755% of average daily net assets.
Class-specific fees and expenses— Expenses that are specific to individual share classes are accrued directly to the respective share class. The principal class-specific fees and expenses are further described below:
Distribution services— American Funds Distributors®, Inc. (“AFD”), an affiliate of CGTC, is the principal underwriter of the fund’s shares. AFD does not receive any compensation related to the sale of shares of the fund.
Transfer agent services— The fund has a shareholder services agreement with AFS under which the fund compensates AFS for providing transfer agent services to each of the fund’s share classes. These services include recordkeeping, shareholder communications and transaction processing. In addition, the fund reimburses AFS for amounts paid to third parties for performing transfer agent services on behalf of fund shareholders.
Administrative services— The fund has an administrative services agreement with CIInc under which the fund compensates CIInc for providing administrative services to Class F-3 and R-6 shares. These services include, but are not limited to, coordinating, monitoring, assisting and overseeing third parties that provide services to fund shareholders. Under the agreement, Class F-3 and R-6 shares pay an annual fee of 0.05% of their respective average daily net assets.
| 22 | Emerging Markets Growth Fund |
For the six months ended December 31, 2018, class-specific expenses under the agreements were as follows (dollars in thousands):
| Share class | | Transfer agent
services | | | Administrative
services | |
| Class M | | $ | 2 | | | $ | — | |
| Class F-3 | | | — | * | | | 3 | |
| Class R-6 | | | — | * | | | — | |
| Total class-specific expenses | | $ | 2 | | | $ | 3 | |
| * | Amount less than one thousand. |
Directors’ deferred compensation— Directors who were unaffiliated with CIInc may have elected to defer the cash payment of part or all of their compensation. These deferred amounts, which remain as liabilities of the fund, are treated as if invested in shares of the fund or other American Funds. These amounts represent general, unsecured liabilities of the fund and vary according to the total returns of the selected funds. Directors’ compensation of $(112,000) in the fund’s statement of operations reflects $74,000 in current fees and a net decrease of $186,000 in the value of the deferred amounts.
Affiliated officers and directors— Officers and certain directors of the fund are or may be considered to be affiliated with CIInc, AFD and AFS. No affiliated officers or directors received any compensation directly from the fund.
Security transactions with related funds— The fund may purchase from, or sell securities to, other funds managed by CIInc (or funds managed by certain affiliates of CIInc) under procedures adopted by the fund’s board of directors. The funds involved in such transactions are considered related by virtue of having a common investment adviser (or affiliated investment advisers), common directors and/or common officers. When such transactions occur, each transaction is executed at the current market price of the security and no brokerage commissions or fees are paid in accordance with Rule 17a-7 of the 1940 Act.
Interfund lending— Pursuant to an exemptive order issued by the SEC, the fund, along with other CIInc-managed funds (or funds managed by certain affiliates of CIInc), may participate in an interfund lending program. The program provides an alternate credit facility that permits the funds to lend or borrow cash for temporary purposes directly to or from one another, subject to the conditions of the exemptive order. The fund did not lend or borrow cash through the interfund lending program at any time during the six months ended December 31, 2018.
8. Committed line of credit
The fund participates with other funds managed by CIInc (or funds managed by certain affiliates of CIInc) in a $1.5 billion credit facility (the “line of credit”) to be utilized for temporary purposes to support shareholder redemptions. The fund has agreed to pay commitment fees on its pro-rata portion of the line of credit, which are reflected in other expenses in the fund’s statement of operations. The fund did not borrow on this line of credit at any time during the six months ended December 31, 2018.
| Emerging Markets Growth Fund | 23 |
9. Capital share transactions
Capital share transactions in the fund were as follows (dollars and shares in thousands):
| | | Sales* | | | Reinvestments of
distributions | | | Repurchases* | | | Net (decrease)
increase | |
| Share class | | Amount | | | Shares | | | Amount | | | Shares | | | Amount | | | Shares | | | Amount | | | Shares | |
| | | | | | | | | | | | | | | | | | | | | | | | | |
| Six months ended December 31, 2018 | | | | | | | | | | | | | | | | | | | | | | | | | |
| | | | | | | | | | | | | | | | | | | | | | | | | | | | | | | | | |
| Class M | | $ | 11,067 | | | | 1,497 | | | $ | 28,987 | | | | 4,147 | | | $ | (112,588 | ) | | | (14,645 | ) | | $ | (72,534 | ) | | | (9,001 | ) |
| Class F-3 | | | 14,010 | | | | 1,935 | | | | 366 | | | | 52 | | | | (1,317 | ) | | | (185 | ) | | | 13,059 | | | | 1,802 | |
| Class R-6 | | | — | | | | — | | | | — | | | | — | | | | — | | | | — | | | | — | | | | — | |
| Total net increase (decrease) | | $ | 25,077 | | | | 3,432 | | | $ | 29,353 | | | | 4,199 | | | $ | (113,905 | ) | | | (14,830 | ) | | $ | (59,475 | ) | | | (7,199 | ) |
| | | | | | | | | | | | | | | | | | | | | | | | | | | | | | | | | |
| Year ended June 30, 2018 | | | | | | | | | | | | | | | | | | | | | | | | | | | |
| | | | | | | | | | | | | | | | | | | | | | | | | | | | | | | | | |
| Class M | | $ | 29,867 | | | | 3,745 | | | $ | 11,039 | | | | 1,325 | | | $ | (288,649 | ) | | | (35,949 | ) | | $ | (247,743 | ) | | | (30,879 | ) |
| Class F-3† | | | 6,915 | | | | 818 | | | | 25 | | | | 3 | | | | (143 | ) | | | (17 | ) | | | 6,797 | | | | 804 | |
| Class R-6† | | | 10 | | | | 1 | | | | — | | | | — | | | | — | | | | — | | | | 10 | | | | 1 | |
| Total net increase (decrease) | | $ | 36,792 | | | | 4,564 | | | $ | 11,064 | | | | 1,328 | | | $ | (288,792 | ) | | | (35,966 | ) | | $ | (240,936 | ) | | | (30,074 | ) |
| * | Includes exchanges between share classes of the fund. |
| † | Class F-3 and R-6 shares began investment operations on September 1, 2017. |
10. Investment transactions
The fund made purchases and sales of investment securities, excluding short-term securities and U.S. government obligations, if any, of $342,692,000 and $387,028,000, respectively, during the six months ended December 31, 2018.
| 24 | Emerging Markets Growth Fund |
Financial highlights
| | | | | | (Loss) income from
investment operations1 | | | Dividends and distributions | | | | | | | | | | | | | | | | | | | |
| Period ended | | Net asset
value,
beginning
of period | | | Net
Investment
income2 | | | Net (losses)
gains on
securities (both
realized and
unrealized) | | | Total from
investment
operations | | | Dividends
(from net
investment
income) | | | Distributions
(from capital
gains) | | | Total
dividends
and
distributions | | | Net asset
value, end
of period | | | Total return3 | | | Net assets,
end of period
(in millions) | | | Ratio of
expenses to
average net
assets before
reimbursements4 | | | Ratio of
expenses to
average net
assets after
reimbursements3,4 | | | Ratio of
net income
to average
net assets2,3 | |
| Class M: | | | | | | | | | | | | | | | | | | | | | | | | | | | | | | | | | | | | | | | | | | | | | | | | | | | | |
| 12/31/20185,6 | | $ | 7.87 | | | $ | .04 | | | $ | (.71 | ) | | $ | (.67 | ) | | $ | (.09 | ) | | $ | (.06 | ) | | $ | (.15 | ) | | $ | 7.05 | | | | (8.41 | )%7 | | $ | 2,164 | | | | .84 | %8 | | | .84 | %8 | | | .98 | %8 |
| 6/30/2018 | | | 7.34 | | | | .09 | | | | .53 | | | | .62 | | | | (.09 | ) | | | — | | | | (.09 | ) | | | 7.87 | | | | 8.43 | | | | 2,487 | | | | .87 | | | | .87 | | | | 1.06 | |
| 6/30/2017 | | | 5.92 | | | | .09 | | | | 1.40 | | | | 1.49 | | | | (.07 | ) | | | — | | | | (.07 | ) | | | 7.34 | | | | 25.43 | | | | 2,545 | | | | .85 | | | | .85 | | | | 1.40 | |
| 6/30/2016 | | | 6.94 | | | | .08 | | | | (.93 | ) | | | (.85 | ) | | | (.17 | ) | | | — | | | | (.17 | ) | | | 5.92 | | | | (12.09 | ) | | | 2,740 | | | | .78 | | | | .78 | | | | 1.44 | |
| 6/30/20159 | | | 7.97 | | | | .08 | | | | (.71 | ) | | | (.63 | ) | | | (.14 | ) | | | (.26 | ) | | | (.40 | ) | | | 6.94 | | | | (7.71 | ) | | | 4,621 | | | | .75 | | | | .75 | | | | 1.12 | |
| 6/30/2014 | | | 7.45 | | | | .07 | | | | .86 | | | | .93 | | | | (.10 | ) | | | (.31 | ) | | | (.41 | ) | | | 7.97 | | | | 12.69 | | | | 6,526 | | | | .73 | | | | .73 | | | | .88 | |
| Class F-3: | | | | | | | | | | | | | | | | | | | | | | | | | | | | | | | | | | | | | | | | | | | | | | | | | | | | |
| 12/31/20185,6 | | | 7.87 | | | | .03 | | | | (.71 | ) | | | (.68 | ) | | | (.09 | ) | | | (.06 | ) | | | (.15 | ) | | | 7.04 | | | | (8.56 | )7 | | | 18 | | | | .85 | 8 | | | .85 | 8 | | | .76 | 8 |
| 6/30/20185,10 | | | 7.82 | | | | .11 | | | | .03 | | | | .14 | | | | (.09 | ) | | | — | | | | (.09 | ) | | | 7.87 | | | | 1.77 | 7 | | | 6 | | | | .88 | 8 | | | .88 | 8 | | | 1.59 | 8 |
| Class R-6: | | | | | | | | | | | | | | | | | | | | | | | | | | | | | | | | | | | | | | | | | | | | | | | | | | | | |
| 12/31/20185,6 | | | 7.86 | | | | .03 | | | | (.70 | ) | | | (.67 | ) | | | (.08 | ) | | | (.06 | ) | | | (.14 | ) | | | 7.05 | | | | (8.39 | )7 | | | — | 11 | | | 1.03 | 8 | | | .90 | 8 | | | .78 | 8 |
| 6/30/20185,10 | | | 7.82 | | | | .07 | | | | .06 | | | | .13 | | | | (.09 | ) | | | — | | | | (.09 | ) | | | 7.86 | | | | 1.59 | 7 | | | — | 11 | | | 1.07 | 8 | | | .92 | 8 | | | .99 | 8 |
| | | Six months ended
December 31, | | Year ended June 30 |
| | | 20185,6,7 | | 2018 | | 2017 | | 2016 | | 2015 | | 2014 |
| Portfolio turnover rate for all share classes | | | 15 | % | | | 37 | % | | | 46 | % | | | 48 | %12 | | | 26 | % | | | 41 | % |
| 1 | Based on average shares outstanding. |
| 2 | For the year ended June 30, 2017, this reflects the impact of European Union tax reclaims received that resulted in a one-time increase to net investment income. If the reclaim had not occurred, the net investment income per share and ratio of net income to average net assets would have been lower by $.02 and .34 percentage points, respectively. |
| 3 | This column reflects the impact, if any, of certain reimbursements from CIInc. During some of the periods shown, CIInc reimbursed a portion of miscellaneous fees and expenses and paid a portion of the fund’s transfer agent services fees. |
| 4 | This ratio does not include acquired fund fees and expenses. |
| 5 | Based on operations for a period that is less than a full year. |
| 6 | Unaudited. |
| 7 | Not annualized. |
| 8 | Annualized. |
| 9 | Prior to October 31, 2014, the fund operated as an open-end interval fund, with monthly redemptions and weekly purchases. |
| 10 | Class F-3 and R-6 shares began investment operations on September 1, 2017. |
| 11 | Amount less than $1 million. |
| 12 | The portfolio turnover calculation has been adjusted to exclude the value of securities acquired in connection with the fund’s acquisition of the assets of the Capital Group Emerging Markets Equity Trust (US) on November 6, 2015. Should the calculation not have been subject to such adjustment, the fund’s portfolio turnover ratio would have been 58%. |
See notes to financial statements
| Emerging Markets Growth Fund | 25 |
As a fund shareholder, you incur ongoing costs, including investment advisory services fees and other expenses. This example is intended to help you understand your ongoing costs (in dollars) of investing in the fund so you can compare these costs with the ongoing costs of investing in other mutual funds. The example is based on an investment of $1,000 invested at the beginning of the period and held for the entire six-month period (July 1, 2018, through December 31, 2018).
Actual expenses:
The first line of each share class in the table on the following page provides information about actual account values and actual expenses. You may use the information in this line, together with the amount you invested, to estimate the expenses that you paid over the period. Simply divide your account value by $1,000 (for example, an $8,600 account value divided by $1,000 = 8.6), then multiply the result by the number in the first line under the heading titled “Expenses paid during period” to estimate the expenses you paid on your account during this period.
Hypothetical example for comparison purposes:
The second line of each share class in the table on the following page provides information about hypothetical account values and hypothetical expenses based on the actual expense ratio for the share class and an assumed rate of return of 5.00% per year before expenses, which is not the actual return of the share class. The hypothetical account values and expenses may not be used to estimate the actual ending account balance or expenses you paid for the period. You may use this information to compare the ongoing costs of investing in the fund and other funds. To do so, compare this 5.00% hypothetical example with the 5.00% hypothetical examples that appear in the shareholder reports of the other funds.
Notes:
Retirement plan participants may be subject to certain fees charged by the plan sponsor, and Class F-3 shareholders may be subject to fees charged by financial intermediaries, typically ranging from 0.75% to 1.50% of assets annually depending on services offered. You can estimate the impact of these fees by adding the amount of the fees to the total estimated expenses you paid on your account during the period as calculated above. In addition, your ending account value would be lower by the amount of these fees.
Note that the expenses shown in the table on the following page are meant to highlight your ongoing costs only and do not reflect any transactional costs, such as sales charges (loads). Therefore, the second line of each share class in the table is useful in comparing ongoing costs only and will not help you determine the relative total costs of owning different funds. In addition, if these transactional costs were included, your costs would have been higher.
| 26 | Emerging Markets Growth Fund |
| | | Beginning
account value
7/1/2018 | | | Ending
account value
12/31/2018 | | | Expenses paid
during period* | | | Annualized
expense ratio | |
| Class M – actual return | | $ | 1,000.00 | | | $ | 915.87 | | | $ | 4.06 | | | | .84 | % |
| Class M – assumed 5% return | | | 1,000.00 | | | | 1,020.97 | | | | 4.28 | | | | .84 | |
| Class F-3 – actual return | | | 1,000.00 | | | | 914.36 | | | | 4.10 | | | | .85 | |
| Class F-3 – assumed 5% return | | | 1,000.00 | | | | 1,020.92 | | | | 4.33 | | | | .85 | |
| Class R-6 – actual return | | | 1,000.00 | | | | 916.06 | | | | 4.35 | | | | .90 | |
| Class R-6 – assumed 5% return | | | 1,000.00 | | | | 1,020.01 | | | | 4.58 | | | | .90 | |
| * | The “expenses paid during period” are equal to the “annualized expense ratio,” multiplied by the average account value over the period, multiplied by the number of days in the period, and divided by 365 (to reflect the one-half year period). |
| Emerging Markets Growth Fund | 27 |
Results of special meeting of shareholders
Held November 28, 2018
Shares outstanding (all classes) on August 31, 2018 (record date):
307,219,988
Total shares voting on November 28, 2018:
229,466,520 (74.7% of shares outstanding)
The proposal: to elect board members
| | | Votes for | | Percent
of shares
voting for | | Votes
withheld | | Percent
of shares
withheld |
| John S. Armour | | | 229,220,948 | | | | 99.9 | % | | | 245,572 | | | | 0.1 | % |
| Joseph C. Berenato | | | 229,220,948 | | | | 99.9 | | | | 245,572 | | | | 0.1 | |
| Vanessa C. L. Chang | | | 229,220,948 | | | | 99.9 | | | | 245,572 | | | | 0.1 | |
| James G. Ellis | | | 229,220,948 | | | | 99.9 | | | | 245,572 | | | | 0.1 | |
| Jennifer Feikin | | | 229,220,948 | | | | 99.9 | | | | 245,572 | | | | 0.1 | |
| Pablo R. González Guarjardo | | | 182,597,954 | | | | 79.6 | | | | 46,868,566 | | | | 20.4 | |
| Leslie Stone Heisz | | | 229,220,948 | | | | 99.9 | | | | 245,572 | | | | 0.1 | |
| William D. Jones | | | 229,220,948 | | | | 99.9 | | | | 245,572 | | | | 0.1 | |
| 28 | Emerging Markets Growth Fund |

Offices of the fund and of the investment adviser
Capital International, Inc.
11100 Santa Monica Boulevard
Los Angeles, CA 90025-3302
333 South Hope Street
Los Angeles, CA 90071-1406
400 South Hope Street
Los Angeles, CA 90071-2801
6455 Irvine Center Drive
Irvine, CA 92618-4518
Transfer agent for shareholder accounts
American Funds Service Company
6455 Irvine Center Drive
Irvine, CA 92618-4518
Custodian of assets
JPMorgan Chase Bank
270 Park Avenue
New York, NY 10017-2070
Counsel
Morgan, Lewis & Bockius LLP
One Federal Street
Boston, MA 02110-1726
Independent registered public accounting firm
PricewaterhouseCoopers LLP
601 South Figueroa Street
Los Angeles, CA 90017-3874
Principal underwriter
American Funds Distributors, Inc.
333 South Hope Street
Los Angeles, CA 90071-1406
This report is for the information of shareholders of Emerging Markets Growth Fund, but it also may be used as sales literature when preceded or accompanied by the current prospectus, which gives details about charges, expenses, investment objectives and operating policies of the fund.
If used as sales material after March 31, 2019, this report must be accompanied by a statistical update for the most recently completed calendar quarter.
Investors should carefully consider investment objectives, risks, charges and expenses. This and other important information is in the prospectus, which can be obtained from Capital International by calling (800) 421-4989 and should be read carefully before investing. Fund shares offered through American Funds Distributors, Inc.

ITEM 2 – Code of Ethics
Not applicable for filing of semi-annual reports to shareholders.
ITEM 3 – Audit Committee Financial Expert
Not applicable for filing of semi-annual reports to shareholders.
ITEM 4 – Principal Accountant Fees and Services
Not applicable for filing of semi-annual reports to shareholders.
ITEM 5 – Audit Committee of Listed Registrants
Not applicable to this Registrant, insofar as the Registrant is not a listed issuer as defined in Rule 10A-3 under the Securities Exchange Act of 1934.
ITEM 6 – Schedule of Investments
Not applicable, insofar as the schedule is included as part of the report to shareholders filed under Item 1 of this Form.
ITEM 7 – Disclosure of Proxy Voting Policies and Procedures for Closed-End Management Investment Companies
Not applicable to this Registrant, insofar as the Registrant is not a closed-end management investment company.
ITEM 8 – Portfolio Managers of Closed-End Management Investment Companies
Not applicable to this Registrant, insofar as the Registrant is not a closed-end management investment company.
ITEM 9 – Purchases of Equity Securities by Closed-End Management Investment Company and Affiliated Purchasers
Not applicable to this Registrant, insofar as the Registrant is not a closed-end management investment company.
ITEM 10 – Submission of Matters to a Vote of Security Holders
There have been no material changes to the procedures by which shareholders may recommend nominees to the Registrant’s board of directors since the Registrant last submitted a proxy statement to its shareholders. The procedures are as follows. The Registrant has a nominating committee comprised solely of persons who are not considered ‘‘interested persons’’ of the Registrant within the meaning of the Investment Company Act of 1940, as amended. The committee periodically reviews such issues as the board’s composition, responsibilities, committees, compensation and other relevant issues, and recommends any appropriate changes to the full board of directors. While the committee normally is able to identify from its own resources an ample number of qualified candidates, it will consider shareholder suggestions of persons to be considered as nominees to fill future vacancies on the board. Such suggestions must be sent in writing to the nominating committee of the Registrant, c/o the Registrant’s Secretary, and must be accompanied by complete biographical and occupational data on the prospective nominee, along with a written consent of the prospective nominee for consideration of his or her name by the nominating committee.
ITEM 11 – Controls and Procedures
| (a) | The Registrant’s Principal Executive Officer and Principal Financial Officer have concluded, based on their evaluation of the Registrant’s disclosure controls and procedures (as such term is defined in Rule 30a-3 under the Investment Company Act of 1940), that such controls and procedures are adequate and reasonably designed to achieve the purposes described in paragraph (c) of such rule. |
| | |
| (b) | Effective May 28, 2018, the Emerging Markets Growth Fund, Inc.’s investment adviser implemented a new fixed income order management, trading, and compliance system. In connection with introducing this new system, additional automated and manual controls were implemented and some existing controls were modified. None of these changes were in response to any identified deficiency or weakness in the Emerging Markets Growth Fund, Inc.’s internal control over financial reporting. |
ITEM 12 – Exhibits
| (a)(1) | Not applicable for filing of semi-annual reports to shareholders. |
| | |
| (a)(2) | The certifications required by Rule 30a-2 of the Investment Company Act of 1940 and Sections 302 and 906 of the Sarbanes-Oxley Act of 2002 are attached as exhibits hereto. |
SIGNATURES
Pursuant to the requirements of the Securities Exchange Act of 1934 and the Investment Company Act of 1940, the Registrant has duly caused this report to be signed on its behalf by the undersigned, thereunto duly authorized.
| | EMERGING MARKETS GROWTH FUND, INC. |
| | |
| | By/s/ Victor D. Kohn |
| | Victor D. Kohn, President and Principal Executive Officer |
| | |
| | Date: February 28, 2019 |
Pursuant to the requirements of the Securities Exchange Act of 1934 and the Investment Company Act of 1940, this report has been signed below by the following persons on behalf of the Registrant and in the capacities and on the dates indicated.
| By/s/ Victor D. Kohn |
Victor D. Kohn, President and Principal Executive Officer |
| |
| Date: February 28, 2019 |
| By/s/ Gregory F. Niland |
Gregory F. Niland, Treasurer and Principal Financial Officer |
| |
| Date: February 28, 2019 |