UNITED STATES
SECURITIES AND EXCHANGE COMMISSION
Washington, D.C. 20549
FORM N-CSR
Certified Shareholder Report of
Registered Management Investment Companies
Investment Company Act File Number: 811-04692
Emerging Markets Growth Fund, Inc.
(Exact Name of Registrant as Specified in Charter)
6455 Irvine Center Drive
Irvine, California 92618
(Address of Principal Executive Offices)
Registrant's telephone number, including area code: (949) 975-5000
Date of fiscal year end: June 30
Date of reporting period: June 30, 2021
Gregory F. Niland
Emerging Markets Growth Fund, Inc.
5300 Robin Hood Road
Norfolk, Virginia 23513
(Name and Address of Agent for Service)
ITEM 1 – Reports to Stockholders
 | Emerging Markets
Growth FundSM Annual report
for the year ended
June 30, 2021 |

Emerging Markets Growth Fund seeks long-term growth of capital and invests primarily in common stock and other equity securities of issuers in developing countries.
Fund results shown in this report are for past periods and are not predictive of results for future periods. The results shown are before taxes on fund distributions and sale of fund shares. Current and future results may be lower or higher than those shown. Share prices and returns will vary, so investors may lose money. Investing for short periods makes losses more likely. For current information and month-end results, please call (800) 421-4989.
Investing in developing markets may be subject to risks, such as significant currency and price fluctuations, political instability, differing securities regulations and periods of illiquidity, which are detailed in the fund’s prospectus. Investments in developing markets have been more volatile than investments in developed markets, reflecting the greater uncertainties of investing in less established economies. Individuals investing in developing markets should have a long-term perspective and be able to tolerate potentially sharp declines in the value of their investments.
Investments are not FDIC-insured, nor are they deposits of or guaranteed by a bank or any other entity, so they may lose value.
Contents
| 1 | | Letter to investors |
| 5 | | Investment portfolio |
| 11 | | Financial statements |
| 31 | | Board of directors and other officers |
Fellow investors:
Emerging markets stocks rebounded sharply from the COVID-19—induced downturn during the fund’s fiscal year, bolstered by demand for commodities, semiconductor components and consumer goods as economies gradually reopened around the world.
The value of Emerging Markets Growth Fund increased 41.33% with dividends reinvested for the 12 months ended June 30, 2021, while its benchmark, the unmanaged MSCI Emerging Markets Investable Market Index (IMI), rose 43.21%.*
Market review
The MSCI China IMI, the largest component of the composite benchmark, rose 28% during the 12-month period. China led the global economic rebound coming out of the pandemic, boosting returns for a number of companies as factories reopened and construction activity picked up. But gains for Chinese stocks slowed in the first half of 2021. Government officials curbed stimulus measures, escalated scrutiny of large internet platform companies and imposed fresh restrictions aimed at limiting speculation in the housing market.
China’s regulators in November 2020 derailed the initial public offering of Alibaba fintech affiliate Ant Group, a deal that was expected to be the world’s largest IPO ever. Over the following months, government authorities expanded their anti-monopoly and data privacy probe to a number of companies involved in e-commerce and internet services, hurting equity prices. Alibaba
| * | Unless otherwise noted, country and sector returns are based on MSCI EM IMI indices, expressed in U.S. dollars, and assume the reinvestment of dividends. Results reflect dividends net of withholding taxes. |
Results at a glance
For periods ended June 30, 2021, with distributions reinvested
| | | Cumulative
total returns | | Average annual total returns |
| | | 6 months | | 1 year | | 3 years | | 5 years | | 10 years | | Lifetime1 |
| | | | | | | | | | | | | |
| Emerging Markets Growth Fund (Class M shares) | | | 10.01 | % | | | 41.33 | % | | | 14.95 | % | | | 15.61 | % | | | 4.39 | % | | | 13.31 | % |
| MSCI Emerging Markets IMI2 | | | 8.75 | | | | 43.21 | | | | 11.38 | | | | 12.86 | | | | 4.31 | | | | 10.36 | |
| 1 | Since May 30, 1986. |
| 2 | MSCI Emerging Markets IMI Index (linked index) is a broad measure of market results for investment companies that invest in developing markets. Returns for the MSCI Emerging Markets IMI Index (linked) were calculated using the International Finance Corporation (IFC) Global Composite Index from May 30, 1986, to December 31, 1987, the MSCI Emerging Markets Index with dividends gross of withholding taxes from January 1, 1988, to December 31, 2000, the MSCI Emerging Markets Index with dividends net of withholding taxes from January 1, 2001, to November 30, 2007, and the MSCI Emerging Markets Investable Market Index with dividends net of withholding taxes thereafter. The index is unmanaged, and therefore has no expenses. Investors cannot invest directly in an index. Results include reinvested dividends and/or distributions but do not reflect the effect of commissions, expenses or U.S. federal income taxes. Source: MSCI. |
The total annual fund operating expense ratio is 0.76% as of the most recent fiscal year-end, and is 0.77% including “acquired fund” fees and expenses. The investment adviser is currently reimbursing a portion of the other expenses. This reimbursement will be in effect through at least September 1, 2021. The adviser may elect at its discretion to extend, modify or terminate the reimbursement at that time.
| Emerging Markets Growth Fund | 1 |
was eventually hit with a $2.8 billion antitrust fine. Meanwhile, more U.S.-listed Chinese companies continued to debut on the Hong Kong Stock Exchange amid geopolitical tensions and reforms to Hong Kong’s equity markets.
Taiwan and South Korea, two countries that are vital to worldwide technology supply chains, registered massive gains. The MSCI Taiwan IMI and the MSCI Korea IMI each soared approximately 68%. A global shortage of semiconductor chips for everything from cars to consumer electronics to kitchen appliances boosted share prices of semiconductor manufacturers and component suppliers. Indonesian stocks lagged the broader market, gaining nearly 12% as the country struggled to contain the coronavirus.
Indian equities surged 62%, powered by gains in the materials and information technology sectors. Stocks overcame a second wave of COVID infections that disrupted the reopening of the country’s economy as well as loan losses in the state-dominated banking sector. On the reform front, the government took steps to attract investments in the manufacturing sector as multinational corporations reassess their global supply chains. They also unveiled plans to sell government stakes in state-run banks and other businesses to help finance spending in other areas. Meanwhile, in the private sector, food delivery firm Zomato filed for an initial public offering, raising hopes that several Indian startups involved in fintech and internet services will go public over the next 12 months.
Commodity-rich countries that produce industrial metals and crude oil rallied. Brazilian stocks soared 49% and Russian stocks rose 40%. Both country indexes were led by companies in the materials, energy and financials sectors. Rising inflation spurred the central banks of both countries to hike their key lending rates three times in the first half of 2021, reversing rate cuts over the preceding 24 months. Brazil’s central bank hiked its benchmark rate to 4.25% in June, while Russia’s central bank raised its key rate to 5.5%.
Portfolio review
An investment in Elang Mahkota Teknologi, also known as Emtek, was a leading contributor to relative results. Shares of the Indonesian-based media conglomerate benefited from its significant stake in Bukalapak, one of the country’s leading e-commerce platforms. Bukalapak recently filed for an initial public offering. Indonesia’s tech sector has been garnering the interest of U.S. technology giants and several other mature startups are reportedly planning IPOs.
Chinese biopharmaceutical firm BeiGene boosted relative returns. Shares rallied on several positive developments over the past year, including a collaboration and licensing deal with Novartis to develop, manufacture and commercialize a cancer drug across countries in North America, Europe and Asia. BeiGene already has a partnership with Amgen to develop cancer drugs in China. BeiGene also filed an application to list its shares on the Science and Technology Innovation Board (STAR) of the Shanghai Stock Exchange. If the listing is completed, BeiGene would become the world’s first biotech company concurrently listed on the Nasdaq, Hong Kong and Shanghai STAR Board exchanges.
Other top contributors included Yeahka, a leading payment-based technology platform in China for small businesses, and Yunnan Energy New Material, a Chinese supplier of components used in electric vehicle batteries.
The limited exposure to China technology giants Alibaba and Tencent was also beneficial.
In contrast, overweight positions in Chinese health care companies Jiangsu Hengrui Medicine and Legend Biotech detracted from relative results. Shares of both companies edged lower during the 12-month period. Hengrui, China’s largest pharmaceutical company, agreed to lower prices for certain cancer drugs in order to have them included on the national reimbursement drug list (NRDL) of China’s state medical insurance program. The company is currently transitioning its business from generics to innovative drugs and has been building a pipeline of candidates for approval.
Ping An Insurance, China’s largest insurer, was another detractor on a relative basis. Its shares posted a slight decline. The below-index exposure to Taiwan Semiconductor Manufacturing (TSMC), the world’s largest chip manufacturer, also detracted. Both Ping An and TSMC remained top fund holdings as of June 30. The lack of investment in Chinese electric vehicle maker Nio also weighed on relative returns.
Outlook
An acceleration of global growth and supply chain restocking could help support companies in emerging markets, especially those that supply industrial metals and make electronic components for consumer goods. Central banks in most developing countries have further room to tighten interest rates to help control inflationary pressures without potentially damaging growth. While there are huge divergences from country to country, economic policies in many countries are quite orthodox, embracing independent central banks, moderate fiscal stimulus and floating exchange rates.
| 2 | Emerging Markets Growth Fund |
Even as more countries emerge from lockdowns, there remains the possibility that global growth may be challenged by the delta and other COVID-19 variants. Furthermore, a recent selloff in China’s equity markets amid regulatory pressures affecting the country’s technology sector has raised concerns about potential government intervention in other sectors. Managers have been closely monitoring the situation and making adjustments to their portfolios as they see fit.
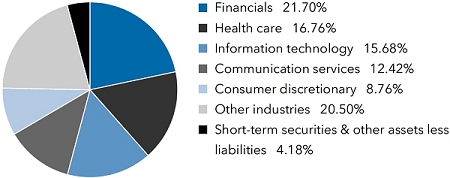
On a regional basis, the portfolio has the largest exposure to Greater China (mainland China, Hong Kong, Macau and Taiwan), India and Russia. On a sector basis, some of the portfolio’s largest areas of investment are in commercial banks, biopharmaceutical companies and technology-related businesses.
Health care makes up nearly 17% of the portfolio, with a larger exposure to Chinese biopharmaceutical companies versus the benchmark. These companies are either developing new drugs or conducting clinical research for global pharmaceutical giants. Health care is a strategic priority for the government, and portfolio managers believe the sector has a long runway for growth as China’s population ages. Meanwhile, exposure to certain Chinese technology companies was reduced over the past 12 months, primarily due to China’s widening regulatory probe and increased competition in the e-commerce market.
Financials account for close to 22% of the portfolio. Managers like commercial banks leveraged to a broader economic rebound, those that are positioned to take market share from state-owned banks and those that are more technologically savvy. They continue to have conviction in Asian-based insurers that sell products to China’s middle class.
The information technology sector makes up almost 16% of the portfolio. Semiconductor manufacturers with dominant market share positions are among the largest holdings in the portfolio. Other sector holdings are focused on financial payment technology providers.
We thank you for the trust you have placed in us and for your continued investment in the fund, and look forward to reporting to you again in six months.
Cordially,

Victor D. Kohn
President
August 16, 2021
About the fund and its adviser
Emerging Markets Growth Fund was organized in 1986 by the International Finance Corporation (IFC), an affiliate of the World Bank, as a vehicle for investing in the securities of companies based in developing countries. The premise behind the formation of the fund was that rapid growth in these countries could create very attractive investment opportunities. It also was felt that the availability of equity capital would stimulate the development of capital markets and encourage countries to liberalize their investment regulations.
Capital International, Inc., the fund’s investment adviser, is part of The Capital Group Companies,SM Inc., one of the world’s most experienced investment advisory organizations, with roots dating back to 1931. The fund has been managed by Capital International or an affiliate since 1986. Capital Group employs a research-driven approach to investing and has a global investment research network spanning three continents. This network of analysts and portfolio managers travels the world, scrutinizing thousands of companies and keeps a close watch on industry trends and government actions.
Capital Group has devoted substantial resources to the task of evaluating and managing investments in developing countries. It is an intensive effort that combines company and industry analysis with broader political and macroeconomic views. We believe that our extensive worldwide research capabilities and integrated global investment process continue to provide Emerging Markets Growth Fund with a competitive edge.
| Emerging Markets Growth Fund | 3 |
The value of a long-term investment
How a hypothetical $10,000 investment has grown (for the period December 31, 1987, to June 30, 2021, with distributions reinvested)
This chart shows how a hypothetical $10,000 investment in Emerging Markets Growth Fund (EMGF) grew from December 31, 1987 — the inception of the MSCI Emerging Markets Index — through June 30, 2021, the end of the fund’s latest fiscal year.

| Total returns | | | | |
| (with all distributions reinvested for periods ended June 30, 2021) | | Cumulative total returns | | Average annual total returns |
| | | | | |
| 1 year | | | 41.33 | % | | | 41.33 | % |
| 5 years | | | 106.56 | | | | 15.61 | |
| 10 years | | | 53.72 | | | | 4.39 | |
Results are for past periods and are not predictive of results for future periods. The results shown are before taxes on fund distributions and sale of fund shares. When applicable, investment results reflect expense reimbursements, without which results would have been lower. Current and future results may be lower or higher than those shown. Share prices and returns will vary, so investors may lose money. Investing for short periods makes losses more likely. For current information and month-end results, please call (800) 421-4989.
| * | Returns for the MSCI Emerging Markets Index were calculated using the MSCI Emerging Markets Index with gross dividends from December 31, 1987, to December 31, 2000, and with net dividends from January 1, 2001, to November 30, 2007, and using the MSCI EM IMI with net dividends thereafter. The indices are unmanaged and, therefore, have no expenses. Investors cannot invest directly in an index. Source: MSCI. |
| † | For the period December 31, 1987 (inception of the MSCI Emerging Markets Index), through June 30, 1988. EMGF began operations on May 30, 1986. |
| 4 | Emerging Markets Growth Fund |
| Investment portfolio June 30, 2021 | |
| | |
| Industry sector diversification | Percent of net assets |
| Common stocks 93.30% | | Shares | | | Value
(000) | |
| Asia-Pacific 69.86% | | | | | | | | |
| China 36.51% | | | | | | | | |
| Adagene, Inc. (ADR)1 | | | 140,269 | | | $ | 1,902 | |
| Aier Eye Hospital Group Co., Ltd., Class A | | | 356,948 | | | | 3,921 | |
| Alibaba Group Holding, Ltd.1 | | | 306,602 | | | | 8,687 | |
| Alibaba Group Holding, Ltd. (ADR)1 | | | 58,281 | | | | 13,217 | |
| Alibaba Health Information Technology, Ltd.1 | | | 4,048,000 | | | | 8,978 | |
| BeiGene, Ltd. (ADR)1 | | | 244,871 | | | | 84,037 | |
| CanSino Biologics, Inc., Class H1,2 | | | 932,283 | | | | 49,542 | |
| China East Education Holdings, Ltd. | | | 1,346,187 | | | | 2,115 | |
| China Feihe, Ltd. | | | 630,000 | | | | 1,360 | |
| China Gas Holdings Ltd. | | | 5,052,800 | | | | 15,424 | |
| China Merchants Bank Co., Ltd., Class H | | | 4,667,500 | | | | 39,826 | |
| China Resources Gas Group, Ltd. | | | 1,558,000 | | | | 9,351 | |
| China Resources Land, Ltd. | | | 5,344,787 | | | | 21,650 | |
| China Tower Corp., Ltd., Class H | | | 15,430,000 | | | | 2,126 | |
| ENN Energy Holdings, Ltd. | | | 610,000 | | | | 11,612 | |
| Foshan Haitian Flavouring and Food Co., Ltd., Class A | | | 91,520 | | | | 1,826 | |
| Gracell Biotechnologies, Inc., Class A (ADR)1 | | | 455,824 | | | | 5,926 | |
| Gree Electric Appliances, Inc. of Zhuhai, Class A | | | 1,115,586 | | | | 8,995 | |
| Haitian International Holdings, Ltd. | | | 1,764,000 | | | | 5,918 | |
| Hangzhou Tigermed Consulting Co., Ltd., Class A | | | 400,325 | | | | 11,976 | |
| Hangzhou Tigermed Consulting Co., Ltd., Class H | | | 156,700 | | | | 3,673 | |
| HBM Holdings, Ltd.1 | | | 13,019,551 | | | | 16,601 | |
| Hefei Meyer Optoelectronic Technology, Inc., Class A | | | 646,557 | | | | 5,580 | |
| Huazhu Group, Ltd. (ADR)1 | | | 494,808 | | | | 26,131 | |
| Hutchison China MediTech Ltd. (ADR)1,2 | | | 1,246,680 | | | | 48,957 | |
| Hutchmed China Ltd. (GBP denominated)1 | | | 21,080 | | | | 163 | |
| JD Health International, Inc.1,2 | | | 581,450 | | | | 8,335 | |
| Jiangsu Hengrui Medicine Co., Ltd., Class A | | | 4,259,408 | | | | 44,806 | |
| Jonjee Hi-Tech Industrial and Commercial Holding Co., Ltd., Class A | | | 459,800 | | | | 2,990 | |
| Kingdee International Software Group Co., Ltd.1 | | | 2,599,000 | | | | 8,820 | |
| Kuaishou Technology, Class B1,2,3,4 | | | 365,937 | | | | 8,469 | |
| Kweichow Moutai Co., Ltd., Class A | | | 50,561 | | | | 16,094 | |
| Legend Biotech Corp. (ADR)1 | | | 888,001 | | | | 36,452 | |
| Longfor Group Holdings, Ltd. | | | 6,736,112 | | | | 37,739 | |
| Meituan, Class B1 | | | 187,700 | | | | 7,746 | |
| Midea Group Co., Ltd., Class A | | | 776,760 | | | | 8,580 | |
| Ming Yuan Cloud Group Holdings Ltd. | | | 510,988 | | | | 2,537 | |
| NetEase, Inc. | | | 763,829 | | | | 17,305 | |
| NetEase, Inc. (ADR) | | | 233,106 | | | | 26,865 | |
| Ping An Insurance (Group) Company of China, Ltd., Class H | | | 4,721,700 | | | | 46,248 | |
| Pop Mart International Group, Ltd.2 | | | 471,328 | | | | 4,674 | |
| Shandong Pharmaceutical Glass Co., Ltd., Class A | | | 435,000 | | | | 2,286 | |
| Shandong Sinocera Functional Material Co., Ltd., Class A | | | 584,332 | | | | 4,409 | |
| Tencent Holdings, Ltd. | | | 621,800 | | | | 46,769 | |
| Trip.com Group, Ltd. (ADR)1 | | | 583,098 | | | | 20,677 | |
| Emerging Markets Growth Fund | 5 |
| Common stocks (continued) | | Shares | | | Value
(000) | |
| Asia-Pacific (continued) | | | | | | | | |
| China (continued) | | | | | | | | |
| Venustech Group, Inc., Class A | | | 4,175,909 | | | $ | 18,749 | |
| WuXi Biologics (Cayman), Inc.1 | | | 1,063,500 | | | | 19,491 | |
| Xpeng, Inc., Class A (ADR)1 | | | 188,929 | | | | 8,392 | |
| Yeahka Ltd.1,2 | | | 2,594,400 | | | | 16,323 | |
| Yihai International Holding, Ltd.2 | | | 361,000 | | | | 2,425 | |
| Yunnan Energy New Material Co., Ltd., Class A | | | 635,473 | | | | 23,023 | |
| | | | | | | | 849,698 | |
| | | | | | | | | |
| Hong Kong 5.31% | | | | | | | | |
| AIA Group, Ltd. | | | 5,116,000 | | | | 63,585 | |
| ESR Cayman, Ltd.1 | | | 1,593,400 | | | | 5,377 | |
| First Pacific Co. Ltd. | | | 31,018,000 | | | | 10,587 | |
| Galaxy Entertainment Group, Ltd.1 | | | 2,486,500 | | | | 19,903 | |
| Hong Kong Exchanges and Clearing, Ltd. | | | 267,600 | | | | 15,951 | |
| Wynn Macau, Ltd.1 | | | 5,226,829 | | | | 8,226 | |
| | | | | | | | 123,629 | |
| | | | | | | | | |
| India 12.16% | | | | | | | | |
| Asian Paints, Ltd. | | | 192,609 | | | | 7,755 | |
| Astral, Ltd. | | | 363,782 | | | | 9,737 | |
| Avenue Supermarts, Ltd.1 | | | 82,536 | | | | 3,713 | |
| Berger Paints India, Ltd. | | | 698,799 | | | | 7,569 | |
| Bharti Airtel, Ltd. | | | 3,286,820 | | | | 23,244 | |
| City Union Bank, Ltd. | | | 879,028 | | | | 1,970 | |
| Coforge, Ltd. | | | 352,801 | | | | 19,732 | |
| Dabur India, Ltd. | | | 971,945 | | | | 7,437 | |
| Genpact, Ltd. | | | 365,276 | | | | 16,595 | |
| Godrej Consumer Products, Ltd.1 | | | 314,141 | | | | 3,678 | |
| Havells India, Ltd. | | | 417,707 | | | | 5,508 | |
| HDFC Bank, Ltd. | | | 1,067,639 | | | | 21,515 | |
| HDFC Bank, Ltd. (ADR)2 | | | 6,300 | | | | 461 | |
| ICICI Bank, Ltd.1 | | | 1,189,449 | | | | 10,096 | |
| ICICI Bank, Ltd. (ADR)1,2 | | | 1,529,268 | | | | 26,151 | |
| Indian Energy Exchange, Ltd. | | | 754,858 | | | | 3,810 | |
| Indus Towers, Ltd. | | | 1,884,110 | | | | 6,049 | |
| Info Edge (India) Ltd. | | | 16,131 | | | | 1,067 | |
| Infosys Ltd. | | | 336,396 | | | | 7,154 | |
| ITC, Ltd. | | | 2,183,049 | | | | 5,953 | |
| Kotak Mahindra Bank, Ltd.1 | | | 488,440 | | | | 11,210 | |
| MakeMyTrip Ltd., non-registered shares1 | | | 96,086 | | | | 2,888 | |
| Maruti Suzuki India, Ltd. | | | 34,527 | | | | 3,491 | |
| Power Grid Corporation of India, Ltd. | | | 5,138,871 | | | | 16,067 | |
| Reliance Industries, Ltd. | | | 958,079 | | | | 27,205 | |
| TeamLease Services Ltd.1 | | | 355,773 | | | | 17,314 | |
| Tube Investments of India, Ltd. | | | 94,986 | | | | 1,493 | |
| United Spirits, Ltd.1 | | | 897,251 | | | | 7,987 | |
| Varun Beverages, Ltd. | | | 521,503 | | | | 5,119 | |
| Westlife Development, Ltd.1 | | | 160,126 | | | | 1,076 | |
| | | | | | | | 283,044 | |
| | | | | | | | | |
| Indonesia 4.66% | | | | | | | | |
| Astra International Tbk PT | | | 23,937,800 | | | | 8,155 | |
| Bank BTPN Syariah Tbk PT | | | 44,566,259 | | | | 8,852 | |
| Bank Central Asia Tbk PT | | | 1,766,860 | | | | 3,671 | |
| Bank Mandiri (Persero) Tbk PT | | | 95,474,908 | | | | 38,849 | |
| Bank Rakyat Indonesia (Persero) Tbk PT | | | 28,202,900 | | | | 7,663 | |
| Elang Mahkota Teknologi Tbk PT1 | | | 146,658,150 | | | | 25,286 | |
| PT Surya Citra Media Tbk1 | | | 127,106,344 | | | | 15,866 | |
| | | | | | | | 108,342 | |
| | | | | | | | | |
| Philippines 1.22% | | | | | | | | |
| Ayala Corp. | | | 677,970 | | | | 11,111 | |
| Bloomberry Resorts Corp.1 | | | 49,384,000 | | | | 6,586 | |
| International Container Terminal Services, Inc. | | | 3,162,076 | | | | 10,604 | |
| | | | | | | | 28,301 | |
| 6 | Emerging Markets Growth Fund |
| Common stocks (continued) | | Shares | | | Value
(000) | |
| Asia-Pacific (continued) | | | | | | | | |
| Singapore 0.61% | | | | | | | | |
| Sea, Ltd., Class A (ADR)1 | | | 40,300 | | | $ | 11,066 | |
| Yoma Strategic Holdings Ltd.1 | | | 31,959,732 | | | | 3,185 | |
| | | | | | | | 14,251 | |
| | | | | | | | | |
| South Korea 4.28% | | | | | | | | |
| Hugel, Inc.1 | | | 27,374 | | | | 5,824 | |
| Korea Investment Holdings Co., Ltd. | | | 120,388 | | | | 11,011 | |
| NAVER Corp. | | | 52,409 | | | | 19,430 | |
| NCSoft Corp. | | | 1,172 | | | | 853 | |
| NHN KCP Corp.1 | | | 135,648 | | | | 6,998 | |
| Samsung Electronics Co., Ltd. | | | 502,814 | | | | 36,032 | |
| Samsung Electronics Co., Ltd. (GDR)4 | | | 9,684 | | | | 17,272 | |
| SK hynix, Inc. | | | 13,356 | | | | 1,512 | |
| Tokai Carbon Korea Co., Ltd. | | | 4,151 | | | | 743 | |
| | | | | | | | 99,675 | |
| | | | | | | | | |
| Taiwan 3.77% | | | | | | | | |
| MediaTek, Inc. | | | 510,042 | | | | 17,610 | |
| Momo.com, Inc.1 | | | 33,000 | | | | 2,233 | |
| Taiwan Semiconductor Manufacturing Company, Ltd. | | | 2,956,812 | | | | 63,142 | |
| Vanguard International Semiconductor Corp. | | | 1,106,000 | | | | 4,684 | |
| | | | | | | | 87,669 | |
| | | | | | | | | |
| Thailand 0.13% | | | | | | | | |
| Airports of Thailand PCL, foreign registered shares | | | 1,516,800 | | | | 2,935 | |
| | | | | | | | | |
| Vietnam 1.21% | | | | | | | | |
| Masan Group Corp. | | | 2,875,120 | | | | 13,916 | |
| Vinhomes JSC1 | | | 2,776,495 | | | | 14,235 | |
| | | | | | | | 28,151 | |
| | | | | | | | | |
| Total Asia-Pacific | | | | | | | 1,625,695 | |
| | | | | | | | | |
| Eastern Europe and Middle East 10.08% | | | | | | | | |
| Hungary 0.03% | | | | | | | | |
| Wizz Air Holdings PLC1 | | | 9,700 | | | | 626 | |
| | | | | | | | | |
| Kazakhstan 1.17% | | | | | | | | |
| Halyk Savings Bank of Kazakhstan OJSC (GDR)4 | | | 891,987 | | | | 13,826 | |
| Kaspi.kz JSC4 | | | 126,292 | | | | 13,387 | |
| | | | | | | | 27,213 | |
| | | | | | | | | |
| Poland 0.41% | | | | | | | | |
| CD Projekt SA2 | | | 55,755 | | | | 2,705 | |
| Huuuge, Inc.1 | | | 693,800 | | | | 6,778 | |
| | | | | | | | 9,483 | |
| | | | | | | | | |
| Russian Federation 7.96% | | | | | | | | |
| Alrosa PJSC | | | 2,230,604 | | | | 4,099 | |
| Baring Vostok Capital Fund IV Supplemental Fund, LP1,3,5,6,7,8 | | | 43,189,450 | | | | 4,721 | |
| Baring Vostok Private Equity Fund IV, LP1,3,5,6,7,8 | | | 23,604,516 | | | | 3,283 | |
| Detsky Mir PJSC | | | 4,749,187 | | | | 9,820 | |
| Gazprom PJSC (ADR) | | | 1,389,421 | | | | 10,590 | |
| Moscow Exchange MICEX-RTS PJSC | | | 5,386,066 | | | | 12,572 | |
| QIWI PLC, Class B (ADR) | | | 183,518 | | | | 1,956 | |
| Rosneft Oil Company PJSC (GDR) | | | 624,586 | | | | 4,834 | |
| Sberbank of Russia PJSC | | | 1,220,014 | | | | 5,100 | |
| Sberbank of Russia PJSC (ADR) | | | 2,669,409 | | | | 44,326 | |
| TCS Group Holding PLC (GDR)4 | | | 214,424 | | | | 18,762 | |
| TCS Group Holding PLC (GDR) | | | 141,882 | | | | 12,415 | |
| X5 Retail Group NV (GDR) | | | 108,031 | | | | 3,788 | |
| Yandex NV, Class A1 | | | 691,612 | | | | 48,932 | |
| | | | | | | | 185,198 | |
| Emerging Markets Growth Fund | 7 |
| Common stocks (continued) | | Shares | | | Value
(000) | |
| Eastern Europe and Middle East (continued) | | | | | | | | |
| Slovenia 0.31% | | | | | | | | |
| Nova Ljubljanska Banka dd (GDR) | | | 477,955 | | | $ | 7,311 | |
| | | | | | | | | |
| Turkey 0.20% | | | | | | | | |
| Aktas Elektrik Ticaret AS1,3 | | | 4,273 | | | | — | 9 |
| Pegasus Hava Tasimaciligi AS1 | | | 422,160 | | | | 3,493 | |
| Sok Marketler Ticaret AS, non-registered shares1 | | | 851,967 | | | | 1,149 | |
| | | | | | | | 4,642 | |
| | | | | | | | | |
| Total Eastern Europe and Middle East | | | | | | | 234,473 | |
| | | | | | | | | |
| Latin America 9.09% | | | | | | | | |
| Argentina 0.20% | | | | | | | | |
| Loma Negra Compania Industrial Argentina SA (ADR) | | | 675,049 | | | | 4,597 | |
| | | | | | | | | |
| Brazil 6.47% | | | | | | | | |
| Boa Vista Servicos SA | | | 1,633,875 | | | | 3,610 | |
| BR Malls Participacoes SA, ordinary nominative shares1 | | | 3,569,519 | | | | 7,277 | |
| CCR SA, ordinary nominative shares | | | 1,705,714 | | | | 4,613 | |
| Diagnósticos da América SA | | | 742,978 | | | | 9,229 | |
| ENGIE Brasil Energia SA, ordinary nominative (ADR) | | | 6 | | | | — | 9 |
| Estre Ambiental Inc.1,4 | | | 591,120 | | | | 43 | |
| Gerdau SA (ADR) | | | 527,211 | | | | 3,111 | |
| Hypera SA, ordinary nominative shares | | | 3,579,829 | | | | 24,809 | |
| Lojas Americanas SA, ordinary nominative shares | | | 1,317,383 | | | | 5,472 | |
| Nexa Resources SA | | | 421,777 | | | | 3,699 | |
| PagSeguro Digital, Ltd., Class A1 | | | 400,890 | | | | 22,418 | |
| Patria Investments, Ltd., Class A | | | 477,819 | | | | 8,419 | |
| Rede D’Or Sao Luiz SA | | | 828,500 | | | | 11,498 | |
| Vale SA, ordinary nominative shares | | | 703,546 | | | | 16,019 | |
| Vale SA, ordinary nominative shares (ADR) | | | 1,326,871 | | | | 30,266 | |
| | | | | | | | 150,483 | |
| | | | | | | | | |
| Mexico 1.26% | | | | | | | | |
| América Móvil, SAB de CV, Series L (ADR) | | | 1,060,797 | | | | 15,912 | |
| Bolsa Mexicana de Valores, SAB de CV, Series A | | | 6,105,600 | | | | 13,449 | |
| | | | | | | | 29,361 | |
| | | | | | | | | |
| Uruguay 1.16% | | | | | | | | |
| DLocal, Ltd., Class A1 | | | 515,800 | | | | 27,095 | |
| | | | | | | | | |
| Total Latin America | | | | | | | 211,536 | |
| | | | | | | | | |
| Other markets 2.19% | | | | | | | | |
| Canada 0.10% | | | | | | | | |
| Barrick Gold Corp. | | | 107,666 | | | | 2,226 | |
| | | | | | | | | |
| United Kingdom 1.10% | | | | | | | | |
| Airtel Africa PLC | | | 7,245,400 | | | | 7,722 | |
| British American Tobacco PLC | | | 101,341 | | | | 3,925 | |
| Network International Holdings PLC1 | | | 1,816,289 | | | | 9,188 | |
| Sedibelo Platinum Mines Ltd.1,3,5 | | | 17,665,800 | | | | 4,846 | |
| | | | | | | | 25,681 | |
| | | | | | | | | |
| United States 0.99% | | | | | | | | |
| Fabrinet, non-registered shares1 | | | 15,180 | | | | 1,455 | |
| MercadoLibre, Inc.1 | | | 10,841 | | | | 16,888 | |
| Philip Morris International, Inc. | | | 47,274 | | | | 4,686 | |
| | | | | | | | 23,029 | |
| | | | | | | | | |
| Total Other markets | | | | | | | 50,936 | |
| 8 | Emerging Markets Growth Fund |
| Common stocks (continued) | | Shares | | | Value
(000) | |
| Africa 2.08% | | | | | | | | |
| Federal Republic of Nigeria 0.35% | | | | | | | | |
| Guaranty Trust Holding Co. PLC | | | 126,924,542 | | | $ | 8,075 | |
| | | | | | | | | |
| South Africa 1.73% | | | | | | | | |
| AngloGold Ashanti, Ltd. | | | 143,546 | | | | 2,669 | |
| Discovery Ltd.1 | | | 2,010,186 | | | | 17,775 | |
| MTN Group, Ltd.1 | | | 2,759,900 | | | | 19,951 | |
| | | | | | | | 40,395 | |
| | | | | | | | | |
| Total Africa | | | | | | | 48,470 | |
| | | | | | | | | |
| Total common stocks (cost: $1,325,059,000) | | | | | | | 2,171,110 | |
| | | | | | | | | |
| Preferred securities 2.32% | | | | | | | | |
| Asia-Pacific 1.84% | | | | | | | | |
| South Korea 1.84% | | | | | | | | |
| Samsung Electronics Co., Ltd., nonvoting preferred shares | | | 655,461 | | | | 42,896 | |
| | | | | | | | | |
| Latin America 0.48% | | | | | | | | |
| Brazil 0.48% | | | | | | | | |
| Azul SA, preferred nominative shares (ADR)1,2 | | | 132,216 | | | | 3,490 | |
| GOL Linhas Aéreas Inteligentes SA, preferred nominative shares1 | | | 603,427 | | | | 2,786 | |
| GOL Linhas Aéreas Inteligentes SA, preferred nominative shares (ADR)1,2 | | | 535,000 | | | | 4,933 | |
| | | | | | | | 11,209 | |
| | | | | | | | | |
| Total preferred securities (cost: $39,885,000) | | | | | | | 54,105 | |
| | | | | | | | | |
| Rights & warrants 0.20% | | | | | | | | |
| Asia-Pacific 0.20% | | | | | | | | |
| China 0.20% | | | | | | | | |
| OPT Machine Vision Tech Co., Ltd., Class A, warrants, expire 20231,3,4 | | | 65,900 | | | | 4,599 | |
| | | | | | | | | |
| Total rights & warrants (cost: $2,696,000) | | | | | | | 4,599 | |
| | | | | | | | | |
| Short-term securities 6.39% | | | | | | | | |
| Money market investments 4.37% | | | | | | | | |
| Capital Group Central Cash Fund 0.04%10,11 | | | 1,015,577 | | | | 101,558 | |
| | | | | | | | | |
| Money market investments purchased with collateral from securities on loan 2.02% | | | | | | | | |
| BlackRock Liquidity Funds – FedFund, Institutional Shares 0.03%10,12 | | | 11,700,000 | | | | 11,700 | |
| Goldman Sachs Financial Square Government Fund, Institutional Shares 0.02%10,12 | | | 11,700,000 | | | | 11,700 | |
| Capital Group Central Cash Fund 0.04%10,11,12 | | | 77,549 | | | | 7,755 | |
| Invesco Short-Term Investments Trust – Government & Agency Portfolio, Institutional Class 0.03%10,12 | | | 7,124,923 | | | | 7,125 | |
| Morgan Stanley Institutional Liquidity Funds – Government Portfolio, Institutional Class 0.03%10,12 | | 2,800,000 | | | | 2,800 | |
| State Street Institutional U.S. Government Money Market Fund, Premier Class 0.03%10,12 | | | 2,800,000 | | | | 2,800 | |
| Fidelity Investments Money Market Government Portfolio, Class I 0.01%10,12 | | | 1,800,000 | | | | 1,800 | |
| RBC Funds Trust – U.S. Government Money Market Fund, RBC Institutional Class 1 0.03%10,12 | | | 1,400,000 | | | | 1,400 | |
| | | | | | | | 47,080 | |
| | | | | | | | | |
| Total short-term securities (cost: $148,645,000) | | | | | | | 148,638 | |
| Total investment securities 102.21% (cost: $1,516,285,000) | | | | | | | 2,378,452 | |
| Other assets less liabilities (2.21)% | | | | | | | (51,503 | ) |
| | | | | | | | | |
| Net assets 100.00% | | | | | | $ | 2,326,949 | |
| Emerging Markets Growth Fund | 9 |
Investments in affiliates11
| | | Value of
affiliates at
7/1/2020
(000) | | | Additions
(000) | | | Reductions
(000) | | | Net
realized
loss
(000) | | | | Net
unrealized
depreciation
(000) | | | Value of
affiliates at
6/30/2021
(000) | | | Dividend
income
(000) | |
| Short-term securities 4.70% |
| Money market investments 4.37% |
| Capital Group Central Cash Fund 0.04%10 | | $ | 20,231 | | | $ | 465,915 | | | $ | 384,580 | | | $ | — | 9 | | | $ | | (8 | ) | | $ | 101,558 | | | $ | 50 | |
| Money market investments purchased with collateral from securities on loan 0.33% | | | | | | | | | | | | | | | | | | | | | | | | | | | | | | |
| Capital Group Central Cash Fund 0.04%10,12 | | | — | | | | 7,755 | 13 | | | | | | | | | | | | | | | | | 7,755 | | | | — | 14 |
| Total short-term securities | | | | | | | | | | | | | | | | | | | | | | | | | 109,313 | | | | | |
| Total 4.70% | | | | | | | | | | | | | | $ | — | 9 | | | $ | | (8 | ) | | $ | 109,313 | | | $ | 50 | |
| 1 | | Security did not produce income during the last 12 months. |
| 2 | | All or a portion of this security was on loan. The total value of all such securities was $45,029,000, which represented 1.94% of the net assets of the fund. Refer to Note 5 for more information on securities lending. |
| 3 | | Valued under fair value procedures adopted by authority of the board of directors. The total value of all such securities was $25,641,000, which represented 1.10% of the net assets of the fund. |
| 4 | | Acquired in a transaction exempt from registration under Rule 144A of the Securities Act of 1933. May be resold in the U.S. in transactions exempt from registration, normally to qualified institutional buyers. The total value of all such securities was $76,081,000, which represented 3.27% of the net assets of the fund. |
| 5 | | Value determined using significant unobservable inputs. |
| 6 | | Cost and market value do not include prior distributions to the fund from income or proceeds realized from securities held by the private equity fund. Therefore, the cost and market value may not be indicative of the private equity fund’s performance. For private equity funds structured as limited partnerships, shares are not applicable and therefore the fund’s interest in the partnership is reported. |
| 7 | | Excludes an unfunded capital commitment representing an agreement which obligates the fund to meet capital calls in the future. Capital calls can only be made if and when certain requirements have been fulfilled; thus, the timing and the amount of such capital calls cannot readily be determined. |
| 8 | | Acquired through a private placement transaction exempt from registration under the Securities Act of 1933. May be subject to legal or contractual restrictions on resale. Further details on these holdings appear below. |
| 9 | | Amount less than one thousand. |
| 10 | | Rate represents the seven-day yield at 6/30/2021. |
| 11 | | Part of the same “group of investment companies” as the fund as defined under the Investment Company Act of 1940, as amended. |
| 12 | | Security purchased with cash collateral from securities on loan. Refer to Note 5 for more information on securities lending. |
| 13 | | Represents net activity. Refer to Note 5 for more information on securities lending. |
| 14 | | Dividend income is included with securities lending income in the fund’s statement of operations and is not shown in this table. |
| Private placement securities | | | Acquisition
date(s) | | | | Cost
(000) | | | | Value
(000) | | | Percent
of net
assets | |
| Baring Vostok Capital Fund IV Supplemental Fund, LP | | | 10/8/2007-8/29/2019 | | | | $ | 27,019 | | | | $ | 4,721 | | | | | .20 | % |
| Baring Vostok Private Equity Fund IV, LP | | | 4/25/2007-12/28/2020 | | | | | 12,444 | | | | $ | 3,283 | | | | | .14 | |
| Total private placement securities | | | | | | | $ | 39,463 | | | | $ | 8,004 | | | | | .34 | % |
Key to abbreviations
ADR = American Depositary Receipts
GBP = British pounds
GDR = Global Depositary Receipts
See notes to financial statements.
| 10 | Emerging Markets Growth Fund |
Financial statements
| Statement of assets and liabilities | | | |
| at June 30, 2021 | | (dollars in thousands) | |
| | | | |
| Assets: | | | | | | | | |
| Investment securities, at value (includes $45,029 of investment securities on loan): | | | | | | | | |
| Unaffiliated issuers (cost: $1,406,965) | | $ | 2,269,139 | | | | | |
| Affiliated issuers (cost: $109,320) | | | 109,313 | | | $ | 2,378,452 | |
| Cash | | | | | | | 1,035 | |
| Cash denominated in currencies other than U.S. dollars (cost: $1,298) | | | | | | | 1,303 | |
| Receivables for: | | | | | | | | |
| Sales of investments | | | 257 | | | | | |
| Sales of fund’s shares | | | 1,246 | | | | | |
| Services provided by related parties | | | 101 | | | | | |
| Dividends | | | 5,017 | | | | | |
| Securities lending income | | | 2 | | | | | |
| Other | | | 149 | | | | 6,772 | |
| | | | | | | | 2,387,562 | |
| Liabilities: | | | | | | | | |
| Collateral for securities on loan | | | | | | | 47,080 | |
| Payables for: | | | | | | | | |
| Purchases of investments | | | 357 | | | | | |
| Repurchases of fund’s shares | | | 554 | | | | | |
| Investment advisory services | | | 1,431 | | | | | |
| Directors’ deferred compensation | | | 1,615 | | | | | |
| Non-U.S. taxes | | | 9,494 | | | | | |
| Other | | | 82 | | | | 13,533 | |
| Net assets at June 30, 2021 | | | | | | $ | 2,326,949 | |
| | | | | | | | | |
| Net assets consist of: | | | | | | | | |
| Capital paid in on shares of capital stock | | | | | | $ | 1,342,161 | |
| Total distributable earnings | | | | | | | 984,788 | |
| Net assets at June 30, 2021 | | | | | | $ | 2,326,949 | |
(dollars and shares in thousands, except per-share amounts)
Total authorized capital stock — 2,000,000 shares,
$.01 par value (225,234 total shares outstanding)
| | | | | | Shares | | | Net asset value | |
| | | Net assets | | | outstanding | | | per share | |
| Class M | | $ | 2,222,252 | | | | 215,069 | | | $ | 10.33 | |
| Class F-3 | | | 104,684 | | | | 10,164 | | | | 10.30 | |
| Class R-6 | | | 13 | | | | 1 | | | | 10.38 | |
See notes to financial statements.
| Emerging Markets Growth Fund | 11 |
Financial statements (continued)
| Statement of operations | unaudited |
| for the year ended June 30, 2021 | (dollars in thousands) |
| Investment income: | | | | | | | | |
| Income: | | | | | | | | |
| Dividends (net of non-U.S. taxes of $3,730; also includes $50 from affiliates) | | $ | 38,581 | | | | | |
| Securities lending income (net of fees) | | | 685 | | | | | |
| Interest | | | 1 | | | $ | 39,267 | |
| Fees and expenses*: | | | | | | | | |
| Investment advisory services | | | 15,827 | | | | | |
| Transfer agent services | | | 5 | | | | | |
| Administrative services | | | 24 | | | | | |
| Reports to shareholders | | | 27 | | | | | |
| Registration statement and prospectus | | | 64 | | | | | |
| Directors’ compensation | | | 830 | | | | | |
| Auditing and legal | | | 198 | | | | | |
| Custodian | | | 857 | | | | | |
| State and local taxes | | | 1 | | | | | |
| Other | | | 193 | | | | | |
| Total fees and expenses before reimbursements | | | 18,026 | | | | | |
| Less reimbursements of fees and expenses: | | | | | | | | |
| Transfer agent services reimbursement | | | — | † | | | | |
| Miscellaneous fee reimbursement | | | 2,096 | | | | | |
| Total fees and expenses after reimbursements | | | | | | | 15,930 | |
| Net investment income | | | | | | | 23,337 | |
| | | | | | | | | |
| Net realized gain and unrealized appreciation: | | | | | | | | |
| Net realized gain (loss) on: | | | | | | | | |
| Investments: | | | | | | | | |
| Unaffiliated issuers | | | 217,540 | | | | | |
| Affiliated issuers | | | — | † | | | | |
| Forward currency contracts | | | 259 | | | | | |
| Currency transactions | | | (965 | ) | | | 216,834 | |
| Net unrealized appreciation (depreciation) on: | | | | | | | | |
| Investments (net of non-U.S. taxes of $9,256): | | | | | | | | |
| Unaffiliated issuers | | | 448,660 | | | | | |
| Affiliated issuers | | | (8 | ) | | | | |
| Forward currency contracts | | | (287 | ) | | | | |
| Currency translations | | | 140 | | | | 448,505 | |
| Net realized gain and unrealized appreciation | | | | | | | 665,339 | |
| | | | | | | | | |
| Net increase in net assets resulting from operations | | | | | | $ | 688,676 | |
| * | Additional information related to class-specific fees and expenses is included in the notes to financial statements. |
| † | Amount less than one thousand. |
See notes to financial statements.
| 12 | Emerging Markets Growth Fund |
Financial statements (continued)
Statements of changes in net assets
(dollars in thousands)
| | | Year ended June 30, | |
| | | 2021 | | | 2020 | |
| Operations: | | | | | | | | |
| Net investment income | | $ | 23,337 | | | $ | 19,716 | |
| Net realized gain | | | 216,834 | | | | 153,645 | |
| Net unrealized appreciation (depreciation) | | | 448,505 | | | | (130,873 | ) |
| Net increase in net assets resulting from operations | | | 688,676 | | | | 42,488 | |
| | | | | | | | | |
| Distributions paid to shareholders | | | (132,058 | ) | | | (108,460 | ) |
| | | | | | | | | |
| Net capital share transactions | | | 70,368 | | | | (488,623 | ) |
| | | | | | | | | |
| Total increase (decrease) in net assets | | | 626,986 | | | | (554,595 | ) |
| | | | | | | | | |
| Net assets: | | | | | | | | |
| Beginning of year | | | 1,699,963 | | | | 2,254,558 | |
| End of year | | $ | 2,326,949 | | | $ | 1,699,963 | |
See notes to financial statements.
| Emerging Markets Growth Fund | 13 |
Notes to financial statements
1. Organization
Emerging Markets Growth Fund, Inc. (the “fund”) is registered under the Investment Company Act of 1940, as amended (the “1940 Act”), as an open-end, diversified management investment company. The fund seeks long-term growth of capital.
The fund has three share classes consisting of two retail share classes (Classes M and F-3), and one retirement plan share class (Class R-6). The retirement plan share class is generally offered only through eligible employer-sponsored retirement plans. The fund’s share classes are described further in the following table:
| Share class | | Initial sales charge | | Contingent deferred sales charge upon
redemption | | Conversion feature |
| Classes M* and F-3 | | None | | None | | None |
| Class R-6 | | None | | None | | None |
| * | Class M shares of the fund are not available for purchase. |
Holders of all share classes have equal pro rata rights to the assets, dividends and liquidation proceeds of the fund. Each share class has identical voting rights, except for the exclusive right to vote on matters affecting only its class. Share classes have different fees and expenses (“class-specific fees and expenses”), primarily due to different arrangements for distribution, transfer agent and administrative services. Differences in class-specific fees and expenses will result in differences in net investment income and, therefore, the payment of different per-share dividends by each share class.
2. Significant accounting policies
The fund is an investment company that applies the accounting and reporting guidance issued in Topic 946 by the U.S. Financial Accounting Standards Board. The fund’s financial statements have been prepared to comply with U.S. generally accepted accounting principles (“U.S. GAAP”). These principles require the fund’s investment adviser to make estimates and assumptions that affect reported amounts and disclosures. Actual results could differ from those estimates. Subsequent events, if any, have been evaluated through the date of issuance in the preparation of the financial statements. The fund follows the significant accounting policies described in this section, as well as the valuation policies described in the next section on valuation.
Security transactions and related investment income — Security transactions are recorded by the fund as of the date the trades are executed with brokers. Realized gains and losses from security transactions are determined based on the specific identified cost of the securities. In the event a security is purchased with a delayed payment date, the fund will segregate liquid assets sufficient to meet its payment obligations. Dividend income is recognized on the ex-dividend date and interest income is recognized on an accrual basis. Market discounts, premiums and original issue discounts on fixed-income securities are amortized daily over the expected life of the security.
Class allocations — Income, fees and expenses (other than class-specific fees and expenses), realized gains and losses and unrealized appreciation and depreciation are allocated daily among the various share classes based on their relative net assets. Class-specific fees and expenses, such as distribution, transfer agent and administrative services, are charged directly to the respective share class.
Distributions paid to shareholders — Income dividends and capital gain distributions are recorded on the ex-dividend date.
Currency translation — Assets and liabilities, including investment securities, denominated in currencies other than U.S. dollars are translated into U.S. dollars at the exchange rates supplied by one or more pricing vendors on the valuation date. Purchases and sales of investment securities and income and expenses are translated into U.S. dollars at the exchange rates on the dates of such transactions. The effects of changes in exchange rates on investment securities are included with the net realized gain or loss and net unrealized appreciation or depreciation on investments in the fund’s statement of operations. The realized gain or loss and unrealized appreciation or depreciation resulting from all other transactions denominated in currencies other than U.S. dollars are disclosed separately.
3. Valuation
Capital International, Inc. (“CIInc”), the fund’s investment adviser, values the fund’s investments at fair value as defined by U.S. GAAP. The net asset value per share is calculated once daily as of the close of regular trading on the New York Stock Exchange, normally 4 p.m. New York time, each day the New York Stock Exchange is open.
| 14 | Emerging Markets Growth Fund |
Methods and inputs — The fund’s investment adviser uses the following methods and inputs to establish the fair value of the fund’s assets and liabilities. Use of particular methods and inputs may vary over time based on availability and relevance as market and economic conditions evolve.
Equity securities are generally valued at the official closing price of, or the last reported sale price on, the exchange or market on which such securities are traded, as of the close of business on the day the securities are being valued or, lacking any sales, at the last available bid price. Prices for each security are taken from the principal exchange or market on which the security trades.
Fixed-income securities, including short-term securities, are generally valued at prices obtained from one or more pricing vendors. Vendors value such securities based on one or more of the inputs described in the following table. The table provides examples of inputs that are commonly relevant for valuing particular classes of fixed-income securities in which the fund is authorized to invest. However, these classifications are not exclusive, and any of the inputs may be used to value any other class of fixed-income security.
| Fixed-income class | | Examples of standard inputs |
| All | | Benchmark yields, transactions, bids, offers, quotations from dealers and trading systems, new issues, spreads and other relationships observed in the markets among comparable securities; and proprietary pricing models such as yield measures calculated using factors such as cash flows, financial or collateral performance and other reference data (collectively referred to as “standard inputs”) |
| Corporate bonds, notes & loans; convertible securities | | Standard inputs and underlying equity of the issuer |
| Bonds & notes of governments & government agencies | | Standard inputs and interest rate volatilities |
When the fund’s investment adviser deems it appropriate to do so (such as when vendor prices are unavailable or deemed to be not representative), fixed-income securities will be valued in good faith at the mean quoted bid and ask prices that are reasonably and timely available (or bid prices, if ask prices are not available) or at prices for securities of comparable maturity, quality and type.
Securities with both fixed-income and equity characteristics, or equity securities traded principally among fixed-income dealers, are generally valued in the manner described for either equity or fixed-income securities, depending on which method is deemed most appropriate by the fund’s investment adviser. The Capital Group Central Cash Fund (“CCF”), a fund within the Capital Group Central Fund Series (“Central Funds”), is valued based upon a floating net asset value, which fluctuates with changes in the value of CCF’s portfolio securities. The underlying securities are valued based on the policies and procedures in CCF’s statement of additional information. Forward currency contracts are valued based on the spot and forward exchange rates obtained from one or more pricing vendors.
Securities and other assets for which representative market quotations are not readily available or are considered unreliable by the fund’s investment adviser are fair valued as determined in good faith under fair valuation guidelines adopted by authority of the fund’s board of directors as further described. The investment adviser follows fair valuation guidelines, consistent with U.S. Securities and Exchange Commission rules and guidance, to consider relevant principles and factors when making fair value determinations. The investment adviser considers relevant indications of value that are reasonably and timely available to it in determining the fair value to be assigned to a particular security, such as the type and cost of the security; contractual or legal restrictions on resale of the security; relevant financial or business developments of the issuer; actively traded similar or related securities; conversion or exchange rights on the security; related corporate actions; significant events occurring after the close of trading in the security; and changes in overall market conditions. In addition, the closing prices of equity securities that trade in markets outside U.S. time zones may be adjusted to reflect significant events that occur after the close of local trading but before the net asset value of each share class of the fund is determined. Fair valuations and valuations of investments that are not actively trading involve judgment and may differ materially from valuations that would have been used had greater market activity occurred.
Processes and structure — The fund’s board of directors has delegated authority to the fund’s investment adviser to make fair value determinations, subject to board oversight. The investment adviser has established a Joint Fair Valuation Committee (the “Fair Valuation Committee”) to administer, implement and oversee the fair valuation process, and to make fair value decisions. The Fair Valuation Committee regularly reviews its own fair value decisions, as well as decisions made under its standing instructions to the investment adviser’s valuation teams. The Fair Valuation Committee reviews changes in fair value measurements from period to period and may, as deemed appropriate, update the fair valuation guidelines to better reflect the results of back testing and address new or evolving issues. The Fair Valuation Committee reports any changes to the fair valuation guidelines to the board of directors. The fund’s board and audit committee also regularly review reports that describe fair value determinations and methods.
| Emerging Markets Growth Fund | 15 |
The fund’s investment adviser has also established a Fixed-Income Pricing Review Group to administer and oversee the fixed-income valuation process, including the use of fixed-income pricing vendors. This group regularly reviews pricing vendor information and market data. Pricing decisions, processes and controls over security valuation are also subject to additional internal reviews facilitated by the investment adviser’s global risk management group.
Classifications — The fund’s investment adviser classifies the fund’s assets and liabilities into three levels based on the inputs used to value the assets or liabilities. Level 1 values are based on quoted prices in active markets for identical securities. Level 2 values are based on significant observable market inputs, such as quoted prices for similar securities and quoted prices in inactive markets. Certain securities trading outside the U.S. may transfer between Level 1 and Level 2 due to valuation adjustments resulting from significant market movements following the close of local trading. Level 3 values are based on significant unobservable inputs that reflect the investment adviser’s determination of assumptions that market participants might reasonably use in valuing the securities. The valuation levels are not necessarily an indication of the risk or liquidity associated with the underlying investment. For example, U.S. government securities are reflected as Level 2 because the inputs used to determine fair value may not always be quoted prices in an active market. The following table presents the fund’s valuation levels as of June 30, 2021 (dollars in thousands):
| | | Investment securities | |
| | | Level 1 | | | Level 2 | | | Level 3 | | | Total | |
| Assets: | | | | | | | | | | | | | | | | |
| Common stocks: | | | | | | | | | | | | | | | | |
| Asia-Pacific | | $ | 1,617,503 | | | $ | 8,192 | | | $ | — | | | $ | 1,625,695 | |
| Eastern Europe and Middle East | | | 226,469 | | | | — | | | | 8,004 | | | | 234,473 | |
| Latin America | | | 211,536 | | | | — | | | | — | | | | 211,536 | |
| Other markets | | | 46,090 | | | | — | | | | 4,846 | | | | 50,936 | |
| Africa | | | 48,470 | | | | — | | | | — | | | | 48,470 | |
| Preferred securities | | | 54,105 | | | | — | | | | — | | | | 54,105 | |
| Rights & warrants | | | — | | | | 4,599 | | | | — | | | | 4,599 | |
| Short-term securities | | | 148,638 | | | | — | | | | — | | | | 148,638 | |
| Total | | $ | 2,352,811 | | | $ | 12,791 | | | $ | 12,850 | | | $ | 2,378,452 | |
4. Risk factors
Investing in the fund may involve certain risks including, but not limited to, those described below.
Market conditions — The prices of, and the income generated by, the common stocks and other securities held by the fund may decline – sometimes rapidly or unpredictably – due to various factors, including events or conditions affecting the general economy or particular industries; overall market changes; local, regional or global political, social or economic instability; governmental, governmental agency or central bank responses to economic conditions; and currency exchange rate, interest rate and commodity price fluctuations.
Economies and financial markets throughout the world are highly interconnected. Economic, financial or political events, trading and tariff arrangements, wars, terrorism, cybersecurity events, natural disasters, public health emergencies (such as the spread of infectious disease) and other circumstances in one country or region, including actions taken by governmental or quasi-governmental authorities in response to any of the foregoing, could have impacts on global economies or markets. As a result, whether or not the fund invests in securities of issuers located in or with significant exposure to the countries affected, the value and liquidity of the fund’s investments may be negatively affected by developments in other countries and regions.
Issuer risks — The prices of, and the income generated by, securities held by the fund may decline in response to various factors directly related to the issuers of such securities, including reduced demand for an issuer’s goods or services, poor management performance, major litigation, investigations or other controversies related to the issuer, changes in government regulations affecting the issuer or its competitive environment and strategic initiatives such as mergers, acquisitions or dispositions and the market response to any such initiatives.
| 16 | Emerging Markets Growth Fund |
Investing outside the U.S. — Securities of issuers domiciled outside the U.S., or with significant operations or revenues outside the U.S., may lose value because of adverse political, social, economic or market developments (including social instability, regional conflicts, terrorism and war) in the countries or regions in which the issuers operate or generate revenue. These securities may also lose value due to changes in foreign currency exchange rates against the U.S. dollar and/or currencies of other countries. Issuers of these securities may be more susceptible to actions of foreign governments, such as nationalization, currency blockage or the imposition of price controls or punitive taxes, each of which could adversely impact the value of these securities. Securities markets in certain countries may be more volatile and/or less liquid than those in the U.S. Investments outside the U.S. may also be subject to different accounting and auditing practices and standards and different regulatory, legal and reporting requirements, and may be more difficult to value, than those in the U.S. In addition, the value of investments outside the U.S. may be reduced by foreign taxes, including foreign withholding taxes on interest and dividends. Further, there may be increased risks of delayed settlement of securities purchased or sold by the fund. The risks of investing outside the U.S. may be heightened in connection with investments in developing countries.
Investing in developing countries — Investing in countries with developing economies and/or markets may involve risks in addition to and greater than those generally associated with investing in the securities markets of developed countries. For instance, emerging market countries tend to have less developed political, economic and legal systems and accounting and auditing practices and standards than those in developed countries. Accordingly, the governments of these countries may be less stable and more likely to intervene in the market economy, for example, by imposing capital controls, nationalizing a company or industry, placing restrictions on foreign ownership and on withdrawing sale proceeds of securities from the country, and/or imposing punitive taxes that could adversely affect the prices of securities. Information regarding issuers in emerging markets may be limited, incomplete or inaccurate, and there may be fewer rights and remedies available to the fund and its shareholders. In addition, the economies of these countries may be dependent on relatively few industries and may be more susceptible to changes in local and global trade conditions and downturns in the world economy. Securities markets in these countries can also be relatively small and have substantially lower trading volumes. As a result, securities issued in these countries may be more volatile and less liquid, and may be more difficult to value, than securities issued in countries with more developed economies and/or markets. Less certainty with respect to security valuations may lead to additional challenges and risks in calculating the fund’s net asset value. Additionally, emerging markets are more likely to experience problems with the clearing and settling of trades and the holding of securities by banks, agents and depositories that are less established than those in developed countries.
Exposure to country, region, industry or sector — Subject to the fund’s investment limitations, the fund may have significant exposure to a particular country, region, industry or sector. Such exposure may cause the fund to be more impacted by risks relating to and developments affecting the country, region, industry or sector, and thus its net asset value may be more volatile, than a fund without such levels of exposure. For example, if the fund has significant exposure in a particular country, then social, economic, regulatory or other issues that negatively affect that country may have a greater impact on the fund than on a fund that is more geographically diversified.
Investing in growth-oriented stocks — Growth-oriented common stocks and other equity-type securities (such as preferred stocks, convertible preferred stocks and convertible bonds) may involve larger price swings and greater potential for loss than other types of investments. These risks may be even greater in the case of smaller capitalization stocks.
Investing in small companies — Investing in smaller companies may pose additional risks. For example, it is often more difficult to value or dispose of small company stocks and more difficult to obtain information about smaller companies than about larger companies. Furthermore, smaller companies often have limited product lines, operating histories, markets and/or financial resources, may be dependent on one or a few key persons for management, and can be more susceptible to losses. Moreover, the prices of their stocks may be more volatile than stocks of larger, more established companies, particularly during times of market turmoil.
Investing in depositary receipts — Depositary receipts are securities that evidence ownership interests in, and represent the right to receive, a security or a pool of securities that have been deposited with a bank or trust depository. Such securities may be less liquid or may trade at a lower price than the underlying securities of the issuer. Additionally, receipt of corporate information about the underlying issuer and proxy disclosure may not be timely and there may not be a correlation between such information and the market value of the depositary receipts.
Management — The investment adviser to the fund actively manages the fund’s investments. Consequently, the fund is subject to the risk that the methods and analyses, including models, tools and data, employed by the investment adviser in this process may be flawed or incorrect and may not produce the desired results. This could cause the fund to lose value or its investment results to lag relevant benchmarks or other funds with similar objectives.
| Emerging Markets Growth Fund | 17 |
5. Certain investment techniques
Securities lending — The fund has entered into securities lending transactions in which the fund earns income by lending investment securities to brokers, dealers or other institutions. Each transaction involves three parties: the fund, acting as the lender of the securities, a borrower, and a lending agent that acts as an intermediary.
Securities lending transactions are entered into by the fund under a securities lending agent agreement with the lending agent. The lending agent facilitates the exchange of securities between the fund and approved borrowers, ensures that securities loans are properly coordinated and documented, marks-to-market the value of collateral daily, secures additional collateral from a borrower if it falls below preset terms, and may reinvest cash collateral on behalf of the fund according to agreed parameters. The lending agent provides indemnification to the fund against losses resulting from a borrower default. Although risk is mitigated by the collateral and indemnification, the fund could experience a delay in recovering its securities and a potential loss of income or value if a borrower fails to return securities, collateral investments decline in value or the lending agent fails to perform.
The borrower is required to post highly liquid assets, such as cash or U.S. government securities, as collateral for the loan in an amount at least equal to the value of the securities loaned. Investments made with cash collateral are recognized as assets in the fund’s investment portfolio. The same amount is recorded as a liability in the fund’s statement of assets and liabilities. While securities are on loan, the fund will continue to receive the equivalent of the interest, dividends or other distributions paid by the issuer, as well as a portion of the interest on the investment of the collateral. Additionally, although the fund does not have the right to vote on securities while they are on loan, the fund has a right to consent on corporate actions and a right to recall loaned securities to vote. A borrower is obligated to return loaned securities at the conclusion of a loan or, during the pendency of a loan, on demand from the fund.
As of June 30, 2021, the total value of securities on loan was $45,029,000, and the total value of collateral received was $47,080,000, which consisted entirely of cash. Investment securities purchased from cash collateral are disclosed in the fund’s investment portfolio as short-term securities. Securities received as collateral, if any, are not recognized as fund assets. The contractual maturity of cash collateral received under the securities lending agreement is classified as overnight and continuous.
Unfunded commitments — The fund invests in private equity funds that involve unfunded capital commitments, which obligate the fund to meet capital calls in the future. Payment would be made when a capital call is requested. Capital calls can only be made if and when certain requirements have been fulfilled; thus, the timing of such capital calls cannot readily be determined. As of June 30, 2021, the fund’s maximum potential exposure from the unfunded commitment was $3,366,000, which would represent .14% of the net assets of the fund should such commitment become due.
Forward currency contracts — The fund has entered into forward currency contracts, which represent agreements to exchange currencies on specific future dates at predetermined rates. The fund’s investment adviser uses forward currency contracts to manage the fund’s exposure to changes in exchange rates. Upon entering into these contracts, risks may arise from the potential inability of counterparties to meet the terms of their contracts and from possible movements in exchange rates.
On a daily basis, the fund’s investment adviser values forward currency contracts and records unrealized appreciation or depreciation for open forward currency contracts in the fund’s statement of assets and liabilities. Realized gains or losses are recorded at the time the forward currency contract is closed or offset by another contract with the same broker for the same settlement date and currency.
Closed forward currency contracts that have not reached their settlement date are included in the respective receivables or payables for closed forward currency contracts in the fund’s statement of assets and liabilities. Net realized gains or losses from closed forward currency contracts and net unrealized appreciation or depreciation from open forward currency contracts are recorded in the fund’s statement of operations. As of June 30, 2021, the fund did not have any open forward currency contracts. The average month-end notional amount of open forward currency contracts while held was $2,955,000.
The following table identifies the location and effect on the fund’s statement of operations resulting from the fund’s use of forward currency contracts as of, or for the year ended, June 30, 2021 (dollars in thousands):
| | | | | Net realized gain | | | Net unrealized depreciation | |
| Contracts | | Risk type | | Location on statement of
operations | | Value | | | Location on statement of
operations | | Value | |
| Forward currency | | Currency | | Net realized gain on forward currency contracts | | $ | 259 | | | Net unrealized depreciation on forward currency contracts | | $ | (287 | ) |
| 18 | Emerging Markets Growth Fund |
Collateral — The fund receives or pledges highly liquid assets, such as cash or U.S. government securities, as collateral due to securities lending and its use of forward currency contracts. For securities lending, the fund receives collateral in exchange for lending investment securities. The lending agent may reinvest cash collateral from securities lending transactions according to agreed parameters. Cash collateral reinvested by the lending agent, if any, is disclosed in the fund’s investment portfolio. For forward currency contracts, the fund either receives or pledges collateral based on the net gain or loss on unsettled forward currency contracts by counterparty. The purpose of the collateral is to cover potential losses that could occur in the event that either party cannot meet its contractual obligation. Non-cash collateral pledged by the fund, if any, is disclosed in the fund’s investment portfolio, and cash collateral pledged by the fund, if any, is held in a segregated account with the fund’s custodian, which is reflected as pledged cash collateral in the fund’s statement of assets and liabilities.
6. Taxation and distributions
Federal income taxation — The fund complies with the requirements under Subchapter M of the Internal Revenue Code applicable to mutual funds and intends to distribute substantially all of its net taxable income and net capital gains each year. The fund is not subject to income taxes to the extent such distributions are made. Therefore, no federal income tax provision is required.
As of and during the year ended June 30, 2021, the fund did not have a liability for any unrecognized tax benefits. The fund recognizes interest and penalties, if any, related to unrecognized tax benefits as income tax expense in the statement of operations. During the period, the fund did not incur any significant interest or penalties.
The fund’s tax returns are generally not subject to examination by federal, state and, if applicable, non-U.S. tax authorities after the expiration of each jurisdiction’s statute of limitations, which is typically three years after the date of filing but can be extended in certain jurisdictions.
Non-U.S. taxation — Dividend and interest income are recorded net of non-U.S. taxes paid. The fund may file withholding tax reclaims in certain jurisdictions to recover a portion of amounts previously withheld. As a result of rulings from European courts, the fund filed for additional reclaims related to prior years. These reclaims are recorded when the amount is known and there are no significant uncertainties on collectability. Gains realized by the fund on the sale of securities in certain countries, if any, may be subject to non-U.S. taxes. If applicable, the fund records an estimated deferred tax liability based on unrealized gains to provide for potential non-U.S. taxes payable upon the sale of these securities.
Distributions — Distributions determined on a tax basis may differ from net investment income and net realized gains for financial reporting purposes. These differences are due primarily to different treatment for items such as currency gains and losses; short-term capital gains and losses; capital losses related to sales of certain securities within 30 days of purchase; unrealized appreciation of certain investments in securities outside the U.S.; deferred expenses; cost of investments sold and income on certain investments. The fiscal year in which amounts are distributed may differ from the year in which the net investment income and net realized gains are recorded by the fund for financial reporting purposes. The fund may also designate a portion of the amount paid to redeeming shareholders as a distribution for tax purposes.
During the year ended June 30, 2021, the fund reclassified $2,429,000 from total distributable earnings to capital paid in on shares of beneficial interest to align financial reporting with tax reporting.
As of June 30, 2021, the tax basis components of distributable earnings, unrealized appreciation (depreciation) and cost of investments were as follows (dollars in thousands):
| Undistributed ordinary income | | $ | 26,889 | |
| Undistributed long-term capital gains | | | 101,984 | |
| Gross unrealized appreciation on investments | | | 966,719 | |
| Gross unrealized depreciation on investments | | | (100,086 | ) |
| Net unrealized appreciation on investments | | | 866,633 | |
| Cost of investments | | | 1,511,819 | |
| Emerging Markets Growth Fund | 19 |
Distributions paid were characterized for tax purposes as follows (dollars in thousands):
| | | Year ended June 30, 2021 | | | Year ended June 30, 2020 | |
| | | | | | | | | Total | | | | | | | | | Total | |
| | | Ordinary | | | Long-term | | | distributions | | | Ordinary | | | Long-term | | | distributions | |
| Share class | | income | | | capital gains | | | paid | | | income | | | capital gains | | | paid | |
| Class M | | $ | 27,174 | | | $ | 100,217 | | | $ | 127,391 | | | $ | 27,756 | | | $ | 76,700 | | | $ | 104,456 | |
| Class F-3 | | | 978 | | | | 3,688 | | | | 4,666 | | | | 978 | | | | 2,741 | | | | 3,719 | |
| Class R-6 | | | — | * | | | 1 | | | | 1 | | | | 75 | | | | 210 | | | | 285 | |
| Total | | $ | 28,152 | | | $ | 103,906 | | | $ | 132,058 | | | $ | 28,809 | | | $ | 79,651 | | | $ | 108,460 | |
| * | Amount less than one thousand. |
7. Fees and transactions with related parties
CIInc is the fund’s investment adviser. American Funds Distributors®, Inc. (“AFD”), the fund’s principal underwriter, and American Funds Service Company® (“AFS”), the fund’s transfer agent are affiliated with CIInc. CIInc, AFD and AFS are considered related parties to the fund.
Investment advisory services — The fund has an investment advisory and service agreement with CIInc that provides for monthly fees accrued daily. These fees are based on a series of decreasing annual rates beginning with 0.900% on the first $400 million of daily net assets and decreasing to 0.520% on such assets in excess of $20 billion. For the year ended June 30, 2021, the investment advisory services fees were $15,827,000, which were equivalent to an annualized rate of 0.765% of average daily net assets.
Class-specific fees and expenses — Expenses that are specific to individual share classes are accrued directly to the respective share class. The principal class-specific fees and expenses are further described below:
Distribution services — American Funds Distributors®, Inc. (“AFD”), an affiliate of CIInc, is the principal underwriter of the fund’s shares. AFD does not receive any compensation related to the sale of shares of the fund.
Transfer agent services — The fund has a shareholder services agreement with AFS under which the fund compensates AFS for providing transfer agent services to each of the fund’s share classes. These services include recordkeeping, shareholder communications and transaction processing. In addition, the fund reimburses AFS for amounts paid to third parties for performing transfer agent services on behalf of fund shareholders. For the year ended June 30, 2021, CIInc reimbursed transfer agent services fees of less than $1,000 for Class R-6 shares. CIInc does not intend to recoup this reimbursement.
Administrative services — The fund has an administrative services agreement with CIInc under which the fund compensates CIInc for providing administrative services to Class F-3 and R-6 shares. Administrative services are provided by CIInc and its affiliates to help assist third parties providing non-distribution services to fund shareholders. These services include providing in depth information on the fund and market developments that impact fund investments. Administrative services also include, but are not limited to, coordinating, monitoring and overseeing third parties that provide services to fund shareholders. The agreement provides the fund the ability to charge an administrative services fee at the annual rate of 0.05% of the average daily net assets attributable to Class F-3 and R-6 shares. Currently the fund pays CIInc an administrative services fee at the annual rate of 0.03% of the average daily net assets attributable to Class F-3 and R-6 shares for CIInc’s provision of administrative services.
For the year ended June 30, 2021, class-specific expenses under the agreements were as follows (dollars in thousands):
| | Transfer agent | | | Administrative | |
| Share class | | services | | | services | |
| Class M | | $ | | 4 | | | $ | | — | |
| Class F-3 | | | | 1 | | | | | 24 | |
| Class R-6 | | | | — | * | | | | — | * |
| Total class-specific expenses | | $ | | 5 | | | $ | | 24 | |
| | * | Amount less than one thousand. |
| 20 | Emerging Markets Growth Fund |
Miscellaneous fee reimbursement — Expense limitations have been imposed through at least September 1, 2021, to limit the Class M total annual operating expense. For the year ended June 30, 2021, CIInc reimbursed miscellaneous fees of $2,096,000 for Class M shares, which CIInc does not intend to recoup. Fees and expenses in the statement of operations are presented gross of any reimbursements from CIInc.
Directors’ deferred compensation — Directors who were unaffiliated with CIInc may have elected to defer the cash payment of part or all of their compensation. These deferred amounts, which remain as liabilities of the fund, are treated as if invested in shares of the fund or other American Funds. These amounts represent general, unsecured liabilities of the fund and vary according to the total returns of the selected funds. Directors’ compensation of $830,000 in the fund’s statement of operations reflects $181,000 in current fees and a net increase of $649,000 in the value of the deferred amounts.
Affiliated officers and directors — Officers and certain directors of the fund are or may be considered to be affiliated with CIInc, AFD and AFS. No affiliated officers or directors received any compensation directly from the fund.
Investment in CCF — The fund holds shares of CCF, an institutional prime money market fund managed by Capital Research and Management Company (“CRMC”), an affiliate of CIInc. CCF invests in high-quality, short-term money market instruments. CCF is used as the primary investment vehicle for the fund’s short-term investments. CCF shares are only available for purchase by CRMC, its affiliates, and other funds managed by CRMC or its affiliates, and are not available to the public. CRMC does not receive an investment advisory services fee from CCF.
Security transactions with related funds — The fund purchased securities from, and sold securities to, other funds managed by CIInc (or funds managed by certain affiliates of CIInc) under procedures adopted by the fund’s board of directors. The funds involved in such transactions are considered related by virtue of having a common investment adviser (or affiliated investment advisers), common directors and/or common officers. Each transaction was executed at the current market price of the security and no brokerage commissions or fees were paid in accordance with Rule 17a-7 of the 1940 Act. During the year ended June 30, 2021, the fund engaged in such purchase and sale transactions with related funds in the amounts of $11,196,000 and $34,286,000, respectively, which generated $9,660,000 of net realized gains from such sales.
Interfund lending — Pursuant to an exemptive order issued by the SEC, the fund, along with other CIInc-managed funds (or funds managed by certain affiliates of CIInc), may participate in an interfund lending program. The program provides an alternate credit facility that permits the funds to lend or borrow cash for temporary purposes directly to or from one another, subject to the conditions of the exemptive order. The fund did not lend or borrow cash through the interfund lending program at any time during the year ended June 30, 2021.
8. Committed line of credit
The Fund participates with certain CIInc affiliates in a $1.5 billion credit facility (the “line of credit”) to be utilized for temporary purposes to support shareholder redemptions. The fund has agreed to pay commitment fees on its pro-rata portion of the line of credit, which are reflected in other expenses in the fund’s statement of operations. The fund did not borrow on this line of credit at any time during the year ended June 30, 2021.
9. Indemnifications
The fund’s organizational documents provide board members and officers with indemnification against certain liabilities or expenses in connection with the performance of their duties to the fund. In the normal course of business, the fund may also enter into contracts that provide general indemnifications. The fund’s maximum exposure under these arrangements is unknown since it is dependent on future claims that may be made against the fund. The risk of material loss from such claims is considered remote. Insurance policies are also available to the fund’s board members and officers.
| Emerging Markets Growth Fund | 21 |
10. Capital share transactions
Capital share transactions in the fund were as follows (dollars and shares in thousands):
| | | | | | | | | Reinvestments of | | | | | | Net increase | |
| | | Sales* | | | distributions | | | Repurchases* | | | (decrease) | |
| Share class | | Amount | | | Shares | | | Amount | | | Shares | | | Amount | | | Shares | | | Amount | | | Shares | |
| | | | | | | | | | | | | | | | | | | | | | | | | |
| Year ended June 30, 2021 | | | | | | | | | | | | | | | | | | | |
| | | | | | | | | | | | | | | | | | | | | | | | | | | | | | | | | |
| Class M | | $ | 30,815 | | | | 3,303 | | | $ | 113,289 | | | | 12,477 | | | $ | (85,971 | ) | | | (9,324 | ) | | $ | 58,133 | | | | 6,456 | |
| Class F-3 | | | 31,958 | | | | 3,349 | | | | 3,949 | | | | 436 | | | | (23,672 | ) | | | (2,722 | ) | | | 12,235 | | | | 1,063 | |
| Class R-6 | | | — | | | | — | | | | — | | | | — | | | | — | | | | — | | | | — | | | | — | |
| Total net increase (decrease) | | $ | 62,773 | | | | 6,652 | | | $ | 117,238 | | | | 12,913 | | | $ | (109,643 | ) | | | (12,046 | ) | | $ | 70,368 | | | | 7,519 | |
| | | | | | | | | | | | | | | | | | | | | | | | | | | | | | | | | |
| Year ended June 30, 2020 | | | | | | | | | | | | | | | | | | | |
| | | | | | | | | | | | | | | | | | | | | | | | | | | | | | | | | |
| Class M | | $ | 16,915 | | | | 2,306 | | | $ | 85,790 | | | | 10,449 | | | $ | (615,606 | ) | | | (78,299 | ) | | $ | (512,901 | ) | | | (65,544 | ) |
| Class F-3 | | | 29,666 | | | | 3,687 | | | | 3,163 | | | | 386 | | | | (3,699 | ) | | | (478 | ) | | | 29,130 | | | | 3,595 | |
| Class R-6 | | | — | | | | — | | | | 284 | | | | 34 | | | | (5,136 | ) | | | (620 | ) | | | (4,852 | ) | | | (586 | ) |
| Total net increase (decrease) | | $ | 46,581 | | | | 5,993 | | | $ | 89,237 | | | | 10,869 | | | $ | (624,441 | ) | | | (79,397 | ) | | $ | (488,623 | ) | | | (62,535 | ) |
| * | Includes exchanges between share classes of the fund. |
11. Investment transactions
The fund made purchases and sales of investment securities, excluding short-term securities and U.S. government obligations, if any, of $691,032,000 and $799,909,000, respectively, during the year ended June 30, 2021.
| 22 | Emerging Markets Growth Fund |
Financial highlights
| | | | | | Income from
investment operations1 | | | Dividends and distributions | | | | | | | | | | | | | | | | | | | |
| Period ended | | Net asset
value,
beginning
of year | | | Net
investment
income2,3 | | | Net gains on
securities (both
realized and
unrealized) | | | Total from
investment
operations | | | Dividends
(from net
investment
income) | | | Distributions
(from capital
gains) | | | Total
dividends
and
distributions | | | Net asset
value, end
of year | | | Total return4 | | | Net assets,
end of year
(in millions) | | | Ratio of
expenses to
average net
assets before
reimbursements5,6 | | | Ratio of
expenses to
average net
assets after
reimbursements4,5,6 | | | Ratio of
net income
to average
net assets2,3,4 | |
| Class M: | | | | | | | | | | | | | | | | | | | | | | | | | | | | | | | | | | | | | | | | | | | | | | | | | | | | |
| 6/30/2021 | | $ | 7.81 | | | $ | .11 | | | $ | 3.03 | | | $ | 3.14 | | | $ | (.08 | ) | | $ | (.54 | ) | | $ | (.62 | ) | | $ | 10.33 | | | | 41.33 | % | | $ | 2,222 | | | | .87 | % | | | .76 | % | | | 1.13 | % |
| 6/30/2020 | | | 8.06 | | | | .08 | | | | .16 | | | | .24 | | | | (.13 | ) | | | (.36 | ) | | | (.49 | ) | | | 7.81 | | | | 2.64 | | | | 1,629 | | | | .86 | | | | .78 | | | | 1.04 | |
| 6/30/2019 | | | 7.87 | | | | .09 | | | | .25 | | | | .34 | | | | (.09 | ) | | | (.06 | ) | | | (.15 | ) | | | 8.06 | | | | 4.71 | | | | 2,206 | | | | .84 | | | | .84 | | | | 1.25 | |
| 6/30/2018 | | | 7.34 | | | | .09 | | | | .53 | | | | .62 | | | | (.09 | ) | | | — | | | | (.09 | ) | | | 7.87 | | | | 8.43 | | | | 2,487 | | | | .87 | | | | .87 | | | | 1.06 | |
| 6/30/2017 | | | 5.92 | | | | .09 | | | | 1.40 | | | | 1.49 | | | | (.07 | ) | | | — | | | | (.07 | ) | | | 7.34 | | | | 25.43 | | | | 2,545 | | | | .85 | | | | .85 | | | | 1.40 | |
| Class F-3: | | | | | | | | | | | | | | | | | | | | | | | | | | | | | | | | | | | | | | | | | | | | | | | | | | | | |
| 6/30/2021 | | | 7.79 | | | | .10 | | | | 3.03 | | | | 3.13 | | | | (.08 | ) | | | (.54 | ) | | | (.62 | ) | | | 10.30 | | | | 41.27 | | | | 105 | | | | .89 | | | | .89 | | | | 1.06 | |
| 6/30/2020 | | | 8.05 | | | | .08 | | | | .15 | | | | .23 | | | | (.13 | ) | | | (.36 | ) | | | (.49 | ) | | | 7.79 | | | | 2.49 | | | | 71 | | | | .89 | | | | .89 | | | | 1.00 | |
| 6/30/2019 | | | 7.87 | | | | .14 | | | | .19 | | | | .33 | | | | (.09 | ) | | | (.06 | ) | | | (.15 | ) | | | 8.05 | | | | 4.55 | | | | 44 | | | | .88 | | | | .88 | | | | 1.79 | |
| 6/30/20187,8 | | | 7.82 | | | | .11 | | | | .03 | | | | .14 | | | | (.09 | ) | | | — | | | | (.09 | ) | | | 7.87 | | | | 1.77 | 9 | | | 6 | | | | .88 | 10 | | | .88 | 10 | | | 1.59 | 10 |
| Class R-6: | | | | | | | | | | | | | | | | | | | | | | | | | | | | | | | | | | | | | | | | | | | | | | | | | | | | |
| 6/30/2021 | | | 7.79 | | | | .09 | | | | 3.04 | | | | 3.13 | | | | — | | | | (.54 | ) | | | (.54 | ) | | | 10.38 | | | | 41.13 | | | | — | 11 | | | 1.00 | | | | .90 | | | | .99 | |
| 6/30/2020 | | | 8.05 | | | | .06 | | | | .17 | | | | .23 | | | | (.13 | ) | | | (.36 | ) | | | (.49 | ) | | | 7.79 | | | | 2.48 | | | | — | 11 | | | .91 | | | | .91 | | | | .71 | |
| 6/30/2019 | | | 7.86 | | | | .33 | | | | — | 12 | | | .33 | | | | (.08 | ) | | | (.06 | ) | | | (.14 | ) | | | 8.05 | | | | 4.60 | | | | 5 | | | | .90 | | | | .90 | | | | 4.20 | |
| 6/30/20187,8 | | | 7.82 | | | | .07 | | | | .06 | | | | .13 | | | | (.09 | ) | | | — | | | | (.09 | ) | | | 7.86 | | | | 1.59 | 9 | | | — | 11 | | | 1.07 | 10 | | | .92 | 10 | | | .99 | 10 |
| | | Year ended June 30, |
| | | 2021 | | 2020 | | 2019 | | 2018 | | 2017 |
| Portfolio turnover rate for all share classes13 | | | 35 | % | | | 40 | % | | | 38 | % | | | 37 | % | | | 46 | % |
| 1 | | Based on average shares outstanding. |
| 2 | | For the year ended June 30, 2020, this reflects the impact of European Union tax reclaims received that resulted in an increase to net investment income. Had the reclaims not been paid, the Class M net investment income per share and ratio of net income to average net assets would have been lower by $.01 and .12 percentage points, respectively. The impact to other share classes would have been similar. |
| 3 | | For the year ended June 30, 2017, this reflects the impact of European Union tax reclaims received that resulted in an increase to net investment income. Had the reclaims not been paid, the Class M net investment income per share and ratio of net income to average net assets would have been lower by $.02 and .34 percentage points, respectively. |
| 4 | | This column reflects the impact, if any, of certain reimbursements from CIInc. During some of the periods shown, CIInc reimbursed a portion of transfer agent services fees and/or reimbursed a portion of miscellaneous fees and expenses. |
| 5 | | This ratio does not include acquired fund fees and expenses. |
| 6 | | Ratios do not include expenses of any Central Funds. The fund indirectly bears its proportionate share of the expenses of any Central Funds. |
| 7 | | Based on operations for a period that is less than a full year. |
| 8 | | Class F-3 and R-6 shares began investment operations on September 1, 2017. |
| 9 | | Not annualized. |
| 10 | | Annualized. |
| 11 | | Amount less than $1 million. |
| 12 | | Amount less than $.01. |
| 13 | | Rates do not include the fund’s portfolio activity with respect to any Central Funds. |
See notes to financial statements.
| Emerging Markets Growth Fund | 23 |
Report of Independent Registered Public Accounting Firm
To the Board of Directors and Shareholders of Emerging Markets Growth Fund, Inc.
Opinion on the Financial Statements
We have audited the accompanying statement of assets and liabilities, including the investment portfolio, of Emerging Markets Growth Fund, Inc. (the “Fund”) as of June 30, 2021, the related statement of operations for the year ended June 30, 2021, the statement of changes in net assets for each of the two years in the period ended June 30, 2021, including the related notes, and the financial highlights for each of the periods indicated therein (collectively referred to as the “financial statements”). In our opinion, the financial statements present fairly, in all material respects, the financial position of the Fund as of June 30, 2021, the results of its operations for the year then ended, the changes in its net assets for each of the two years in the period ended June 30, 2021 and the financial highlights for each of the periods indicated therein in conformity with accounting principles generally accepted in the United States of America.
Basis for Opinion
These financial statements are the responsibility of the Fund’s management. Our responsibility is to express an opinion on the Fund’s financial statements based on our audits. We are a public accounting firm registered with the Public Company Accounting Oversight Board (United States) (PCAOB) and are required to be independent with respect to the Fund in accordance with the U.S. federal securities laws and the applicable rules and regulations of the Securities and Exchange Commission and the PCAOB.
We conducted our audits of these financial statements in accordance with the standards of the PCAOB. Those standards require that we plan and perform the audit to obtain reasonable assurance about whether the financial statements are free of material misstatement, whether due to error or fraud.
Our audits included performing procedures to assess the risks of material misstatement of the financial statements, whether due to error or fraud, and performing procedures that respond to those risks. Such procedures included examining, on a test basis, evidence regarding the amounts and disclosures in the financial statements. Our audits also included evaluating the accounting principles used and significant estimates made by management, as well as evaluating the overall presentation of the financial statements. Our procedures included confirmation of securities owned as of June 30, 2021 by correspondence with the custodian, transfer agent and brokers; when replies were not received from brokers, we performed other auditing procedures. We believe that our audits provide a reasonable basis for our opinion.
/s/ PricewaterhouseCoopers LLP
Los Angeles, California
August 16, 2021
We have served as the auditor of one or more investment companies in The Capital Group Companies Investment Company Complex since 1934.
| 24 | Emerging Markets Growth Fund |
As a fund shareholder, you incur ongoing costs, including investment advisory services fees and other expenses. This example is intended to help you understand your ongoing costs (in dollars) of investing in the fund so you can compare these costs with the ongoing costs of investing in other mutual funds. The example is based on an investment of $1,000 invested at the beginning of the period and held for the entire six-month period (January 1, 2021, through June 30, 2021).
Actual expenses:
The first line of each share class in the table on the following page provides information about actual account values and actual expenses. You may use the information in this line, together with the amount you invested, to estimate the expenses that you paid over the period. Simply divide your account value by $1,000 (for example, an $8,600 account value divided by $1,000 = 8.6), then multiply the result by the number in the first line under the heading titled “Expenses paid during period” to estimate the expenses you paid on your account during this period.
Hypothetical example for comparison purposes:
The second line of each share class in the table on the following page provides information about hypothetical account values and hypothetical expenses based on the actual expense ratio for the share class and an assumed rate of return of 5.00% per year before expenses, which is not the actual return of the share class. The hypothetical account values and expenses may not be used to estimate the actual ending account balance or expenses you paid for the period. You may use this information to compare the ongoing costs of investing in the fund and other funds. To do so, compare this 5.00% hypothetical example with the 5.00% hypothetical examples that appear in the shareholder reports of the other funds.
Notes:
Retirement plan participants may be subject to certain fees charged by the plan sponsor, and Class F-3 shareholders may be subject to fees charged by financial intermediaries, typically ranging from 0.75% to 1.50% of assets annually depending on services offered. You can estimate the impact of these fees by adding the amount of the fees to the total estimated expenses you paid on your account during the period as calculated above. In addition, your ending account value would be lower by the amount of these fees.
Note that the expenses shown in the table on the following page are meant to highlight your ongoing costs only and do not reflect any transactional costs, such as sales charges (loads). Therefore, the second line of each share class in the table is useful in comparing ongoing costs only and will not help you determine the relative total costs of owning different funds. In addition, if these transactional costs were included, your costs would have been higher.
| Emerging Markets Growth Fund | 25 |
Expense example (continued)
| | | Beginning
account value
1/1/2021 | | | Ending
account value
6/30/2021 | | | Expenses paid
during period* | | | Annualized
expense ratio | |
| Class M – actual return | | $ | 1,000.00 | | | $ | 1,100.10 | | | $ | 3.96 | | | | .76 | % |
| Class M – assumed 5% return | | | 1,000.00 | | | | 1,021.03 | | | | 3.81 | | | | .76 | |
| Class F-3 – actual return | | | 1,000.00 | | | | 1,099.26 | | | | 4.53 | | | | .87 | |
| Class F-3 – assumed 5% return | | | 1,000.00 | | | | 1,020.48 | | | | 4.36 | | | | .87 | |
| Class R-6 – actual return | | | 1,000.00 | | | | 1,100.75 | | | | 3.75 | | | | .72 | |
| Class R-6 – assumed 5% return | | | 1,000.00 | | | | 1,021.22 | | | | 3.61 | | | | .72 | |
| * | The “expenses paid during period” are equal to the “annualized expense ratio,” multiplied by the average account value over the period, multiplied by the number of days in the period, and divided by 365 (to reflect the one-half year period). |
We are required to advise you of the federal tax status of certain distributions received by shareholders during the fiscal year. The fund hereby designates the following amounts for the fund’s fiscal year ended June 30, 2021:
| Long-term capital gains | | | $103,906,000 |
| Foreign taxes | | | $0.02 per share |
| Foreign source income | | | $0.19 per share |
| Qualified dividend income | | | $29,389,000 |
| Corporate dividends received deduction | | | $206,000 |
| U.S. government income that may be exempt from state taxation | | | $14,000 |
Individual shareholders should refer to their Form 1099 or other tax information, which will be mailed in January 2022, to determine the calendar year amounts to be included on their 2021 tax returns. Shareholders should consult their tax advisors.
| 26 | Emerging Markets Growth Fund |
Approval of Investment Advisory and Service Agreement
The fund’s board has approved the continuation of the fund’s Investment Advisory and Service Agreement (the “agreement”) with Capital International, Inc. (the “investment adviser”) for an additional one-year term through July 31, 2022. The board approved the agreement following the recommendation of the fund’s Contracts Committee (the “committee”), which is composed of all the fund’s independent board members. The board and the committee determined in the exercise of their business judgment that the fund’s advisory fee structure was fair and reasonable in relation to the services provided, and that approving the agreement was in the best interests of the fund and its shareholders.
In reaching this decision, the board and the committee took into account information furnished to them throughout the year and otherwise provided to them, as well as information prepared specifically in connection with their review of the agreement, and were advised by their independent counsel with respect to the matters considered. They considered the following factors, among others, but did not identify any single issue or particular piece of information that, in isolation, was the controlling factor, and each board and committee member did not necessarily attribute the same weight to each factor.
1. Nature, extent and quality of services
The board and the committee considered the depth and quality of the investment adviser’s investment management process, including its global research capabilities; the experience, capability and integrity of its senior management and other personnel; the low turnover rates of its key personnel; the overall financial strength and stability of the investment adviser and the Capital Group organization; the resources and systems the investment adviser devotes to investment management (the manner in which the fund’s assets are managed, including liquidity management), financial, investment operations, compliance, trading, proxy voting, shareholder communications, and other services; and the ongoing evolution of the investment adviser’s organizational structure designed to maintain and strengthen these qualities. The board and the committee also considered the nature, extent and quality of administrative and shareholder services provided by the investment adviser to the fund under the agreement and other agreements, as well as the benefits to fund shareholders from investing in a fund that is part of a large family of funds. The board and the committee considered the risks assumed by the investment adviser in providing services to the fund, including operational, business, financial, reputational, regulatory and litigation risks. The board and the committee concluded that the nature, extent and quality of the services provided by the investment adviser have benefited and should continue to benefit the fund and its shareholders.
2. Investment results
The board and the committee considered the investment results of the fund in light of its objective. They compared the fund’s investment results with those of other funds (including funds that currently form the basis of the Lipper index for the category in which the fund is included), and data such as relevant market and fund indexes over various periods (including the fund’s lifetime) through December 31, 2020. They generally placed greater emphasis on investment results over longer term periods. On the basis of this evaluation and the board’s and the committee’s ongoing review of investment results, and considering the relative market conditions during certain reporting periods, the board and the committee concluded that the fund’s investment results have been satisfactory for renewal of the agreement, and that the investment adviser’s record in managing the fund indicated that its continued management should benefit the fund and its shareholders.
3. Advisory fees and total expenses
The board and the committee compared the advisory fees and total expense levels of the fund to those of other relevant funds. They observed that the fund’s advisory fees and expenses generally compared favorably to those of other similar funds included in the comparable Lipper category. The board and the committee also considered the breakpoint discounts in the fund’s advisory fee structure that reduce the level of fees charged by the investment adviser to the fund as fund assets increase. In addition, they reviewed information regarding the effective advisory fees charged to non-mutual fund clients by the investment adviser and its affiliates. They noted that, to the extent there were differences between the advisory fees paid by the fund and the advisory fees paid by those clients, the differences appropriately reflected the investment, operational, regulatory and market differences between advising the fund and the other clients. The board and the committee concluded that the fund’s cost structure was fair and reasonable in relation to the services provided, as well as in relation to the risks assumed by the adviser in sponsoring and managing the fund, and that the fund’s shareholders receive reasonable value in return for the advisory fees and other amounts paid to the investment adviser by the fund.
| Emerging Markets Growth Fund | 27 |
4. Ancillary benefits
The board and the committee considered a variety of other benefits that the investment adviser and its affiliates receive as a result of the investment adviser’s relationship with the fund, including fees for administrative services provided to the investment adviser; fees paid to the investment adviser’s affiliated transfer agent; sales charges and distribution fees received and retained by the fund’s principal underwriter, an affiliate of the investment adviser; and possible ancillary benefits to the investment adviser and its institutional management affiliates in managing other investment vehicles. The board and the committee reviewed the investment adviser’s portfolio trading practices, noting that, since 2019, the investment adviser has borne the cost of third-party research. The board and committee also noted that the investment adviser benefited from the use of commissions from portfolio transactions made on behalf of the fund to facilitate payment to certain broker-dealers for research to comply with regulatory requirements, with all such amounts reimbursed to the fund by the investment adviser. The board and the committee took these ancillary benefits into account in evaluating the reasonableness of the advisory fees and other amounts paid to the investment adviser by the fund.
5. Adviser financial information
The board and the committee reviewed information regarding the investment adviser’s costs of providing services to the fund, including personnel, systems and resources of investment, compliance, trading, accounting and other administrative operations. They considered the investment adviser’s costs and related cost allocation methodology as well as its track record of investing in technology, infrastructure and staff to maintain and expand services and capabilities, respond to industry and regulatory developments, and attract and retain qualified personnel. They noted information regarding the compensation structure for the investment adviser’s investment professionals. They reviewed information on the profitability of the investment adviser and its affiliates. The board and the committee also compared Capital Group’s profitability and compensation data to the reported results and data of several large, publicly held investment management companies. The board and the committee noted the competitiveness and cyclicality of both the mutual fund industry and the capital markets, and the importance in that environment of the Capital Group organization’s long-term profitability for maintaining its independence, company culture and management continuity. They further considered the breakpoint discounts in the fund’s advisory fee structure and the investment adviser’s sharing of potential economies of scale, or efficiencies, through breakpoints and other fee reductions and costs voluntarily absorbed. The board and the committee concluded that the fund’s advisory fee structure reflected a reasonable sharing of benefits between the investment adviser and the fund’s shareholders.
| 28 | Emerging Markets Growth Fund |
This page was intentionally left blank.
| Emerging Markets Growth Fund | 29 |
This page was intentionally left blank.
| 30 | Emerging Markets Growth Fund |
Board of directors and other officers
Independent directors1
Name, year of birth
and position with fund | | Year first
elected
a director
of the fund2 | | Principal occupation(s) during past five years | | Number of
portfolios in fund
complex3 overseen
by director | | Other directorships4
held by director |
| Joseph C. Berenato, 1946 | | 2016 | | Former Chairman and CEO, Ducommun Incorporated (aerospace components manufacturer) | | 15 | | Former director of Ducommun Incorporated (until 2017) |
Vanessa C. L. Chang, 1952
Chairman of the Board
(Independent and Non-Executive) | | 2016 | | Former Director, EL & EL Investments (real estate) | | 16 | | Edison International;
Southern California Edison; Sykes Enterprises; Transocean Ltd. |
| James G. Ellis, 1947 | | 2019 | | Professor of Marketing and former Dean, Marshall School of Business, University of Southern California | | 99 | | Advanced Merger Partners; J. G. Boswell (agricultural production); Mercury General Corporation |
| Jennifer C. Feikin, 1968 | | 2019 | | Business Advisor; previously held positions at Google; AOL, 20th Century Fox and McKinsey & Company; Trustee, The Nature Conservancy of California; former Director, First Descents | | 9 | | None |
| Pablo R. González Guajardo, 1967 | | 2019 | | CEO, Kimberly-Clark de México, SAB de CV | | 16 | | América Móvil, SAB de CV; Grupo Lala, SAB de CV; Grupo Sanborns, SAB de CV; Kimberly-Clark de México, SAB de CV |
| Leslie Stone Heisz, 1961 | | 2019 | | Former Managing Director, Lazard (retired 2010); Director, Edwards Lifesciences; Trustee, Public Storage; Director, Kaiser Permanente (California public benefit corporation); Lecturer, UCLA Anderson School of Management | | 9 | | Former director of Ingram Micro(technology distributor) (until 2016); Towers Watson (actuary/ benefits consultancy) (until 2016) |
| William D. Jones, 1955 | | 2019 | | Real estate developer/owner, President and CEO, CityLink Investment Corporation (acquires, develops and manages real estate ventures in urban communities) and for the former City Scene Management Company(provided commercial asset management services) | | 17 | | Biogen Inc.; Sempra Energy |
Interested director5
Name, year of birth
and position with fund | | Year first
elected
a director
or officer
of the fund2 | | Principal occupation(s) during past five years and
positions held with affiliated entities of the fund | | Number of
portfolios in fund
complex3 overseen
by director | | Other directorships4
held by director |
John S. Armour, 1957
Trustee | | 2019 | | President, Private Client Services Division, Capital Bank and Trust Company6 | | 9 | | None |
| Emerging Markets Growth Fund | 31 |
Other officers
Name, year of birth
and position with fund | | Year first
elected
an officer
of the fund2 | | Principal occupation(s) during past five years
and positions held with affiliated entities of the fund |
Victor D. Kohn, 1957
President | | 1996 | | Partner — Capital International Investors, Capital Research and Management Company;6
Partner — Capital International Investors, Capital Bank and Trust Company6
President and Director, Capital International, Inc. |
Michael W. Stockton, 1967
Executive Vice President | | 2021 | | Senior Vice President – Fund Business Management Group, Capital Research and Management Company6 |
Eu-Gene Cheah, 1965
Senior Vice President | | 2019 | | Partner – Capital International Investors, Capital International, Inc. |
F. Chapman Taylor, 1959
Senior Vice President | | 2011 | | Partner — Capital International Investors, Capital Research and Management Company6 |
Timothy W. McHale, 1978
Vice President | | 2016 | | Senior Vice President and Senior Counsel — Fund Business Management Group, Capital Research and Management Company;6 Secretary, American Funds Distributors, Inc.6 |
Courtney R. Taylor, 1975
Secretary | | 2016 | | Assistant Vice President — Fund Business Management Group, Capital Research and Management Company,6 |
Gregory F. Niland, 1971
Treasurer | | 2016 | | Vice President — Investment Operations, Capital Research and Management Company6 |
Susan K. Countess, 1966
Assistant Secretary | | 2016 | | Associate — Fund Business Management Group, Capital Research and Management Company6 |
Sandra Chuon, 1972
Assistant Treasurer | | 2019 | | Assistant Vice President — Investment Operations, Capital Research and Management Company6 |
Kyle J. Ilsley, 1980
Assistant Treasurer | | 2020 | | Assistant Vice President — Investment Operations, Capital Research and Management Company6 |
The fund’s statement of additional information (SAI) includes further details about fund directors. The address for all directors and officers of the fund is 333 South Hope Street, Los Angeles, CA 90071, Attention: Secretary.
The fund’s SAI, Proxy Voting Policy and Procedures, and proxy voting record for the 12 months ended June 30 are available free of charge on the U.S. Securities and Exchange Commission (SEC) website at sec.gov or upon request by calling (800) 421-4989.
The fund files a complete list of its portfolio holdings with the SEC for the first and third quarters of each fiscal year on Form N-PORT-EX. This filing is available free of charge on the SEC website. Additionally, the list of portfolio holdings is available by calling (800) 421-4989.
| 1 | The term independent director refers to a director who is not an “interested person” of the fund within the meaning of the Investment Company Act of 1940. |
| 2 | Directors and officers of the fund serve until their resignation, removal or retirement. |
| 3 | Funds managed by Capital International, Inc. or its affiliates. |
| 4 | This includes all directorships (other than those in the fund) that are held by each director as a director of a company with a class of securities registered pursuant to Section 12 of the Securities Exchange Act of 1934 or subject to the requirements of Section 15(d) of the Securities Exchange Act of 1934 or a company registered as an investment company under the 1940 Act. |
| 5 | The term interested director refers to a director who is an “interested person” within the meaning of the Investment Company Act of 1940, on the basis of their affiliation with the fund’s investment adviser, Capital International, Inc., or affiliated entities (including the fund’s principal underwriter). |
| 6 | Company affiliated with Capital International, Inc. |
| 32 | Emerging Markets Growth Fund |

Office of the fund
6455 Irvine Center Drive
Irvine, CA 92618-4518
Investment adviser
Capital International, Inc.
333 South Hope Street
Los Angeles, CA 90071-1406
Transfer agent for shareholder accounts
American Funds Service Company
6455 Irvine Center Drive
Irvine, CA 92618-4518
Custodian of assets
JPMorgan Chase Bank
270 Park Avenue
New York, NY 10017-2070
Counsel
Morgan, Lewis & Bockius LLP
One Federal Street
Boston, MA 02110-1726
Independent registered public accounting firm
PricewaterhouseCoopers LLP
601 South Figueroa Street
Los Angeles, CA 90017-3874
Principal underwriter
American Funds Distributors, Inc.
333 South Hope Street
Los Angeles, CA 90071-1406
This report is for the information of shareholders of Emerging Markets Growth Fund, but it also may be used as sales literature when preceded or accompanied by the current prospectus, which gives details about charges, expenses, investment objectives and operating policies of the fund.
If used as sales material after September 30, 2021, this report must be accompanied by a statistical update for the most recently completed calendar quarter.
Investors should carefully consider investment objectives, risks, charges and expenses. This and other important information is in the prospectus, which can be obtained from Capital International by calling (800) 421-4989 and should be read carefully before investing.
MSCI has not approved, reviewed or produced this report, makes no express or implied warranties or representations and is not liable whatsoever for any data in the report. You may not redistribute the MSCI data or use it as a basis for other indices or investment products.
All Capital Group trademarks mentioned are owned by The Capital Group Companies, Inc., an affiliated company or fund. All other company and product names mentioned are the property of their respective companies.
American Funds Distributors, Inc., member FINRA.

ITEM 2 – Code of Ethics
The Registrant has adopted a Code of Ethics that applies to its Principal Executive Officer and Principal Financial Officer. The Registrant undertakes to provide to any person without charge, upon request, a copy of the Code of Ethics. Such request can be made by calling 800/421-4989 or to the Secretary of the Registrant, 6455 Irvine Center Drive, Irvine, California 92618.
ITEM 3 – Audit Committee Financial Expert
The Registrant’s board has determined that Pablo R. González Guajardo, a member of the Registrant’s audit committee, is an “audit committee financial expert” and "independent," as such terms are defined in this Item. This designation will not increase the designee’s duties, obligations or liability as compared to his or her duties, obligations and liability as a member of the audit committee and of the board, nor will it reduce the responsibility of the other audit committee members. There may be other individuals who, through education or experience, would qualify as "audit committee financial experts" if the board had designated them as such. Most importantly, the board believes each member of the audit committee contributes significantly to the effective oversight of the Registrant’s financial statements and condition.
ITEM 4 – Principal Accountant Fees and Services
| a) Audit Fees: | | |
| Audit | 2020 | 1,000 |
| | 2021 | 119,000 |
| | | |
| b) Audit-Related Fees: | | |
| | 2020 | None |
| | 2021 | None |
| | | |
| c) Tax Fees: | | |
| | 2020 | 16,000 |
| | 2021 | 8,000 |
| | The tax fees consist of professional services relating to the preparation of the Registrant’s tax returns. | |
| | | |
| d) All Other Fees: | | |
| | 2020 | None |
| | 2021 | None |
| | | |
| | Adviser and affiliates (includes only fees for non-audit services billed to the adviser and affiliates for engagements that relate directly to the operations and financial reporting of the Registrant and were subject to the pre-approval policies described below): | |
| a) Audit Fees: | | |
| | Not Applicable | |
| | | |
| b) Audit-Related Fees: | | |
| | 2020 | None |
| | 2021 | None |
| | The audit-related fees consist of assurance and related services relating to the examination of the Registrant’s transfer agent, principal underwriter and investment adviser conducted in accordance with Statement on Standards for Attestation Engagements Number 18 issued by the American Institute of Certified Public Accountants. | |
| | | |
| c) Tax Fees: | | |
| | 2020 | 14,000 |
| | 2021 | None |
| | The tax fees consist of consulting services relating to the Registrant’s investments. | |
| | | |
| | | |
| d) All Other Fees: | | |
| | 2020 | 16,000 |
| | 2021 | None |
| | The other fees consist of subscription services related to an accounting research tool. | |
| | | |
| | | |
| | All audit and permissible non-audit services that the Registrant’s audit committee considers compatible with maintaining the independent registered public accounting firm’s independence are required to be pre-approved by the committee. The pre-approval requirement will extend to all non-audit services provided to the Registrant, the investment adviser, and any entity controlling, controlled by, or under common control with the investment adviser that provides ongoing services to the Registrant, if the engagement relates directly to the operations and financial reporting of the Registrant. The committee will not delegate its responsibility to pre-approve these services to the investment adviser. The committee may delegate to one or more committee members the authority to review and pre-approve audit and permissible non-audit services. Actions taken under any such delegation will be reported to the full committee at its next meeting. The pre-approval requirement is waived with respect to non-audit services if certain conditions are met. The pre-approval requirement was not waived for any of the non-audit services listed above provided to the Registrant, adviser and affiliates. | |
| | | |
| | Aggregate non-audit fees paid to the Registrant’s auditors, including fees for all services billed to the Registrant, adviser and affiliates that provide ongoing services to the Registrant, were $46,000 for fiscal year 2020 and $8,000 for fiscal year 2021. The non-audit services represented by these amounts were brought to the attention of the committee and considered to be compatible with maintaining the auditors’ independence. | |
ITEM 5 – Audit Committee of Listed Registrants
Not applicable to this Registrant, insofar as the Registrant is not a listed issuer as defined in Rule 10A-3 under the Securities Exchange Act of 1934.
ITEM 6 – Schedule of Investments
Not applicable, insofar as the schedule is included as part of the report to shareholders filed under Item 1 of this Form.
ITEM 7 – Disclosure of Proxy Voting Policies and Procedures for Closed-End Management Investment Companies
Not applicable to this Registrant, insofar as the Registrant is not a closed-end management investment company.
ITEM 8 – Portfolio Managers of Closed-End Management Investment Companies
Not applicable to this Registrant, insofar as the Registrant is not a closed-end management investment company.
ITEM 9 – Purchases of Equity Securities by Closed-End Management Investment Company and Affiliated Purchasers
Not applicable to this Registrant, insofar as the Registrant is not a closed-end management investment company.
ITEM 10 – Submission of Matters to a Vote of Security Holders
There have been no material changes to the procedures by which shareholders may recommend nominees to the Registrant’s board of directors since the Registrant last submitted a proxy statement to its shareholders. The procedures are as follows. The Registrant has a nominating committee comprised solely of persons who are not considered ‘‘interested persons’’ of the Registrant within the meaning of the Investment Company Act of 1940, as amended. The committee periodically reviews such issues as the board’s composition, responsibilities, committees, compensation and other relevant issues, and recommends any appropriate changes to the full board of directors. While the committee normally is able to identify from its own resources an ample number of qualified candidates, it will consider shareholder suggestions of persons to be considered as nominees to fill future vacancies on the board. Such suggestions must be sent in writing to the nominating committee of the Registrant, c/o the Registrant’s Secretary, and must be accompanied by complete biographical and occupational data on the prospective nominee, along with a written consent of the prospective nominee for consideration of his or her name by the nominating committee.
ITEM 11 – Controls and Procedures
| (a) | The Registrant’s Principal Executive Officer and Principal Financial Officer have concluded, based on their evaluation of the Registrant’s disclosure controls and procedures (as such term is defined in Rule 30a-3 under the Investment Company Act of 1940), that such controls and procedures are adequate and reasonably designed to achieve the purposes described in paragraph (c) of such rule. |
| | |
| (b) | There were no changes in the Registrant’s internal controls over financial reporting (as defined in Rule 30a-3(d) under the Investment Company Act of 1940) that occurred during the Registrant’s semi-annual period covered by this report that has materially affected, or is reasonably likely to materially affect, the Registrant’s internal control over financial reporting. |
ITEM 12 – Exhibits
| (a)(1) | The Code of Ethics that is the subject of the disclosure required by Item 2 is attached as an exhibit hereto. |
| | |
| (a)(2) | The certifications required by Rule 30a-2 of the Investment Company Act of 1940 and Sections 302 and 906 of the Sarbanes-Oxley Act of 2002 are attached as exhibits hereto. |
SIGNATURES
Pursuant to the requirements of the Securities Exchange Act of 1934 and the Investment Company Act of 1940, the Registrant has duly caused this report to be signed on its behalf by the undersigned, thereunto duly authorized.
| | EMERGING MARKETS GROWTH FUND, INC. |
| | |
| | By __/s/ Victor D. Kohn_________________ |
| | Victor D. Kohn, President and Principal Executive Officer |
| | |
| | Date: August 31, 2021 |
Pursuant to the requirements of the Securities Exchange Act of 1934 and the Investment Company Act of 1940, this report has been signed below by the following persons on behalf of the Registrant and in the capacities and on the dates indicated.
| By _ /s/ Victor D. Kohn_____________ |
Victor D. Kohn, President and Principal Executive Officer |
| |
| Date: August 31, 2021 |
| By ___/s/ Gregory F. Niland________________ |
Gregory F. Niland, Treasurer and Principal Financial Officer |
| |
| Date: August 31, 2021 |