Item 1. Report to Stockholders:
The following is a copy of the report transmitted to stockholders pursuant to Rule 30e-1 under the Investment Company Act of 1940:

What makes Putnam different?

In 1830, Massachusetts Supreme Judicial Court Justice Samuel Putnam established The Prudent Man Rule, a legal foundation for responsible money management.
THE PRUDENT MAN RULE
All that can be required of a trustee to invest is that he shall conduct himself faithfully and exercise a sound discretion. He is to observe how men of prudence, discretion, and intelligence manage their own affairs, not in regard to speculation, but in regard to the permanent disposition of their funds, considering the probable income, as well as the probable safety of the capital to be invested.

A time-honored tradition in money management
Since 1937, our values have been rooted in a profound sense of responsibility for the money entrusted to us.
A prudent approach to investing
We use a research-driven team approach to seek consistent, dependable, superior investment results over time, although there is no guarantee a fund will meet its objectives.
Funds for every investment goal
We offer a broad range of mutual funds and other financial products so investors and their advisors can build diversified portfolios.
A commitment to doing what’s right for investors
We have below-average expenses and stringent investor protections, and provide a wealth of information about the Putnam funds.
Industry-leading service
We help investors, along with their financial advisors, make informed investment decisions with confidence.
Putnam Ohio
Tax Exempt
Income Fund
|
11| 30| 05
Semiannual Report
| Message from the Trustees | 2 |
| About the fund | 4 |
| Report from the fund managers | 7 |
| Performance | 12 |
| Expenses | 15 |
| Portfolio turnover | 17 |
| Risk | 18 |
| Your fund’s management | 19 |
| Terms and definitions | 22 |
| Trustee approval of management contract | 24 |
| Other information for shareholders | 29 |
| Financial statements | 30 |
Cover photograph: © Richard H. Johnson
Message from the Trustees
Dear Fellow Shareholder
During the course of 2005, U.S. and global economies proved resilient in the face of some emerging challenges. Higher energy prices, mounting inflationary pressures, and damage caused by an unusually active hurricane season appeared at times to pose a risk to corporate earnings, raising investors’ concerns. The Federal Reserve Board’s program of interest-rate increases remained in effect throughout the year, as well. Nevertheless, in recent months the financial markets have demonstrated trends consistent with an expanding economy -- relative weakness for bonds and relative strength for stocks. With many companies appearing likely to deliver strong earnings, our teams are working to identify investment opportunities while remaining cognizant of the risks posed by higher energy prices in the winter months, as well as the possibility of continued increases in interest rates in 2006.
In our view, the professional research, diversification, and active management that mutual funds provide continue to make them an intelligent choice for investors. We want you to know that Putnam Investments’ management team, under the leadership of Chief Executive Officer Ed Haldeman, continues to focus on investment performance and remains committed to putting the interests of shareholders first. Also, in keeping with these goals, we have redesigned and expanded our shareholder reports to make it easier for you to learn more about your fund. Furthermore, on page 24 we provide information about the 2005 approval by the Trustees of your fund’s management contract with Putnam.
2
In the following pages, members of your fund’s management team discuss the fund’s performance and strategies, and their outlook for the months ahead. We thank you for your support of the Putnam funds throughout 2005 and wish you a happy and prosperous 2006.

Putnam Ohio Tax Exempt Income Fund: pursuing
tax-advantaged income for Ohio investors
Municipal bonds can help investors keep more of their investment income while also financing important public projects such as schools, roads, and hospitals. Municipal bonds are typically issued by states and local municipalities to raise funds for building and maintaining public facilities, and they offer income that is generally exempt from federal income tax.
For residents of the state where the bond is issued, income is typically exempt from state and any local income taxes as well. While the stated yields on municipal bonds are usually lower than those on taxable bonds, tax exemption is an especially powerful advantage in Ohio because the state’s top income tax rate is among the highest in the United States. And the sheer size of the Ohio municipal bond market provides a wide array of investment opportunities.
Putnam Ohio Tax Exempt Income Fund capitalizes on investment opportunities in Ohio by investing in bonds across a range of market sectors. The fund also combines bonds of differing credit quality to increase income potential. In addition to investing in high-quality bonds, the fund’s management team allocates a smaller portion of the portfolio to lower-rated bonds, which may offer higher income in return for more risk.
When deciding whether to invest in a bond, the fund’s management team considers the risks involved -- including credit risk, interest-rate risk, and the risk that the bond will be prepaid. The management team is backed by the resources of Putnam’s fixed-income organization, one of the largest in the investment industry, in which municipal bond analysts are grouped into sector teams and conduct ongoing, rigorous research. Once a bond has been purchased, the team continues to monitor developments that affect the bond market, the sector, and the issuer of the bond.
Municipal bonds may finance a range of projects in your community and thus play a key role in its development.

The goal of the fund’s in-depth research and active management is to stay a step ahead of the industry and pinpoint opportunities to adjust the fund’s holdings for the benefit of the fund and its shareholders.
The fund concentrates its investments by region and involves more risk than a fund that invests more broadly. Capital gains, if any, are taxable for federal and, in most cases, state purposes. For some investors, investment income may be subject to the federal alternative minimum tax. Income from federally exempt funds may be subject to state and local taxes. Mutual funds that invest in bonds are subject to certain risks, including interest-rate risk, credit risk, and inflation risk. As interest rates rise, the prices of bonds fall. Long-term bonds are more exposed to interest-rate risk than short-term bonds. Unlike bonds, bond funds have ongoing fees and expenses. Tax-free funds may not be suitable for IRAs and other non-taxable accounts. Please consult with your tax advisor for more information.
Understanding tax-equivalent yield
To understand the value of tax-free income, it is helpful to compare a municipal bond’s yield with the “tax-equivalent yield” - -- the before-tax yield that must be offered by a taxable bond in order to equal the municipal bond’s yield after taxes.
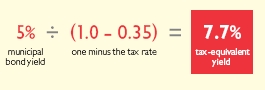
How to calculate tax-equivalent yield:
The tax-equivalent yield equals the municipal bond’s yield divided by “one minus the tax rate.” For example, if a municipal bond’s yield is 5%, then its tax-equivalent yield is 7.7%, assuming the maximum 35% federal tax rate for 2005.

Putnam Ohio Tax Exempt Income Fund seeks to provide as high a level of current income free from federal and state of Ohio personal income taxes as we believe to be consistent with the preservation of capital. It may be suitable for Ohio investors seeking tax-free income through a diversified portfolio of municipal bonds primarily issued in Ohio.
Highlights
• For the six months ended November 30, 2005, Putnam Ohio Tax Exempt Income Fund’s class A shares had a total return of –0.04% without sales charge.
• The fund’s benchmark, the Lehman Municipal Bond Index, returned 0.37% .
• The average return for the fund’s Lipper category, Ohio Municipal Debt Funds, was –0.19% .
• Additional fund performance, comparative performance, and Lipper data can be found in the performance section beginning on page 12.
Performance
Total return for class A shares for periods ended 11/30/05
Since the fund’s inception (10/23/89), average annual return is 5.93% at NAV and 5.68% at POP.
| | Average annual return | Cumulative return |
|
| | NAV | POP | NAV | POP |
| 10 years | 4.74% | 4.34% | 58.96% | 52.95% |
|
| 5 years | 5.26 | 4.45 | 29.24 | 24.35 |
|
| 3 years | 4.22 | 2.90 | 13.20 | 8.95 |
|
| 1 year | 3.22 | –0.63 | 3.22 | –0.63 |
|
| 6 months | -- | -- | –0.04 | –3.82 |
|
Data is historical. Past performance does not guarantee future results. More recent returns may be less or more than those shown. Investment return and principal value will fluctuate, and you may have a gain or a loss when you sell your shares. Performance assumes reinvestment of distributions and does not account for taxes. Returns at NAV do not reflect a sales charge of 3.75% . For the most recent month-end performance, visit www.putnam.com. For a portion of the period, this fund limited expenses, without which returns would have been lower. A short-term trading fee of up to 2% may apply.
6
Report from the fund managers
The period in review
Interest rates trended higher in the final months of the reporting period, eroding gains from earlier in the fiscal year, when rates were lower. Despite this inverse relationship of bond prices to interest rates, which contributed to lackluster returns for the period, Putnam Ohio Tax Exempt Income Fund enjoyed success on a number of fronts. Strong investor demand and solid credit fundamentals helped the lower-quality municipal bonds in the fund’s portfolio to outperform other sectors of the municipal bond market -- particularly tobacco settlement and hospital bonds. The pre-refunding of a revenue bond in the nursing home/assisted living sector also proved rewarding. The interplay of these and other positive factors generated performance at net asset value (NAV, or without sales charge) that was in line with the average return for the fund’s Lipper category. However, the fund’s performance at NAV modestly underperformed that of the Lehman Municipal Bond Index which invests in investment-grade municipal bonds from around the nation. Your fund invests mainly in Ohio municipal bonds, which were not among the stronger performers in the municipal bond market during the period.
Market overview
Signs of solid economic growth, and the desire to curb the potential inflation that may accompany economic growth, prompted the Federal Reserve Board (the Fed) to increase short-term interest rates four times in 0.25% increments during the first half of the fund’s fiscal year. As a result, the federal funds rate rose from 3.00% at the beginning of the period to 4.00% at period-end. Yields rose across all maturities during the period and the yield curve flattened as shorter-term rates rose more than longer-term rates. The yield curve is a graphical representation of yields for bonds of comparable quality plotted from the shortest to the longest maturity.
An improving economy and rising corporate earnings contributed to the strong performance of lower-rated
7
bonds. Among uninsured bonds in general and especially bonds rated Baa and below, yield spreads tightened based on strong interest among buyers in search of higher yields. Based on continued favorable legal rulings, spreads on tobacco settlement bonds narrowed. Airline-related industrial development bonds (IDBs) exhibited a high level of volatility and ended on price weakness as both Northwest and Delta filed for bankruptcy in September 2005. On a geographic basis, municipal bonds issued in the territory of Puerto Rico, which are tax exempt in all states, underperformed during the period. Callable bonds (which can be redeemed by their issuers before maturity) outperformed non-callable bonds, as investors expect that callable bonds will be generally less sensitive to interest-rate increases.
Strategy overview
Given our expectation for rising interest rates, we maintained a short (defensive) duration position for your fund’s portfolio, a strategy that contributed to relative results for the period as most rates rose. Duration is a measure of a fund’s sensitivity to changes in interest rates. Having a shorter-duration portfolio may help protect principal when interest rates are rising, but it can reduce the fund’s potential for appreciation when rates fall. One of the strategies we used to manage duration was selling Treasury bond futures. This
| Market sector performance | |
These indexes provide an overview of performance in different market sectors for the six months ended 11/30/05. | |
| Bonds | |
|
| Lehman Municipal Bond Index (tax-exempt bonds) | 0.37% |
|
| Lehman Aggregate Bond Index (broad bond market) | –0.48% |
|
| Lehman Intermediate Government Bond Index | |
| (intermediate-maturity U.S. Treasury and agency securities) | –0.21% |
|
| JP Morgan Global High Yield Index (global high-yield corporate bonds) | 2.72% |
| |
| Equities | |
|
| S&P 500 Index (broad stock market) | 5.88% |
|
| Russell 2000 Index (small-company stocks) | 10.47% |
|
| MSCI EAFE Index (international stocks) | 11.23% |
|
8
enabled us to achieve our target duration without trading large volumes of securities, which takes time and can be more expensive for the fund.
The fund benefited from its overweight to lower-rated, higher-yielding bonds in comparison with other funds in its peer group, as this segment of the market outperformed during the period. An overweight to tobacco settlement bonds relative to the fund’s peer group contributed to results as this sector also outperformed. The fund’s relative underweight to airline-related IDBs also contributed to relative performance as this sector underperformed over the period. We increased the fund’s exposure to the single-family housing sector, as we believe rising interest rates and declining mortgage prepayments will help this sector outperform.
Your fund’s holdings
With the U.S. economy prospering, higher-yielding, lower-rated municipal bonds performed well during the six-month period. Increased demand and the ensuing higher prices of these bonds have contributed to a narrowing of the yield spread between higher- and lower-quality issues in the sector. As a result, your fund’s investments in bonds rated Baa and below appreciated nicely.
Sometimes, avoiding the wrong investments can be just as rewarding as picking the right ones. Given our outlook for the automobile sector, we began to scale back the fund’s investments in
Comparison of the fund’s maturity and duration
This chart compares changes in the fund’s duration (a measure of its sensitivity to interest-rate changes) and its average effective maturity (a weighted average of the holdings’ maturities).

Average effective maturity also takes into account put and call features, where applicable, and reflects prepayments for mortgage-backed securities.
9
General Motors Corp. industrial development bonds (IDBs) early in 2005. IDBs are issued by municipalities but backed by the company that expects to benefit from the financing; thus, their performance tends to reflect trends in the backing company’s industry. By October, we had sold the entire position in the belief that these municipal bonds were in for a period of underperformance. This decision, which proved wise following the downgrading of these bonds, was the product of coordinated research among Putnam’s analysts in many areas of the fixed-income market -- tax exempt, investment-grade corporate, and taxable high yield. By sharing information and research efforts across markets, we believe we can maximize returns for our shareholders and minimize market risks and the inefficiencies that come from duplication of effort.
We believe that the market has over-discounted the potentially negative impact of mortgage prepayments on the single-family housing sector, particularly in light of rising interest rates, which are likely to slow prepayments. In August, we purchased single-family mortgage revenue bonds issued by the Ohio Housing Finance Agency. These bonds performed favorably this past fall in the higher-interest-rate environment.
Tobacco settlement bonds also enjoyed strong performance. Payments from tobacco settlement bonds are secured by income promised to various states through settlements
Credit quality overview
Credit qualities shown as a percentage of portfolio value as of 11/30/05. A bond rated Baa or higher is considered investment grade. The chart reflects Moody’s ratings; percentages may include bonds not rated by Moody’s but considered by Putnam Management to be of comparable quality. Ratings will vary over time.

10
from tobacco companies. This income could be jeopardized as a result of large judgments against the companies, and market sentiment with regard to this sector has tended to shift from concern about litigation to optimism. Bonds from this sector strengthened considerably as the outcome of various litigation efforts proved positive for the tobacco industry. The fund holds tobacco settlement bonds issued by the Children’s Trust Fund Tobacco Settlement of Puerto Rico as well as bonds issued by the Tobacco Settlement Financial Corporation of the Virgin Islands. Bonds issued by Puerto Rico and the Virgin Islands offer tax-exempt income to investors in all 50 states.
Please note that the holdings discussed in this report may not have been held by the fund for the entire period discussed, are subject to review in accordance with the fund’s investment strategy, and may vary in the future.
The outlook for your fund
The following commentary reflects anticipated developments that could affect your fund over the next six months, as well as your management team’s plans for responding to them.
We expect the Fed to maintain its policy of increasing rates into 2006. We also expect more Fed tightening than is currently anticipated by the market, and believe that bond yields may begin to rise more quickly as other investors come to the same conclusion. We currently plan to maintain the fund’s defensive duration and to continue to seek opportunities to increase the fund’s exposure to callable bonds, which, in our opinion, are likely to outperform in a rising-rate cycle.
We have a positive view of the single-family housing sector and plan to add selectively to the fund’s positions. As the outperformance of lower-rated, higher-yielding bonds appears to be slowing, we plan to continue to reduce the fund’s exposure to this segment of the credit spectrum. We remain bearish on airline-related IDBs, while our view on tobacco settlement bonds is positive.
We will continue to search for the most attractive opportunities among tax-exempt securities, and work to balance the pursuit of current income with prudent risk management.
The views expressed in this report are exclusively those of Putnam Management. They are not meant as investment advice.
This fund concentrates its investments by region and involves more risk than a fund that invests more broadly. Capital gains, if any, are taxable for federal and, in most cases, state purposes. For some investors, investment income may be subject to the federal alternative minimum tax. Income from federally exempt funds may be subject to state and local taxes. Mutual funds that invest in bonds are subject to certain risks, including interest-rate risk, credit risk, and inflation risk. As interest rates rise, the prices of bonds fall. Long-term bonds are more exposed to interest-rate risk than short-term bonds. Unlike bonds, bond funds have ongoing fees and expenses. Tax-free funds may not be suitable for IRAs and other non-taxable accounts.
11
This section shows your fund’s performance during the first half of its fiscal year, which ended November 30, 2005. In accordance with regulatory requirements, we also include performance for the most current calendar quarter-end. Performance should always be considered in light of a fund’s investment strategy. Data represents past performance. Past performance does not guarantee future results. More recent returns may be less or more than those shown. Investment return and principal value will fluctuate, and you may have a gain or a loss when you sell your shares. For the most recent month-end performance, please visit www.putnam.com or call Putnam at 1-800-225-1581.
| Fund performance | | | | | | | | |
Total return for periods ended 11/30/05 | | | | | | | | |
|
| |
| | Class A | | | Class B | | | Class M | |
|
| (inception dates) | (10/23/89) | | | (7/15/93) | | | (4/3/95) | |
|
| | NAV | POP | | NAV | CDSC | | NAV | POP |
| Annual average | | | | | | | | |
| (life of fund) | 5.93% | 5.68% | | 5.18% | 5.18% | | 5.57% | 5.36% |
|
| 10 years | 58.96 | 52.95 | | 49.10 | 49.10 | | 54.42 | 49.31 |
| Annual average | 4.74 | 4.34 | | 4.08 | 4.08 | | 4.44 | 4.09 |
|
| 5 years | 29.24 | 24.35 | | 25.13 | 23.13 | | 27.46 | 23.32 |
| Annual average | 5.26 | 4.45 | | 4.59 | 4.25 | | 4.97 | 4.28 |
|
| 3 years | 13.20 | 8.95 | | 11.00 | 8.00 | | 12.30 | 8.67 |
| Annual average | 4.22 | 2.90 | | 3.54 | 2.60 | | 3.94 | 2.81 |
|
| 1 year | 3.22 | –0.63 | | 2.55 | –2.41 | | 2.91 | –0.49 |
|
| 6 months | –0.04 | –3.82 | | –0.37 | –5.28 | | –0.19 | –3.46 |
|
Performance assumes reinvestment of distributions and does not account for taxes. Returns at public offering price (POP) for class A and M shares reflect a sales charge of 3.75% and 3.25%, respectively. Class B share returns reflect the applicable contingent deferred sales charge (CDSC), which is 5% in the first year, declining to 1% in the sixth year, and is eliminated thereafter. Performance for class B and M shares before their inception is derived from the historical performance of class A shares, adjusted for the applicable sales charge (or CDSC) and the higher operating expenses for such shares.
For a portion of the period, this fund limited expenses, without which returns would have been lower.
A 2% short-term trading fee may be applied to shares exchanged or sold within 5 days of purchase.
12
Comparative index returns
For periods ended 11/30/05
|
| | | Lipper Ohio |
| | Lehman Municipal | Municipal Debt Funds |
| | Bond Index | category average* |
|
| Annual average | | |
| (life of fund) | 6.85% | 6.13% |
|
| 10 years | 74.50 | 57.81 |
| Annual average | 5.73 | 4.66 |
|
| 5 years | 33.35 | 26.90 |
| Annual average | 5.93 | 4.87 |
|
| 3 years | 15.33 | 12.63 |
| Annual average | 4.87 | 4.04 |
|
| 1 year | 3.90 | 2.95 |
|
| 6 months | 0.37 | –0.19 |
|
Index and Lipper results should be compared to fund performance at net asset value.
* Over the 6-month and 1-, 3-, 5-, and 10-year periods ended 11/30/05, there were 42, 42, 42, 39, and 33 funds, respectively, in this Lipper category.
13
Fund price and distribution information
For the six-month period ended 11/30/05
| | | Class A | | | Class B | | | Class M | |
|
| Distributions (number) | | 6 | | | 6 | | | 6 | |
|
| Income1 | | $0.175015 | | $0.145130 | | | $0.161457 |
|
| Capital gains1 | | -- | | | -- | | | -- | |
|
| Total | | $0.175015 | | $0.145130 | | | $0.161457 |
|
| Share value: | | NAV | POP | | NAV | | | NAV | POP |
| 5/31/05 | | $9.22 | $9.58 | | $9.21 | | | $9.23 | $9.54 |
|
| 11/30/05 | | 9.04 | 9.39 | | 9.03 | | | 9.05 | 9.35 |
|
| Current yield (end of period) | | | | | | | | | |
| Current dividend rate2 | | 3.94% | 3.80% | | 3.27% | | | 3.63% | 3.52% |
|
| Taxable equivalent3 | | 6.55 | 6.32 | | 5.44 | | | 6.04 | 5.85 |
|
| Current 30-day SEC yield4 | | 3.15 | 3.04 | | 2.51 | | | 2.86 | 2.76 |
|
| Taxable equivalent3 | | 5.24 | 5.06 | | 4.17 | | | 4.76 | 4.59 |
|
1 Capital gains, if any, are taxable for federal and, in most cases, state purposes. For some investors, investment income may be subject to the federal alternative minimum tax. Income from federally exempt funds may be subject to state and local taxes.
2 Most recent distribution, excluding capital gains, annualized and divided by NAV or POP at end of period.
3 Assumes maximum 39.88% federal and state combined tax rate for 2005. Results for investors subject to lower tax rates would not be as advantageous.
4 Based only on investment income, calculated using SEC guidelines.
Fund performance for most recent calendar quarter
Total return for periods ended 12/31/05
| | Class A | | | Class B | | | Class M | |
|
| (inception dates) | (10/23/89) | | | (7/15/93) | | | (4/3/95) | |
|
| | NAV | POP | | NAV | CDSC | | NAV | CDSC |
| Annual average | | | | | | | | |
| (life of fund) | 5.94% | 5.70% | | 5.20% | 5.20% | | 5.59% | 5.38% |
|
| 10 years | 58.75 | 52.81 | | 48.97 | 48.97 | | 54.28 | 49.19 |
| Annual average | 4.73 | 4.33 | | 4.07 | 4.07 | | 4.43 | 4.08 |
|
| 5 years | 27.33 | 22.57 | | 23.27 | 21.27 | | 25.61 | 21.55 |
| Annual average | 4.95 | 4.15 | | 4.27 | 3.93 | | 4.67 | 3.98 |
|
| 3 years | 12.04 | 7.89 | | 9.73 | 6.74 | | 11.06 | 7.39 |
| Annual average | 3.86 | 2.56 | | 3.14 | 2.20 | | 3.56 | 2.41 |
|
| 1 year | 2.79 | –1.13 | | 2.12 | –2.82 | | 2.49 | –0.90 |
|
| 6 months | 0.30 | –3.47 | | –0.02 | –4.94 | | 0.17 | –3.11 |
|
14
Your fund’s expenses
As a mutual fund investor, you pay ongoing expenses, such as management fees, distribution fees (12b-1 fees), and other expenses. Using the information below, you can estimate how these expenses affect your investment and compare them with the expenses of other funds. You may also pay one-time transaction expenses, including sales charges (loads) and redemption fees, which are not shown in this section and would have resulted in higher total expenses. For more information, see your fund’s prospectus or talk to your financial advisor.
Review your fund’s expenses
The table below shows the expenses you would have paid on a $1,000 investment in Putnam Ohio Tax Exempt Income Fund from June 1, 2005, to November 30, 2005. It also shows how much a $1,000 investment would be worth at the close of the period, assuming actual returns and expenses.
| | Class A | Class B | | | Class M |
|
| Expenses paid per $1,000* | $ 4.36 | $ 7.61 | | | $ 5.86 |
|
| Ending value (after expenses) | $999.60 | $996.30 | | | $998.10 |
|
* Expenses for each share class are calculated using the fund’s annualized expense ratio for each class, which represents the ongoing expenses as a percentage of net assets for the six months ended 11/30/05. The expense ratio may differ for each share class (see the table at the bottom of the next page). Expenses are calculated by multiplying the expense ratio by the average account value for the period; then multiplying the result by the number of days in the period; and then dividing that result by the number of days in the year.
Estimate the expenses you paid
To estimate the ongoing expenses you paid for the six months ended November 30, 2005, use the calculation method below. To find the value of your investment on June 1, 2005, go to www.putnam.com and log on to your account. Click on the “Transaction History” tab in your Daily Statement and enter 06/01/2005 in both the “from” and “to” fields. Alternatively, call Putnam at 1-800-225-1581.

15
Compare expenses using the SEC’s method
The Securities and Exchange Commission (SEC) has established guidelines to help investors assess fund expenses. Per these guidelines, the table below shows your fund’s expenses based on a $1,000 investment, assuming a hypothetical 5% annualized return. You can use this information to compare the ongoing expenses (but not transaction expenses or total costs) of investing in the fund with those of other funds. All mutual fund shareholder reports will provide this information to help you make this comparison. Please note that you cannot use this information to estimate your actual ending account balance and expenses paid during the period.
| | Class A | Class B | | | Class M |
|
| Expenses paid per $1,000* | $ 4.41 | $ 7.69 | | | $ 5.92 |
|
| Ending value (after expenses) | $1,020.71 | $1,017.45 | | | $1,019.20 |
|
* Expenses for each share class are calculated using the fund’s annualized expense ratio for each class, which represents the ongoing expenses as a percentage of net assets for the six months ended 11/30/05. The expense ratio may differ for each share class (see the table at the bottom of this page). Expenses are calculated by multiplying the expense ratio by the average account value for the period; then multiplying the result by the number of days in the period; and then dividing that result by the number of days in the year.
Compare expenses using industry averages
You can also compare your fund’s expenses with the average of its peer group, as defined by Lipper, an independent fund-rating agency that ranks funds relative to others that Lipper considers to have similar investment styles or objectives. The expense ratio for each share class shown below indicates how much of your fund’s net assets have been used to pay ongoing expenses during the period.
| | Class A | Class B | Class M |
|
| Your fund’s annualized expense ratio | 0.87% | 1.52% | 1.17% |
|
| Average annualized expense ratio for Lipper peer group† | 0.91% | 1.56% | 1.21% |
|
† Simple average of the expenses of all front-end load funds in the fund’s Lipper peer group, calculated in accordance with Lipper’s standard method for comparing fund expenses (excluding 12b-1 fees and without giving effect to any expense offset and brokerage service arrangements that may reduce fund expenses). This average reflects each fund’s expenses for its most recent fiscal year available to Lipper as of 9/30/05. To facilitate comparison, Putnam has adjusted this average to reflect the 12b-1 fees carried by each class of shares. The peer group may include funds that are significantly smaller or larger than the fund, which may limit the comparability of the fund’s expenses to the simple average, which typically is higher than the asset-weighted average.
16
Your fund’s
portfolio turnover
|
Putnam funds are actively managed by teams of experts who buy and sell securities based on intensive analysis of companies, industries, economies, and markets. Portfolio turnover is a measure of how often a fund’s managers buy and sell securities for your fund. A portfolio turnover of 100%, for example, means that the managers sold and replaced securities valued at 100% of a fund’s assets within a one-year period. Funds with high turnover may be more likely to generate capital gains and dividends that must be distributed to shareholders as taxable income. High turnover may also cause a fund to pay more brokerage commissions and other transaction costs, which may detract from performance.
Funds that invest in bonds or other fixed-income instruments may have higher turnover than funds that invest only in stocks. Short-term bond funds tend to have higher turnover than longer-term bond funds, because shorter-term bonds will mature or be sold more frequently than longer-term bonds. You can use the table below to compare your fund’s turnover with the average turnover for funds in its Lipper category.
| Turnover comparisons | | | | | |
Percentage of holdings that change every year | | | |
|
| |
| | 2005 | 2004 | 2003 | 2002 | 2001 |
|
| Putnam Ohio Tax Exempt | | | | | |
| Income Fund | 12% | 17% | 26% | 17% | 12% |
|
| Lipper Ohio Municipal Debt | | | | | |
| Funds category average | 24% | 22% | 32% | 25% | 24% |
|
Turnover data for the fund is calculated based on the fund’s fiscal-year period, which ends on May 31. Turnover data for the fund’s Lipper category is calculated based on the average of the turnover of each fund in the category for its fiscal year ended during the indicated year. Fiscal years vary across funds in the Lipper category, which may limit the comparability of the fund’s portfolio turnover rate to the Lipper average. Comparative data for 2005 is based on information available as of 9/30/05.
17
Your fund’s risk
This risk comparison is designed to help you understand how your fund compares with other funds. The comparison utilizes a risk measure developed by Morningstar, an independent fund-rating agency. This risk measure is referred to as the fund’s Overall Morningstar Risk.
Your fund’s Overall Morningstar® Risk

Your fund’s Overall Morningstar Risk is shown alongside that of the average fund in its broad asset class, as determined by Morningstar. The risk bar broadens the comparison by translating the fund’s Overall Morningstar Risk into a percentile, which is based on the fund’s ranking among all funds rated by Morningstar as of December 31, 2005. A higher Overall Morningstar Risk generally indicates that a fund’s monthly returns have varied more widely.
Morningstar determines a fund’s Overall Morningstar Risk by assessing variations in the fund’s monthly returns -- with an emphasis on downside variations -- over 3-, 5-, and 10-year periods, if available. Those measures are weighted and averaged to produce the fund’s Overall Morningstar Risk. The information shown is provided for the fund’s class A shares only; information for other classes may vary. Overall Morningstar Risk is based on historical data and does not indicate future results. Morningstar does not purport to measure the risk associated with a current investment in a fund, either on an absolute basis or on a relative basis. Low Overall Morningstar Risk does not mean that you cannot lose money on an investment in a fund. Copyright 2004 Morningstar, Inc. All Rights Reserved. The information contained herein (1) is proprietary to Morningstar and/or its content providers; (2) may not be copied or distributed; and (3) is not warranted to be accurate, complete, or timely. Neither Morningstar nor its content providers are responsible for any damages or losses arising from any use of this information.
18
Your fund is managed by the members of the Putnam Tax Exempt Fixed-Income Team. David Hamlin is the Portfolio Leader, and Paul Drury, Susan McCormack, and James St. John are Portfolio Members of your fund. The Portfolio Leader and Portfolio Members coordinate the team’s management of the fund.
For a complete listing of the members of the Putnam Tax Exempt Fixed-Income Team, including those who are not Portfolio Leaders or Portfolio Members of your fund, visit Putnam’s Individual Investor Web site at www.putnam.com.
Fund ownership by the Portfolio Leader and Portfolio Members
The table below shows how much the fund’s current Portfolio Leader and Portfolio Members have invested in the fund (in dollar ranges). Information shown is as of November 30, 2005, and November 30, 2004.
| | | | $1 – | $10,001 – | $50,001 – | $100,001 – | $500,001 – | $1,000,001 |
| | Year | $0 | $10,000 | $50,000 | $100,000 | $500,000 | $1,000,000 | and over |
|
| David Hamlin | 2005 | • | | | | | | |
|
|
| Portfolio Leader | 2004 | • | | | | | | |
|
| Paul Drury | 2005 | • | | | | | | |
|
|
| Portfolio Member | 2004 | • | | | | | | |
|
| Susan McCormack | 2005 | • | | | | | | |
|
|
| Portfolio Member | 2004 | • | | | | | | |
|
| James St. John | 2005 | • | | | | | | |
|
|
| Portfolio Member | 2004 | • | | | | | | |
|
19
Fund manager compensation
|
The total 2004 fund manager compensation that is attributable to your fund is approximately $50,000. This amount includes a portion of 2004 compensation paid by Putnam Management to the fund managers listed in this section for their portfolio management responsibilities, calculated based on the fund assets they manage taken as a percentage of the total assets they manage. The compensation amount also includes a portion of the 2004 compensation paid to the Chief Investment Officer of the team and the Group Chief Investment Officer of the fund’s broader investment category for their oversight responsibilities, calculated based on the fund assets they oversee taken as a percentage of the total assets they oversee. This amount does not include compensation of other personnel involved in research, trading, administration, systems, compliance, or fund operations; nor does it include non-compensation costs. These percentages are determined as of the fund’s fiscal period-end. For personnel who joined Putnam Management during or after 2004, the calculation reflects annualized 2004 compensation or an estimate of 2005 compensation, as applicable.
Other Putnam funds managed by the Portfolio Leader and Portfolio Members
David Hamlin is the Portfolio Leader and Paul Drury, Susan McCormack, and James St. John are Portfolio Members for Putnam’s tax-exempt funds for the following states: Arizona, California, Florida, Massachusetts, Michigan, Minnesota, New Jersey, New York, and Pennsylvania. The same group also manages Putnam AMT-Free Insured Municipal Fund, Putnam California Investment Grade Municipal Trust, Putnam High Yield Municipal Trust, Putnam Investment Grade Municipal Trust, Putnam Managed Municipal Income Trust, Putnam Municipal Bond Fund, Putnam Municipal Opportunities Trust, Putnam New York Investment Grade Municipal Trust, Putnam Tax Exempt Income Fund, Putnam Tax-Free Health Care Fund, and Putnam Tax-Free High Yield Fund.
David Hamlin, Paul Drury, Susan McCormack, and James St. John may also manage other accounts and variable trust funds advised by Putnam Management or an affiliate.
Changes in your fund’s Portfolio Leader and Portfolio Members
Your fund’s Portfolio Leader and Portfolio Members did not change during the year ended November 30, 2005.
20
Fund ownership by Putnam’s Executive Board
The table below shows how much the members of Putnam’s Executive Board have invested in the fund (in dollar ranges). Information shown is as of November 30, 2005, and November 30, 2004.
| | | | | $1 – | $10,001 – | $50,001– | $100,001 |
| | Year | $0 | | $10,000 | $50,000 | $100,000 | and over |
| Philippe Bibi | 2005 | • | | | | |
|
|
| Chief Technology Officer | 2004 | • | | | | |
|
| Joshua Brooks | 2005 | • | | | | |
|
|
| Deputy Head of Investments | N/A | | | | | | |
|
| William Connolly | 2005 | • | | | | |
|
|
| Head of Retail Management | N/A | | | | | | |
|
| Kevin Cronin | 2005 | • | | | | |
|
|
| Head of Investments | 2004 | • | | | | |
|
| Charles Haldeman, Jr. | 2005 | | | | • | | |
|
|
| President and CEO | 2004 | | | | • | | |
|
| Amrit Kanwal | 2005 | • | | | | |
|
|
| Chief Financial Officer | 2004 | • | | | | |
|
| Steven Krichmar | 2005 | • | | | | |
|
|
| Chief of Operations | 2004 | • | | | | |
|
| Francis McNamara, III | 2005 | • | | | | |
|
|
| General Counsel | 2004 | • | | | | |
|
| Richard Robie, III | 2005 | • | | | | |
|
|
| Chief Administrative Officer | 2004 | • | | | | |
|
| Edward Shadek | 2005 | • | | | | |
|
|
| Deputy Head of Investments | N/A | | | | | | |
|
| Sandra Whiston | 2005 | • | | | | |
|
|
| Head of Institutional Management | N/A | | | | | | |
|
N/A indicates the individual was not a member of Putnam’s Executive Board as of 11/30/04.
21
Terms and definitions
Important terms
Total return shows how the value of the fund’s shares changed over time, assuming you held the shares through the entire period and reinvested all distributions in the fund.
Net asset value (NAV) is the price, or value, of one share of a mutual fund, without a sales charge. NAVs fluctuate with market conditions. NAV is calculated by dividing the net assets of each class of shares by the number of outstanding shares in the class.
Public offering price (POP) is the price of a mutual fund share plus the maximum sales charge levied at the time of purchase. POP performance figures shown here assume the 3.75% maximum sales charge for class A shares and 3.25% for class M shares.
Contingent deferred sales charge (CDSC) is a charge applied at the time of the redemption of class B shares and assumes redemption at the end of the period. Your fund’s class B CDSC declines from a 5% maximum during the first year to 1% during the sixth year. After the sixth year, the CDSC no longer applies.
Share classes
Class A shares are generally subject to an initial sales charge and no sales charge on redemption (except on certain redemptions of shares bought without an initial sales charge).
Class B shares may be subject to a sales charge upon redemption.
Class M shares have a lower initial sales charge and a higher 12b-1 fee than class A shares and no sales charge on redemption.
22
Comparative indexes
JP Morgan Global High Yield Index is an unmanaged index of global high-yield fixed-income securities.
Lehman Aggregate Bond Index is an unmanaged index of U.S. investment-grade fixed-income securities.
Lehman Intermediate Government Bond Index is an unmanaged index of U.S. Treasury and agency securities with maturities between 1 and 10 years.
Lehman Municipal Bond Index is an unmanaged index of long-term fixed-rate investment-grade tax-exempt bonds.
Morgan Stanley Capital International (MSCI) EAFE Index is an unmanaged index of equity securities from developed countries in Western Europe, the Far East, and Australasia.
Russell 2000 Index is an unmanaged index of the 2,000 smallest companies in the Russell 3000 Index.
S&P 500 Index is an unmanaged index of common stock performance.
Indexes assume reinvestment of all distributions and do not account for fees. Securities and performance of a fund and an index will differ. You cannot invest directly in an index.
Lipper is a third-party industry-ranking entity that ranks mutual funds. Lipper rankings are based on total return at net asset value and do not reflect sales charges. Funds are ranked among other funds with similar current investment styles or objectives as determined by Lipper. Lipper may change a fund’s category assignment at its discretion. Lipper category averages reflect performance trends for funds within a category.
23
Trustee approval of
management contract
|
General conclusions
The Board of Trustees of the Putnam funds oversees the management of each fund and, as required by law, determines annually whether to approve the continuance of your fund’s management contract with Putnam Management. In this regard, the Board of Trustees, with the assistance of its Contract Committee consisting solely of Trustees who are not “interested persons” (as such term is defined in the Investment Company Act of 1940, as amended) of the Putnam funds (the “Independent Trustees”), requests and evaluates all information it deems reasonably necessary under the circumstances. Over the course of several months beginning in March and ending in June 2005, the Contract Committee met five times to consider the information provided by Putnam Management and other information developed with the assistance of the Board’s independent counsel and independent staff. The Contract Committee reviewed and discussed key aspects of this information with all of the Independent Trustees. Upon completion of this review, the Contract Committee recommended and the Independent Trustees approved the continuance of your fund’s management contract, effective July 1, 2005.
This approval was based on the following conclusions:
• That the fee schedule currently in effect for your fund represents reasonable compensation in light of the nature and quality of the services being provided to the fund, the fees paid by competitive funds and the costs incurred by Putnam Management in providing such services, and
• That such fee schedule represents an appropriate sharing between fund shareholders and Putnam Management of such economies of scale as may exist in the management of the fund at current asset levels.
These conclusions were based on a comprehensive consideration of all information provided to the Trustees and were not the result of any single factor. Some of the factors that figured particularly in the Trustees’ deliberations and how the Trustees considered these factors are described below, although individual Trustees may have evaluated the information presented differently, giving different weights to various factors. It is also important to recognize that the fee arrangements for your fund and the other Putnam funds are the result of many years of review and discussion between the Independent Trustees and Putnam Management, that certain aspects of such arrangements may receive greater scrutiny in some years than others, and that the Trustees’ conclusions may be based, in part, on their consideration of these same arrangements in prior years.
24
Model fee schedules and categories; total expenses
The Trustees’ review of the management fees and total expenses of the Putnam funds focused on three major themes:
• Consistency. The Trustees, working in cooperation with Putnam Management, have developed and implemented a series of model fee schedules for the Putnam funds designed to ensure that each fund’s management fee is consistent with the fees for similar funds in the Putnam family of funds and compares favorably with fees paid by competitive funds sponsored by other investment advisors. Under this approach, each Putnam fund is assigned to one of several fee categories based on a combination of factors, including competitive fees and perceived difficulty of management, and a common fee schedule is implemented for all funds in a given fee category. The Trustees reviewed the model fee schedule currently in effect for your fund, including fee levels and breakpoints, and the assignment of the fund to a particular fee category under this structure. (“Breakpoints” refer to reductions in fee rates that apply to additional assets once specified asset levels are reached.) The Trustees concluded that no changes should be made in the fund’s current fee schedule at this time.
• Competitiveness. The Trustees also reviewed comparative fee and expense information for competitive funds, which indicated that, in a custom peer group of competitive funds selected by Lipper Inc., your fund ranked in the 44th percentile in management fees and in the 44th percentile in total expenses (less any applicable 12b-1 fees) as of December 31, 2004 (the first percentile being the least expensive funds and the 100th percentile being the most expensive funds). (Because the fund’s custom peer group is smaller than the fund’s broad Lipper Inc. peer group, this expense comparison may differ from the Lipper peer expense information found elsewhere in this report.) The Trustees noted that expense ratios for a number of Putnam funds, which show the percentage of fund assets used to pay for management and administrative services, distribution (12b-1) fees and other expenses, had been increasing recently as a result of declining net assets and the natural operation of fee breakpoints. They noted that such expense ratio increases were currently being controlled by expense limitations implemented in January 2004 and which Putnam Management, in consultation with the Contract Committee, has committed to maintain at least through 2006. The Trustees expressed their intention to monitor this information closely to ensure that fees and expenses of the Putnam funds continue to meet evolving competitive standards.
• Economies of scale. The Trustees concluded that the fee schedule currently in effect for your fund represents an appropriate sharing of economies of scale at current asset levels. Your fund currently has the benefit of breakpoints in its management fee that provide shareholders with significant economies of scale, which means that the effective management fee rate of a fund (as a percentage of fund assets) declines as a fund grows in size and crosses specified asset thresholds. The Trustees examined the existing breakpoint structure of the Putnam funds’ management fees in light of competitive industry practices. The Trustees considered various possible modifications to the Putnam funds’ current breakpoint structure, but
25
ultimately concluded that the current breakpoint structure continues to serve the interests of fund shareholders. Accordingly, the Trustees continue to believe that the fee schedules currently in effect for the funds represent an appropriate sharing of economies of scale at current asset levels. The Trustees noted that significant redemptions in many Putnam funds, together with significant changes in the cost structure of Putnam Management, have altered the economics of Putnam Management’s business in significant ways. In view of these changes, the Trustees intend to consider whether a greater sharing of the economies of scale by fund shareholders would be appropriate if and when aggregate assets in the Putnam funds begin to experience meaningful growth.
In connection with their review of the management fees and total expenses of the Putnam funds, the Trustees also reviewed the costs of the services to be provided and profits to be realized by Putnam Management and its affiliates from the relationship with the funds. This information included trends in revenues, expenses and profitability of Putnam Management and its affiliates relating to the investment management and distribution services provided to the funds. In this regard, the Trustees also reviewed an analysis of Putnam Management’s revenues, expenses and profitability with respect to the funds’ management contracts, allocated on a fund-by-fund basis.
The quality of the investment process provided by Putnam Management represented a major factor in the Trustees’ evaluation of the quality of services provided by Putnam Management under your fund’s management contract. The Trustees were assisted in their review of the funds’ investment process and performance by the work of the Investment Oversight Committees of the Trustees, which meet on a regular monthly basis with the funds’ portfolio teams throughout the year. The Trustees concluded that Putnam Management generally provides a high-quality investment process -- as measured by the experience and skills of the individuals assigned to the management of fund portfolios, the resources made available to such personnel, and in general the ability of Putnam Management to attract and retain high-quality personnel -- but also recognize that this does not guarantee favorable investment results for every fund in every time period. The Trustees considered the investment performance of each fund over multiple time periods and considered information comparing the fund’s performance with various benchmarks and with the performance of competitive funds. The Trustees noted the satisfactory investment performance of many Putnam funds. They also noted the disappointing investment performance of certain funds in recent years and continued to discuss with senior management of Putnam Management the factors contributing to such underperformance and actions being taken to improve performance. The Trustees recognized that, in recent years, Putnam Management has made significant changes in its investment personnel and processes and in the fund product line to address areas of
26
underperformance. The Trustees indicated their intention to continue to monitor performance trends to assess the effectiveness of these changes and to evaluate whether additional remedial changes are warranted.
In the case of your fund, the Trustees considered that your fund’s class A share performance at net asset value was in the following percentiles of its Lipper Inc. peer group (compared using tax-adjusted performance to recognize the different federal income tax treatment for capital gains distributions and exempt-interest distributions) for the one-, three- and five-year periods ended December 31, 2004 (the first percentile being the best-performing funds and the 100th percentile being the worst-performing funds):
| One-year period | Three-year period | Five-year period |
|
| 51st | 40th | 36th |
(Because of the passage of time, these performance results may differ from the performance results for more recent periods shown elsewhere in this report.)
As a general matter, the Trustees believe that cooperative efforts between the Trustees and Putnam Management represent the most effective way to address investment performance problems. The Trustees believe that investors in the Putnam funds have, in effect, placed their trust in the Putnam organization, under the oversight of the funds’ Trustees, to make appropriate decisions regarding the management of the funds. Based on the responsiveness of Putnam Management in the recent past to Trustee concerns about investment performance, the Trustees believe that it is preferable to seek change within Putnam Management to address performance shortcomings. In the Trustees’ view, the alternative of terminating a management contract and engaging a new investment advisor for an underperforming fund would entail significant disruptions and would not provide any greater assurance of improved investment performance.
Brokerage and soft-dollar allocations; other benefits
The Trustees considered various potential benefits that Putnam Management may receive in connection with the services it provides under the management contract with your fund. These include principally benefits related to brokerage and soft-dollar allocations, whereby a portion of the commissions paid by a fund for brokerage is earmarked to pay for research services that may be utilized by a fund’s investment advisor, subject to the obligation to seek best execution. The Trustees believe that soft-dollar credits and other potential benefits associated with the allocation of fund brokerage, which pertains mainly to funds investing in equity securities, represent assets of the funds that should be used for the benefit of fund shareholders. This area has been marked by significant change in recent years. In July 2003, acting upon the Contract Committee’s recommendation, the Trustees directed that allocations of brokerage to reward firms that sell fund shares be discontinued no later than December 31, 2003. In addition,
27
commencing in 2004, the allocation of brokerage commissions by Putnam Management to acquire research services from third-party service providers has been significantly reduced, and continues at a modest level only to acquire research that is customarily not available for cash. The Trustees will continue to monitor the allocation of the funds’ brokerage to ensure that the principle of “best price and execution” remains paramount in the portfolio trading process.
The Trustees’ annual review of your fund’s management contract also included the review of its distributor’s contract and distribution plan with Putnam Retail Management Limited Partnership and the custodian agreement and investor servicing agreement with Putnam Fiduciary Trust Company, all of which provide benefits to affiliates of Putnam Management.
Comparison of retail and institutional fee schedules
The information examined by the Trustees as part of their annual contract review has included for many years information regarding fees charged by Putnam Management and its affiliates to institutional clients such as defined benefit pension plans, college endowments, etc. This information included comparison of such fees with fees charged to the funds, as well as a detailed assessment of the differences in the services provided to these two types of clients. The Trustees observed, in this regard, that the differences in fee rates between institutional clients and the mutual funds are by no means uniform when examined by individual asset sectors, suggesting that differences in the pricing of investment management services to these types of clients reflect to a substantial degree historical competitive forces operating in separate market places. The Trustees considered the fact that fee rates across all asset sectors are higher on average for mutual funds than for institutional clients, as well as the differences between the services that Putnam Management provides to the Putnam funds and those that it provides to institutional clients of the firm, but have not relied on such comparisons to any significant extent in concluding that the management fees paid by your fund are reasonable.
28
Other information
for shareholders
|
Important notice regarding delivery of shareholder documents
In accordance with SEC regulations, Putnam sends a single copy of annual and semiannual shareholder reports, prospectuses, and proxy statements to Putnam shareholders who share the same address. If you prefer to receive your own copy of these documents, please call Putnam at 1-800-225-1581, and Putnam will begin sending individual copies within 30 days.
Proxy voting
Putnam is committed to managing our mutual funds in the best interests of our shareholders. The Putnam funds’ proxy voting guidelines and procedures, as well as information regarding how your fund voted proxies relating to portfolio securities during the 12-month period ended June 30, 2005, are available on the Putnam Individual Investor Web site, www.putnam.com/individual, and on the SEC’s Web site, www.sec.gov. If you have questions about finding forms on the SEC’s Web site, you may call the SEC at 1-800-SEC-0330. You may also obtain the Putnam funds’ proxy voting guidelines and procedures at no charge by calling Putnam’s Shareholder Services at 1-800-225-1581.
Fund portfolio holdings
The fund will file a complete schedule of its portfolio holdings with the SEC for the first and third quarters of each fiscal year on Form N-Q. Shareholders may obtain the fund’s Forms N-Q on the SEC’s Web site at www.sec.gov. In addition, the fund’s Forms N-Q may be reviewed and copied at the SEC’s public reference room in Washington, D.C. You may call the SEC at 1-800-SEC-0330 for information about the SEC’s Web site or the operation of the public reference room.
29
Financial statements
A guide to financial statements
These sections of the report, as well as the accompanying Notes, constitute the fund’s financial statements.
The fund’s portfolio lists all the fund’s investments and their values as of the last day of the reporting period. Holdings are organized by asset type and industry sector, country, or state to show areas of concentration and diversification.
Statement of assets and liabilities shows how the fund’s net assets and share price are determined. All investment and noninvestment assets are added together. Any unpaid expenses and other liabilities are subtracted from this total. The result is divided by the number of shares to determine the net asset value per share, which is calculated separately for each class of shares. (For funds with preferred shares, the amount subtracted from total assets includes the liquidation preference of preferred shares.)
Statement of operations shows the fund’s net investment gain or loss. This is done by first adding up all the fund’s earnings -- from dividends and interest income - -- and subtracting its operating expenses to determine net investment income (or loss). Then, any net gain or loss the fund realized on the sales of its holdings - -- as well as any unrealized gains or losses over the period -- is added to or subtracted from the net investment result to determine the fund’s net gain or loss for the fiscal period.
Statement of changes in net assets shows how the fund’s net assets were affected by the fund’s net investment gain or loss, by distributions to shareholders, and by changes in the number of the fund’s shares. It lists distributions and their sources (net investment income or realized capital gains) over the current reporting period and the most recent fiscal year-end. The distributions listed here may not match the sources listed in the Statement of operations because the distributions are determined on a tax basis and may be paid in a different period from the one in which they were earned.
Financial highlights provide an overview of the fund’s investment results, per-share distributions, expense ratios, net investment income ratios, and portfolio turnover in one summary table, reflecting the five most recent reporting periods. In a semiannual report, the highlight table also includes the current reporting period. For open-end funds, a separate table is provided for each share class.
30
The fund’s portfolio 11/30/05 (Unaudited)
| Key to abbreviations | |
| AMBAC AMBAC Indemnity Corporation | FSA Financial Security Assurance |
| COP Certificate of Participation | GNMA Coll. Government National Mortgage |
| FGIC Financial Guaranty Insurance Company | Association Collateralized |
| FHA Insd. Federal Housing Administration Insured | G.O. Bonds General Obligation Bonds |
| FHLMC Coll. Federal Home Loan Mortgage | IFB Inverse Floating Rate Bonds |
| Corporation Collateralized | MBIA MBIA Insurance Company |
| FNMA Coll. Federal National Mortgage | VRDN Variable Rate Demand Notes |
| Association Collateralized | |
| MUNICIPAL BONDS AND NOTES (95.1%)* | | | | | |
|
| | Rating ** | Principal amount | | Value |
| |
| Ohio (91.8%) | | | | | |
| Akron, Wtr. Wks. Rev. Bonds, MBIA | | | | | |
| 6s, 12/1/12 | Aaa | $ | 875,000 | $ | 995,628 |
| 5 1/4s, 12/1/17 | Aaa | | 1,285,000 | | 1,383,714 |
| Allen Cnty., G.O. Bonds, AMBAC, | | | | | |
| 5s, 12/1/06 | Aaa | | 1,375,000 | | 1,398,760 |
| Anthony Wayne Local School Dist. G.O. | | | | | |
| Bonds (School Fac. Construction & Impt.), | | | | | |
| FSA, 5 1/2s, 12/1/19 | Aaa | | 1,565,000 | | 1,694,113 |
| Brecksville-Broadview Heights, City School | | | | | |
| Dist. G.O. Bonds, FGIC, 6 1/2s, 12/1/16 | Aaa | | 1,500,000 | | 1,575,660 |
| Brookville, Local School Dist. G.O. Bonds, | | | | | |
| FSA, 5s, 12/1/26 | Aaa | | 1,500,000 | | 1,559,040 |
| Butler Cnty., G.O. Bonds, MBIA, | | | | | |
| 5 1/4s, 12/1/20 | Aaa | | 1,000,000 | | 1,075,550 |
| Cincinnati, City School Dist. G.O. Bonds | | | | | |
| (Classroom Fac. Construction & Impt.), FSA | | | | | |
| 5s, 12/1/27 | Aaa | | 1,500,000 | | 1,555,965 |
| 5s, 12/1/06 | AAA | | 3,000,000 | | 3,051,840 |
| Cleveland, G.O. Bonds, FGIC, 5 1/4s, | | | | | |
| 8/1/23 (Prerefunded) | AAA | | 500,000 | | 549,135 |
| Cleveland, Muni. School Dist. G.O. Bonds, | | | | | |
| FSA, 5s, 12/1/27 | Aaa | | 1,375,000 | | 1,428,955 |
| Cleveland, State U. Rev. Bonds, FGIC, | | | | | |
| 5s, 6/1/29 # | AAA | | 3,000,000 | | 3,111,270 |
| Cleveland, Urban Renewal Increment | | | | | |
| Rev. Bonds (Rock & Roll Hall of Fame), | | | | | |
| 6 3/4s, 3/15/18 | BBB-/P | | 1,150,000 | | 1,154,991 |
| Cleveland-Cuyahoga Cnty., Port. Auth. | | | | | |
| Rev. Bonds (Rock & Roll Hall of Fame), | | | | | |
| FSA, 3.6s, 12/1/14 | Aaa | | 500,000 | | 500,165 |
| Cuyahoga Cnty., G.O. Bonds, 5s, | | | | | |
| 12/1/18 (Prerefunded) | Aa1 | | 1,500,000 | | 1,597,935 |
31
| MUNICIPAL BONDS AND NOTES (95.1%)* continued | | | | |
|
| | Rating ** | Principal amount | | Value |
| |
| Ohio continued | | | | | |
| Cuyahoga Cnty., Rev. Bonds, Ser. A, 6s, 1/1/32 | Aa3 | $ | 1,500,000 | $ | 1,642,980 |
| Cuyahoga Cnty., Hosp. VRDN (U. Hosp.), | | | | | |
| 2.9s, 1/1/16 | VMIG1 | | 4,000,000 | | 4,000,000 |
| Cuyahoga Falls, G.O. Bonds, MBIA, | | | | | |
| 5s, 12/1/24 | Aaa | | 1,645,000 | | 1,714,287 |
| Delaware City, School Dist. G.O. Bonds, | | | | | |
| MBIA, 5s, 12/1/20 | AAA | | 1,160,000 | | 1,228,881 |
| Delaware Cnty., Cap. Fac. G.O. Bonds, | | | | | |
| 6 1/4s, 12/1/16 (Prerefunded) | AA+ | | 1,000,000 | | 1,132,800 |
| Dublin, G.O. Bonds, Ser. B, 6.4s, 12/1/14 | Aaa | | 1,300,000 | | 1,505,179 |
| Erie Cnty., OH Hosp. Fac. Rev. Bonds | | | | | |
| (Firelands Regl. Med. Ctr.), 5 5/8s, 8/15/32 | A2 | | 1,000,000 | | 1,053,130 |
| Field, Local School Dist. G.O. Bonds | | | | | |
| (School Fac. Construction & Impt.), | | | | | |
| AMBAC, 5s, 12/1/22 | Aaa | | 1,170,000 | | 1,230,466 |
| Franklin Cnty., G.O. Bonds | | | | | |
| 5 3/8s, 12/1/20 | Aaa | | 2,170,000 | | 2,319,795 |
| 5s, 6/1/07 | Aaa | | 2,955,000 | | 3,028,698 |
| Franklin Cnty., Rev. Bonds (OCLC Online | | | | | |
| Computer Library Ctr.), 5s, 4/15/13 | A | | 2,610,000 | | 2,729,120 |
| Franklin Cnty., Dev. Rev. Bonds (American | | | | | |
| Chemical Society), 5.8s, 10/1/14 | A | | 2,000,000 | | 2,146,440 |
| Franklin Cnty., Econ. Dev. Rev. Bonds | | | | | |
| (Capitol South Cmnty. Urban), 5 3/4s, 6/1/11 | BBB-/P | | 1,000,000 | | 1,053,240 |
| Franklin Cnty., Hlth. Care Fac. Rev. Bonds | | | | | |
| (OH Presbyterian Svcs.), 7 1/8s, 7/1/29 | BBB | | 2,000,000 | | 2,188,960 |
| Greater Cleveland Regl. Trans. Auth. | | | | | |
| G.O. Bonds (Cap. Impt.), MBIA, 5s, 12/1/24 | Aaa | | 1,350,000 | | 1,414,706 |
| Greene Cnty., Swr. Syst. Rev. Bonds | | | | | |
| (Governmental Enterprise), AMBAC, 5 5/8s, | | | | | |
| 12/1/13 (Prerefunded) | Aaa | | 1,380,000 | | 1,524,113 |
| Hamilton, City School Dist. G.O. Bonds, | | | | | |
| Ser. A, 5 1/2s, 12/1/24 (Prerefunded) | AA | | 2,000,000 | | 2,171,360 |
| Hillard, School Dist. G.O. Bonds (School | | | | | |
| Impts.), FGIC, 5 3/4s, 12/1/24 (Prerefunded) | Aaa | | 3,000,000 | | 3,330,300 |
| Huran Cnty., Human Svcs. Rev. Bonds, | | | | | |
| MBIA, 6.55s, 12/1/20 | Aaa | | 1,800,000 | | 2,184,048 |
| Kent, School Dist. G.O. Bonds, FGIC, | | | | | |
| 5 3/4s, 12/1/21 (Prerefunded) | Aaa | | 1,500,000 | | 1,586,025 |
| Lake Ohio, School Dist. G.O. Bonds, FGIC, | | | | | |
| 5 3/4s, 12/1/21 (Prerefunded) | Aaa | | 1,000,000 | | 1,101,690 |
| Lakota, School Dist. Rev. Bonds, AMBAC, | | | | | |
| 7s, 12/1/10 | Aaa | | 1,000,000 | | 1,152,020 |
| Lorain Cnty., Elderly Hsg. Corp. Multi-Fam. | | | | | |
| Rev. Bonds (Harr Plaza & Intl.), Ser. A, | | | | | |
| 6 3/8s, 7/15/19 | BBB+ | | 1,770,000 | | 1,771,080 |
| Lorain Cnty., Hosp. Rev. Bonds (Catholic | | | | | |
| Hlth. Care Refurbish & Impt.), Ser. A, | | | | | |
| 5 1/4s, 10/1/33 | AA- | | 750,000 | | 775,695 |
32
| MUNICIPAL BONDS AND NOTES (95.1%)* continued | | | |
|
| | Rating ** | Principal amount | | Value |
| |
| Ohio continued | | | | |
| Madeira, City School Dist. G.O. Bonds | | | | |
| (School Impt.), MBIA | | | | |
| 5s, 12/1/26 | Aaa | $ 1,620,000 | $ | 1,690,292 |
| 5s, 12/1/25 | Aaa | 1,530,000 | | 1,599,860 |
| Mason, City School Dist. G.O. Bonds, | | | | |
| 5.3s, 12/1/17 | Aa2 | 2,500,000 | | 2,695,700 |
| Massillon, Rev. Bonds (Lincoln Ctr. Phase II), | | | | |
| AMBAC, 6.95s, 12/1/10 (Prerefunded) | Aaa | 1,040,000 | | 1,060,800 |
| Miami Cnty., Hosp. Fac. Rev. Bonds (Upper | | | | |
| Valley Med. Ctr.), Ser. A, 6 3/8s, 5/15/26 | Baa1 | 2,200,000 | | 2,262,634 |
| Middletown, City School Dist. G.O. Bonds | | | | |
| (School Impt.), FGIC | | | | |
| 5s, 12/1/25 | Aaa | 1,285,000 | | 1,338,212 |
| 5s, 12/1/24 | Aaa | 1,080,000 | | 1,126,948 |
| 5s, 12/1/23 | Aaa | 1,545,000 | | 1,611,095 |
| 4 3/4s, 12/1/22 | Aaa | 1,000,000 | | 1,025,390 |
| 4 3/4s, 12/1/21 | Aaa | 1,500,000 | | 1,543,185 |
| Midview, School Dist. COP (School Bldg. Fac.), | | | | |
| 5 1/4s, 11/1/17 | A | 1,265,000 | | 1,336,371 |
| Montgomery Cnty., Rev. Bonds (Catholic | | | | |
| Hlth. Initiatives), Ser. A, 5s, 5/1/32 | Aa2 | 1,000,000 | | 1,024,780 |
| Montgomery Cnty., Hlth. Syst. Rev. Bonds, | | | | |
| Ser. B-1 | | | | |
| 8.1s, 7/1/18 (Prerefunded) | Aaa | 1,720,000 | | 1,800,118 |
| 8.1s, 7/1/18 (Prerefunded) | AAA | 155,000 | | 161,543 |
| Montgomery Cnty., Hosp. Rev. Bonds | | | | |
| (Kettering Med. Ctr.), 6 3/4s, 4/1/22 | A2 | 1,500,000 | | 1,618,950 |
| (Grandview Hosp. & Med Ctr.), 5.6s, | | | | |
| 12/1/11 (Prerefunded) | A | 580,000 | | 625,652 |
| Northwestern, School Dist. Rev. Bonds | | | | |
| (Wayne & Ashland Cntys. School Impt.), | | | | |
| FGIC, 7.2s, 12/1/10 | Aaa | 835,000 | | 936,185 |
| OH Hsg. Fin. Agcy. Rev. Bonds | | | | |
| Ser. B, GNMA Coll., 5s, 3/1/34 | Aaa | 1,800,000 | | 1,853,190 |
| (Res. Dev.), Ser. A, GNMA Coll., | | | | |
| 4.6s, 9/1/28 | Aaa | 765,000 | | 768,756 |
| (Res. Mtge.), Ser. E, GNMA Coll., FNMA | | | | |
| Coll., FHLMC Coll., 4 1/4s, 3/1/15 | Aaa | 500,000 | | 497,105 |
| (Res. Mtge.), Ser. C, GNMA/FNMA | | | | |
| Coll., 4.1s, 3/1/15 | Aaa | 450,000 | | 444,186 |
| (Res. Mtge.), Ser. E, GNMA Coll., FNMA | | | | |
| Coll., FHLMC Coll., 3 3/4s, 3/1/10 | Aaa | 355,000 | | 352,373 |
| (Res. Mtge.), Ser. C, GNMA/FNMA | | | | |
| Coll., 3.7s, 3/1/11 | Aaa | 470,000 | | 466,005 |
| OH Hsg. Fin. Agcy. Single Fam. Mtge. | | | | |
| IFB, Ser. G, GNMA Coll., 7.14s, 3/2/23 | Aaa | 200,000 | | 201,216 |
| OH Hsg. Fin. Agcy. Single Fam. Mtge. | | | | |
| Rev. Bonds, Ser. 85-A, FGIC, zero %, 1/15/15 | Aaa | 15,000 | | 6,111 |
33
| MUNICIPAL BONDS AND NOTES (95.1%)* continued | | | |
|
| | Rating ** | Principal amount | | Value |
| |
| Ohio continued | | | | |
| OH State Air Quality Dev. Auth. VRDN | | | | |
| (Columbus Southern), Ser. C, 3.07s, 12/1/38 | VMIG1 | $ 3,000,000 | $ | 3,000,000 |
| OH State Env. Impt. Rev. Bonds (USX Corp.), | | | | |
| 5 5/8s, 5/1/29 | Baa1 | 750,000 | | 790,200 |
| OH State Higher Edl. Fac. Mandatory Put Bonds | | | | |
| (Kenyon College), 5.05s, 7/1/16 | A2 | 2,000,000 | | 2,110,620 |
| OH State Higher Edl. Fac. Rev. Bonds | | | | |
| (Case Western Reserve U.), 6 1/4s, 10/1/18 | AA- | 4,000,000 | | 4,806,280 |
| (Case Western Reserve U.), 6s, 10/1/14 | AA | 1,000,000 | | 1,146,580 |
| (Oberlin College), 5.12s, 10/1/24 | AA | 1,500,000 | | 1,581,375 |
| OH State Higher Edl. Fac. Commn. Rev. Bonds | | | | |
| (John Carroll U.), 5 1/2s, 11/15/18 | A2 | 335,000 | | 364,152 |
| (John Carroll U.), 5 1/2s, 11/15/17 | A2 | 420,000 | | 458,027 |
| (Denison U.), 5 1/8s, 11/1/21 | AA | 2,270,000 | | 2,405,814 |
| (Oberlin College), 5s, 10/1/33 | AA | 1,000,000 | | 1,024,640 |
| (Northern U.), 4 3/4s, 5/1/19 | A2 | 2,500,000 | | 2,530,600 |
| (John Carroll U.), 3 1/2s, 11/15/08 | A2 | 300,000 | | 298,668 |
| (John Carroll U.), 3s, 11/15/07 | A2 | 500,000 | | 489,805 |
| OH State Poll. Control Rev. Bonds | | | | |
| (Standard Oil Co.), 6 3/4s, 12/1/15 | AA+ | 3,350,000 | | 4,071,624 |
| OH State Solid Waste Mandatory Put Bonds, | | | | |
| 4.85s, 11/1/07 | BBB | 1,500,000 | | 1,523,115 |
| OH State U. Rev. Bonds, Ser. A, 5 1/8s, 12/1/31 | Aa2 | 1,000,000 | | 1,051,190 |
| OH State Wtr. Dev. Auth. Solid Waste Disp. | | | | |
| Rev. Bonds (Bay Shore Power Co.), Ser. A, | | | | |
| 5 7/8s, 9/1/20 | BB+/P | 1,100,000 | | 1,105,973 |
| OH U. Gen. Recipients Athens Rev. Bonds, | | | | |
| MBIA, 5s, 12/1/25 | Aaa | 2,265,000 | | 2,363,663 |
| Powell, G.O. Bonds, FGIC, 5 1/2s, 12/1/25 | Aaa | 1,500,000 | | 1,632,180 |
| Rickenbacker, Port Auth. Rev. Bonds (OASBO | | | | |
| Expanded Asset Pooled), Ser. A, 5 3/8s, 1/1/32 | A2 | 2,165,000 | | 2,322,049 |
| River Valley, Local School Dist. G.O. Bonds | | | | |
| (School Fac. Construction & Impt.), FSA, | | | | |
| 5 1/4s, 11/1/23 | Aaa | 300,000 | | 335,724 |
| Rocky River, G.O. Bonds, AMBAC, 5s, 12/1/24 | Aaa | 2,455,000 | | 2,572,668 |
| Sandusky Cnty., Hosp. Fac. Rev. Bonds | | | | |
| (Memorial Hosp.) | | | | |
| 5.15s, 1/1/10 | BBB- | 830,000 | | 829,361 |
| 5.15s, 1/1/08 | BBB- | 500,000 | | 500,465 |
| 5.05s, 1/1/07 | BBB- | 685,000 | | 686,158 |
| Tallmadge, City School Dist. G.O. Bonds | | | | |
| (School Fac.), FSA, 5s, 12/1/26 | AAA | 1,410,000 | | 1,473,929 |
| Toledo, G.O. Bonds (Macys), Ser. A, MBIA, | | | | |
| 6.35s, 12/1/25 | Aaa | 1,500,000 | | 1,596,255 |
| Toledo, Swr. Syst. Mtge. Rev. Bonds, | | | | |
| AMBAC, 6.2s, 11/15/12 | Aaa | 2,925,000 | | 3,361,410 |
| Toledo, Wtr. Wks. Mtge. Rev. Bonds, | | | | |
| AMBAC, 6.2s, 11/15/12 | Aaa | 1,175,000 | | 1,350,310 |
34
| MUNICIPAL BONDS AND NOTES (95.1%)* continued | | | |
|
| | Rating ** | Principal amount | | Value |
| |
| Ohio continued | | | | |
| Toledo-Lucas Cnty., Port Auth. Rev. Bonds | | | | |
| (CSX Transn, Inc.), 6.45s, 12/15/21 | Baa2 | $ 1,900,000 | $ | 2,178,521 |
| Twin Valley, Cmnty. Local School Dist. Rev. | | | | |
| Bonds, FGIC, 7.05s, 12/1/11 | Aaa | 1,000,000 | | 1,136,460 |
| U. of Cincinnati COP (Jefferson Ave. | | | | |
| Residence Hall), MBIA, 5 1/8s, 6/1/28 | Aaa | 1,000,000 | | 1,029,900 |
| U. of Cincinnati Rev. Bonds, Ser. D, AMBAC | | | | |
| 5s, 6/1/24 | Aaa | 2,000,000 | | 2,091,440 |
| 5s, 6/1/23 | Aaa | 1,275,000 | | 1,336,991 |
| Westerville, City School Dist. Rev. Bonds | | | | |
| (School Impt.) | | | | |
| 6 1/4s, 12/1/09 | Aa3 | 1,610,000 | | 1,771,612 |
| 6 1/4s, 12/1/08 | Aa3 | 1,590,000 | | 1,715,403 |
| Woodridge, School Dist. Rev. Bonds, | | | | |
| AMBAC, 6.8s, 12/1/14 | Aaa | 3,000,000 | | 3,478,320 |
| Zanesville, Hsg. Dev. Corp. Mtge. Rev. | | | | |
| Bonds, FHA Insd. | | | | |
| 7 3/8s, 10/1/21 (Prerefunded) | AAA/P | 220,000 | | 283,351 |
| 7 3/8s, 10/1/20 (Prerefunded) | AAA/P | 205,000 | | 264,032 |
| 7 3/8s, 10/1/19 (Prerefunded) | AAA/P | 185,000 | | 238,273 |
| 7 3/8s, 10/1/18 (Prerefunded) | AAA/P | 180,000 | | 231,833 |
| 7 3/8s, 10/1/17 (Prerefunded) | AAA/P | 160,000 | | 206,074 |
| 7 3/8s, 10/1/16 (Prerefunded) | AAA/P | 155,000 | | 199,634 |
| | | | | 158,609,070 |
|
| |
| Puerto Rico (2.7%) | | | | |
| Children’s Trust Fund Tobacco Settlement | | | | |
| Rev. Bonds, 5 3/8s, 5/15/33 | BBB | 370,000 | | 374,100 |
| Cmnwlth. of PR, Muni. Fin. Agcy. G.O. | | | | |
| Bonds, Ser. A, FSA, 5 7/8s, 8/1/14 | Aaa | 3,000,000 | | 3,272,010 |
| PR Indl. Tourist Edl. Med. & Env. Control Fac. | | | | |
| Rev. Bonds (Cogen. Fac.-AES), 6 5/8s, 6/1/26 | Baa3 | 1,000,000 | | 1,073,455 |
| | | | | 4,719,565 |
|
| |
| Virgin Islands (0.6%) | | | | |
| Tobacco Settlement Fin. Corp. Rev. Bonds, | | | | |
| 5s, 5/15/21 (Virgin Islands) | Baa3 | 960,000 | | 967,152 |
|
| |
| |
| TOTAL INVESTMENTS | | | | |
| Total investments (cost $156,115,036) | | | $ | 164,295,787 |
| * | Percentages indicated are based on net assets of $172,764,925. |
| |
| ** | The Moody’s or Standard & Poor’s ratings indicated are believed to be the most recent ratings available at November 30, 2005 for the securities listed. Ratings are generally ascribed to securities at the time of issuance. While the agencies may from time to time revise such ratings, they undertake no obligation to do so, and the ratings do not necessarily represent what the agencies would ascribe to these securities at November 30, 2005. Securities rated by Putnam are indicated by “/P.” Security ratings are defined in the Statement of Additional Information. |
| |
35
# A portion of this security was pledged and segregated with the custodian to cover margin requirements for futures contracts at November 30, 2005.
At November 30, 2005, liquid assets totaling $4,025,625 have been designated as collateral for open future contracts.
The rates shown on VRDN and Mandatory Put Bonds are the current interest rates at November 30, 2005.
The dates shown on Mandatory Put Bonds are the next mandatory put dates.
Inverse Floating Rate Bonds (IFB) are securities that pay interest rates that vary inversely to changes in the market interest rates. As interest rates rise, inverse floaters produce less current income. The interest rates shown are the current interest rates at November 30, 2005.
The fund had the following industry group concentrations greater than 10% at November 30, 2005 (as a percentage of net assets):
Education 17.3%
Health care 11.1
The fund had the following insurance concentrations greater than 10% at November 30, 2005
(as a percentage of net assets):
FGIC 12.5%
AMBAC 11.9
MBIA 10.6
| FUTURES CONTRACTS OUTSTANDING at 11/30/05 (Unaudited) | | |
|
| | Number of | | Expiration | Unrealized |
| | contracts | Value | date | depreciation |
|
| U.S. Treasury Note 5 yr (Long) | 38 | $4,025,625 | Mar-06 | $(20,005) |
|
| INTEREST RATE SWAP CONTRACTS OUTSTANDING at 11/30/05 (Unaudited) | | |
|
| | | Notional | Termination | Unrealized |
| | | amount | date | appreciation |
|
| Agreement with JPMorgan Chase Bank, N.A. dated | | | |
| September 19, 2005 to receive quarterly the notional | | | |
| amount multiplied by 3.693% and pay quarterly the | | | |
| notional amount multiplied by the U.S. Bond Market | | | |
| Association Municipal Swap Index. | | $3,000,000 | 3/21/16 | $48,041 |
The accompanying notes are an integral part of these financial statements.
36
| Statement of assets and liabilities 11/30/05 (Unaudited) | |
|
| |
| ASSETS | |
| Investment in securities, at value (Note 1): | |
| Unaffiliated issuers (identified cost $156,115,036) | $164,295,787 |
|
| Cash | 5,944,568 |
|
| Interest and other receivables | 3,180,978 |
|
| Receivable for shares of the fund sold | 47,458 |
|
| Receivable for securities sold | 165,000 |
|
| Unrealized appreciation on swap contracts (Note 1) | 48,041 |
|
| Total assets | 173,681,832 |
|
| |
| LIABILITIES | |
| Distributions payable to shareholders | 360,947 |
|
| Payable for shares of the fund repurchased | 172,236 |
|
| Payable for compensation of Manager (Note 2) | 217,757 |
|
| Payable for investor servicing and custodian fees (Note 2) | 9,477 |
|
| Payable for Trustee compensation and expenses (Note 2) | 36,351 |
|
| Payable for administrative services (Note 2) | 2,328 |
|
| Payable for distribution fees (Note 2) | 66,884 |
|
| Payable for variation margin (Note 1) | 2,969 |
|
| Other accrued expenses | 47,958 |
|
| Total liabilities | 916,907 |
|
| Net assets | $172,764,925 |
|
| |
| REPRESENTED BY | |
| Paid-in capital (Unlimited shares authorized) (Notes 1 and 4) | $166,846,831 |
|
| Distributions in excess of net investment income (Note 1) | 139,754 |
|
| Accumulated net realized loss on investments (Note 1) | (2,430,447) |
|
| Net unrealized appreciation of investments | 8,208,787 |
|
| Total -- Representing net assets applicable to capital shares outstanding | $172,764,925 |
| |
| (Continued on next page) | |
37
| Statement of assets and liabilities (Continued) | |
|
| |
| COMPUTATION OF NET ASSET VALUE AND OFFERING PRICE | |
|
| Net asset value and redemption price per class A share | |
| ($148,671,784 divided by 16,445,731 shares) | $9.04 |
|
| Offering price per class A share | |
| (100/96.25 of $9.04)* | $9.39 |
|
| Net asset value and offering price per class B share | |
| ($22,644,324 divided by 2,507,214 shares)** | $9.03 |
|
| Net asset value and redemption price per class M share | |
| ($1,448,817 divided by 160,115 shares) | $9.05 |
|
| Offering price per class M share | |
| (100/96.75 of $9.05)*** | $9.35 |
* On single retail sales of less than $100,000. On sales of $100,000 or more and on group sales, the offering price is reduced.
** Redemption price per share is equal to net asset value less any applicable contingent deferred sales charge.
*** On single retail sales of less than $50,000. On sales of $50,000 or more and on group sales, the offering price is reduced.
The accompanying notes are an integral part of these financial statements.
38
| Statement of operations Six months ended 11/30/05 (Unaudited) | |
|
| |
| INTEREST INCOME | $ 4,149,288 |
|
| |
| EXPENSES | |
|
| Compensation of Manager (Note 2) | 442,954 |
|
| Investor servicing fees (Note 2) | 49,417 |
|
| Custodian fees (Note 2) | 32,141 |
|
| Trustee compensation and expenses (Note 2) | 10,856 |
|
| Administrative services (Note 2) | 7,549 |
|
| Distribution fees -- Class A (Note 2) | 152,664 |
|
| Distribution fees -- Class B (Note 2) | 103,897 |
|
| Distribution fees -- Class M (Note 2) | 3,474 |
|
| Non-recurring costs (Notes 2 and 5) | 826 |
|
| Costs assumed by Manager (Notes 2 and 5) | (826) |
|
| Other | 55,511 |
|
| Total expenses | 858,463 |
|
| Expense reduction (Note 2) | (44,266) |
|
| Net expenses | 814,197 |
|
| Net investment income | 3,335,091 |
|
| Net realized loss on investments (Notes 1 and 3) | (55,904) |
|
| Net realized loss on futures contracts (Note 1) | (42,762) |
|
| Net realized gain on swap contracts (Note 1) | 163,002 |
|
| Net unrealized depreciation of investments, futures contracts, | |
| and swap contracts during the period | (3,548,594) |
|
| Net loss on investments | (3,484,258) |
|
| Net decrease in net assets resulting from operations | $ (149,167) |
The accompanying notes are an integral part of these financial statements.
39
| Statement of changes in net assets | | |
|
| |
| DECREASE IN NET ASSETS | | |
|
| Six months ended | Year ended |
| | 11/30/05* | 5/31/05 |
|
| Operations: | | |
| Net investment income | $ 3,335,091 | $ 6,963,964 |
|
| Net realized gain on investments | 64,336 | 986,883 |
|
| Net unrealized appreciation (depreciation) of investments | (3,548,594) | 4,654,615 |
|
| Net increase (decrease) in net assets resulting from operations | (149,167) | 12,605,462 |
|
| Distributions to shareholders: (Note 1) | | |
|
| From ordinary income | | |
|
| Class A | -- | (10,114) |
|
| Class B | -- | (1,997) |
|
| Class M | -- | (57) |
|
| From tax-exempt income | | |
|
| Class A | (2,894,181) | (5,850,554) |
|
| Class B | (388,037) | (951,628) |
|
| Class M | (24,115) | (30,399) |
|
| Redemption fees (Note 1) | -- | 396 |
|
| Decrease from capital share transactions (Note 4) | (3,558,184) | (13,588,695) |
|
| Total decrease in net assets | (7,013,684) | (7,827,586) |
|
| |
| NET ASSETS | | |
|
| Beginning of period | 179,778,609 | 187,606,195 |
|
| End of period (including undistributed | | |
| net investment income of $139,754 | | |
| and $110,996, respectively) | $172,764,925 | $179,778,609 |
| | |
* Unaudited The accompanying notes are an integral part of these financial statements.
40
Financial highlights (For a common share outstanding throughout the period)
| CLASS A | | | | | | |
|
| PER-SHARE OPERATING PERFORMANCE | | | | |
|
| | Six months ended** | | | Year ended | | |
| | 11/30/05 | 5/31/05 | 5/31/04 | 5/31/03 | 5/31/02 | 5/31/01 |
|
| Net asset value, | | | | | | |
| beginning of period | $9.22 | $8.94 | $9.33 | $8.87 | $8.77 | $8.29 |
|
| Investment operations: | | | | | | |
| Net investment income | .18 | .35(c) | .34(c) | .36 | .42 | .44 |
|
| Net realized and unrealized | | | | | | |
| gain (loss) on investments | (.18) | .28 | (.38) | .46 | .10 | .47 |
|
| Total from | | | | | | |
| investment operations | -- | .63 | (.04) | .82 | .52 | .91 |
|
| Less distributions: | | | | | | |
| From net investment income | (.18) | (.35) | (.35) | (.36) | (.42) | (.43) |
|
| Total distributions | (.18) | (.35) | (.35) | (.36) | (.42) | (.43) |
|
| Redemption fees | -- | --(d) | -- | -- | -- | -- |
|
| Net asset value, | | | | | | |
| end of period | $9.04 | $9.22 | $8.94 | $9.33 | $8.87 | $8.77 |
|
| Total return at | | | | | | |
| net asset value (%)(a) | (0.04)* | 7.15 | (.49) | 9.48 | 5.98 | 11.22 |
|
| |
| RATIOS AND SUPPLEMENTAL DATA | | | | | |
|
| Net assets, end of period | | | | | | |
| (in thousands) | $148,672 | $153,016 | $153,317 | $183,383 | $167,223 | $153,806 |
|
| Ratio of expenses to | | | | | | |
| average net assets (%)(b) | .44* | .89(c) | .89(c) | .88 | .91 | .88 |
|
| Ratio of net investment | | | | | | |
| income to average | | | | | | |
| net assets (%) | 1.93* | 3.88(c) | 3.75(c) | 3.94 | 4.70 | 5.03 |
|
| Portfolio turnover (%) | .51* | 12.34 | 17.43 | 25.66 | 17.26 | 11.88 |
* Not annualized.
** Unaudited.
(a) Total return assumes dividend reinvestment and does not reflect the effect of sales charges.
(b) Includes amounts paid through expense offset arrangements (Note 2).
(c) Reflects an involuntary contractual expense limitation in effect during the period. As a result of such limitation, expenses of the fund for the periods ended May 31, 2005 and May 31, 2004 reflect a reduction of 0.01% based on average net assets for class A shares.
(d) Amount represents less than $0.01 per share.
The accompanying notes are an integral part of these financial statements.
41
Financial highlights (For a common share outstanding throughout the period)
| CLASS B | | | | | | |
|
| PER-SHARE OPERATING PERFORMANCE | | | | |
|
| Six months ended** | | | Year ended | | |
| | 11/30/05 | 5/31/05 | 5/31/04 | 5/31/03 | 5/31/02 | 5/31/01 |
|
| Net asset value, | | | | | | |
| beginning of period | $9.21 | $8.93 | $9.32 | $8.86 | $8.76 | $8.28 |
|
| Investment operations: | | | | | | |
| Net investment income | .15 | .29(c) | .28(c) | .30 | .36 | .38 |
|
| Net realized and unrealized | | | | | | |
| gain (loss) on investments | (.18) | .28 | (.38) | .47 | .10 | .48 |
|
| Total from | | | | | | |
| investment operations | (.03) | .57 | (.10) | .77 | .46 | .86 |
|
| Less distributions: | | | | | | |
| From net investment income | (.15) | (.29) | (.29) | (.31) | (.36) | (.38) |
|
| Total distributions | (.15) | (.29) | (.29) | (.31) | (.36) | (.38) |
|
| Redemption fees | -- | --(d) | -- | -- | -- | -- |
|
| Net asset value, | | | | | | |
| end of period | $9.03 | $9.21 | $8.93 | $9.32 | $8.86 | $8.76 |
|
| Total return at | | | | | | |
| net asset value (%)(a) | (0.37)* | 6.47 | (1.15) | 8.78 | 5.30 | 10.51 |
|
| |
| RATIOS AND SUPPLEMENTAL DATA | | | | | |
|
| Net assets, end of period | | | | | | |
| (in thousands) | $22,644 | $25,898 | $33,382 | $43,983 | $43,696 | $51,687 |
|
| Ratio of expenses to | | | | | | |
| average net assets (%)(b) | .76* | 1.54(c) | 1.54(c) | 1.53 | 1.56 | 1.53 |
|
| Ratio of net investment | | | | | | |
| income to average | | | | | | |
| net assets (%) | 1.61* | 3.23(c) | 3.10(c) | 3.30 | 4.05 | 4.38 |
|
| Portfolio turnover (%) | .51* | 12.34 | 17.43 | 25.66 | 17.26 | 11.88 |
* Not annualized.
** Unaudited.
(a) Total return assumes dividend reinvestment and does not reflect the effect of sales charges.
(b) Includes amounts paid through expense offset arrangements (Note 2).
(c) Reflects an involuntary contractual expense limitation in effect during the period. As a result of such limitation, expenses of the fund for the periods ended May 31, 2005 and May 31, 2004 reflect a reduction of 0.01% based on average net assets for class B shares.
(d) Amount represents less than $0.01 per share.
The accompanying notes are an integral part of these financial statements.
42
Financial highlights (For a common share outstanding throughout the period)
| CLASS M | | | | | | |
|
| PER-SHARE OPERATING PERFORMANCE | | | | | |
|
| Six months ended** | | | Year ended | | |
| | 11/30/05 | 5/31/05 | 5/31/04 | 5/31/03 | 5/31/02 | 5/31/01 |
|
| Net asset value, | | | | | | |
| beginning of period | $9.23 | $8.94 | $9.33 | $8.88 | $8.77 | $8.29 |
|
| Investment operations: | | | | | | |
| Net investment income | .17 | .33(c) | .32(c) | .33 | .39 | .41 |
|
| Net realized and unrealized | | | | | | |
| gain (loss) on investments | (.19) | .28 | (.39) | .46 | .11 | .48 |
|
| Total from | | | | | | |
| investment operations | (.02) | .61 | (.07) | .79 | .50 | .89 |
|
| Less distributions: | | | | | | |
| From net investment income | (.16) | (.32) | (.32) | (.34) | (.39) | (.41) |
|
| Total distributions | (.16) | (.32) | (.32) | (.34) | (.39) | (.41) |
|
| Redemption fees | -- | --(d) | -- | -- | -- | -- |
|
| Net asset value, | | | | | | |
| end of period | $9.05 | $9.23 | $8.94 | $9.33 | $8.88 | $8.77 |
|
| Total return at | | | | | | |
| net asset value (%)(a) | (0.19)* | 6.94 | (.80) | 9.03 | 5.78 | 10.88 |
|
| |
| RATIOS AND SUPPLEMENTAL DATA | | | | | |
|
| Net assets, end of period | | | | | | |
| (in thousands) | $1,449 | $865 | $907 | $3,457 | $2,988 | $1,932 |
|
| Ratio of expenses to | | | | | | |
| average net assets (%)(b) | .59* | 1.19(c) | 1.19(c) | 1.18 | 1.21 | 1.18 |
|
| Ratio of net investment | | | | | | |
| income to average | | | | | | |
| net assets (%) | 1.79* | 3.58(c) | 3.41(c) | 3.64 | 4.39 | 4.73 |
|
| Portfolio turnover (%) | .51* | 12.34 | 17.43 | 25.66 | 17.26 | 11.88 |
* Not annualized.
** Unaudited.
(a) Total return assumes dividend reinvestment and does not reflect the effect of sales charges.
(b) Includes amounts paid through expense offset arrangements (Note 2).
(c) Reflects an involuntary contractual expense limitation in effect during the period. As a result of such limitation, expenses of the fund for the periods ended May 31, 2005 and May 31, 2004 reflect a reduction of 0.01% based on average net assets for class M shares.
(d) Amount represents less than $0.01 per share.
The accompanying notes are an integral part of these financial statements.
43
Notes to financial statements 11/30/05 (Unaudited)
Note 1: Significant accounting policies
Putnam Ohio Tax Exempt Income Fund (the “fund”), a Massachusetts business trust, is registered under the Investment Company Act of 1940, as amended, as a diversified, open-end management investment company. The fund seeks as high a level of current income exempt from federal income tax and Ohio personal income tax as Putnam Investment Management, LLC (“Putnam Management”), the fund’s manager, an indirect wholly-owned subsidiary of Putnam, LLC, believes is consistent with preservation of capital by investing primarily in a portfolio of investment-grade Ohio tax-exempt securities with intermediate- to long-term maturities. The fund may be affected by economic and political developments in the state of Ohio.
The fund offers class A, class B and class M shares. Class A and class M shares are sold with a maximum front-end sales charge of 3.75% and 3.25%, respectively, and generally do not pay contingent deferred sales charges.Class B shares, which convert to class A shares after approximately eight years, do not pay a front-end sales charge, and are subject to a contingent deferred sales charge, if those shares are redeemed within six years of purchase. The expenses for class A, class B and class M shares may differ based on the distribution fee of each class, which is identified in Note 2.
A 2.00% redemption fee may apply to any shares that are redeemed (either by selling or exchanging into another fund) within 5 days of purchase. The redemption fee is accounted for as an addition to paid-in-capital.
Investment income, realized and unrealized gains and losses and expenses of the fund are borne pro-rata based on the relative net assets of each class to the total net assets of the fund, except that each class bears expenses unique to that class (including the distribution fees applicable to such classes). Each class votes as a class only with respect to its own distribution plan or other matters on which a class vote is required by law or determined by the Trustees. Shares of each class would receive their pro-rata share of the net assets of the fund, if the fund were liquidated. In addition, the Trustees declare separate dividends on each class of shares.
In the normal course of business, the fund enters into contracts that may include agreements to indemnify another party under given circumstances. The fund’s maximum exposure under these arrangements is unknown as this would involve future claims that may be, but have not yet been, made against the fund. However, the fund expects the risk of material loss to be remote.
The following is a summary of significant accounting policies consistently followed by the fund in the preparation of its financial statements. The preparation of financial statements is in conformity with accounting principles generally accepted in the United States of America and requires management to make estimates and assumptions that affect the reported amounts of assets and liabilities in the financial statements and the reported amounts of increases and decreases in net assets from operations during the reporting period. Actual results could differ from those estimates.
A) Security valuation Tax-exempt bonds and notes are valued on the basis of valuations provided by an independent pricing service, approved by the Trustees. Such services use information with respect to transactions in bonds, quotations from bond dealers, market transactions in comparable securities and various relationships between securities in determining value. Other investments are valued at fair value following procedures approved by the Trustees. Such valuations and procedures are reviewed periodically by the Trustees.
B) Security transactions and related investment income Security transactions are recorded on the trade date (date the order to buy or sell is executed). Gains or losses on securities sold are determined on the identified cost basis.
Interest income is recorded on the accrual basis. All premiums/discounts are amortized/accreted on a yield-to-maturity basis. The premium in excess of the call price, if any, is amortized to the
44
call date; thereafter, any remaining premium is amortized to maturity.
C) Futures and options contracts The fund may use futures and options contracts to hedge against changes in the values of securities the fund owns or expects to purchase. The fund may also write options on swaps or securities it owns or in which it may invest to increase its current returns. The potential risk to the fund is that the change in value of futures and options contracts may not correspond to the change in value of the hedged instruments. In addition, losses may arise from changes in the value of the underlying instruments, if there is an illiquid secondary market for the contracts, or if the counterparty to the contract is unable to perform. Risks may exceed amounts recognized on the statement of assets and liabilities. When the contract is closed, the fund records a realized gain or loss equal to the difference between the value of the contract at the time it was opened and the value at the time it was closed. Realized gains and losses on purchased options are included in realized gains and losses on investment securities. If a written call option is exercised, the premium originally received is recorded as an addition to sales proceeds. If a written put option is exercised, the premium originally received is recorded as a reduction to the cost of investments.
Futures contracts are valued at the quoted daily settlement prices established by the exchange on which they trade. The fund and the broker agree to exchange an amount of cash equal to the daily fluctuation in the value of the futures contract. Such receipts or payments are known as “variation margin.” Exchange traded options are valued at the last sale price, or if no sales are reported, the last bid price for purchased options and the last ask price for written options. Options traded over-the-counter are valued using prices supplied by dealers. Futures and written option contracts outstanding at period end, if any, are listed after the fund’s portfolio.
D) Interest rate swap contracts The fund may enter into interest rate swap contracts, which are arrangements between two parties to exchange cash flows based on a notional principal amount, to manage the fund’s exposure to interest rates. Interest rate swap contracts are marked to market daily based upon quotations from market makers and the change, if any, is recorded as unrealized gain or loss. Payments received or made are recorded as realized gains or loss. The fund could be exposed to credit or market risk due to unfavorable changes in the fluctuation of interest rates or if the counterparty defaults on its obligation to perform. Risk of loss may exceed amounts recognized on the statement of assets and liabilities. Interest rate swap contracts outstanding at period end, if any, are listed after the fund’s portfolio.
E) Federal taxes It is the policy of the fund to distribute all of its income within the prescribed time and otherwise comply with the provisions of the Internal Revenue Code of 1986 (the “Code”) applicable to regulated investment companies. It is also the intention of the fund to distribute an amount sufficient to avoid imposition of any excise tax under Section 4982 of the Code, as amended. Therefore, no provision has been made for federal taxes on income, capital gains or unrealized appreciation on securities held nor for excise tax on income and capital gains.
At May 31, 2005, the fund had a capital loss carryover of $1,533,682 available to the extent allowed by the Code to offset future net capital gain, if any. The amount of the carryover and the expiration dates are:
| Loss Carryover | Expiration |
|
| $1,173,437 | May 31, 2009 |
|
| 360,245 | May 31, 2010 |
|
The aggregate identified cost on a tax basis is $156,115,036, resulting in gross unrealized appreciation and depreciation of $8,722,084 and $541,333, respectively, or net unrealized appreciation of $8,180,751.
45
F) Distributions to shareholders Income dividends are recorded daily by the fund and are paid monthly. Distributions from capital gains, if any, are recorded on the ex-dividend date and paid at least annually. The amount and character of income and gains to be distributed are determined in accordance with income tax regulations which may differ from generally accepted accounting principles. Reclassifications are made to the fund’s capital accounts to reflect income and gains available for distribution (or available capital loss carryovers) under income tax regulations.
Note 2: Management fee, administrative services and other transactions
Putnam Management is paid for management and investment advisory services quarterly based on the average net assets of the fund. Such fee is based on the lesser of (i) an annual rate of 0.50% of the average net assets of the fund or (ii) the following annual rates expressed as a percentage of the fund’s average net assets: 0.60% of the first $500 million, 0.50% of the next $500 million, 0.45% of the next $500 million, 0.40% of the next $5 billion, 0.375% of the next $5 billion, 0.355% of then next $5 billion, 0.34% of the next $5 billion and 0.33% thereafter.
Putnam Management has agreed to waive fees and reimburse expenses of the fund through May 31, 2006, to the extent necessary to ensure that the fund’s expenses do not exceed the average expenses of the front-end load funds viewed by Lipper Inc. as having the same investment classification or objective as the fund. The expense reimbursement is based on a comparison of the fund’s expenses with the average annualized operating expenses of the funds in its Lipper peer group for each calendar quarter during the fund’s last fiscal year, excluding 12b-1 fees and without giving effect to any expense offset and brokerage service arrangements that may reduce fund expenses. For the period ended November 30, 2005, Putnam Management did not waive any of its management fee from the fund.
For the period ended November 30, 2005, Putnam Management has assumed $826 of legal, shareholder servicing and communication, audit and Trustee fees incurred by the fund in connection with certain legal and regulatory matters (including those described in Note 5).
The fund reimburses Putnam Management an allocated amount for the compensation and related expenses of certain officers of the fund and their staff who provide administrative services to the fund. The aggregate amount of all such reimbursements is determined annually by the Trustees.
Custodial functions for the fund’s assets are provided by Putnam Fiduciary Trust Company (“PFTC”), a subsidiary of Putnam, LLC. PFTC receives fees for custody services based on the fund’s asset level, the number of its security holdings and transaction volumes. Putnam Investor Services, a division of PFTC, provides investor servicing agent functions to the fund. Putnam Investor Services receives fees for investor servicing based on the number of shareholder accounts in the fund and the level of defined contribution plan assets in the fund. During the period ended November 30, 2005, the fund incurred $81,558 for these services.
The fund has entered into an arrangement with PFTC whereby credits realized as a result of uninvested cash balances are used to reduce a portion of the fund’s expenses. For the six months ended November 30, 2005, the fund’s expenses were reduced by $44,266 under these arrangements.
Each independent Trustee of the fund receives an annual Trustee fee, of which $257, as a quarterly retainer, has been allocated to the fund, and an additional fee for each Trustees meeting attended. Trustees receive additional fees for attendance at certain committee meetings, industry seminars and for certain compliance-related matters. Trustees also are reimbursed for expenses they incur relating to their services as Trustees. George Putnam, III, who is not an independent Trustee, also receives the foregoing fees for his services as Trustee.
46
The fund has adopted a Trustee Fee Deferral Plan (the “Deferral Plan”) which allows the Trustees to defer the receipt of all or a portion of Trustees fees payable on or after July 1, 1995. The deferred fees remain invested in certain Putnam funds until distribution in accordance with the Deferral Plan.
The fund has adopted an unfunded noncontribu-tory defined benefit pension plan (the “Pension Plan”) covering all Trustees of the fund who have served as a Trustee for at least five years and were first elected prior to 2004. Benefits under the Pension Plan are equal to 50% of the Trustee’s average total retainer and meeting fees for the three years preceding retirement. Pension expense for the fund is included in Trustee compensation and expenses in the statement of operations. Accrued pension liability is included in Payable for Trustee compensation and expenses in the statement of assets and liabilities. The Trustees have terminated the Pension Plan with respect to any Trustee first elected after 2003.
The fund has adopted distribution plans (the “Plans”) with respect to its class A, class B and class M shares pursuant to rule 12b-1 under the Investment Company Act of 1940. The purpose of the Plans is to compensate Putnam Retail Management, a wholly-owned subsidiary of Putnam, LLC and Putnam Retail Management GP, Inc., for services provided and expenses incurred in distributing shares of the fund. The Plans provide for payments by the fund to Putnam Retail Management at an annual rate of up to 0.35%, 1.00% and 1.00% of the average net assets attributable to class A, class B and class M shares, respectively. The Trustees have approved payment by the fund at the annual rate of 0.85% and 0.50% for class B and class M shares. For class A shares, the annual payment rate will equal the weighted average of (i) 0.20% on the net assets of the fund attributable to class A shares purchased and paid for prior to April 1, 2005 and (ii) 0.25% on all other net assets of the fund attributable to class A shares.
For the six months ended November 30, 2005, Putnam Retail Management, acting as underwriter, received net commissions of $8,098 and $75 from the sale of class A and class M shares, respectively, and received $13,004 in contingent deferred sales charges from redemptions of class B shares. A deferred sales charge of up to 1.00% is assessed on certain redemptions of class A shares that were purchased without an initial sales charge as part of an investment of $1 million or more. For the six months ended November 30, 2005, Putnam Retail Management, acting as underwriter, received no monies on class A redemptions.
Note 3: Purchases and sales of securities
During the six months ended November 30, 2005, cost of purchases and proceeds from sales of investment securities other than short-term investments aggregated $853,750 and $10,009,343, respectively. There were no purchases or sales of U.S. government securities.
Note 4: Capital shares
At November 30, 2005, there was an unlimited number of shares of beneficial interest authorized. Transactions in capital shares were as follows:
47
| CLASS A | Shares | Amount |
|
| Six months ended 11/30/05: | |
| Shares sold | 669,604 | $ 6,123,966 |
|
| Shares issued | | |
| in connection | | |
| with reinvestment | | |
| of distributions | 225,764 | 2,062,838 |
|
| | 895,368 | 8,186,804 |
|
| Shares | | |
| repurchased | (1,047,323) | (9,577,822) |
|
| Net decrease | (151,955) | $ (1,391,018) |
| |
| Year ended 5/31/05: | | |
| Shares sold | 1,196,814 | $ 10,935,043 |
|
| Shares issued | | |
| in connection | | |
| with reinvestment | | |
| of distributions | 448,843 | 4,097,133 |
|
| | 1,645,657 | 15,032,176 |
|
| Shares | | |
| repurchased | (2,203,208) | (20,095,203) |
|
| Net decrease | (557,551) | $ (5,063,027) |
|
| |
| CLASS B | Shares | Amount |
|
| Six months ended 11/30/05: | |
| Shares sold | 78,235 | $ 715,361 |
|
| Shares issued | | |
| in connection | | |
| with reinvestment | | |
| of distributions | 27,584 | 251,863 |
|
| | 105,819 | 967,224 |
|
| Shares | | |
| repurchased | (410,406) | (3,747,886) |
|
| Net decrease | (304,587) | $ (2,780,662) |
| |
| Year ended 5/31/05: | | |
| Shares sold | 110,632 | $ 1,010,679 |
|
| Shares issued | | |
| in connection | | |
| with reinvestment | | |
| of distributions | 67,531 | 615,630 |
|
| | 178,163 | 1,626,309 |
|
| Shares | | |
| repurchased | (1,105,026) | (10,082,862) |
|
| Net decrease | (926,863) | $ (8,456,553) |
| CLASS M | | | Shares | | | Amount |
|
| Six months ended 11/30/05: | | | | |
| Shares sold | | | 72,618 | | | $ 669,816 |
|
| Shares issued | | | | | | |
| in connection | | | | | | |
| with reinvestment | | | | | | |
| of distributions | | | 1,964 | | | 17,939 |
|
| | | | 74,582 | | | 687,755 |
|
| Shares | | | | | | |
| repurchased | | | (8,171) | | | (74,259) |
|
| Net increase | | | 66,411 | | | $ 613,496 |
| |
| Year ended 5/31/05: | | | | | | |
| Shares sold | | | 3,512 | | | $ 31,807 |
|
| Shares issued | | | | | | |
| in connection | | | | | | |
| with reinvestment | | | | | | |
| of distributions | | | 2,481 | | | 22,660 |
|
| | | | 5,993 | | | 54,467 |
|
| Shares | | | | | | |
| repurchased | | | (13,733) | | | (123,582) |
|
| Net decrease | | | (7,740) | | | $ (69,115) |
Note 5: Regulatory matters and litigation
Putnam Management has entered into agreements with the Securities and Exchange Commission and the Massachusetts Securities Division settling charges connected with excessive short-term trading by Putnam employees and, in the case of the charges brought by the Massachusetts Securities Division, by participants in some Putnam-administered 401(k) plans. Pursuant to these settlement agreements, Putnam Management will pay a total of $193.5 million in penalties and restitution, with $153.5 million being paid to certain open-end funds and their shareholders. The amount will be allocated to shareholders and funds pursuant to a plan developed by an independent consultant, and will be paid following approval of the plan by the SEC and the Massachusetts Securities Division.
The Securities and Exchange Commission’s and Massachusetts Securities Division’s allegations and related matters also serve as the general basis for
48
numerous lawsuits, including purported class action lawsuits filed against Putnam Management and certain related parties, including certain Putnam funds. Putnam Management will bear any costs incurred by Putnam funds in connection with these lawsuits. Putnam Management believes that the likelihood that the pending private lawsuits and purported class action lawsuits will have a material adverse financial impact on the fund is remote, and the pending actions are not likely to materially affect its ability to provide investment management services to its clients, including the Putnam funds.
Putnam Investments has recorded a charge of $30 million for the estimated cost, excluding interest, that it believes will be necessary to address issues relating to the calculation of certain amounts paid by the Putnam mutual funds in previous years. The previous payments were cost reimbursements by the Putnam funds to Putnam for transfer agent services relating to defined contribution operations. Putnam currently anticipates that any payments made by Putnam related to this issue will be paid to the Putnam funds. Review of this issue is ongoing.
Putnam Management and Putnam Retail Management are named as defendants in a civil suit in which the plaintiffs allege that the management and distribution fees paid by certain Putnam funds were excessive and seek recovery under the Investment Company Act of 1940. Putnam Management and Putnam Retail Management have contested the plaintiffs’ claims and the matter is currently pending in the U.S. District Court for the District of Massachusetts. Based on currently available information, Putnam Management believes that this action is without merit and that it is unlikely to have a material effect on Putnam Management’s and Putnam Retail Management’s ability to provide services to their clients, including the fund.
49
The Putnam
family of funds
|
The following is a complete list of Putnam’s open-end mutual funds. Investors should carefully consider the investment objective, risks, charges, and expenses of a fund before investing. For a prospectus containing this and other information for any Putnam fund or product, call your financial advisor at 1-800-225-1581 and ask for a prospectus. Please read the prospectus carefully before investing.
| Growth funds |
| Discovery Growth Fund |
| Growth Opportunities Fund |
| Health Sciences Trust |
| International New Opportunities Fund* |
| New Opportunities Fund |
| OTC & Emerging Growth Fund |
| Small Cap Growth Fund |
| Vista Fund |
| Voyager Fund |
| |
| Blend funds |
| Capital Appreciation Fund |
| Capital Opportunities Fund |
| Europe Equity Fund* |
| Global Equity Fund* |
| Global Natural Resources Fund* |
| International Capital |
| Opportunities Fund* |
| International Equity Fund* |
| Investors Fund |
| Research Fund |
| Tax Smart Equity Fund® |
| Utilities Growth and Income Fund |
| Value funds |
| Classic Equity Fund |
| Convertible Income-Growth Trust |
| Equity Income Fund |
| The George Putnam Fund of Boston |
| The Putnam Fund for Growth |
| and Income |
| International Growth and Income Fund* |
| Mid Cap Value Fund |
| New Value Fund |
| Small Cap Value Fund† |
| |
| Income funds |
| American Government Income Fund |
| Diversified Income Trust |
| Floating Rate Income Fund |
| Global Income Trust* |
| High Yield Advantage Fund*† |
| High Yield Trust* |
| Income Fund |
| Limited Duration Government |
| Income Fund‡ |
| Money Market Fund§ |
| U.S. Government Income Trust |
* A 1% redemption fee on total assets redeemed or exchanged between 6 and 90 days of purchase may be imposed for all share classes of these funds.
† Closed to new investors.
‡ Formerly Putnam Intermediate U.S. Government Income Fund.
§ An investment in a money market fund is not insured or guaranteed by the Federal Deposit Insurance Corporation or any other government agency. Although the fund seeks to preserve your investment at $1.00 per share, it is possible to lose money by investing in the fund.
50
| Tax-free income funds |
| AMT-Free Insured Municipal Fund** |
| Tax Exempt Income Fund |
| Tax Exempt Money Market Fund§ |
| Tax-Free High Yield Fund |
State tax-free income funds: |
| Arizona, California, Florida, Massachusetts, |
| Michigan, Minnesota, New Jersey, New York, |
| Ohio, and Pennsylvania |
| |
| Asset allocation funds |
| Income Strategies Fund |
| Putnam Asset Allocation Funds -- three |
| investment portfolios that spread your |
| money across a variety of stocks, bonds, |
| and money market investments. |
The three portfolios: |
| Asset Allocation: Balanced Portfolio |
| Asset Allocation: Conservative Portfolio |
| Asset Allocation: Growth Portfolio |
| Putnam RetirementReady® Funds |
| Putnam RetirementReady Funds -- ten |
| investment portfolios that offer diversifica- |
| tion among stocks, bonds, and money |
| market instruments and adjust to become |
| more conservative over time based on a |
| target date for withdrawing assets. |
The ten funds: |
| Putnam RetirementReady 2050 Fund |
| Putnam RetirementReady 2045 Fund |
| Putnam RetirementReady 2040 Fund |
| Putnam RetirementReady 2035 Fund |
| Putnam RetirementReady 2030 Fund |
| Putnam RetirementReady 2025 Fund |
| Putnam RetirementReady 2020 Fund |
| Putnam RetirementReady 2015 Fund |
| Putnam RetirementReady 2010 Fund |
| Putnam RetirementReady Maturity Fund |
** Formerly Putnam Tax-Free Insured Fund.
With the exception of money market funds, a 2% redemption fee may be applied to shares exchanged or sold within 5 days of purchase.
Check your account balances and the most recent month-end performance at www.putnam.com.
51
Fund information
Founded over 65 years ago, Putnam Investments was built around the concept that a balance between risk and reward is the hallmark of a well-rounded financial program. We manage over 100 mutual funds in growth, value, blend, fixed income, and international.
| Investment Manager |
| Putnam Investment |
| Management, LLC |
| One Post Office Square |
| Boston, MA 02109 |
Marketing Services |
| Putnam Retail Management |
| One Post Office Square |
| Boston, MA 02109 |
Custodian |
| Putnam Fiduciary |
| Trust Company |
Legal Counsel |
| Ropes & Gray LLP |
Trustees |
| John A. Hill, Chairman |
| Jameson Adkins Baxter, |
| Vice Chairman |
| Charles B. Curtis |
| Myra R. Drucker |
| Charles E. Haldeman, Jr. |
| Paul L. Joskow |
| Elizabeth T. Kennan |
| John H. Mullin, III |
| Robert E. Patterson |
| George Putnam, III |
| W. Thomas Stephens |
| Richard B. Worley |
| Officers |
| George Putnam, III |
| President |
Charles E. Porter |
| Executive Vice President, |
| Associate Treasurer and |
| Principal Executive Officer |
Jonathan S. Horwitz |
| Senior Vice President |
| and Treasurer |
Steven D. Krichmar |
| Vice President and |
| Principal Financial Officer |
Michael T. Healy |
| Assistant Treasurer and |
| Principal Accounting Officer |
Daniel T. Gallagher |
| Senior Vice President, |
| Staff Counsel and |
| Compliance Liaison |
Beth S. Mazor |
| Vice President |
James P. Pappas |
| Vice President |
Richard S. Robie, III |
| Vice President |
| Mark C. Trenchard |
| Vice President and |
| BSA Compliance Officer |
Francis J. McNamara, III |
| Vice President and |
| Chief Legal Officer |
Charles A. Ruys de Perez |
| Vice President and |
| Chief Compliance Officer |
Judith Cohen |
| Vice President, Clerk and |
| Assistant Treasurer |
Wanda M. McManus |
| Vice President, Senior Associate |
| Treasurer and Assistant Clerk |
Nancy T. Florek |
| Vice President, Assistant Clerk, |
| Assistant Treasurer |
| and Proxy Manager |
This report is for the information of shareholders of Putnam Ohio Tax Exempt Income Fund. It may also be used as sales literature when preceded or accompanied by the current prospectus, the most recent copy of Putnam’s Quarterly Performance Summary, and Putnam’s Quarterly Ranking Summary. For more recent performance, please visit www.putnam.com. Investors should carefully consider the investment objective, risks, charges, and expenses of a fund, which are described in its prospectus. For this and other information or to request a prospectus, call 1-800-225-1581 toll free. Please read the prospectus carefully before investing. The fund’s Statement of Additional Information contains additional information about the fund’s Trustees and is available without charge upon request by calling 1-800-225-1581.
52

Item 2. Code of Ethics:
Not applicable
Item 3. Audit Committee Financial Expert:
Not applicable
Item 4. Principal Accountant Fees and Services:
Not applicable
Item 5. Audit Committee
Not applicable
Item 6. Schedule of Investments:
Not applicable
Item 7. Disclosure of Proxy Voting Policies and Procedures For Closed-End Management Investment Companies:
Not applicable
Item 8. Portfolio Managers of Closed-End Investment Companies
Not Applicable
Item 9. Purchases of Equity Securities by Closed-End Management Investment Companies and Affiliated Purchasers:
Not applicable
Item 10. Submission of Matters to a Vote of Security Holders:
Not applicable
Item 11. Controls and Procedures: |
(a) The registrant's principal executive officer and principal financial officer have concluded, based on their evaluation of the effectiveness of the design and operation of the registrant's disclosure controls and procedures as of a date within 90 days of the filing date of this report, that the design and operation of such procedures are generally effective to provide reasonable assurance that information required to be disclosed by the registrant in this report is recorded, processed, summarized and reported within the time periods specified in the Commission's rules and forms.
(b) Changes in internal control over financial reporting:
Not applicable
Item 12. Exhibits:
(a) Not applicable
(b) A separate certification for each principal executive officer and principal financial officer of the registrant as required by Rule 30a-2 under the Investment Company Act of 1940, as amended, and the officer certifications as required by Section 906 of the Sarbanes-Oxley Act of 2002 are filed herewith.
SIGNATURES
Pursuant to the requirements of the Securities Exchange Act of 1934 and the Investment Company Act of 1940, the registrant has duly caused this report to be signed on its behalf by the undersigned, thereunto duly authorized.
NAME OF REGISTRANT
By (Signature and Title):
/s/Michael T. Healy
Michael T. Healy
Principal Accounting Officer
Date: January 27, 2006 |
Pursuant to the requirements of the Securities Exchange Act of 1934 and the Investment Company Act of 1940, this report has been signed below by the following persons on behalf of the registrant and in the capacities and on the dates indicated.
By (Signature and Title):
/s/Charles E. Porter
Charles E. Porter
Principal Executive Officer
Date: January 27, 2006
By (Signature and Title):
/s/Steven D. Krichmar
Steven D. Krichmar
Principal Financial Officer
Date: January 27, 2006 |