UNITED STATES
SECURITIES AND EXCHANGE COMMISSION
Washington, D.C. 20549
FORM N-CSR
CERTIFIED SHAREHOLDER REPORT OF REGISTERED
MANAGEMENT INVESTMENT COMPANIES
Investment Company Act file number: (811- 04528 )
Exact name of registrant as specified in charter: Putnam Ohio Tax Exempt Income Fund
Address of principal executive offices: One Post Office Square, Boston, Massachusetts 02109
| Name and address of agent for service: | Beth S. Mazor, Vice President |
| | One Post Office Square |
| | Boston, Massachusetts 02109 |
| |
| Copy to: | John W. Gerstmayr, Esq. |
| | Ropes & Gray LLP |
| | One International Place |
| | Boston, Massachusetts 02110 |
Registrant’s telephone number, including area code: (617) 292-1000
Date of fiscal year end: May 31, 2006
Date of reporting period: June 1, 2005—May 31, 2006
Item 1. Report to Stockholders:
The following is a copy of the report transmitted to stockholders pursuant to Rule 30e-1 under the Investment Company Act of 1940:
What makes Putnam different?

In 1830, Massachusetts Supreme Judicial Court Justice Samuel Putnam established The Prudent Man Rule, a legal foundation for responsible money management.
THE PRUDENT MAN RULE
All that can be required of a trustee to invest is that he shall conduct himself faithfully and exercise a sound discretion. He is to observe how men of prudence, discretion, and intelligence manage their own affairs, not in regard to speculation, but in regard to the permanent disposition of their funds, considering the probable income, as well as the probable safety of the capital to be invested.

A time-honored tradition
in money management
Since 1937, our values have been rooted
in a profound sense of responsibility for the
money entrusted to us.
A prudent approach to investing
We use a research-driven team approach to seek
consistent, dependable, superior investment
results over time, although there is no guarantee
a fund will meet its objectives.
Funds for every investment goal
We offer a broad range of mutual funds and other
financial products so investors and their financial
representatives can build diversified portfolios.
A commitment to doing
what’s right for investors
We have below-average expenses and stringent
investor protections, and provide a wealth of
information about the Putnam funds.
Industry-leading service
We help investors, along with their financial
representatives, make informed investment
decisions with confidence.
|
Putnam Ohio
Tax Exempt
Income Fund
|
| Message from the Trustees | 2 |
| About the fund | 4 |
| Report from the fund managers | 7 |
| Performance | 13 |
| Expenses | 16 |
| Portfolio turnover | 18 |
| Risk | 19 |
| Your fund’s management | 20 |
| Terms and definitions | 23 |
| Trustee approval of management contract | 25 |
| Other information for shareholders | 30 |
| Financial statements | 31 |
| Federal tax information | 52 |
| About the Trustees | 53 |
| Officers | 59 |
Cover photograph: © Richard H. Johnson
Message from the Trustees
|
Dear Fellow Shareholder
Investors continue to keep a close watch on the course of the economy. Globally, it appears that, assuming economic growth exceeds 4% in 2006, we will have seen the strongest economic performance over a four-year period in over thirty years. Corporate profits have boomed around the world, business capacity utilization rates have moved up, and unemployment rates have come down. Given such a sustained period of robust growth, it is not surprising that prices have begun to rise, inflation rates have crept up, and central banks in many countries, particularly the Federal Reserve (the Fed) in the United States, have pushed interest rates higher.
In recent weeks, investors have worried that these higher rates could threaten the fundamentals of the global economy, prompting a widespread sell-off. However, we believe that today’s higher interest rates, far from being a threat to global economic fundamentals, are in fact an integral part of them. Higher interest rates are bringing business borrowing costs closer to the rate of return available from investments. In our view, this should help provide the basis for a longer and more durable business expansion and a continued healthy investment environment.
You can be assured that the investment professionals managing your fund are closely monitoring the factors that influence the performance of the securities in which your fund invests. Moreover, Putnam Investments’ management team, under the leadership of Chief Executive Officer Ed Haldeman, continues to focus on investment performance and remains committed to putting the interests of shareholders first.
2
In the following pages, members of your fund’s management team discuss the fund’s performance and strategies for the fiscal period ended May 31, 2006, and provide their outlook for the months ahead. As always, we thank you for your support of the Putnam funds.
Putnam Ohio Tax Exempt Income Fund: pursuing
tax-advantaged income for Ohio investors
|
Municipal bonds can help investors keep more of their investment income while also financing important public projects such as schools, roads, and hospitals. Municipal bonds are typically issued by states and local municipalities to raise funds for building and maintaining public facilities, and they offer income that is generally exempt from federal income tax.
For residents of the state where the bond is issued, income is typically exempt from state and any local income taxes as well. While the stated yields on municipal bonds are usually lower than those on taxable bonds, tax exemption is an especially powerful advantage in Ohio because the state’s top income tax rate is among the highest in the United States. And the sheer size of the Ohio municipal bond market provides a wide array of investment opportunities.
Putnam Ohio Tax Exempt Income Fund seeks to capitalize on investment opportunities in Ohio by investing in bonds across a range of market sectors. The fund also combines bonds of differing credit quality to increase income potential. In addition to investing in high-quality bonds, the fund’s management team allocates a smaller portion of the portfolio to lower-rated bonds, which may offer higher income in return for more risk.
When deciding whether to invest in a bond, the fund’s management team considers the risks involved — including credit risk, interest-rate risk, and the risk that the bond will be prepaid. The management team is backed by the resources of Putnam’s fixed-income organization, one of the largest in the investment industry, in which municipal bond analysts are grouped into sector teams and conduct ongoing, rigorous research. Once a bond has been purchased, the team continues to monitor developments that affect the bond market, the sector, and the issuer of the bond.
Municipal bonds may finance a range of projects in your
community and thus play a key role in its development.

The goal of the fund’s in-depth research and active management is to stay a step ahead of the industry and pinpoint opportunities to adjust the fund’s holdings for the benefit of the fund and its shareholders.
The fund concentrates its investments by region and involves more risk than a fund that invests more broadly. Capital gains, if any, are taxable for federal and, in most cases, state purposes. For some investors, investment income may be subject to the federal alternative minimum tax. Tax-free funds may not be suitable for IRAs and other non-taxable accounts. Please consult with your tax advisor for more information. Mutual funds that invest in bonds are subject to certain risks, including interest-rate risk, credit risk, and inflation risk. As interest rates rise, the prices of bonds fall. Long-term bonds are more exposed to interest-rate risk than short-term bonds. Unlike bonds, bond funds have ongoing fees and expenses.
Understanding tax-equivalent yield
To understand the value of tax-free income, it is helpful to compare a municipal bond’s yield with the “tax-equivalent yield” — the before-tax yield that must be offered by a taxable bond in order to equal the municipal bond’s yield after taxes.
How to calculate tax-equivalent yield:
The tax-equivalent yield equals the municipal bond’s yield divided by “one minus the tax rate.” For example, if a municipal bond’s yield is 5%, then its tax-equivalent yield is 7.7%, assuming the maximum 35% federal tax rate for 2006.
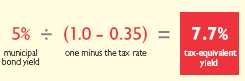
Results for investors subject to lower tax rates would not be as advantageous.

Putnam Ohio Tax Exempt Income Fund seeks to provide as high a level of current income free from federal and state of Ohio personal income taxes as we believe to be consistent with the preservation of capital. It may be suitable for Ohio investors seeking tax-free income through a diversified portfolio of municipal bonds primarily issued in Ohio.
| Highlights |
* | For the 12 months ended May 31, 2006, Putnam Ohio Tax Exempt Income Fund’s class A |
| shares returned 1.13% without sales charges. |
* | The fund’s benchmark, the Lehman Municipal Bond Index, returned 1.88%. |
* | The average return for the fund’s Lipper category, Ohio Municipal Debt Funds, was 0.98%. |
* | Additional fund performance, comparative performance, and Lipper data can be found in the |
| performance section beginning on page 13. |
Performance
Total return for class A shares for periods ended 5/31/06
|
| Since the fund’s inception (10/23/89), average annual return is 5.82% at NAV and 5.57% at POP. | |
|
| | Average annual return | Cumulative return |
| | NAV | POP | NAV | POP |
|
| 10 years | 5.01% | 4.61% | 63.08% | 56.93% |
|
| 5 years | 4.59 | 3.78 | 25.13 | 20.41 |
|
| 3 years | 2.54 | 1.25 | 7.82 | 3.79 |
|
| 1 year | 1.13 | –2.70 | 1.13 | –2.70 |
|
Data is historical. Past performance does not guarantee future results. More recent returns may be less or more than those shown. Investment return and principal value will fluctuate, and you may have a gain or a loss when you sell your shares. Performance assumes reinvestment of distributions and does not account for taxes. Returns at NAV do not reflect a sales charge of 3.75% . For the most recent month-end performance, visit www.putnam.com. For a portion of the period, this fund limited expenses, without which returns would have been lower. A short-term trading fee of up to 2% may apply.
6
Report from the fund managers
The year in review
|
Strong demand from yield-hungry investors pushed bond prices in the more credit-sensitive sectors of the municipal bond market higher during your fund’s fiscal year. Many of the fund’s investments in the tobacco settlement, health-care, and utility sectors performed well as a result. The fund also benefited from its relatively short duration positioning, which was designed to reduce the portfolio’s sensitivity to rising interest rates. The pre-refunding of two holdings also contributed favorably to results. Fund returns at net asset value (NAV, or without sales charges) surpassed the average return for its Lipper category for the 12 months ended May 31, 2006. However, the fund underperformed its nationally diversified benchmark because of its single-state focus. The portfolio’s yield curve positioning — which emphasized intermediate-maturity bonds while limiting exposure to longer-maturity bonds — was also a factor in this underperformance.
Market overview
Amid continuing signs of solid economic growth, and the potential for inflation that often accompanies such growth, the Fed increased the federal funds rate eight times during the fund’s fiscal year, lifting this benchmark for overnight loans between banks from 3.00% to 5.00% . Bond yields rose across the maturity spectrum, leading to a convergence of shorter- and longer-term rates. As rates converged, the yield curve — a graphical representation of yields for bonds of comparable quality plotted from the shortest to the longest maturity — flattened.
During the period, tax-exempt bonds generally outperformed comparable Treasury bonds, as prices of tax-exempt bonds declined less than Treasury prices across all maturities. Municipal bonds typically perform better than Treasuries when interest rates are rising. However, the degree to which they outperformed Treasuries was greater than we expected.
7
A robust economy and rising corporate earnings contributed to the strong relative performance of lower-rated bonds. Among uninsured bonds in general and especially bonds rated Baa and below, yield spreads tightened as lower-rated bonds performed better than higher-rated bonds. The superior performance of lower-rated bonds was primarily the result of strong demand by buyers searching for higher yields. Non-rated bonds also rallied. In addition, as a result of favorable legal rulings, tobacco settlement bonds generally outperformed the broader market. Also, airline-related industrial development bonds (IDBs) performed exceptionally well, in our view.
Strategy overview
Given our expectation for rising interest rates, we maintained a short (defensive) portfolio duration relative to the fund’s Lipper peer group, a strategy that contributed positively to results for the period as rates rose. Duration is a measure of a fund’s sensitivity to changes in interest rates. Having a shorter-duration portfolio may help protect principal when interest rates rise, but it can reduce appreciation potential when rates fall.
The fund’s yield curve positioning, or the maturity profile of its holdings, detracted from performance during the period but did not negate the positive contribution provided by our duration strategy. In order to keep the fund’s duration short, we limited exposure to
| Market sector performance | |
| These indexes provide an overview of performance in different market sectors for the | |
| 12 months ended 5/31/06. | |
|
| |
| Bonds | |
|
| Lehman Municipal Bond Index (tax-exempt bonds) | 1.88% |
|
| Lehman Aggregate Bond Index (broad bond market) | –0.48% |
|
| Lehman Intermediate Government Bond Index | |
| (intermediate-maturity U.S. Treasury and agency securities) | 0.22% |
|
| JP Morgan Global High Yield Index (global high-yield corporate bonds) | 7.40% |
|
| Equities | |
|
| S&P 500 Index (broad stock market) | 8.64% |
|
| Russell 2000 Index (small-company stocks) | 18.24% |
|
| MSCI EAFE Index (international stocks) | 28.24% |
|
8
longer-maturity bonds, favoring intermediate-maturity securities instead. However, as the yield curve flattened and the yield differences between shorter- and longer-term bonds converged, bonds with longer maturities performed better than their intermediate-maturity counterparts.
The fund’s overweight position in Baa-rated bonds, compared to other funds in its peer group, boosted results as securities in this area of the market continued to perform well. In contrast, the fund’s underweight position in the lowest-rated bonds (i.e., those rated Ba and lower), compared to other funds in its peer group, detracted from results as securities in this area of the market rallied substantially. We maintained this underweighting because we believed that better relative value existed in bonds rated Baa and higher at this point in the credit cycle, when the narrowing of credit spreads —or the reduced premium investors stand to receive by investing in lower-rated issues — appears to be unsupported by credit fundamentals.
During the period, we increased the fund’s holdings in the single-family housing sector, a strategy that proved helpful to results as rising interest rates and declining mortgage prepayments helped this sector perform exceptionally well.
Your fund’s holdings
Lower-rated municipal bonds
delivered some of the best performance
Comparison of the fund’s maturity and duration
This chart compares changes in the fund’s average effective maturity (a weighted average of 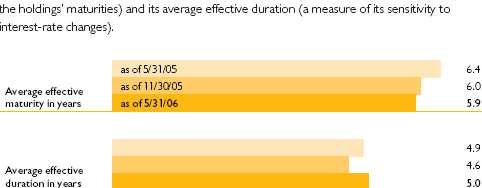
Average effective duration and average effective maturity take into account put and call features, where applicable, and reflect prepayments for mortgage-backed securities. Duration is usually shorter than maturity because it reflects interest payments on a bond prior to its maturity.
9
in the municipal bond market during the reporting period, helped in large part by strong economic growth, relatively low inflation, and record demand. After such strong appreciation, we have become more cautious regarding this sector, since we don’t think investors are being adequately compensated for the increased risk associated with investing in these lower-quality investments. While this decision curbed the fund’s participation in the rally, we think it may help protect the value of the portfolio when credit spreads begin to widen. The fund’s investments in Miami County Ohio revenue bonds for Upper Valley Medical Center exemplify our strategy in this sector. These bonds are financing improvements tothe hospital, which has dominant market share in the community it serves and has demonstrated strong profit margins and favorable cash flow. Moody’s changed its outlook for this bond from stable to positive in September 2005.
The fund’s overweight position in tobacco settlement bonds contributed positively to results, as these bonds continued to strengthen during the period. While tobacco settlement bonds generally carry investment-grade ratings of Baa, they are secured by the income stream from tobacco companies’ settlement obligations to the states and generally offer higher yields than bonds of comparable quality.
Furthermore, we think tobacco bonds
Credit qualities shown as a percentage of portfolio value as of 5/31/06. A bond rated Baa or higher is considered investment grade. The chart reflects Moody’s ratings; percentages may include bonds not rated by Moody’s but considered by Putnam Management to be of comparable quality. Ratings will vary over time.
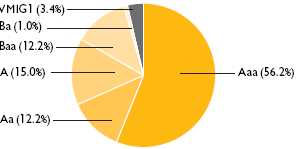
10
provide valuable diversification since their performance is not as closely tied to the direction of economic growth as other, more economically sensitive, holdings. The fund holds tobacco settlement bonds issued by the Children’s Trust Fund Tobacco Settlement of Puerto Rico as well as bonds issued by the Tobacco Settlement Financial Corporation of the Virgin Islands.
Puerto Rico municipal bonds offer tax-exempt income to investors in all 50 states and have, over time, proven useful in diversifying the fund’s portfolio. However, general obligation bonds issued in Puerto Rico were downgraded near the end of the period due to financial turmoil that led to a partial government shutdown. Prices of uninsured Puerto Rico bonds declined, providing the fund with an opportunity to add to its holdings at favorable levels. By the end of the period, the fund had increased its Puerto Rico holdings from an underweight position relative to the Lipper peer group to an allocation that is approximately in line with the peer group average.
Two of the fund’s investment-grade holdings rallied during the fiscal year when the bonds were pre-refunded. Montgomery County Hospital revenue bonds for Kettering Medical Center and Franklin County Health Care Facility revenue bonds for Ohio Presbyterian Services were pre-refunded this year in January and May, respectively. Pre-refundings occur when a municipality issues new bonds to raise funds to pay off an older issue. This money is then invested in a secure investment — usually U.S. Treasury securities — that matures at the older bond’s first call date, effectively raising the bond’s perceived rating and frequently its market value.
Please note that the holdings discussed in this report may not have been held by the fund for the entire period. Portfolio composition is subject to review in accordance with the fund’s investment strategy and may vary in the future.
11
The outlook for your fund
|
The following commentary reflects anticipated developments that could affect your fund over the next six months, as well as your management team’s plans for responding to them.
We believe that the Fed’s tightening cycle is nearing an end but expect that rates will continue to rise over the near term. Consequently, we currently plan to maintain the fund’s defensive duration because we believe that the municipal bond market may be susceptible to weaker returns in the coming months. A key reason for this belief is the market’s unusually strong performance versus taxable equivalents for the fiscal period. In our view, the municipal market’s exceptional results can be attributed primarily to a combination of robust demand and limited new-issue supply.
It appears to us that the extended rally among lower-rated, higher-yielding bonds may be in its final stages. We base this view, in part, on the fact that the difference in yields between Aaa-rated bonds and Baa-rated bonds — the lowest investment-grade rating — is at its narrowest point since late 1999. In other words, the reward in terms of higher yields for assuming additional credit risk has diminished substantially. Therefore, we remain cautious with respect to securities at the lower end of the credit spectrum.
We continue to have a positive view of defensive sectors such as single-family housing bonds, which performed well over most of the fiscal period. Finally, our view on tobacco settlement bonds remains positive as we believe that they represent good investment opportunities relative to the inherent risks associated with the sector.
The views expressed in this report are exclusively those of Putnam Management. They are not meant as investment advice.
This fund concentrates its investments by region and involves more risk than a fund that invests more broadly. Capital gains, if any, are taxable for federal and, in most cases, state purposes. For some investors, investment income may be subject to the federal alternative minimum tax. Mutual funds that invest in bonds are subject to certain risks, including interest-rate risk, credit risk, and inflation risk. As interest rates rise, the prices of bonds fall. Long-term bonds are more exposed to interest-rate risk than short-term bonds. Unlike bonds, bond funds have ongoing fees and expenses. Tax-free funds may not be suitable for IRAs and other non-taxable accounts.
12
This section shows your fund’s performance for periods ended May 31, 2006, the end of its fiscal year. In accordance with regulatory requirements for mutual funds, we also include performance as of the most recent calendar quarter-end. Performance should always be considered in light of a fund’s investment strategy. Data represents past performance. Past performance does not guarantee future results. More recent returns may be less or more than those shown. Investment return and principal value will fluctuate, and you may have a gain or a loss when you sell your shares. For the most recent month-end performance, please visit www.putnam.com or call Putnam at 1-800-225-1581.
| Fund performance | | | | | | |
| Total return for periods ended 5/31/06 | | | | | | |
|
| |
| | Class A | | Class B | | Class M | |
| (inception dates) | (10/23/89) | | (7/15/93) | | (4/3/95) | |
| | NAV | POP | NAV | CDSC | NAV | POP |
|
| Annual average | | | | | | |
| (life of fund) | 5.82% | 5.57% | 5.07% | 5.07% | 5.46% | 5.25% |
|
| 10 years | 63.08 | 56.93 | 52.78 | 52.78 | 58.39 | 53.33 |
| Annual average | 5.01 | 4.61 | 4.33 | 4.33 | 4.71 | 4.37 |
|
| 5 years | 25.13 | 20.41 | 21.08 | 19.08 | 23.34 | 19.42 |
| Annual average | 4.59 | 3.78 | 3.90 | 3.55 | 4.28 | 3.61 |
|
| 3 years | 7.82 | 3.79 | 5.73 | 2.84 | 6.98 | 3.48 |
| Annual average | 2.54 | 1.25 | 1.87 | 0.94 | 2.27 | 1.15 |
|
| 1 year | 1.13 | –2.70 | 0.47 | –4.40 | 0.83 | –2.46 |
|
Performance assumes reinvestment of distributions and does not account for taxes. Returns at public offering price (POP) for class A and M shares reflect a sales charge of 3.75% and 3.25%, respectively. Class B share returns reflect the applicable contingent deferred sales charge (CDSC), which is 5% in the first year, declining to 1% in the sixth year, and is eliminated thereafter. Performance for class B and M shares before their inception is derived from the historical performance of class A shares, adjusted for the applicable sales charge (or CDSC).
For a portion of the period, this fund limited expenses, without which returns would have been lower.
A 2% short-term trading fee may be applied to shares exchanged or sold within 5 days of purchase.
13
Change in the value of a $10,000 investment ($9,625 after sales charge)
Cumulative total return from 5/31/96 to 5/31/06
|
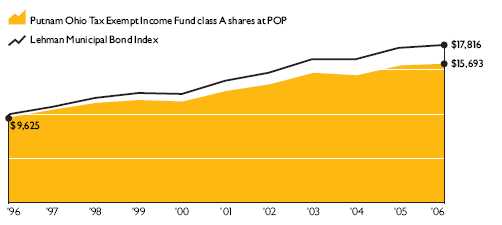
Past performance does not indicate future results. At the end of the same time period, a $10,000 investment in the fund’s class B shares would have been valued at $15,278, and no contingent deferred sales charges would apply. A $10,000 investment in the fund’s class M shares would have been valued at $15,839 ($15,333 at public offering price). See first page of performance section for performance calculation method.
Comparative index returns
For periods ended 5/31/06
| | | Lipper Ohio |
| | Lehman Municipal | Municipal Debt Funds |
| | Bond Index | category average* |
|
| Annual average | | |
| (life of fund) | 6.73% | 6.02% |
|
| 10 years | 78.16 | 61.49 |
| Annual average | 5.95 | 4.90 |
|
| 5 years | 29.26 | 23.32 |
| Annual average | 5.27 | 4.27 |
|
| 3 years | 9.97 | 7.00 |
| Annual average | 3.22 | 2.27 |
|
| 1 year | 1.88 | 0.98 |
|
Index and Lipper results should be compared to fund performance at net asset value.
* Over the 1-, 3-, 5-, and 10-year periods ended 5/31/06, there were 42, 42, 39, and 33 funds, respectively, in this Lipper category.
14
Fund price and distribution information
For the 12-month period ended 5/31/06
|
| Distributions | Class A | | | Class B | | Class M | |
|
| Number | 12 | | | 12 | | 12 | |
|
| Income1 | $0.349994 | | $0.290781 | | $0.323231 |
|
| Capital gains2 | — | | | — | | — | |
|
| Total | $0.349994 | | $0.290781 | | $0.323231 |
|
| Share value: | NAV | POP | | NAV | | NAV | POP |
| 5/31/05 | $9.22 | $9.58 | | $9.21 | | $9.23 | $9.54 |
|
| 5/31/06 | 8.97 | 9.32 | | 8.96 | | 8.98 | 9.28 |
|
| Current yield (end of period) | | | | | | | |
| Current dividend rate3 | 3.91% | 3.77% | | 3.27% | | 3.62% | 3.50% |
|
| Taxable equivalent4 | 6.46 | 6.23 | | 5.40 | | 5.98 | 5.78 |
|
| Current 30-day SEC yield5 | 3.46 | 3.33 | | 2.82 | | 3.16 | 3.06 |
|
| Taxable equivalent4 | 5.72 | 5.50 | | 4.66 | | 5.22 | 5.06 |
|
1 For some investors, investment income may be subject to the federal alternative minimum tax.
2 Capital gains, if any, are taxable for federal and, in most cases, state purposes.
3 Most recent distribution, excluding capital gains, annualized and divided by NAV or POP at end of period.
4 Assumes maximum 39.47% federal and state combined tax rate for 2006. Results for investors subject to lower tax rates would not be as advantageous.
5 Based only on investment income, calculated using SEC guidelines.
Fund performance for most recent calendar quarter
Total return for periods ended 6/30/06
| | Class A | | Class B | | Class M | |
|
| (inception dates) | (10/23/89) | | (7/15/93) | | (4/3/95) | |
|
| | NAV | POP | NAV | CDSC | NAV | POP |
| Annual average | | | | | | |
| (life of fund) | 5.77% | 5.52% | 5.02% | 5.02% | 5.40% | 5.20% |
|
| 10 years | 60.88 | 54.88 | 50.74 | 50.74 | 56.12 | 50.94 |
| Annual average | 4.87 | 4.47 | 4.19 | 4.19 | 4.56 | 4.20 |
|
| 5 years | 23.74 | 19.13 | 19.78 | 17.78 | 21.85 | 17.87 |
| Annual average | 4.35 | 3.56 | 3.68 | 3.33 | 4.03 | 3.34 |
|
| 3 years | 7.91 | 3.84 | 5.82 | 2.94 | 6.83 | 3.34 |
| Annual average | 2.57 | 1.26 | 1.90 | 0.97 | 2.23 | 1.10 |
|
| 1 year | 0.35 | –3.44 | –0.30 | –5.13 | –0.04 | –3.30 |
|
15
Your fund’s expenses
As a mutual fund investor, you pay ongoing expenses, such as management fees, distribution fees (12b-1 fees), and other expenses. In the most recent six-month period, your fund limited these expenses; had it not done so, expenses would have been higher. Using the information below, you can estimate how these expenses affect your investment and compare them with the expenses of other funds. You may also pay one-time transaction expenses, including sales charges (loads) and redemption fees, which are not shown in this section and would have resulted in higher total expenses. For more information, see your fund’s prospectus or talk to your financial advisor.
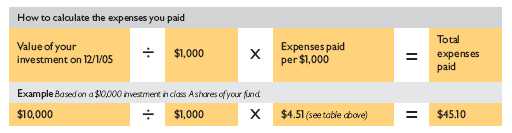
Review your fund’s expenses
The table below shows the expenses you would have paid on a $1,000 investment in Putnam Ohio Tax Exempt Income Fund from December 1, 2005, to May 31, 2006. It also shows how much a $1,000 investment would be worth at the close of the period, assuming actual returns and expenses.
| | Class A | Class B | Class M |
|
| Expenses paid per $1,000* | $ 4.51 | $ 7.76 | $ 6.01 |
|
| Ending value (after expenses) | $1,011.70 | $1,008.50 | $1,010.20 |
|
* Expenses for each share class are calculated using the fund’s annualized expense ratio for each class, which represents the ongoing expenses as a percentage of net assets for the six months ended 5/31/06. The expense ratio may differ for each share class (see the table at the bottom of the next page). Expenses are calculated by multiplying the expense ratio by the average account value for the period; then multiplying the result by the number of days in the period; and then dividing that result by the number of days in the year.
Estimate the expenses you paid
To estimate the ongoing expenses you paid for the six months ended May 31, 2006, use the calculation method below. To find the value of your investment on December 1, 2005, go to www.putnam.com and log on to your account. Click on the “Transaction History” tab in your Daily Statement and enter 12/01/2005 in both the “from” and “to” fields. Alternatively, call Putnam at 1-800-225-1581.
16
Compare expenses using the SEC’s method
The Securities and Exchange Commission (SEC) has established guidelines to help investors assess fund expenses. Per these guidelines, the table below shows your fund’s expenses based on a $1,000 investment, assuming a hypothetical 5% annualized return. You can use this information to compare the ongoing expenses (but not transaction expenses or total costs) of investing in the fund with those of other funds. All mutual fund shareholder reports will provide this information to help you make this comparison. Please note that you cannot use this information to estimate your actual ending account balance and expenses paid during the period.
| | Class A | Class B | Class M |
|
| Expenses paid per $1,000* | $ 4.53 | $ 7.80 | $ 6.04 |
|
| Ending value (after expenses) | $1,020.44 | $1,017.20 | $1,018.95 |
|
* Expenses for each share class are calculated using the fund’s annualized expense ratio for each class, which represents the ongoing expenses as a percentage of net assets for the six months ended 5/31/06. The expense ratio may differ for each share class (see the table at the bottom of this page). Expenses are calculated by multiplying the expense ratio by the average account value for the period; then multiplying the result by the number of days in the period; and then dividing that result by the number of days in the year.
Compare expenses using industry averages
You can also compare your fund’s expenses with the average of its peer group, as defined by Lipper, an independent fund-rating agency that ranks funds relative to others that Lipper considers to have similar investment styles or objectives. The expense ratio for each share class shown below indicates how much of your fund’s net assets have been used to pay ongoing expenses during the period.
| | Class A | Class B | Class M |
|
| Your fund’s annualized expense ratio* | 0.90% | 1.55% | 1.20% |
|
| Average annualized expense ratio for Lipper peer group† | 0.91% | 1.56% | 1.21% |
|
* For the fund’s most recent fiscal half year; may differ from expense ratios based on one-year data in the financial highlights.
† Simple average of the expenses of all front-end load funds in the fund’s Lipper peer group, calculated in accordance with Lipper’s standard method for comparing fund expenses (excluding 12b-1 fees and without giving effect to any expense offset and brokerage service arrangements that may reduce fund expenses). This average reflects each fund’s expenses for its most recent fiscal year available to Lipper as of 3/31/06. To facilitate comparison, Putnam has adjusted this average to reflect the 12b-1 fees carried by each class of shares. The peer group may include funds that are significantly smaller or larger than the fund, which may limit the comparability of the fund’s expenses to the simple average, which typically is higher than the asset-weighted average.
17
Your fund’s
portfolio turnover
|
Putnam funds are actively managed by teams of experts who buy and sell securities based on intensive analysis of companies, industries, economies, and markets. Portfolio turnover is a measure of how often a fund’s managers buy and sell securities for your fund. A portfolio turnover of 100%, for example, means that the managers sold and replaced securities valued at 100% of a fund’s assets within a one-year period. Funds with high turnover may be more likely to generate capital gains and dividends that must be distributed to shareholders as taxable income. High turnover may also cause a fund to pay more brokerage commissions and other transaction costs, which may detract from performance.
Funds that invest in bonds or other fixed-income instruments may have higher turnover than funds that invest only in stocks. Short-term bond funds tend to have higher turnover than longer-term bond funds, because shorter-term bonds will mature or be sold more frequently than longer-term bonds. You can use the table below to compare your fund’s turnover with the average turnover for funds in its Lipper category.
| Turnover comparisons | | | | | |
| Percentage of holdings that change every year | | | |
|
| |
| | 2006 | 2005 | 2004 | 2003 | 2002 |
|
| Putnam Ohio Tax Exempt | | | | | |
| Income Fund | 6% | 12% | 17% | 26% | 17% |
|
| Lipper Ohio Municipal Debt | | | | | |
| Funds category average | 16% | 17% | 19% | 37% | 23% |
|
Turnover data for the fund is calculated based on the fund’s fiscal-year period, which ends on May 31. Turnover data for the fund’s Lipper category is calculated based on the average of the turnover of each fund in the category for its fiscal year ended during the indicated year. Fiscal years vary across funds in the Lipper category, which may limit the comparability of the fund’s portfolio turnover rate to the Lipper average. Comparative data for 2006 is based on information available as of 5/31/06.
18
Your fund’s risk
This risk comparison is designed to help you understand how your fund compares with other funds. The comparison utilizes a risk measure developed by Morningstar, an independent fund-rating agency. This risk measure is referred to as the fund’s Overall Morningstar Risk.
Your fund’s Overall Morningstar® Risk
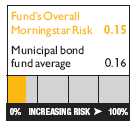
Your fund’s Overall Morningstar Risk is shown alongside that of the average fund in its broad asset class, as determined by Morningstar. The risk bar broadens the comparison by translating the fund’s Overall Morningstar Risk into a percentile, which is based on the fund’s ranking among all funds rated by Morningstar as of June 30, 2006. A higher Overall Morningstar Risk generally indicates that a fund’s monthly returns have varied more widely.
Morningstar determines a fund’s Overall Morningstar Risk by assessing variations in the fund’s monthly returns — with an emphasis on downside variations — over 3-, 5-, and 10-year periods, if available. Those measures are weighted and averaged to produce the fund’s Overall Morningstar Risk. The information shown is provided for the fund’s class A shares only; information for other classes may vary. Overall Morningstar Risk is based on historical data and does not indicate future results. Morningstar does not purport to measure the risk associated with a current investment in a fund, either on an absolute basis or on a relative basis. Low Overall Morningstar Risk does not mean that you cannot lose money on an investment in a fund. Copyright 2006 Morningstar, Inc. All Rights Reserved. The information contained herein (1) is proprietary to Morningstar and/or its content providers; (2) may not be copied or distributed; and (3) is not warranted to be accurate, complete, or timely. Neither Morningstar nor its content providers are responsible for any damages or losses arising from any use of this information.
19
Your fund’s management
Your fund is managed by the members of the Putnam Tax Exempt Fixed-Income Team. David Hamlin is the Portfolio Leader, and Paul Drury, Susan McCormack, and James St. John are Portfolio Members of your fund. The Portfolio Leader and Portfolio Members coordinate the team’s management of the fund.
For a complete listing of the members of the Putnam Tax Exempt Fixed-Income Team, including those who are not Portfolio Leaders or Portfolio Members of your fund, visit Putnam’s Individual Investor Web site at www.putnam.com.
Fund ownership by the Portfolio Leader and Portfolio Members
The table below shows how much the fund’s current Portfolio Leader and Portfolio Members have invested in the fund (in dollar ranges). Information shown is as of May 31, 2006, and May 31, 2005.
| | | | $1 – | $10,001 – | $50,001 – | $100,001 – | $500,001 – | $1,000,001 |
| | Year | $0 | $10,000 | $50,000 | $100,000 | $500,000 | $1,000,000 | and over |
|
| David Hamlin | 2006 | * | | | | | | |
|
|
| Portfolio Leader | 2005 | * | | | | | | |
|
| Paul Drury | 2006 | * | | | | | | |
|
|
| Portfolio Member | 2005 | * | | | | | | |
|
| Susan McCormack | 2006 | * | | | | | | |
|
|
| Portfolio Member | 2005 | * | | | | | | |
|
| James St. John | 2006 | * | | | | | | |
|
|
| Portfolio Member | 2005 | * | | | | | | |
|
20
Fund manager compensation
|
The total 2005 fund manager compensation that is attributable to your fund is approximately $80,000. This amount includes a portion of 2005 compensation paid by Putnam Management to the fund managers listed in this section for their portfolio management responsibilities, calculated based on the fund assets they manage taken as a percentage of the total assets they manage. The compensation amount also includes a portion of the 2005 compensation paid to the Chief Investment Officer of the team and the Group Chief Investment Officer of the fund’s broader investment category for their oversight responsibilities, calculated based on the fund assets they oversee taken as a percentage of the total assets they oversee. This amount does not include compensation of other personnel involved in research, trading, administration, systems, compliance, or fund operations; nor does it include non-compensation costs. These percentages are determined as of the fund’s fiscal period-end. For personnel who joined Putnam Management during or after 2005, the calculation reflects annualized 2005 compensation or an estimate of 2006 compensation, as applicable.
Other Putnam funds managed by the Portfolio Leader and Portfolio Members
David Hamlin is the Portfolio Leader and Paul Drury, Susan McCormack, and James St. John are Portfolio Members for Putnam’s tax-exempt funds for the following states: Arizona, California, Florida, Massachusetts, Michigan, Minnesota, New Jersey, New York, and Pennsylvania. The same group also manages Putnam AMT-Free Insured Municipal Fund, Putnam California Investment Grade Municipal Trust, Putnam High Yield Municipal Trust, Putnam Investment Grade Municipal Trust, Putnam Managed Municipal Income Trust, Putnam Municipal Bond Fund, Putnam Municipal Opportunities Trust, Putnam New York Investment Grade Municipal Trust, Putnam Tax Exempt Income Fund, Putnam Tax-Free Health Care Fund, and Putnam Tax-Free High Yield Fund.
David Hamlin, Paul Drury, Susan McCormack, and James St. John may also manage other accounts and variable trust funds advised by Putnam Management or an affiliate.
Changes in your fund’s Portfolio Leader and Portfolio Members
Your fund’s Portfolio Leader and Portfolio Members did not change during the year ended May 31, 2006.
21
Fund ownership by Putnam’s Executive Board
The table below shows how much the members of Putnam’s Executive Board have invested in the fund (in dollar ranges). Information shown is as of May 31, 2006, and May 31, 2005.
| | | | $1 – | $10,001 – | $50,001– | $100,001 |
| | Year | $0 | $10,000 | $50,000 | $100,000 | and over |
|
| Philippe Bibi | 2006 | * | | | | |
|
|
| Chief Technology Officer | 2005 | * | | | | |
|
| Joshua Brooks | 2006 | * | | | | |
|
|
| Deputy Head of Investments | 2005 | * | | | | |
|
| William Connolly | 2006 | * | | | | |
|
|
| Head of Retail Management | N/A | | | | | |
|
| Kevin Cronin | 2006 | * | | | | |
|
|
| Head of Investments | 2005 | * | | | | |
|
| Charles Haldeman, Jr. | 2006 | | | * | | |
|
|
| President and CEO | 2005 | | | * | | |
|
| Amrit Kanwal | 2006 | * | | | | |
|
|
| Chief Financial Officer | 2005 | * | | | | |
|
| Steven Krichmar | 2006 | * | | | | |
|
|
| Chief of Operations | 2005 | * | | | | |
|
| Francis McNamara, III | 2006 | * | | | | |
|
|
| General Counsel | 2005 | * | | | | |
|
| Richard Robie, III | 2006 | * | | | | |
|
|
| Chief Administrative Officer | 2005 | * | | | | |
|
| Edward Shadek | 2006 | * | | | | |
|
|
| Deputy Head of Investments | 2005 | * | | | | |
|
| Sandra Whiston | 2006 | * | | | | |
|
|
| Head of Institutional Management | N/A | | | | | |
|
N/A indicates the individual was not a member of Putnam’s Executive Board as of 5/31/05.
22
Total return shows how the value of the fund’s shares changed over time, assuming you held the shares through the entire period and reinvested all distributions in the fund.
Net asset value (NAV) is the price, or value, of one share of a mutual fund, without a sales charge. NAVs fluctuate with market conditions. NAV is calculated by dividing the net assets of each class of shares by the number of outstanding shares in the class.
Public offering price (POP) is the price of a mutual fund share plus the maximum sales charge levied at the time of purchase. POP performance figures shown here assume the 3.75% maximum sales charge for class A shares and 3.25% for class M shares.
Contingent deferred sales charge (CDSC) is generally a charge applied at the time of the redemption of class B shares and assumes redemption at the end of the period. Your fund’s class B CDSC declines from a 5% maximum during the first year to 1% during the sixth year. After the sixth year, the CDSC no longer applies.
Class A shares are generally subject to an initial sales charge and no CDSC (except on certain redemptions of shares bought without an initial sales charge).
Class B shares are not subject to an initial sales charge. They may be subject to a CDSC.
Class M shares have a lower initial sales charge and a higher 12b-1 fee than class A shares and CDSC.
23
JP Morgan Global High Yield Index is an unmanaged index of global high-yield fixed-income securities.
Lehman Aggregate Bond Index is an unmanaged index of U.S. investment-grade fixed-income securities.
Lehman Intermediate Government Bond Index is an unmanaged index of U.S. Treasury and agency securities with maturities between 1 and 10 years.
Lehman Municipal Bond Index is an unmanaged index of long-term fixed-rate investment-grade tax-exempt bonds.
Morgan Stanley Capital International (MSCI) EAFE Index is an unmanaged index of equity securities from developed countries in Western Europe, the Far East, and Australasia. Russell 2000 Index is an unmanaged index of the 2,000 smallest companies in the Russell 3000 Index.
S&P 500 Index is an unmanaged index of common stock performance.
Indexes assume reinvestment of all distributions and do not account for fees. Securities and performance of a fund and an index will differ. You cannot invest directly in an index.
Lipper is a third-party industry-ranking entity that ranks mutual funds. Its rankings do not reflect sales charges. Lipper rankings are based on total return at net asset value relative to other funds that have similar current investment styles or objectives as determined by Lipper. Lipper may change a fund’s category assignment at its discretion. Lipper category averages reflect performance trends for funds within a category.
24
Trustee approval of
management contract
|
General conclusions
The Board of Trustees of the Putnam funds oversees the management of each fund and, as required by law, determines annually whether to approve the continuance of your fund’s management contract with Putnam Management. In this regard, the Board of Trustees, with the assistance of its Contract Committee consisting solely of Trustees who are not “interested persons” (as such term is defined in the Investment Company Act of 1940, as amended) of the Putnam funds (the “Independent Trustees”), requests and evaluates all information it deems reasonably necessary under the circumstances. Over the course of several months beginning in March and ending in June 2005, the Contract Committee met five times to consider the information provided by Putnam Management and other information developed with the assistance of the Board’s independent counsel and independent staff. The Contract Committee reviewed and discussed key aspects of this information with all of the Independent Trustees. Upon completion of this review, the Contract Committee recommended and the Independent Trustees approved the continuance of your fund’s management contract, effective July 1, 2005.
This approval was based on the following conclusions:
| * | That the fee schedule currently in effect for your fund represents reasonable compensation |
| in light of the nature and quality of the services being provided to the fund, the fees paid |
| by competitive funds and the costs incurred by Putnam Management in providing such |
| services, and |
* | That such fee schedule represents an appropriate sharing between fund shareholders and |
| Putnam Management of such economies of scale as may exist in the management of the fund |
| at current asset levels. |
These conclusions were based on a comprehensive consideration of all information provided to the Trustees and were not the result of any single factor. Some of the factors that figured particularly in the Trustees’ deliberations and how the Trustees considered these factors are described below, although individual Trustees may have evaluated the information presented differently, giving different weights to various factors. It is also important to recognize that the fee arrangements for your fund and the other Putnam funds are the result of many years of review and discussion between the Independent Trustees and Putnam Management, that certain aspects of such arrangements may receive greater scrutiny in some years than others, and that the Trustees’ conclusions may be based, in part, on their consideration of these same arrangements in prior years.
25
Model fee schedules and categories; total expenses
The Trustees’ review of the management fees and total expenses of the Putnam funds focused on three major themes:
* Consistency. The Trustees, working in cooperation with Putnam Management, have developed and implemented a series of model fee schedules for the Putnam funds designed to ensure that each fund’s management fee is consistent with the fees for similar funds in the Putnam family of funds and compares favorably with fees paid by competitive funds sponsored by other investment advisors. Under this approach, each Putnam fund is assigned to one of several fee categories based on a combination of factors, including competitive fees and perceived difficulty of management, and a common fee schedule is implemented for all funds in a given fee category. The Trustees reviewed the model fee schedule then in effect for your fund, including fee levels and breakpoints, and the assignment of the fund to a particular fee category under this structure. (“Breakpoints” refer to reductions in fee rates that apply to additional assets once specified asset levels are reached.) The Trustees concluded that no changes should be made in the fund’s current fee schedule at this time.
* Competitiveness. The Trustees also reviewed comparative fee and expense information for competitive funds, which indicated that, in a custom peer group of competitive funds selected by Lipper Inc., your fund ranked in the 44th percentile in management fees and in the 44th percentile in total expenses (less any applicable 12b-1 fees) as of December 31, 2004 (the first percentile being the least expensive funds and the 100th percentile being the most expensive funds). (Because the fund’s custom peer group is smaller than the fund’s broad Lipper Inc. peer group, this expense comparison may differ from the Lipper peer expense information found elsewhere in this report.) The Trustees noted that expense ratios for a number of Putnam funds, which show the percentage of fund assets used to pay for management and administrative services, distribution (12b-1) fees and other expenses, had been increasing recently as a result of declining net assets and the natural operation of fee breakpoints. They noted that such expense ratio increases were currently being controlled by expense limitations implemented in January 2004 and which Putnam Management, in consultation with the Contract Committee, had committed to maintain at least through 2006. The Trustees expressed their intention to monitor this information closely to ensure that fees and expenses of the Putnam funds continue to meet evolving competitive standards.
* Economies of scale. The Trustees concluded that the fee schedule currently in effect for your fund represents an appropriate sharing of economies of scale at current asset levels. Your fund currently has the benefit of breakpoints in its management fee that provide shareholders with significant economies of scale, which means that the effective management fee rate of a fund (as a percentage of fund assets) declines as a fund grows in size and crosses specified asset thresholds. The Trustees examined the existing breakpoint structure of the Putnam funds’ management fees in light of competitive industry practices. The Trustees considered various possible modifications to the Putnam funds’ current breakpoint structure, but
26
ultimately concluded that the current breakpoint structure continues to serve the interests of fund shareholders. Accordingly, the Trustees continue to believe that the fee schedules currently in effect for the funds represent an appropriate sharing of economies of scale at current asset levels. The Trustees noted that significant redemptions in many Putnam funds, together with significant changes in the cost structure of Putnam Management, have altered the economics of Putnam Management’s business in significant ways. In view of these changes, the Trustees intend to consider whether a greater sharing of the economies of scale by fund shareholders would be appropriate if and when aggregate assets in the Putnam funds begin to experience meaningful growth.
In connection with their review of the management fees and total expenses of the Putnam funds, the Trustees also reviewed the costs of the services to be provided and profits to be realized by Putnam Management and its affiliates from the relationship with the funds. This information included trends in revenues, expenses and profitability of Putnam Management and its affiliates relating to the investment management and distribution services provided to the funds. In this regard, the Trustees also reviewed an analysis of Putnam Management’s revenues, expenses and profitability with respect to the funds’ management contracts, allocated on a fund-by-fund basis.
The quality of the investment process provided by Putnam Management represented a major factor in the Trustees’ evaluation of the quality of services provided by Putnam Management under your fund’s management contract. The Trustees were assisted in their review of the funds’ investment process and performance by the work of the Investment Oversight Committees of the Trustees, which meet on a regular monthly basis with the funds’ portfolio teams throughout the year. The Trustees concluded that Putnam Management generally provides a high-quality investment process — as measured by the experience and skills of the individuals assigned to the management of fund portfolios, the resources made available to such personnel, and in general the ability of Putnam Management to attract and retain high-quality personnel — but also recognize that this does not guarantee favorable investment results for every fund in every time period. The Trustees considered the investment performance of each fund over multiple time periods and considered information comparing the fund’s performance with various benchmarks and with the performance of competitive funds. The Trustees noted the satisfactory investment performance of many Putnam funds. They also noted the disappointing investment performance of certain funds in recent years and continued to discuss with senior management of Putnam Management the factors contributing to such underperformance and actions being taken to improve performance. The Trustees recognized that, in recent years, Putnam Management has made significant changes in its investment personnel and processes and in the fund product line to address areas of
27
underperformance. The Trustees indicated their intention to continue to monitor performance trends to assess the effectiveness of these changes and to evaluate whether additional remedial changes are warranted.
In the case of your fund, the Trustees considered that your fund’s class A share cumulative total return performance at net asset value was in the following percentiles of its Lipper Inc. peer group (Lipper Ohio Municipal Debt Funds; compared using tax-adjusted performance to recognize the different federal income tax treatment for capital gains distributions and exempt-interest distributions) for the one-, three- and five-year periods ended December 31, 2004 (the first percentile being the best-performing funds and the 100th percentile being the worst-performing funds):
| One-year period | Three-year period | Five-year period |
|
| 51st | 40th | 36th |
(Because of the passage of time, these performance results may differ from the performance results for more recent periods shown elsewhere in this report. Over the one-, three-, and five-year periods ended December 31, 2004, there were 42, 39, and 37 funds, respectively, in your fund’s Lipper peer group.* Past performance is no guarantee of future performance.) As a general matter, the Trustees believe that cooperative efforts between the Trustees and Putnam Management represent the most effective way to address investment performance problems. The Trustees believe that investors in the Putnam funds have, in effect, placed their trust in the Putnam organization, under the oversight of the funds’ Trustees, to make appropriate decisions regarding the management of the funds. Based on the responsiveness of Putnam Management in the recent past to Trustee concerns about investment performance, the Trustees believe that it is preferable to seek change within Putnam Management to address performance shortcomings. In the Trustees’ view, the alternative of terminating a management contract and engaging a new investment advisor for an underperforming fund would entail significant disruptions and would not provide any greater assurance of improved investment performance.
Brokerage and soft-dollar allocations; other benefits
The Trustees considered various potential benefits that Putnam Management may receive in connection with the services it provides under the management contract with your fund. These include principally benefits related to brokerage and soft-dollar allocations, whereby a portion of the commissions paid by a fund for brokerage is earmarked to pay for research services that may be utilized by a fund’s investment advisor, subject to the obligation to seek best execution.
* The percentile rankings for your fund’s class A share annualized total return performance in the Lipper Ohio Municipal Debt Funds category for the one-, five-, and ten-year periods ended June 30, 2006, were 26%, 28%, and 42%, respectively. Over the one-, five-, and ten-year periods ended June 30, 2006, the fund ranked 11th out of 42, 11th out of 39, and 14th out of 33 funds, respectively. Note that this more recent information was not available when the Trustees approved the continuance of your fund’s management contract.
28
The Trustees believe that soft-dollar credits and other potential benefits associated with the allocation of fund brokerage, which pertains mainly to funds investing in equity securities, represent assets of the funds that should be used for the benefit of fund shareholders. This area has been marked by significant change in recent years. In July 2003, acting upon the Contract Committee’s recommendation, the Trustees directed that allocations of brokerage to reward firms that sell fund shares be discontinued no later than December 31, 2003. In addition, commencing in 2004, the allocation of brokerage commissions by Putnam Management to acquire research services from third-party service providers has been significantly reduced, and continues at a modest level only to acquire research that is customarily not available for cash. The Trustees will continue to monitor the allocation of the funds’ brokerage to ensure that the principle of “best price and execution” remains paramount in the portfolio trading process.
The Trustees’ annual review of your fund’s management contract also included the review of its distributor’s contract and distribution plan with Putnam Retail Management Limited Partnership and the custodian agreement and investor servicing agreement with Putnam Fiduciary Trust Company, all of which provide benefits to affiliates of Putnam Management.
Comparison of retail and institutional fee schedules
The information examined by the Trustees as part of their annual contract review has included for many years information regarding fees charged by Putnam Management and its affiliates to institutional clients such as defined benefit pension plans, college endowments, etc. This information included comparison of such fees with fees charged to the funds, as well as a detailed assessment of the differences in the services provided to these two types of clients. The Trustees observed, in this regard, that the differences in fee rates between institutional clients and the mutual funds are by no means uniform when examined by individual asset sectors, suggesting that differences in the pricing of investment management services to these types of clients reflect to a substantial degree historical competitive forces operating in separate market places. The Trustees considered the fact that fee rates across all asset sectors are higher on average for mutual funds than for institutional clients, as well as the differences between the services that Putnam Management provides to the Putnam funds and those that it provides to institutional clients of the firm, but have not relied on such comparisons to any significant extent in concluding that the management fees paid by your fund are reasonable.
29
Other information
for shareholders
|
Putnam’s policy on confidentiality
|
In order to conduct business with our shareholders, we must obtain certain personal information such as account holders’ addresses, telephone numbers, Social Security numbers, and the names of their financial advisors. We use this information to assign an account number and to help us maintain accurate records of transactions and account balances. It is our policy to protect the confidentiality of your information, whether or not you currently own shares of our funds, and in particular, not to sell information about you or your accounts to outside marketing firms. We have safeguards in place designed to prevent unauthorized access to our computer systems and procedures to protect personal information from unauthorized use. Under certain circumstances, we share this information with outside vendors who provide services to us, such as mailing and proxy solicitation. In those cases, the service providers enter into confidentiality agreements with us, and we provide only the information necessary to process transactions and perform other services related to your account. We may also share this information with our Putnam affiliates to service your account or provide you with information about other Putnam products or services. It is also our policy to share account information with your financial advisor, if you’ve listed one on your Putnam account. If you would like clarification about our confidentiality policies or have any questions or concerns, please don’t hesitate to contact us at 1-800-225-1581, Monday through Friday, 8:30 a.m. to 7:00 p.m., or Saturdays from 9:00 a.m. to 5:00 p.m. Eastern Time.
Putnam is committed to managing our mutual funds in the best interests of our shareholders. The Putnam funds’ proxy voting guidelines and procedures, as well as information regarding how your fund voted proxies relating to portfolio securities during the 12-month period ended June 30, 2005, are available on the Putnam Individual Investor Web site, www.putnam.com/individual, and on the SEC’s Web site, www.sec.gov. If you have questions about finding forms on the SEC’s Web site, you may call the SEC at 1-800-SEC-0330. You may also obtain the Putnam funds’ proxy voting guidelines and procedures at no charge by calling Putnam’s Shareholder Services at 1-800-225-1581.
The fund will file a complete schedule of its portfolio holdings with the SEC for the first and third quarters of each fiscal year on Form N-Q. Shareholders may obtain the fund’s Forms N-Q on the SEC’s Web site at www.sec.gov. In addition, the fund’s Forms N-Q may be reviewed and copied at the SEC’s Public Reference Room in Washington, D.C. You may call the SEC at 1-800-SEC-0330 for information about the SEC’s Web site or the operation of the Public Reference Room.
30
A guide to financial statements
|
These sections of the report, as well as the accompanying Notes, preceded by the Report of Independent Registered Public Accounting Firm, constitute the fund’s financial statements.
The fund’s portfolio lists all the fund’s investments and their values as of the last day of the reporting period. Holdings are organized by asset type and industry sector, country, or state to show areas of concentration and diversification.
Statement of assets and liabilities shows how the fund’s net assets and share price are determined. All investment and noninvestment assets are added together. Any unpaid expenses and other liabilities are subtracted from this total. The result is divided by the number of shares to determine the net asset value per share, which is calculated separately for each class of shares. (For funds with preferred shares, the amount subtracted from total assets includes the liquidation preference of preferred shares.)
Statement of operations shows the fund’s net investment gain or loss. This is done by first adding up all the fund’s earnings — from dividends and interest income — and subtracting its operating expenses to determine net investment income (or loss). Then, any net gain or loss the fund realized on the sales of its holdings — as well as any unrealized gains or losses over the period — is added to or subtracted from the net investment result to determine the fund’s net gain or loss for the fiscal year.
Statement of changes in net assets shows how the fund’s net assets were affected by the fund’s net investment gain or loss, by distributions to shareholders, and by changes in the number of the fund’s shares. It lists distributions and their sources (net investment income or realized capital gains) over the current reporting period and the most recent fiscal year-end. The distributions listed here may not match the sources listed in the Statement of operations because the distributions are determined on a tax basis and may be paid in a different period from the one in which they were earned.
Financial highlights provide an overview of the fund’s investment results, per-share distributions, expense ratios, net investment income ratios, and portfolio turnover in one summary table, reflecting the five most recent reporting periods. In a semiannual report, the highlight table also includes the current reporting period.
31
Report of Independent Registered
Public Accounting Firm
To the Trustees and Shareholders of
Putnam Ohio Tax Exempt Income Fund:
|
In our opinion, the accompanying statement of assets and liabilities, including the fund’s portfolio, and the related statements of operations and of changes in net assets and the financial highlights present fairly, in all material respects, the financial position of Putnam Ohio Tax Exempt Income Fund (the “fund”) at May 31, 2006, and the results of its operations, the changes in its net assets and the financial highlights for each of the periods indicated, in conformity with accounting principles generally accepted in the United States of America. These financial statements and financial highlights (hereafter referred to as “financial statements”) are the responsibility of the fund’s management; our responsibility is to express an opinion on these financial statements based on our audits. We conducted our audits of these financial statements in accordance with the standards of the Public Company Accounting Oversight Board (United States). Those standards require that we plan and perform the audit to obtain reasonable assurance about whether the financial statements are free of material misstatement. An audit includes examining, on a test basis, evidence supporting the amounts and disclosures in the financial statements, assessing the accounting principles used and significant estimates made by management, and evaluating the overall financial statement presentation. We believe that our audits, which included confirmation of investments owned at May 31, 2006, by correspondence with the custodian and brokers, provide a reasonable basis for our opinion.
PricewaterhouseCoopers LLP
Boston, Massachusetts
July 11, 2006
|
32
| The fund’s portfolio 5/31/06 | |
|
| Key to abbreviations | |
| |
| AMBAC AMBAC Indemnity Corporation | FSA Financial Security Assurance |
| |
| COP Certificate of Participation | GNMA Coll. Government National Mortgage |
| Association Collateralized |
| FGIC Financial Guaranty Insurance Company | |
| G.O. Bonds General Obligation Bonds |
| FHA Insd. Federal Housing Administration Insured | |
| IFB Inverse Floating Rate Bonds |
| FHLMC Coll. Federal Home Loan Mortgage | |
| Corporation Collateralized | MBIA MBIA Insurance Company |
| |
| FNMA Coll. Federal National Mortgage | VRDN Variable Rate Demand Notes |
| Association Collateralized | |
| |
| MUNICIPAL BONDS AND NOTES (98.1%)* | | | | | |
|
| | Rating ** | | Principal amount | | Value |
|
| Ohio (93.1%) | | | | | |
| Akron, Wtr. Wks. Rev. Bonds, MBIA | | | | | |
| 6s, 12/1/12 | Aaa | $ | 875,000 | $ | 978,381 |
| 5 1/4s, 12/1/17 | Aaa | | 1,285,000 | | 1,370,710 |
| Allen Cnty., G.O. Bonds, AMBAC, 5s, 12/1/06 | Aaa | | 1,375,000 | | 1,384,501 |
| Anthony Wayne Local School Dist. G.O. | | | | | |
| Bonds (School Fac. Construction & Impt.), | | | | | |
| FSA, 5 1/2s, 12/1/19 | Aaa | | 1,565,000 | | 1,670,919 |
| Brecksville-Broadview Heights, City School | | | | | |
| Dist. G.O. Bonds, FGIC, 6 1/2s, 12/1/16 | Aaa | | 1,500,000 | | 1,550,145 |
| Brookville, Local School Dist. G.O. Bonds, | | | | | |
| FSA, 5s, 12/1/26 | Aaa | | 1,500,000 | | 1,553,010 |
| Butler Cnty., G.O. Bonds, MBIA, 5 1/4s, | | | | | |
| 12/1/20 | Aaa | | 1,000,000 | | 1,066,200 |
| Cincinnati, City School Dist. G.O. Bonds | | | | | |
| (Classroom Fac. Construction & Impt.), | | | | | |
| FSA | | | | | |
| 5s, 12/1/27 | Aaa | | 1,500,000 | | 1,552,050 |
| 5s, 12/1/06 | Aaa | | 3,000,000 | | 3,020,730 |
| Cleveland, G.O. Bonds, FGIC, 5 1/4s, | | | | | |
| 8/1/23 (Prerefunded) | Aaa | | 500,000 | | 541,120 |
| Cleveland, Muni. School Dist. G.O. Bonds, | | | | | |
| FSA, 5s, 12/1/27 | Aaa | | 1,375,000 | | 1,424,431 |
| Cleveland, State U. Rev. Bonds, FGIC, 5s, | | | | | |
| 6/1/29 # | Aaa | | 3,000,000 | | 3,101,760 |
| Cleveland, Urban Renewal Increment Rev. | | | | | |
| Bonds (Rock & Roll Hall of Fame), 6 3/4s, | | | | | |
| 3/15/18 | BBB-/P | | 1,150,000 | | 1,154,635 |
| Cleveland-Cuyahoga Cnty., Port. Auth. Rev. | | | | | |
| Bonds (Rock & Roll Hall of Fame), FSA, | | | | | |
| 3.6s, 12/1/14 | Aaa | | 500,000 | | 488,890 |
33
| MUNICIPAL BONDS AND NOTES (98.1%)* continued | | | | |
|
| | Rating ** | | Principal amount | | Value |
|
| Ohio continued | | | | | |
| Cuyahoga Cnty., G.O. Bonds, 5s, 12/1/18 | | | | | |
| (Prerefunded) | Aa1 | $ | 1,500,000 | $ | 1,578,060 |
| Cuyahoga Cnty., Rev. Bonds, Ser. A, 6s, | | | | | |
| 1/1/32 | A+ | | 1,500,000 | | 1,645,410 |
| Cuyahoga Cnty., Hosp. VRDN (U. Hosp.), | | | | | |
| 3.56s, 1/1/16 | VMIG1 | | 2,300,000 | | 2,300,000 |
| Cuyahoga Falls, G.O. Bonds, MBIA, 5s, | | | | | |
| 12/1/24 | Aaa | | 1,645,000 | | 1,704,138 |
| Delaware City, School Dist. G.O. Bonds, | | | | | |
| MBIA, 5s, 12/1/20 | Aaa | | 1,160,000 | | 1,218,916 |
| Delaware Cnty., Cap. Fac. G.O. Bonds, | | | | | |
| 6 1/4s, 12/1/16 (Prerefunded) | Aa1 | | 1,000,000 | | 1,113,930 |
| Dublin, G.O. Bonds, Ser. B, 6.4s, 12/1/14 | Aaa | | 1,300,000 | | 1,477,866 |
| Erie Cnty., OH Hosp. Fac. Rev. Bonds | | | | | |
| (Firelands Regl. Med. Ctr.), 5 5/8s, | | | | | |
| 8/15/32 | A | | 1,000,000 | | 1,044,670 |
| Field, Local School Dist. G.O. Bonds | | | | | |
| (School Fac. Construction & Impt.), | | | | | |
| AMBAC, 5s, 12/1/22 | Aaa | | 1,170,000 | | 1,222,533 |
| Franklin Cnty., G.O. Bonds | | | | | |
| 5 3/8s, 12/1/20 | Aaa | | 2,170,000 | | 2,296,880 |
| 5s, 6/1/07 | Aaa | | 2,955,000 | | 2,995,395 |
| Franklin Cnty., Rev. Bonds (OCLC Online | | | | | |
| Computer Library Ctr.), 5s, 4/15/13 | A | | 2,610,000 | | 2,701,742 |
| Franklin Cnty., Dev. Rev. Bonds (American | | | | | |
| Chemical Society), 5.8s, 10/1/14 | A | | 2,000,000 | | 2,120,660 |
| Franklin Cnty., Econ. Dev. Rev. Bonds | | | | | |
| (Capitol South Cmnty. Urban), 5 3/4s, | | | | | |
| 6/1/11 | BBB-/P | | 1,000,000 | | 1,032,750 |
| Franklin Cnty., Hlth. Care Fac. Rev. Bonds | | | | | |
| (OH Presbyterian Svcs.), 7 1/8s, 7/1/29 | | | | | |
| (Prerefunded) | BBB | | 2,000,000 | | 2,220,860 |
| Greater Cleveland Regl. Trans. Auth. G.O. | | | | | |
| Bonds (Cap. Impt.), MBIA, 5s, 12/1/24 | Aaa | | 1,350,000 | | 1,405,890 |
| Greene Cnty., Swr. Syst. Rev. Bonds | | | | | |
| (Governmental Enterprise), AMBAC, 5 5/8s, | | | | | |
| 12/1/13 (Prerefunded) | Aaa | | 1,380,000 | | 1,501,840 |
| Hamilton, City School Dist. G.O. Bonds, | | | | | |
| Ser. A, 5 1/2s, 12/1/24 (Prerefunded) | AA | | 2,000,000 | | 2,137,120 |
| Hillard, School Dist. G.O. Bonds (School | | | | | |
| Impts.), FGIC, 5 3/4s, 12/1/24 | | | | | |
| (Prerefunded) | Aaa | | 3,000,000 | | 3,280,260 |
| Huran Cnty., Human Svcs. Rev. Bonds, MBIA, | | | | | |
| 6.55s, 12/1/20 | Aaa | | 1,800,000 | | 2,166,408 |
| Kent State U. VRDN, MBIA, 3.28s, 5/1/31 | VMIG1 | | 3,290,000 | | 3,290,000 |
| Kent, School Dist. G.O. Bonds, FGIC, | | | | | |
| 5 3/4s, 12/1/21 (Prerefunded) | Aaa | | 1,500,000 | | 1,561,230 |
| Lake Ohio, School Dist. G.O. Bonds, FGIC, | | | | | |
| 5 3/4s, 12/1/21 (Prerefunded) | Aaa | | 1,000,000 | | 1,084,930 |
34
| MUNICIPAL BONDS AND NOTES (98.1%)* continued | | | | |
| |
| | Rating ** | | Principal amount | | Value |
|
| Ohio continued | | | | | |
| Lakota, School Dist. Rev. Bonds, AMBAC, | | | | | |
| 7s, 12/1/10 | Aaa | $ | 1,000,000 | $ | 1,130,480 |
| Lorain Cnty., Elderly Hsg. Corp. | | | | | |
| Multi-Fam. Rev. Bonds (Harr Plaza & | | | | | |
| Intl.), Ser. A, 6 3/8s, 7/15/19 | BBB | | 1,500,000 | | 1,502,445 |
| Lorain Cnty., Hosp. Rev. Bonds (Catholic | | | | | |
| Hlth. Care Refurbish & Impt.), Ser. A, | | | | | |
| 5 1/4s, 10/1/33 | Aa3 | | 750,000 | | 772,448 |
| Madeira, City School Dist. G.O. Bonds | | | | | |
| (School Impt.), MBIA | | | | | |
| 5s, 12/1/26 | Aaa | | 1,620,000 | | 1,683,569 |
| 5s, 12/1/25 | Aaa | | 1,530,000 | | 1,592,240 |
| Mason, City School Dist. G.O. Bonds, 5.3s, | | | | | |
| 12/1/17 (Prerefunded) | Aa2 | | 2,500,000 | | 2,655,175 |
| Miami Cnty., Hosp. Fac. Rev. Bonds (Upper | | | | | |
| Valley Med. Ctr.), Ser. A, 6 3/8s, 5/15/26 | Baa1 | | 2,200,000 | | 2,261,842 |
| Middletown, City School Dist. G.O. Bonds | | | | | |
| (School Impt.), FGIC | | | | | |
| 5s, 12/1/25 | Aaa | | 1,285,000 | | 1,332,070 |
| 5s, 12/1/24 | Aaa | | 1,080,000 | | 1,120,262 |
| 5s, 12/1/23 | Aaa | | 1,545,000 | | 1,599,600 |
| 4 3/4s, 12/1/22 | Aaa | | 1,000,000 | | 1,021,480 |
| 4 3/4s, 12/1/21 | Aaa | | 1,500,000 | | 1,535,100 |
| Midview, School Dist. COP (School Bldg. | | | | | |
| Fac.), 5 1/4s, 11/1/17 | A | | 1,265,000 | | 1,325,315 |
| Montgomery Cnty., Rev. Bonds (Catholic | | | | | |
| Hlth. Initiatives), Ser. A, 5s, 5/1/32 | Aa2 | | 1,000,000 | | 1,020,900 |
| Montgomery Cnty., Hlth. Syst. Rev. Bonds, | | | | | |
| Ser. B-1 | | | | | |
| 8.1s, 7/1/18 (Prerefunded) | Aaa | | 1,720,000 | | 1,759,732 |
| 8.1s, 7/1/18 (Prerefunded) | AAA | | 155,000 | | 157,892 |
| Montgomery Cnty., Hosp. Rev. Bonds | | | | | |
| (Kettering Med. Ctr.), 6 3/4s, 4/1/22 | | | | | |
| (Prerefunded) | A2 | | 1,500,000 | | 1,672,905 |
| (Grandview Hosp. & Med Ctr.), 5.6s, | | | | | |
| 12/1/11 (Prerefunded) | A | | 580,000 | | 615,560 |
| Northwestern, School Dist. Rev. Bonds | | | | | |
| (Wayne & Ashland Cntys. School Impt.), | | | | | |
| FGIC, 7.2s, 12/1/10 | Aaa | | 835,000 | | 916,246 |
| OH Hsg. Fin. Agcy. Rev. Bonds | | | | | |
| Ser. B, GNMA Coll., 5s, 3/1/34 | Aaa | | 1,700,000 | | 1,739,984 |
| (Res. Dev.), Ser. A, GNMA Coll., 4.6s, | | | | | |
| 9/1/28 | Aaa | | 640,000 | | 641,715 |
| (Res. Mtge.), Ser. E, GNMA Coll., FNMA | | | | | |
| Coll., FHLMC Coll., 4 1/4s, 3/1/15 | Aaa | | 500,000 | | 494,720 |
| (Res. Mtge.), Ser. C, GNMA/FNMA Coll., | | | | | |
| 4.1s, 3/1/15 | Aaa | | 450,000 | | 442,188 |
35
| MUNICIPAL BONDS AND NOTES (98.1%)* continued | | | | |
|
| | Rating ** | | Principal amount | | Value |
|
| Ohio continued | | | | | |
| OH Hsg. Fin. Agcy. Rev. Bonds | | | | | |
| (Res. Mtge.), Ser. E, GNMA Coll., FNMA | | | | | |
| Coll., FHLMC Coll., 3 3/4s, 3/1/10 | Aaa | $ | 355,000 | $ | 349,050 |
| (Res. Mtge.), Ser. C, GNMA Coll., | | | | | |
| FNMA Coll., 3.7s, 3/1/11 | Aaa | | 470,000 | | 462,316 |
| OH Hsg. Fin. Agcy. Single Fam. Mtge. IFB, | | | | | |
| Ser. G, GNMA Coll., 7.14s, 3/2/23 | Aaa | | 200,000 | | 202,706 |
| OH Hsg. Fin. Agcy. Single Fam. Mtge. Rev. | | | | | |
| Bonds, Ser. 85-A, FGIC, FHA Insd., | | | | | |
| zero %, 1/15/15 | Aaa | | 15,000 | | 6,474 |
| OH State Rev. Bonds (Revitalization), | | | | | |
| Ser. A, AMBAC, 5s, 4/1/19 | Aaa | | 1,750,000 | | 1,851,518 |
| OH State Env. Impt. Rev. Bonds | | | | | |
| (USX Corp.), 5 5/8s, 5/1/29 | Baa1 | | 750,000 | | 785,258 |
| OH State Higher Edl. Fac. Mandatory Put | | | | | |
| Bonds (Kenyon College), 5.05s, 7/1/16 | A2 | | 2,000,000 | | 2,098,160 |
| OH State Higher Edl. Fac. Rev. Bonds | | | | | |
| (Case Western Reserve U.), 6 1/4s, 10/1/18 | AA- | | 2,000,000 | | 2,372,000 |
| (Case Western Reserve U.), 6s, 10/1/14 | AA- | | 1,000,000 | | 1,131,250 |
| (Oberlin College), 5.12s, 10/1/24 | AA | | 1,500,000 | | 1,571,175 |
| OH State Higher Edl. Fac. Commn. Rev. Bonds | | | | | |
| (John Carroll U.), 5 1/2s, 11/15/18 | A2 | | 335,000 | | 360,370 |
| (John Carroll U.), 5 1/2s, 11/15/17 | A2 | | 420,000 | | 453,470 |
| (Denison U.), 5 1/8s, 11/1/21 | AA | | 2,270,000 | | 2,384,158 |
| (Oberlin College), 5s, 10/1/33 | Aa2 | | 1,000,000 | | 1,024,560 |
| (Northern U.), 4 3/4s, 5/1/19 | A2 | | 2,500,000 | | 2,517,600 |
| (John Carroll U.), 3 1/2s, 11/15/08 | A2 | | 300,000 | | 295,323 |
| (John Carroll U.), 3s, 11/15/07 | A2 | | 500,000 | | 489,620 |
| OH State Poll. Control Rev. Bonds | | | | | |
| (Standard Oil Co.), 6 3/4s, 12/1/15 | AA+ | | 3,350,000 | | 4,007,069 |
| OH State Solid Waste Mandatory Put Bonds, | | | | | |
| 4.85s, 11/1/07 | BBB | | 1,500,000 | | 1,513,725 |
| OH State U. Rev. Bonds, Ser. A, 5 1/8s, | | | | | |
| 12/1/31 | Aa2 | | 1,000,000 | | 1,045,700 |
| OH State Wtr. Dev. Auth. Solid Waste Disp. | | | | | |
| Rev. Bonds (Bay Shore Power Co.), Ser. A, | | | | | |
| 5 7/8s, 9/1/20 | BB+/P | | 1,100,000 | | 1,101,309 |
| OH U. Gen. Recipients Athens Rev. Bonds, | | | | | |
| MBIA, 5s, 12/1/25 | Aaa | | 2,265,000 | | 2,352,610 |
| Olentangy, Local School Dist. G.O. Bonds, | | | | | |
| FSA, 5s, 12/1/19 | Aaa | | 1,750,000 | | 1,852,988 |
| Powell, G.O. Bonds, FGIC, 5 1/2s, 12/1/25 | Aaa | | 1,500,000 | | 1,614,150 |
| Rickenbacker, Port Auth. Rev. Bonds (OASBO | | | | | |
| Expanded Asset Pooled), Ser. A, 5 3/8s, | | | | | |
| 1/1/32 | A2 | | 2,165,000 | | 2,320,512 |
| River Valley, Local School Dist. G.O. | | | | | |
| Bonds (School Fac. Construction & Impt.), | | | | | |
| FSA, 5 1/4s, 11/1/23 | Aaa | | 300,000 | | 332,709 |
| Rocky River, G.O. Bonds, AMBAC, 5s, 12/1/24 | Aaa | | 2,455,000 | | 2,556,637 |
36
| MUNICIPAL BONDS AND NOTES (98.1%)* continued | | | | |
|
| | Rating ** | | Principal amount | | Value |
|
| Ohio continued | | | | | |
| Sandusky Cnty., Hosp. Fac. Rev. Bonds | | | | | |
| (Memorial Hosp.) | | | | | |
| 5.15s, 1/1/10 | BBB- | $ | 830,000 | $ | 829,427 |
| 5.15s, 1/1/08 | BBB- | | 500,000 | | 500,615 |
| 5.05s, 1/1/07 | BBB- | | 685,000 | | 686,925 |
| Summit Cnty., G.O. Bonds, Ser. R, FGIC, | | | | | |
| 5 1/2s, 12/1/18 | Aaa | | 500,000 | | 561,630 |
| Tallmadge, City School Dist. G.O. Bonds | | | | | |
| (School Fac.), FSA, 5s, 12/1/26 | AAA | | 1,410,000 | | 1,467,993 |
| Toledo, G.O. Bonds (Macys), Ser. A, MBIA, | | | | | |
| 6.35s, 12/1/25 | Aaa | | 1,500,000 | | 1,576,950 |
| Toledo, Swr. Syst. Mtge. Rev. Bonds, | | | | | |
| AMBAC, 6.2s, 11/15/12 | Aaa | | 2,925,000 | | 3,301,477 |
| Toledo, Wtr. Wks. Mtge. Rev. Bonds, AMBAC, | | | | | |
| 6.2s, 11/15/12 | Aaa | | 1,175,000 | | 1,326,234 |
| Toledo-Lucas Cnty., Port Auth. Rev. Bonds | | | | | |
| (CSX Transn, Inc.), 6.45s, 12/15/21 | Baa2 | | 1,900,000 | | 2,155,246 |
| Twin Valley, Cmnty. Local School Dist. | | | | | |
| Rev. Bonds, FGIC, 7.05s, 12/1/11 | Aaa | | 1,000,000 | | 1,114,300 |
| U. of Cincinnati COP (Jefferson Ave. | | | | | |
| Residence Hall), MBIA, 5 1/8s, 6/1/28 | Aaa | | 1,000,000 | | 1,026,370 |
| U. of Cincinnati Rev. Bonds | | | | | |
| Ser. D, AMBAC, 5s, 6/1/24 | Aaa | | 2,000,000 | | 2,071,900 |
| Ser. D, AMBAC, 5s, 6/1/23 | Aaa | | 1,275,000 | | 1,322,570 |
| Ser. A, FSA, 5s, 6/1/20 | Aaa | | 1,200,000 | | 1,266,624 |
| Westerville, City School Dist. Rev. Bonds | | | | | |
| (School Impt.) | | | | | |
| 6 1/4s, 12/1/09 | Aa3 | | 1,610,000 | | 1,737,737 |
| 6 1/4s, 12/1/08 | Aa3 | | 1,590,000 | | 1,682,840 |
| Woodridge, School Dist. Rev. Bonds, AMBAC, | | | | | |
| 6.8s, 12/1/14 | Aaa | | 3,000,000 | | 3,417,540 |
| Zanesville, Hsg. Dev. Corp. Mtge. Rev. | | | | | |
| Bonds, FHA Insd. | | | | | |
| 7 3/8s, 10/1/21 (Prerefunded) | AAA/P | | 220,000 | | 277,959 |
| 7 3/8s, 10/1/20 (Prerefunded) | AAA/P | | 205,000 | | 259,007 |
| 7 3/8s, 10/1/19 (Prerefunded) | AAA/P | | 185,000 | | 233,738 |
| 7 3/8s, 10/1/18 (Prerefunded) | AAA/P | | 180,000 | | 227,421 |
| 7 3/8s, 10/1/17 (Prerefunded) | AAA/P | | 160,000 | | 202,152 |
| 7 3/8s, 10/1/16 (Prerefunded) | AAA/P | | 155,000 | | 195,835 |
| | | | | | 157,447,745 |
37
| MUNICIPAL BONDS AND NOTES (98.1%)* continued | | | | |
|
| | Rating ** | | Principal amount | | Value |
|
| Puerto Rico (4.5%) | | | | | |
| Children’s Trust Fund Tobacco Settlement | | | | | |
| Rev. Bonds, 5 3/8s, 5/15/33 | BBB | $ | 365,000 | $ | 373,647 |
| Cmnwlth. of PR, Govt. Dev. Bank Rev. | | | | | |
| Bonds, Ser. AA, 5s, 12/1/16 | BBB | | 1,000,000 | | 1,038,040 |
| Cmnwlth. of PR, Hwy. & Trans. Auth. Rev. | | | | | |
| Bonds | | | | | |
| Ser. G, 5s, 7/1/33 | BBB+ | | 295,000 | | 295,510 |
| Ser. K, 5s, 7/1/13 | BBB+ | | 500,000 | | 520,205 |
| Cmnwlth. of PR, Muni. Fin. Agcy. G.O. | | | | | |
| Bonds, Ser. A, FSA, 5 7/8s, 8/1/14 | | | | | |
| (Prerefunded) | Aaa | | 3,000,000 | | 3,224,790 |
| PR Indl. Tourist Edl. Med. & Env. Control | | | | | |
| Fac. Rev. Bonds (Cogen. Fac.-AES), | | | | | |
| 6 5/8s, 6/1/26 | Baa3 | | 1,000,000 | | 1,092,440 |
| PR Muni. Fin. Agcy. G.O. Bonds, Ser. C, | | | | | |
| 5s, 8/1/10 | BBB | | 560,000 | | 579,914 |
| PR Pub. Fin. Corp. Rev. Bonds (Cmnwlth. | | | | | |
| Appropriation), Ser. A, 5 3/4s, 8/1/27 | BBB- | | 500,000 | | 533,440 |
| | | | | | 7,657,986 |
|
| |
| Virgin Islands (0.5%) | | | | | |
| Tobacco Settlement Fin. Corp. Rev. Bonds, | | | | | |
| 5s, 5/15/21 (Virgin Islands) | Baa3 | | 915,000 | | 921,257 |
|
| TOTAL INVESTMENTS | | | | | |
| Total investments (cost $159,229,954) | | | | $ | 166,026,988 |
* Percentages indicated are based on net assets of $169,125,826.
** The Moody’s or Standard & Poor’s ratings indicated are believed to be the most recent ratings available at May 31, 2006 for the securities listed. Ratings are generally ascribed to securities at the time of issuance. While the agencies may from time to time revise such ratings, they undertake no obligation to do so, and the ratings do not necessarily represent what the agencies would ascribe to these securities at May 31, 2006. Securities rated by Putnam are indicated by “/P” . Ratings are not covered by the Report of Independent Registered Public Accounting Firm. Security ratings are defined in the Statement of Additional Information.
# A portion of this security was pledged and segregated with the custodian to cover margin requirements for futures contracts at May 31, 2006.
At May 31, 2006, liquid assets totaling $5,665,781 have been designated as collateral for open futures contracts. The rates shown on VRDN and Mandatory Put Bonds are the current interest rates at May 31, 2006.
The dates shown on Mandatory Put Bonds are the next mandatory put dates.
Inverse Floating Rate Bonds (IFB) are securities that pay interest rates that vary inversely to changes in the market interest rates. As interest rates rise, inverse floaters produce less current income. The interest rates shown are the current interest rates at May 31, 2006.
| The fund had the following industry group concentration greater than 10% at May 31, 2006 (as a percentage of net assets): |
Education | 17.5% |
The fund had the following insurance concentrations greater than 10% at May 31, 2006 (as a percentage of net assets): |
FGIC | 13.0% |
| MBIA | 12.7 |
| AMBAC | 12.5 |
| FSA | 10.6 |
38
| FUTURES CONTRACTS OUTSTANDING at 5/31/06 | | | |
|
| | | Number of | | Expiration | Unrealized |
| | | contracts | Value | date | depreciation |
|
| U.S. Treasury Note 10 yr (Long) | 54 | $5,665,781 | Sep-06 | $(31,381) |
|
| INTEREST RATE SWAP CONTRACTS OUTSTANDING at 5/31/06 | | |
|
| | | Payments | Payments | | |
| Swap counterparty / | Termination | made by | received by | | Unrealized |
| Notional amount | date | fund per annum | fund per annum | depreciation |
|
| Merrill Lynch Capital Services, Inc. | | | | |
| $4,100,000 | 11/22/16 | 4.1735% | 3 month U.S. Bond | |
| | | | Market Association | |
| | | | Municipal Swap Index | $(12,138) |
|
| 2,900,000 | 11/22/16 | 3 month USD-LIBOR-BBA | 5.711% | | (493) |
|
| Total | | | | | $(12,631) |
The accompanying notes are an integral part of these financial statements.
39
| Statement of assets and liabilities 5/31/06 | |
|
| |
| ASSETS | |
|
| Investment in securities, at value (Note 1): | |
| Unaffiliated issuers (identified cost $159,229,954) | $166,026,988 |
|
| Cash | 711,926 |
|
| Interest and other receivables | 3,218,256 |
|
| Receivable for shares of the fund sold | 7,858 |
|
| Total assets | 169,965,028 |
|
| |
| LIABILITIES | |
|
| Payable for variation margin (Note 1) | 16,156 |
|
| Distributions payable to shareholders | 383,449 |
|
| Payable for shares of the fund repurchased | 22,716 |
|
| Payable for compensation of Manager (Note 2) | 194,231 |
|
| Payable for investor servicing and custodian fees (Note 2) | 21,334 |
|
| Payable for Trustee compensation and expenses (Note 2) | 45,163 |
|
| Payable for administrative services (Note 2) | 3,976 |
|
| Payable for distribution fees (Note 2) | 65,039 |
|
| Unrealized depreciation on swap contracts (Note 1) | 12,631 |
|
| Other accrued expenses | 74,507 |
|
| Total liabilities | 839,202 |
|
| Net assets | $169,125,826 |
|
| |
| REPRESENTED BY | |
|
| Paid-in capital (Unlimited shares authorized) (Notes 1 and 4) | $164,509,694 |
|
| Undistributed net investment income (Note 1) | 149,253 |
|
| Accumulated net realized loss on investments (Note 1) | (2,286,143) |
|
| Net unrealized appreciation of investments | 6,753,022 |
|
| Total — Representing net assets applicable to capital shares outstanding | $169,125,826 |
| |
| (Continued on next page) | |
40
| Statement of assets and liabilities (Continued) | |
|
| |
| COMPUTATION OF NET ASSET VALUE AND OFFERING PRICE | |
|
| Net asset value and redemption price per class A share | |
| ($148,135,323 divided by 16,514,702 shares) | $8.97 |
|
| Offering price per class A share | |
| (100/96.25 of $8.97)* | $9.32 |
|
| Net asset value and offering price per class B share | |
| ($19,643,072 divided by 2,191,936 shares)** | $8.96 |
|
| Net asset value and redemption price per class M share | |
| ($1,347,431 divided by 150,078 shares) | $8.98 |
|
| Offering price per class M share | |
| (100/96.75 of $8.98)*** | $9.28 |
* On single retail sales of less than $100,000. On sales of $100,000 or more and on group sales, the offering price is reduced.
** Redemption price per share is equal to net asset value less any applicable contingent deferred sales charge.
*** On single retail sales of less than $50,000. On sales of $50,000 or more and on group sales, the offering price is reduced.
The accompanying notes are an integral part of these financial statements.
41
| Statement of operations Year ended 5/31/06 | | |
|
| |
| INTEREST INCOME | $ | 8,154,887 |
|
| |
| EXPENSES | | |
|
| Compensation of Manager (Note 2) | | 868,088 |
|
| Investor servicing fees (Note 2) | | 96,299 |
|
| Custodian fees (Note 2) | | 91,003 |
|
| Trustee compensation and expenses (Note 2) | | 30,461 |
|
| Administrative services (Note 2) | | 19,769 |
|
| Distribution fees — Class A (Note 2) | | 302,363 |
|
| Distribution fees — Class B (Note 2) | | 194,768 |
|
| Distribution fees — Class M (Note 2) | | 6,898 |
|
| Other | | 107,957 |
|
| Non-recurring costs (Notes 2 and 5) | | 1,223 |
|
| Costs assumed by Manager (Notes 2 and 5) | | (1,223) |
|
| Fees waived and reimbursed by Manager (Note 2) | | (18,654) |
|
| Total expenses | | 1,698,952 |
|
| Expense reduction (Note 2) | | (112,988) |
|
| Net expenses | | 1,585,964 |
|
| Net investment income | | 6,568,923 |
|
| Net realized gain on investments (Notes 1 and 3) | | 115,480 |
|
| Net realized loss on futures contracts (Note 1) | | (110,223) |
|
| Net realized gain on swap contracts (Note 1) | | 205,189 |
|
| Net unrealized depreciation of investments, futures | | |
| contracts, and swap contracts during the year | | (5,004,359) |
|
| Net loss on investments | | (4,793,913) |
|
| Net increase in net assets resulting from operations | $ | 1,775,010 |
The accompanying notes are an integral part of these financial statements.
42
| Statement of changes in net assets | | |
|
| |
| DECREASE IN NET ASSETS | | |
|
| | Year ended | Year ended |
| | 5/31/06 | 5/31/05 |
|
| Operations: | | |
| Net investment income | $ 6,568,923 | $ 6,963,964 |
|
| Net realized gain on investments | 210,446 | 986,883 |
|
| Net unrealized appreciation (depreciation) of investments | (5,004,359) | 4,654,615 |
|
| Net increase in net assets resulting from operations | 1,775,010 | 12,605,462 |
|
| Distributions to shareholders: (Note 1) | | |
|
| From ordinary income | | |
|
| Class A | (27,963) | (10,114) |
|
| Class B | (4,246) | (1,997) |
|
| Class M | (272) | (57) |
|
| From tax-exempt income | | |
|
| Class A | (5,721,391) | (5,850,554) |
|
| Class B | (730,162) | (951,628) |
|
| Class M | (48,438) | (30,399) |
|
| Redemption fees (Note 1) | — | 396 |
|
| Decrease from capital share transactions (Note 4) | (5,895,321) | (13,588,695) |
|
| Total decrease in net assets | (10,652,783) | (7,827,586) |
|
| |
| NET ASSETS | | |
|
| Beginning of year | 179,778,609 | 187,606,195 |
|
| End of year (including undistributed net investment | | |
| income of $149,253 and $110,996, respectively) | $169,125,826 | $179,778,609 |
The accompanying notes are an integral part of these financial statements.
43
| Financial highlights (For a common share outstanding throughout the period) | | | | | | | |
|
| |
| INVESTMENT OPERATIONS: | | | | LESS DISTRIBUTIONS: | | | | RATIOS AND SUPPLEMENTAL DATA: | |
|
| | | | Net | | | | | | Total | | | Ratio of net | |
| | Net asset | | realized and | Total | From | | | Net asset | return | Net | Ratio of | investment | |
| | value, | Net | unrealized | from | net | | | value, | at net | assets, | expenses to | income (loss) | Portfolio |
| | beginning | investment | gain (loss) on | investment | investment | Total | Redemption | end | asset | end of period | average net | to average | turnover |
| Period ended | of period | income (loss) | investments | operations | income | distributions | fees | of period | value (%)(a) | (in thousands) | assets (%)(b) | net assets (%) | (%) |
|
| CLASS A | | | | | | | | | | | | | |
| May 31, 2006 | $9.22 | .35(c) | (.25) | .10 | (.35) | (.35) | — | $8.97 | 1.13 | $148,135 | .89(c) | 3.87(c) | 5.77 |
| May 31, 2005 | 8.94 | .35(c) | .28 | .63 | (.35) | (.35) | —(d) | 9.22 | 7.15 | 153,016 | .89(c) | 3.88(c) | 12.34 |
| May 31, 2004 | 9.33 | .34(c) | (.38) | (.04) | (.35) | (.35) | — | 8.94 | (.49) | 153,317 | .89(c) | 3.75(c) | 17.43 |
| May 31, 2003 | 8.87 | .36 | .46 | .82 | (.36) | (.36) | — | 9.33 | 9.48 | 183,383 | .88 | 3.94 | 25.66 |
| May 31, 2002 | 8.77 | .42 | .10 | .52 | (.42) | (.42) | — | 8.87 | 5.98 | 167,223 | .91 | 4.70 | 17.26 |
|
| CLASS B | | | | | | | | | | | | | |
| May 31, 2006 | $9.21 | .29(c) | (.25) | .04 | (.29) | (.29) | — | $8.96 | .47 | $19,643 | 1.54(c) | 3.22(c) | 5.77 |
| May 31, 2005 | 8.93 | .29(c) | .28 | .57 | (.29) | (.29) | —(d) | 9.21 | 6.47 | 25,898 | 1.54(c) | 3.23(c) | 12.34 |
| May 31, 2004 | 9.32 | .28(c) | (.38) | (.10) | (.29) | (.29) | — | 8.93 | (1.15) | 33,382 | 1.54(c) | 3.10(c) | 17.43 |
| May 31, 2003 | 8.86 | .30 | .47 | .77 | (.31) | (.31) | — | 9.32 | 8.78 | 43,983 | 1.53 | 3.30 | 25.66 |
| May 31, 2002 | 8.76 | .36 | .10 | .46 | (.36) | (.36) | — | 8.86 | 5.30 | 43,696 | 1.56 | 4.05 | 17.26 |
|
| CLASS M | | | | | | | | | | | | | |
| May 31, 2006 | $9.23 | .33(c) | (.26) | .07 | (.32) | (.32) | — | $8.98 | .83 | $1,347 | 1.19(c) | 3.58(c) | 5.77 |
| May 31, 2005 | 8.94 | .33(c) | .28 | .61 | (.32) | (.32) | —(d) | 9.23 | 6.94 | 865 | 1.19(c) | 3.58(c) | 12.34 |
| May 31, 2004 | 9.33 | .32(c) | (.39) | (.07) | (.32) | (.32) | — | 8.94 | (.80) | 907 | 1.19(c) | 3.41(c) | 17.43 |
| May 31, 2003 | 8.88 | .33 | .46 | .79 | (.34) | (.34) | — | 9.33 | 9.03 | 3,457 | 1.18 | 3.64 | 25.66 |
| May 31, 2002 | 8.77 | .39 | .11 | .50 | (.39) | (.39) | — | 8.88 | 5.78 | 2,988 | 1.21 | 4.39 | 17.26 |
|
(a) Total return assumes dividend reinvestment and does not reflect the effect of sales charges.
(b) Includes amounts paid through expense offset arrangements (Note 2).
(c) Reflects an involuntary contractual expense limitation in effect during the period. As a result of such limitation, the expenses of each class, as a percentage of its net assets, reflect a reduction of the following amounts (Note 2):
| | 5/31/06 | 5/31/05 | 5/31/04 |
|
| Class A | 0.01% | 0.01% | 0.01% |
|
| Class B | 0.01 | 0.01 | 0.01 |
|
| Class M | 0.01 | 0.01 | 0.01 |
|
(d) Amount represents less than $0.01 per share.
The accompanying notes are an integral part of these financial statements.
Notes to financial statements 5/31/06
Note 1: Significant accounting policies
Putnam Ohio Tax Exempt Income Fund (the “fund”), a Massachusetts business trust, is registered under the Investment Company Act of 1940, as amended, as a diversified, open-end management investment company. The fund seeks as high a level of current income exempt from federal income tax and Ohio personal income tax as Putnam Investment Management, LLC (“Putnam Management”), the fund’s manager, an indirect wholly-owned subsidiary of Putnam, LLC, believes is consistent with preservation of capital by investing primarily in a portfolio of investment-grade Ohio tax-exempt securities with intermediate- to long-term maturities. The fund may be affected by economic and political developments in the state of Ohio.
The fund offers class A, class B and class M shares. Class A and class M shares are sold with a maximum front-end sales charge of 3.75% and 3.25%, respectively, and generally do not pay contingent deferred sales charges. Class B shares, which convert to class A shares after approximately eight years, do not pay a front-end sales charge, and are subject to a contingent deferred sales charge, if those shares are redeemed within six years of purchase. The expenses for class A, class B and class M shares may differ based on the distribution fee of each class, which is identified in Note 2.
A 2.00% redemption fee may apply to any shares that are redeemed (either by selling or exchanging into another fund) within 5 days of purchase. The redemption fee is accounted for as an addition to paid-in-capital.
Investment income, realized and unrealized gains and losses and expenses of the fund are borne pro-rata based on the relative net assets of each class to the total net assets of the fund, except that each class bears expenses unique to that class (including the distribution fees applicable to such classes). Each class votes as a class only with respect to its own distribution plan or other matters on which a class vote is required by law or determined by the Trustees. Shares of each class would receive their pro-rata share of the net assets of the fund, if the fund were liquidated. In addition, the Trustees declare separate dividends on each class of shares.
In the normal course of business, the fund enters into contracts that may include agreements to indemnify another party under given circumstances. The fund’s maximum exposure under these arrangements is unknown as this would involve future claims that may be, but have not yet been, made against the fund. However, the fund expects the risk of material loss to be remote.
The following is a summary of significant accounting policies consistently followed by the fund in the preparation of its financial statements. The preparation of financial statements is in conformity with accounting principles generally accepted in the United States of America and requires management to make estimates and assumptions that affect the reported amounts of assets and liabilities in the financial statements and the reported amounts of increases and decreases in net assets from operations during the reporting period. Actual results could differ from those estimates.
A) Security valuation Tax-exempt bonds and notes are generally valued on the basis of valuations provided by an independent pricing service approved by the Trustees. Such services use information with respect to transactions in bonds, quotations from bond dealers, market transactions in comparable securities and various relationships between securities in determining value. Other investments are valued at fair value following procedures approved by the Trustees. Such valuations and procedures are reviewed periodically by the Trustees. The fair value of securities is generally determined as the amount that the fund could reasonably expect to realize from an orderly disposition of such securities over a reasonable period of time. By its nature, a fair value price is a good faith estimate of the value of a security at a given point in time and does not reflect an actual market price.
46
B) Security transactions and related investment income Security transactions are recorded on the trade date (date the order to buy or sell is executed). Gains or losses on securities sold are determined on the identified cost basis.
Interest income is recorded on the accrual basis. All premiums/discounts are amortized/accreted on a yield-to-maturity basis. The premium in excess of the call price, if any, is amortized to the call date; thereafter, any remaining premium is amortized to maturity.
C) Futures and options contracts The fund may use futures and options contracts to hedge against changes in the values of securities the fund owns or expects to purchase, or for other investment purposes. The fund may also write options on swaps or securities it owns or in which it may invest to increase its current returns.
The potential risk to the fund is that the change in value of futures and options contracts may not correspond to the change in value of the hedged instruments. In addition, losses may arise from changes in the value of the underlying instruments, if there is an illiquid secondary market for the contracts, or if the counterparty to the contract is unable to perform. Risks may exceed amounts recognized on the statement of assets and liabilities. When the contract is closed, the fund records a realized gain or loss equal to the difference between the value of the contract at the time it was opened and the value at the time it was closed. Realized gains and losses on purchased options are included in realized gains and losses on investment securities. If a written call option is exercised, the premium originally received is recorded as an addition to sales proceeds. If a written put option is exercised, the premium originally received is recorded as a reduction to the cost of investments.
Futures contracts are valued at the quoted daily settlement prices established by the exchange on which they trade. The fund and the broker agree to exchange an amount of cash equal to the daily fluctuation in the value of the futures contract. Such receipts or payments are known as “variation margin.” Exchange traded options are valued at the last sale price or, if no sales are reported, the last bid price for purchased options and the last ask price for written options. Options traded over-the-counter are valued using prices supplied by dealers. Futures and written option contracts outstanding at period end, if any, are listed after the fund’s portfolio.
D) Interest rate swap contracts The fund may enter into interest rate swap contracts, which are arrangements between two parties to exchange cash flows based on a notional principal amount, to manage the fund’s exposure to interest rates. Interest rate swap contracts are marked to market daily based upon quotations from an independent pricing service or market makers and the change, if any, is recorded as unrealized gain or loss. Payments received or made are recorded as realized gains or loss. The fund could be exposed to credit or market risk due to unfavorable changes in the fluctuation of interest rates or if the counterparty defaults on its obligation to perform. Risk of loss may exceed amounts recognized on the statement of assets and liabilities. Interest rate swap contracts outstanding at period end, if any, are listed after the fund’s portfolio.
E) Federal taxes It is the policy of the fund to distribute all of its income within the prescribed time and otherwise comply with the provisions of the Internal Revenue Code of 1986 (the “Code”) applicable to regulated investment companies. It is also the intention of the fund to distribute an amount sufficient to avoid imposition of any excise tax under Section 4982 of the Code, as amended. Therefore, no provision has been made for federal taxes on income, capital gains or unrealized appreciation on securities held nor for excise tax on income and capital gains.
47
At May 31, 2006, the fund had a capital loss carryover of $1,341,598 available to the extent allowed by the Code to offset future net capital gain, if any. The amount of the carryover and the expiration dates are:
| Loss Carryover | Expiration |
|
| $981,353 | May 31, 2009 |
|
| 360,245 | May 31, 2010 |
|
F) Distributions to shareholders Income dividends are recorded daily by the fund and are paid monthly. Distributions from capital gains, if any, are recorded on the ex-dividend date and paid at least annually. The amount and character of income and gains to be distributed are determined in accordance with income tax regulations which may differ from generally accepted accounting principles. These differences include temporary and permanent differences of dividends payable and straddle loss deferrals. Reclassifications are made to the fund’s capital accounts to reflect income and gains available for distribution (or available capital loss carryovers) under income tax regulations. For the year ended May 31, 2006, the fund reclassified $1,806 to increase undistributed net investment income and $1,806 to increase accumulated net realized losses.
The tax basis components of distributable earnings and the federal tax cost as of period end May 31, 2006 were as follows:
| Unrealized appreciation | $ 7,500,814 |
| Unrealized depreciation | (703,780) |
| | ——————— |
| Net unrealized appreciation | 6,797,034 |
| Undistributed tax exempt income | 517,386 |
| Undistributed ordinary income | 8,790 |
| Capital loss carryforward | (1,341,598) |
| Cost for federal income | |
| tax purposes | $159,229,954 |
Note 2: Management fee, administrative
services and other transactions
Putnam Management is paid for management and investment advisory services quarterly based on the average net assets of the fund. Such fee is based on the lesser of (i) an annual rate of 0.50% of the average net assets of the fund or (ii) the following annual rates expressed as a percentage of the fund’s average net assets: 0.60% of the first $500 million, 0.50% of the next $500 million, 0.45% of the next $500 million, 0.40% of the next $5 billion, 0.375% of the next $5 billion, 0.355% of then next $5 billion, 0.34% of the next $5 billion and 0.33% thereafter.
Putnam Management has agreed to waive fees and reimburse expenses of the fund through May 31, 2007 to the extent necessary to ensure that the fund’s expenses do not exceed the simple average of the expenses of all front-end load funds viewed by Lipper Inc. as having the same investment classification or objective as the fund. The expense reimbursement is based on a comparison of the fund’s expenses with the average annualized operating expenses of the funds in its Lipper peer group for each calendar quarter during the fund’s last fiscal year, excluding 12b-1 fees and without giving effect to any expense offset and brokerage service arrangements that may reduce fund expenses. For the year ended May 31, 2006, Putnam Management waived $18,654 of its management fee from the fund.
For the year ended May 31, 2006, Putnam Management has assumed $1,223 of legal, shareholder servicing and communication, audit and Trustee fees incurred by the fund in connection with certain legal and regulatory matters (including those described in Note 5).
The fund reimburses Putnam Management an allocated amount for the compensation and related expenses of certain officers of the fund and their staff who provide administrative services to the fund. The aggregate amount of all such reimbursements is determined annually by the Trustees.
Custodial functions for the fund’s assets are provided by Putnam Fiduciary Trust Company (“PFTC”), a subsidiary of Putnam, LLC. PFTC receives fees for custody services based on the fund’s asset level, the number of its security
48
holdings and transaction volumes. Putnam Investor Services, a division of PFTC, provides investor servicing agent functions to the fund. Putnam Investor Services receives fees for investor servicing based on the number of shareholder accounts in the fund and the level of defined contribution plan assets in the fund. During the year ended May 31, 2006, the fund incurred $187,302 for these services.
The fund has entered into an arrangement with PFTC whereby credits realized as a result of uninvested cash balances are used to reduce a portion of the fund’s expenses. For the year ended May 31, 2006, the fund’s expenses were reduced by $112,988 under these arrangements.
Each independent Trustee of the fund receives an annual Trustee fee, of which $274, as a quarterly retainer, has been allocated to the fund, and an additional fee for each Trustees meeting attended. Trustees receive additional fees for attendance at certain committee meetings, industry seminars and for certain compliance-related matters. Trustees also are reimbursed for expenses they incur relating to their services as Trustees. George Putnam, III, who is not an independent Trustee, also receives the foregoing fees for his services as Trustee.
The fund has adopted a Trustee Fee Deferral Plan (the “Deferral Plan”) which allows the Trustees to defer the receipt of all or a portion of Trustees fees payable on or after July 1, 1995. The deferred fees remain invested in certain Putnam funds until distribution in accordance with the Deferral Plan.
The fund has adopted an unfunded noncontributory defined benefit pension plan (the “Pension Plan”) covering all Trustees of the fund who have served as a Trustee for at least five years and were first elected prior to 2004. Benefits under the Pension Plan are equal to 50% of the Trustee’s average annual attendance and retainer fees for the three years ended December 31, 2005. Pension expense for the fund is included in Trustee compensation and expenses in the statement of operations. Accrued pension liability is included in Payable for Trustee compensation and expenses in the statement of assets and liabilities. The Trustees have terminated the Pension Plan with respect to any Trustee first elected after 2003.
The fund has adopted distribution plans (the “Plans”) with respect to its class A, class B and class M shares pursuant to rule 12b-1 under the Investment Company Act of 1940. The purpose of the Plans is to compensate Putnam Retail Management, a wholly-owned subsidiary of Putnam, LLC and Putnam Retail Management GP, Inc., for services provided and expenses incurred in distributing shares of the fund. The Plans provide for payments by the fund to Putnam Retail Management at an annual rate of up to 0.35%, 1.00% and 1.00% of the average net assets attributable to class A, class B and class M shares, respectively. The Trustees have approved payment by the fund at the annual rate of 0.85% and 0.50% for class B and class M shares. For class A shares, the annual payment rate will equal the weighted average of (i) 0.20% on the net assets of the fund attributable to class A shares purchased and paid for prior to April 1, 2005 and (ii) 0.25% on all other net assets of the fund attributable to class A shares.
For the year ended May 31, 2006, Putnam Retail Management, acting as underwriter, received net commissions of $15,236 and $89 from the sale of class A and class M shares, respectively, and received $25,267 in contingent deferred sales charges from redemptions of class B shares.
A deferred sales charge of up to 1.00% is assessed on certain redemptions of class A shares that were purchased without an initial sales charge as part of an investment of $1 million or more. For the year ended May 31, 2006, Putnam Retail Management, acting as underwriter, received no monies on class A redemptions.
49
Note 3: Purchases and sales of securities
During the year ended May 31, 2006, cost of purchases and proceeds from sales of investment securities other than short-term investments aggregated $9,424,754 and $13,969,990, respectively. There were no purchases or sales of U.S. government securities.
Note 4: Capital shares
At May 31, 2006, there was an unlimited number of shares of beneficial interest authorized. Transactions in capital shares were as follows:
| CLASS A | Shares | | Amount |
|
| Year ended 5/31/06: | | | |
| Shares sold | 1,572,462 | $ | 14,263,576 |
|
| Shares issued | | | |
| in connection | | | |
| with reinvestment | | | |
| of distributions | 450,813 | | 4,093,495 |
|
| | 2,023,275 | | 18,357,071 |
|
| Shares | | | |
| repurchased | (2,106,259) | | (19,150,738) |
|
| Net decrease | (82,984) | $ | (793,667) |
| |
| Year ended 5/31/05: | | | |
| Shares sold | 1,196,814 | $ | 10,935,043 |
|
| Shares issued | | | |
| in connection | | | |
| with reinvestment | | | |
| of distributions | 448,843 | | 4,097,133 |
|
| | 1,645,657 | | 15,032,176 |
|
| Shares | | | |
| repurchased | (2,203,208) | | (20,095,203) |
|
| Net decrease | (557,551) | $ | (5,063,027) |
| CLASS B | Shares | | Amount |
| Year ended 5/31/06: | | | |
| Shares sold | 111,657 | $ | 1,016,565 |
|
| Shares issued | | | |
| in connection | | | |
| with reinvestment | | | |
| of distributions | 52,383 | | 475,470 |
|
| | 164,040 | | 1,492,035 |
|
| Shares | | | |
| repurchased | (783,905) | | (7,116,153) |
|
| Net decrease | (619,865) | $ | (5,624,118) |
| |
| Year ended 5/31/05: | | | |
| Shares sold | 110,632 | $ | 1,010,679 |
|
| Shares issued | | | |
| in connection | | | |
| with reinvestment | | | |
| of distributions | 67,531 | | 615,630 |
|
| | 178,163 | | 1,626,309 |
|
| Shares | | | |
| repurchased | (1,105,026) | | (10,082,862) |
|
| Net decrease | (926,863) | $ | (8,456,553) |
|
| |
| CLASS M | Shares | | Amount |
|
| Year ended 5/31/06: | | | |
| Shares sold | 73,485 | $ | 677,648 |
|
| Shares issued | | | |
| in connection | | | |
| with reinvestment | | | |
| of distributions | 4,189 | | 38,047 |
|
| | 77,674 | | 715,695 |
|
| Shares | | | |
| repurchased | (21,300) | | (193,231) |
|
| Net increase | 56,374 | $ | 522,464 |
| |
| Year ended 5/31/05: | | | |
| Shares sold | 3,512 | $ | 31,807 |
|
| Shares issued | | | |
| in connection | | | |
| with reinvestment | | | |
| of distributions | 2,481 | | 22,660 |
|
| | 5,993 | | 54,467 |
|
| Shares | | | |
| repurchased | (13,733) | | (123,582) |
|
| Net decrease | (7,740) | $ | (69,115) |
50
Note 5: Regulatory matters and litigation
Putnam Management has entered into agreements with the Securities and Exchange Commission and the Massachusetts Securities Division settling charges connected with excessive short-term trading by Putnam employees and, in the case of the charges brought by the Massachusetts Securities Division, by participants in some Putnam-administered 401(k) plans. Pursuant to these settlement agreements, Putnam Management will pay a total of $193.5 million in penalties and restitution, with $153.5 million being paid to certain open-end funds and their shareholders. The amount will be allocated to shareholders and funds pursuant to a plan developed by an independent consultant, and will be paid following approval of the plan by the SEC and the Massachusetts Securities Division.
The Securities and Exchange Commission’s and Massachusetts Securities Division’s allegations and related matters also serve as the general basis for numerous lawsuits, including purported class action lawsuits filed against Putnam Management and certain related parties, including certain Putnam funds. Putnam Management will bear any costs incurred by Putnam funds in connection with these lawsuits. Putnam Management believes that the likelihood that the pending private lawsuits and purported class action lawsuits will have a material adverse financial impact on the fund is remote, and the pending actions are not likely to materially affect its ability to provide investment management services to its clients, including the Putnam funds.
Putnam Management and Putnam Retail Management are named as defendants in a civil suit in which the plaintiffs allege that the management and distribution fees paid by certain Putnam funds were excessive and seek recovery under the Investment Company Act of 1940. Putnam Management and Putnam Retail Management have contested the plaintiffs’ claims and the matter is currently pending in the U.S. District Court for the District of Massachusetts. Based on currently available information, Putnam Management believes that this action is without merit and that it is unlikely to have a material effect on Putnam Management’s and Putnam Retail Management’s ability to provide services to their clients, including the fund.
51
Federal tax information
(Unaudited)
|
The fund has designated 99.50% of dividends paid from net investment income during the fiscal year as tax exempt for Federal income tax purposes.
The Form 1099 you receive in January 2007 will show the tax status of all distributions paid to your account in calendar 2006.
52
About the Trustees
Jameson A. Baxter (Born 1943), Trustee since 1994, Vice Chairman since 2005
Ms. Baxter is the President of Baxter Associates, Inc., a private investment firm that she founded in 1986.
Ms. Baxter serves as a Director of ASHTA Chemicals, Inc., Banta Corporation (a printing and digital imaging firm), Ryerson Tull, Inc. (a steel service corporation), the Mutual Fund Directors Forum, Advocate Health Care and BoardSource, formerly the National Center for Nonprofit Boards. She is Chairman Emeritus of the Board of Trustees, Mount Holyoke College, having served as Chairman for five years and as a board member for thirteen years. Until 2002, Ms. Baxter was a Director of Intermatic Corporation (a manufacturer of energy control products).
Ms. Baxter has held various positions in investment banking and corporate finance, including Vice President and Principal of the Regency Group, and Vice President of and Consultant to First Boston Corporation. She is a graduate of Mount Holyoke College.
Charles B. Curtis (Born 1940), Trustee since 2001
Mr. Curtis is President and Chief Operating Officer of the Nuclear Threat Initiative (a private foundation dealing with national security issues) and serves as Senior Advisor to the United Nations Foundation.
Mr. Curtis is a member of the Council on Foreign Relations and the Trustee Advisory Council of the Applied Physics Laboratory, Johns Hopkins University. Until 2003, Mr. Curtis was a member of the Electric Power Research Institute Advisory Council and the University of Chicago Board of Governors for Argonne National Laboratory. Prior to 2002, Mr. Curtis was a Member of the Board of Directors of the Gas Technology Institute and the Board of Directors of the Environment and Natural Resources Program Steering Committee, John F. Kennedy School of Government, Harvard University. Until 2001, Mr. Curtis was a member of the Department of Defense Policy Board and Director of EG&G Technical Services, Inc. (a fossil energy research and development support company).
From August 1997 to December 1999, Mr. Curtis was a Partner at Hogan & Hartson L.L.P., a Washington, D.C. law firm. Prior to May 1997, Mr. Curtis was Deputy Secretary of Energy and Under Secretary of the U.S. Department of Energy. He served as Chairman of the Federal Energy Regulatory Commission from 1977 to 1981 and has held positions on the staff of the U.S. House of Representatives, the U.S. Treasury Department, and the SEC.
53
Myra R. Drucker (Born 1948), Trustee since 2004
Ms. Drucker is a Vice Chair of the Board of Trustees of Sarah Lawrence College, Vice Chair of the Board of Trustees of the Commonfund (a not-for-profit firm specializing in asset management for educational endowments and foundations) and a member of the Investment Committee of the Kresge Foundation (a charitable trust).
Ms. Drucker is an ex-officio member of the New York Stock Exchange (NYSE) Pension Managers Advisory Committee, having served as Chair for seven years and a member of the Executive Committee of the Committee on Investment of Employee Benefit Assets. She is Chair of the Advisory Board of Hamilton Lane Advisors (an investment management firm) and a member of the Advisory Board of RCM (an investment management firm). Until August 31, 2004, Ms. Drucker was Managing Director and a member of the Board of Directors of General Motors Asset Management and Chief Investment Officer of General Motors Trust Bank. Ms. Drucker also served as a member of the NYSE Corporate Accountability and Listing Standards Committee and the NYSE/NASD IPO Advisory Committee.
Prior to joining General Motors Asset Management in 2001, Ms. Drucker held various executive positions in the investment management industry. Ms. Drucker served as Chief Investment Officer of Xerox Corporation (a technology and service company in the document industry), where she was responsible for the investment of the company’s pension assets. Ms. Drucker was also Staff Vice President and Director of Trust Investments for International Paper (a paper, paper distribution, packaging and forest products company) and previously served as Manager of Trust Investments for Xerox Corporation. Ms. Drucker received a B.A. degree in Literature and Psychology from Sarah Lawrence College and pursued graduate studies in economics, statistics and portfolio theory at Temple University.
John A. Hill (Born 1942), Trustee since 1985 and Chairman since 2000
Mr. Hill is Vice Chairman of First Reserve Corporation, a private equity buyout firm that specializes in energy investments in the diversified worldwide energy industry.
Mr. Hill is a Director of Devon Energy Corporation, TransMontaigne Oil Company and various private companies controlled by First Reserve Corporation, as well as Chairman of TH Lee, Putnam Investment Trust (a closed-end investment company advised by an affiliate of Putnam Management). He is also a Trustee of Sarah Lawrence College. Until 2005, he was a Director of Continuum Health Partners of New York.
Prior to acquiring First Reserve Corporation in 1983, Mr. Hill held executive positions in investment banking and investment management with several firms and with the federal government, including Deputy Associate Director of the Office of Management and Budget and Deputy
54
Director of the Federal Energy Administration. He is active in various business associations, including the Economic Club of New York, and lectures on energy issues in the United States and Europe. Mr. Hill holds a B.A. degree in Economics from Southern Methodist University and pursued graduate studies there as a Woodrow Wilson Fellow.
Paul L. Joskow (Born 1947), Trustee since 1997
|
Dr. Joskow is the Elizabeth and James Killian Professor of Economics and Management, and Director of the Center for Energy and Environmental Policy Research at the Massachusetts Institute of Technology.
Dr. Joskow serves as a Director of National Grid plc (a UK-based holding company with interests in electric and gas transmission and distribution and telecommunications infrastructure) and TransCanada Corporation (an energy company focused on natural gas transmission and power services). He also serves on the Board of Overseers of the Boston Symphony Orchestra. Prior to February 2005, he served on the board of the Whitehead Institute for Biomedical Research (a non-profit research institution) and has been President of the Yale University Council since 1993. Prior to February 2002, he was a Director of State Farm Indemnity Company (an automobile insurance company), and, prior to March 2000, he was a Director of New England Electric System (a public utility holding company).
Dr. Joskow has published five books and numerous articles on topics in industrial organization, government regulation of industry, and competition policy. He is active in industry restructuring, environmental, energy, competition and privatization policies — serving as an advisor to governments and corporations worldwide. Dr. Joskow holds a Ph.D. and M. Phil from Yale University and a B.A. from Cornell University.
Elizabeth T. Kennan (Born 1938), Trustee since 1992
Dr. Kennan is a Partner of Cambus-Kenneth Farm (thoroughbred horse and cattle breeding). She is President Emeritus of Mount Holyoke College.
Dr. Kennan served as Chairman and is now Lead Director of Northeast Utilities. Until 2005, she was a Director of Talbots, Inc. She has served as Director on a number of other boards, including Bell Atlantic, Chastain Real Estate, Shawmut Bank, Berkshire Life Insurance and Kentucky Home Life Insurance. She is a Trustee of the National Trust for Historic Preservation, of Centre College and of Midway College in Midway, Kentucky. Until 2006, she was a member of The Trustees of Reservations. Dr. Kennan has served on the oversight committee of the Folger Shakespeare Library, as President of Five Colleges Incorporated, as a Trustee of Notre Dame University and is active in various educational and civic associations.
55
As a member of the faculty of Catholic University for twelve years, until 1978, Dr. Kennan directed the post-doctoral program in Patristic and Medieval Studies, taught history and published numerous articles. Dr. Kennan holds a Ph.D. from the University of Washington in Seattle, an M.S. from St. Hilda’s College at Oxford University and an A.B. from Mount Holyoke College. She holds several honorary doctorates.
Robert E. Patterson (Born 1945), Trustee since 1984
Mr. Patterson is Senior Partner of Cabot Properties, L.P. and Chairman of Cabot Properties, Inc. (a private equity firm investing in commercial real estate).
Mr. Patterson serves as Chairman Emeritus and Trustee of the Joslin Diabetes Center and as a Director of Brandywine Trust Group, LLC. Prior to June 2003, he was a Trustee of Sea Education Association. Prior to December 2001, he was President and Trustee of Cabot Industrial Trust (a publicly traded real estate investment trust). Prior to February 1998, he was Executive Vice President and Director of Acquisitions of Cabot Partners Limited Partnership (a registered investment adviser involved in institutional real estate investments). Prior to 1990, he served as Executive Vice President of Cabot, Cabot & Forbes Realty Advisors, Inc. (the predecessor company of Cabot Partners).
Mr. Patterson practiced law and held various positions in state government and was the founding Executive Director of the Massachusetts Industrial Finance Agency. Mr. Patterson is a graduate of Harvard College and Harvard Law School.
W. Thomas Stephens (Born 1942), Trustee since 1997
Mr. Stephens is Chairman and Chief Executive Officer of Boise Cascade, L.L.C. (a paper, forest products and timberland assets company).
Until 2005, Mr. Stephens was a director of TransCanadaPipelines, Ltd. Until 2004, Mr. Stephens was a Director of Xcel Energy Incorporated (a public utility company), Qwest Communications, and Norske Canada, Inc. (a paper manufacturer). Until 2003, Mr. Stephens was a Director of Mail-Well, Inc. (a diversified printing company). He served as Chairman of Mail-Well until 2001 and as CEO of MacMillan-Bloedel, Ltd. (a forest products company) until 1999.
Prior to 1996, Mr. Stephens was Chairman and Chief Executive Officer of Johns Manville Corporation. He holds B.S. and M.S. degrees from the University of Arkansas.
56
Richard B. Worley (Born 1945), Trustee since 2004
Mr. Worley is Managing Partner of Permit Capital LLC, an investment management firm.
Mr. Worley serves on the Executive Committee of the University of Pennsylvania Medical Center, is a Trustee of The Robert Wood Johnson Foundation (a philanthropic organization devoted to health care issues) and is a Director of The Colonial Williamsburg Foundation (a historical preservation organization). Mr. Worley also serves on the investment committees of Mount Holyoke College and World Wildlife Fund (a wildlife conservation organization).
Prior to joining Permit Capital LLC in 2002, Mr. Worley served as Chief Strategic Officer of Morgan Stanley Investment Management. He previously served as President, Chief Executive Officer and Chief Investment Officer of Morgan Stanley Dean Witter Investment Management and as a Managing Director of Morgan Stanley, a financial services firm. Mr. Worley also was the Chairman of Miller Anderson & Sherrerd, an investment management firm.
Mr. Worley holds a B.S. degree from University of Tennessee and pursued graduate studies in economics at the University of Texas.
Charles E. Haldeman, Jr.* (Born 1948), Trustee since 2004
Mr. Haldeman is President and Chief Executive Officer of Putnam, LLC (“Putnam Investments”). He is a member of Putnam Investments’ Executive Board of Directors and Advisory Council. Prior to November 2003, Mr. Haldeman served as Co-Head of Putnam Investments’ Investment Division.
Prior to joining Putnam Investments in 2002, Mr. Haldeman held executive positions in the investment management industry. He previously served as Chief Executive Officer of Delaware Investments and President & Chief Operating Officer of United Asset Management. Mr. Haldeman was also a partner and director of Cooke & Bieler, Inc. (an investment management firm).
Mr. Haldeman currently serves on the Board of Governors of the Investment Company Institute and as a Trustee of Dartmouth College, and he is a member of the Partners HealthCare Systems Investment Committee. He is a graduate of Dartmouth College, Harvard Law School and Harvard Business School. Mr. Haldeman is also a Chartered Financial Analyst (CFA) charterholder.
57
George Putnam, III* (Born 1951), Trustee since 1984 and President since 2000
Mr. Putnam is President of New Generation Research, Inc. (a publisher of financial advisory and other research services), and of New Generation Advisers, Inc. (a registered investment advisor to private funds). Mr. Putnam founded the New Generation companies in 1986.
Mr. Putnam is a Director of The Boston Family Office, LLC (a registered investment adviser). He is a Trustee of St. Mark’s School and Shore Country Day School, and until 2002 was a Trustee of the Sea Education Association.
Mr. Putnam previously worked as an attorney with the law firm of Dechert LLP (formerly known as Dechert Price & Rhoads) in Philadelphia. He is a graduate of Harvard College, Harvard Business School and Harvard Law School.
The address of each Trustee is One Post Office Square, Boston, MA 02109.
As of May 31, 2006, there were 108 Putnam Funds. All Trustees serve as Trustees of all Putnam funds. Each Trustee serves for an indefinite term, until his or her resignation, retirement at age 72, death, or removal.
* Trustees who are or may be deemed to be “interested persons” (as defined in the Investment Company Act of 1940) of the fund, Putnam Management, Putnam Retail Management, or Marsh & McLennan Companies, Inc., the parent company of Putnam, LLC and its affiliated companies. Messrs. Haldeman and Putnam, III are deemed “interested persons” by virtue of their positions as officers of the fund, Putnam Management or Putnam Retail Management and as shareholders of Marsh & McLennan Companies, Inc. Mr. Putnam, III is the President of your fund and each of the other Putnam funds. Mr. Haldeman is President and Chief Executive Officer of Putnam Investments.
58
Officers
In addition to George Putnam, III, the other officers of the fund are shown below:
| Charles E. Porter (Born 1938) | Richard S. Robie, III (Born 1960) |
| Executive Vice President, Associate Treasurer | Vice President |
| and Principal Executive Officer | Since 2004 |
| Since 1989 | |
| Senior Managing Director, Putnam |
| Jonathan S. Horwitz (Born 1955) | Investments, Putnam Management |
| Senior Vice President and Treasurer | and Putnam Retail Management. Prior |
| Since 2004 | to 2003, Senior Vice President, United |
| Asset Management Corporation |
| Prior to 2004, Managing Director, | |
| Putnam Investments | Francis J. McNamara, III (Born 1955) |
| Vice President and Chief Legal Officer |
| Steven D. Krichmar (Born 1958) | Since 2004 |
| Vice President and Principal Financial Officer | |
| Since 2002 | Senior Managing Director, Putnam |
| Investments, Putnam Management |
| Senior Managing Director, Putnam | and Putnam Retail Management. Prior |
| Investments. Prior to July 2001, Partner, | to 2004, General Counsel, State Street |
| PricewaterhouseCoopers LLP | Research & Management Company |
| | |
| Michael T. Healy (Born 1958) | Charles A. Ruys de Perez (Born 1957) |
| Assistant Treasurer and Principal | Vice President and Chief Compliance Officer |
| Accounting Officer | Since 2004 |
| Since 2000 | |
| Managing Director, Putnam Investments |
| Managing Director, Putnam Investments | |
| Mark C. Trenchard (Born 1962) |
| Beth S. Mazor (Born 1958) | Vice President and BSA Compliance Officer |
| Vice President | Since 2002 |
| Since 2002 | |
| Managing Director, Putnam Investments |
| Managing Director, Putnam Investments | |
| Judith Cohen (Born 1945) |
| James P. Pappas (Born 1953) | Vice President, Clerk and Assistant Treasurer |
| Vice President | Since 1993 |
| Since 2004 | |
| Wanda M. McManus (Born 1947) |
| Managing Director, Putnam Investments | Vice President, Senior Associate Treasurer |
| and Putnam Management. During 2002, | and Assistant Clerk |
| Chief Operating Officer, Atalanta/Sosnoff | Since 2005 |
| Management Corporation; prior to 2001, | |
| President and Chief Executive Officer, | Nancy E. Florek (Born 1957) |
| UAM Investment Services, Inc. | Vice President, Assistant Clerk, |
| Assistant Treasurer and Proxy Manager |
| | Since 2005 |
| | |
The address of each Officer is One Post Office Square, Boston, MA 02109.
59
Fund information
Founded over 65 years ago, Putnam Investments was built around the concept that a balance between risk and reward is the hallmark of a well-rounded financial program. We manage over 100 mutual funds in growth, value, blend, fixed income, and international.
| Investment Manager | George Putnam, III | Francis J. McNamara, III |
| Putnam Investment | W. Thomas Stephens | Vice President and |
| Management, LLC | Richard B. Worley | Chief Legal Officer |
| One Post Office Square | | |
| Boston, MA 02109 | Officers | Charles A. Ruys de Perez |
| George Putnam, III | Vice President and |
| Marketing Services | President | Chief Compliance Officer |
| Putnam Retail Management | | |
| One Post Office Square | Charles E. Porter | Mark C. Trenchard |
| Boston, MA 02109 | Executive Vice President, | Vice President and |
| Associate Treasurer and | BSA Compliance Officer |
| Custodian | Principal Executive Officer | |
| Putnam Fiduciary | | Judith Cohen |
| Trust Company | Jonathan S. Horwitz | Vice President, Clerk |
| Senior Vice President | and Assistant Treasurer |
| Legal Counsel | and Treasurer | |
| Ropes & Gray LLP | | Wanda M. McManus |
| Steven D. Krichmar | Vice President, Senior Associate |
| Independent Registered | Vice President and | Treasurer and Assistant Clerk |
| Public Accounting Firm | Principal Financial Officer | |
| PricewaterhouseCoopers LLP | | Nancy E. Florek |
| Michael T. Healy | Vice President, Assistant Clerk, |
| Trustees | Assistant Treasurer and | Assistant Treasurer |
| John A. Hill, Chairman | Principal Accounting Officer | and Proxy Manager |
| Jameson Adkins Baxter, | | |
| Vice Chairman | Beth S. Mazor | |
| Charles B. Curtis | Vice President | |
| Myra R. Drucker | | |
| Charles E. Haldeman, Jr.�� | James P. Pappas | |
| Paul L. Joskow | Vice President | |
| Elizabeth T. Kennan | | |
| Robert E. Patterson | Richard S. Robie, III | |
| Vice President | |
| | |
This report is for the information of shareholders of Putnam Ohio Tax Exempt Income Fund. It may also be used as sales literature when preceded or accompanied by the current prospectus, the most recent copy of Putnam’s Quarterly Performance Summary, and Putnam’s Quarterly Ranking Summary. For more recent performance, please visit www.putnam.com. Investors should carefully consider the investment objective, risks, charges, and expenses of a fund, which are described in its prospectus. For this and other information or to request a prospectus, call 1-800-225-1581 toll free. Please read the prospectus carefully before investing. The fund’s Statement of Additional Information contains additional information about the fund’s Trustees and is available without charge upon request by calling 1-800-225-1581.
60

Item 2. Code of Ethics:
(a) The fund’s principal executive, financial and accounting officers are employees of Putnam Investment Management, LLC, the Fund's investment manager. As such they are subject to a comprehensive Code of Ethics adopted and administered by Putnam Investments which is designed to protect the interests of the firm and its clients. The Fund has adopted a Code of Ethics which incorporates the Code of Ethics of Putnam Investments with respect to all of its officers and Trustees who are employees of Putnam Investment Management, LLC. For this reason, the Fund has not adopted a separate code of ethics governing its principal executive, financial and accounting officers.
(c) In July 2005, Putnam Investment Management, LLC, the Fund's investment manager, Putnam Retail Management Limited Partnership, the Fund's principal underwriter, and Putnam Investments Limited, the sub-manager for a portion of the assets of certain funds as determined by Putnam Management from time to time, adopted several amendments to their Code of Ethics. Insofar as such Code of Ethics applies to the Fund's principal executive officer, principal financial officer and principal accounting officer, the amendments provided for an exception to the standard 90-day holding period (one year, in the case of employees deemed to be “access persons” under the Code) for shares of Putnam mutual funds in the case of redemptions from an employee’s account in a college savings plan qualified under Section 529 of the Internal Revenue Code. Under this exception, an employee may, without penalty under the Code, make “qualified redemptions” of shares from such an account less than 90 days (or one year, as applicable) after purchase. “Qualified redemptions” include redemptions for higher education purposes for the account beneficiary and redemptions made upon death or disability. The July 2005 amendments also provide that an employee may, for purposes of the rule limiting the number of trades per calendar quarter in an employee’s personal account to a maximum of 10, count all trades of the same security in the same direction (all buys or all sells) over a period of five consecutive business days as a single trade.
The July 2005 amendments were incorporated into a restated Code of Ethics dated December 2005 (filed as an exhibit hereto).
Item 3. Audit Committee Financial Expert:
The Funds' Audit and Compliance Committee is comprised solely of Trustees who are "independent" (as such term has been defined by the Securities and Exchange Commission ("SEC") in regulations implementing Section 407 of the Sarbanes-Oxley Act (the "Regulations")). The Trustees believe that each of the members of the Audit and Compliance Committee also possess a combination of knowledge and experience with respect to financial accounting matters, as well as other attributes, that qualify them for service on the Committee. In addition, the Trustees have determined that all members of the Funds' Audit and Compliance Committee meet the financial literacy requirements of the New York Stock Exchange's rules and that Mr. Patterson, Mr. Stephens and Mr. Hill qualify as "audit committee financial experts" (as such term has been defined by the Regulations) based on their review of their pertinent experience and education. Certain other Trustees, although not on the Audit and Compliance Committee, would also qualify as "audit committee financial experts." The SEC has stated that the designation or identification of a person as an audit committee financial expert pursuant to this Item 3 of Form N-CSR does not impose on such person any duties, obligations or liability that are greater than the duties, obligations and liability imposed on such person as a member of the Audit and Compliance Committee and the Board of Trustees in the absence of such designation or identification.
Item 4. Principal Accountant Fees and Services:
The following table presents fees billed in each of the last two fiscal years for services rendered to the fund by the fund’s independent auditor:
| Fiscal | | Audit- | | |
| year | Audit | Related | Tax | All Other |
| ended | Fees | Fees | Fees | Fees |
| |
| May 31, 2006 | $43,856* | $-- | $6,790 | $ - |
| May 31, 2005 | $40,400* | $-- | $6,397 | $97 |
* Includes fees of $ 99 and $ 5 billed by the fund’s independent auditor to the fund for audit procedures necessitated by regulatory and litigation matters for the fiscal years ended May 31, 2006 and May 31, 2005, respectively. These fees were reimbursed to the fund by Putnam Investment Management, LLC (“Putnam Management”).
For the fiscal years ended May 31, 2006 and May 31, 2005, the fund’s independent auditor billed aggregate non-audit fees in the amounts of $238,565 and $188,607 respectively, to the fund, Putnam Management and any entity controlling, controlled by or under common control with Putnam Management that provides ongoing services to the fund.
Audit Fees represent fees billed for the fund’s last two fiscal years.
Audit-Related Fees represent fees billed in the fund’s last two fiscal years for services traditionally performed by the fund’s auditor, including accounting consultation for proposed transactions or concerning financial accounting and reporting standards and other audit or attest services not required by statute or regulation.
Tax Fees represent fees billed in the fund’s last two fiscal years for tax compliance, tax planning and tax advice services. Tax planning and tax advice services include assistance with tax audits, employee benefit plans and requests for rulings or technical advice from taxing authorities.
All Other Fees represent fees billed for services relating to an analysis of recordkeeping fees.
Pre-Approval Policies of the Audit and Compliance Committee. The Audit and Compliance Committee of the Putnam funds has determined that, as a matter of policy, all work performed for the funds by the funds’ independent auditors will be pre-approved by the Committee itself and thus will generally not be subject to pre-approval procedures.
The Audit and Compliance Committee also has adopted a policy to pre-approve the engagement by Putnam Management and certain of its affiliates of the funds’ independent auditors, even in circumstances where pre-approval is not required by applicable law. Any such requests by Putnam Management or certain of its affiliates are typically submitted in writing to the Committee and explain, among other things, the nature of the proposed engagement, the estimated fees, and why this work should be performed by that particular audit firm as opposed to another one.
The following table presents fees billed by the fund’s independent auditor for services required to be approved pursuant to paragraph (c)(7)(ii) of Rule 2-01 of Regulation S-X.
| Fiscal | Audit- | | All | Total |
| year | Related | Tax | Other | Non-Audit |
| ended | Fees | Fees | Fees | Fees |
| May 31, | | | | |
| 2006 | $ - | $98,160 | $ - | $ - |
| May | | | | |
Item 5. Audit Committee of Listed Registrants
Not applicable
Item 6. Schedule of Investments:
The registrant’s schedule of investments in unaffiliated issuers is included in the report to shareholders in Item 1 above.
Item 7. Disclosure of Proxy Voting Policies and Procedures For Closed-End Management Investment Companies:
Not applicable
Item 8. Portfolio Managers of Closed-End Investment Companies
Not Applicable
Item 9. Purchases of Equity Securities by Closed-End Management Investment Companies and Affiliated Purchasers:
Not applicable
Item 10. Submission of Matters to a Vote of Security Holders:
Not applicable
Item 11. Controls and Procedures:
(a) The registrant's principal executive officer and principal financial officer have concluded, based on their evaluation of the effectiveness of the design and operation of the registrant's disclosure controls and procedures as of a date within 90 days of the filing date of this report, that the design and operation of such procedures are generally effective to provide reasonable assurance that information required to be disclosed by the registrant in this report is recorded, processed, summarized and reported within the time periods specified in the Commission's rules and forms.
(b) Changes in internal control over financial reporting: Not applicable
Item 12. Exhibits:
(a)(1) The Code of Ethics of The Putnam Funds, which incorporates the Code of Ethics of Putnam Investments, is filed herewith.
(a)(2) Separate certifications for the principal executive officer and principal financial officer of the registrant as required by Rule 30a-2(a) under the Investment Company Act of 1940, as amended, are filed herewith.
(b) The certifications required by Rule 30a-2(b) under the Investment Company Act of 1940, as amended, are filed herewith.
SIGNATURES
Pursuant to the requirements of the Securities Exchange Act of 1934 and the Investment Company Act of 1940, the registrant has duly caused this report to be signed on its behalf by the undersigned, thereunto duly authorized.
Putnam Ohio Tax Exempt Income Fund
By (Signature and Title):
/s/Michael T. Healy
Michael T. Healy
Principal Accounting Officer
Date: July 27, 2006
Pursuant to the requirements of the Securities Exchange Act of 1934 and the Investment Company Act of 1940, this report has been signed below by the following persons on behalf of the registrant and in the capacities and on the dates indicated.
By (Signature and Title):
/s/Charles E. Porter
Charles E. Porter
Principal Executive Officer
Date: July 27, 2006
By (Signature and Title):
/s/Steven D. Krichmar
Steven D. Krichmar
Principal Financial Officer
Date: July 27, 2006