| | | |
| UNITED STATES |
| SECURITIES AND EXCHANGE COMMISSION |
| Washington, D.C. 20549 |
| |
| FORM N-CSR |
| |
| CERTIFIED SHAREHOLDER REPORT OF REGISTERED |
| MANAGEMENT INVESTMENT COMPANIES |
| | |
| Investment Company Act file number: (811-04528) | |
| |
| Exact name of registrant as specified in charter: | Putnam Ohio Tax Exempt Income Fund |
| |
| Address of principal executive offices: One Post Office Square, Boston, Massachusetts 02109 |
| | | |
| Name and address of agent for service: | | Beth S. Mazor, Vice President |
| | | One Post Office Square |
| | | Boston, Massachusetts 02109 |
| | | |
| Copy to: | | John W. Gerstmayr, Esq. |
| | | Ropes & Gray LLP |
| | | One International Place |
| | | Boston, Massachusetts 02110 |
| | |
| Registrant’s telephone number, including area code: | (617) 292-1000 |
| | |
| Date of fiscal year end: May 31, 2009 | |
| |
| Date of reporting period: June 1, 2008 — May 31, 2009 |
Item 1. Report to Stockholders:
The following is a copy of the report transmitted to stockholders pursuant to Rule 30e-1 under the Investment Company Act of 1940:

Since 1937, when George Putnam created a prudent mix of stocks and bonds in a single, professionally managed portfolio, we have championed the wisdom of the balanced approach. Today, we offer a world of equity, fixed-income, multi-asset, and absolute-return portfolios so investors can pursue a range of financial goals. Our seasoned portfolio managers seek superior results over time, backed by original, fundamental research on a global scale. We believe in service excellence, in the value of experienced financial advice, and in putting clients first in everything we do.
In 1830, Massachusetts Supreme Judicial Court Justice Samuel Putnam established The Prudent Man Rule, a legal foundation for responsible money management.

THE PRUDENT MAN RULE
All that can be required of a trustee to invest is that he shall conduct himself faithfully and exercise a sound discretion. He is to observe how men of prudence, discretion, and intelligence manage their own affairs, not in regard to speculation, but in regard to the permanent disposition of their funds, considering the probable income, as well as the probable safety of the capital to be invested.
Putnam Ohio
Tax Exempt
Income Fund
Annual Report
5|31|09
| |
| Message from the Trustees | 1 |
| About the fund | 2 |
| Performance and portfolio snapshots | 4 |
| Interview with your fund’s Portfolio Manager | 5 |
| Performance in depth | 8 |
| Expenses | 10 |
| Portfolio turnover | 11 |
| Your fund’s management | 12 |
| Terms and definitions | 13 |
| Trustee approval of management contract | 14 |
| Other information for shareholders | 17 |
| Financial statements | 18 |
| Federal tax information | 31 |
| About the Trustees | 32 |
| Officers | 36 |
Message from the Trustees
Dear Fellow Shareholder:
Following many months of painful losses, the stock market finally reversed course this spring and posted solid gains. Returns in the fixed-income area have been more mixed, with Treasuries losing ground but corporate and high-yield debt rebounding. We are pleased to report that, in many instances, Putnam mutual fund performance has also been strong in recent months, demonstrating the power of active portfolio management and the substantial efforts of an investment team infused with new talent and a singular focus.
Putnam Investments and the Board of Trustees continue to evolve during this exciting time of renewal. After several years of steady leadership, Charles E. “Ed” Haldeman, Jr. has stepped down as President of the Putnam Funds and as a member of the Board of Trustees of the Funds. Effective July 1, 2009, Robert L. Reynolds, President and Chief Executive Officer of Putnam Investments and a Trustee of the Putnam Funds, replaced Mr. Haldeman as President of the Putnam Funds.
In other developments at Putnam, Walter C. Donovan, a 25-year investment industry veteran, has joined the firm as Chief Investment Officer. Mr. Donovan will oversee a reinvigorated investment organization strengthened by the recent arrival of several industry-leading senior portfolio managers, research analysts, and traders.
Ravi Akhoury has been elected to the Board of Trustees of the Putnam Funds and W. Thomas Stephens has rejoined the Board. From 1992 to 2007, Mr. Akhoury was Chairman and CEO of MacKay Shields, a multi-product investment management firm with more than $40 billion in assets under management. Mr. Stephens retired in December 2008 as Chairman and Chief Executive Officer of Boise Cascade, L.L.C., a paper, forest products, and timberland assets company.
We would like to take this opportunity to welcome new shareholders to the fund and to thank all of our investors for your continued confidence in Putnam.
Respectfully yours,

About the fund
Seeking a high level of tax-free income for Ohio investors
Municipal bonds can help investors keep more of their investment income while also financing important public projects such as schools, roads, and hospitals. Municipal bonds are typically issued by states and local municipalities to raise funds for building and maintaining public facilities, and they offer income that is generally exempt from federal income tax.
For residents of the state where the bond is issued, income is typically exempt from state and local income taxes. While the stated yields on municipal bonds are usually lower than those on taxable bonds, tax exemption is an especially powerful advantage in Ohio because the state’s top income tax rate is among the highest in the United States. And the sheer size of the Ohio municipal bond market provides a wide array of investment opportunities.
Putnam Ohio Tax Exempt Income Fund seeks to capitalize on investment opportunities in Ohio by investing in bonds across a range of market sectors. The fund also combines bonds of differing credit quality to increase income potential. In addition to investing in high-quality bonds, the fund’s managers allocate a smaller portion of the portfolio to lower-rated bonds, which may offer higher income in return for more risk.
When deciding whether to invest in a bond, the fund’s managers consider the risks involved — including credit risk, interest-rate risk, and the risk that the bond will be prepaid. The managers are backed by the resources of Putnam’s fixed-income organization, in which municipal bond analysts are grouped into sector teams and conduct ongoing, rigorous research. Once a bond has been purchased, the managers monitor for developments that may affect the bond market, the sector, and the issuer of the bond.
The goal of the fund’s in-depth research and active management is to stay a step ahead of the industry and pinpoint opportunities for investors.
The fund invests in fewer issuers or concentrates its investments by region or sector, and involves more risk than a fund that invests more broadly. Capital gains, if any, are taxable for federal and, in most cases, state purposes. For some investors, investment income may be subject to the federal alternative minimum tax. Mutual funds that invest in bonds are subject to certain risks, including interest-rate risk, credit risk, and inflation risk. As interest rates rise, the prices of bonds fall. Long-term bonds are more exposed to interest-rate risk than short-term bonds. Unlike bonds, bond funds have ongoing fees and expenses.
Understanding tax-equivalent yield
To understand the value of tax-free income, it is helpful to compare a municipal bond’s yield with the “tax- equivalent yield” — the before-tax yield that must be offered by a taxable bond in order to equal the municipal bond’s yield after taxes.
How to calculate tax-equivalent yield:
The tax-equivalent yield equals the municipal bond’s yield divided by “one minus the tax rate.” For example, if a municipal bond’s yield is 5%, then its tax-equivalent yield is 7.7%, assuming the maximum 35% federal tax rate for 2009.

Results for investors subject to lower tax rates would not be as advantageous.
Municipal bonds may finance a range of projects in your
community and thus play a key role in its development.

Performance and
portfolio snapshots
Average annual total return (%) comparison as of 5/31/09

Current performance may be lower or higher than the quoted past performance, which cannot guarantee future results. Share price, principal value, and return will fluctuate, and you may have a gain or a loss when you sell your shares. Performance of class A shares assumes reinvestment of distributions and does not account for taxes. Fund returns in the bar chart do not reflect a sales charge of 4.00%; had they, returns would have been lower. See pages 5 and 8–10 for additional performance information. For a portion of the periods, this fund may have limited expenses, without which returns would have been lower. Due to market volatility, current performance may be higher or lower than performance shown. A 1% short-term trading fee may apply. To obtain the most recent month-end performance, visit putnam.com.
“Municipal bonds in the first quarter of 2009
posted their best quarterly performance in years.”
Thalia Meehan, Portfolio Manager, Putnam Ohio Tax Exempt Income Fund
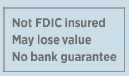
Credit qualities shown as a percentage of portfolio value as of 5/31/09. A bond rated Baa or higher (MIG3/VMIG3 or higher, for short-term debt) is considered investment grade. The chart reflects Moody’s ratings; percentages may include bonds not rated by Moody’s but considered by Putnam Management to be of comparable quality. Ratings will vary over time.
4
Interview with your fund’s Portfolio Manager
Thalia Meehan
The past 12 months have been difficult for fixed-income markets and challenging for national, state, and municipal economies. How did the municipal bond market perform in this environment?
The second half of 2008 was dominated by continued extreme turmoil in the credit markets following the collapse of Lehman Brothers. Forced selling by hedge funds and investment banks also put pressure on municipal bonds as these firms needed to raise capital and cover losses. All of this added up to an environment in which all investment-grade asset classes, including municipal bonds, underperformed U.S. Treasuries.
The economy remained weak in the first quarter of 2009, extending the recession that took hold in 2008, as financial markets, although improved from the fourth quarter, remained volatile. Consumer confidence was weak, housing prices continued to retreat, and unemployment rose to levels not seen in decades. The U.S. government, notably the Fed [Federal Reserve Board] and the Treasury, instituted several wide-ranging measures to restore market stability and investor confidence, joining policymakers around the world in efforts to shore up bank balance sheets and reestablish the flow of credit.
Against this backdrop, municipal bonds in the first quarter of 2009, as measured by the Barclays Capital Municipal Bond Index, posted their best quarterly performance in years. Strong coupon reinvestment in January and February aided performance in high-grade municipal bonds. April marked a continuation of the municipal bond upswing, buoyed by the introduction of Build America Bonds [BABs], a new form of debt that was unveiled as part of the stimulus package.
Designed to help cash-strapped state and local governments achieve easier access to capital, BABs are taxable securities issued by municipalities, which traditionally issue tax-exempt bonds. The municipality receives a 35% subsidy of the interest direct from the Treasury. BABs tamped down the supply of municipal bonds and kept their prices up, continuing the municipal bond rally into May. [For more on BABs, see “In the News” on page 7.]
How did Putnam Ohio Tax Exempt Income Fund perform?
In a volatile market, the fund outperformed its peers. For the 12 months ended May 31, 2009, the fund returned 2.84%, outperforming its Lipper peer group, Ohio Municipal Debt Funds, which returned 0.98%. The fund lagged its
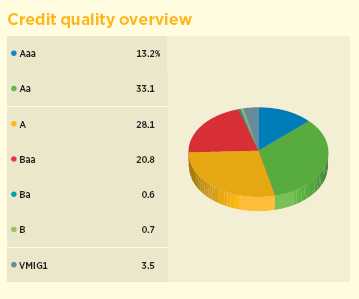
Broad market index and fund performance
This comparison shows your fund’s performance in the context of broad market indexes for the 12 months ended 5/31/09. See the previous page and pages 8–10 for additional fund performance information. Index descriptions can be found on page 13.
5
benchmark, the Barclays Capital Municipal Bond Index, which returned 3.57%. The national benchmark tracks the performance of a broader range of municipal bonds.
What is the state budget situation in Ohio?
Governor Ted Strickland and Buckeye State lawmakers are facing a $3.2 billion budget gap, which is likely to be addressed through program and personnel cuts and other adjustments to close this fiscal year’s shortfall. The state may also tap much of its rainy day fund, but this action would call into question how Ohio will meet its 2010–2011 budget. Ohio is earmarked to receive approximately $8 billion as part of the federal stimulus package, which should help ease budgetary pressures. Given these challenges, the credit rating agency Fitch downgraded the state’s general obligation bonds from AA+ to AA in June, following the close of the reporting period. The move makes it more costly for Ohio to borrow money. Still, many expect the federal stimulus package should help ease budgetary pressures.
What happened with municipal bonds during the period?
During the fourth quarter of 2008, dealer liquidity became more constrained with the bankruptcy of Lehman Brothers, the exit of UBS from the institutional market, and the purchase of Merrill Lynch by Bank of America. We saw a temporary lack of primary market supply as municipal bond issuers delayed new issuance due to market conditions. Because new issues typically help provide price discovery in the marketplace, secondary market liquidity was negatively affected, as dealers delayed pricing new issues. All of these issues put downward pressure on municipal bond prices, further hurting asset class performance. Spreads widened to unprecedented levels in mid-December before partially recovering as the primary market reopened and fund flows turned positive. Municipal bond prices continued to rally in April and May as concerns increased about future supply.
How did you position the portfolio in light of these ongoing issues?
During the period, the fund’s overall credit quality was high and we remained underweight the long end of the yield curve. This positioning aided relative performance as the lower-rated issues underperformed their higher-quality peers. In addition, the portfolio’s underweight to longer maturity issues aided relative performance.
By way of background, the yield curve is a graphical representation of the difference in yields between shorter- and longer-term maturity bonds. A bond with a longer maturity typically carries more risk and ties up an investor’s money for a longer time and therefore offers a higher yield.
From a sector perspective, an overweight to tobacco constrained performance.
Were there any notable contributors and detractors?
High-quality bonds benefited as investors sought out quality during the period. Within Putnam Ohio Tax Exempt Income
Comparison of maturity composition
This chart illustrates the fund’s composition by maturity, showing the percentage of holdings in different maturity ranges and how the composition has changed over the past six months. Holdings and maturity ranges will vary over time. The effective maturity dates of bonds with call features may change as a result of market conditions.

6
Fund, holding issues of Ohio State general obligation bonds aided relative performance. These high-quality, short-maturity issuers fared well during the period as the yield curve steepened and higher-quality issues outperformed their lower-quality counterparts.
Holdings that hurt performance included bonds with longer maturities or lower credit quality. These holdings suffered as the yield curve steepened and lower-rated instruments were punished as investors fled from perceived risk. Buckeye Tobacco bonds, which have longer maturities and lower credit ratings, is an example of this type of holding. Tobacco settlement bonds are secured by the income stream from tobacco companies’ lawsuit settlement obligations to individual states — and generally offer higher yields than bonds of comparable quality. The tobacco sector, however, underper-formed as investors began a flight to quality credit. Because the market for tobacco bonds is large and relatively liquid, investors who wanted to trim credit exposure sold these liquid bonds first, which put pressure on the sector as a whole.
What is your outlook for the municipal bond market?
The Fed and the Treasury have taken unprecedented steps to inject liquidity into the credit markets, boost the economy, and help ease the flow of credit. However, it is important to understand that the effects of many of the changes will take time, and markets are likely, in our view, to remain challenging in the near term — particularly with the lingering concerns over state budgets, the future of bond insurers, and the potential for regulatory changes.
Despite the current market environment, we see two key reasons why municipal bond funds remain attractive. The first is future tax rates. We believe that income tax rates are unlikely to fall from here and may even rise with the Obama administration in the White House, given that the Bush administration tax cuts are scheduled to sunset in 2010. This may cause municipal bonds to become an even more attractive asset class relative to taxable fixed income.
Second, the overall credit quality of the municipal asset class remains strong. The fund has benefited from having a bias for higher-quality holdings in the portfolio. We believe that many areas of the municipal bond market have been oversold by panicked investors, creating unique opportunities for the fund to add highly rated bonds paying unusually high yields.
IN THE NEWS
Build America Bonds (BABs) are designed to help cash-strapped municipalities fund job-creating public works projects, such as roads, bridges, schools, and water treatment plants. Part of the American Recovery and Reinvestment Act, BABs provide an attractive way for state and local governments to issue debt. They are issued as taxable municipal debt, with local and state governments receiving a 35% rebate on the interest payments directly from the U.S. Treasury. BABs are attracting buyers such as pensions and foreign governments that would otherwise invest in corporate, Treasury, or agency debt. The net effect is a lower supply of new tax-exempt debt, which is positive for municipal bond prices.
Thank you, Thalia, for your time and insights today.
The views expressed in this report are exclusively those of Putnam Management. They are not meant as investment advice.
Please note that the holdings discussed in this report may not have been held by the fund for the entire period. Portfolio composition is subject to review in accordance with the fund’s investment strategy and may vary in the future. Current and future portfolio holdings are subject to risk.
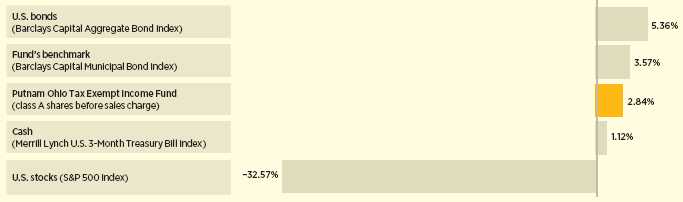
Comparison of top sector weightings
This chart shows how the fund’s top weightings have changed over the past six months. Weightings are shown as a percentage of net assets. Holdings will vary over time. Sector concentrations listed after the portfolio schedule in the Financial Statements section of this shareholder report are exclusive of insured status and may differ from the summary information below.
7
Your fund’s performance
This section shows your fund’s performance, price, and distribution information for periods ended May 31, 2009, the end of its most recent fiscal year. In accordance with regulatory requirements for mutual funds, we also include performance as of the most recent calendar quarter-end and expense information taken from the fund’s current prospectus. Performance should always be considered in light of a fund’s investment strategy. Data represents past performance. Past performance does not guarantee future results. More recent returns may be less or more than those shown. Investment return and principal value will fluctuate, and you may have a gain or a loss when you sell your shares. Performance information does not reflect any deduction for taxes a shareholder may owe on fund distributions or on the redemption of fund shares. For the most recent month-end performance, please visit the Individual Investors section of putnam.com or call Putnam at 1-800-225-1581. Class Y shares are generally only available to corporate and institutional clients and clients in other approved programs. See the Terms and Definitions section in this report for definitions of the share classes offered by your fund.
Fund performance Total return for periods ended 5/31/09
| | | | | | | | | |
| | Class A | Class B | Class C | Class M | Class Y |
| (inception dates) | (10/23/89) | (7/15/93) | (10/3/06) | (4/3/95) | (1/2/08) |
|
| | NAV | POP | NAV | CDSC | NAV | CDSC | NAV | POP | NAV |
|
| Annual average (life of fund) | 5.46% | 5.25% | 4.73% | 4.73% | 4.67% | 4.67% | 5.12% | 4.94% | 5.48% |
|
| 10 years | 50.16 | 44.15 | 40.75 | 40.75 | 39.21 | 39.21 | 45.88 | 41.22 | 50.62 |
| Annual average | 4.15 | 3.72 | 3.48 | 3.48 | 3.36 | 3.36 | 3.85 | 3.51 | 4.18 |
|
| 5 years | 20.21 | 15.41 | 16.42 | 14.46 | 15.73 | 15.73 | 18.61 | 14.73 | 20.58 |
| Annual average | 3.75 | 2.91 | 3.09 | 2.74 | 2.96 | 2.96 | 3.47 | 2.79 | 3.81 |
|
| 3 years | 10.97 | 6.55 | 8.83 | 5.89 | 8.50 | 8.50 | 10.02 | 6.46 | 11.31 |
| Annual average | 3.53 | 2.14 | 2.86 | 1.93 | 2.76 | 2.76 | 3.23 | 2.11 | 3.64 |
|
| 1 year | 2.84 | –1.28 | 2.06 | –2.86 | 2.01 | 1.03 | 2.56 | –0.79 | 3.04 |
|
Current performance may be lower or higher than the quoted past performance, which cannot guarantee future results. After-sales-charge returns (public offering price, or POP) for class A and M shares reflect a maximum 4.00% and 3.25% load, respectively. Class B share returns reflect the applicable contingent deferred sales charge (CDSC), which is 5% in the first year, declining to 1% in the sixth year, and is eliminated thereafter. Class C shares reflect a 1% CDSC for the first year and is eliminated thereafter. Class Y shares have no initial sales charge or CDSC. Performance for class B, C, M, and Y shares before their inception is derived from the historical performance of class A shares, adjusted for the applicable sales charge (or CDSC) and, except for class Y shares, the higher operating expenses for such shares.
For a portion of the periods, this fund may have limited expenses, without which returns would have been lower.
Due to market volatility, current performance may be higher or lower than performance shown. A 1% short-term trading fee may be applied to shares exchanged or sold within 7 days of purchase.
Change in the value of a $10,000 investment ($9,600 after sales charge) Cumulative total return from 5/31/99 to 5/31/09

Past performance does not indicate future results. At the end of the same time period, a $10,000 investment in the fund’s class B and class C shares would have been valued at $14,075 and $13,921, respectively, and no contingent deferred sales charges would apply. A $10,000 investment in the fund’s class M shares ($9,675 after sales charge) would have been valued at $14,122 at public offering price. A $10,000 investment in the fund’s class Y shares would have been valued at $15,062.
8
Comparative index returns For periods ended 5/31/09
| | |
| | Barclays Capital Municipal | Lipper Ohio Municipal Debt Funds |
| | Bond Index | category average* |
|
| Annual average (life of fund) | 6.33% | 5.66% |
|
| 10 years | 62.09 | 46.35 |
| Annual average | 4.95 | 3.87 |
|
| 5 years | 24.08 | 18.63 |
| Annual average | 4.41 | 3.47 |
|
| 3 years | 12.79 | 9.25 |
| Annual average | 4.09 | 2.98 |
|
| 1 year | 3.57 | 0.98 |
|
Index and Lipper results should be compared to fund performance at net asset value.
* Over the 1-year, 3-year, 5-year, 10-year, and life-of-fund periods ended 5/31/09, there were 40, 35, 34, 30, and 7 funds, respectively, in this Lipper category.
Fund price and distribution information For the 12-month period ended 5/31/09
| | | | | | | |
| Distributions | Class A | Class B | Class C | Class M | Class Y |
|
| Number | 12 | 12 | 12 | 12 | 12 |
|
| Income 1 | $0.372696 | $0.317768 | $0.305027 | $0.349479 | $0.391165 |
|
| Capital gains 2 | — | — | — | — | — |
|
| Total | $0.372696 | $0.317768 | $0.305027 | $0.349479 | $0.391165 |
|
| Share value | NAV | POP | NAV | NAV | NAV | POP | NAV |
|
| 5/31/08 | $8.93 | $9.30 | $8.93 | $8.93 | $8.94 | $9.24 | $8.93 |
|
| 5/31/09 | 8.79 | 9.16 | 8.78 | 8.79 | 8.80 | 9.10 | 8.79 |
|
| Current yield (end of period) | NAV | POP | NAV | NAV | NAV | POP | NAV |
|
| Current dividend rate 3 | 4.20% | 4.03% | 3.57% | 3.42% | 3.94% | 3.81% | 4.42% |
|
| Taxable equivalent 4 | 6.87 | 6.59 | 5.84 | 5.59 | 6.44 | 6.23 | 7.23 |
|
| Current 30-day SEC yield 5,6 | | | | | | | |
| (with expense limitation) | N/A | 3.55 | 3.07 | 2.92 | N/A | 3.30 | 3.93 |
|
| Taxable equivalent 4 | N/A | 5.81 | 5.02 | 4.78 | N/A | 5.40 | 6.43 |
|
| Current 30-day SEC yield 6 | | | | | | | |
| (without expense limitation) | N/A | 3.54 | 3.05 | 2.90 | N/A | 3.29 | 3.92 |
|
The classification of distributions, if any, is an estimate. Final distribution information will appear on your year-end tax forms.
1 For some investors, investment income may be subject to the federal alternative minimum tax.
2 Capital gains, if any, are taxable for federal and, in most cases, state purposes.
3 Most recent distribution, excluding capital gains, annualized and divided by NAV or POP at end of period.
4 Assumes maximum 38.85% federal and state combined tax rate for 2009. Results for investors subject to lower tax rates would not be as advantageous.
5 For a portion of the period, this fund may have limited expenses, without which yields would have been lower.
6 Based only on investment income and calculated using the maximum offering price for each share class, in accordance with SEC guidelines.
Fund performance as of most recent calendar quarter Total return for periods ended 6/30/09
| | | | | | | | | |
| | Class A | Class B | Class C | Class M | Class Y |
| (inception dates) | (10/23/89) | (7/15/93) | (10/3/06) | (4/3/95) | (1/2/08) |
|
| | NAV | POP | NAV | CDSC | NAV | CDSC | NAV | POP | NAV |
|
| Annual average (life of fund) | 5.37% | 5.16% | 4.64% | 4.64% | 4.58% | 4.58% | 5.03% | 4.85% | 5.40% |
|
| 10 years | 50.29 | 44.29 | 40.89 | 40.89 | 39.40 | 39.40 | 46.16 | 41.35 | 50.94 |
| Annual average | 4.16 | 3.73 | 3.49 | 3.49 | 3.38 | 3.38 | 3.87 | 3.52 | 4.20 |
|
| 5 years | 18.47 | 13.74 | 14.60 | 12.66 | 14.05 | 14.05 | 16.78 | 12.94 | 19.02 |
| Annual average | 3.45 | 2.61 | 2.76 | 2.41 | 2.66 | 2.66 | 3.15 | 2.46 | 3.54 |
|
| 3 years | 9.95 | 5.57 | 7.84 | 4.92 | 7.51 | 7.51 | 9.13 | 5.58 | 10.44 |
| Annual average | 3.21 | 1.82 | 2.55 | 1.61 | 2.44 | 2.44 | 2.96 | 1.83 | 3.37 |
|
| 1 year | 2.58 | –1.58 | 1.93 | –2.98 | 1.88 | 0.89 | 2.29 | –1.07 | 2.92 |
|
9
Fund’s annual operating expenses For the fiscal year ended 5/31/08
| | | | | |
| | Class A | Class B | Class C | Class M | Class Y† |
|
| Net expenses* | 0.89% | 1.52% | 1.67% | 1.17% | 0.67% |
|
| Total annual fund operating expenses | 0.90 | 1.53 | 1.68 | 1.18 | 0.68 |
|
* Reflects Putnam Management’s decision to contractually limit expenses through 5/31/09.
† Expenses for class Y shares (added 1/2/08) are based on class A shares excluding distribution (12b-1) fees for the last fiscal year.
Expense information in this table is taken from the most recent prospectus, is subject to change, and may differ from that shown in the next section and in the financial highlights of this report. Expenses are shown as a percentage of average net assets.
Your fund’s expenses
As a mutual fund investor, you pay ongoing expenses, such as management fees, distribution fees (12b-1 fees), and other expenses. In the most recent six-month period, your fund limited these expenses; had it not done so, expenses would have been higher. Using the following information, you can estimate how these expenses affect your investment and compare them with the expenses of other funds. You may also pay one-time transaction expenses, including sales charges (loads) and redemption fees, which are not shown in this section and would have resulted in higher total expenses. For more information, see your fund’s prospectus or talk to your financial representative.
Review your fund’s expenses
The following table shows the expenses you would have paid on a $1,000 investment in Putnam Ohio Tax Exempt Income Fund from December 1, 2008, to May 31, 2009. It also shows how much a $1,000 investment would be worth at the close of the period, assuming actual returns and expenses.
| | | | | |
| | Class A | Class B | Class C | Class M | Class Y |
|
| Expenses paid per $1,000* | $4.43 | $7.70 | $8.48 | $5.89 | $3.29 |
|
| Ending value (after expenses) | $1,090.30 | $1,086.90 | $1,087.60 | $1,090.30 | $1,091.50 |
|
* Expenses for each share class are calculated using the fund’s annualized expense ratio for each class, which represents the ongoing expenses as a percentage of average net assets for the six months ended 5/31/09. The expense ratio may differ for each share class (see the last table in this section).
Expenses are calculated by multiplying the expense ratio by the average account value for the period; then multiplying the result by the number of days in the period; and then dividing that result by the number of days in the year.
Estimate the expenses you paid
To estimate the ongoing expenses you paid for the six months ended May 31, 2009, use the following calculation method. To find the value of your investment on December 1, 2008, call Putnam at 1-800-225-1581.

Compare expenses using the SEC’s method
The Securities and Exchange Commission (SEC) has established guidelines to help investors assess fund expenses. Per these guidelines, the following table shows your fund’s expenses based on a $1,000 investment, assuming a hypothetical 5% annualized return. You can use this information to compare the ongoing expenses (but not transaction expenses or total costs) of investing in the fund with those of other funds. All mutual fund shareholder reports will provide this information to help you make this comparison. Please note that you cannot use this information to estimate your actual ending account balance and expenses paid during the period.
| | | | | |
| | Class A | Class B | Class C | Class M | Class Y |
|
| Expenses paid per $1,000* | $4.28 | $7.44 | $8.20 | $5.69 | $3.18 |
|
| Ending value (after expenses) | $1,020.69 | $1,017.55 | $1,016.80 | $1,019.30 | $1,021.79 |
|
* Expenses for each share class are calculated using the fund’s annualized expense ratio for each class, which represents the ongoing expenses as a percentage of average net assets for the six months ended 5/31/09. The expense ratio may differ for each share class (see the last table in this section).
Expenses are calculated by multiplying the expense ratio by the average account value for the period; then multiplying the result by the number of days in the period; and then dividing that result by the number of days in the year.
10
Compare expenses using industry averages
You can also compare your fund’s expenses with the average of its peer group, as defined by Lipper, an independent fund-rating agency that ranks funds relative to others that Lipper considers to have similar investment styles or objectives. The expense ratio for each share class shown indicates how much of your fund’s average net assets have been used to pay ongoing expenses during the period.
| | | | | |
| | Class A | Class B | Class C | Class M | Class Y |
|
| Your fund’s annualized expense ratio* | 0.85% | 1.48% | 1.63% | 1.13% | 0.63% |
|
| Average annualized expense ratio for Lipper peer group† | 0.85% | 1.48% | 1.63% | 1.13% | 0.63% |
|
* For the fund’s most recent fiscal half year; may differ from expense ratios based on one-year data in the financial highlights.
† Putnam keeps fund expenses below the Lipper peer group average expense ratio by limiting our fund expenses if they exceed the Lipper average. The Lipper average is a simple average of front-end load funds in the peer group that excludes 12b-1 fees as well as any expense offset and brokerage/service arrangements that may reduce fund expenses. To facilitate the comparison in this presentation, Putnam has adjusted the Lipper average to reflect 12b-1 fees. Investors should note that the other funds in the peer group may be significantly smaller or larger than the fund, and that an asset-weighted average would likely be lower than the simple average. Also, the fund and Lipper report expense data at different times; the fund’s expense ratio shown here is annualized data for the most recent six-month period, while the quarterly updated Lipper average is based on the most recent fiscal year-end data available for the peer grou p funds as of 3/31/09.
Your fund’s portfolio turnover
Putnam funds are actively managed by experts who buy and sell securities based on intensive analysis of companies, industries, economies, and markets. Portfolio turnover is a measure of how often a fund’s managers buy and sell securities for your fund. A portfolio turnover of 100%, for example, means that the managers sold and replaced securities valued at 100% of a fund’s average portfolio value within a given period. Funds with high turnover may be more likely to generate capital gains that must be distributed to shareholders as taxable income. High turnover may also cause a fund to pay more brokerage commissions and other transaction costs, which may detract from performance.
Funds that invest in bonds or other fixed-income instruments may have higher turnover than funds that invest only in stocks. Short-term bond funds tend to have higher turnover than longer-term bond funds, because shorter-term bonds will mature or be sold more frequently than longer-term bonds. You can use the following table to compare your fund’s turnover with the average turnover for funds in its Lipper category.
Turnover comparisons Percentage of holdings that change every year
| | | | | |
| | 2009 | 2008 | 2007 | 2006 | 2005 |
|
| Putnam Ohio Tax Exempt Income Fund | 20% | 36% | 15% | 6% | 12% |
|
| Lipper Ohio Municipal Debt Funds category average | 29% | 30% | 19% | 17% | 17% |
|
Turnover data for the fund is calculated based on the fund’s fiscal-year period, which ends on May 31. Turnover data for the fund’s Lipper category is calculated based on the average of the turnover of each fund in the category for its fiscal year ended during the indicated year. Fiscal years vary across funds in the Lipper category, which may limit the comparability of the fund’s portfolio turnover rate to the Lipper average. Comparative data for 2009 is based on information available as of 5/31/09.
11
Your fund’s management
In addition to Thalia Meehan, your fund’s Portfolio Managers are Paul Drury, Brad Libby, and Susan McCormack.
Trustee and Putnam employee fund ownership
As of May 31, 2009, all of the Trustees of the Putnam funds owned fund shares. The following table shows the approximate value of investments in the fund and all Putnam funds as of that date by the Trustees and Putnam employees. These amounts include investments by the Trustees’ and employees’ immediate family members and investments through retirement and deferred compensation plans.
| | | |
| Assets in | Total assets in | |
| the fund | all Putnam funds | |
| |
| Trustees | $41,000 | $36,000,000 | |
| |
| Putnam employees | $13,000 | $357,000,000 | |
| |
Other Putnam funds managed by the Portfolio Managers
Thalia Meehan, Paul Drury, Brad Libby, and Susan McCormack are Portfolio Managers of Putnam’s open-end tax-exempt funds for the following states: Arizona, California, Massachusetts, Michigan, Minnesota, New Jersey, New York, Ohio, and Pennsylvania. The same group also manages Putnam AMT-Free Municipal Fund, Putnam Managed Municipal Income Trust, Putnam Municipal Opportunities Trust, Putnam Tax Exempt Income Fund, and Putnam Tax-Free High Yield Fund.
Thalia Meehan, Paul Drury, Brad Libby, and Susan McCormack may also manage other accounts and variable trust funds advised by Putnam Management or an affiliate.
Portfolio management fund ownership
The following table shows how much the fund’s current Portfolio Managers have invested in the fund and in all Putnam mutual funds (in dollar ranges). Information shown is as of May 31, 2009, and May 31, 2008.

12
Terms and definitions
Important terms
Total return shows how the value of the fund’s shares changed over time, assuming you held the shares through the entire period and reinvested all distributions in the fund.
Net asset value (NAV) is the price, or value, of one share of a mutual fund, without a sales charge. NAVs fluctuate with market conditions. NAV is calculated by dividing the net assets of each class of shares by the number of outstanding shares in the class.
Public offering price (POP) is the price of a mutual fund share plus the maximum sales charge levied at the time of purchase. POP performance figures shown here assume the 4.00% maximum sales charge for class A shares and 3.25% for class M shares.
Contingent deferred sales charge (CDSC) is generally a charge applied at the time of the redemption of class B or C shares and assumes redemption at the end of the period. Your fund’s class B CDSC declines from a 5% maximum during the first year to 1% during the sixth year. After the sixth year, the CDSC no longer applies. The CDSC for class C shares is 1% for one year after purchase.
Current yield is the annual rate of return earned from dividends or interest of an investment. Current yield is expressed as a percentage of the price of a security, fund share, or principal investment.
Share classes
Class A shares are generally subject to an initial sales charge and no CDSC (except on certain redemptions of shares bought without an initial sales charge).
Class B shares are not subject to an initial sales charge. They may be subject to a CDSC.
Class C shares are not subject to an initial sales charge and are subject to a CDSC only if the shares are redeemed during the first year.
Class M shares have a lower initial sales charge and a higher 12b-1 fee than class A shares and no CDSC.
Class Y shares are not subject to an initial sales charge or CDSC, and carry no 12b-1 fee. They are generally only available to corporate and institutional clients and clients in other approved programs.
Comparative indexes
Barclays Capital Aggregate Bond Index is an unmanaged index of U.S. investment-grade fixed-income securities.
Barclays Capital Municipal Bond Index is an unmanaged index of long-term fixed-rate investment-grade tax-exempt bonds.
Merrill Lynch U.S. 3-Month Treasury Bill Index is an unmanaged index that seeks to measure the performance of U.S. Treasury bills available in the marketplace.
S&P 500 Index is an unmanaged index of common stock performance.
Indexes assume reinvestment of all distributions and do not account for fees. Securities and performance of a fund and an index will differ. You cannot invest directly in an index.
Lipper is a third-party industry-ranking entity that ranks mutual funds. Its rankings do not reflect sales charges. Lipper rankings are based on total return at net asset value relative to other funds that have similar current investment styles or objectives as determined by Lipper. Lipper may change a fund’s category assignment at its discretion. Lipper category averages reflect performance trends for funds within a category.
13
Trustee approval of management contract
General conclusions
The Board of Trustees of the Putnam funds oversees the management of each fund and, as required by law, determines annually whether to approve the continuance of your fund’s management contract with Putnam Investment Management (“Putnam Management”). In this regard, the Board of Trustees, with the assistance of its Contract Committee consisting solely of Trustees who are not “interested persons” (as such term is defined in the Investment Company Act of 1940, as amended) of the Putnam funds (the “Independent Trustees”), requests and evaluates all information it deems reasonably necessary under the circumstances. Over the course of several months ending in June 2008, the Contract Committee met several times to consider the information provided by Putnam Management and other information developed with the assistance of the Board’s independent counsel and independent staff. The Contract Committee reviewed and discussed key aspects of this information with all of the Independent Trustees. The Contract Committee recommended, and the Independent Trustees approved, the continuance of your fund’s management contract, effective July 1, 2008.
The Independent Trustees’ approval was based on the following conclusions:
• That the fee schedule in effect for your fund represented reasonable compensation in light of the nature and quality of the services being provided to the fund, the fees paid by competitive funds and the costs incurred by Putnam Management in providing such services, and
• That this fee schedule represented an appropriate sharing between fund shareholders and Putnam Management of such economies of scale as may exist in the management of the fund at current asset levels.
These conclusions were based on a comprehensive consideration of all information provided to the Trustees, were subject to the continued application of certain expense reductions and waivers and other considerations noted below, and were not the result of any single factor. Some of the factors that figured particularly in the Trustees’ deliberations and how the Trustees considered these factors are described below, although individual Trustees may have evaluated the information presented differently, giving different weights to various factors. It is also important to recognize that the fee arrangements for your fund and the other Putnam funds are the result of many years of review and discussion between the Independent Trustees and Putnam Management, that certain aspects of such arrangements may receive greater scrutiny in some years than others, and that the Trustees’ conclusions may be based, in part, on their conside ration of these same arrangements in prior years.
Management fee schedules and categories; total expenses
The Trustees reviewed the management fee schedules in effect for all Putnam funds, including fee levels and breakpoints, and the assignment of funds to particular fee categories. In reviewing fees and expenses, the Trustees generally focused their attention on material changes in circumstances — for example, changes in a fund’s size or investment style, changes in Putnam Management’s operating costs or responsibilities, or changes in competitive practices in the mutual fund industry — that suggest that consideration of fee changes might be warranted. The Trustees concluded that the circumstances did not warrant changes to the management fee structure of your fund, which had been carefully developed over the years, re-examined on many occasions and adjusted where appropriate. In this regard, the Trustees also noted that shareholders of your fund voted in 2007 to approve new management contracts containing an identical fee structure. The Trustees f ocused on two areas of particular interest, as discussed further below:
• Competitiveness. The Trustees reviewed comparative fee and expense information for competitive funds, which indicated that, in a custom peer group of competitive funds selected by Lipper Inc., your fund ranked in the 50th percentile in management fees and in the 60th percentile in total expenses (less any applicable 12b-1 fees) as of December 31, 2007 (the first percentile being the least expensive funds and the 100th percentile being the most expensive funds). (Because the fund’s custom peer group is smaller than the fund’s broad Lipper Inc. peer group, this expense information may differ from the Lipper peer expense information found elsewhere in this report.) The Trustees noted that expense ratios for a number of Putnam funds, which show the percentage of fund assets used to pay for management and administrative services, distributio n (12b-1) fees and other expenses, had been increasing recently as a result of declining net assets and the natural operation of fee breakpoints.
The Trustees noted that the expense ratio increases described above were currently being controlled by expense limitations initially implemented in January 2004. The Trustees have received a commitment from Putnam Management and its parent company to continue this program through at least June 30, 2009. These expense limitations give effect to a commitment by Putnam Management that the expense ratio of each open-end fund would be no higher than the average expense ratio of the competitive funds included in the fund’s relevant Lipper universe (exclusive of any applicable 12b-1 charges in each case). The Trustees observed that this commitment to limit fund expenses has served shareholders well since its inception.
In order to ensure that the expenses of the Putnam funds continue to meet evolving competitive standards, the Trustees requested, and Putnam Management agreed, to extend for the twelve months beginning July 1, 2008, an additional expense limitation for certain funds at an amount equal to the average expense ratio (exclusive of 12b-1 charges) of a custom peer group of competitive funds selected by Lipper to correspond to the size of the fund. This additional expense limitation will
14
be applied to those open-end funds that had above-average expense ratios (exclusive of 12b-1 charges) based on the custom peer group data for the period ended December 31, 2007. This additional expense limitation will not be applied to your fund because it had a below-average expense ratio relative to its custom peer group.
In addition, the Trustees devoted particular attention to analyzing the Putnam funds’ fees and expenses relative to those of competitors in fund complexes of comparable size and with a comparable mix of asset categories. The Trustees concluded that this analysis did not reveal any matters requiring further attention at the current time.
• Economies of scale. Your fund currently has the benefit of breakpoints in its management fee that provide shareholders with significant economies of scale, which means that the effective management fee rate of the fund (as a percentage of fund assets) declines as the fund grows in size and crosses specified asset thresholds. Conversely, if the fund shrinks in size — as has been the case for many Putnam funds in recent years — these breakpoints result in increasing fee levels. In recent years, the Trustees have examined the operation of the existing breakpoint structure during periods of both growth and decline in asset levels. The Trustees concluded that the fee schedule in effect for your fund represented an appropriate sharing of economies of scale at current asset levels.
In connection with their review of the management fees and total expenses of the Putnam funds, the Trustees also reviewed the costs of the services to be provided and profits to be realized by Putnam Management and its affiliates from the relationship with the funds. This information included trends in revenues, expenses and profitability of Putnam Management and its affiliates relating to the investment management and distribution services provided to the funds. In this regard, the Trustees also reviewed an analysis of Putnam Management’s revenues, expenses and profitability with respect to the funds’ management contracts, allocated on a fund-by-fund basis.
Investment performance
The quality of the investment process provided by Putnam Management represented a major factor in the Trustees’ evaluation of the quality of services provided by Putnam Management under your fund’s management contract. The Trustees were assisted in their review of the Putnam funds’ investment process and performance by the work of the Investment Oversight Coordinating Committee of the Trustees and the Investment Oversight Committees of the Trustees, which had met on a regular monthly basis with the funds’ portfolio teams throughout the year. The Trustees concluded that Putnam Management generally provides a high-quality investment process — as measured by the experience and skills of the individuals assigned to the management of fund portfolios, the resources made available to such personnel, and in general the ability of Putnam Management to attract and retain high-quality personnel — but also recognized that this does not guarantee fa vorable investment results for every fund in every time period. The Trustees considered the investment performance of each fund over multiple time periods and considered information comparing each fund’s performance with various benchmarks and with the performance of competitive funds.
While the Trustees noted the satisfactory investment performance of certain Putnam funds, they considered the disappointing investment performance of many funds in recent periods, particularly over periods in 2007 and 2008. They discussed with senior management of Putnam Management the factors contributing to such underperformance and actions being taken to improve performance. The Trustees recognized that, in recent years, Putnam Management has taken steps to strengthen its investment personnel and processes to address areas of underperformance, including recent efforts to further centralize Putnam Management’s equity research function. In this regard, the Trustees took into consideration efforts by Putnam Management to improve its ability to assess and mitigate investment risk in individual funds, across asset classes, and across the complex as a whole. The Trustees indicated their intention to continue to monitor performan ce trends to assess the effectiveness of these efforts and to evaluate whether additional changes to address areas of underperformance are warranted. In the case of your fund, the Trustees considered that your fund’s class A share cumulative total return performance at net asset value was in the following percentiles of its Lipper Inc. peer group (Lipper Ohio Municipal Debt Funds) (compared using tax-adjusted performance to recognize the different federal income tax treatment for capital gains distributions and exempt-interest distributions) for the one-year, three-year, and five-year periods ended December 31, 2007 (the first percentile being the best-performing funds and the 100th percentile being the worst-performing funds):
| | |
| One-year period | 17th | |
| |
| Three-year period | 19th | |
| |
| Five-year period | 28th | |
| |
(Because of the passage of time, these performance results may differ from the performance results for more recent periods shown elsewhere in this report.) Over the one-year, three-year, and five-year periods ended December 31, 2007, there were 46, 41, and 41 funds, respectively, in your fund’s Lipper peer group.* Past performance is no guarantee of future returns.
As a general matter, the Trustees believe that cooperative efforts between the
* The percentile rankings for your fund’s class A share annualized total return performance in the Lipper Ohio Municipal Debt Funds category for the one-year, five-year, and ten-year periods ended June 30, 2009, were 47%, 40%, and 39%, respectively. Over the one-year, five-year, and ten-year periods ended June 30, 2009, your fund ranked 19th out of 40, 14th out of 34, and 12th out of 30 funds, respectively. Unlike the information above, these rankings reflect performance before taxes. Note that this more recent information was not available when the Trustees approved the continuance of your fund’s management contract.
15
Trustees and Putnam Management represent the most effective way to address investment performance problems. The Trustees noted that investors in the Putnam funds have, in effect, placed their trust in the Putnam organization, under the oversight of the funds’ Trustees, to make appropriate decisions regarding the management of the funds. Based on the responsiveness of Putnam Management in the recent past to Trustee concerns about investment performance, the Trustees concluded that it is preferable to seek change within Putnam Management to address performance shortcomings. In the Trustees’ view, the alternative of engaging a new investment adviser for an underperforming fund would entail significant disruptions and would not provide any greater assurance of improved investment performance.
Brokerage and soft-dollar allocations; other benefits
The Trustees considered various potential benefits that Putnam Management may receive in connection with the services it provides under the management contract with your fund. These include benefits related to brokerage and soft-dollar allocations, whereby a portion of the commissions paid by a fund for brokerage may be used to acquire research services that may be useful to Putnam Management in managing the assets of the fund and of other clients. The Trustees considered changes made in 2008, at Putnam Management’s request, to the Putnam funds’ brokerage allocation policy, which expanded the permitted categories of brokerage and research services payable with soft dollars and increased the permitted soft dollar allocation to third-party services over what had been authorized in previous years. The Trustees indicated their continued intent to monitor the potential benefits associated with the allocation of fund brokerage and trends in industry practice to ensure that the principle of seeking “best price and execution” remains paramount in the portfolio trading process.
The Trustees’ annual review of your fund’s management contract arrangements also included the review of its distributor’s contract and distribution plan with Putnam Retail Management Limited Partnership and the investor servicing agreement with Putnam Fiduciary Trust Company (“PFTC”), each of which provides benefits to affiliates of Putnam Management. In the case of the investor servicing agreement, the Trustees considered that certain shareholder servicing functions were shifted to a third-party service provider by PFTC in 2007.
Comparison of retail and institutional fee schedules
The information examined by the Trustees as part of their annual contract review has included for many years information regarding fees charged by Putnam Management and its affiliates to institutional clients such as defined benefit pension plans, college endowments, etc. This information included comparisons of such fees with fees charged to the funds, as well as a detailed assessment of the differences in the services provided to these two types of clients. The Trustees observed, in this regard, that the differences in fee rates between institutional clients and mutual funds are by no means uniform when examined by individual asset sectors, suggesting that differences in the pricing of investment management services to these types of clients reflect to a substantial degree historical competitive forces operating in separate market places. The Trustees considered the fact that fee rates across different asset classes are typicall y higher on average for mutual funds than for institutional clients, as well as the differences between the services that Putnam Management provides to the Putnam funds and those that it provides to institutional clients of the firm, but did not rely on such comparisons to any significant extent in concluding that the management fees paid by your fund are reasonable.
16
Other information for shareholders
Putnam’s policy on confidentiality
In order to conduct business with our shareholders, we must obtain certain personal information such as account holders’ addresses, telephone numbers, Social Security numbers, and the names of their financial representatives. We use this information to assign an account number and to help us maintain accurate records of transactions and account balances. It is our policy to protect the confidenti-ality of your information, whether or not you currently own shares of our funds, and, in particular, not to sell information about you or your accounts to outside marketing firms. We have safeguards in place designed to prevent unauthorized access to our computer systems and procedures to protect personal information from unauthorized use. Under certain circumstances, we share this information with outside vendors who provide services to us, such as mailing and proxy solicitation. In those cases, the service providers enter into conf identiality agreements with us, and we provide only the information necessary to process transactions and perform other services related to your account. We may also share this information with our Putnam affiliates to service your account or provide you with information about other Putnam products or services. It is also our policy to share account information with your financial representative, if you’ve listed one on your Putnam account. If you would like clarification about our confidentiality policies or have any questions or concerns, please don’t hesitate to contact us at 1-800-225-1581, Monday through Friday, 8:30 a.m. to 8:00 p.m., or Saturdays from 9:00 a.m. to 5:00 p.m. Eastern Time.
Proxy voting
Putnam is committed to managing our mutual funds in the best interests of our shareholders. The Putnam funds’ proxy voting guidelines and procedures, as well as information regarding how your fund voted proxies relating to portfolio securities during the 12-month period ended June 30, 2008, are available in the Individual Investors section of putnam.com, and on the SEC’s Web site, www.sec.gov. If you have questions about finding forms on the SEC’s Web site, you may call the SEC at 1-800-SEC-0330. You may also obtain the Putnam funds’ proxy voting guidelines and procedures at no charge by calling Putnam’s Shareholder Services at 1-800-225-1581.
Fund portfolio holdings
The fund will file a complete schedule of its portfolio holdings with the SEC for the first and third quarters of each fiscal year on Form N-Q. Shareholders may obtain the fund’s Forms N-Q on the SEC’s Web site at www.sec.gov. In addition, the fund’s Forms N-Q may be reviewed and copied at the SEC’s Public Reference Room in Washington, D.C. You may call the SEC at 1-800-SEC-0330 for information about the SEC’s Web site or the operation of the Public Reference Room.
Financial statements
These sections of the report, as well as the accompanying Notes, preceded by the Report of Independent Registered Public Accounting Firm, constitute the fund’s financial statements.
The fund’s portfolio lists all the fund’s investments and their values as of the last day of the reporting period. Holdings are organized by asset type and industry sector, country, or state to show areas of concentration and diversification.
Statement of assets and liabilities shows how the fund’s net assets and share price are determined. All investment and noninvestment assets are added together. Any unpaid expenses and other liabilities are subtracted from this total. The result is divided by the number of shares to determine the net asset value per share, which is calculated separately for each class of shares. (For funds with preferred shares, the amount subtracted from total assets includes the liquidation preference of preferred shares.)
Statement of operations shows the fund’s net investment gain or loss. This is done by first adding up all the fund’s earnings —from dividends and interest income — and subtracting its operating expenses to determine net investment income (or loss). Then, any net gain or loss the fund realized on the sales of its holdings — as well as any unrealized gains or losses over the period — is added to or subtracted from the net investment result to determine the fund’s net gain or loss for the fiscal year.
Statement of changes in net assets shows how the fund’s net assets were affected by the fund’s net investment gain or loss, by distributions to shareholders, and by changes in the number of the fund’s shares. It lists distributions and their sources (net investment income or realized capital gains) over the current reporting period and the most recent fiscal year-end. The distributions listed here may not match the sources listed in the Statement of operations because the distributions are determined on a tax basis and may be paid in a different period from the one in which they were earned.
Financial highlights provide an overview of the fund’s investment results, per-share distributions, expense ratios, net investment income ratios, and portfolio turnover in one summary table, reflecting the five most recent reporting periods. In a semiannual report, the highlight table also includes the current reporting period.
18
Report of Independent Registered Public Accounting Firm
To the Trustees and Shareholders of
Putnam Ohio Tax Exempt Income Fund:
In our opinion, the accompanying statement of assets and liabilities, including the portfolio, and the related statements of operations and of changes in net assets and the financial highlights present fairly, in all material respects, the financial position of Putnam Ohio Tax Exempt Income Fund (the “fund”) at May 31, 2009, and the results of its operations, the changes in its net assets and the financial highlights for each of the periods indicated, in conformity with accounting principles generally accepted in the United States of America. These financial statements and financial highlights (hereafter referred to as “financial statements”) are the responsibility of the fund’s management. Our responsibility is to express an opinion on these financial statements based on our audits. We conducted our audits of these financial statements in accordance with the standards of the Public Company Accounting Oversight Board (United States). Those s tandards require that we plan and perform the audit to obtain reasonable assurance about whether the financial statements are free of material misstatement. An audit includes examining, on a test basis, evidence supporting the amounts and disclosures in the financial statements, assessing the accounting principles used and significant estimates made by management, and evaluating the overall financial statement presentation. We believe that our audits, which included confirmation of investments owned at May 31, 2009 by correspondence with the custodian, provide a reasonable basis for our opinion.
PricewaterhouseCoopers LLP
Boston, Massachusetts
July 10, 2009
19
The fund’s portfolio 5/31/09
| |
| Key to abbreviations | |
| | |
| AGO Assured Guaranty, Ltd. | FRB Floating Rate Bonds |
| AMBAC AMBAC Indemnity Corporation | FSA Financial Security Assurance |
| Cmnwlth. of PR Gtd. Commonwealth of Puerto Rico Guaranteed | GNMA Coll. Government National Mortgage Association Collateralized |
| COP Certificates of Participation | G.O. Bonds General Obligation Bonds |
| FGIC Financial Guaranty Insurance Company | NATL National Public Finance Guarantee Corp. |
| FHA Insd. Federal Housing Administration Insured | U.S. Govt. Coll. U.S. Government Collateralized |
| FHLMC Coll. Federal Home Loan Mortgage Corporation Collateralized | VRDN Variable Rate Demand Notes |
| FNMA Coll. Federal National Mortgage Association Collateralized | XLCA XL Capital Assurance |
| | | |
| MUNICIPAL BONDS AND NOTES (98.4%)* | Rating** | Principal amount | Value |
|
| Ohio (91.1%) | | | |
| Akron, G.O. Bonds, FSA, 5s, 12/1/25 | AAA | $1,005,000 | $1,065,632 |
|
| Akron, Wtr. Wks. Rev. Bonds, NATL | | | |
| 6s, 12/1/12 | AA– | 875,000 | 965,834 |
| 5 1/4s, 12/1/17 | Baa1 | 1,285,000 | 1,313,334 |
|
| Allen Cnty., Hosp. Fac. VRDN (Catholic Hlth. Care), Ser. B, 0.25s, 10/1/31 | VMIG1 | 400,000 | 400,000 |
|
| American Muni. Pwr. — Ohio, Inc. Rev. Bonds (Prairie State Energy Campus), Ser. A | | | |
| AGO, 5 3/4s, 2/15/39 | AAA | 1,500,000 | 1,531,155 |
| 5s, 2/15/38 | A1 | 1,500,000 | 1,451,070 |
|
| Anthony Wayne Local School Dist. G.O. Bonds (School Fac. Construction & Impt.), | | | |
| FSA, 5 1/2s, 12/1/19 | AAA | 1,565,000 | 1,659,526 |
|
| Barberton, City School Dist. G.O. Bonds (School Impt.), 5 1/4s, 12/1/28 | AA | 1,390,000 | 1,471,690 |
|
| Brookfield, Local School Dist. G.O. Bonds (School Fac. Impt.), FSA, 5s, 1/15/26 | AAA | 1,000,000 | 1,067,730 |
|
| Buckeye, Tobacco Settlement Fin. Auth. Rev. Bonds | | | |
| Ser. A-2, 6s, 6/1/42 | BBB | 250,000 | 173,190 |
| Ser. A-2, 5 3/4s, 6/1/34 | BBB | 6,000,000 | 4,344,720 |
| Ser. A-2, 5 3/8s, 6/1/24 | BBB | 695,000 | 603,191 |
| Ser. A-3, stepped coupon zero % (6.25%s, 12/1/12), 2037 †† | BBB | 1,200,000 | 622,104 |
|
| Canal Winchester, Local School Dist. G.O. Bonds, NATL, zero %, 12/1/33 | A3 | 1,180,000 | 290,846 |
|
| Cincinnati, City School Dist. COP (School Impt.), FSA, 5s, 12/15/28 | AAA | 2,500,000 | 2,548,675 |
|
| Cleveland, G.O. Bonds, Ser. A | | | |
| AGO, 5s, 12/1/29 | AAA | 2,000,000 | 2,023,640 |
| FGIC, NATL, 4 3/4s, 11/15/26 | AA | 1,790,000 | 1,799,380 |
|
| Cleveland, Arpt. Syst. FRB, Ser. C, FSA, 5s, 1/1/23 | AAA | 1,500,000 | 1,565,265 |
|
| Cleveland, Income Tax Rev. Bonds (Bridges & Roadways), Ser. B, AGO, 5s, 10/1/29 | AAA | 1,000,000 | 1,038,250 |
|
| Cleveland, Muni. School Dist. G.O. Bonds, FSA, 5s, 12/1/27 | AAA | 1,375,000 | 1,414,738 |
|
| Cleveland, Parking Fac. Rev. Bonds, FSA, 5 1/4s, 9/15/22 | AAA | 2,400,000 | 2,495,400 |
|
| Cleveland, Pub. Pwr. Syst. Rev. Bonds, Ser. B-1, NATL, zero %, 11/15/25 | AA– | 3,000,000 | 1,320,750 |
|
| Cleveland, Urban Renewal Increment Rev. Bonds (Rock & Roll Hall of Fame), 6 3/4s, 3/15/18 | B+/P | 1,150,000 | 1,150,173 |
|
| Columbus, City School Dist. G.O. Bonds, FSA, zero %, 12/1/27 | AAA | 1,895,000 | 785,345 |
|
| Cuyahoga Cmnty., College Dist. Rev. Bonds, Ser. C, 5s, 8/1/25 | Aa3 | 1,500,000 | 1,563,015 |
|
| Cuyahoga Cnty., Hosp. VRDN (U. Hosp.), 0.16s, 1/1/16 | VMIG1 | 1,545,000 | 1,545,000 |
|
| Dublin, G.O. Bonds, Ser. B, 6.4s, 12/1/14 | Aaa | 1,300,000 | 1,480,258 |
|
| Elyria, OH City School Dist. G.O. Bonds (Classroom Fac. & School Impt.), XLCA, 5s, 12/1/35 | A3 | 500,000 | 501,305 |
|
| Erie Cnty., OH Hosp. Fac. Rev. Bonds (Firelands Regl. Med. Ctr.), 5 5/8s, 8/15/32 | A | 1,000,000 | 840,440 |
|
| Field, Local School Dist. G.O. Bonds (School Fac. Construction & Impt.), AMBAC, 5s, 12/1/22 | A/P | 1,170,000 | 1,137,556 |
|
| Franklin Cnty., Rev. Bonds (OCLC Online Computer Library Ctr.), 5s, 4/15/13 | A | 2,610,000 | 2,844,952 |
|
| Franklin Cnty., Dev. Rev. Bonds (American Chemical Society), 5.8s, 10/1/14 | A+ | 2,000,000 | 2,039,860 |
|
| Franklin Cnty., Econ. Dev. Rev. Bonds (Capitol South Cmnty. Urban), 5 3/4s, 6/1/11 | BBB–/P | 1,000,000 | 987,640 |
|
| Franklin Cnty., Hlth. Care Fac. Rev. Bonds (OH Presbyterian Svcs.), U.S. Govt. Coll., | | | |
| 7 1/8s, 7/1/29 (Prerefunded) | BBB | 2,000,000 | 2,251,300 |
|
| Hamilton Cnty., Rev. Bonds, Ser. B, AMBAC, zero %, 12/1/22 | A2 | 500,000 | 240,115 |
|
| Hamilton Cnty., Econ. Dev. Rev. Bonds (King Highland Cmnty. Urban), Ser. A, NATL, 5s, 6/1/22 | AA– | 1,745,000 | 1,844,011 |
|
| Hamilton Cnty., Sales Tax Rev. Bonds, Ser. B, AMBAC, zero %, 12/1/24 | A2 | 3,000,000 | 1,253,910 |
|
| Hamilton Cnty., Swr. Syst. Rev. Rev. Bonds (Metro. Swr. Dist.), Ser. A, NATL, 5s, 12/1/28 | AA | 1,500,000 | 1,567,635 |
|
20
| | | |
| MUNICIPAL BONDS AND NOTES (98.4%)* cont. | Rating** | Principal amount | Value |
|
| Ohio cont. | | | |
| Hamilton, City School Dist. G.O. Bonds (School Impt.), FSA, 5s, 12/1/26 | AAA | $3,000,000 | $3,149,070 |
|
| Huran Cnty., Human Svcs. Rev. Bonds, NATL, 6.55s, 12/1/20 | AA– | 1,800,000 | 2,160,774 |
|
| Kings, Local School Dist. G.O. Bonds (School Impt.), NATL, 5s, 12/1/27 | AA | 750,000 | 776,228 |
|
| Lake Cnty., Hosp. Fac. Rev. Bonds (Lake Hosp. Syst.), Ser. C, 6s, 8/15/43 | Baa1 | 850,000 | 772,812 |
|
| Lakewood, City School Dist. G.O. Bonds | | | |
| FGIC, NATL, zero %, 12/1/17 | Aa3 | 1,190,000 | 876,661 |
| FSA, zero %, 12/1/16 | AAA | 1,250,000 | 985,325 |
|
| Lakota, School Dist. Rev. Bonds, AMBAC, 7s, 12/1/10 | Aa1 | 1,000,000 | 1,081,130 |
|
| Lorain Cnty., Elderly Hsg. Corp. Multi-Fam. Rev. Bonds (Harr Plaza & Intl.), Ser. A, | | | |
| 6 3/8s, 7/15/19 | BBB | 1,165,000 | 1,142,562 |
|
| Lorain Cnty., Hosp. Rev. Bonds (Catholic), Ser. H, AGO, 5s, 2/1/29 | AAA | 2,000,000 | 2,022,960 |
|
| Miami Cnty., Hosp. Fac. Rev. Bonds (Upper Valley Med. Ctr.), 5 1/4s, 5/15/17 | A3 | 1,250,000 | 1,146,800 |
|
| Midview, School Dist. COP (School Bldg. Fac.), 5 1/4s, 11/1/17 | A | 2,535,000 | 2,642,991 |
|
| Montgomery Cnty., Rev. Bonds (Catholic Hlth. Initiatives), Ser. D, 6 1/4s, 10/1/33 | Aa2 | 1,000,000 | 1,112,570 |
|
| Montgomery Cnty., VRDN (Catholic Hlth. Initiatives), Ser. B-2, 0.1s, 4/1/37 | VMIG1 | 600,000 | 600,000 |
|
| Mount Healthy, City School Dist. G.O. Bonds (School Impt.), FSA, 5 1/4s, 12/1/22 | Aa3 | 1,105,000 | 1,224,329 |
|
| OH Hsg. Fin. Agcy. Rev. Bonds | | | |
| Ser. B, GNMA Coll., 5s, 3/1/34 | Aaa | 810,000 | 804,079 |
| (Res. Dev.), Ser. A, GNMA Coll., 4.6s, 9/1/28 | Aaa | 25,000 | 24,951 |
| (Res. Mtge.), Ser. E, GNMA Coll., FNMA Coll., FHLMC Coll., 4 1/4s, 3/1/15 | Aaa | 430,000 | 427,162 |
| (Res. Mtge.), Ser. C, GNMA Coll., FNMA Coll., 4.1s, 3/1/15 | Aaa | 420,000 | 411,835 |
|
| OH Hsg. Fin. Agcy. Single Fam. Mtge. Rev. Bonds | | | |
| Ser. G, GNMA Coll., 7.14s, 3/2/23 | Aaa | 100,000 | 100,000 |
| Ser. 85-A, FGIC, FHA Insd., zero %, 1/15/15 | AAA/P | 15,000 | 8,556 |
|
| OH State Rev. Bonds | | | |
| Ser. A, 5s, 10/1/22 | AA– | 3,090,000 | 3,287,018 |
| (Revitalization), Ser. A, AMBAC, 5s, 4/1/19 | AA– | 1,750,000 | 1,892,660 |
|
| OH State Air Quality Dev. Auth. Mandatory Put Bonds (OH Pwr.), 7 1/8s, 6/1/10 | A3 | 500,000 | 511,305 |
|
| OH State Air Quality Dev. Auth. VRDN (First Energy), Ser. B, 0.2s, 8/1/29 | VMIG1 | 2,800,000 | 2,800,000 |
|
| OH State Env. Impt. Rev. Bonds (USX Corp.), 5 5/8s, 5/1/29 | Baa1 | 750,000 | 674,925 |
|
| OH State Higher Edl. Fac. Mandatory Put Bonds (Kenyon College), 5.05s, 7/1/16 | A1 | 2,000,000 | 2,053,780 |
|
| OH State Higher Edl. Fac. Rev. Bonds | | | |
| (Case Western Reserve U.), 6 1/4s, 10/1/18 | AA– | 1,000,000 | 1,185,660 |
| (Case Western Reserve U.), 6s, 10/1/14 | AA– | 1,000,000 | 1,146,650 |
| (U. of Dayton), 5 1/2s, 12/1/36 | A2 | 1,000,000 | 1,007,350 |
| (Oberlin College), 5 1/8s, 10/1/24 | Aa2 | 1,500,000 | 1,568,790 |
|
| OH State Higher Edl. Fac. Commn. Rev. Bonds | | | |
| (U. Hosp. Hlth. Syst.), Ser. 09-A, 6 3/4s, 1/15/39 | A2 | 2,000,000 | 2,108,060 |
| (John Carroll U.), 5 1/2s, 11/15/18 | A2 | 335,000 | 358,108 |
| (John Carroll U.), 5 1/2s, 11/15/17 | A2 | 420,000 | 448,791 |
| (Oberlin College), 5s, 10/1/33 | Aa2 | 1,000,000 | 1,012,730 |
| (Northern U.), 4 3/4s, 5/1/19 | A3 | 2,500,000 | 2,512,075 |
|
| OH State Hsg. Fin. Agcy. Rev. Bonds (Res. Mtge.) | | | |
| Ser. F, GNMA Coll., FNMA Coll., FHLMC Coll., 5.45s, 9/1/33 | Aaa | 1,990,000 | 2,038,476 |
| Ser. L, GNMA Coll., FNMA Coll., 4 3/4s, 3/1/37 | Aaa | 2,000,000 | 1,720,940 |
|
| OH State Poll. Control Rev. Bonds (Standard Oil Co.), 6 3/4s, 12/1/15 | Aa1 | 3,350,000 | 3,880,640 |
|
| OH State U. Rev. Bonds, Ser. A | | | |
| 5 1/8s, 12/1/31 | Aa2 | 1,000,000 | 1,015,800 |
| 5s, 12/1/27 | Aa2 | 1,000,000 | 1,050,910 |
|
| OH State Wtr. Dev. Auth. Poll. Control Rev. Bonds (Wtr. Quality), Ser. B, zero %, 12/1/14 | Aaa | 3,500,000 | 3,012,275 |
|
| OH State Wtr. Dev. Auth. Poll. Control Fac. Mandatory Put Bonds (First Energy Generation), | | | |
| Ser. C, 7 1/4s, 11/1/12 | Baa2 | 500,000 | 516,965 |
|
| OH State Wtr. Dev. Auth. Solid Waste Disp. Rev. Bonds (Bay Shore Power Co.), Ser. A, | | | |
| 5 7/8s, 9/1/20 | BB+/P | 1,000,000 | 847,480 |
|
| OH U. Gen. Recipients Athens Rev. Bonds, NATL, 5s, 12/1/25 | AA– | 2,265,000 | 2,296,937 |
|
| Powell, G.O. Bonds, FGIC, NATL, 5 1/2s, 12/1/25 | AA+ | 1,500,000 | 1,548,000 |
|
| Rickenbacker, Port Auth. Rev. Bonds (OASBO Expanded Asset Pooled), Ser. A, 5 3/8s, 1/1/32 | A2 | 2,165,000 | 2,092,148 |
|
21
| | | |
| MUNICIPAL BONDS AND NOTES (98.4%)* cont. | Rating** | Principal amount | Value |
|
| Ohio cont. | | | |
| River Valley, Local School Dist. G.O. Bonds (School Fac. Construction & Impt.), FSA, | | | |
| 5 1/4s, 11/1/23 | Aa2 | $300,000 | $349,737 |
|
| Sandusky Cnty., Hosp. Fac. Rev. Bonds (Memorial Hosp.), 5.15s, 1/1/10 | BBB– | 830,000 | 827,585 |
|
| Scioto Cnty., Hosp. Rev. Bonds (Southern Med. Ctr.), 5 1/2s, 2/15/28 | A2 | 1,750,000 | 1,624,455 |
|
| South Western City, School Dist. G.O. Bonds (Franklin & Pickway Cnty.), FSA, 4 3/4s, 12/1/23 | AAA | 2,000,000 | 2,089,720 |
|
| Summit Cnty., G.O. Bonds, Ser. R, FGIC, NATL, 5 1/2s, 12/1/18 | Aa2 | 500,000 | 597,590 |
|
| Sylvania, City School Dist. G.O. Bonds (School Impt.), AGO, 5s, 12/1/27 | AAA | 1,500,000 | 1,536,735 |
|
| Tallmadge, City School Dist. G.O. Bonds (School Fac.), FSA, 5s, 12/1/26 | AAA | 1,410,000 | 1,473,027 |
|
| Toledo, G.O. Bonds (Macys), Ser. A, NATL, 6.35s, 12/1/25 | AA– | 1,500,000 | 1,500,225 |
|
| Toledo, Swr. Syst. Mtge. Rev. Bonds, AMBAC, 6.2s, 11/15/12 | A | 2,405,000 | 2,770,488 |
|
| Toledo, Wtr. Wks. Mtge. Rev. Bonds, AMBAC, 6.2s, 11/15/12 | A | 965,000 | 1,106,749 |
|
| Toledo-Lucas Cnty., Port Auth. Rev. Bonds (CSX Transn, Inc.), 6.45s, 12/15/21 | Baa3 | 1,900,000 | 2,008,870 |
|
| Twin Valley, Cmnty. Local School Dist. Rev. Bonds, FGIC, NATL, 7.05s, 12/1/11 | AA– | 785,000 | 827,508 |
|
| U. of Cincinnati COP (Jefferson Ave. Residence Hall), NATL, 5 1/8s, 6/1/28 | AA– | 1,000,000 | 1,000,070 |
|
| Westerville, G.O. Bonds, AMBAC, 5s, 12/1/26 | Aa1 | 1,320,000 | 1,388,046 |
|
| Woodridge, School Dist. Rev. Bonds, AMBAC, 6.8s, 12/1/14 | A | 2,650,000 | 2,963,734 |
|
| Youngstown State U. Rev. Bonds, AGO, 5 1/4s, 12/15/29 | AAA | 500,000 | 516,130 |
|
| Zanesville, Hsg. Dev. Corp. Mtge. Rev. Bonds, U.S. Govt. Coll. | | | |
| 7 3/8s, 10/1/21 (Prerefunded) | AAA/P | 220,000 | 289,676 |
| 7 3/8s, 10/1/20 (Prerefunded) | AAA/P | 205,000 | 269,926 |
| 7 3/8s, 10/1/19 (Prerefunded) | AAA/P | 185,000 | 243,591 |
| 7 3/8s, 10/1/18 (Prerefunded) | AAA/P | 180,000 | 237,008 |
| 7 3/8s, 10/1/17 (Prerefunded) | AAA/P | 160,000 | 210,674 |
| 7 3/8s, 10/1/16 (Prerefunded) | AAA/P | 155,000 | 204,090 |
|
| | | | 141,293,537 |
| Puerto Rico (6.9%) | | | |
| Children’s Trust Fund Tobacco Settlement Rev. Bonds, 5 3/8s, 5/15/33 | BBB | 525,000 | 437,120 |
|
| Cmnwlth. of PR, Aqueduct & Swr. Auth. Rev. Bonds, Ser. A | | | |
| 6s, 7/1/44 | Baa3 | 1,000,000 | 978,460 |
| 6s, 7/1/38 | Baa3 | 3,350,000 | 3,331,542 |
|
| Cmnwlth. of PR, Hsg. Fin. Corp. Rev. Bonds, Ser. B, GNMA Coll., FNMA Coll., FHLMC Coll., | | | |
| 4.45s, 6/1/27 | Aaa | 155,000 | 154,298 |
|
| Cmnwlth. of PR, Hwy. & Trans. Auth. Rev. Bonds | | | |
| Ser. W, 5 1/2s, 7/1/15 | BBB+ | 1,000,000 | 1,019,070 |
| Ser. G, 5s, 7/1/33 | BBB | 100,000 | 84,377 |
| Ser. G, 5s, 7/1/33 (Prerefunded) | Aaa | 195,000 | 221,565 |
| Ser. K, 5s, 7/1/13 | BBB | 500,000 | 501,075 |
|
| Cmnwlth. of PR, Indl. Tourist Edl. Med. & Env. Control Fac. Rev. Bonds (Cogen. Fac.-AES), | | | |
| 6 5/8s, 6/1/26 | Baa3 | 1,000,000 | 1,002,590 |
|
| Cmnwlth. of PR, Infrastructure Fin. Auth. Special Tax Bonds, Ser. C, FGIC, 5 1/2s, 7/1/19 | BBB+ | 1,000,000 | 1,004,560 |
|
| Cmnwlth. of PR, Pub. Bldg. Auth. Rev. Bonds (Govt. Fac.) | | | |
| Ser. M-3, NATL, Cmnwlth. of PR Gtd., 6s, 7/1/28 | AA | 500,000 | 501,010 |
| Ser. N, Cmnwlth. of PR Gtd., 5 1/2s, 7/1/19 | Baa3 | 1,070,000 | 1,074,098 |
|
| Cmnwlth. of PR, Sales Tax Fin. Corp. Rev. Bonds, Ser. A, NATL, zero %, 8/1/43 | AA– | 3,000,000 | 373,860 |
|
| | | | 10,683,625 |
| Virgin Islands (0.4%) | | | |
| Tobacco Settlement Fin. Corp. Rev. Bonds, 5s, 5/15/21 (Virgin Islands) | Baa3 | 675,000 | 562,230 |
|
| | | | 562,230 |
|
| TOTAL INVESTMENTS | | | |
|
| Total investments (cost $149,685,796) | | | $152,539,392 |
22
* Percentages indicated are based on net assets of $154,978,488.
** The Moody’s, Standard & Poor’s or Fitch ratings indicated are believed to be the most recent ratings available at May 31, 2009 for the securities listed. Ratings are generally ascribed to securities at the time of issuance. While the agencies may from time to time revise such ratings, they undertake no obligation to do so, and the ratings do not necessarily represent what the agencies would ascribe to these securities at May 31, 2009. Securities rated by Putnam are indicated by “/P.” Securities rated by Fitch are indicated by “/F.” The rating of an insured security represents what is believed to be the most recent rating of the insurer’s claims-paying ability available at May 31, 2009 and does not reflect any subsequent changes. Ratings are not covered by the Report of Independent Registered Public Accounting Firm. Security ratings are defined in the Statement of Additional Information.
†† The interest rate and date shown parenthetically represent the new interest rate to be paid and the date the fund will begin accruing interest at this rate.
The rates shown on FRB, Mandatory Put Bonds and VRDN are the current interest rates at May 31, 2009.
The dates shown on Mandatory Put Bonds are the next mandatory put dates.
The dates shown on debt obligations other than Mandatory Put Bonds are the original maturity dates.
The fund had the following sector concentrations greater than 10% at May 31, 2009 (as a percentage of net assets):
| | | |
| Local government | 28.9% | | |
| Education | 13.9 | | |
| Utilities | 13.7 | | |
The fund had the following insurance concentrations greater than 10% at May 31, 2009 (as a percentage of net assets):
In September 2006, the FASB issued Statement of Financial Accounting Standards No. 157, Fair Value Measurements (” SFAS 157” ). SFAS 157 is effective for financial statements issued for fiscal years beginning after November 15, 2007 and interim periods within those fiscal years. While the adoption of SFAS 157 does not have a material effect on the fund’s net asset value, it does require additional disclosures about fair value measurements. SFAS 157 establishes a three-level hierarchy for disclosure of fair value measurements. The valuation hierarchy is based upon the transparency of inputs to the valuation of the fund’s investments. The three levels are defined as follows:
Level 1 — Valuations based on quoted prices for identical securities in active markets.
Level 2 — Valuations based on quoted prices in markets that are not active or for which all significant inputs are observable, either directly or indirectly.
Level 3 — Valuations based on inputs that are unobservable and significant to the fair value measurement.
The following is a summary of the inputs used to value the fund’s net assets as of May 31, 2009:
| | |
| Valuation inputs | Investments in securities | Other financial instruments |
|
| Level 1 | $— | $— |
|
| Level 2 | 152,539,392 | — |
|
| Level 3 | — | — |
|
| Total | $152,539,392 | $— |
Other financial instruments include futures, written options, TBA sale commitments, swaps and forward contracts which are valued at the unrealized appreciation/(depreciation) on the instrument.
The accompanying notes are an integral part of these financial statements.
23
Statement of assets and liabilities 5/31/09
| |
| ASSETS | |
|
| Investment in securities, at value (Note 1): | |
| Unaffiliated issuers (identified cost $149,685,796) | $152,539,392 |
|
| Cash | 1,090,830 |
|
| Interest and other receivables | 2,551,245 |
|
| Receivable for shares of the fund sold | 103,271 |
|
| Receivable for investments sold | 270,000 |
|
| Total assets | 156,554,738 |
| |
| |
| LIABILITIES | |
|
| Distributions payable to shareholders | 211,906 |
|
| Payable for shares of the fund repurchased | 969,553 |
|
| Payable for compensation of Manager (Note 2) | 167,058 |
|
| Payable for investor servicing fees (Note 2) | 7,573 |
|
| Payable for custodian fees (Note 2) | 3,044 |
|
| Payable for Trustee compensation and expenses (Note 2) | 59,672 |
|
| Payable for administrative services (Note 2) | 1,447 |
|
| Payable for distribution fees (Note 2) | 60,605 |
|
| Other accrued expenses | 95,392 |
|
| Total liabilities | 1,576,250 |
| |
| |
| Net assets | $154,978,488 |
|
| |
| REPRESENTED BY | |
|
| Paid-in capital (Unlimited shares authorized) (Notes 1 and 4) | $153,432,995 |
|
| Distributions in excess of net investment income (Note 1) | (126,346) |
|
| Accumulated net realized loss on investments (Note 1) | (1,181,757) |
|
| Net unrealized appreciation of investments | 2,853,596 |
|
| Total — Representing net assets applicable to | |
| capital shares outstanding | $154,978,488 |
|
|
| COMPUTATION OF NET ASSET VALUE AND OFFERING PRICE | |
|
| Net asset value and redemption price per class A share | |
| ($142,288,089 divided by 16,191,143 shares) | $8.79 |
|
| Offering price per class A share (100/96.00 of $8.79)* | $9.16 |
|
| Net asset value and offering price per class B share | |
| ($6,387,124 divided by 727,470 shares)** | $8.78 |
|
| Net asset value and offering price per class C share | |
| ($4,984,536 divided by 567,293 shares)** | $8.79 |
|
| Net asset value and redemption price per class M share | |
| ($1,084,889 divided by 123,341 shares) | $8.80 |
|
| Offering price per class M share (100/96.75 of $8.80)*** | $9.10 |
|
| Net asset value, offering price and redemption price | |
| per class Y share ($233,850 divided by 26,592 shares) | $8.79 |
|
* On single retail sales of less than $100,000. On sales of $100,000 or more the offering price is reduced.
** Redemption price per share is equal to net asset value less any applicable contingent deferred sales charge.
*** On single retail sales of less than $50,000. On sales of $50,000 or more the offering price is reduced.
The accompanying notes are an integral part of these financial statements.
24
| |
| Statement of operations Year ended 5/31/09 | |
| |
| INTEREST INCOME | $7,816,023 |
|
| |
| EXPENSES | |
|
| Compensation of Manager (Note 2) | $758,384 |
|
| Investor servicing fees (Note 2) | 97,892 |
|
| Custodian fees (Note 2) | 7,694 |
|
| Trustee compensation and expenses (Note 2) | 29,251 |
|
| Administrative services (Note 2) | 21,235 |
|
| Distribution fees — Class A (Note 2) | 297,183 |
|
| Distribution fees — Class B (Note 2) | 62,375 |
|
| Distribution fees — Class C (Note 2) | 41,853 |
|
| Distribution fees — Class M (Note 2) | 4,926 |
|
| Other | 132,384 |
|
| Fees reimbursed by Manager (Note 2) | (91,685) |
|
| Total expenses | 1,361,492 |
| | |
| | |
| Expense reduction (Note 2) | (10,234) |
|
| Net expenses | 1,351,258 |
| |
| |
| Net investment income | 6,464,765 |
|
| Net realized loss on investments (Notes 1 and 3) | (110,264) |
|
| Net realized loss on swap contracts (Note 1) | (37,986) |
|
| Net realized loss on futures contracts (Note 1) | (338,202) |
|
| Net unrealized depreciation of investments, futures | |
| contracts and swap contracts commitments during the year | (2,415,827) |
|
| Net loss on investments | (2,902,279) |
|
| Net increase in net assets resulting from operations | $3,562,486 |
|
| | |
| Statement of changes in net assets | |
| |
| INCREASE (DECREASE) IN NET ASSETS | | |
| | Year ended | Year ended |
| | 5/31/09 | 5/31/08 |
|
| Operations: | | |
|
| Net investment income | $6,464,765 | $6,031,286 |
|
| Net realized gain (loss) on investments | (486,452) | 794,200 |
|
| Net unrealized depreciation of investments | (2,415,827) | (1,449,043) |
|
| Net increase in net assets resulting | | |
| from operations | 3,562,486 | 5,376,443 |
|
| Distributions to shareholders (Note 1): | | |
|
| From ordinary income | | |
|
| Taxable net investment income | | |
|
| Class A | (57,343) | (5,517) |
|
| Class B | (2,881) | (450) |
|
| Class C | (1,834) | (31) |
|
| Class M | (435) | (44) |
|
| Class Y | (70) | — |
|
| From tax-exempt net investment income | | |
|
| Class A | (5,991,783) | (5,614,801) |
|
| Class B | (270,200) | (382,626) |
|
| Class C | (146,697) | (34,846) |
|
| Class M | (39,705) | (40,884) |
|
| Class Y | (4,661) | (180) |
|
| Redemption fees (Note 1) | 765 | 40 |
|
| Increase from capital share | | |
| transactions (Note 4) | 2,133,932 | 2,631,558 |
|
| Total increase (decrease) in net assets | (818,426) | 1,928,662 |
| |
| |
| NET ASSETS | | |
|
| Beginning of year | 155,796,914 | 153,868,252 |
|
| End of year (including distributions in excess | | |
| of net investment income of $126,346 and | | |
| undistributed net investment income of | | |
| $45,092, respectively) | $154,978,488 | $155,796,914 |
|
The accompanying notes are an integral part of these financial statements.
25
Financial highlights (For a common share outstanding throughout the period)
| | | | | | | | | | | | | |
| INVESTMENT OPERATIONS: | | | | LESS DISTRIBUTIONS: | | | RATIOS AND SUPPLEMENTAL DATA: | |
|
| | | | | | | | | | | | | Ratio of net | |
| | | | Net realized and | | | | | | Total return | Net assets, | Ratio of expenses | investment income | |
| | Net asset value, | Net investment | unrealized gain (loss) | Total from investment | From net | | Redemption | Net asset value, | at net asset | end of period | to average | (loss) to average | Portfolio |
| Period ended | beginning of period | income (loss) a | on investments | operations | investment income | Total distributions | fees | end of period | value (%) b | (in thousands) | net assets (%) a,c | net assets (%) a | turnover (%) |
|
| Class A | | | | | | | | | | | | | |
| May 31, 2009 | $8.93 | .36 | (.13) | .23 | (.37) | (.37) | — d | $8.79 | 2.84 | $142,288 | .84 | 4.32 | 19.58 |
| May 31, 2008 | 8.98 | .36 | (.04) | .32 | (.37) | (.37) | — d | 8.93 | 3.62 | 142,524 | .88 | 4.06 | 36.24 |
| May 31, 2007 | 8.97 | .36 | .01 | .37 | (.36) | (.36) | — d | 8.98 | 4.16 | 139,448 | .89 | 3.91 | 15.46 |
| May 31, 2006 | 9.22 | .35 | (.25) | .10 | (.35) | (.35) | — | 8.97 | 1.13 | 148,135 | .89 | 3.87 | 5.77 |
| May 31, 2005 | 8.94 | .35 | .28 | .63 | (.35) | (.35) | — d | 9.22 | 7.15 | 153,016 | .89 | 3.88 | 12.34 |
|
| Class B | | | | | | | | | | | | | |
| May 31, 2009 | $8.93 | .31 | (.14) | .17 | (.32) | (.32) | — d | $8.78 | 2.06 | $6,387 | 1.48 | 3.67 | 19.58 |
| May 31, 2008 | 8.97 | .31 | (.04) | .27 | (.31) | (.31) | — d | 8.93 | 3.07 | 9,189 | 1.52 | 3.41 | 36.24 |
| May 31, 2007 | 8.96 | .30 | .01 | .31 | (.30) | (.30) | — d | 8.97 | 3.47 | 12,931 | 1.53 | 3.27 | 15.46 |
| May 31, 2006 | 9.21 | .29 | (.25) | .04 | (.29) | (.29) | — | 8.96 | .47 | 19,643 | 1.54 | 3.22 | 5.77 |
| May 31, 2005 | 8.93 | .29 | .28 | .57 | (.29) | (.29) | — d | 9.21 | 6.47 | 25,898 | 1.54 | 3.23 | 12.34 |
|
| Class C | | | | | | | | | | | | | |
| May 31, 2009 | $8.93 | .30 | (.13) | .17 | (.31) | (.31) | — d | $8.79 | 2.01 | $4,985 | 1.63 | 3.55 | 19.58 |
| May 31, 2008 | 8.97 | .29 | (.04) | .25 | (.29) | (.29) | — d | 8.93 | 2.89 | 3,088 | 1.67 | 3.27 | 36.24 |
| May 31, 2007 † | 9.09 | .19 | (.12) | .07 | (.19) | (.19) | — | 8.97 | .80 * | 332 | 1.11 * | 2.04 * | 15.46 |
|
| Class M | | | | | | | | | | | | | |
| May 31, 2009 | $8.94 | .34 | (.13) | .21 | (.35) | (.35) | — d | $8.80 | 2.56 | $1,085 | 1.13 | 4.03 | 19.58 |
| May 31, 2008 | 8.98 | .34 | (.04) | .30 | (.34) | (.34) | — d | 8.94 | 3.45 | 986 | 1.17 | 3.77 | 36.24 |
| May 31, 2007 | 8.98 | .33 | — d | .33 | (.33) | (.33) | — d | 8.98 | 3.73 | 1,157 | 1.18 | 3.63 | 15.46 |
| May 31, 2006 | 9.23 | .33 | (.26) | .07 | (.32) | (.32) | — | 8.98 | .83 | 1,347 | 1.19 | 3.58 | 5.77 |
| May 31, 2005 | 8.94 | .33 | .28 | .61 | (.32) | (.32) | — d | 9.23 | 6.94 | 865 | 1.19 | 3.58 | 12.34 |
|
| Class Y | | | | | | | | | | | | | |
| May 31, 2009 | $8.93 | .38 | (.13) | .25 | (.39) | (.39) | — d | $8.79 | 3.04 | $234 | .63 | 4.63 | 19.58 |
| May 31, 2008 †† | 9.00 | .16 | (.07) | .09 | (.16) | (.16) | — | 8.93 | 1.03 * | 10 | .28 * | 1.78 * | 36.24 |
|
* Not annualized.
† For the period October 3, 2006 (commencement of operations) to May 31, 2007.
†† For the period January 2, 2008 (commencement of operations) to May 31, 2008.
a Reflects an involuntary contractual expense limitation in effect during the period. As a result of such limitation, the expenses of each class reflect a reduction of the following amounts (Note 2):
b Total return assumes dividend reinvestment and does not reflect the effect of sales charges.
c Includes amounts paid through expense offset arrangements (Note 2).
d Amount represents less than $0.01 per share.
| | | |
| | Percentage of average net assets | | |
| May 31, 2009 | 0.06% | | |
| | |
| May 31, 2008 | 0.01 | | |
| | |
| May 31, 2007 | 0.01 | | |
| | |
| May 31, 2006 | 0.01 | | |
| | |
| May 31, 2005 | 0.01 | | |
| | |
The accompanying notes are an integral part of these financial statements.
Notes to financial statements 5/31/09
Note 1: Significant accounting policies
Putnam Ohio Tax Exempt Income Fund (the “fund”), a Massachusetts business trust, is registered under the Investment Company Act of 1940, as amended, as a diversified, open-end management investment company. The fund seeks as high a level of current income exempt from federal income tax and Ohio personal income tax as Putnam Investment Management, LLC (“Putnam Management”), the fund’s manager, a wholly-owned subsidiary of Putnam, LLC, believes is consistent with preservation of capital by investing primarily in a portfolio of investment-grade Ohio tax-exempt securities with intermediate- to long-term maturities. The fund may be affected by economic and political developments in the state of Ohio.
The fund offers class A, class B, class C, class M and class Y shares. Class A and class M shares are sold with a maximum front-end sales charge of 4.00% and 3.25%, respectively, and generally do not pay a contingent deferred sales charge. Class B shares, which convert to class A shares after approximately eight years, do not pay a front-end sales charge and are subject to a contingent deferred sales charge, if those shares are redeemed within six years of purchase. Class C shares have a one-year 1.00% contingent deferred sales charge and do not convert to class A shares. The expenses for class A, class B, class C, and class M shares may differ based on the distribution fee of each class, which is identified in Note 2. Class Y shares, which are sold at net asset value, are generally subject to the same expenses as class A, class B, class C, and class M shares, but do not bear a distribution fee. Class Y shares are generally only available to corporate and institutio nal clients and clients in other approved programs.
A 1.00% redemption fee may apply on any shares that are redeemed (either by selling or exchanging into another fund) within 7 days of purchase. The redemption fee is accounted for as an addition to paid-in-capital. Investment income, realized and unrealized gains and losses and expenses of the fund are borne pro-rata based on the relative net assets of each class to the total net assets of the fund, except that each class bears expenses unique to that class (including the distribution fees applicable to such classes). Each class votes as a class only with respect to its own distribution plan or other matters on which a class vote is required by law or determined by the Trustees. If the fund were liquidated, shares of each class would receive their pro-rata share of the net assets of the fund. In addition, the Trustees declare separate dividends on each class of shares.
In the normal course of business, the fund enters into contracts that may include agreements to indemnify another party under given circumstances. The fund’s maximum exposure under these arrangements is unknown as this would involve future claims that may be, but have not yet been, made against the fund. However, the fund’s management team expects the risk of material loss to be remote.
The following is a summary of significant accounting policies consistently followed by the fund in the preparation of its financial statements. The preparation of financial statements is in conformity with accounting principles generally accepted in the United States of America and requires management to make estimates and assumptions that affect the reported amounts of assets and liabilities in the financial statements and the reported amounts of increases and decreases in net assets from operations during the reporting period. Actual results could differ from those estimates.
A) Security valuation Tax-exempt bonds and notes are generally valued on the basis of valuations provided by an independent pricing service approved by the Trustees. Such services use information with respect to transactions in bonds, quotations from bond dealers, market transactions in comparable securities and various relationships between securities in determining value. Certain investments, including certain restricted and illiquid securities and derivatives are also valued at fair value following procedures approved by the Trustees. Such valuations and procedures are reviewed periodically by the Trustees. The fair value of securities is generally determined as the amount that the fund could reasonably expect to realize from an orderly disposition of such securities over a reasonable period of time. By its nature, a fair value price is a good faith estimate of the value of a security at a given point in time and does not reflect an actual market price, which may be different by a material amount.
B) Security transactions and related investment income Security transactions are recorded on the trade date (date the order to buy or sell is executed). Gains or losses on securities sold are determined on the identified cost basis.
Interest income is recorded on the accrual basis. All premiums/discounts are amortized/accreted on a yield-to-maturity basis. The premium in excess of the call price, if any, is amortized to the call date; thereafter, any remaining premium is amortized to maturity.
C) Futures and options contracts The fund may use futures and options contracts to hedge against changes in the values of securities the fund owns, owned or expects to purchase, or for other investment purposes. The fund may also write options on swaps or securities it owns or in which it may invest to increase its current returns.
The potential risk to the fund is that the change in value of futures and options contracts may not correspond to the change in value of the hedged instruments. In addition, losses may arise from changes in the value of the underlying instruments, if there is an illiquid secondary market for the contracts, interest or exchange rates moving unexpectedly or if the counterparty to the contract is unable to perform. With futures, there is minimal counterparty credit risk to the fund since futures are exchange traded and the exchange’s clearinghouse, as counterparty to all exchange traded futures, guarantees the futures against default. Risks may exceed amounts recognized on the Statement of assets and liabilities. When the contract is closed, the fund records a realized gain or loss equal to the difference between the value of the contract at the time it was opened and the value at the time it was closed. Realized gains and losses on purchased options are included in realized gains and losses on investment securities. If a written call option is exercised, the premium originally received is recorded as an addition to sales proceeds. If a written put option is exercised, the premium originally received is recorded as a reduction to the cost of investments.
Futures contracts are valued at the quoted daily settlement prices established by the exchange on which they trade. The fund and the broker agree to exchange an amount of cash equal to the daily fluctuation in the value of the futures contract. Such receipts or payments are known as “variation margin.” Exchange traded options are valued at the last sale price or, if no sales are reported, the last bid price for purchased options and the last ask price for written options. Options traded over-the-counter are valued using prices supplied by dealers. Futures and written option contracts outstanding at period end, if any, are listed after the fund’s portfolio.
D) Total return swap contracts The fund may enter into total return swap contracts, which are arrangements to exchange a market linked return for a periodic payment, both based on a notional principal amount, to help enhance the funds return and manage the fund’s exposure to credit risk. To the extent that the total return of the security, index or other financial measure underlying the transaction exceeds or falls short of the offsetting interest rate obligation, the fund will receive a payment from or make a payment to the counterparty. Total return swap contracts are marked to market daily based upon quotations from market makers and the change, if any, is recorded as an unrealized gain or loss. Payments received or made are recorded as realized gains or losses. Certain total return swap contracts may include extended effective dates. Payments related to these swap contracts are accrued based on the terms of the con tract. The fund could be exposed to credit or market risk due to unfavorable changes in the fluctuation of interest rates or in the price of the underlying security or index, the possibility that there is no liquid market for these agreements or that the counterparty may default on its obligation to perform. The fund’s maximum risk of loss from counterparty risk is the fair value of the contract. This risk may
28
be mitigated by having a master netting arrangement between the fund and the counterparty. Risk of loss may exceed amounts recognized on the Statement of assets and liabilities. Total return swap contracts outstanding at period end, if any, are listed after the fund’s portfolio.
E) Master agreements The fund is a party to ISDA (International Swap and Derivatives Association, Inc.) Master Agreements (“Master Agreements”) with certain counterparties that govern over the counter derivative and foreign exchange contracts entered into from time to time. The Master Agreements may contain provisions regarding, among other things, the parties’ general obligations, representations, agreements, collateral requirements, events of default and early termination. With respect to certain counterparties, in accordance with the terms of the Master Agreements, collateral posted to the fund is held in a segregated account by the fund’s custodian and with respect to those amounts which can be sold or repledged, are presented in the fund’s portfolio; collateral pledged by the fund is segregated by the fund’s custodian and identified in the fund’s portfolio. Collateral can be in the fo rm of cash or debt securities issued by the U.S. Government or related agencies or other securities as agreed to by the fund and the applicable counterparty. Collateral requirements are determined based on the fund’s net position with each counterparty. Termination events applicable to the fund may occur upon a decline in the fund’s net assets below a specified threshold over a certain period of time. Termination events applicable to counterparties may occur upon a decline in the counterparty’s long-term and short-term credit ratings below a specified level. In each case, upon occurrence, the other party may elect to terminate early and cause settlement of all derivative and foreign exchange contracts outstanding, including the payment of any losses and costs resulting from such early termination, as reasonably determined by the terminating party. Any decision by one or more of the fund’s counterparties to elect early termination could impact the fund’s future derivative activity.
F) Federal taxes It is the policy of the fund to distribute all of its income within the prescribed time and otherwise comply with the provisions of the Internal Revenue Code of 1986, as amended (the “Code”), applicable to regulated investment companies. It is also the intention of the fund to distribute an amount sufficient to avoid imposition of any excise tax under Section 4982 of the Code. The fund is subject to the provisions of FASB Interpretation No. 48, Accounting for Uncertainties in Income Taxes (“FIN 48”). FIN 48 sets forth a minimum threshold for financial statement recognition of the benefit of a tax position taken or expected to be taken in a tax return. The fund did not have any unrecognized tax benefits in the accompanying financial statements. No provision has been made for federal taxes on income, capital gains or unrealized appreciation on securities held nor for excise tax on income a nd capital gains. Each of the fund’s federal tax returns for the prior three fiscal years remains subject to examination by the Internal Revenue Service and state departments of revenue.
At May 31, 2009, the fund had a capital loss carryover of $773,467 available to the extent allowed by the Code to offset future net capital gain, if any. The amount of the carryover and the expiration dates are:
| | | |
| Loss Carryover | Expiration | | |
| | |
| $360,245 | May 31, 2010 | | |
| | |
| 413,222 | May 31, 2017 | | |
| | |
Pursuant to federal income tax regulations applicable to regulated investment companies, the fund has elected to defer to its fiscal year ending May 31, 2010 $276,250 of losses recognized during the period November 1, 2008 to May 31, 2009.
G) Distributions to shareholders Income dividends are recorded daily by the fund and are paid monthly. Distributions from capital gains, if any, are recorded on the ex-dividend date and paid at least annually. The amount and character of income and gains to be distributed are determined in accordance with income tax regulations which may differ from generally accepted accounting principles. These differences include temporary and/or permanent differences of post-October loss deferrals, the expiration of a capital loss carryover,dividends payable and straddle loss deferrals. Reclassifications are made to the fund’s capital accounts to reflect income and gains available for distribution (or available capital loss carryovers) under income tax regulations. For the year ended May 31, 2009, the fund reclassified $120,594 to increase distribution in excess of net investment income and $318, 560 to decrease paid-in-capital, with a decrease to accumulated net realized losses of $439,154.
The tax basis components of distributable earnings and the federal tax cost as of May 31, 2009 were as follows:
| |
| Unrealized appreciation | $6,204,455 |
| Unrealized depreciation | (3,350,859) |
|
| Net unrealized appreciation | 2,853,596 |
| Undistributed tax-exempt income | 31,606 |
| Undistributed ordinary income | 53,954 |
| Capital loss carryforward | (773,467) |
| Post-October loss | (276,250) |
|
| Cost for federal income tax purposes | $149,685,796 |
Note 2: Management fee, administrative services and other transactions
The fund pays Putnam Management for management and investment advisory services quarterly based on the average net assets of the fund. Such fee is based on the lesser of (i) an annual rate of 0.50% of the average net assets of the fund or (ii) the following annual rates expressed as a percentage of the fund’s average net assets: 0.60% of the first $500 million, 0.50% of the next $500 million, 0.45% of the next $500 million, 0.40% of the next $5 billion, 0.375% of the next $5 billion, 0.355% of the next $5 billion, 0.34% of the next $5 billion and 0.33% thereafter.
Putnam Management has agreed to waive fees and reimburse expenses of the fund through July 31, 2009 to the extent necessary to ensure that the fund’s expenses do not exceed the simple average of the expenses of all front-end load funds viewed by Lipper Inc. as having the same investment classification or objective as the fund. The expense reimbursement is based on a comparison of the fund’s expenses with the average annualized operating expenses of the funds in its Lipper peer group for each calendar quarter during the fund’s last fiscal year, excluding 12b-1 fees and without giving effect to any expense offset and brokerage/service arrangements that may reduce fund expenses. For the year ended May 31, 2009, Putnam Management waived $91,685 of its management fee from the fund.
The fund reimburses Putnam Management an allocated amount for the compensation and related expenses of certain officers of the fund and their staff who provide administrative services to the fund. The aggregate amount of all such reimbursements is determined annually by the Trustees.
Custodial functions for the fund’s assets are provided by State Street Bank and Trust Company (“State Street”). Custody fees are based on the fund’s asset level, the number of its security holdings and transaction volumes.
Putnam Investor Services, Inc., an affiliate of Putnam Management, provided investor servicing agent functions to the fund. Prior to December 31, 2008, these services were provided by Putnam Investor Services, a division of Putnam Fiduciary Trust Company (“PFTC”), which is an affiliate of Putnam Management. Putnam Investor Services, Inc. and Putnam Investor Services received fees for investor servicing, subject to certain limitations, based on the number of shareholder accounts in the fund and the level of defined contribution plan assets in the fund. The amounts incurred for investor servicing agent functions provided by affiliates of Putnam Management during the year ended May 31, 2009 are included in Investor servicing fees in the Statement of operations.
The fund has entered into expense offset arrangements with PFTC and State Street whereby PFTC’s and State Street’s fees are reduced by credits allowed
29
on cash balances. For the year ended May 31, 2009, the fund’s expenses were reduced by $10,234 under the expense offset arrangements.
Each independent Trustee of the fund receives an annual Trustee fee, of which $339, as a quarterly retainer, has been allocated to the fund, and an additional fee for each Trustees meeting attended. Trustees receive additional fees for attendance at certain committee meetings and industry seminars and for certain compliance-related matters. Trustees also are reimbursed for expenses they incur relating to their services as Trustees.
The fund has adopted a Trustee Fee Deferral Plan (the “Deferral Plan”) which allows the Trustees to defer the receipt of all or a portion of Trustees fees payable on or after July 1, 1995. The deferred fees remain invested in certain Putnam funds until distribution in accordance with the Deferral Plan.
The fund has adopted an unfunded noncontributory defined benefit pension plan (the “Pension Plan”) covering all Trustees of the fund who have served as a Trustee for at least five years and were first elected prior to 2004. Benefits under the Pension Plan are equal to 50% of the Trustee’s average annual attendance and retainer fees for the three years ended December 31, 2005. The retirement benefit is payable during a Trustee’s lifetime, beginning the year following retirement, for the number of years of service through December 31, 2006. Pension expense for the fund is included in Trustee compensation and expenses in the Statement of operations. Accrued pension liability is included in Payable for Trustee compensation and expenses in the Statement of assets and liabilities. The Trustees have terminated the Pension Plan with respect to any Trustee first elected after 2003.
The fund has adopted distribution plans (the “Plans”) with respect to its class A, class B, class C and class M shares pursuant to Rule 12b-1 under the Investment Company Act of 1940. The purpose of the Plans is to compensate Putnam Retail Management Limited Partnership, a wholly-owned subsidiary of Putnam, LLC and Putnam Retail Management GP, Inc., for services provided and expenses incurred in distributing shares of the fund. The Plans provide for payments by the fund to Putnam Retail Management Limited Partnership at an annual rate of up to 0.35%, 1.00%, 1.00% and 1.00% of the average net assets attributable to class A, class B, class C and class M shares, respectively. The Trustees have approved payment by the fund at the annual rate of 0.85%, 1.00% and 0.50% of the average net assets for class B, class C and class M shares, respectively. For class A shares, the annual payment rate will equal the weighted average of (i) 0.20% on the net assets of the f und attributable to class A shares purchased and paid for prior to April 1, 2005 and (ii) 0.25% on all other net assets of the fund attributable to class A shares.
For the year ended May 31, 2009, Putnam Retail Management Limited Partnership, acting as underwriter, received net commissions of $26,930 and $147 from the sale of class A and class M shares, respectively, and received $2,909 and $3,655 in contingent deferred sales charges from redemptions of class B and class C shares, respectively.
A deferred sales charge of up to 1.00% is assessed on certain redemptions of class A shares that were purchased without an initial sales charge as part of an investment of $1 million or more. For the year ended May 31, 2009 Putnam Retail Management Limited Partnership, acting as underwriter, received $22,922 on class A redemptions.
Note 3: Purchases and sales of securities
During the year ended May 31, 2009, cost of purchases and proceeds from sales of investment securities other than short-term investments aggregated $28,508,442 and $31,136,019, respectively. There were no purchases or sales of U.S. government securities.
Note 4: Capital shares
At May 31, 2009, there was an unlimited number of shares of beneficial interest authorized. Transactions in capital shares were as follows:
| | | | |
| | Year ended 5/31/09 | Year ended 5/31/08 |
|
| Class A | Shares | Amount | Shares | Amount |
|
| Shares sold | 3,118,855 | $26,658,352 | 2,068,954 | $18,510,533 |
|
| Shares issued in | 496,002 | 4,234,566 | 443,354 | 3,959,065 |
| connection with | | | | |
| reinvestment of | | | | |
| distributions | | | | |
|
| | 3,614,857 | 30,892,918 | 2,512,308 | 22,469,598 |
|
| Shares | (3,375,148) | (28,460,691) | (2,096,696) | (18,750,891) |
| repurchased | | | | |
|
| Net increase | 239,709 | $2,432,227 | 415,612 | $3,718,707 |
|
| |
| | Year ended 5/31/09 | Year ended 5/31/08 |
|
| Class B | Shares | Amount | Shares | Amount |
|
| Shares sold | 46,617 | $400,610 | 56,799 | $512,310 |
|
| Shares issued in | 22,557 | 192,540 | 31,079 | 277,346 |
| connection with | | | | |
| reinvestment of | | | | |
| distributions | | | | |
|
| | 69,174 | 593,150 | 87,878 | 789,656 |
|
| Shares | (371,169) | (3,150,709) | (500,541) | (4,483,021) |
| repurchased | | | | |
|
| Net decrease | (301,995) | $(2,557,559) | (412,663) | $(3,693,365) |
|
| |
| | Year ended 5/31/09 | Year ended 5/31/08 |
|
| Class C | Shares | Amount | Shares | Amount |
|
| Shares sold | 351,214 | $3,042,664 | 309,890 | $2,771,883 |
|
| Shares issued in | 9,601 | 81,880 | 1,476 | 13,133 |
| connection with | | | | |
| reinvestment of | | | | |
| distributions | | | | |
|
| | 360,815 | 3,124,544 | 311,366 | 2,785,016 |
|
| Shares | (139,313) | (1,187,804) | (2,546) | (22,799) |
| repurchased | | | | |
|
| Net increase | 221,502 | $1,936,740 | 308,820 | $2,762,217 |
|
| |
| | Year ended 5/31/09 | Year ended 5/31/08 |
|
| Class M | Shares | Amount | Shares | Amount |
|
| Shares sold | 20,201 | $168,538 | 1,329 | $11,906 |
|
| Shares issued in | 3,840 | 32,823 | 3,625 | 32,403 |
| connection with | | | | |
| reinvestment of | | | | |
| distributions | | | | |
|
| | 24,041 | 201,361 | 4,954 | 44,309 |
|
| Shares | (10,949) | (93,784) | (23,514) | (210,485) |
| repurchased | | | | |
|
| Net increase | 13,092 | $107,577 | (18,560) | $(166,176) |
| (decrease) | | | | |
|
30
| | | | |
| | | | For the period 1/2/08 |
| | | | (commencement of |
| | Year ended 5/31/09 | operations) to 5/31/08 |
|
| Class Y | Shares | Amount | Shares | Amount |
|
| Shares sold | 28,476 | $240,630 | 1,233 | $11,116 |
|
| Shares issued in | 490 | 4,172 | 20 | 180 |
| connection with | | | | |
| reinvestment of | | | | |
| distributions | | | | |
|
| | 28,966 | 244,802 | 1,253 | 11,296 |
|
| Shares | (3,505) | (29,855) | (122) | (1,121) |
| repurchased | | | | |
|
| Net increase | 25,461 | $214,947 | 1,131 | $10,175 |
|
At May 31, 2009, Putnam Investments, LLC owned 1,184 class Y shares of the fund (4% of class Y shares outstanding), valued at $10,407.
Note 5: Summary of derivative activity
As of May 31, 2009, the fund did not hold any derivative instruments.
The following is a summary of realized and unrealized gains or losses of derivative instruments on the Statement of operations for the year ended May 31, 2009 (see Note 1).
Amount of realized gain (loss) on derivatives recognized in income
| | | |
| Derivatives not accounted | | | |
| for as hedging instruments | | | |
| under Statement 133 | Futures | Swaps | Total |
|
| Credit contracts | — | 26,239 | 26,239 |
|
| Interest rate contracts | (338,202) | (64,225) | (402,427) |
|
| Total | (338,202) | (37,986) | (376,188) |
|
Change in unrealized appreciation (depreciation) on derivatives recognized in income
| | | |
| Derivatives not accounted | | | |
| for as hedging instruments | | | |
| under Statement 133 | Futures | Swaps | Total |
|
| Credit contracts | — | (102,180) | (102,180) |
|
| Interest rate contracts | (75,960) | — | (75,960) |
|
| Total | (75,960) | (102,180) | (178,140) |
|
Federal tax information (unaudited)
The fund has designated 99.04% of dividends paid from net investment income during the fiscal year as tax exempt for Federal income tax purposes.
The Form 1099 you receive in January 2010 will show the tax status of all distributions paid to your account in calendar 2009.
Note 6: Regulatory matters and litigation
In late 2003 and 2004, Putnam Management settled charges brought by the Securities and Exchange Commission (the “SEC”) and the Massachusetts Securities Division in connection with excessive short-term trading in Putnam funds. Distribution of payments from Putnam Management to certain open-end Putnam funds and their shareholders is expected to be completed in the next several months. These allegations and related matters have served as the general basis for certain lawsuits, including purported class action lawsuits against Putnam Management and, in a limited number of cases, some Putnam funds. Putnam Management believes that these lawsuits will have no material adverse effect on the funds or on Putnam Management’s ability to provide investment management services. In addition, Putnam Management has agreed to bear any costs incurred by the Putnam funds as a result of these matters.
Note 7: New accounting pronouncement
In April 2009, FASB issued FASB Staff Position FSP FAS 157-4 which amends FASB Statement No. 157, Fair Value Measurements, and is effective for interim and annual periods ending after June 15, 2009. FSP FAS 157-4 provides additional guidance when the volume and level of activity for the asset or liability measured at fair value has significantly decreased. Additionally, FSP FAS 157-4 expands disclosure by reporting entities with respect to categories of assets and liabilities carried at fair value. Putnam Management believes applying the provisions of FSP FAS 157-4 will not have a material impact on the fund’s financial statements.
Note 8: Market and credit risk
In the normal course of business, the fund trades financial instruments and enters into financial transactions where risk of potential loss exists due to changes in the market (market risk) or failure of the contracting party to the transaction to perform (credit risk). The fund may be exposed to additional credit risk that an institution or other entity with which the fund has unsettled or open transactions will default.
31
About the Trustees
Ravi Akhoury
Born 1947, Trustee since 2009
Mr. Akhoury serves as Advisor to New York Life Insurance Company, and previously was a Member of its Executive Management Committee. He is also a Director of Jacob Ballas Capital India (a non-banking finance company focused on private equity advisory services) and serves as a Trustee of American India Foundation and of the Rubin Museum, serving on its Investment Committee.
Previously, Mr. Akhoury was a Director and on the Compensation Committee of MaxIndia/New York Life Insurance Company in India. He was also Vice President and Investment Policy Committee Member of Fischer, Francis, Trees and Watts (a fixed-income portfolio management firm). He has also served on the Board of Bharti Telecom (an Indian telecommunications company), serving as a member of its Audit and Compensation committees, and as a member of the Audit Committee on the Board of Thompson Press (a publishing company). From 1992 to 2007, he was Chairman and CEO of MacKay Shields, a multi-product investment management firm with over $40 billion in assets under management.
Jameson A. Baxter
Born 1943, Trustee since 1994, Vice Chairman since 2005
Ms. Baxter is the President of Baxter Associates, Inc., a private investment firm.
Ms. Baxter serves as a Director of ASHTA Chemicals, Inc., and the Mutual Fund Directors Forum. Until 2007, she was a Director of Banta Corporation (a printing and supply chain management company), Ryerson, Inc. (a metals service corporation), and Advocate Health Care. Until 2004, she was a Director of BoardSource (formerly the National Center for Nonprofit Boards); and until 2002, she was a Director of Intermatic Corporation (a manufacturer of energy control products). She is Chairman Emeritus of the Board of Trustees, Mount Holyoke College, having served as Chairman for five years.
Ms. Baxter has held various positions in investment banking and corporate finance, including Vice President of and Consultant to First Boston Corporation and Vice President and Principal of the Regency Group. She is a graduate of Mount Holyoke College.
Charles B. Curtis
Born 1940, Trustee since 2001
Mr. Curtis is President and Chief Operating Officer of the Nuclear Threat Initiative (a private foundation dealing with national security issues), and serves as Senior Advisor to the United Nations Foundation.
Mr. Curtis is a member of the Council on Foreign Relations and serves as Director of Edison International and Southern California Edison. Until 2006, Mr. Curtis served as a member of the Trustee Advisory Council of the Applied Physics Laboratory, Johns Hopkins University. Until 2003, Mr. Curtis was a member of the Electric Power Research Institute Advisory Council and the University of Chicago Board of Governors for Argonne National Laboratory. Prior to 2002, Mr. Curtis was a member of the Board of Directors of the Gas Technology Institute and the Board of Directors of the Environment and Natural Resources Program Steering Committee, John F. Kennedy School of Government, Harvard University. Until 2001, Mr. Curtis was a member of the Department of Defense Policy Board and Director of EG&G Technical Services, Inc. (a fossil energy research and development support company).
From August 1997 to December 1999, Mr. Curtis was a Partner at Hogan & Hartson LLP, an international law firm headquartered in Washington, D.C. Prior to May 1997, Mr. Curtis was Deputy Secretary of Energy and Under Secretary of the U.S. Department of Energy. He served as Chairman of the Federal Energy Regulatory Commission from 1977 to 1981 and has held positions on the staff of the U.S. House of Representatives, the U.S. Treasury Department, and the SEC.
Robert J. Darretta
Born 1946, Trustee since 2007
Mr. Darretta serves as Director of United Health Group, a diversified health-care company.
Until April 2007, Mr. Darretta was Vice Chairman of the Board of Directors of Johnson & Johnson, one of the world’s largest and most broadly based health-care companies. Prior to 2007, he had responsibility for Johnson & Johnson’s finance, investor relations, information technology, and procurement function. He served as Johnson & Johnson Chief Financial Officer for a decade, prior to which he spent two years as Treasurer of the corporation and over ten years leading various Johnson & Johnson operating companies.
Mr. Darretta received a B.S. in Economics from Villanova University.
Myra R. Drucker
Born 1948, Trustee since 2004
Ms. Drucker is Chair of the Board of Trustees of Commonfund (a not-for-profit firm specializing in managing assets for educational endowments and foundations), Vice Chair of the Board of Trustees of Sarah Lawrence College, and a member of the Investment Committee of the Kresge Foundation (a charitable trust). She is also a Director of Interactive Data Corporation (a provider of financial market data and analytics to financial institutions and investors).
Ms. Drucker is an ex-officio member of the New York Stock Exchange (NYSE) Pension Managers Advisory Committee, having served as Chair for seven years. She serves as an advisor to RCM Capital Management (an investment management firm) and to the Employee Benefits Investment Committee of The Boeing Company (an aerospace firm).
From November 2001 until August 2004, Ms. Drucker was Managing Director and a member of the Board of Directors of General Motors Asset Management
32
and Chief Investment Officer of General Motors Trust Bank. From December 1992 to November 2001, Ms. Drucker served as Chief Investment Officer of Xerox Corporation (a document company). Prior to December 1992, Ms. Drucker was Staff Vice President and Director of Trust Investments for International Paper (a paper and packaging company).
Ms. Drucker received a B.A. degree in Literature and Psychology from Sarah Lawrence College and pursued graduate studies in economics, statistics, and portfolio theory at Temple University.
John A. Hill
Born 1942, Trustee since 1985 and Chairman since 2000
Mr. Hill is founder and Vice-Chairman of First Reserve Corporation, the leading private equity buyout firm specializing in the worldwide energy industry, with offices in Greenwich, Connecticut; Houston, Texas; London, England; and Shanghai, China. The firm’s investments on behalf of some of the nation’s largest pension and endowment funds are currently concentrated in 26 companies with annual revenues in excess of $13 billion, which employ over 100,000 people in 23 countries.
Mr. Hill is Chairman of the Board of Trustees of the Putnam Mutual Funds, a Director of Devon Energy Corporation and various private companies owned by First Reserve, and serves as a Trustee of Sarah Lawrence College where he chairs the Investment Committee.
Prior to forming First Reserve in 1983, Mr. Hill served as President of F. Eberstadt and Company, an investment banking and investment management firm. Between 1969 and 1976, Mr. Hill held various senior positions in Washington, D.C. with the federal government, including Deputy Associate Director of the Office of Management and Budget and Deputy Administrator of the Federal Energy Administration during the Ford Administration.
Born and raised in Midland, Texas, he received his B.A. in Economics from Southern Methodist University and pursued graduate studies as a Woodrow Wilson Fellow.
Paul L. Joskow
Born 1947, Trustee since 1997
Dr. Joskow is an economist and President of the Alfred P. Sloan Foundation (a philanthropic institution focused primarily on research and education on issues related to science, technology, and economic performance). He is on leave from his position as the Elizabeth and James Killian Professor of Economics and Management at the Massa-chusetts Institute of Technology (MIT), where he has been on the faculty since 1972. Dr. Joskow was the Director of the Center for Energy and Environmental Policy Research at MIT from 1999 through 2007.
Dr. Joskow serves as a Trustee of Yale University, as a Director of TransCanada Corporation (an energy company focused on natural gas transmission and power services) and of Exelon Corporation (an energy company focused on power services), and as a member of the Board of Overseers of the Boston Symphony Orchestra. Prior to August 2007, he served as a Director of National Grid (a UK-based holding company with interests in electric and gas transmission and distribution and telecommunications infrastructure). Prior to July 2006, he served as President of the Yale University Council. Prior to February 2005, he served on the board of the White-head Institute for Biomedical Research (a non-profit research institution). Prior to February 2002, he was a Director of State Farm Indemnity Company (an automobile insurance company), and prior to March 2000, he was a Director of New England Electric System (a public utility holding company).
Dr. Joskow has published six books and numerous articles on industrial organization, government regulation of industry, and competition policy. He is active in industry restructuring, environmental, energy, competition, and privatization policies —serving as an advisor to governments and corporations worldwide. Dr. Joskow holds a Ph.D. and MPhil from Yale University and a B.A. from Cornell University.
Elizabeth T. Kennan
Born 1938, Trustee since 1992
Dr. Kennan is a Partner of Cambus-Kenneth Farm (thoroughbred horse and cattle breeding). She is President Emeritus of Mount Holyoke College.
Dr. Kennan served as Chairman and is now Lead Director of Northeast Utilities. She is a Trustee of the National Trust for Historic Preservation, of Centre College, and of Midway College in Midway, Kentucky. Until 2006, she was a member of The Trustees of Reservations. Prior to 2001, Dr. Kennan served on the oversight committee of the Folger Shakespeare Library. Prior to June 2005, she was a Director of Talbots, Inc., and she has served as Director on a number of other boards, including Bell Atlantic, Chastain Real Estate, Shawmut Bank, Berkshire Life Insurance, and Kentucky Home Life Insurance. Dr. Kennan has also served as President of Five Colleges Incorporated and as a Trustee of the University of Notre Dame, and is active in various educational and civic associations.
As a member of the faculty of Catholic University for twelve years, until 1978, Dr. Kennan directed the post-doctoral program in Patristic and Medieval Studies, taught history, and published numerous articles and two books. Dr. Kennan holds a Ph.D. from the University of Washington in Seattle, an M.S. from St. Hilda’s College at Oxford University, and an A.B. from Mount Holyoke College. She holds several honorary doctorates.
Kenneth R. Leibler
Born 1949, Trustee since 2006
Mr. Leibler is a founder and former Chairman of the Boston Options Exchange, an electronic marketplace for the trading of derivative securities.
33
Mr. Leibler currently serves as a Trustee of Beth Israel Deaconess Hospital in Boston. He is also Lead Director of Ruder Finn Group, a global communications and advertising firm, and a Director of Northeast Utilities, which operates New England’s largest energy delivery system. Prior to December 2006, he served as a Director of the Optimum Funds group. Prior to October 2006, he served as a Director of ISO New England, the organization responsible for the operation of the electric generation system in the New England states. Prior to 2000, Mr. Leibler was a Director of the Investment Company Institute in Washington, D.C.
Prior to January 2005, Mr. Leibler served as Chairman and Chief Executive Officer of the Boston Stock Exchange. Prior to January 2000, he served as President and Chief Executive Officer of Liberty Financial Companies, a publicly traded diversified asset management organization. Prior to June 1990, Mr. Leibler served as President and Chief Operating Officer of the American Stock Exchange (AMEX), and at the time was the youngest person in AMEX history to hold the title of President. Prior to serving as AMEX President, he held the position of Chief Financial Officer, and headed its management and marketing operations. Mr. Leibler graduated magna cum laude with a degree in Economics from Syra-cuse University, where he was elected Phi Beta Kappa.
Robert E. Patterson
Born 1945, Trustee since 1984
Mr. Patterson is Senior Partner of Cabot Properties, LP and Chairman of Cabot Properties, Inc. (a private equity firm investing in commercial real estate).
Mr. Patterson serves as Chairman Emeritus and Trustee of the Joslin Diabetes Center. Prior to June 2003, he was a Trustee of Sea Education Association. Prior to December 2001, Mr. Patterson was President and Trustee of Cabot Industrial Trust (a publicly traded real estate investment trust). Prior to February 1998, he was Executive Vice President and Director of Acquisitions of Cabot Partners Limited Partnership (a registered investment adviser involved in institutional real estate investments). Prior to 1990, he served as Executive Vice President of Cabot, Cabot & Forbes Realty Advisors, Inc. (the predecessor company of Cabot Partners). Mr. Patterson practiced law and held various positions in state government, and was the founding Executive Director of the Massa-chusetts Industrial Finance Agency. Mr. Patterson is a graduate of Harvard College and Harvard Law School.
George Putnam, III
Born 1951, Trustee since 1984
Mr. Putnam is Chairman of New Generation Research, Inc. (a publisher of financial advisory and other research services), and President of New Generation Advisers, Inc. (a registered investment adviser to private funds). Mr. Putnam founded the New Generation companies in 1986.
Mr. Putnam is a Director of The Boston Family Office, LLC (a registered investment adviser). He is a Trustee of St. Mark’s School and a Trustee of the Marine Biological Laboratory in Woods Hole, Massachusetts. Until 2006, he was a Trustee of Shore Country Day School, and until 2002, was a Trustee of the Sea Education Association.
Mr. Putnam previously worked as an attorney with the law firm of Dechert LLP (formerly known as Dechert Price & Rhoads) in Philadelphia. He is a graduate of Harvard College, Harvard Business School, and Harvard Law School.
Robert L. Reynolds*
Born 1952, Trustee since 2008 and President of the Funds since 2009
Mr. Reynolds is President and Chief Executive Officer of Putnam Investments, a member of Putnam Investments’ Executive Board of Directors, and President of the Putnam Funds. He has more than 30 years of investment and financial services experience.
Prior to joining Putnam Investments in 2008, Mr. Reynolds was Vice Chairman and Chief Operating Officer of Fidelity Investments from 2000 to 2007. During this time, he served on the Board of Directors for FMR Corporation, Fidelity Investments Insurance Ltd., Fidelity Investments Canada Ltd., and Fidelity Management Trust Company. He was also a Trustee of the Fidelity Family of Funds. From 1984 to 2000, Mr. Reynolds served in a number of increasingly responsible leadership roles at Fidelity.
Mr. Reynolds serves on several not-for-profit boards, including those of the West Virginia University Foundation, Concord Museum, Dana-Farber Cancer Institute, Lahey Clinic, and Initiative for a Competitive Inner City in Boston. He is a member of the Chief Executives Club of Boston, the National Innovation Initiative, and the Council on Competitiveness.
Mr. Reynolds received a B.S. in Business Administration/Finance from West Virginia University.
W. Thomas Stephens
Born 1942, Trustee since 2009
Mr. Stephens is a Director of TransCanada Pipelines, Ltd. (an energy infrastructure company). From 1997 to 2008, Mr. Stephens served as a Trustee on the Board of the Putnam Funds, which he rejoined as a Trustee in 2009.
Mr. Stephens retired as Chairman and Chief Executive Officer of Boise Cascade, L.L.C. (a paper, forest products, and timberland assets company) in December 2008. Until 2004, Mr. Stephens was a Director of Xcel Energy Incorporated (a public utility company), Qwest Communications, and Norske Canada, Inc. (a paper manufacturer). Until 2003, Mr. Stephens was a Director of Mail-Well, Inc. (a diversified printing company). He served as Chairman of Mail-Well until 2001 and as CEO of MacMillan Bloedel, Ltd. (a forest products company) until 1999. Prior to 1996, Mr. Stephens was Chairman and Chief Executive Officer of Johns Manville Corporation.
He holds B.S. and M.S. degrees from the University of Arkansas.
34
Richard B. Worley
Born 1945, Trustee since 2004
Mr. Worley is Managing Partner of Permit Capital LLC, an investment management firm.
Mr. Worley serves as a Trustee of the University of Pennsylvania Medical Center, The Robert Wood Johnson Foundation (a philanthropic organization devoted to health-care issues), and the National Constitution Center. He is also a Director of The Colonial Williamsburg Foundation (a historical preservation organization), and the Philadelphia Orchestra Association. Mr. Worley also serves on the investment committees of Mount Holyoke College and World Wildlife Fund (a wildlife conservation organization).
Prior to joining Permit Capital LLC in 2002, Mr. Worley served as President, Chief Executive Officer, and Chief Investment Officer of Morgan Stanley Dean Witter Investment Management and as a Managing Director of Morgan Stanley, a financial services firm. Mr. Worley also was the Chairman of Miller Anderson & Sherrerd, an investment management firm that was acquired by Morgan Stanley in 1996.
Mr. Worley holds a B.S. degree from the University of Tennessee and pursued graduate studies in economics at the University of Texas.
The address of each Trustee is One Post Office Square, Boston, MA 02109.
As of May 31, 2009, there were over 100 Putnam funds. All Trustees serve as Trustees of all Putnam funds.
Each Trustee serves for an indefinite term, until his or her resignation, retirement at age 72, death, or removal.
* Trustee who is an “interested person” (as defined in the Investment Company Act of 1940) of the fund, Putnam Management, and/or Putnam Retail Management. Mr. Reynolds is President and Chief Executive Officer of Putnam Investments, as well as the President of your fund and each of the other Putnam funds.
35
Officers
In addition to Robert L. Reynolds, the other officers of the fund are shown below:
| | |
| Charles E. Porter (Born 1938) | James P. Pappas (Born 1953) | Wanda M. McManus (Born 1947) |
| Executive Vice President, Principal | Vice President | Vice President, Senior Associate |
| Executive Officer, Associate Treasurer, | Since 2004 | Treasurer and Assistant Clerk |
| and Compliance Liaison | Managing Director, Putnam Investments | Since 2005 |
| Since 1989 | and Putnam Management. During 2002, | Senior Associate Treasurer/Assistant Clerk |
| Jonathan S. Horwitz (Born 1955) | Chief Operating Officer, Atalanta/Sosnoff | of Funds |
| Senior Vice President and Treasurer | Management Corporation | |
| Since 2004 | | Nancy E. Florek (Born 1957) |
| Prior to 2004, Managing Director, | Francis J. McNamara, III (Born 1955) | Vice President, Assistant Clerk, |
| Putnam Investments | Vice President and Chief Legal Officer | Assistant Treasurer and Proxy Manager |
| Since 2004 | Since 2005 |
| Steven D. Krichmar (Born 1958) | Senior Managing Director, Putnam | Manager, Mutual Fund Proxy Voting |
| Vice President and | Investments, Putnam Management and | |
| Principal Financial Officer | Putnam Retail Management. Prior to 2004, | |
| Since 2002 | General Counsel, State Street Research & | |
| Senior Managing Director, | Management Company | |
| Putnam Investments | | |
| Robert R. Leveille (Born 1969) | |
| Janet C. Smith (Born 1965) | Vice President and | |
| Vice President, Principal Accounting | Chief Compliance Officer | |
| Officer and Assistant Treasurer | Since 2007 | |
| Since 2007 | Managing Director, Putnam Investments, | |
| Managing Director, Putnam Investments | Putnam Management, and Putnam Retail | |
| and Putnam Management | Management. Prior to 2004, member of | |
| | Bell Boyd & Lloyd LLC. Prior to 2003, | |
| Susan G. Malloy (Born 1957) | Vice President and Senior Counsel, | |
| Vice President and Assistant Treasurer | Liberty Funds Group LLC | |
| Since 2007 | | |
| Managing Director, Putnam Investments | Mark C. Trenchard (Born 1962) | |
| | Vice President and | |
| Beth S. Mazor (Born 1958) | BSA Compliance Officer | |
| Vice President | Since 2002 | |
| Since 2002 | Managing Director, Putnam Investments | |
| Managing Director, Putnam Investments | | |
| | Judith Cohen (Born 1945) | |
| | Vice President, | |
| | Clerk and Assistant Treasurer | |
| | Since 1993 | |
The address of each Officer is One Post Office Square, Boston, MA 02109.
36
Fund information
Founded over 70 years ago, Putnam Investments was built around the concept that a balance between risk and reward is the hallmark of a well-rounded financial program. We manage over 100 mutual funds across income, value, blend, growth, asset allocation, absolute return, and global sector categories.
| | |
| Investment Manager | Officers | Judith Cohen |
| Putnam Investment | Robert L. Reynolds | Vice President, Clerk and |
| Management, LLC | President | Assistant Treasurer |
| One Post Office Square | | |
| Boston, MA 02109 | Charles E. Porter | Wanda M. McManus |
| Executive Vice President, Principal | Vice President, Senior Associate Treasurer |
| Marketing Services | Executive Officer, Associate Treasurer | and Assistant Clerk |
| Putnam Retail Management | and Compliance Liaison | |
| One Post Office Square | | Nancy E. Florek |
| Boston, MA 02109 | Jonathan S. Horwitz | Vice President, Assistant Clerk, Assistant |
| Senior Vice President and Treasurer | Treasurer and Proxy Manager |
| Custodian | | |
| State Street Bank and Trust Company | Steven D. Krichmar | |
| | Vice President and Principal | |
| Legal Counsel | Financial Officer | |
| Ropes & Gray LLP | | |
| Janet C. Smith | |
| Independent Registered Public | Vice President, Principal Accounting | |
| Accounting Firm | Officer and Assistant Treasurer | |
| PricewaterhouseCoopers LLP | | |
| | Susan G. Malloy | |
| Trustees | Vice President and Assistant Treasurer | |
| John A. Hill, Chairman | | |
| Jameson A. Baxter, Vice Chairman | Beth S. Mazor | |
| Ravi Akhoury | Vice President | |
| Charles B. Curtis | | |
| Robert J. Darretta | James P. Pappas | |
| Myra R. Drucker | Vice President | |
| Paul L. Joskow | | |
| Elizabeth T. Kennan | Francis J. McNamara, III | |
| Kenneth R. Leibler | Vice President and Chief Legal Officer | |
| Robert E. Patterson | | |
| George Putnam, III | Robert R. Leveille | |
| Robert L. Reynolds | Vice President and | |
| W. Thomas Stephens | Chief Compliance Officer | |
| Richard B. Worley | | |
| Mark C. Trenchard | |
| Vice President and BSA Compliance Officer | |
| | |
| | |
| | |
| | |
This report is for the information of shareholders of Putnam Ohio Tax Exempt Income Fund. It may also be used as sales literature when preceded or accompanied by the current prospectus, the most recent copy of Putnam’s Quarterly Performance Summary, and Putnam’s Quarterly Ranking Summary. For more recent performance, please visit putnam.com. Investors should carefully consider the investment objective, risks, charges, and expenses of a fund, which are described in its prospectus. For this and other information or to request a prospectus, call 1-800-225-1581 toll free. Please read the prospectus carefully before investing. The fund’s Statement of Additional Information contains additional information about the fund’s Trustees and is available without charge upon request by calling 1-800-225-1581.

Item 2. Code of Ethics:
(a) The fund’s principal executive, financial and accounting officers are employees of Putnam Investment Management, LLC, the Fund's investment manager. As such they are subject to a comprehensive Code of Ethics adopted and administered by Putnam Investments which is designed to protect the interests of the firm and its clients. The Fund has adopted a Code of Ethics which incorporates the Code of Ethics of Putnam Investments with respect to all of its officers and Trustees who are employees of Putnam Investment Management, LLC. For this reason, the Fund has not adopted a separate code of ethics governing its principal executive, financial and accounting officers.
(c) In May 2008, the Code of Ethics of Putnam Investment Management, LLC was updated in its entirety to include the amendments adopted in August 2007 as well as a several additional technical, administrative and non-substantive changes. In May of 2009, the Code of Ethics of Putnam Investment Management, LLC was amended to reflect that all employees will now be subject to a 90-day blackout restriction on holding Putnam open-end funds, except for portfolio managers and their supervisors (and each of their immediate family members), who will be subject to a one-year blackout restriction on the funds that they manage or supervise.
Item 3. Audit Committee Financial Expert:
The Funds' Audit and Compliance Committee is comprised solely of Trustees who are "independent" (as such term has been defined by the Securities and Exchange Commission ("SEC") in regulations implementing Section 407 of the Sarbanes-Oxley Act (the "Regulations")). The Trustees believe that each of the members of the Audit and Compliance Committee also possess a combination of knowledge and experience with respect to financial accounting matters, as well as other attributes, that qualify them for service on the Committee. In addition, the Trustees have determined that each of Mr. Patterson, Mr. Leibler, Mr. Hill, Mr. Darretta and Mr. Stephens qualifies as an "audit committee financial expert" (as such term has been defined by the Regulations) based on their review of his pertinent experience and education. The SEC has stated that the designation or identification of a person as an audit committee financial expert pursuant to this Item 3 of Form N-CSR does not impose on such person any duties, obligations or liability that are greater than the duties, obligations and liability imposed on such person as a member of the Audit and Compliance Committee and the Board of Trustees in the absence of such designation or identification.
Item 4. Principal Accountant Fees and Services:
The following table presents fees billed in each of the last two fiscal years for services rendered to the fund by the fund’s independent auditor:
| | | | |
| Fiscal | | Audit- | | |
| year | Audit | Related | Tax | All Other |
| ended | Fees | Fees | Fees | Fees |
| |
| May 31, 2009 | $61,646 | $-- | $8,044 | $291* |
| May 31, 2008 | $55,367 | $-- | $7,536 | $44* |
* Includes fees of $291 and $44 billed by the fund’s independent auditor to the fund for procedures necessitated by regulatory and litigation matters for the fiscal years ended May 31, 2009 and May 31, 2008, respectively. These fees were reimbursed to the fund by Putnam Investment Management, LLC (“Putnam Management”).
For the fiscal years ended May 31, 2009 and May 31, 2008, the fund’s independent auditor billed aggregate non-audit fees in the amounts of $490,160 and $54,632 respectively, to the fund, Putnam Management and any entity controlling, controlled by or under common control with Putnam Management that provides ongoing services to the fund.
Audit Fees represent fees billed for the fund's last two fiscal years relating to the audit and review of the financial statements included in annual reports and registration statements, and other services that are normally provided in connection with statutory and regulatory filings or engagements.
Audit-Related Fees represent fees billed in the fund’s last two fiscal years for services traditionally performed by the fund’s auditor, including accounting consultation for proposed transactions or concerning financial accounting and reporting standards and other audit or attest services not required by statute or regulation.
Tax Fees represent fees billed in the fund’s last two fiscal years for tax compliance, tax planning and tax advice services. Tax planning and tax advice services include assistance with tax audits, employee benefit plans and requests for rulings or technical advice from taxing authorities.
All Other Fees represent fees billed for services relating procedures necessitated by regulatory and litigation matters.
Pre-Approval Policies of the Audit and Compliance Committee. The Audit and Compliance Committee of the Putnam funds has determined that, as a matter of policy, all work performed for the funds by the funds’ independent auditors will be pre-approved by the Committee itself and thus will generally not be subject to pre-approval procedures.
The Audit and Compliance Committee also has adopted a policy to pre-approve the engagement by Putnam Management and certain of its affiliates of the funds’ independent auditors, even in circumstances where pre-approval is not required by applicable law. Any such requests by Putnam Management or certain of its affiliates are typically submitted in writing to the Committee and explain, among other things, the nature of the proposed engagement, the estimated fees, and why this work should be performed by that particular audit firm as opposed to another one. In reviewing such requests, the Committee considers, among other things, whether the provision of such services by the audit firm are compatible with the independence of the audit firm.
The following table presents fees billed by the fund’s independent auditor for services required to be approved pursuant to paragraph (c)(7)(ii) of Rule 2-01 of Regulation S-X.
| | | | |
| Fiscal | Audit- | | All | Total |
| year | Related | Tax | Other | Non-Audit |
| ended | Fees | Fees | Fees | Fees |
| |
| May 31, 2009 | $ - | $ 415,341 | $ - | $ - |
| May 31, 2008 | $ - | $ 15,000 | $ - | $ - |
Item 5. Audit Committee of Listed Registrants
Not applicable
Item 6. Schedule of Investments:
The registrant’s schedule of investments in unaffiliated issuers is included in the report to shareholders in Item 1 above.
Item 7. Disclosure of Proxy Voting Policies and Procedures For Closed-End Management Investment Companies:
Not applicable
Item 8. Portfolio Managers of Closed-End Investment Companies
Not Applicable
Item 9. Purchases of Equity Securities by Closed-End Management Investment Companies and Affiliated Purchasers:
Not applicable
Item 10. Submission of Matters to a Vote of Security Holders:
Not applicable
Item 11. Controls and Procedures:
(a) The registrant's principal executive officer and principal financial officer have concluded, based on their evaluation of the effectiveness of the design and operation of the registrant's disclosure controls and procedures as of a date within 90 days of the filing date of this report, that the design and operation of such procedures are generally effective to provide reasonable assurance that information required to be disclosed by the registrant in this report is recorded, processed, summarized and reported within the time periods specified in the Commission's rules and forms.
(b) Changes in internal control over financial reporting: Not applicable
Item 12. Exhibits:
(a)(1) The Code of Ethics of The Putnam Funds, which incorporates the Code of Ethics of Putnam Investments, is filed herewith.
(a)(2) Separate certifications for the principal executive officer and principal financial officer of the registrant as required by Rule 30a-2(a) under the Investment Company Act of 1940, as amended, are filed herewith.
(b) The certifications required by Rule 30a-2(b) under the Investment Company Act of 1940, as amended, are filed herewith.
SIGNATURES
Pursuant to the requirements of the Securities Exchange Act of 1934 and the Investment Company Act of 1940, the registrant has duly caused this report to be signed on its behalf by the undersigned, thereunto duly authorized.
Putnam Ohio Tax Exempt Income Fund
By (Signature and Title):
/s/Janet C. Smith
Janet C. Smith
Principal Accounting Officer
Date: July 29, 2009
Pursuant to the requirements of the Securities Exchange Act of 1934 and the Investment Company Act of 1940, this report has been signed below by the following persons on behalf of the registrant and in the capacities and on the dates indicated.
By (Signature and Title):
/s/Charles E. Porter
Charles E. Porter
Principal Executive Officer
Date: July 29, 2009
By (Signature and Title):
/s/Steven D. Krichmar
Steven D. Krichmar
Principal Financial Officer
Date: July 29, 2009